Cambridge A Level Mathematics 9709 — 2010 Oct/Nov Paper 7 · Variant 2
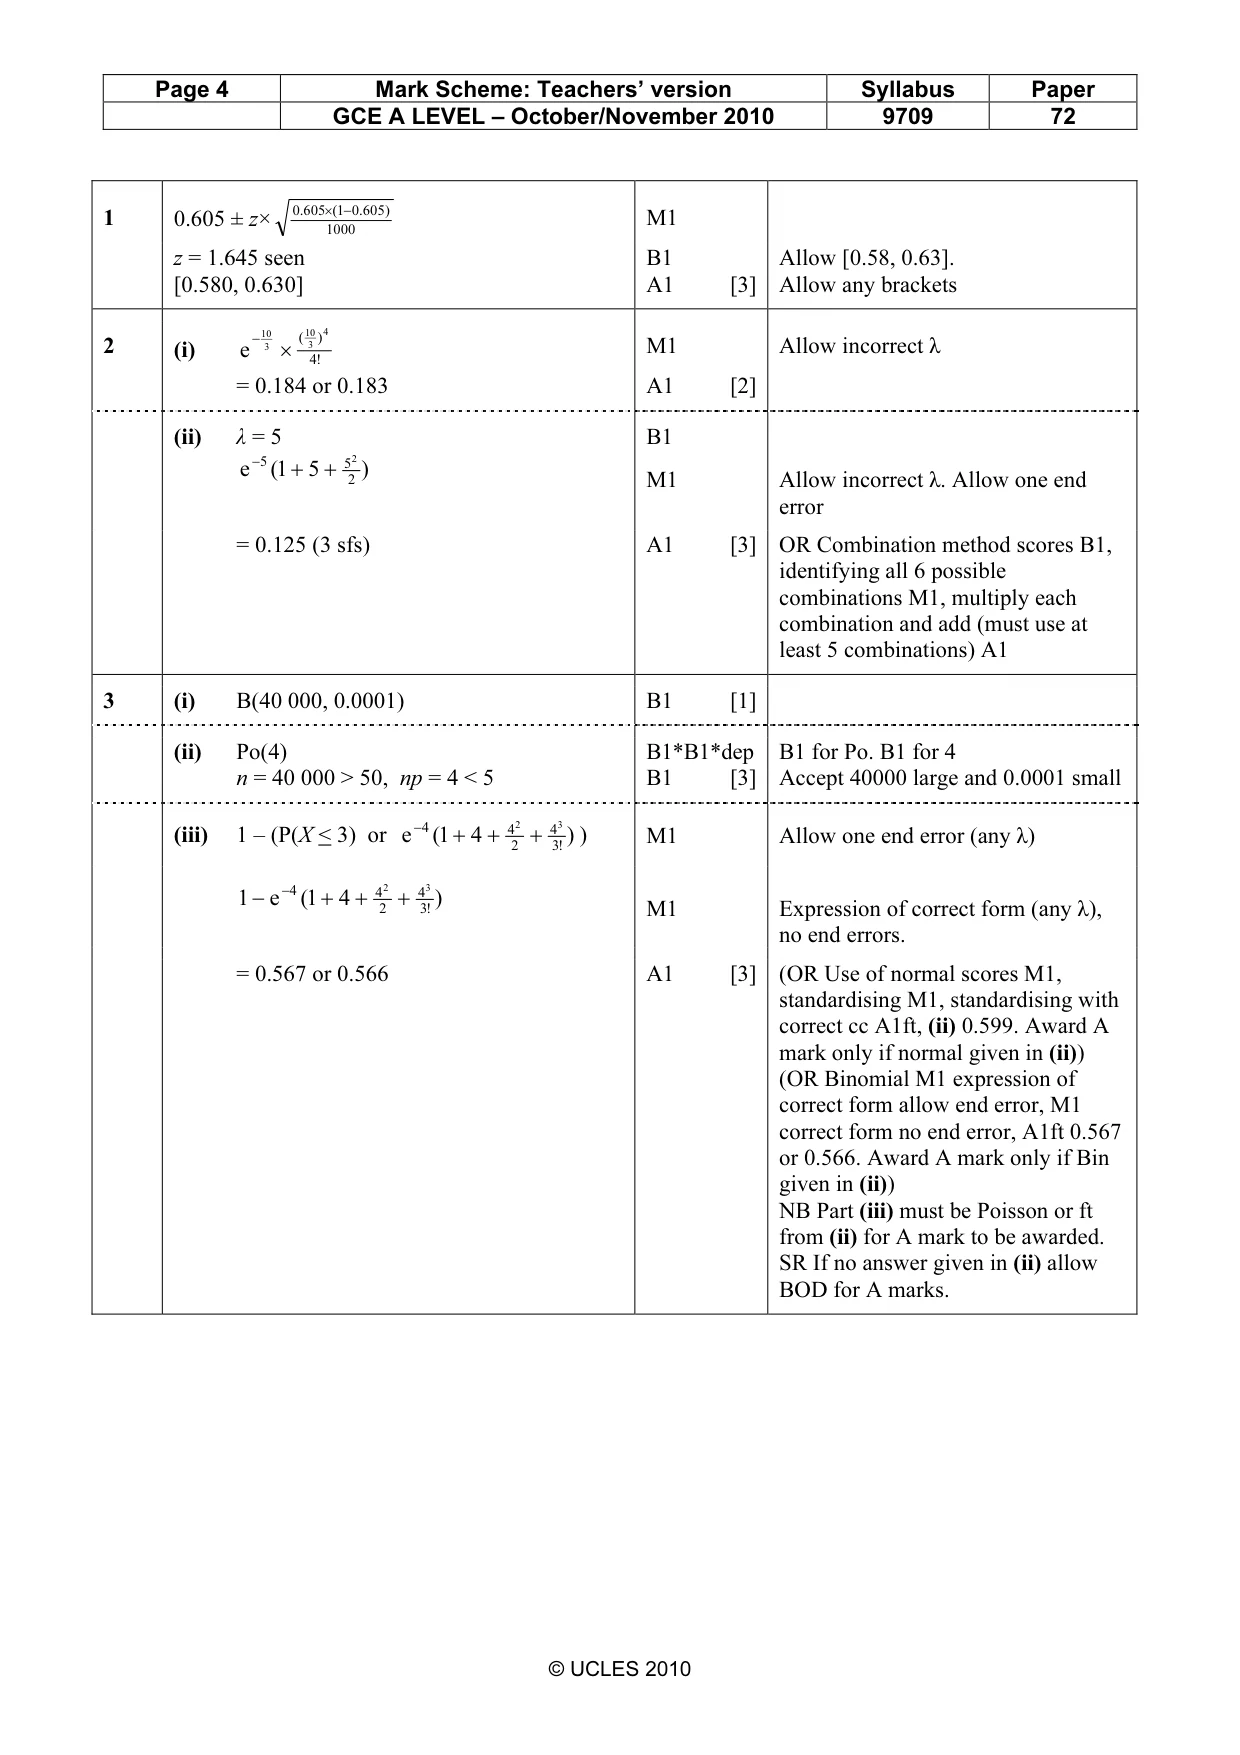
9709/72/O/N/10 · 7 questions · 50 marks · ≈56 min
The question paper and its mark scheme, free to read here and free to download. This is Cambridge’s own paper, exactly as it was sat.
Question paper4 pages
Mark scheme6 pages
Answers below. Sit the paper first if you are practising.
Questions as text
Q1 · In a survey of 1000 randomly chosen adults, 605 said that they used email
1 In a survey of 1000 randomly chosen adults, 605 said that they used email. Calculate a 90% confidence interval for the proportion of adults in the whole population who use email. [3]
Mark scheme: 1 0.605 ± z× .0605×10001(− .0 605 ) M1 z = 1.645 seen B1 Allow [0.58, 0.63]. [0.580, 0.630] A1 [3] Allow any brackets 10 ( 10 ) 4
Q2 · People arrive randomly and independently at a supermarket checkout at an average rate of…
2 People arrive randomly and independently at a supermarket checkout at an average rate of 2 people every 3 minutes. (i) Find the probability that exactly 4 people arrive in a 5-minute period. [2] At another checkout in the same supermarket, people arrive randomly and independently at an average rate of 1 person each minute. (ii) Find the probability that a total of fewer than 3 people arrive at the two checkouts in a 3-minute period. [3]
Mark scheme: − 103 ( 103 ) 42 (i) e × 4! M1 Allow incorrect λ = 0.184 or 0.183 A1 [2] (ii) λ = 5 B1 e −5 1( + 5 + 522 ) M1 Allow incorrect λ. Allow one end error = 0.125 (3 sfs) A1 [3] OR Combination method scores B1, identifying all 6 possible combinations M1, multiply each combination and add (must use at least 5 combinations) A1
Q3 · A book contains 40 000 words
3 A book contains 40 000 words. For each word, the probability that it is printed wrongly is 0.0001 and these errors occur independently. The number of words printed wrongly in the book is represented by the random variable X. (i) State the exact distribution of X, including the values of any parameters. [1] (ii) State an approximate distribution for X, including the values of any parameters, and explain why this approximate distribution is appropriate. [3] (iii) Use this approximate distribution to find the probability that there are more than 3 words printed wrongly in the book. [3]
Mark scheme: 3 (i) B(40 000, 0.0001) B1 [1] (ii) Po(4) B1*B1*dep B1 for Po. B1 for 4 n = 40 000 > 50, np = 4 < 5 B1 [3] Accept 40000 large and 0.0001 small (iii) 1 – (P(X < 3) or e −4 1( + 4 + 422 + 4!33 ) ) M1 Allow one end error (any λ) 1 − e −4 1( + 4 + 422 + 4!33 ) M1 Expression of correct form (any λ), no end errors. = 0.567 or 0.566 A1 [3] (OR Use of normal scores M1, standardising M1, standardising with correct cc A1ft, (ii) 0.599. Award A mark only if normal given in (ii)) (OR Binomial M1 expression of correct form allow end error, M1 correct form no end error, A1ft 0.567 or 0.566. Award A mark only if Bin given in (ii)) NB Part (iii) must be Poisson or ft from (ii) for A mark to be awarded. SR If no answer given in (ii) allow BOD for A marks. GCE A LEVEL – October/November 2010 9709 72 1.5 ( ) ∫ d
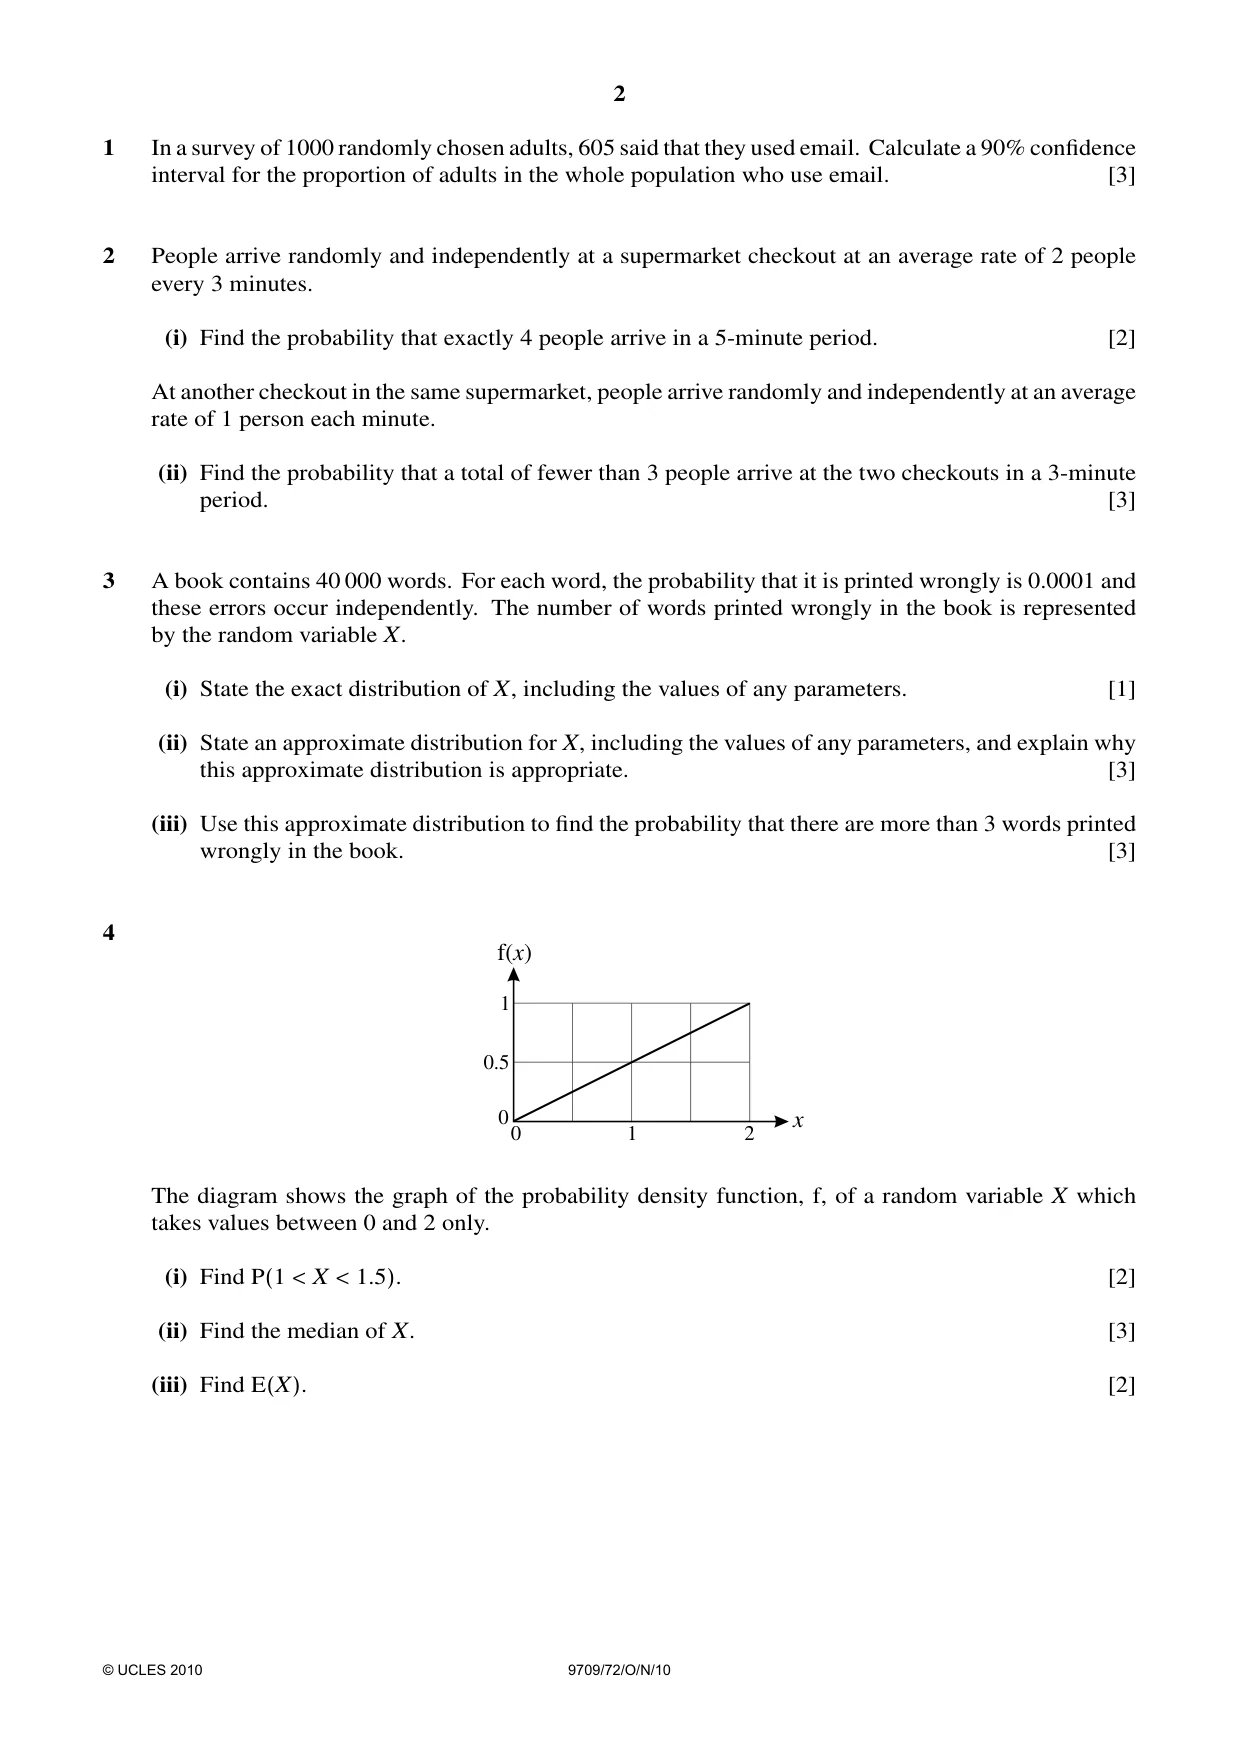
Q4 · F()x 1 0.5 0 x 0 1 2 The diagram shows the graph of the probability density function, f…
4 f()x 1 0.5 0 x 0 1 2 The diagram shows the graph of the probability density function, f, of a random variable X which takes values between 0 and 2 only. (i) Find P(1 < X < 1.5). [2] (ii) Find the median of X. [3] (iii) Find E(X). [2]
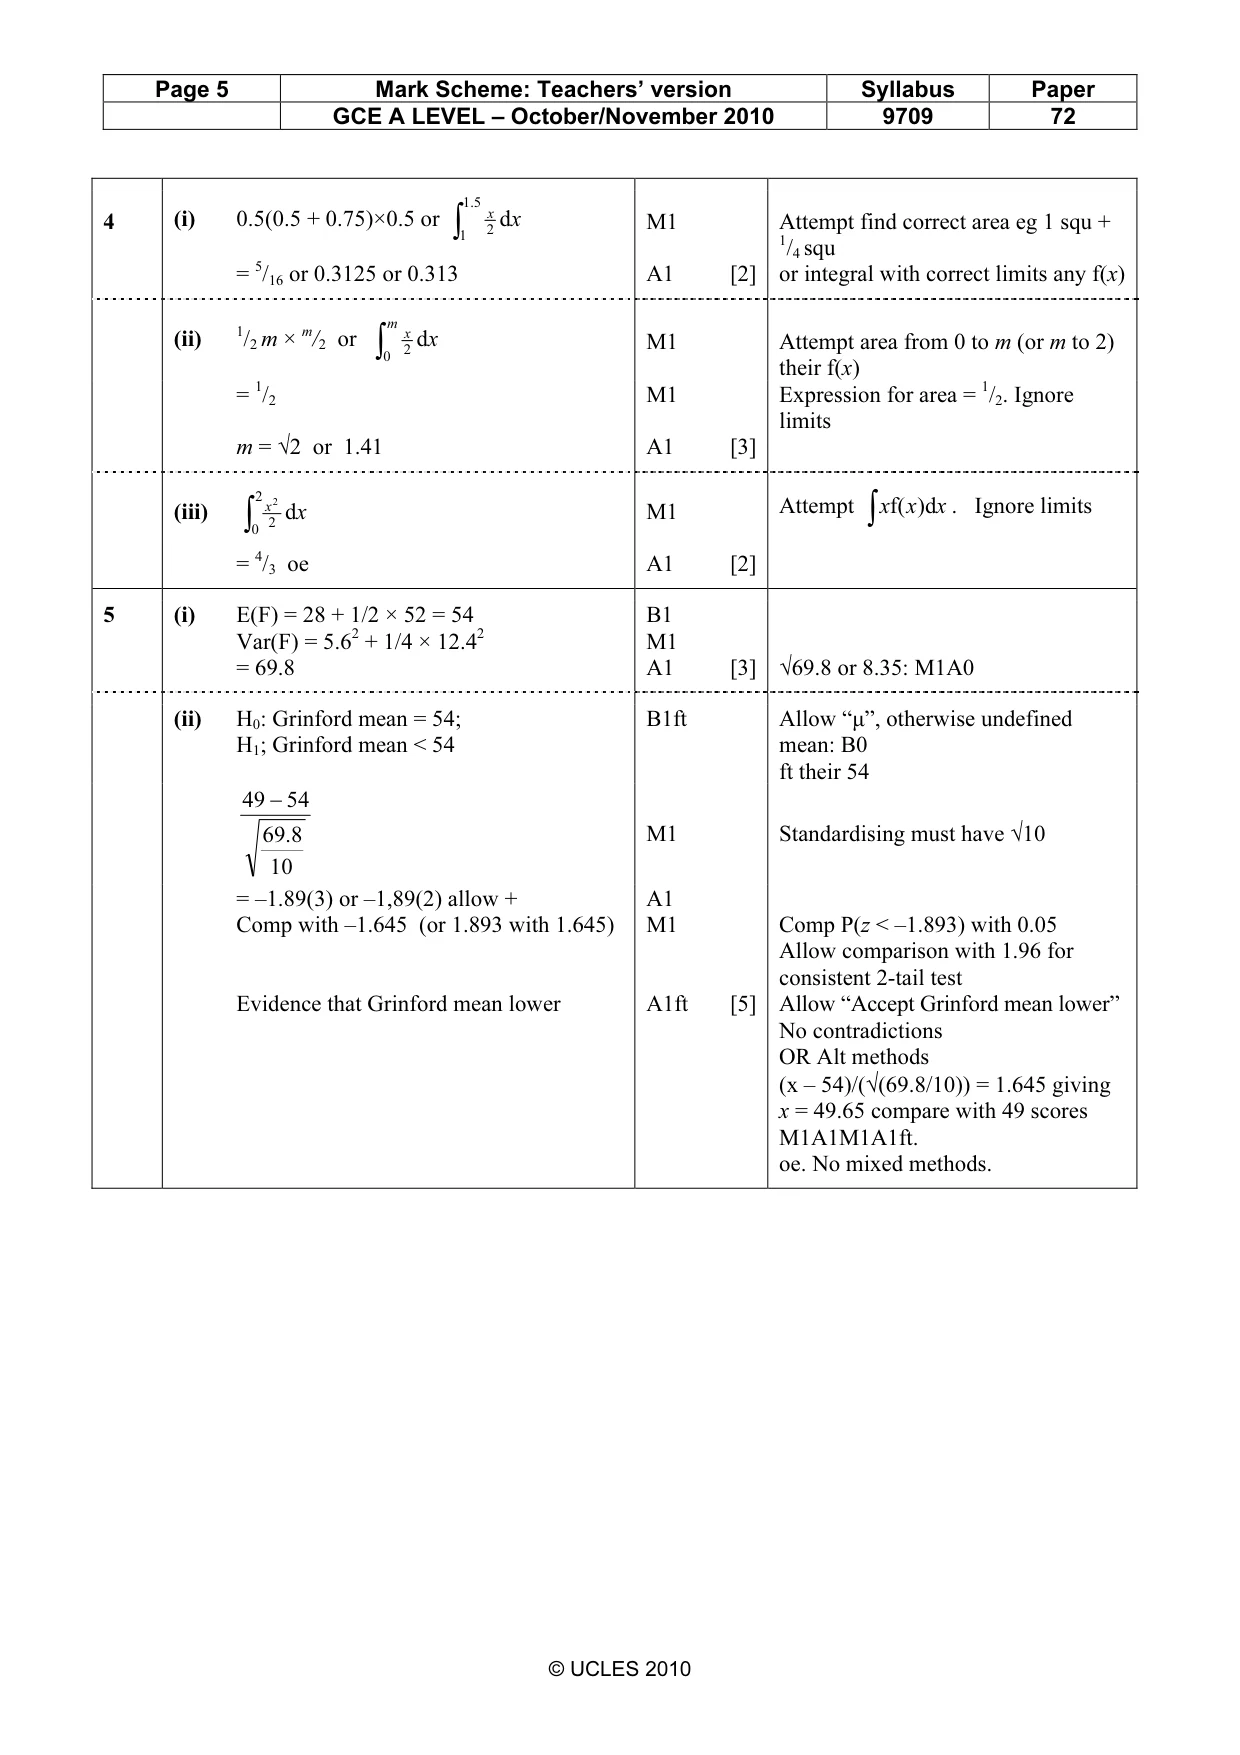
Mark scheme: x dx M1 Attempt find correct area eg 1 squ + 24 (i) 0.5(0.5 + 0.75)×0.5 or ∫1 1/4 squ = 5/16 or 0.3125 or 0.313 A1 [2] or integral with correct limits any f(x) m x d x M1 Attempt area from 0 to m (or m to 2) 2 (ii) 1/2 m × m/2 or ∫ 0 their f(x) = 1/2 M1 Expression for area = 1/2. Ignore limits m = √2 or 1.41 A1 [3] 2 x (iii) 2 2 d x M1 Attempt ∫ xf( x )dx . Ignore limits ∫ 0 = 4/3 oe A1 [2]
Q5 · The marks of candidates in Mathematics and English in 2009 were represented by the…
5 The marks of candidates in Mathematics and English in 2009 were represented by the independent random variables X and Y with distributions N(28, 5.62) and N(52, 12.42) respectively. Each candidate’s marks were combined to give a final mark F, where F = X + 12Y. (i) Find E(F) and Var(F). [3] (ii) The final marks of a random sample of 10 candidates from Grinford in 2009 had a mean of 49. Test at the 5% significance level whether this result suggests that the mean final mark of all candidates from Grinford in 2009 was lower than elsewhere. [5]
Mark scheme: 5 (i) E(F) = 28 + 1/2 × 52 = 54 B1 Var(F) = 5.62 + 1/4 × 12.42 M1 = 69.8 A1 [3] √69.8 or 8.35: M1A0 (ii) H0: Grinford mean = 54; B1ft Allow “µ”, otherwise undefined H1; Grinford mean < 54 mean: B0 ft their 54 49 − 54 698. M1 Standardising must have √10 10 = –1.89(3) or –1,89(2) allow + A1 Comp with –1.645 (or 1.893 with 1.645) M1 Comp P(z < –1.893) with 0.05 Allow comparison with 1.96 for consistent 2-tail test Evidence that Grinford mean lower A1ft [5] Allow “Accept Grinford mean lower” No contradictions OR Alt methods (x – 54)/(√(69.8/10)) = 1.645 giving x = 49.65 compare with 49 scores M1A1M1A1ft. oe. No mixed methods. GCE A LEVEL – October/November 2010 9709 72 1 1
Q6 · It is claimed that a certain 6-sided die is biased so that it is more likely to show a…
6 It is claimed that a certain 6-sided die is biased so that it is more likely to show a six than if it was fair. In order to test this claim at the 10% significance level, the die is thrown 10 times and the number of sixes is noted. (i) Given that the die shows a six on 3 of the 10 throws, carry out the test. [5] On another occasion the same test is carried out again. (ii) Find the probability of a Type I error. [3] (iii) Explain what is meant by a Type II error in this context. [1]
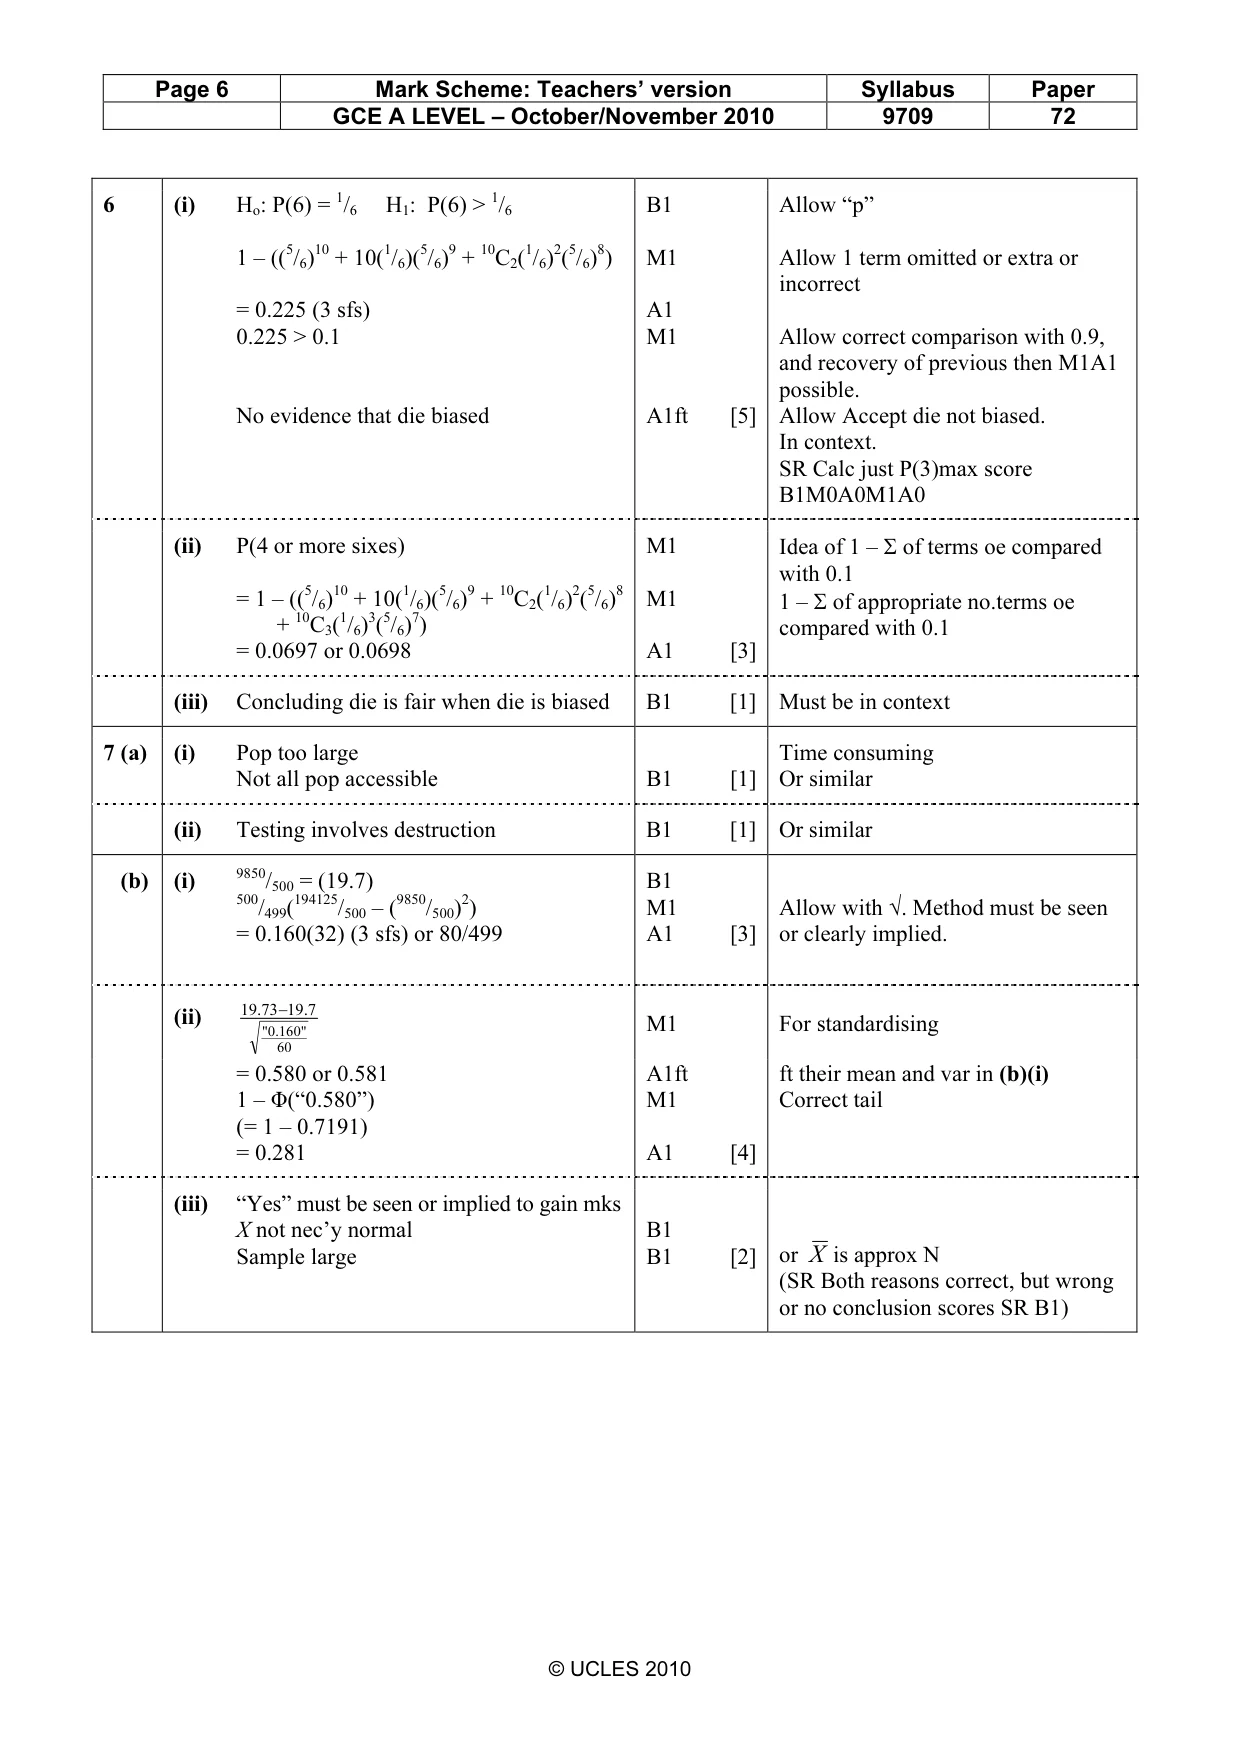
Mark scheme: 6 (i) Ho: P(6) = 1/6 H1: P(6) > 1/6 B1 Allow “p” 1 – ((5/6)10 + 10(1/6)(5/6)9 + 10C2(1/6)2(5/6)8) M1 Allow 1 term omitted or extra or incorrect = 0.225 (3 sfs) A1 0.225 > 0.1 M1 Allow correct comparison with 0.9, and recovery of previous then M1A1 possible. No evidence that die biased A1ft [5] Allow Accept die not biased. In context. SR Calc just P(3)max score B1M0A0M1A0 (ii) P(4 or more sixes) M1 Idea of 1 – Σ of terms oe compared with 0.1 = 1 – ((5/6)10 + 10(1/6)(5/6)9 + 10C2(1/6)2(5/6)8 M1 1 – Σ of appropriate no.terms oe + 10C3(1/6)3(5/6)7) compared with 0.1 = 0.0697 or 0.0698 A1 [3] (iii) Concluding die is fair when die is biased B1 [1] Must be in context
Q7 · Give a reason why sampling would be required in order to reach a conclusion about (i) the…
7 (a) Give a reason why sampling would be required in order to reach a conclusion about (i) the mean height of adult males in England, [1] (ii) the mean weight that can be supported by a single cable of a certain type without the cable breaking. [1] (b) The weights, in kg, of sacks of potatoes are represented by the random variable X with mean µ and standard deviation σ. The weights of a random sample of 500 sacks of potatoes are found and the results are summarised below. n = 500, Σx = 9850, Σx2 = 194 125. (i) Calculate unbiased estimates of µ and σ2. [3] (ii) A further random sample of 60 sacks of potatoes is taken. Using your values from part (b) (i), find the probability that the mean weight of this sample exceeds 19.73 kg. [4] (iii) Explain whether it was necessary to use the Central Limit Theorem in your calculation in part (b) (ii). [2]
Mark scheme: 7 (a) (i) Pop too large Time consuming Not all pop accessible B1 [1] Or similar (ii) Testing involves destruction B1 [1] Or similar (b) (i) 9850/500 = (19.7) B1 500/499(194125/500 – (9850/500)2) M1 Allow with √. Method must be seen = 0.160(32) (3 sfs) or 80/499 A1 [3] or clearly implied. (ii) 19.73 −197. ".0 160" M1 For standardising 60 = 0.580 or 0.581 A1ft ft their mean and var in (b)(i) 1 – Φ(“0.580”) M1 Correct tail (= 1 – 0.7191) = 0.281 A1 [4] (iii) “Yes” must be seen or implied to gain mks X not nec’y normal B1 Sample large B1 [2] or X is approx N (SR Both reasons correct, but wrong or no conclusion scores SR B1)
What was in this paper
The subtopics covered by these 7 questions, and how many questions each got. Open one in a new tab to see every Cambridge question on it.
What you needed in this session
Cambridge’s own grade thresholds for 2010 Oct/Nov, Paper 7 · Variant 2. A higher threshold means an easier paper — the bar moves with how the cohort did.