Cambridge A Level Mathematics 9709 — 2010 Oct/Nov Paper 7 · Variant 3
9709/73/O/N/10 · 2 questions · 50 marks · ≈56 min
The question paper and its mark scheme, free to read here and free to download. This is Cambridge’s own paper, exactly as it was sat.
Question paper4 pages
Mark scheme7 pages
Answers below. Sit the paper first if you are practising.
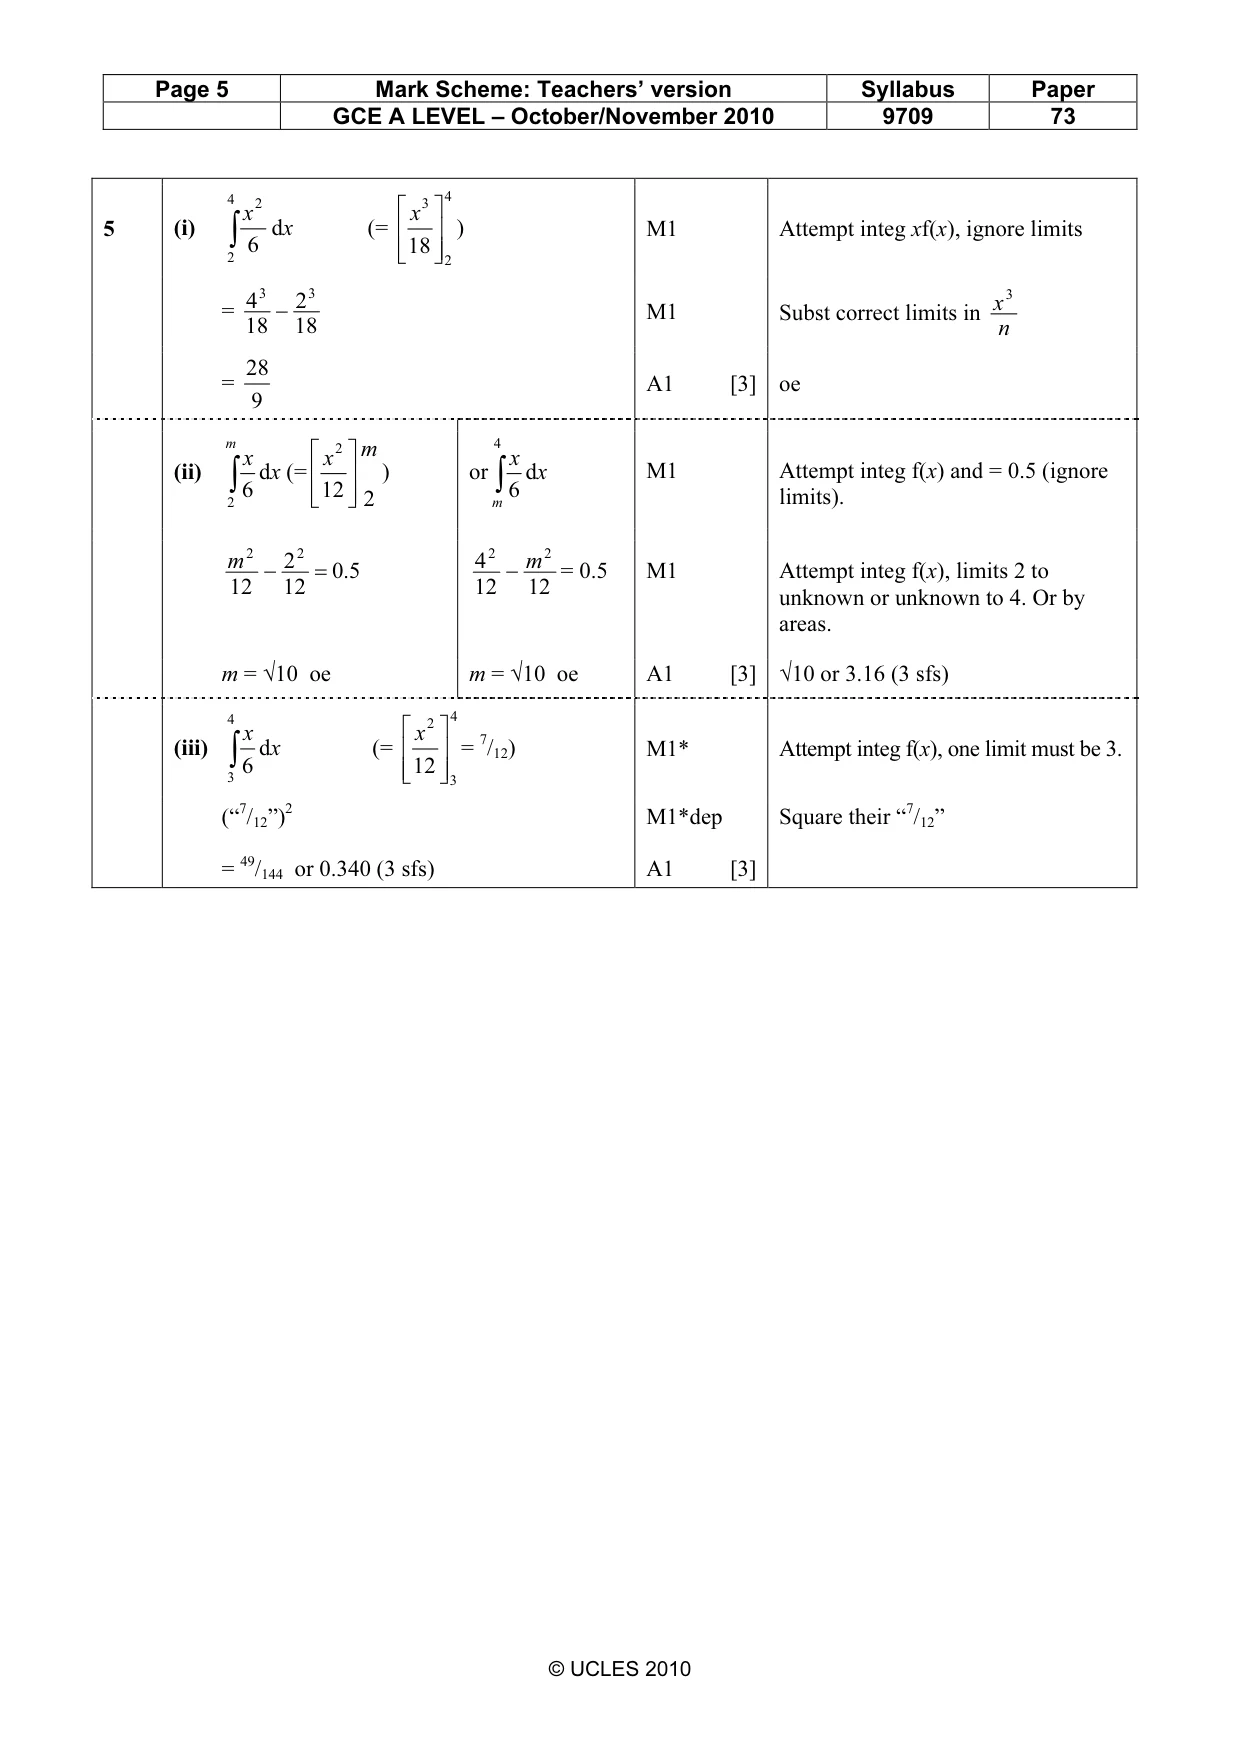
Questions as text
Q6 · A clinic monitors the amount, X milligrams per litre, of a certain chemical in the blood…
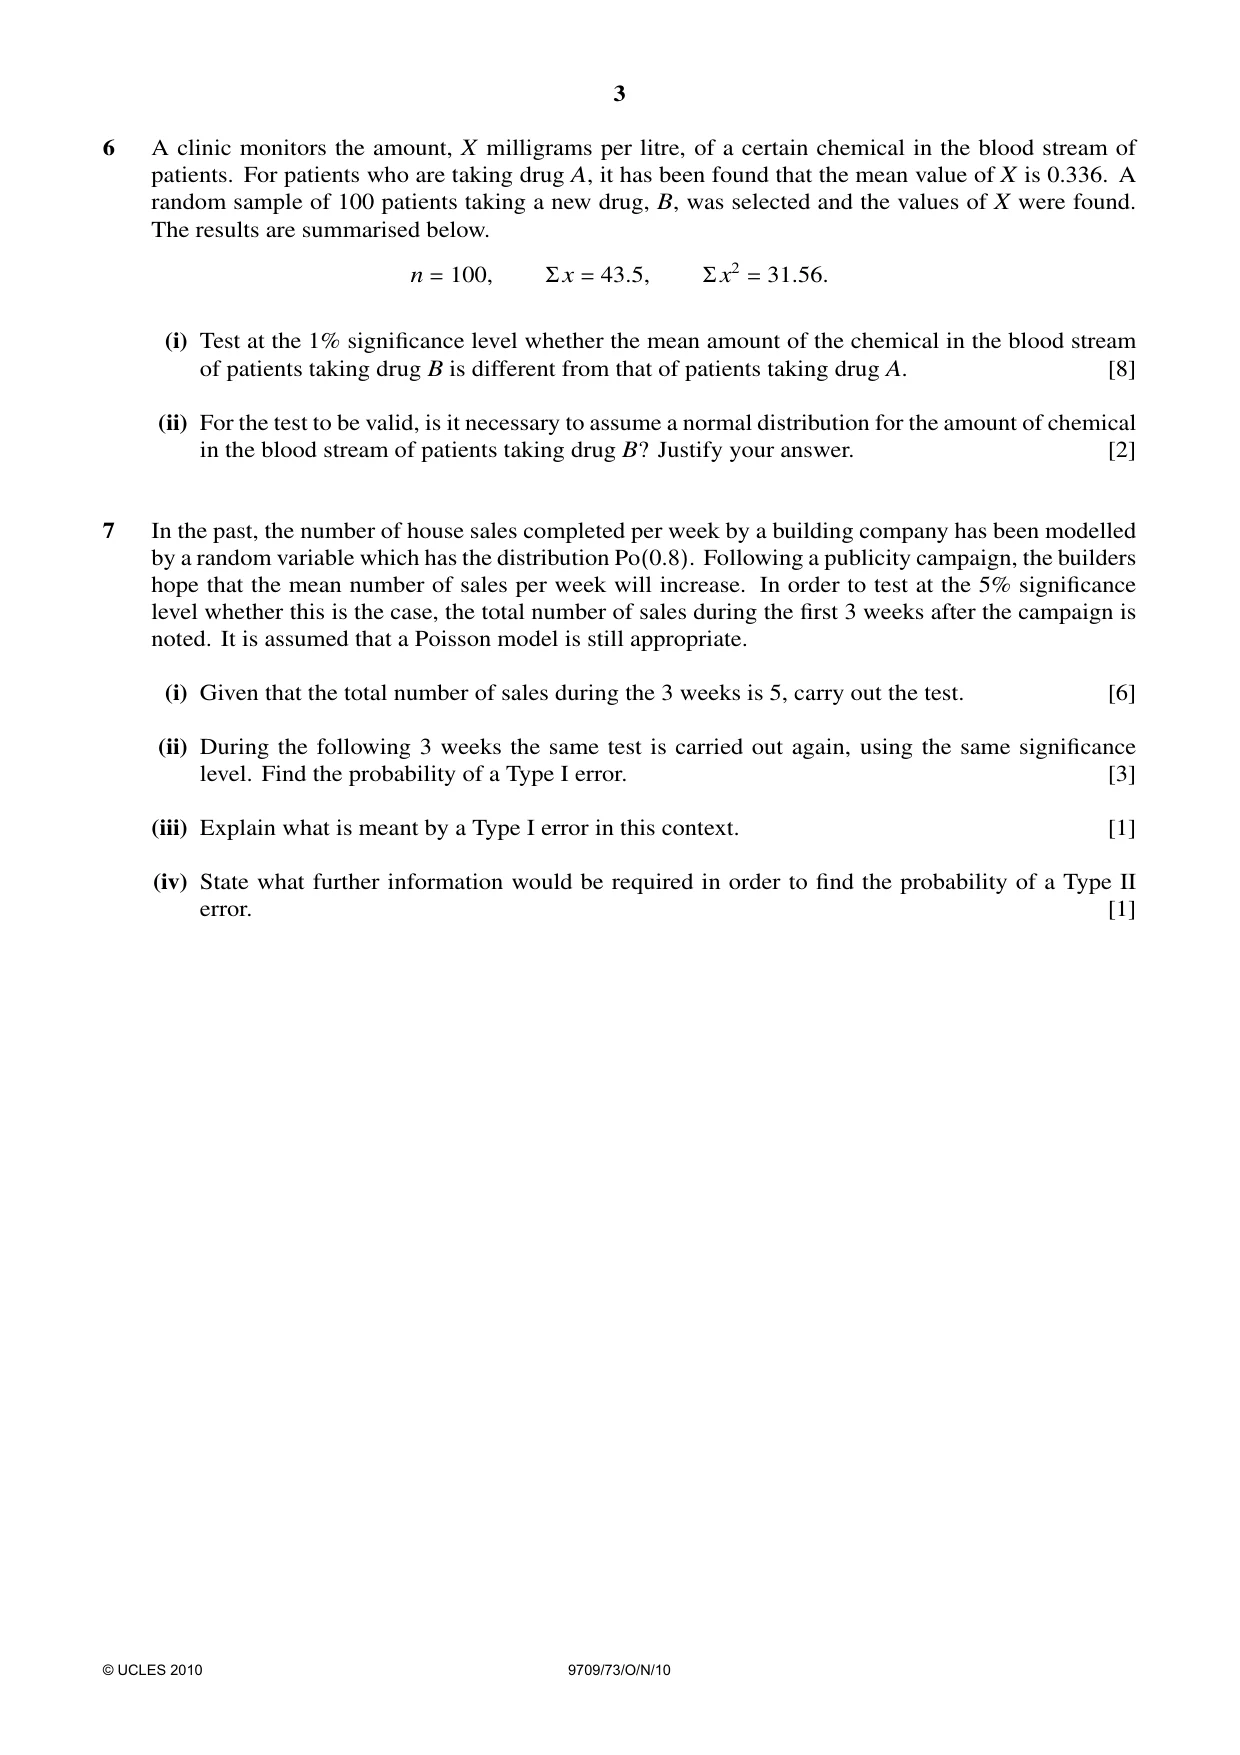
6 A clinic monitors the amount, X milligrams per litre, of a certain chemical in the blood stream of patients. For patients who are taking drug A, it has been found that the mean value of X is 0.336. A random sample of 100 patients taking a new drug, B, was selected and the values of X were found. The results are summarised below. n = 100, Σ x = 43.5, Σx2 = 31.56. (i) Test at the 1% significance level whether the mean amount of the chemical in the blood stream of patients taking drug B is different from that of patients taking drug A. [8] (ii) For the test to be valid, is it necessary to assume a normal distribution for the amount of chemical in the blood stream of patients taking drug B? Justify your answer. [2]
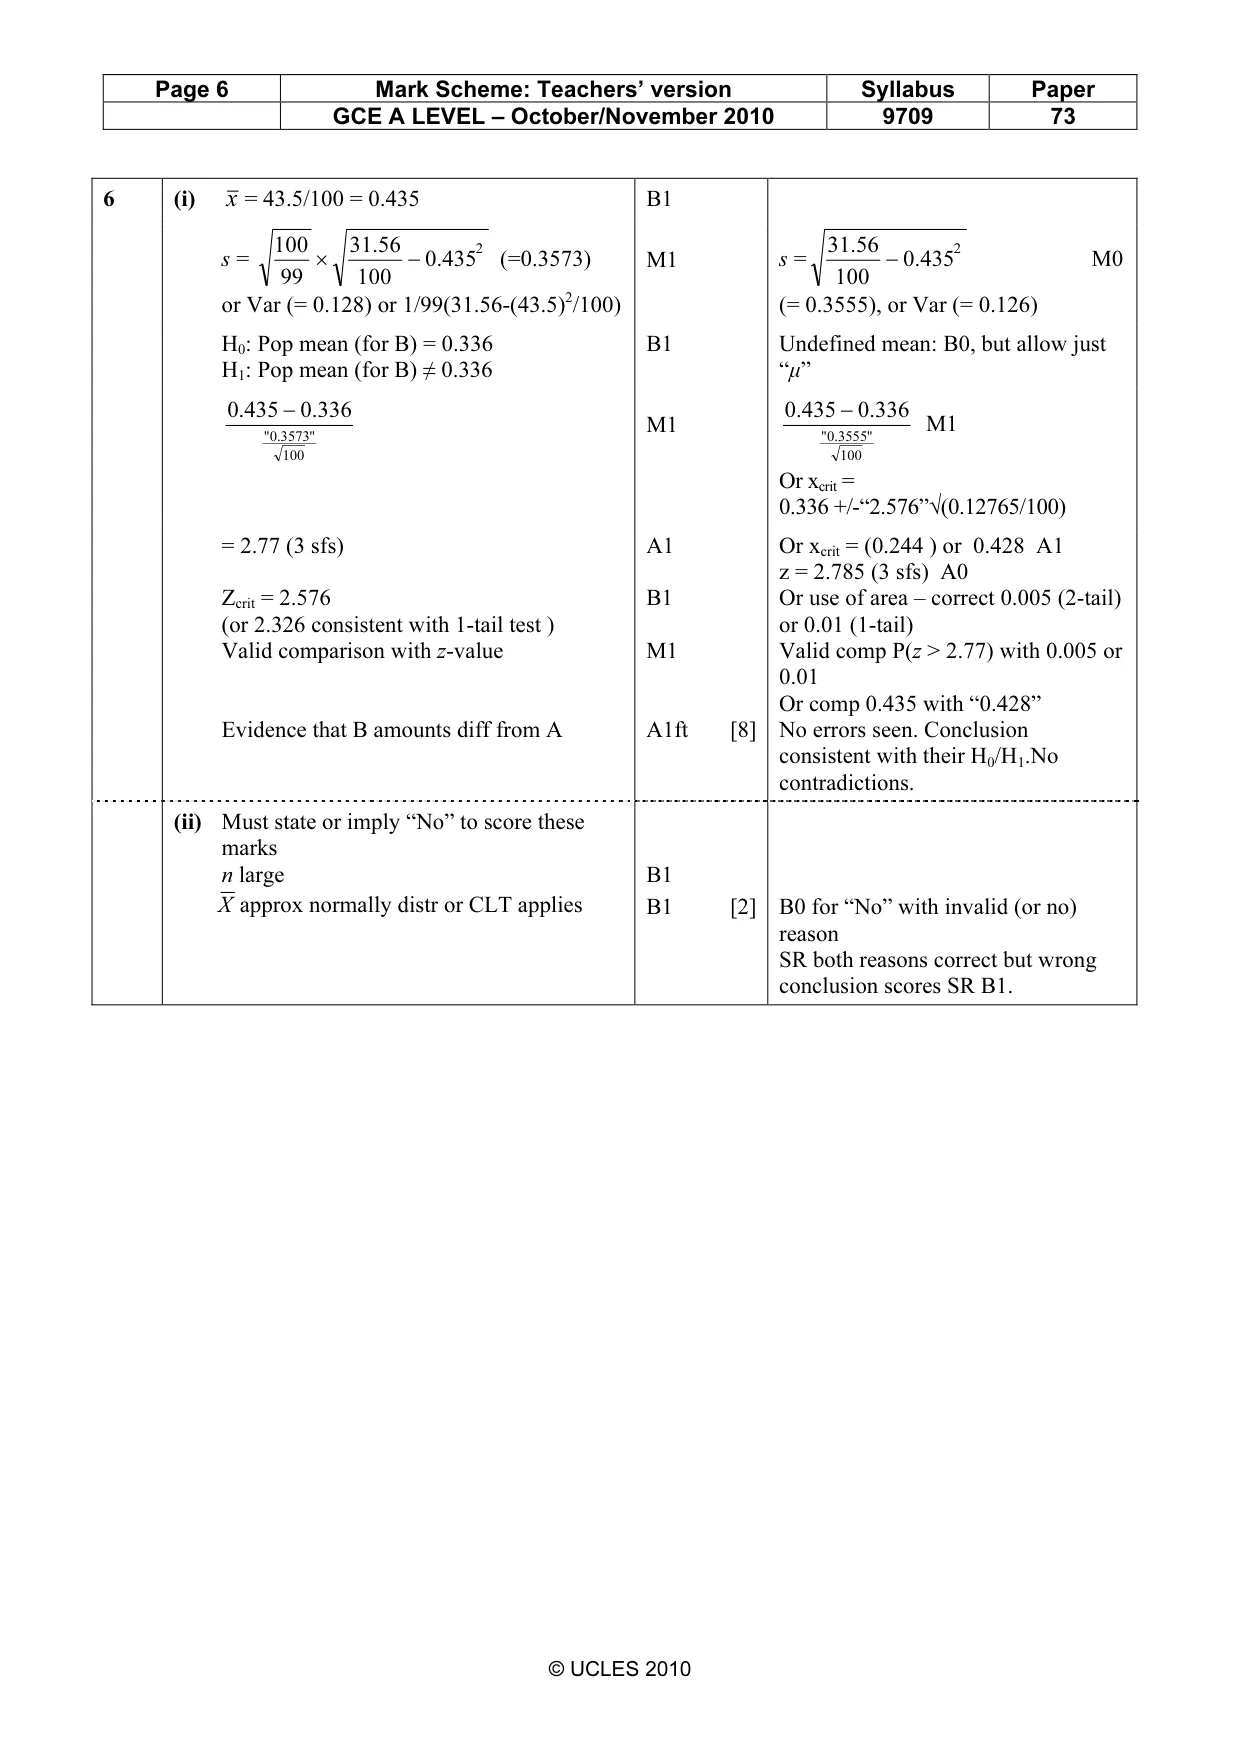
Mark scheme: 6 (i) x = 43.5/100 = 0.435 B1 100 31. 56 2 31. 56 2 s = × − .0 435 (=0.3573) M1 s = − .0 435 M0 99 100 100 or Var (= 0.128) or 1/99(31.56-(43.5)2/100) (= 0.3555), or Var (= 0.126) H0: Pop mean (for B) = 0.336 B1 Undefined mean: B0, but allow just H1: Pop mean (for B) ≠ 0.336 “µ” .0435 − .0336 .0435 − .0336 M1 M1 ".03573" ".03555" 100 100 Or xcrit = 0.336 +/-“2.576”√(0.12765/100) = 2.77 (3 sfs) A1 Or xcrit = (0.244 ) or 0.428 A1 z = 2.785 (3 sfs) A0 Zcrit = 2.576 B1 Or use of area – correct 0.005 (2-tail) (or 2.326 consistent with 1-tail test ) or 0.01 (1-tail) Valid comparison with z-value M1 Valid comp P(z > 2.77) with 0.005 or 0.01 Or comp 0.435 with “0.428” Evidence that B amounts diff from A A1ft [8] No errors seen. Conclusion consistent with their H0/H1.No contradictions. (ii) Must state or imply “No” to score these marks n large B1 X approx normally distr or CLT applies B1 [2] B0 for “No” with invalid (or no) reason SR both reasons correct but wrong conclusion scores SR B1. GCE A LEVEL – October/November 2010 9709 73
Q7 · In the past, the number of house sales completed per week by a building company has been…
7 In the past, the number of house sales completed per week by a building company has been modelled by a random variable which has the distribution Po(0.8). Following a publicity campaign, the builders hope that the mean number of sales per week will increase. In order to test at the 5% significance level whether this is the case, the total number of sales during the first 3 weeks after the campaign is noted. It is assumed that a Poisson model is still appropriate. (i) Given that the total number of sales during the 3 weeks is 5, carry out the test. [6] (ii) During the following 3 weeks the same test is carried out again, using the same significance level. Find the probability of a Type I error. [3] (iii) Explain what is meant by a Type I error in this context. [1] (iv) State what further information would be required in order to find the probability of a Type II error. [1]
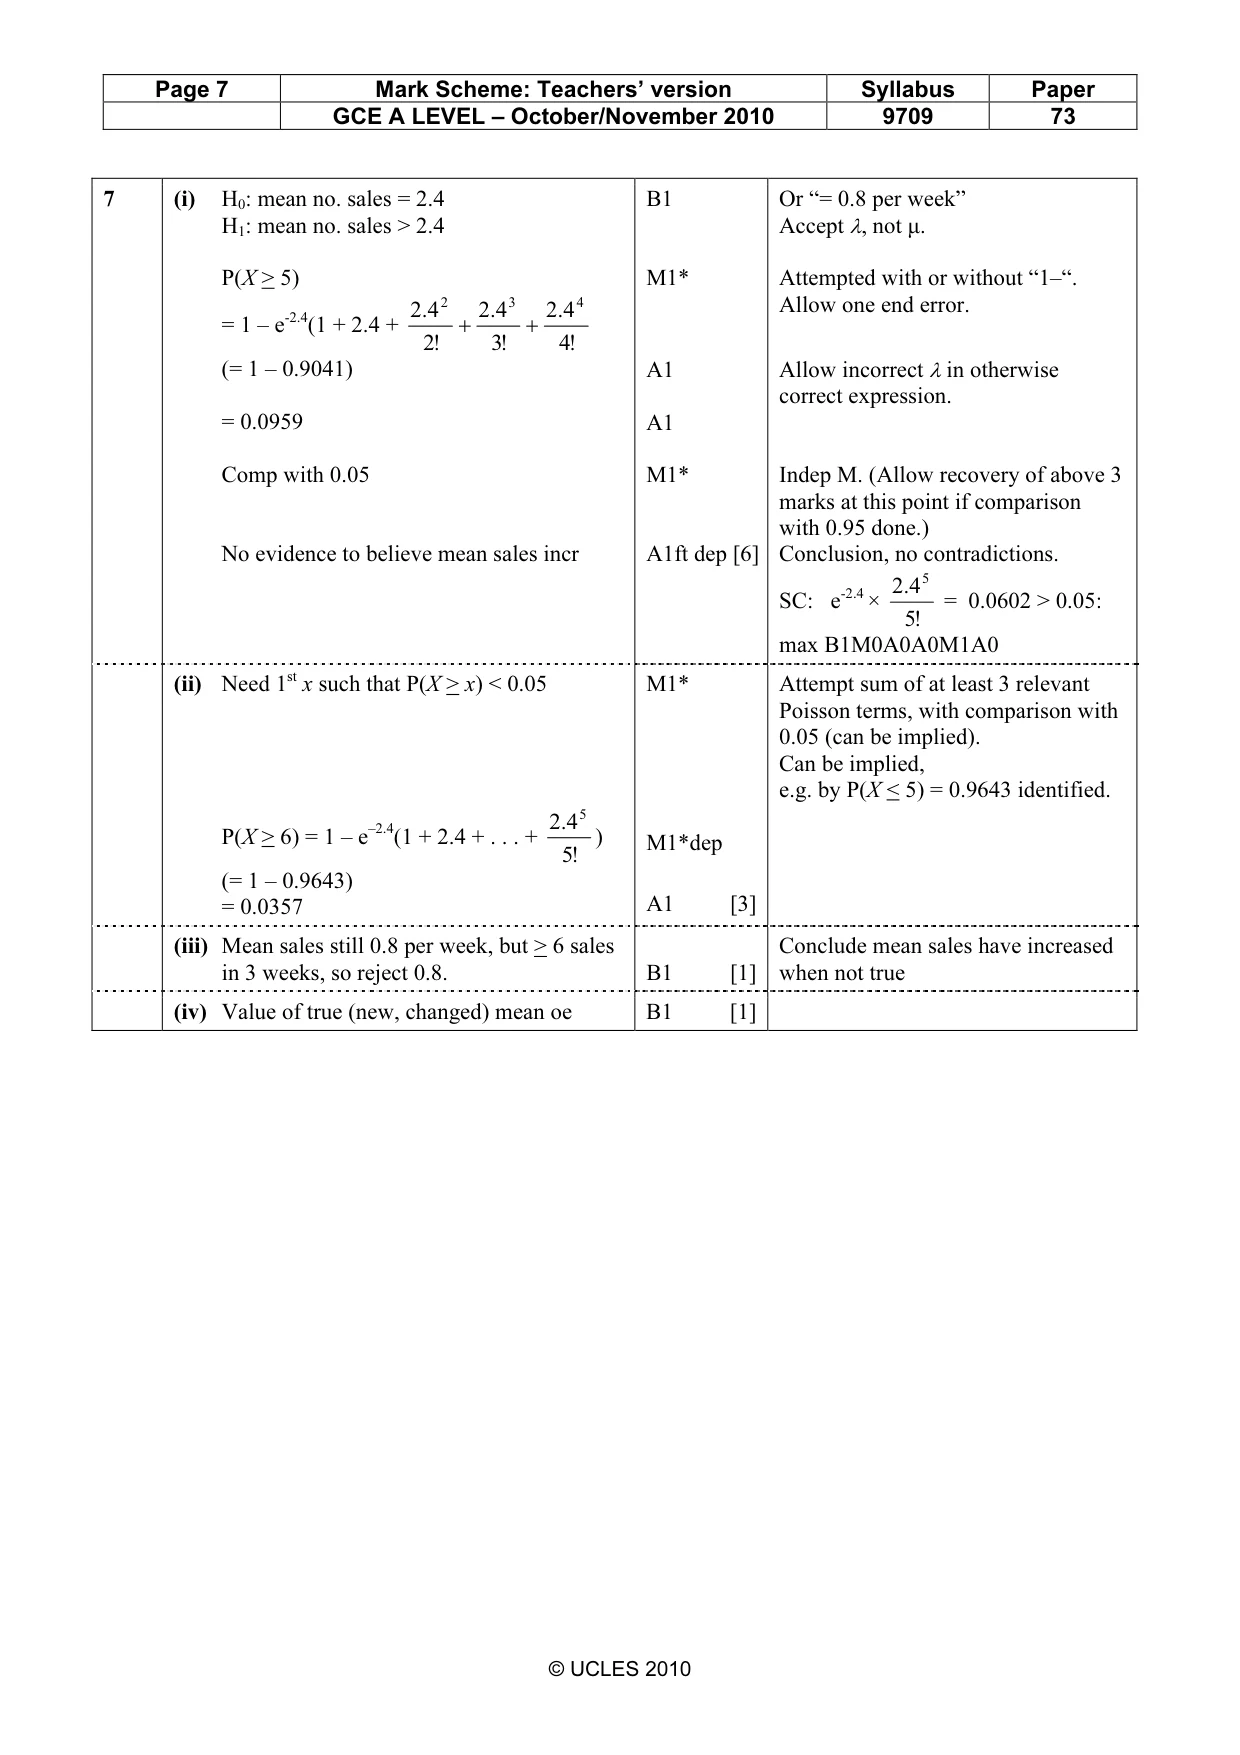
Mark scheme: 7 (i) H0: mean no. sales = 2.4 B1 Or “= 0.8 per week” H1: mean no. sales > 2.4 Accept λ, not µ. P(X > 5) M1* Attempted with or without “1–“. 4.2 2 4.2 3 4.2 4 Allow one end error. = 1 – e-2.4(1 + 2.4 + + + !2 !3 !4 (= 1 – 0.9041) A1 Allow incorrect λ in otherwise correct expression. = 0.0959 A1 Comp with 0.05 M1* Indep M. (Allow recovery of above 3 marks at this point if comparison with 0.95 done.) No evidence to believe mean sales incr A1ft dep [6] Conclusion, no contradictions. 4.2 5 SC: e-2.4 × = 0.0602 > 0.05: !5 max B1M0A0A0M1A0 (ii) Need 1st x such that P(X > x) < 0.05 M1* Attempt sum of at least 3 relevant Poisson terms, with comparison with 0.05 (can be implied). Can be implied, e.g. by P(X < 5) = 0.9643 identified. 4.2 5 P(X > 6) = 1 – e–2.4(1 + 2.4 + . . . + ) M1*dep !5 (= 1 – 0.9643) = 0.0357 A1 [3] (iii) Mean sales still 0.8 per week, but > 6 sales Conclude mean sales have increased in 3 weeks, so reject 0.8. B1 [1] when not true (iv) Value of true (new, changed) mean oe B1 [1]
What was in this paper
The subtopics covered by these 2 questions, and how many questions each got. Open one in a new tab to see every Cambridge question on it.
What you needed in this session
Cambridge’s own grade thresholds for 2010 Oct/Nov, Paper 7 · Variant 3. A higher threshold means an easier paper — the bar moves with how the cohort did.