Questions as text
Q1 · The time in minutes taken by candidates to answer a question in an examination has… 9709/71 May/June 2009
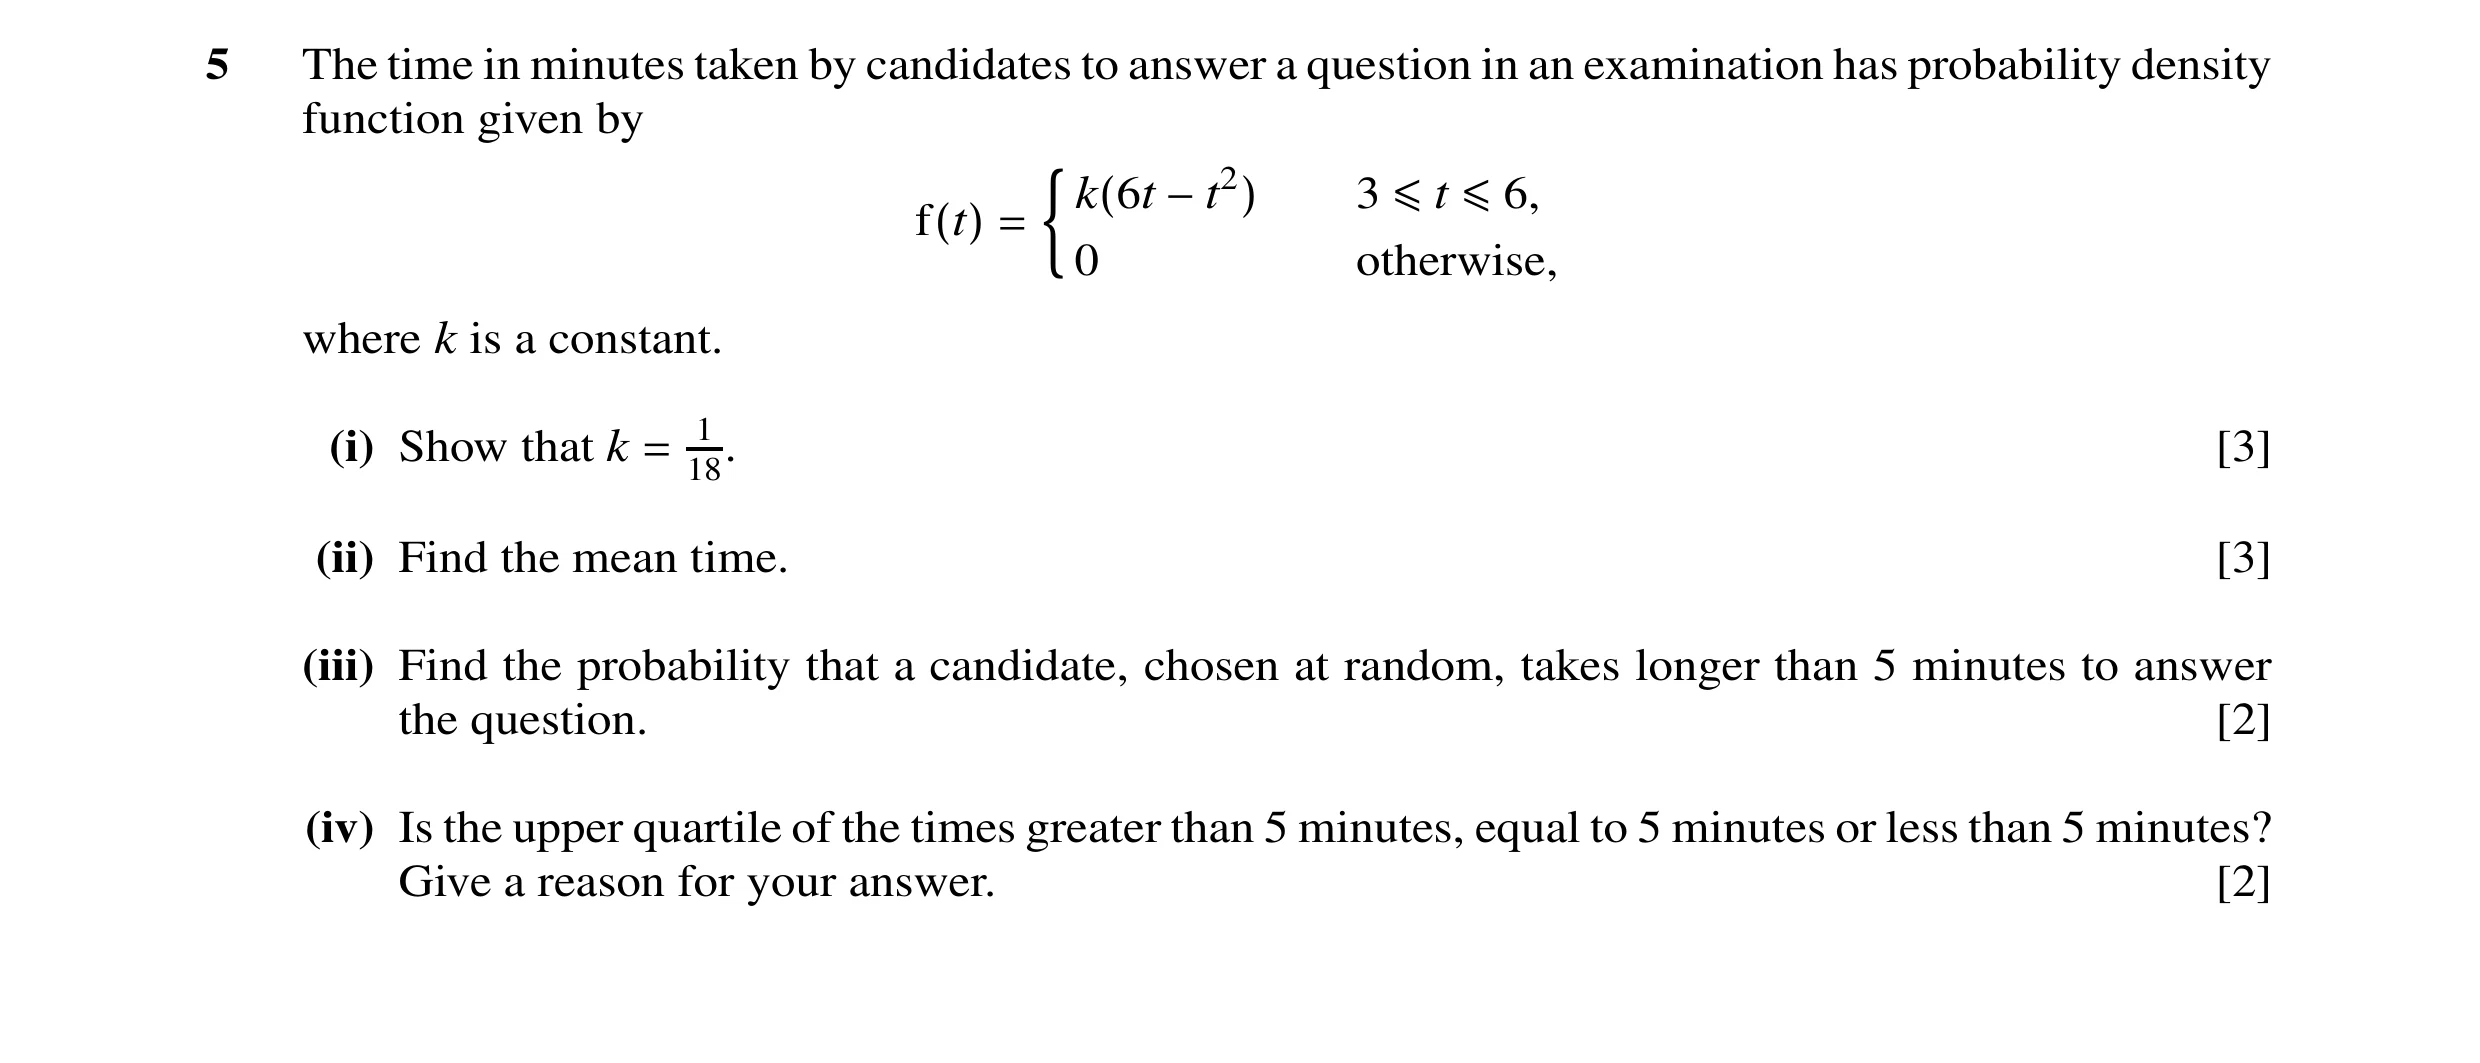
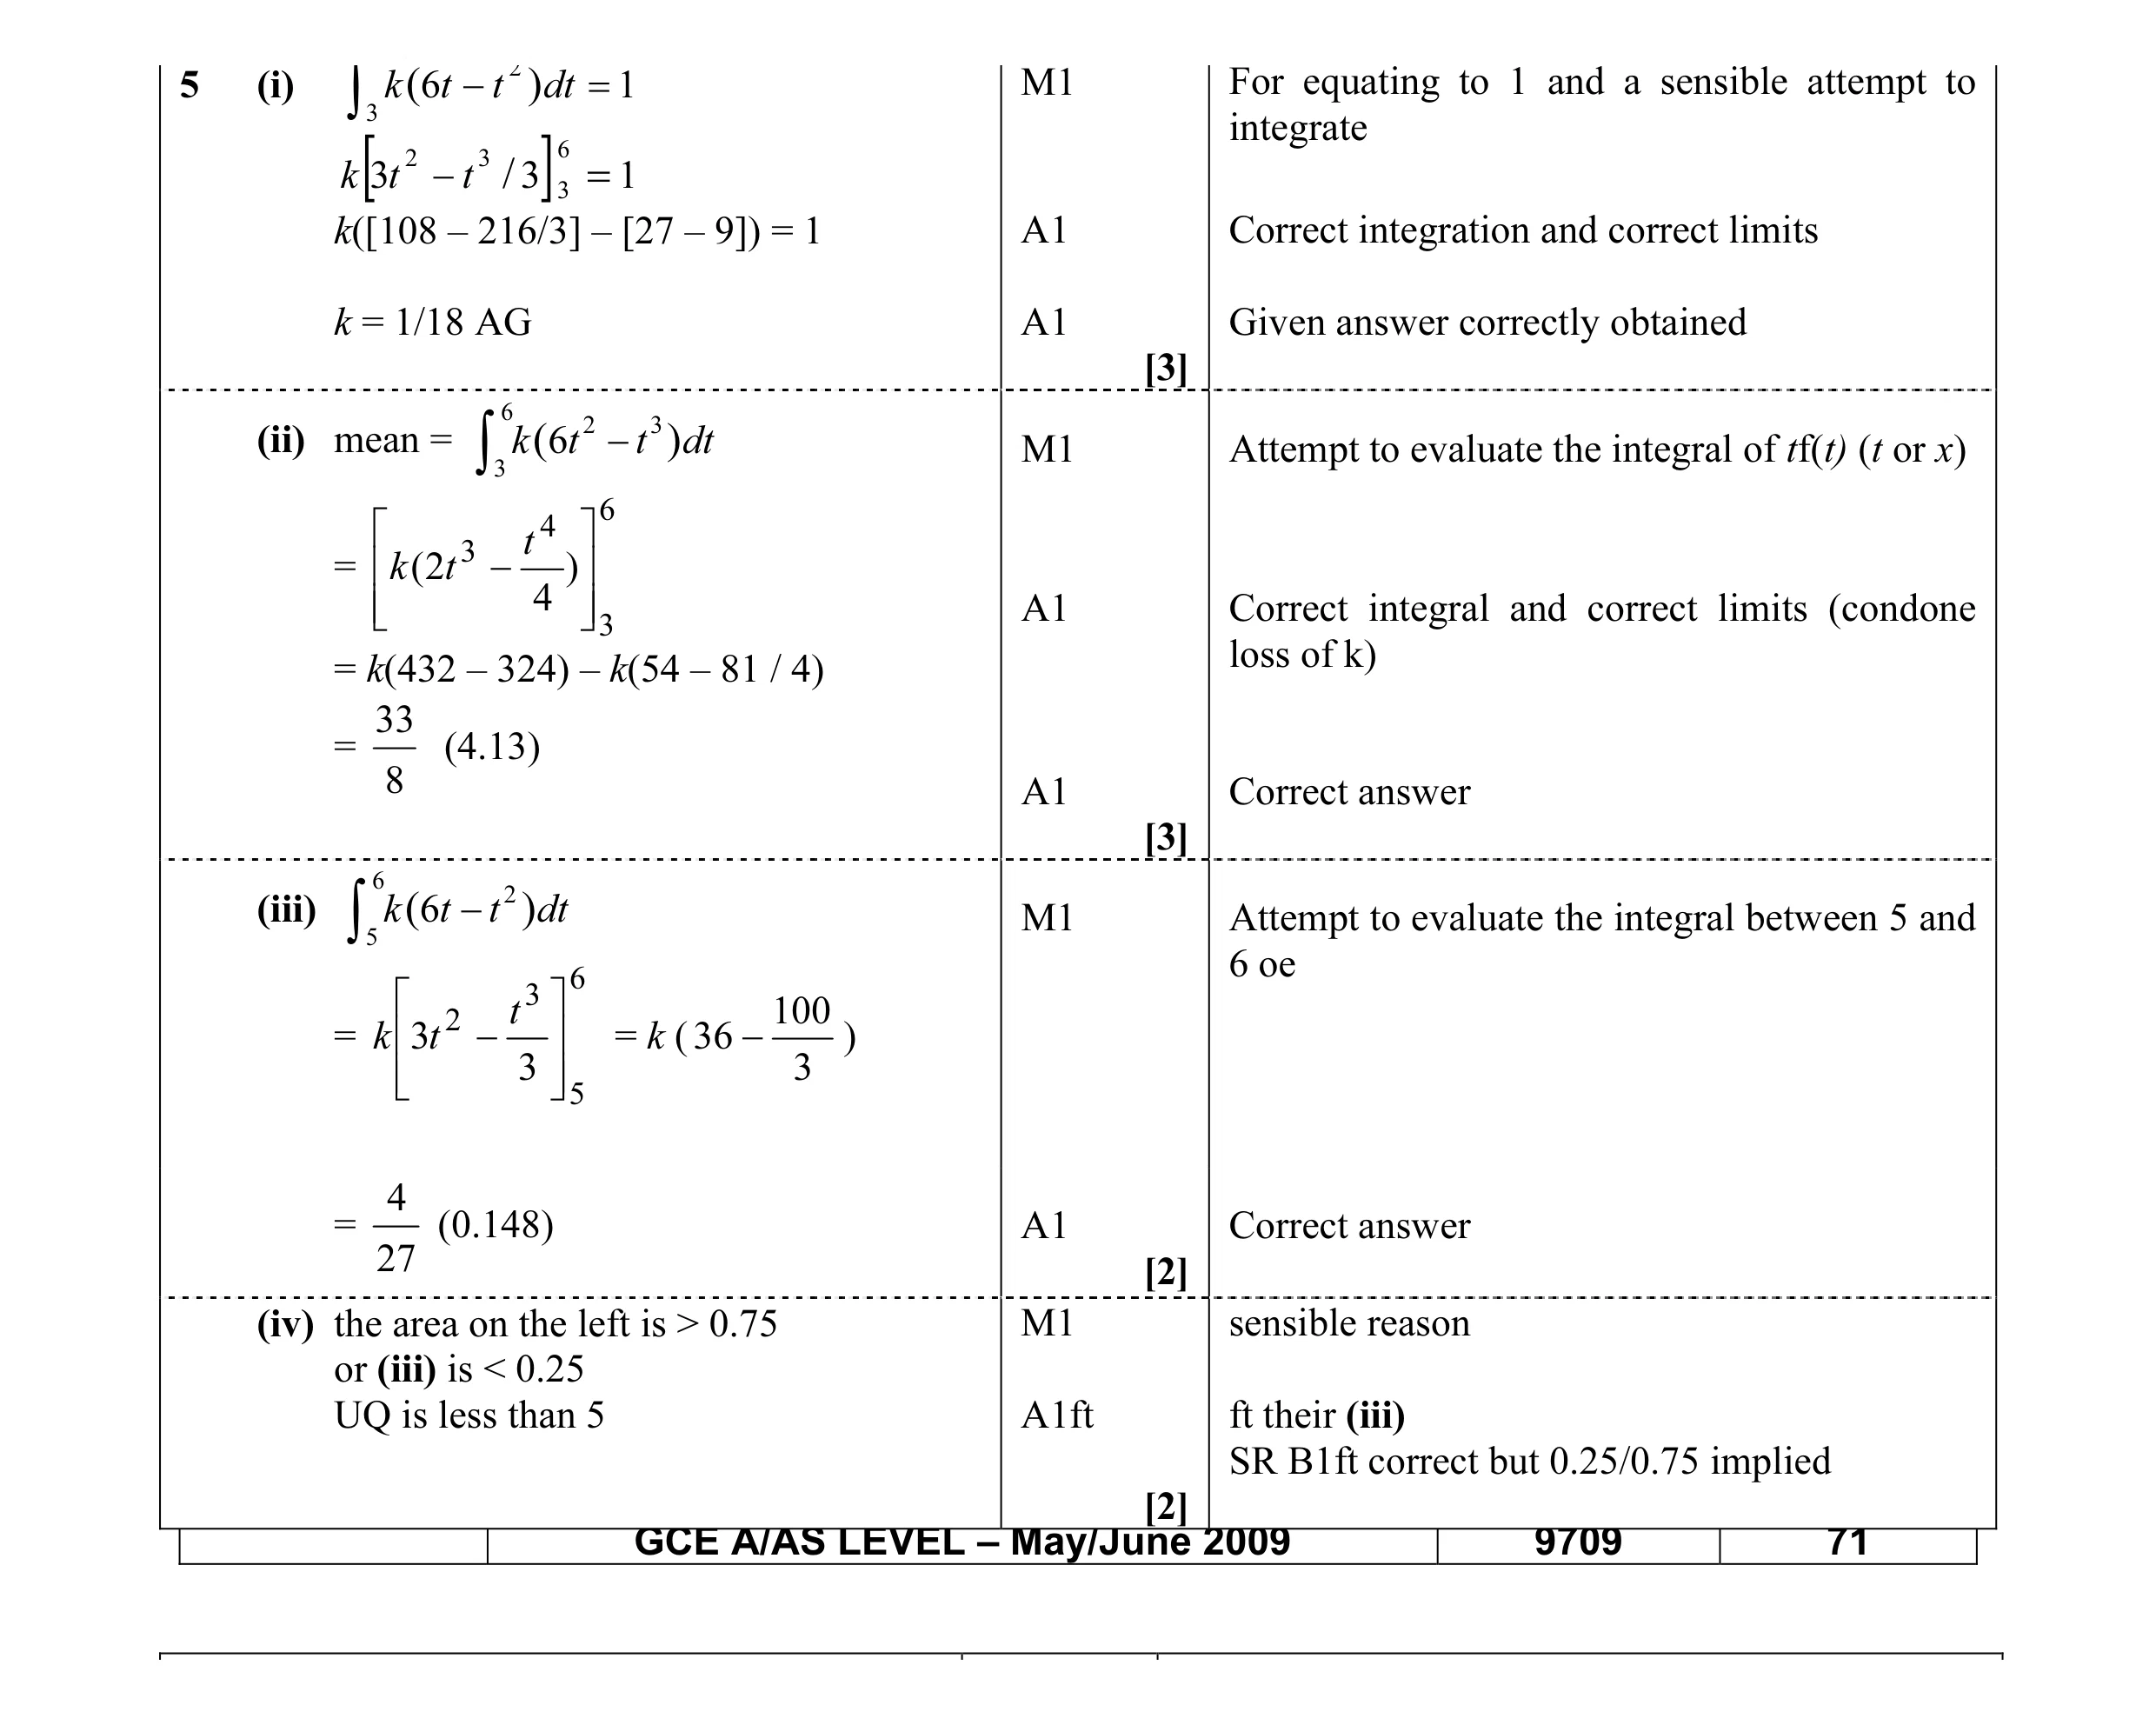
5 The time in minutes taken by candidates to answer a question in an examination has probability density function given by k(6t −t2) 3 ≤t ≤6, f(t) = 0 otherwise, where k is a constant. (i) Show that k = 1 [3] 18. (ii) Find the mean time. [3] (iii) Find the probability that a candidate, chosen at random, takes longer than 5 minutes to answer the question. [2] (iv) Is the upper quartile of the times greater than 5 minutes, equal to 5 minutes or less than 5 minutes? Give a reason for your answer. [2]
10 marks
Mark scheme: 5 (i) ∫ 3 k ( 6t − t 2 ) dt = 1 M1 For equating to 1 and a sensible attempt to integrate 2 3 6 k [3t −t / 3] 3 = 1 k([108 – 216/3] – [27 – 9]) = 1 A1 Correct integration and correct limits k = 1/18 AG A1 Given answer correctly obtained [3] 6 (ii) mean = ∫ 3 k (6t 2 − t 3 ) dt M1 Attempt to evaluate the integral of tf(t) (t or x) 6 4 3 = k ( 2t −t ) A1 Correct integral and correct limits (condone 4 3 loss of k) = k(432 – 324) – k(54 – 81 / 4) 33 = (4.13) 8 A1 Correct answer [3] 6 (iii) ∫ 5 k (6t − t 2) dt M1 Attempt to evaluate the integral between 5 and 6 6 oe 3 100 2 = k 3t −t = k ( 36 − ) 3 5 3 4 = (0.148) A1 Correct answer 27 [2] (iv) the area on the left is > 0.75 M1 sensible reason or (iii) is < 0.25 UQ is less than 5 A1ft ft their (iii) SR B1ft correct but 0.25/0.75 implied [2] GCE A/AS LEVEL – May/June 2009 9709 71
This question in 9709/71 May/June 2009
Q2 · 2% of biscuits on a production line are broken 9709/71 Oct/Nov 2009
1 2% of biscuits on a production line are broken. Broken biscuits occur randomly. 180 biscuits are checked to see whether they are broken. Use a suitable approximation to find the probability that fewer than 4 are broken. [3]
3 marks
Mark scheme: 1 X ~ B(180, 0.02) ~ Po(3.6) B1 Poisson with mean 180 × 0.02 P(X < 4) = e–3.6 (1 + 3.6 + 3.62 / 2 + 3.63 / 6) M1 Poisson attempt with their λ allow end errors = 0.515 A1 [3] Correct answer SR1 Use of Bin scores B1 only for ans 0.514 SR2 Use of Normal scores B1 only for 0.479 1 5 1 1 5
This question in 9709/71 Oct/Nov 2009
Q3 · The continuous random variable X has probability density function given by cos x 0 ≤x… 9709/71 Oct/Nov 2009
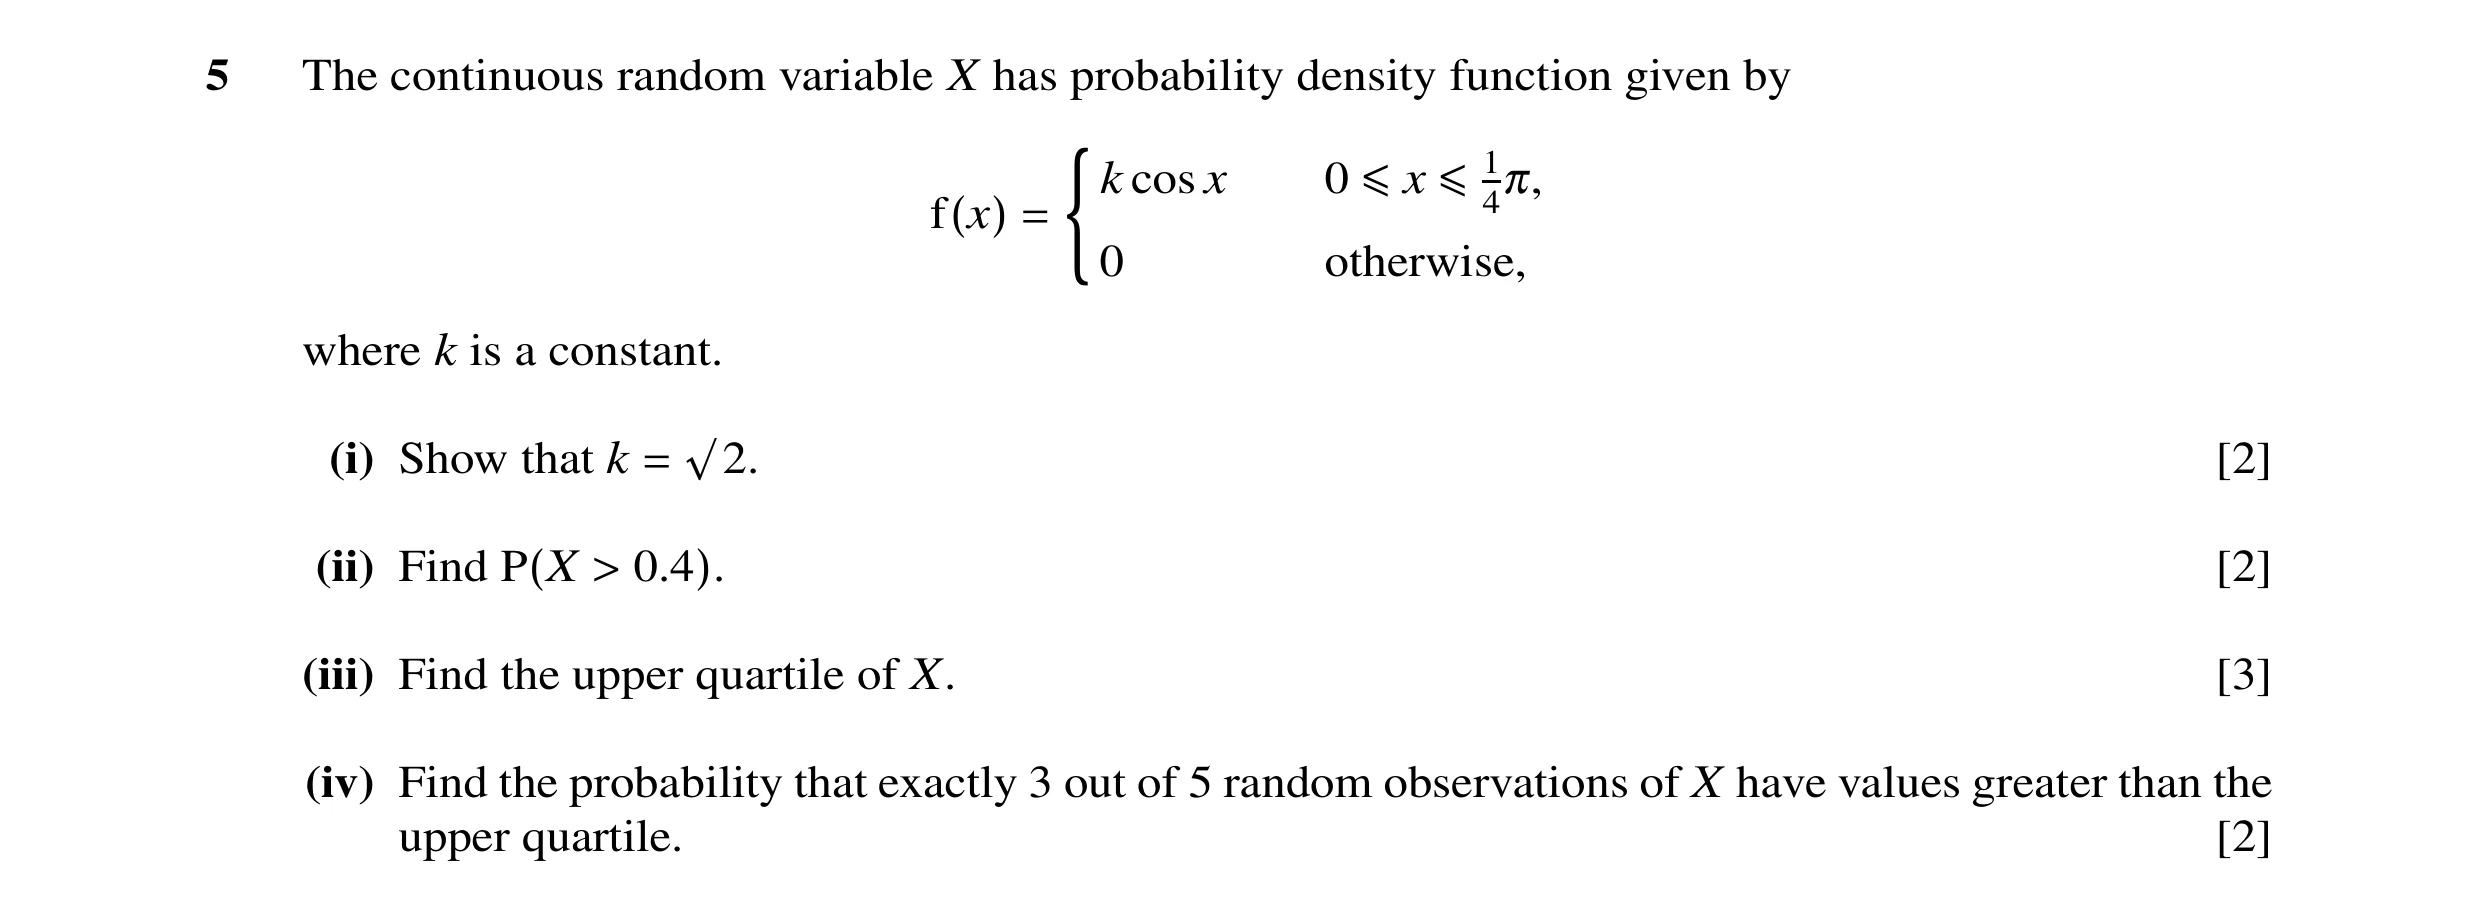
5 The continuous random variable X has probability density function given by cos x 0 ≤x ≤14π, f(x) = (k0 otherwise, where k is a constant. (i) Show that k √2. [2] = [2] (ii) Find P(X > 0.4). (iii) Find the upper quartile of X. [3] (iv) Find the probability that exactly 3 out of 5 random observations of X have values greater than the upper quartile. [2]
9 marks
Mark scheme: 5 (i) = 1 M1 Equating to 1 and attempt to integrate with k∫ cos x dx 0 limits [k sin x ]π0 / 4 = 1 k sin (π/4) = 1 ⇒ k / 2 = 1 k = 2 AG A1 [2] Correct answer legit obtained (no decimals seen) π / 4 = [k sin x ]π4.0/ 4 M1 Attempt to integrate from 0.4 to π/4 o.e. (ii) ∫ k cos x dx 4.0 = 1 – k sin(0.4) = 0.449 A1 [2] Correct answer Q 3 M1 Equation with integral on one side and 0.75 (iii) ∫ k cos x dx = .075 0 on the other o.e. = 0.75 M1 Attempt to solve their integral for Q3 [k sin x ]Q0 3 k sinQ3 – 0 = 0.75 Q3 = 0.559 A1 [3] Correct answer (iv) 5C3 × (0.25)3 × (0.75)2 M1 Binomial expression involving 5C3, 0.25 and 0.75 = 0.0879 (45/512) A1 [2] Correct answer
This question in 9709/71 Oct/Nov 2009
Q4 · An airline knows that some people who have bought tickets may not arrive for the flight 9709/72 Oct/Nov 2009
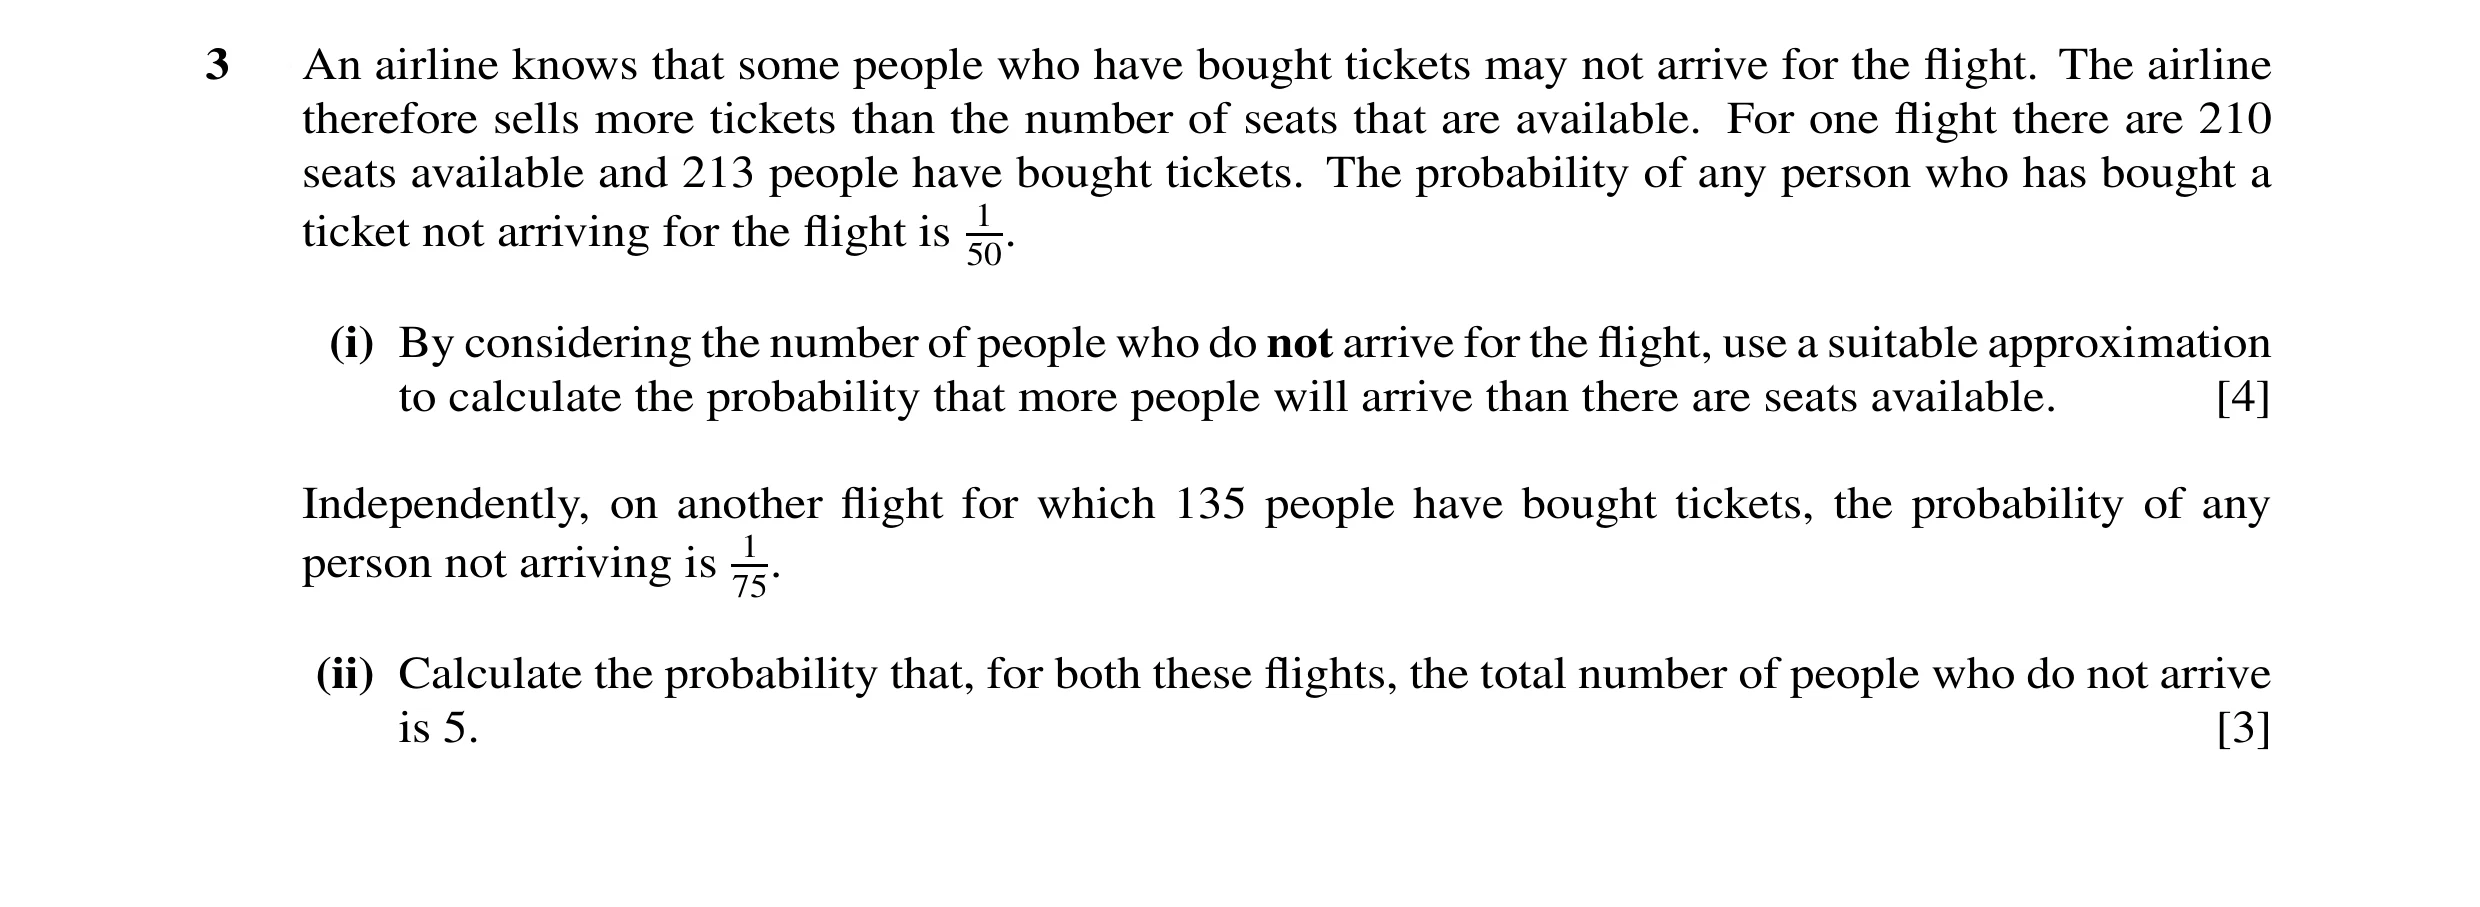
3 An airline knows that some people who have bought tickets may not arrive for the flight. The airline therefore sells more tickets than the number of seats that are available. For one flight there are 210 seats available and 213 people have bought tickets. The probability of any person who has bought a ticket not arriving for the flight is 50.1 (i) By considering the number of people who do not arrive for the flight, use a suitable approximation to calculate the probability that more people will arrive than there are seats available. [4] Independently, on another flight for which 135 people have bought tickets, the probability of any person not arriving is 75.1 (ii) Calculate the probability that, for both these flights, the total number of people who do not arrive is 5. [3]
7 marks
Mark scheme: 3 (i) Poisson mean 4.26 B1 Correct mean P(overbooked) = P(0, 1, 2 not arrive) .426 2 M1 Poisson attempt at P(0,1,2), their 4.26, allow = e–4.26 1 + .426 + end errors. 2 A1 ft Correct unsimplified answer, ft their mean. = 0.202 A1 Correct answer, as final answer. [4] (ii) mean = 135/75 = 1.8 Σ (Poissons) new mean = 4.26 + 1.8 = M1 Adding their two means. 6.06 .606 5 P(5) = e–6.06 M1 Attempt at Poisson P(5) with their mean. !5 = 0.159 A1 Correct answer [3] (i) SR Normal B1 N(4.26, 4.17(5)) or N(208.74 (209), 4.17(5)) B1 Prob = 0.195 SR Binomial B(213 , 1/50) B1 correct unsimplified expression for P(0,1,2) B1 Prob = 0.200 or 0.199 . (ii) SR Binomials M2 all cases of binomial products A1 prob = 0.160 GCE A/AS LEVEL – October/November 2009 9709 72 10
This question in 9709/72 Oct/Nov 2009
Q5 · It is not known whether a certain coin is fair or biased 9709/72 Oct/Nov 2009
4 It is not known whether a certain coin is fair or biased. In order to perform a hypothesis test, Raj tosses the coin 10 times and counts the number of heads obtained. The probability of obtaining a head on any throw is denoted by p. (i) The null hypothesis is p = 0.5. Find the acceptance region for the test, given that the probability of a Type I error is to be at most 0.1. [4] (ii) Calculate the probability of a Type II error in this test if the actual value of p is 0.7. [3]
7 marks
Mark scheme: 4 (i) P(0) = 0.510 = 0.000976 = P(10) M1 Evaluating two Binomial end probs of 0 and 1, P(1) = 10C1 × 0.51 × 0.59 = 0.00976 = P(9) (or 10 and 9). Σ 4 probs = 0.02147 < 10% M1 Summing either/both ends and comparing to 10% (doesn’t have to be two-tailed here). P(2) = 10C2 × 0.52 × 0.58 = 0.0439 = P(8) Σ 6 probs = 0.1093 > 10% M1 Summing a third/last end probability and comparing to 10% (needn’t be two-tailed here) Values of h are 2, 3, 4, 5, 6, 7, 8 A1 Correct answer only. A1 dep on all 3 Ms. No errors seen. [4] (ii) P(Type II error) = P(2, 3, 4, 5, 6, 7, 8) (= 1 – P(0, 1, 9, 10)) B1ft Identifying correct probs ft their ans (i) ( 3.0) 10 + 10 C 1 ( 7.0 )( )3.0 9 M1 Binomial expression for their P(Type II error) = 1 – 10 9 10 + C 9 ( 7.0 ) ( 3.0) + ( 7.0 ) with powers summing to 10, 10C somethings and 0.3 and 0.7 seen. = 1 – 0.149 = 0.851 A1 Correct final answer. [3]
This question in 9709/72 Oct/Nov 2009
Q6 · The random variable T denotes the time in seconds for which a firework burns before… 9709/71 May/June 2010
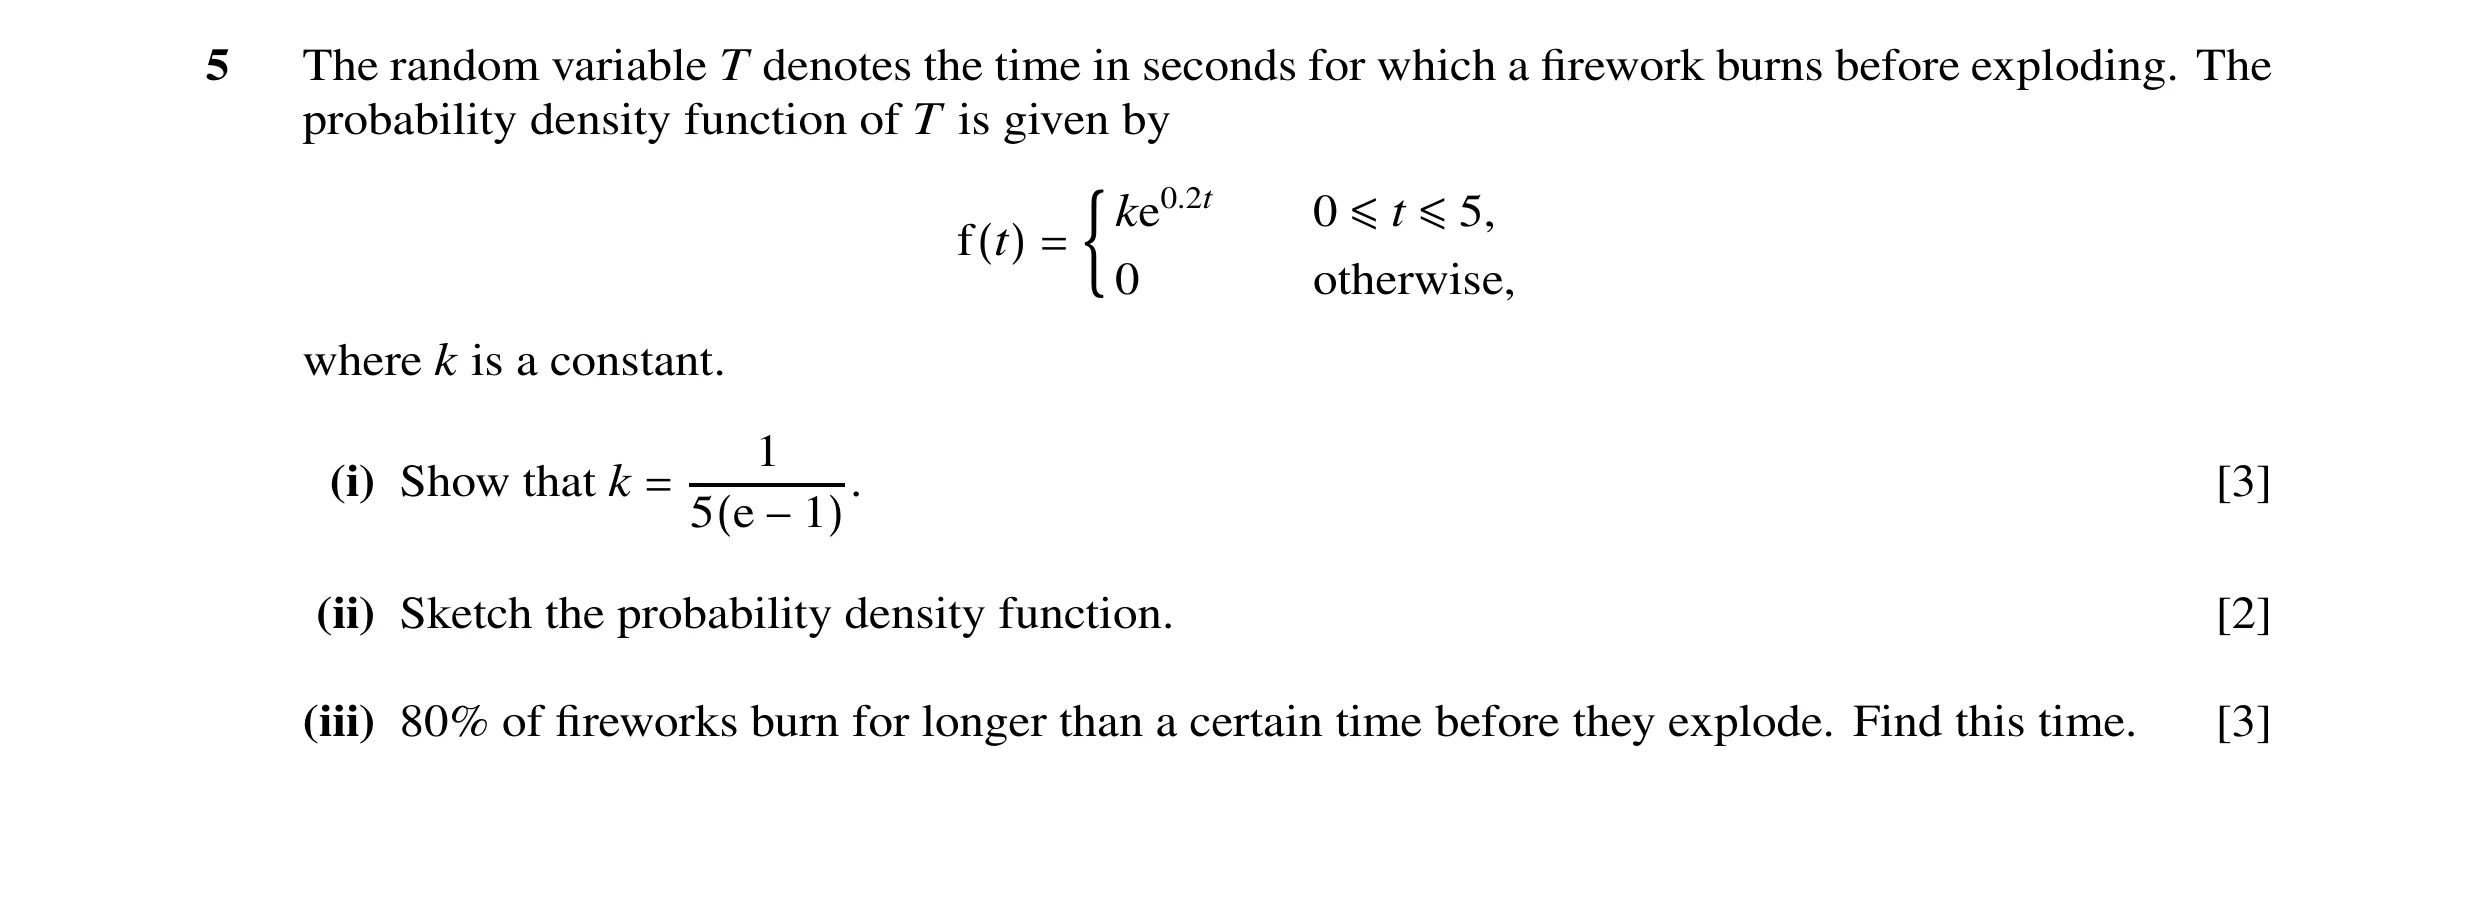
5 The random variable T denotes the time in seconds for which a firework burns before exploding. The probability density function of T is given by ke0.2t 0 ≤t ≤5, f(t) = 0 otherwise, where k is a constant. 1 (i) Show that k = [3] 5(e −1). (ii) Sketch the probability density function. [2] (iii) 80% of fireworks burn for longer than a certain time before they explode. Find this time. [3]
8 marks
Mark scheme: M1 Equating to 1 and attempting to integrate5 (i) ∫ ke 2.0 t dt = 1 0 k 0.1 k 0 e − e = 1 A1 Correct integrand and limits 2.0 2.0 k (e − 1) = 1 2.0 1 k = AG A1 Correct answer legitimately obtained 5e( − )1 [3] (ii) B1 Correct curve shape 0 5 B1 Correct horizontal lines (need to see a 5) [2] T M1 Equation relating T and 0.2 or 0.8 (iii) ∫ ke 2.0 tdt = 2.0 0 2.0T [5 ke ] − [5 k ] = 2.0 A1 Correct equation (can be in ‘k’) 2.0 T 2.0 e = + 1 = .1344 5 k T = 1.48 (seconds) A1 Correct answer [3] GCE AS/A LEVEL – May/June 2010 9709 71
This question in 9709/71 May/June 2010
Q7 · The time, in minutes, taken by volunteers to complete a task is modelled by the random… 9709/73 May/June 2010
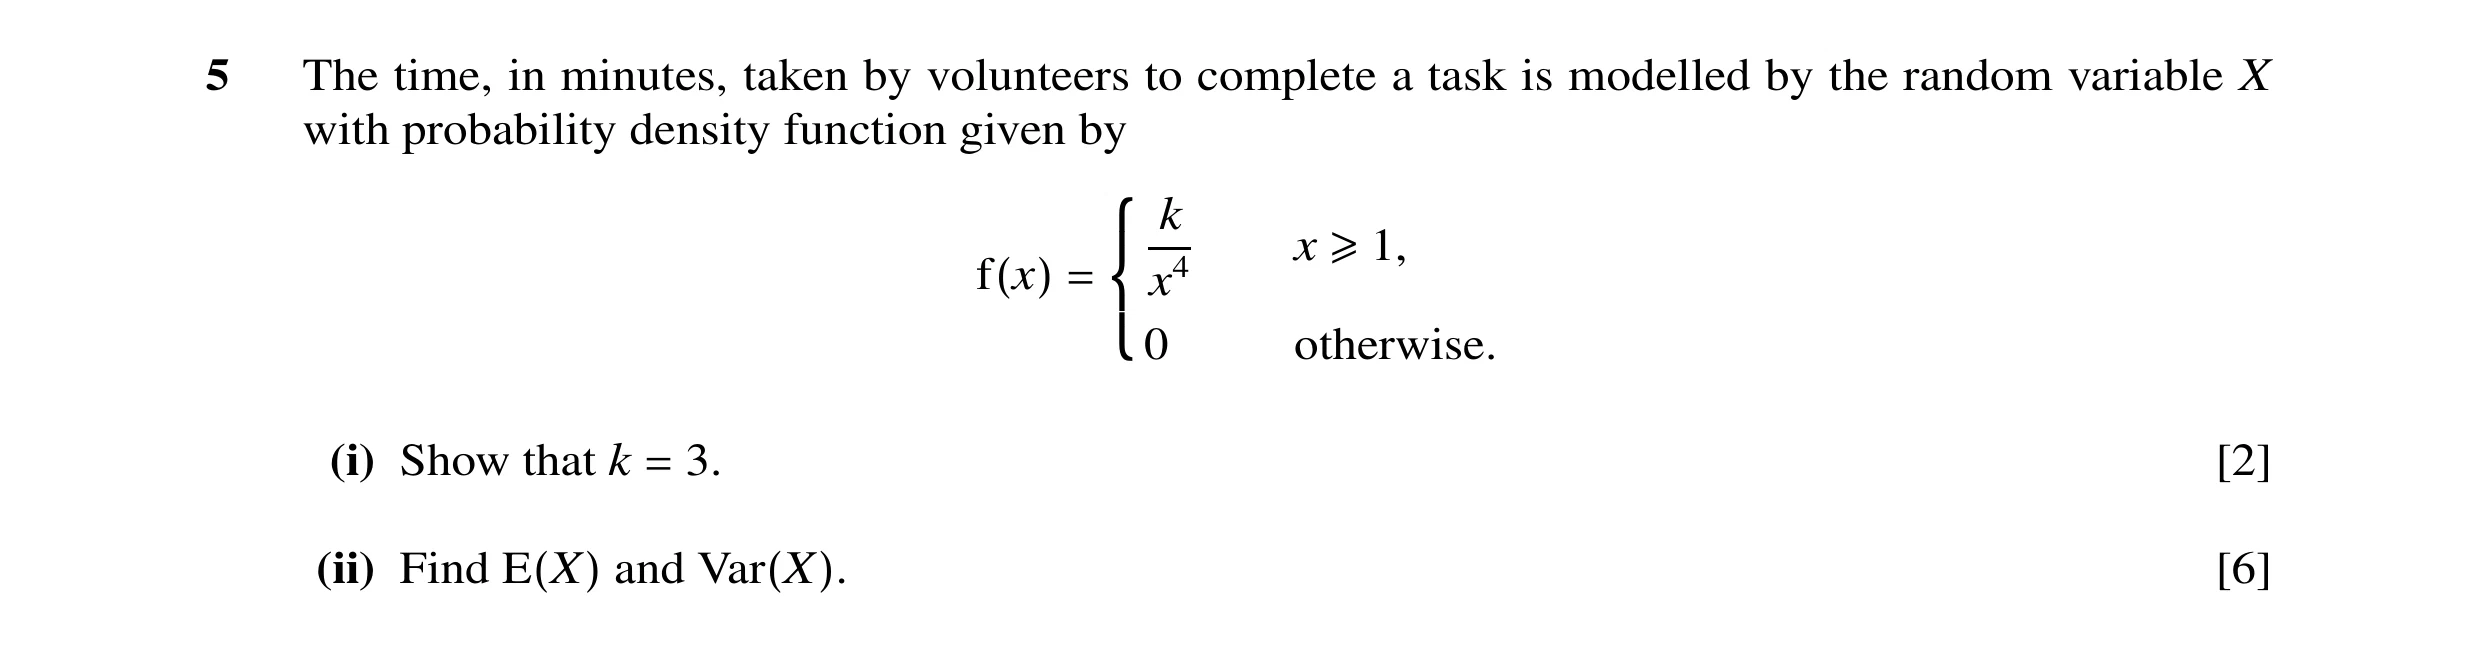
5 The time, in minutes, taken by volunteers to complete a task is modelled by the random variable X with probability density function given by k x ≥1, x4 f(x) = 0 otherwise. (i) Show that k = 3. [2] (ii) Find E(X) and Var(X). [6]
8 marks
Mark scheme: k d x = 1 M1 Attempt integ f(x) & “= 1”; ignore limits 45 (i) ∫1 x ∞ − k = 1 oe Correct integrand & limits leading to AG, no 3 3x 1 errors seen k ( 0 + = 1 ⇒ k = 3 AG) A1 3 [2] ∞ 3 dx M1 Attempt integ xf(x); ignore limits. 4 (ii) ∫1 x × x − 3 ∞ 2 x 2 1 3 = A1 CWO 2 ∞ 3 dx M1* Attempt integ x2f(x); ignore limits. 4 ∫1 x 2 × x − 3 ∞ (= 3) A1 Correct integrand; correct limits x 1 3 2 “3” –(" ") M1*dep dep 2nd M1 attempt E(X 2) – [E(X )]2 2 3 = A1 cwo 4 [6] GCE AS/A LEVEL – May/June 2010 9709 73
This question in 9709/73 May/June 2010
Q8 · It is claimed that a certain 6-sided die is biased so that it is more likely to show a… 9709/71 Oct/Nov 2010
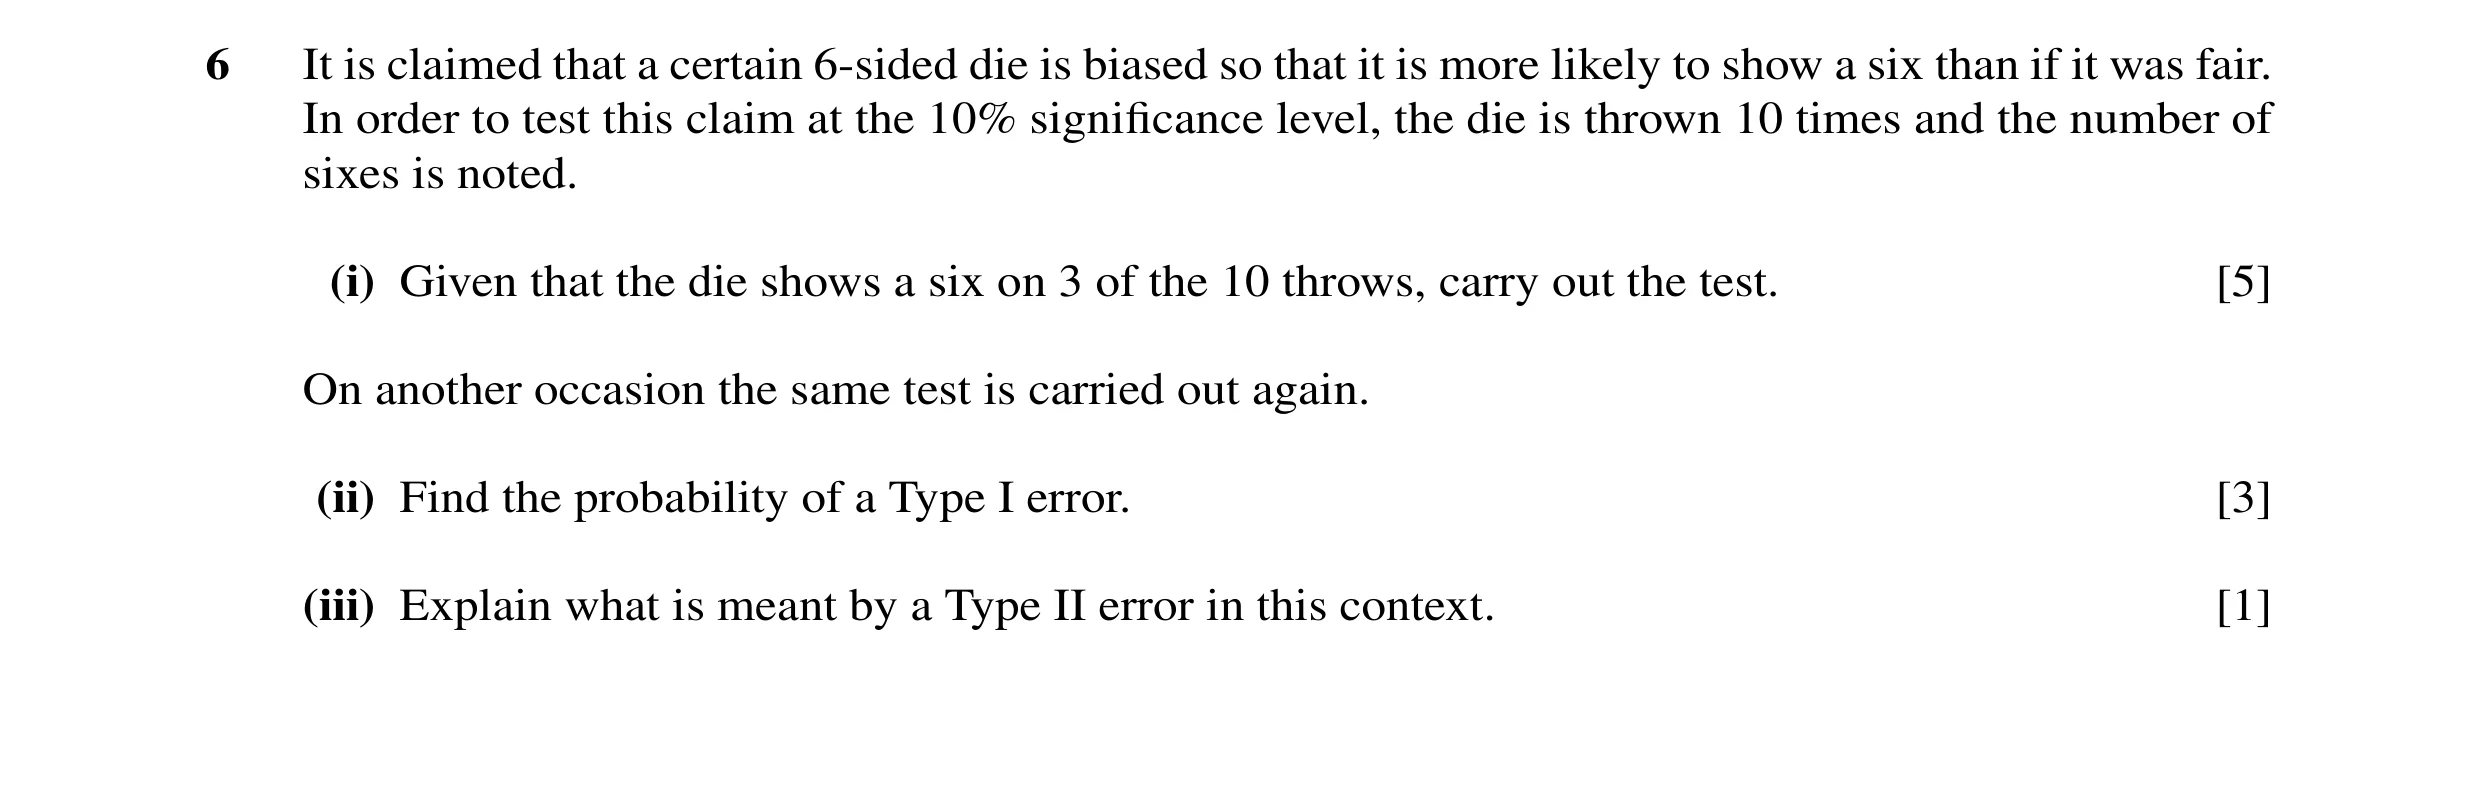
6 It is claimed that a certain 6-sided die is biased so that it is more likely to show a six than if it was fair. In order to test this claim at the 10% significance level, the die is thrown 10 times and the number of sixes is noted. (i) Given that the die shows a six on 3 of the 10 throws, carry out the test. [5] On another occasion the same test is carried out again. (ii) Find the probability of a Type I error. [3] (iii) Explain what is meant by a Type II error in this context. [1]
9 marks
Mark scheme: 6 (i) Ho: P(6) = 1/6 H1: P(6) > 1/6 B1 Allow “p” 1 – ((5/6)10 + 10(1/6)(5/6)9 + 10C2(1/6)2(5/6)8) M1 Allow 1 term omitted or extra or incorrect = 0.225 (3 sfs) A1 0.225 > 0.1 M1 Allow correct comparison with 0.9, and recovery of previous then M1A1 possible. No evidence that die biased A1ft [5] Allow Accept die not biased. In context. SR Calc just P(3)max score B1M0A0M1A0 (ii) P(4 or more sixes) M1 Idea of 1 – Σ of terms oe compared with 0.1 = 1 – ((5/6)10 + 10(1/6)(5/6)9 + 10C2(1/6)2(5/6)8 M1 1 – Σ of appropriate no.terms oe + 10C3(1/6)3(5/6)7) compared with 0.1 = 0.0697 or 0.0698 A1 [3] (iii) Concluding die is fair when die is biased B1 [1] Must be in context
This question in 9709/71 Oct/Nov 2010
Q9 · F()x 1 0.5 0 x 0 1 2 The diagram shows the graph of the probability density function, f… 9709/72 Oct/Nov 2010
4 f()x 1 0.5 0 x 0 1 2 The diagram shows the graph of the probability density function, f, of a random variable X which takes values between 0 and 2 only. (i) Find P(1 < X < 1.5). [2] (ii) Find the median of X. [3] (iii) Find E(X). [2]
7 marks
Mark scheme: x dx M1 Attempt find correct area eg 1 squ + 24 (i) 0.5(0.5 + 0.75)×0.5 or ∫1 1/4 squ = 5/16 or 0.3125 or 0.313 A1 [2] or integral with correct limits any f(x) m x d x M1 Attempt area from 0 to m (or m to 2) 2 (ii) 1/2 m × m/2 or ∫ 0 their f(x) = 1/2 M1 Expression for area = 1/2. Ignore limits m = √2 or 1.41 A1 [3] 2 x (iii) 2 2 d x M1 Attempt ∫ xf( x )dx . Ignore limits ∫ 0 = 4/3 oe A1 [2]
This question in 9709/72 Oct/Nov 2010
Q10 · On average, 2 people in every 10 000 in the UK have a particular gene 9709/71 May/June 2011
1 On average, 2 people in every 10 000 in the UK have a particular gene. A random sample of 6000 people in the UK is chosen. The random variable X denotes the number of people in the sample who have the gene. Use an approximating distribution to calculate the probability that there will be more than 2 people in the sample who have the gene. [4]
4 marks
Mark scheme: 1 Poisson B1 λ = 1.2 B1 1.2 seen 2 1 – e–1.2(1 + 1.2 + 2.1 ) M1 1 – Poisson P(0, 1, 2, 3) attempted, any λ, allow 2 A1 1 end error = 0.121 [4] SC: using Bin, ans 0.120: B1 32 6
This question in 9709/71 May/June 2011
Q11 · Past experience has shown that the heights of a certain variety of rose bush have been… 9709/71 May/June 2011
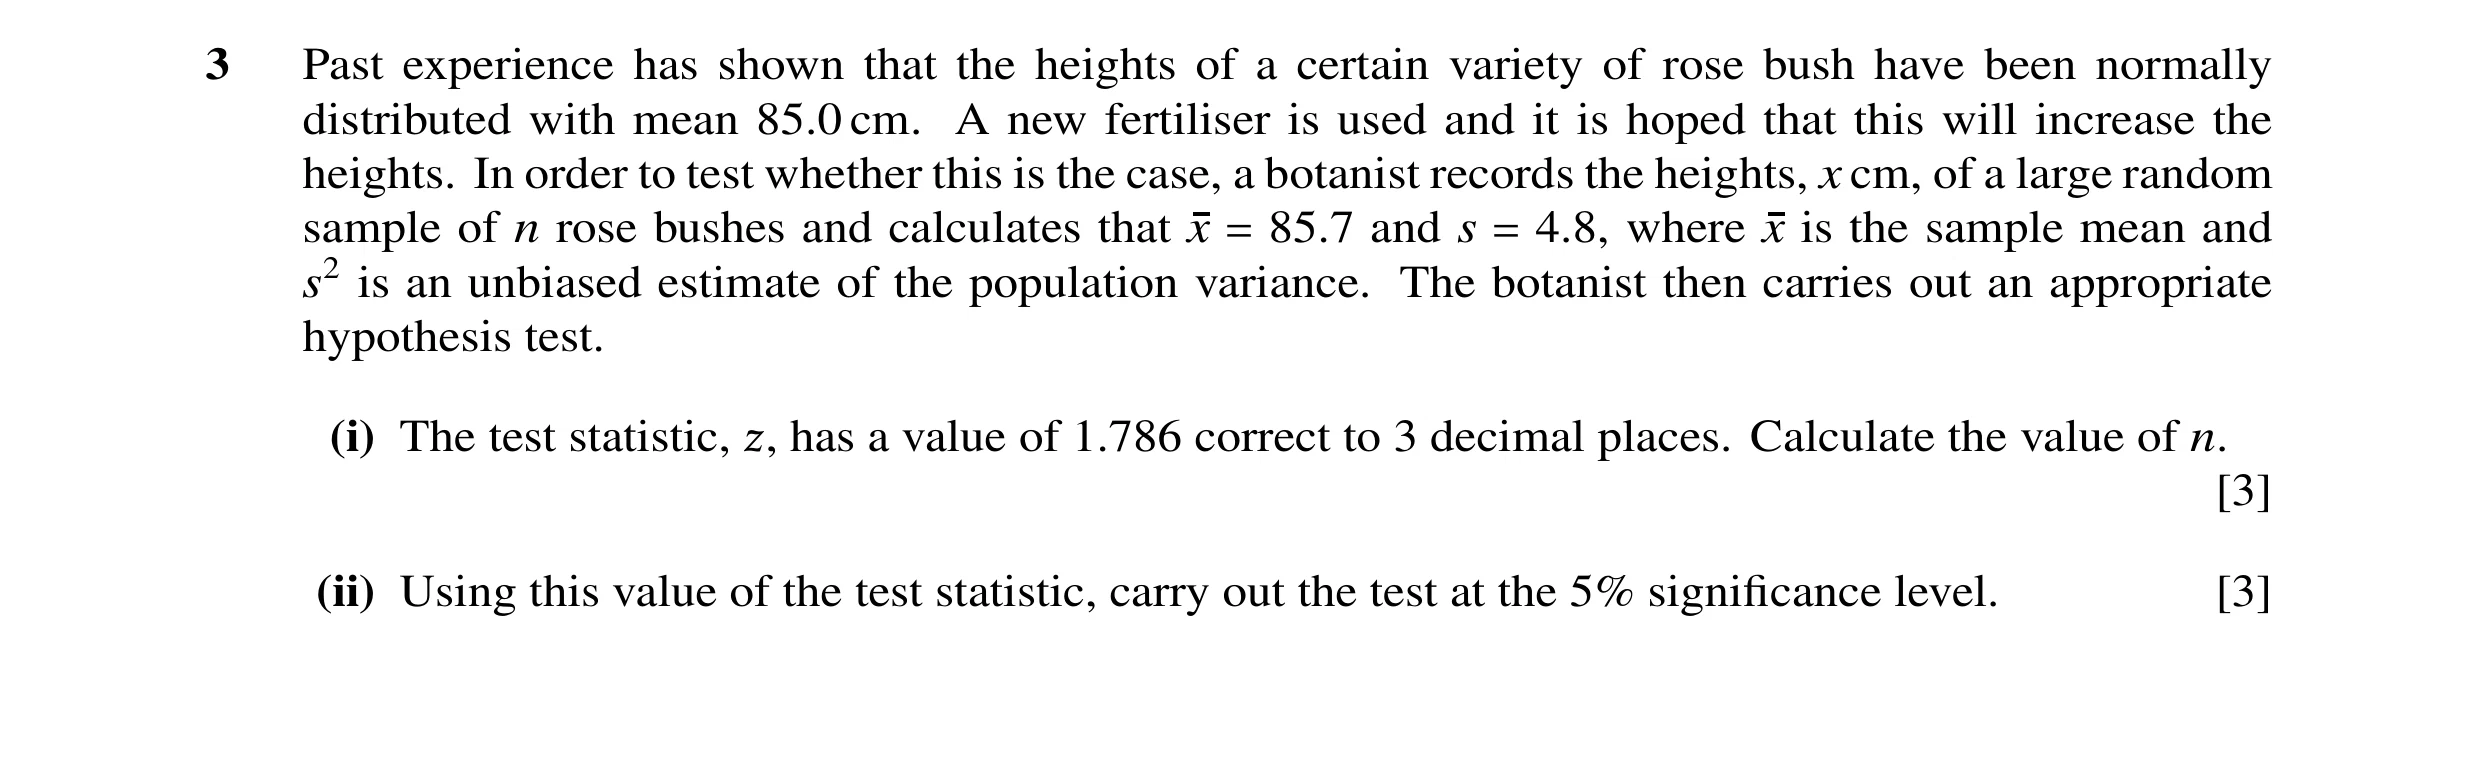
3 Past experience has shown that the heights of a certain variety of rose bush have been normally distributed with mean 85.0 cm. A new fertiliser is used and it is hoped that this will increase the heights. In order to test whether this is the case, a botanist records the heights, x cm, of a large random sample of n rose bushes and calculates that x = 85.7 and s = 4.8, where x is the sample mean and s2 is an unbiased estimate of the population variance. The botanist then carries out an appropriate hypothesis test. (i) The test statistic, ß, has a value of 1.786 correct to 3 decimal places. Calculate the value of n. [3] (ii) Using this value of the test statistic, carry out the test at the 5% significance level. [3]
6 marks
Mark scheme: 3 (i) 8.4 (= 1.786) M1 n n = ( .1786 × 8.4 ) 2 A1 Correct equation in n 7.0 = 150 A1 [3] (ii) H0: µ = 85.0 H1: µ > 85.0 B1 z = 1.645 M1 Comparison 1.786 and 1.645 Allow 1.96 if H1: µ ≠ 85.0 Evidence that µ increased A1f Correct conc. No contradictions. ft H1 [3]
This question in 9709/71 May/June 2011
Q12 · G( )x h( )x 1 1 x x 0 1 2 0 1 2 –1 –1 The diagrams show the graphs of two functions, g… 9709/71 May/June 2011
4 (a) g( )x h( )x 1 1 x x 0 1 2 0 1 2 –1 –1 The diagrams show the graphs of two functions, g and h. For each of the functions g and h, give a reason why it cannot be a probability density function. [2] (b) The distance, in kilometres, travelled in a given time by a cyclist is represented by the continuous random variable X with probability density function given by 30 10 ≤x ≤15, x2 f(x) = 0 otherwise. (i) Show that E(X) = 30 ln 1.5. [3] (ii) Find the median of X. Find also the probability that X lies between the median and the mean. [5]
10 marks
Mark scheme: 4 (a) g: Area ≠ 1 or > 1 B1 h: pdf cannot be neg B1 [2] 15 30 (b) (i) dx M1 Attempt integ xf(x), ignore limits ∫ x 10 = [30 ln x ] 1510 A1 Correct integrand and limits = 30(ln15 – ln10) A1 or 30ln(15/10) (= 30ln1.5 AG) [3] m 30 (ii) 2 dx = 0.5 M1 Integ f(x) = 0.5, limits 10 to unknown ∫ x 10 [− 30 x −1 ] 10m = 0.5 A1 Correct integrand, limits and = 0.5 −m30 − ( − 1030 ) = 0.5 m = 12 A1 30 ln1.5 30 2 dx M1 ∫ x '12 ' = 0.0337 (3 sfs) A1 [5] GCE AS/A LEVEL – May/June 2011 9709 71
This question in 9709/71 May/June 2011
Q13 · The distance travelled, in kilometres, by a Grippo brake pad before it needs to be… 9709/73 May/June 2011
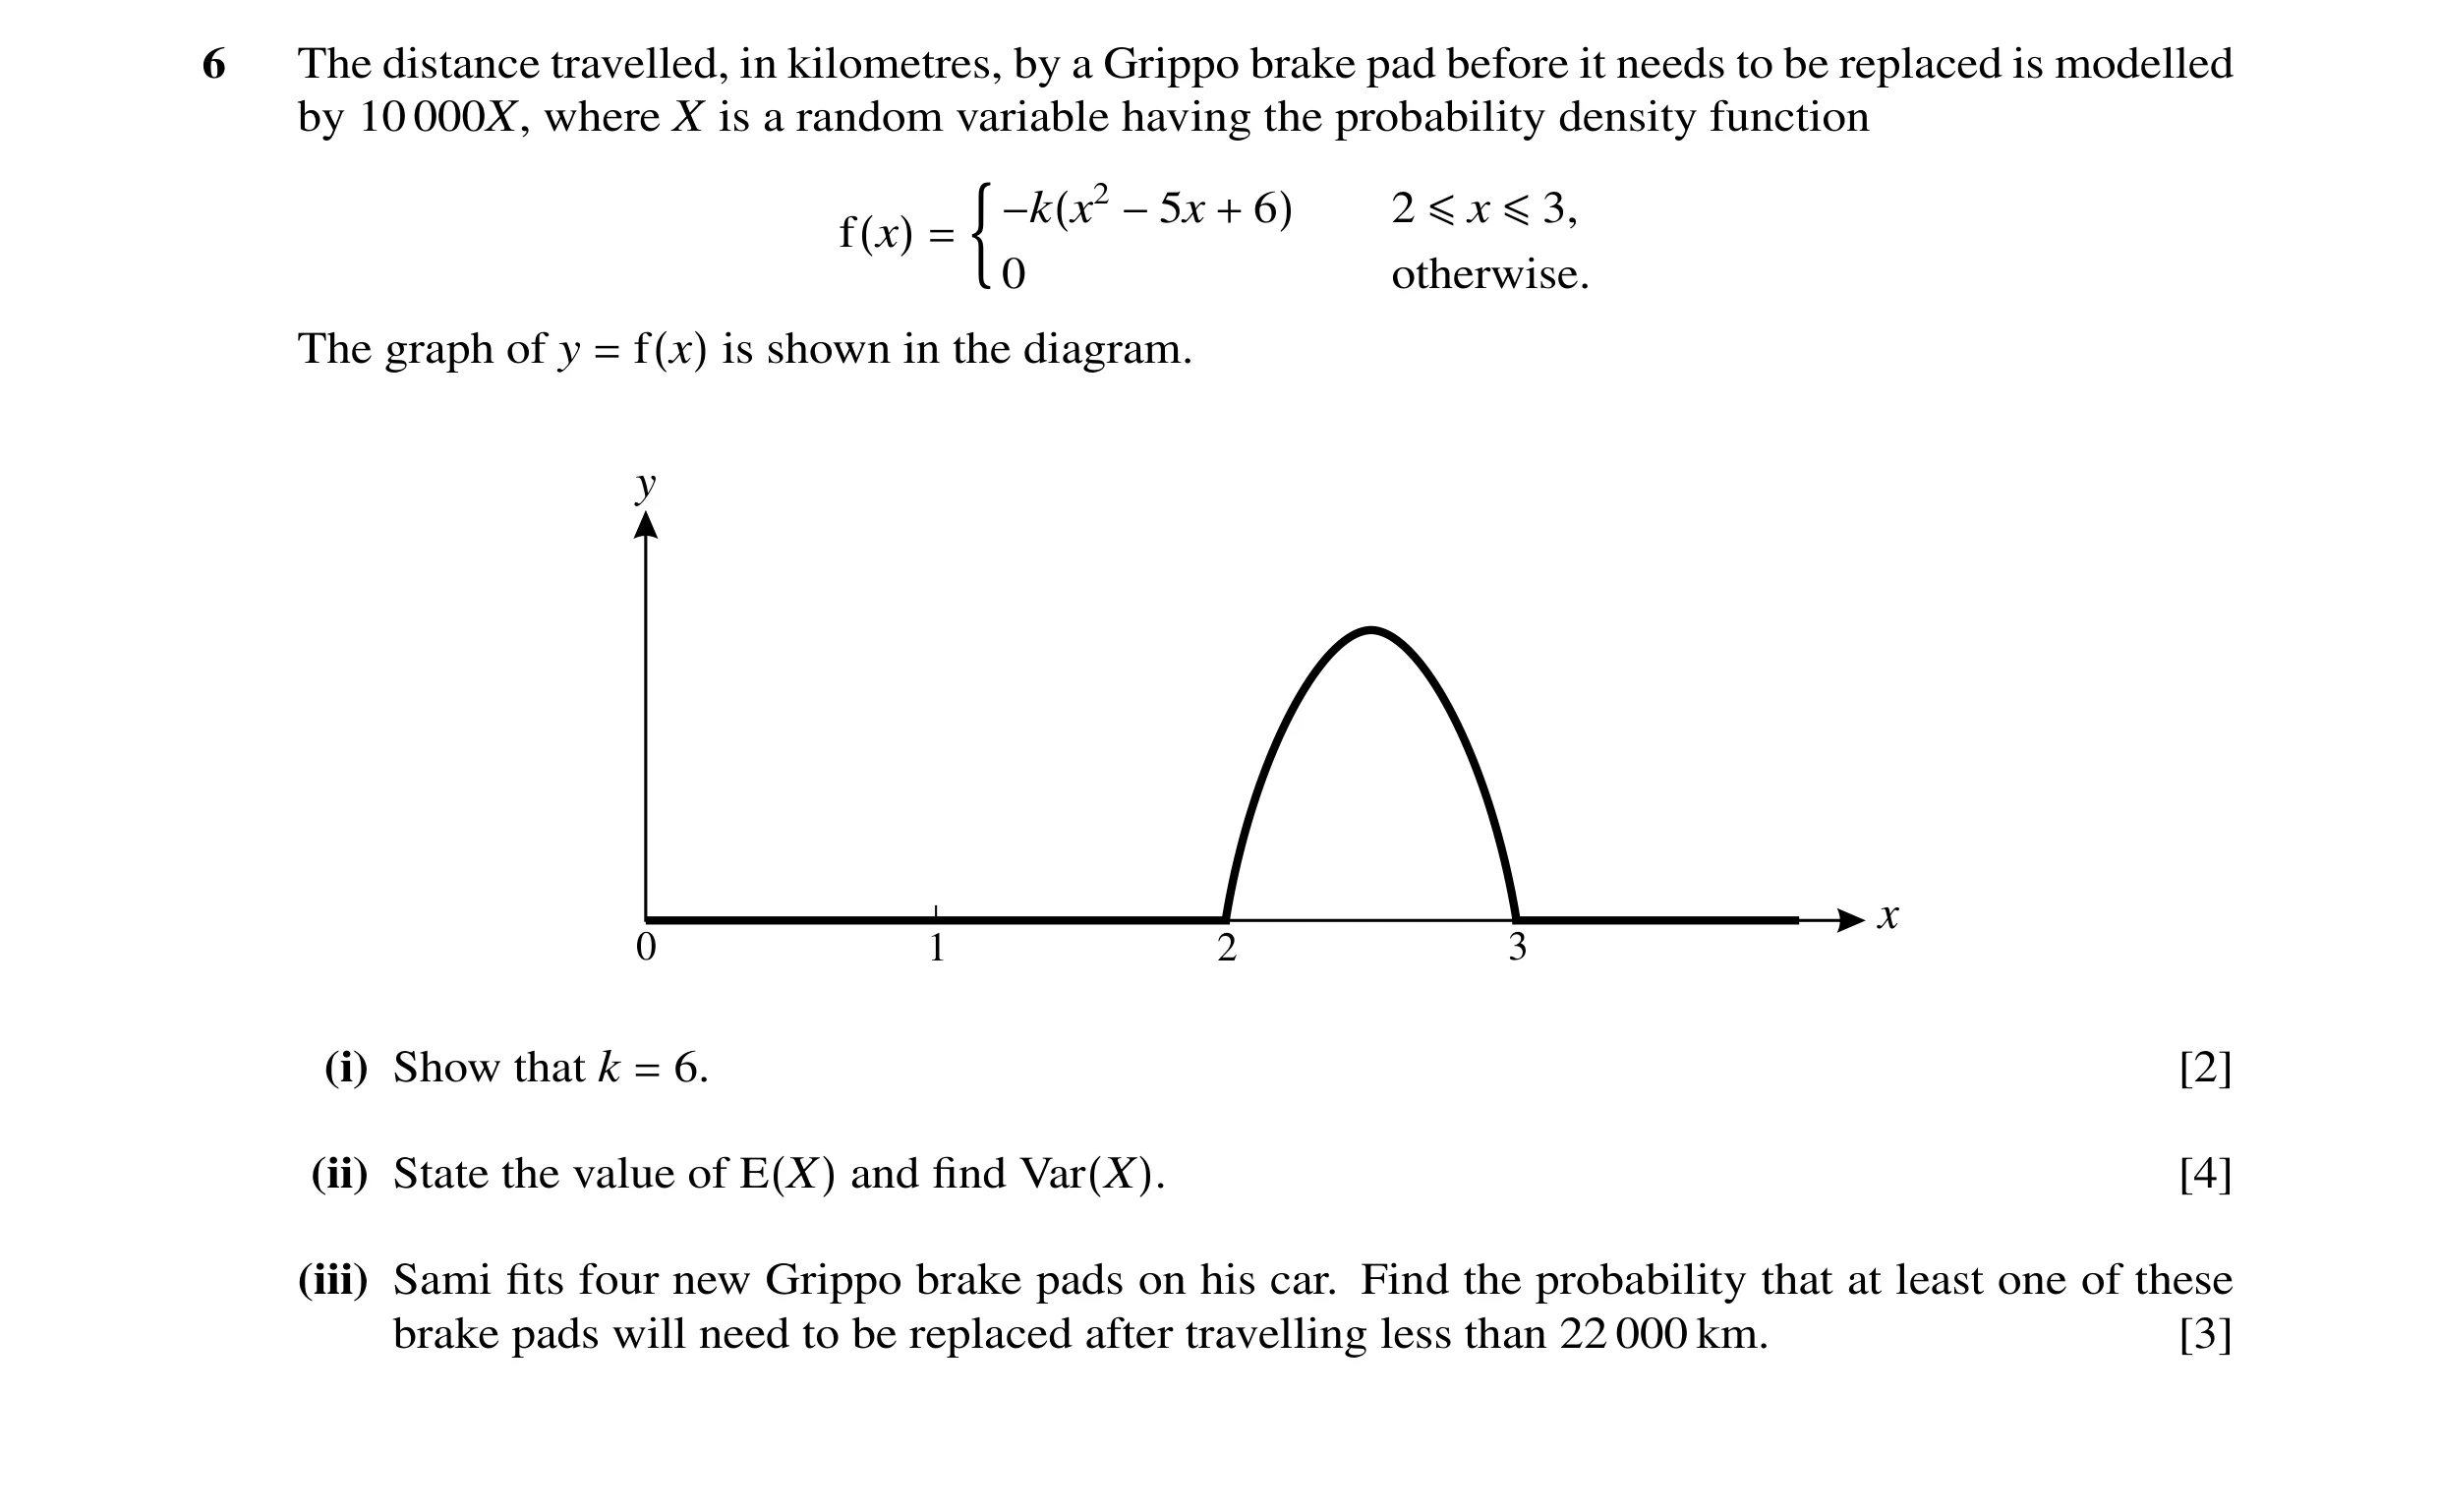
6 The distance travelled, in kilometres, by a Grippo brake pad before it needs to be replaced is modelled by 10 000X, where X is a random variable having the probability density function −k(x2 −5x + 6) 2 ≤x ≤3, f(x) = 0 otherwise. The graph of y = f(x) is shown in the diagram. y x 0 1 2 3 (i) Show that k = 6. [2] (ii) State the value of E(X) and find Var(X). [4] (iii) Sami fits four new Grippo brake pads on his car. Find the probability that at least one of these brake pads will need to be replaced after travelling less than 22 000 km. [3]
9 marks
Mark scheme: 6 (i) − k ∫ 2 ( x 2 − 5 x + 6) d x = 1 M1 Integ = 1; ignore − 6 ∫ 2 ( x 2 − 5 x + 6) d x 3 2 3 2 limits (–k( 33 − 5 × 32 + 6 × 3 − [ 23 − 5 × 22 + 6 × 2 ] ) = 1) ignore limits –k × (– 1 ) = 1 or k × 1 = 1 A1 [2] Correctly obtain Correctly obtain 1 6 6 (k = 6 AG) – 16 or 16 CWO No rounded decimals (ii) E(X) = 2.5 B1 Condone 25000 3 − 6 ∫ 2 ( x 4 − 5 x 3 + 6 x 2 ) d x (= –6 × (–1.05)) M1* Integ x2f(x); ignore limits – “2.5”2 Dep Subtr µ2, M1* = 0.05 A1 [4] ISW 2.2 (iii) − 6 ∫ 2 ( x 2 − 5 x + 6 ) d x (= 0.104) M1 Integ with limits 2, 2.2 or 2.2, 3 1 – (1 – “0.104”)4 M1 Or equivalent = 0.355/0.356 A1 [3] [Total: 9] GCE AS/A LEVEL – May/June 2011 9709 73 121 11
This question in 9709/73 May/June 2011
Q14 · 4 4 4 4 2 2 2 2 t u v w 0 1 0 1 0 1 0 1 Fig 9709/71 Oct/Nov 2011
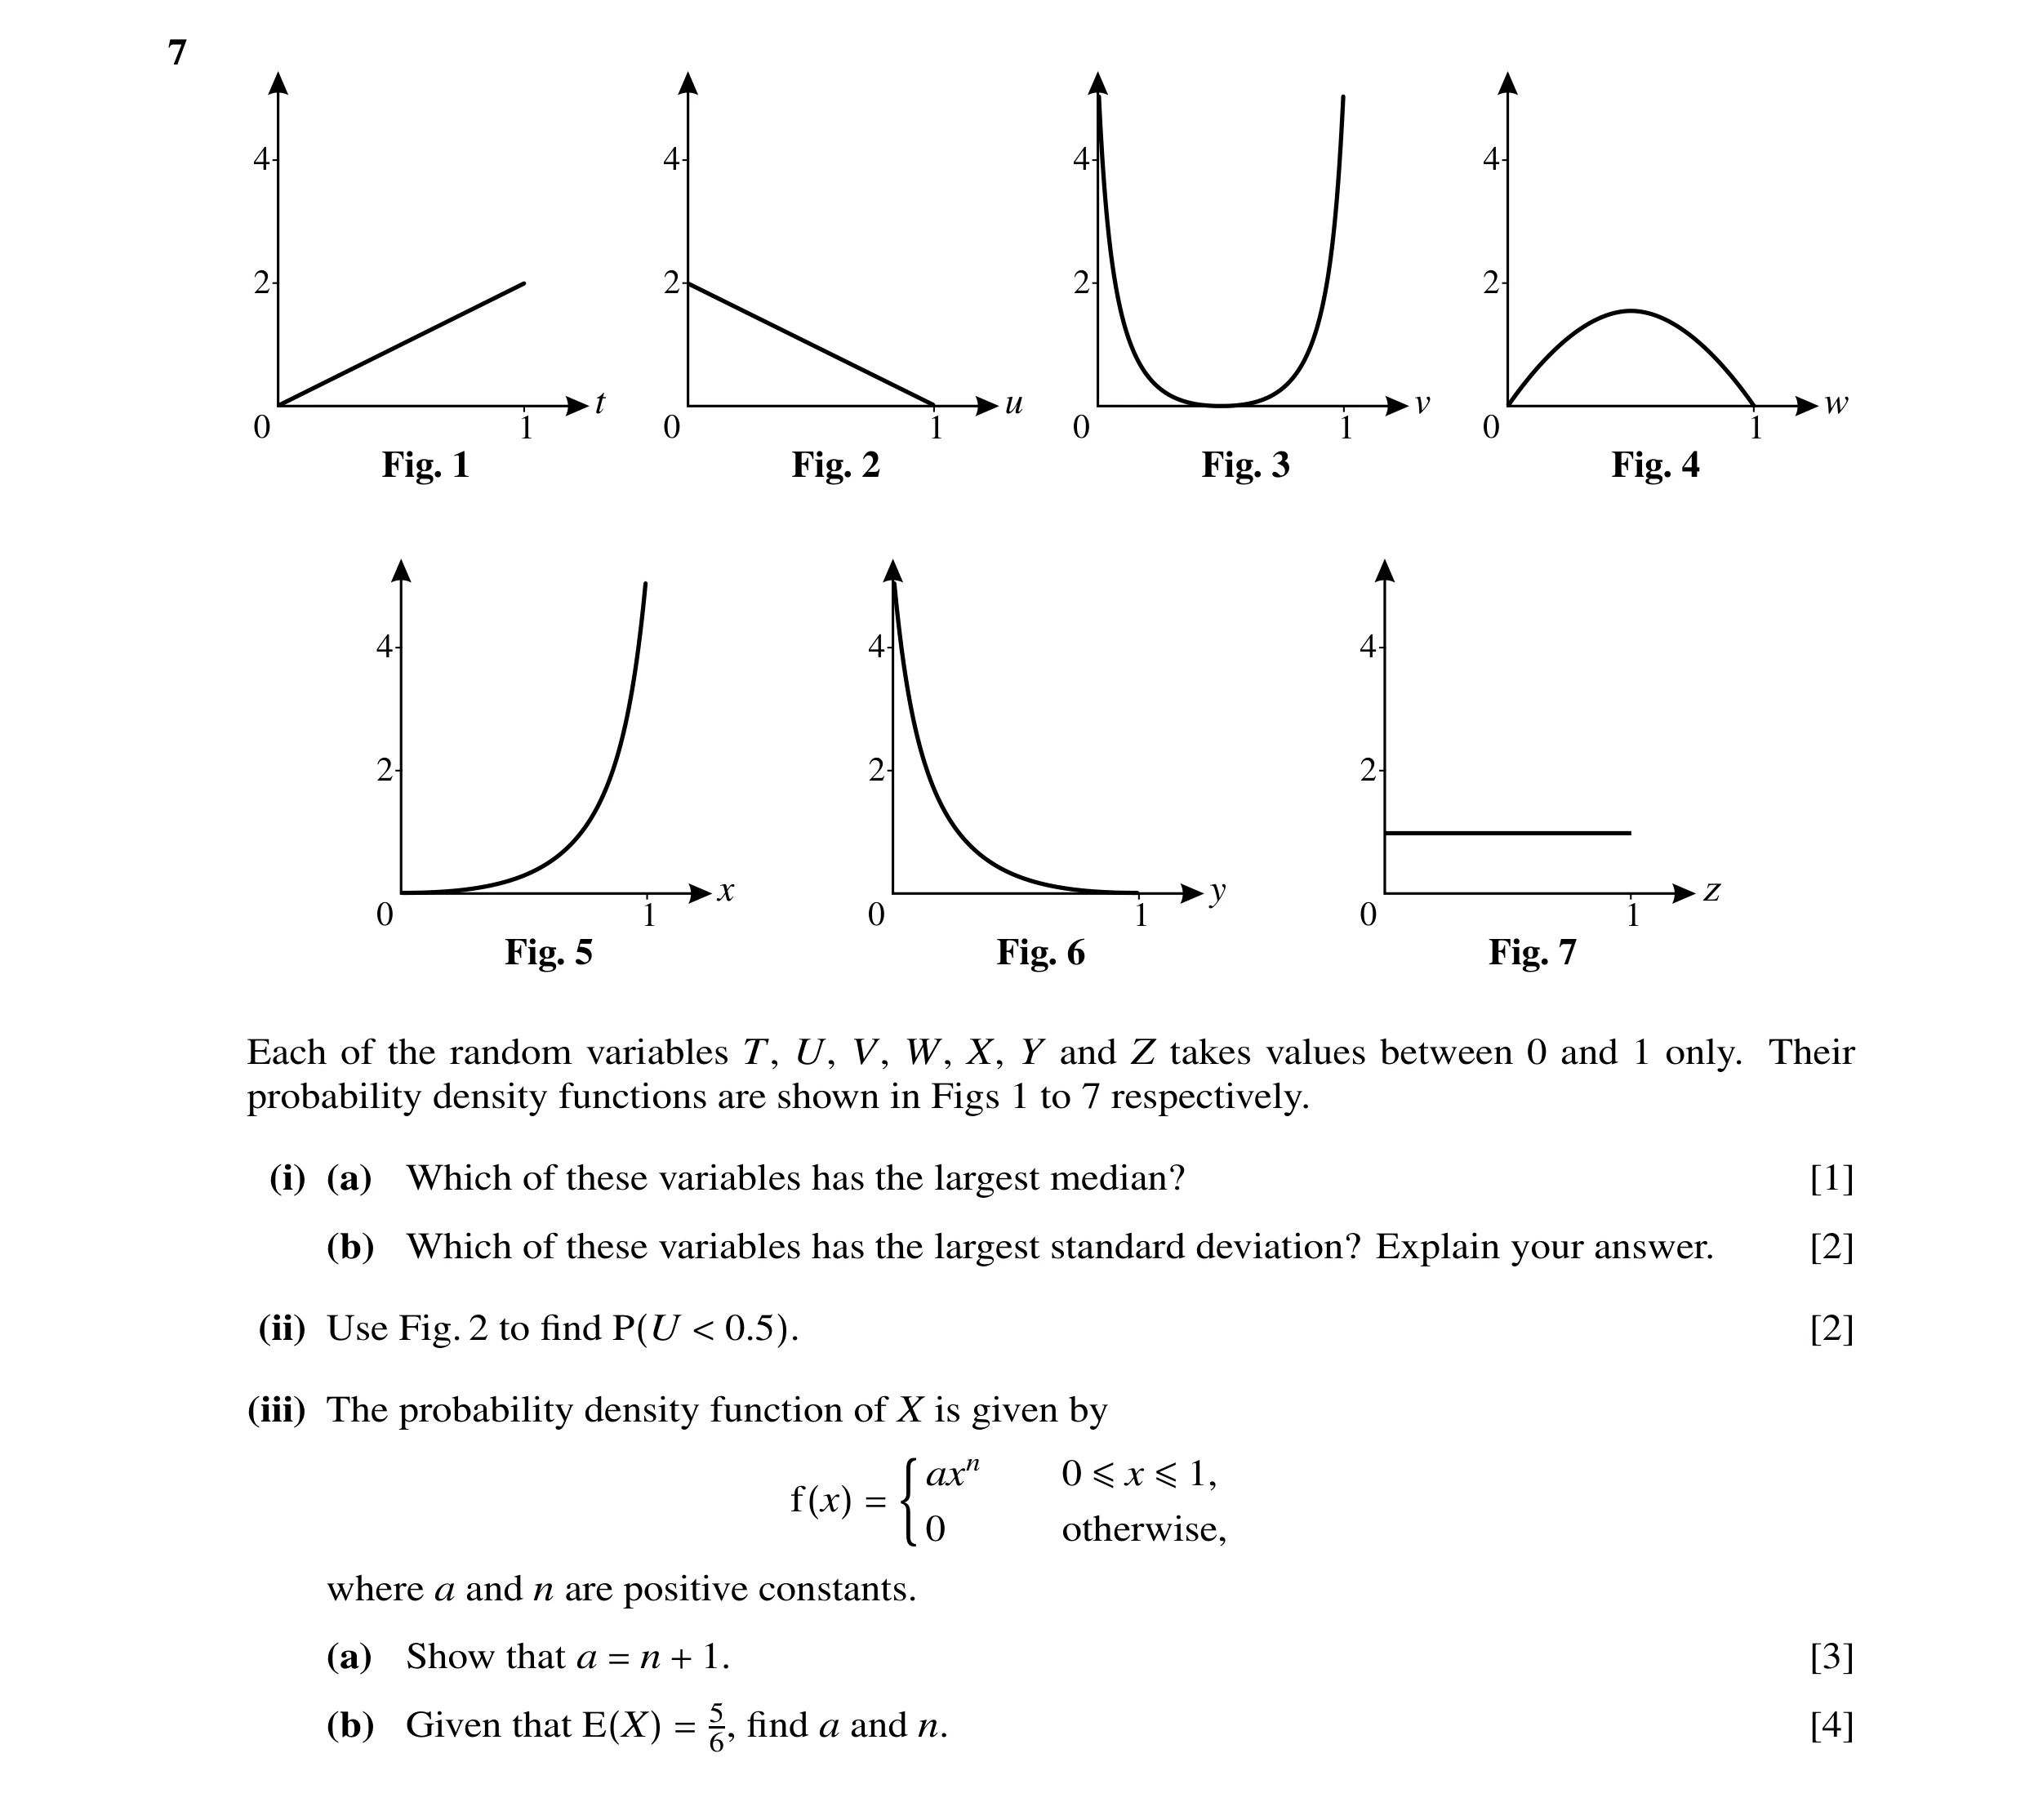
7 4 4 4 4 2 2 2 2 t u v w 0 1 0 1 0 1 0 1 Fig. 1 Fig. 2 Fig. 3 Fig. 4 4 4 4 2 2 2 z x y 0 1 0 1 0 1 Fig. 5 Fig. 6 Fig. 7 Each of the random variables T, U, V, W, X, Y and Z takes values between 0 and 1 only. Their probability density functions are shown in Figs 1 to 7 respectively. (i) (a) Which of these variables has the largest median? [1] (b) Which of these variables has the largest standard deviation? Explain your answer. [2] (ii) Use Fig. 2 to find P(U < 0.5). [2] (iii) The probability density function of X is given by axn 0 ≤x ≤1, f(x) = 0 otherwise, where a and n are positive constants. (a) Show that a = n + 1. [3] (b) Given that E(X) = 56, find a and n. [4]
12 marks
Mark scheme: 7 (i) (a) X or 5 B1 [1] (b) V or 3 B1 Should mention values or prob Not just graph or spread eg not “More spread” Higher and lower values more likely or B1dep there are more higher and lower values or more prob at both extremes [2] 2 + 1 5.0 (ii) M1 (‘or’ method requires linear function and × 5.0 or∫0 ( 2 − 2 x ) d x 2 correct limits) = 0.75 A1 [2] CWO 1 M1 Attempt integ of correct form = 1 (iii) (a) ∫0 axn dx = 1 (ignore limits) ax n +1 1 = 1 A1 Correct integrand & limits n + 1 0 a = 1 A1 No errors seen n + 1 (a = n + 1 AG) [3] 1 5 5 n +1 = , M1* Integral of form ∫ xf ( x )dx (b) ∫0 ax dx = 6 oe 6 ignore limits ax n + 2 1 5 = oe A1 Correct integrand & limits n + 2 0 6 a 5 = M1dep Attempt to use a = n + 1 within 2nd equ n + 2 6 to get an equ in n (or a) (6a = 5n + 10) a = 5, n = 4 A1 [4]
This question in 9709/71 Oct/Nov 2011
Q15 · 4 4 4 4 2 2 2 2 t u v w 0 1 0 1 0 1 0 1 Fig 9709/72 Oct/Nov 2011
7 4 4 4 4 2 2 2 2 t u v w 0 1 0 1 0 1 0 1 Fig. 1 Fig. 2 Fig. 3 Fig. 4 4 4 4 2 2 2 z x y 0 1 0 1 0 1 Fig. 5 Fig. 6 Fig. 7 Each of the random variables T, U, V, W, X, Y and Z takes values between 0 and 1 only. Their probability density functions are shown in Figs 1 to 7 respectively. (i) (a) Which of these variables has the largest median? [1] (b) Which of these variables has the largest standard deviation? Explain your answer. [2] (ii) Use Fig. 2 to find P(U < 0.5). [2] (iii) The probability density function of X is given by axn 0 ≤x ≤1, f(x) = 0 otherwise, where a and n are positive constants. (a) Show that a = n + 1. [3] (b) Given that E(X) = 56, find a and n. [4]
12 marks
Mark scheme: 7 (i) (a) X or 5 B1 [1] (b) V or 3 B1 Should mention values or prob Not just graph or spread eg not “More spread” Higher and lower values more likely or B1dep there are more higher and lower values or more prob at both extremes [2] 2 + 1 5.0 (ii) M1 (‘or’ method requires linear function and × 5.0 or∫0 ( 2 − 2 x ) d x 2 correct limits) = 0.75 A1 [2] CWO 1 M1 Attempt integ of correct form = 1 (iii) (a) ∫0 axn dx = 1 (ignore limits) ax n +1 1 = 1 A1 Correct integrand & limits n + 1 0 a = 1 A1 No errors seen n + 1 (a = n + 1 AG) [3] 1 5 5 n +1 = , M1* Integral of form ∫ xf ( x )dx (b) ∫0 ax dx = 6 oe 6 ignore limits ax n + 2 1 5 = oe A1 Correct integrand & limits n + 2 0 6 a 5 = M1dep Attempt to use a = n + 1 within 2nd equ n + 2 6 to get an equ in n (or a) (6a = 5n + 10) a = 5, n = 4 A1 [4]
This question in 9709/72 Oct/Nov 2011
Q16 · Records show that the distance driven by a bus driver in a week is normally distributed… 9709/73 Oct/Nov 2011
5 Records show that the distance driven by a bus driver in a week is normally distributed with mean 1150 km and standard deviation 105 km. New driving regulations are introduced and in the next 20 weeks he drives a total of 21 800 km. (i) Stating any assumption(s), test, at the 1% significance level, whether his mean weekly driving distance has decreased. [6] (ii) A similar test at the 1% significance level was carried out using the data from another 20 weeks. State the probability of a Type I error and describe what is meant by a Type I error in this context. [2]
8 marks
Mark scheme: 5 (i) Assume pop sd same (105) B1 H0: Pop mean = 1150 B1 Allow “µ” but not just “mean” H1: Pop mean < 1150 21800 M1 105 − 1150 Allow ÷ . (Accept “totals” method) 20 20 105 20 = ±2.556 or 2.56 A1 Or 0.0053 if prob/area comparison used Compare with z = ±2.326 M1 Correct comparison of z or prob/area (for a clear 2 tail test compare with ±2.576) consistent with their test Evidence that mean distance decreased A1ft In context. Allow mean dist decreased [6] ft their z and/or clear 2 tail test (ii) 0.01 B1 Concluding there has been a decrease when B1 In context there has not. [2] GCE AS/A LEVEL – October/November 2011 9709 73
This question in 9709/73 Oct/Nov 2011
Q17 · The random variable X has probability density function given by k 0 ≤x ≤1, (x + 1)2 f(x)… 9709/71 May/June 2012
4 The random variable X has probability density function given by k 0 ≤x ≤1, (x + 1)2 f(x) = 0 otherwise, where k is a constant. (i) Show that k = 2. [2] (ii) Find a such that P(X < a) = 15. [3] (iii) y 2 1 x 0 1 The diagram shows the graph of y = f(x). The median of X is denoted by m. Use the diagram to explain whether m < 0.5, m = 0.5 or m > 0.5. [2]
7 marks
Mark scheme: 4 (i) 1 k ∫ 0 ( x +1) 2 d x = 1 M1 Any attempt integ f(x) & = 1. Ignore limits 1 k 0 = 1 –[( x +1) ] 1 − k − 1 = 1 2 A1 oe, with limits inserted correctly (k = 2 AG) [2] a (ii) 2 d x = 1 ( x + 1) 2 5 M1 Attempt integ f(x) & = 15 (oe), ignore limits ∫ 0 2 a = 1 –[( x +1) ] 0 5 2 1 A1 oe, with correct limits inserted correctly − − 2 = 5 a + 1 A1 a = 1 9 [3] (iii) Area below x = 0.5 is greater than 0.5 B1 oe, eg More area at left hand end m < 0.5 B1dep [2] GCE AS/A LEVEL – May/June 2012 9709 71
This question in 9709/71 May/June 2012
Q18 · A survey taken last year showed that the mean number of computers per household in… 9709/71 May/June 2012
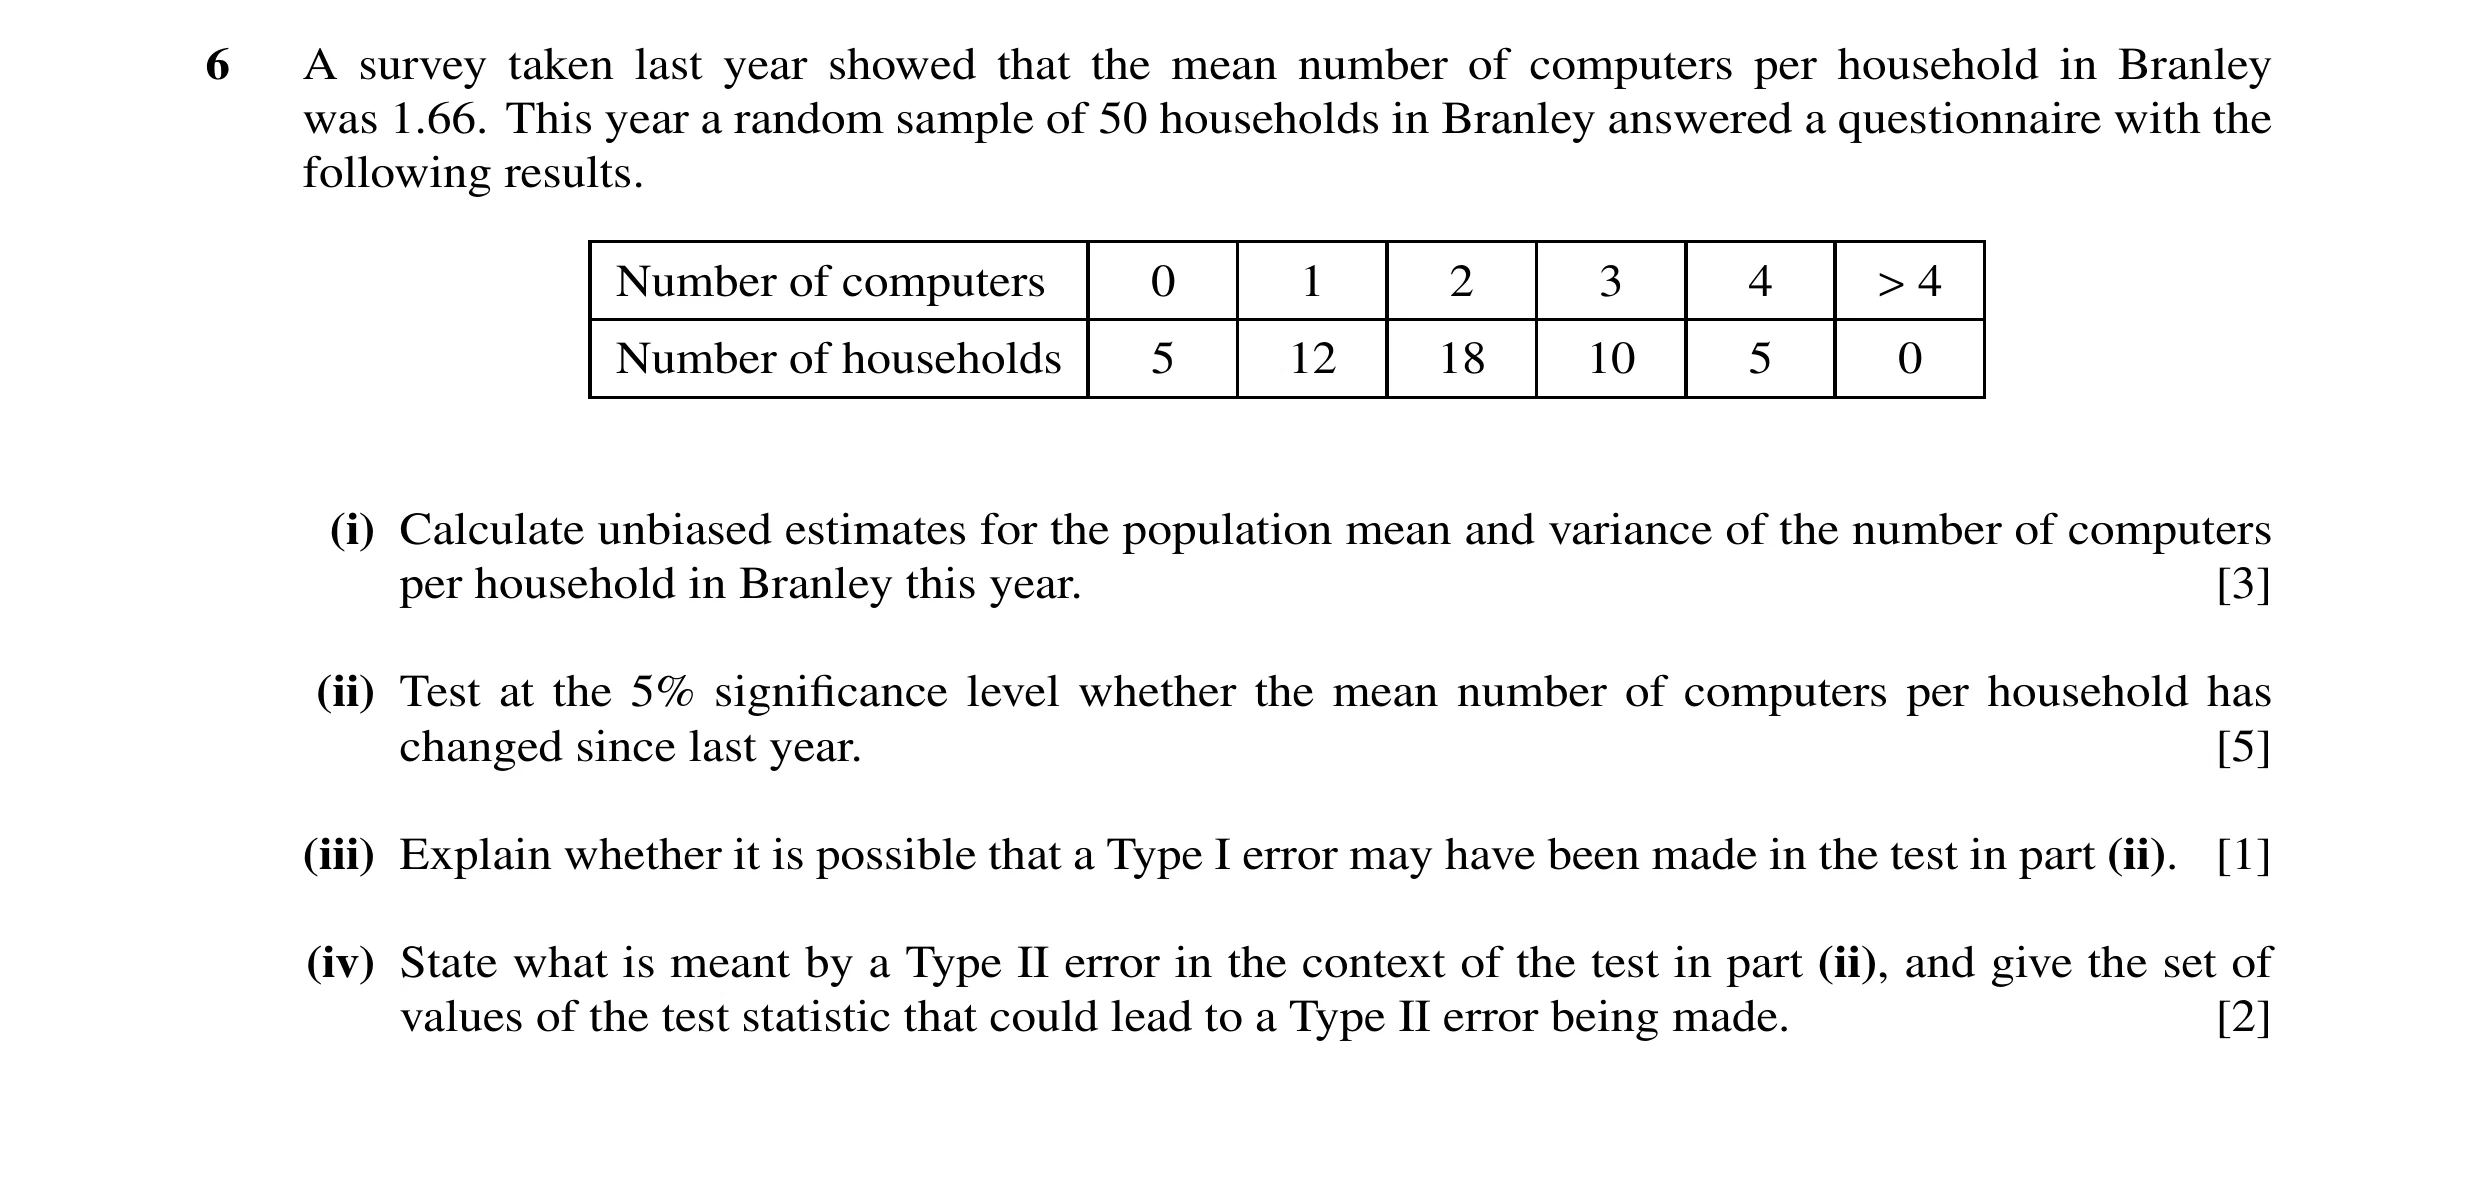
6 A survey taken last year showed that the mean number of computers per household in Branley was 1.66. This year a random sample of 50 households in Branley answered a questionnaire with the following results. Number of computers 0 1 2 3 4 > 4 Number of households 5 12 18 10 5 0 (i) Calculate unbiased estimates for the population mean and variance of the number of computers per household in Branley this year. [3] (ii) Test at the 5% significance level whether the mean number of computers per household has changed since last year. [5] (iii) Explain whether it is possible that a Type I error may have been made in the test in part (ii). [1] (iv) State what is meant by a Type II error in the context of the test in part (ii), and give the set of values of the test statistic that could lead to a Type II error being made. [2]
11 marks
Mark scheme: 6 (i) x = 1.96 B1 (Σx2f = 254) 50 254 2 S2 = x − .1 96 M1 Correct sub in S2 formula 49 50 A1 = 1548 or 1.2637 [3] 1225 (ii) H0: Pop mean = 1.66 H0: Pop mean = 1.66 H1: Pop mean ≠ 1.66 B1 H1: Pop mean > 1.66 B0 .196 −.1 66 M1 .196 −.1 66 M1 .1 2637 .1 2637 50 50 A1 = 1.887 = 1.887 A1 z = 1.96 1.887<1.96 M1 z = 1.645 M1 No evidence that mean has changed A1ft In context Evidence mean has changed A1ft [5] (iii) No because H0 not rejected B1f If H0 rejected in (ii): Yes because H0 rejected [1] (iv) State mean not changed when it B1 In State mean not increased when it has context has B1 B1 test stat < 1.645 B1 –1.96 < test stat < 1.96 [2] GCE AS/A LEVEL – May/June 2012 9709 71
This question in 9709/71 May/June 2012
Q19 · Joshi suspects that a certain die is biased so that the probability of showing a six is… 9709/73 Oct/Nov 2012
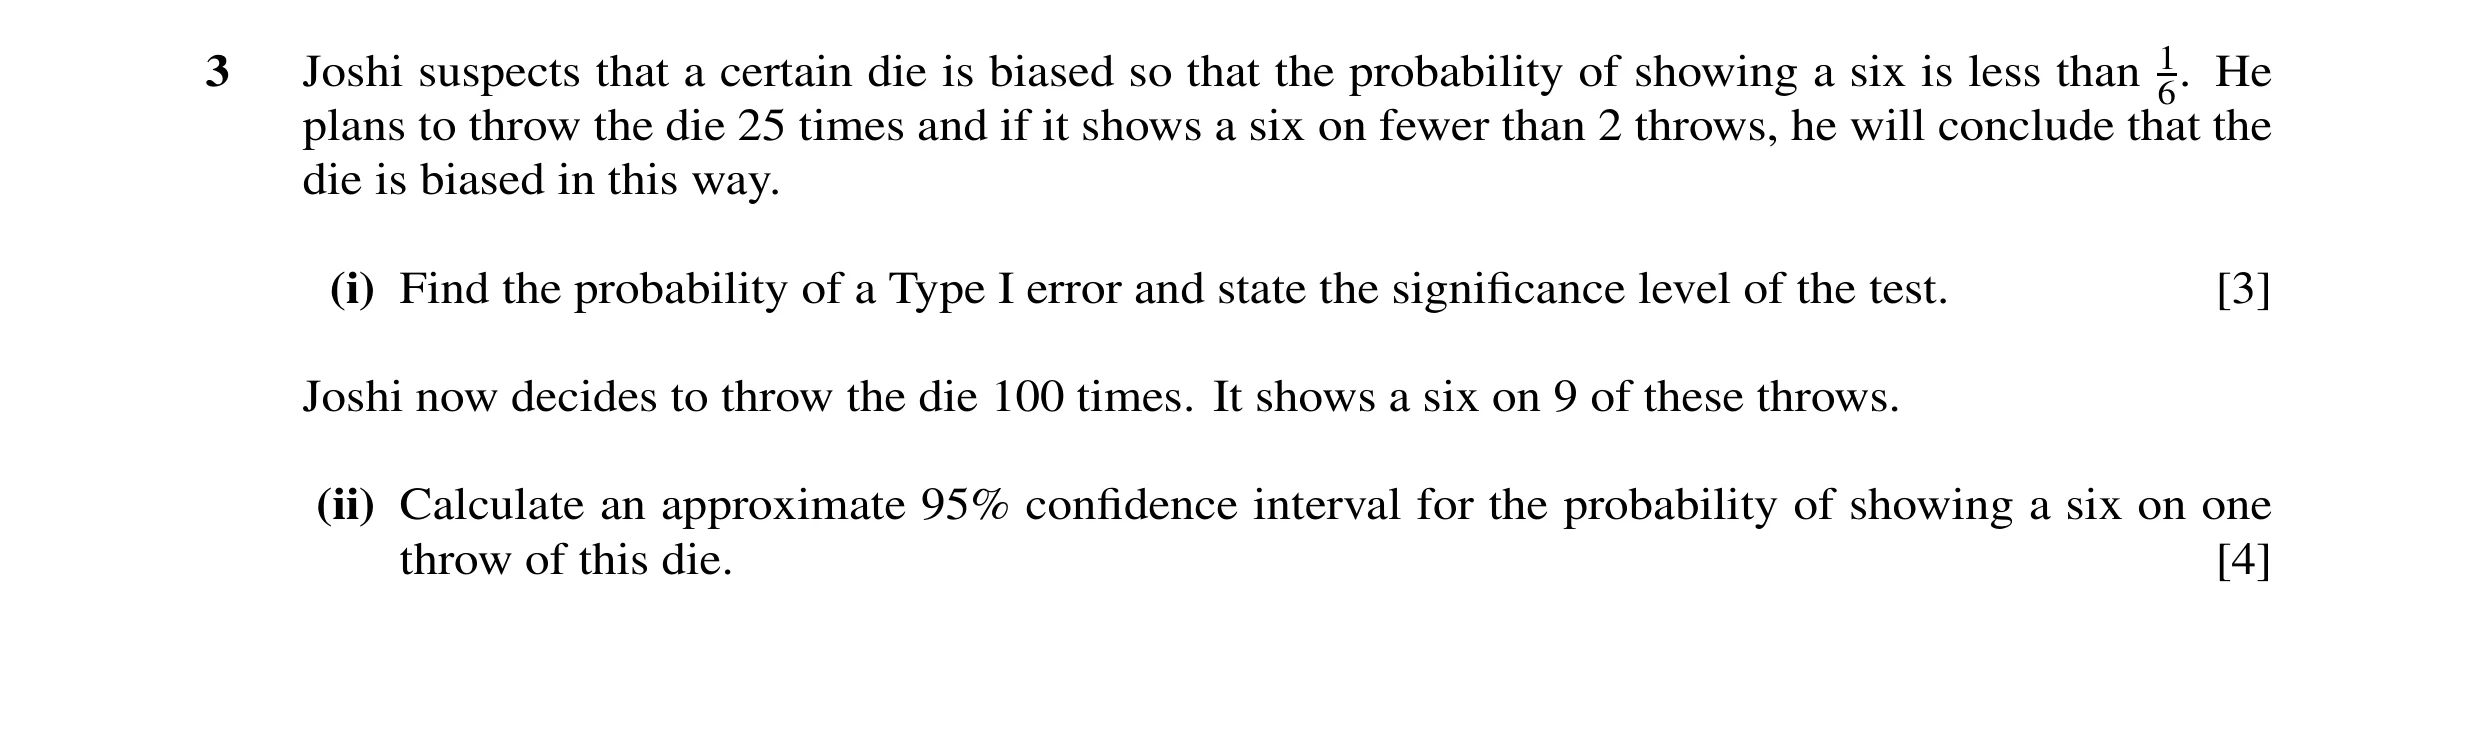
3 Joshi suspects that a certain die is biased so that the probability of showing a six is less than 6.1 He plans to throw the die 25 times and if it shows a six on fewer than 2 throws, he will conclude that the die is biased in this way. (i) Find the probability of a Type I error and state the significance level of the test. [3] Joshi now decides to throw the die 100 times. It shows a six on 9 of these throws. (ii) Calculate an approximate 95% confidence interval for the probability of showing a six on one throw of this die. [4]
7 marks
Mark scheme: 3 (i) 25 24 M1 Allow end errors, but just P(2) implies M0 5 5 1 + 25 Accept p/q mix 6 6 6 = 0.0629 final answer A1 Sig level = 6.29% B1ft [3] ft their P(X < 1) with Binomial used. Allow 6.3% or 6% (ii) .009 × .091 Var (p) ≈ 100 M1 For pq /100 seen ( any p/q ) ( must be probs ) (= 0.000819) B1 z = 1.96 .009 × .091 0.09 ± z M1 For correct form of C.I. ( any p/q ) ( must be probs ) 100 = 0.034 to 0.146 (3 dps) A1 [4] Total [7] GCE A LEVEL – October/November 2012 9709 73
This question in 9709/73 Oct/Nov 2012
Q20 · Darts are thrown at random at a circular board 9709/73 Oct/Nov 2012
6 Darts are thrown at random at a circular board. The darts hit the board at distances X centimetres from the centre, where X is a random variable with probability density function given by 2 x 0 ≤x ≤a, a2 f(x) = 0 otherwise, where a is a positive constant. (i) Verify that f is a probability density function whatever the value of a. [3] It is now given that E(X) = 8. (ii) Find the value of a. [3] (iii) Find the probability that a dart lands more than 6 cm from the centre of the board. [3]
9 marks
Mark scheme: 6 (i) f(x) [ 0 for all x defined B1 a 2 x ) dx with limits 0, a . Must be a. ∫ 0 xdx M1 Attempt ∫ f( a 2 2 x 2 a = A1 Or equivalent methods ( e.g. by areas ) 0 2 a 2 = 1 [3] (ii) a 2 2 x dx (= 8) , ignore limits ∫ 0 M1 Attempt ∫ xf( x ) d x a 2 2 x 3 a 2 (= 8) A1 Correct integrand and limits a 3 0 2a = 8 A1 3 a = 12 [3] (iii) 2 2 1 – 6∫0 144 xdx or 12∫6 144 xd x M1 Correct expr’n incl limits; ft their ‘a’ 1 x 2 6 =1 – 1 − or A1ft Correct integrand and limits; ft their ‘a’ 72 2 0 1 x 2 12 72 2 6 3 = 4 A1ft [3] ft their ‘a’, dep 0 < ans < 1 Total [9] GCE A LEVEL – October/November 2012 9709 73
This question in 9709/73 Oct/Nov 2012
Q21 · Marie wants to choose one student at random from Anthea, Bill and Charlie 9709/71 May/June 2013
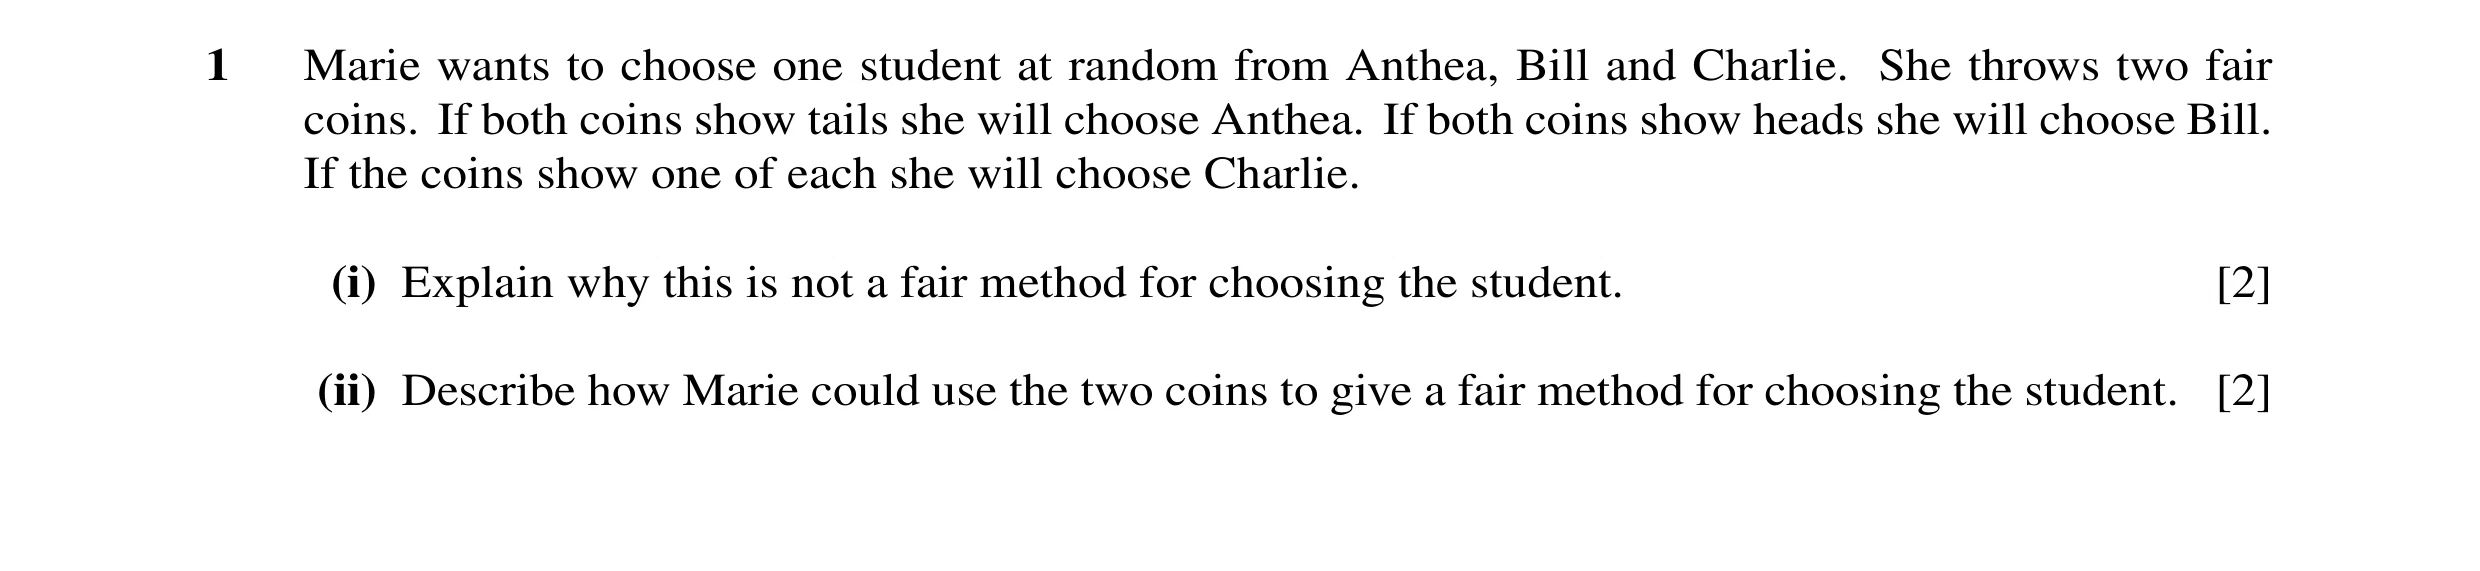
1 Marie wants to choose one student at random from Anthea, Bill and Charlie. She throws two fair coins. If both coins show tails she will choose Anthea. If both coins show heads she will choose Bill. If the coins show one of each she will choose Charlie. (i) Explain why this is not a fair method for choosing the student. [2] (ii) Describe how Marie could use the two coins to give a fair method for choosing the student. [2]
4 marks
Mark scheme: 1 (i) One of each is more likely B1 P(one of each = 0.5), P(HH) = 0.25 B1 or P(TT) = 0.25 [2] (ii) Choose Charlie only if H then T B1 or similar e.g. HH for A, HT for B, TT for C Throw again if T then H B1 or vice versa [2]
This question in 9709/71 May/June 2013
Q22 · Each of a random sample of 15 students was asked how long they spent revising for an exam 9709/73 May/June 2013
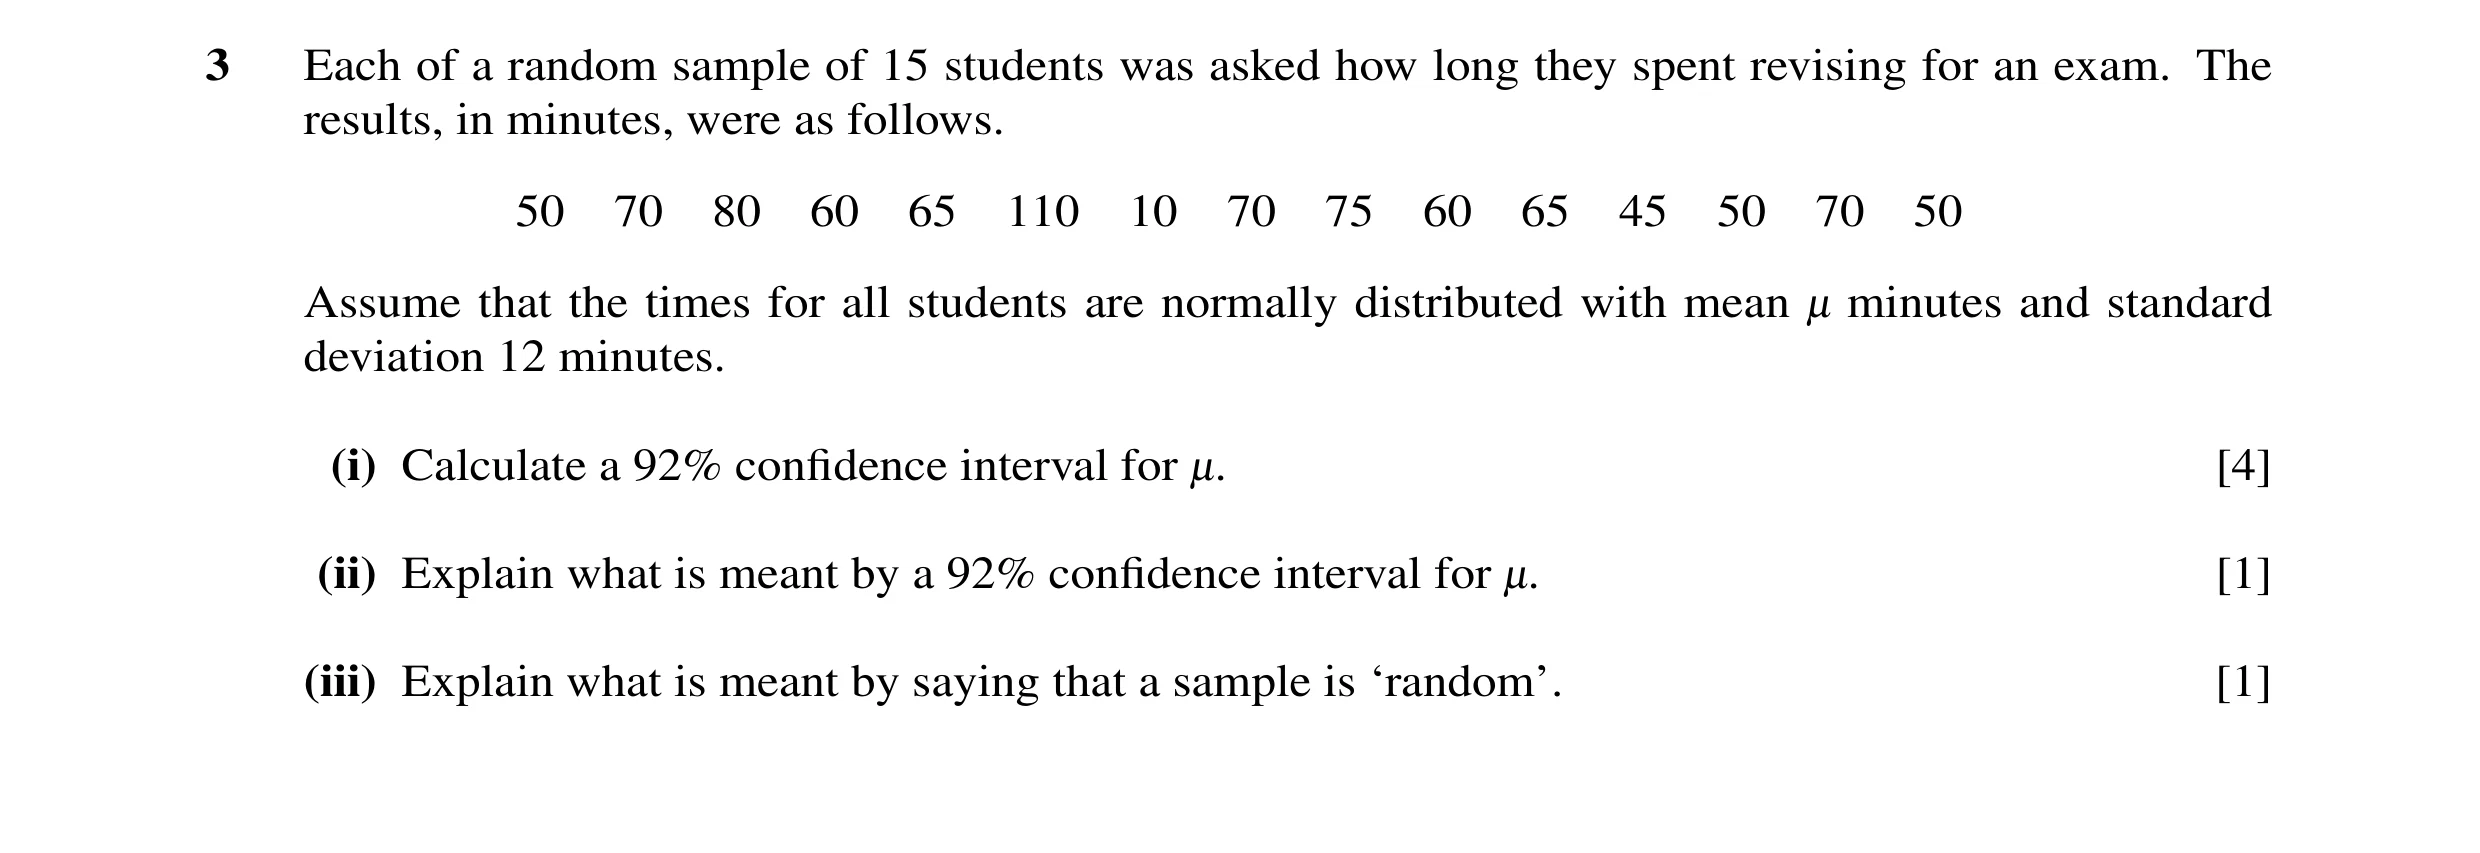
3 Each of a random sample of 15 students was asked how long they spent revising for an exam. The results, in minutes, were as follows. 50 70 80 60 65 110 10 70 75 60 65 45 50 70 50 Assume that the times for all students are normally distributed with mean - minutes and standard deviation 12 minutes. (i) Calculate a 92% confidence interval for -. [4] (ii) Explain what is meant by a 92% confidence interval for -. [1] (iii) Explain what is meant by saying that a sample is ‘random’. [1]
6 marks
Mark scheme: 3 (i) x = 930/15 =(62) B1 z = 1.751 B1 12 ‘62’ ± z × M1 Any z 15 = 56.6 to 67.4 (3 sf) A1 4 Must be an interval (ii) 92 % of such intervals will contain µ B1 1 Accept P(This interval contains µ) = 0.92 (iii) Each possible sample of this size is B1 1 Each member of pop equally likely to be equally likely chosen [Total: 6] GCE AS/A LEVEL – May/June 2013 9709 73
This question in 9709/73 May/June 2013
Q23 · X −1 0 1 2 3 4 5 A random variable X takes values between 0 and 4 only and has… 9709/73 May/June 2014
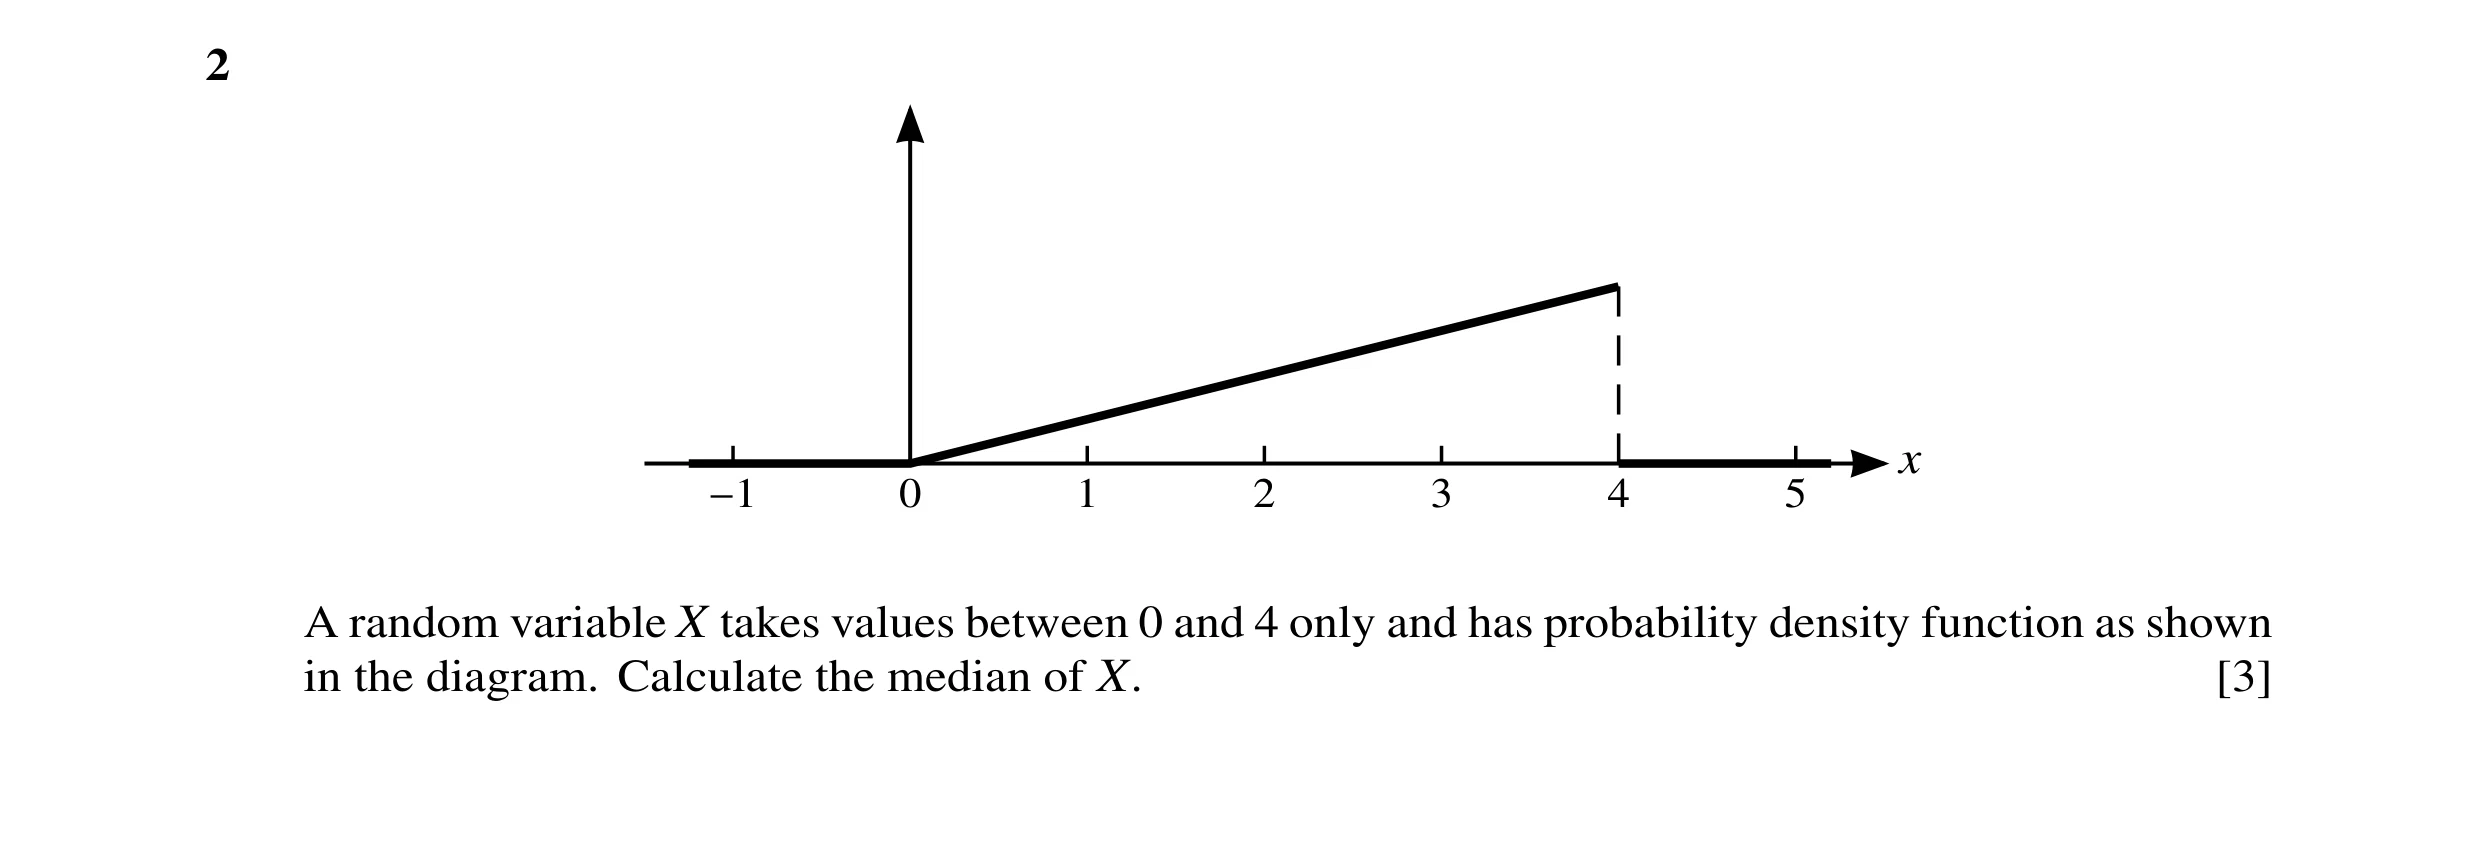
2 x −1 0 1 2 3 4 5 A random variable X takes values between 0 and 4 only and has probability density function as shown in the diagram. Calculate the median of X. [3]
3 marks
Mark scheme: 2 1 1 ht = seen B1 or y = x 2 8 1 m 1 1 1 1 1 m 2 1 × m × × " " = M1 × m ×( " " m ) = or = o.e. 2 4 2 2 2 8 2 16 2 N.B. B1 M1 must be consistent Or Integrating linear function of form y = kx with limits 0 and m or m and 4 and equated to 0.5 m = √8 or 2√2 or 2.83 (3 s.f.) A1 [3]
This question in 9709/73 May/June 2014
Q24 · The lifetime, X years, of a certain type of battery has probability density function… 9709/73 May/June 2014
5 The lifetime, X years, of a certain type of battery has probability density function given by t k 1 ≤x ≤a, f x = x2 0 otherwise, where k and a are positive constants. (i) State what the value of a represents in this context. [1] a (ii) Show that k = [3] a −1. (iii) Experience has shown that the longest that any battery of this type lasts is 2.5 years. Find the mean lifetime of batteries of this type. [3]
7 marks
Mark scheme: 5 (i) Longest lifetime B1 [1] Must be in context (ii) a k dx = 1 ∫ M1 Int f(x) and equate to 1. Ignore limits 2 1 x a k = 1 A1 Correct integral and limits −x1 1 k − + 1 = 1 1a −1 + a k = 1 or k (–1 + a) = a a a AG A1 [3] Must be convinced (AG) k = a − 1 (iii) 5.2 5.2 1 1 5 d x d x or k ∫ ∫ M1 Int xf(x). Ignore limits x x 3 1 1 5 5.2 5.2 = [lnx] or k[lnx] A1 Correct integral and limits 3 1 1 (Accept “k” or “their k”) 5 = ln2.5 or 1.53 (3 s.f.) A1 [3] 3
This question in 9709/73 May/June 2014
Q25 · A machine is designed to generate random digits between 1 and 5 inclusive 9709/73 May/June 2014
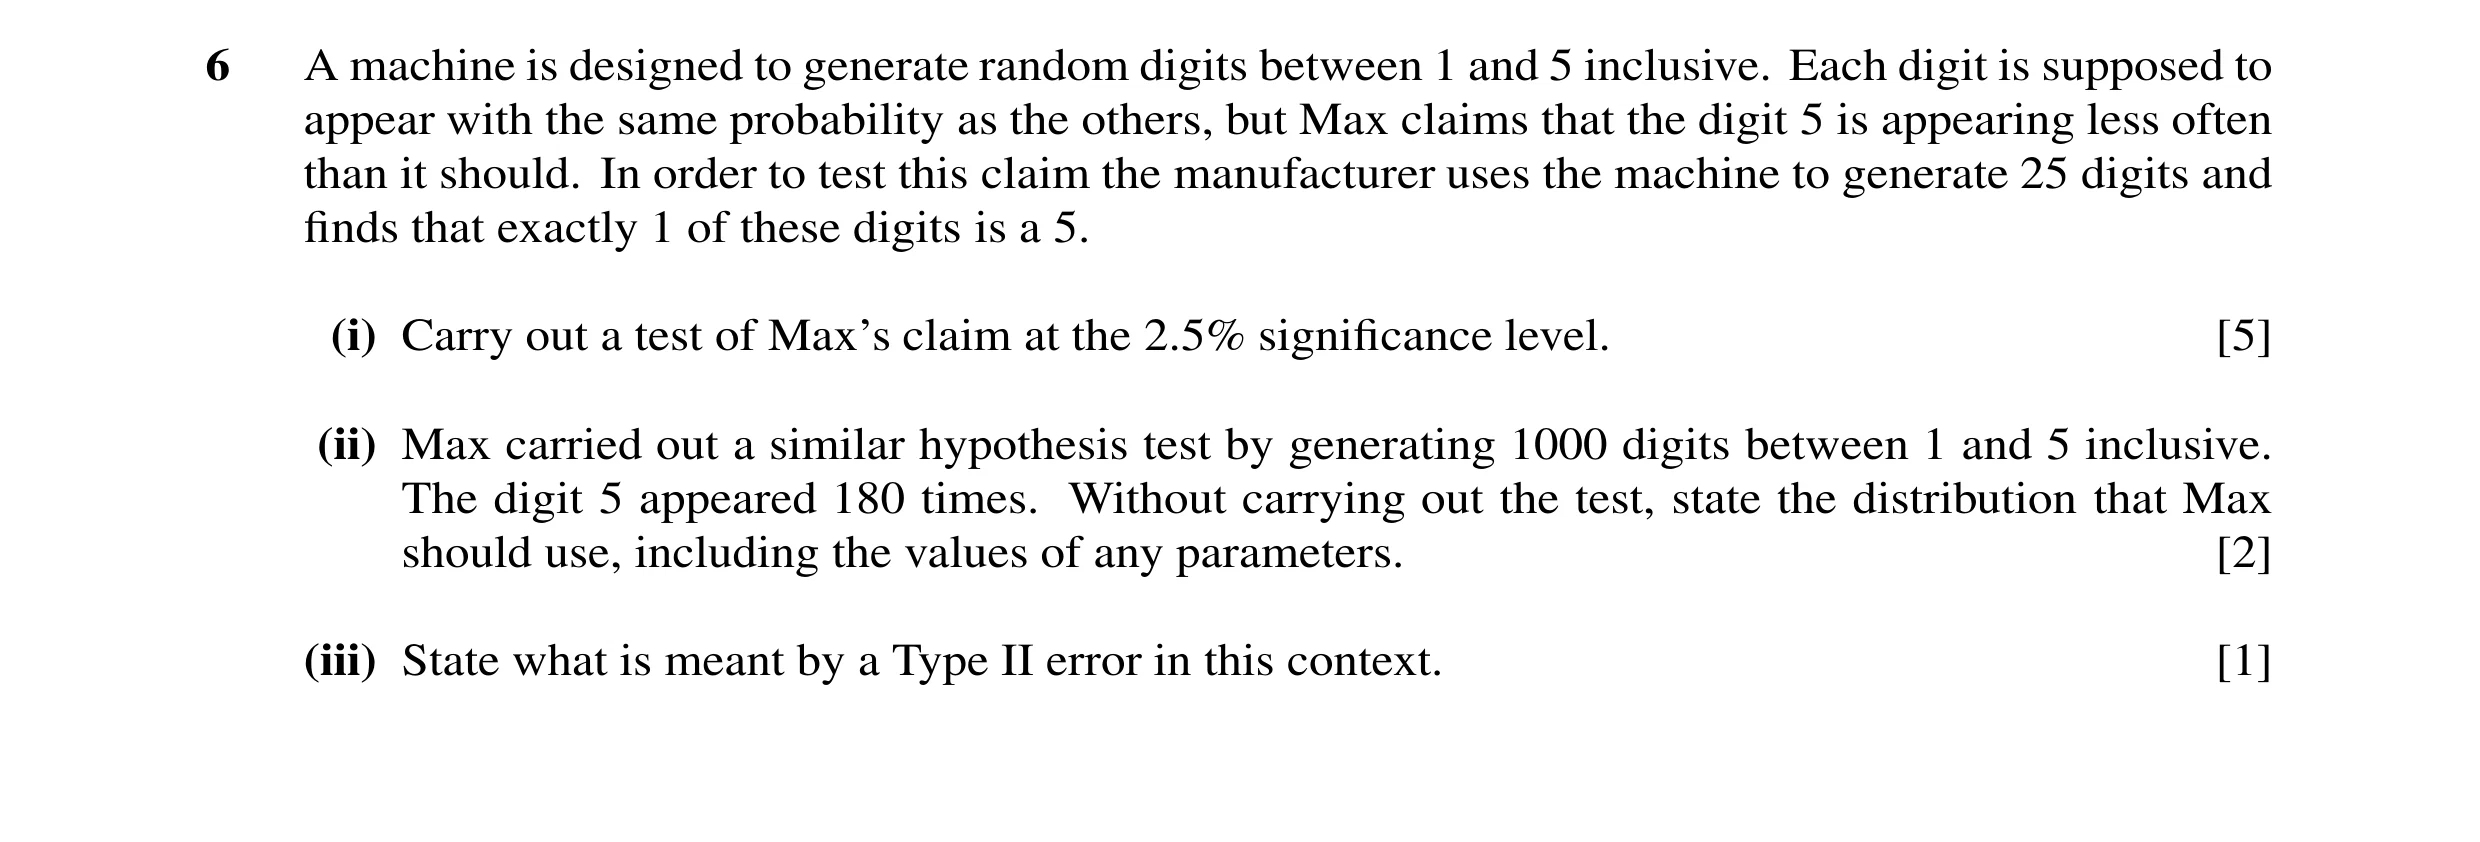
6 A machine is designed to generate random digits between 1 and 5 inclusive. Each digit is supposed to appear with the same probability as the others, but Max claims that the digit 5 is appearing less often than it should. In order to test this claim the manufacturer uses the machine to generate 25 digits and finds that exactly 1 of these digits is a 5. (i) Carry out a test of Max’s claim at the 2.5% significance level. [5] (ii) Max carried out a similar hypothesis test by generating 1000 digits between 1 and 5 inclusive. The digit 5 appeared 180 times. Without carrying out the test, state the distribution that Max should use, including the values of any parameters. [2] (iii) State what is meant by a Type II error in this context. [1]
8 marks
Mark scheme: 6 (i) H0: p = 0.2 H1: p < 0.2 B1 (Allow π) P(0 or 1 5s in 25 | H0) M1 0.825 + 25 × 0.824 × 0.2 Use of B(25,1/5) and P(0) or P(1) or both – may be implied by “0.0274” = 0.0274 (3 s.f.) A1 Comp with 0.025 M1 Valid comparison No evidence (at 2.5% level) to A1 [5] No contradictions support claim SR Use of Normal N(5,4) leading to z = 1.75 or 0.0401 B1* H0 µ = 5 H1 µ < 5 B1. Comparison 1.75 < 1.96 or 0.0401 > 0.025 B1* dep (ii) Normal B1 µ = 200, σ2 = 160 or σ =√160 B1 [2] (iii) Concluding that the machine Not concluding that the machine produces too produces the right proportion of 5s, few 5s although it does. Must be in context although it doesn’t. B1 [1] o.e. No contradictions GCE A LEVEL – May/June 2014 9709 73
This question in 9709/73 May/June 2014
Q26 · The probability that a randomly chosen plant of a certain kind has a particular defect is… 9709/71 Oct/Nov 2014
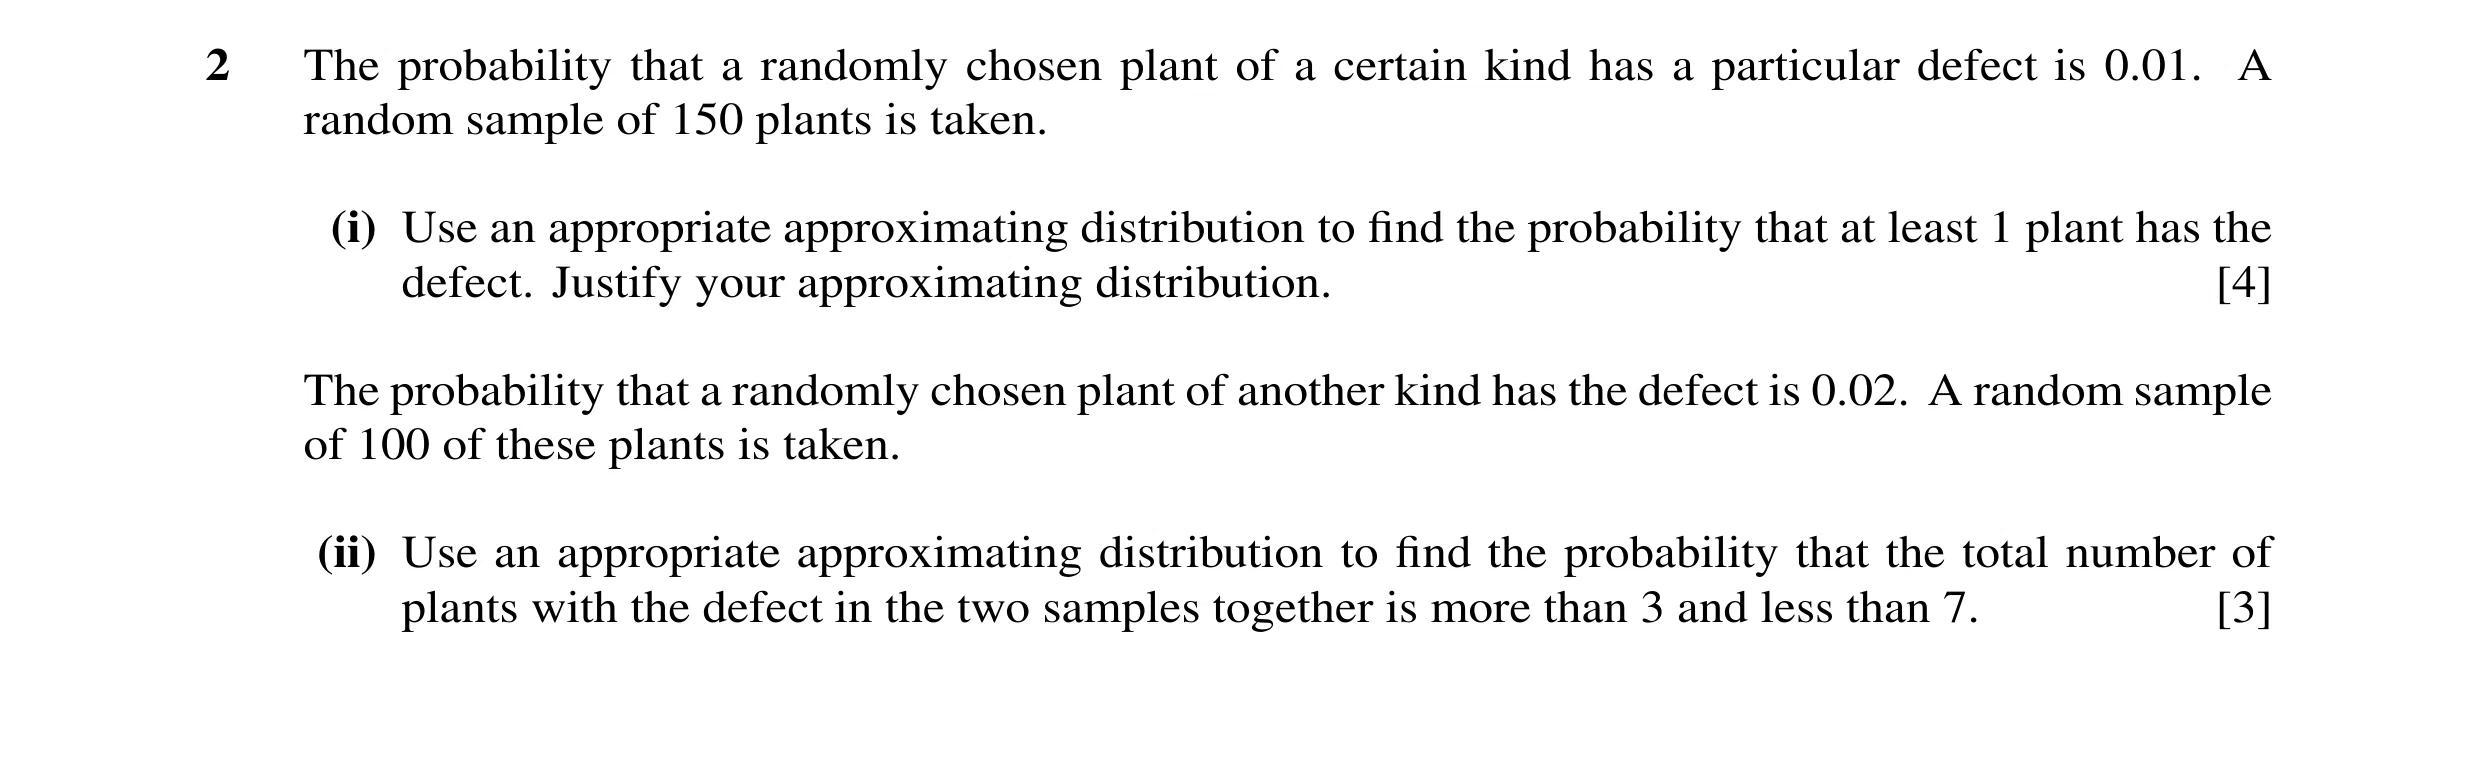
2 The probability that a randomly chosen plant of a certain kind has a particular defect is 0.01. A random sample of 150 plants is taken. (i) Use an appropriate approximating distribution to find the probability that at least 1 plant has the defect. Justify your approximating distribution. [4] The probability that a randomly chosen plant of another kind has the defect is 0.02. A random sample of 100 of these plants is taken. (ii) Use an appropriate approximating distribution to find the probability that the total number of plants with the defect in the two samples together is more than 3 and less than 7. [3]
7 marks
Mark scheme: 2 (i) (Bin) with n > 50 and mean (or np) < 5 B1 Accept n ‘large’, p ‘small’ Po(1.5) B1 Poisson with correct mean stated or implied 1 – e–1.5 M1 Poisson 1 – P(X = 0); allow incorrect λ; allow 1 end error = 0.777 (3 sf) A1 4 SR If zero scored use of Bin leading to 0.778 / 0.779 scores B1 (ii) 3.5 B1 Correct mean stated or implied − 5.3 5.3 4 5.3 5 5.3 6 M1 Poisson P(X = 4, 5, 6); allow incorrect λ; e + + allow 1 end error !4 !5 !6 = 0.398 (3 sf) A1 3 Total: 7 5.0 2 ( ) ∫
This question in 9709/71 Oct/Nov 2014
Q27 · In a survey a random sample of 150 households in Nantville were asked to fill in a… 9709/71 Oct/Nov 2014
4 In a survey a random sample of 150 households in Nantville were asked to fill in a questionnaire about household budgeting. (i) The results showed that 33 households owned more than one car. Find an approximate 99% confidence interval for the proportion of all households in Nantville with more than one car. [4] (ii) The results also included the weekly expenditure on food, x dollars, of the households. These were summarised as follows. n = 150 Σx = 19 035 Σx2 = 4 054 716 Find unbiased estimates of the mean and variance of the weekly expenditure on food of all households in Nantville. [3] (iii) The government has a list of all the households in Nantville numbered from 1 to 9526. Describe briefly how to use random numbers to select a sample of 150 households from this list. [3]
10 marks
Mark scheme: 150 1504 (i) Var(Ps) = (= 0.001144) M1 150 Seen. Accept 2.574 to 2.579 z = 2.576 B1 33 ± z√‘0.001144’ M1 Expression of correct form. Any z 150 = 0.133 to 0.307 (3 sf) A1 4 Must be an interval 19035 (ii) (= 126.9 =127(3sf)) B1 150 150 4054716 19035 2 − o.e. M1 For use of a correct formula 149 150 150 = 11001.17 or 11000(3 sf) A1 3 (iii) 4-digit nos. each digit 0-9 B1 Some valid way of generating 4 digit Ignore nos > 9526 B1 random nos Ignore repeats B1 3 from valid method from valid method SR If zero score, full explanation of method for drawing numbers out of a hat can score B1. NB Systematic sampling follows the scheme with first B1 for some way of generating a random starting point. Total: 10 8.4 4 8 2 √
This question in 9709/71 Oct/Nov 2014
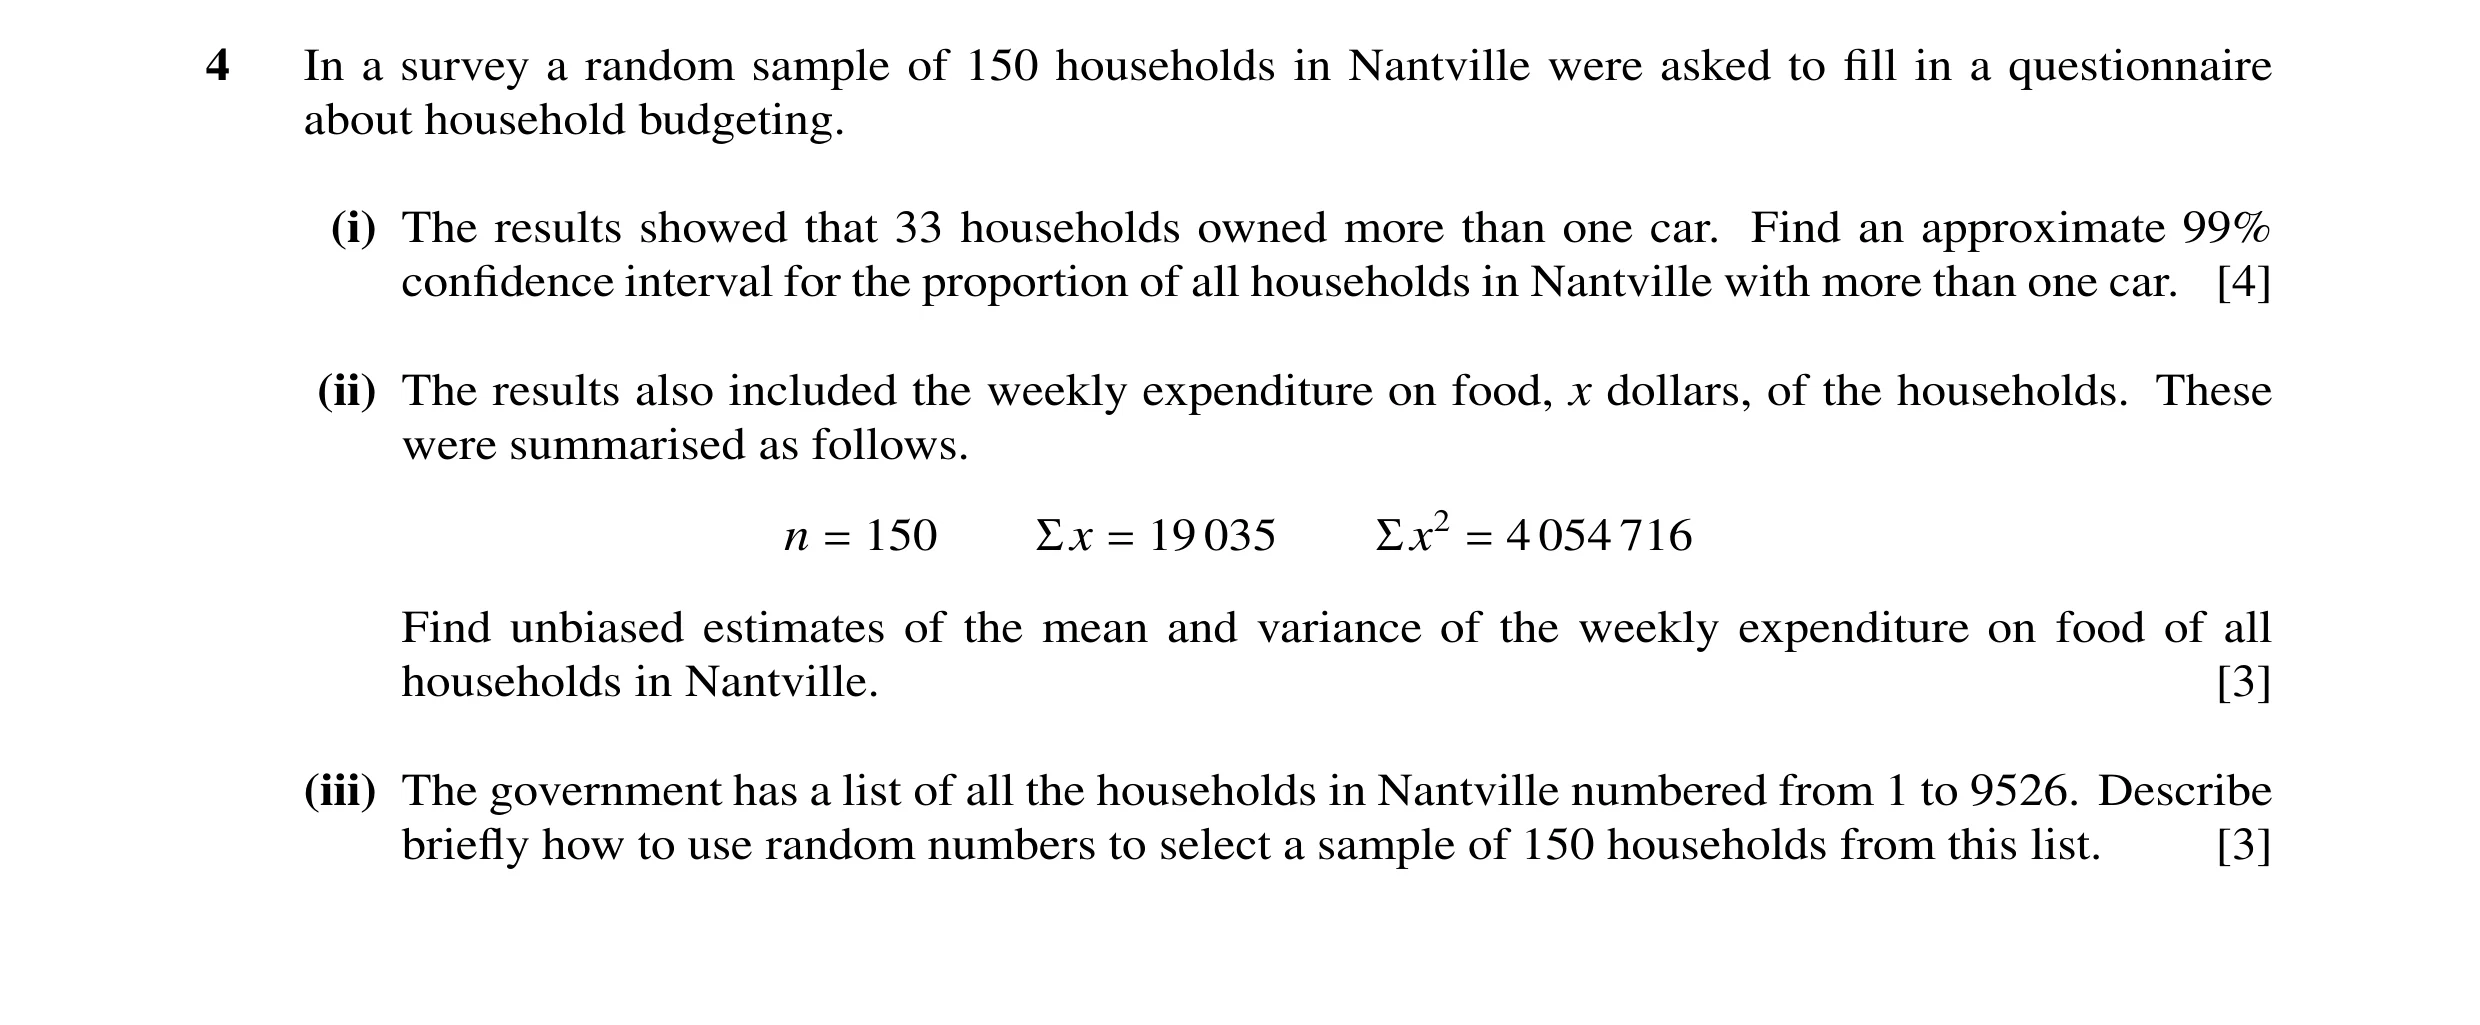
Q28 · In a survey a random sample of 150 households in Nantville were asked to fill in a… 9709/72 Oct/Nov 2014
4 In a survey a random sample of 150 households in Nantville were asked to fill in a questionnaire about household budgeting. (i) The results showed that 33 households owned more than one car. Find an approximate 99% confidence interval for the proportion of all households in Nantville with more than one car. [4] (ii) The results also included the weekly expenditure on food, x dollars, of the households. These were summarised as follows. n = 150 Σx = 19 035 Σx2 = 4 054 716 Find unbiased estimates of the mean and variance of the weekly expenditure on food of all households in Nantville. [3] (iii) The government has a list of all the households in Nantville numbered from 1 to 9526. Describe briefly how to use random numbers to select a sample of 150 households from this list. [3]
10 marks
Mark scheme: 150 1504 (i) Var(Ps) = (= 0.001144) M1 150 Seen. Accept 2.574 to 2.579 z = 2.576 B1 33 ± z√‘0.001144’ M1 Expression of correct form. Any z 150 = 0.133 to 0.307 (3 sf) A1 4 Must be an interval 19035 (ii) (= 126.9 =127(3sf)) B1 150 150 4054716 19035 2 − o.e. M1 For use of a correct formula 149 150 150 = 11001.17 or 11000(3 sf) A1 3 (iii) 4-digit nos. each digit 0-9 B1 Some valid way of generating 4 digit Ignore nos > 9526 B1 random nos Ignore repeats B1 3 from valid method from valid method SR If zero score, full explanation of method for drawing numbers out of a hat can score B1. NB Systematic sampling follows the scheme with first B1 for some way of generating a random starting point. Total: 10 8.4 4 8 2 √
This question in 9709/72 Oct/Nov 2014
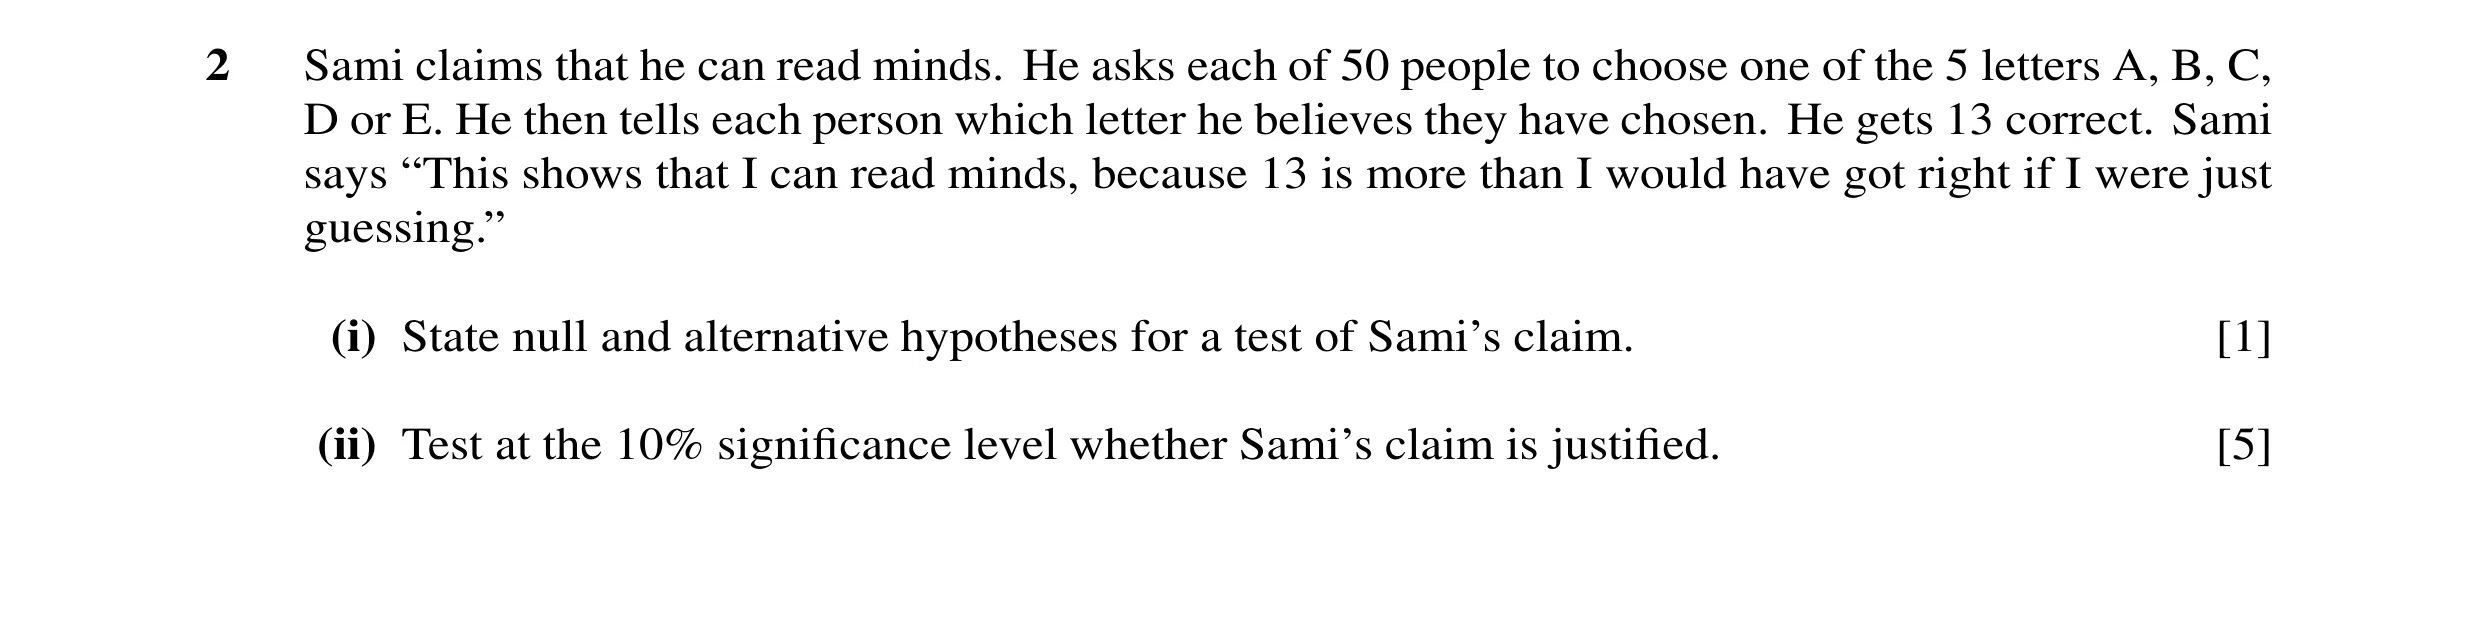
Q29 · Sami claims that he can read minds 9709/71 May/June 2015
2 Sami claims that he can read minds. He asks each of 50 people to choose one of the 5 letters A, B, C, D or E. He then tells each person which letter he believes they have chosen. He gets 13 correct. Sami says “This shows that I can read minds, because 13 is more than I would have got right if I were just guessing.” (i) State null and alternative hypotheses for a test of Sami’s claim. [1] (ii) Test at the 10% significance level whether Sami’s claim is justified. [5]
6 marks
Mark scheme: 2 3 x A1f correct integral and limits, but ft their a= 3 0
This question in 9709/71 May/June 2015
Q30 · The masses, m grams, of a random sample of 80 strawberries of a certain type were… 9709/71 May/June 2015
5 The masses, m grams, of a random sample of 80 strawberries of a certain type were measured and summarised as follows. n = 80 Σm = 4200 Σm2 = 229 000 (i) Find unbiased estimates of the population mean and variance. [3] (ii) Calculate a 98% confidence interval for the population mean. [3] 50 random samples of size 80 were taken and a 98% confidence interval for the population mean, -, was found from each sample. (iii) Find the number of these 50 confidence intervals that would be expected to include the true value of -. [1]
7 marks
Mark scheme: 5 (i) 4200/80 (=52.5) B1 80 229 000 2 M1 = − '52.5' (= 107.595) 79 80 A1 [3] = 108 (3 sf) (ii) '52 '5.± z '10780. 595 ' M1 Correct form – must be z-value – allow one side only z = 2.326 B1 Seen 49.8 to 55.2 A1f [3] ft their 52.5 and 107.595. Must be an interval (iii) 49 B1 [1] [Total: 7] 2
This question in 9709/71 May/June 2015
Q31 · The volumes, v millilitres, of juice in a random sample of 50 bottles of Cooljoos are… 9709/72 May/June 2015
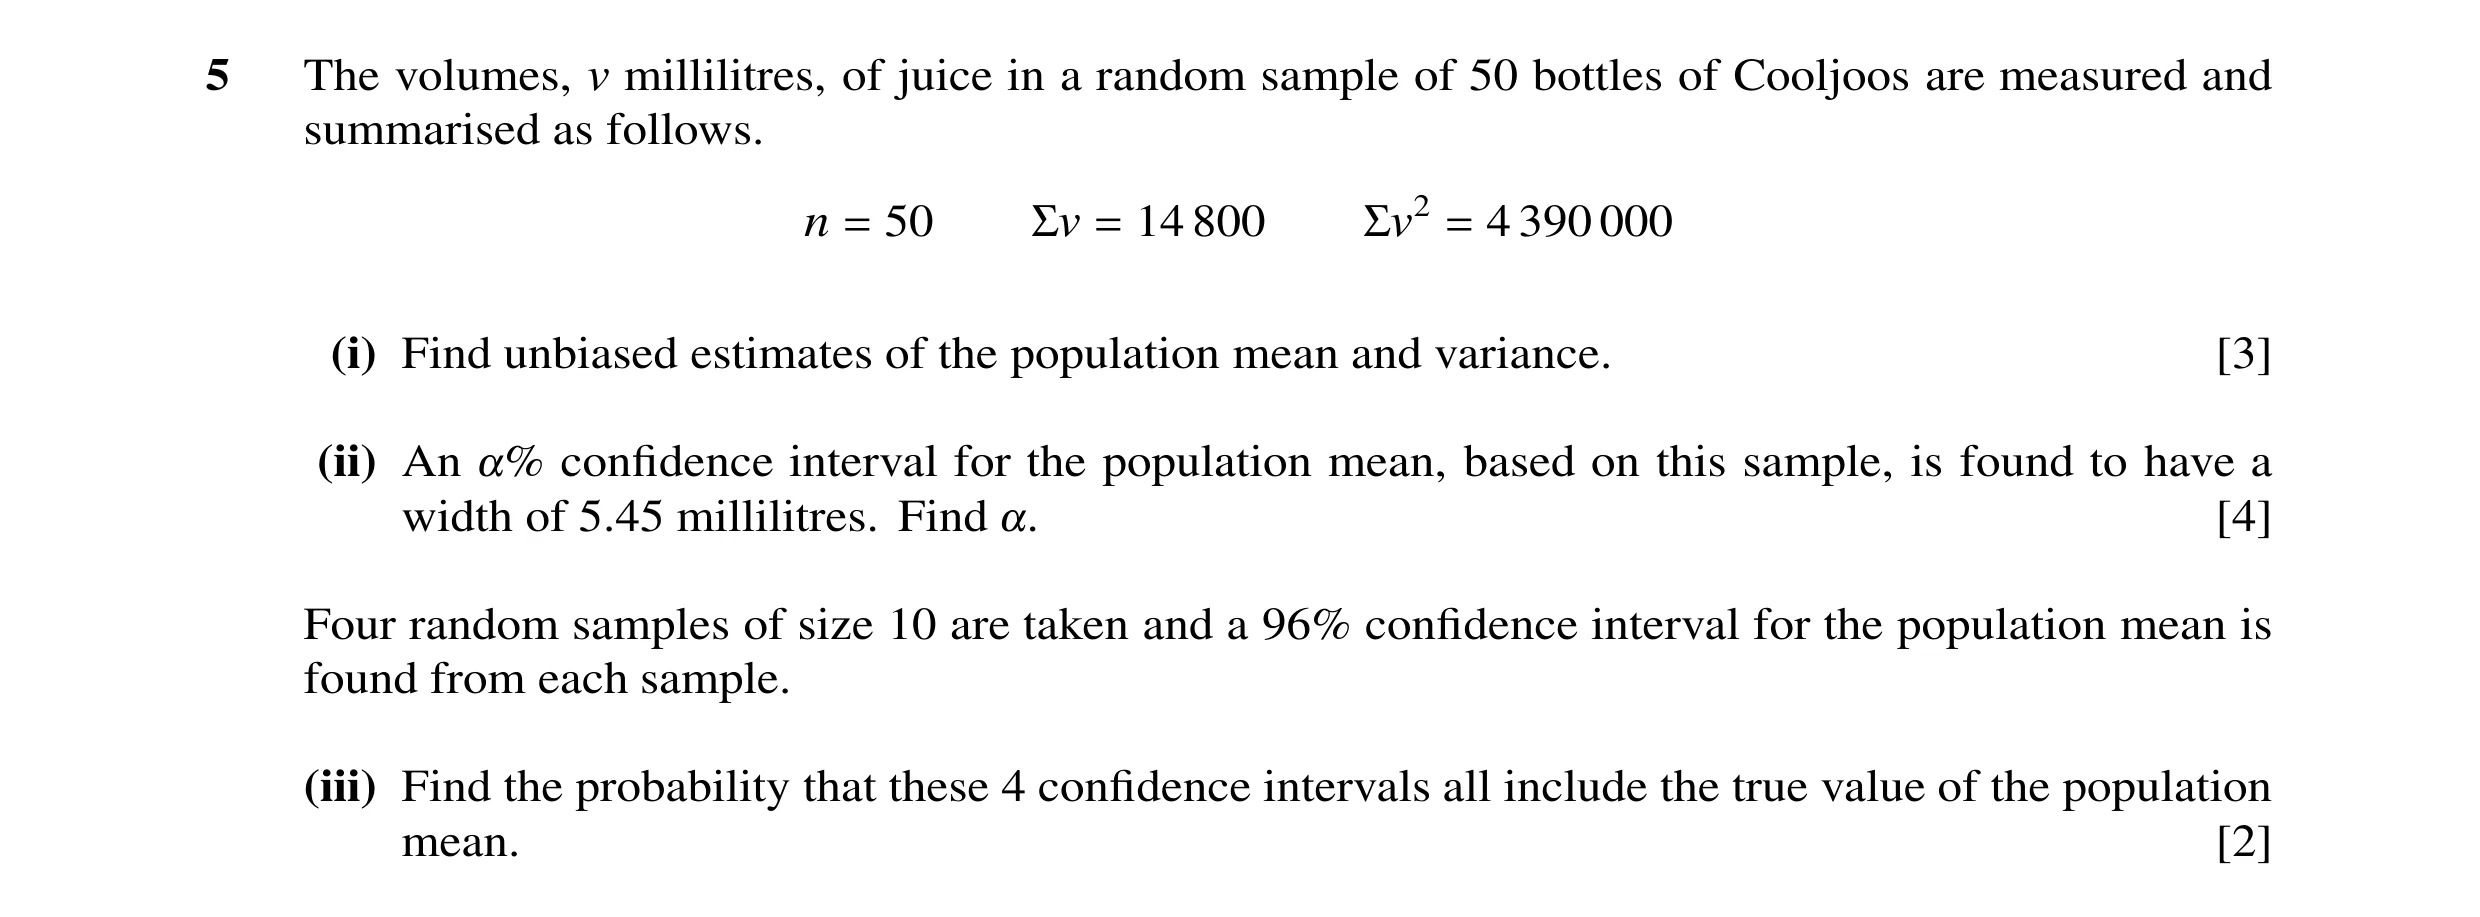
5 The volumes, v millilitres, of juice in a random sample of 50 bottles of Cooljoos are measured and summarised as follows. n = 50 Σv = 14 800 Σv2 = 4 390 000 (i) Find unbiased estimates of the population mean and variance. [3] (ii) An !% confidence interval for the population mean, based on this sample, is found to have a width of 5.45 millilitres. Find !. [4] Four random samples of size 10 are taken and a 96% confidence interval for the population mean is found from each sample. (iii) Find the probability that these 4 confidence intervals all include the true value of the population mean. [2]
9 marks
Mark scheme: 5 (i) 14800/50 or 296 B1 50 4390000 2 M1 Oe − '296' (= 187.755) 49 50 A1 3 = 188 (3 sf) (ii) '187.755' M1 '187.755' 2 × z × = 5.45 oe If ‘2 ×’ omitted: z × = 5.45 M1 50 A1 50 z = 1.406 or 1.405 z = 2.812 or 2.810 A0 Φ(‘1.406’) (= 0.92 or 0.9199) Φ(‘2.812’) (= 0.9975) M1 α = 99.5 or 99 or 100 M1 A0 α = 84 (2 sf) allow 83.98 A1 4 For complete method to find α SR use of biased var(184) scores M1A1(1.4205) Α=84.5 M1A1 (iii) 0.964 M1 = 0.849 (3 sf) A1 2 Total 9 15 ∫ 2
This question in 9709/72 May/June 2015
Q32 · A die is biased so that the probability that it shows a six on any throw is p 9709/73 May/June 2015
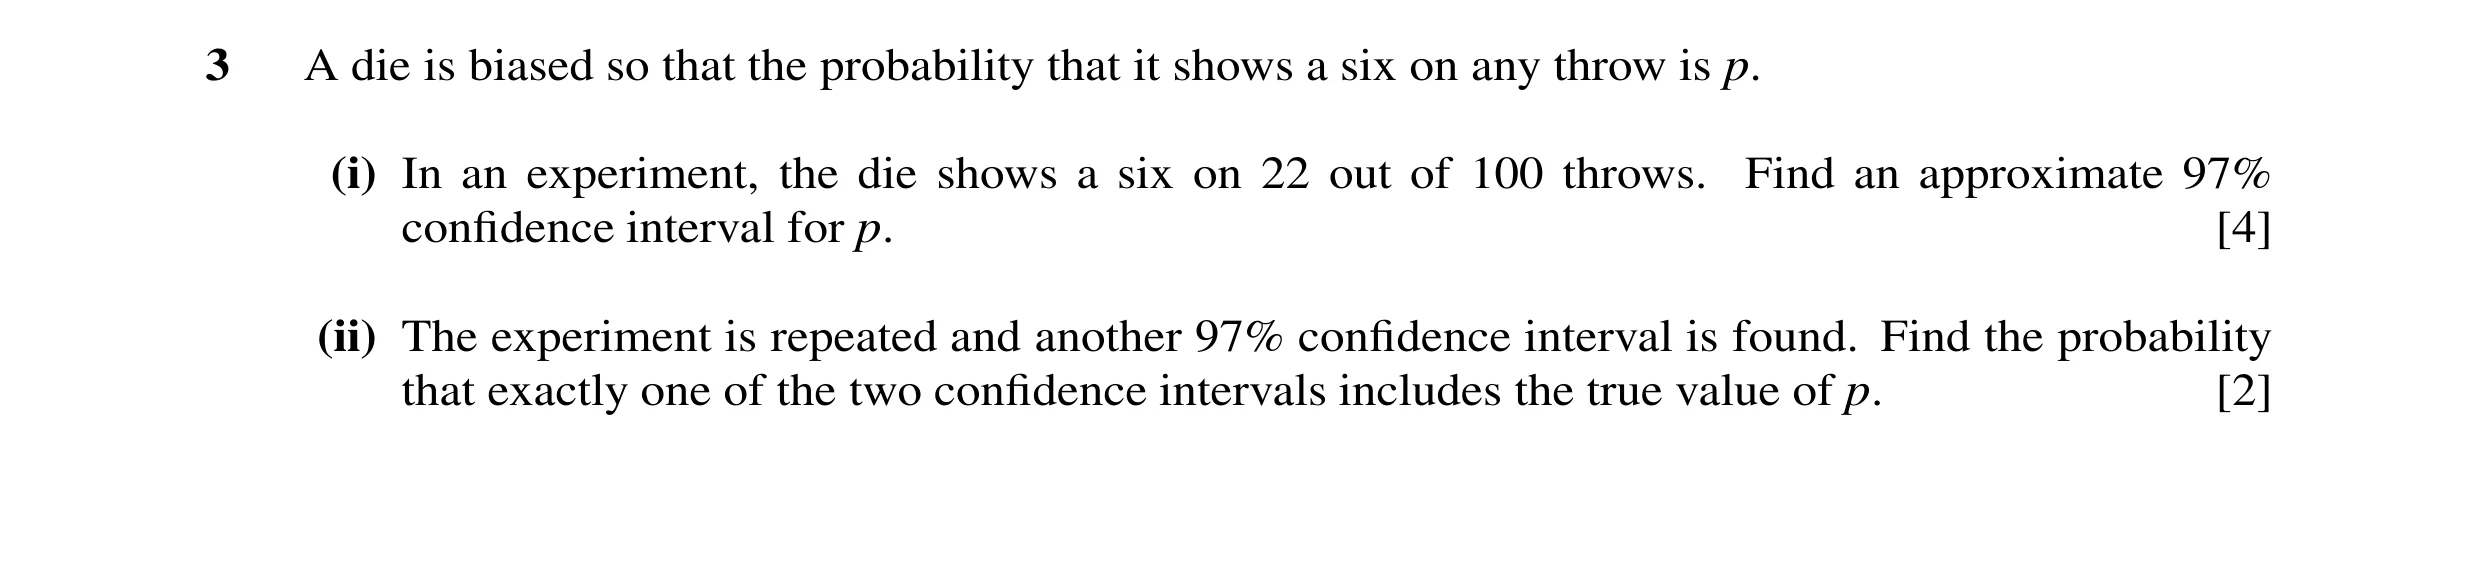
3 A die is biased so that the probability that it shows a six on any throw is p. (i) In an experiment, the die shows a six on 22 out of 100 throws. Find an approximate 97% confidence interval for p. [4] (ii) The experiment is repeated and another 97% confidence interval is found. Find the probability that exactly one of the two confidence intervals includes the true value of p. [2]
6 marks
Mark scheme: .0 22 × (1 .022 ) 3 (i) Var(ps) = M1 pq/100 100 = 429 or .0 001716 250 000 429 .0 22 ± z ' ' M1 Expression of correct form with their variance 250 000 Any z (must be a z value) accept one side only z = 2.17 or 2.168/9 or 2.171 B1 Seen 0.13(0) to 0.31(0) (2 sf) A1 [4] Must be an interval (ii) ‘2’ × (1 – 0.97) × 0.97 M1 = 0.0582 A1 [2] Total 6 1508 ( )
This question in 9709/73 May/June 2015
Q33 · A random variable X has probability density function given by D k 3 −x 1 ≤x ≤2, f x = 0… 9709/71 Oct/Nov 2015
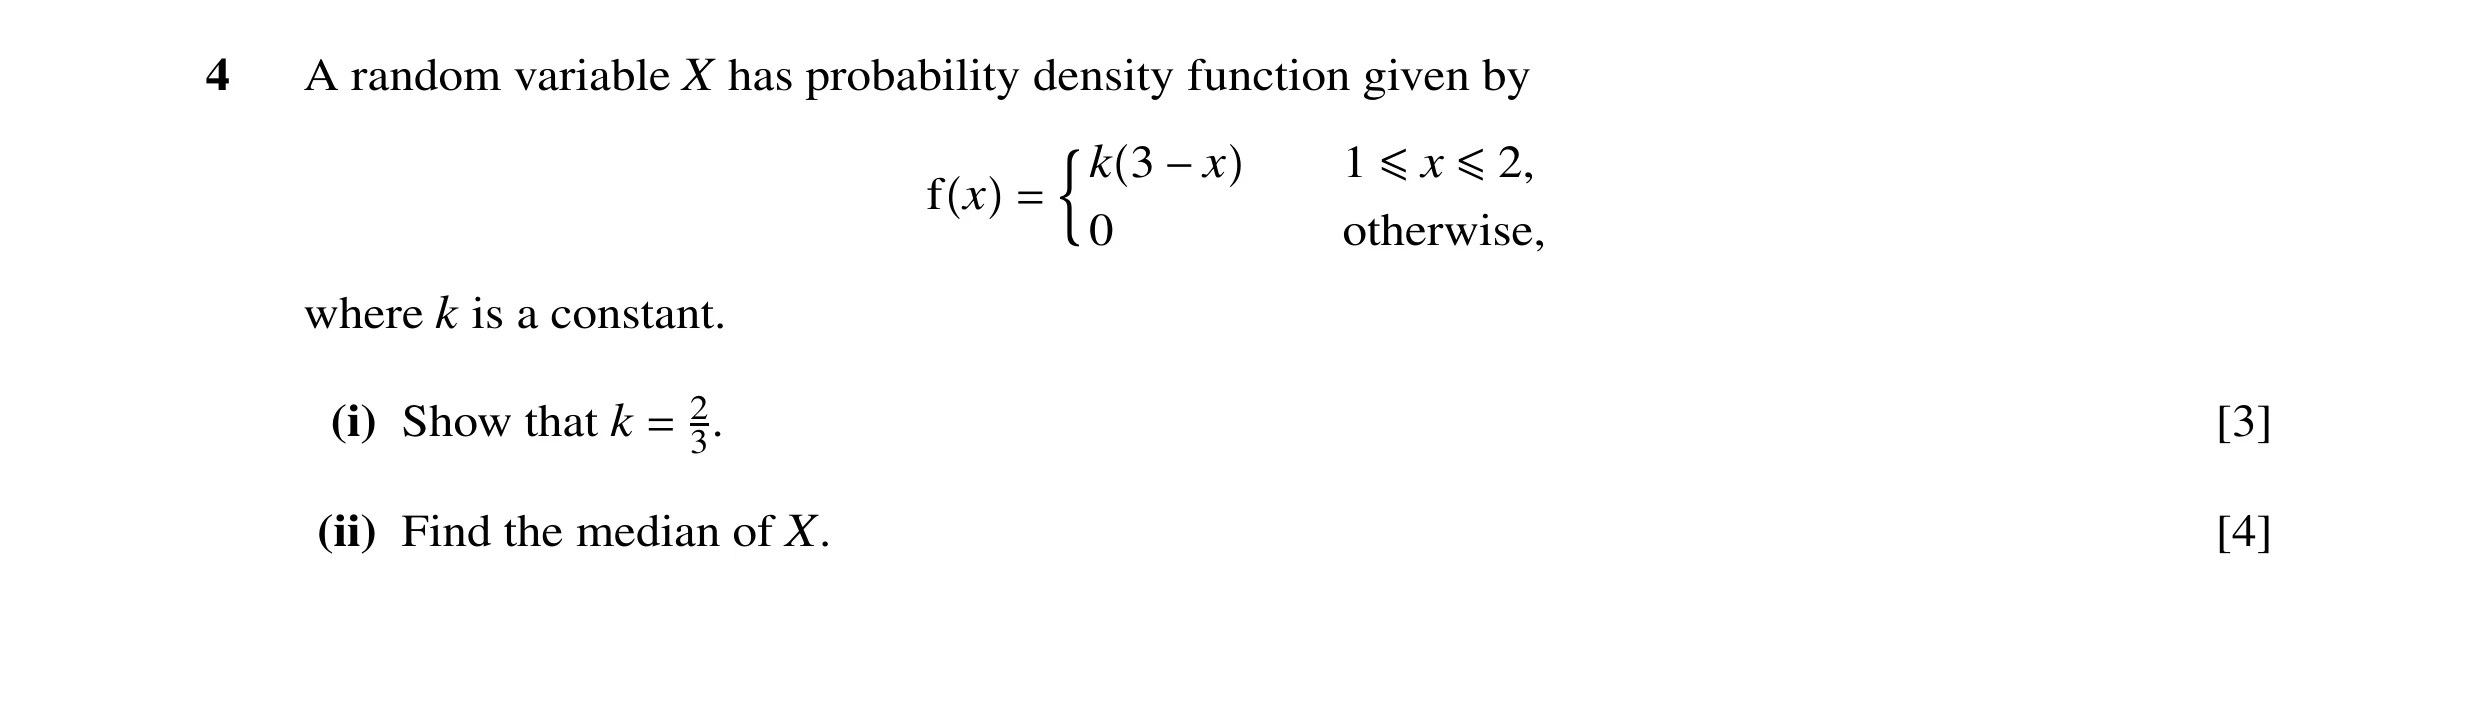
4 A random variable X has probability density function given by D k 3 −x 1 ≤x ≤2, f x = 0 otherwise, where k is a constant. (i) Show that k = 2 [3] 3. (ii) Find the median of X. [4]
7 marks
Mark scheme: Attempt ∫f(x) = 1, ignore limits or4 (i) k ∫ (3 − x ) d x = 1 M1 1 k (h1 + h2) = 1 2 2 2 A1 Correct integration & limits or k 3 x −x = 1 2 k 1 (2 + 1) = 1 2 (k(6 – 2 – (3 – 0.5)) = 1) 3 1 k × 1.5 = 1 or k × = 1 or k = oe 2 5.1 k = 2 AG A1 [3] No errors seen 3 m 2 (ii) 3 ∫ ( 3 − x ) d x = 5.0 oe ∫ from m to 2 M1* Attempt Int f(x) = 0.5, ignore limits oe 1 Or use of area of trapezium 2 m 2 x 3 x − = 5.0 3 2 1 2 2 dep M1* Sub of correct limits into their integral. 3m −m − 5.2 = 5.0 3 2 Or trapezium using 1 and m/m and 2 Any correct 3-term QE = 0 or (m–3)² =2.5 2 A1 m −m6 + 5.6 = 0 oe 6 ± 36 − 4 × 5.6 m = = .1 42 or .4 58 2 6 − 10 A1 [4] or oe; single correct ans m = 1.42 (3 sf) 2 Total: 7
This question in 9709/71 Oct/Nov 2015
Q34 · On average, 1 in 2500 adults has a certain medical condition 9709/71 Oct/Nov 2015
5 On average, 1 in 2500 adults has a certain medical condition. (i) Use a suitable approximation to find the probability that, in a random sample of 4000 people, more than 3 have this condition. [3] (ii) In a random sample of n people, where n is large, the probability that none has the condition is less than 0.05. Find the smallest possible value of n. [4]
7 marks
Mark scheme: 5 (i) Po(1.6) stated or implied M1 6.1 2 6.1 3 M1 + P ( X > 3) = 1 − e −6.1 1 + 6.1 + Allow M1 for 1 – P(X ⩽3), incorrect λ 2 !3 and allow one end error A1 [3] SR Use of Bin scores B1 only for 0.0788 = 0.0788 (3 sf) n or or (ii) B1 µ λ = -e 2500 < 0.05 M1 2499 B1 n 2500 − e 2500 < .005 Allow = M1 n 2499 Allow incorrect λ < .005 2500 M1 2499 n M1 –µ < ln 0.05 M1 nln < ln .005 − < ln .005 Attempt ln bs 2500 (µ > 2.9957) 2500 n > 7489.3 (1 dp) M1 Smallest n = 7490 A1 [4] n = µ × 2500 B1 Smallest n = 7488 Smallest n = 7490 A1 A1 Total: 7
This question in 9709/71 Oct/Nov 2015
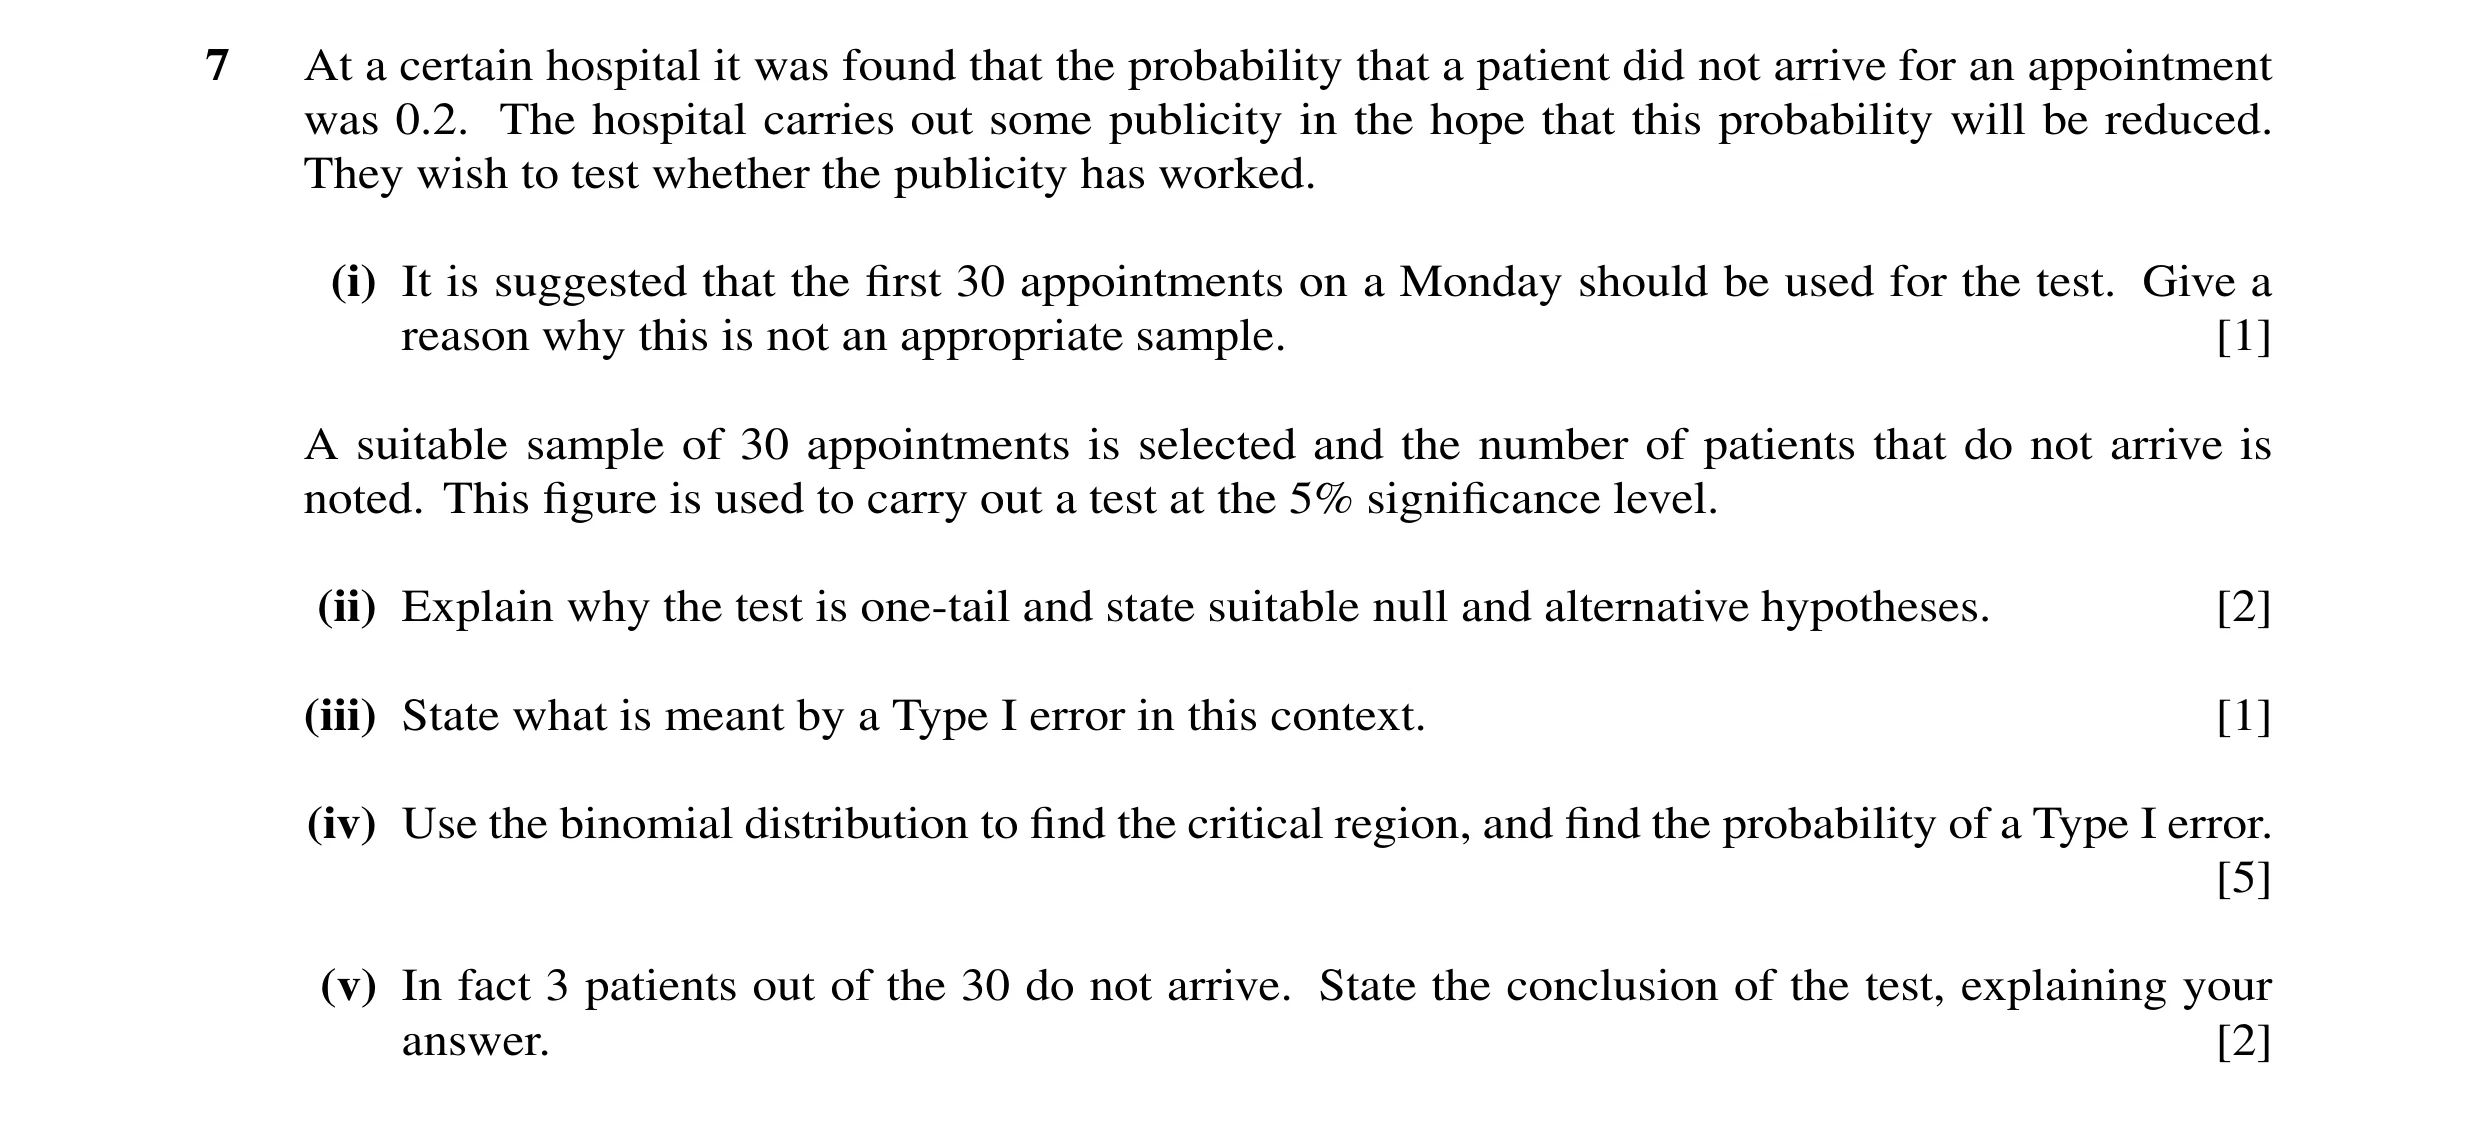
Q35 · At a certain hospital it was found that the probability that a patient did not arrive for… 9709/71 Oct/Nov 2015
7 At a certain hospital it was found that the probability that a patient did not arrive for an appointment was 0.2. The hospital carries out some publicity in the hope that this probability will be reduced. They wish to test whether the publicity has worked. (i) It is suggested that the first 30 appointments on a Monday should be used for the test. Give a reason why this is not an appropriate sample. [1] A suitable sample of 30 appointments is selected and the number of patients that do not arrive is noted. This figure is used to carry out a test at the 5% significance level. (ii) Explain why the test is one-tail and state suitable null and alternative hypotheses. [2] (iii) State what is meant by a Type I error in this context. [1] (iv) Use the binomial distribution to find the critical region, and find the probability of a Type I error. [5] (v) In fact 3 patients out of the 30 do not arrive. State the conclusion of the test, explaining your answer. [2]
11 marks
Mark scheme: 7 (i) Prob could be different later in day B1 [1] or any explanation why not random or on a different day oe or “Not random” or “Not representative” (ii) Looking for decrease (or improvement) B1 oe H0: P(not arrive) = 0.2 Allow “p = 0.2” H1: P(not arrive) < 0.2 B1 [2] (iii) Concluding that prob has decreased (or B1 [1] In context publicity has worked) when it hasn’t oe (iv) P(X = 0) and P(X = 1) attempted M1 B(30, 0.2) Not nec’y added May be implied by calc P(X ⩽ 2) or P(X ⩽ 3) P(X ⩽ 2) = 0.830 + 30 × 0.829 × 0.2 + M1 30C2 × 0.828 × 0.22 (= 0.0442) Attempt P(X ⩽ 2) B1 P(X ⩽ 3) = 0.830 + 30 × 0.829 × 0.2 + Or ‘0.0442’ + 30C3 × 0.827 × 0.23 = 0.123 30C2×0.828×0.22 + 30C3×0.827×0.23 = 0.123 cr is X ⩽ 2 A1 P(Type I) = 0.0442 (3 sf) A1 [5] (v) 3 is outside cr M1 Comparison of 3 with their cr or P(X ⩽ 3) = 0.123 which is > 0.05 No evidence that p has decreased (or that A1 [2] Correct conclusion. No contradictions publicity has worked) Total: 11 Total for paper: 50
This question in 9709/71 Oct/Nov 2015
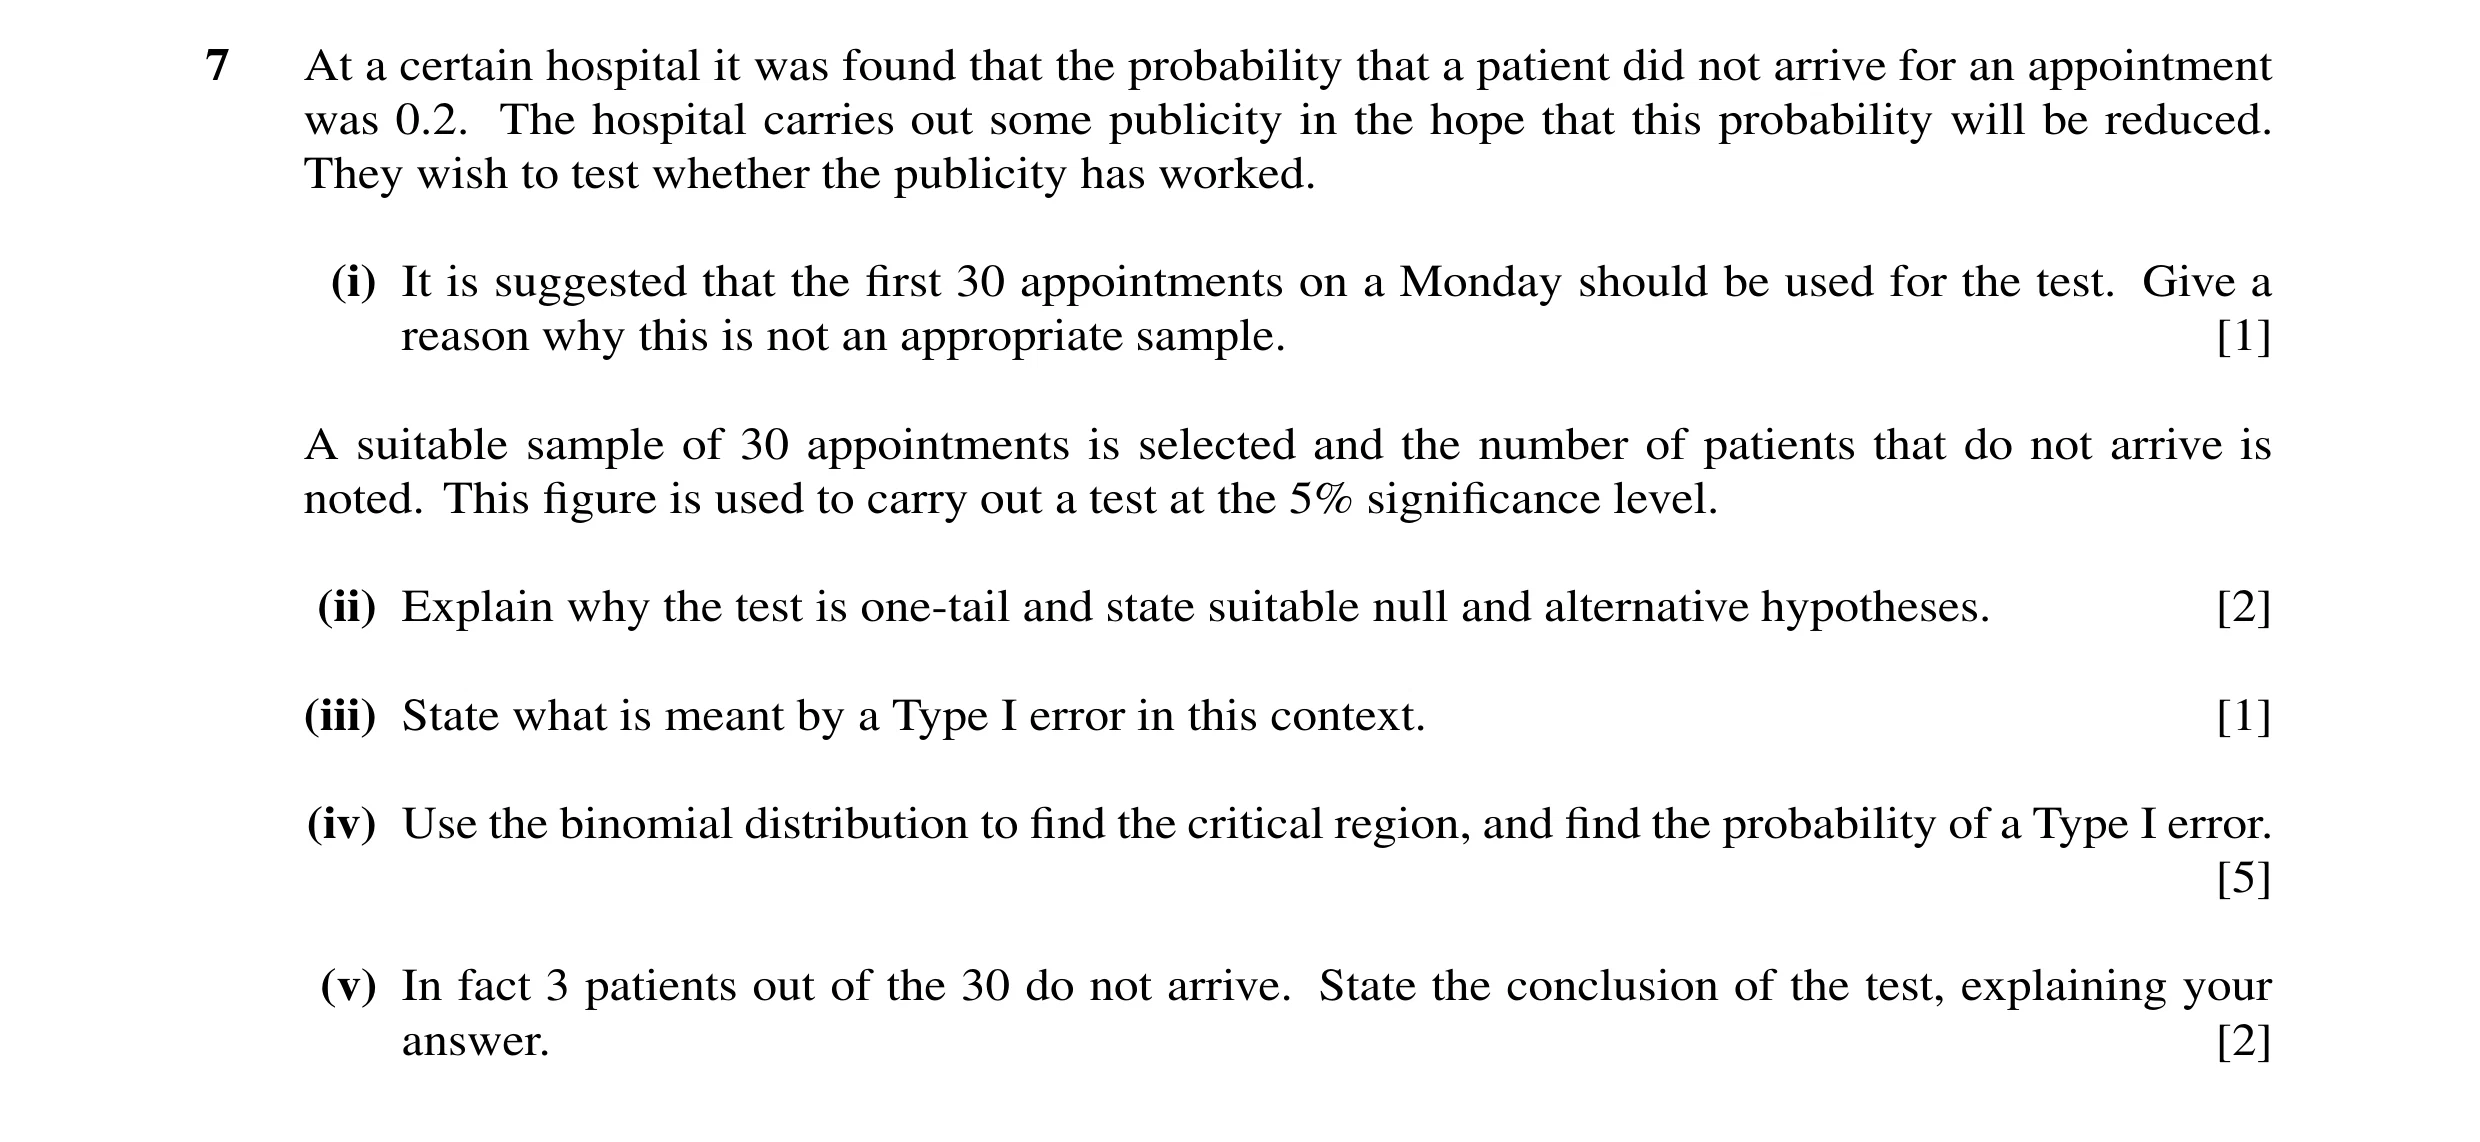
Q36 · At a certain hospital it was found that the probability that a patient did not arrive for… 9709/72 Oct/Nov 2015
7 At a certain hospital it was found that the probability that a patient did not arrive for an appointment was 0.2. The hospital carries out some publicity in the hope that this probability will be reduced. They wish to test whether the publicity has worked. (i) It is suggested that the first 30 appointments on a Monday should be used for the test. Give a reason why this is not an appropriate sample. [1] A suitable sample of 30 appointments is selected and the number of patients that do not arrive is noted. This figure is used to carry out a test at the 5% significance level. (ii) Explain why the test is one-tail and state suitable null and alternative hypotheses. [2] (iii) State what is meant by a Type I error in this context. [1] (iv) Use the binomial distribution to find the critical region, and find the probability of a Type I error. [5] (v) In fact 3 patients out of the 30 do not arrive. State the conclusion of the test, explaining your answer. [2]
11 marks
Mark scheme: 7 (i) Prob could be different later in day B1 [1] or any explanation why not random or on a different day oe or “Not random” or “Not representative” (ii) Looking for decrease (or improvement) B1 oe H0: P(not arrive) = 0.2 Allow “p = 0.2” H1: P(not arrive) < 0.2 B1 [2] (iii) Concluding that prob has decreased (or B1 [1] In context publicity has worked) when it hasn’t oe (iv) P(X = 0) and P(X = 1) attempted M1 B(30, 0.2) Not nec’y added May be implied by calc P(X ⩽ 2) or P(X ⩽ 3) P(X ⩽ 2) = 0.830 + 30 × 0.829 × 0.2 + M1 30C2 × 0.828 × 0.22 (= 0.0442) Attempt P(X ⩽ 2) B1 P(X ⩽ 3) = 0.830 + 30 × 0.829 × 0.2 + Or ‘0.0442’ + 30C3 × 0.827 × 0.23 = 0.123 30C2×0.828×0.22 + 30C3×0.827×0.23 = 0.123 cr is X ⩽ 2 A1 P(Type I) = 0.0442 (3 sf) A1 [5] (v) 3 is outside cr M1 Comparison of 3 with their cr or P(X ⩽ 3) = 0.123 which is > 0.05 No evidence that p has decreased (or that A1 [2] Correct conclusion. No contradictions publicity has worked) Total: 11 Total for paper: 50
This question in 9709/72 Oct/Nov 2015
Q37 · The diameter, in cm, of pistons made in a certain factory is denoted by X, where X is… 9709/73 Oct/Nov 2015
7 The diameter, in cm, of pistons made in a certain factory is denoted by X, where X is normally distributed with mean - and variance 32. The diameters of a random sample of 100 pistons were measured, with the following results. n = 100 Σx = 208.7 Σx2 = 435.57 (i) Calculate unbiased estimates of - and 32. [3] The pistons are designed to fit into cylinders. The internal diameter, in cm, of the cylinders is denoted by Y, where Y has an independent normal distribution with mean 2.12 and variance 0.000 144. A piston will not fit into a cylinder if Y −X < 0.01. (ii) Using your answers to part (i), find the probability that a randomly chosen piston will not fit into a randomly chosen cylinder. [6]
9 marks
Mark scheme: 7 (i) est µ = 2.087 B1 allow 2.09 100 435.57 2 est σ2 = − .2087 M1 1 / 99 (435.57 – 208.72 / 100 ) 99 100 100 without : 0.000131 M0A0 = 0.000132(3232) or 131 / 99 0000 A1 [3] 99 (ii) E(Y – X) = 2.12 – 2.087 ( = 0.033 ) B1 or 2.12 – 2.087 – 0.01 for Y – X – 0.01 < 0 allow 2.09 for 2.087 Var(Y – X) = 0.000144 + ‘0.00013232’ M1 or √(0.0122 + ‘0.00013232’) M1 = 0.000276(32) A1 = 0.016623 A1 .0 01− .0' 033' (= –1.384) M1 their E(Y – X) & Var(Y – X) .0' 00027632 ' var must be a combination of the two vars Φ(‘–1.384’) = 1 – Φ(‘1.384’) M1 correct area / prob consistent with their working = 0.0832 A1 [6] SR use of biased var ( 0.000131 ) in (i) and (ii) scores in (ii) B1M1 A1 for 0.000275 and M1M1 A1 for 0.0827 ( 6 / 6 available) Total [9] Total for paper [50]
This question in 9709/73 Oct/Nov 2015
Q38 · Jill shoots arrows at a target 9709/72 Feb/March 2016
2 Jill shoots arrows at a target. Last week, 65% of her shots hit the target. This week Jill claims that she has improved. Out of her first 20 shots this week, she hits the target with 18 shots. Assuming shots are independent, test Jill’s claim at the 1% significance level. [5]
5 marks
Mark scheme: 2 H0: P(hit target) = 0.65 Allow p = 0.65 H1: P(hit target) > 0.65 B1 Allow p > 0.65 20C2 × 0.352 × 0.6518 + 19 × 0.35 × 0.6519 M1 Allow one end error. Allow p/q mix. Allow (1– ) + 0.6520 for M mark = 0.0121 (3 sf) A1 A mark recovered following valid comparison For valid comparison Comp 0.01 M1 She has probably not improved. No There is no evidence (at the 1% level) A1 [5] contradictions. that she has improved (SR Use of Normal M0, but M1A1 for valid comparison could be awarded)
This question in 9709/72 Feb/March 2016
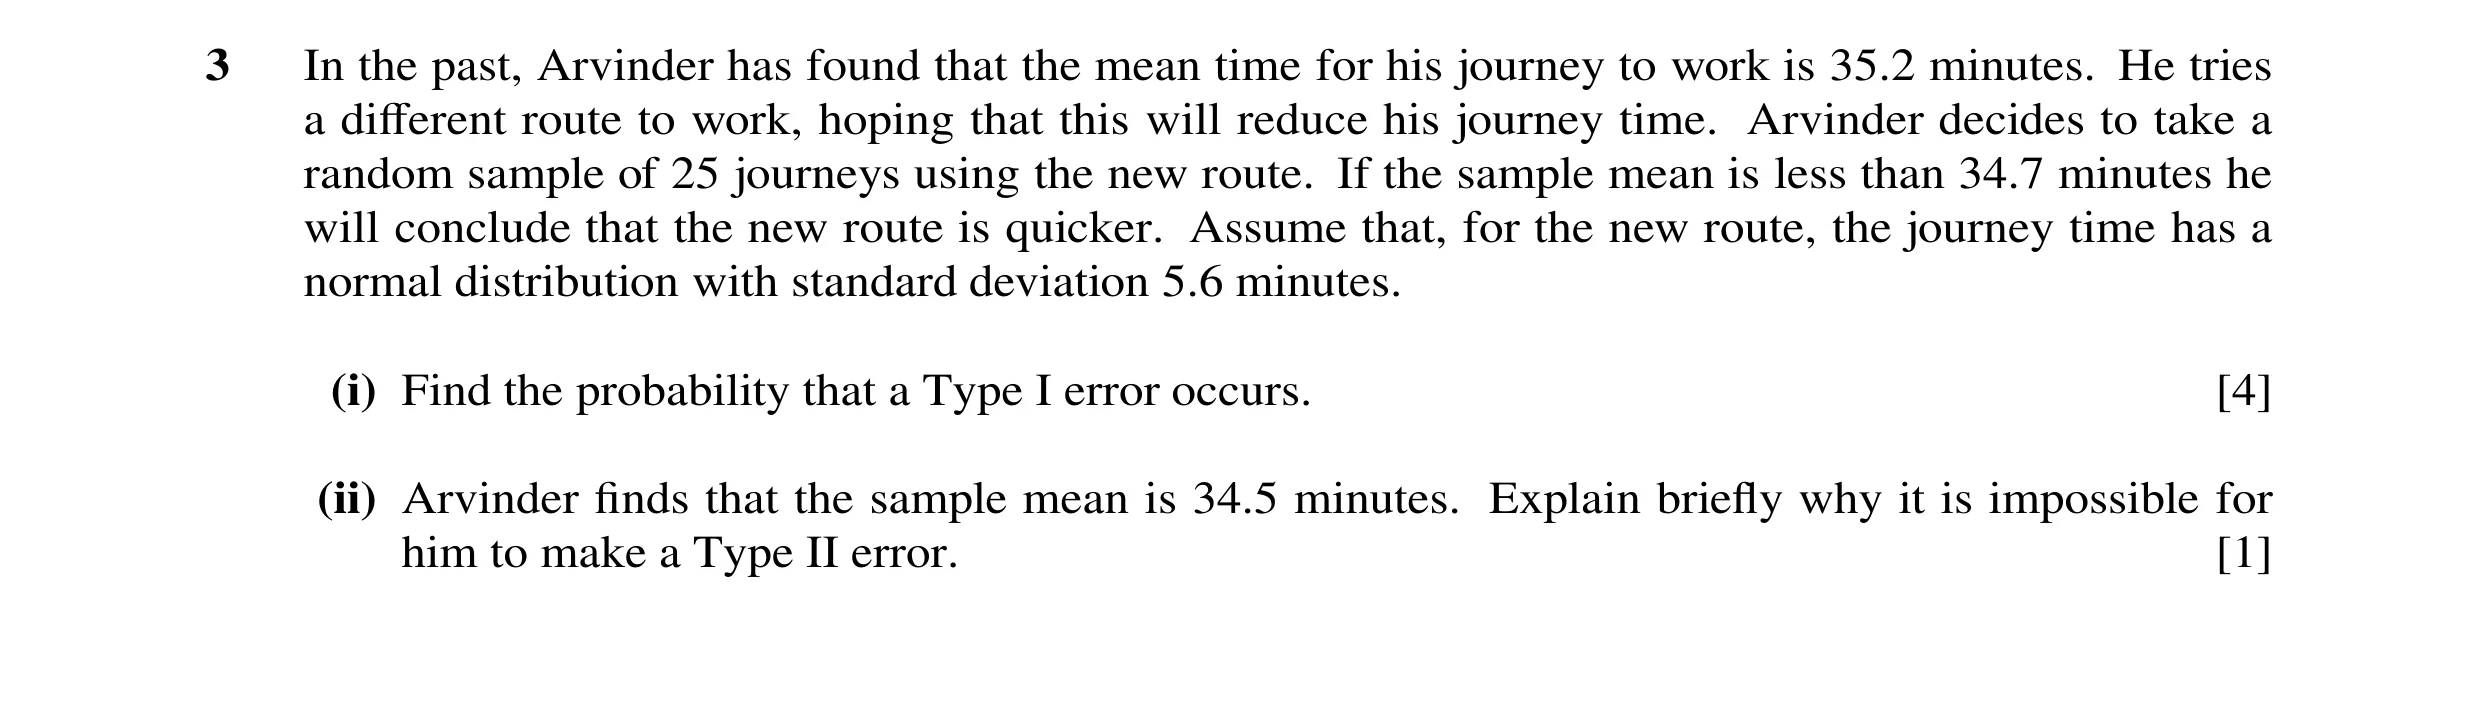
Q39 · In the past, Arvinder has found that the mean time for his journey to work is 35.2 minutes 9709/72 Feb/March 2016
3 In the past, Arvinder has found that the mean time for his journey to work is 35.2 minutes. He tries a different route to work, hoping that this will reduce his journey time. Arvinder decides to take a random sample of 25 journeys using the new route. If the sample mean is less than 34.7 minutes he will conclude that the new route is quicker. Assume that, for the new route, the journey time has a normal distribution with standard deviation 5.6 minutes. (i) Find the probability that a Type I error occurs. [4] (ii) Arvinder finds that the sample mean is 34.5 minutes. Explain briefly why it is impossible for him to make a Type II error. [1]
5 marks
Mark scheme: 3 (i) H0: pop mean journey time = 35.2 mins Allow "µ". Not "mean journey time" H1: pop mean journey time < 35.2 mins B1 34.7 − 35.2 (= –0.446) M1 For standardising (√25 needed) 5.6/ 25 Φ(< "–0.446") = 1 – Φ("0.446") M1 For correct area consistent with their working = 0.328 (3 sf) A1 [4] As final answer (ii) H0 is rejected but Type II error can only B1 [1] Allow just "H0 is rejected." oe be made if H0 is not rejected 2 2 2 2
This question in 9709/72 Feb/March 2016
Q40 · 1% of adults in a certain country own a yellow car 9709/73 May/June 2016
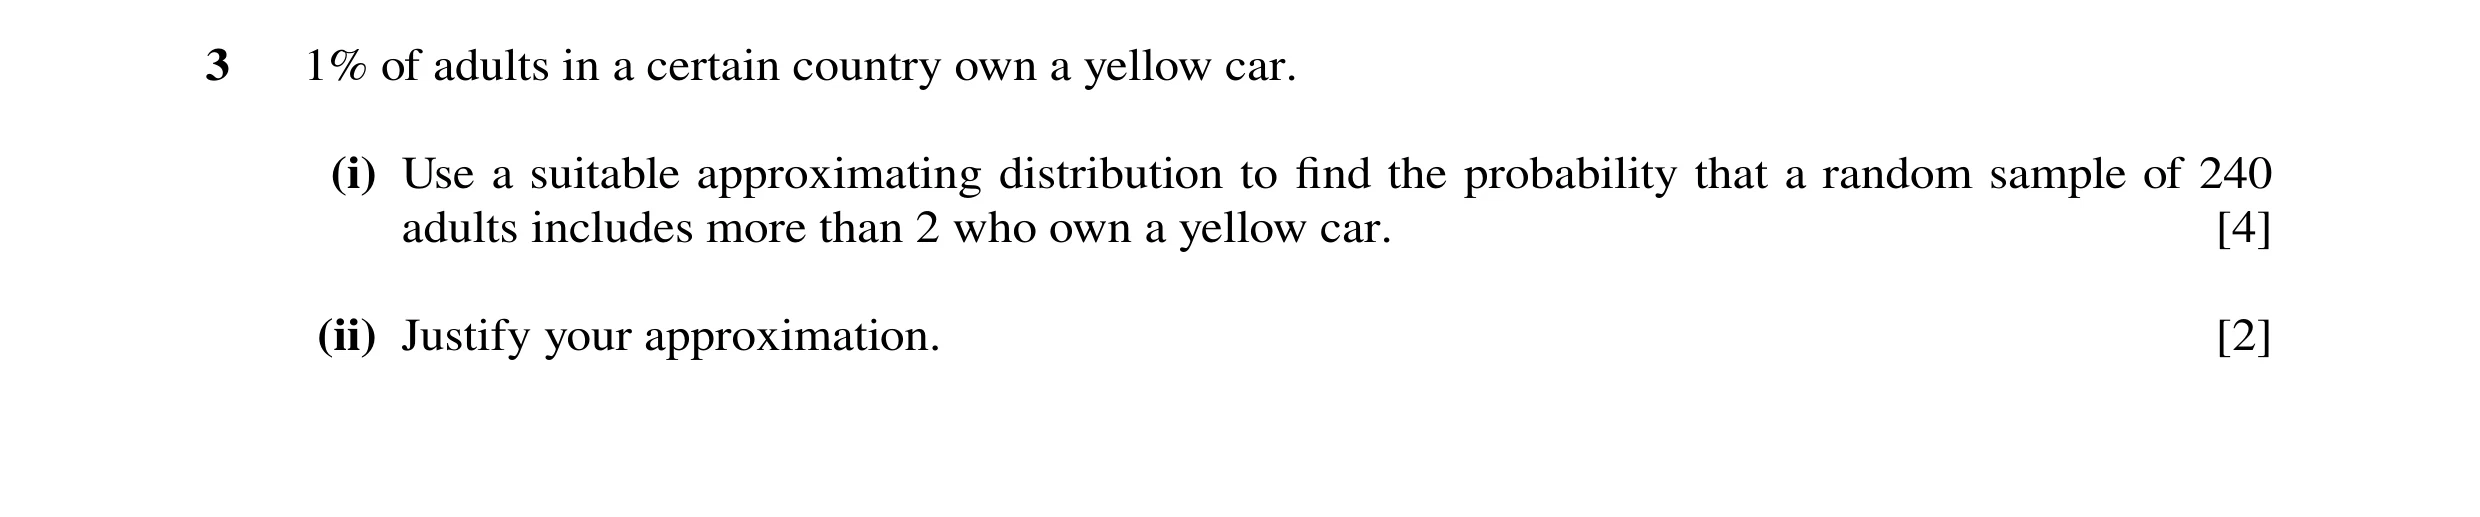
3 1% of adults in a certain country own a yellow car. (i) Use a suitable approximating distribution to find the probability that a random sample of 240 adults includes more than 2 who own a yellow car. [4] (ii) Justify your approximation. [2]
6 marks
Mark scheme: 3 (i) Use of Poisson B1 Mean = 2.4 B1 1 – e-2.4(1 + 2.4 + 2.42 2 ) M1 Allow any λ (Allow one end error) Final answer A1 [4] = 0.43(0) (3 sf) SR Use of binomial: B1 for ans 0.431 (3 sf) (ii) 240 > 50 or n>50 B1 240 × 0.01 = 2.4 < 5 or np<5 or p<0.1 B1 [2] SR n large, p small: B1
This question in 9709/73 May/June 2016
Q41 · A die has six faces numbered 1, 2, 3, 4, 5, 6 9709/71 Oct/Nov 2016
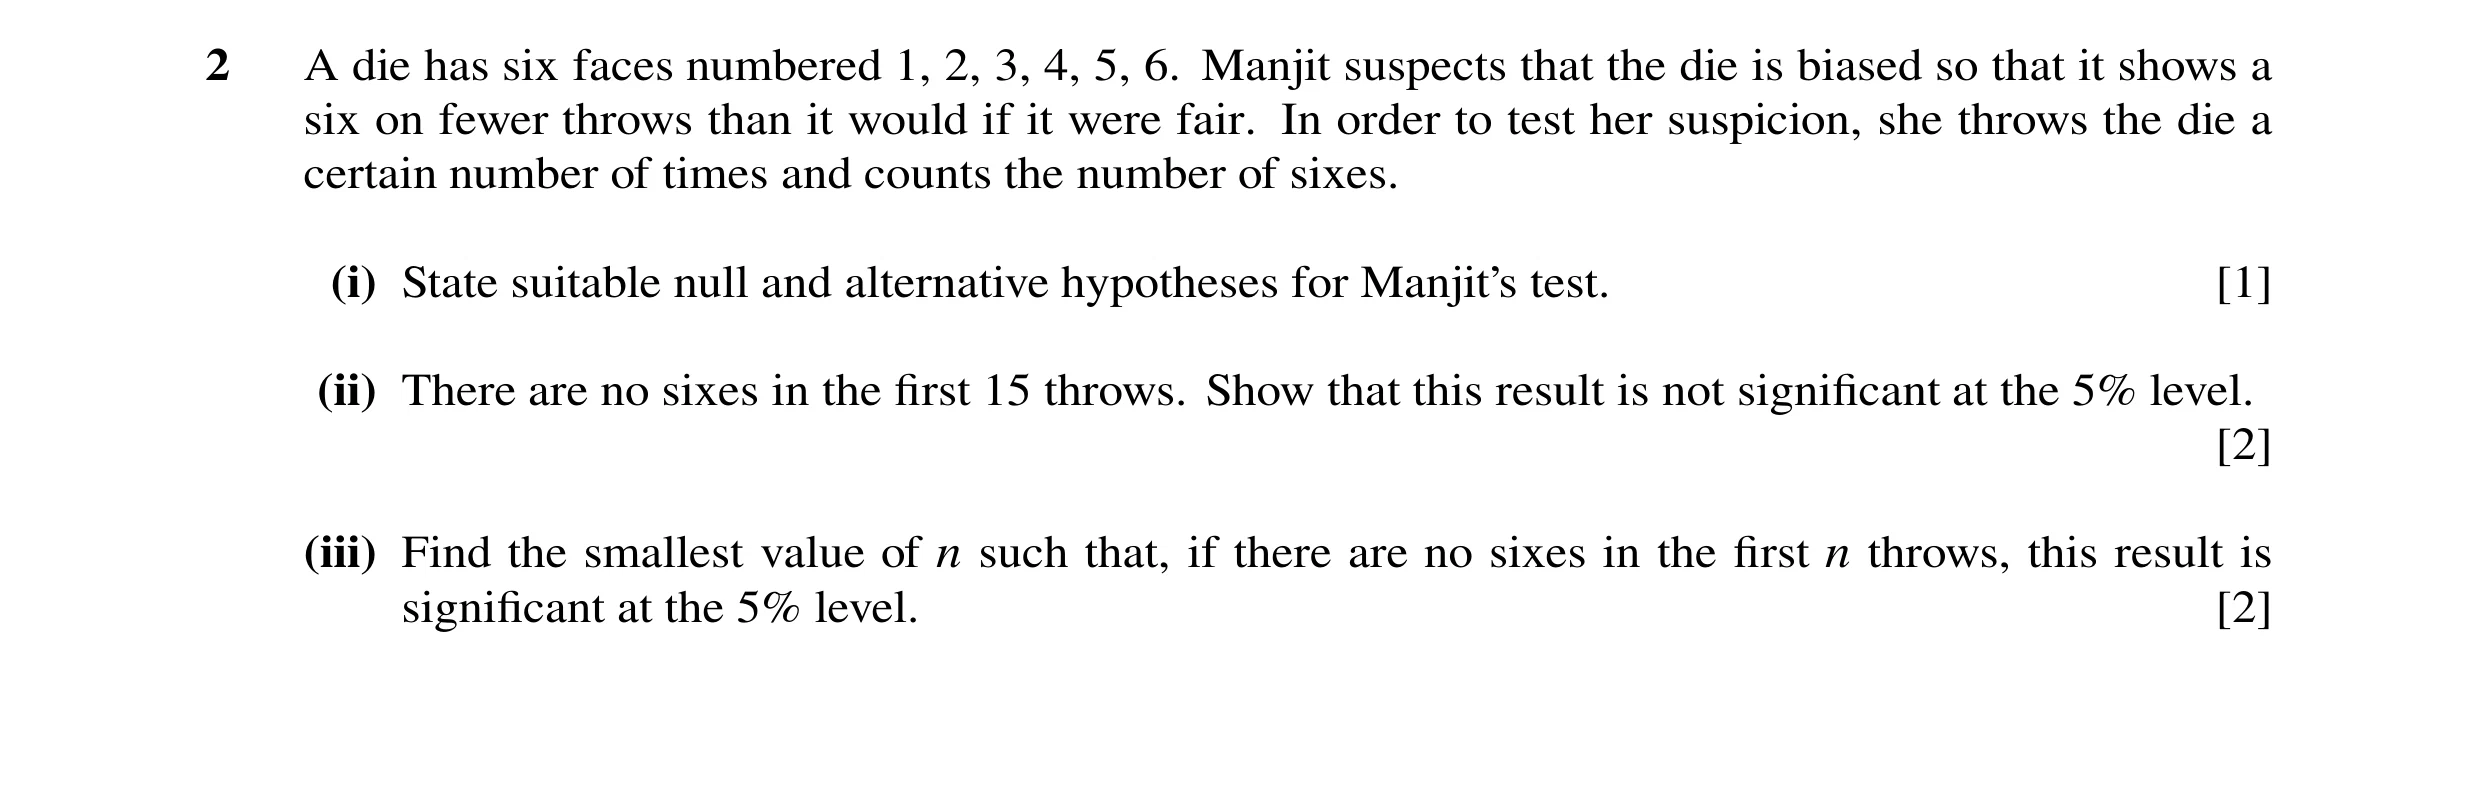
2 A die has six faces numbered 1, 2, 3, 4, 5, 6. Manjit suspects that the die is biased so that it shows a six on fewer throws than it would if it were fair. In order to test her suspicion, she throws the die a certain number of times and counts the number of sixes. (i) State suitable null and alternative hypotheses for Manjit’s test. [1] (ii) There are no sixes in the first 15 throws. Show that this result is not significant at the 5% level. [2] (iii) Find the smallest value of n such that, if there are no sixes in the first n throws, this result is significant at the 5% level. [2]
5 marks
Mark scheme: 2 (i) H0: P(6) = 1/6 H1: P(6) < 1/6 B1 [1] Allow H0: p = 1/6 H1: p < 1/6 5 M1 (ii) 15 ( 6 ) = 0.065 > 0.05 A1 [2] Correct result and comparison needed for A1 SR if 2 tail test followed allow A1 for 0.065 > 0.025 (iii) ( 56 )16 = 0.054 and ( 56 )17 = 0.045 M1 both Smallest n is 17 A1 [2] No errors seen OR 5 ( 6 ) n < 0.05 and attempt to solve M1 5 nln( 6 ) < ln 0.05 A1 smallest n is 17
This question in 9709/71 Oct/Nov 2016
Q42 · A die has six faces numbered 1, 2, 3, 4, 5, 6 9709/72 Oct/Nov 2016
2 A die has six faces numbered 1, 2, 3, 4, 5, 6. Manjit suspects that the die is biased so that it shows a six on fewer throws than it would if it were fair. In order to test her suspicion, she throws the die a certain number of times and counts the number of sixes. (i) State suitable null and alternative hypotheses for Manjit’s test. [1] (ii) There are no sixes in the first 15 throws. Show that this result is not significant at the 5% level. [2] (iii) Find the smallest value of n such that, if there are no sixes in the first n throws, this result is significant at the 5% level. [2]
5 marks
Mark scheme: 2 (i) H0: P(6) = 1/6 H1: P(6) < 1/6 B1 [1] Allow H0: p = 1/6 H1: p < 1/6 5 M1 (ii) 15 ( 6 ) = 0.065 > 0.05 A1 [2] Correct result and comparison needed for A1 SR if 2 tail test followed allow A1 for 0.065 > 0.025 (iii) ( 56 )16 = 0.054 and ( 56 )17 = 0.045 M1 both Smallest n is 17 A1 [2] No errors seen OR 5 ( 6 ) n < 0.05 and attempt to solve M1 5 nln( 6 ) < ln 0.05 A1 smallest n is 17
This question in 9709/72 Oct/Nov 2016
Q43 · Dominic wishes to choose a random sample of five students from the 150 students in his year 9709/73 Oct/Nov 2016
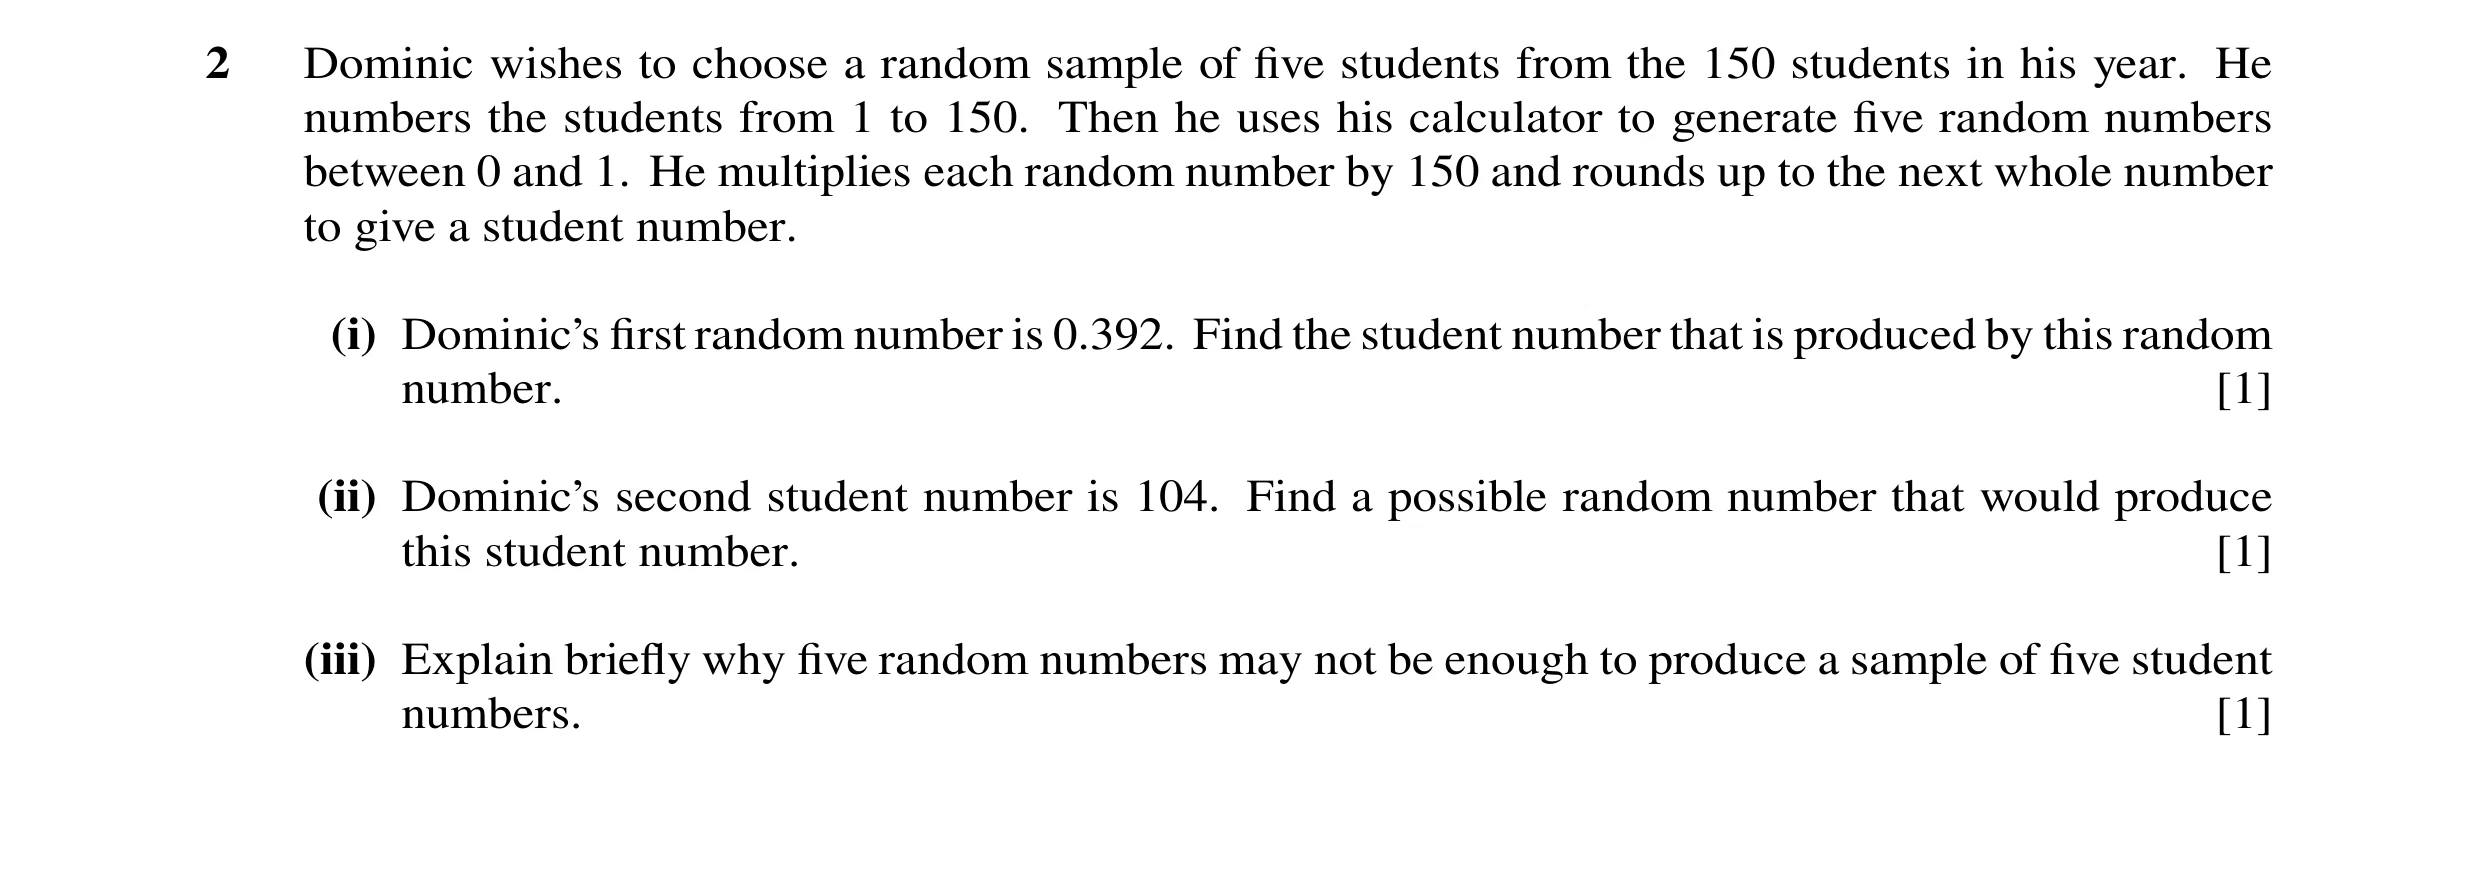
2 Dominic wishes to choose a random sample of five students from the 150 students in his year. He numbers the students from 1 to 150. Then he uses his calculator to generate five random numbers between 0 and 1. He multiplies each random number by 150 and rounds up to the next whole number to give a student number. (i) Dominic’s first random number is 0.392. Find the student number that is produced by this random number. [1] (ii) Dominic’s second student number is 104. Find a possible random number that would produce this student number. [1] (iii) Explain briefly why five random numbers may not be enough to produce a sample of five student numbers. [1]
3 marks
Mark scheme: 2 (i) 59 B1 [1] Any x such that 0.687 ⩽ x ⩽ 0.693 (3 (ii) sf) B1 [1] or 0.69 or “ ... 0.686.. < 0.693 rec “ (iii) Possible repeats B1 [1]
This question in 9709/73 Oct/Nov 2016
Q44 · It is claimed that 30% of packets of Froogum contain a free gift 9709/73 Oct/Nov 2016
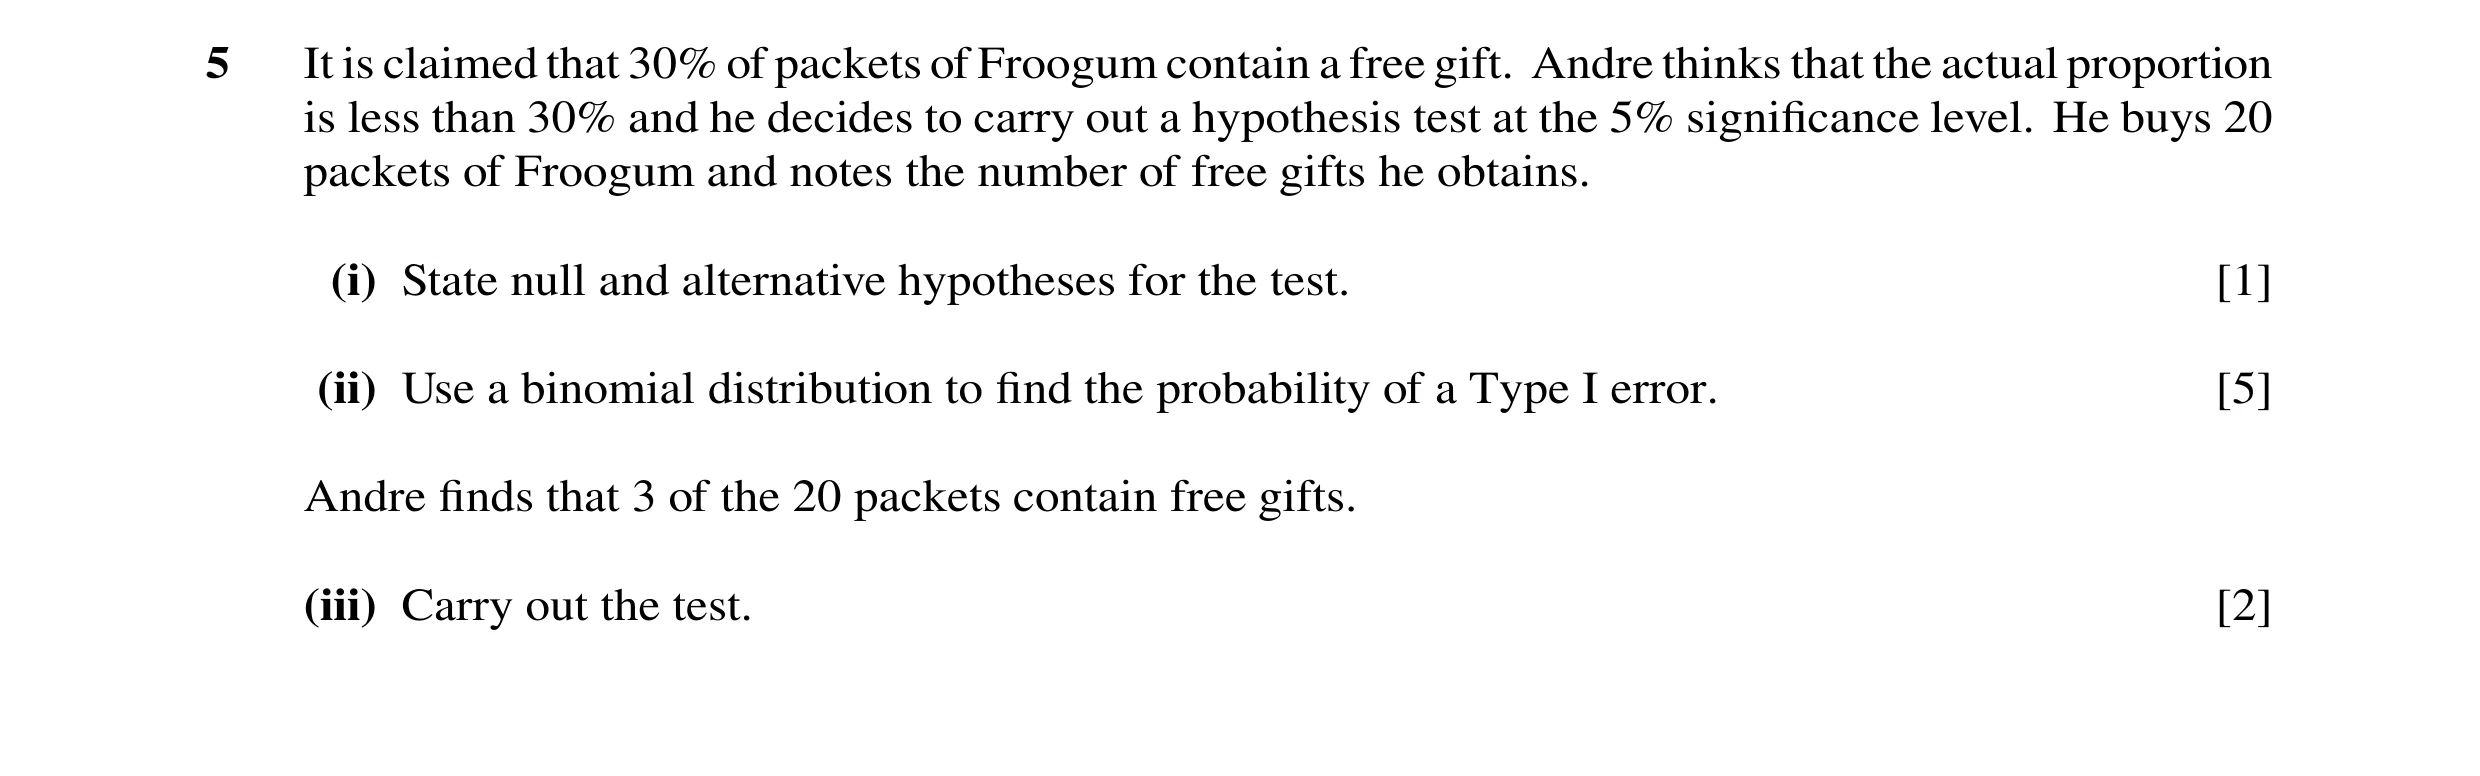
5 It is claimed that 30% of packets of Froogum contain a free gift. Andre thinks that the actual proportion is less than 30% and he decides to carry out a hypothesis test at the 5% significance level. He buys 20 packets of Froogum and notes the number of free gifts he obtains. (i) State null and alternative hypotheses for the test. [1] (ii) Use a binomial distribution to find the probability of a Type I error. [5] Andre finds that 3 of the 20 packets contain free gifts. (iii) Carry out the test. [2]
8 marks
Mark scheme: 5 (i) H0: P(free gift) = 0.3 or p = 0.3 H1: P(free gift) < 0.3 or p < 0.3 B1 [1] (ii) P(X ⩽ 2) = 0.720 + 20 × 0.719 × 0.3 + 20C2 × 0.718 × 0.32 M1* P(X ⩽ 2) attempted = 0.03548 or 0.0355 A1 P(X ⩽ 3) = ‘0.03548’ + 20C3 × 0.717 × 0.33 (= M1* P(X ⩽ 3) attempted 0.107 ) One comparison with 0.05 seen M1* or implied by fully correct methods for P(X ⩽ 2) and P(X ⩽ 3) P(Type I error) = 0.0355 (3 sf) DA1 [5] dep on all 3 Ms (iii) P(X ⩽ 3) = ‘0.107’ ‘0.107’ > 0.05 or cv = 2 and compare 3 >2 M1 Compare their P(X ⩽ 3) with 0.05 No evidence to reject claim oe A1 No evidence that 30% is not correct oe [2] ft their 0.107
This question in 9709/73 Oct/Nov 2016
Q45 · It is claimed that 1 in every 4 packets of certain biscuits contains a free gift 9709/72 May/June 2017
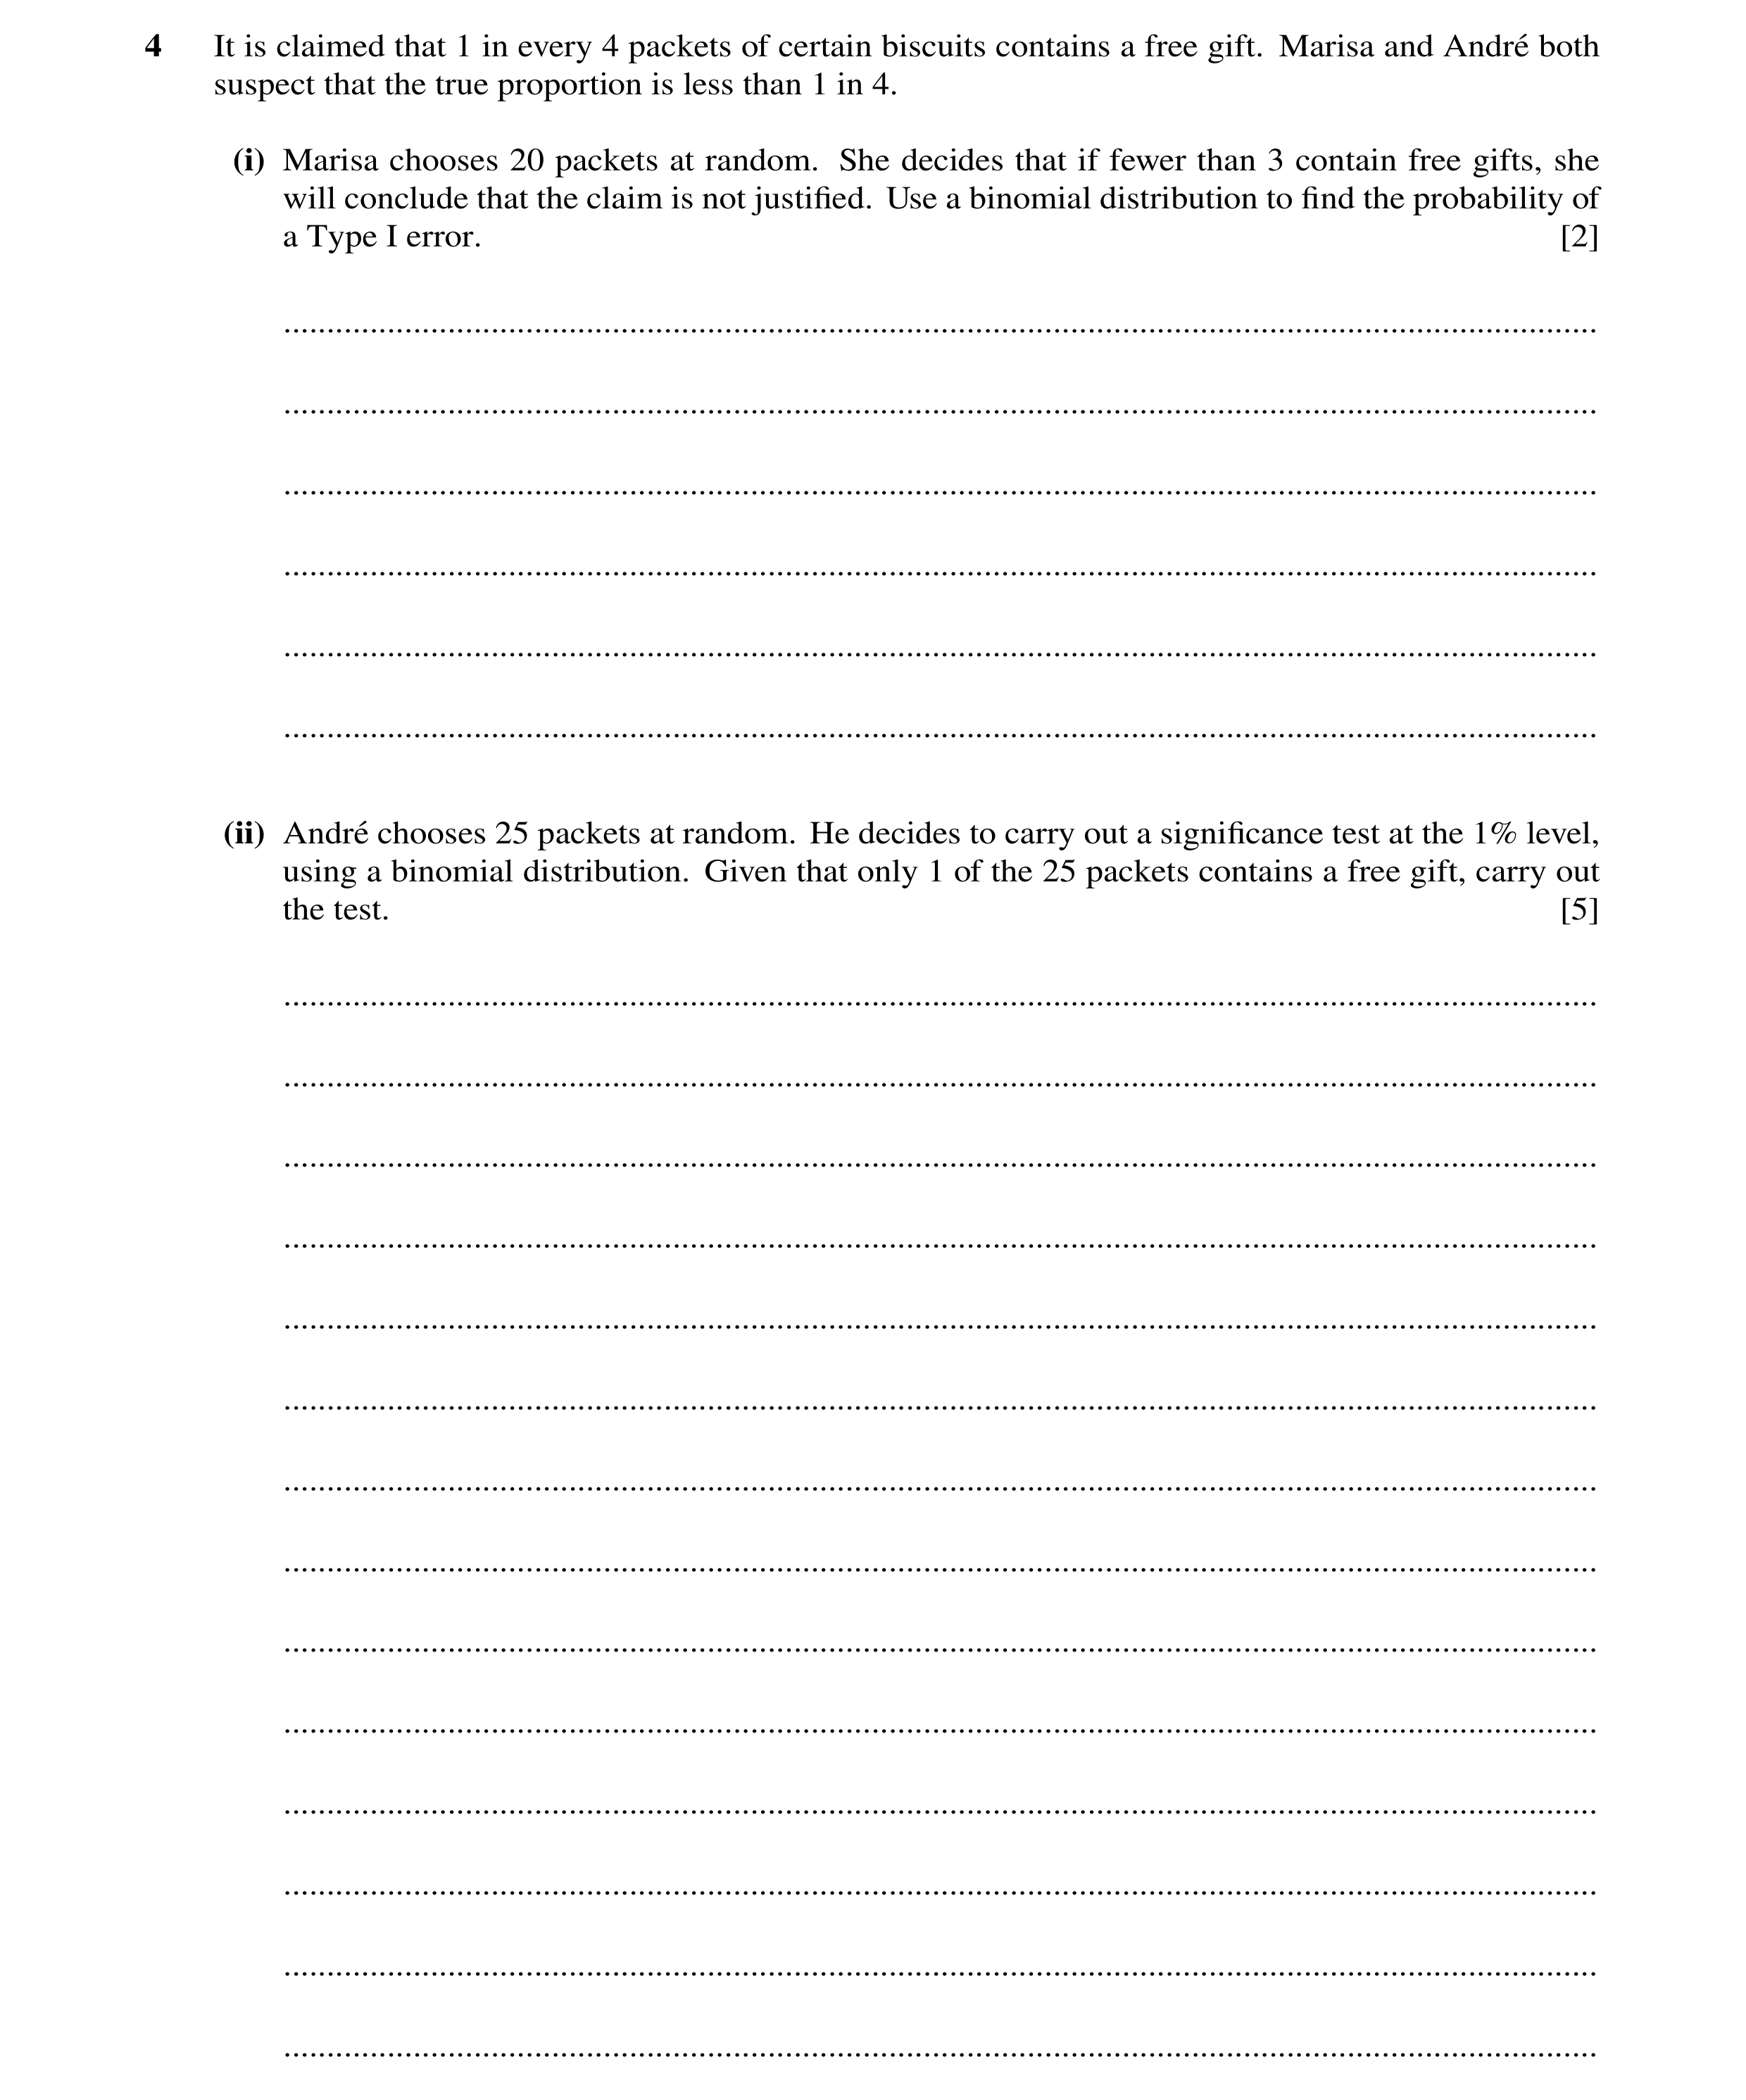
4 It is claimed that 1 in every 4 packets of certain biscuits contains a free gift. Marisa and Andr´e both suspect that the true proportion is less than 1 in 4. (i) Marisa chooses 20 packets at random. She decides that if fewer than 3 contain free gifts, she will conclude that the claim is not justified. Use a binomial distribution to find the probability of a Type I error. [2] … … … … … … (ii) Andr´e chooses 25 packets at random. He decides to carry out a significance test at the 1% level, using a binomial distribution. Given that only 1 of the 25 packets contains a free gift, carry out the test. [5] … … … … … … … … … … … … … …
7 marks
Mark scheme: 4(i) M1 = 0.0913 A1 As final answer Total: 2 4(ii) H0: Pop proportion=0.25 H1: Pop proportion<0.25 B1 Allow p or π, not "proportion" (Accept anywhere in the question) 0.7525 + 25 × 0.7524 × 0.25 M1 Must be B(25,0,25) No end errors = 0.00702 A1 comp 0.01 M1 Valid comparison There is evidence that the claim is not justified A1 FT OE. No contradictions Total: 5
This question in 9709/72 May/June 2017
Q46 · In a random sample of 200 shareholders of a company, 103 said that they wanted a change… 9709/73 May/June 2017
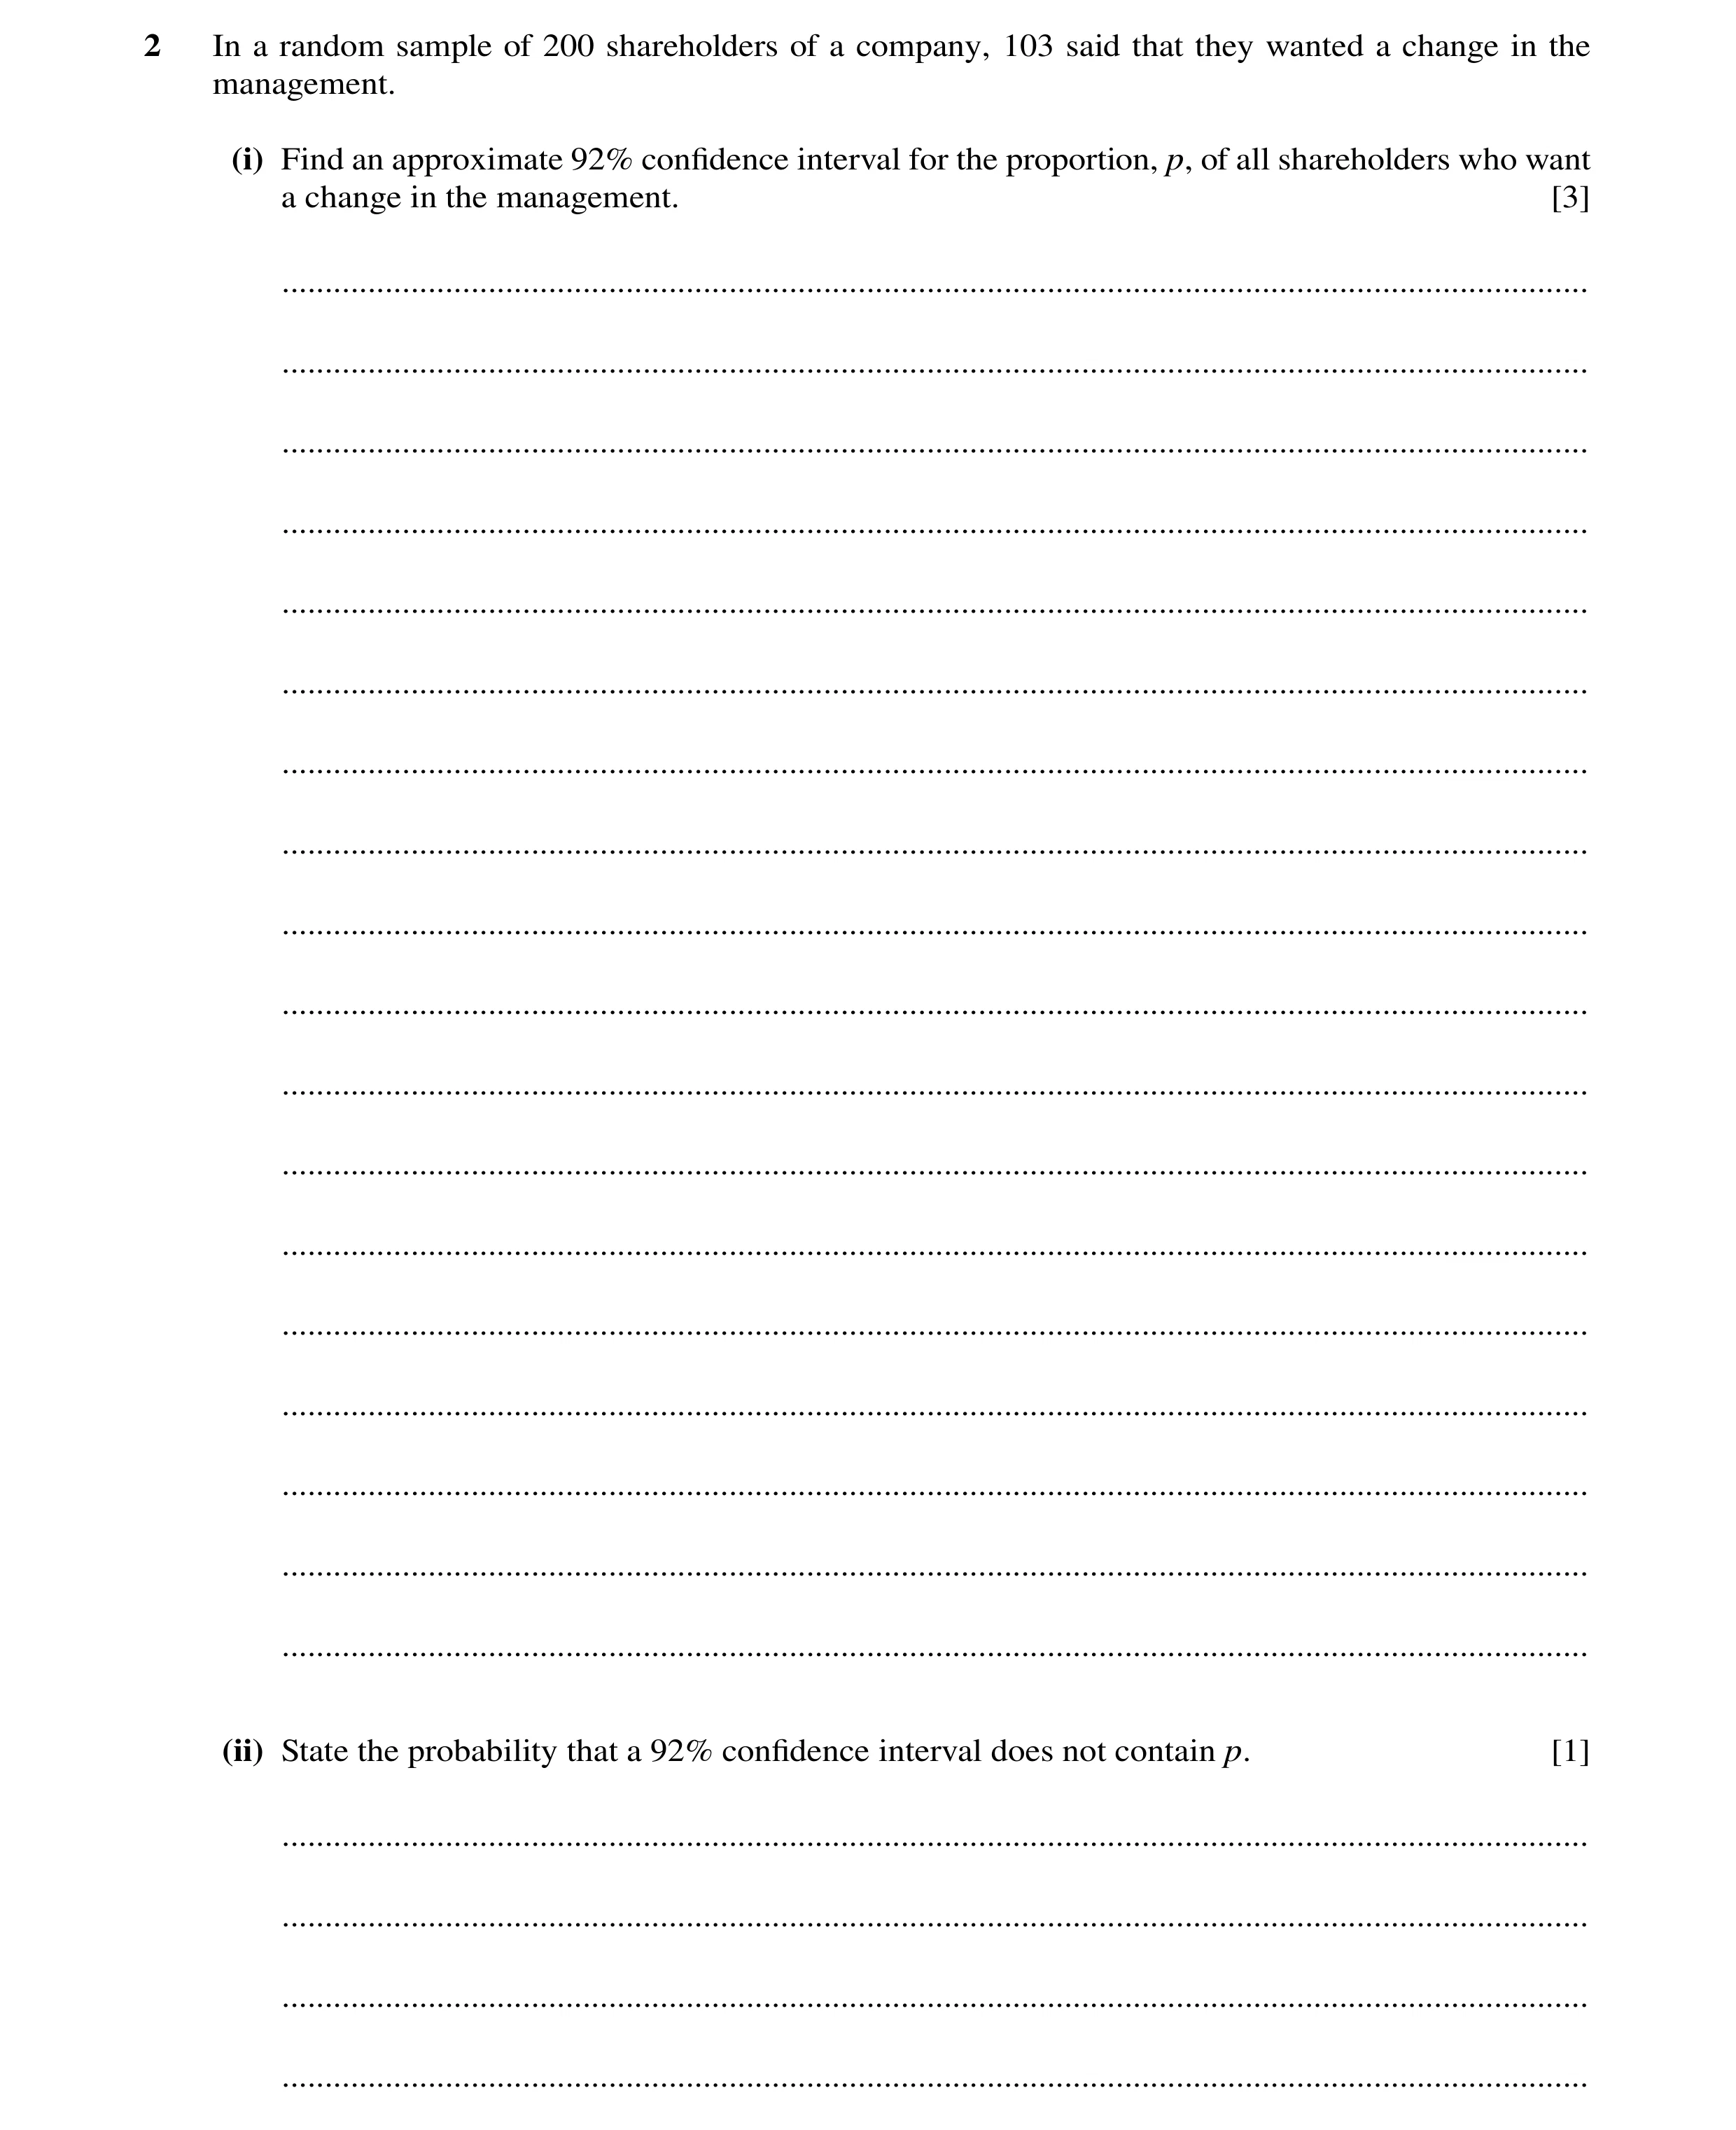
2 In a random sample of 200 shareholders of a company, 103 said that they wanted a change in the management. (i) Find an approximate 92% confidence interval for the proportion, p, of all shareholders who want a change in the management. [3] … … … … … … … … … … … … … … … … … … (ii) State the probability that a 92% confidence interval does not contain p. [1] … … … …
4 marks
Mark scheme: 2(i) z = 1.751 B1 103 200 ± z 103 103 200 200 (1 ) 200 × − oe M1 all correct except for recognisable value of z, allow for one side only = 0.453 to 0.577 (3 sf) as final answer A1 must be an interval Total: 3 2(ii) 0.08 oe 8%, 8/100 B1 SOI
This question in 9709/73 May/June 2017
Q47 · An airline has found that, on average, 1 in 100 passengers do not arrive for each flight… 9709/71 Oct/Nov 2017
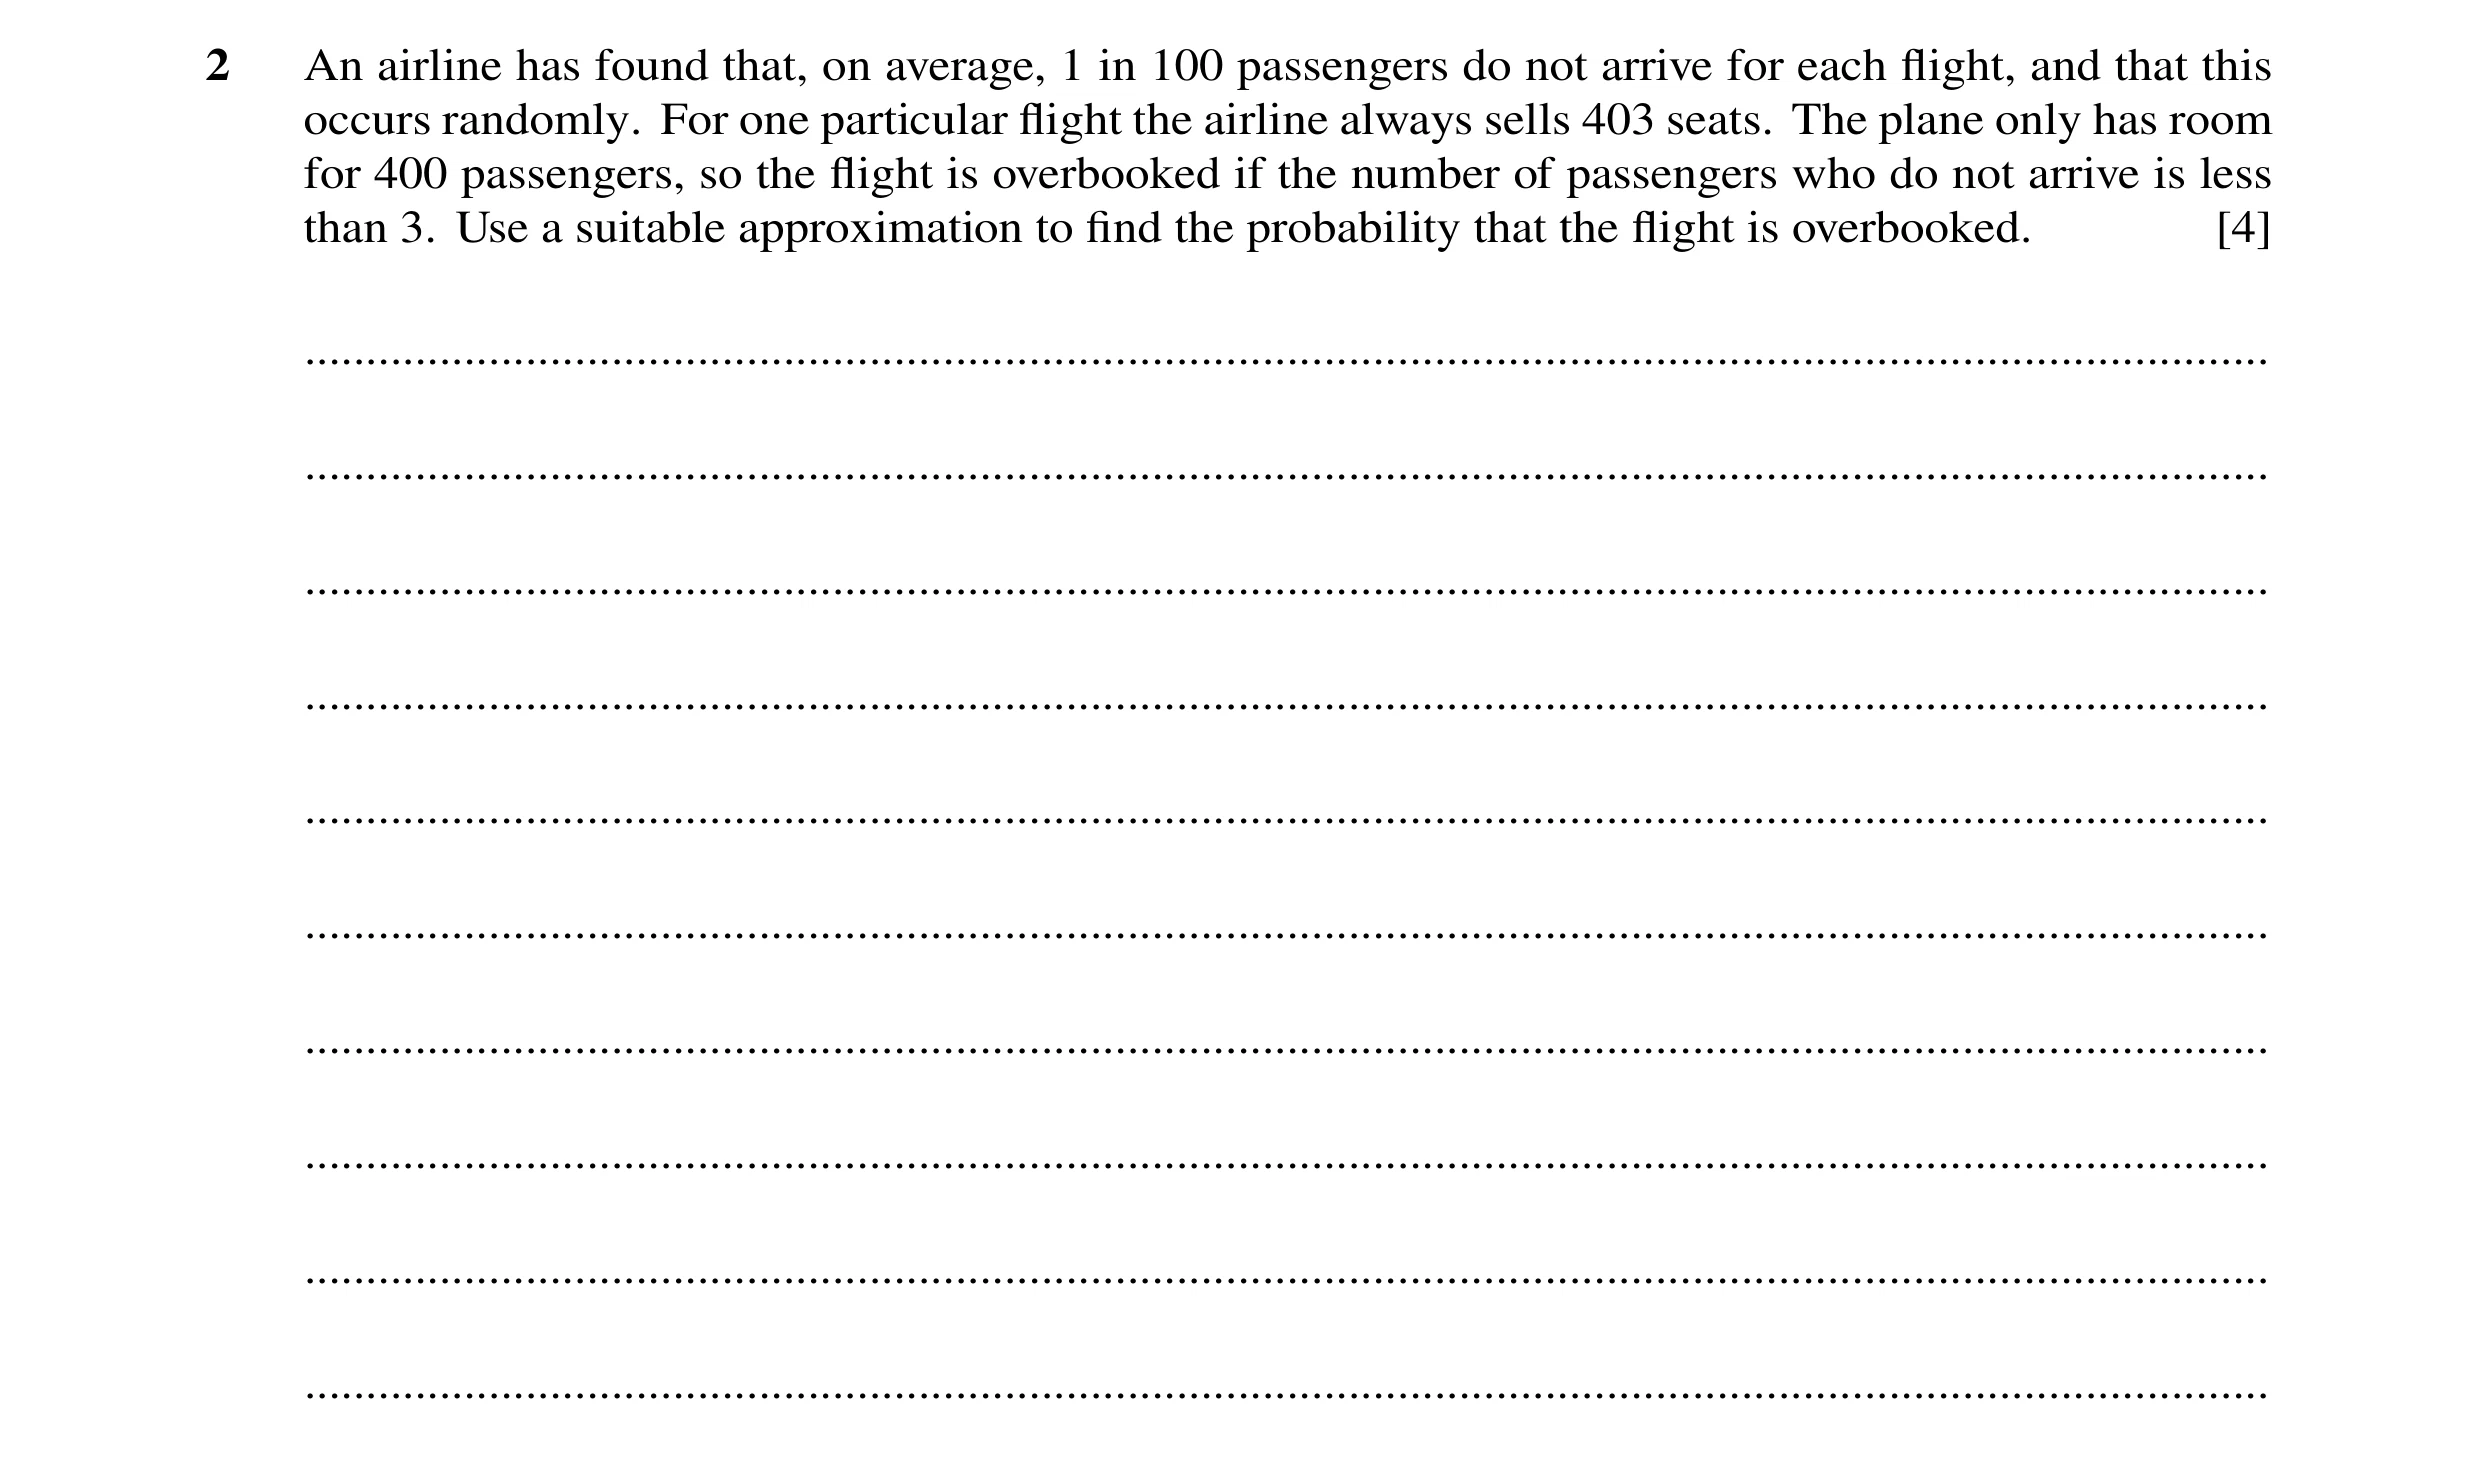
2 An airline has found that, on average, 1 in 100 passengers do not arrive for each flight, and that this occurs randomly. For one particular flight the airline always sells 403 seats. The plane only has room for 400 passengers, so the flight is overbooked if the number of passengers who do not arrive is less than 3. Use a suitable approximation to find the probability that the flight is overbooked. [4] … … … … … … … … … …
4 marks
Mark scheme: 2 Poisson B1 seen or implied λ= 4.03 B1 seen or implied e–4.03(1 + 4.03 + 4.032! 2 ) M1 any λ; e.g. allow λ = 4 no extra or missing terms = 0.234 (3 sf) A1 4
This question in 9709/71 Oct/Nov 2017
Q48 · In order to test the effect of a drug, a researcher monitors the concentration, X, of a… 9709/71 Oct/Nov 2017
8 In order to test the effect of a drug, a researcher monitors the concentration, X, of a certain protein in the blood stream of patients. For patients who are not taking the drug the mean value of X is 0.185. A random sample of 150 patients taking the drug was selected and the values of X were found. The results are summarised below. n = 150 Σ x = 27.0 Σ x2 = 5.01 The researcher wishes to test at the 1% significance level whether the mean concentration of the protein in the blood stream of patients taking the drug is less than 0.185. (i) Carry out the test. [7] … … … … … … … … … … … … … … … … … … … … … (ii) Given that, in fact, the mean concentration for patients taking the drug is 0.175, find the probability of a Type II error occurring in the test. [5] … … … … … … … … … … … … … … … … … … … … … … … … …
12 marks
Mark scheme: 8(i) x = 27/150 (= 0.18) B1 150 5.01 2 M1 or var = 1/149(5.01 – 27.02/150) s = × − 0.18 or variance 149 150 (= 0.031729) (var = 3/2980 = 0.0010067) H0: Pop mean = 0.185 B1 allow just ‘µ’ H1: Pop mean < 0.185 0.18 − 0.185 M1 standardising, need 150 '0.031729' 150 = ( – ) 1.930 (3 sfs) or 1.93 A1 Comp with z = ( – ) 2.326 M1 consistent signs or using probs 0.0268 > 0.01 or 0.9732 < 0.99 or using xcrit 0.18 > 0.17897 There is no evidence (at 1% level) that A1 FT conclusion FT concentration with drug is less than no contradictions without drug 7 8(ii) cv − 0.185 M1 must use 0.185 and 150 ( = – 2.326 ) '0.031729' 150 = 0.17897 or 0.179 A1 acceptance region ( for H0 ) is > 0.179 "0.17897"− 0.175 M1 must use 0.175 and 150 (=1.534) '0.031729' 150 1 – φ(“1.534”) M1 indep mark = 0.0625 (3 sf) A1 Accept 0.0610 to 0.0628 5
This question in 9709/71 Oct/Nov 2017
Q49 · The marks in paper 1 and paper 2 of an examination are denoted by X and Y respectively… 9709/72 Oct/Nov 2017
5 The marks in paper 1 and paper 2 of an examination are denoted by X and Y respectively, where X and Y have the independent continuous distributions N 56, 62 and N 43, 52 respectively. (i) Find the probability that a randomly chosen paper 1 mark is more than a randomly chosen paper 2 mark. [5] … … … … … … … … … … … … … … … … … … … … … … … (ii) Each candidate’s overall mark is M where M = X + 1.5Y. The minimum overall mark for grade A is 135. Find the proportion of students who gain a grade A. [5] … … … … … … … … … … … … … … … … … … … … … … … … …
10 marks
Mark scheme: 5(i) E(X − Y) = 56-43 (= 13) B1 Var(X− Y) = 62 + 52 (= 61) M1 ' 61 ' 13 0− (= −1.664) M1 Ignore any attempted cc/no SD/var mixes. var must be attempt at a combination 1 – ɸ('−1.664') = ɸ('1.664') M1 For area consistent with their working = 0.952 (3 sf) A1 Similar scheme for use of Y – X 5 Question Answer Marks Guidance 5(ii) E(M) = 56 +1.5(43) (= 120.5) B1 Var(M) = 62 + 1.52×52 (= 92.25) M1 25 . 92 ' 5. 120 135− (= 1.510) M1 Ignore any attempted cc/no SD/var mixes. var must be attempt at a combination 1 − ɸ('1.510') M1 For area consistent with their working = 0.0655 or 0.0656 or 6.55% or 6.56% (3 sf) As final answer A1 Allow 6.6% or 6.5% or 7% if correct working seen 5
This question in 9709/72 Oct/Nov 2017
Q50 · An airline has found that, on average, 1 in 100 passengers do not arrive for each flight… 9709/73 Oct/Nov 2017
2 An airline has found that, on average, 1 in 100 passengers do not arrive for each flight, and that this occurs randomly. For one particular flight the airline always sells 403 seats. The plane only has room for 400 passengers, so the flight is overbooked if the number of passengers who do not arrive is less than 3. Use a suitable approximation to find the probability that the flight is overbooked. [4] … … … … … … … … … …
4 marks
Mark scheme: 2 Poisson B1 seen or implied λ= 4.03 B1 seen or implied e–4.03(1 + 4.03 + 4.032! 2 ) M1 any λ; e.g. allow λ = 4 no extra or missing terms = 0.234 (3 sf) A1 4
This question in 9709/73 Oct/Nov 2017
Q51 · A ten-sided spinner has edges numbered 1, 2, 3, 4, 5, 6, 7, 8, 9, 10 9709/72 May/June 2018
7 A ten-sided spinner has edges numbered 1, 2, 3, 4, 5, 6, 7, 8, 9, 10. Sanjeev claims that the spinner is biased so that it lands on the 10 more often than it would if it were unbiased. In an experiment, the spinner landed on the 10 in 3 out of 9 spins. (i) Test at the 1% significance level whether Sanjeev’s claim is justified. [5] … … … … … … … … … … … … … … … … … (ii) Explain why a Type I error cannot have been made. [1] … … … … … In fact the spinner is biased so that the probability that it will land on the 10 on any spin is 0.5. (iii) Another test at the 1% significance level, also based on 9 spins, is carried out. Calculate the probability of a Type II error. [6] … … … … … … … … … … … … … … … … … … … … … … … …
12 marks
Mark scheme: 7(i) H0: P(10) = 0.1 H1: P(10) > 0.1 B1 B(9,0.1) P(X ⩾ 3) = 1 – (0.99 + 9×0.98 × 0.1 + 9C2 × 0.97 × 0.12) M1 Allow one extra term in bracket = 0.05297... or 0.053(0) A1 comp 0.01 M1 Valid comparison. (comparison with 0.99 can recover previous M1 A1 for 0.9470) No evidence (at 1% level) to reject H0 Claim not justified A1ft No contradictions 5 7(ii) H0 not rejected oe B1 1 7(iii) P(X ⩾ 4) = "0.05297" – 9C3×0.96×0.13 M1 or 1–(0.99 + 9 × 0.98 × 0.1 + 9C2 × 0.97 × 0.12 + 9C3 × 0.96 × 0.13) = 0.00833 A1 Note: 0.05297 and 0.00833 both needed in (i) or (iii) to justify CV Hence crit value is 4 B1 Allow without working. Or in (i) May be implied by attempt at P(X < 4) below B(9,0.5) P(X < 4) M1 stated or implied = 0.59 + 9 × 0.58 × 0.5 + 9C2 × 0.57 × 0.52 + 9C3×0.56×0.53 M1 Attempt P(X < 4) with p = 0.5 P(Type II) = 0.254 (3 sf) A1 6
This question in 9709/72 May/June 2018
Q52 · The time, in minutes, that John takes to travel to work has a normal distribution 9709/71 May/June 2019
2 The time, in minutes, that John takes to travel to work has a normal distribution. Last year the mean and standard deviation were 26.5 and 4.8 respectively. This year John uses a different route and he finds that the mean time for his first 150 journeys is 27.5 minutes. (i) Stating a necessary assumption, test at the 1% significance level whether the mean time for his journey to work has increased. [6] … … … … … … … … … … … … … … … (ii) State, with a reason, whether it was necessary to use the Central Limit theorem in your answer to part (i). [1] … … … … … …
7 marks
Mark scheme: 2(i) Assume sd still 4.8 or is unchanged B1 or Assume the 150 times can be treated as a random sample / are independent H0: Pop mean = 26.5 H1: Pop mean > 26.5 B1 Allow ‘µ ’ but not just ‘mean’ 4.8 150 27.5 26.5 − M1 Standardise, with √ Accept CV method = 2.552 A1 Comp with z-value ‘2.552’ > 2.326 M1 or comp 1 – Φ(‘2.552’) with 0.01 1 – 0.9946 = 0.0054 < 0.01 There is evidence time has increased A1ft oe No contradictions (2 tail test scores max. B1 B0 M1 A1 M1 (for comparison with 2.576) A0 no ft) 6 Question Answer Marks Guidance 2(ii) No because pop is normal so distr of X is normal B1 Condone just ‘No because pop is normal’ 1
This question in 9709/71 May/June 2019
Q53 · Sumitra has a six-sided die 9709/71 May/June 2019
3 Sumitra has a six-sided die. She suspects that it is biased so that it shows a six less often than it would if it were fair. She decides to test the die by throwing it 30 times and noting the number of throws on which it shows a six. (i) It shows a six on exactly 2 throws. Use a binomial distribution to carry out the test at the 5% significance level. [5] … … … … … … … … … … … … … … … … … … … … … … … … … … … … … … … … … (ii) Later, Sumitra repeats the test at the 5% significance level by throwing the die 30 times again. Find the probability of a Type I error in this second test. [2] … … … … … … … … … … … … … …
7 marks
Mark scheme: 3(i) H0: P(6) = 1 6 H1: P(6) < 1 6 B1 ( 5 6 )30 + 30( 1 6 ) × ( 5 6 )29 + 30C2( 1 6 )2 × ( 5 6 )28 M1 Allow one term incorrect, omitted or extra = 0.103 A1 ‘0.103’ > 0.05 M1 No evidence (at 5% level) that die biased A1ft oe No contradictions 5 3(ii) ( 5 6 )30 + 30( 1 6 ) × ( 5 6 )29 M1 P(Type I) = 0.0295 A1 2
This question in 9709/71 May/June 2019
Q54 · The manufacturer of a certain type of biscuit claims that 10% of packets include a free… 9709/72 May/June 2019
5 The manufacturer of a certain type of biscuit claims that 10% of packets include a free offer printed on the packet. Jyothi suspects that the true proportion is less than 10%. He plans to test the claim by looking at 40 randomly selected packets and, if the number which include the offer is less than 2, he will reject the manufacturer’s claim. (i) State suitable hypotheses for the test. [1] … … … … … (ii) Find the probability of a Type I error. [3] … … … … … … … … … … … … … … … … On another occasion Jyothi looks at 80 randomly selected packets and finds that exactly 6 include the free offer. (iii) Calculate an approximate 90% confidence interval for the proportion of packets that include the offer. [3] … … … … … … … … … … … … … … … (iv) Use your confidence interval to comment on the manufacturer’s claim. [1] … … … … … … …
8 marks
Mark scheme: 5(i) H0: p = 0.1 H1: p < 0.1 B1 1 5(ii) B(40, 0.1) stated or implied by use of B1 e.g. by 40Cx or 0.9p×0.1q (p + q = 40) 0.940 + 40×0.939×0.1 M1 Correct working (if seen). If working not seen, M1 may be implied by 0.0805 = 0.0805 A1 3 Question Answer Marks Guidance 5(iii) z = 1.645 B1 seen 6 80 ± z (80 6) 6 80 80 80 − × M1 Formula of correct form. Must be a ‘z’ = 0.0266 to 0.123 (3 sfs) A1 Allow 0.03 to 0.12 or better Must be an interval 3 5(iv) 10% (or manufacturer’s claim) is within CI Hence no reason to question claim B1 FT Allow ‘10% is within CI, accept claim’ oe Must include both parts. No contradictions. FT their CI Note if CI is centred on 0.1 allow ft 0.075 is within CI, accept claim 1
This question in 9709/72 May/June 2019
Q55 · Luis has to choose one person at random from four people, A, B, C and D 9709/73 May/June 2019
3 Luis has to choose one person at random from four people, A, B, C and D. He throws a fair six-sided die. If the score is 1, he will choose A. If the score is 2 he will choose B. If the score is 3, he will choose C. If the score is 4 or more he will choose D. (i) Explain why the choice made by this method is not random. [1] … … … … … (ii) Describe how Luis could use a single throw of the die to make a random choice. [1] … … … … … On another day, Luis has to choose two people at random from the same four people, A, B, C and D. (iii) List the possible choices of two people and hence describe how Luis could use a single throw of the die to make this random choice. [2] … … … … … … … … …
4 marks
Mark scheme: 3(i) D more likely to be chosen B1 oe, e.g. P(D) > P(A) e.g. P(A)=P(B)=P(C)=1/6 P(D)=1/2 no contradictions 1 3(ii) Reject scores of 5 or 6 B1 or other correct: choose D when the score is 4 1 Question Answer Marks Guidance 3(iii) AB AC AD BC BD CD B1 Allocate as follows: 1: AB; 2: AC; 3: AD; 4: BC; 5: BD 6: CD B1 or similar 2
This question in 9709/73 May/June 2019
Q56 · Each day at a certain doctor’s surgery there are 70 appointments available in the morning… 9709/73 May/June 2019
7 Each day at a certain doctor’s surgery there are 70 appointments available in the morning and 60 in the afternoon. All the appointments are filled every day. The probability that any patient misses a particular morning appointment is 0.04, and the probability that any patient misses a particular afternoon appointment is 0.05. All missed appointments are independent of each other. Use suitable approximating distributions to answer the following. (i) Find the probability that on a randomly chosen morning there are at least 3 missed appointments. [3] … … … … … … … … … … … (ii) Find the probability that on a randomly chosen day there are a total of exactly 6 missed appointments. [3] … … … … … … … … … … … … … … … (iii) Find the probability that in a randomly chosen 10-day period there are more than 50 missed appointments. [4] … … … … … … … … … … … … … … … … …
10 marks
Mark scheme: 7(i) M1 1 – e-2.8(1 + 2.8 + 2 2.8 2 ) ) M1 Any λ allowing one end error = 0.531or 0.53(0) (3 sf) A1 SC Binomial 0.534 B1 3 7(ii) Use of Po(5.8) M1 May be implied e-5.8 × 6 5.8 6! M1 Any λ = 0.16(0) (3 sf) A1 3 Question Answer Marks Guidance 7(iii) Use of N(58, 58) M1 May be implied or N(58, 55.38) 50.5 '58' '58' − (= -0.985) M1 Standardised with their values, allow wrong or incorrect cc Φ('0.985') M1 Correct area consistent with their working or ( ) Φ "1.008 = 0.838 (3 sf) A1 or 0.843 4
This question in 9709/73 May/June 2019

 1 / 31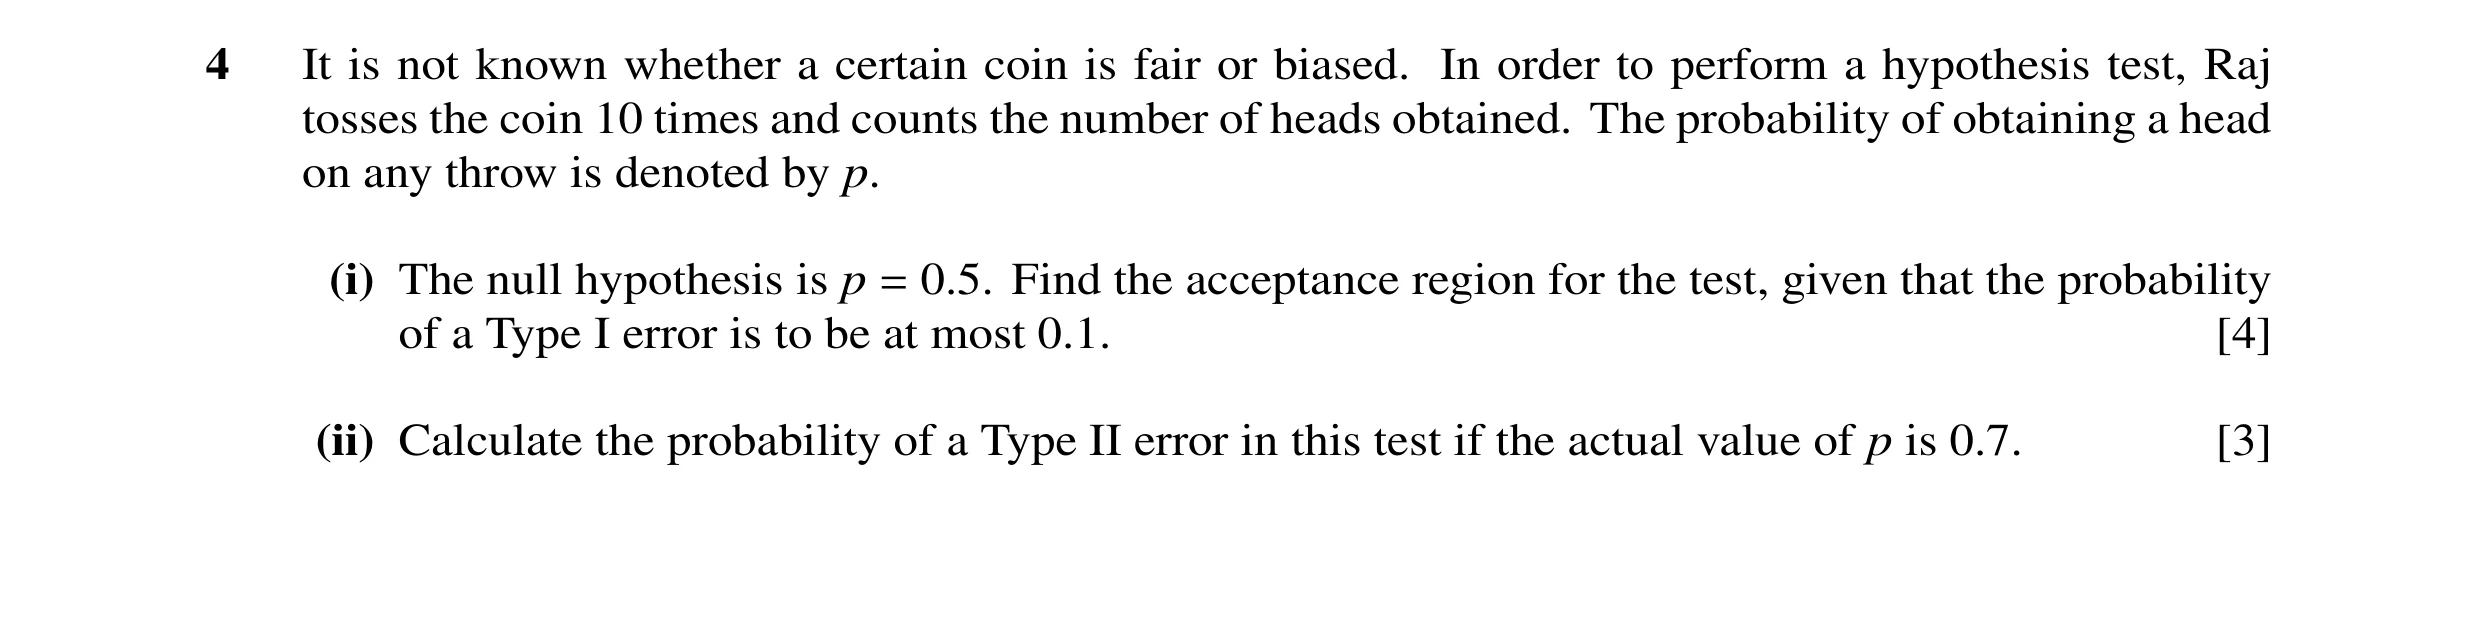
 2 / 31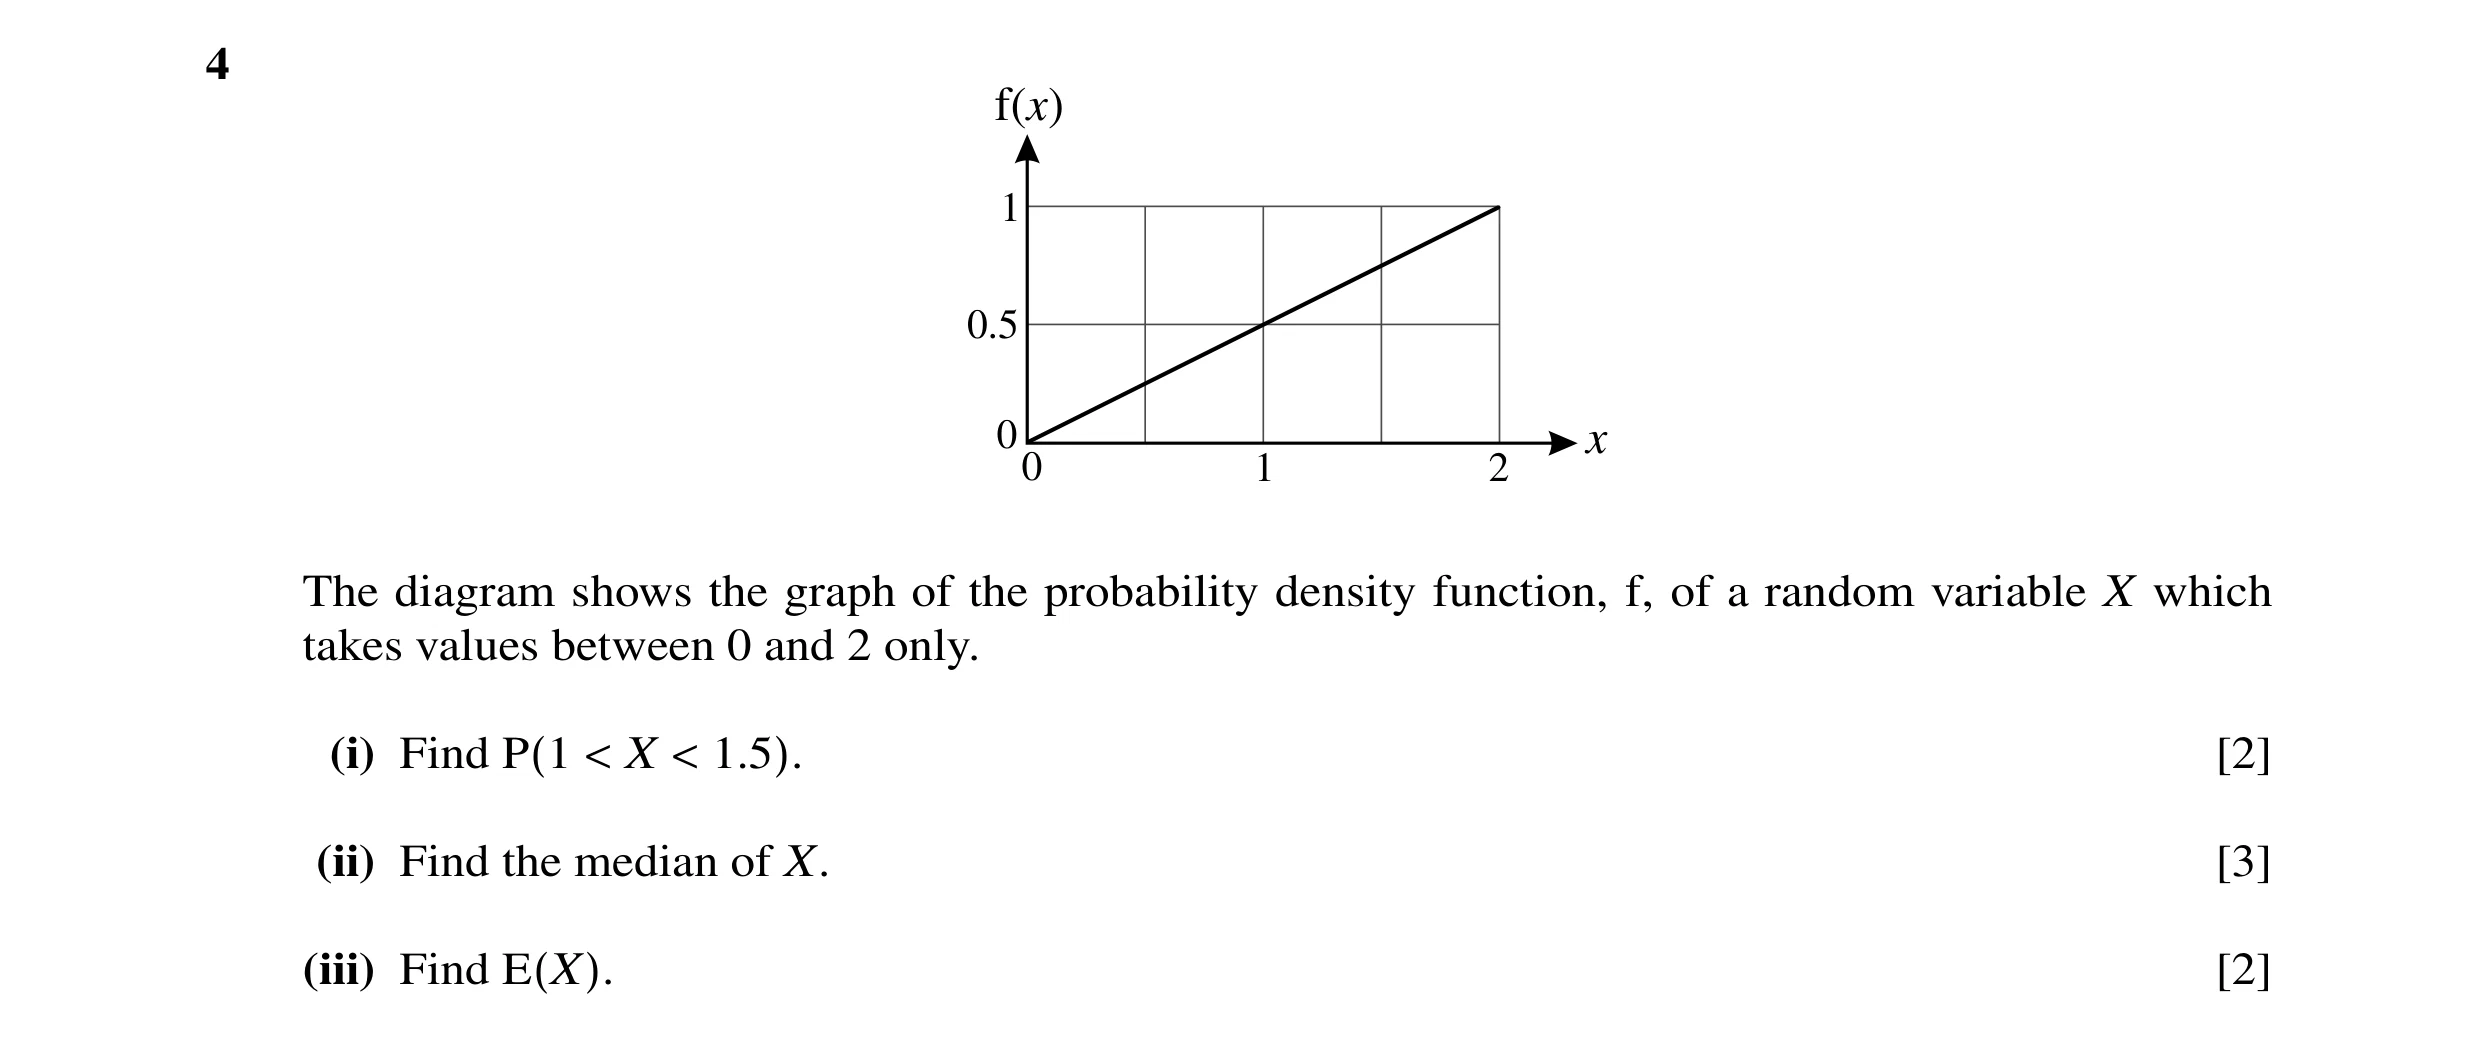

 3 / 31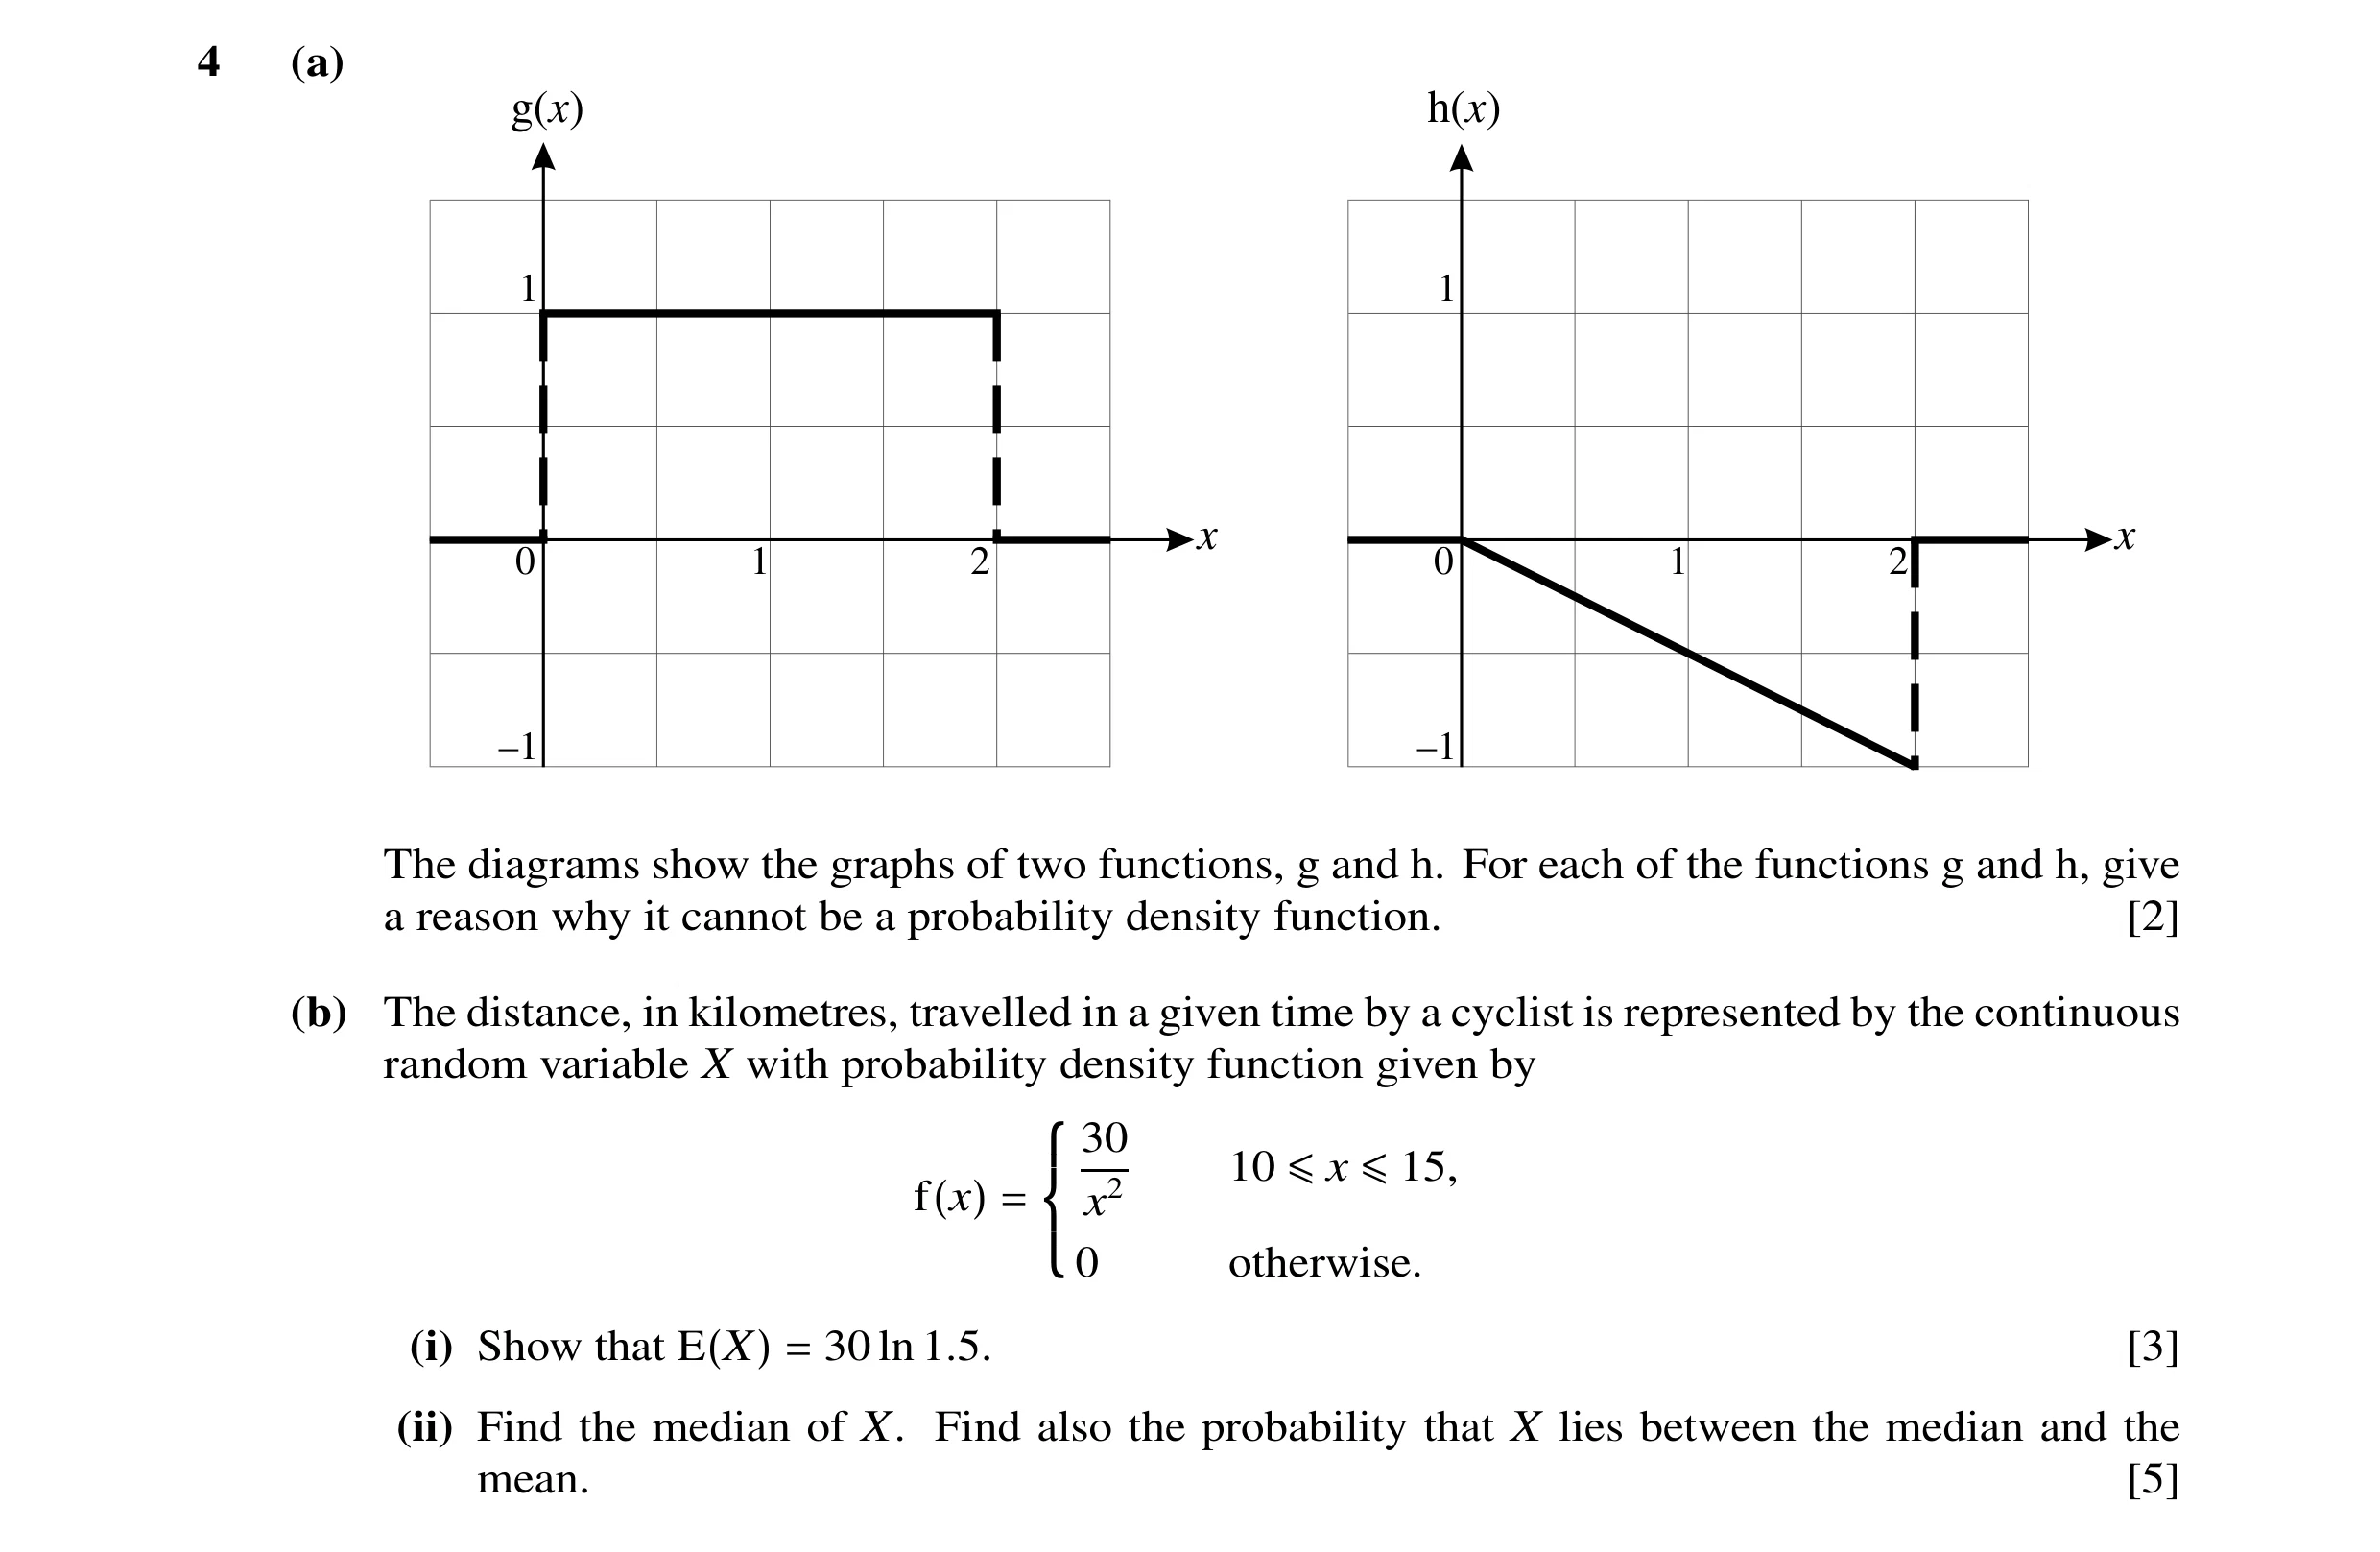
 4 / 31
 5 / 31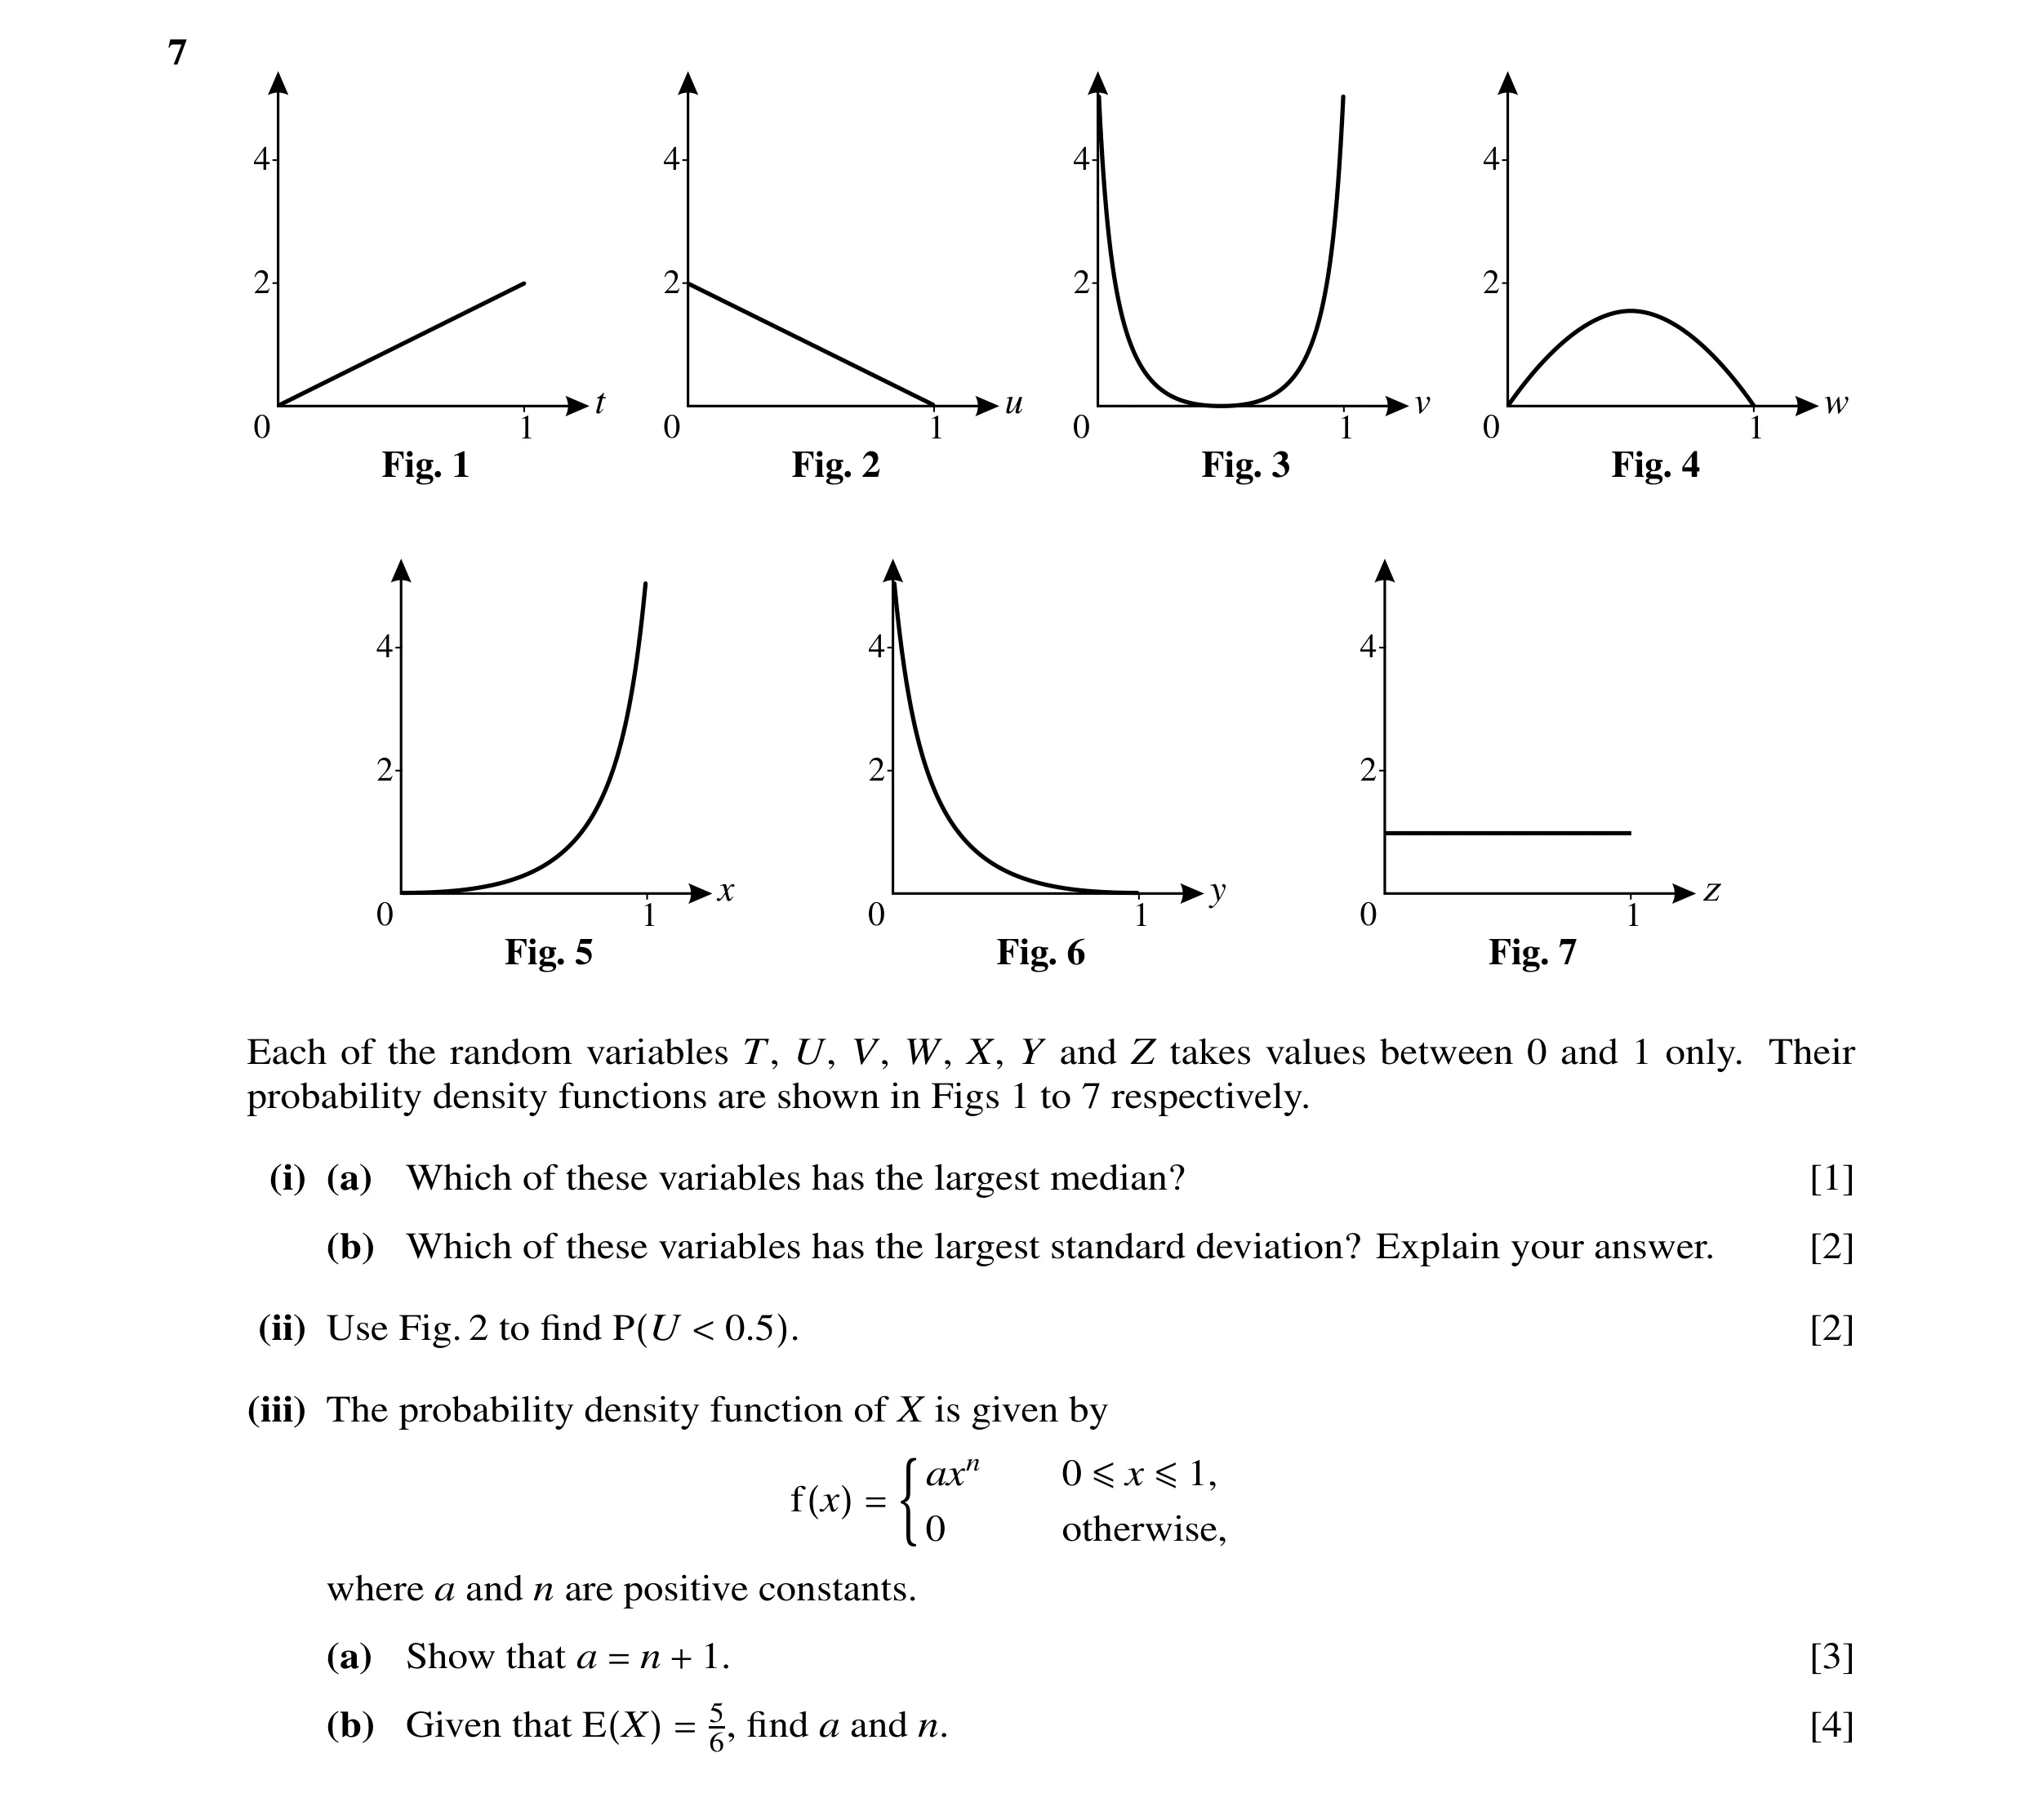
 6 / 31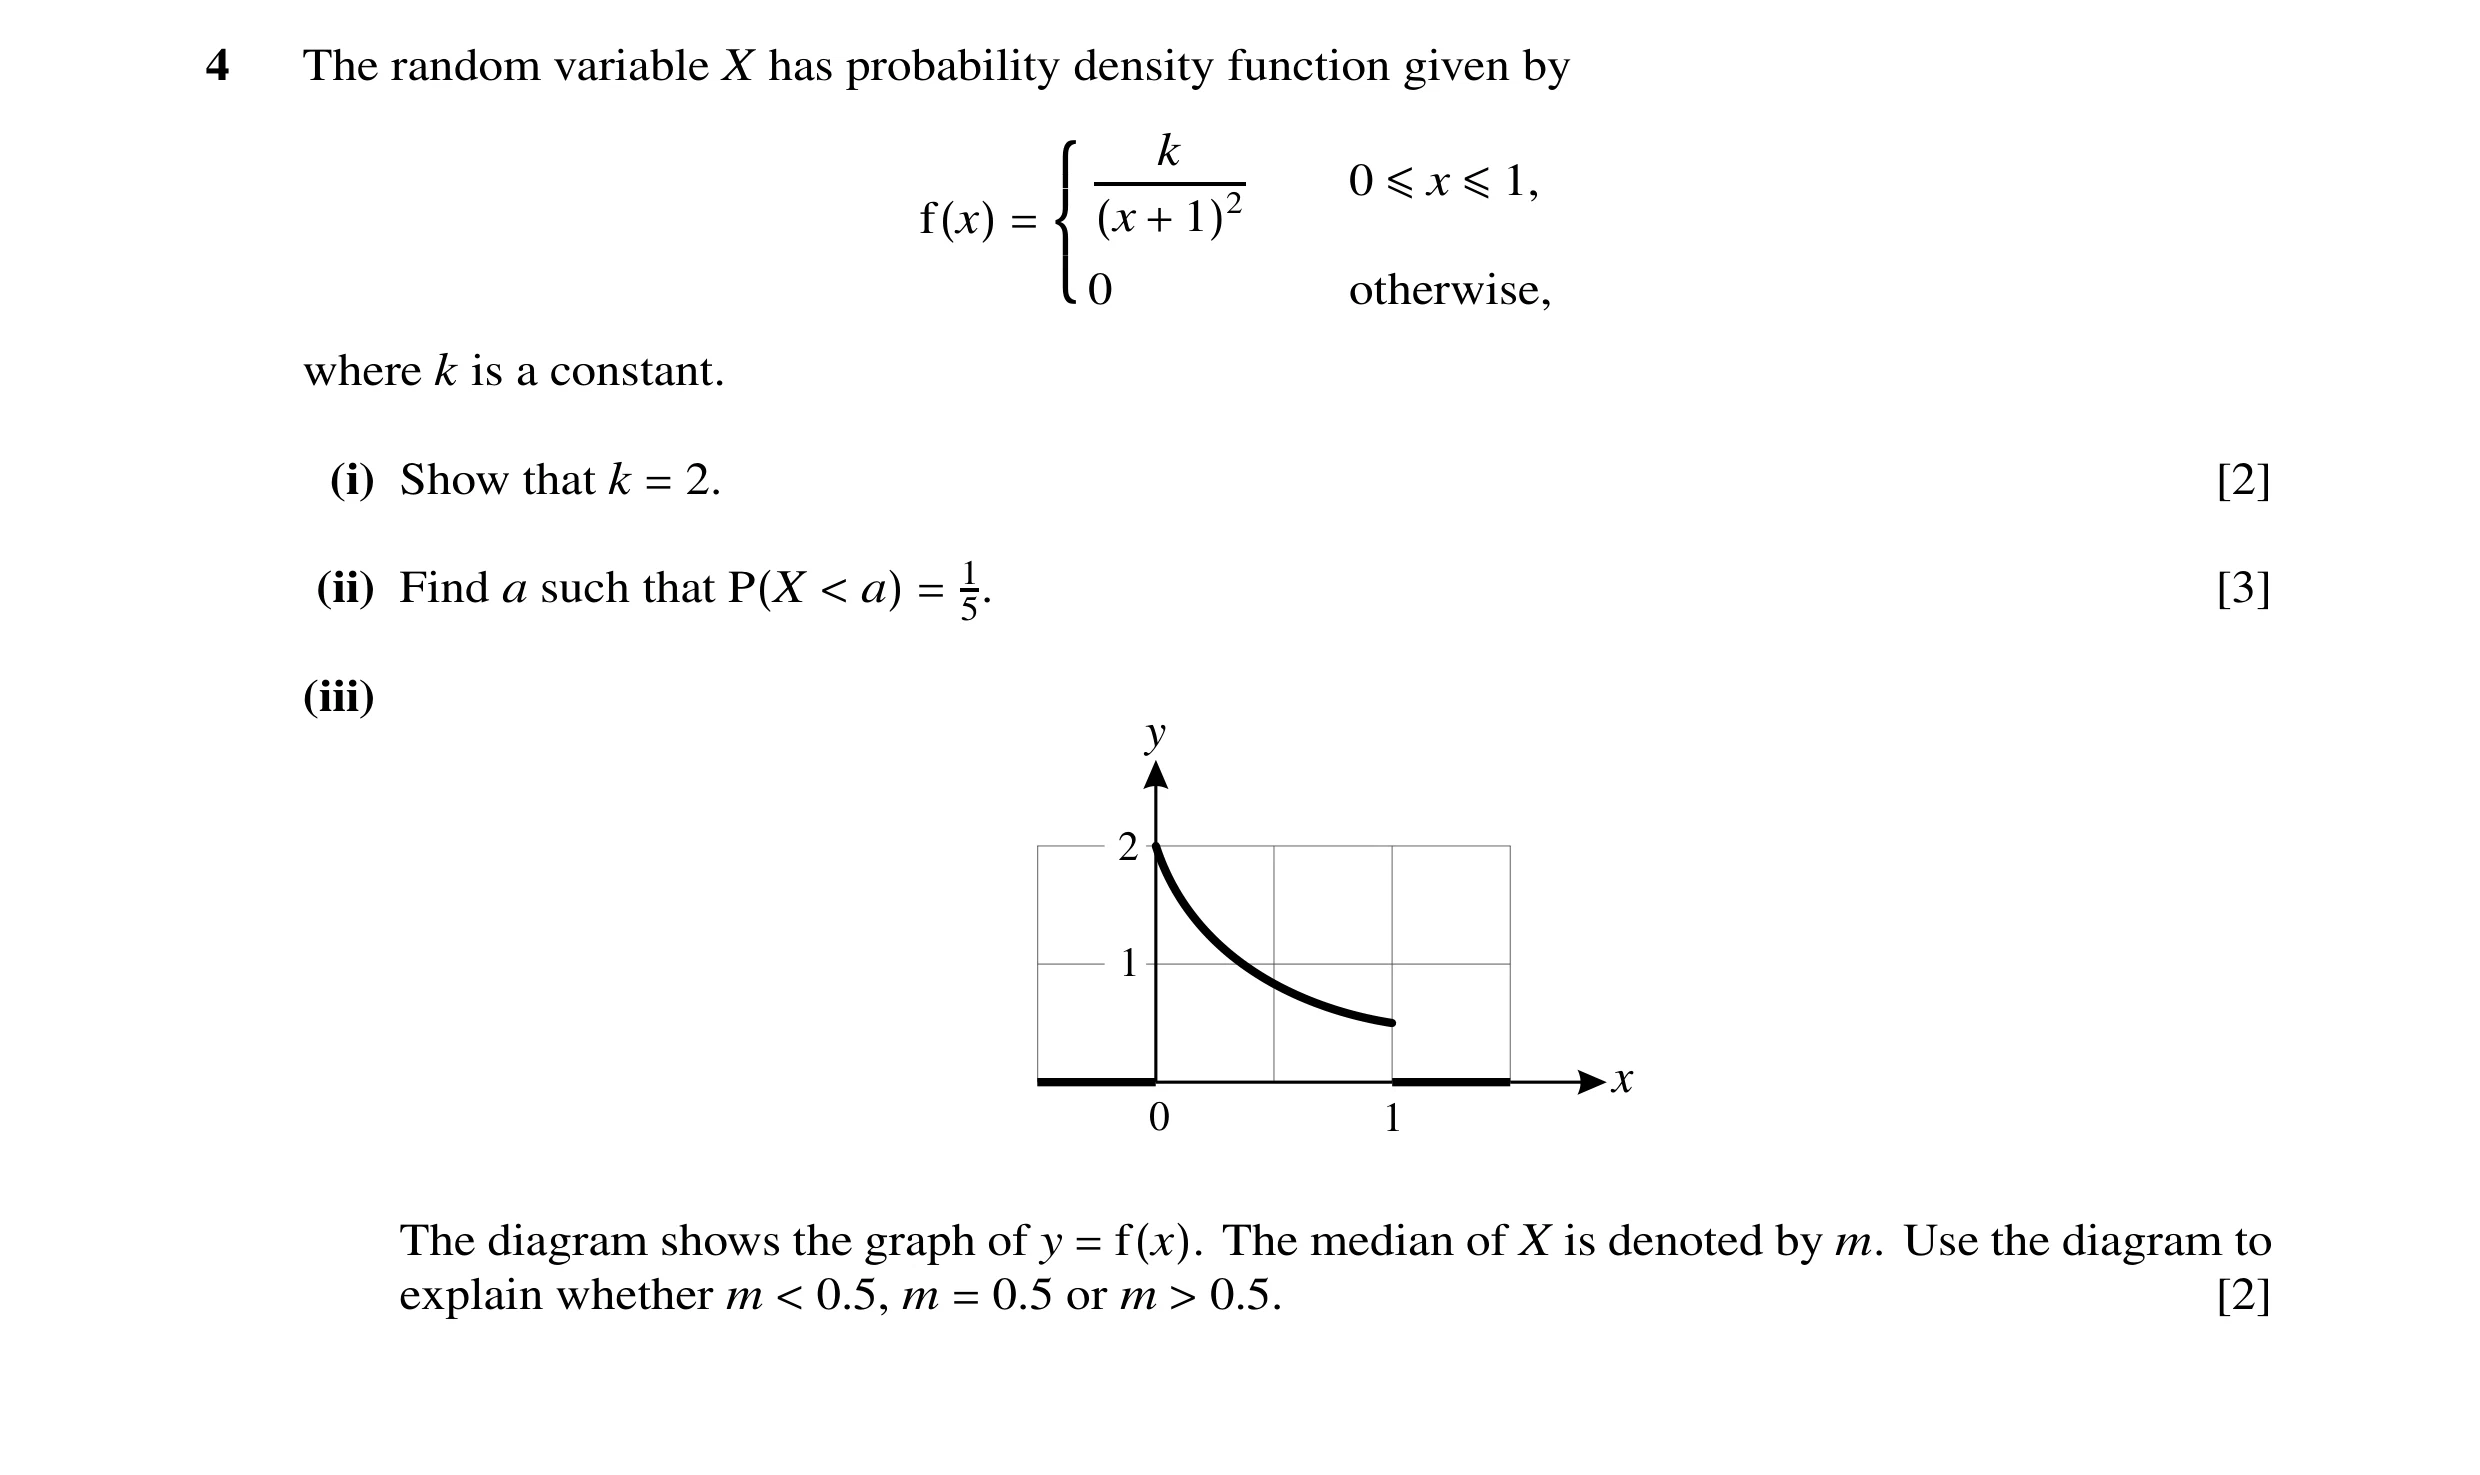
 7 / 31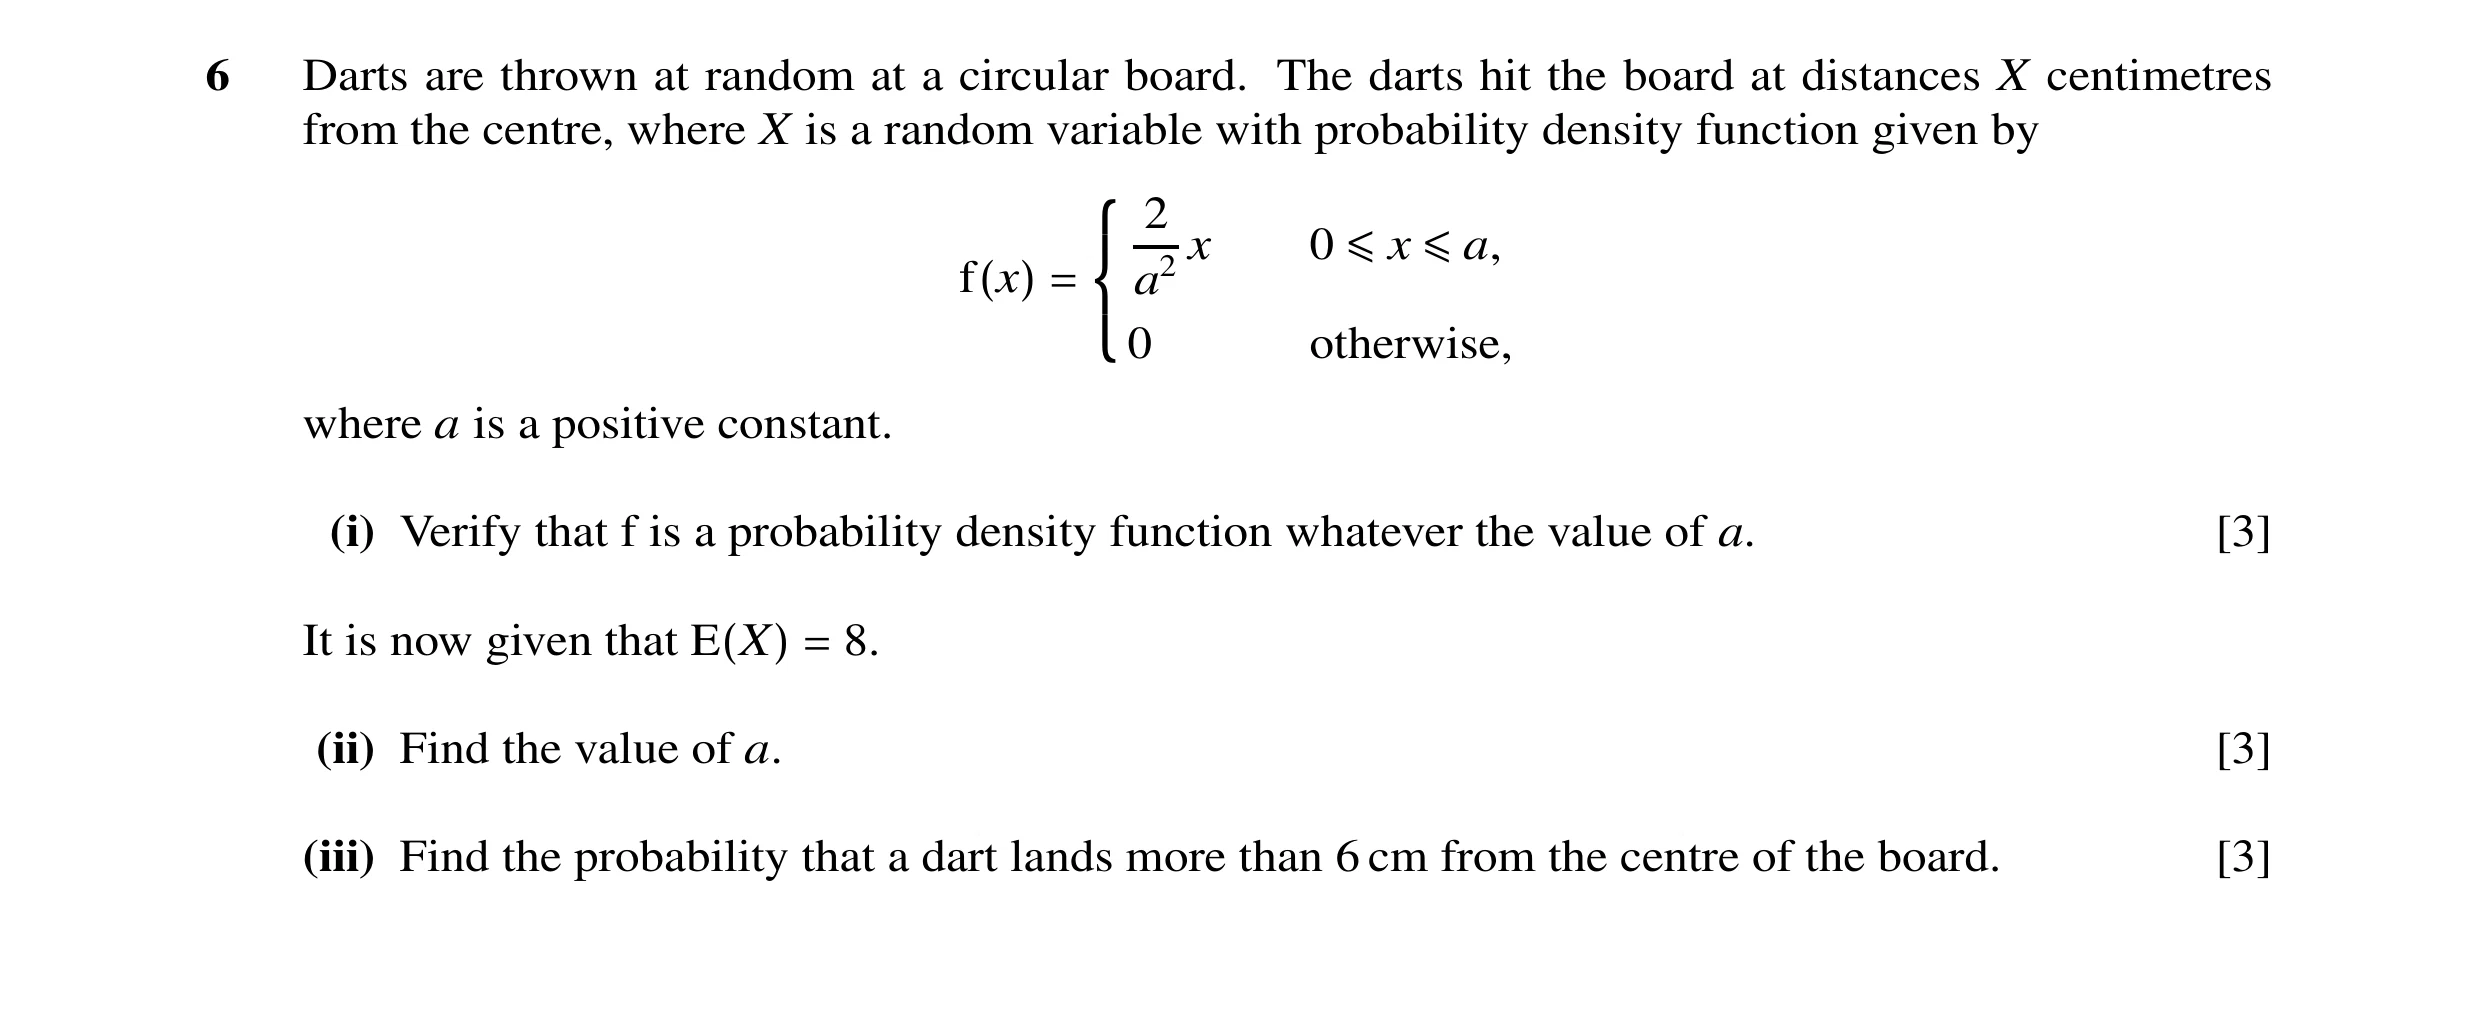
 8 / 31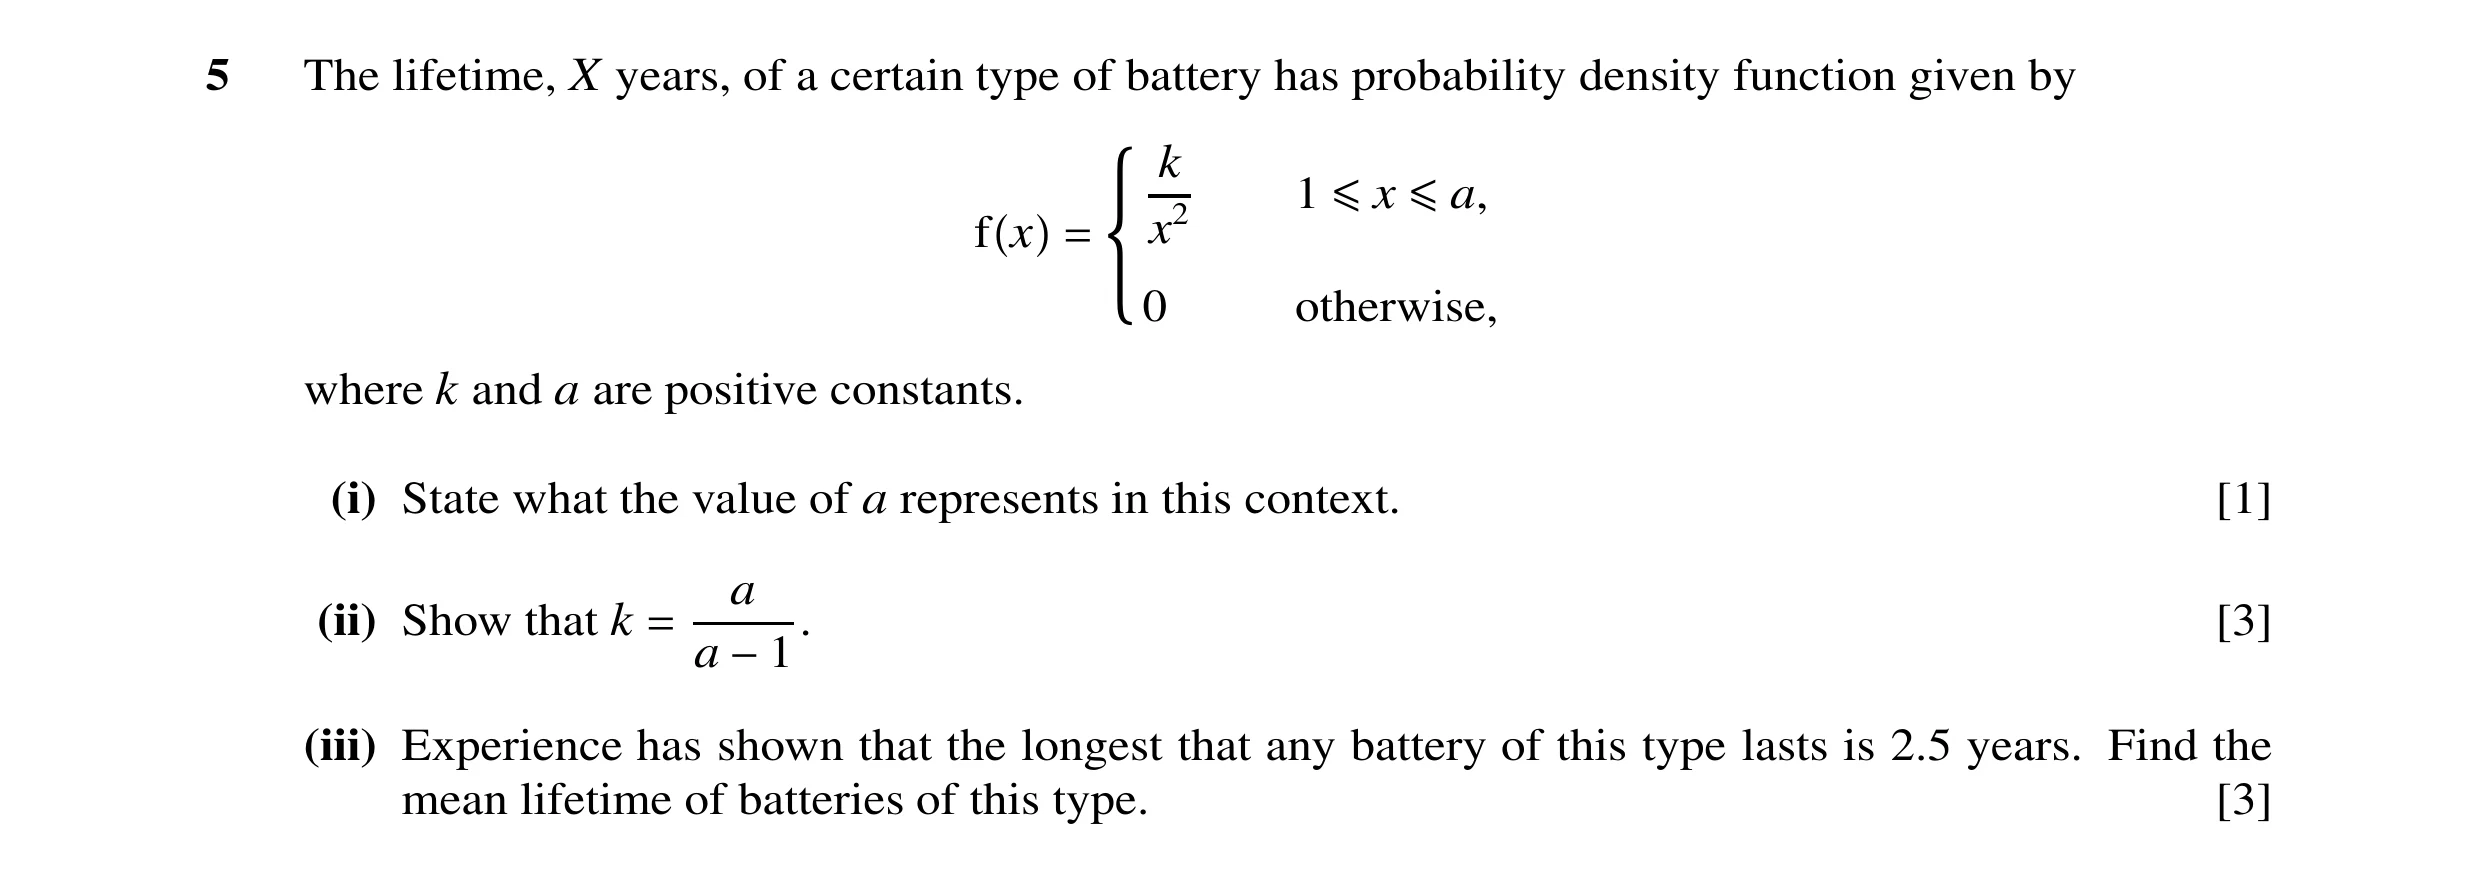
 9 / 31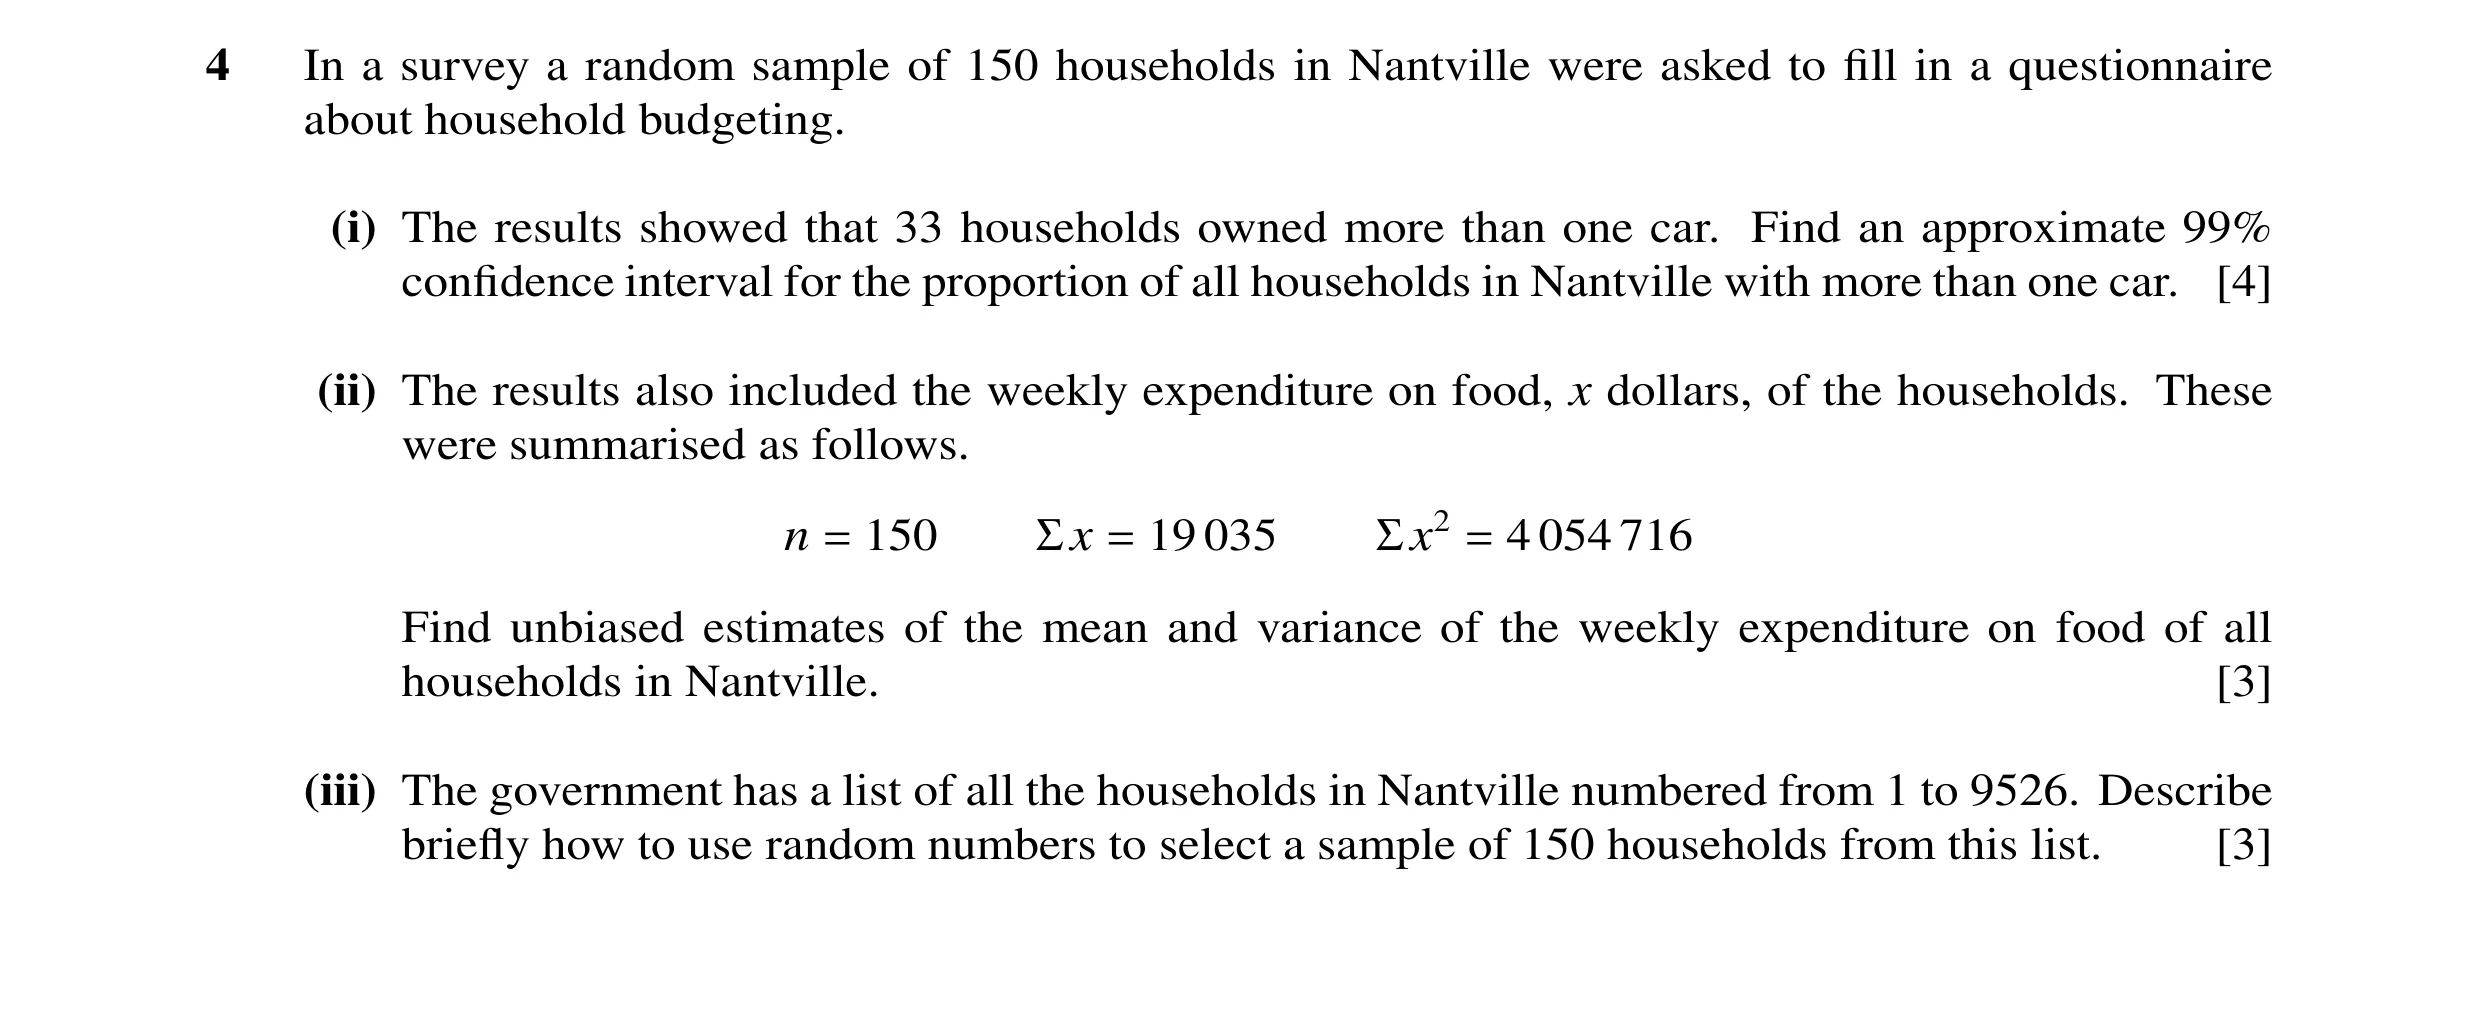
 10 / 31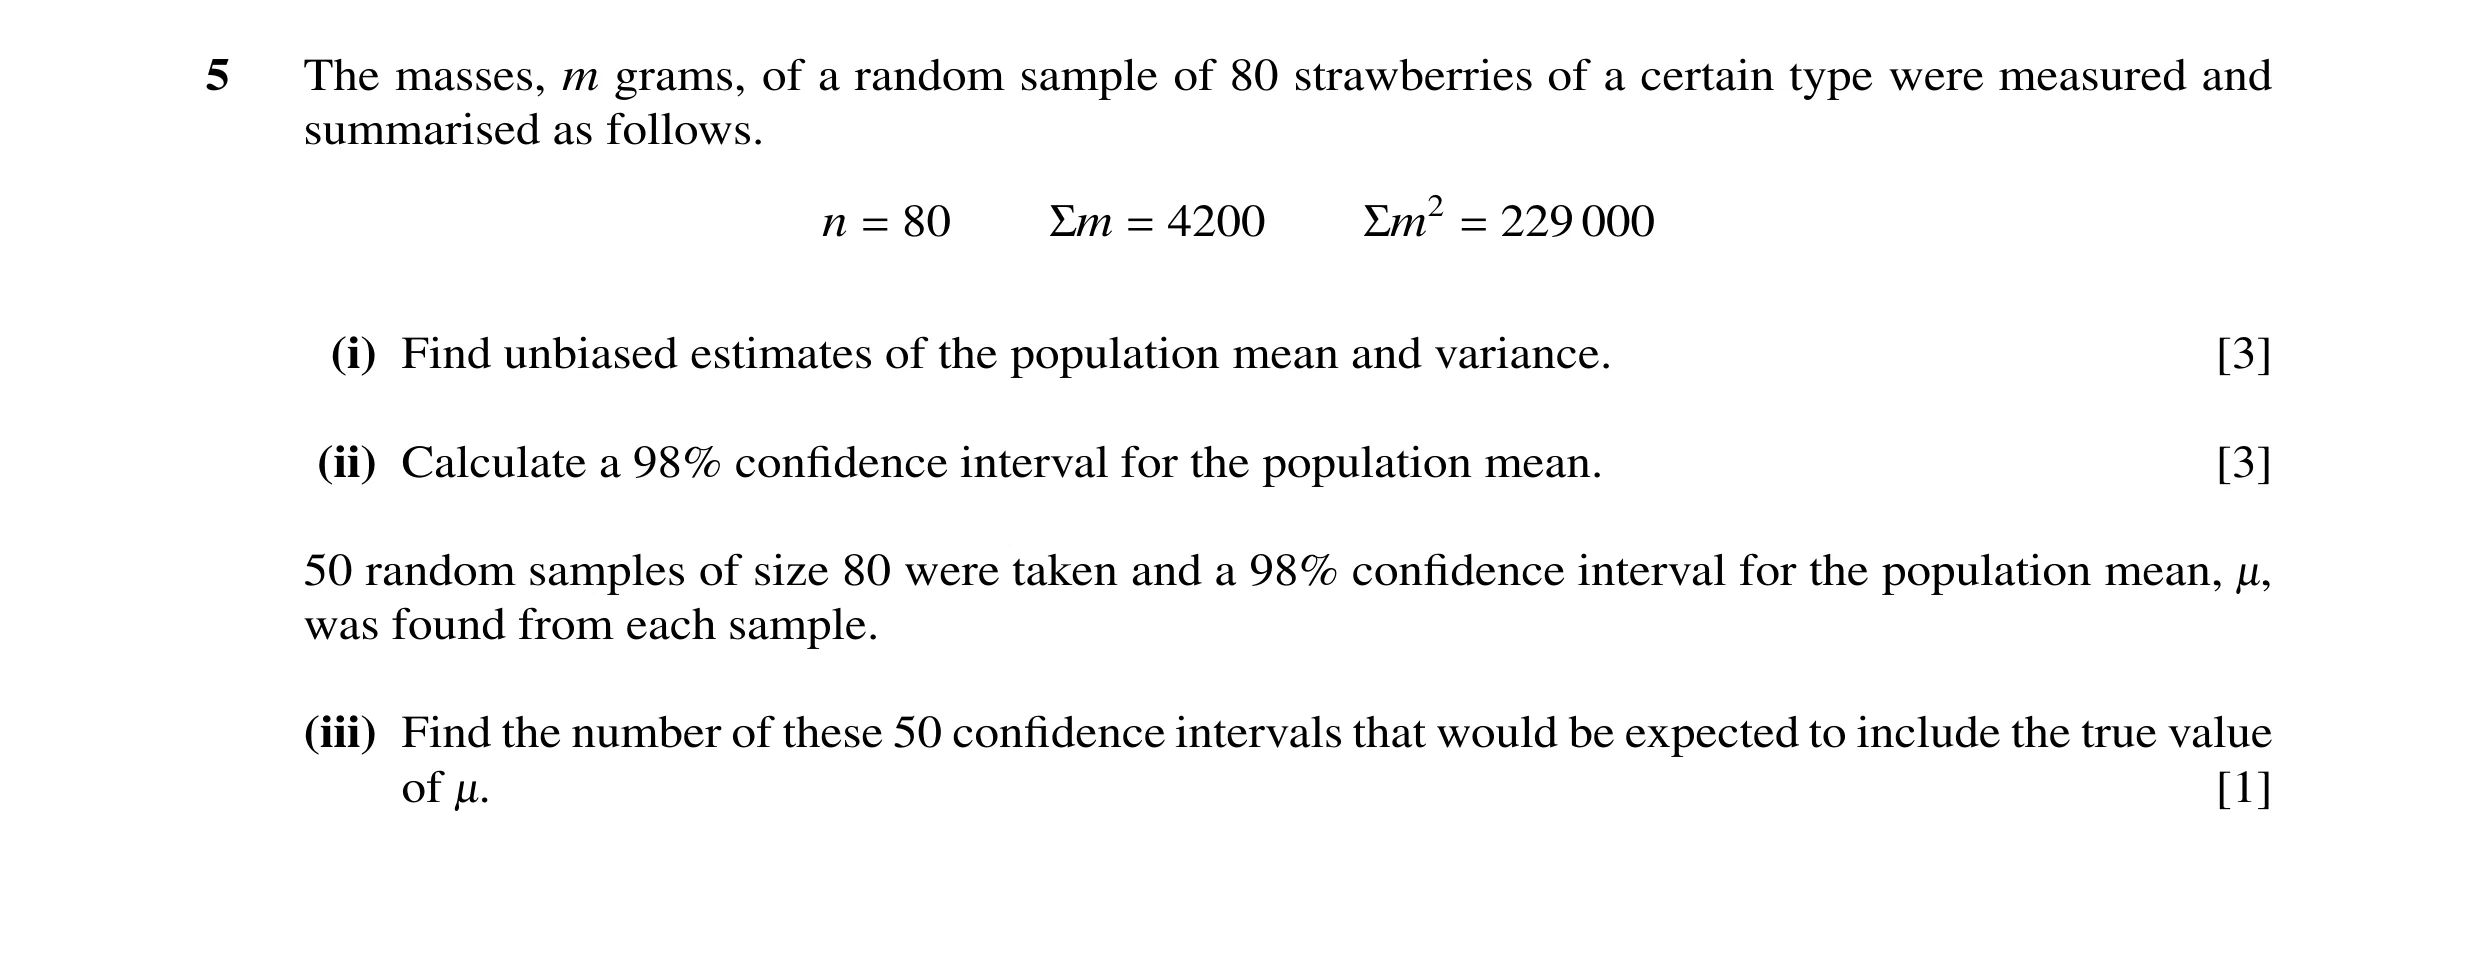
 11 / 31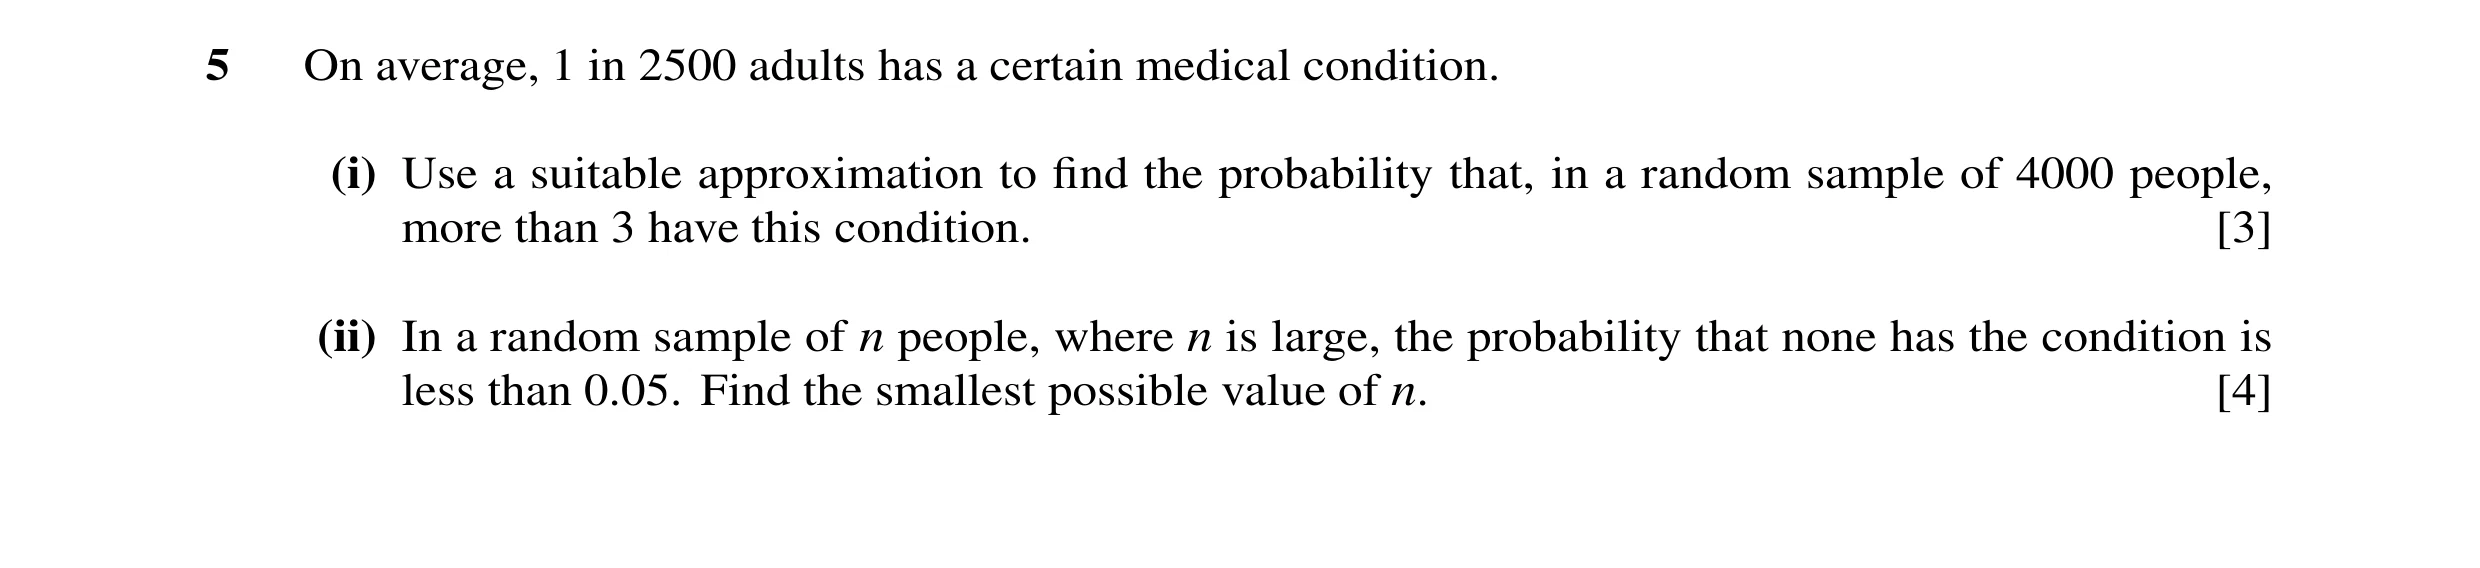
 12 / 31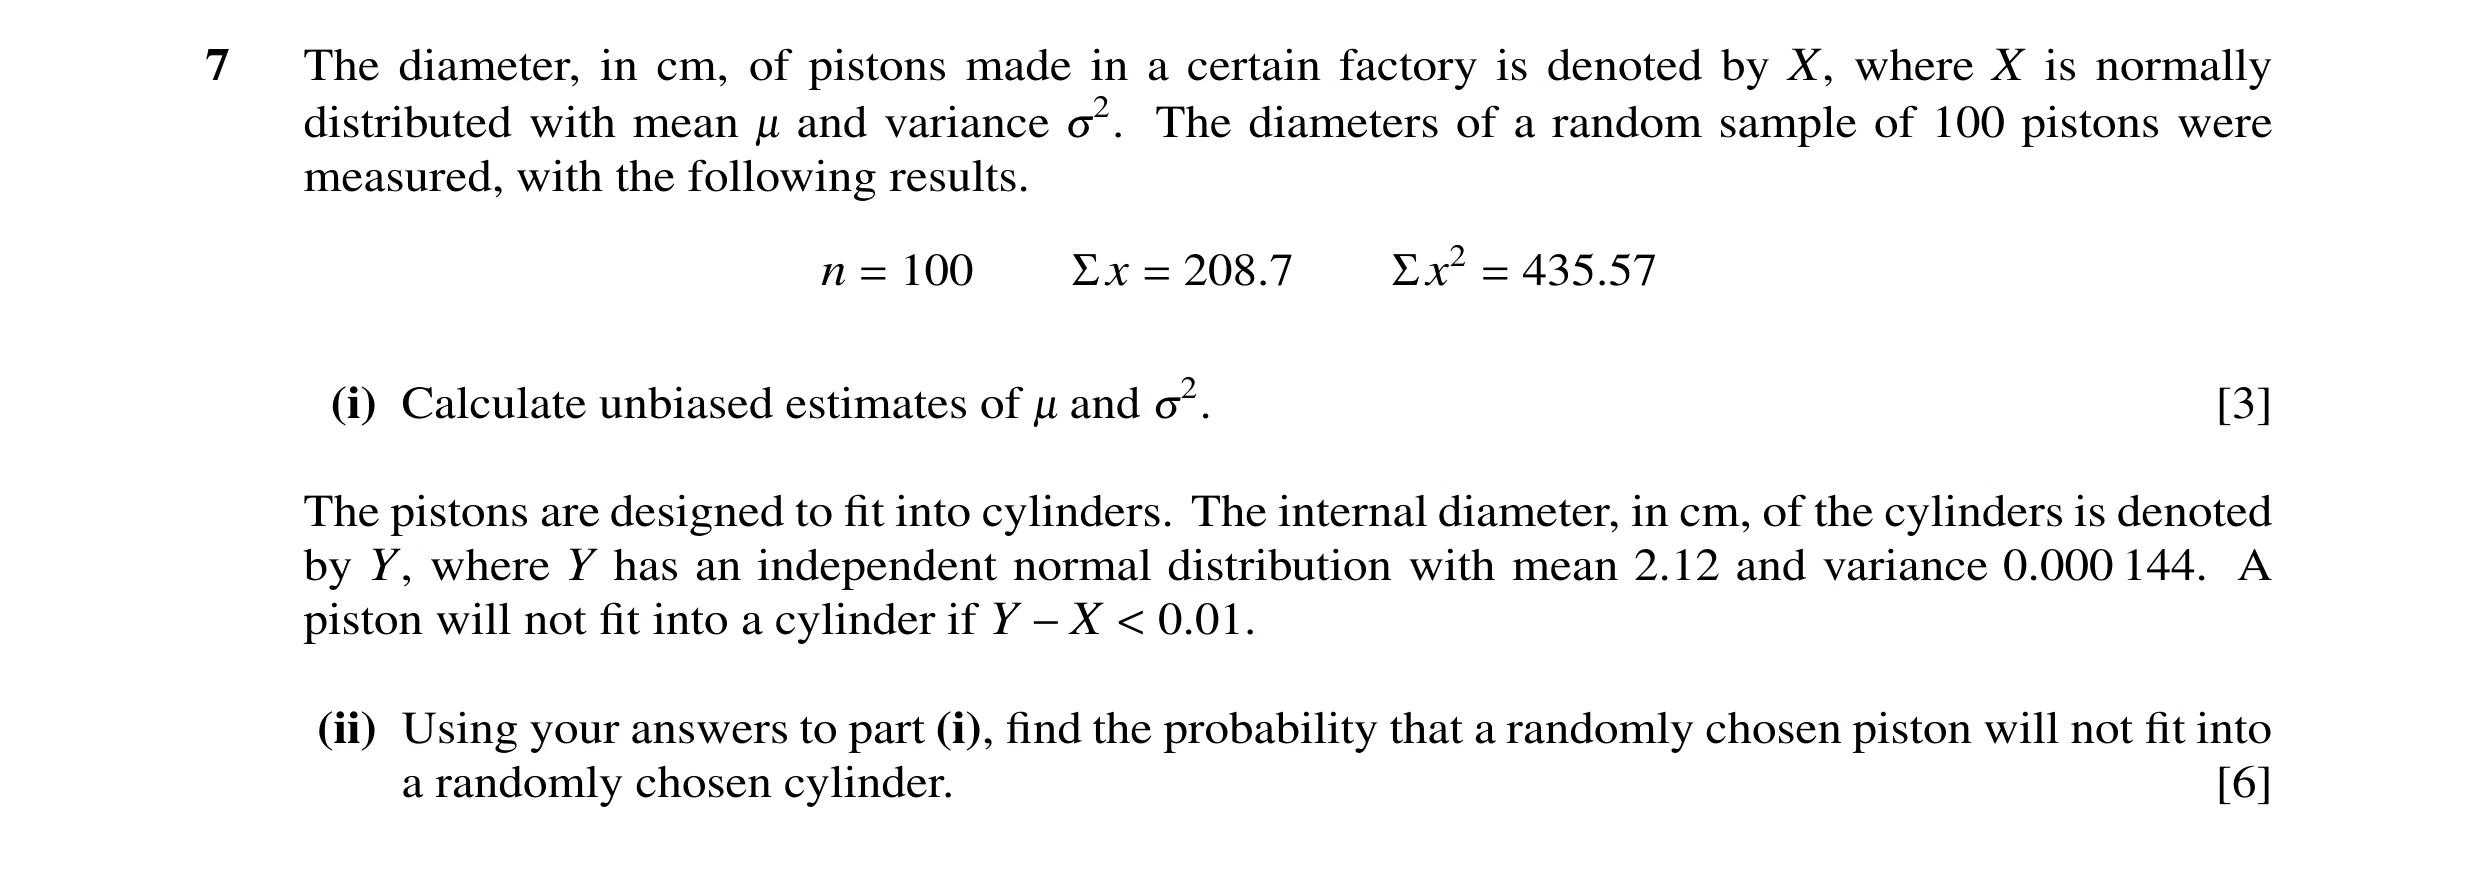

 13 / 31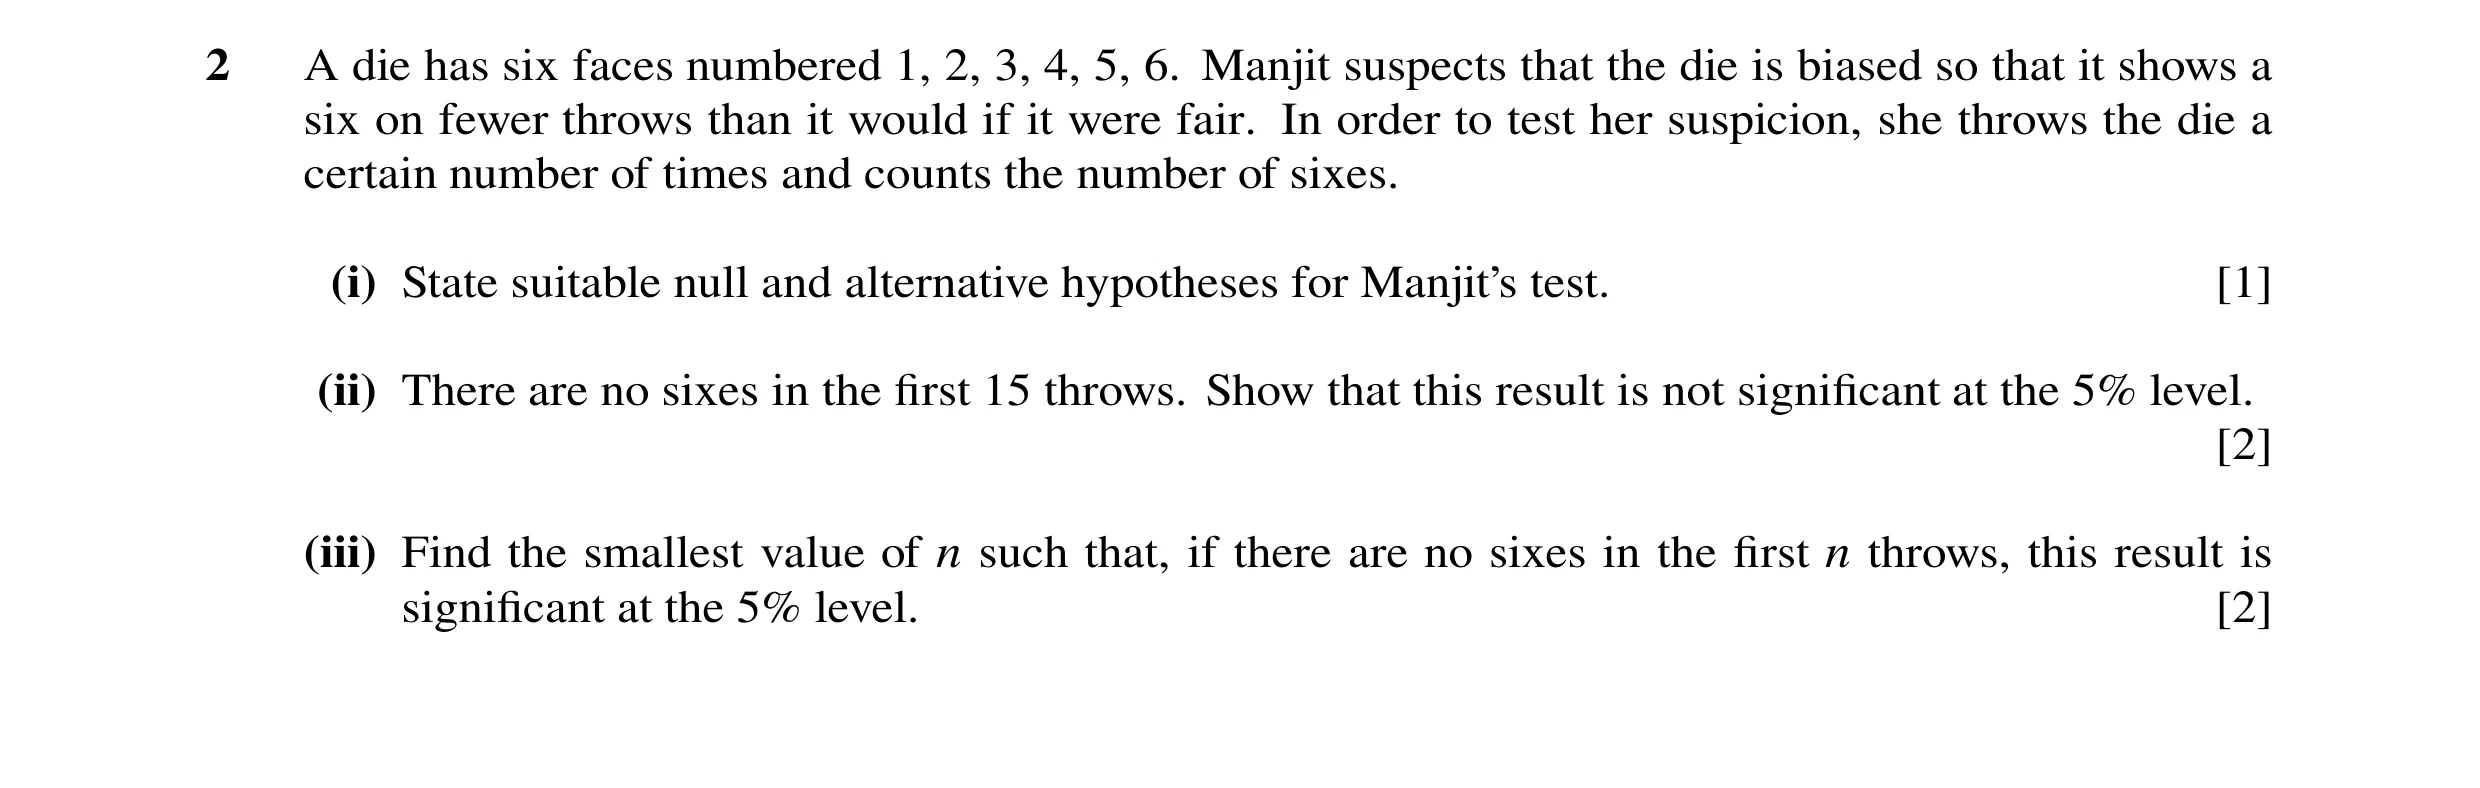
 14 / 31
 15 / 31
 16 / 31
 17 / 31
 21 / 31
 24 / 31
 29 / 31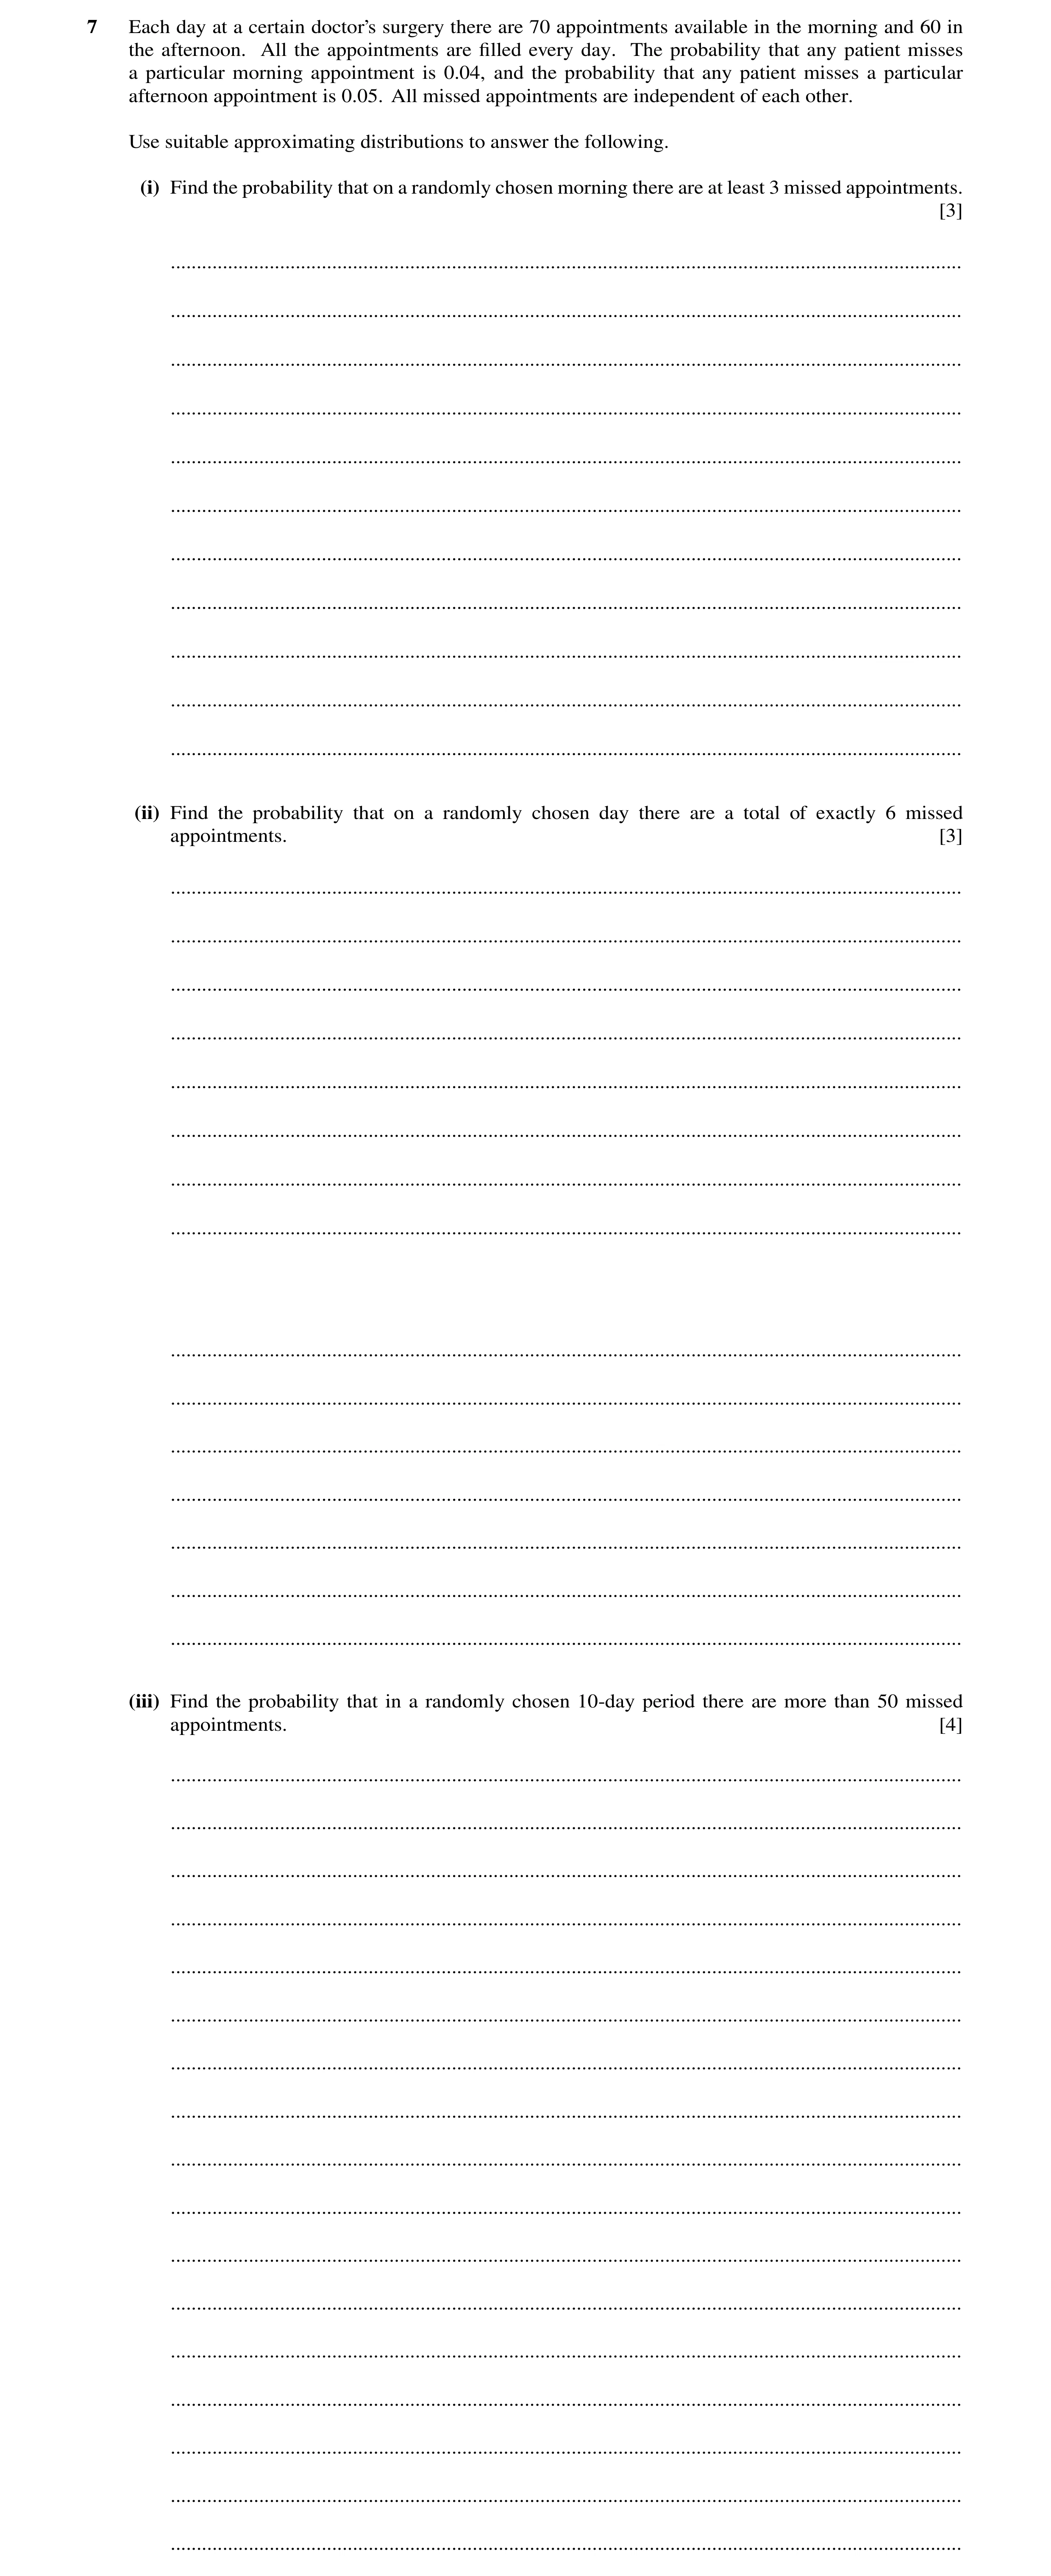
 10
10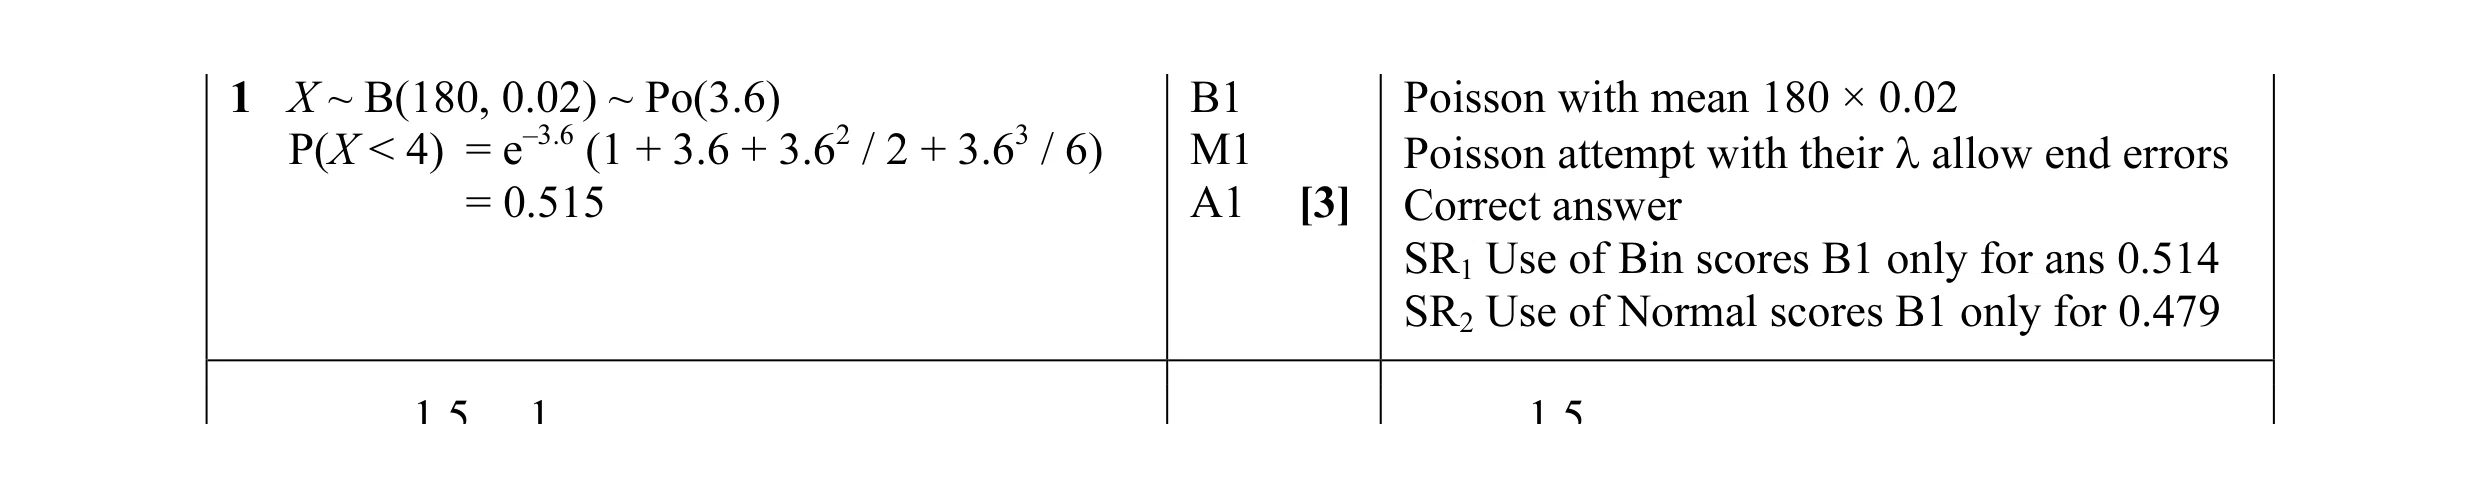 3
3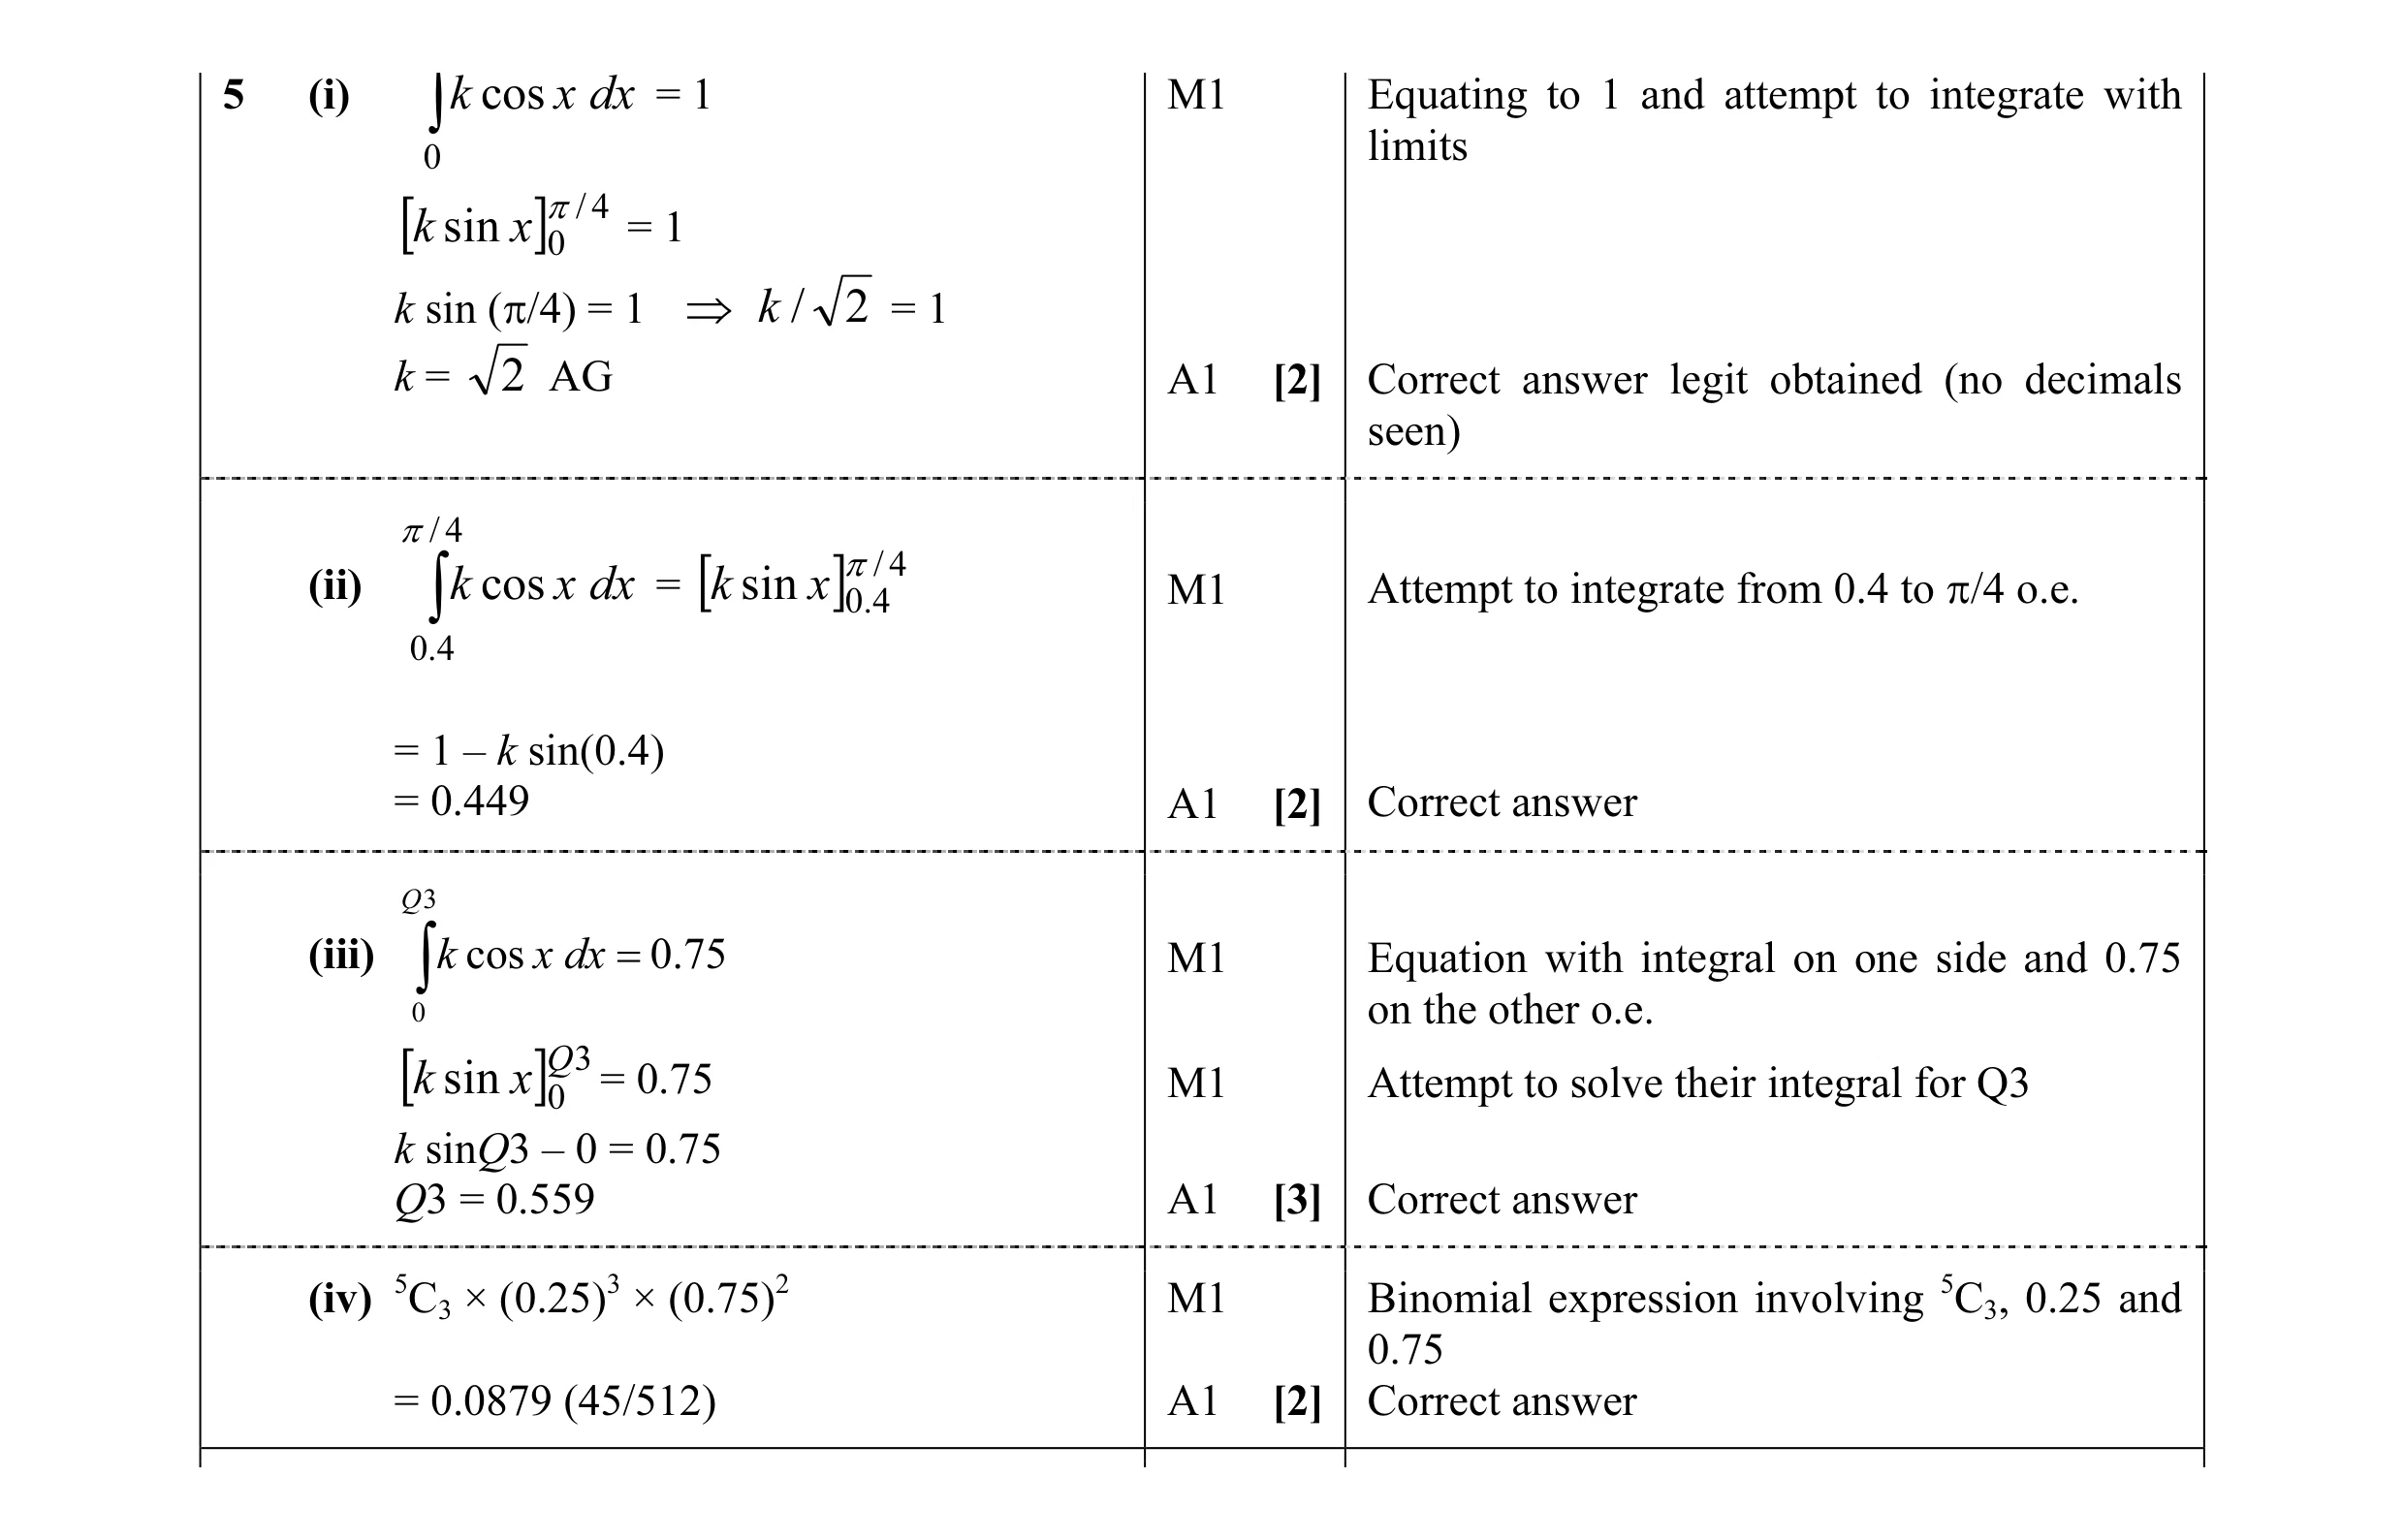 9
9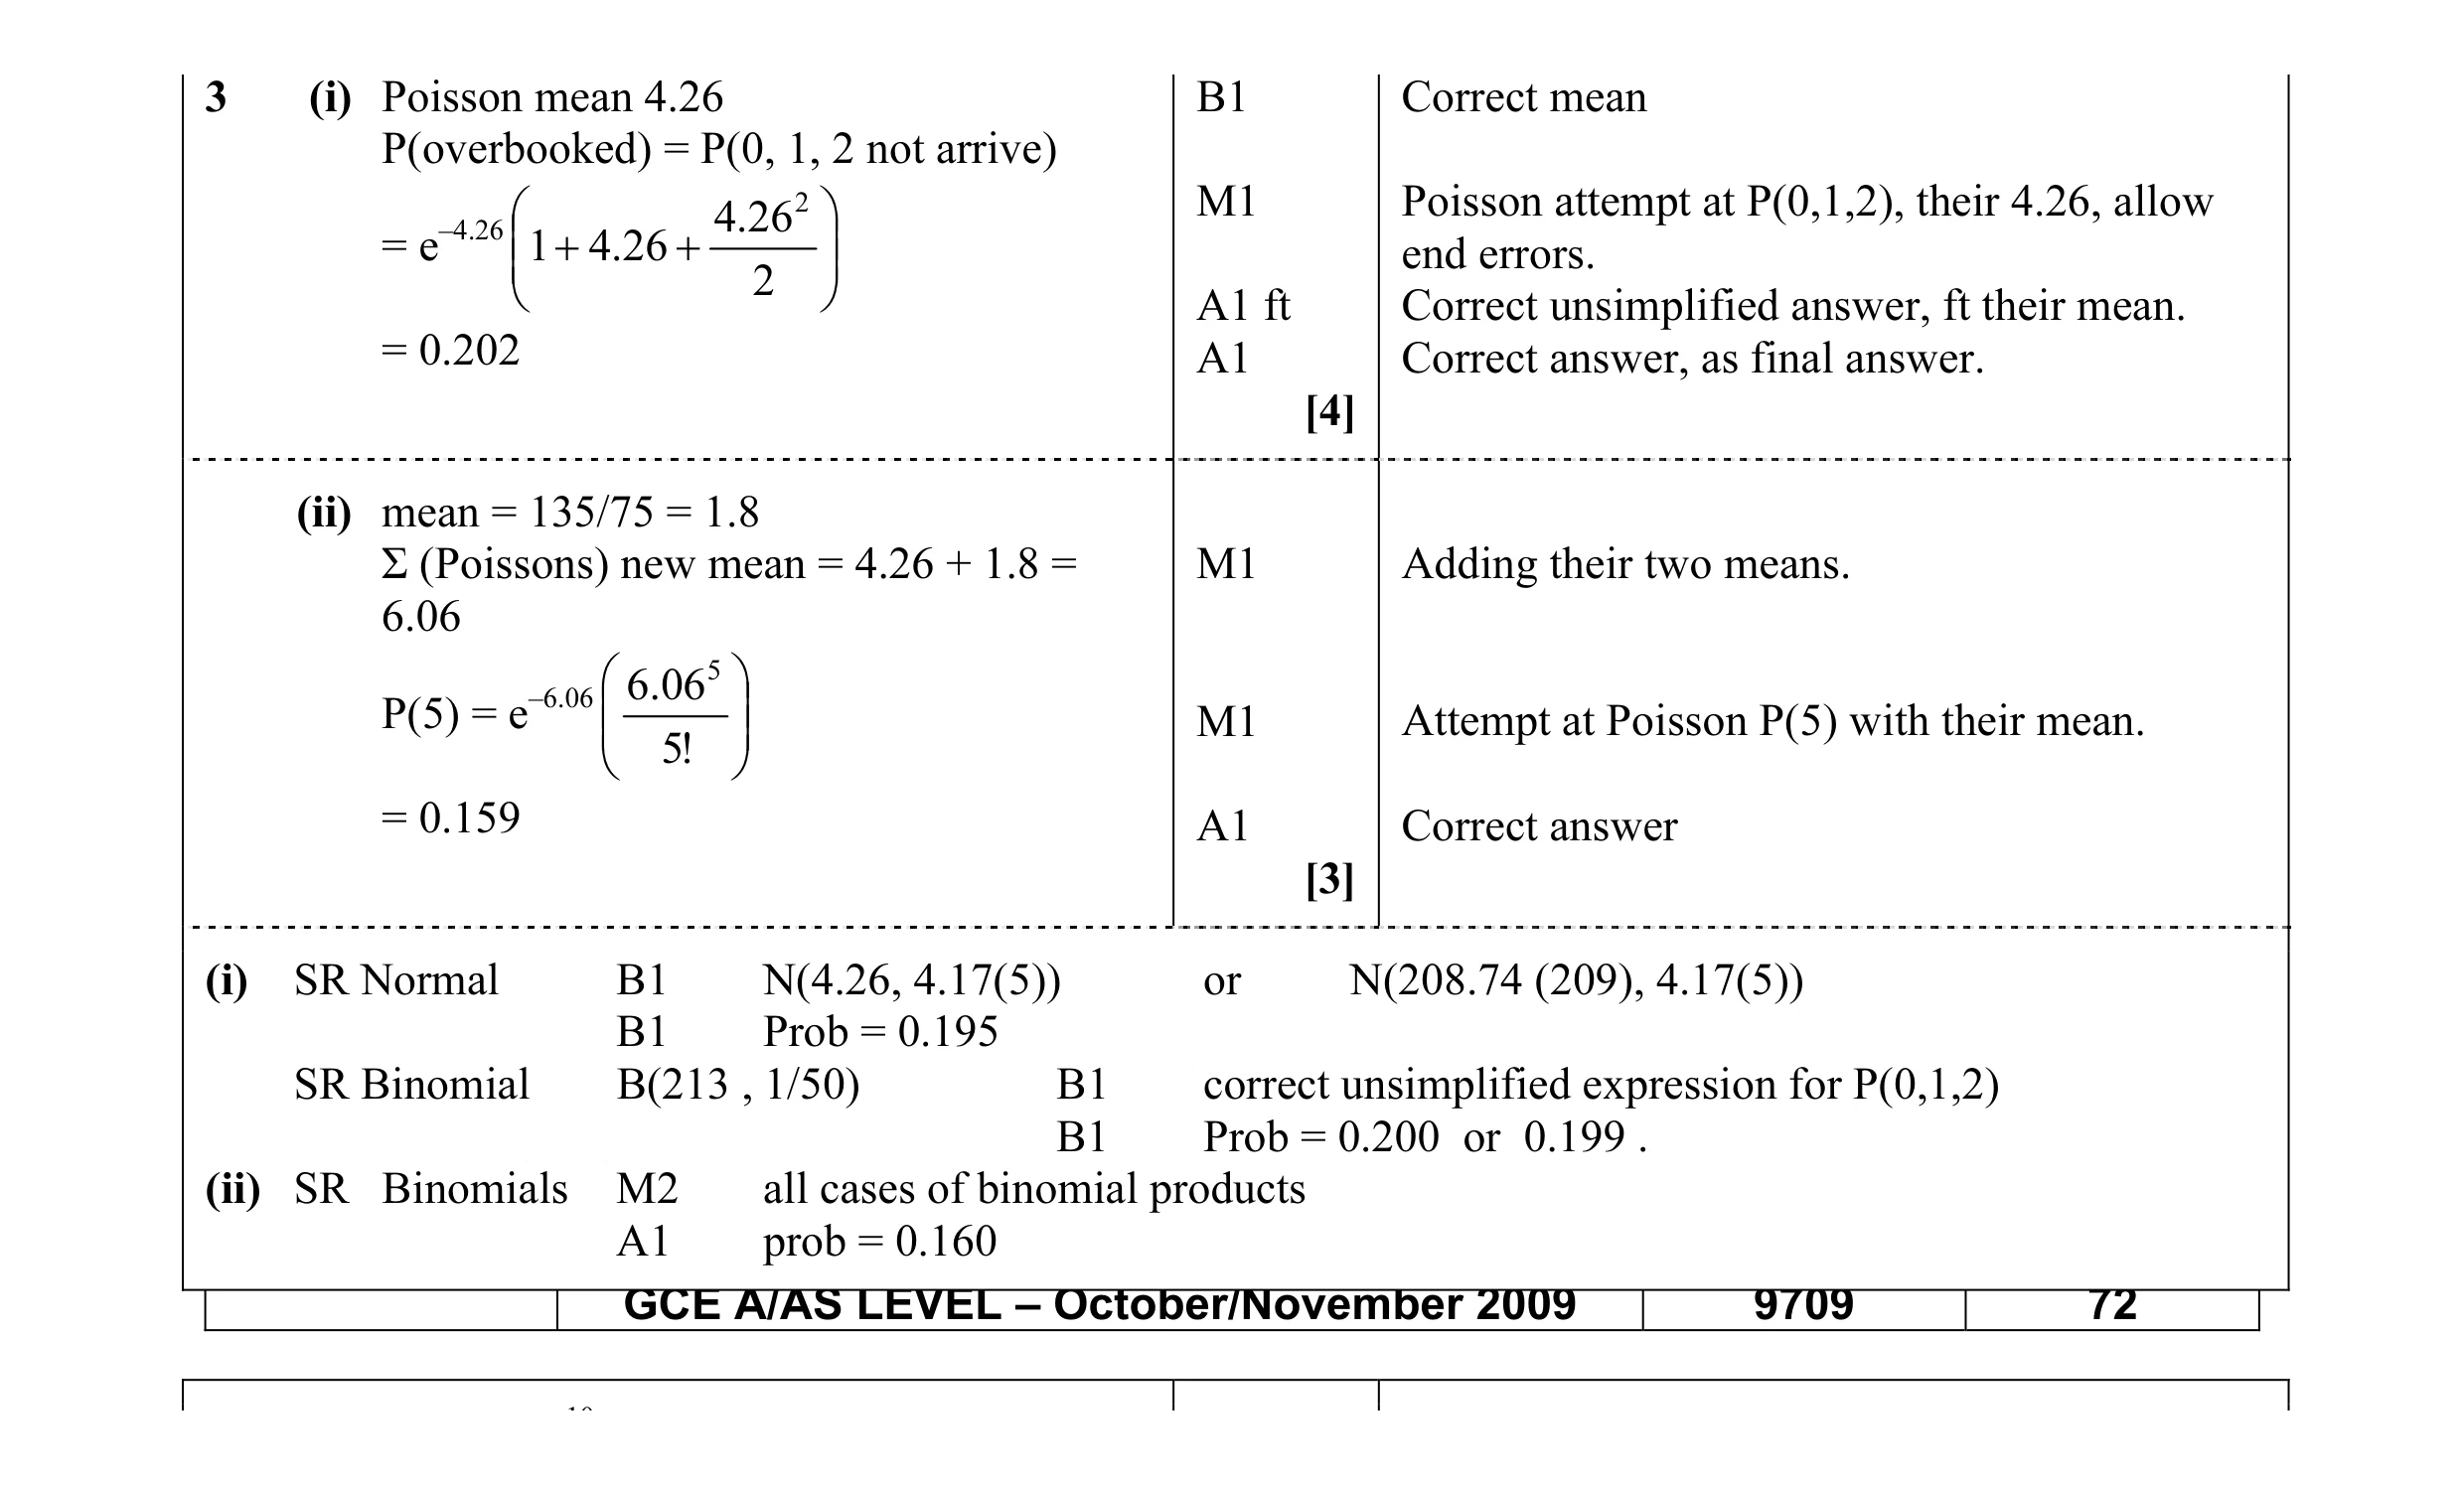 7
7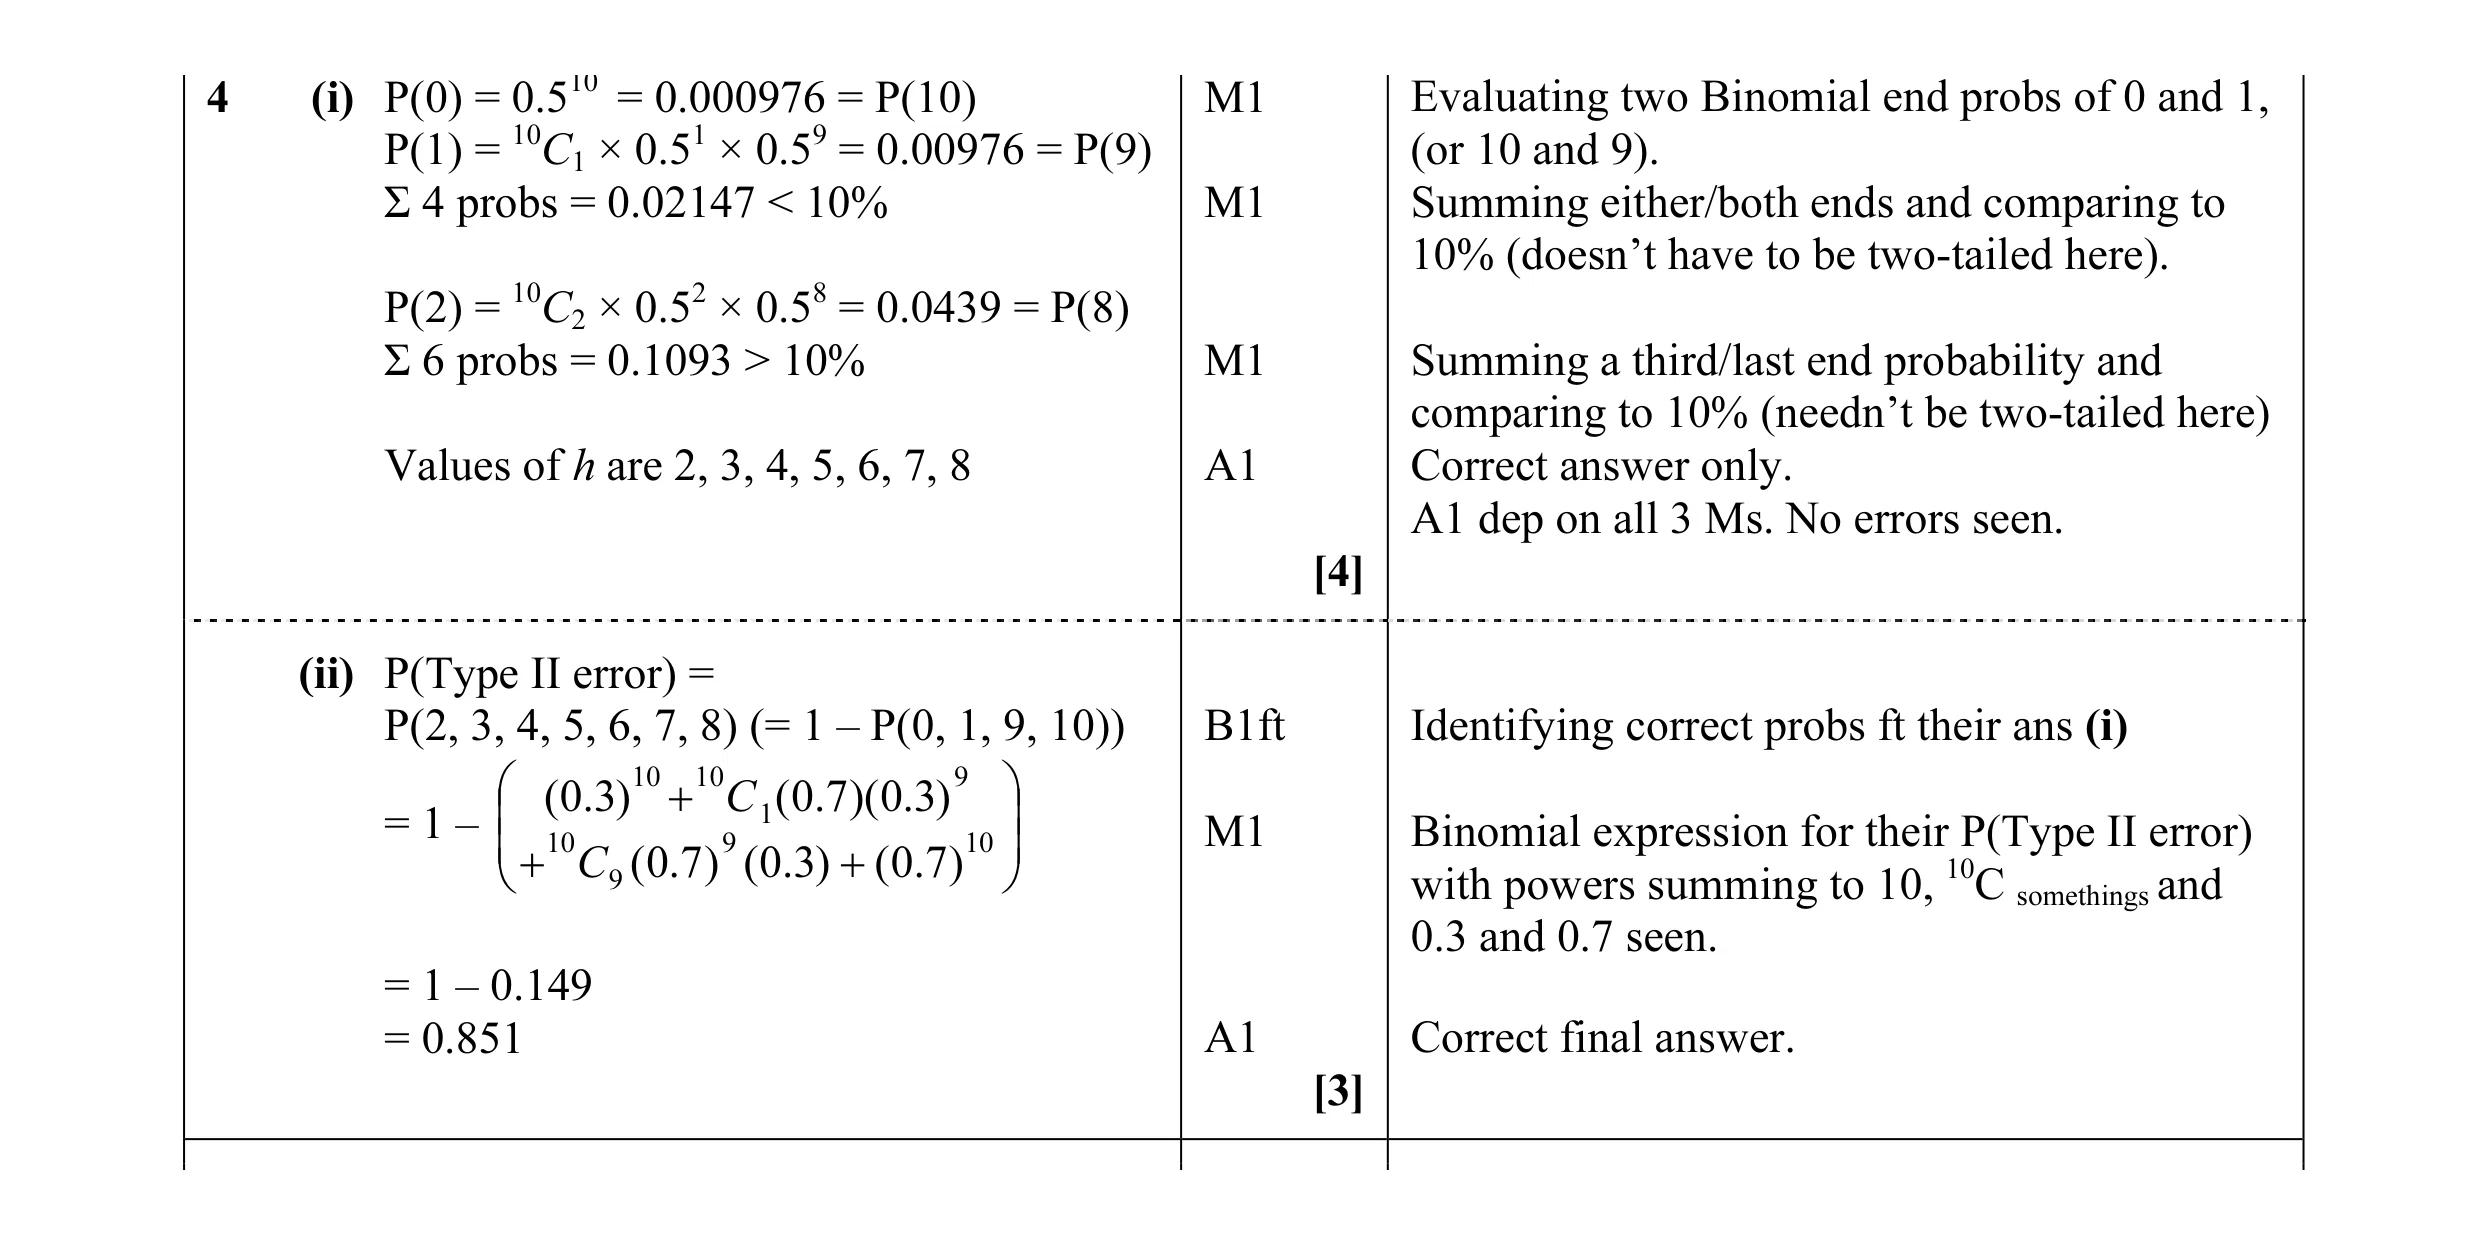 7
7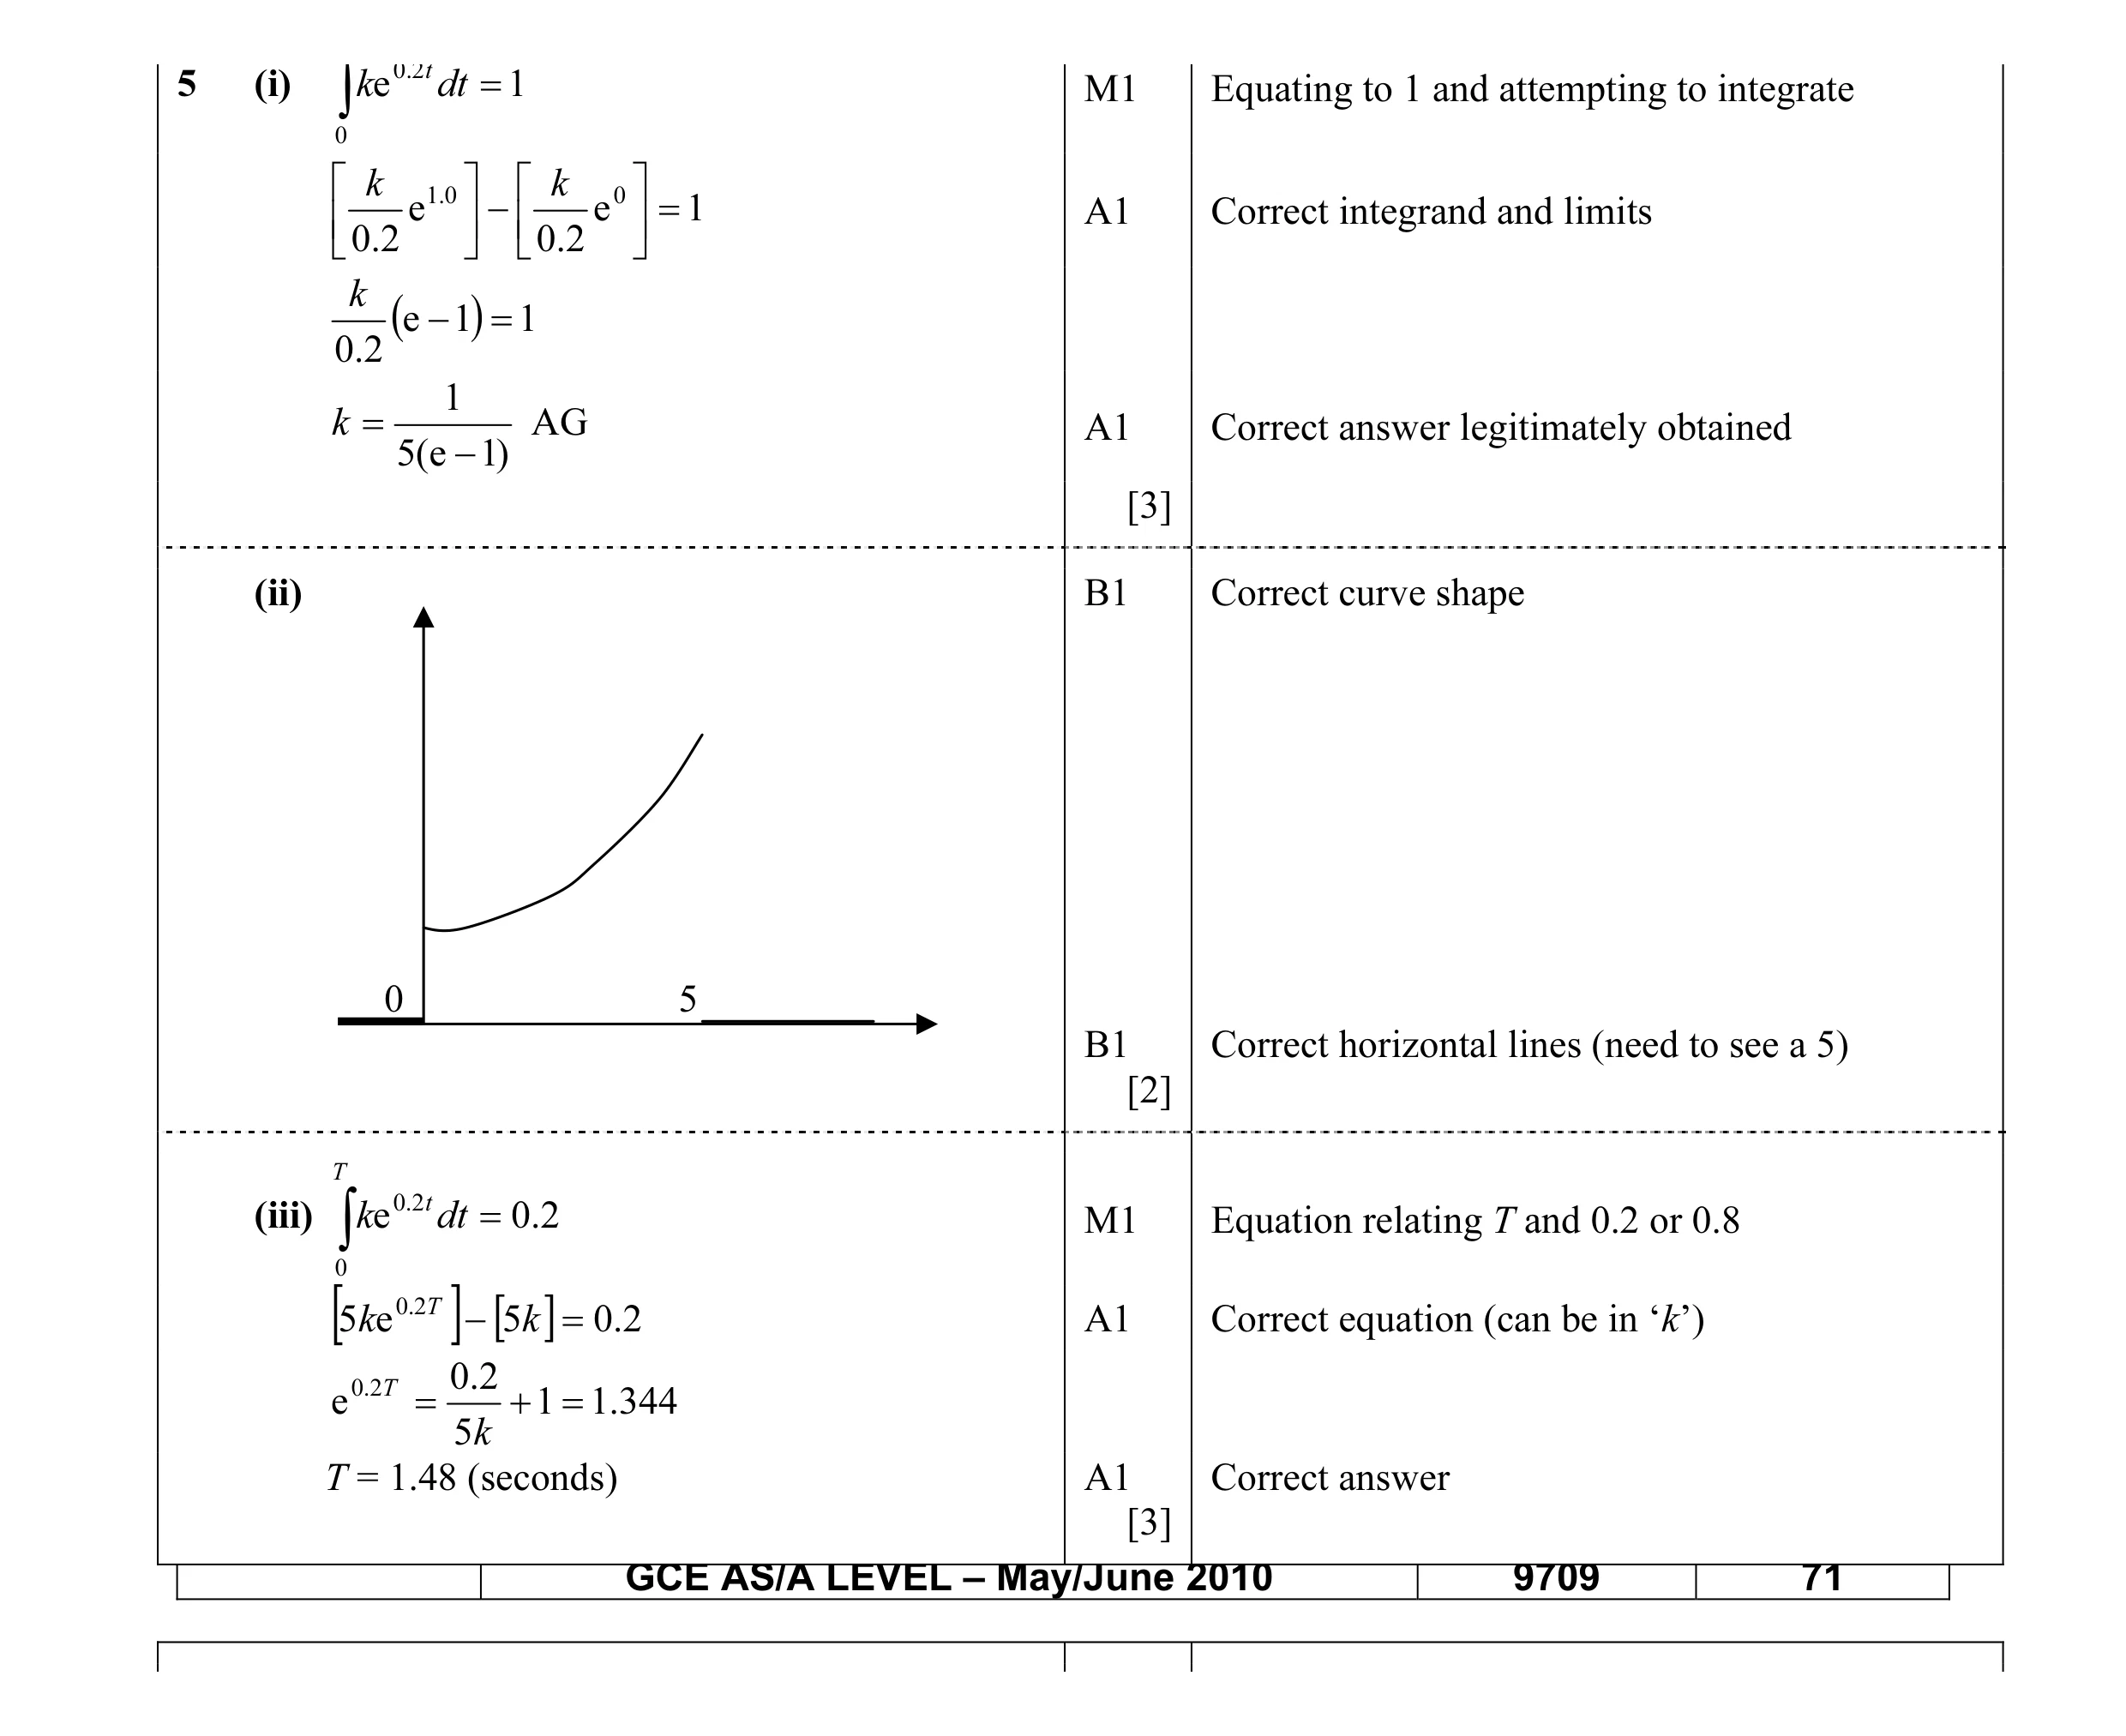 8
8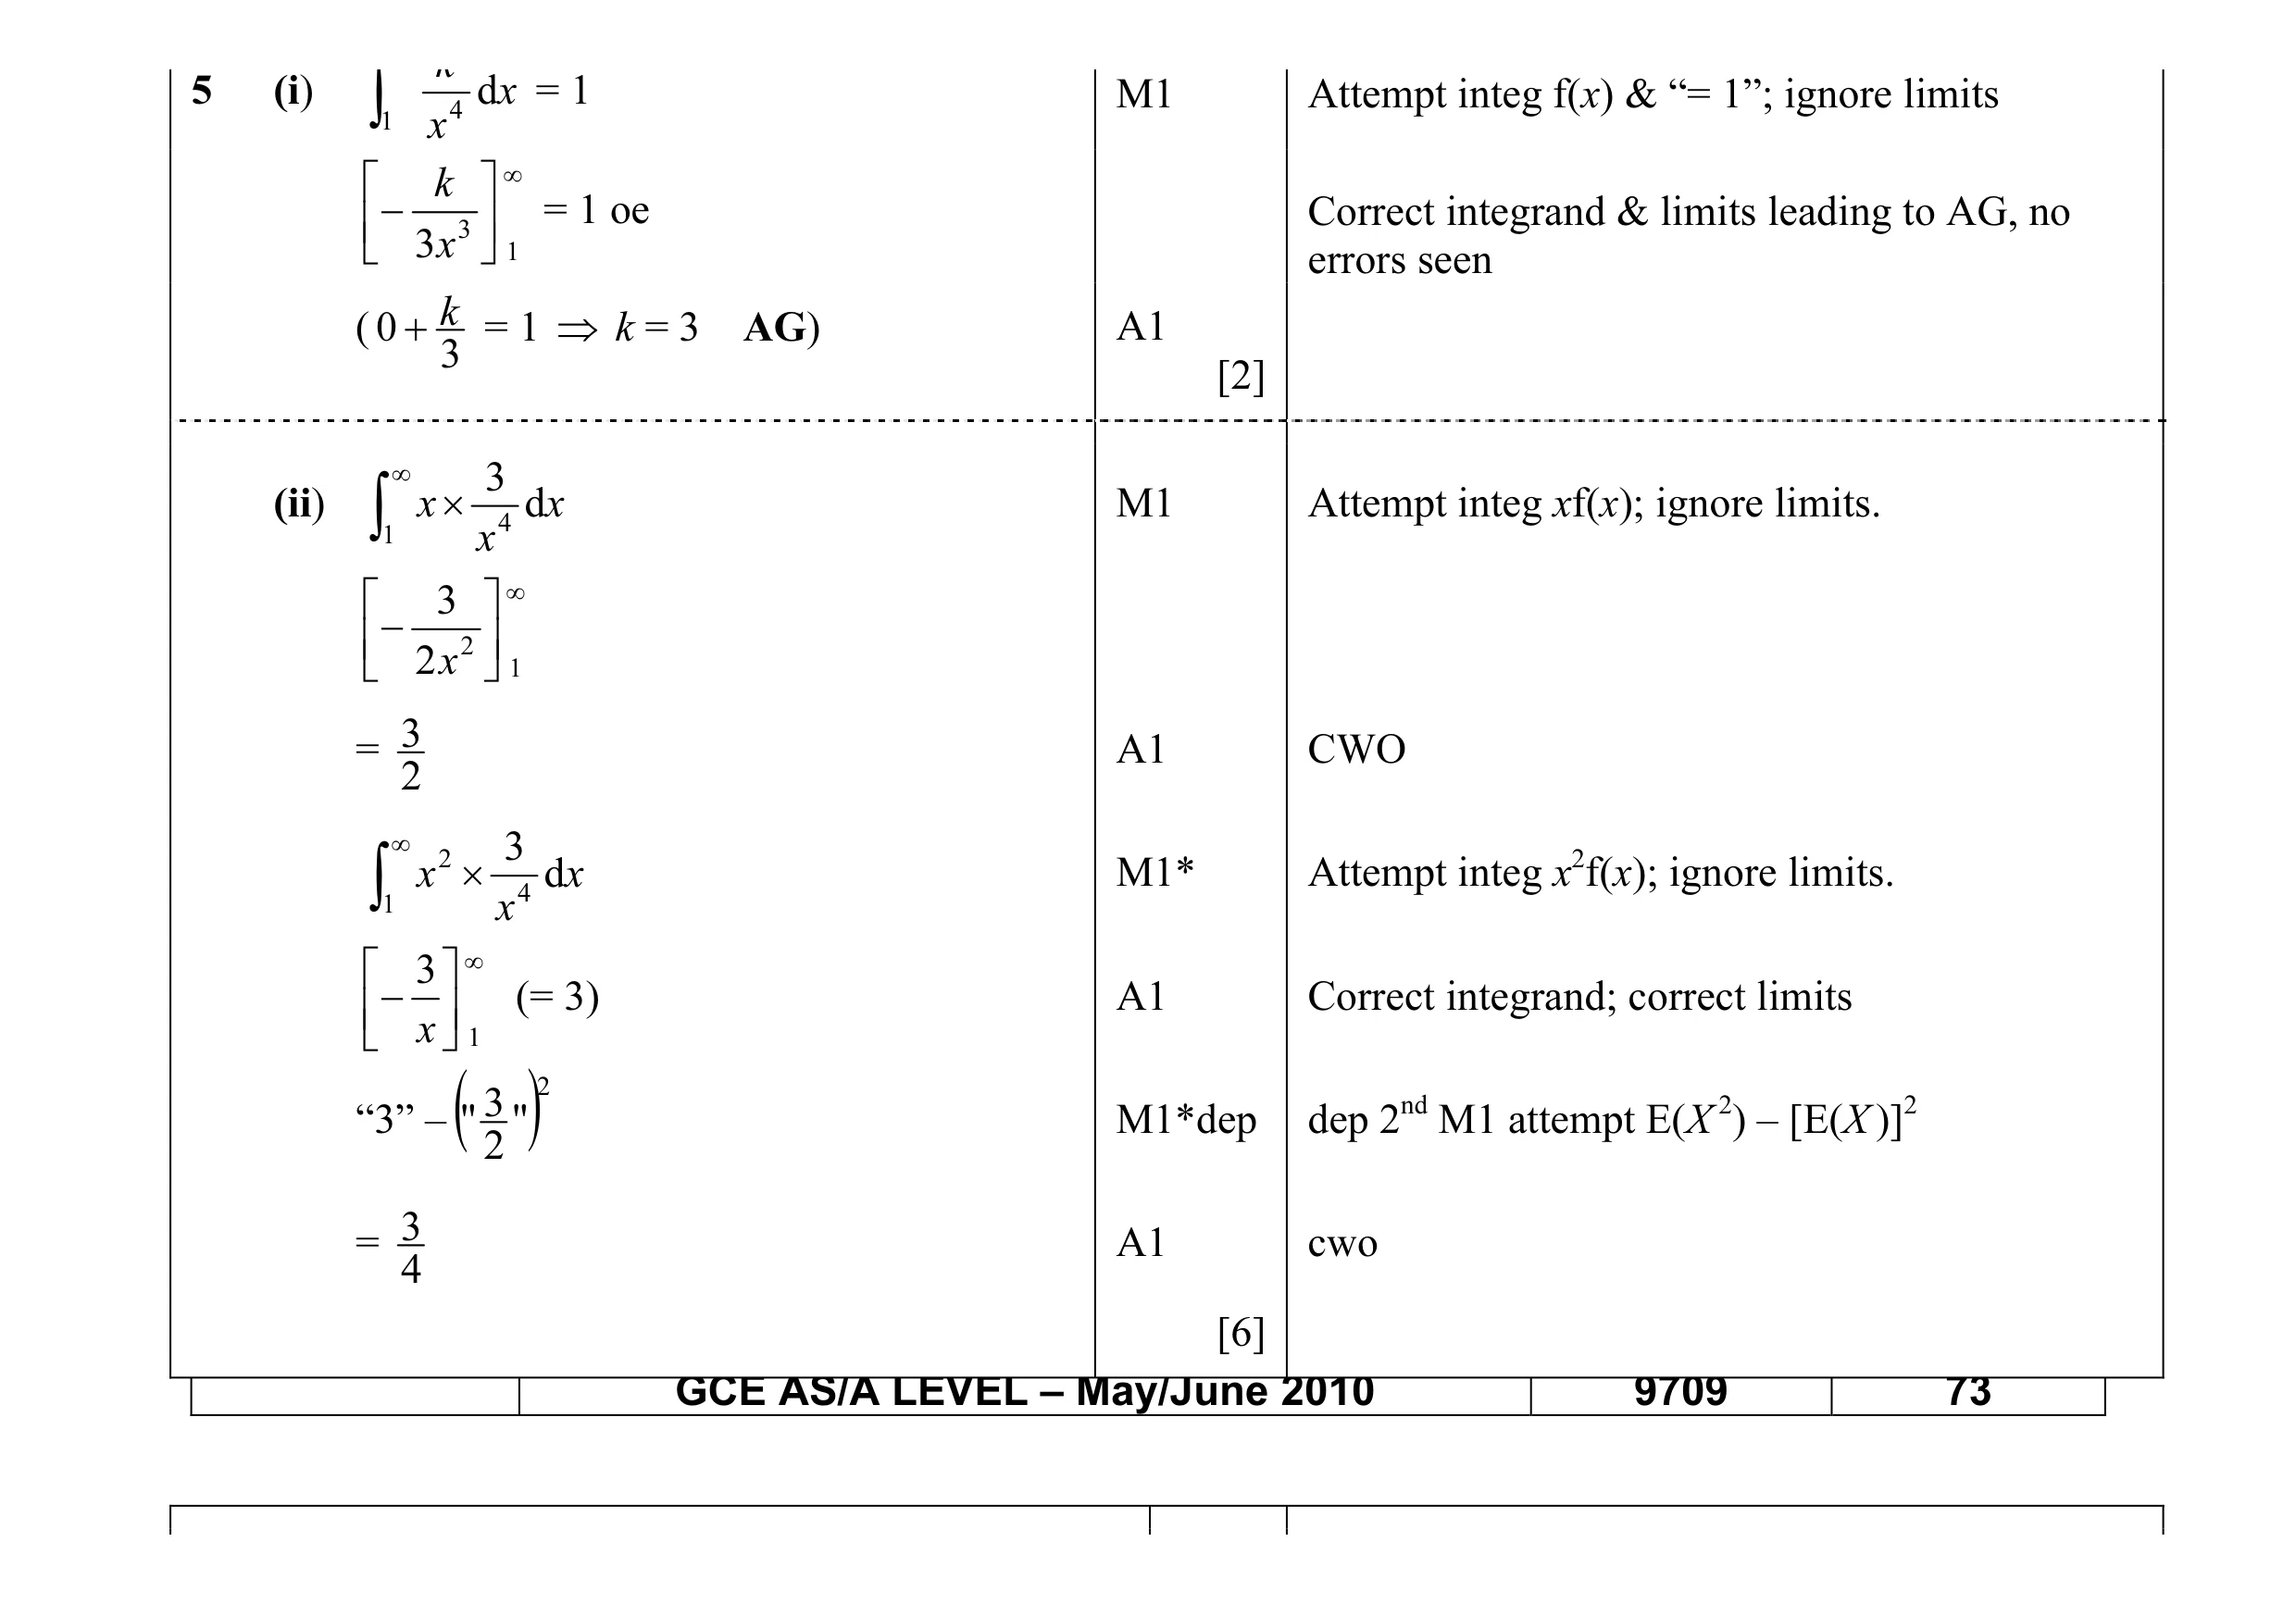 8
8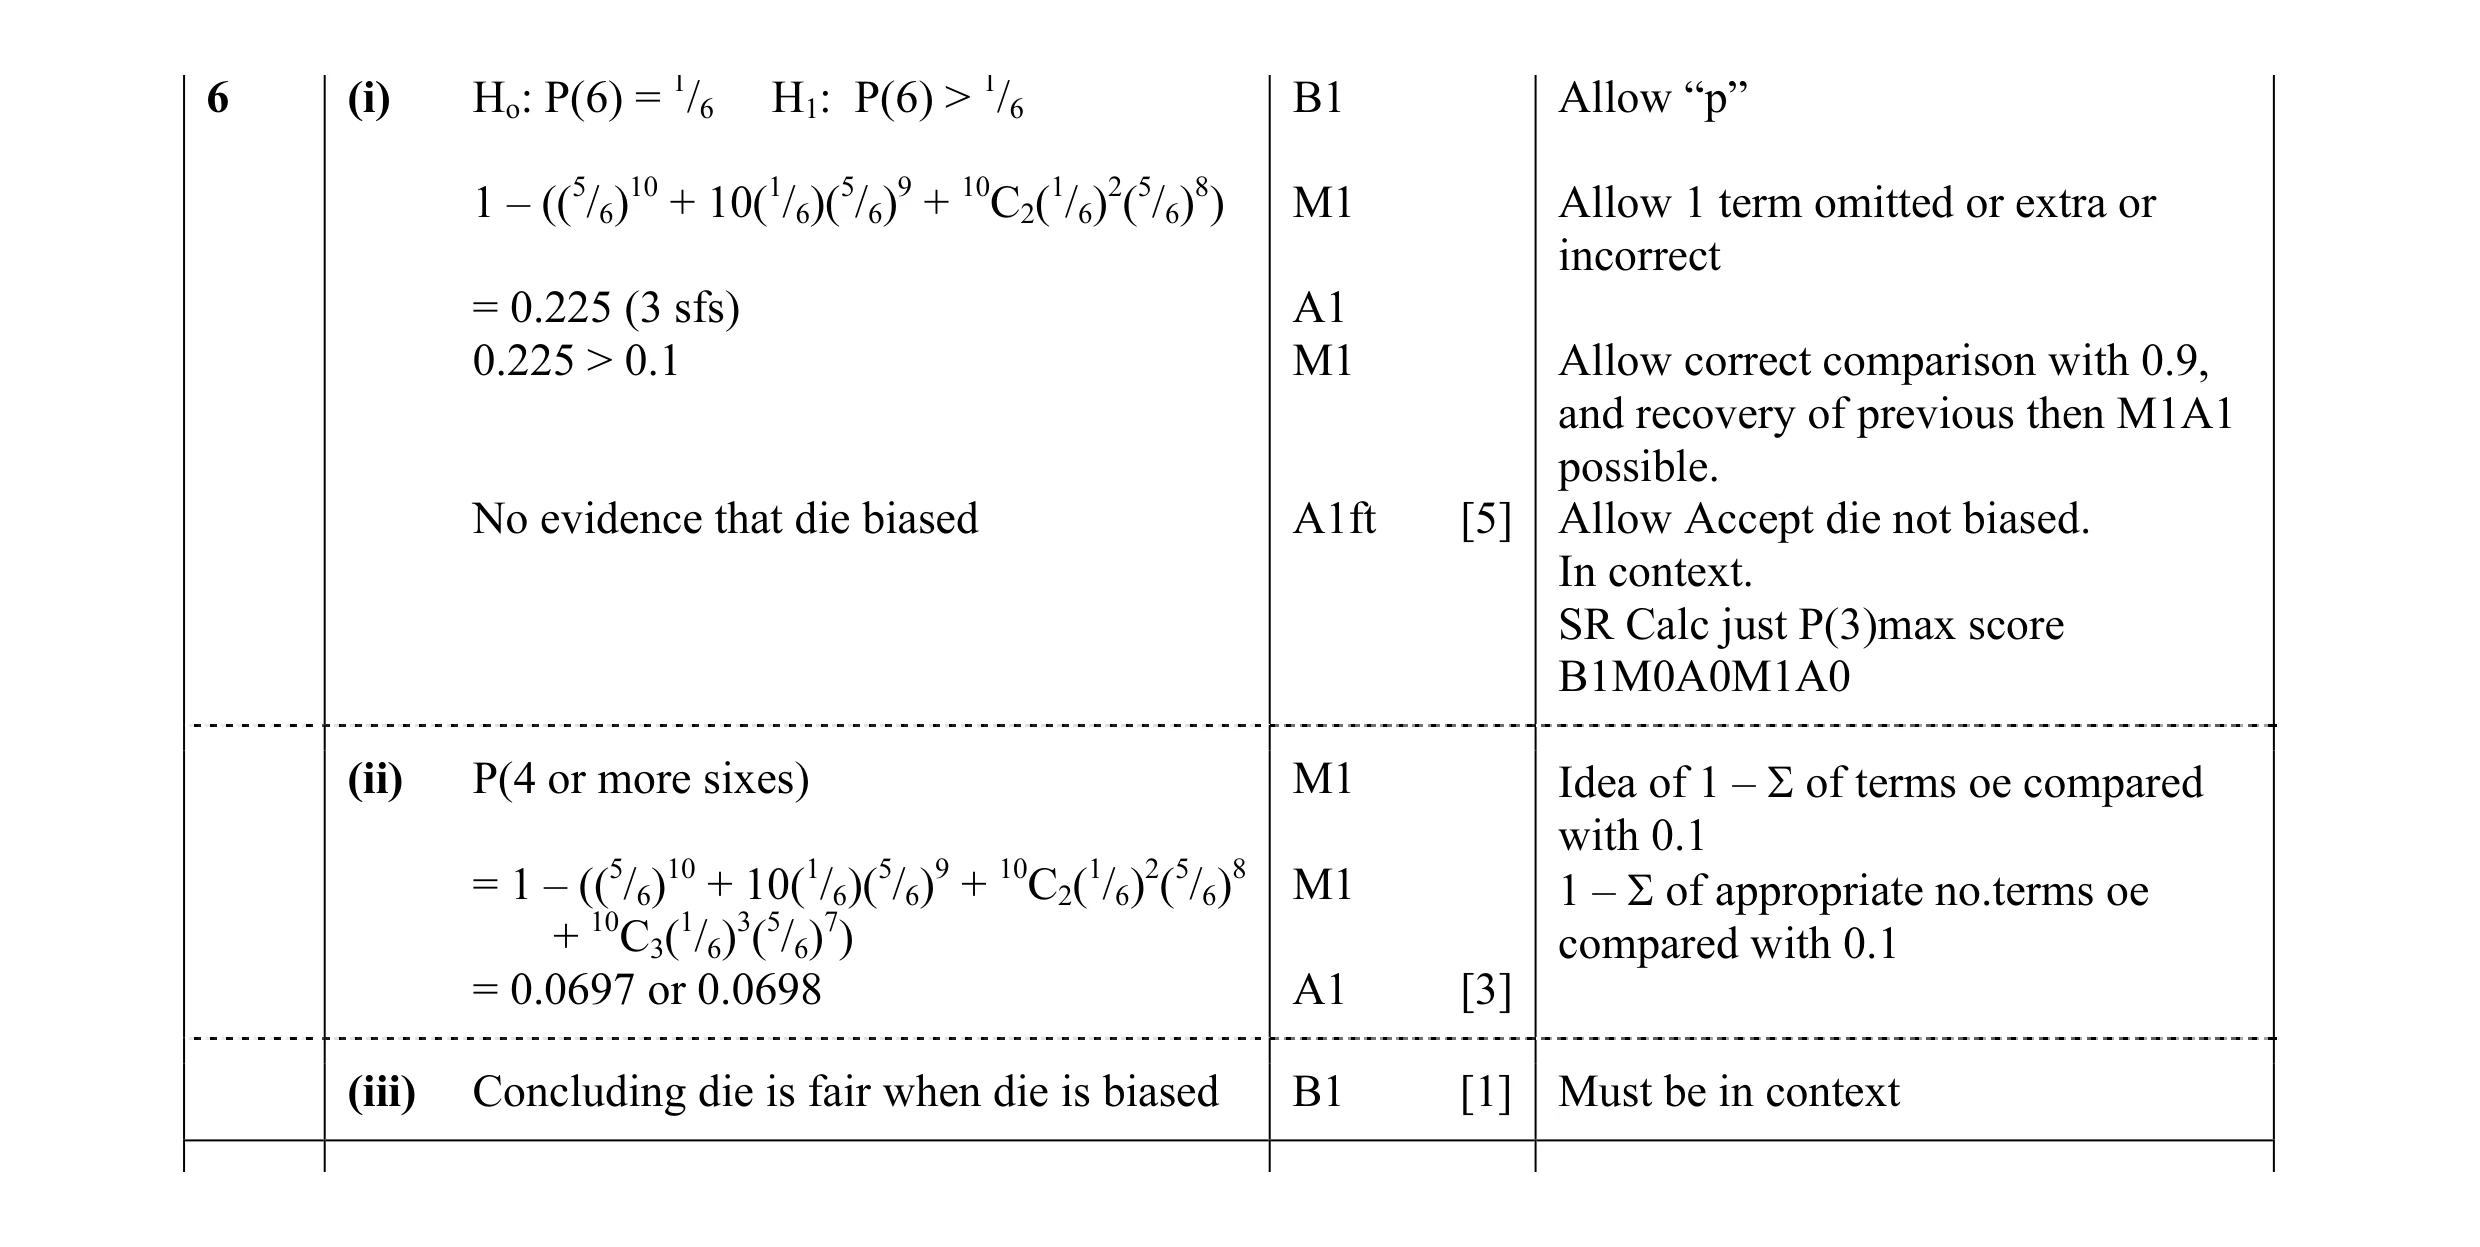 9
9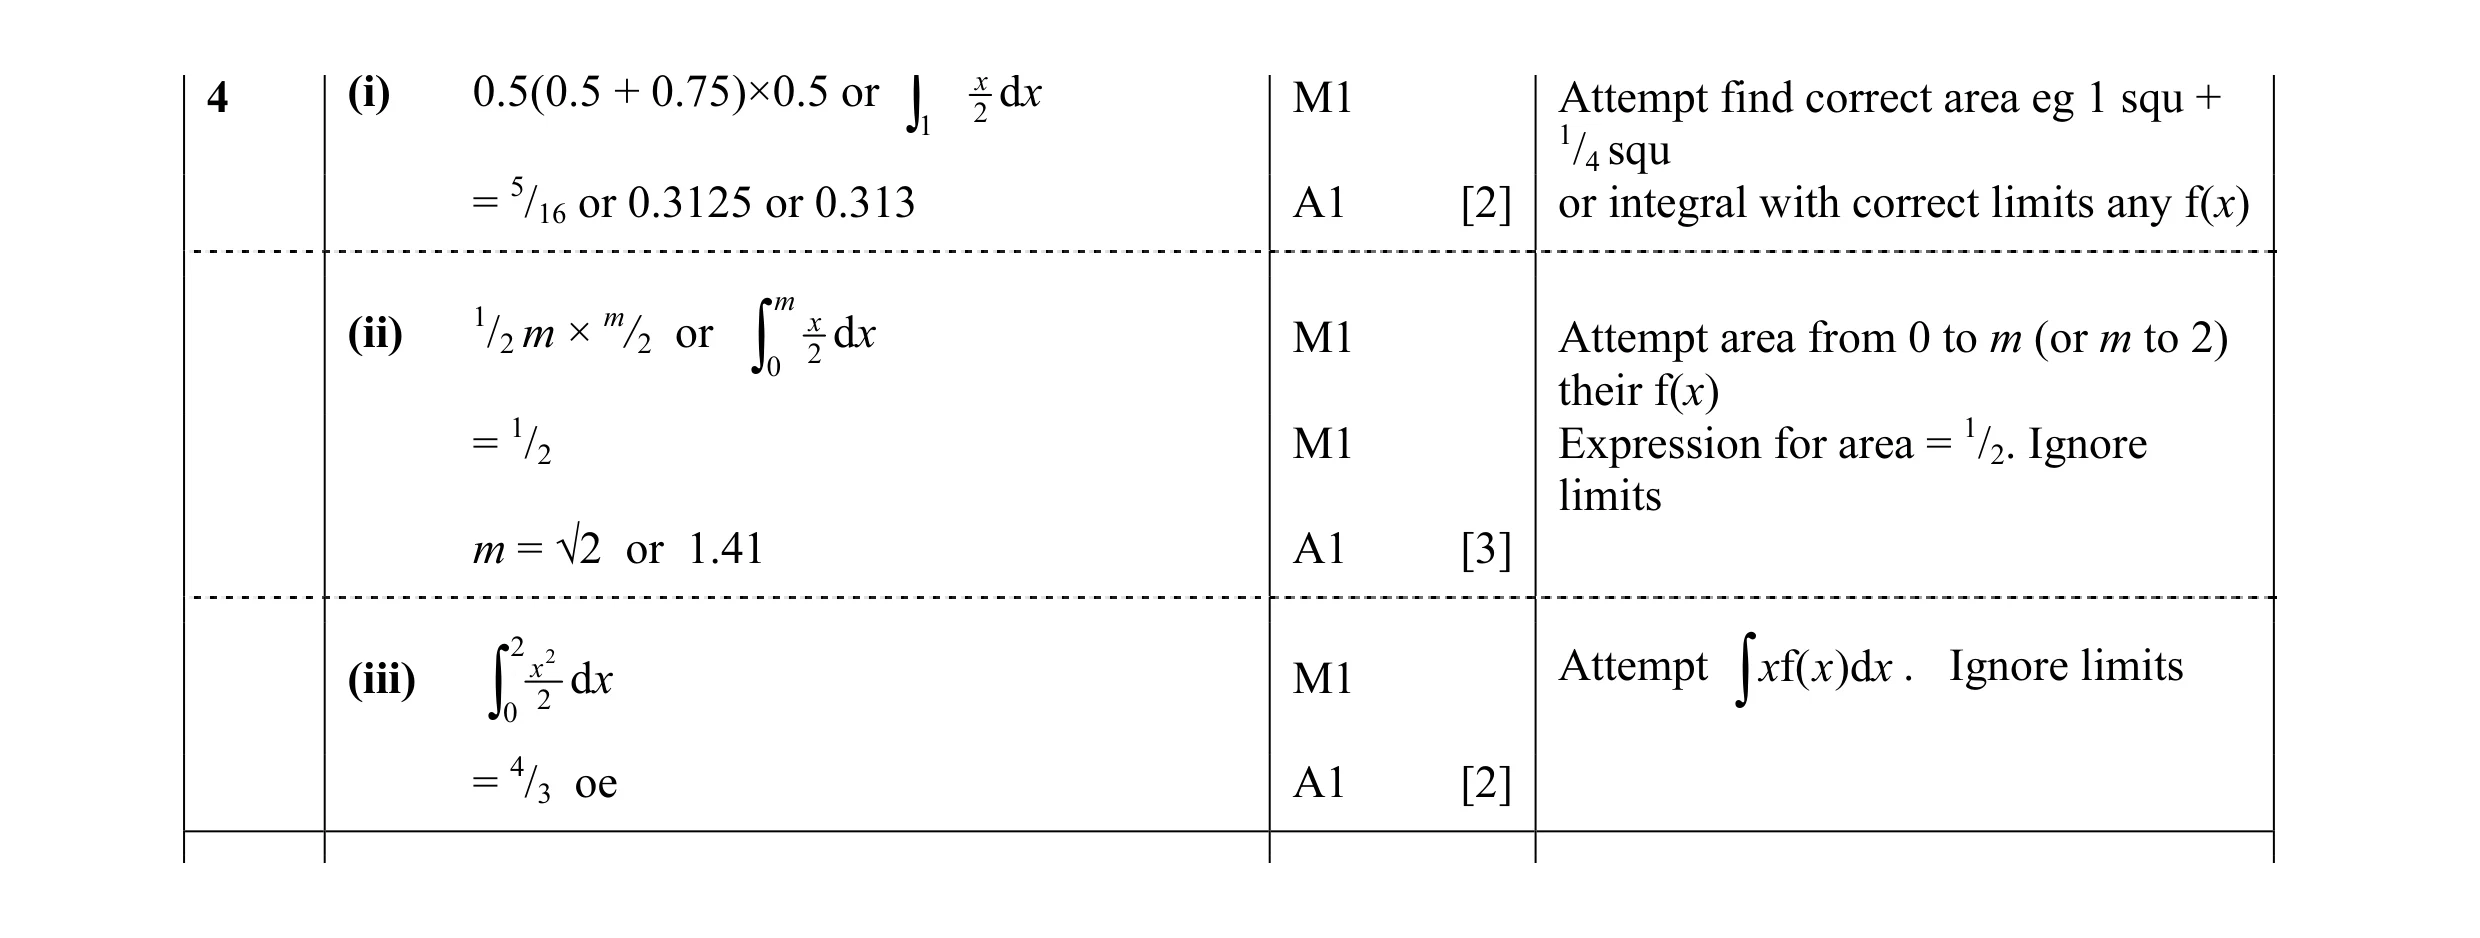 7
7 4
4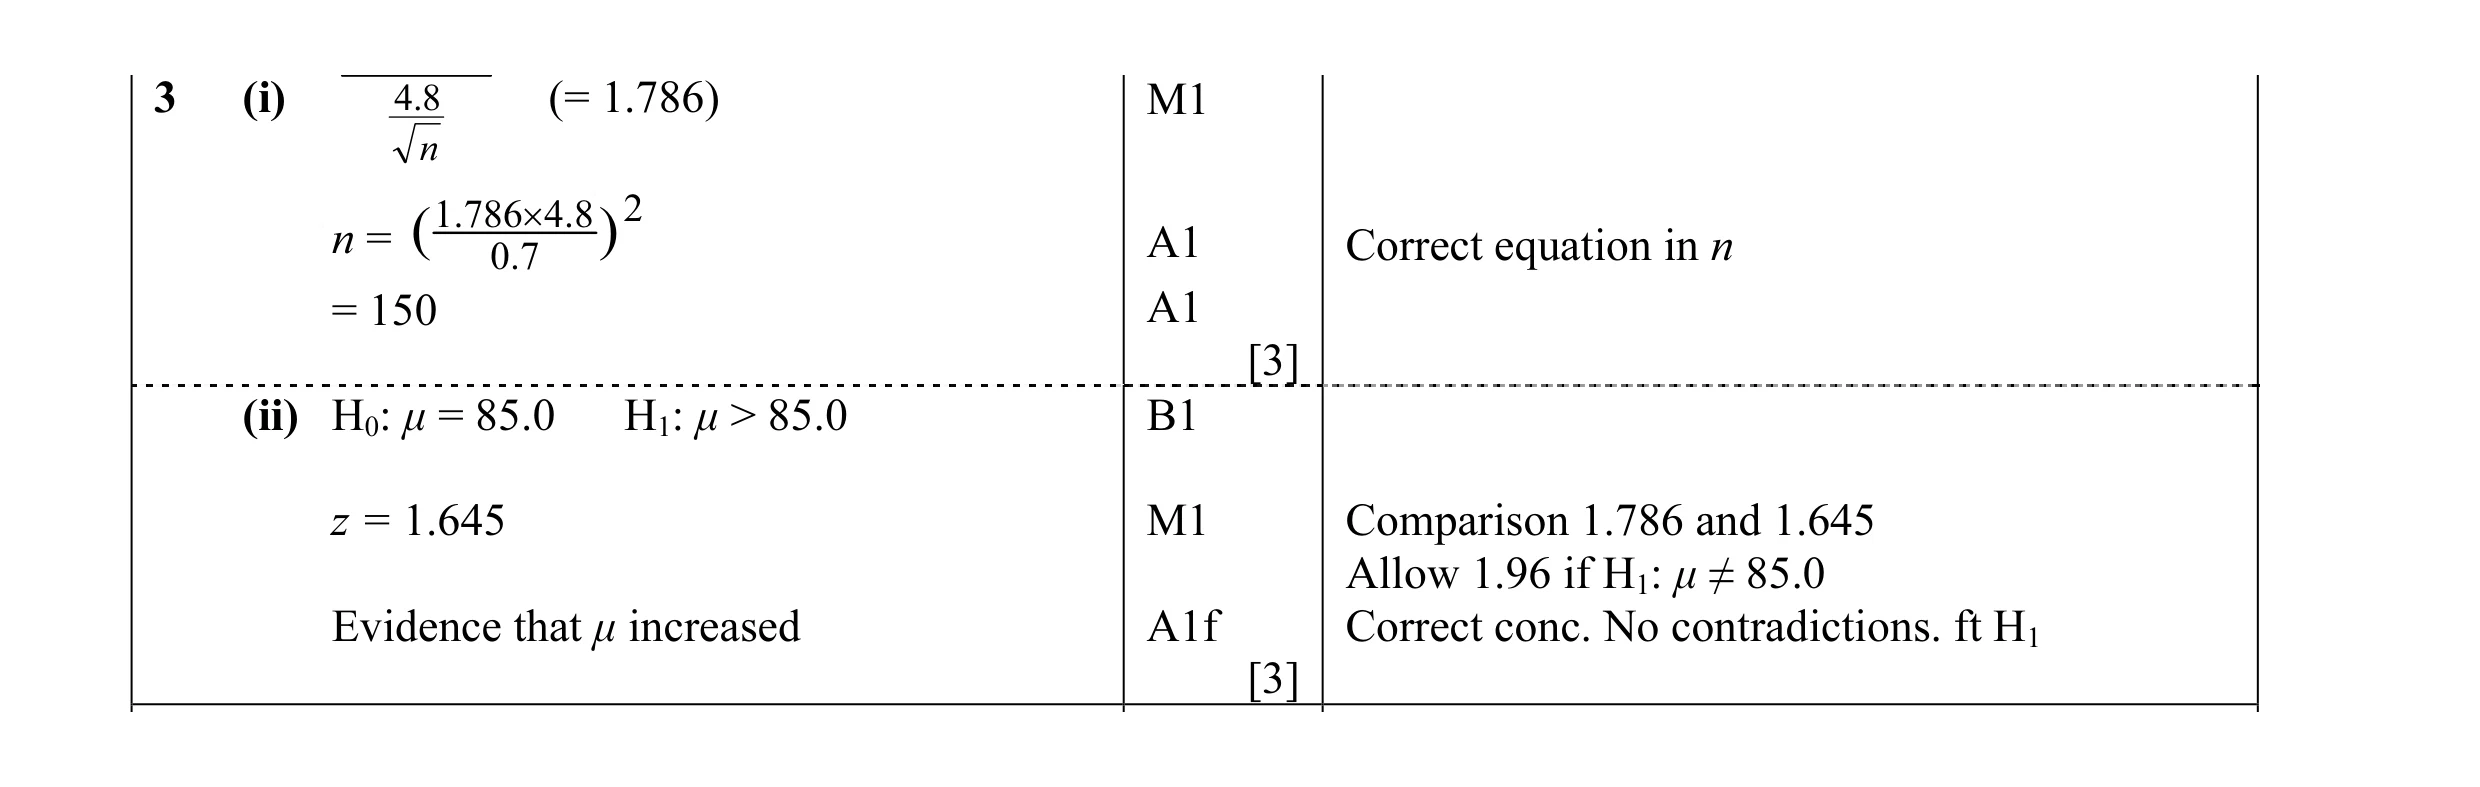 6
6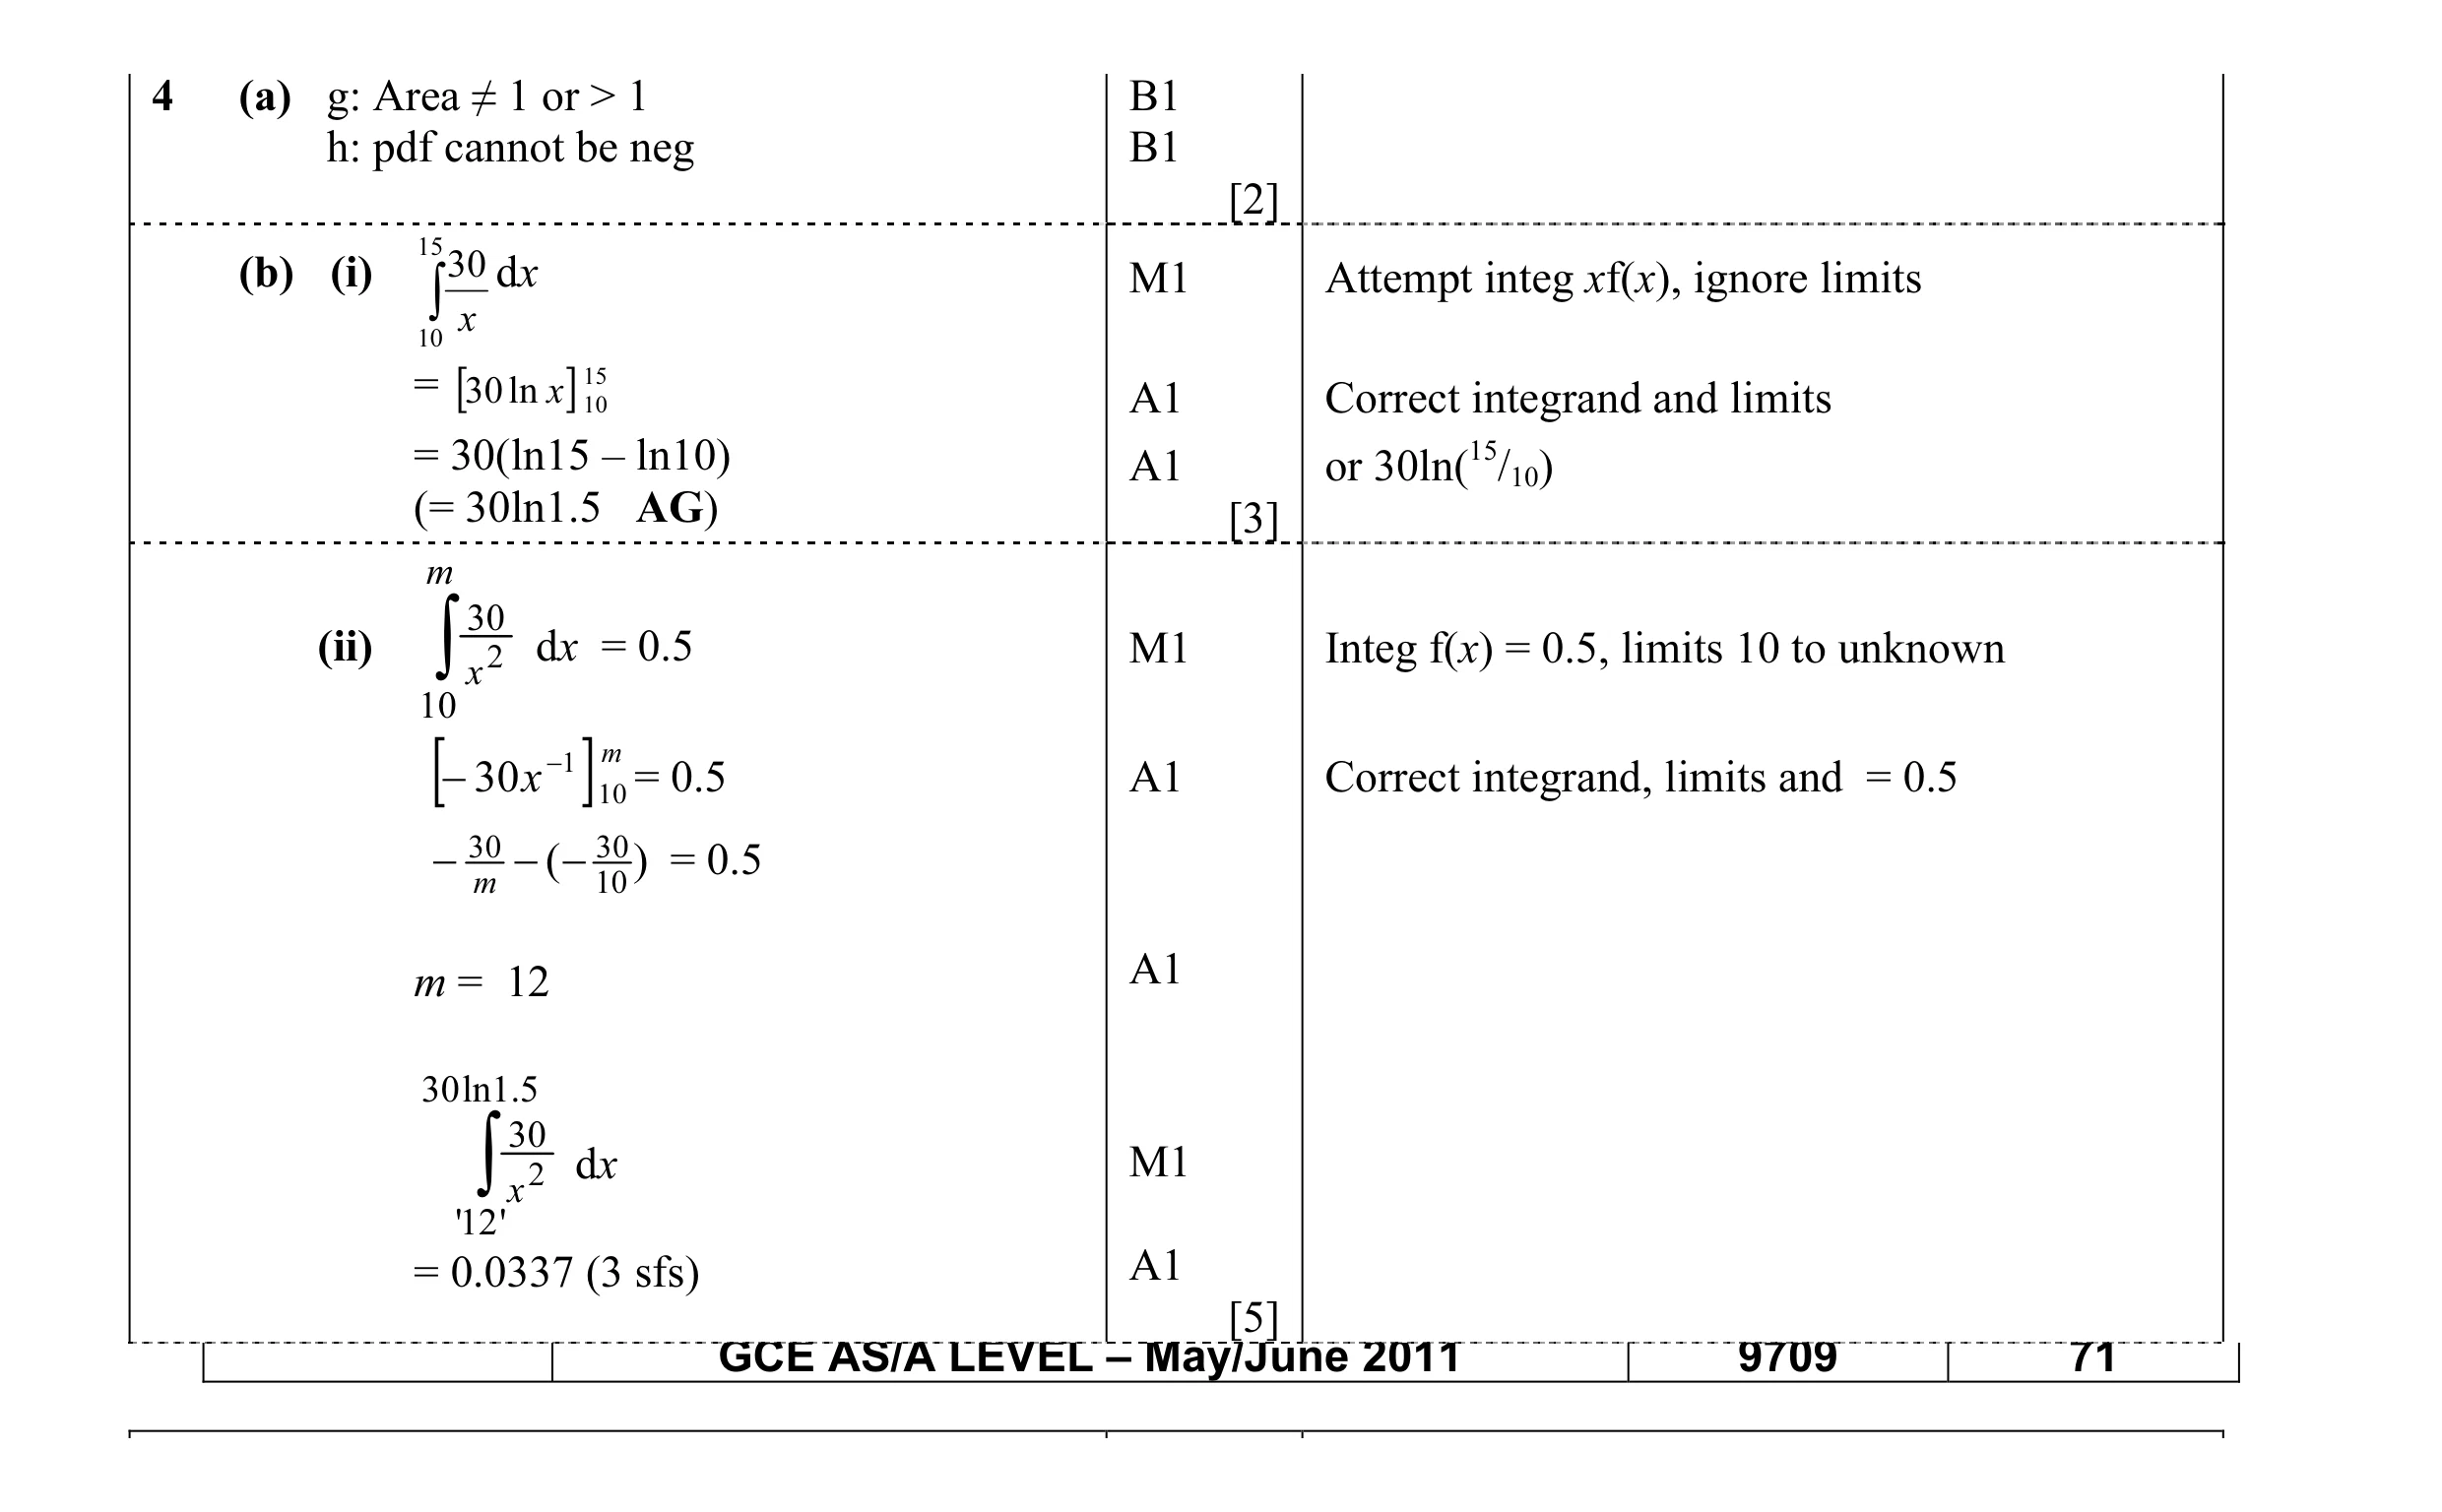 10
10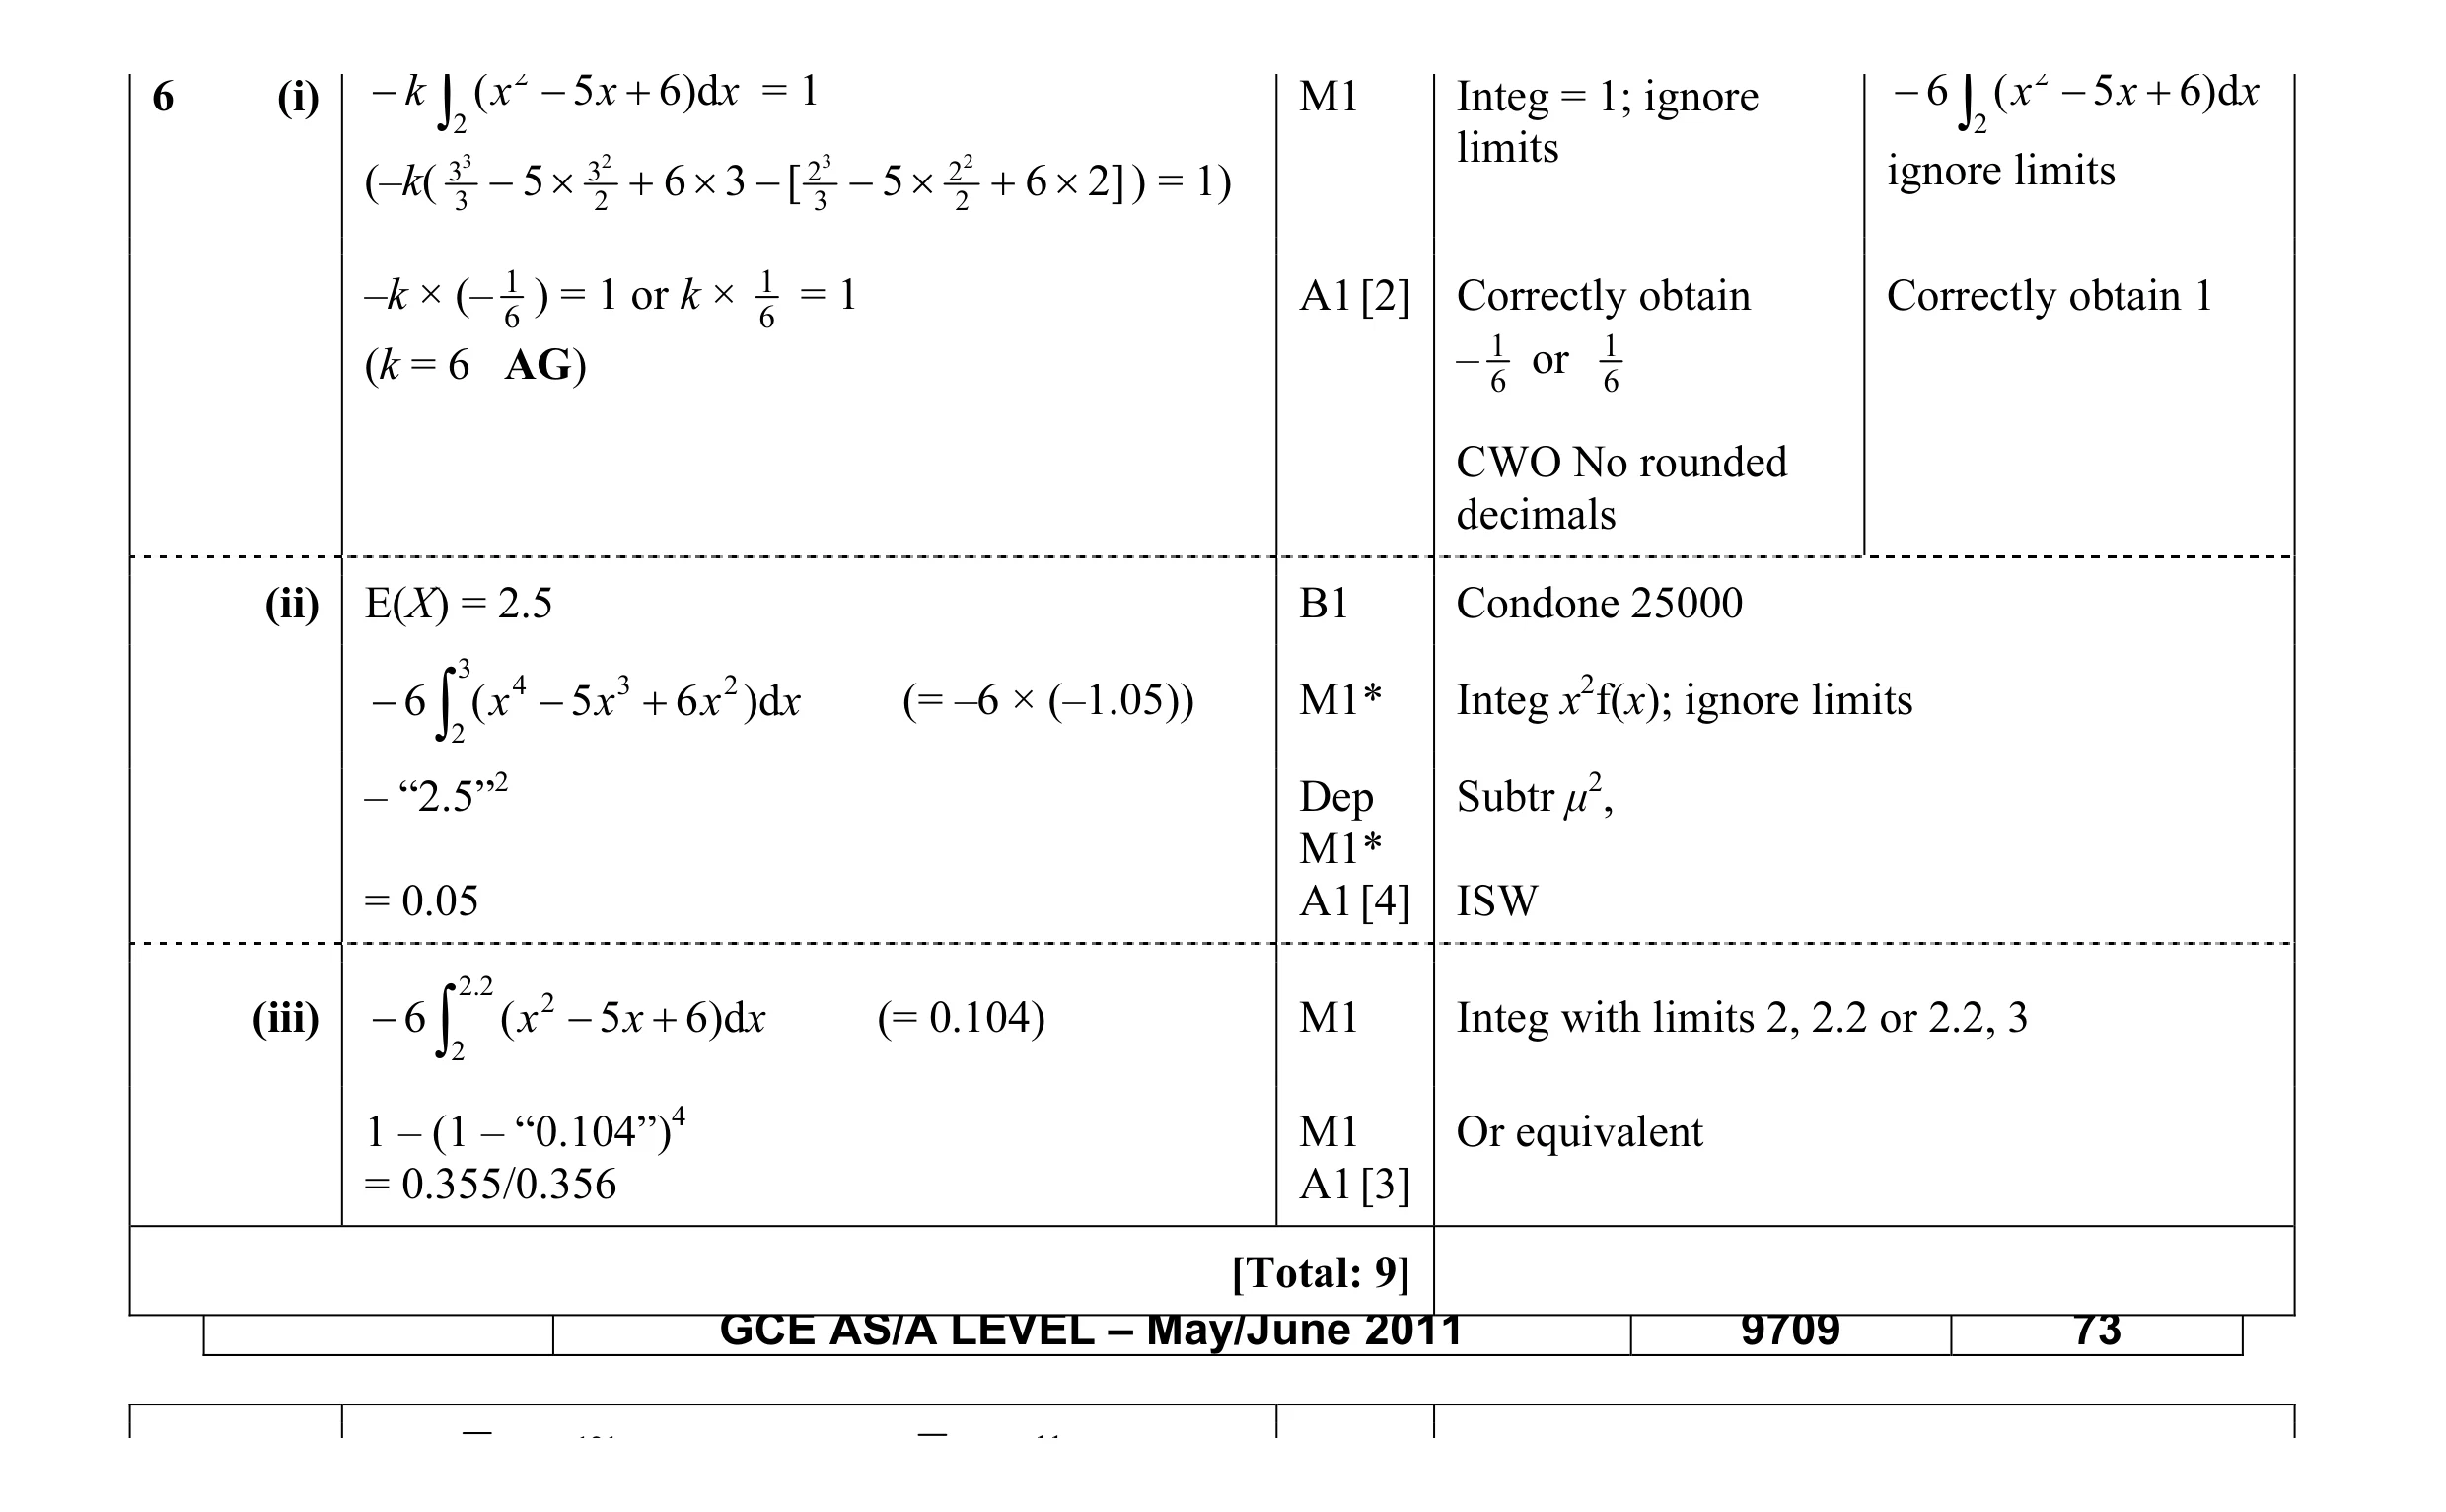 9
9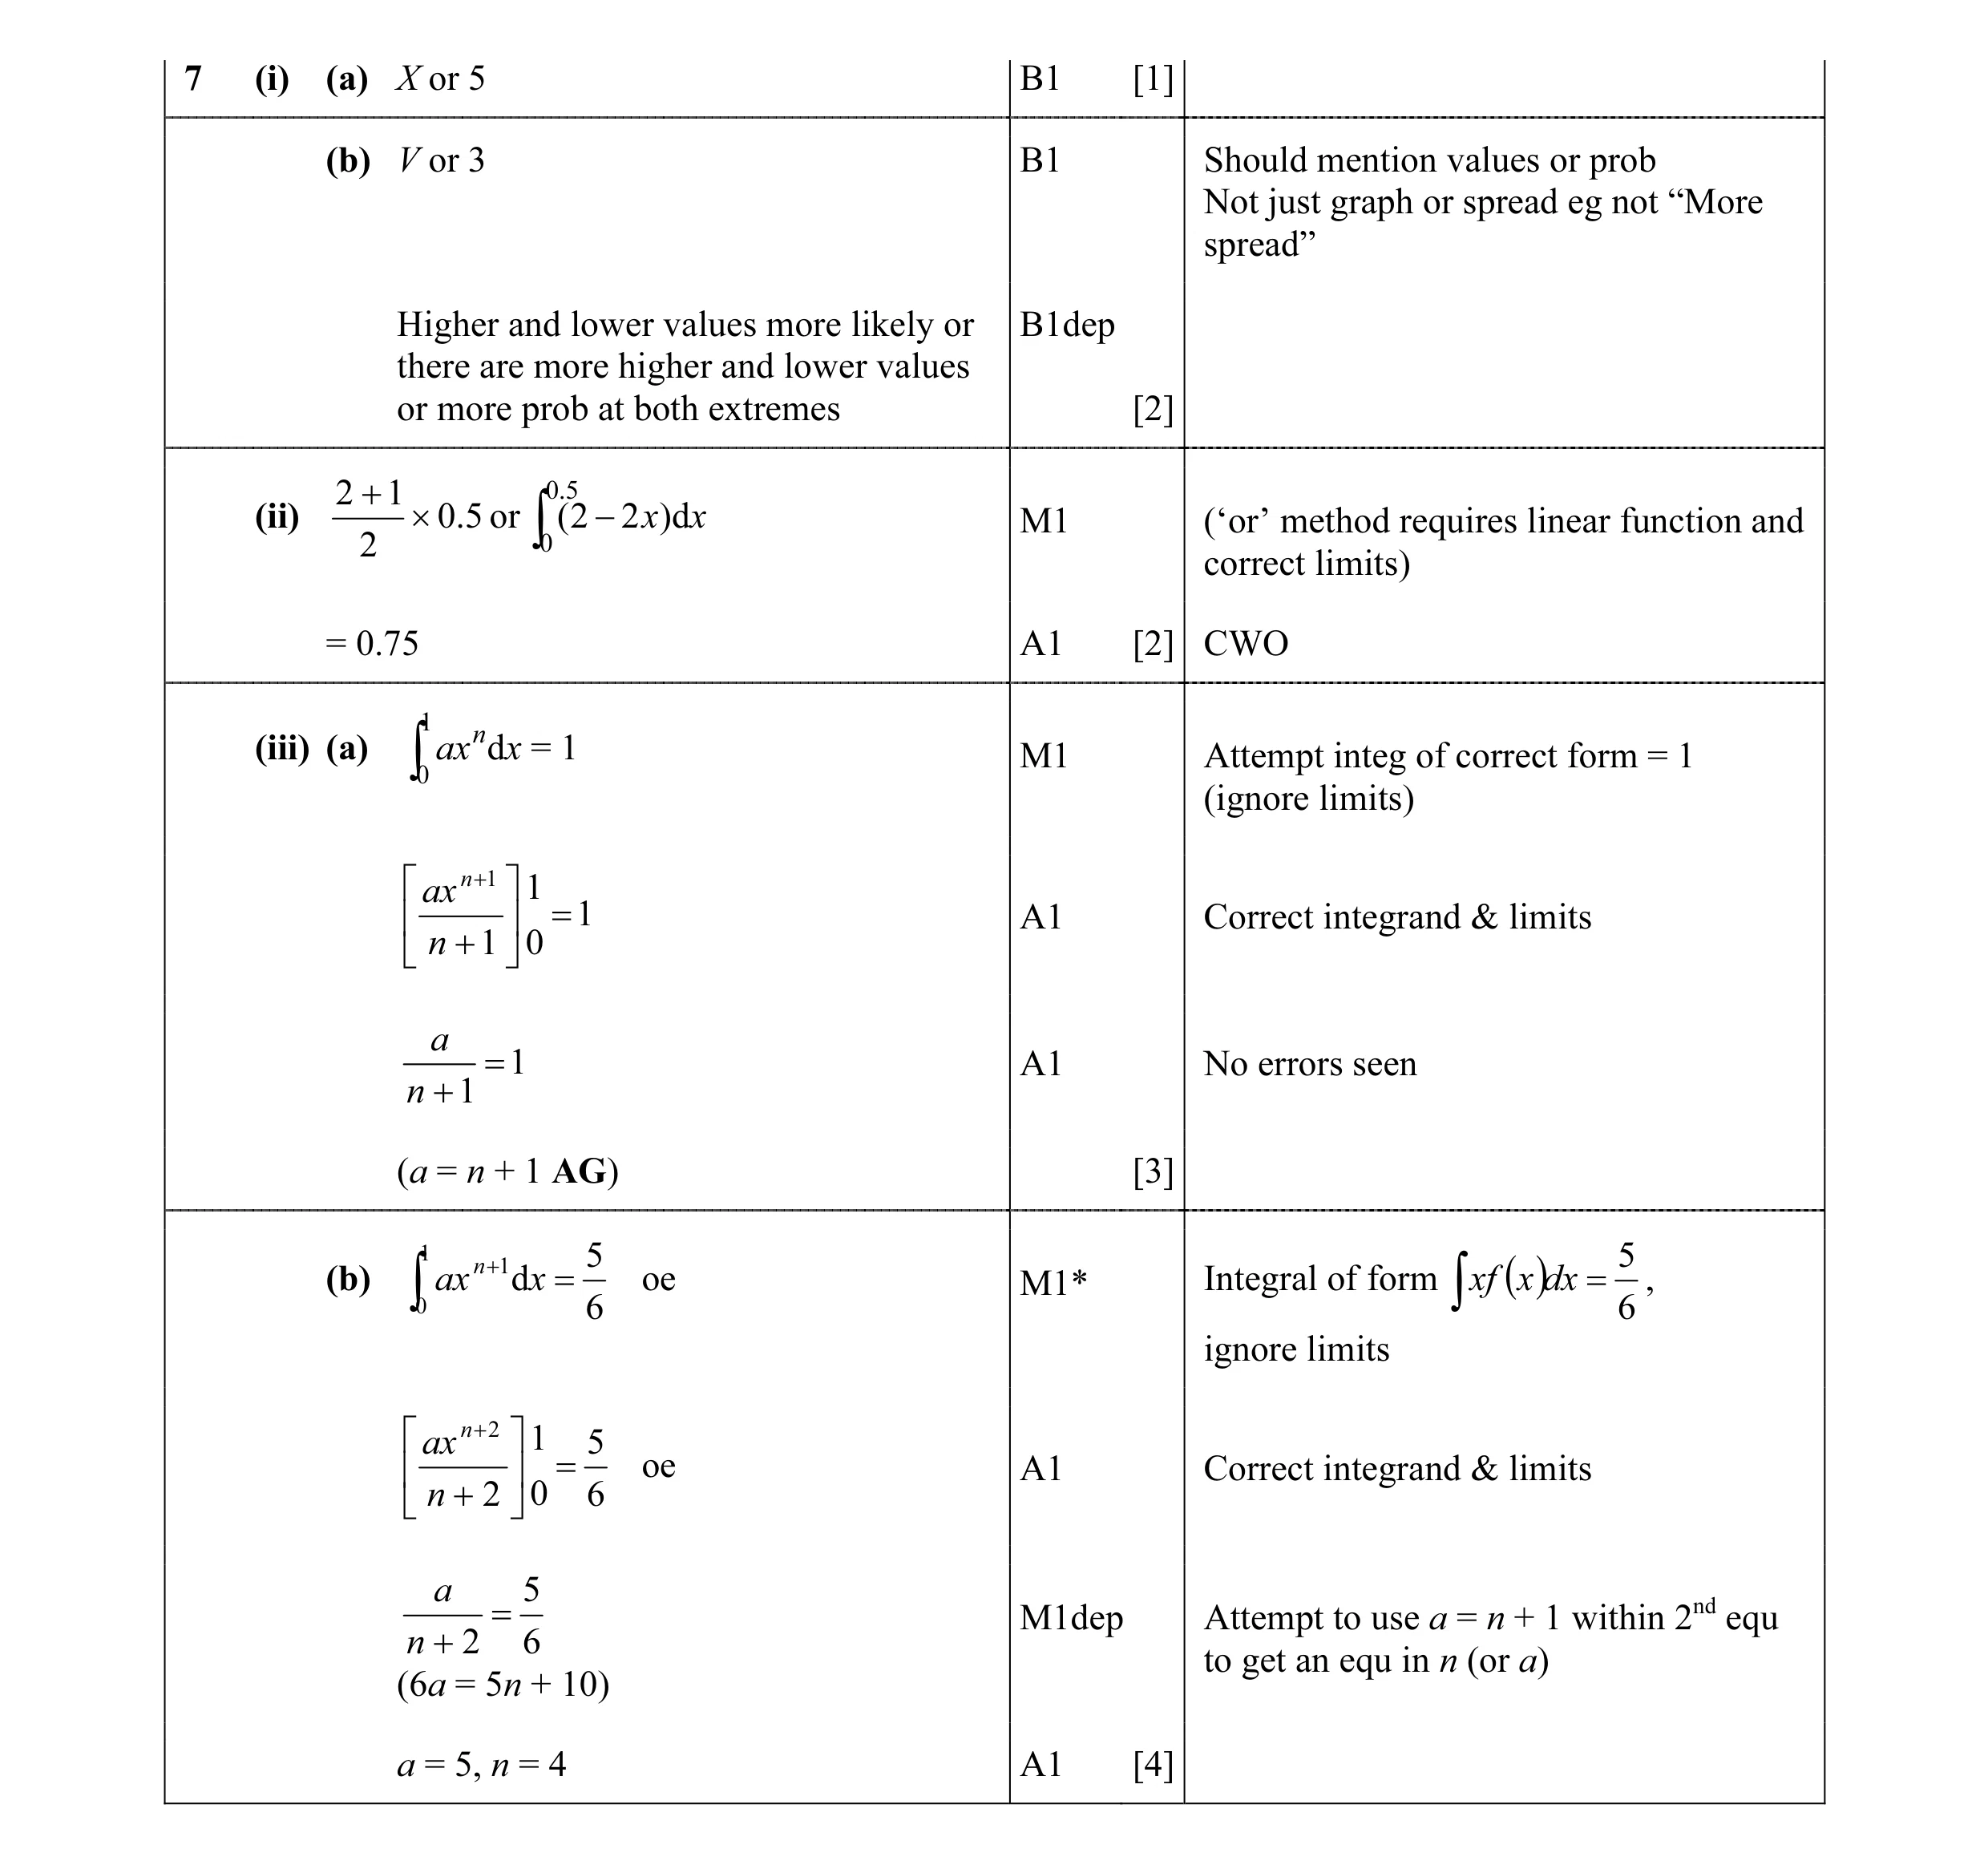 12
12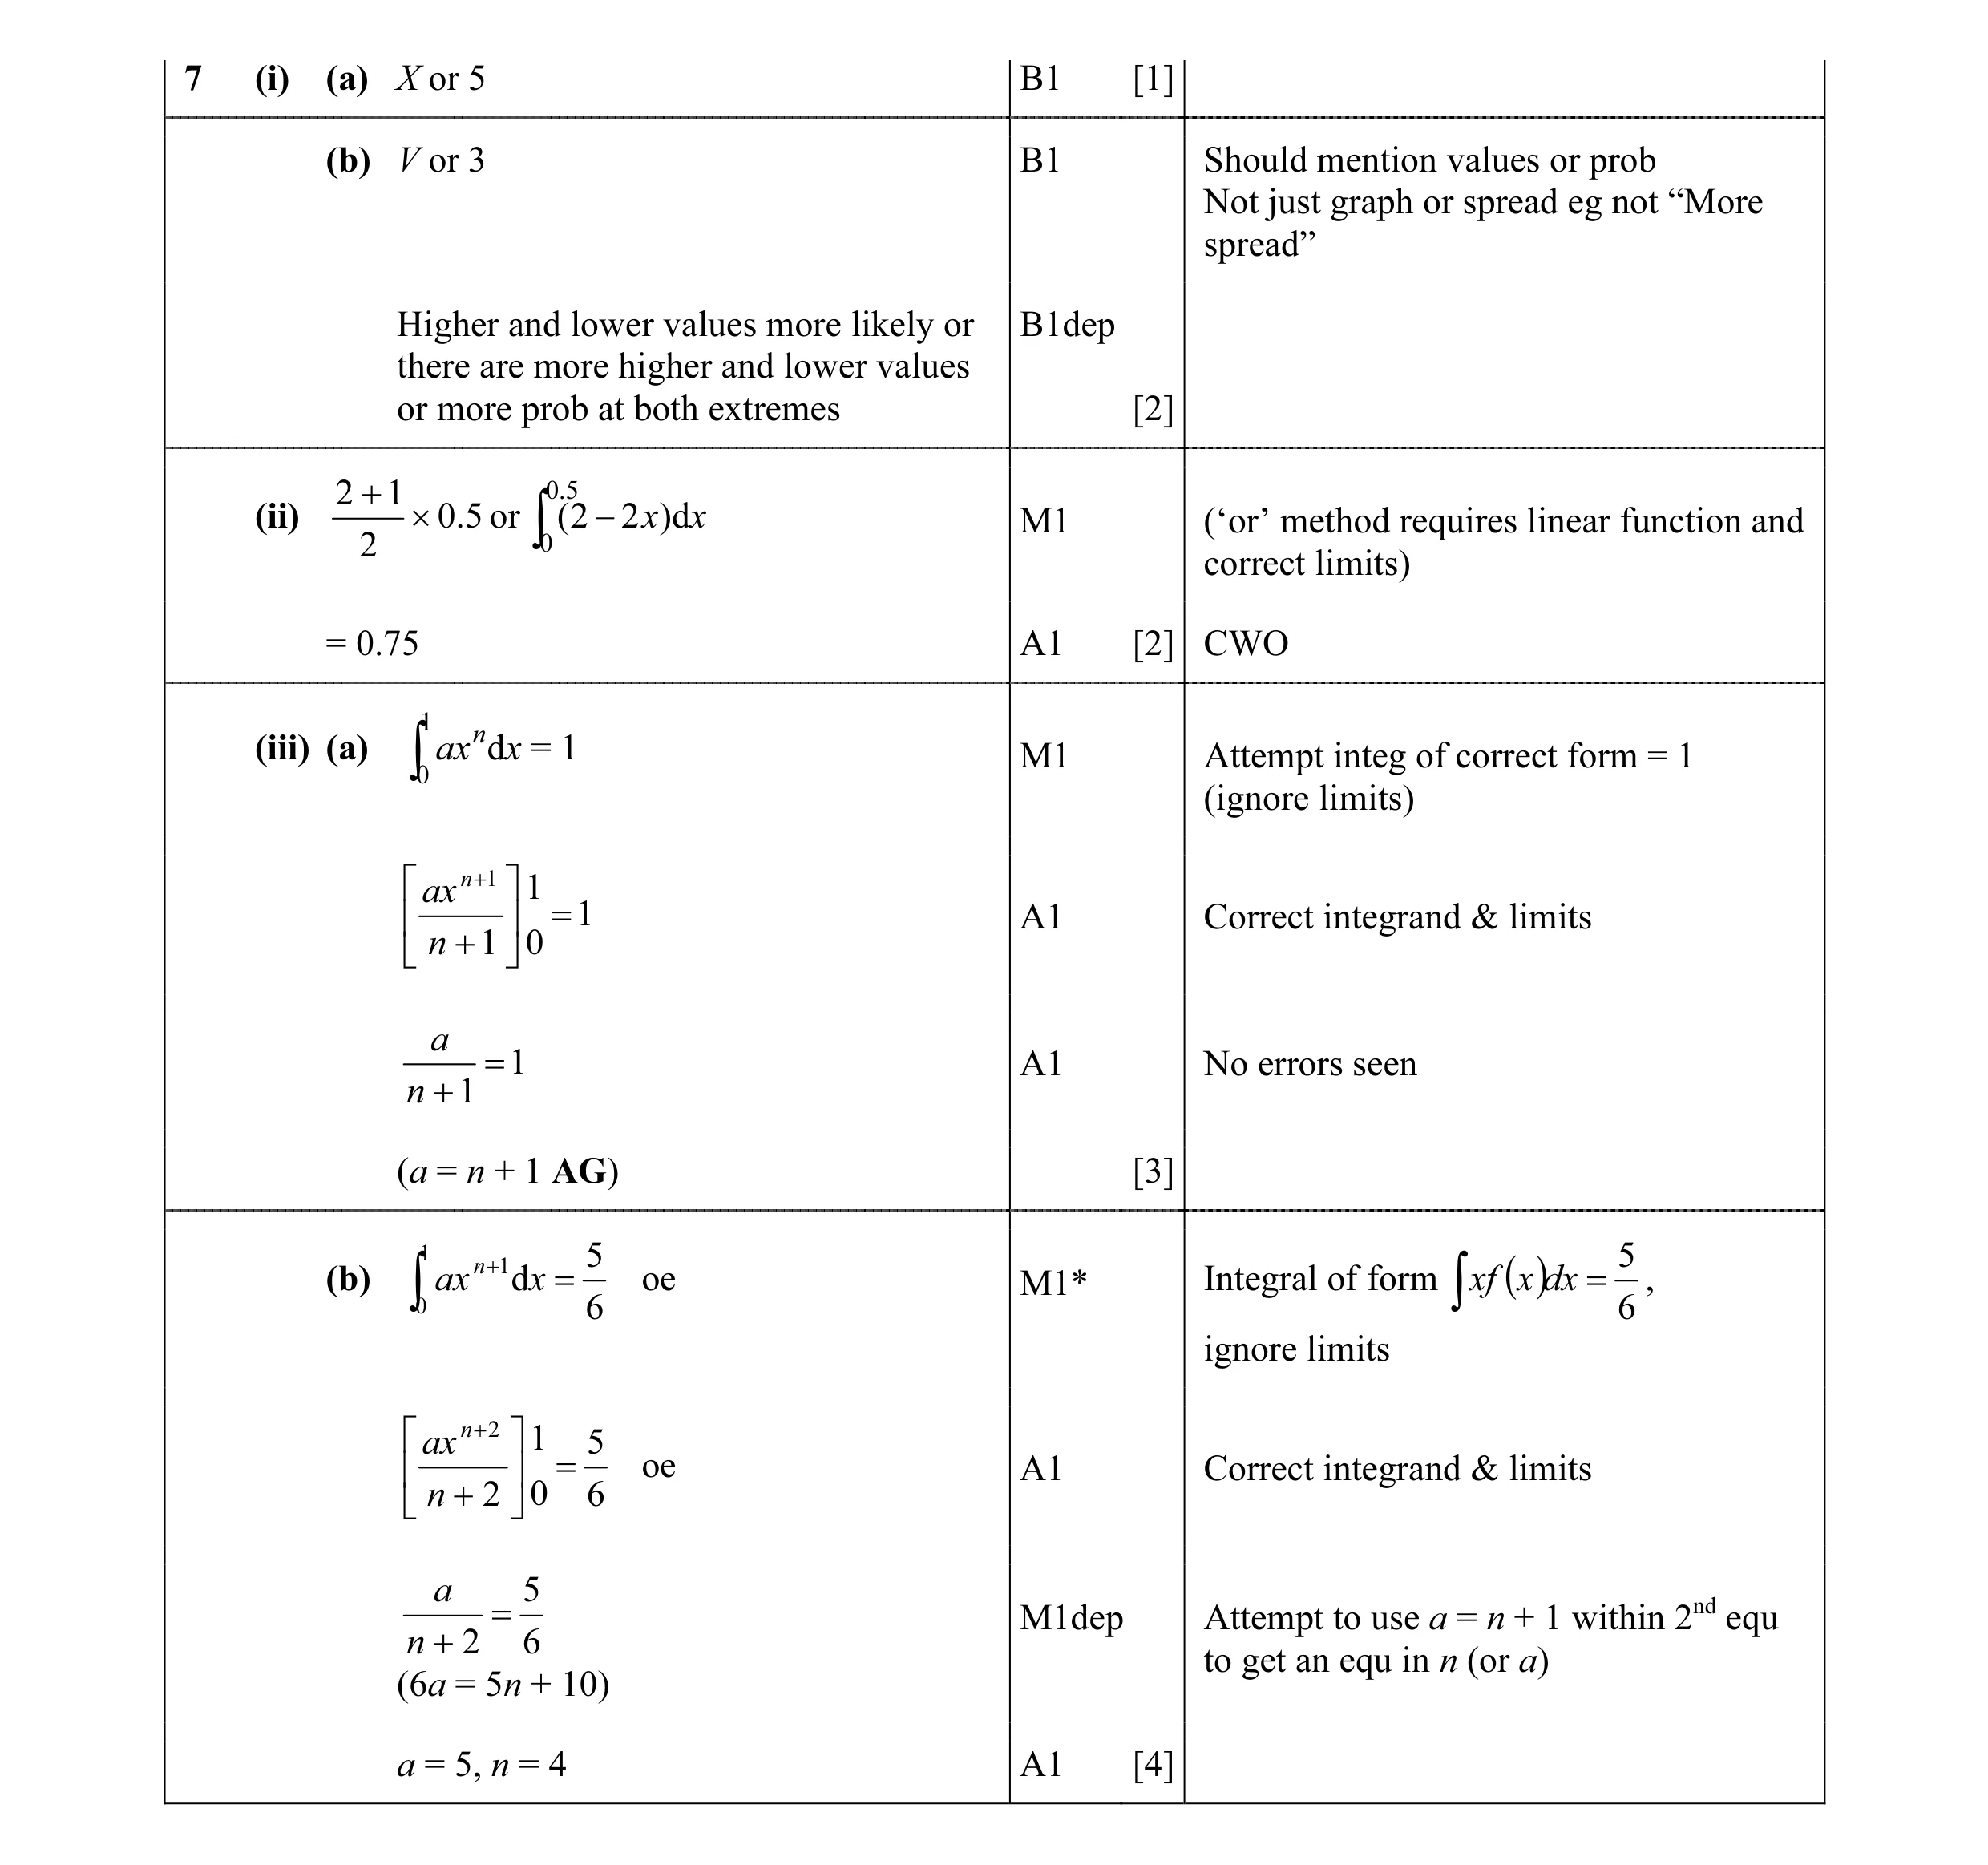 12
12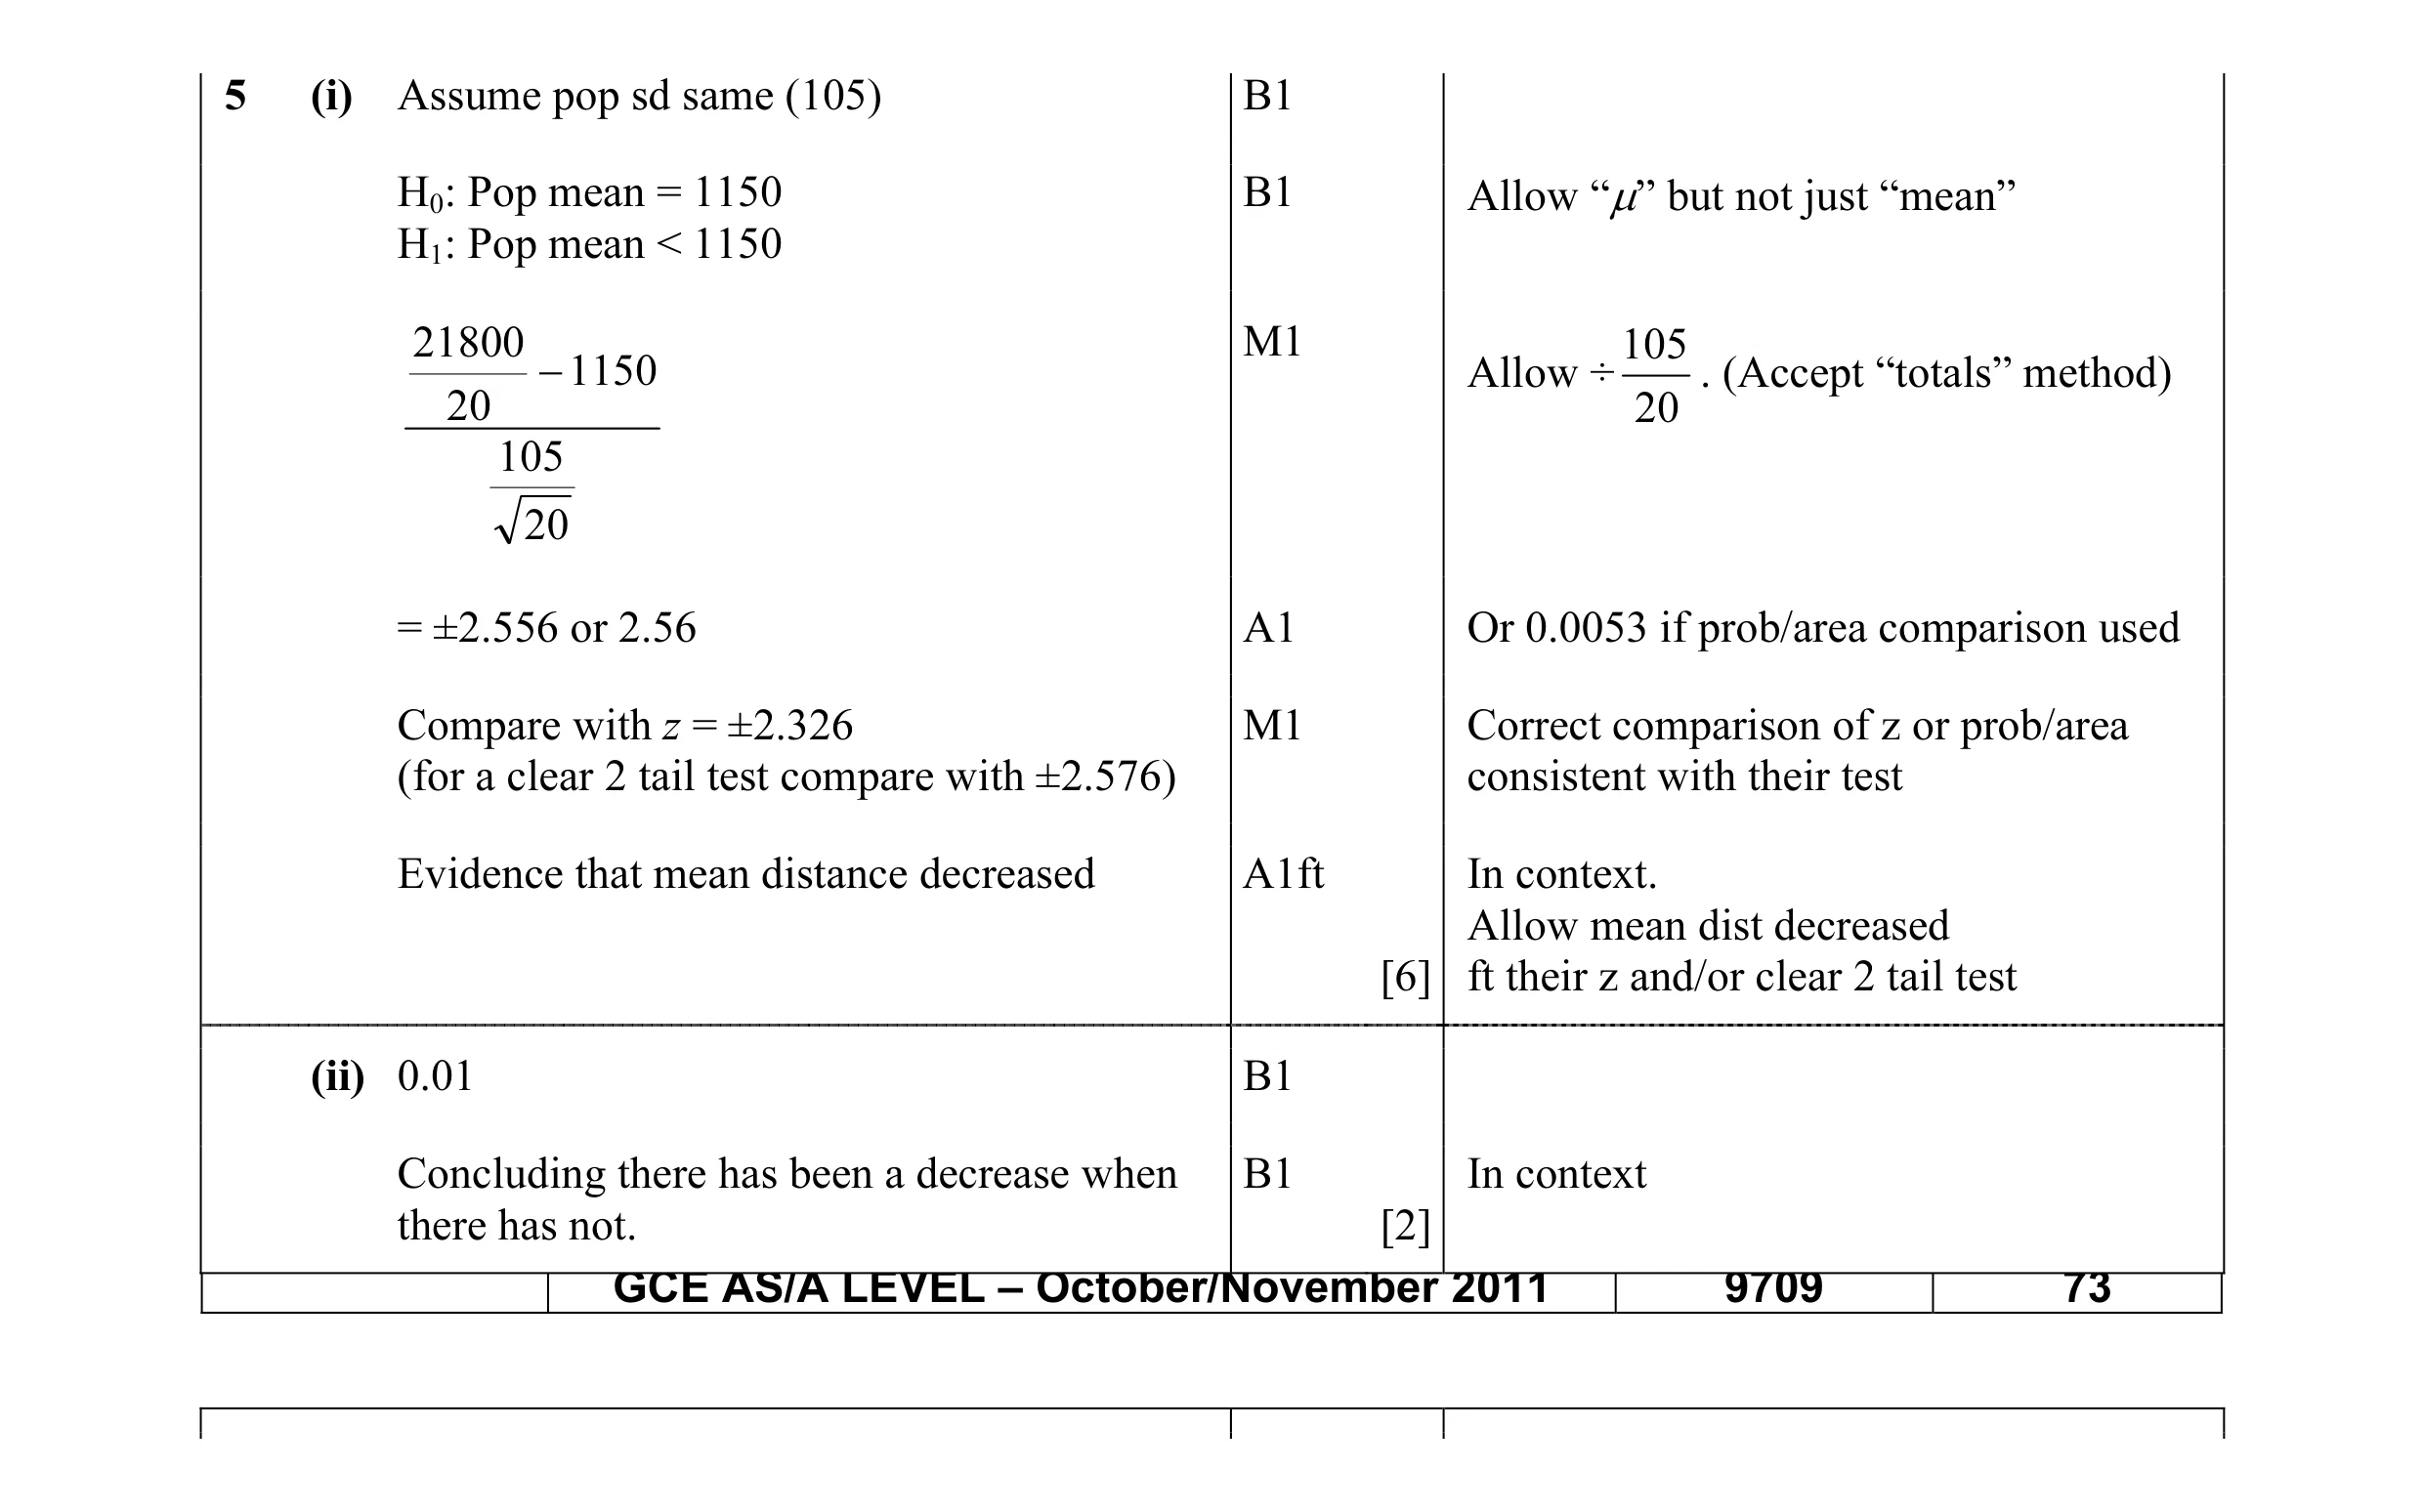 8
8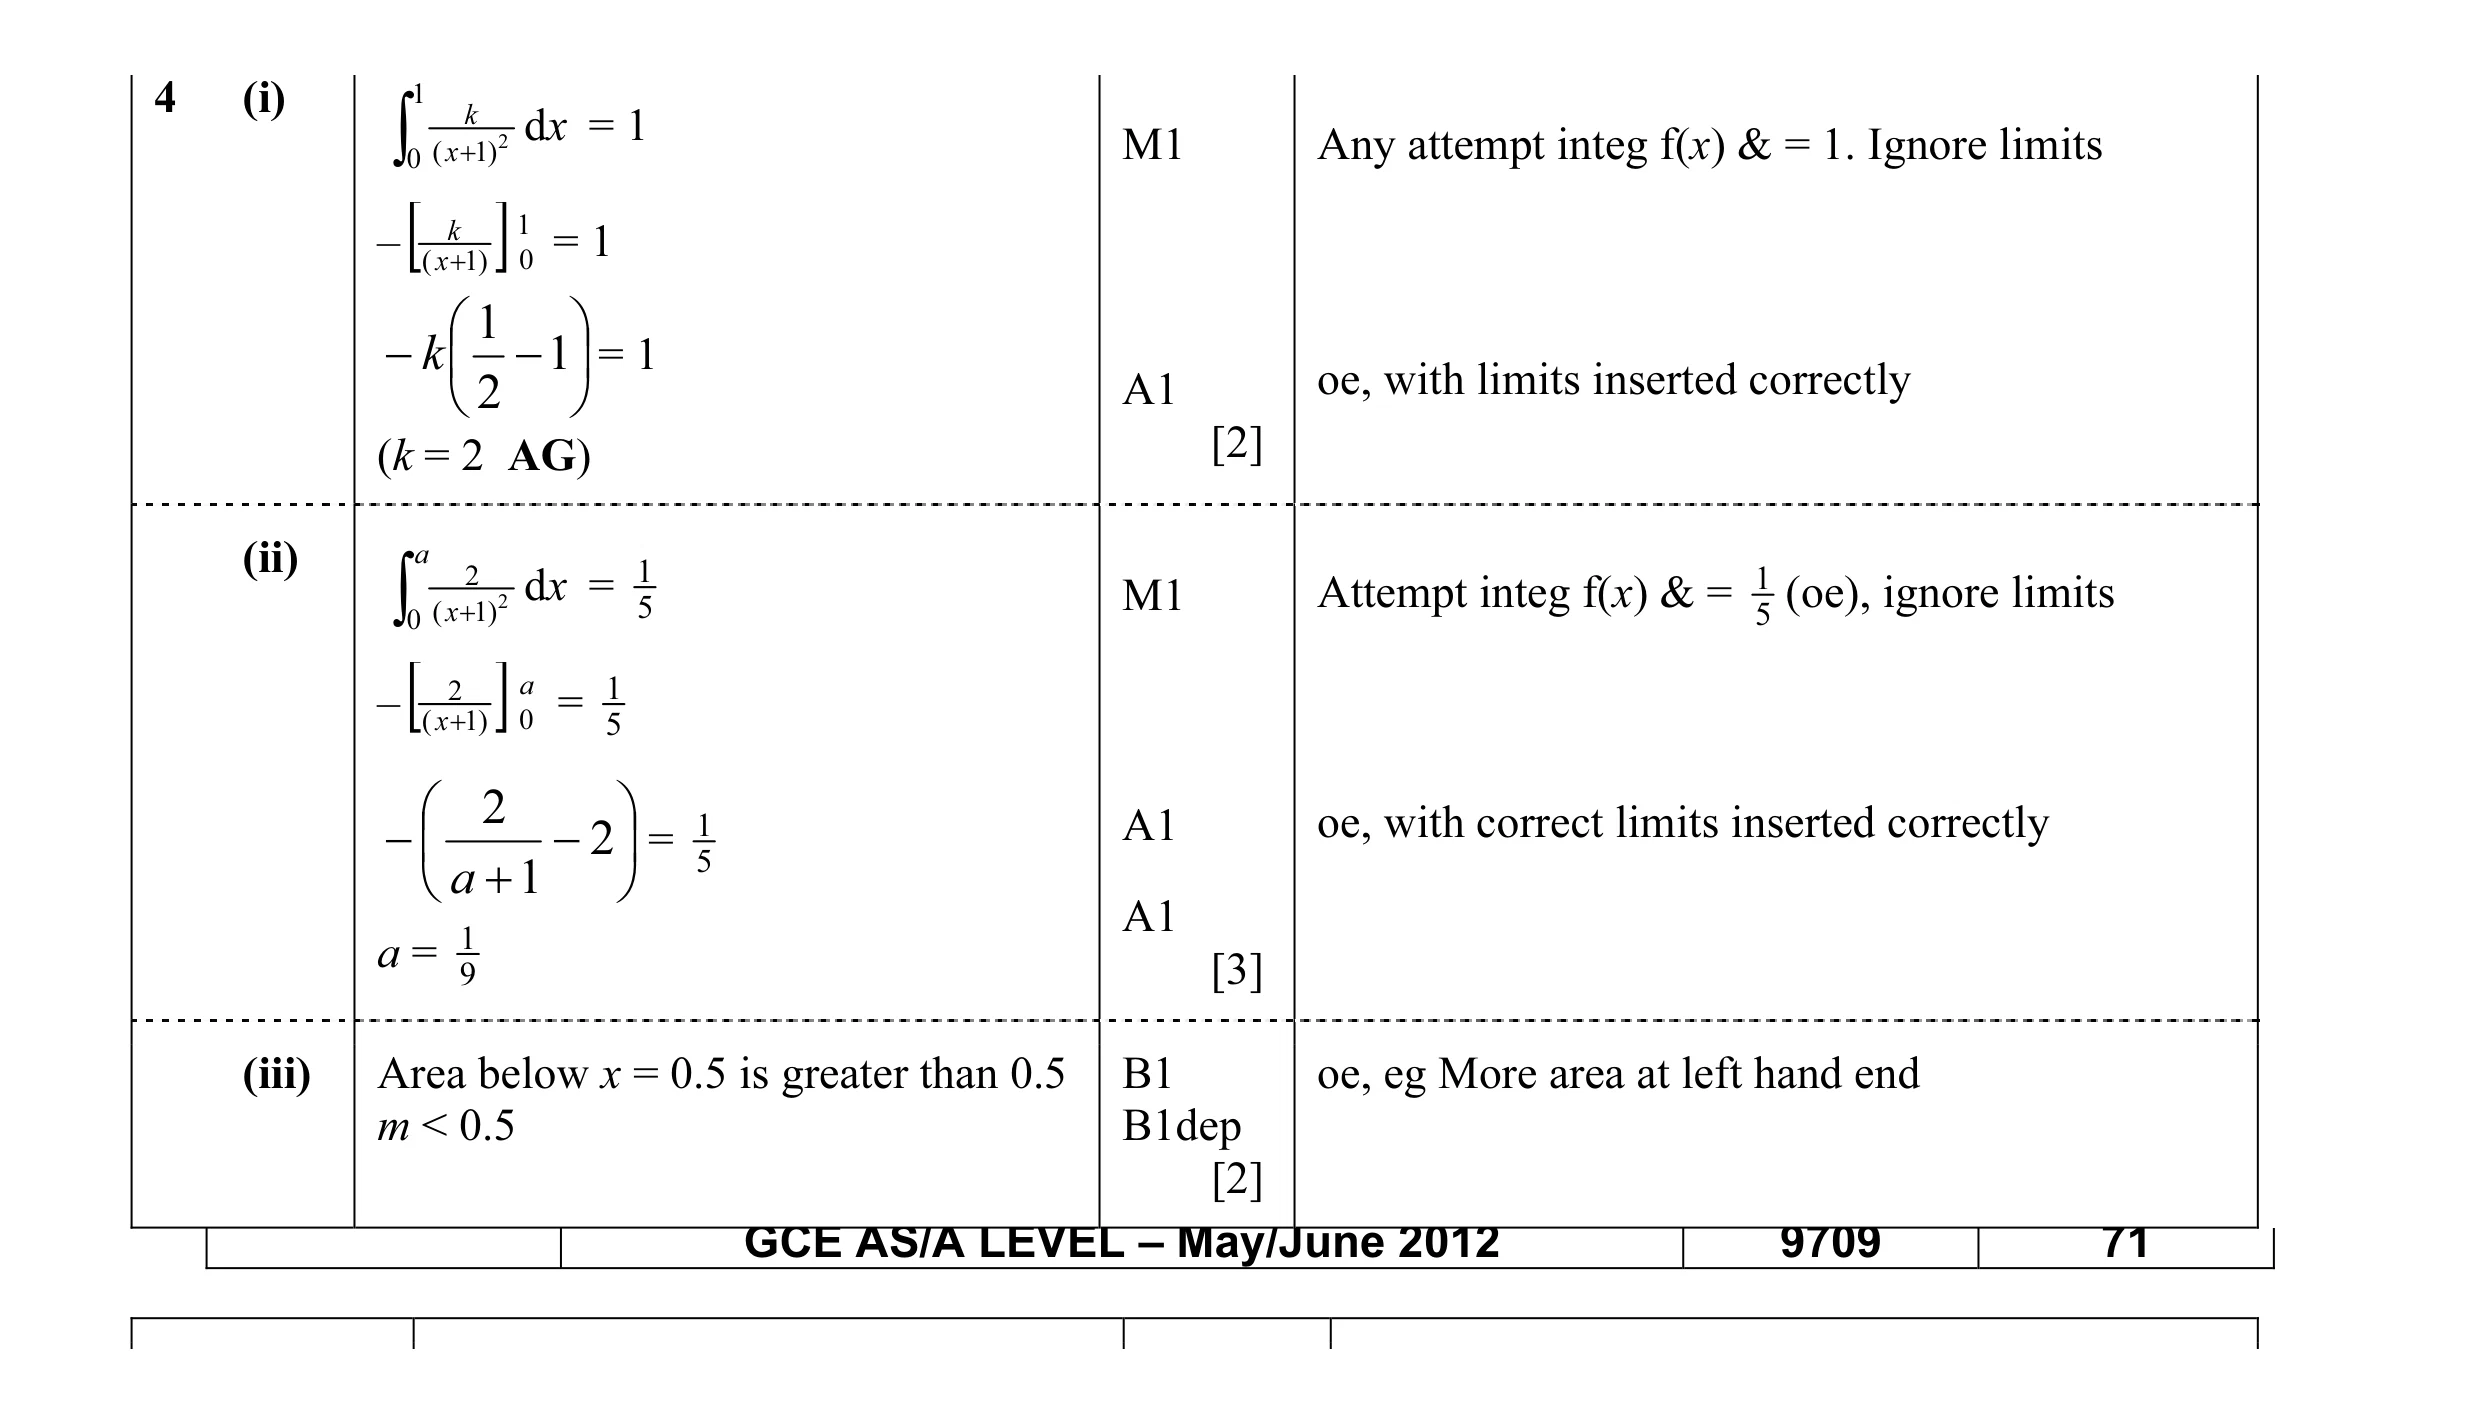 7
7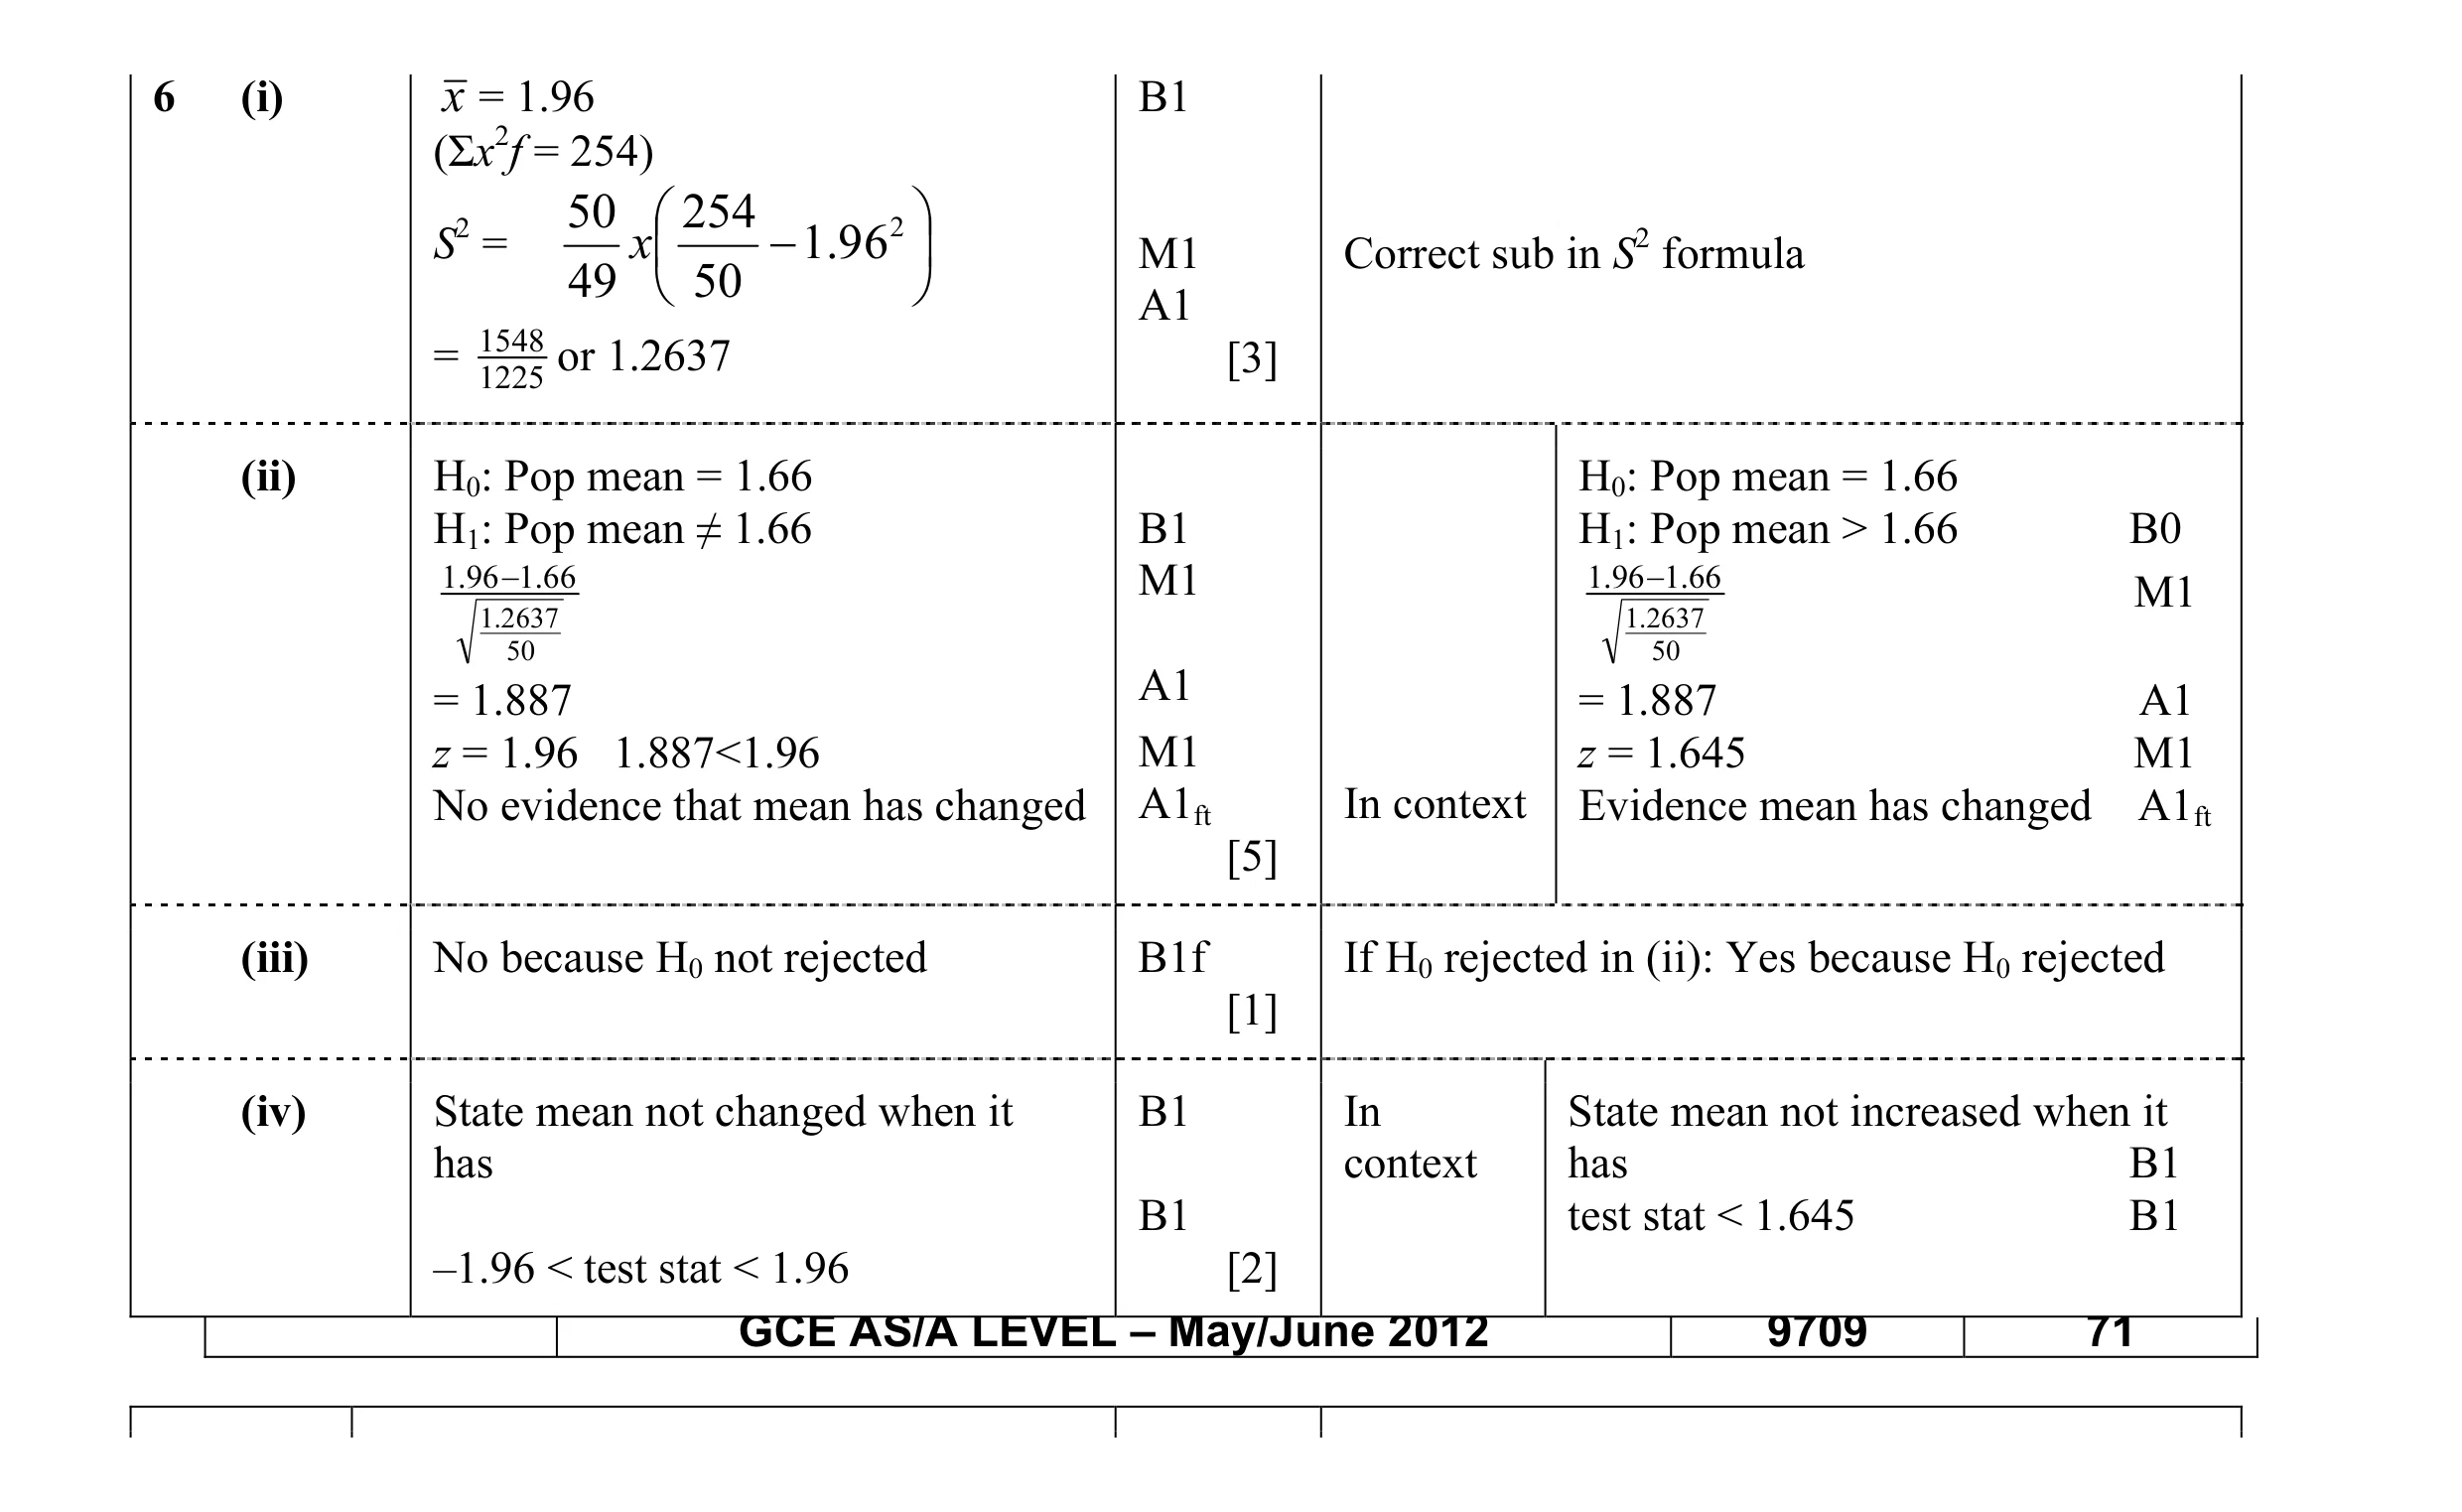 11
11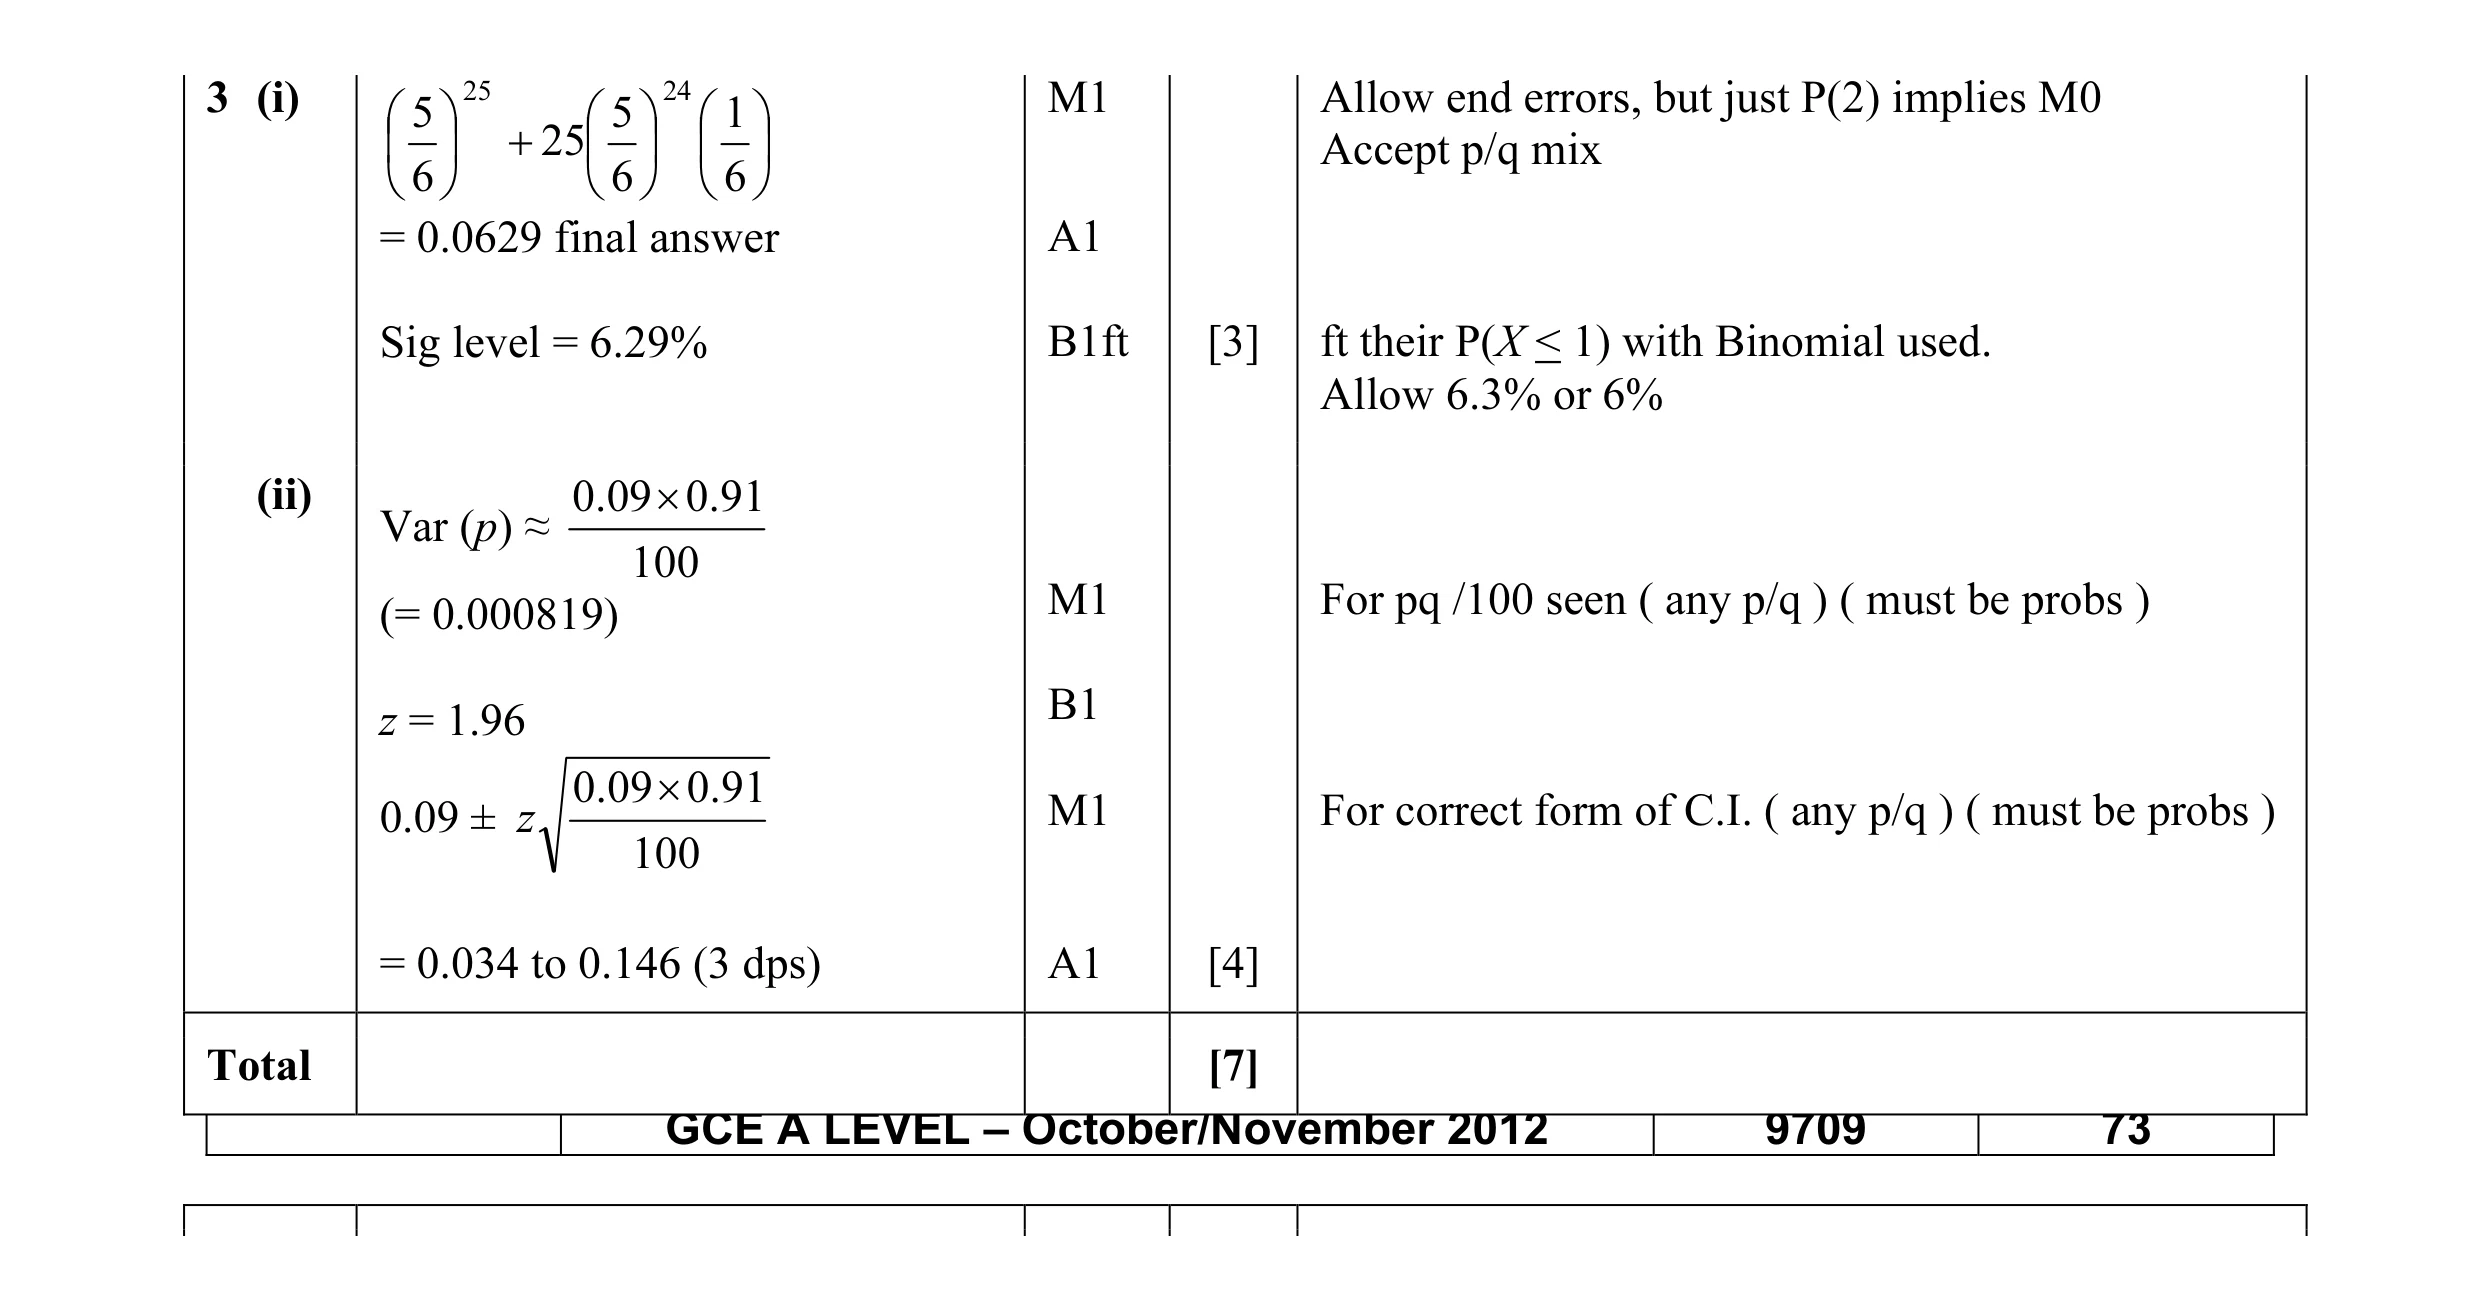 7
7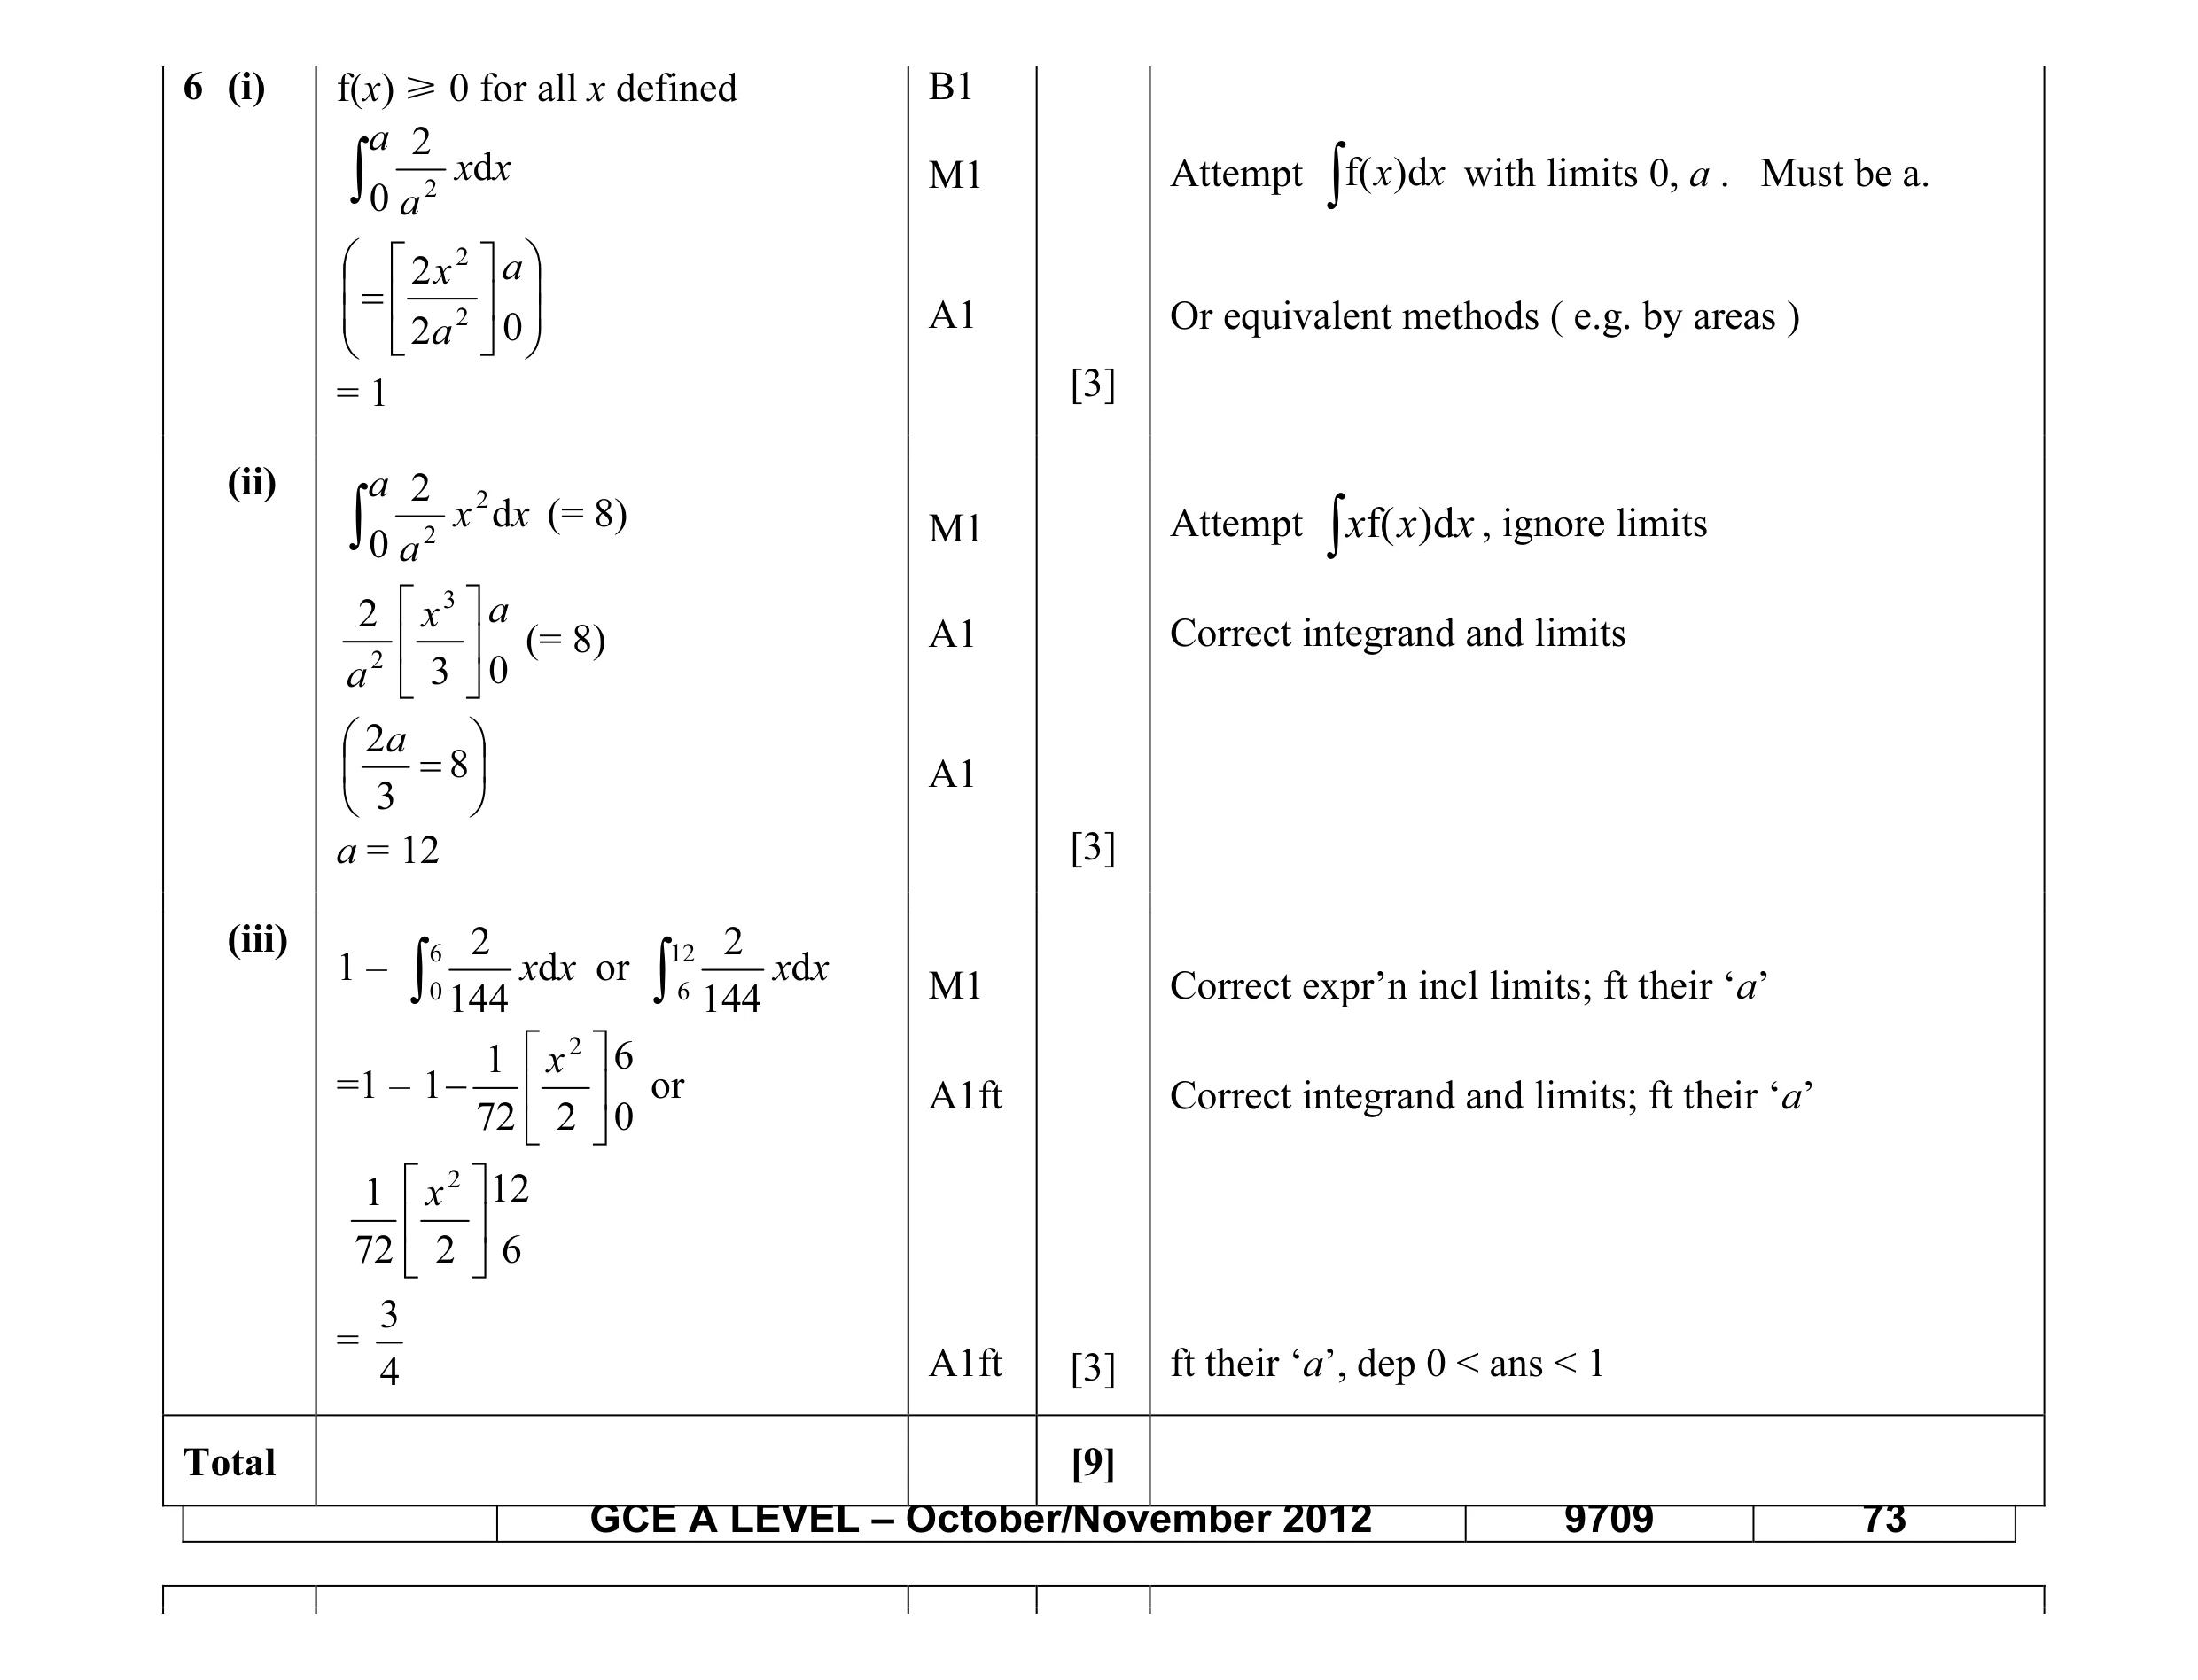 9
9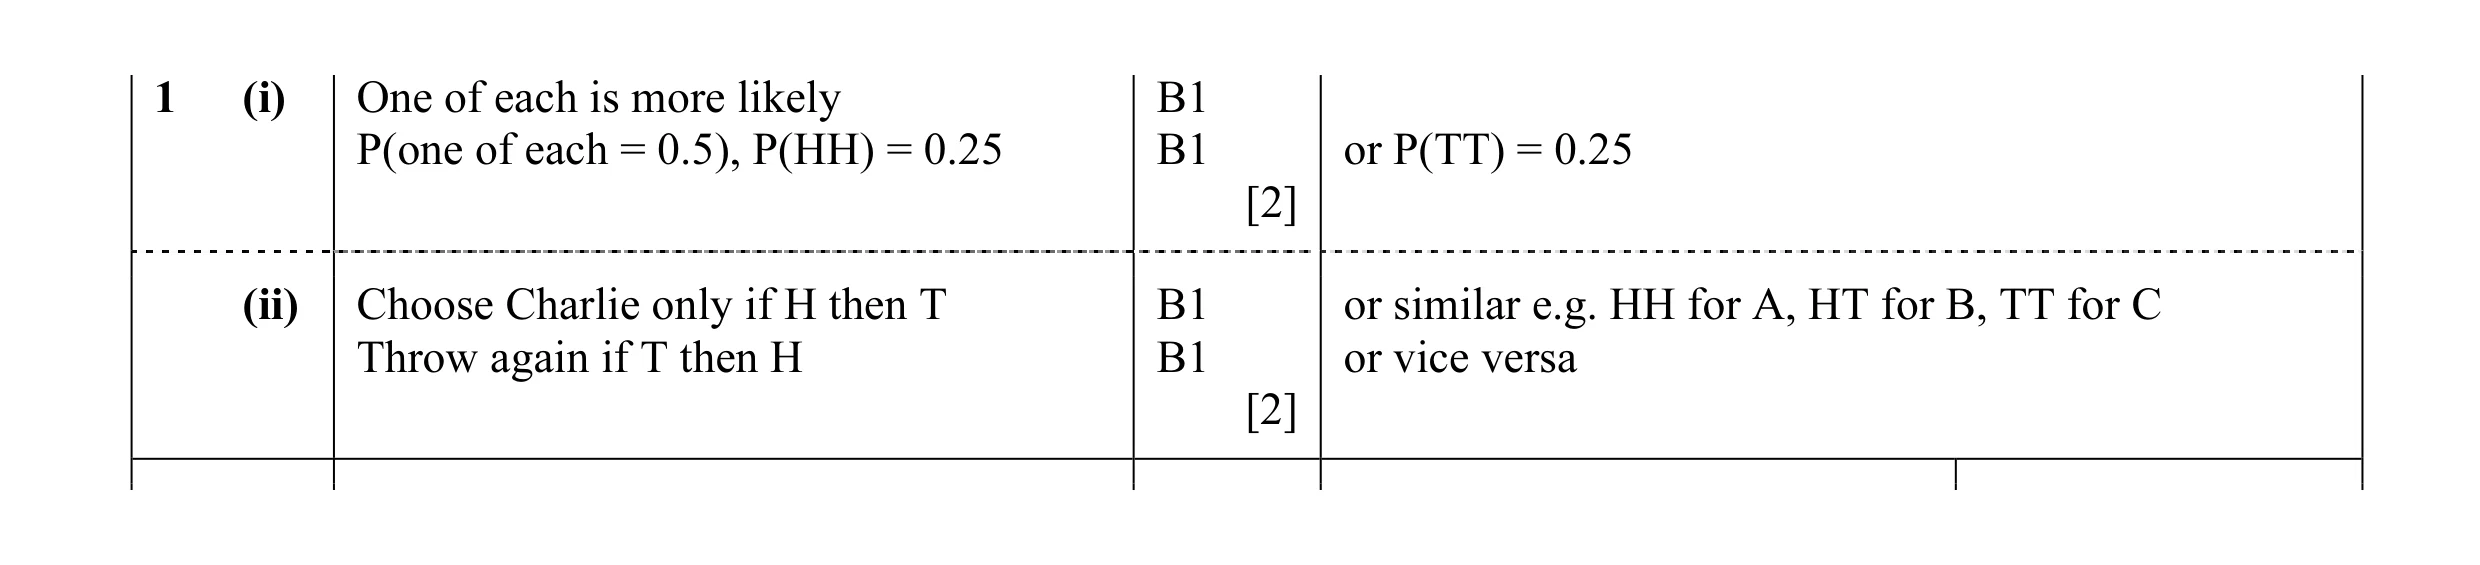 4
4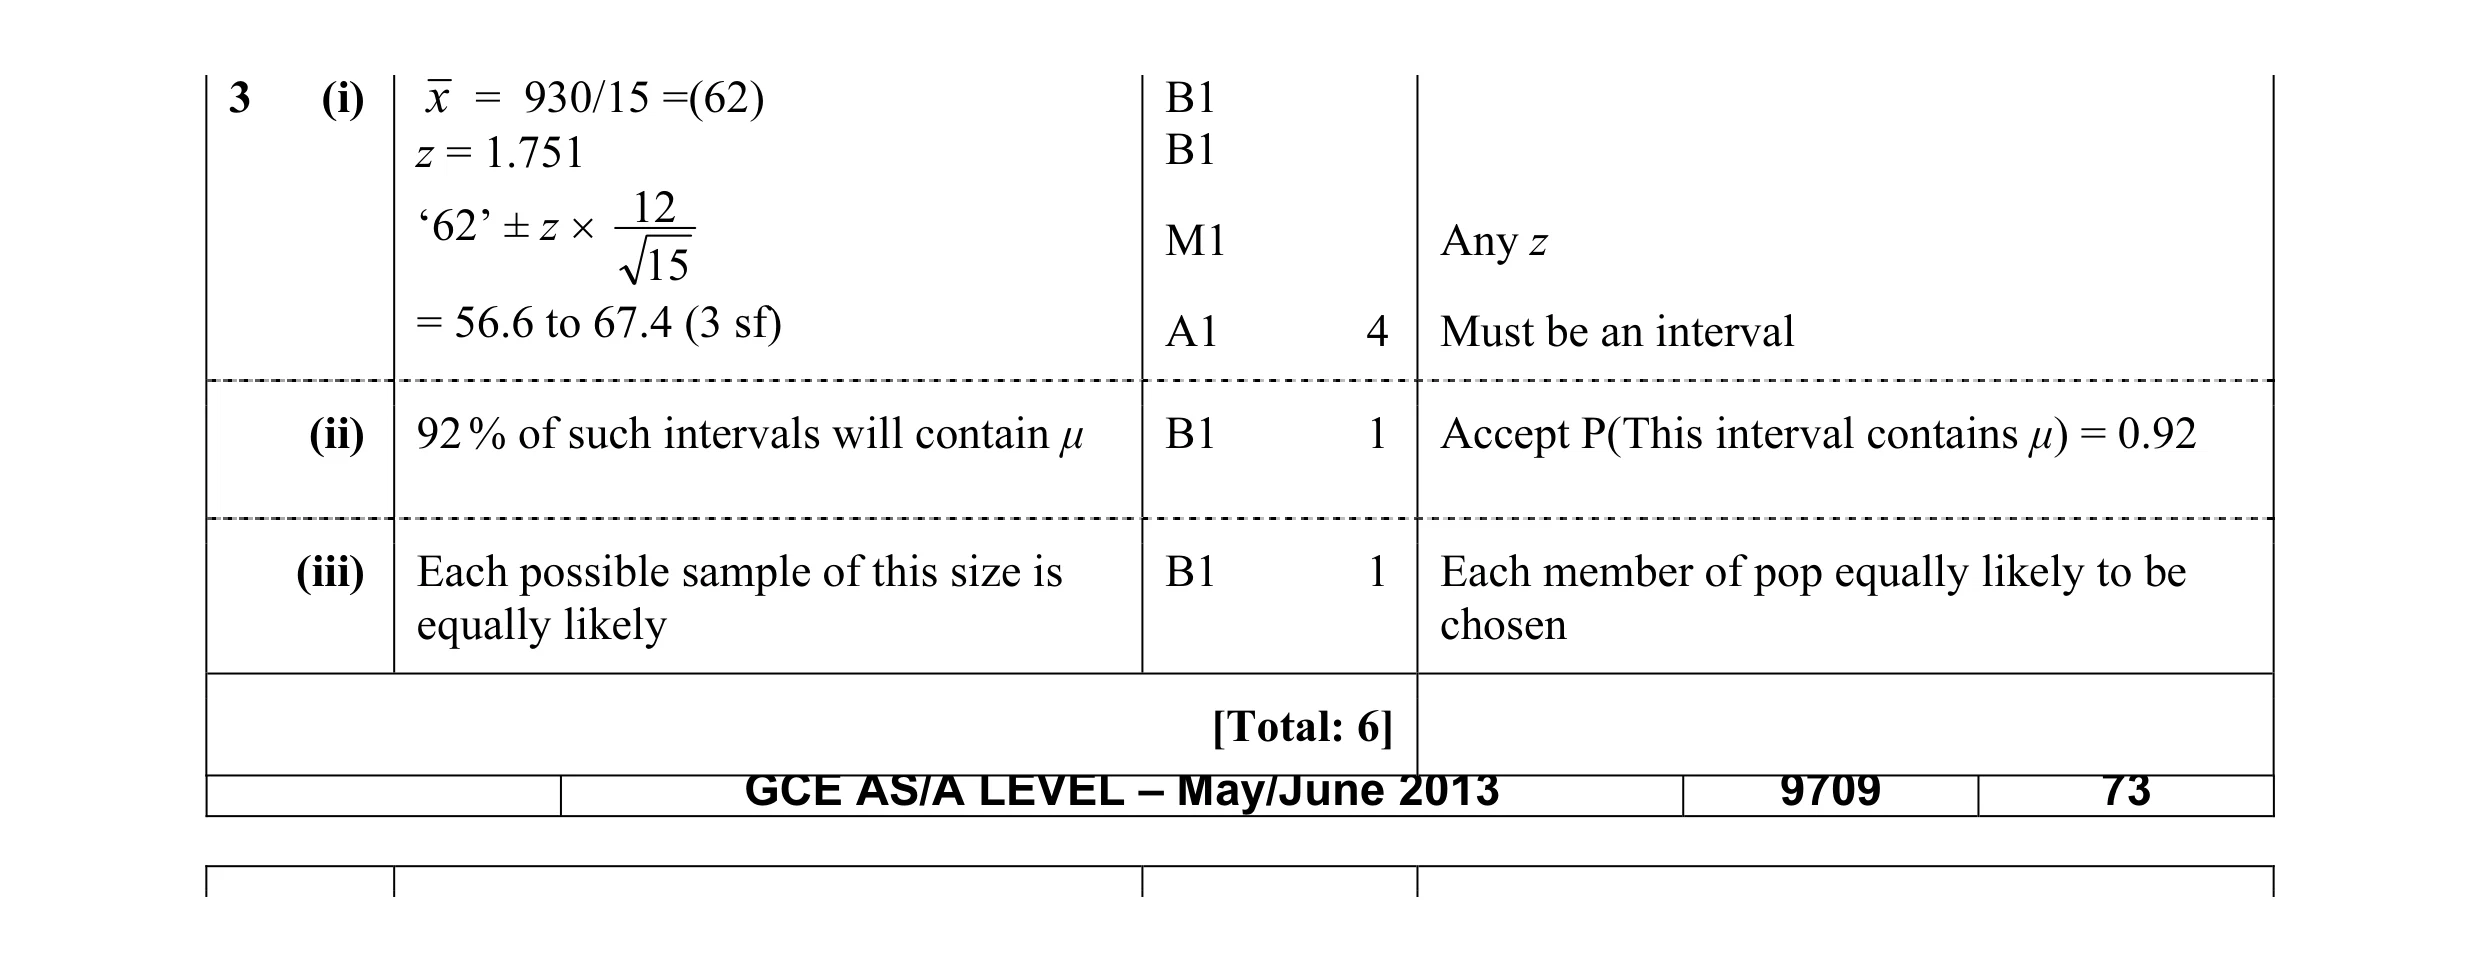 6
6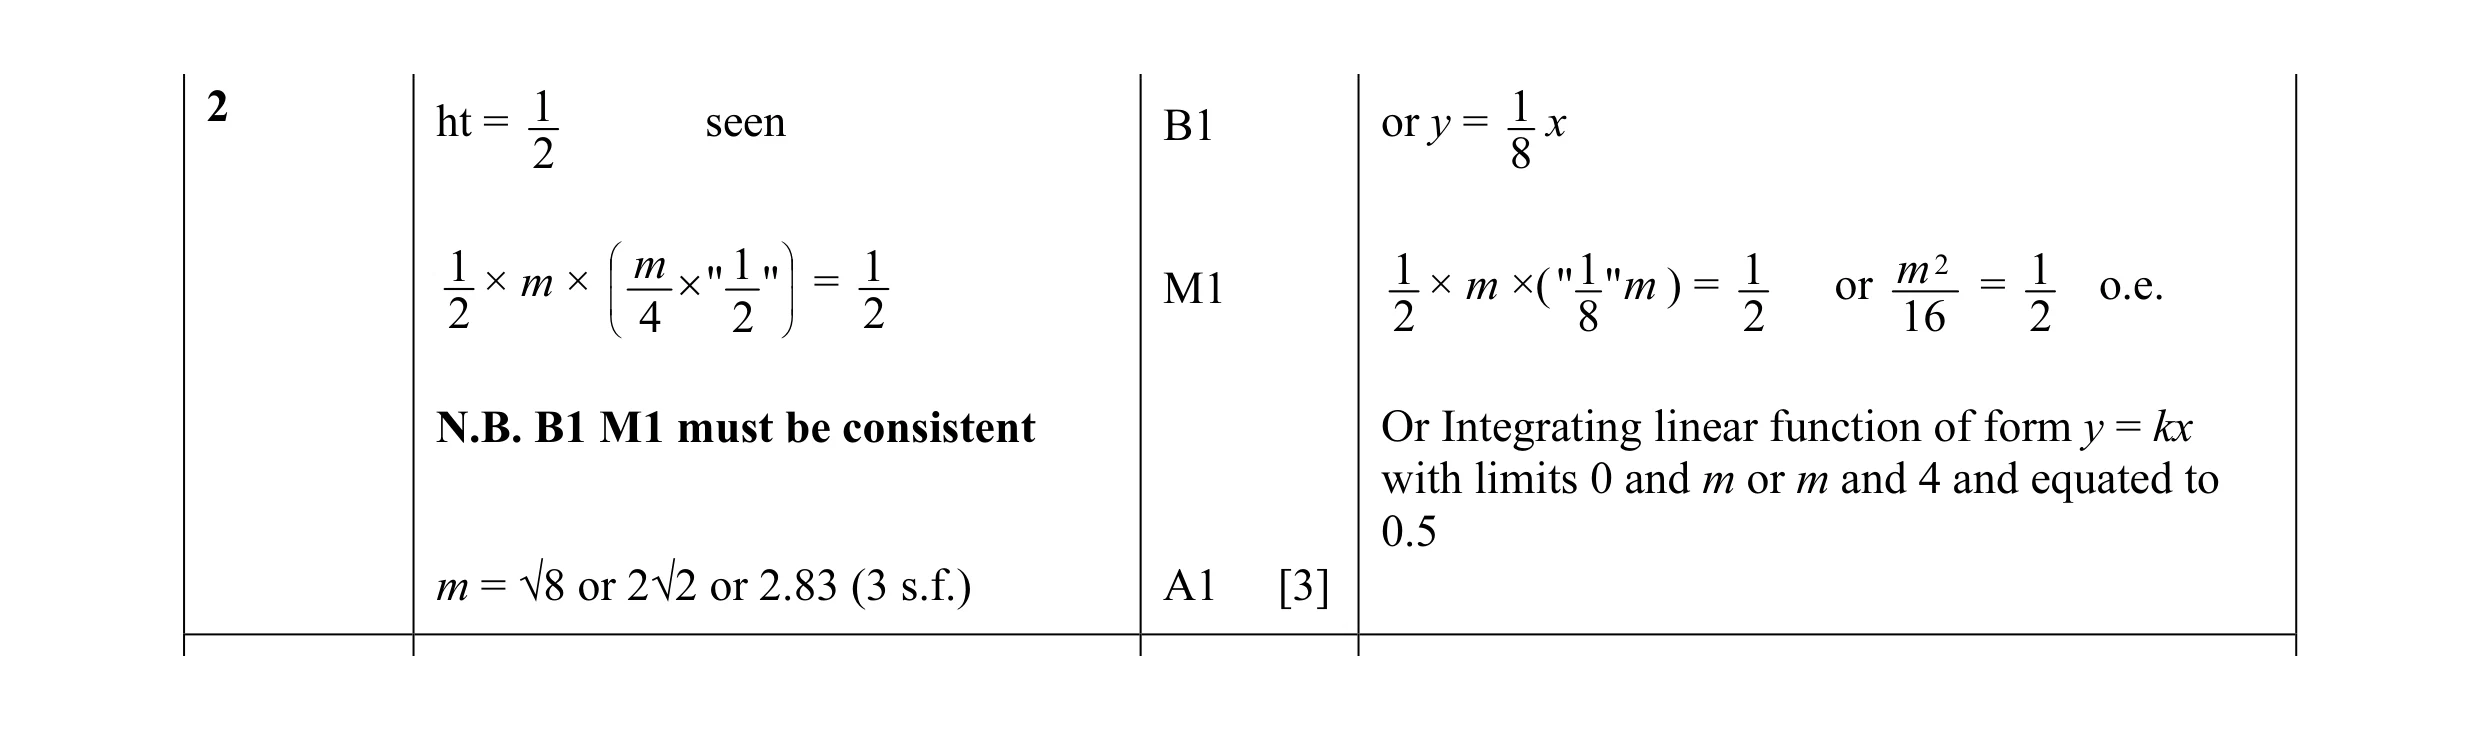 3
3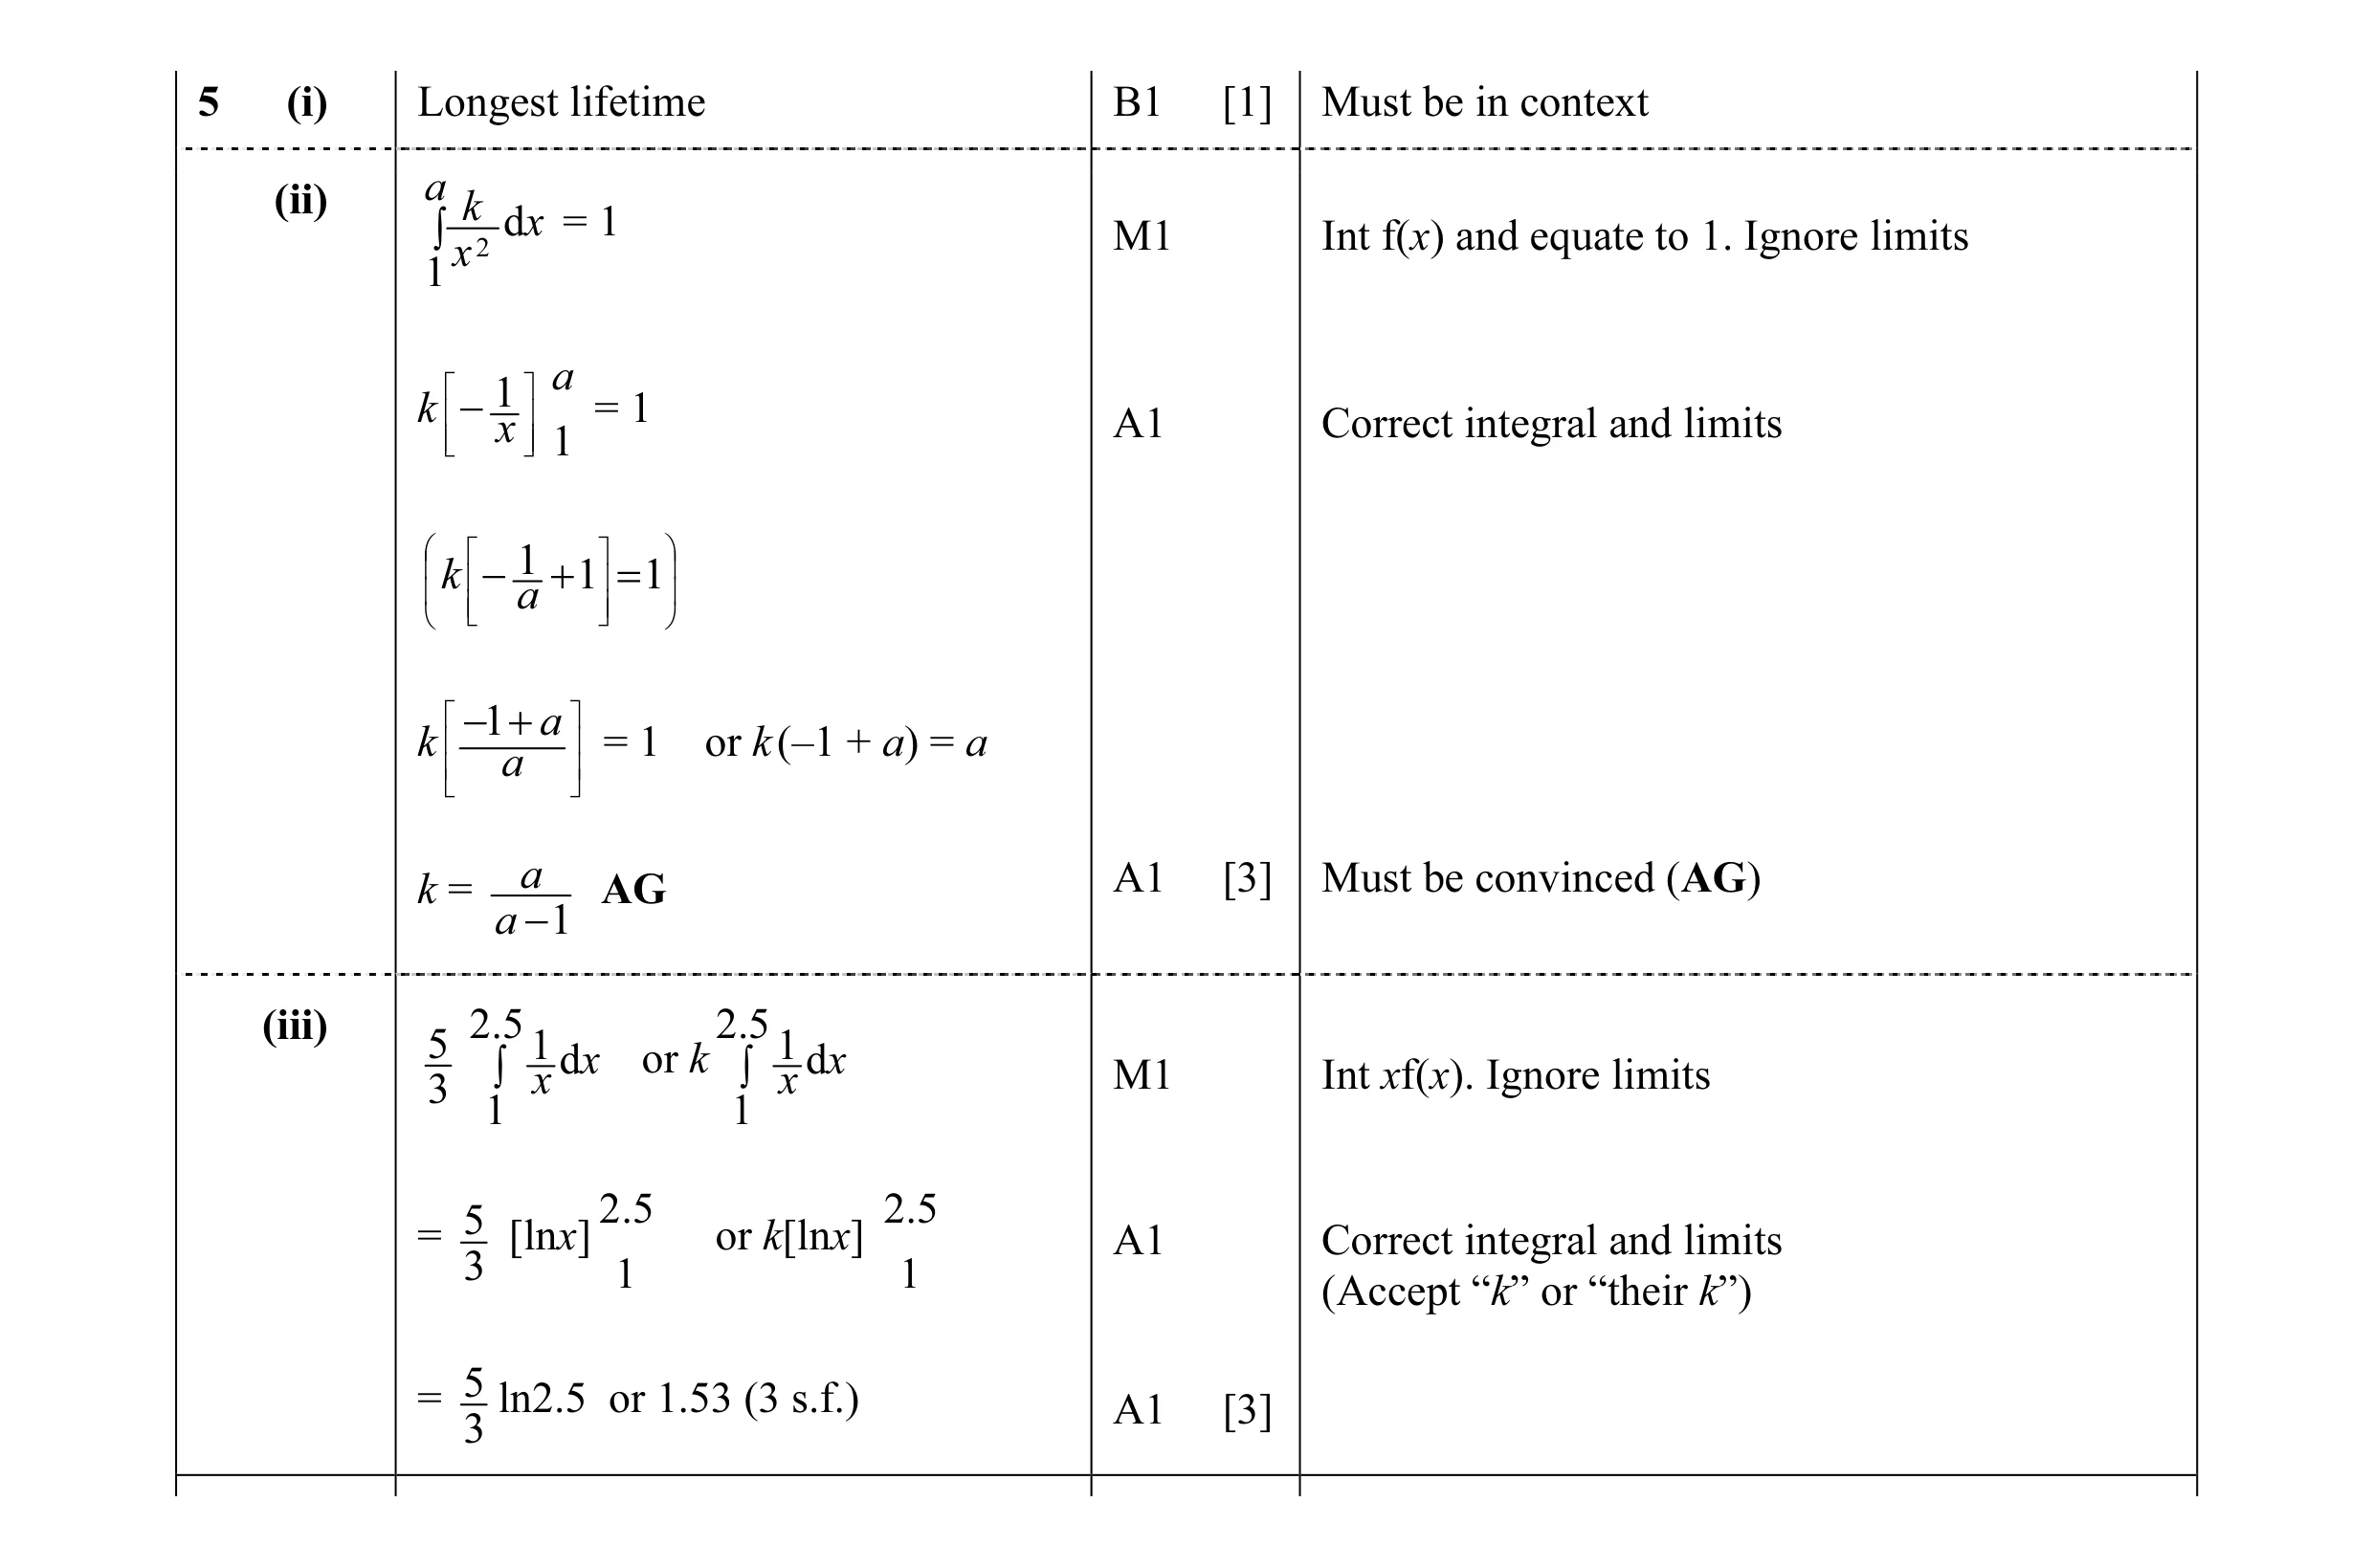 7
7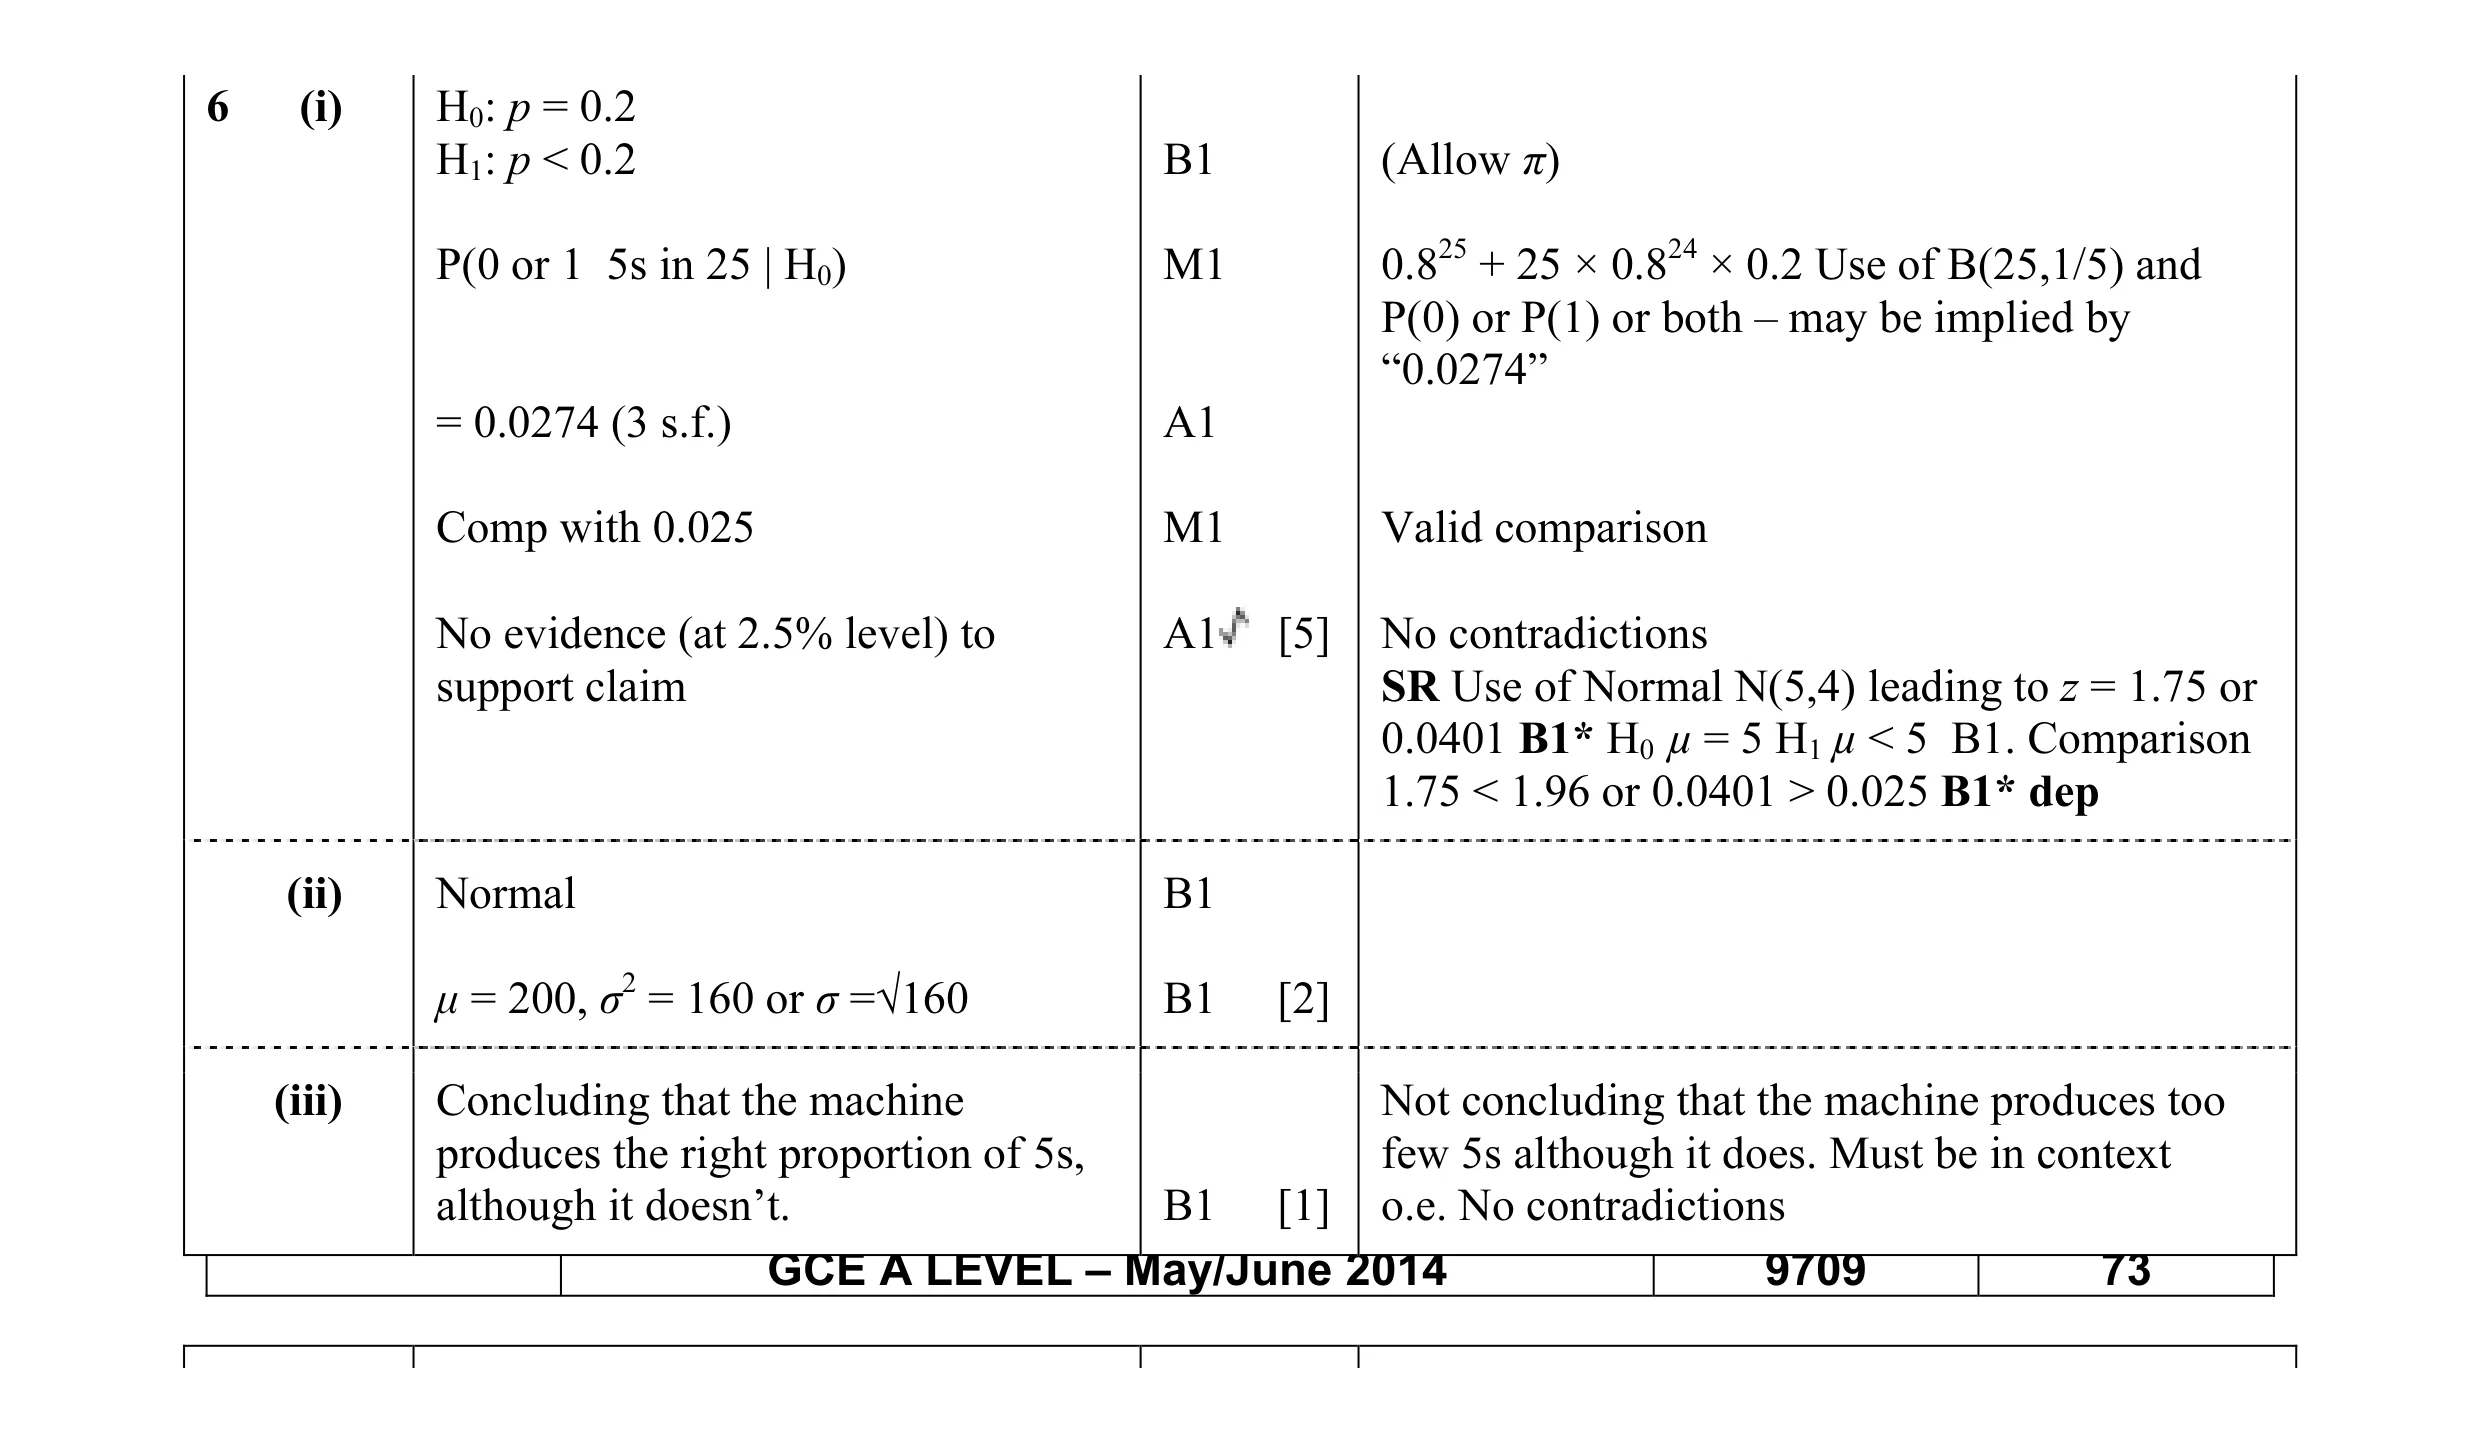 8
8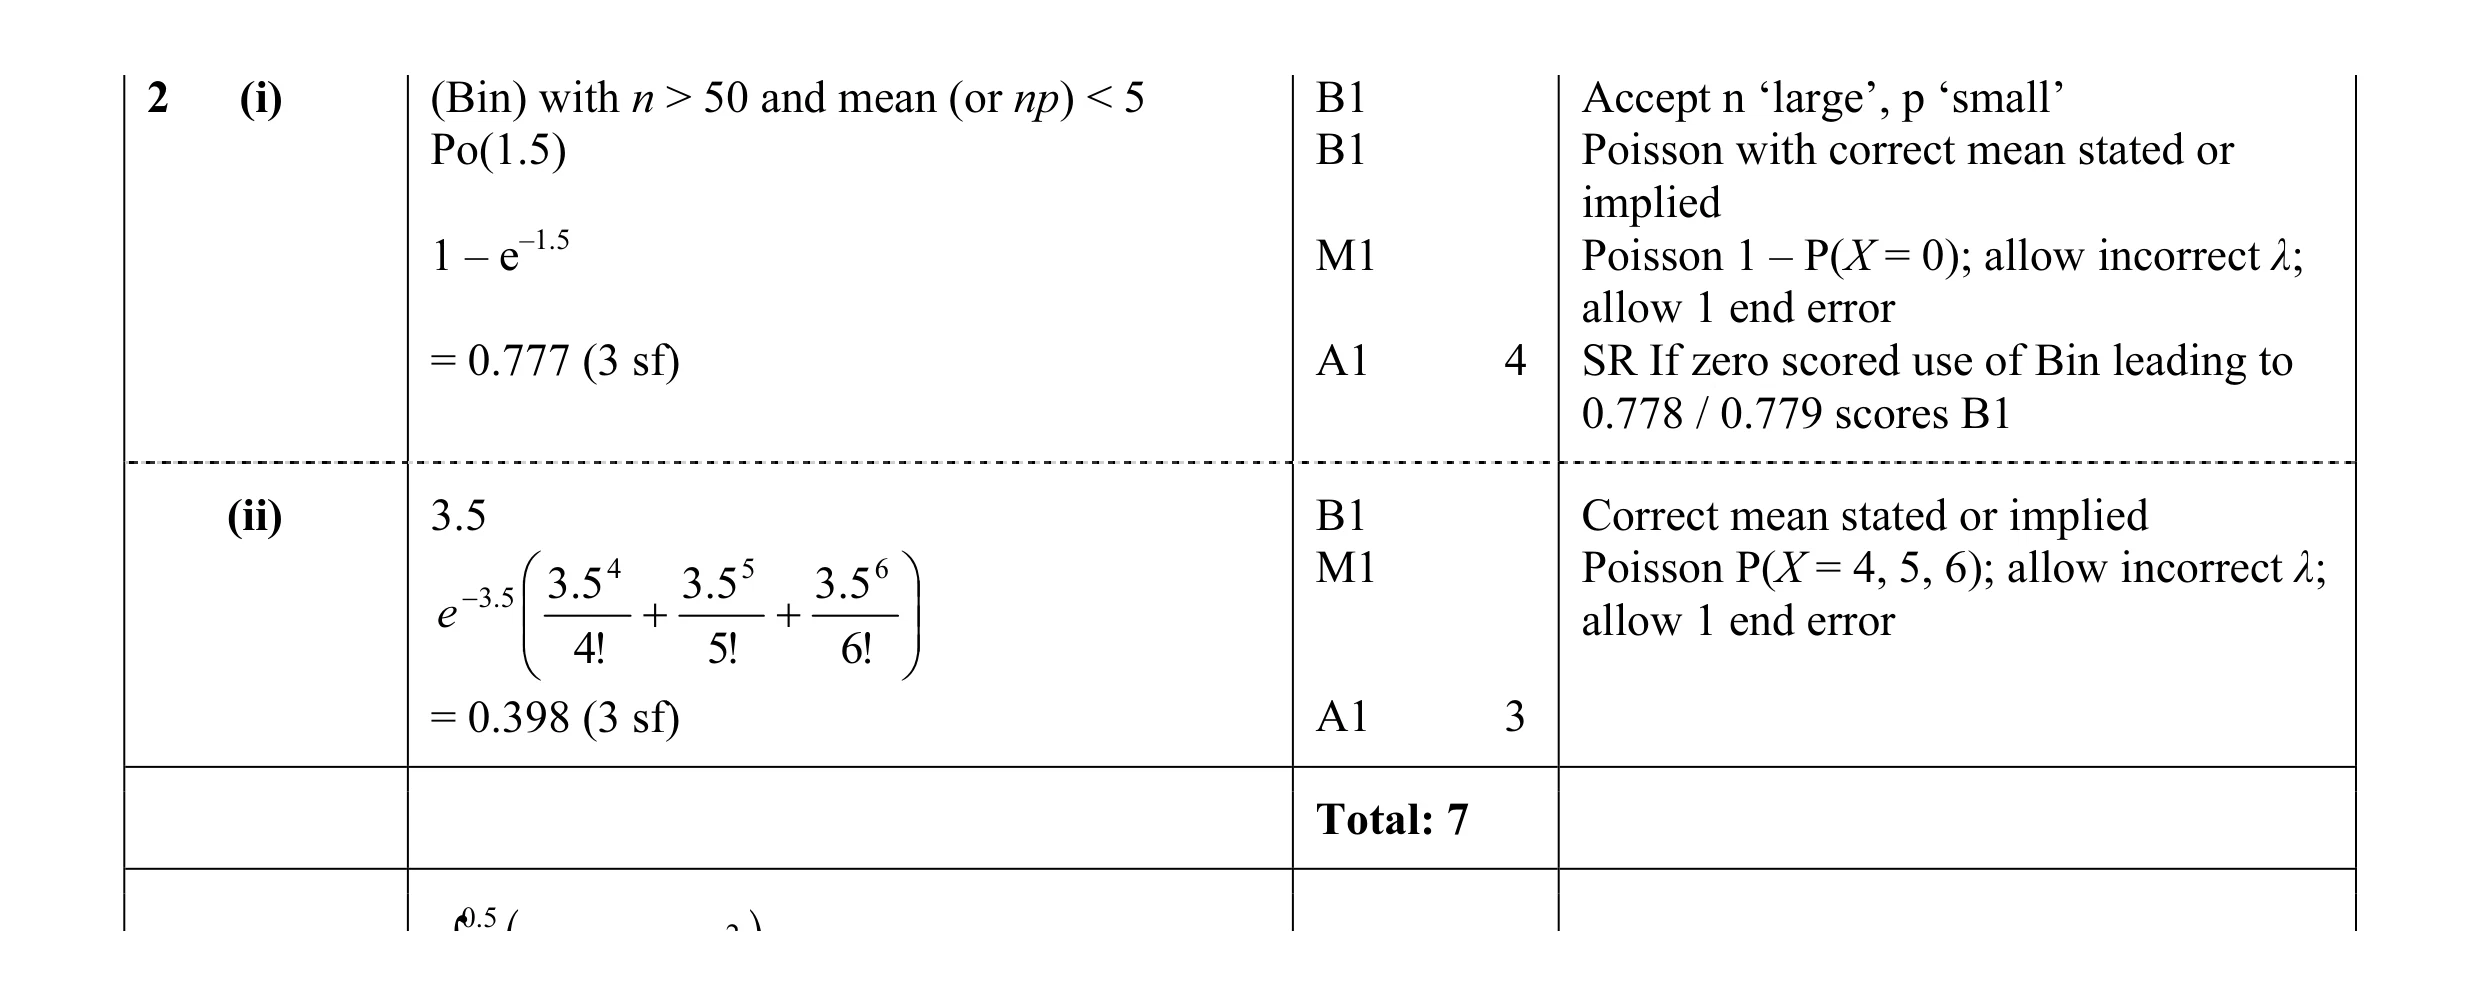 7
7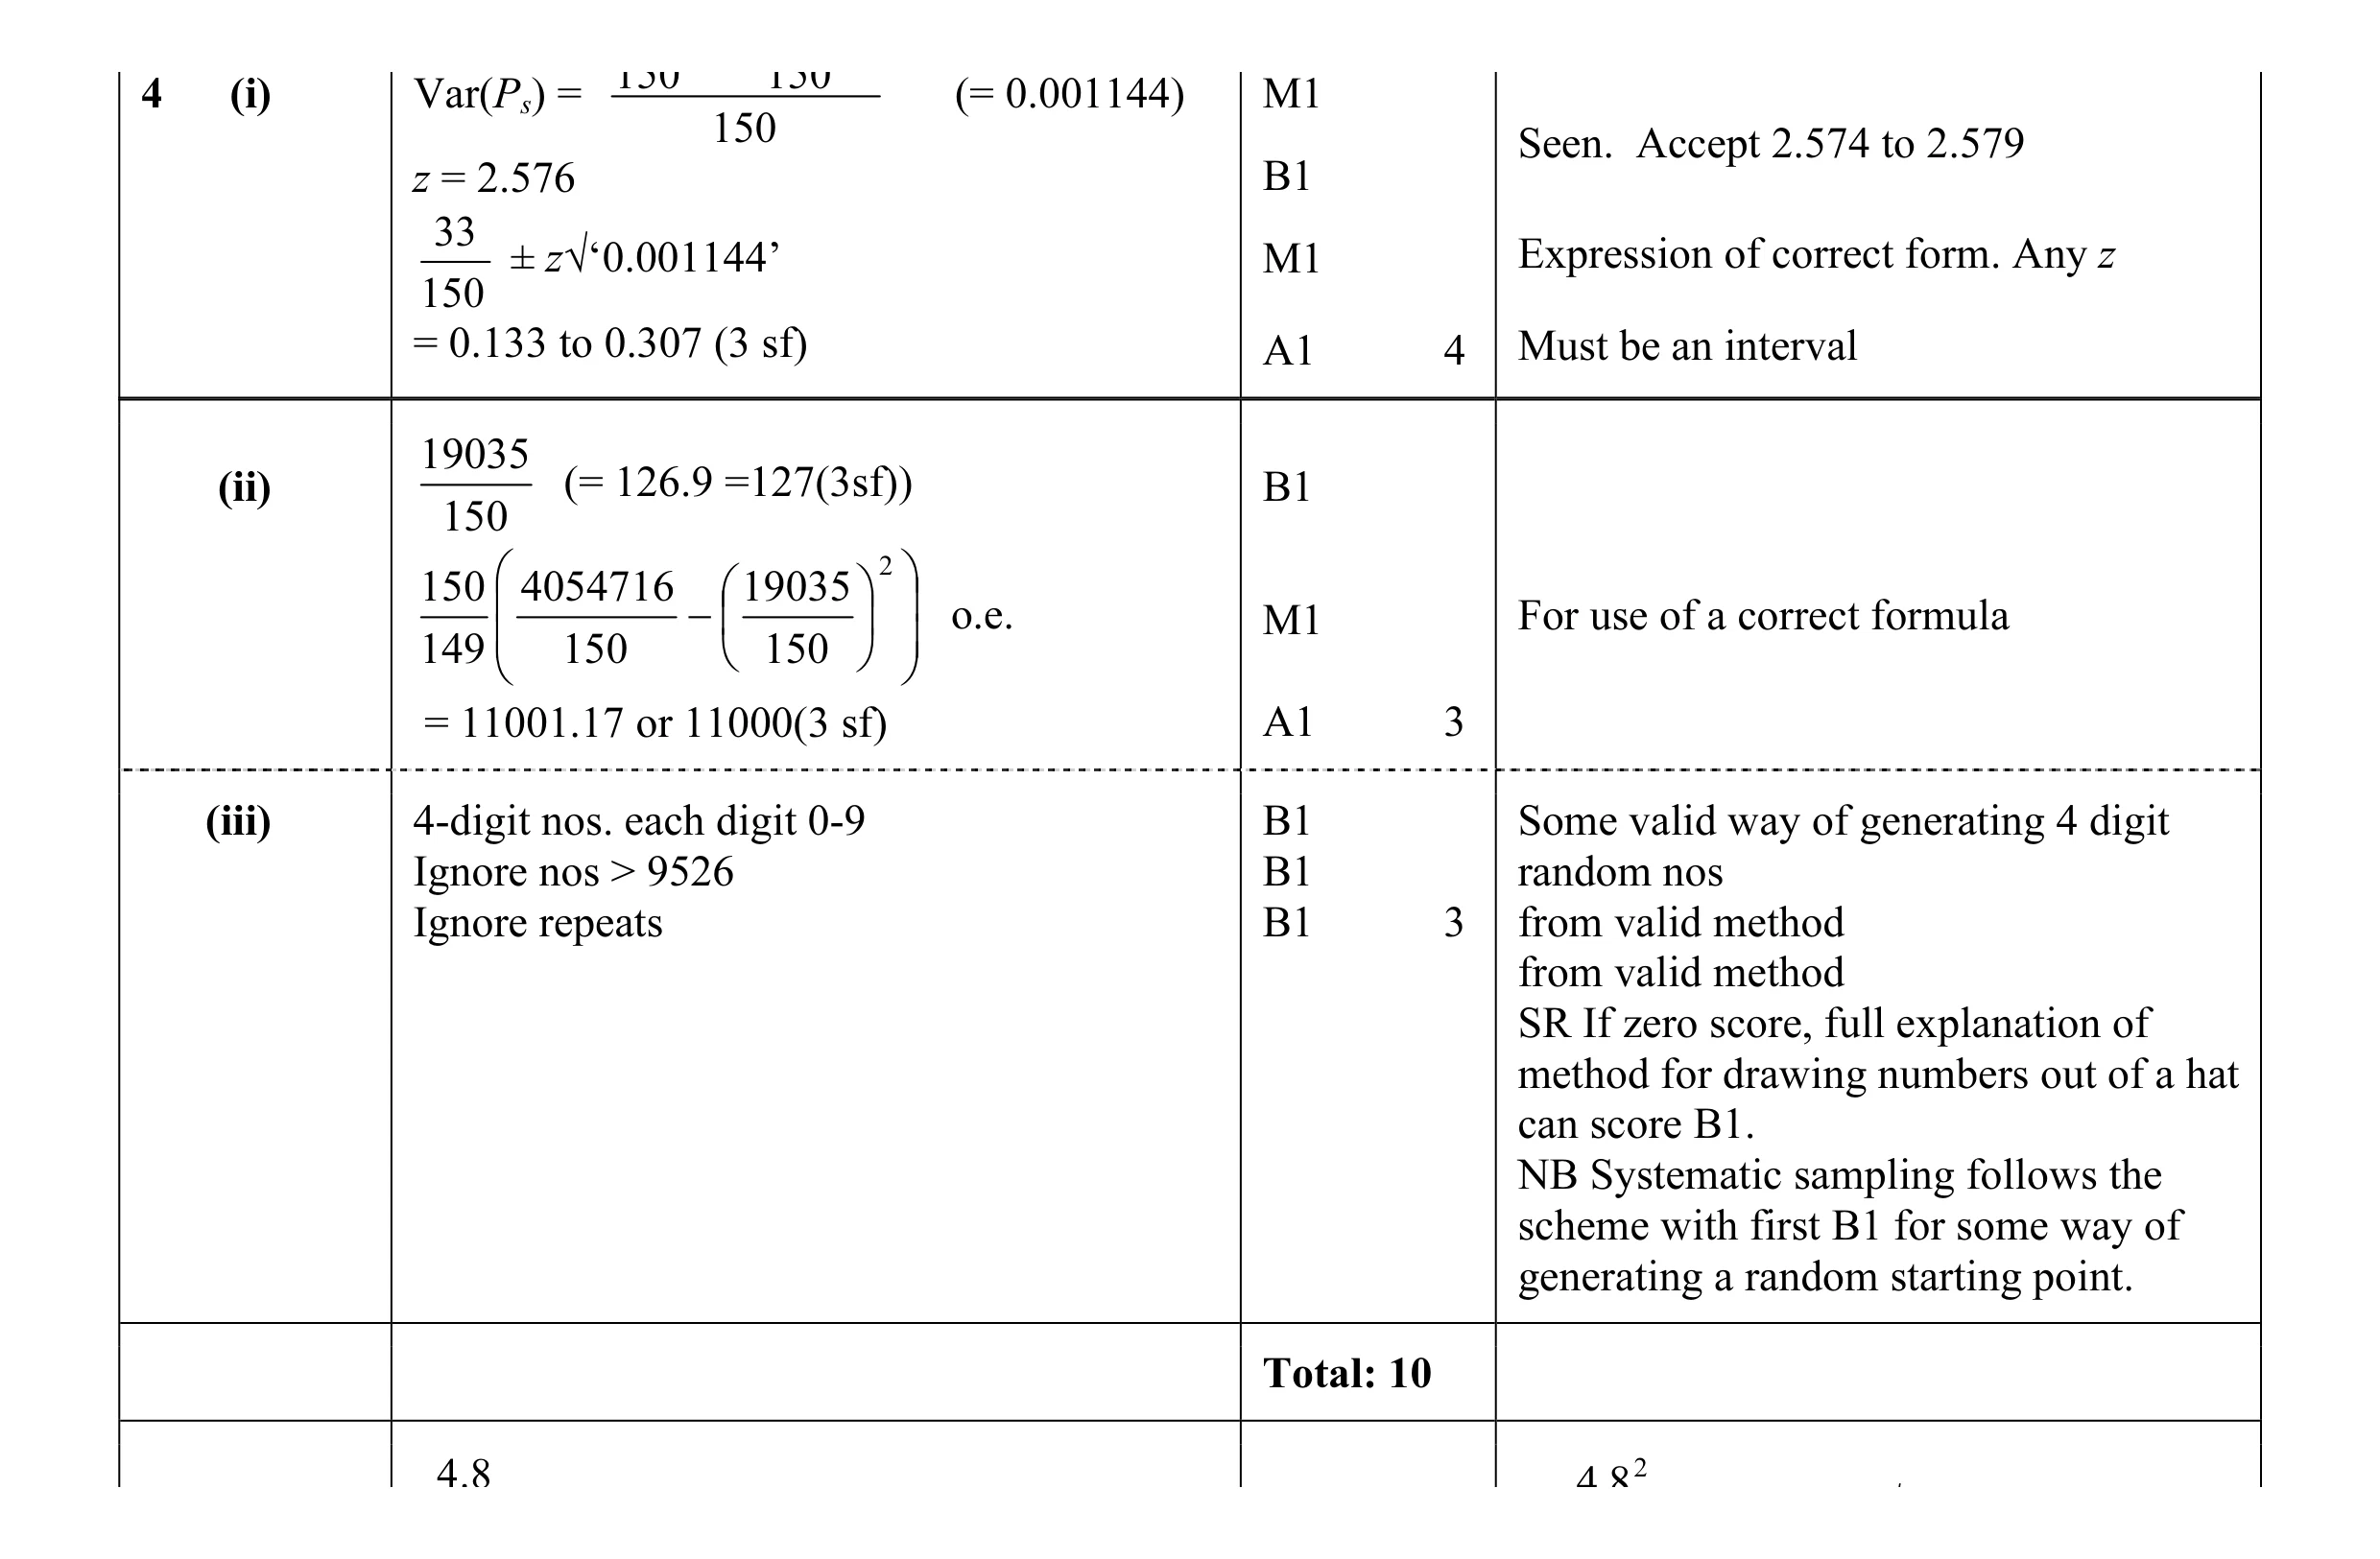 10
10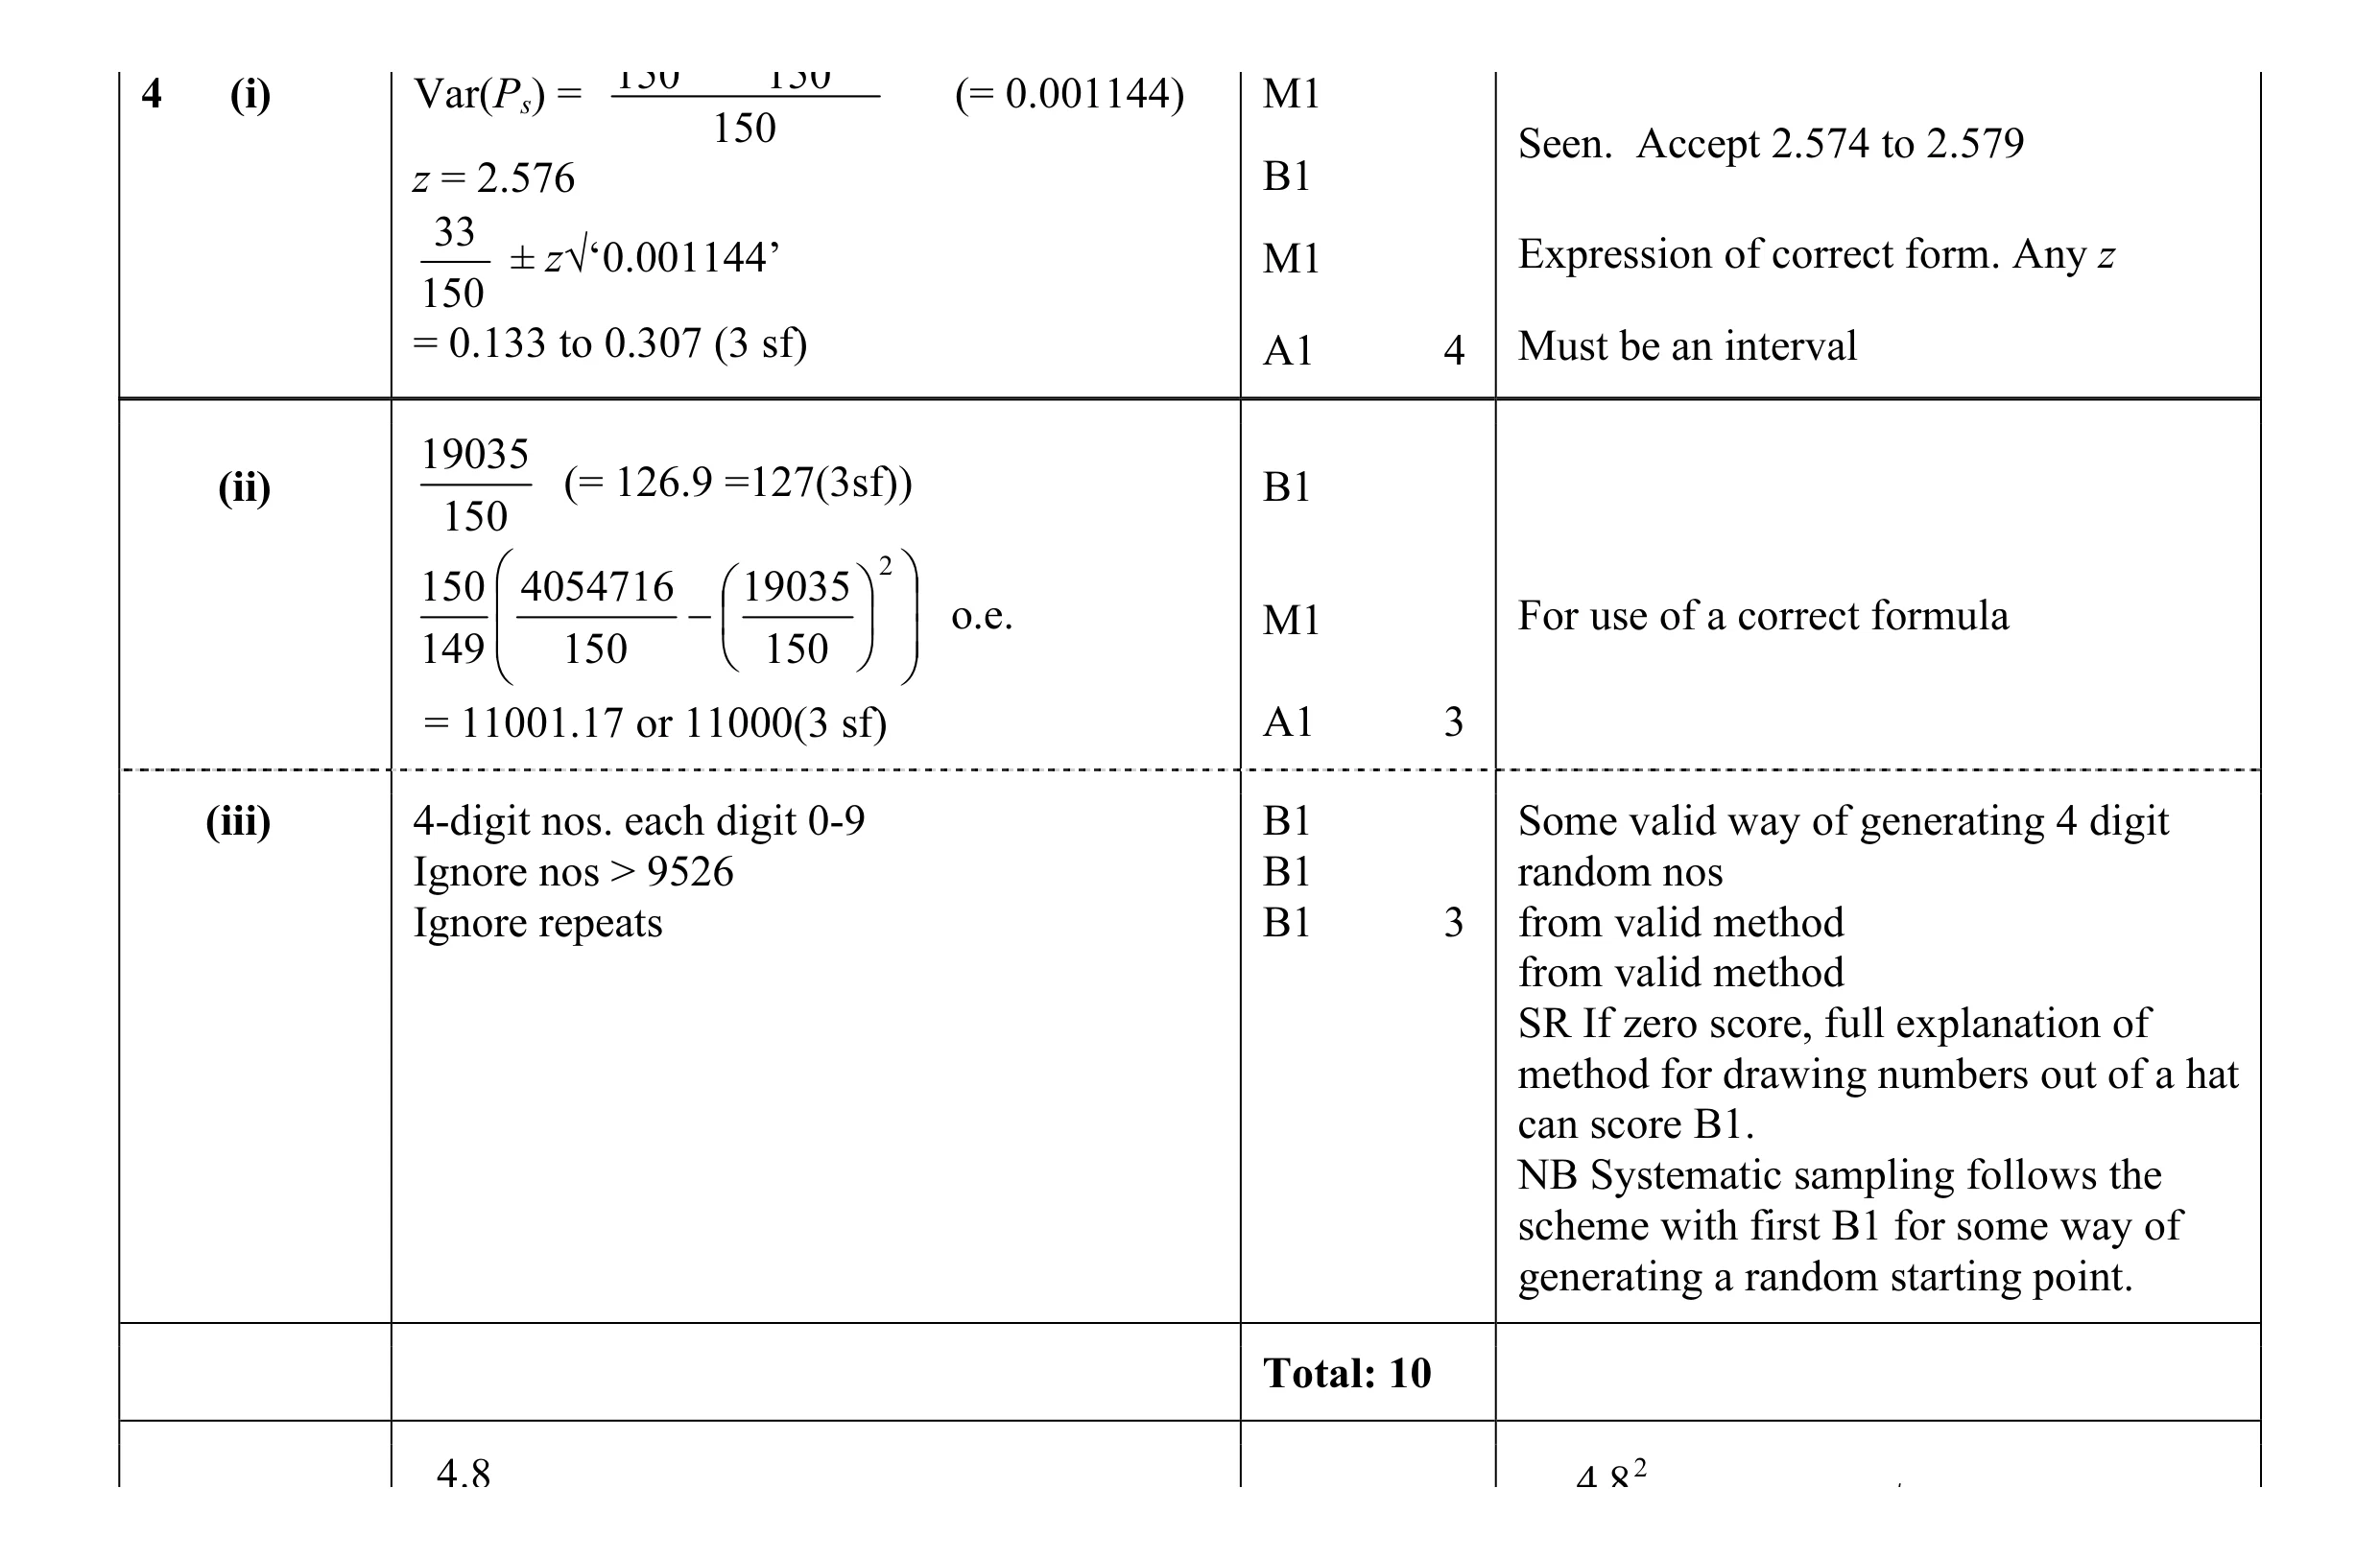 10
10 6
6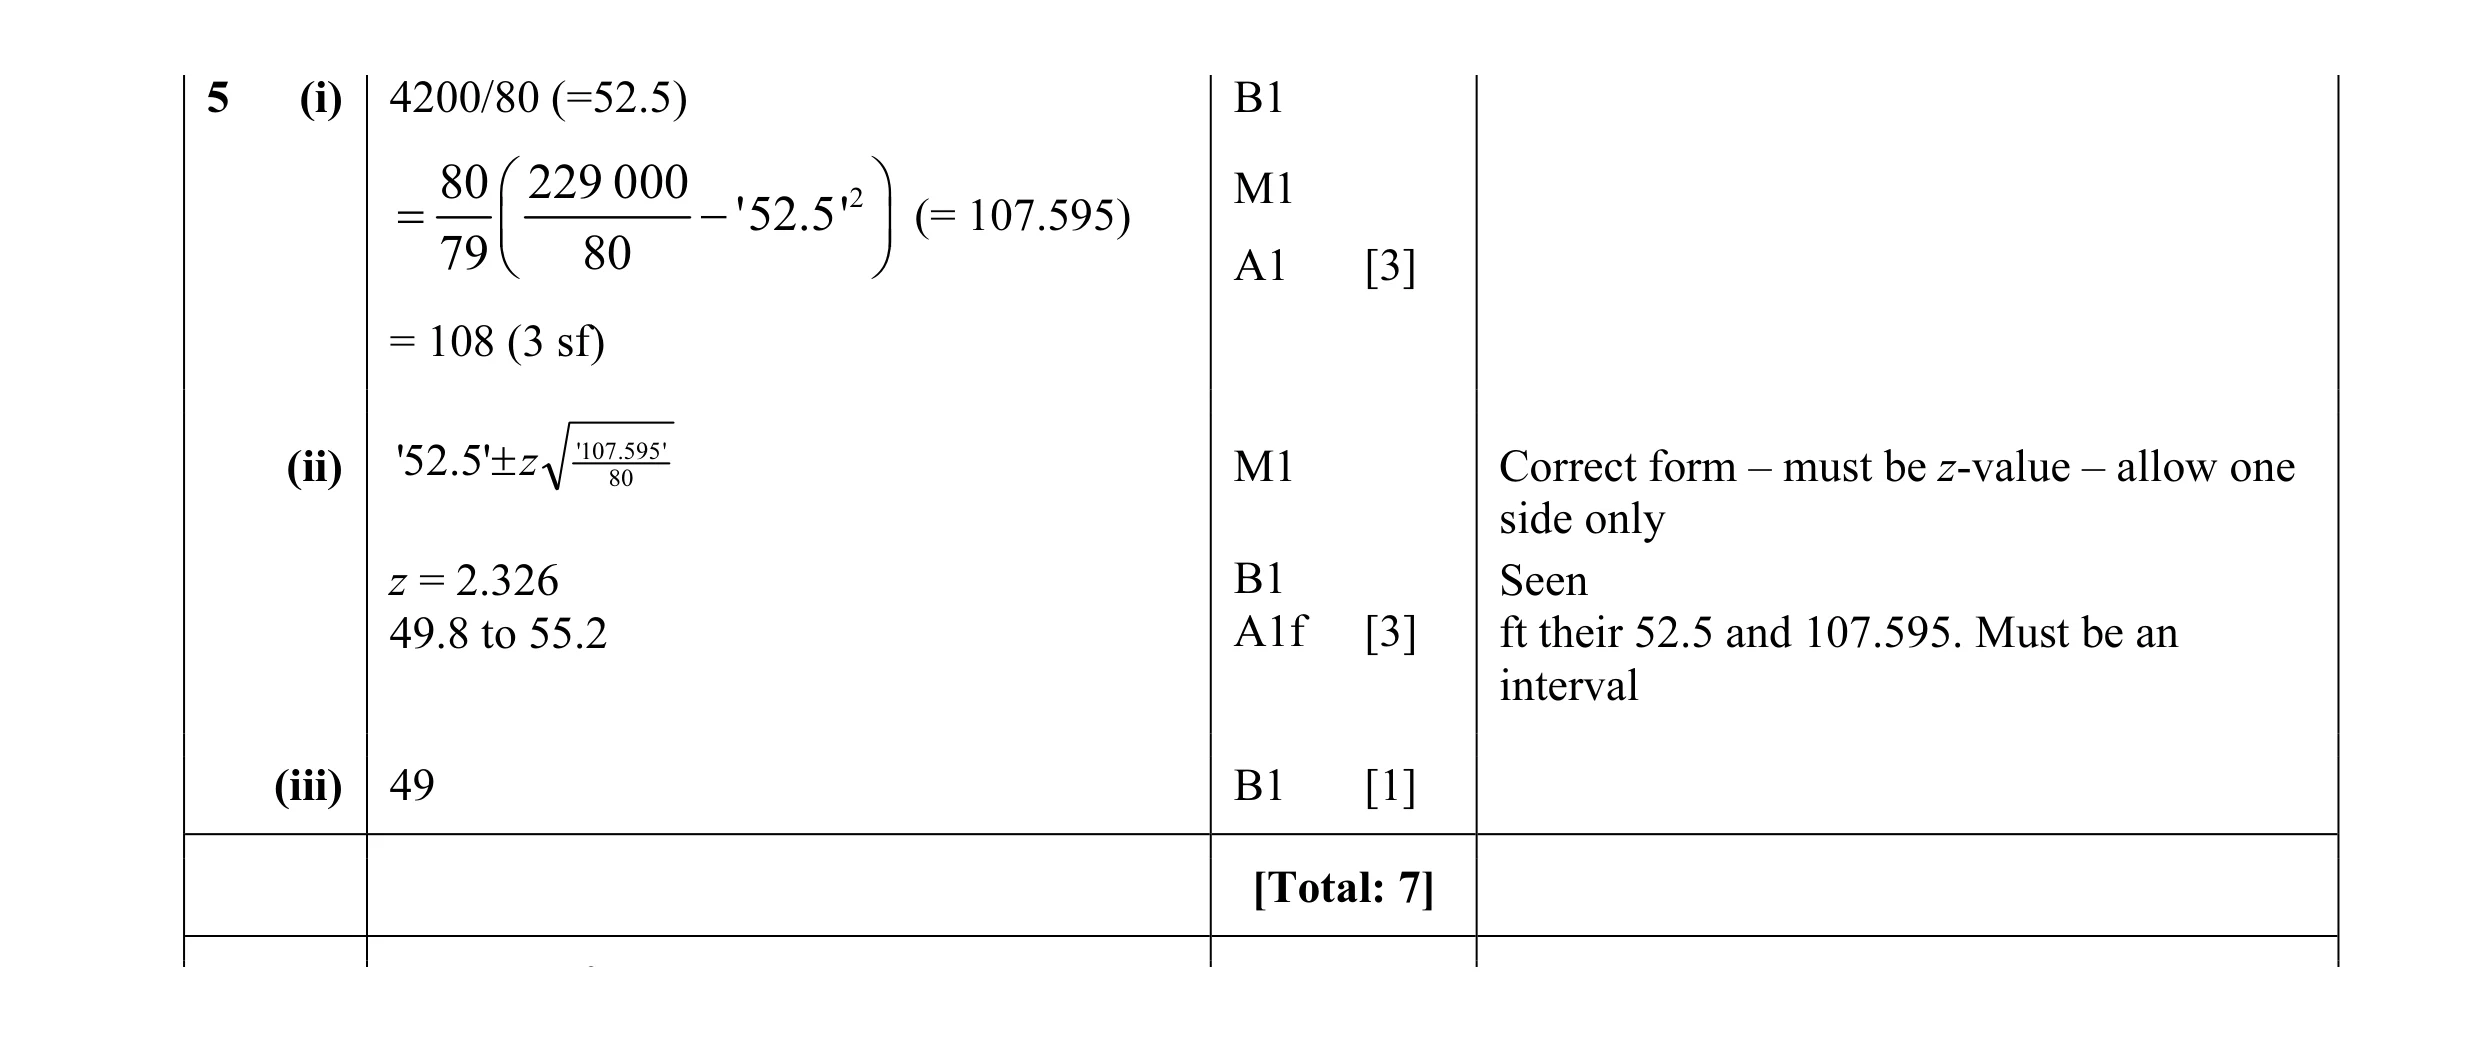 7
7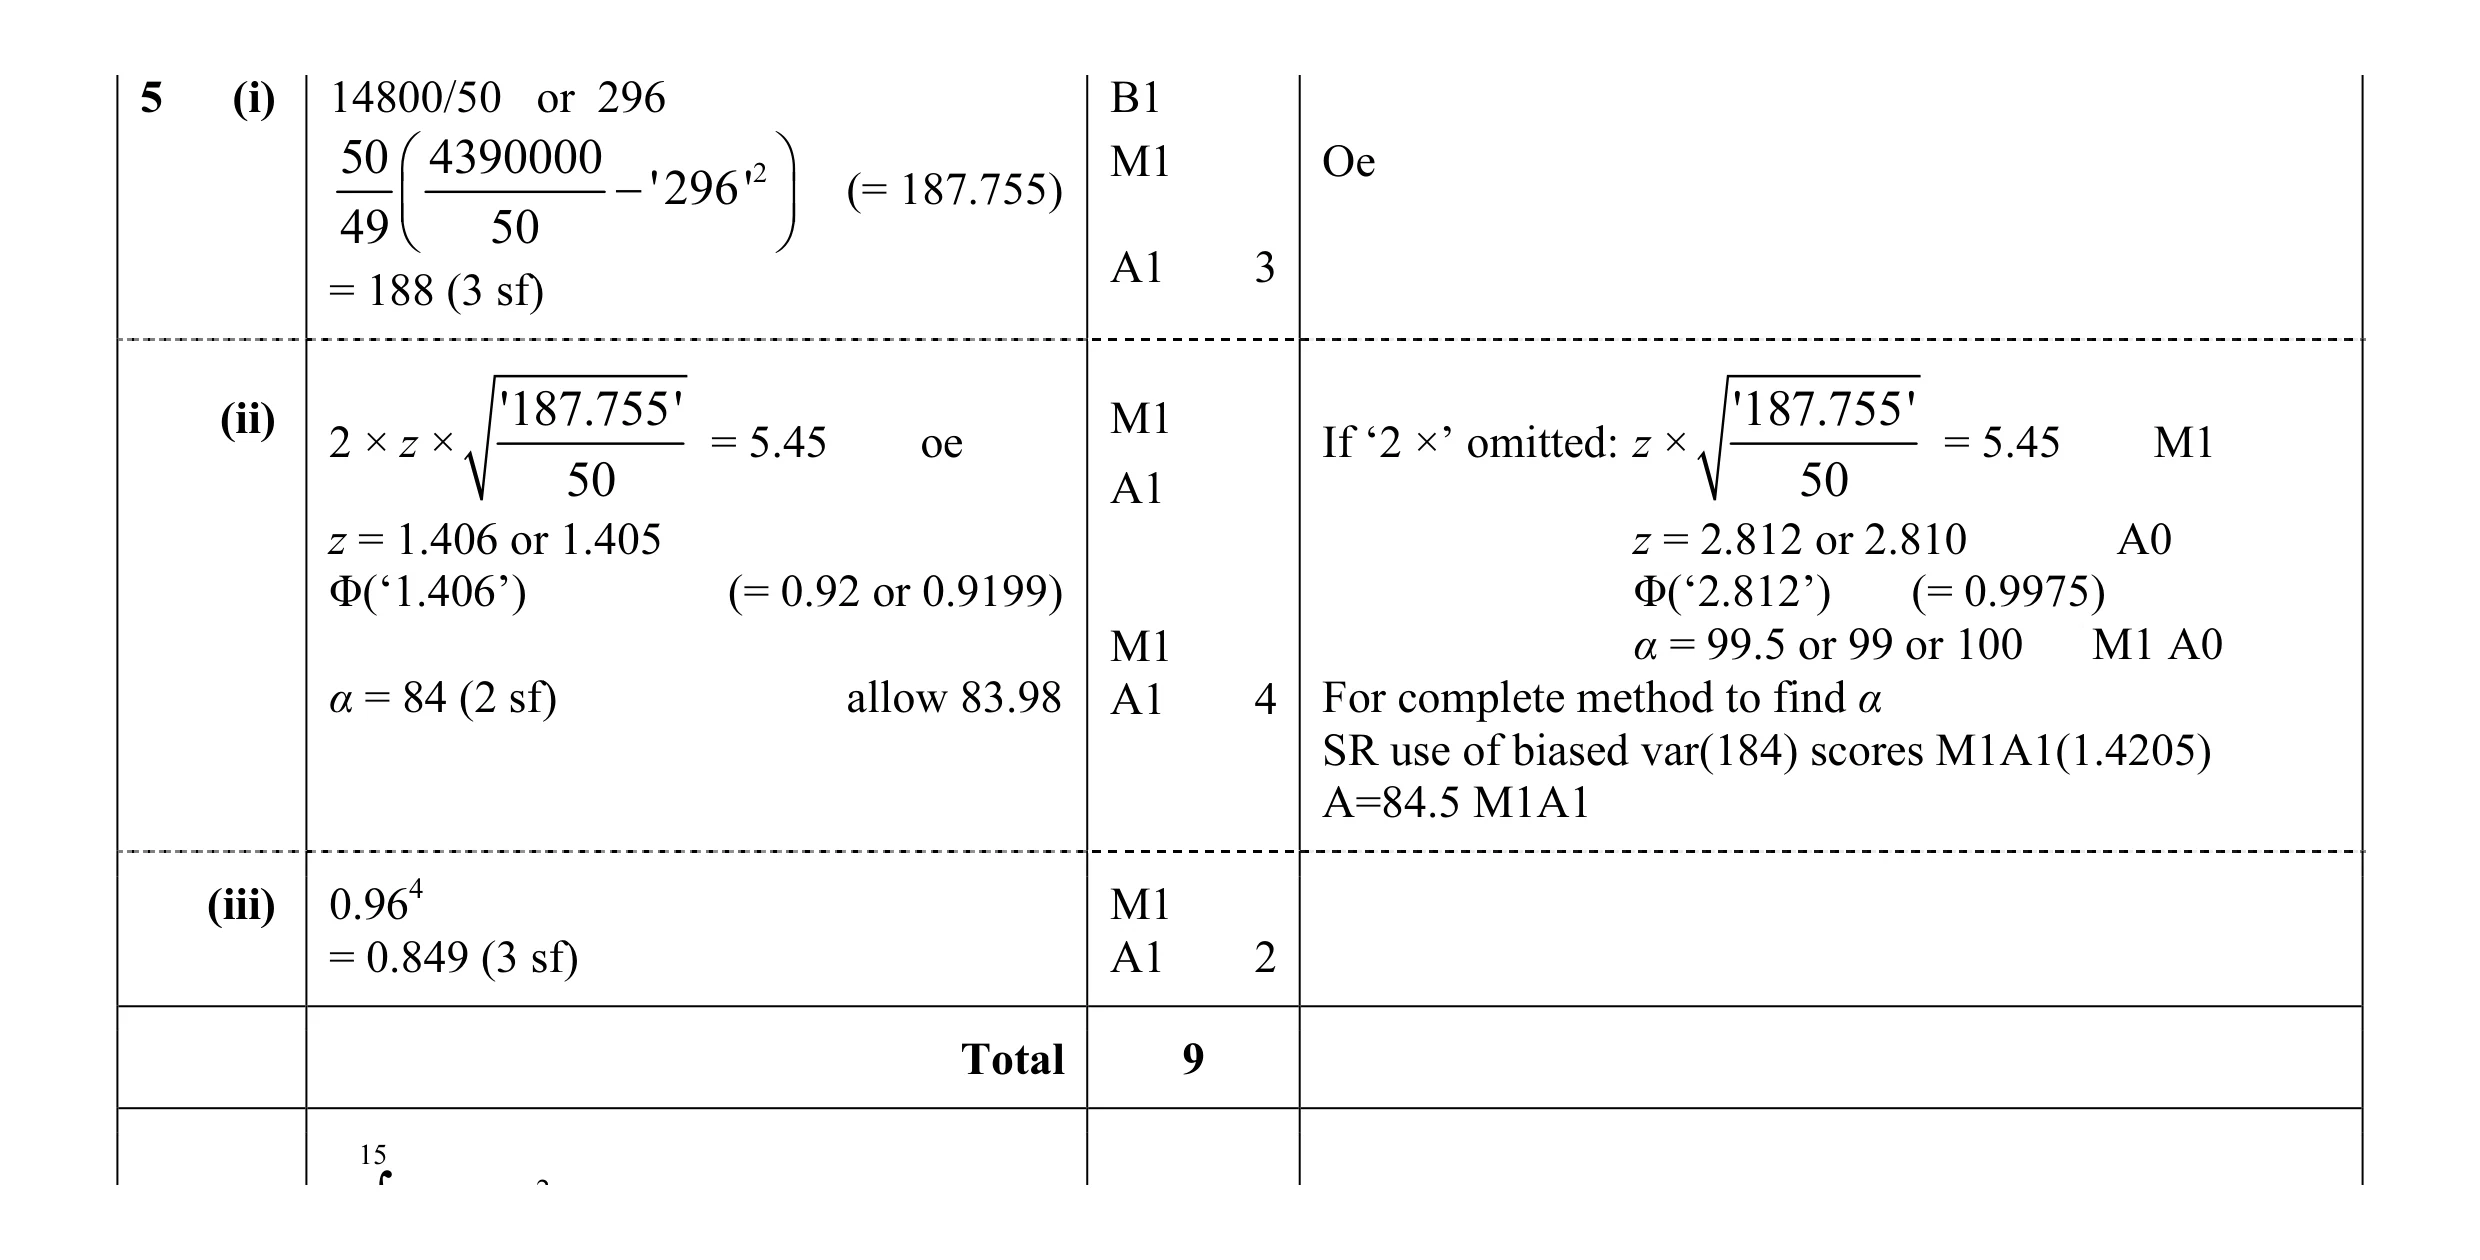 9
9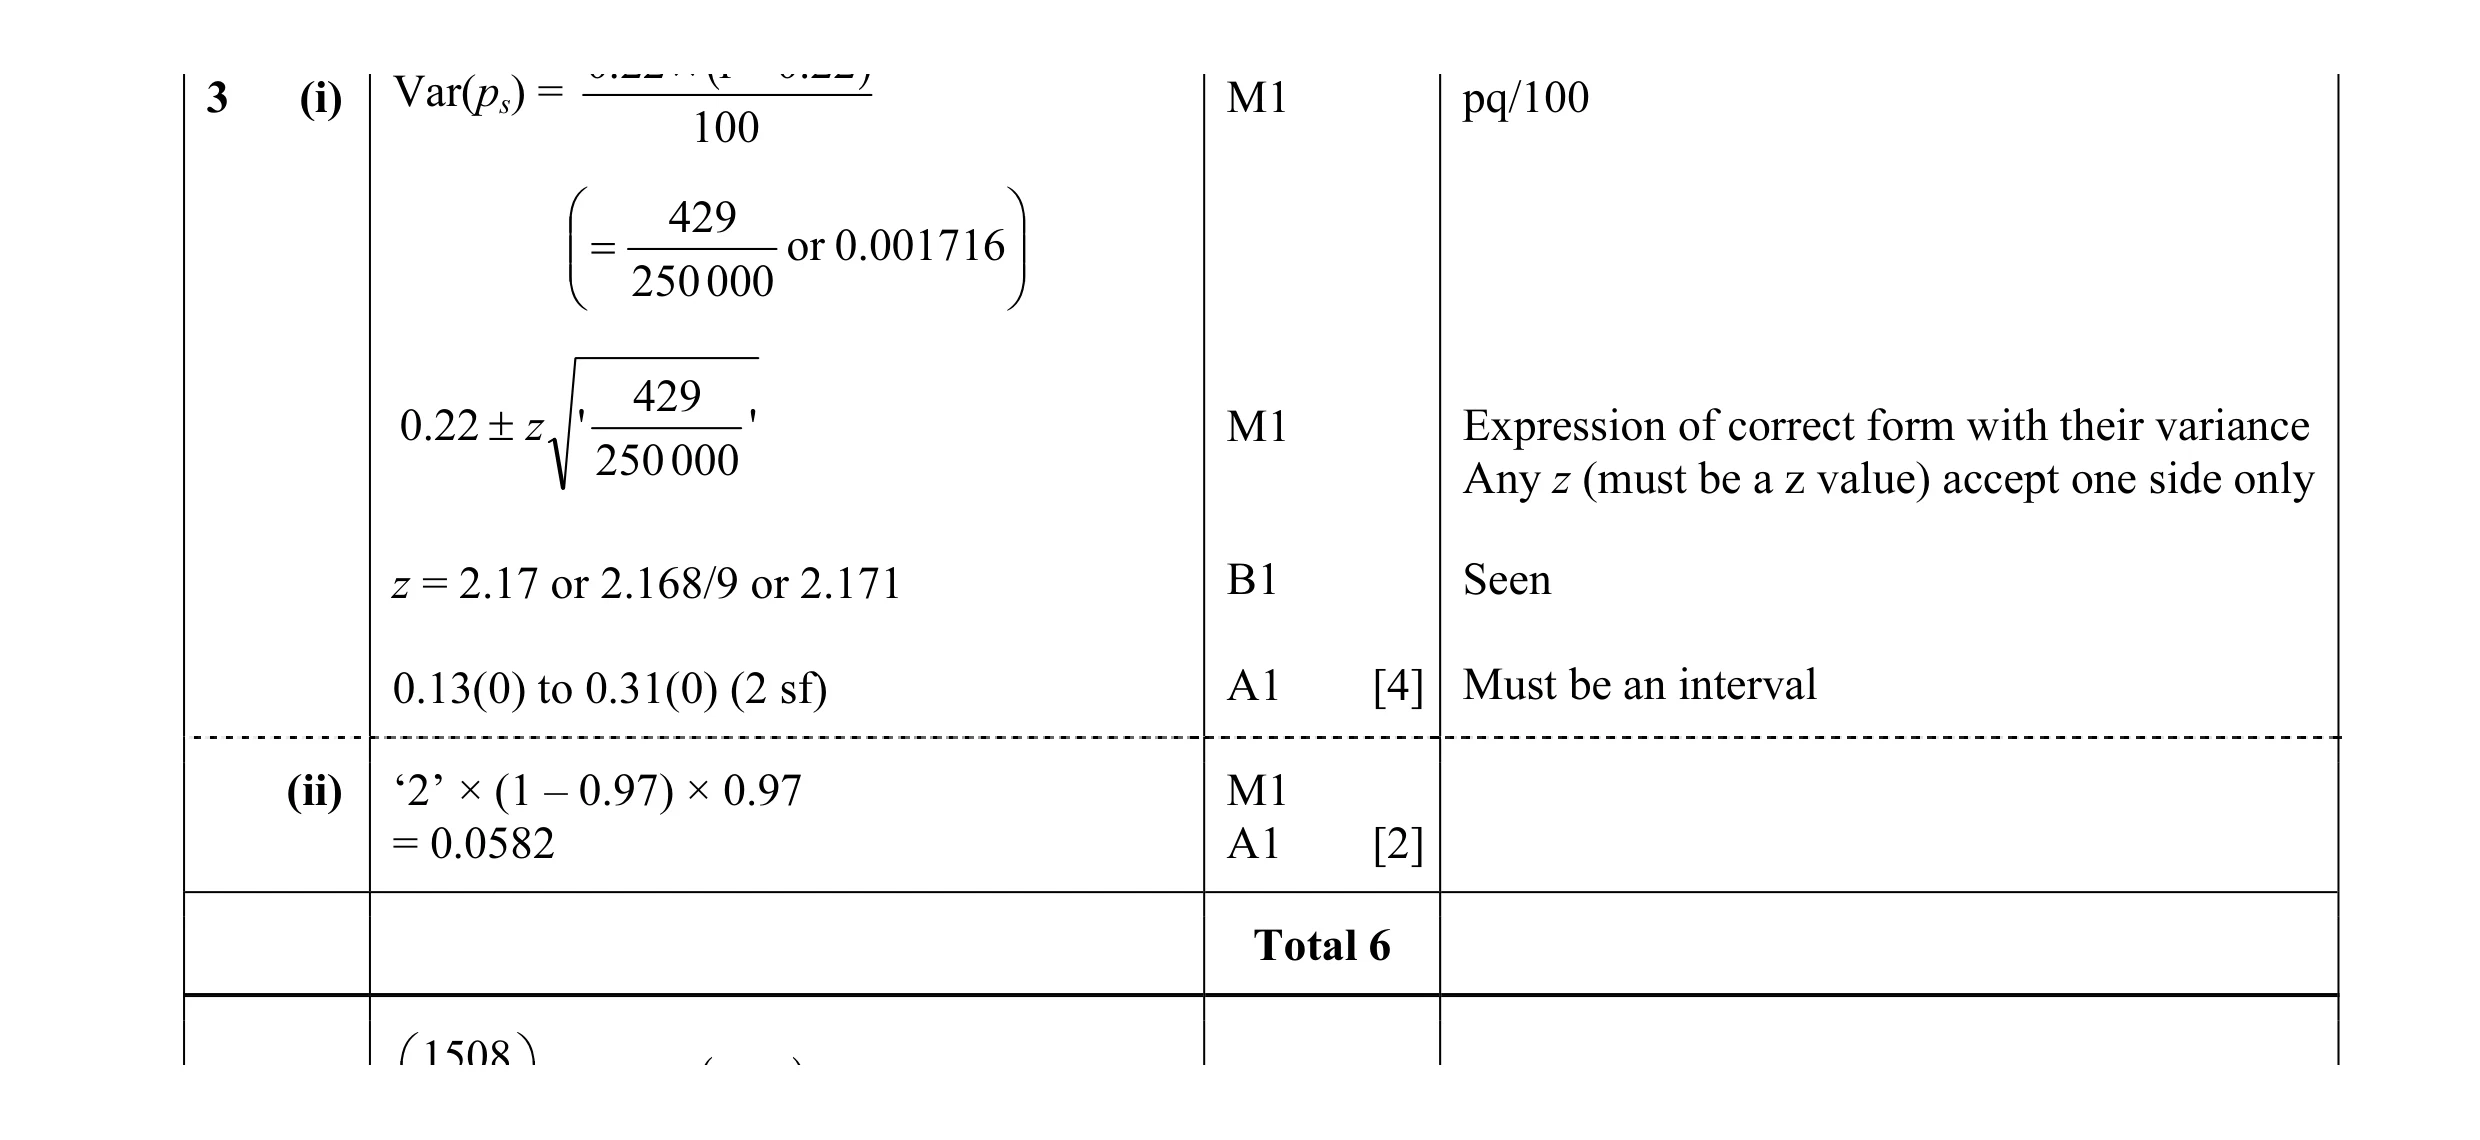 6
6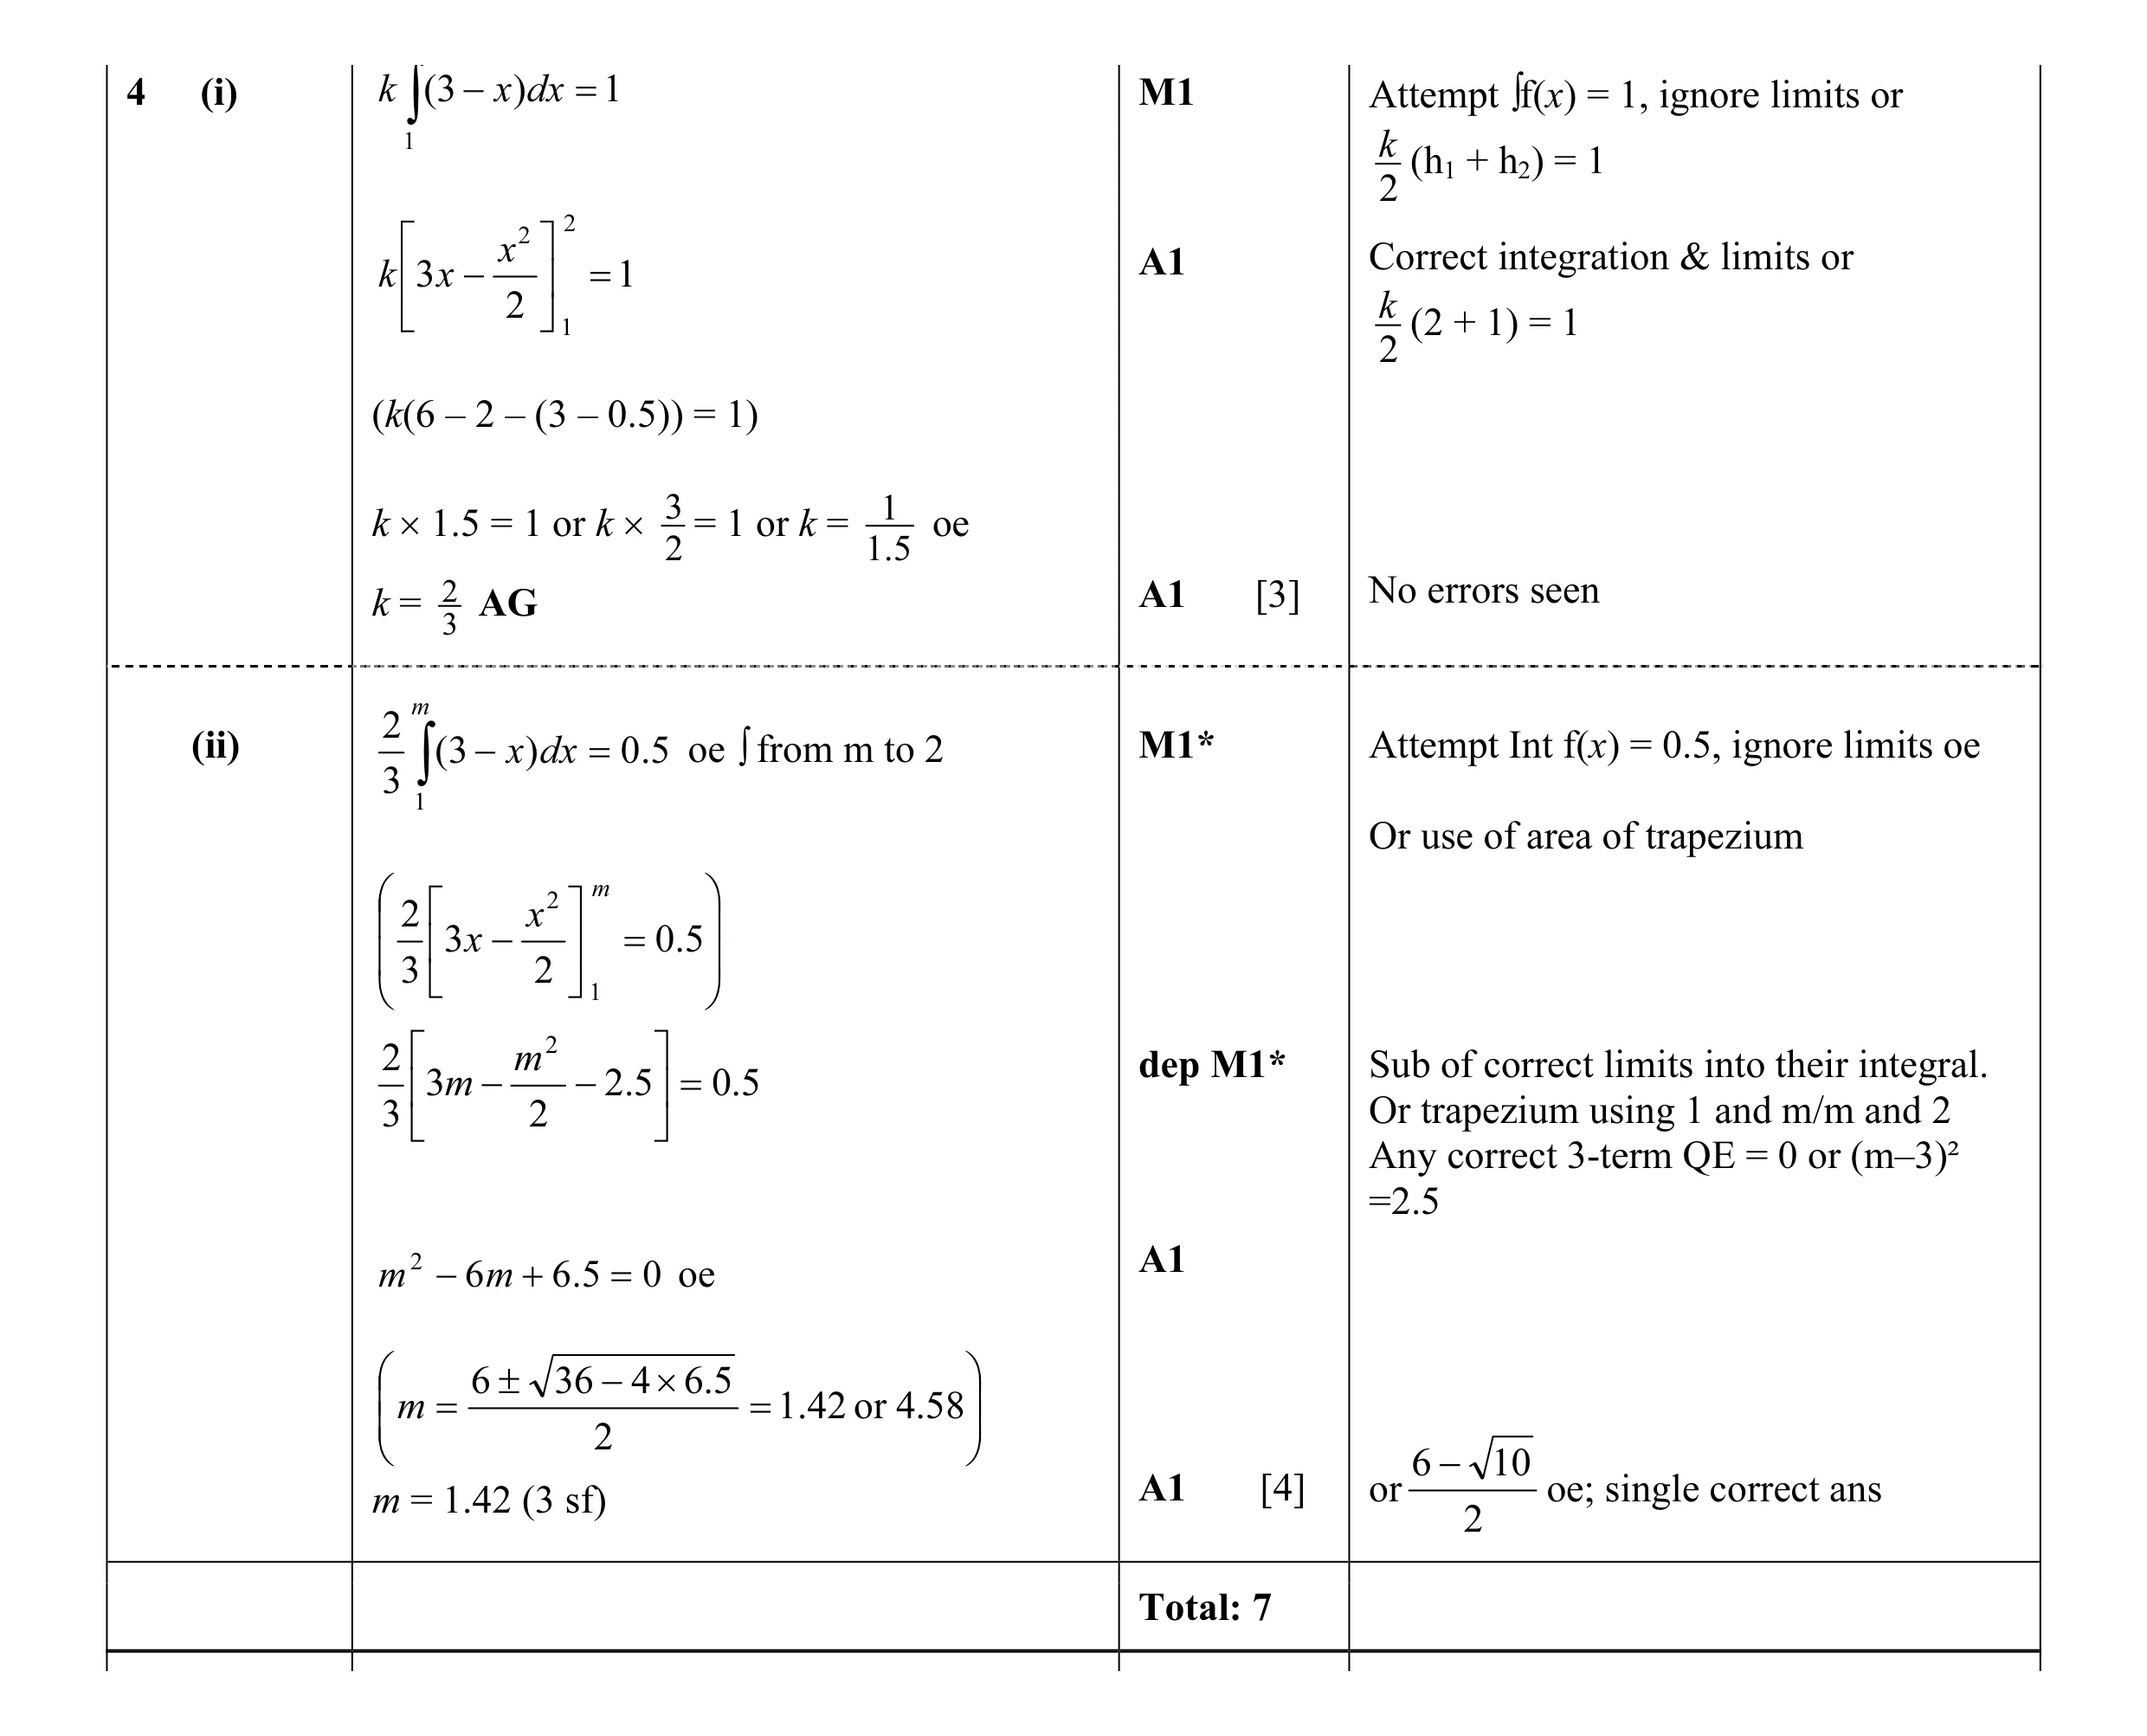 7
7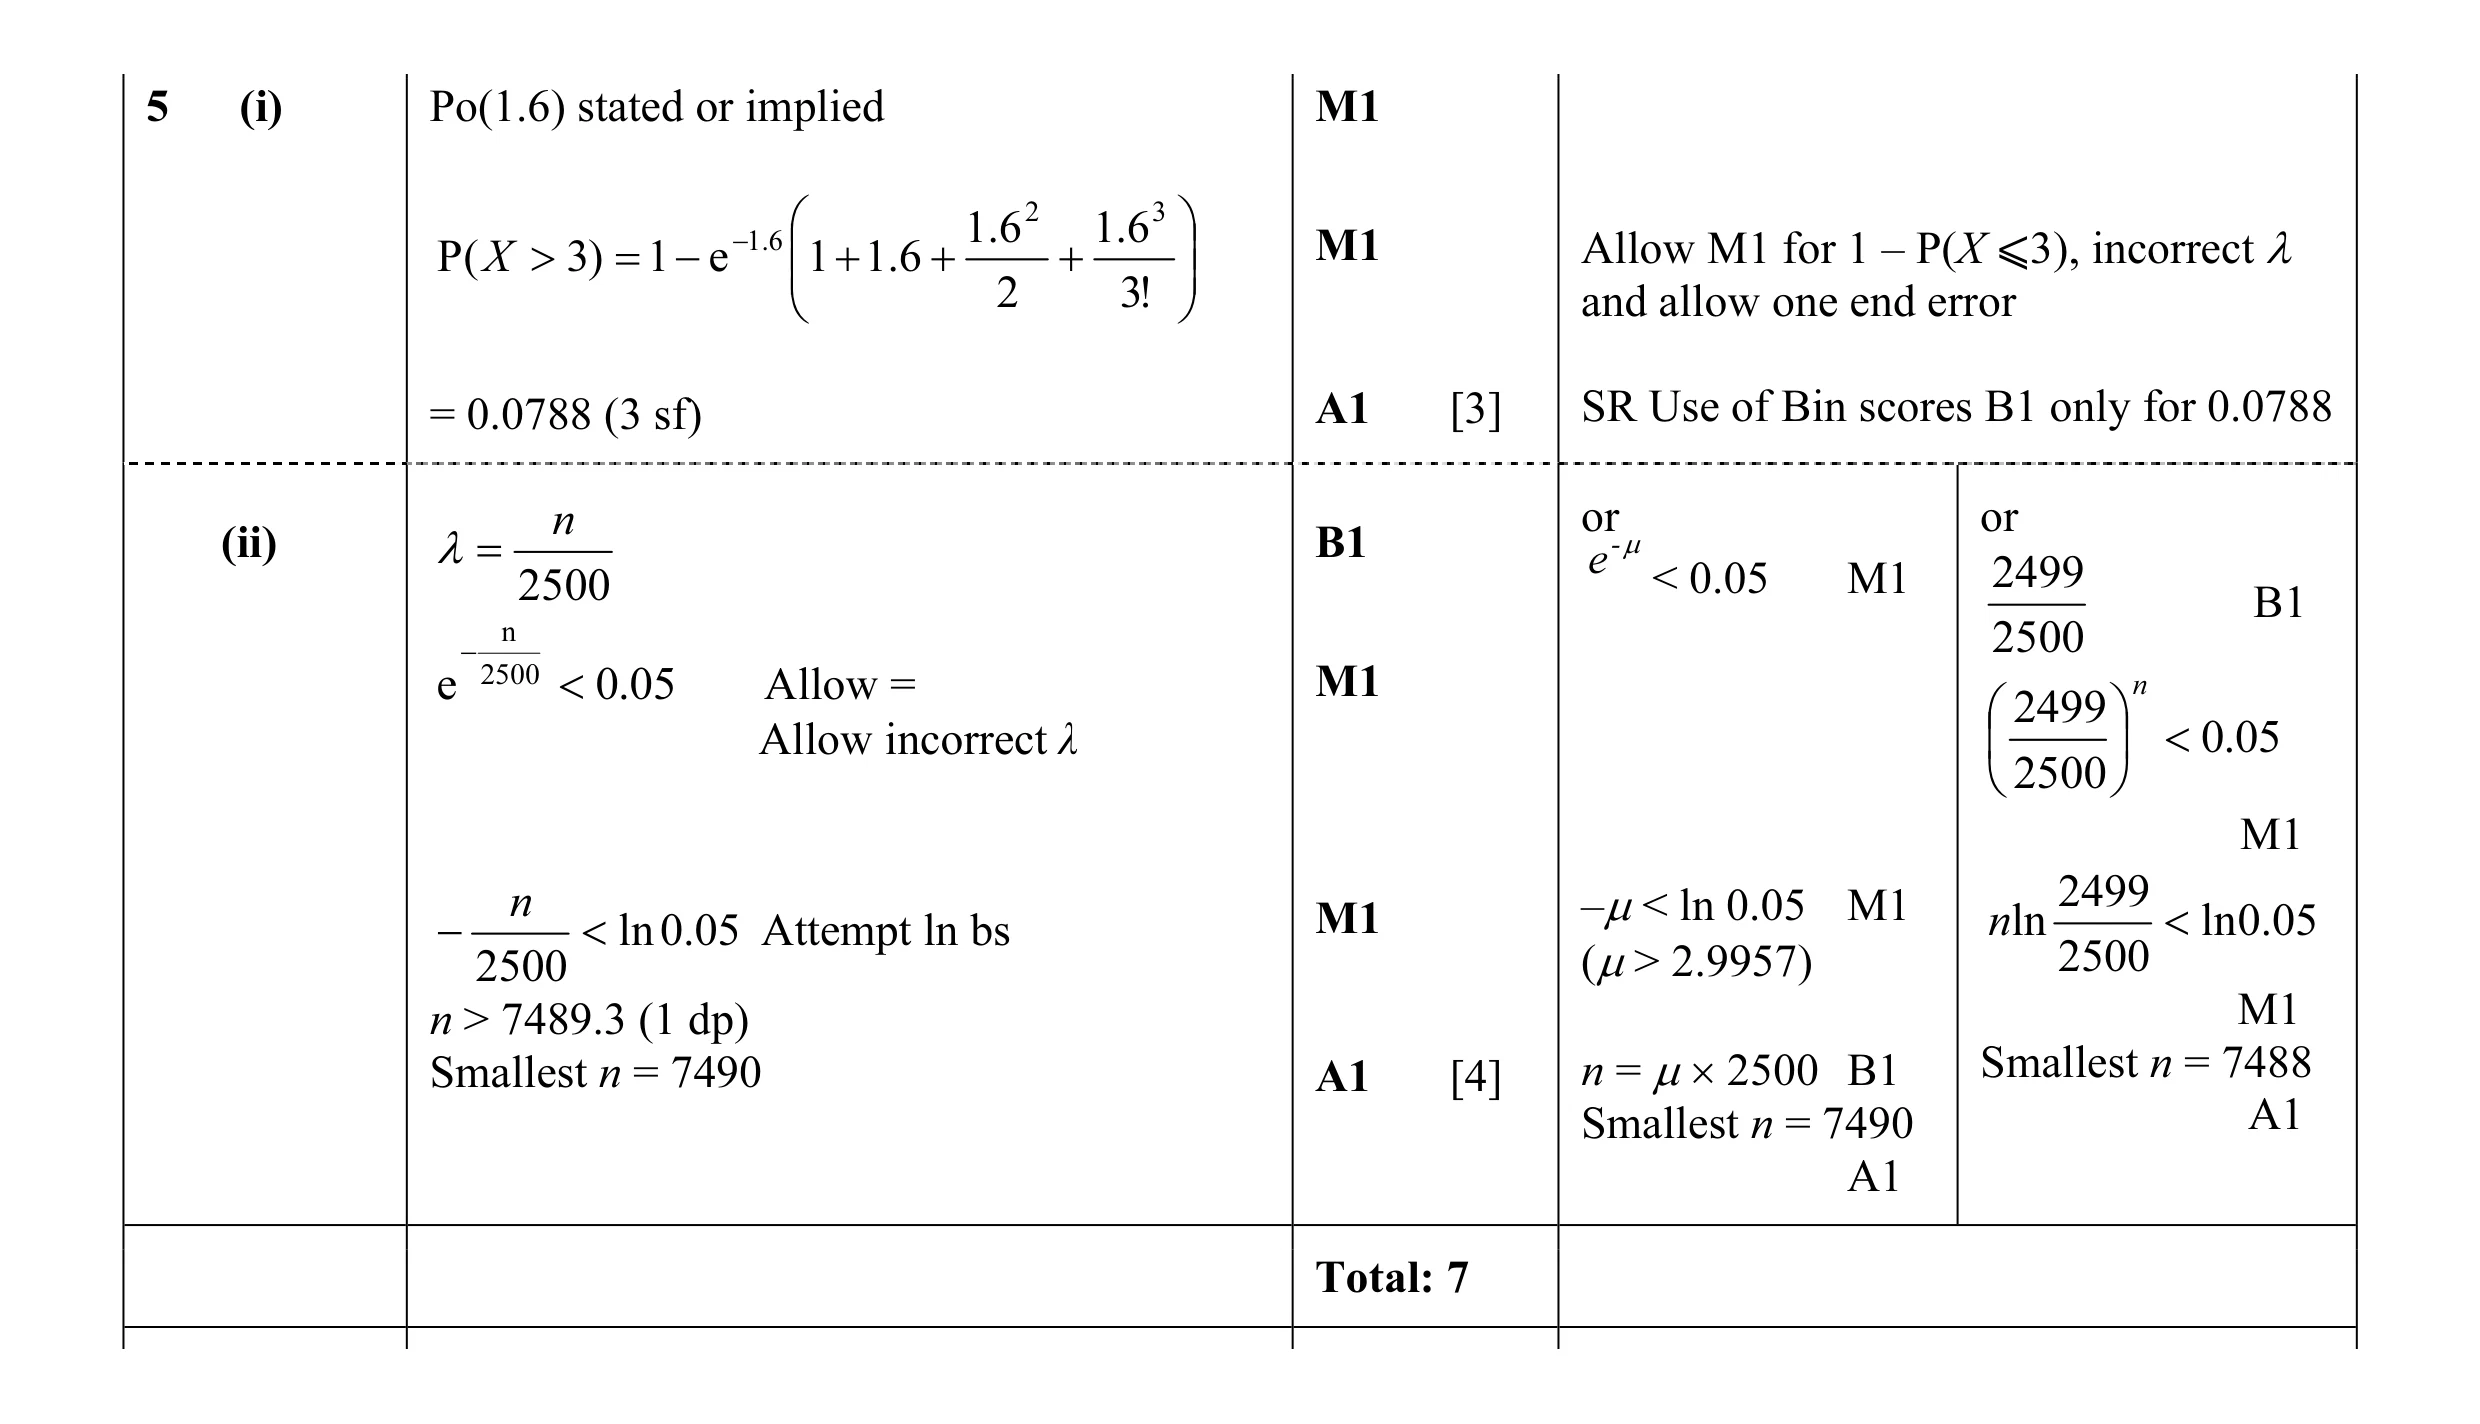 7
7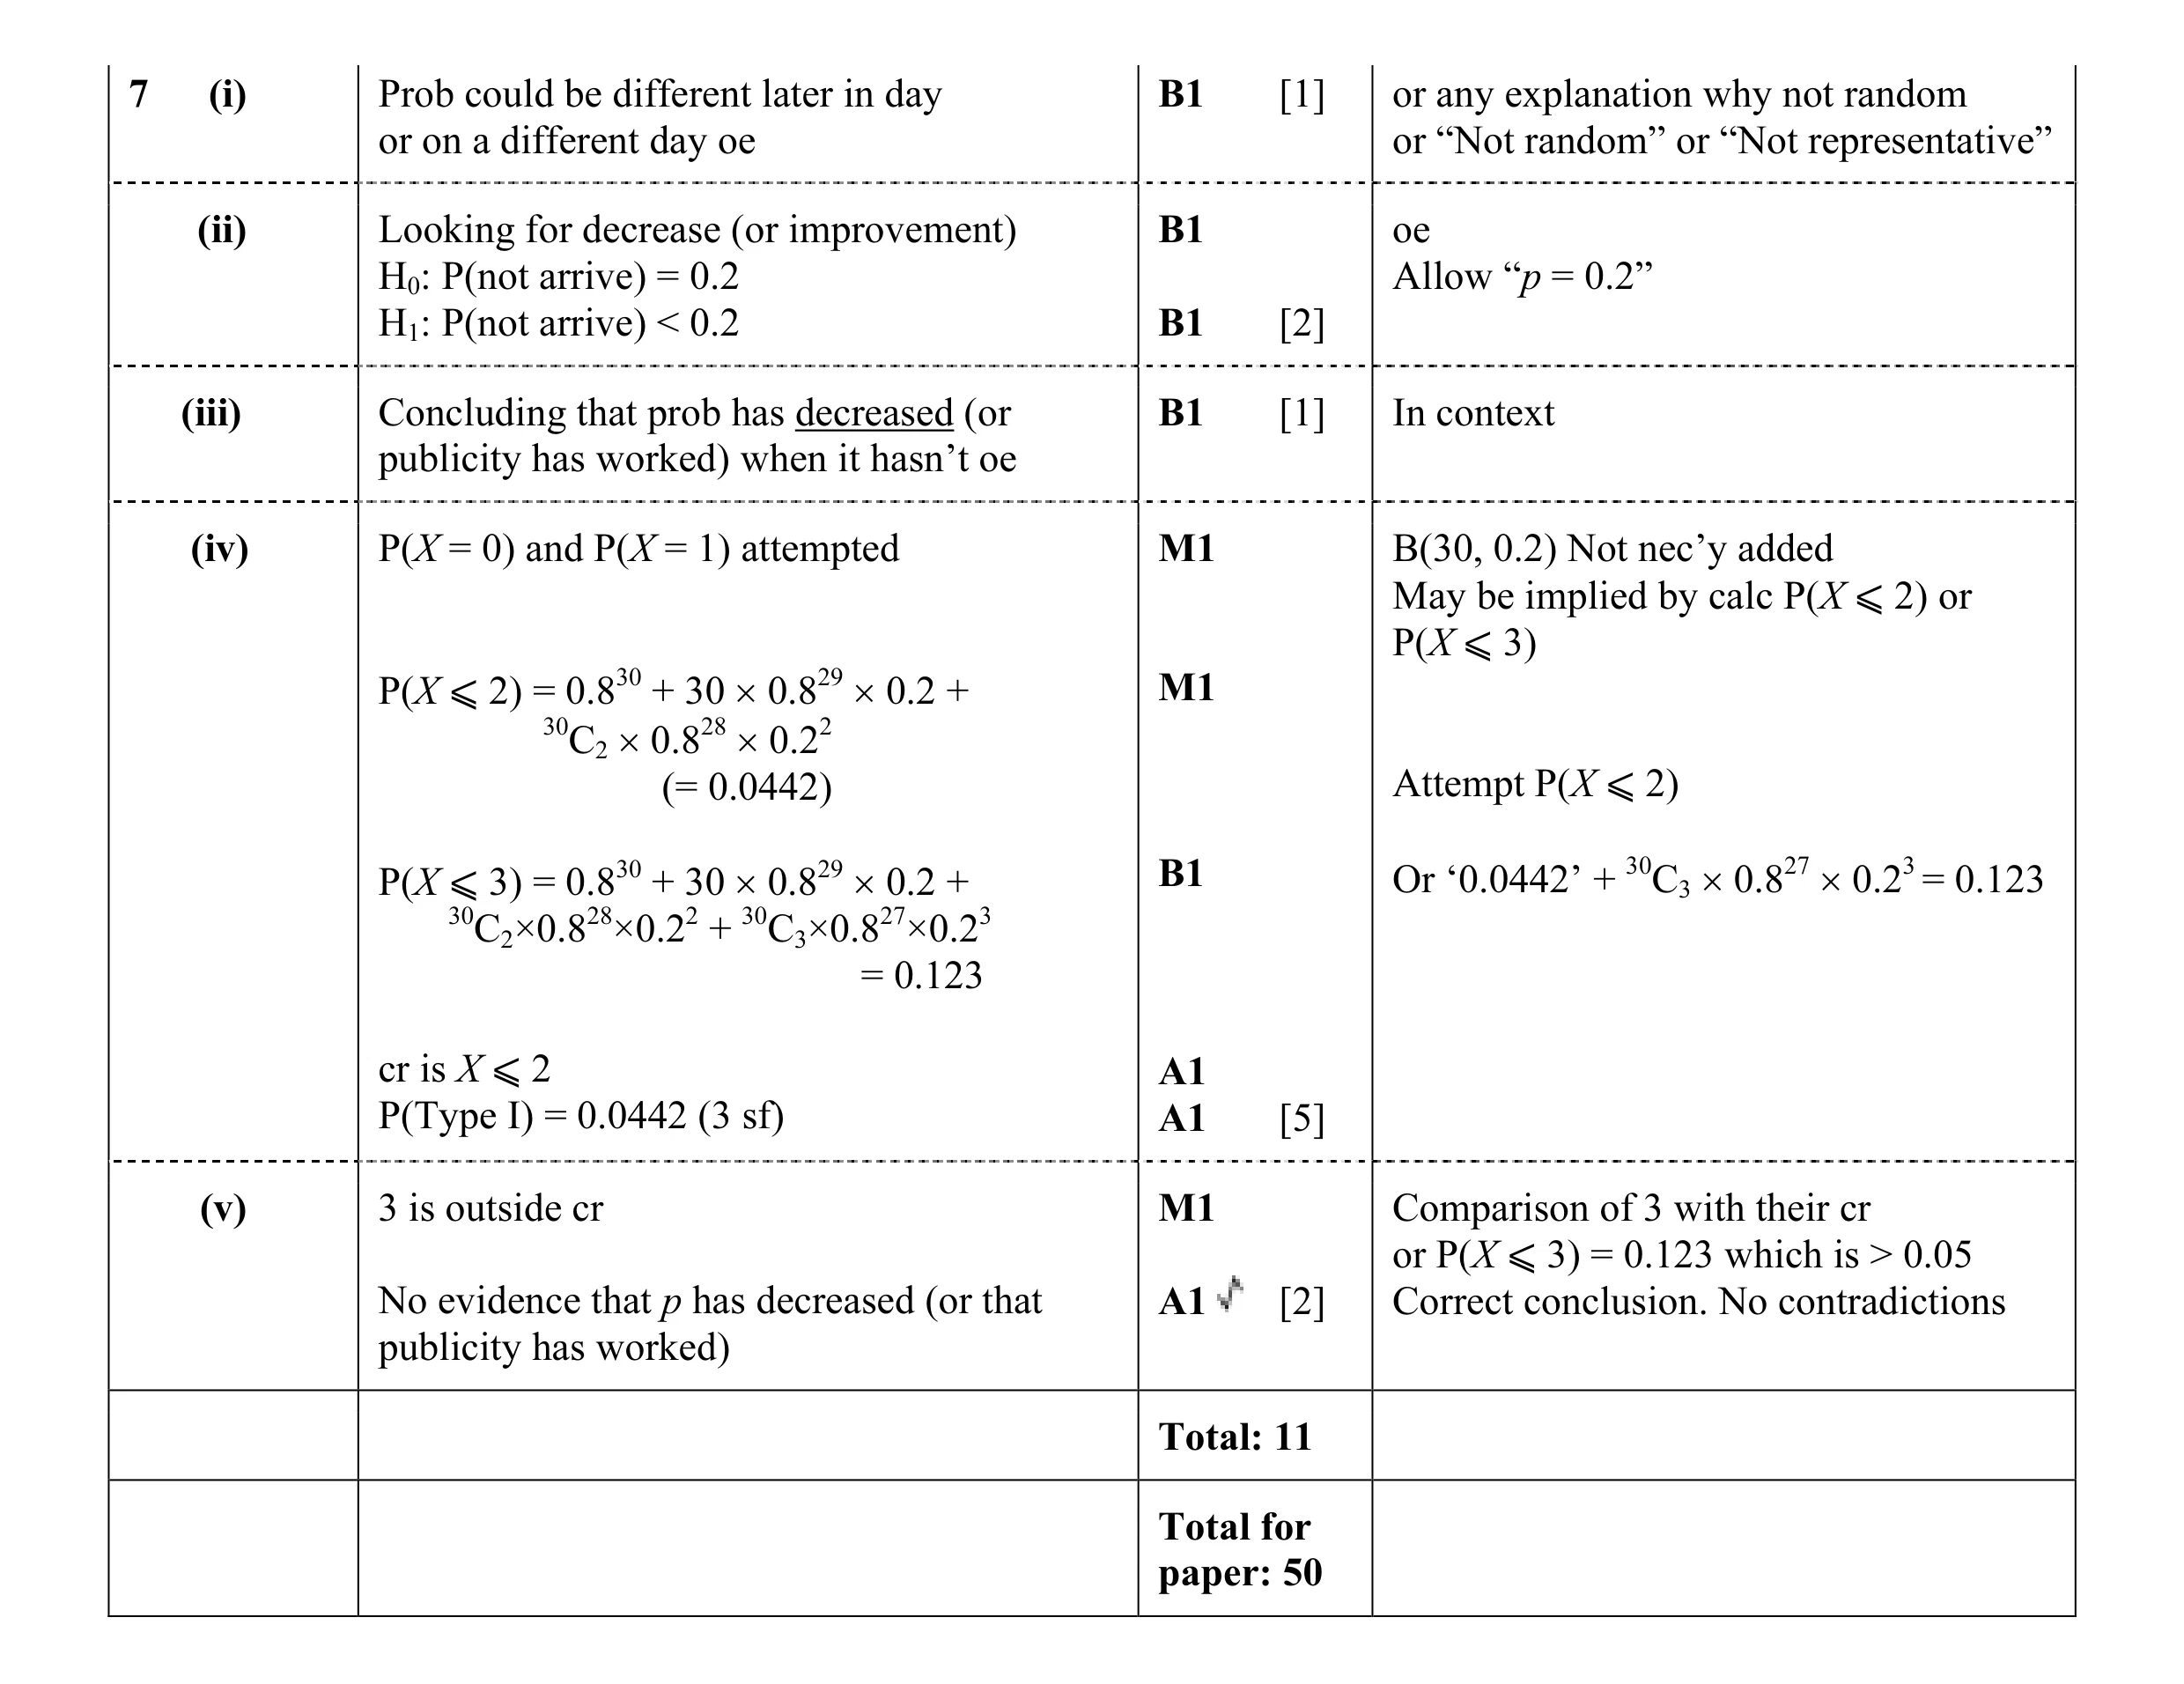 11
11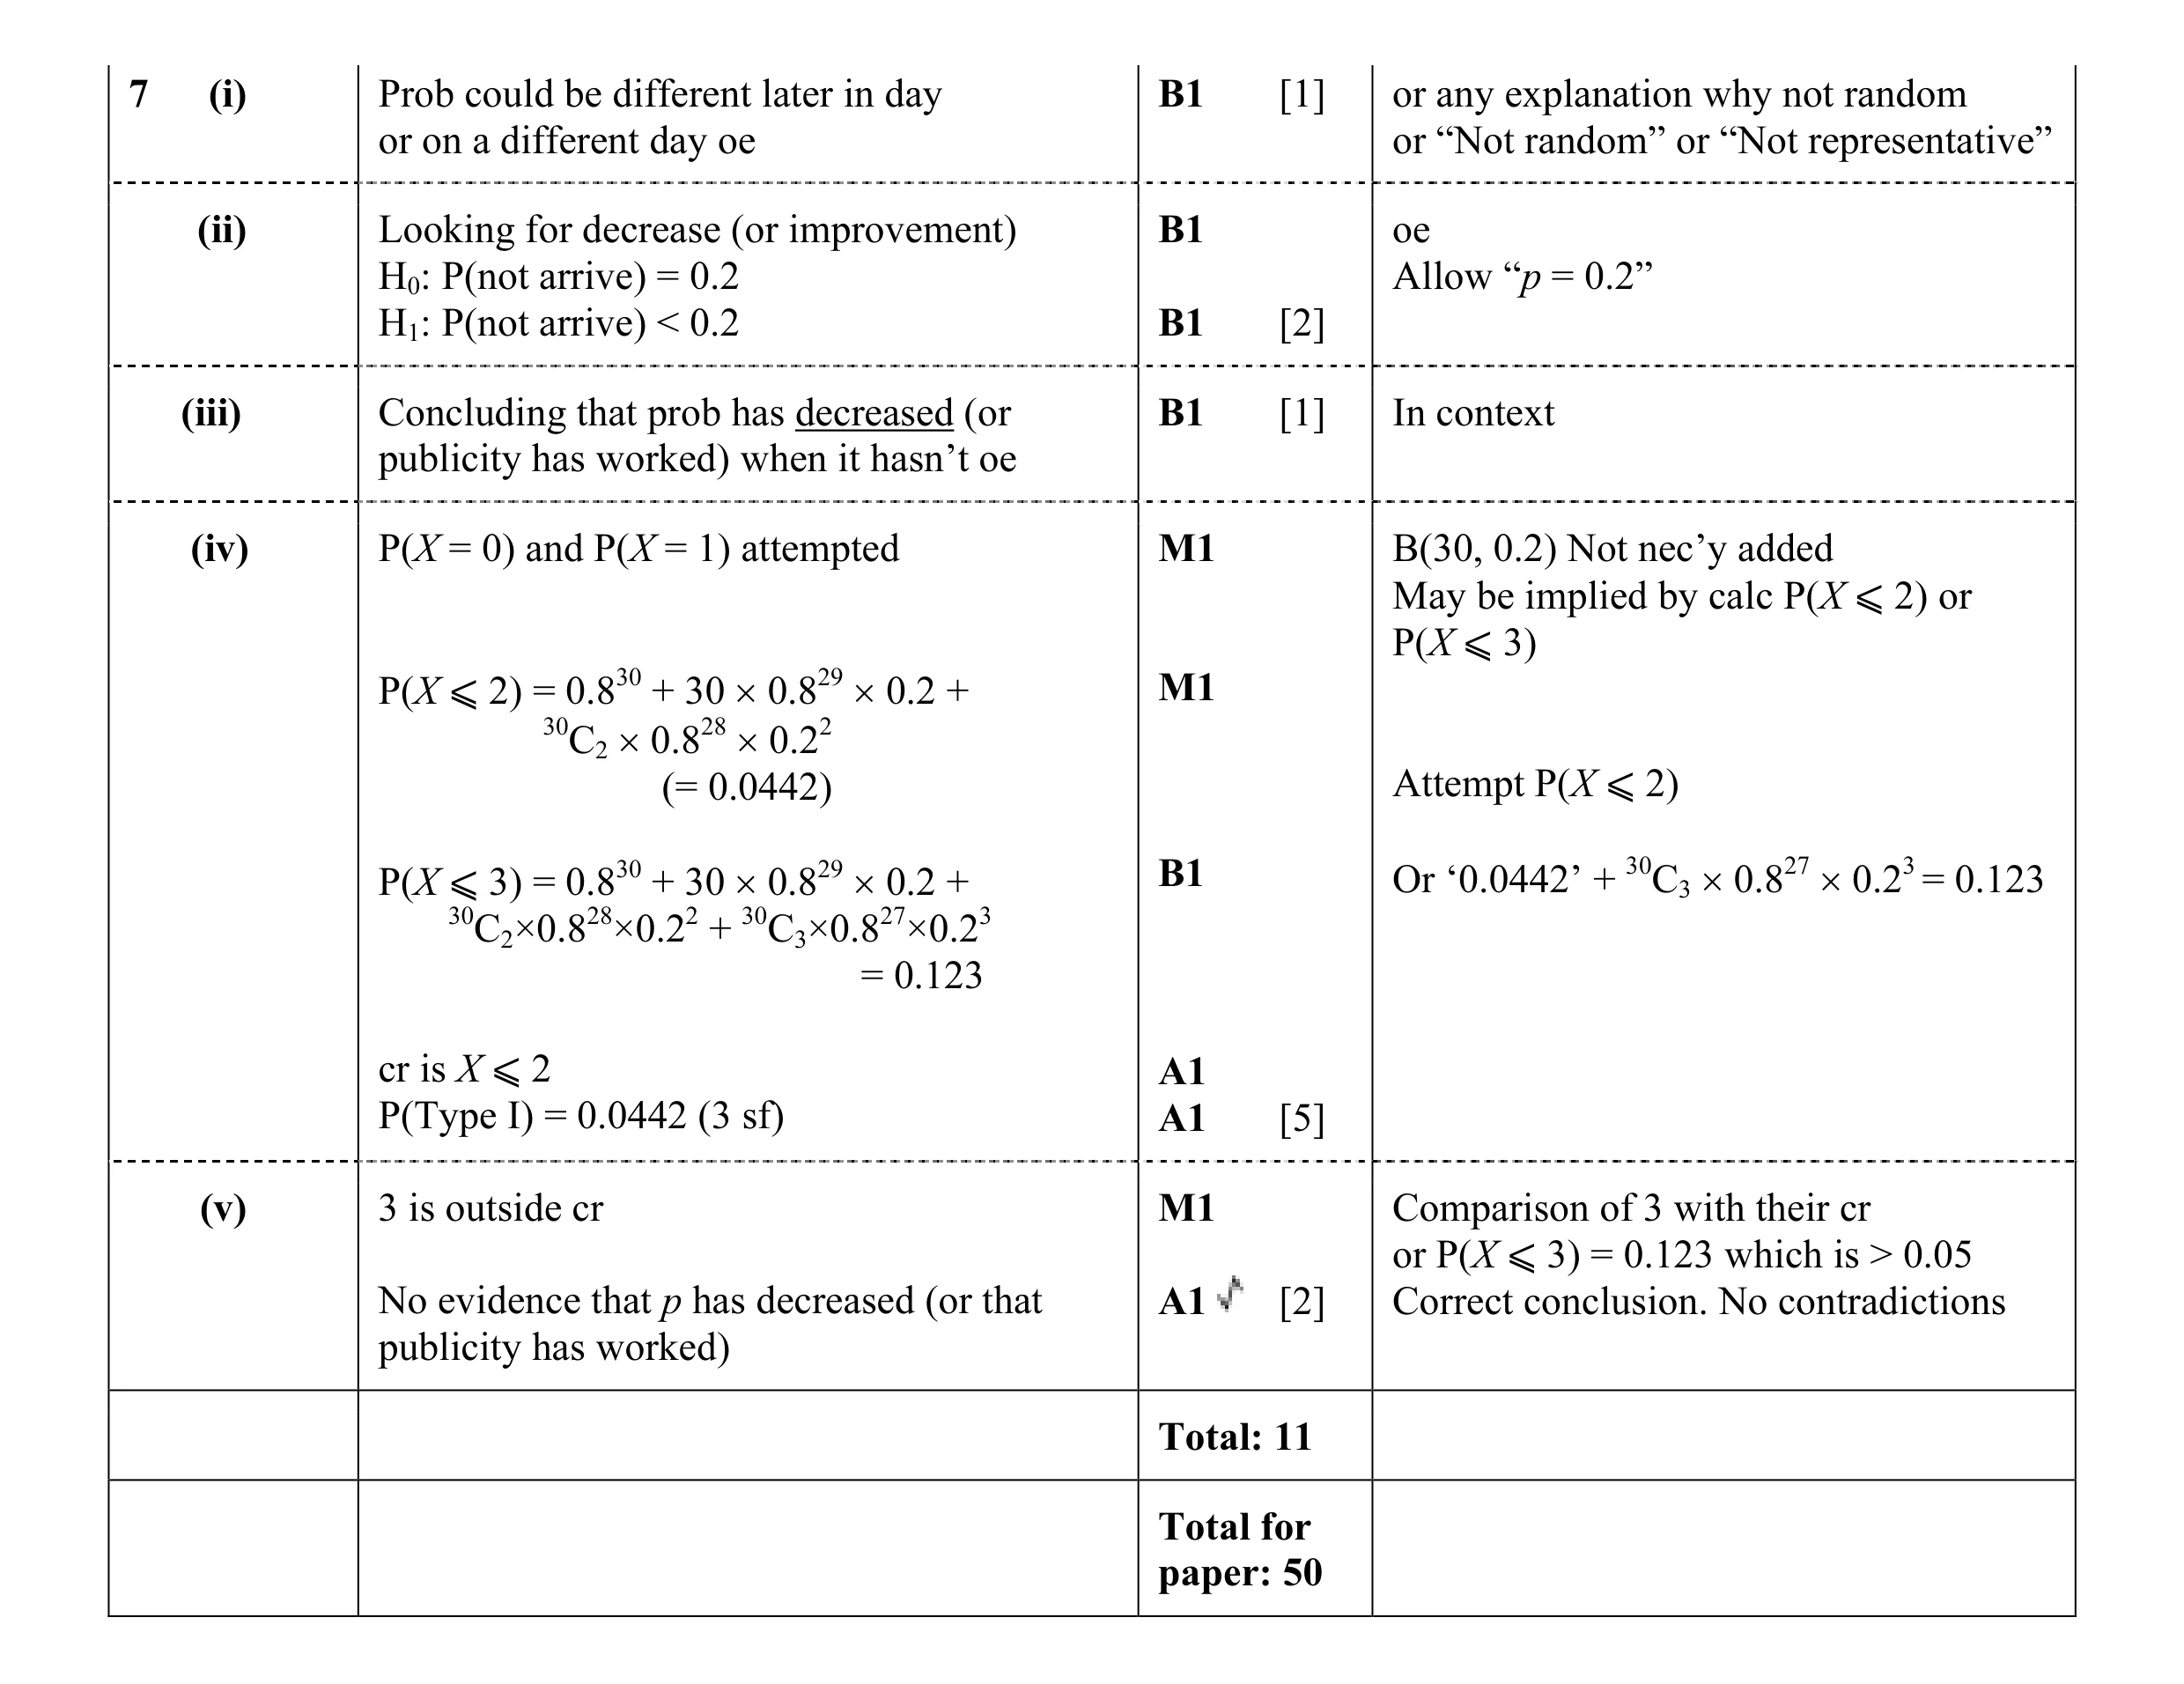 11
11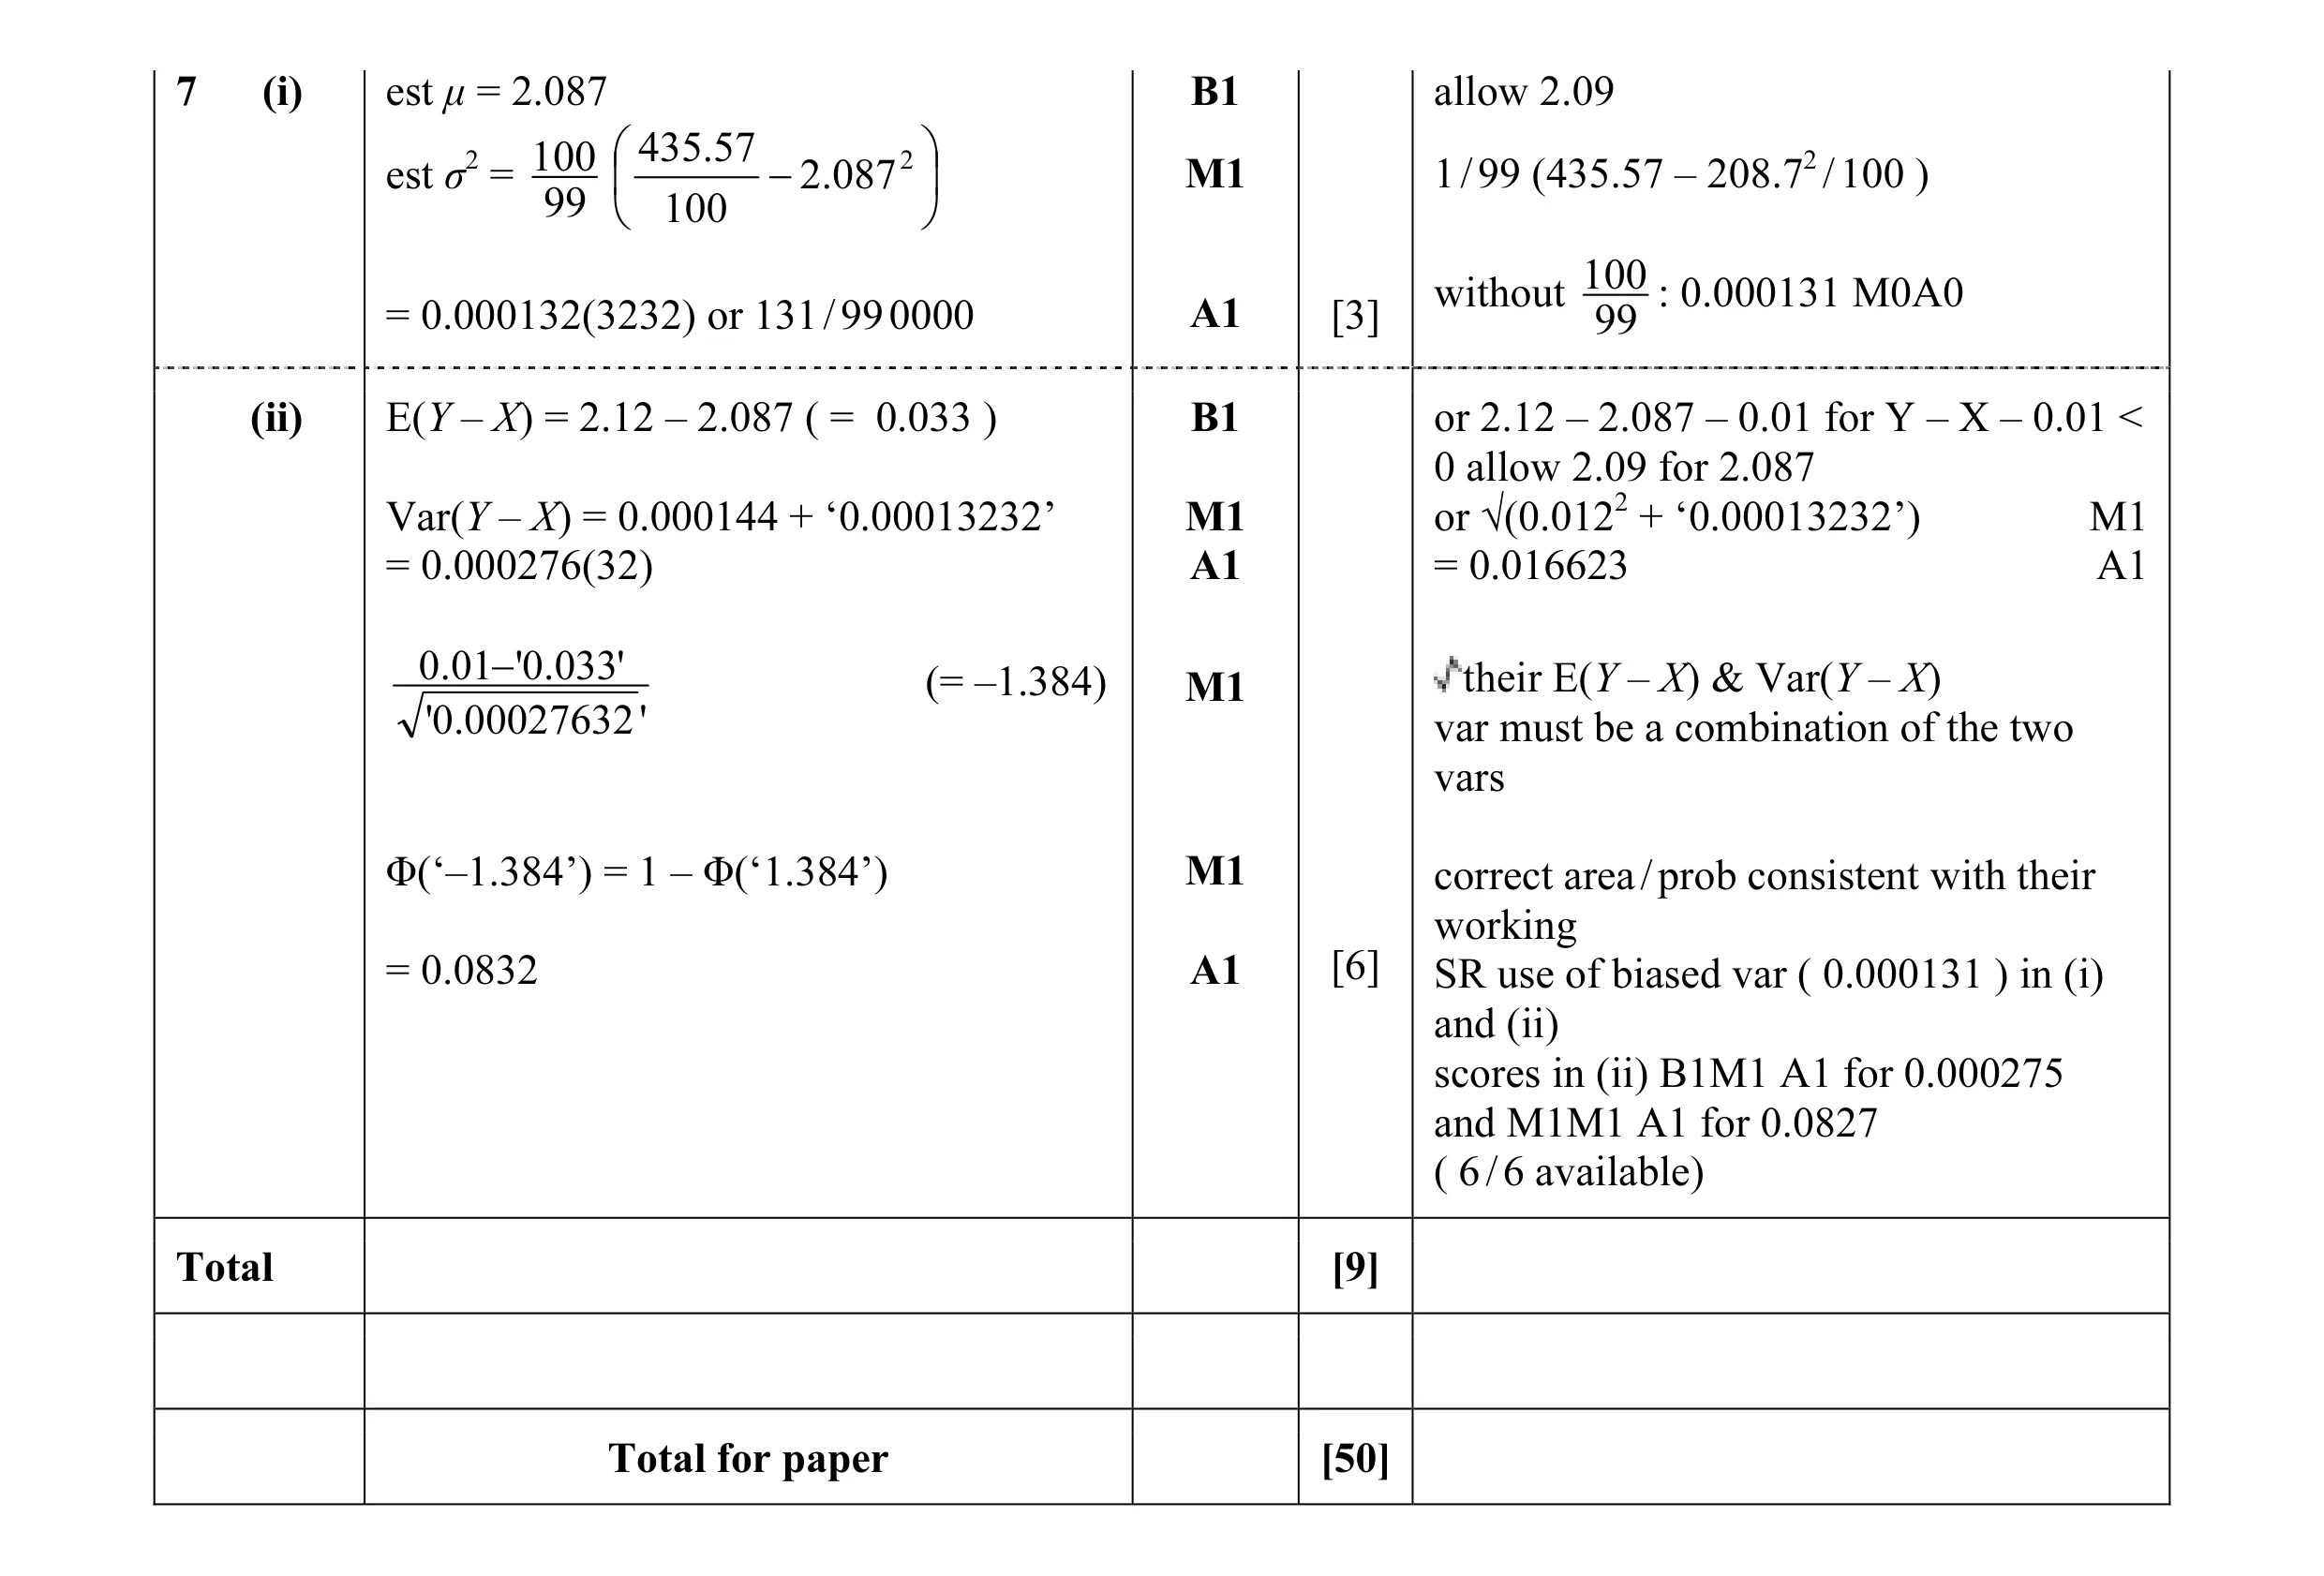 9
9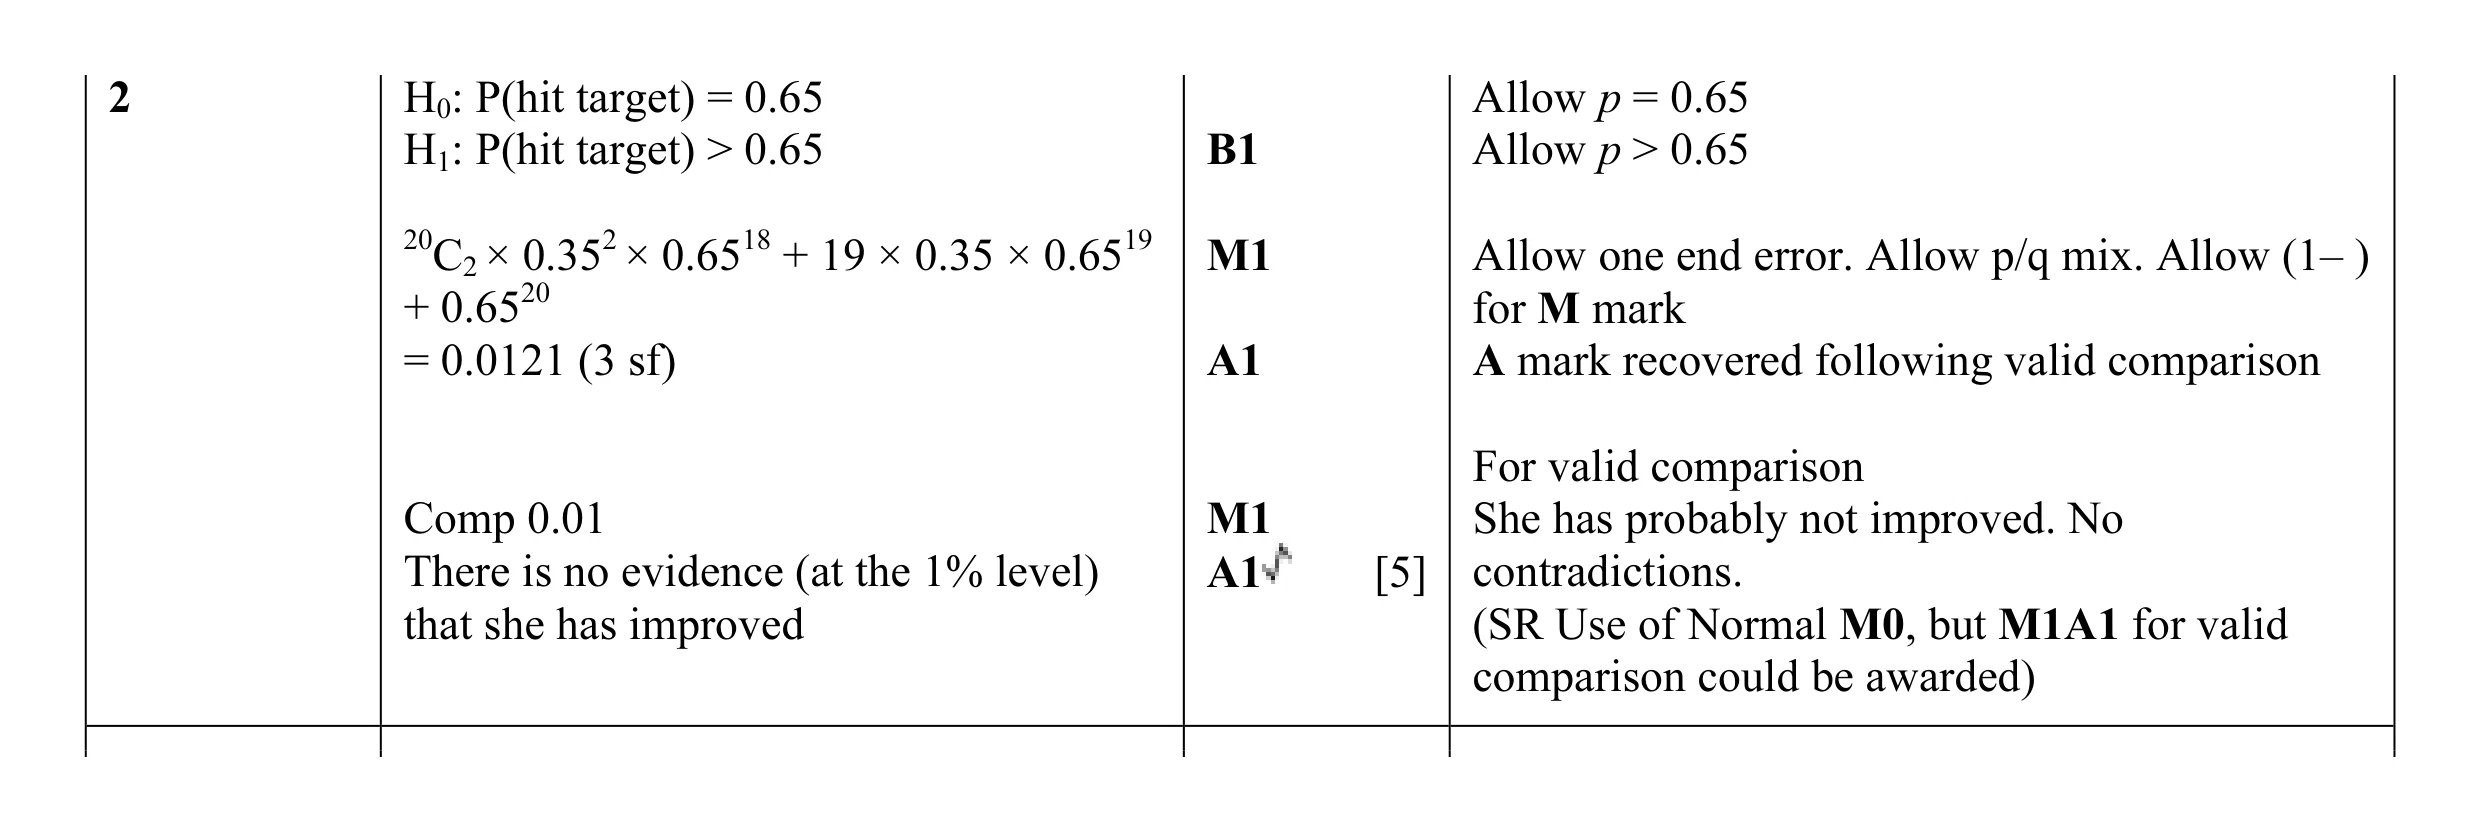 5
5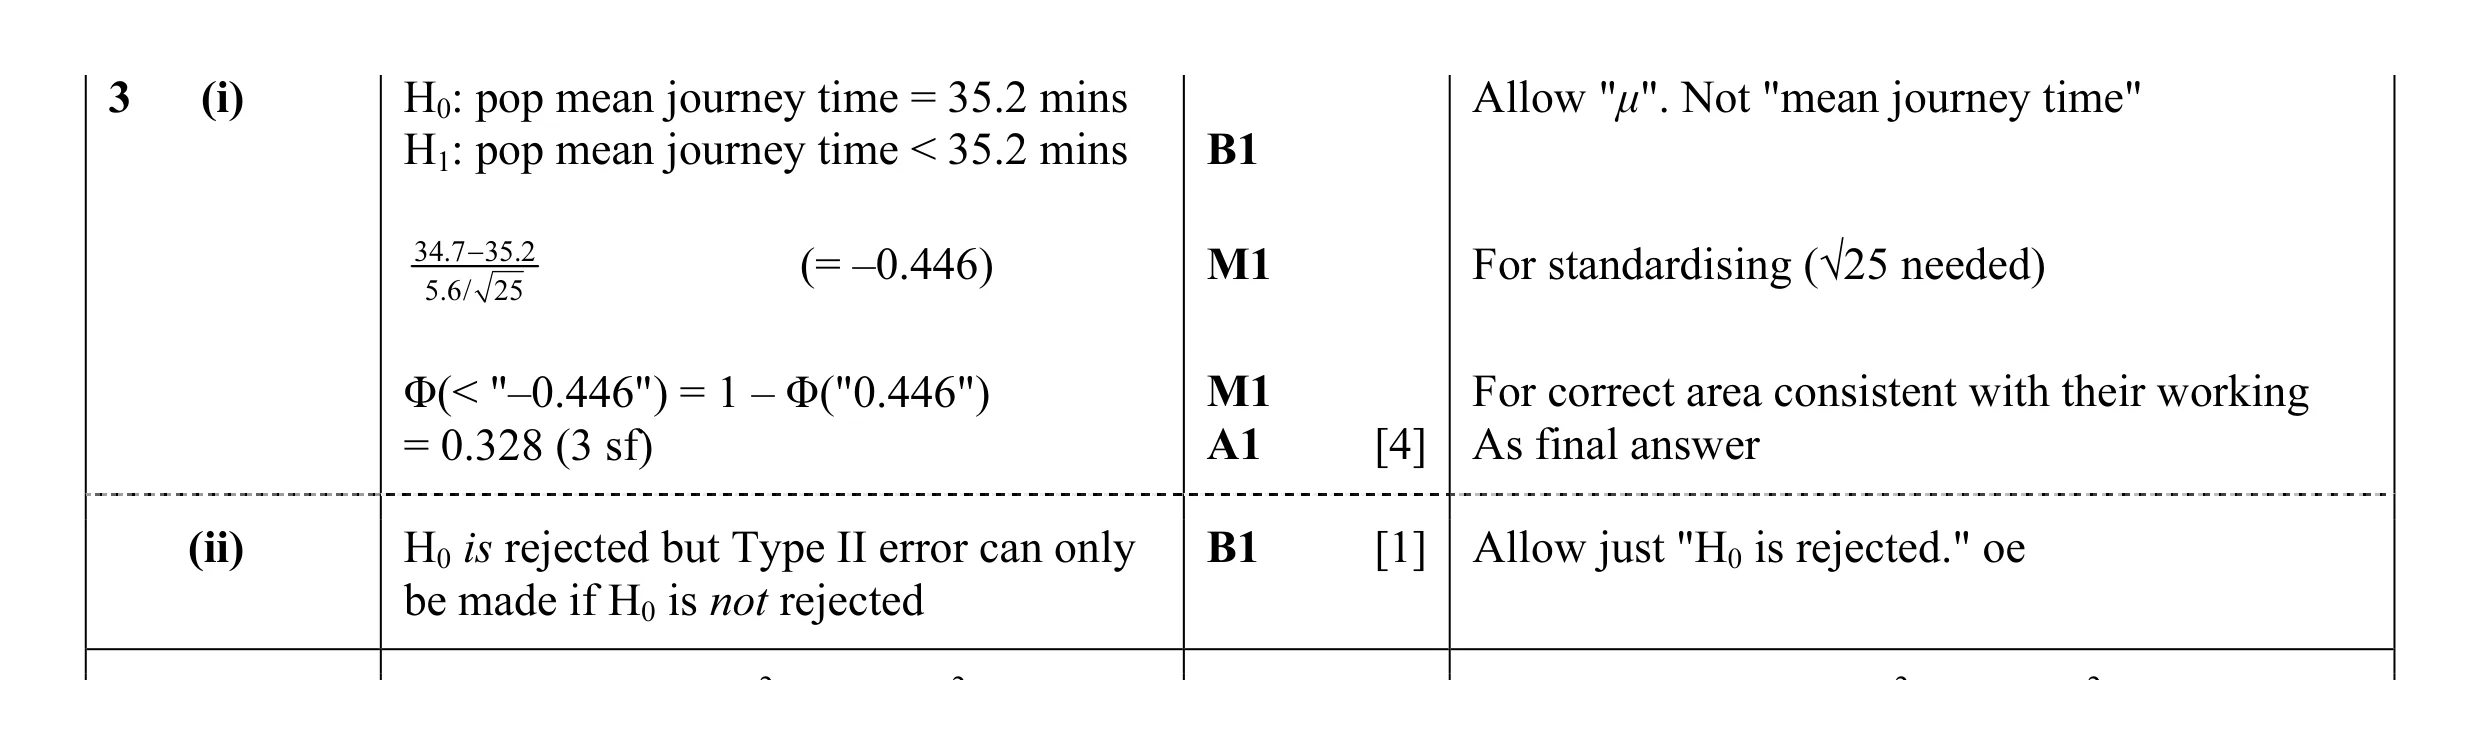 5
5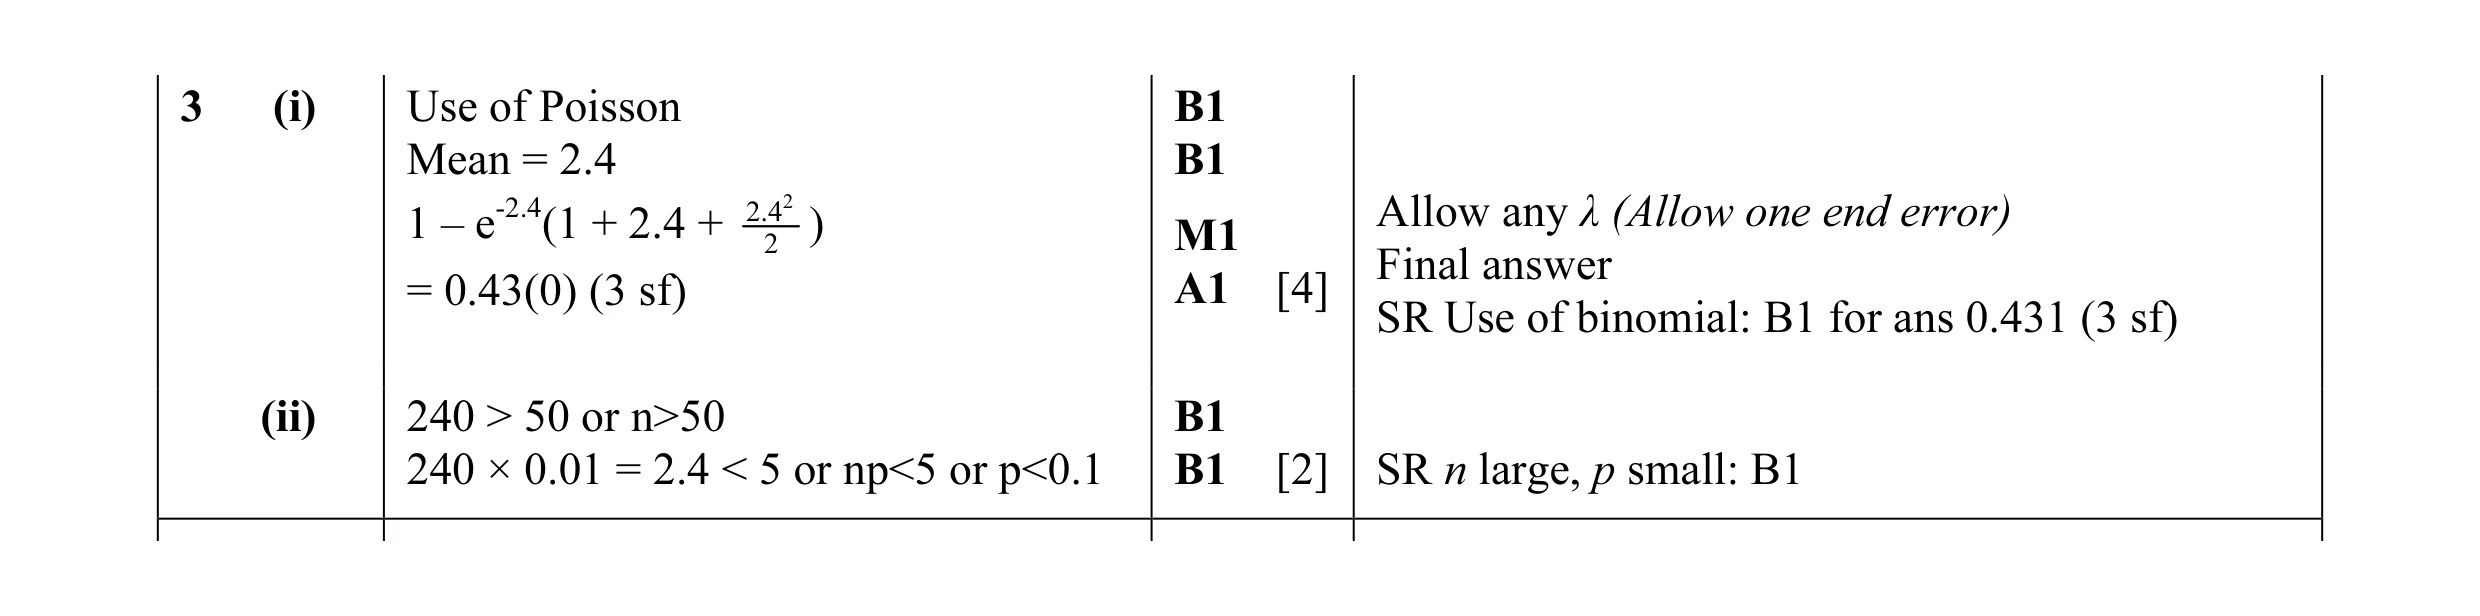 6
6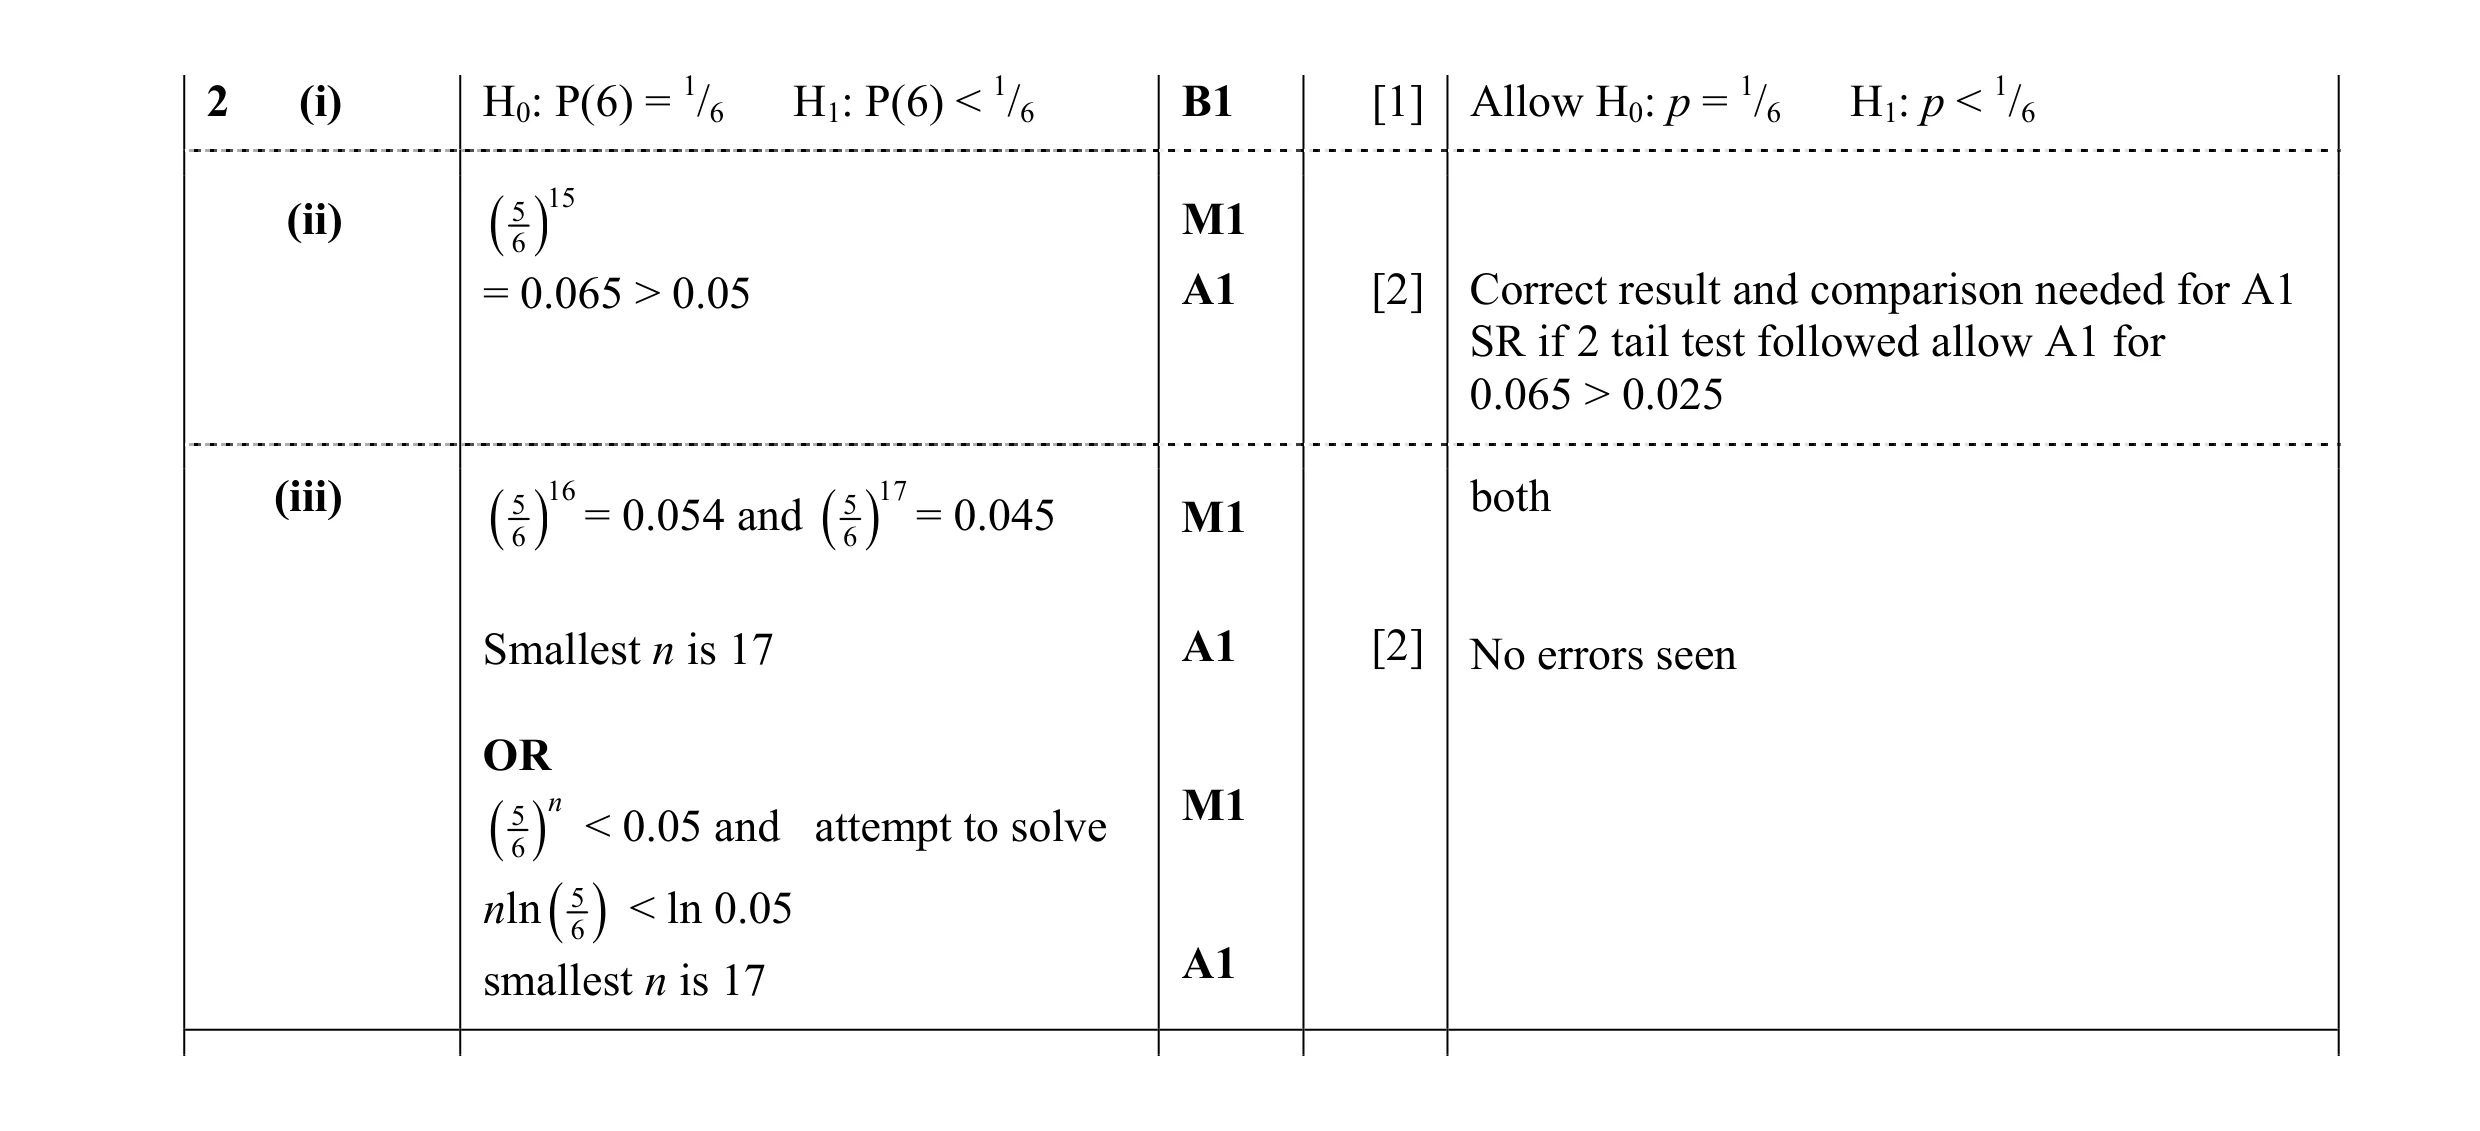 5
5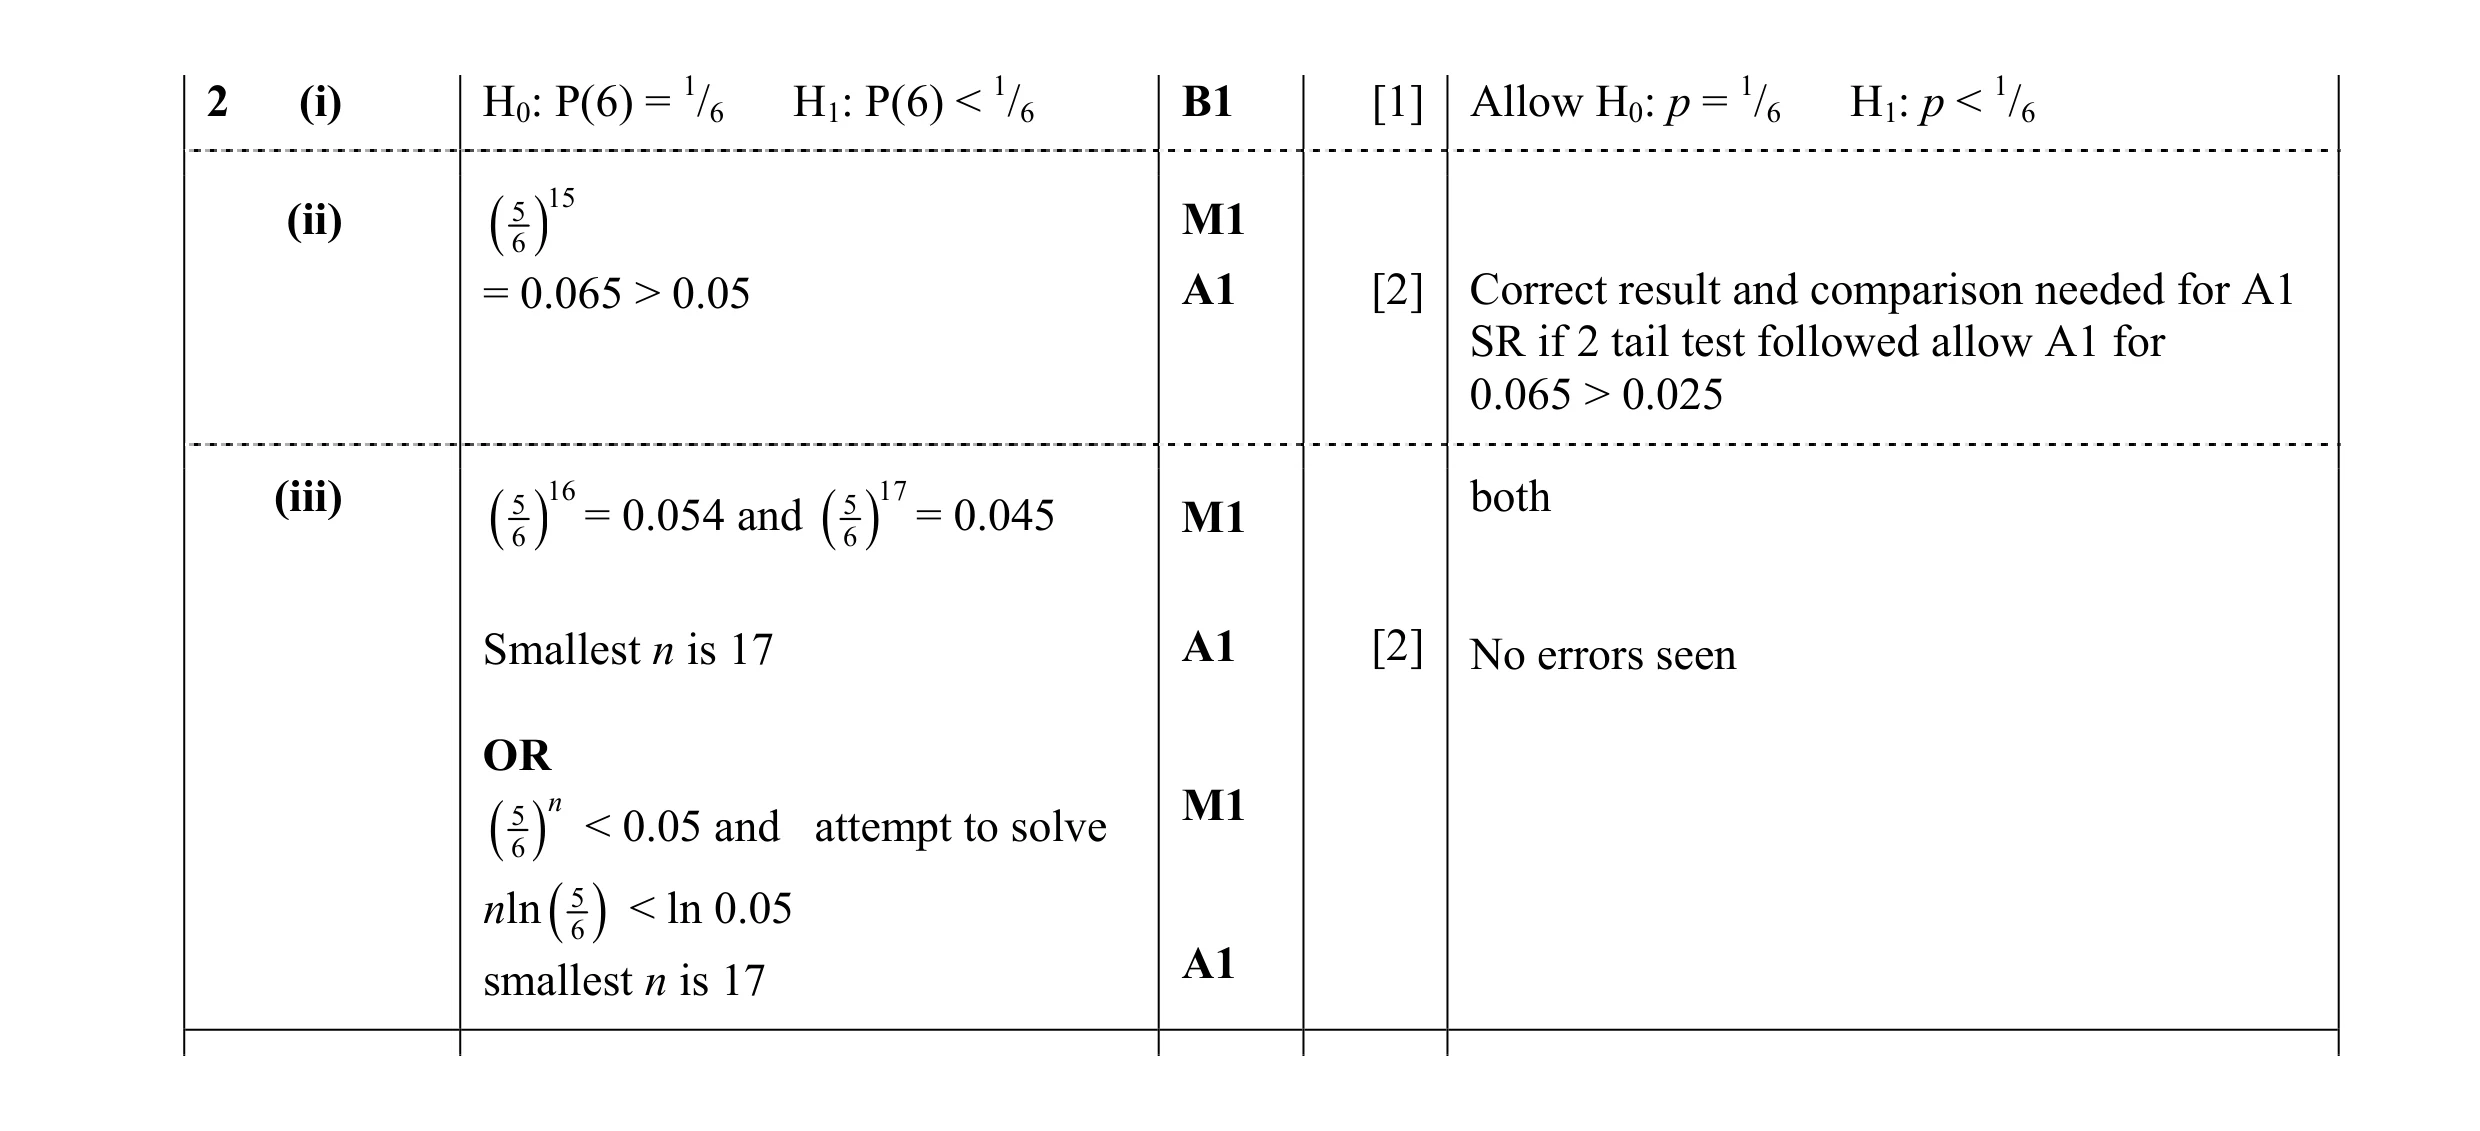 5
5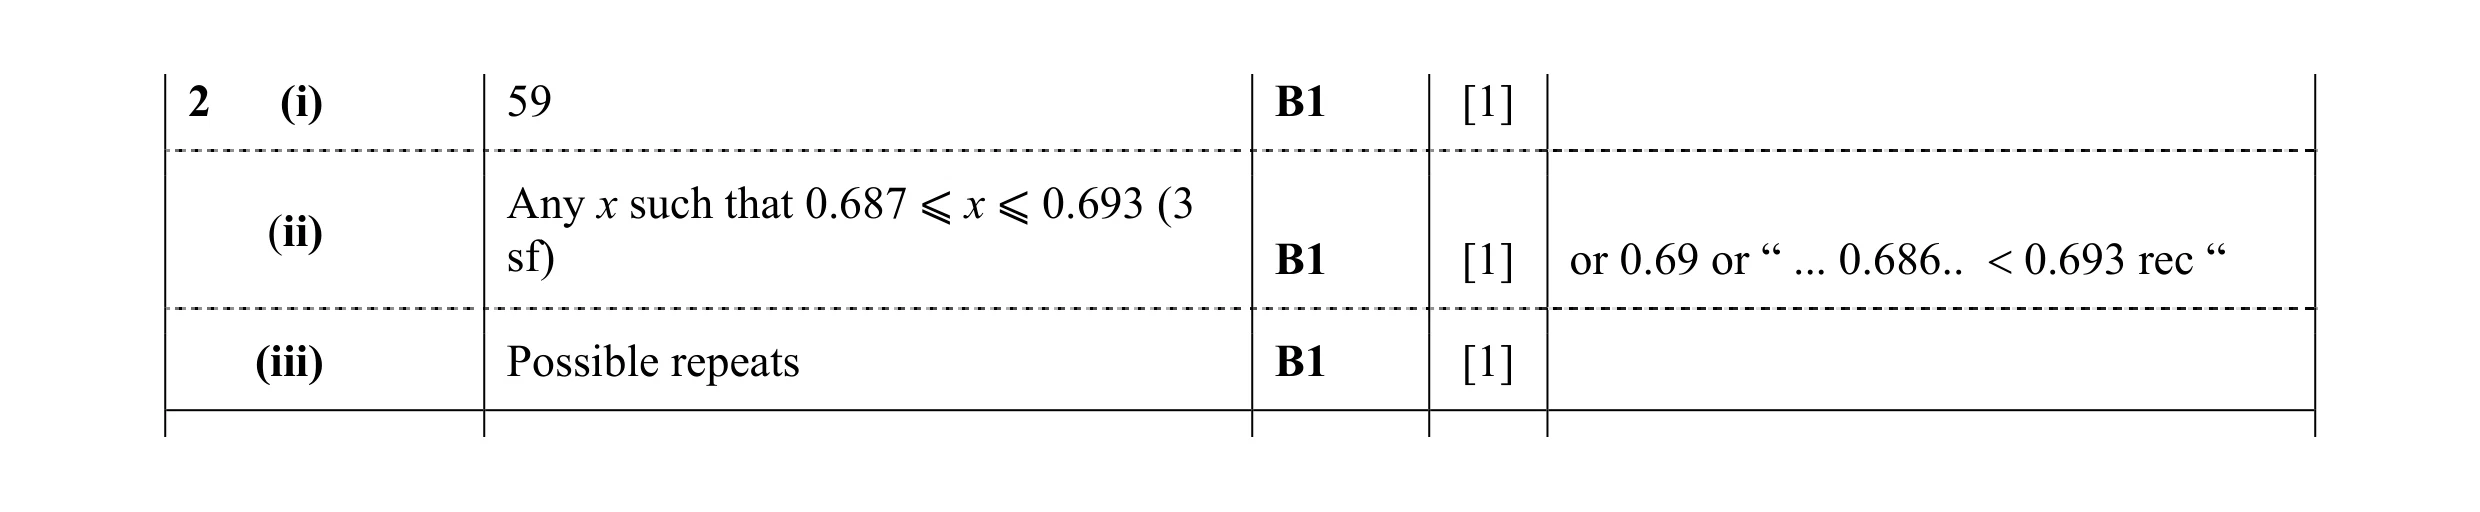 3
3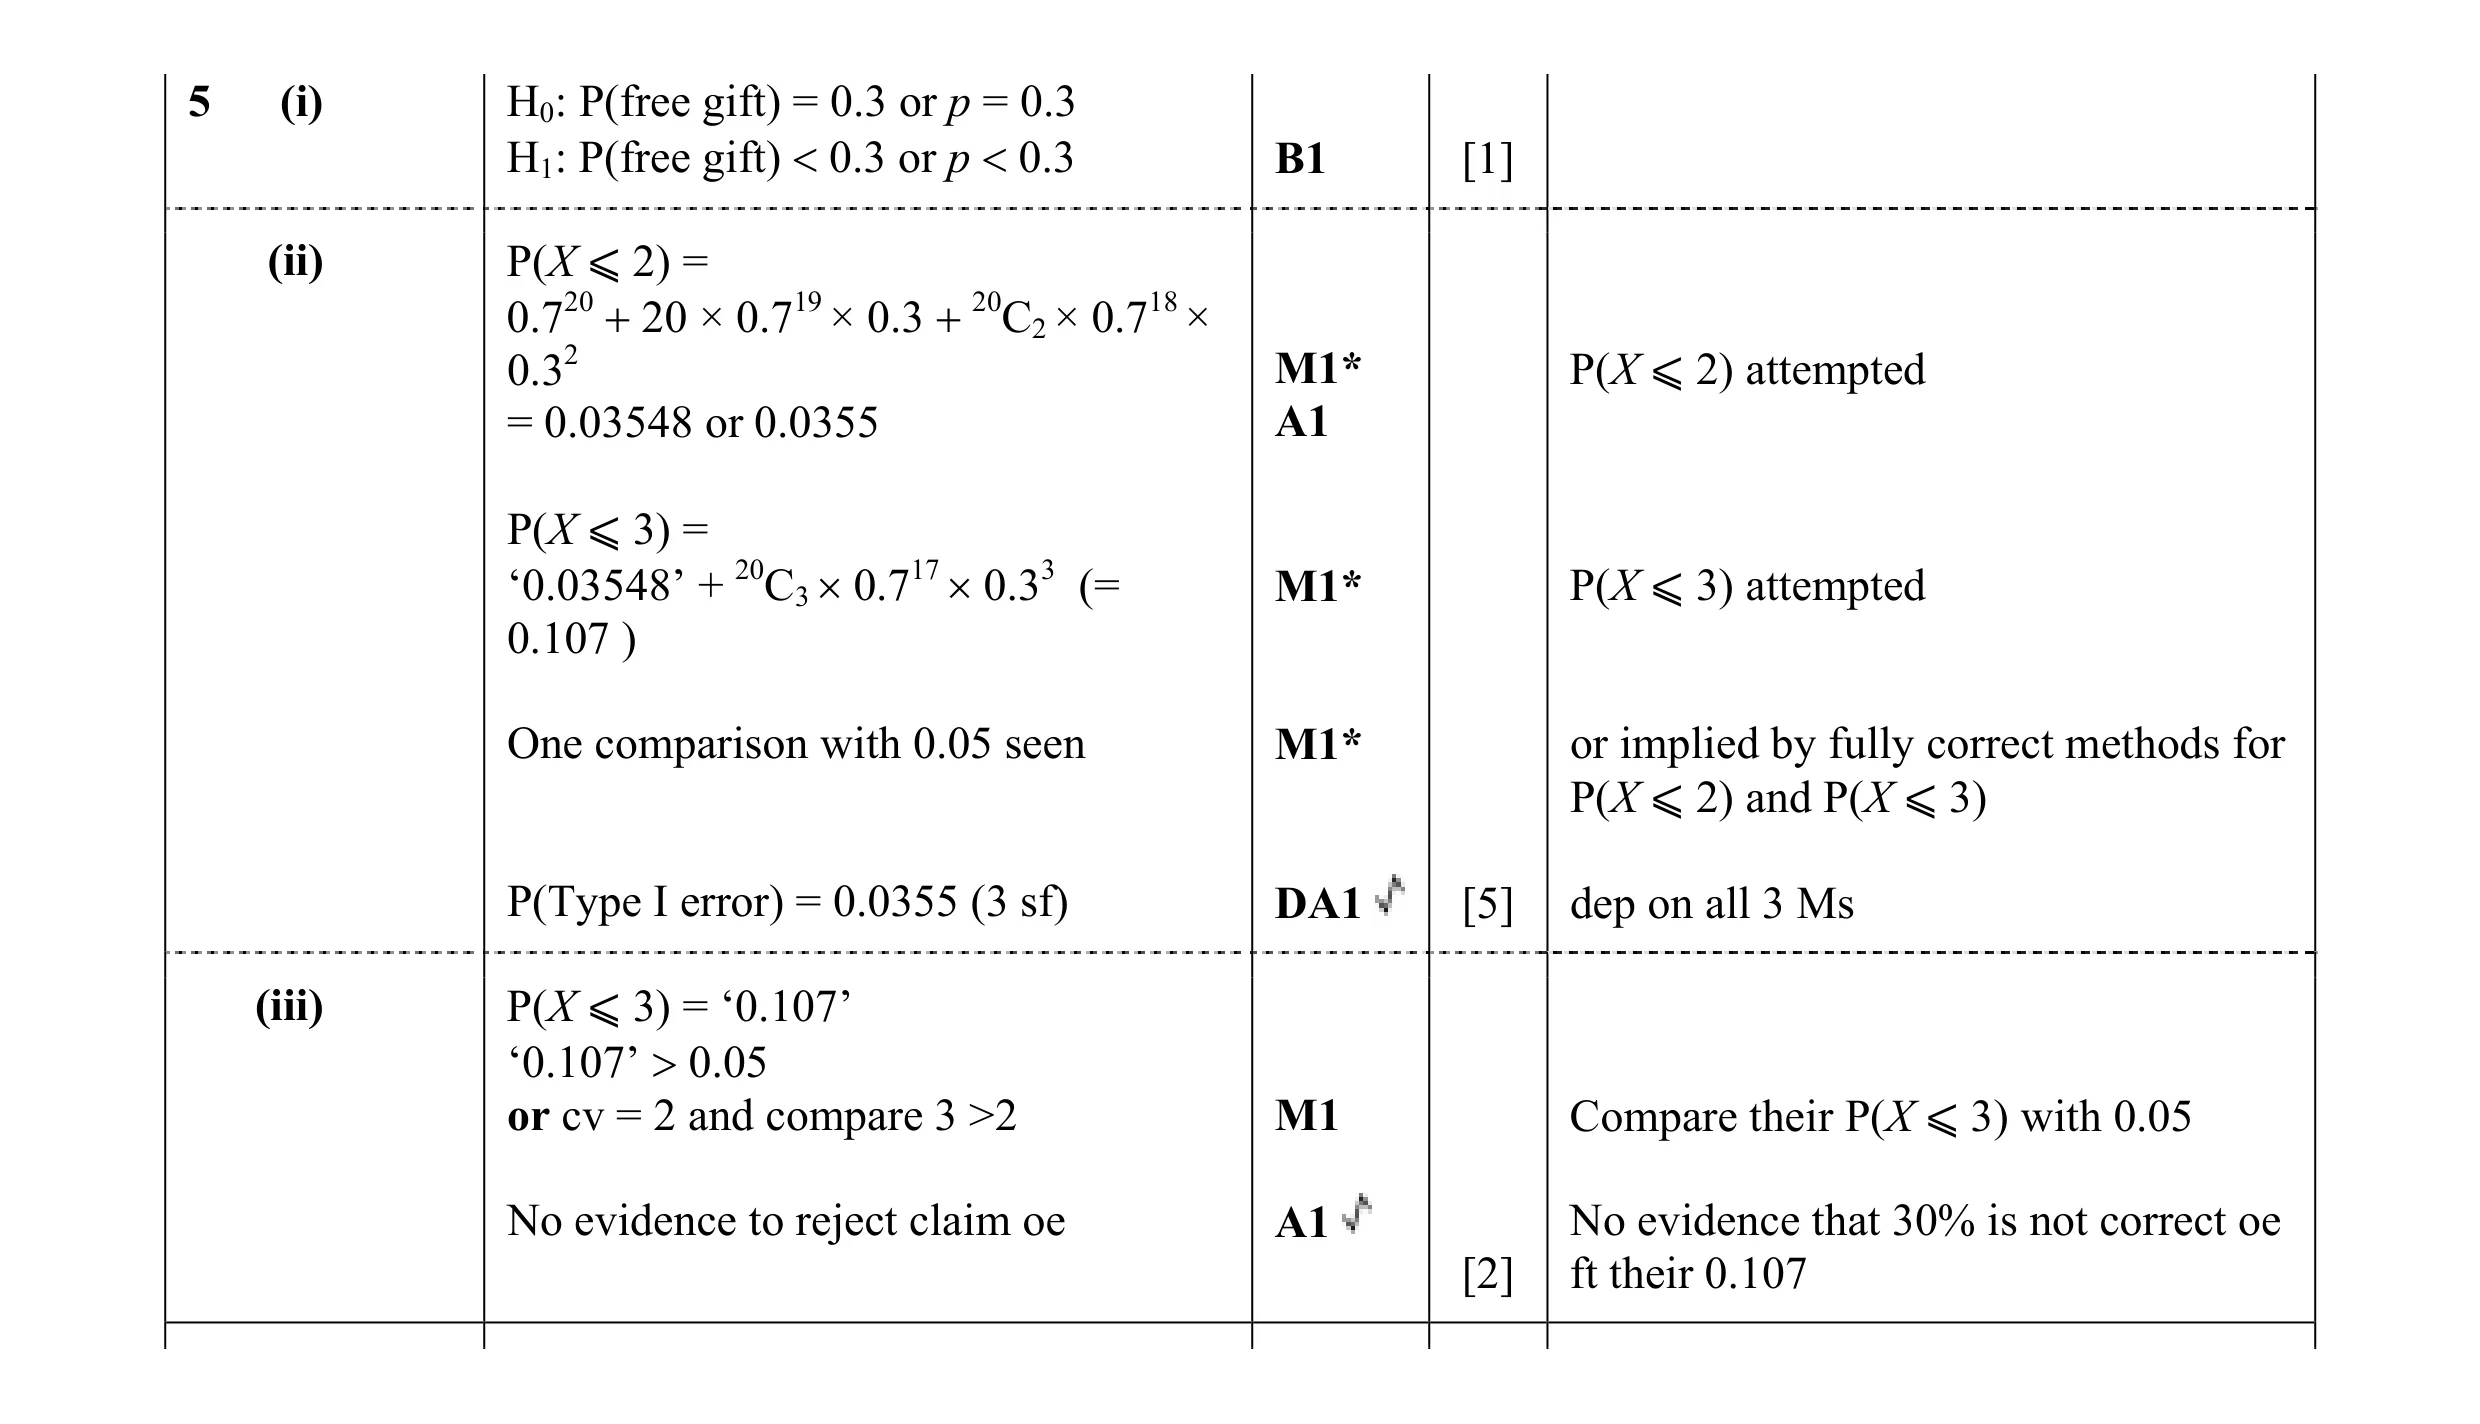 8
8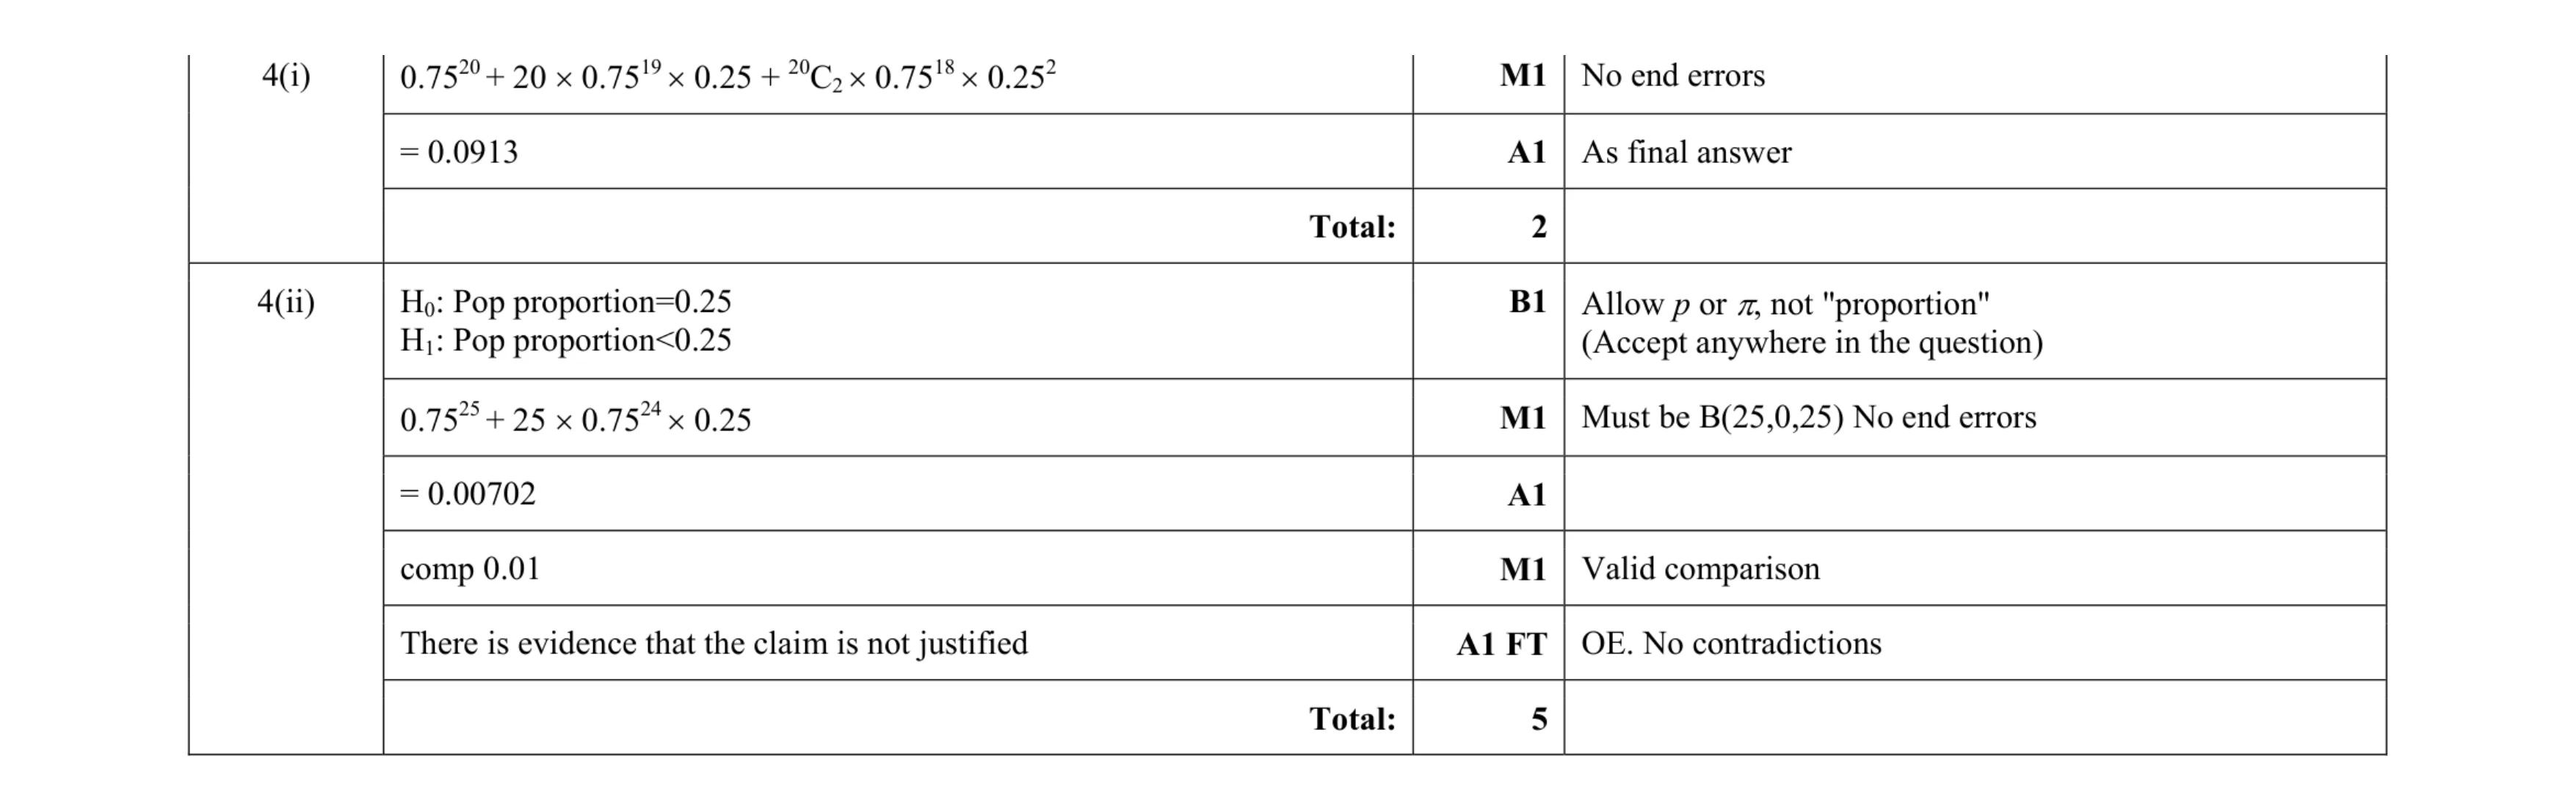 7
7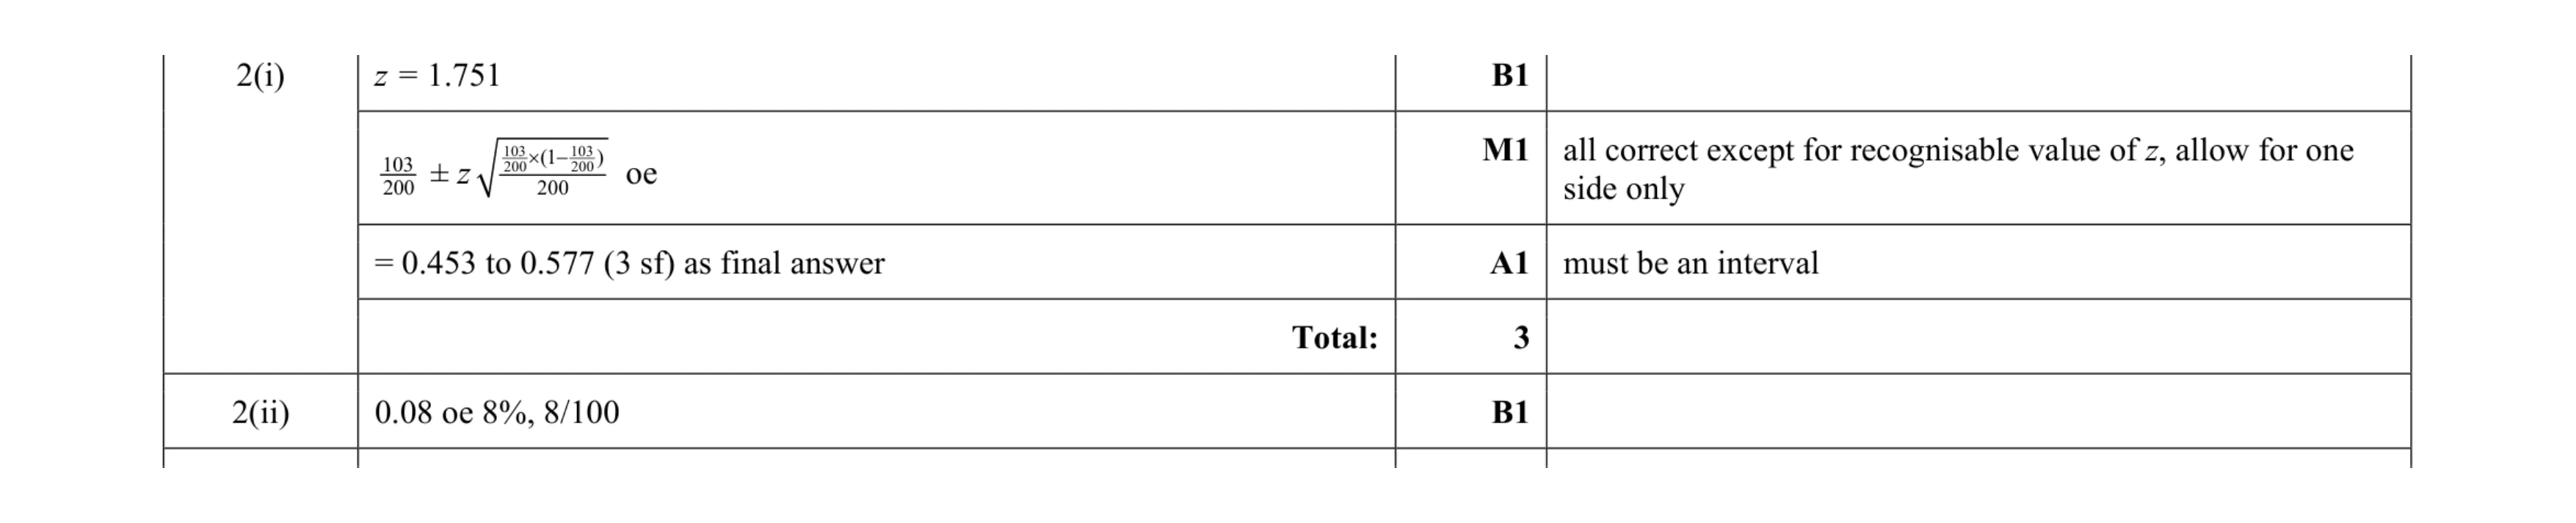 4
4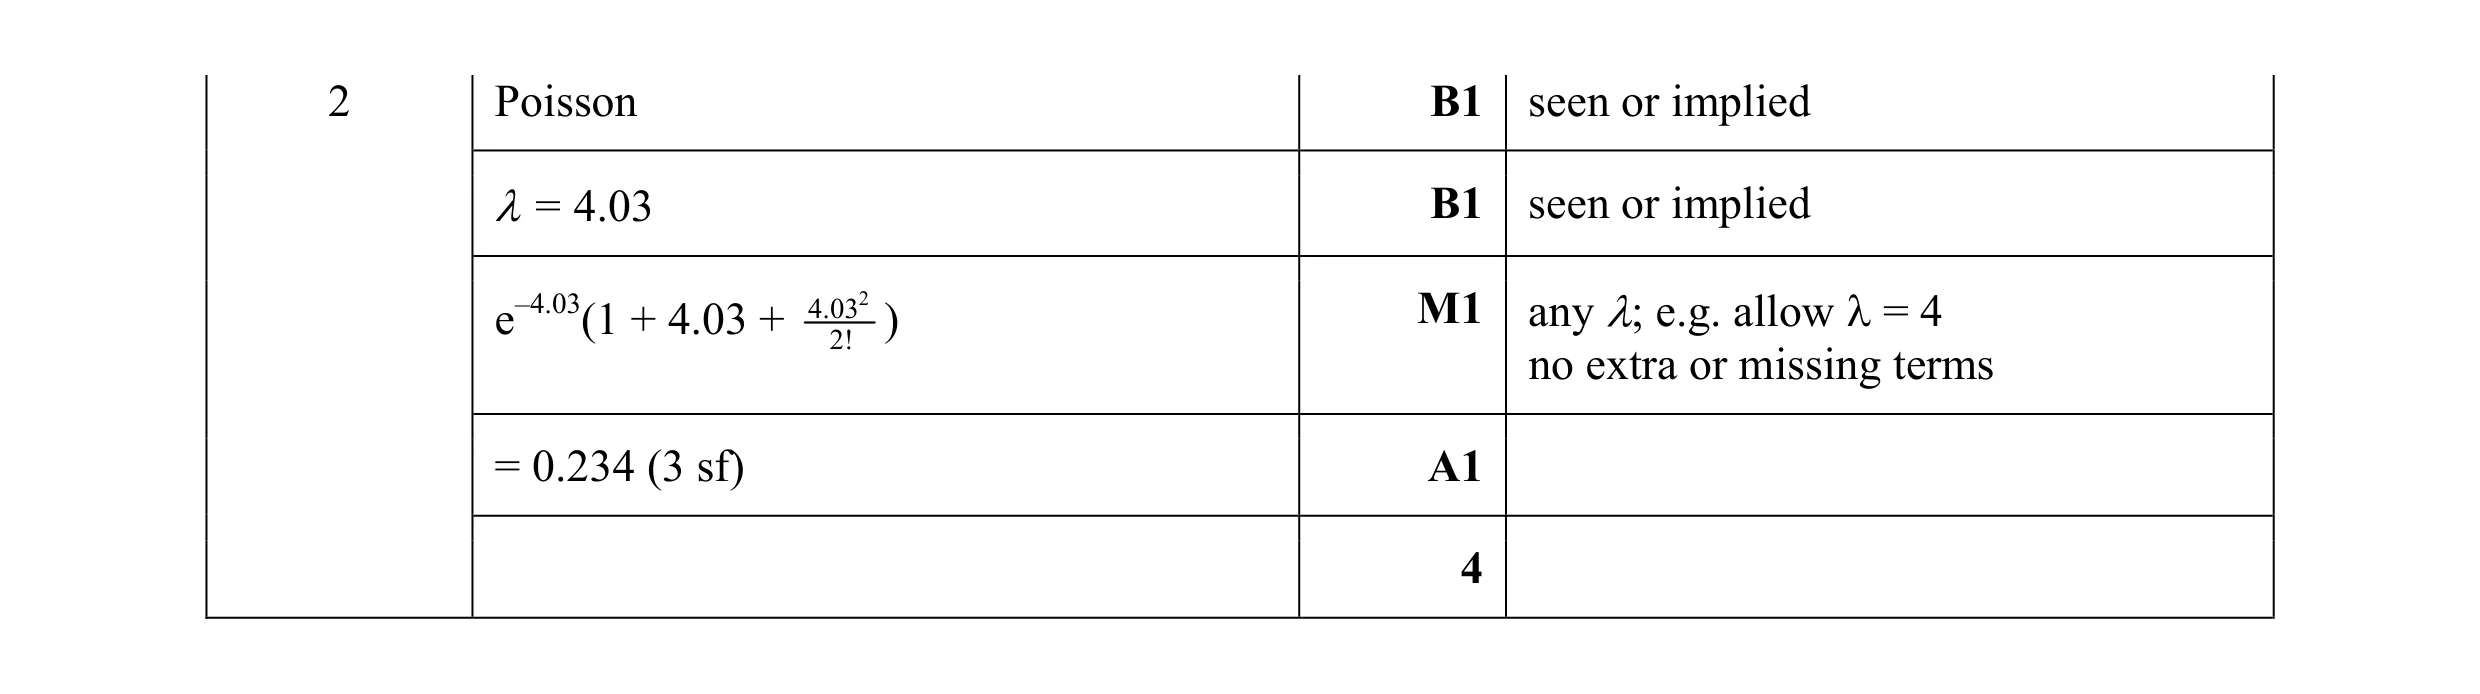 4
4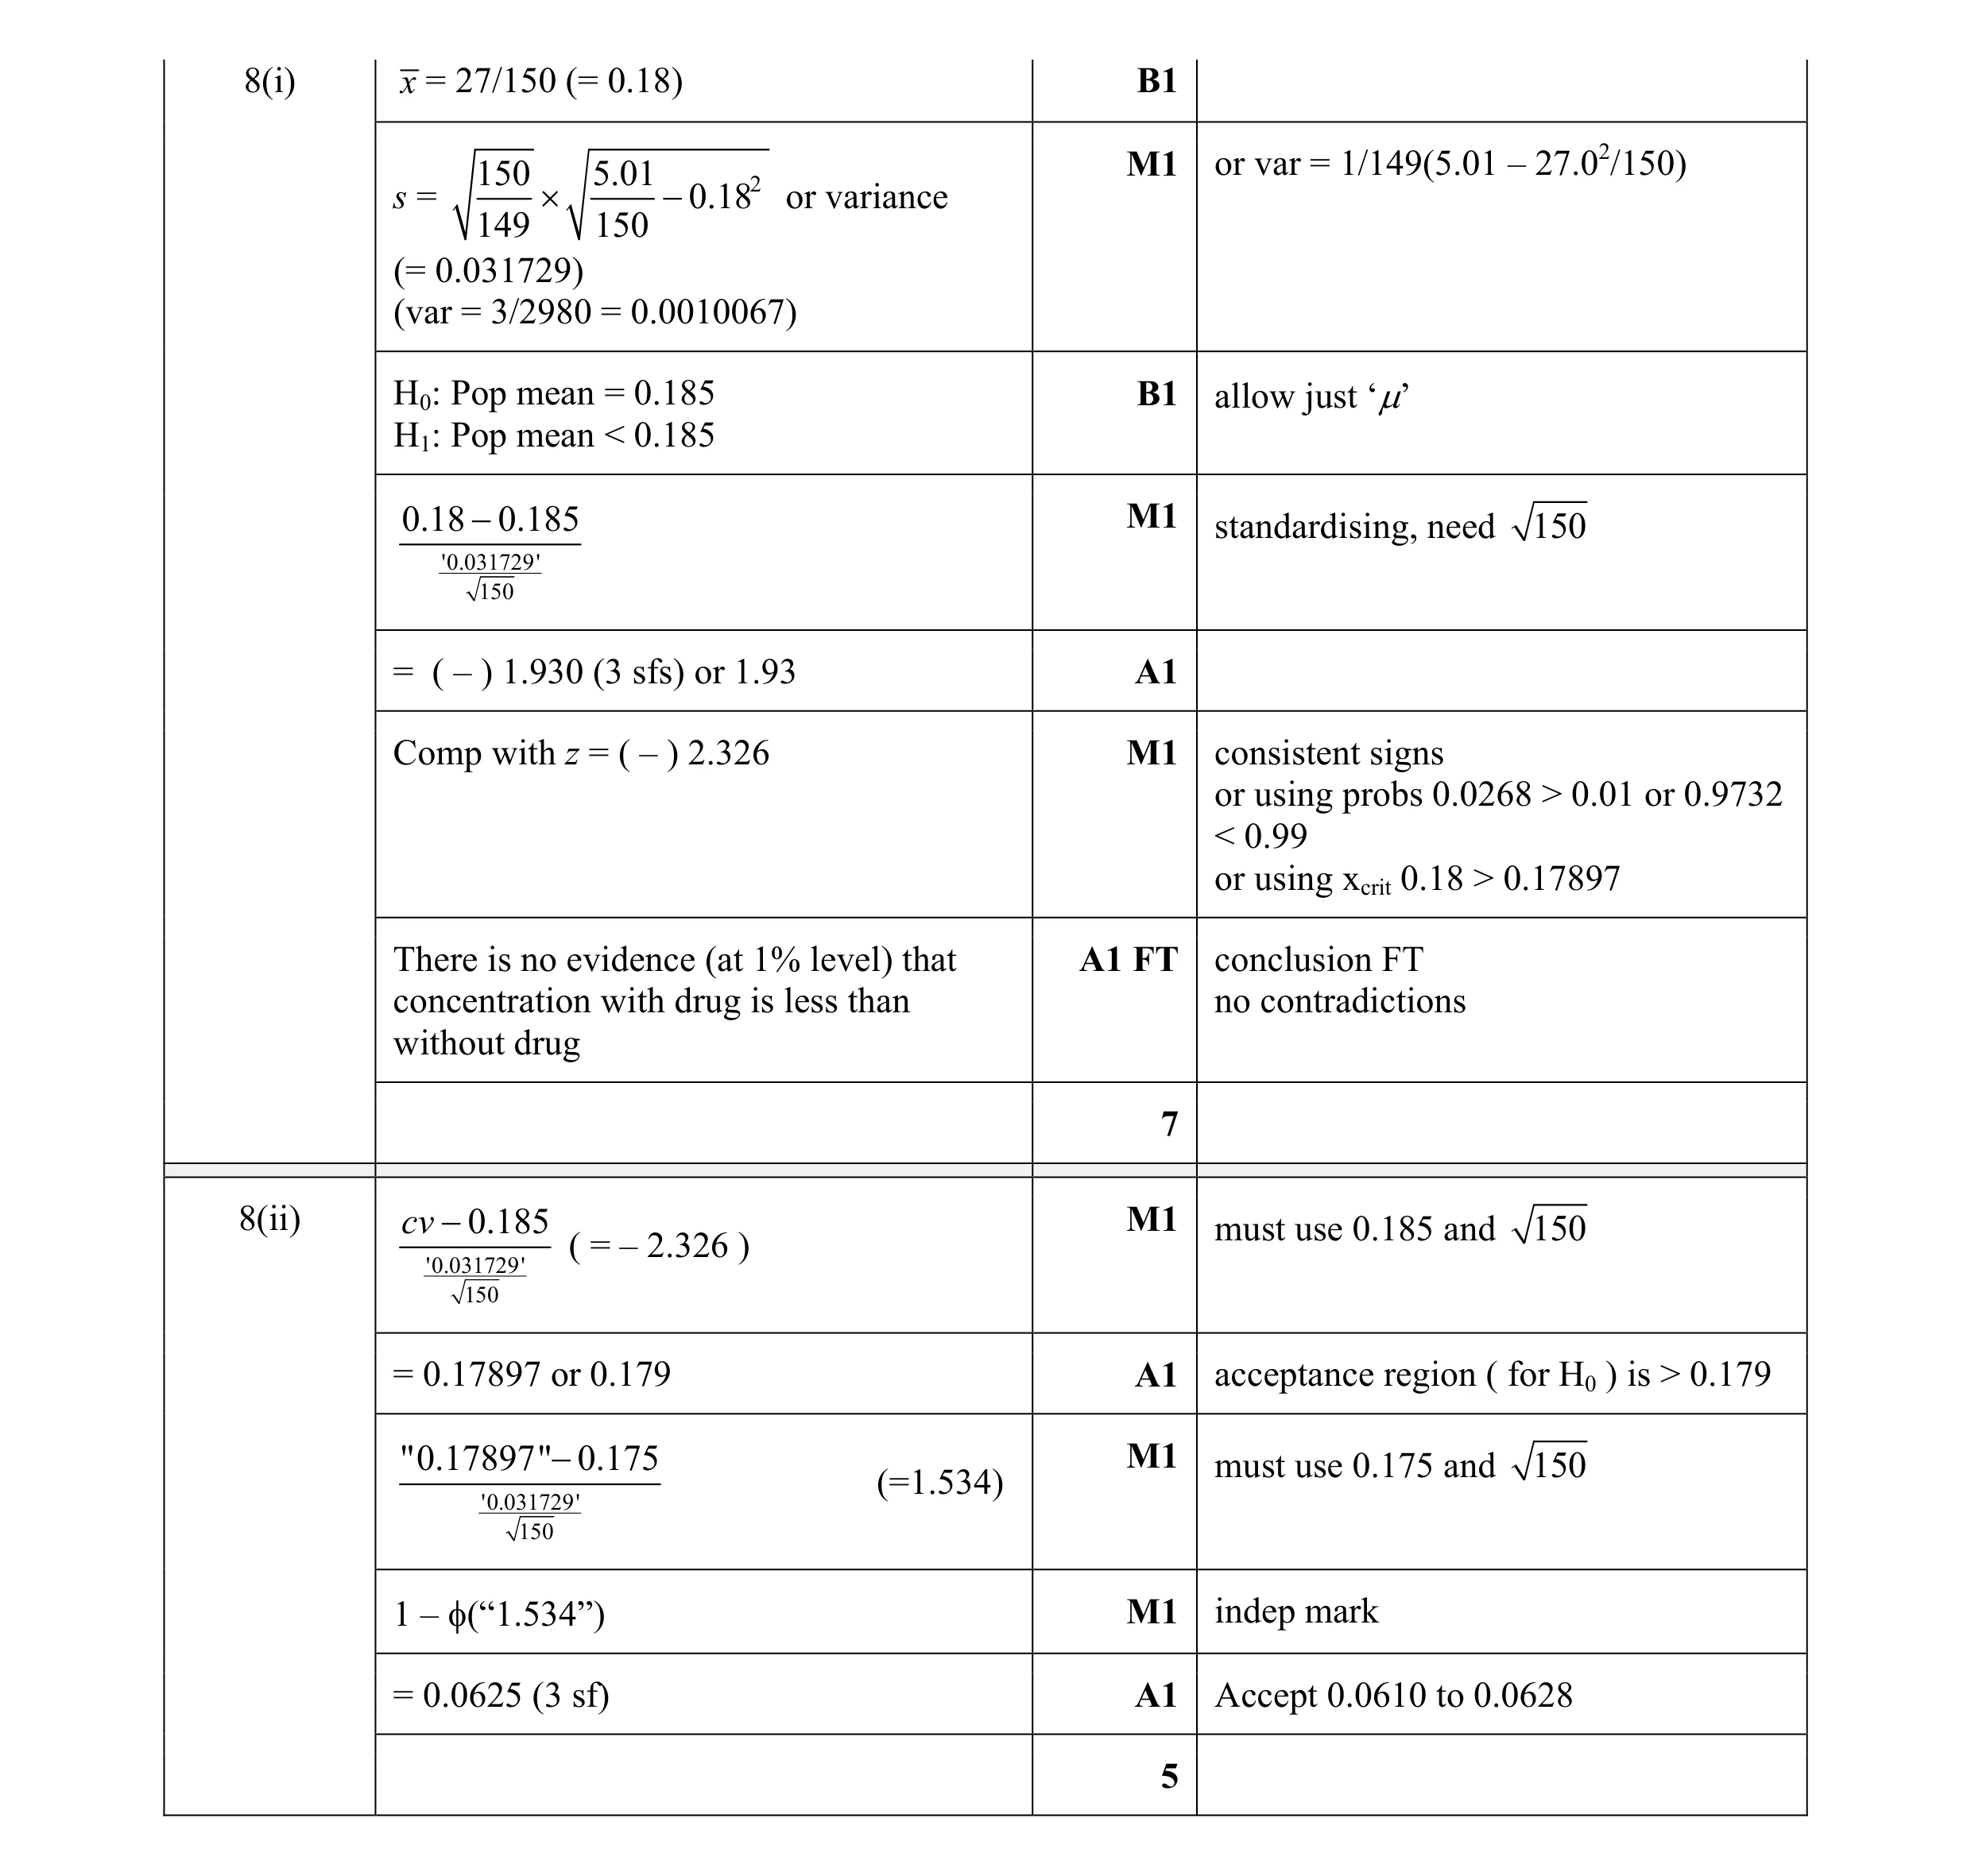 12
12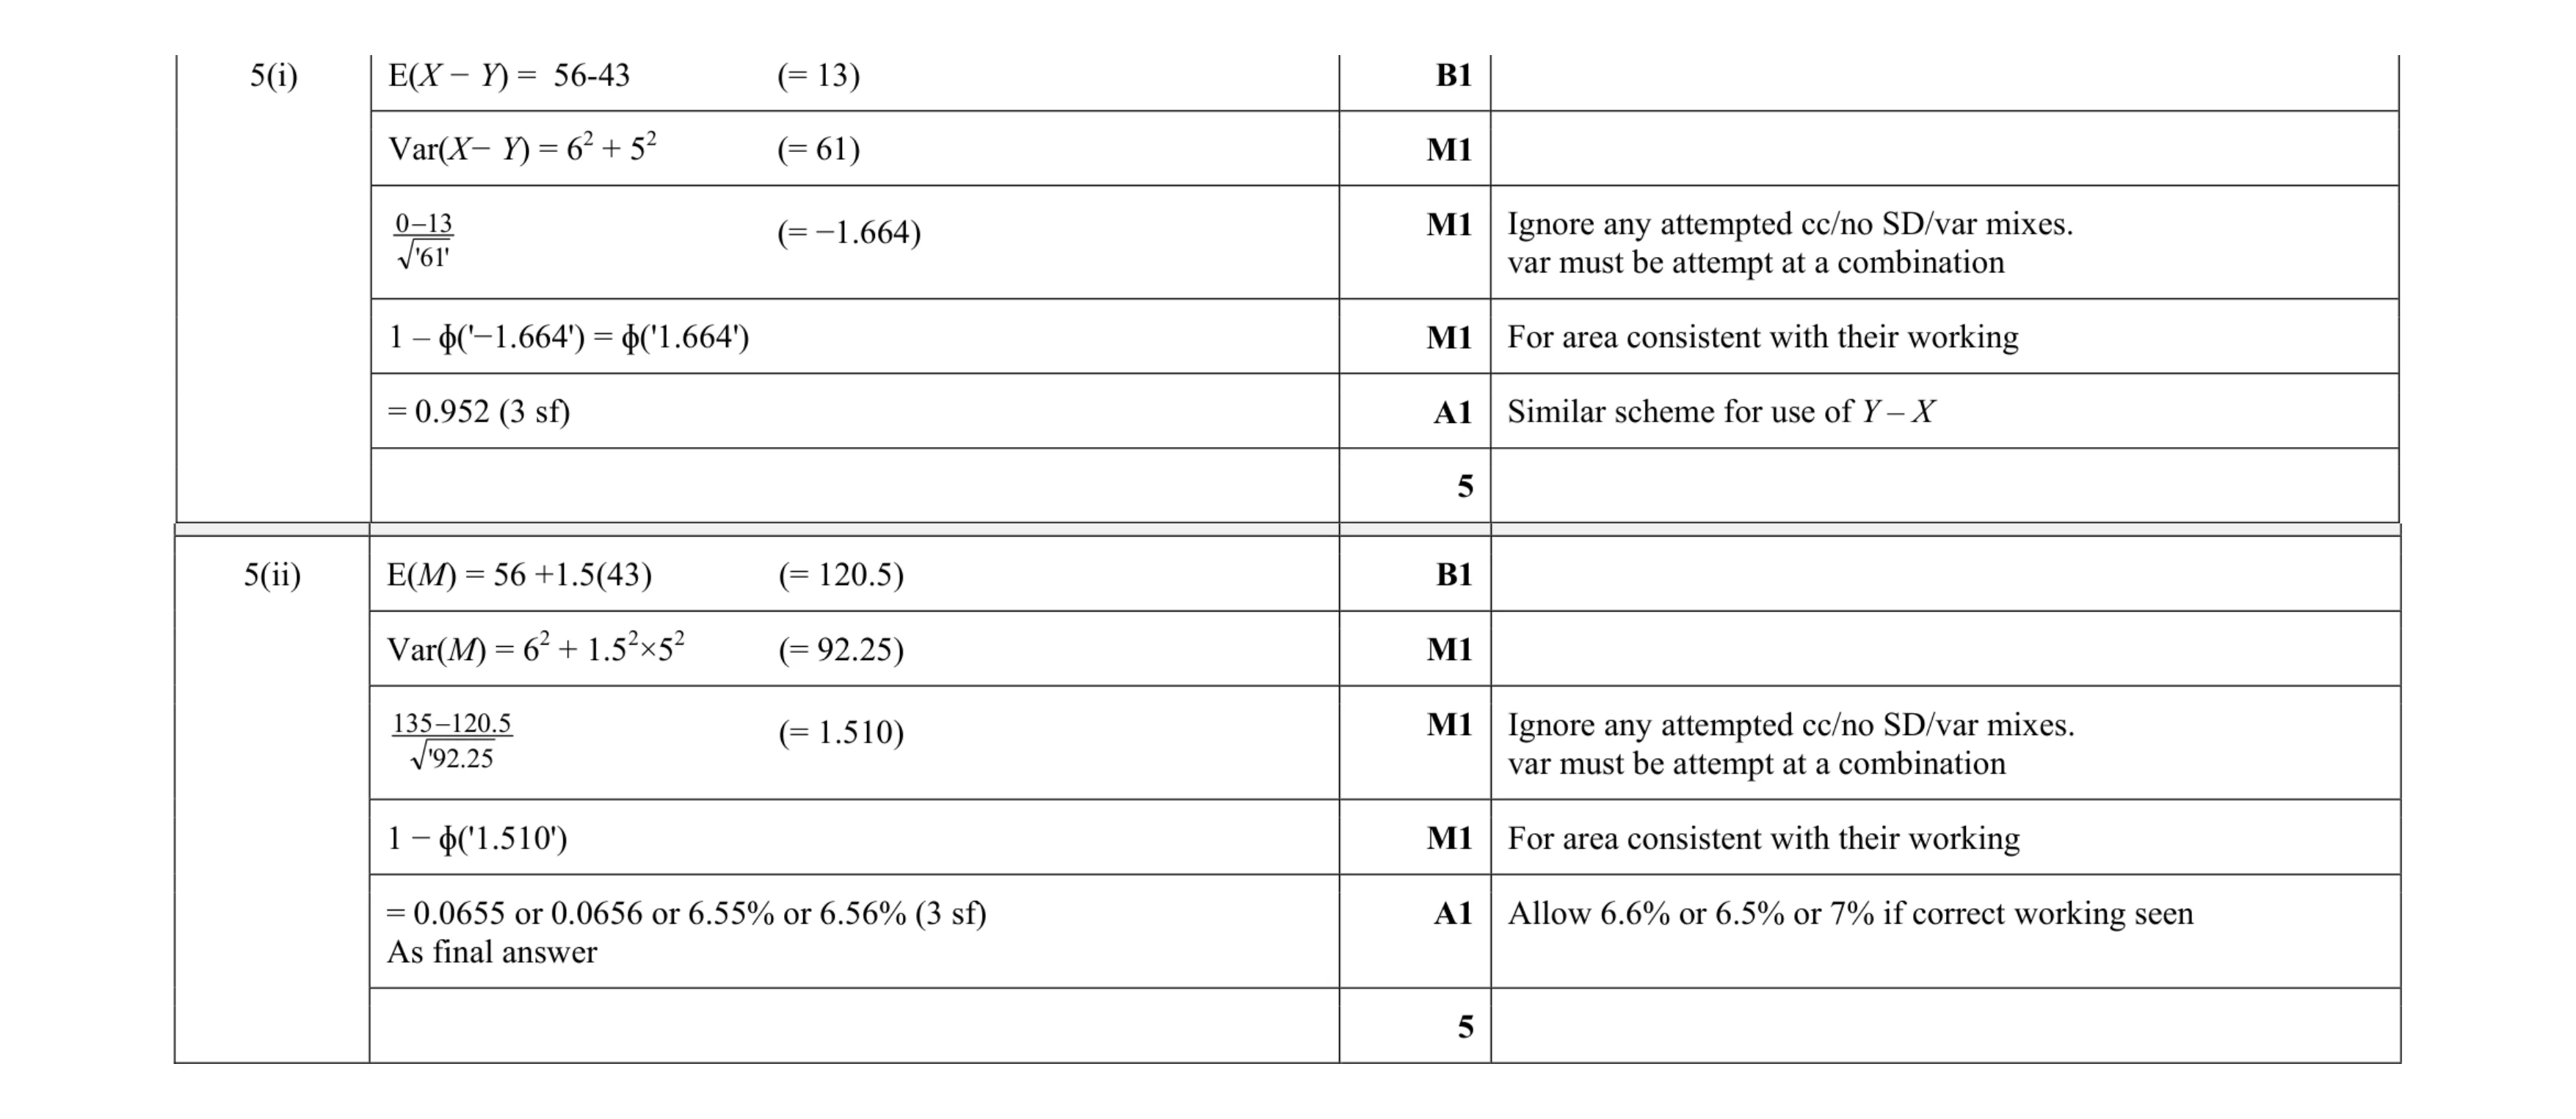 10
10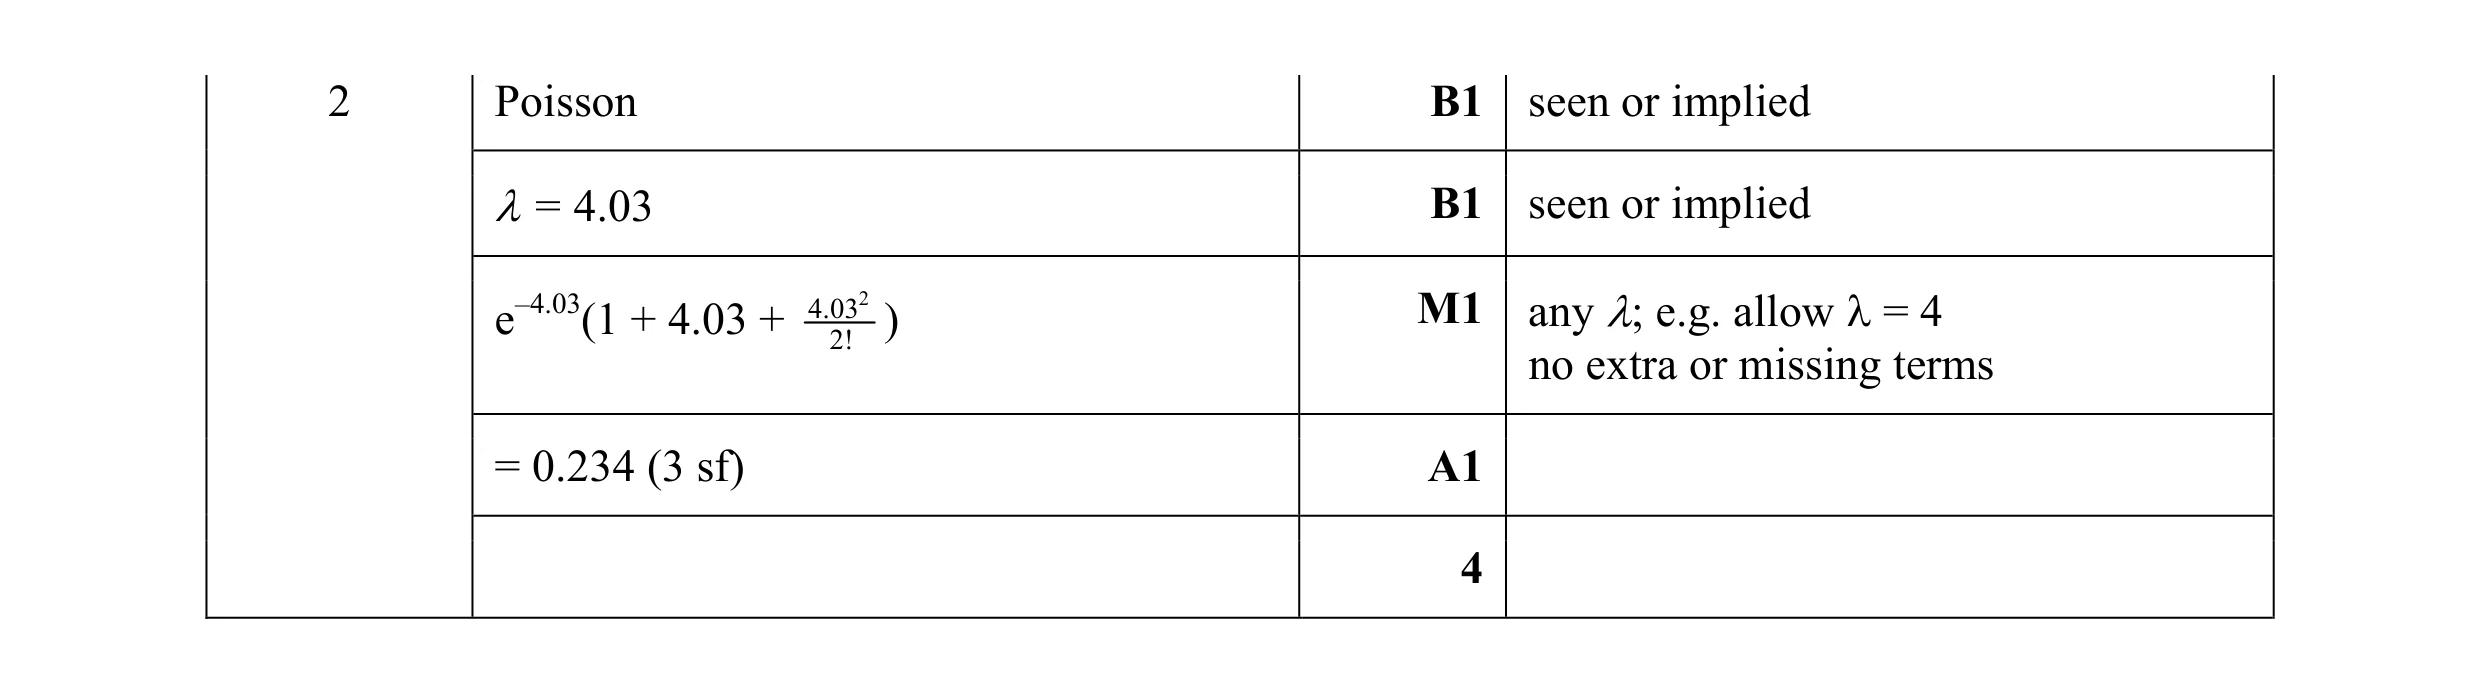 4
4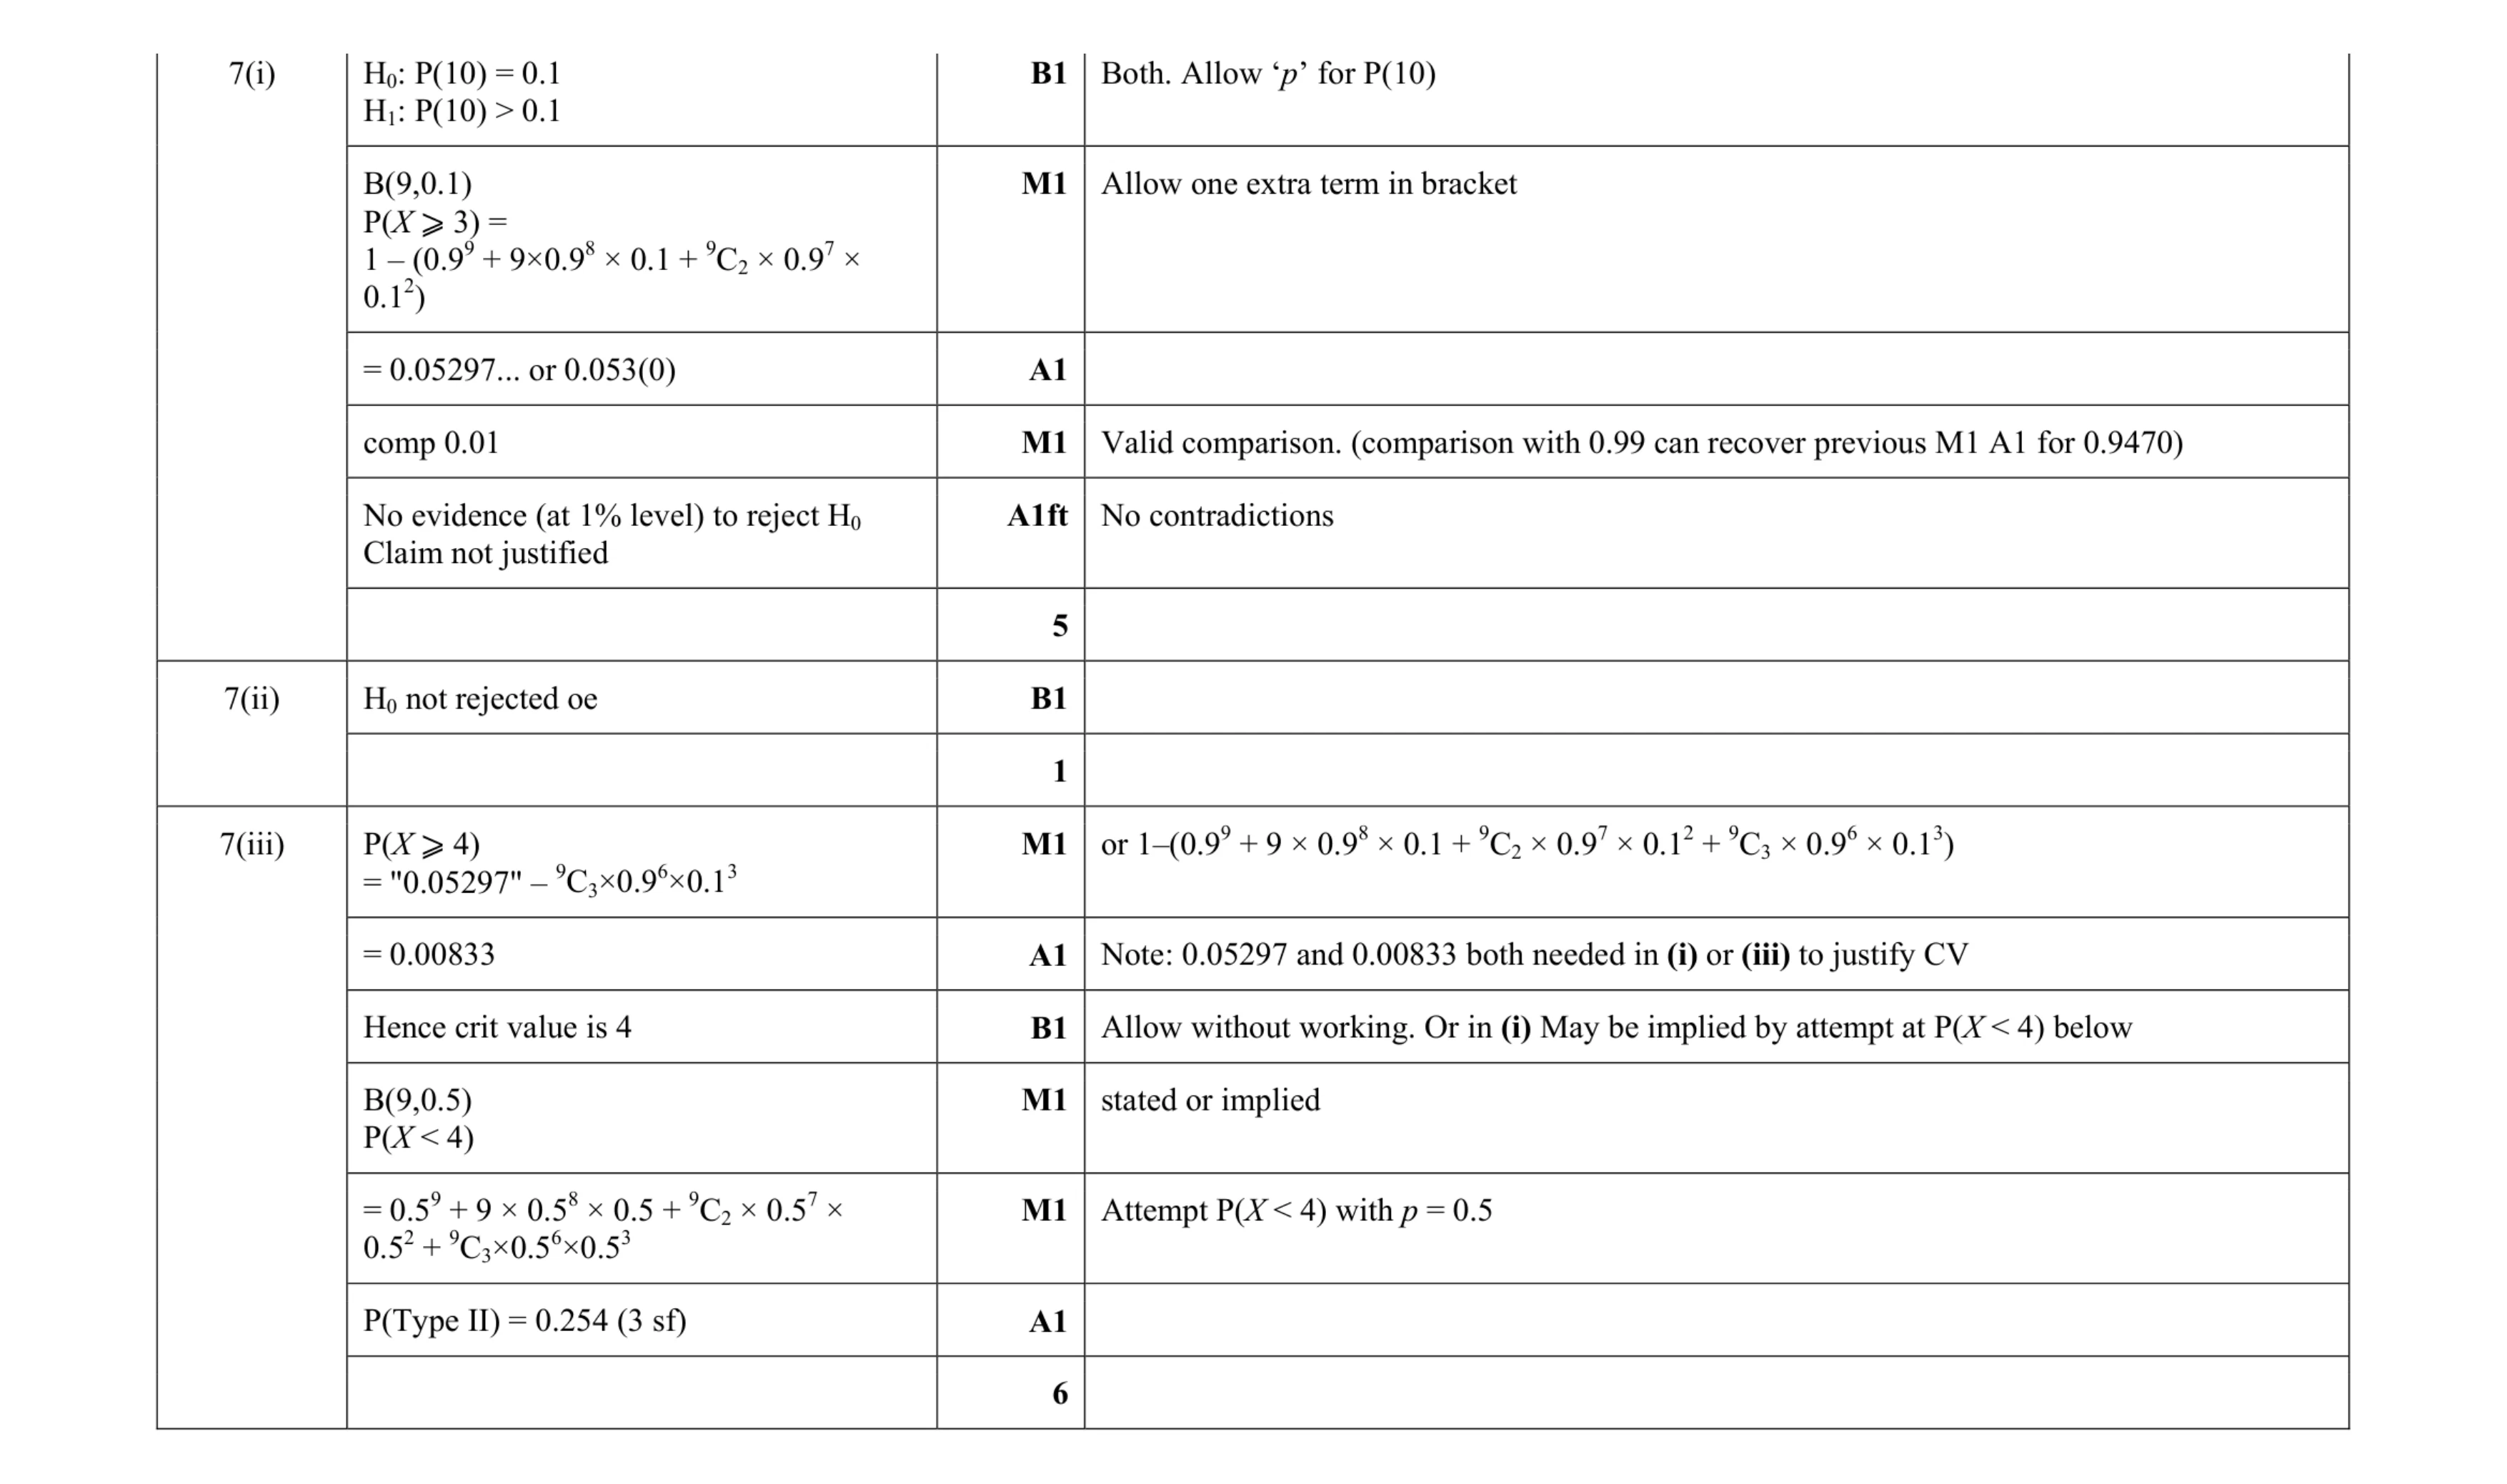 12
12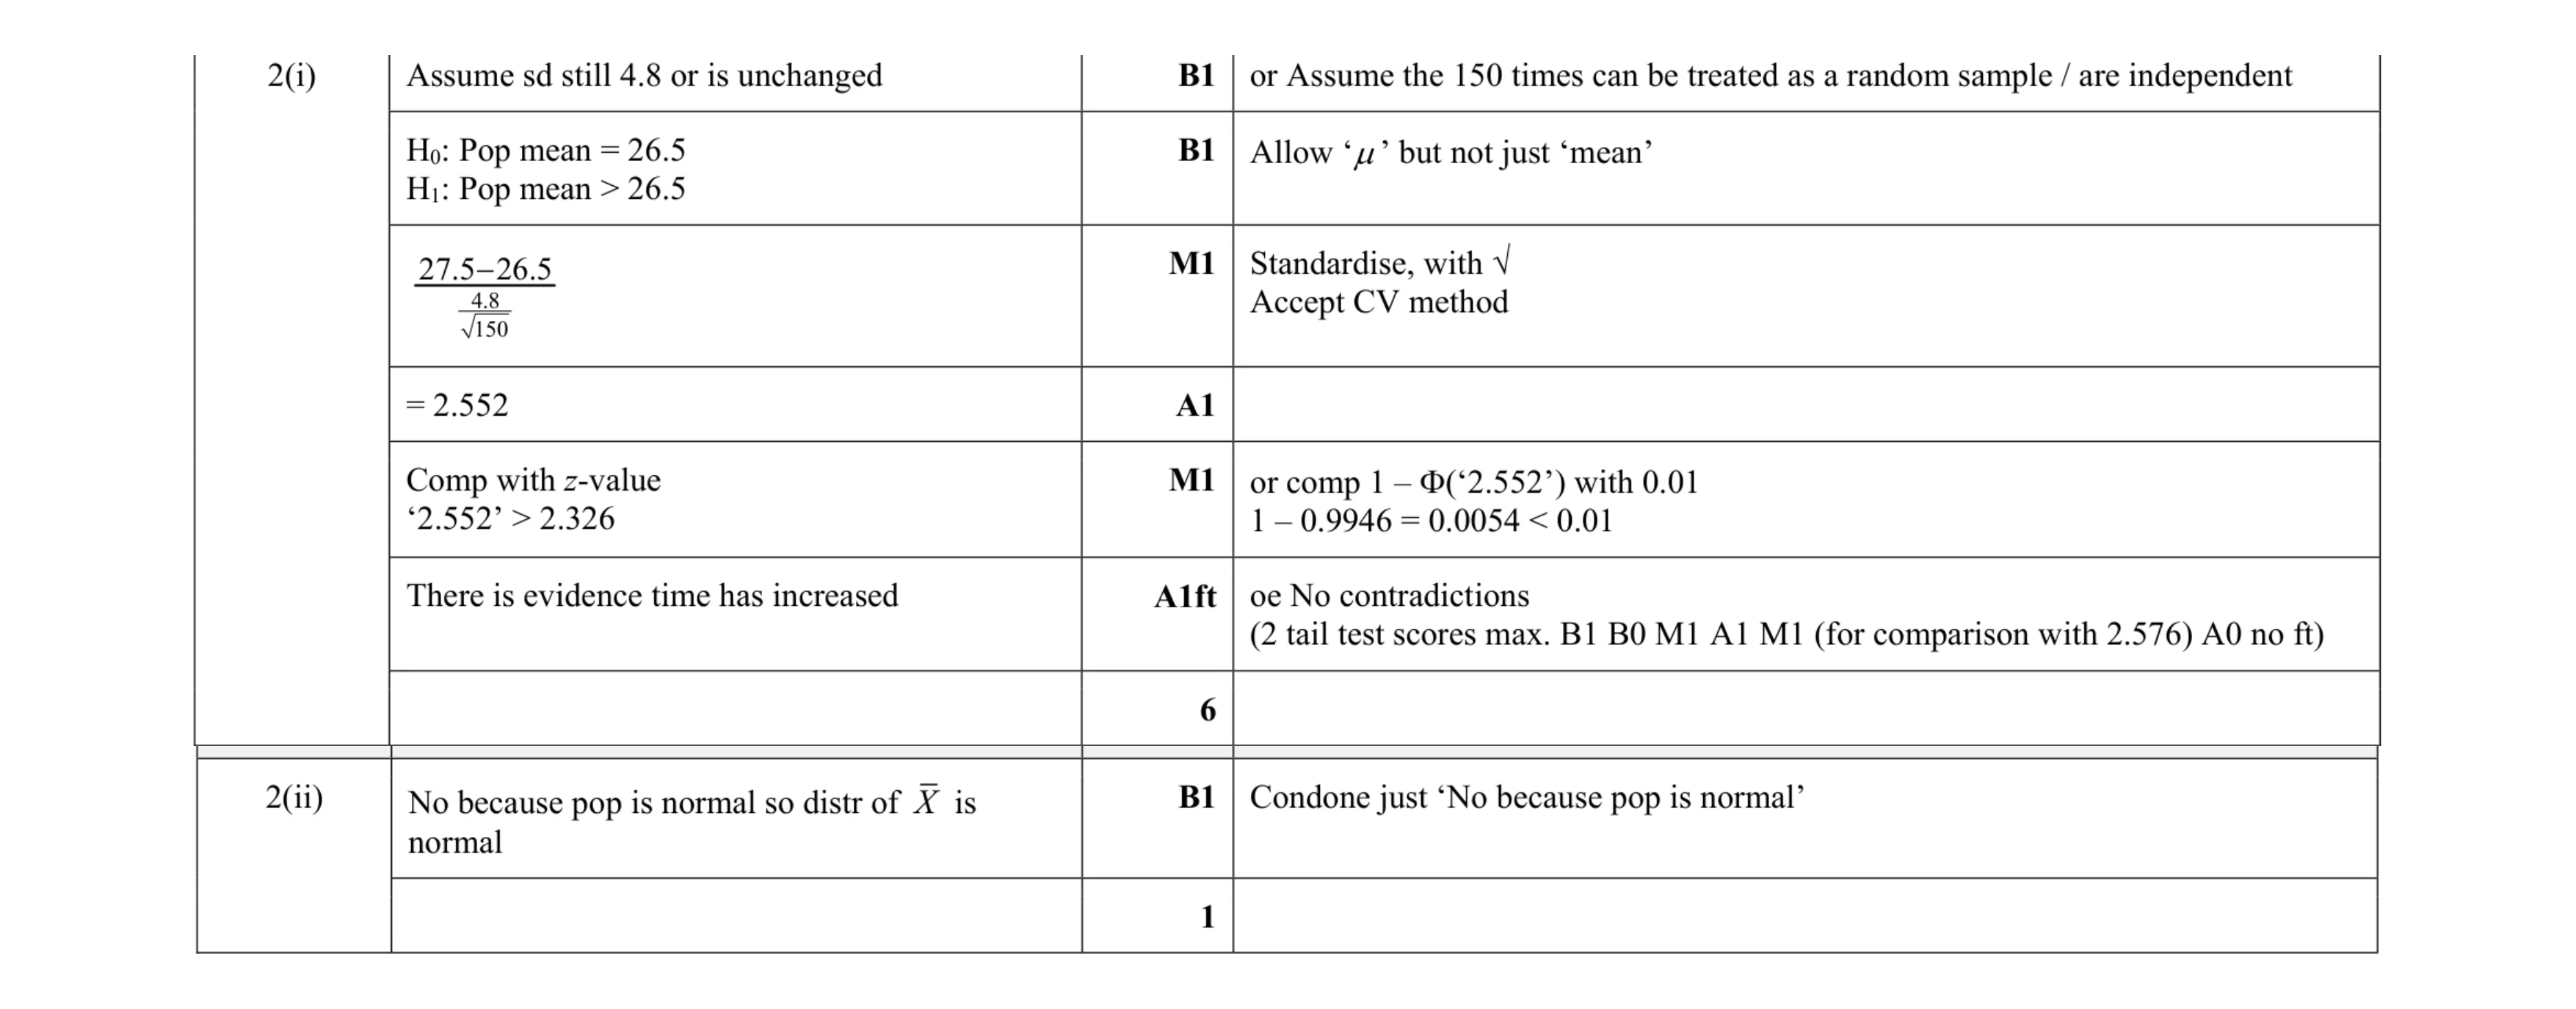 7
7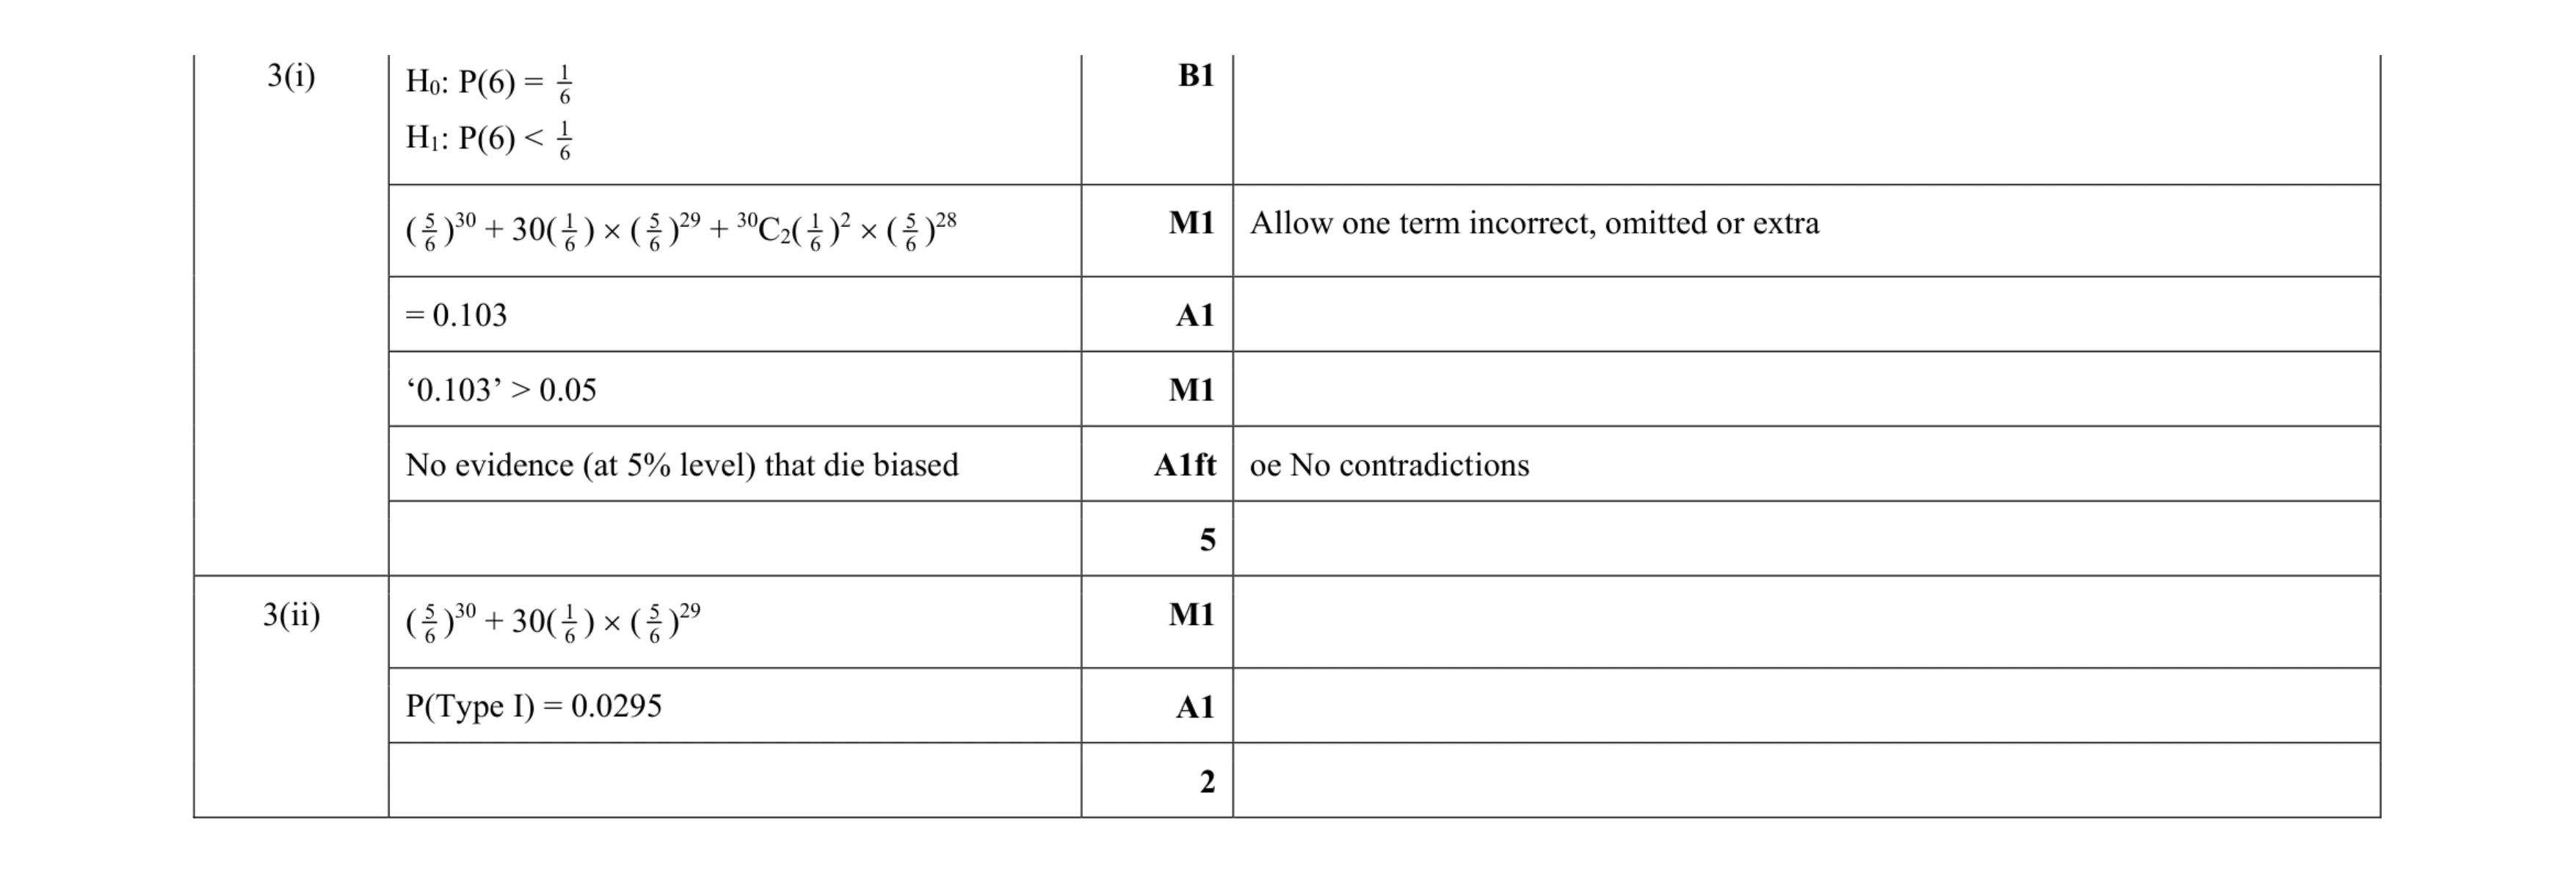 7
7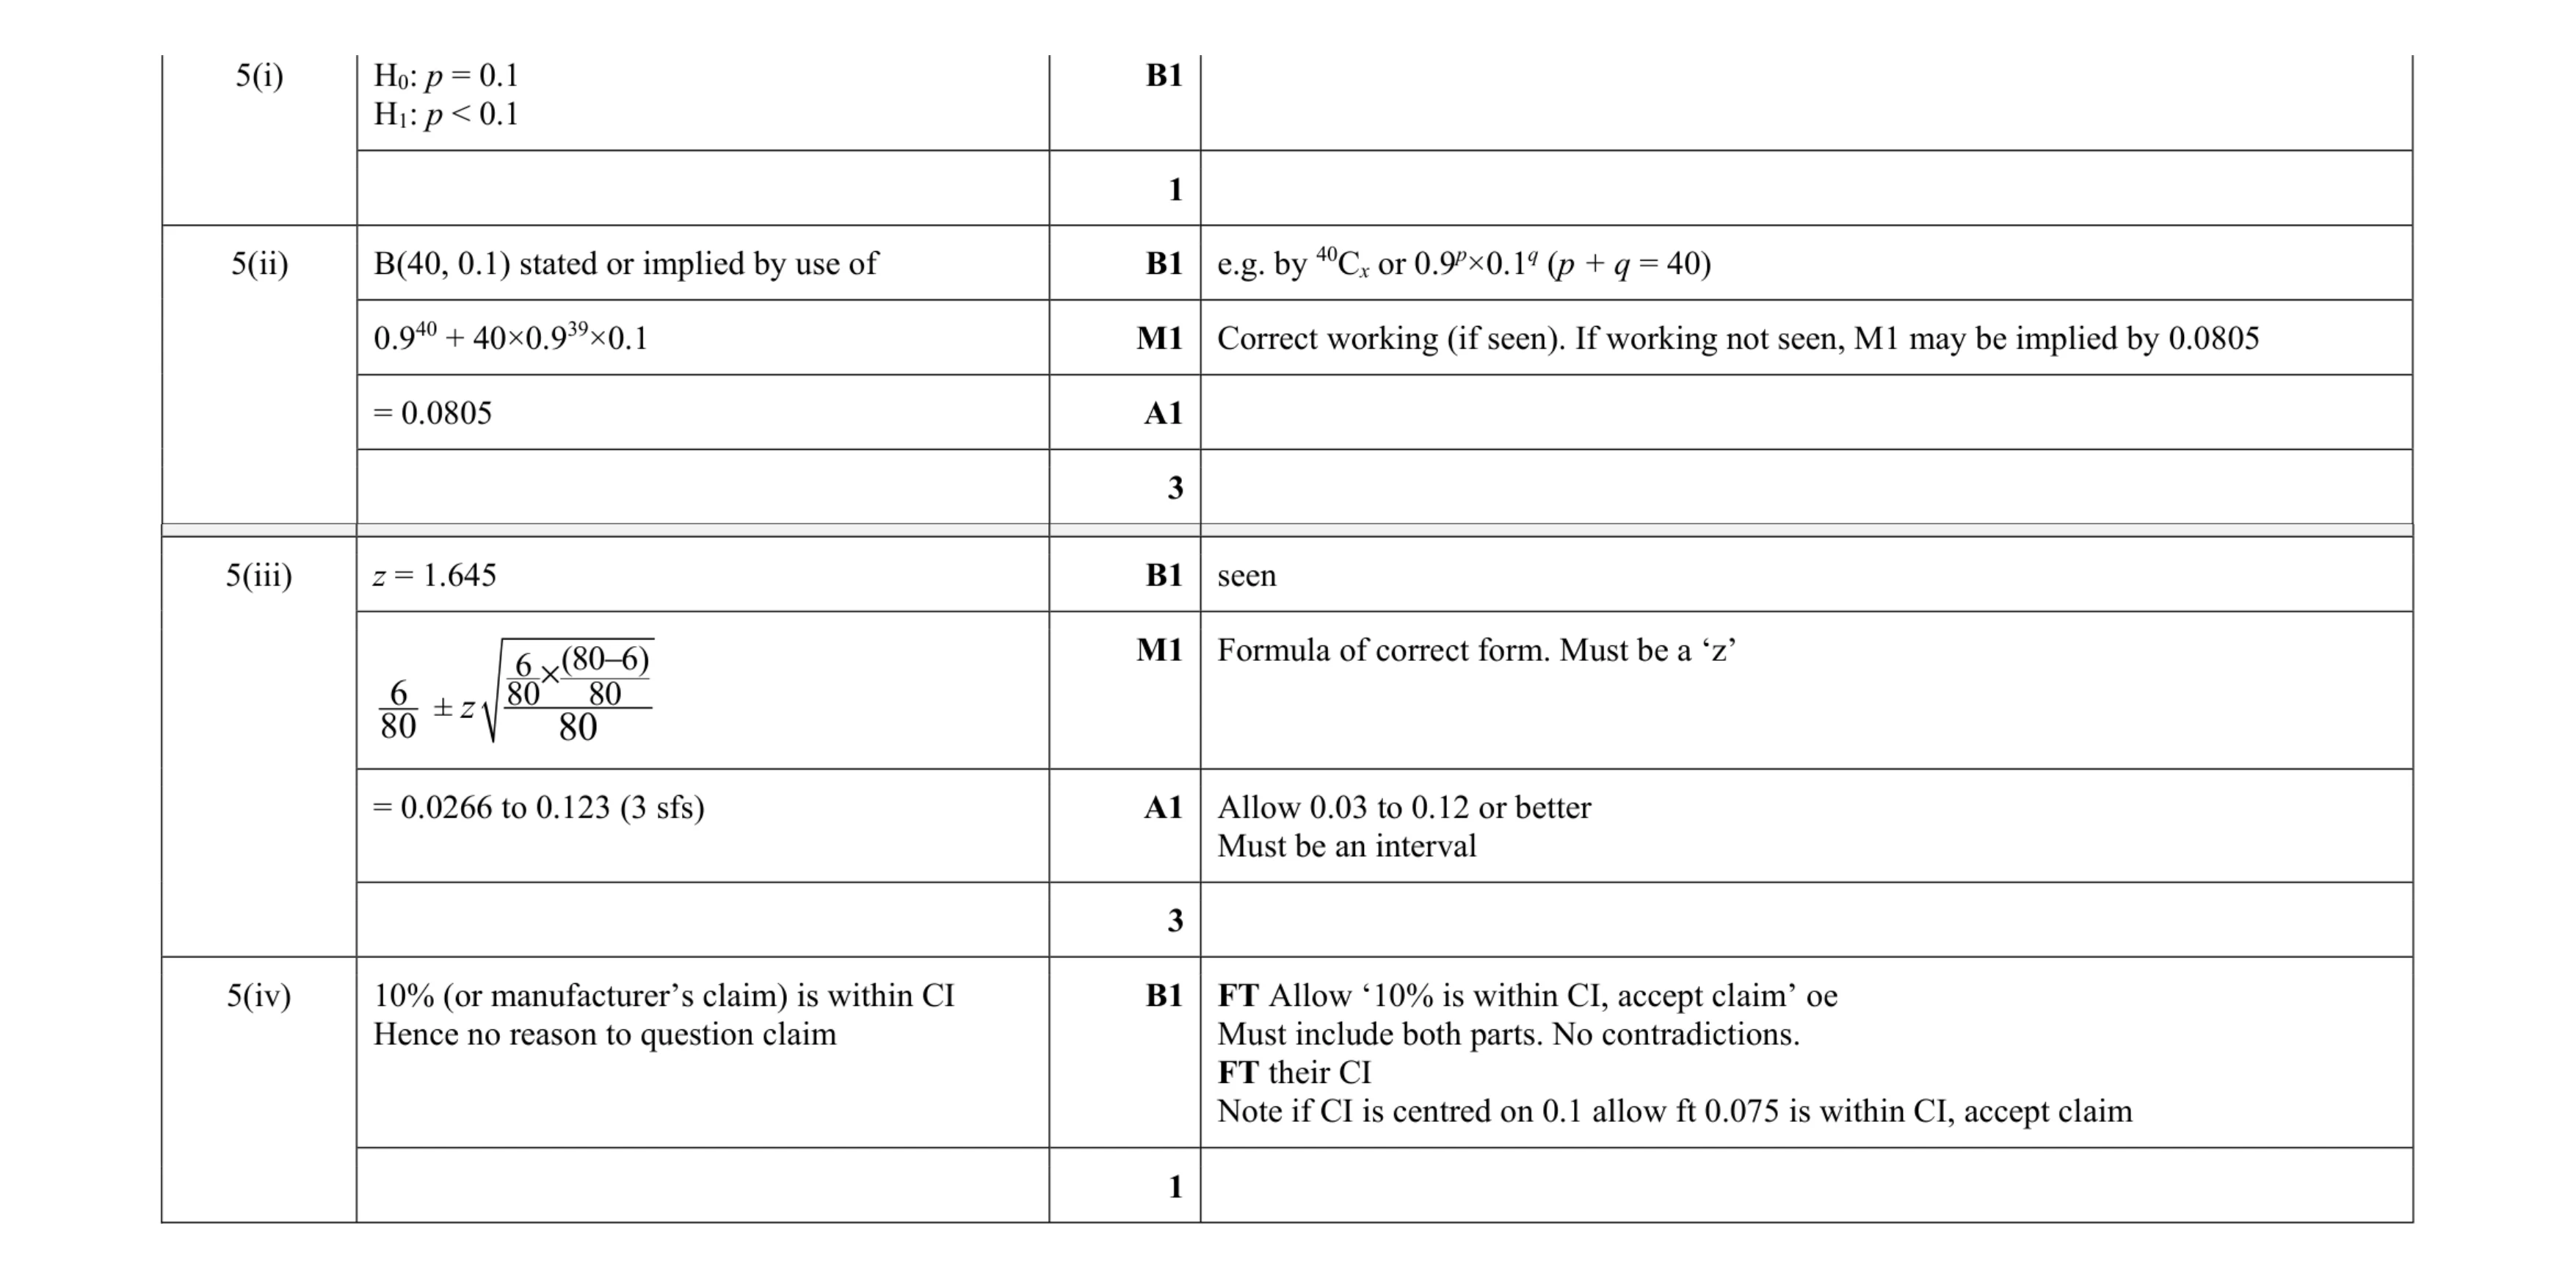 8
8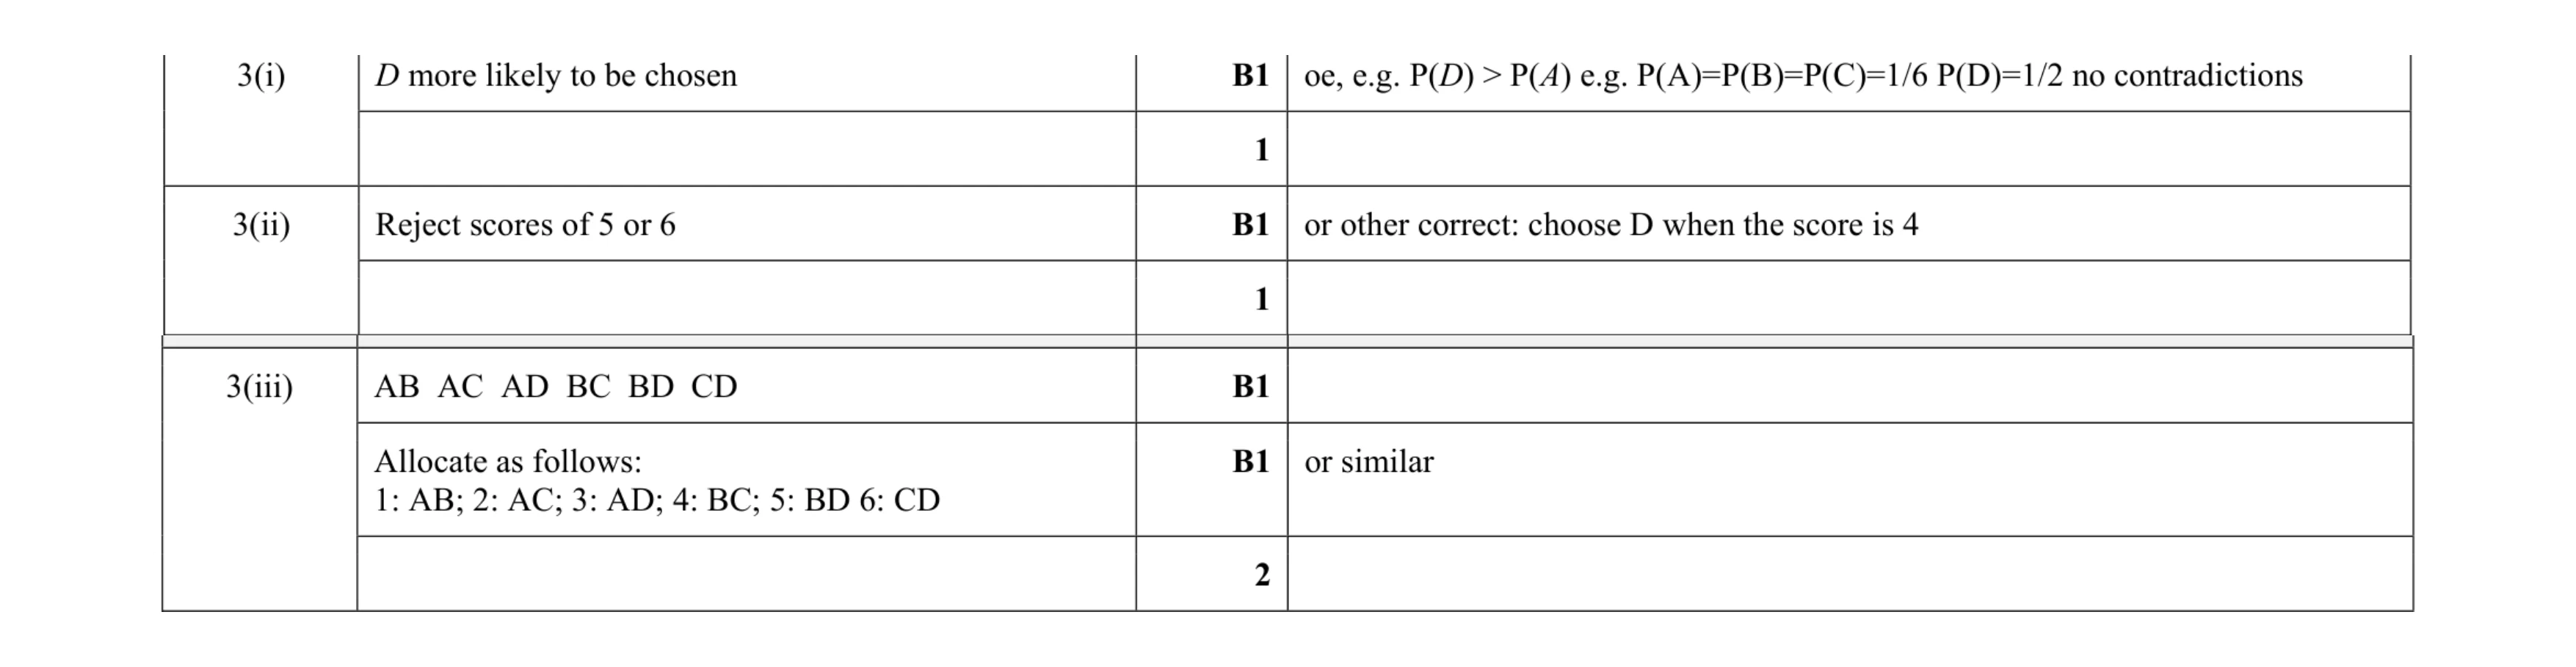 4
4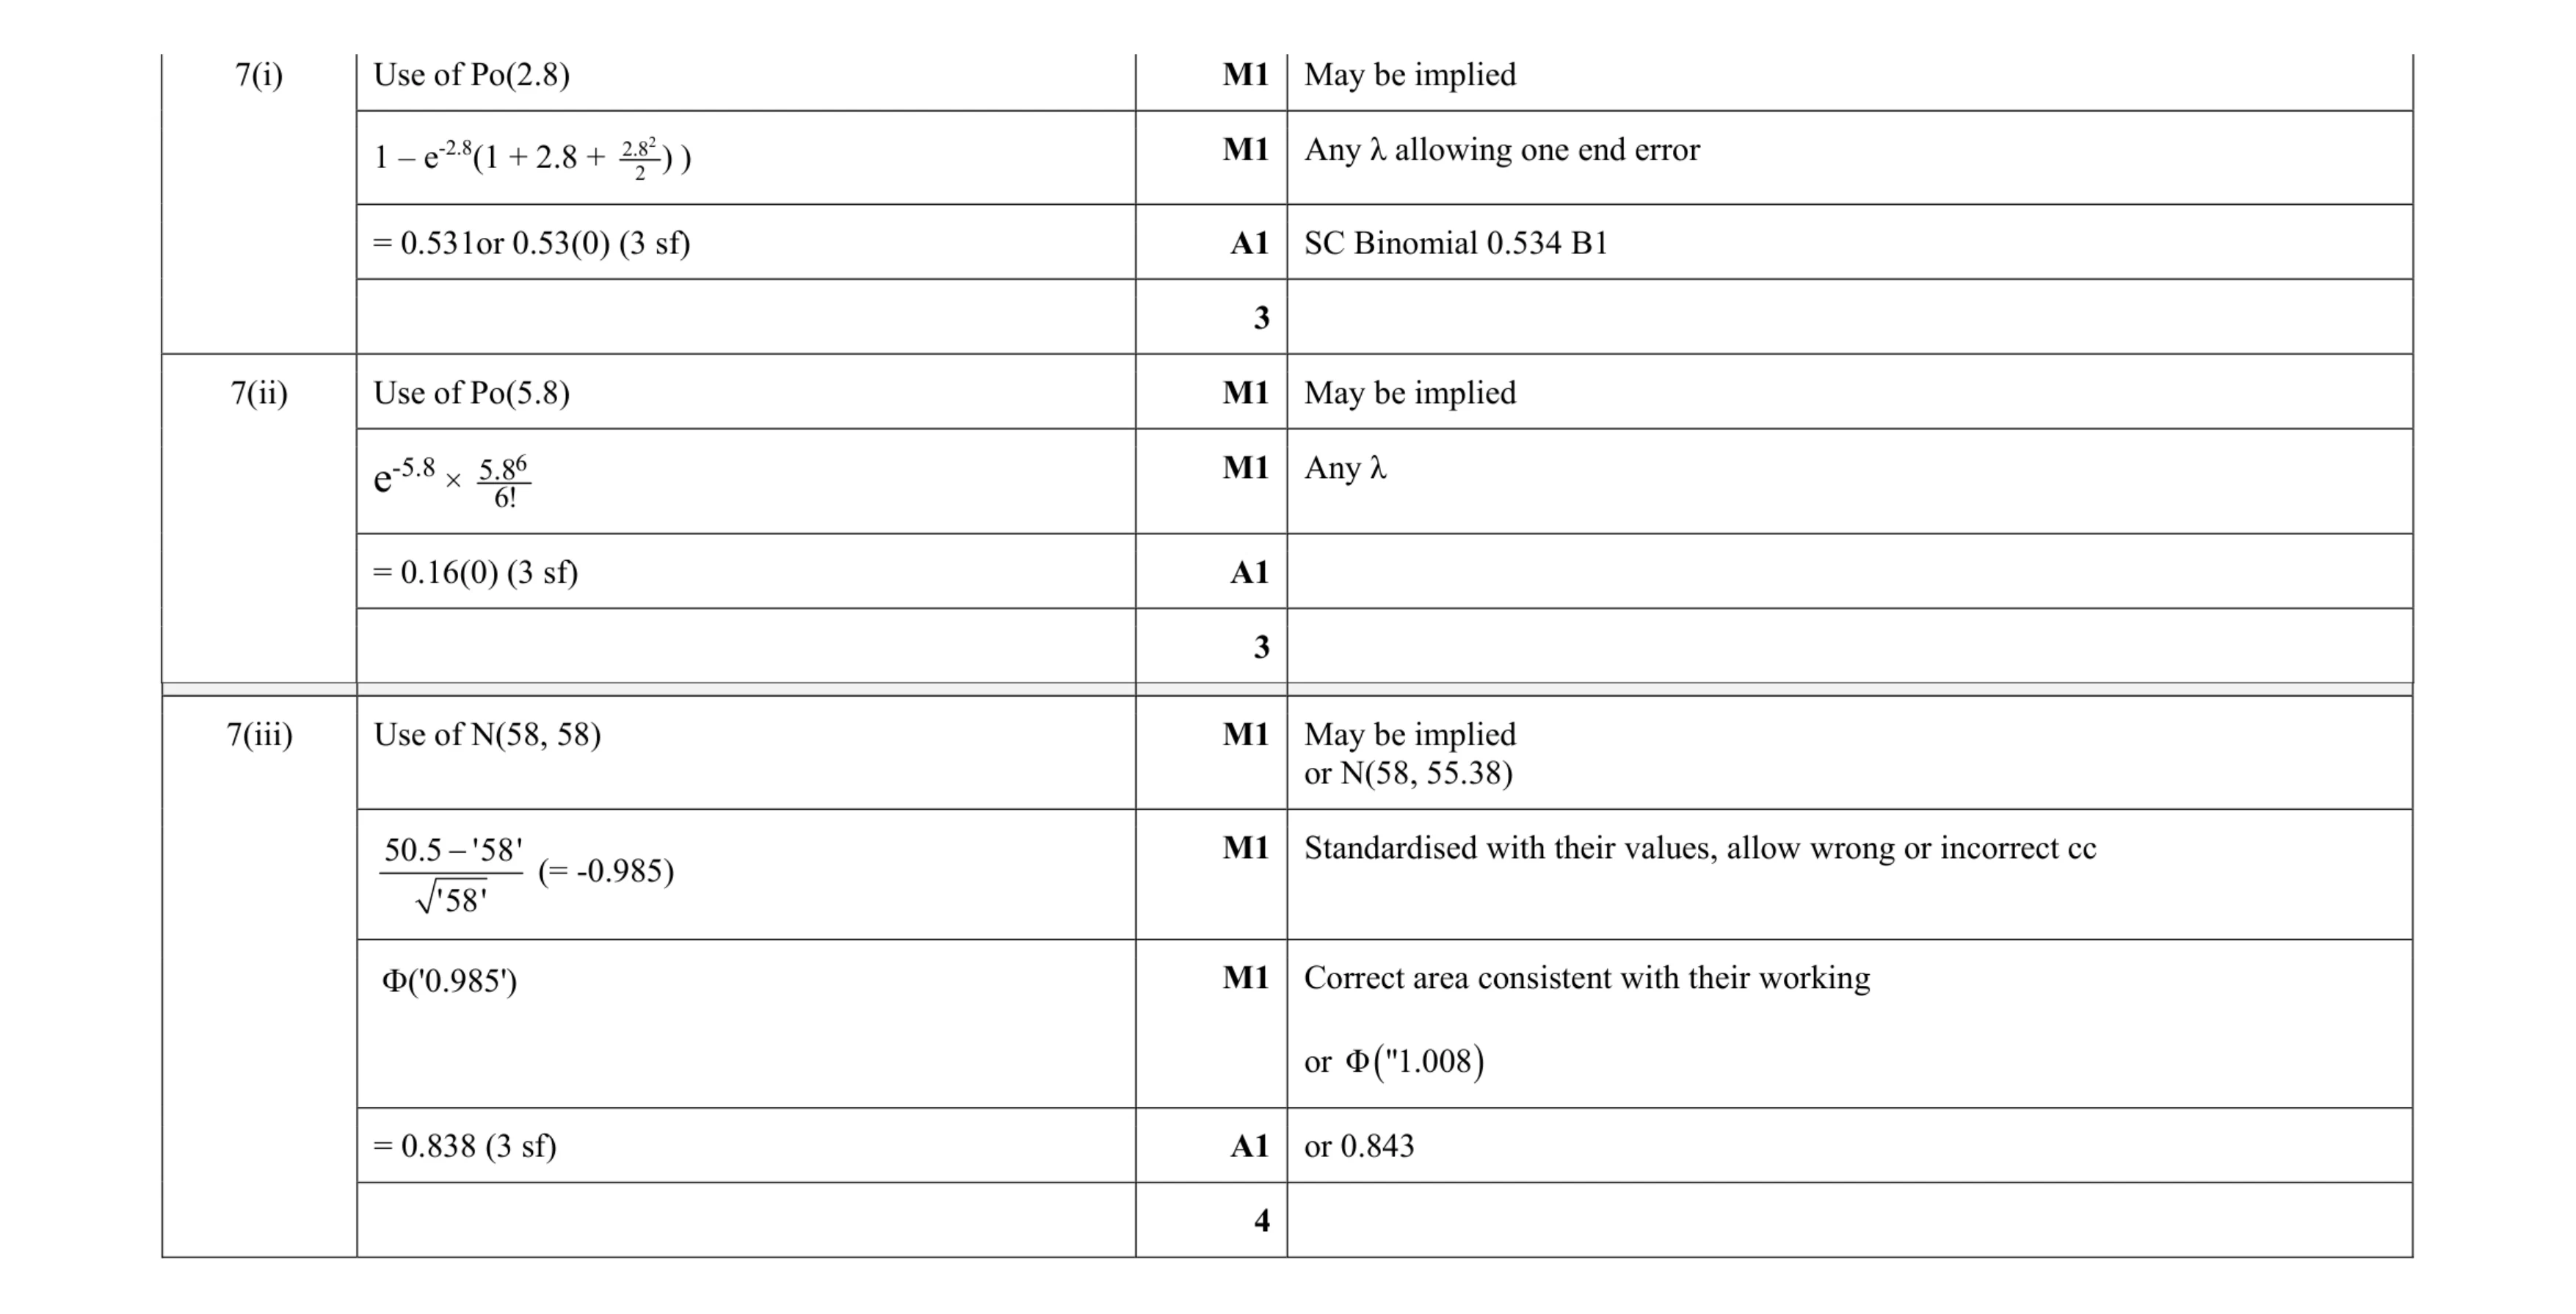 10
10