Questions as text
Q1 · The activity of three enzymes, A, B and C, at different pHs 0654/41 May/June 2017
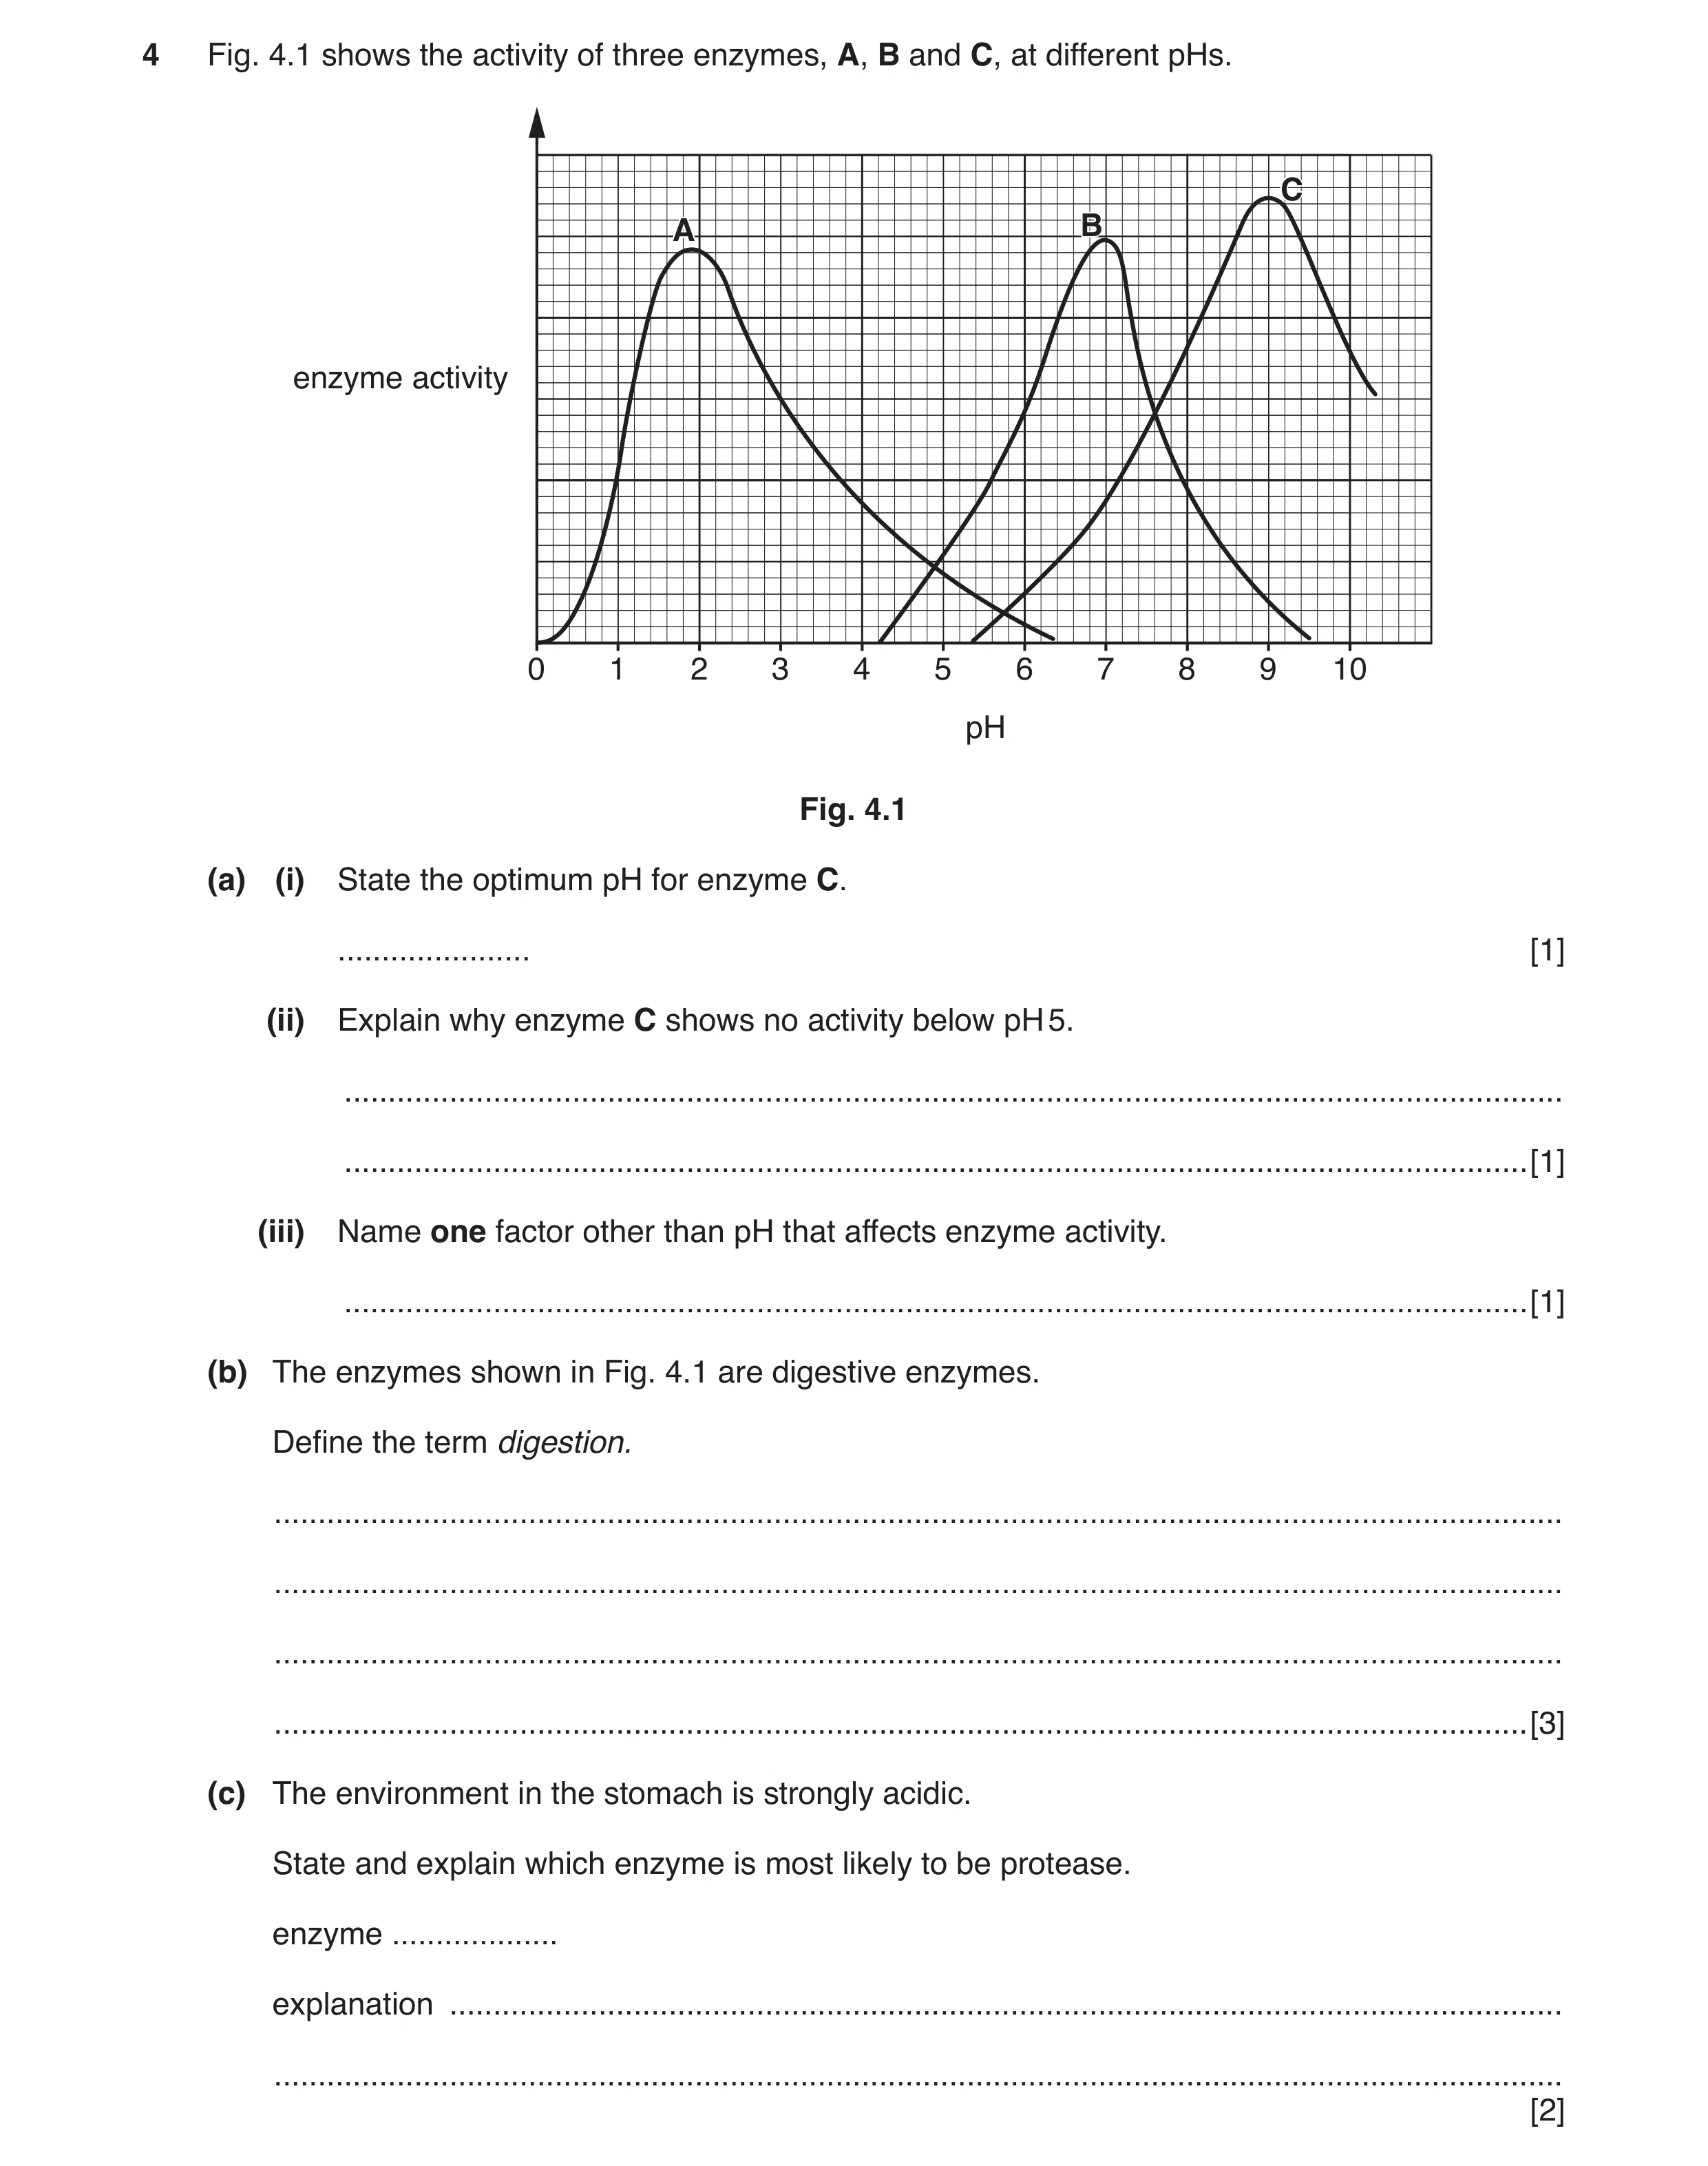
4 Fig. 4.1 shows the activity of three enzymes, A, B and C, at different pHs. C A B enzyme activity 0 1 2 3 4 5 6 7 8 9 10 pH Fig. 4.1 (a) (i) State the optimum pH for enzyme C. … [1] (ii) Explain why enzyme C shows no activity below pH 5. … … [1] (iii) Name one factor other than pH that affects enzyme activity. … [1] (b) The enzymes shown in Fig. 4.1 are digestive enzymes. Define the term digestion. … … … … [3] (c) The environment in the stomach is strongly acidic. State and explain which enzyme is most likely to be protease. enzyme … explanation … … [2]
8 marks
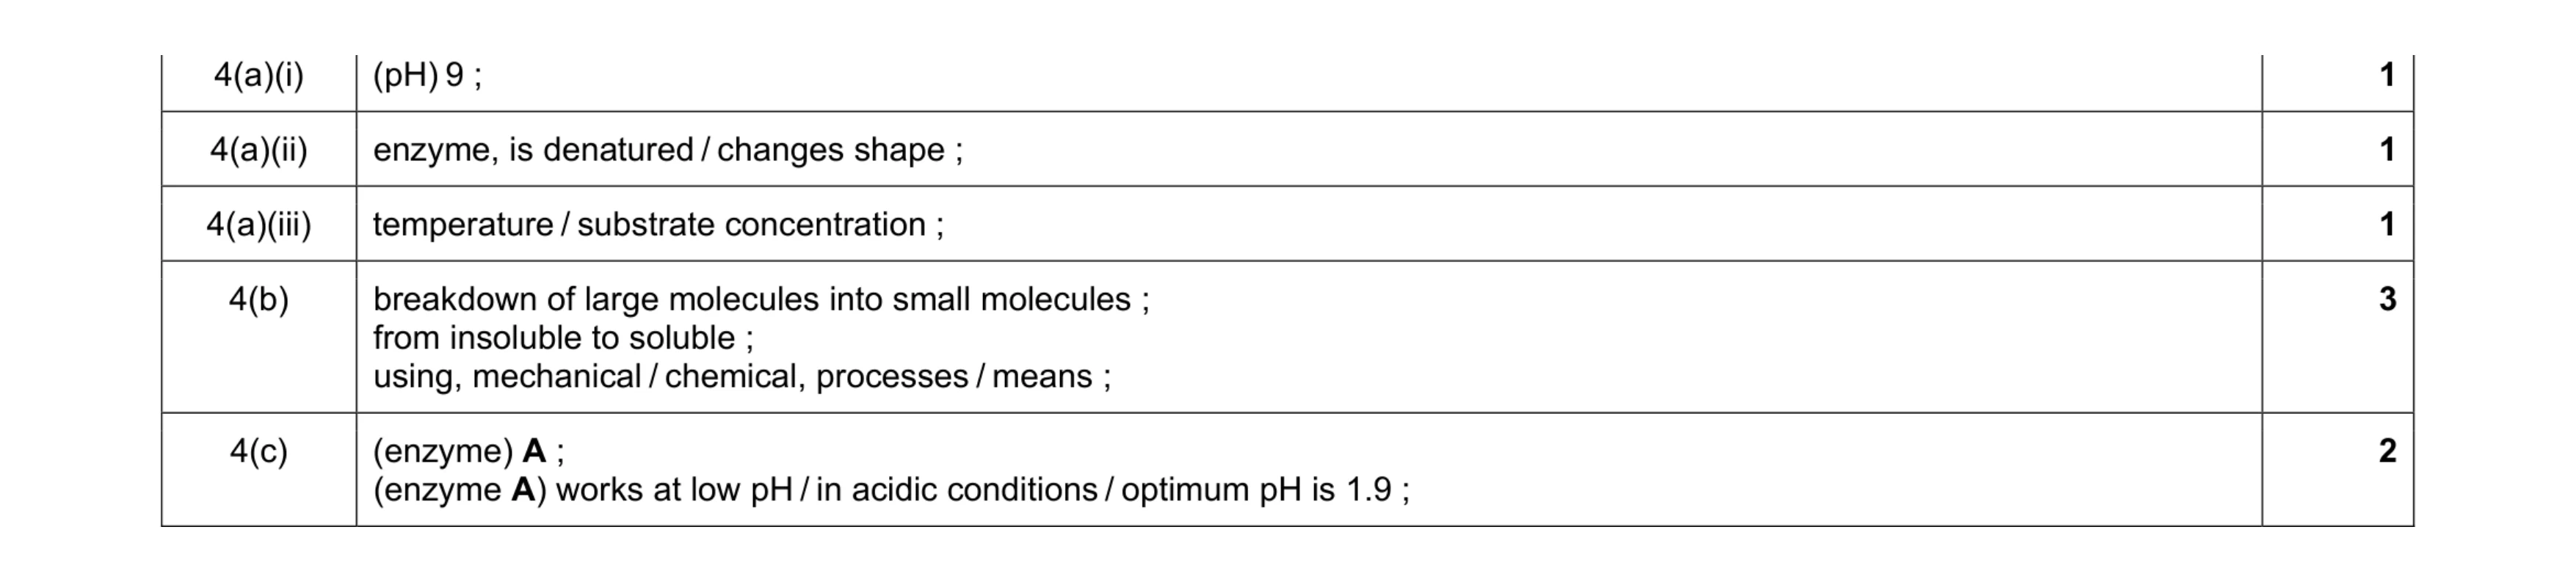
Mark scheme: 4(a)(i) (pH) 9 ; 1 4(a)(ii) enzyme, is denatured / changes shape ; 1 4(a)(iii) temperature / substrate concentration ; 1 4(b) breakdown of large molecules into small molecules ; from insoluble to soluble ; using, mechanical / chemical, processes / means ; 3 4(c) (enzyme) A ; (enzyme A) works at low pH / in acidic conditions / optimum pH is 1.9 ; 2
This question in 0654/41 May/June 2017
Q2 · The stages involved in the production of yoghurt 0654/42 Oct/Nov 2018
4 (a) Fig. 4.1 shows the stages involved in the production of yoghurt. stage 1 – pasteurisation milk is heated to 90 °C milk is then cooled to 45 °C bacteria added stage 2 – incubation milk and bacteria mixture kept at 45 °C for several hours milk and bacteria mixture thickens to form yoghurt stage 3 – cooling yoghurt is cooled to 4 °C Fig. 4.1 (i) Suggest why the milk is pasteurised during stage 1. … … [1] (ii) Explain why the acidity of the milk mixture increases during stage 2. … … … [2] (iii) Explain why cooling to 4 °C stops the yoghurt production during stage 3. … … … [2] (b) (i) Yoghurt contains some of the nutrients needed for a balanced diet. The boxes on the left show some of the nutrients needed for a balanced diet. The boxes on the right show good sources of these nutrients. Draw four lines to link each nutrient with its good source. nutrient good source carbohydrate butter fat rice protein satsuma fruit vitamin C tuna fish [3] (ii) Name a deficiency disease that is caused by a lack of vitamin C. … [1]
9 marks
Mark scheme: 4(a)(i) sterilises it / kills, harmful / unwanted bacteria ; 1 4(a)(ii) bacteria, anaerobically respiring ; producing lactic acid ; 2 4(a)(iii) bacteria / enzymes become inactive at low temperature ; enzyme-controlled reaction ; lower rate of collisions between enzyme and substrate / less energy of particles ; max 2 4(b)(i) carbohydrate butter fat rice protein satsuma fruit vitamin C tuna fish 1 correct ; 2 or 3 correct ; 4 correct ; 3 4(b)(ii) scurvy ; 1
This question in 0654/42 Oct/Nov 2018
Q3 · Enzymes are biological catalysts with a specific shape 0654/41 May/June 2019
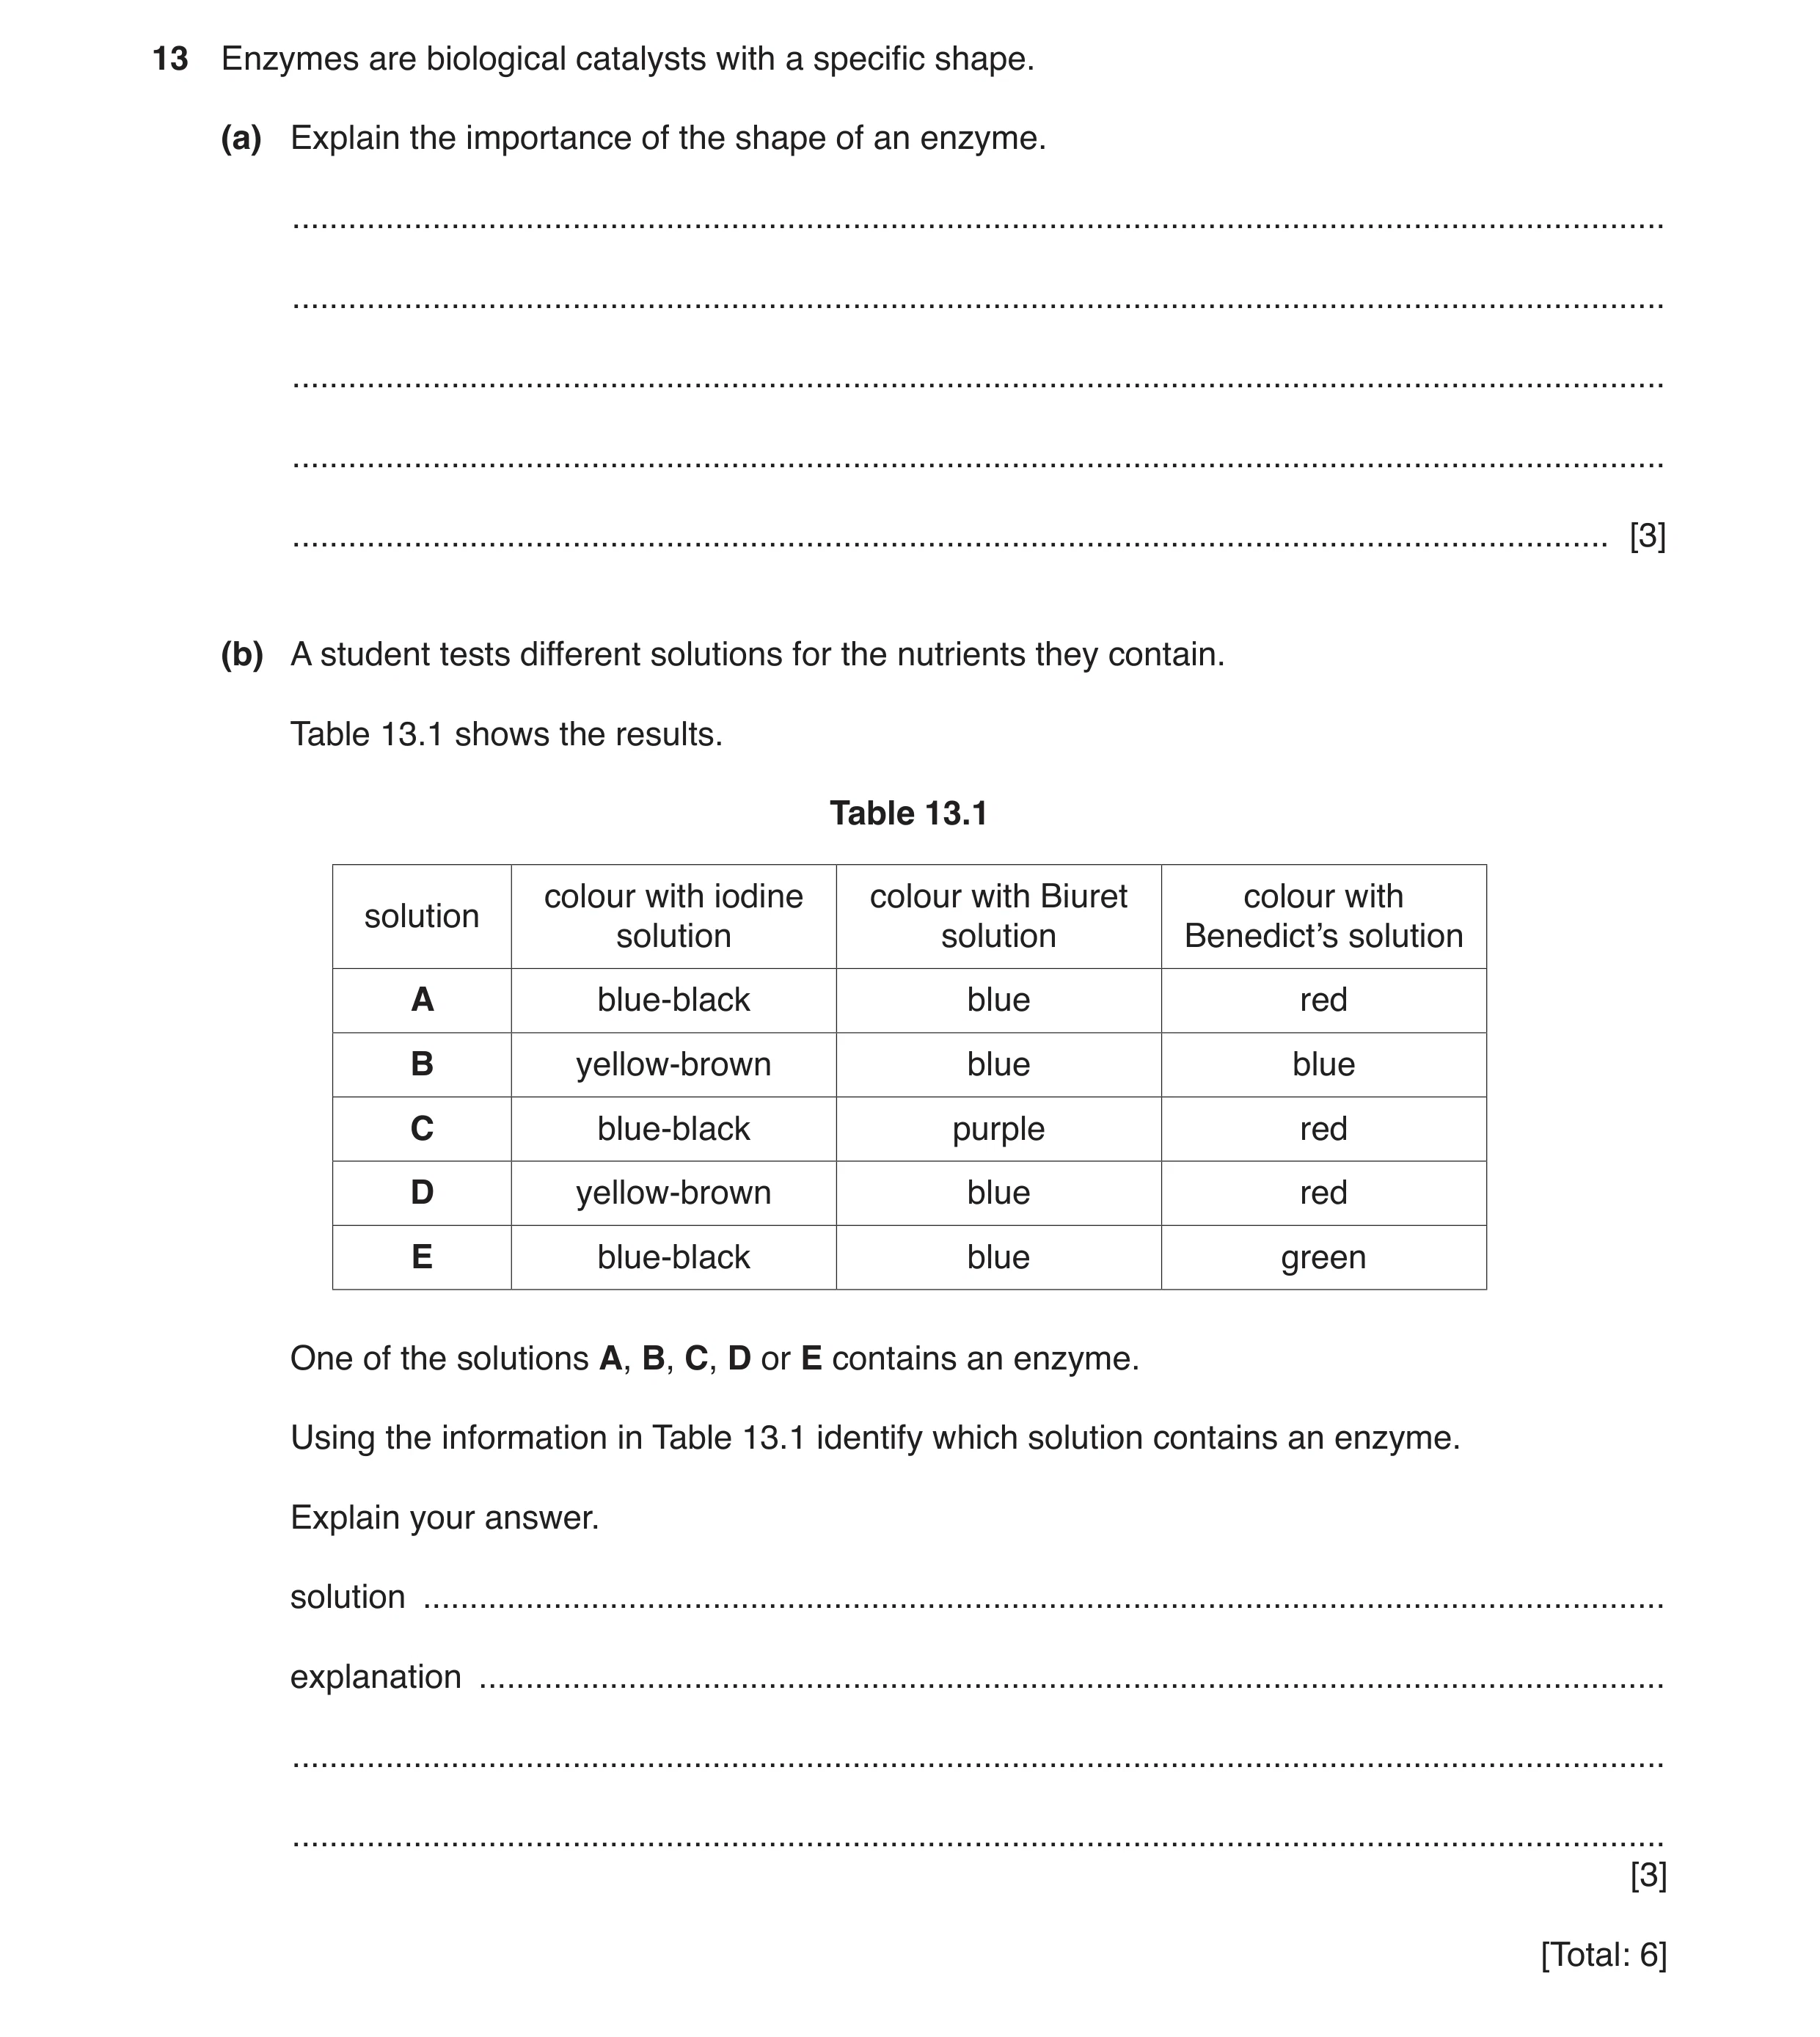
13 Enzymes are biological catalysts with a specific shape. (a) Explain the importance of the shape of an enzyme. … … … … … [3] (b) A student tests different solutions for the nutrients they contain. Table 13.1 shows the results. Table 13.1 colour with iodine colour with Biuret colour with solution solution solution Benedict’s solution A blue-black blue red B yellow-brown blue blue C blue-black purple red D yellow-brown blue red E blue-black blue green One of the solutions A, B, C, D or E contains an enzyme. Using the information in Table 13.1 identify which solution contains an enzyme. Explain your answer. solution … explanation … … … [3] [Total: 6]
6 marks
Mark scheme: 13(a) ref to active site ; active site / enzyme, and substrate have complementary shape ; so substrate can bind to active site / enzyme ; 3 13(b) C ; (C) contains proteins / enzymes are proteins ; proteins turn Biuret solution purple ; 3
This question in 0654/41 May/June 2019
Q4 · The graph in Fig 0654/42 May/June 2019
1 (a) The graph in Fig. 1.1 shows the effect of temperature on enzyme activity. enzyme activity 0 10 20 30 40 50 60 70 temperature / °C Fig. 1.1 (i) State the optimum temperature of the enzyme in Fig. 1.1. … °C [1] (ii) Explain the results in Fig. 1.1 at 60 °C. … … … … [2] (b) Enzyme activity is also affected by pH. Complete the graph in Fig. 1.2 to show how the activity of a protease enzyme in the stomach is affected by pH. Include on your graph: • labels for both axes • a sketch of a suitable curve. 1 2 3 4 5 6 7 8 9 10 11 12 Fig. 1.2 [3] (c) A solution containing an enzyme is tested with biuret solution. State the colour change you would expect. Give a reason for your answer. the colour changes from … to … reason … … [2] [Total: 8]
8 marks
Mark scheme: 1(a)(i) 45 (°C) ; 1 1(a)(ii) enzyme denatures ; shape of, active site / enzyme, changes or substrate no longer fits into enzyme / active site ; 2 1(b) correct axes labels ; correct shape ; peak in acidic region ; 3 1(c) blue to purple ; enzymes are proteins ; 2
This question in 0654/42 May/June 2019
Q5 · A graph showing the effect of pH on an enzyme’s activity at 20 °C 0654/43 May/June 2019
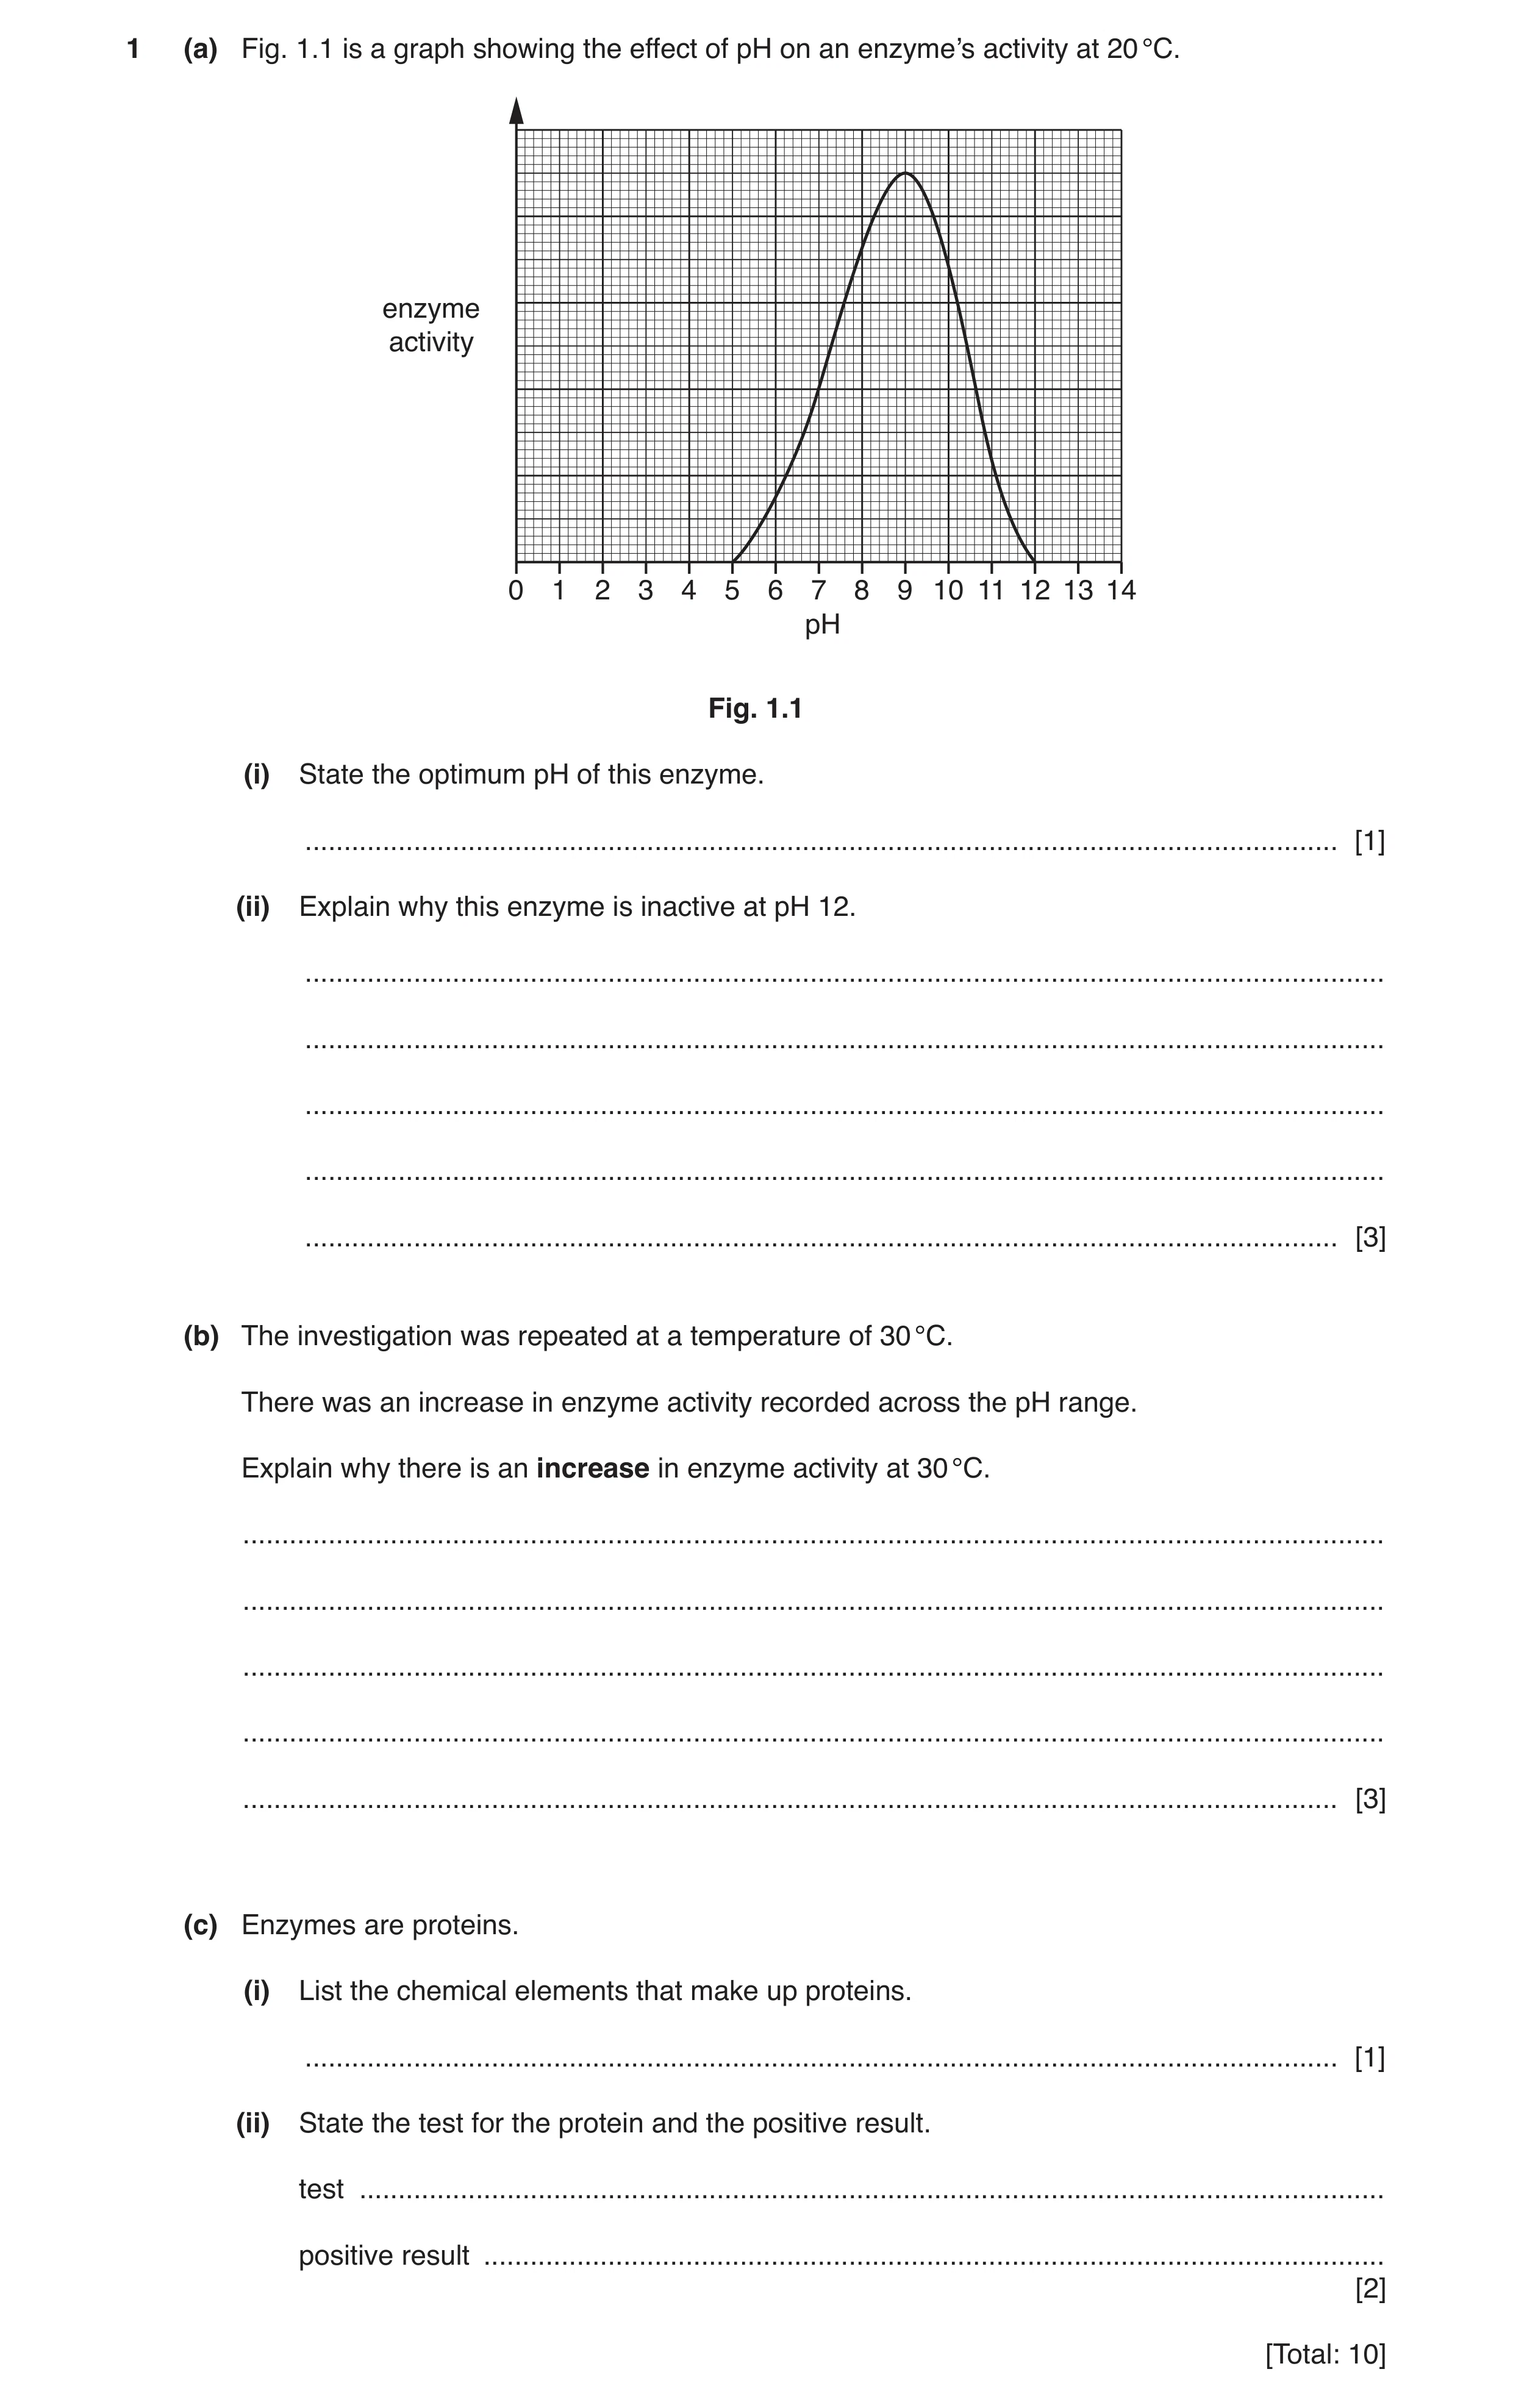
1 (a) Fig. 1.1 is a graph showing the effect of pH on an enzyme’s activity at 20 °C. enzyme activity 0 1 2 3 4 5 6 7 8 9 10 11 12 13 14 pH Fig. 1.1 (i) State the optimum pH of this enzyme. … [1] (ii) Explain why this enzyme is inactive at pH 12. … … … … … [3] (b) The investigation was repeated at a temperature of 30 °C. There was an increase in enzyme activity recorded across the pH range. Explain why there is an increase in enzyme activity at 30 °C. … … … … … [3] (c) Enzymes are proteins. (i) List the chemical elements that make up proteins. … [1] (ii) State the test for the protein and the positive result. test … positive result … [2] [Total: 10]
10 marks
Mark scheme: 1(a)(i) 9 ; 1 1(a)(ii) enzyme denatures ; shape of active site changes ; substrate no longer fits into enzyme / active site, or substrate and enzyme / active site are no longer complimentary ; 3 1(b) particles move faster / increased kinetic energy (of the particles) ; at higher temperature greater frequency of collision ; more successful collisions ; 3 1(c)(i) carbon, hydrogen, oxygen, nitrogen ; 1 1(c)(ii) add biuret solution ; solution would turn purple ; 2
This question in 0654/43 May/June 2019
Q6 · Lipase is a digestive enzyme 0654/41 Oct/Nov 2019
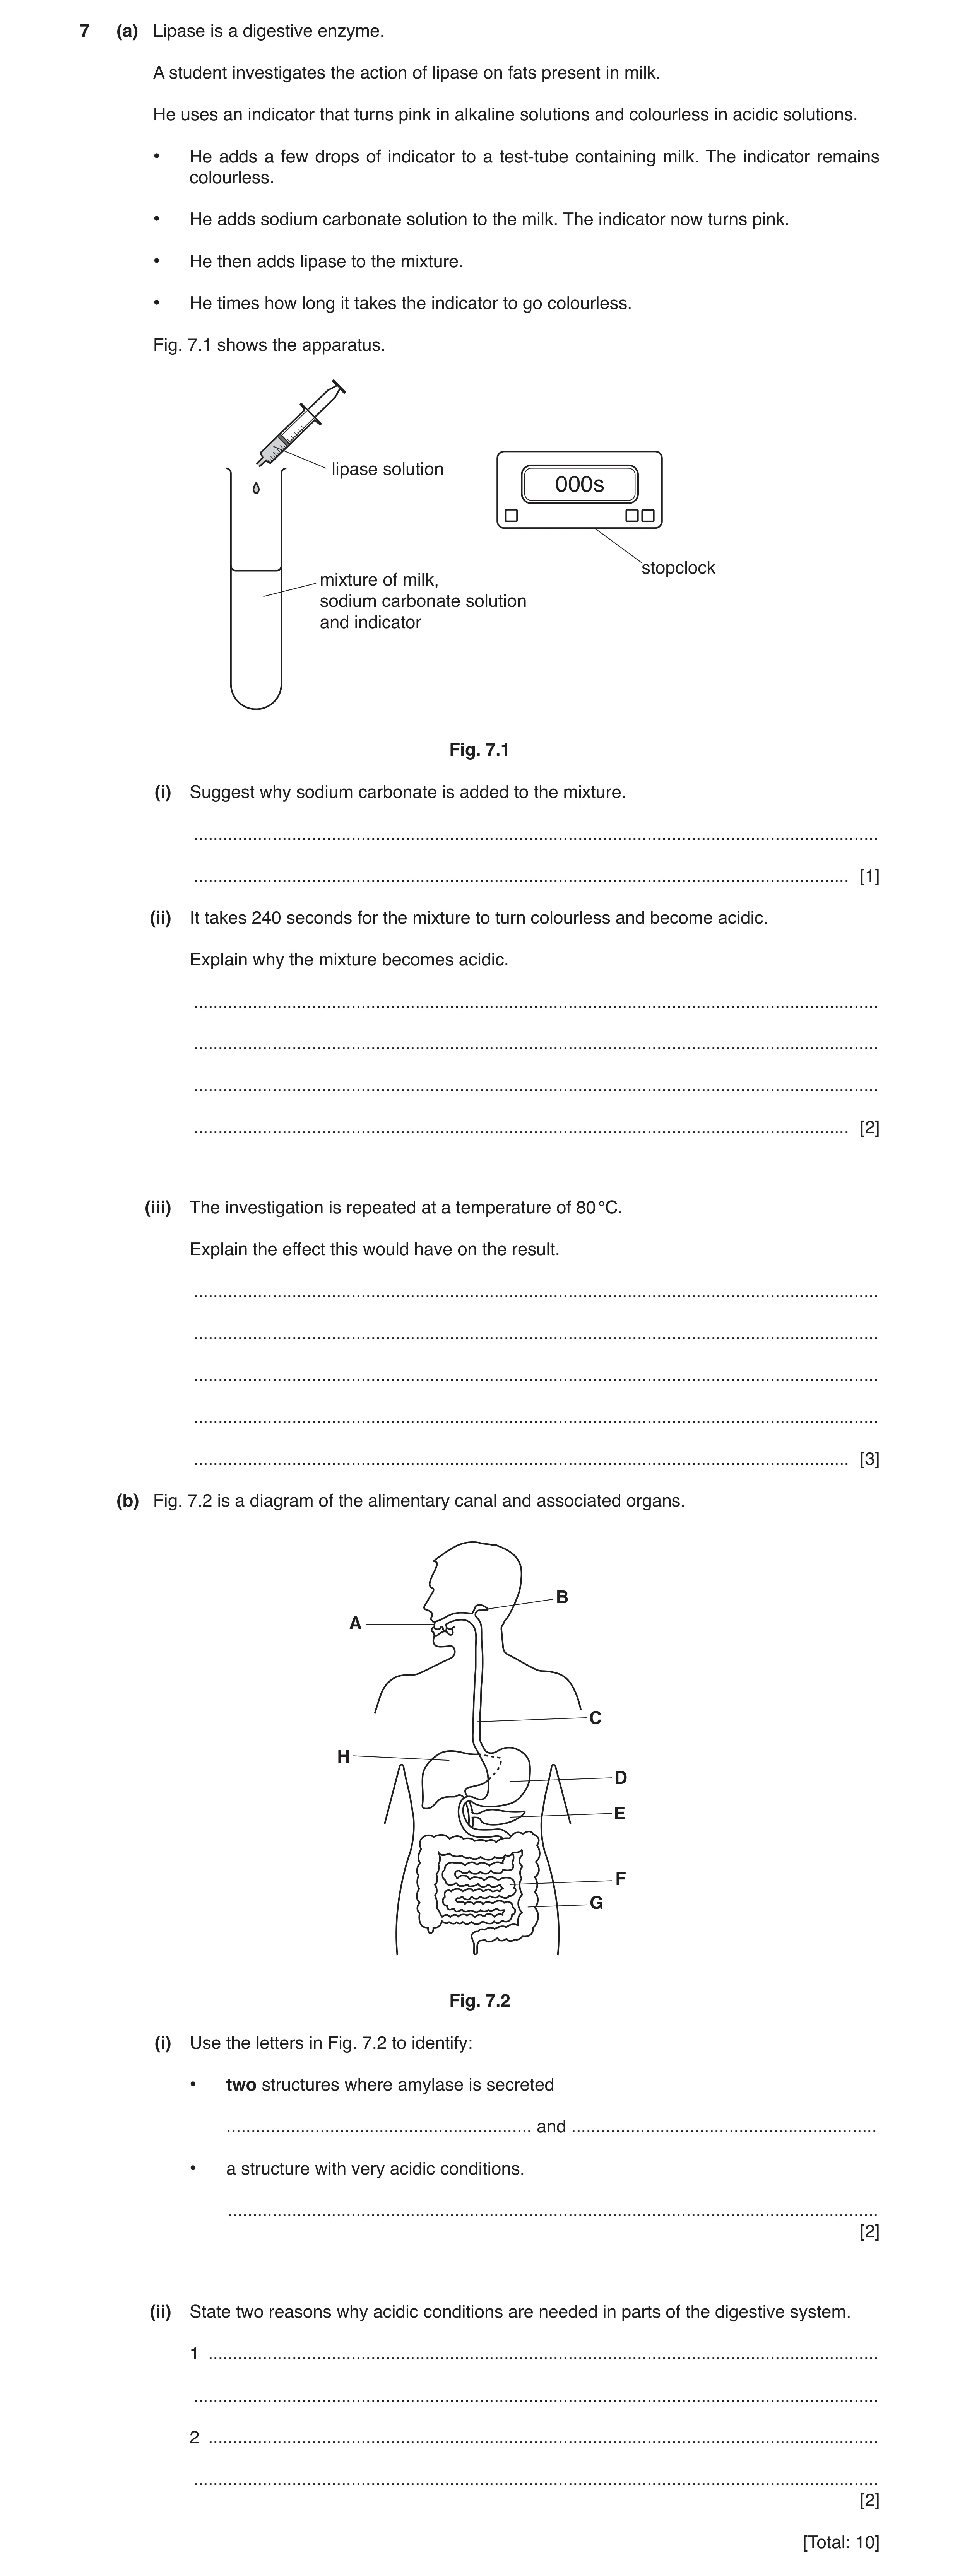
7 (a) Lipase is a digestive enzyme. A student investigates the action of lipase on fats present in milk. He uses an indicator that turns pink in alkaline solutions and colourless in acidic solutions. • He adds a few drops of indicator to a test-tube containing milk. The indicator remains colourless. • He adds sodium carbonate solution to the milk. The indicator now turns pink. • He then adds lipase to the mixture. • He times how long it takes the indicator to go colourless. Fig. 7.1 shows the apparatus. lipase solution 000s stopclock mixture of milk, sodium carbonate solution and indicator Fig. 7.1 (i) Suggest why sodium carbonate is added to the mixture. … … [1] (ii) It takes 240 seconds for the mixture to turn colourless and become acidic. Explain why the mixture becomes acidic. … … … … [2] (iii) The investigation is repeated at a temperature of 80 °C. Explain the effect this would have on the result. … … … … … [3] (b) Fig. 7.2 is a diagram of the alimentary canal and associated organs. B A C H D E F G Fig. 7.2 (i) Use the letters in Fig. 7.2 to identify: • two structures where amylase is secreted … and … • a structure with very acidic conditions. … [2] (ii) State two reasons why acidic conditions are needed in parts of the digestive system. 1 … … 2 … … [2] [Total: 10]
10 marks
Mark scheme: 7(a)(i) to make the solution alkaline / so the solution changes colour (when acid is formed) ; 1 7(a)(ii) lipase breaks down the fat (in the milk) ; into fatty acids (and glycerol) ; 2 7(a)(iii) the mixture would not become colourless ; lipase / enzyme is denatured (at higher temperature) ; fat is no longer broken down / fatty acids not produced ; 3 7(b)(i) any two from B, E, F ; D ; 2 7(b)(ii) Kill microorganisms (in food) ; acidic conditions needed for protein digestion ; 2
This question in 0654/41 Oct/Nov 2019
Q7 · A student investigates the effect of temperature on the rate of photosynthesis in elodea… 0654/41 May/June 2020
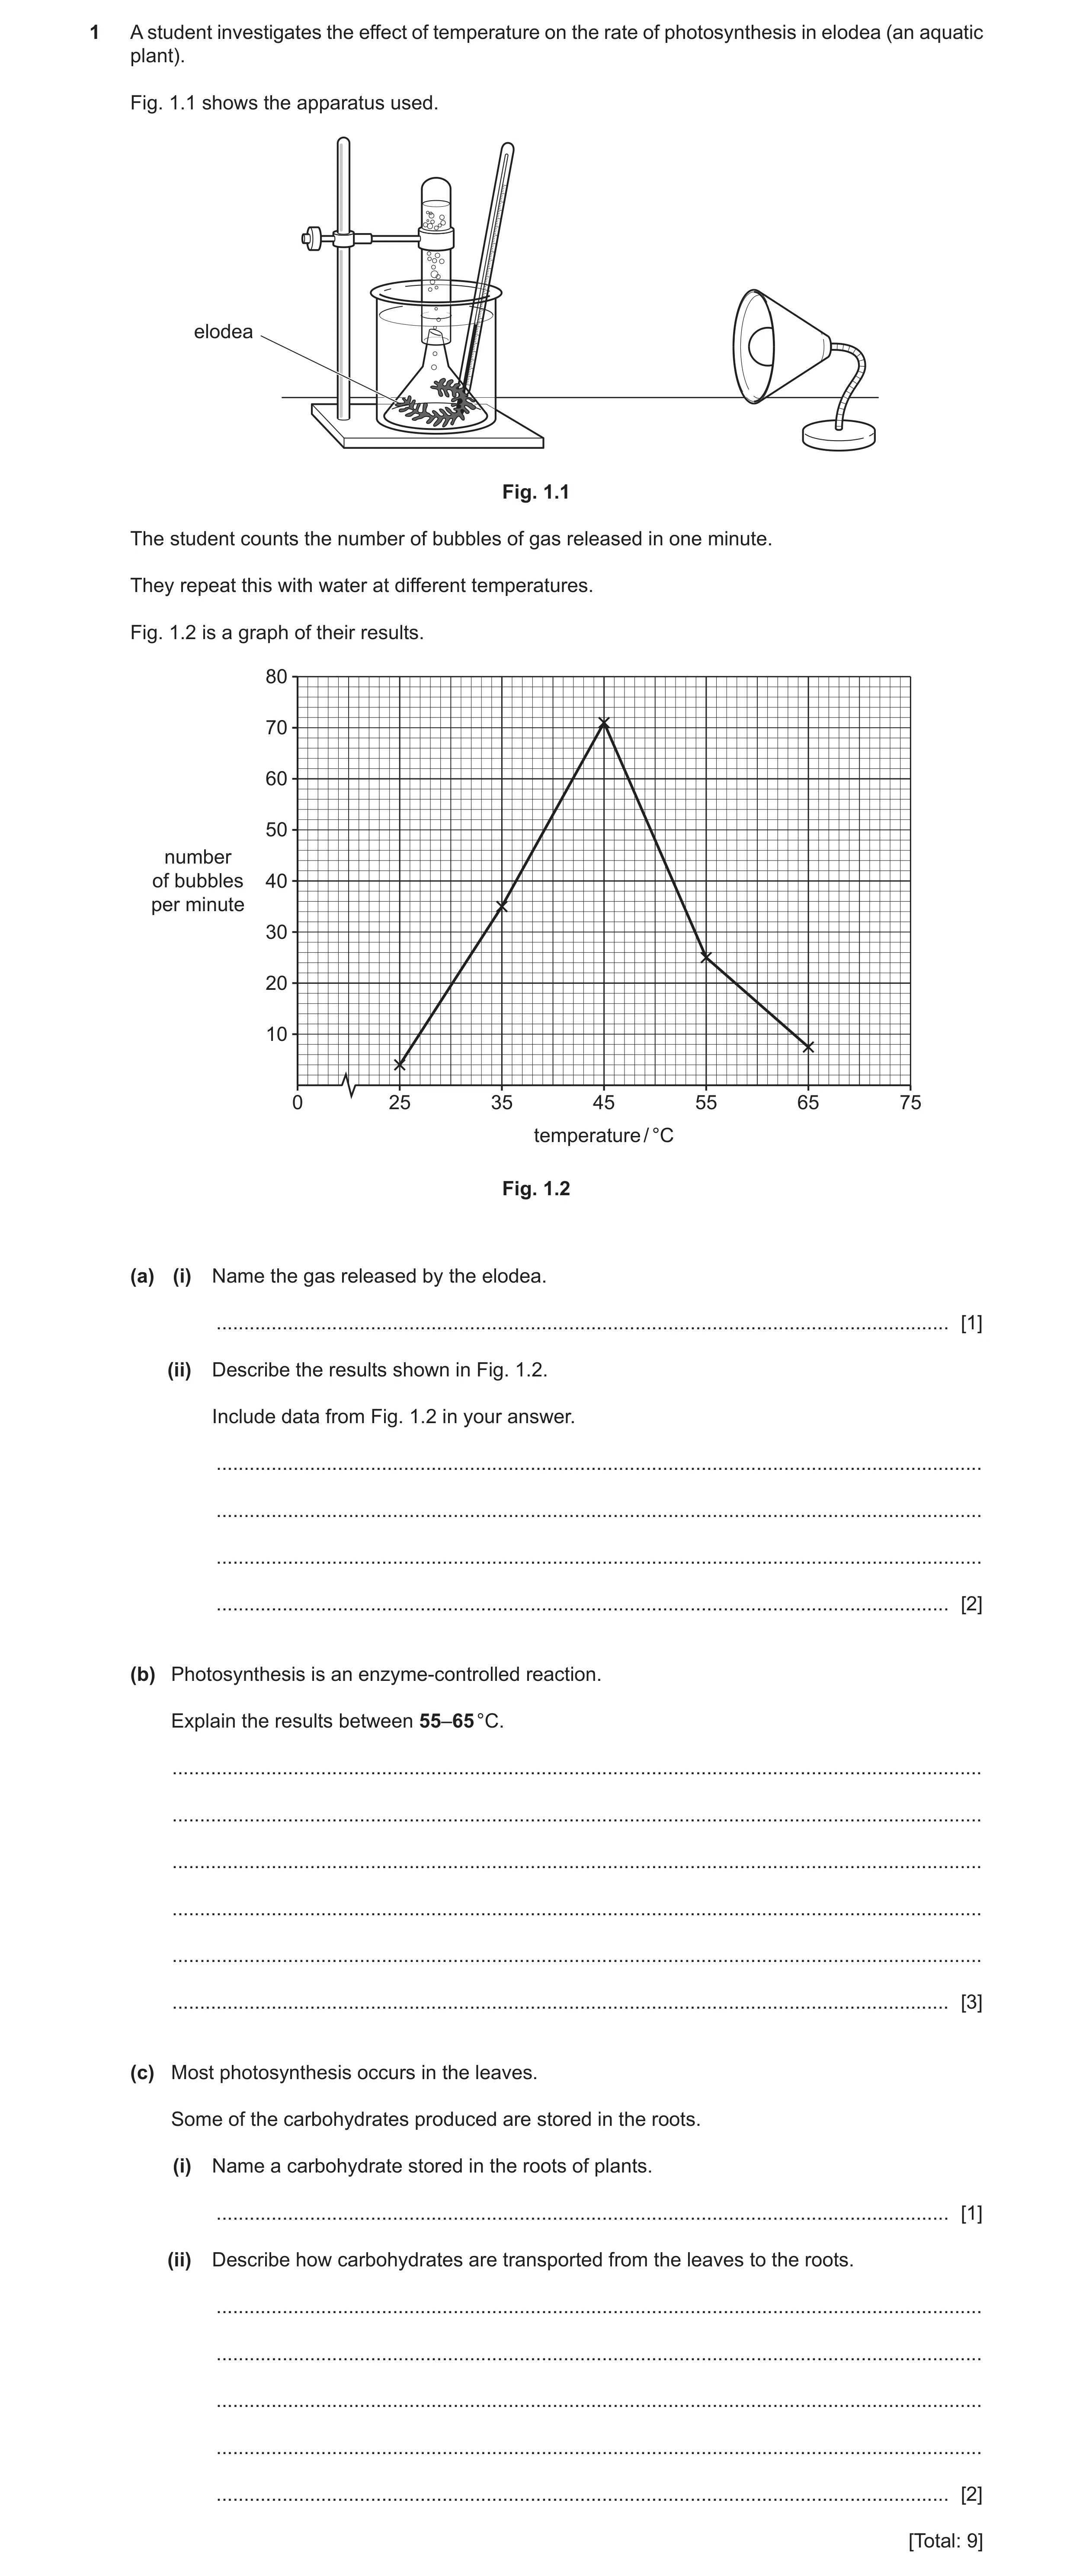
1 A student investigates the effect of temperature on the rate of photosynthesis in elodea (an aquatic plant). Fig. 1.1 shows the apparatus used. elodea Fig. 1.1 The student counts the number of bubbles of gas released in one minute. They repeat this with water at different temperatures. Fig. 1.2 is a graph of their results. 80 70 60 50 number of bubbles 40 per minute 30 20 10 0 25 35 45 55 65 75 temperature / °C Fig. 1.2 (a) (i) Name the gas released by the elodea. … [1] (ii) Describe the results shown in Fig. 1.2. Include data from Fig. 1.2 in your answer. … … … … [2] (b) Photosynthesis is an enzyme-controlled reaction. Explain the results between 55–65 °C. … … … … … … [3] (c) Most photosynthesis occurs in the leaves. Some of the carbohydrates produced are stored in the roots. (i) Name a carbohydrate stored in the roots of plants. … [1] (ii) Describe how carbohydrates are transported from the leaves to the roots. … … … … … [2] [Total: 9]
9 marks
Mark scheme: 1(a)(i) oxygen ; 1 1(a)(ii) the number of bubbles released / rate of photosynthesis increases and decreases (with temperature) ; peak at 45°C / 71 bubbles per minute ; 2 1(b) enzymes denature at high temperature ; active site shape is changed ; substrate can no longer fit ; so rate of, reaction / photosynthesis decreases ; max 3 1(c)(i) starch ; 1 1(c)(ii) ref to translocation ; transported as sucrose ; through the phloem ; max 2
This question in 0654/41 May/June 2020
Q8 · Enzymes have an important role in the process of digestion 0654/42 Oct/Nov 2021
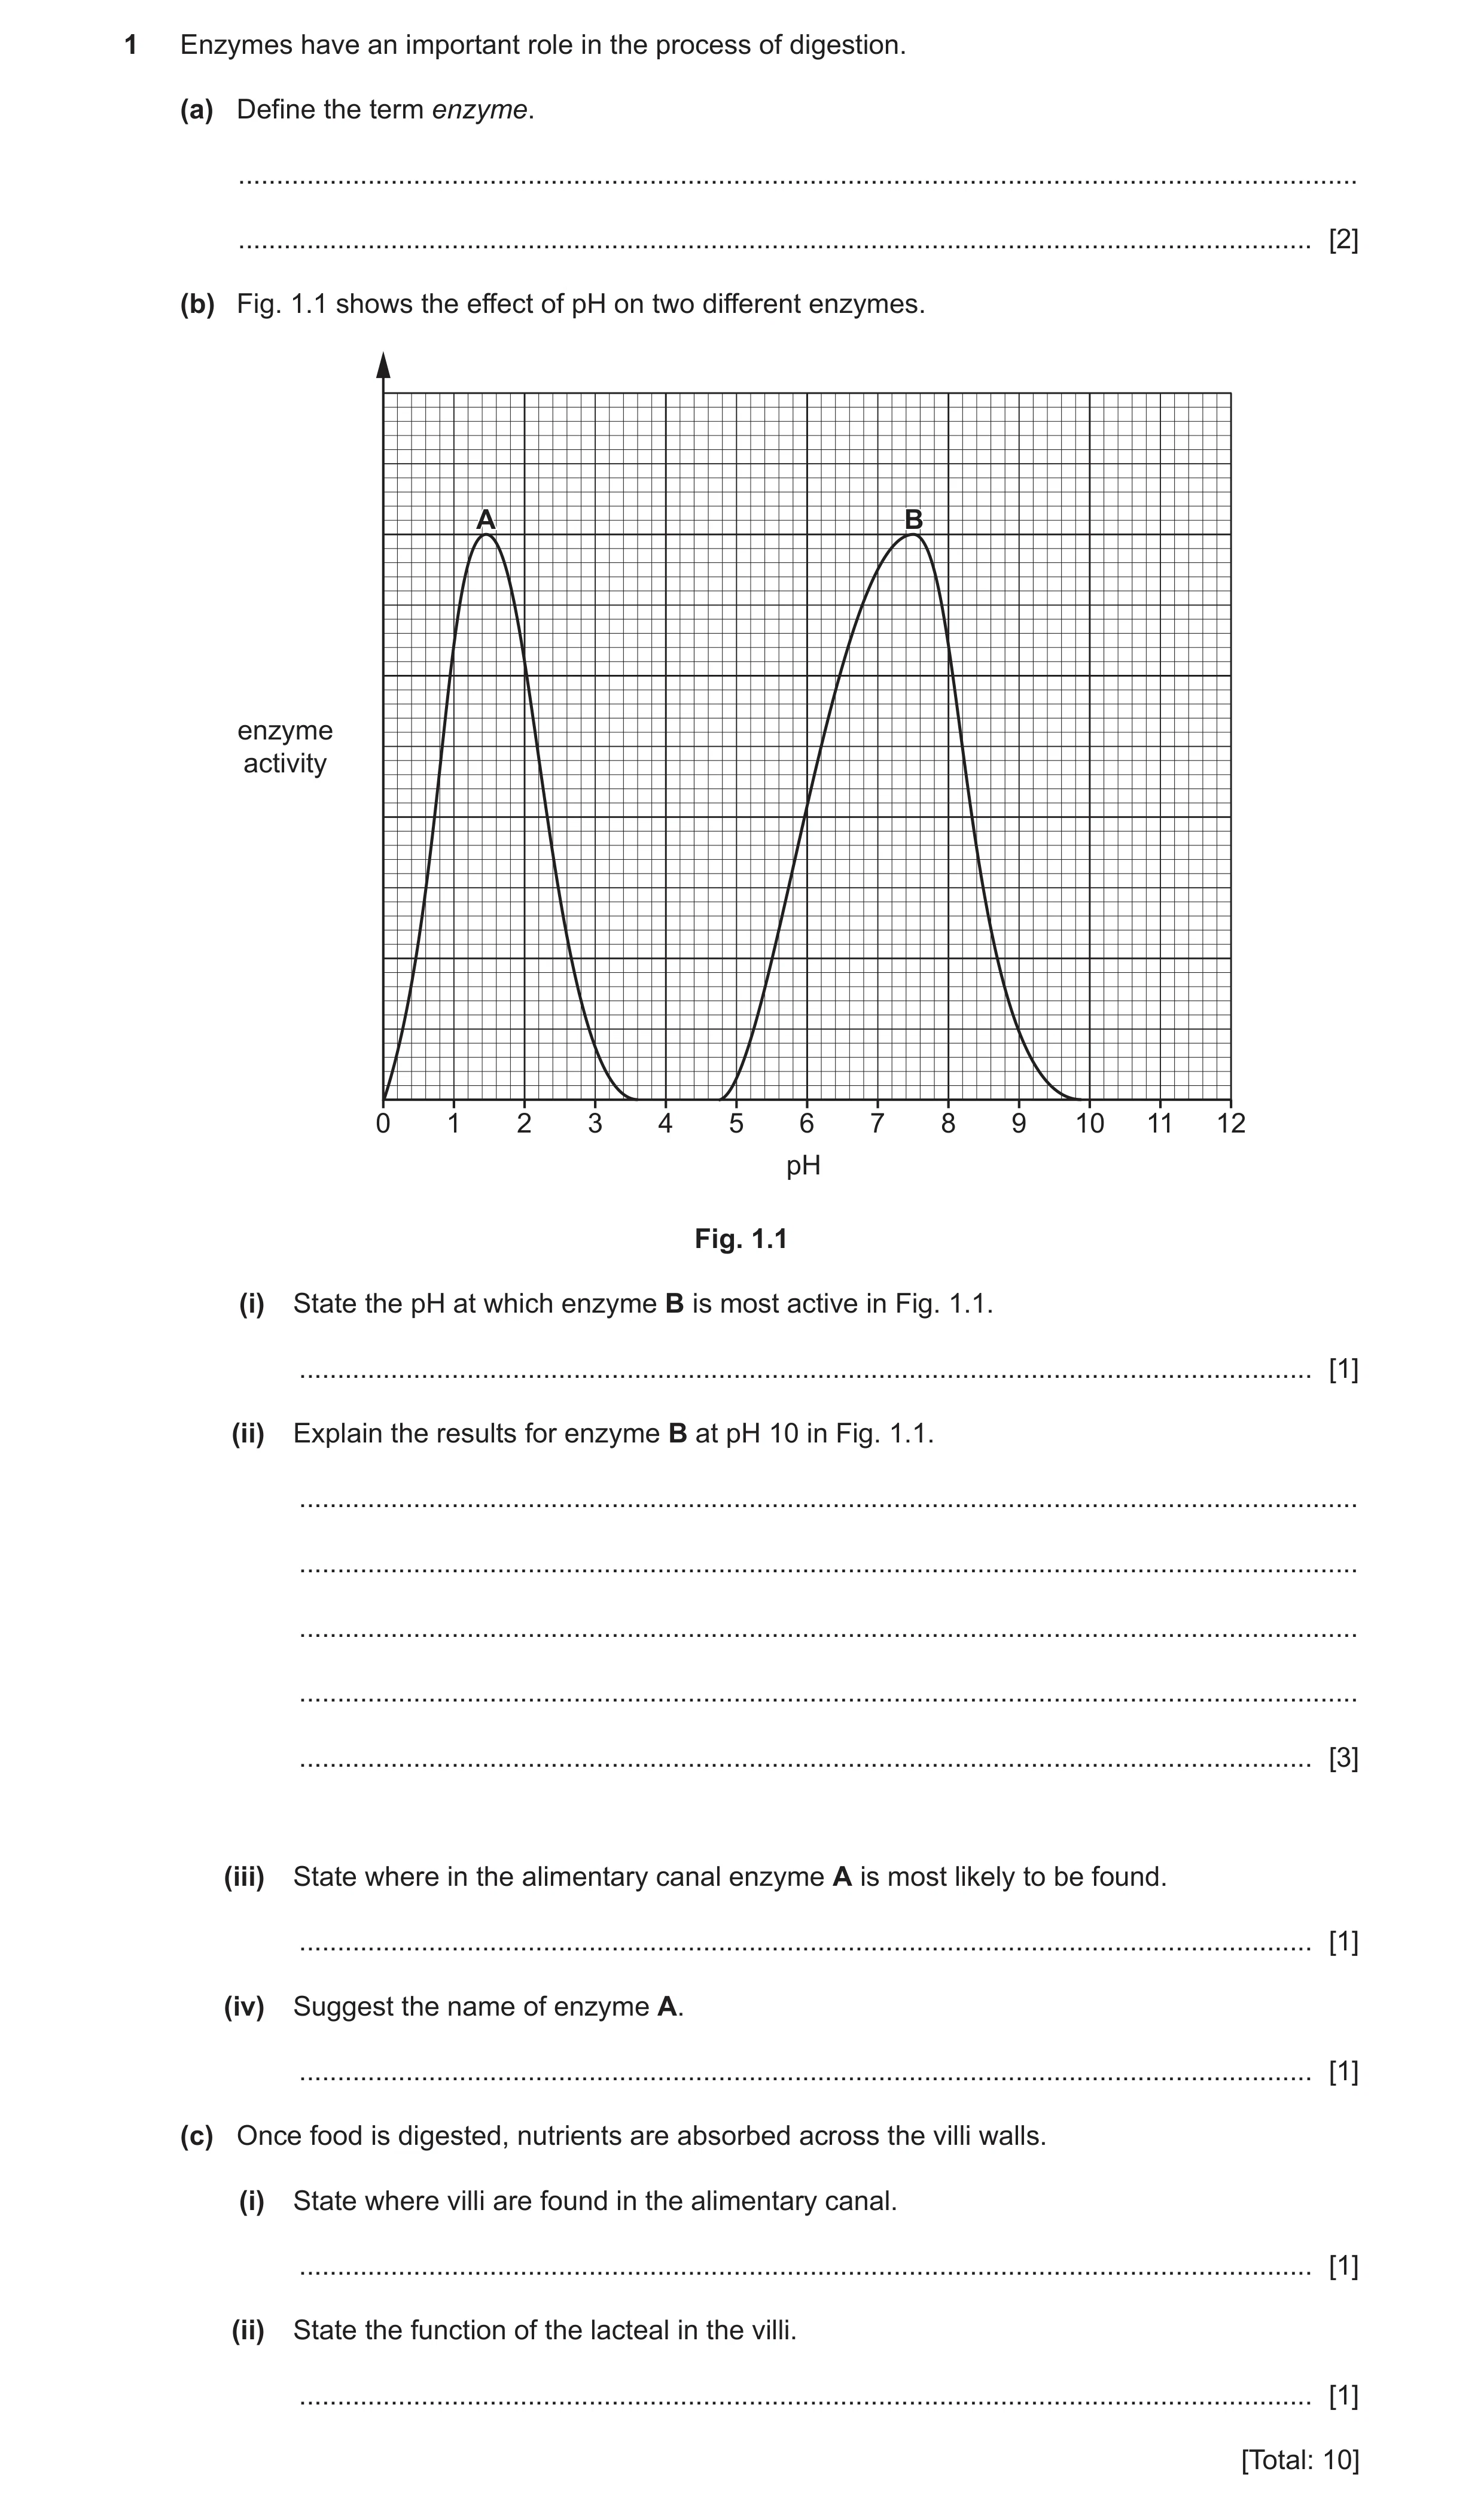
1 Enzymes have an important role in the process of digestion. (a) Define the term enzyme. … … [2] (b) Fig. 1.1 shows the effect of pH on two different enzymes. AA BB enzyme activity 0 1 2 3 4 5 6 7 8 9 10 11 12 pH Fig. 1.1 (i) State the pH at which enzyme B is most active in Fig. 1.1. … [1] (ii) Explain the results for enzyme B at pH 10 in Fig. 1.1. … … … … … [3] (iii) State where in the alimentary canal enzyme A is most likely to be found. … [1] (iv) Suggest the name of enzyme A. … [1] (c) Once food is digested, nutrients are absorbed across the villi walls. (i) State where villi are found in the alimentary canal. … [1] (ii) State the function of the lacteal in the villi. … [1] [Total: 10]
10 marks
Mark scheme: 1(a) a protein ; (that acts as) a biological catalyst ; 2 1(b)(i) 7.5 ; 1 1(b)(ii) any three from: ref to denaturation ; active site changes shape ; substrate can no longer fit into the, enzyme / active site ; no products released / no breakdown of substances ; 3 1(b)(iii) stomach ; 1 1(b)(iv) protease ; 1 1(c)(i) small intestine ; 1 1(c)(ii) fat absorption ; 1
This question in 0654/42 Oct/Nov 2021
Q9 · A student investigates the effect of bile and lipase on the digestion of fat in milk 0654/42 Feb/March 2022
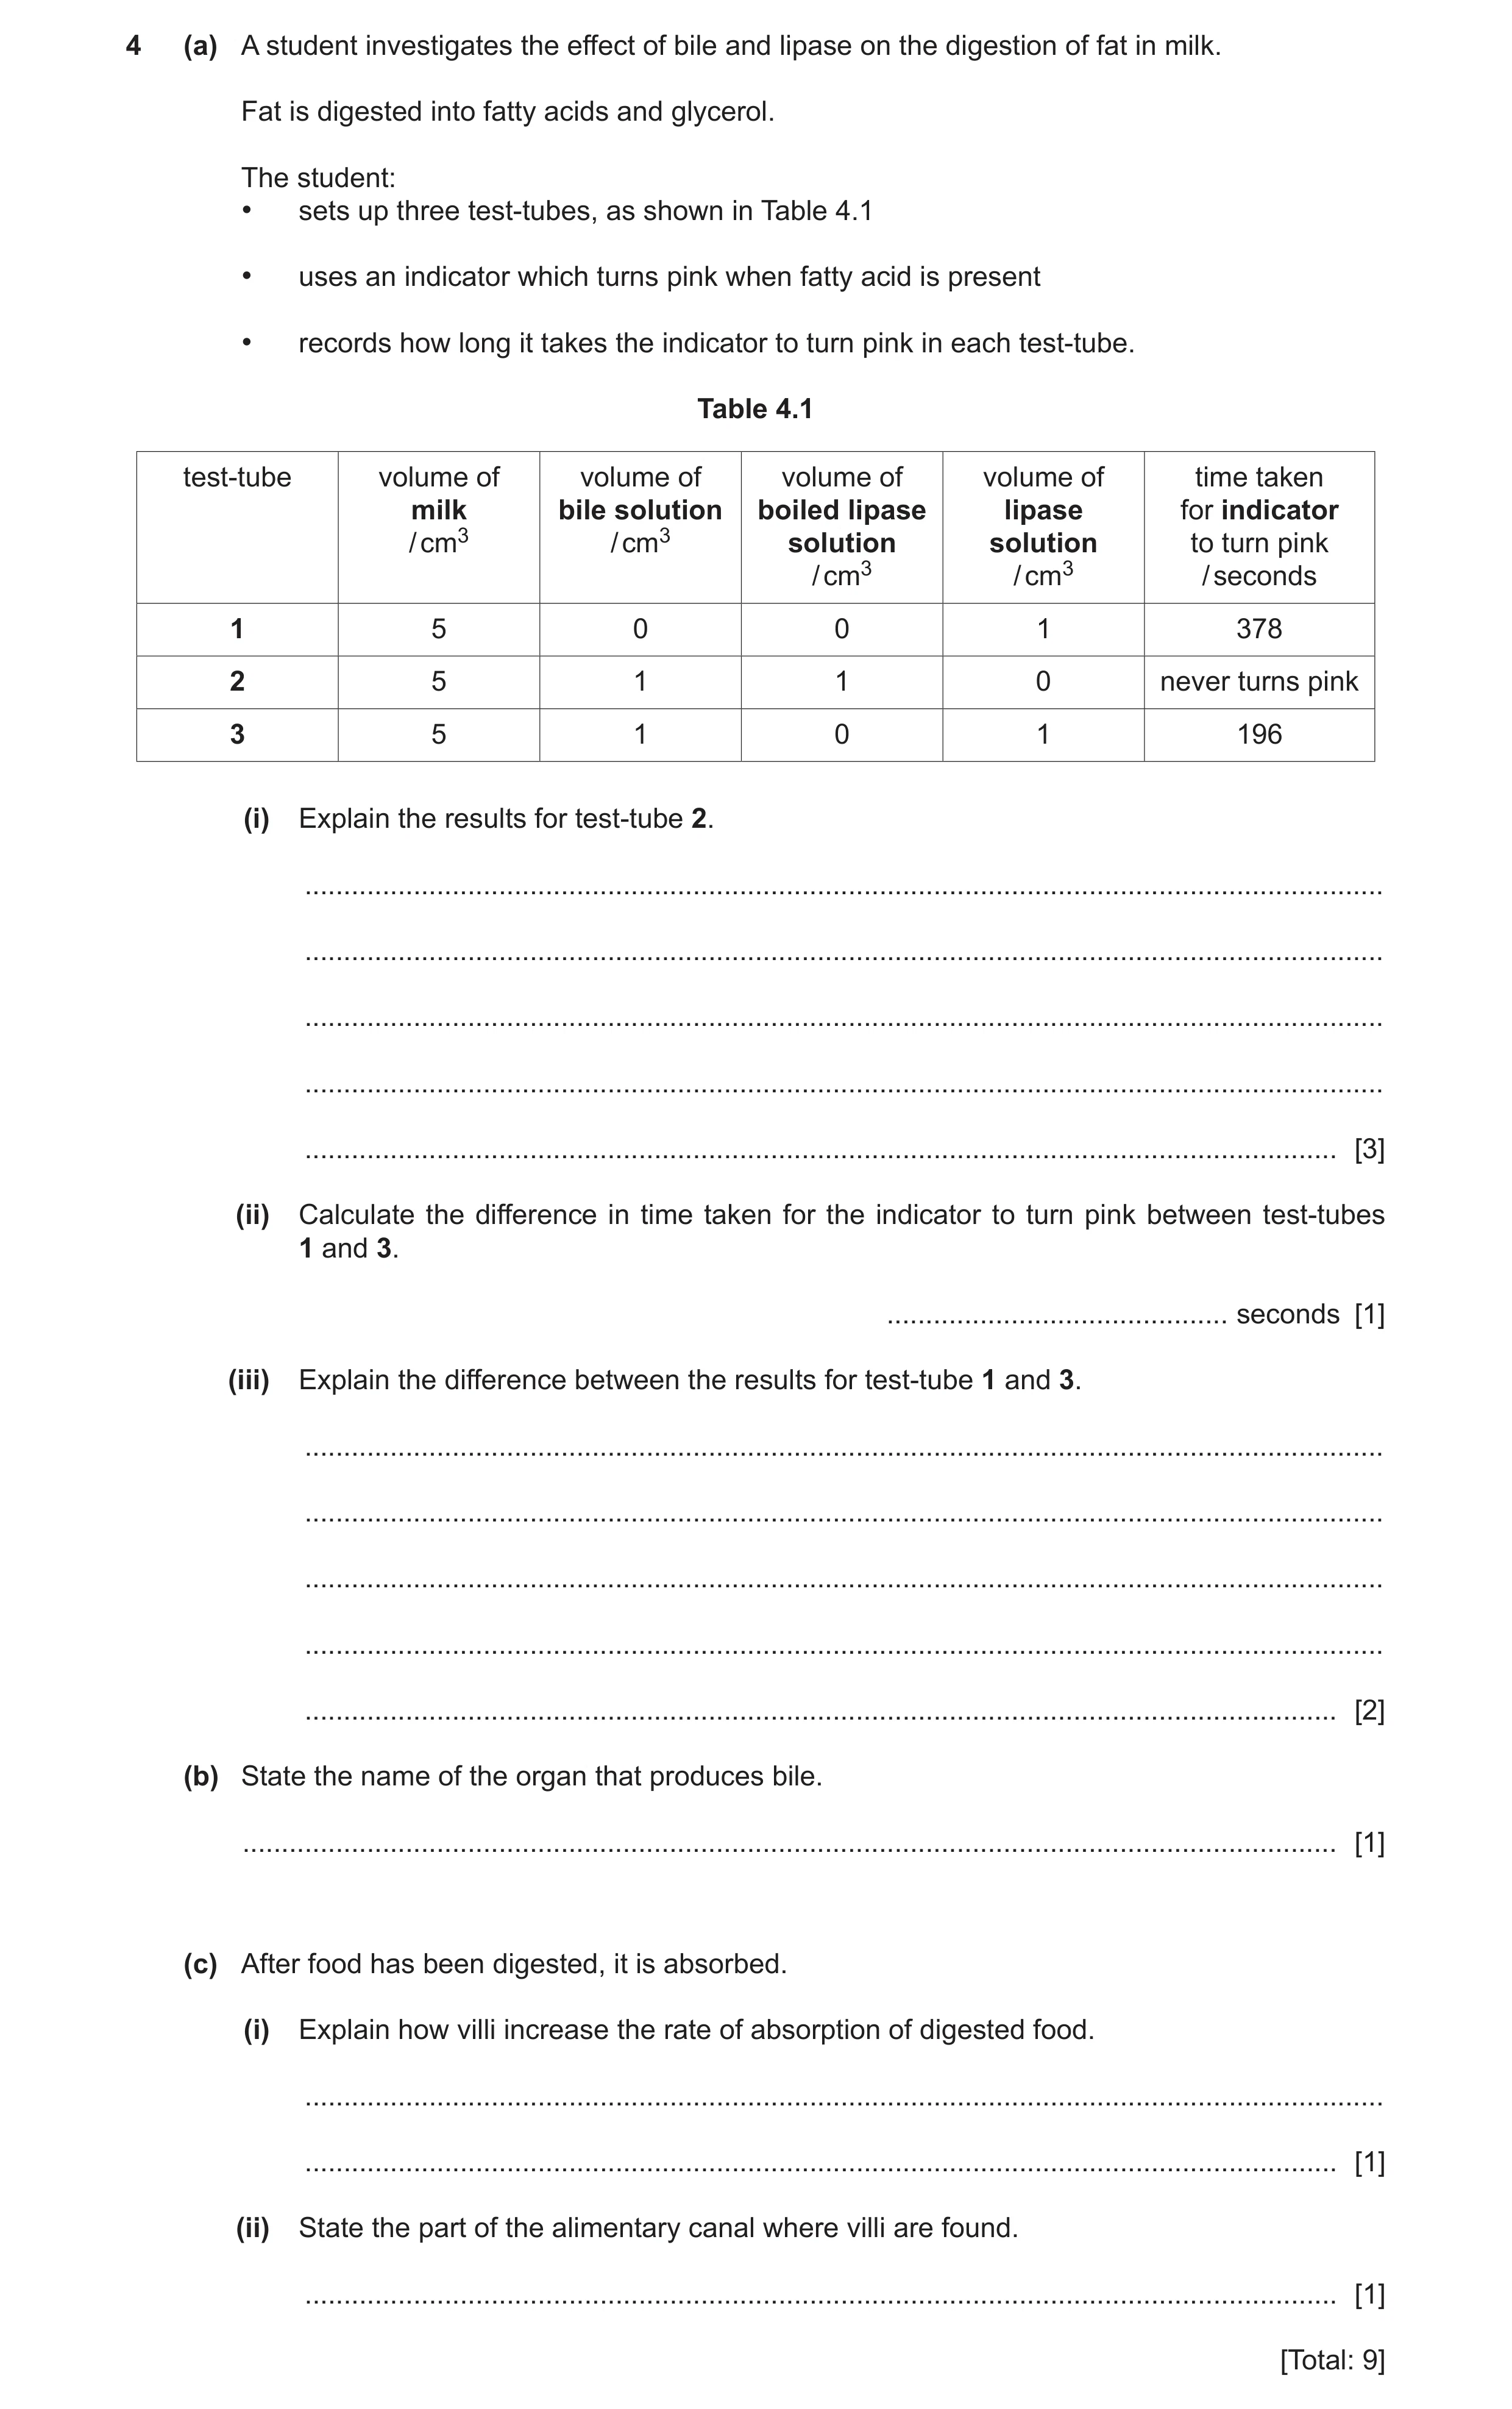
4 (a) A student investigates the effect of bile and lipase on the digestion of fat in milk. Fat is digested into fatty acids and glycerol. The student: • sets up three test-tubes, as shown in Table 4.1 • uses an indicator which turns pink when fatty acid is present • records how long it takes the indicator to turn pink in each test-tube. Table 4.1 test-tube volume of volume of volume of volume of time taken milk bile solution boiled lipase lipase for indicator / cm3 / cm3 solution solution to turn pink / cm3 / cm3 / seconds 1 5 0 0 1 378 2 5 1 1 0 never turns pink 3 5 1 0 1 196 (i) Explain the results for test-tube 2. … … … … … [3] (ii) Calculate the difference in time taken for the indicator to turn pink between test-tubes 1 and 3. … seconds [1] (iii) Explain the difference between the results for test-tube 1 and 3. … … … … … [2] (b) State the name of the organ that produces bile. … [1] (c) After food has been digested, it is absorbed. (i) Explain how villi increase the rate of absorption of digested food. … … [1] (ii) State the part of the alimentary canal where villi are found. … [1] [Total: 9]
9 marks
Mark scheme: 4(a)(i) any three from: enzymes were denatured (due to boiling) ; change in shape of active site ; enzyme is no longer complementary to substrate ; bile alone does not digest fats / fats weren’t broken down into fatty acids and glycerol ; 3 4(a)(ii) 182 (seconds) ; 1 4(a)(iii) any two from: bile, emulsifies the fat ; increases surface area of fat ; so there is faster, breakdown / digestion (by lipase) ; 2 4(b) liver ; 1 4(c)(i) large surface area ; 1 4(c)(ii) small intestine ; 1
This question in 0654/42 Feb/March 2022
Q10 · A student investigates the effect of temperature on the rate of photosynthesis 0654/43 May/June 2022
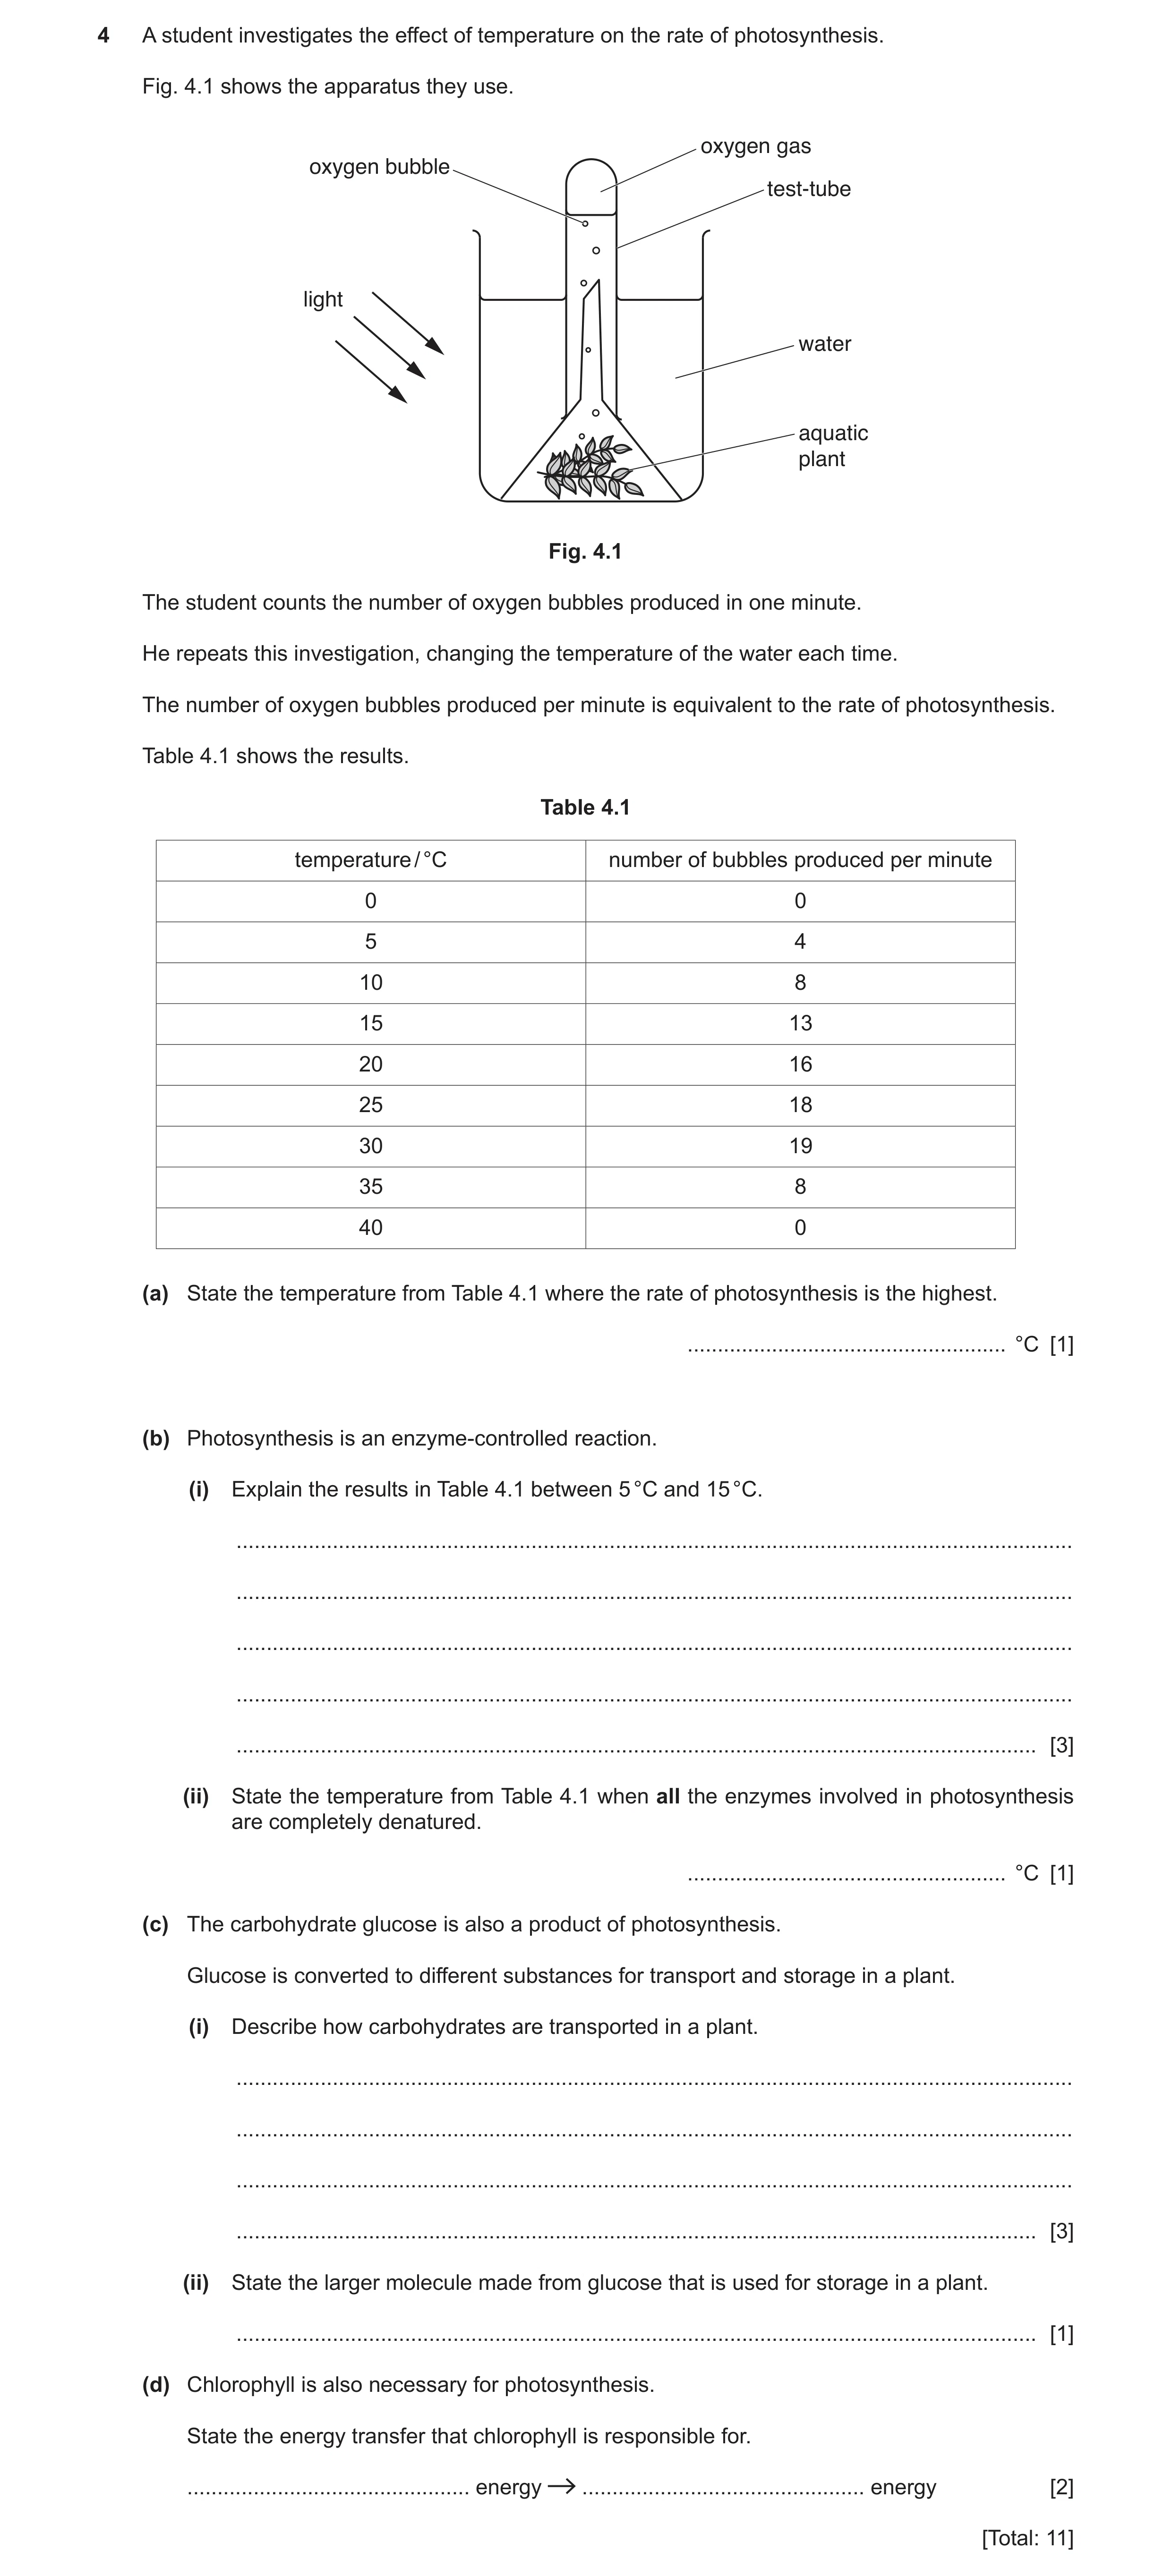
4 A student investigates the effect of temperature on the rate of photosynthesis. Fig. 4.1 shows the apparatus they use. oxygen gas oxygen bubble test-tube light water aquatic plant Fig. 4.1 The student counts the number of oxygen bubbles produced in one minute. He repeats this investigation, changing the temperature of the water each time. The number of oxygen bubbles produced per minute is equivalent to the rate of photosynthesis. Table 4.1 shows the results. Table 4.1 temperature / °C number of bubbles produced per minute 0 0 5 4 10 8 15 13 20 16 25 18 30 19 35 8 40 0 (a) State the temperature from Table 4.1 where the rate of photosynthesis is the highest. … °C [1] (b) Photosynthesis is an enzyme-controlled reaction. (i) Explain the results in Table 4.1 between 5 °C and 15 °C. … … … … … [3] (ii) State the temperature from Table 4.1 when all the enzymes involved in photosynthesis are completely denatured. … °C [1] (c) The carbohydrate glucose is also a product of photosynthesis. Glucose is converted to different substances for transport and storage in a plant. (i) Describe how carbohydrates are transported in a plant. … … … … [3] (ii) State the larger molecule made from glucose that is used for storage in a plant. … [1] (d) Chlorophyll is also necessary for photosynthesis. State the energy transfer that chlorophyll is responsible for. … energy … energy [2] [Total: 11]
11 marks
Mark scheme: 4(a) 30 (°C) ; 1 4(b)(i) (increasing temperature) increases the energy / speed of molecules ; increases number of molecules reaching activation energy ; increases frequency of (effective) collisions ; faster rate of photosynthesis ; max 3 3 4(b)(ii) 40 (°C) ; 1 4(c)(i) as sucrose ; in the phloem ; by translocation ; 3 4(c)(ii) starch ; 1 4(d) light ; chemical ; 2
This question in 0654/43 May/June 2022
Q11 · The effect of pH on the activity of one digestive enzyme 0654/42 Feb/March 2023
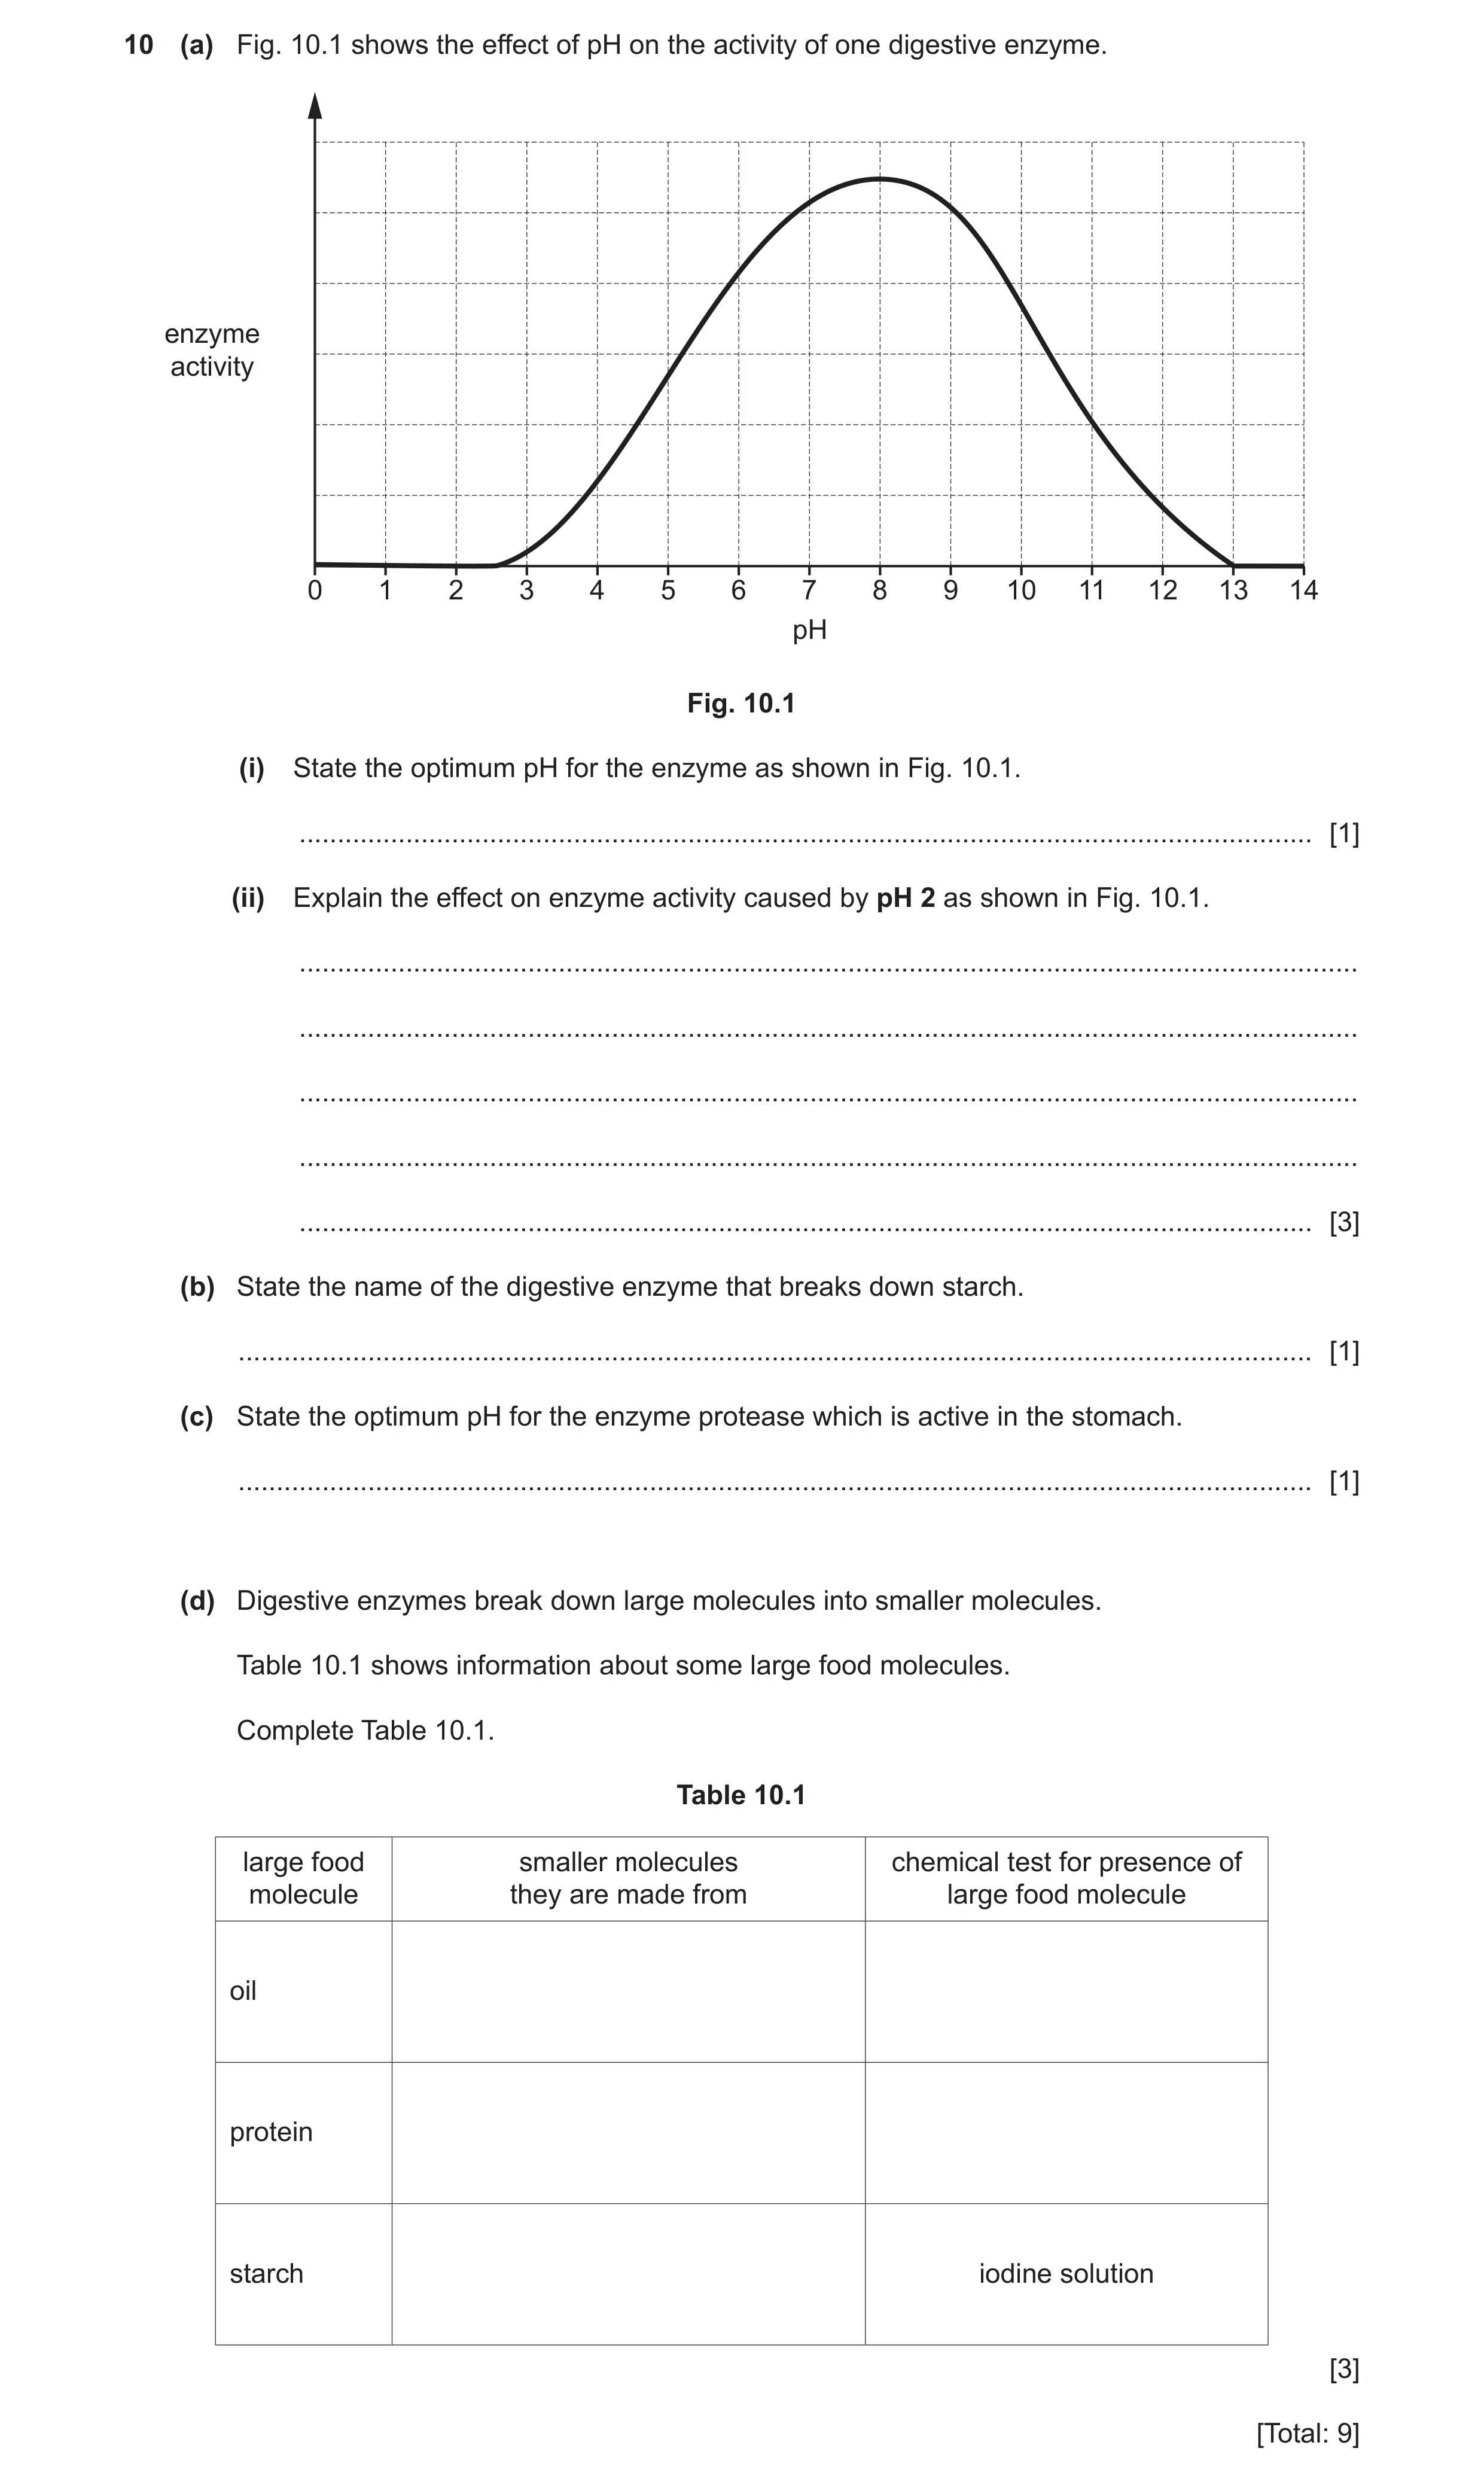
10 (a) Fig. 10.1 shows the effect of pH on the activity of one digestive enzyme. enzyme activity 0 1 2 3 4 5 6 7 8 9 10 11 12 13 14 pH Fig. 10.1 (i) State the optimum pH for the enzyme as shown in Fig. 10.1. … [1] (ii) Explain the effect on enzyme activity caused by pH 2 as shown in Fig. 10.1. … … … … … [3] (b) State the name of the digestive enzyme that breaks down starch. … [1] (c) State the optimum pH for the enzyme protease which is active in the stomach. … [1] (d) Digestive enzymes break down large molecules into smaller molecules. Table 10.1 shows information about some large food molecules. Complete Table 10.1. Table 10.1 large food smaller molecules chemical test for presence of molecule they are made from large food molecule oil protein starch iodine solution [3] [Total: 9]
9 marks
Mark scheme: 10(a)(i) 8 ; 1 10(a)(ii) (no activity at pH2) 3 enzymes are denatured ; (low / acidic, pH) causes shape of active site to change ; substrate is no longer complementary to the, active site or enzyme ; 10(b) amylase ; 1 10(c) pH 1–3 ; 1 10(d) 3 smaller molecules chemical test for presence large food molecule they are made from of large food molecule fatty acids and fats and oils ethanol emulsion glycerol protein amino acids biuret (solution) starch glucose iodine solution ;;;
This question in 0654/42 Feb/March 2023
Q12 · A scientist measures the activity of the enzyme amylase at different temperatures 0654/41 Oct/Nov 2023
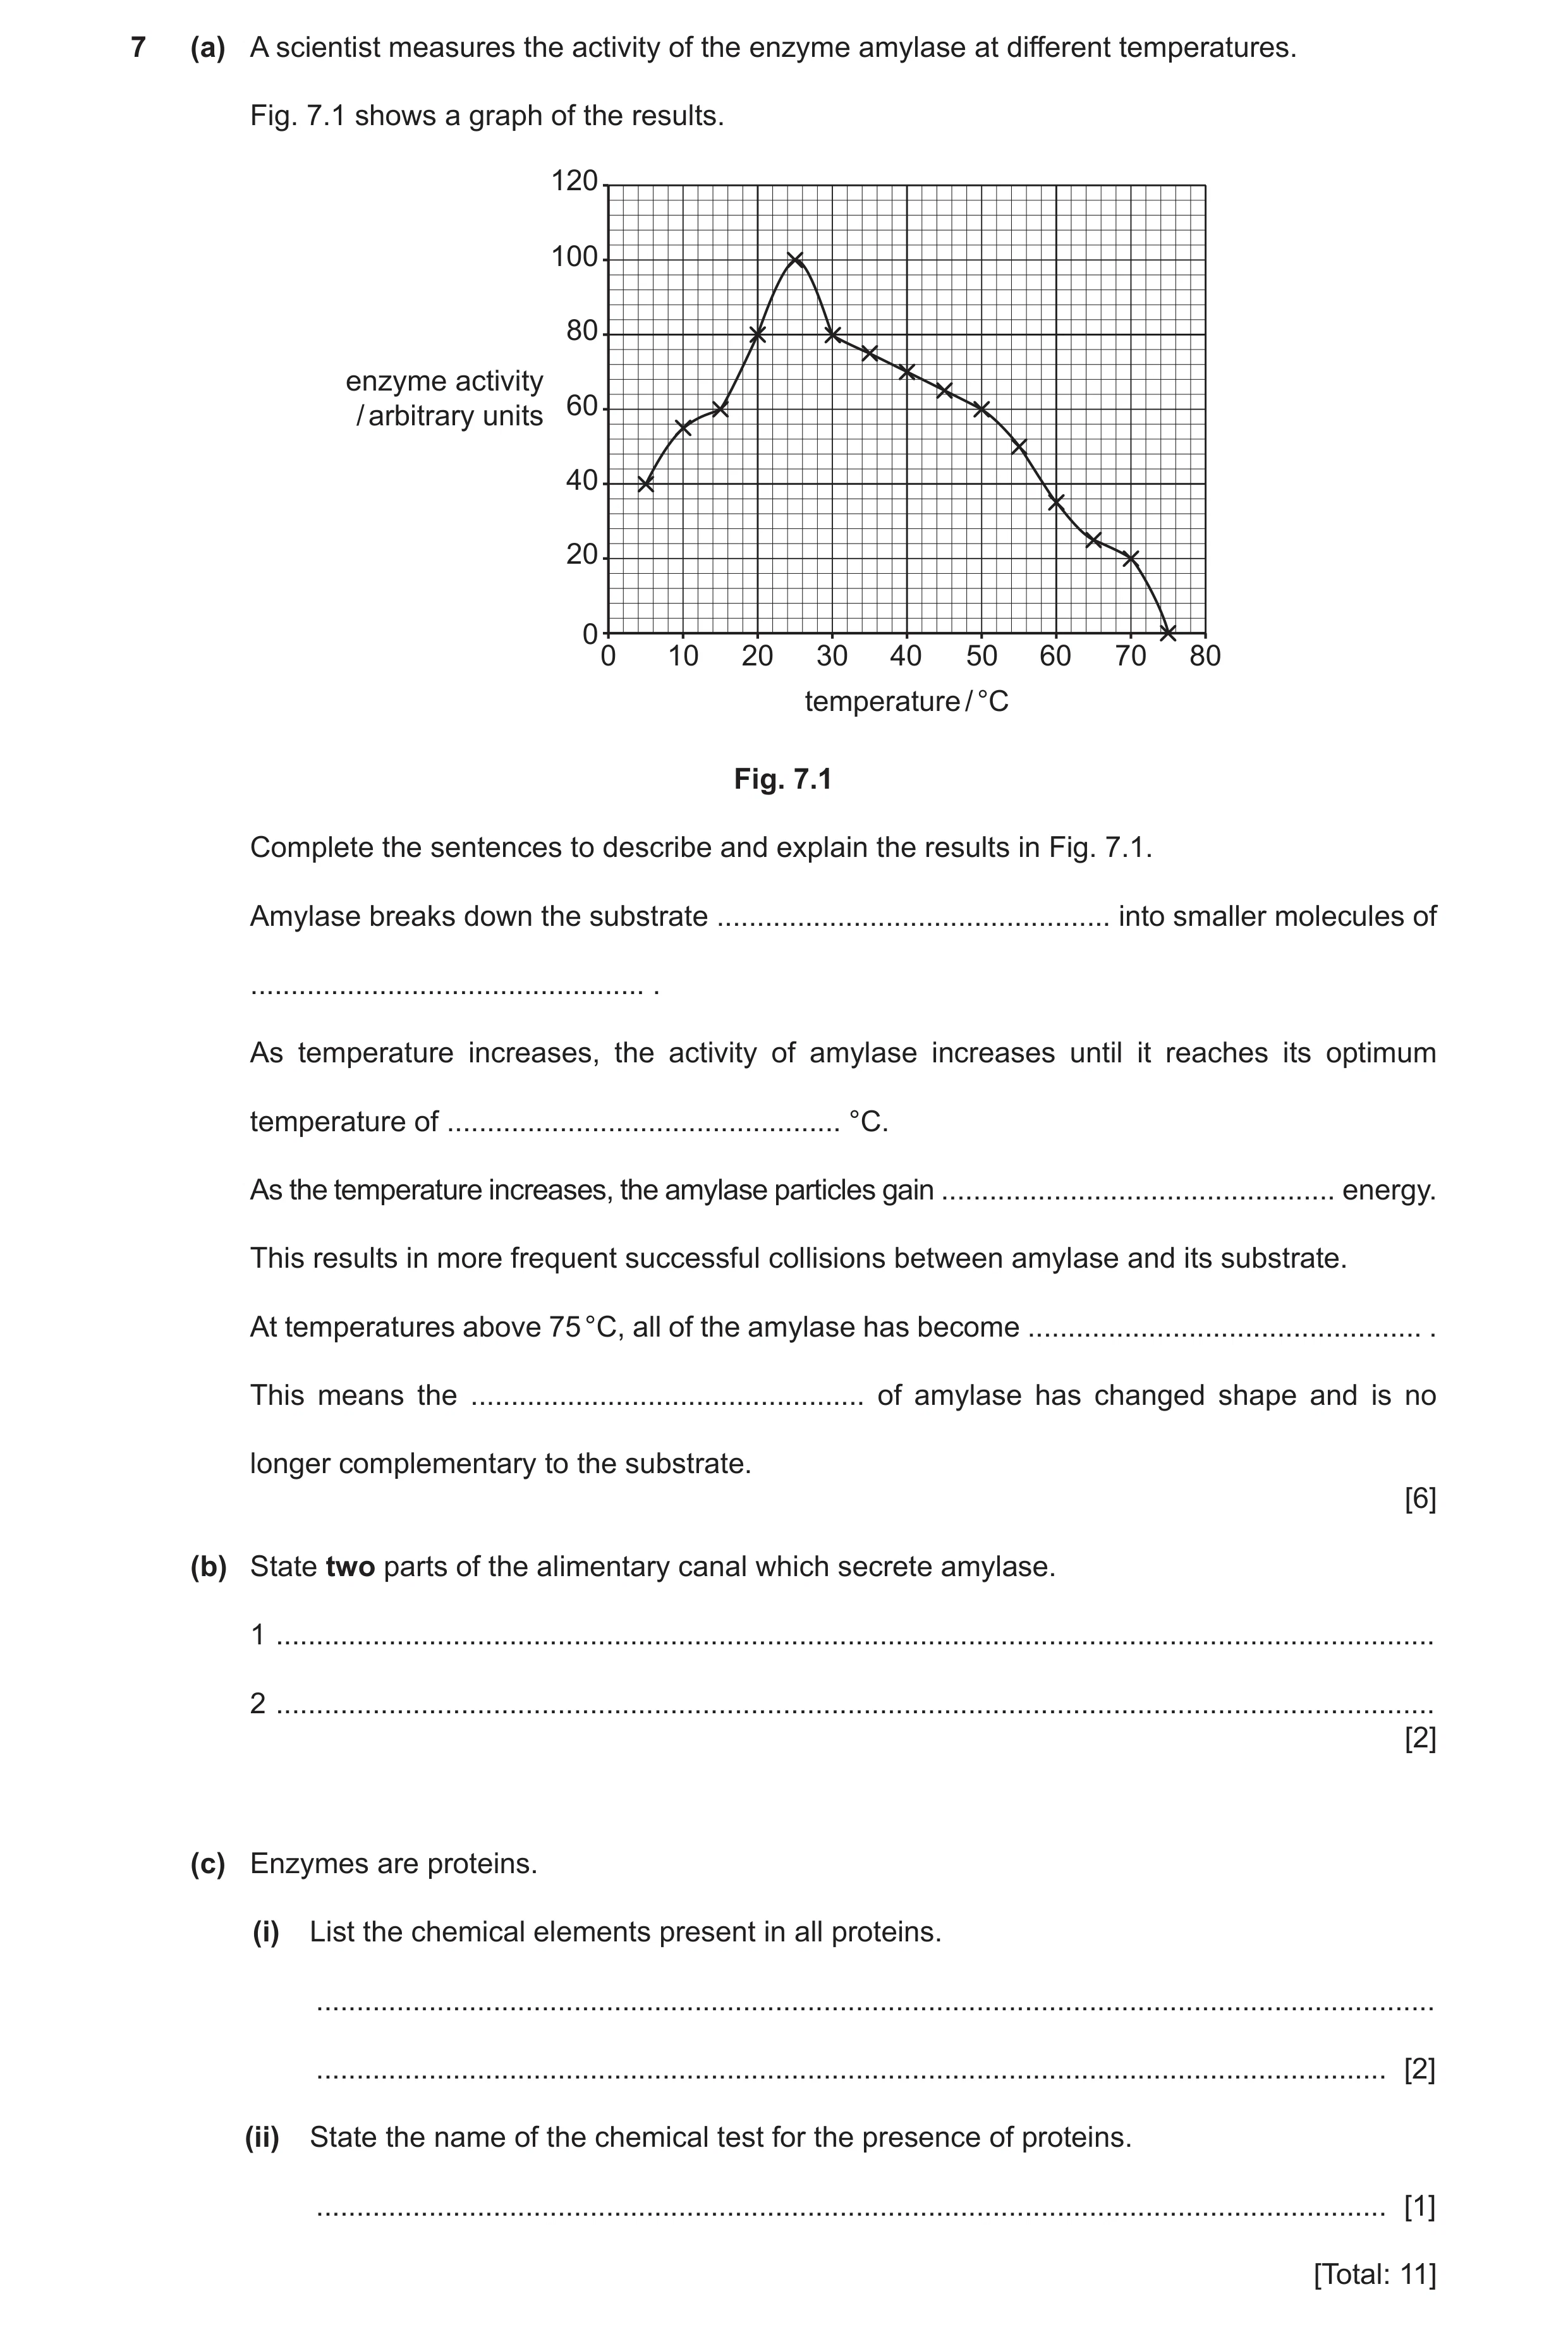
7 (a) A scientist measures the activity of the enzyme amylase at different temperatures. Fig. 7.1 shows a graph of the results. 120 100 80 enzyme activity 60 / arbitrary units 40 20 00 10 20 30 40 50 60 70 80 temperature / °C Fig. 7.1 Complete the sentences to describe and explain the results in Fig. 7.1. Amylase breaks down the substrate … into smaller molecules of … . As temperature increases, the activity of amylase increases until it reaches its optimum temperature of … °C. As the temperature increases, the amylase particles gain … energy. This results in more frequent successful collisions between amylase and its substrate. At temperatures above 75 °C, all of the amylase has become … . This means the … of amylase has changed shape and is no longer complementary to the substrate. [6] (b) State two parts of the alimentary canal which secrete amylase. 1 … 2 … [2] (c) Enzymes are proteins. (i) List the chemical elements present in all proteins. … … [2] (ii) State the name of the chemical test for the presence of proteins. … [1] [Total: 11]
11 marks
Mark scheme: 7(a) starch ; 6 simpler sugars ; 25 ; kinetic ; denatured ; active site ; 7(b) any two from: 2 salivary glands ; pancreas ; small intestine ; 7(c)(i) carbon 2 hydrogen oxygen nitrogen ;; four correct = 2 marks two or three correct = 1 mark 7(c)(ii) biuret ; 1
This question in 0654/41 Oct/Nov 2023
Q13 · Phenylketonuria (PKU) is an inherited disorder controlled by a single gene 0654/42 Feb/March 2024
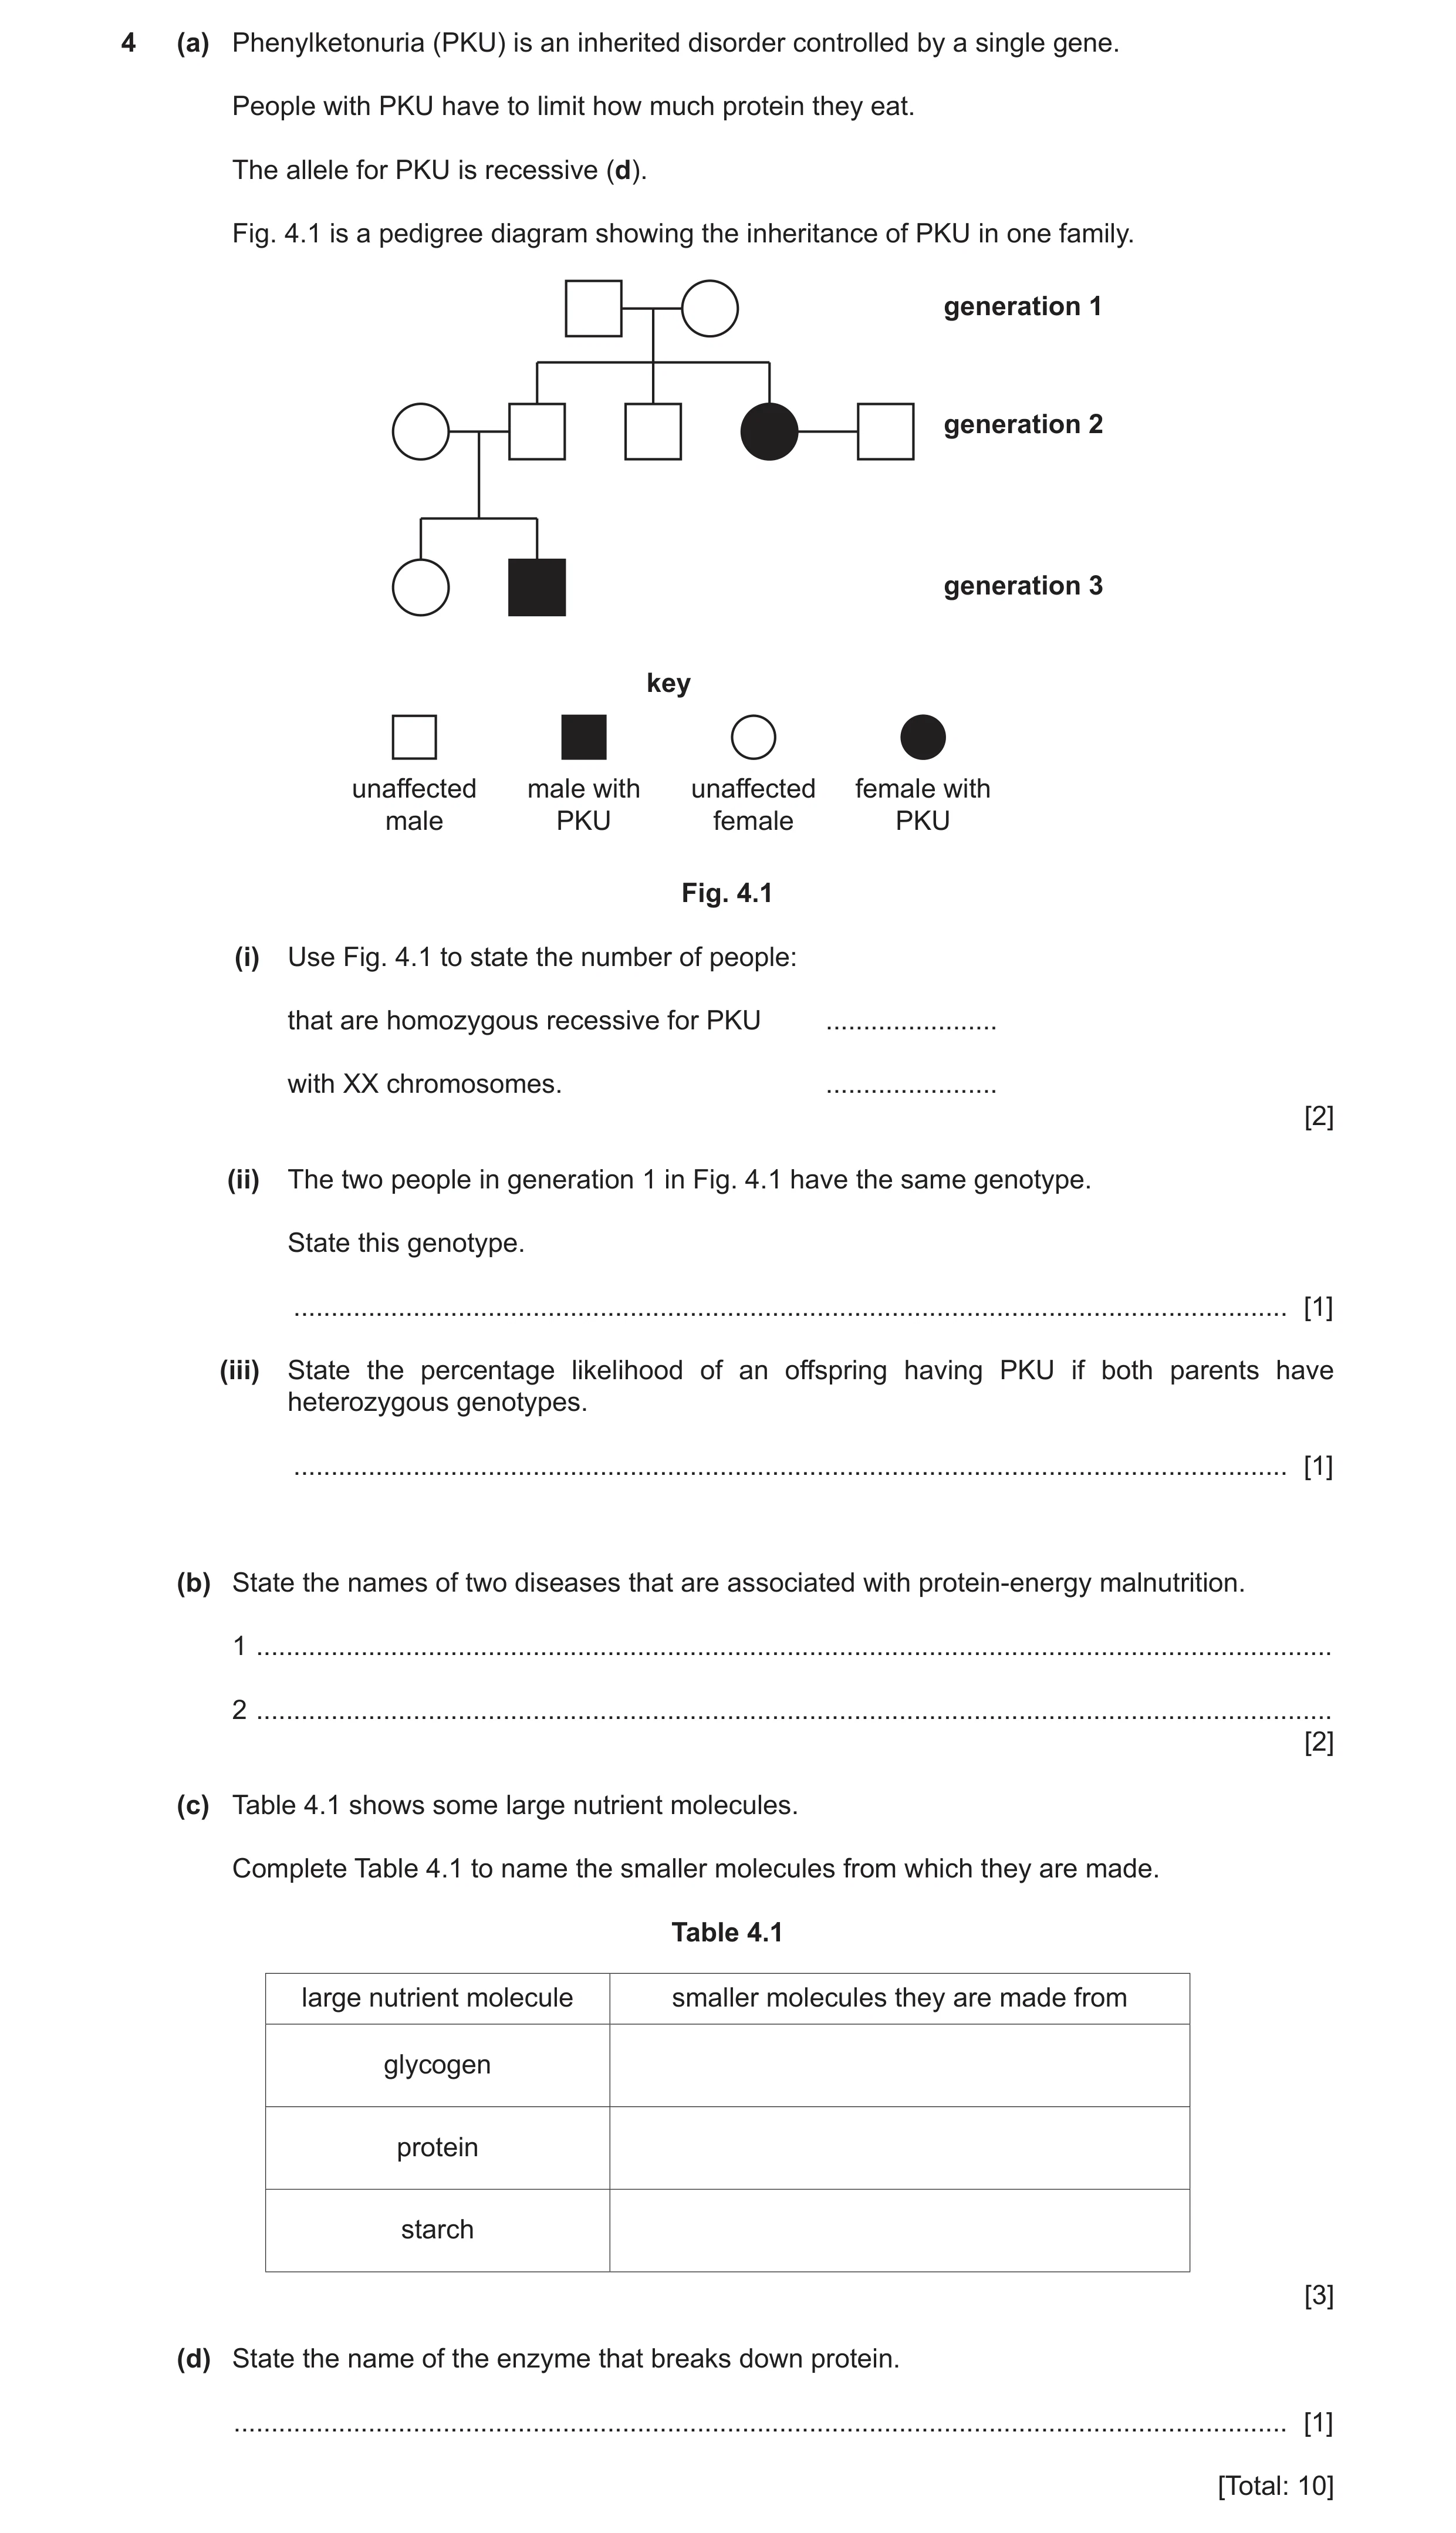
4 (a) Phenylketonuria (PKU) is an inherited disorder controlled by a single gene. People with PKU have to limit how much protein they eat. The allele for PKU is recessive (d). Fig. 4.1 is a pedigree diagram showing the inheritance of PKU in one family. generation 1 generation 2 generation 3 key unaffected male with unaffected female with male PKU female PKU Fig. 4.1 (i) Use Fig. 4.1 to state the number of people: that are homozygous recessive for PKU … with XX chromosomes. … [2] (ii) The two people in generation 1 in Fig. 4.1 have the same genotype. State this genotype. … [1] (iii) State the percentage likelihood of an offspring having PKU if both parents have heterozygous genotypes. … [1] (b) State the names of two diseases that are associated with protein-energy malnutrition. 1 … 2 … [2] (c) Table 4.1 shows some large nutrient molecules. Complete Table 4.1 to name the smaller molecules from which they are made. Table 4.1 large nutrient molecule smaller molecules they are made from glycogen protein starch [3] (d) State the name of the enzyme that breaks down protein. … [1] [Total: 10]
10 marks
Mark scheme: 4(a)(i) 2 ; 2 4 ; 4(a)(ii) Dd ; 1 4(a)(iii) 25 (%) ; 1 4(b) marasmus ; 2 kwashiorkor ; 4(c) glucose ; 3 amino acids ; glucose ; 4(d) protease ; 1
This question in 0654/42 Feb/March 2024
Q14 · A diagram of the alimentary canal and some of the associated organs in humans 0654/43 May/June 2024
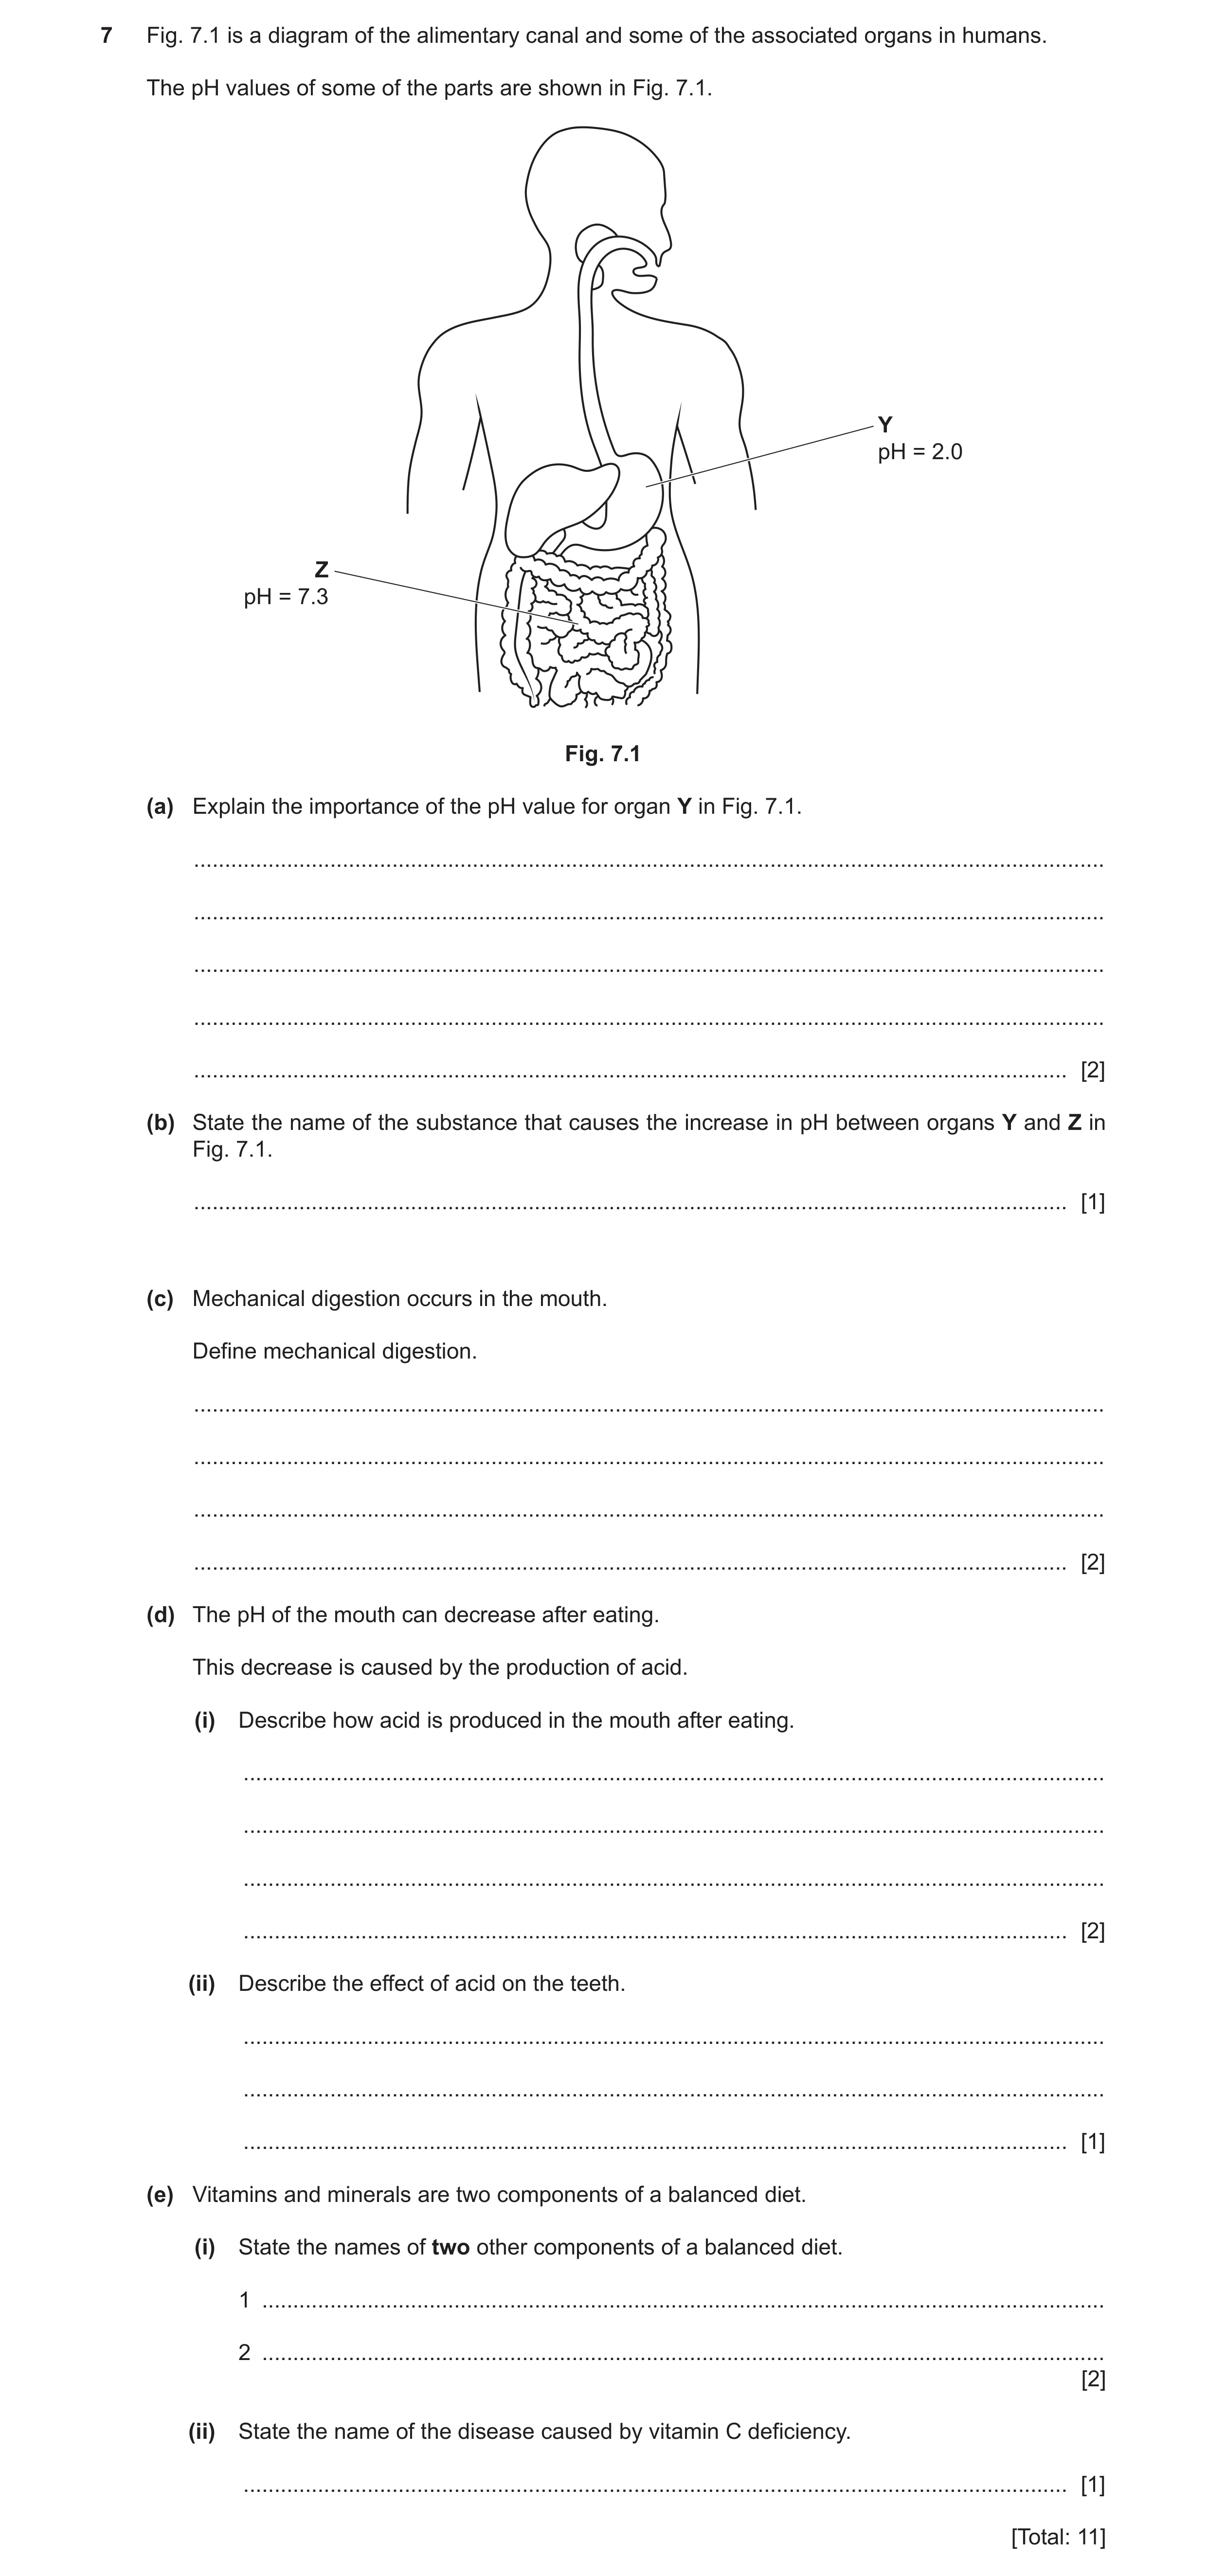
7 Fig. 7.1 is a diagram of the alimentary canal and some of the associated organs in humans. The pH values of some of the parts are shown in Fig. 7.1. Y pH = 2.0 Z pH = 7.3 Fig. 7.1 (a) Explain the importance of the pH value for organ Y in Fig. 7.1. … … … … … [2] (b) State the name of the substance that causes the increase in pH between organs Y and Z in Fig. 7.1. … [1] (c) Mechanical digestion occurs in the mouth. Define mechanical digestion. … … … … [2] (d) The pH of the mouth can decrease after eating. This decrease is caused by the production of acid. (i) Describe how acid is produced in the mouth after eating. … … … … [2] (ii) Describe the effect of acid on the teeth. … … … [1] (e) Vitamins and minerals are two components of a balanced diet. (i) State the names of two other components of a balanced diet. 1 … 2 … [2] (ii) State the name of the disease caused by vitamin C deficiency. … [1] [Total: 11]
11 marks
Mark scheme: 7(a) (acidic environment) kills, bacteria / microorganisms / denatures enzymes in microorganisms or bacteria ; provides, optimum / suitable, pH for protease ; 7(b) bile ; 1 7(c) the breakdown of food into smaller pieces / AW ; without chemical change (to the food molecules) ; 2 7(d)(i) ref to bacteria ; respiring (sugars) ; 2 7(d)(ii) dissolving enamel or dentine / (dental) decay ; 1 7(e)(i) any two from: carbohydrates ; fats ; protein ; fibre ; water ; 2 Question Answer Marks 7(e)(ii) scurvy ; 1
This question in 0654/43 May/June 2024
Q15 · State the balanced symbol equation for photosynthesis 0654/42 Oct/Nov 2024
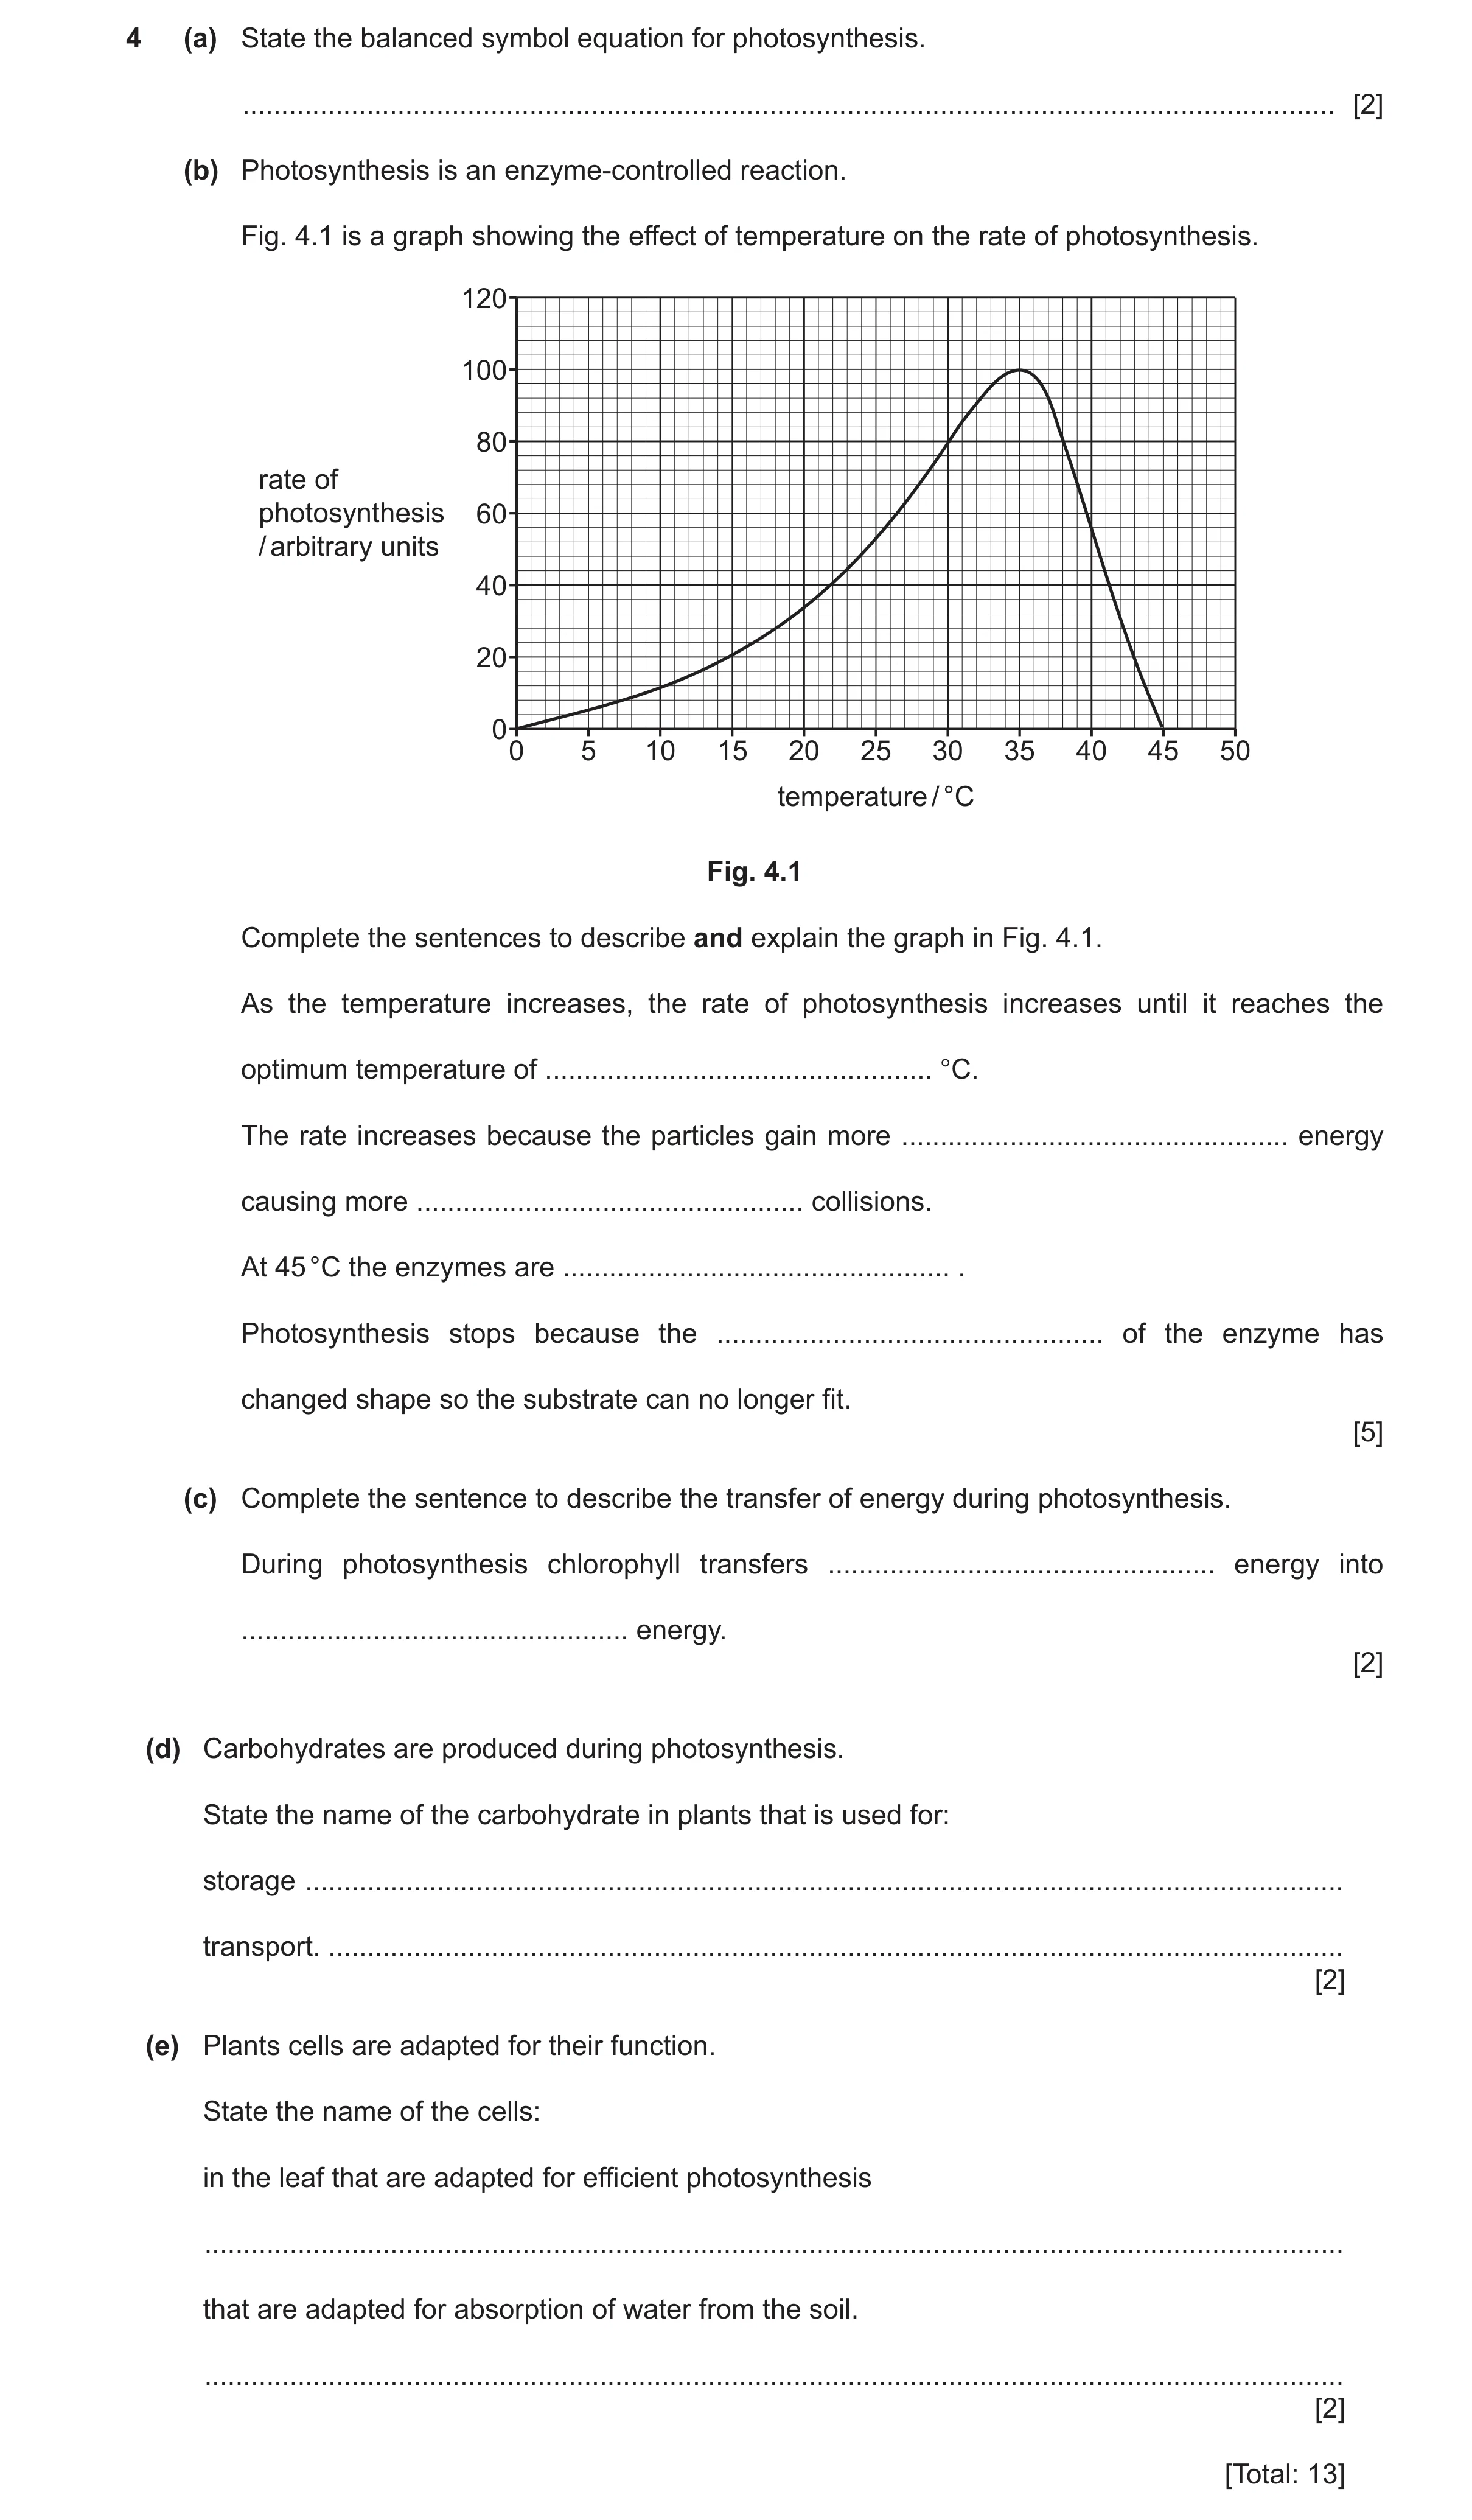
4 (a) State the balanced symbol equation for photosynthesis. … [2] (b) Photosynthesis is an enzyme-controlled reaction. Fig. 4.1 is a graph showing the effect of temperature on the rate of photosynthesis. 120 100 80 rate of photosynthesis 60 / arbitrary units 40 20 00 5 10 15 20 25 30 35 40 45 50 temperature / °C Fig. 4.1 Complete the sentences to describe and explain the graph in Fig. 4.1. As the temperature increases, the rate of photosynthesis increases until it reaches the optimum temperature of … °C. The rate increases because the particles gain more … energy causing more … collisions. At 45 °C the enzymes are … . Photosynthesis stops because the … of the enzyme has changed shape so the substrate can no longer fit. [5] (c) Complete the sentence to describe the transfer of energy during photosynthesis. During photosynthesis chlorophyll transfers … energy into … energy. [2] (d) Carbohydrates are produced during photosynthesis. State the name of the carbohydrate in plants that is used for: storage … transport. … [2] (e) Plants cells are adapted for their function. State the name of the cells: in the leaf that are adapted for efficient photosynthesis … that are adapted for absorption of water from the soil. … [2] [Total: 13]
13 marks
Mark scheme: 4(a) 2 6CO2 + 6H2O → C6H12O6 + 6O2 one mark for correctly balanced reactants (either order) ; one mark for correctly balanced products (either order) ; 4(b) 35 ; 5 kinetic ; successful / effective / frequent ; denatured ; active site ; 4(c) light ; 2 chemical ; 4(d) starch ; 2 sucrose ; 4(e) palisade mesophyll (cell) ; 2 root hair (cell) ;
This question in 0654/42 Oct/Nov 2024
Q16 · Carbon dioxide is taken in for the process of photosynthesis 0654/41 May/June 2025
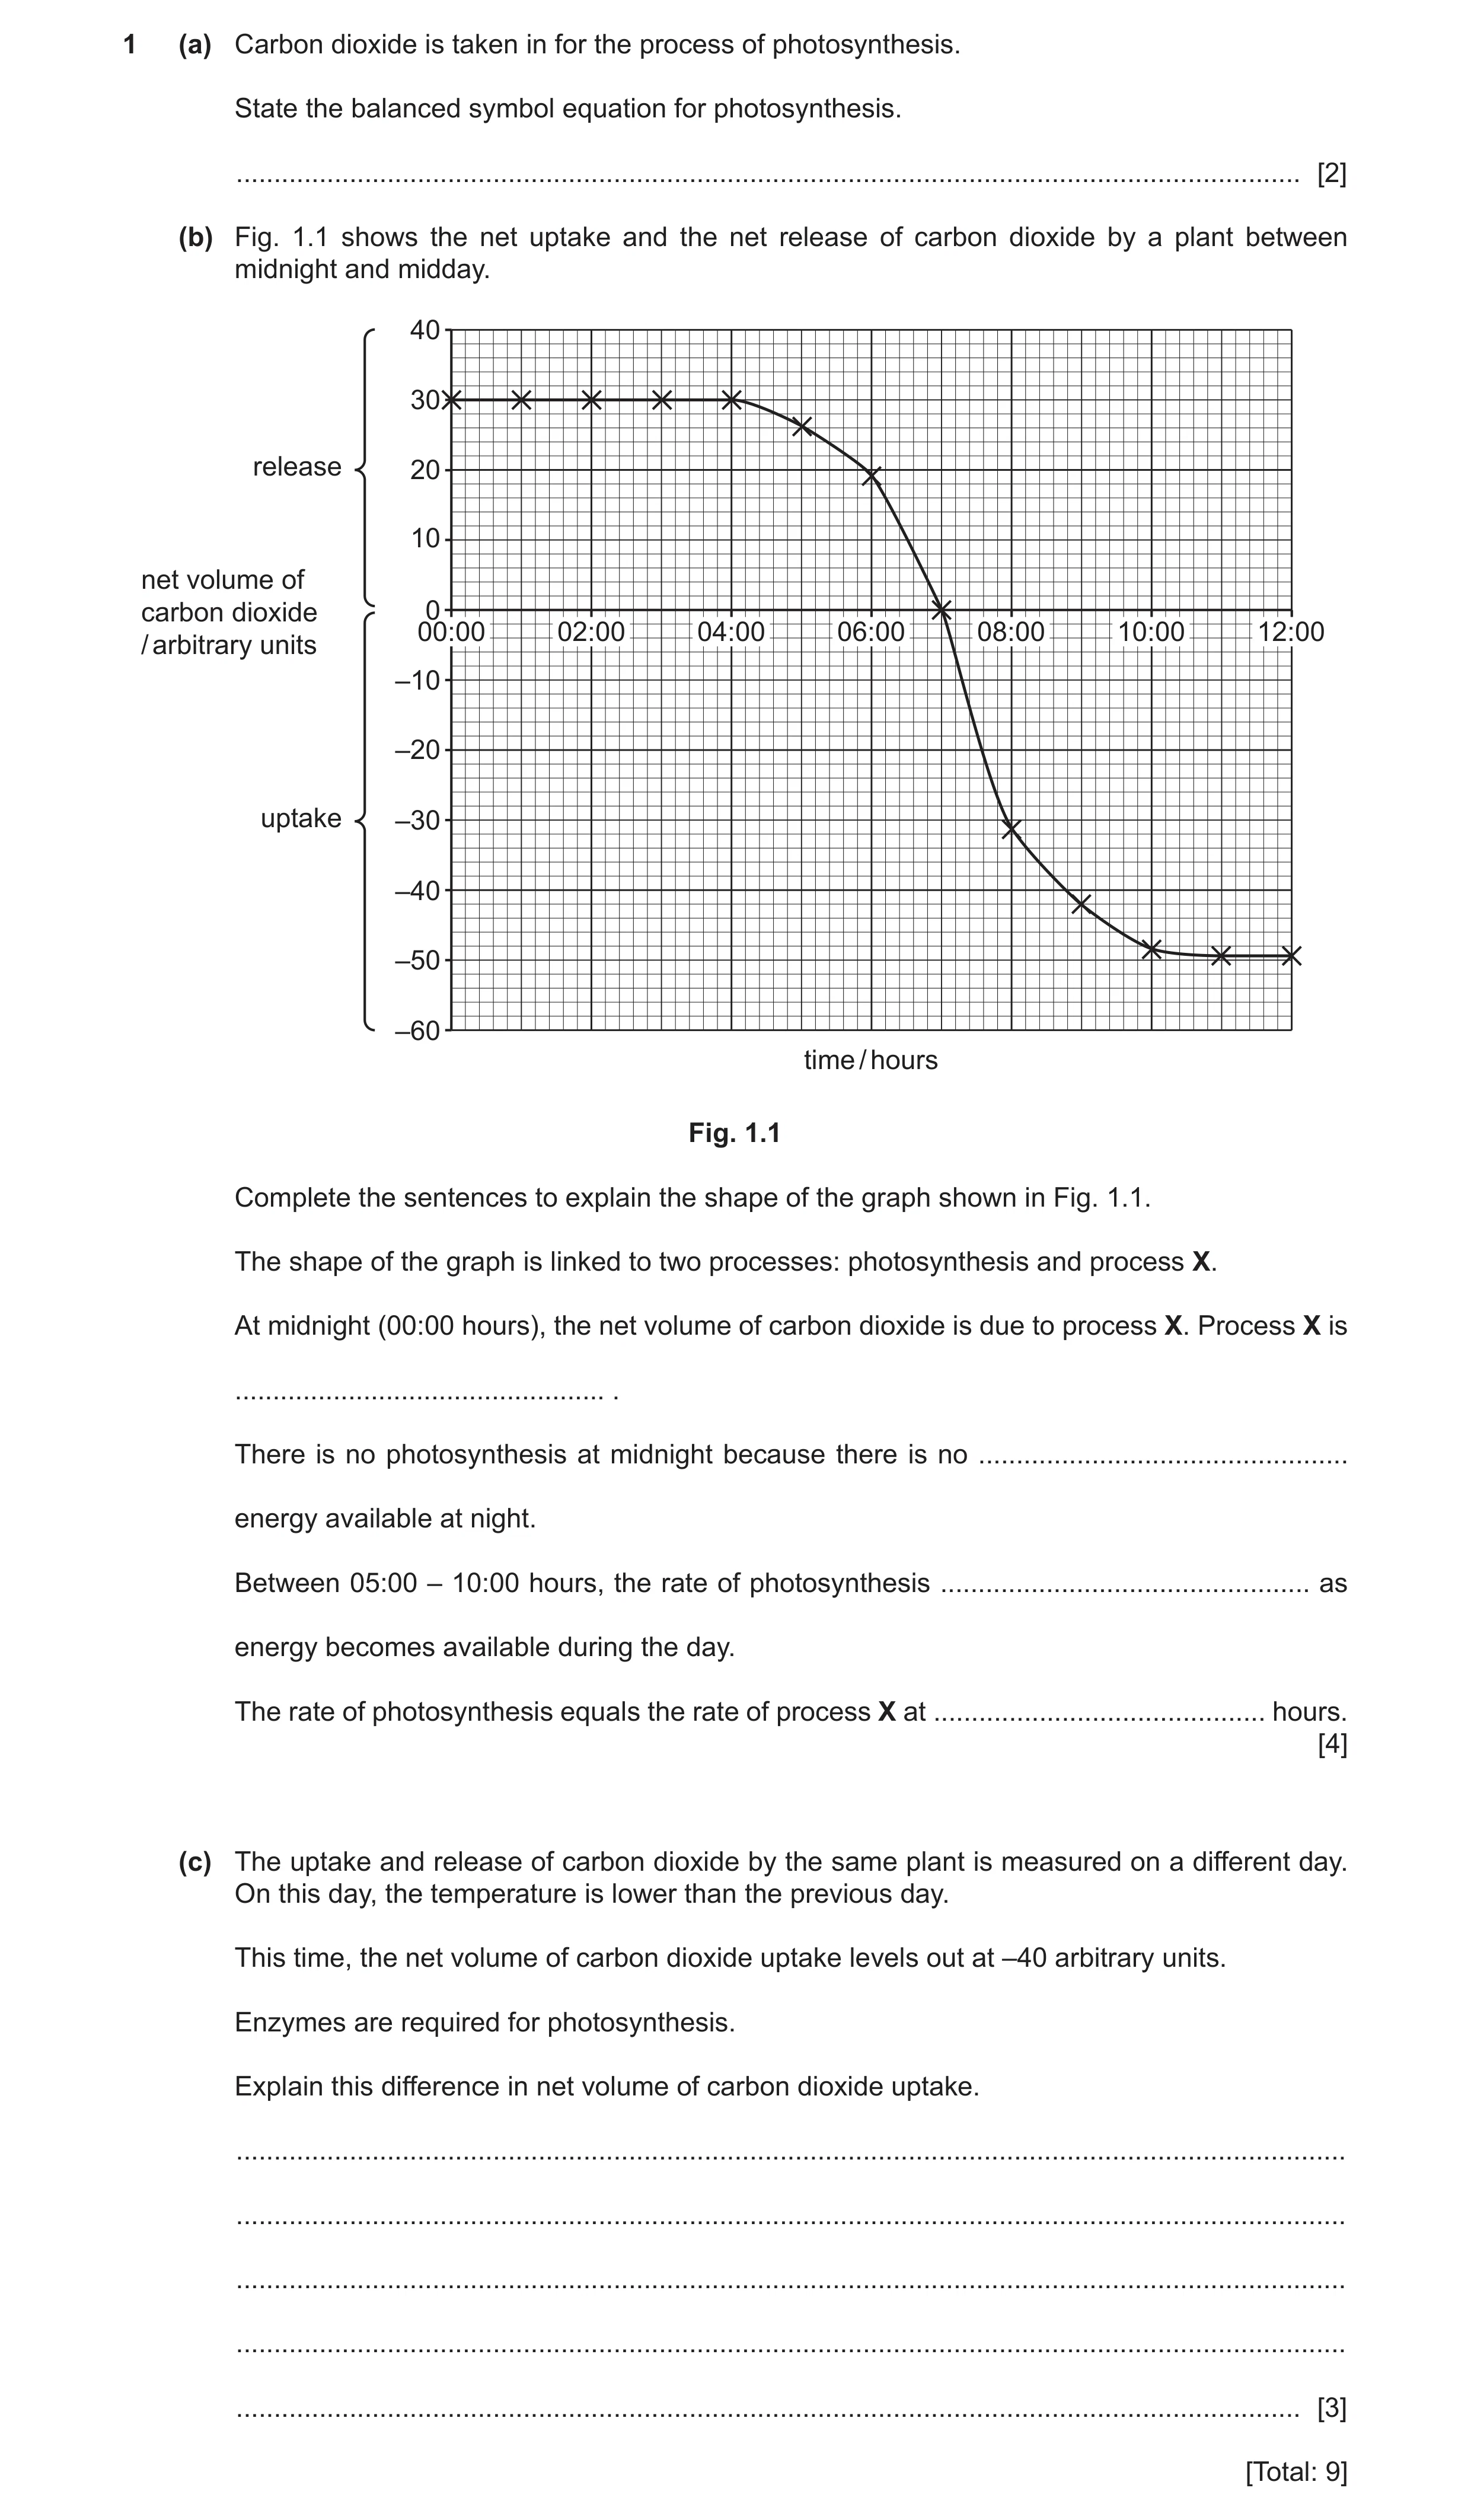
1 (a) Carbon dioxide is taken in for the process of photosynthesis. State the balanced symbol equation for photosynthesis. … [2] (b) Fig. 1.1 shows the net uptake and the net release of carbon dioxide by a plant between midnight and midday. 40 30 release 20 10 net volume of carbon dioxide 0 00:00 02:00 04:00 06:00 08:00 10:00 12:00 / arbitrary units –10 –20 uptake –30 –40 –50 –60 time / hours Fig. 1.1 Complete the sentences to explain the shape of the graph shown in Fig. 1.1. The shape of the graph is linked to two processes: photosynthesis and process X. At midnight (00:00 hours), the net volume of carbon dioxide is due to process X. Process X is … . There is no photosynthesis at midnight because there is no … energy available at night. Between 05:00 – 10:00 hours, the rate of photosynthesis … as energy becomes available during the day. The rate of photosynthesis equals the rate of process X at … hours. [4] (c) The uptake and release of carbon dioxide by the same plant is measured on a different day. On this day, the temperature is lower than the previous day. This time, the net volume of carbon dioxide uptake levels out at –40 arbitrary units. Enzymes are required for photosynthesis. Explain this difference in net volume of carbon dioxide uptake. … … … … … [3] [Total: 9]
9 marks
Mark scheme: Question Answer Marks 1(a) 6CO2 + 6H2O → 6O2 + C6H12O6 ; ; 2 1(b) respiration ; 4 light ; increases ; 07:00 ; 1(c) (less uptake of carbon dioxide because) slower rate of photosynthesis / photosynthesis limited by temperature ; 3 less kinetic energy / not enough KE ; lower frequency of / fewer effective / successful collisions (between enzyme and substrate) ;
This question in 0654/41 May/June 2025
Q17 · A diagram of a germinating bean seed 0654/43 May/June 2025
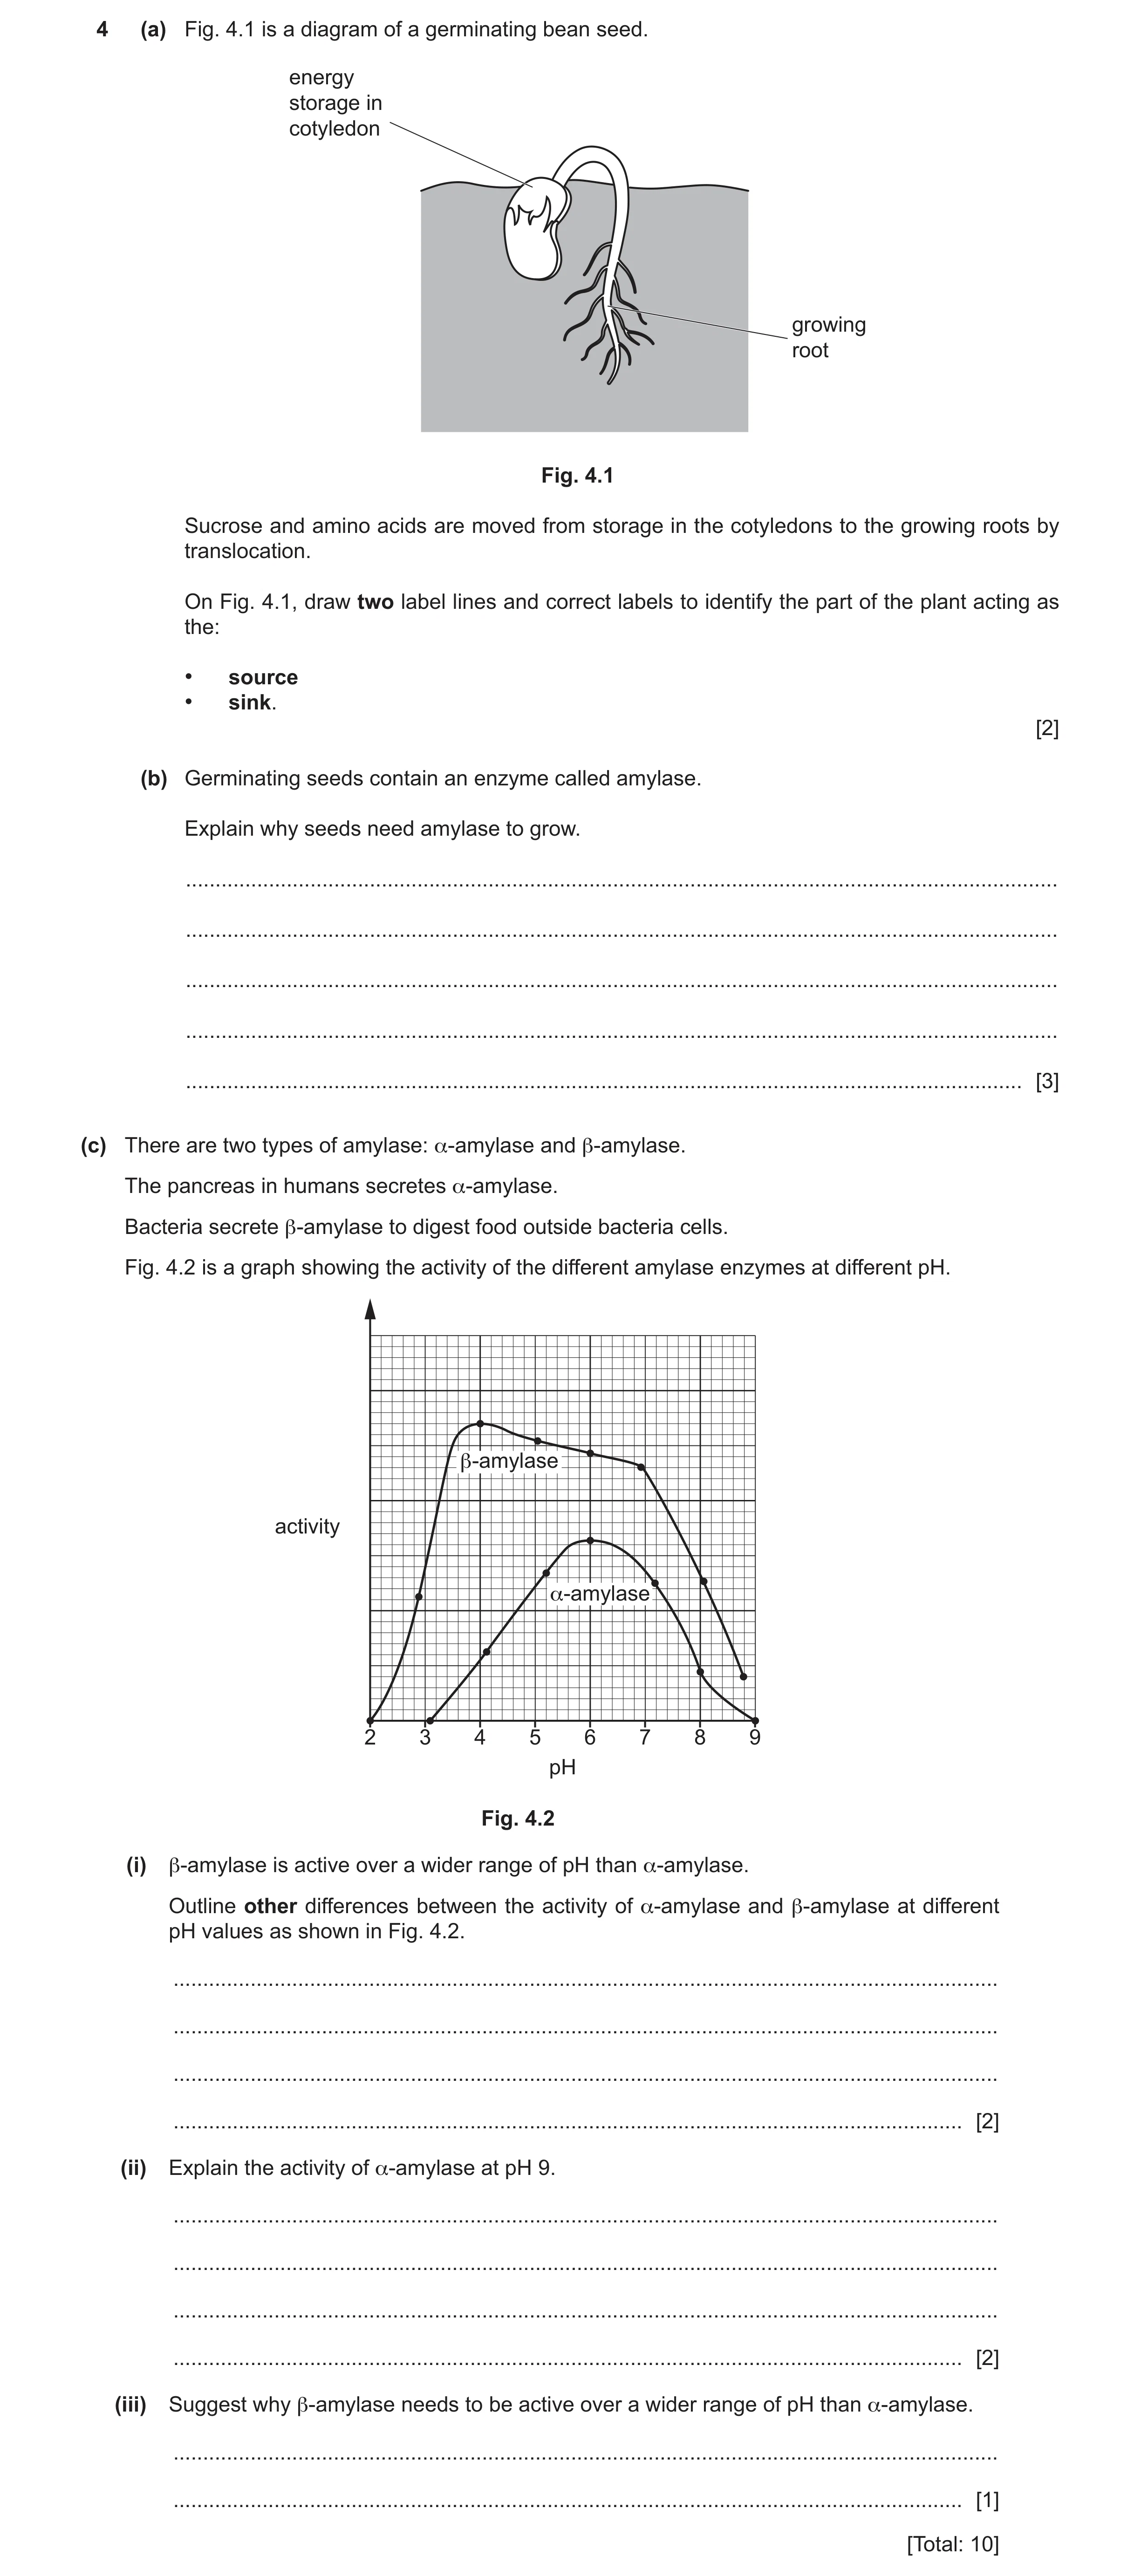
4 (a) Fig. 4.1 is a diagram of a germinating bean seed. energy storage in cotyledon growing root Fig. 4.1 Sucrose and amino acids are moved from storage in the cotyledons to the growing roots by translocation. On Fig. 4.1, draw two label lines and correct labels to identify the part of the plant acting as the: • source • sink. [2] (b) Germinating seeds contain an enzyme called amylase. Explain why seeds need amylase to grow. … … … … … [3] (c) There are two types of amylase: α-amylase and β-amylase. The pancreas in humans secretes α-amylase. Bacteria secrete β-amylase to digest food outside bacteria cells. Fig. 4.2 is a graph showing the activity of the different amylase enzymes at different pH. β-amylase activity α-amylase 2 3 4 5 6 7 8 9 pH Fig. 4.2 (i) β-amylase is active over a wider range of pH than α-amylase. Outline other differences between the activity of α-amylase and β-amylase at different pH values as shown in Fig. 4.2. … … … … [2] (ii) Explain the activity of α-amylase at pH 9. … … … … [2] (iii) Suggest why β-amylase needs to be active over a wider range of pH than α-amylase. … … [1] [Total: 10]
10 marks
Mark scheme: 4(a) 2 source sink source label to the cotyledons; sink label to the roots; 4(b) any three from 3 starch (in seeds) is energy store; starch is a large molecule (so cannot be transported); amylase breaks down starch to (simple reducing) sugars; (sugars) used in respiration; energy needed (for growth of plant); 4(c)(i) two comparative differences;; 2 4(c)(ii) enzyme is denatured; 2 active site no longer complementary to substrate / starch; 4(c)(iii) idea that in cells / small intestine, pH value stays the same but outside cells it, varies / changes; 1
This question in 0654/43 May/June 2025
 1 / 25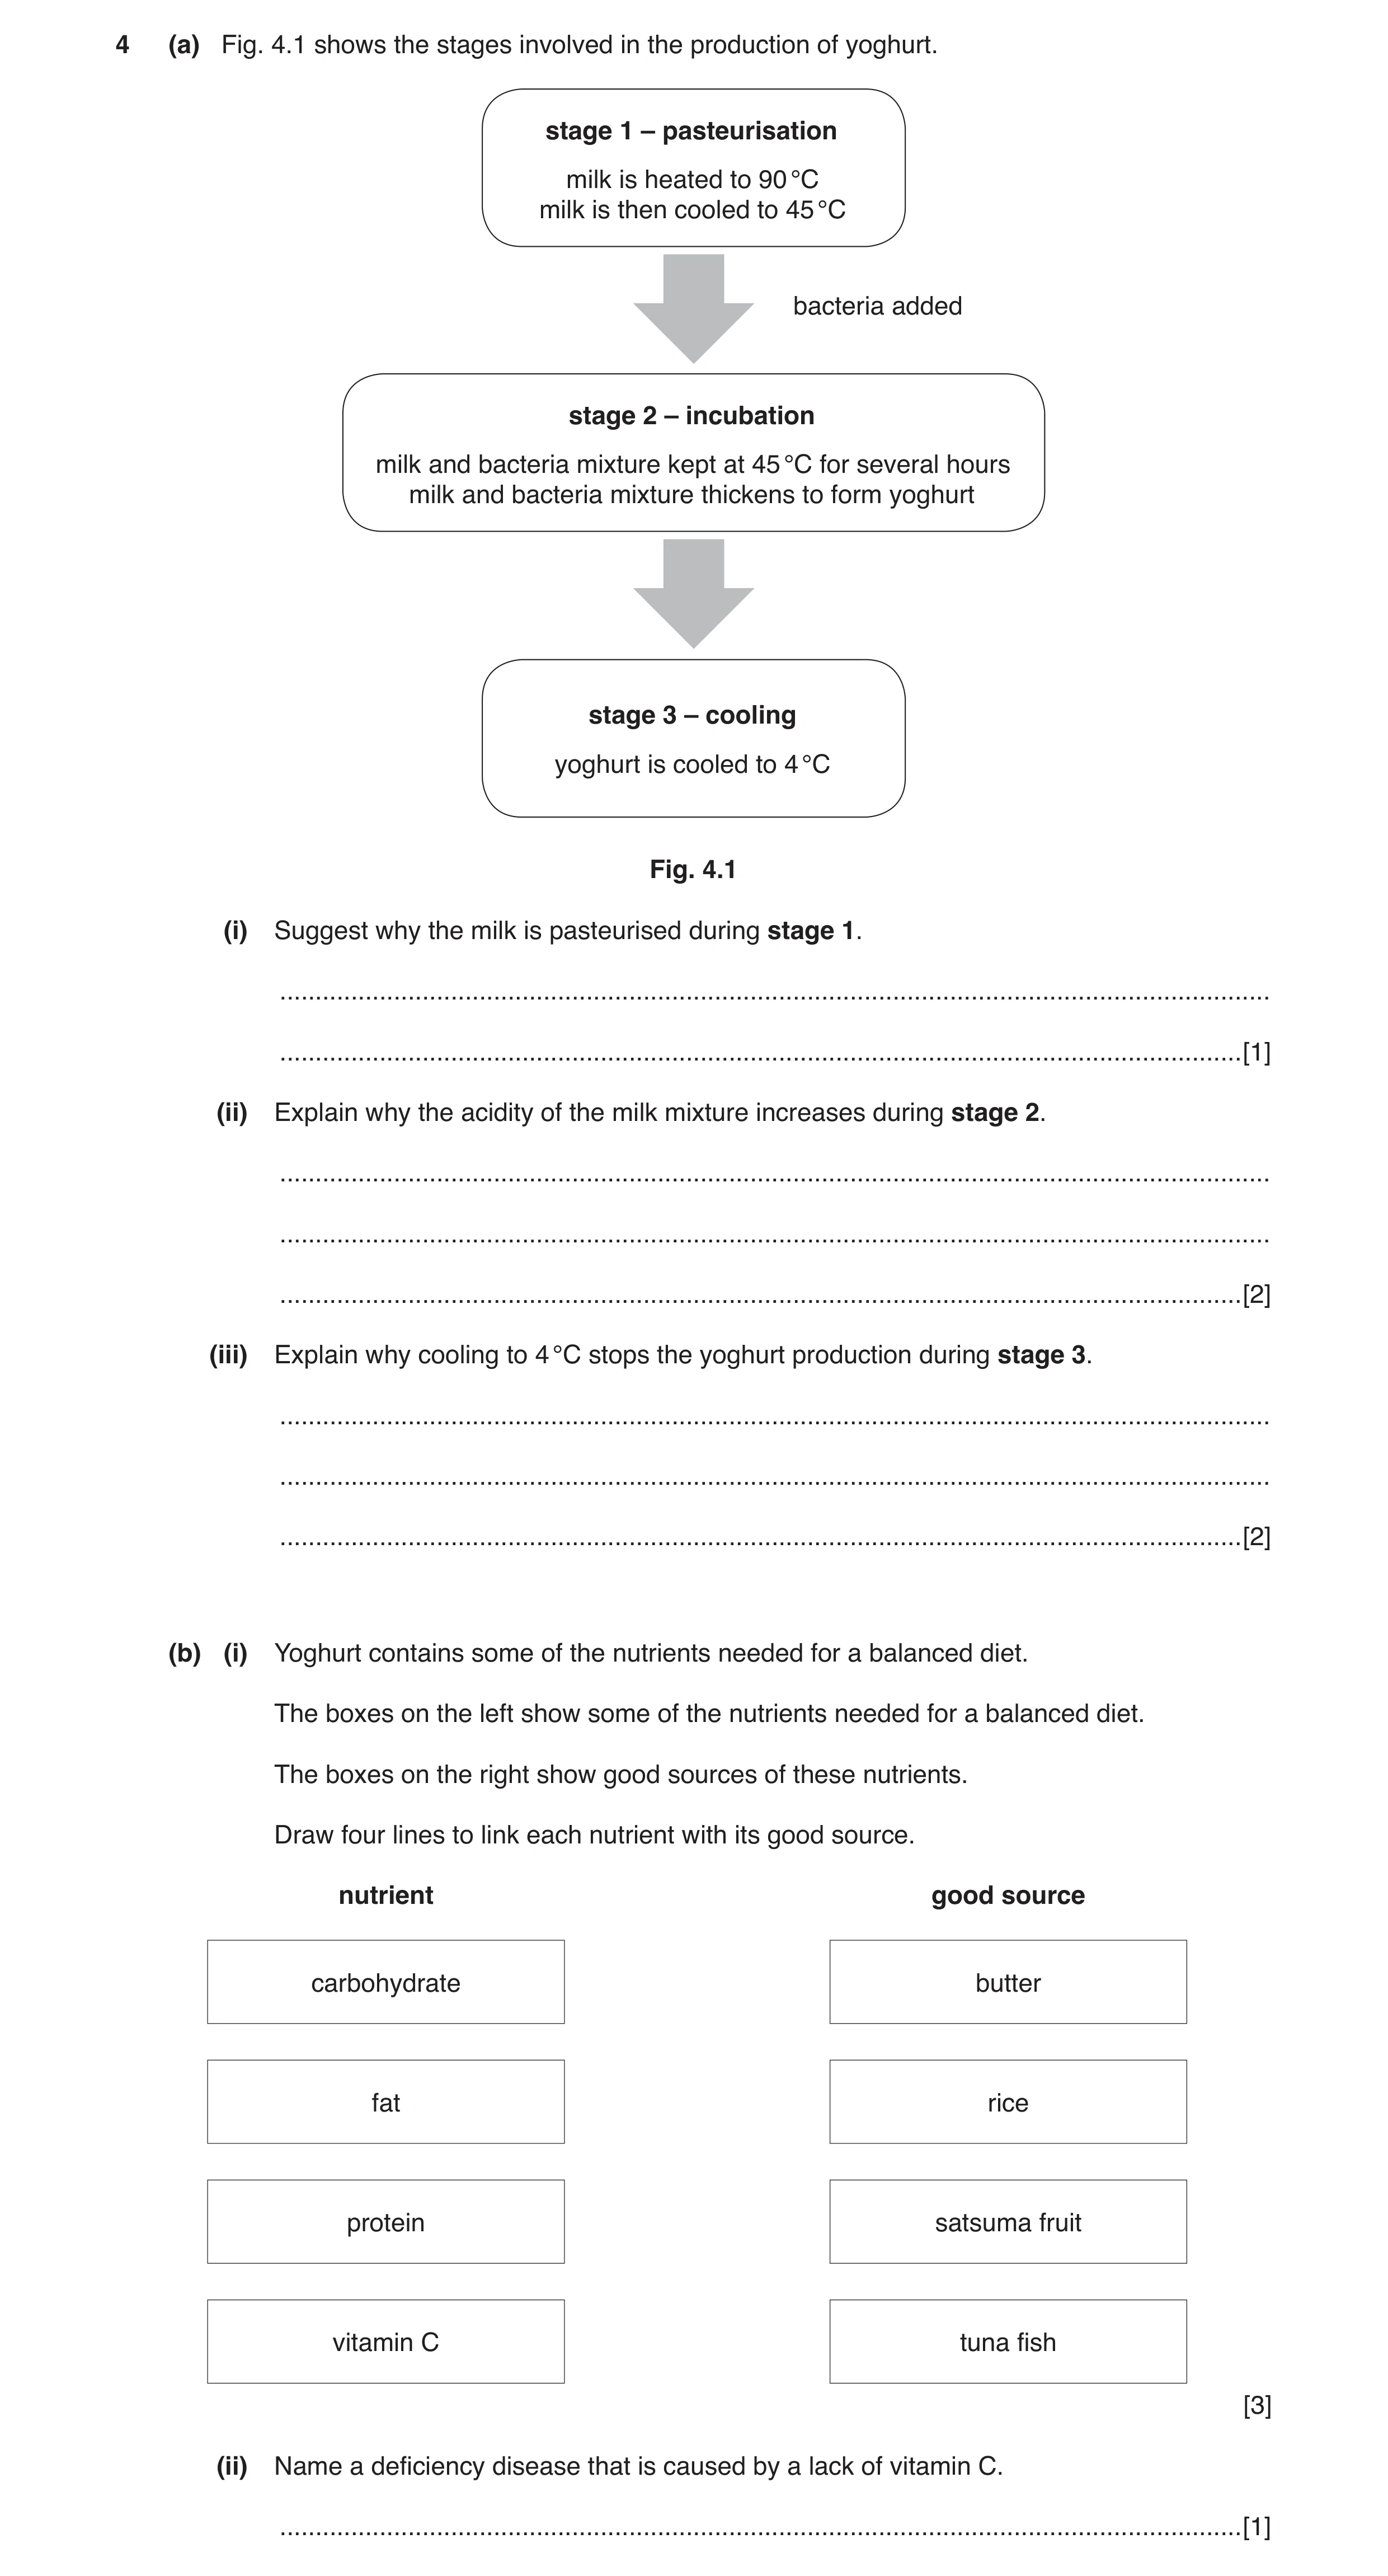
 4 / 25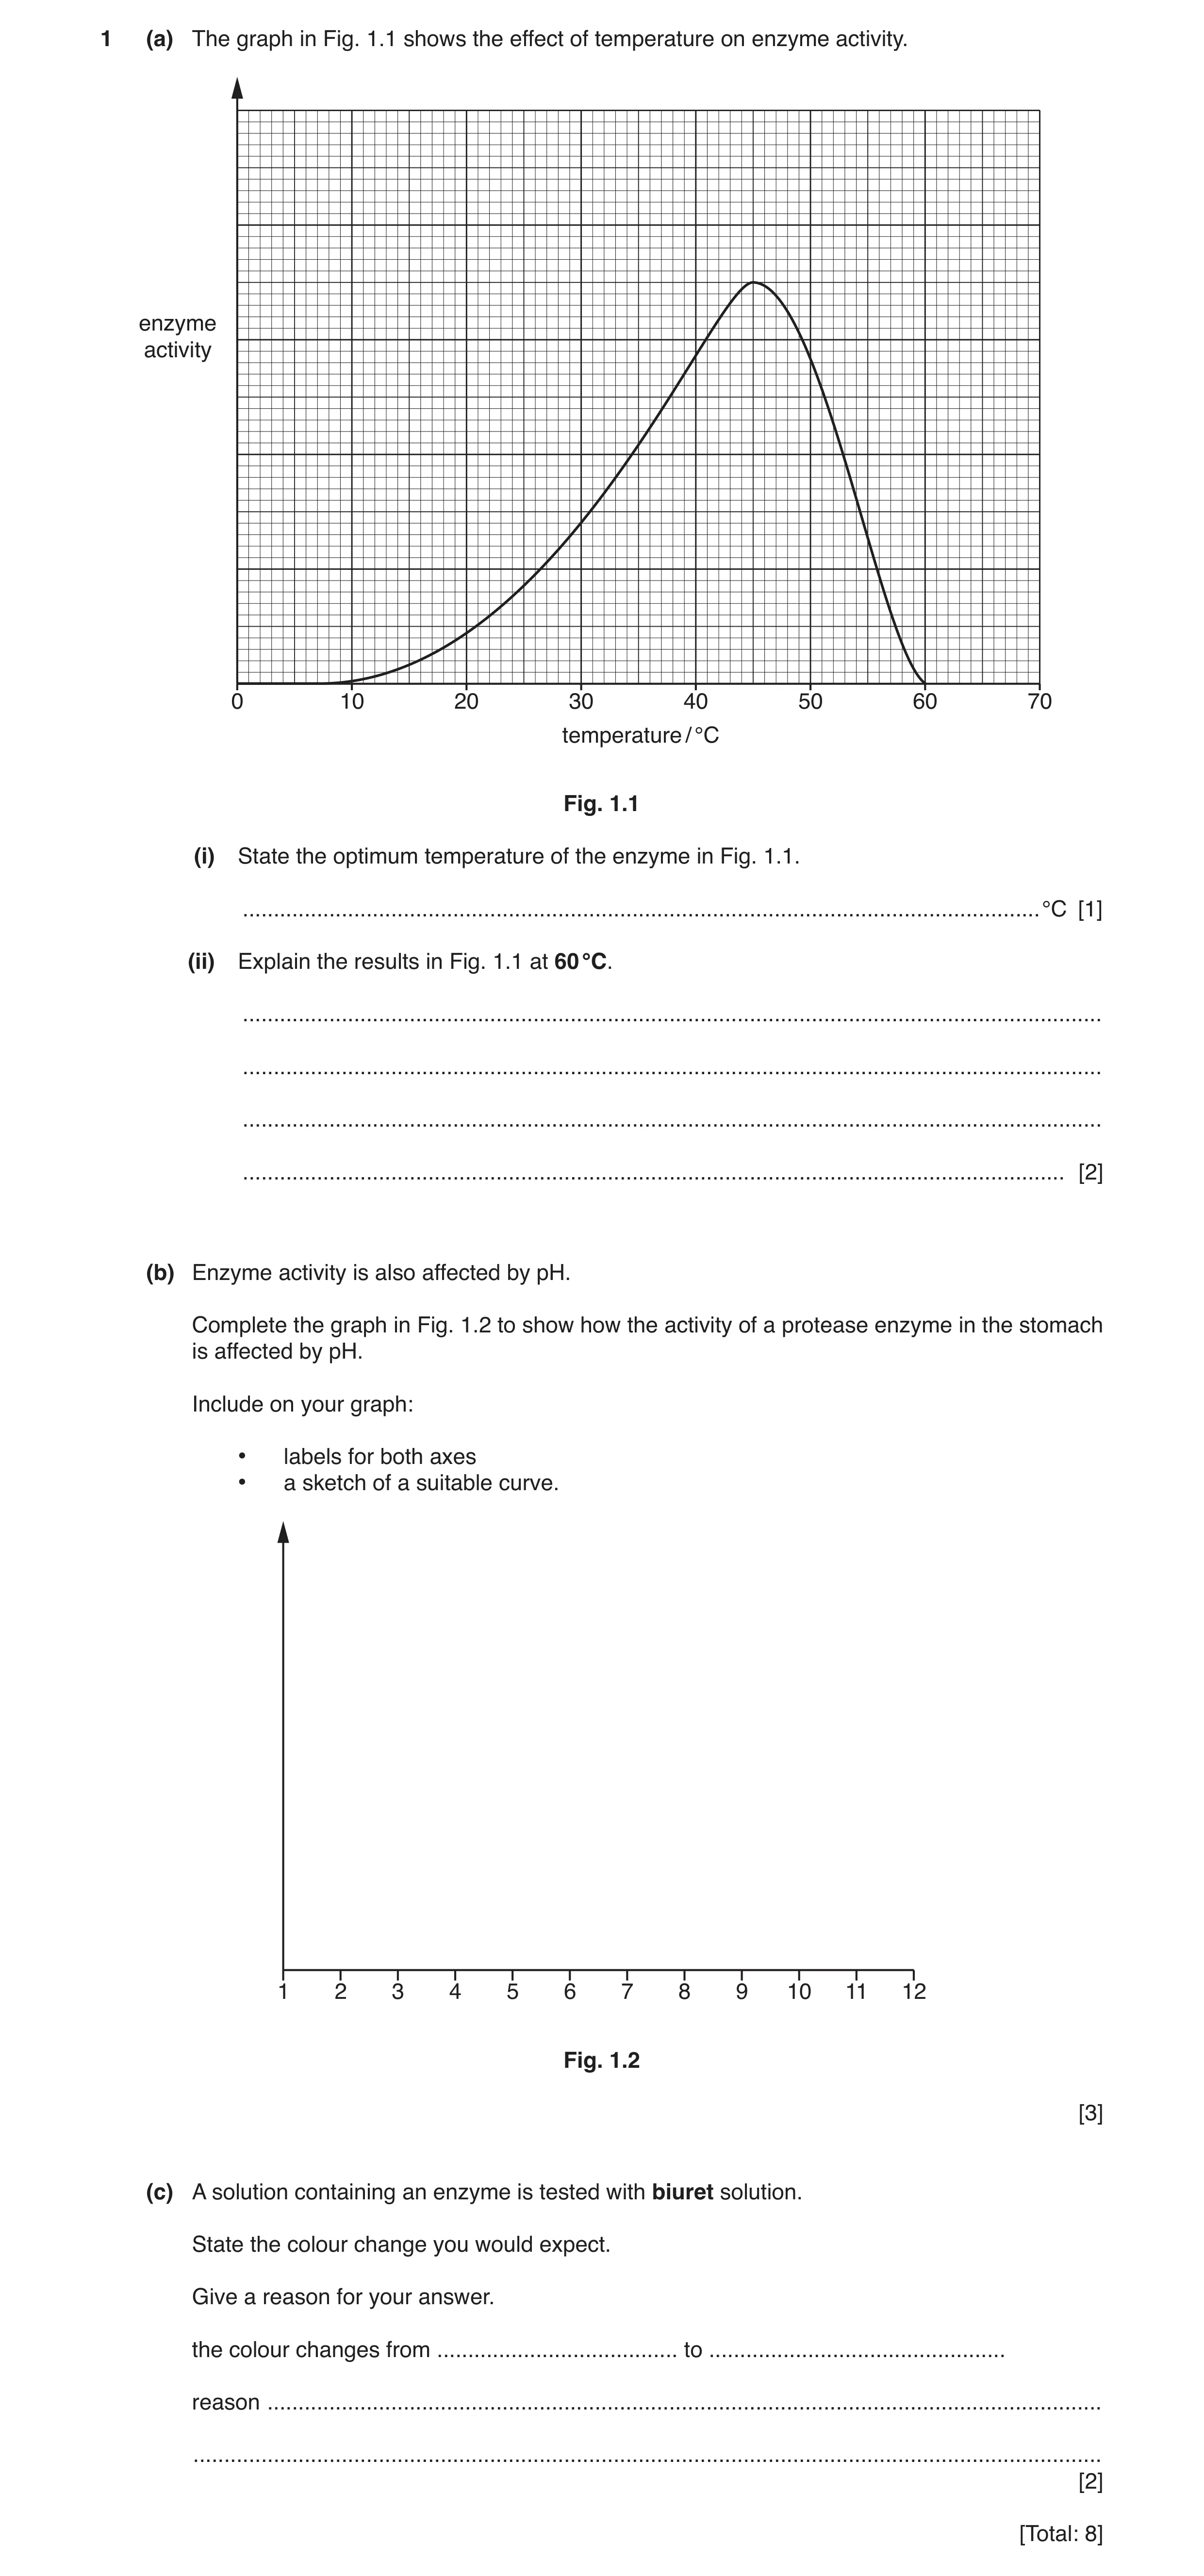
 8
8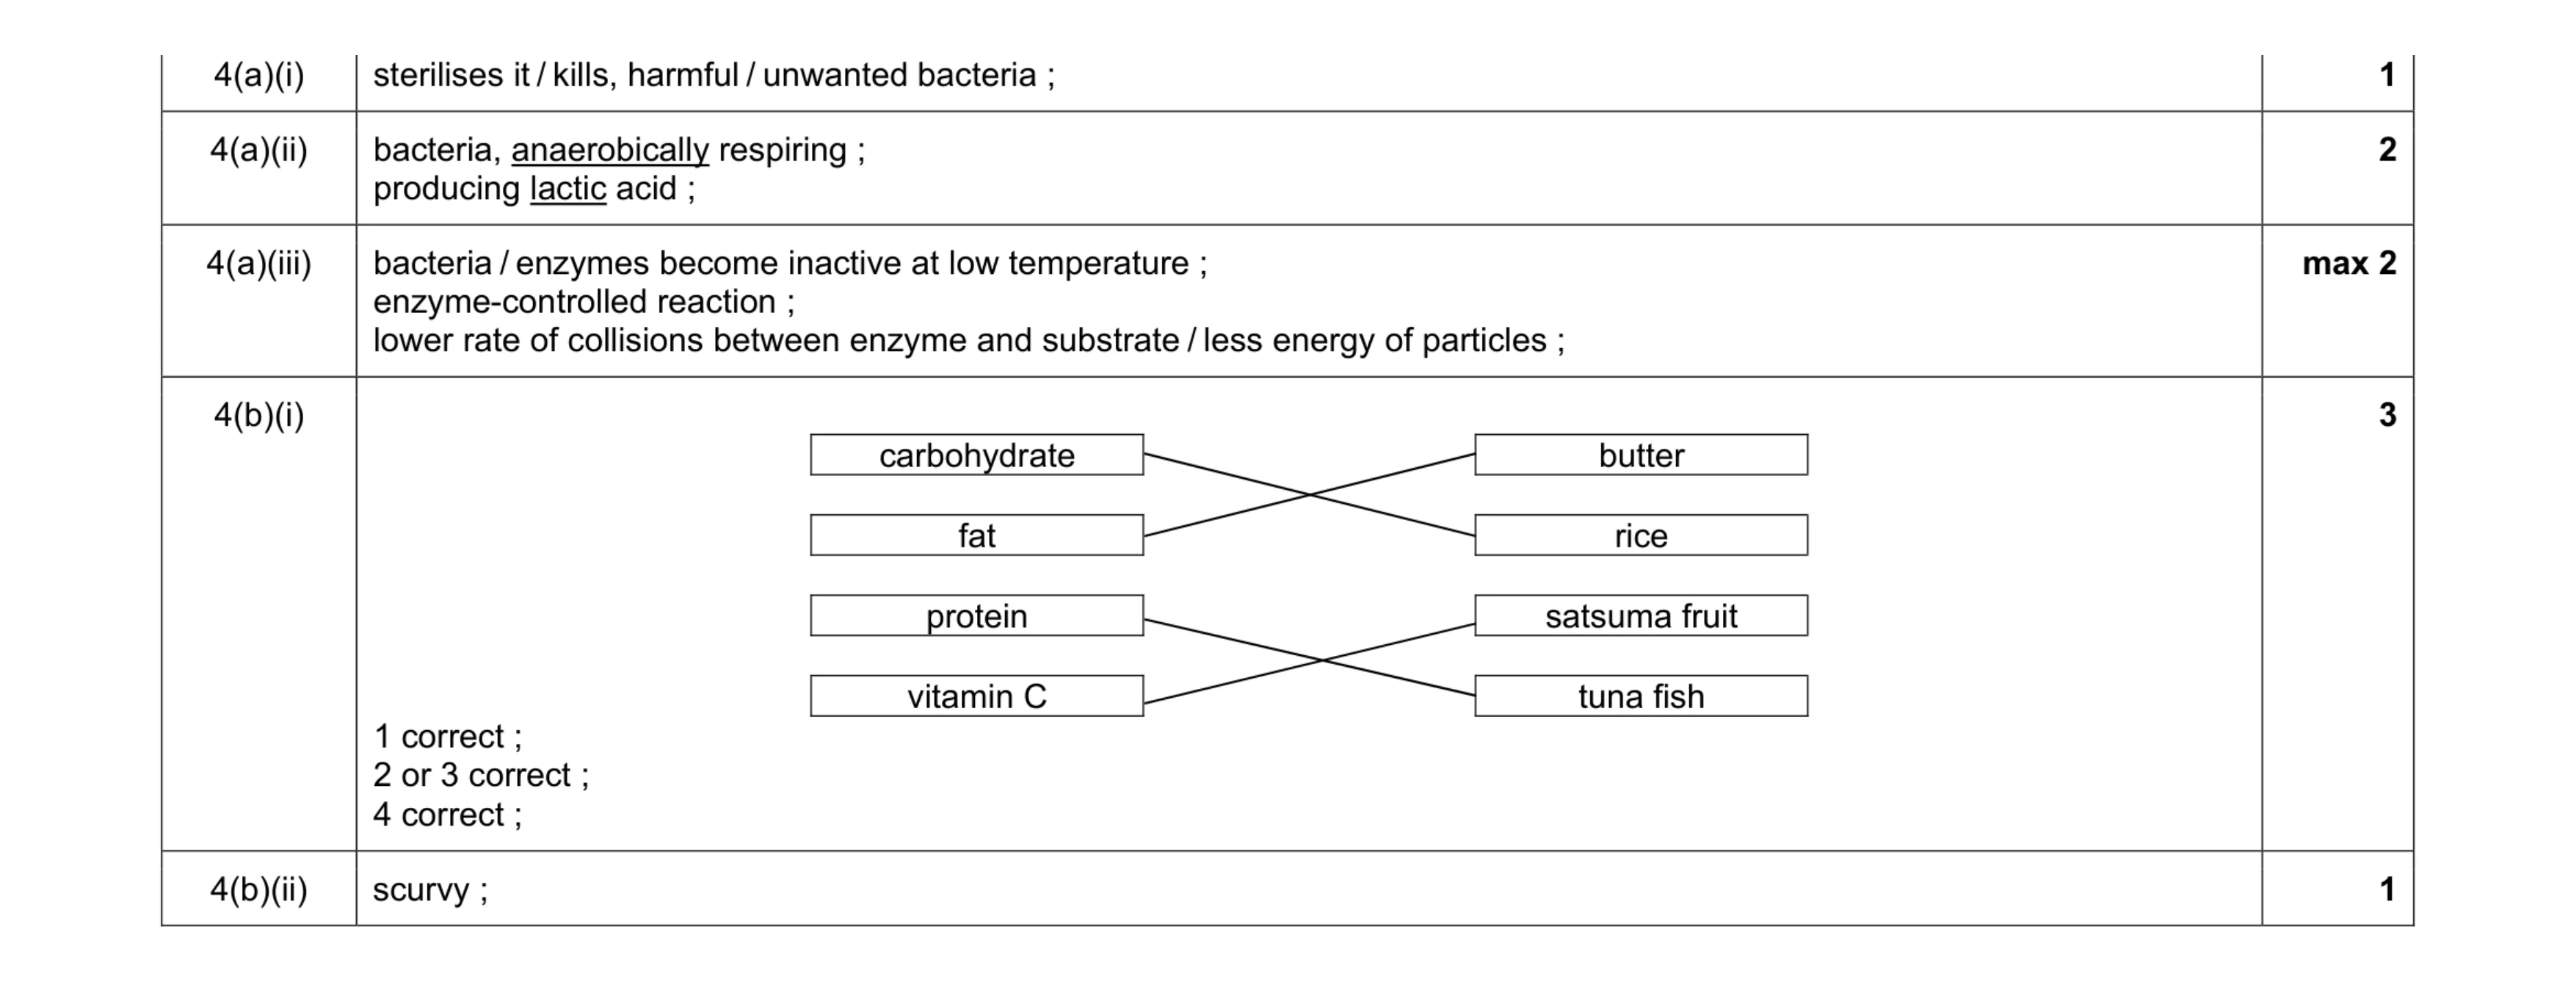 9
9 6
6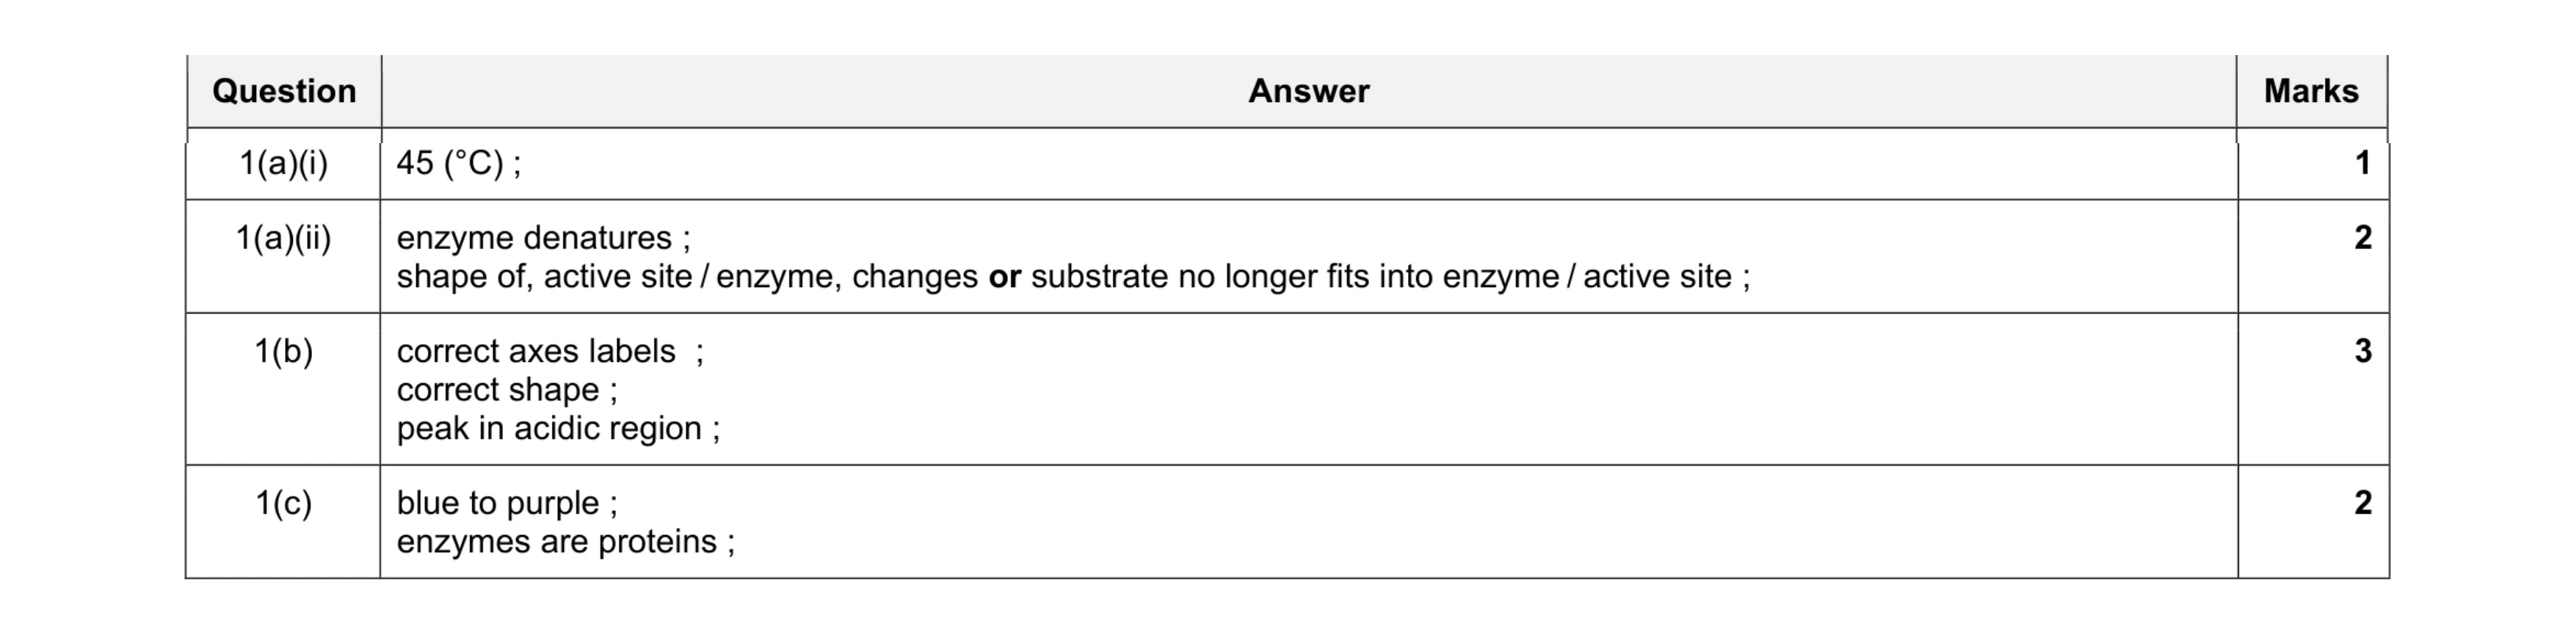 8
8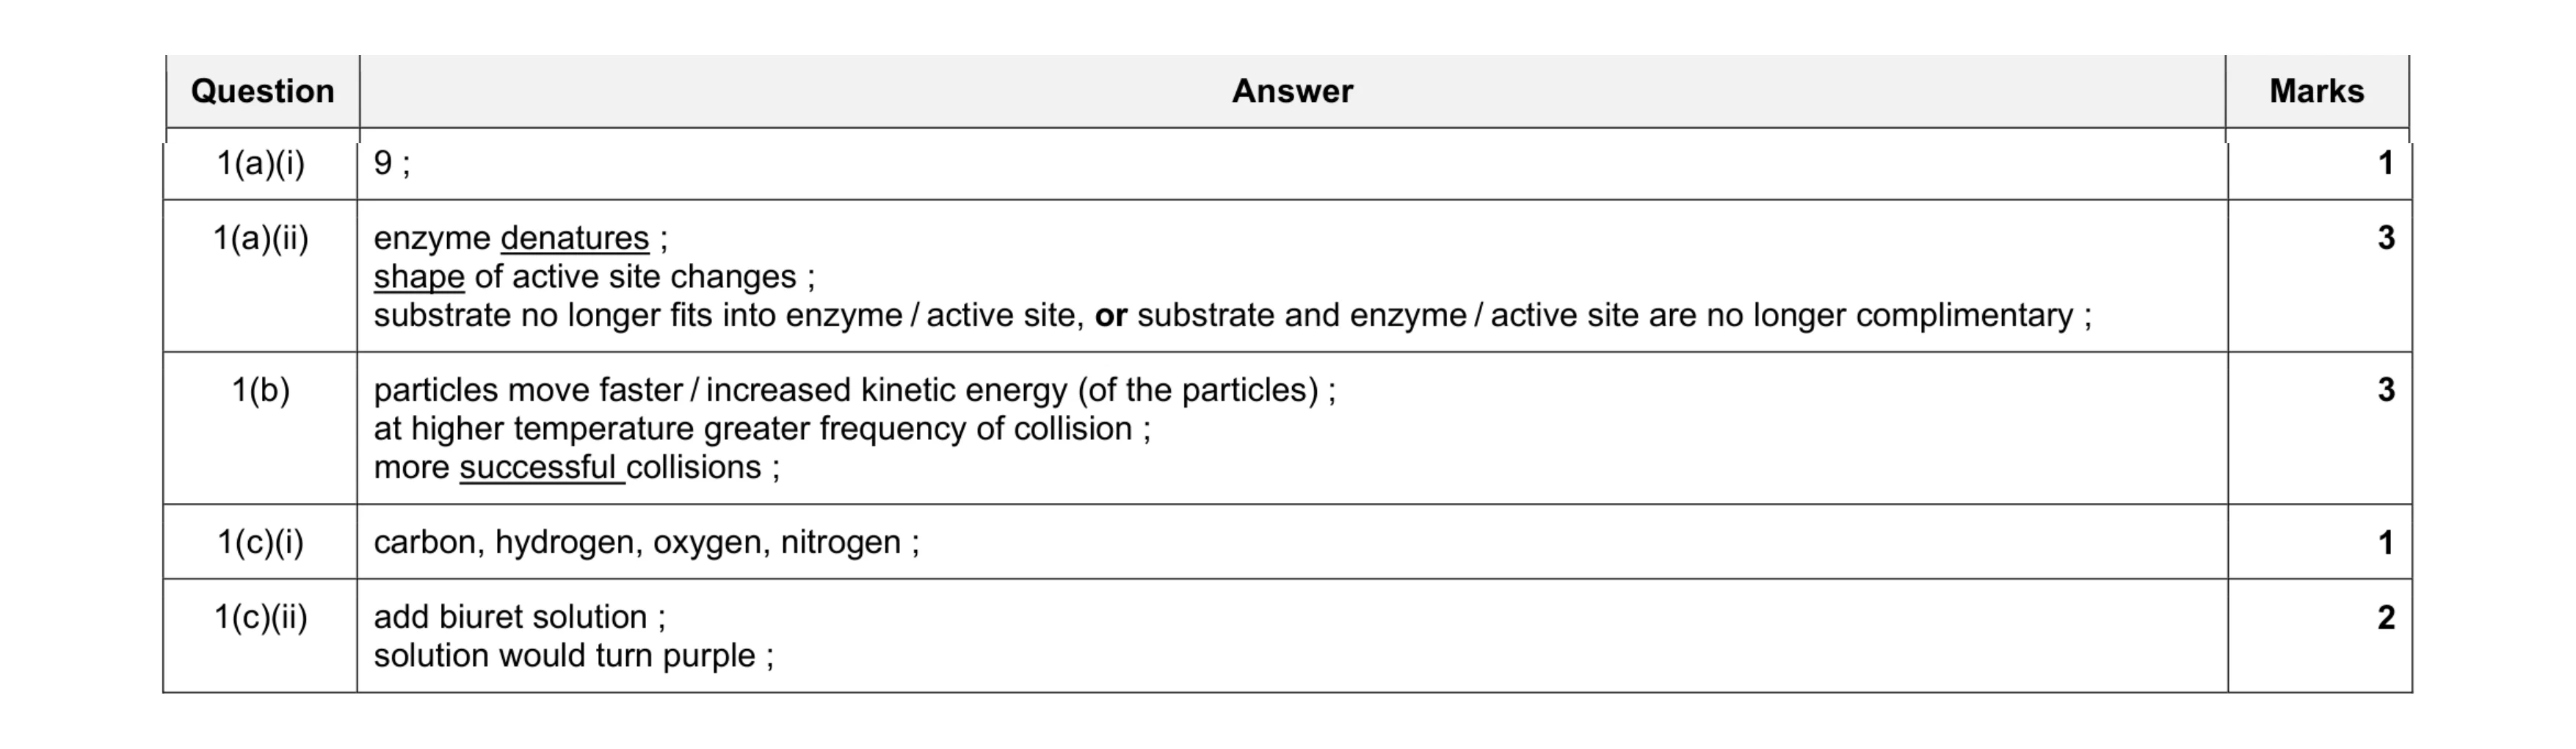 10
10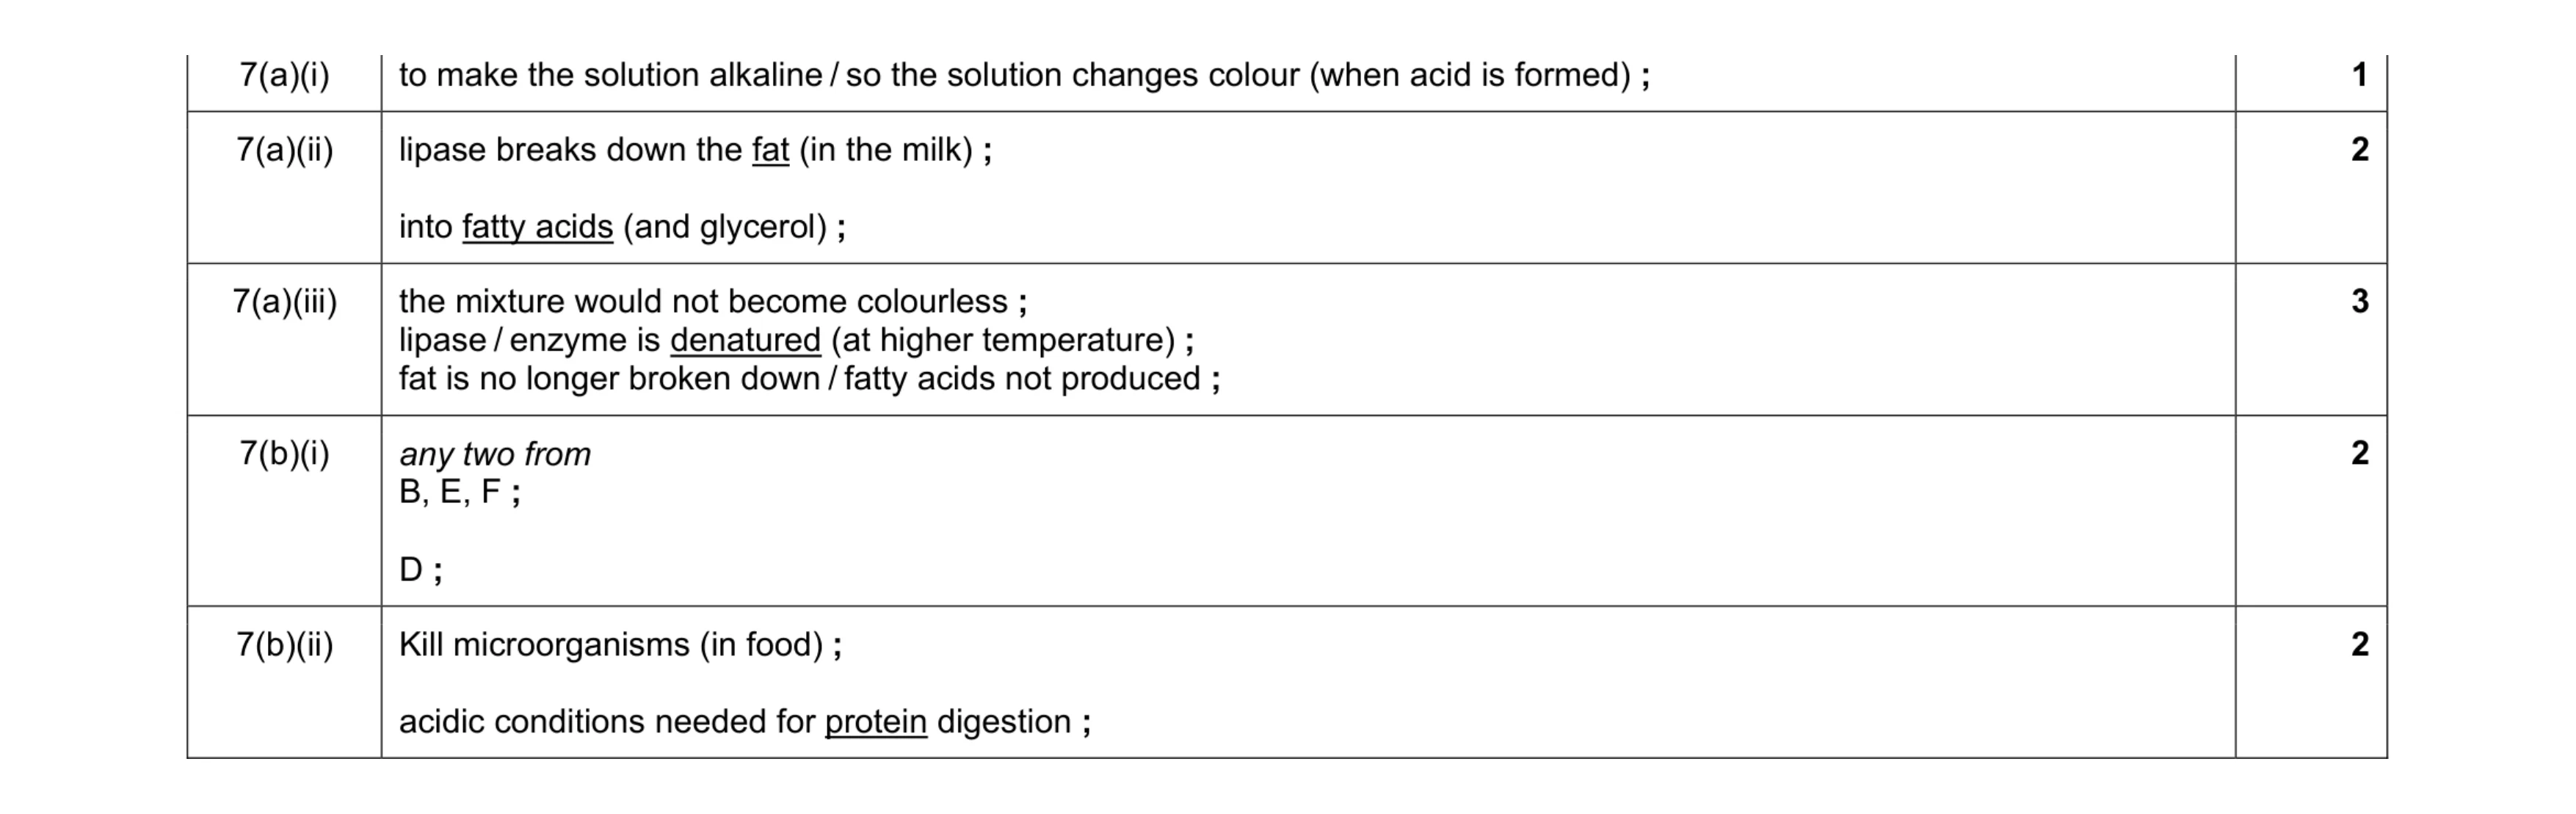 10
10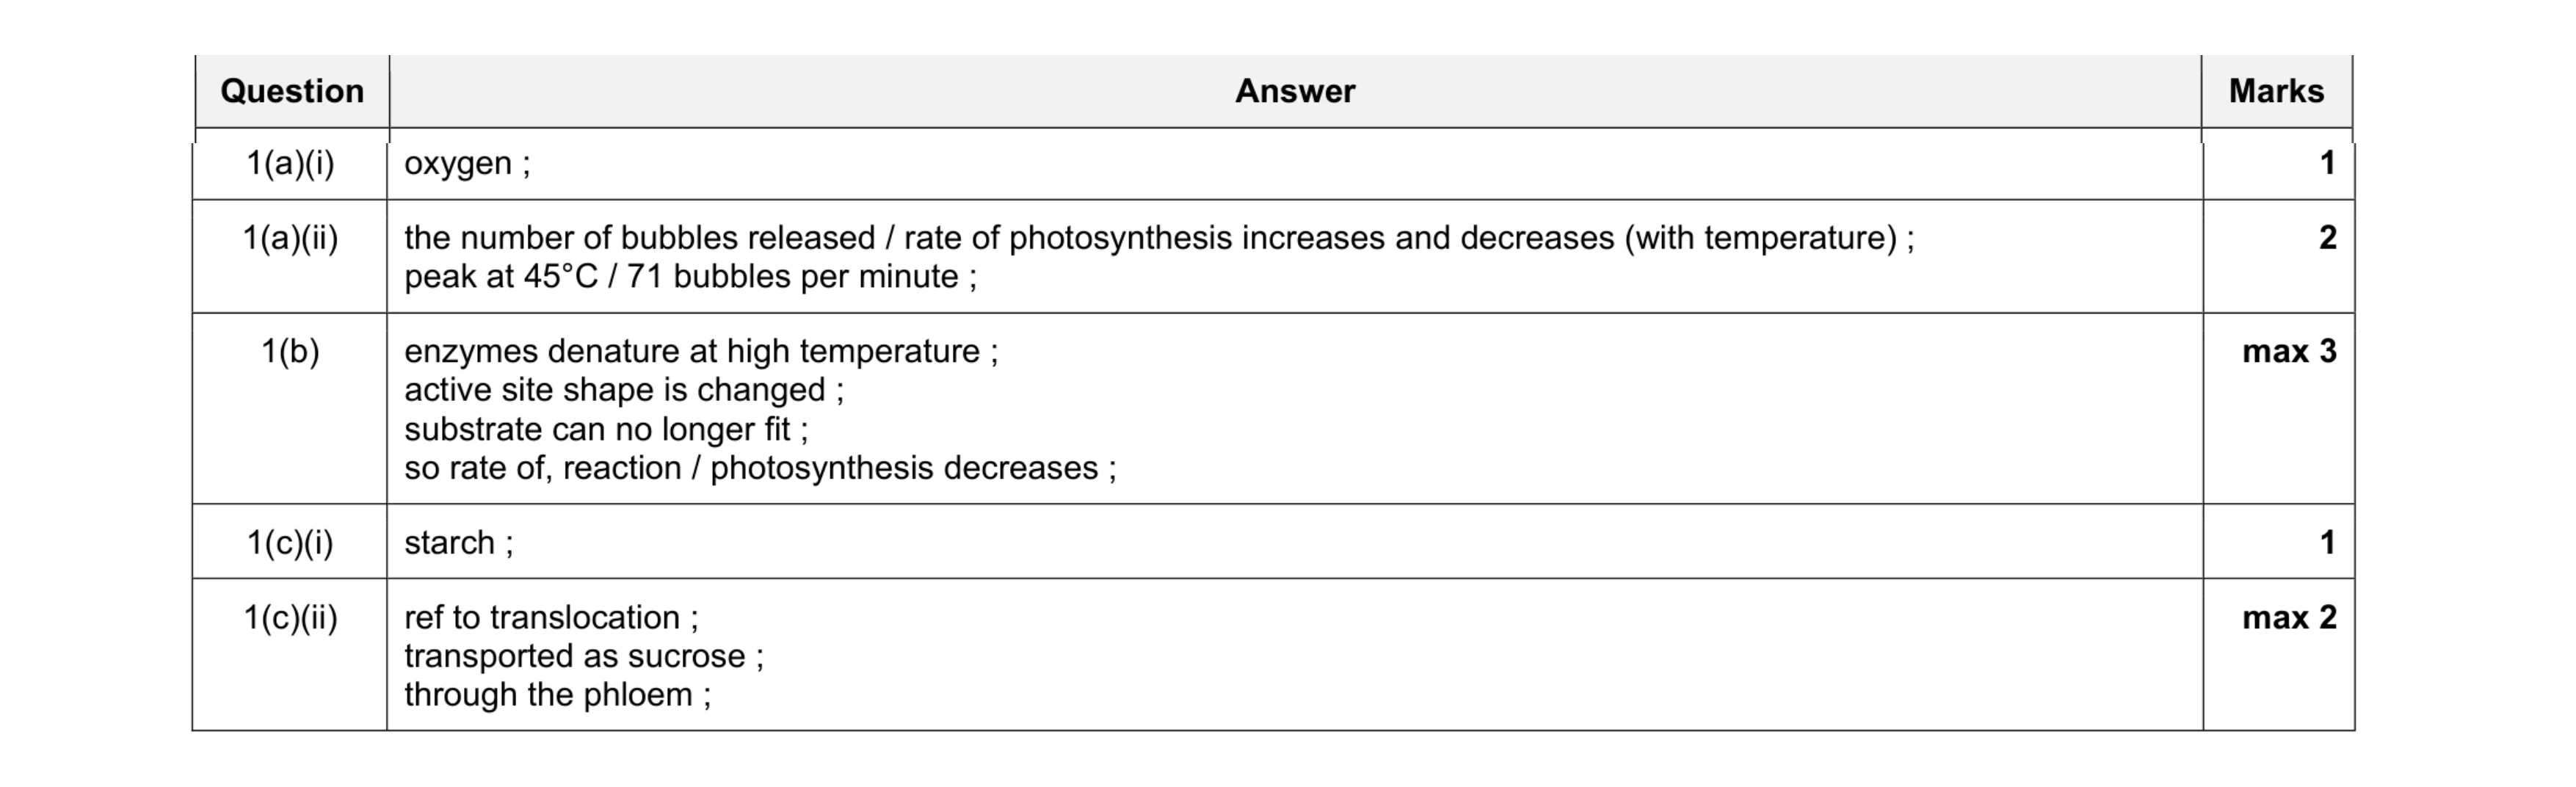 9
9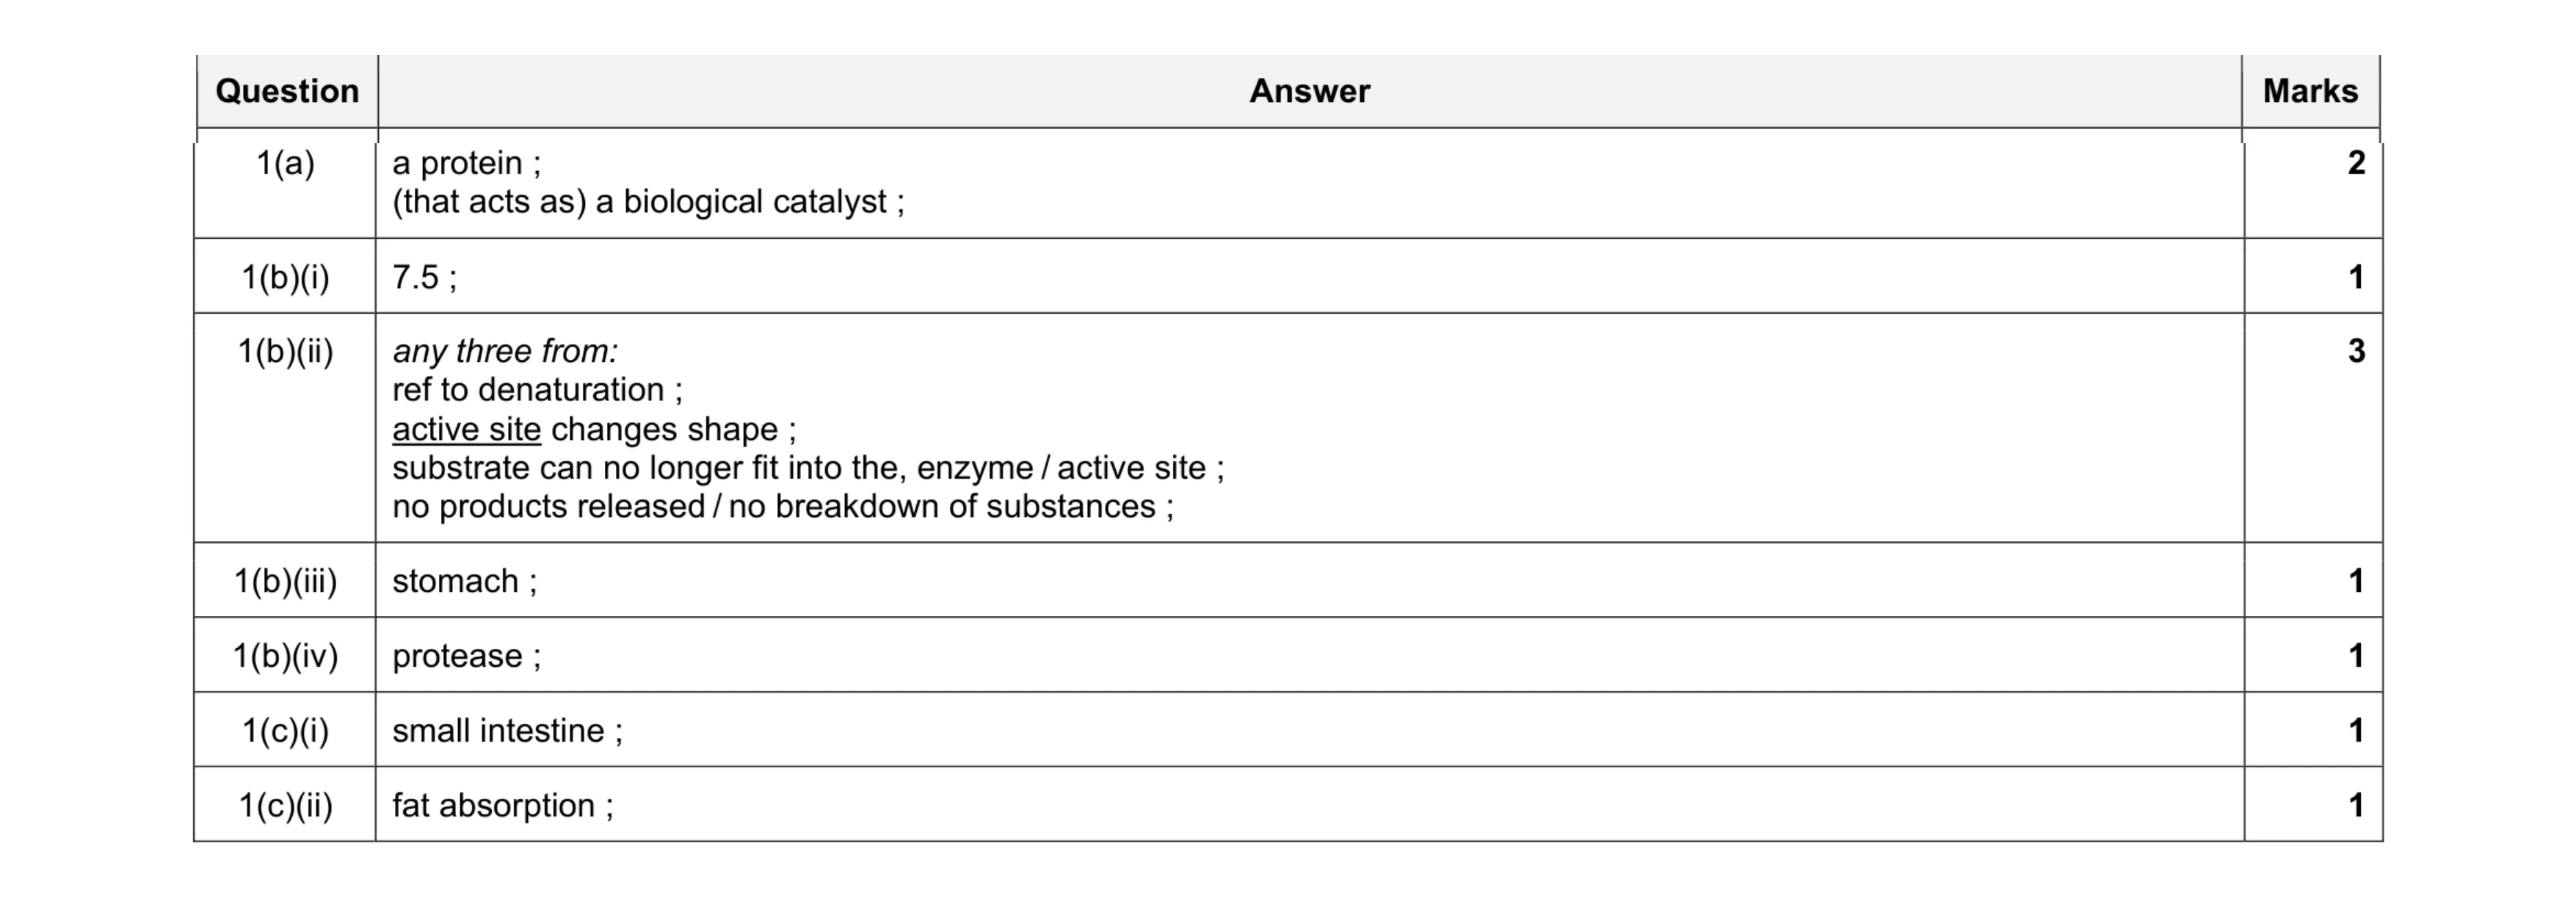 10
10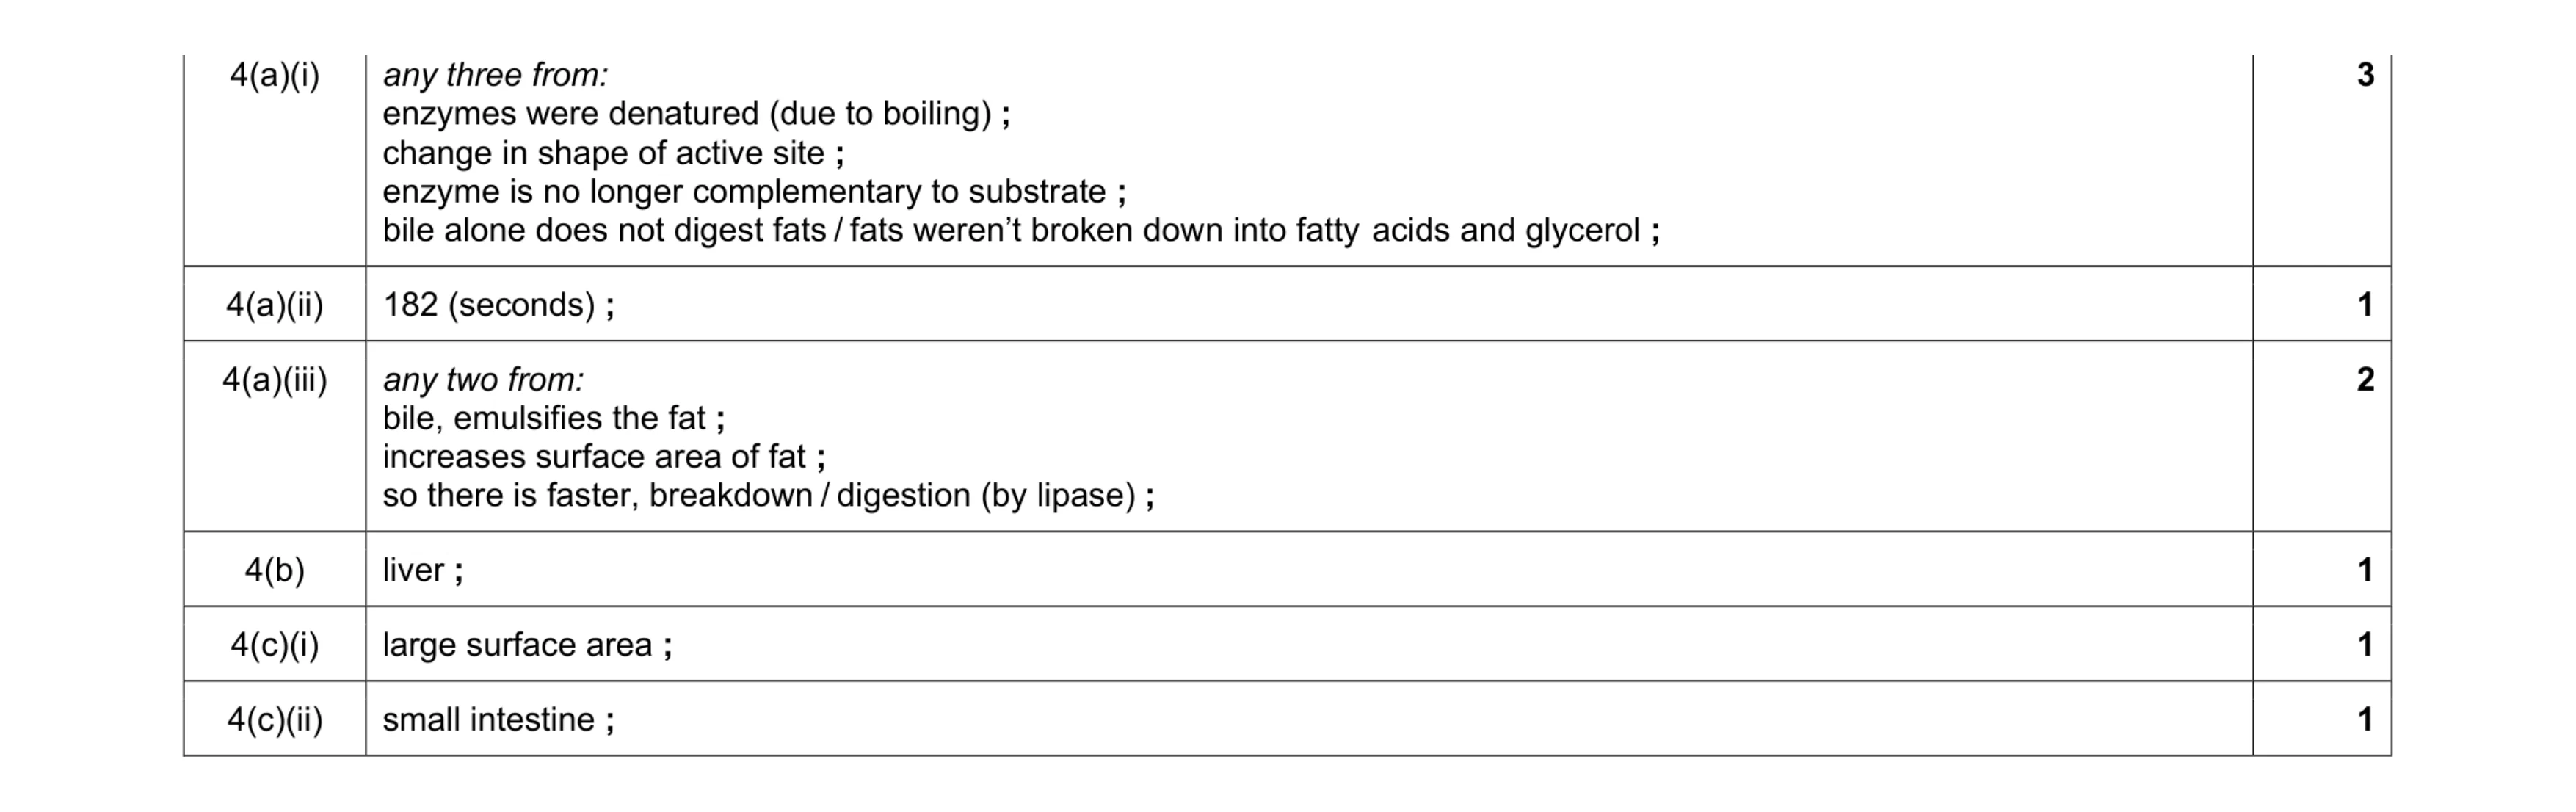 9
9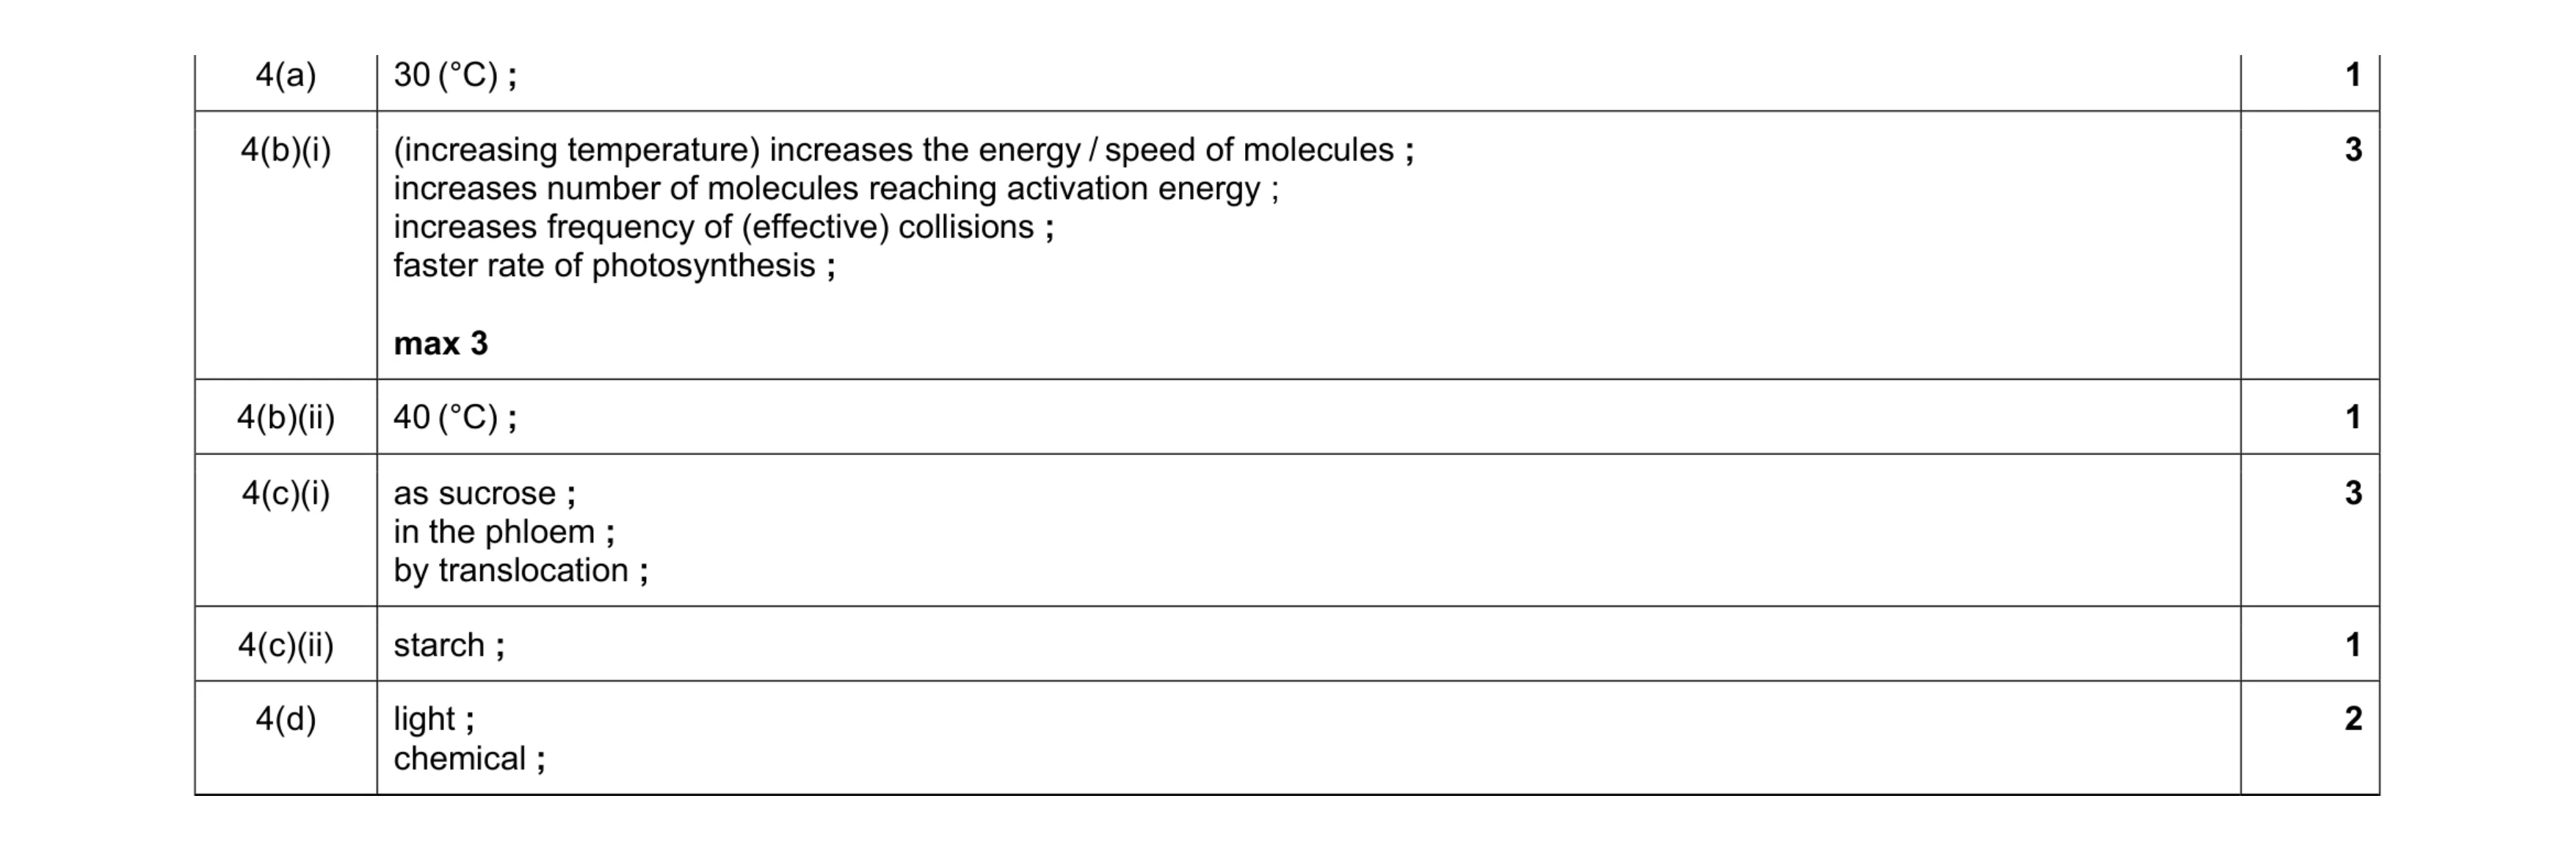 11
11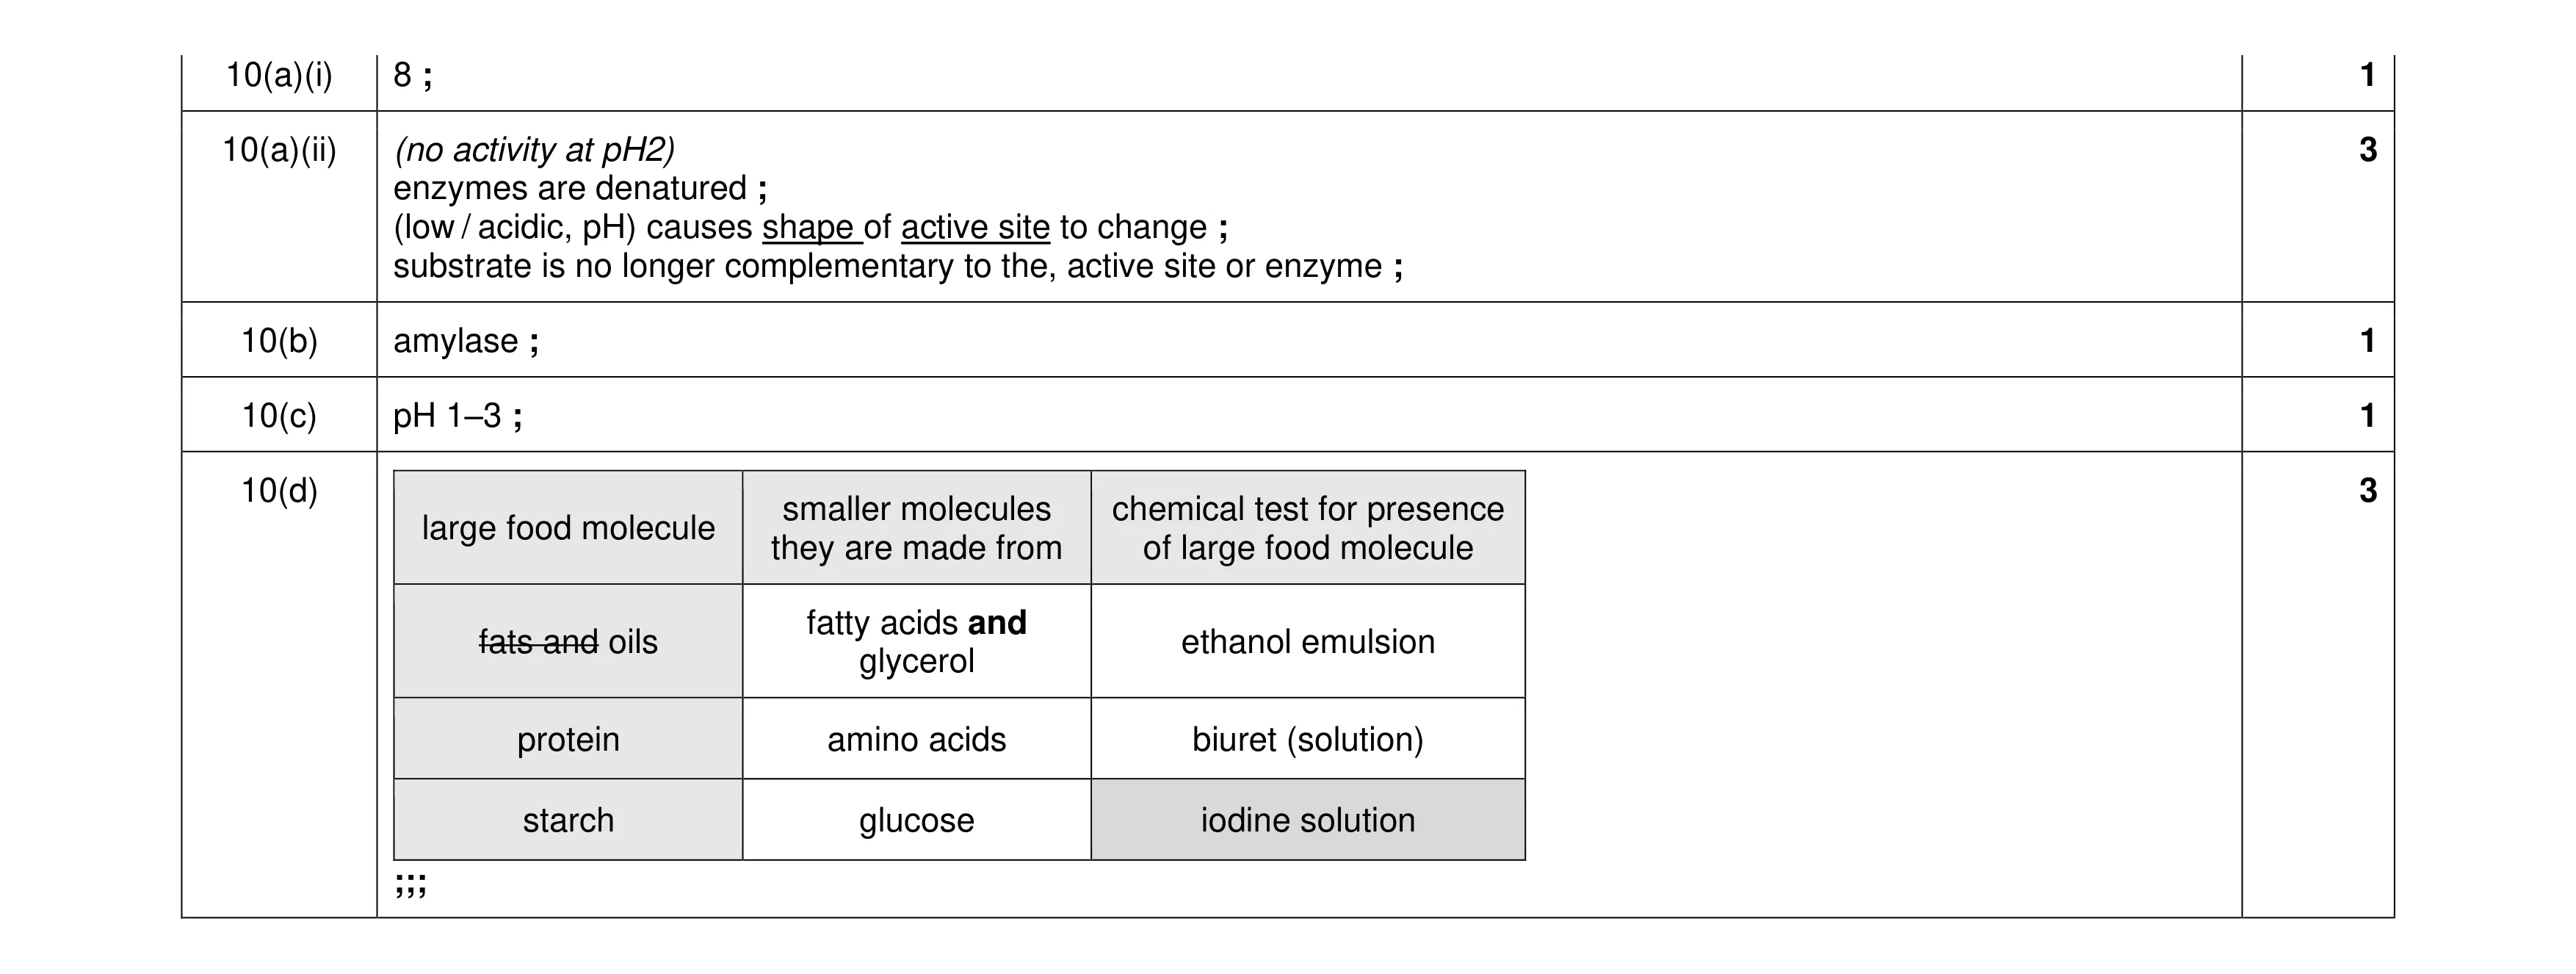 9
9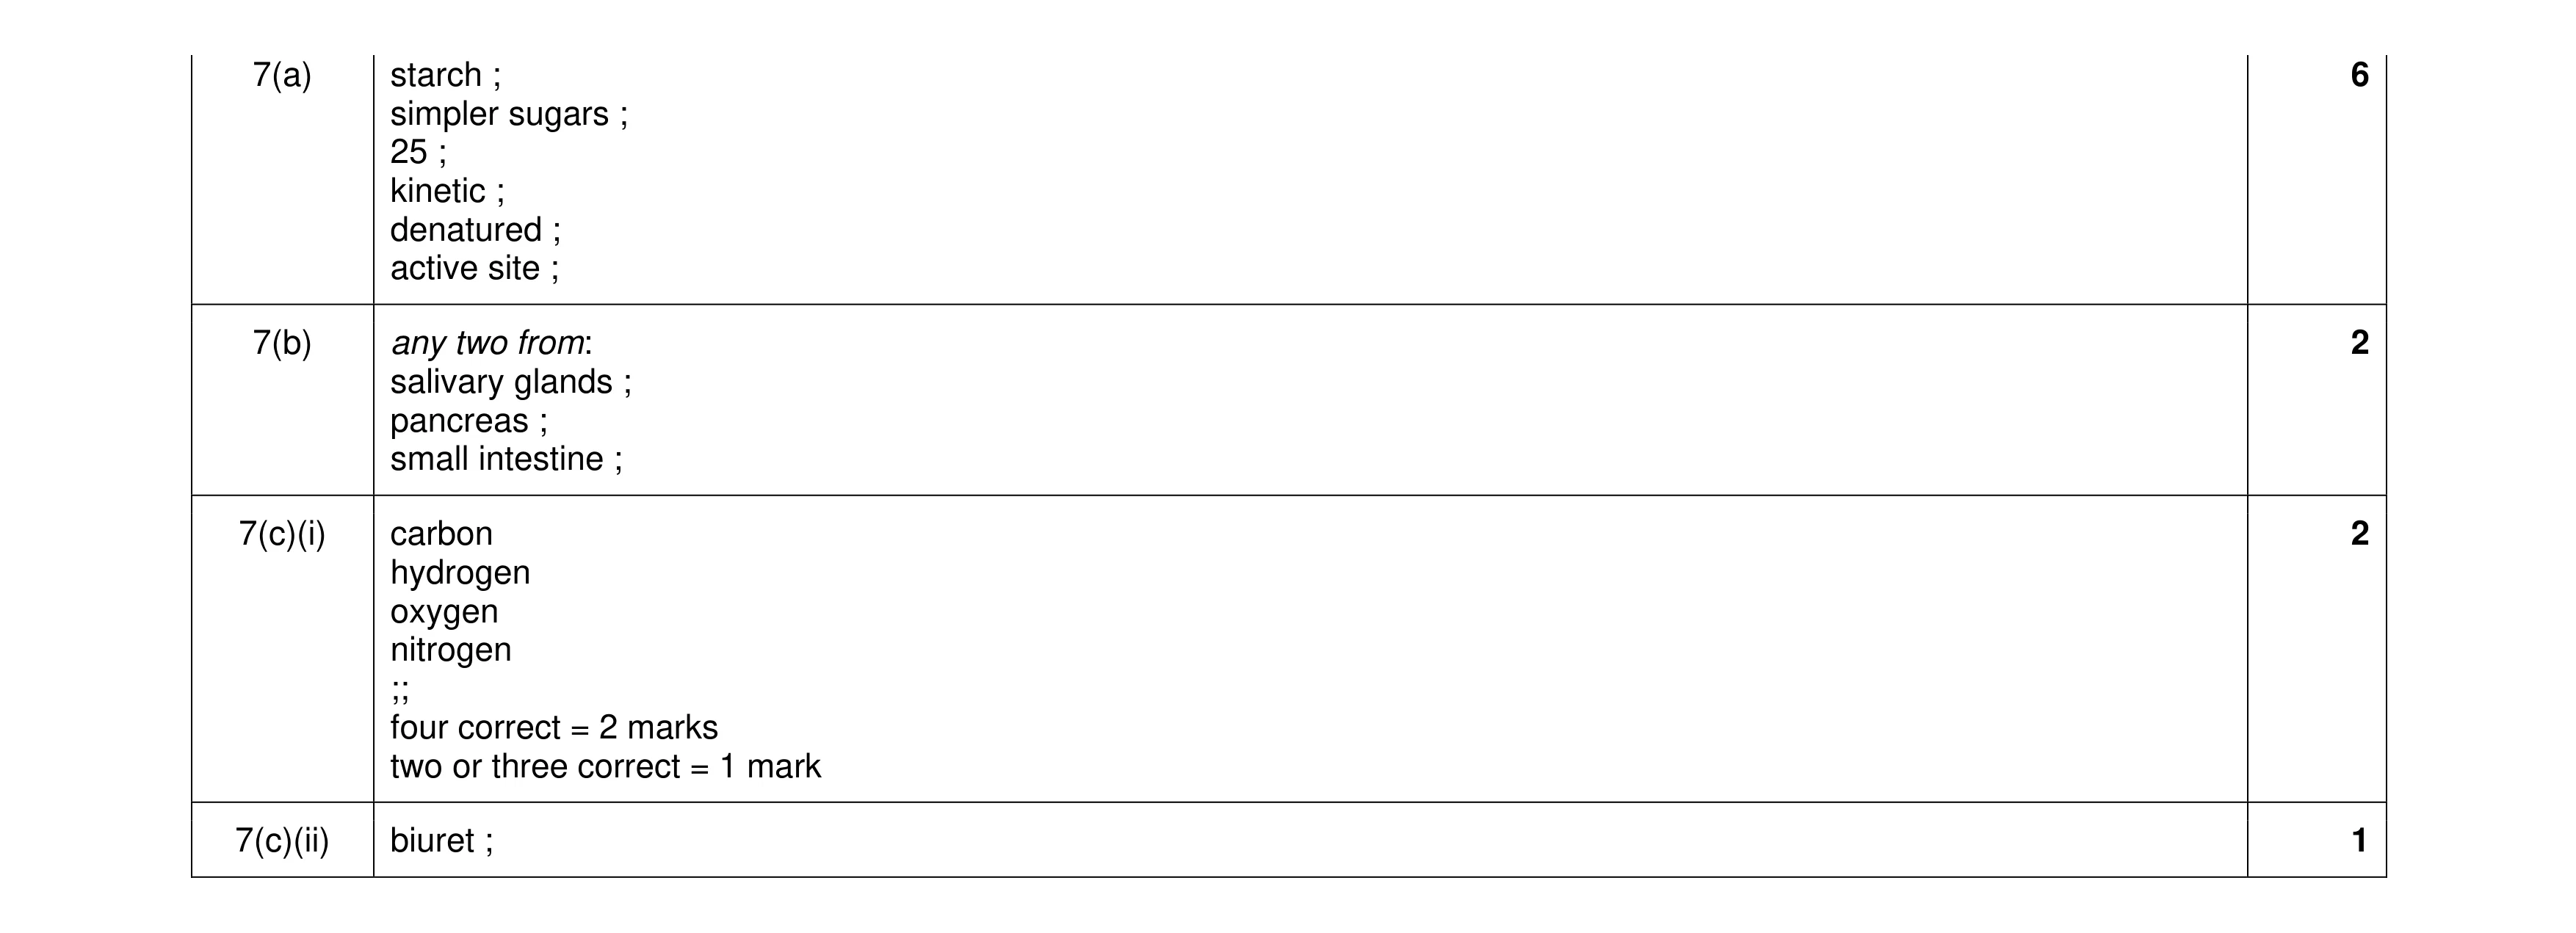 11
11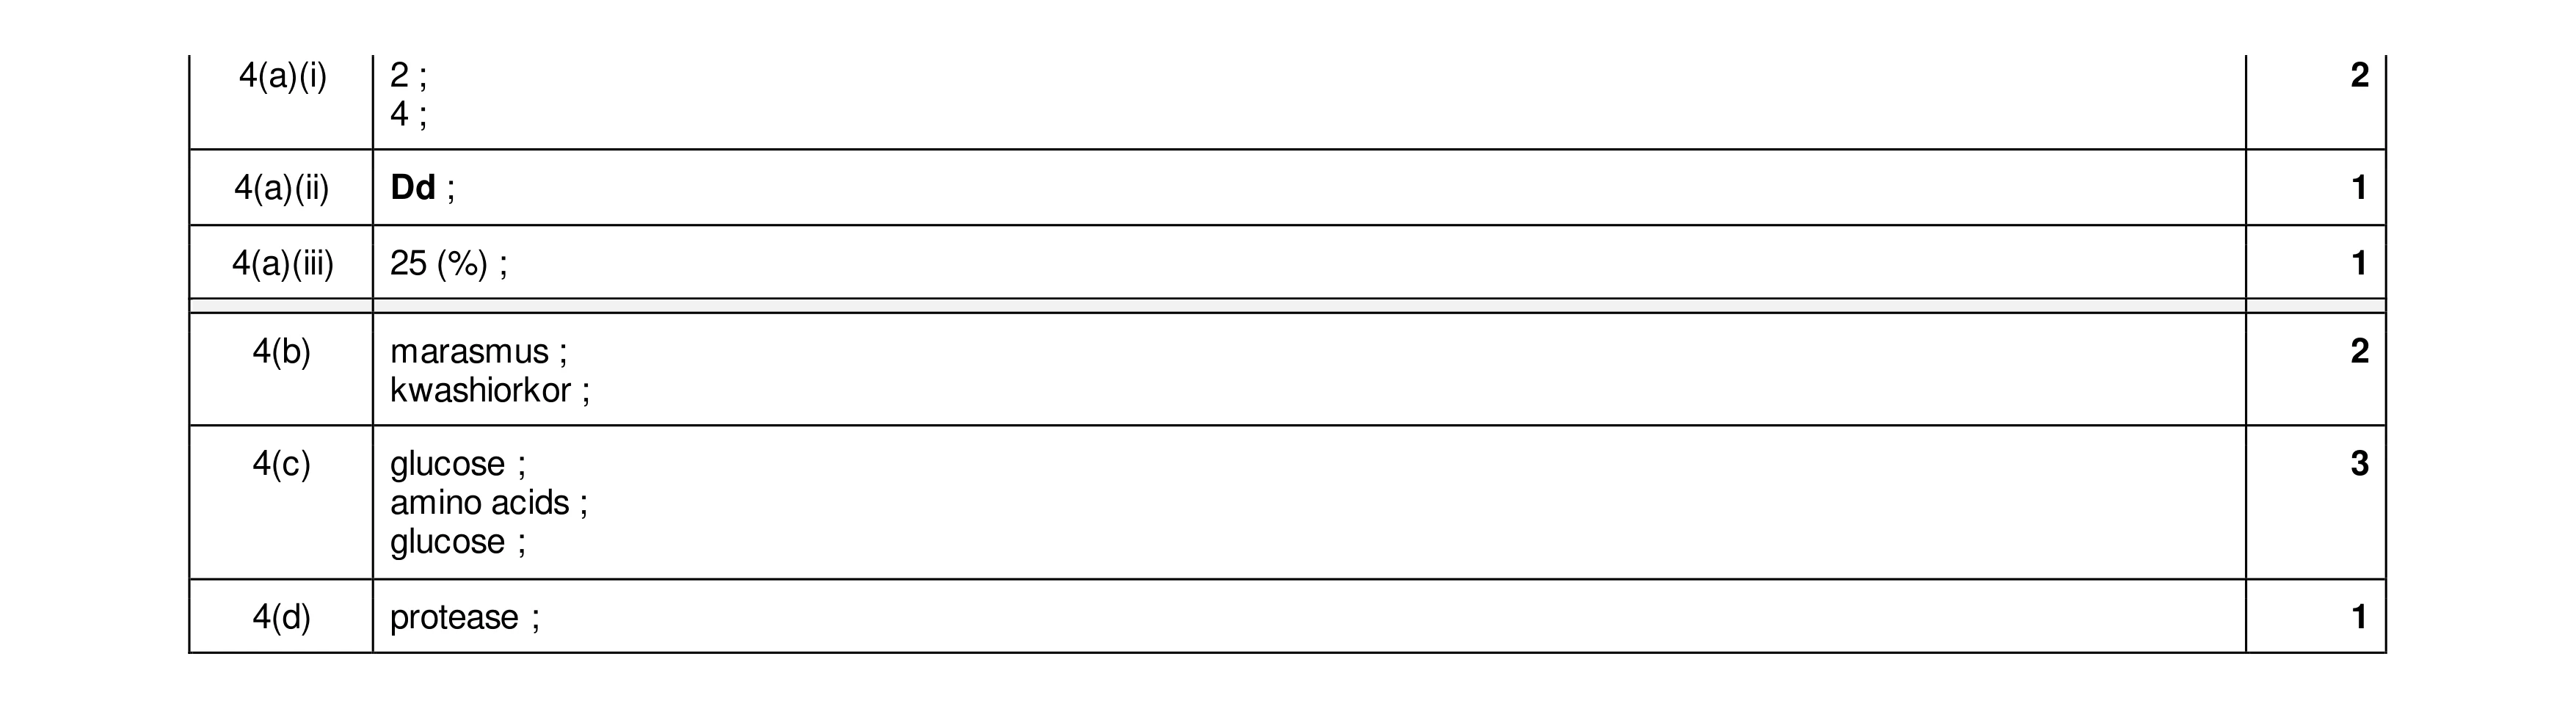 10
10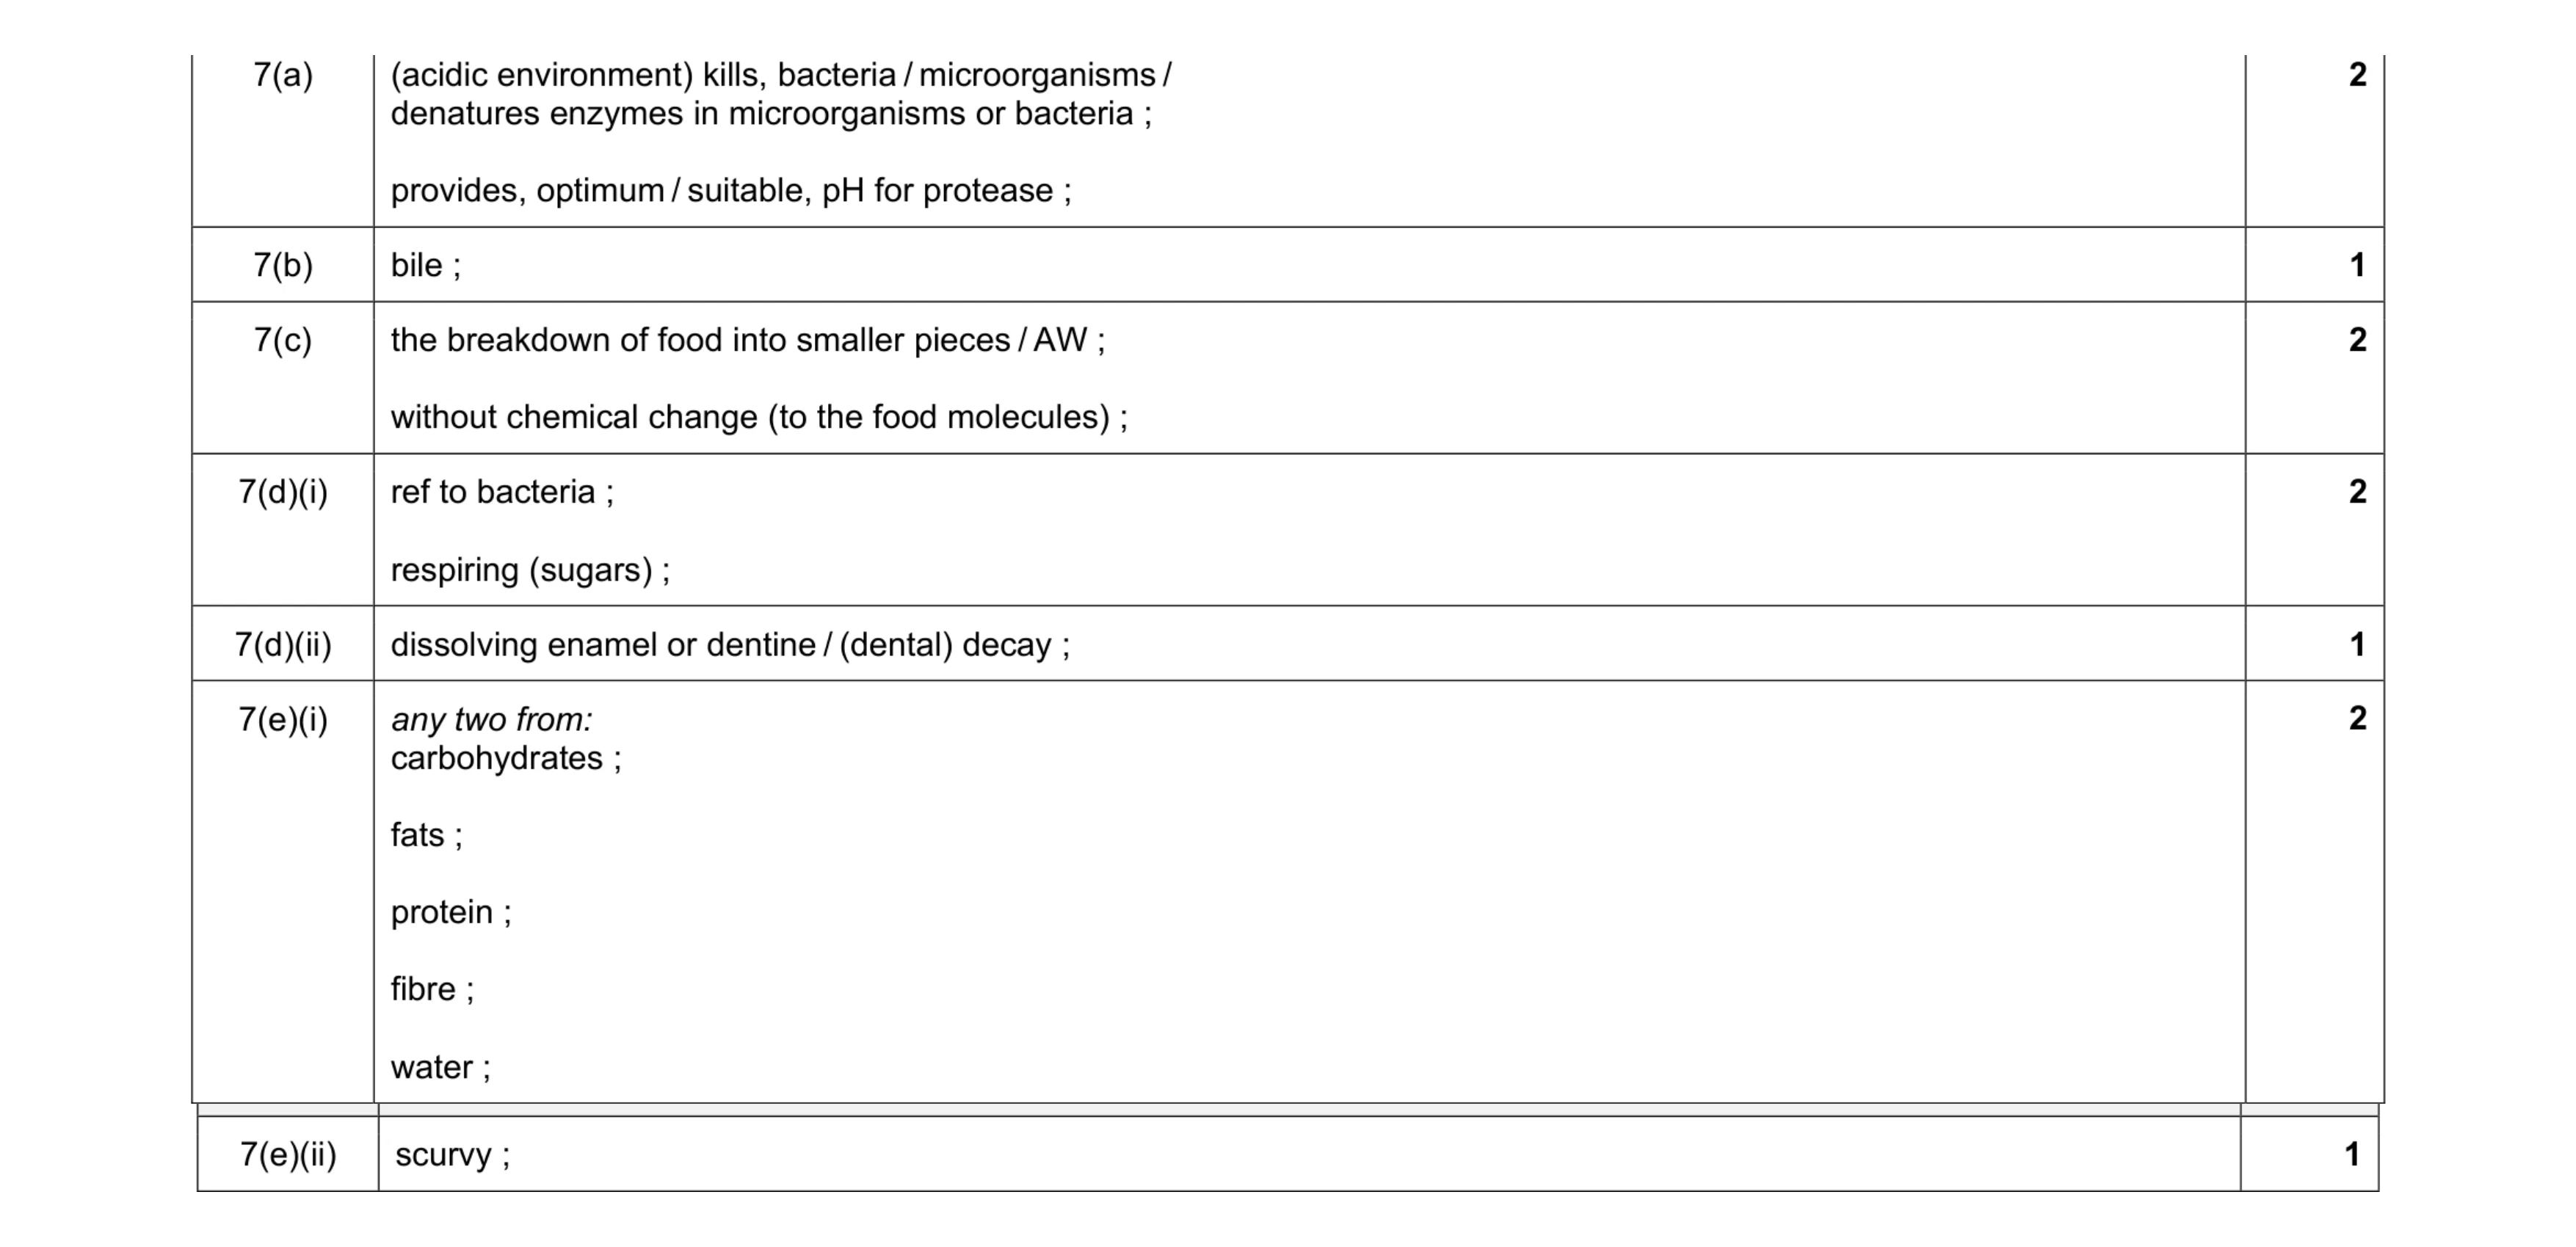 11
11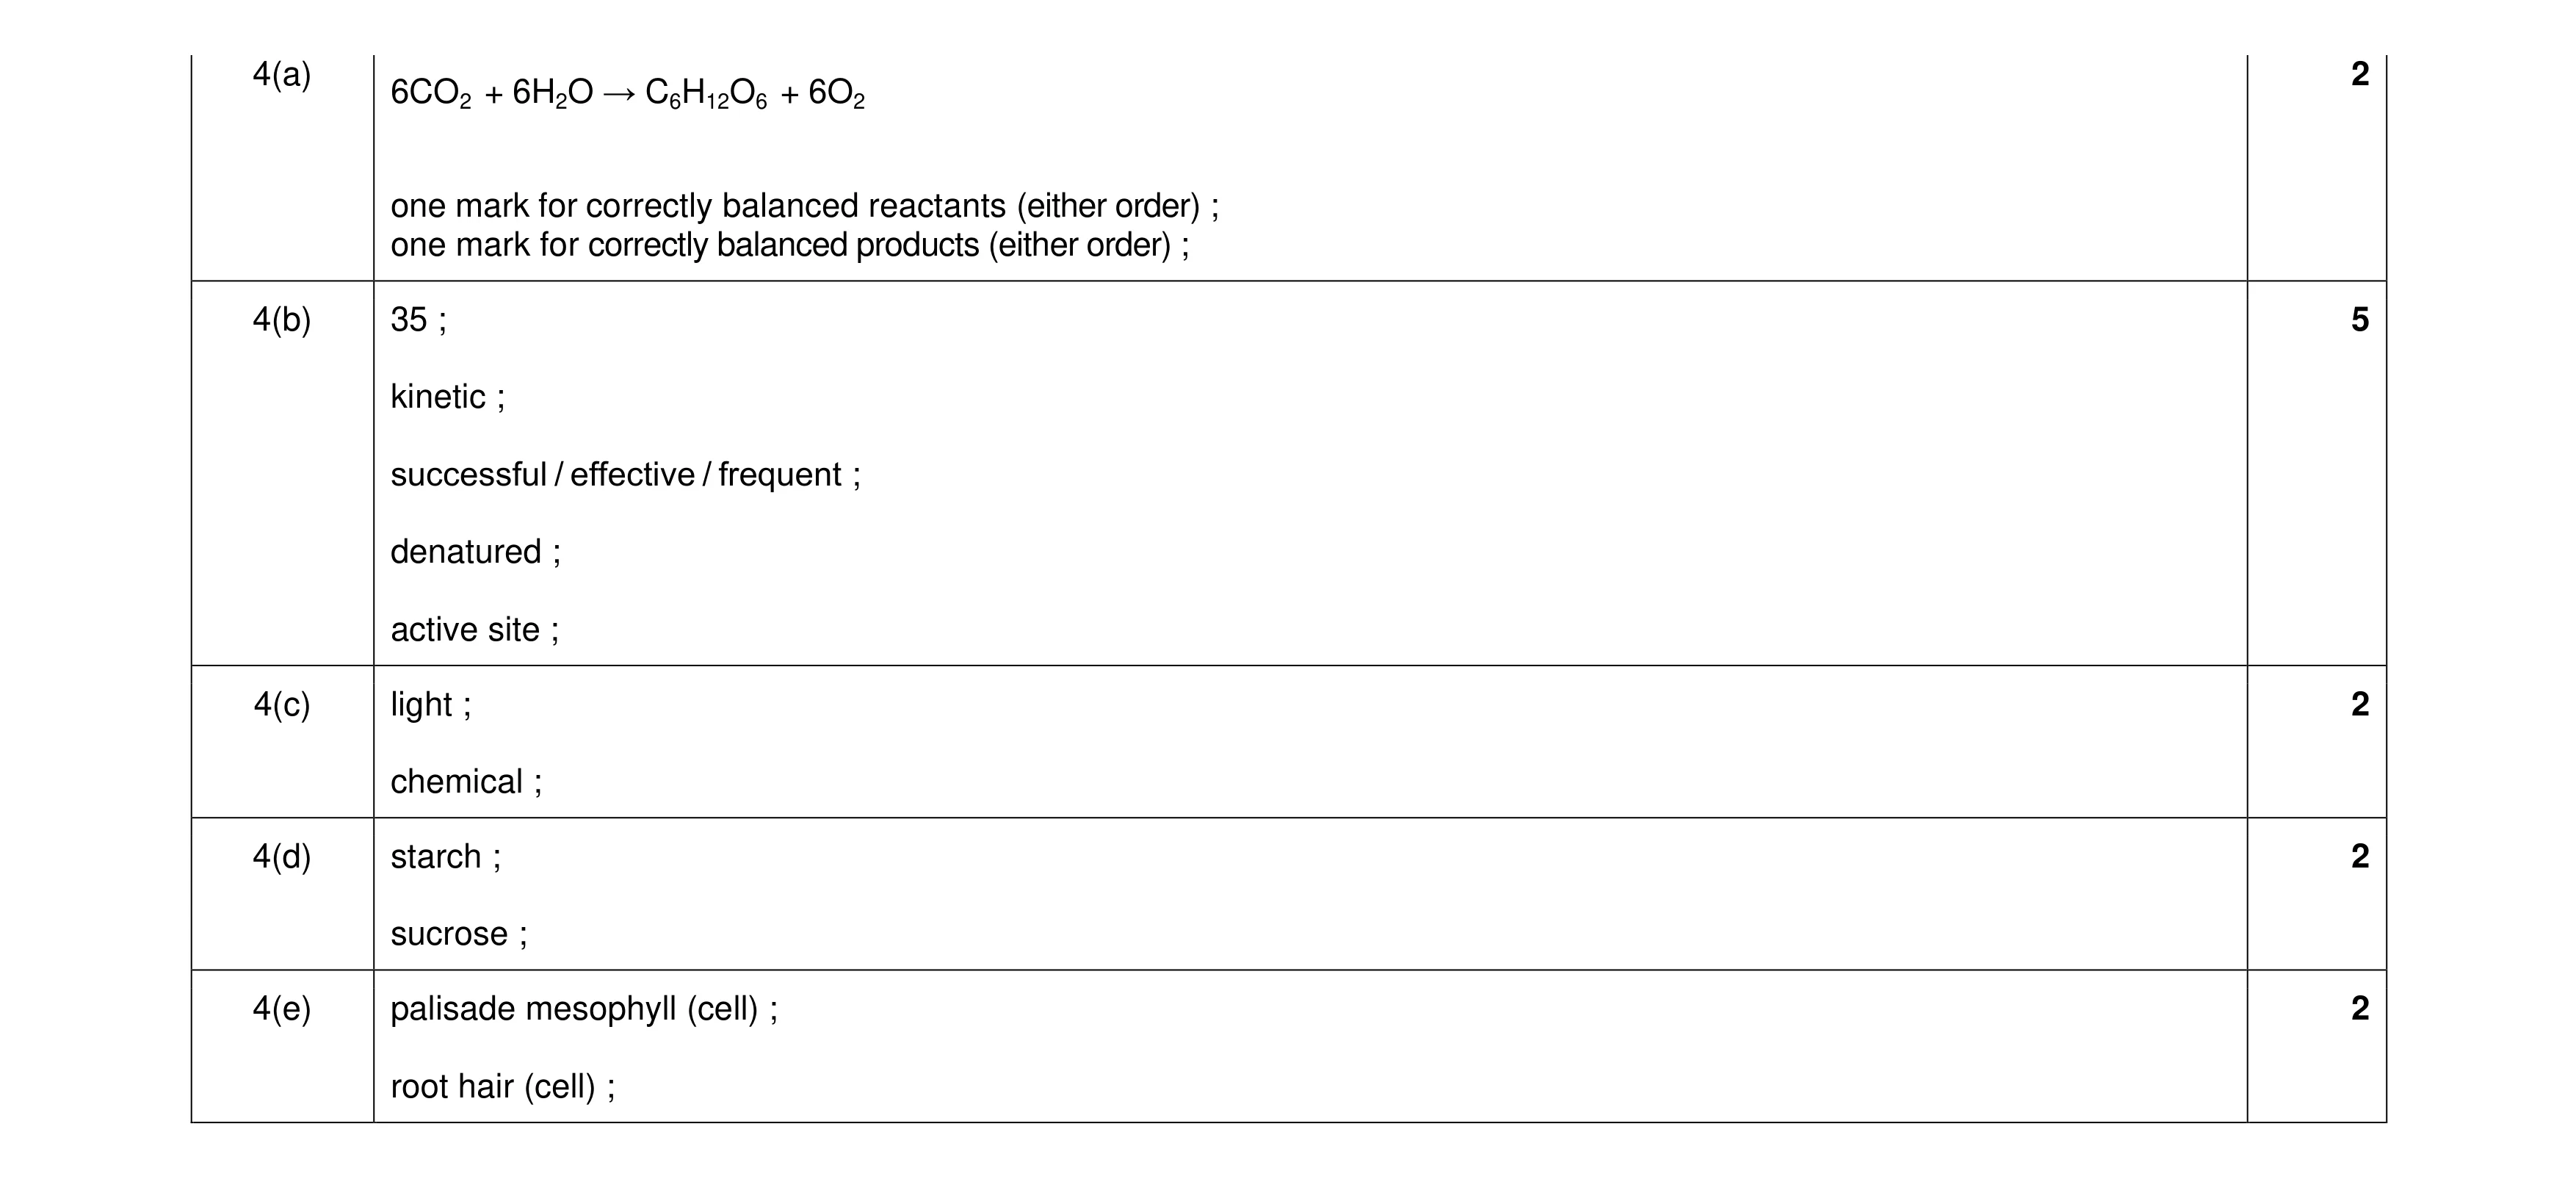 13
13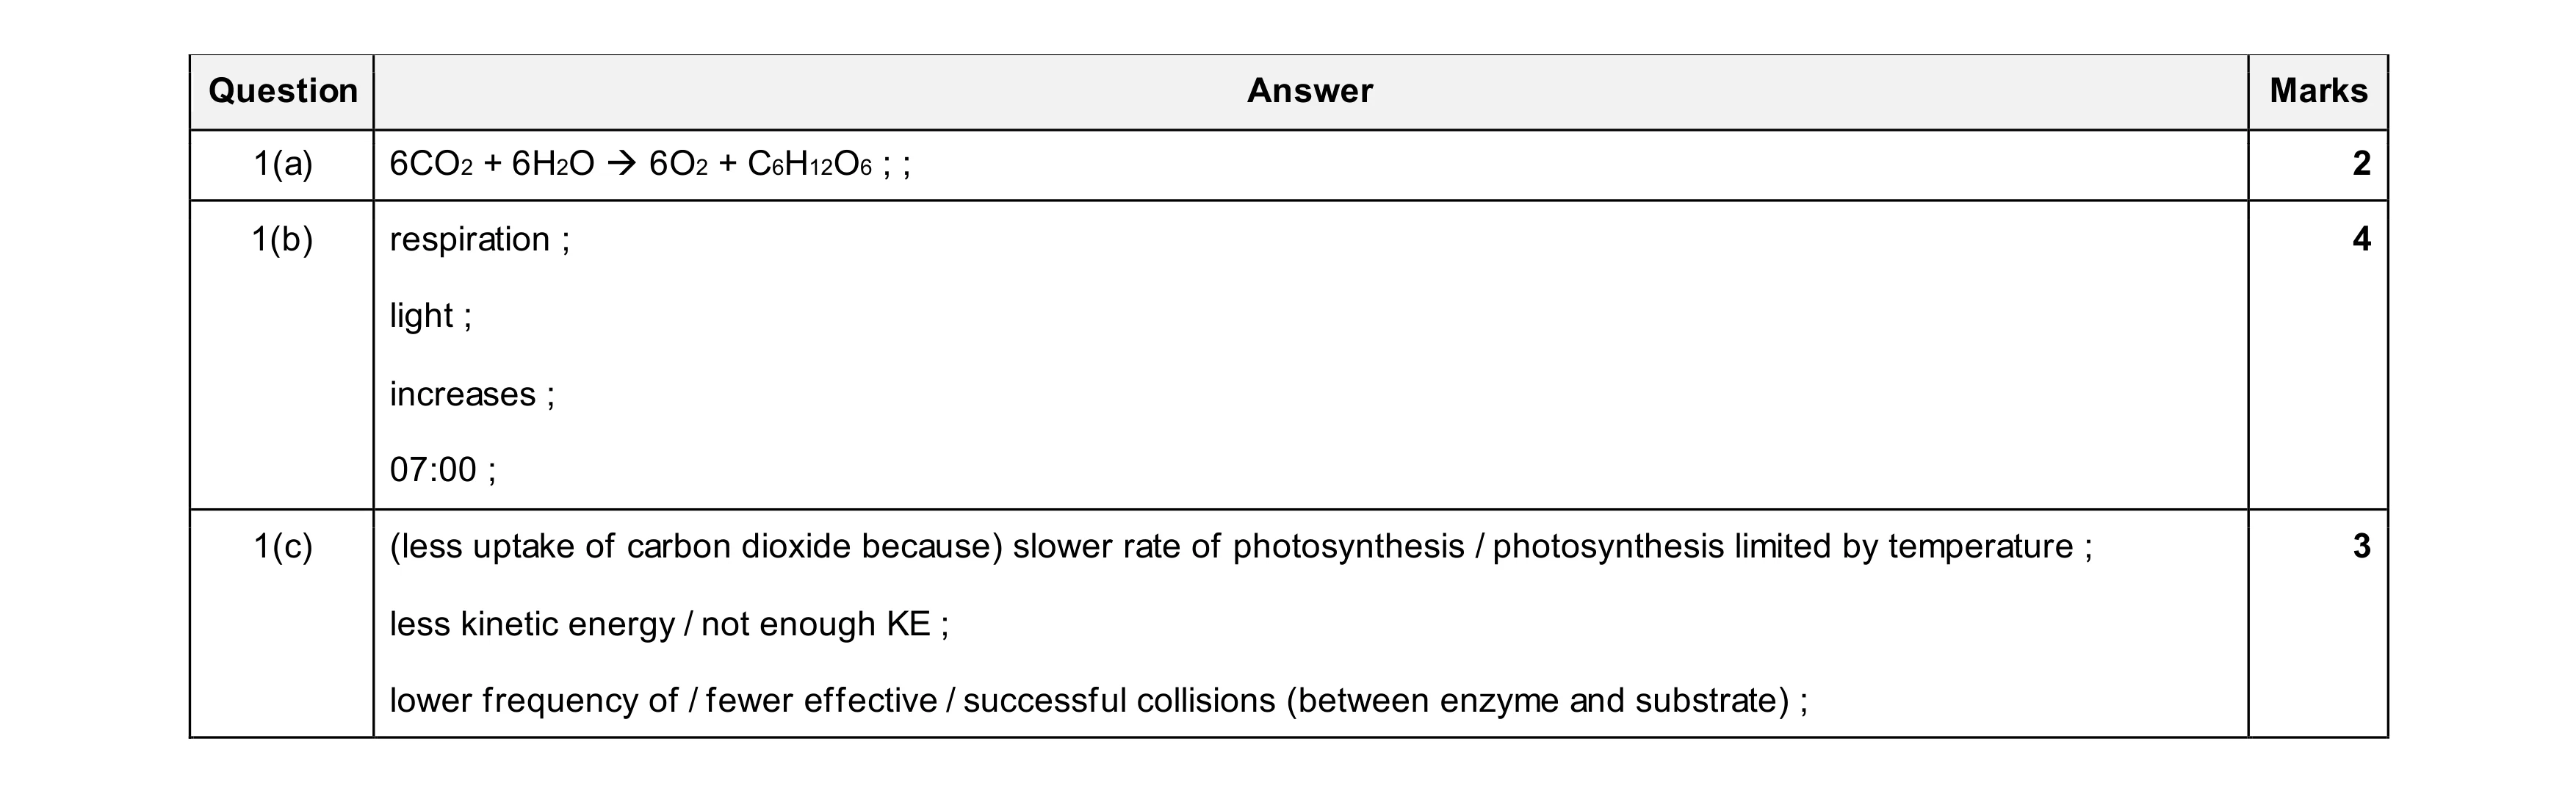 9
9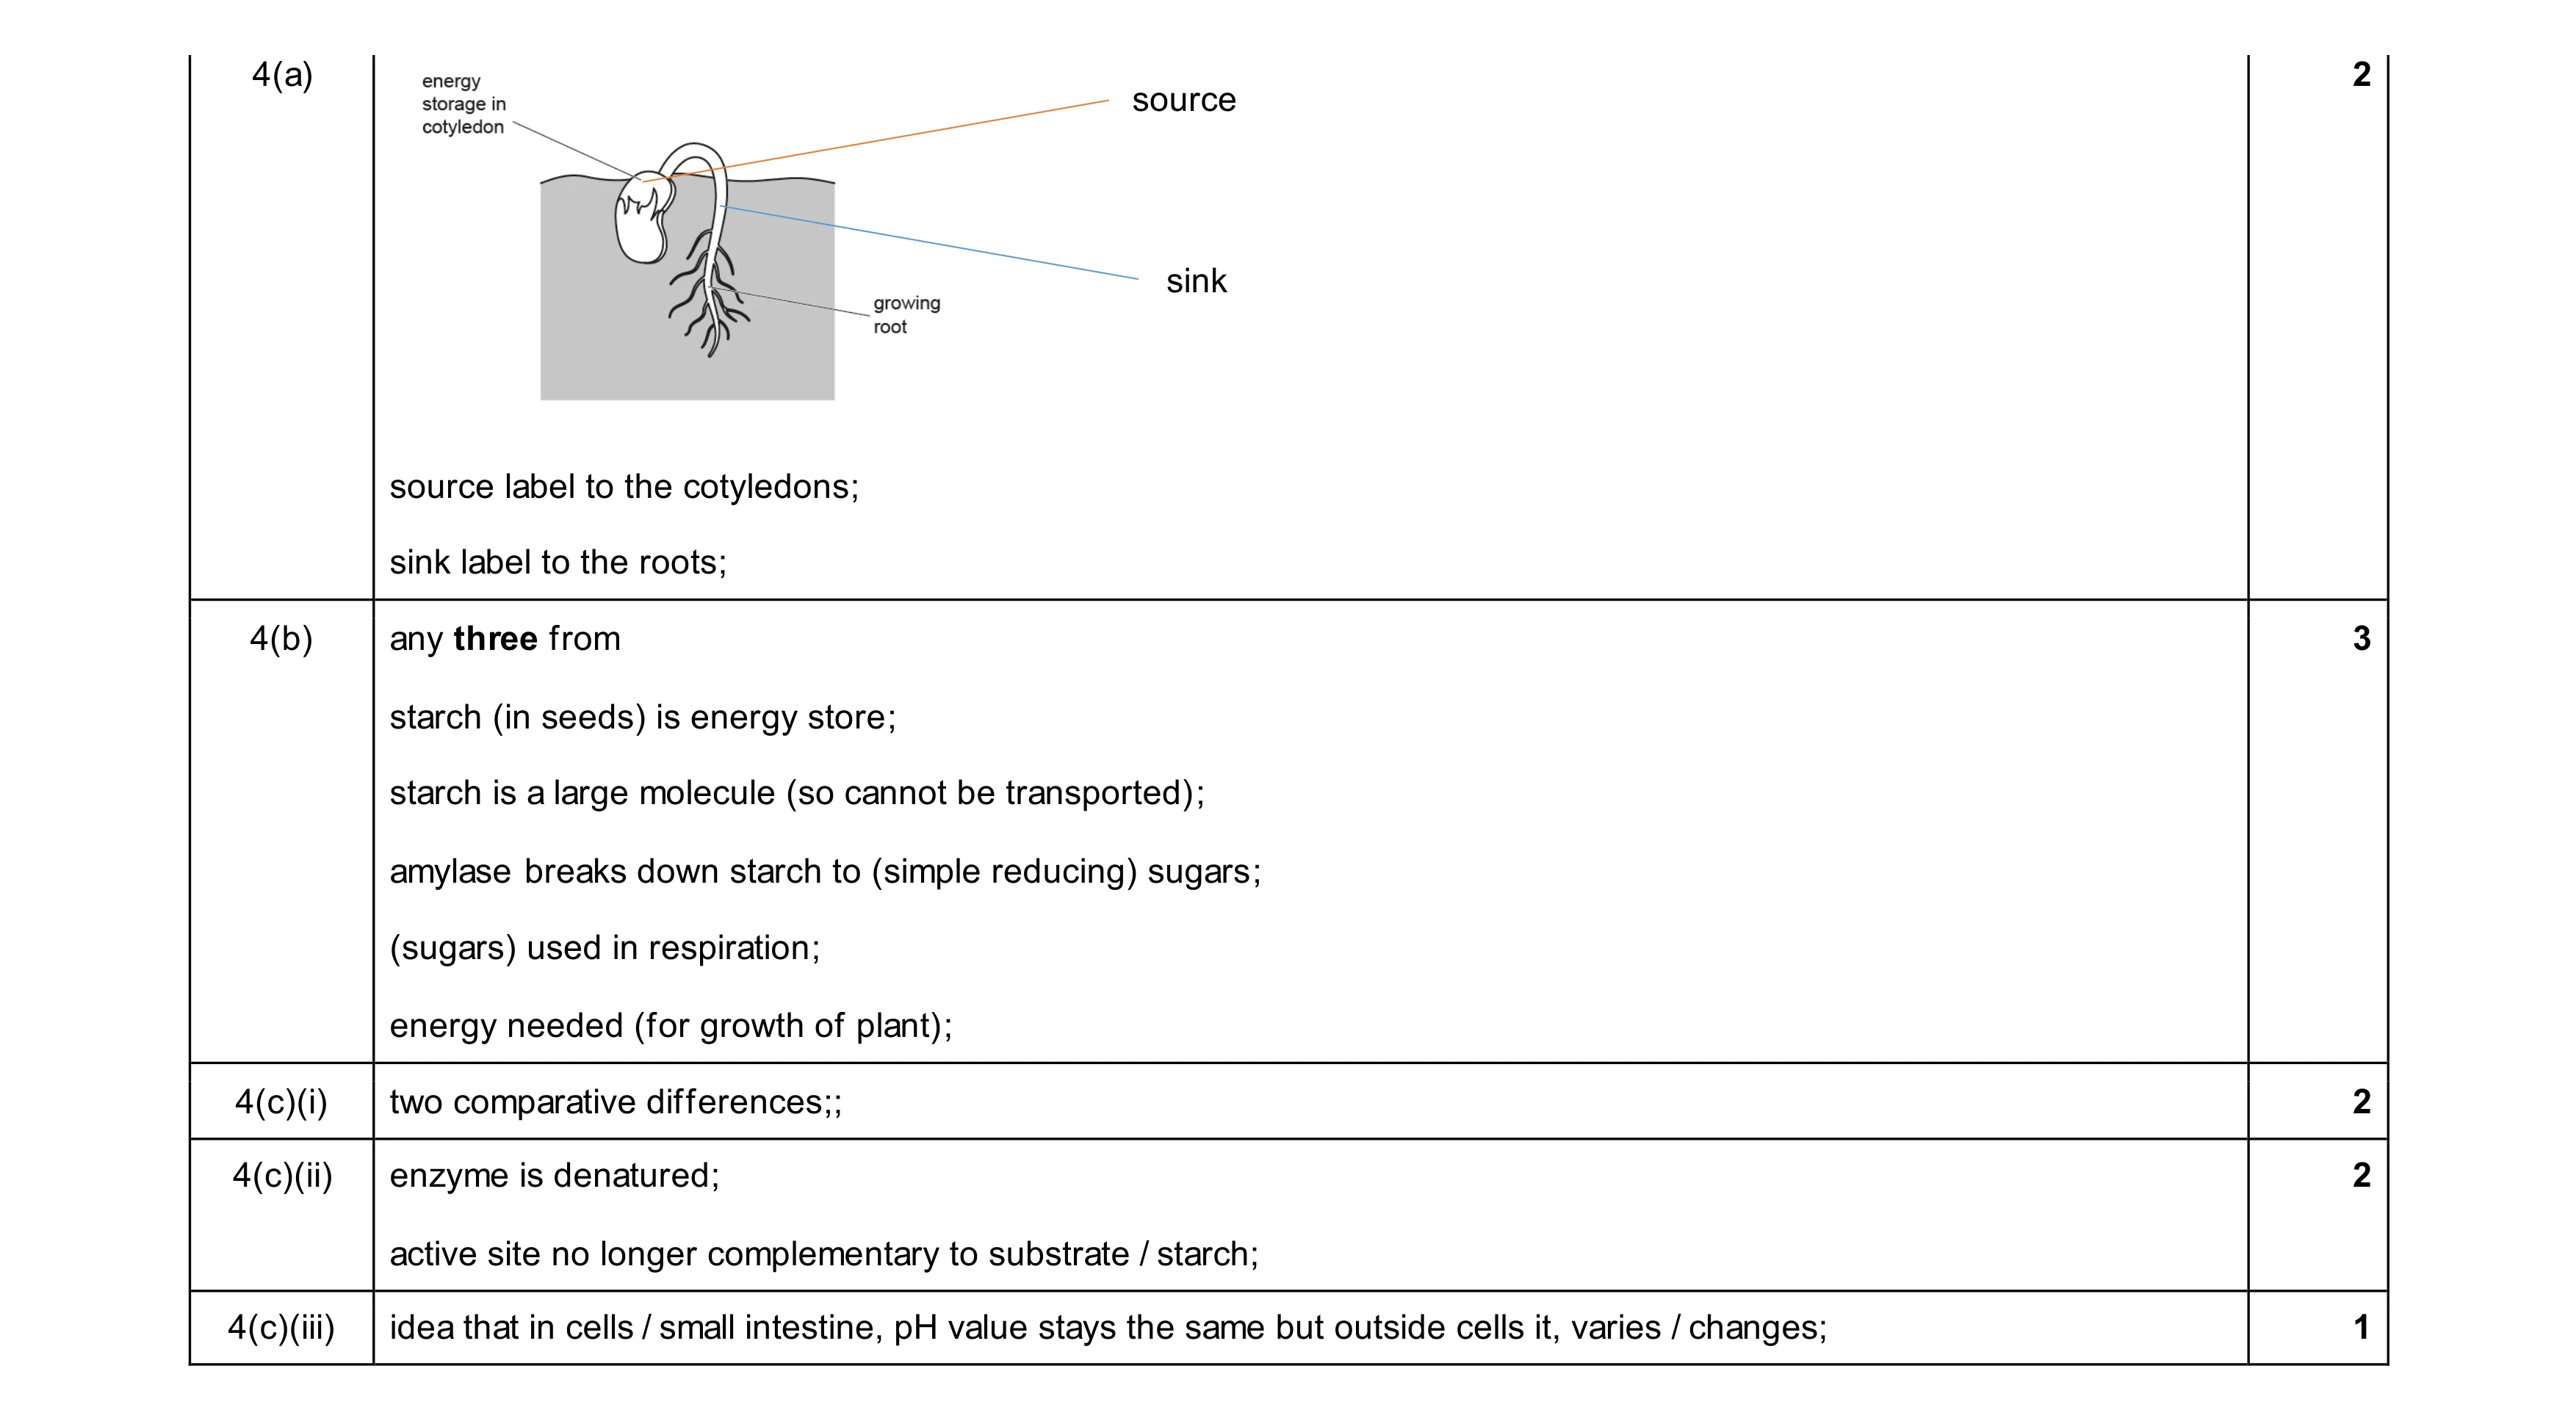 10
10