Questions as text
Q1 · Sales of bottled water in China doubled between 2010 and 2015 0455/21 May/June 2017
2 Sales of bottled water in China doubled between 2010 and 2015. In 2013 China overtook the USA as the biggest market for water by volume, but not value as the price of a bottle was higher in the USA. The increase in global consumption of bottled water has increased the size of firms producing bottled water but has also increased pollution. (a) Why is pollution an example of market failure? [2] (b) Explain two causes of a shift of a supply curve to the right. [4] (c) Analyse why the price of a product may be higher in the USA than China. [6] (d) Discuss whether large firms or small firms benefit consumers more. [8]
20 marks
Mark scheme: 2(a) Why is pollution an example of market failure? It is a cost/harmful effect/external cost (1) on a third party (1) not taken into account by the market (1) will cause social costs to exceed private costs (1) may result in the inefficient use of resources (1). 2 2(b) Explain two causes of a shift of a supply curve to the right. 1 mark each for each of two causes identified: • a reduction in the costs of production • advances in technology • increase in labour productivity • cuts in indirect taxes • government subsidies • good weather • reduction in diseases affecting livestock and crops • fall in price of other products produced by the firms 1 mark each for each of two explanations given: • lower costs of production will make firms more willing and able to supply/raise profits • advances in technology makes it cheaper to produce • cuts in taxation effectively lower costs of production • government subsidies provide a financial incentive to produce more • good weather increases fertility of land/increases crop yields • reduction in diseases increase crop yields and the number of livestock that can be sold • fall in price of other products produced by firms may lower their profitability, encouraging firms to switch resources 4 Do not accept a change in the price of the product. Question Answer Marks Guidance 2(c) Analyse why the price of a product may be higher in the USA than China. • Demand may be higher in the USA (1) due to e.g. higher incomes (1) • The product may be advertised more in the USA (1) the product may have fewer substitutes in the USA (1) • Difference in markets (1) monopoly in USA (1) lower output/higher prices (1) greater competition in China (1) greater output and lower prices (1) • Good may be imported from china (1) higher transportation costs raises price (1) • Supply may be lower in the USA (1) due to e.g. higher costs of production (1) • The tax on the product may be higher in the USA (1) • The Chinese government may subsidise the product (1) • Demand may be more inelastic in USA (1) hence producers can charge higher price (1) • Diseconomies of scale in the USA (1) lead to higher average costs and higher prices(1) economies of scale in China (1) lead lower average costs and lower prices (1) • Chinese exchange rate has fallen (1) will mean difference in the price of goods imported (1) resulting in higher costs of importing into the USA (1) 6 Maximum of 3 marks for a list-like approach. 2(d) Discuss whether larger firms or smaller firms may benefit consumers more Up to 5 marks for why larger firms* might: They may be able to benefit from economies of scale (1) example/s of economies of scale (1) lower average costs (1) lower prices for consumers (1). They may have more funds to invest (1) increase innovation / research (1) improve the quality of products (1). Large firms may offer greater variety to consumers (1). Up to 5 marks for why larger firms* might not: They may experience diseconomies of scale (1) example/s of diseconomies of scale (1) higher average costs (1) higher prices for consumers (1). They may provide less of a personal service (1) they may be less responsive to changes in consumer demand (1) as may be less in touch with consumers (1). A larger firm may be a monopolist (1) can restrict output and charge a higher price (1) lack innovation (1). Smaller firm may have monopoly power (1) in a niche market (1). 8 *Opposite wording of the argument is acceptable, i.e. why smaller firms may benefit consumers more than larger firms. A response may develop a mixture of relevant points to achieve up to 5 marks on either side. Maximum of 2 marks on each side of the discussion for a list-like approach.
This question in 0455/21 May/June 2017
Q2 · In 2015 the world saw many changes in demand and advances in technology 0455/22 May/June 2017
6 In 2015 the world saw many changes in demand and advances in technology. People were using new ways to transfer money and there was an increase in the number of stock exchanges. Some governments also raised the school-leaving age, that is the minimum age at which children are legally allowed to leave school. (a) What is sold on a stock exchange? [2] (b) Explain how money helps specialisation and trade to occur. [4] (c) Analyse how advances in technology can affect demand and supply. [6] (d) Discuss the economic arguments for and against a government raising the school-leaving age. [8]
20 marks
Mark scheme: 6(a) What is sold on a stock exchange? Shares/stocks (1) in public limited companies (1) government bonds/securities (1). 2 6(b) Explain how money helps specialisation and trade to occur. • If workers and firms specialise they have to sell what they produce (1) to get the products they want/to buy other products (1) • Money helps trade as it avoids the need for barter (1) overcomes the double coincidence of wants (1) • Any functions of money e.g. medium of exchange or store of value (max 2) 4 6(c) Analyse how advances in technology can affect demand and supply. • Advances in technology reduce costs of production (1) increases the speed of production (1) increases supply (1) lower price (1) increases quality/efficiency/reduces waste (1) lower price causes an extension in demand (1) • Advances in technology create new products and newer versions of products (1) higher demand will increase price (1) higher prices will cause supply to extend (1) • Advances in technology decreases demand for some products (1) example (1) • Advances in technology may reduce demand for labour (1) as machines may replace workers (1) example (1) • Advances in technology may enable firms to extract raw materials more easily (1) increasing the supply of raw materials (1) example (1) 6 Maximum of 4 marks if there is only reference to demand or supply. Question Answer Marks Guidance 6(d) Discuss the economic arguments for and against a government raising the school- leaving age. Up to 5 marks for why it should: • It may increase educational standards (1) increase skills (1) raise labour productivity (1) increase innovation/technology (1) lower costs of production (1) raise output (1) improve the current account position (1). • More educated workers are likely to be in higher demand from employers (1) more occupationally mobile (1) lower unemployment (1) create jobs for teachers (1) raise wages (1) improve living standards (1) may reduce income inequality (1). • It may attract more MNCs to set up in the country (1) as they will expect a more skilled labour force (1) which may increase GDP(1). Up to 5 marks for why it should not: • It will increase government spending (1) opportunity cost (1) example (1) may lead to higher taxes (1). • Workers may be sufficiently qualified/there may not be vacancies for more-skilled workers (1) inappropriate use of resources (1) workers may become over-qualified for the jobs they do (1). • In the short run will reduce the size of the labour force (1) lower output/productive potential (1). 8 A response may develop a mixture of relevant points to achieve up to 5 marks on either side. Reward but do not expect education being a merit good. Maximum of 2 marks on each side of the discussion for a list- like approach.
This question in 0455/22 May/June 2017
Q3 · Coal mining Coal is used directly to heat homes throughout the world and produces more… 0455/23 May/June 2017
1 Coal mining Coal is used directly to heat homes throughout the world and produces more than 40% of the world’s electricity. There are, however, a number of challenges facing the coal industry. These include increasing concerns about the environmental effects of using coal and the increased competition from other fuels. Mining and using coal to produce electricity causes air pollution. Coal-fired power stations emit carbon dioxide, which has a harmful effect on people’s health. Wildlife habitats are damaged when new mines are opened and when coal waste is dumped on landfill sites. However, demand for coal has declined recently. This resulted in the price of a tonne of coal falling from US$300 in 2010 to US$150 in 2015. Even China, the world’s largest consumer of coal, purchased less in 2015. Some high-cost deep mines were closed in the USA. In the same year, Europe’s largest producer, Poland, sold coal at a loss of US$37 a tonne. The fall in demand for coal arises partly from competition from renewable energy. For instance, advances in technology are reducing the costs of producing energy from wind power. Fig. 1 shows how the market for wind power changed in 2015. S1 S2 price of wind power P1 P2 D1 O Q1 Q2 quantity of wind power Fig. 1 The market for wind power in 2015 Some countries protect their energy industries from foreign competition, in some cases to reduce a current account deficit. The governments of a number of coal-producing countries also regulate their coal industries. The extent of government intervention is influenced by the type of economic system operated. (a) Identify, using information from the extract, two external costs that arise from using coal to produce electricity. [2] (b) Explain two reasons why a firm may continue to produce a good despite making a loss. [4] (c) Calculate, using information from the extract: (i) the percentage fall in the price of coal between 2010 and 2015 [2] (ii) the cost (in US$) of producing a tonne of coal in Poland in 2015. [2] (d) Analyse how resources are allocated in a mixed economy. [5] (e) Discuss whether governments should regulate the coal industries of their countries. [5] (f) Explain, using information from the extract and Fig. 1, what happened to the market for wind power in 2015. [4] (g) Discuss whether a government should use trade protection to reduce a current account deficit. [6]
30 marks
Mark scheme: 1(a) Identify, using information from the extract, two external costs that arise from using coal to produce electricity. Air pollution/carbon dioxide emissions (1) damage to wildlife habitats (1) ill health (1). 2 1(b) Explain two reasons why a firm may continue to produce a good despite making a loss. 1 mark each for each of two reasons identified: • expectation revenue/profits may increase (1) expectation costs may fall (1) • government subsidy (1) to preserve jobs (1) sales maximisation as a goal (1) • aim is social welfare (1) it is a strategic industry (1) the firm has seasonal demand (1) • the firm cannot produce any other product (1) the firm may be state owned (1) • the firm does not make an overall loss (1) but covers losses from other products (1) 1 mark each for each of two explanations: • expectation revenue will rise if anticipate demand will be higher in the future (1) • expectation costs will fall e.g. as the firm expands or new resources are discovered (1) • a government subsidy may cover a loss (1) • jobs preserved in the short term in anticipation of an upturn in future (1) • sales maximisation in the short-term for greater future profits e.g. monopoly (1) • non-profit making organisations cover losses by e.g. donations, government support (1) • firm will make losses in winter but anticipate profits in summer (1) • the firm will keep producing its only product until bankrupt (1) • nationalised industries e.g. railways, providing a public service (1) 4 1(c)(i) Calculate, using information from the extract, the percentage fall in the price of coal between 2010 and 2015. Correct answer: 50% (2) Correct working: e.g. 150 ÷ 300 × 100 (1) 2 Question Answer Marks Guidance 1(c)(ii) Calculate, using information from the extract, the cost in (US$) of producing a tonne of coal in Poland in 2015. Correct answer: $187 (2) Correct working: e.g. $150 + $37 (1) 2 $ sign required for 2 marks 1(d) Analyse how resources are allocated in a mixed economy. A mixed economy consists of resource allocation by both public and private sectors (1) Up to 3 marks for analysis of the role of the public sector: • Government production of goods which private sector is unable/unwilling to do (1) government sets prices (1) • Government influencing prices through taxes and subsidies (1) • Government laws and regulations to protect public (1) • Government redistributing incomes (1) Up to 3 marks for analysis of the role of the private sector: • Role of price mechanism (1) responding to changes in demand and supply (1) signalled by price changes (1) • resources moving to making products in increasing demand (1) away from products falling in demand (1) profit incentive (1) creating an efficient use of resources (1) • Those earning the highest income (1) have the greatest purchasing power (1) differences in income provide incentives (1) 5 Question Answer Marks Guidance 1(e) Discuss whether governments should regulate the coal industries of their countries. Up to 3 marks for why they should: • Control of negative externalities (1) harmful effects on third parties (1) e.g. regulations on air pollution or noise pollution (1) • To ensure regular fuel supplies (1) by having output targets (1) • Consumer protection (1) price controls (1) through maximum and/or minimum prices (1) • Worker protection (1) regulation of working conditions/safety in coal industry (1) • Control of any monopoly power (1) preventing price being driven up (1). Up to 3 marks for why they should not: • Regulation may be difficult to enforce (1) expensive to enforce/uses up resources (1) difficult to determine who has caused the pollution (1) coal industry not the only pollution source (1) • May reduce coal industry output (1) reducing GDP economic growth (1) creating unemployment (1) reducing coal exports (1) may reduce government tax revenue (1) • May add to firms’ costs (1) increasing coal prices (1) causing cost-push inflation (1) • May discourage investment in the coal industry (1) raising production costs (1) increasing prices (1) 5 Pollution on its own is insufficient, it needs to be a specific example. 1(f) Explain, using the information from the extract and Figure 1, what happened to the market for wind power in 2015. The diagram shows: • supply increasing/more wind power produced (1) • price falling (1) • demand extending (1) • more wind power traded (1) • costs of production fell (1) due to advances in technology (1) • inelastic demand (1) inelastic supply (1) 4 Question Answer Marks Guidance 1(g) Discuss whether a government should use trade protection to reduce a current account deficit. Up to 4 marks for why it should: • Trade protection/tariffs may increase import prices (1) import volumes will fall (1). • Trade protection/quotas will reduce the quantity of imports (1) • Trade protection/embargoes will stop imports of certain products (1) may cause lower import expenditure (1) reducing a current account deficit (1) • Trade protection may prevent other countries from dumping their output (1) • A reduction in a current account can increase output (1) raise incomes (1) reduce unemployment (1) Up to 4 marks for why it should not: • Trade protection may provoke retaliation (1) if other countries impose trade restrictions (1) the current account may not improve (1) GDP may fall (1) unemployment may rise (1). • Trade protection may discourage firms from becoming efficient (1) this will mean the deficit will continue (1). • Other policies may be more effective (1) e.g. increase in income tax (1). • Trade protection can disadvantage domestic consumers/producers (1) raise price (1) reduce imports of e.g. raw materials (1) reduce quality (1). • Some products cannot be produced domestically (1). 6
This question in 0455/23 May/June 2017
Q4 · From inflation to deflation For some time, many central banks have tried to achieve a… 0455/22 Oct/Nov 2017
1 From inflation to deflation For some time, many central banks have tried to achieve a target inflation rate of about 2%. A small and steady rise in the price level can bring a number of benefits to an economy. For central banks and governments, the problem used to be stopping the inflation rate from going above the target rate while keeping the unemployment rate low. Now the problem has changed, and the risk is that inflation will fall below this target rate. At the end of 2014 the consumer prices index in China stood at 100.5. The inflation rate in the country in 2015 was 2%. Meanwhile, a number of countries in Europe experienced deflation. This had several consequences, including increasing the gap between the wages of skilled and unskilled workers. One major reason for the downward pressure on inflation was a fall in the global price of oil from US$120 to US$66 a barrel in 2015. This reduced the price of energy and transport. Lower transport costs had a noticeable impact on the price of food. Fig. 1 shows how the market for food was affected in 2015. S1 price of food S2 P1 P2 D O Q1 Q2 quantity of food Fig. 1 The market for food in 2015 At the same time as falling inflation, some countries experienced falling unemployment. Other countries, however, experienced both falling inflation and rising unemployment. For example, France saw unemployment rising between 2014 and 2015. This put upward pressure on French Government spending. (a) Identify, from the extract, two aims of government policies. [2] (b) Explain two problems caused by inflation. [4] (c) Calculate, using information from the extract: (i) the percentage fall in the global price of a barrel of oil in 2015 [2] (ii) the consumer prices index in China at the end of 2015. [2] (d) Analyse why an increase in unemployment might cause an increase in government spending. [5] (e) Discuss whether the supply of workers for unskilled jobs will be high in a country. [5] (f) Explain, using information from the extract and Fig. 1, what happened to the market for food in 2015. [4] (g) Discuss whether a decrease in income tax would reduce deflation. [6]
30 marks
Mark scheme: 1(a) Identify, from the extract, two aims of government policies. Price stability / low inflation / stopping inflation rate rising above target (1) full employment / low unemployment (1). 2 Question Answer Marks Guidance 1(b) Explain two problems caused by inflation. 1 mark each for each of two problems identified: • worsen current account position • redistribution of income • uncertainty • menu costs • shoe leather costs • inflationary noise • fiscal drag • higher unemployment • money may cease to carry out its functions • lower demand / lower output / lower economic growth • lower purchasing power / fall in the value of money • lower standards of living / higher cost of living. 1 mark each for each of two explanations: • export prices will rise – reduce international competitiveness • lenders / those on fixed incomes may lose and borrowers may gain • lack of certainty may discourage investment • cost of changing e.g. price labels • cost of moving money around in search of highest interest rate • confusion caused by not being able to work out change in relative prices • people’s income being dragged into higher tax brackets • costs of production may increase, causing firms to reduce the number of workers they employ • during periods of hyperinflation, money may cease to be generally acceptable • cost-push inflation will reduce total demand • purchasing power will fall if incomes rise by less than prices 4 Fall in the value of the currency on its own is too vague – must make clear reference to internal value. Question Answer Marks Guidance 1(c)(i) Calculate, using information from the extract, the percentage fall in the global price of a barrel of oil in 2015 45% (2) Correct working i.e. $54 / $120 × 100 (1) 2 1(c)(ii) Calculate, using information from the extract, the consumer prices index in China at the end of 2015. 102.51 (2) Correct working i.e. 100.5 × 2 / 100 + 100.5 or 2.01 (1) 2 Accept 102.5 Question Answer Marks Guidance 1(d) Analyse why an increase in unemployment might cause an increase in government spending. It may increase government spending on unemployment benefits (1) the unemployed may suffer worse health (1) this may increase government spending on healthcare (1) if crime rises, the government may spend more on law and order (1). To reduce unemployment, the government may adopt expansionary fiscal policy / policy to stimulate the economy / policy to increase economic growth (1) to increase total demand (1) to create more jobs (1). Government may provide subsidies to firms (1) to encourage them to increase output and employment (1). Government may spend more on education (1) to increase skills of workers (1) reduce structural unemployment (1). Unemployment may increase poverty (1) leading to more spending on other benefits (1). Government may employ more workers in the public sector (1) to reduce unemployment / will increase wage bill (1). Government may spend on infrastructure (1) to raise labour mobility (1). 5 Maximum of 3 marks for a list-like approach. Question Answer Marks Guidance 1(e) Discuss whether the supply of workers for unskilled jobs will be high in a country. Up to 3 marks for why it might: Levels of education and training may be low (1) in some developing countries there is a relatively high illiteracy rate (1) workers may lack skills/qualifications (1). Unskilled jobs may provide good non-wage benefits (1) example e.g. short working hours (1). The supply may be high due to immigration of unskilled workers / high population (1) attracted by wages that are higher than the countries they come from (1). Most workers may be employed in the primary sector (1) which may offer largely unskilled jobs (1). May be high unemployment (1) so some skilled workers may have to apply for unskilled jobs (1). May be high unemployment benefit (1) discourages incentive to work (1). Up to 3 marks for why it might not: Unskilled jobs are likely to be relatively poorly paid (1) wage rate is a key influence on jobs workers select (1). Unskilled jobs may offer poor working conditions (1) example e.g. hard manual work (1). Unskilled workers may emigrate to other countries (1) if wages/working conditions are better in other countries (1). Work may be capital-intensive (1) requiring high skills (1). 5 Question Answer Marks Guidance 1(f) Explain, using information from the extract and Fig. 1, what happened to the market for food in 2015. The diagram shows supply increasing (1) price falling (1) demand extending / more food / higher quantity (1) costs of production falling due to lower transport costs (1) inelastic supply (1) inelastic demand (1). 4 1(g) Discuss whether a decrease in income tax would reduce deflation. Up to 4 marks for why it might: A reduction in income tax will increase disposable income (1) may raise consumer expenditure (1) may raise investment (1) increase total demand (1) higher demand may encourage firms to raise prices / demand-pull inflation (1). Up to 4 marks for why it might not: Consumers may not spend more / may save more (1) if concerned about the future (1) if expect prices to be lower in the future (1). A decrease in income tax may not reduce deflation caused by lower costs of production (1) e.g. advances in technology / investment may continue pushing down the price level (1). A decrease in income tax may reduce government spending (1) higher consumer spending may be offset by lower government spending (1). May act as incentive to work (1) may increase productivity / efficiency (1) lower costs of production / increase total (aggregate) supply (1). Consumers may spend on imports (1). 6
This question in 0455/22 Oct/Nov 2017
Q5 · Changes in the global balance of economic power In 2014, global Gross Domestic Product… 0455/23 Oct/Nov 2017
1 Changes in the global balance of economic power In 2014, global Gross Domestic Product (GDP) stood at US$78 000 billion. A year later it had increased to US$80 730 billion. In the past, countries such as the USA and Germany might have been expected to have made the largest contribution to the increase in GDP. China accounted for 20% of the increase in world output in 2015. China is set to become the largest economy. It is becoming a stronger competitor in a number of markets. This increased price competitiveness is the result of a number of factors including maintaining a low exchange rate, providing subsidies to a number of industries and increased labour productivity. However, in 2015 the Chinese Government was considering whether to reduce the size of the country’s steel industry, possibly by cutting the subsidy it received. Fig. 1 shows how the market for steel might be affected by such a change. price of steel S2 S1 P2 P1 D1 O Q2 Q1 quantity of steel Fig. 1 The market for steel in China in 2015 Some developed countries have been struggling recently. For example, Australia has seen its economic growth rate declining. To try to increase domestic economic activity the Reserve Bank of Australia has cut interest rates. Developing and emerging economies’ economic growth rates are increasing. In Africa, this is in part because of the discovery and exploitation of oil and mineral resources. These countries have different exchange rate systems and have different records of success in attracting multinational companies. Many African countries use protectionist measures but some are moving towards free trade. In most developing and emerging economies the birth rate is falling. The impact of this change is influenced by the relative size of the fall. For instance, Nauru is one of the smallest countries in the world having a population of only 10 000. Its birth rate fell from 26 to 25 in 2015. (a) Identify, from the extract, two monetary policy measures. [2] (b) Explain two causes of a fall in the birth rate. [4] (c) Calculate, using information from the extract: (i) the value in US$ of China’s contribution to global GDP growth in 2015 [2] (ii) the number of children born in Nauru in 2015. [2] (d) Analyse, using a production possibility curve diagram, how the discovery of new oil reserves would affect an economy. [5] (e) Discuss whether a firm would benefit from a fall in its country’s exchange rate. [5] (f) Explain, using information from the extract and Fig. 1, what might have happened to the market for steel in China in 2015. [4] (g) Discuss whether engaging in free trade increases living standards in a country. [6]
30 marks
Mark scheme: 1(a) Identify from the extract, two monetary policy measures. interest rates (1) exchange rates (1) 2 expansionary monetary policy 1(b) Explain two causes of a fall in the birth rate. 1 mark each for each of two causes identified: • rise in incomes / standard of living • Increase in education • more women working • improved family planning • women marrying later • improved social provision / more affordable healthcare • higher cost of raising children / cut in government child benefits • fall in infant mortality rates • government discourages births. 1 mark each for each of two explanations: • richer people tend to have fewer children – tend to spend more on their education, do not rely on children to support them • increased education raises people’s expectations of living standards for themselves and for their children • more educated women tend to marry later • more knowledge and availability of ways to limit families will reduce the number of unwanted births • more children surviving to adulthood so fewer births • working women tend to limit their families to avoid too many career breaks • provision of state pensions and healthcare reduces parents, need to have children to look after them • reduces incentives to have children. 4 Question Answer Marks Guidance 1(c)(i) Calculate, using information from the extract: the value in US$ of China’s contribution to global GDP growth in 2015 $546 billion (2) Correct method, i.e. 20% of US$2.730 billion or $546/546 billion (1) 2 1(c)(ii) Calculate, using information from the extract: the number of children born in Nauru in 2015. 250 (2) Correct method, i.e. 25 × 10 (1) 2500 (1) 2 1(d) Analyse, using a production possibility curve diagram, how the discovery of new oil reserves would affect an economy. Up to 4 marks for the diagram: • 1 mark for axes correctly labelled • 1 mark for original curve/straight downward sloping line drawn to the axes. • 1 mark for new production possibility curve • 1 mark for indicating curve will shift to the right – either by arrows or labels. Up to 1 mark for explanation: A discovery of new oil reserves will increase productive potential / capacity / be able to produce more / results in economic growth (1) 5 Accept any reasonable label of axis. If labelled with oil / petrol accept parallel PPCs. Do not reward output / production increases O e.g. capital goods e.g. consumer goods B B A A O other products oil / petrol B1 A B Question Answer Marks Guidance 1(e) Discuss whether a firm would benefit from a fall in its country’s exchange rate. Up to 3 marks for why it might: Lower prices of exports (1) increase demand for its products (1) raise sales / revenue (1) increase profits (1). Increase size of market (1) enabling it to take greater advantage of economies of scale (1) lower average costs of production (1). Domestic producers can produce goods cheaper than overseas goods (1) resulting in higher home sales (1). Up to 3 marks for why it might not: Increase price of imports (1) raise a firm’s costs of production (1) lower profits (1). If demand for exports is price-inelastic (1) a fall in price of exports will cause a fall in revenue (1). A fall in the exchange rate (1) may create uncertainty making it difficult for a firm to plan (1) Maybe recession in other countries (1) will not result in increased sales (1). Quality of goods may be poor compared with other competitors (1) sales do not rise (1). 5 To achieve full marks, benefits to a firm must be discussed. 1(f) Explain, using information from the extract and Fig. 1, what might have happened to the market for steel in China in 2015. The diagram shows: supply decreasing (1). price rising (1). demand contracting / less steel / fall in quantity (1). if the subsidy to steel industry was cut (1). demand and supply are inelastic (1). 4 Question Answer Marks Guidance 1(g) Discuss whether engaging in free trade increases living standards in a country. Up to 4 marks for why it might: Free trade may increase competition / removal of tariffs and quotas (1) encourages multinational corporations (MNCs) to set up in country (1) specialise (1) drives down prices (1) promotes efficiency (1) encourages innovation (1) increases quality (1) increase the range of products available (1) reduce unemployment (1) raise income/GDP (1). May increase the size of firms’ markets (1) allowing them to take advantage of economies of scale (1). Up to 4 marks for why it might not: Free trade may cause some industries to go out of business (1) increasing unemployment (1) reducing incomes / GDP falls (1) may cause higher pollution (1). Unsafe products/low quality products may be imported (1). Dumping may occur (1) driving out domestic producers (1) which can raise prices (1) lower quality in the long run (1). 6
This question in 0455/23 Oct/Nov 2017
Q6 · Russia’s struggle for economic recovery Shortly after the 2014 Winter Olympic Games in… 0455/21 Oct/Nov 2018
1 Russia’s struggle for economic recovery Shortly after the 2014 Winter Olympic Games in Sochi, Russia, the value of the Russian currency, the rouble, depreciated significantly against the US$. Russian Gross Domestic Product (GDP) growth rates also became negative. Political and economic instability in the region contributed to these changes. To avoid further outflows of financial capital from the Russian economy and further falls in the value of the Russian rouble, the central bank of Russia increased the official interest rate to 17%. By 2016, the rouble fell even more and the central bank considered selling its foreign reserves to raise the exchange rate against the US$. Overall, things did not look good for the Russian economy in 2016. Export values fell and foreign investors lacked confidence in the Russian economy. This not only had a negative impact on unemployment rates and economic growth but also had an impact on poverty rates which were expected to return to pre-2007 levels. Demographic trends did not help as Russia’s population declined due to high death rate, low fertility rate, and a high level of emigration. Domestic consumption and investment, however, showed some positive signs. Consumers bought more domestic products and domestic investment increased. However, inflation rose and the central bank introduced policy measures to avoid a rapid increase in prices. As an oil producer, Russia’s economy was affected by falling international oil prices. Saudi Arabia, the world’s second largest oil producer, continued to increase oil production despite pressures by other producers to cut production. In addition, global demand for oil was weak. Table 1 shows the price of oil between 2010 and 2016. Table 1 Price of Oil 2010–16 (US$) Price of Oil Year (US$ per barrel) 2010 82 2011 92 2012 103 2013 93 2014 95 2015 53 2016 37 In 2016, domestic Russian oil producers struggled to make a profit due to economic uncertainty and competition from renewable energy. They were also concerned that it may become even more difficult for them to make a profit in the future. This was because the government wanted to increase tax on oil producers to raise more revenue. The government believed that such an extra tax would not actually hurt the large oil producers. (a) Calculate, using the information in Table 1, the percentage change in the price of oil between 2010 and 2016. [2] (b) Explain, using information from the extract, two reasons for falling oil prices. [4] (c) Identify, using information from the extract, two ways a central bank could try to stop a fall in the international value of its currency. [2] (d) Explain, using information from the extract, two reasons for Russia’s declining population. [4] (e) Analyse the extent to which a rise in oil prices will cause inflation. [5] (f) Discuss whether or not increasing taxes on Russian oil producers will be harmful to those producers. [5] (g) Identify one way in which monetary policy differs from fiscal policy. [2] (h) Discuss whether or not the Russian government should have been concerned about the state of the Russian economy in 2016. [6]
30 marks
Mark scheme: 1(a) Calculate, using the information in Table 1, the percentage change in the price of oil between 2010 and 2016. 54.9 (2) − $37 $82 $82 × 100 correct working (1) 2 1(b) Explain, using information from the extract, two reasons for falling oil prices. Saudi Arabia’s output of oil is growing (1) increasing the supply / shown on accurate diagram (1). (Global) demand for oil is weak/decreasing / shown on accurate diagram (1) due to global economic uncertainty / competition from renewable energy / price reduced to attract consumers (1). 4 1(c) Identify, using information from the extract, two ways a central bank could try to stop a fall in the international value of its currency. Increase interest rate (1). Sell its foreign reserves / buy its own currency (1). 2 1(d) Explain, using information from the extract, two reasons for Russia’s declining population. High death rate (1) e.g. low life expectancy / poor health of the population / poor healthcare system (1). Low fertility rate (1) e.g. low birth rate / birth rates below the replacement rate (1). High levels of emigration (1) e.g. better opportunities elsewhere, unemployment, poverty, domestic political, social, and economic instability (1). 4 Question Answer Marks Guidance 1(e) Analyse the extent to which a rise in oil prices will cause inflation. Rise in oil prices will increase costs of production (1) e.g. higher energy costs / transport costs (1) resulting in cost-push inflation (1). Demand for oil is price-inelastic (1) if prices rise most consumers will keep buying it (1) some producers and consumers however may switch to other products (1) The extent will depend upon the proportion of oil costs in the total costs of other products (1) other costs may be falling (1). Because of rising oil prices, workers may demand higher wages (1) causing cost-push inflation (1). Movements in exchange rates will affect the impact on inflation (1) a rise in the exchange rate would reduce the overall effect (1). For oil producing countries export revenue may rise (1) causing higher demand (1) and demand-pull inflation (1). 5 Question Answer Marks Guidance 1(f) Discuss whether or not increasing taxes on Russian oil producers will be harmful to those producers. Up to 3 marks for reasons why it would be harmful: Producers’ costs will rise (1) they will become less profitable (1) and they already struggled to make a profit (1) small producers will find it difficult to absorb the extra costs (1). They may need to cut production / stop production completely (1) or cut costs (1) causing unemployment of the workforce (1). They might pass on the tax (1) by raising prices (1) to maintain profits (1) but this could reduce demand (1) by making them less competitive with other countries e.g. Saudi Arabia (1) less competitive with other energies e.g. renewables (1) Investments in the oil industry may fall (1) due to less funds available (1). Up to 3 marks for reasons why it would not be harmful: Demand for oil is likely to be price inelastic (1) this may enable the producers to pass on the tax in higher price to consumers (1) without losing revenue (1). Most oil producers are large (1) and earn very high profits (1) paying extra tax will not harm them significantly (1). Some of the tax revenue may be used on e.g. education/training (1) which could increase productivity of workers (1) lowering oil producer’s costs (1). 5 Each point may be credited only once, on either side of an argument, but separate development as to how/why the outcome may differ is to be rewarded. 1(g) Identify one way in which monetary policy differs from fiscal policy. Fiscal policy includes taxes / government spending (1) monetary policy includes interest rates / money supply / exchange rate (1). Fiscal policy is conducted by the government of the country (1) while monetary policy is conducted by the central bank of the country (1). 2 Maximum 1 mark for reference to only monetary OR fiscal. Question Answer Marks Guidance 1(h) Discuss whether or not the Russian government should have been concerned about the state of the Russian economy in 2016. Up to 4 marks for why they should have been concerned: Negative economic growth / recession (1) increasing unemployment (1) increasing poverty rates (1) possible policy measures to reduce poverty (1) e.g. costs of healthcare may rise (1) need for greater spending on benefits e.g. unemployment benefits (1) falling tax revenues (1) may have to increase taxes (1) opportunity cost(s) involved / reduced spending on other areas e.g. defence (1). Rising inflation (1) making goods and services less affordable (1). Emigration from Russia is increasing (1) reducing the available workforce (1). Export values are falling (1) so less foreign currency is earned (1) falling value of the rouble (1) causing imported inflation (1) leading to higher interest rates (1) higher cost of borrowing for government (1). Investors lacked confidence in the Russian economy (1) may have reduced productive potential (1). Up to 4 marks for why it is less of a cause for concern: Government spending may not need to rise (1) and tax revenue may increase (1). Domestic consumption is increasing (1) and domestic investment is increasing (1) this may create employment (1) and offset decreases in foreign investments and exports (1) therefore total (aggregate) demand might not decrease significantly (1). Inflation may be a sign of increasing demand (1) showing confidence in the economy (1). Emigration may be mainly of unskilled workers (1) who are less valuable to firms (1). The falling exchange rate may improve the current account (1) with no need for government / central bank action (1). 6 For all ‘Discuss’ questions Each point may be credited only once, on either side of an argument, but separate development as to how/why the outcome may differ is to be rewarded. Generic example Mark Economic growth will increase 1 because of reason« e.g. demand for services is increasing globally 1 Economic growth will decrease (reverse of 1st argument) 0 because of a different reason / not a reverse argument e.g. a country’s resources may be more suited to producing primary products. 1
This question in 0455/21 Oct/Nov 2018
Q7 · In 2016, there was a global surplus in the steel market pushing down steel prices 0455/21 Oct/Nov 2018
2 In 2016, there was a global surplus in the steel market pushing down steel prices. This situation led to various calls for protectionist measures by other steel producers such as those in the EU and the USA. However, such measures were not supported by car producers as approximately 22% of a car manufacturer’s costs depend on steel prices. (a) Define protectionism. [2] (b) Explain two methods of trade protection. [4] (c) Analyse, using a demand and supply diagram, the effect of falling steel prices on the market for cars. [6] (d) Discuss whether or not protectionism is effective in raising living standards. [8]
20 marks
Mark scheme: 2(a) Define protectionism. Protectionism is the deliberate attempt to limit imports or promote exports / make foreign products less competitive (1) have trade restrictions (1). 2 2(b) Explain two methods of trade protection. Tariffs (1) tax on imports that would increase the price of imports (1). Quotas (1) limit on the volume of imported goods allowed into the country (1). Subsidies (1) to reduce the costs of domestic firms / reduce the price of domestic goods and services (1). Embargoes (1) total restriction / ban on imported goods (1). Exchange controls (1) limit on the amount of foreign currency that can be purchased (1) Regulations (1) making it difficult to import (1) 4 Question Answer Marks Guidance 2(c) Analyse, using a demand and supply diagram, the effect of falling steel prices on the market for cars. Diagram up to 3 marks: • P, Q, S, D correctly labelled • Shift in supply curve to the right • Decrease in P and increase in Q • New equilibrium indicated Written analysis up to 3 marks: • Steel prices decreasing will lead to a decrease in car manufacturers’ costs (1) • This may be passed on in lower price of cars (1) • The extent of the change might be influenced by PED/PES (1) 6 O Price Quantity D P1 Q1 Q2 P2 S2 S1 Question Answer Marks Guidance 2(d) Discuss whether or not protectionism is effective in raising living standards. Up to 5 marks on how it will be effective in raising living standards: Protectionism may increase the price of imports (1) the quantity of imports demanded will decrease (1) the quantity of domestic goods demanded may increase (1) demand for labour is derived demand (1) demand for workers will increase (1), therefore unemployment decreases (1) domestic incomes increase (1) consumption of goods and services increase (1) employment in infant/declining (sunrise/sunset) industries may be protected (1). Increased demand for products of domestic firms may lead to an increase in total revenue (1) and profits (1). Protectionism can decrease imports of demerit goods (1) reducing external costs (1) e.g. pollution, health/social problems (1). Up to 5 marks on how it will not be effective in raising living standards: Protectionism may reduce the possibility of specialisation (1) to produce what a country is best at (1) increasing production costs (1) increasing import prices (1). Protectionism might lead to retaliation (1) other countries may adopt protectionist policies on imports (1) increasing the price of the country’s exports (1) decreasing the demand for exports (1) reducing the demand for workers (1) unemployment increases (1) less income (1) consumption/production of goods and services decreases (1). Protectionism may reduce competition / choices available to domestic consumers (1) reducing the quality of the products available (1). Protectionist policies in one country could reduce employment in other countries (1) as they are no longer able to export the same amount (1). 8 Each point may be credited only once, on either side of an argument, but separate development as to how/why the outcome may differ is to be rewarded.
This question in 0455/21 Oct/Nov 2018
Q8 · Droughts in the Pacific Coast region of the US and regulations, in the form of limits on… 0455/21 Oct/Nov 2018
3 Droughts in the Pacific Coast region of the US and regulations, in the form of limits on the amount of salmon that can be caught in the wild, have reduced the supply of wild salmon. These limits were imposed to avoid market failure in the salmon market. However, the effect of this on the revenue of salmon producers is uncertain. In addition, producers of farmed salmon in the US states of Washington and Alaska have received subsidies from the US government. (a) Define supply. [2] (b) Explain one market failure that may occur in the salmon market. [4] (c) Analyse how information on changes in a firm’s revenue can be obtained from price elasticity of demand calculations. [6] (d) Discuss whether or not government subsidies are beneficial to producers. [8]
20 marks
Mark scheme: 3(a) Define supply. The number of products firms are willing to provide/sell (1) and are able to provide/sell (1) at a given price (1). 2 3(b) Explain one market failure that may occur in the salmon market. Market mechanism fails to allocate resources efficiently / not all costs are considered (1). Social cost is greater than private cost (1) as there are external costs / negative externalities (1) consumption at the current rate may lead to depletion of stock (1) consumption becomes unsustainable (1) overconsumption / resources are overused (1) these resources could be conserved for future generations (1) cost to future generations who will not be able to enjoy the product (1) pollution may occur e.g. water pollution (1). Monopoly / one large producer (1) no competition (1) can charge high prices / exploit consumers (1) excess profits of producers (1). Inequality (1) high price (1) poor cannot afford the product (1) and will not be able to attain any health benefits of consuming the product (1). 4 Question Answer Marks Guidance 3(c) Analyse how information on changes in a firm’s revenue can be obtained from price elasticity of demand calculations. PED definition or formula (1) PED provides information on how consumers react to a change in price (1). If PED is elastic / PED > 1, a fall in price will raise revenue (1) as quantity demanded will increase more (1) than proportionately/percentage (1). A rise in price will decrease revenue (1) as quantity demanded will decrease more than proportionately (1). If PED is inelastic / PED < 1, a rise in price will raise revenue (1) as quantity demanded will decrease less (1) than proportionately / percentage (1). A fall in price will decrease revenue (1) as quantity demanded will increase less than proportionately (1). If PED is perfectly elastic, a rise in price will cause revenue to fall to 0 (1) as consumers will stop buying completely (1) If PED is perfectly inelastic / PED = 0, a rise in price will raise revenue (1) as consumers will continue to buy the same amount (1) If PED has unit elasticity / PED = 1, a change in price will keep revenue unchanged (1) as quantity demanded will change by the same proportion (1). 6 Maximum 4 marks for reference to only elastic OR inelastic. Question Answer Marks Guidance 3(d) Discuss whether or not government subsidies are always beneficial to producers. Up to 5 marks on how subsidies are beneficial to producers: Subsidies will lead to a decrease in cost of production (1) leading to a decrease in the price of products / shown on a diagram (1) and an increase the quantity demanded for producers / shown on a diagram (1). Total revenue for producers may increase (1) increasing profits (1). Subsidies will enable producers to increase investment (1) increasing future output (1) Producers can maintain a stable livelihood (1) ensure a stable income (1) ensure jobs can continue to be provided (1). Subsidies can encourage new entrants to an industry (1) increasing competition (1) Up to 5 marks on how subsidies are not beneficial: Subsidies may be relatively small (1) and not be enough to offset the firm’s losses (1) or not enough to offset higher costs (1). Subsidies can lead to complacency (1) where producers do not use subsidies in an effective way (1) they will be reluctant to lose the subsidies (1) and producers not receiving the subsidy e.g. those in a competing industry will be at a disadvantage (1). Subsidies have opportunity cost for the government (1). Other government provisions might be sacrificed (1) e.g. healthcare and education (1). 8 Each point may be credited only once, on either side of an argument, but separate development as to how/why the outcome may differ is to be rewarded.
This question in 0455/21 Oct/Nov 2018
Q9 · Indian Railways is a state-owned enterprise, owned and operated by the Ministry of… 0455/22 Feb/March 2019
7 Indian Railways is a state-owned enterprise, owned and operated by the Ministry of Railways. There is currently only one privately-owned railway line in India. The market for rail travel is influenced by changes in the markets for other forms of transport. For instance, changes in the supply of oil and petrol influence the market for car travel. (a) Define a market. [2] (b) Explain two reasons why the supply of a raw material such as oil may rise in the future. [4] (c) Analyse, using a demand and supply diagram, how the market for oil would be affected when the demand for oil increases by more than the supply of oil. [6] (d) Discuss whether or not car travel will increase in the future. [8]
20 marks
Mark scheme: 7(a) Define a market. 2 An arrangement that brings buyers and sellers into contact / products are bought and sold (2). Buyers (1) sellers (1). Example of the purchase and sale of products (1). 7(b) Explain two reasons why the supply of a raw material such as oil may 4 rise in the future. • New supplies may be discovered (1) after investment searching for them (1) • Price may rise (1) giving suppliers a profit incentive to supply more (1) • Advances in technology / cuts in wages (1) may reduce costs of obtaining the raw material (1) • Government subsidies (1) providing finance to search for oil / greater incentive to increase output (1) 7(c) Analyse, using a demand and supply diagram, how the market for oil 6 would be affected when the demand for oil increases by more than the supply of oil. Up to 4 marks for the diagram: Axes correctly labelled – price and quantity or P and Q (1). Demand and supply curves correctly labelled D1 and S1 (1). Demand and supply curves shifted to the right D2 and S2 (1). Equilibrium – shown by lines e.g. P2 Q2 or at point e.g. E2 (1). S1 price S2 of oil P2 E2 P1 D2 D1 O Q1 Q2 quantity of oil Up to 2 marks for written comments: More of the product will be traded / quantity will rise (1). Price will be higher (1). Note: Do not reward analysis marks for description of diagram e.g. price changes from P2 to P1 or quantity changes from Q1 to Q2. 7(d) Discuss whether or not car travel will increase in the future. 8 Up to 5 marks for why it might: Price of cars may fall (1) encouraging more people to buy cars (1). Price of petrol may fall (1) making it cheaper to run a car/petrol is a complement to cars (1). Population may increase (1) more potential drivers (1). More roads may be built (1) reduce time of car journeys (1). People may live further from work (1) requiring longer journeys (1). Driverless cars (1) may enable more people e.g. those with poor eyesight to use cars (1). Income may rise (1) enabling people to buy and use more cars (1). Up to 5 marks for why it might not: Price of substitute travel may fall (1) e.g. due to government subsidising rail travel (1). Taxes on car travel may rise (1) raising the cost of car travel (1). Parking charges may increase (1) parking is a complement to car travel (1). Congestion may rise (1) increasing travel time (1). Greater concern about the environment (1) may encourage some people to switch to more environmentally friendly forms of transport (1).
This question in 0455/22 Feb/March 2019
Q10 · In February 2017, Europe experienced a shortage of fresh vegetables due to bad weather 0455/21 May/June 2019
3 In February 2017, Europe experienced a shortage of fresh vegetables due to bad weather. For a period of time, the markets for a number of vegetables, including broccoli and lettuces, were not in equilibrium. The price of food tends to fluctuate more than the price of manufactured goods and services. These fluctuations influence the rate of inflation. (a) When is a market in equilibrium? [2] (b) Explain how a rise in the price of food would affect a country’s consumer prices index (CPI). [4] (c) Analyse, using a demand and supply diagram, how bad weather is likely to affect the market for broccoli. [6] (d) Discuss whether or not a higher inflation rate will benefit producers. [8]
20 marks
Mark scheme: 3(a) When is a market in equilibrium? When demand equals supply / when there is no pressure for price to change (2). When it is in balance (1). 2 drawn demand and supply diagram showing equilibrium. 3(b) Explain how a rise in the price of food would affect a country’s consumer prices index (CPI). CPI is a measure of inflation (1) Demand for food is inelastic / necessity (1). A rise in price of food would cause an increase in inflation / CPI (1). Food is an item in the CPI (1) it has a relatively high weighting (1) people spend a relatively high proportion on food (1) proportion declines as income rises (1). 4 3(c) Analyse, using a demand and supply diagram, how bad weather is likely to affect the market for broccoli. Up to 4 marks for the diagram: Axes correctly labelled – price and quantity or P and Q (1). Demand and supply curves correctly labelled (1). Supply curve shifted to the left (1). Equilibriums – shown by lines or e.g. E1 and E2 (1). Up to 2 marks for written comments: Bad weather will destroy crops / reduce supply of broccoli / quantity traded falls (1). Weather is an important influence on the supply of agricultural products / cost of producing broccoli will rise / price will rise (1). 6 S2 S1 Q2 Q1 P1 P2 D O quantity of broccoli price of broccoli Question Answer Marks Guidance 3(d) Discuss whether or not a higher inflation rate will benefit producers. Up to 5 marks for why it might: Producers may receive higher prices / revenue for their products (1) if costs rise by less (1) profits will rise (1) may encourage investment (1) expand the business (1). Producers may be able to borrow more cheaply (1) the burden of past debts will fall (1) if the rate of inflation is above the rate of interest (1). An inflation rate may rise from a low or negative rate (1) and this would provide a greater incentive for producers (1). Higher inflation rate in other countries (1) will make this country’s products more competitive (1). If demand is inelastic (1) a rise in price will increase revenue (1). Higher inflation will reduce the cost of borrowing (1). Up to 5 marks it might not: If cost of production rises (1) output may fall (1) firms’ profits may fall (1). Producers may have to spend time adjusting prices (1) menu costs (1). A lower and stable rate of inflation (1) may increase the confidence of producers (1). Producers may find it more difficult to export abroad / exports may fall (1) lower revenue (1). Producers may find it harder to assess relative prices (1) and so may make inefficient decisions (1). 8
This question in 0455/21 May/June 2019
Q11 · The South Korean economy was dominated by many family-owned firms which have now become… 0455/23 May/June 2019
5 The South Korean economy was dominated by many family-owned firms which have now become large public limited companies. The government provided subsidies and imposed trade protection to help their domestic firms to grow. Since 2010, average earnings have risen in South Korea. (a) Define public limited company. [2] (b) Explain two reasons for growth in average earnings. [4] (c) Analyse, using a demand and supply diagram, how government subsidies help firms grow. [6] (d) Discuss whether or not trade protection supports the growth of domestic firms. [8]
20 marks
Mark scheme: 5(a) Define public limited company. A company whose shares are traded on a stock exchange (1) these shares can be bought and sold by the public (1) the company has limited liability (1). 2 5(b) Explain two reasons for growth in average earnings. • increase in demand for goods and services (1) increase demand for workers / derived demand (1) an increase in demand would increase wages (1) • increase in inflation (1) workers demand higher wages (1) • trade union bargaining power (1) e.g. threat of industrial action (1) • increased productivity of workers (1) increasing demand for labour (1) • reduction in income tax (1) increasing disposable incomes (1) • the legal minimum wage increases (1) the lowest paid earn more, increasing the average (1) 4 2 marks could be awarded for an accurately drawn demand and supply diagram. 5(c) Analyse, using a demand and supply diagram, how government subsidies help firms grow. Up to 4 marks for the diagram: Axes correctly labelled – price and quantity or P and Q (1) Demand and supply curves correctly labelled (1) Shift in supply curve to the right (1) Equilibriums – shown by lines or labels e.g. E1 and E2 (1) Up to 2 marks for written analysis: Will lead to a decrease in cost of production (1) output increases / price will fall (1). Profits / revenue of firms may increase (1) profits can be reinvested (1) increasing productivity (1) increasing competitiveness of firms (1). 6 S2 S1 Q2 Q1 P1 P2 D O quantity price Question Answer Marks Guidance 5(d) Discuss whether or not trade protection supports the growth of domestic firms. Up to 5 marks for how it might: Protectionism may increase the price of imports (1) making imports less desirable (1) quantity of imports demanded decreases (1) quantity of domestic goods demanded increases (1). Protectionism may reduce the quantity of imports e.g. quotas (1) An increase in demand for domestic goods may lead to an increase in revenue (1) and profits (1) of domestic firms, encouraging them to hire more workers (1) decreasing unemployment (1). Trade protection can allow infant industries to grow / prevent sunset industries from declining (1) which may enable then to take greater advantage of economies of scale (1) making them more internationally competitive (1). Up to 5 marks for how it might not: Protectionism might lead to retaliation (1) other countries might put a protectionist policy on domestically produced goods (1) increasing the price of the country’s exports / reducing the quantity allowed (1) decreasing the demand for exports (1). An increase in price of imported raw materials may increase some firms costs of production (1) lowering profits (1). Domestic substitute raw materials may be of a lower quality (1) which will reduce the quality of the output of domestic firms (1) may lead to lower demand (1). Trade protection may make domestic firms complacent/less efficent (1) may become reliant on protection (1) less incentive to grow (1). 8
This question in 0455/23 May/June 2019
Q12 · Mali is a developing country 0455/22 Oct/Nov 2019
4 Mali is a developing country. Its Human Development Index (HDI) rose from 0.297 in 2000 to 0.442 in 2016. Most of Mali’s workers are employed in agriculture and cotton is the country’s main agricultural crop. The country’s main export, however, is gold. The country is the third largest exporter of gold in Africa. (a) Identify two components of the HDI. [2] (b) Explain how the proportion of a country’s resources devoted to the primary, secondary and tertiary sectors change as its economy develops. [4] (c) Analyse, using a demand and supply diagram, how a fall in the price of cotton would affect the market for cotton shirts. [6] (d) Discuss whether or not an increase in the size of a country’s gold mining industry will benefit an economy. [8]
20 marks
Mark scheme: 4(a) Identify two components of the HDI. • GDP (GNI) per head / income per head / average income • education • life expectancy 2 For education accept (adult) literacy. 4(b) Explain how the proportion of a country’s resources devoted to the primary, secondary and tertiary sectors change as its economy develops. A smaller proportion of resources are likely to be devoted to the primary sector (1) increases in technology / productivity / education requires fewer resources / resources move to more financially rewarding uses / use of more machinery (1). A greater proportion of resources are devoted to manufacturing at first (1) and then a smaller proportion (1) the manufacturing sector becomes more efficient (1). The service sector continues to grow (1) in developed economies, most labour is employed in the service sector (1). Some developing countries’ tertiary sector has grown faster than secondary sector – jumped a stage (1). 4 Question Answer Marks Guidance 4(c) Analyse, using a demand and supply diagram, how a fall in the price of cotton would affect the market for cotton shirts. Up to 4 marks for the diagram: Axes correctly labelled – price and quantity or P and Q (1). Demand and supply curves correctly labelled (1). Supply curve shifted to the right (1). Equilibriums – shown by lines or e.g. E1 and E2 (1). Up to 2 marks for written analysis: A fall in the price of cotton will reduce the cost of producing cotton shirts (1) price will fall / quantity will rise (1). Do not reward analysis marks for description of diagram e.g. quantity changes from Q1 to Q2. 6 S2 S1 Q1 Q2 P2 P1 D O quantity of cotton shirts price of cotton shirts Question Answer Marks Guidance 4(d) Discuss whether or not an increase in the size of a country’s gold mining industry will benefit an economy. Up to 5 marks for why it might: It may provide more jobs (1) reduce unemployment (1). It may increase output / cause economic growth (1) increase wages (1) increase living standards (1). Some of the gold may be exported (1) improve the current account position (1). The industry may experience (external) economies of scale (1) lower average cost (1) example of an external economy (1). It will be more beneficial if world demand is increasing (1). May attract multinational companies to set up in the country (1). Tax revenue may increase (1) enabling government to spend more on e.g. infrastructure (1). Up to 5 marks for why it might not: A rise in the supply of gold may reduce its price (1) reduce revenue (1) reduce exports (1). External costs may be created (1) damage to the natural environment / pollution (1). The industry may experience (external) diseconomies of scale (1) higher average cost (1) example of an external economy (1). Mining is a dangerous occupation (1) wages may be low as primary sector (1) jobs may be unskilled (1). Resource of gold may be depleted (1) stopping future generations being able to take advantage of them (1). It will be less beneficial if other gold producing countries are increasing their output (1). 8
This question in 0455/22 Oct/Nov 2019
Q13 · Calculate India’s economic growth rate in 2017 0455/22 Feb/March 2020
1 (a) Calculate India’s economic growth rate in 2017. [1] (b) Identify two methods of protection. [2] (c) State why India is a mixed economy. [2] (d) Explain why external costs cause market failure. [4] (e) Draw a demand and supply diagram to show the effects of a decrease in the costs of production on the market for cars. [4] (f) Analyse the relationship between the size of countries’ primary sector output and GDP per head. [5] (g) Discuss whether or not increasing subsidies given to bus travel would reduce pollution in India. [6] (h) Discuss whether or not India is likely to experience a deficit on the current account of its balance of payments in the future. [6]
30 marks
Mark scheme: 1(a) Calculate India’s economic growth rate in 2017. 7% (1). 1 1(b) Identify two methods of protection. One mark each for any two from: • tariff • quota 2 1(c) State why India is a mixed economy. It has a private sector / private sector firms (1) and a public sector / public sector firms /government intervention (1). 2 1(d) Explain why external costs cause market failure. Logical explanation which might include: External costs are not considered (1) base decisions just on private costs and benefits (1). They cause harmful effects to third parties / negative side effects (1) they result in overconsumption (1) and overproduction (1). Their existence may mean that social costs exceed social benefits (1). Examples of causes or costs: e.g. driving, pollution / environmental damage, burning fields and mining (up to 2). They result in a misallocation of resources / inefficient use of resources (1). 4 Question Answer Marks Guidance 1(e) Draw a demand and supply diagram to show the effects of a decrease in the costs of production on the market for cars. Axes correctly labelled – price and quantity or P and Q (1). Demand and supply curves correctly labelled (1). Supply curve shifted to the right (1). Equilibriums – shown by lines P1, P2 / Q1, Q2: or marking the equilibrium points E1 and E2 (1). 4 Question Answer Marks Guidance 1(f) Analyse the relationship between the size of countries’ primary sector output and GDP per head. Coherent analysis which might include: Generally, the countries with the relatively smallest primary sectors have the highest GDP per head / inverse relationship (1). Evidence e.g. US has only 1% of output accounted for by the primary sector and the highest GDP per head (1) another piece of supporting evidence e.g. the two countries with the largest primary sectors have the lowest GDP per head (1). Exception is India/Philippines (1) India has a smaller relative sized primary sector but a lower GDP per head (1). This is the expected relationship as primary sector tends to decline as an economy develops / often larger in developing economies / resources move into secondary and then tertiary sectors (1) tertiary sector tends to generate higher incomes / primary sector tends to generate lower incomes (1). 5 Question Answer Marks Guidance 1(g) Discuss whether or not increasing subsidies given to bus travel would reduce pollution in India. Award up to 4 marks for logical reasons why it might, which may include: • subsidies reduce costs (1) increase supply (1) lower prices (1) raise quality of bus travel (1) and cause demand to extend / higher demand (1) • people using buses will reduce the volume of traffic/reduce congestion (1) • buses use cleaner fuel (1). Award up to 4 marks for logical reasons why it might not, which may include: • people may not switch from car to bus travel (1) price of cars may fall (1) cost of producing cars is declining (1) other reason why e.g. more comfortable / door to door (1). • providers of bus transport may not pass on much of the subsidies in the form of lower prices (1) • opportunity cost of using subsidies (1) could spend money on other ways to reduce pollution e.g. education (1) • economy is growing so incomes rising (1) both bus and car travel may increase (1). 6 Apply this example to all questions with the command word DISCUSS (1g, 1h, 2d, 3d, 4d and 5d) Each point may be credited only once, on either side of an argument, but separate development as to how/why the outcome may differ is rewarded. Generic example mark Tax revenue may decrease… 1 ...because of reason e.g. incomes may be lower. 1 Tax revenue may increase because incomes may be higher i.e. reverse of a previous argument. 0 Tax revenue may increase because of a different reason i.e. not the reverse of previous argument e.g. government spending on subsidies may stimulate the economy more than spending on education. 1 Reward application of subsidies to producers and/or consumers. Increase in supply, lower prices, extension in demand may be shown on a demand and supply diagram. Question Answer Marks Guidance 1(h) Discuss whether or not India is likely to experience a deficit on the current account of its balance of payments in the future. Award up to 4 marks for logical reasons why it might, which may include: • there was a deficit in 2016 and 2017 (1) and it was on an upward trend (1) • incomes are rising / economic growth is occurring (1) and so more imports may be purchased both by consumers and by firms (1) • it is expected that the exchange rate will rise (1) this may increase the price of exports (1) and demand for exports may fall (1) price of imports may fall (1) so demand for imports may rise (1) • Indian trade restrictions may be reduced / Indian government promoting free trade (1) which may increase imports (1). • tax rates may be cut (1) with more disposable income (1) people may buy more imports (1). Award up to 4 marks for logical reasons why it might not, which may include: • there may be more foreign tourists (1) if pollution declines (1) • lower tariff on imported raw materials / imported capital goods (1) may reduce costs of production (1). • other countries may remove their trade restrictions (1) allowing India’s exports to rise (1) • if the government does spend more on education (1) productivity may rise (1) and India’s products may become more price and quality competitive (1). • MNCs may be attracted for a number of the reasons given (1) MNCs may produce exports / import substitutes (1). • Higher investment (1) may raise quality of exports / domestic products (1) lower price of exports (1). • Car production is rising (1) more cars may be exported / fewer cars may be imported (1). 6
This question in 0455/22 Feb/March 2020
Q14 · The Indian government has declared that the country, now a major car producer, will sell… 0455/22 May/June 2020
2 The Indian government has declared that the country, now a major car producer, will sell only electric cars by 2030. The government wants to reduce external costs, some of which are caused by petrol and diesel cars. Demand for electric cars is currently relatively low and price-elastic. The government, however, thinks that it will not need to subsidise the production of electric cars to achieve its target. (a) Define external costs. [2] (b) Explain two influences on whether demand for a product is price-elastic or price-inelastic. [4] (c) Analyse, using a demand and supply diagram, how a subsidy given to producers could affect the market for electric cars. [6] (d) Discuss whether cars should be produced by the private sector or the public sector. [8]
20 marks
Mark scheme: 2(a) Define external costs. 2 Harmful effects (1) on third parties (1). Social costs – private costs (1). 2(b) Explain two influences on whether demand for a product is price- 4 elastic or price-inelastic. Logical explanation which might include: Availability of substitutes (1) close substitutes will be likely to result in demand being price-elastic (1). Whether the product is a luxury or necessity (1) luxuries tend to have elastic demand/necessities tend to have inelastic demand (1). Proportion of income spent on the production (1) demand tends to be inelastic if a small proportion is spent on it/ elastic if a high proportion is spent on it (1) Whether the purchase can be postponed (1) if so, demand is likely to be elastic, if not inelastic. Addictiveness of the product (1) addictive products are likely to have inelastic demand (1). Time period (1) demand tends to become elastic over time (1). 2(c) Analyse, using a demand and supply diagram, how a subsidy given to 6 producers could affect the market for electric cars. price of S1 electric S2 cars P1 P2 D1 O Q1 Q2 quantity of electric cars Up to 4 marks for the diagram: Axes correctly labelled – price and quantity or p and q (1). Demand and supply curves correctly labelled (1). Supply curve shifted to the right (1). Equilibriums – shown by lines P1 and P2 / Q1 and Q2 or equilibrium points E1 and E2 (1). Up to 2 marks for coherent analysis which might include: A subsidy encourages firms to produce more/equivalent to a reduction in costs (1). Price will fall/quantity traded will rise (1). 2(d) Discuss whether cars should be produced by the private sector or the 8 public sector. In assessing each answer, use the table below. Level Description Marks 3 A reasoned discussion which accurately examines both 6–8 sides of the economic argument, making use of economic information and clear and logical analysis to evaluate economic issues and situations. One side of the argument may have more depth than the other but, overall, both sides of the argument are considered and developed. There is thoughtful evaluation of economic concepts, terminology, information and/or data appropriate to the question. The discussion may also point out the possible uncertainties of alternative decisions and outcomes. 2 A reasoned discussion which makes use of economic 3–5 information and clear analysis to evaluate economic issues and situations. The answer may lack some depth and development may be one-sided. There is relevant use of economic concepts, terminology, information and data appropriate to the question. 1 There is a simple attempt at using economic definitions 1–2 and terminology. Some reference may be made to economic theory, with occasional understanding. 0 A mark of zero should be awarded for no creditable 0 content. Why cars should be produced by the private sector: • may be a more competitive market and so prices may be lower • profit incentive may raise efficiency and encourage firms to produce what consumers want and keep costs low • may be higher investment which could improve quality and lower costs • may be easier to raise finance as can sell shares • may be forced to be efficient as may not be supported by the government Why cars should be produced by the public sector: • a private sector monopoly may abuse market power and may restrict supply and raise price • public sector firm to charge low prices/prices below cost for cheap cars to help the poor • public sector firms may take into account external costs and benefits/welfare • the state may have more financial resources and be able to invest on a larger scale.
This question in 0455/22 May/June 2020
Q15 · Calculate the percentage of total world output of palm oil produced by Indonesia in 2017 0455/22 Oct/Nov 2020
1 (a) Calculate the percentage of total world output of palm oil produced by Indonesia in 2017. [1] (b) Identify two variable costs of producing palm oil. [2] (c) Explain one opportunity cost of conserving forests in Indonesia. [2] (d) Explain two external costs of the destruction of forests in Indonesia. [4] (e) Draw a demand and supply diagram to show the effect of a ban on burning stubble on the market for rice. [4] (f) Analyse the relationship between countries’ GDP per head ranking and HDI ranking. [5] (g) Discuss whether or not the immigration of workers would be likely to benefit the Indonesian economy. [6] (h) Discuss whether or not the Indonesian tourism industry will increase in the future. [6]
30 marks
Mark scheme: 1(a) Calculate the percentage of total world output of palm oil produced by Indonesia in 2017. 60% (1). 1 Accept 60. 1(b) Identify two variable costs of producing palm oil. • fertilisers • palm oil seeds • casual labour 2 If more than two are given, consider the first two only. Accept ‘labour’, ‘workers’ or ‘wages’ for ‘casual labour’. 1(c) Explain one opportunity cost of conserving forests in Indonesia. Logical explanation which might include: Palm oil not produced / rice not produced / tourism lost as a result of building fewer hotels / lost opportunity to Norwegian government to spend on e.g. education (1) (next) best alternative forgone (1). 2 1(d) Explain two external costs of the destruction of forests in Indonesia. Logical explanation which might include: Loss of wildlife habitats (1) extinction of species / harmful effect on animals not involved in the economic decision (1). Harmful gases/air pollution/pollution (1) unpleasant atmosphere for local residents / illnesses / global warming (1). 4 One mark for each of two costs identified and one mark for each of two explanations. Question Answer Marks Guidance 1(e) Draw a demand and supply diagram to show the effect of a ban on burning stubble on the market for rice. Axes correctly labelled – price and quantity or p and q (1). Demand and supply curves correctly labelled (1). Supply curve shifted to the left (1). Equilibriums – shown by lines P1 and Q1 and P2 and Q2, or by labelling equilibrium points as E1 and E2 (1). 4 For quantity label accept Q, quantity demanded, quantity supplied. Do not reward a completely macro diagram. O S2 P2 Q2 Q1 P1 S1 D1 price of rice quantity of rice Question Answer Marks Guidance 1(f) Analyse the relationship between countries’ GDP per head ranking and HDI ranking. Coherent analysis which might include: Expected relationship: Generally, the higher the GDP per head ranking, the higher the HDI ranking / positive relationship / direct relationship (1). Supporting evidence: The top country, the top two or top three countries with the highest GDP per head ranking have the highest HDI ranking (1) the country, two countries with the lowest GDP per head ranking have the lowest HDI ranking (1). Exception: Cuba or Indonesia (1) supportive data – Cuba has a lower GDP per head ranking than Indonesia but a higher HDI ranking than Indonesia (1). Analysis: It is the expected relationship (1). GDP is a component of HDI / HDI ranking influenced by additional factors – education and/or life expectancy / higher GDP per head enables more to be spent on education and healthcare (1). 5 HDI now includes years of schooling but accept an idea that it includes education - adult literacy rate was included in the old measure. Responses do not have to be in the format suggested but they should address the expected/normal relationship, offer supporting evidence of that, highlight any exceptions to that, and analyse the overall data. Question Answer Marks Guidance 1(g) Discuss whether or not the immigration of workers would be likely to benefit the Indonesian economy. Up to 4 marks why it might: • may be skilled workers (1) who may be more productive (1) • may be motivated to work harder (1) to improve quality of life (1) • bring in new ideas (1) improving production methods / use advanced technology (1) • may pay taxes (1) enabling the government to spend more (1) • fill vacancies left by Indonesians going to work abroad (1) • increase size of labour force (1) increase productive capacity (1) reduce dependency ratio (1) • may increase exports / total (aggregate) demand (1) may result in economic growth / increase output (1). Up to 4 marks why it might not: • population is already increasing (1) immigration may take it above the optimum level / lead to overpopulation / put pressure on resources (1) • pressure may be put on housing / education / food (1) • may put downward pressure on wages (1) may replace Indonesian workers / cause unemployment (1) lowering living standards (1) • may need training (1) increasing firms’ costs (1) • may increase pollution (1) • may send money home to relatives (1) may have to import more e.g. rice (1) negative impact on the current account of the balance of payments (1). 6 For an answer that examines the effects of migration of workers from Indonesia, a maximum of 2 marks. Apply this example to all questions with the command word DISCUSS (1(g), 1(h), 2(d), 3(d), 4(d) and 5(d)). Each point may be credited only once, on either side of an argument, but separate development as to how/why the outcome may differ is rewarded. Generic example mark Tax revenue may decrease … 1 ... because of reason e.g. incomes may be lower. 1 Tax revenue may increase because incomes may be higher i.e. reverse of a previous argument. 0 Tax revenue may increase because of a different reason i.e. not the reverse of a previous argument e.g. government spending on subsidies may stimulate the economy more than spending on education. 1 Question Answer Marks Guidance 1(h) Discuss whether or not the Indonesian tourism industry will increase in the future. Up to 4 marks for why it might: • it is currently price competitive (1) • if the exchange rate continues to fall (1), price of tourism for foreign visitors will fall (1) • it has natural tourist attractions (1) may preserve forests (1) • global economy is growing (1), incomes are rising (1) enabling foreigners to afford more holidays (1) • people coming from abroad to work in high paid jobs may be skilled / highly motivated (1) raise quality of tourism (1). • Indonesian government may subsidise the tourism industry (1) lowering costs of production (1). • the industry may be promoted /advertised (1) • air travel is falling in price (1) air travel is a complement to holidays (1) • foreign investment may be attracted into the industry (1) Up to 4 marks for why it might not: • pollution may discourage visitors (1) worried about health (1) • there are substitutes (1) Indonesia has competition from neighbouring countries (1) • natural areas of beauty may be destroyed (1) by e.g. new palm oil plantations / natural disasters (1) • net emigration (1) may mean there are not enough workers (1). • Covid-19 may continue to reduce tourism (1). 6
This question in 0455/22 Oct/Nov 2020
Q16 · The economic problem means that countries have to decide what to produce 0455/22 Feb/March 2022
5 The economic problem means that countries have to decide what to produce. Ghana uses much of its agricultural land to grow cocoa. Cocoa is sold to chocolate producers. The world’s main chocolate producer in 2019 was a US firm with a 14% share of the global market. That firm was the largest seller of chocolate in the US and, if it merges, may become a monopoly. (a) Define the economic problem. [2] (b) Explain whether land is mobile. [4] (c) Analyse the causes of a shift to the right in the supply curve of chocolate. [6] (d) Discuss whether or not consumers would benefit from a firm becoming a monopoly. [8]
20 marks
Mark scheme: 5(a) Define the economic problem. Finite/limited resources (1) unlimited/infinite wants (1). Wants exceeding resources (2). Scarcity (1). 2 5(b) Explain whether land is mobile. Logical explanation which might include: Most land is geographically immobile (1) fixed in one place / cannot move from one place to another place (1). Some forms of land e.g. wildlife can be moved from one place to another (1). Land is occupationally mobile (1) capable of changing its use / e.g. land can be used for farming or housing (1). 4 Question Answer Marks Guidance 5(c) Analyse the causes of a shift to the right in the supply curve of chocolate. Coherent analysis which might include: A shift to the right of the supply curve means that more will be supplied at each and every price / supply has increased due to a non-price factor/influence (1). Lower costs of production (1) due to any cause (other than tax or subsidy) e.g. lower wages / higher productivity / lower transport costs (1). Subsidy (1) providing an additional income / effectively lowering costs / providing a financial incentive (1). Advances in technology (1) increasing output per unit of resource / increase efficiency / raise productivity of capital (1) Good harvest of cocoa / raw material (1) perhaps due to improvement in weather conditions / improvements in fertilisers (1) reducing price of raw material (1) increasing supply of raw material (1). Lower tax on chocolate / lower indirect tax / lower corporate tax (1) making it more profitable to produce (1). Fall in price/rise in cost of production/ fall in profitability of another product produced by chocolate firms (1) encouraging the switch of some resources to chocolate production (1). 6 Note: no marks for a diagram. Question Answer Marks Guidance 5(d) Discuss whether or not consumers would benefit from a firm becoming a monopoly. In assessing each answer, use the table opposite. Why they might: • a monopoly may have lower average costs of production due to economies of scale • lower costs of production may result in lower prices • a monopoly may have larger profits which can be spent on R&D • higher R&D can improve the quality of the product • may be a state-owned monopoly which seeks to increase social welfare. Why they might not: • monopoly may use market power to increase price • lack of competition may reduce pressure to improve quality • consumers will have less choice • there may be a lack of availability if the monopoly restricts supply to drive up price • a monopoly may have higher average costs due to diseconomies of scale. 8 Level Description Marks 3 A reasoned discussion which accurately examines both sides of the economic argument, making use of economic information and clear and logical analysis to evaluate economic issues and situations. One side of the argument may have more depth than the other, but overall both sides of the argument are considered and developed. There is thoughtful evaluation of economic concepts, terminology, information and/or data appropriate to the question. The discussion may also point out the possible uncertainties of alternative decisions and outcomes. 6–8 Question Answer Marks Guidance 5(d) Level Description Marks 2 A reasoned discussion which makes use of economic information and clear analysis to evaluate economic issues and situations. The answer may lack some depth and development may be one-sided. There is relevant use of economic concepts, terminology, information and data appropriate to the question. 3–5 1 There is a simple attempt at using economic definitions and terminology. Some reference may be made to economic theory, with occasional understanding. 1–2 0 A mark of zero should be awarded for no creditable content. 0
This question in 0455/22 Feb/March 2022
Q17 · Nicaragua experienced a 4% decrease in GDP in 2019, although household spending rose 0455/22 May/June 2022
5 Nicaragua experienced a 4% decrease in GDP in 2019, although household spending rose. One Nicaraguan product that increased in supply was bananas, which are a merit good. The Nicaraguan government encouraged its banana farmers and its other producers to increase their output. Increases in output can affect a firm’s average costs of production. (a) Define supply. [2] (b) Explain two ways a government could increase the consumption of merit goods. [4] (c) Analyse how the level and pattern of household spending may change when GDP decreases. [6] (d) Discuss whether or not a firm will benefit from an increase in its output. [8]
20 marks
Mark scheme: 5(a) Define supply. Willingness to sell a product (1) and ability to sell a product (1). Supply at a given price / in a given time period (1). 2 Allow one mark in total for amount produced or amount sold. Need idea of selling / making available to consumers for full two marks. 5(b) Explain two ways a government could increase the consumption of merit goods. Logical explanation which might include: Provide information/education (1) about the benefits of merit goods / consumers may be unaware of full benefits (1). Provide merit goods free / direct provision (1) e.g. education and healthcare / nationalise industries producing merit goods (1). Subsidise the production of merit goods (1) to lower prices (1). Subsidise the consumption of merit goods (1) by e.g. providing vouchers (1). Set a maximum price / price ceiling (1) to make merit goods more affordable / to lower price (1), Pass laws / introduce regulation (1) to make consumption of merit goods compulsory (1). Remove / cut indirect taxes on merit goods (1) to make them more affordable / to lower price (1). 4 One mark for each of two ways identified and one mark for each explanation. Can accept lower price as a development of a subsidy for a mark and lower price as another mark if given as a development of indirect taxes or maximum price. Question Answer Marks Guidance 5(c) Analyse how the level and pattern of household spending may change when GDP decreases. Coherent analysis which might include: Spending may decrease (1) as households may have less income (1) less able to buy goods and services / lower purchasing power (1). Lower GDP may reduce confidence / create greater uncertainty (1) encouraging people to save more (1). May borrow less (1) may be concerned cannot repay (1). May expect prices to fall further (1) delay purchases (1). Spending may not decrease if households think the decrease is temporary (1) may borrow (1) as interest rates may be lower (1) may use past saving to finance spending (1). May spend a higher proportion on basic necessities (1) less on luxuries/wants (1). May spend a higher proportion of income (1) as saving may fall by more than spending (1). Households may spend less on imports (1) imports may be higher in price / lower in quality (1). GDP may decrease but GDP per head may rise (1) if population falls by more than GDP (1). 6 Reward but do not expect: reference to inferior and normal goods. dissaving. Nominal GDP may fall but real GDP may rise if there is deflation Question Answer Marks Guidance 5(d) Discuss whether or not a firm will benefit from an increase in its output. In assessing each answer, use the table opposite. Why it might: may increase average revenue, if higher output is result of higher demand profits may rise if average revenue raises more than average cost may be able to make greater use of spare capacity higher output may increase a firm’s market power greater advantage may be taken of technical, marketing managerial, labour and risk bearing economies of scale. Why it might not: average revenue may fall, higher output may reduce price not all of the higher output may be sold / may be a lack of demand diseconomies of scale may be experienced managerial / communication problems may occur / labour relations may decline growth achieved by vertical merger may lead to problems of co-ordination. 8 Level Description Marks 3 A reasoned discussion which accurately examines both sides of the economic argument, making use of economic information and clear and logical analysis to evaluate economic issues and situations. One side of the argument may have more depth than the other, but overall, both sides of the argument are considered and developed. There is thoughtful evaluation of economic concepts, terminology, information and/or data appropriate to the question. The discussion may also point out the possible uncertainties of alternative decisions and outcomes. 68 Question Answer Marks Guidance 5(d) 2 A reasoned discussion which makes use of economic information and clear analysis to evaluate economic issues and situations. The answer may lack some depth and development may be one-sided. There is relevant use of economic concepts, terminology, information and data appropriate to the question. 35 1 There is a simple attempt at using economic definitions and terminology. Some reference may be made to economic theory, with occasional understanding. 12 0 A mark of zero should be awarded for no creditable content. 0
This question in 0455/22 May/June 2022
Q18 · Medan is the third largest city in Indonesia by population 0455/21 Oct/Nov 2022
2 Medan is the third largest city in Indonesia by population. It is sometimes known as the city of a million shop-houses as many people start small firms at the street level of their homes. This has led to an increase in the market supply of industries such as cafes and clothes shops. Also, due to the growth in demand for food delivery, the unemployment rate has fallen. However, mobility of labour is limited both within Medan and within Indonesia. (a) Identify the difference between individual supply and market supply. [2] (b) Explain two influences on the mobility of labour. [4] (c) Analyse the reasons for the existence of small firms. [6] (d) Discuss whether or not a reduction in the unemployment rate benefits an economy. [8]
20 marks
Mark scheme: 2(a) Identify the difference between individual supply and market supply. 2 Individual supply is the amount that a single firm is willing and able to supply at a specific price (1) while market supply is the total of all individual supply / the amount that all the firms in the market is willing and able to supply at a specific price (1). 2(b) Explain two influences on the mobility of labour. 4 Also accept answers based on influences for low mobility of labour. Logical explanation which might include: Good transport links (1) such as public transport / highways (1) ease of workers moving from one place to another to take up a job (1). Cheap cost of living / relocation (1) such as good access to affordable homes in different places (1). Similar culture (1) such as similar languages / work culture (1). Ease of workers moving from one job to another job (1) lots of re-training opportunities (1) good quality education (1) skills/qualification needed between different jobs are similar (1). 2(c) Analyse the reasons for the existence of small firms 6 Coherent analysis which might include: Barriers to entry may be low (1) easy for firms to enter (1) e.g. low capital start-up cost / low government regulations (1). Small firms can be monopolist (1) small / niche market (1). Lots of government support for small firms (1) e.g. subsidies to SME (1) to maintain competition (1). Firms desire to remain small (1) keep it within family members (1) easy to control (1) satisfied with amount of profit (1). Difficult for firm to grow (1) as there are dominant firms in the market (1) or difficult to get enough capital to grow large (1). Economies of scale may be very small (1) low long average costs at low levels of output (1) e.g. not much bulk discount, not much expensive equipment (1). Diseconomies of scale may be achieved at low levels of output (1) due to the productive inefficiency (1). 2(d) Discuss whether or not a reduction in the unemployment rate benefits 8 Level Description Marks an economy. 3 A reasoned 6–8 In assessing each answer, use the table opposite. discussion which accurately examines Why it might be beneficial: both sides of the • increase in output, increase economic growth / GDP economic argument, • increase in tax revenue making use of • decrease cost of unemployment benefits economic • increase income for individuals information and • decrease inequality clear and logical • decrease crime rates analysis to evaluate • decrease stress level, decrease occurrence of homelessness and economic issues family breakdown and situations. One • decrease indebtedness. side of the argument may have more Why it might not be beneficial: depth than the other, • wages increasing, higher cost of production, increase cost-push but overall both inflation sides of the • increase consumption, increased total demand, increase demand-pull argument are inflation considered and • decrease competitiveness of exports developed. There is • decrease attractiveness to foreign investors. thoughtful evaluation of economic concepts, terminology, information and/or data appropriate to the question. The discussion may also point out the possible uncertainties of alternative decisions and outcomes. 2(d) Level Description Marks 1 There is a simple 1–2 attempt at using economic definitions and terminology. Some reference may be made to economic theory, with occasional understanding. 0 A mark of zero 0 should be awarded for no creditable content.
This question in 0455/21 Oct/Nov 2022
Q19 · Calculate Tunisia’s balance on the current account of its balance of payments 0455/22 May/June 2024
1 (a) Calculate Tunisia’s balance on the current account of its balance of payments. [1] (b) Identify two qualities of a good tax that the Tunisian government aimed to achieve. [2] (c) Explain one reason why the Tunisian government regulates the price of flour and milk. [2] (d) Explain two ways the Tunisian government tried to reduce frictional unemployment. [4] (e) Analyse the relationship between the change in Tunisia’s average wage and inflation rate. [4] (f) Analyse, using a demand and supply diagram, how an increase in wage costs would affect the market for shoes. [5] (g) Discuss whether or not the Tunisian government should continue to subsidise electricity production. [6] (h) Discuss whether or not a rise in the value of the Tunisian dinar would benefit the Tunisian economy. [6]
30 marks
Mark scheme: 1(a) Calculate Tunisia’s balance on the current account of its balance of payments. –$2.4bn 1 Accept –2.4bn. Also accept –6.8 or –6.9 billion TND. 1(b) Identify two qualities of a good tax that the Tunisian government aimed to achieve. Efficiency / efficient / the tax should improve market performance / reduce market failure (1). Economical / economy / the tax should raise more in revenue than it costs to collect it (1). 2 If more than 2 qualities are given, consider the first 3. 1(c) Explain one reason why the Tunisian government regulates the price of flour and milk. Reduce poverty (1) flour and milk are basic necessities /essential products / people may be able to buy enough basic necessities / make them affordable / keep price relatively low (1). Or Prevent monopoly firms exploiting their market power (1) stop the firms raising price to a high level (1). 2 One mark for a reason identified and one mark for an explanation. Question Answer Marks Guidance 1(d) Explain two ways the Tunisian government tried to reduce frictional unemployment. Logical explanation which might include: Increased the labour market information available to workers and employers (1) so workers would be more aware of job vacancies / skills and qualifications required / employers more aware of those seeking jobs / may enable workers to move more quickly/easily between jobs / reduce search time / increase mobility of workers (1). Did not raise unemployment benefit (in line with inflation) (1) so, the purchasing power of unemployment benefit would fall / increase the incentive to work (1). 4 One mark for each of two ways identified and one mark for each of two explanations. If more than 2 ways are given, consider the first 3. Question Answer Marks Guidance 1(e) Analyse the relationship between the change in Tunisia’s average wage and the inflation rate. Relationship (up to 2 marks) Direct relationship / positive relationship (1) as change in the average wage increases so does the inflation rate / if change in average wage / rise in average wage falls so does the inflation rate / both fall and rose together / same trend (1). Evidence (up to 3 marks) 2016 – 2017 / 2018 both the average wage / change in average wage and inflation rate rose (1). Between 2014 – 2018, the average wage rose more rapidly than the inflation rate (1) real wages would have increased between 2014 – 2018 (1). Between 2018 – 2020 / in 2019 – 2020, the inflation rate was higher than the rise in the average wage (1) real wages would have fallen (1). Between 2014 – 2015/2016 / 2018 – 2019/2020 both the change in average wage and inflation rate fell (1). 2018 had the highest rise in the average wage and the highest inflation (1). 2016 had the lowest increase in the inflation rate but not the lowest increase in the average wage / 2020 had the lowest increase in the average wage but not the lowest inflation rate (1). Over the whole period the inflation rate rose while the increase in the average wage fell (1). Explanation (up to 2 marks) A rise in the average wage may increase costs of production / cause cost push inflation / a higher inflation rate will encourage workers to press for a wage rise (1). A rise in the average wage may increase disposable income / consumer expenditure / total demand / cause demand-pull inflation (1). 4 Responses do not have to be in the format suggested but they should address the expected/normal relationship, offer supporting evidence of that, highlight any exceptions to that, and analyse the overall data. Note: average wage did not fall. Question Answer Marks Guidance 1(f) Analyse, using a demand and supply diagram, how an increase in wage costs would affect the market for shoes. Coherent analysis which might include: D&S diagram: Axes correctly labelled – price and quantity or p and q (1). Original demand and supply curves correctly labelled (1). New supply curve shifted to the left (1). Equilibriums – shown by lines P1 and Q1 and P2 and Q2 or equilibrium points marked as E1 and E2 (1). Written analysis: An increase in wage costs would increase costs of production which may raise price (1). 5 Note: higher price needs to be linked to higher costs of production/higher costs/higher wage costs. Question Answer Marks Guidance 1(g) Discuss whether or not the Tunisian government should continue to subsidise electricity production. Award up to 4 marks for logical reasons why it might, which may include: reduce costs of producing electricity (1) increase supply of electricity (1) lower price of electricity (1) make electricity more affordable / reduce poverty (1) lower costs of firms that use electricity (1) which may encourage them to expand / attract MNCs / increase output / increase GDP / cause economic growth (1) increase employment / lower unemployment (1) reduce inflation / firms lower prices (1) make Tunisia’s products more internationally competitive / increase exports / lower imports / improve the current account balance (1) may reduce pollution / external costs (1) if subsidising green sources of energy (1). Award up to 4 marks for logical reasons why it might not, which may include: electricity firms may rely on the subsidy (1) may not keep costs low / become inefficient (1) may not pass on the subsidy in the form of lower price (1) opportunity cost (1) government could spend money on e.g. healthcare (1) may result in a budget deficit / increase in taxes (1) may cause pollution / external costs (1) if e.g. coal powered / deplete non-renewable resources (1). 6 Apply this example to all questions with the command word DISCUSS (1g, 1h, 2d, 3d, 4d and 5d) Each point may be credited only once, on either side of an argument, but separate development as to how/why the outcome may differ is rewarded. Generic example Mark Tax revenue may decrease… 1 ...because of reason e.g. incomes may be lower. 1 Tax revenue may increase because incomes may be higher i.e. reverse of a previous argument. 0 Tax revenue may increase because of a different reason i.e. not the reverse of a previous argument e.g. government spending on subsidies may stimulate the economy more than spending on education. 1 Question Answer Marks Guidance 1(h) Discuss whether or not a rise in the value of the Tunisian dinar would benefit the Tunisian economy. Award up to 4 marks for logical reasons why it might, which may include: may reduce inflation (1) imports would be cheaper (1) enable households to buy more imports / higher purchasing power (1) more choice (1) may lower price of some raw materials and/or capital goods (1) increase competitive pressure on domestic firms (1) lower costs of production (1) lower total (aggregate) demand (1) which may reduce demand-pull inflation (1) may be taken as an indicator of a strong economy / increase confidence (1) encourage investment / attract MNCs (1) if demand for exports is price inelastic, export revenue may rise (1). Award up to 4 marks for logical reasons why it might not, which may include: higher export prices / may reduce exports / export revenue (1) lower price of imports (1) may increase imports / import expenditure (1) reduce international competitiveness (1) increase the deficit / reduce surplus on the current account of Tunisia’s balance of payments (1) lower net exports may reduce GDP / economic growth (1) which may increase unemployment / reduce employment (1) may discourage MNCs / investment (1) because of higher cost of setting up in the country (1). 6 Note: lower total demand may be credited on either side but only once. Note: the generic advice above in terms of MNCs. One mark for attract or discourage MNCs. Another mark could be gained by explaining why they may be attracted and another mark for explaining why they may be discouraged.
This question in 0455/22 May/June 2024
Q20 · Calculate the average cost of producing a car in Belarus in 2021 0455/23 Oct/Nov 2024
1 (a) Calculate the average cost of producing a car in Belarus in 2021. [1] (b) Identify two reasons why Belarus is described as a mixed economy. [2] (c) Explain the type of inflation experienced by Belarus. [2] (d) Explain two reasons why the production possibility curve (PPC) of Belarus may have shifted to the left between 2011 and 2021. [4] (e) Analyse the relationship between life expectancy and HDI value. [4] (f) Analyse, using a demand and supply diagram, how subsidising the production of milk would affect the market for milk. [5] (g) Discuss whether or not the construction of electric vehicle charging stations would benefit an economy. [6] (h) Discuss whether or not people should be fined for being unemployed. [6]
30 marks
Mark scheme: Question Answer Marks Guidance 1(a) Calculate the average cost of producing a car in Belarus 1 Accept 10 650 or 0.010650million or 0.1065m. in 2021. Needs to be to at least 2 dp e.g. 0.011m $10 650 (1). 1(b) Identify two reasons why Belarus is described as a 2 mixed economy. • There is a public sector / some people work in the public sector / there are state-owned firms / there is government intervention e.g. fining the unemployed (1). • There is a private sector (1). 1(c) Explain the type of inflation experienced by Belarus. 2 Cost-push (1) due to a rise in the price of energy / increase in costs of production of firms (1). 1(d) Explain two reasons why the production possibility 4 One mark each for each of two reasons identified and one curve (PPC) of Belarus may have shifted to the left mark for each of two explanations. between 2011 and 2021. No marks for drawing a PPC diagram. Logical explanation which might include: • a decline in the size of the country’s labour force (1) reduction in the quantity of resources / fewer workers will be likely to reduce country’s ability to produce products (1) • a decrease in the number of students going to university (1) reduce quality of resources / labour skills / productivity / (1). 1(e) Analyse the relationship between life expectancy and 4 Responses do not have to be in the format suggested but HDI value. they should address the expected/normal relationship, offer supporting evidence of that, highlight any exceptions to that, Coherent analysis which might include: and analyse the overall data. Expected relationship: Note: simply repeating the data is not enough for a mark as • a high life expectancy would be expected to be it is only description whereas the skill being tested is associated with a high HDI value (1) analysis. • positive relationship / direct relationship / move in the same direction (1). Supporting evidence: • two countries with the longest life expectancy have the highest HDI value OR two countries with the lowest life expectancy also have the lowest HDI value (1) • specific reference to a country e.g. Norway had the longest life expectancy and the highest HDI value (1). Analysis of expected relationship: • life expectancy is one of the components of HDI (1) accounts for a third of its value / explanation of how better health / life expectancy raises standard of living (1). Exception: • Belarus / Thailand (1) Belarus has a shorter life expectancy but a higher HDI value (1). Analysis of exception: • there are other components of the HDI: education / GDP (GNI) per head (1). 1(f) Analyse, using a demand and supply diagram, how 5 subsidising the production of milk would affect the market for milk. Coherent analysis which might include: D&S diagram: • axes correctly labelled – price and quantity or P and Q (1) • original demand and supply curves correctly labelled (1) • new supply curve shifted to the right (1) • equilibriums – shown by lines P1 and Q1 and P2 and Q2 or equilibrium points marked as E1 and E2 (1). Written analysis: • reduction in cost of production / increase in supply / increase in quantity traded / reduction in price (1). 1(g) Discuss whether or not the construction of electric 6 Apply this example to all questions with the command vehicle charging stations would benefit an economy. word DISCUSS (1(g), 1(h), 2(d), 3(d), 4(d) and 5(d) Award up to 4 marks for logical reasons why it might benefit, which may include: Each point may be credited only once, on either side of an • likely to encourage use of electric vehicles (1) stations argument, but separate development as to how/why the and vehicles are complements (1) outcome may differ is rewarded. • improve the environment (1) reduce external costs (1) including air / noise pollution (1) reduce healthcare Generic example Mark costs / improve health of workers (1) • building the stations / building more electric cars may Tax revenue may decrease… 1 create employment (1) • government / private sector investment / purchase of ...because of reason e.g. incomes 1 electric vehicles may raise total (aggregate) demand (1) may be lower. causing higher output / economic growth (1). Tax revenue may increase 0 Award up to 4 marks for logical reasons why it might not because incomes may be higher benefit, which may include: i.e. reverse of a previous • other forms of transport may have more beneficial argument. effects on the environment (1) e.g. cycling / buses (1) • some people may be reluctant to switch (1) price of Tax revenue may increase 1 electric cars may be too high (1) resources are wasted because of a different reason i.e. (1) not the reverse of a previous • if people do switch, it may cause unemployment (1) in argument e.g. government e.g. oil firms / production of diesel and petrol cars / less spending on subsidies may public transport (1) stimulate the economy more than • Increase in electric vehicles on road (1) causes road spending on education. congestion (1) • Opportunity cost of government investment (1) monies could have been spent e.g. education /health / infrastructure (1) • If economy at full employment (1) investment may lead to demand-pull inflation (1). 1(h) Discuss whether or not people should be fined for being 6 unemployed. Award up to 4 marks for logical reasons why they should be fined, which may include: • if frictional unemployment (1) a fine would encourage workers to put more effort into finding a job (1) spend less time between jobs (1) help move economy towards full employment (1) higher output (1) and economic growth (1) • fines may increase government revenue (1) which could be spent on e.g. healthcare / support to find a job (1) • may not be seeking a job as receive benefits (1) fines may encourage them to find work and reduce government spending on unemployment benefits (1). Award up to 4 marks for logical reasons why they should not be fined, which may include: • may be a lack of suitable jobs available (1) the unemployed may have lacked the skills required (1) may not have been able to move to other areas of the country (1) may have disabilities / ill-health (1) providing support may reduce unemployment more quickly (1) • unemployment may be structural / cyclical (1) it would have been more effective to increase training (1) increase total demand (1) • unemployed may have little income to pay the fine (1) may increase their debt (1) lead to greater poverty / unable to pay for basic necessities (1) affect their mental health / wellbeing / causes depression (1) • may encourage the growth of the shadow/unofficial/informal economy (1) as not registered as unemployed (1) • may reduce wages (1) workers may be forced to accept low-paid jobs (1).
This question in 0455/23 Oct/Nov 2024
Q21 · Davos is a ski resort in Switzerland famous for hosting a world economic conference for… 0455/23 Oct/Nov 2024
4 Davos is a ski resort in Switzerland famous for hosting a world economic conference for leaders from both private and public sectors. Topics discussed usually relate to global economic development. Hospitality firms in Davos depend on seasonal migrant labour, especially when they want to increase the supply of goods and services quickly. (a) Define supply. [2] (b) Explain the difference between the private sector and the public sector. [4] (c) Analyse the causes of differences in economic development between countries. [6] (d) Discuss whether or not the employment of migrant workers can benefit an economy. [8]
20 marks
Mark scheme: 4(a) Define supply 2 Accept an incomplete answer for one mark e.g. amount of a good/service produced by a firm / available in the market (1). The willingness (1) and ability to sell/provide a good/service (1). 4(b) Explain the difference between the private sector and 4 Alternatively candidates may present as the public sector. Motive: profit v social welfare Logical explanation which might include: Ownership: individuals / firms v government • private sector is operated and owned by individuals / firms (1) and decisions are made based on self-interest / profits / own utility / efficiency (1) • public sector is operated and owned by the government (1) and decisions are made based on the overall welfare of society / people / externalities (1). 4(c) Analyse the causes of differences in economic development 6 Do not reward economic growth as being the same as between countries. economic development Coherent analysis which might include differences in: • level of income (1) affecting levels of affordability (1) and consumption of various goods and services (1) • education (1) affecting skills / productivity (1) job opportunities (1) purchasing power (1) • healthcare (1) affecting life expectancy (1) level of labour absences from work (1) output (1) • levels of population growth (1) affecting size of workforce (1) affecting dependency ratios (1) which could also affect cost of labour (1) • size of primary, secondary and tertiary sectors (1) large size primary sector usually leads to lower levels of development than the other two sectors (1) lower value added in primary / higher value added in secondary and tertiary (1) • government expenditure / overseas investment (FDI) (1) e.g. in infrastructure projects / education/healthcare (1) raising job opportunities / reducing poverty (1) • availability / development of resources / factors of production (1) e.g. beautiful landscape / labour (1) impact on economic development (1). 4(d) Discuss whether or not the employment of migrant Level Description Marks workers can benefit an economy 3 A reasoned discussion which accurately 6–8 In assessing each answer, use the table opposite. examines both sides of the economic argument, making use of economic Why it might benefit: migrant labour information and clear and logical analysis to evaluate economic issues and • increases supply of labour –reduce wage cost situations. One side of the argument may • increases the quantity of factors of production in the have more depth than the other, but economy overall both sides of the argument are • increase productive capacity of the economy and considered and developed. There is economic growth thoughtful evaluation of economic • more skilled concepts, terminology, information and/or • more productive data appropriate to the question. The • takes up jobs that locals don’t want to take up discussion may also point out the • income received may create new jobs. possible uncertainties of alternative decisions and outcomes. Why it might not benefit: migrant labour 2 A reasoned discussion which makes use 3–5 • Increases unemployment – takes jobs from local of economic information and clear workers analysis to evaluate economic issues and • usually willing to take jobs at lower pay than local labour situations. The answer may lack some lowering wage rates for all workers depth and development may be one- • means economy may not have capacity to sided. There is relevant use of economic accommodate them leading to lack of housing and other concepts, terminology, information and infrastructure. data appropriate to the question. 1 There is a simple attempt at using 1–2 economic definitions and terminology. Some reference may be made to economic theory, with occasional understanding. 0 A mark of zero should be awarded for no 0 creditable content.
This question in 0455/23 Oct/Nov 2024
Q22 · Calculate the value of Gabon’s oil production as a percentage of Gabon’s GDP 0455/21 May/June 2025
1 (a) Calculate the value of Gabon’s oil production as a percentage of Gabon’s GDP. [1] (b) Identify two external benefits of rainforests. [2] (c) Explain what effect an increase in tourism may have on Gabon’s current account of the balance of payments. [2] (d) Explain two reasons why the Gabonese Government wants to reduce reliance on oil. [4] (e) Draw a demand and supply diagram to show the effect of the discovery of new gold deposits on the market for gold. [4] (f) Analyse the relationship between the literacy rate and the percentage of the labour force employed in agriculture. [5] (g) Discuss whether or not a government should pay private sector firms to give work experience to unemployed young people. [6] (h) Discuss whether or not a growth in the size of firms in Gabon’s textile industry will reduce their average cost of production. [6]
30 marks
Mark scheme: Question Answer Marks Guidance 1(a) Calculate the value of Gabon’s oil production as a 1 Accept 30 without %. percentage of Gabon’s GDP. 30%. 1(b) Identify two external benefits of rainforests. 2 If more than two benefits given, consider the first three. Two from: • reduce air pollution / pollution / improves air quality (1) • protect against floods (1) • prevent soil erosion (1). 1(c) Explain what effect an increase in tourism may have on 2 No marks for simply saying current account of the balance of Gabon’s current account of the balance of payments. payments increases. • Increase in exports (1) • increase trade in services (invisible) surplus / reduces deficit (1) • Improves the current account balance surplus / reduces deficit (1). 1(d) Explain two reasons why the Gabonese Government 4 One mark each for each of two reasons identified and one wants to reduce reliance on oil. mark each for each of two explanations. Logical explanation which might include: Only these two reasons are acceptable. • Running out of oil / create a shortage (1) revenue from the industry will decline / employment in the industry will decline / GDP will decline /cause recession / conserve for future generations / may need to import oil / price for oil may rise (1). • Oil industry creates water pollution / pollution (1) an external cost / harms health / reduces standard of living / protect the environment / attract tourists (1). 1(e) Draw a demand and supply diagram to show the effect 4 of the discovery of new gold deposits on the market for gold. Coherent analysis which might include: D&S diagram: Axes correctly labelled – price and quantity or p and q (1). Original demand and supply curves correctly labelled (1). New supply curve shifted to the right (1). Equilibriums – shown by lines P1 and Q1 and P2 and Q2 or equilibrium points marked as E1 and E2 (1). 1(f) Analyse the relationship between the literacy rate and 5 Responses do not have to be in the format suggested but the percentage of the labour force employed in they should address the expected/normal relationship, offer agriculture. supporting evidence of that, highlight any exceptions to that, and analyse the overall data. Coherent analysis which might include: Supporting evidence should involve interpretation, not just Expected relationship: description. Simply stating percentages without analysis of • Generally, an inverse / negative relationship (1) the being high or low gets no marks. higher the literacy rate, the smaller the % of the labour force employed in agriculture (1). Accept as analysis where two countries with different levels of adult literacy and percentage employed in agriculture are Supporting evidence: directly compared. • South Africa had the highest literacy rate and the lowest % of the labour force employed in agriculture (1). • Zambia / Sierra Leone / Mali had the lowest literacy rates and the highest %s of labour force employed in agriculture (1). Analysis of expected relationship: • A high literacy rate may increase the chance of workers gaining jobs in high paid tertiary jobs (1) a low literacy rate may mean workers have to undertake unskilled jobs in agriculture / a high proportion of workers employed in agriculture may mean that high literacy rate is not required (1). Exception: • Gabon (1) Gabon has a high literacy rate but also a high % of the labour force employed in agriculture (1). Analysis of exception: • Some jobs in agriculture are skilled / secondary and tertiary sectors may be small (1). 1(g) Discuss whether or not a government should pay 6 Apply this example to all questions with the command private sector firms to give work experience to word DISCUSS unemployed young people. (1(g), 1(h), 2(d), 3(d), 4(d) and 5(d)) Award up to 4 marks for logical reasons why it should, Each point may be credited only once, on either side of an which may include: argument, but separate development as to how/why the outcome may differ is rewarded. • can enable young workers to develop their skills / raise their productivity (1) increase their confidence / Generic example mark motivation to get a job / get higher paid jobs (1) young people may make mistakes and cost firm money while Tax revenue may decrease 1 being trained (1) • can increase the chances of young people gaining a job because of reason e.g. incomes may be lower. 1 (1) reduce unemployment (1) reduce the cost of unemployment benefits (1) reduce future training costs Tax revenue may increase because incomes 0 (1) increase tax revenue (1) leads to economic growth may be higher i.e. reverse of a previous (1). argument. Award up to 4 marks for logical reasons why it should Tax revenue may increase because of a 1 not, which may include: different reason i.e. not the reverse of a previous argument e.g. government spending • the quality of the work experience may not be good (1) on subsidies may stimulate the economy more the young may be given unskilled jobs (1) poor working than spending on education. conditions / not regulated (1) • opportunity cost [implied] (1) government spending could be used to e.g. improve state education (1) government incurs additional expenditure / raises taxes to pay for it (1) the young may have been employed by the private sector without payment by the government (1) • it may reduce the efficiency of private firms (1) reduce their output (1) firms may be corrupt (1). 1(h) Discuss whether or not a growth in the size of firms in 6 Maximum of 2 marks for just listing different types of Gabon’s textile industry will reduce their average cost economies and diseconomies of scale or just stating of production. economies of scale and diseconomies of scale may be experienced without references to examples. Award up to 4 marks for logical reasons why it might, which may include: Essentially full marks can be gained for identification and explanation of two economies of scale and one diseconomy • labour economies (1) workers can specialise / increase of scale OR one economy of scale and two diseconomies of labour productivity (1) scale. • managerial economies (1) employ specialists (1) • technical economies (1) using advanced capital Note there is no marks awarded for simply stating that equipment (1) average costs may or rise or for drawing a diagram showing • buying / purchasing economies (1) receiving a discount average costs changing as a firm grows in size. as buying in bulk (1) • selling economies (1) reducing transport costs (1) • marketing economies (1) spreads fixed costs over more output (1) • financial economies (1) easier / cheaper to borrow (1) • research and development economies (1) introduce new products / new production methods (1) • risk bearing economies (1) able to suffer fall in demand for one product or supply problems connected to one product (1) • may experience external economies of scale (1) example (1). Award up to 4 marks for logical reasons why it might not, which may include: • difficulty of controlling a large firm (1) may be slower to make decisions (1) 1(h) • communication problems (1) may be more difficult to 6 keep everyone informed (1) • poor industrial relations (1) may be less contact between managers and workers / decreasing productivity (1).
This question in 0455/21 May/June 2025
Q23 · In recent years, the quantity of Latvia’s factors of production has changed 0455/21 May/June 2025
3 In recent years, the quantity of Latvia’s factors of production has changed. Since 2008, its capital has increased and its land has not changed significantly, but its labour force and its enterprise have decreased. Enterprise and conditions of supply can affect firms’ prices. In 2022, the Latvian Government increased the country’s national minimum wage (NMW). Its NMW did, however, remain one of the lowest in the European Union. (a) Identify the rewards to capital and land. [2] (b) Explain two causes of a decrease in enterprise in an economy. [4] (c) Analyse how changes in conditions of supply can affect a firm’s prices. [6] (d) Discuss whether or not a rise in a national minimum wage will harm an economy. [8]
20 marks
Mark scheme: 3(a) Identify the rewards to capital and land. 2 If just names the two rewards, they can be in any order. • Interest (1) • rent (1) 3(b) Explain two causes of a decrease in enterprise in an 4 One mark each for each of two causes identified and one economy. mark each for each of two explanations. Logical explanation which might include: If more than two causes given, consider the first three. • Decrease in profit / increase in corporate income MAX of two marks if not identifying what changes. (corporation) tax (1) increase in interest rates for borrowing (1) reduce financial incentive to become an entrepreneur (1). • Reduction in education (1) reduce those with the skills to become entrepreneurs (1). • Reduction in immigration / reduction in population (1) reduce the number of people who can become entrepreneurs (1). • Entrepreneurs move abroad (1) better prospects / less tax (1). • Reduction in the retirement age (1) reduces supply of potential entrepreneurs (1). • Recession / war (1) firms may go out of business / reduces willingness to take risks / reduces confidence / certainty (1). • Increased government regulation (1) excessive rules may discourage entrepreneurs (1). • Nationalisation of an industry / growth of monopolies (1) removal of entrepreneurs (1). 3(c) Analyse how changes in conditions of supply can affect 6 Only allow one mark for reference to a rise in price and one a firm’s prices. mark for reference to a fall in price. Coherent analysis which might include: MAX 4 marks if not identifying change in conditions of supply. • Increase in costs of production (1) due to rise in wages / raw material costs / capital goods costs / tariffs (1) raise price (1) to maintain profit (1). • Natural disasters (1) can create a shortage (1) raise price (1). • Changes in weather (1) good weather can create a surplus in supply e.g. agriculture (1) prices fall (1) or poor weather can create a shortage (1) prices rise (1) • Increase in indirect tax / corporate income (corporation) tax (1) a firm may pass this onto consumers as higher prices (1) especially if demand is inelastic (1). • Government subsidies to firms (1) reduce the cost of production (1) the firm may be able to gain the same revenue and profit (1) with a lower price (1). • Discovery of new source of raw materials (1) enabling the firm to supply (1) more at a lower price (1). • Advances in technology (1) example (1) could lower costs of production (1) reducing price (1). • Improvements in education and training (1) raise productivity (1) lower prices (1). 3(d) Discuss whether or not a rise in a national minimum 8 Accurate diagram can achieve Level 1. wage will harm an economy. Level Description Marks In assessing each answer, use the table opposite. 3 A reasoned discussion which accurately 6–8 Why it might: examines both sides of the economic • increase unemployment if firms cannot afford to pay argument, making use of economic higher wages information and clear and logical • higher unemployment would reduce total demand analysis to evaluate economic issues • lower total demand would reduce output and situations. One side of the • tax revenue may fall, and expenditure on state benefits argument may have more depth than may rise the other, but overall both sides of the • if higher wages are paid, there may be inflation. argument are considered and developed. There is thoughtful Why it might not: evaluation of economic concepts, • reduce poverty as raise the income of the low-paid terminology, information and/or data • encourage more people to enter the labour force appropriate to the question. The • increase productivity as workers may be more discussion may also point out the motivated possible uncertainties of alternative • encourage firms to train workers to gain better return decisions and outcomes. • may be set below the existing equilibrium wage level. 2 A reasoned discussion which makes 3–5 use of economic information and clear analysis to evaluate economic issues and situations. The answer may lack some depth and development may be one-sided. There is relevant use of economic concepts, terminology, information and data appropriate to the question. 3(d) 8 Level Description Marks 1 There is a simple attempt at using 1–2 economic definitions and terminology. Some reference may be made to economic theory, with occasional understanding. 0 A mark of zero should be awarded for 0 no creditable content.
This question in 0455/21 May/June 2025
Question 24 0455/22 May/June 2025
1 (a) Calculate St. Kitts and Nevis’s government budget deficit in 2022. [1] (b) Identify two examples of the factor of production ‘land’ in St. Kitts and Nevis. [2] (c) Explain how tourism causes external costs in St. Kitts and Nevis. [2] (d) Explain two reasons why a foreign bank may open a branch in St. Kitts and Nevis. [4] (e) Draw a demand and supply diagram to show the effect of an increase in the productivity of onion farmers on the market for onions. [4] (f) Analyse the relationship between healthcare spending as a percentage of GDP and life expectancy. [5] (g) Discuss whether or not an increase in the size of its fishing industry would benefit St. Kitts and Nevis. [6] (h) Discuss whether or not deflation is likely to have harmed St. Kitts and Nevis. [6]
30 marks
Mark scheme: Question Answer Mark Guidance 1(a) Calculate St. Kitts and Nevis’s Government budget 1 Accept 18m. deficit in 2022. ($)18 000 000 / – ($)18 000 000. $18 m / – $18 m (1). 1(b) Identify two examples of the factor of production land in 2 If more than two examples given, consider the first three. St. Kitts and Nevis. Two from: beaches (1), (coral) reefs (1), marine life / fish (1) rainforests (1) and soil (1). 1(c) Explain how tourism causes external costs in St. Kitts 2 One mark for explanation of external costs. and Nevis. One mark for example based on tourism. • Social costs are greater than private costs / social costs include private costs and external costs / harmful effects on third parties / those not directly involved in producing or consuming the product (1). • Example of an external cost caused by tourism in St Kitts and Nevis e.g. pollution / environmental damage / death of wildlife / death of marine life / overcrowding (1). 1(d) Explain two reasons why a foreign bank may open a 4 One mark each for each of two reasons identified and one branch in St. Kitts and Nevis. mark each for each of two explanations. Logical explanation which might include: If more than two reasons given, consider the first three. • High incomes in the country (1) high demand for Most of the explanation points e.g. high profit could be banking services / high demand for loans / may save linked to any of the three identification points except high more / borrowers likely to be able to repay loans / high disposable income should be linked to absence of personal profit / high revenue (1). income tax. • Absence (low) of personal income tax (1) workers would be able to keep all of their income / more disposable Do not give two explanation marks for one identification. income / firms may be able to pay lower wages / increase workers’ motivation (1). Explanation marks here are dependent on the • Relatively high literacy rates (1) awareness of benefits identifications. of having a bank account / saving / skilled workers / high productivity (1). 1(e) Draw a demand and supply diagram to show the effect 4 of an increase in the productivity of onion farmers on the market for onions. D&S diagram: Axes correctly labelled – price and quantity or p and q (1). Original demand and supply curves correctly labelled (1). New supply curve shifted to the right (1). Equilibriums – shown by lines P1 and Q1 and P2 and Q2 or equilibrium points marked as E1 and E2 (1). 1(f) Analyse the relationship between healthcare spending 5 Responses do not have to be in the format suggested but as a percentage of GDP and life expectancy. they should address the expected/normal relationship, offer supporting evidence of that, highlight any exceptions to that, Expected relationship: and analyse the overall data. Direct / positive relationship (1). Generally, the higher healthcare spending, the higher the life expectancy (1). Supporting evidence should involve interpretation, not just description. Supporting evidence: E.g.: Haiti has the second lowest % healthcare spending and the shortest life expectancy (1) Canada spends a higher % on healthcare than Egypt and has a longer life expectancy / Canada spends the highest percentage on health care and has the second highest longest life expectancy / Canada and Sweden spend a high % on healthcare and have long life expectancy (1). Analysis of the supporting information: Higher spending on healthcare would be expected to raise the health of the population / provide better quality healthcare (1) increase awareness of need for healthy living / provide more check-ups / preventative medical care / reduce the death rate (1). Exception: Monaco (1) spends the lowest % on healthcare but has the longest life expectancy (1). Analysis of exception: 1.9% of a very high GDP can mean higher spending than e.g. 12.9% of a lower GDP / Monaco may have a high GDP (1). There are other influences on life expectancy e.g. nutrition / education/housing/war (1). 1(g) Discuss whether or not an increase in the size of its 6 Award one mark in total for higher / lower average costs, fishing industry would benefit St. Kitts and Nevis. one mark for lower / higher fish prices, one mark for higher / lower profits (1). Award up to 4 marks for logical reasons why it might, which may include: Higher / lower profits should be linked to the fishing industry. • may reduce imports of fish (1) reduce risk of supply-side shocks / imports being cut off (1) enable fish to be Apply this example to all questions with the command exported (1) may improve the current account word DISCUSS balance / improve the balance of payments (1) (1(g), 1(h), 2(d), 3(d), 4(d) and 5(d)) • may increase employment / increase job opportunities / reduce unemployment (1) raise incomes Each point may be credited only once, on either side of an (1) increase living standards (1) increase argument, but separate development as to how/why the GDP / increase output / cause economic growth (1) outcome may differ is rewarded. higher tax revenue (1) • may enable greater advantage to be taken of Generic example Mark economies of scale (1) example (1) lower average cost (1) lower fish prices (1) Tax revenue may decrease … 1 • (larger boats) may be more efficient / more productive (1) make the industry more profitable / increase profits ... because of reason e.g. incomes may be 1 from fishing (1). lower. Tax revenue may increase because incomes 0 may be higher i.e. reverse of a previous argument. Tax revenue may increase because of a different 1 reason i.e. not the reverse of a previous argument e.g. government spending on subsidies may stimulate the economy more than spending on education. 1(g) Award up to 4 marks for logical reasons why it might not, which may include: • opportunity cost (1) could use resources in other industries / government can spend more on e.g. education / increase budget deficit (1) • over-fishing (1) deplete fish stocks / lose marine life / deplete resources (1) raise fish prices in the long run (1) • may experience diseconomies of scale (1) example (1) higher average cost (1) reduce profit (1) • may cause external costs / environmental harm (1) may damage coral reefs / cause pollution (1) harm tourism (1) • may be a dangerous occupation (1) may be low-paid (1) low-skilled (1) may experience seasonal unemployment (1) • risk of over specialisation / too great a dependency on the industry (1) may be harmed by a fall in demand for fish / rise in competition from other countries (1). 1(h) Discuss whether or not deflation is likely to have 6 Award one mark for malign (bad) deflation is harmful harmed St. Kitts and Nevis. whereas benign (good) deflation is beneficial. Award up to 4 marks for logical reasons why it might, which Mark for higher employment and mark for higher GDP can may include: only be awarded if come from higher total supply. • may have increased real value of debt (1) may default (1) may have decreased investment (1) ‘save more’ may be credited on either side but only once. • may have resulted in a deflationary spiral (1) may have resulted from lower total demand (1) lower GDP / lower output / reduce economic growth / may cause a recession (1) lower employment / increased unemployment (1) lowered wages / income (1) • may reduce confidence (1) may discourage MNCs (1) • may reduce consumer expenditure / save more / create uncertainty (1) delay buying goods and services (until price is lower) (1). Award up to 4 marks for logical reasons why it might not, which may include: • may have increased purchasing power / real income / with the same income more goods and services can be purchased (1) (some) people may spend / consume more (1) • value of saving may have increased (1) increasing wealth (1) • may be the result of higher total supply (1) due to advances in technology / lower costs of production (1) higher output / economic growth (1) higher employment (1) • may have increased international competitiveness of its products / lower export prices (1) increased exports / export revenue (1) reduced imports / import expenditure (1) improve current account balance (1).
This question in 0455/22 May/June 2025
Q25 · As cities experience economic growth, the buildings in the city become taller 0455/23 May/June 2025
4 As cities experience economic growth, the buildings in the city become taller. This is driven by an increase in the willingness and ability of consumers to live in tall buildings. Changes in the conditions of supply have also increased the number of tall buildings being constructed. However, there is a limit to the height of buildings – above a certain height, the total cost of constructing the building will exceed the total revenue generated. (a) Define total cost. [2] (b) Explain two causes of an increase in the supply of a product. [4] (c) Analyse factors that can increase the willingness and ability of consumers to buy a certain product. [6] (d) Discuss whether or not economic growth will improve living standards in a city. [8]
20 marks
Mark scheme: 4(a) Define total cost. 2 Total cost is addition of all costs / overall costs (1) fixed cost (1) plus variable cost (1). 4(b) Explain two causes of an increase in the supply of a 4 One mark each for each of two reasons identified and one product. mark each for each of two explanations. Logical explanation which might include: If more than two causes given, consider the first three. • lower costs (1) e.g. cost of raw materials / greater potential profitability (1) • increased productivity (1) e.g. due to better technology (1) • reduced regulations (1) easier / cheaper to produce more (1) • reduced taxes (1) reducing cost of production (1) • increased subsidies (1) enabling producers to be able to produce more with the same amount of financial capital / money / cover some costs / provide additional revenue (1) • better weather / more suitable season (1) increasing crop yield / less destruction or damage to crops(1) • increases in stocks / inventories (1). 4(c) Analyse factors that can increase the willingness and 6 Maximum of two marks for just listing different reasons for ability of consumers to buy a certain product. increase in willingness and ability of consumers to buy a certain product. Coherent analysis which might include: Reward increase in demand only once and reward decrease • decrease in the price of the product itself / subsidy (1) in demand only once. makes the product more affordable (1) increasing demand (1) • increase in the price of substitutes (1) which are goods that provide the similar levels of satisfaction / example of substitutes (1) increasing demand (1) • decrease in the price of complements (1) goods that are in joint demand / example of complements (1) increasing demand (1) • increase in expected price in future (1) consumers willing to buy more now when prices are lower (1) instead of the future when prices go up (1) • increase in incomes (1) consumers more able to buy the product now (1) since affordability / purchasing power increase (1) • change in trends / popularity (1) some products become more fashionable / more popular (1) • increase in quality (1) making the product more desirable (1) • increase in or more effective advertising / marketing (1) informing consumers about the product (1) persuading consumers to buy the product (1) • increased peer pressure to buy the product (1) e.g. conspicuous consumption / to keep in with friends (1) • government health campaigns (1) encouraging consumption of merit goods (1) • change in seasons / weather (1) some products become more needed / desired at certain times (1) relevant example (1). 4(d) Discuss whether or not economic growth will improve 8 Maximum of four marks if no reference to a city. living standards in a city. Level Description Marks In assessing each answer, use the table opposite. 3 A reasoned discussion which accurately 6–8 Why it might: examines both sides of the economic • increase job opportunities in the city – increase income argument, making use of economic • increase government revenue – more public and merit information and clear and logical goods for the city analysis to evaluate economic issues • increase amount of investment in the city – more choice and situations. One side of the argument of goods and services may have more depth than the other, but overall both sides of the argument are Why it might not: considered and developed. There is • increase negative externalities such as pollution and thoughtful evaluation of economic congestion concepts, terminology, information • overcrowding as more people attracted to come to cities and/or data appropriate to the question. • increase inequality The discussion may also point out the • may produce inflationary pressures – reducing possible uncertainties of alternative affordability decisions and outcomes. 2 A reasoned discussion which makes use 3–5 of economic information and clear analysis to evaluate economic issues and situations. The answer may lack some depth and development may be one-sided. There is relevant use of economic concepts, terminology, information and data appropriate to the question. 4(d) 8 Level Description Marks 1 There is a simple attempt at using 1–2 economic definitions and terminology. Some reference may be made to economic theory, with occasional understanding. 0 A mark of zero should be awarded for no 0 creditable content.
This question in 0455/23 May/June 2025
Q26 · Calculate the total financial sector contribution (in $) to Switzerland’s GDP 0455/21 Oct/Nov 2025
1 (a) Calculate the total financial sector contribution (in $) to Switzerland’s GDP. [1] (b) Identify two microeconomic policy measures. [2] (c) Explain one reason why overdependence on foreign markets is a disadvantage to the Swiss economy. [2] (d) Draw a demand and supply diagram to show how a subsidy to solar energy producers would affect the market for solar energy. [4] (e) Explain two reasons why Switzerland had a current account surplus. [4] (f) Analyse the relationship between the global GDP growth rate and the change in the value of the Swiss franc. [5] (g) Discuss whether or not an increase in interest rates will harm the Swiss economy. [6] (h) Discuss whether or not a bank merger will benefit Swiss consumers and workers. [6]
30 marks
Mark scheme: Question Answer Marks Guidance 1(a) Calculate the total financial sector contribution (in $) to 1 Accept $73 billion or 73 billion. Switzerland’s GDP. $72 720 000 000. 7.27 1010 $72.7 billion 1(b) Identify two microeconomic policy measures. 2 Accept organising mergers. maximum prices (1) If more than two suggested measures are given, consider subsidies (1) the first three. 1(c) Explain one reason why overdependence on foreign 2 One mark for the reason and one mark for an explanation. markets is a disadvantage to the Swiss economy. Makes it more exposed to external shocks (1) as anything that happens in other countries could also affect the Swiss economy, for example reduced exports / increased import prices / potential shortages (1). 1(d) Draw a demand and supply diagram to show how a 4 subsidy to solar energy producers would affect the market for solar energy. D&S diagram: Axes correctly labelled – price and quantity or p and q (1). Original demand and supply curves correctly labelled (1). New supply curve shifted to the right (1). Equilibriums – shown by lines P1 and Q1 and P2 and Q2 or equilibrium points marked as E1 and E2 (1). 1(e) Explain two reasons why Switzerland had a current 4 One mark each for each of two reasons identified and one account surplus. mark each for each of two explanations. Logical explanation which might include: If more than two reasons are given, consider the first three. • low inflation (1) price of Swiss exports relatively lower, leading to increased exports / price of domestically produced goods relatively lower leading to decreased imports (1) • high-quality products (1) demand for Swiss exports higher, leading to increased exports / demand for domestically produced goods higher, leading to decreased imports (1) • strong currency (1) has kept cost of imported raw materials in Switzerland low, reducing costs of production (1). 1(f) Analyse the relationship between the global GDP 5 Responses do not have to be in the format suggested but growth rate and the change in the value of the Swiss they should address the expected / normal relationship, offer Franc. supporting evidence of that, highlight any exceptions to that, and analyse the overall data. Coherent analysis which might include the following. Expected relationship: generally negative / inverse relationship (1) as the global growth rate falls, the value of the Swiss Franc rises / as the global growth rate rises, the value of the Swiss Franc falls (1). Supporting evidence: fall in global growth rate led to rise in the value of Swiss Franc from 2018–2019 or 2019–2020 (1), rise in global growth rate led to fall in the value of Swiss Franc from 2020–2021 (1). Analysis: Swiss Franc’s status as a “safe haven” currency (1) when investors are unsure about the economy, they usually keep their money in Swiss francs (1). Exception: 2021–2022 (1) where global growth was falling but Swiss Franc was stable / rising only slightly (1). Analysis for exception: Other reasons could affect the value of Swiss Franc (1), for example Switzerland was also affected by the Covid–19 pandemic (1). 1(g) Discuss whether or not an increase in interest rates will 6 Falling profits can only be rewarded once. harm the Swiss economy. Apply this example to all questions with the command Award up to 4 marks for logical reasons why it might, which word DISCUSS (1g, 1h, 2d, 3d, 4d and 5d). may include: Each point may be credited only once, on either side of an • cost of borrowing increases for firms (1) increasing total argument, but separate development as to how / why the costs (1) reducing profits (1) outcome may differ is rewarded. • firms may invest less (1) may have to shut down (1) • unemployment rises (1) decreasing incomes Generic example Mark (1)decreasing total demand (1) decreasing economic growth (1) Tax revenue may decrease… 1 • consumers may borrow less (1) save more (1) less spending (1) demand for goods and services decreases ...because of reason e.g. incomes may be 1 (1) as returns from savings increase (1) decreasing lower. revenues of firms (1) decreasing profits (1) • Government borrowing costs more (1) leaving less Tax revenue may increase because 0 funding available for e.g. education / health (1). incomes may be higher i.e. reverse of a previous argument. Award up to 4 marks for logical reasons why it might not, which may include: Tax revenue may increase because of a 1 different reason i.e. not the reverse of a • hot money inflows strengthen the Swiss Franc (1) previous argument e.g. government reduce cost of e.g. imported raw materials (1) reducing spending on subsidies may stimulate the inflation (1) increasing export competitiveness (1) economy more than spending on education. • reduced demand-pull inflationary pressures (1) as cost of borrowing increases (1) decreasing demand for loans (1) increasing saving / decreasing consumption (1) investment (1) decreasing total demand (1) firms may reduce prices (1) increasing affordability of goods and services for consumers (1). • costs of production may decrease (1) reducing cost- push inflationary pressures (1). 1(h) Discuss whether or not a bank merger will benefit Swiss 6 Award a maximum of 4 marks if candidates only mention consumers and workers. one of consumers or workers. Award up to 4 marks for logical reasons why it might, which Reward, but do not expect reference to inelasticity of may include: demand in monopoly. • to avoid one of them collapsing (1) reducing confidence in the whole banking system (1) greater job security (1) less chance of bank customers losing their savings (1) • economies of scale (1) as output increases (average) costs fall (1) prices may decrease (1) goods and services more affordable for consumers (1) • the merged firm may make higher profits (1) able to pay higher wages to workers who remain employed (1) • workers in merged firm can share skills (1) improving efficiency (1). Award up to 4 marks for logical reasons why it might not, which may include: • monopoly power may increase (1) restricting supply (1) decreasing consumer choice (1) increasing prices (1) decreasing quality (1) • workers may lose their jobs (1) as the bank might shut down some operations / reduce duplication (1) increasing unemployment (1) • the merged firm may be too large / experience diseconomies of scale (1) example (1) reducing efficiency (1).
This question in 0455/21 Oct/Nov 2025
Q27 · Calculate the number of Malawians who had access to electricity in 2022 0455/23 Oct/Nov 2025
1 (a) Calculate the number of Malawians who had access to electricity in 2022. [1] (b) Identify two capital goods used in Malawi. [2] (c) Explain what is likely to have happened to Malawi’s production possibility curve (PPC) in January 2022. [2] (d) Explain two reasons why the supply of Malawian tea may increase. [4] (e) Draw a demand and supply diagram to show the effect of a report stating the health risks of consuming sugar on the market for sugar. [4] (f) Analyse the relationship between GDP per head and the percentage of children who complete primary education. [5] (g) Discuss whether or not Malawi should develop a solar energy industry. [6] (h) Discuss whether or not a government should try to stop its country’s foreign exchange rate falling in value. [6]
30 marks
Mark scheme: Question Answer Marks Guidance 1(a) Calculate the number of Malawians who had access to 1 Accept 3.3 106. electricity in 2022. 3.3 m or 3 300 000. 1(b) Identify two capital goods used in Malawi. 2 If more than two capital goods are given, consider the first three. Two from: Factories (1) power stations (1) solar panels (1) electricity (1) fertilisers (1). 1(c) Explain what is likely to have happened to Malawi’s 2 Accept an accurate and fully labelled PPC diagram showing production possibility curve (PPC) in January 2022. the PPC shifting to the left for the first mark. • It is likely to have shifted to the left / inside / inwards / Second mark for any relevant reason from the source contract (1). material. • due to natural disasters / Storm (Ana) / resources destroyed / productive capacity (or land) reduced / less labour (1). 1(d) Explain two reasons why the supply of Malawian tea 4 One mark each for two reasons identified and one mark may increase. each for two explanations. Logical explanation which might include: If more than two reasons are given, consider the first three. • good weather conditions (1) would increase crop yields / Do not accept an answer that links tea with sugar. prevent crops being destroyed (1). • government subsidies (1) provide a financial incentive / additional payment to that received from consumers / reduce costs of production (1). • fall in price of fertiliser (1) which reduces cost of production / increase crop yields / allows farmers to purchase more fertiliser (1). • fall in exchange rate (1) higher demand for Malawian tea (1). 1(e) Draw a demand and supply diagram to show the effect 4 of a report stating the health risks of consuming sugar on the market for sugar. Coherent analysis which might include the following. D&S diagram: • Axes correctly labelled – price and quantity or p and q (1). • Original demand and supply curves correctly labelled (1). • New labelled demand curve shifted to the left (1). • Equilibriums – shown by lines P1 and Q1 and P2 and Q2 or equilibrium points marked as E1 and E2 (1). 1(f) Analyse the relationship between GDP per head and the 5 Responses do not have to be in the format suggested but percentage of children who complete primary they should address the expected / normal relationship, offer education. supporting evidence of that, highlight any exceptions to that, and analyse the overall data. Coherent analysis which might include the following. Supporting evidence should involve interpretation, not just Expected relationship: description e.g. simply quoting data without reference to Generally, a direct / positive relationship (1) the higher the high or low. GDP per head, the higher the percentage of children who complete primary education (1). 1(f) Supporting evidence: Four countries with the highest GDP per head had the highest percentage of children who complete primary education / Malawi / Uganda have the lowest of both (1). South Africa had the highest GDP per head and the highest percentage of children who complete primary education (1). Comparison of two countries (e.g. Namibia and Senegal where GDP falls as does percentage of children completing primary education). Analysis of the expected relationship: Parents in countries with high incomes are more likely to be able to afford to keep their children in primary education (1). Government tax revenue is likely to be higher in countries with high incomes and so will be able to spend more on primary education (1). Completing primary education may increase the chance of skilled / occupationally mobile high income earning workers (1). Exception: Malawi / Uganda (1) Malawi has a lower GDP per head but a higher percentage of children who complete primary education than Uganda (1). Analysis of exception: A higher percentage of children may complete primary education but the quality of the education may be low leading to a low GDP per head / GDP per head may be high but there may be a high degree of inequality with a relatively high proportion of the population unable to keep their children in primary education (1). 1(g) Discuss whether or not Malawi should develop a solar 6 Apply this example to all questions with the command energy industry. word DISCUSS (1g, 1h, 2d, 3d, 4d and 5d) Award up to 4 marks for logical reasons why it might, which may include: Each point may be credited only once, on either side of an • a sustainable source of energy (1) enables future argument, but separate development as to how / why the generations to access energy (1) outcome may differ is rewarded. • would create less pollution / external costs than burning wood and charcoal / improve air quality (1) reduce Generic example mark deforestation (1) improve health (1) • may enable more Malawian households to gain access Tax revenue may decrease… 1 to electricity (1) increase living standards / reduce inequality (1) ...because of reason e.g. incomes may be lower. 1 • setting up solar panels creates jobs (1) leads to increased output / economic growth / access to Tax revenue may increase because incomes 0 electricity for Malawian firms (1) may be higher i.e. reverse of a previous • long hours / 3000 hours of sunshine (1) a good / viable argument. source of energy (1) • less need to import energy (1) reduce current account Tax revenue may increase because of a different 1 deficit (1) reason i.e. not the reverse of a previous • develops employment opportunities (1) raising incomes argument e.g. government spending on subsidies (1). may stimulate the economy more than spending on education. 1(g) Award up to 4 marks for logical reasons why it might not, which may include: • opportunity cost of installing (1) example (1) • opportunity cost of land use (1) reduced agricultural output (1) • dependent on weather / sunshine and days lost (1) unstable supply (1) may experience storm damage / natural disasters (1) • visual pollution (1) might reduce tourism / reduce house prices (1) • cost of developing an electricity distribution network may be prohibitive • cost of switching from fossil-fuel burning domestic appliances to electrical ones may not be affordable to households (1) limiting the impact of the switch (1) • expensive to install (1) worsen government budget position (1) • visual pollution (1) might reduce tourism / reduce house prices (1) • solar panels could be damaged by storms (1) making them inefficient (1). 1(h) Discuss whether or not a government should try to stop 6 Note: many candidates provide incorrect analysis e.g. its country’s foreign exchange rate falling in value. wrong way around. Award up to 4 marks for logical reasons why it should try to Maximum of 3 marks if there is no development / evaluation stop it falling in value e.g. the disadvantages of the fall, of reasons given. including: • will increase import prices (1) reducing imports (1) may increase cost of imported raw materials and capital goods cost (1) cause cost-push inflation (1) cause slow economic growth (1) • may reduce pressure on domestic firms to keep prices low (1) quality high (1) • may reduce confidence in the economy (1) reduce investment (1) increase debt (1). Award up to 4 marks for logical reasons why it should allow a fall in value e.g. the advantages of the fall, including: • will reduce export prices (1) increase exports (1) reduce imports (1) • make domestic goods more competitive (1) reduce a current account deficit / improve the balance of payments (1) • may increase economic growth (1) reduce unemployment (1) attract MNCs / attract investment (1) increase tourism (1) • opportunity cost / costly for government to intervene (1) e.g. less funding for education / healthcare / housing (1) • may increase government tax revenue (1).
This question in 0455/23 Oct/Nov 2025
 1 / 13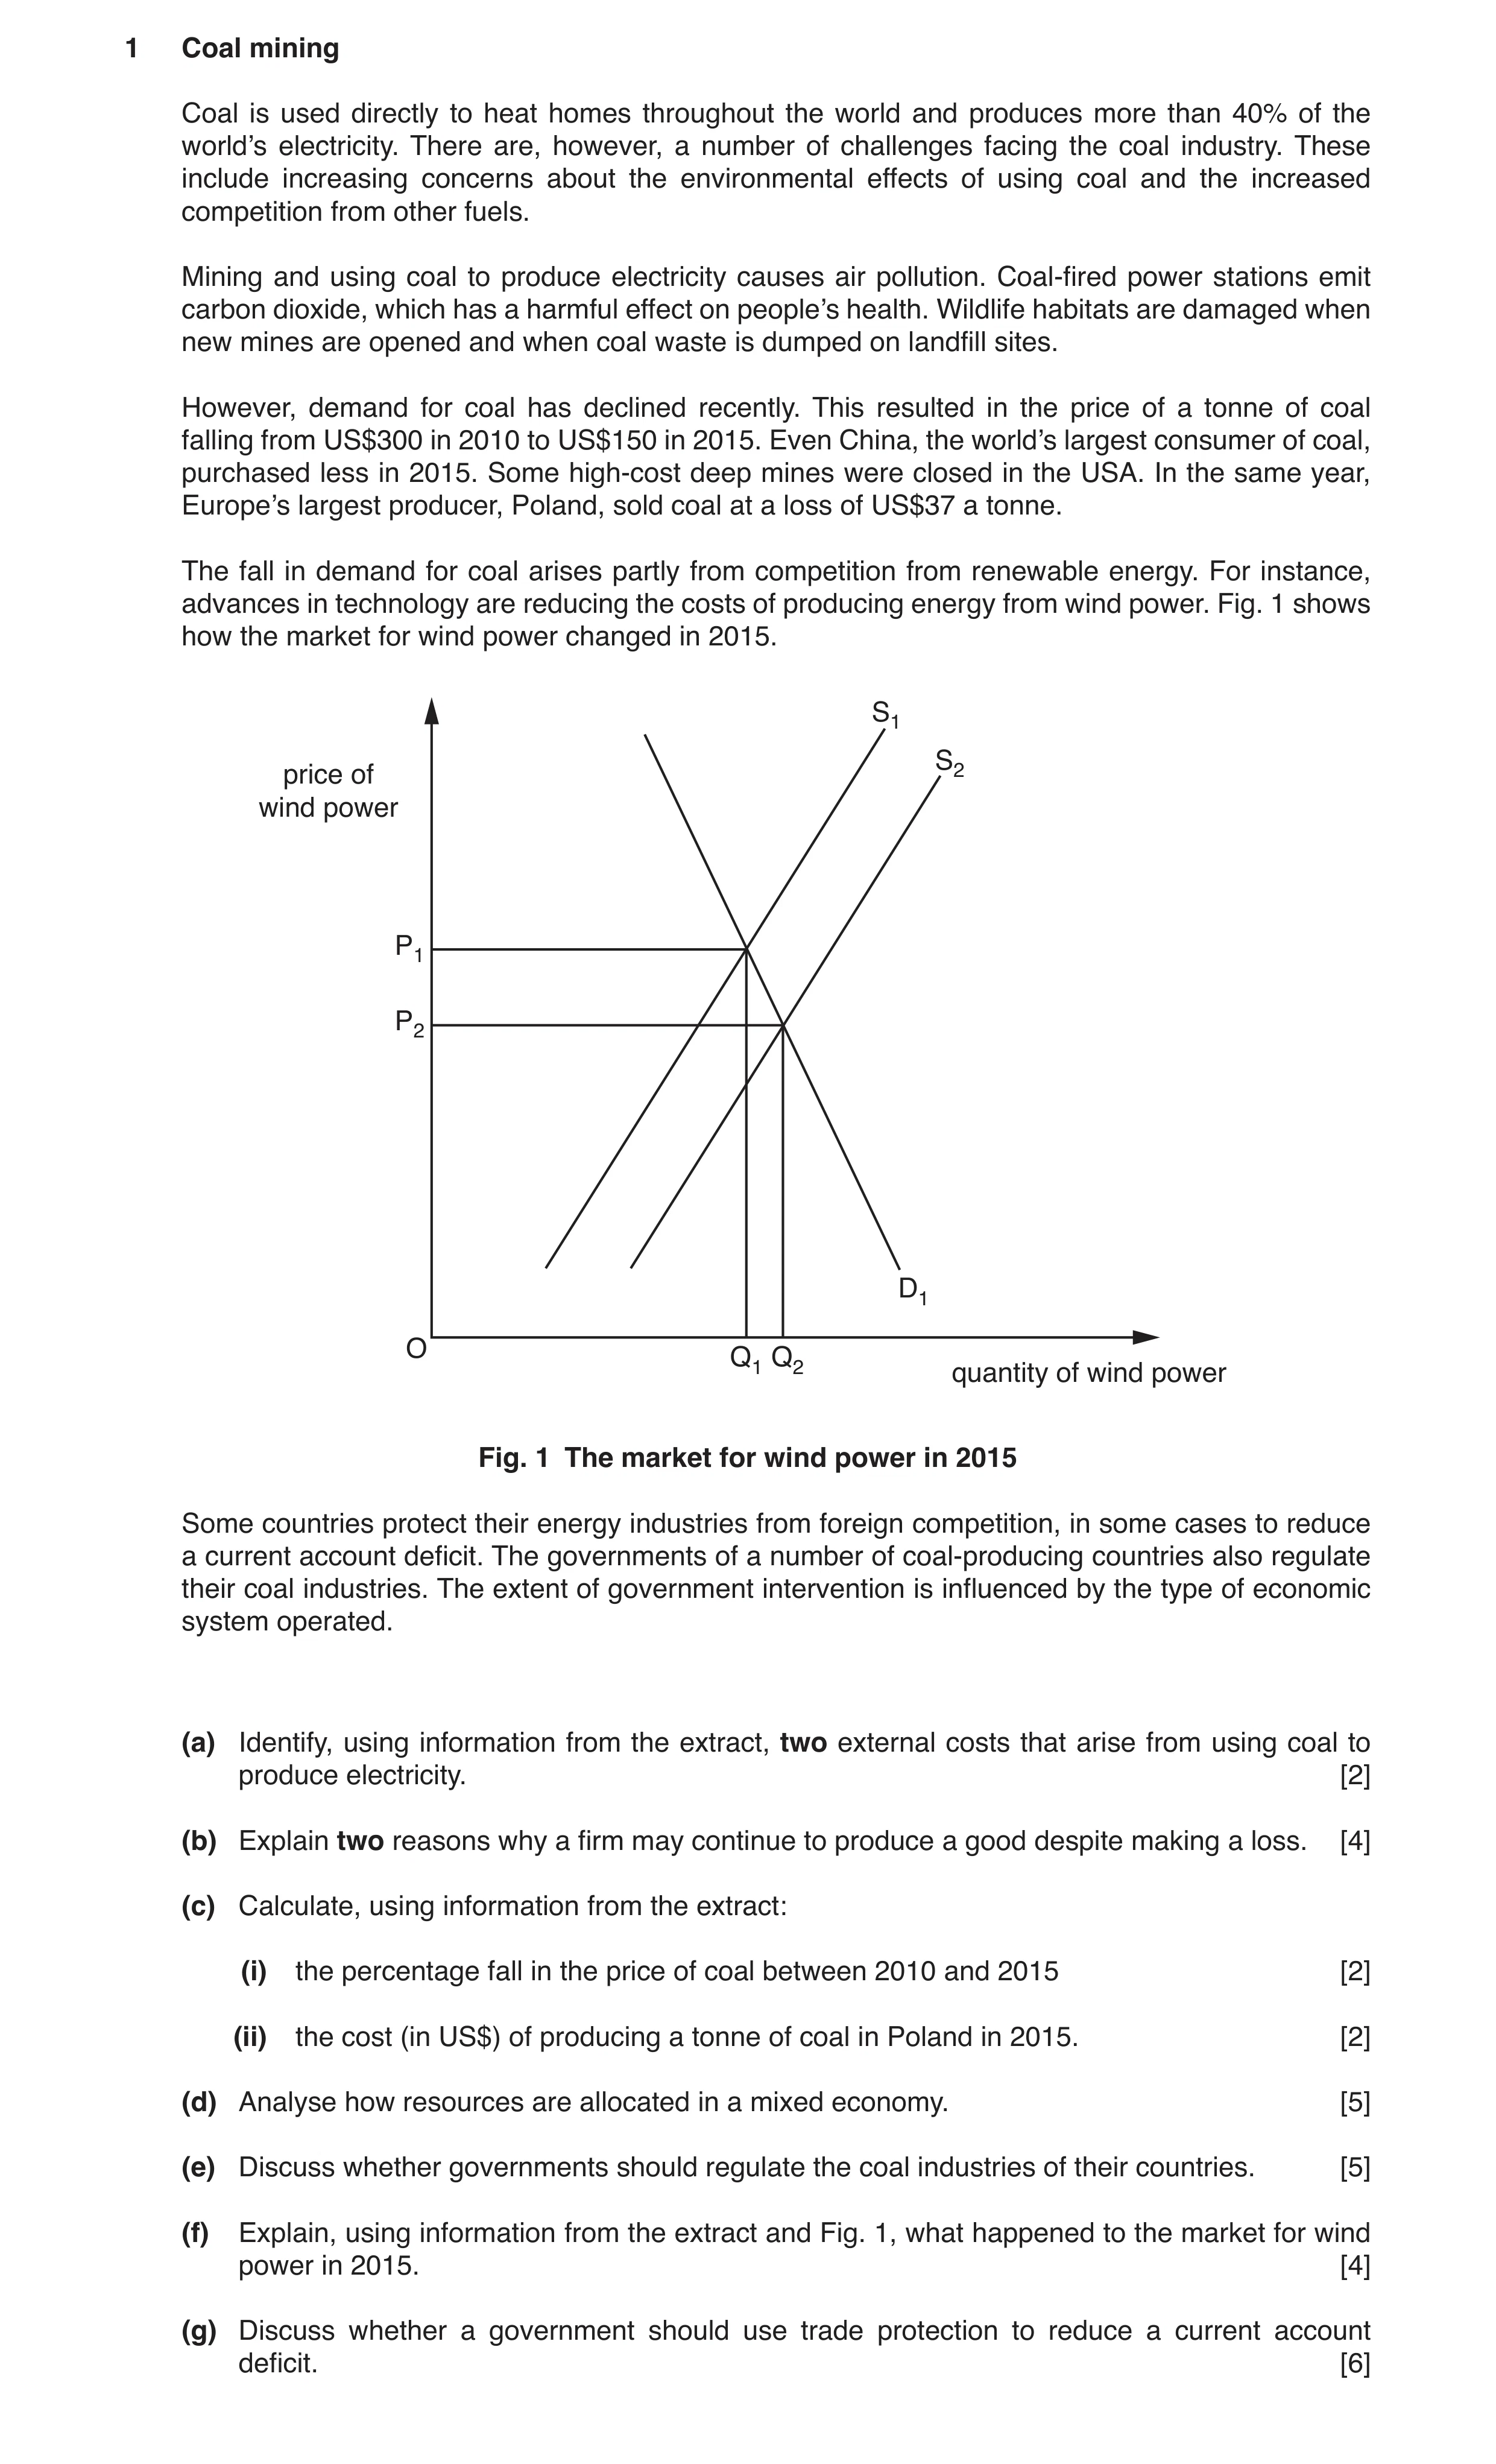
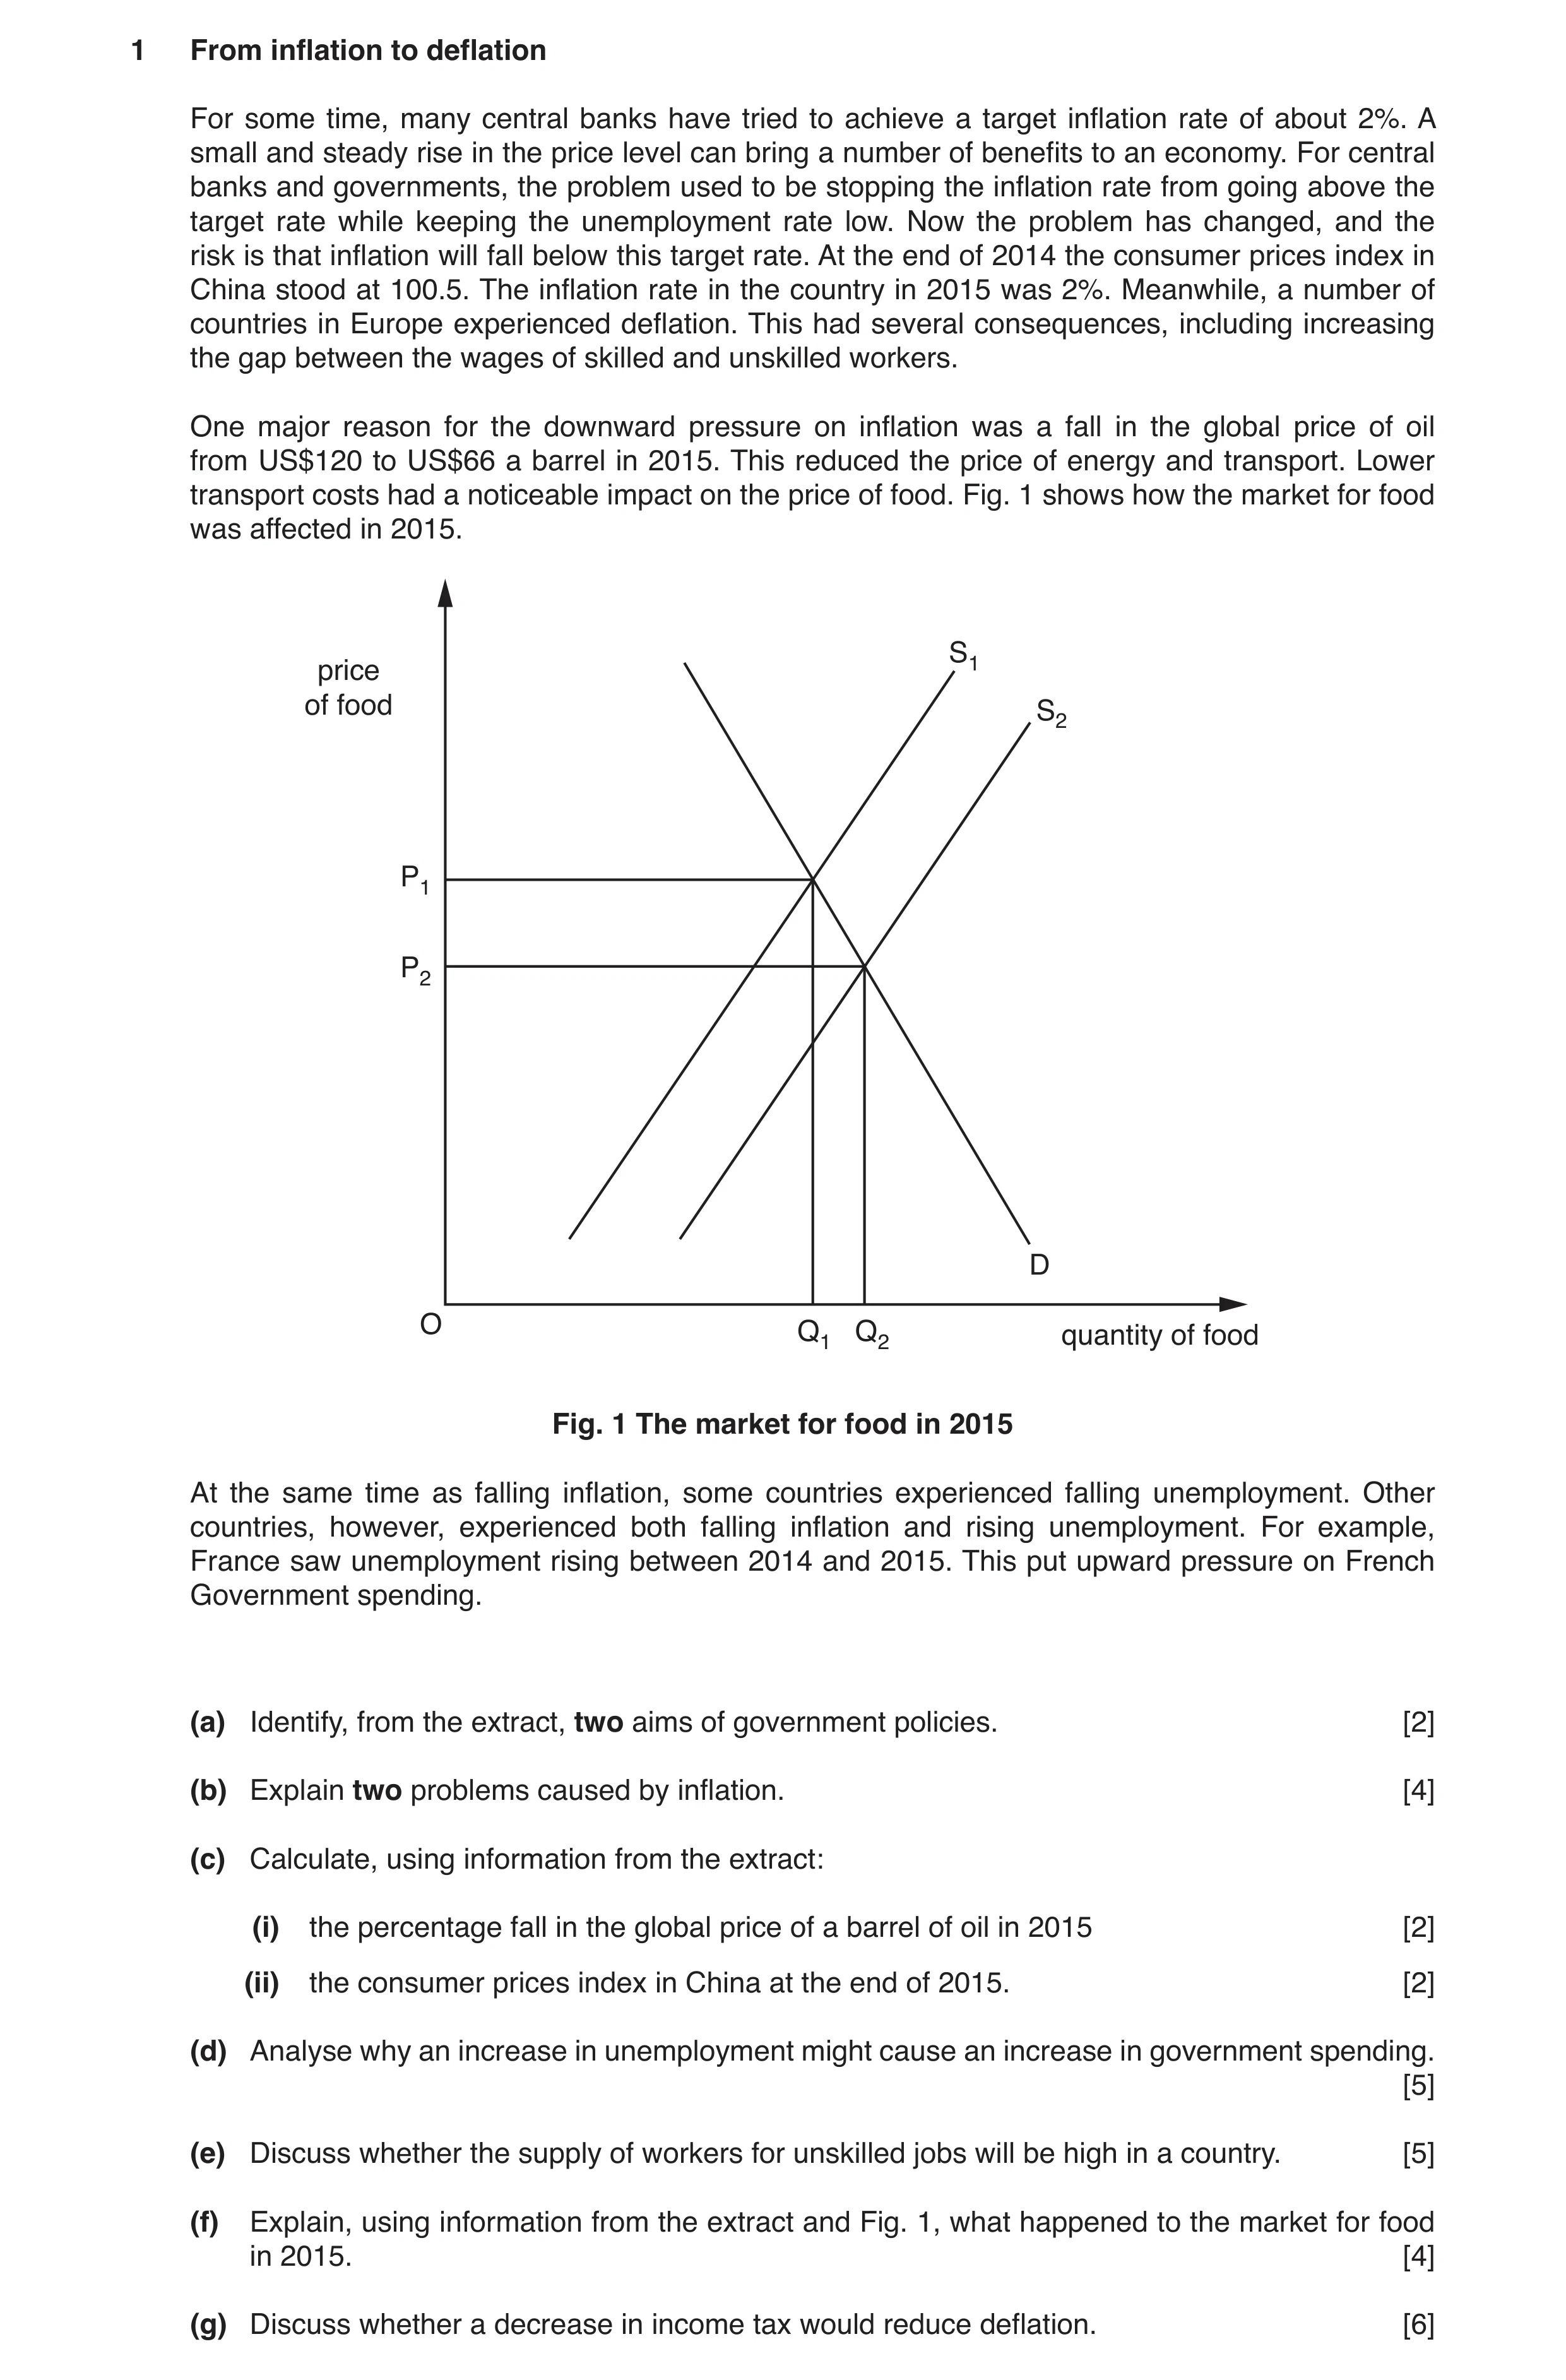
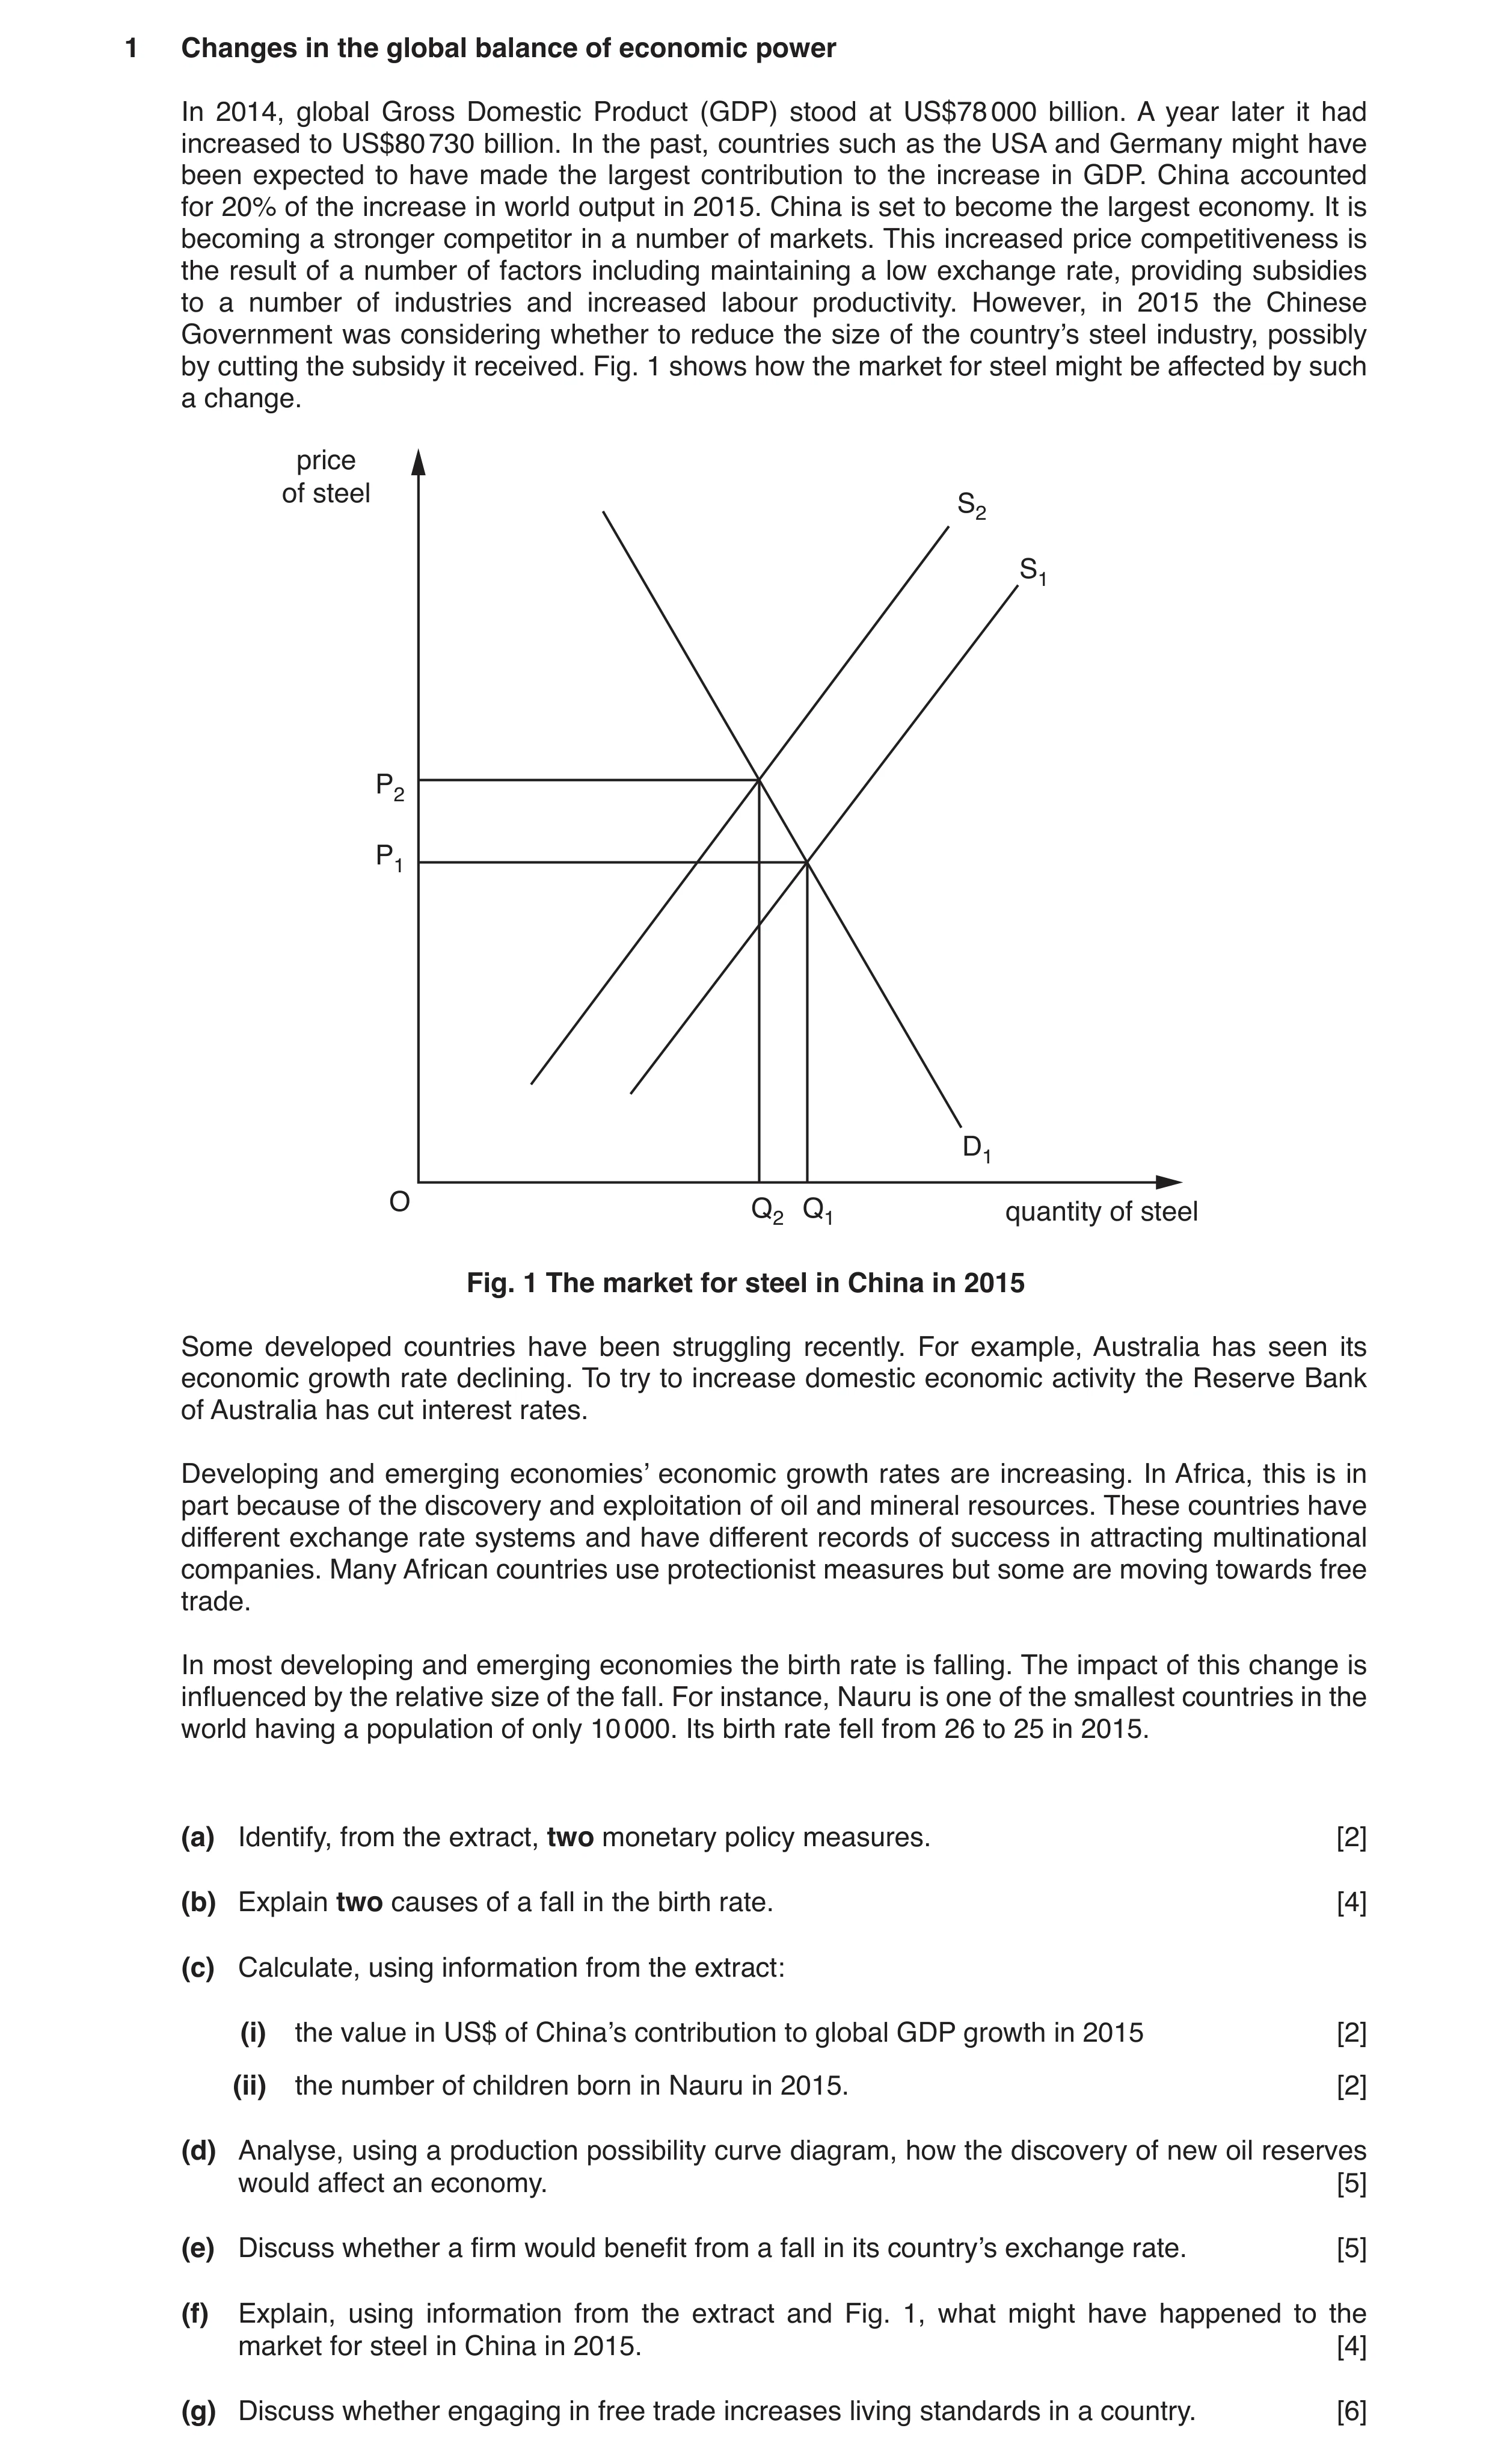
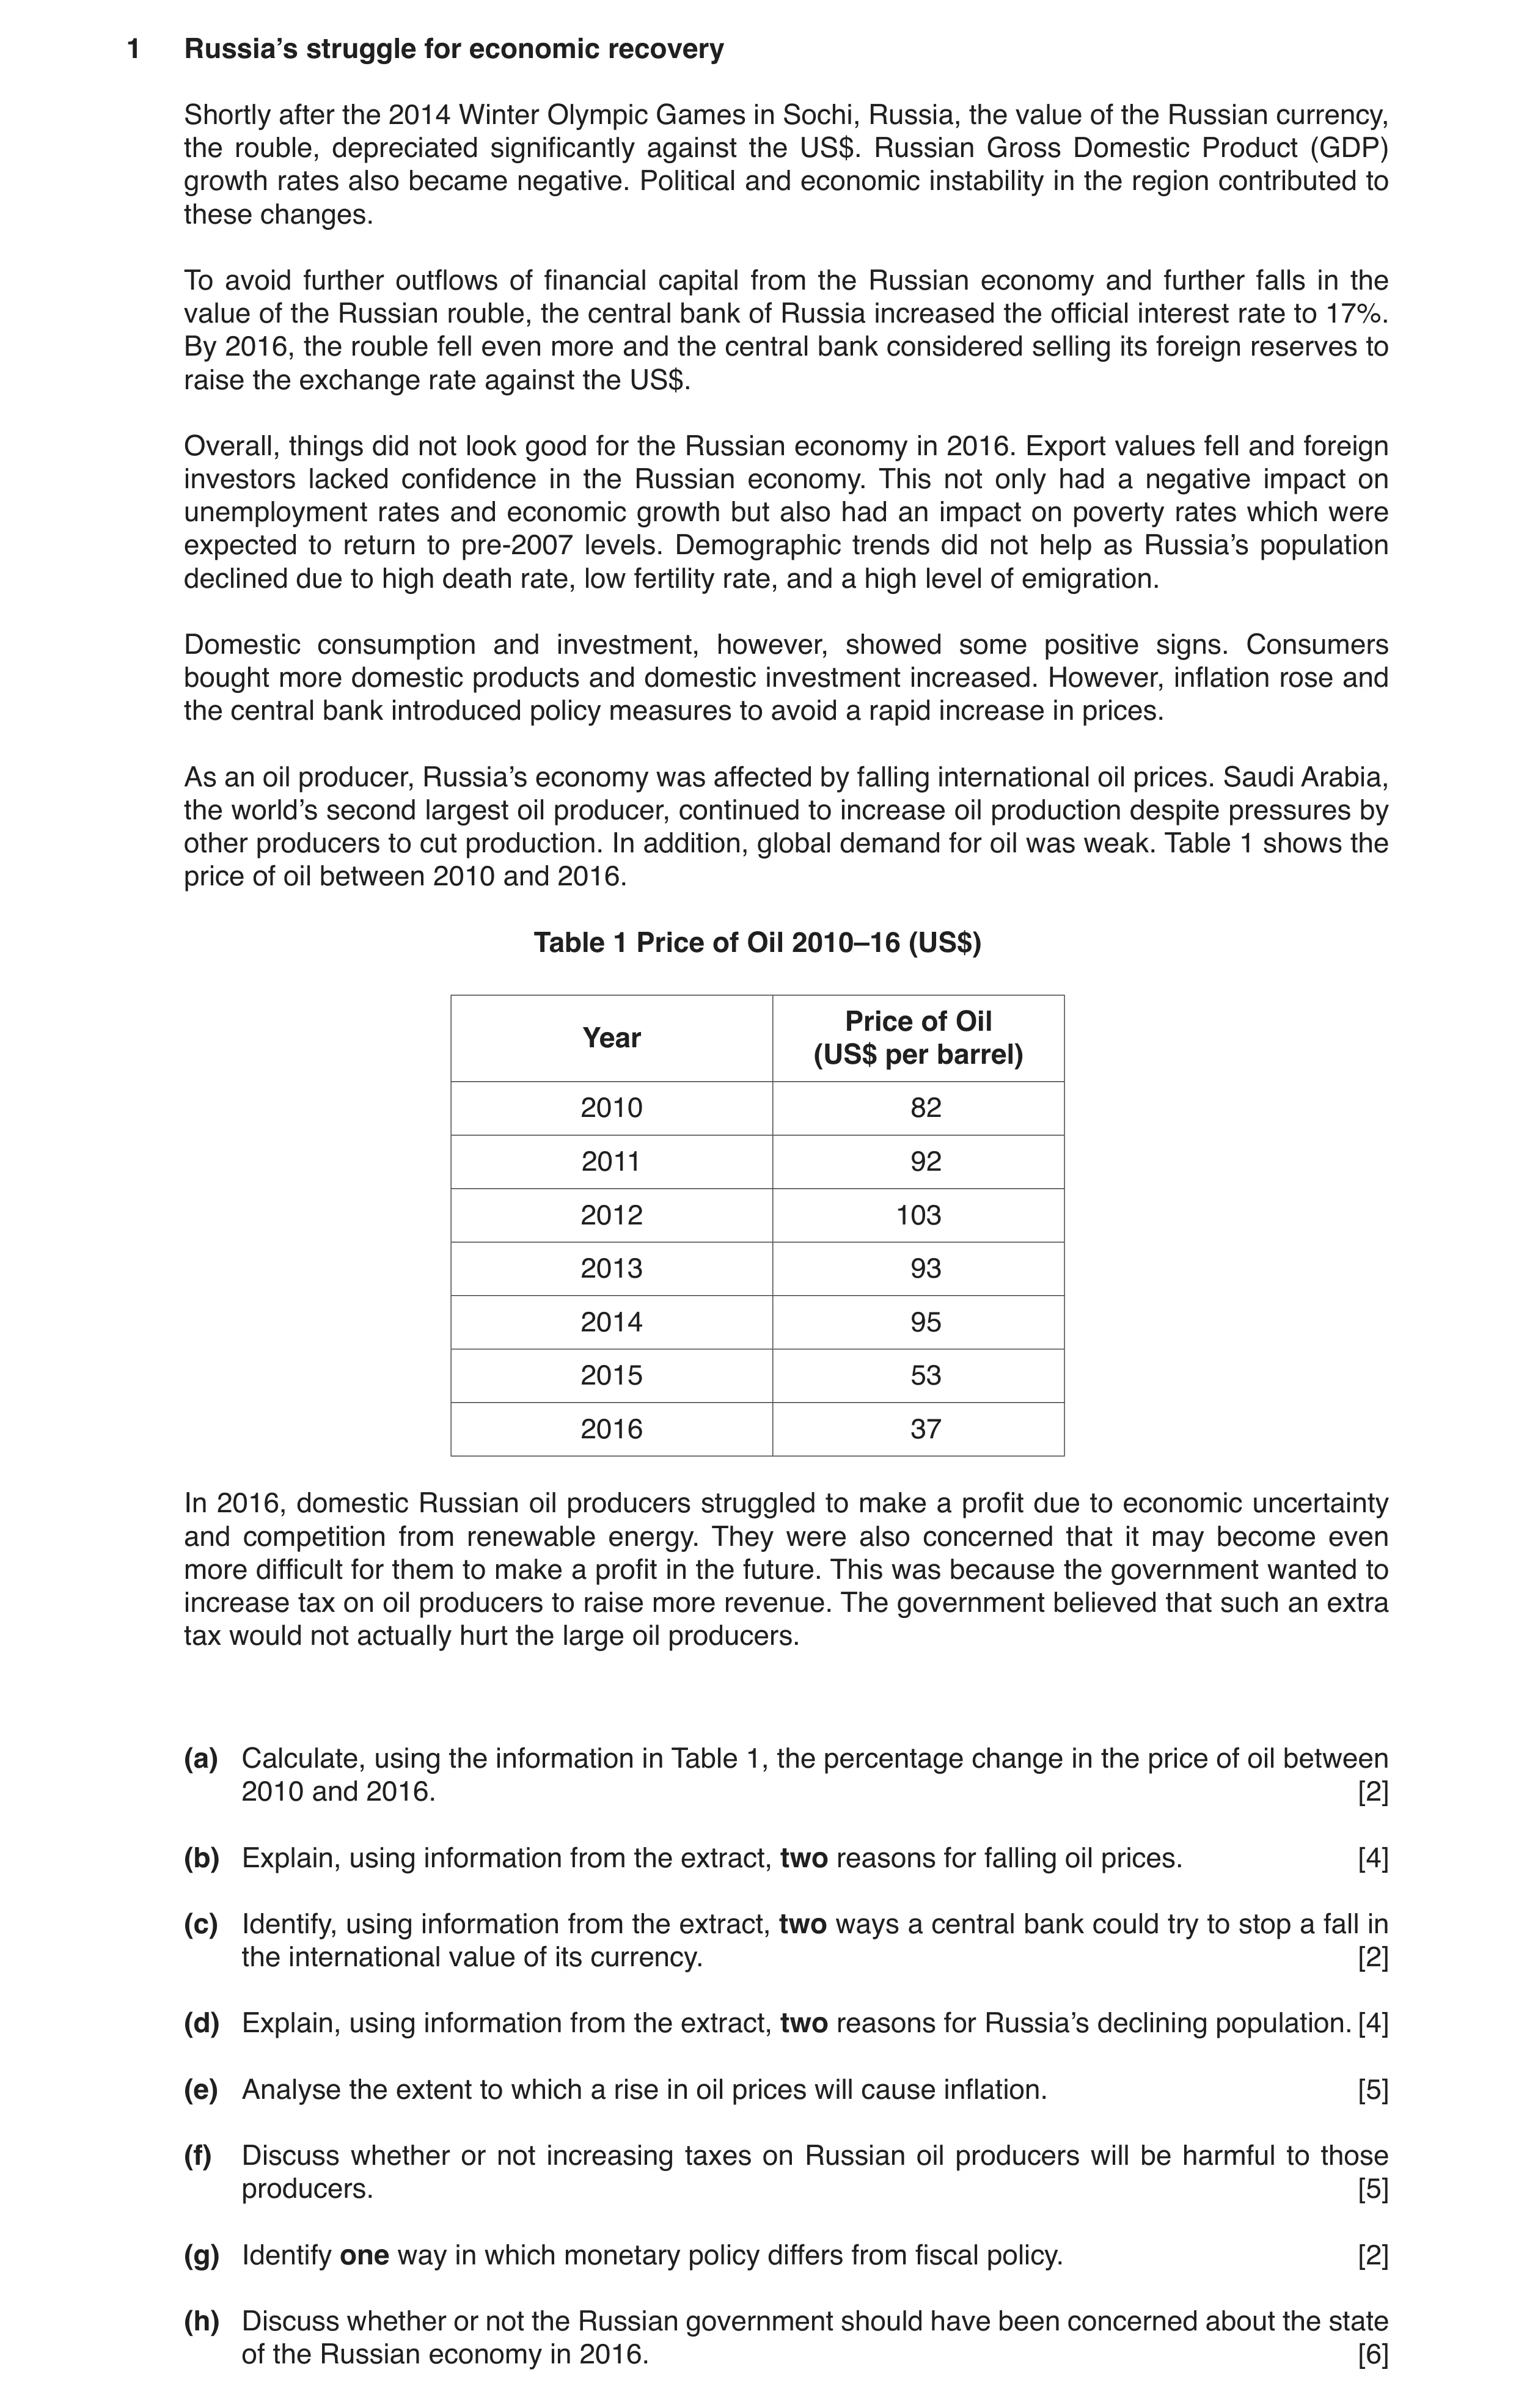
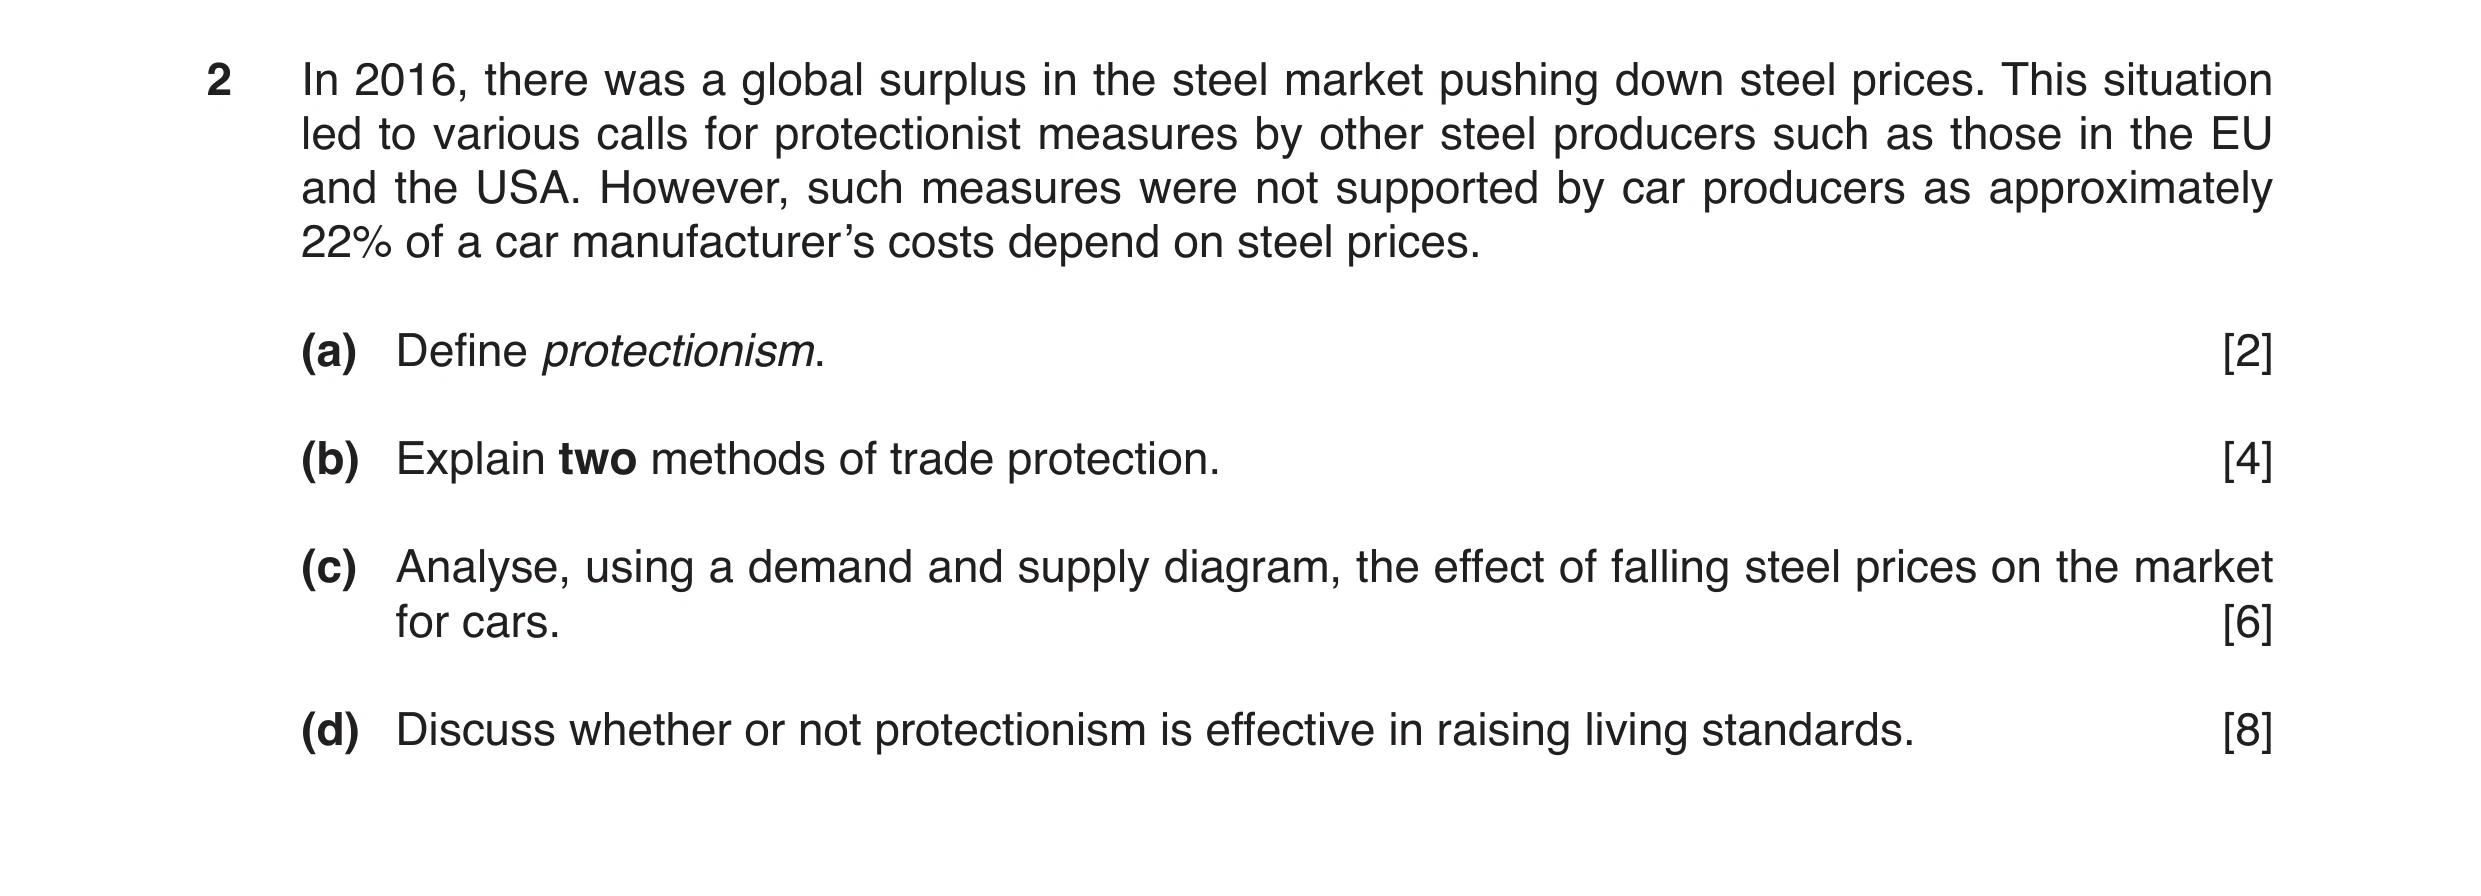 6 / 13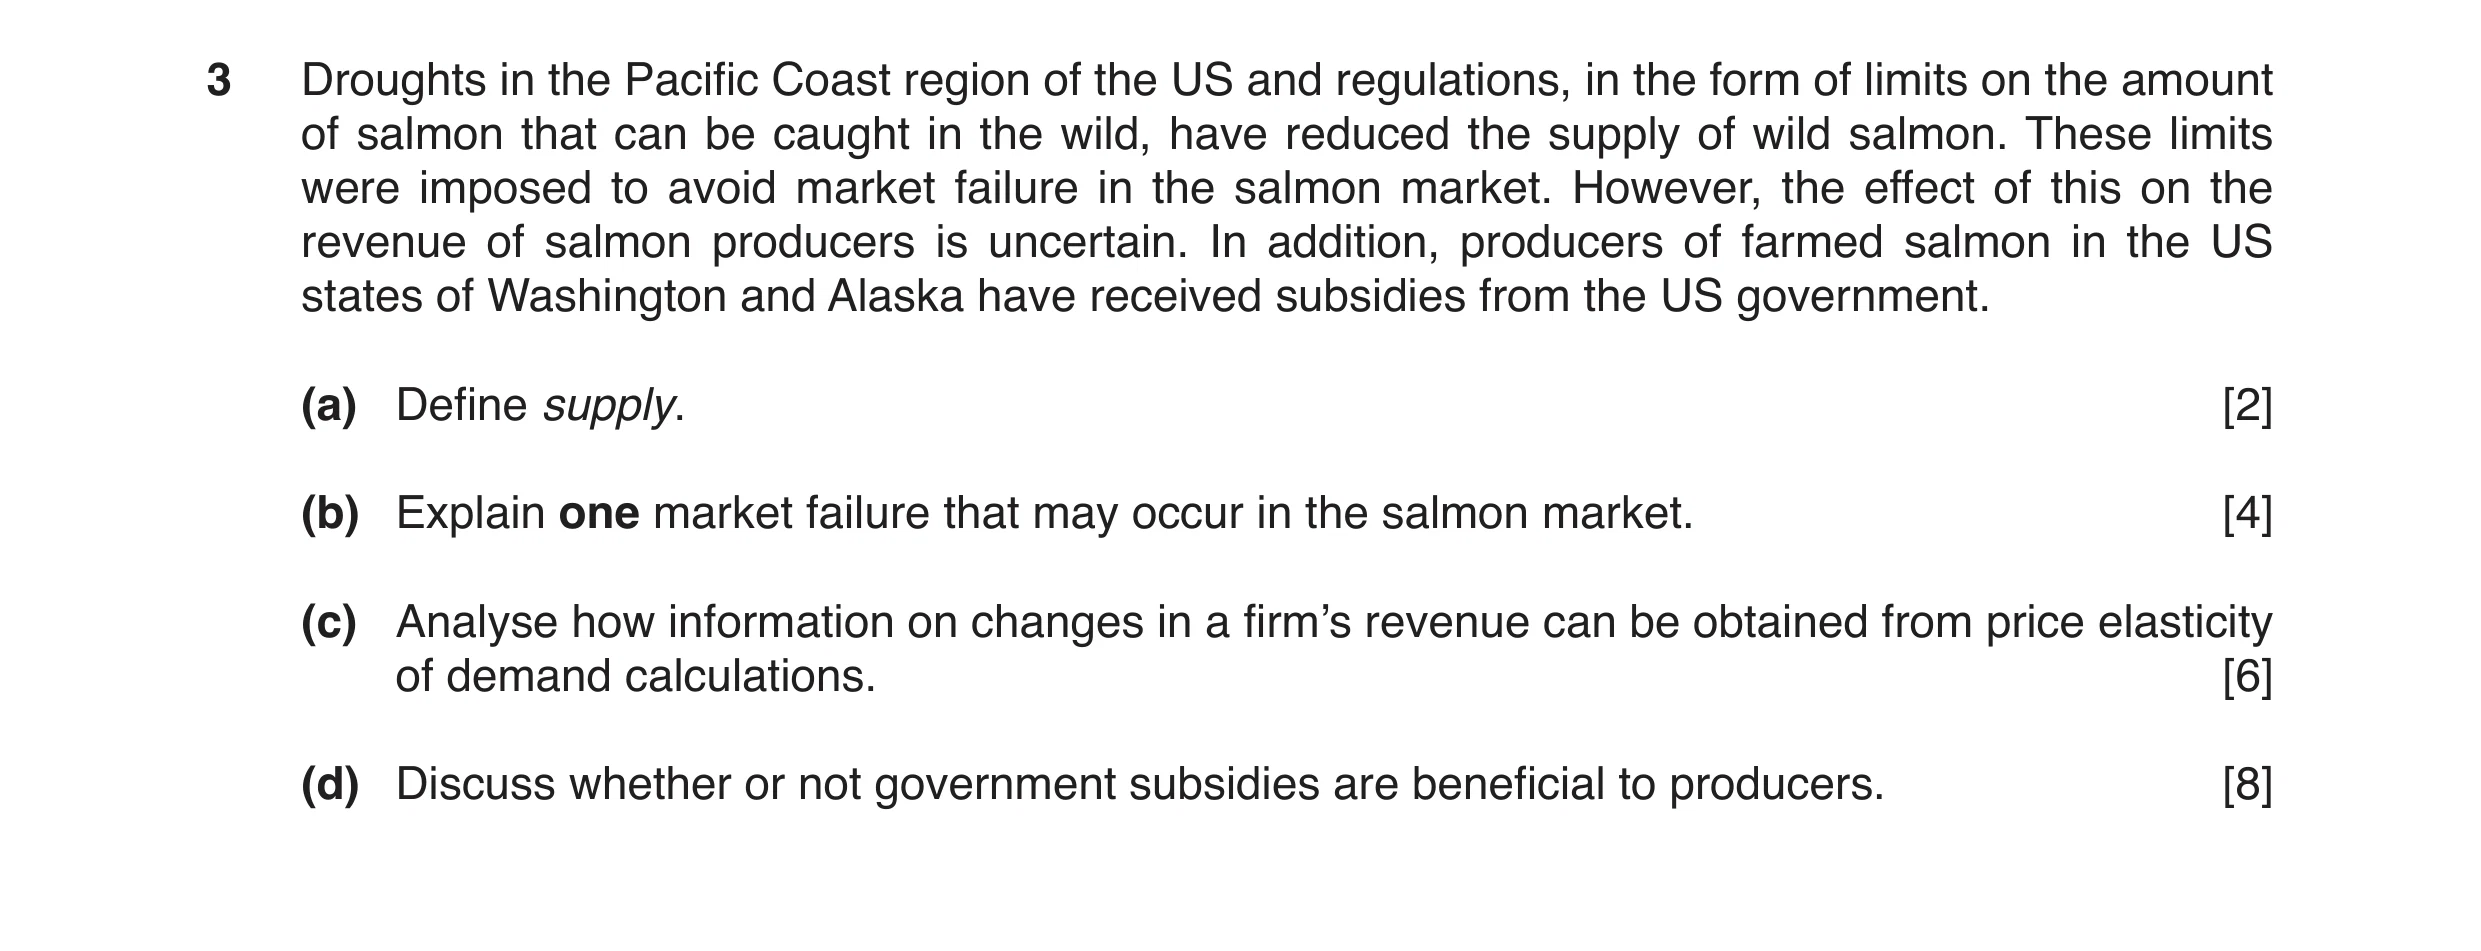
 7 / 13
![Question 13: (a) Calculate India’s economic growth rate in 2017. [1] (b) Identify two methods of protection. [2] (c) State why India is a mixed economy.…](https://img.pastlit.com/crops/5bf0d89b-9dfc-4330-8be1-12b6ec2785a9/q1.webp) 8 / 13
8 / 13
![Question 15: (a) Calculate the percentage of total world output of palm oil produced by Indonesia in 2017. [1] (b) Identify two variable costs of produc…](https://img.pastlit.com/crops/5a673893-06b0-42f3-86c9-97cce6ecfc5a/q1.webp)
 9 / 13
![Question 19: (a) Calculate Tunisia’s balance on the current account of its balance of payments. [1] (b) Identify two qualities of a good tax that the Tu…](https://img.pastlit.com/crops/be2eae48-7d6d-4658-a839-9de8b9e591eb/q1.webp) 10 / 13
10 / 13![Question 20: (a) Calculate the average cost of producing a car in Belarus in 2021. [1] (b) Identify two reasons why Belarus is described as a mixed econ…](https://img.pastlit.com/crops/694c5e96-092a-4fd5-aadb-0306b621e45b/q1.webp)
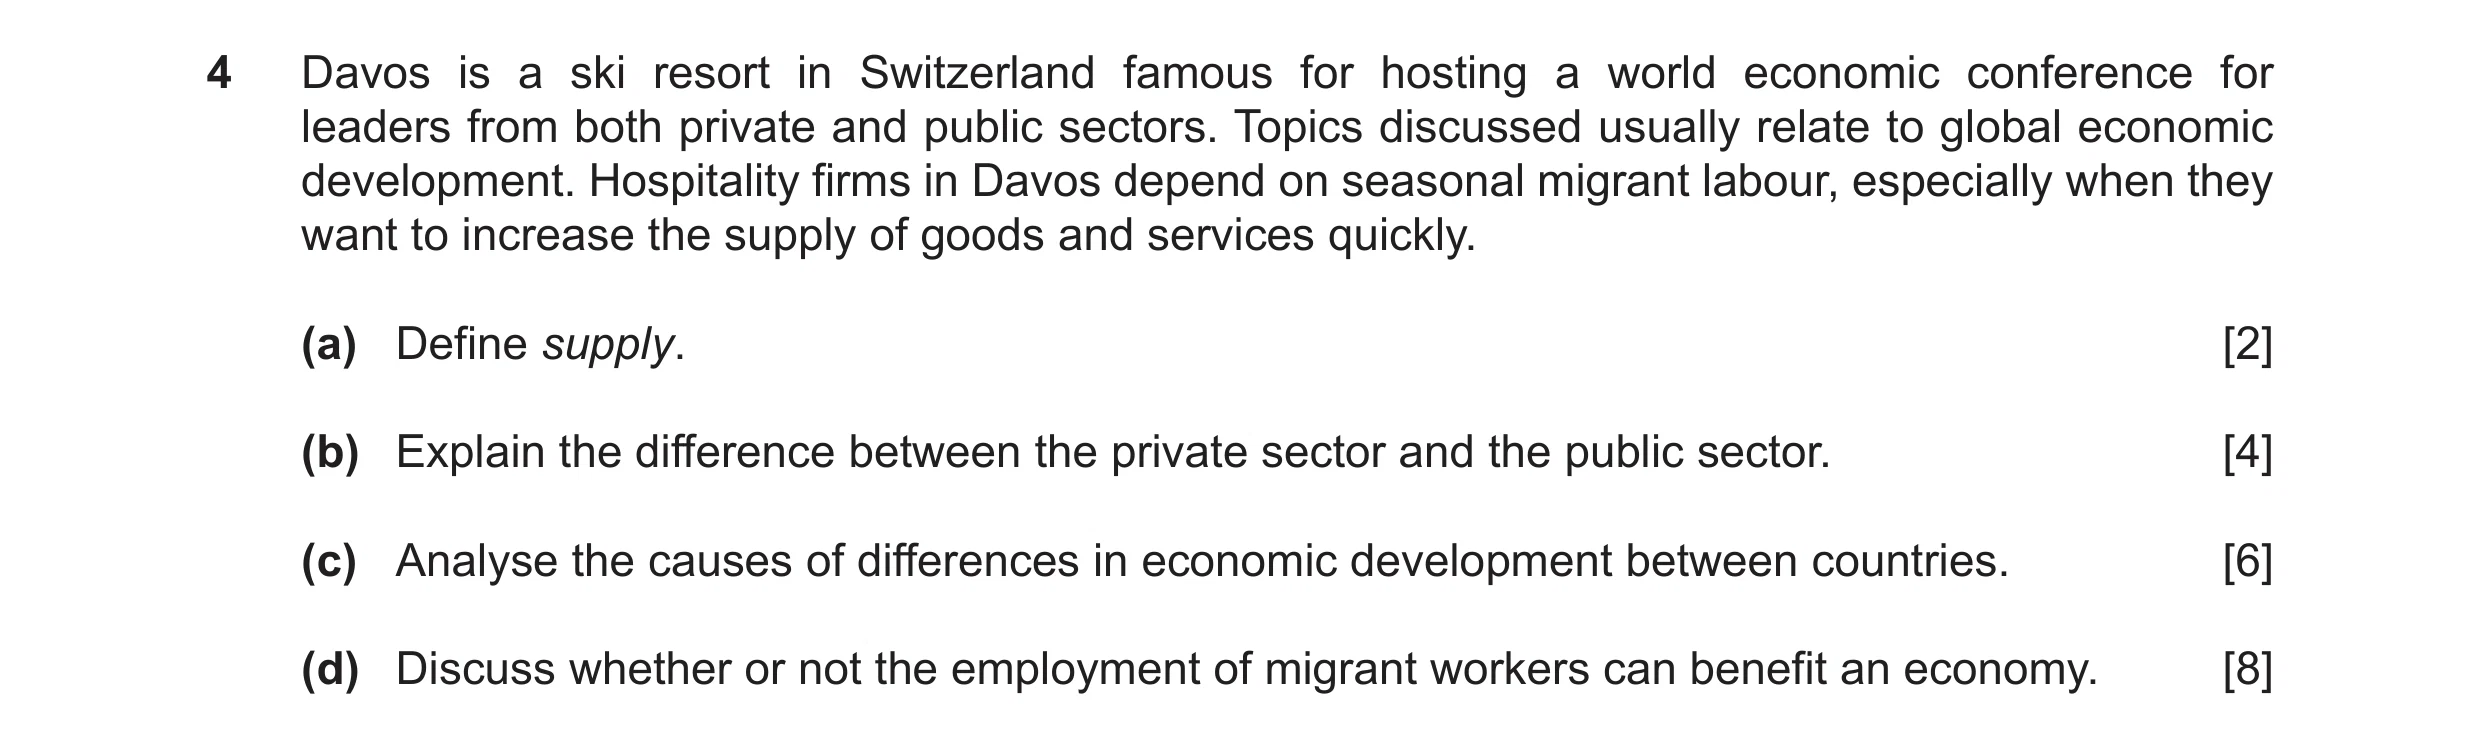
![Question 22: (a) Calculate the value of Gabon’s oil production as a percentage of Gabon’s GDP. [1] (b) Identify two external benefits of rainforests. [2…](https://img.pastlit.com/crops/a6ddbc31-564d-42aa-be39-86043cb5f3e2/q1.webp) 11 / 13
11 / 13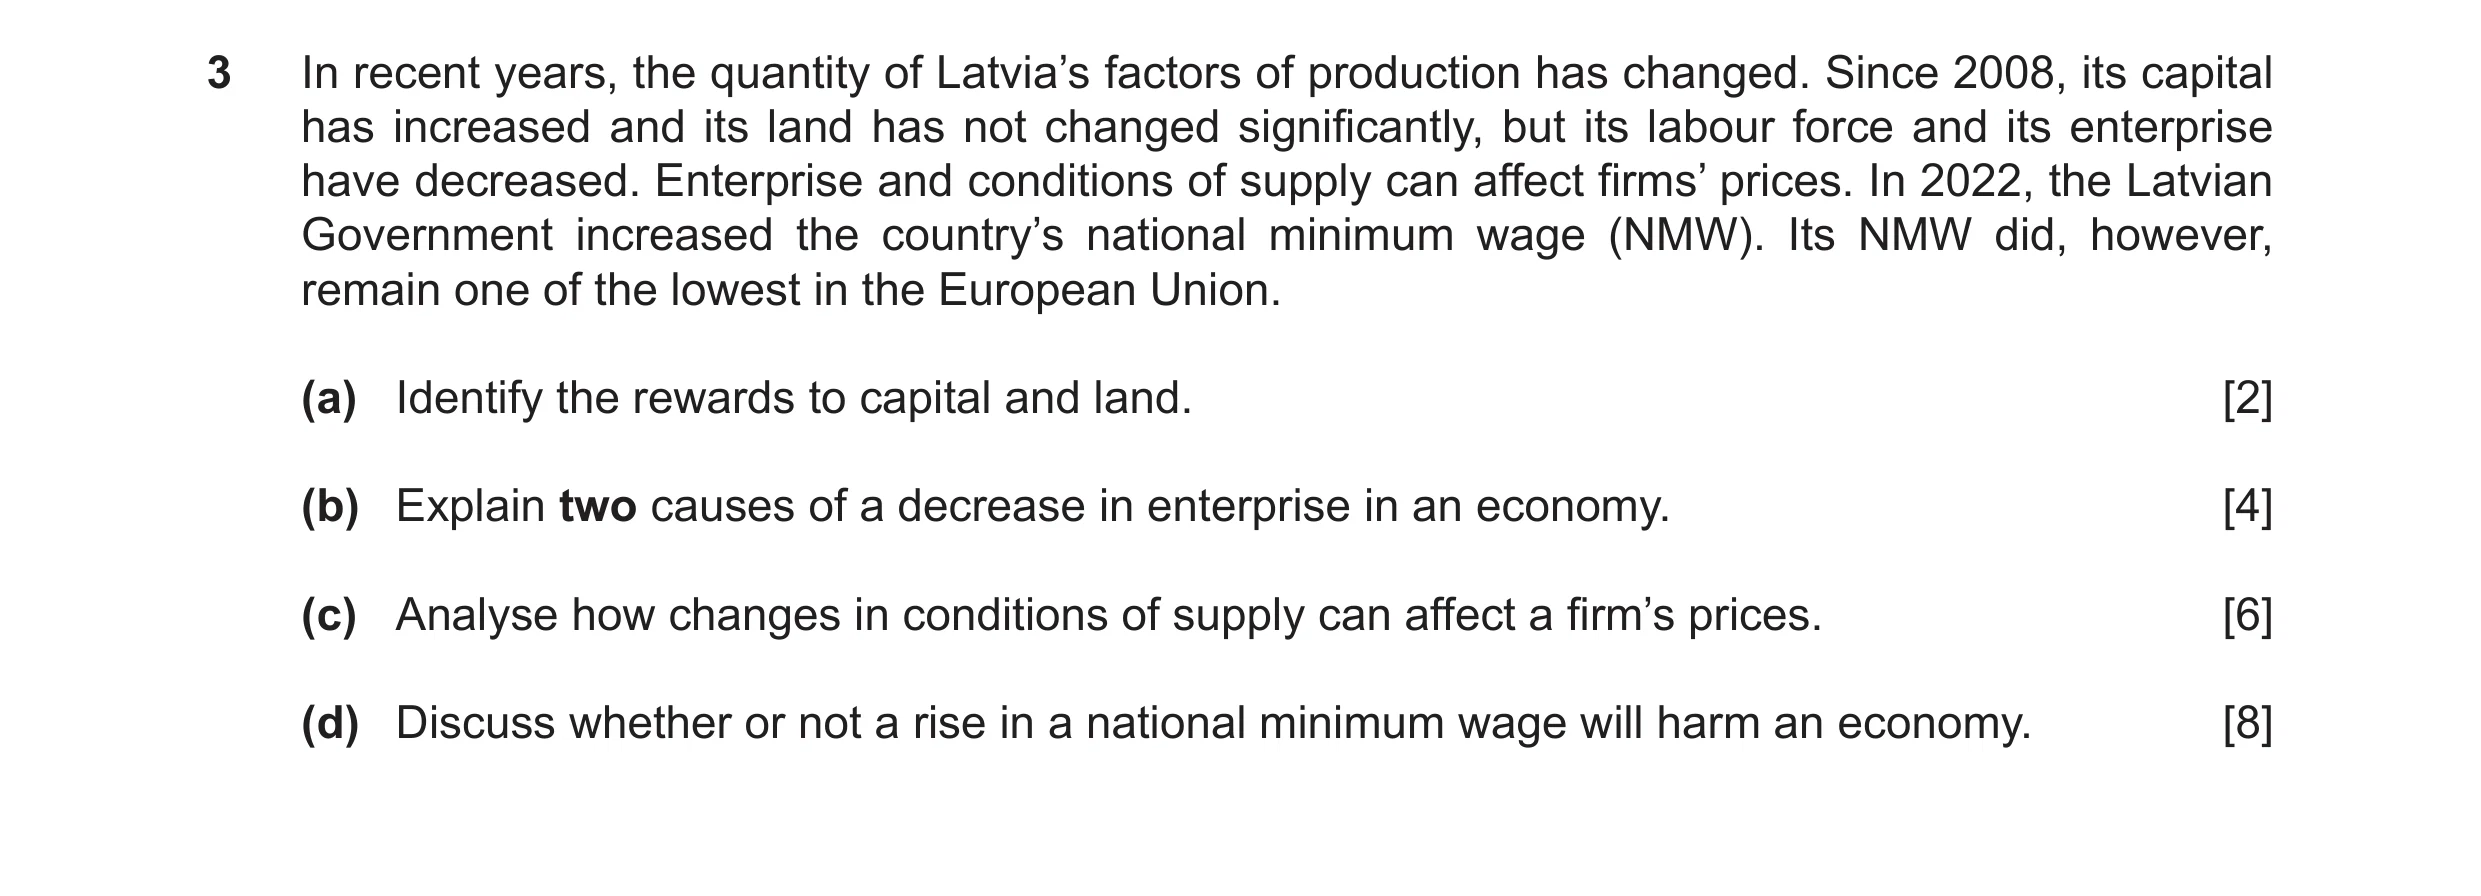
![Question 24: (a) Calculate St. Kitts and Nevis’s government budget deficit in 2022. [1] (b) Identify two examples of the factor of production ‘land’ in …](https://img.pastlit.com/crops/b22807ab-7c1a-4326-a6ef-7ec4f298b82a/q1.webp)
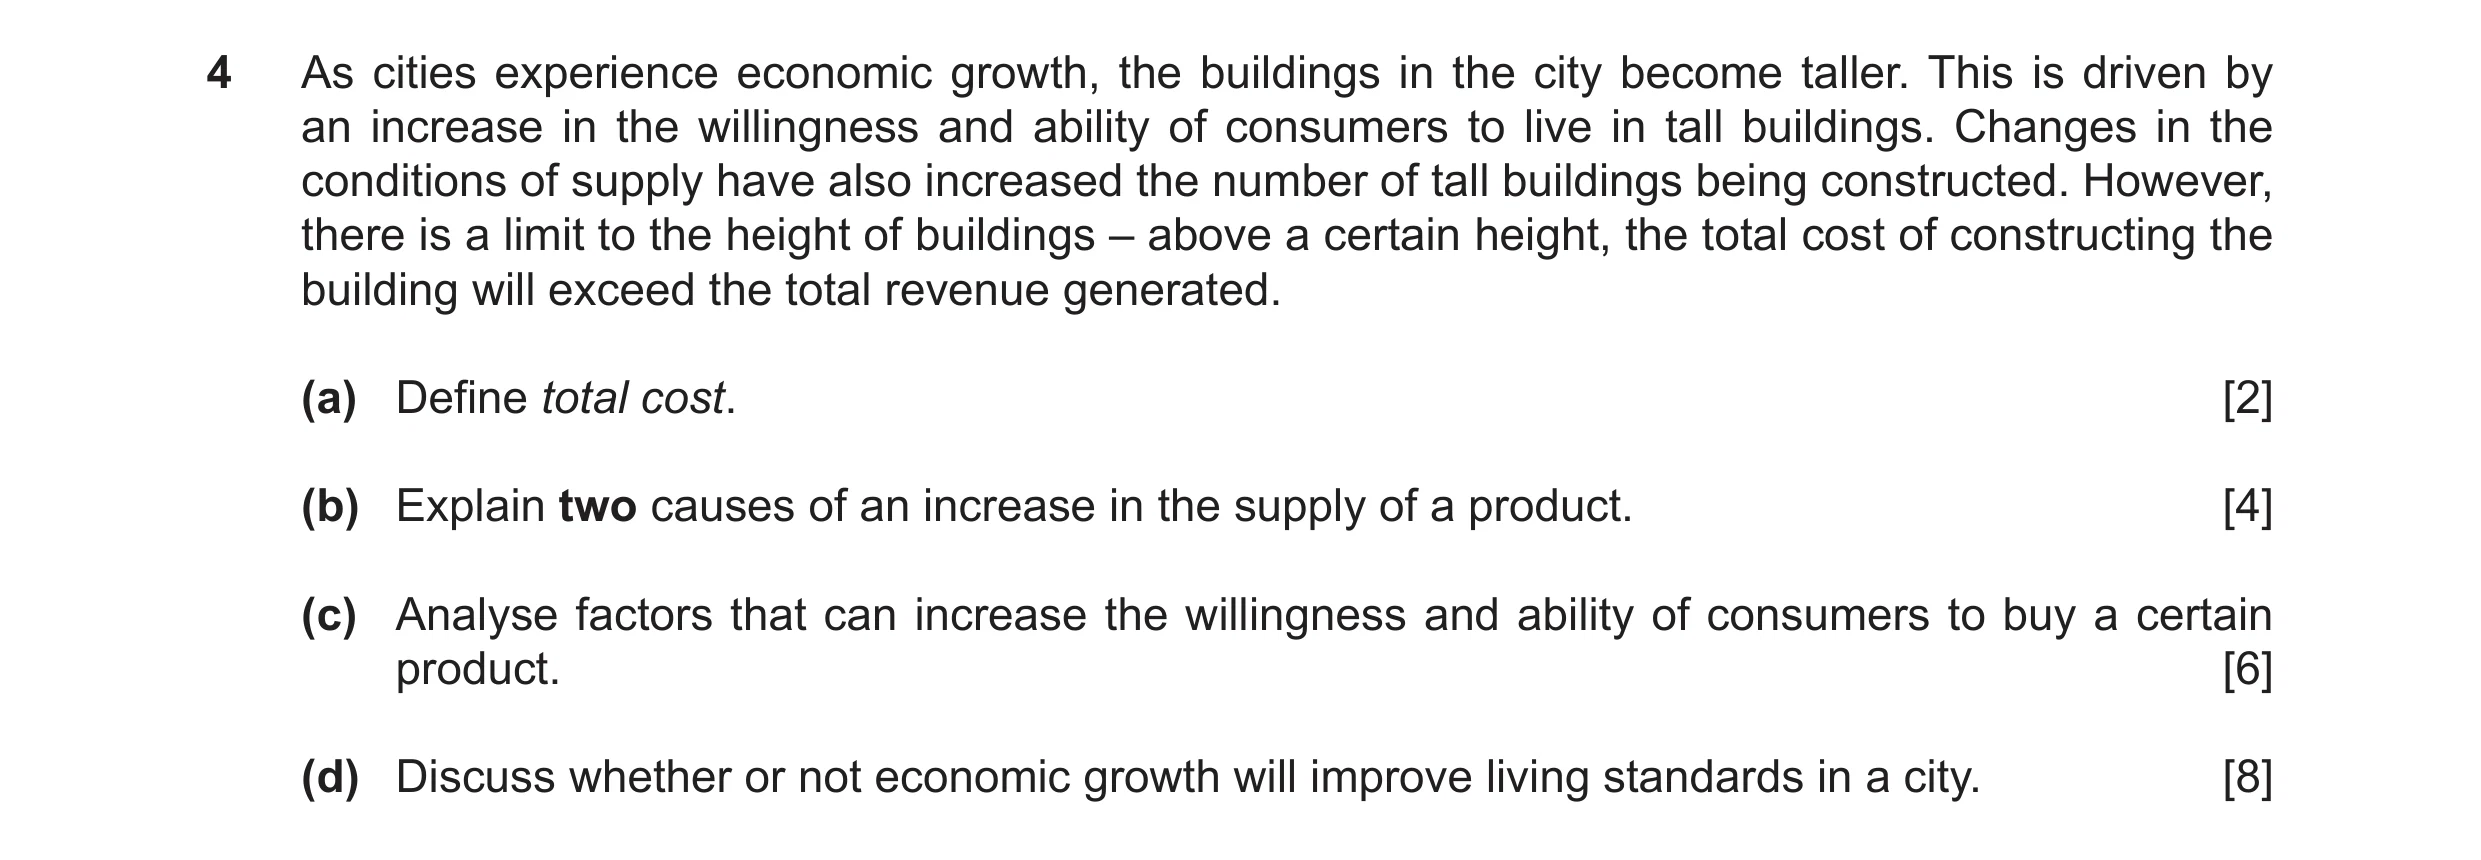 12 / 13
![Question 26: (a) Calculate the total financial sector contribution (in $) to Switzerland’s GDP. [1] (b) Identify two microeconomic policy measures. [2] …](https://img.pastlit.com/crops/b38e75ad-fcd4-44cf-951d-3089d4177a8a/q1.webp)
![Question 27: (a) Calculate the number of Malawians who had access to electricity in 2022. [1] (b) Identify two capital goods used in Malawi. [2] (c) Exp…](https://img.pastlit.com/crops/b205f8e6-b286-4d23-b321-d74a5c411a28/q1.webp) 13 / 13
13 / 13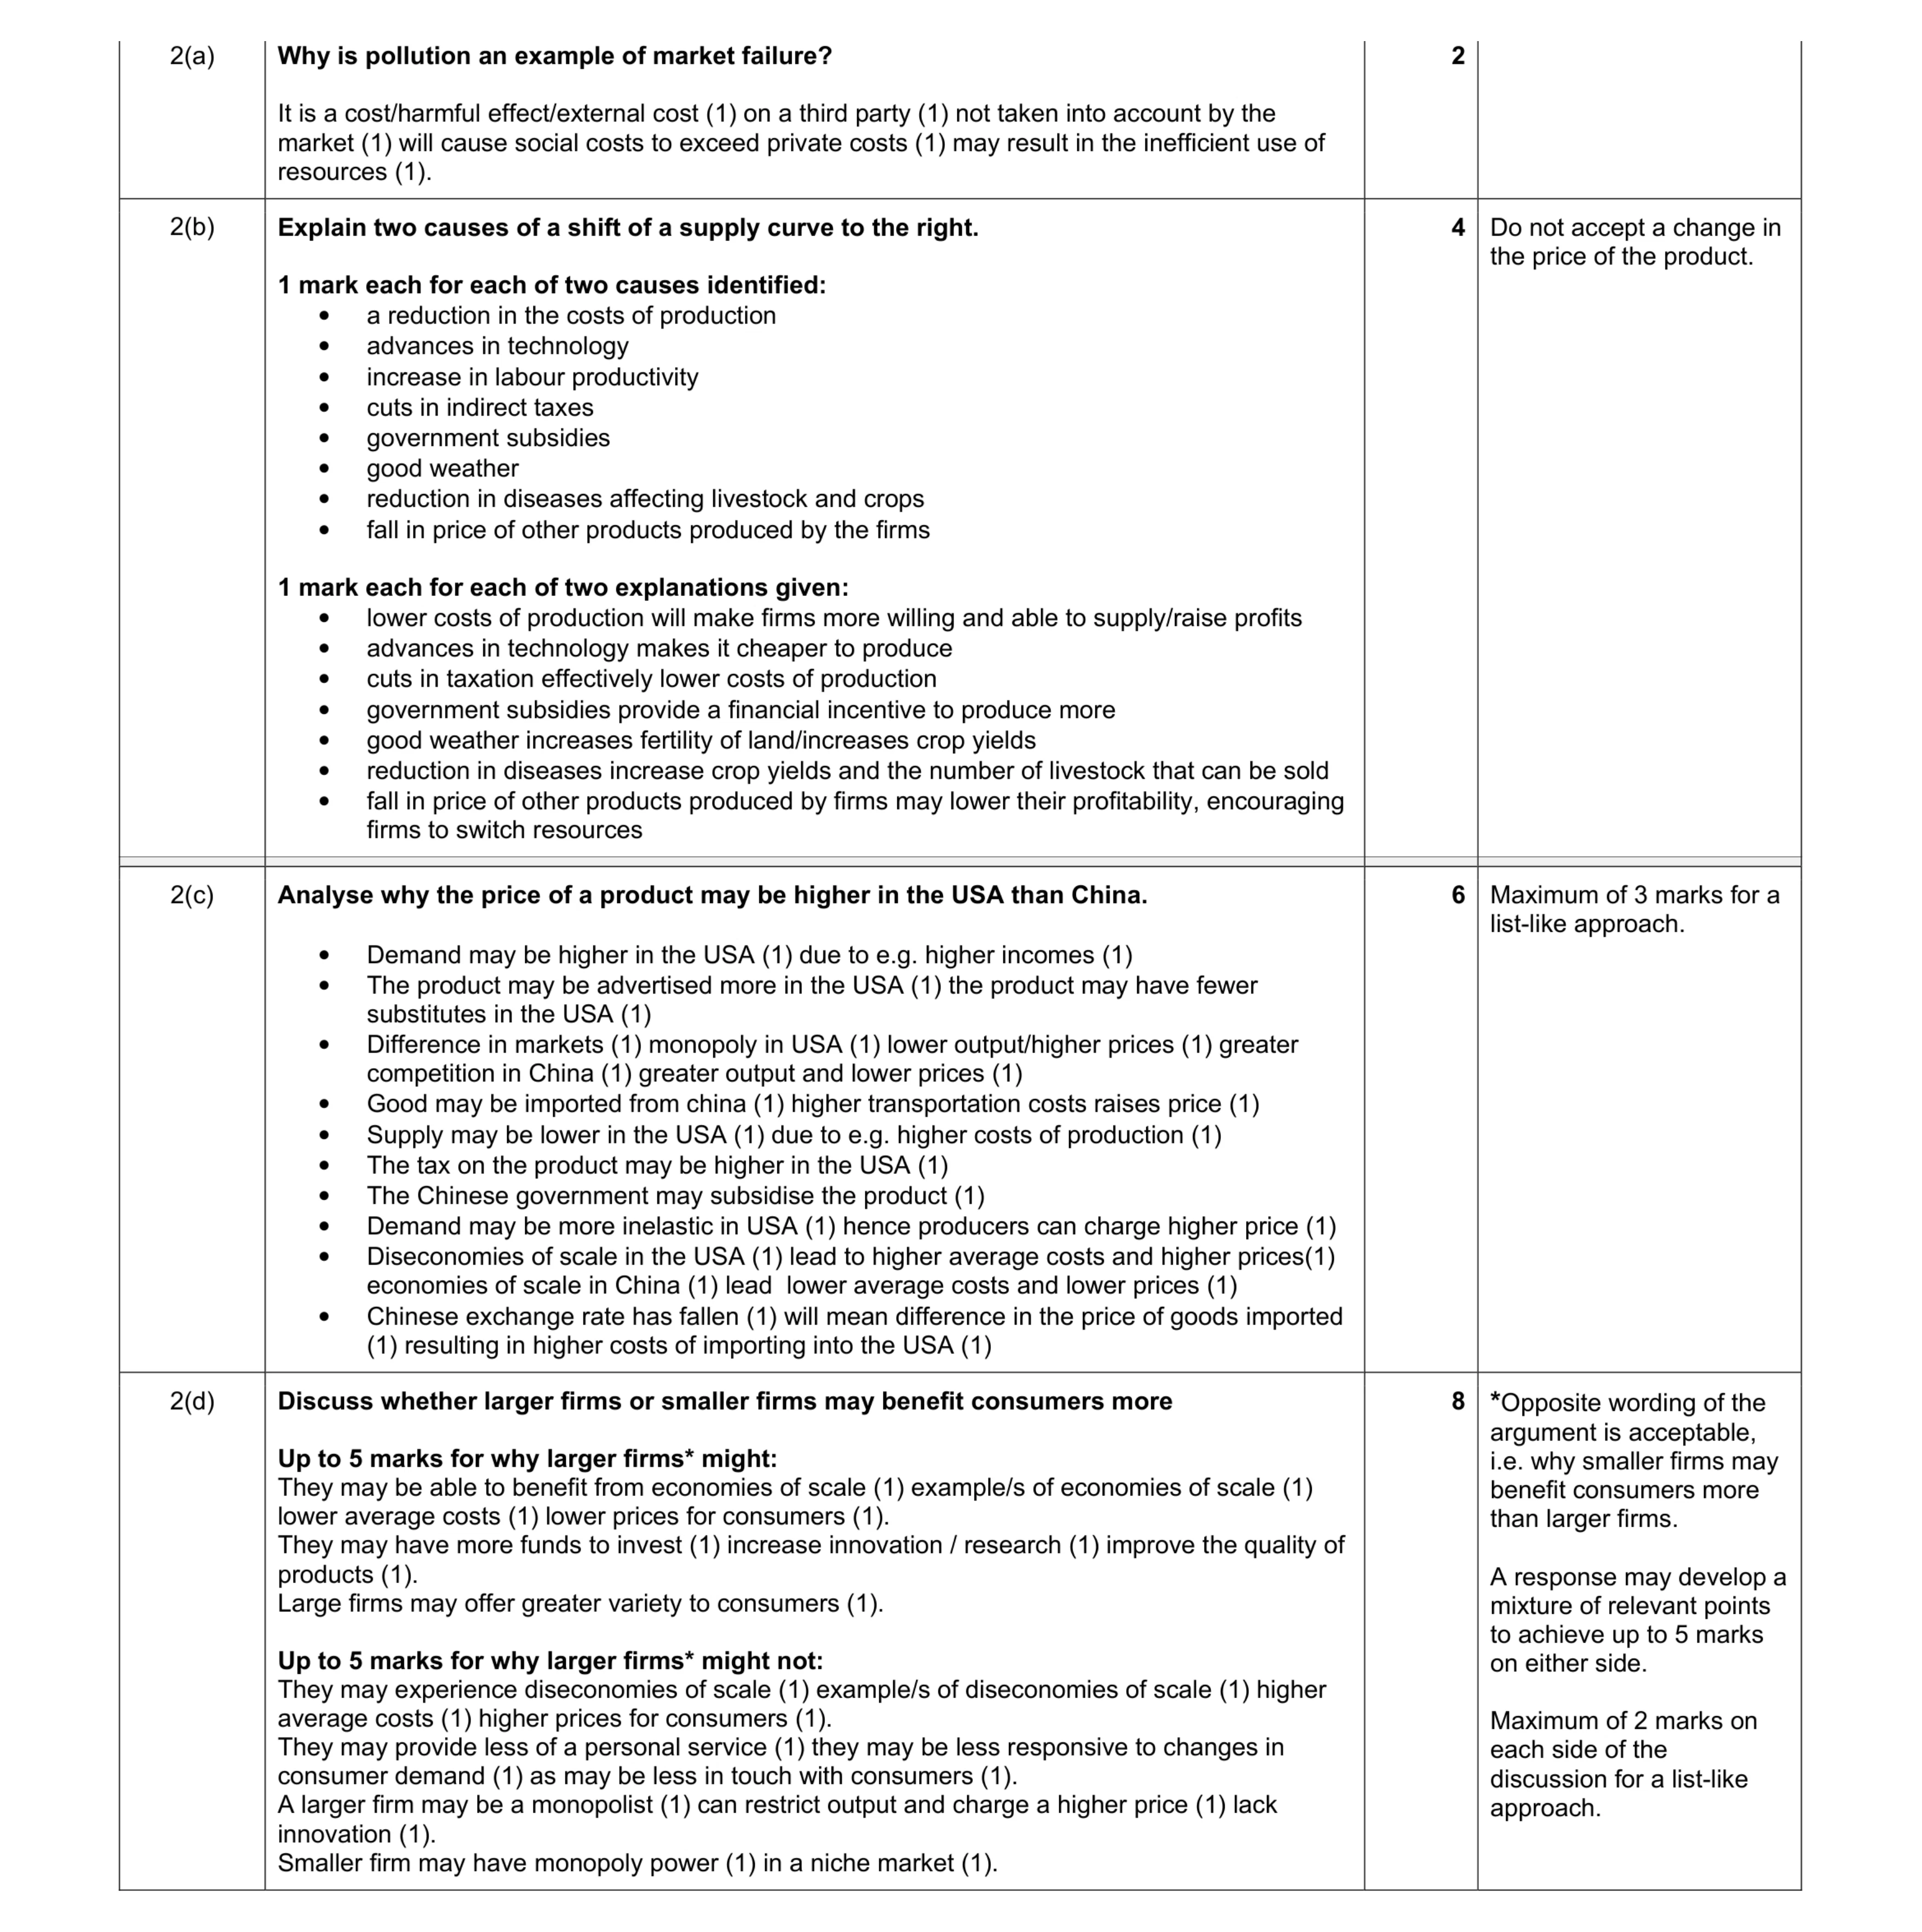 20
20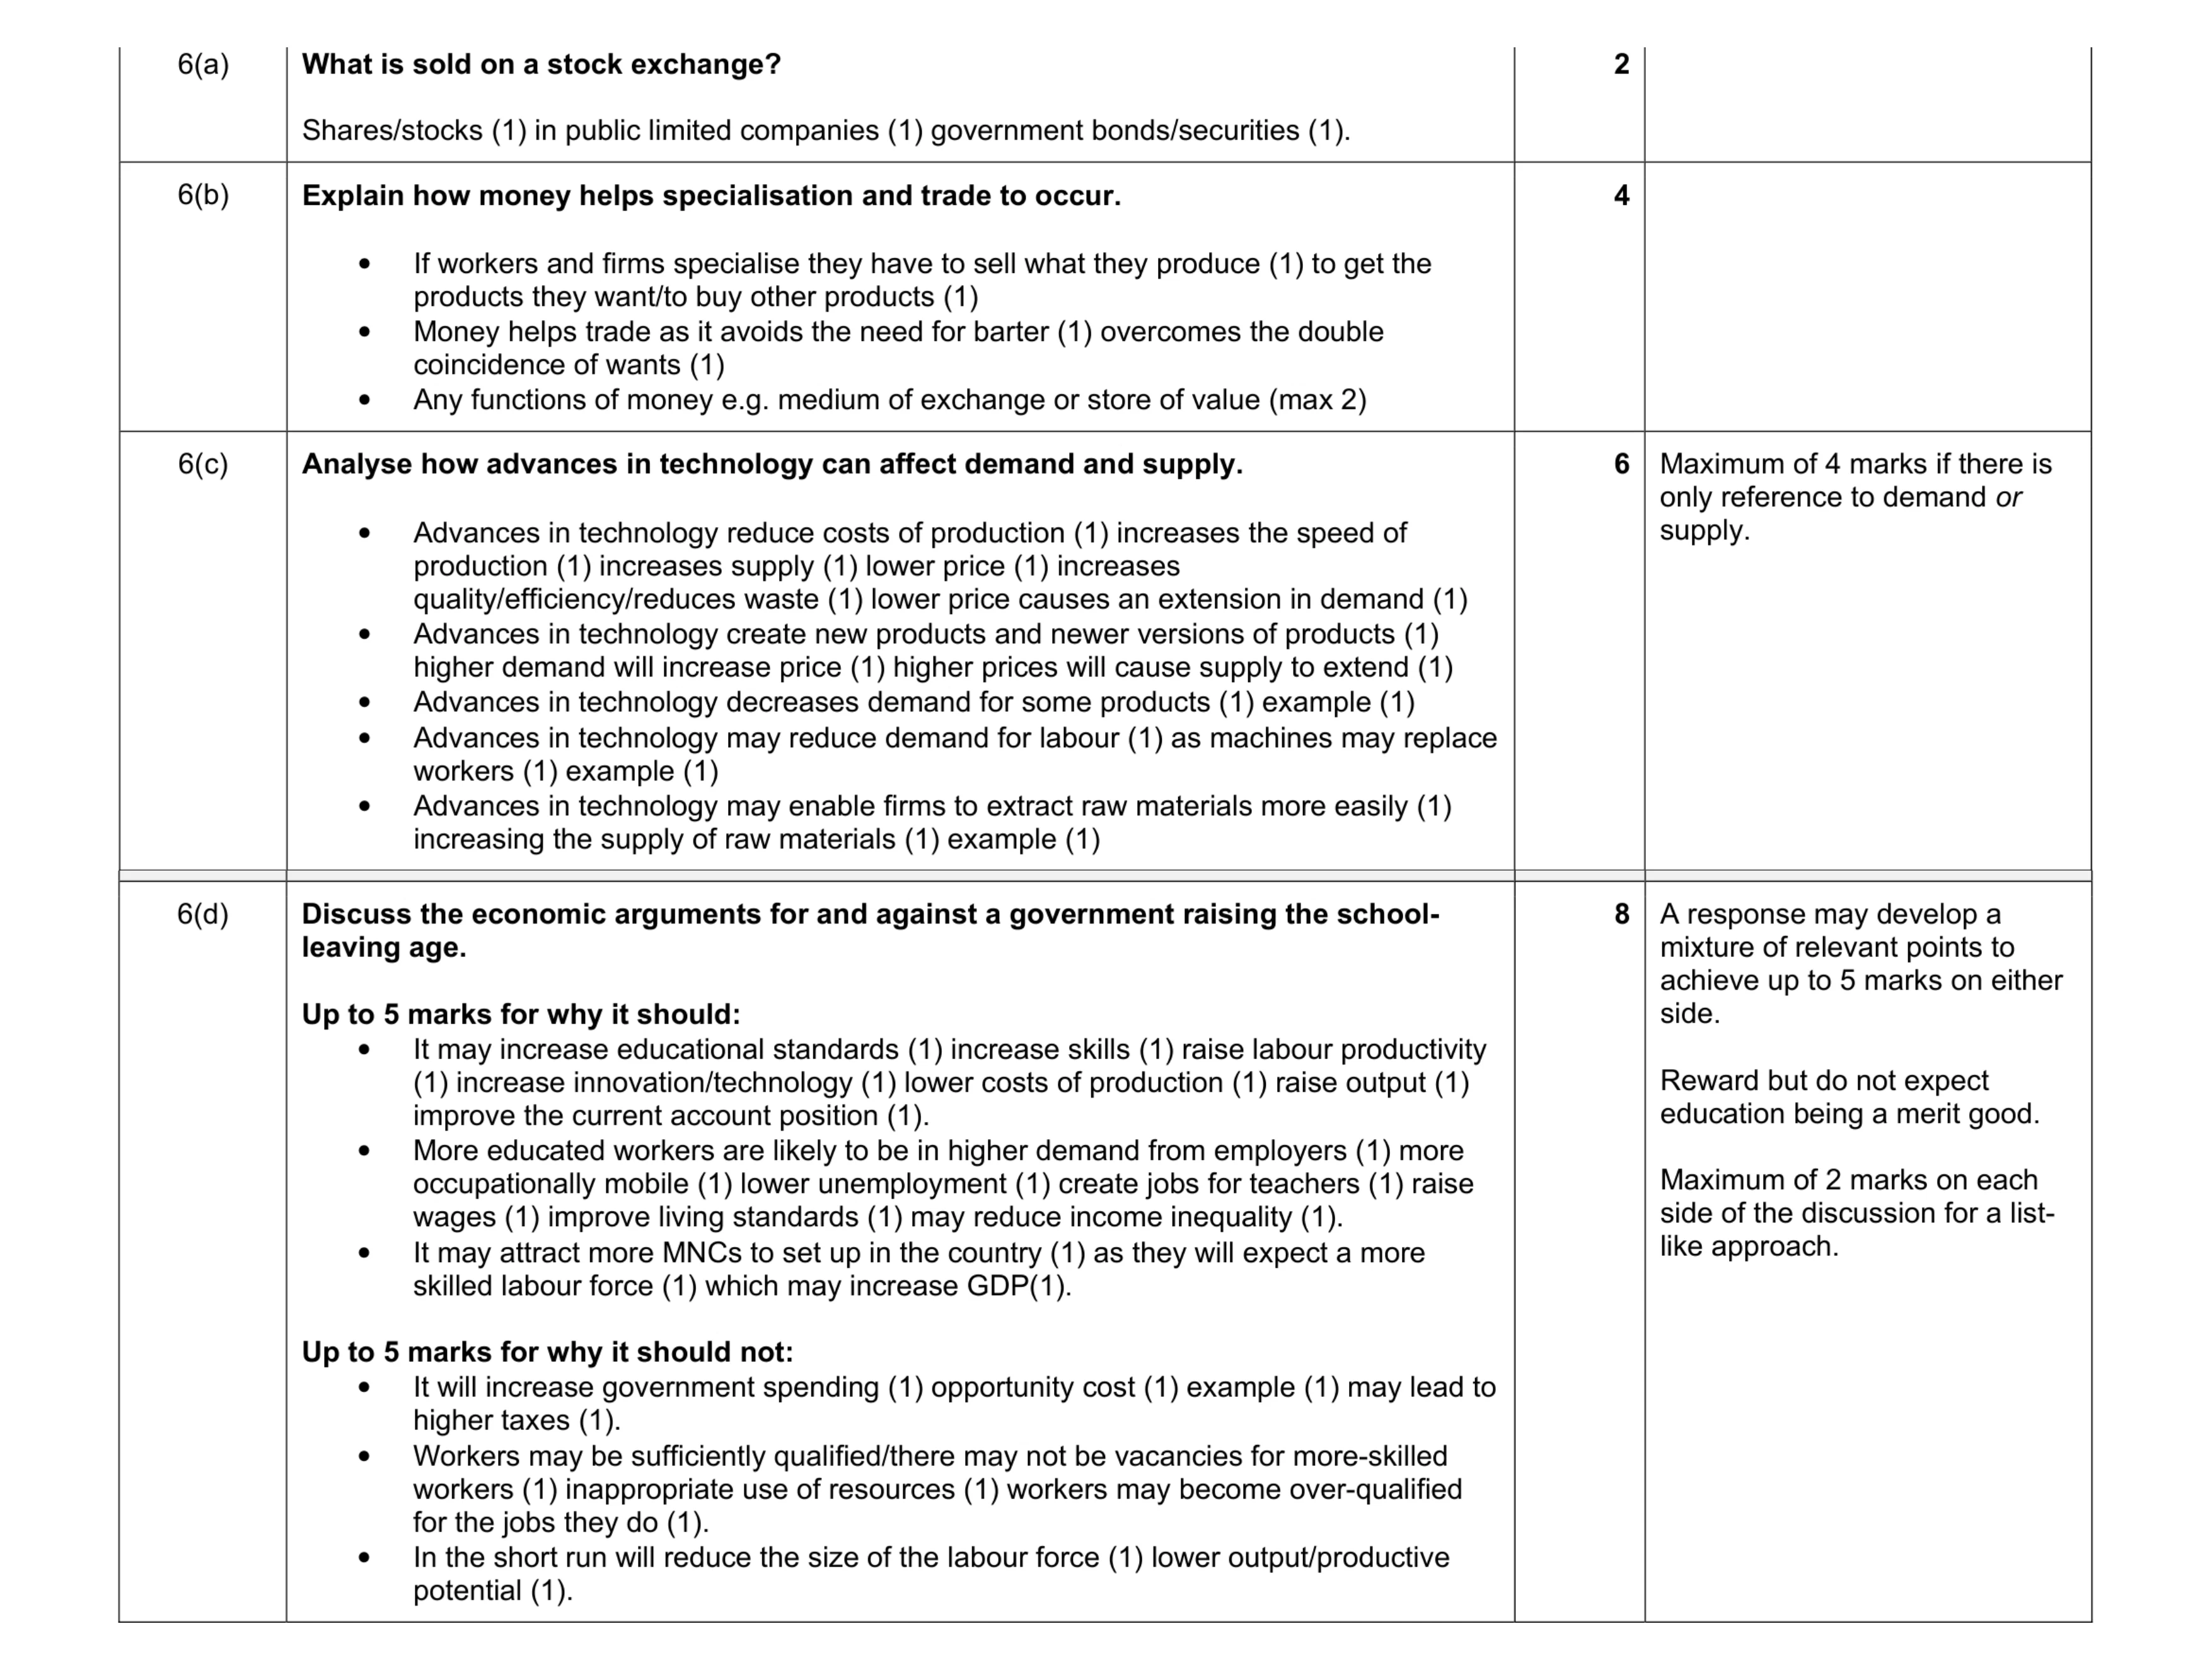 20
20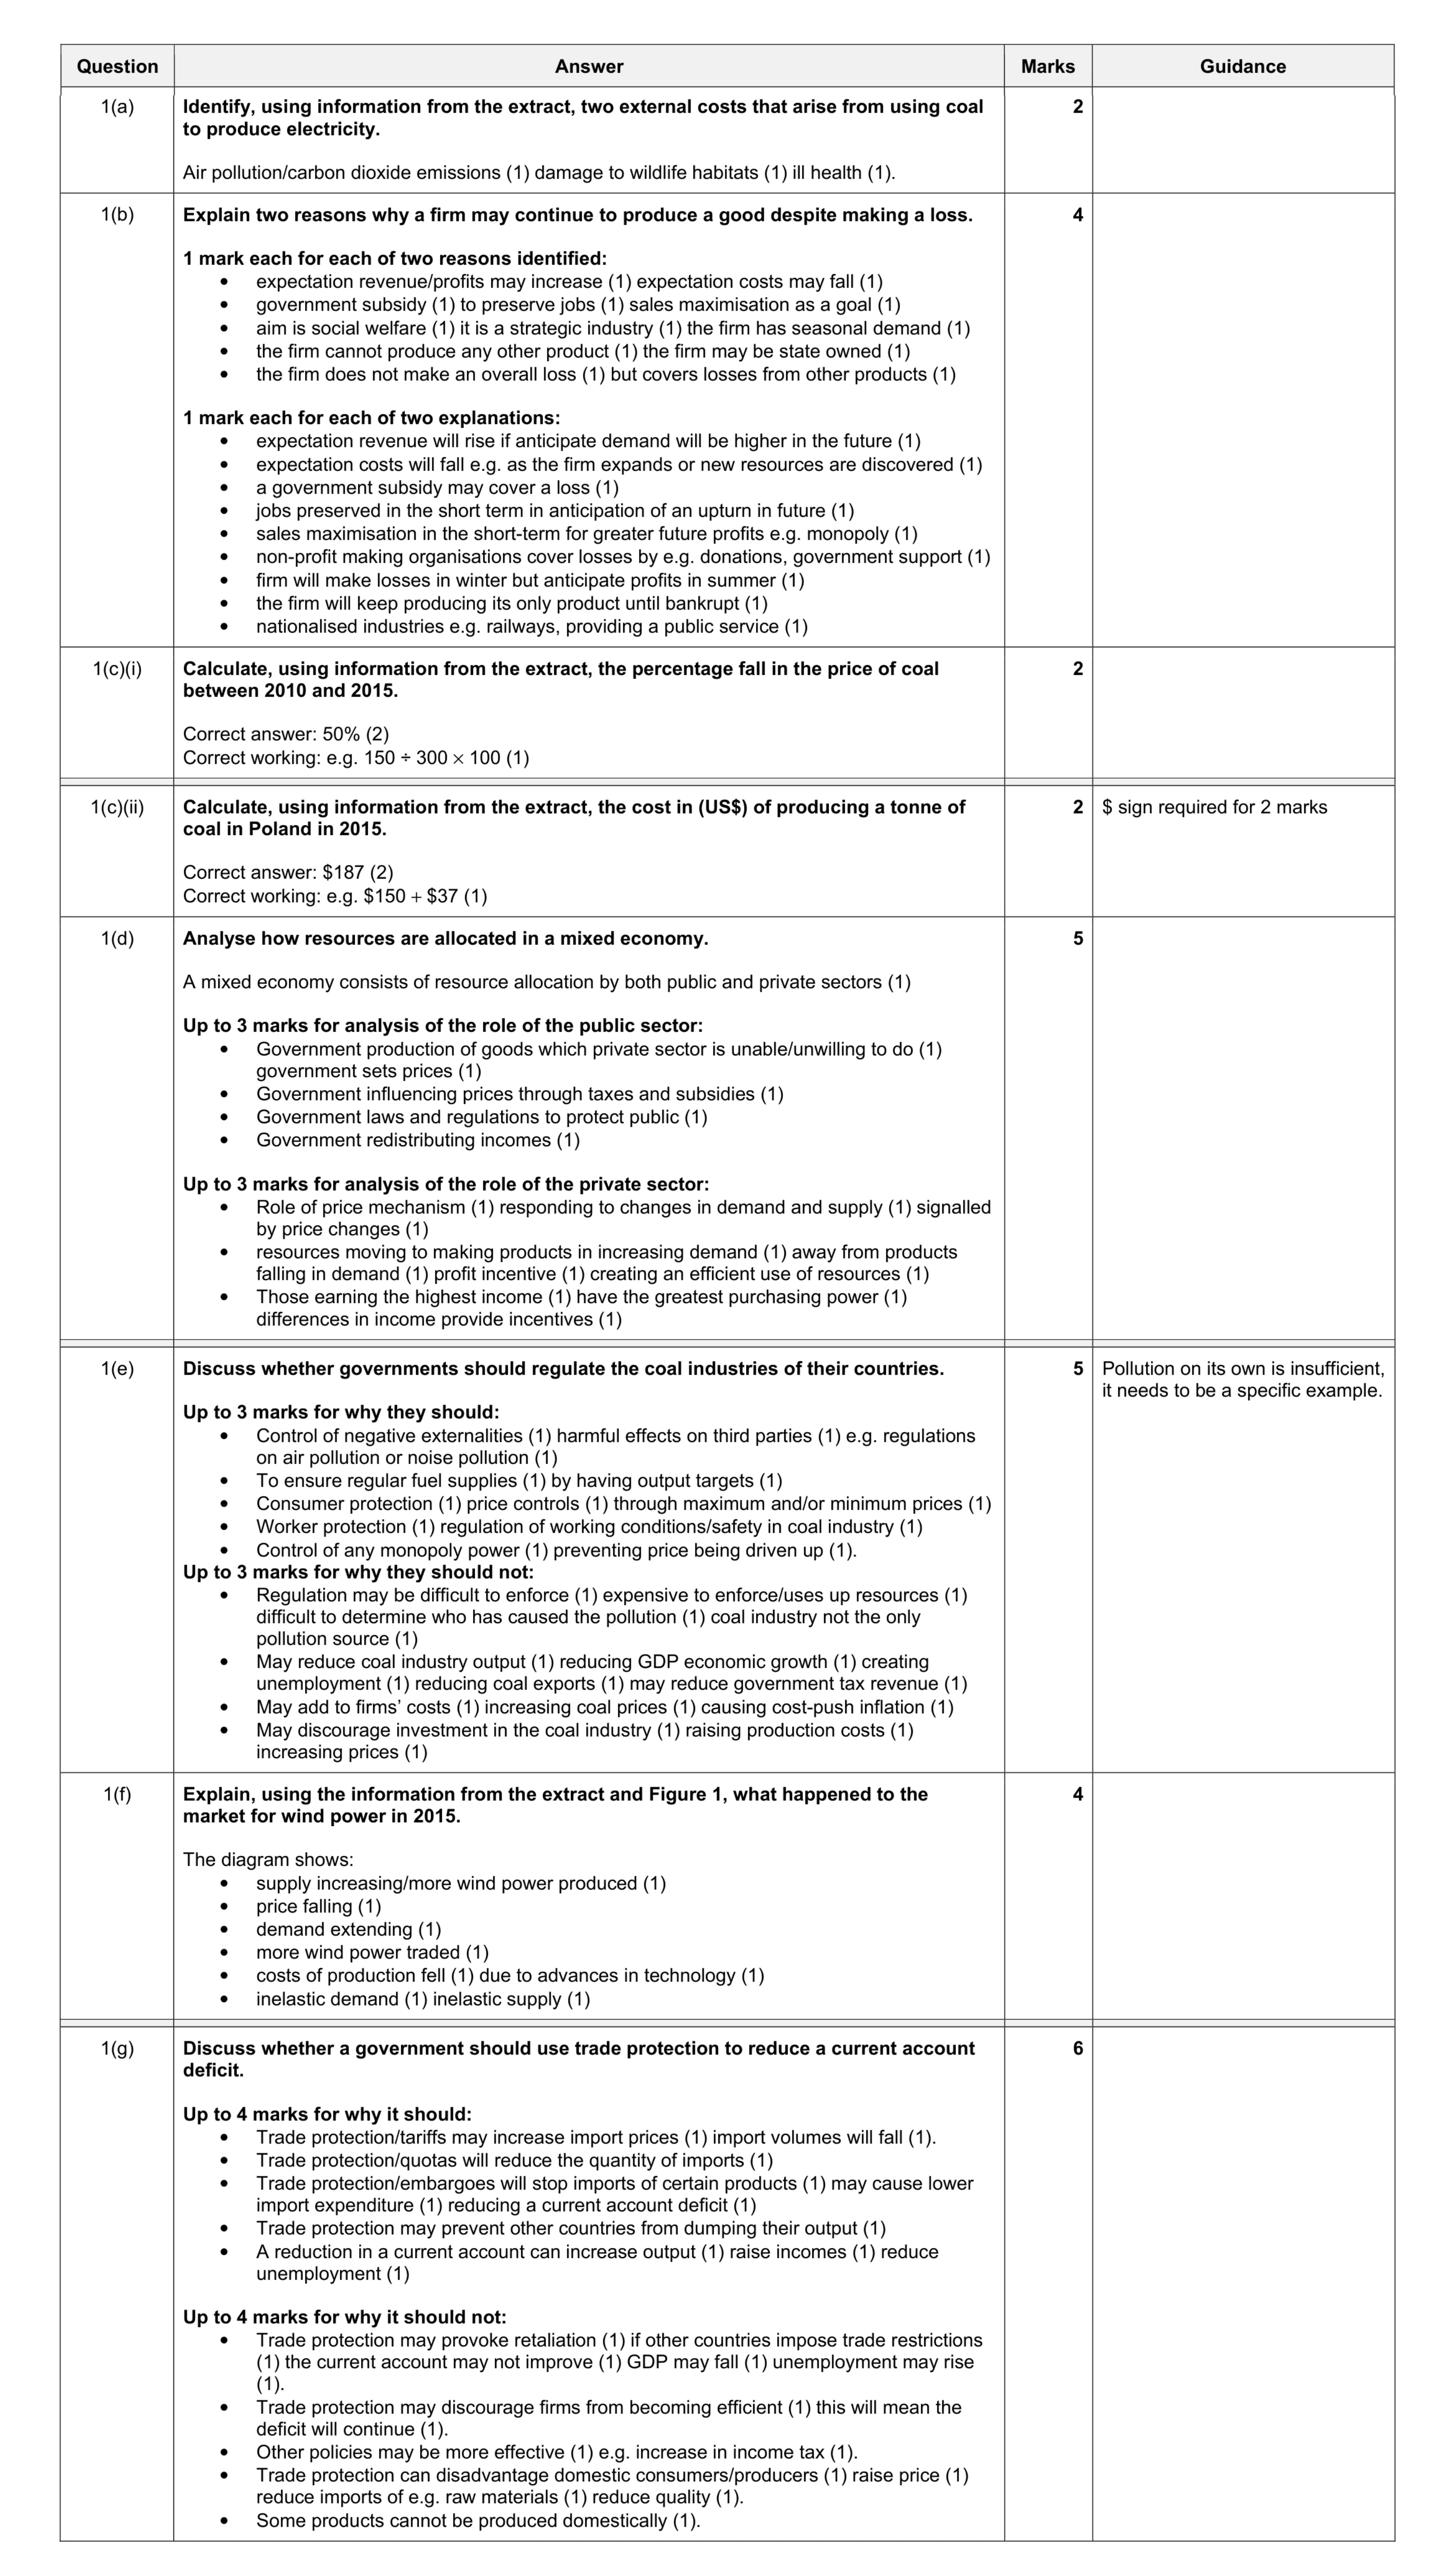 30
30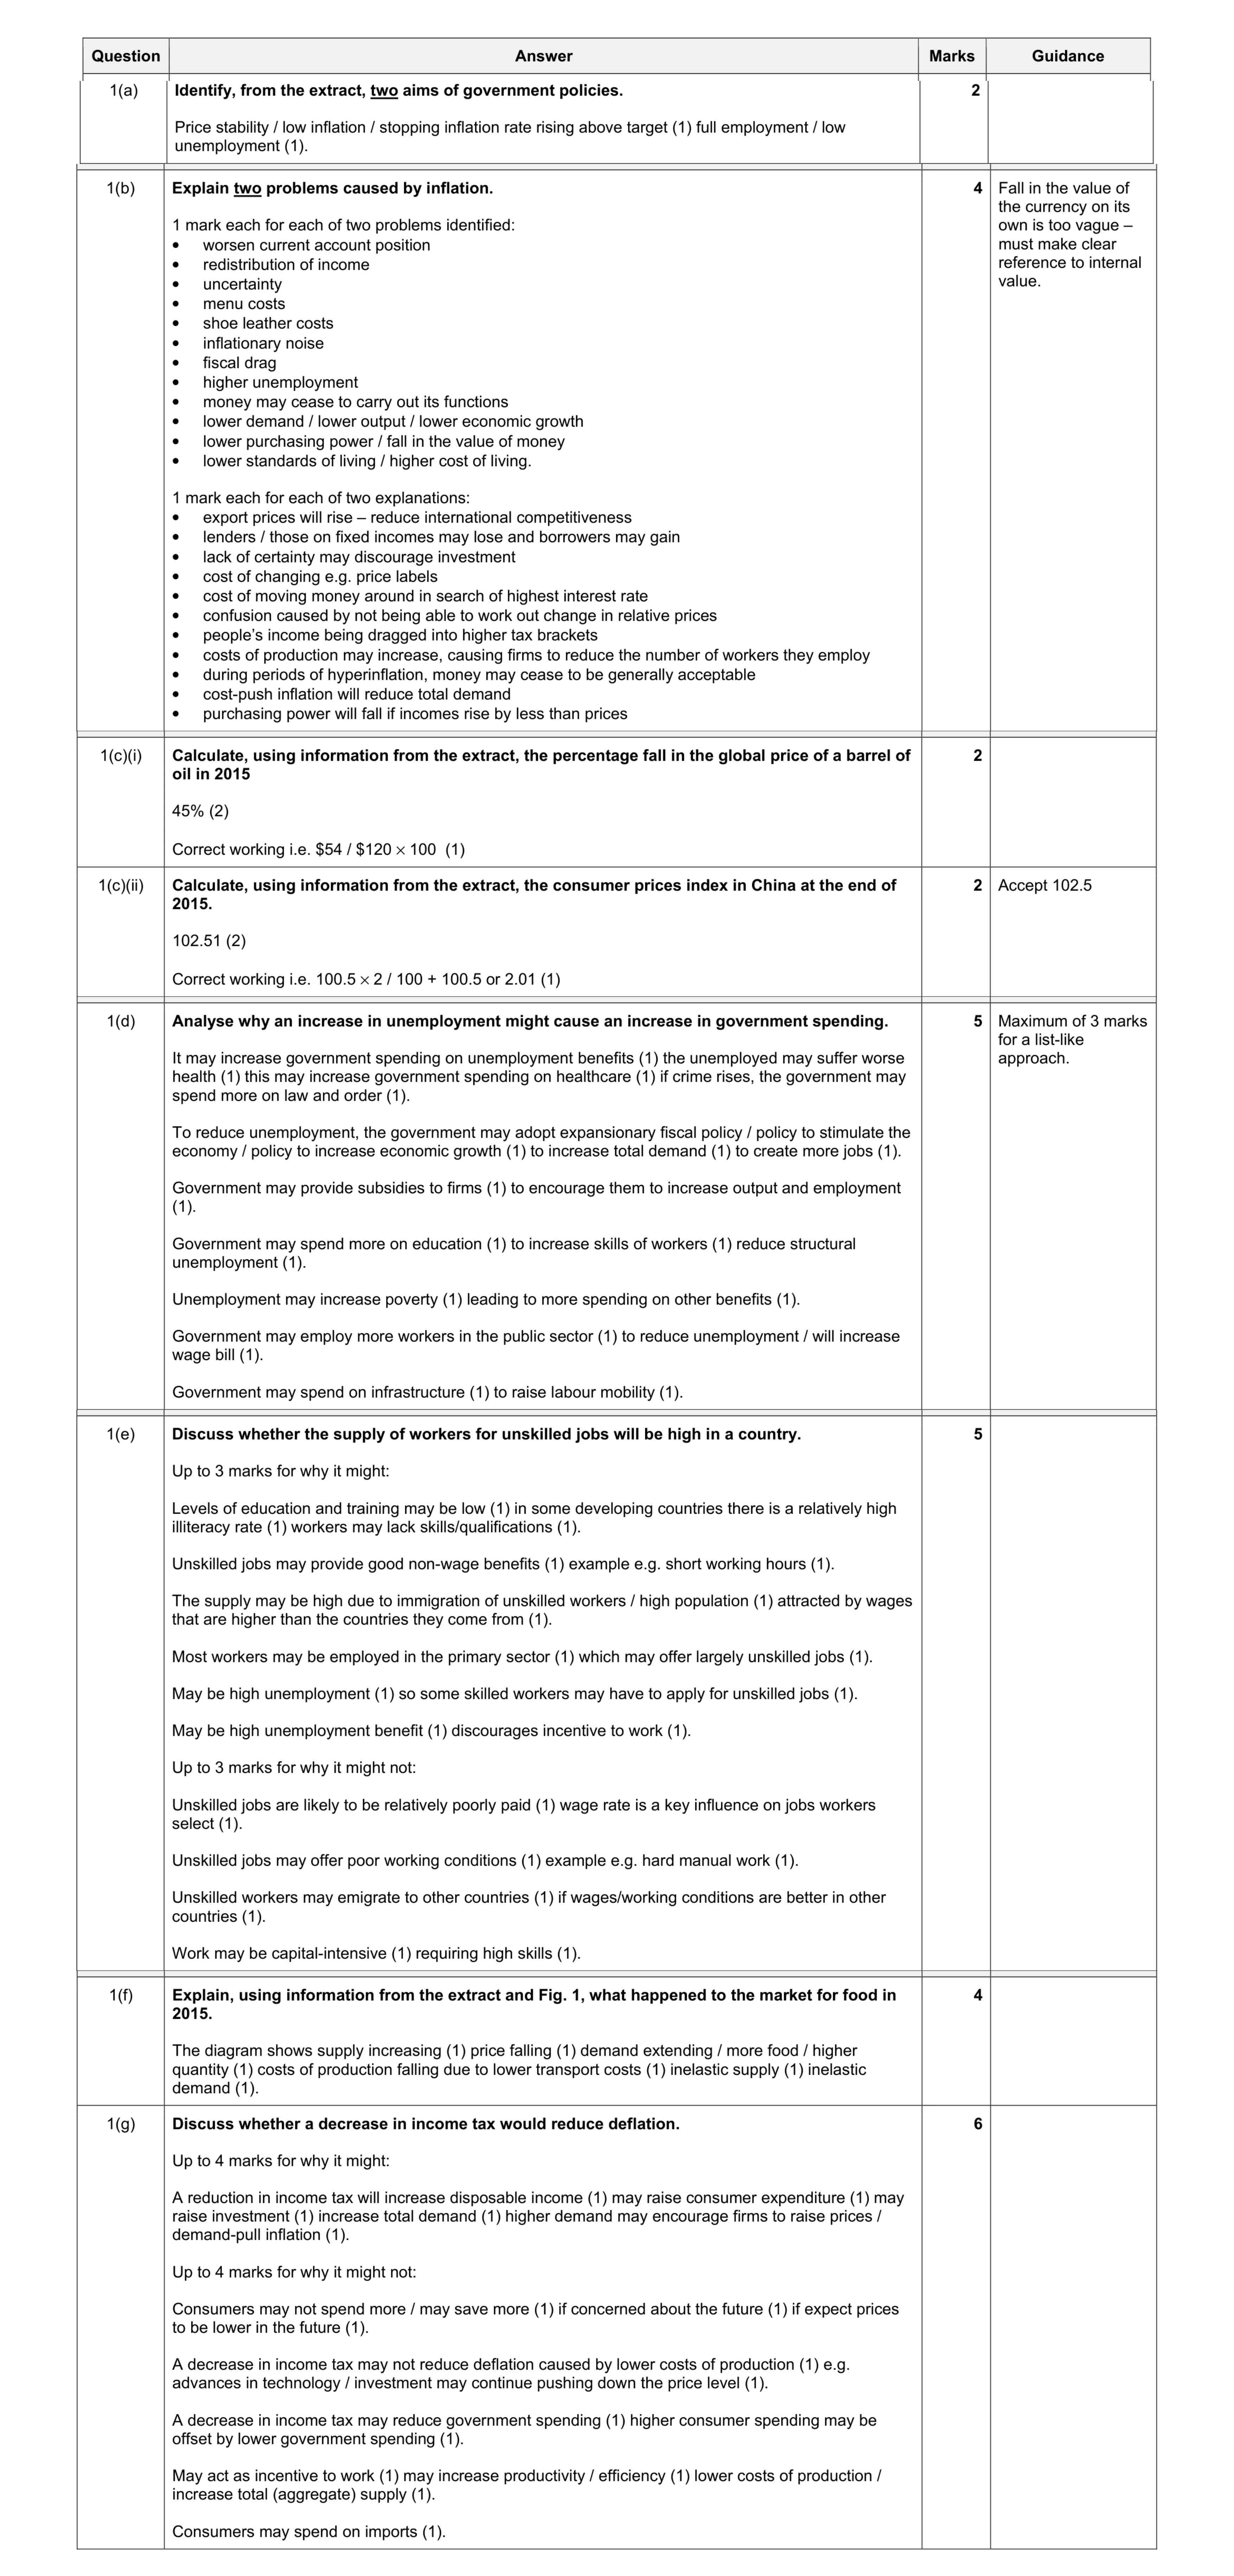 30
30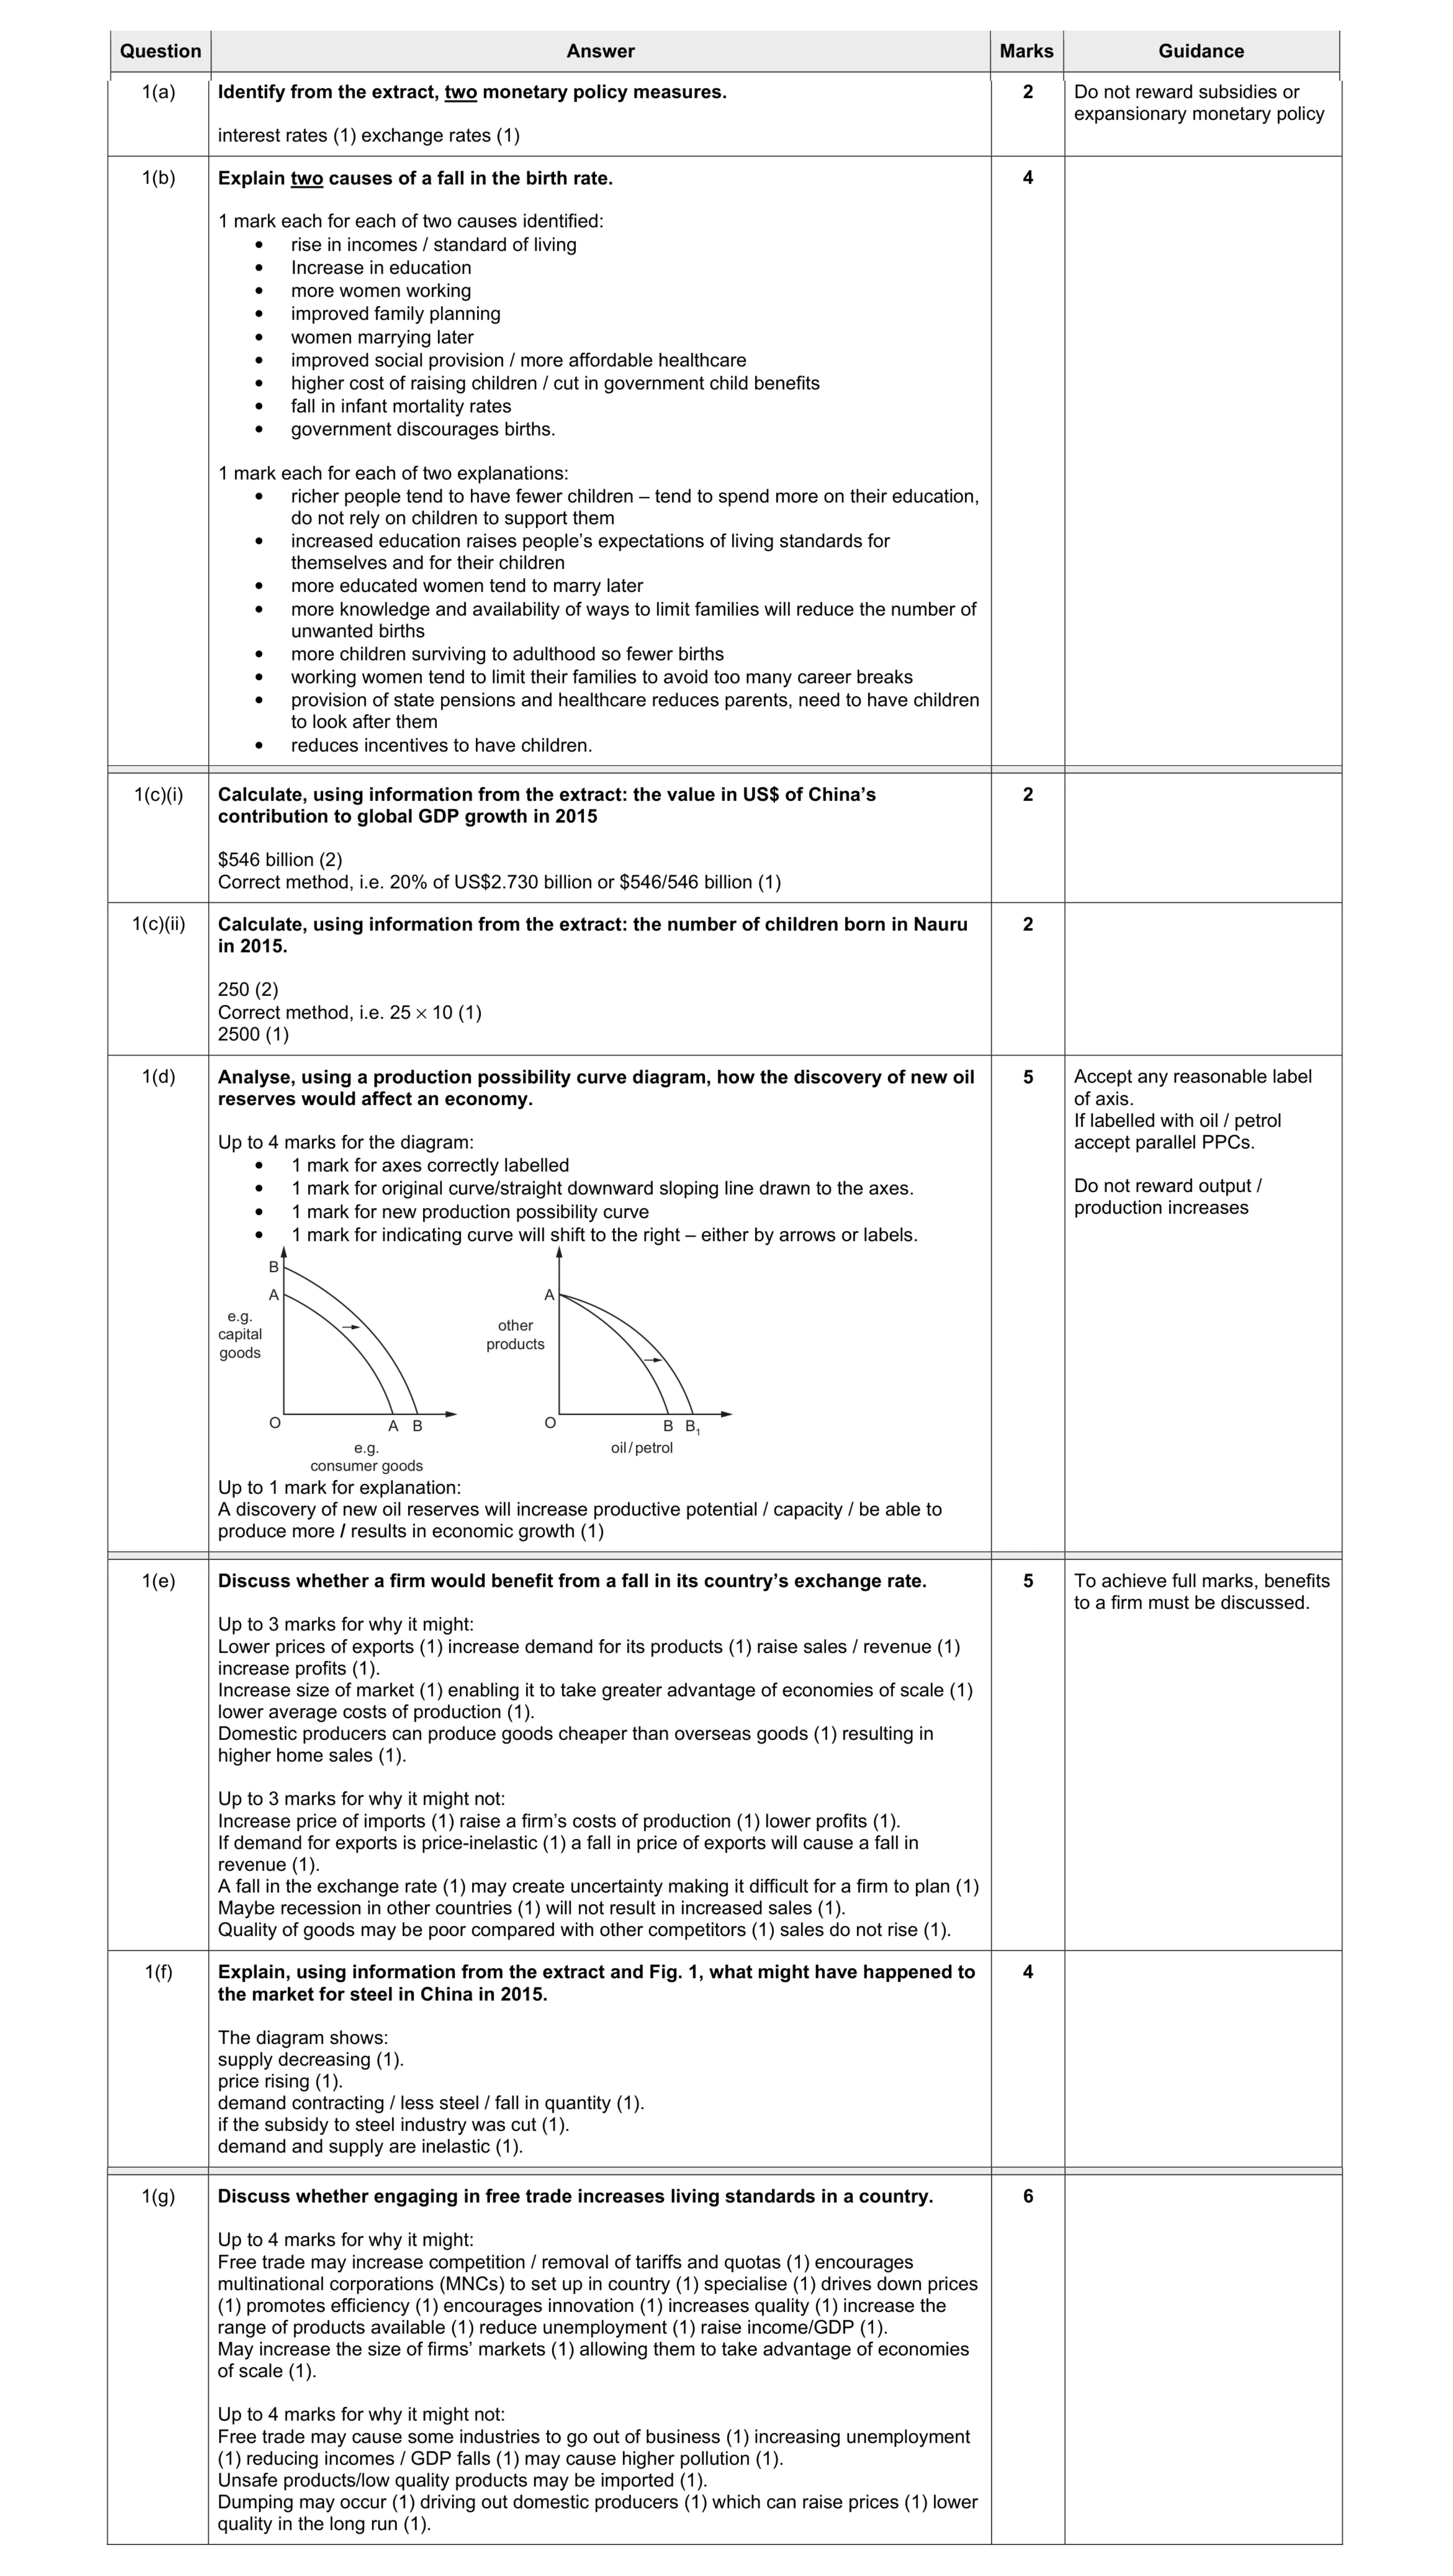 30
30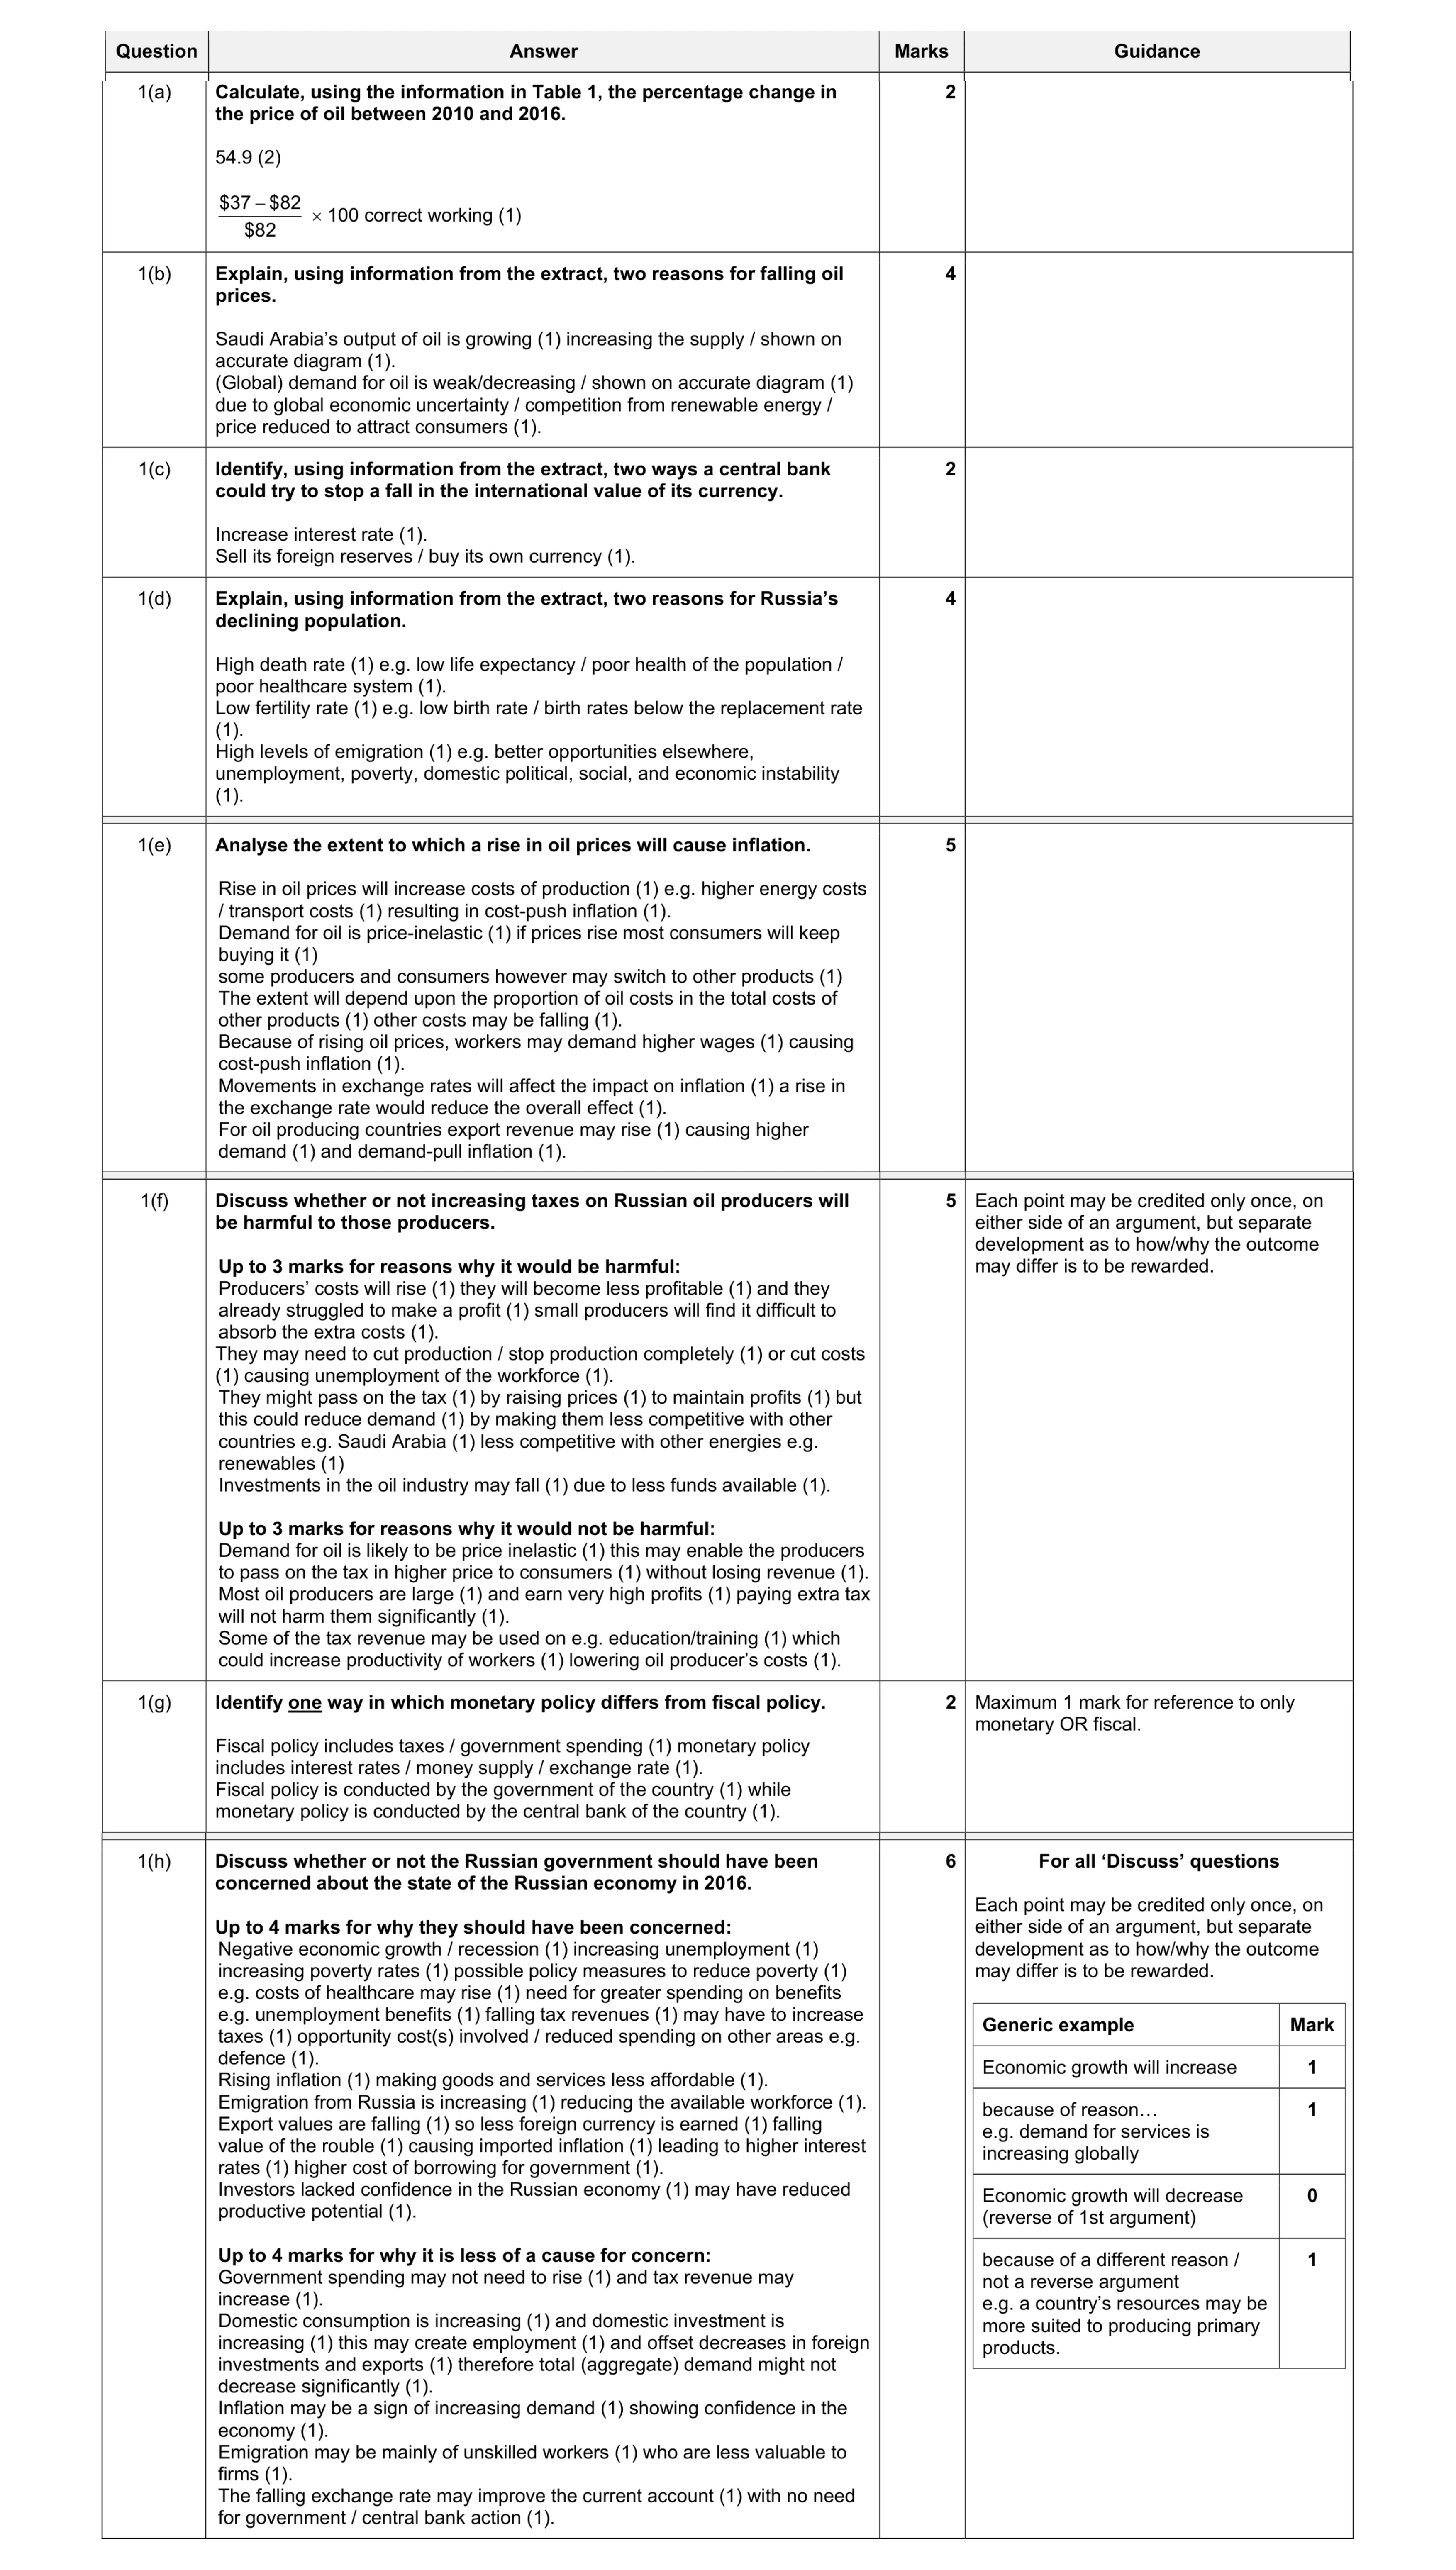 30
30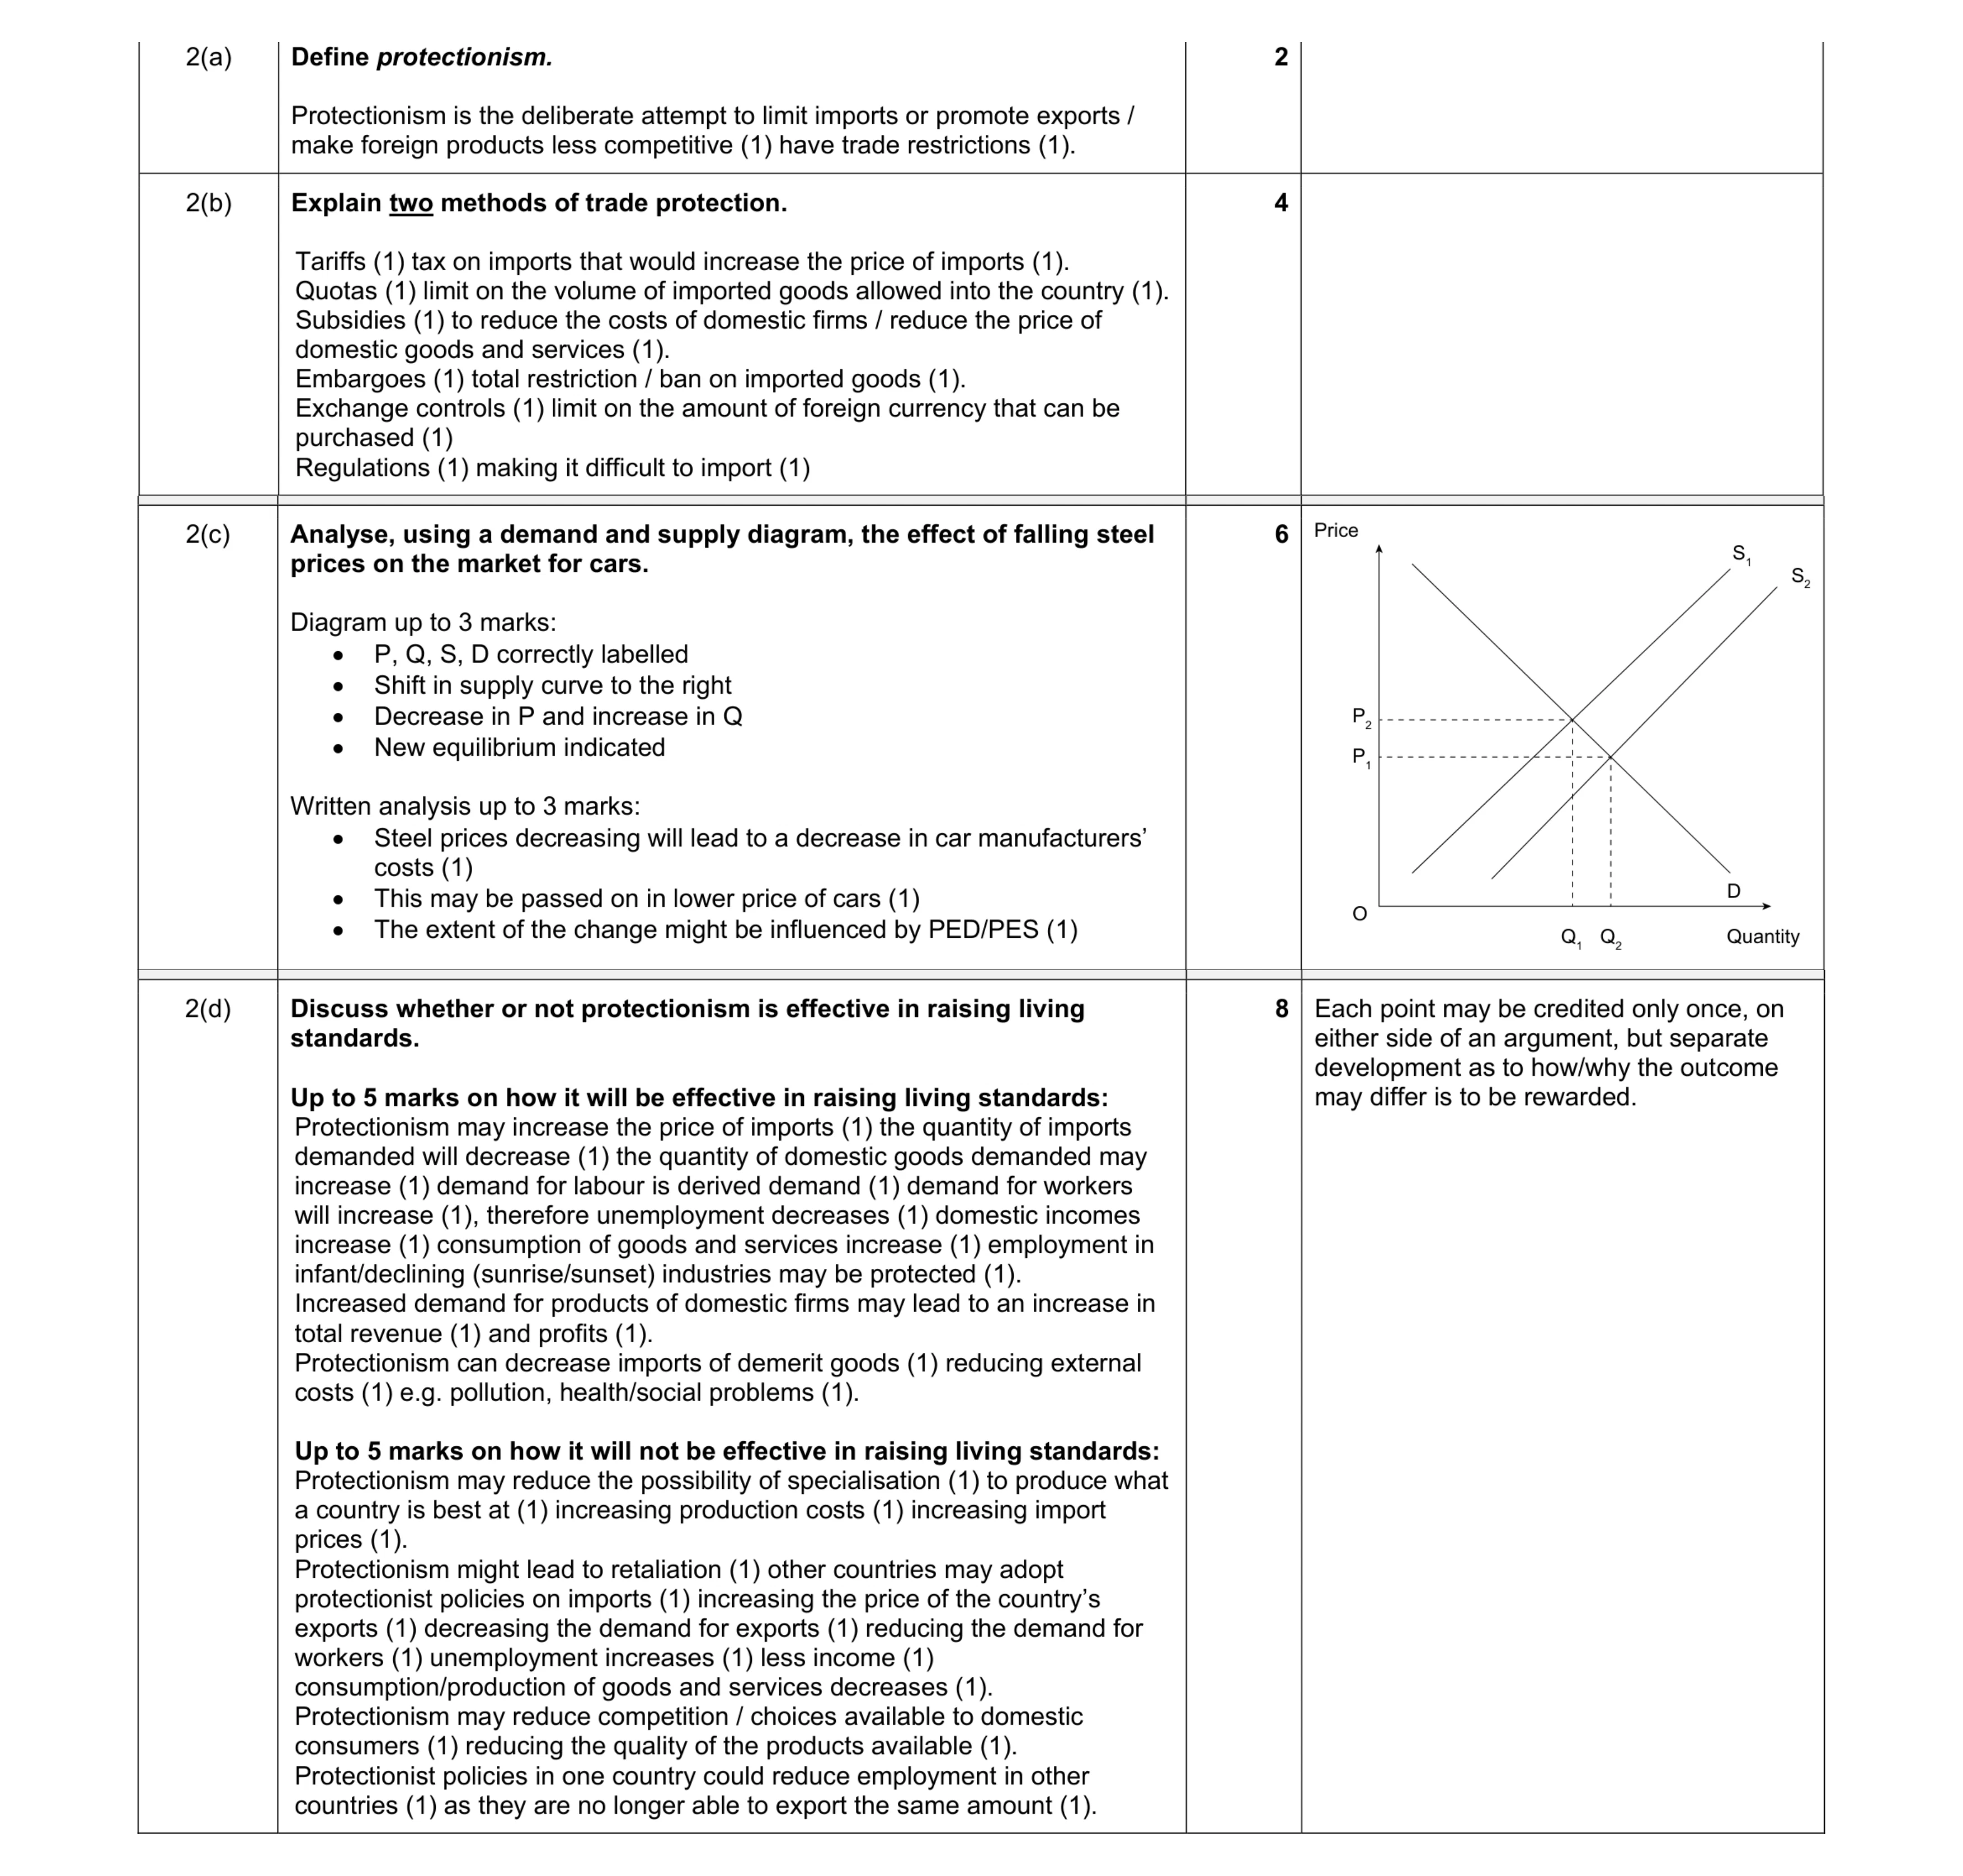 20
20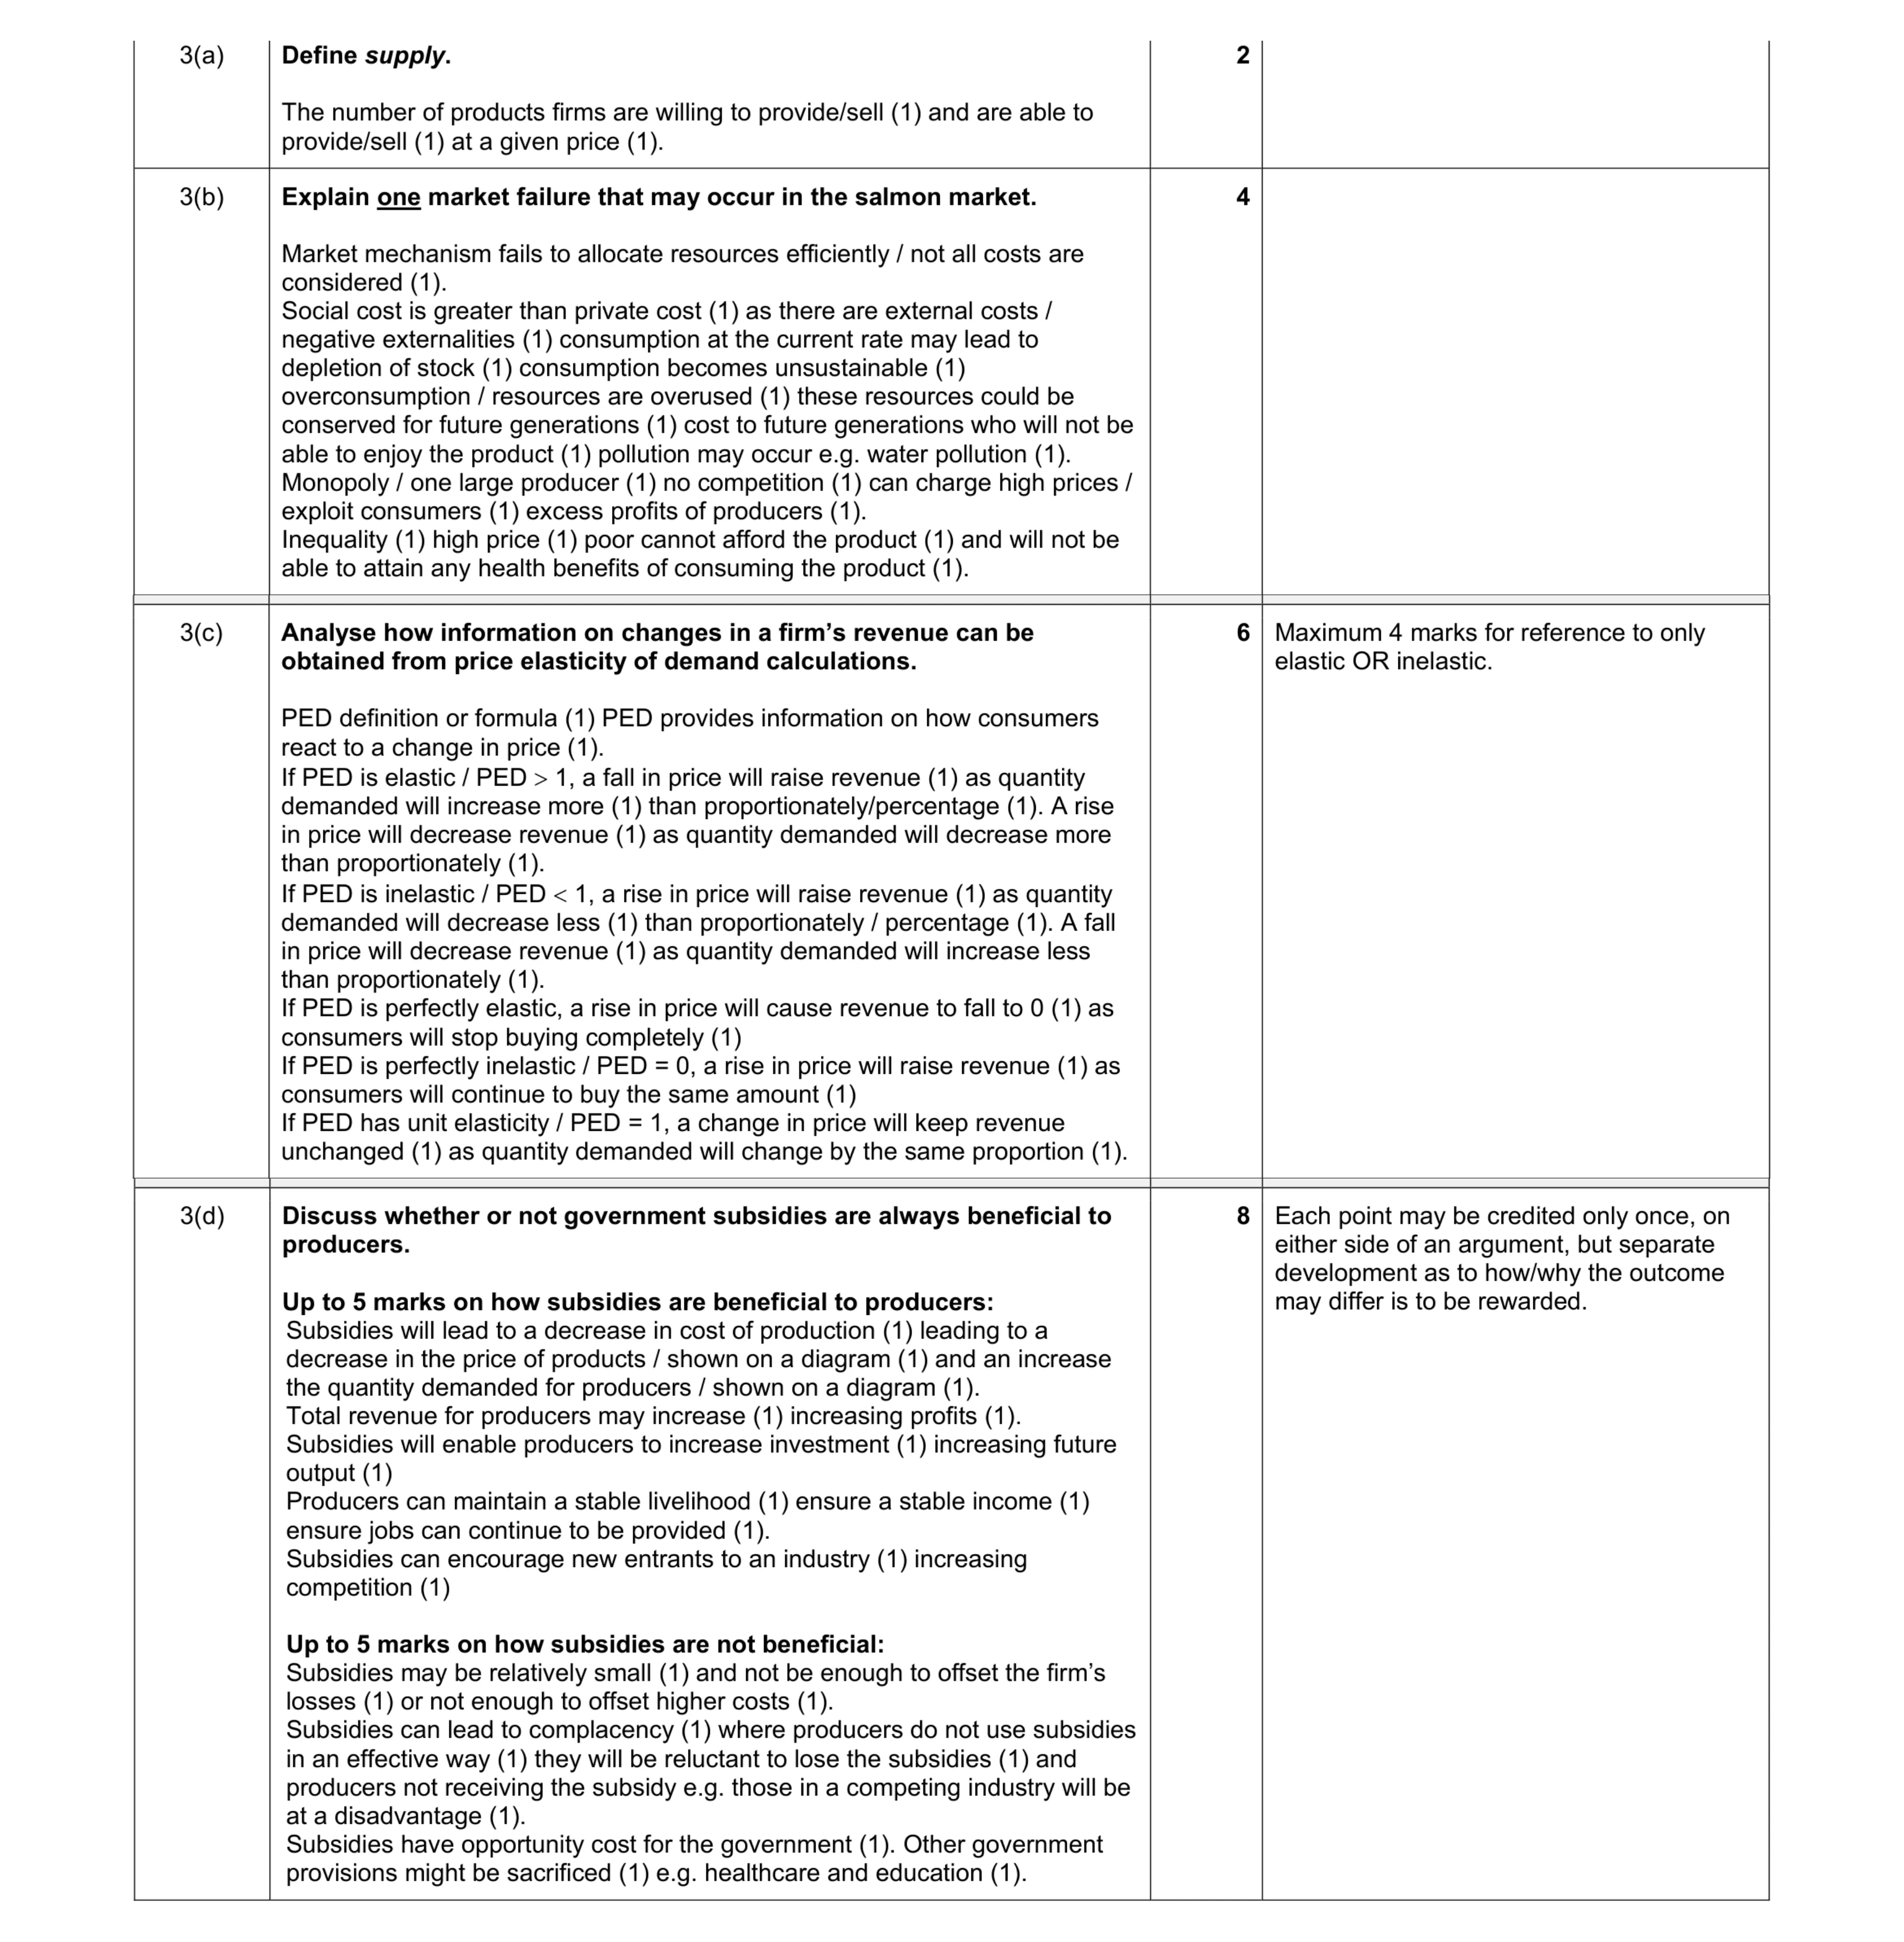 20
20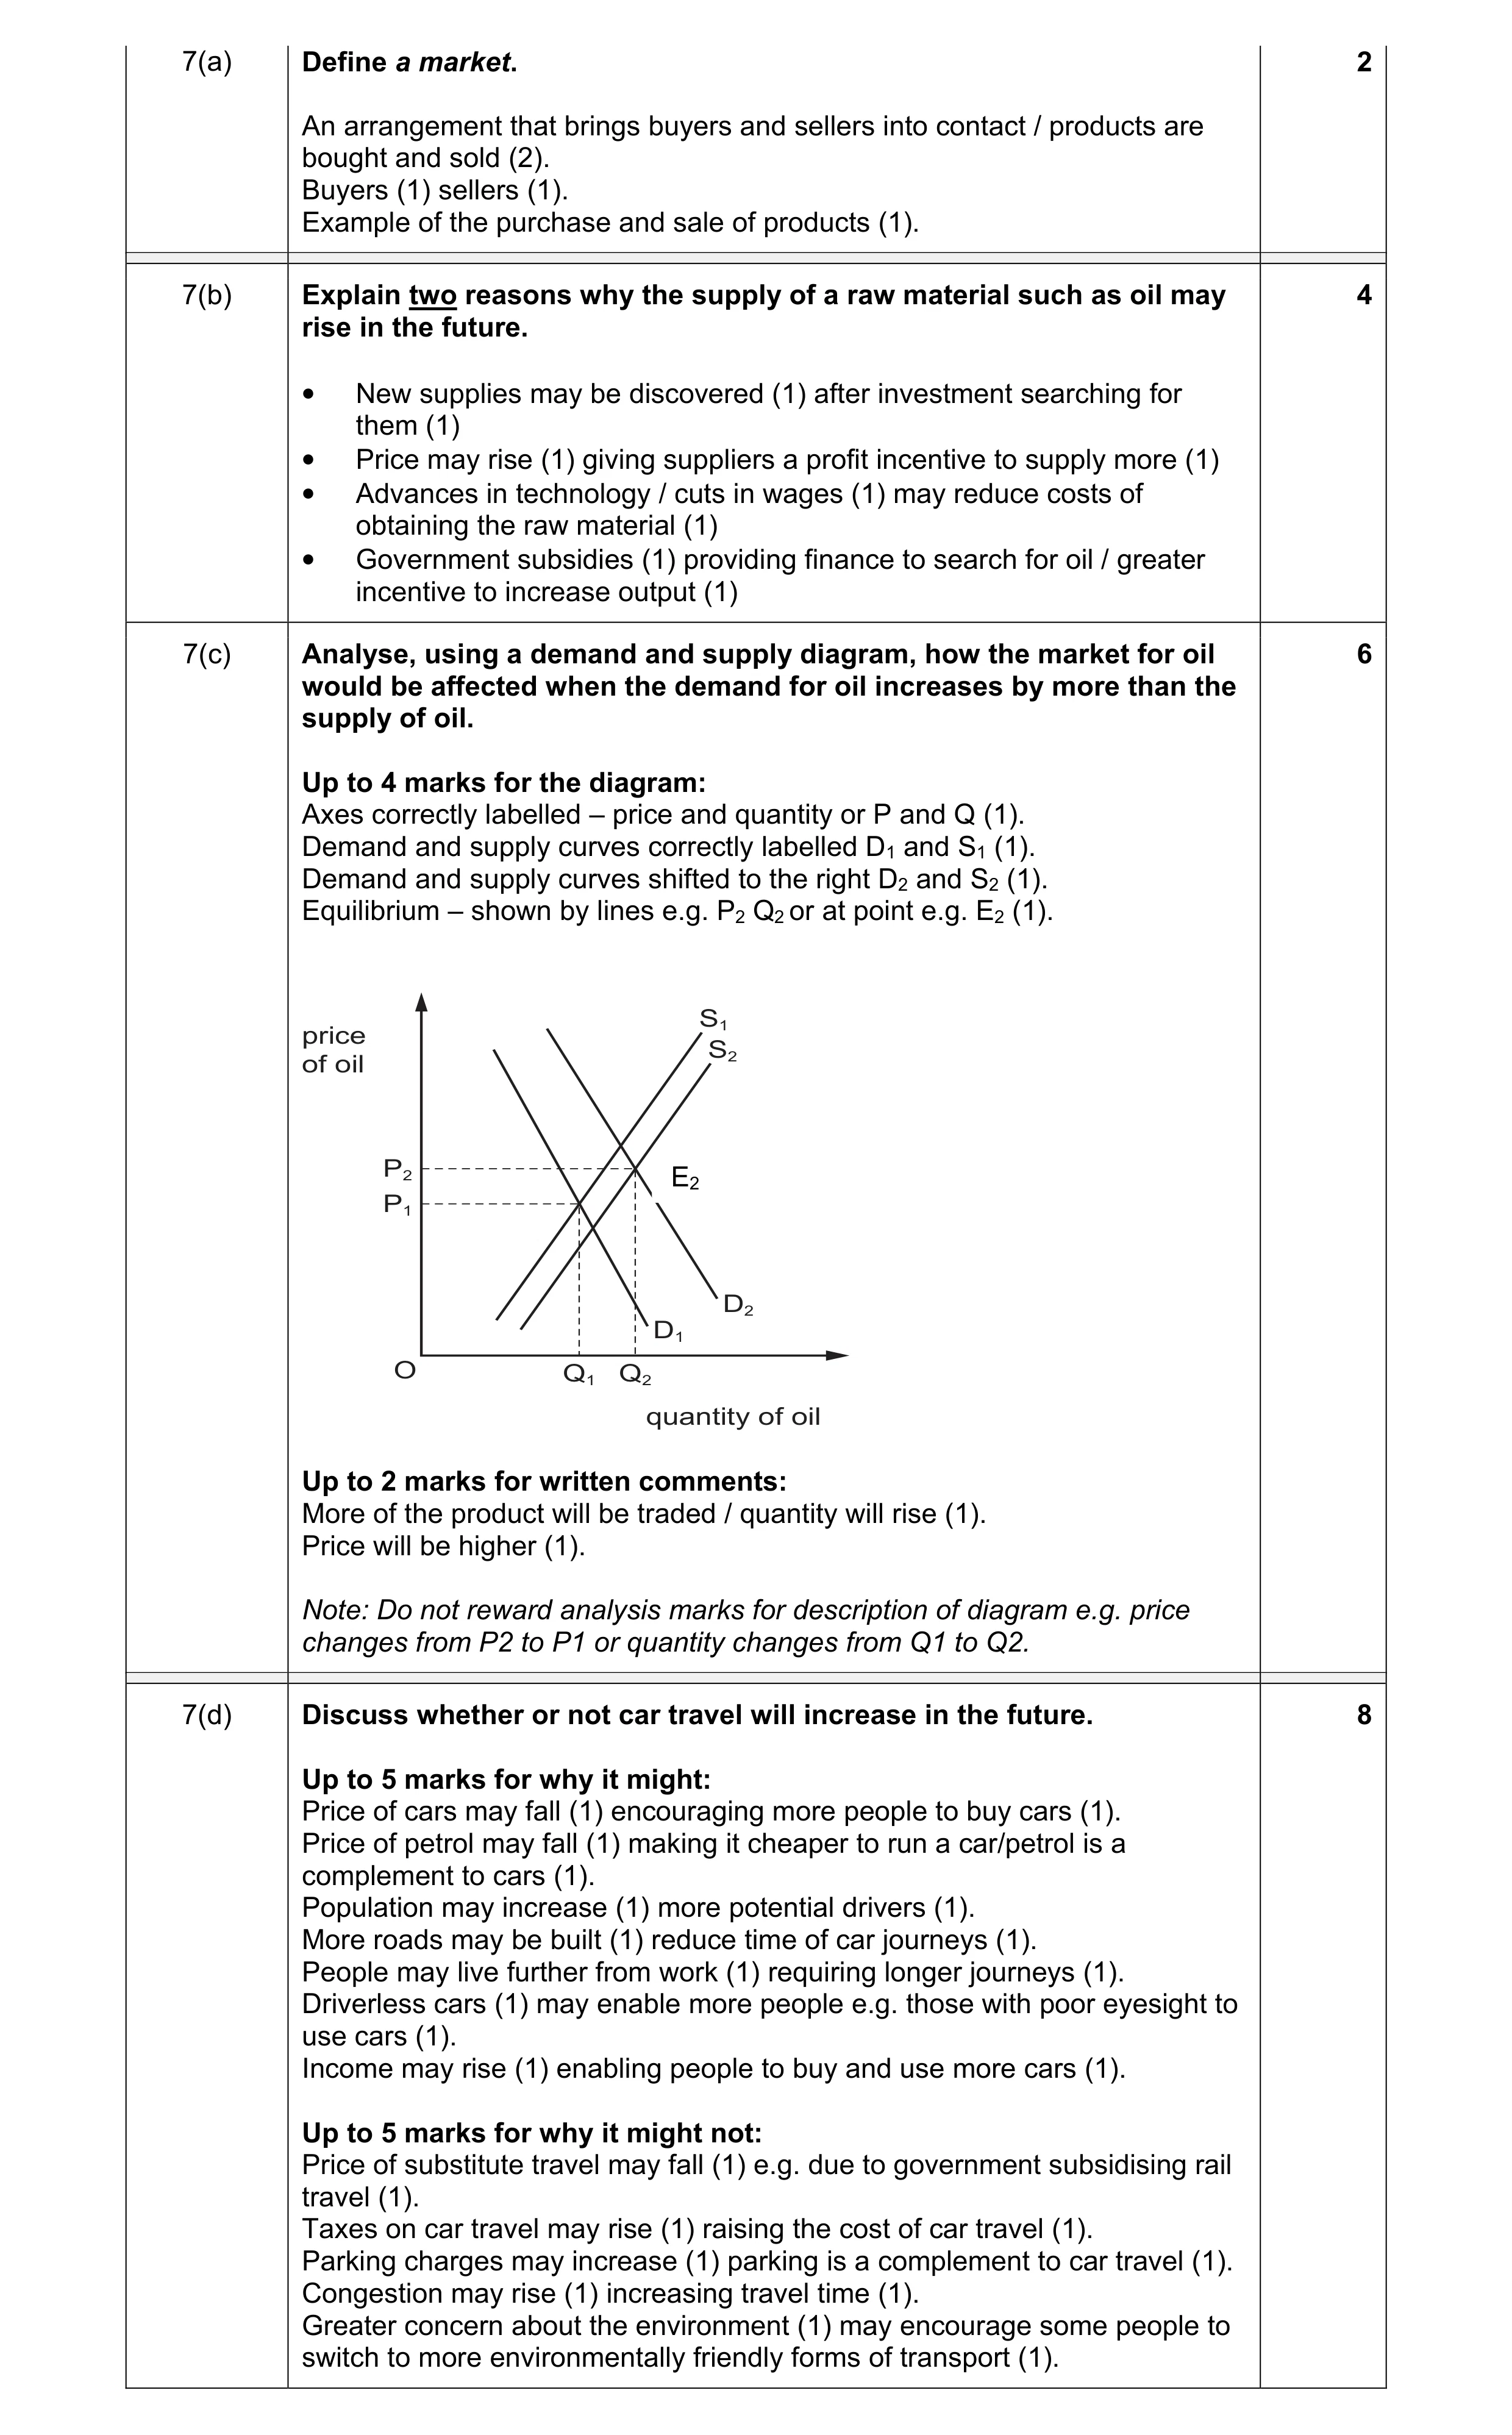 20
20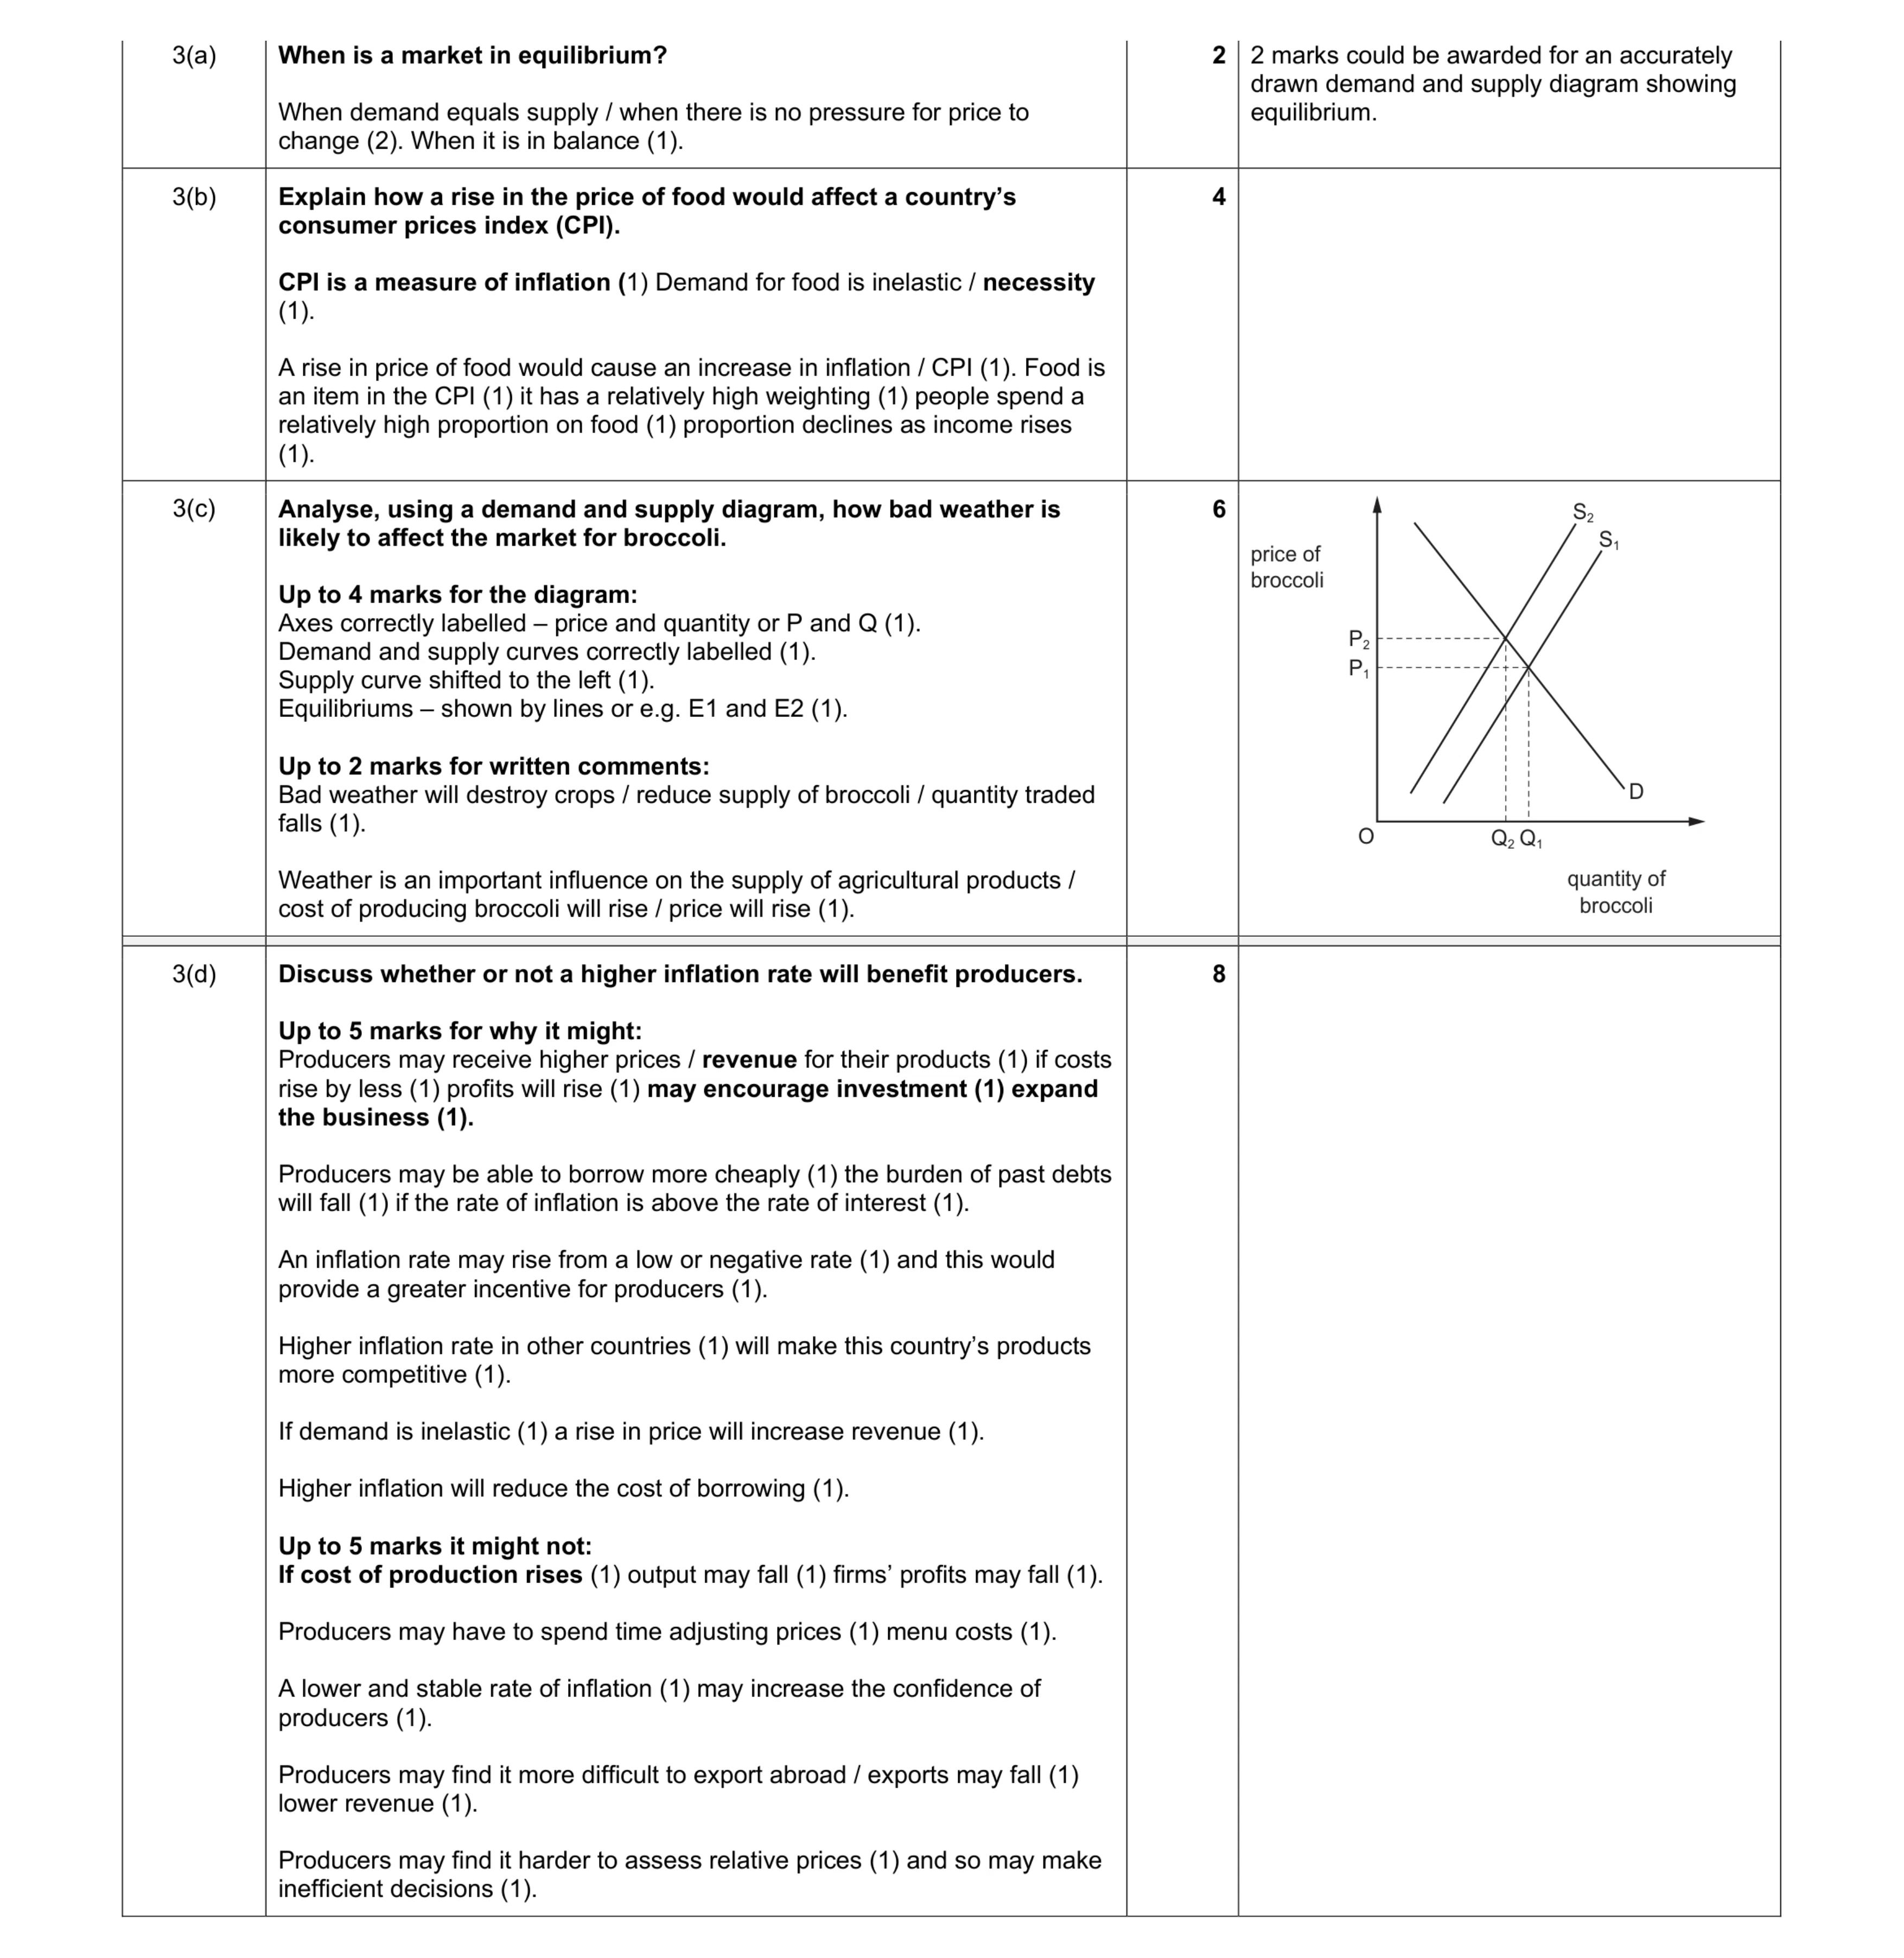 20
20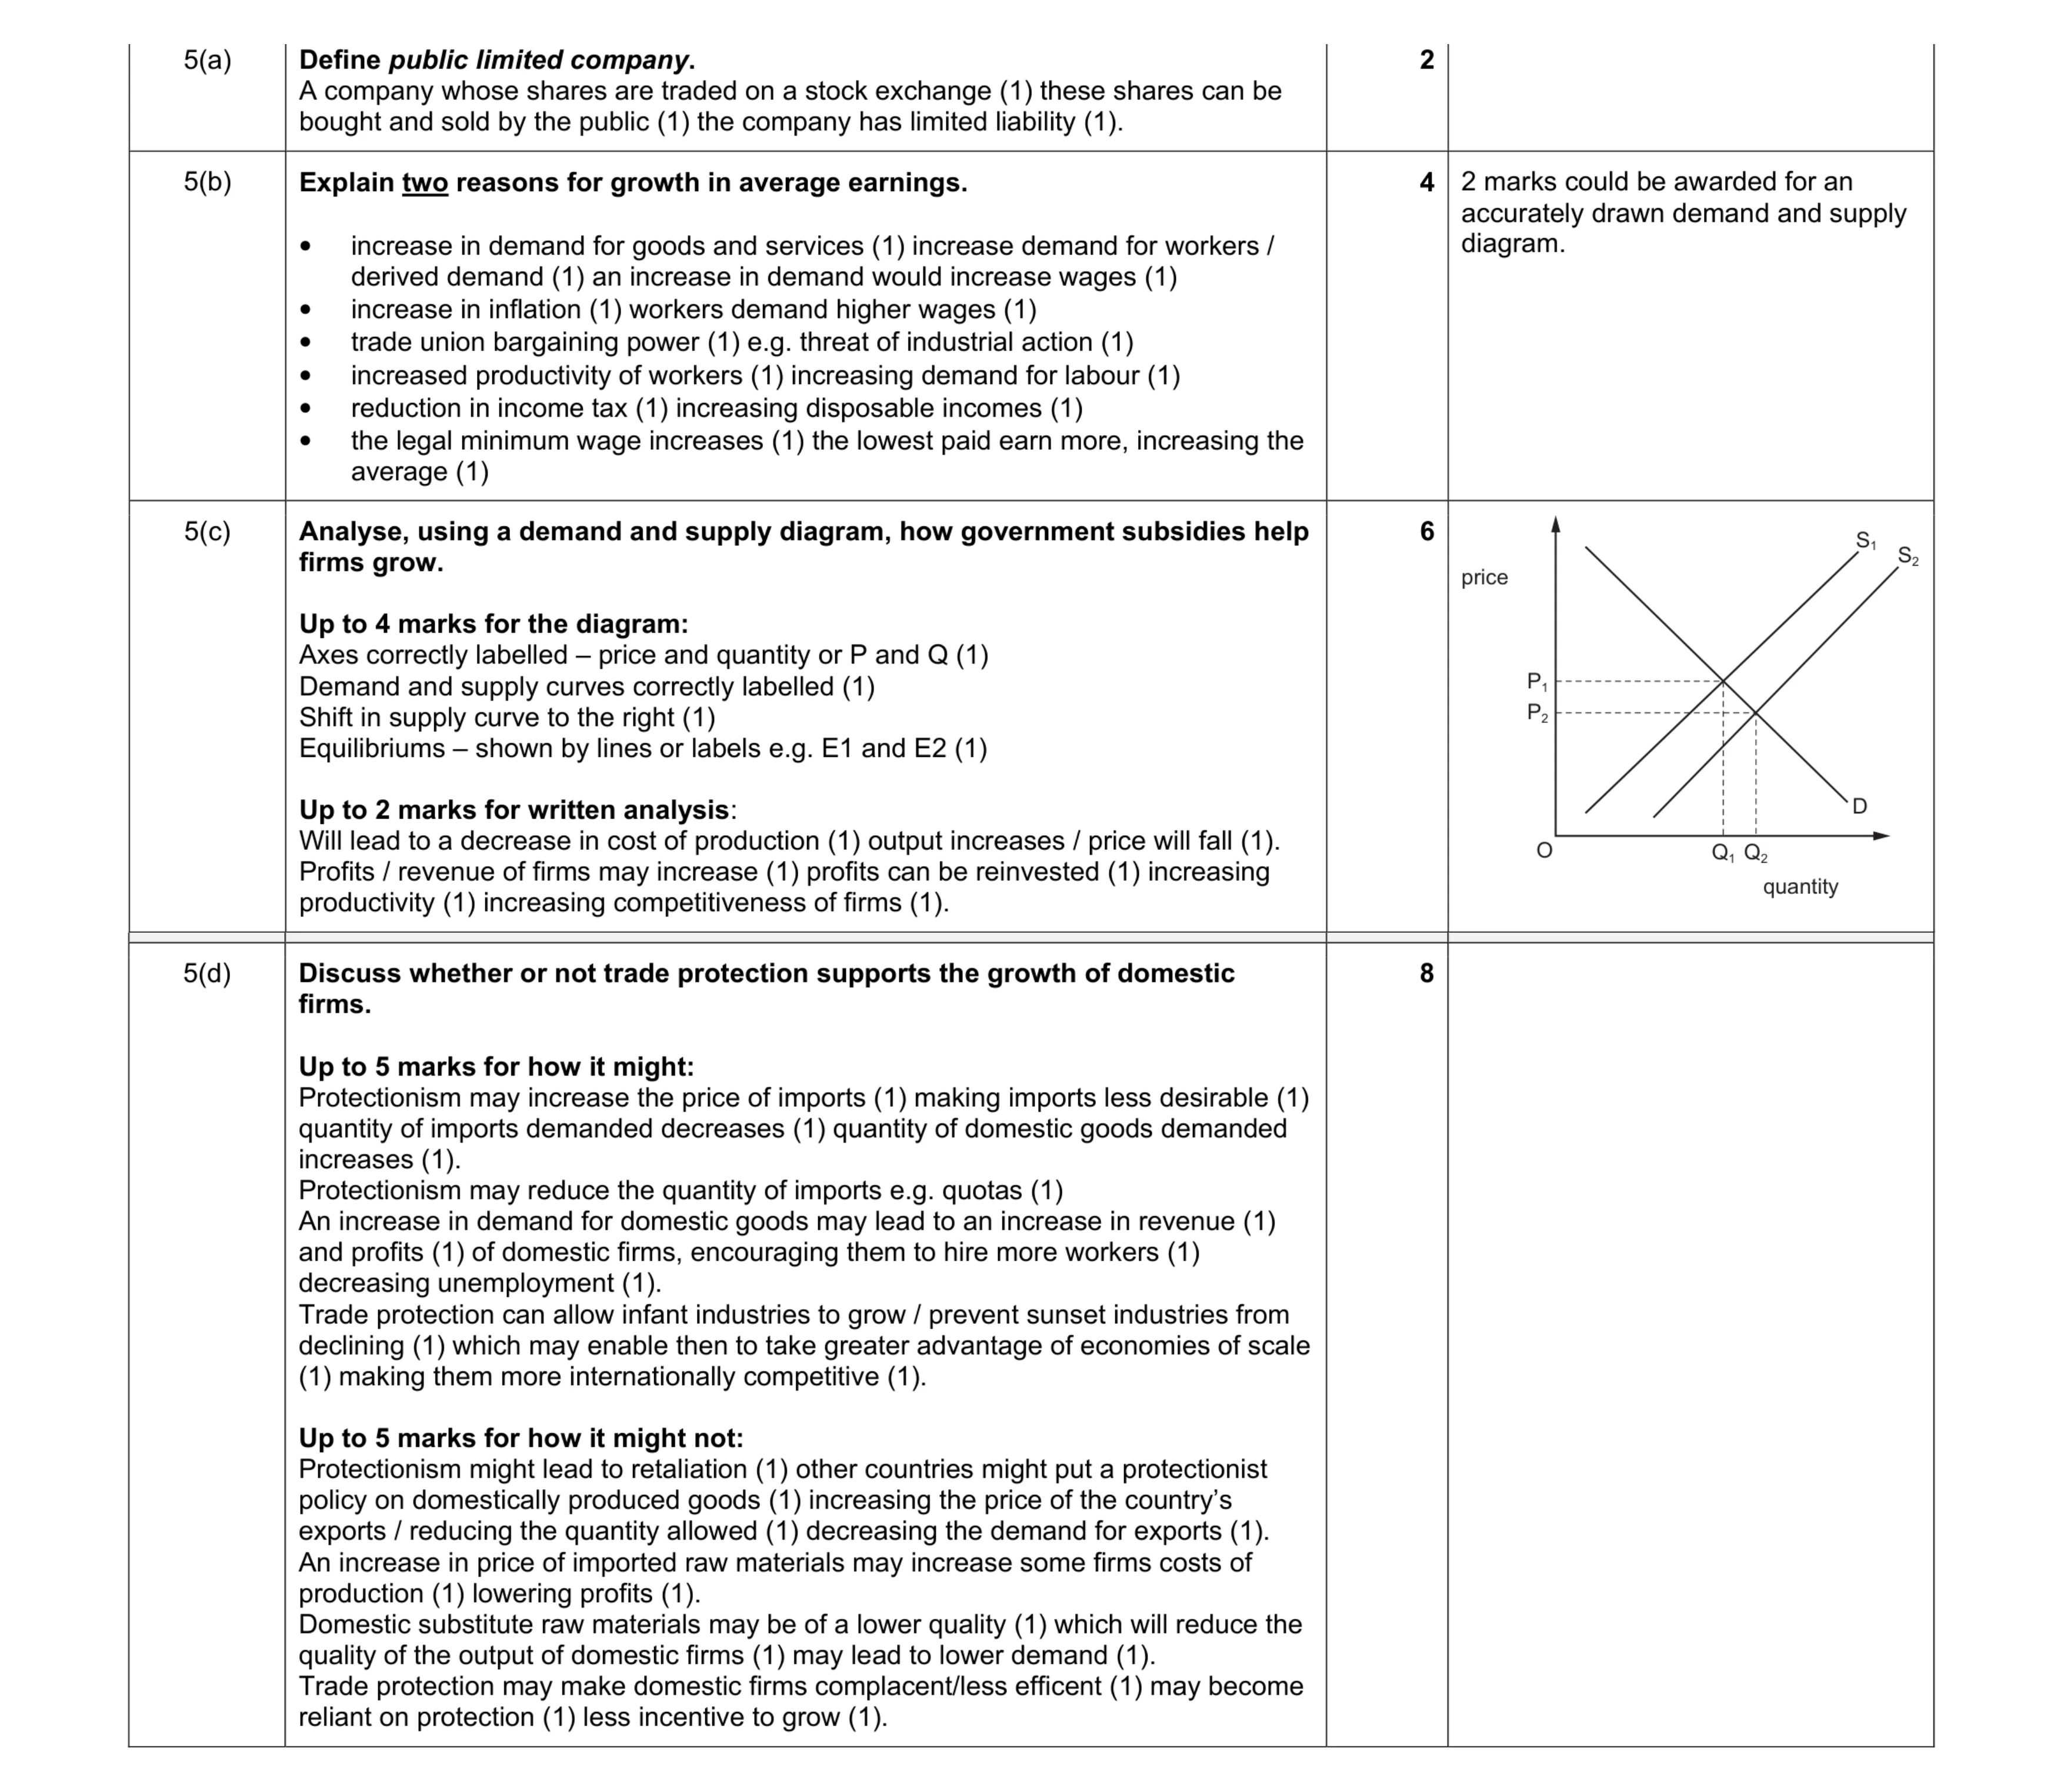 20
20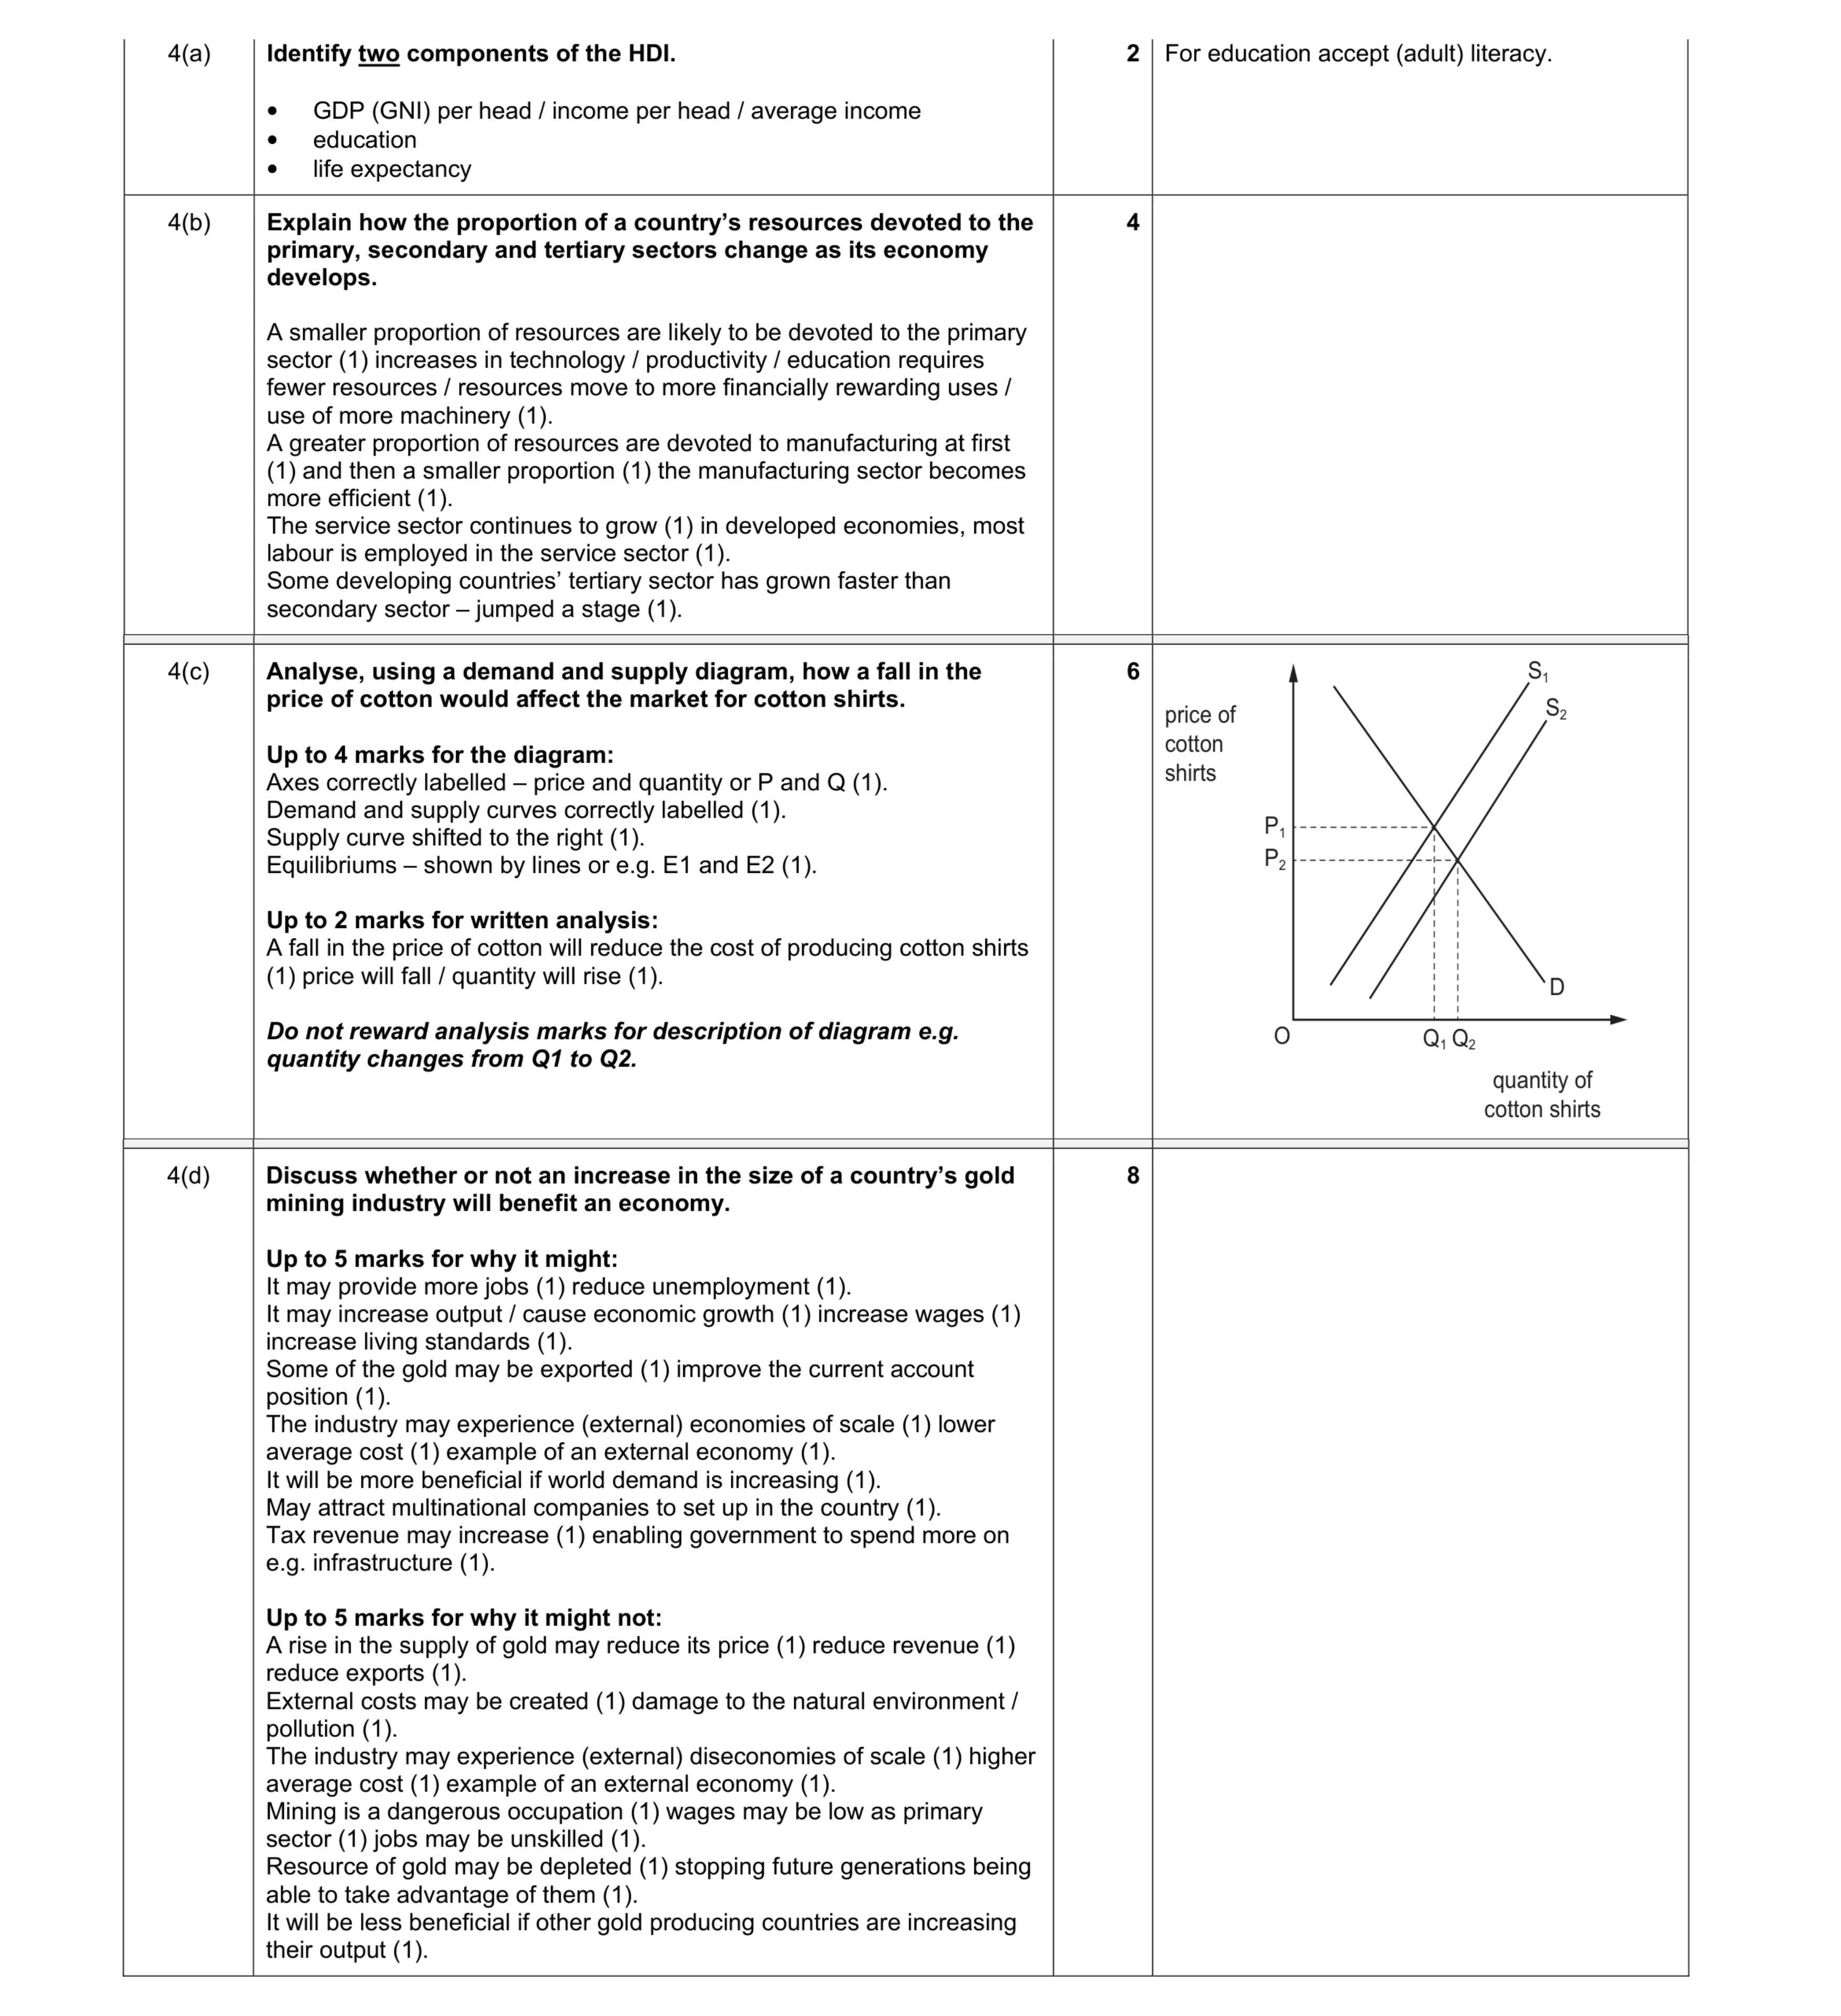 20
20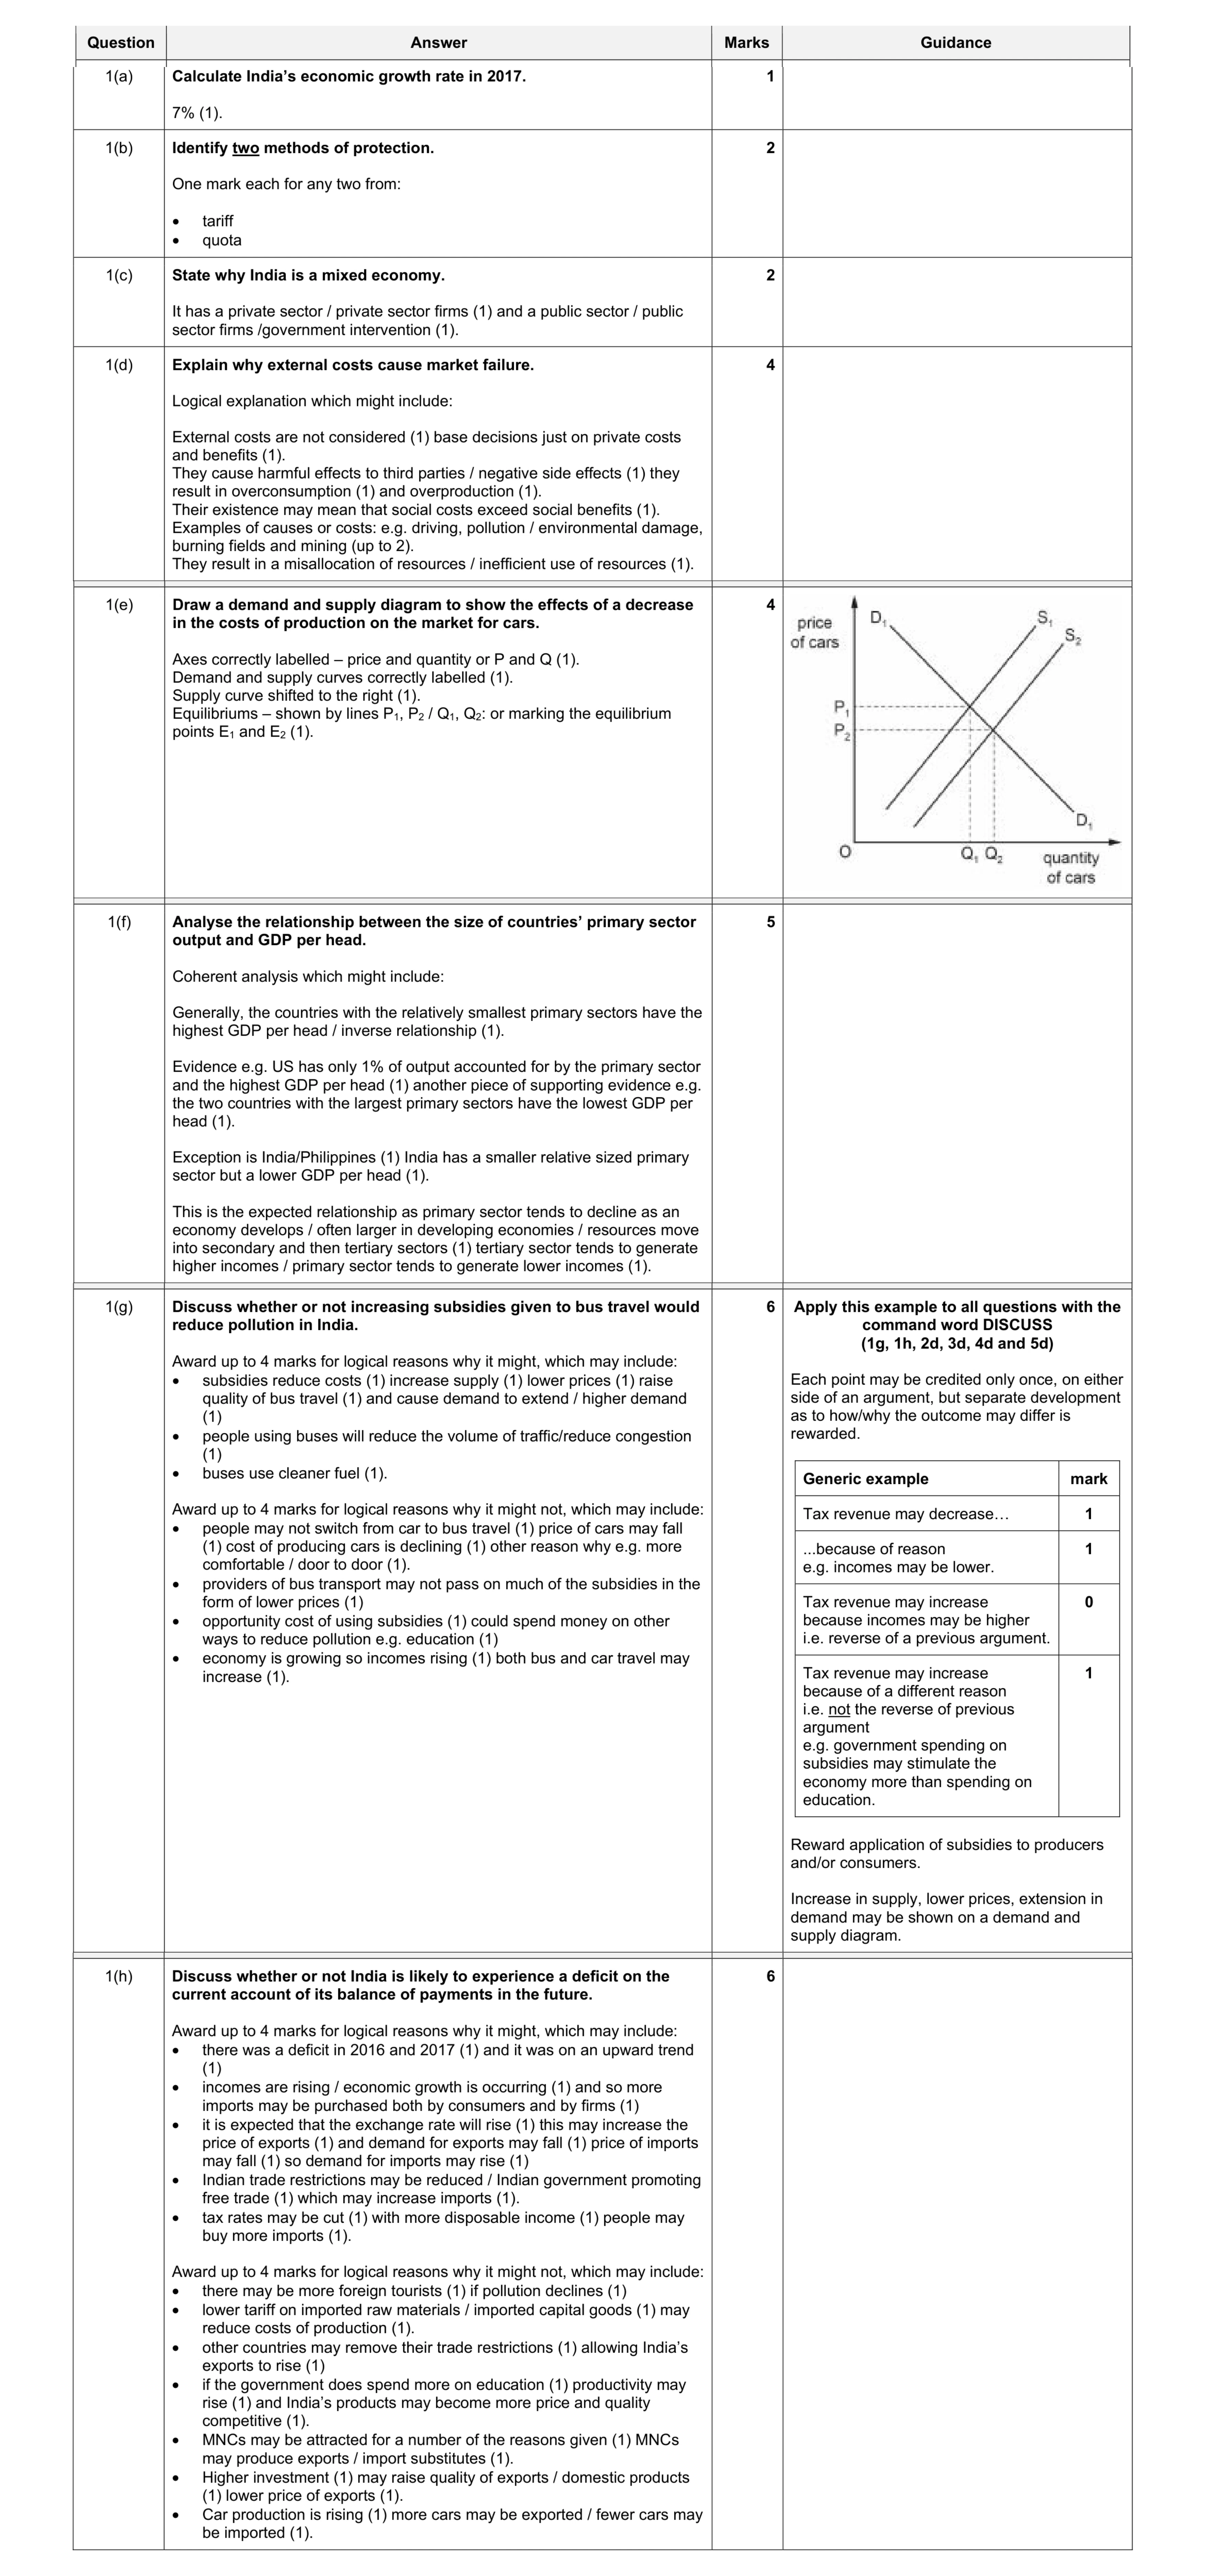 30
30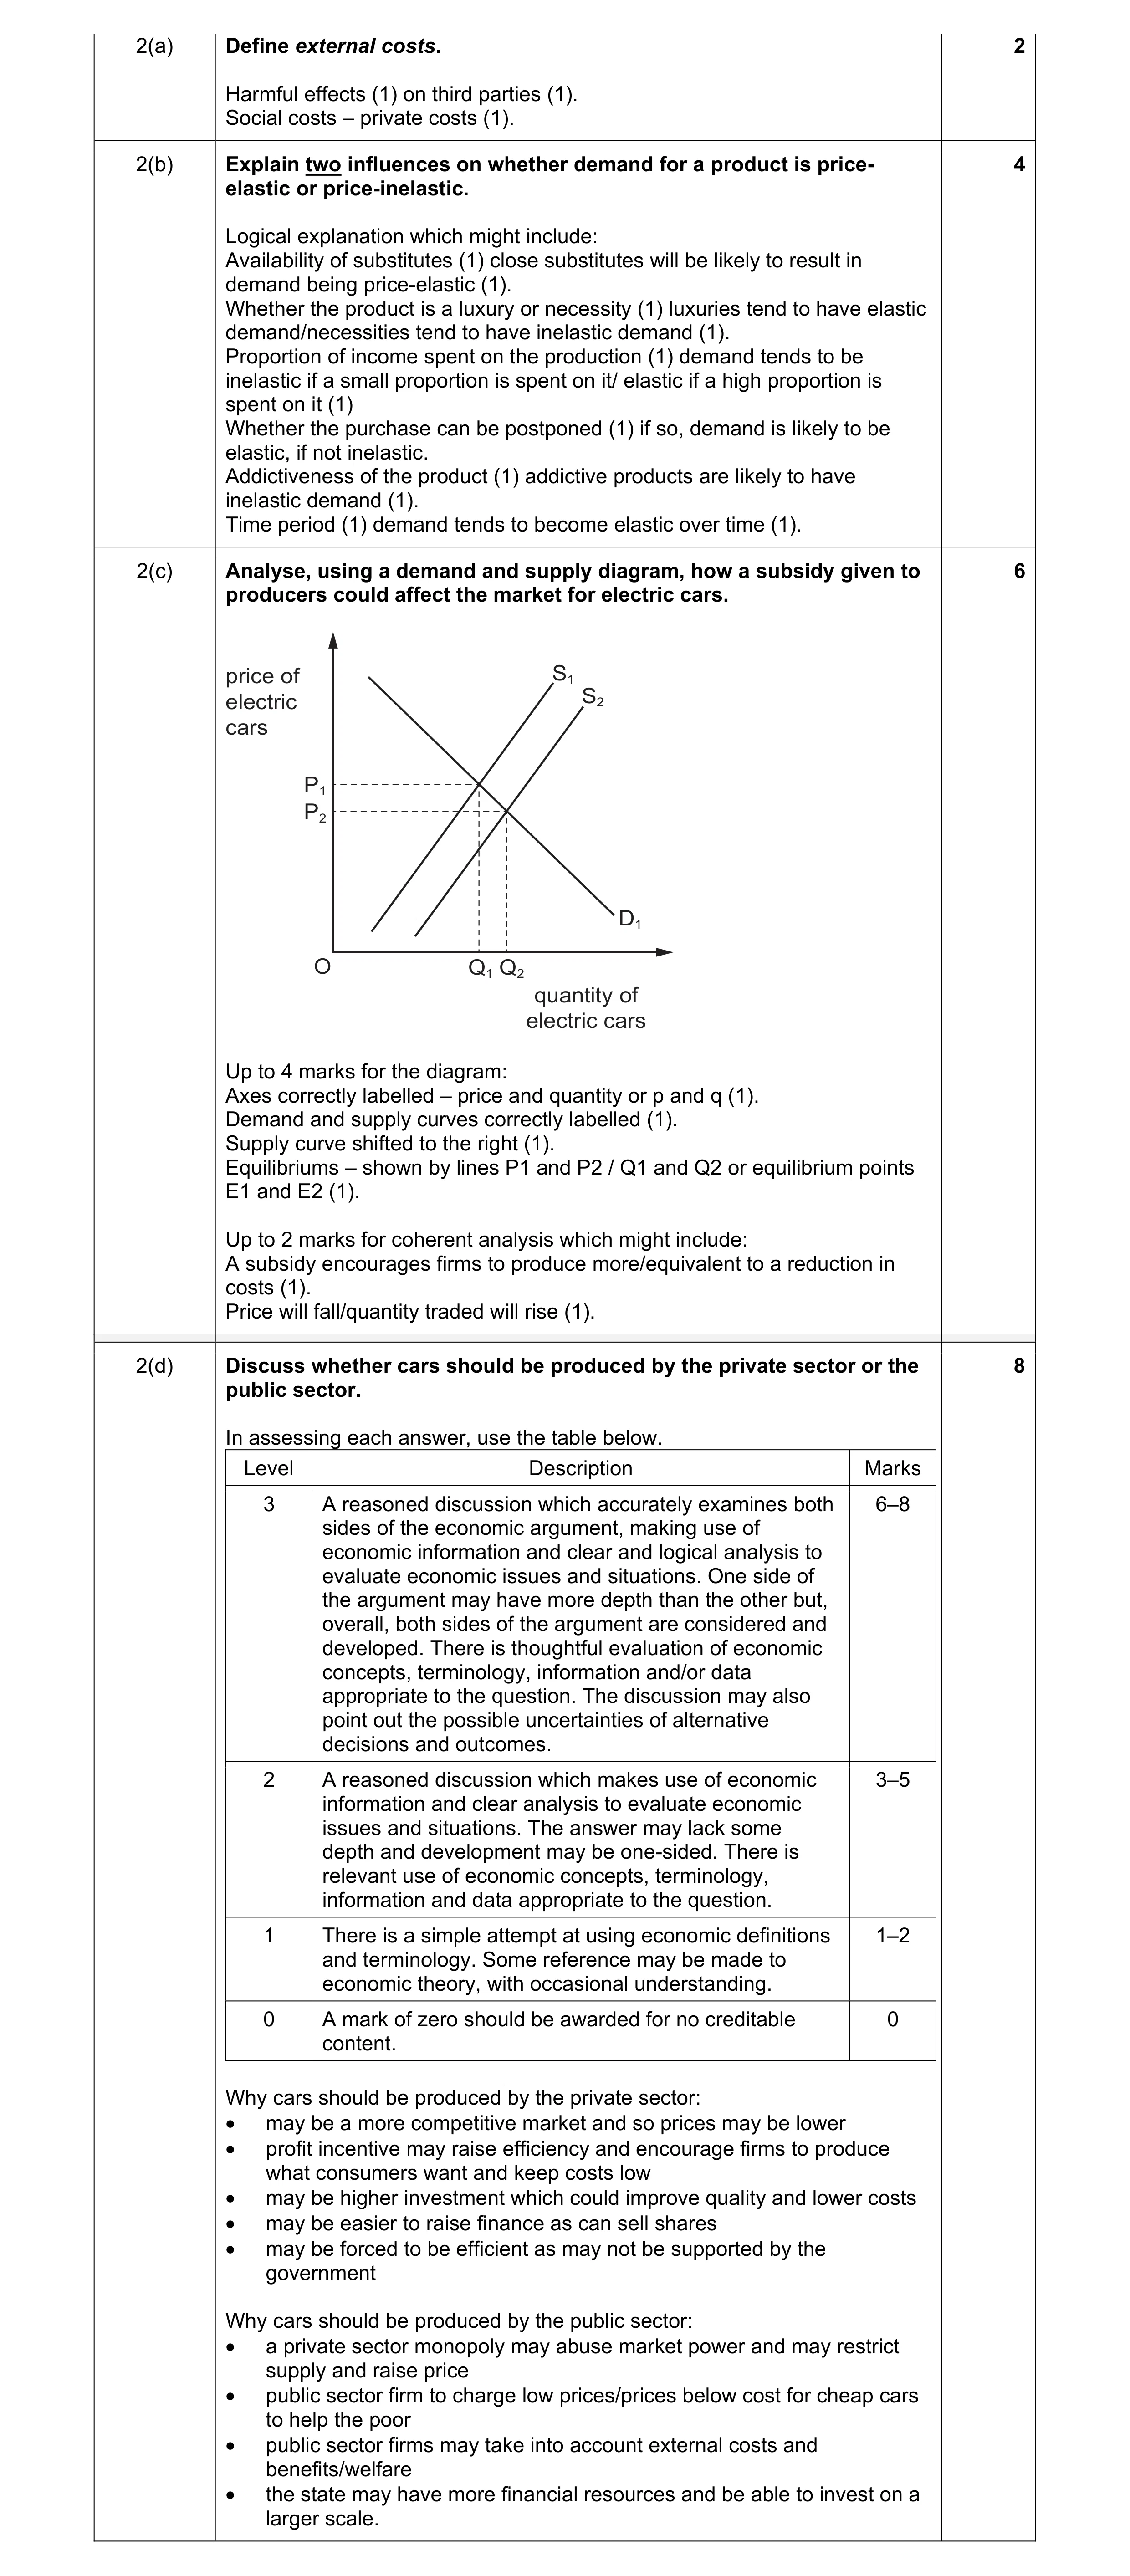 20
20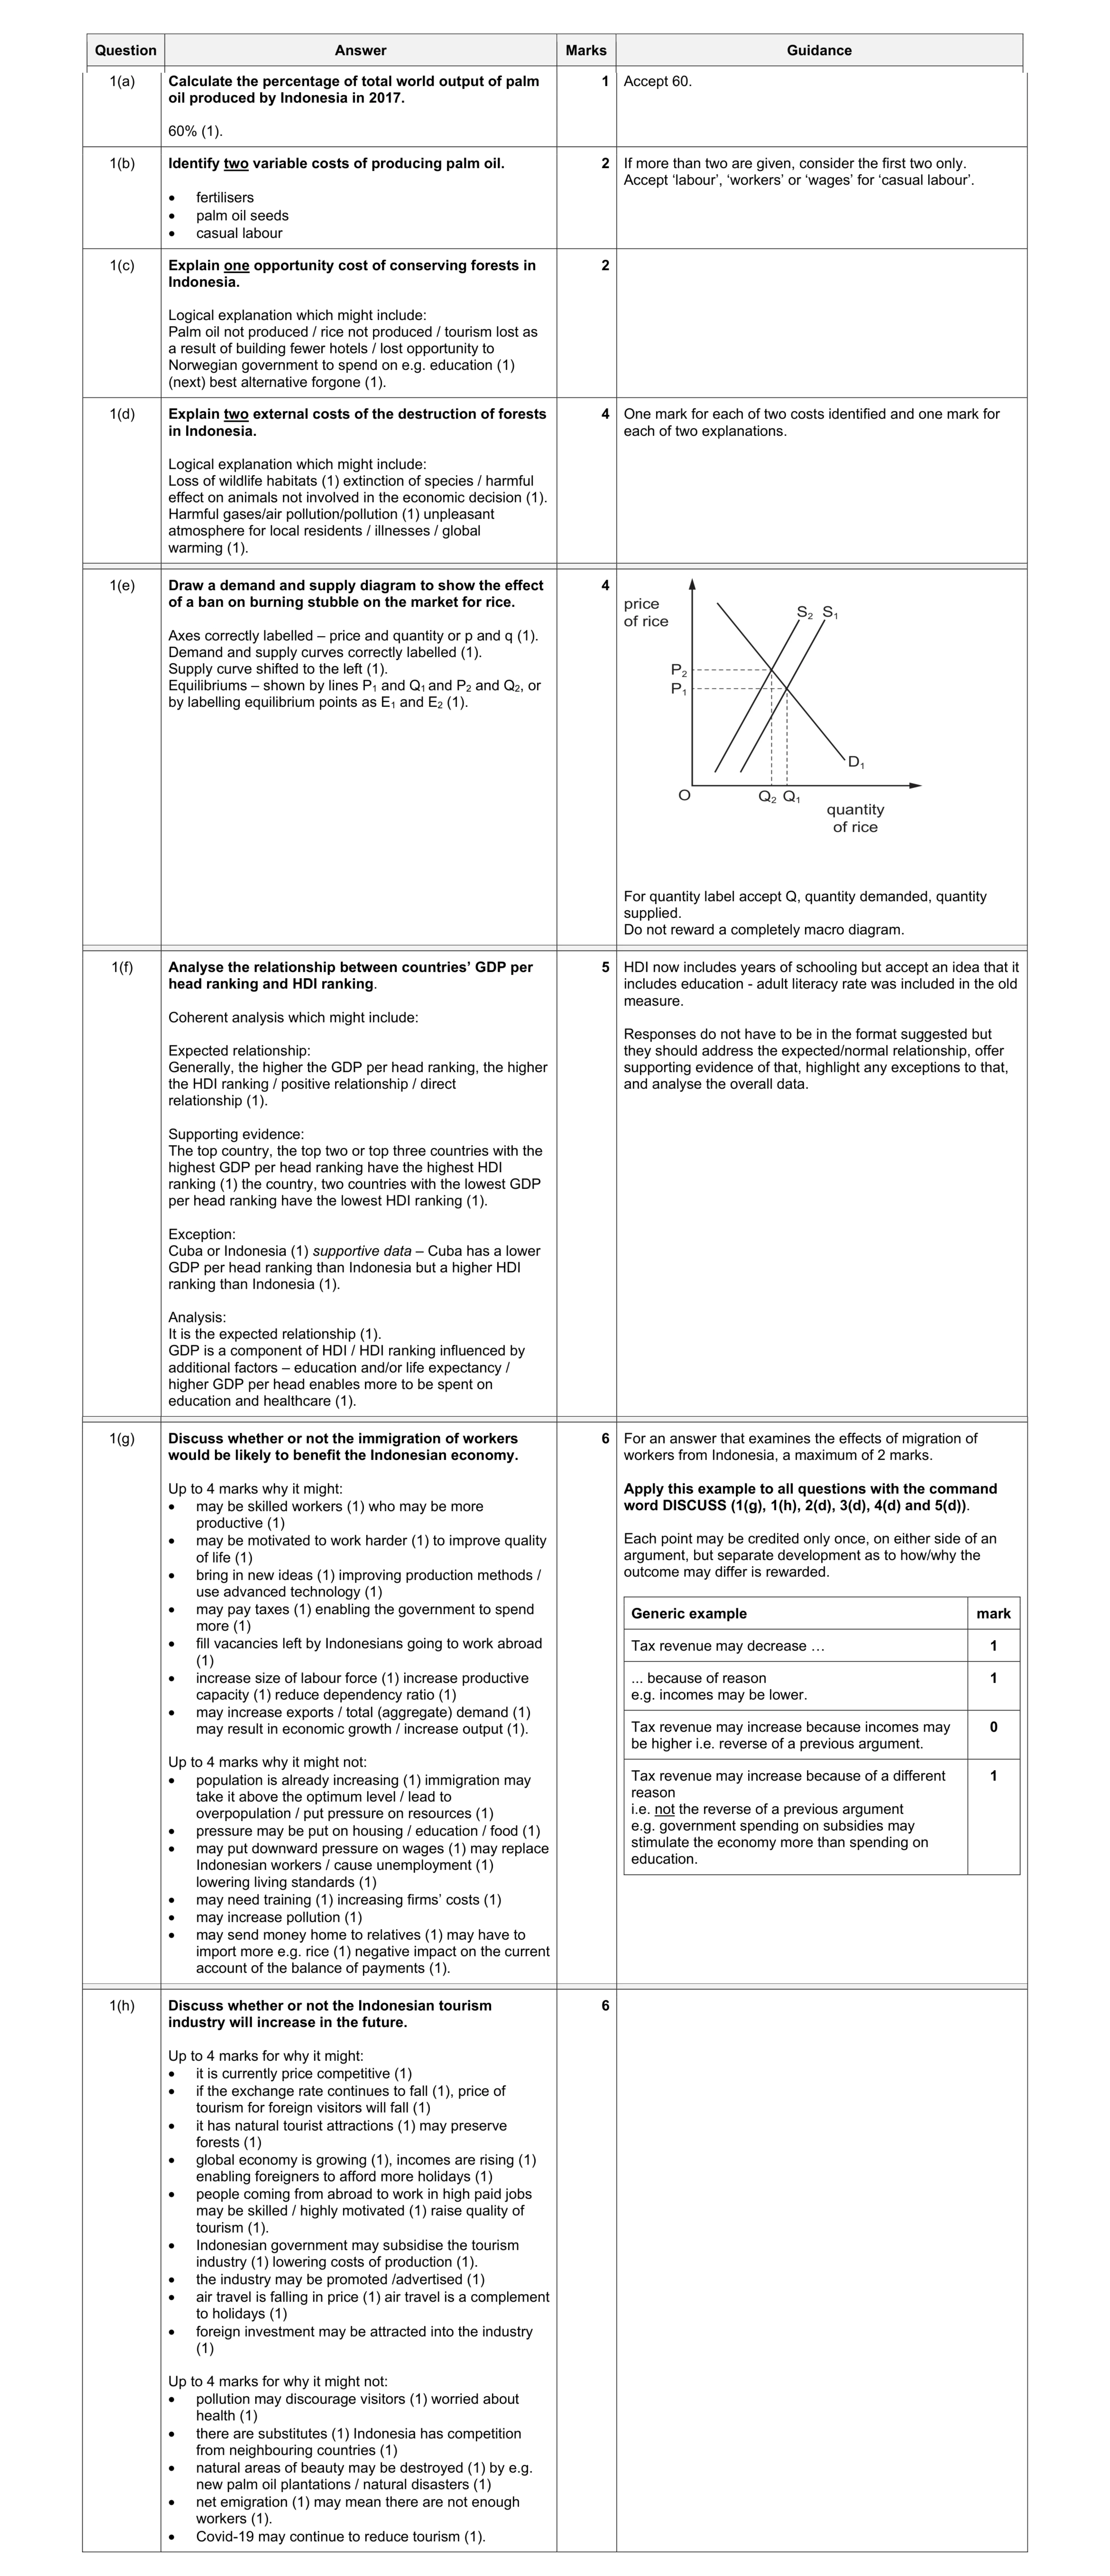 30
30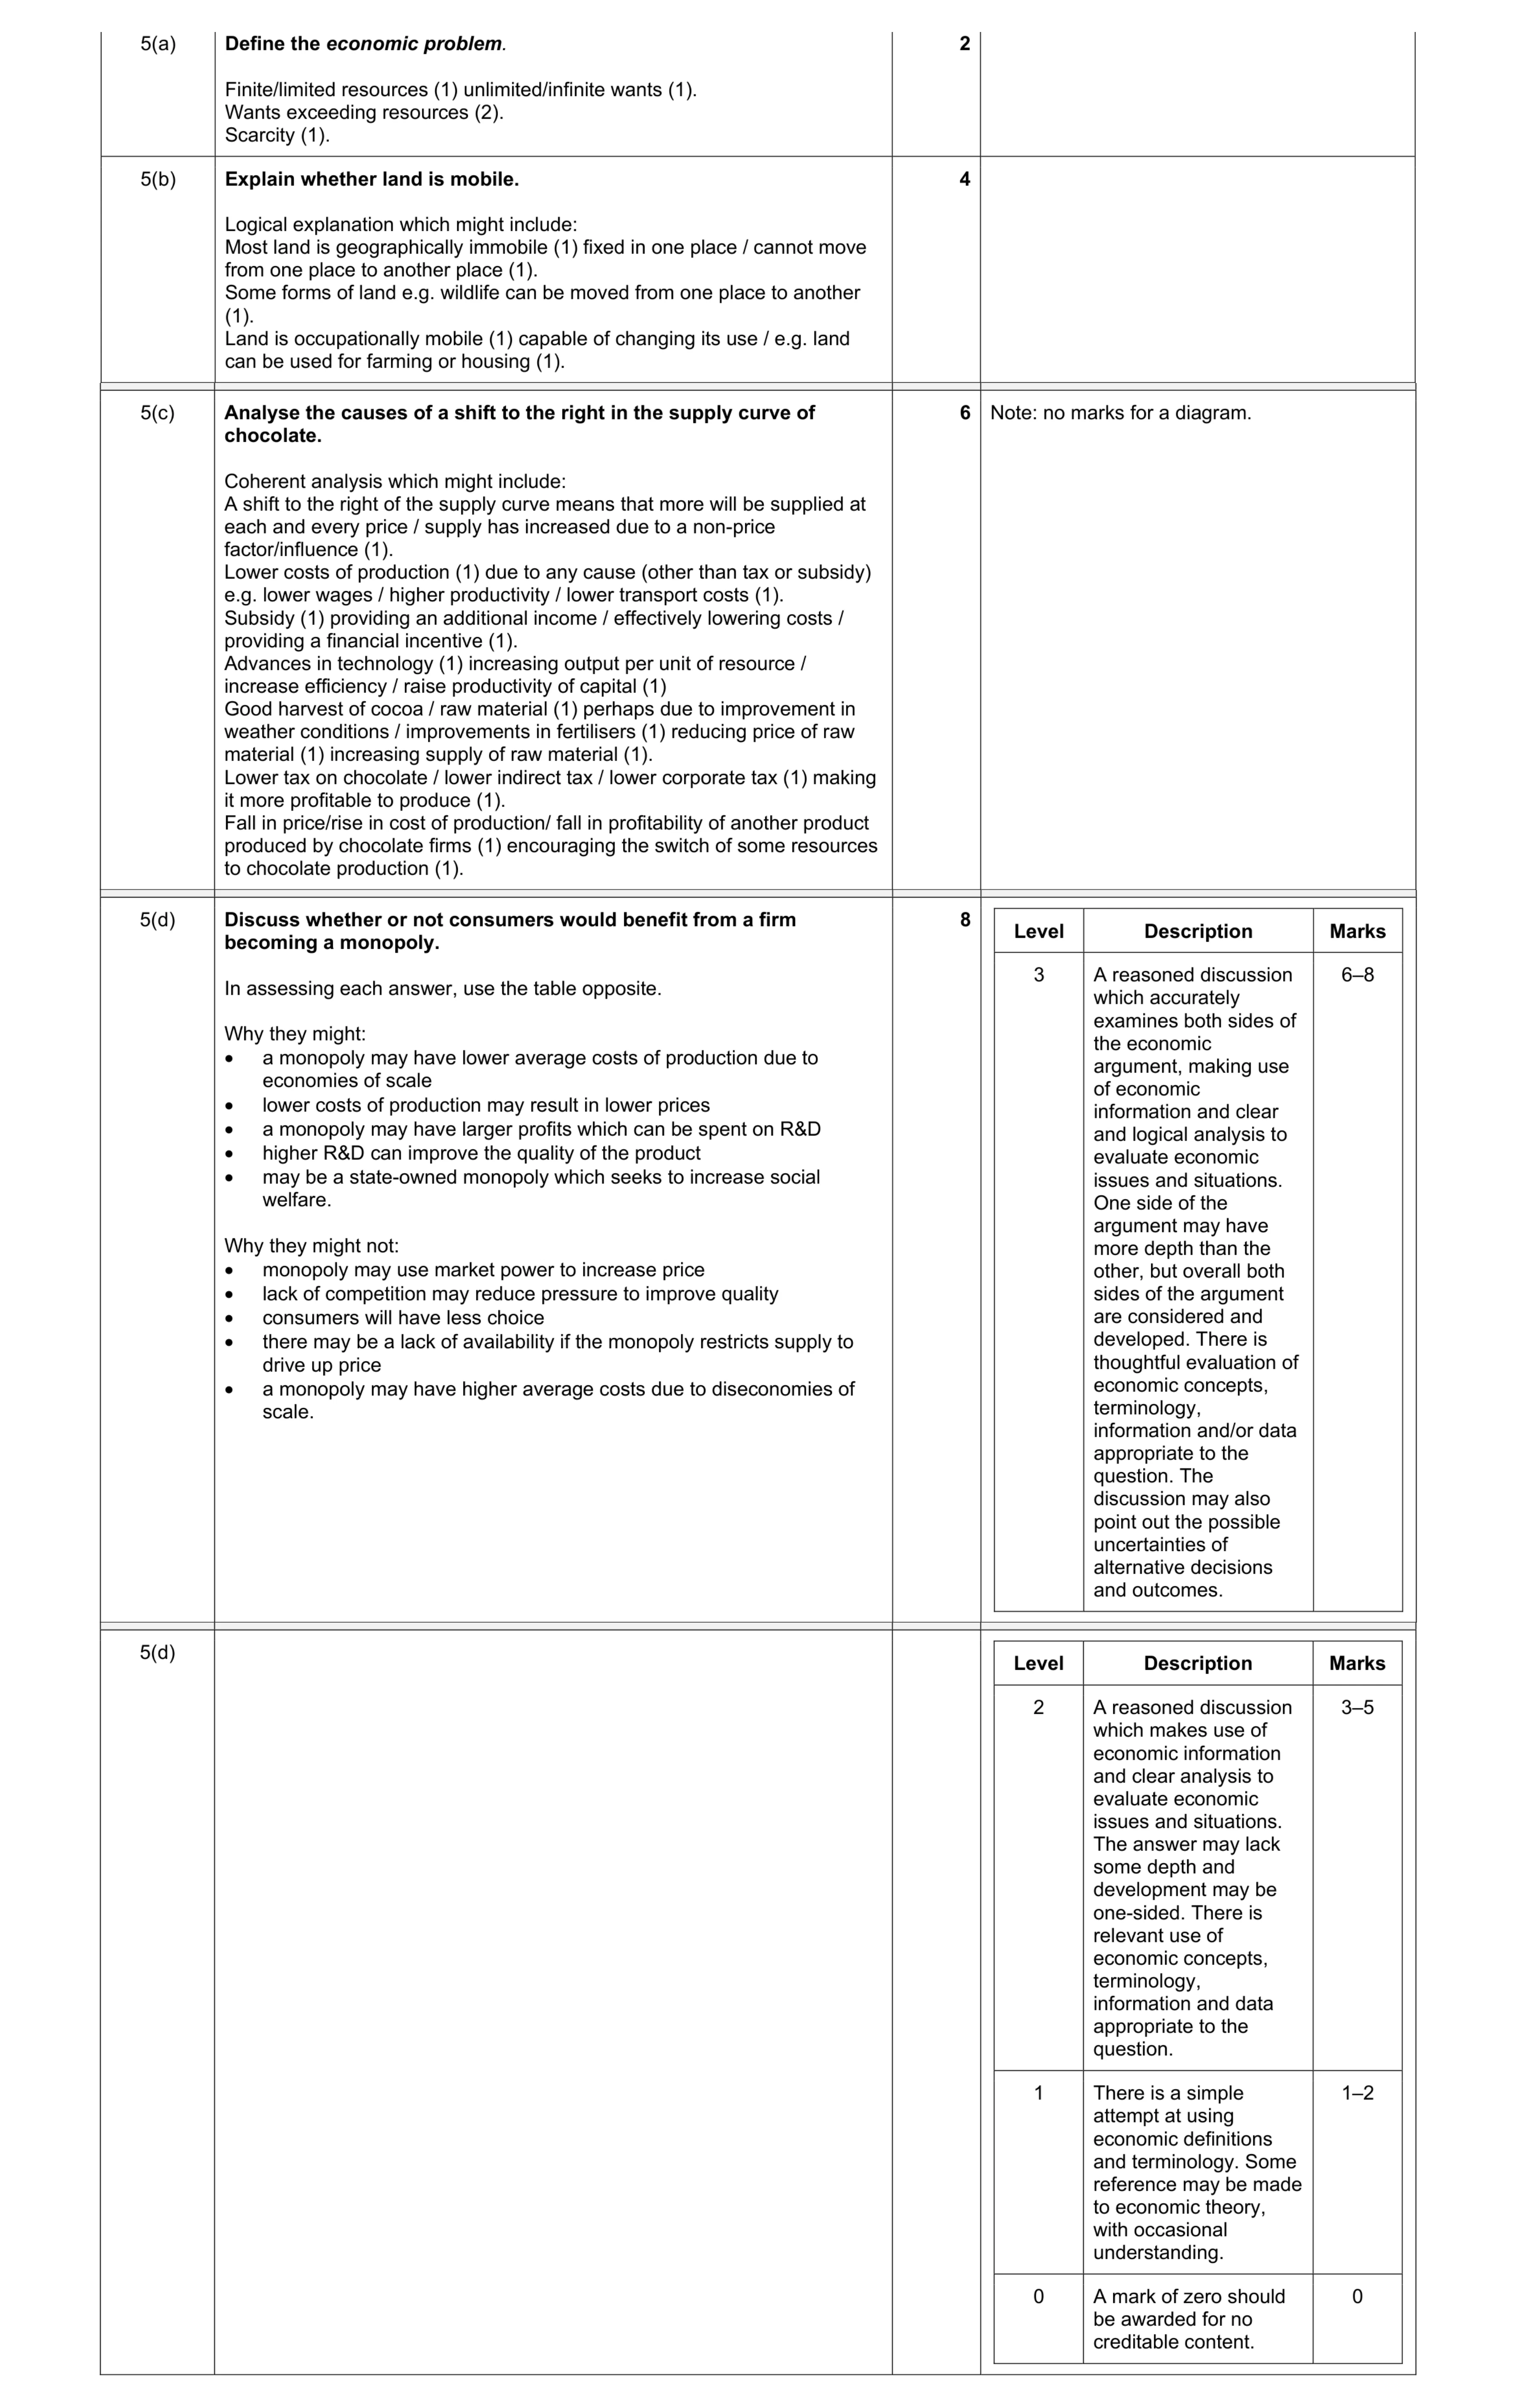 20
20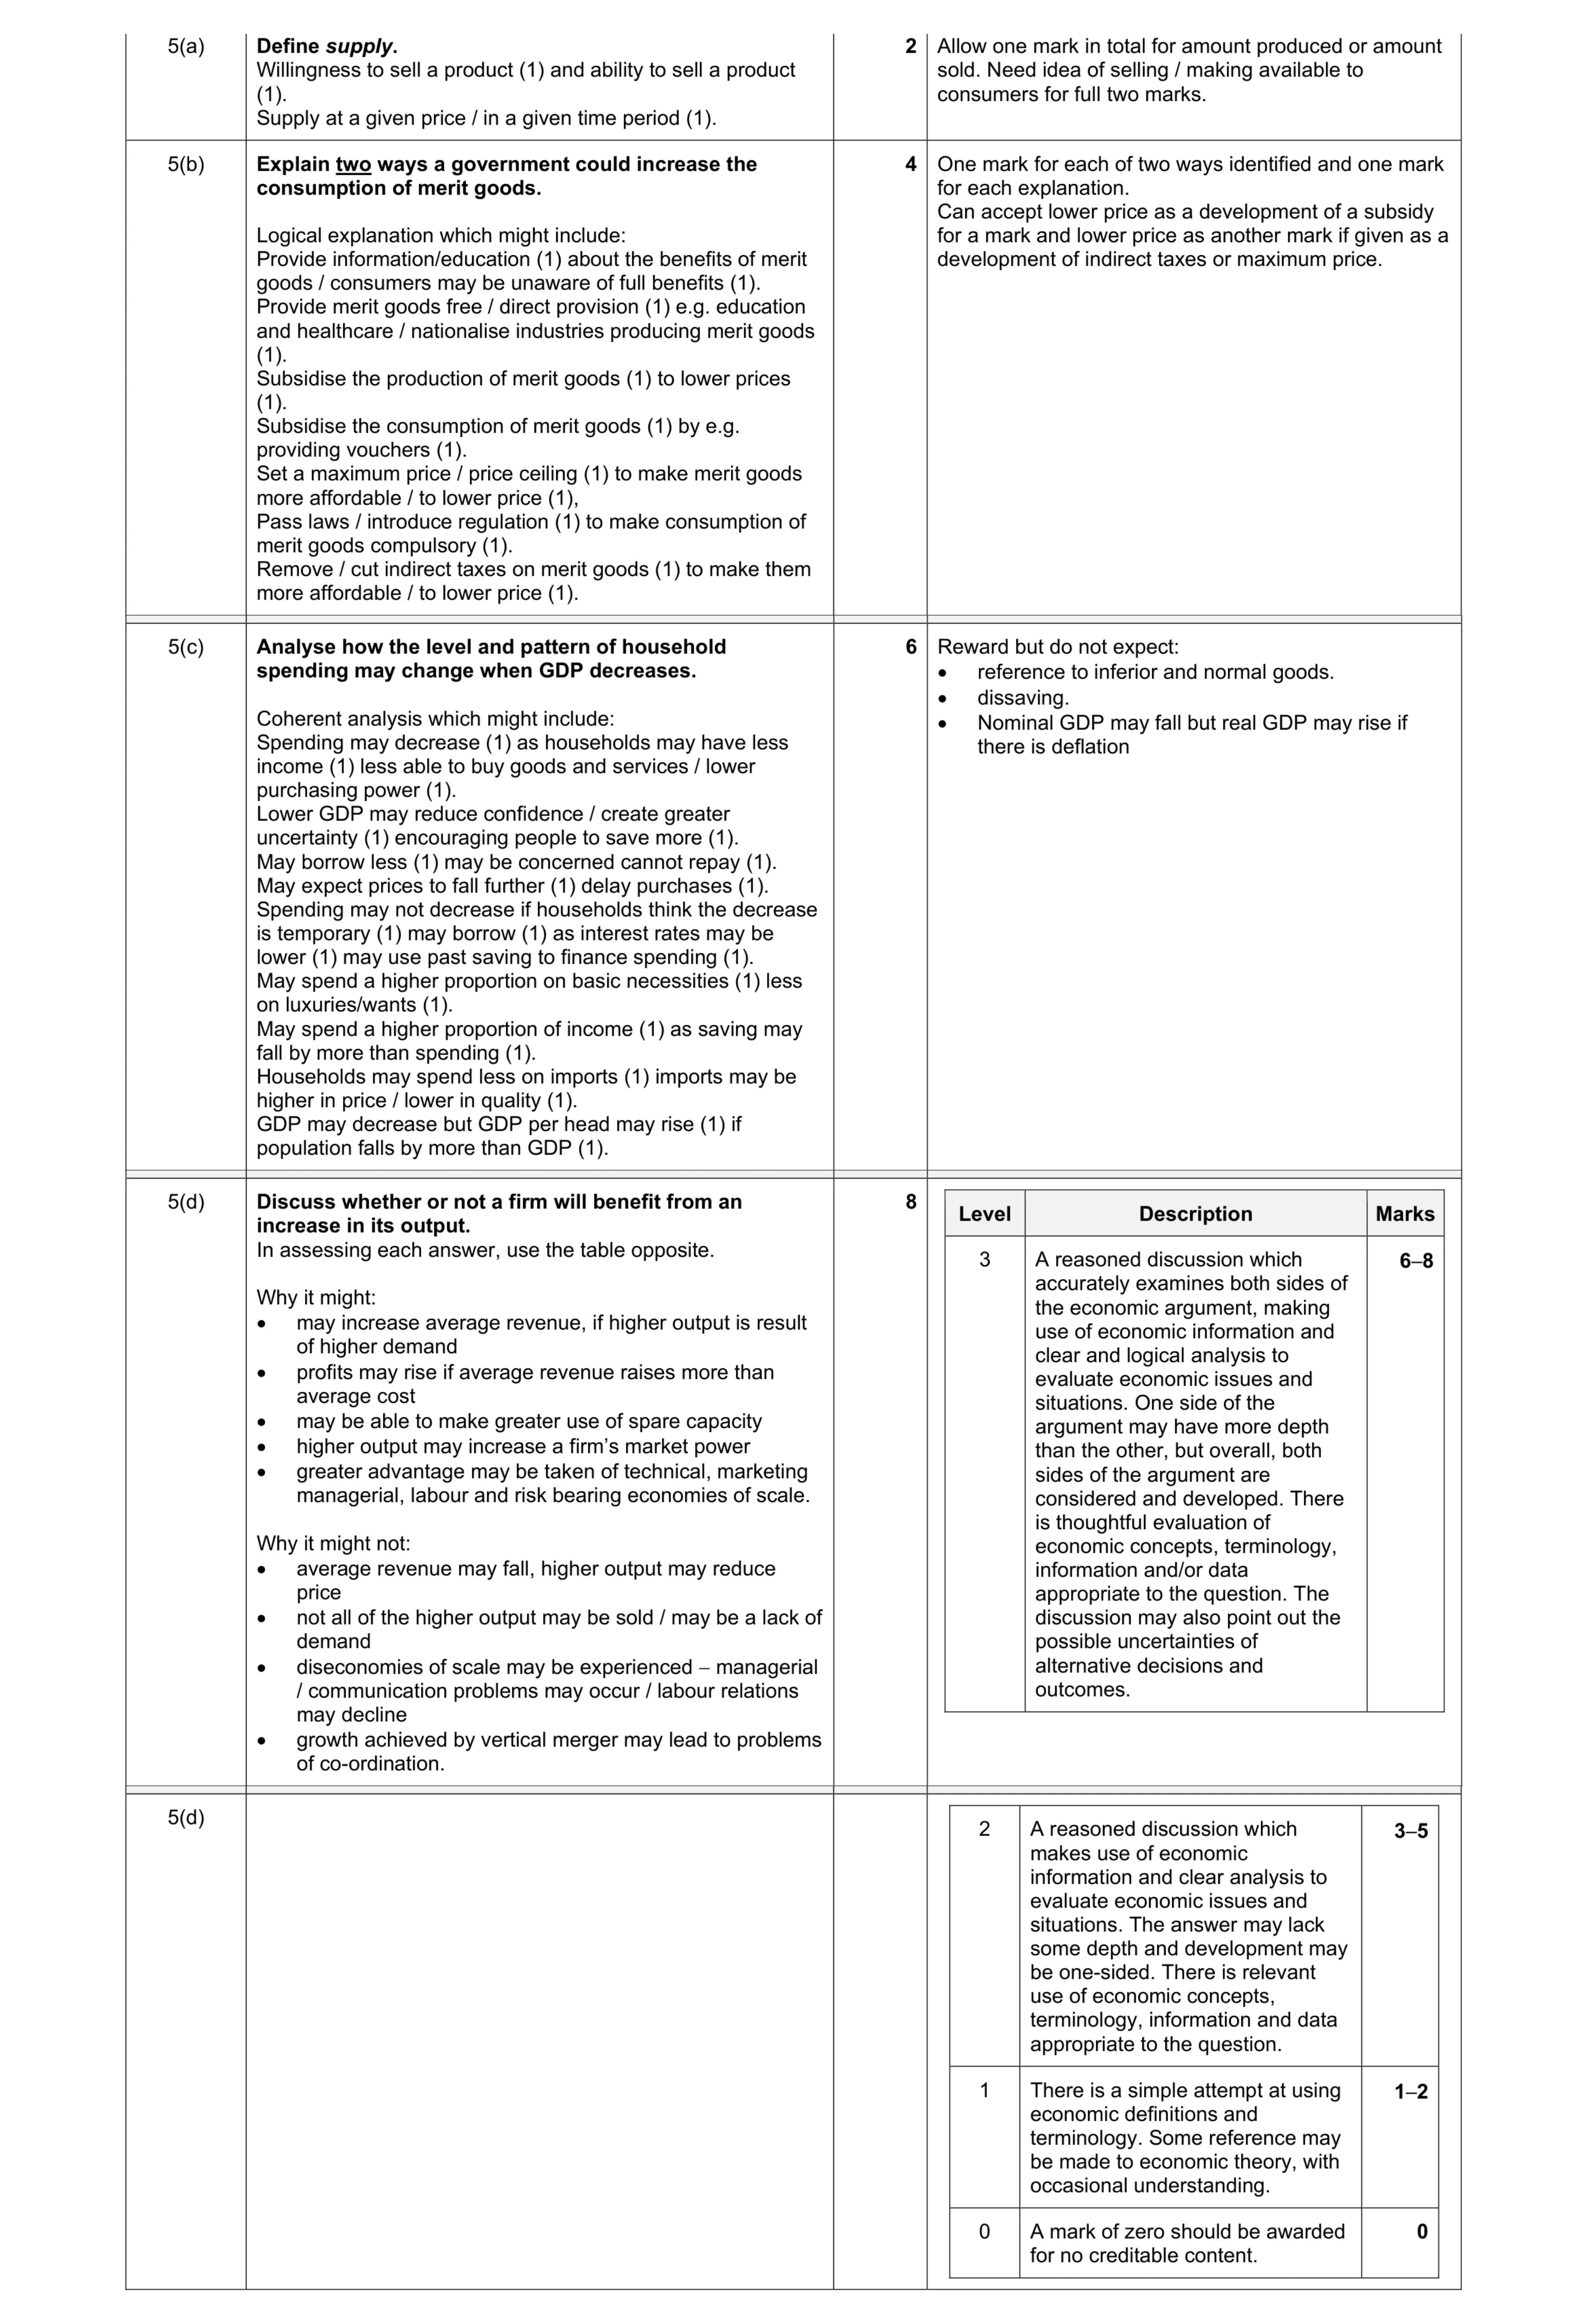 20
20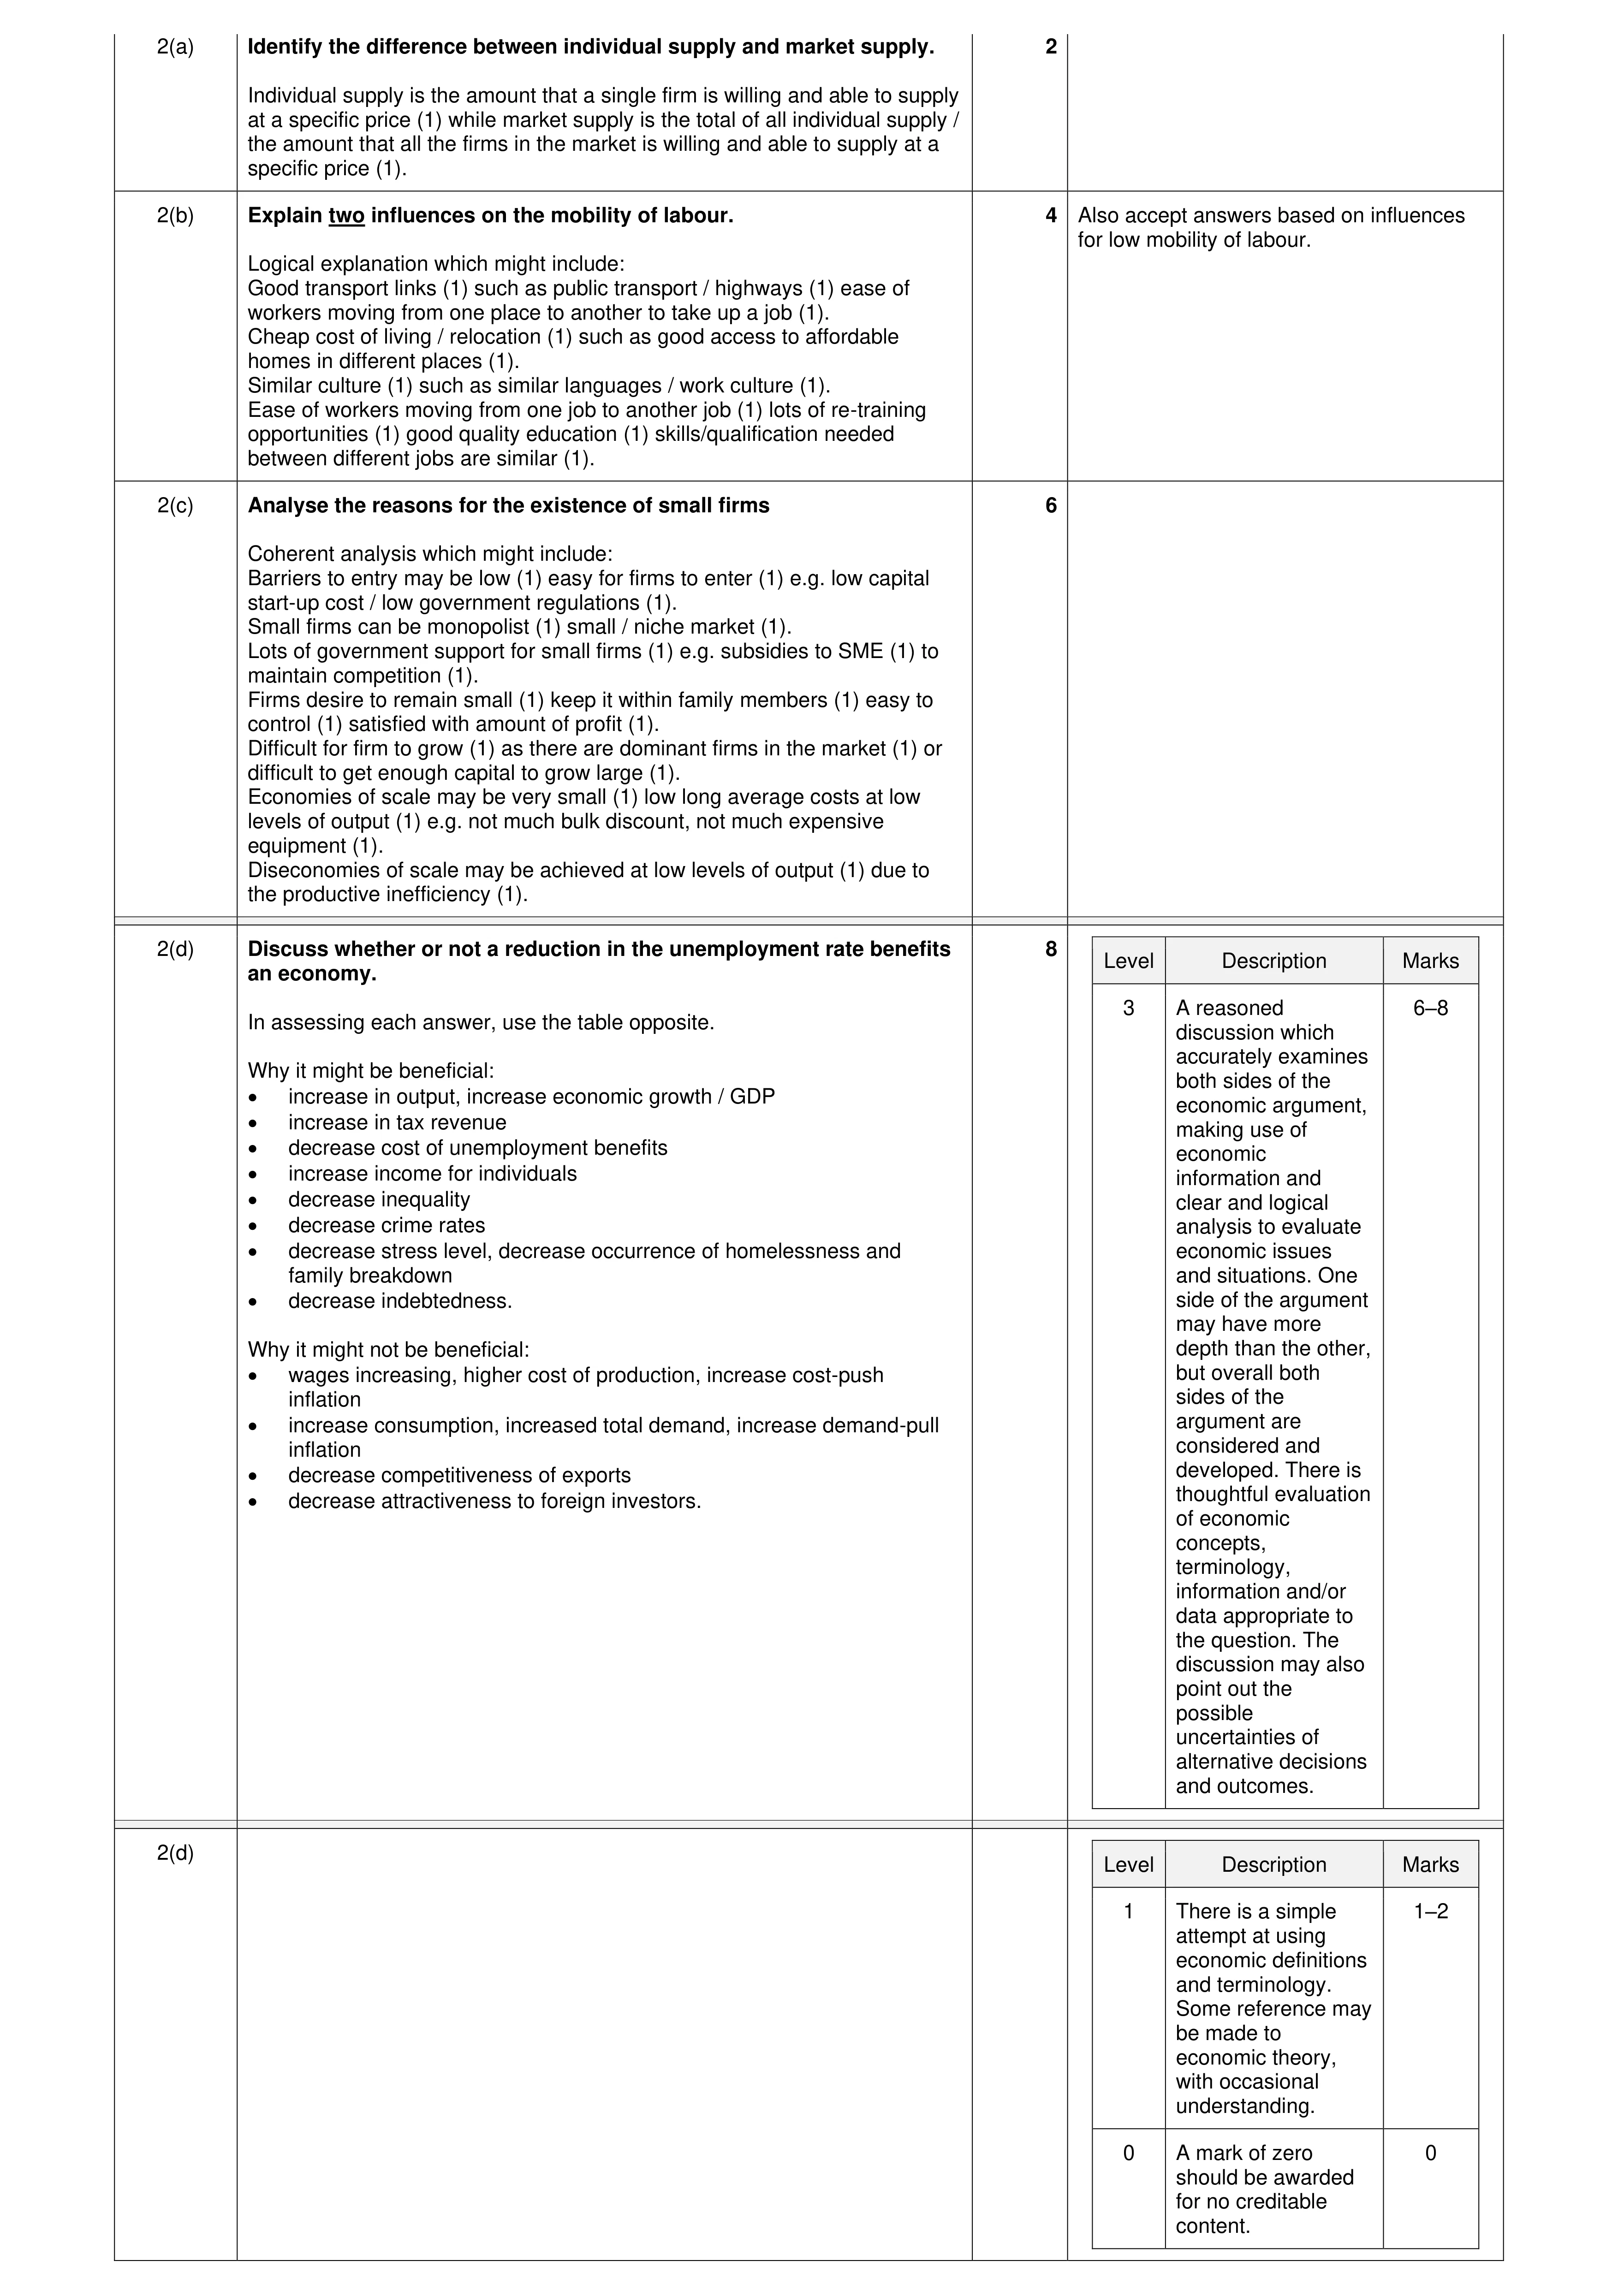 20
20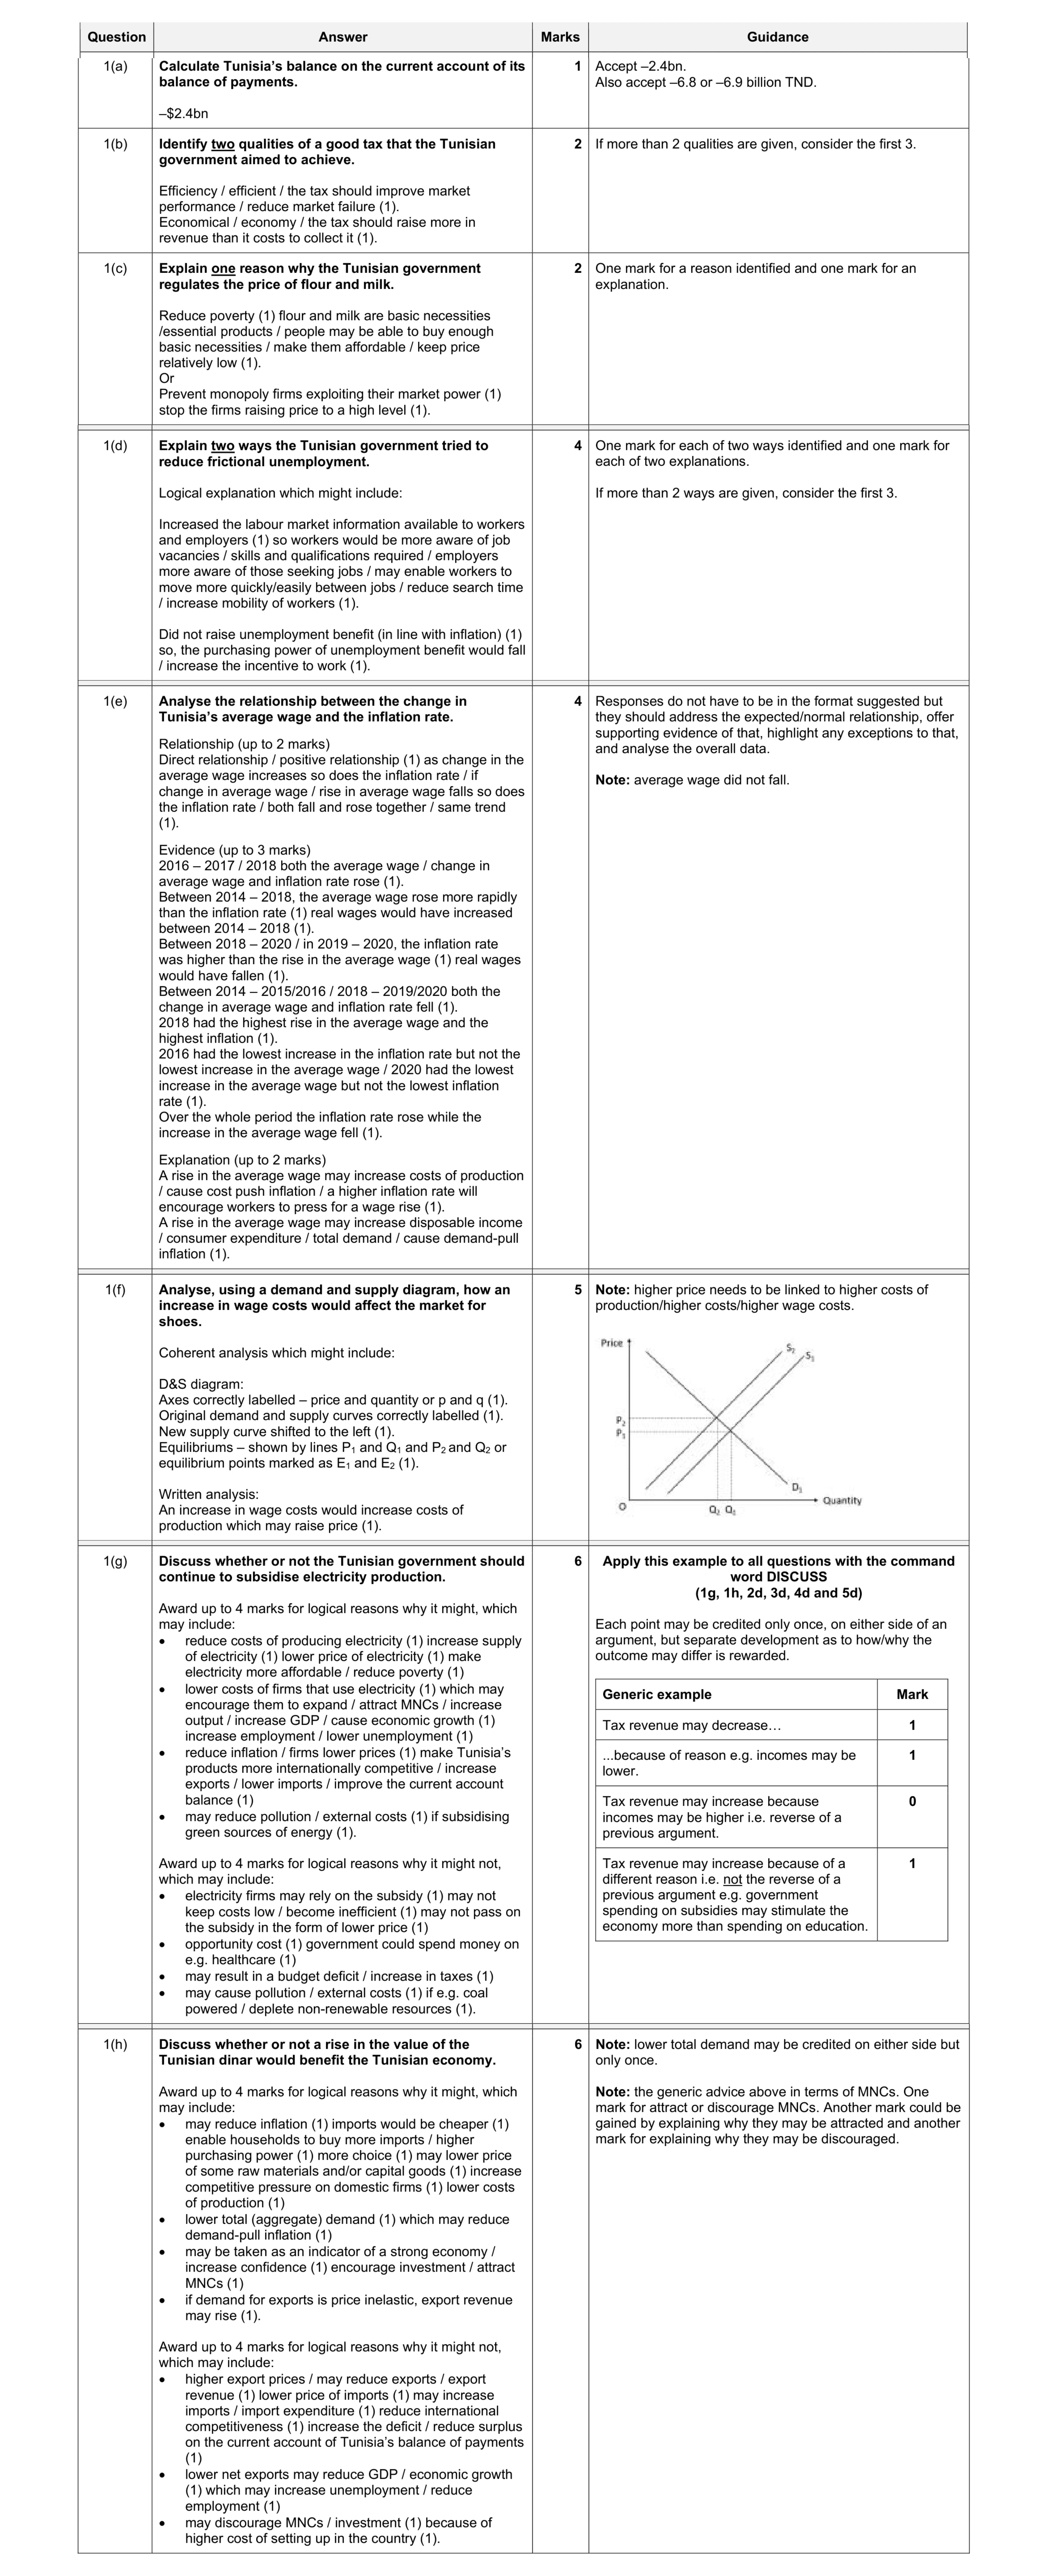 30
30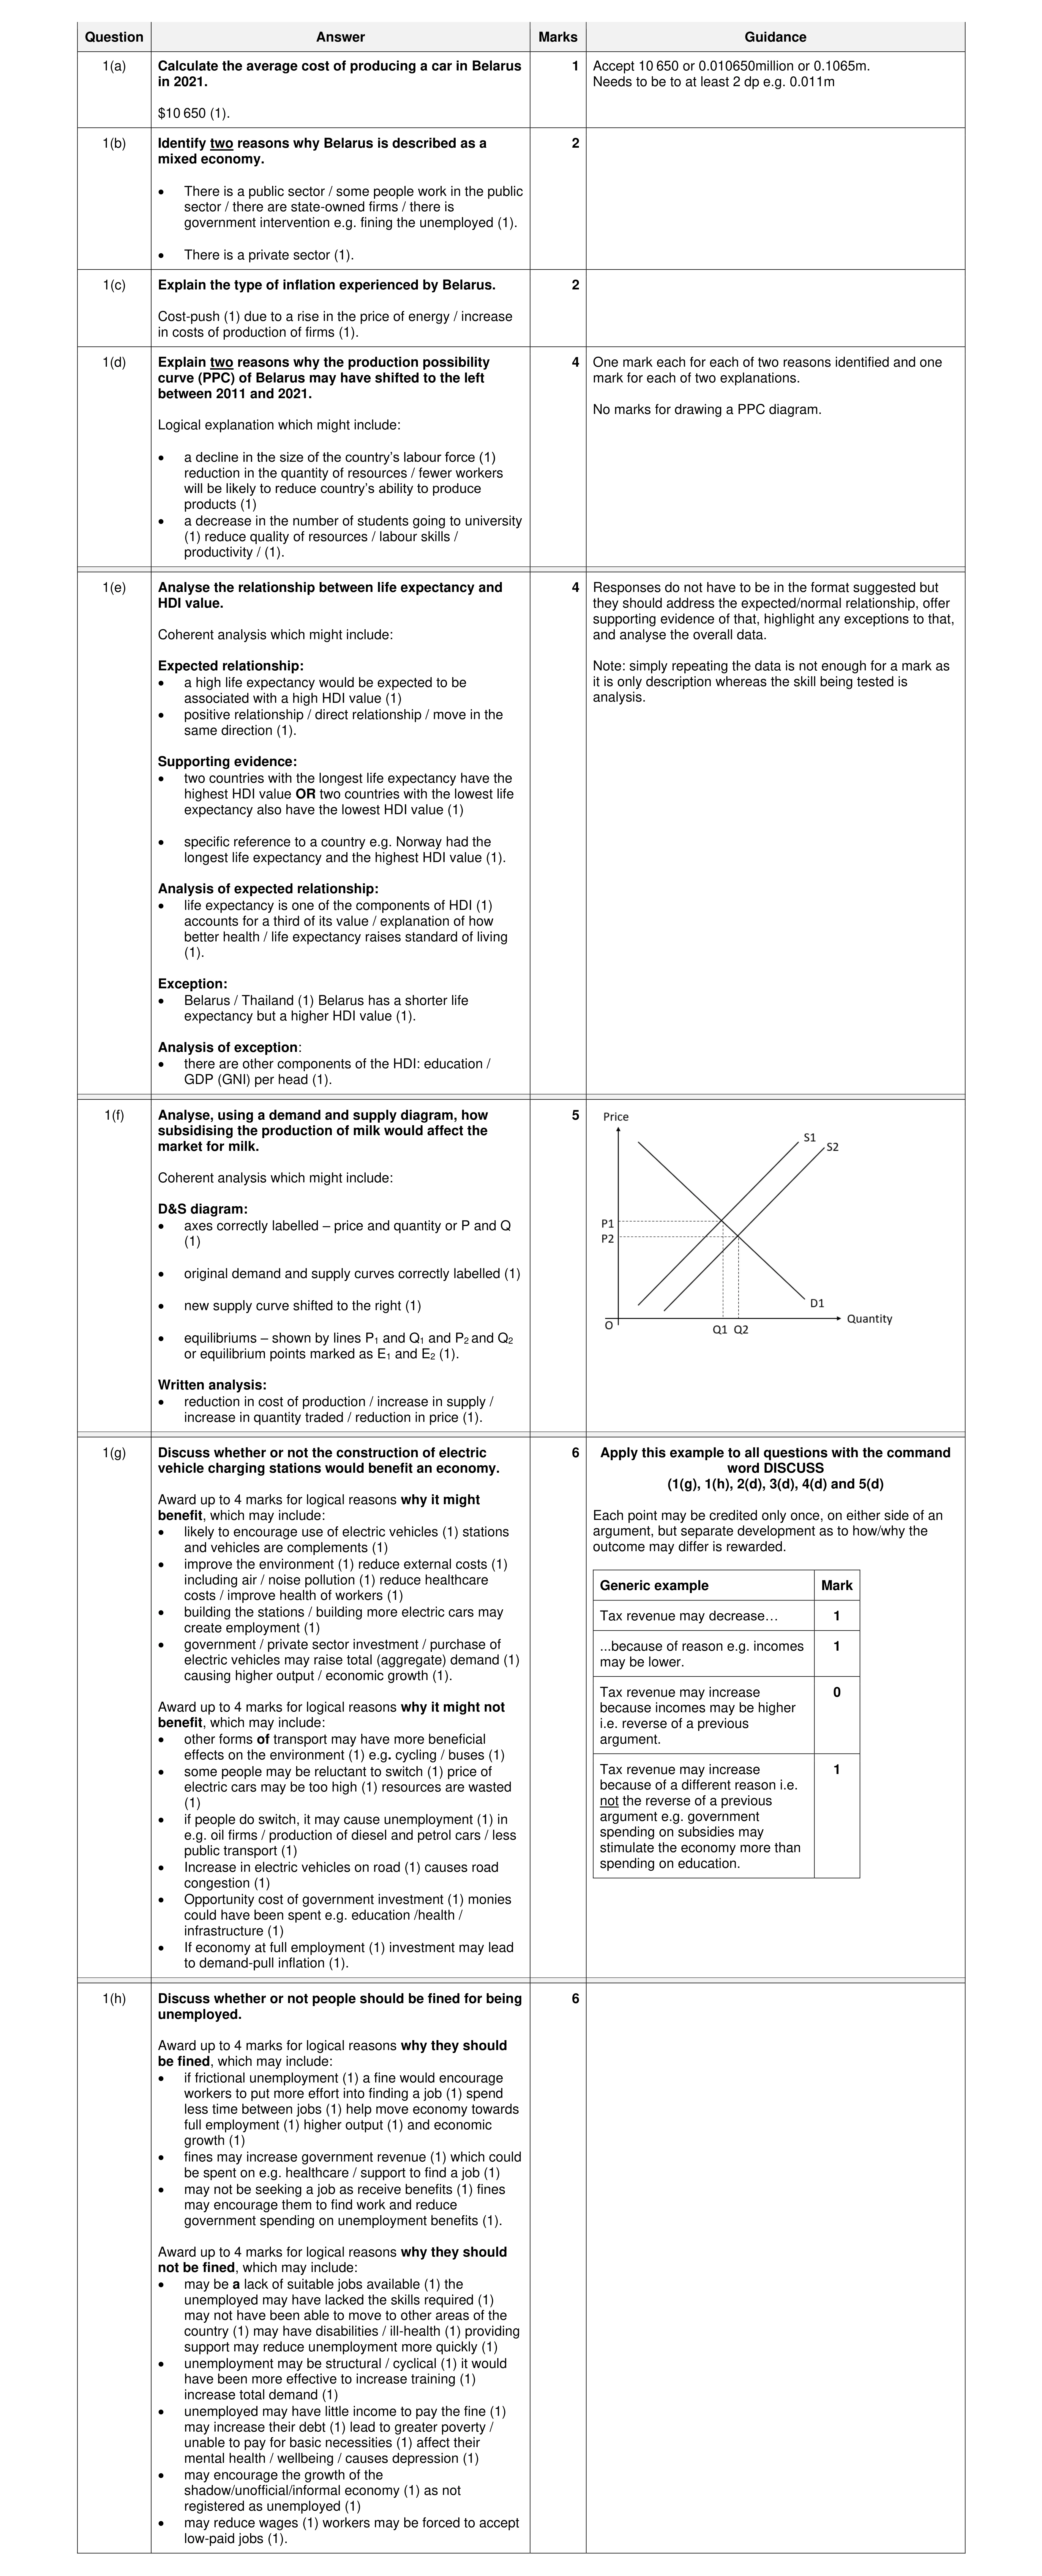 30
30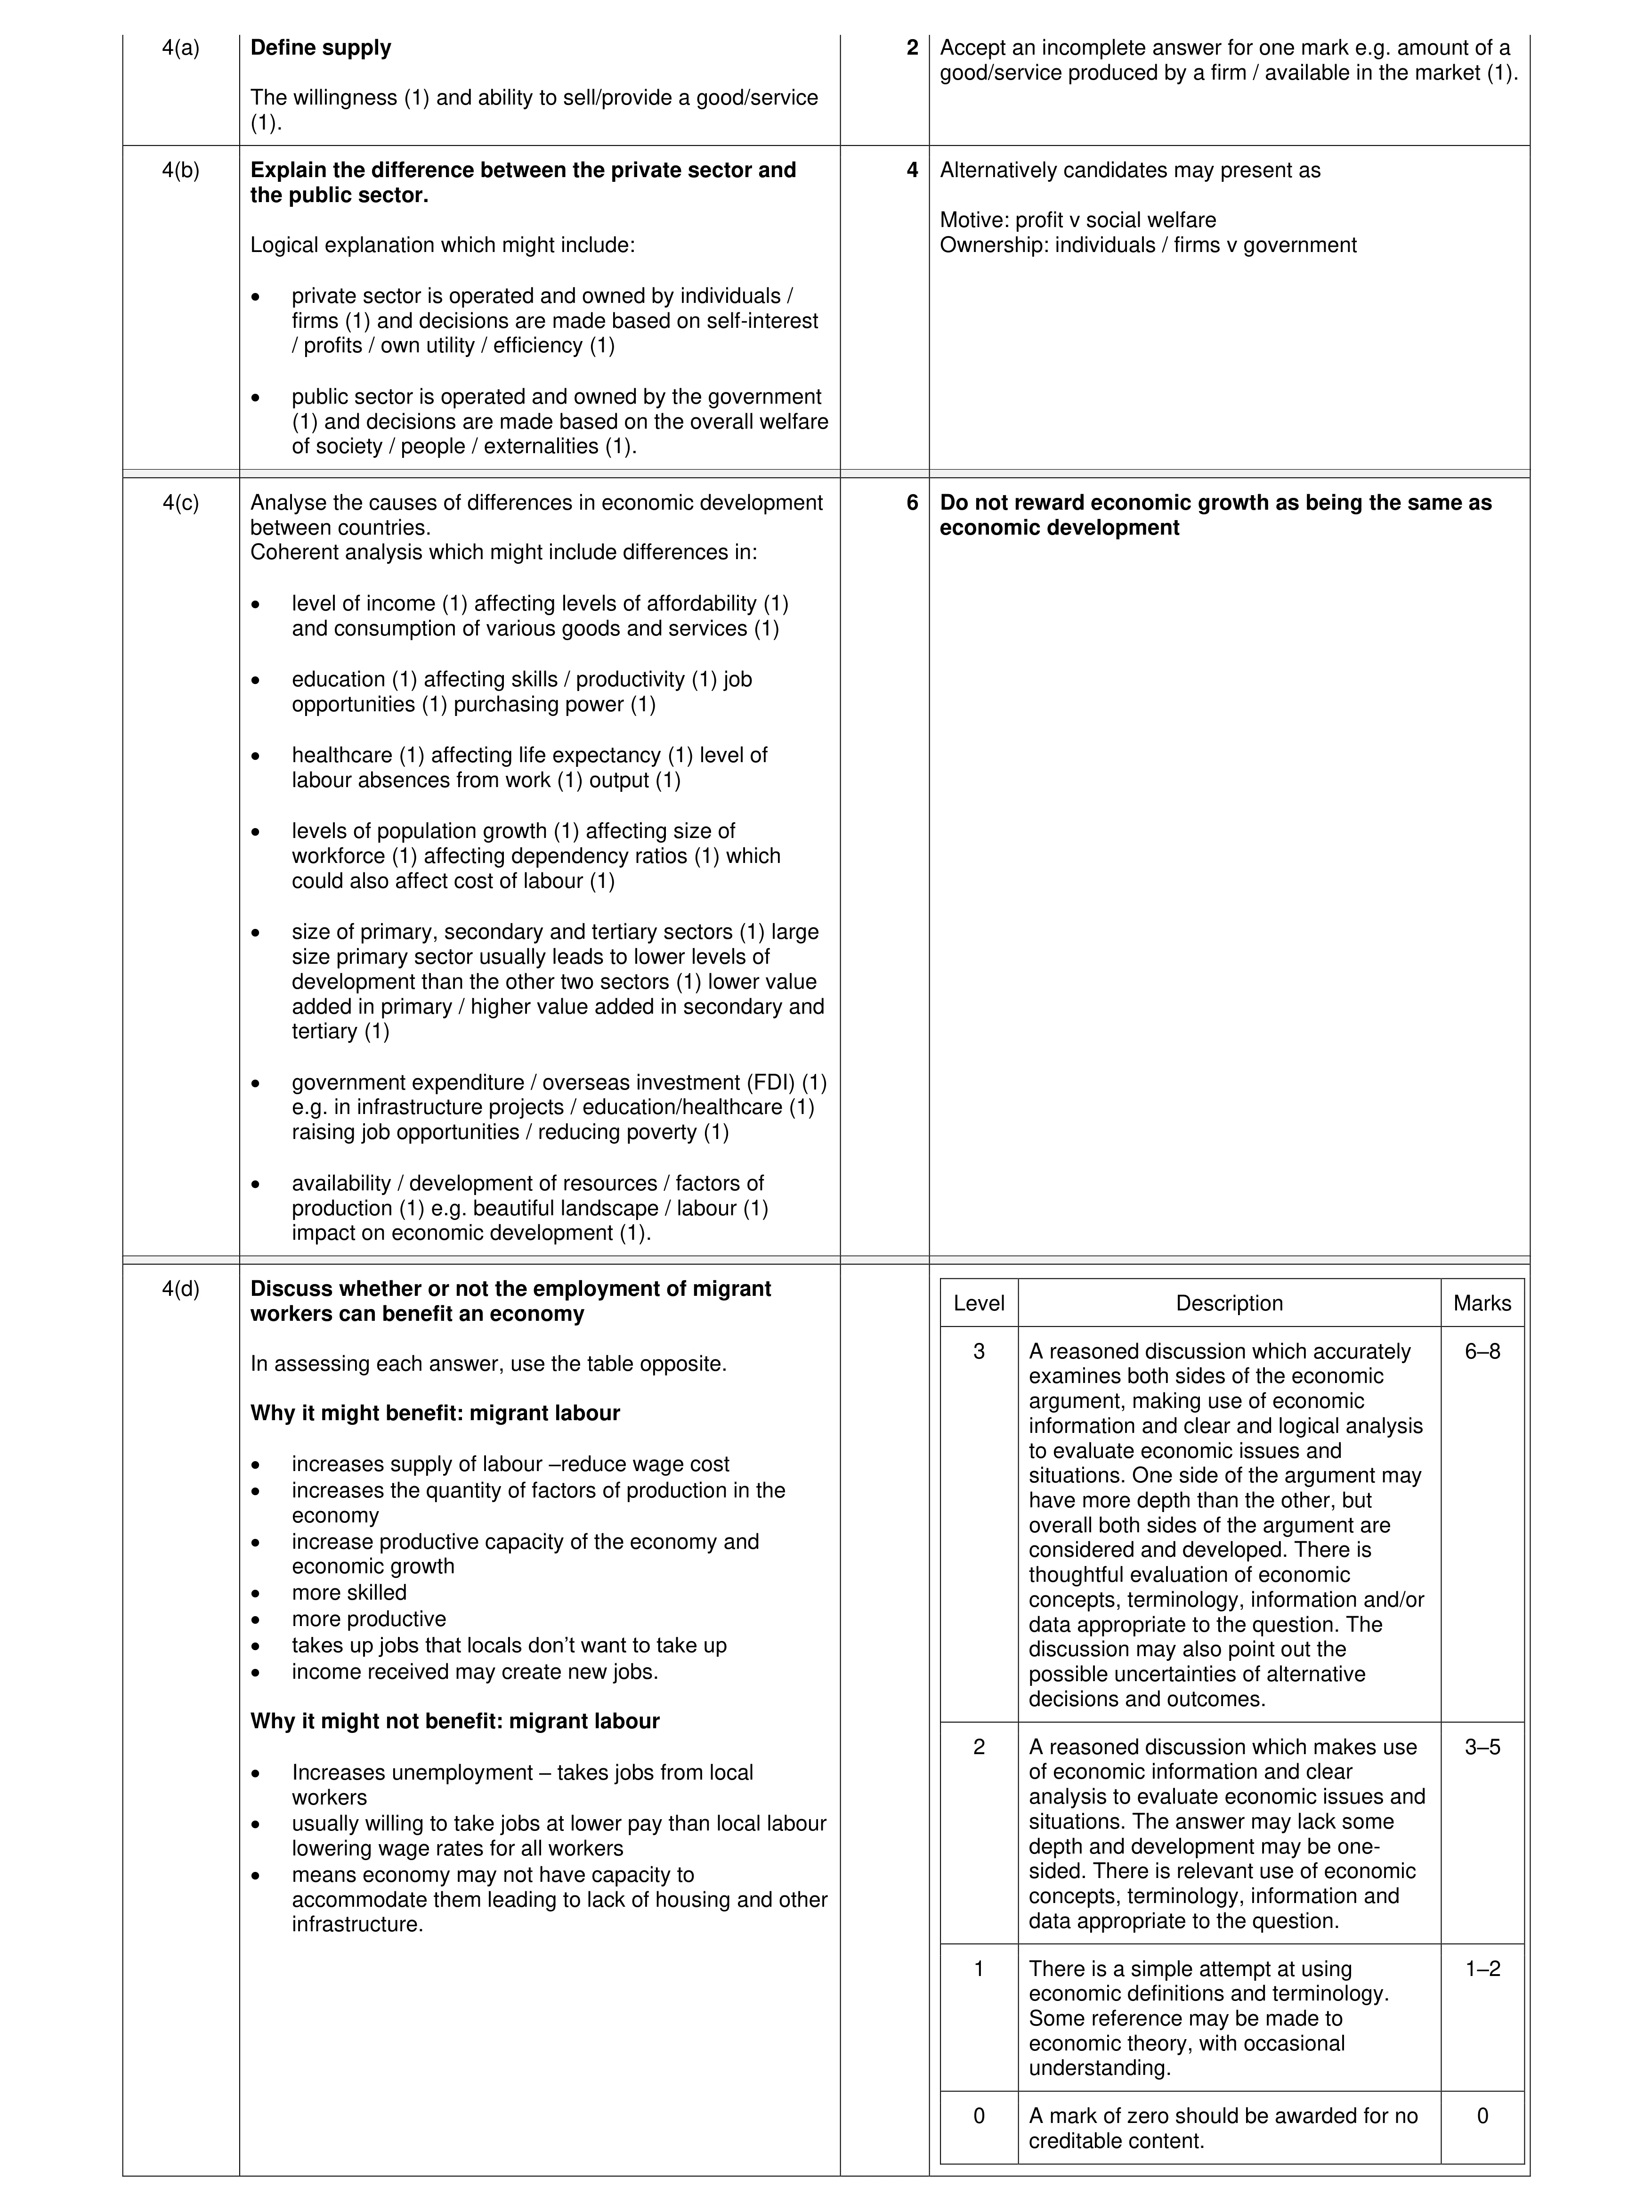 20
20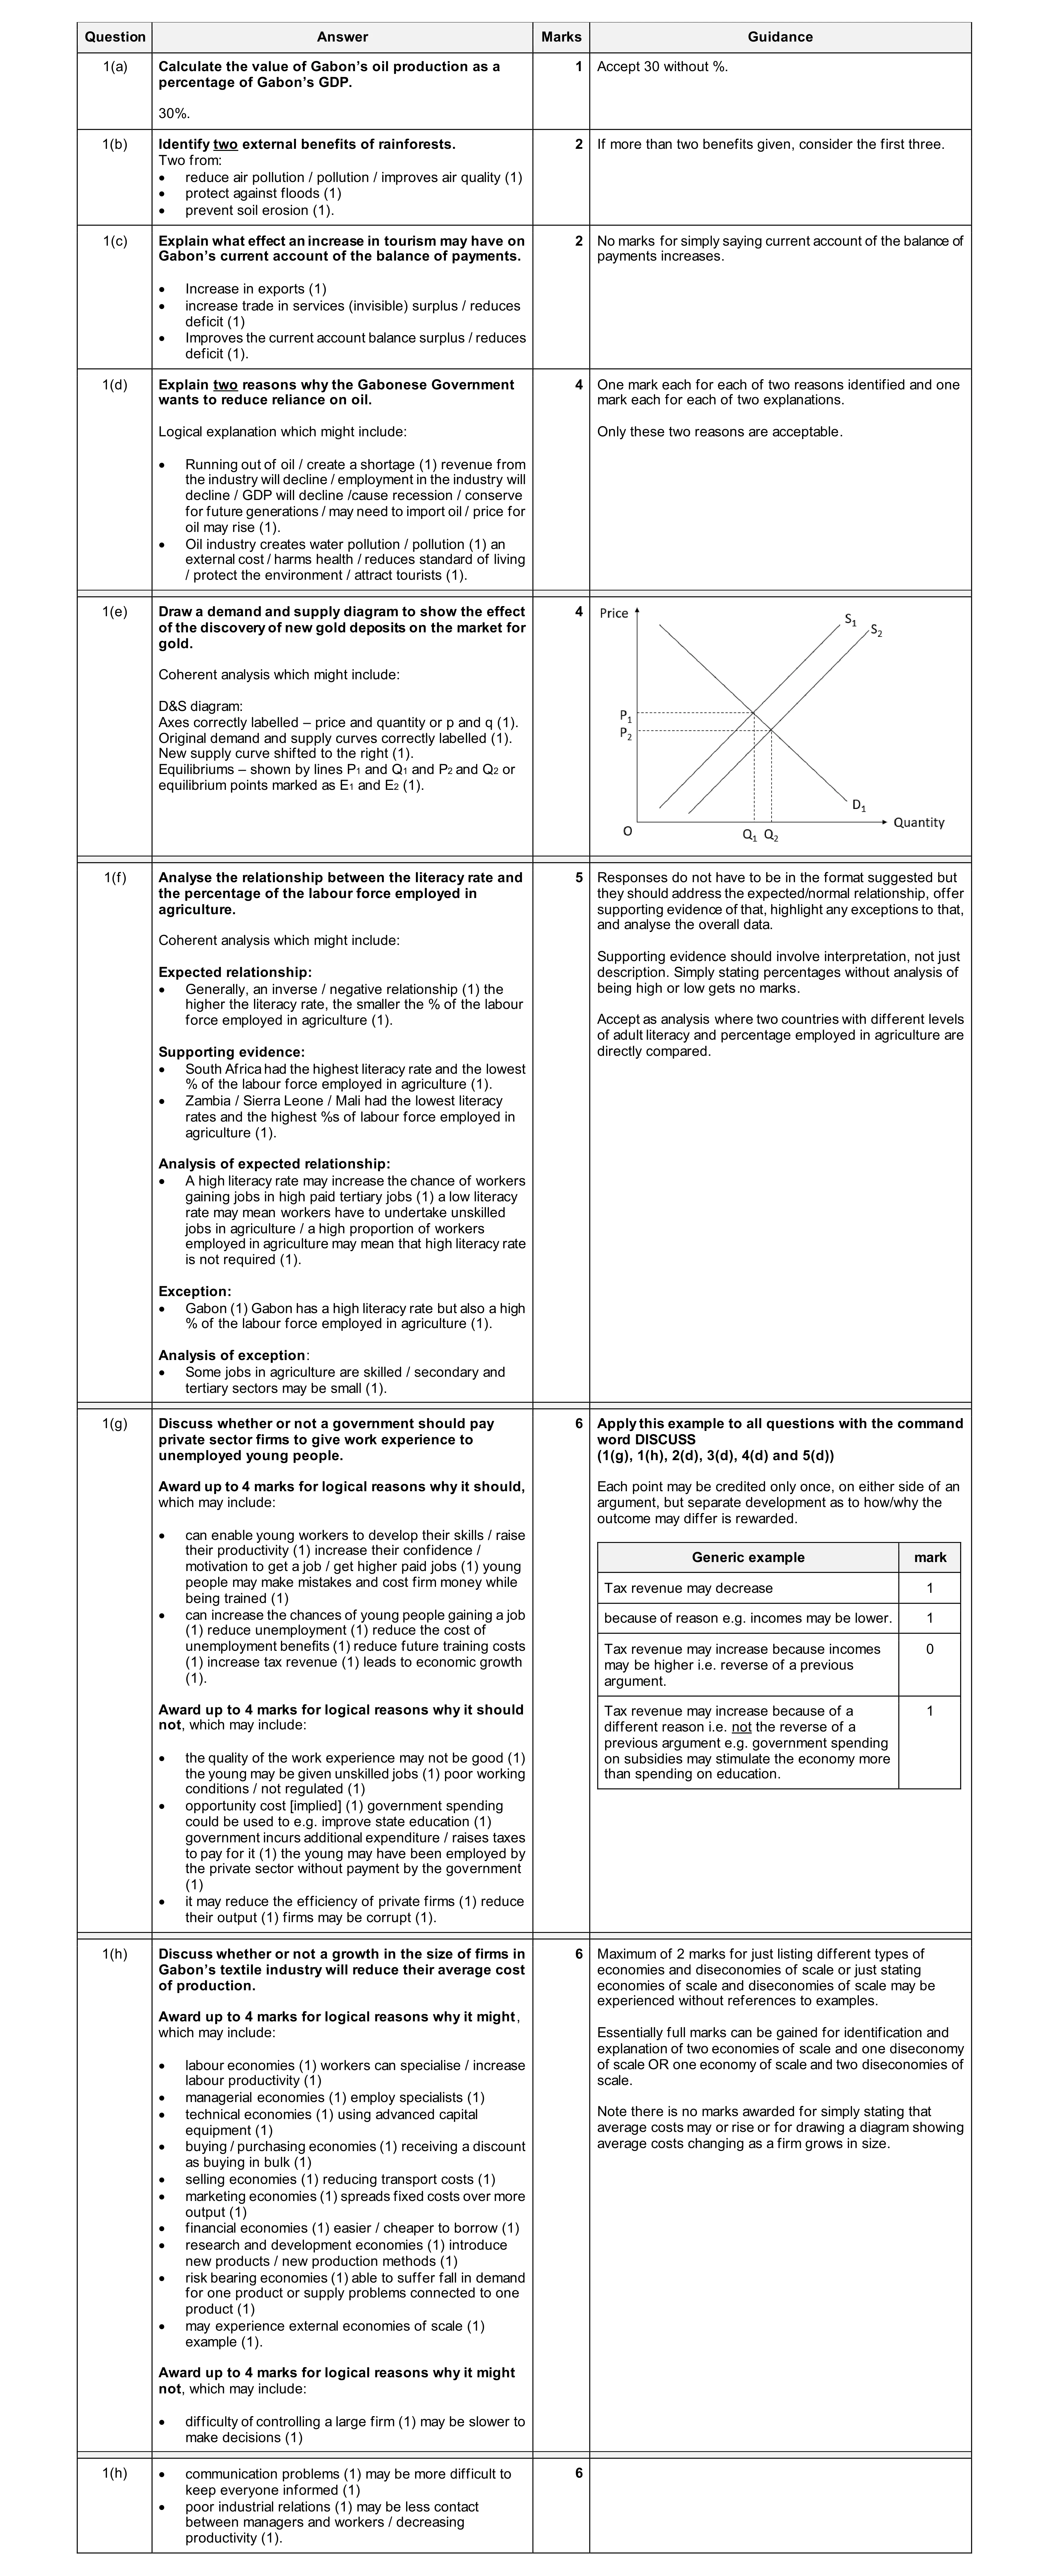 30
30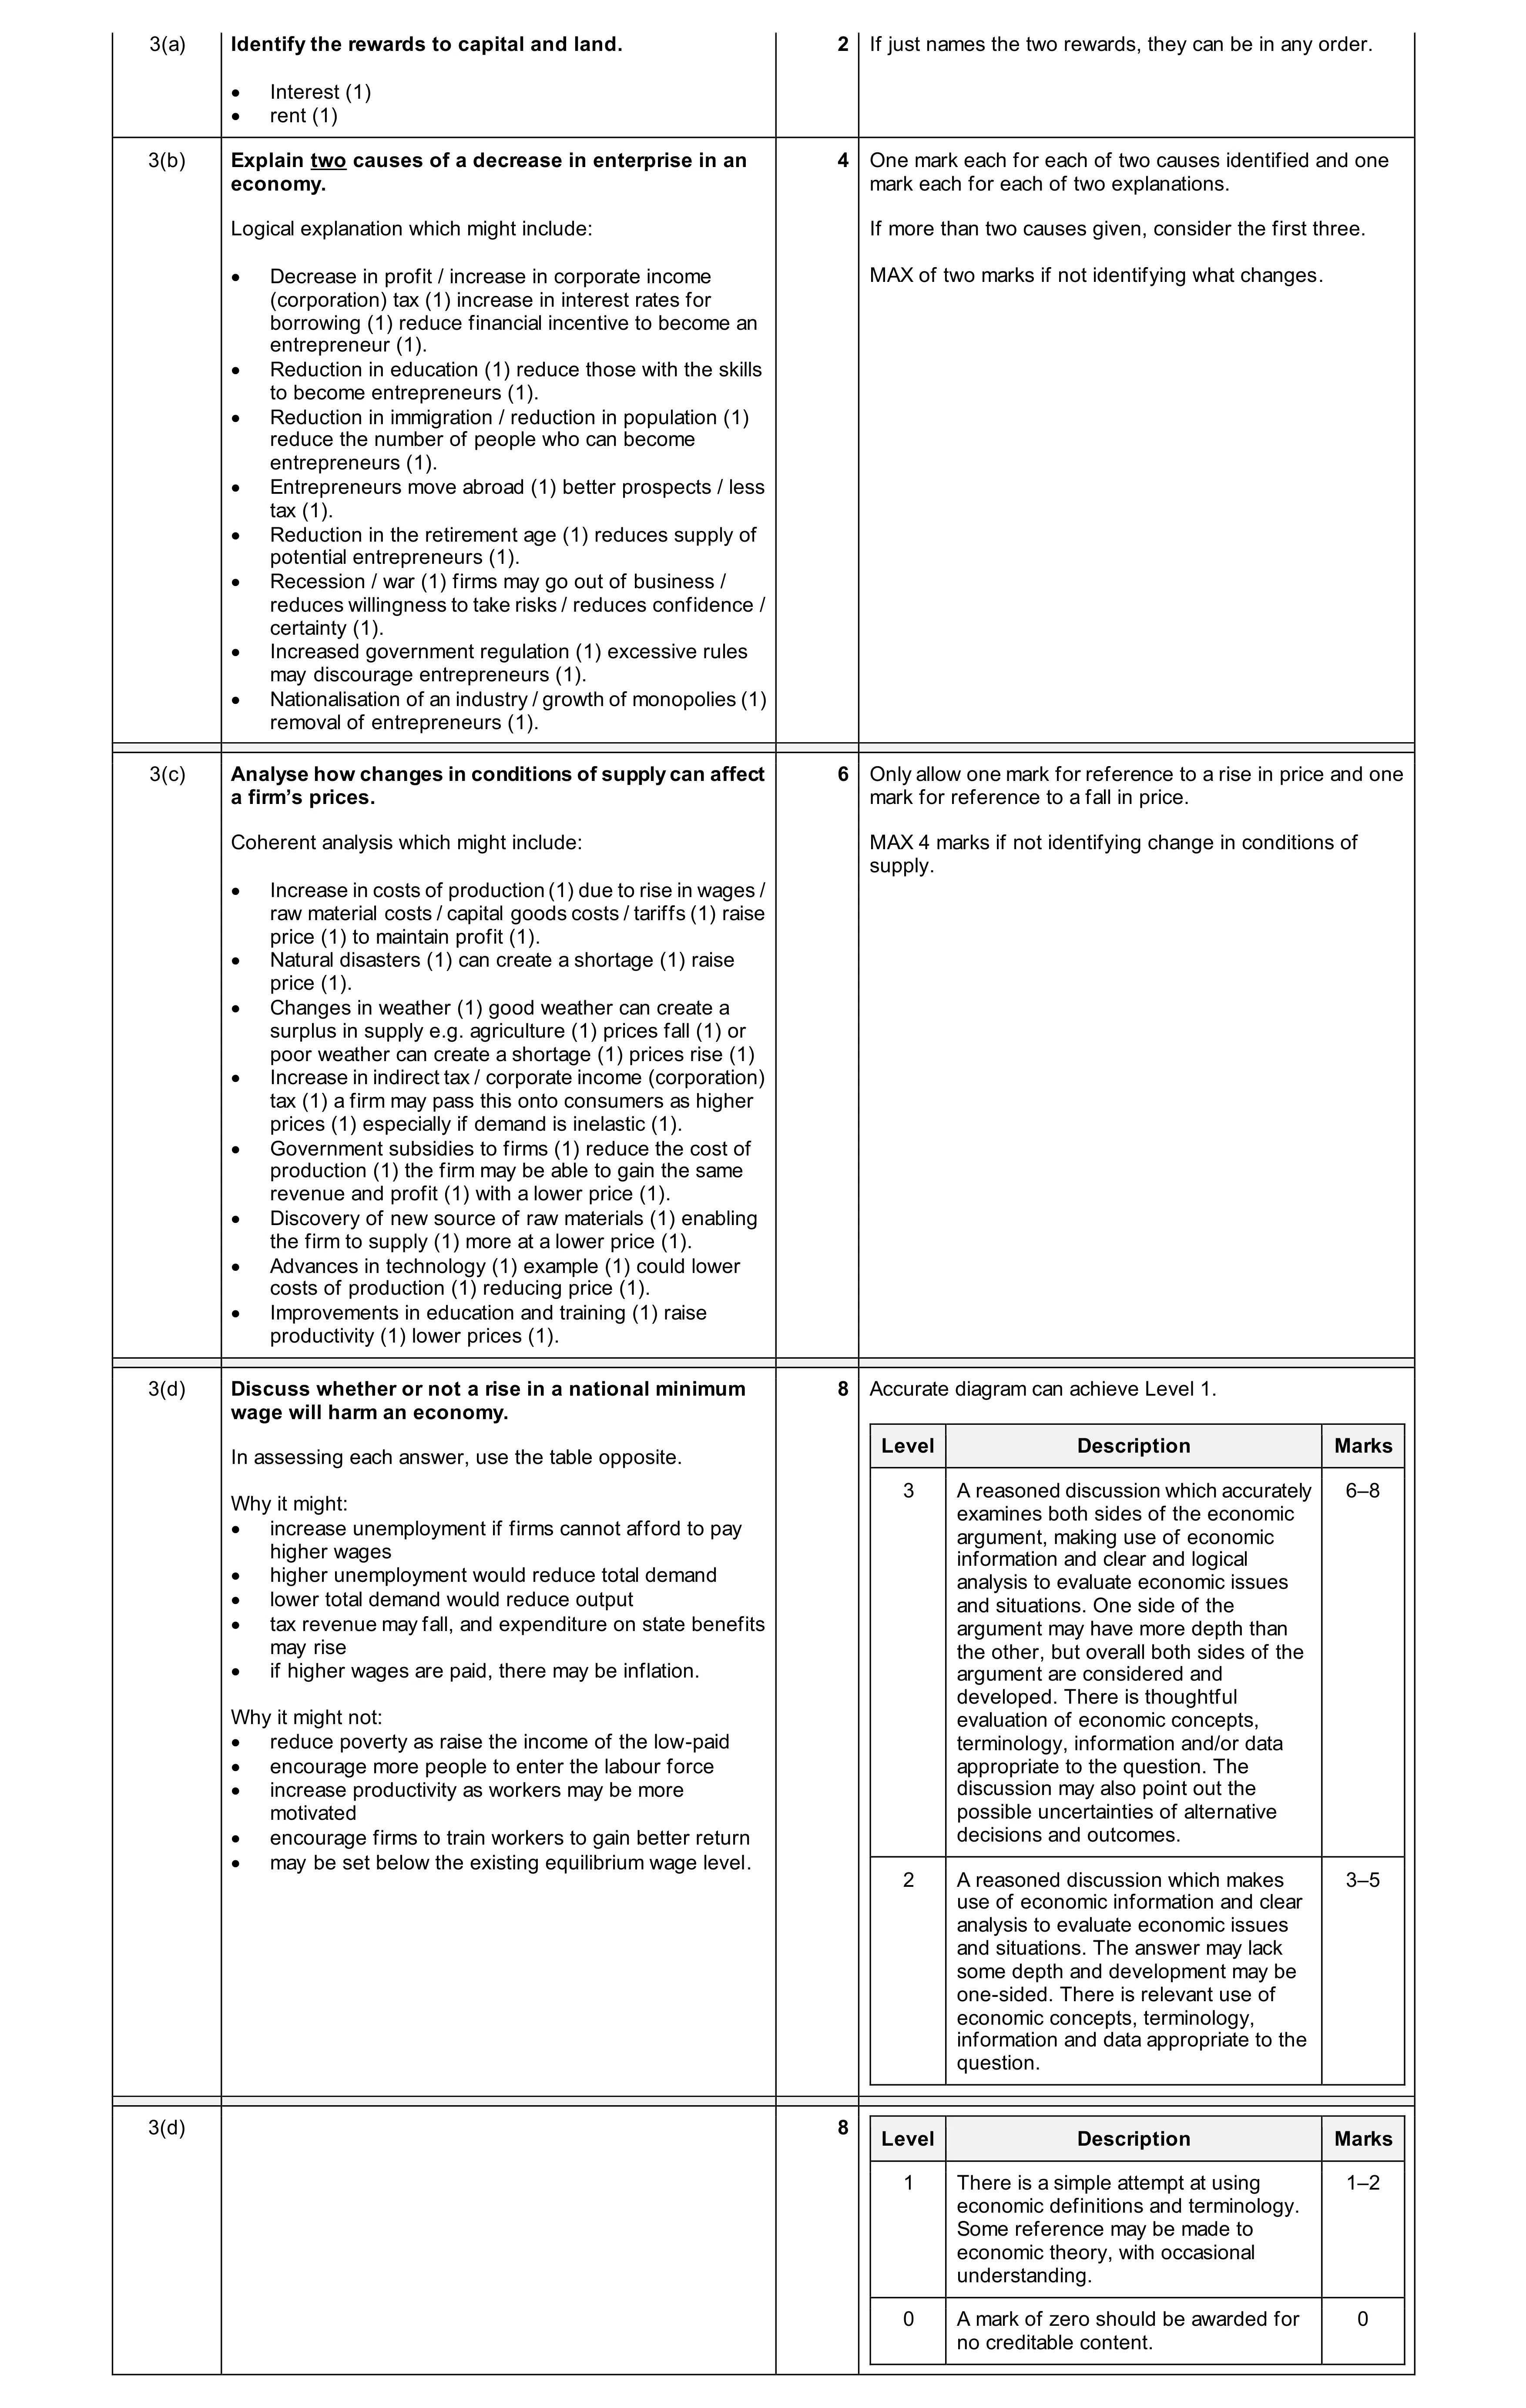 20
20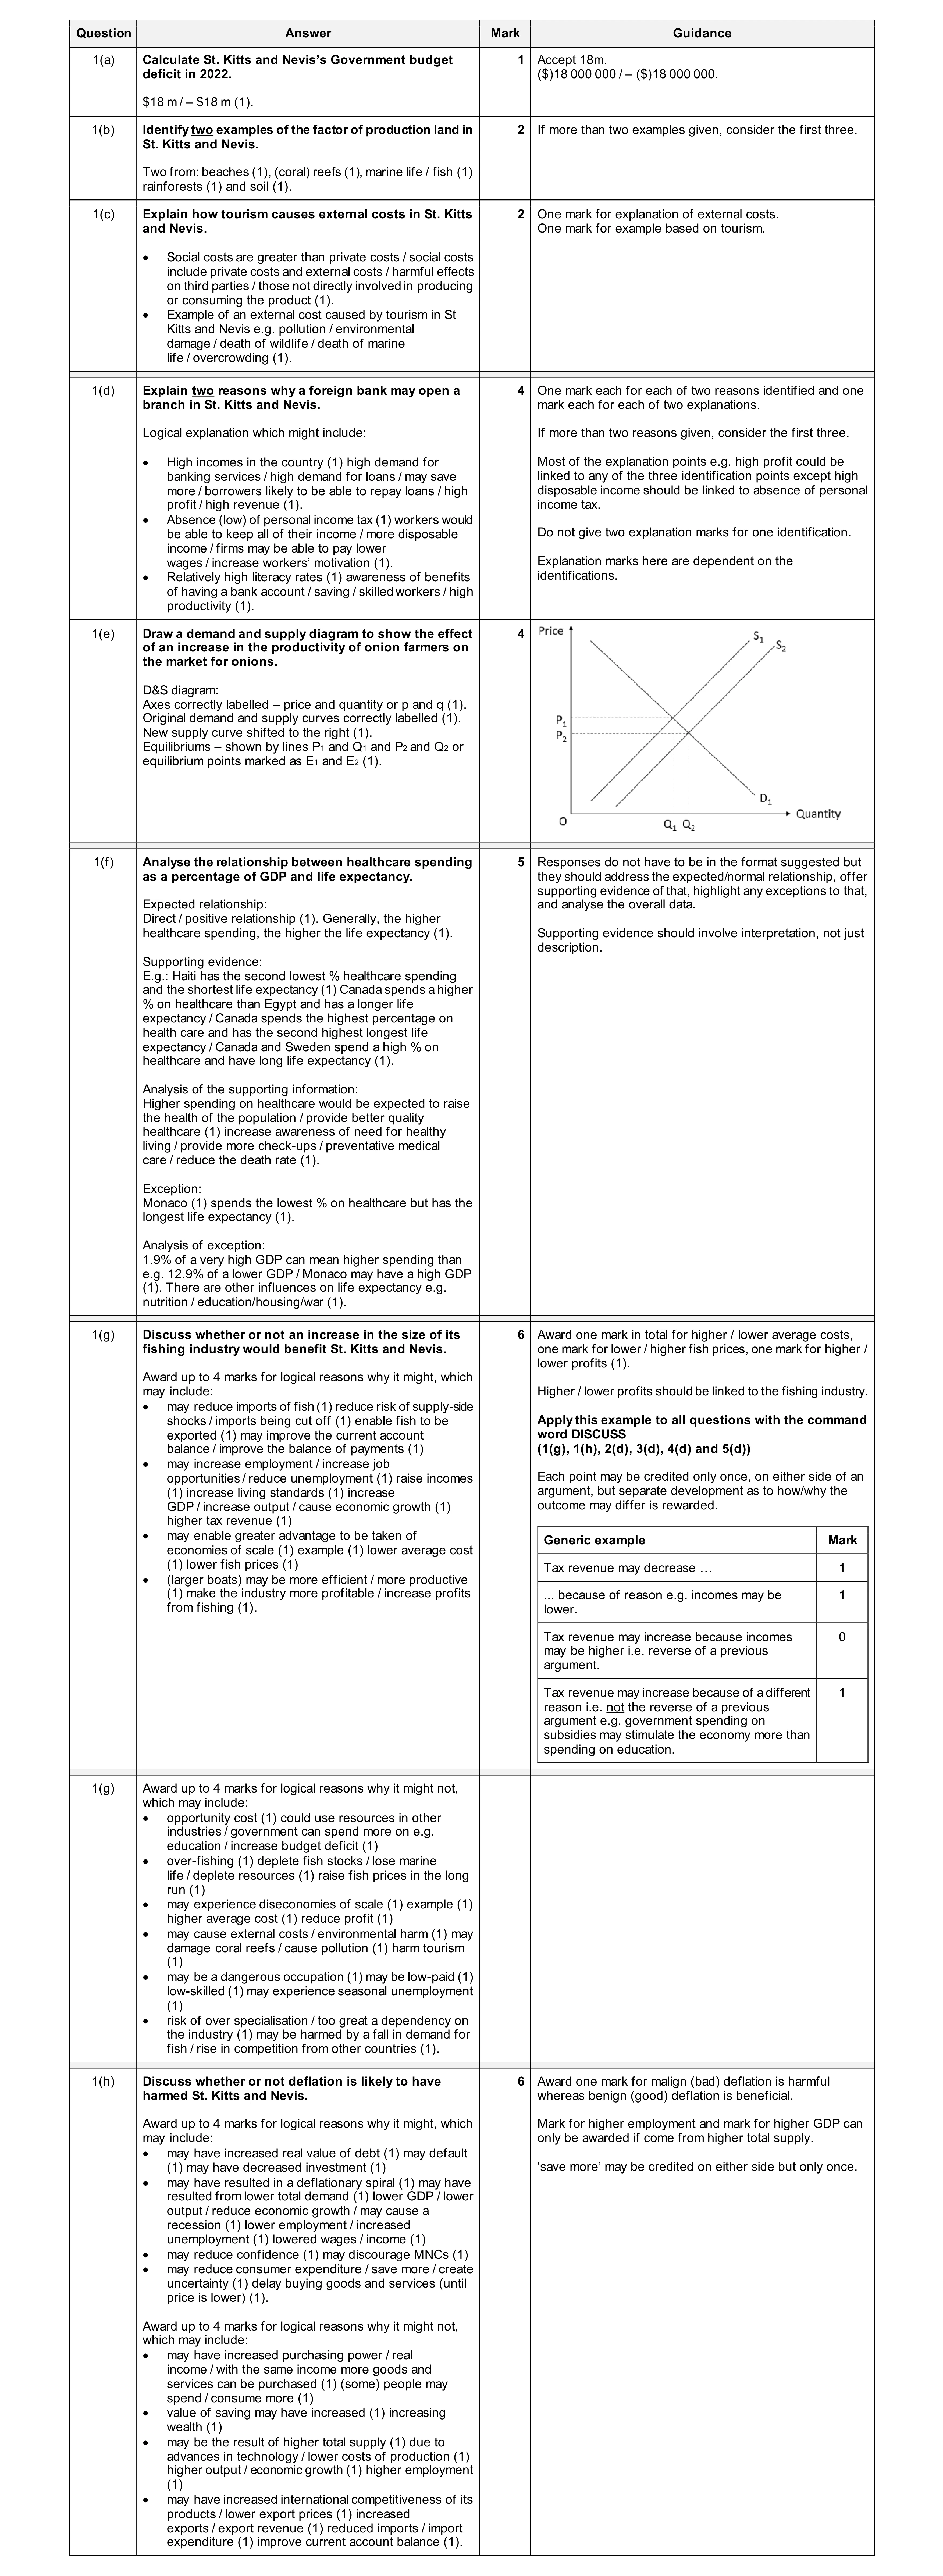 30
30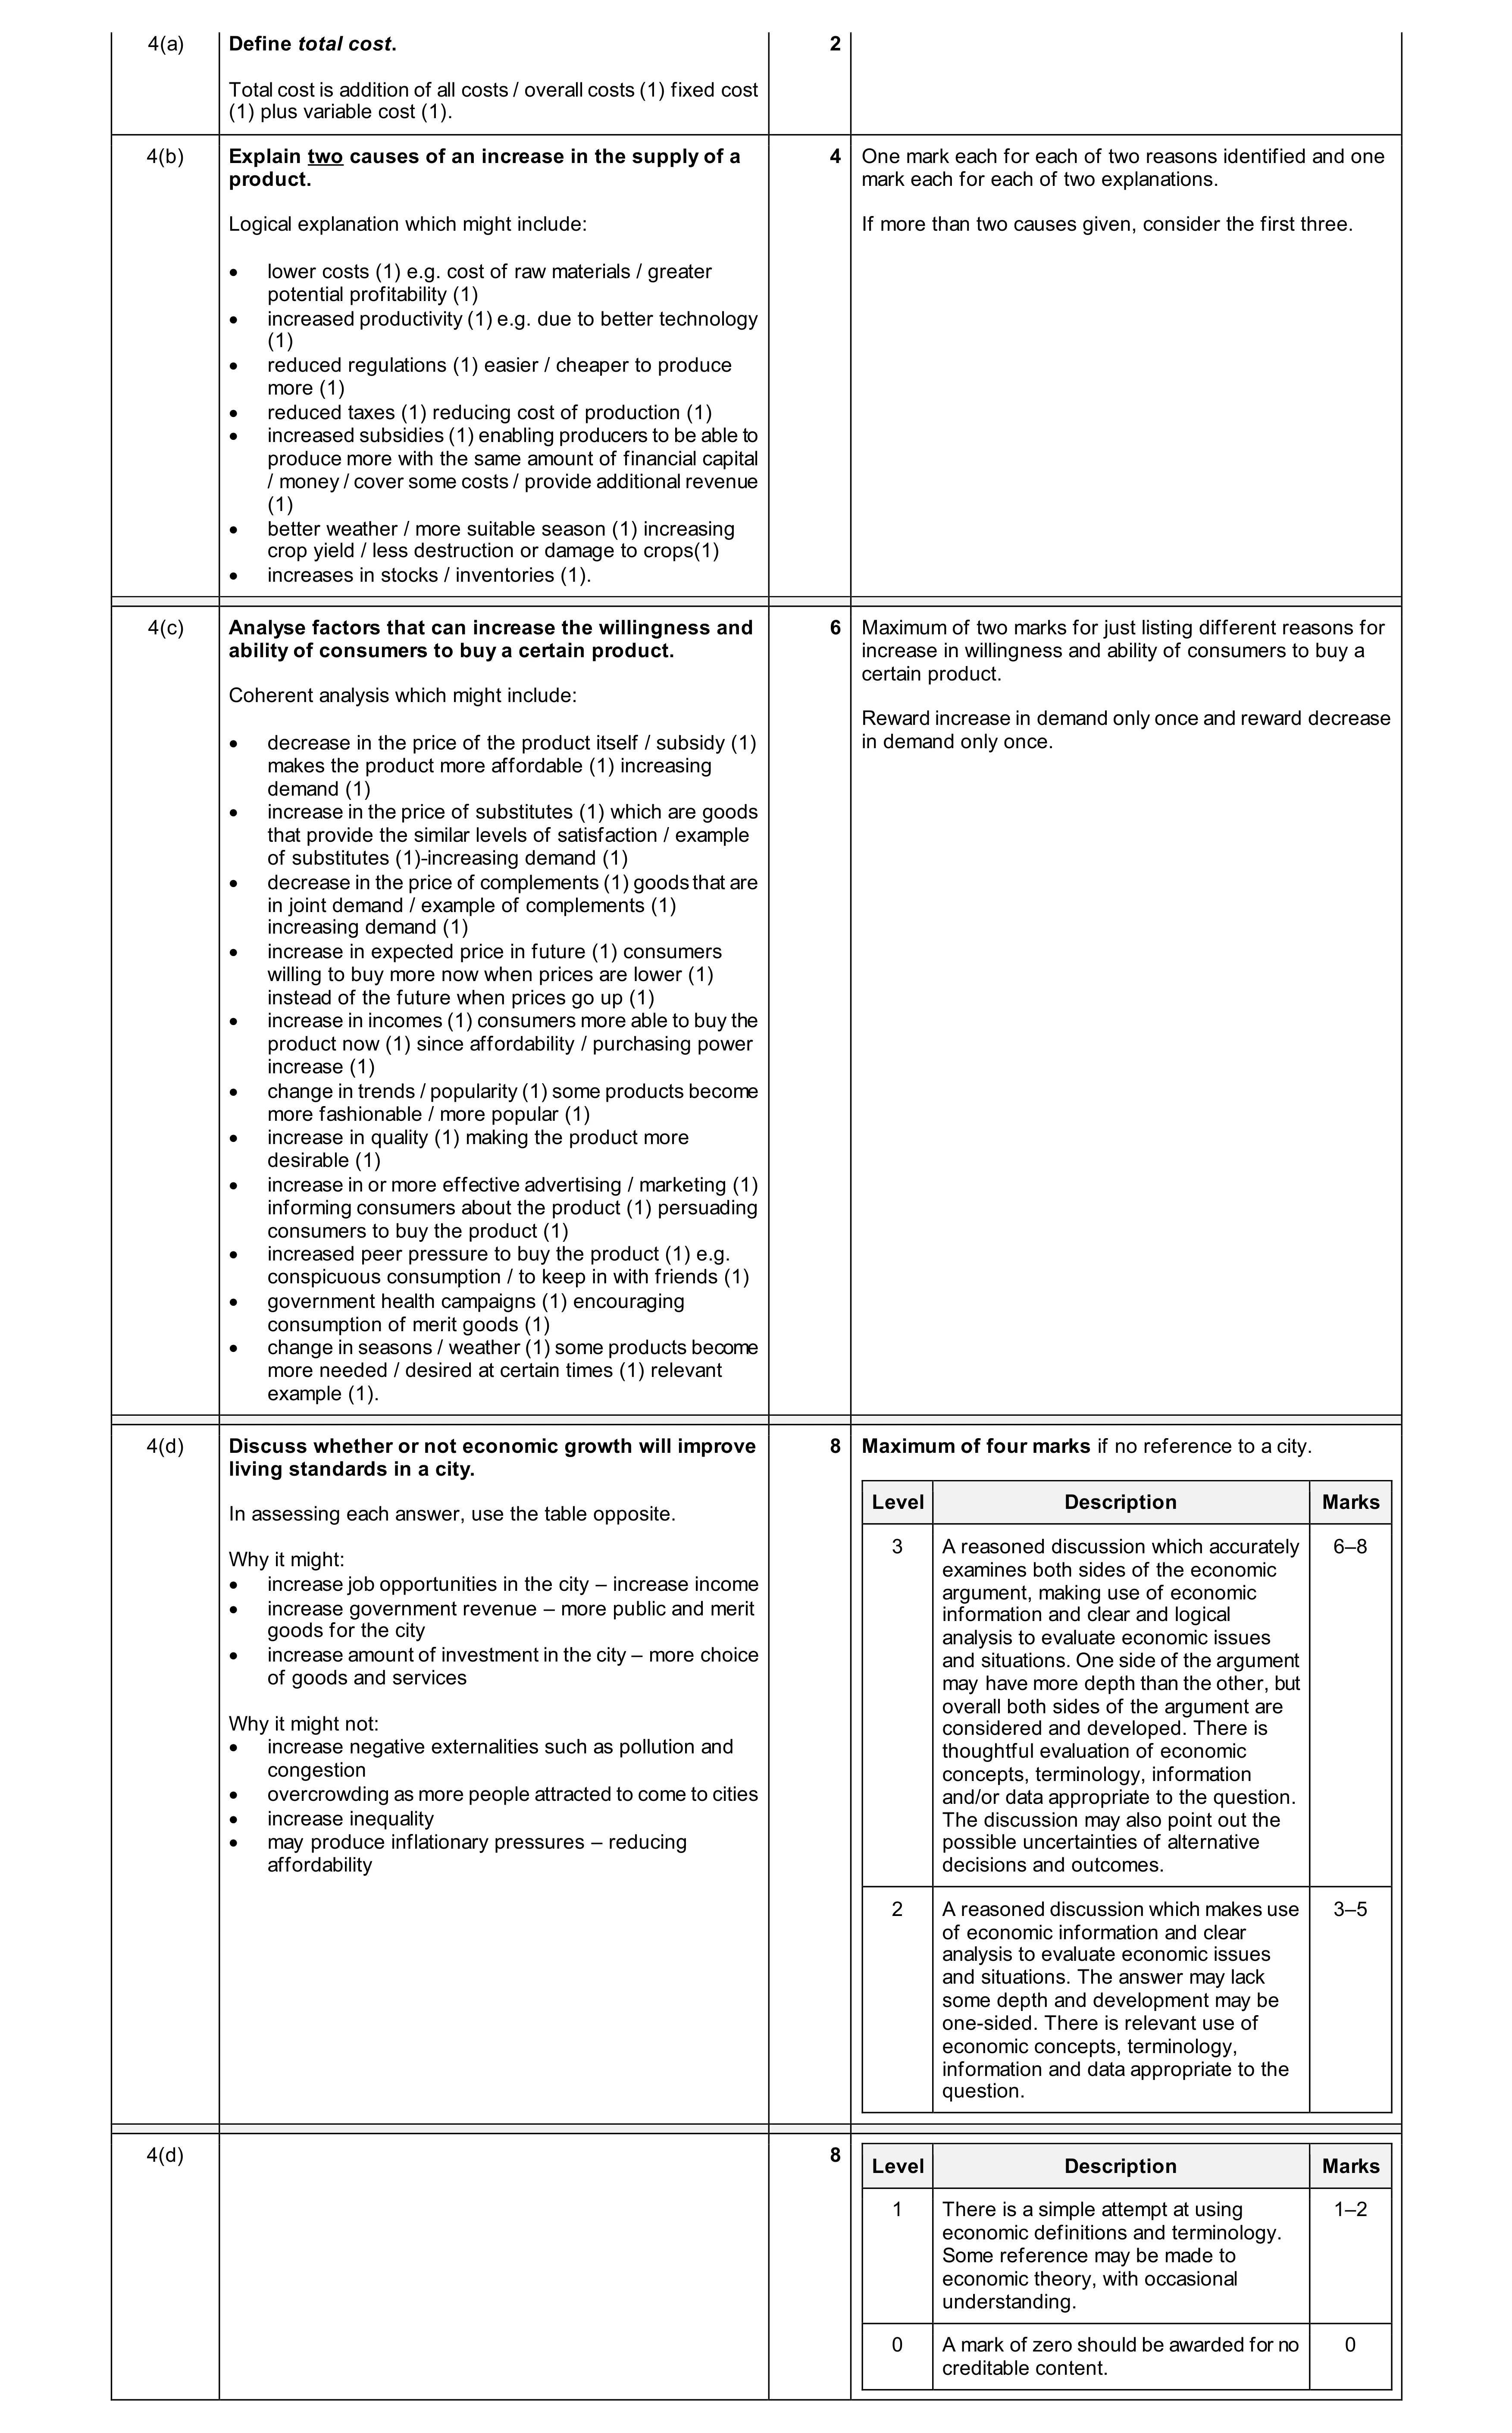 20
20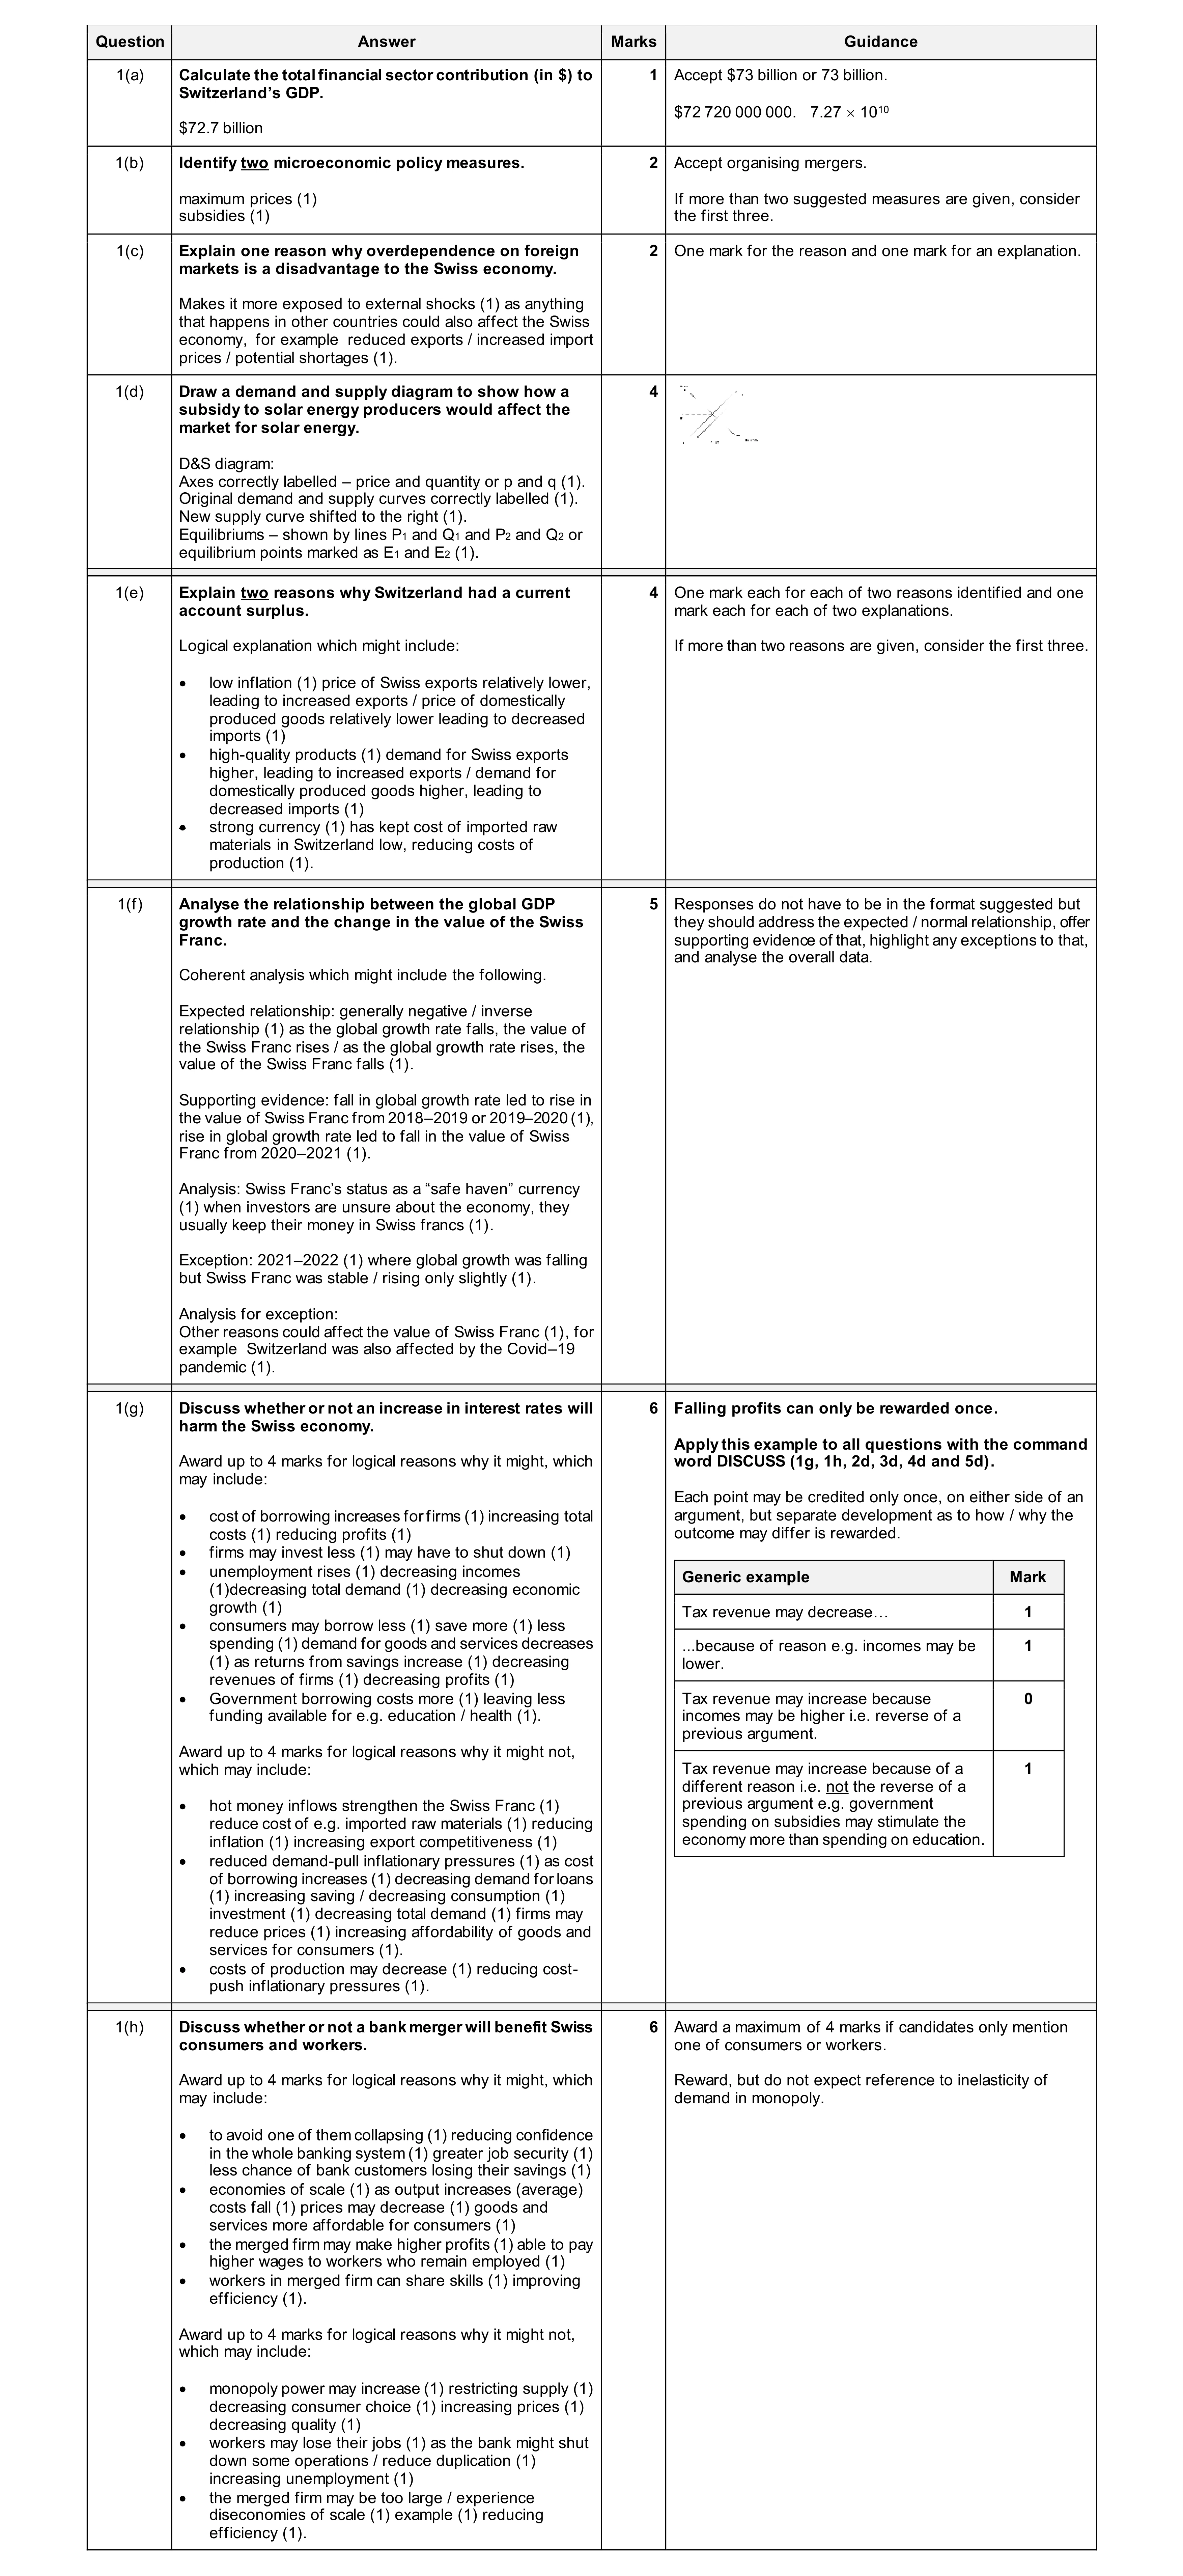 30
30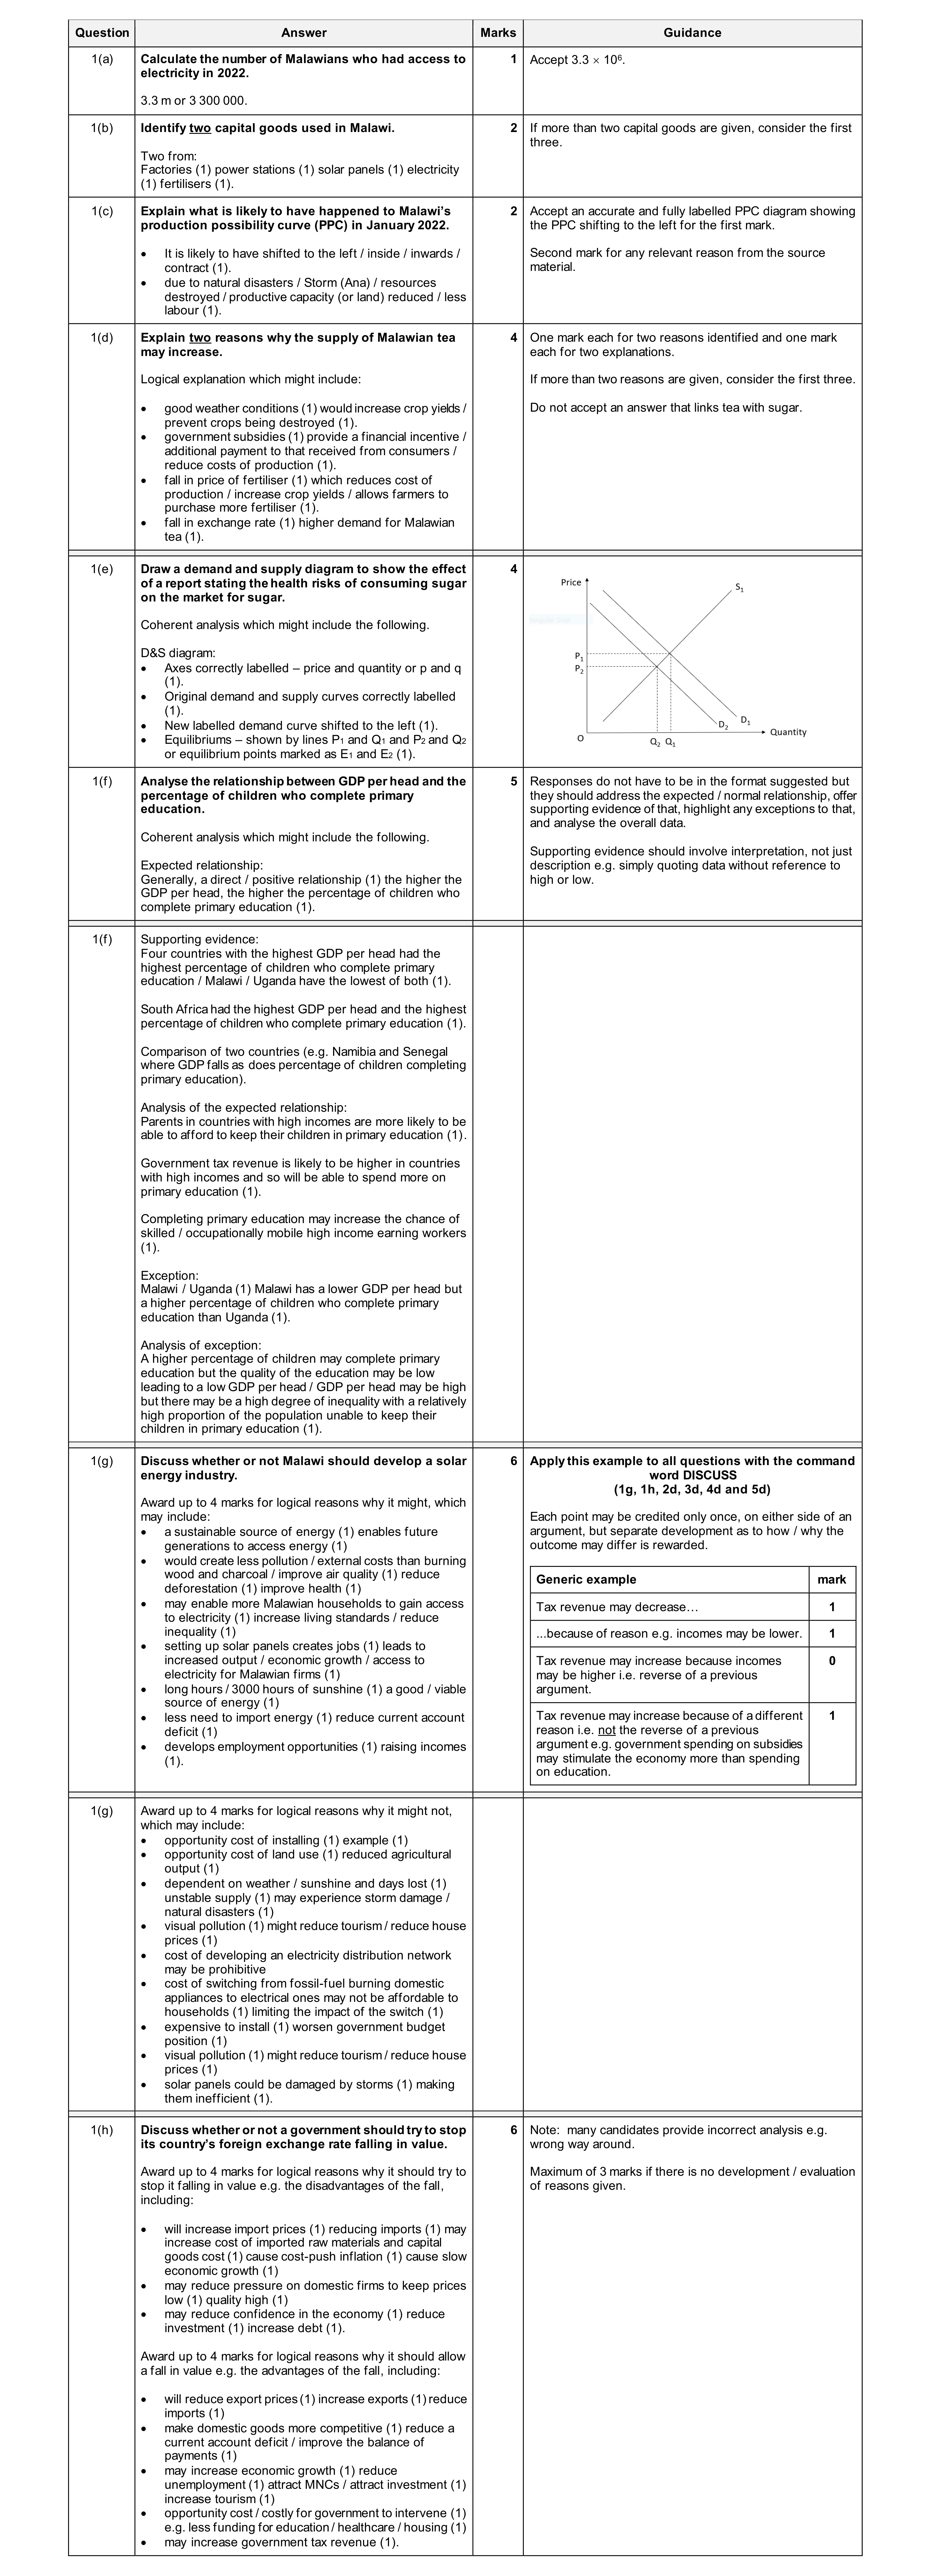 30
30