Questions as text
Q1 · A sample of chlorine containing isotopes of mass numbers 35 and 37 was analysed in a… 9701/11 May/June 2006
2 A sample of chlorine containing isotopes of mass numbers 35 and 37 was analysed in a mass-spectrometer. How many peaks corresponding to Cl were recorded? + 2 A 2 B 3 C 4 D 5
1 marks
Answer: B
This question in 9701/11 May/June 2006
Q2 · The relative atomic mass of copper is 63.5 9701/13 May/June 2016
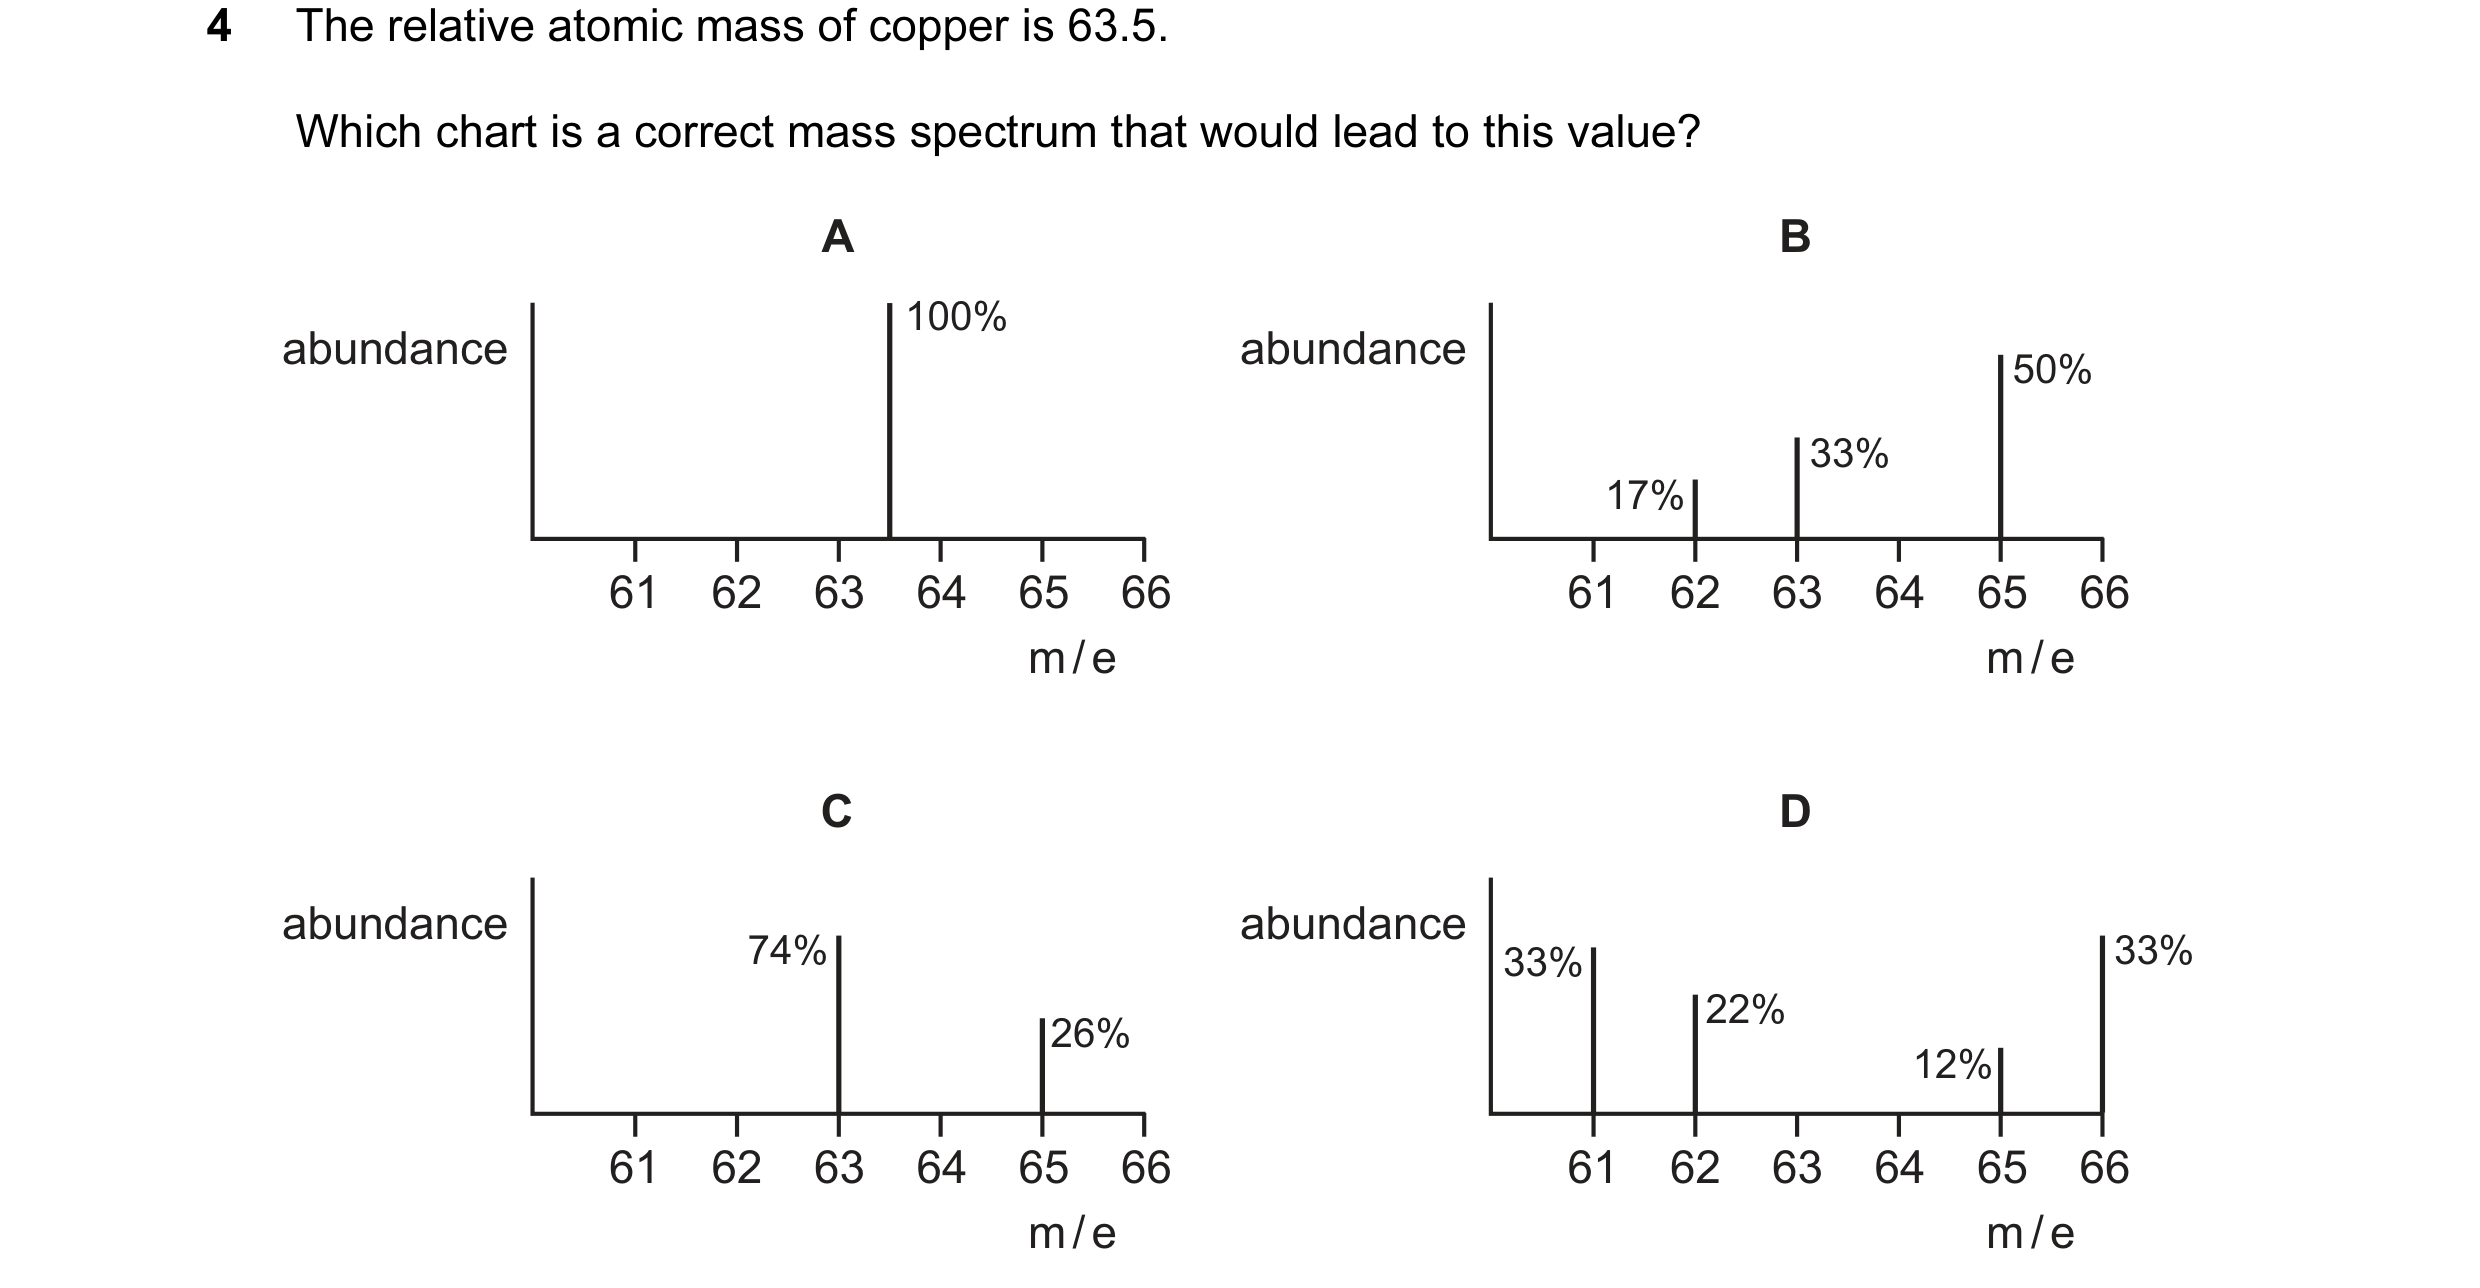
4 The relative atomic mass of copper is 63.5. Which chart is a correct mass spectrum that would lead to this value? A B 100% abundance abundance 50% 33% 17% 61 62 63 64 65 66 61 62 63 64 65 66 m / e m / e C D abundance abundance 74% 33% 33% 22% 26% 12% 61 62 63 64 65 66 61 62 63 64 65 66 m / e m / e
1 marks
Answer: C
This question in 9701/13 May/June 2016
Q3 · A sample of boron contains aluminium as the only impurity 9701/11 Oct/Nov 2016
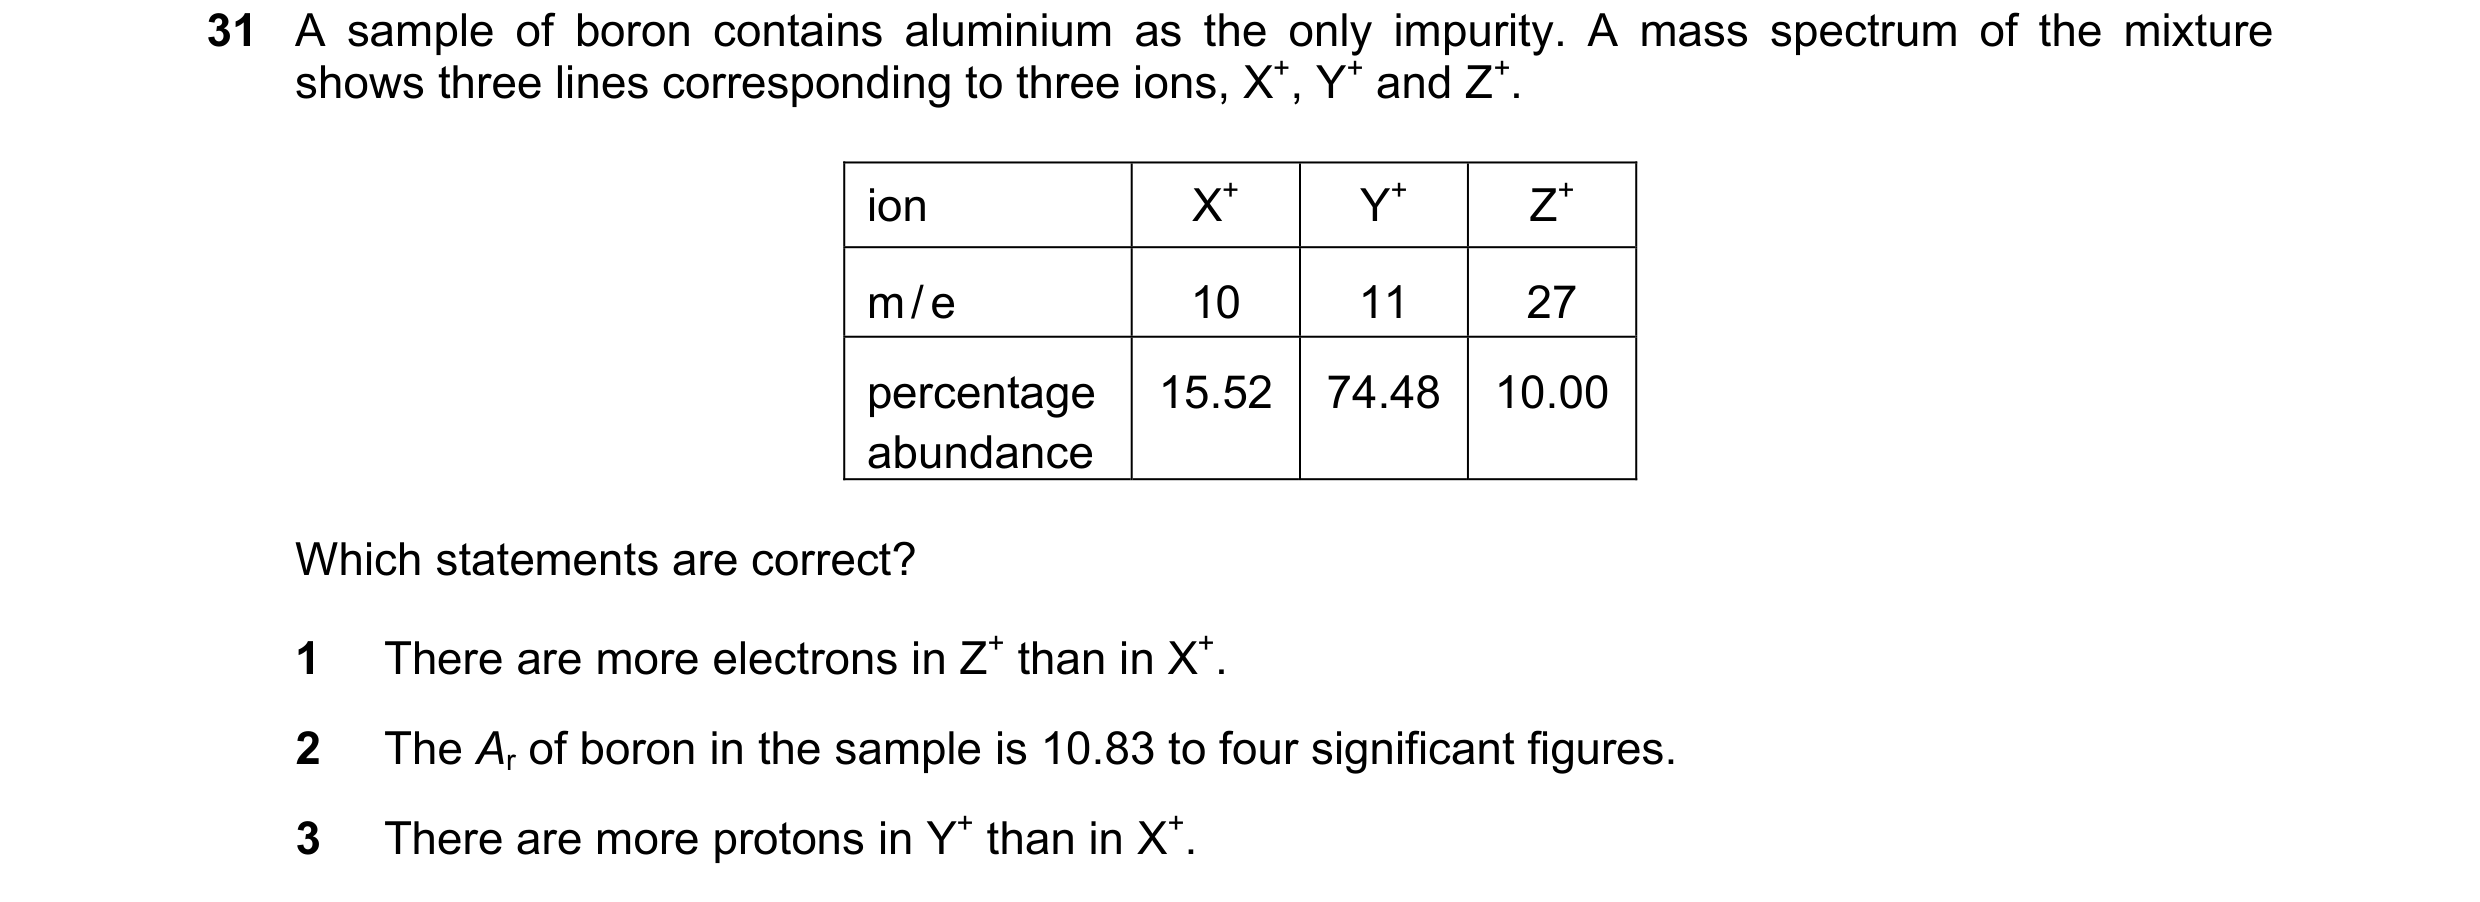
31 A sample of boron contains aluminium as the only impurity. A mass spectrum of the mixture shows three lines corresponding to three ions, X+, Y+ and Z+. ion X+ Y+ Z+ m / e 10 11 27 percentage 15.52 74.48 10.00 abundance Which statements are correct? 1 There are more electrons in Z+ than in X+. 2 The Ar of boron in the sample is 10.83 to four significant figures. 3 There are more protons in Y+ than in X+.
1 marks
Answer: B
This question in 9701/11 Oct/Nov 2016
Q4 · A sample of boron contains aluminium as the only impurity 9701/13 Oct/Nov 2016
31 A sample of boron contains aluminium as the only impurity. A mass spectrum of the mixture shows three lines corresponding to three ions, X+, Y+ and Z+. ion X+ Y+ Z+ m / e 10 11 27 percentage 15.52 74.48 10.00 abundance Which statements are correct? 1 There are more electrons in Z+ than in X+. 2 The Ar of boron in the sample is 10.83 to four significant figures. 3 There are more protons in Y+ than in X+.
1 marks
Answer: B
This question in 9701/13 Oct/Nov 2016
Q5 · A sample of element X is analysed using mass spectrometry 9701/11 May/June 2019
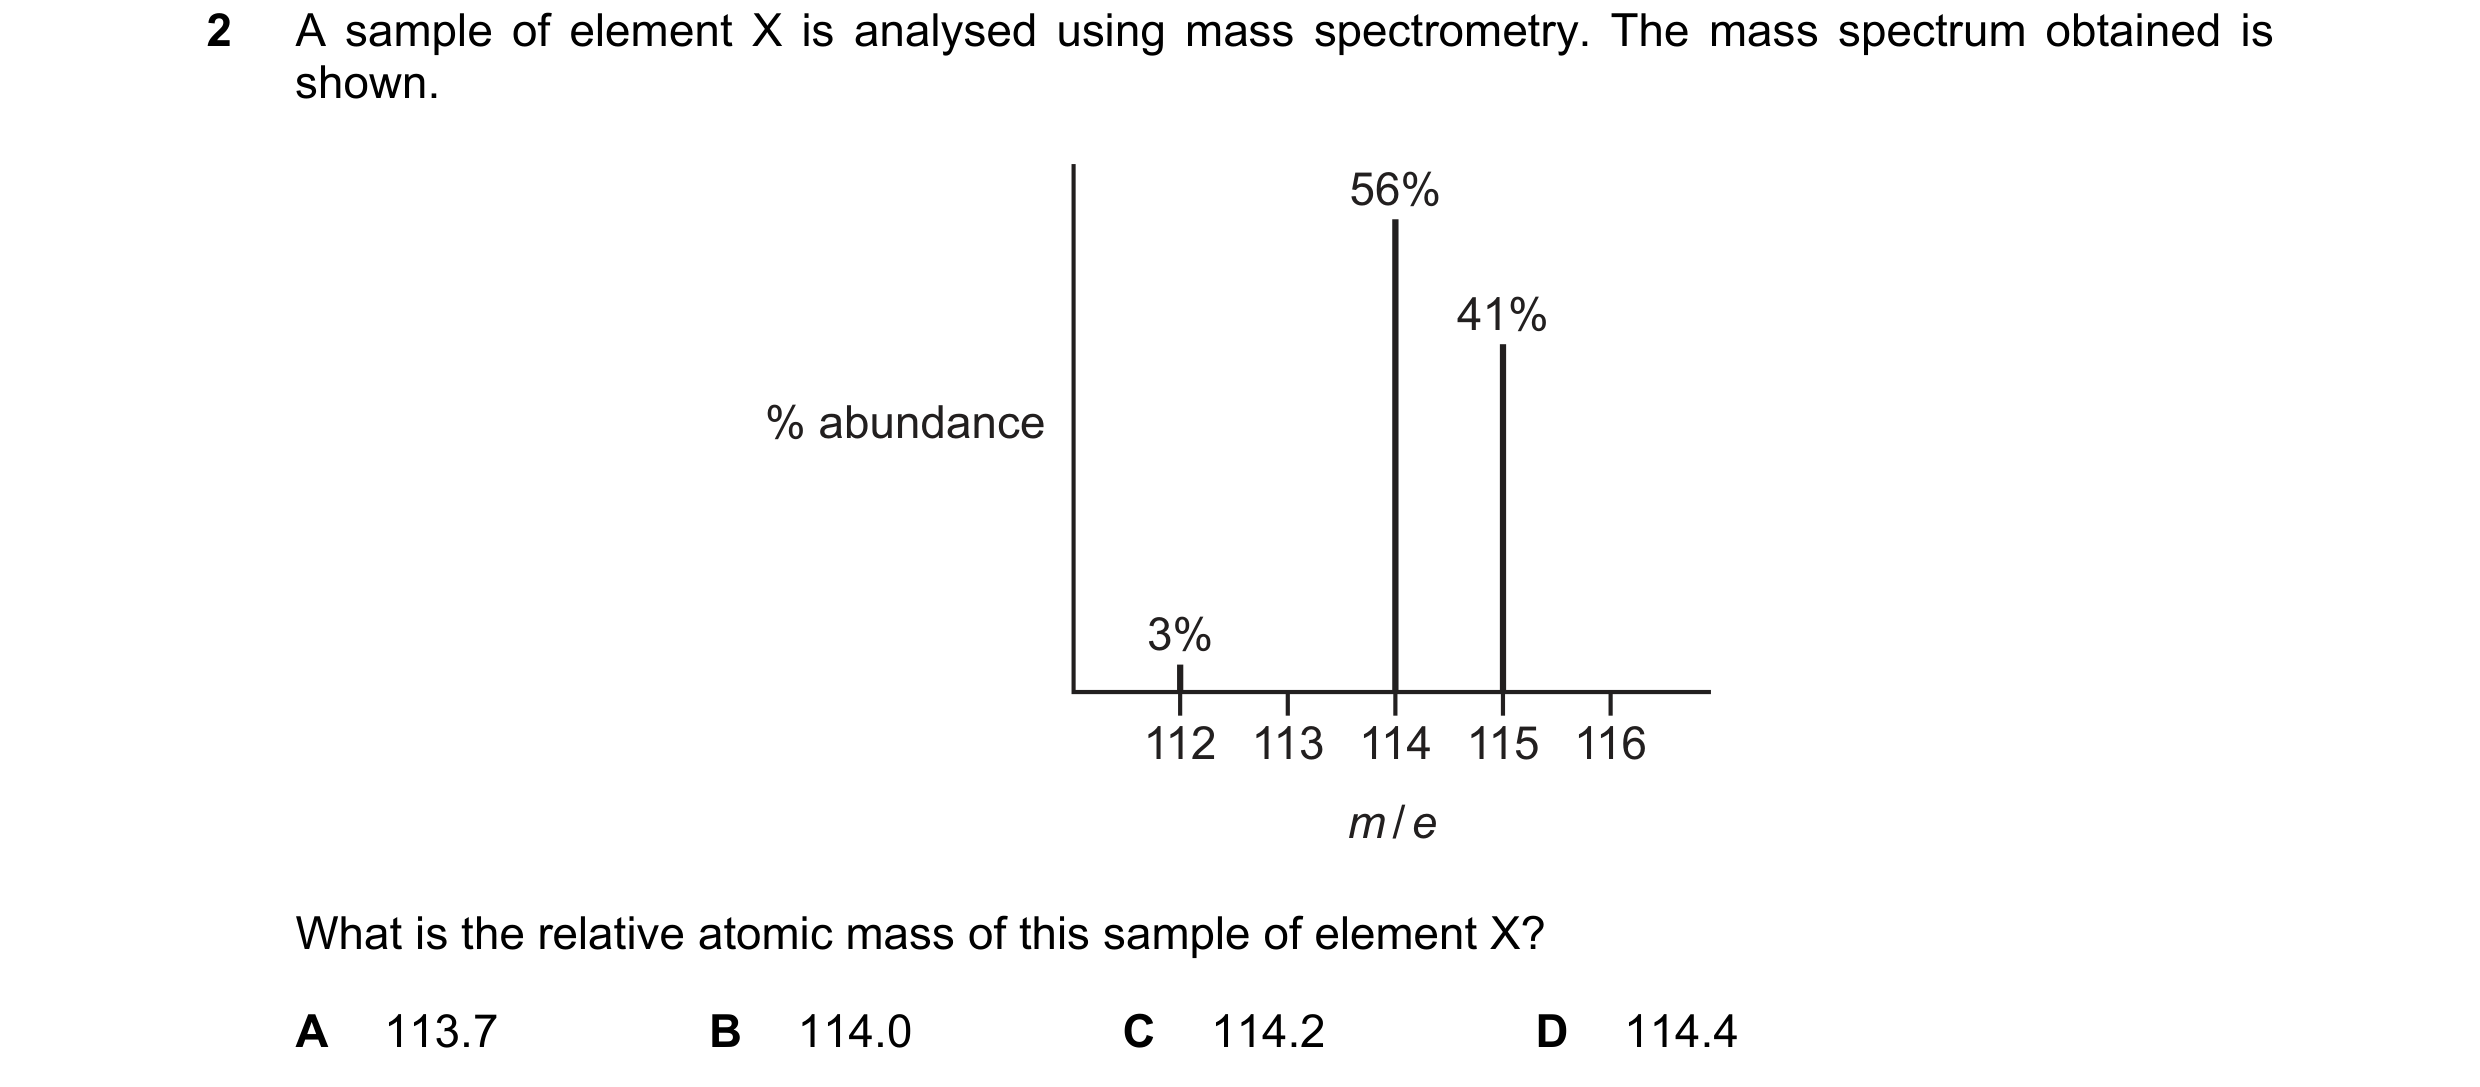
2 A sample of element X is analysed using mass spectrometry. The mass spectrum obtained is shown. 56% 41% % abundance 3% 112 113 114 115 116 m / e What is the relative atomic mass of this sample of element X? A 113.7 B 114.0 C 114.2 D 114.4
1 marks
Answer: D
This question in 9701/11 May/June 2019
Q6 · Oxygen has three stable isotopes, 16O, 17O and 18O 9701/12 May/June 2019
2 Oxygen has three stable isotopes, 16O, 17O and 18O. All three isotopes are present in a sample of oxygen gas, O2, which was analysed using a mass spectrometer. How many peaks associated with the O2 + ion would be expected? A 3 B 5 C 6 D 9
1 marks
Answer: B
This question in 9701/12 May/June 2019
Q7 · The mass spectrum of an alloy of copper and gold is shown 9701/13 May/June 2019
2 The mass spectrum of an alloy of copper and gold is shown. 60 56.36 50 40 percentage 30 abundance 25.14 20 18.50 10 0 6365 197 m / e Which expression can be used to calculate the relative atomic mass, Ar, of copper present in this sample? (56.36 × 63) + (25.14 × 65) A (56.36 + 25.14 + 18.50) (56.36 × 63) + (25.14 × 65) + (18.50 × 197) B (56.36 + 25.14 + 18.50) (56.36 × 63) + (25.14 × 65) C (56.36 + 25.14) (56.36 × 63) + (25.14 × 65) D (63 + 6 5 )
1 marks
Answer: C
This question in 9701/13 May/June 2019
Q8 · The mass spectrum of a sample of neon is shown 9701/11 Oct/Nov 2021
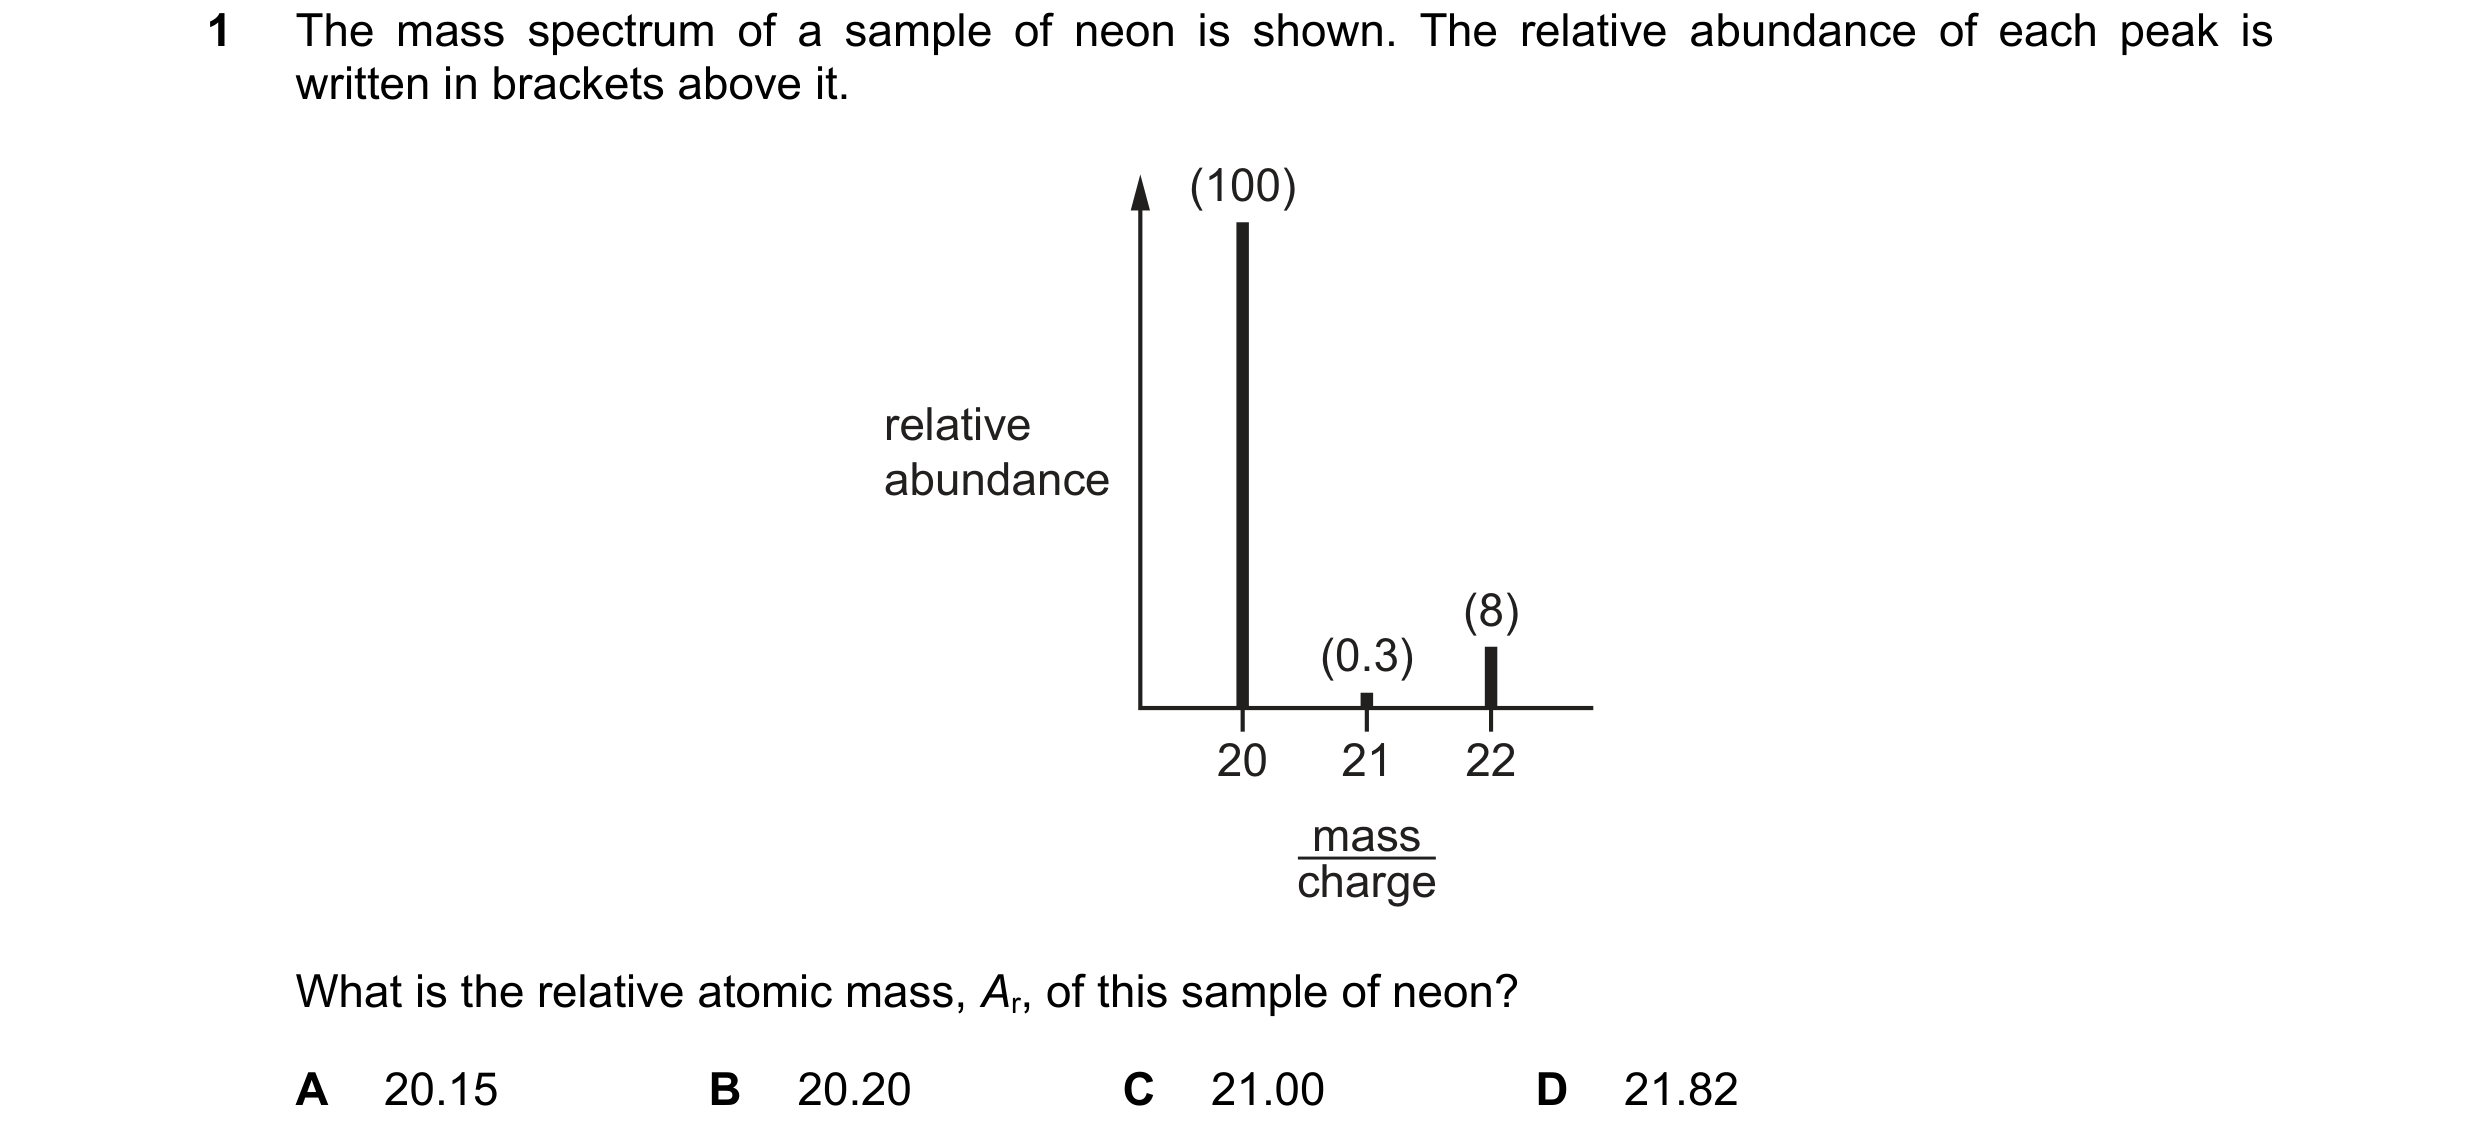
1 The mass spectrum of a sample of neon is shown. The relative abundance of each peak is written in brackets above it. (100) relative abundance (8) (0.3) 20 21 22 mass charge What is the relative atomic mass, Ar, of this sample of neon? A 20.15 B 20.20 C 21.00 D 21.82
1 marks
Answer: A
This question in 9701/11 Oct/Nov 2021
Q9 · The mass spectrum of a sample of neon is shown 9701/13 Oct/Nov 2021
1 The mass spectrum of a sample of neon is shown. The relative abundance of each peak is written in brackets above it. (100) relative abundance (8) (0.3) 20 21 22 mass charge What is the relative atomic mass, Ar, of this sample of neon? A 20.15 B 20.20 C 21.00 D 21.82
1 marks
Answer: A
This question in 9701/13 Oct/Nov 2021
Q10 · Three organic compounds are listed 9701/12 May/June 2022
40 Three organic compounds are listed. 1 ethanal 2 propan-1-ol 3 propan-2-ol Which compounds will have a mass spectrum that contains a fragment peak at m / e = 43? A 1 only B 1 and 2 only C 2 and 3 only D 1, 2 and 3
1 marks
Answer: D
This question in 9701/12 May/June 2022
Q11 · In the mass spectrum of a compound, Z, the relative abundances of the M and M+1 peaks are… 9701/11 Oct/Nov 2022
40 In the mass spectrum of a compound, Z, the relative abundances of the M and M+1 peaks are in the ratio 13 : 1. What is compound Z? A butyl butanoate B hexan-3-one C 2,2,3-trimethylhexane D 3,3-dimethylpentan-1-ol
1 marks
Answer: D
This question in 9701/11 Oct/Nov 2022
Q12 · In the mass spectrum of a compound, Z, the relative abundances of the M and M+1 peaks are… 9701/13 Oct/Nov 2022
40 In the mass spectrum of a compound, Z, the relative abundances of the M and M+1 peaks are in the ratio 13 : 1. What is compound Z? A butyl butanoate B hexan-3-one C 2,2,3-trimethylhexane D 3,3-dimethylpentan-1-ol
1 marks
Answer: D
This question in 9701/13 Oct/Nov 2022
Q13 · The mass spectrum of compound X has M, M+1 and M+2 peaks 9701/13 May/June 2023
40 The mass spectrum of compound X has M, M+1 and M+2 peaks. Other peaks are also present. Peak M is the molecular ion peak, M+. Peak M has a relative abundance fifteen times that of peak M+1. Peaks M and M+2 are of equal height. What could be compound X? A 1-chloro-2,2-dimethylpentane B 2-chloro-3-methylpentane C 2-bromo-2-methylhexane D 3-bromo-2,2-dimethylbutane
1 marks
Answer: D
This question in 9701/13 May/June 2023
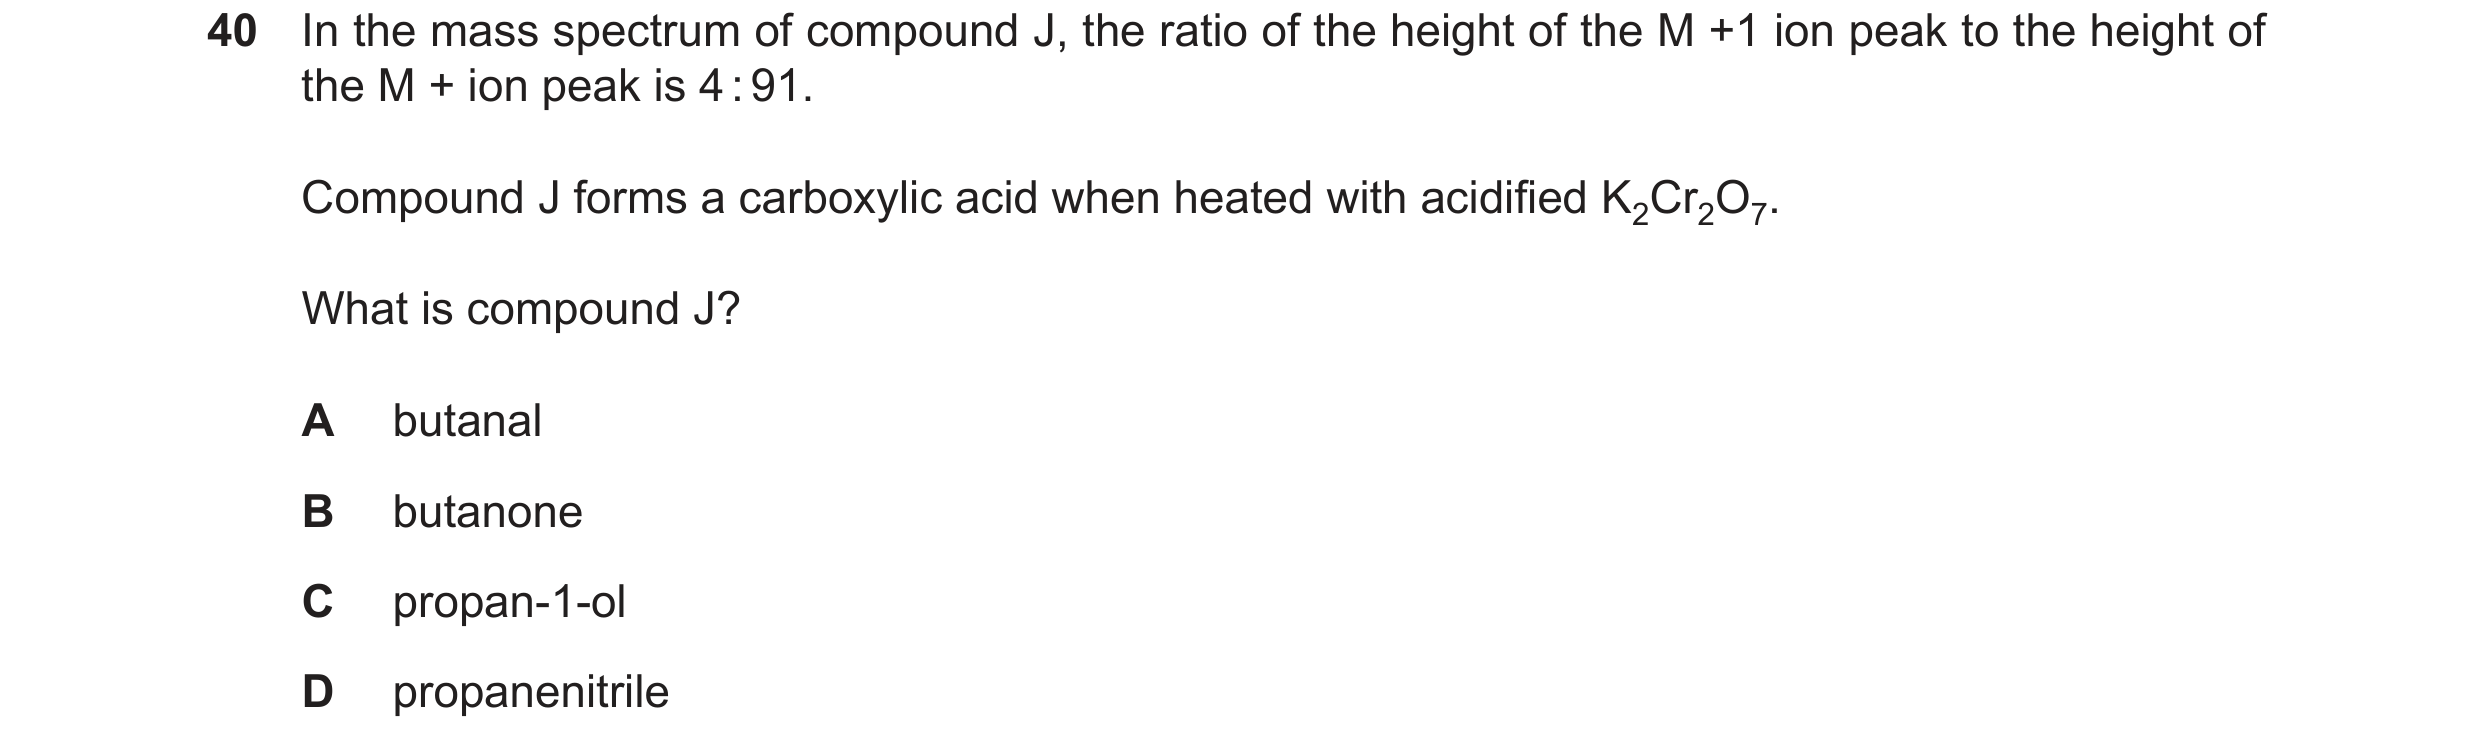
Q14 · In the mass spectrum of compound J, the ratio of the height of the M +1 ion peak to the… 9701/11 Oct/Nov 2023
40 In the mass spectrum of compound J, the ratio of the height of the M +1 ion peak to the height of the M + ion peak is 4:91. Compound J forms a carboxylic acid when heated with acidified K2Cr2O7. What is compound J? A butanal B butanone C propan-1-ol D propanenitrile
1 marks
Answer: A
This question in 9701/11 Oct/Nov 2023
Q15 · Oxygen has three stable isotopes, 16O, 17O and 18O 9701/12 Oct/Nov 2023
40 Oxygen has three stable isotopes, 16O, 17O and 18O. All three isotopes are present in a sample of oxygen gas, O2, which was analysed using a mass spectrometer. + ion would be expected? How many peaks associated with the O2 A 3 B 5 C 6 D 9
1 marks
Answer: B
This question in 9701/12 Oct/Nov 2023
Q16 · In the mass spectrum of compound J, the ratio of the height of the M +1 ion peak to the… 9701/13 Oct/Nov 2023
40 In the mass spectrum of compound J, the ratio of the height of the M +1 ion peak to the height of the M + ion peak is 4:91. Compound J forms a carboxylic acid when heated with acidified K2Cr2O7. What is compound J? A butanal B butanone C propan-1-ol D propanenitrile
1 marks
Answer: A
This question in 9701/13 Oct/Nov 2023
Q17 · The diagram shows the mass spectrum of a sample of chlorine 9701/11 Oct/Nov 2024
40 The diagram shows the mass spectrum of a sample of chlorine. Peaks V, W, X, Y and Z are labelled. 100 X V 80 Y 60 relative intensity 40 W 20 Z 0.0 30 40 50 60 70 80 m / e Which statements about this spectrum are correct? 1 The relative atomic mass of chlorine can be calculated from the abundances and m / e values of 2 of the 5 peaks. 2 37.0 g of the species responsible for peak Z contains 3.011 1023 molecules. 3 The relative molecular mass of chlorine can be calculated from the abundances and m / e values of peaks X, Y and Z. A 1, 2 and 3 B 1 and 2 only C 1 and 3 only D 2 and 3 only
1 marks
Answer: A
This question in 9701/11 Oct/Nov 2024
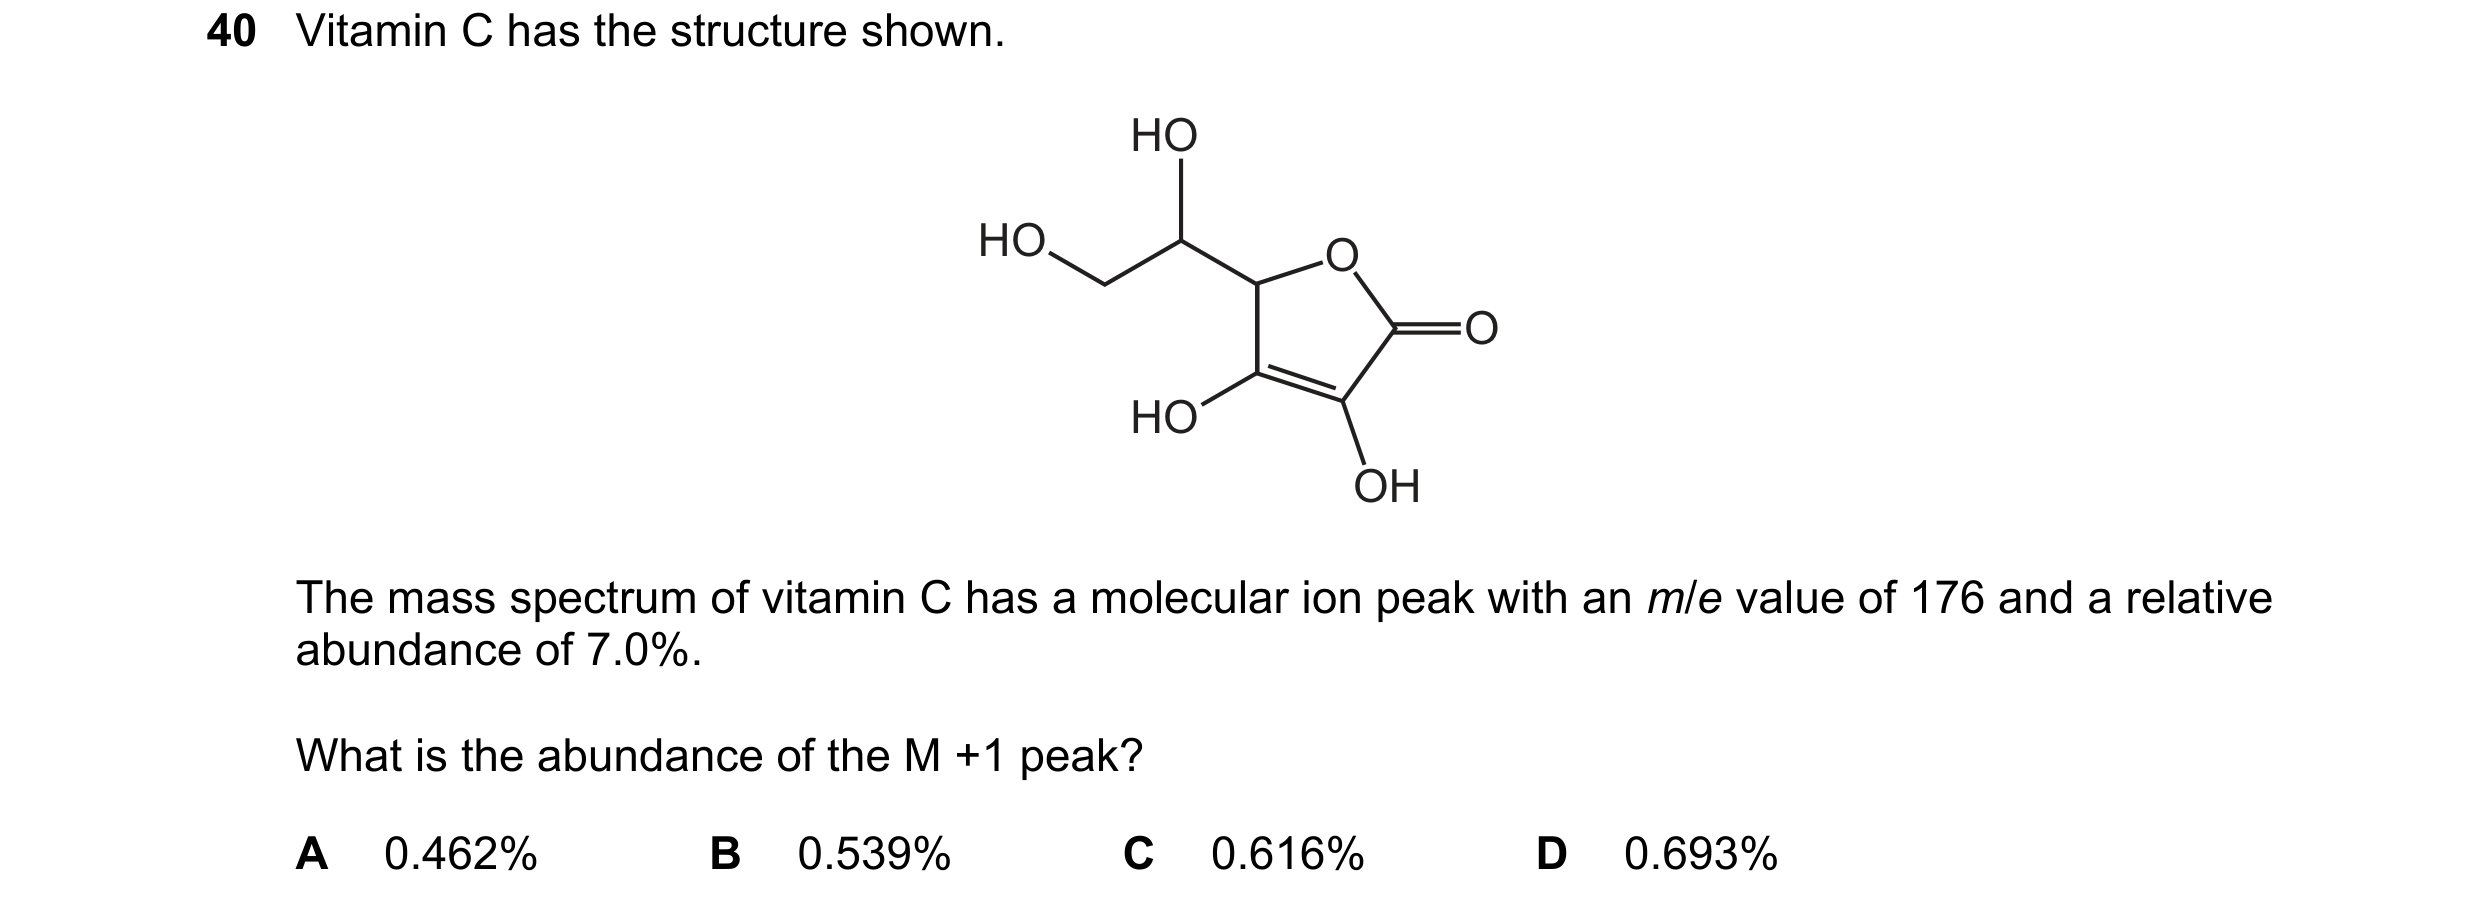
Q18 · Vitamin C has the structure shown 9701/12 Oct/Nov 2024
40 Vitamin C has the structure shown. HO HO O O HO OH The mass spectrum of vitamin C has a molecular ion peak with an m/e value of 176 and a relative abundance of 7.0%. What is the abundance of the M +1 peak? A 0.462% B 0.539% C 0.616% D 0.693%
1 marks
Answer: A
This question in 9701/12 Oct/Nov 2024
Q19 · The diagram shows the mass spectrum of a sample of chlorine 9701/13 Oct/Nov 2024
40 The diagram shows the mass spectrum of a sample of chlorine. Peaks V, W, X, Y and Z are labelled. 100 X V 80 Y 60 relative intensity 40 W 20 Z 0.0 30 40 50 60 70 80 m / e Which statements about this spectrum are correct? 1 The relative atomic mass of chlorine can be calculated from the abundances and m / e values of 2 of the 5 peaks. 2 37.0 g of the species responsible for peak Z contains 3.011 1023 molecules. 3 The relative molecular mass of chlorine can be calculated from the abundances and m / e values of peaks X, Y and Z. A 1, 2 and 3 B 1 and 2 only C 1 and 3 only D 2 and 3 only
1 marks
Answer: A
This question in 9701/13 Oct/Nov 2024
Q20 · Compound L contains carbon atoms 9701/12 Feb/March 2025
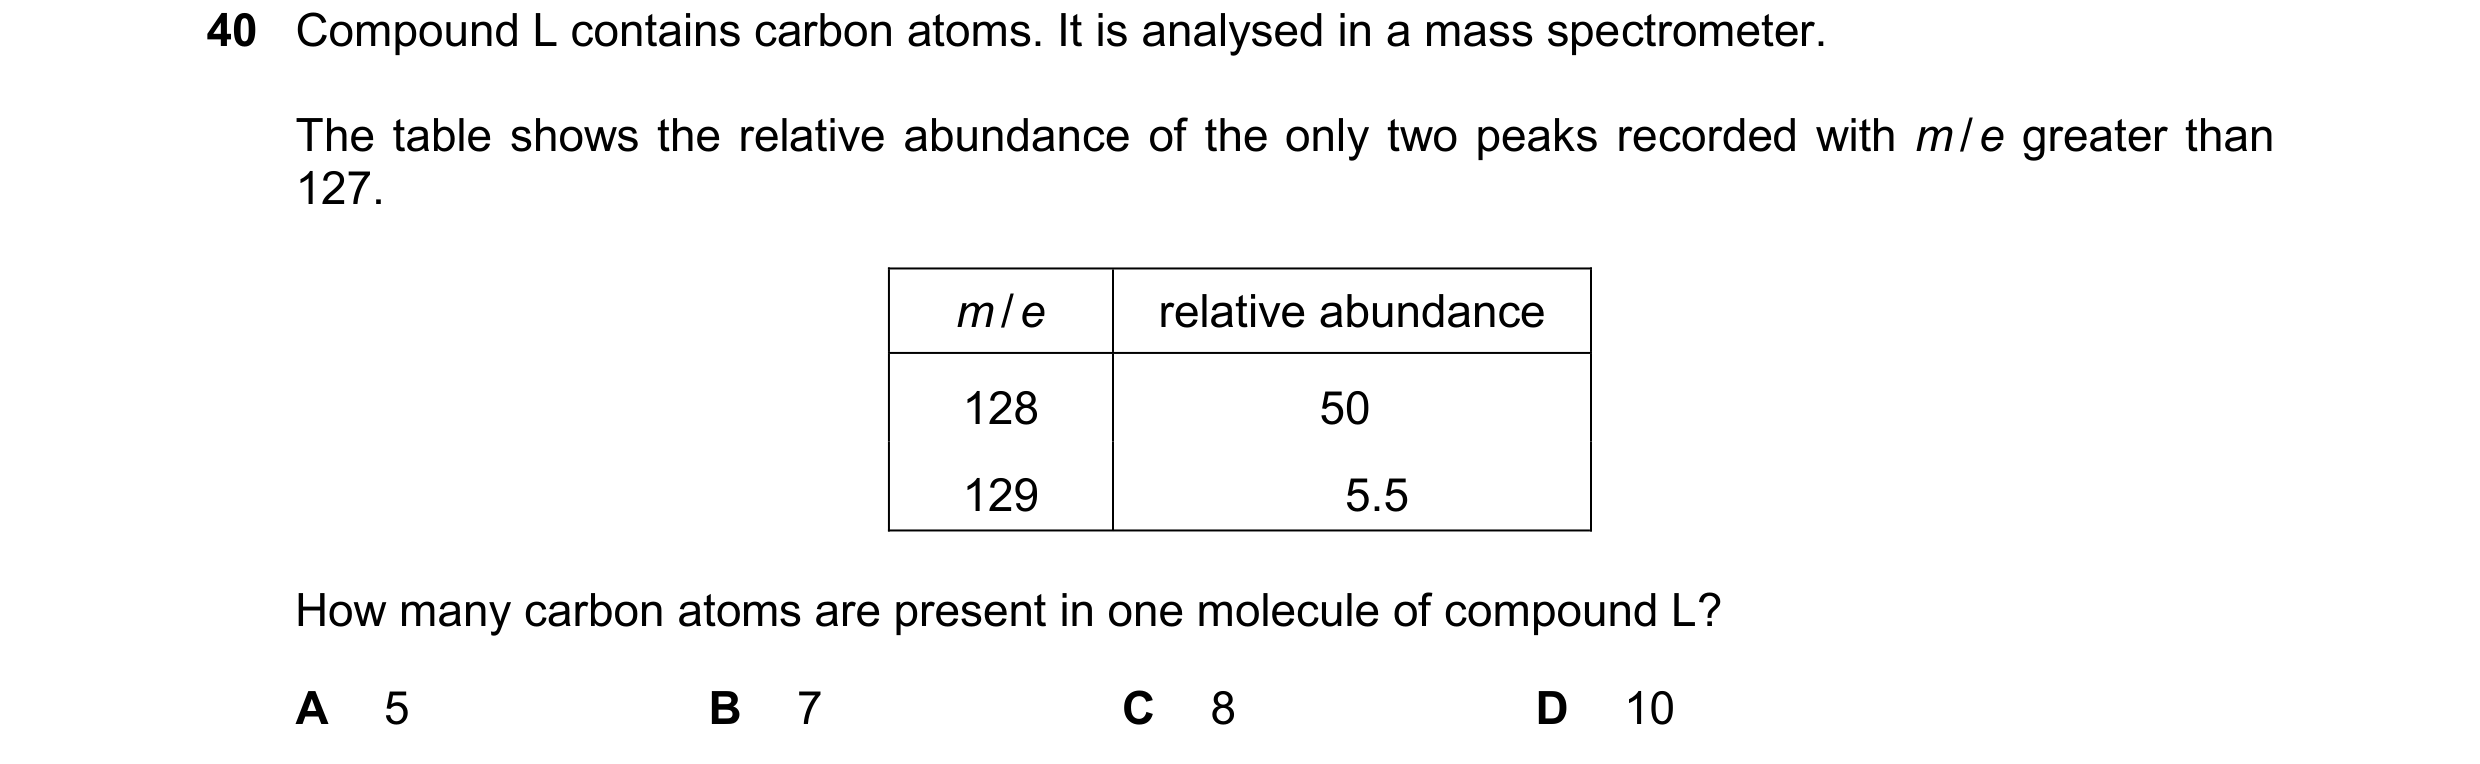
40 Compound L contains carbon atoms. It is analysed in a mass spectrometer. The table shows the relative abundance of the only two peaks recorded with m / e greater than 127. m / e relative abundance 128 50 129 5.5 How many carbon atoms are present in one molecule of compound L? A 5 B 7 C 8 D 10
1 marks
Answer: D
This question in 9701/12 Feb/March 2025
Q21 · Hydrocarbon X is saturated 9701/11 May/June 2025
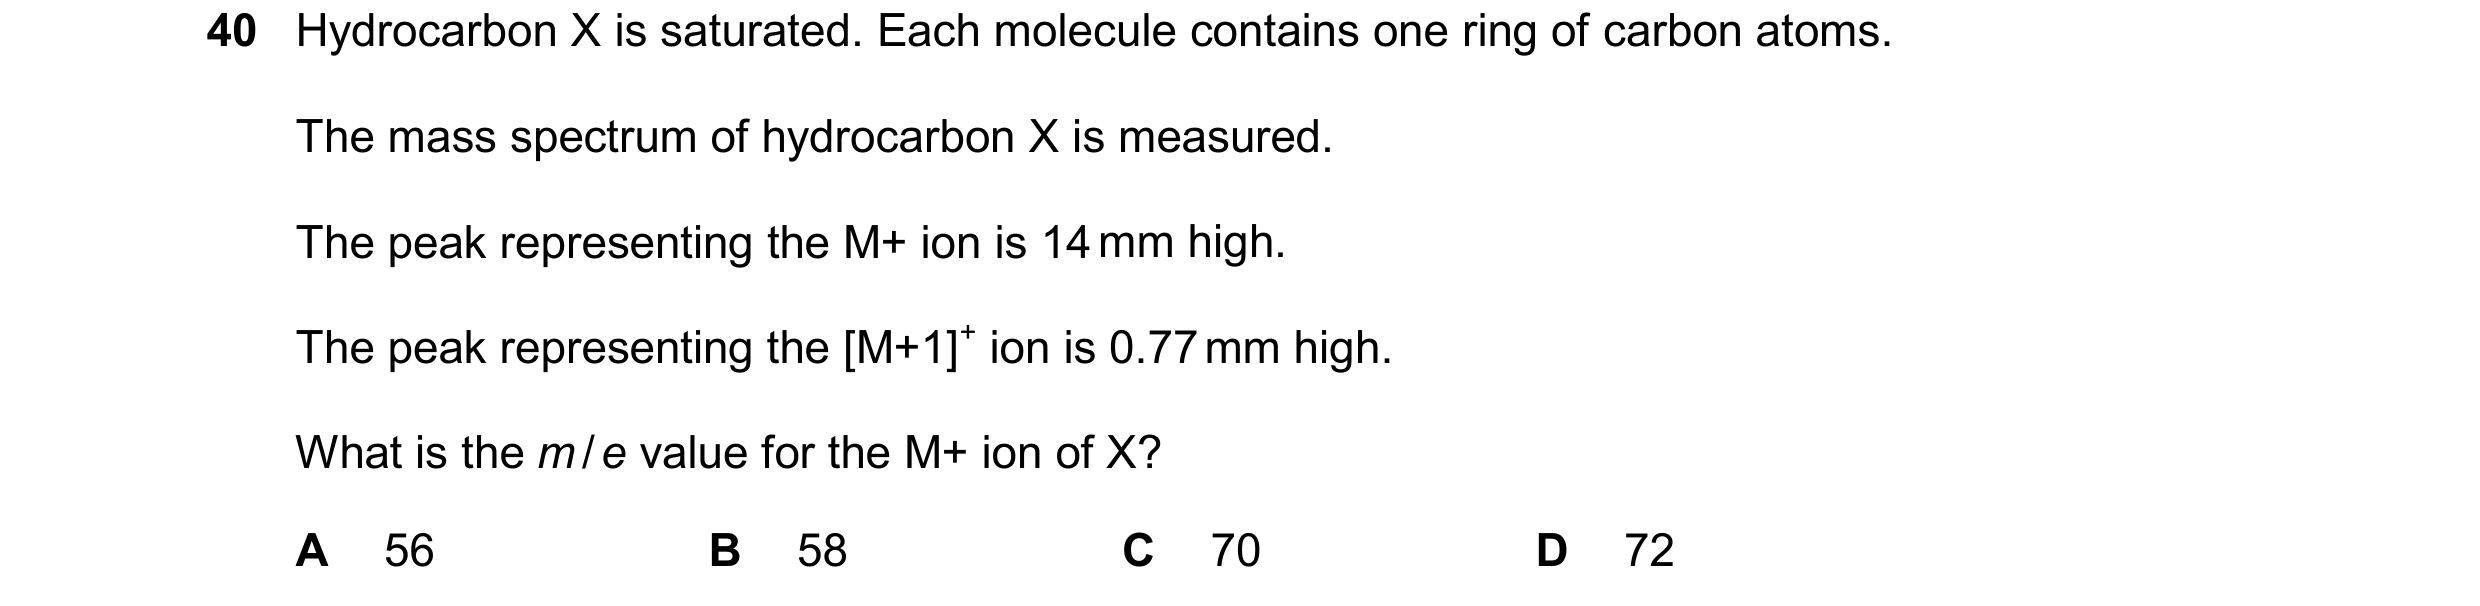
40 Hydrocarbon X is saturated. Each molecule contains one ring of carbon atoms. The mass spectrum of hydrocarbon X is measured. The peak representing the M+ ion is 14mm high. The peak representing the [M+1]+ ion is 0.77mm high. What is the m/e value for the M+ ion of X? A 56 B 58 C 70 D 72
1 marks
Answer: C
This question in 9701/11 May/June 2025
Q22 · The mass spectrum of CH3Cl shows a molecular ion peak, M+, at the m / e value of 50 with… 9701/12 May/June 2025
40 The mass spectrum of CH3Cl shows a molecular ion peak, M+, at the m / e value of 50 with a relative abundance of 18.0%. Other peaks are present in the mass spectrum. What is seen in the mass spectrum at the m / e value of 52? A a peak with relative abundance of 4.5% B a peak with relative abundance of 6.0% C a peak with relative abundance of 18.0% D a peak with relative abundance of 54.0%
1 marks
Answer: B
This question in 9701/12 May/June 2025
Q23 · The mass spectrum of an organic compound has the following features 9701/13 May/June 2025
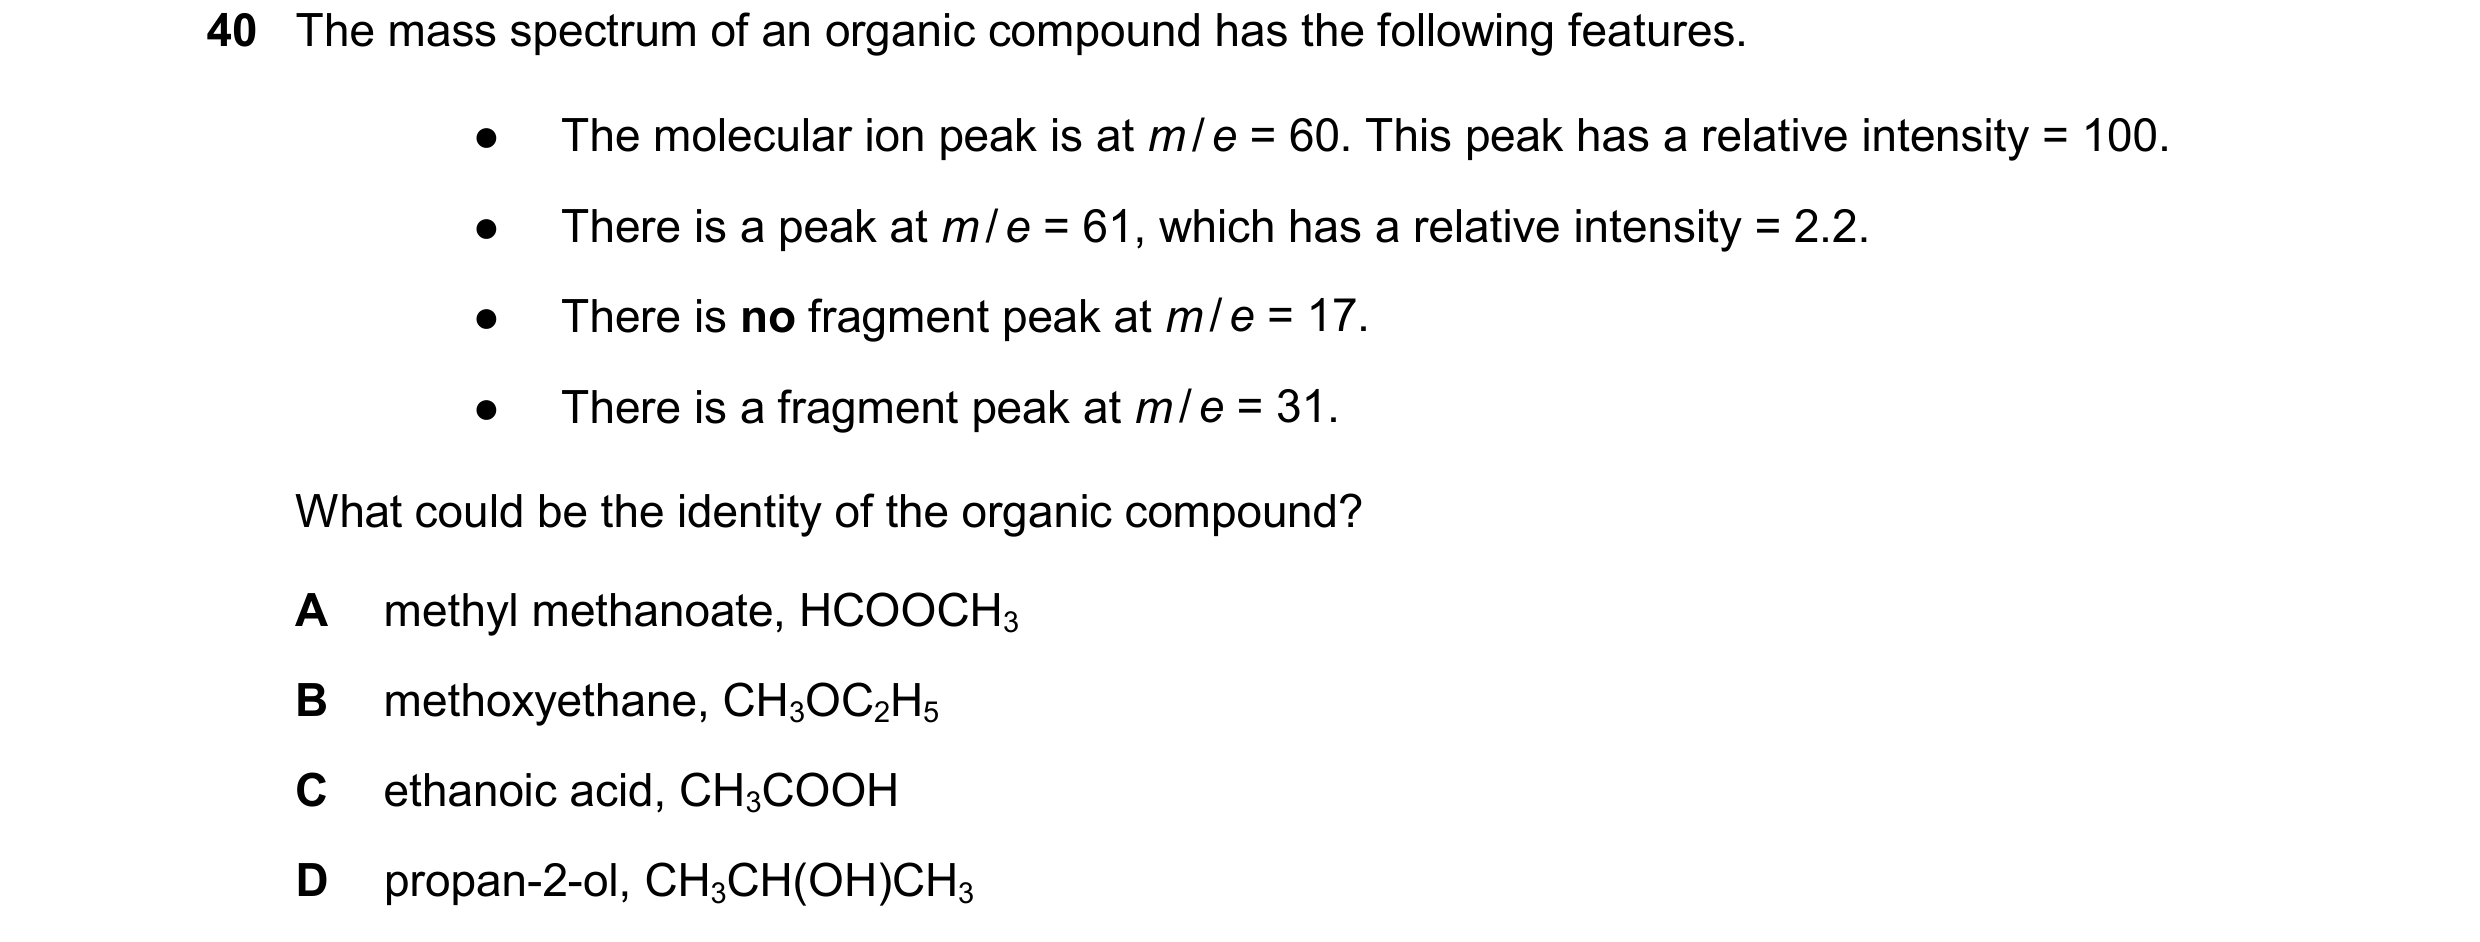
40 The mass spectrum of an organic compound has the following features. ● The molecular ion peak is at m/e = 60. This peak has a relative intensity = 100. ● There is a peak at m/e = 61, which has a relative intensity = 2.2. ● There is no fragment peak at m/e = 17. ● There is a fragment peak at m/e = 31. What could be the identity of the organic compound? A methyl methanoate, HCOOCH3 B methoxyethane, CH3OC2H5 C ethanoic acid, CH3COOH D propan-2-ol, CH3CH(OH)CH3
1 marks
Answer: A
This question in 9701/13 May/June 2025
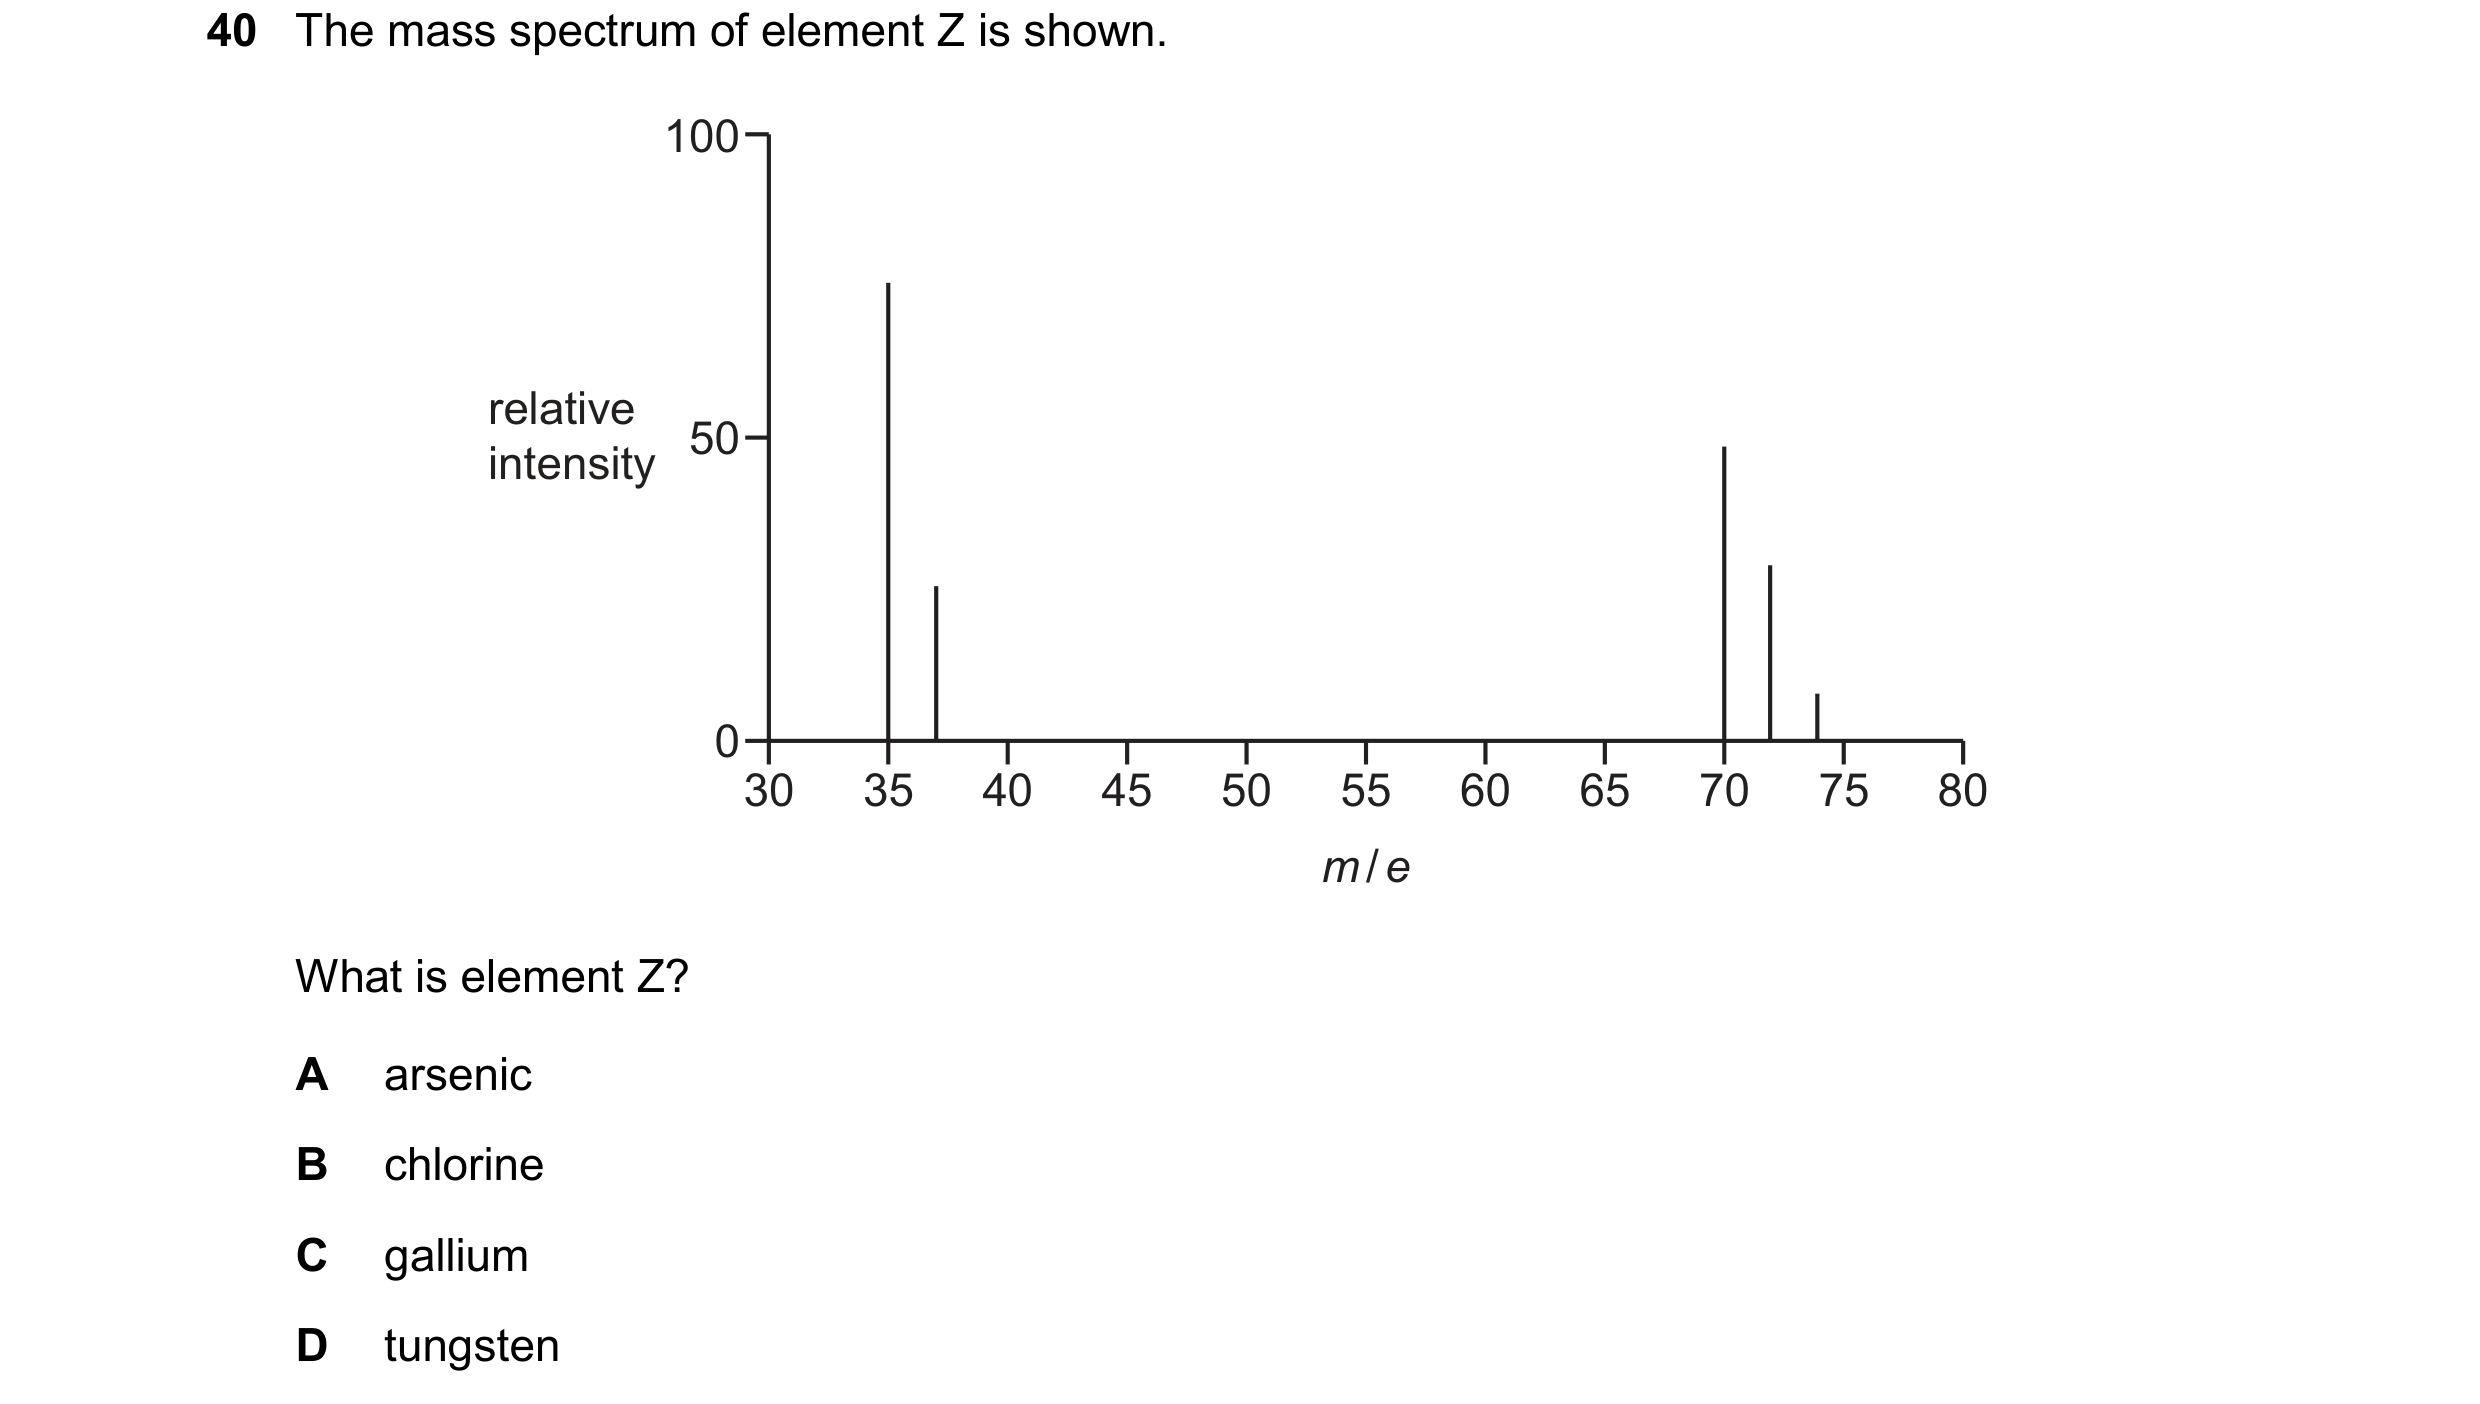
Q24 · The mass spectrum of element Z is shown 9701/14 May/June 2025
40 The mass spectrum of element Z is shown. 100 relative 50 intensity 0 30 35 40 45 50 55 60 65 70 75 80 m / e What is element Z? A arsenic B chlorine C gallium D tungsten
1 marks
Answer: B
This question in 9701/14 May/June 2025

 1 / 8
1 / 8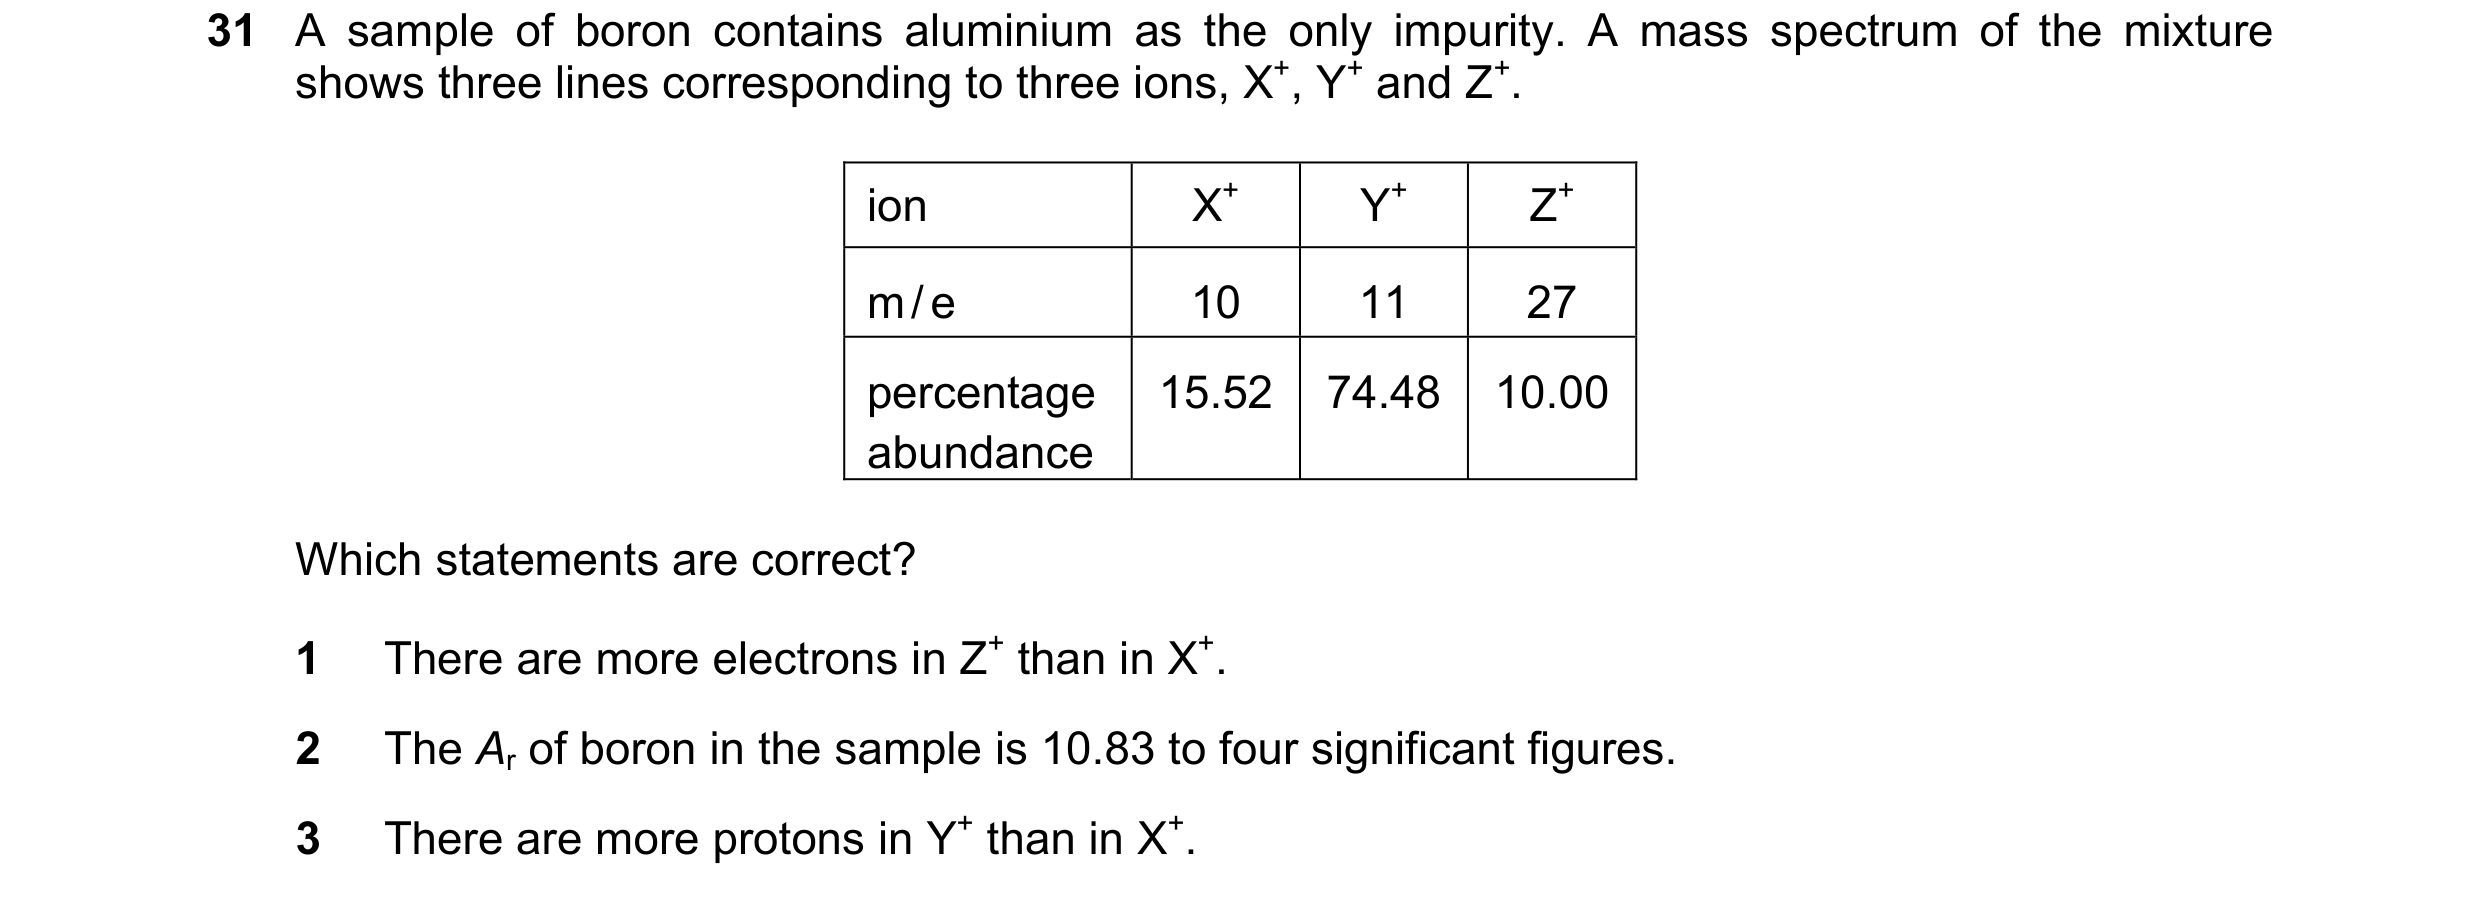
 2 / 8
2 / 8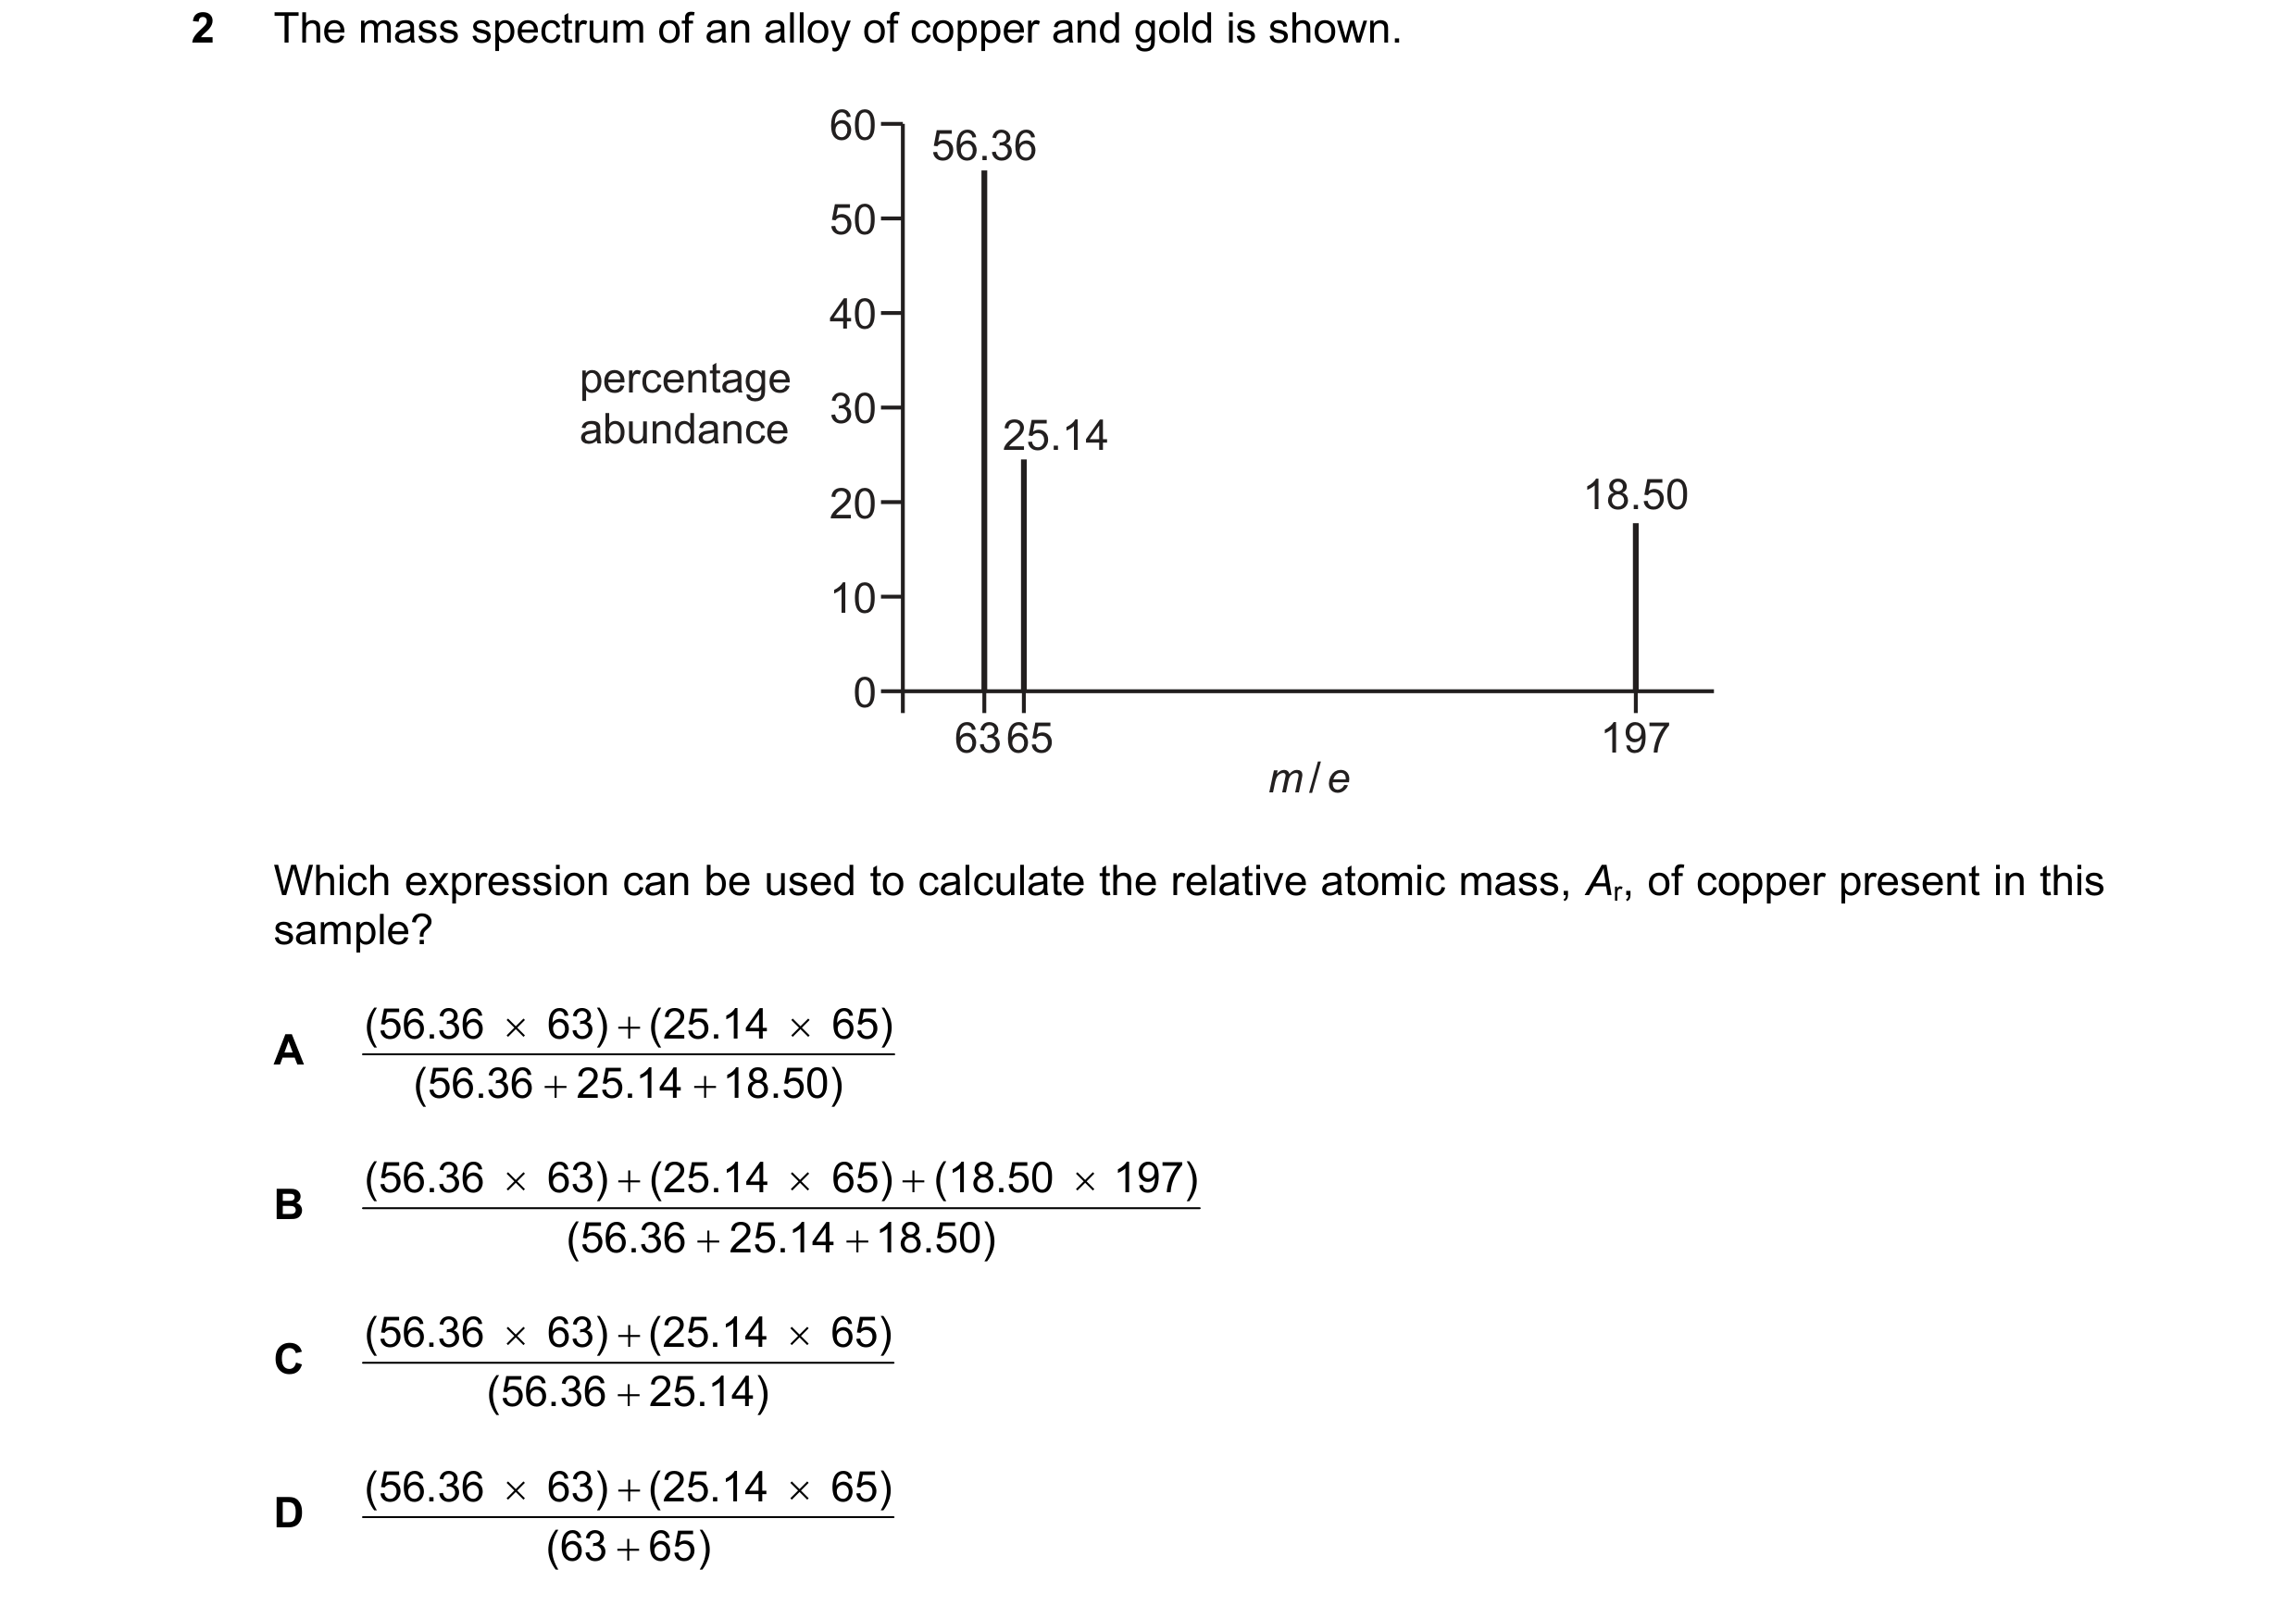
 3 / 8
3 / 8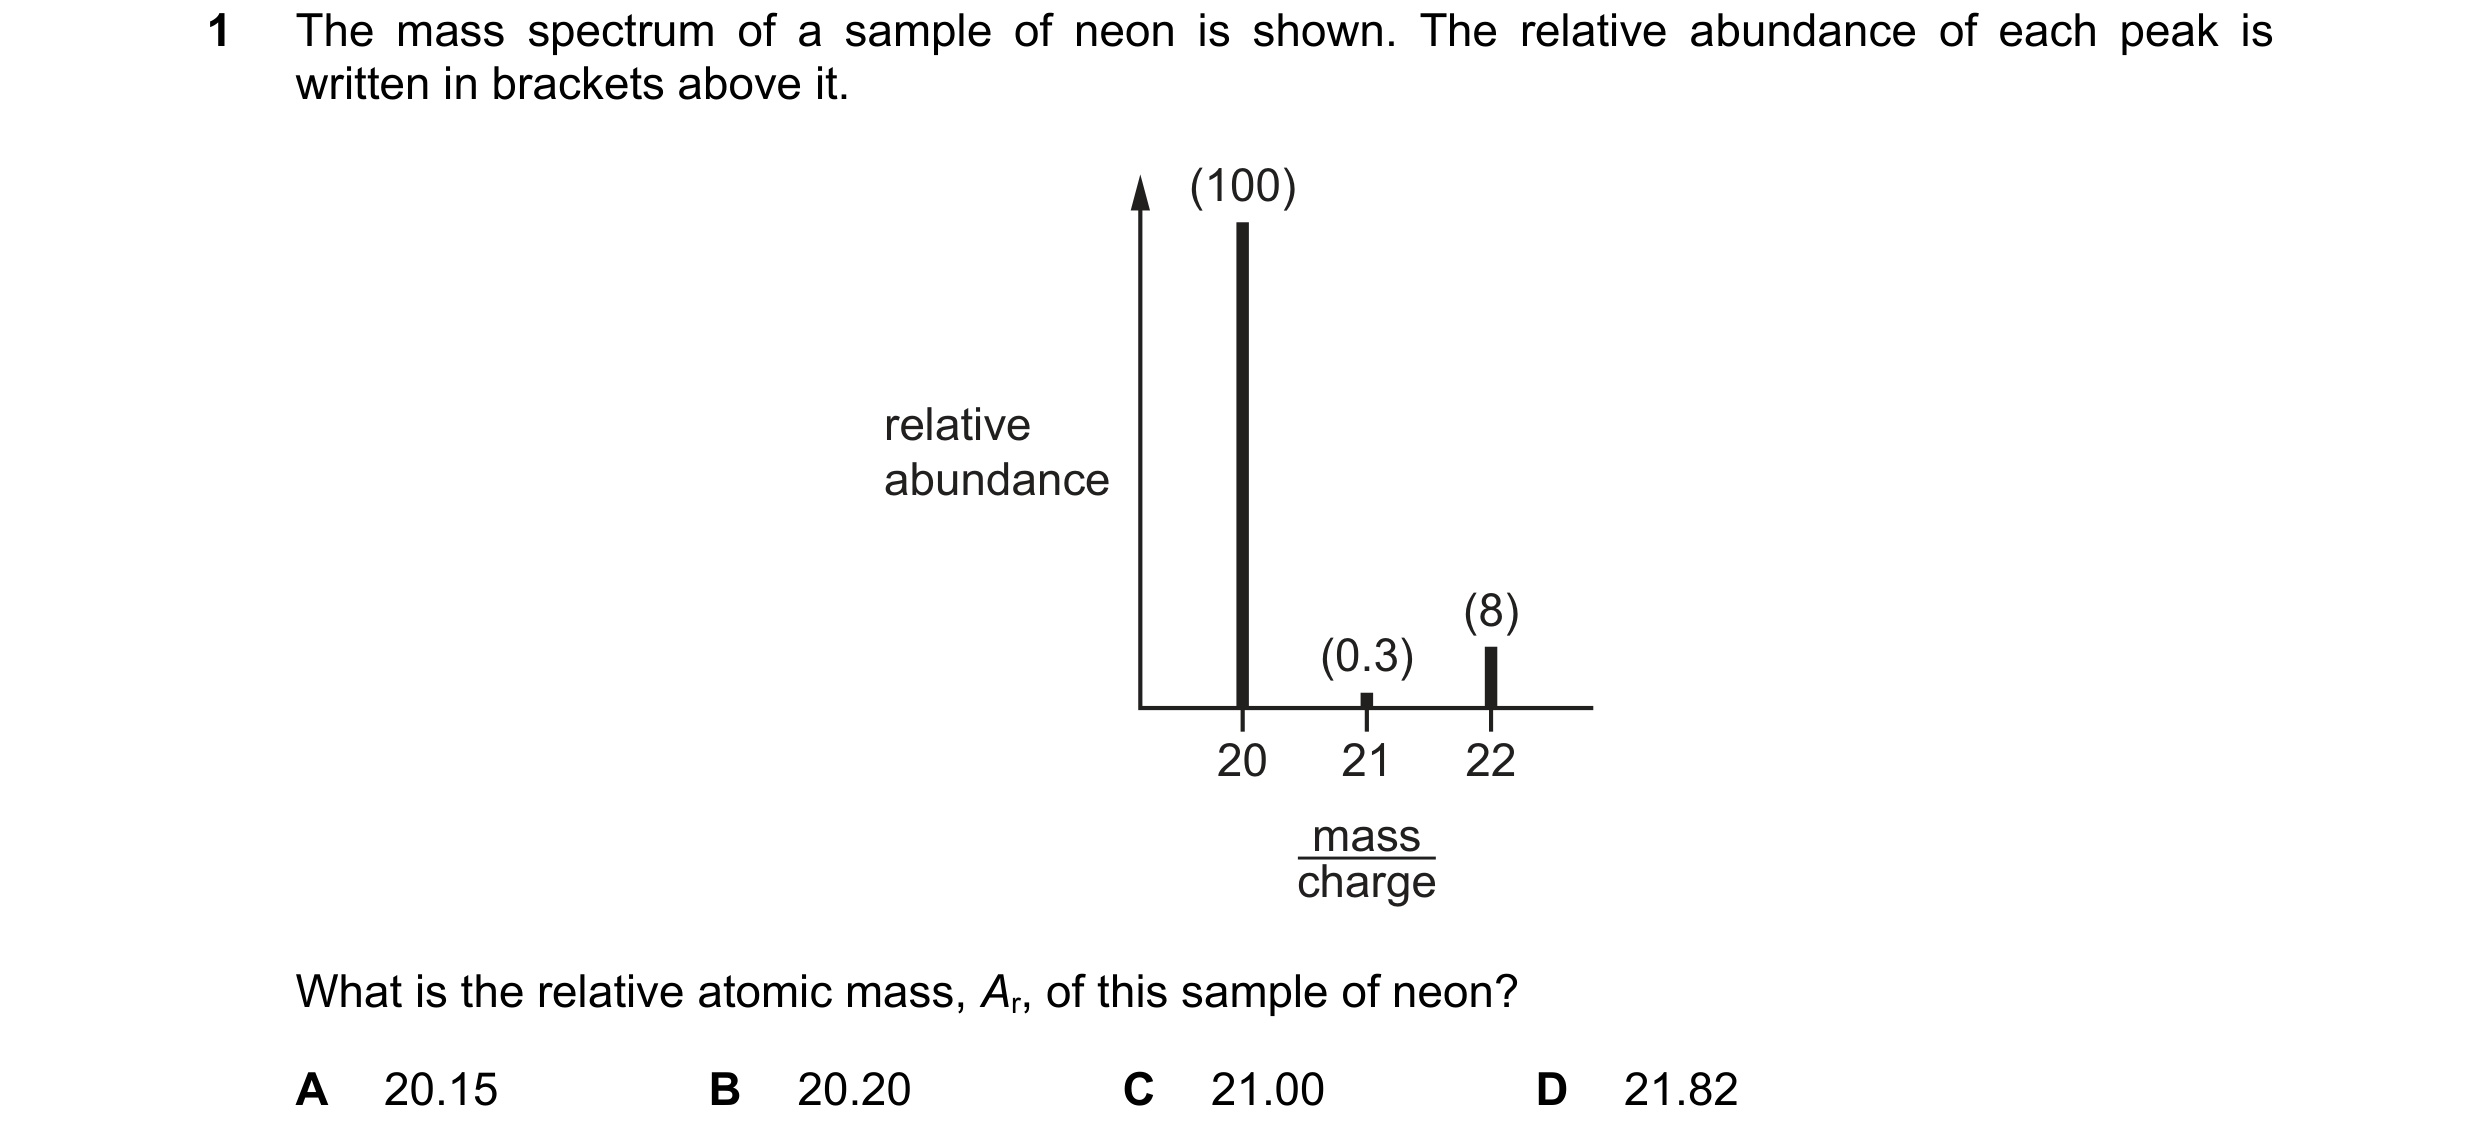
 4 / 8
4 / 8

 5 / 8
5 / 8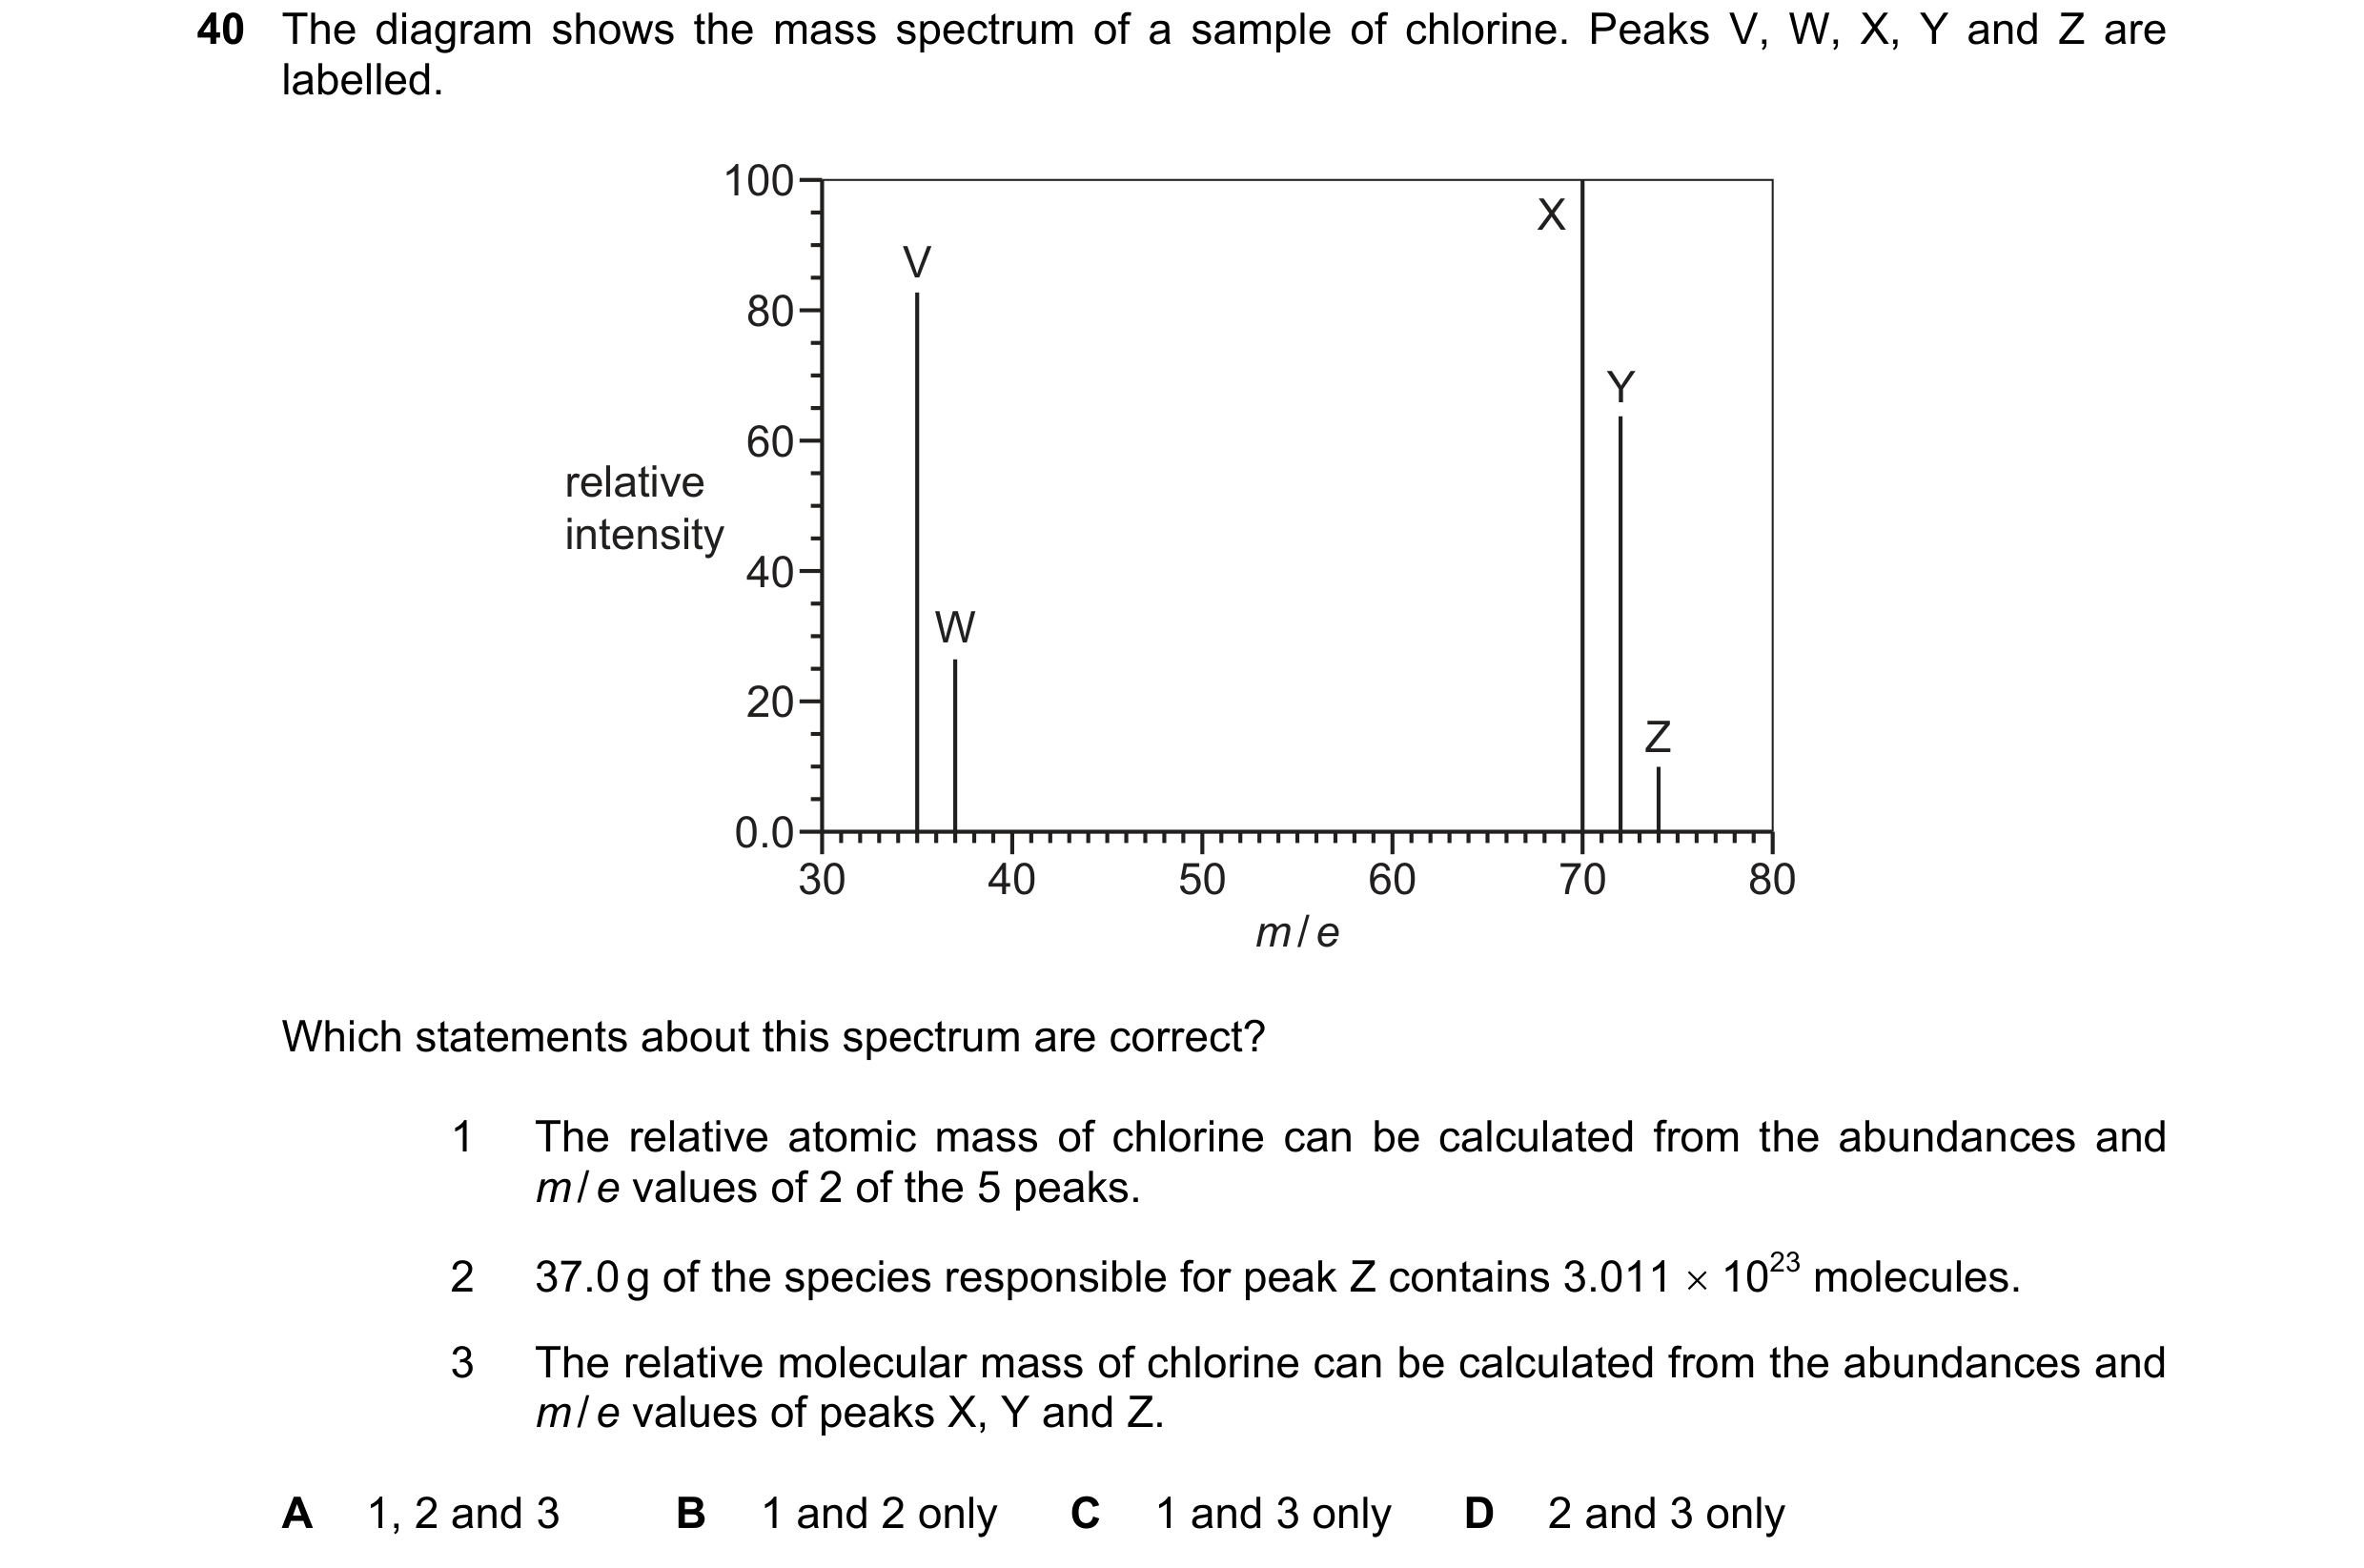
 6 / 8
6 / 8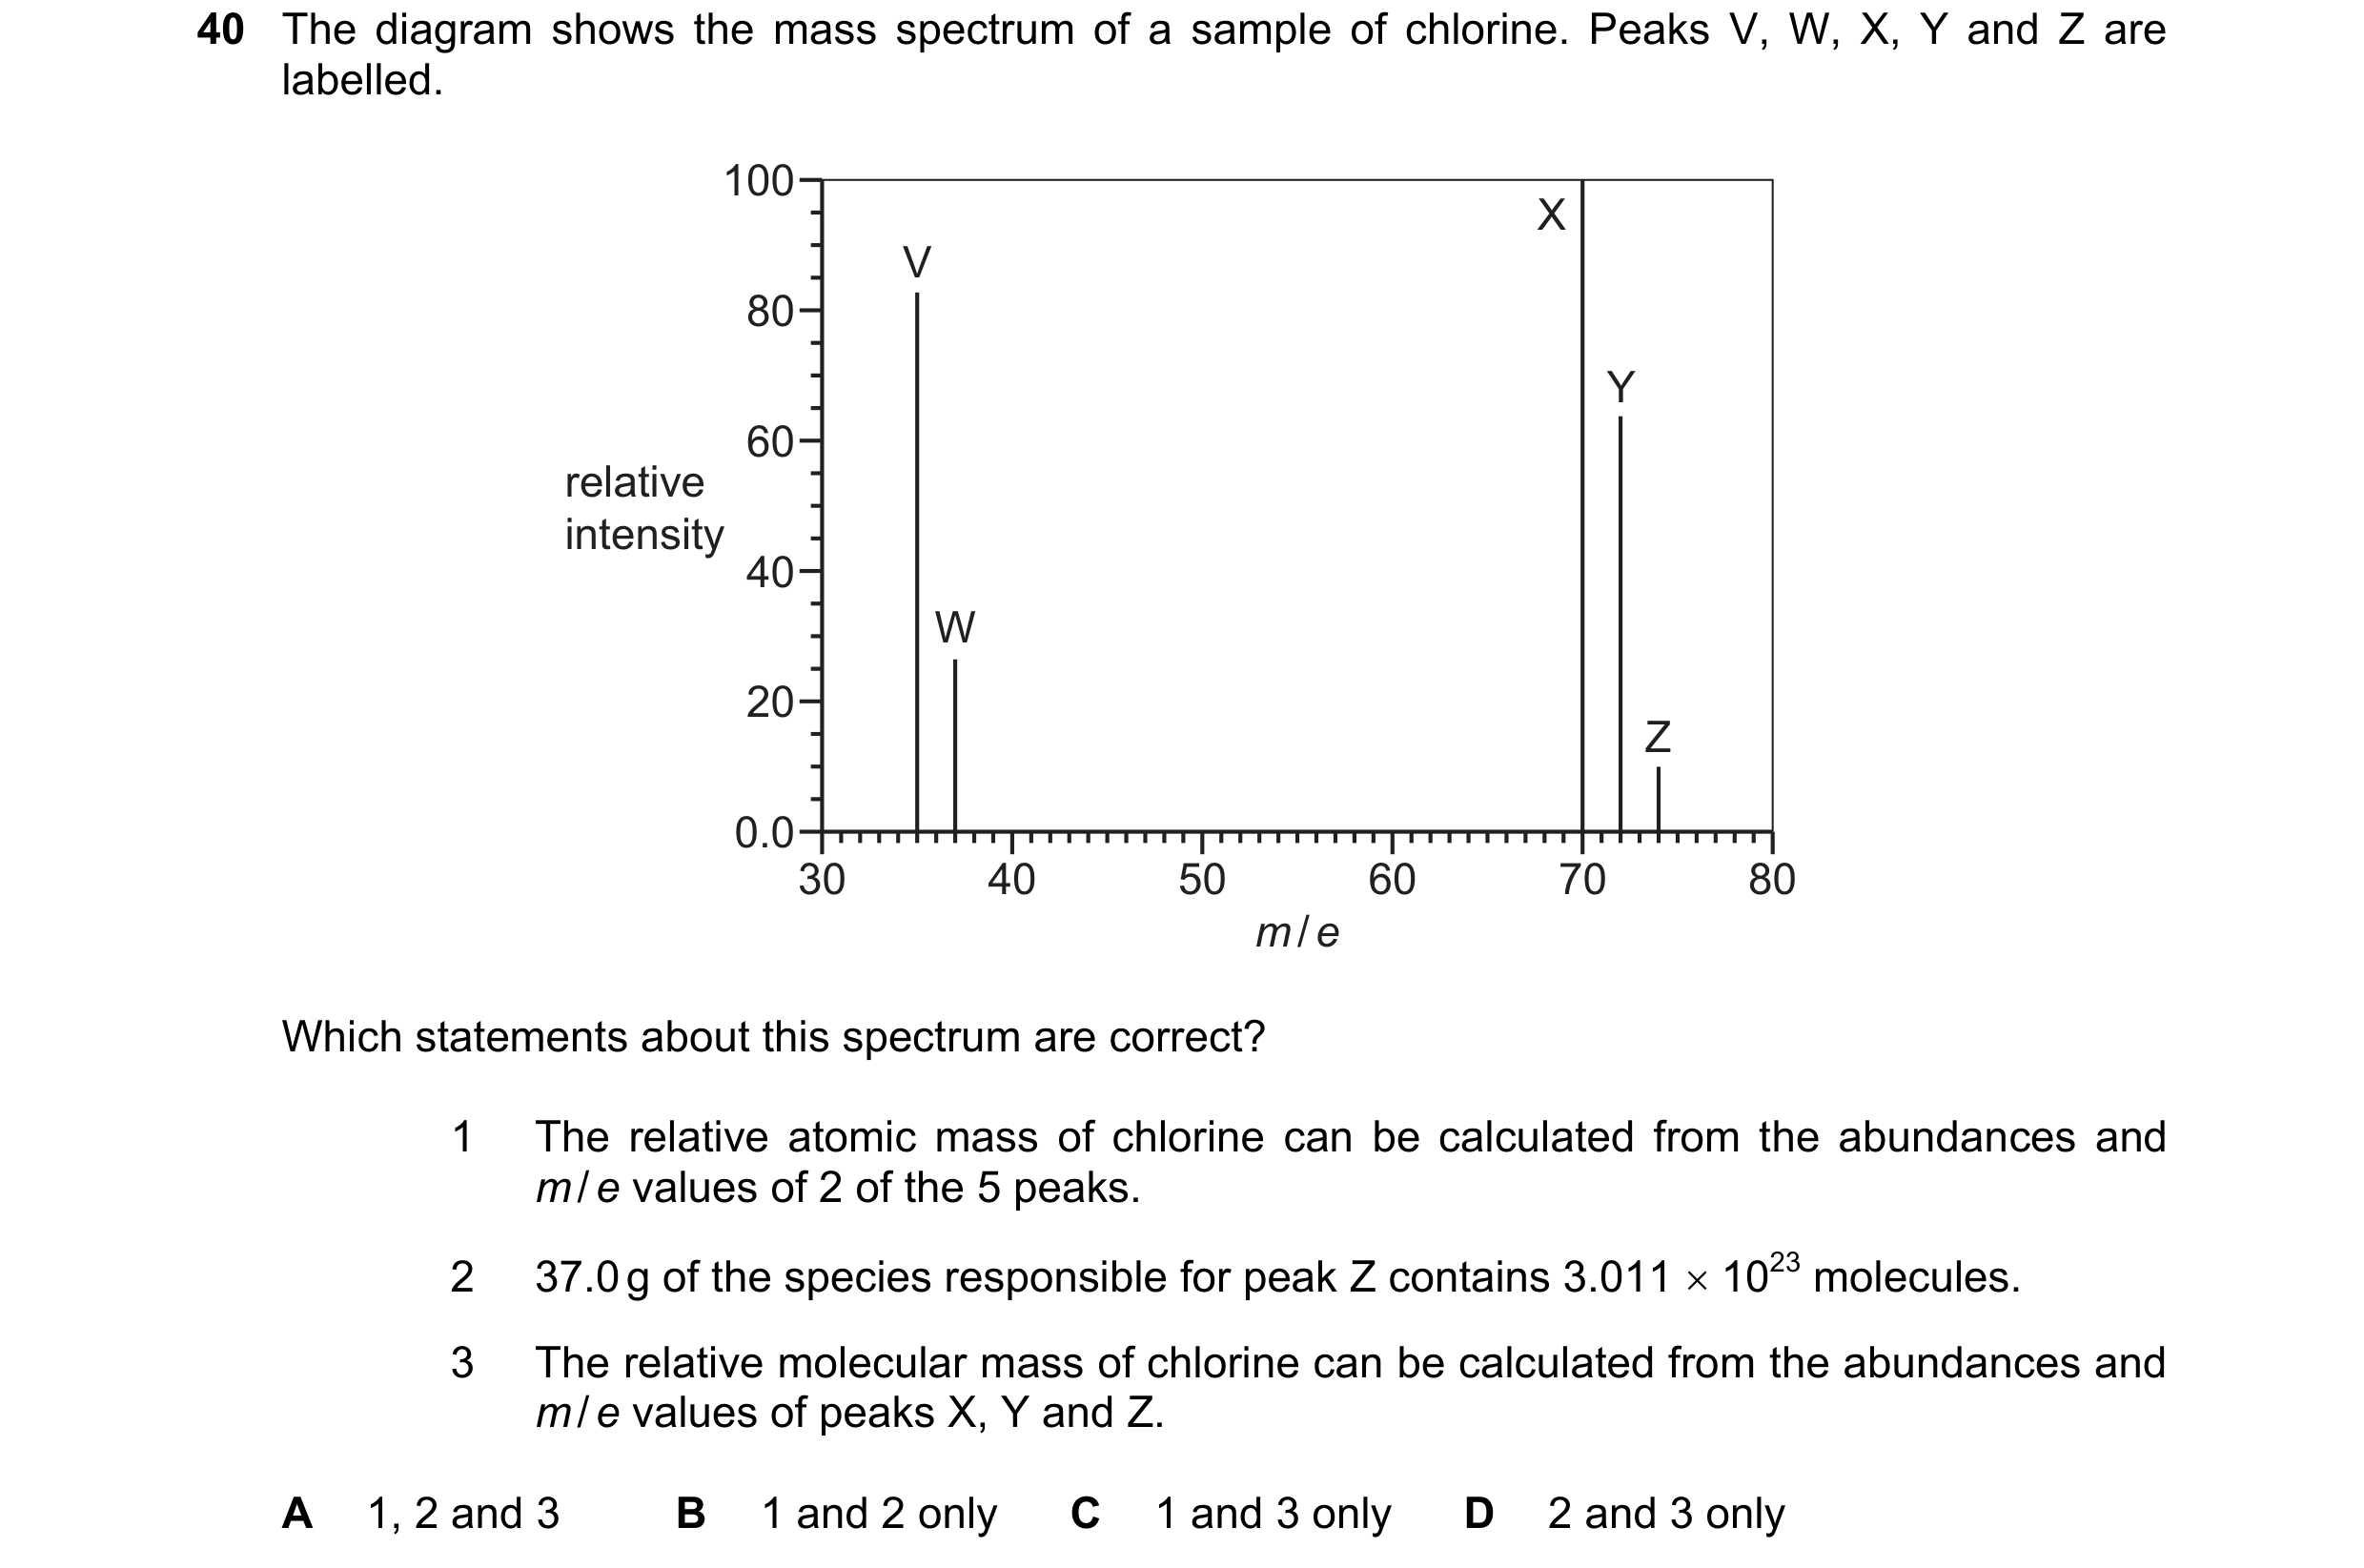
 7 / 8
7 / 8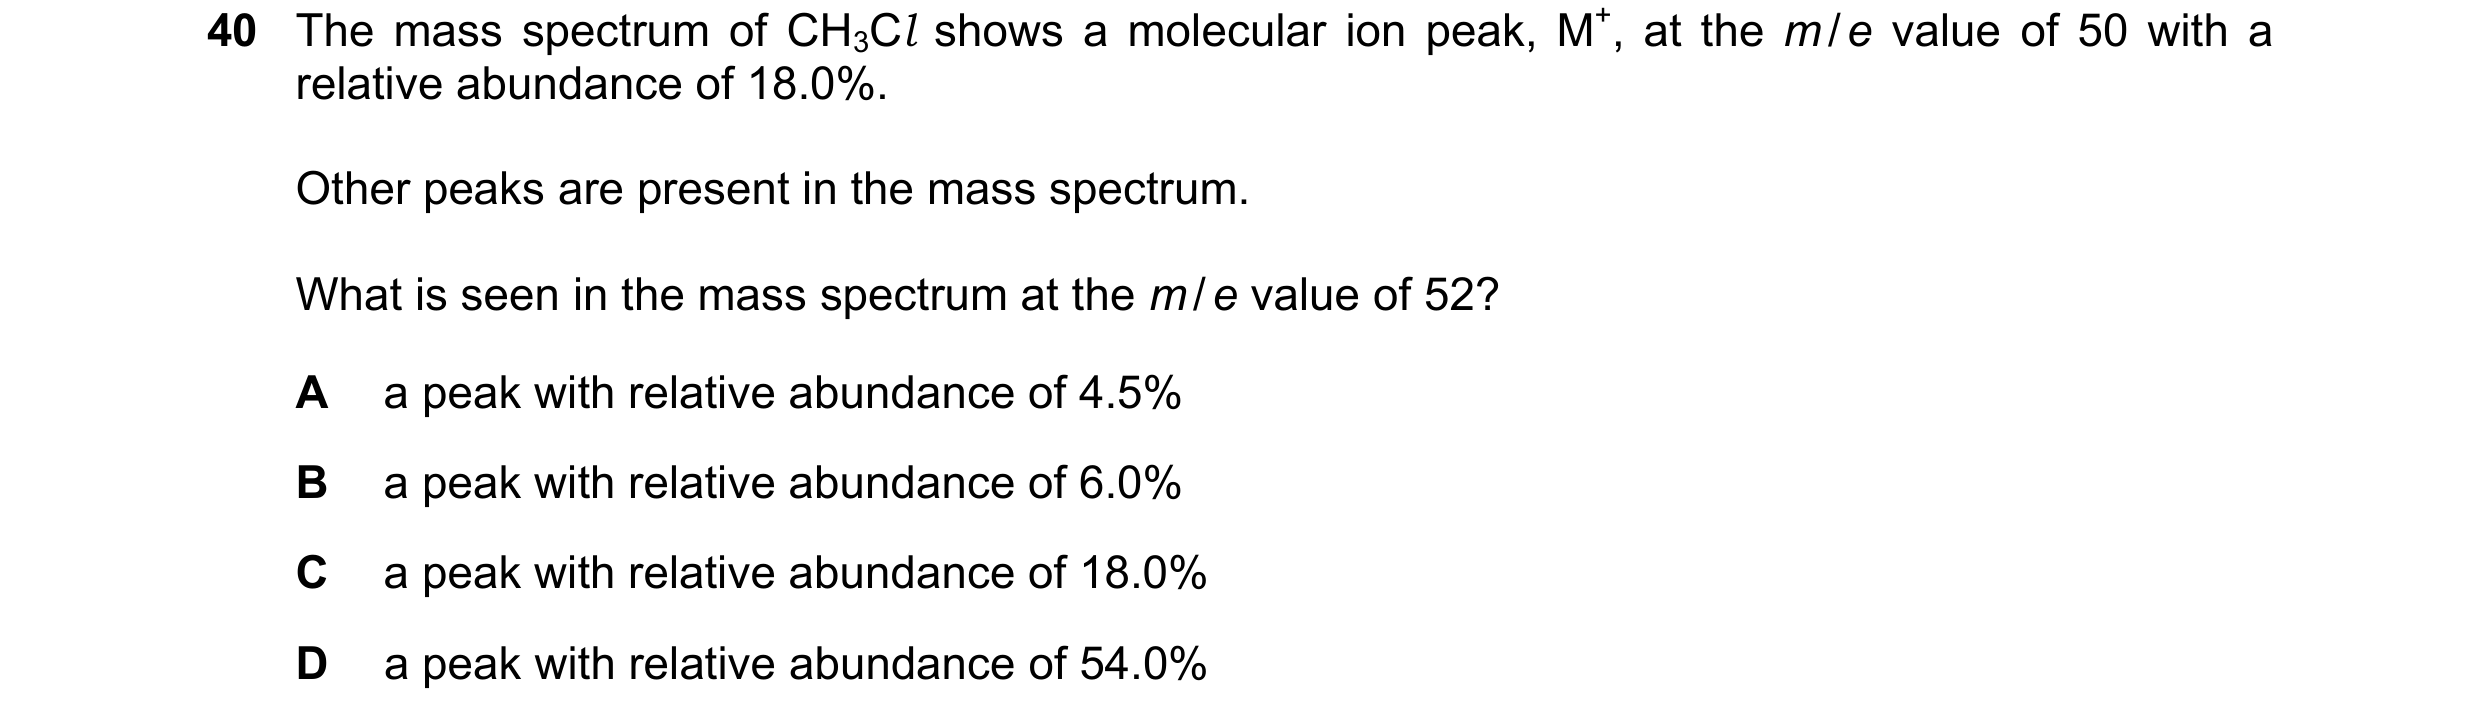
 8 / 8
8 / 8