Questions as text
Q1 · Two judges each give a mark out of ten for each dancer in a competition 0607/42 May/June 2017
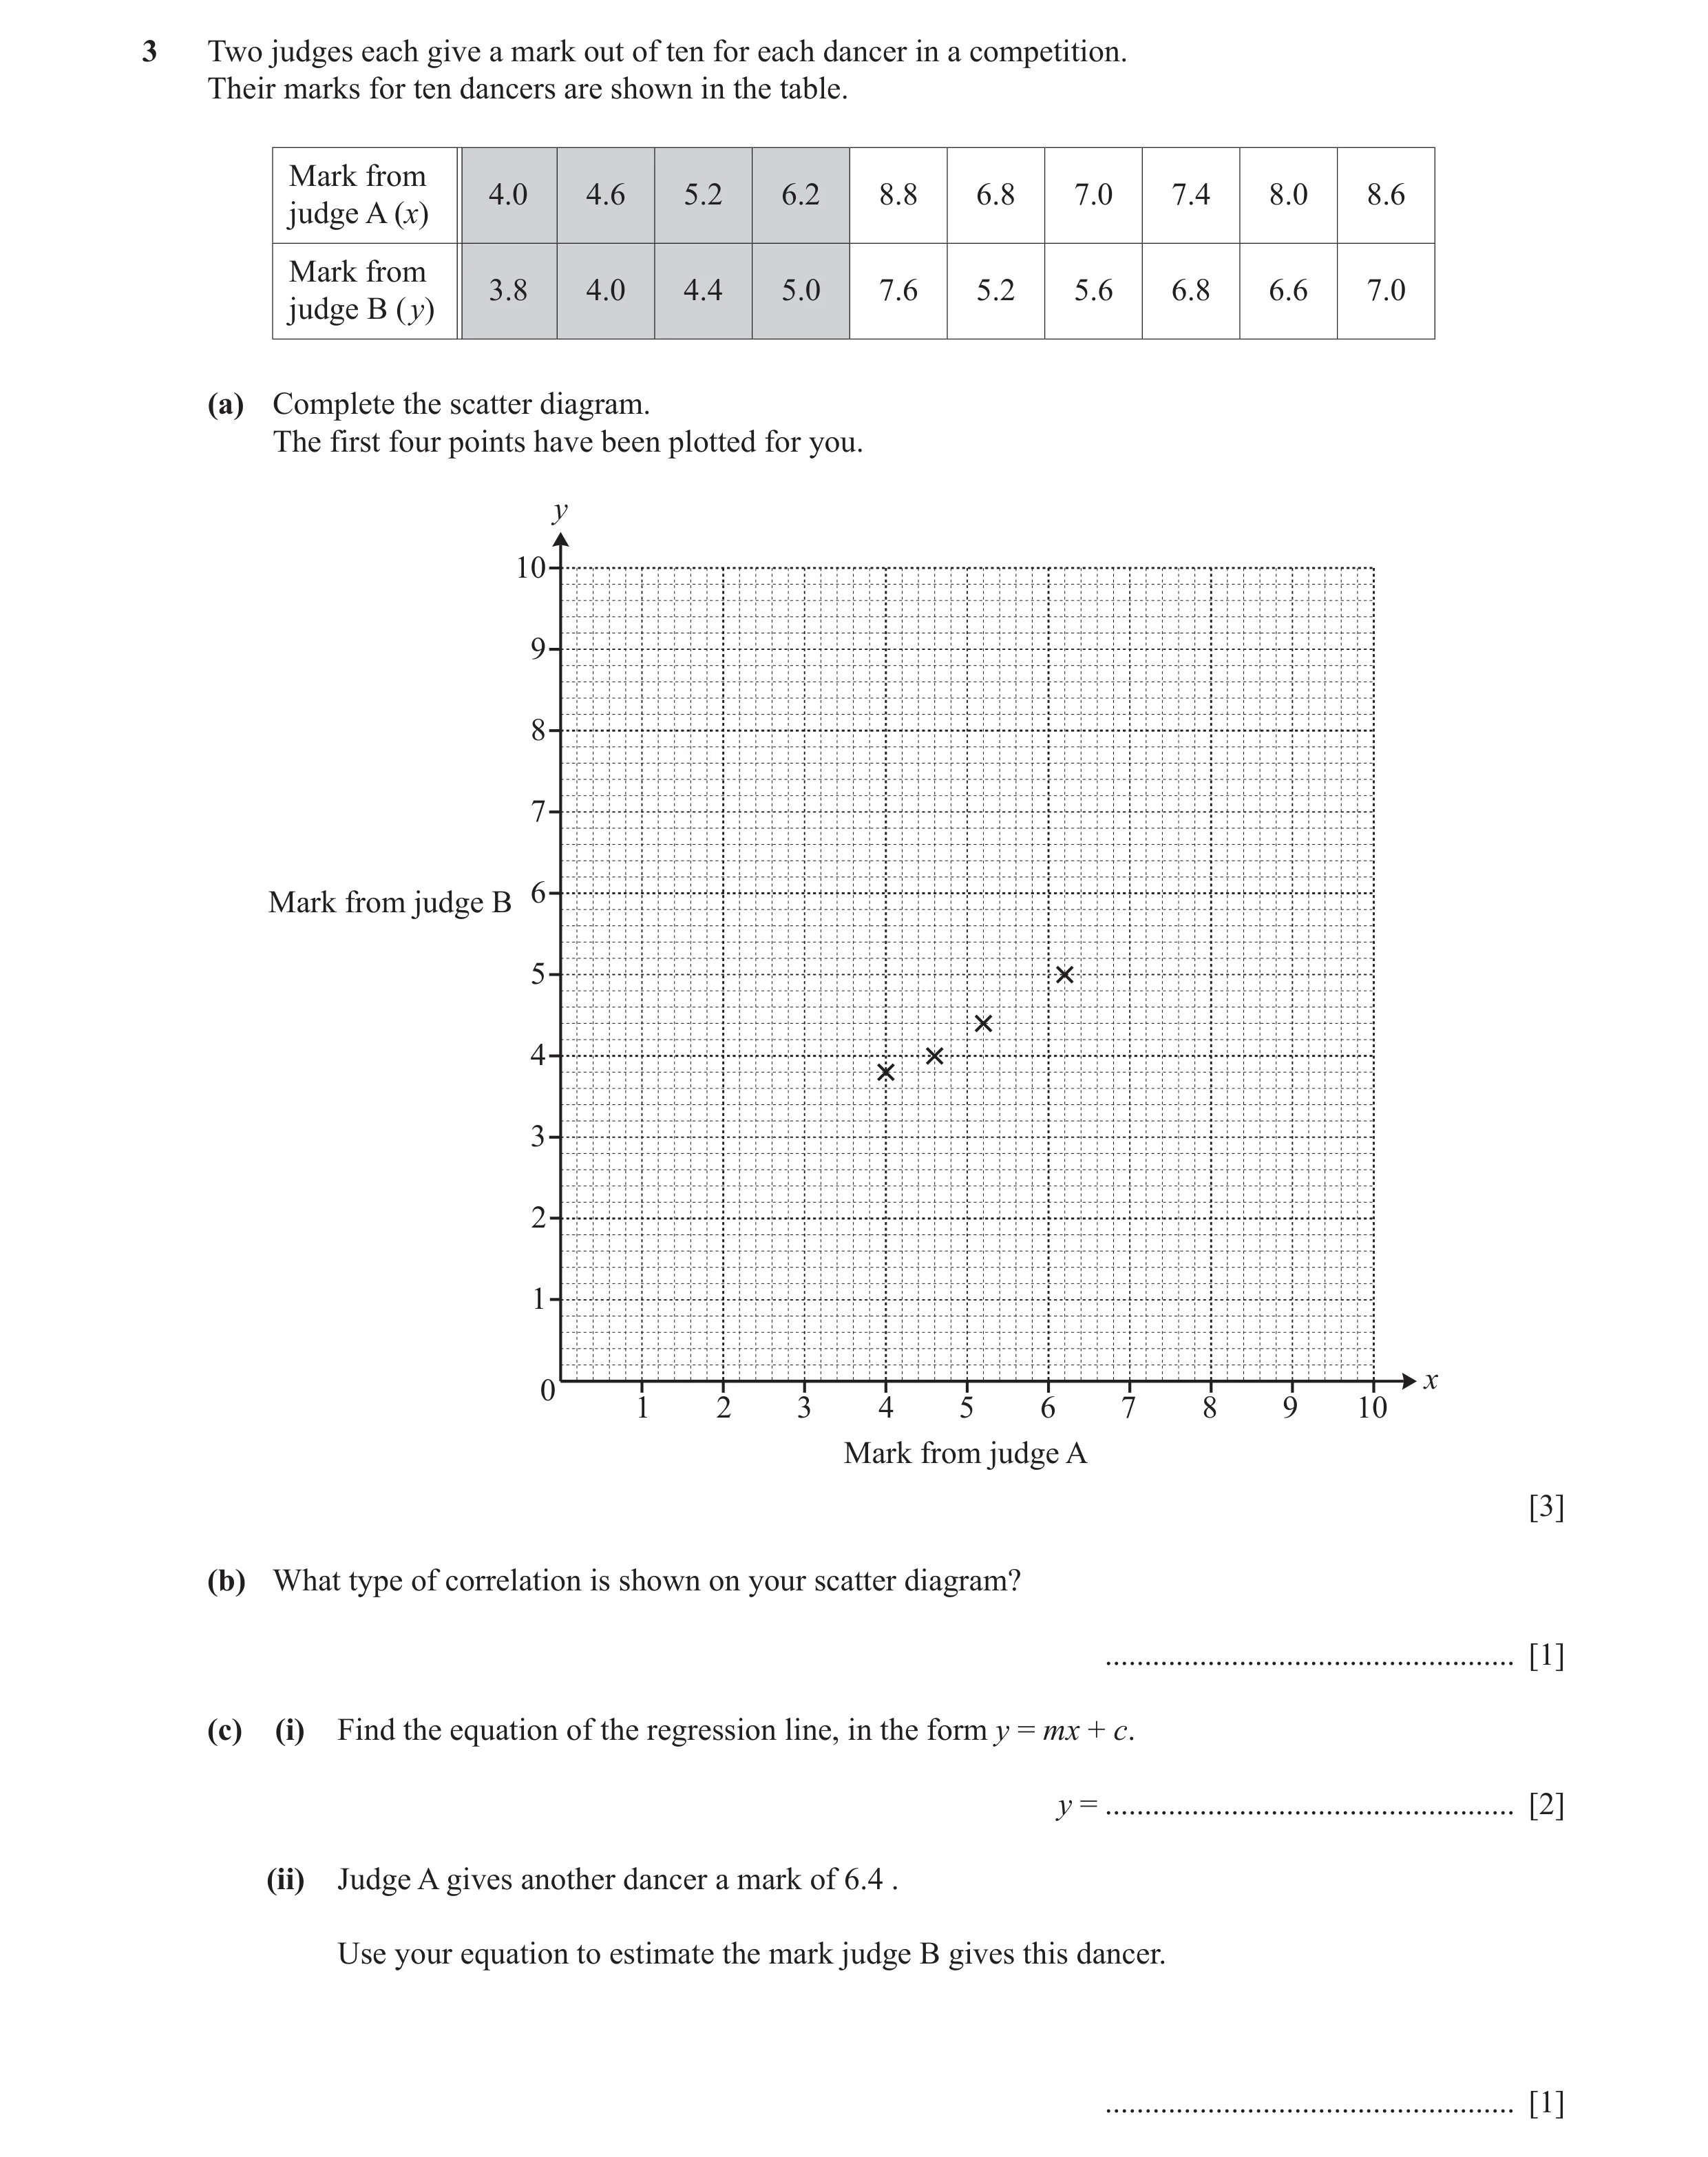
3 Two judges each give a mark out of ten for each dancer in a competition. Their marks for ten dancers are shown in the table. Mark from 4.0 4.6 5.2 6.2 8.8 6.8 7.0 7.4 8.0 8.6 judge A (x) Mark from 3.8 4.0 4.4 5.0 7.6 5.2 5.6 6.8 6.6 7.0 judge B (y) (a) Complete the scatter diagram. The first four points have been plotted for you. y 10 9 8 7 6 Mark from judge B 5 4 3 2 1 x 0 1 2 3 4 5 6 7 8 9 10 Mark from judge A [3] (b) What type of correlation is shown on your scatter diagram? … [1] (c) (i) Find the equation of the regression line, in the form y = mx + c. y = … [2] (ii) Judge A gives another dancer a mark of 6.4 . Use your equation to estimate the mark judge B gives this dancer. … [1]
7 marks
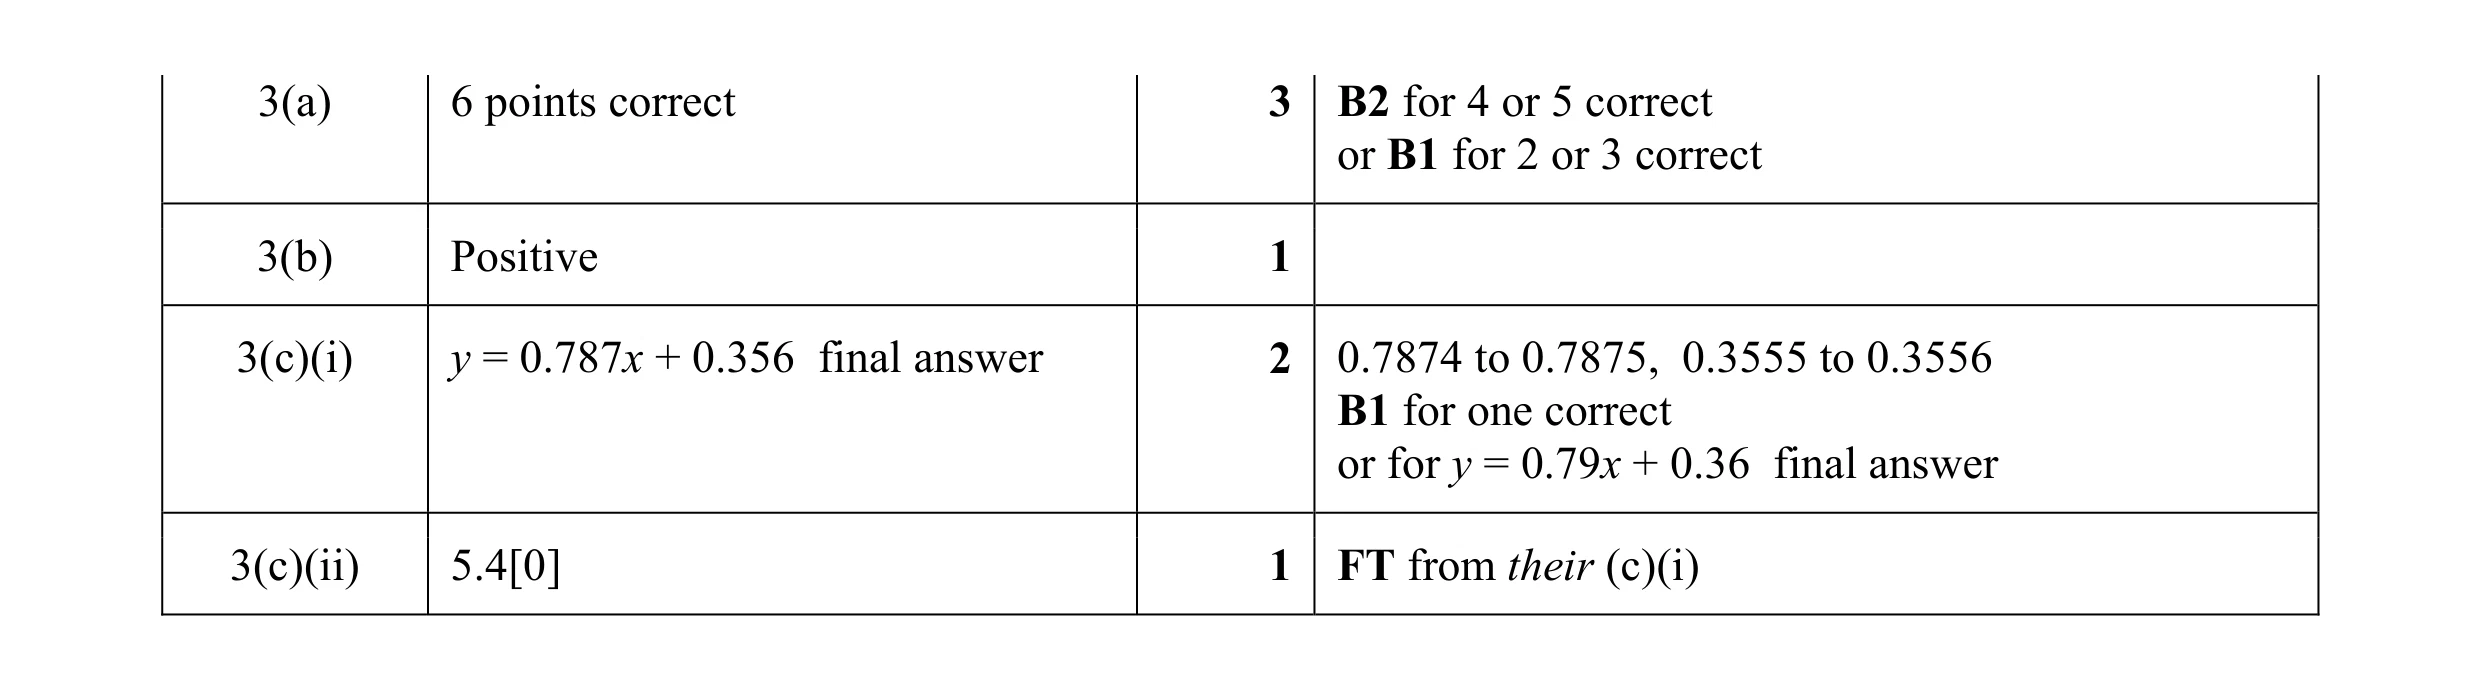
Mark scheme: 3(a) 6 points correct 3 B2 for 4 or 5 correct or B1 for 2 or 3 correct 3(b) Positive 1 3(c)(i) y = 0.787x + 0.356 final answer 2 0.7874 to 0.7875, 0.3555 to 0.3556 B1 for one correct or for y = 0.79x + 0.36 final answer 3(c)(ii) 5.4[0] 1 FT from their (c)(i)
This question in 0607/42 May/June 2017
Q2 · 12 students take part in a quiz 0607/43 May/June 2017
3 (a) 12 students take part in a quiz. The table shows the number of correct answers given by each student. Student A B C D E F G H I J K L Number of 7 6 9 5 6 4 7 8 4 10 9 3 correct answers Find (i) the median, … [1] (ii) the lower quartile, … [1] (iii) the number of students with a smaller number of correct answers than the lower quartile. … [1] (b) The table shows the average monthly temperature and the average monthly rainfall in Maseru, Lesotho. Month Jan Feb Mar Apr May Jun Jul Aug Sep Oct Nov Dec Temperature 21 21 19 15 11 8 8 11 15 17 19 21 (t ˚C) Rainfall (r mm) 113 102 99 59 28 12 12 14 27 62 83 88 (i) What type of correlation is there between the monthly temperature and the monthly rainfall? … [1] (ii) Find the range of these temperatures. … ˚C [1] (iii) Find the mean of these temperatures. … ˚C [1] (iv) Find the equation of the line of regression, giving r in terms of t. r = … [2] (v) On the diagram, sketch the graph of the regression line for 8 G t G 21. r 100 0 t 8 21 [2]
10 marks
Mark scheme: 3(a)(i) 6.5 1 3(a)(ii) 4.5 1 3(a)(iii) 3 1 3(b)(i) Positive 1 3(b)(ii) 13 1 3(b)(iii) 15.5 1 3(b)(iv) 7.32t – 55.3 2 (7.322 to 7.323)t – (55.25…) B1 for 7.32t + k or kt – 55.3 or SC1 for 7.3t − 55 3(b)(v) Correct line (positive gradient and not 2 B1 for positive gradient below the x-axis)
This question in 0607/43 May/June 2017
Q3 · Pepe wants to find out if there is a correlation between the hours of sunshine, x hours… 0607/43 Oct/Nov 2017
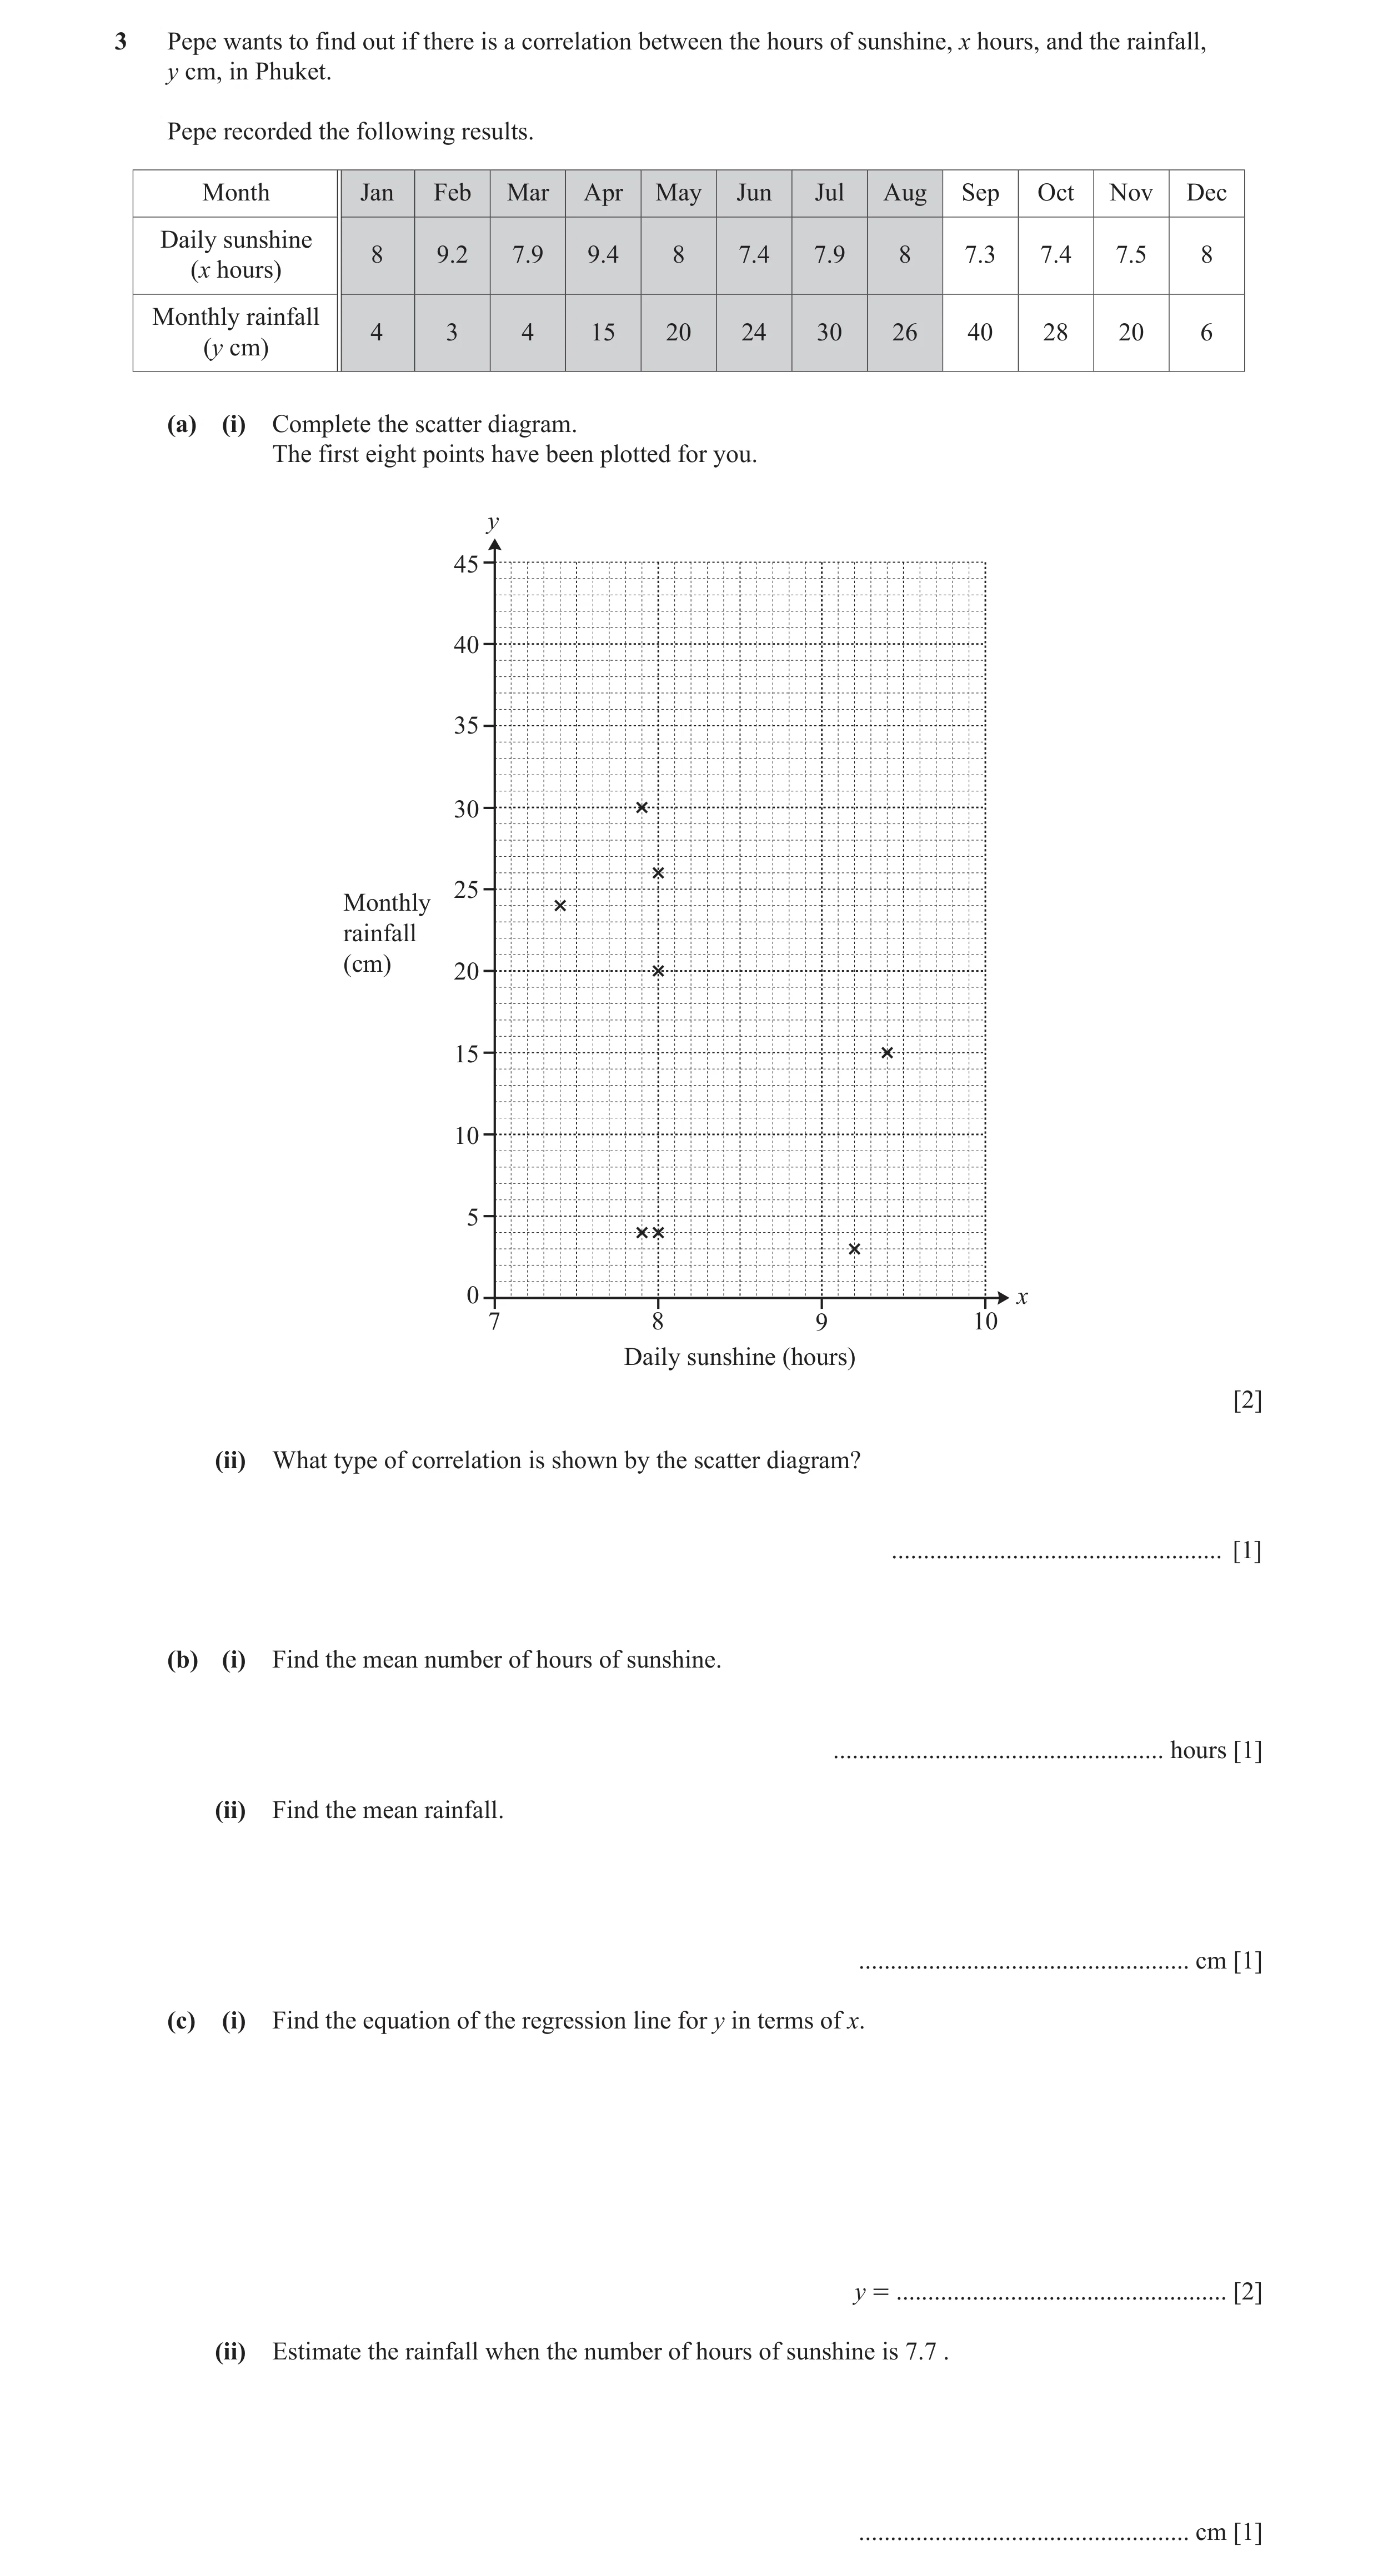
3 Pepe wants to find out if there is a correlation between the hours of sunshine, x hours, and the rainfall, y cm, in Phuket. Pepe recorded the following results. Month Jan Feb Mar Apr May Jun Jul Aug Sep Oct Nov Dec Daily sunshine 8 9.2 7.9 9.4 8 7.4 7.9 8 7.3 7.4 7.5 8 (x hours) Monthly rainfall 4 3 4 15 20 24 30 26 40 28 20 6 (y cm) (a) (i) Complete the scatter diagram. The first eight points have been plotted for you. y 45 40 35 30 25 Monthly rainfall (cm) 20 15 10 5 0 x 7 8 9 10 Daily sunshine (hours) [2] (ii) What type of correlation is shown by the scatter diagram? … [1] (b) (i) Find the mean number of hours of sunshine. … hours [1] (ii) Find the mean rainfall. … cm [1] (c) (i) Find the equation of the regression line for y in terms of x. y = … [2] (ii) Estimate the rainfall when the number of hours of sunshine is 7.7 . … cm [1]
8 marks
Mark scheme: 3(a)(i) Points correctly plotted 2 B1 for 2 or 3 correct points 3(a)(ii) Negative 1 3(b)(i) 8 1 3(b)(ii) 1 1 18.3 or 18.33 or 183 3(c)(i) y = 97 [.0 ] − 9.84 x 2 or 97.02... and –9.836... B1 for 97[.0] + kx, or a – 9.84x, If 0 scored SC1 for 97 – 9.8x 3(c)(ii) 21.2 to 21.3 or 21 1 Strict FT their (c)(i) provided a linear expression
This question in 0607/43 Oct/Nov 2017
Q4 · Wasim sprays different amounts of fertiliser on some seedlings 0607/42 May/June 2018
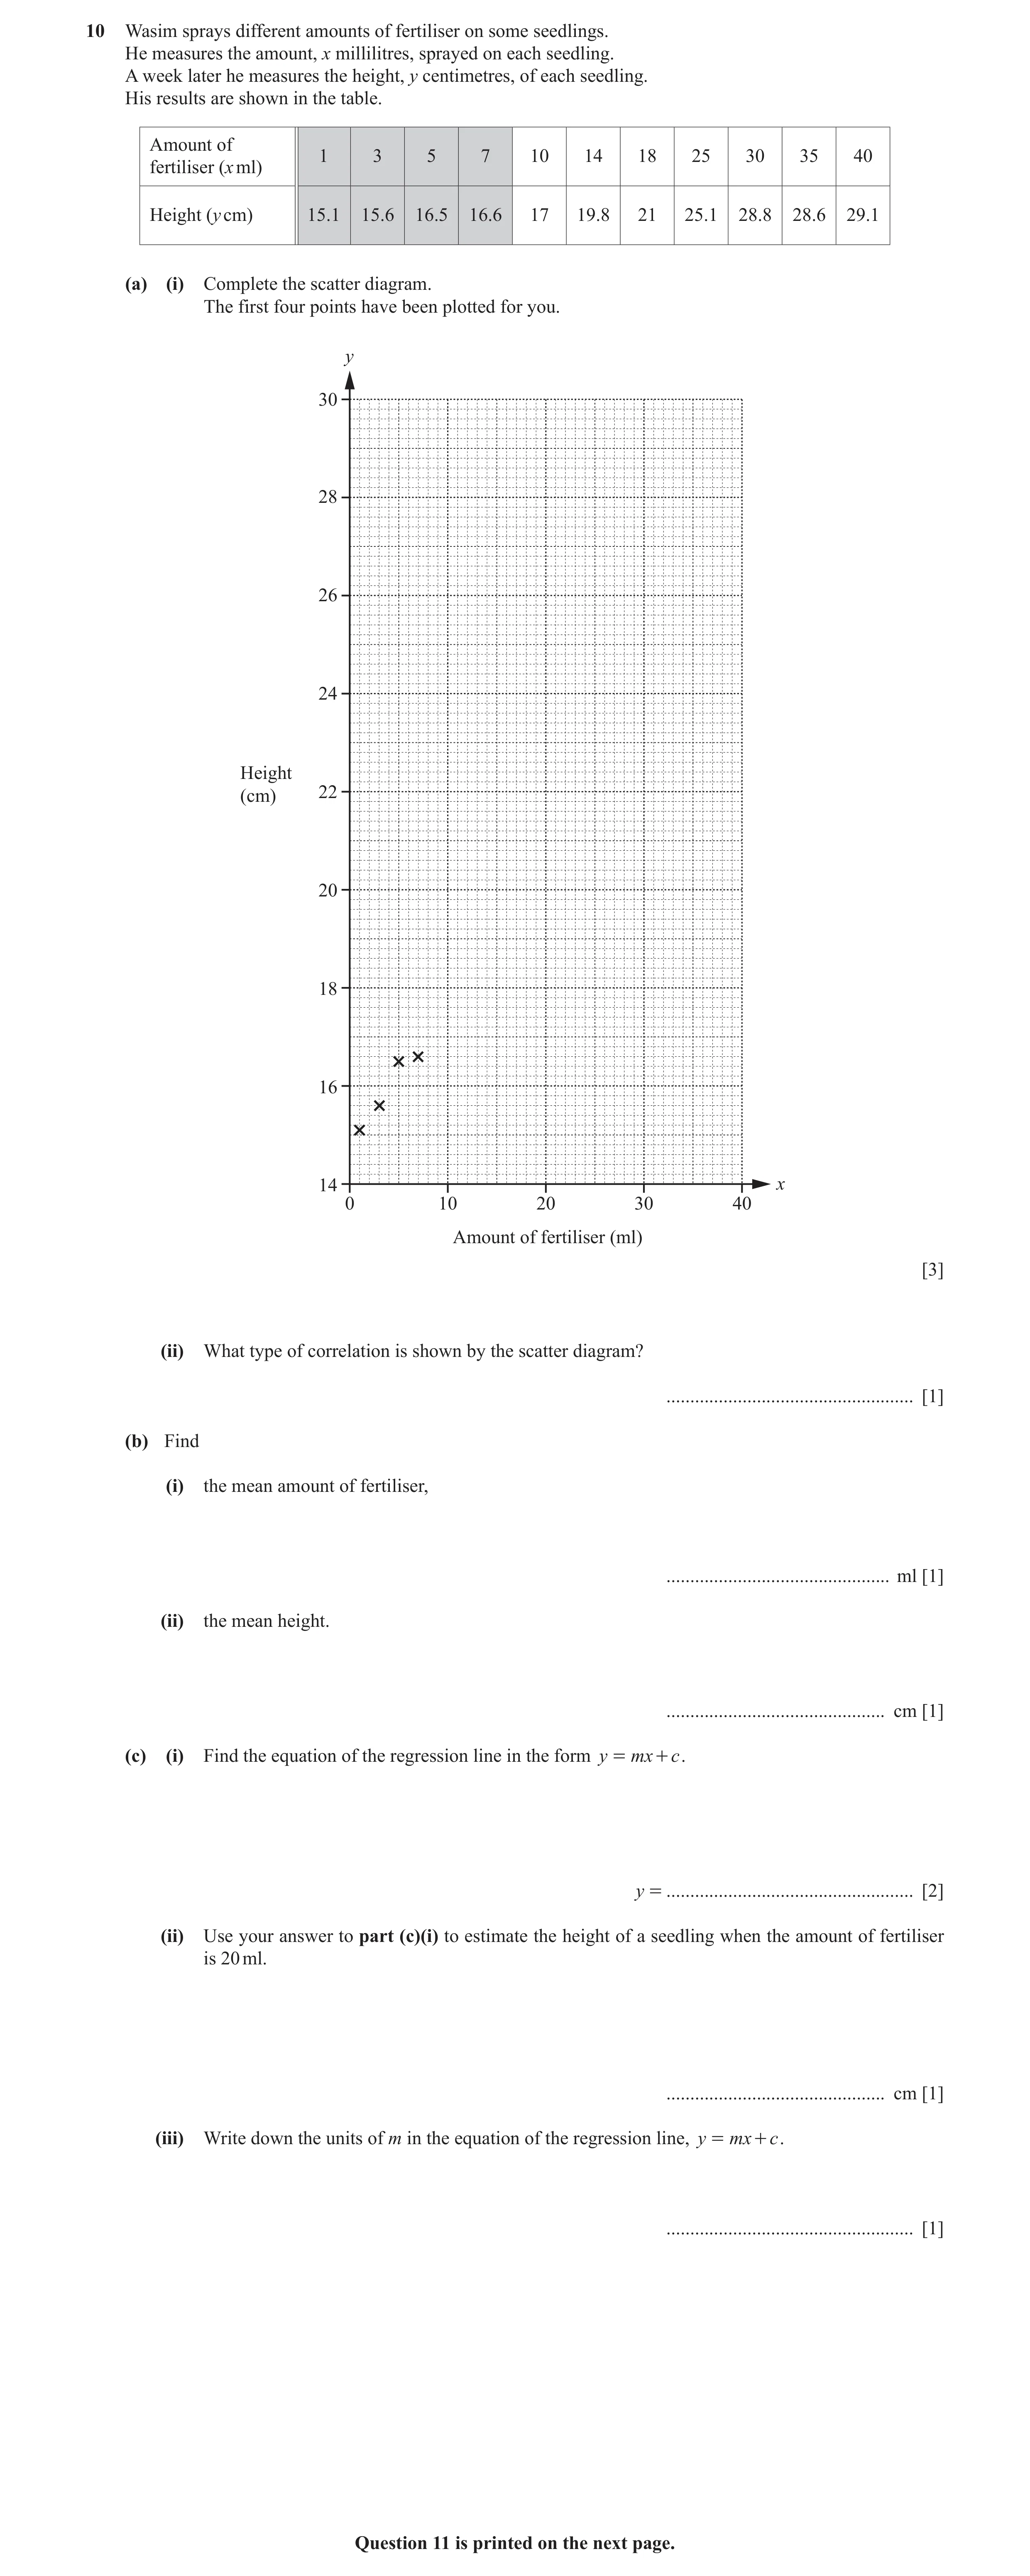
10 Wasim sprays different amounts of fertiliser on some seedlings. He measures the amount, x millilitres, sprayed on each seedling. A week later he measures the height, y centimetres, of each seedling. His results are shown in the table. Amount of 1 3 5 7 10 14 18 25 30 35 40 fertiliser (x ml) Height (y cm) 15.1 15.6 16.5 16.6 17 19.8 21 25.1 28.8 28.6 29.1 (a) (i) Complete the scatter diagram. The first four points have been plotted for you. y 30 28 26 24 Height (cm) 22 20 18 16 14 x 0 10 20 30 40 Amount of fertiliser (ml) [3] (ii) What type of correlation is shown by the scatter diagram? … [1] (b) Find (i) the mean amount of fertiliser, … ml [1] (ii) the mean height. … cm [1] (c) (i) Find the equation of the regression line in the form y = mx + c . y = … [2] (ii) Use your answer to part (c)(i) to estimate the height of a seedling when the amount of fertiliser is 20 ml. … cm [1] (iii) Write down the units of m in the equation of the regression line, y = mx + c . … [1] Question 11 is printed on the next page.
10 marks
Mark scheme: 10(a)(i) Points correctly plotted 3 B2 for 5 or 6 correct points B1 for 3 or 4 correct points 10(a)(ii) Positive 1 10(b)(i) 17.1 or 17.09… 1 10(b)(ii) 21.2 1 10(c)(i) y = 14.2 + 0.411x 2 B1 for 14.2 + kx or a + 0.411x If 0 scored, SC1 for 14 + 0.41x 10(c)(ii) 22.4 or 22.39 to 22.42 1 FT their (c)(i) 10(c)(iii) cm/ml oe 1
This question in 0607/42 May/June 2018
Q5 · Hamid records the population density, p persons/km2, in ten regions of the city in which… 0607/43 May/June 2018
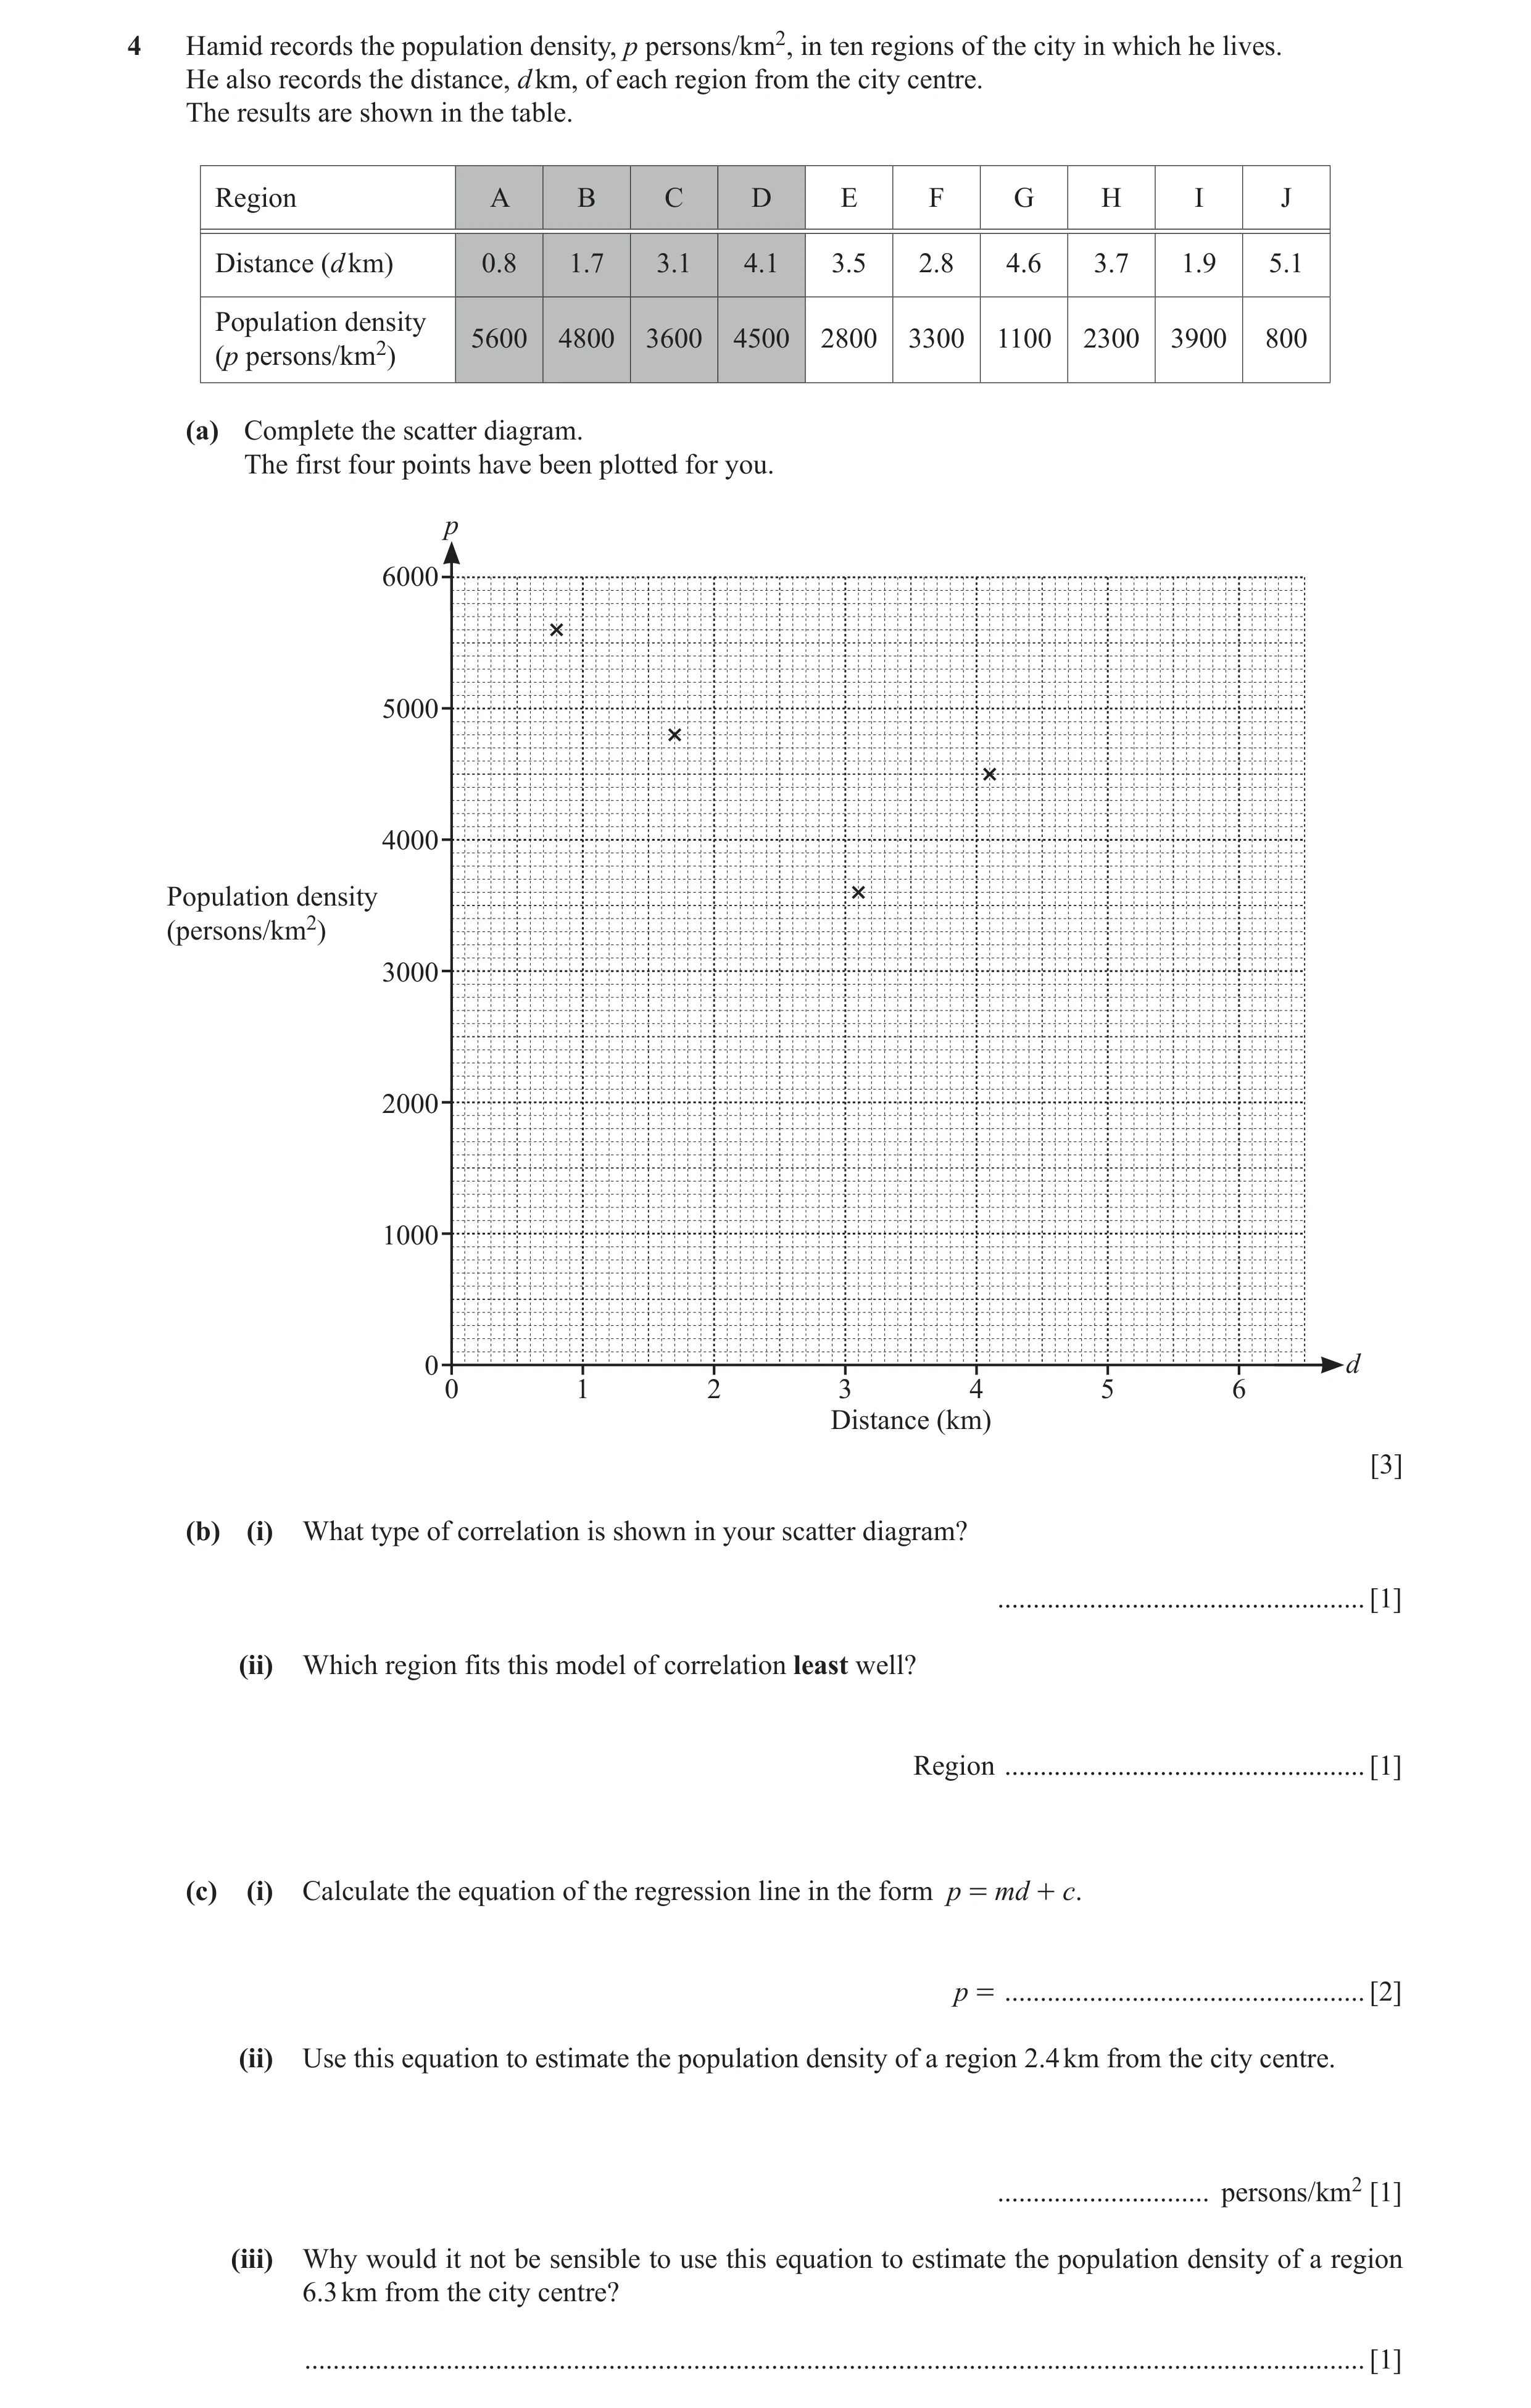
4 Hamid records the population density, p persons/km2, in ten regions of the city in which he lives. He also records the distance, d km, of each region from the city centre. The results are shown in the table. Region A B C D E F G H I J Distance (d km) 0.8 1.7 3.1 4.1 3.5 2.8 4.6 3.7 1.9 5.1 Population density 5600 4800 3600 4500 2800 3300 1100 2300 3900 800 (p persons/km2) (a) Complete the scatter diagram. The first four points have been plotted for you. p 6000 5000 4000 Population density (persons/km2) 3000 2000 1000 0 d 0 1 2 3 4 5 6 Distance (km) [3] (b) (i) What type of correlation is shown in your scatter diagram? … [1] (ii) Which region fits this model of correlation least well? Region … [1] (c) (i) Calculate the equation of the regression line in the form p = md + c. p = … [2] (ii) Use this equation to estimate the population density of a region 2.4 km from the city centre. … persons/km2 [1] (iii) Why would it not be sensible to use this equation to estimate the population density of a region 6.3 km from the city centre? … [1]
9 marks
Mark scheme: 4(a) 6 points plotted correctly 3 B2 for 4 or 5 correct or B1 for 2 or 3 correct 4(b)(i) Negative 1 4(b)(ii) D 1 4(c)(i) p = –967d + 6300 2 or (–967.4 to –967.3)d + 6297 to 6298 or B1 for –967d + k or kd + 6300 4(c)(ii) 3980 or 4000 or 3975 to 3980 1 FT 4(c)(iii) [Too] far outside range of data oe 1
This question in 0607/43 May/June 2018
Q6 · The table shows the marks of 10 students in a physics examination and a chemistry… 0607/43 May/June 2019
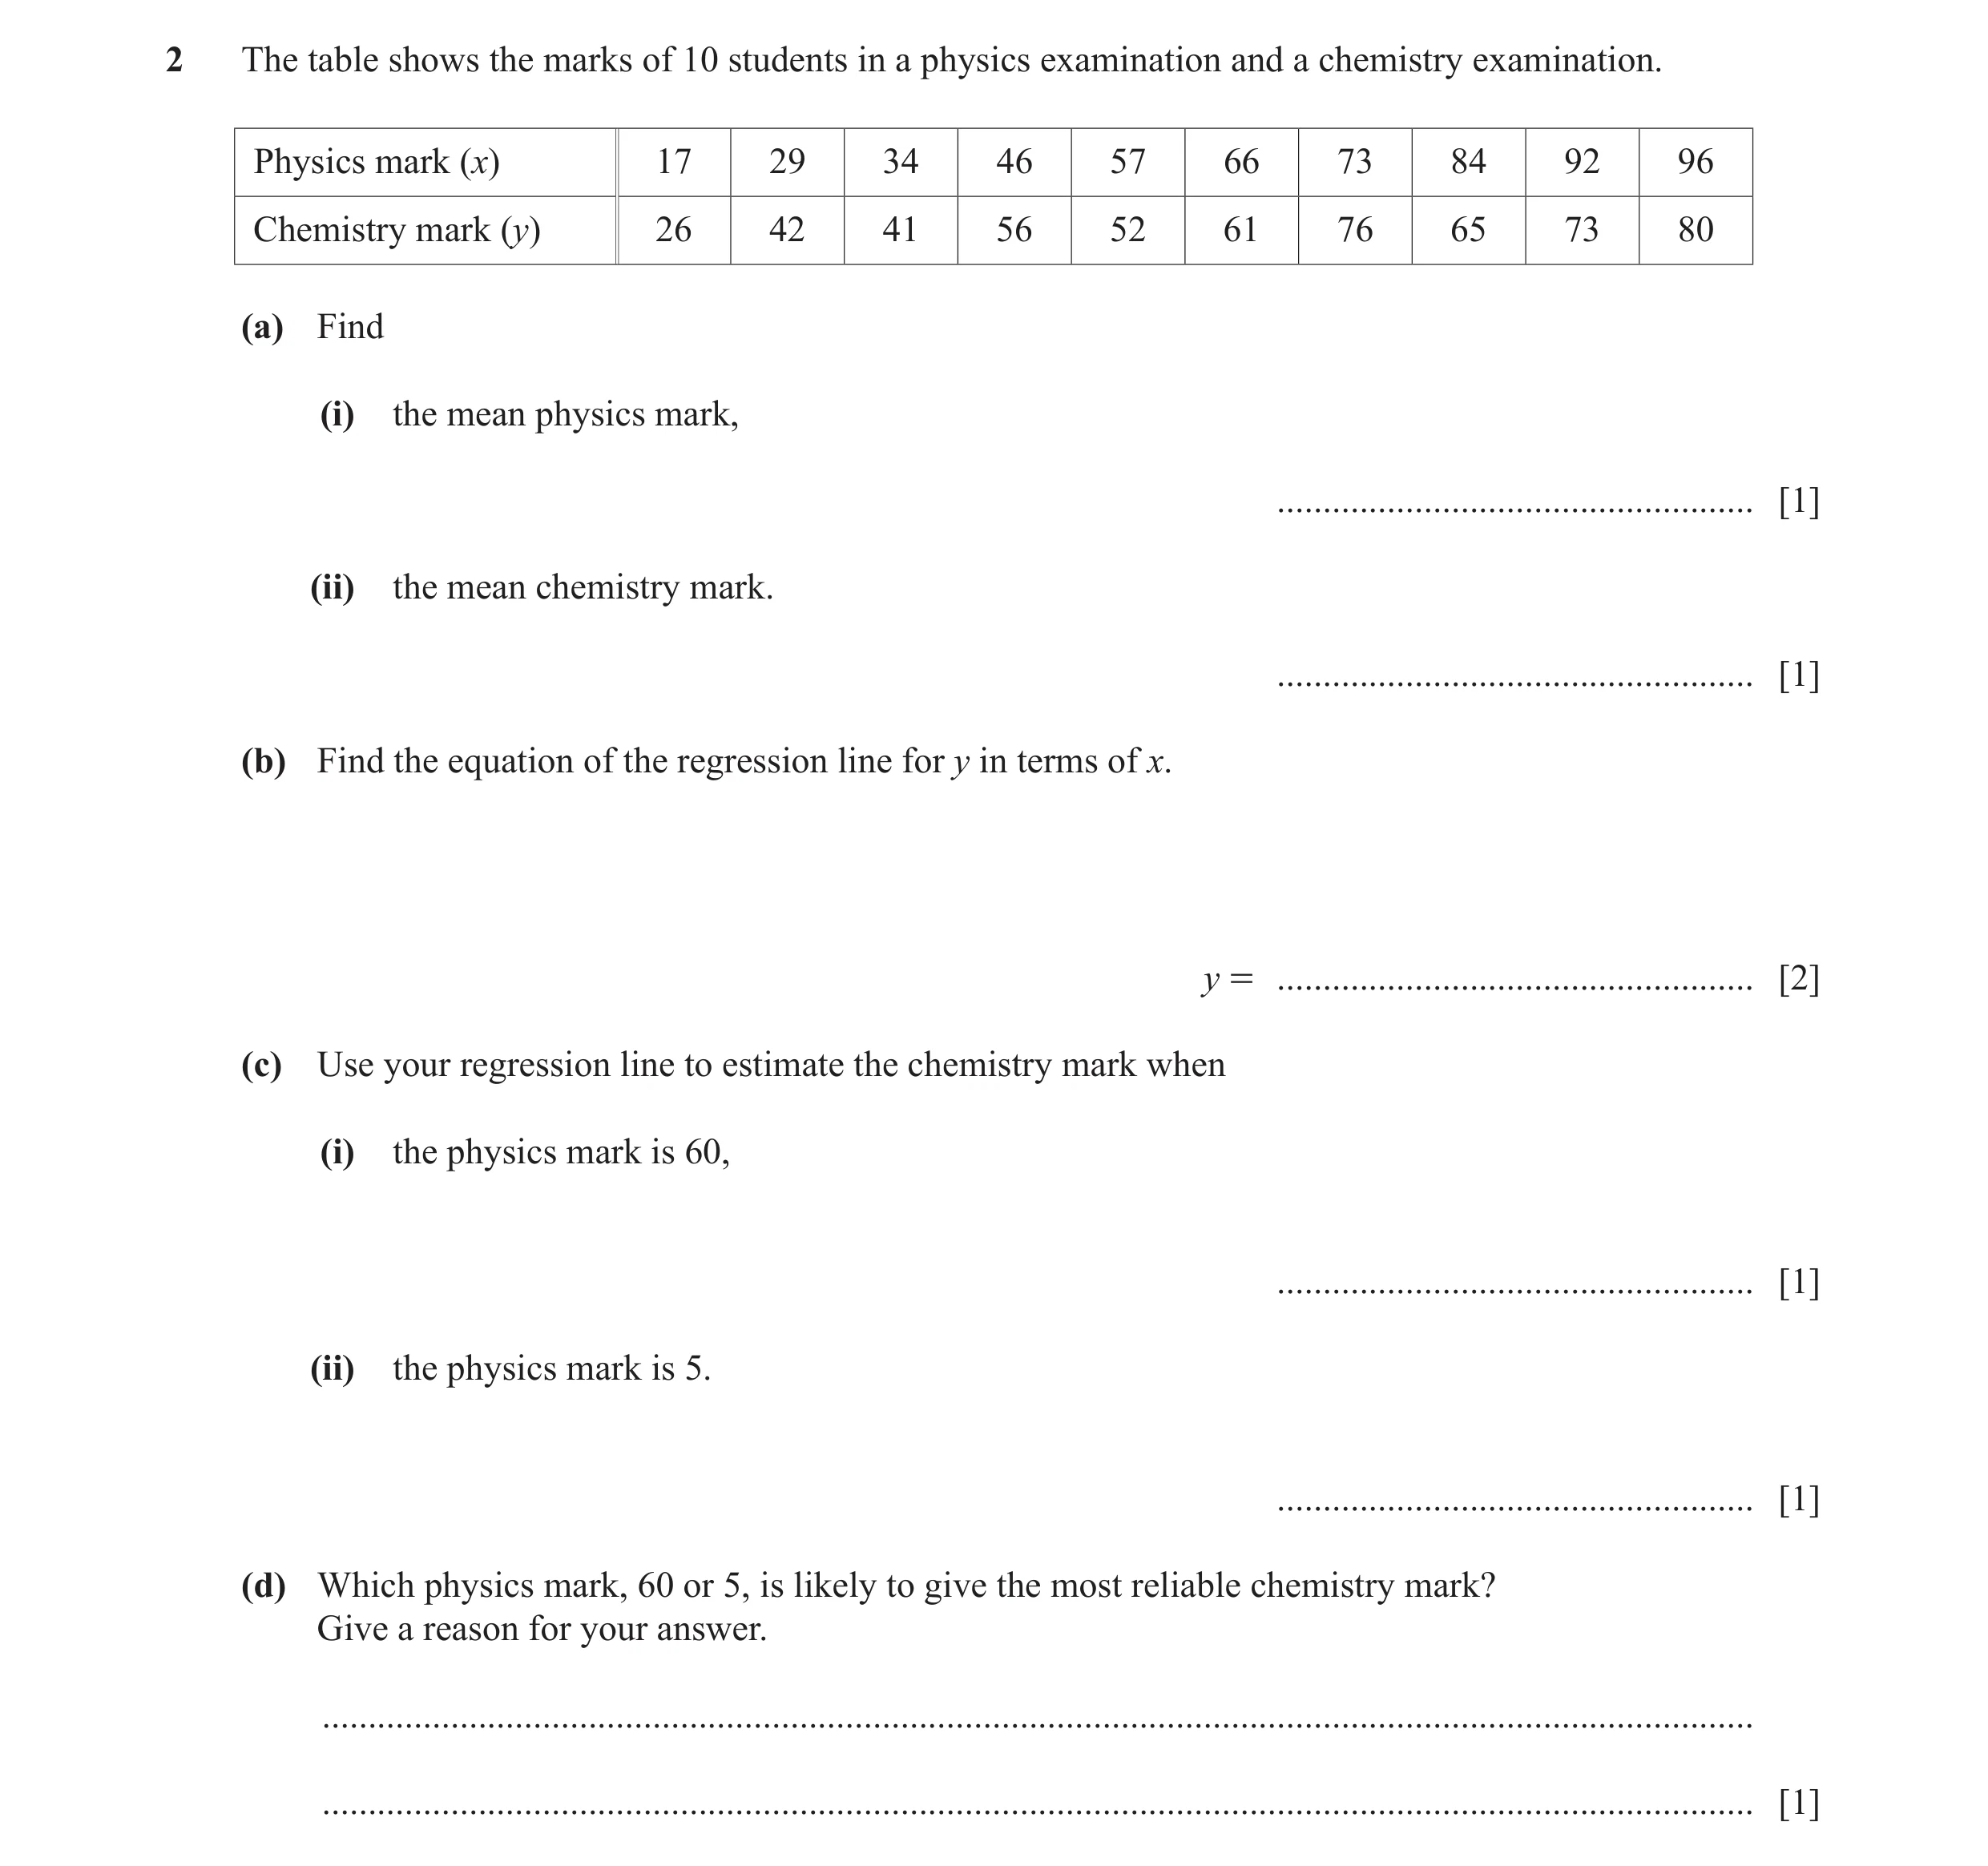
2 The table shows the marks of 10 students in a physics examination and a chemistry examination. Physics mark (x) 17 29 34 46 57 66 73 84 92 96 Chemistry mark (y) 26 42 41 56 52 61 76 65 73 80 (a) Find (i) the mean physics mark, … [1] (ii) the mean chemistry mark. … [1] (b) Find the equation of the regression line for y in terms of x. y = … [2] (c) Use your regression line to estimate the chemistry mark when (i) the physics mark is 60, … [1] (ii) the physics mark is 5. … [1] (d) Which physics mark, 60 or 5, is likely to give the most reliable chemistry mark? Give a reason for your answer. … … [1]
7 marks
Mark scheme: 2(a)(i) 59.4 1 2(a)(ii) 57.2 1 2(b) [ y = ] 21.8 + 0.596 x 2 B1 for [ y = ] 21.8 + kx or [ y = ] k + 0.596 x or 22 + 0.6[0]x 2(c)(i) 58 or 57.5 to 57.8 1 FT their (b) 2(c)(ii) 25 or 24.8 or 24.75 to 24.78 1 FT their (b) 2(d) 60 1 Both needed Data within range oe
This question in 0607/43 May/June 2019
Q7 · The table shows the mathematics mark and the physics mark for each of 10 students in an… 0607/43 Oct/Nov 2019
4 The table shows the mathematics mark and the physics mark for each of 10 students in an examination. Mathematics 14 28 38 41 60 66 76 82 90 98 mark (m) Physics 8 28 66 43 67 56 51 74 85 88 mark (p) (a) Complete the scatter diagram. The first five points have been plotted for you. p 100 90 80 70 60 Physics mark 50 40 30 20 10 0 m 0 10 20 30 40 50 60 70 80 90 100 Mathematics mark [2] (b) Write down the type of correlation shown by the scatter diagram. … [1] (c) Find the equation of the regression line. Write the answer in the form p = am + b . p = … [2] (d) A student was absent for the physics examination but gained 56 marks in the mathematics examination. Use your answer to part (c) to estimate a physics mark for this student. … [1] (e) The school decided that the physics examination was too difficult and added 5 marks to each of the physics marks. Write down the new equation of the regression line. … [1]
7 marks
Mark scheme: 4(a) 5 points plotted correctly 2 B1 for 3 or 4 points correct 4(b) Positive 1 4(c) p = 0.78[0]m + 10.4 2 0.7798 to 0.7799, 10.35... B1 for p = 0.780m + c or p = km + 10.4 4(d) 54 1 FT their 0.780 × 56 + their 10.4 4(e) [p =] 0.78[0]m + 15.4 oe 1 FT their (c)
This question in 0607/43 Oct/Nov 2019
Q8 · Petra is a singer 0607/42 May/June 2020
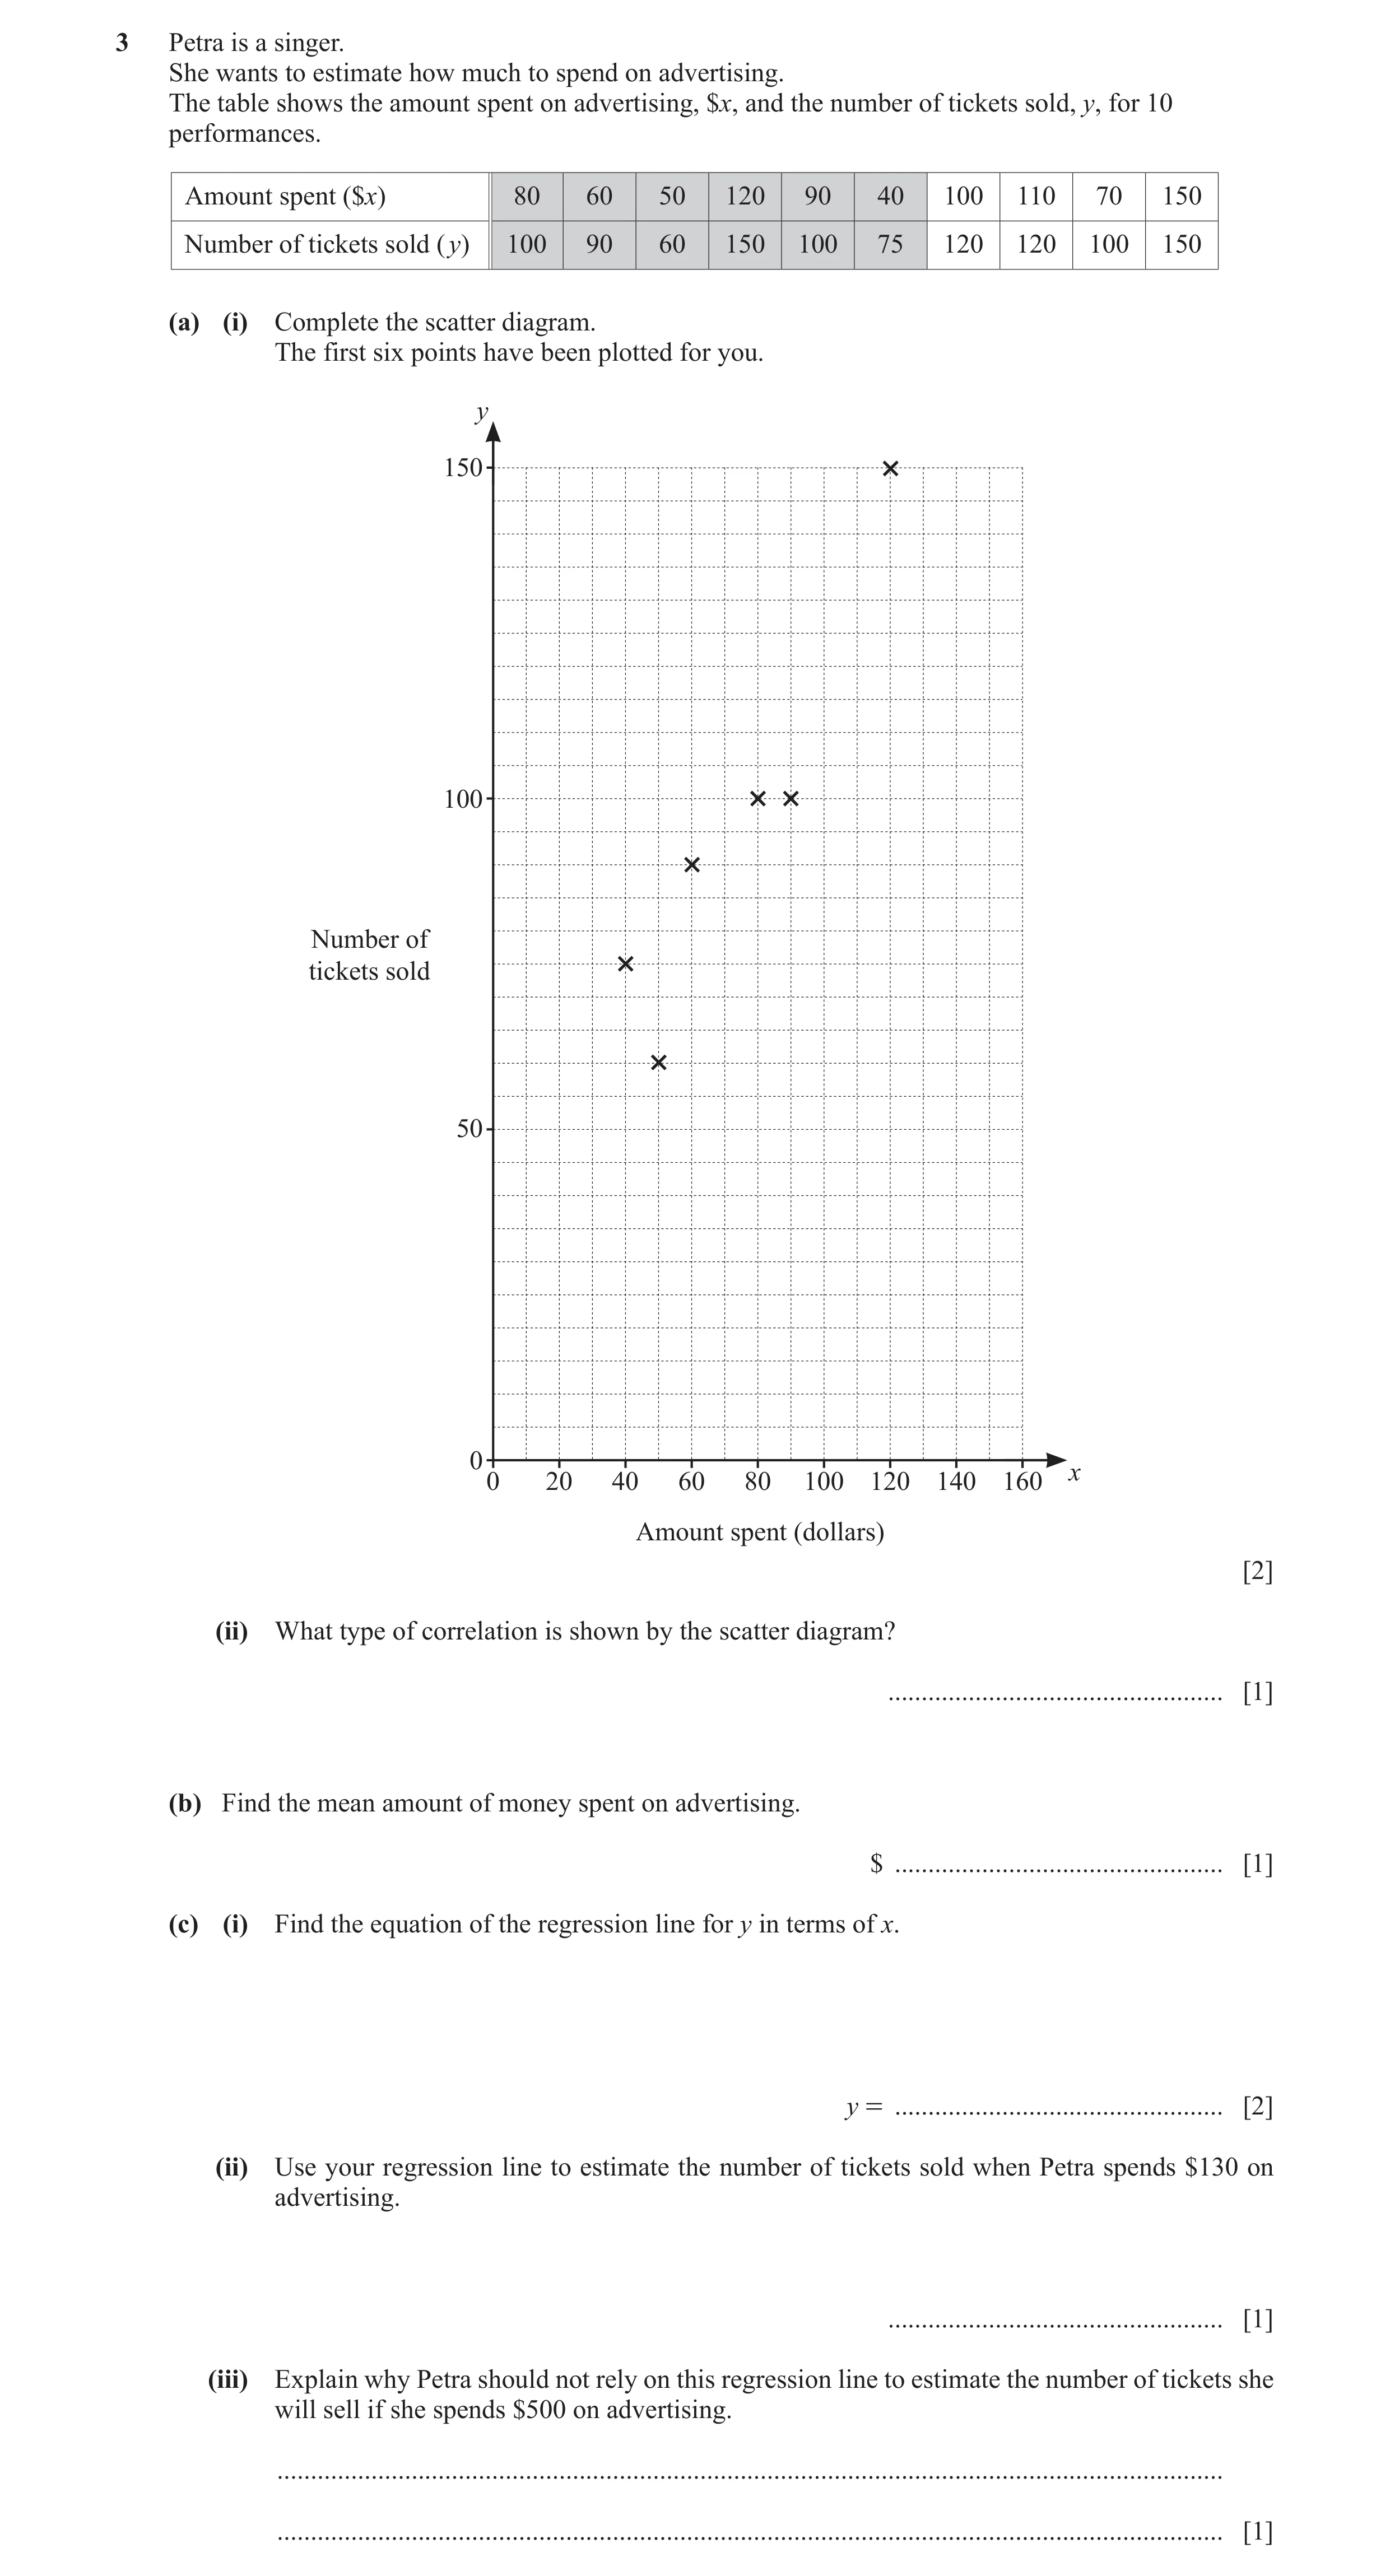
3 Petra is a singer. She wants to estimate how much to spend on advertising. The table shows the amount spent on advertising, $x, and the number of tickets sold, y, for 10 performances. Amount spent ($x) 80 60 50 120 90 40 100 110 70 150 Number of tickets sold ( y) 100 90 60 150 100 75 120 120 100 150 (a) (i) Complete the scatter diagram. The first six points have been plotted for you. y 150 100 Number of tickets sold 50 0 x 0 20 40 60 80 100 120 140 160 Amount spent (dollars) [2] (ii) What type of correlation is shown by the scatter diagram? … [1] (b) Find the mean amount of money spent on advertising. $ … [1] (c) (i) Find the equation of the regression line for y in terms of x. y = … [2] (ii) Use your regression line to estimate the number of tickets sold when Petra spends $130 on advertising. … [1] (iii) Explain why Petra should not rely on this regression line to estimate the number of tickets she will sell if she spends $500 on advertising. … … [1]
8 marks
Mark scheme: 3(a)(i) All four points correct 2 B1 for two or three correct points 3(a)(ii) positive 1 3(b) 87 1 3(c)(i) [ y = ] 35.9 + 0.811x 2 B1 for 35.9 + kx, or for a + 0.811x, If 0 scored SC1 for 36 + 0.81x 3(c)(ii) 141 1 FT their (i) 3(c)(iii) Outside data range oe 1
This question in 0607/42 May/June 2020
Q9 · 10 students take a language examination 0607/43 May/June 2020
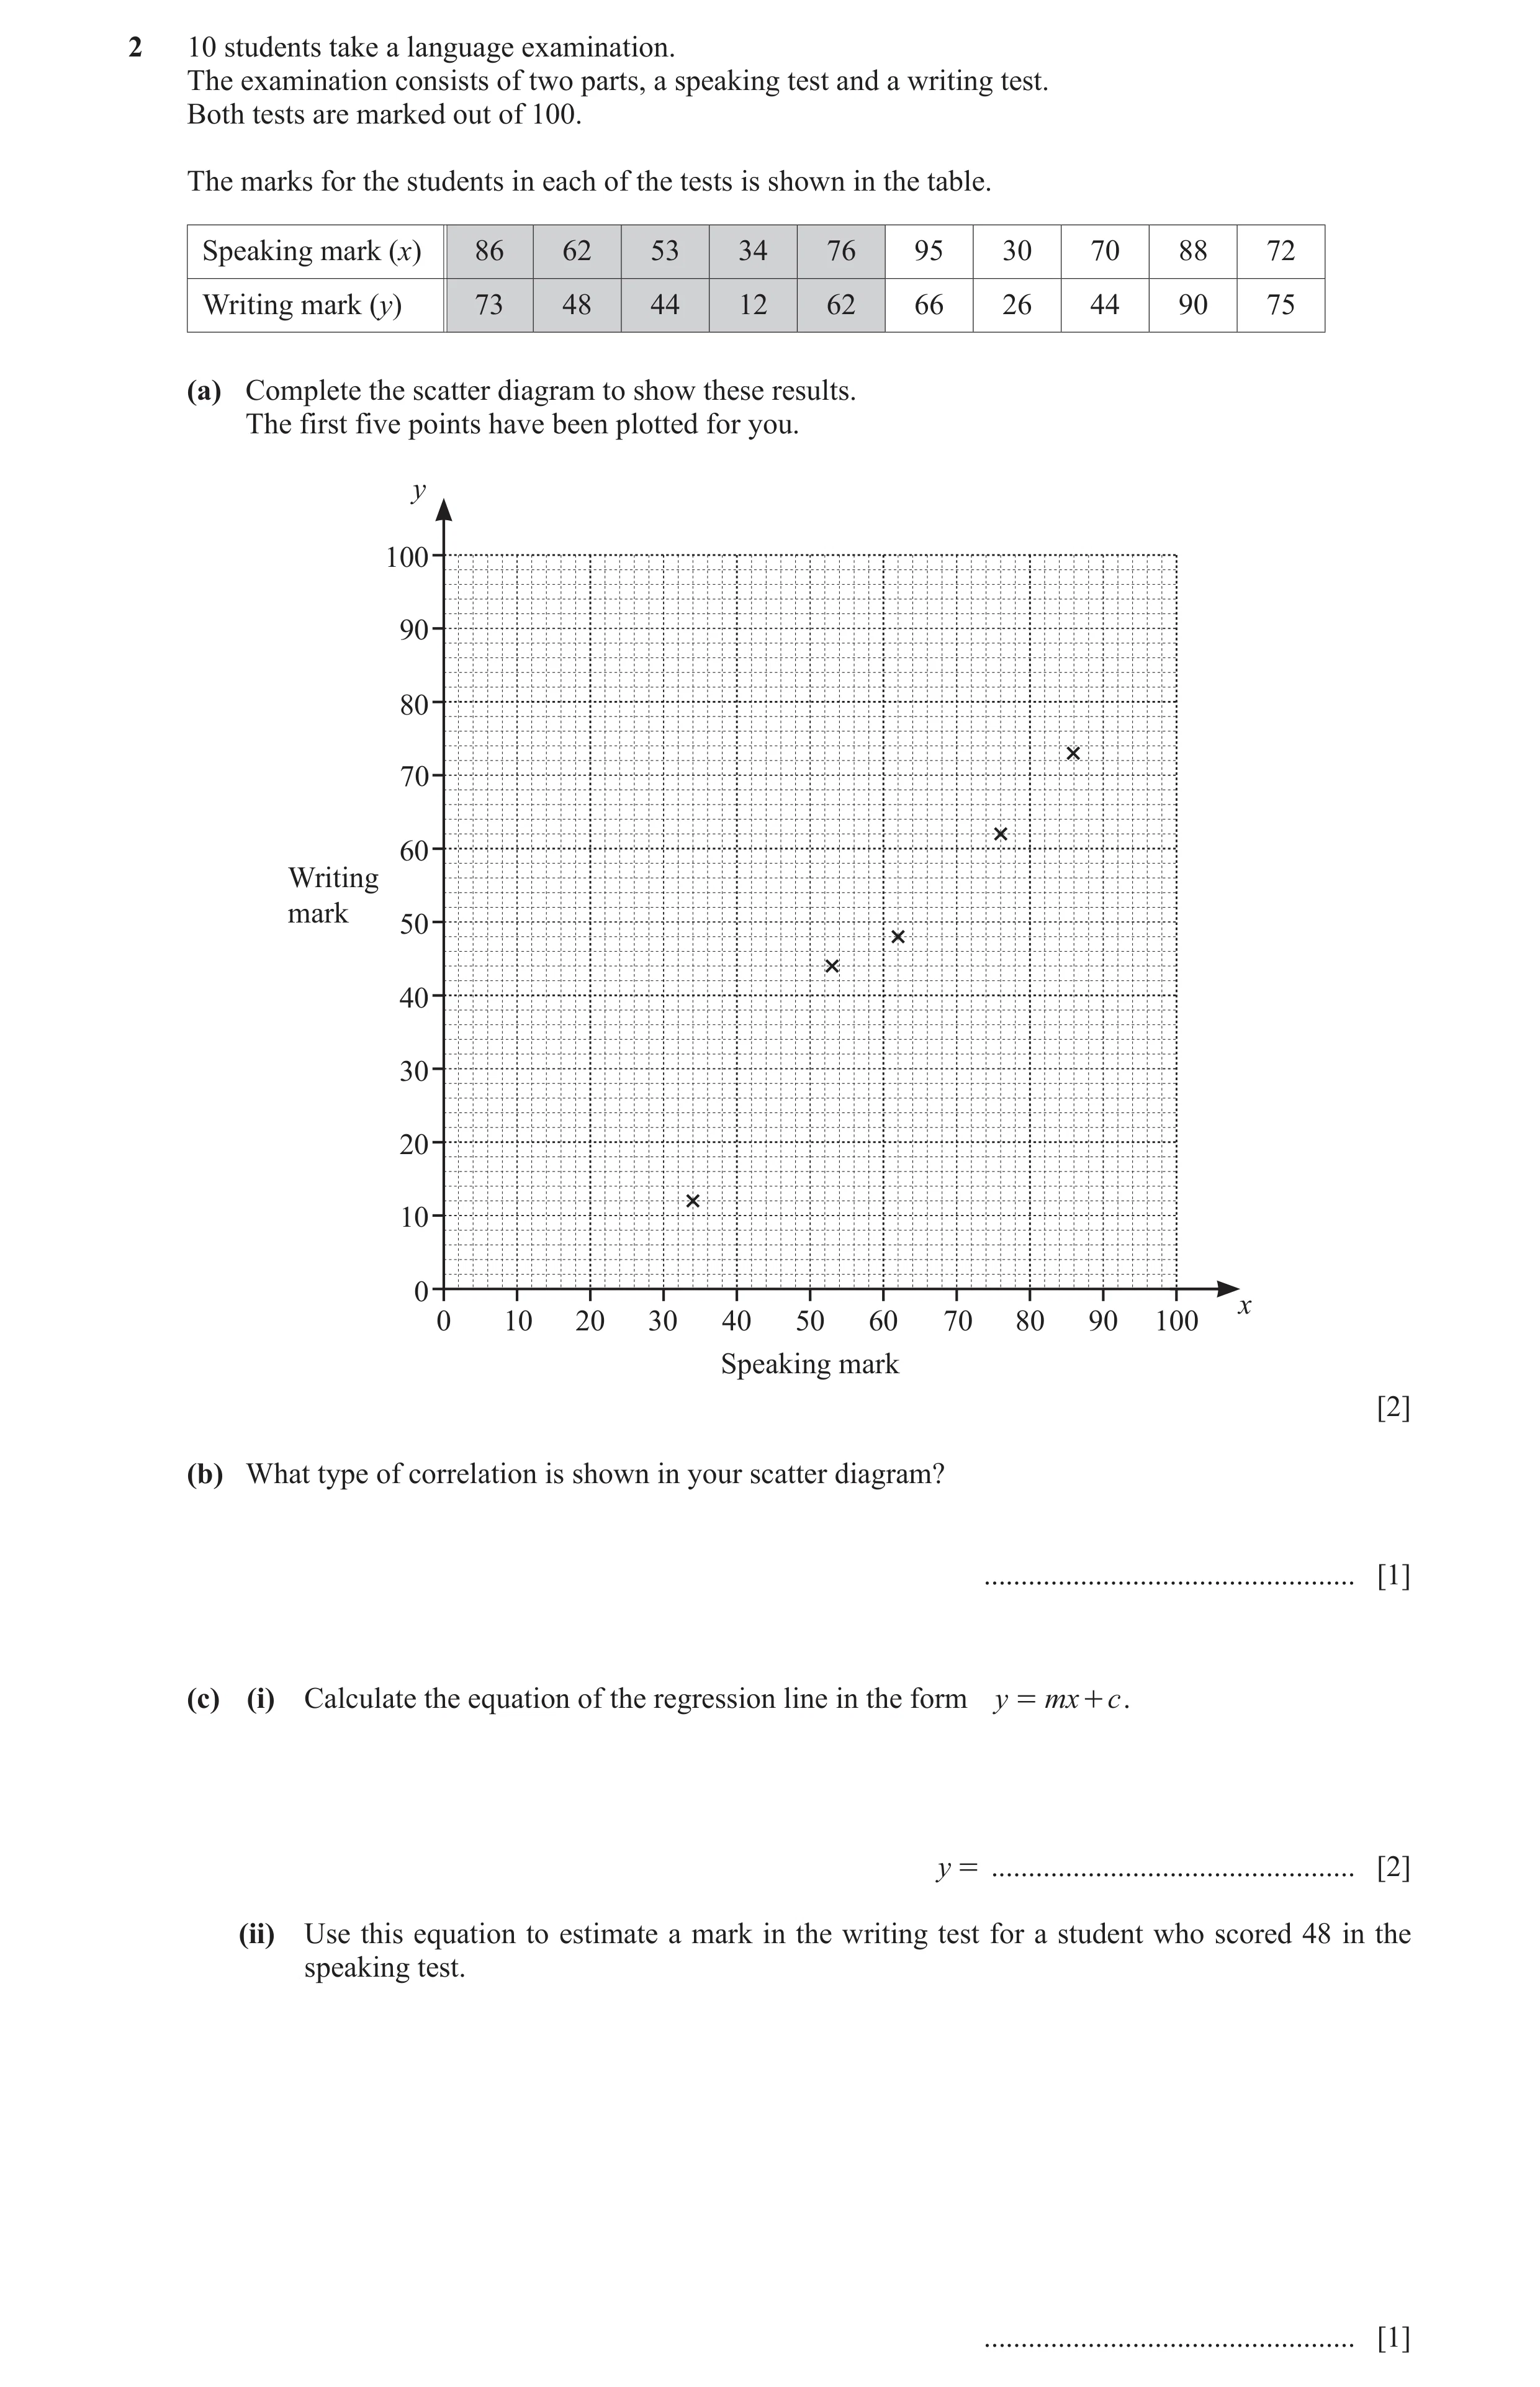
2 10 students take a language examination. The examination consists of two parts, a speaking test and a writing test. Both tests are marked out of 100. The marks for the students in each of the tests is shown in the table. Speaking mark (x) 86 62 53 34 76 95 30 70 88 72 Writing mark (y) 73 48 44 12 62 66 26 44 90 75 (a) Complete the scatter diagram to show these results. The first five points have been plotted for you. y 100 90 80 70 60 Writing mark 50 40 30 20 10 0 x 0 10 20 30 40 50 60 70 80 90 100 Speaking mark [2] (b) What type of correlation is shown in your scatter diagram? … [1] (c) (i) Calculate the equation of the regression line in the form y = mx + c . y = … [2] (ii) Use this equation to estimate a mark in the writing test for a student who scored 48 in the speaking test. … [1]
6 marks
Mark scheme: 2(a) Five points plotted correctly 2 B1 for 3 or 4 points plotted correctly 2(b) Positive 1 2(c)(i) 0.957x – 9.76 2 or 0.9574..., –9.764 to –9.765 B1 for 0.957x – c or mx – 9.76 2(c)(ii) 36 or 36.2 or 36.19... 1 FT their (i)
This question in 0607/43 May/June 2020
Q10 · Ten students at a school each study chemistry and physics 0607/41 Oct/Nov 2020
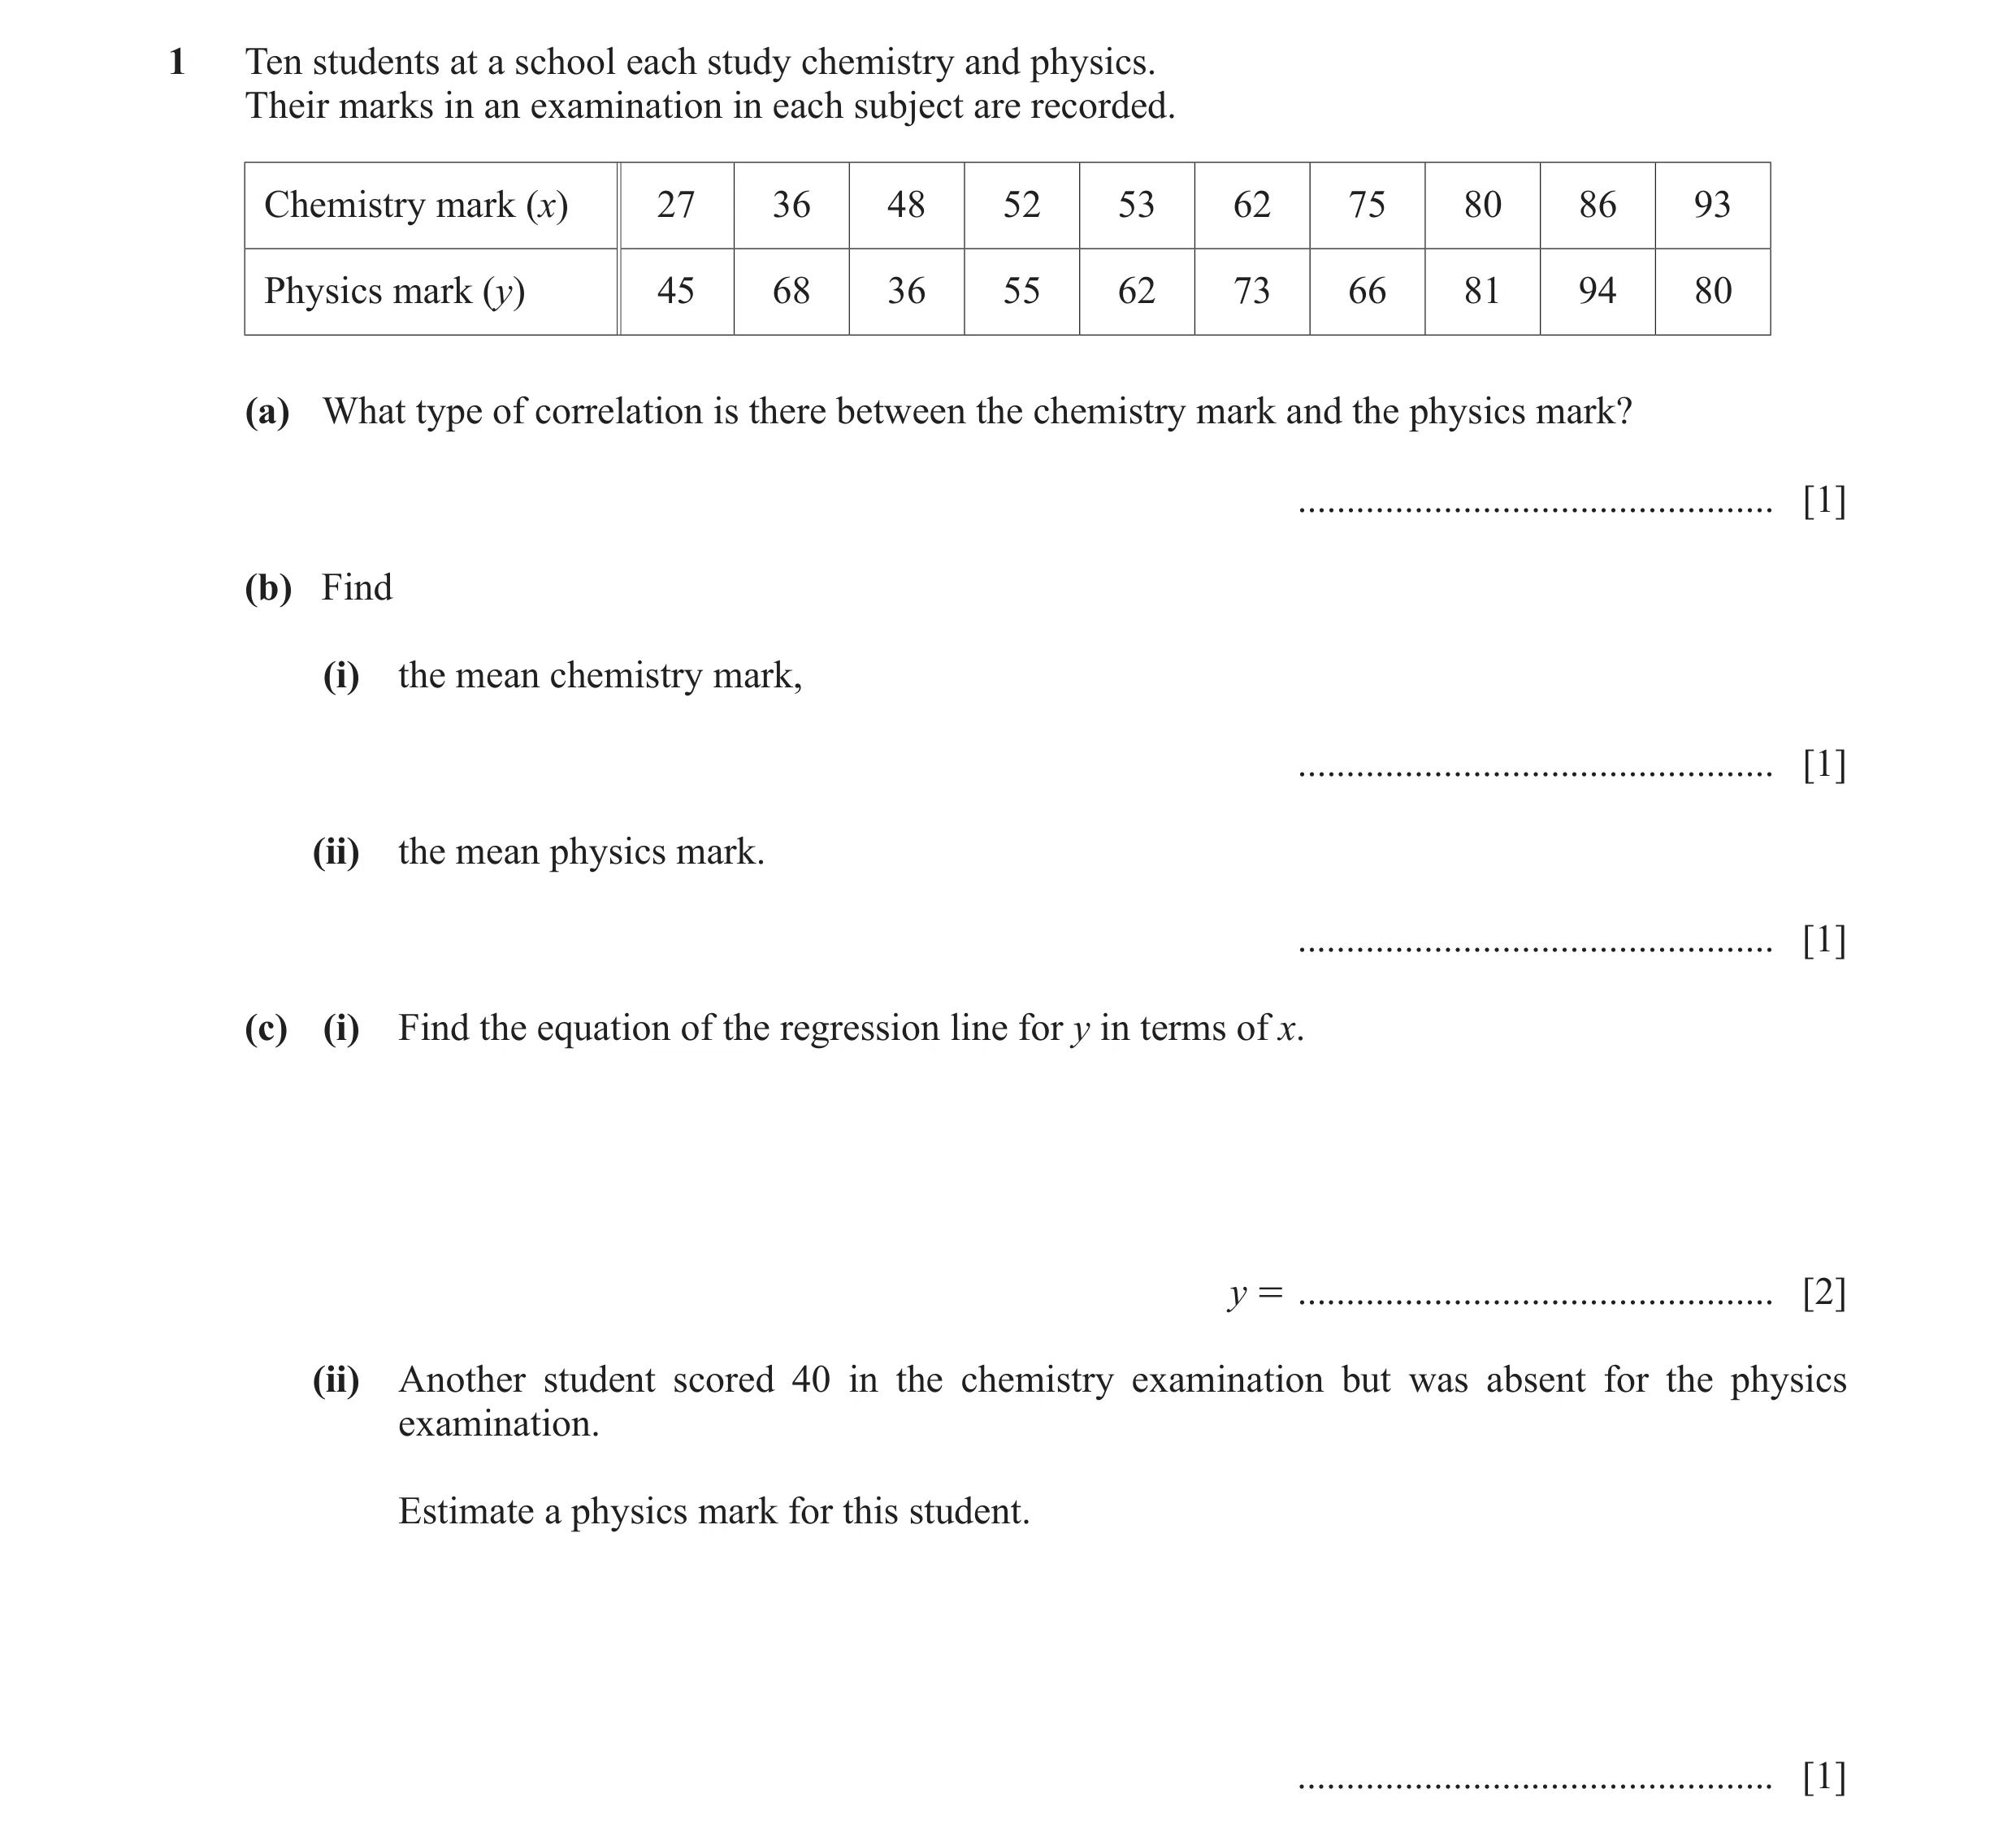
1 Ten students at a school each study chemistry and physics. Their marks in an examination in each subject are recorded. Chemistry mark (x) 27 36 48 52 53 62 75 80 86 93 Physics mark (y) 45 68 36 55 62 73 66 81 94 80 (a) What type of correlation is there between the chemistry mark and the physics mark? … [1] (b) Find (i) the mean chemistry mark, … [1] (ii) the mean physics mark. … [1] (c) (i) Find the equation of the regression line for y in terms of x. y = … [2] (ii) Another student scored 40 in the chemistry examination but was absent for the physics examination. Estimate a physics mark for this student. … [1]
6 marks
Mark scheme: Question Answer Marks Partial Marks 1(a) positive 1 1(b)(i) 61.2 1 1(b)(ii) 66 1 1(c)(i) [ y = ] 28.7 + 0.61[0] x 2 B1 for [ y = ] 28.7 + kx or [ y = ] k + 0.61[0] x or 29 + 0.6[1]x 1(c)(ii) 53 or 53.1 1 FT their (i)
This question in 0607/41 Oct/Nov 2020
Q11 · Eva records her science homework marks during the school year 0607/43 Oct/Nov 2020
3 (a) Eva records her science homework marks during the school year. The table shows the results. Homework mark 5 6 7 8 9 10 Frequency 2 7 11 13 5 2 Find (i) the range, … [1] (ii) the mode, … [1] (iii) the median, … [1] (iv) the lower quartile, … [1] (v) the mean. … [2] (b) Frank compares the science marks, x, with the mathematics marks, y, of ten students. The table shows the results. Science mark (x) 14 18 15 20 17 17 18 15 18 15 Mathematics mark (y) 13 19 16 19 17 14 17 15 15 12 (i) Complete the scatter diagram. The first six points have been plotted for you. y 20 19 18 17 16 Mathematics mark 15 14 13 12 11 10 x 10 11 12 13 14 15 16 17 18 19 20 Science mark [2] (ii) What type of correlation is shown on the scatter diagram? … [1] (iii) Find the equation of the line of regression, giving y in terms of x. y = … [2] (iv) Another student’s science mark is 16. Use your answer to part (b)(iii) to find an expected mathematics mark for this student. … [1] (c) Georgio records the time, t minutes, he takes to complete each of 40 pieces of mathematics homework. The table shows his results. Time (t minutes) 0 1 t G 10 10 1 t G 15 15 1 t G 20 20 1 t G 40 Frequency 9 20 6 5 Calculate an estimate of the mean. … min [2]
14 marks
Mark scheme: 3(a)(i) 5 1 3(a)(ii) 8 1 3(a)(iii) 7.5 1 3(a)(iv) 7 1 3(a)(v) 7.45 2 M1 for at least three of the products 2 × 5, 7 × 6, 11 × 7, 13 × 8, 5 × 9, 2 × 10 soi by 298 3(b)(i) Four points correctly plotted 2 B1 for 2 or 3 correct 3(b(ii) Positive 1 3(b)(iii) 0.938x + 0.0405 2 B1 for 0.938x + k 0.9376 to 0.9377 or for kx + 0.0405 0.04049 to 0.04050 or for 0.94x + 0.04[0] 3(b)(iv) 15 or to 15.0 to 15.1 1 FT 3(c) 13.75 2 M1 for at least 3 mid-values seen 5, 12.5, 17.5, 30 implied by 45, 250, 105, 150 or 550
This question in 0607/43 Oct/Nov 2020
Q12 · A stadium sells tickets at 10 different prices for a sporting event 0607/41 May/June 2021
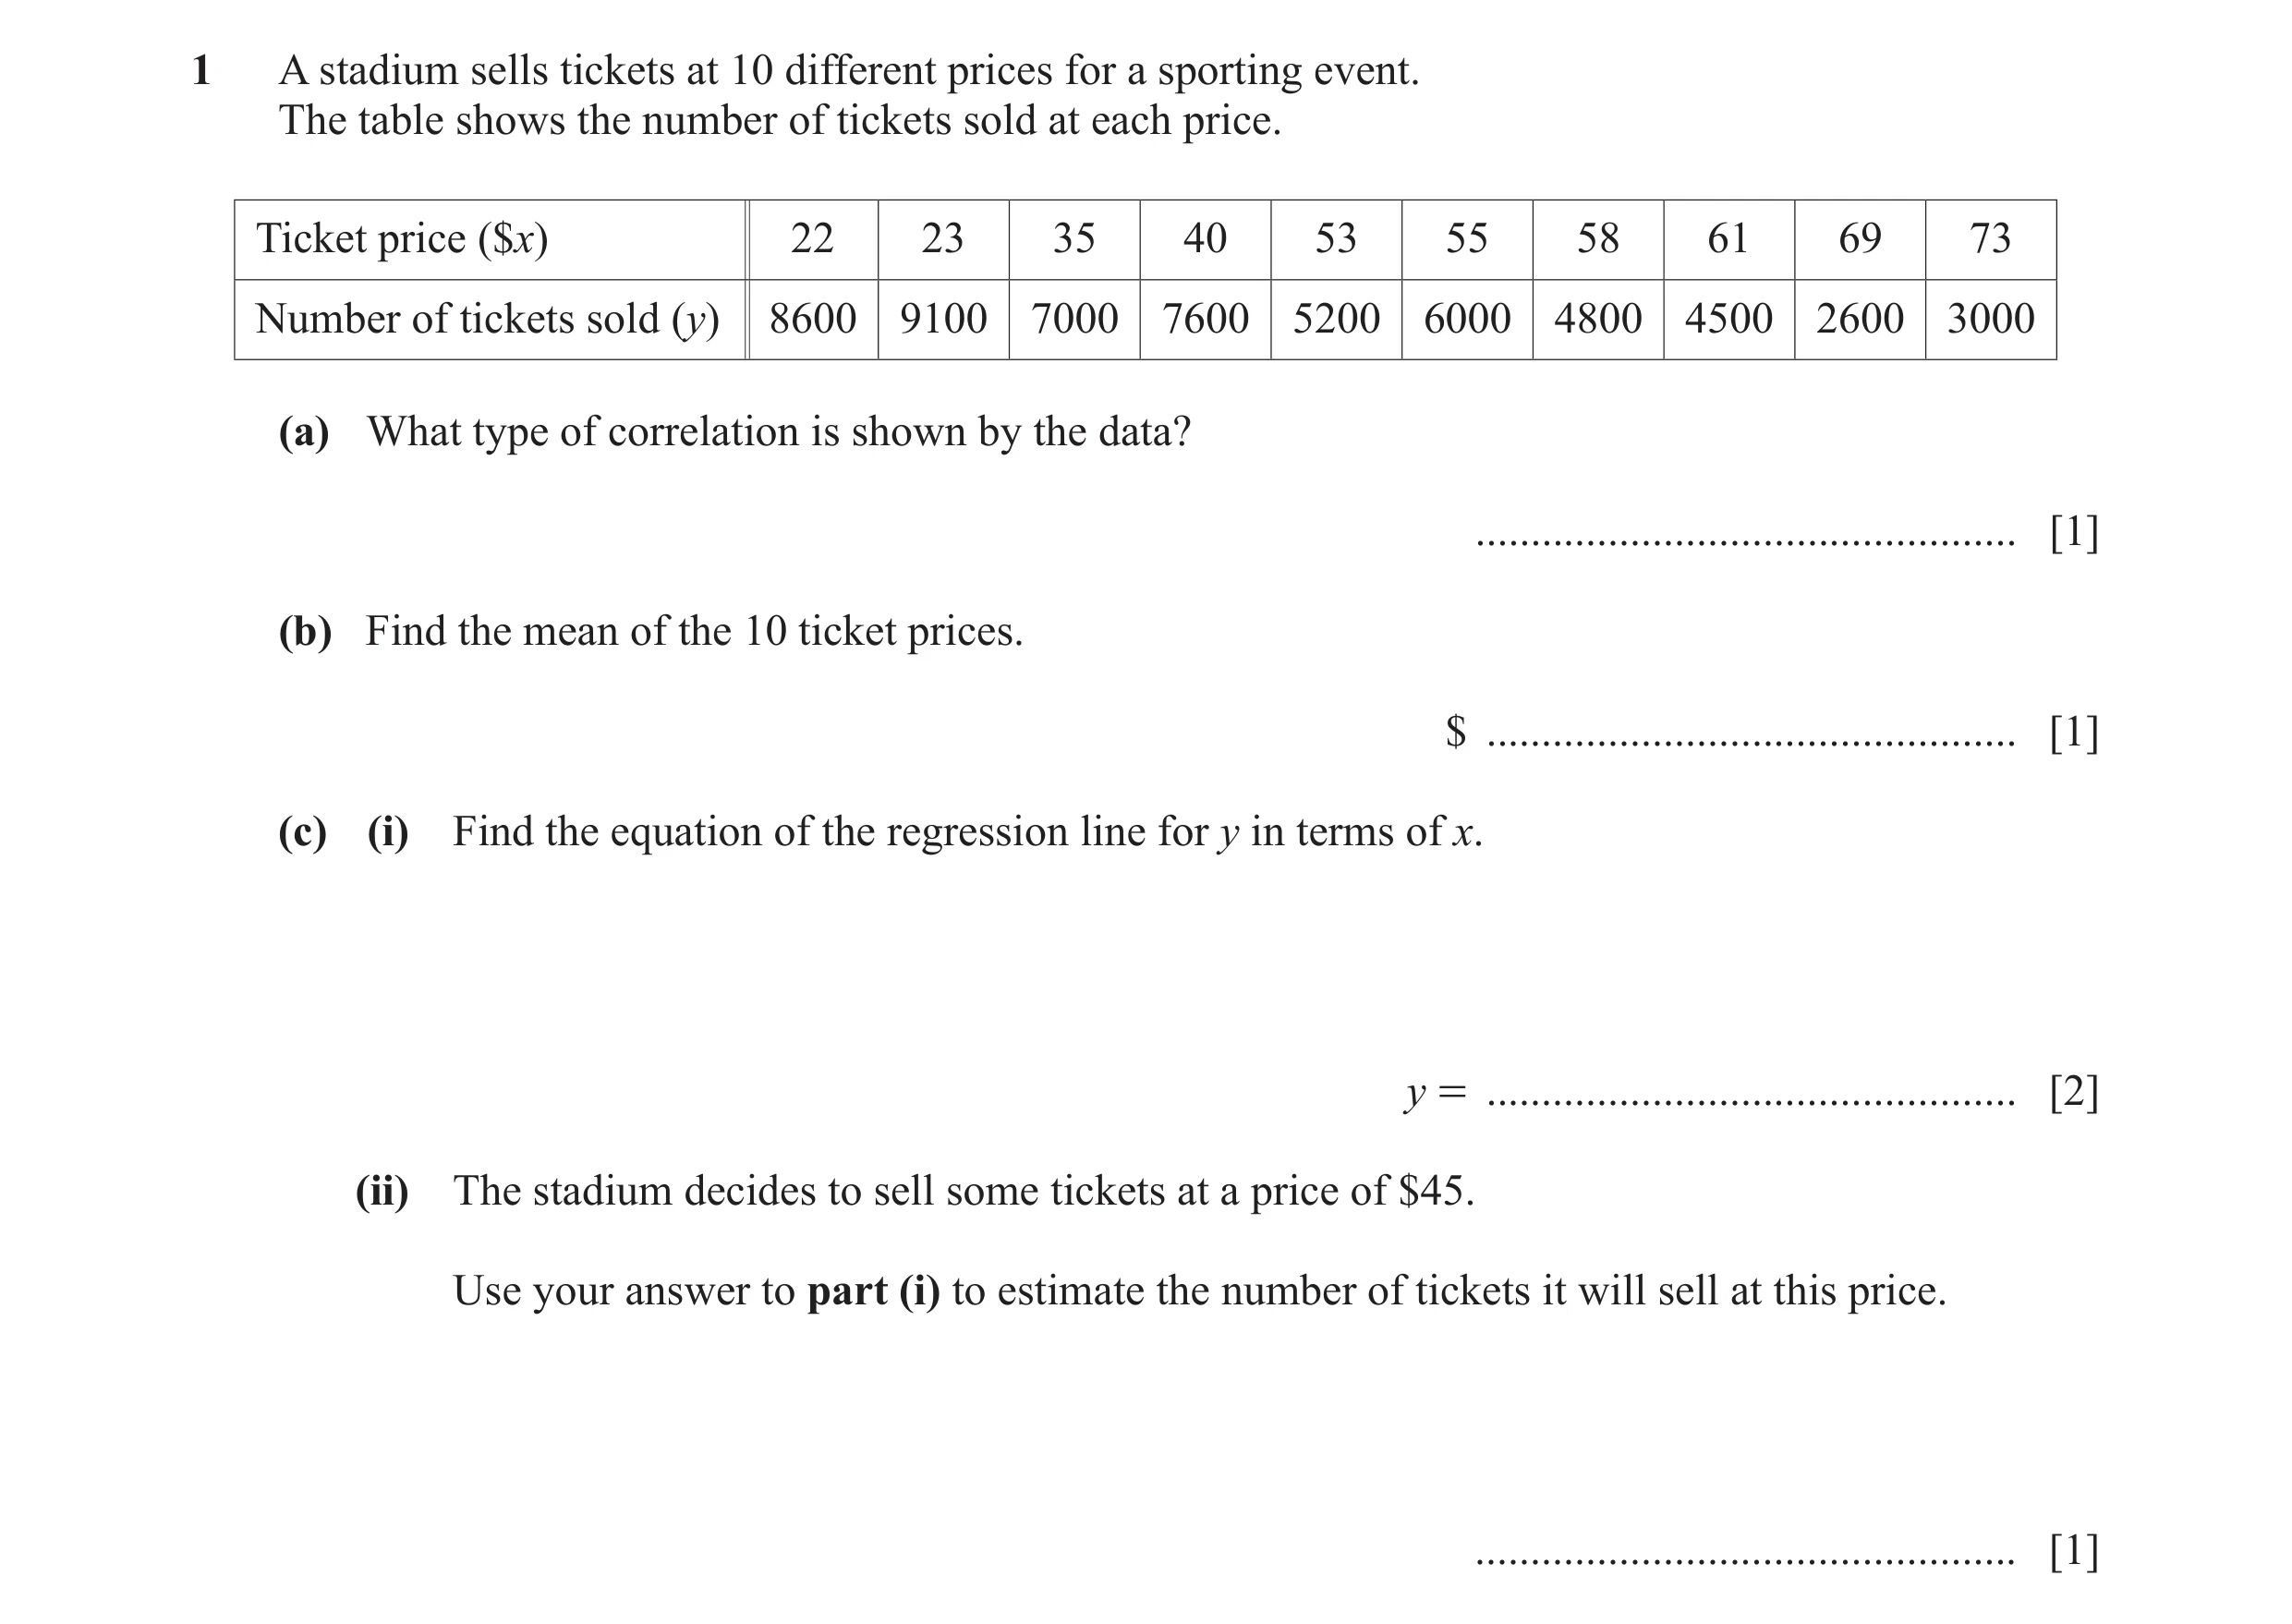
1 A stadium sells tickets at 10 different prices for a sporting event. The table shows the number of tickets sold at each price. Ticket price ($x) 22 23 35 40 53 55 58 61 69 73 Number of tickets sold (y) 8600 9100 7000 7600 5200 6000 4800 4500 2600 3000 (a) What type of correlation is shown by the data? … [1] (b) Find the mean of the 10 ticket prices. $ … [1] (c) (i) Find the equation of the regression line for y in terms of x. y = … [2] (ii) The stadium decides to sell some tickets at a price of $45. Use your answer to part (i) to estimate the number of tickets it will sell at this price. … [1]
5 marks
Mark scheme: Question Answer Marks Partial Marks 1(a) Negative 1 1(b) 48.9[0] 1 1(c)(i) –120x + 11 700 2 B1 for –120x + k or –kx + 11 700 1(c)(ii) 6300 or 6294 to 6320 1 FT their (i)
This question in 0607/41 May/June 2021
Q13 · Ten students compare their test marks in Physics (x) and Chemistry (y) 0607/43 May/June 2021
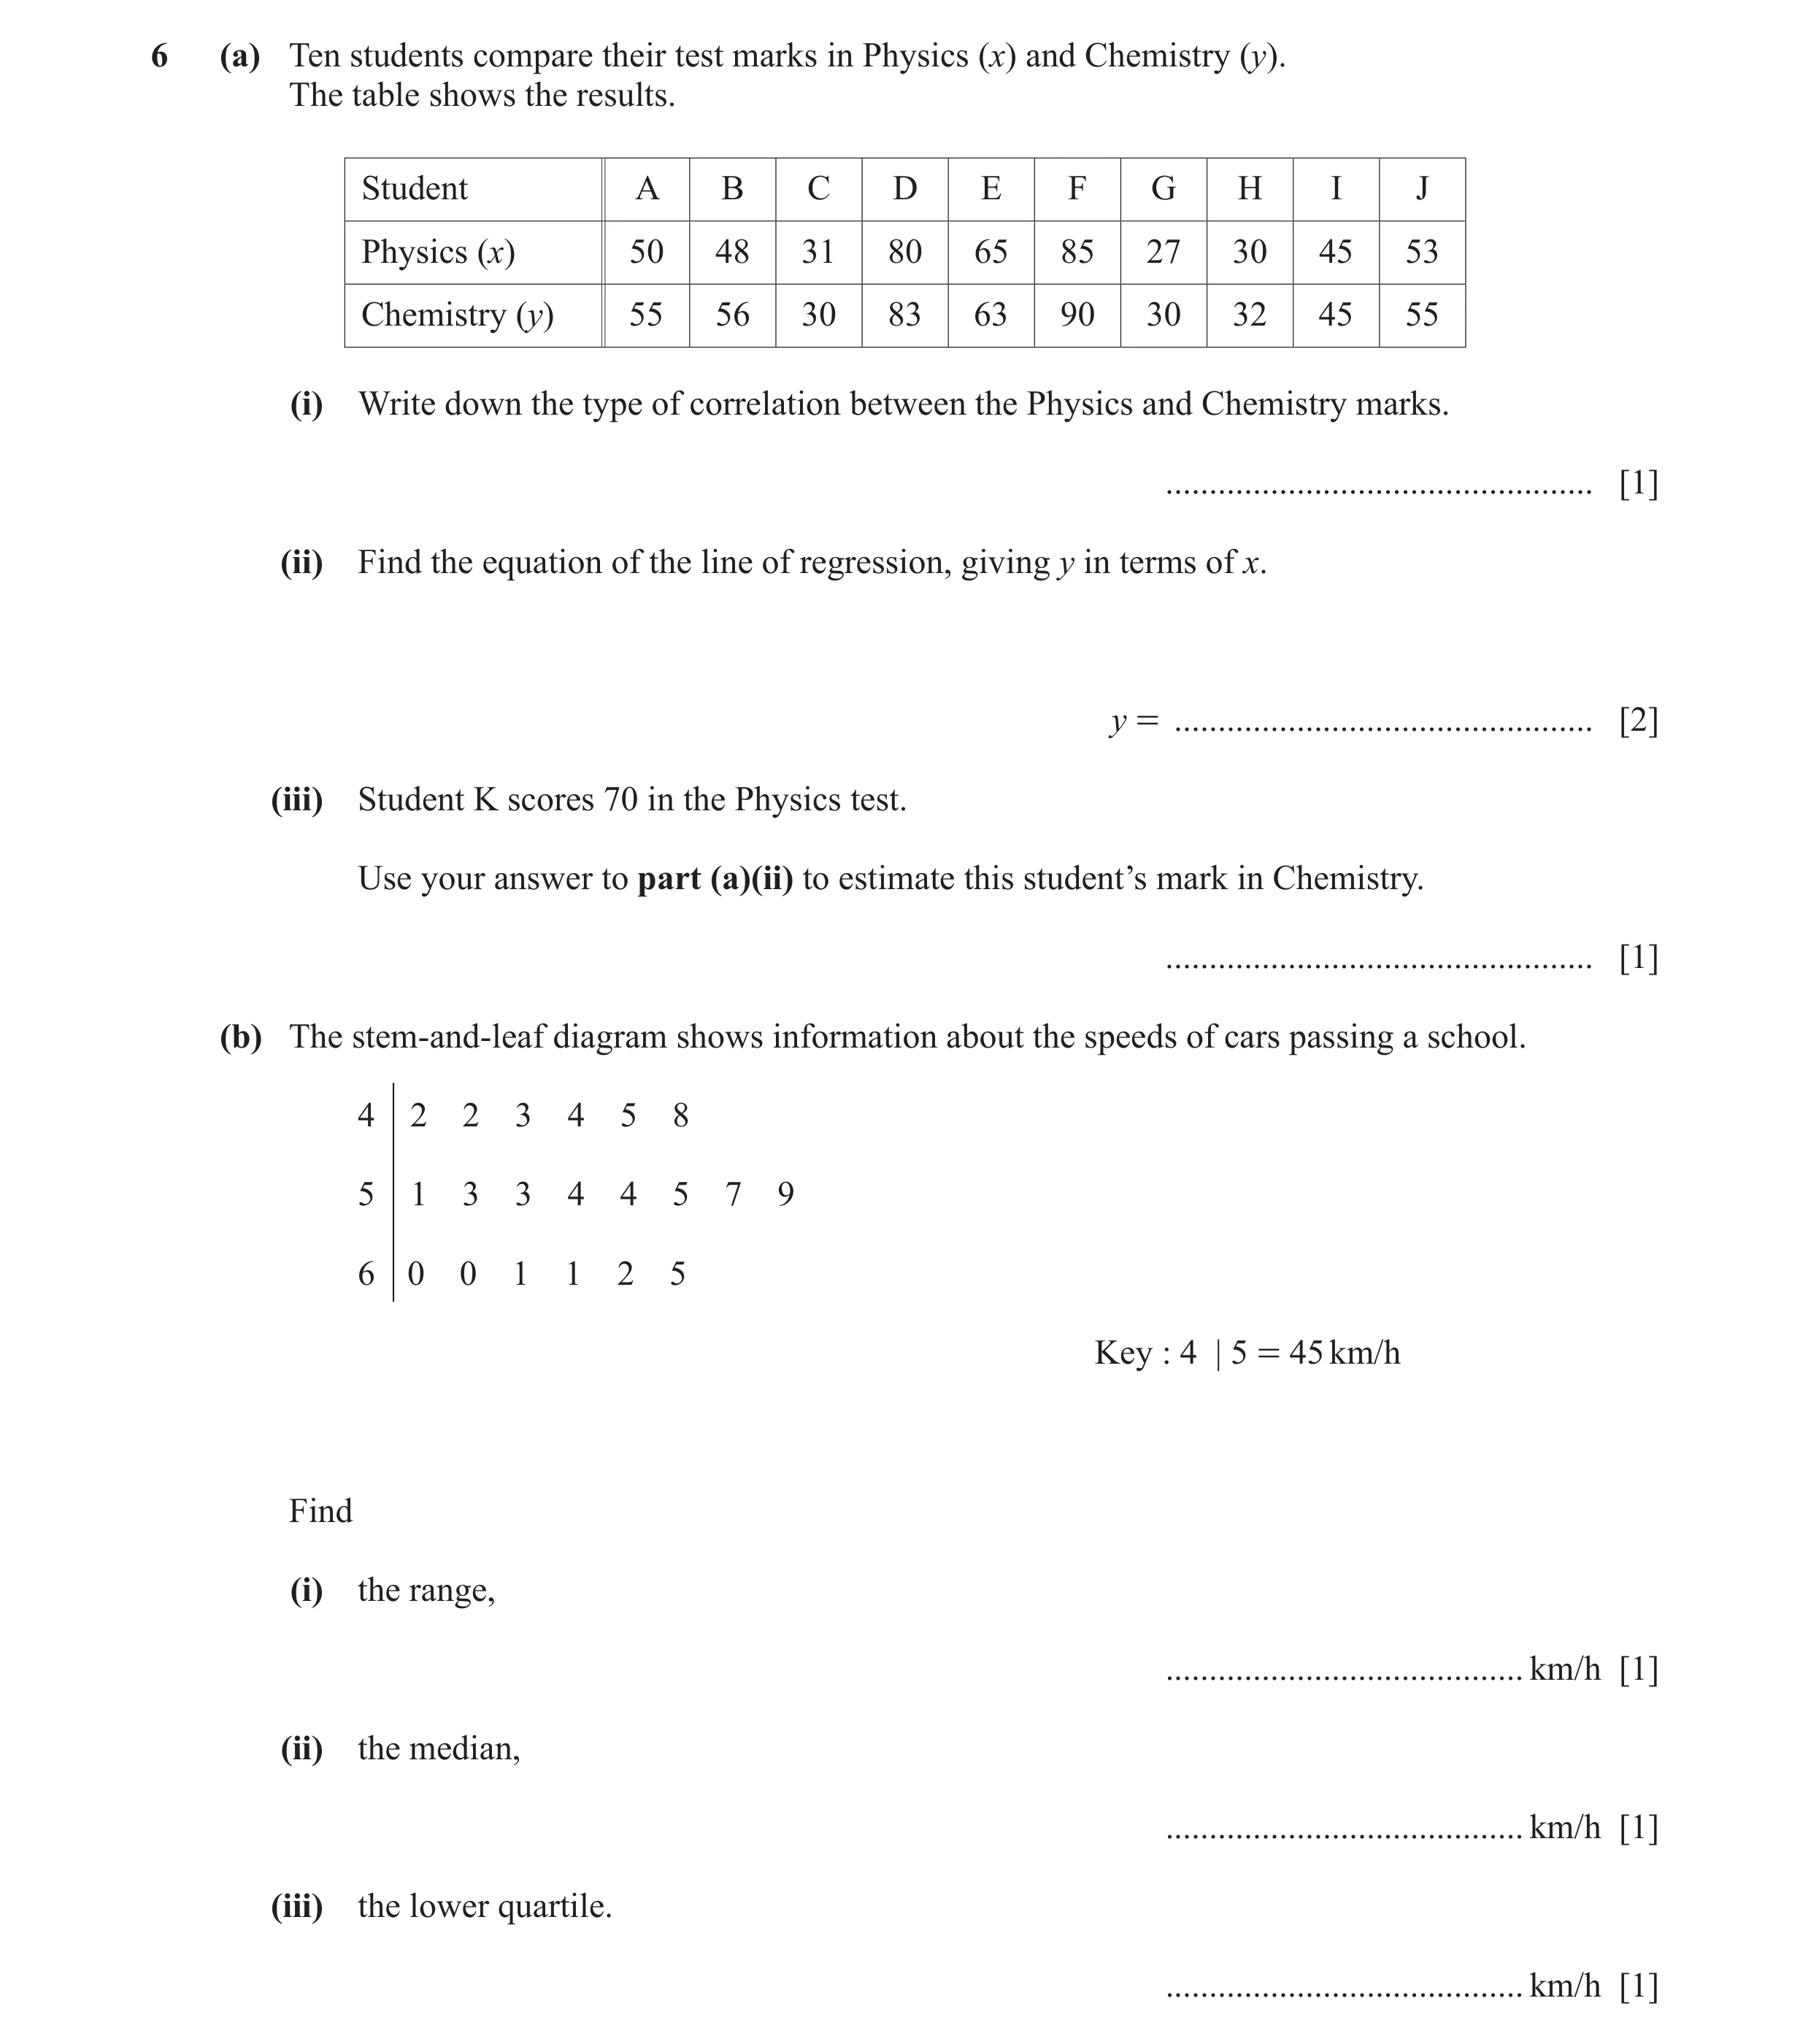
6 (a) Ten students compare their test marks in Physics (x) and Chemistry (y). The table shows the results. Student A B C D E F G H I J Physics (x) 50 48 31 80 65 85 27 30 45 53 Chemistry (y) 55 56 30 83 63 90 30 32 45 55 (i) Write down the type of correlation between the Physics and Chemistry marks. … [1] (ii) Find the equation of the line of regression, giving y in terms of x. y = … [2] (iii) Student K scores 70 in the Physics test. Use your answer to part (a)(ii) to estimate this student’s mark in Chemistry. … [1] (b) The stem-and-leaf diagram shows information about the speeds of cars passing a school. 4 2 2 3 4 5 8 5 1 3 3 4 4 5 7 9 6 0 0 1 1 2 5 Key : 4 | 5 = 45 km/h Find (i) the range, … km/h [1] (ii) the median, … km/h [1] (iii) the lower quartile. … km/h [1]
7 marks
Mark scheme: 6(a)(i) Positive 1 6(a)(ii) 1.03x + 1.1[0] or 2 B1 for 1.03x + k or kx + 1.1[0] 1.027...x + 1.095... or 1.027...x + k or kx + 1.095... 6(a)(iii) 73 1 FT their (a)(ii) 6(b)(i) 23 1 6(b)(ii) 54 1 6(b)(iii) 46.5 1
This question in 0607/43 May/June 2021
Q14 · The cumulative frequency curve shows the marks for 300 students in a history test 0607/41 May/June 2022
2 (a) The cumulative frequency curve shows the marks for 300 students in a history test. 300 250 200 Cumulative 150 frequency 100 50 0 0 10 20 30 40 50 History mark (i) Find an estimate for the median. … [1] (ii) Estimate the number of students with a mark of more than 20. … [2] (iii) 70% of the students pass the test. Find the pass mark. … [2] (b) The table shows the marks for 100 students in a geography test. Mark m 10 1 m G 20 20 1 m G 30 30 1 m G 40 40 1 m G 50 Frequency 2 28 57 13 Calculate an estimate of the mean. … [2] (c) The table shows the marks for 9 students in chemistry and in physics. Chemistry 33 28 39 40 22 25 38 43 36mark (x) Physics 45 32 26 49 18 36 29 40 35mark (y) (i) Find the equation of the regression line for y in terms of x. y = … [2] (ii) What type of correlation is seen in this data? … [1] (iii) Use your answer to part (c)(i) to estimate the physics mark for a student with a mark of 30 in chemistry. … [1]
11 marks
Mark scheme: 2(a)(i) 31 1 2(a)(ii) 260 2 B1 for 40 seen 2(a)(iii) 27 2 70 30 M1 for 300 soi or 300 100 100 2(b) 33.1 2 M1 for at least three mid-values soi 2(c)(i) y 0.618 x 13.6 2 B1 for 0.618x + k or kx + 13.6 or 0.62x + 14 2(c)(ii) positive 1 2(c)(iii) 32 or 32.0 to 32.6 1 FT their (c)(i) if linear eqn
This question in 0607/41 May/June 2022
Q15 · The number of hours, x, spent revising and the mark scored, y, in an examination for each… 0607/42 May/June 2022
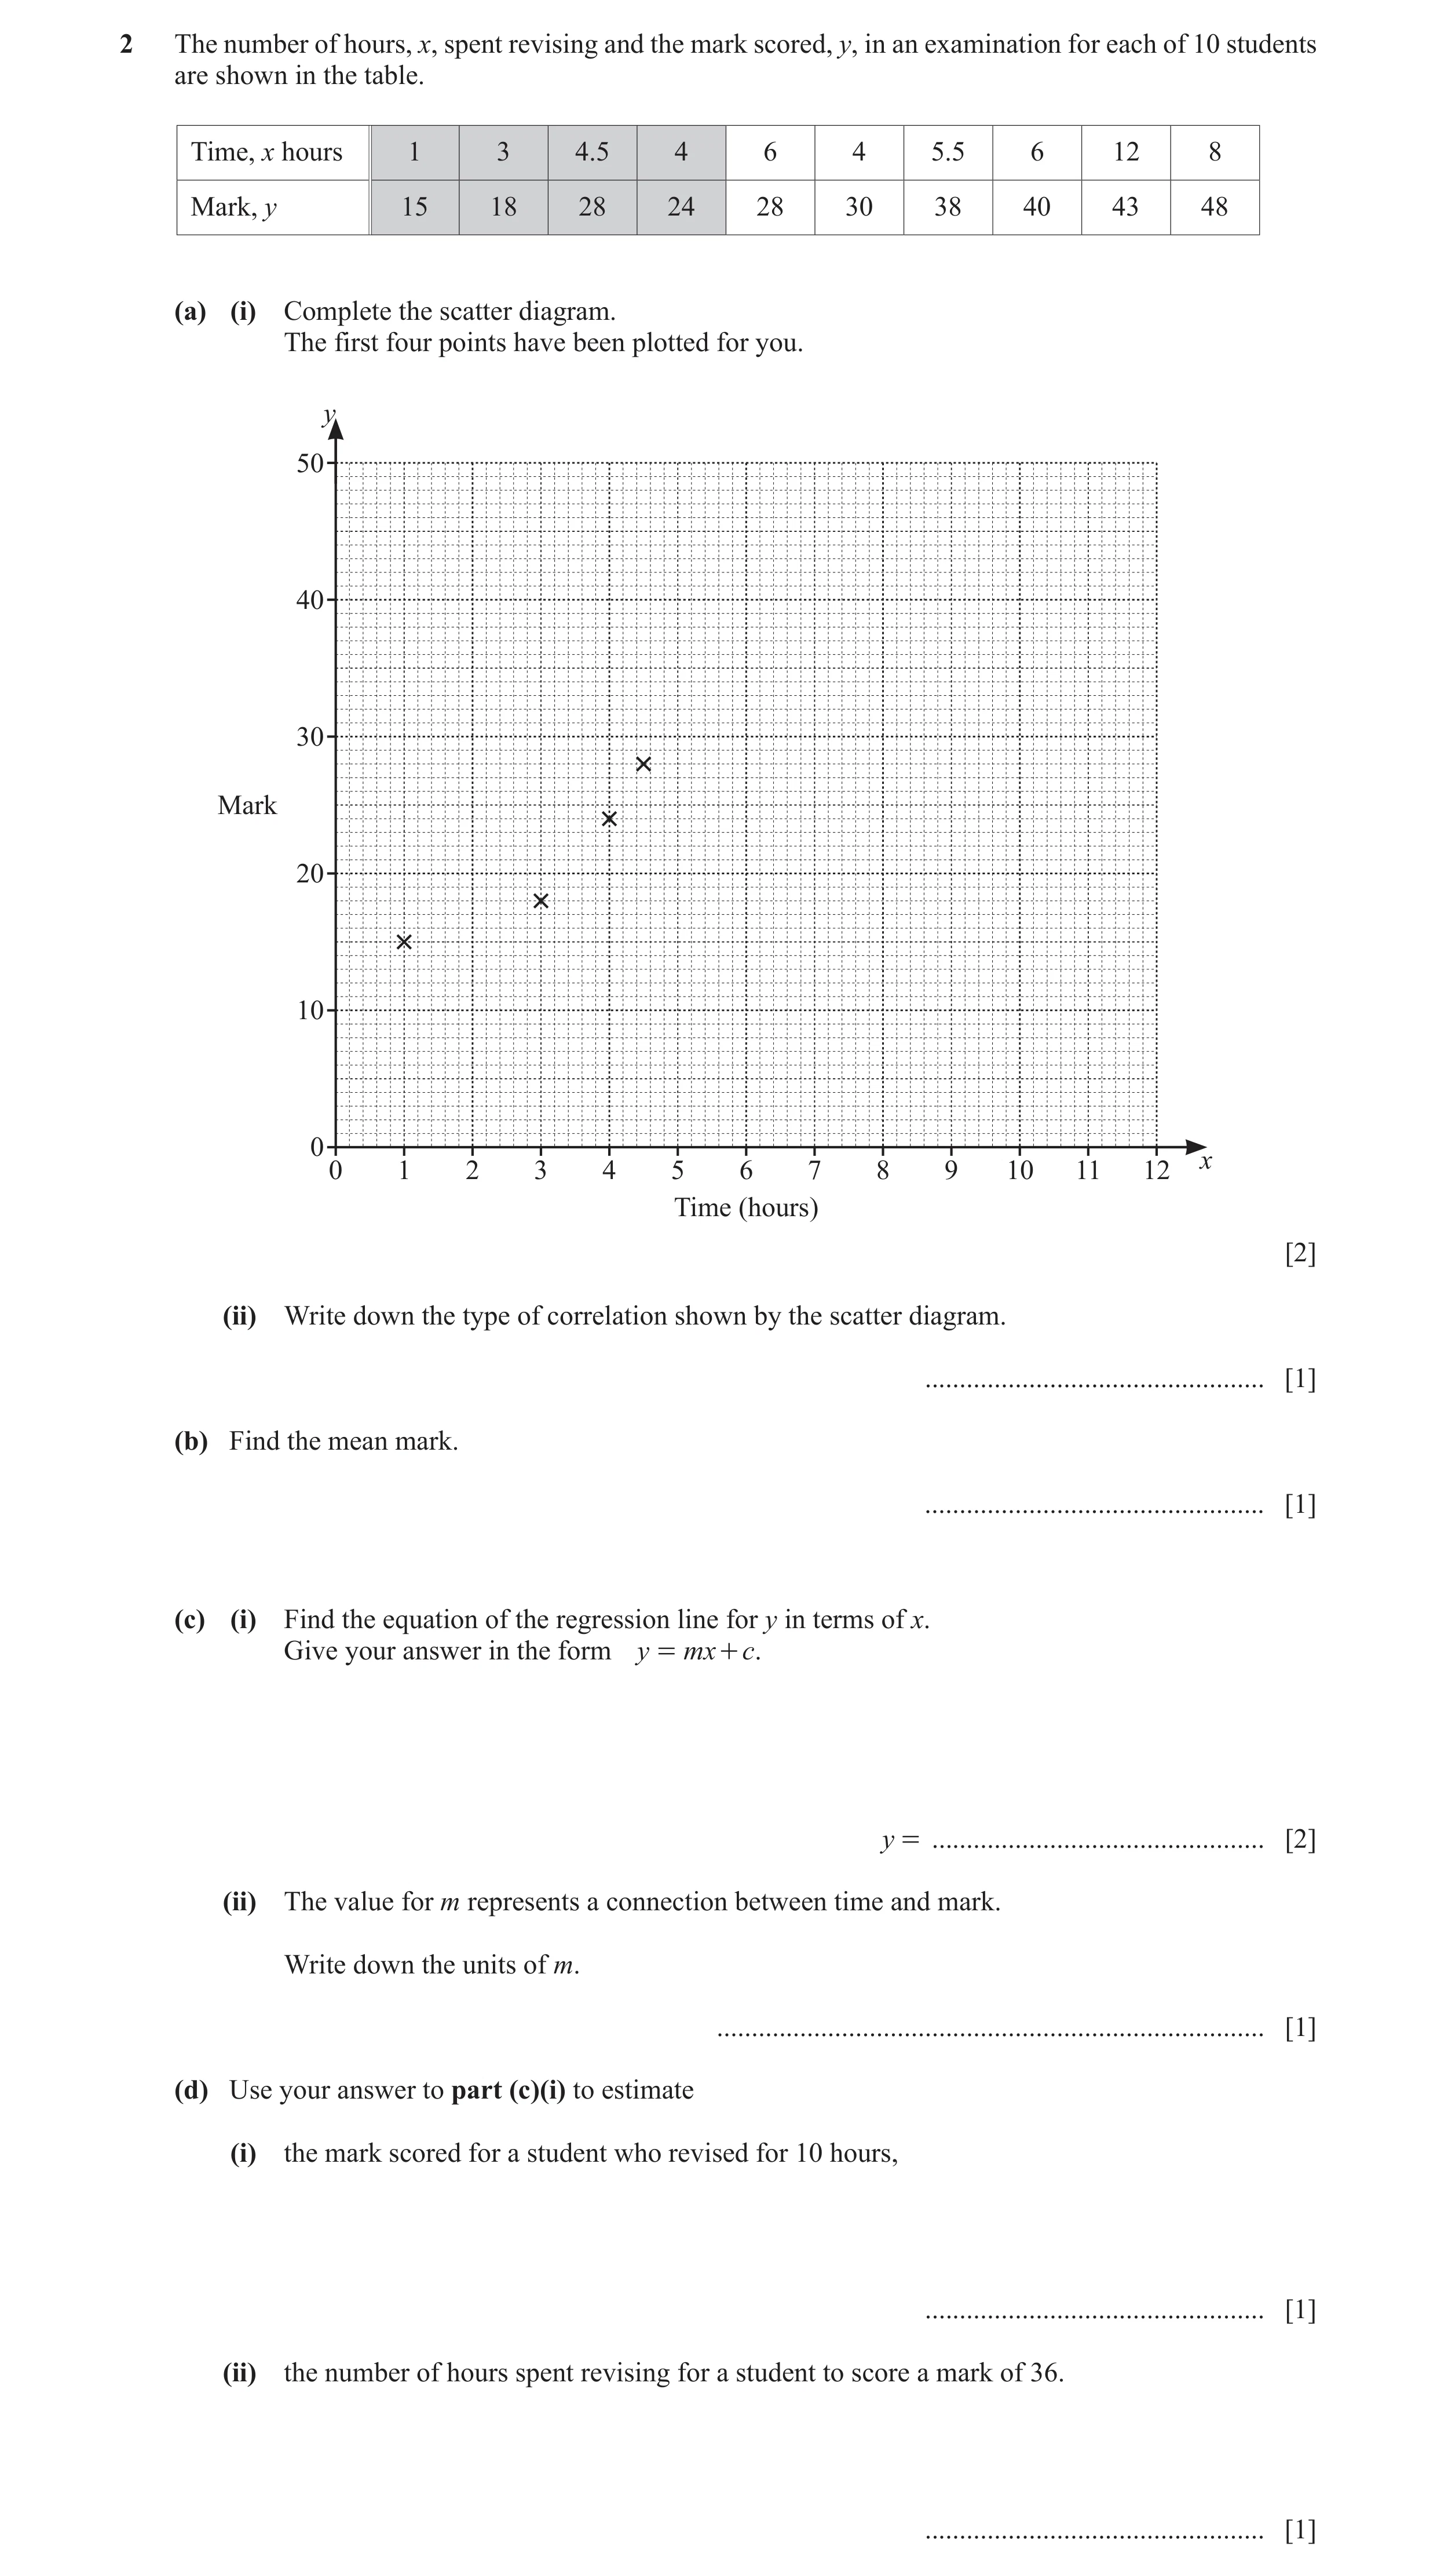
2 The number of hours, x, spent revising and the mark scored, y, in an examination for each of 10 students are shown in the table. Time, x hours 1 3 4.5 4 6 4 5.5 6 12 8 Mark, y 15 18 28 24 28 30 38 40 43 48 (a) (i) Complete the scatter diagram. The first four points have been plotted for you. y 50 40 30 Mark 20 10 0 x 0 1 2 3 4 5 6 7 8 9 10 11 12 Time (hours) [2] (ii) Write down the type of correlation shown by the scatter diagram. … [1] (b) Find the mean mark. … [1] (c) (i) Find the equation of the regression line for y in terms of x. Give your answer in the form y = mx + c. y = … [2] (ii) The value for m represents a connection between time and mark. Write down the units of m. … [1] (d) Use your answer to part (c)(i) to estimate (i) the mark scored for a student who revised for 10 hours, … [1] (ii) the number of hours spent revising for a student to score a mark of 36. … [1]
9 marks
Mark scheme: 2(a)(i) Correct points 2 B1 for 4 or 5 points correct 2(a)(ii) Positive 1 2(b) 31.2 1 2(c)(i) y = 3.01x + 15[.0] 2 B1 for y = 3x + 15 or y = 3.01x + k or y = kx + 15[.0] 2(c)(ii) Marks per hour oe 1 2(d)(i) 45 1 FT their (c)(i) if linear and answer is positive 2(d)(ii) 7 1 FT their (c)(i) if linear and answer is positive
This question in 0607/42 May/June 2022
Q16 · The number of barrels of oil produced and the price of one barrel of oil on ten… 0607/41 Oct/Nov 2022
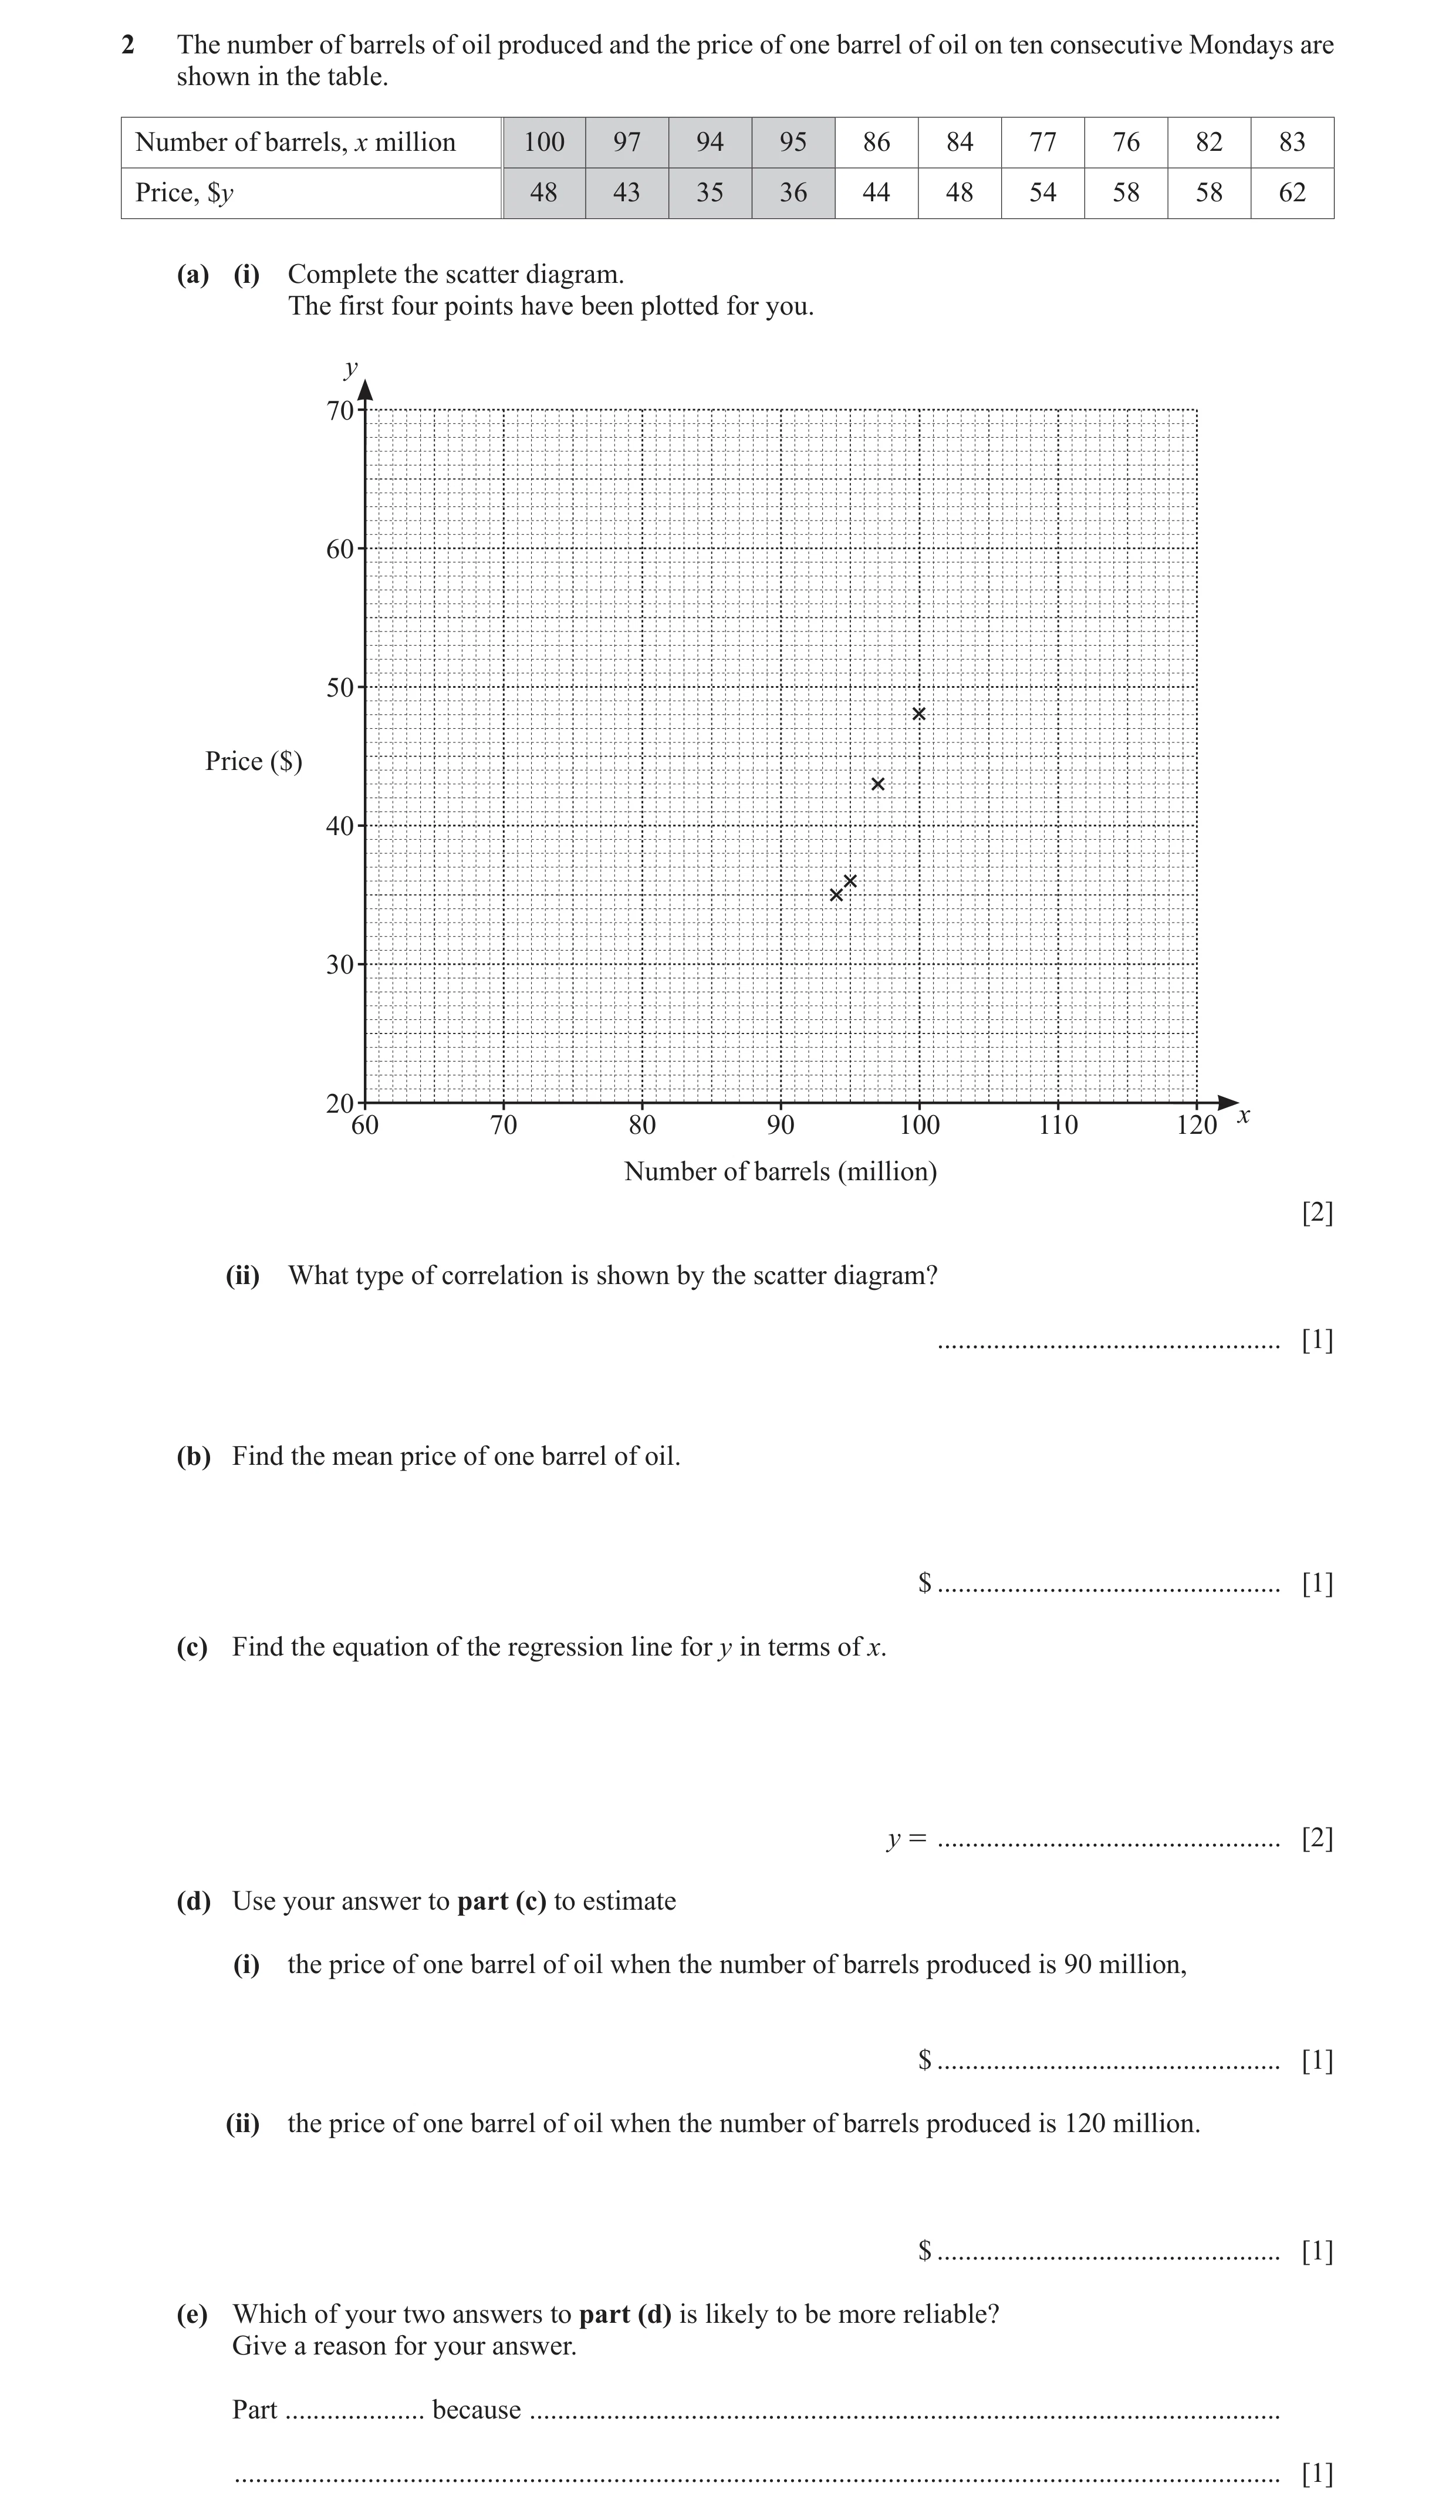
2 The number of barrels of oil produced and the price of one barrel of oil on ten consecutive Mondays are shown in the table. Number of barrels, x million 100 97 94 95 86 84 77 76 82 83 Price, $y 48 43 35 36 44 48 54 58 58 62 (a) (i) Complete the scatter diagram. The first four points have been plotted for you. y 70 60 50 Price ($) 40 30 20 x 60 70 80 90 100 110 120 Number of barrels (million) [2] (ii) What type of correlation is shown by the scatter diagram? … [1] (b) Find the mean price of one barrel of oil. $ … [1] (c) Find the equation of the regression line for y in terms of x. y = … [2] (d) Use your answer to part (c) to estimate (i) the price of one barrel of oil when the number of barrels produced is 90 million, $ … [1] (ii) the price of one barrel of oil when the number of barrels produced is 120 million. $ … [1] (e) Which of your two answers to part (d) is likely to be more reliable? Give a reason for your answer. Part … because … … [1]
9 marks
Mark scheme: 2(a)(i) Correct points plotted 2 B1 for 4 or 5 points correct 2(a)(ii) Negative 1 2(b) 48.6 [0] 1 2(c) y = 117 − 0.784 x 2 B1 for y = 120 − 0.78 x or y = 117 + kx or y = k − 0.784 x 2(d)(i) 46.4 to 46.9 1 FT (c)(i) if linear equation and positive answer 2(d)(ii) 22.9 to 23.5 1 FT (c)(i) if linear equation and positive answer 2(e) Part (i) [because] part (ii) is outside data 1 oe
This question in 0607/41 Oct/Nov 2022
Q17 · The times, t minutes, taken for 12 people to do a task and their ages, x years, are… 0607/42 Oct/Nov 2022
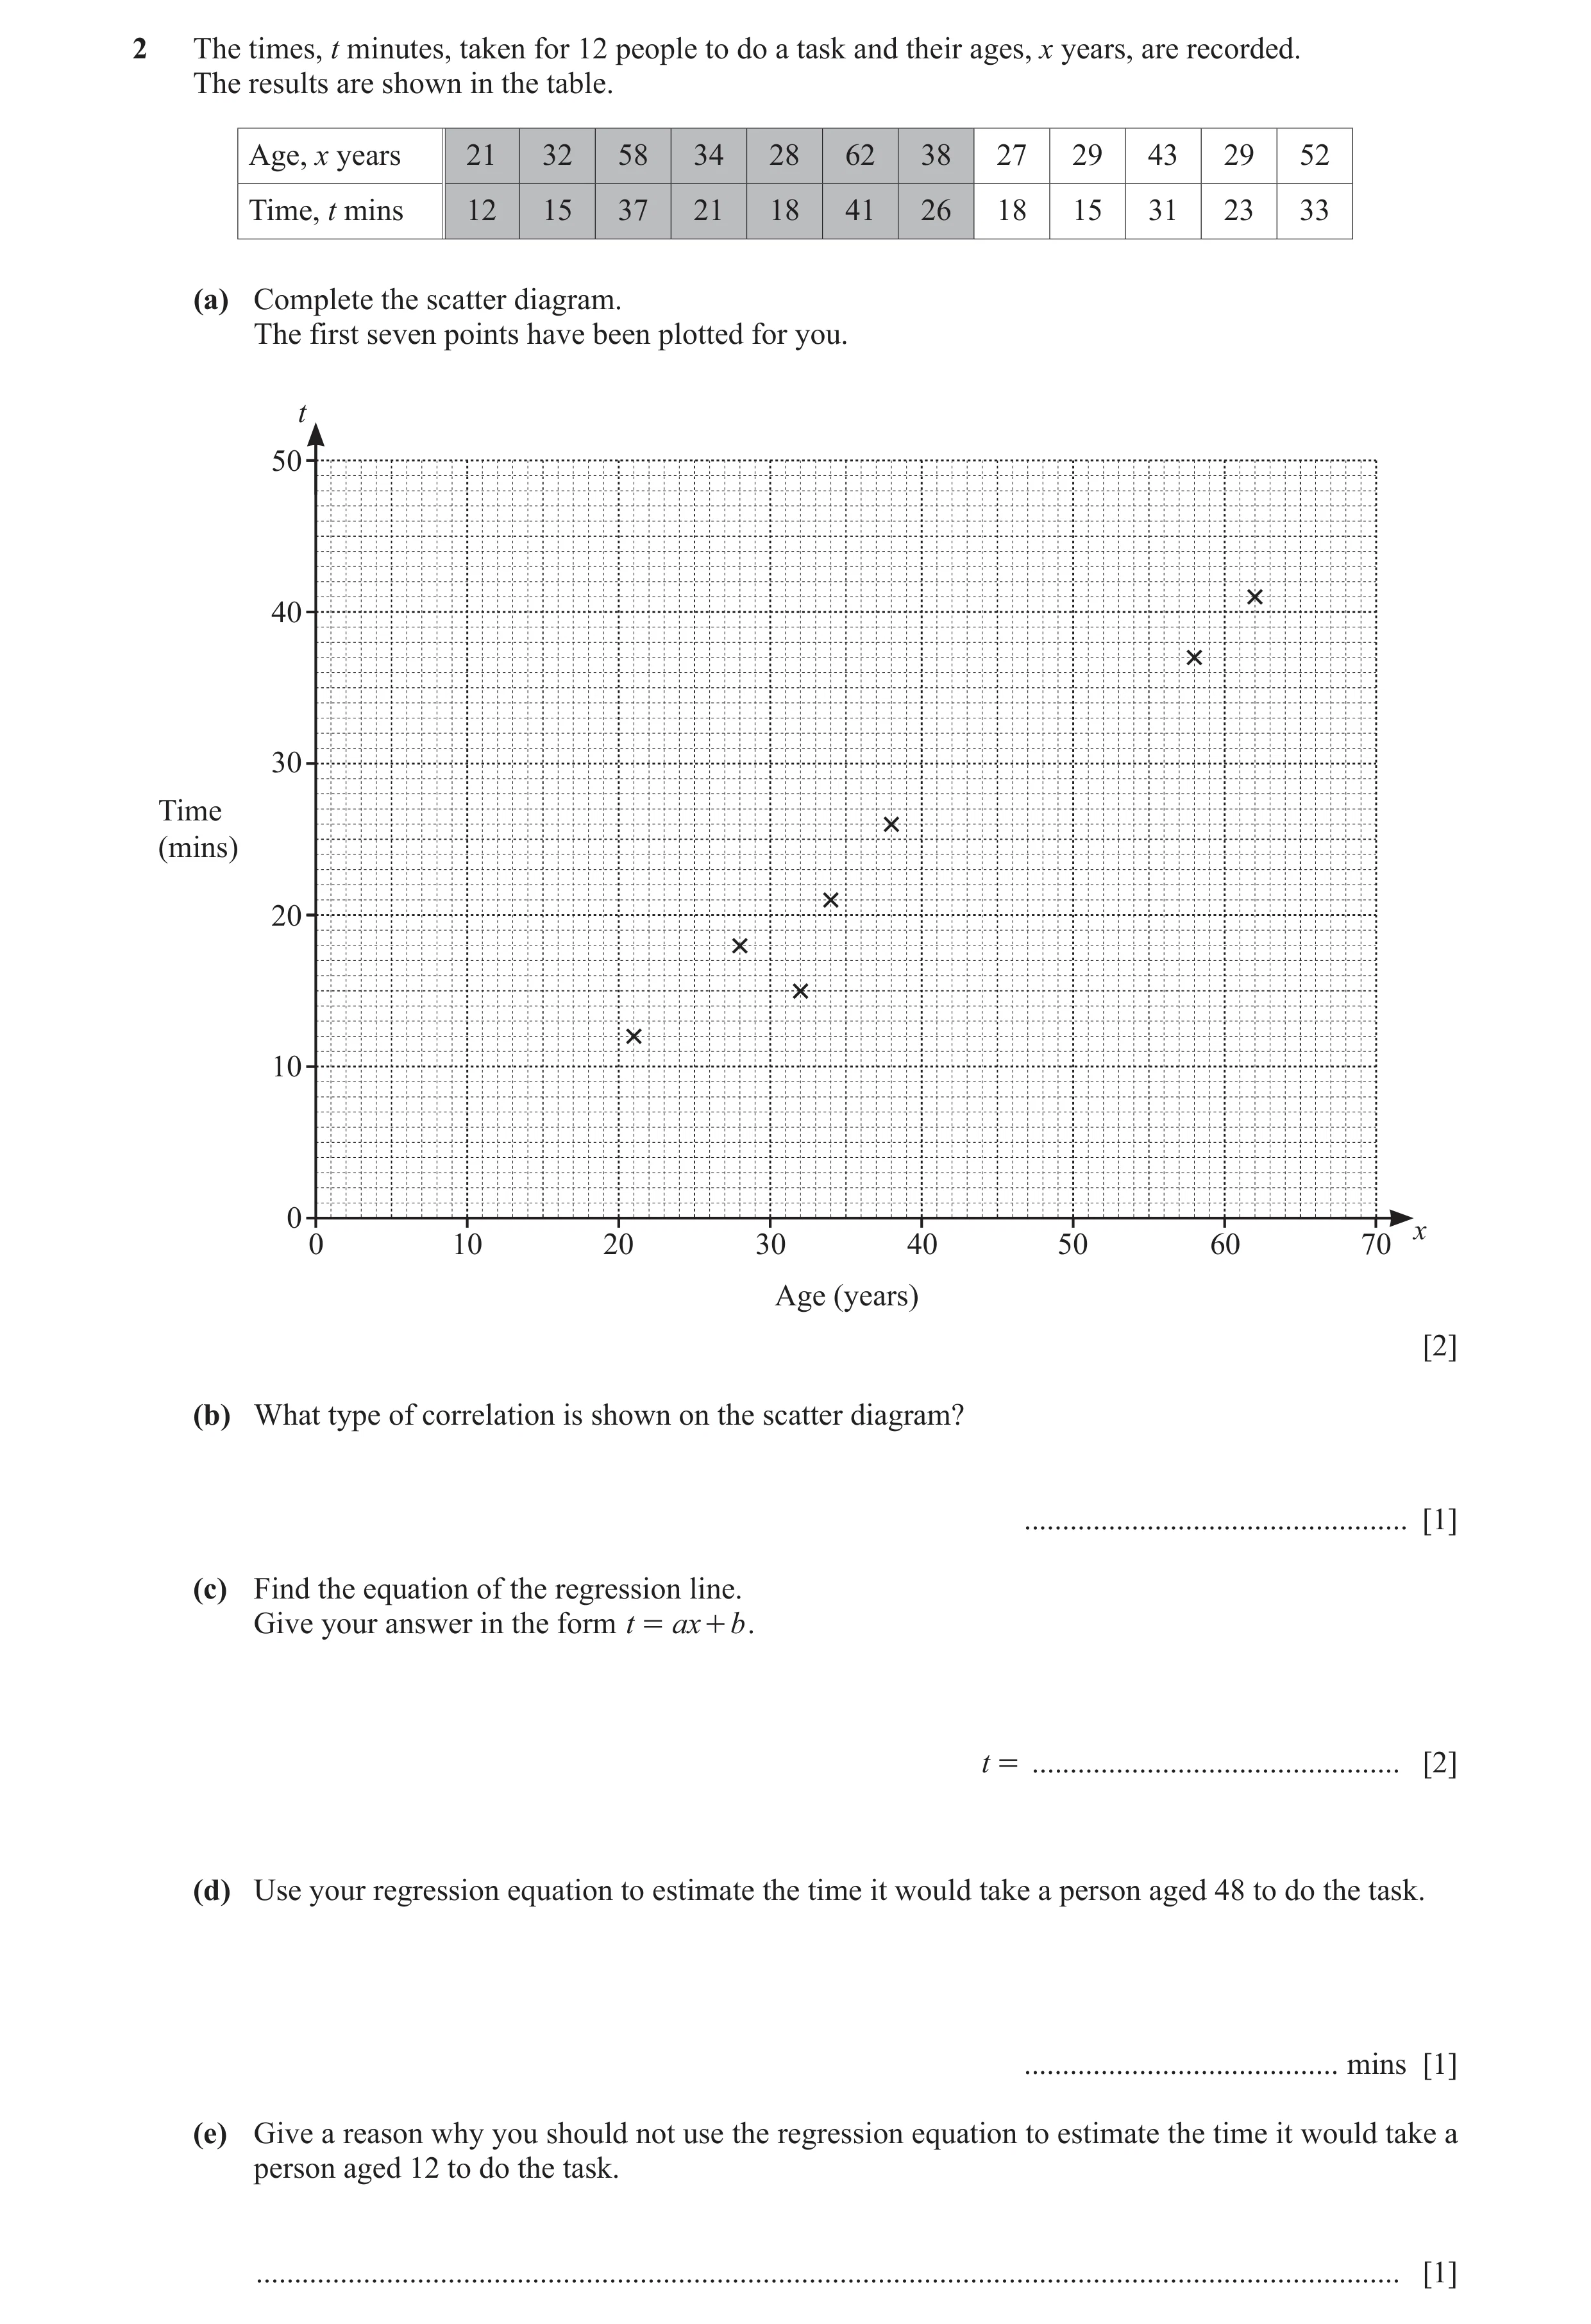
2 The times, t minutes, taken for 12 people to do a task and their ages, x years, are recorded. The results are shown in the table. Age, x years 21 32 58 34 28 62 38 27 29 43 29 52 Time, t mins 12 15 37 21 18 41 26 18 15 31 23 33 (a) Complete the scatter diagram. The first seven points have been plotted for you. t 50 40 30 Time (mins) 20 10 0 x 0 10 20 30 40 50 60 70 Age (years) [2] (b) What type of correlation is shown on the scatter diagram? … [1] (c) Find the equation of the regression line. Give your answer in the form t = ax + b . t = … [2] (d) Use your regression equation to estimate the time it would take a person aged 48 to do the task. … mins [1] (e) Give a reason why you should not use the regression equation to estimate the time it would take a person aged 12 to do the task. … [1]
7 marks
Mark scheme: 2(a) 5 points plotted correctly 2 B1 for 3 or 4 correct points 2(b) Positive 1 2(c) 0.685x – 1.69 2 0.6850 to 0.6851, –1.695 to –1.694 B1 for ax – 1.69 or 0.685x + b or for 0.69x – 1.7 2(d) 31 or 31.1 to 31.2 1 FT their (c) 2(e) Too far outside range of data oe 1
This question in 0607/42 Oct/Nov 2022
Q18 · The time, t hours, spent watching television in one week by each of 100 students is shown… 0607/43 Oct/Nov 2022
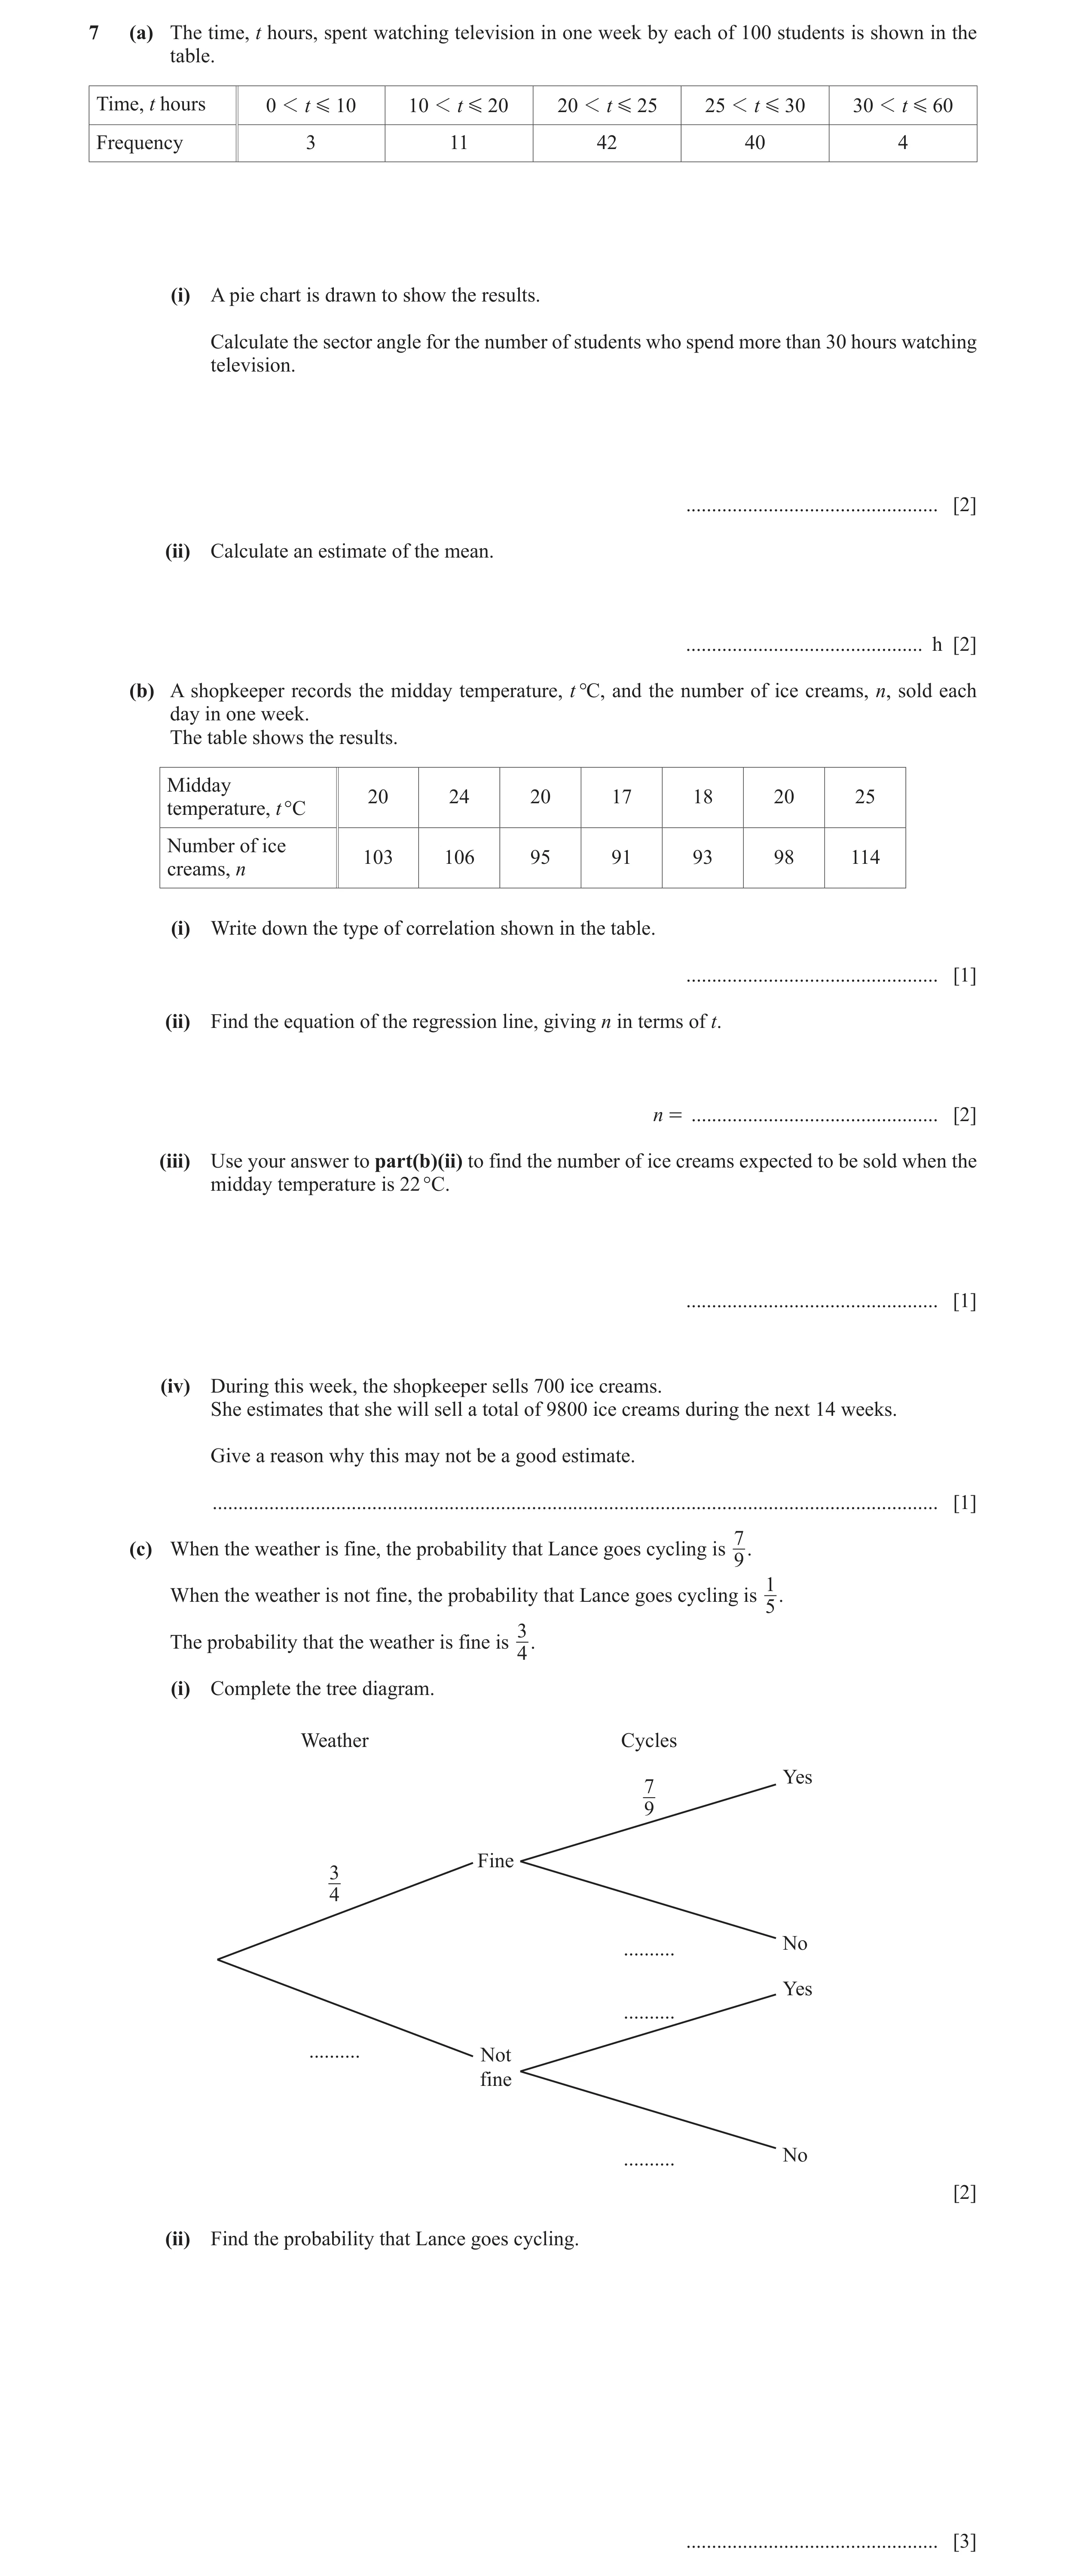
7 (a) The time, t hours, spent watching television in one week by each of 100 students is shown in the table. Time, t hours 0 1 t G 10 10 1 t G 20 20 1 t G 25 25 1 t G 30 30 1 t G 60 Frequency 3 11 42 40 4 (i) A pie chart is drawn to show the results. Calculate the sector angle for the number of students who spend more than 30 hours watching television. … [2] (ii) Calculate an estimate of the mean. … h [2] (b) A shopkeeper records the midday temperature, t °C, and the number of ice creams, n, sold each day in one week. The table shows the results. Midday 20 24 20 17 18 20 25 temperature, t °C Number of ice 103 106 95 91 93 98 114 creams, n (i) Write down the type of correlation shown in the table. … [1] (ii) Find the equation of the regression line, giving n in terms of t. n = … [2] (iii) Use your answer to part(b)(ii) to find the number of ice creams expected to be sold when the midday temperature is 22 °C. … [1] (iv) During this week, the shopkeeper sells 700 ice creams. She estimates that she will sell a total of 9800 ice creams during the next 14 weeks. Give a reason why this may not be a good estimate. … [1] (c) When the weather is fine, the probability that Lance goes cycling is 7. 9 When the weather is not fine, the probability that Lance goes cycling is 1. 5 The probability that the weather is fine is 3. 4 (i) Complete the tree diagram. Weather Cycles Yes 7 9 Fine 3 4 No … Yes … … Not fine … No [2] (ii) Find the probability that Lance goes cycling. … [3]
14 marks
Mark scheme: 7(a)(i) 14.4 2 4 M1 for 360 100 7(a)(ii) 24.05 or 24.1 2 M1 for at least 3 mid-values soi 7(b)(i) positive 1 7(b)(ii) n = 2.61t + 46.3 2 B1 for 2.61t + k or kt + 46.3 or 2.6t + 46 7(b)(iii) 103 or 104 1 FT their (c)(ii) but must be integer answer 7(b)(iv) small sample oe or reference to weather 1 7(c)(i) 1 2 1 4 2 B1 for 2 correct , , , 4 9 5 5 7(c)(ii) 19 3 3 7 1 1 oe M2 FT for + their their 30 4 9 4 5 or M1 FT for one of the products only FT probabilities < 1
This question in 0607/43 Oct/Nov 2022
Q19 · The table shows the marks of 12 students in a French examination and a Spanish examination 0607/43 May/June 2023
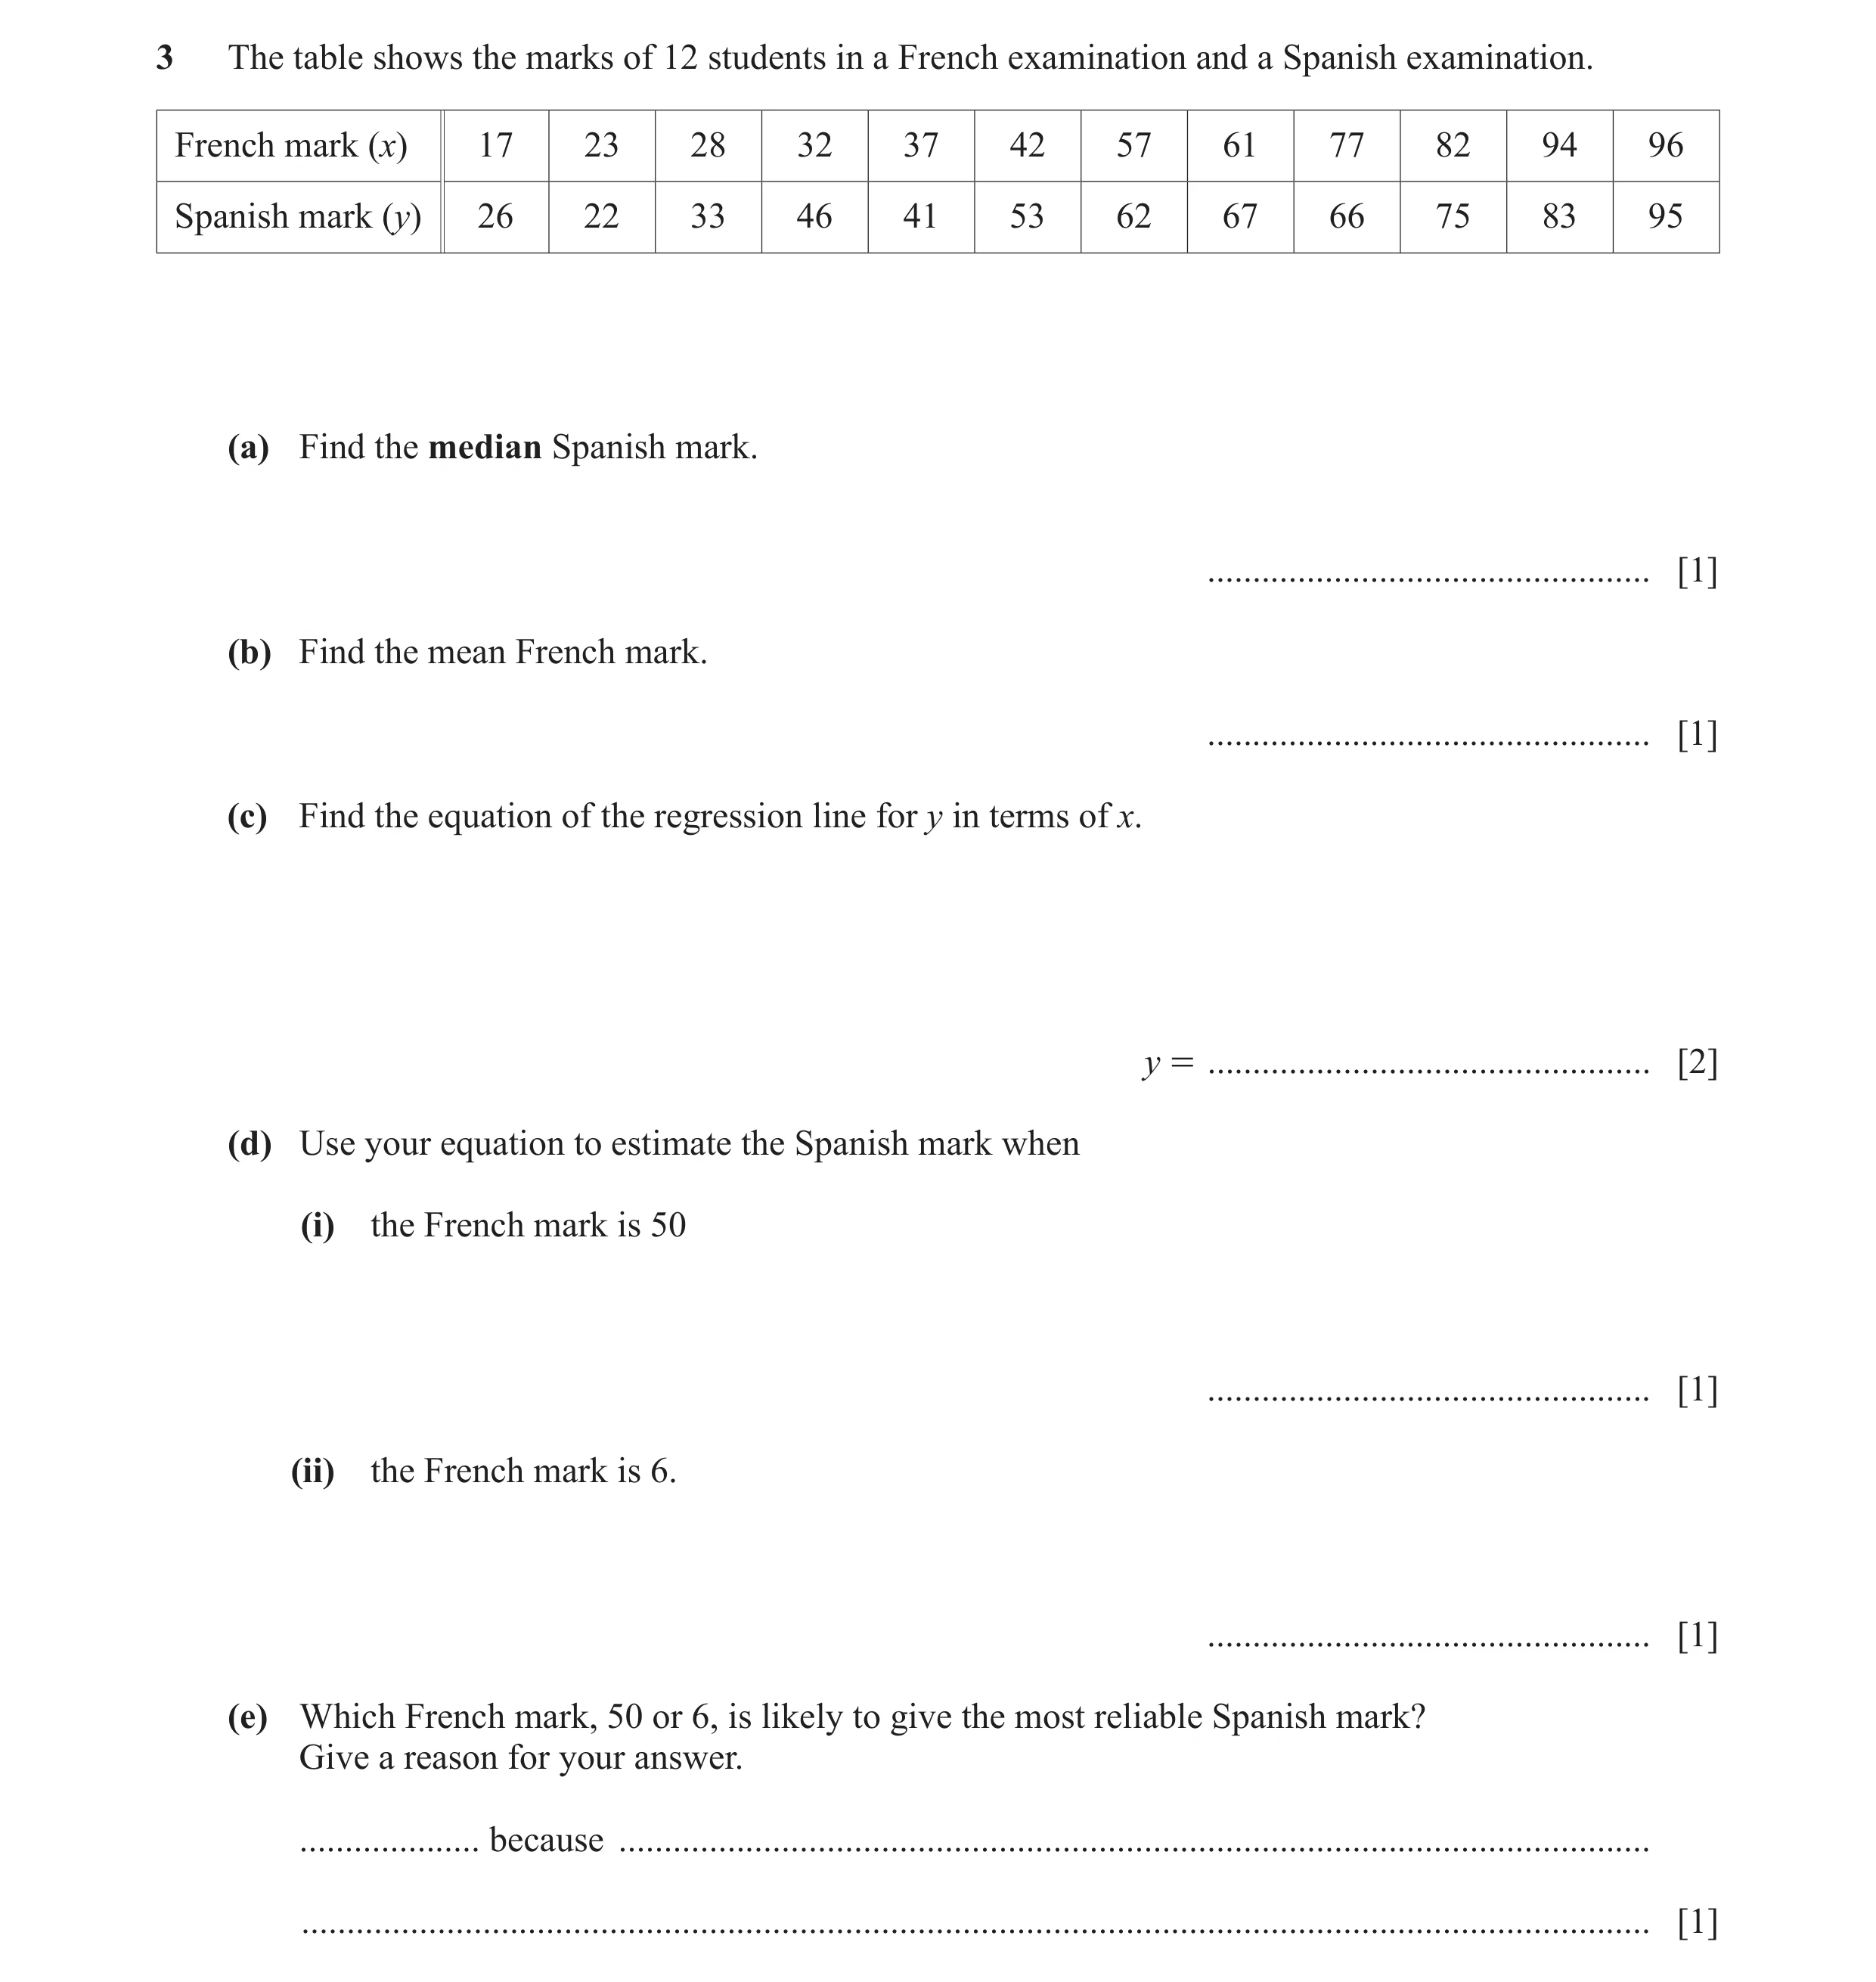
3 The table shows the marks of 12 students in a French examination and a Spanish examination. French mark (x) 17 23 28 32 37 42 57 61 77 82 94 96 Spanish mark (y) 26 22 33 46 41 53 62 67 66 75 83 95 (a) Find the median Spanish mark. … [1] (b) Find the mean French mark. … [1] (c) Find the equation of the regression line for y in terms of x. y = … [2] (d) Use your equation to estimate the Spanish mark when (i) the French mark is 50 … [1] (ii) the French mark is 6. … [1] (e) Which French mark, 50 or 6, is likely to give the most reliable Spanish mark? Give a reason for your answer. … because … … [1]
7 marks
Mark scheme: 3(a) 57.5 1 3(b) 53.8 or 53.83… 1 3(c) 0.791x + 13.2 2 M1 for 0.791x + k or kx + 13.2 or 0.79x + 13 3(d)(i) 53 or 52.7 to 52.8 1 FT their part (b) 3(d)(ii) 18 or 17.90 to 17.95 1 FT their part (b) 3(e) 50, within range 1 or 50 as 6 is not in range
This question in 0607/43 May/June 2023
Q20 · A group of 10 people were asked the time, correct to the nearest minute, they each spent… 0607/42 Oct/Nov 2023
4 (a) A group of 10 people were asked the time, correct to the nearest minute, they each spent listening to the news and reading the news on Monday. The results are shown in the table. Minutes listening (x) 1 9 3 3 11 8 2 7 1 4 Minutes reading (y) 5 10 9 7 2 1 3 6 11 5 (i) Complete the scatter diagram. The first six points have been plotted for you. y 12 10 8 Minutes 6 reading 4 2 x 0 2 4 6 8 10 12 Minutes listening [2] (ii) Find the median time spent reading the news on Monday. … min [1] (iii) Find the equation of the line of regression. Give your answer in the form y = mx + c . y = … [2] (iv) On Tuesday, each person spends the same time listening to the news as they did on Monday. They each spend 5 minutes longer reading the news than they did on Monday. Write down the equation of the line of regression for Tuesday. y = … [1] (b) In February Sancho read the news for a total of 8 hours. This was a reduction of 36% from January. Work out how long Sancho read the news in January. … hours [2] (c) The bar chart shows the number of news articles read one day by each of 23 people. 5 Number of 4 news articles read 3 2 0 1 2 3 4 5 6 7 8 9 10 Number of people Calculate the mean number of articles read. … [2]
10 marks
Mark scheme: 4(a)(i) 4 correct points plotted 2 B1 for 3 correct 4(a)(ii) 5.5 1 4(a)(iii) y = − 0.323 x + 7.48 2 B1 for [ y =] − 0.323 x + k or [y=] kx + 7.48 or [y=] −0.32 x + 7.5 4(a)(iv) y = − 0.323 x + 12.48 1 FT their (k) + 5 4(b) 12.5 2 100 − 36 = M1 for x 8 oe 100 4(c) 3.57 or 3.565... 2 M1 for 5 +5 4 +6 3 +9 2 3 implied by 82
This question in 0607/42 Oct/Nov 2023
Q21 · Ten people trained for a fitness test 0607/42 Feb/March 2024
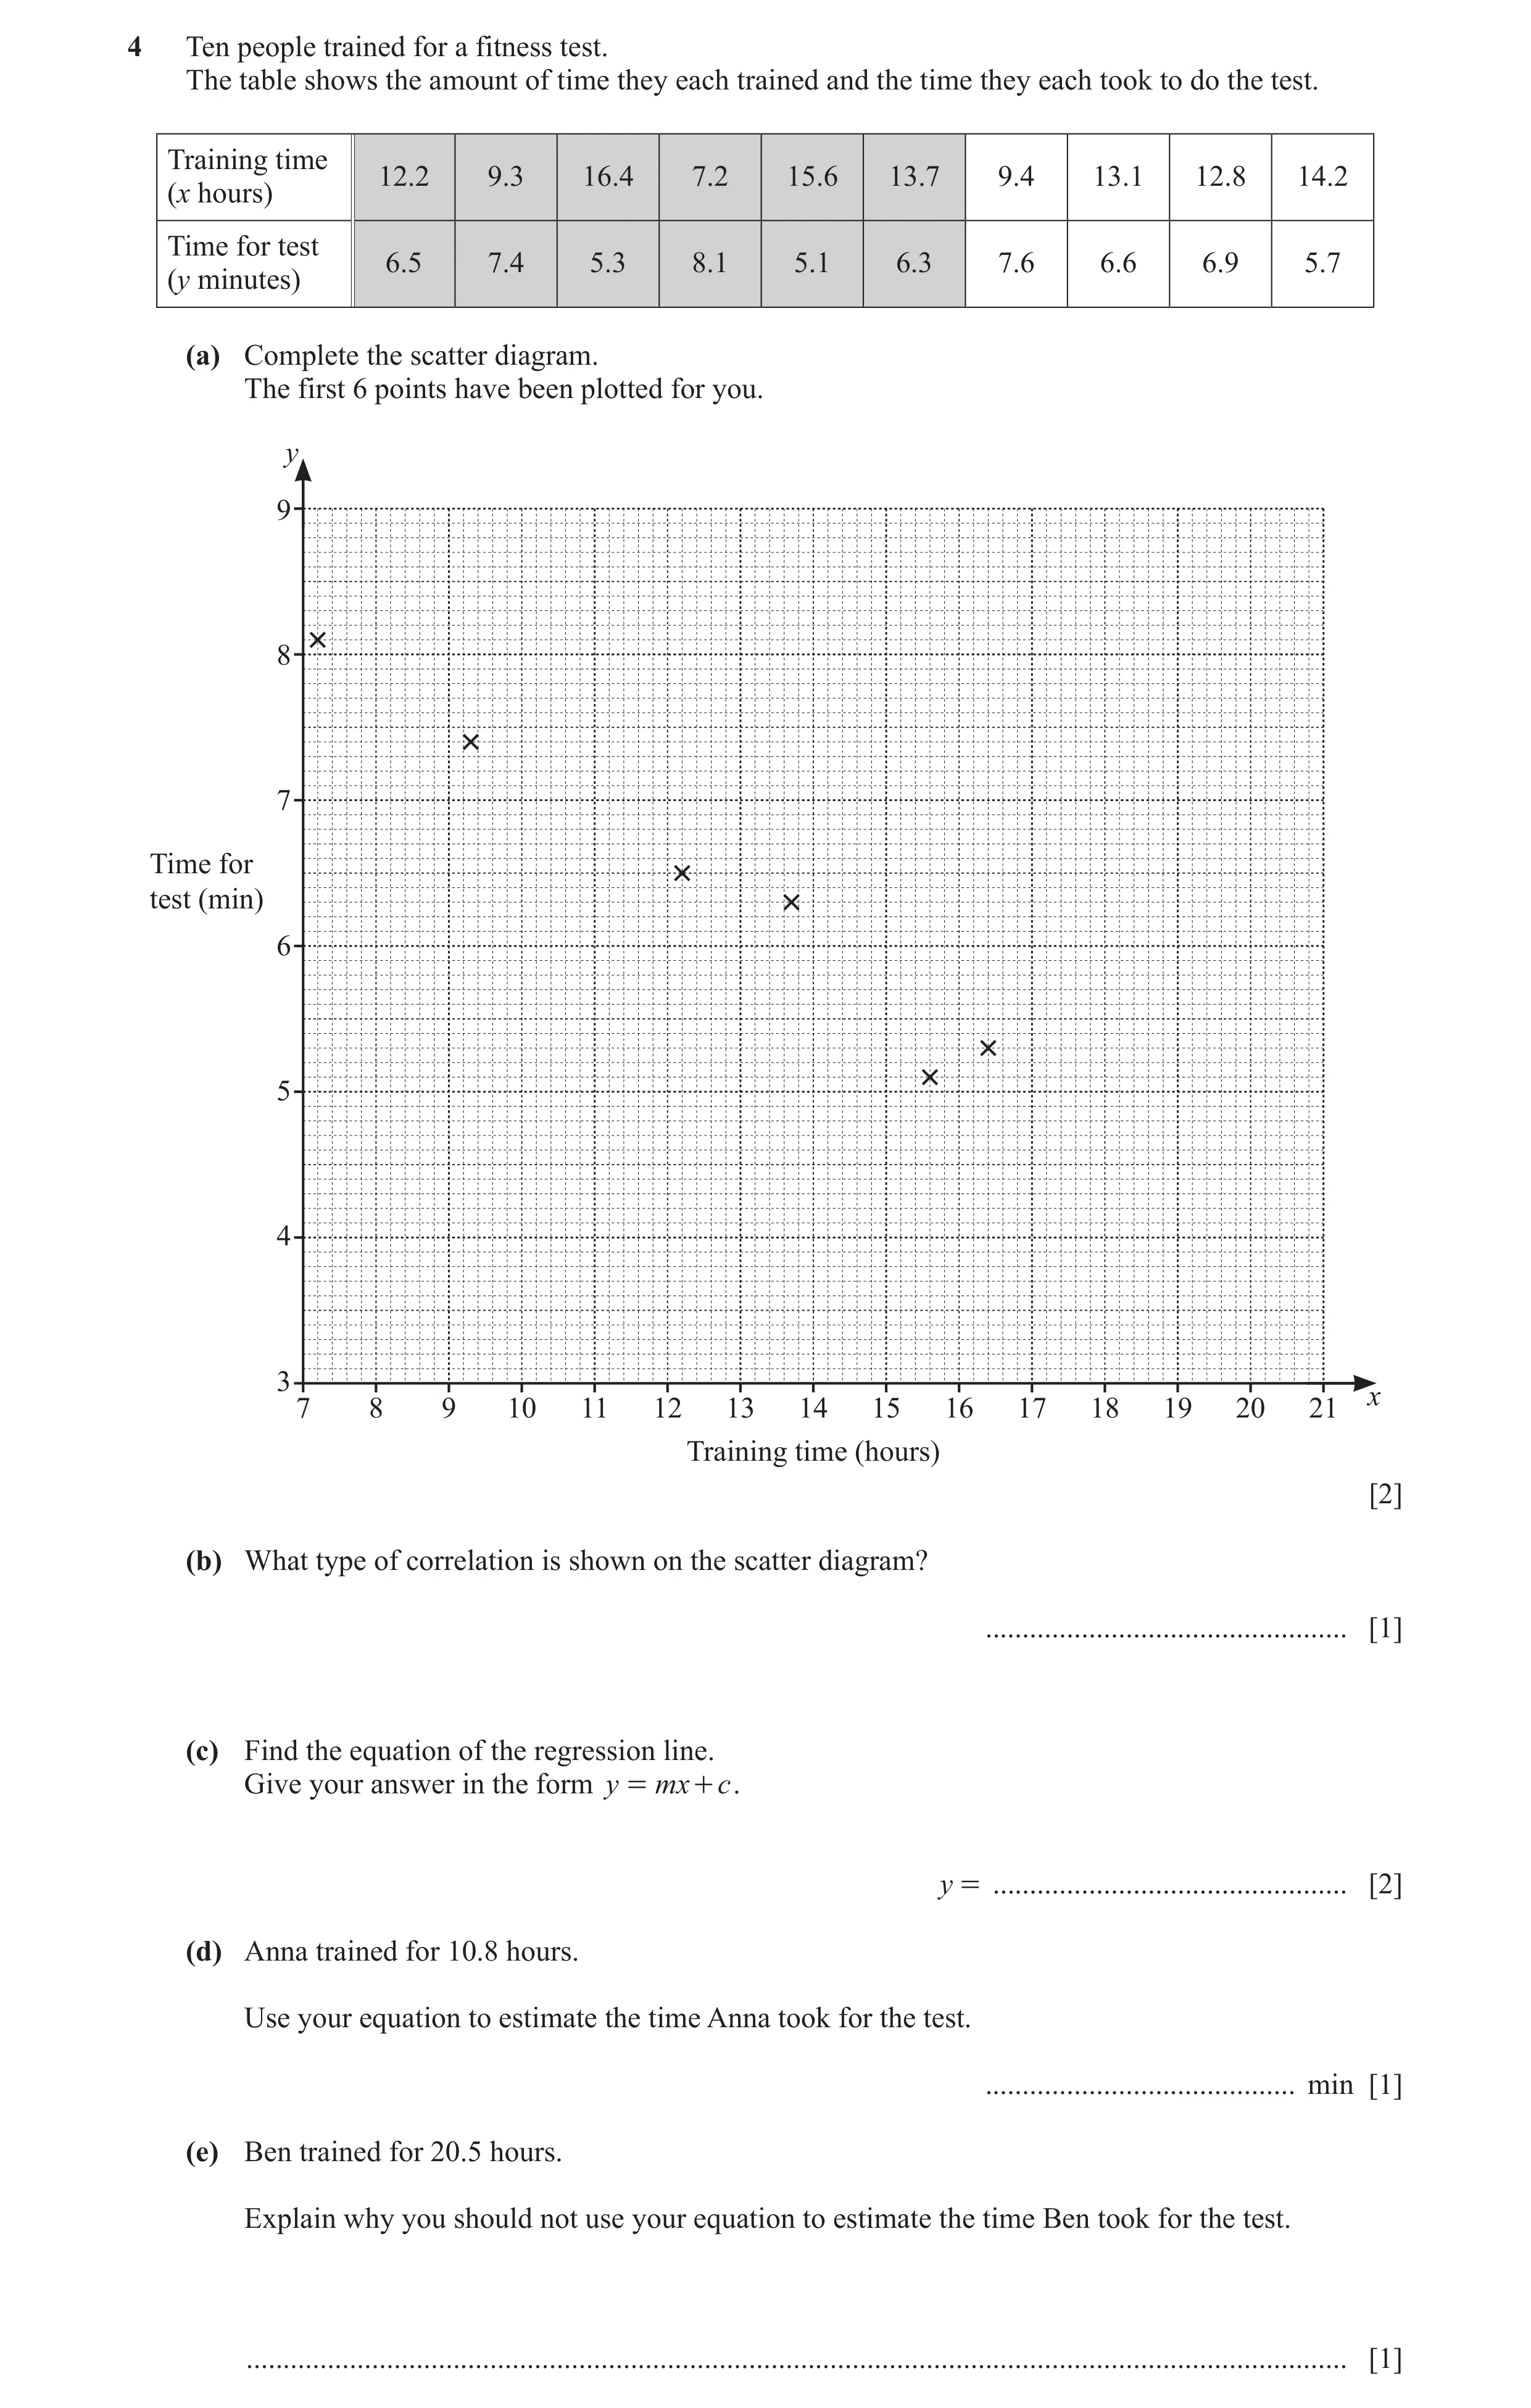
4 Ten people trained for a fitness test. The table shows the amount of time they each trained and the time they each took to do the test. Training time 12.2 9.3 16.4 7.2 15.6 13.7 9.4 13.1 12.8 14.2 (x hours) Time for test 6.5 7.4 5.3 8.1 5.1 6.3 7.6 6.6 6.9 5.7 (y minutes) (a) Complete the scatter diagram. The first 6 points have been plotted for you. y 9 8 7 Time for test (min) 6 5 4 3 x 7 8 9 10 11 12 13 14 15 16 17 18 19 20 21 Training time (hours) [2] (b) What type of correlation is shown on the scatter diagram? … [1] (c) Find the equation of the regression line. Give your answer in the form y = mx + c . y = … [2] (d) Anna trained for 10.8 hours. Use your equation to estimate the time Anna took for the test. … min [1] (e) Ben trained for 20.5 hours. Explain why you should not use your equation to estimate the time Ben took for the test. … [1]
7 marks
Mark scheme: 4(a) 4 points plotted correctly 2 B1 for 2 correct. 4(b) Negative 1 4(c) y = – 0.325x + 10.6 2 0.3245... , 10.57... B1 for y = – 0.325x + k or y = kx + 10.6 4(d) 7.06 to 7.09 1 FT their (c) 4(e) Too far outside range of data oe 1
This question in 0607/42 Feb/March 2024
Q22 · Paulo compares the fuel consumption of his car and the average speed of his car for ten… 0607/41 Oct/Nov 2024
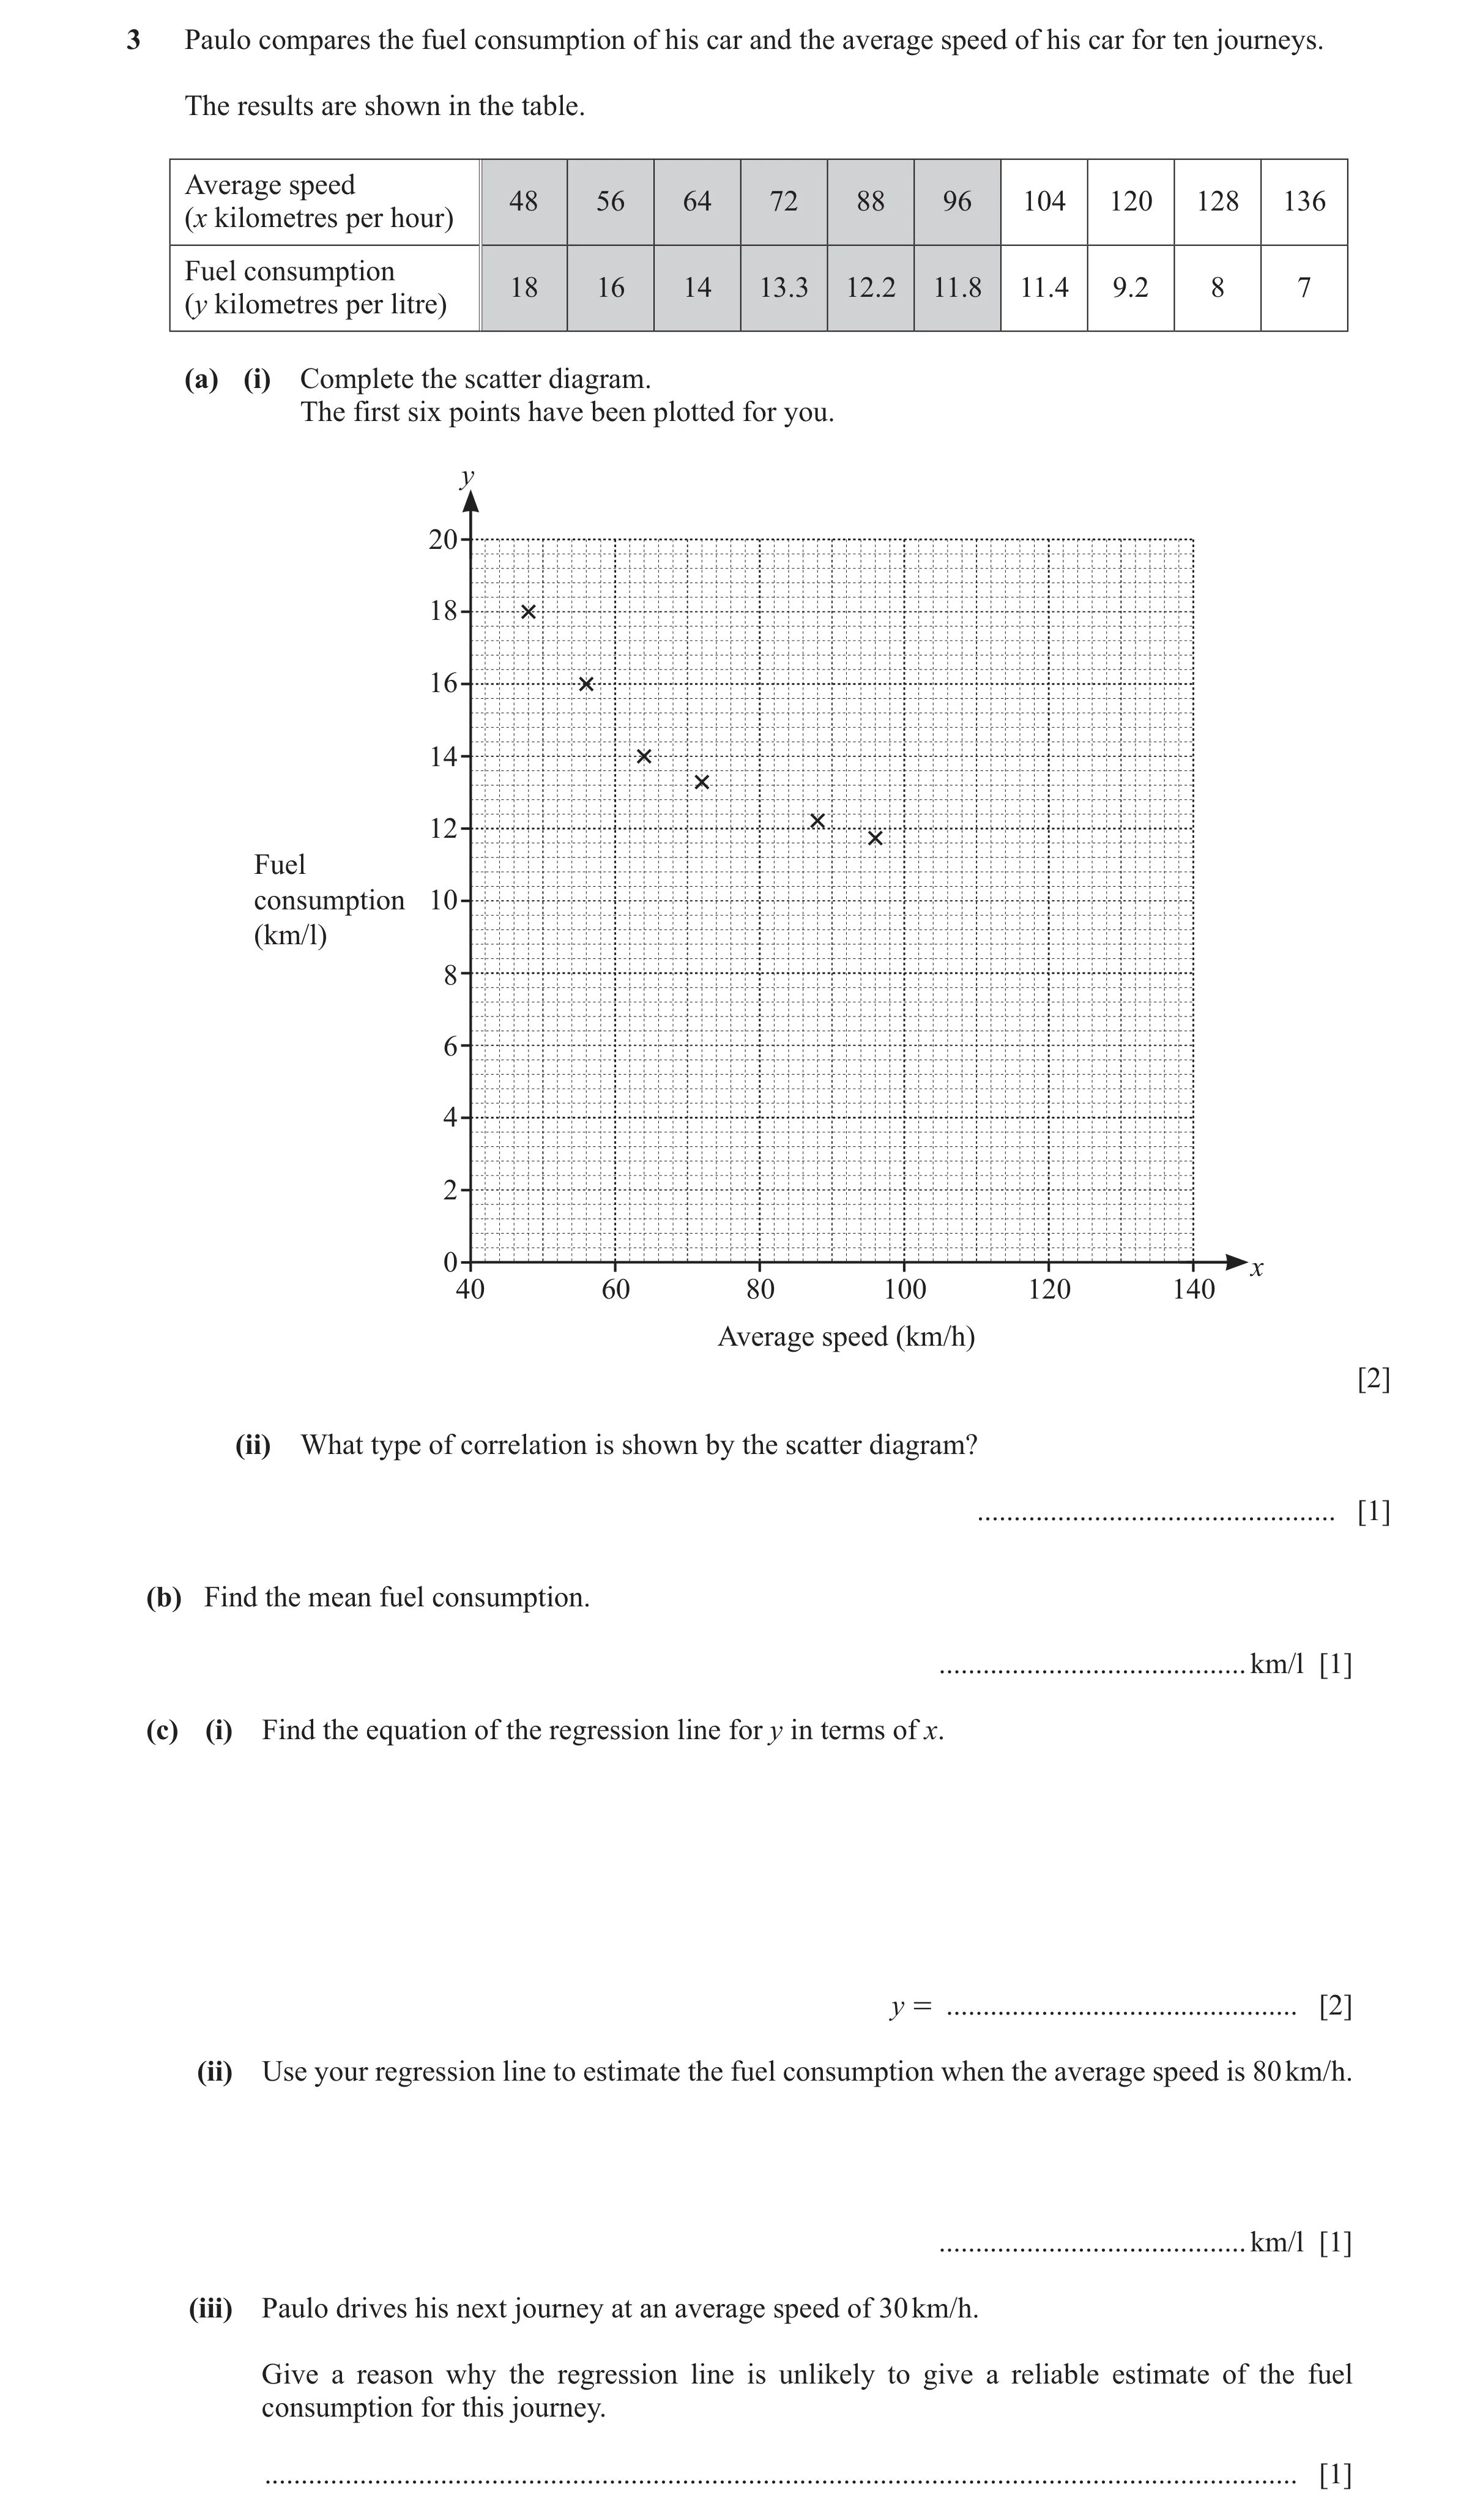
3 Paulo compares the fuel consumption of his car and the average speed of his car for ten journeys. The results are shown in the table. Average speed 48 56 64 72 88 96 104 120 128 136 (x kilometres per hour) Fuel consumption 18 16 14 13.3 12.2 11.8 11.4 9.2 8 7 (y kilometres per litre) (a) (i) Complete the scatter diagram. The first six points have been plotted for you. y 20 18 16 14 12 Fuel consumption 10 (km/l) 8 6 4 2 0 x 40 60 80 100 120 140 Average speed (km/h) [2] (ii) What type of correlation is shown by the scatter diagram? … [1] (b) Find the mean fuel consumption. … km/l [1] (c) (i) Find the equation of the regression line for y in terms of x. y = … [2] (ii) Use your regression line to estimate the fuel consumption when the average speed is 80 km/h. … km/l [1] (iii) Paulo drives his next journey at an average speed of 30 km/h. Give a reason why the regression line is unlikely to give a reliable estimate of the fuel consumption for this journey. … [1]
8 marks
Mark scheme: 3(a)(i) Correct points plotted 2 B1 for 3 points correct 3(a)(ii) negative 1 3(b) 12.1 or 12.09 1 3(c)(i) y = −0.109 x + 22.1 2 B1 for y = − kx + 22.1 or y = −0.109 x + k or y = −0.11x + 22 3(c)(ii) 13.4 or 13.38 1 FT their (c)(i) 3(c)(iii) Outside data range oe 1
This question in 0607/41 Oct/Nov 2024
Q23 · A class of students take a writing test and a speaking test 0607/42 Feb/March 2025
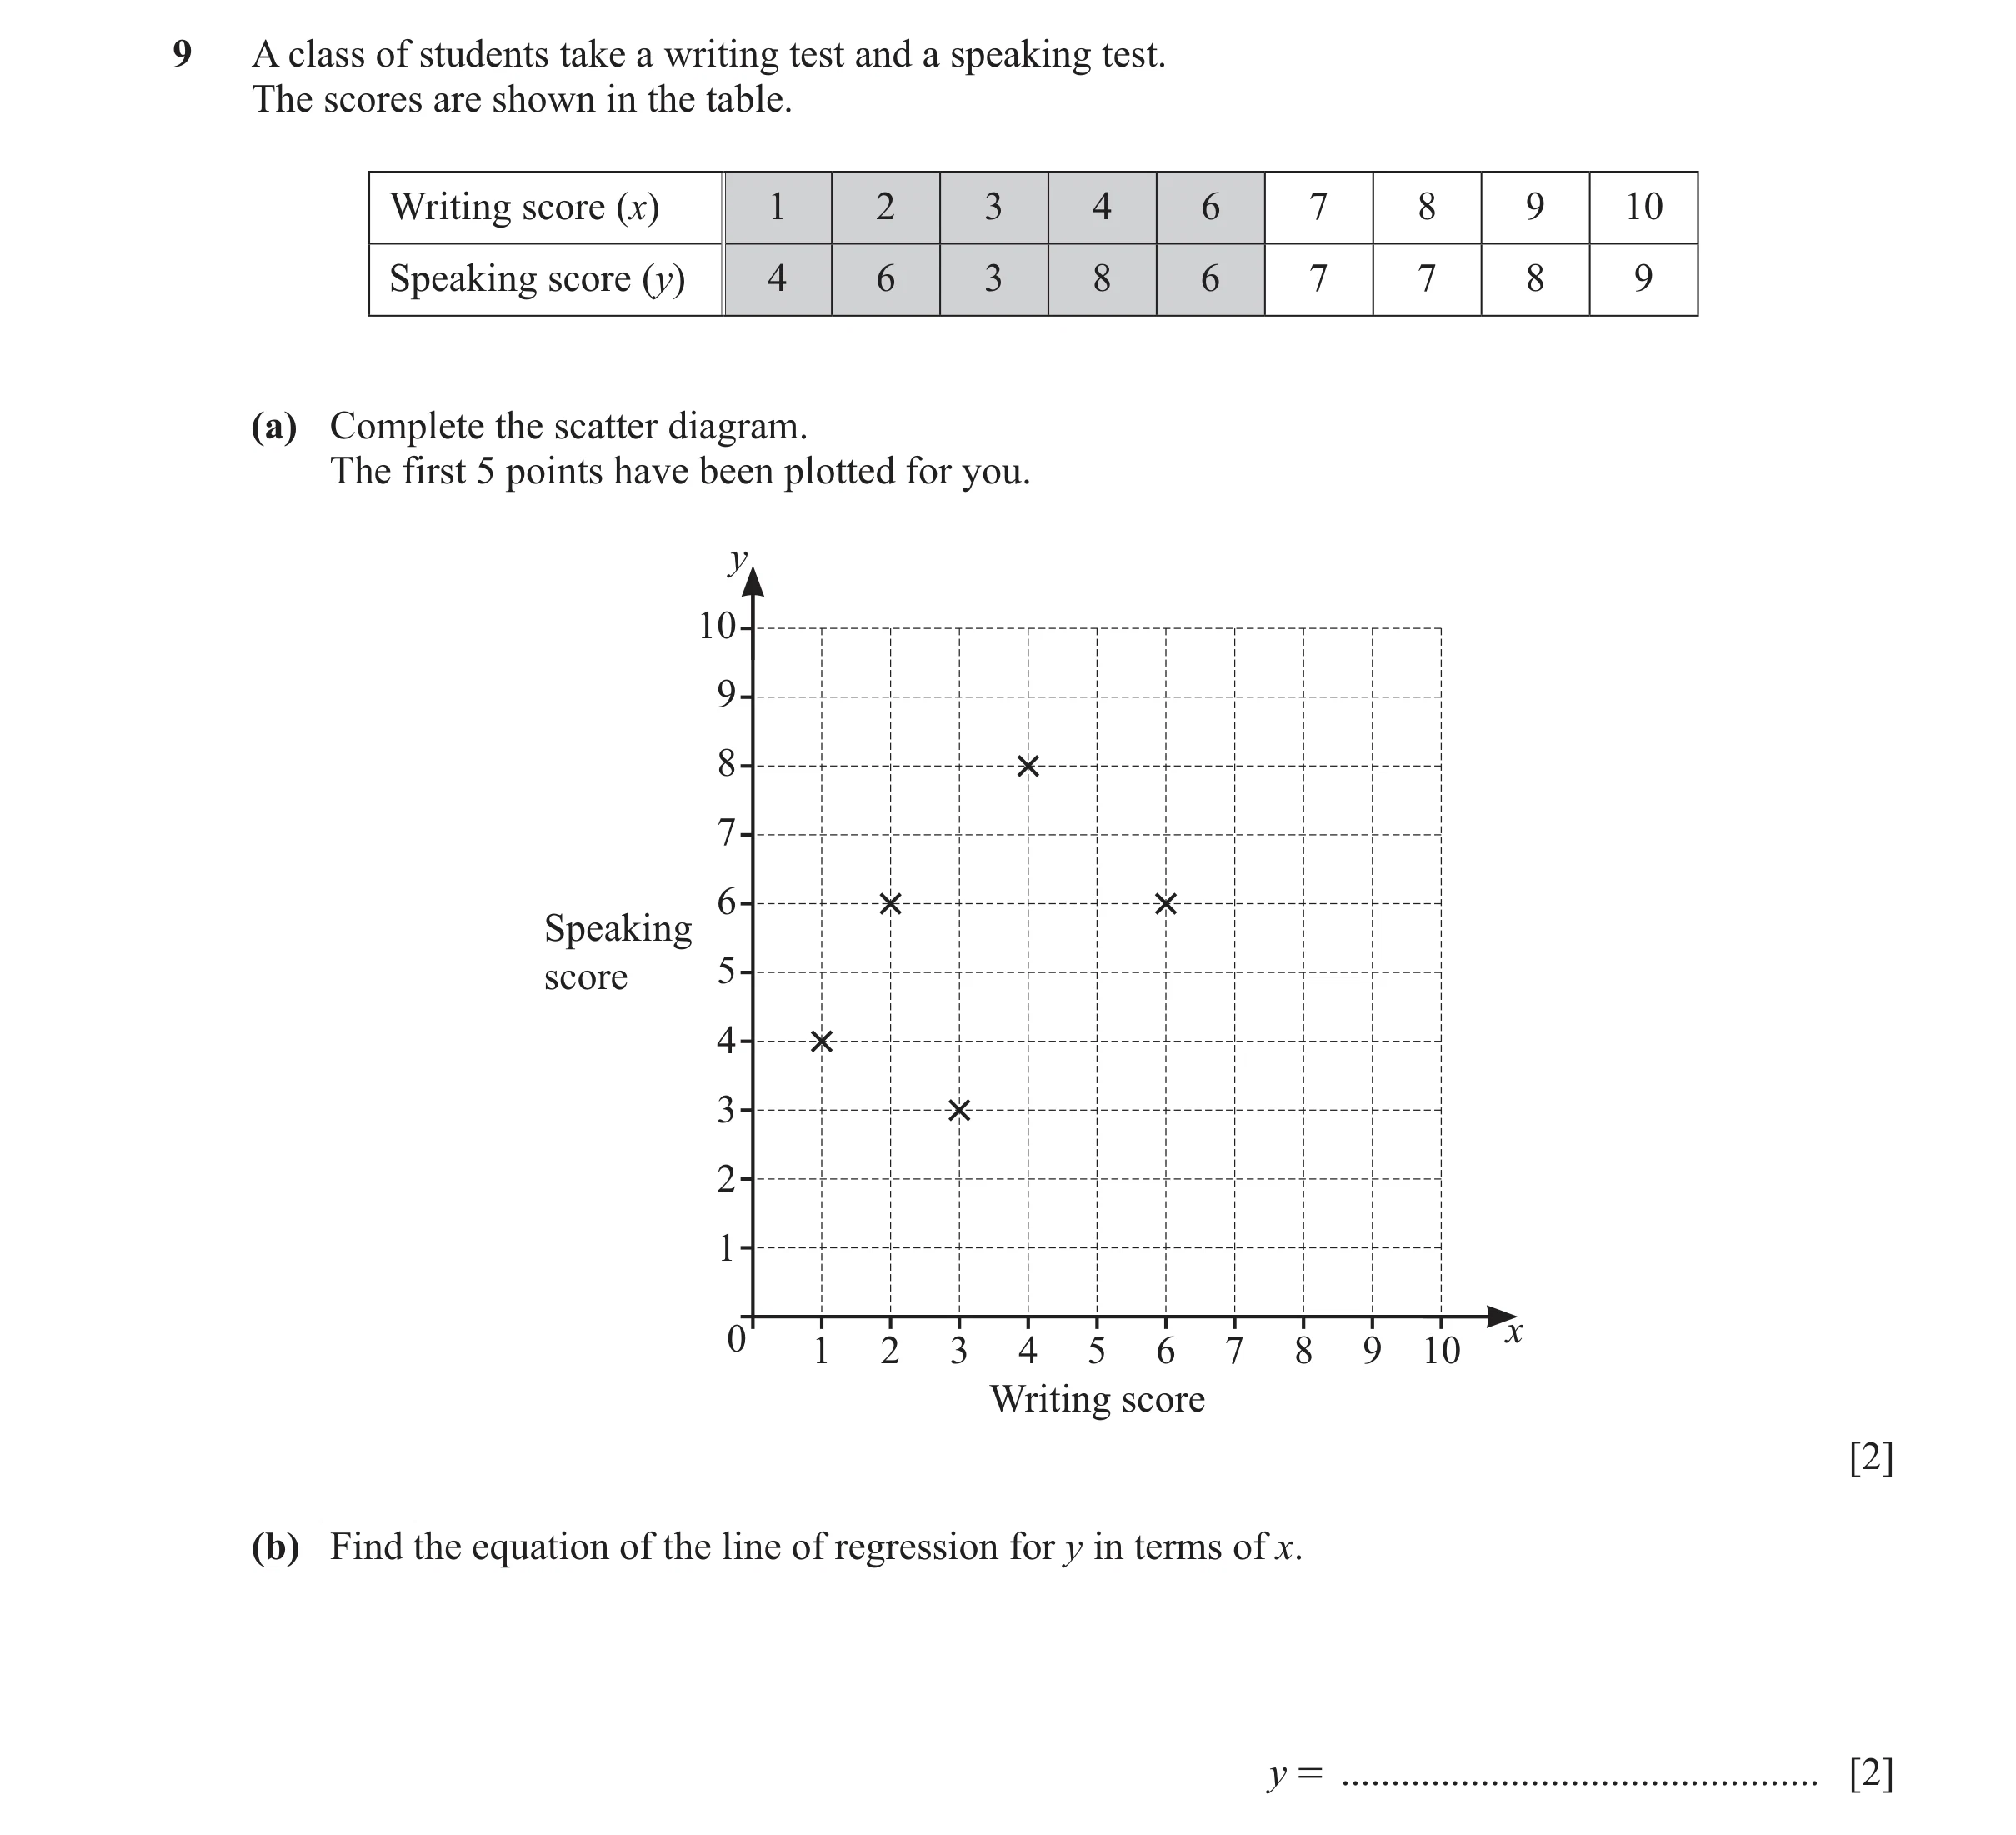
9 A class of students take a writing test and a speaking test. The scores are shown in the table. Writing score (x) 1 2 3 4 6 7 8 9 10 Speaking score (y) 4 6 3 8 6 7 7 8 9 (a) Complete the scatter diagram. The first 5 points have been plotted for you. y 10 9 8 7 6 Speaking score 5 4 3 2 1 0 x 1 2 3 4 5 6 7 8 9 10 Writing score [2] (b) Find the equation of the line of regression for y in terms of x. y = … [2]
4 marks
Mark scheme: 9(a) 2 B1 for 2 correct plots Correct plots 9(b) [y =] 0.459x + 3.89 2 B1 for [y =] 0.459x + k or [y =] kx + 3.89 or [y =] 0.46x + 3.9
This question in 0607/42 Feb/March 2025
Q24 · The table shows the marks of each of 10 students in a physics exam and in a chemistry exam 0607/42 May/June 2025
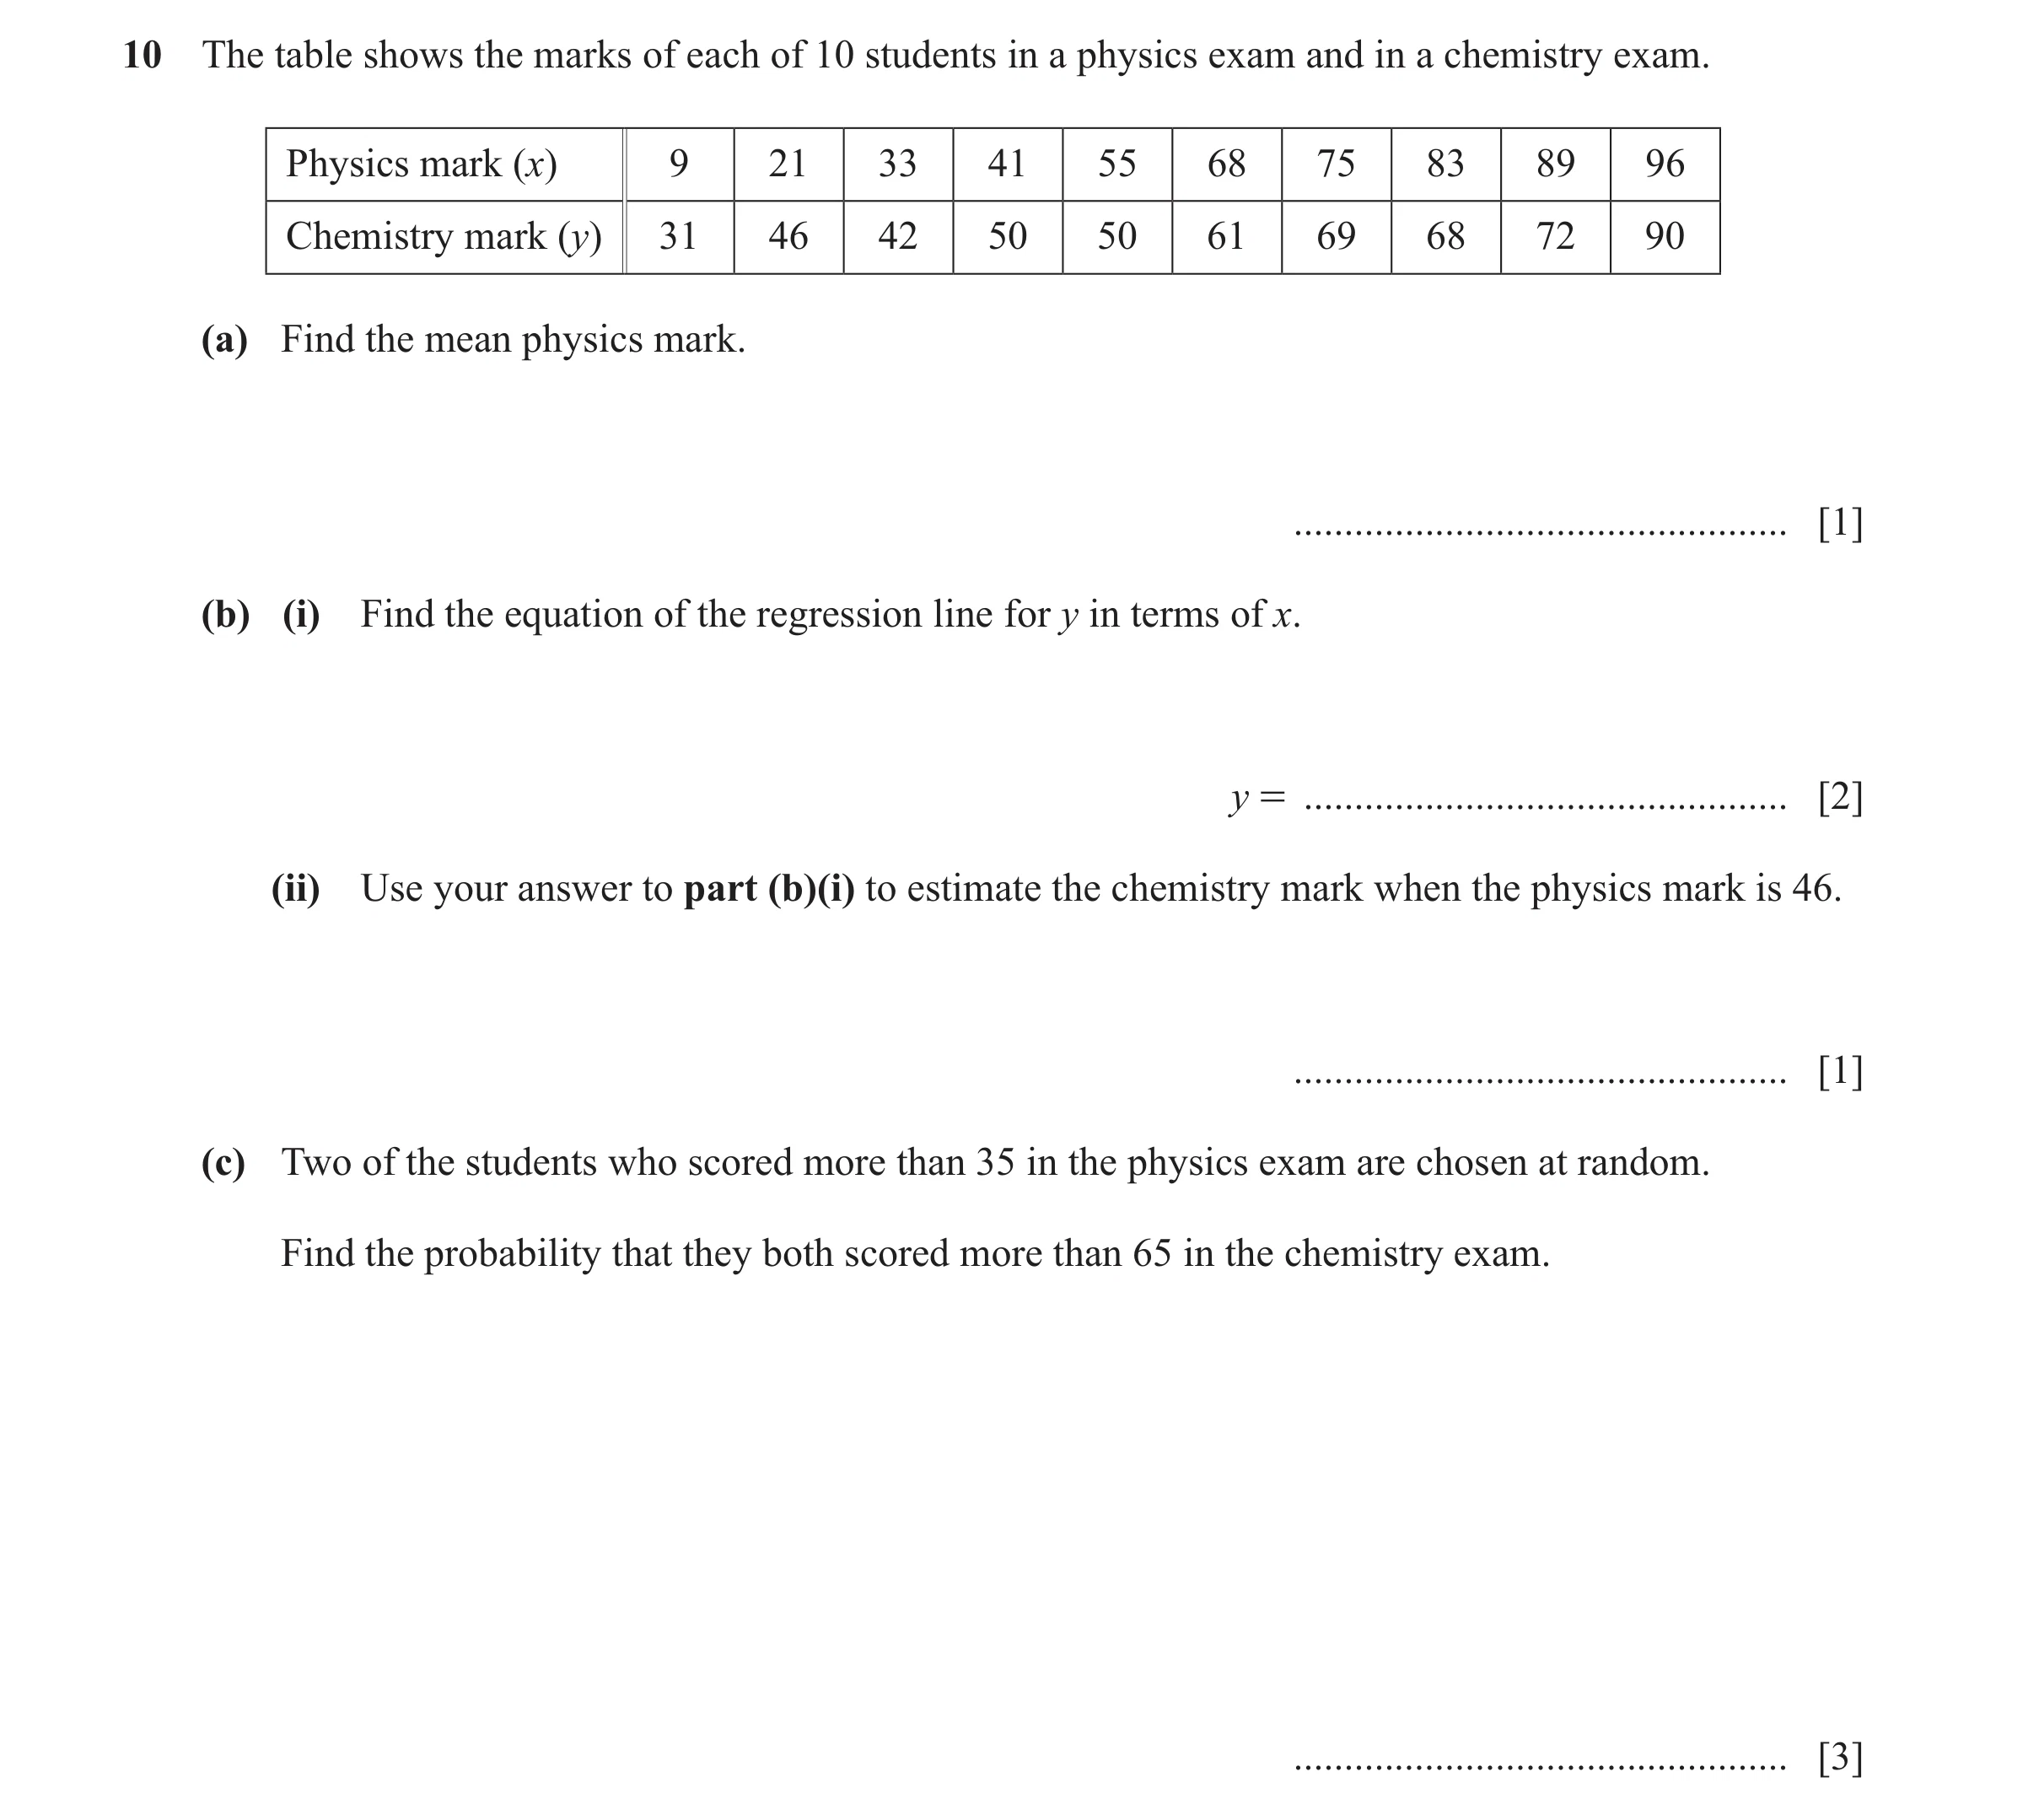
10 The table shows the marks of each of 10 students in a physics exam and in a chemistry exam. Physics mark (x) 9 21 33 41 55 68 75 83 89 96 Chemistry mark (y) 31 46 42 50 50 61 69 68 72 90 (a) Find the mean physics mark. … [1] (b) (i) Find the equation of the regression line for y in terms of x. y = … [2] (ii) Use your answer to part (b)(i) to estimate the chemistry mark when the physics mark is 46. … [1] (c) Two of the students who scored more than 35 in the physics exam are chosen at random. Find the probability that they both scored more than 65 in the chemistry exam. … [3]
7 marks
Mark scheme: 10(a) 57 1 10(b)(i) y = 0.548 x + 26.6 2 B1 for y = kx + 26.6 or y = 0.548x + k or y = 0.55x + 27 10(b)(ii) 52 or 51.8 to 51.9 1 FT their (b)(i) 10(c) 2 3 4 3 oe M2 for 7 7 6 4 or M1 for seen 7 x x − 1 or where x < y and y < 10 y y − 1
This question in 0607/42 May/June 2025
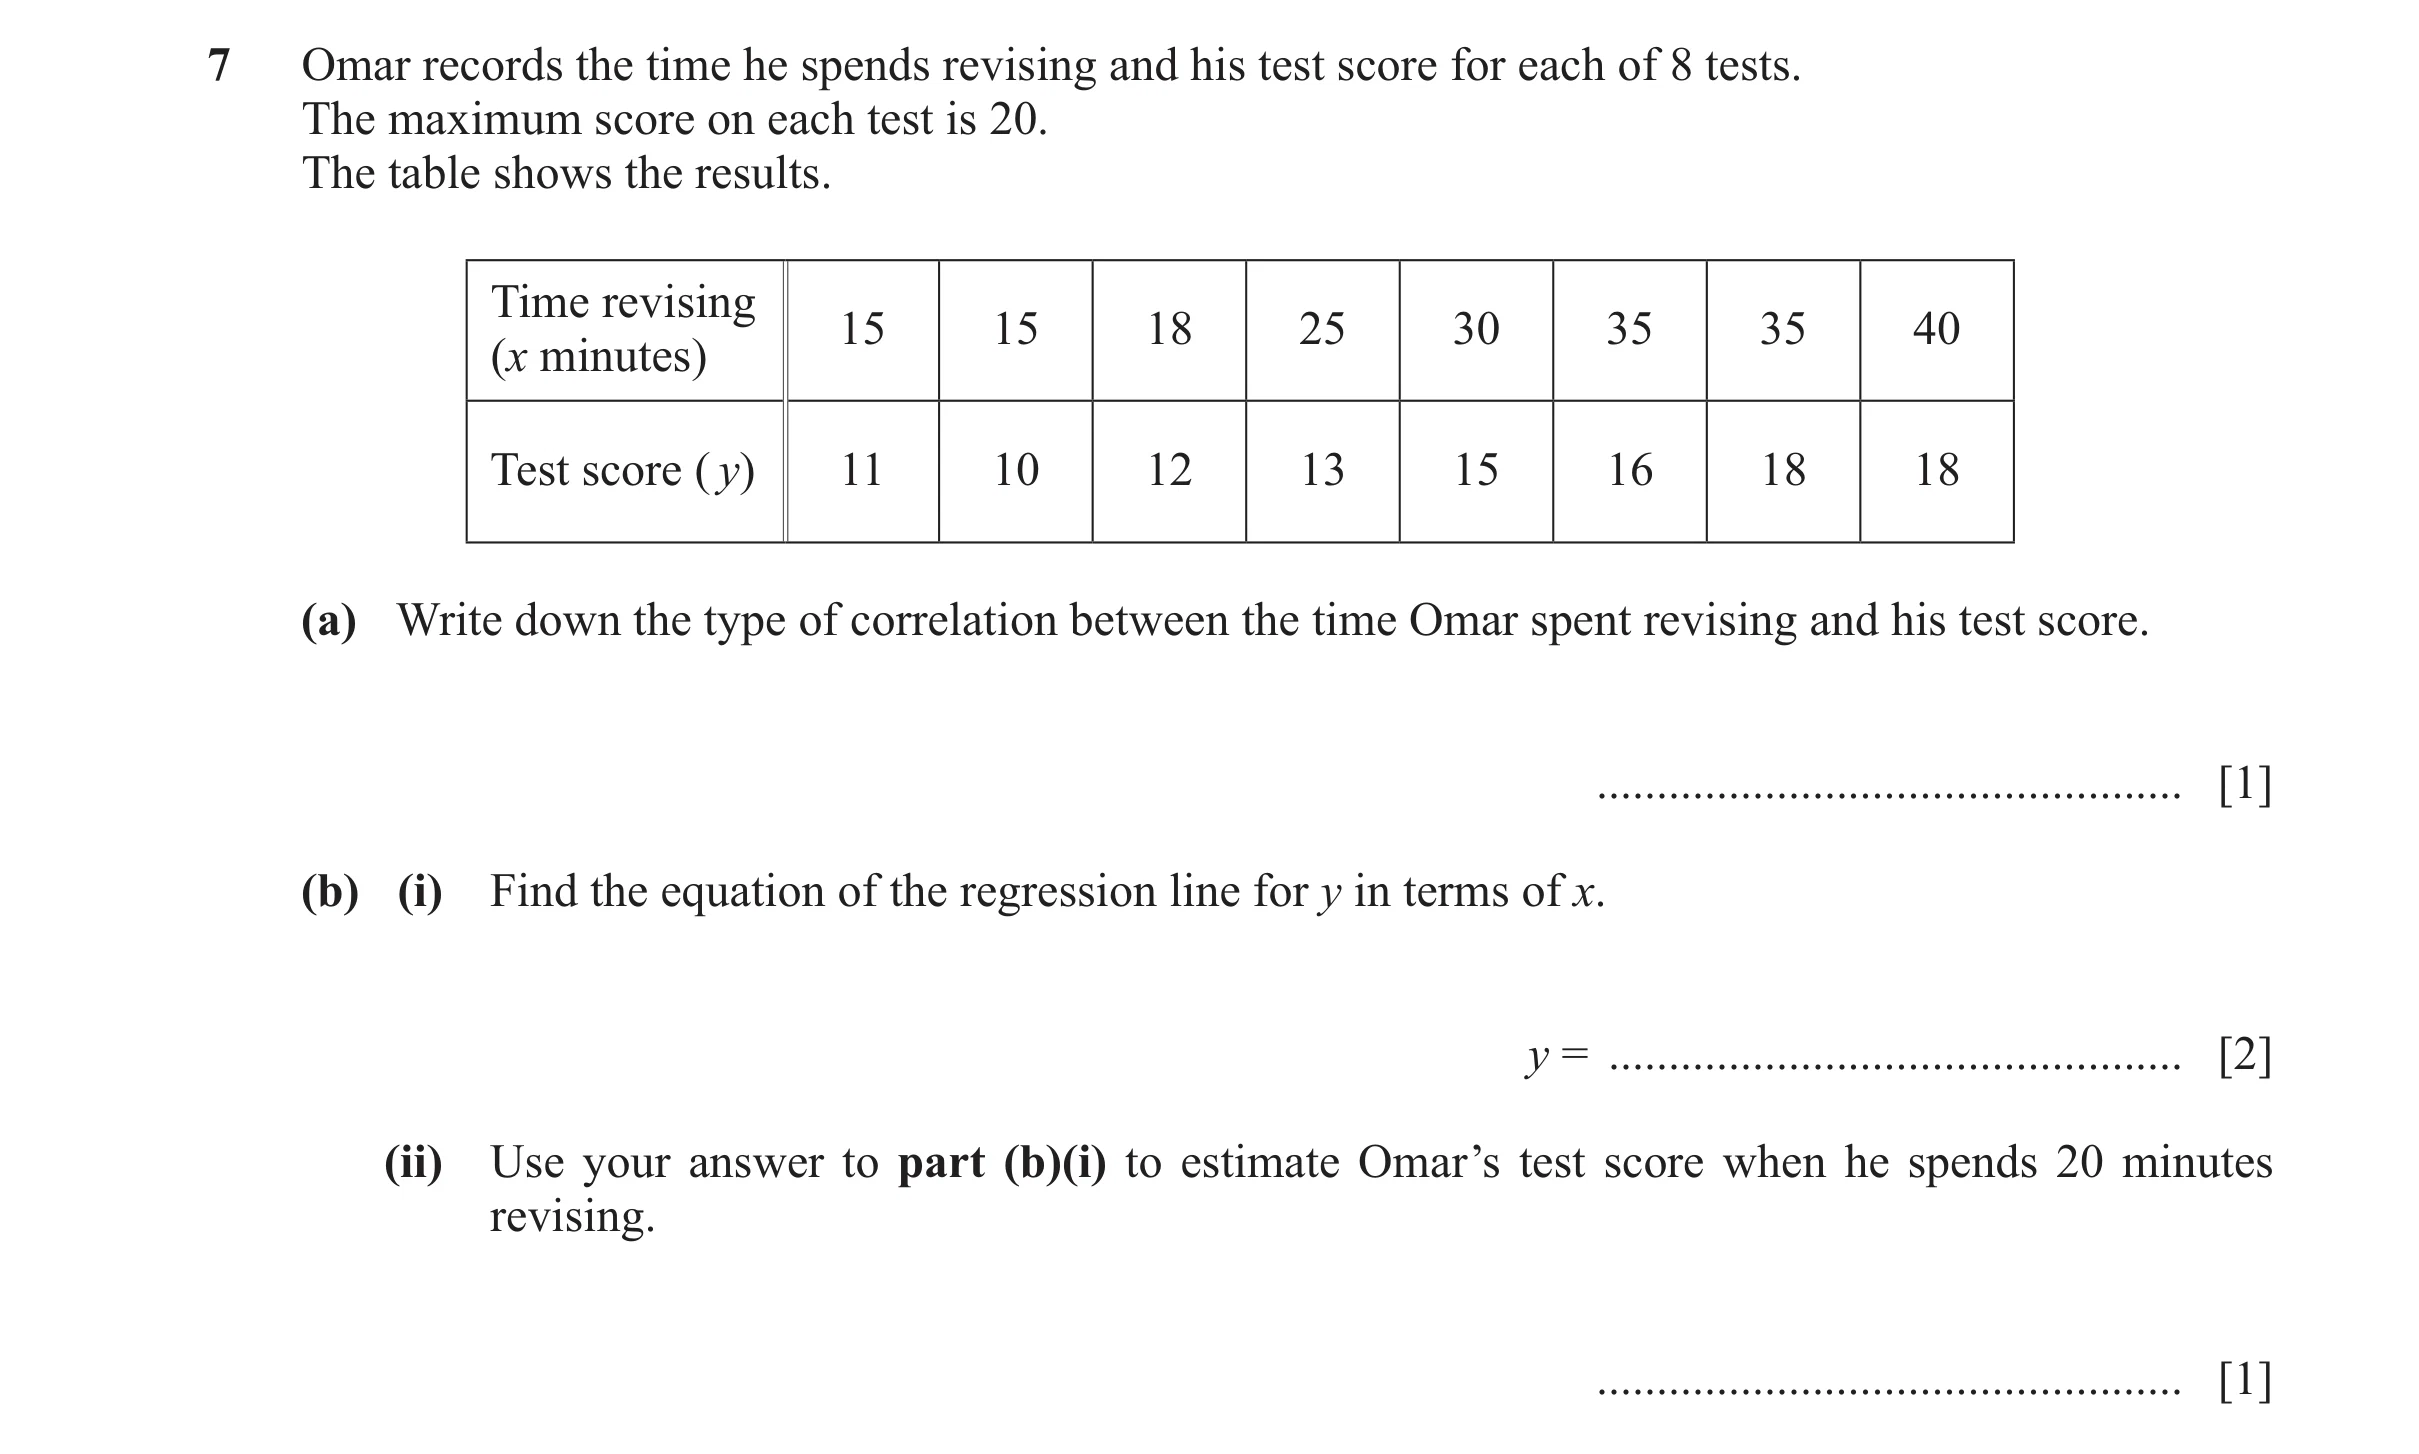
Q25 · Omar records the time he spends revising and his test score for each of 8 tests 0607/43 May/June 2025
7 Omar records the time he spends revising and his test score for each of 8 tests. The maximum score on each test is 20. The table shows the results. Time revising 15 15 18 25 30 35 35 40 (x minutes) Test score ( y) 11 10 12 13 15 16 18 18 (a) Write down the type of correlation between the time Omar spent revising and his test score. … [1] (b) (i) Find the equation of the regression line for y in terms of x. y = … [2] (ii) Use your answer to part (b)(i) to estimate Omar’s test score when he spends 20 minutes revising. … [1]
4 marks
Mark scheme: 7(a) positive 1 7(b)(i) [y =] 0.306x + 5.98 2 B1 for 0.306x + k or kx + 5.98 or 0.31x + 6.[0] 7(b)(ii) 12 or 12.09 to 12.10... 1 FT their (b)(i)
This question in 0607/43 May/June 2025
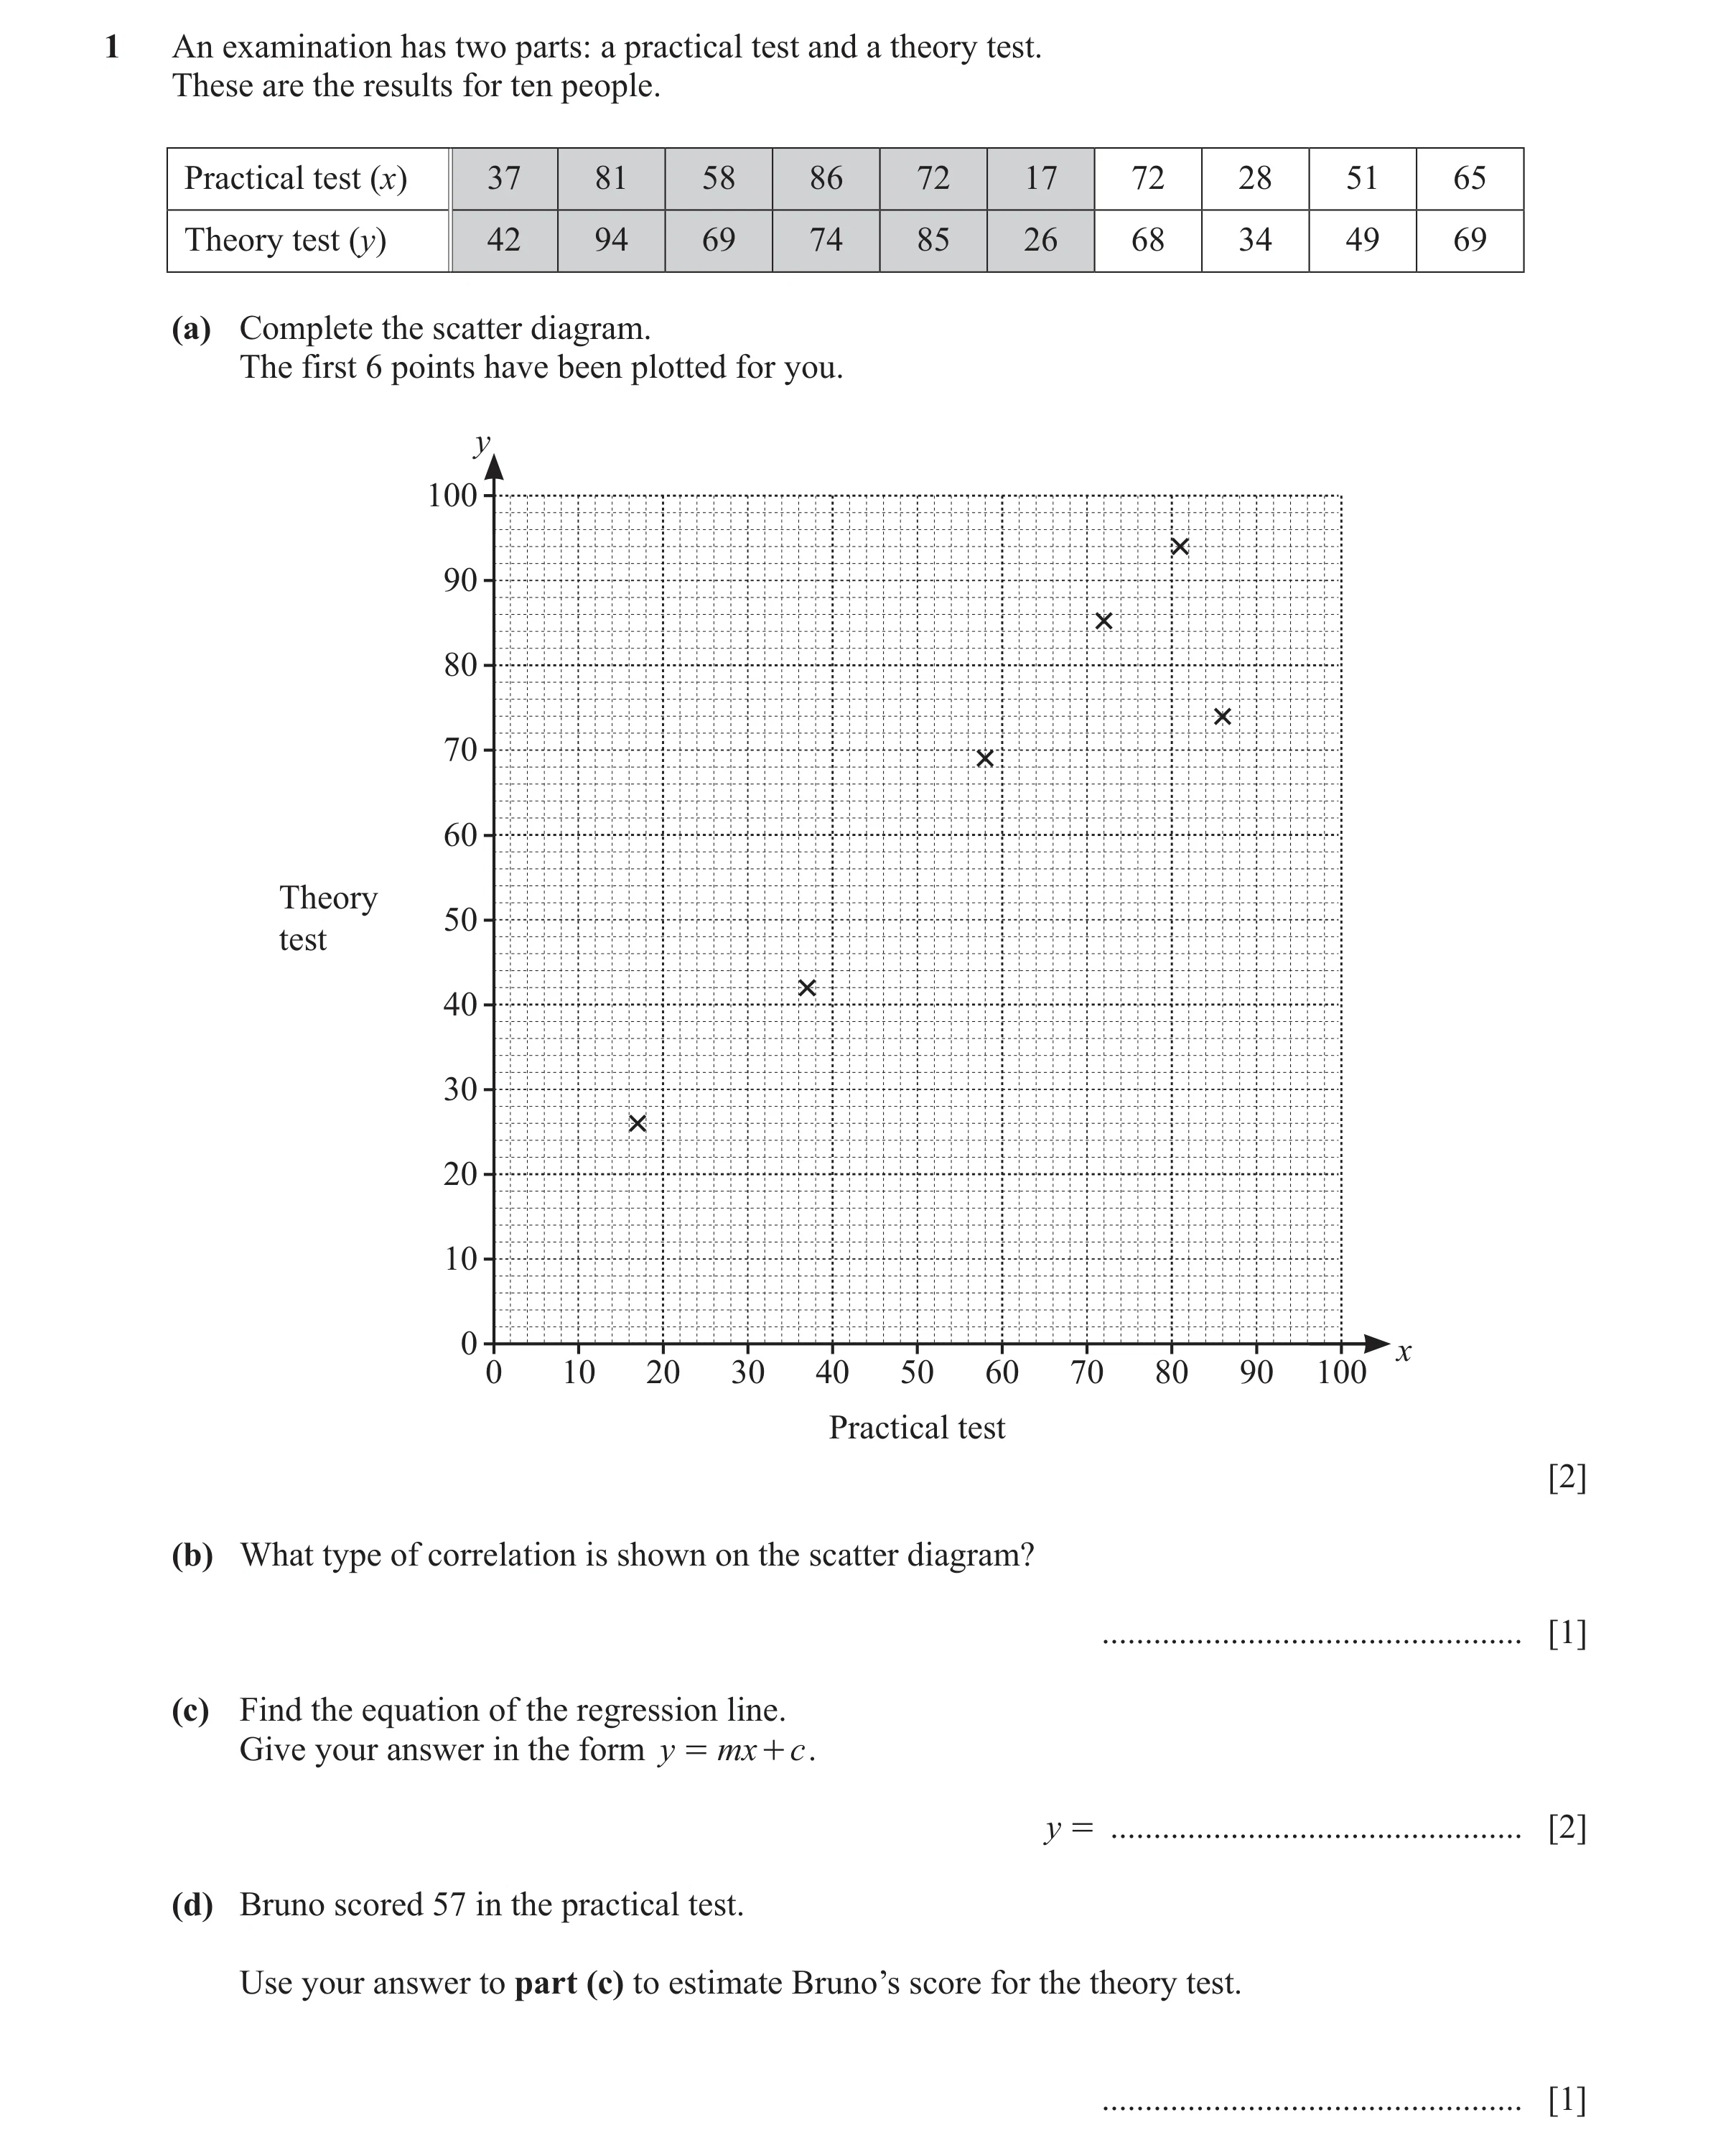
Q26 · An examination has two parts: a practical test and a theory test 0607/41 Oct/Nov 2025
1 An examination has two parts: a practical test and a theory test. These are the results for ten people. Practical test (x) 37 81 58 86 72 17 72 28 51 65 Theory test (y) 42 94 69 74 85 26 68 34 49 69 (a) Complete the scatter diagram. The first 6 points have been plotted for you. y 100 90 80 70 60 Theory 50 test 40 30 20 10 0 x 0 10 20 30 40 50 60 70 80 90 100 Practical test [2] (b) What type of correlation is shown on the scatter diagram? … [1] (c) Find the equation of the regression line. Give your answer in the form y = mx + c . y = … [2] (d) Bruno scored 57 in the practical test. Use your answer to part (c) to estimate Bruno’s score for the theory test. … [1]
6 marks
Mark scheme: Question Answer Marks Partial Marks 1(a) 4 points plotted correctly 2 B1 for 2 correct 1(b) Positive 1 1(c) [y =] 0.903 x + 9.81 2 B1 for [y =] 0.903 x + b or [y =] ax + 9.81 a ≠ 0 or [y =] 0.9[0]x + 9.8 1(d) 61 or 61.2 to 61.3 1 FT from their (c) provided a > 0
This question in 0607/41 Oct/Nov 2025
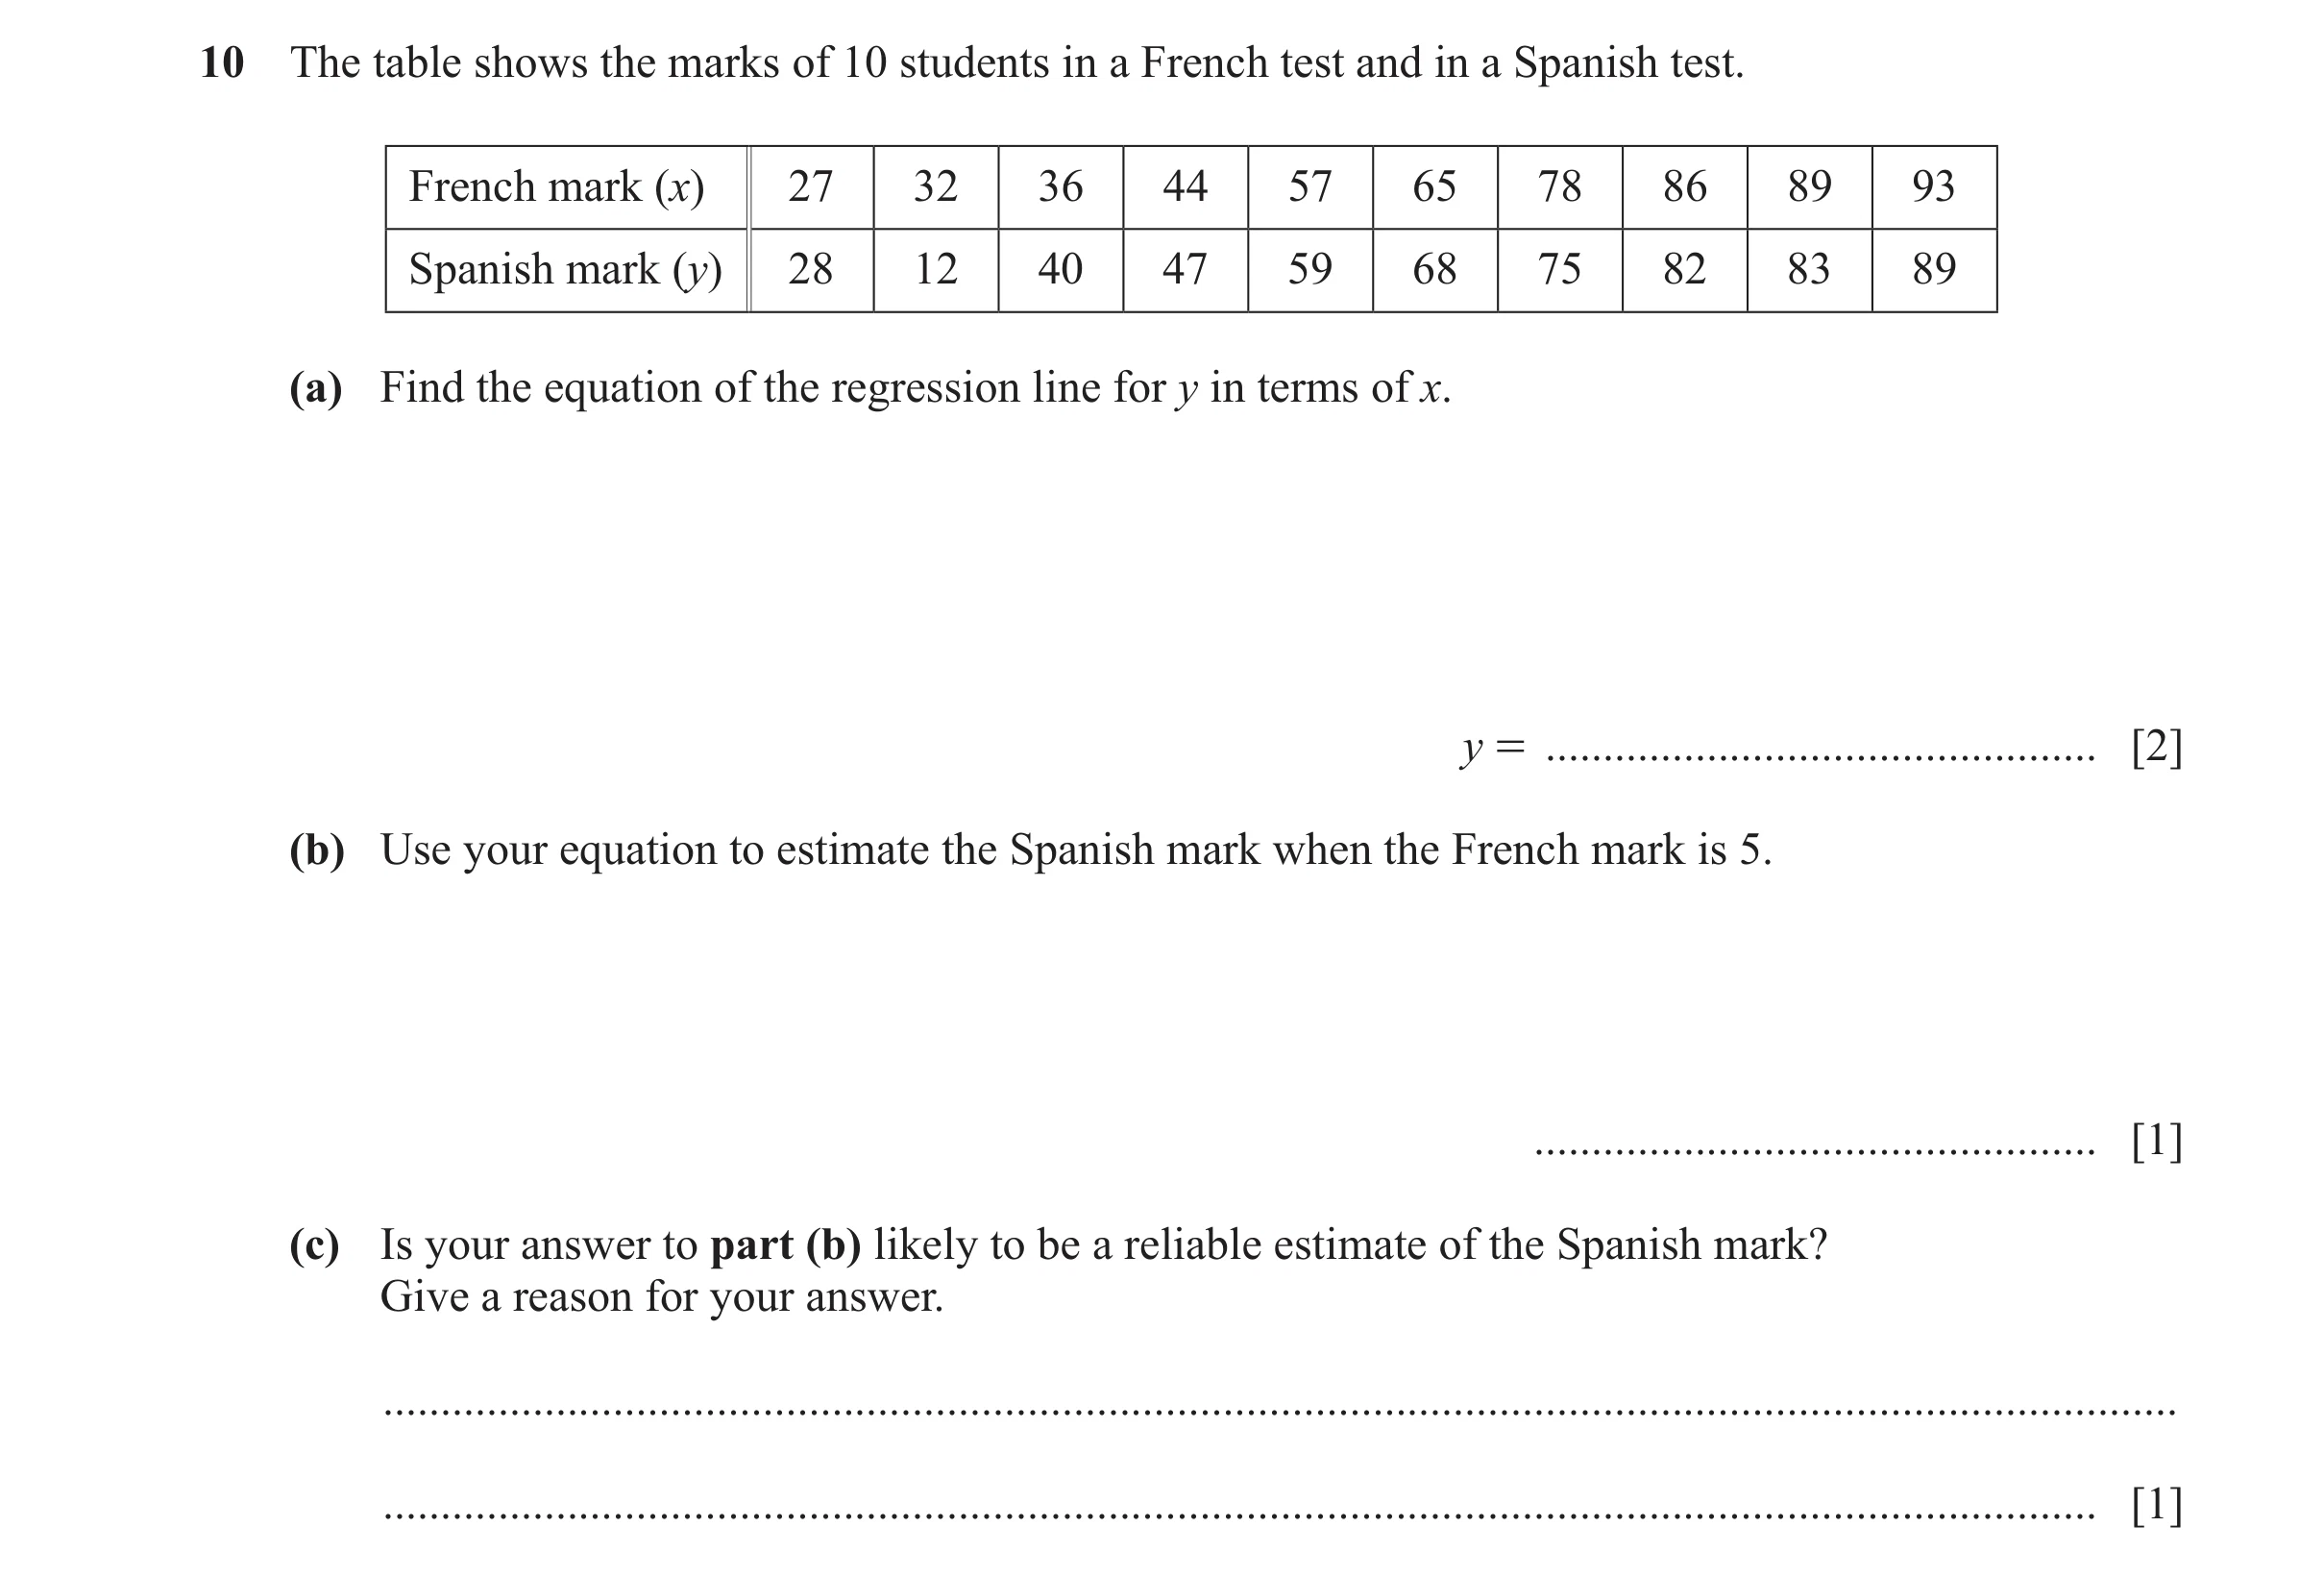
Q27 · The table shows the marks of 10 students in a French test and in a Spanish test 0607/42 Oct/Nov 2025
10 The table shows the marks of 10 students in a French test and in a Spanish test. French mark (x) 27 32 36 44 57 65 78 86 89 93 Spanish mark (y) 28 12 40 47 59 68 75 82 83 89 (a) Find the equation of the regression line for y in terms of x. y = … [2] (b) Use your equation to estimate the Spanish mark when the French mark is 5. … [1] (c) Is your answer to part (b) likely to be a reliable estimate of the Spanish mark? Give a reason for your answer. … … [1]
4 marks
Mark scheme: 10(a) y = –1.81 + 0.99[0] x 2 B1 for y = –1.81 + kx or y = k + 0.99[0] x or y = –1.8 + 0.99 x 10(b) 3.1 or 3.14… or 3 1 FT their (a) must be > 0 10(c) No, outside range of data 1
This question in 0607/42 Oct/Nov 2025
 1 / 35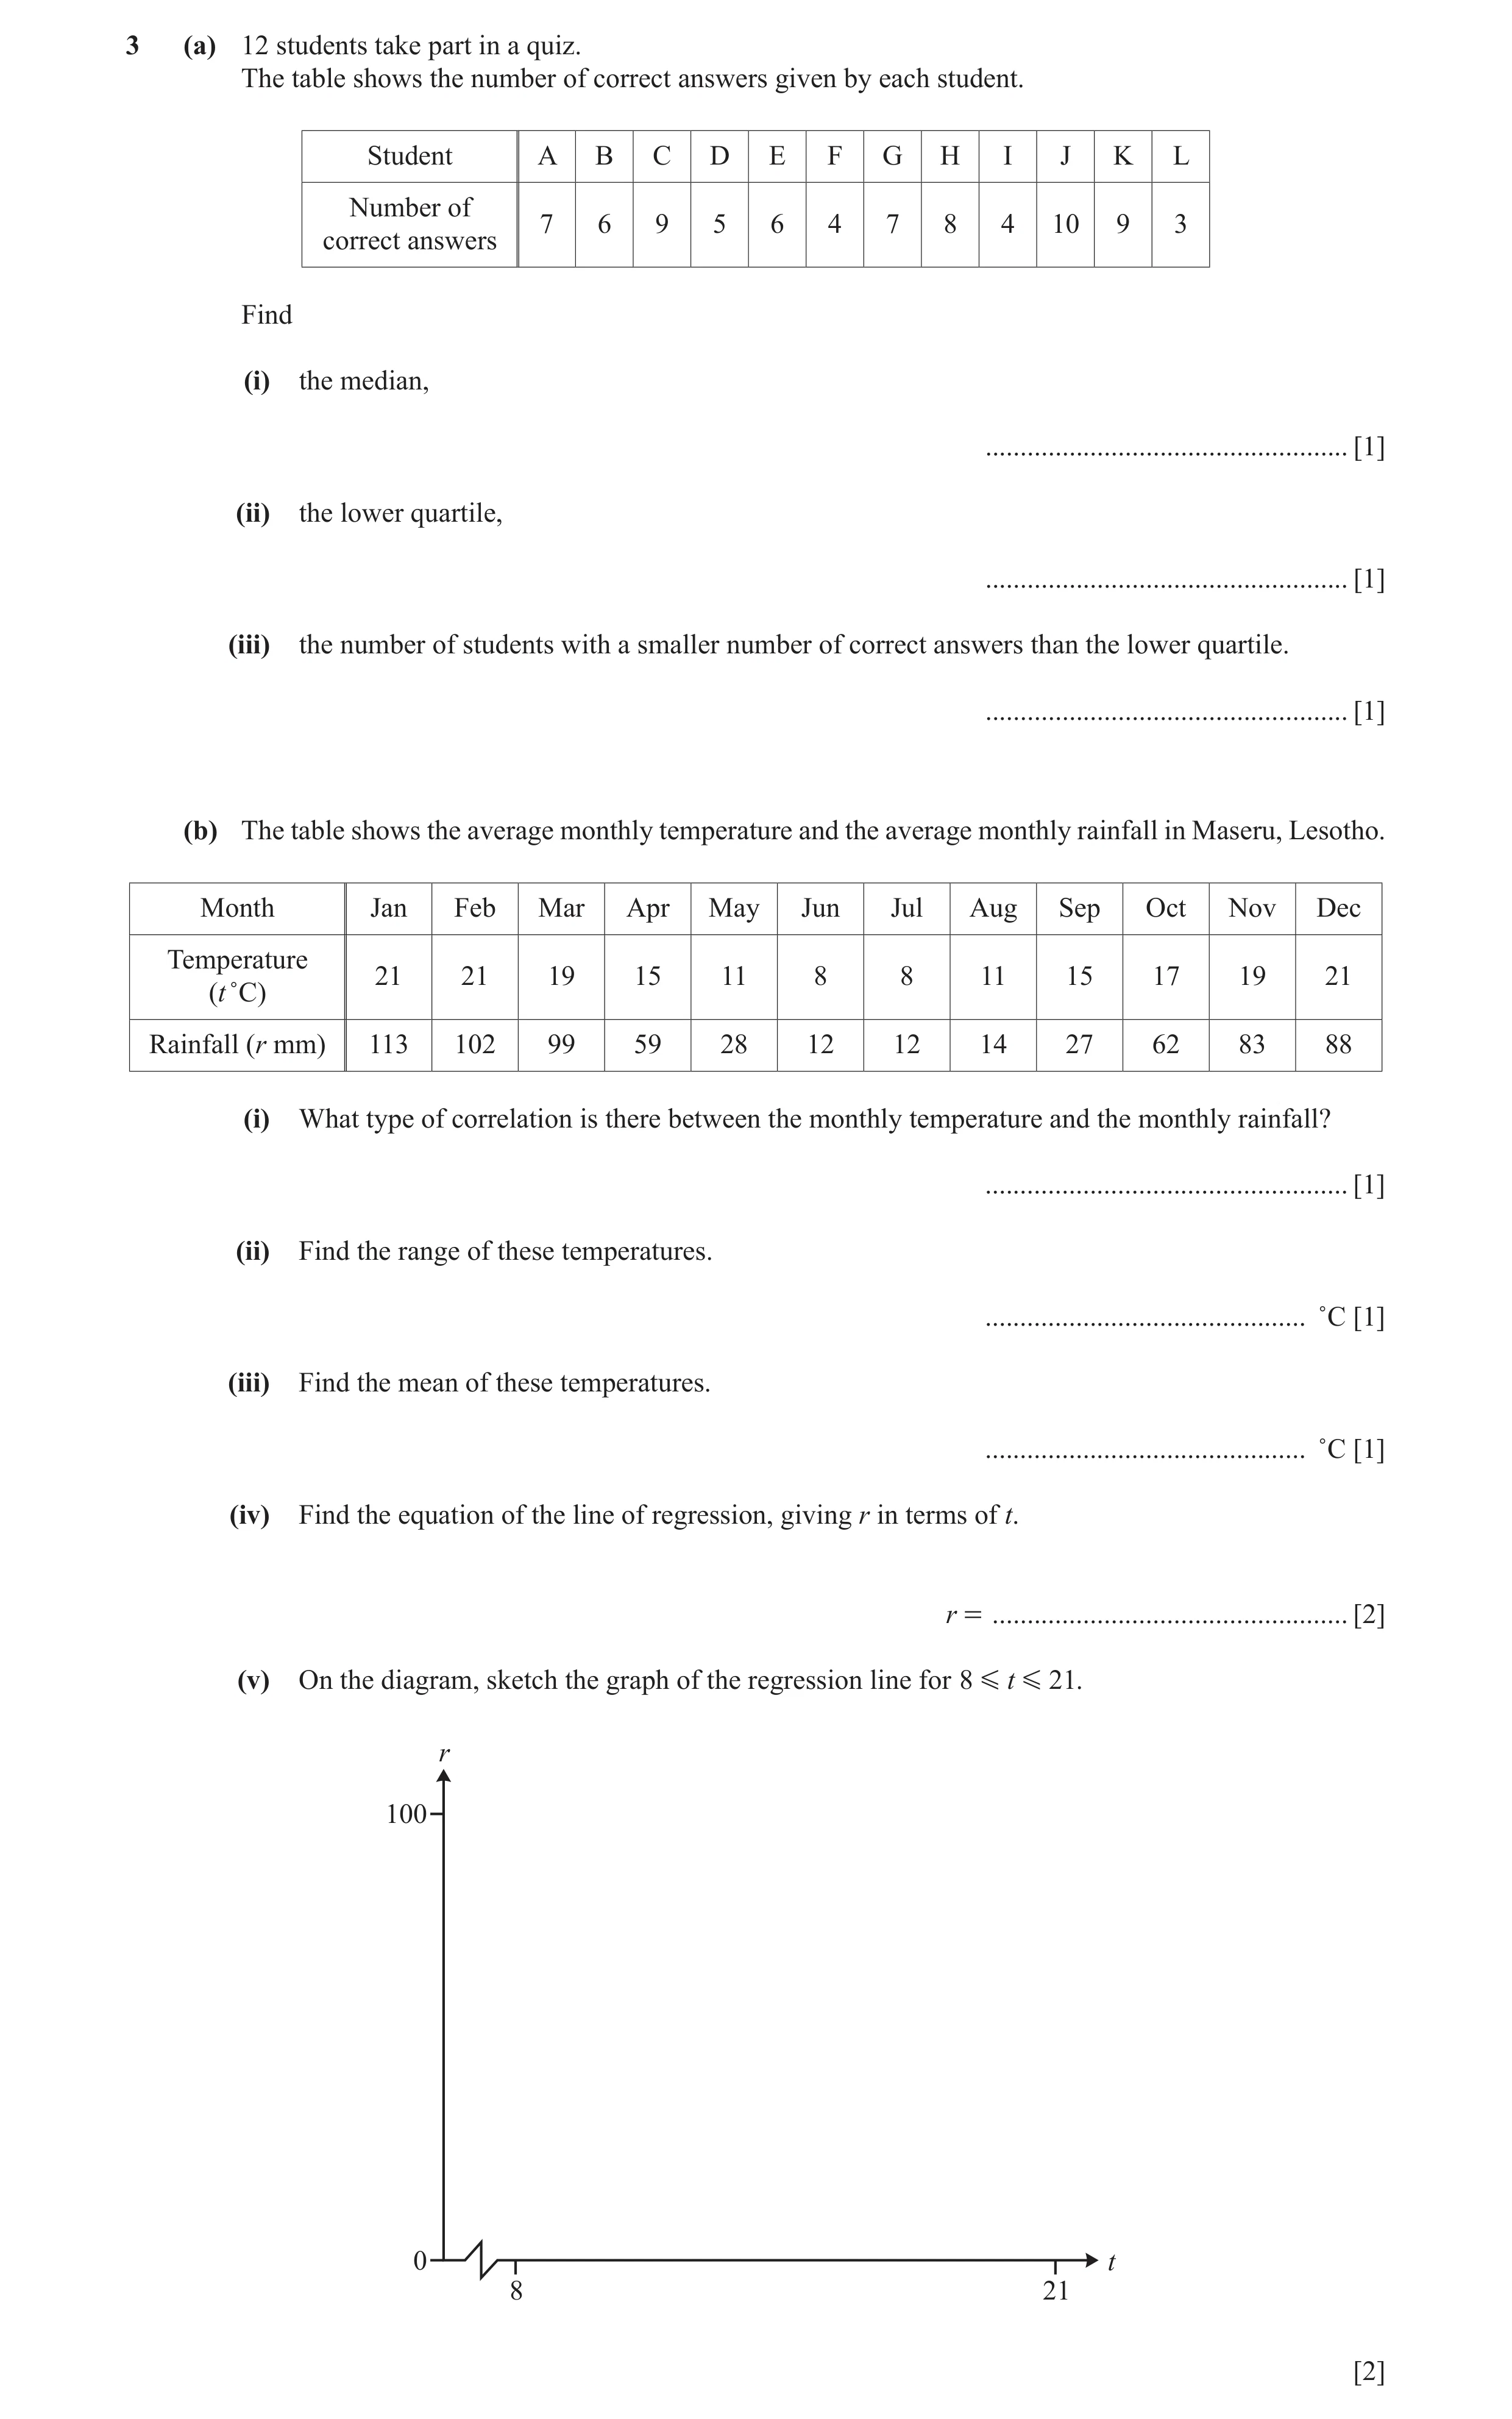
 9 / 35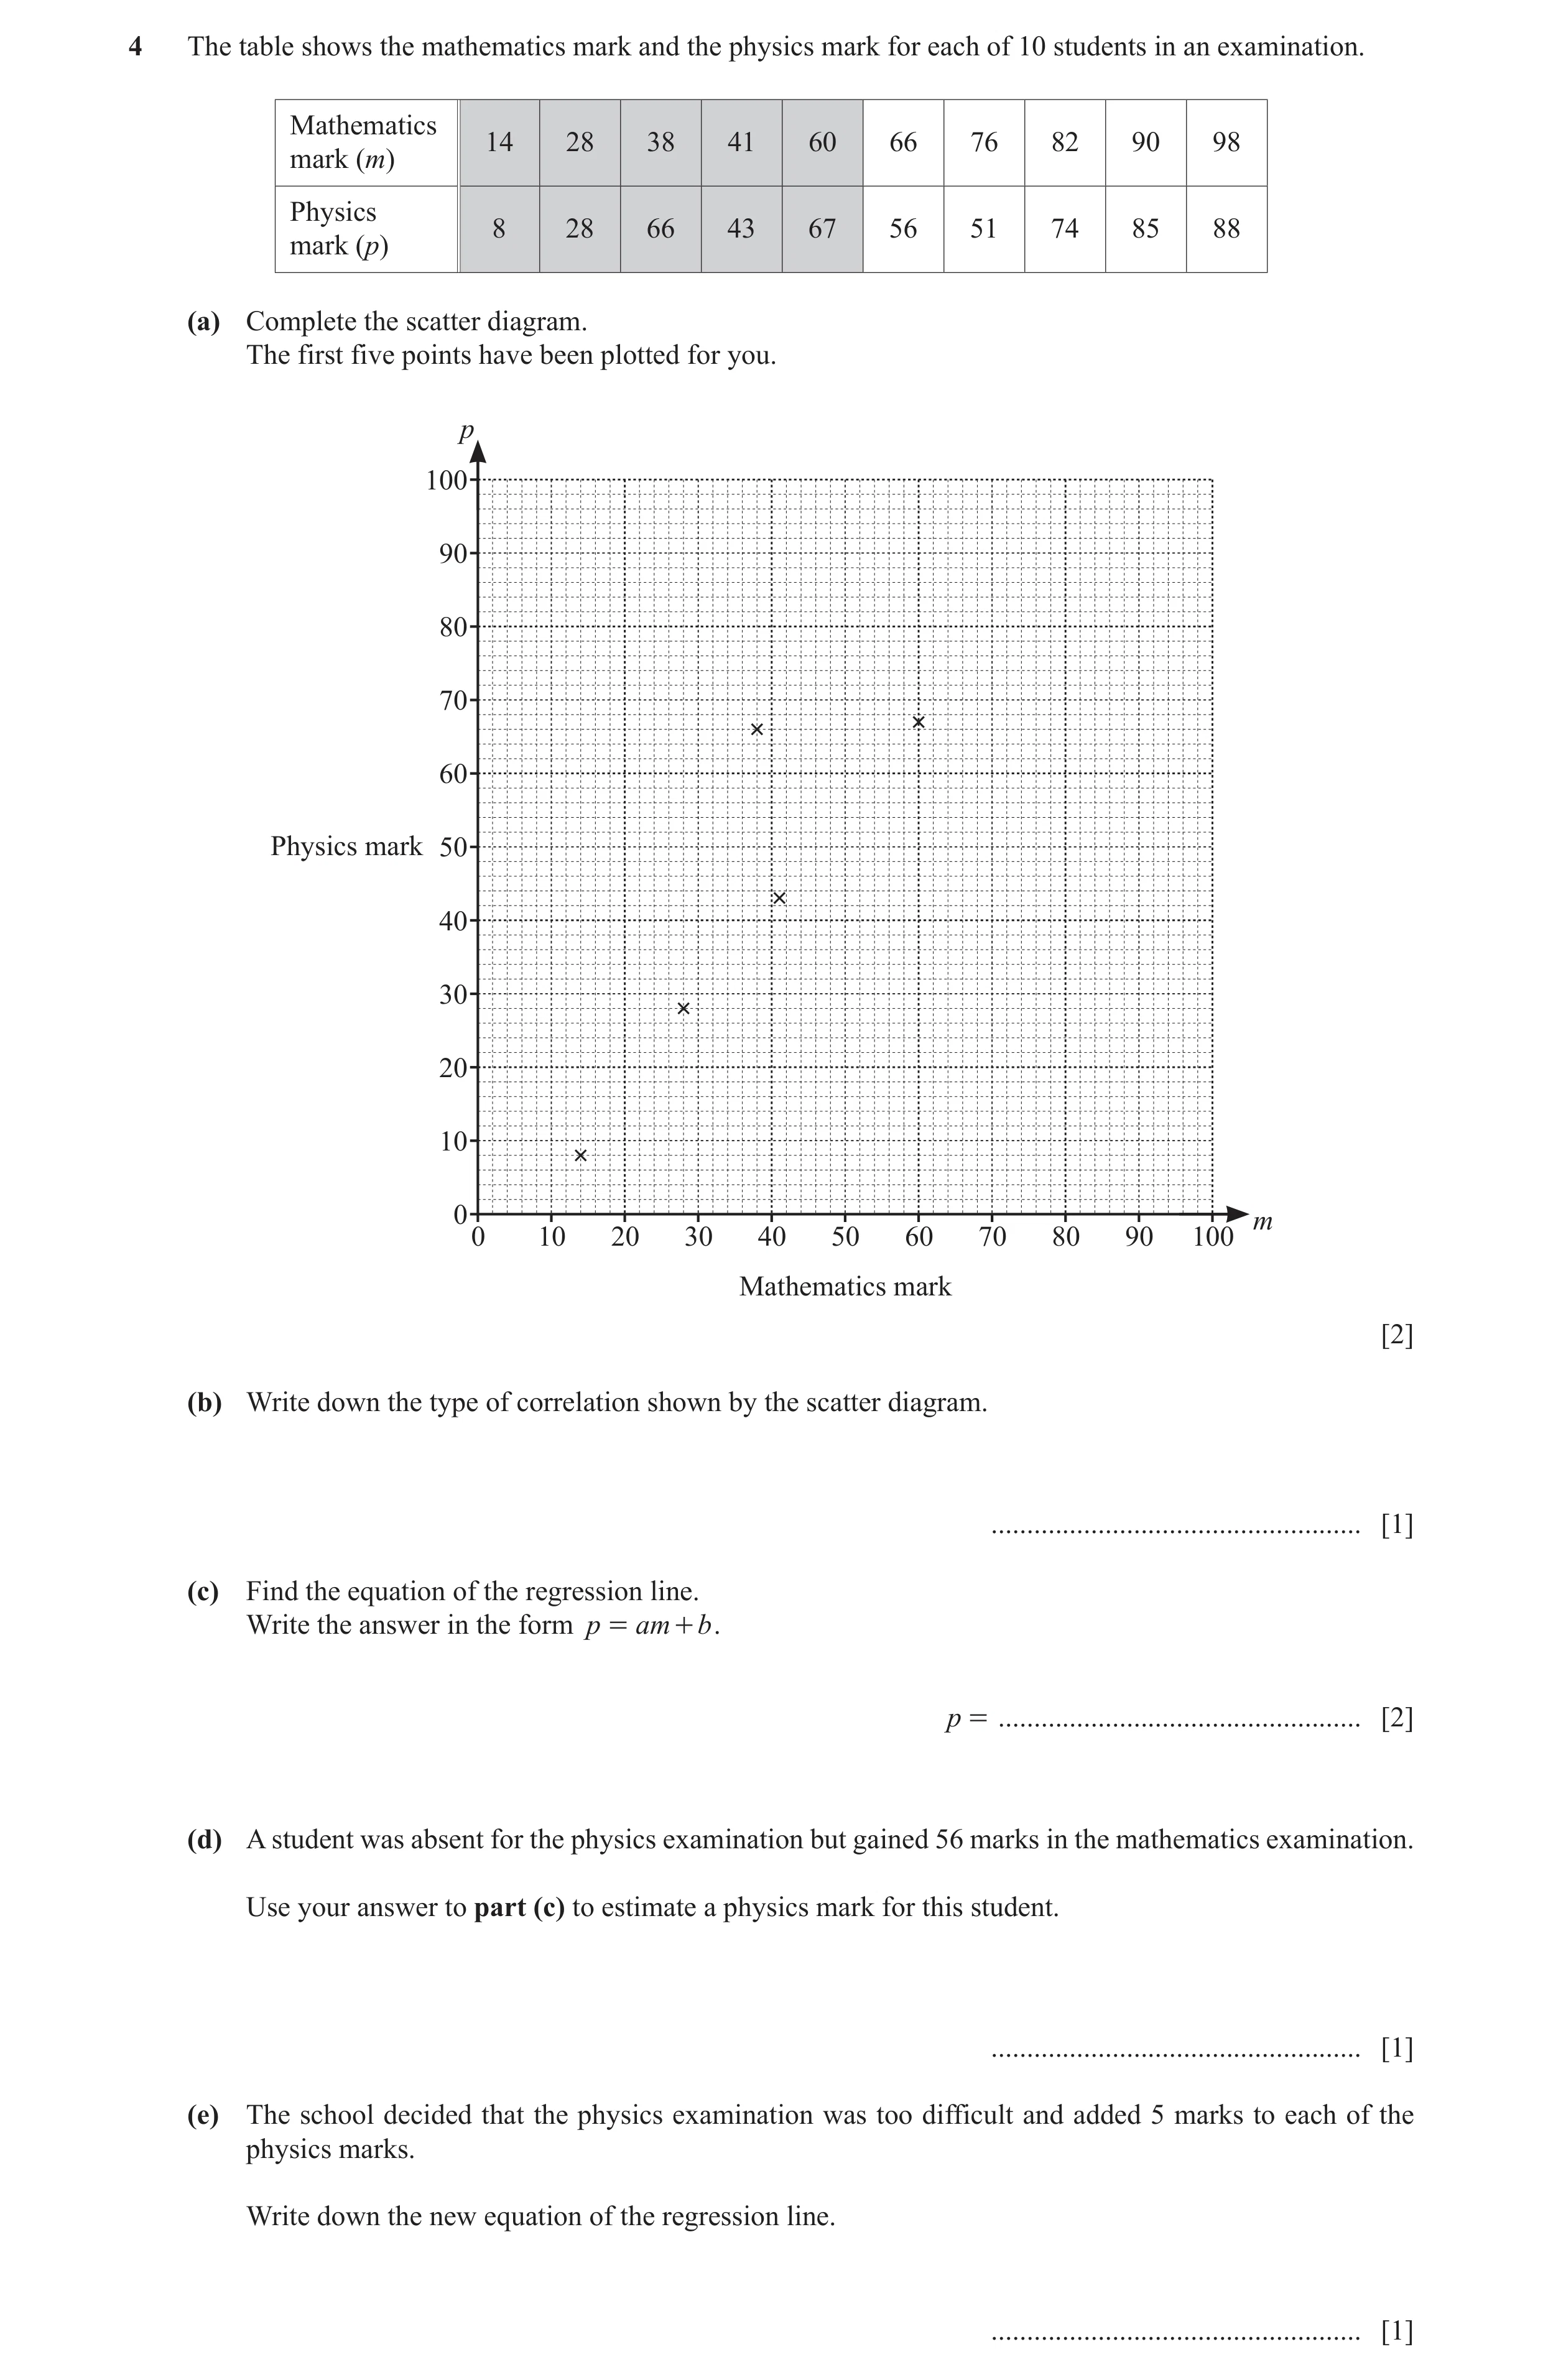
 14 / 35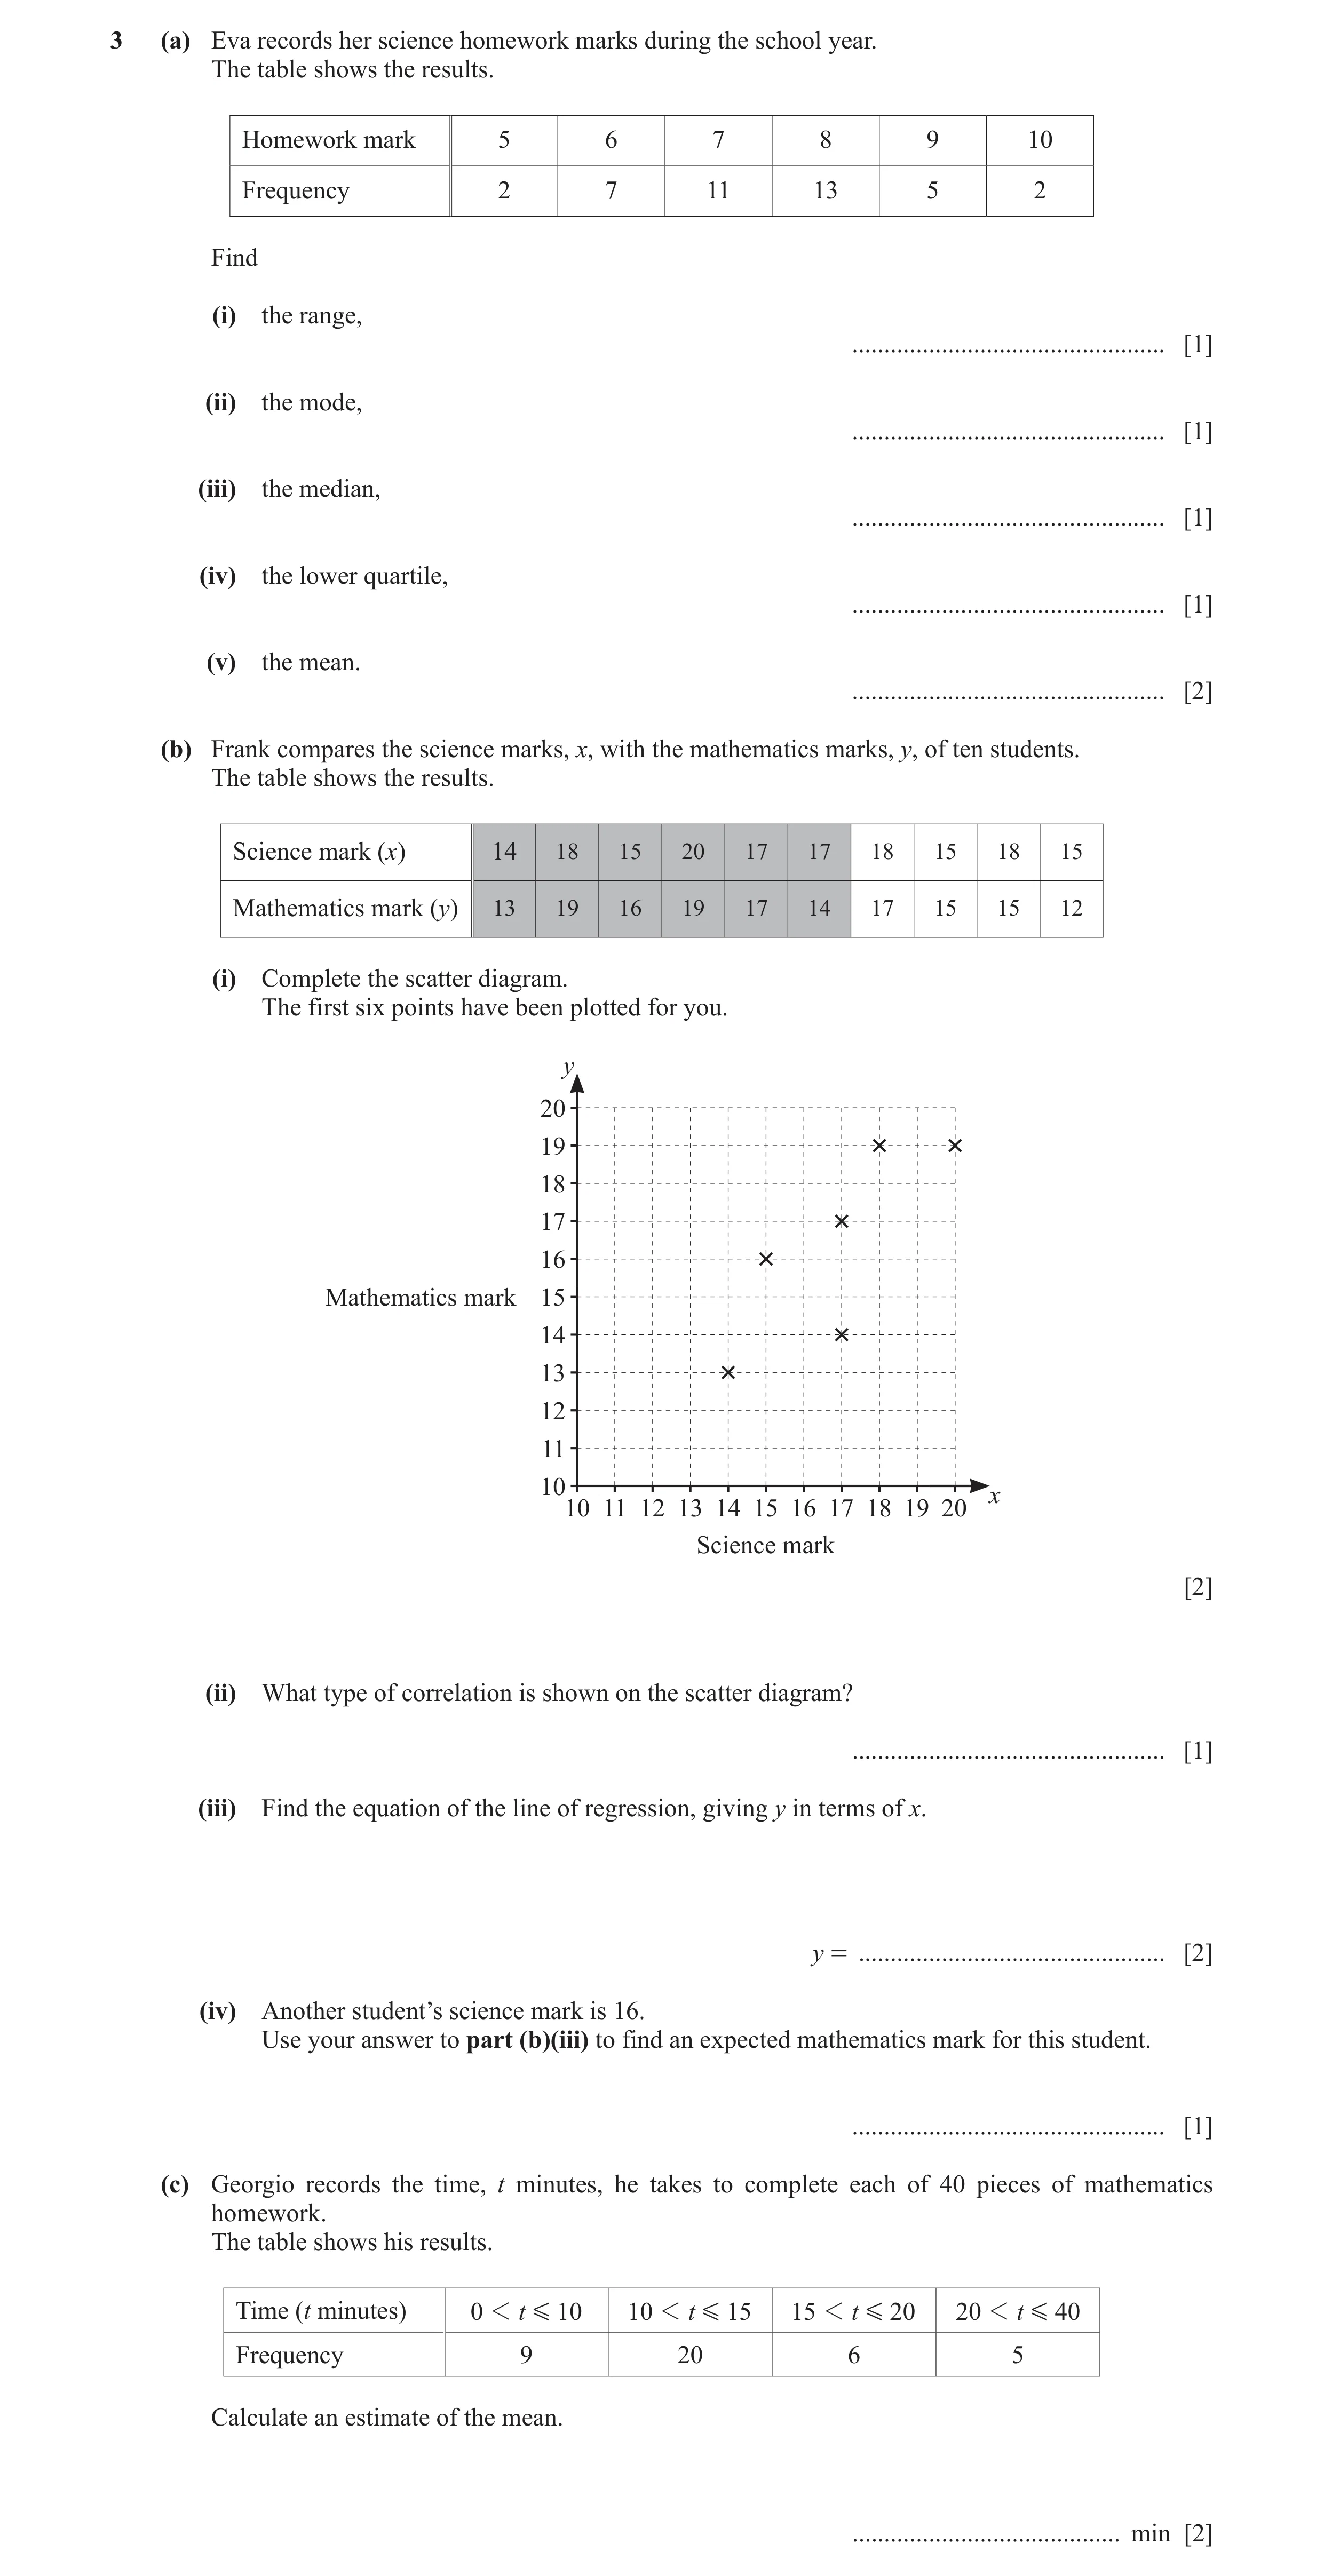
 16 / 35
 17 / 35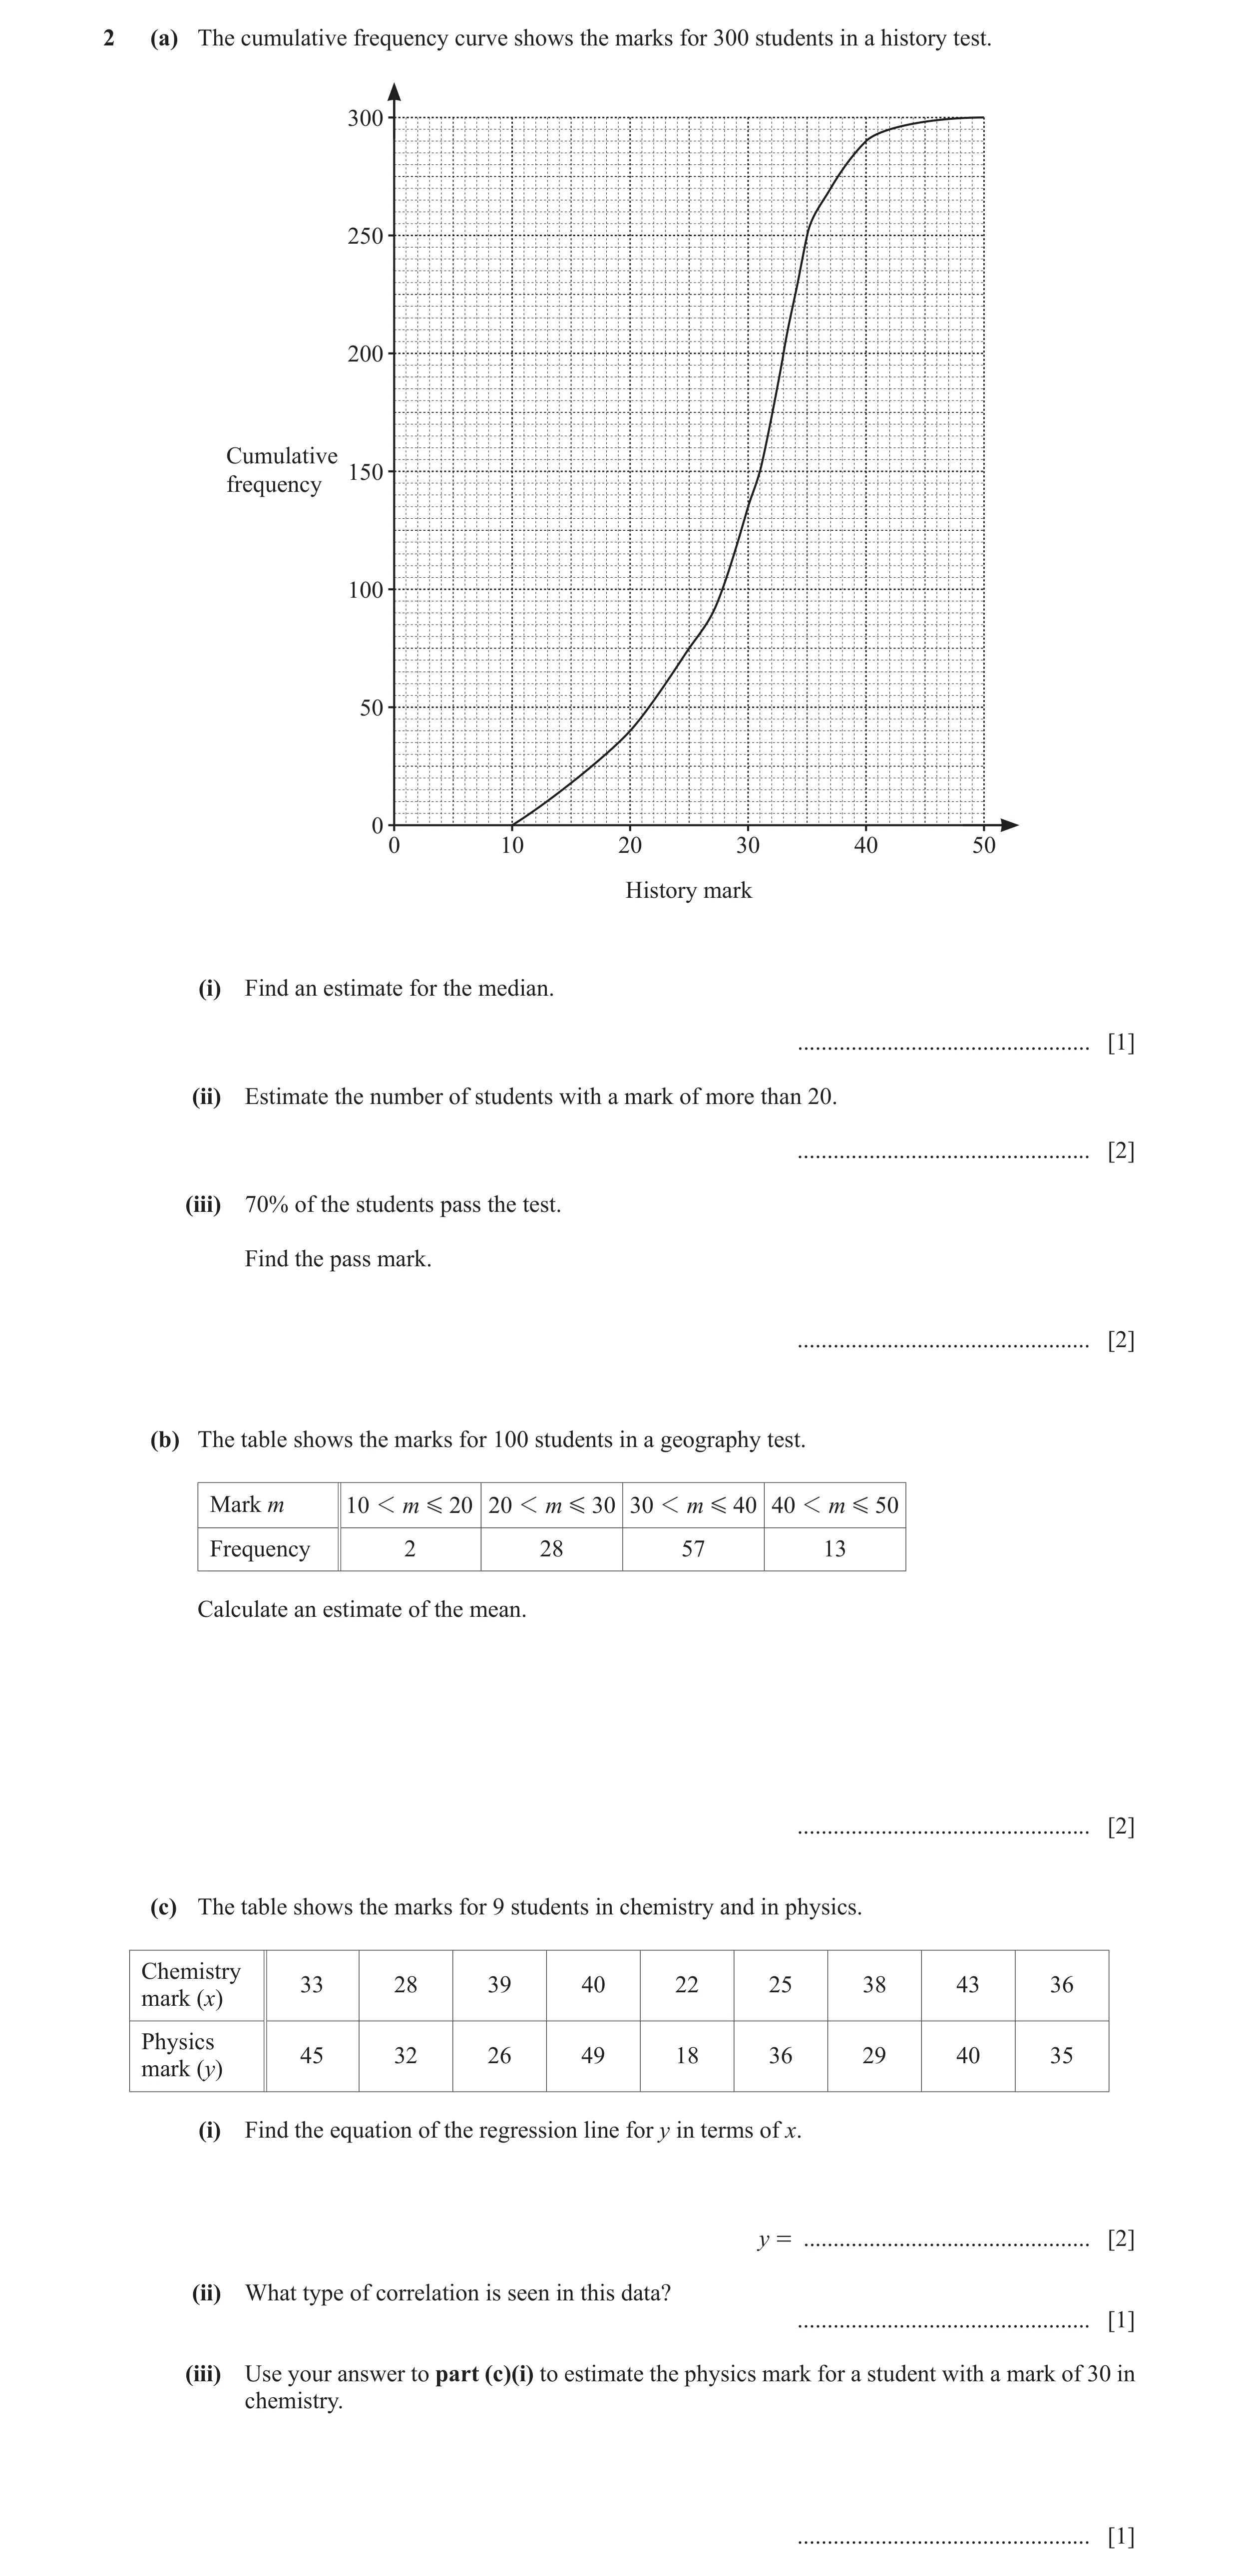
 26 / 35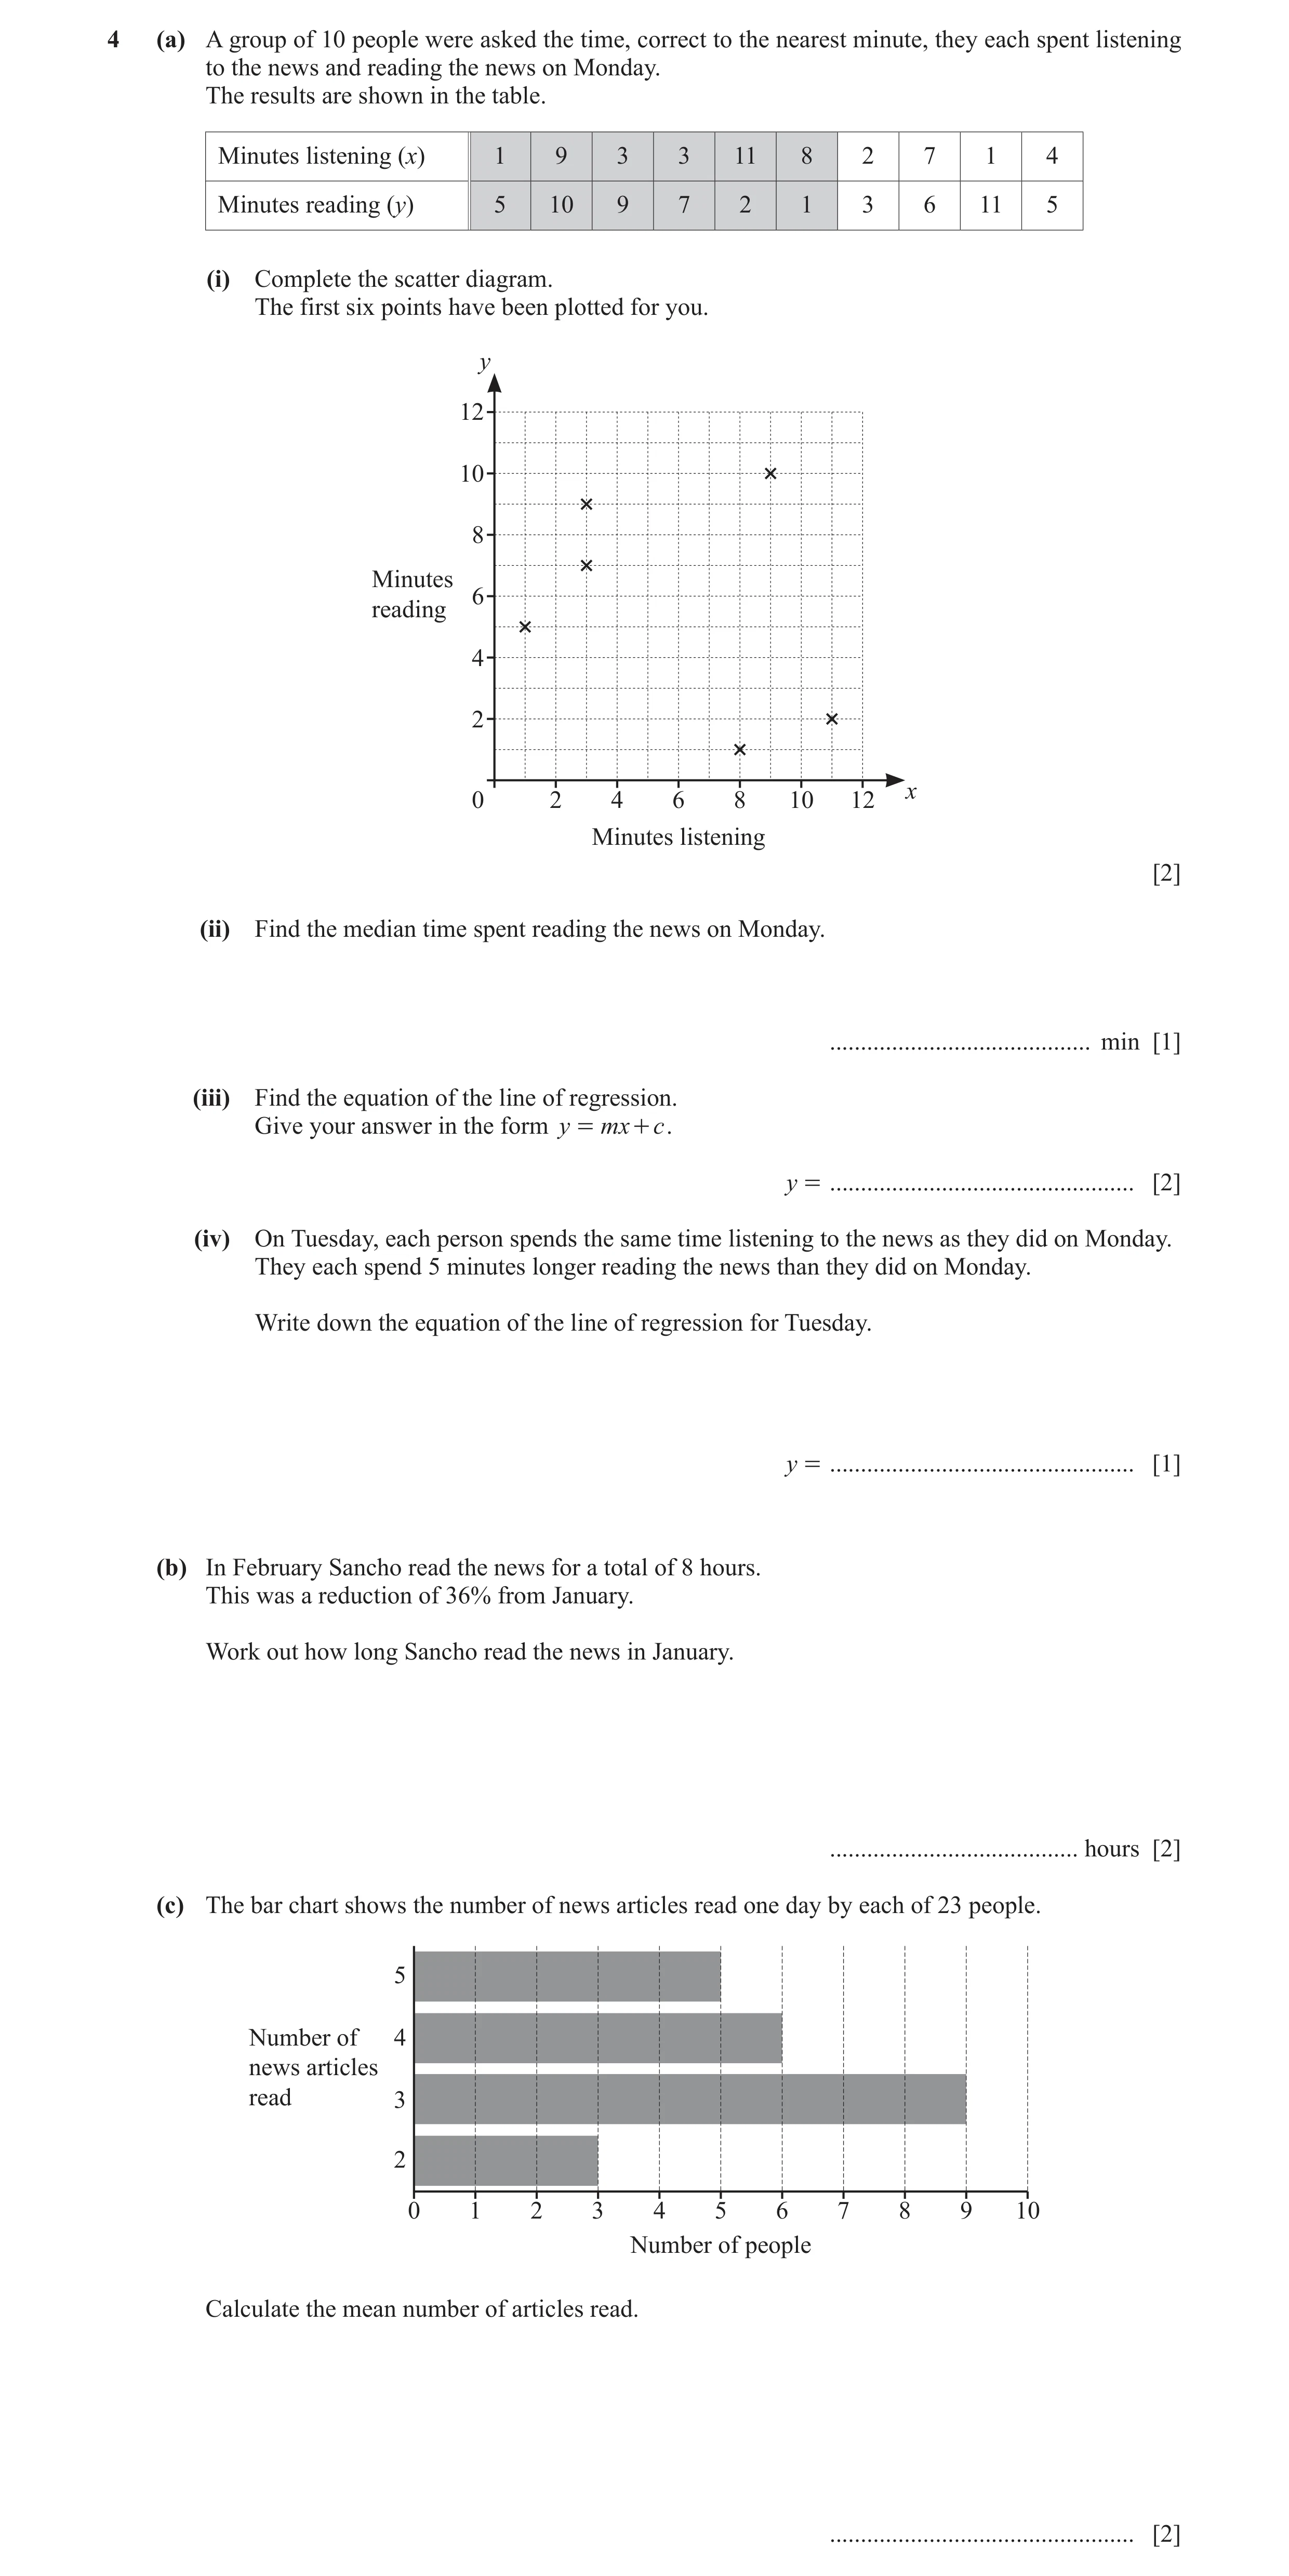
 31 / 35
 32 / 35
 33 / 35
 34 / 35
 35 / 35
 7
7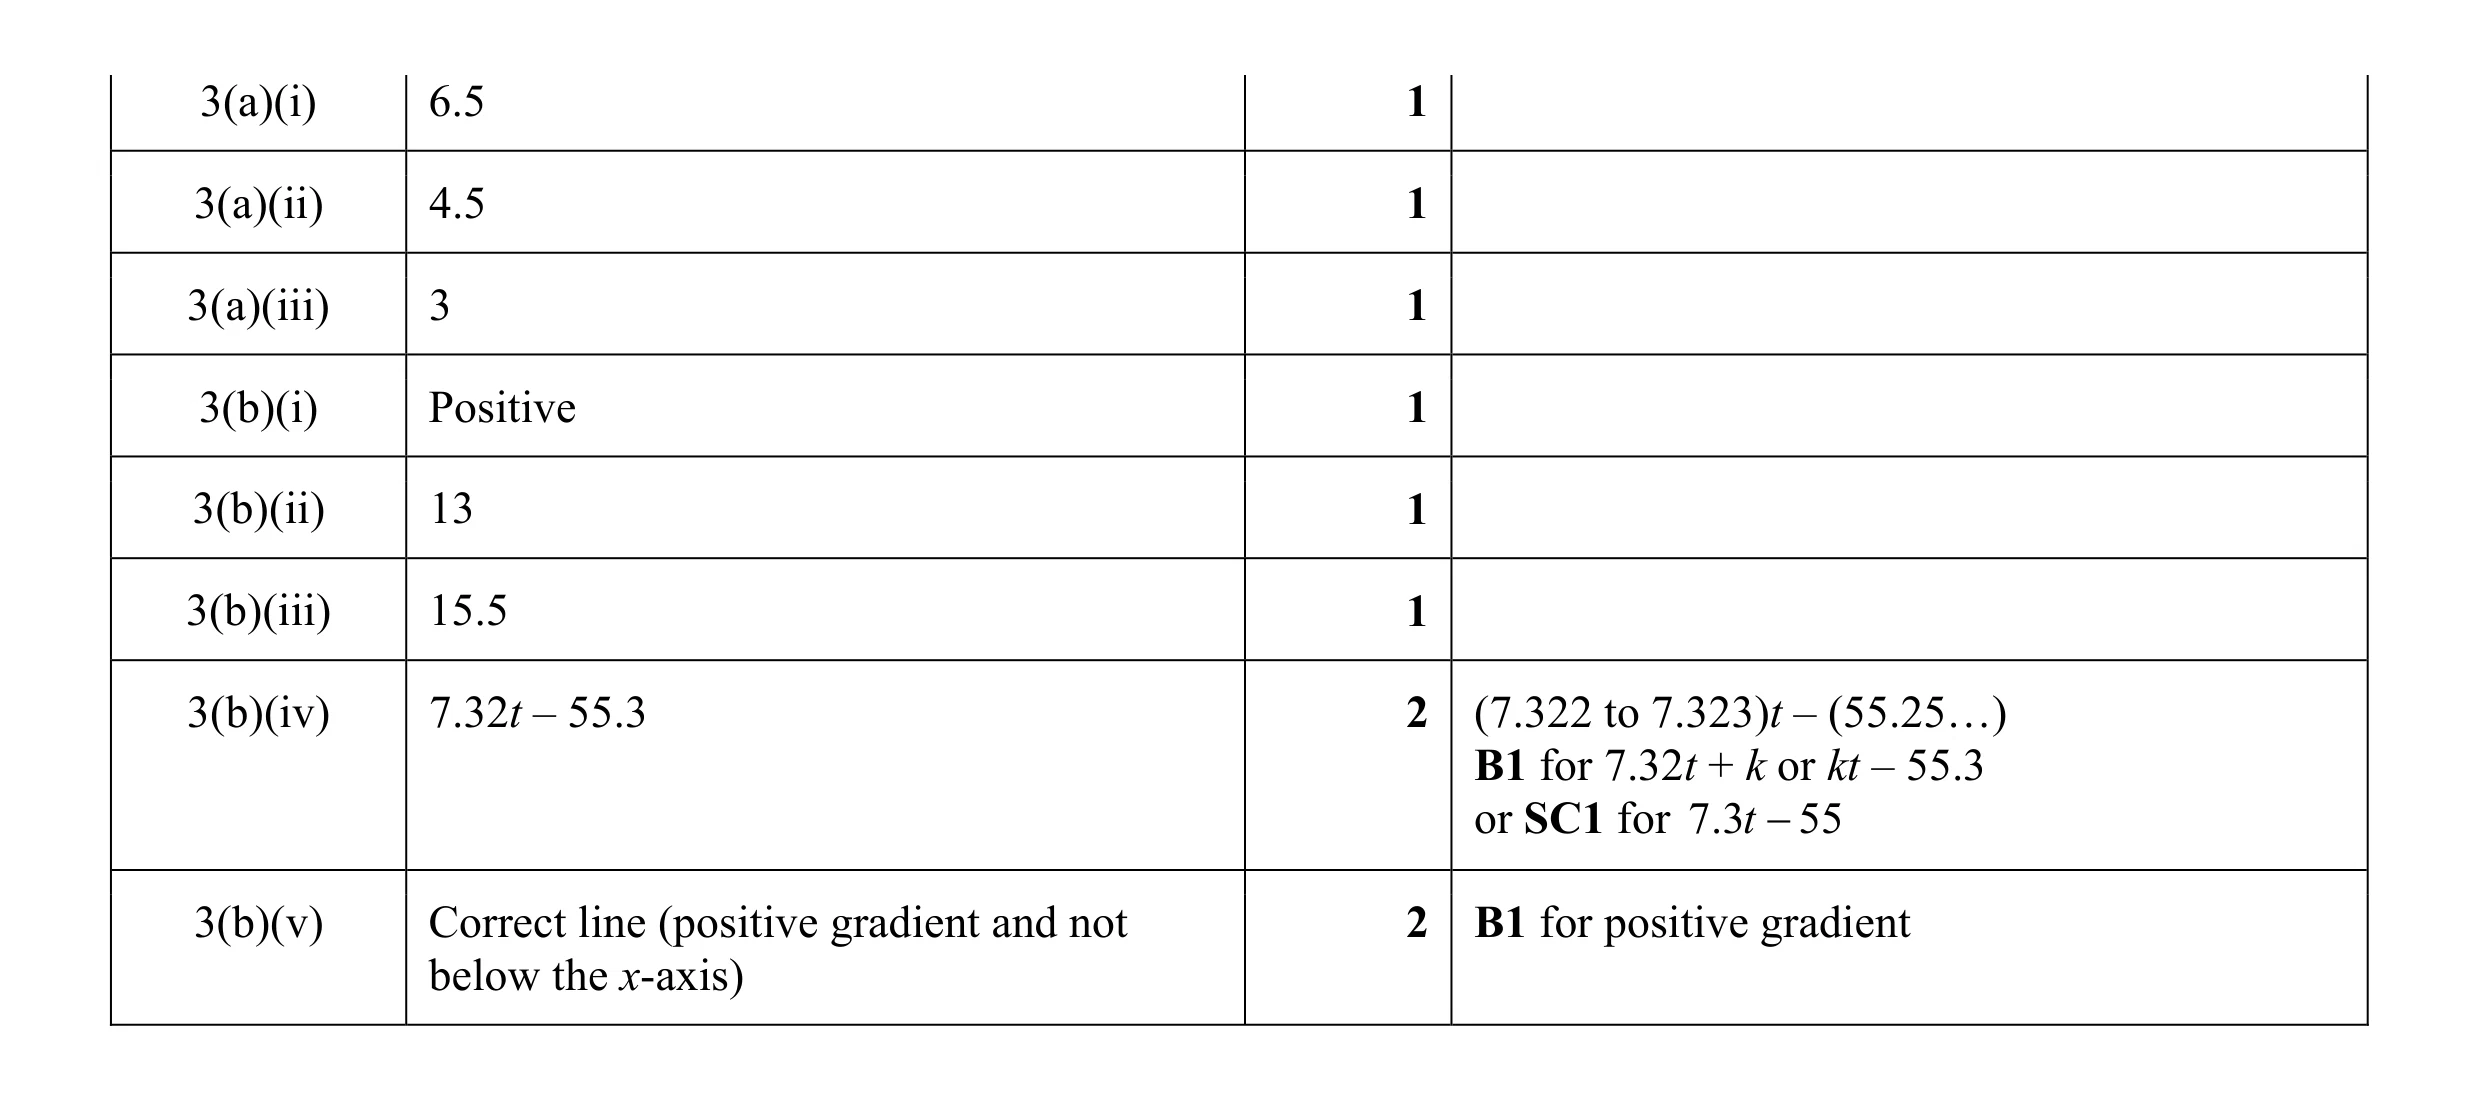 10
10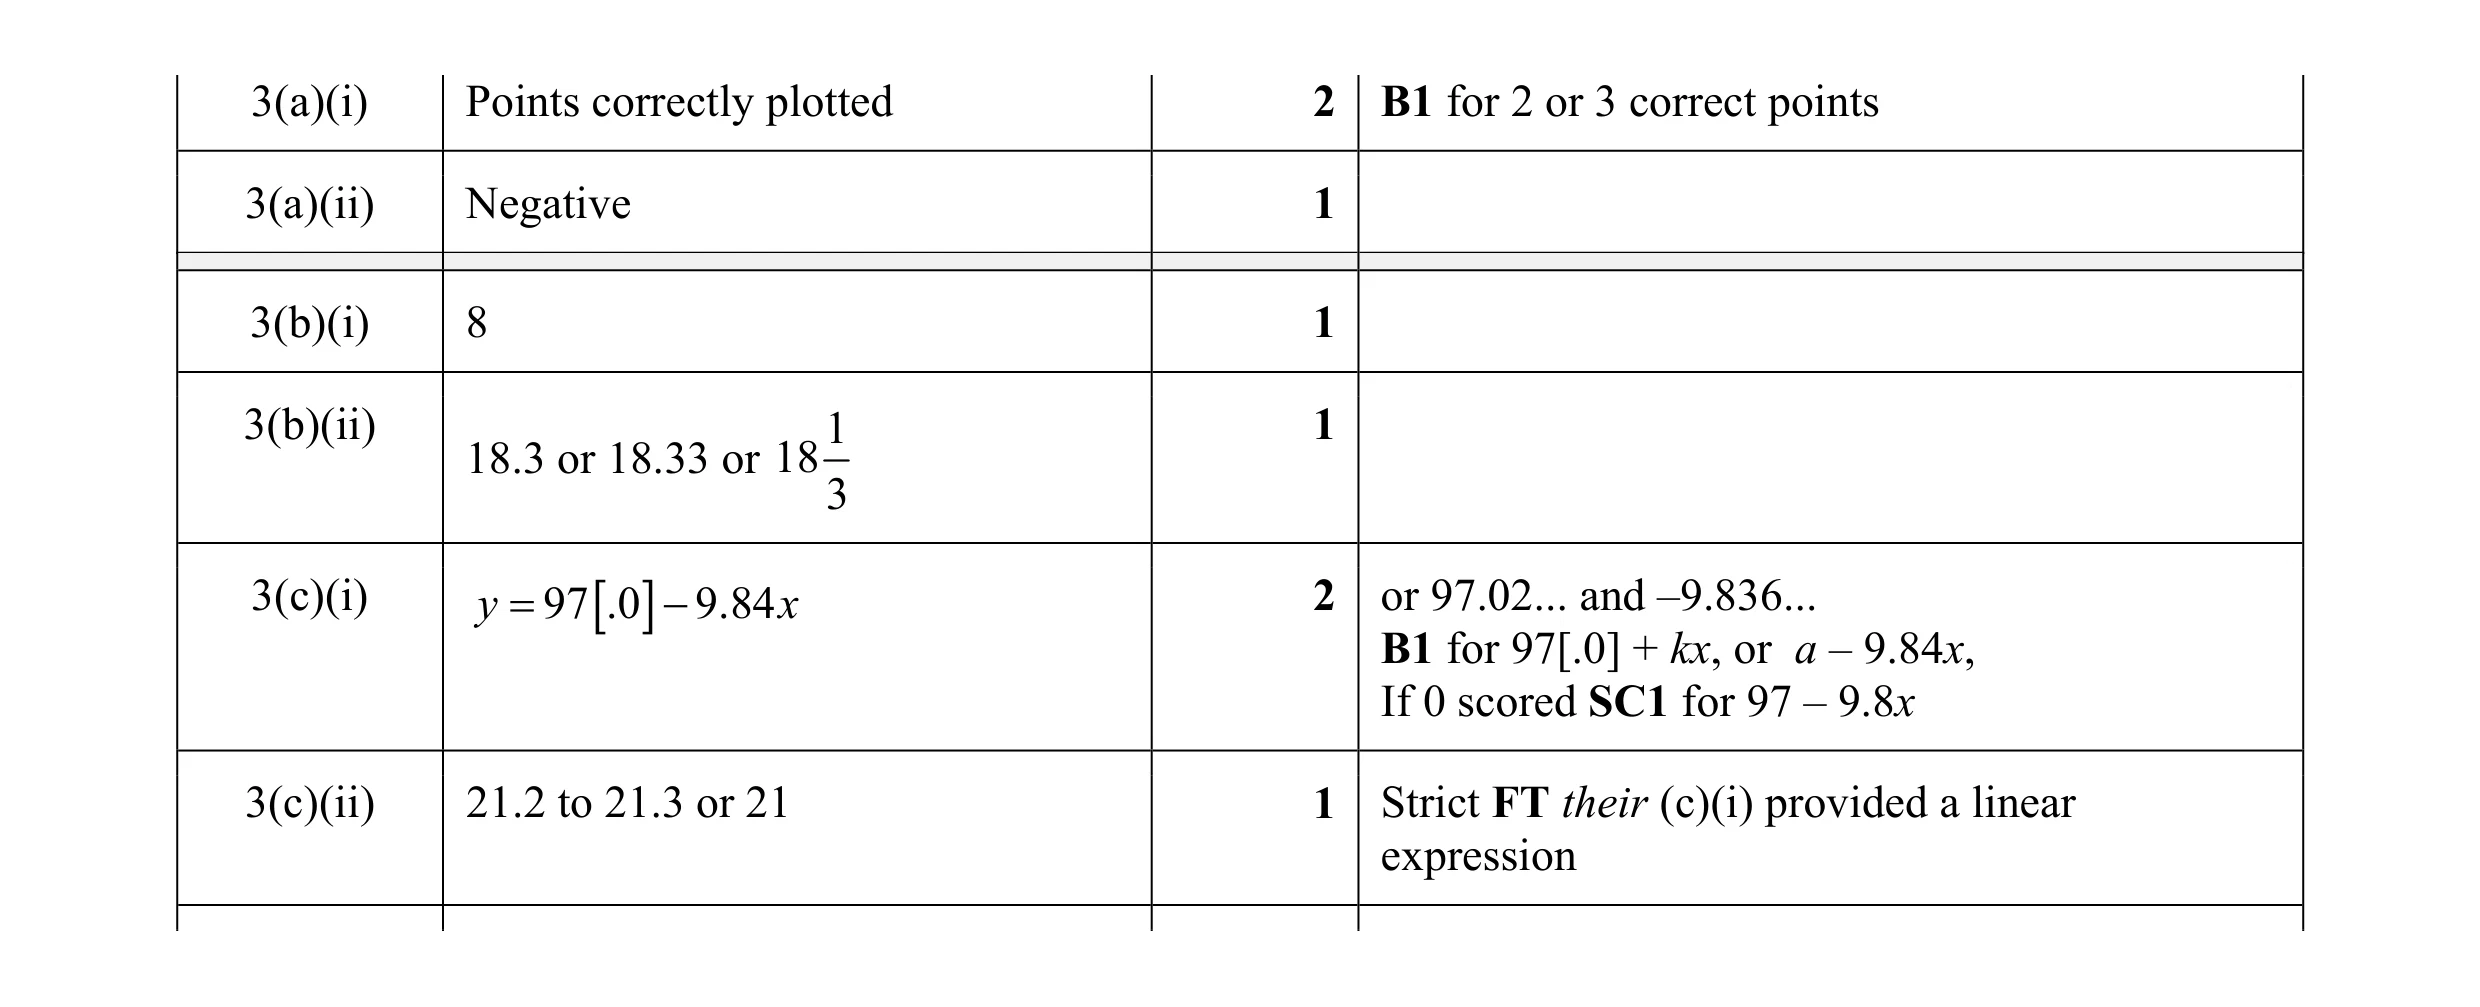 8
8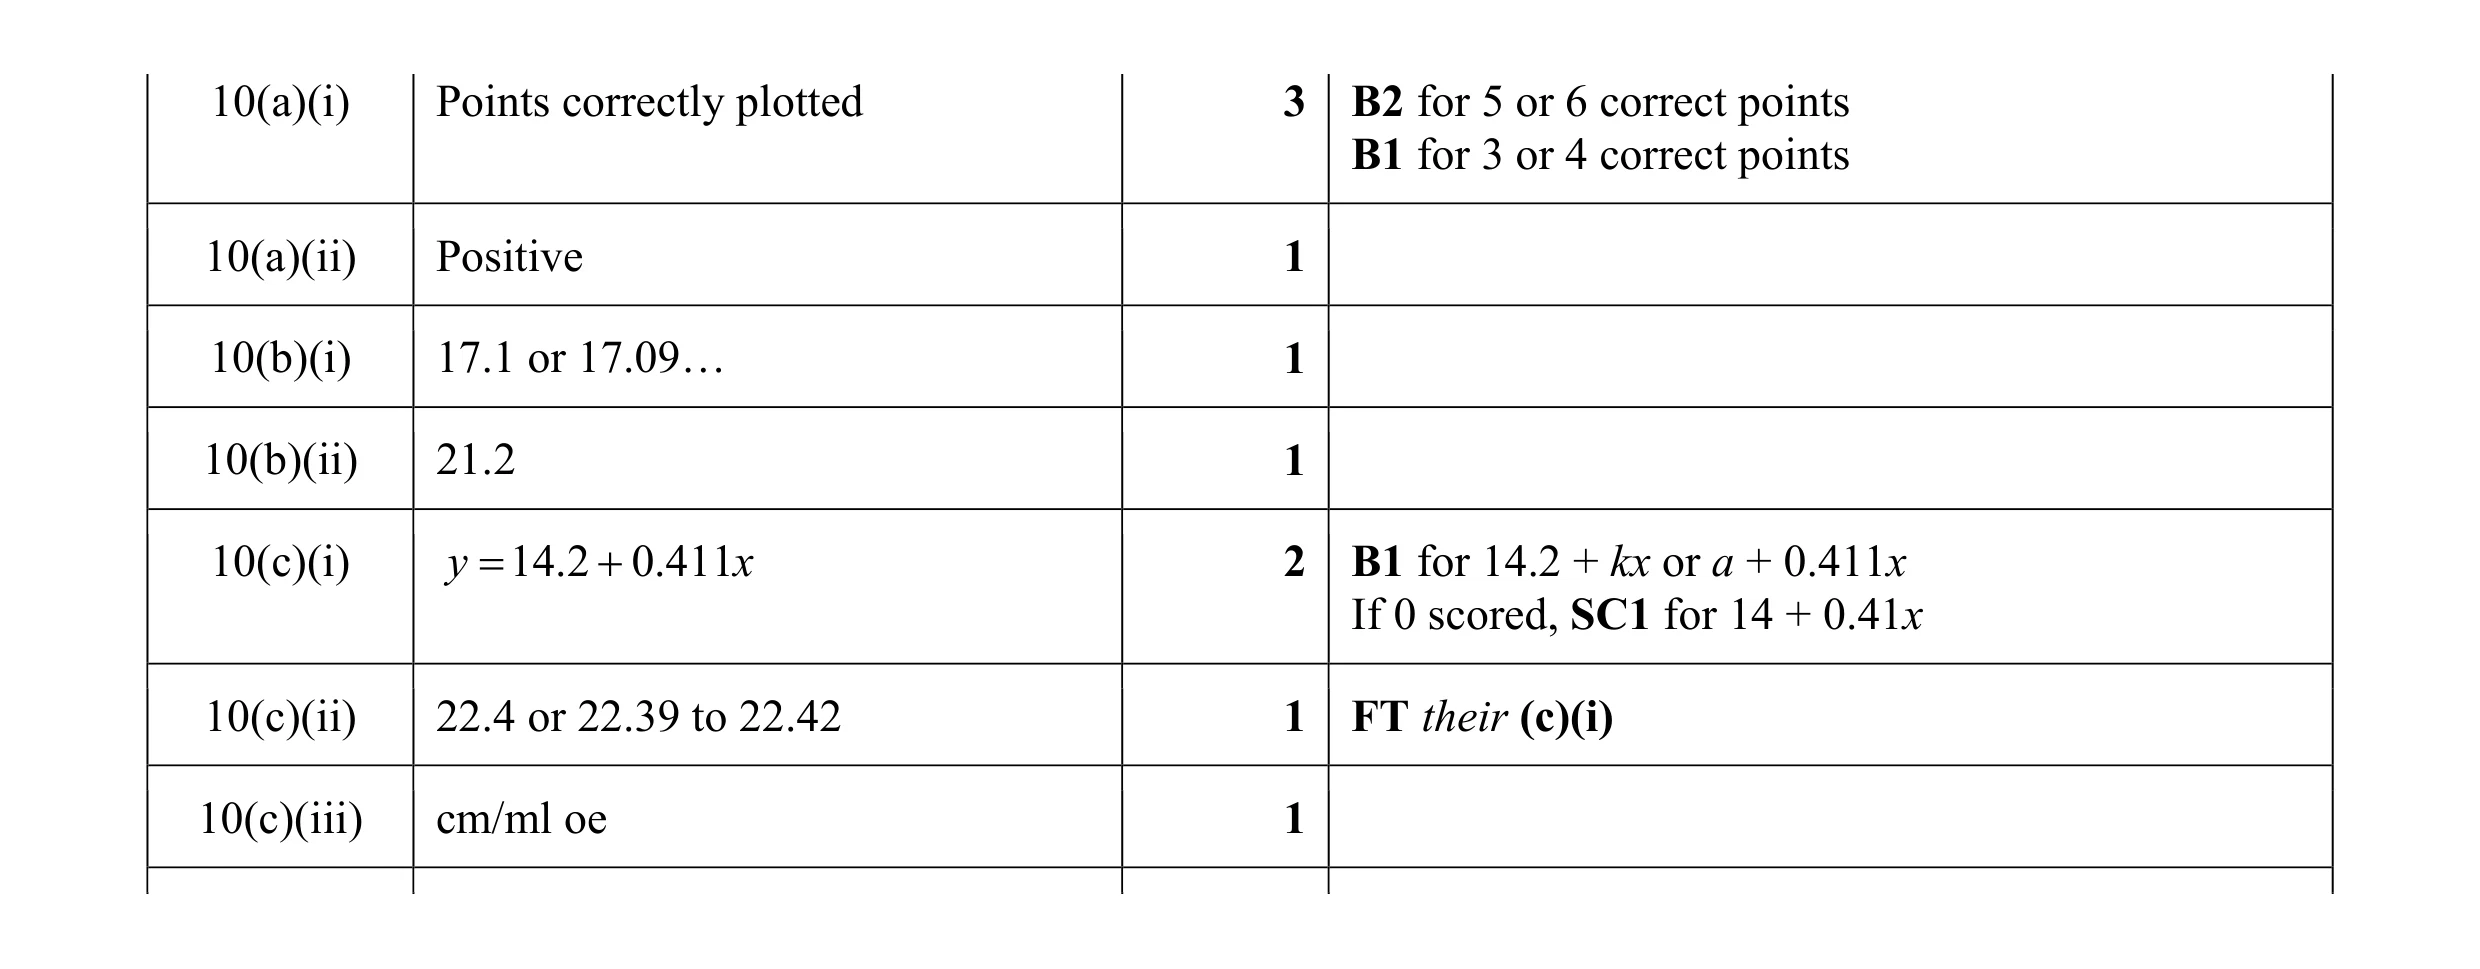 10
10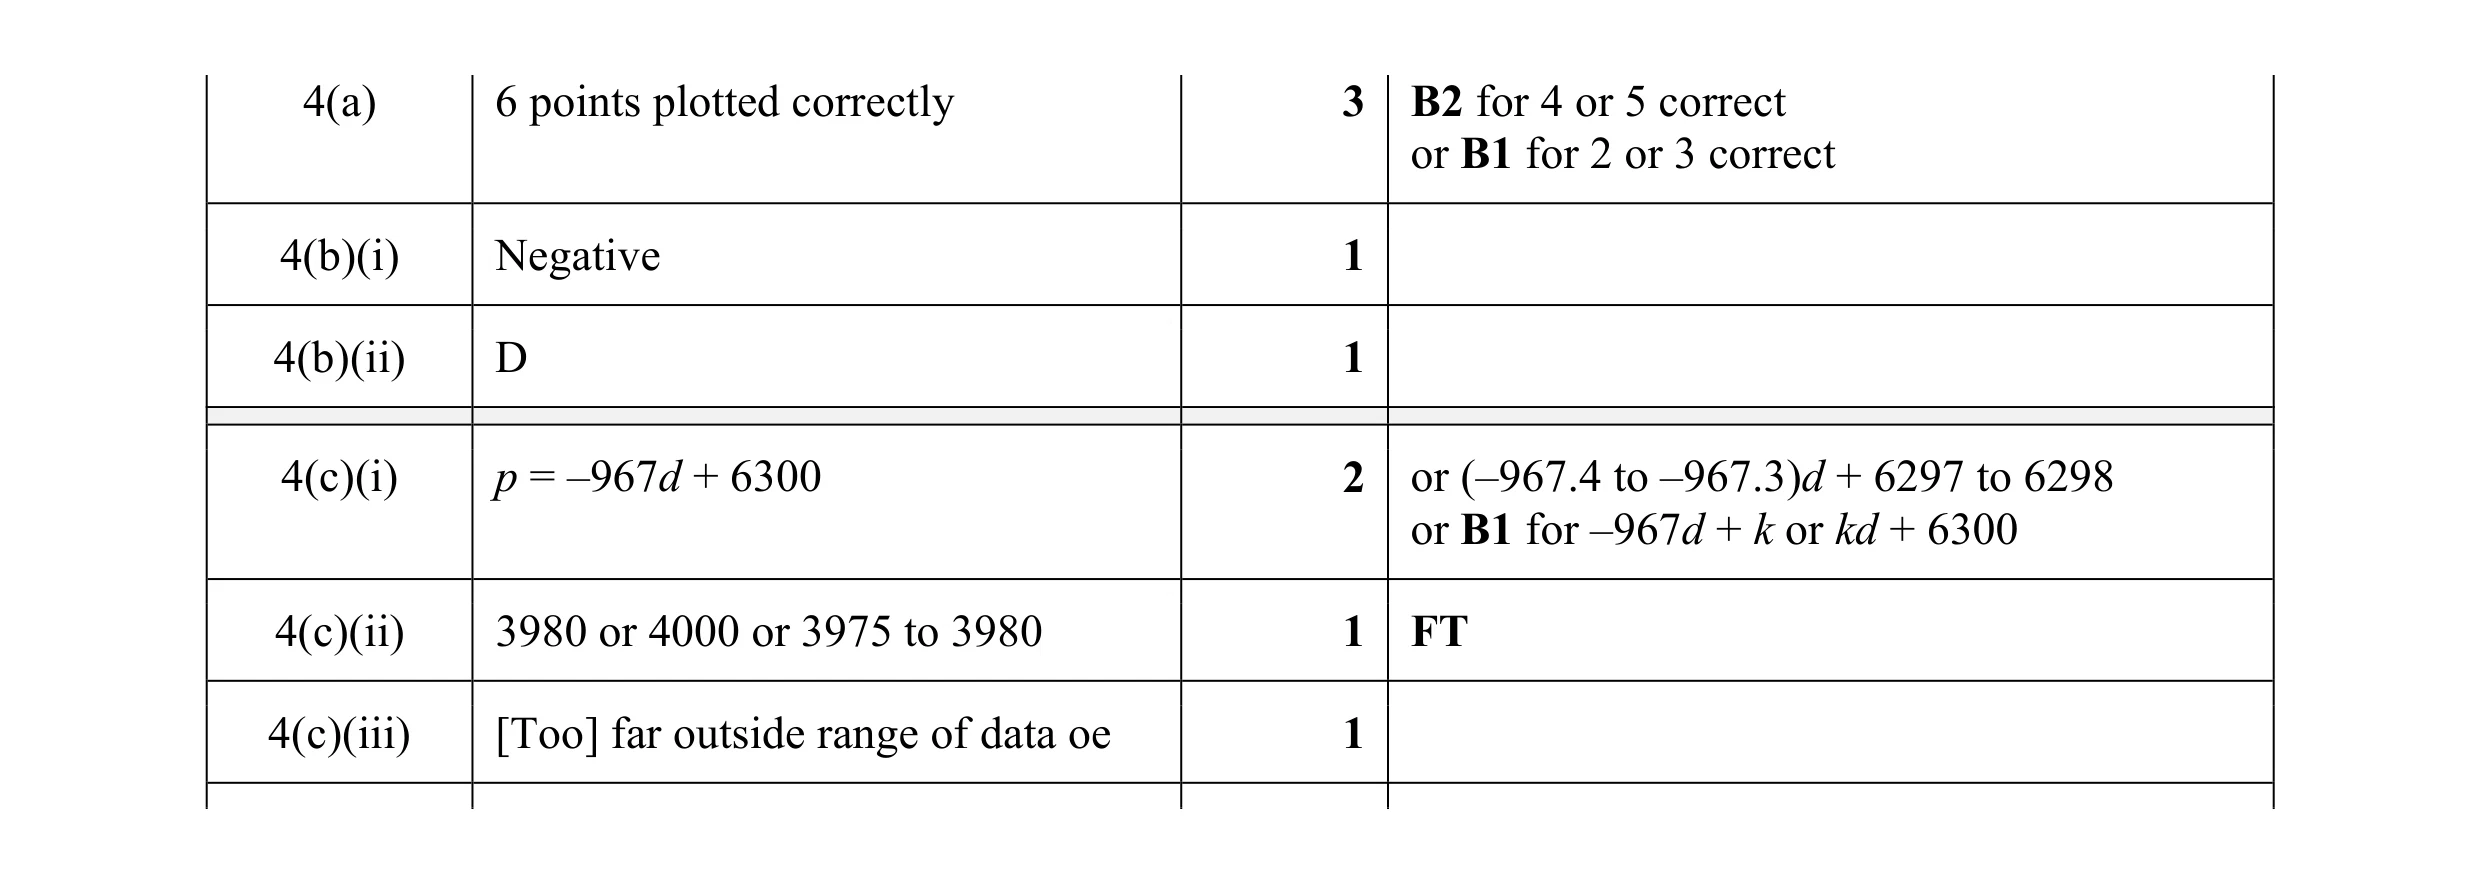 9
9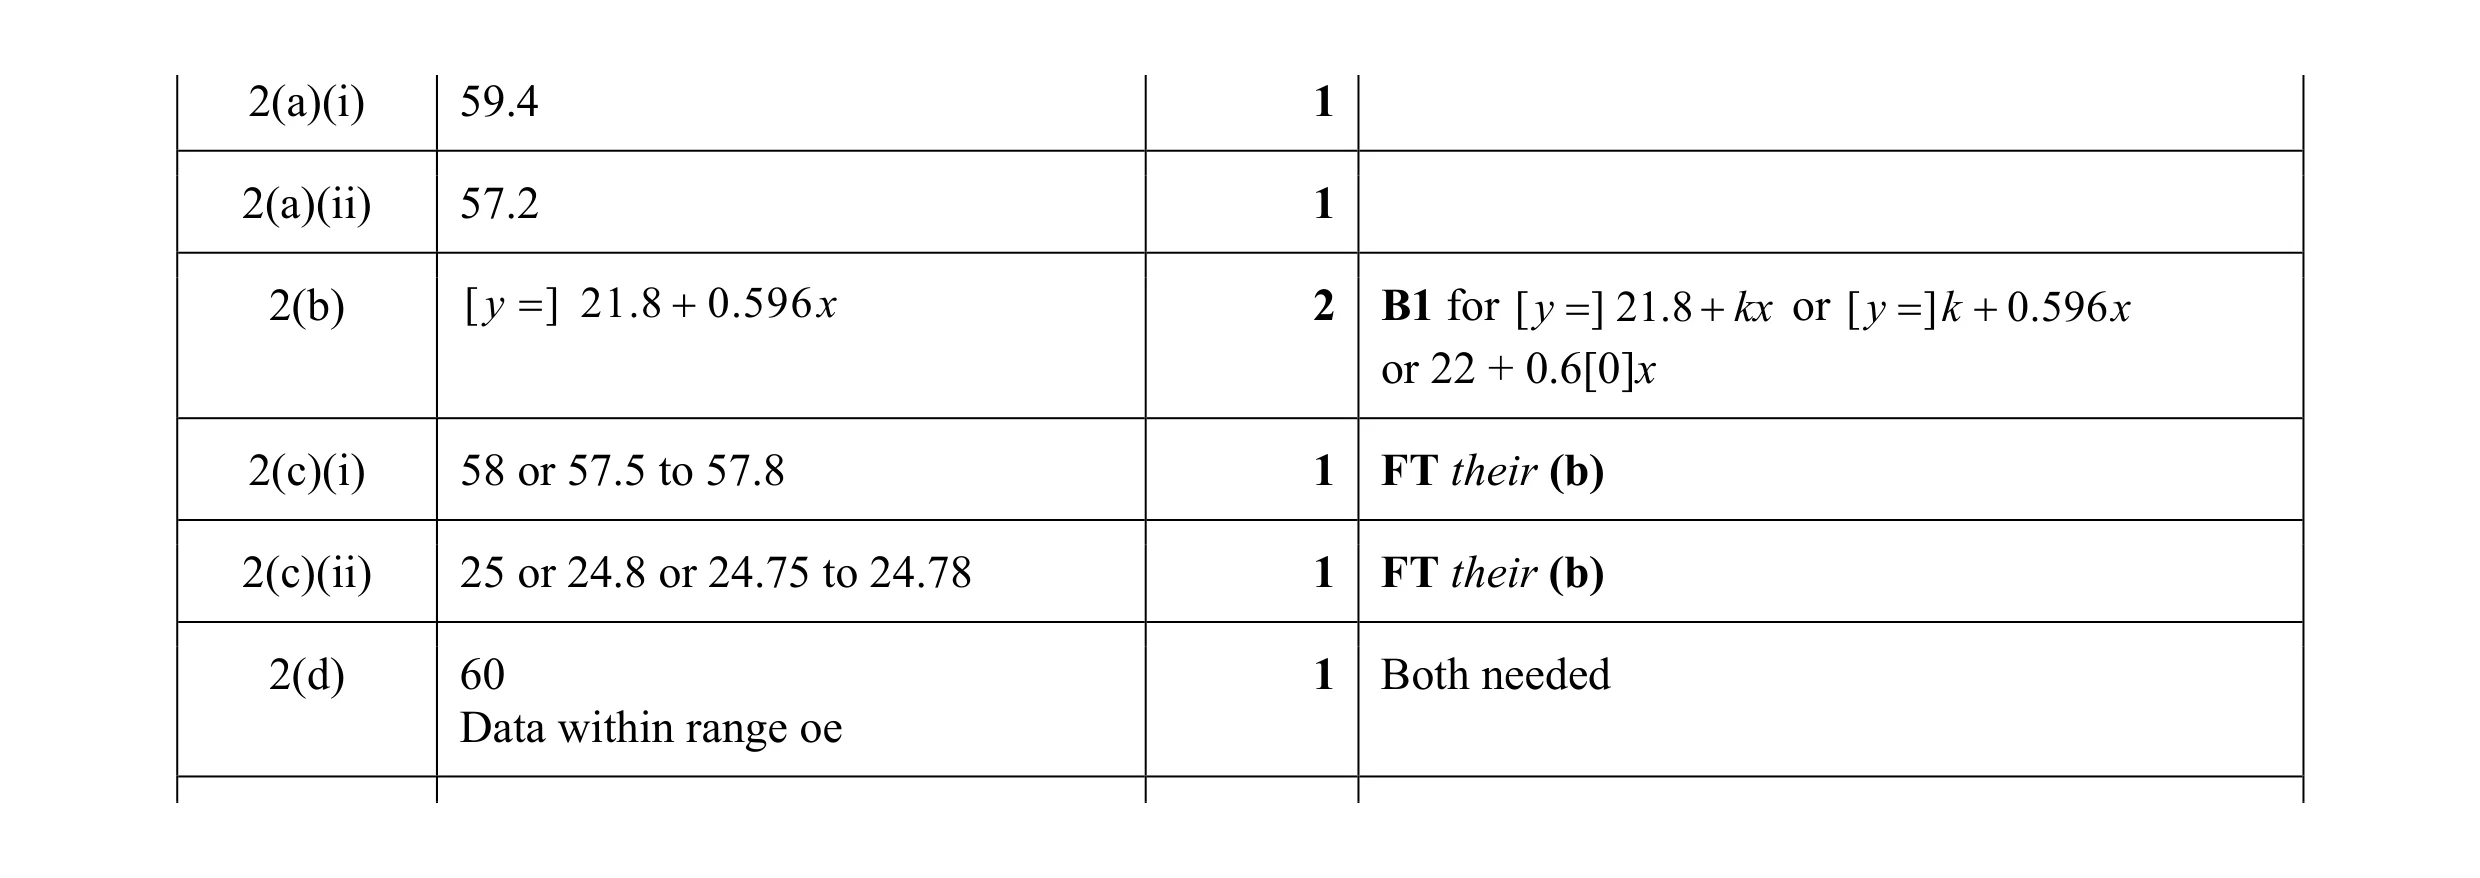 7
7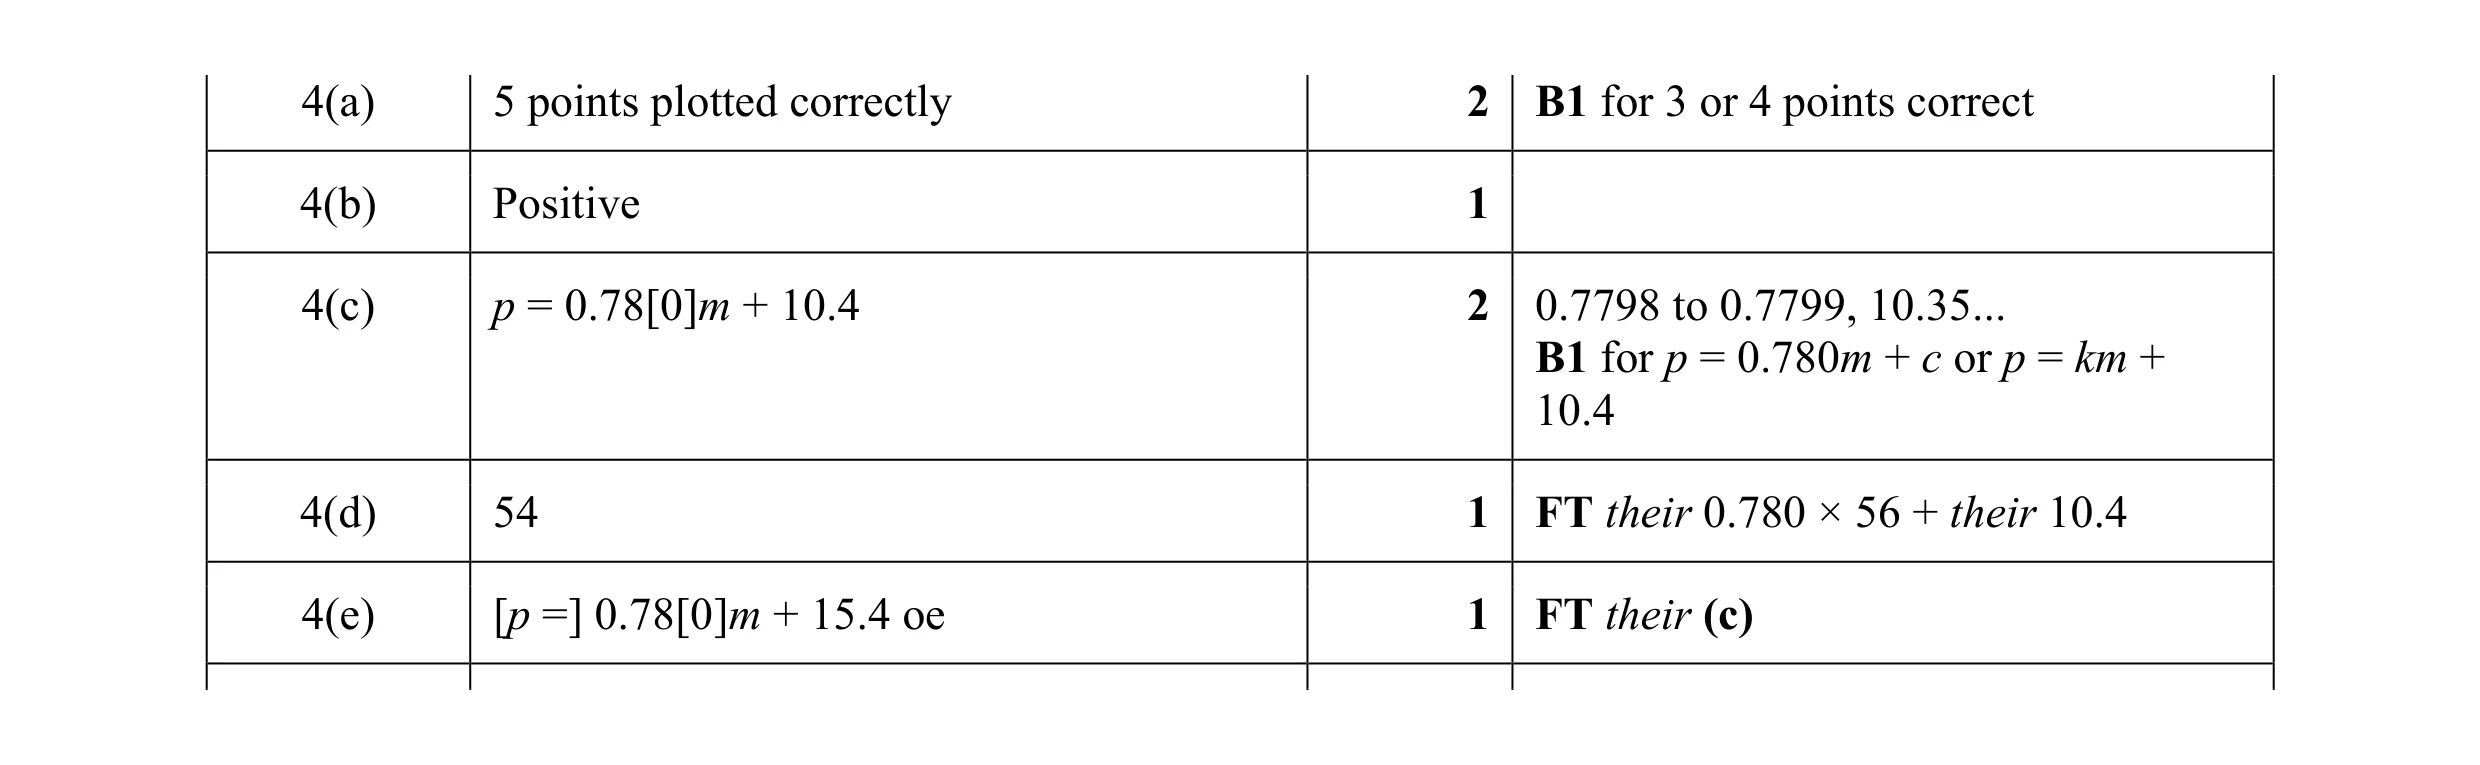 7
7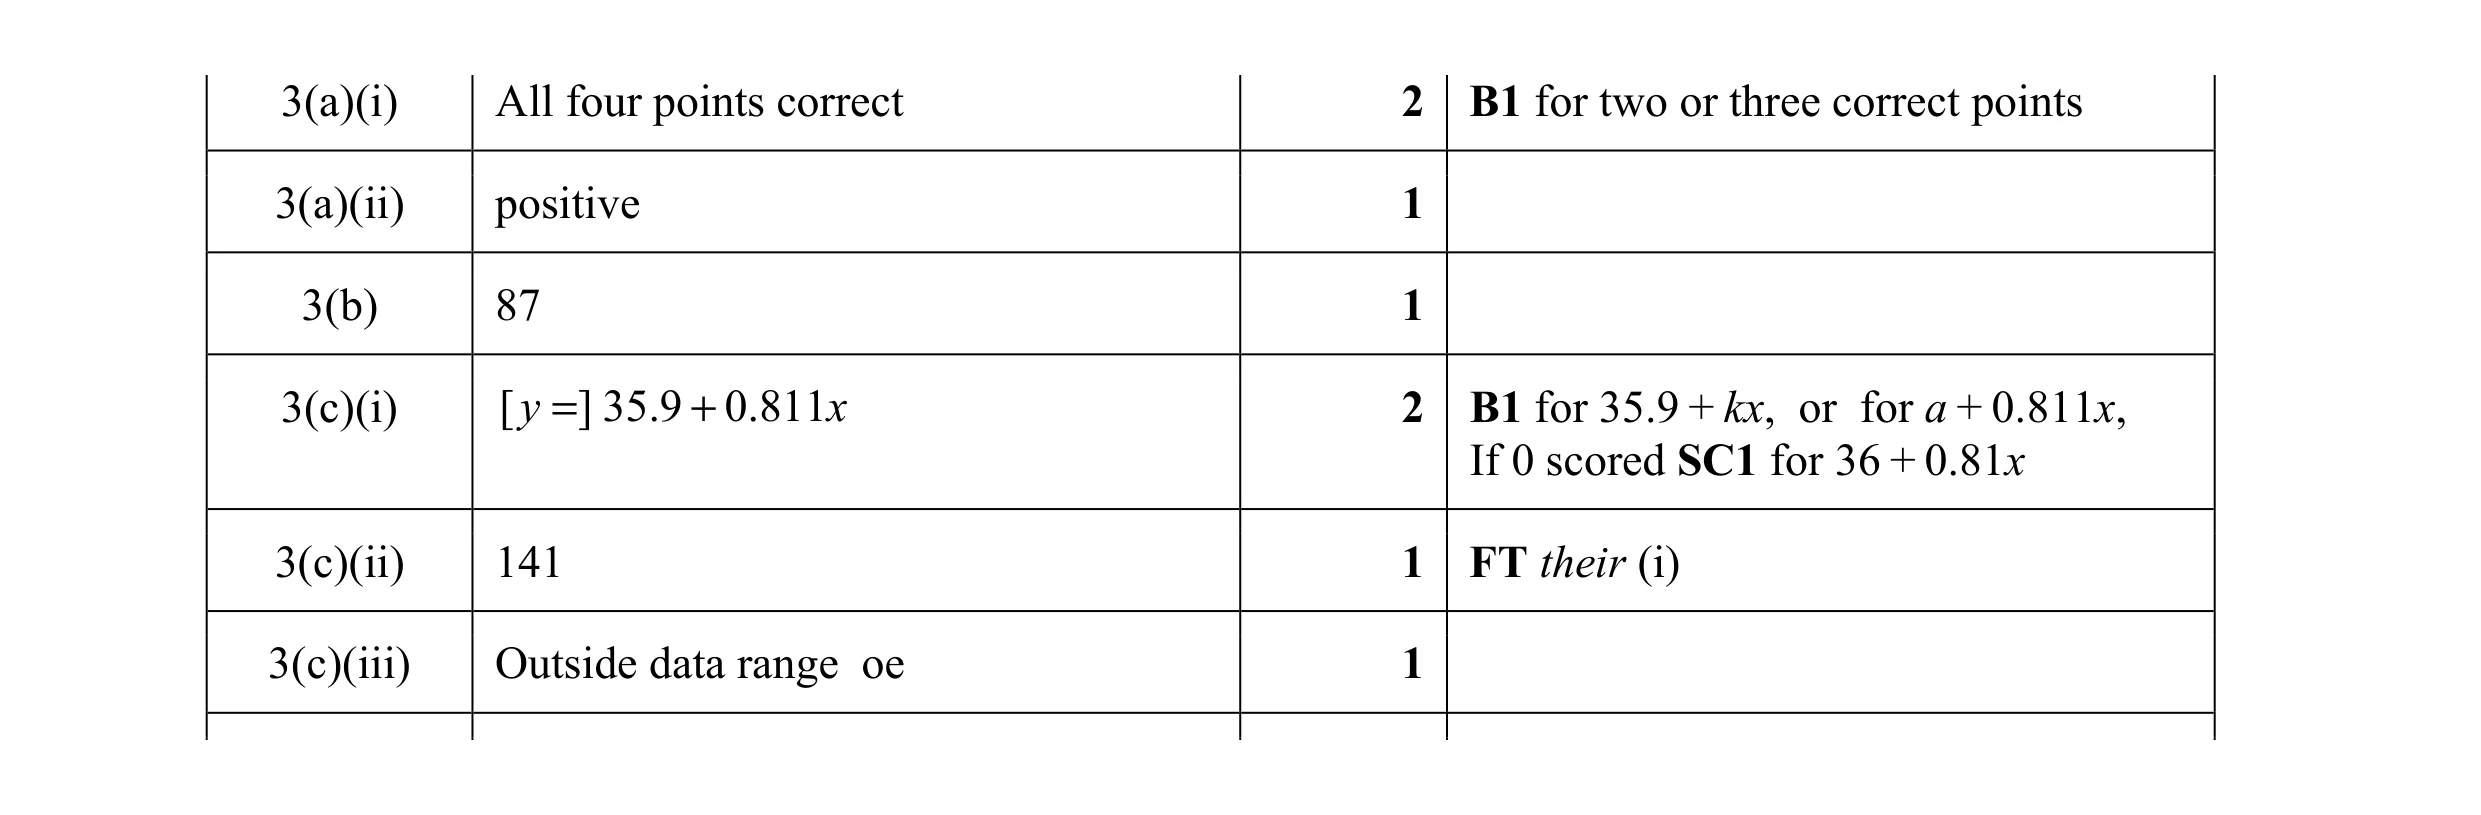 8
8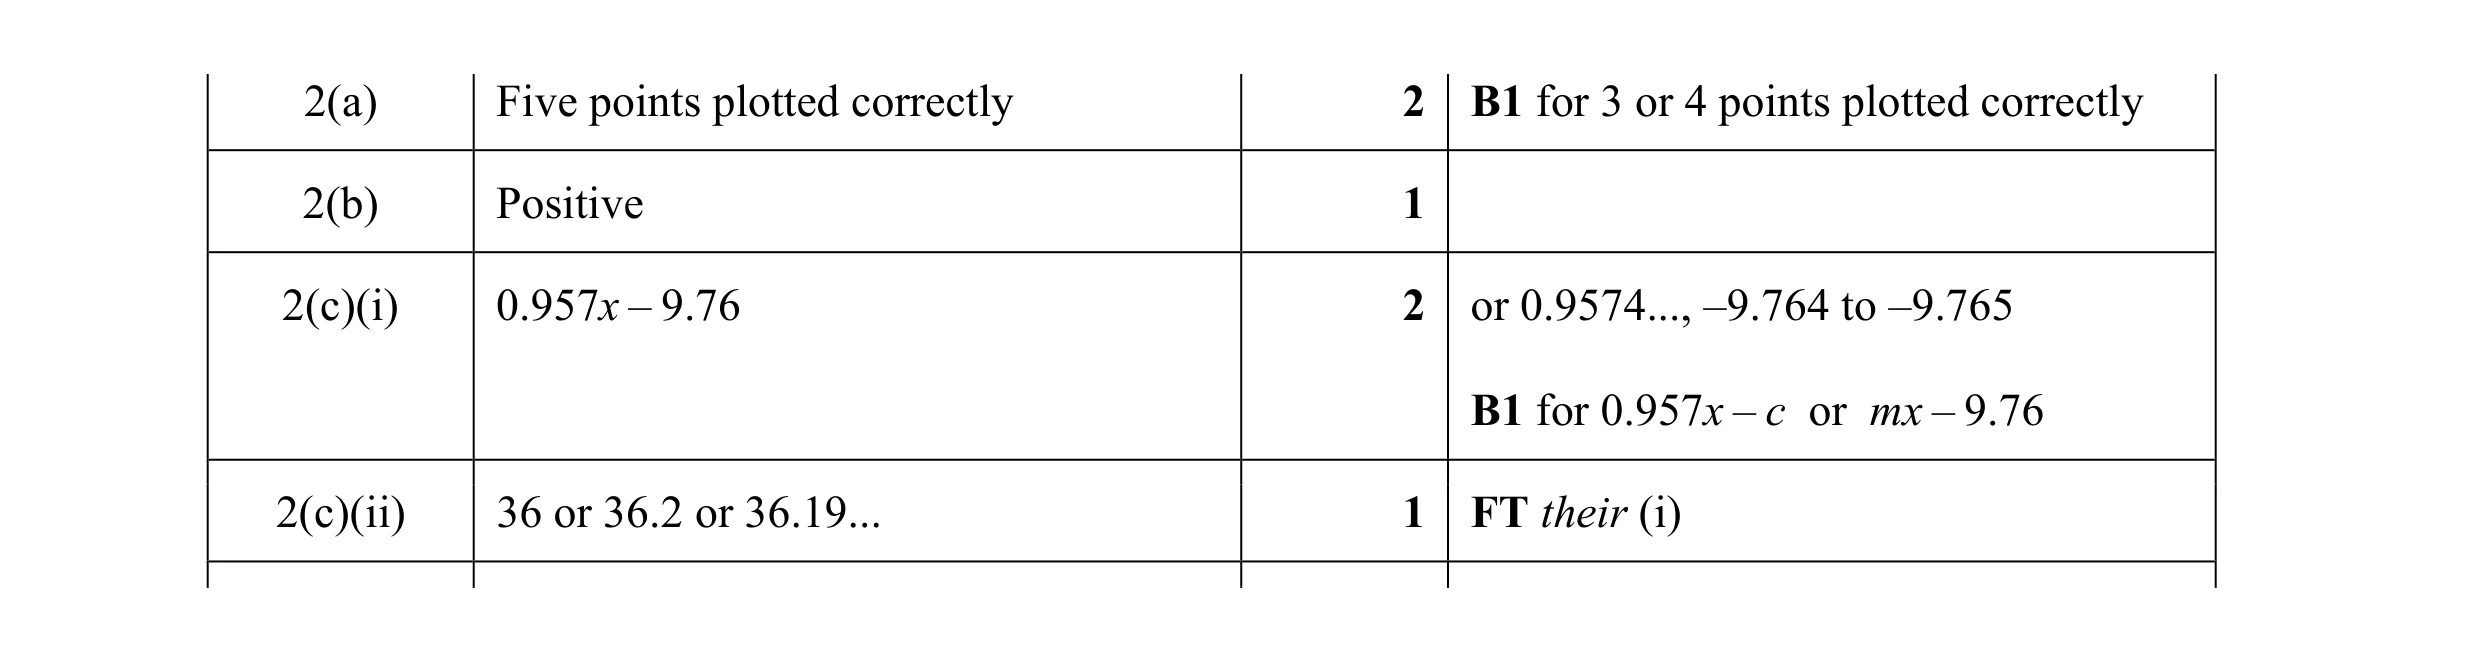 6
6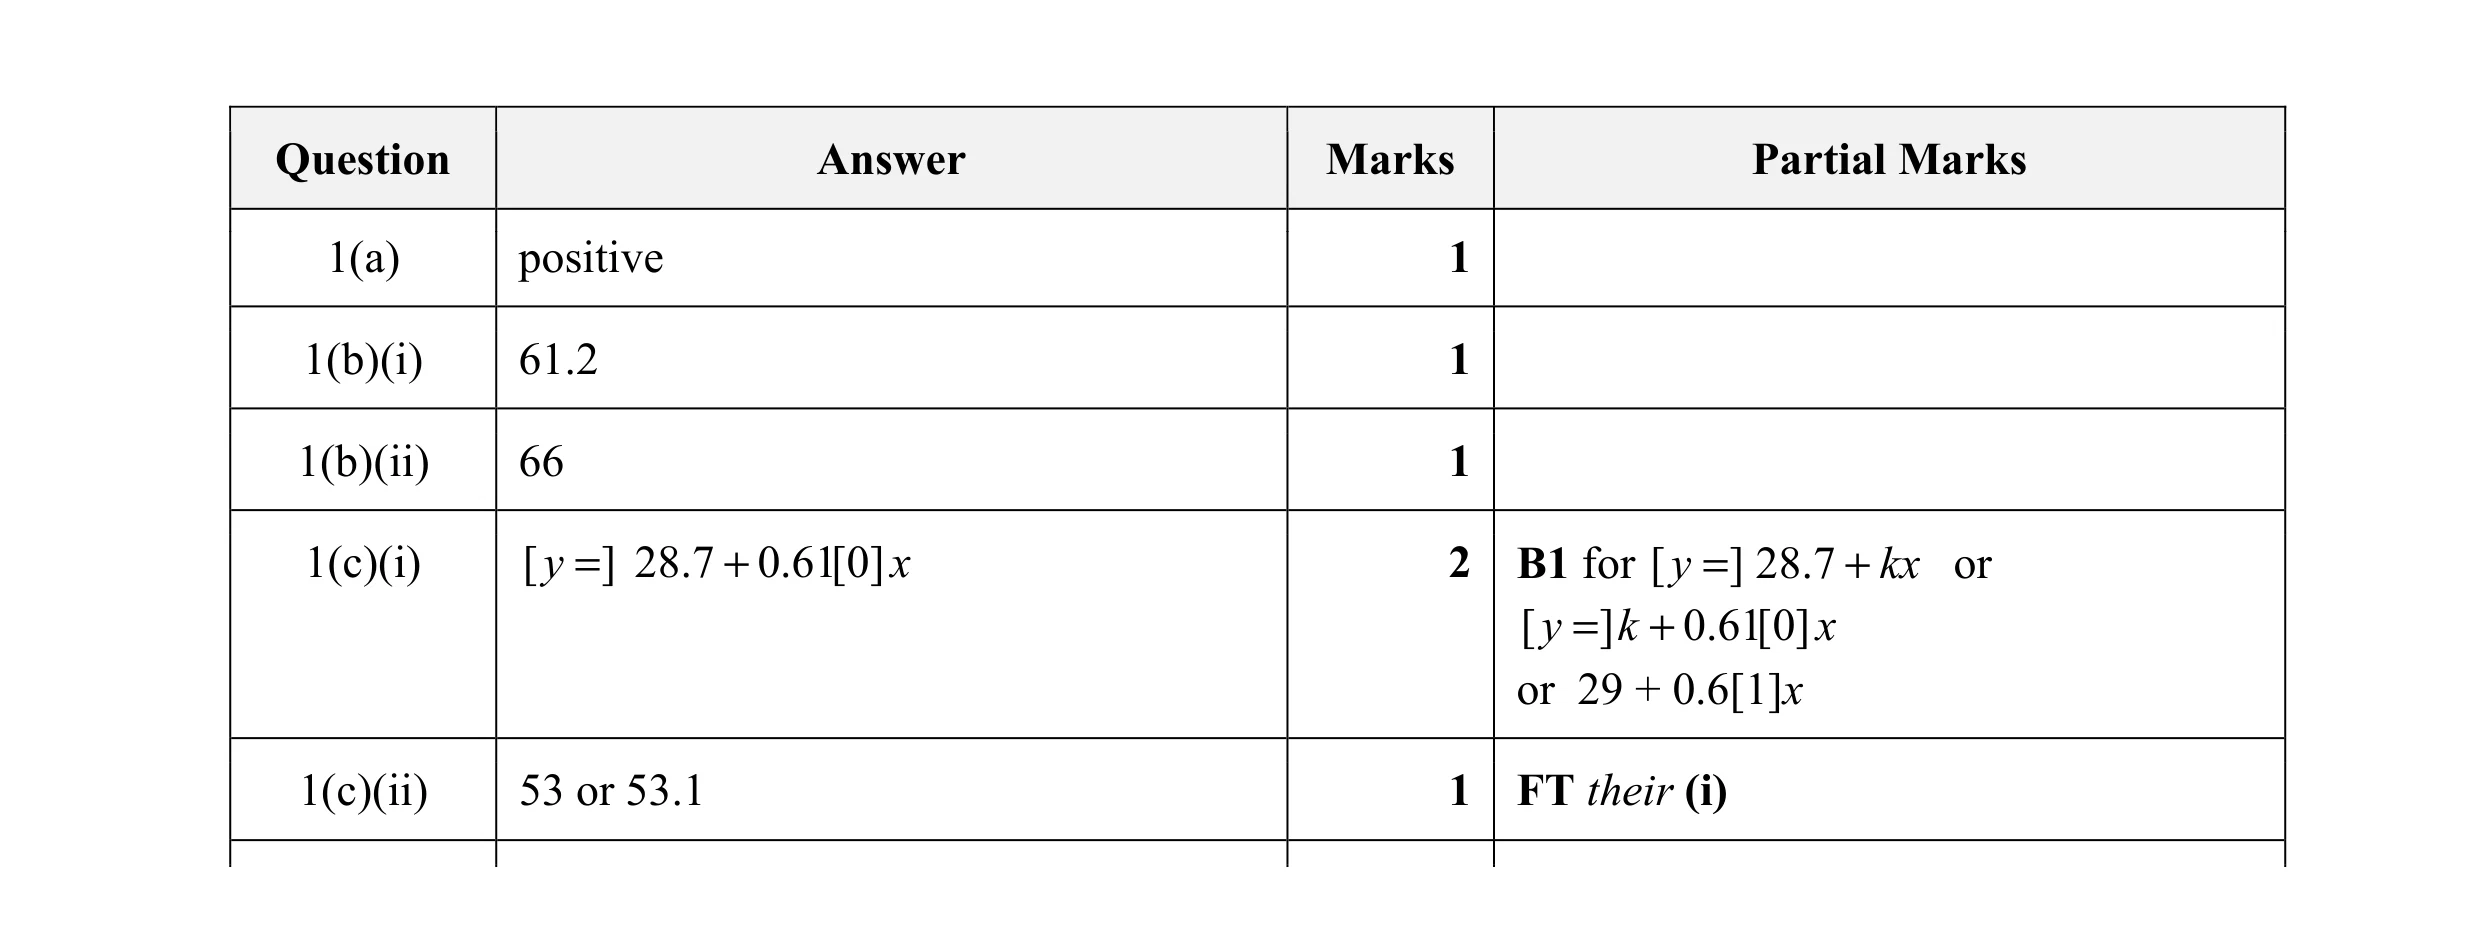 6
6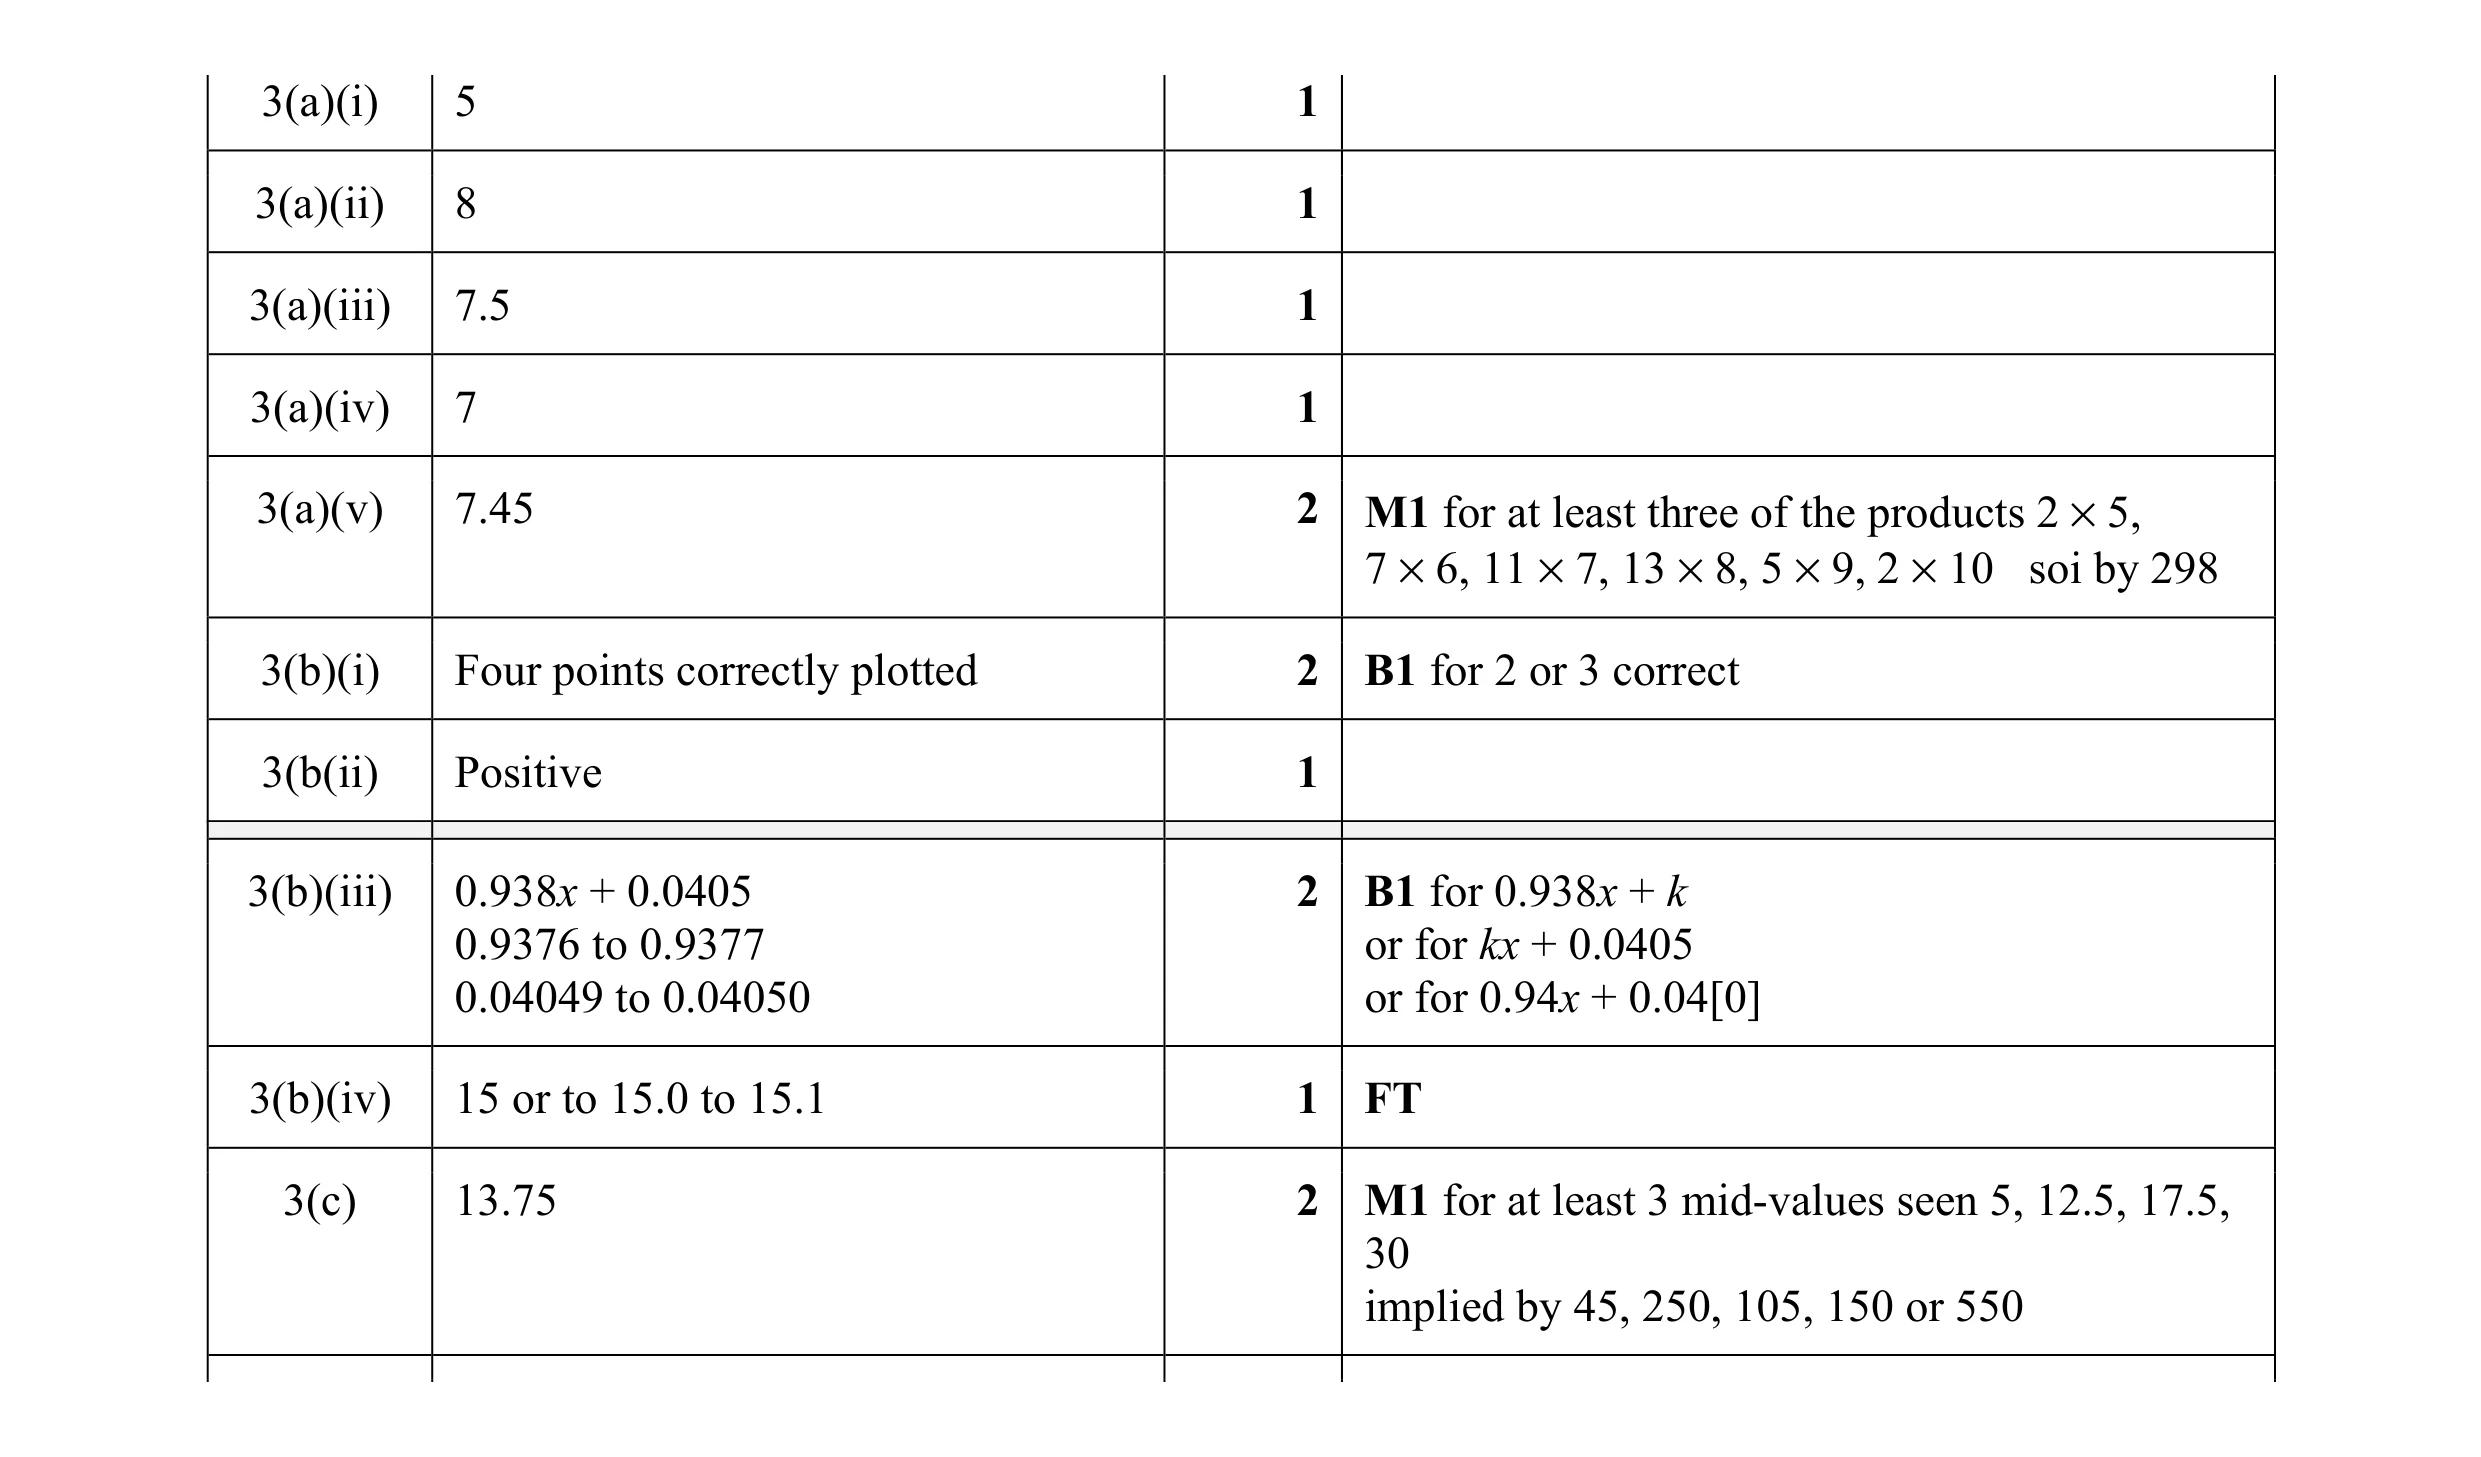 14
14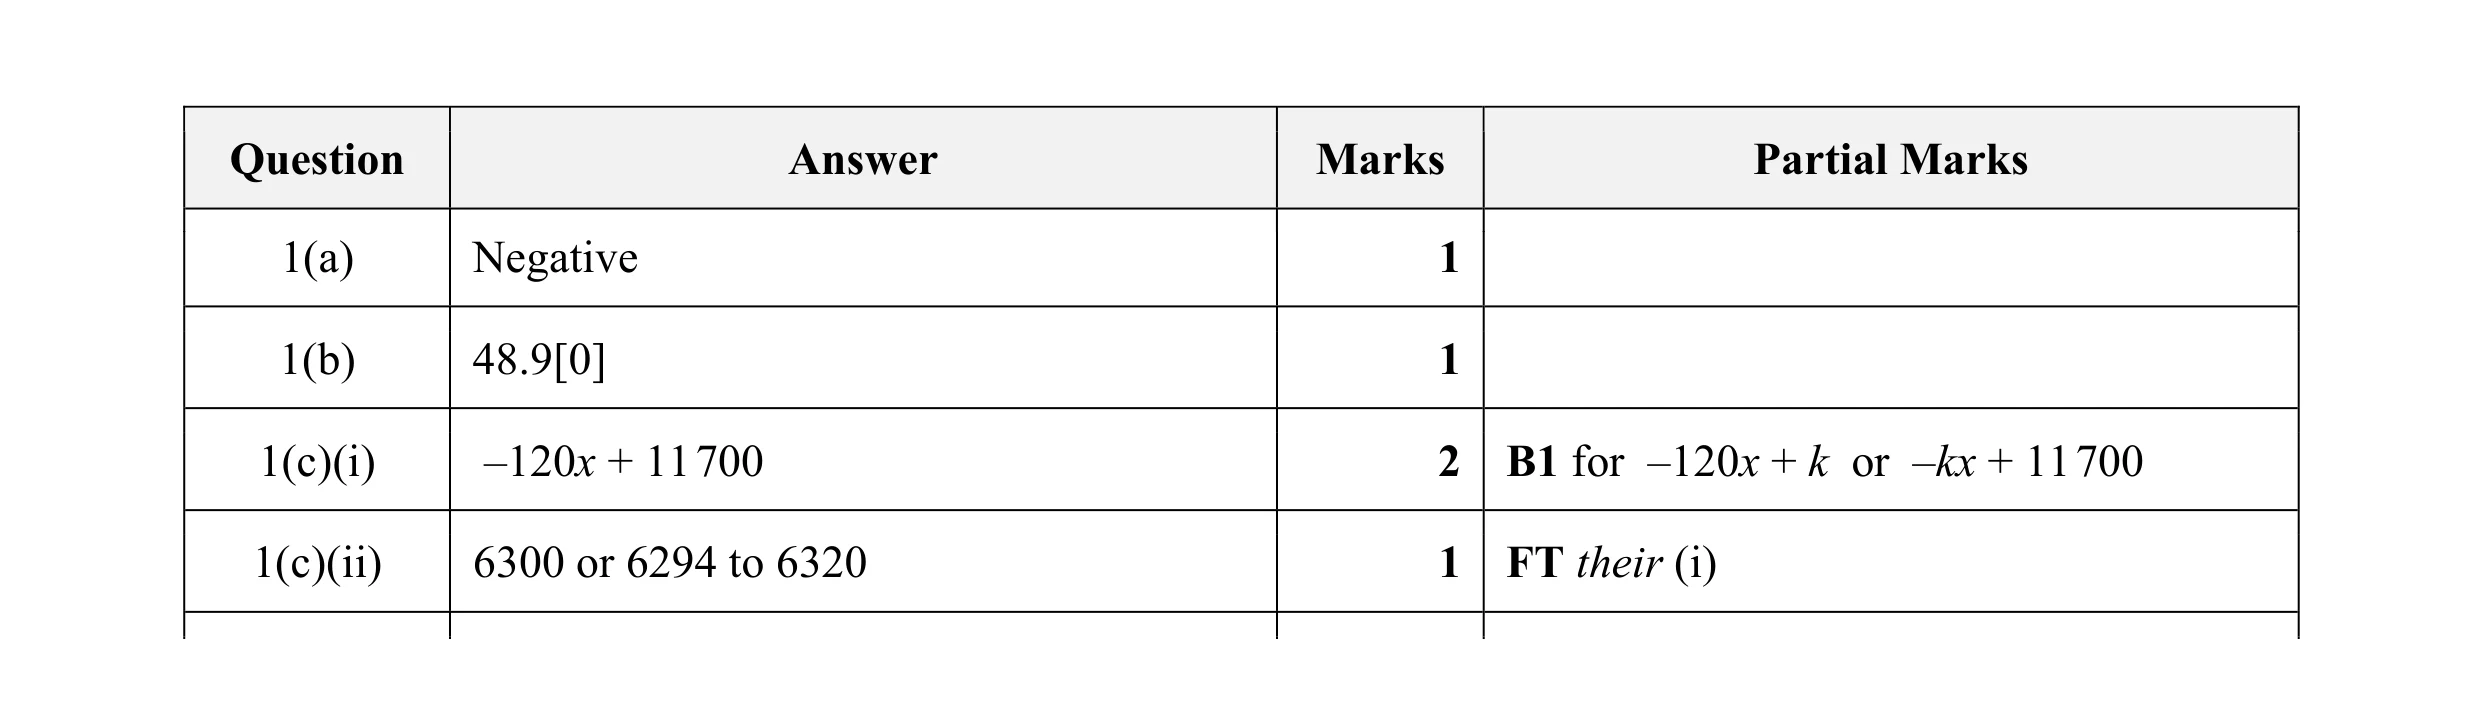 5
5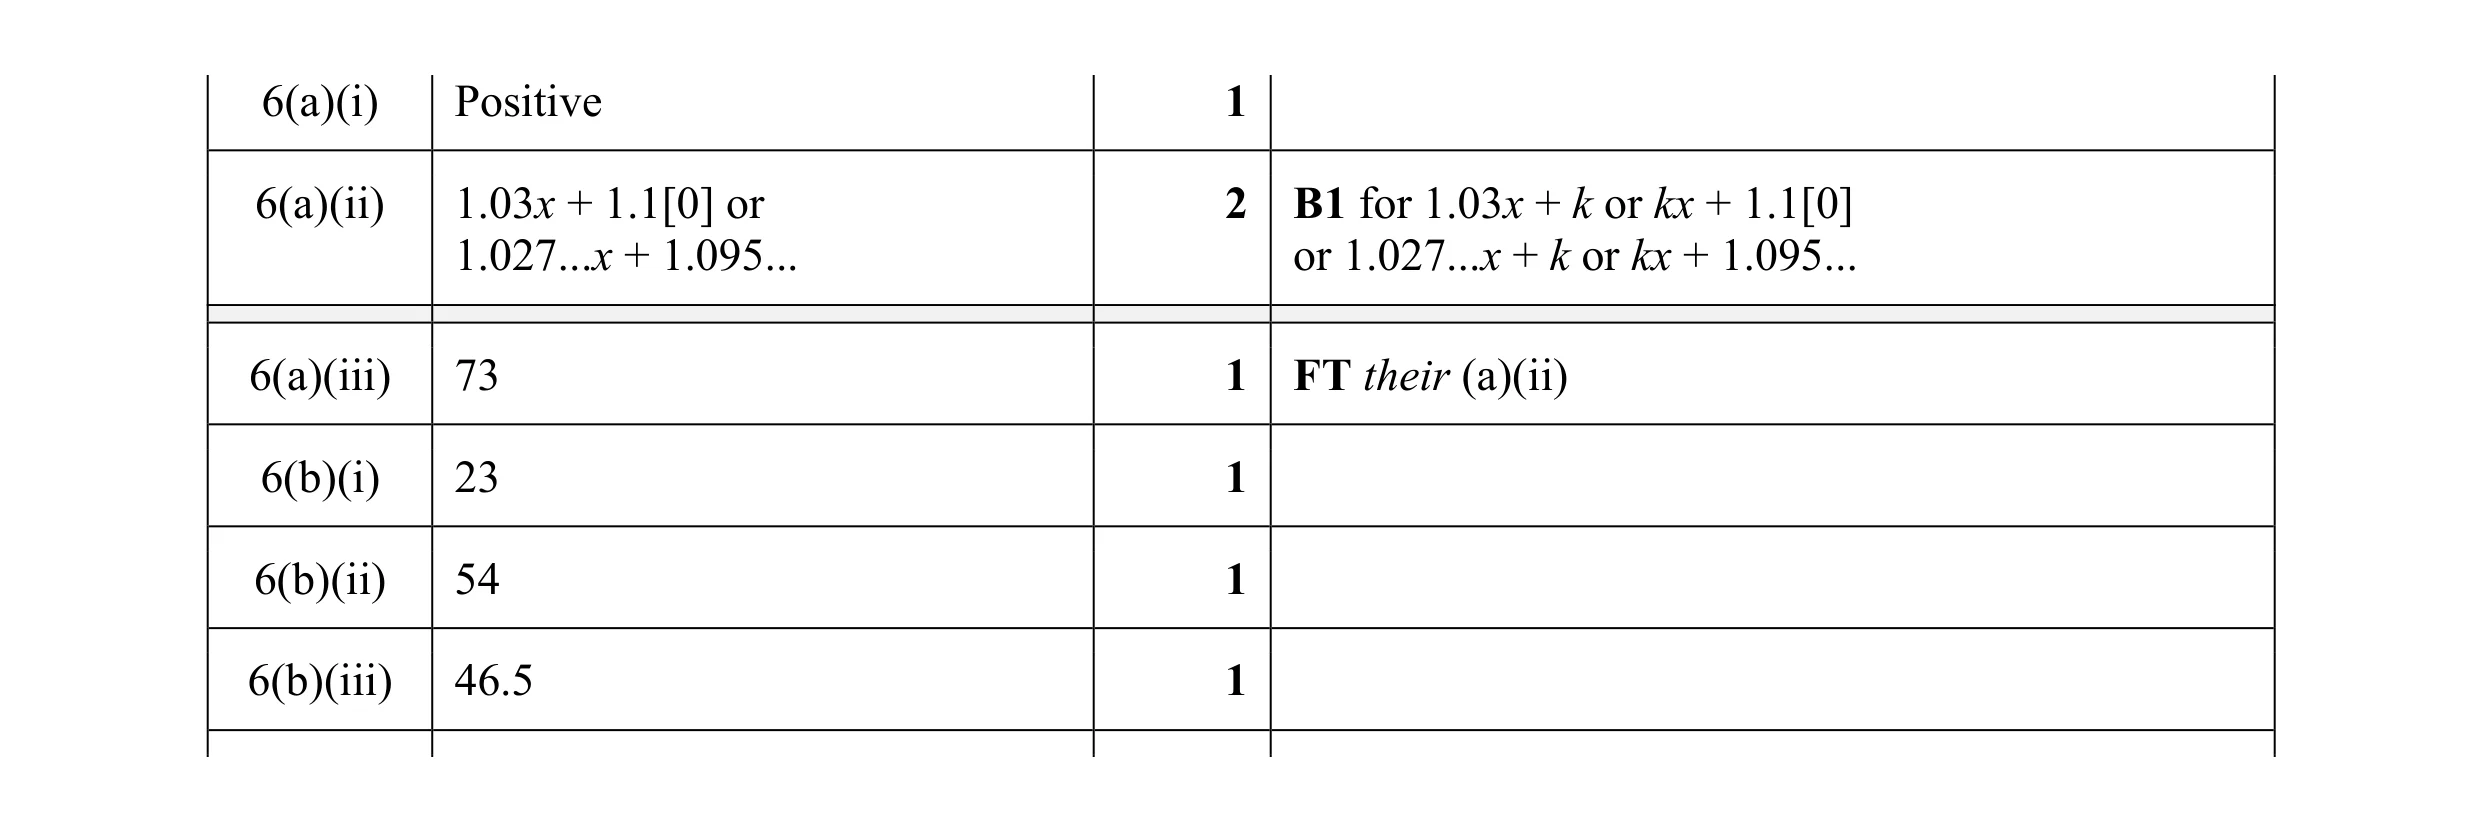 7
7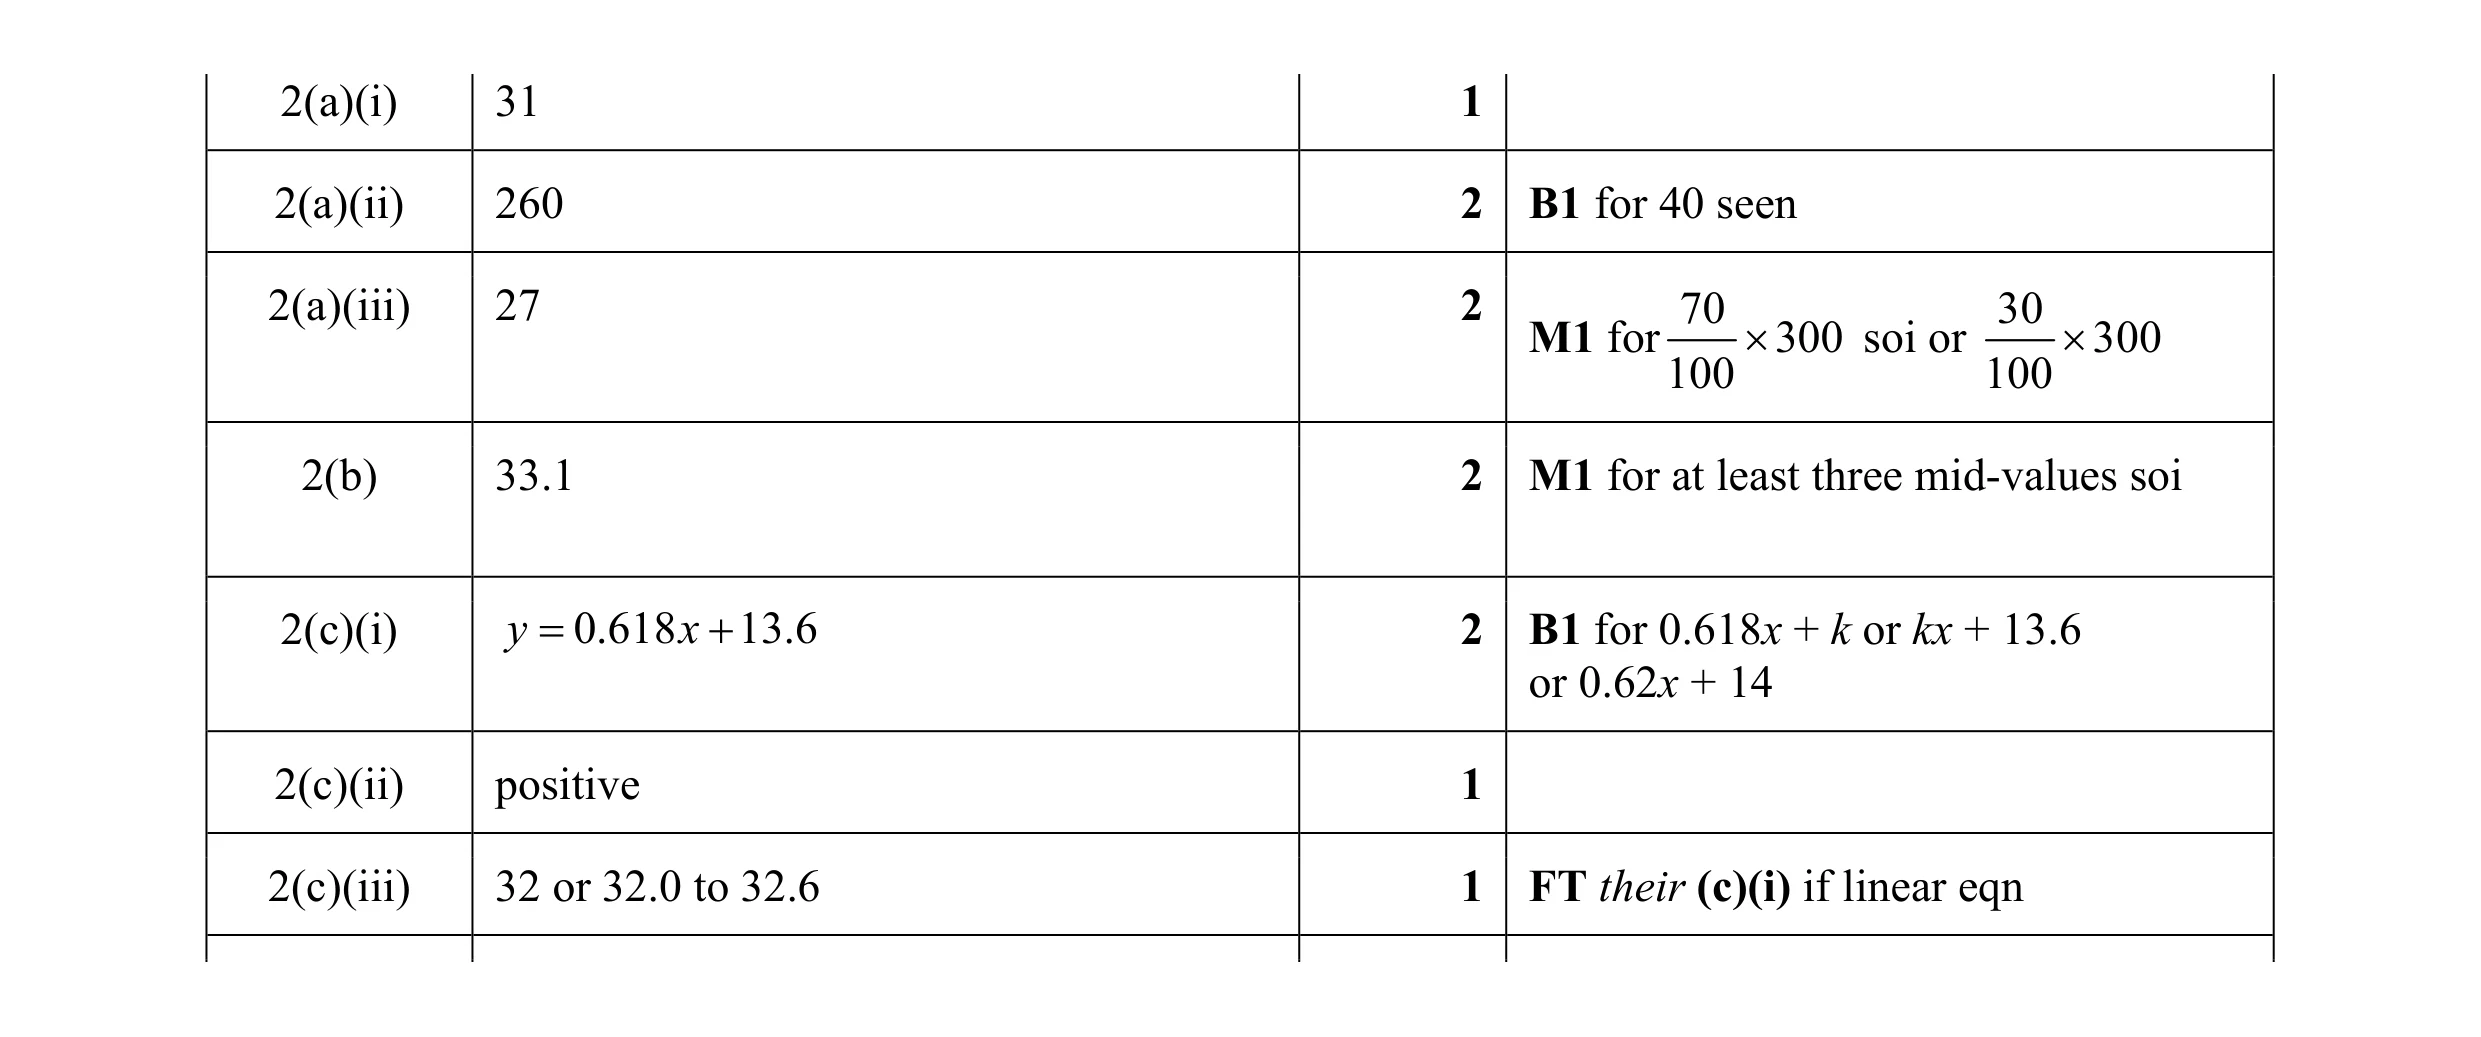 11
11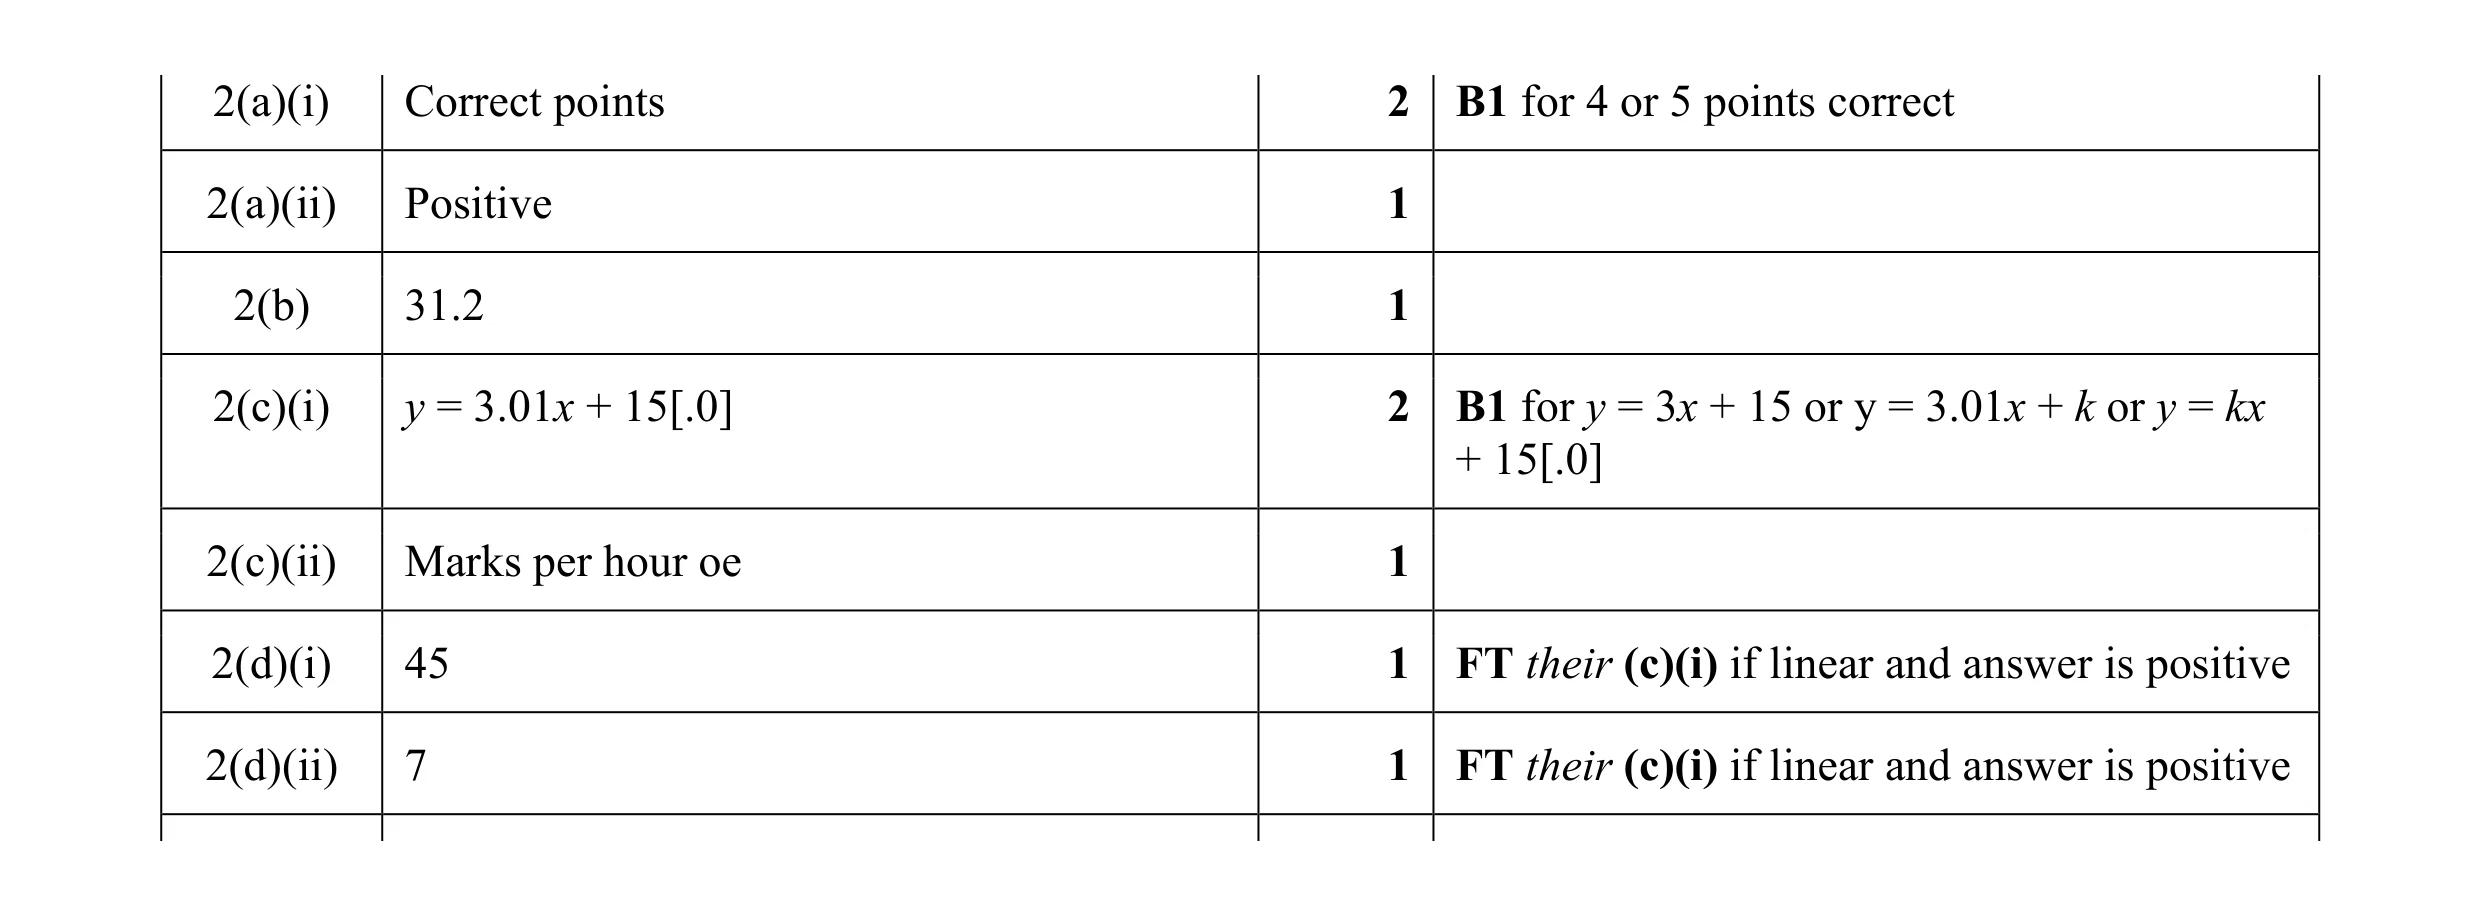 9
9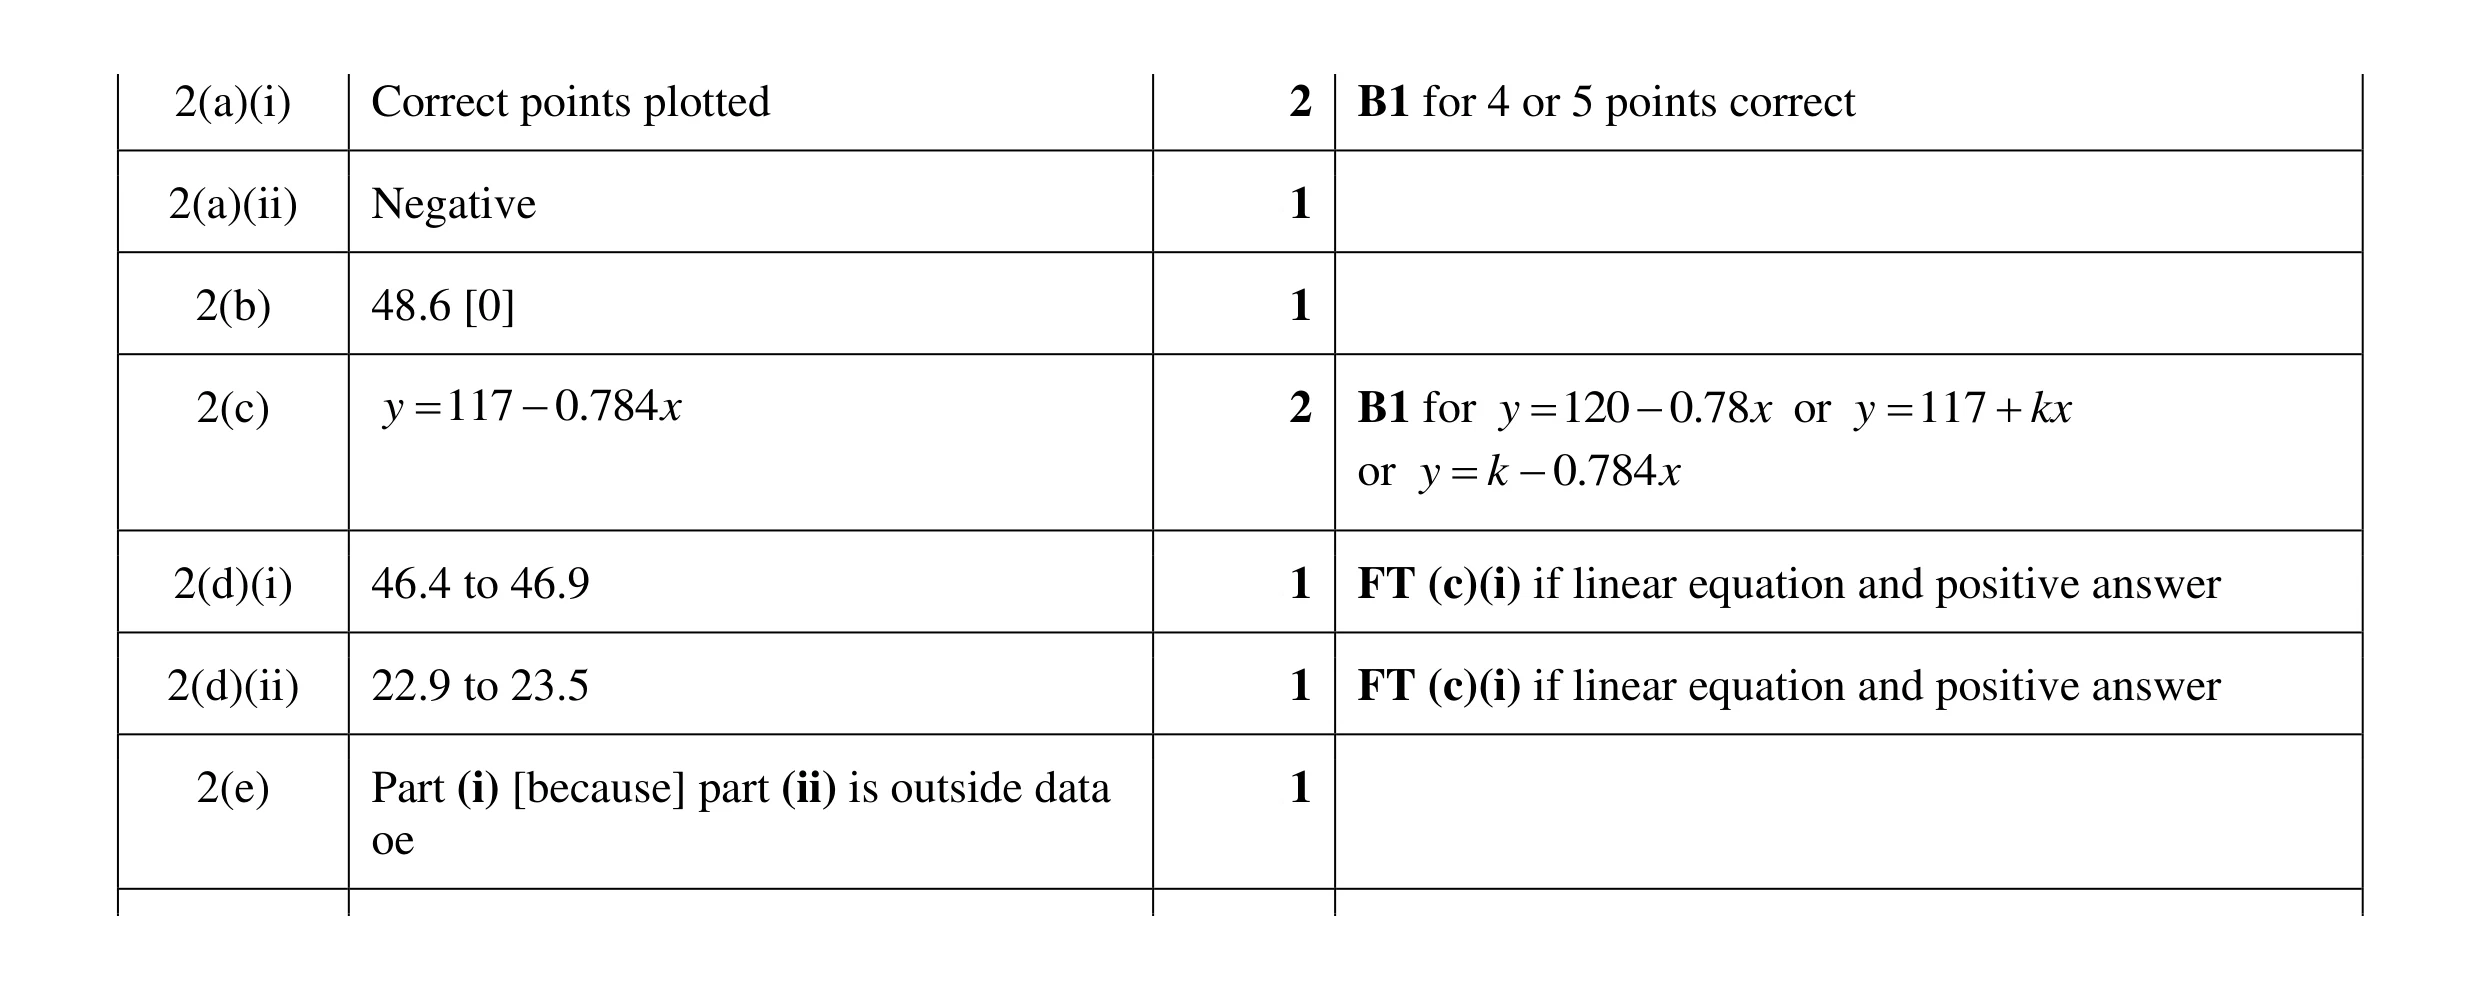 9
9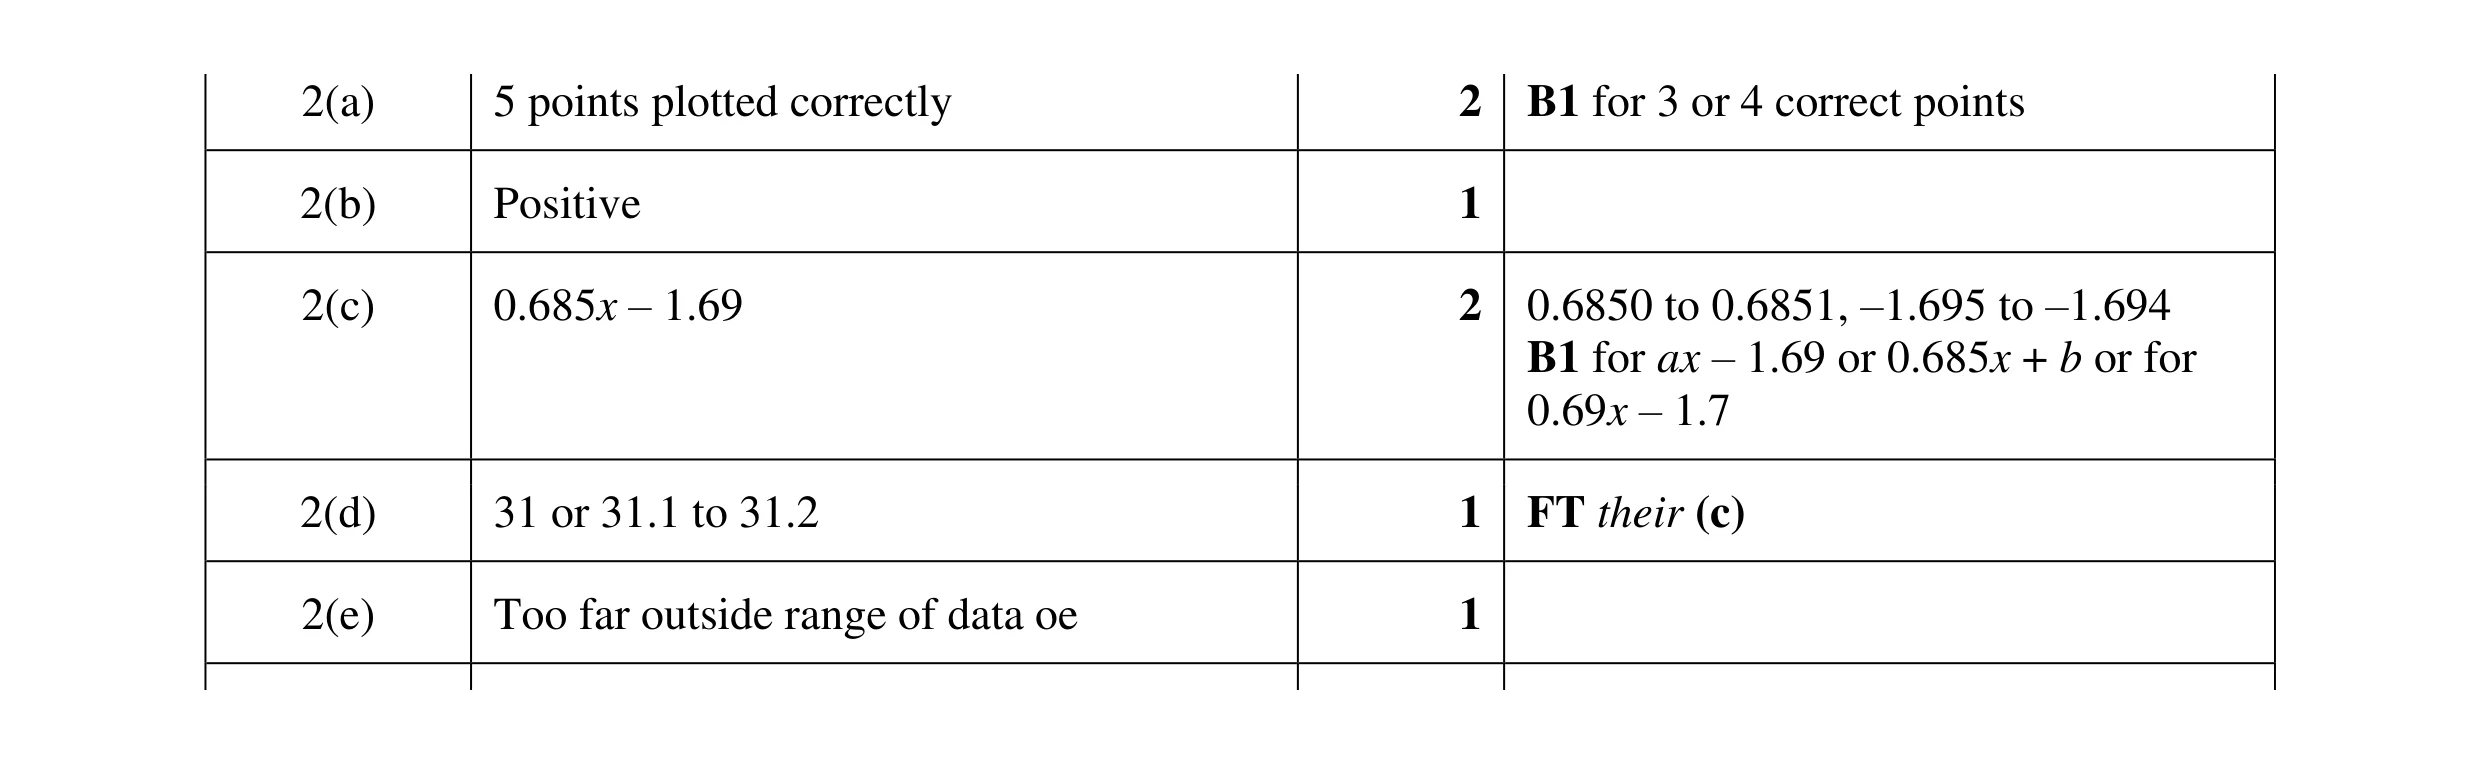 7
7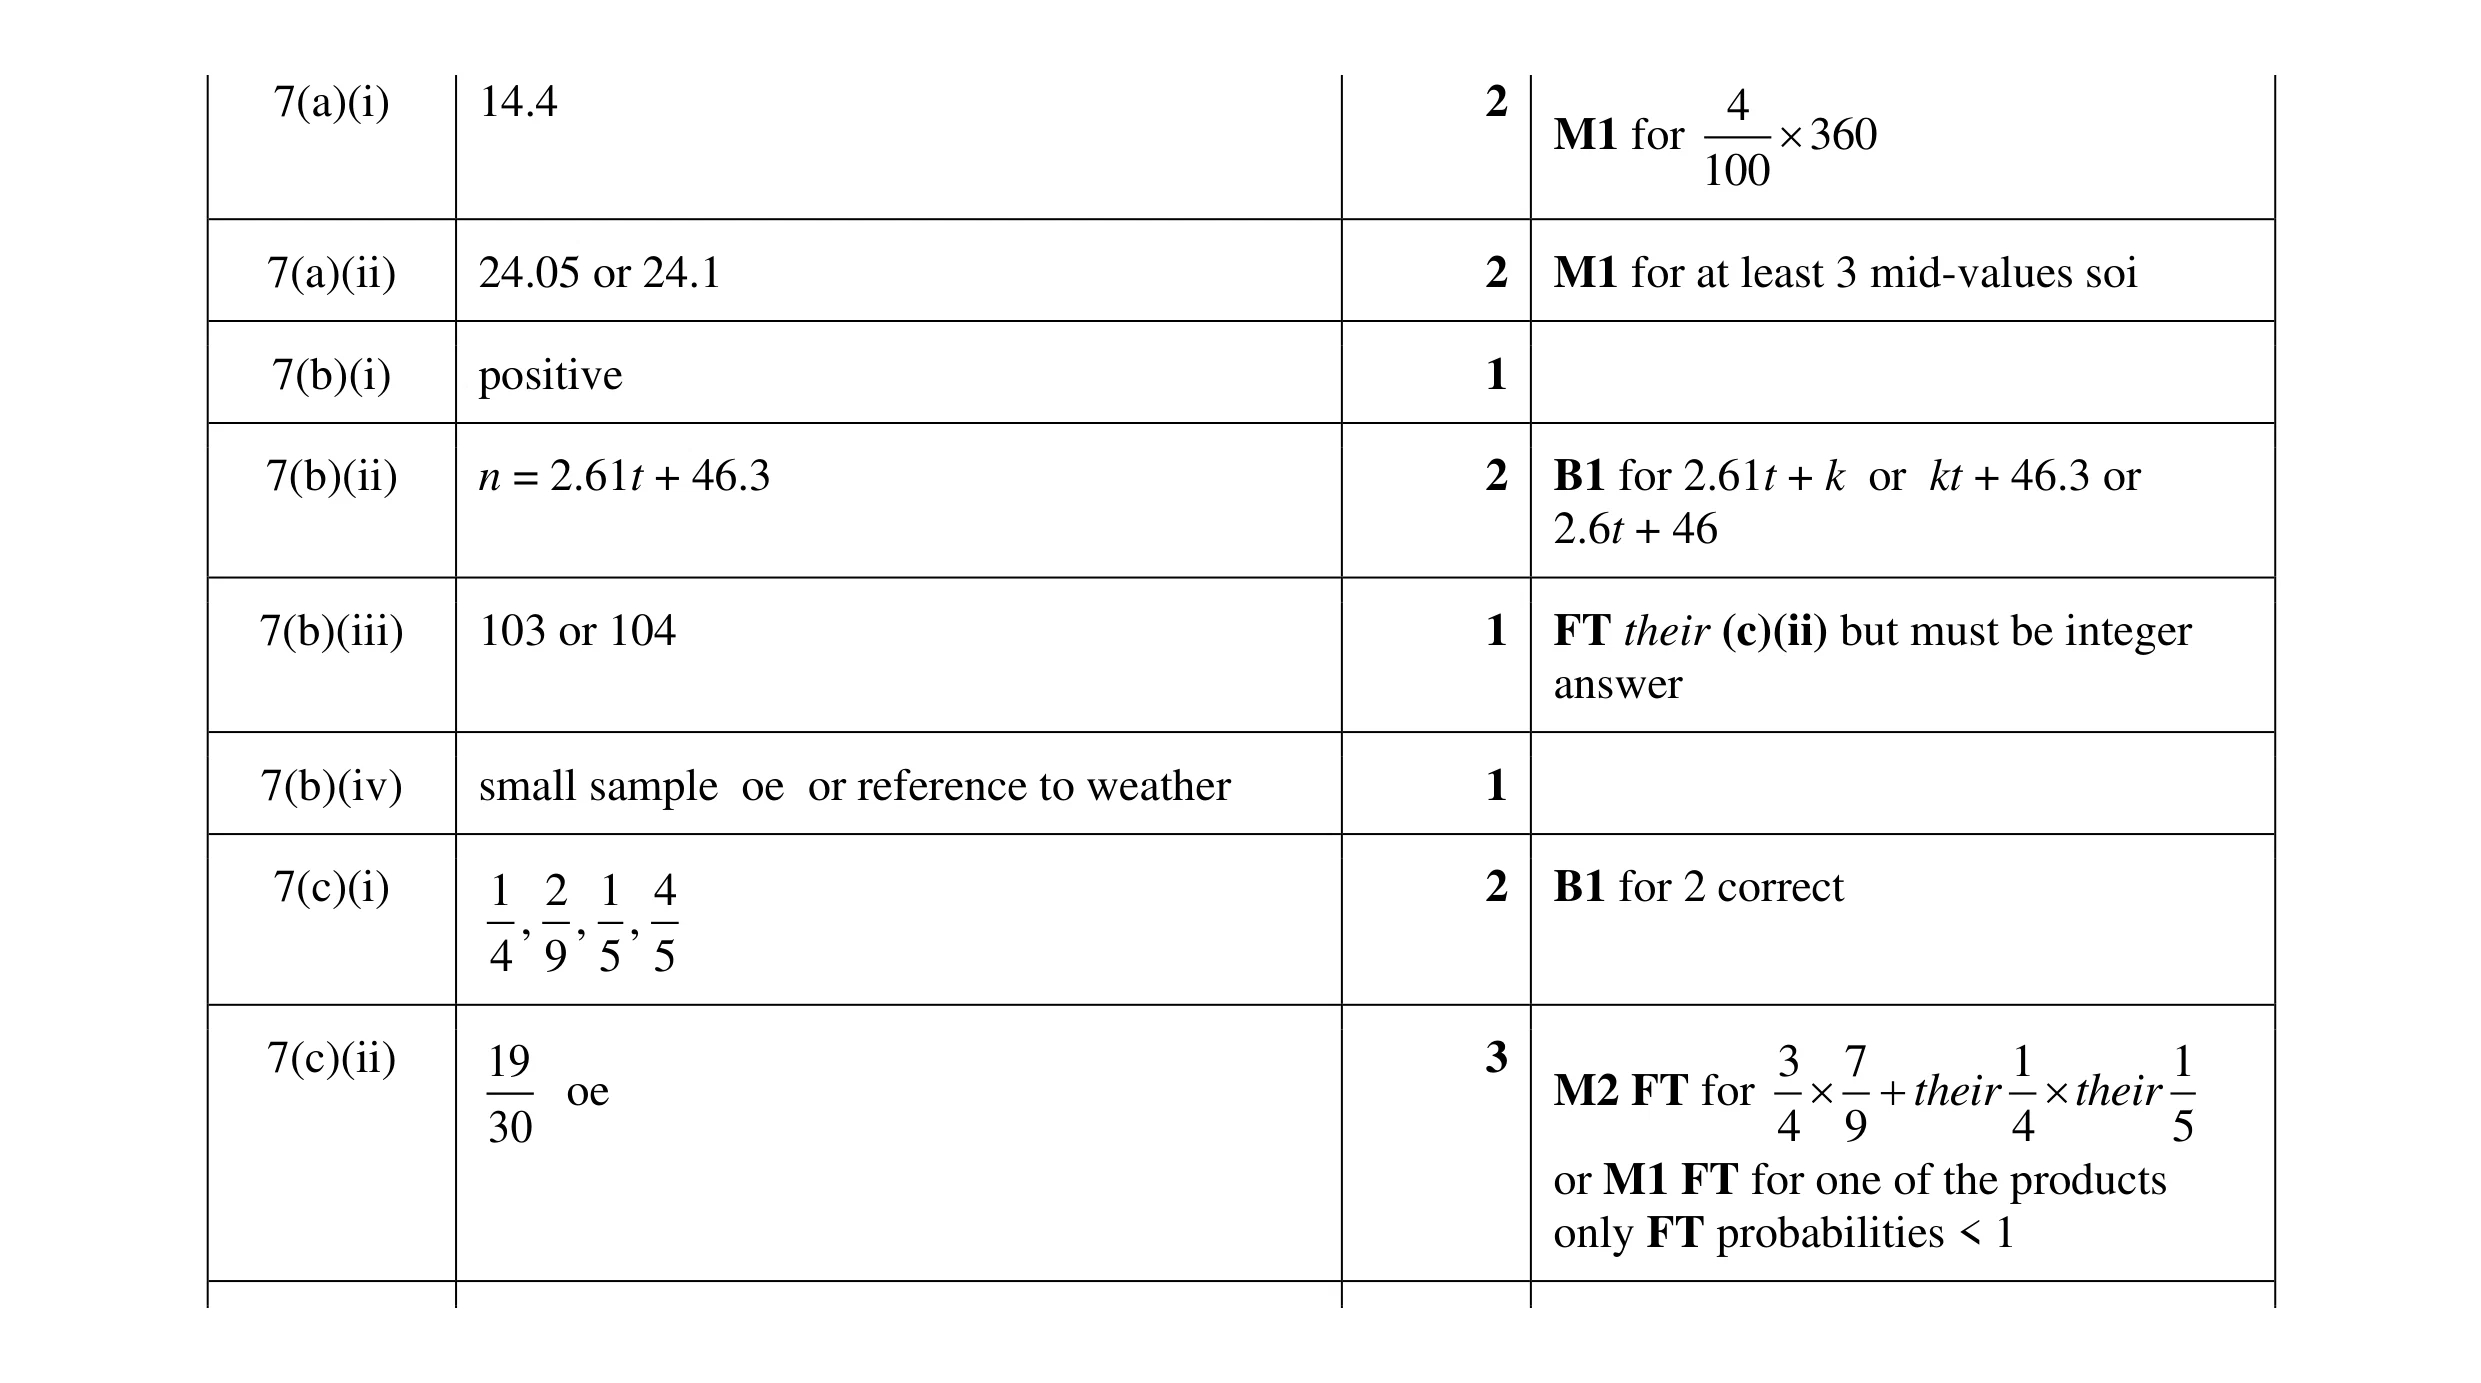 14
14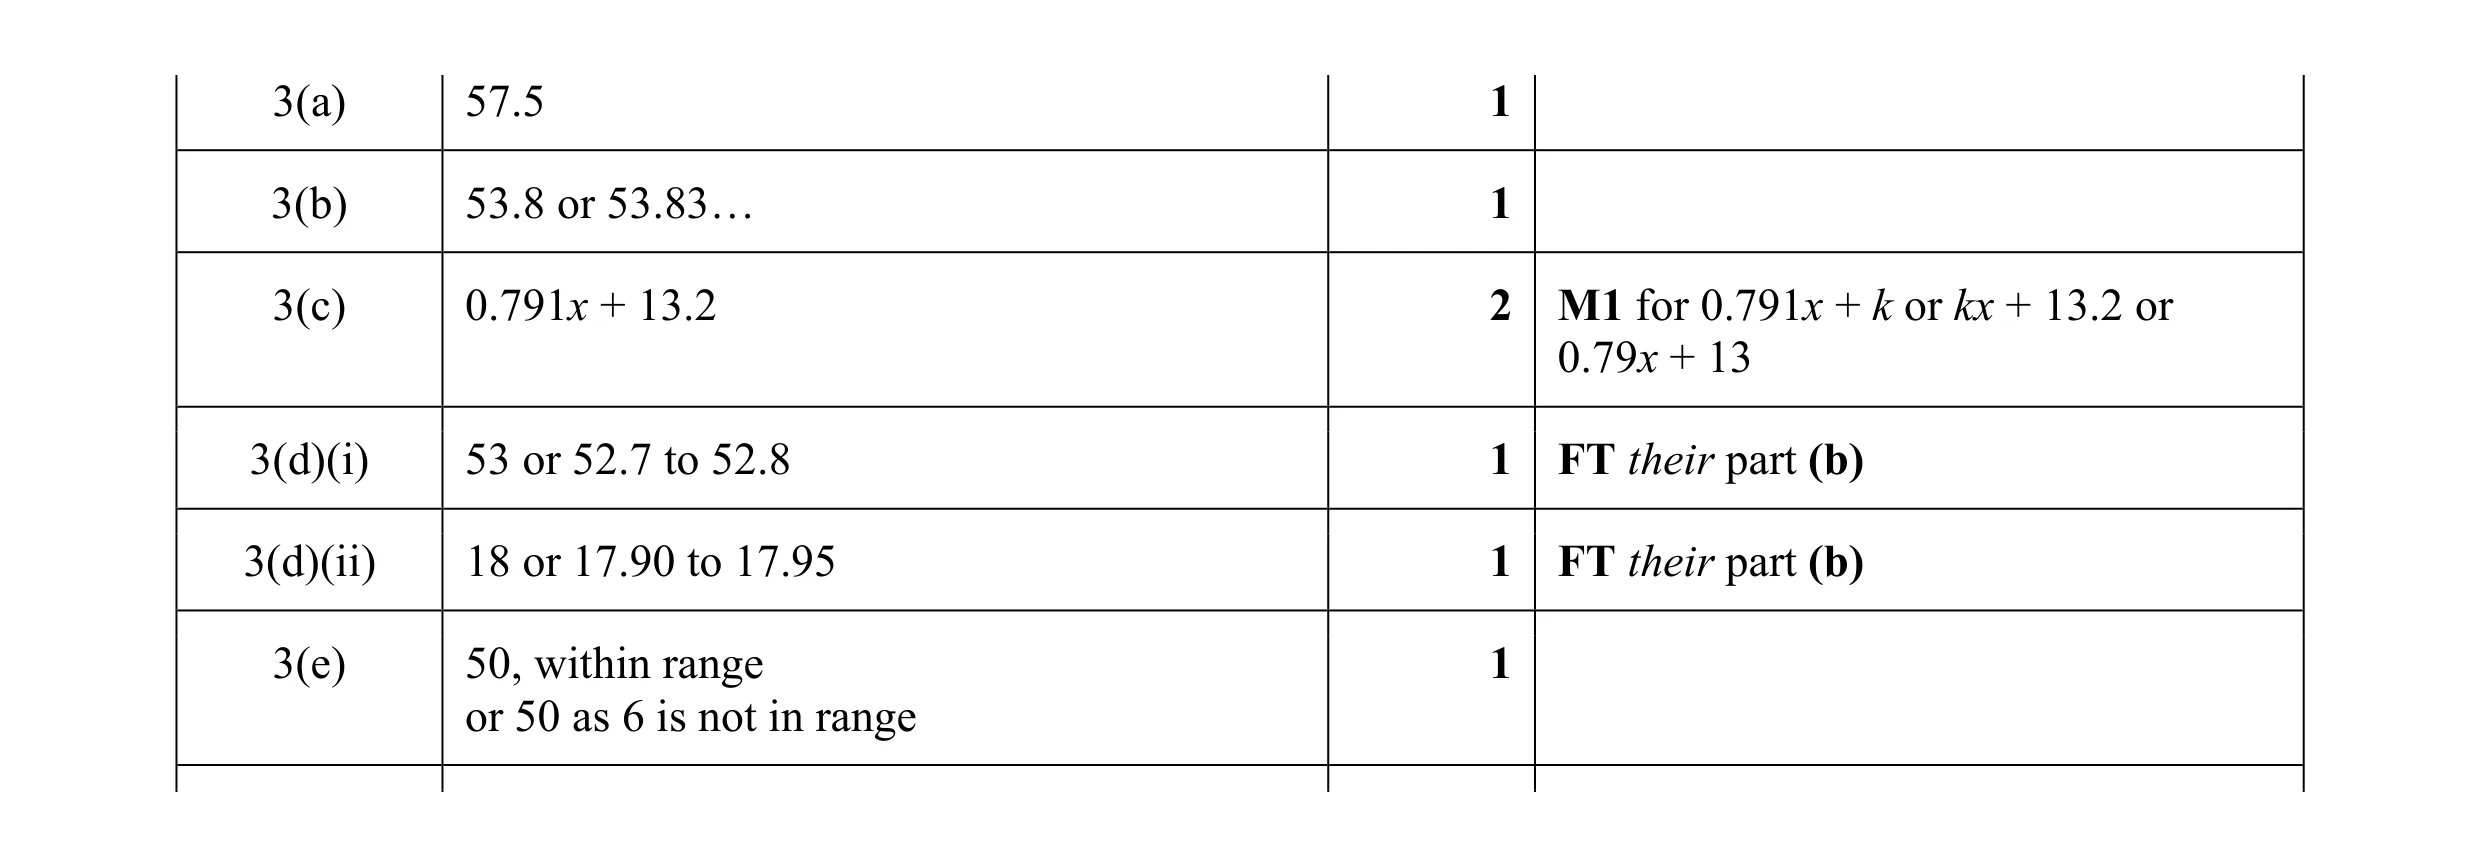 7
7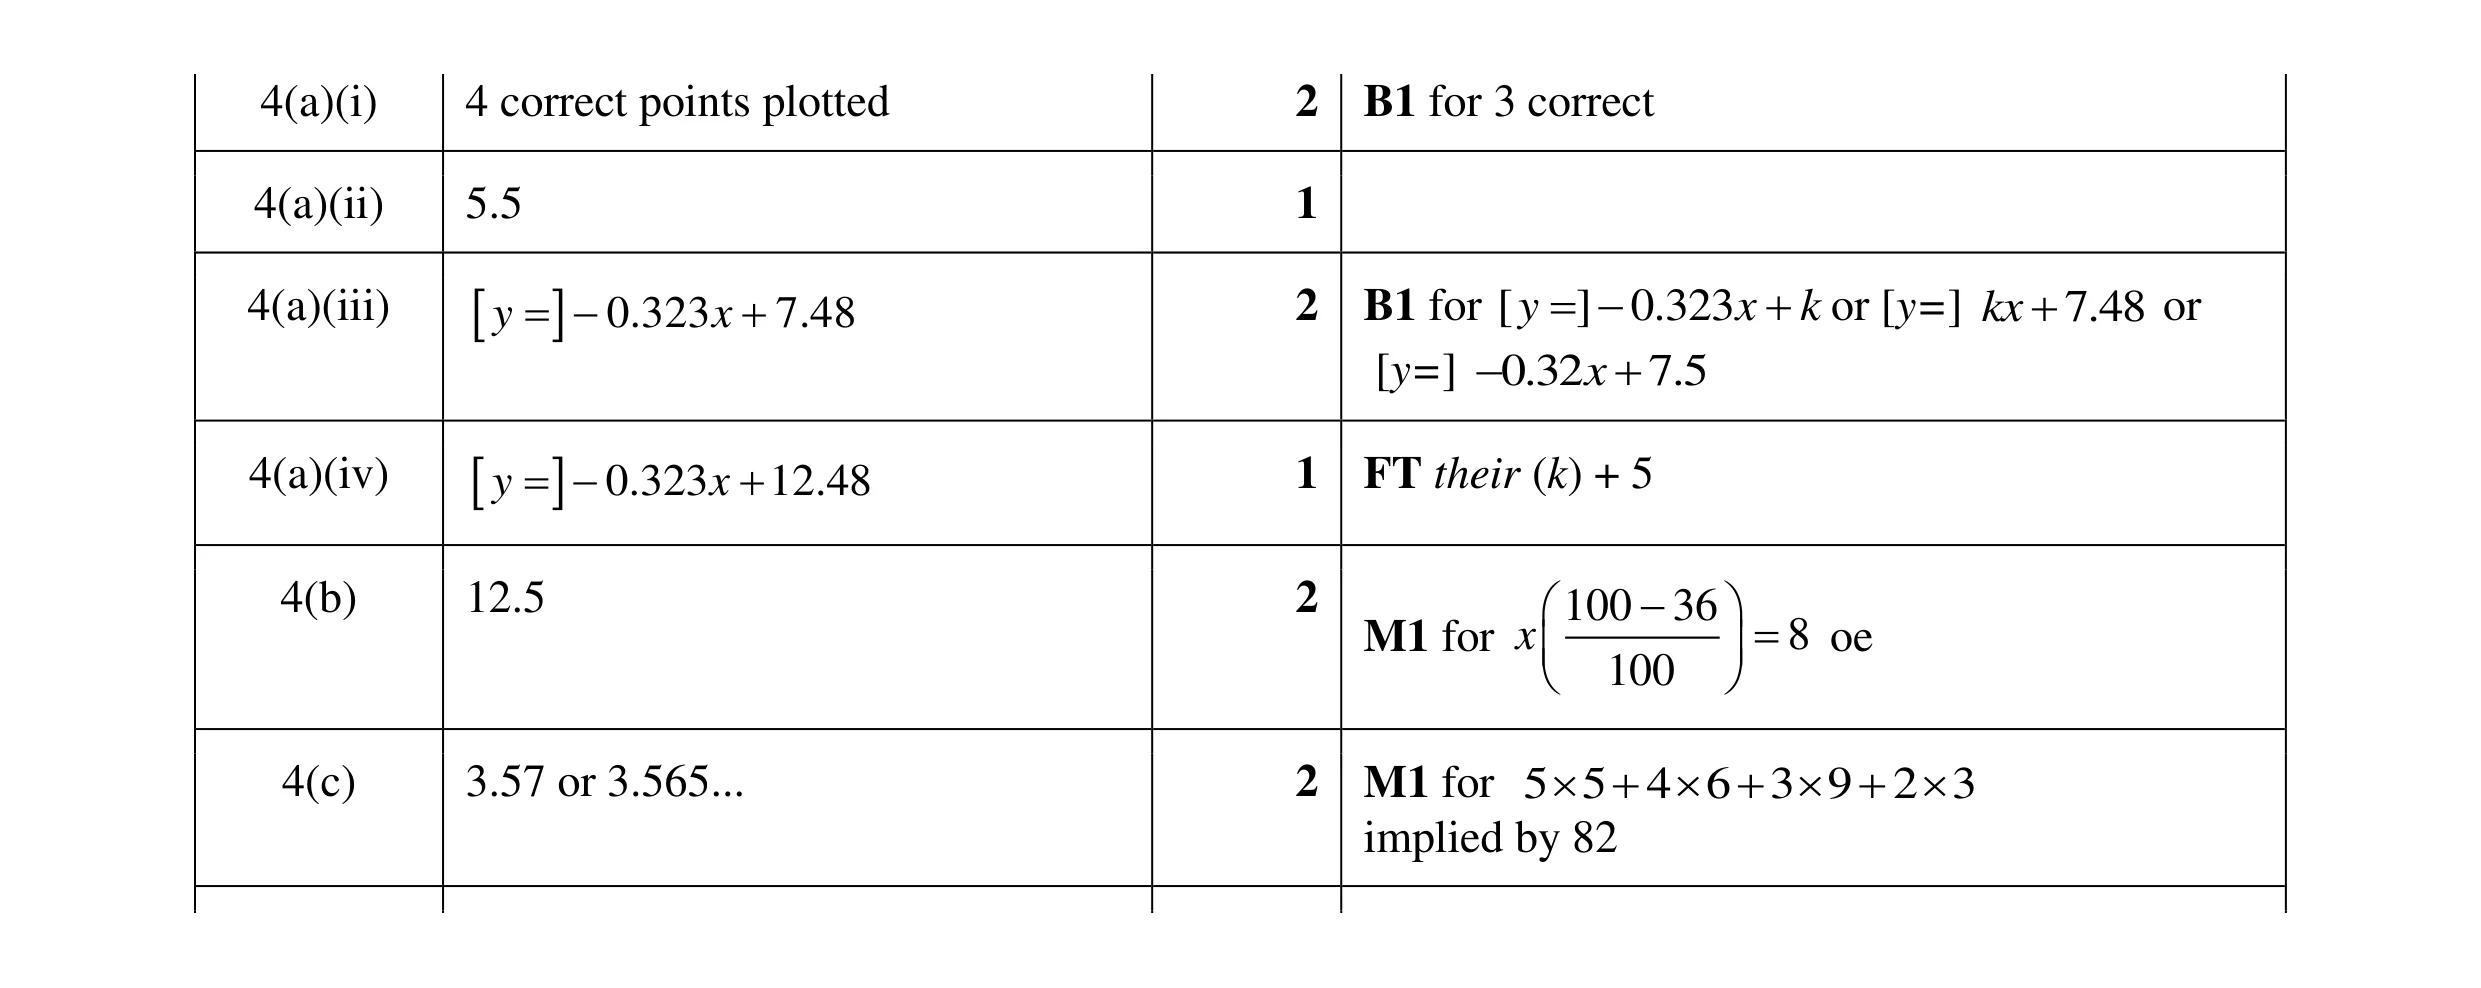 10
10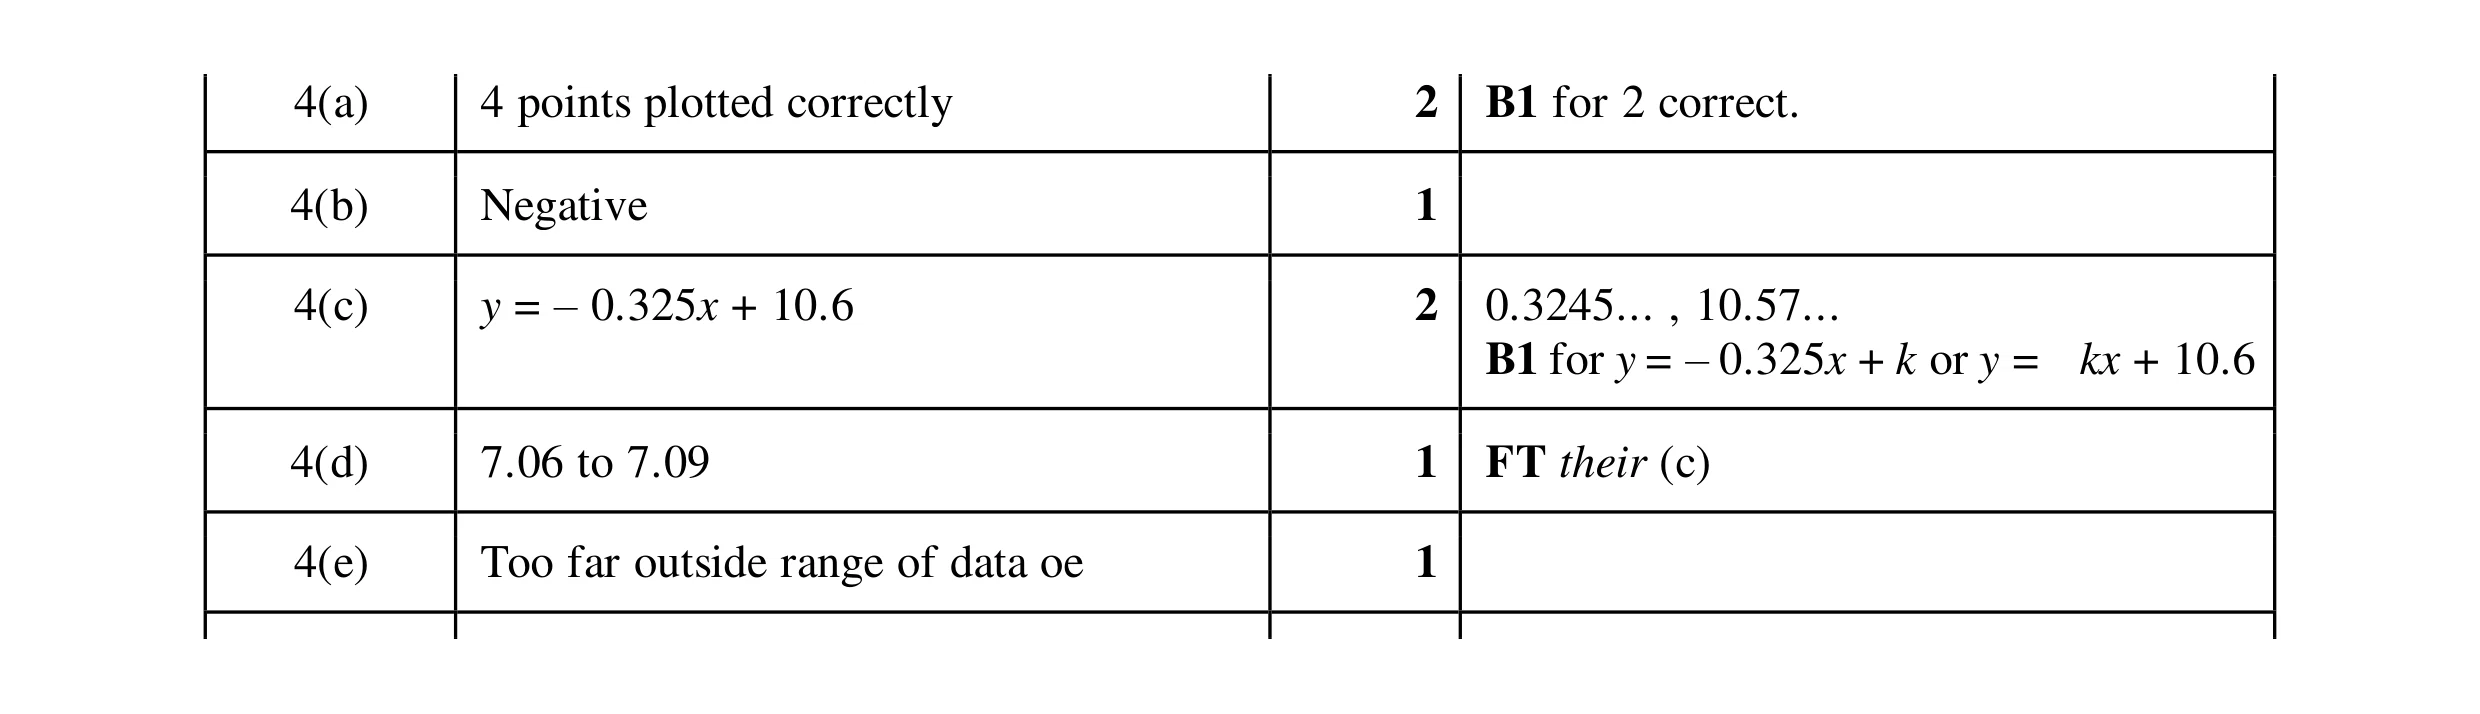 7
7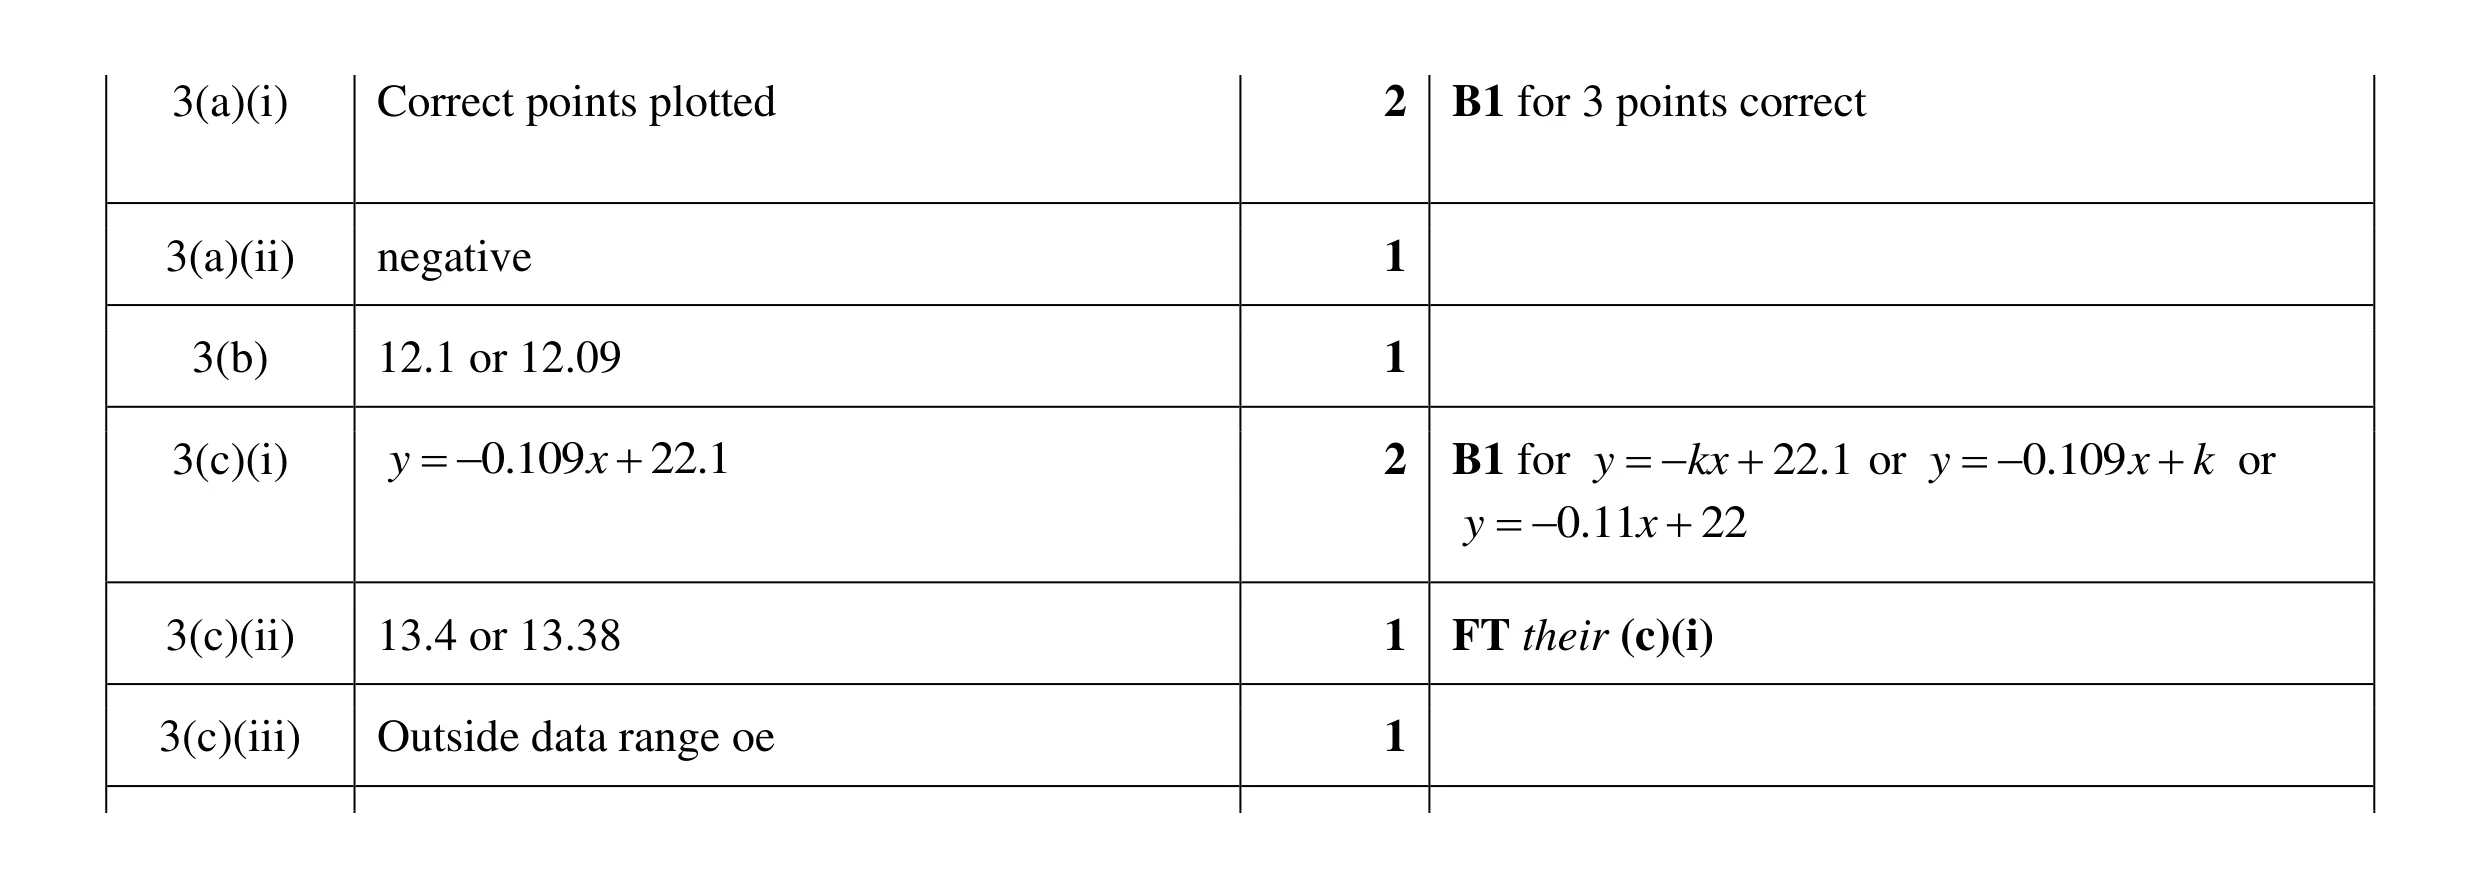 8
8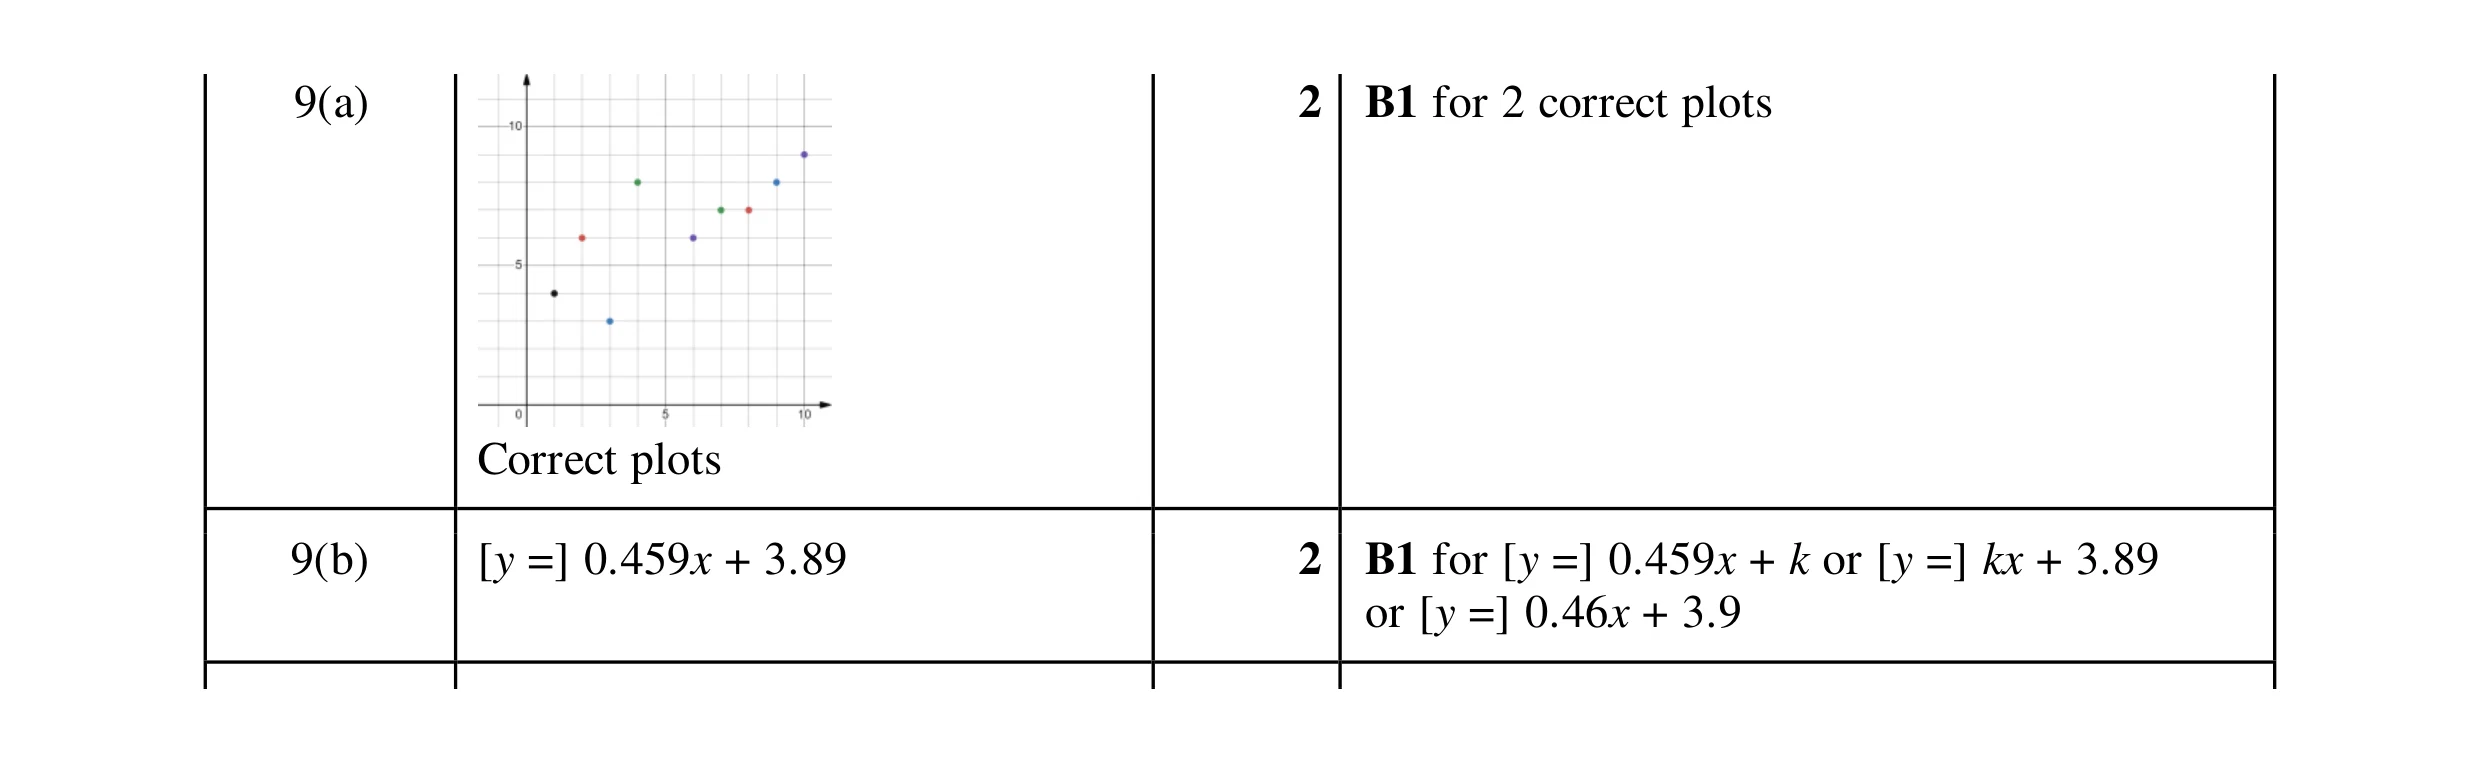 4
4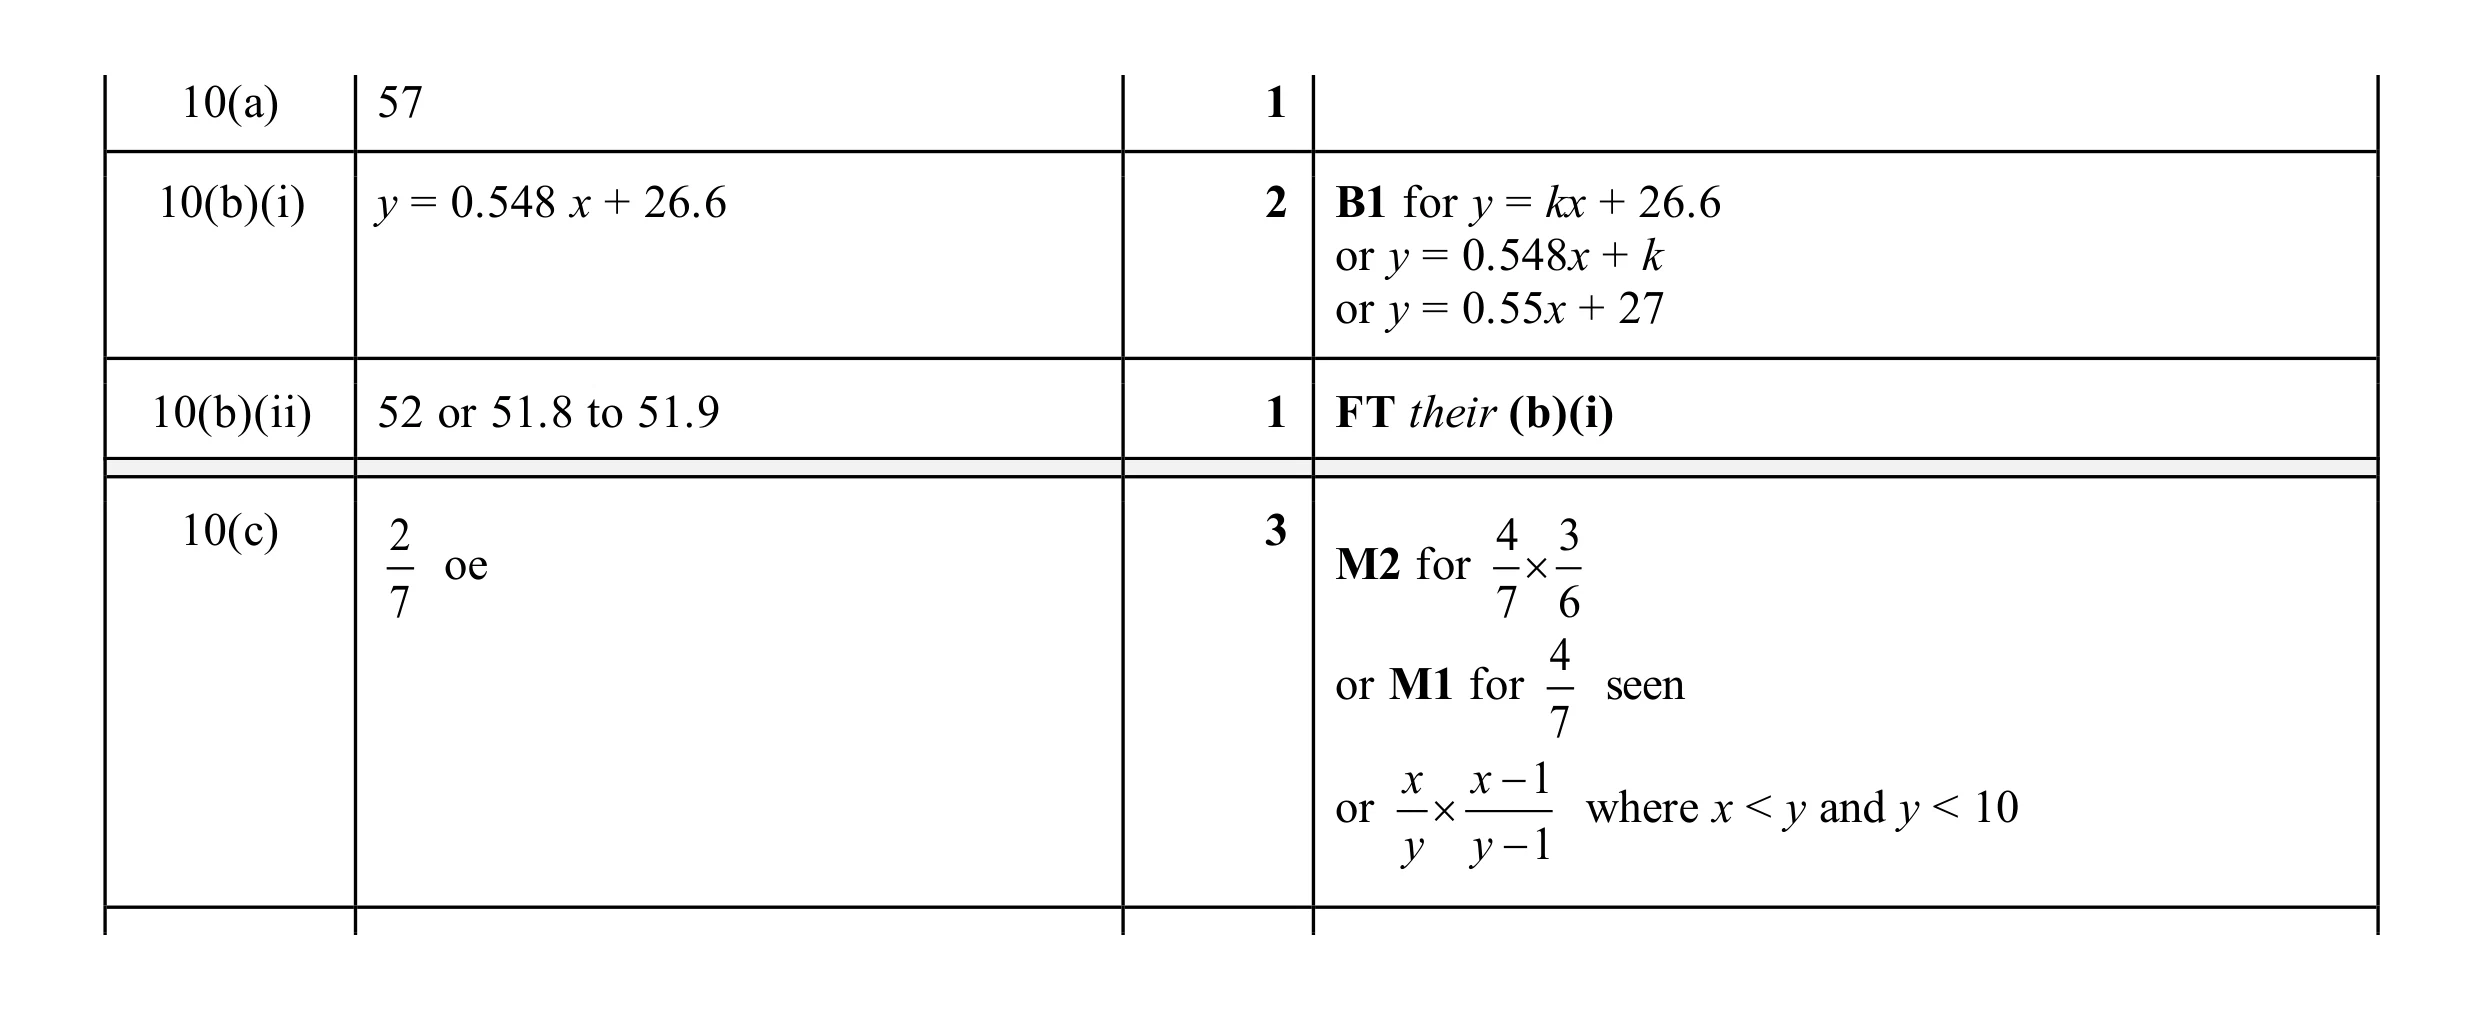 7
7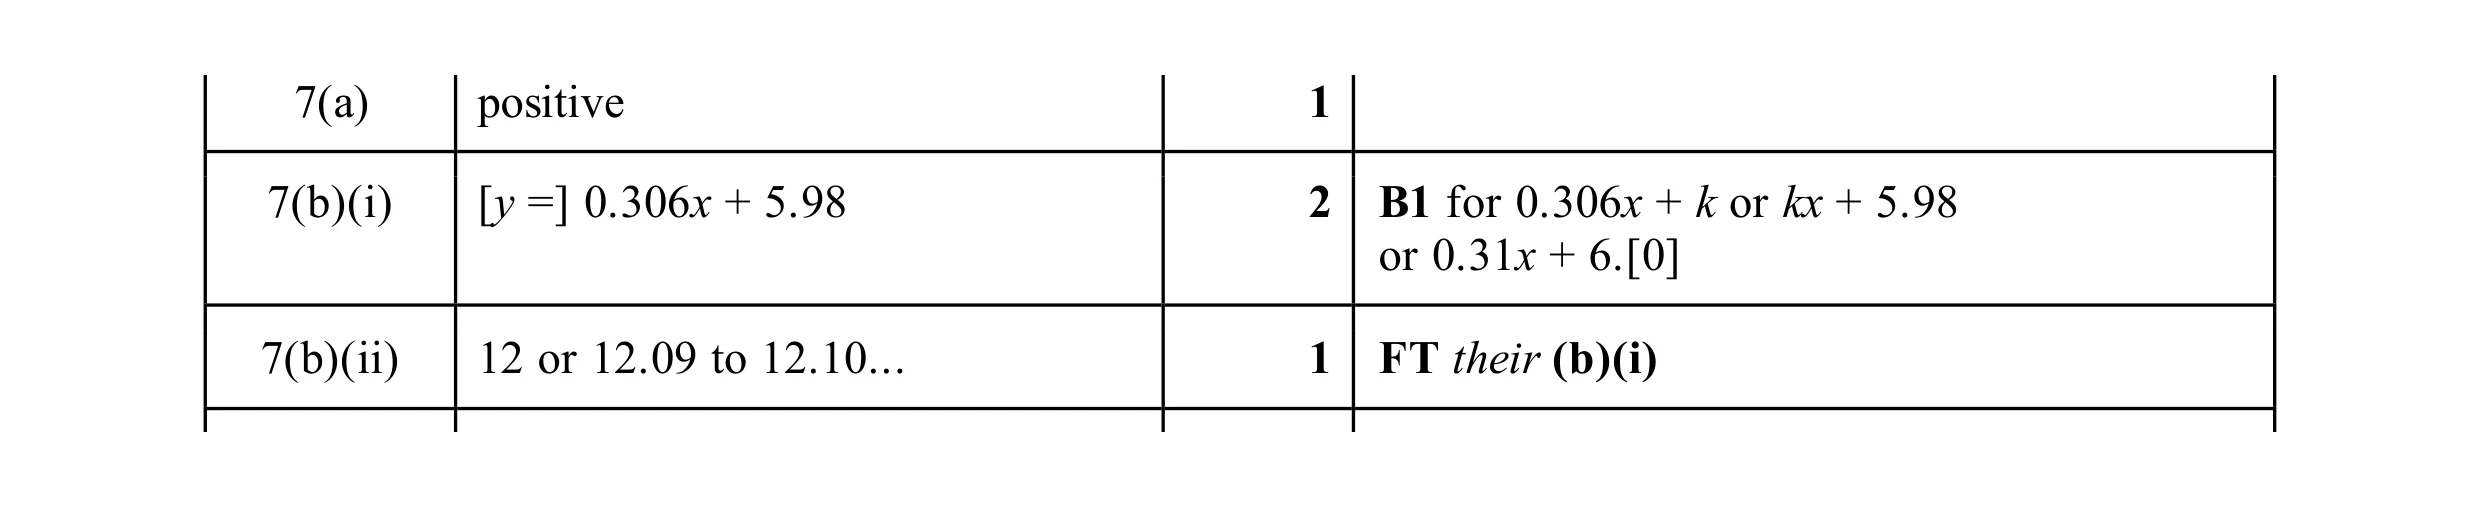 4
4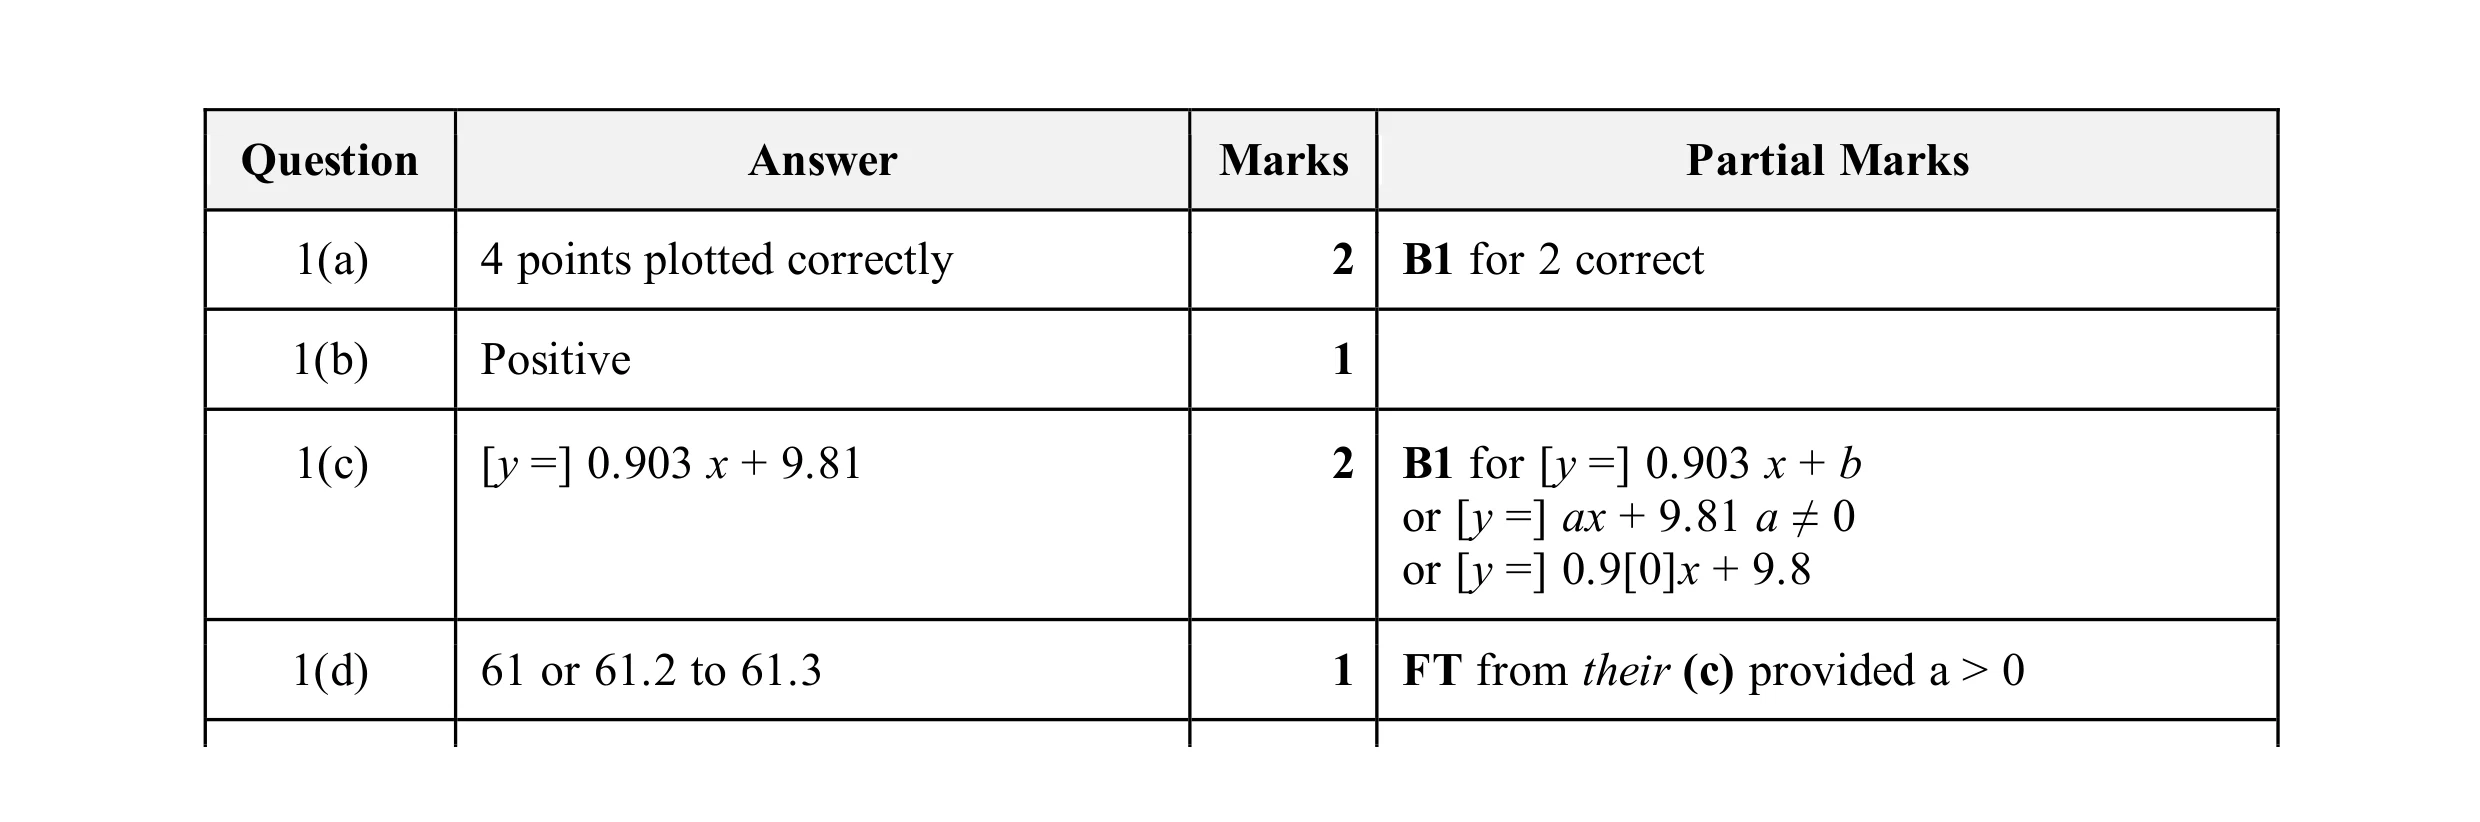 6
6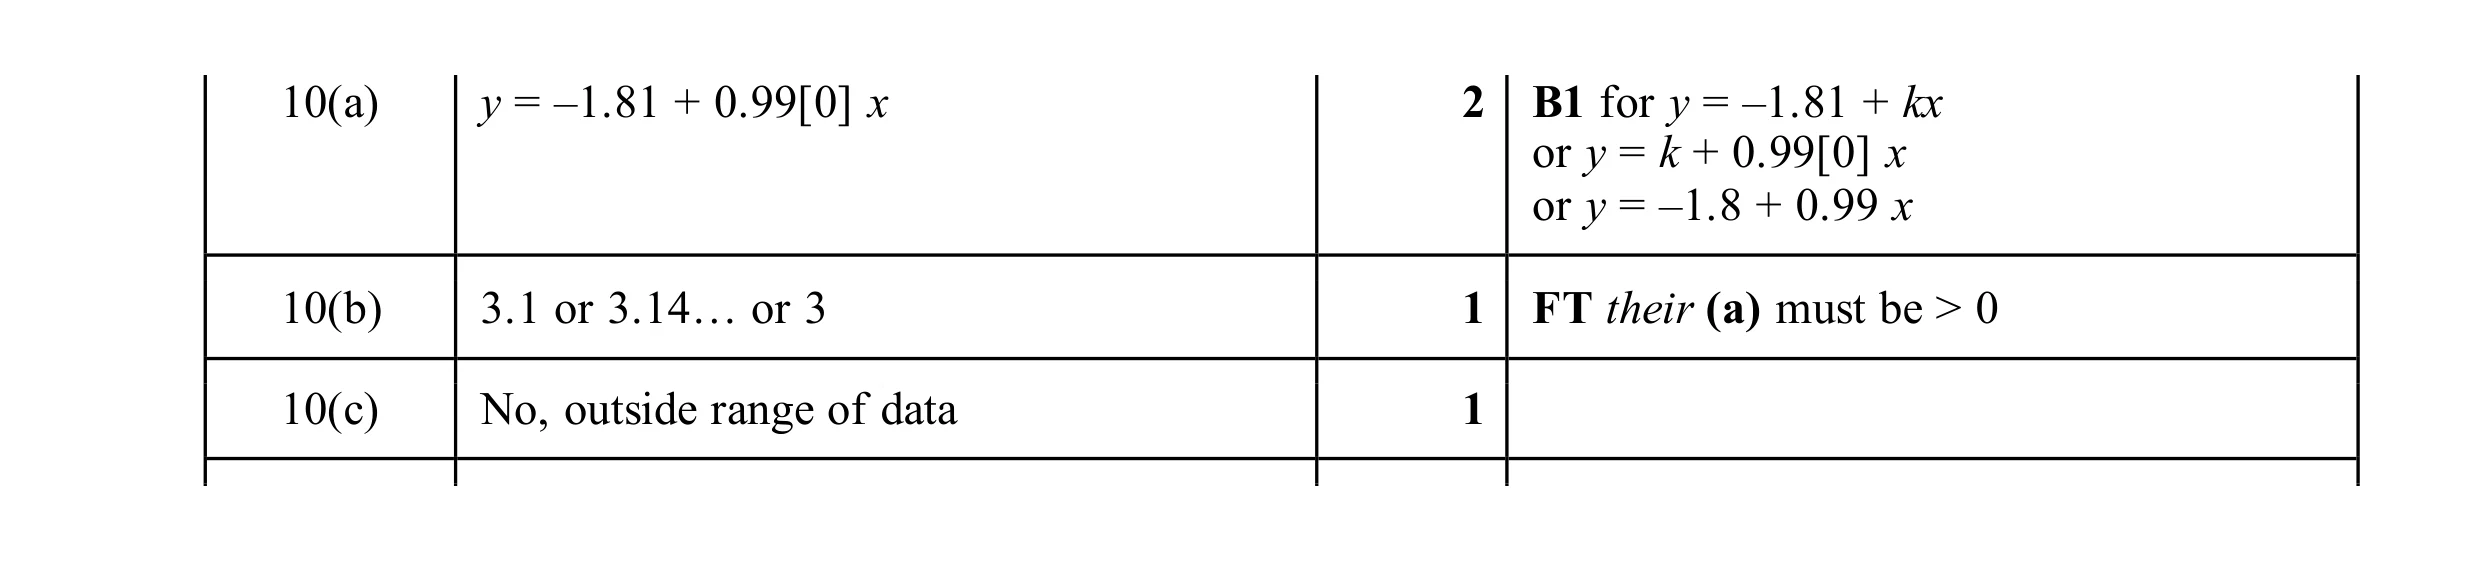 4
4