Questions as text
Q1 · Study Photographs A, B and C (Insert), which show different urban land use zones of… 0460/23 May/June 2017
2 Study Photographs A, B and C (Insert), which show different urban land use zones of Vancouver, Canada. (a) (i) Identify the land use zone shown in Photograph A. … [1] (ii) Give two pieces of evidence shown in Photograph A to support your answer to (a)(i). 1 … … 2 … … [2] (b) State the evidence in Photograph B that it is a zone of mixed land use. … … … … [2] (c) Explain why the area to the right of the river in Photograph C is a good location for industrial land use. … … … … … … [3] [Total: 8 marks]
8 marks
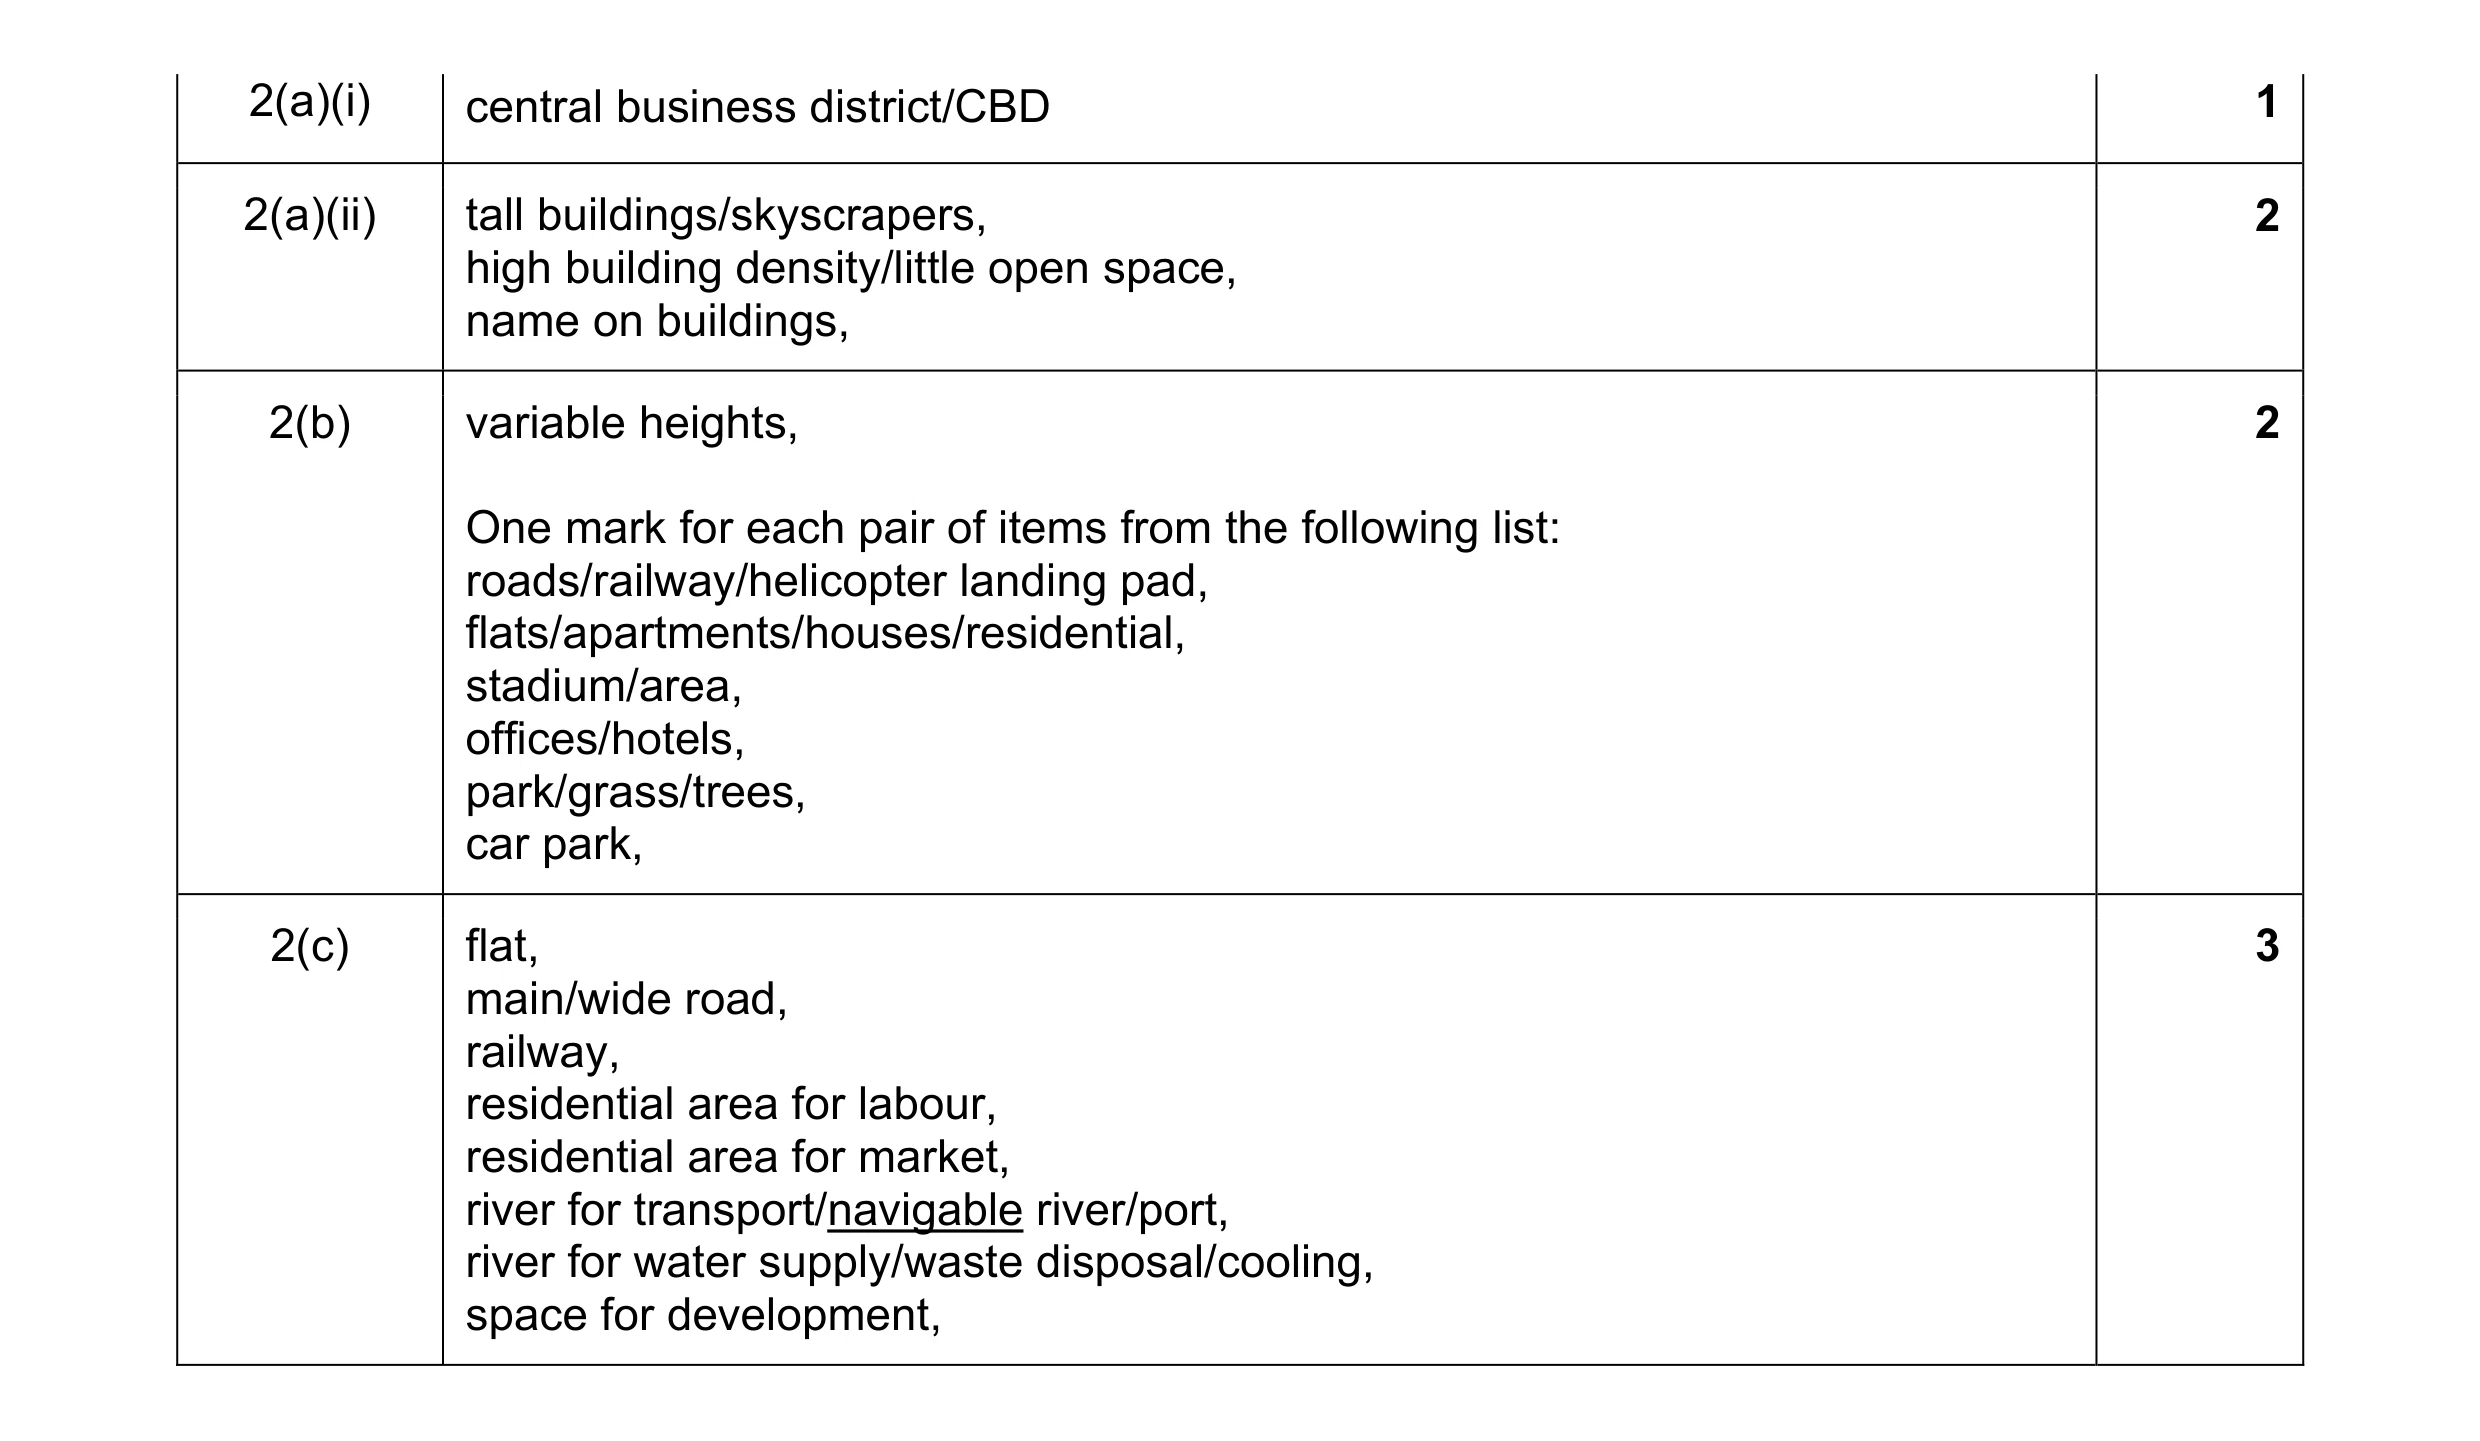
Mark scheme: 2(a)(i) central business district/CBD 1 2(a)(ii) tall buildings/skyscrapers, 2 high building density/little open space, name on buildings, 2(b) variable heights, 2 One mark for each pair of items from the following list: roads/railway/helicopter landing pad, flats/apartments/houses/residential, stadium/area, offices/hotels, park/grass/trees, car park, 2(c) flat, 3 main/wide road, railway, residential area for labour, residential area for market, river for transport/navigable river/port, river for water supply/waste disposal/cooling, space for development,
This question in 0460/23 May/June 2017
Question 2 0460/22 May/June 2018
3 (a) Study Fig. 3.1 (Insert), which is a photograph showing part of an urban area. Suggest which urban zone is shown in the photograph and give four reasons for your choice. Urban zone … Reasons 1 … … 2 … … 3 … … 4 … … [5] (b) Study Fig. 3.2 (Insert), which is a photograph showing the industrial zone of an urban area. Using evidence from the photograph, explain why industry has developed here. … … … … … … … … … [3] [Total: 8]
8 marks
Mark scheme: 3(a) CBD/shopping centre = 1 5 Also allow commercial, city centre, zone 1, inner city, inner zone, transition zone/twilight zone. tall buildings/high rise/multi-storey/skyscrapers, high density buildings, some lower/not very high, traffic congestion/much traffic/many parked cars, many pedestrians, glass fronts/windows, many/ground floor shops, offices, adverts/billboards, petrol station, building site, telecommunications, = 4. 3(b) large area, Allow open space/space for expansion 3 flat/gentle land, many roads, wide/main roads/motorway/highway, street lights, many other firms in the area (agglomeration), similar buildings may mean sites provided in advance, market/labour from urban area/nearby (in background), away from residential therefore less noise/air pollution/traffic, etc.
This question in 0460/22 May/June 2018
Question 3 0460/21 May/June 2019
6 Figs. 6.1 and 6.2 (Insert) are photographs which show two sides of the same street in Cambridge, UK. (a) Describe the buildings seen in Fig. 6.1. … … … … … … … … … … … … [5] (b) Using evidence from Figs. 6.1 and 6.2 only, suggest why the street is a popular destination for tourists. … … … … … … [3] [Total: 8] Additional Pages If you use the following lined pages to complete the answer(s) to any question(s), the question number(s) must be clearly shown. … … … … … … … … … … … … … … … … … … … … … … … … … … … … … … … … … … … … … … … … … … … … … … … … … … … … …
8 marks
Mark scheme: 6(a) tall / narrow, 5 4 / 5 storeys, brick (allow blocks), shops / commercial on ground floor (allow 1st floor), joined to each other / close to each other, balconies, different designs / colours, large windows, chimneys, sloping roofs 6(b) shopping, 3 café / restaurant, history / culture / old, architecture / named building (e.g. palace, church, castle, university)
This question in 0460/21 May/June 2019
Question 4 0460/21 Oct/Nov 2019
3 Figs. 3.1 and 3.2 (Insert) are photographs which show two residential areas of Windhoek, the capital city of Namibia. (a) Describe the housing shown in Fig. 3.1. … … … … … … … … … … … … [5] (b) Give three differences between the residential area shown in Fig. 3.1 and the residential area shown in Fig. 3.2. 1 … … 2 … … 3 … … [3] [Total: 8]
8 marks
Mark scheme: 3(a) Small / single story, 5 spaced/scattered/detached/separated/sparse etc., flat roofs, no / few windows, metal / corrugated sheets, silver/blue/red/grey, tyres on roofs, caravan/trailer, satellite dish, similar style. 3(b) 3.2 denser, (densely populated = 0 unless clearly referring to houses) 3 3.2 larger houses / more storeys, 3.2 better built / better materials / brick or concrete but B.1 metal, 3.2 more trees / vegetation, 3.2 more windows, 3.2 less uniform, 3.2 tarred roads 3.1 gravel roads, 3.2 street lights 3.1 no street lights, 3.2 air con 3.1 none, Or emphasis on 3.1. Must be comparative
This question in 0460/21 Oct/Nov 2019
Question 5 0460/22 Oct/Nov 2020
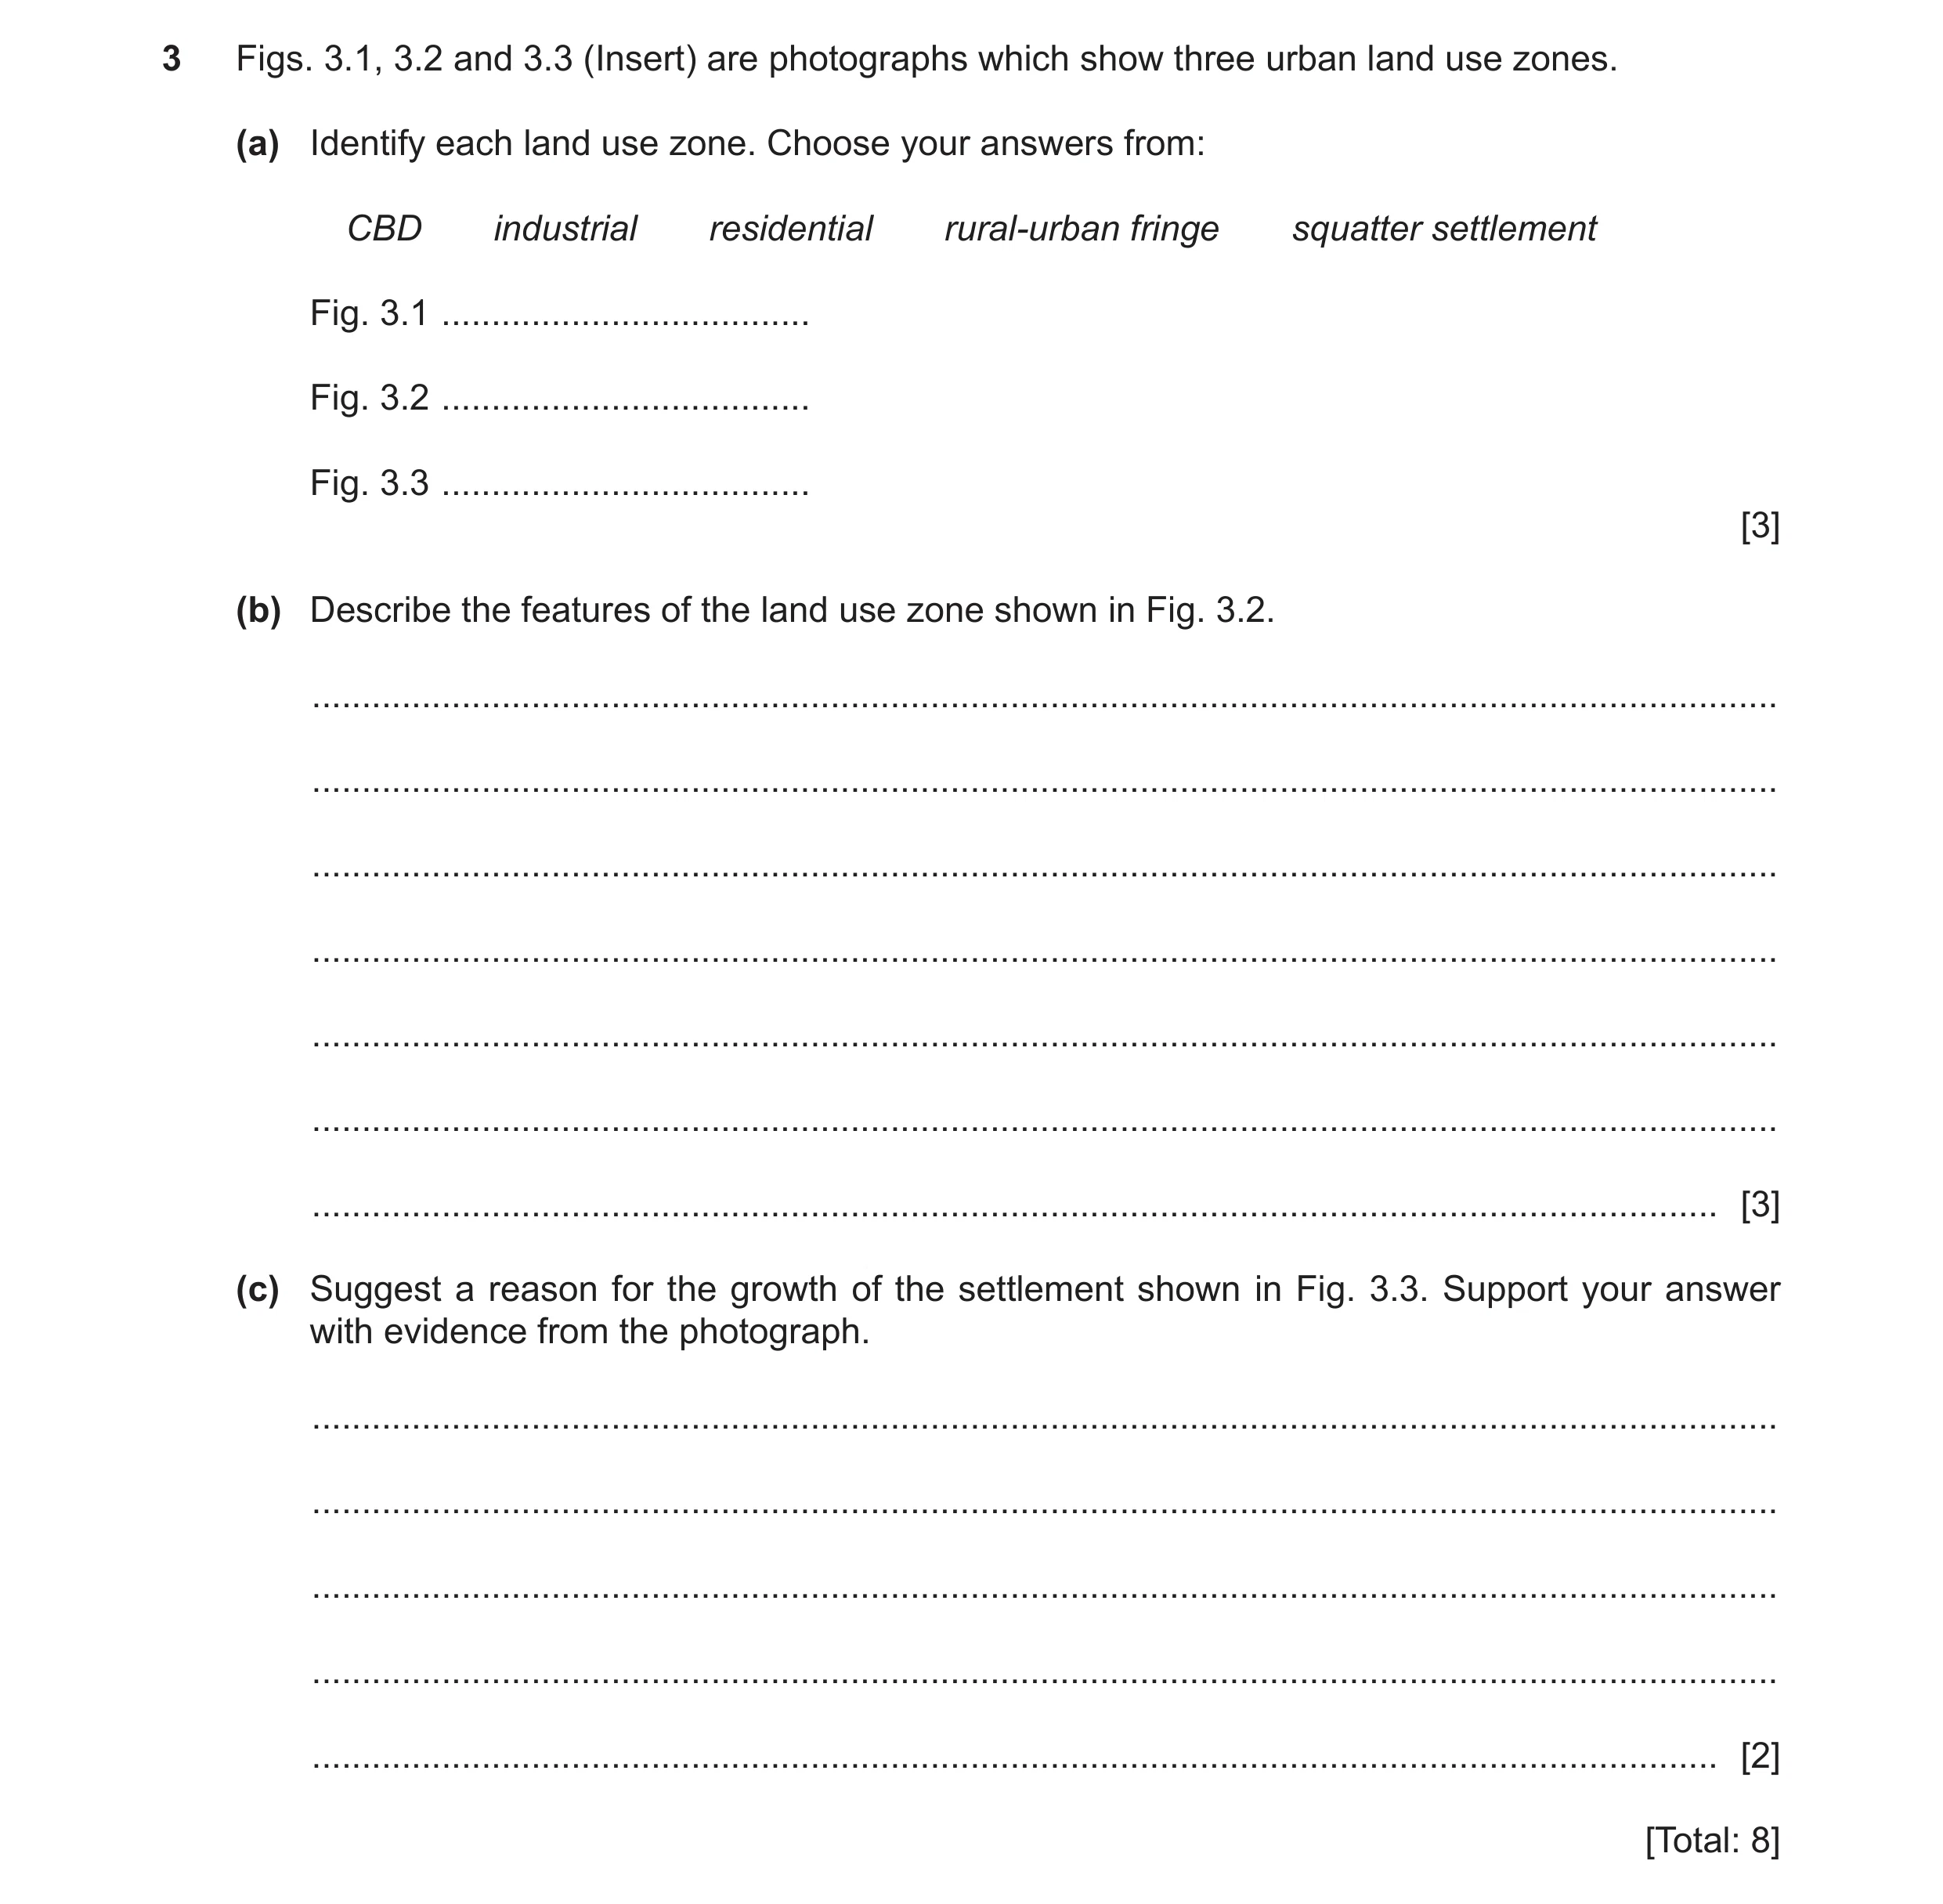
3 Figs. 3.1, 3.2 and 3.3 (Insert) are photographs which show three urban land use zones. (a) Identify each land use zone. Choose your answers from: CBD industrial residential rural-urban fringe squatter settlement Fig. 3.1 … Fig. 3.2 … Fig. 3.3 … [3] (b) Describe the features of the land use zone shown in Fig. 3.2. … … … … … … … [3] (c) Suggest a reason for the growth of the settlement shown in Fig. 3.3. Support your answer with evidence from the photograph. … … … … … [2] [Total: 8]
8 marks
Mark scheme: 3(a) industrial, 3 residential, CBD, 3(b) grid/rectangular/blocks, 3 low rise/single storey/bungalows, trees/vegetation/greenery, swimming pools, gardens/yards, similar size/design/planned, wide/straight roads, street lights, sloping roofs, 3(c) Reason: port/import/export/trading, 2 Evidence: sheltered bay/docks/harbour/cargo ships/ships in dock, or Reason: commerce/business/administration/offices/CBD, Evidence: high-rise buildings/docks/harbour/cargo ships/ships in dock,
This question in 0460/22 Oct/Nov 2020
Q6 · Shenzhen, China has undergone extensive urbanisation 0460/21 May/June 2021
3 Shenzhen, China has undergone extensive urbanisation. Table 3.1 shows the changes in the area covered by different urban land uses from 2001–2005. Table 3.1 year land use 2001 2002 2003 2004 2005 (km2) industrial 137 153 204 240 254 residential 136 143 174 169 184 roads 57 64 71 72 83 (a) (i) Use the information in Table 3.1 to complete Fig. 3.1. [2] 250 200 land use Key (km2) 150 industrial residential roads 100 50 0 2001 2002 2003 2004 2005 year Fig. 3.1 (ii) Using Table 3.1 and Fig. 3.1, state the land use that showed the largest increase between 2001 and 2005. … [1] (iii) Many new industries such as electronics have been located in the rural-urban fringe. Suggest reasons why they have located there. … … … … [2] (b) Study Fig. 3.2 (Insert), which is a photograph showing new residential development in Shenzhen. Using evidence from Fig. 3.2 only, describe three advantages of living there. 1 … … 2 … … 3 … … [3] [Total: 8]
8 marks
Mark scheme: 3(a)(i) correct plots of 204 and 174, 2 both lines drawn correctly using key, 3(a)(ii) industrial, 1 3(a)(iii) market in town, 2 labour from town, space/sites available, cheap land/cheaper to build, pleasant surroundings, good road links/accessibility/little traffic congestion, Allow converse inner city problems. 3(b) close city centre/CBD, 3 open space/landscaped/gardens/greenery/trees, (large) windows, road/good accessibility/no traffic congestion, pedestrian crossings, newly/recently built,
This question in 0460/21 May/June 2021
Question 7 0460/21 Oct/Nov 2021
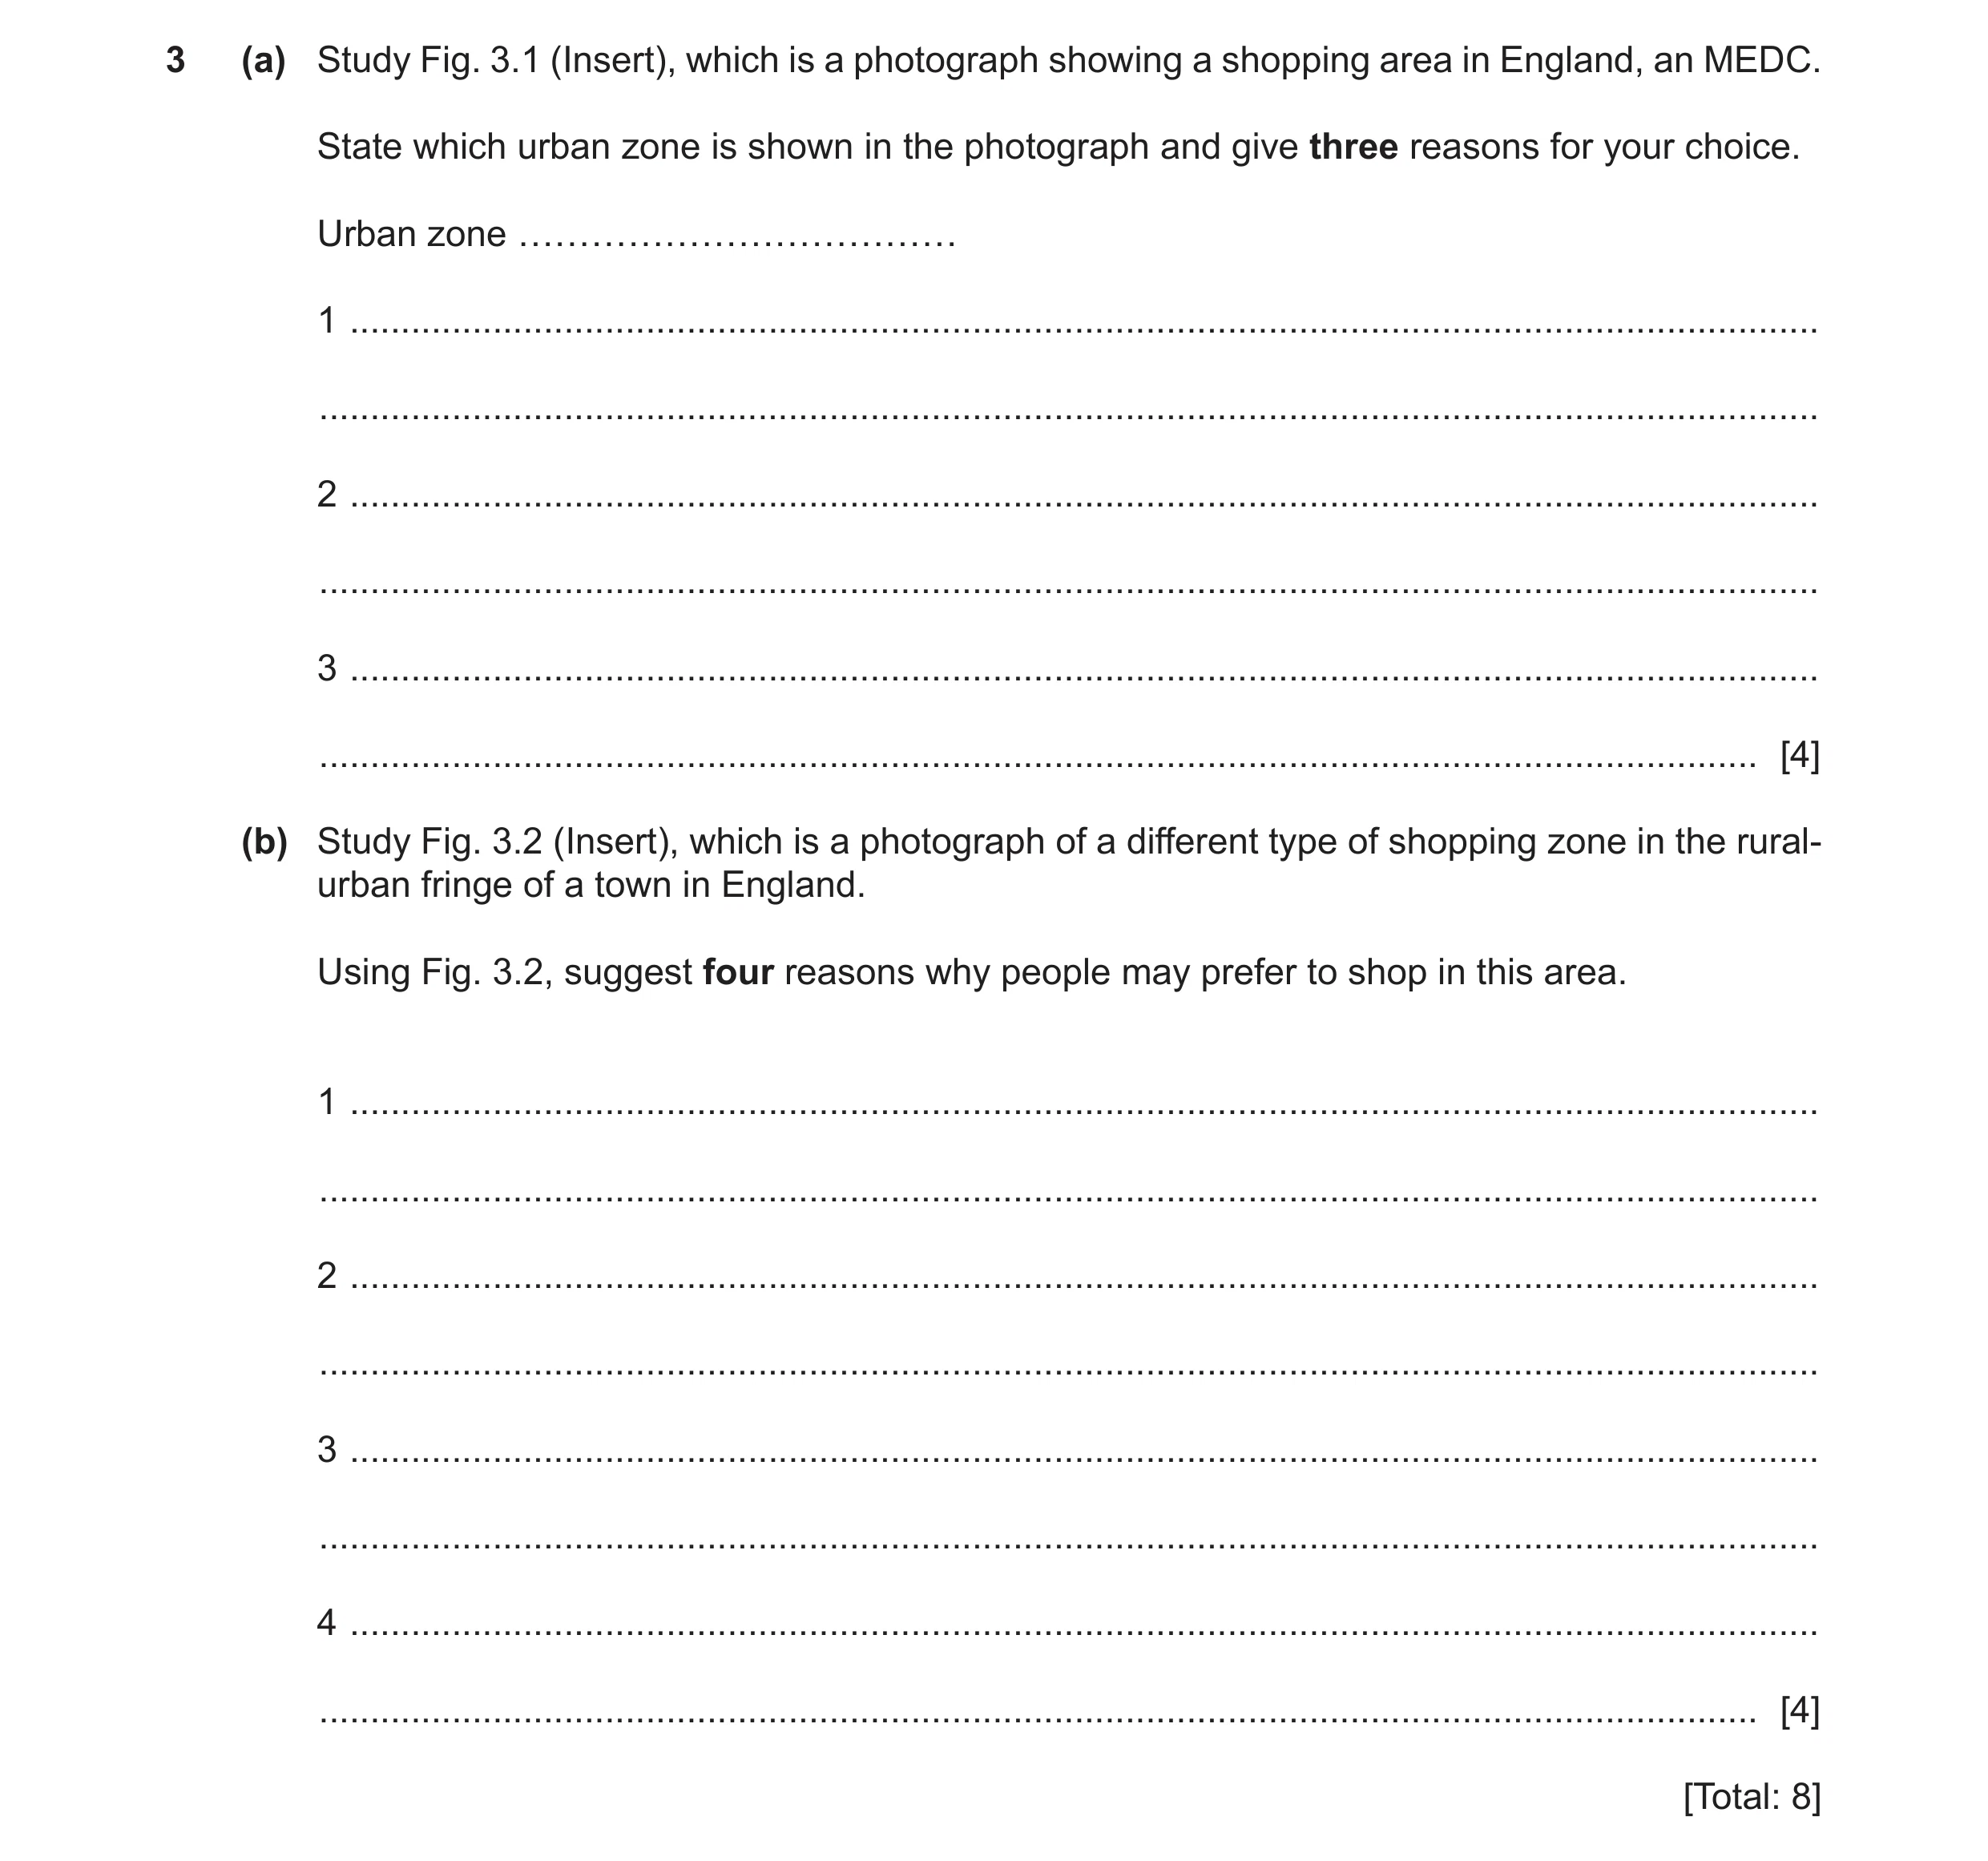
3 (a) Study Fig. 3.1 (Insert), which is a photograph showing a shopping area in England, an MEDC. State which urban zone is shown in the photograph and give three reasons for your choice. Urban zone ……………………………… 1 … … 2 … … 3 … … [4] (b) Study Fig. 3.2 (Insert), which is a photograph of a different type of shopping zone in the rural- urban fringe of a town in England. Using Fig. 3.2, suggest four reasons why people may prefer to shop in this area. 1 … … 2 … … 3 … … 4 … … [4] [Total: 8]
8 marks
Mark scheme: 3(a) CBD, = 1 4 tall buildings, shops/offices/banks, high pedestrian flow/many people, pedestrianised/no cars, = 3 3(b) accessible/vehicle access/quiet roads/main road, 4 large(r) shops, parking, landscaped/pleasant surroundings/open areas, coffee shop, indoors/covered
This question in 0460/21 Oct/Nov 2021
Q8 · Urbanisation is the increase in the percentage of the population living in towns and… 0460/22 Oct/Nov 2021
3 Urbanisation is the increase in the percentage of the population living in towns and cities. Fig. 3.1 shows urbanisation in 2006 and in 2017 in countries with different incomes. 100 90 Key 2006 80 2017 70 60 urban population 50 (%) 40 30 20 10 0 low income middle income high income countries Fig. 3.1 (a) Describe the changes in the urban population shown in Fig. 3.1. Do not use statistics in your answer. … … … … … … … … [3] (b) Urbanisation can lead to urban sprawl and rapid development in the rural-urban fringe. Figs. 3.2 and 3.3 (Insert) show parts of the rural-urban fringe of an urban area in Africa. Give evidence from Figs. 3.2 and 3.3 which shows that urban sprawl is taking place. Fig. 3.2 … … … … … … … … Fig. 3.3 … … … … … … … … [5] [Total: 8]
8 marks
Mark scheme: 3(a) increase in all types, 3 high income countries small(est) increase/already urbanised, middle income countries large(est) increase/doubled, low income countries large(est) increase/doubled, 3(b) Fig. 3.2 5 construction (site)/area cleared (of vegetation), free space/unused areas (for development), motorway/main road/ring road/wide road/new road, sports ground/stadium/recreational area, golf course, residential, offices/factory, low rise/single storey/double storey, Fig. 3.3 shanty/informal settlement/poor quality/squatter/shacks/houses in poor condition/unstable houses, unplanned/randomly arranged/irregular pattern, dirt/sand/gravel/dusty/unbuilt/beginning to be tarred roads, (some) new/modern/brick/well-built houses (on right), main road/wide road (in background), Reserve one mark for each part.
This question in 0460/22 Oct/Nov 2021
Question 9 0460/22 Feb/March 2022
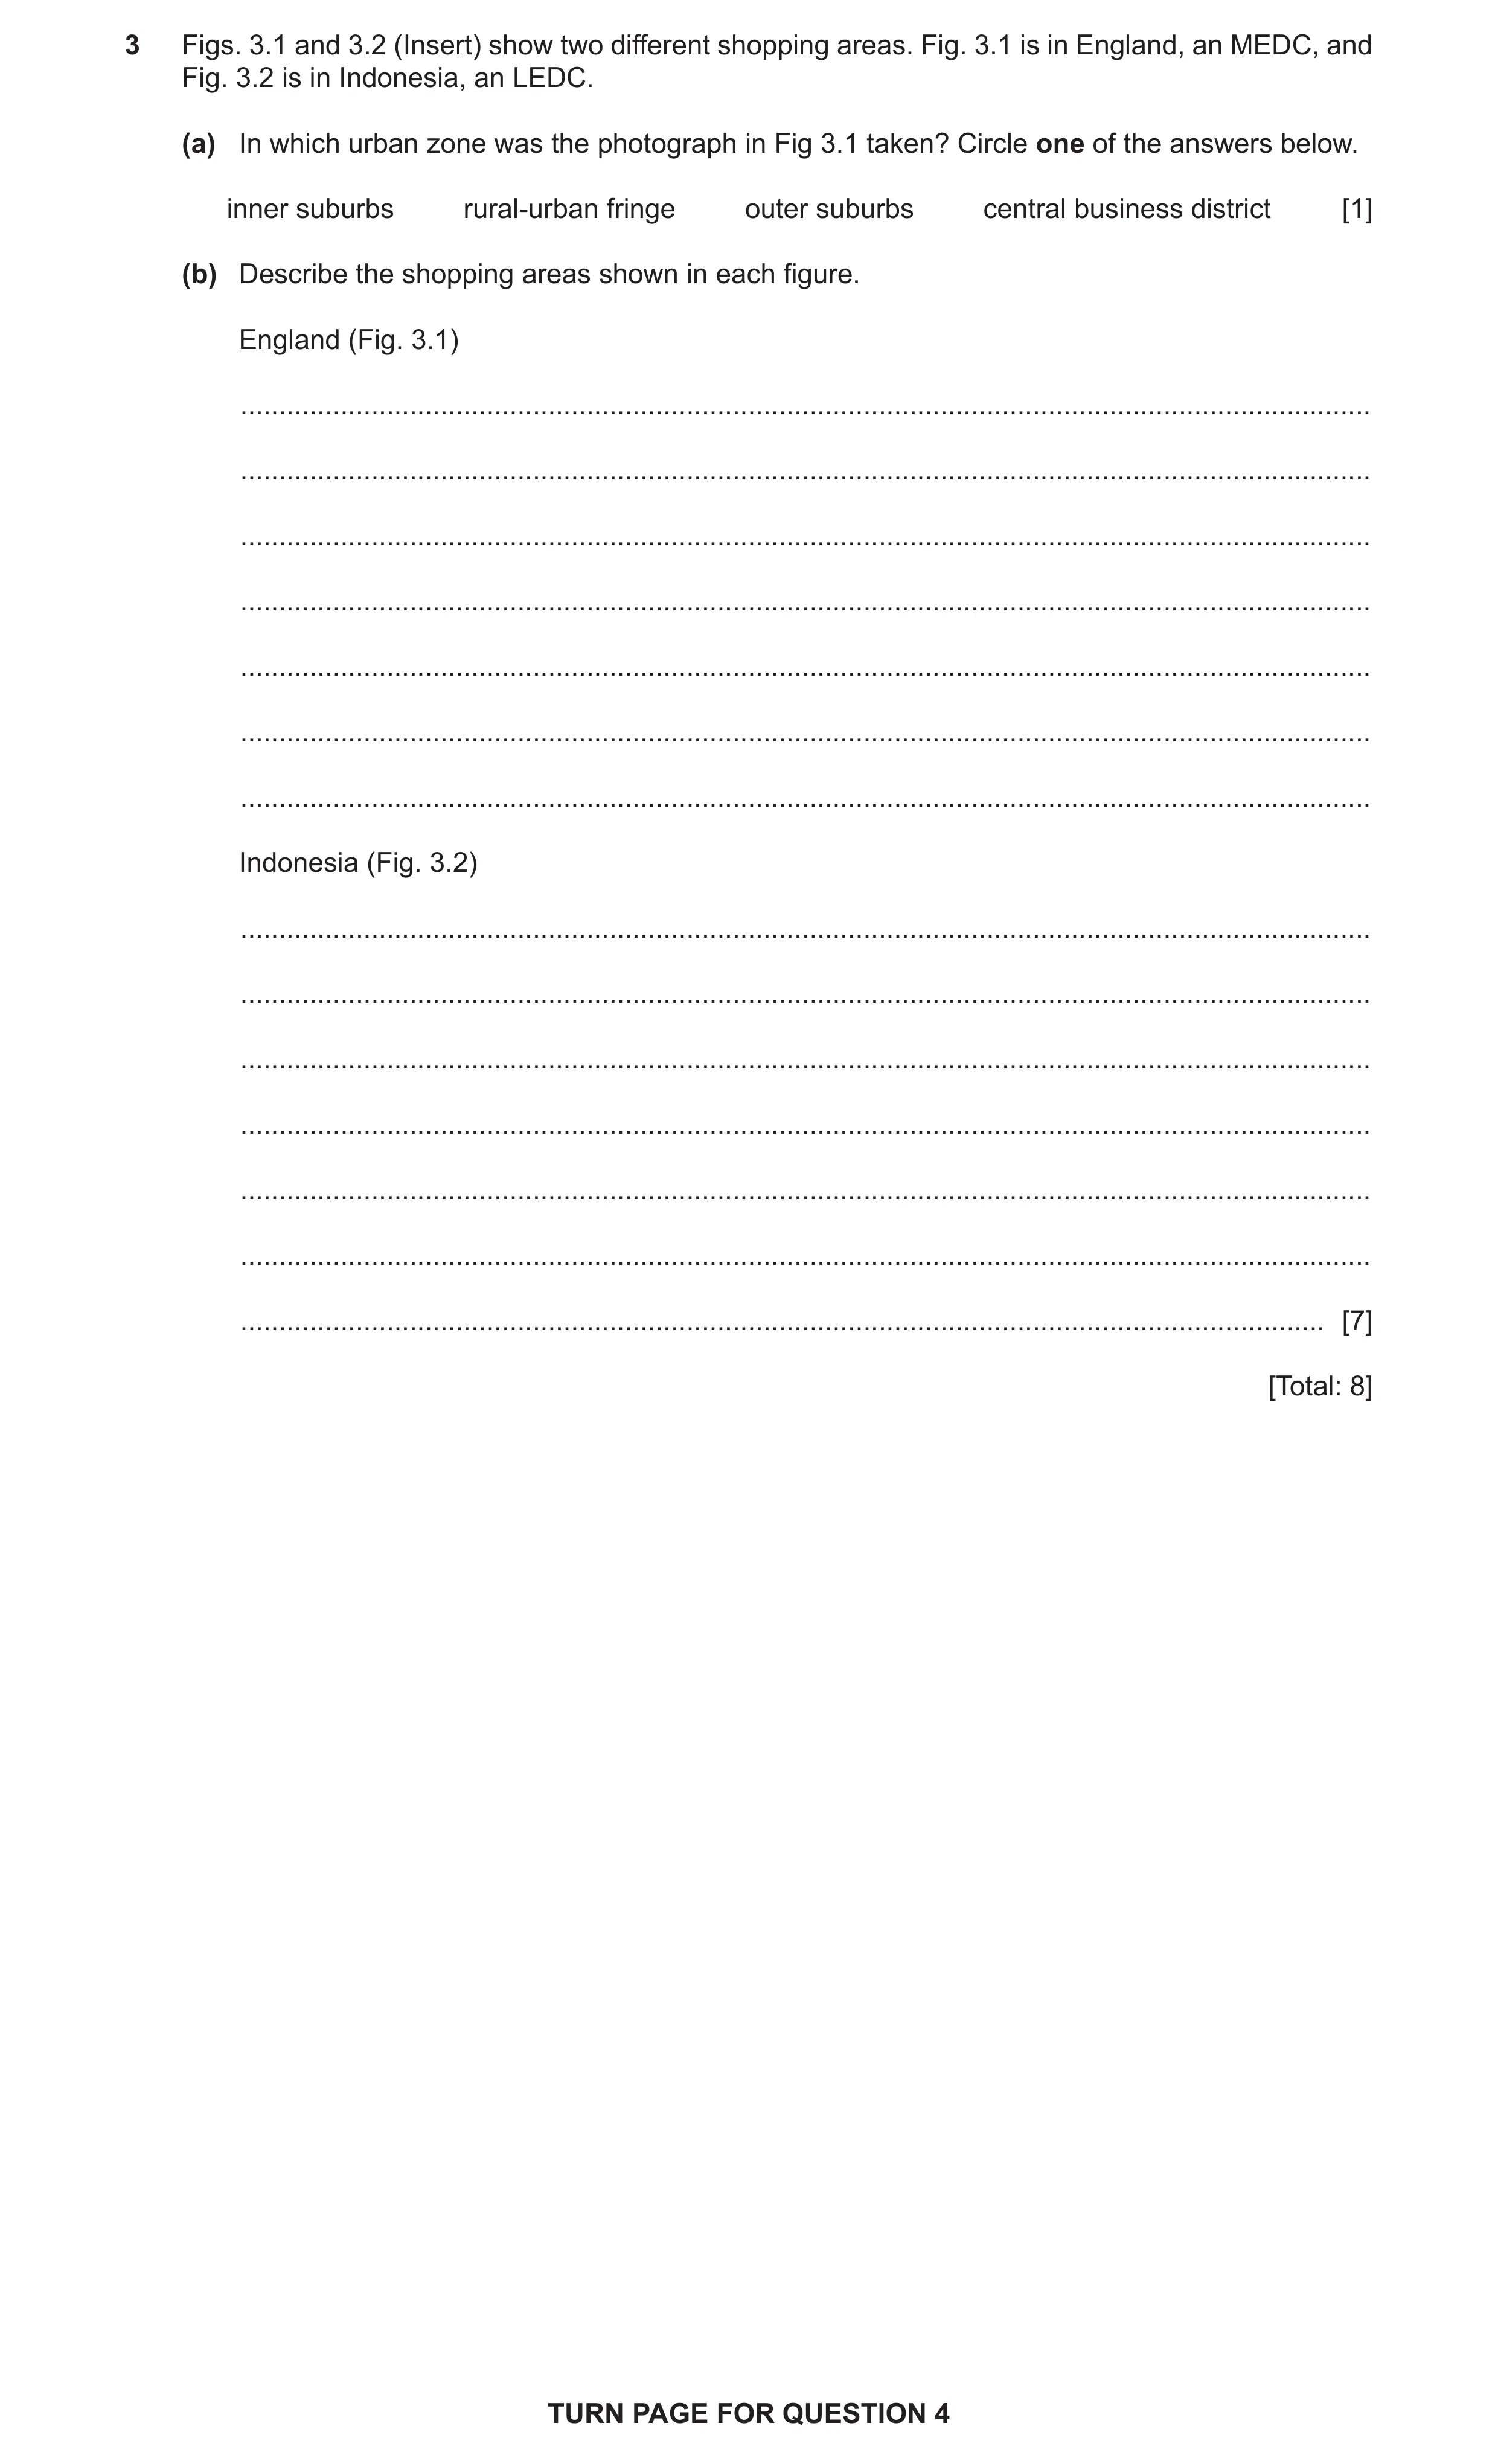
3 Figs. 3.1 and 3.2 (Insert) show two different shopping areas. Fig. 3.1 is in England, an MEDC, and Fig. 3.2 is in Indonesia, an LEDC. (a) In which urban zone was the photograph in Fig 3.1 taken? Circle one of the answers below. inner suburbs rural‑urban fringe outer suburbs central business district [1] (b) Describe the shopping areas shown in each figure. England (Fig. 3.1) … … … … … … … Indonesia (Fig. 3.2) … … … … … … … [7] [Total: 8] TURN PAGE FOR QUESTION 4
8 marks
Mark scheme: 3(a) rural-urban fringe/outer suburbs, 1 3(b) Fig. 3.1 7 shopping centre/mall/supermarket/hypermarket/indoor, large (building), car parking, disabled parking, no/few people/quiet, trolleys, glass front, trees/plants/greenery, security camera, modern, lights Fig. 3.2 stalls/market, open air/outdoor/canopies/tent, busy/lots of people, food/clothes, cafe/seating/benches, lights, traditional, pedestrians/people walk, tightly packed/clustered/crowded (stalls), many/several/multiple/small shops, narrow street, menu (banner) Reserve 2 marks for each part. Allow the points in Fig. 3.2 when expressed as comparatives.
This question in 0460/22 Feb/March 2022
Question 10 0460/23 Oct/Nov 2022
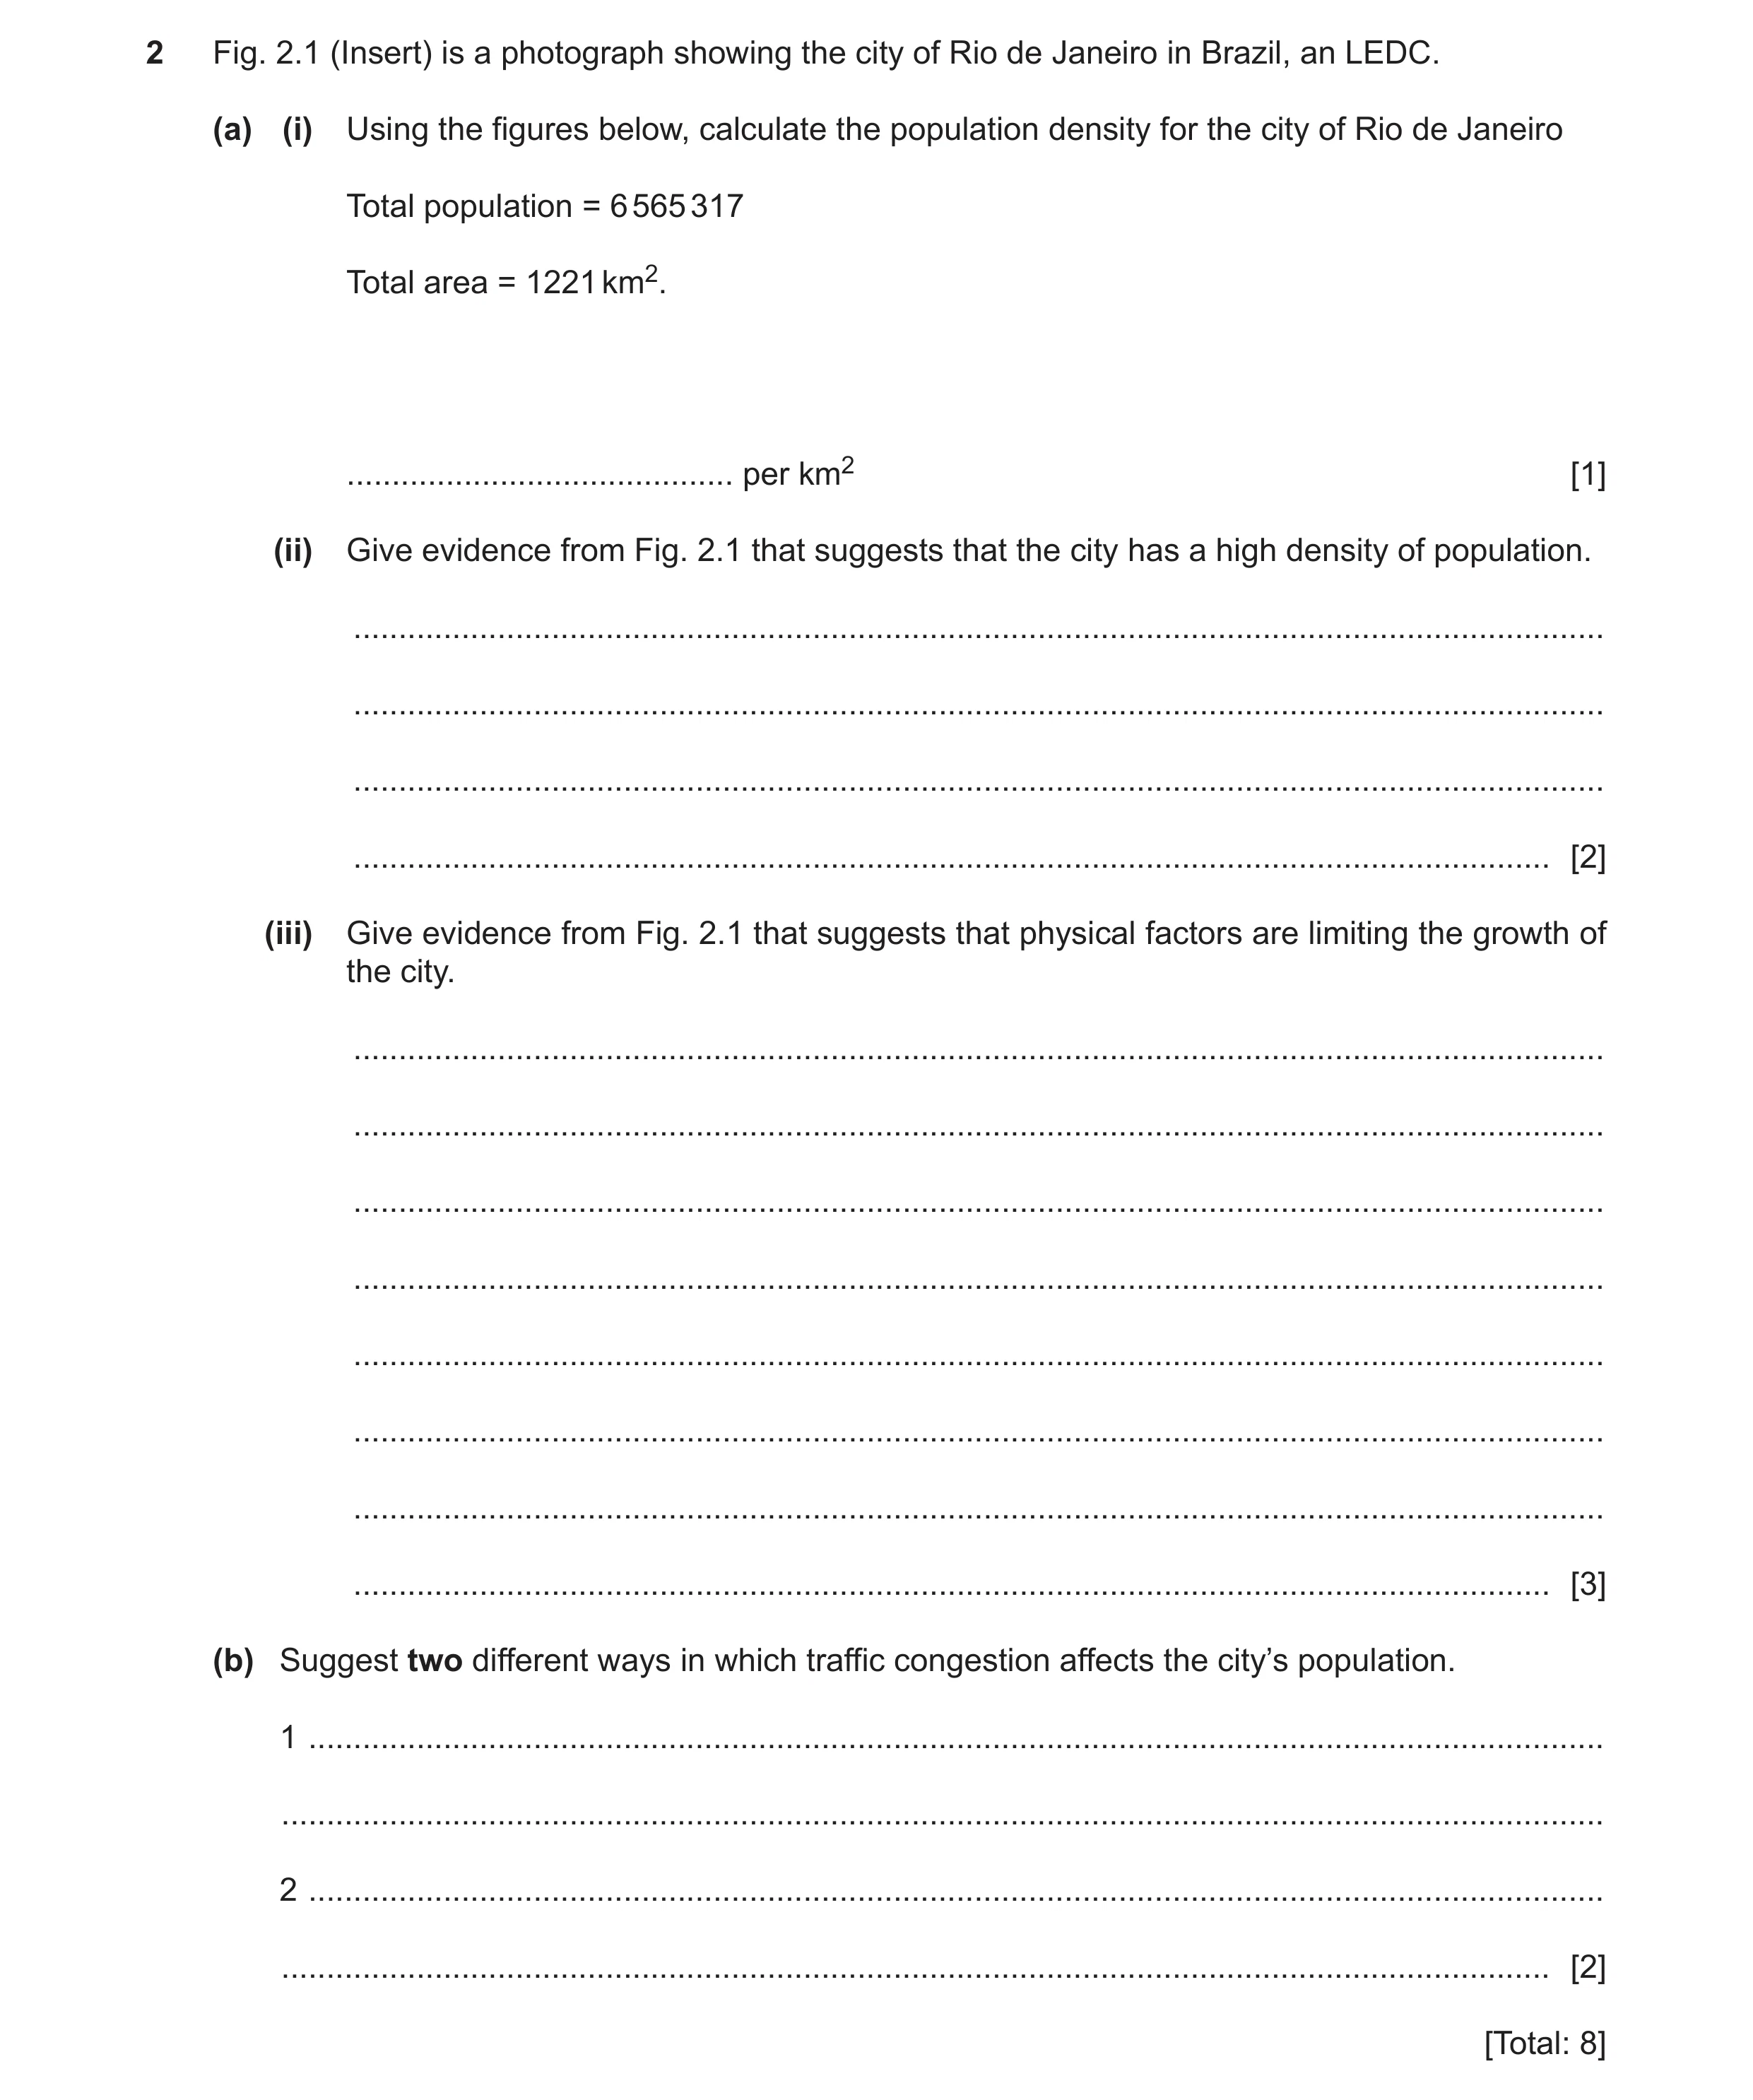
2 Fig. 2.1 (Insert) is a photograph showing the city of Rio de Janeiro in Brazil, an LEDC. (a) (i) Using the figures below, calculate the population density for the city of Rio de Janeiro Total population = 6 565 317 Total area = 1221 km2. … per km2 [1] (ii) Give evidence from Fig. 2.1 that suggests that the city has a high density of population. … … … … [2] (iii) Give evidence from Fig. 2.1 that suggests that physical factors are limiting the growth of the city. … … … … … … … … [3] (b) Suggest two different ways in which traffic congestion affects the city’s population. 1 … … 2 … … [2] [Total: 8]
8 marks
Mark scheme: 2(a)(i) 5377 (per km²) 1 2(a)(ii) High rise/tall buildings/multi-storey; 2 Buildings crowded together/clustered/compact/nucleated; Little open/green space. 2(a)(iii) Little development on highland/mountains/hills/development concentrated 3 on low land; Little development on steep slopes/cliffs/unstable slopes/little flat land; (Dense) forest prevents expansion; Water/sea surrounds city preventing expansion. 2(b) Air pollution causes asthma/breathing difficulties/health problems/ 2 sickness; Noise pollution causes hearing loss/stress/reduces sleep; People late to work/longer travelling time cause road rage/stress/affects people’s mental health; Deliveries/freight delayed; Speed of response to emergencies (hospital/fires) causes increased risk to life; More accidents cause more injuries/insurance claims/vehicle repairs.
This question in 0460/23 Oct/Nov 2022
Q11 · Study the map extract for Kilmarnock, Scotland 0460/21 May/June 2023
1 Study the map extract for Kilmarnock, Scotland. The scale is 1:25 000. (a) Fig. 1.1 shows some of the features around Kilmaurs. Study Fig. 1.1 and the map extract and answer the questions below. 40 41 42 42 42 A E D F 41 41 B C 40 40 40 41 42 Fig. 1.1 Using the map extract, identify the following features shown in Fig. 1.1: (i) the type of road at A … [1] (ii) feature B … [1] (iii) the land use at C … [1] (iv) feature D … [1] (v) the height above sea level of the contour line at E. … metres [1] (b) Study Fig. 1.1 and the map extract. (i) Using the map extract, measure the distance along the railway line from the railway station at Kilmaurs (F) to the railway station at Kilmarnock. … km [1] (ii) Measure the bearing from the railway station at Kilmaurs (F) to the railway station at Kilmarnock. … degrees [1] (iii) What is the six-figure grid reference for the railway station at Kilmarnock? … [1] (c) Annanhill Golf Course (4137) is in the south-west of the map extract. (i) Which two of the following statements are true about the location of Annanhill Golf Course? Tick (3) two boxes below. tick (3) it has a north-west-facing slope it has a south-east-facing slope it has a south-west-facing slope it is in the CBD it is in the rural-urban fringe it is in the countryside [2] (ii) Using map evidence, suggest reasons for the location of the large leisure facility, Annanhill Golf Course. … … … … … … [3] (d) Describe the human and physical (natural) features of the River Irvine, which flows in the south of the map extract. Human features … … … … … … … … … … Physical features … … … … … … … … … … [7] [Total: 20]
20 marks
Mark scheme: Question Answer Marks 1(a)(i) A735/A road/main road. 1 1(a)(ii) Place of worship/church with tower. 1 1(a)(iii) Non-coniferous trees/coppice/scrub/plantation/Long walk plantation. 1 1(a)(iv) Mast. 1 1(a)(v) 80 (metres). 1 1(b)(i) 3.6 kilometres (accept 3.5–3.7 km). 1 1(b)(ii) 146 (degrees) (accept 144−147). 1 1(b)(iii) 426382/427382. 1 1(c)(i) It has a South-east facing slope; 2 It is in the rural-urban fringe. 1(c)(ii) (Large area of) open land/space/not many buildings around; 3 Cheaper land on outskirts/rural-urban fringe; Flatter/gently sloping relief (suits golf); Lowland; Close to settlement for customers/market/supplies; Near to a road. 1(d) Human: 7 Weirs; Bridges/footbridge; Cutting/embankments/levees; Path. Note: can also credit levees under physical for reserve mark. Physical (natural): Meanders; Overall flow to west/west-south-west; Confluence(s)/tributary(s); Gentle gradient; Widens/variable width; Wide/20−30 m wide; Straighter in west/south-west of map extract / more meanders in east/south-east of map extract. Note: 1 mark reserve for human/physical (natural).
This question in 0460/21 May/June 2023
Question 12 0460/21 May/June 2023
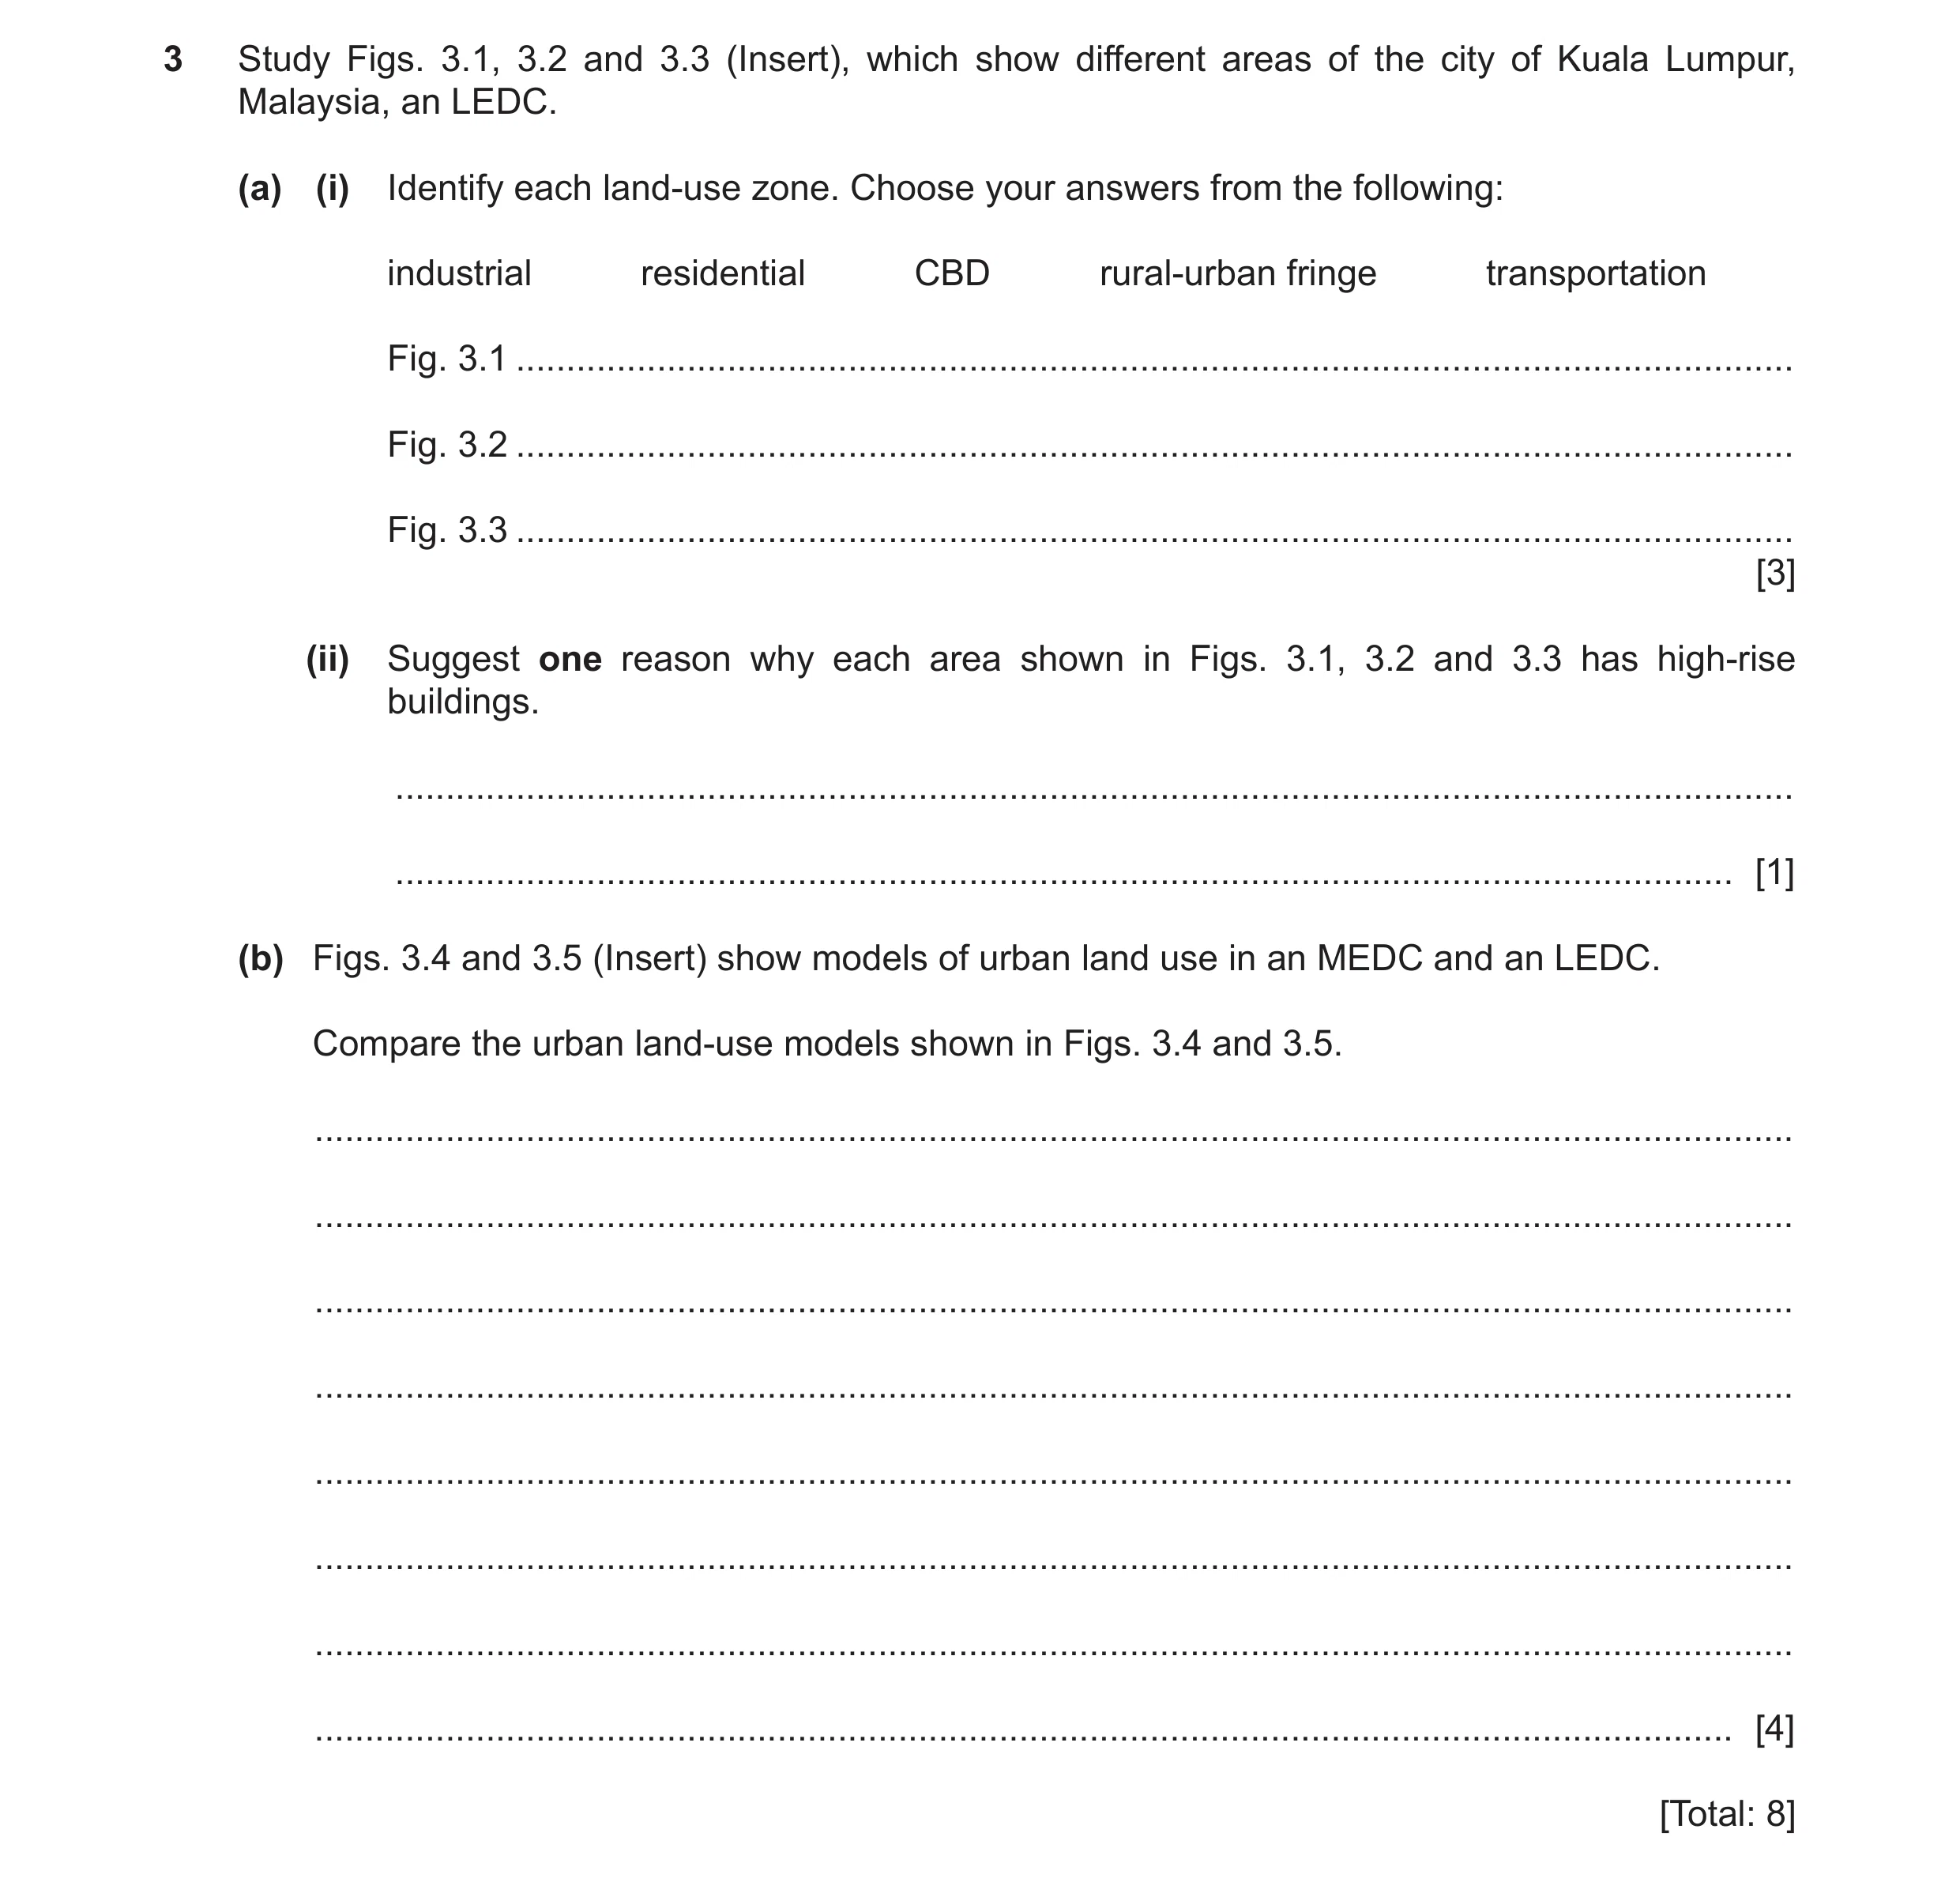
3 Study Figs. 3.1, 3.2 and 3.3 (Insert), which show different areas of the city of Kuala Lumpur, Malaysia, an LEDC. (a) (i) Identify each land-use zone. Choose your answers from the following: industrial residential CBD rural-urban fringe transportation Fig. 3.1 … Fig. 3.2 … Fig. 3.3 … [3] (ii) Suggest one reason why each area shown in Figs. 3.1, 3.2 and 3.3 has high-rise buildings. … … [1] (b) Figs. 3.4 and 3.5 (Insert) show models of urban land use in an MEDC and an LEDC. Compare the urban land-use models shown in Figs. 3.4 and 3.5. … … … … … … … … [4] [Total: 8]
8 marks
Mark scheme: 3(a)(i) CBD; 3 Rural-urban fringe; Residential. 3(a)(ii) High cost of land/cheaper to build upwards; 1 Shortage of land/saves space; Need/demand for housing/offices; Large population can be accommodated. 3(b) CBD in centre in both; 4 Both have rings; MEDC has rings/LEDC has (rings and) wedges; Industry in centre in MEDC and in wedge/toward outskirts in LEDC; High class residential on outskirts in MEDC and in wedge/surrounding CBD in LEDC; No low class residential in LEDC; No medium class residential in LEDC; No informal housing in MEDC; Lower class toward centre in MEDC and toward outskirts in LEDC.
This question in 0460/21 May/June 2023
Question 13 0460/23 May/June 2023
2 Study Fig. 2.1 (Insert), which shows a squatter settlement in Lima, Peru, an LEDC. (a) Describe the housing shown in Fig. 2.1. … … … … … … … … … … [5] (b) The settlement in Fig. 2.1 is built on a steep slope. Using evidence from Fig. 2.1, suggest problems this might cause for the residents. … … … … … … [3] [Total: 8]
8 marks
Mark scheme: 2(a) High density/close together/clustered/congested; 5 Single storey; (Built on) tyres/wheels/terraces; Wood; Metal sheets/corrugated iron/metal roofs; (accept any named metal) Low pitch/flat roofs; Windows; Porch/veranda/balcony; Aerial/dish. 2(b) Unstable buildings/houses likely to collapse/slide downhill; 3 Landslides/mudslides/rockfall; Soil erosion/difficult to grow crops/exposed soil could wash away; Low/dangerous electricity wires; Difficult to access/difficult to walk on slope/only accessible on foot/rocks are a trip hazard.
This question in 0460/23 May/June 2023
Question 14 0460/21 Oct/Nov 2023
3 Figs. 3.1 and 3.2 (Insert) show the land use in and around the settlement of Birmingham, a city in the UK, in 1700 and 2014. (a) Using Fig. 3.1, describe the settlement of Birmingham in 1700. … … … … … … [3] (b) Using Figs. 3.1 and 3.2, describe how the land use has changed between 1700 and 2014. … … … … … … … … … … [5] [Total: 8]
8 marks
Mark scheme: 3(a) Lots of fields/fields on outskirts/farmland; 3 Roads (leading into centre); Lots of residential/residential surrounding centre; Offices/shops at centre; Education/medical/religious in west/north-west; Industrial on outskirts. 3(b) Settlement has grown/increased in size; 5 Fields built on/no fields left; (Large) railway station at centre/railway built; Canals built; Offices/shops increased/mostly offices/shops; Residential has moved outwards/to west/urban sprawl; Recreation/leisure built; More industrial (to east)/industrial still on outskirts; More roads.
This question in 0460/21 Oct/Nov 2023
Q15 · Describe the location of the rural-urban fringe in an MEDC city 0460/22 Feb/March 2024
6 (a) (i) Describe the location of the rural-urban fringe in an MEDC city. … … [1] (ii) State a land-use found in the rural-urban fringe. … [1] (b) Fig. 6.1 (Insert) is a land-use model for an LEDC city. Fig. 6.2 (Insert) is a land-use map of Dar-es-Salaam, a city in Tanzania, an LEDC in Africa. (i) Describe the similarities and differences between the land-use model shown in Fig. 6.1 and the land-use of Dar-es-Salaam shown in Fig. 6.2. … … … … … … … … … … [4] (ii) Using Fig. 6.2, suggest two physical factors which prevent a city like Dar-es-Salaam from fitting the model of an LEDC city. factor 1 … … factor 2 … … [2] [Total: 8] Additional pages If you use the following pages to complete the answer to any question, the question number must be clearly shown. … … … … … … … … … … … … … … … … … … … … … … … … … … Additional pages If you use the following pages to complete the answer to any question, the question number must be clearly shown. … … … … … … … … … … … … … … … … … … … … The boundaries and names shown, the designations used and the presentation of material on any maps contained in this question paper/insert do not imply official endorsement or acceptance by Cambridge Assessment International Education concerning the legal status of any country, territory, or area or any of its authorities, or of the delimitation of its frontiers or boundaries.
8 marks
Mark scheme: 6(a)(i) on the edge/outskirts of the city/expansion of the city into the rural 1 areas/(boundary) between rural and urban area. =0 away from CBD. 6(a)(ii) residential; 1 recreational facilities (allow golf, sports pitches, leisure centres etc); roads/motorways; farming/agriculture; land-fill sites/recycling centres; retail parks/supermarkets/business parks/shops/shopping mall; parks/gardens; woodland; park and ride schemes/car parks; industrial areas/factories; hospitals; water/power/sewage facilities; schools. List rule applies. 6(b)(i) Similarities – Res. 1 4 CBD is in the centre; CBD is generally surrounded by higher quality housing/higher quality housing next to/near the CBD; industry/services along the transport route (to the SW/WSW); there is some higher quality housing going from the centre to the west; there is recent informal housing on the outskirts. Similarities can be implied if goes on to talk about differences. Differences – Res. 1 recent informal housing does not form a ring on the outskirts; recent informal housing tends to follow the roads; old informal housing takes up less space in Dar-es-Salaam than in the model/more spread out; recent informal housing also found close to the CBD/throughout the city (unlike the model); there is no ring of older informal housing which tends to be more scattered; industry/services is also clustered around the river estuary/industry not limited to one area as in Fig. 6.1/more industry/services along transport routes (than in the model); there is a zone of industry to the NW on the outskirts; higher class residential does not extend all the way to the edge of the urban area (compared with the model); there is an area of higher class residential along the coast and to the north; gaps of agriculture and unused land in recent informal housing (not a ring as in Fig. 6.1). Only allow one comparison of the amount of space taken up by a particular land-use. The answer should focus on location. ^ No agricultural/unused land/wetlands in the model. =0 Agriculture and unused land/wetlands near city centre (unlike in model). 6(b)(ii) pattern is disrupted by/presence of wetlands; 2 the presence of the ocean/coastline; the presence of the river estuary; mountains; earthquake zones; land too steep. Credit named factors at 1 mark each (no explanation required). Ignore nos. 1 and 2 on question paper, i.e. 2 marks can be scored in either. Credit can be given for relevant points not on the map. =0 agriculture unused land.
This question in 0460/22 Feb/March 2024
Question 16 0460/23 May/June 2024
6 (a) Study Fig. 6.1 (Insert), showing the distribution of squatter settlements in Cairo, Egypt. Describe the distribution of squatter settlements. … … … … … … [3] (b) Study Figs. 6.2 and 6.3 (Insert), showing two squatter settlements. Suggest reasons why people who live in the squatter settlement in Fig. 6.2 might have a better quality of life than those who live in the squatter settlement in Fig. 6.3. … … … … … … … … … … [5] [Total: 8] Additional pages If you use the following pages to complete the answer to any question, the question number must be clearly shown. … … … … … … … … … … … … … … … … … … … … … … … … … … … … … … … … … … … … … … … … … … … … … … … … … … … … …
8 marks
Mark scheme: 6(a) Uneven/widespread distribution; 3 Groups/clusters/close together; Close/near/along/linear to the river; Many located near/on the edge/within the built-up area; Most are inside the ring road; Outside the ring road to the north/north-east/south/east of the river; Linear pattern to the north/north-east of the city; Groupings/clusters outside the main city/outside ring road by 0–10 km/ 12–25 km/0–25 km. 6(b) Fig. 6.2 buildings look permanent/long lasting/stable/safe/Fig. 6.3 look 5 flimsy/unstable/unsafe; Fig. 6.2 buildings made of strong material/Fig 6.3 made of weak material; Fig. 6.2 houses are big/spacious/Fig 6.3 houses are small; Fig. 6.2 made from bricks/cement/Fig. 6.3 made from (corrugated/sheet) metal/cloth; Fig. 6.2 has windows/doors/Fig. 6.3 (just) openings; Fig. 6.2 has water butts/tanks on roofs/none in Fig. 6.3; Fig. 6.2 weatherproof houses/Fig. 6.3 houses could blow down /be rained into; Fig. 6.2 has drainpipes/none in Fig. 6.3; Fig. 6.2 has trees/vegetation for fresh air/more oxygen/any health benefit/Fig. 6.3 has little vegetation so more CO2/any negative effect on health; Fig 6.2 away from sewage/polluted/disease-carrying water/Fig. 6.3 next to sewage/polluted/disease-carrying water; Fig. 6.2 flooding unlikely/Fig. 6.3 may flood; Fig. 6.2 has streetlights/Fig 6.3 no streetlights. Note: If Fig. 6.2/6.3 not stated, assume Fig. 6.2 due to wording of question.
This question in 0460/23 May/June 2024
Q17 · The urban population living in squatter settlements in 2000 and 2018 in selected world… 0460/22 Feb/March 2025
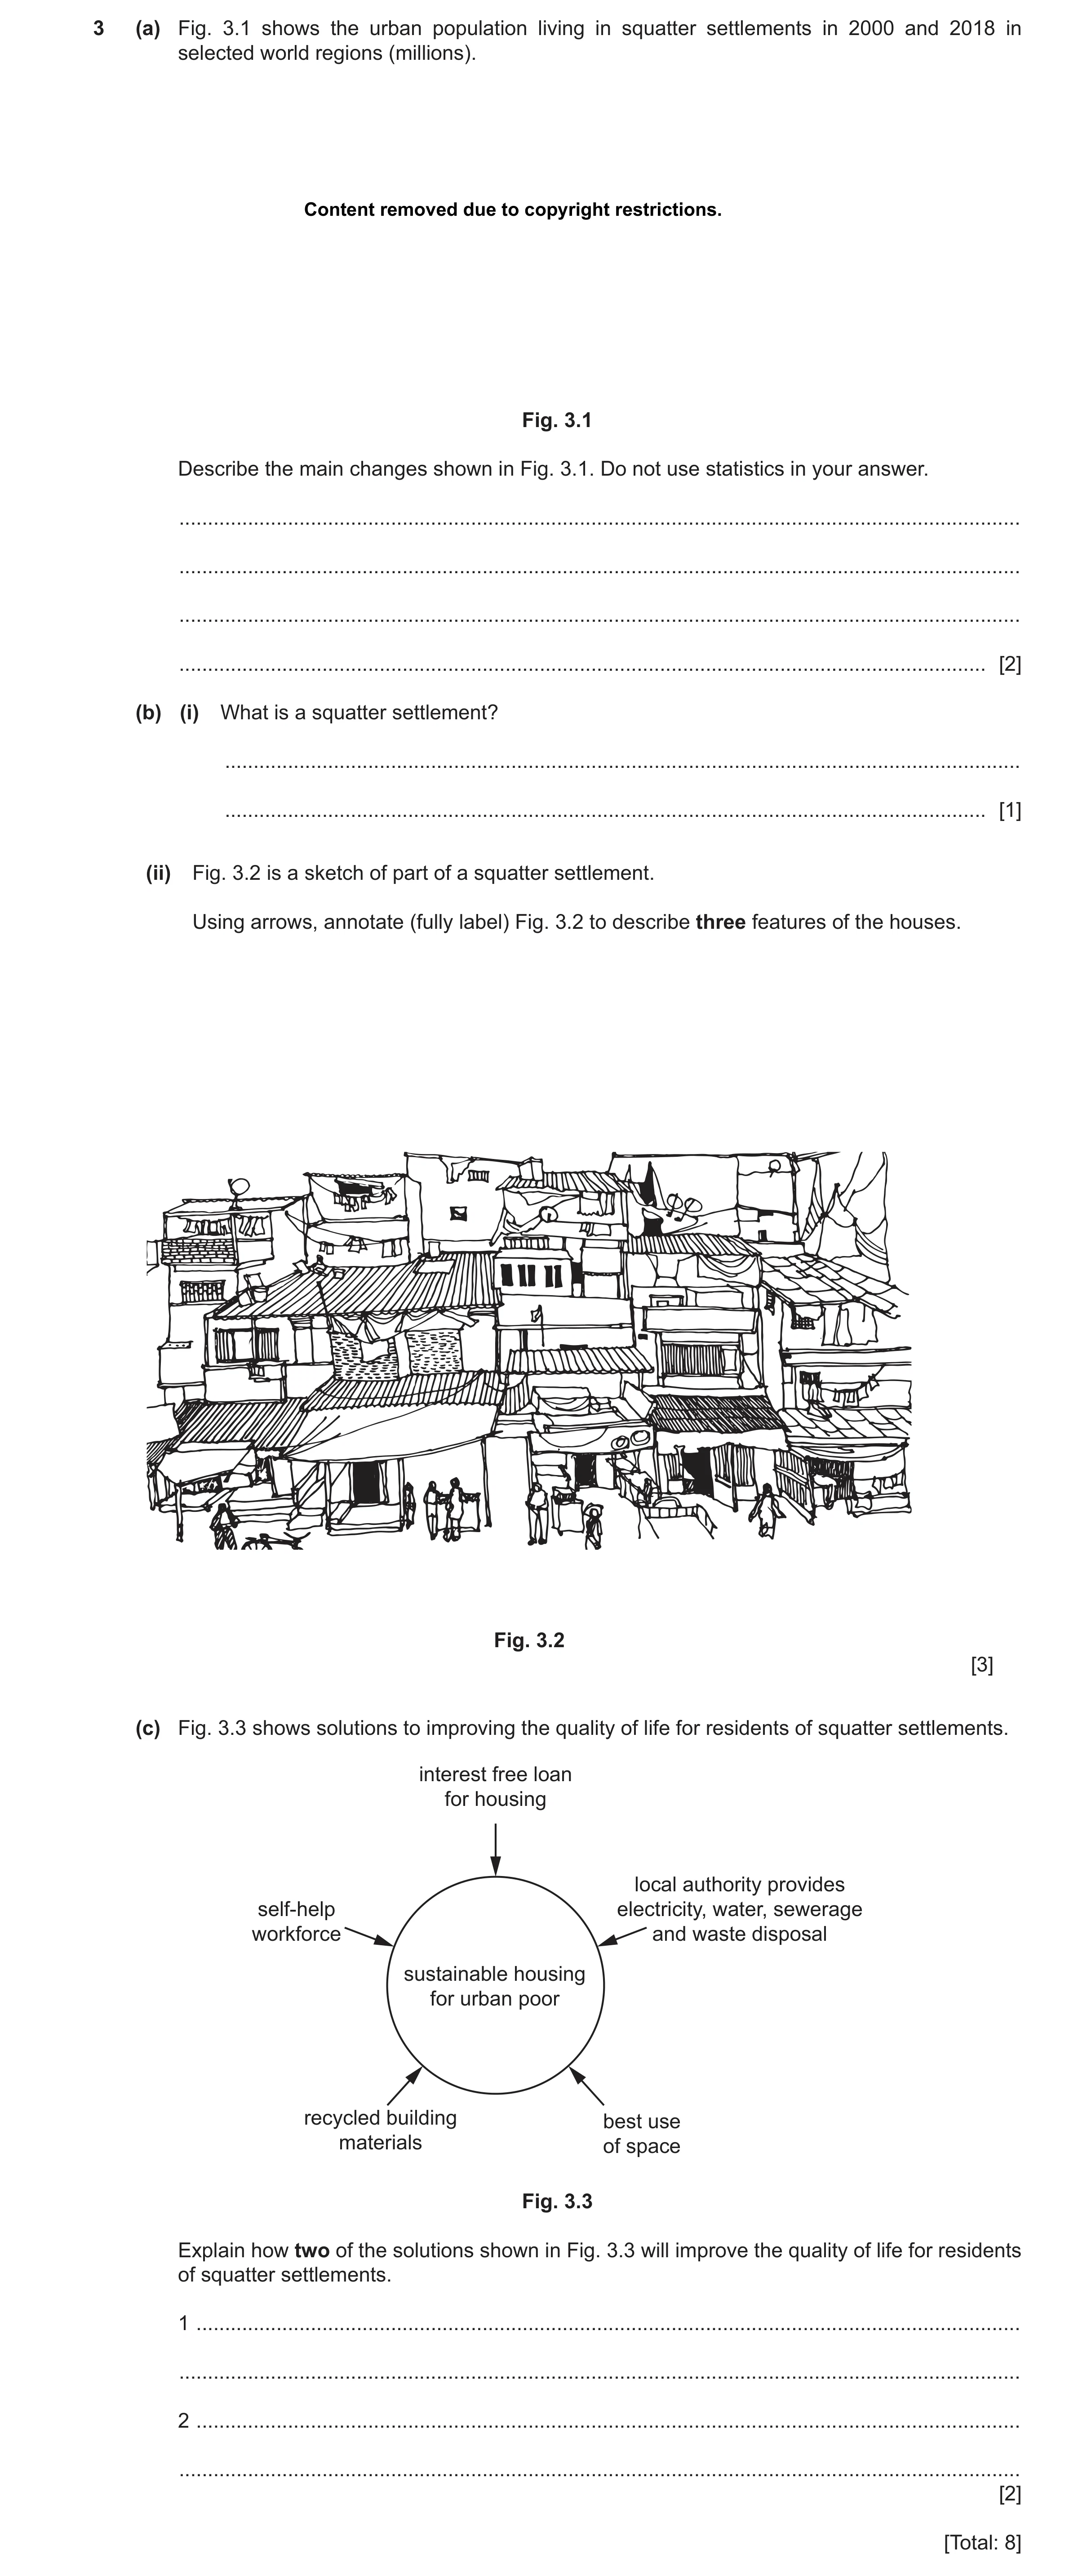
3 (a) Fig. 3.1 shows the urban population living in squatter settlements in 2000 and 2018 in selected world regions (millions). Content removed due to copyright restrictions. Fig. 3.1 Describe the main changes shown in Fig. 3.1. Do not use statistics in your answer. … … … … [2] (b) (i) What is a squatter settlement? … … [1] (ii) Fig. 3.2 is a sketch of part of a squatter settlement. Using arrows, annotate (fully label) Fig. 3.2 to describe three features of the houses. Fig. 3.2 [3] (c) Fig. 3.3 shows solutions to improving the quality of life for residents of squatter settlements. interest free loan for housing local authority provides self-help electricity, water, sewerage workforce and waste disposal sustainable housing for urban poor recycled building best use materials of space Fig. 3.3 Explain how two of the solutions shown in Fig. 3.3 will improve the quality of life for residents of squatter settlements. 1 … … 2 … … [2] [Total: 8]
8 marks
Mark scheme: 3(a) • general increase/world population has increased; 2 • biggest increase in sub-Saharan Africa; • Latin America/the Caribbean have decreased/all regions have increased apart from Latin America and the Caribbean. Allow points even if urban population living in squatter settlements is not mentioned. 3(b)(i) • A collection of buildings/settlement where people have no legal rights to 1 the land they are built on/people are living there illegally/on land not owned or rented by its inhabitants; unofficial = ^ • An area of crowded/low quality/temporary housing/slum occupied by (urban) poor people/people who have a poor living standard. = 0 slum on its own (needs the two parts for the second point), no credit for description of housing materials. 3(b)(ii) • multi-storey/built on top of one another; vertical zoning = ^ 3 • cramped for space/no proper separation between houses/densely packed with no space; small/compact = ^ • no set pattern/unplanned; • roofs of different materials; • made of flimsy/low quality materials/weak structure/prone to collapse/made of wood rather than stone/brick; • patched up with brick in a few places; • made of recycled materials/materials that can be found (e.g. corrugated iron); • sloping roofs/corrugated iron/tin roofs flat roofs = ^ • some have windows/open spaces for windows/window with bars/small windows/windows which lack glass; windows on its own = ^ • cracks in the building structure/damaged walls/poorly maintained. Expect arrows to point to the correct places, e.g. for cracked structures. = ^ list of features, e.g. bricks, antenna, window, steps, temporary housing/rooftops/sheds, unstable. = 0 washing hung out to dry on main streets (not housing), community spirit, people know each other and socialise together (not housing), low standard of housing (not housing), lack doors/infrastructure. 3(c) • self-help workforce means the cost of labour is reduced/residents put 2 more effort into its building/they can help with the building/repairs of homes and have more responsibility/people are in control and can help each other; • interest free loan means residents will find it easier to pay back/makes borrowing cheaper/easier/can afford proper shelter/better housing; • building materials are reused therefore saving money; • best use of space means a large number of people can be accommodated/provides room for facilities such as toilets/sanitation/services/houses not packed so less spread of disease; • water means there will be less chance of disease spreading (through dirty water); • sewerage/waste disposal/sanitation means less waste left on the street/reduces the risk of cholera/promote healthier lives; • electricity means safer environment (lights provided)/people can work longer hours. (needs to go beyond providing basic resources/needs/hygiene/clean water/free services) Each reference to an increase in quality of life must be linked to a solution. = 0 no credit for allowing people to move out of squatter settlements since question is about quality of life of those in squatter settlements, improves quality of life (in question).
This question in 0460/22 Feb/March 2025
Q18 · A mind map drawn by a student studying squatter settlements in a large LEDC city 0460/22 May/June 2025
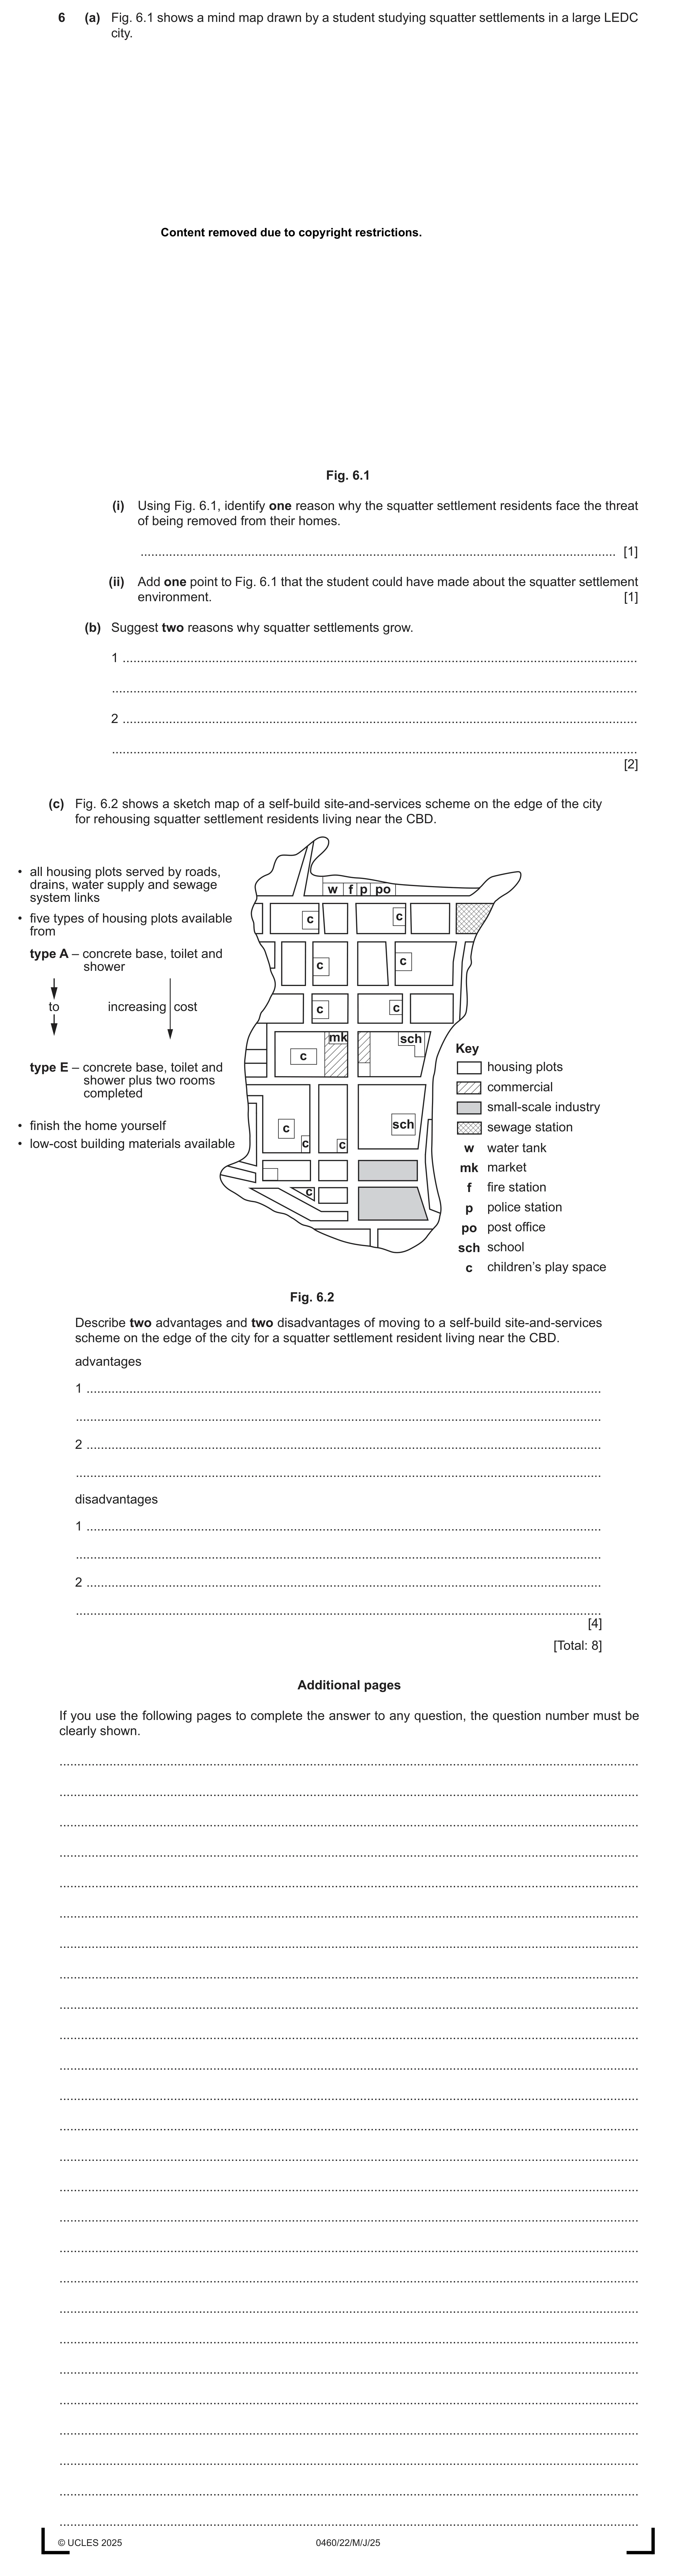
6 (a) Fig. 6.1 shows a mind map drawn by a student studying squatter settlements in a large LEDC city. Content removed due to copyright restrictions. Fig. 6.1 (i) Using Fig. 6.1, identify one reason why the squatter settlement residents face the threat of being removed from their homes. … [1] (ii) Add one point to Fig. 6.1 that the student could have made about the squatter settlement environment. [1] (b) Suggest two reasons why squatter settlements grow. 1 … … 2 … … [2] (c) Fig. 6.2 shows a sketch map of a self-build site-and-services scheme on the edge of the city for rehousing squatter settlement residents living near the CBD. • all housing plots served by roads, drains, water supply and sewage w f p po system links • five types of housing plots available c c from type A – concrete base, toilet and c shower c to increasing cost c c mk sch Key c type E – concrete base, toilet and housing plots shower plus two rooms commercial completed small-scale industry • finish the home yourself c sch sewage station • low-cost building materials available c c w water tank mk market c f fire station p police station po post office sch school c children’s play space Fig. 6.2 Describe two advantages and two disadvantages of moving to a self-build site-and-services scheme on the edge of the city for a squatter settlement resident living near the CBD. advantages 1 … … 2 … … disadvantages 1 … … 2 … … [4] [Total: 8] Additional pages If you use the following pages to complete the answer to any question, the question number must be clearly shown. … … … … … … … … … … … … … … … … … … … … … … … … … … © UCLES 2025 0460/22/M/J/25
8 marks
Mark scheme: 6(a)(i) no legal rights to land 1 6(a)(ii) • sloping site; 1 • air pollution; • land pollution/litter; • water/river pollution; • untreated sewage; • shortage of space/houses cramped together; • houses made of recycled materials/corrugated iron etc. • houses liable to collapse/unstable/flimsy/not sturdy. 6(b) • high/increasing BR/increase in population; 2 • migration (accept from any origin)/move from rural areas to cities/urban areas; • relatives move in to be close to family; • unemployment/people lose their jobs/less job opportunities; • high levels/increase in levels of poverty or examples; • houses in the city are unaffordable/can’t afford rent/shortage of housing/competition for housing. 6(c) Advantages – (Reserve 1 mark) 4 • availability of/access to/better/improved/more services/schools/children’s play area/all services in one place/nearby/greater service provision than in a squatter settlement; • drains/water supply/sewage/healthier environment/better sanitation; • can choose a plot/house that suits their income/have control of what is included in their plot/house/different types of plots available; • lots of job opportunities/availability of jobs/named example of a job from the key; • near commercial area/shops; • security of tenure/legal home/you have ownership over your home/won’t be bulldozed; • low cost/cheap materials for building; • safe due to police station/fire station; • less air/land/litter/noise water pollution (than in the CBD). Disadvantages – (Reserve 1 mark) • loses sense of community/friends/being near relatives/won’t know anybody there; • many migrants can’t afford to pay/can increase debts/higher cost than living in squatter settlements/housing plots are expensive/people can’t afford them; • may have to leave present job (in CBD)/can’t afford transport to job/a long way away from job/no longer in CBD where they work/distance to services (in CBD) is greater; • encourages more migrants/just as crowded/may become overcrowded; • people may not have construction skills/be physically fit enough to finish house/may not be completed to a high/safe standard; • different levels of housing provision may reinforce inequalities; • no healthcare/clinics/doctors/hospitals provided; • Not enough/lack of green areas/open space. Note: no credit for features copied from the key without further comment.
This question in 0460/22 May/June 2025
Q19 · An urban land-use model for an LEDC 0460/23 May/June 2025
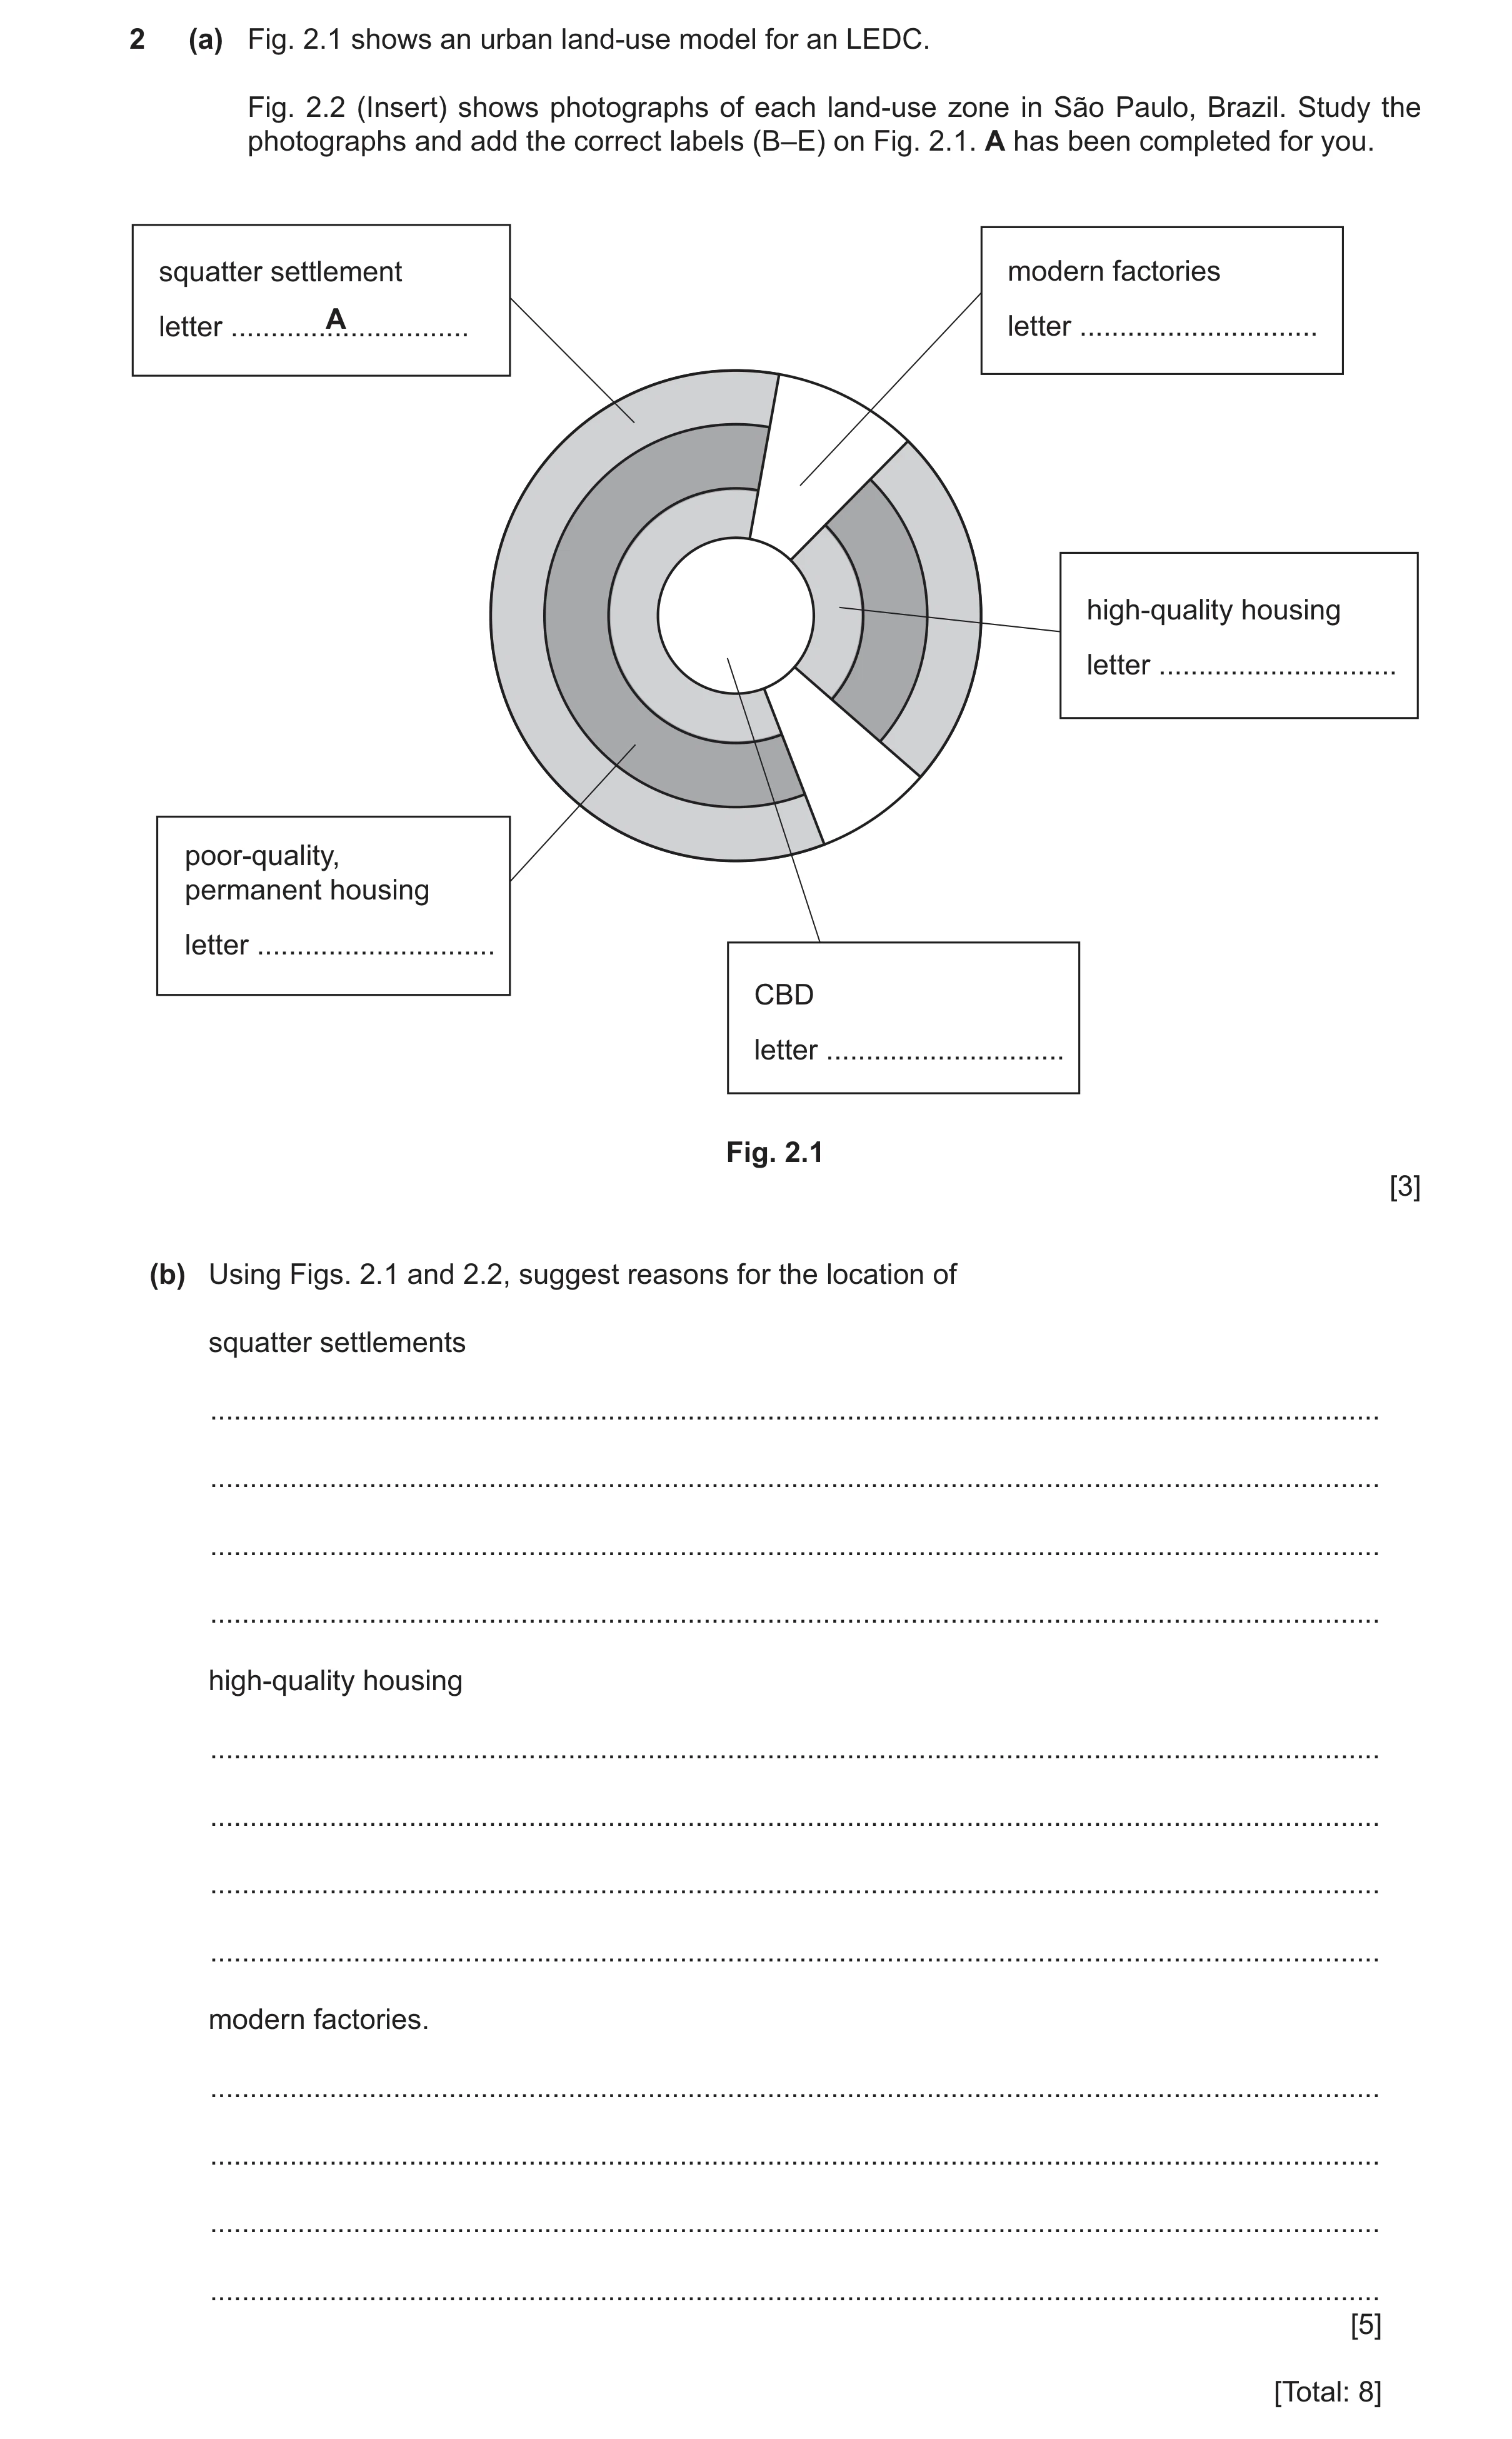
2 (a) Fig. 2.1 shows an urban land-use model for an LEDC. Fig. 2.2 (Insert) shows photographs of each land-use zone in São Paulo, Brazil. Study the photographs and add the correct labels (B–E) on Fig. 2.1. A has been completed for you. squatter settlement modern factories letter … A letter … high-quality housing letter … poor-quality, permanent housing letter … CBD letter … Fig. 2.1 [3] (b) Using Figs. 2.1 and 2.2, suggest reasons for the location of squatter settlements … … … … high-quality housing … … … … modern factories. … … … … [5] [Total: 8]
8 marks
Mark scheme: 2(a) D – modern factories 3 C – high quality housing E – CBD B – poor quality permanent housing 3–4 correct = 3 marks 2 correct = 2 marks 1 correct = 1 mark 2(b) Squatter settlement 5 Unfavourable land/steep/terraced/hilly/swamps/wasteland; Only available land/only unused space; Close to industry; Outskirts first point of arrival for migrants; Less regulation of houses on the outskirts. High quality housing Expensive land (surrounding CBD); Close to jobs/business/retail/entertainment/services; Former colonial housing; Far from squatter settlements. Modern factories Flat land; Next to/along/near transport routes; Access to the CBD to supply goods; On outskirts for space/where land is cheaper; Room for expansion/large land; Accessible to workers from other zones/close to squatter settlements for workers. Note: Reserve 1 mark for each section. Ref to Figs 2.1 and 2.2 not required.
This question in 0460/23 May/June 2025
 1 / 31
 2 / 31
 6 / 31
 7 / 31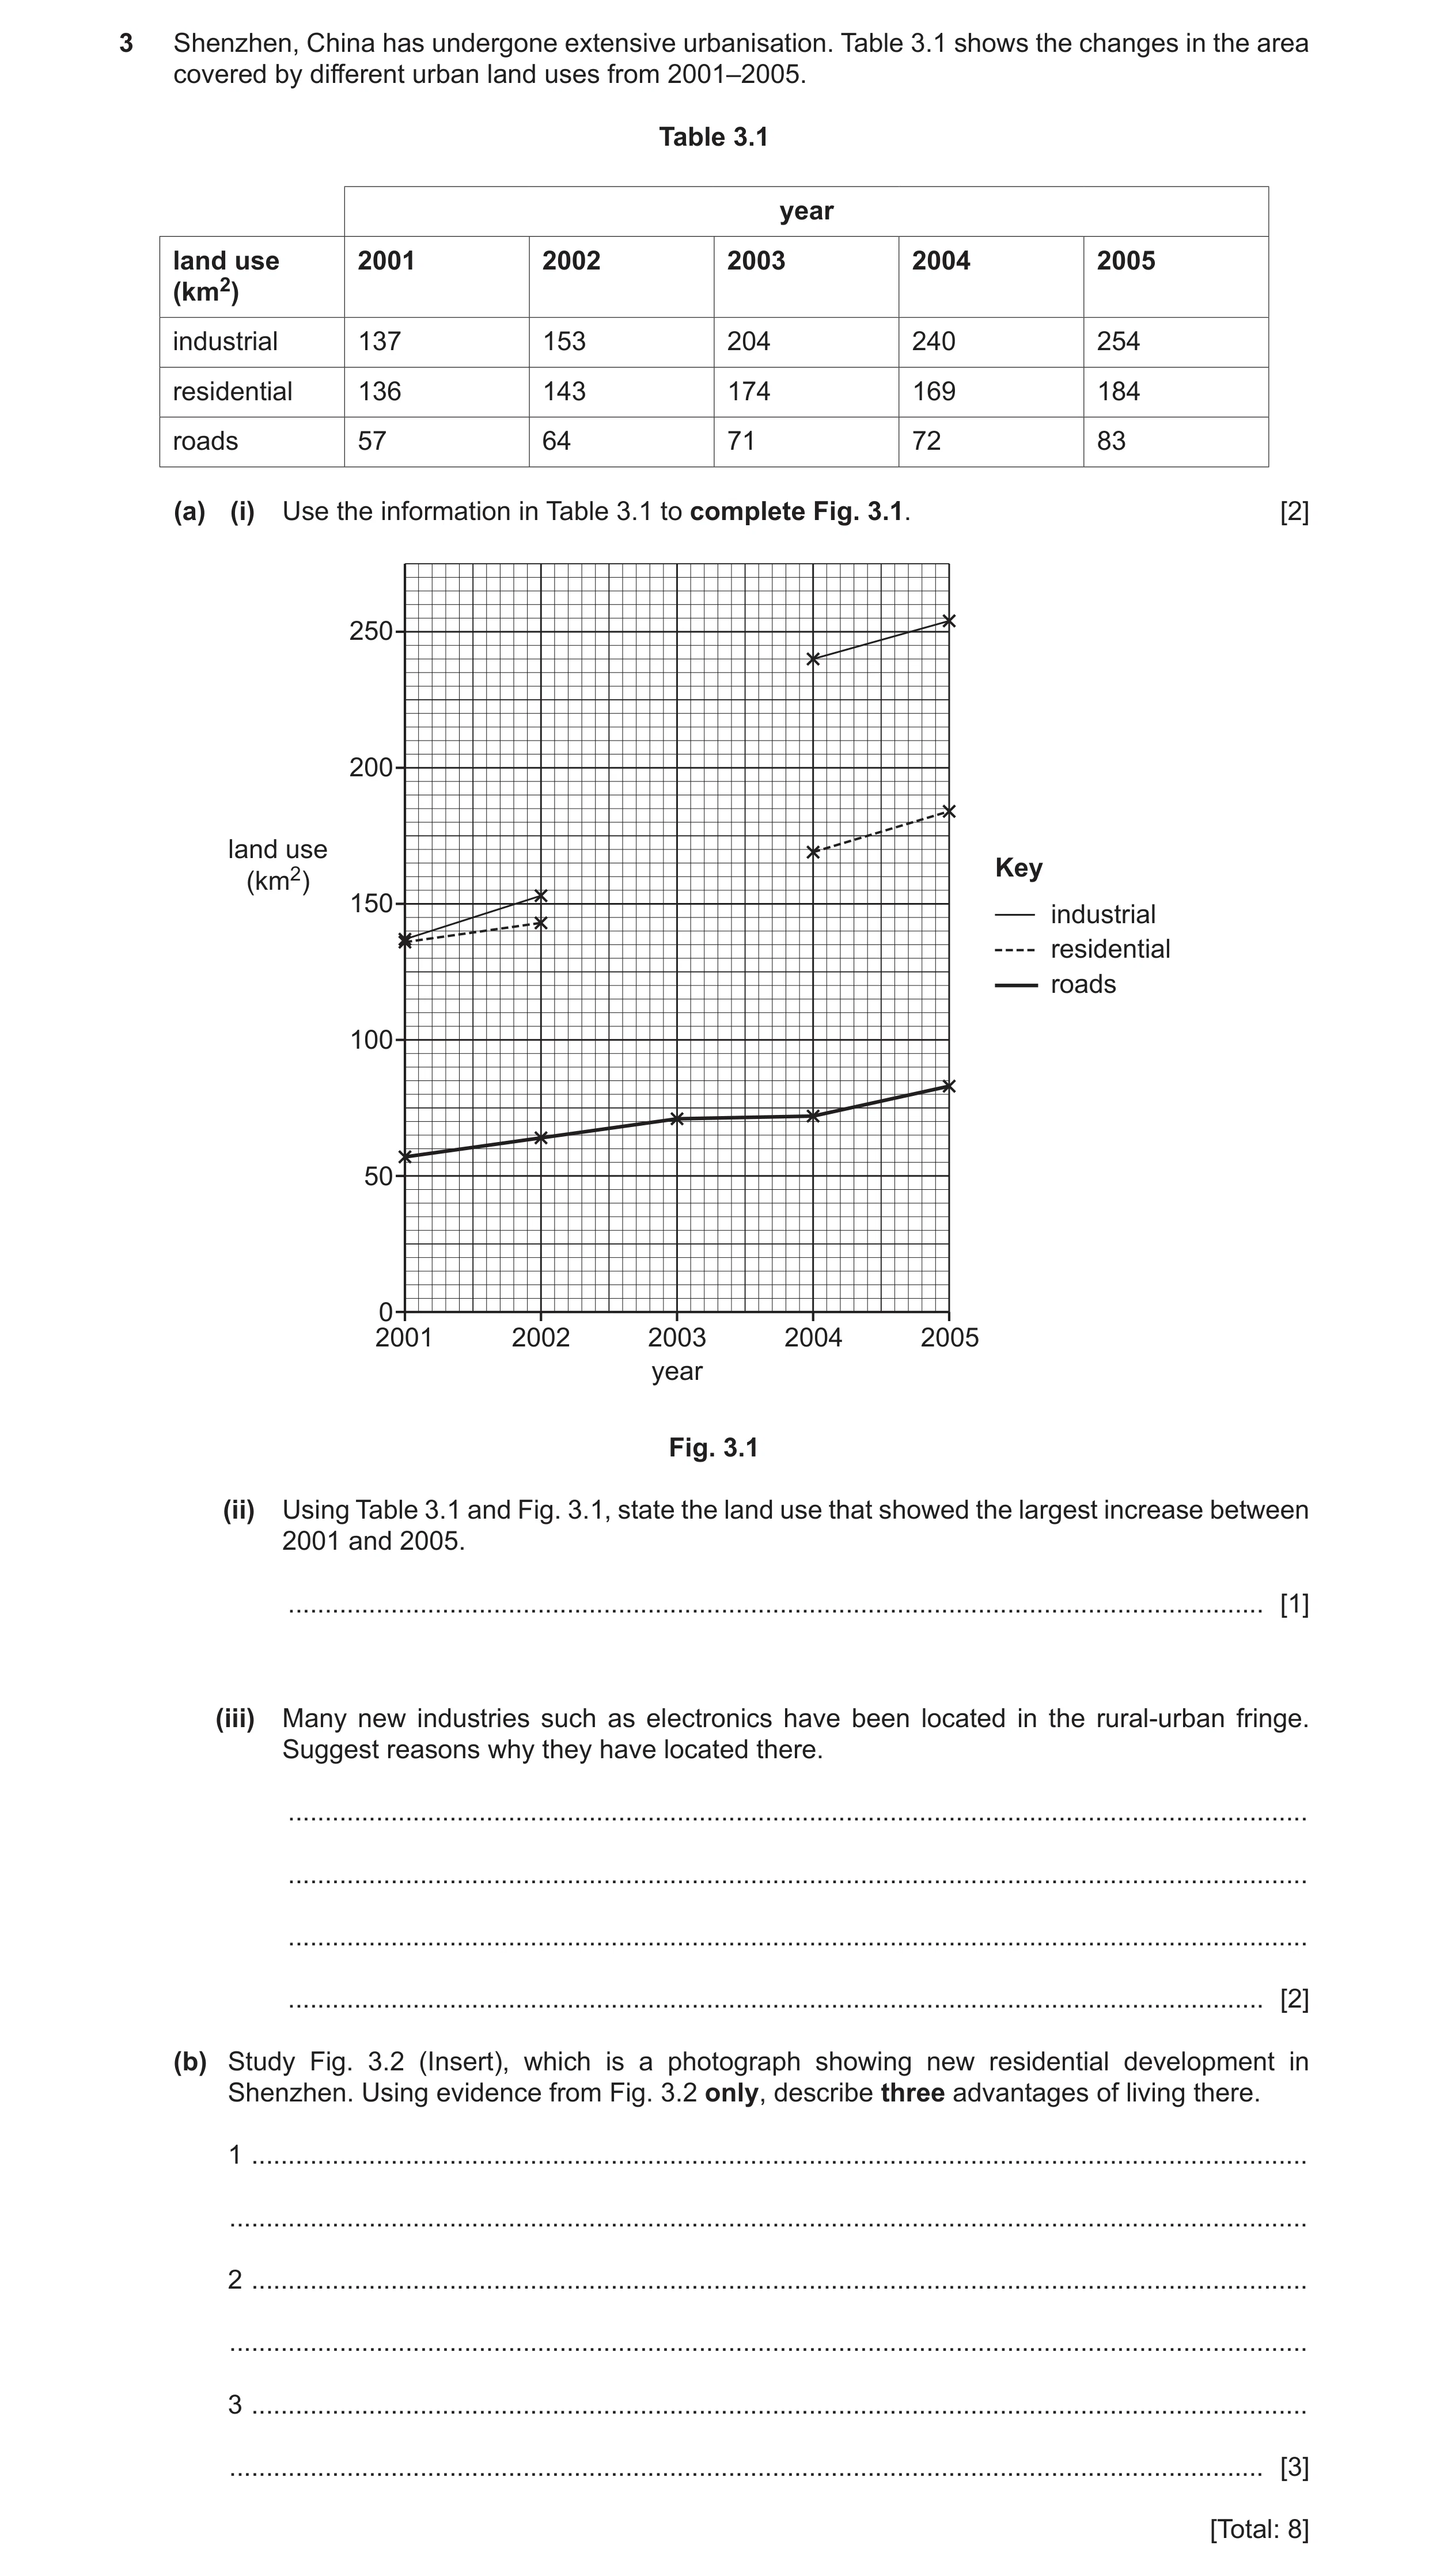
 9 / 31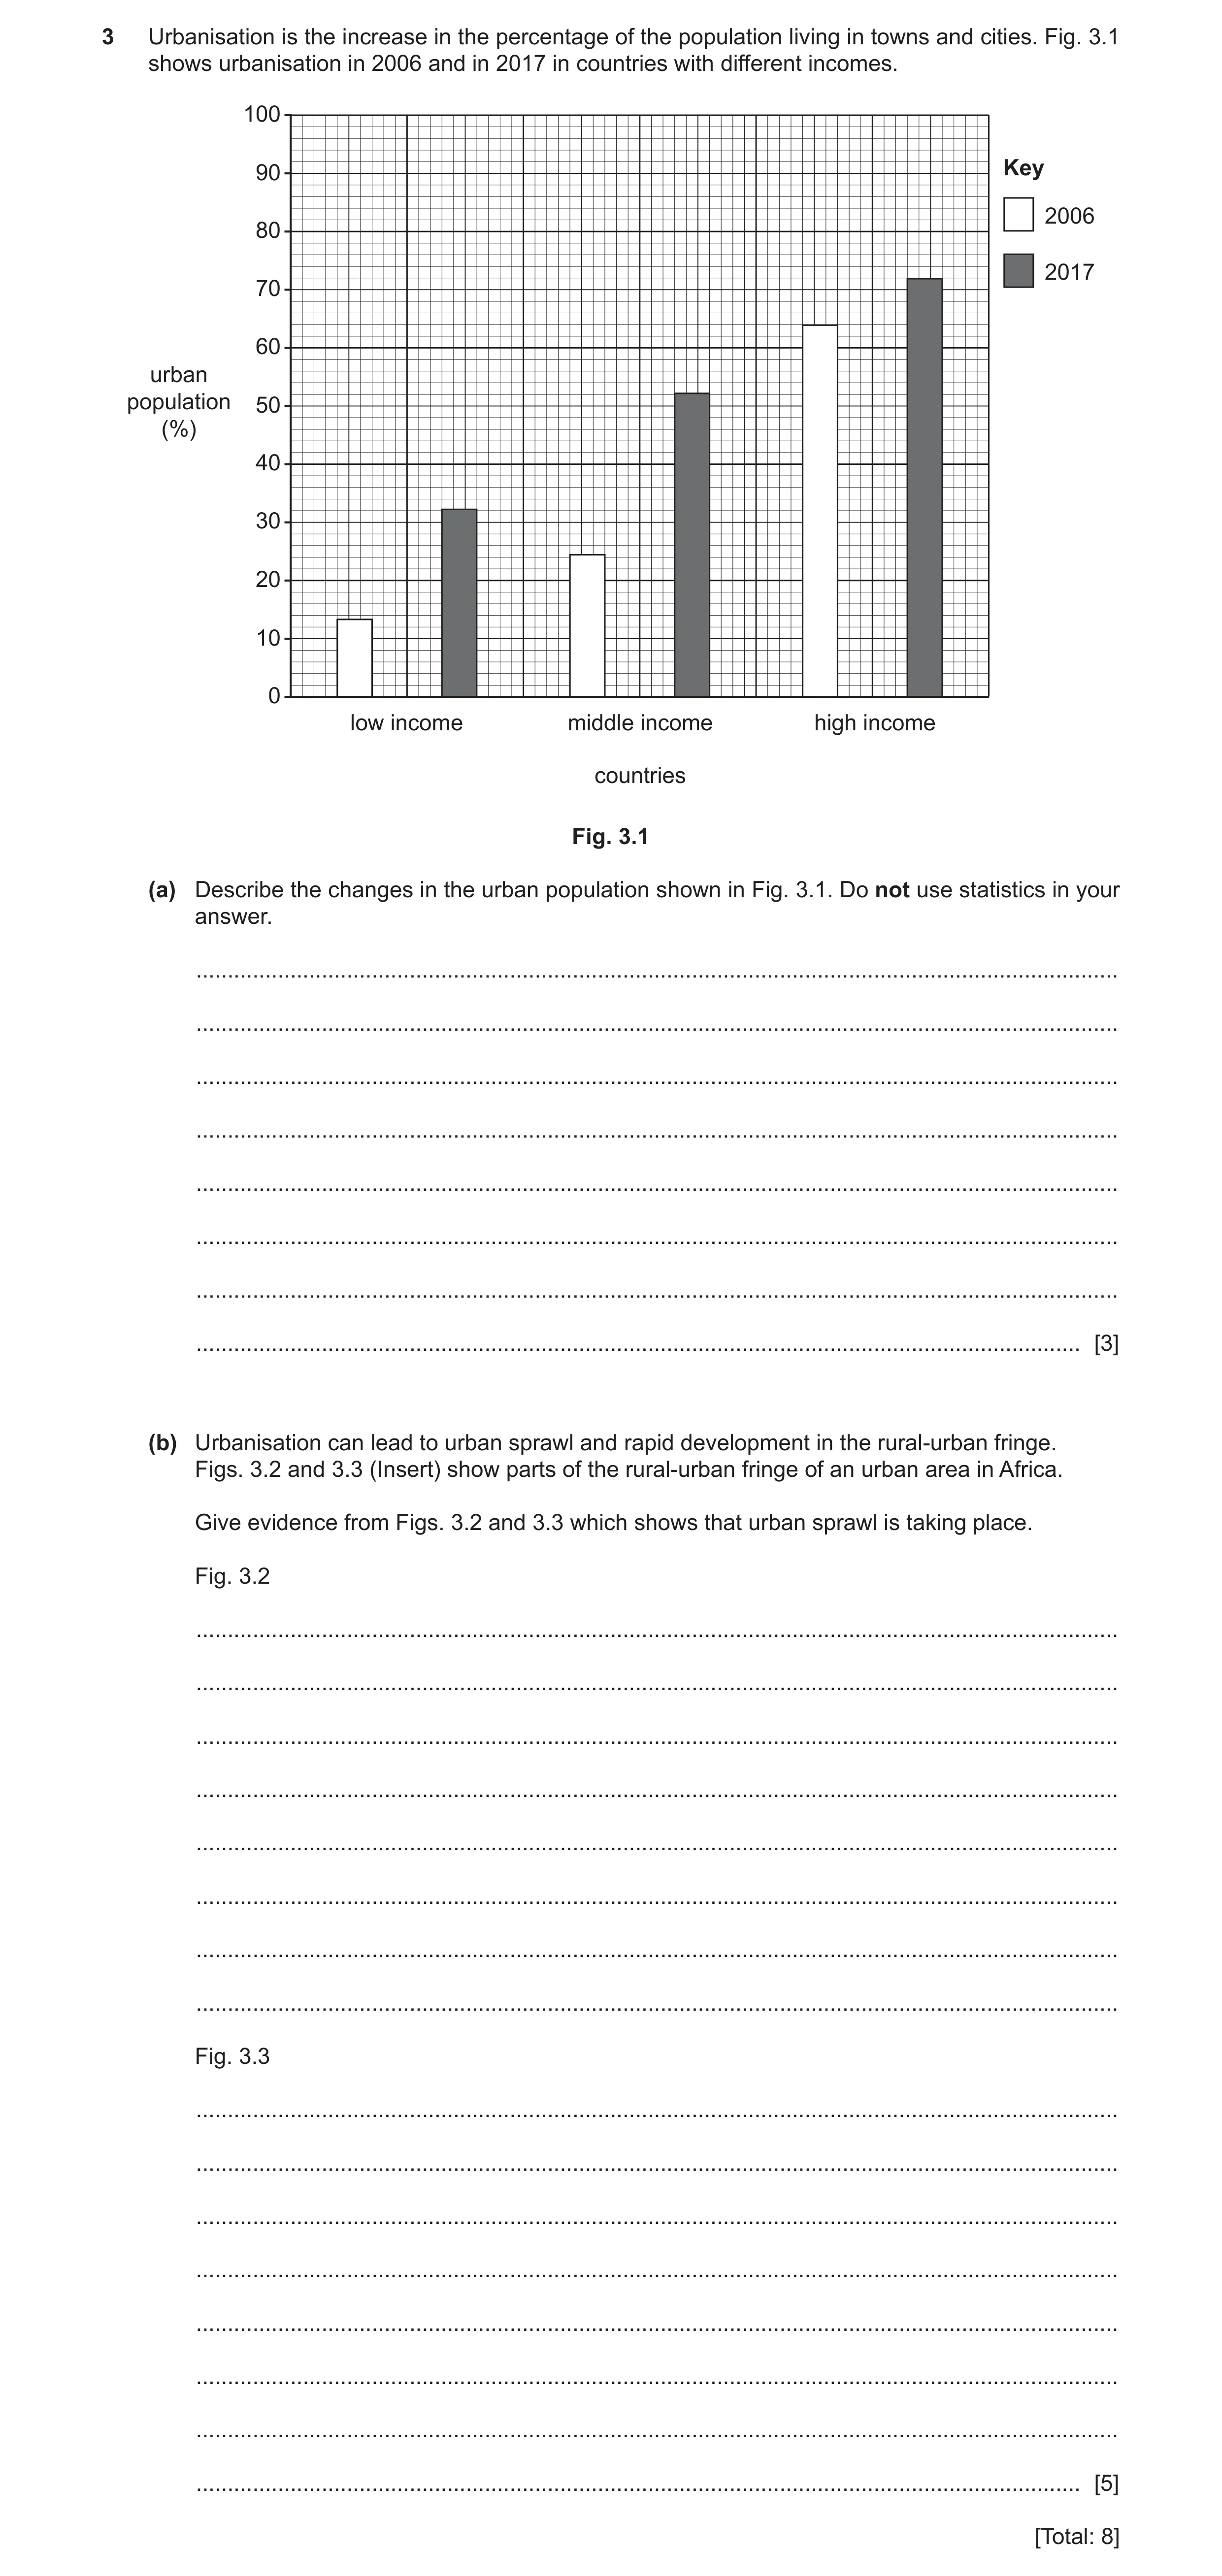
 13 / 31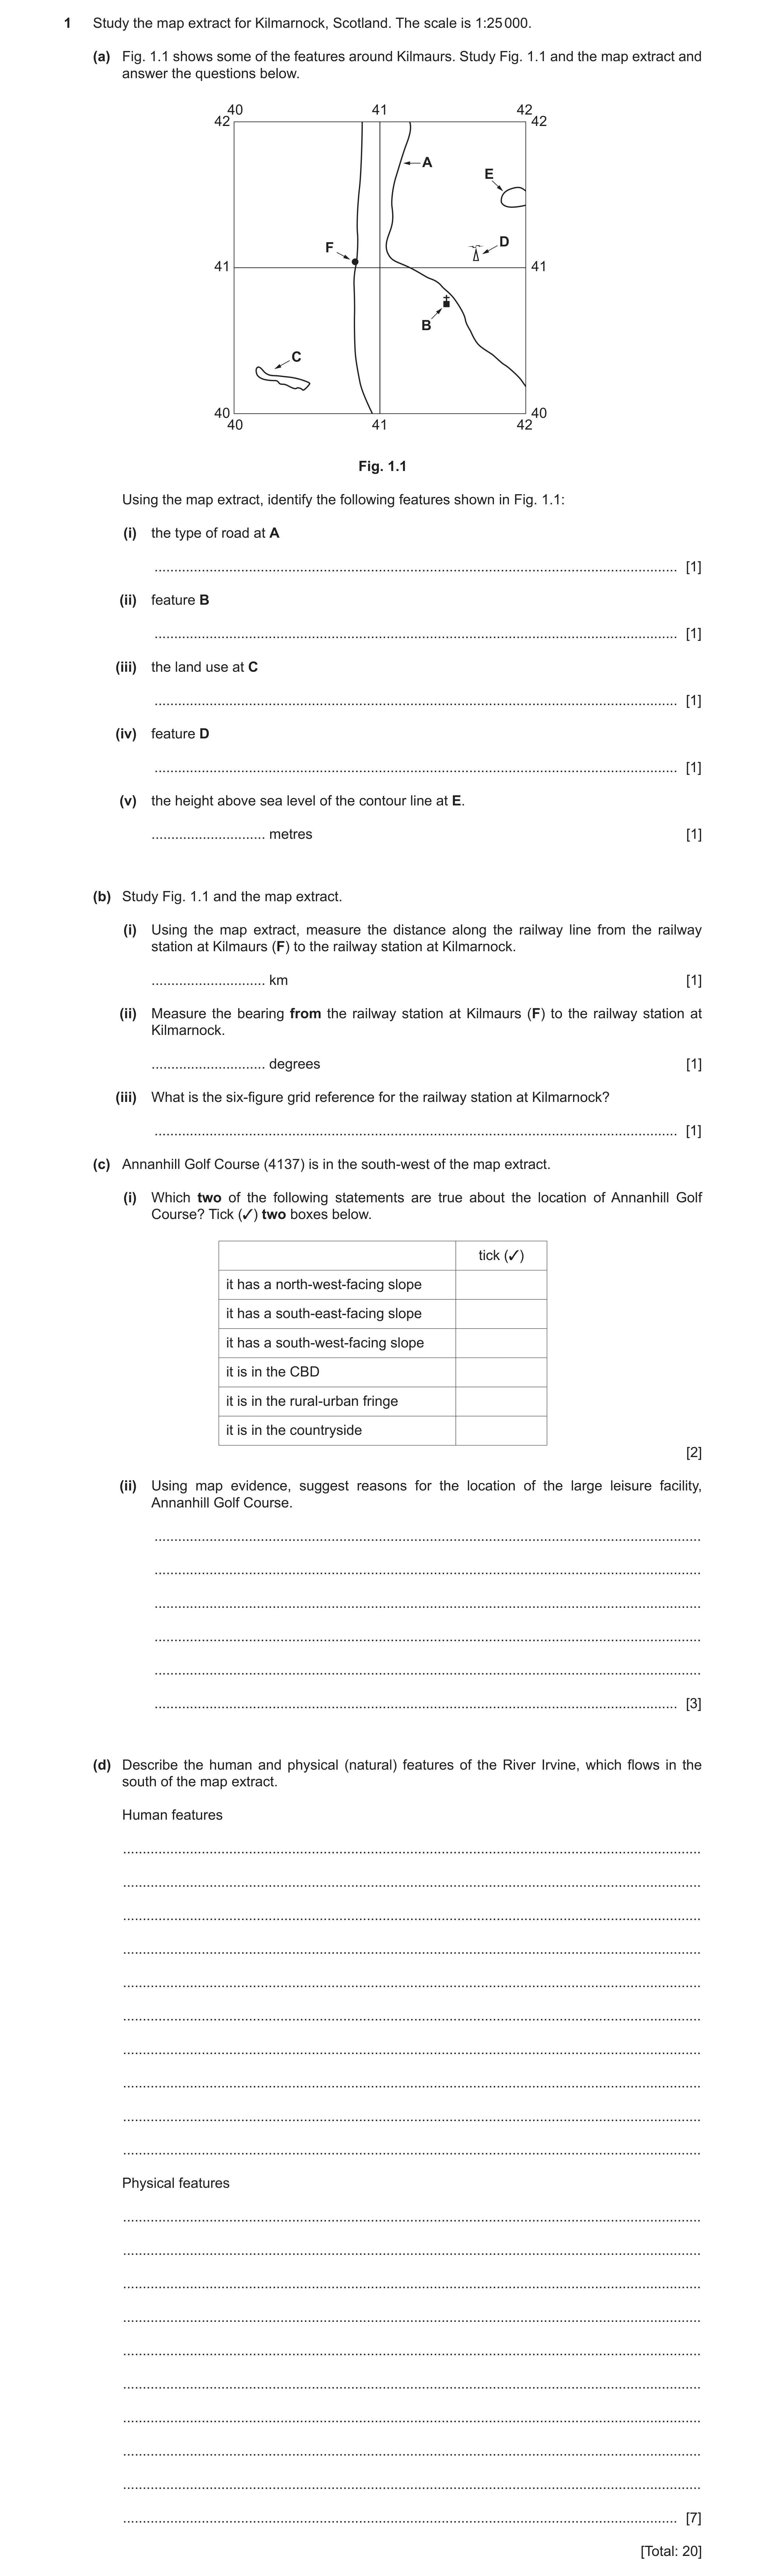
 17 / 31
 18 / 31
 19 / 31
 8
8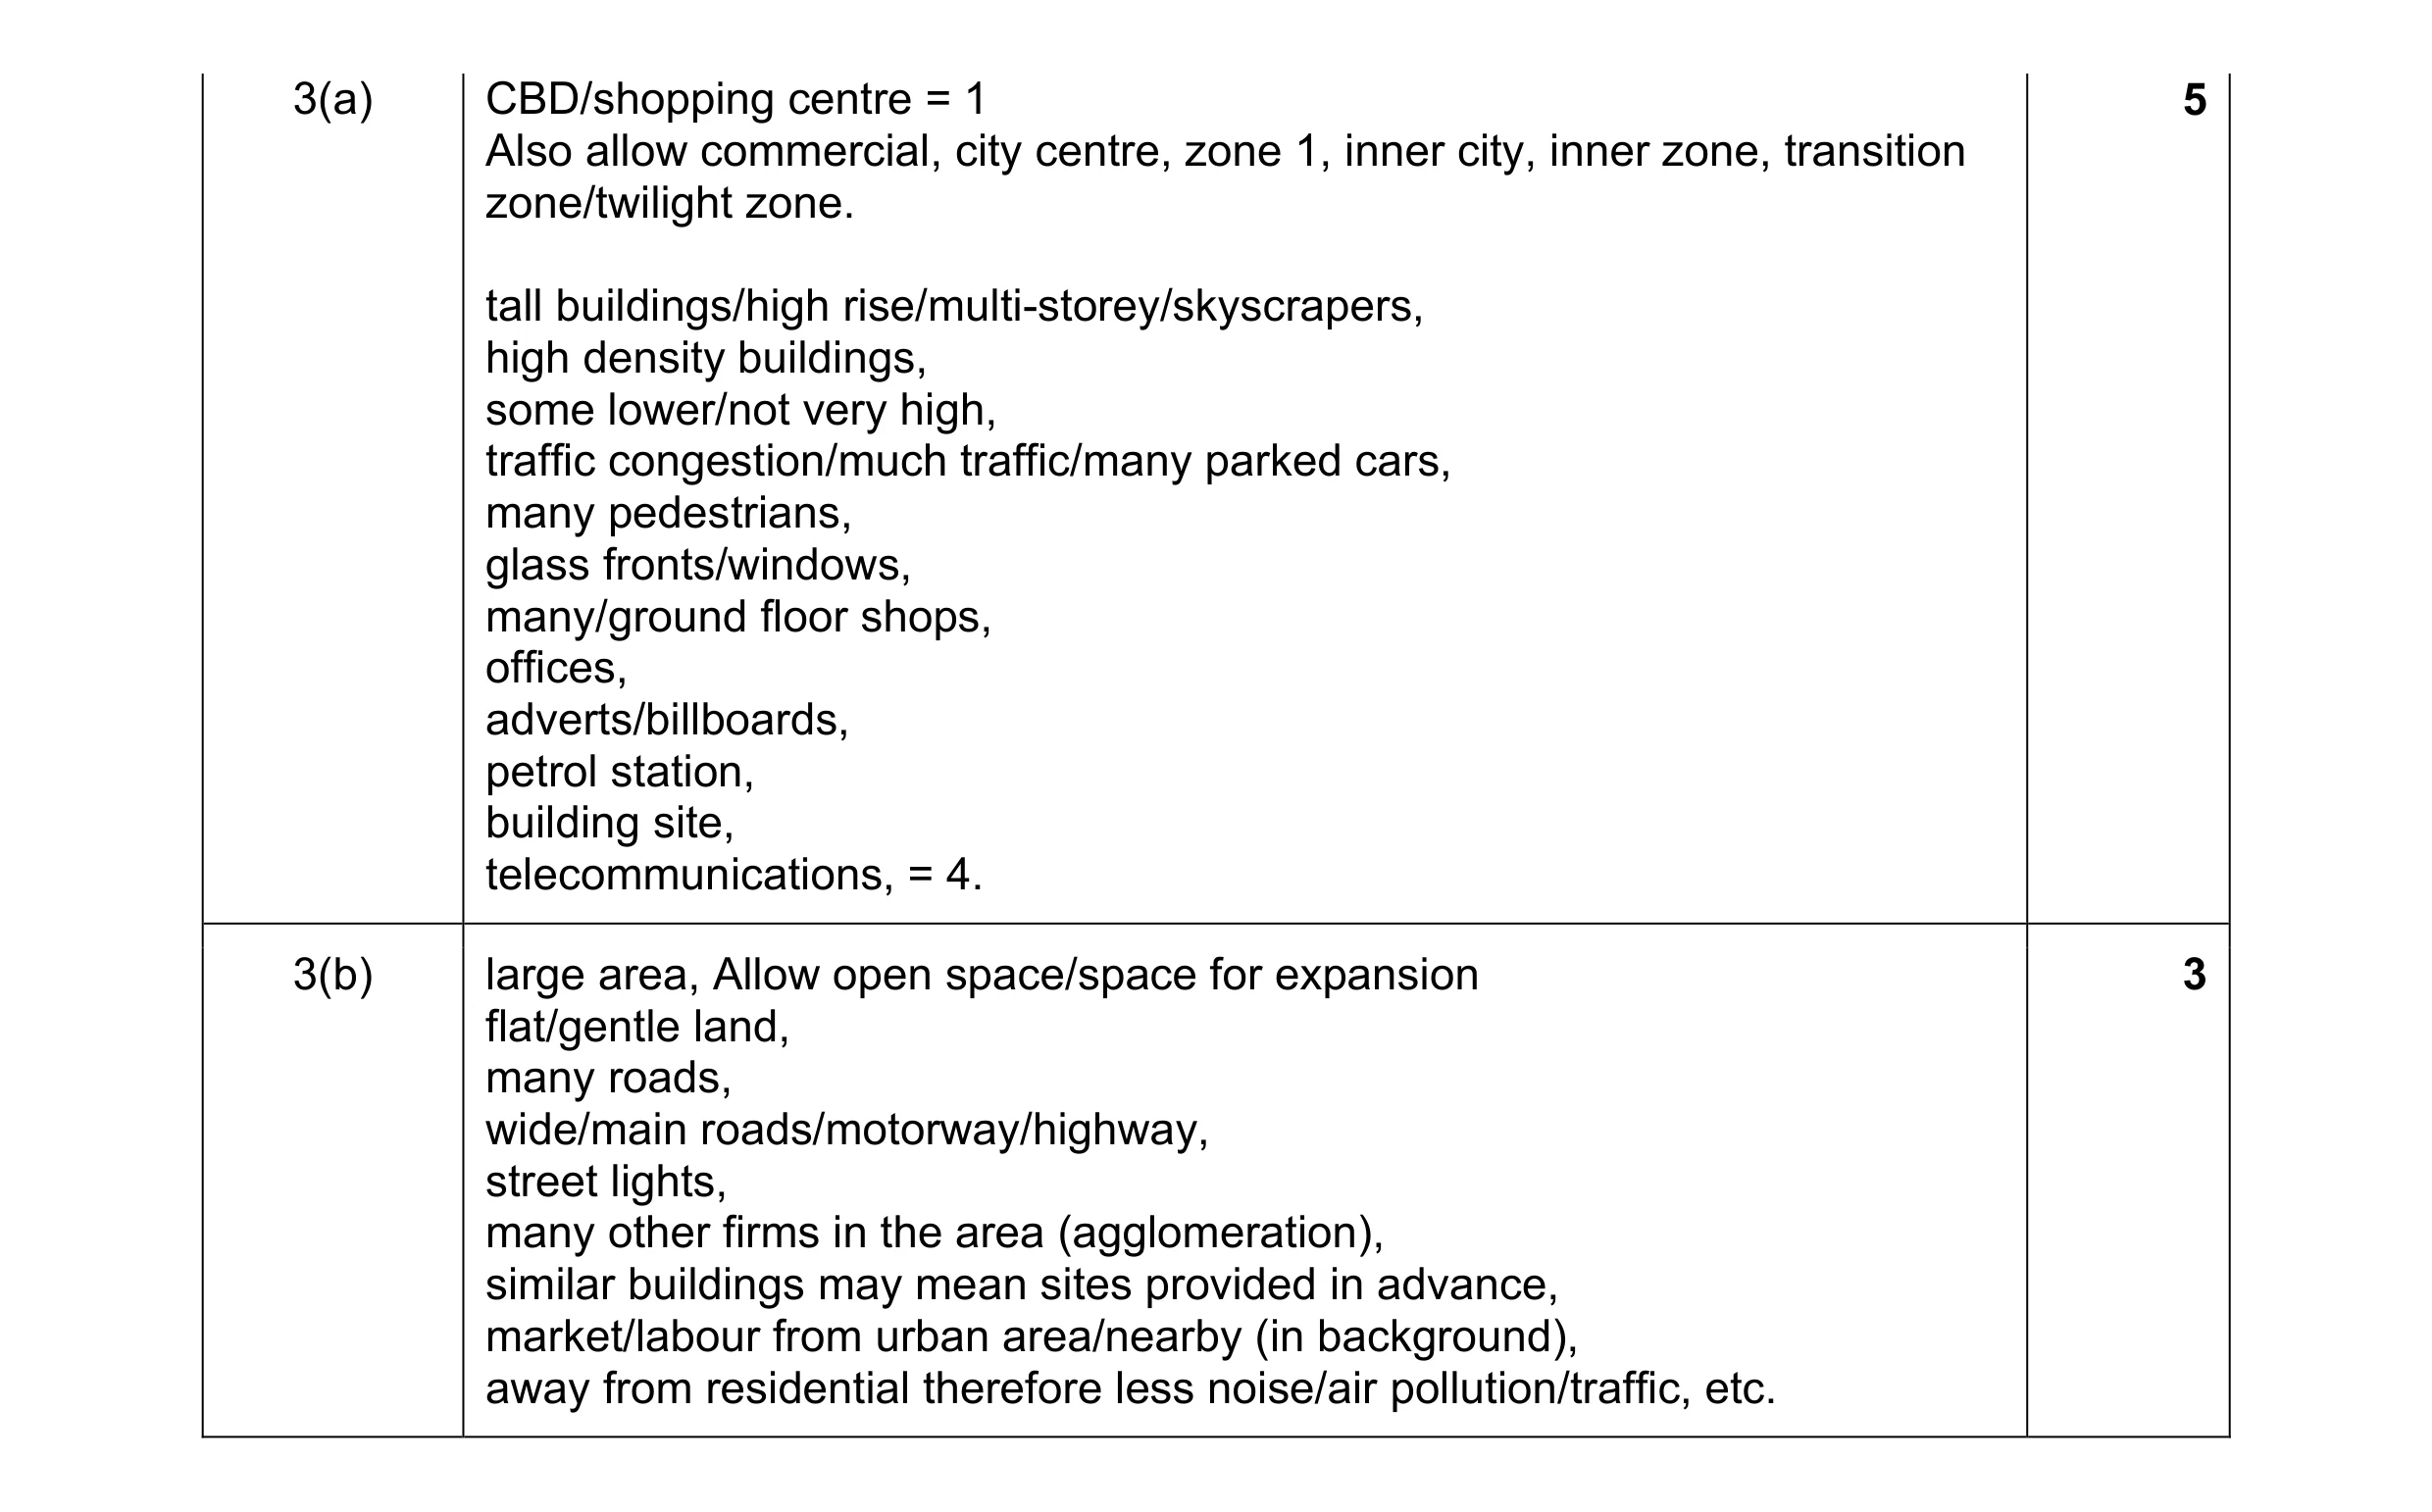 8
8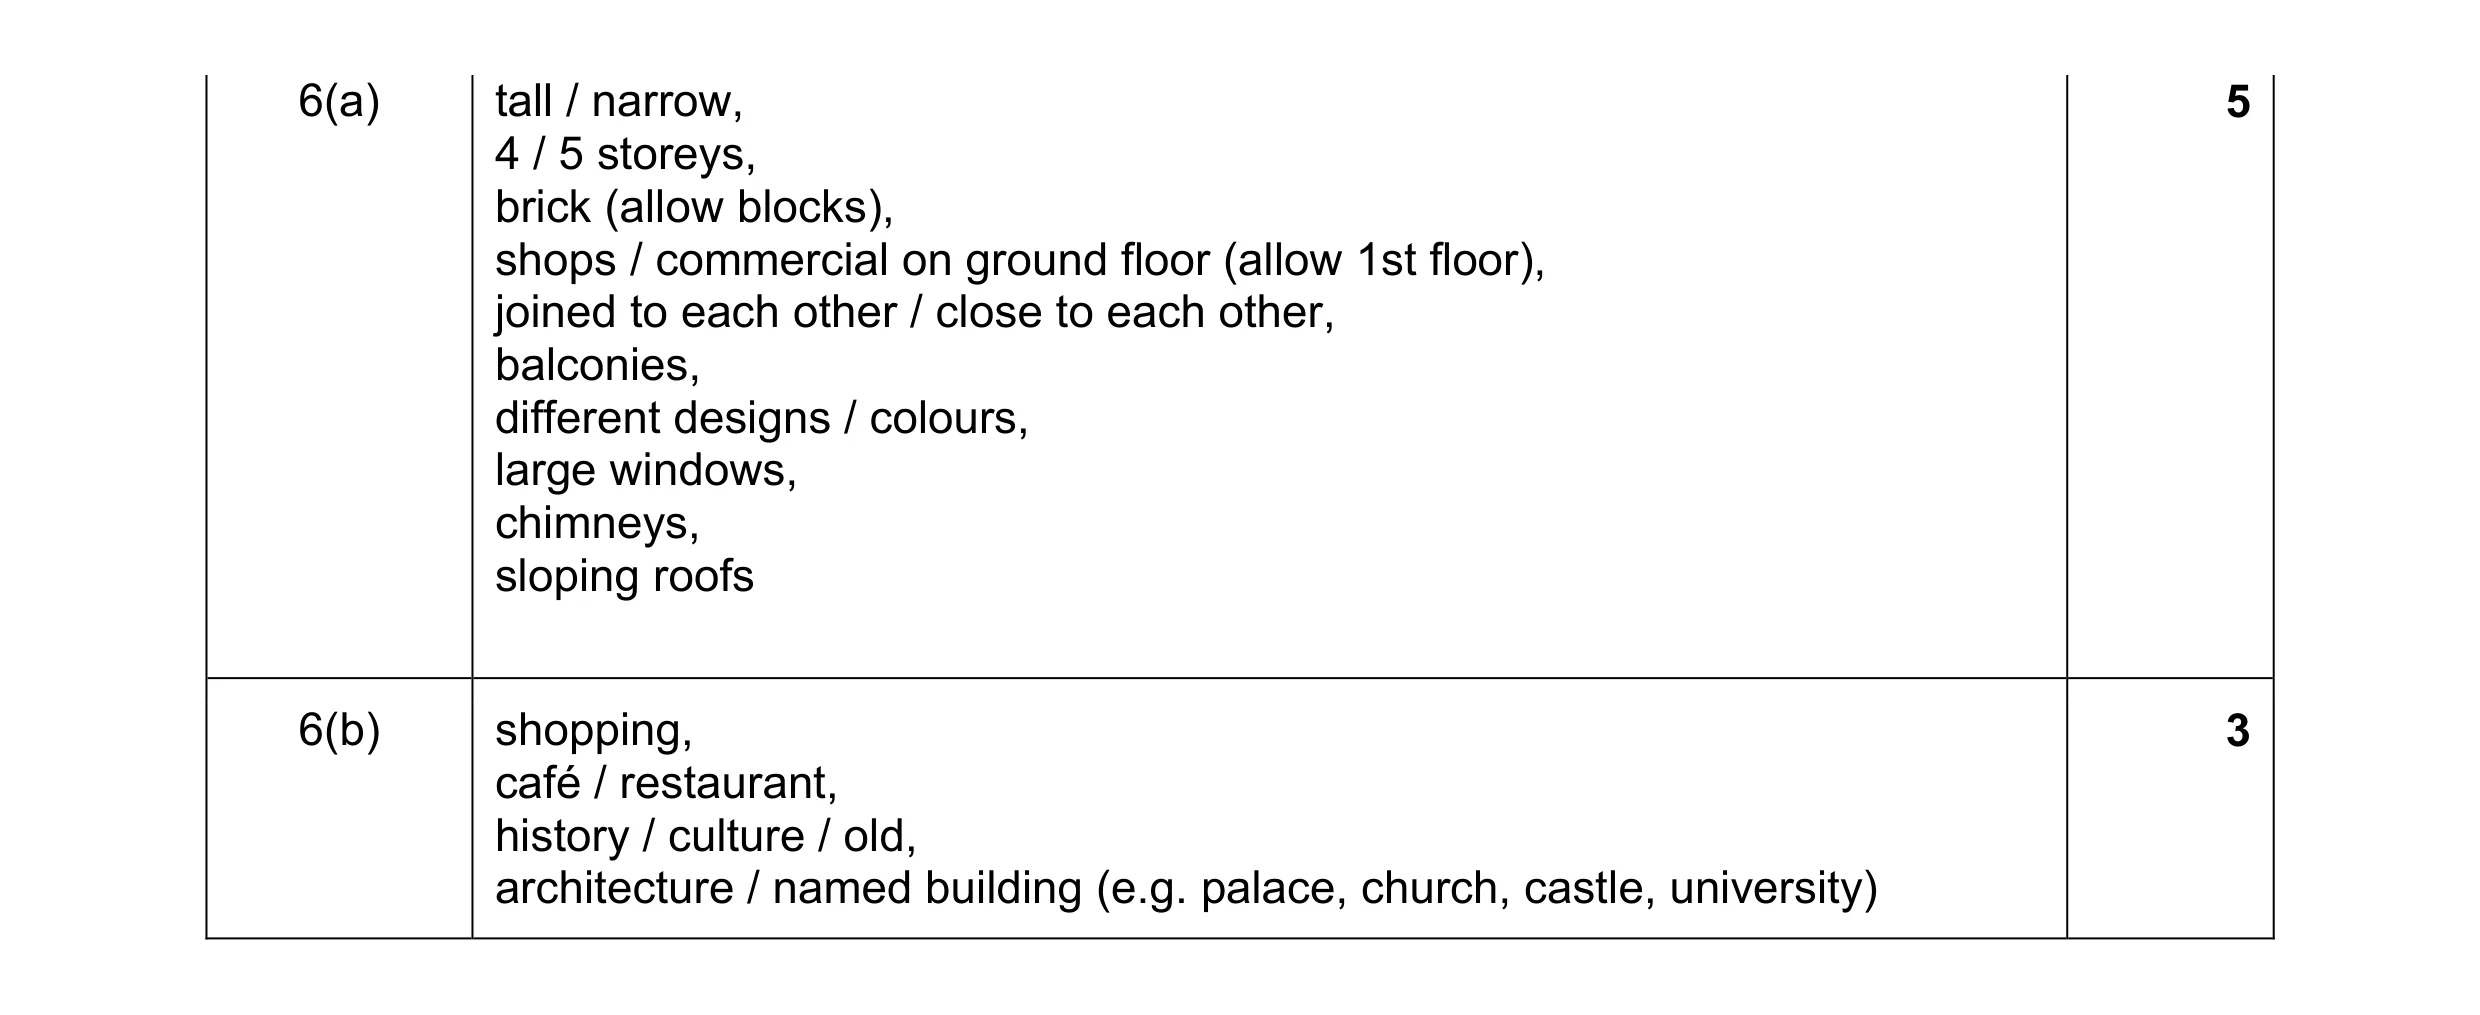 8
8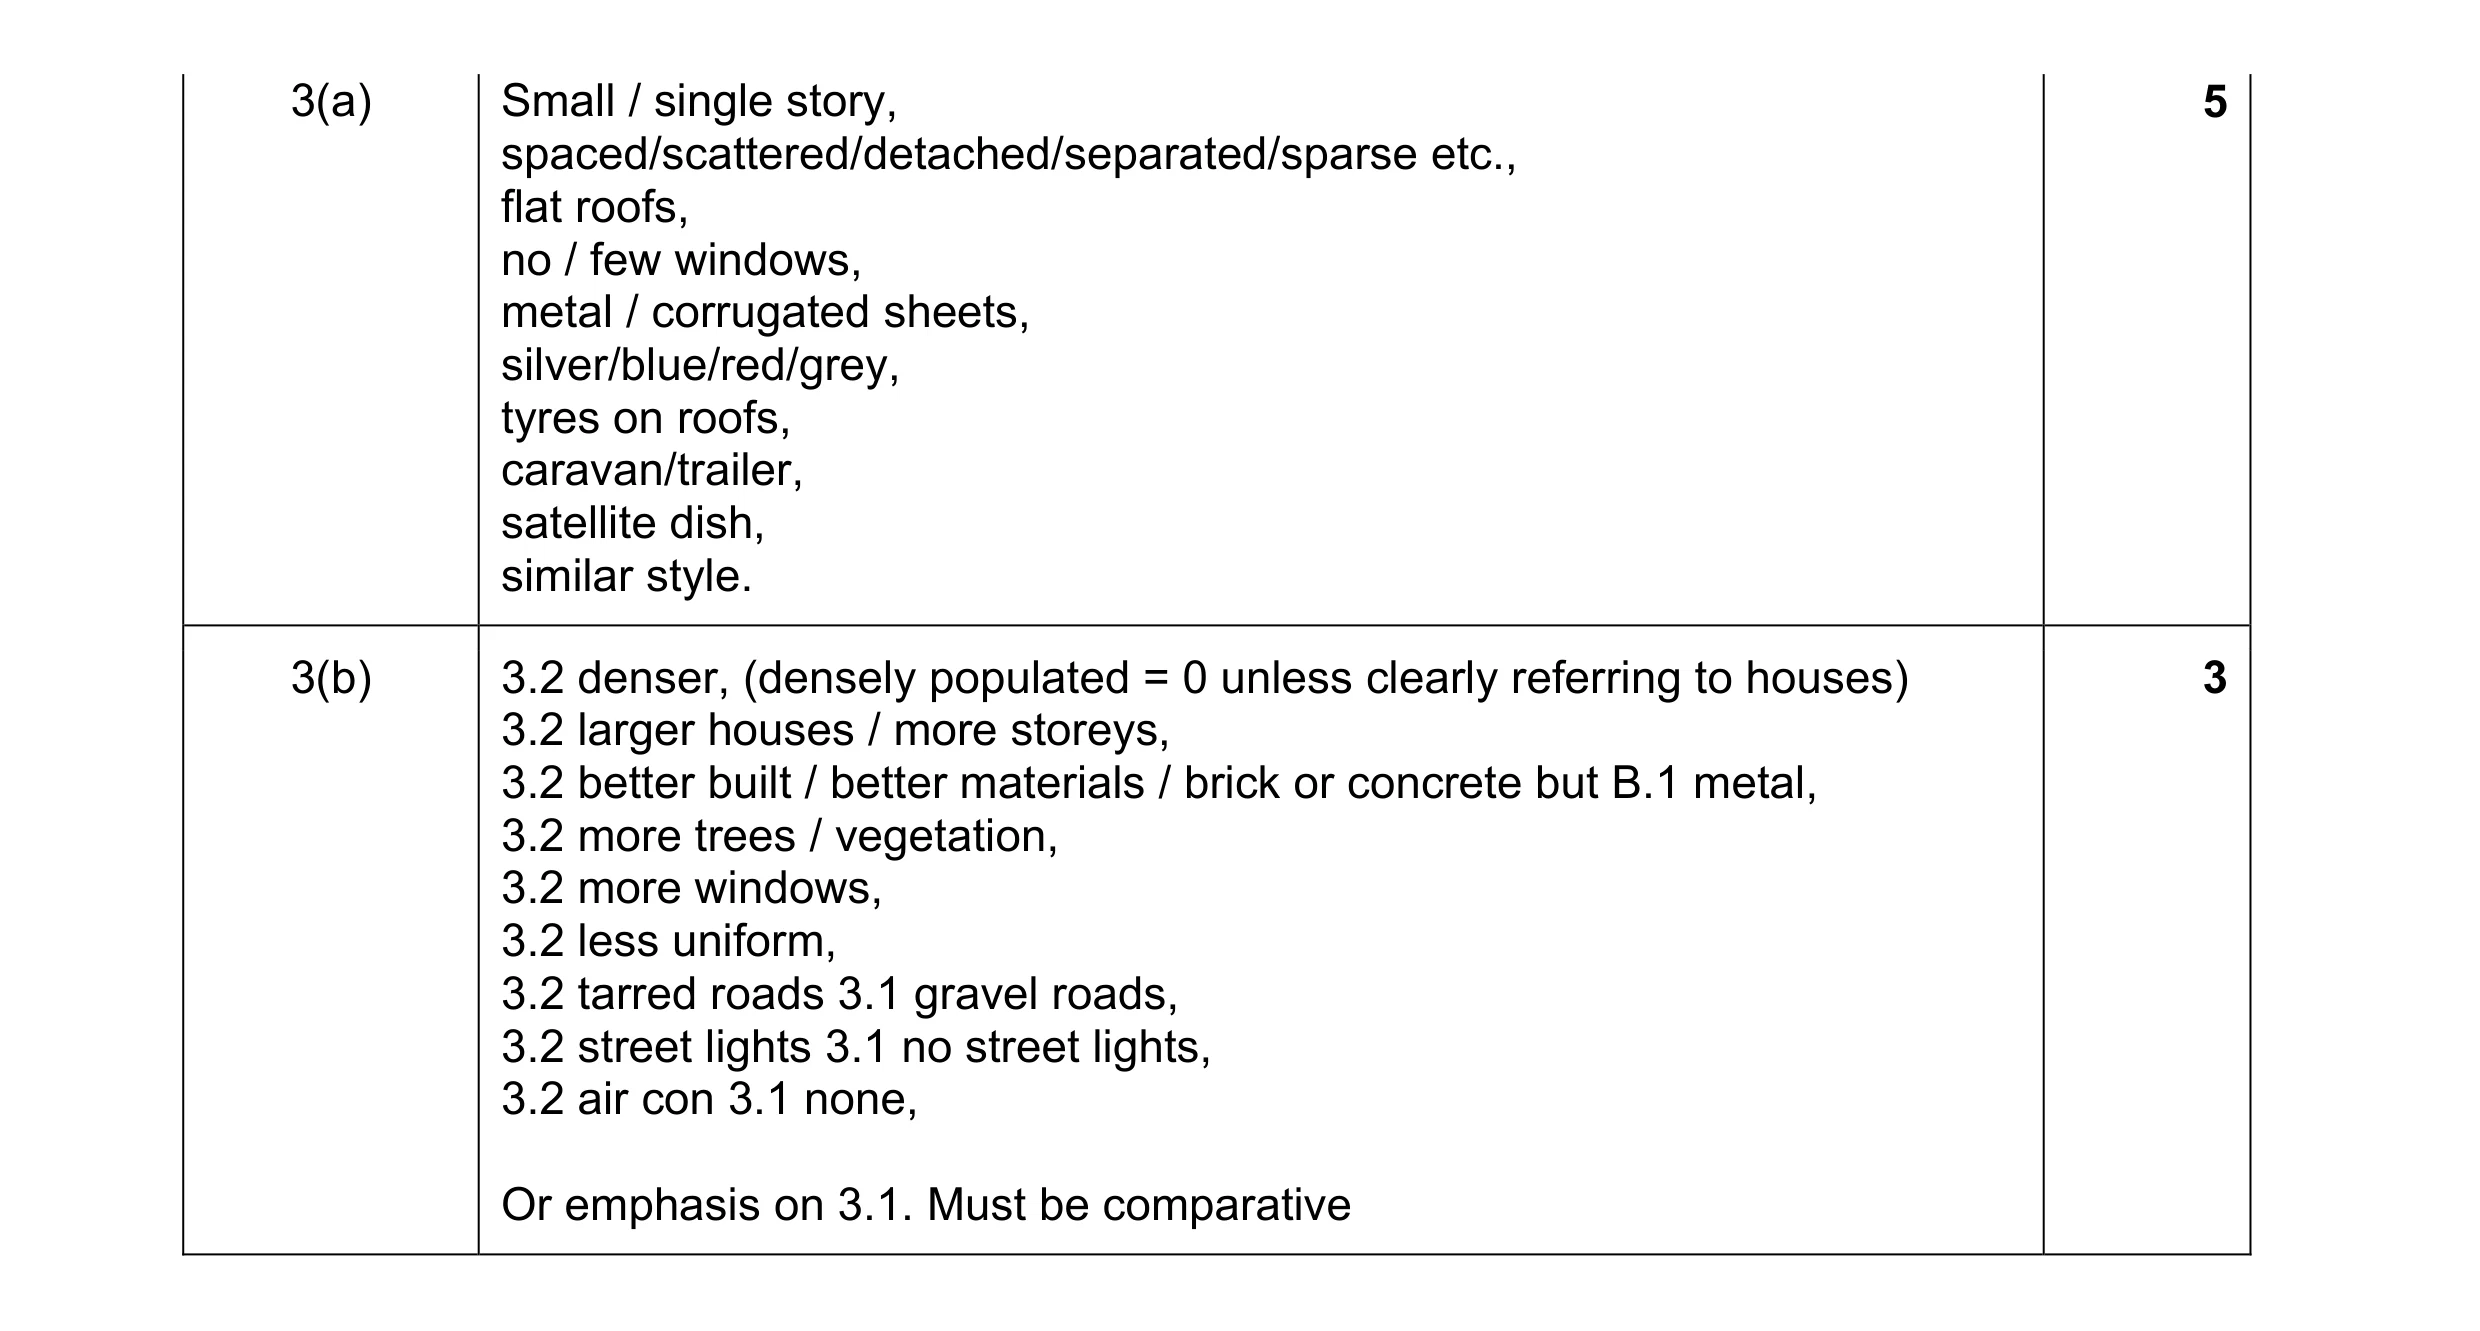 8
8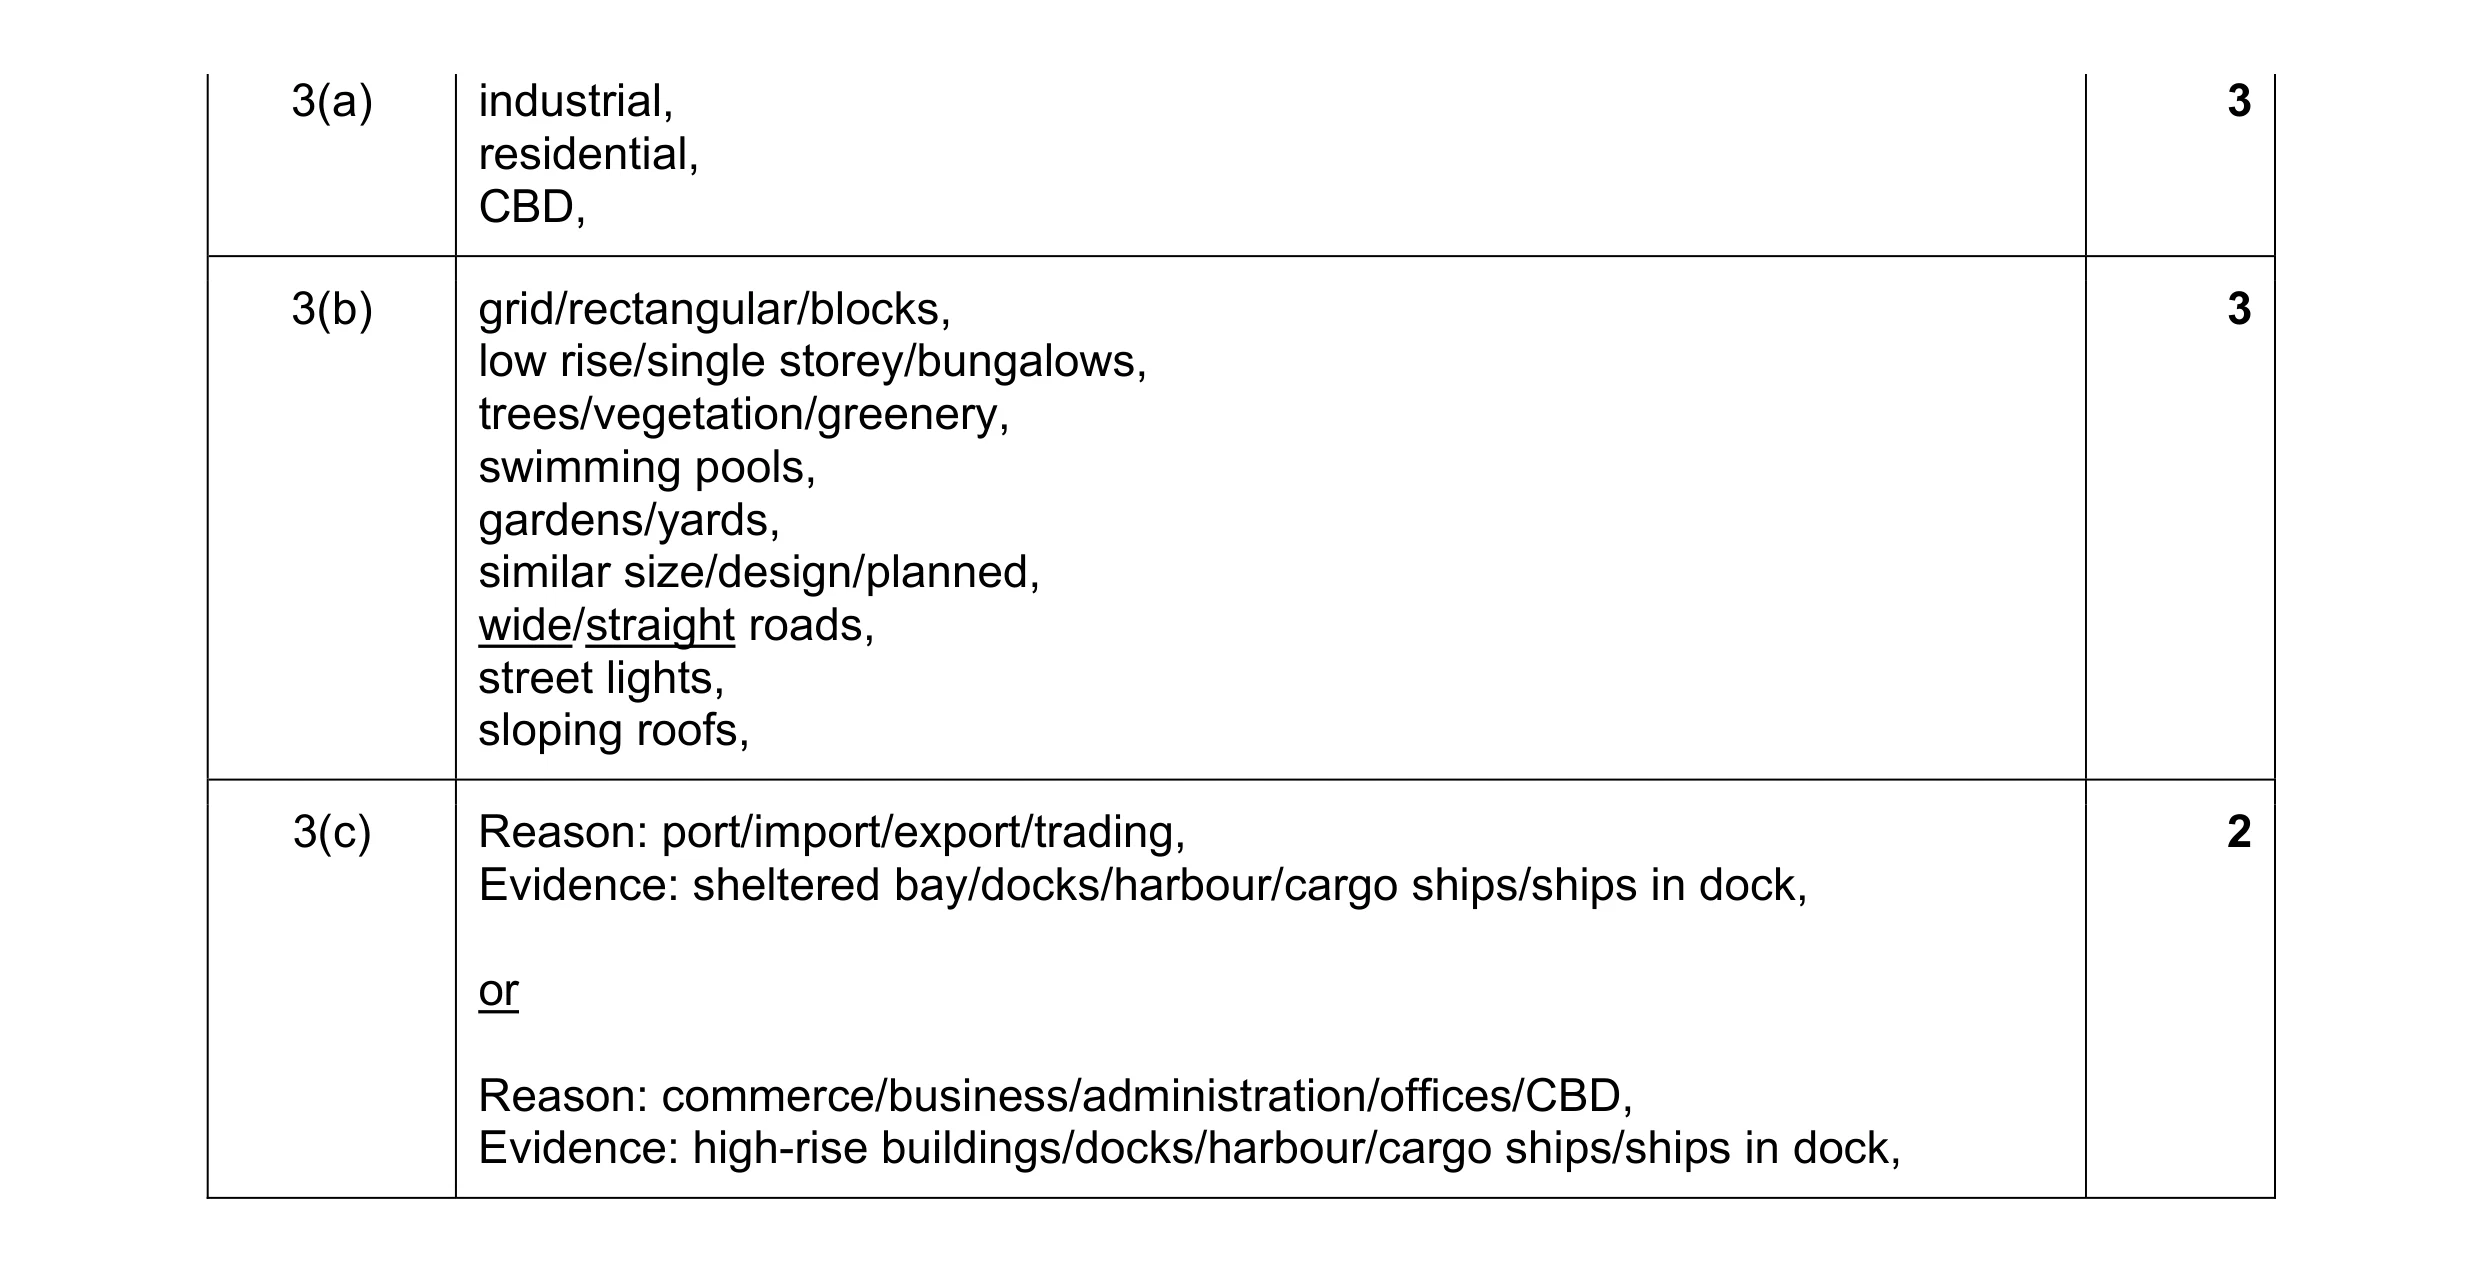 8
8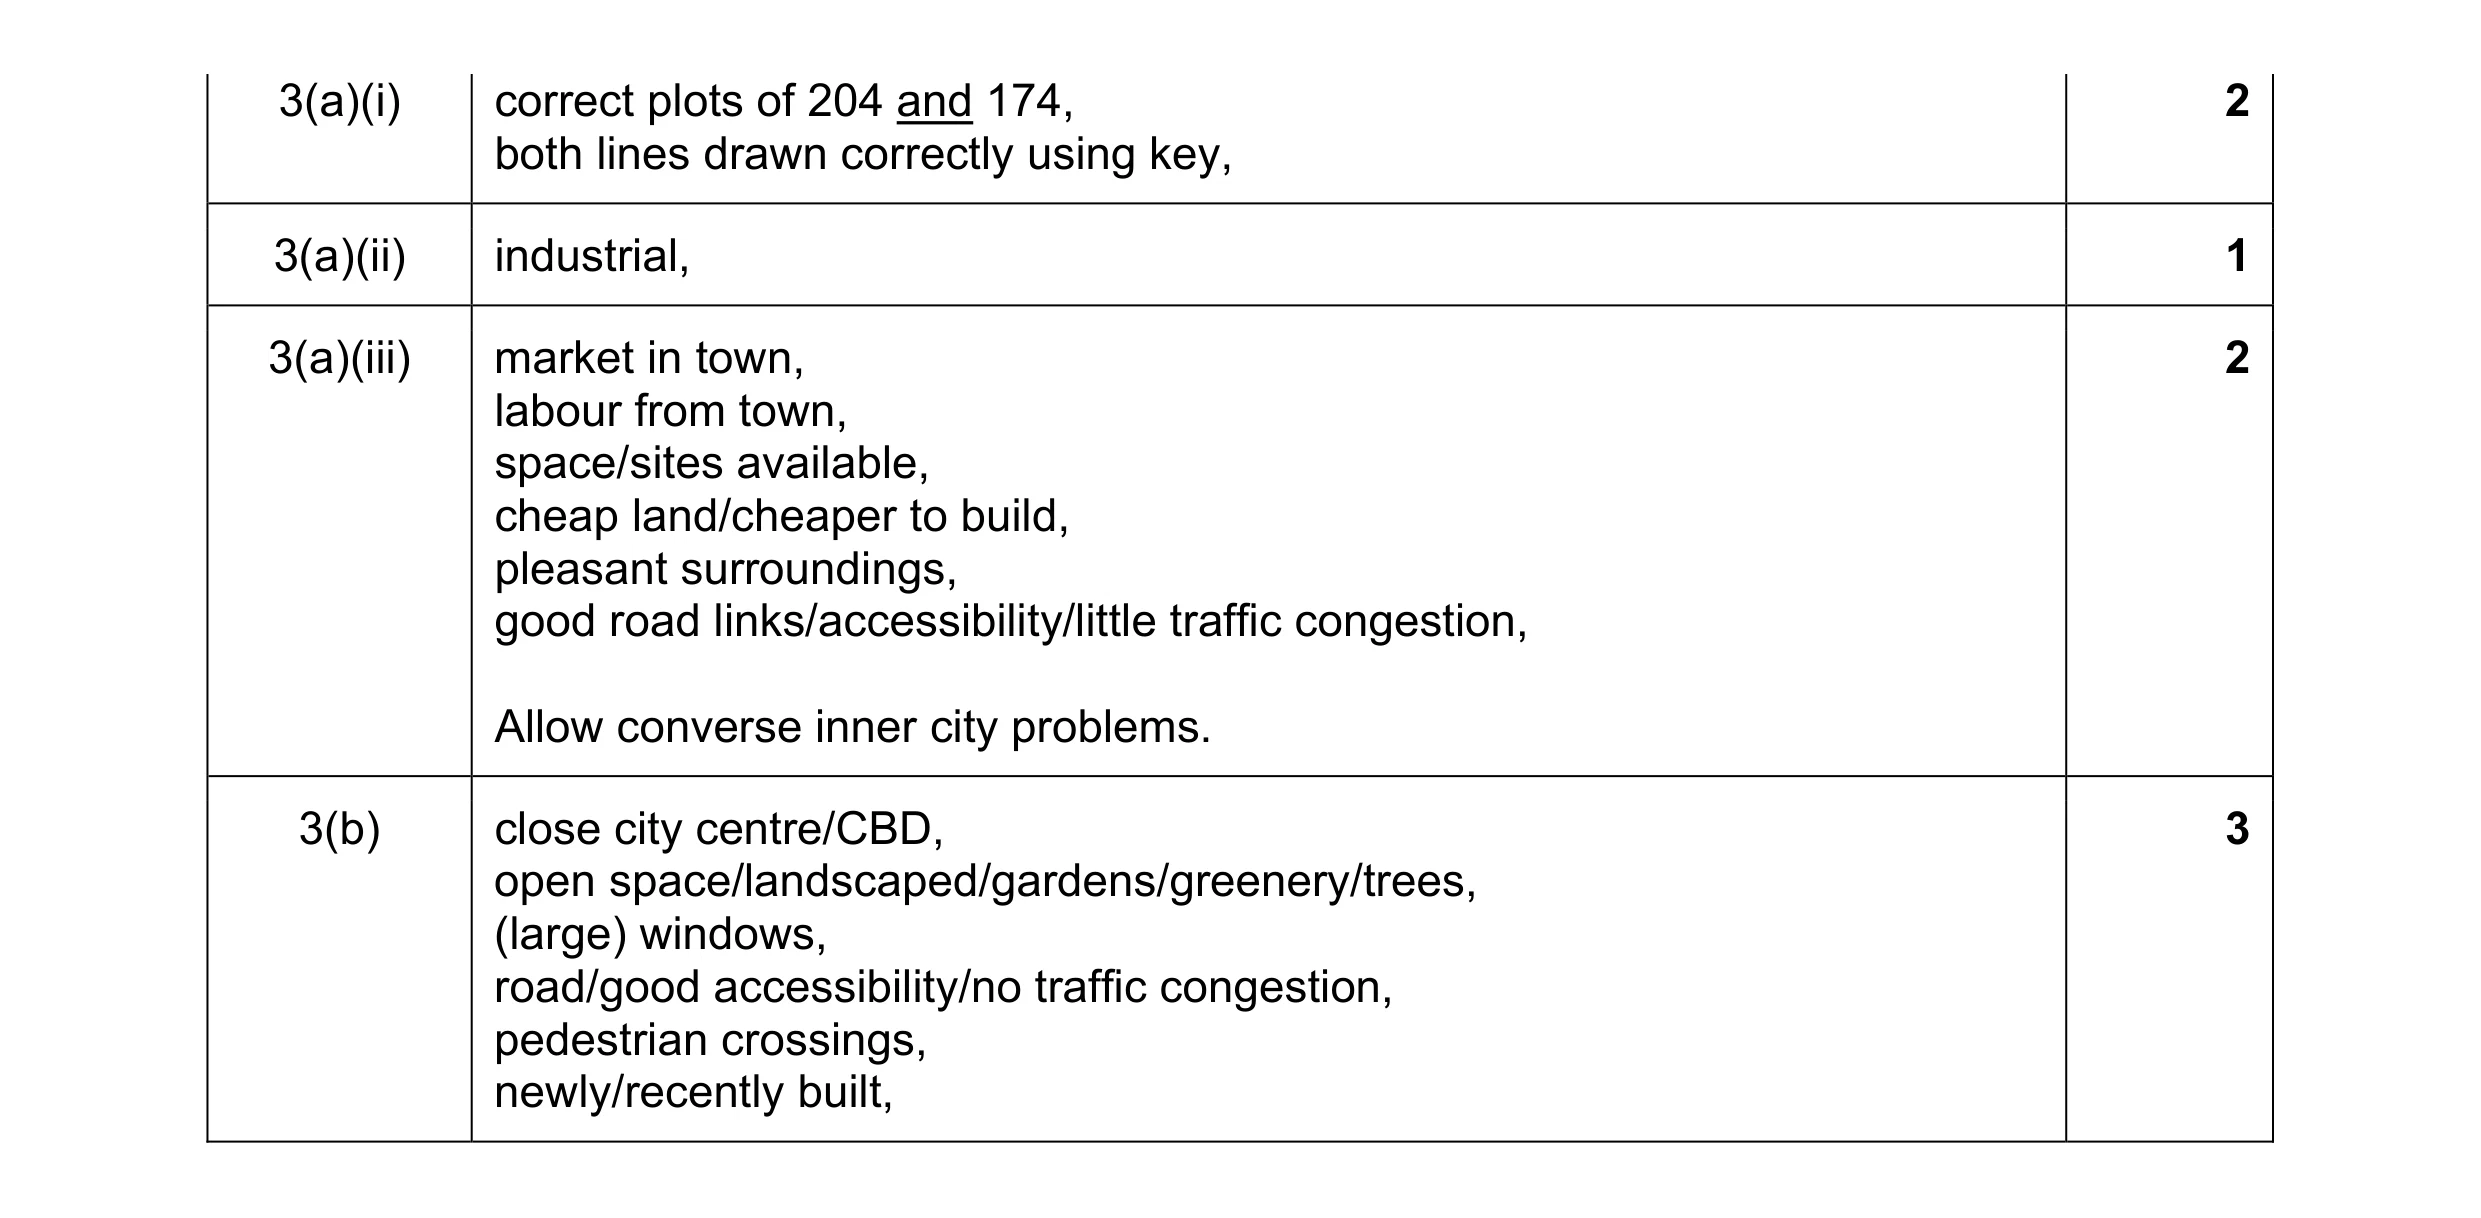 8
8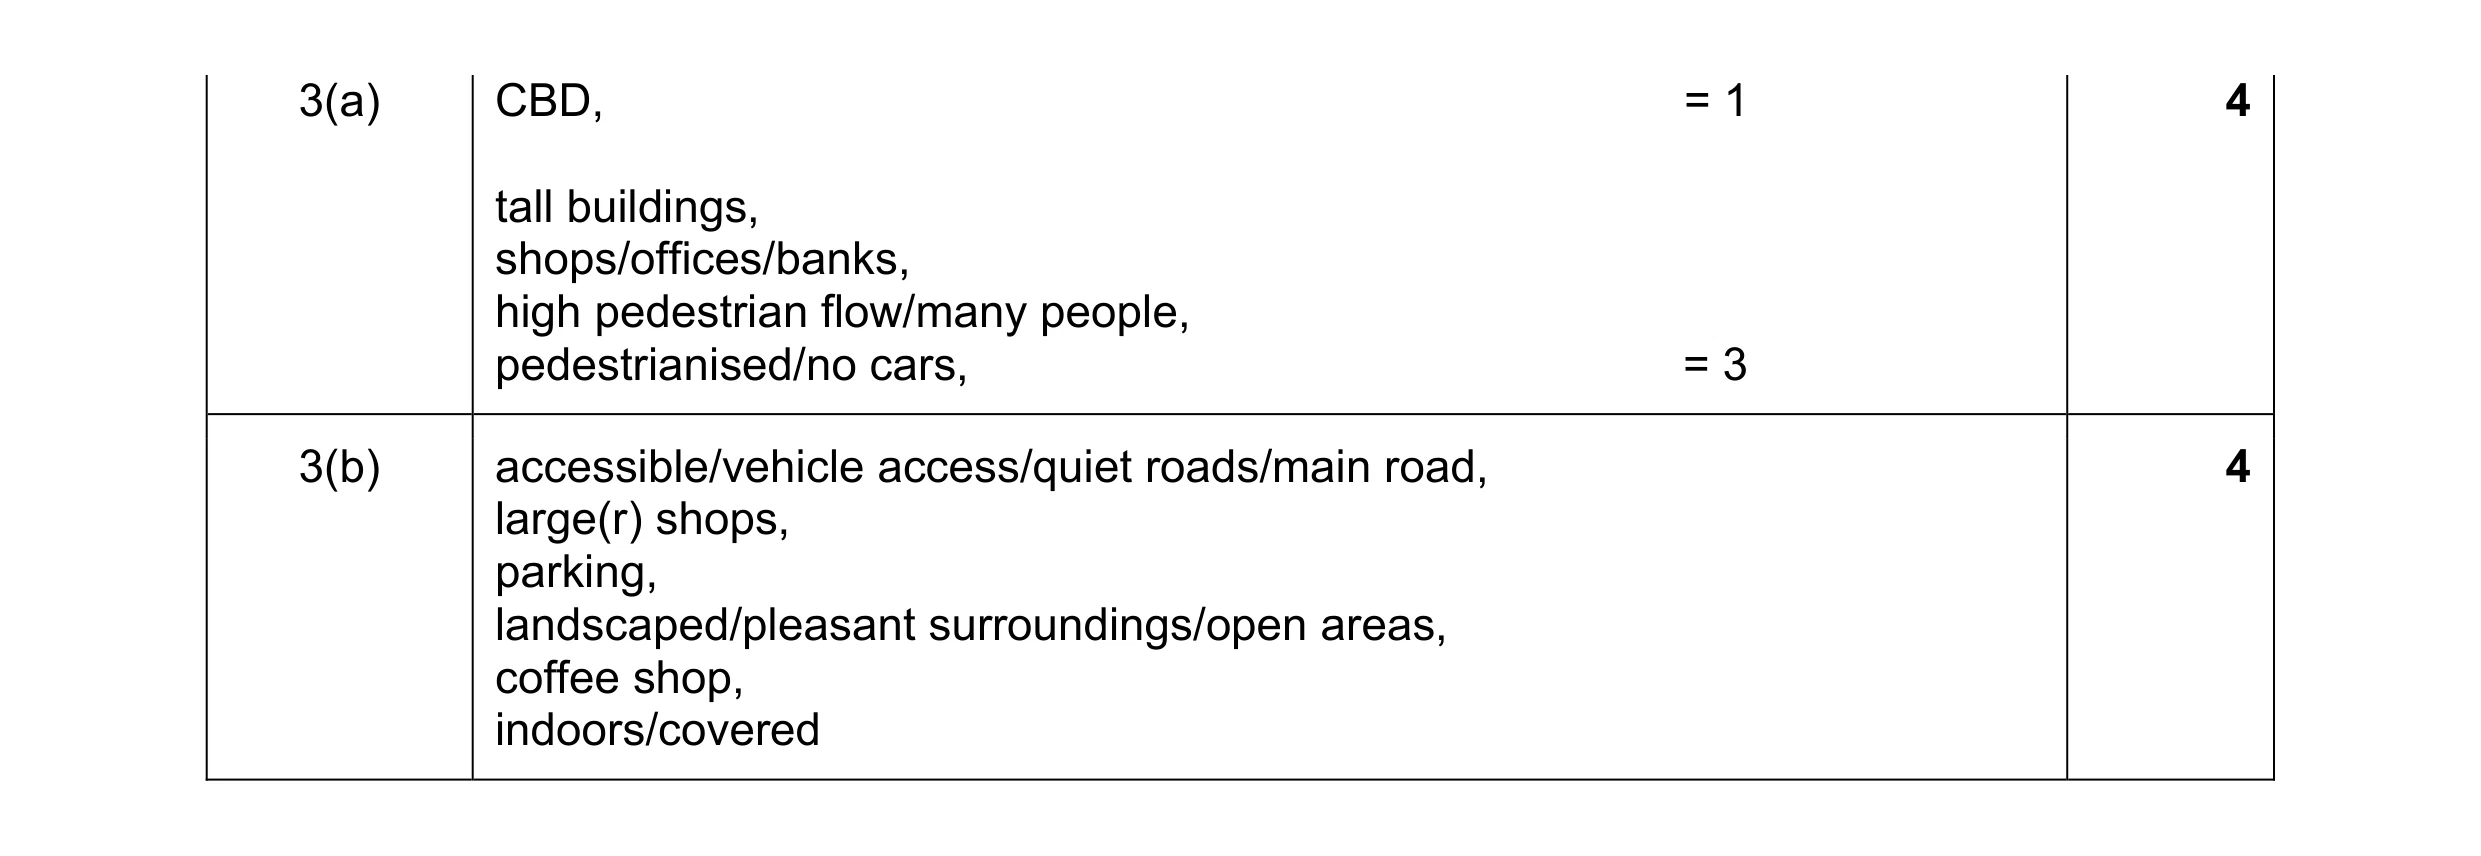 8
8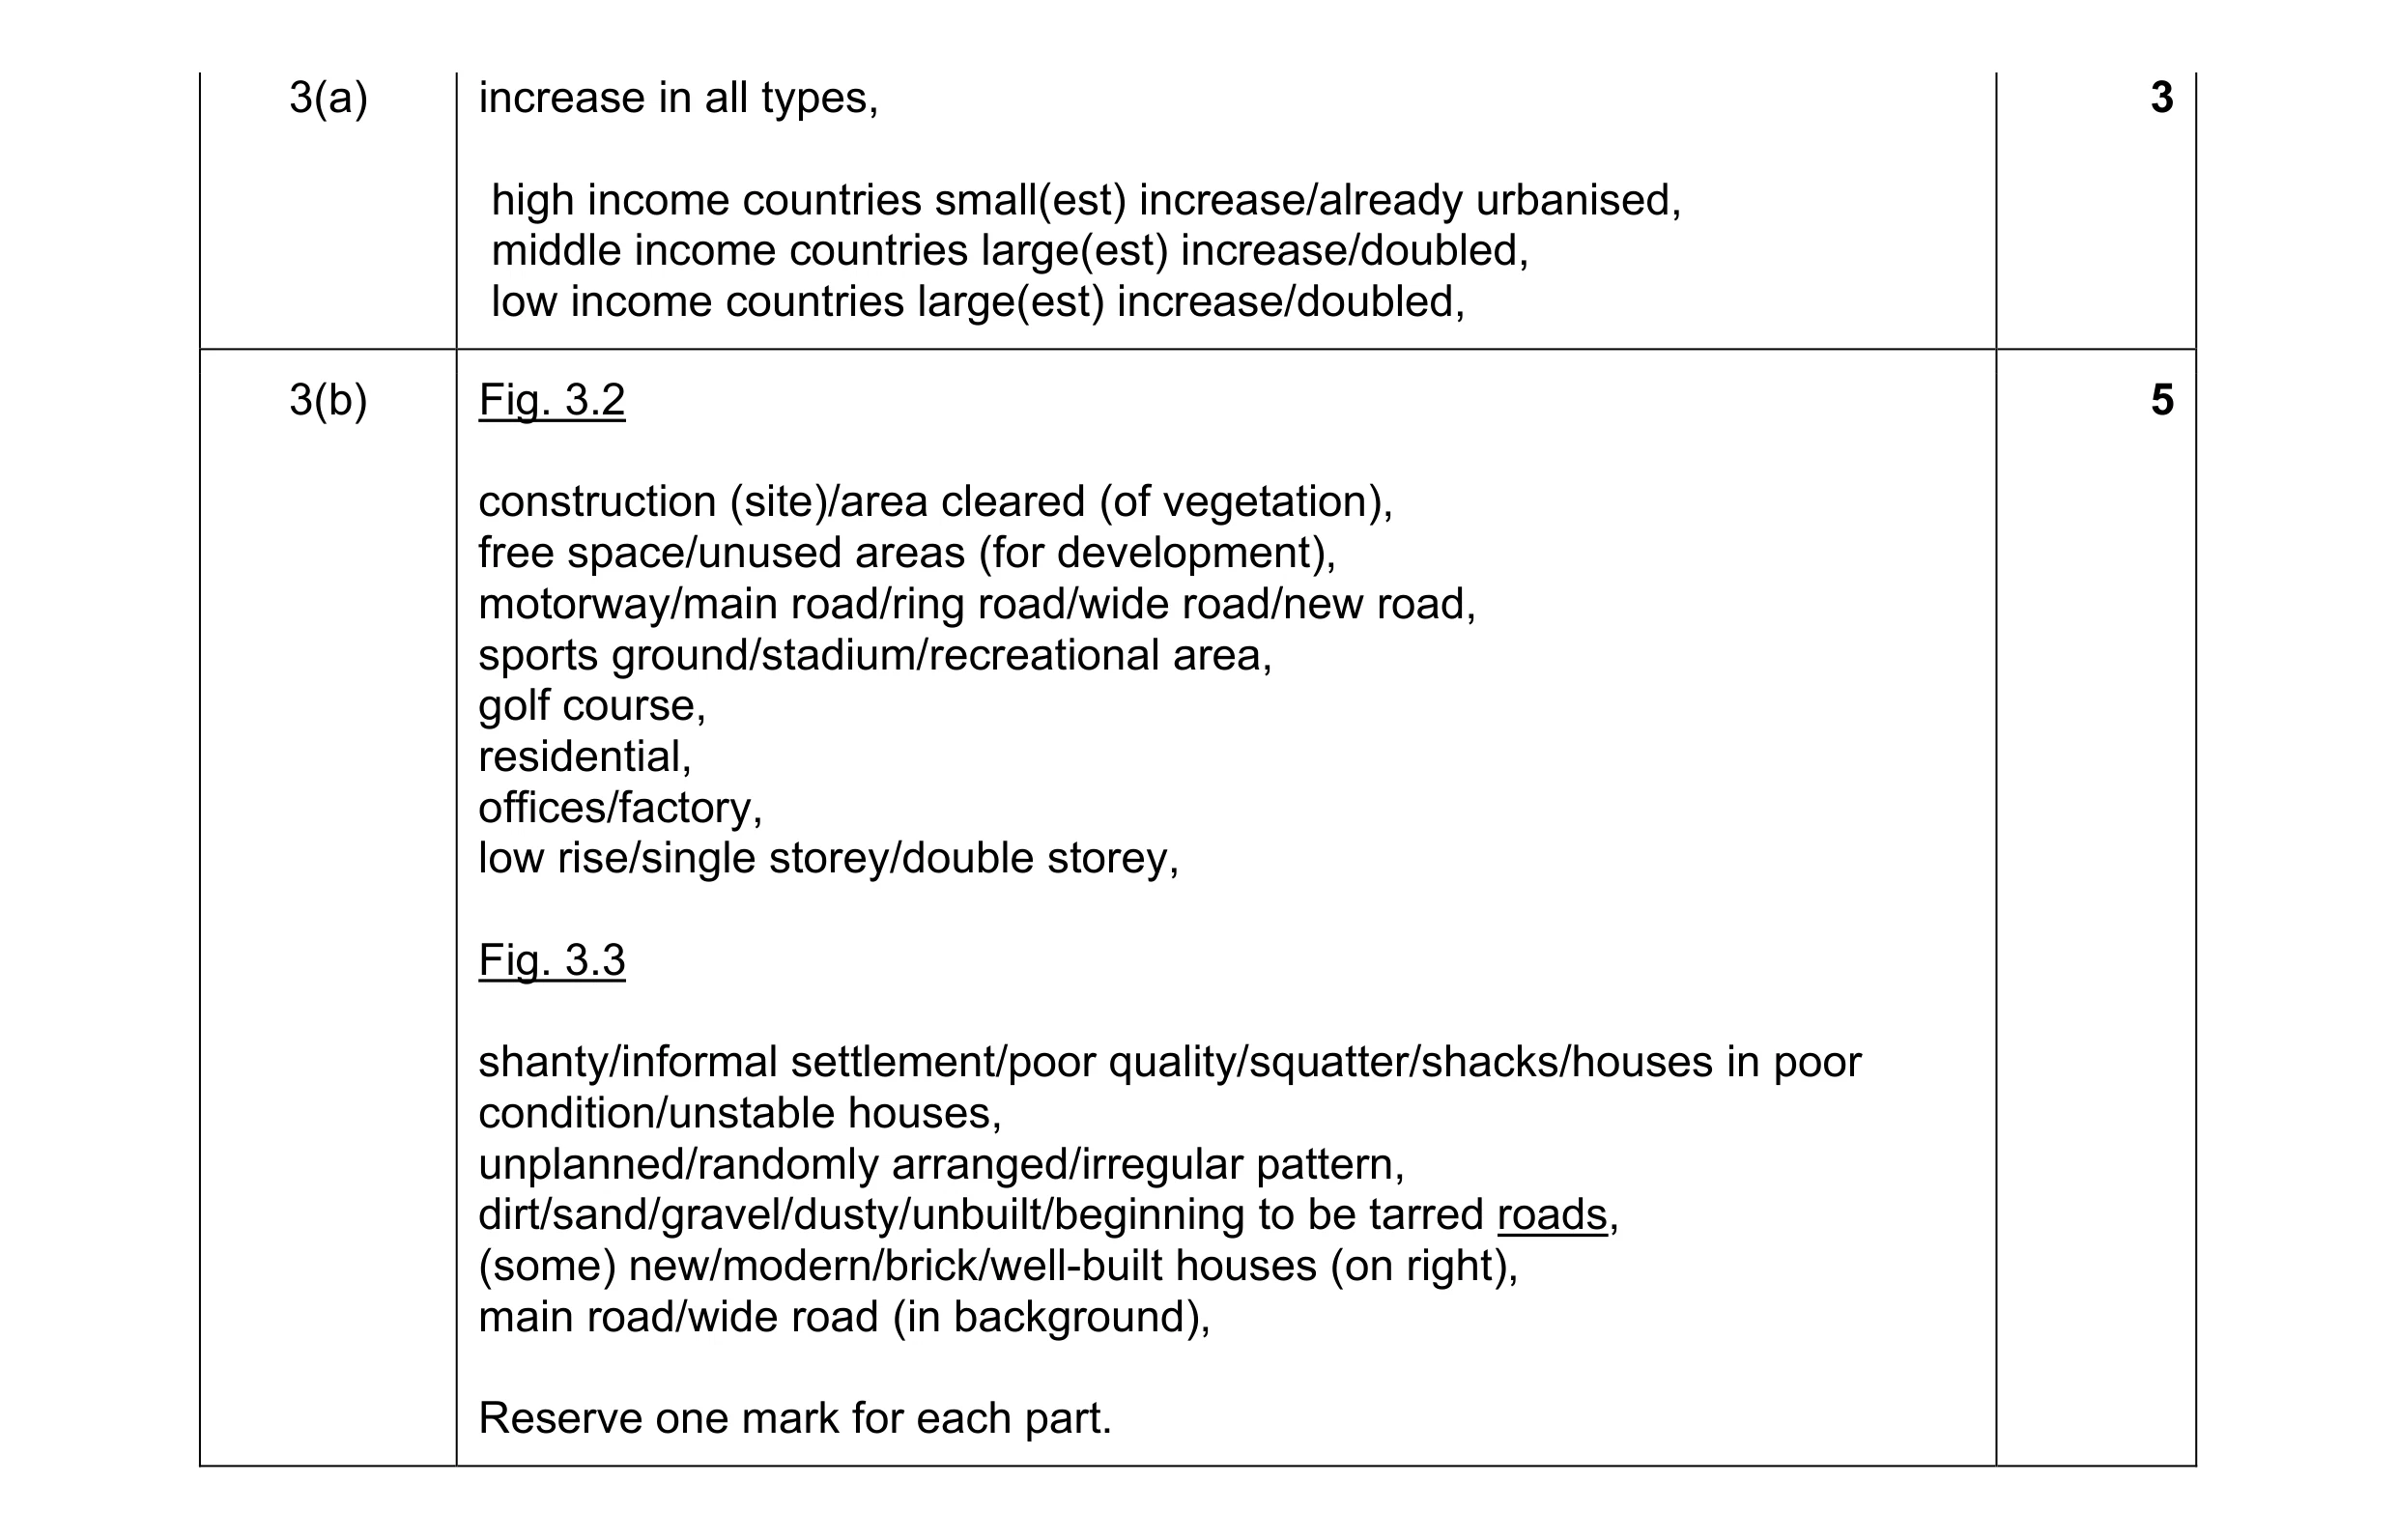 8
8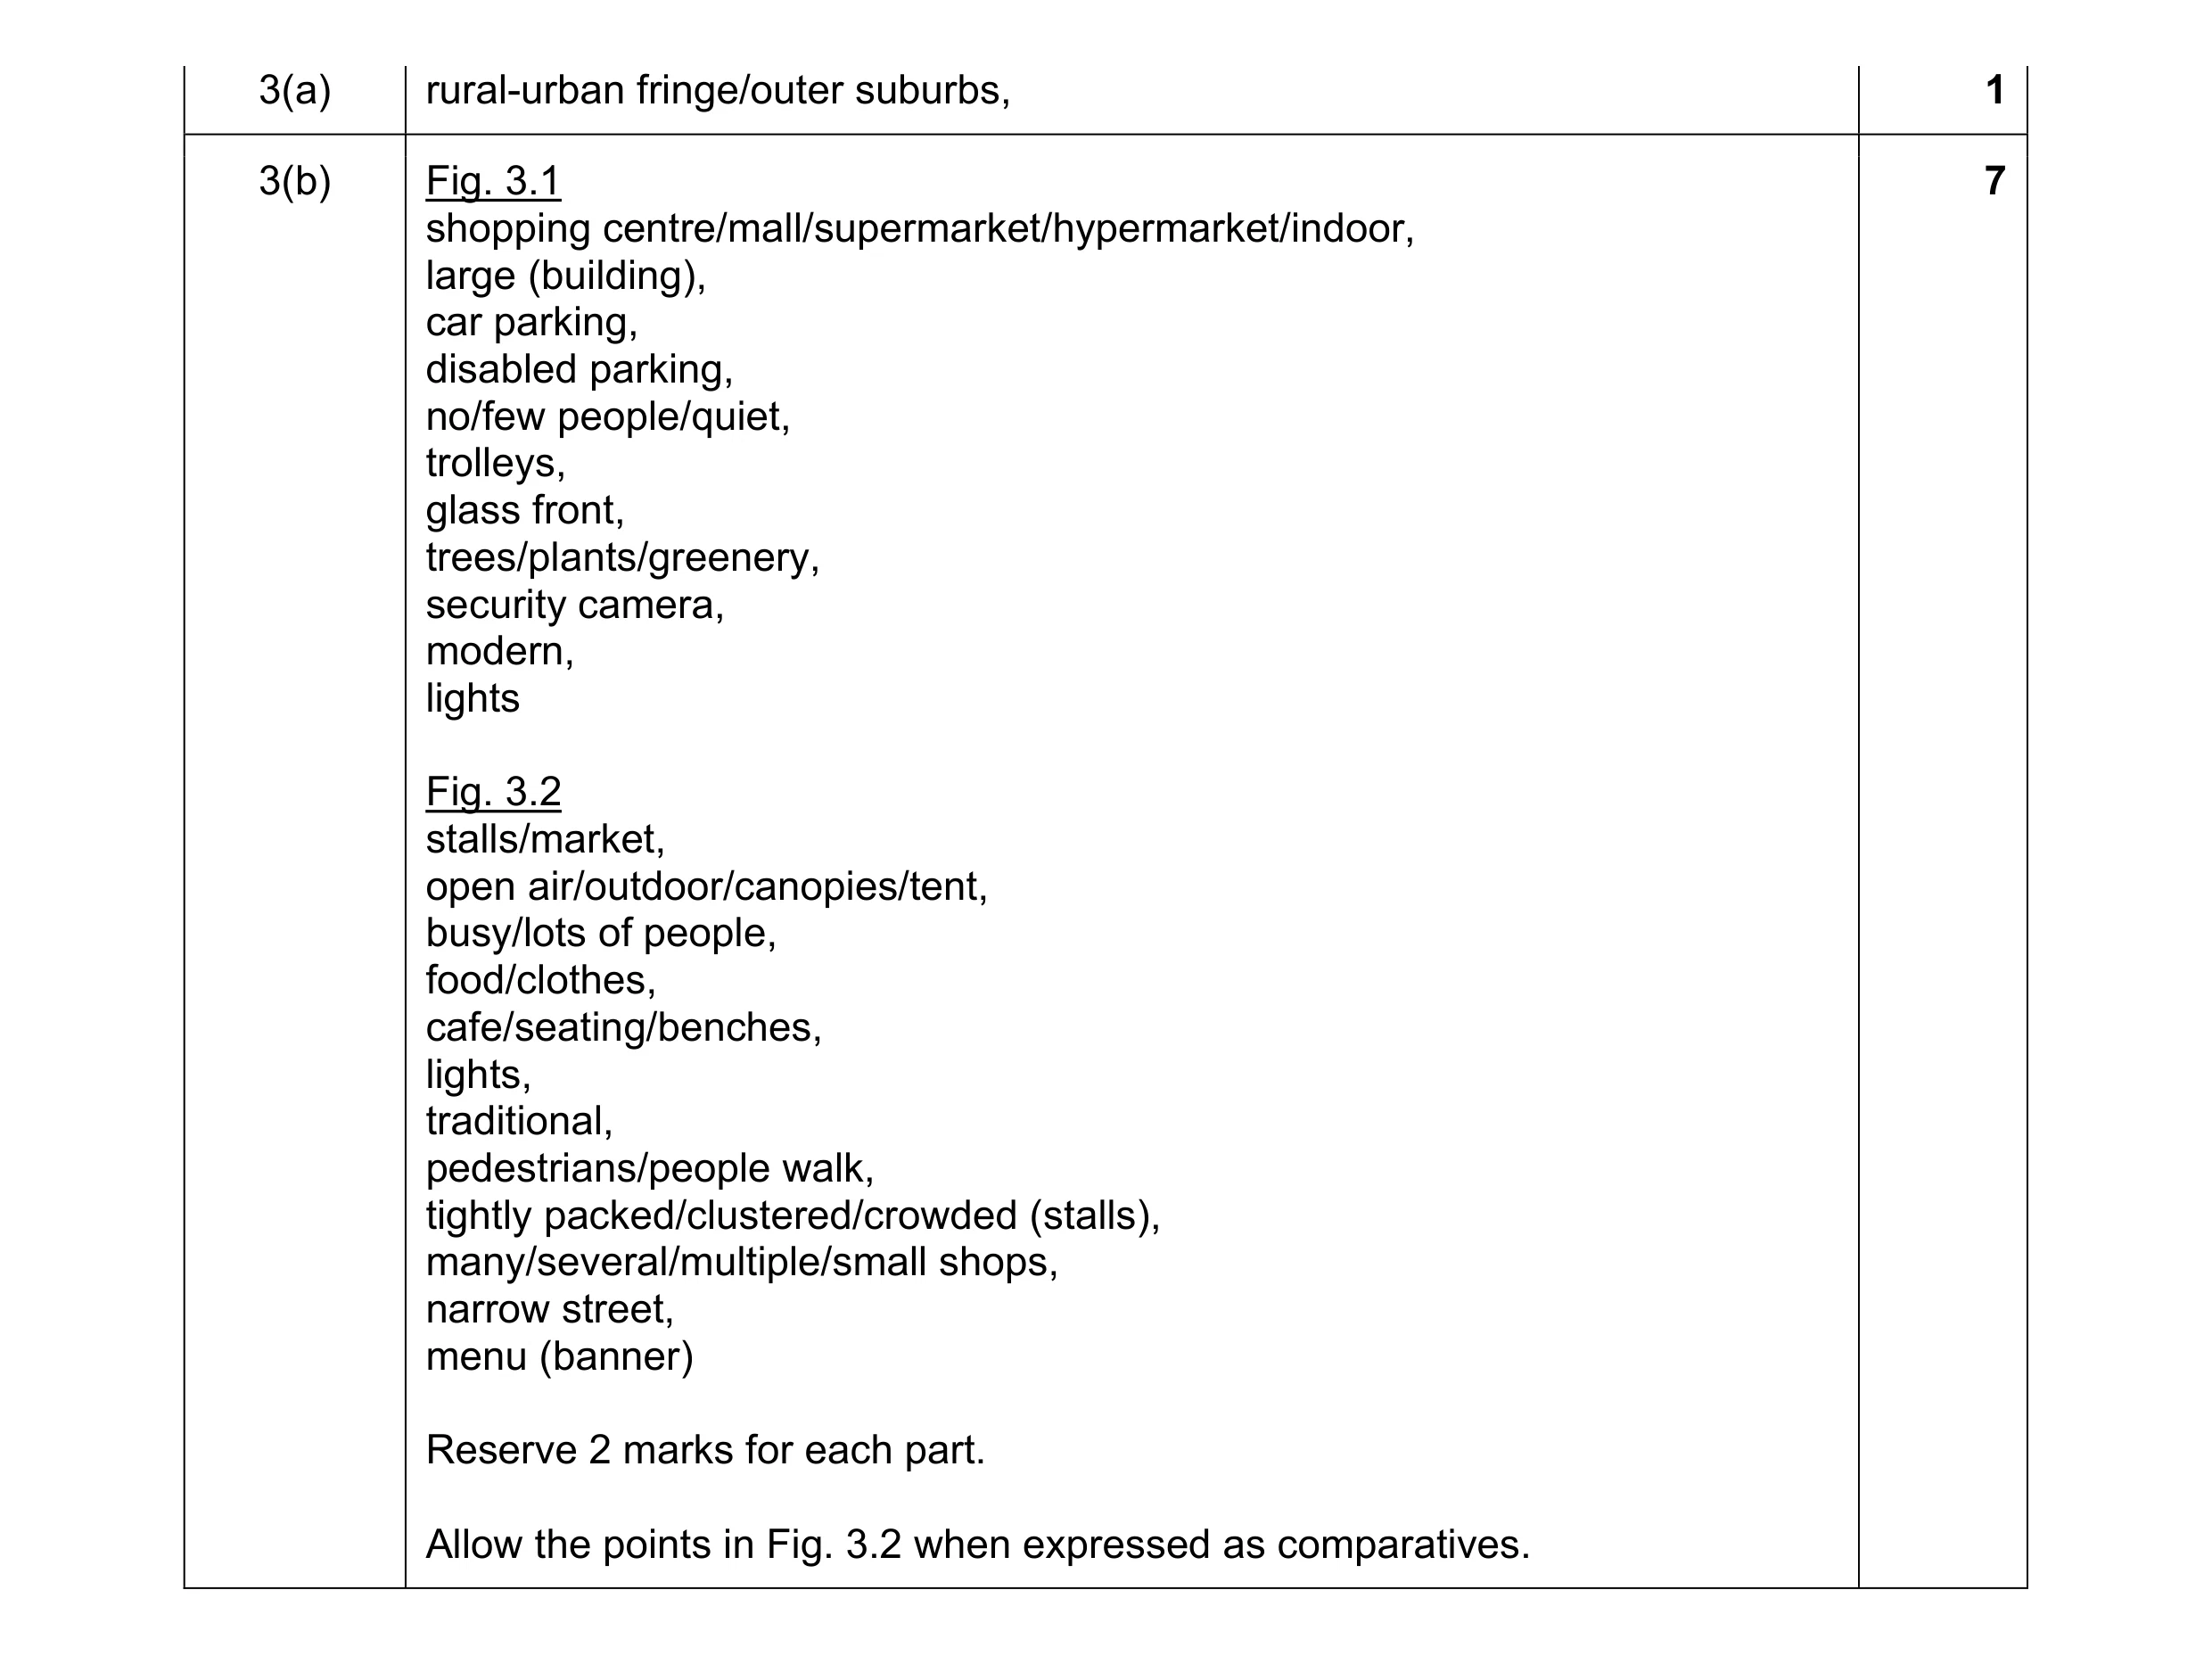 8
8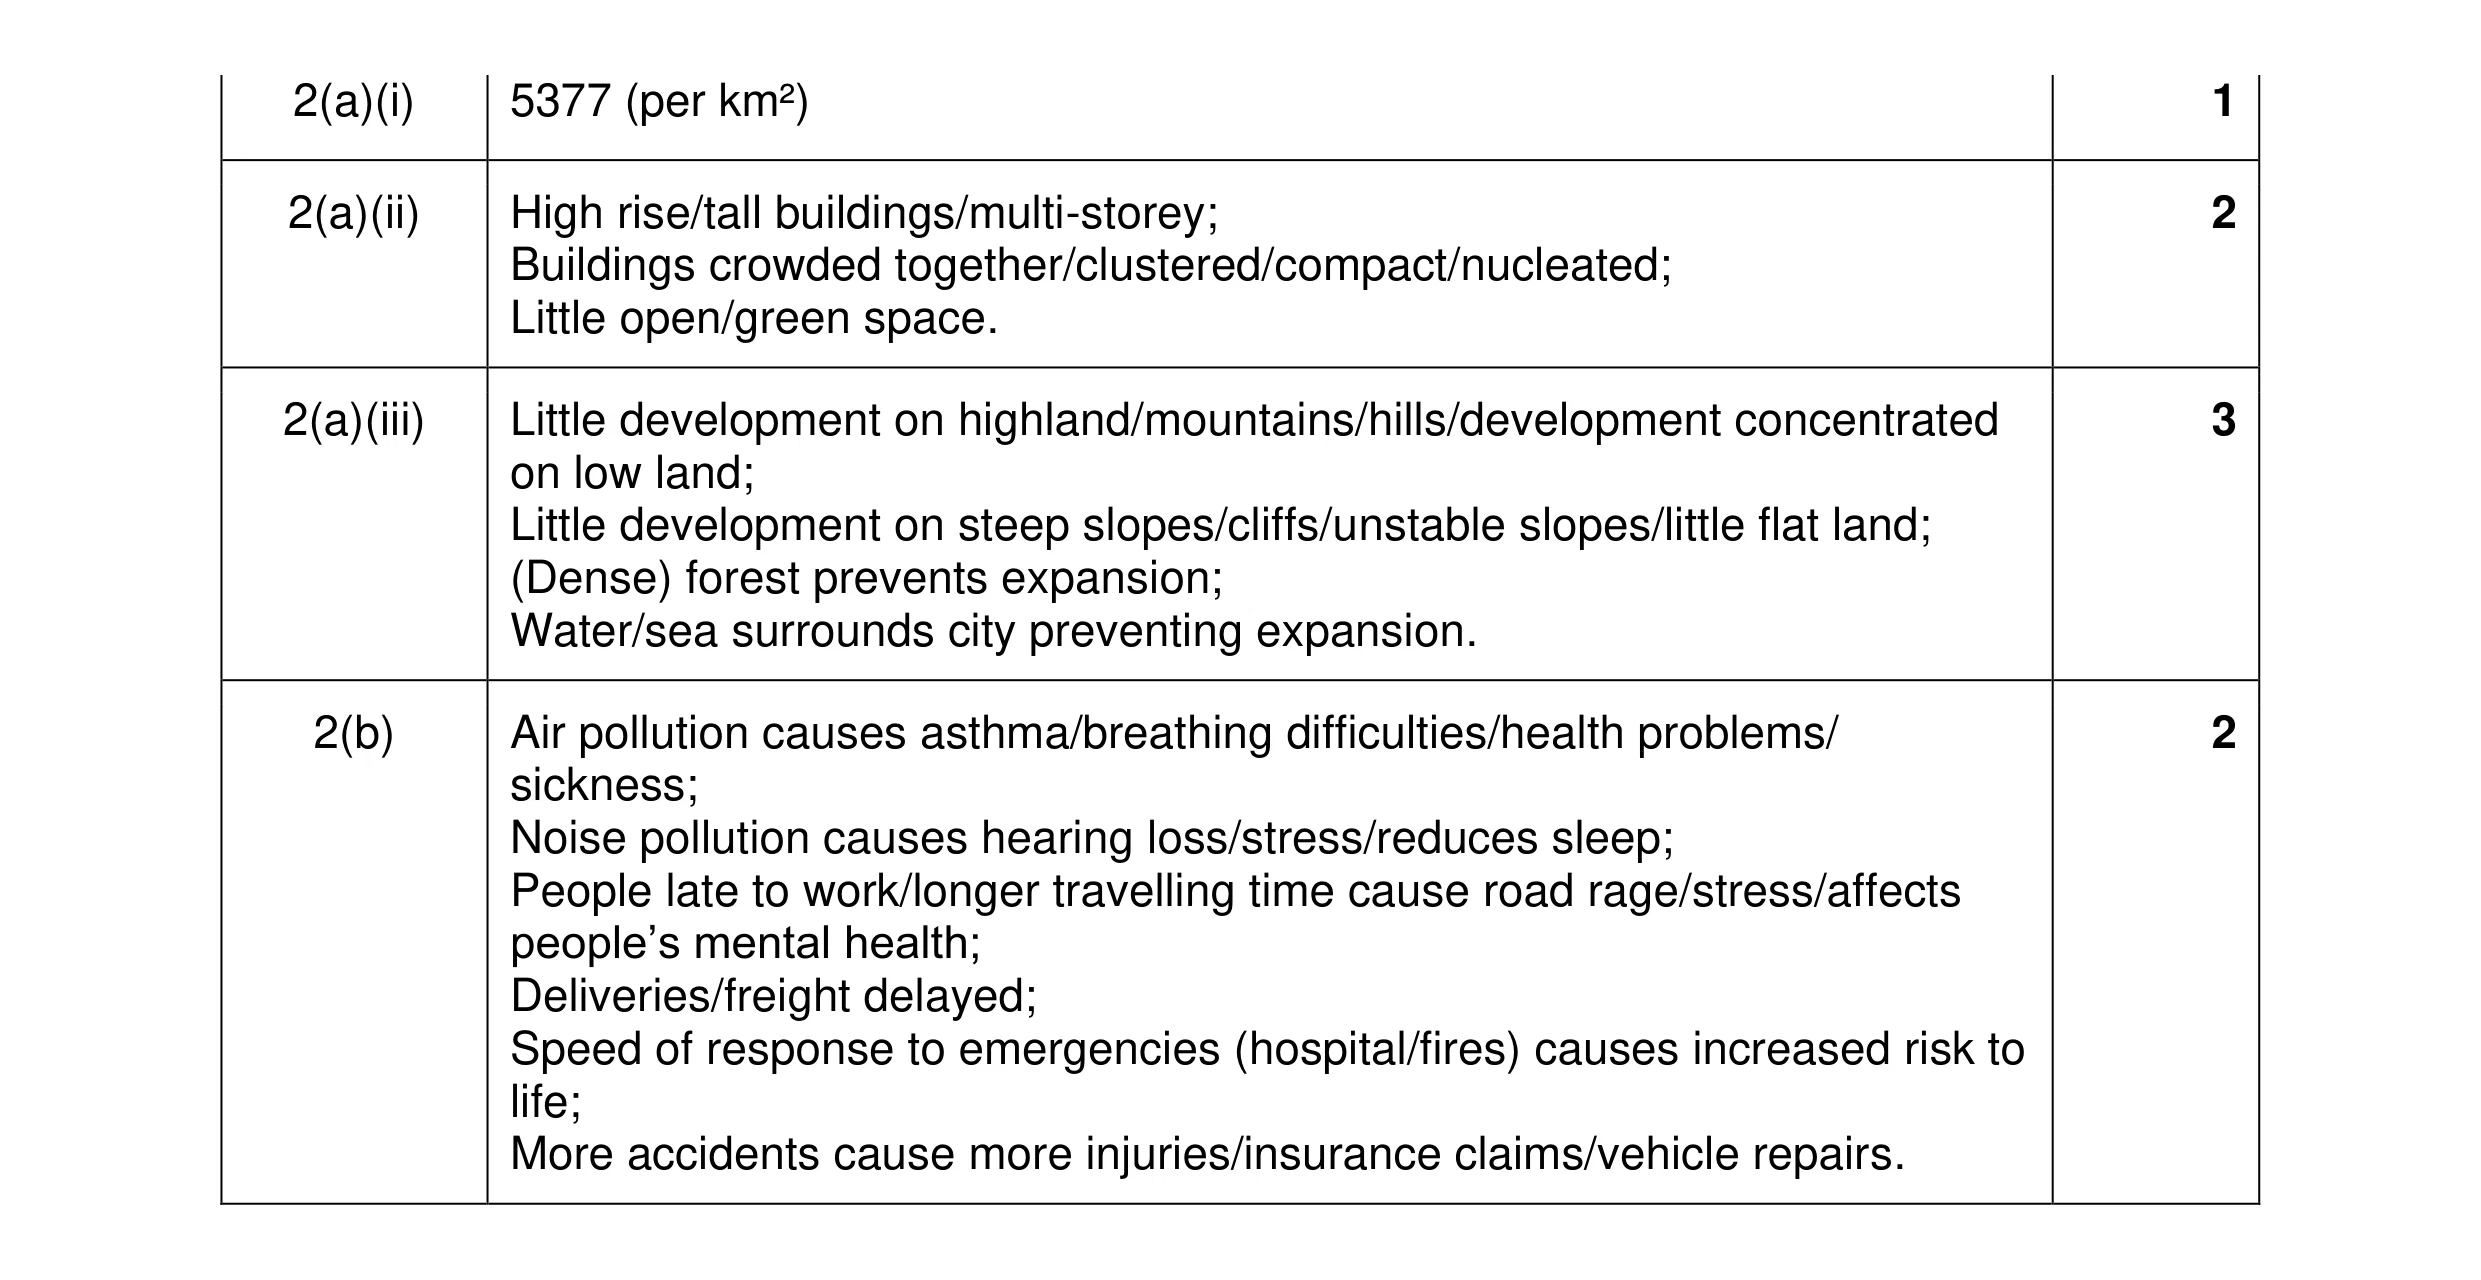 8
8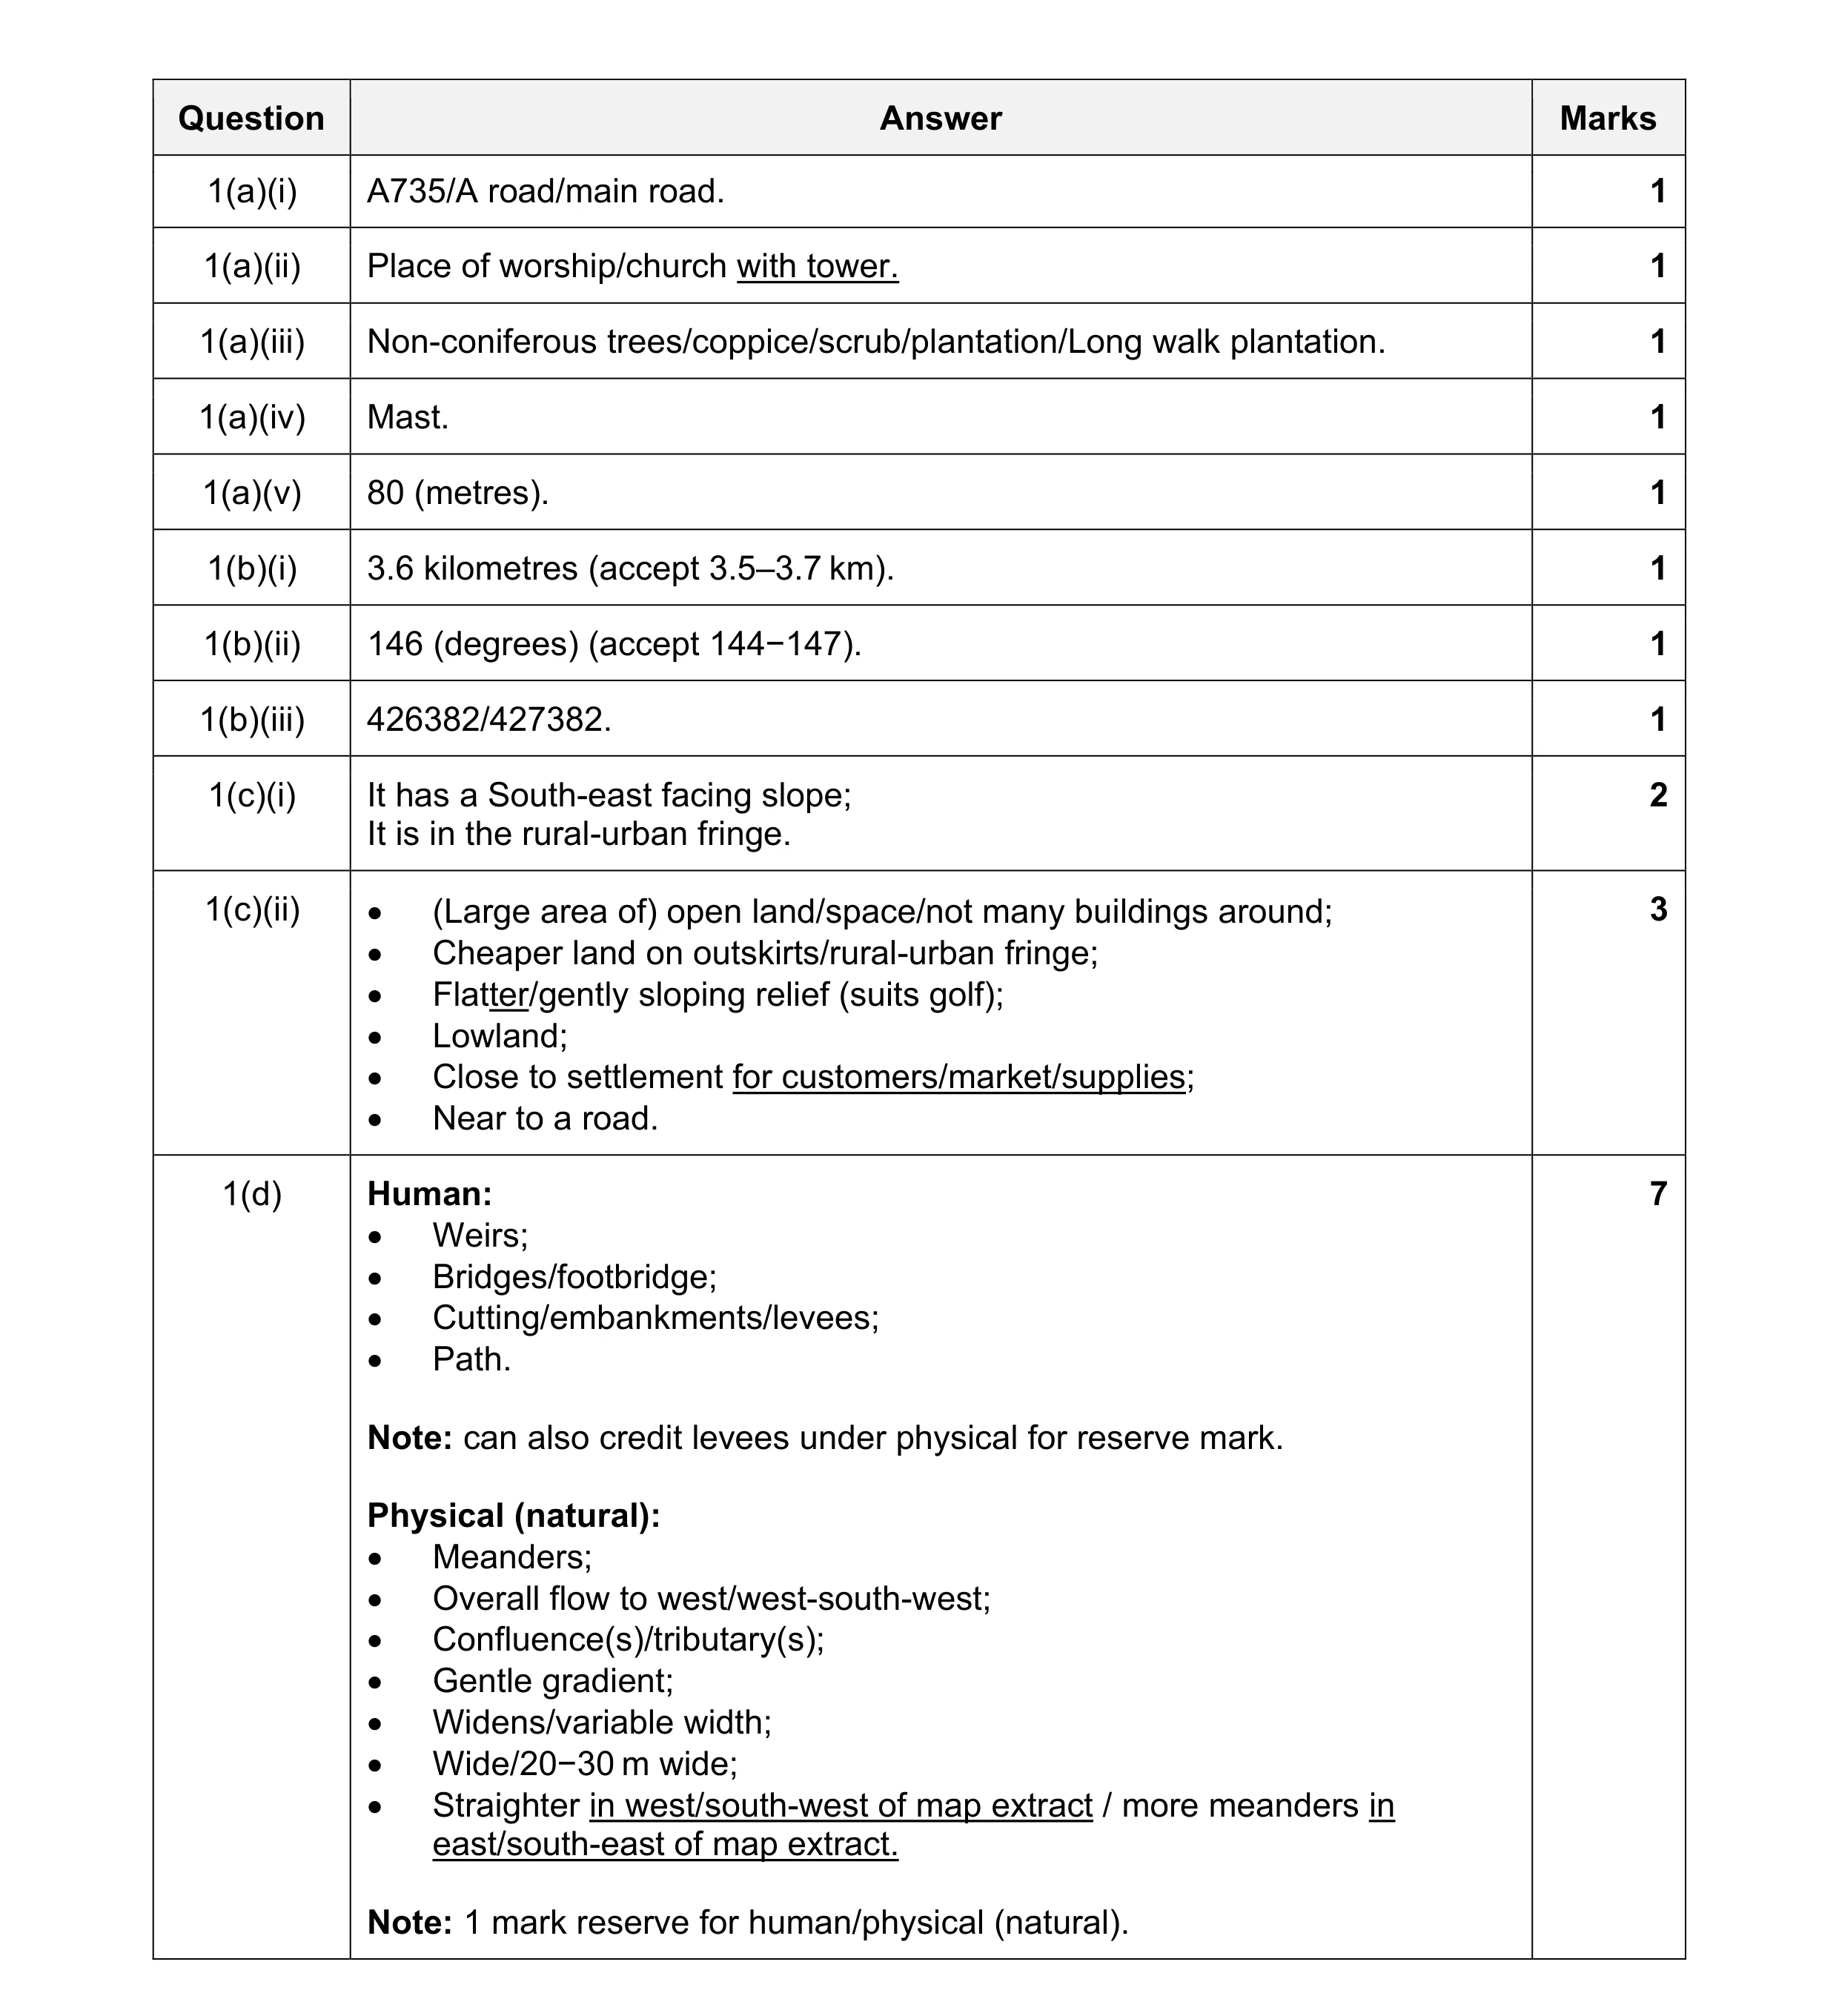 20
20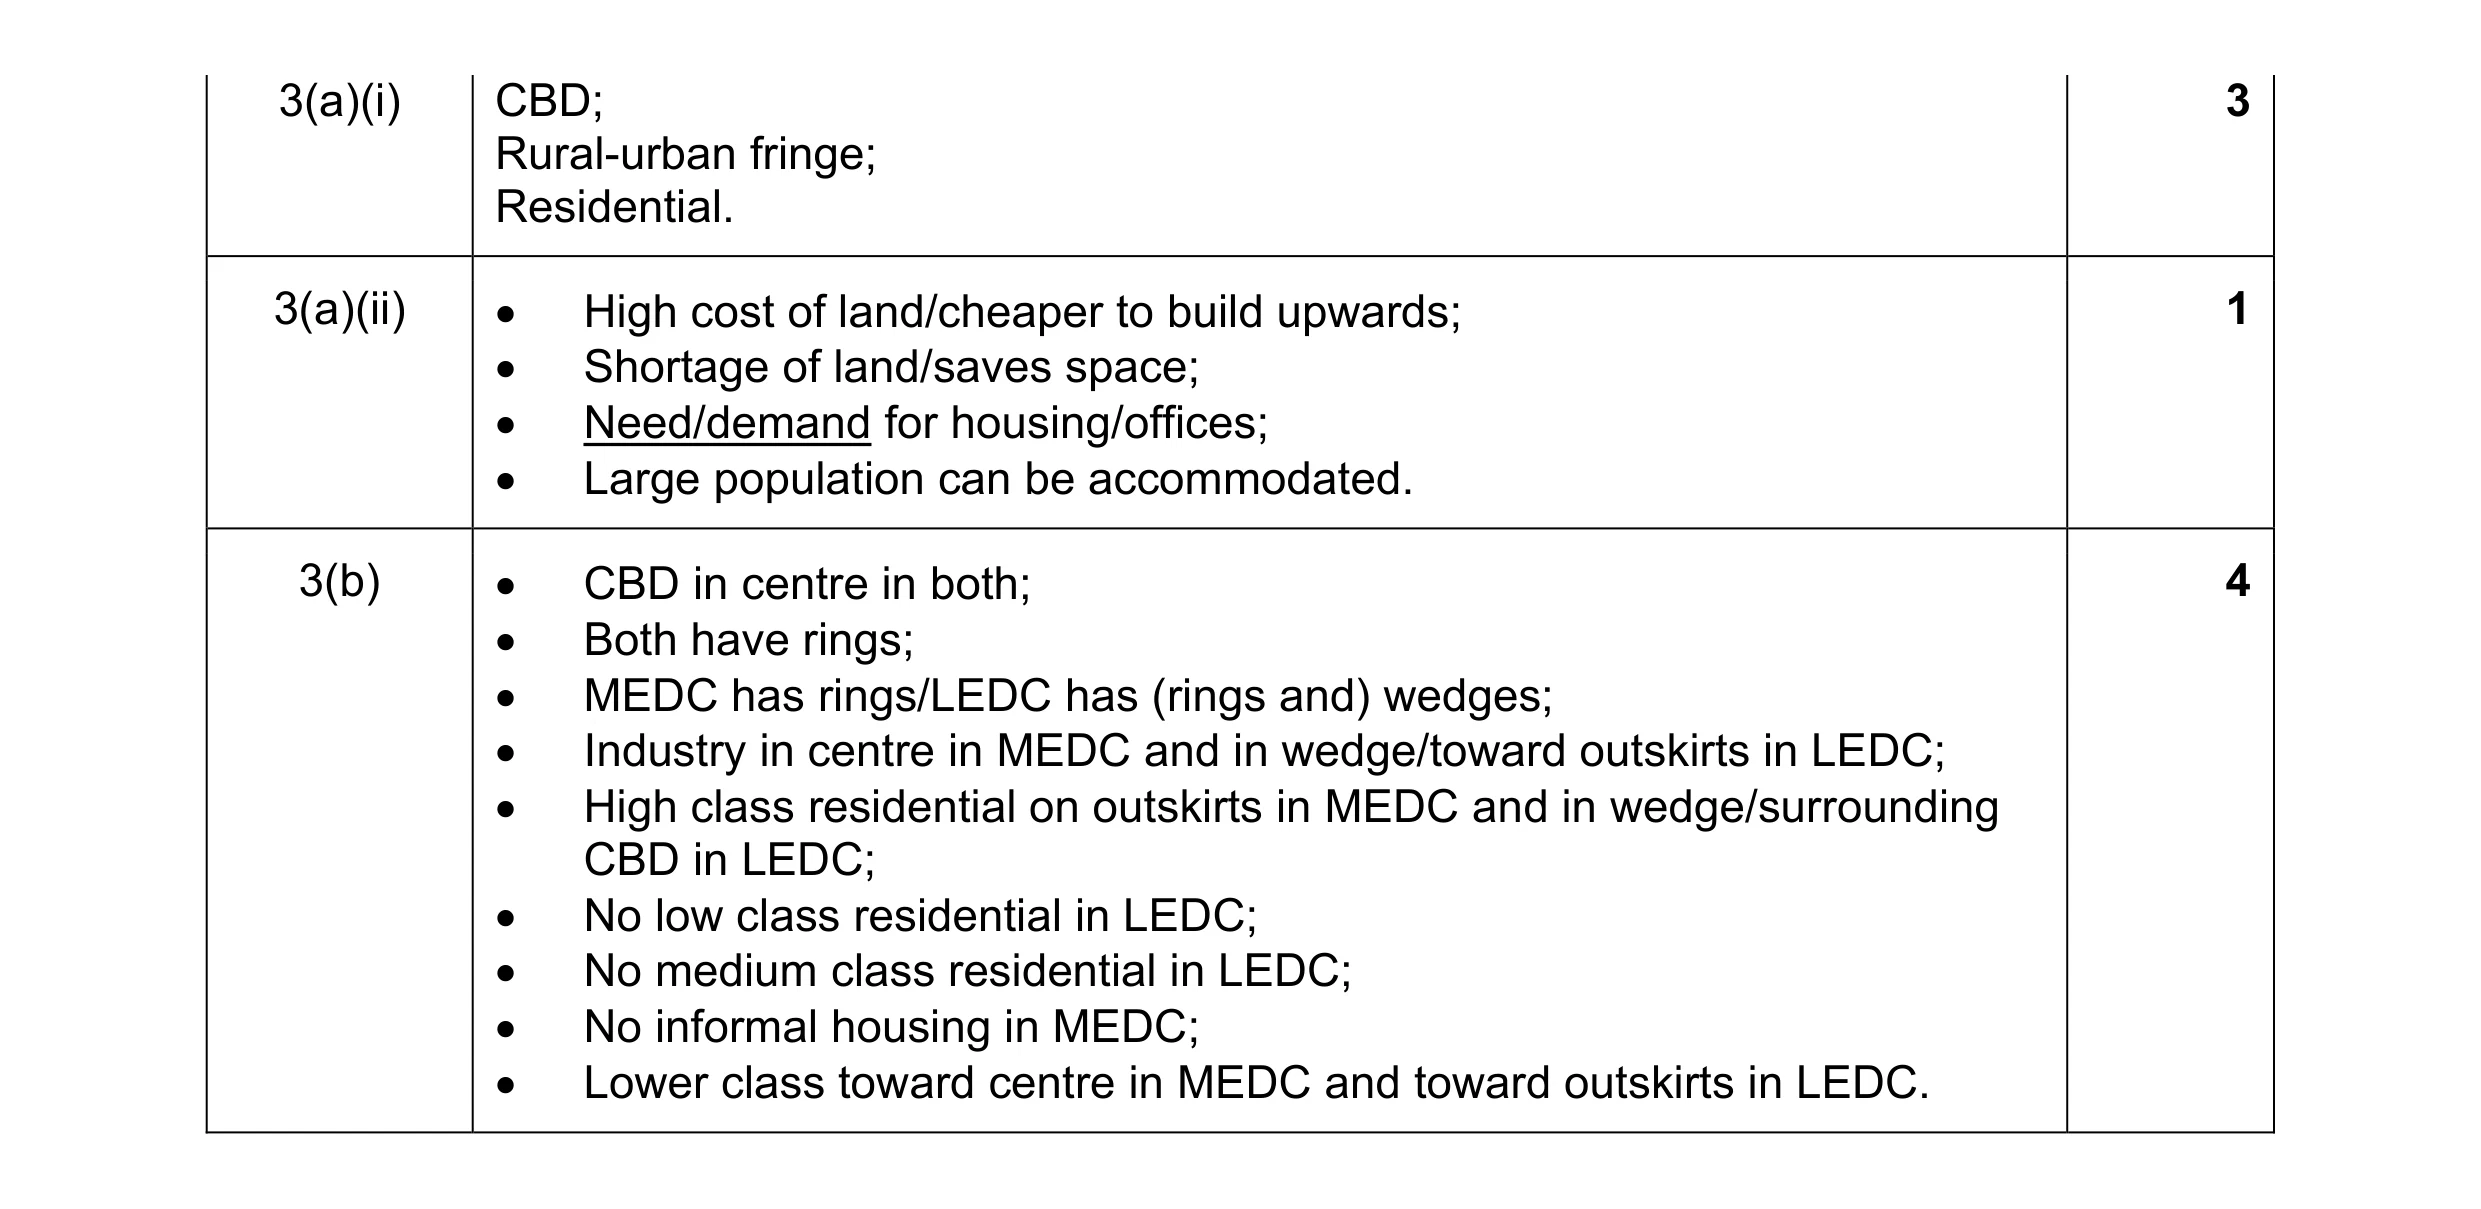 8
8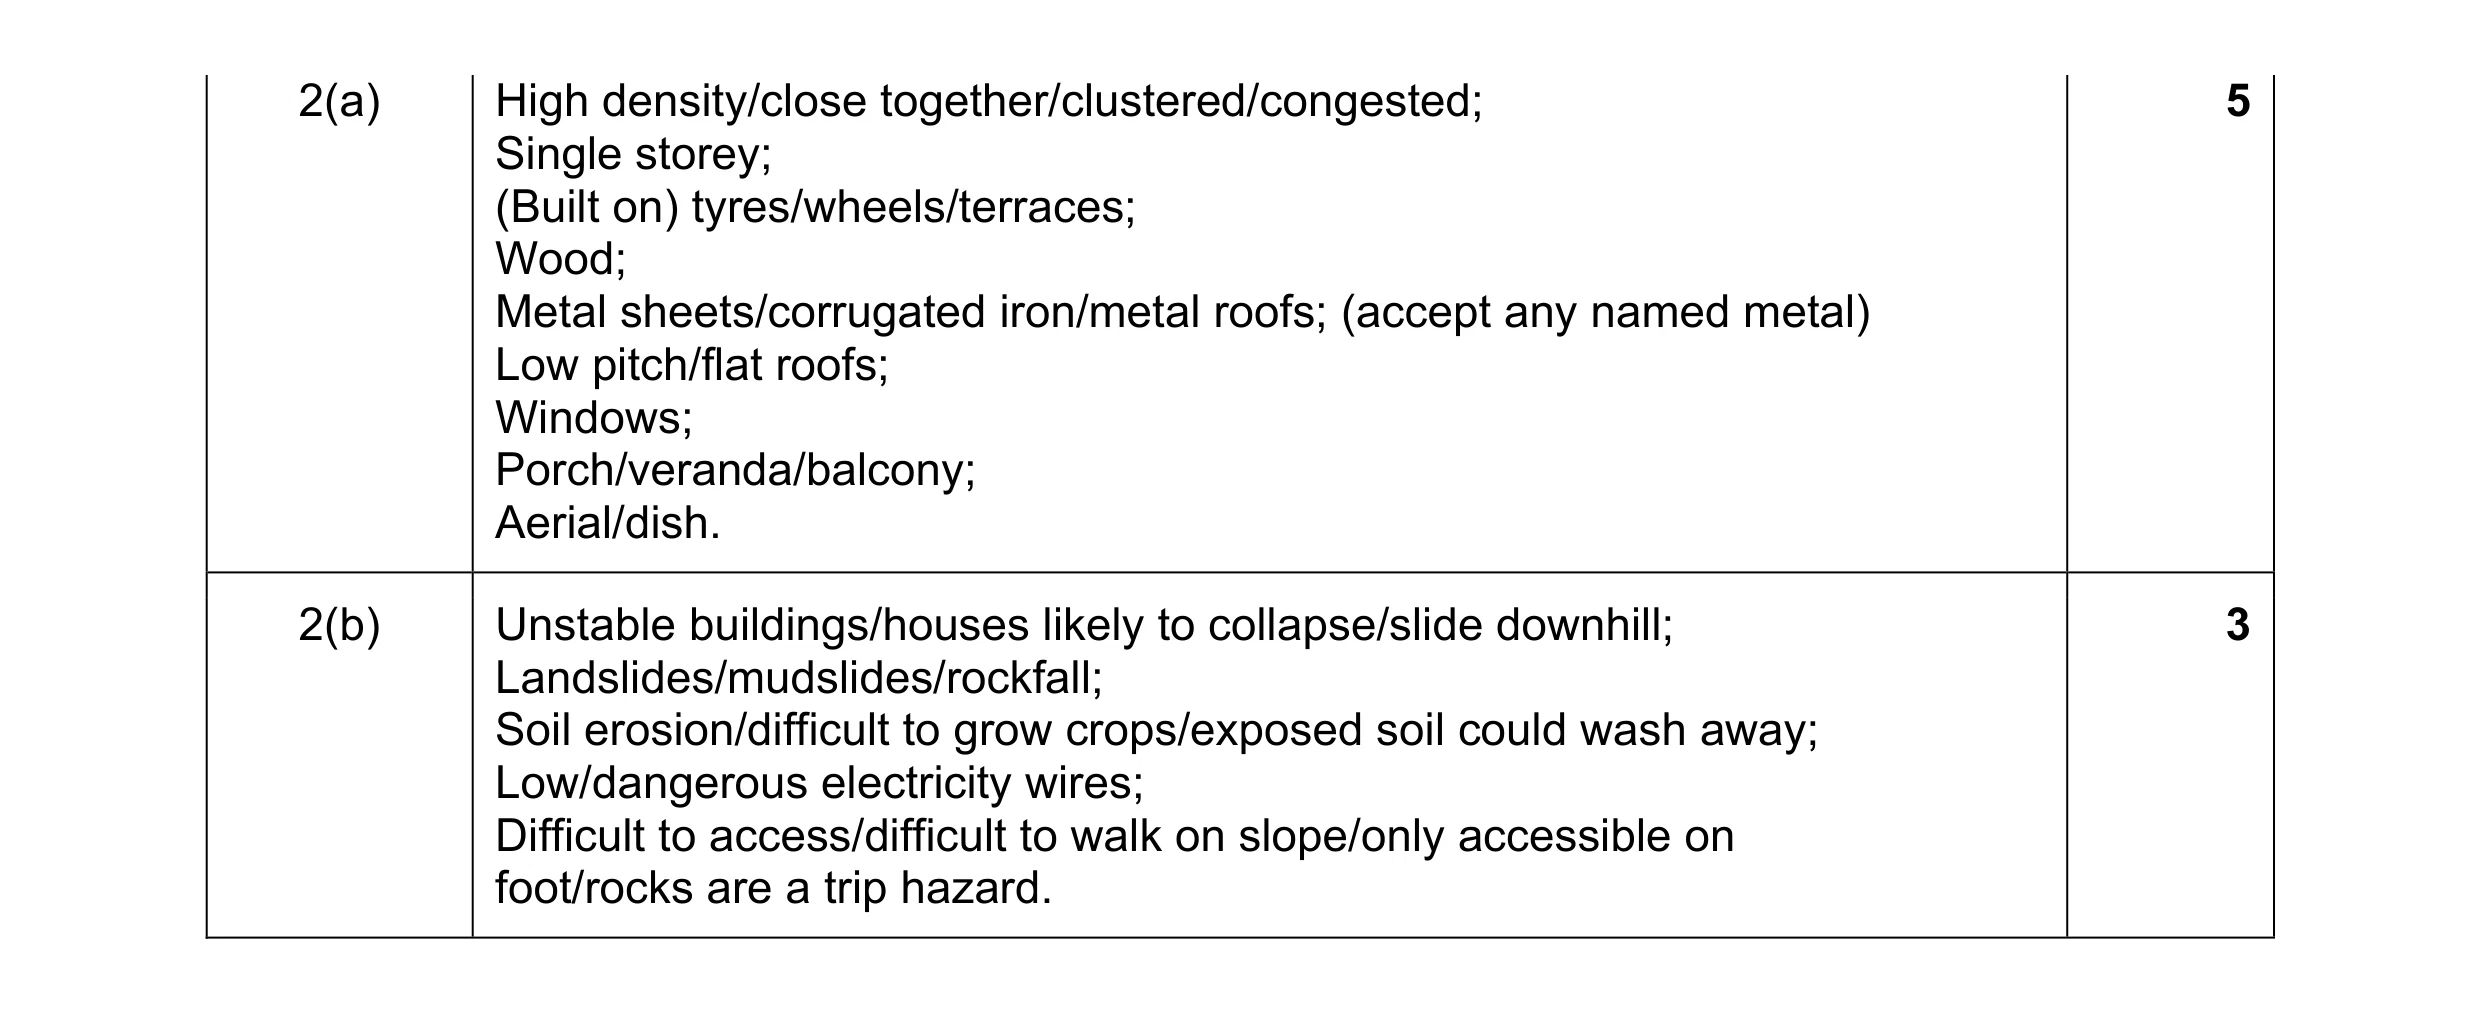 8
8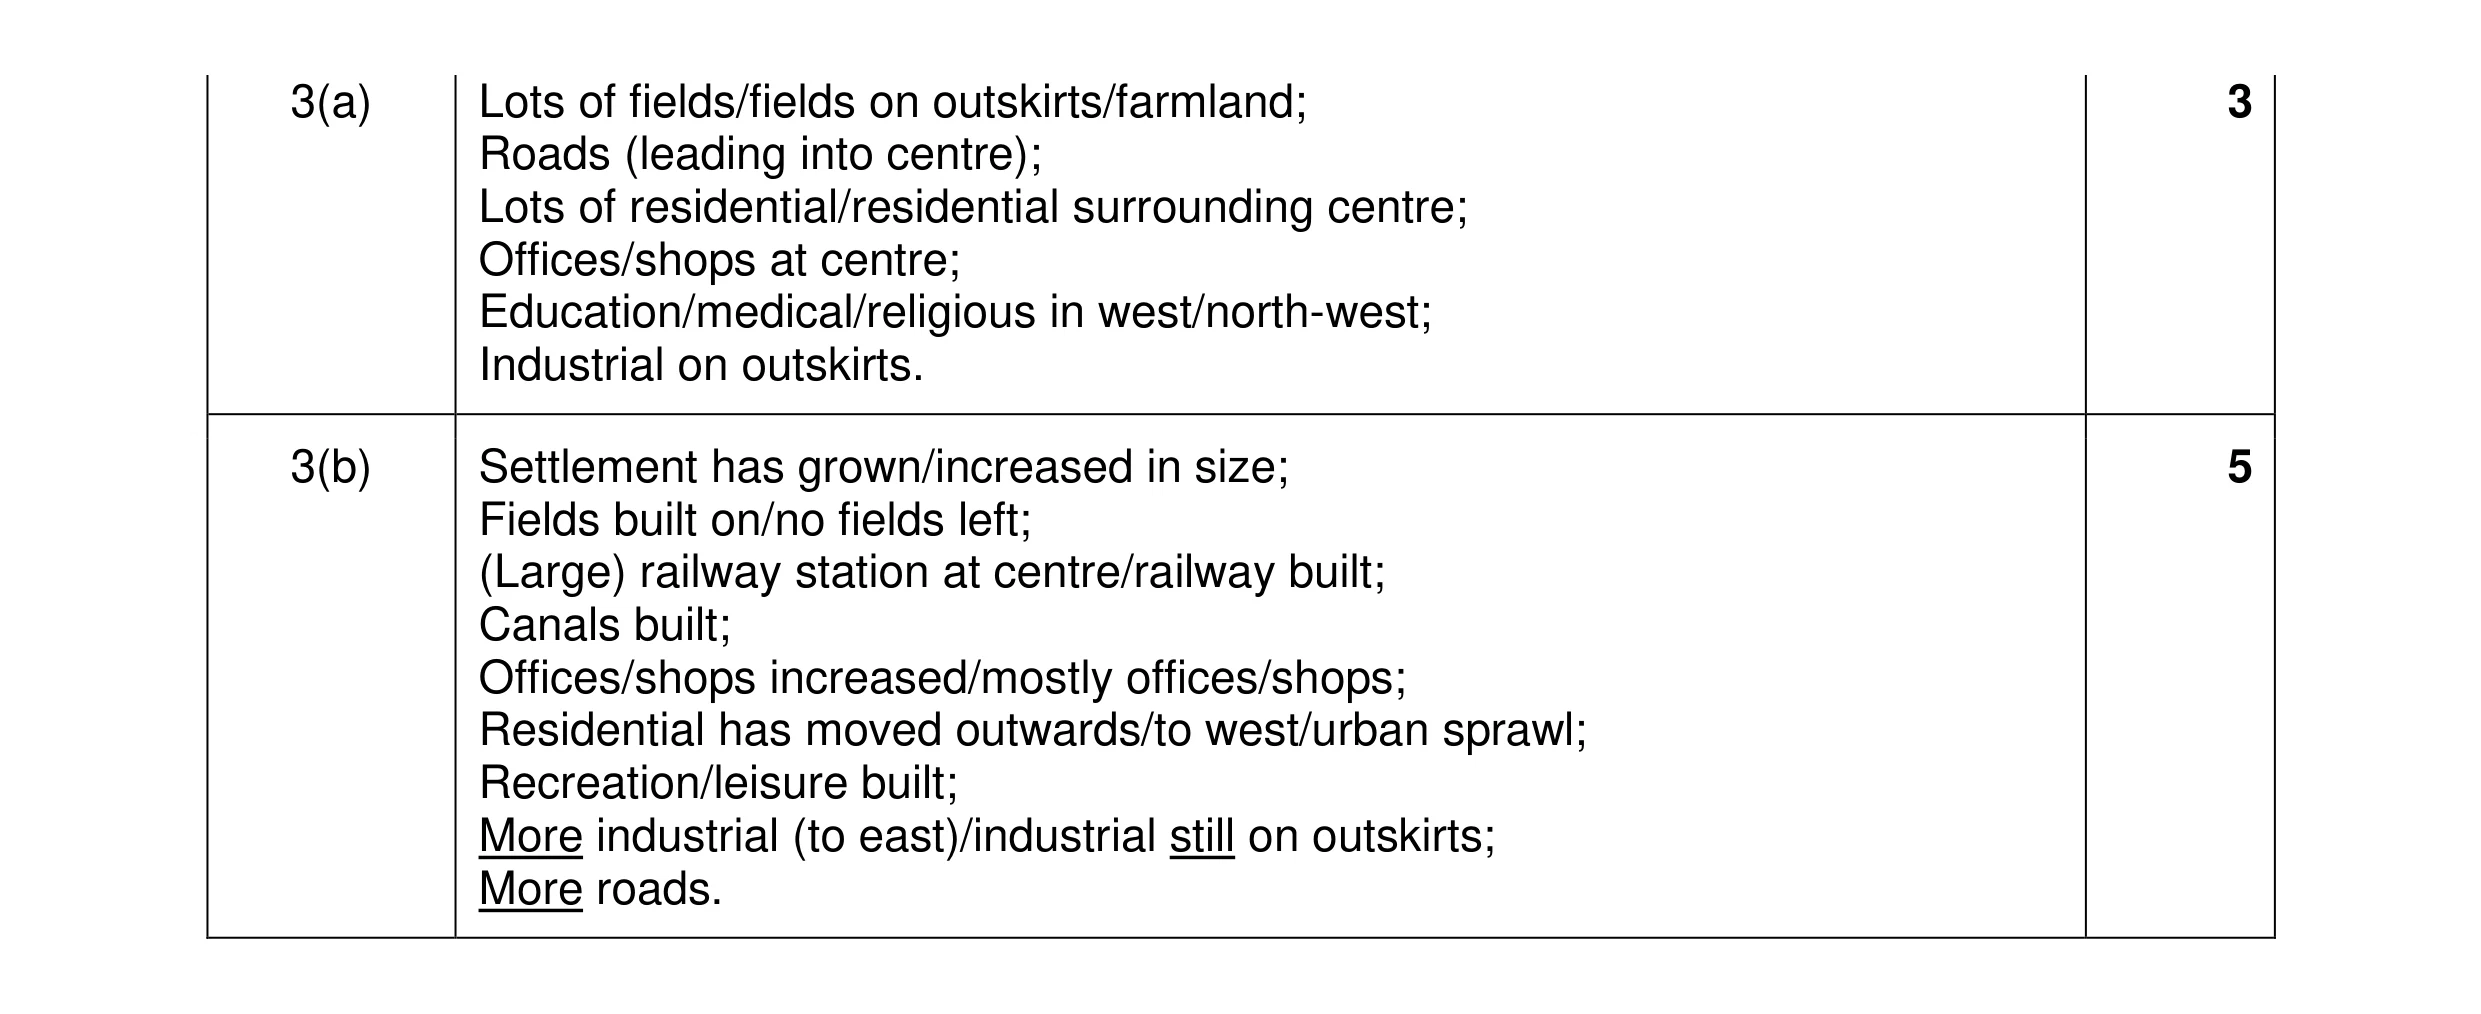 8
8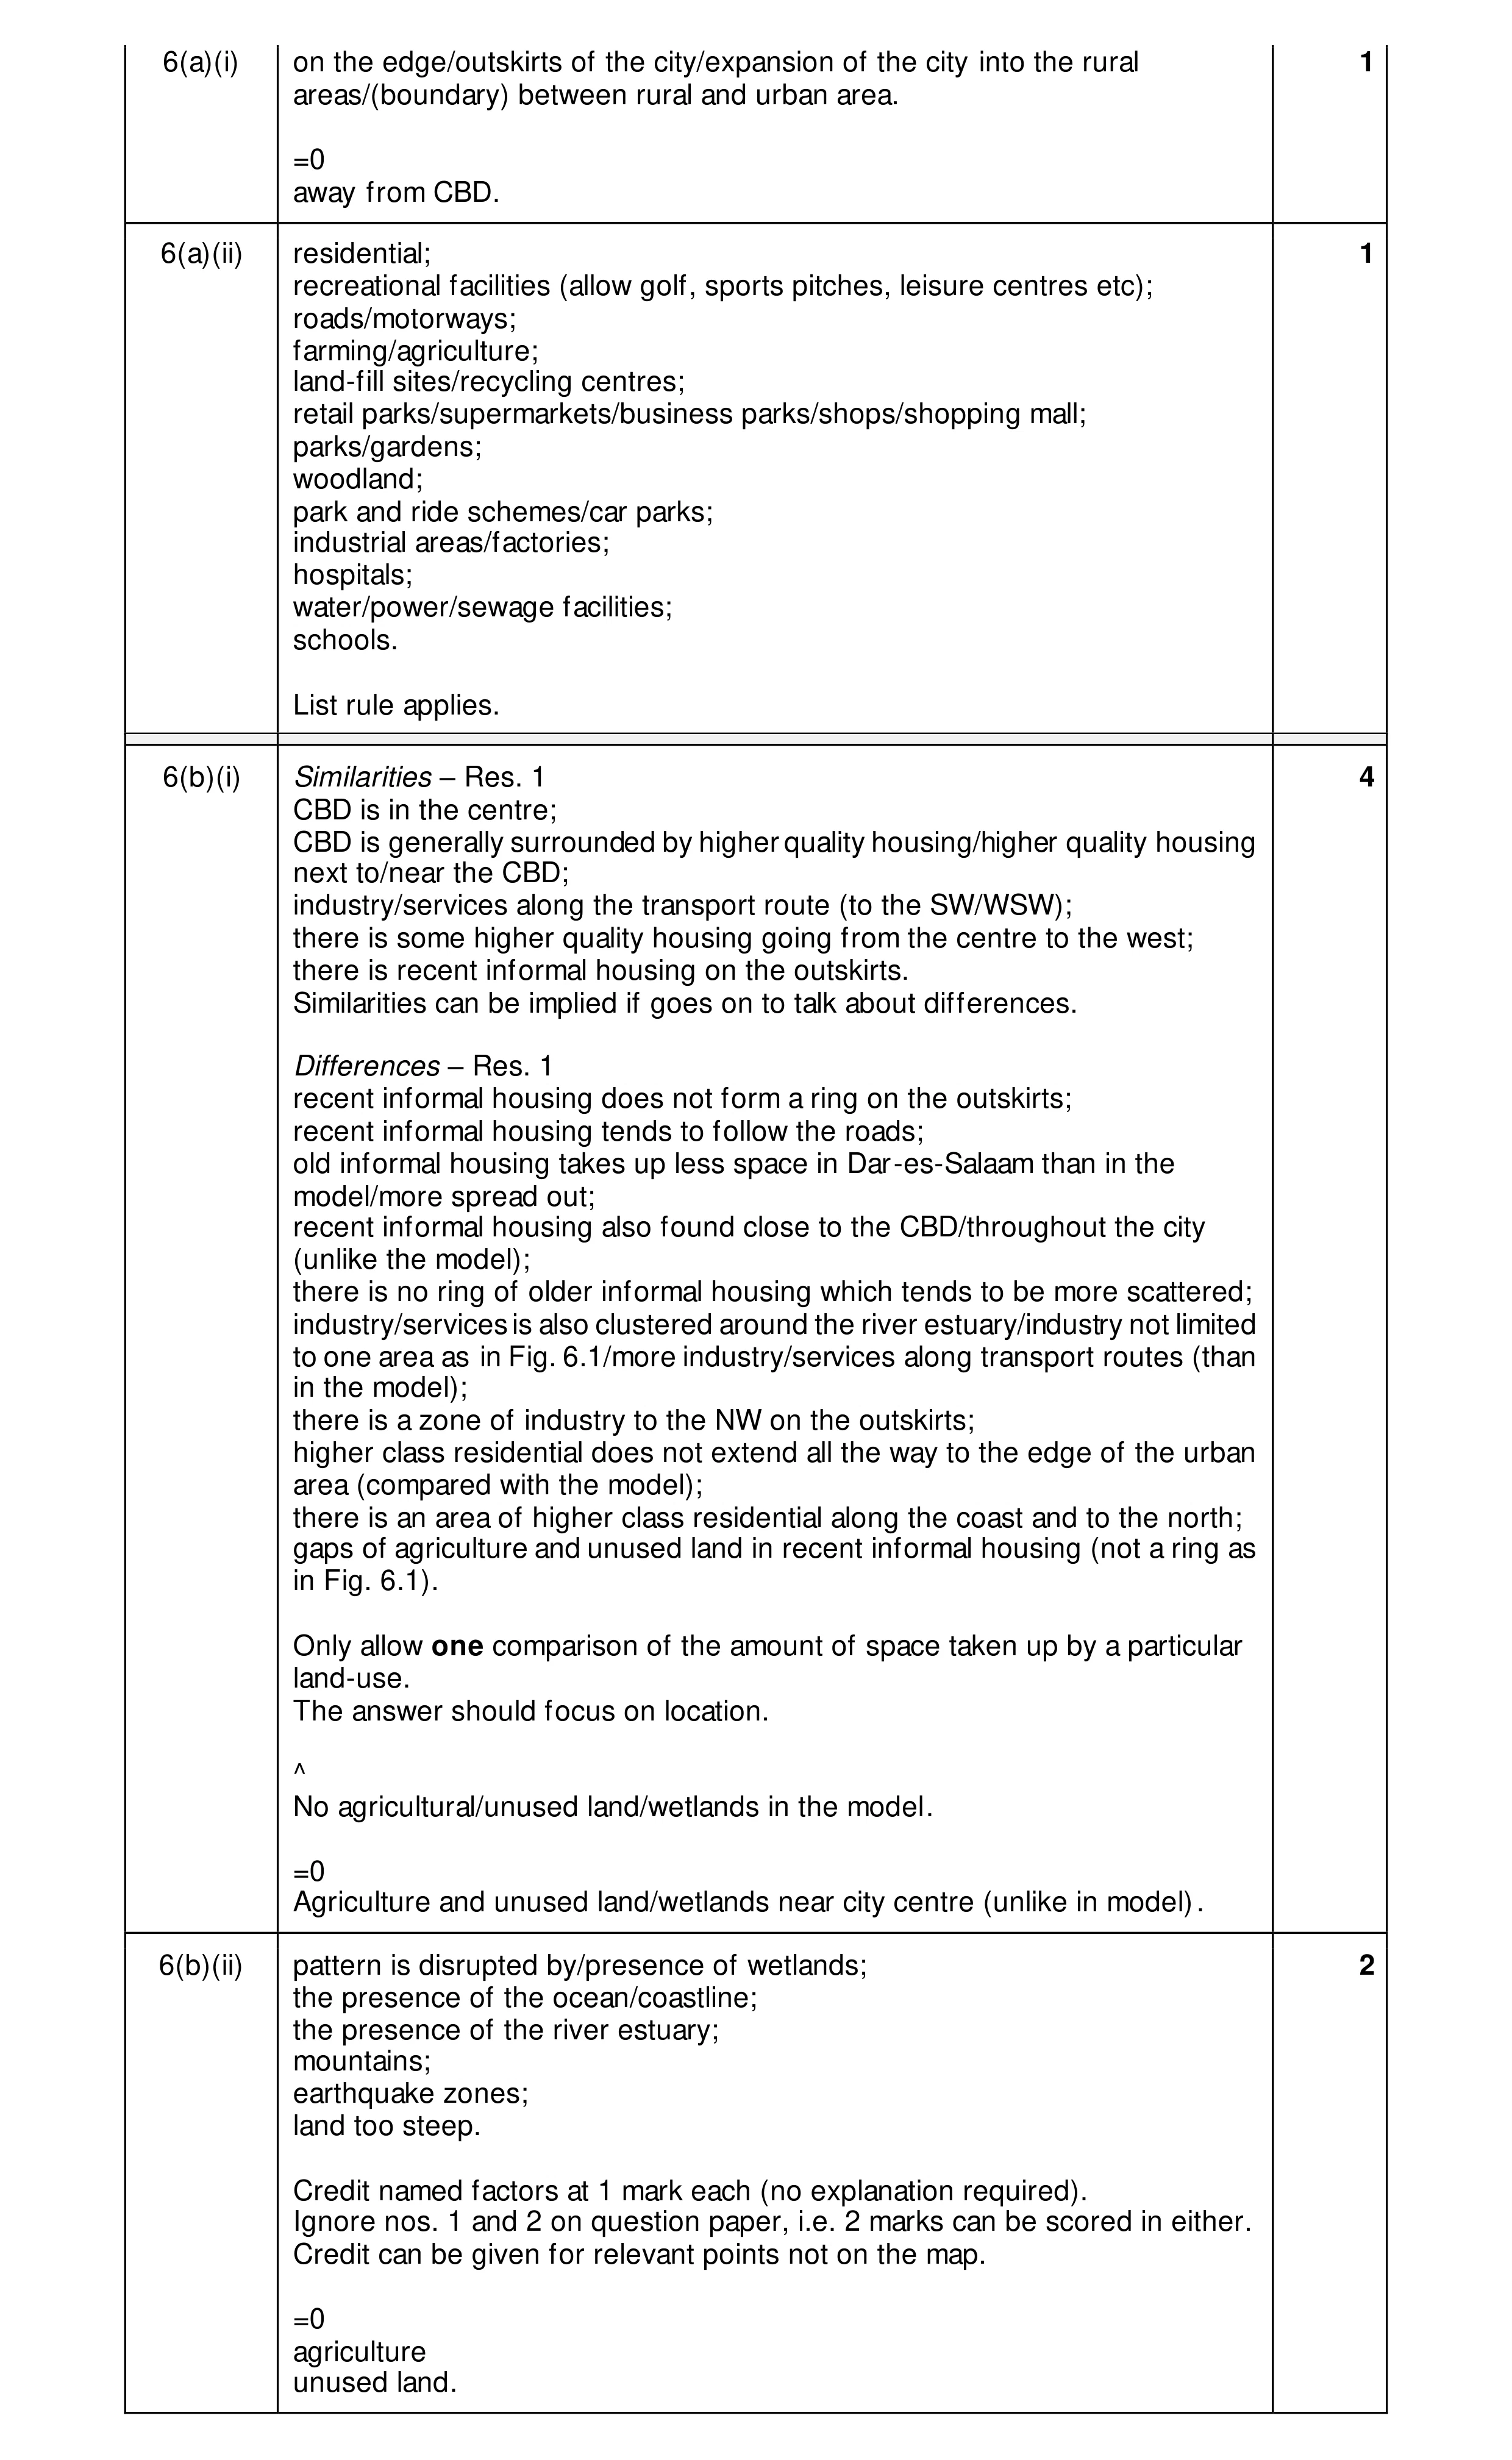 8
8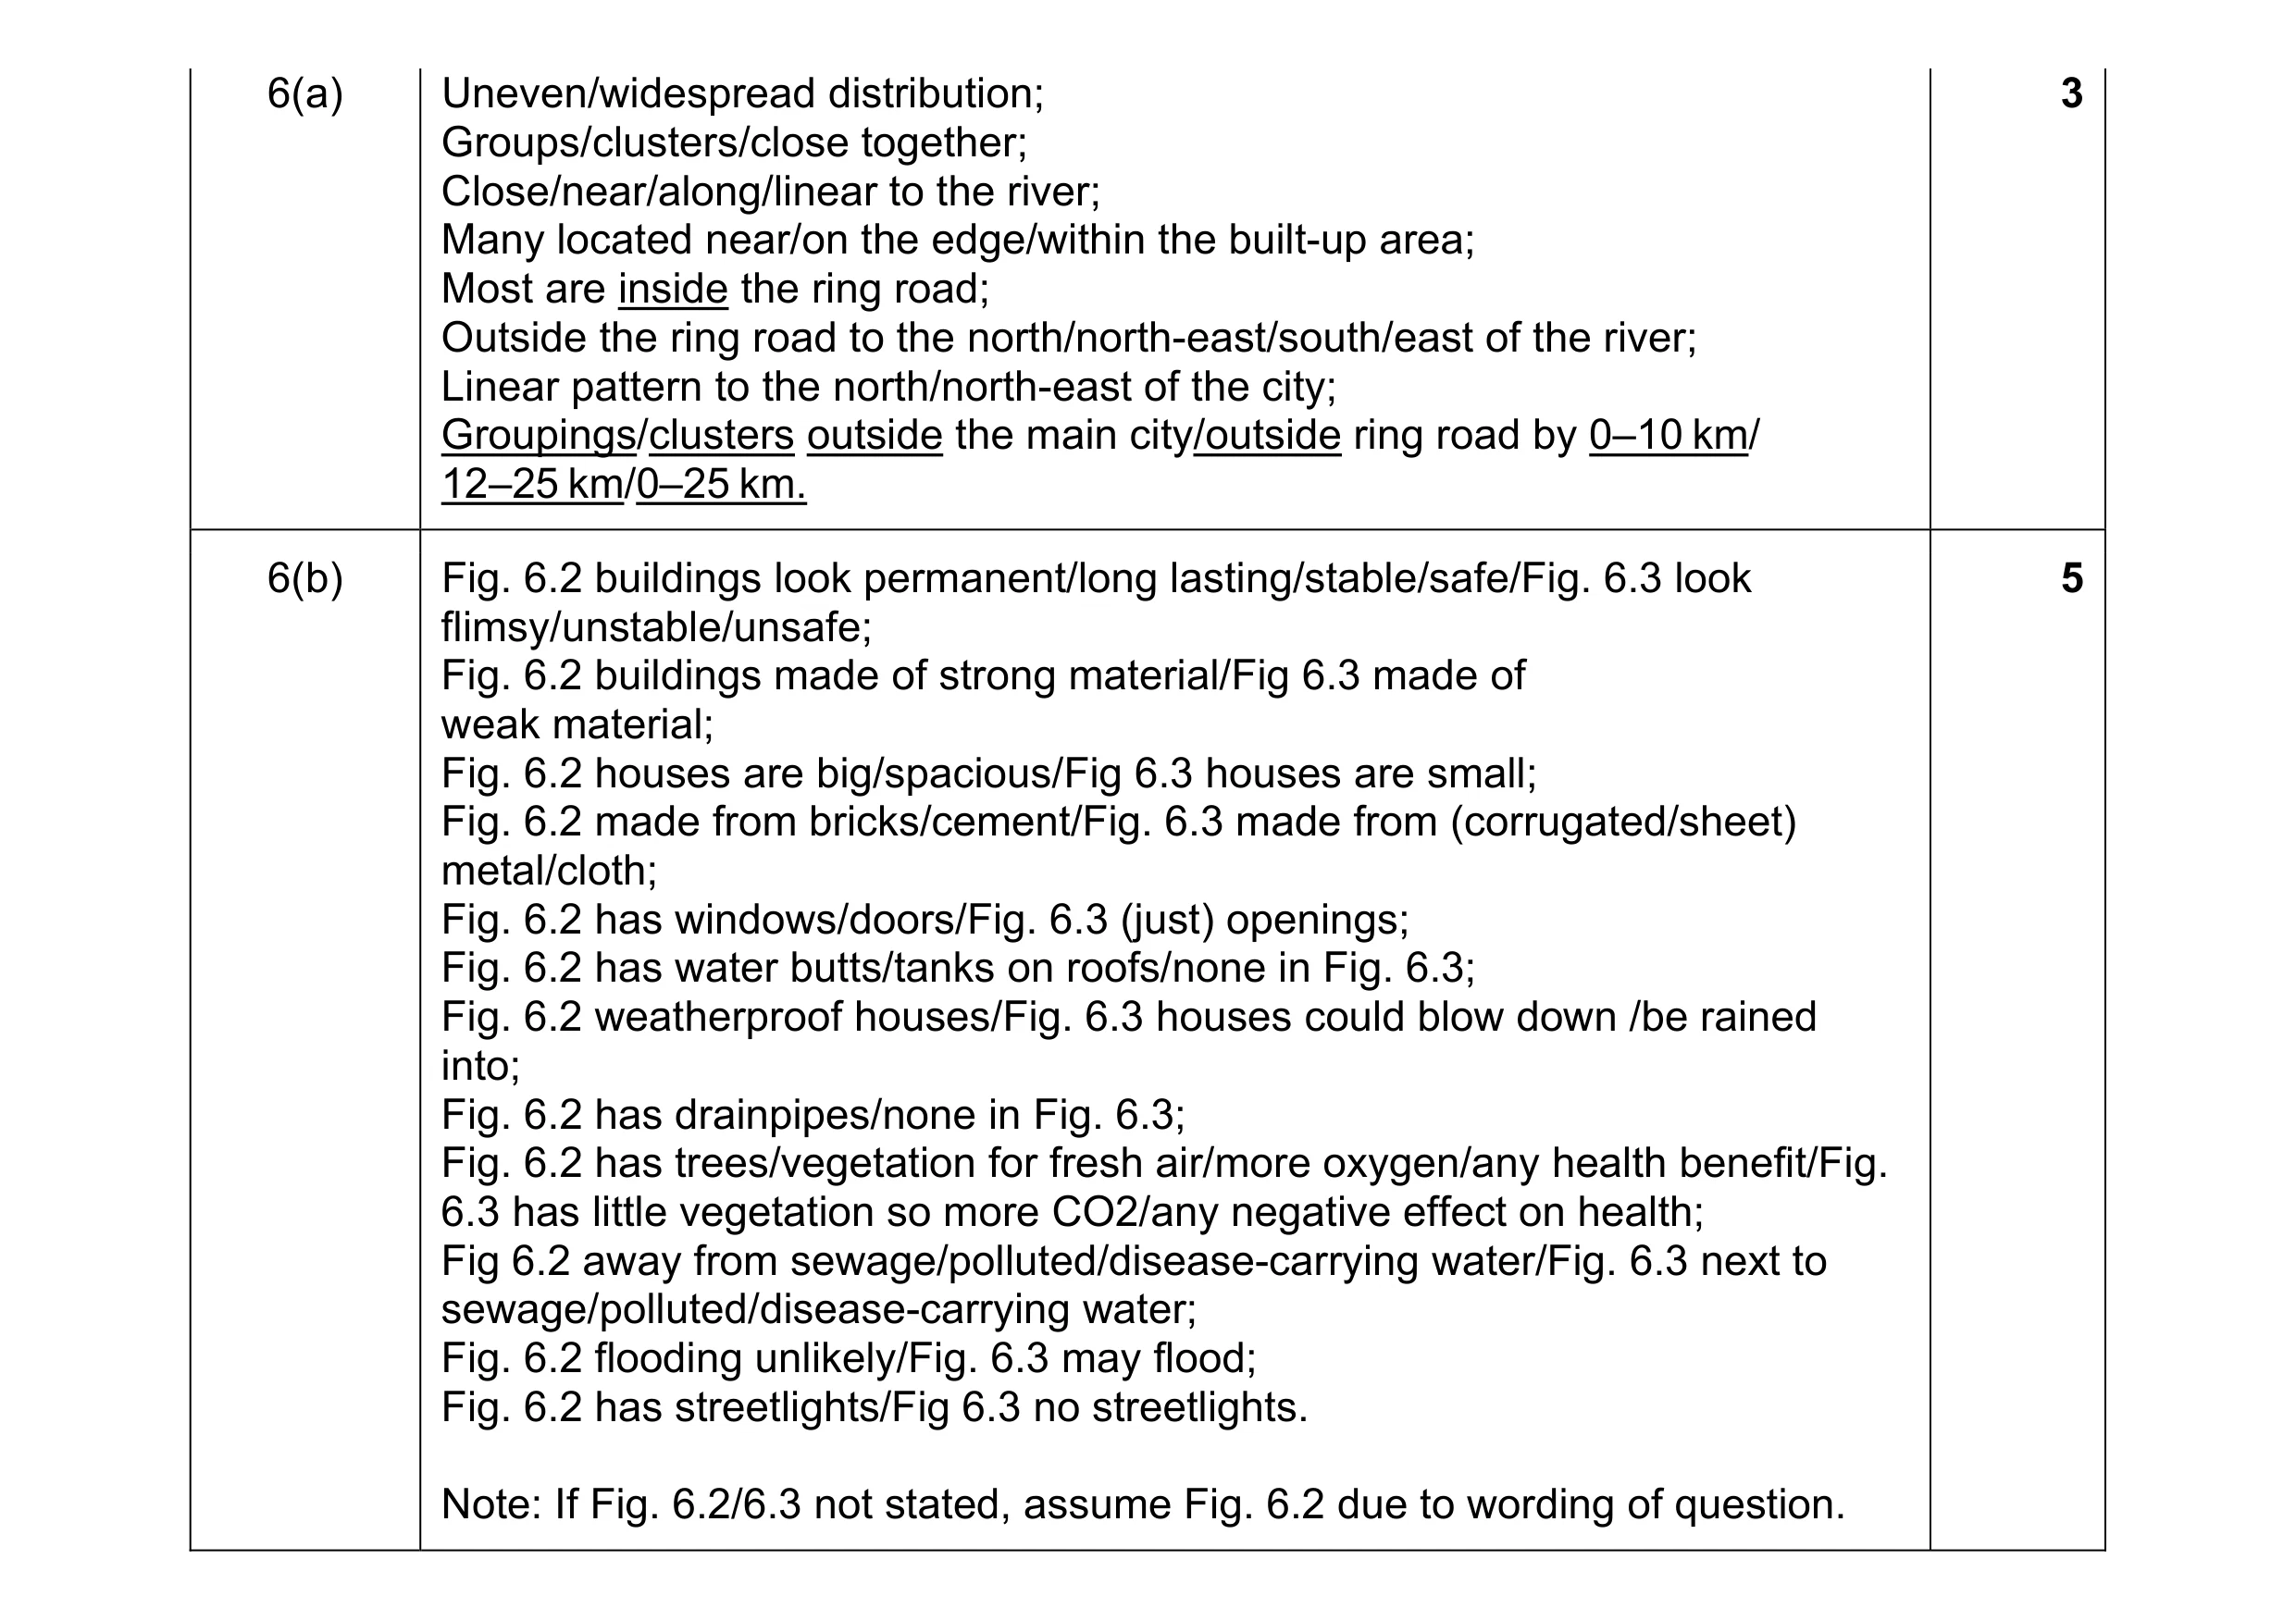 8
8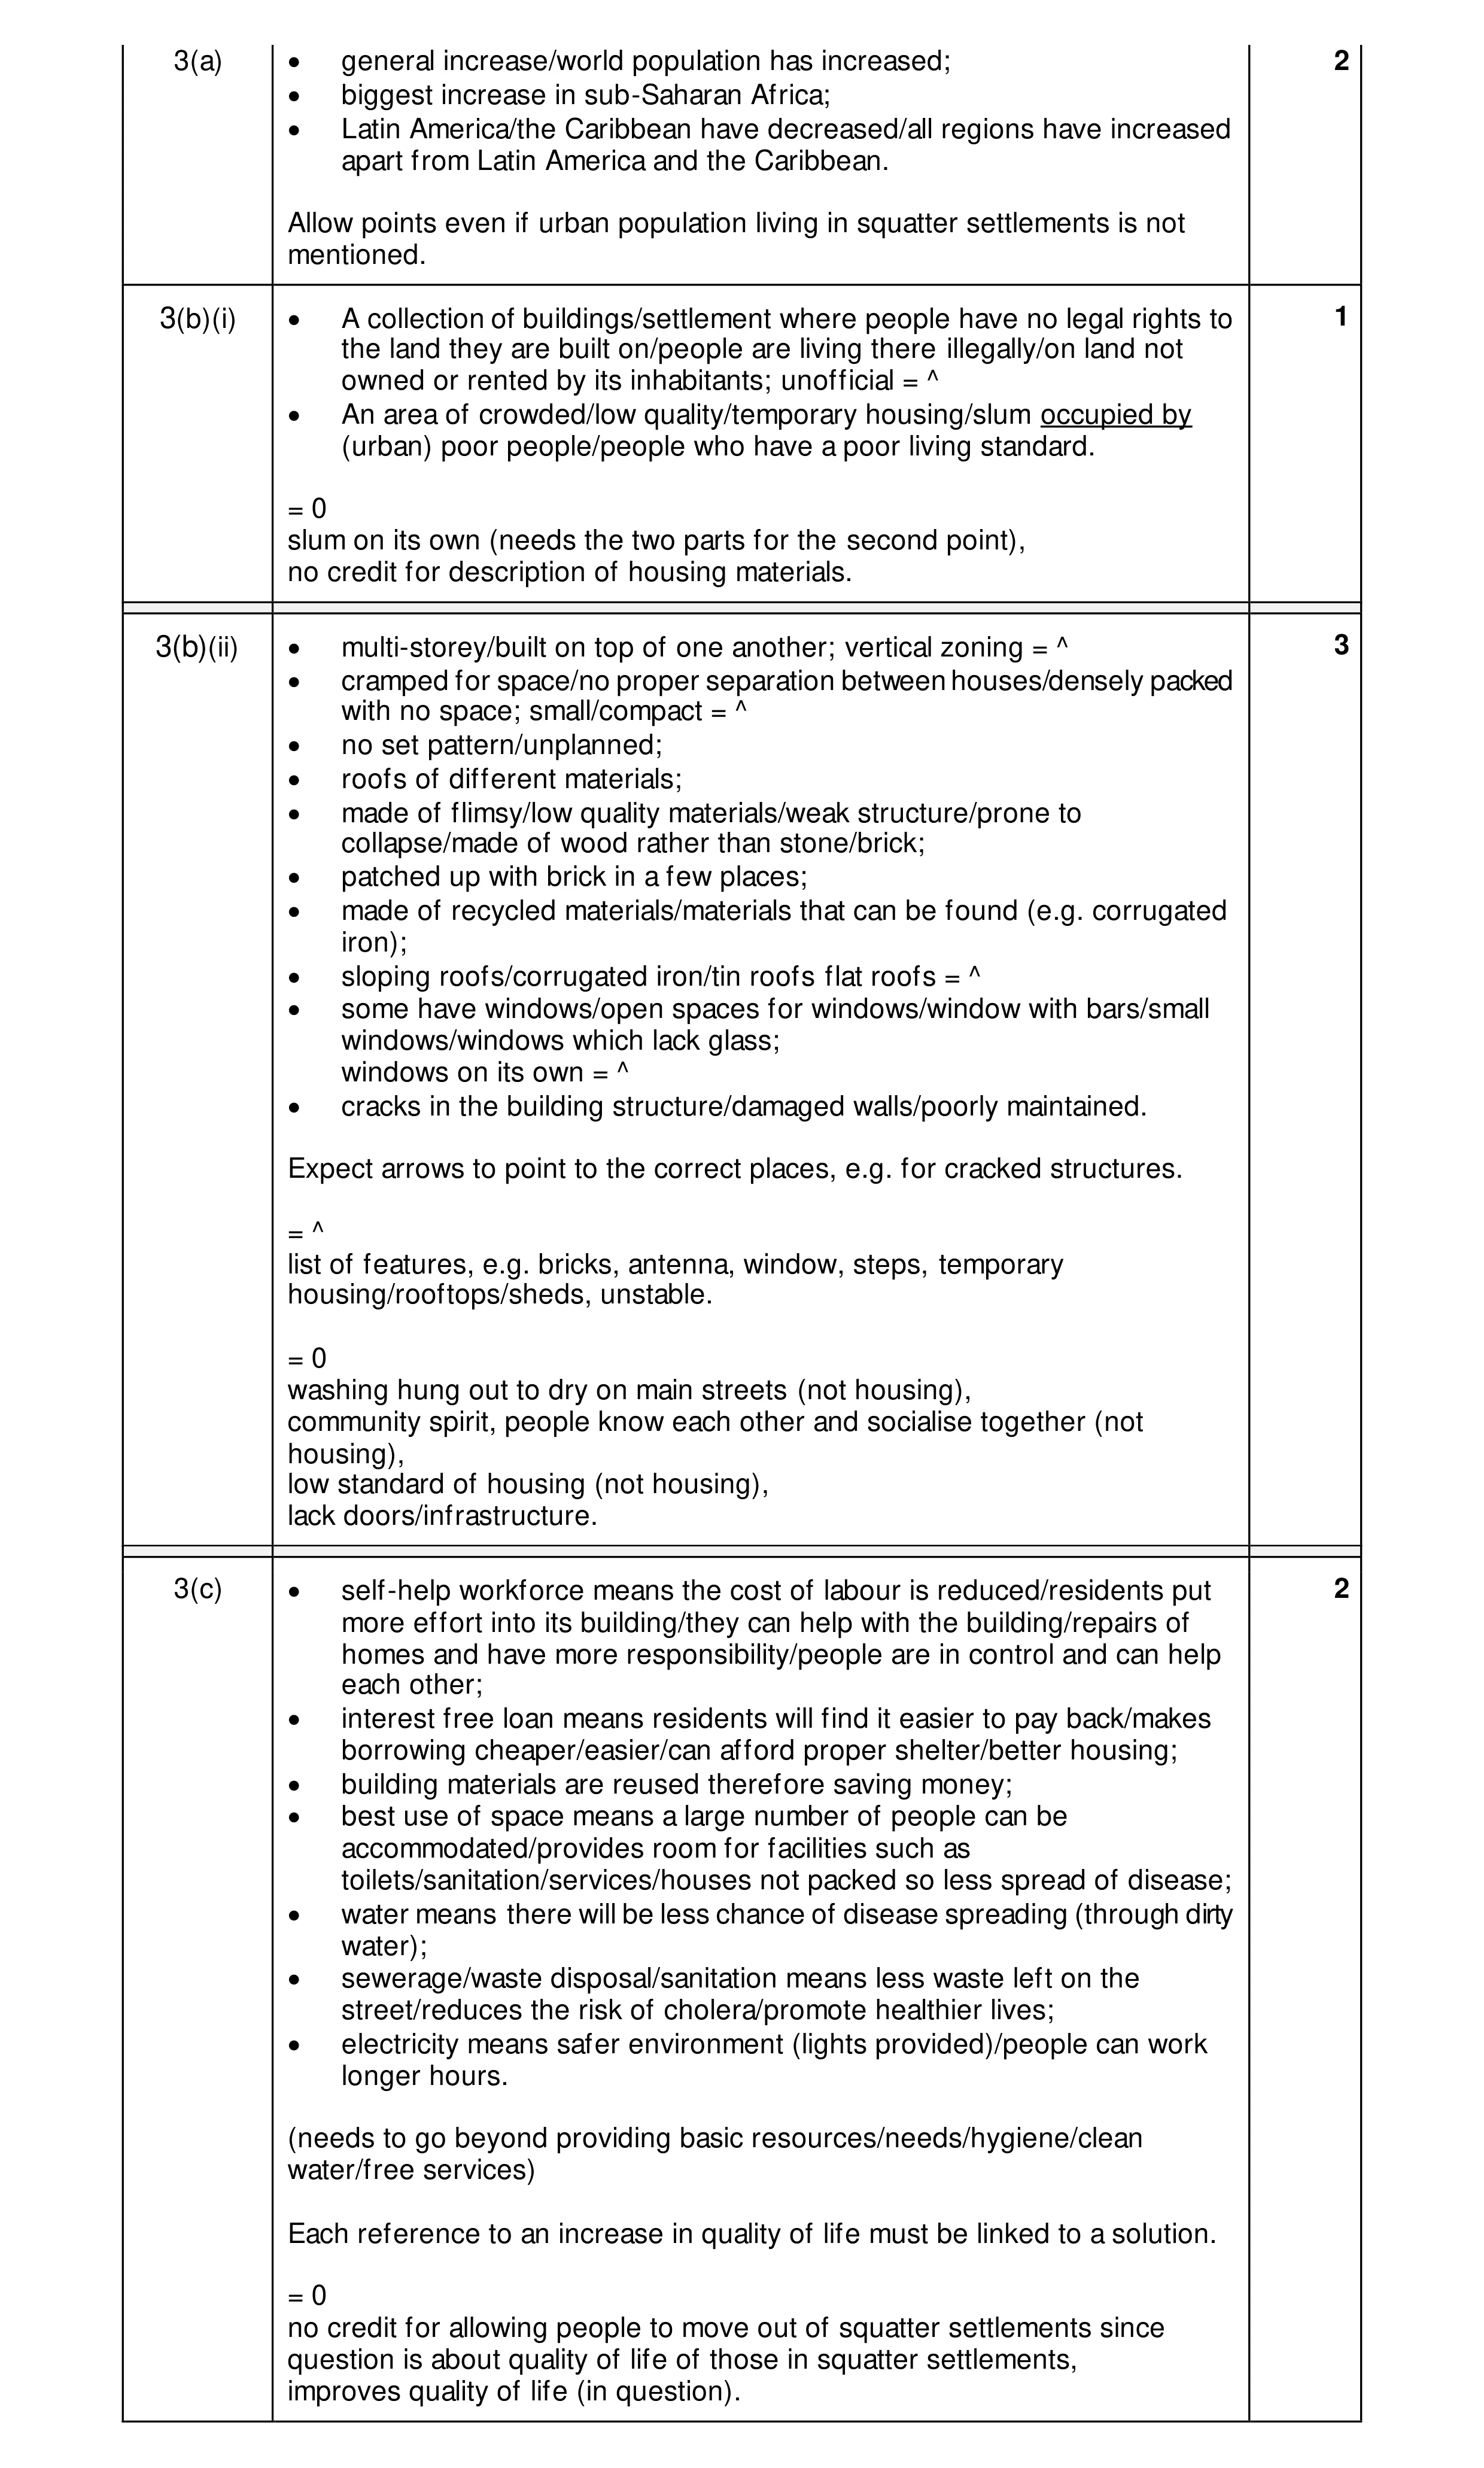 8
8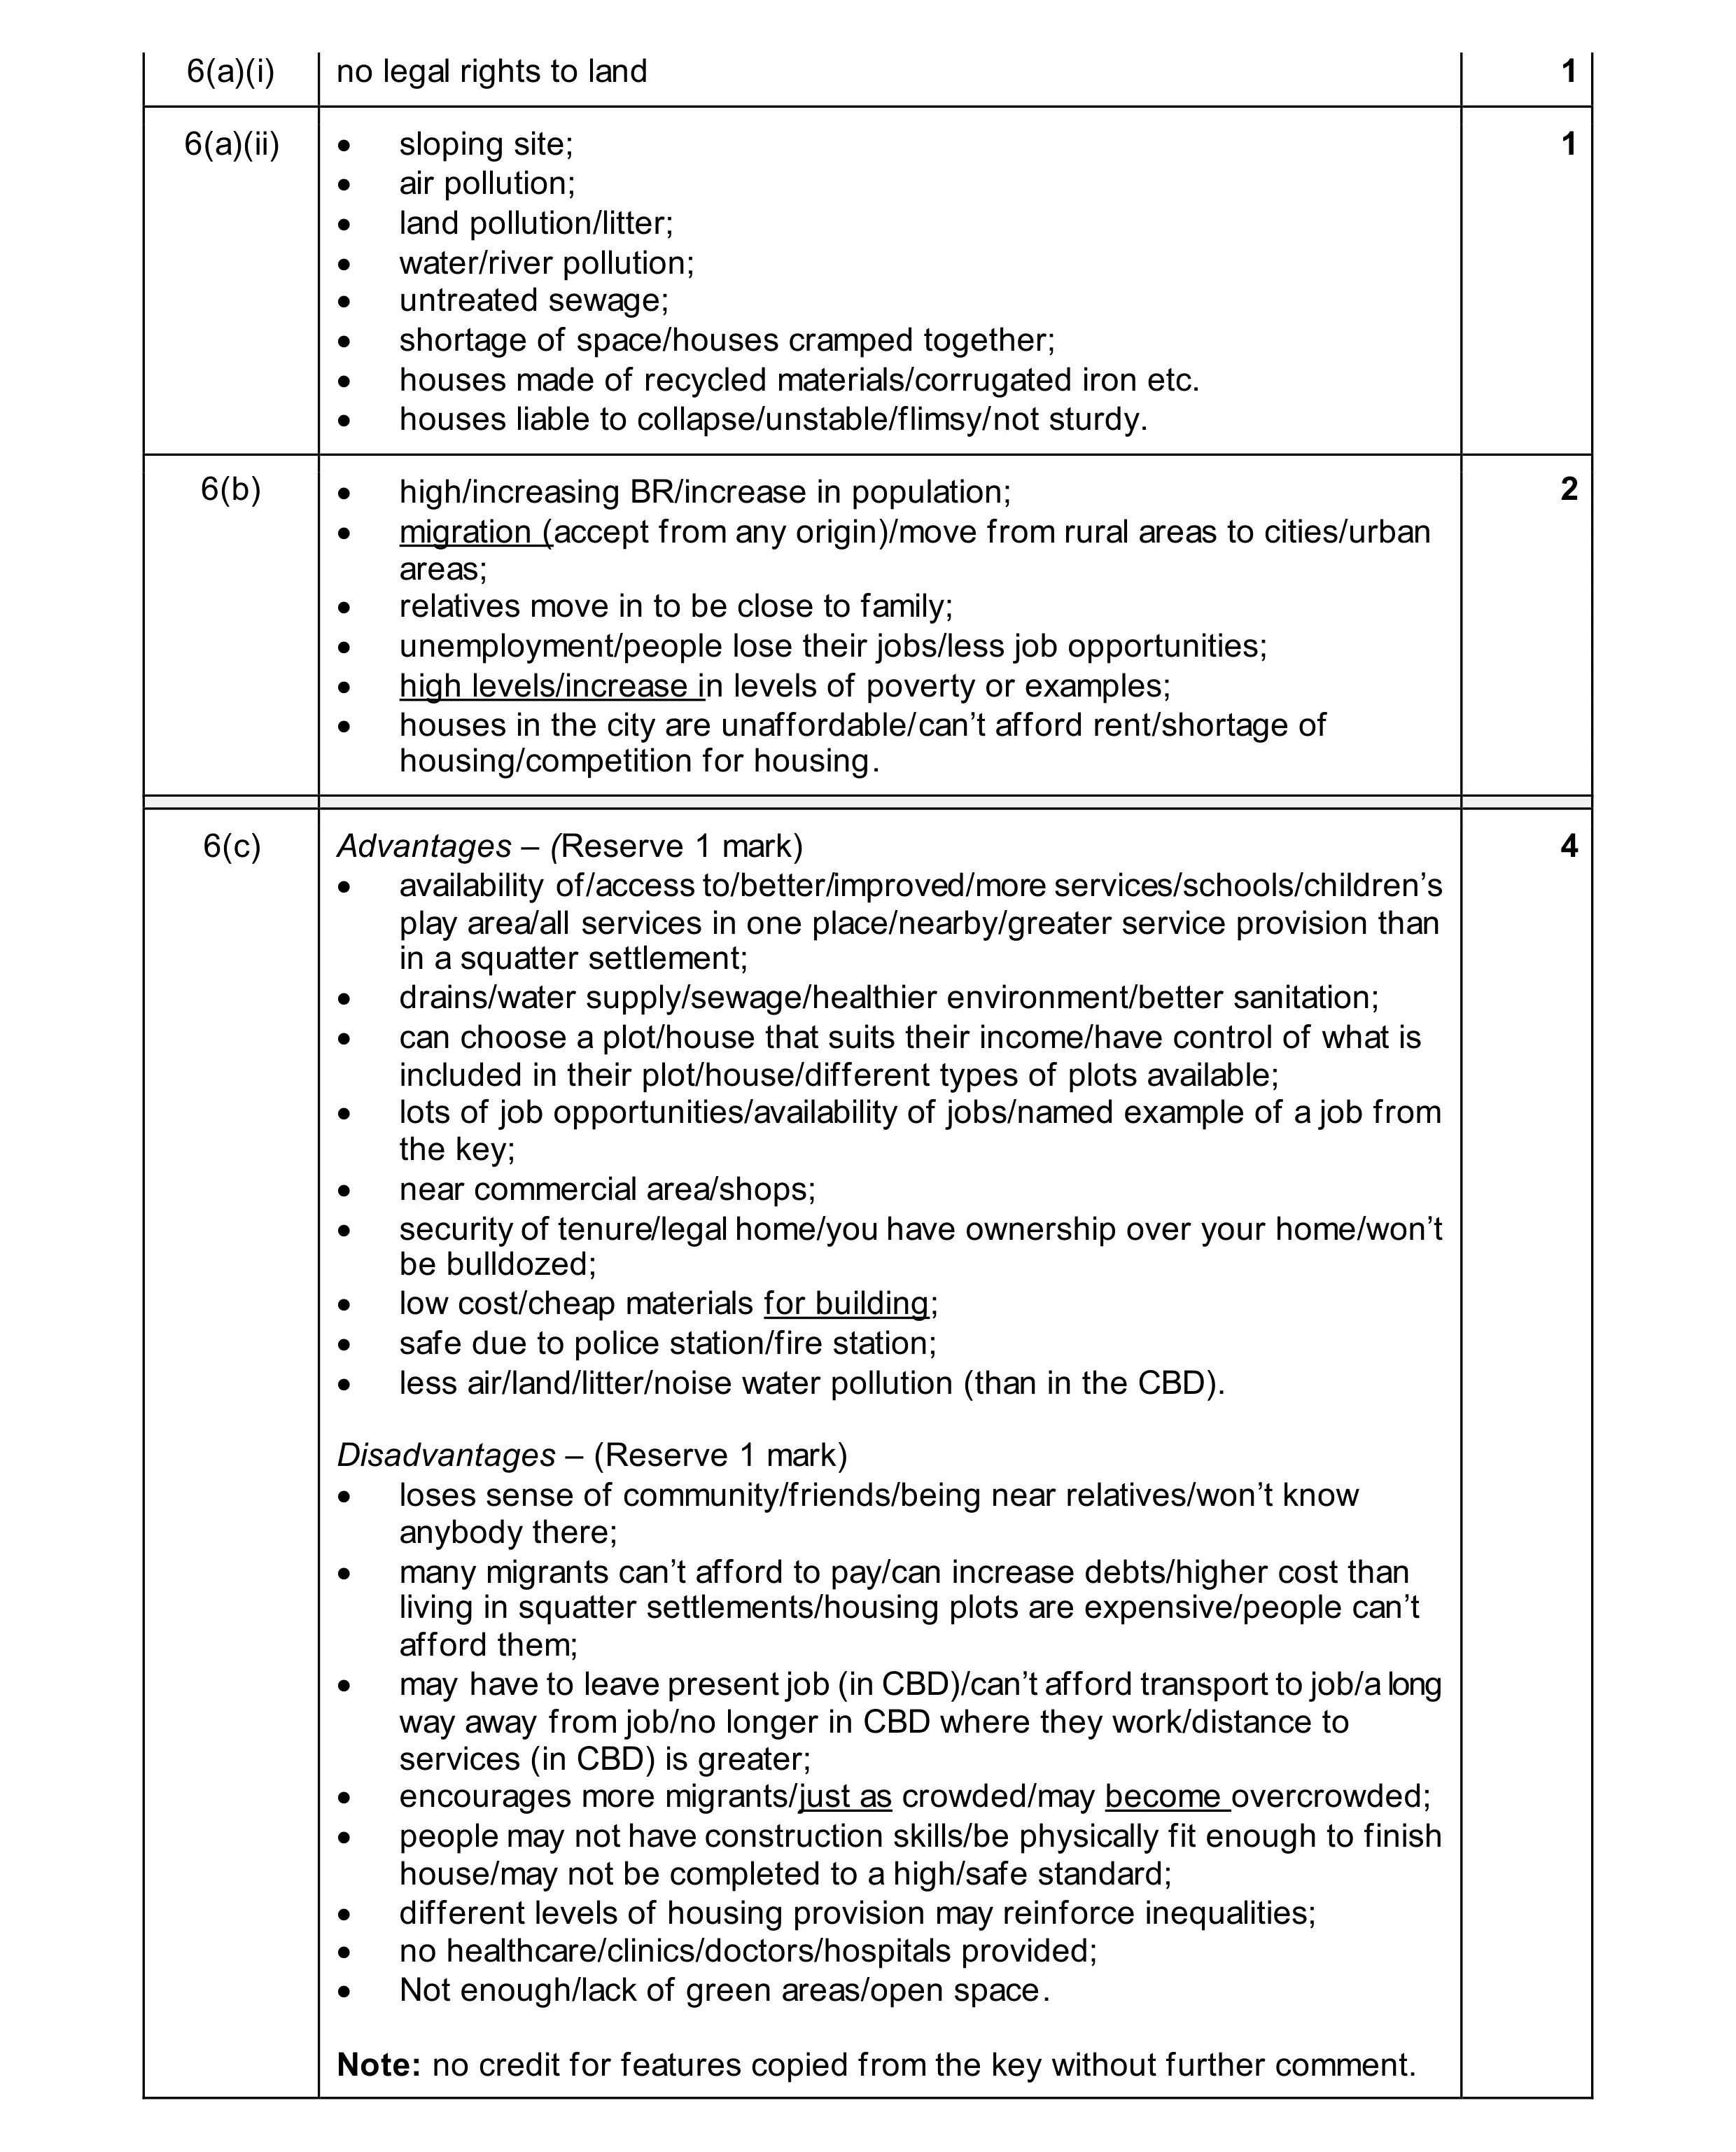 8
8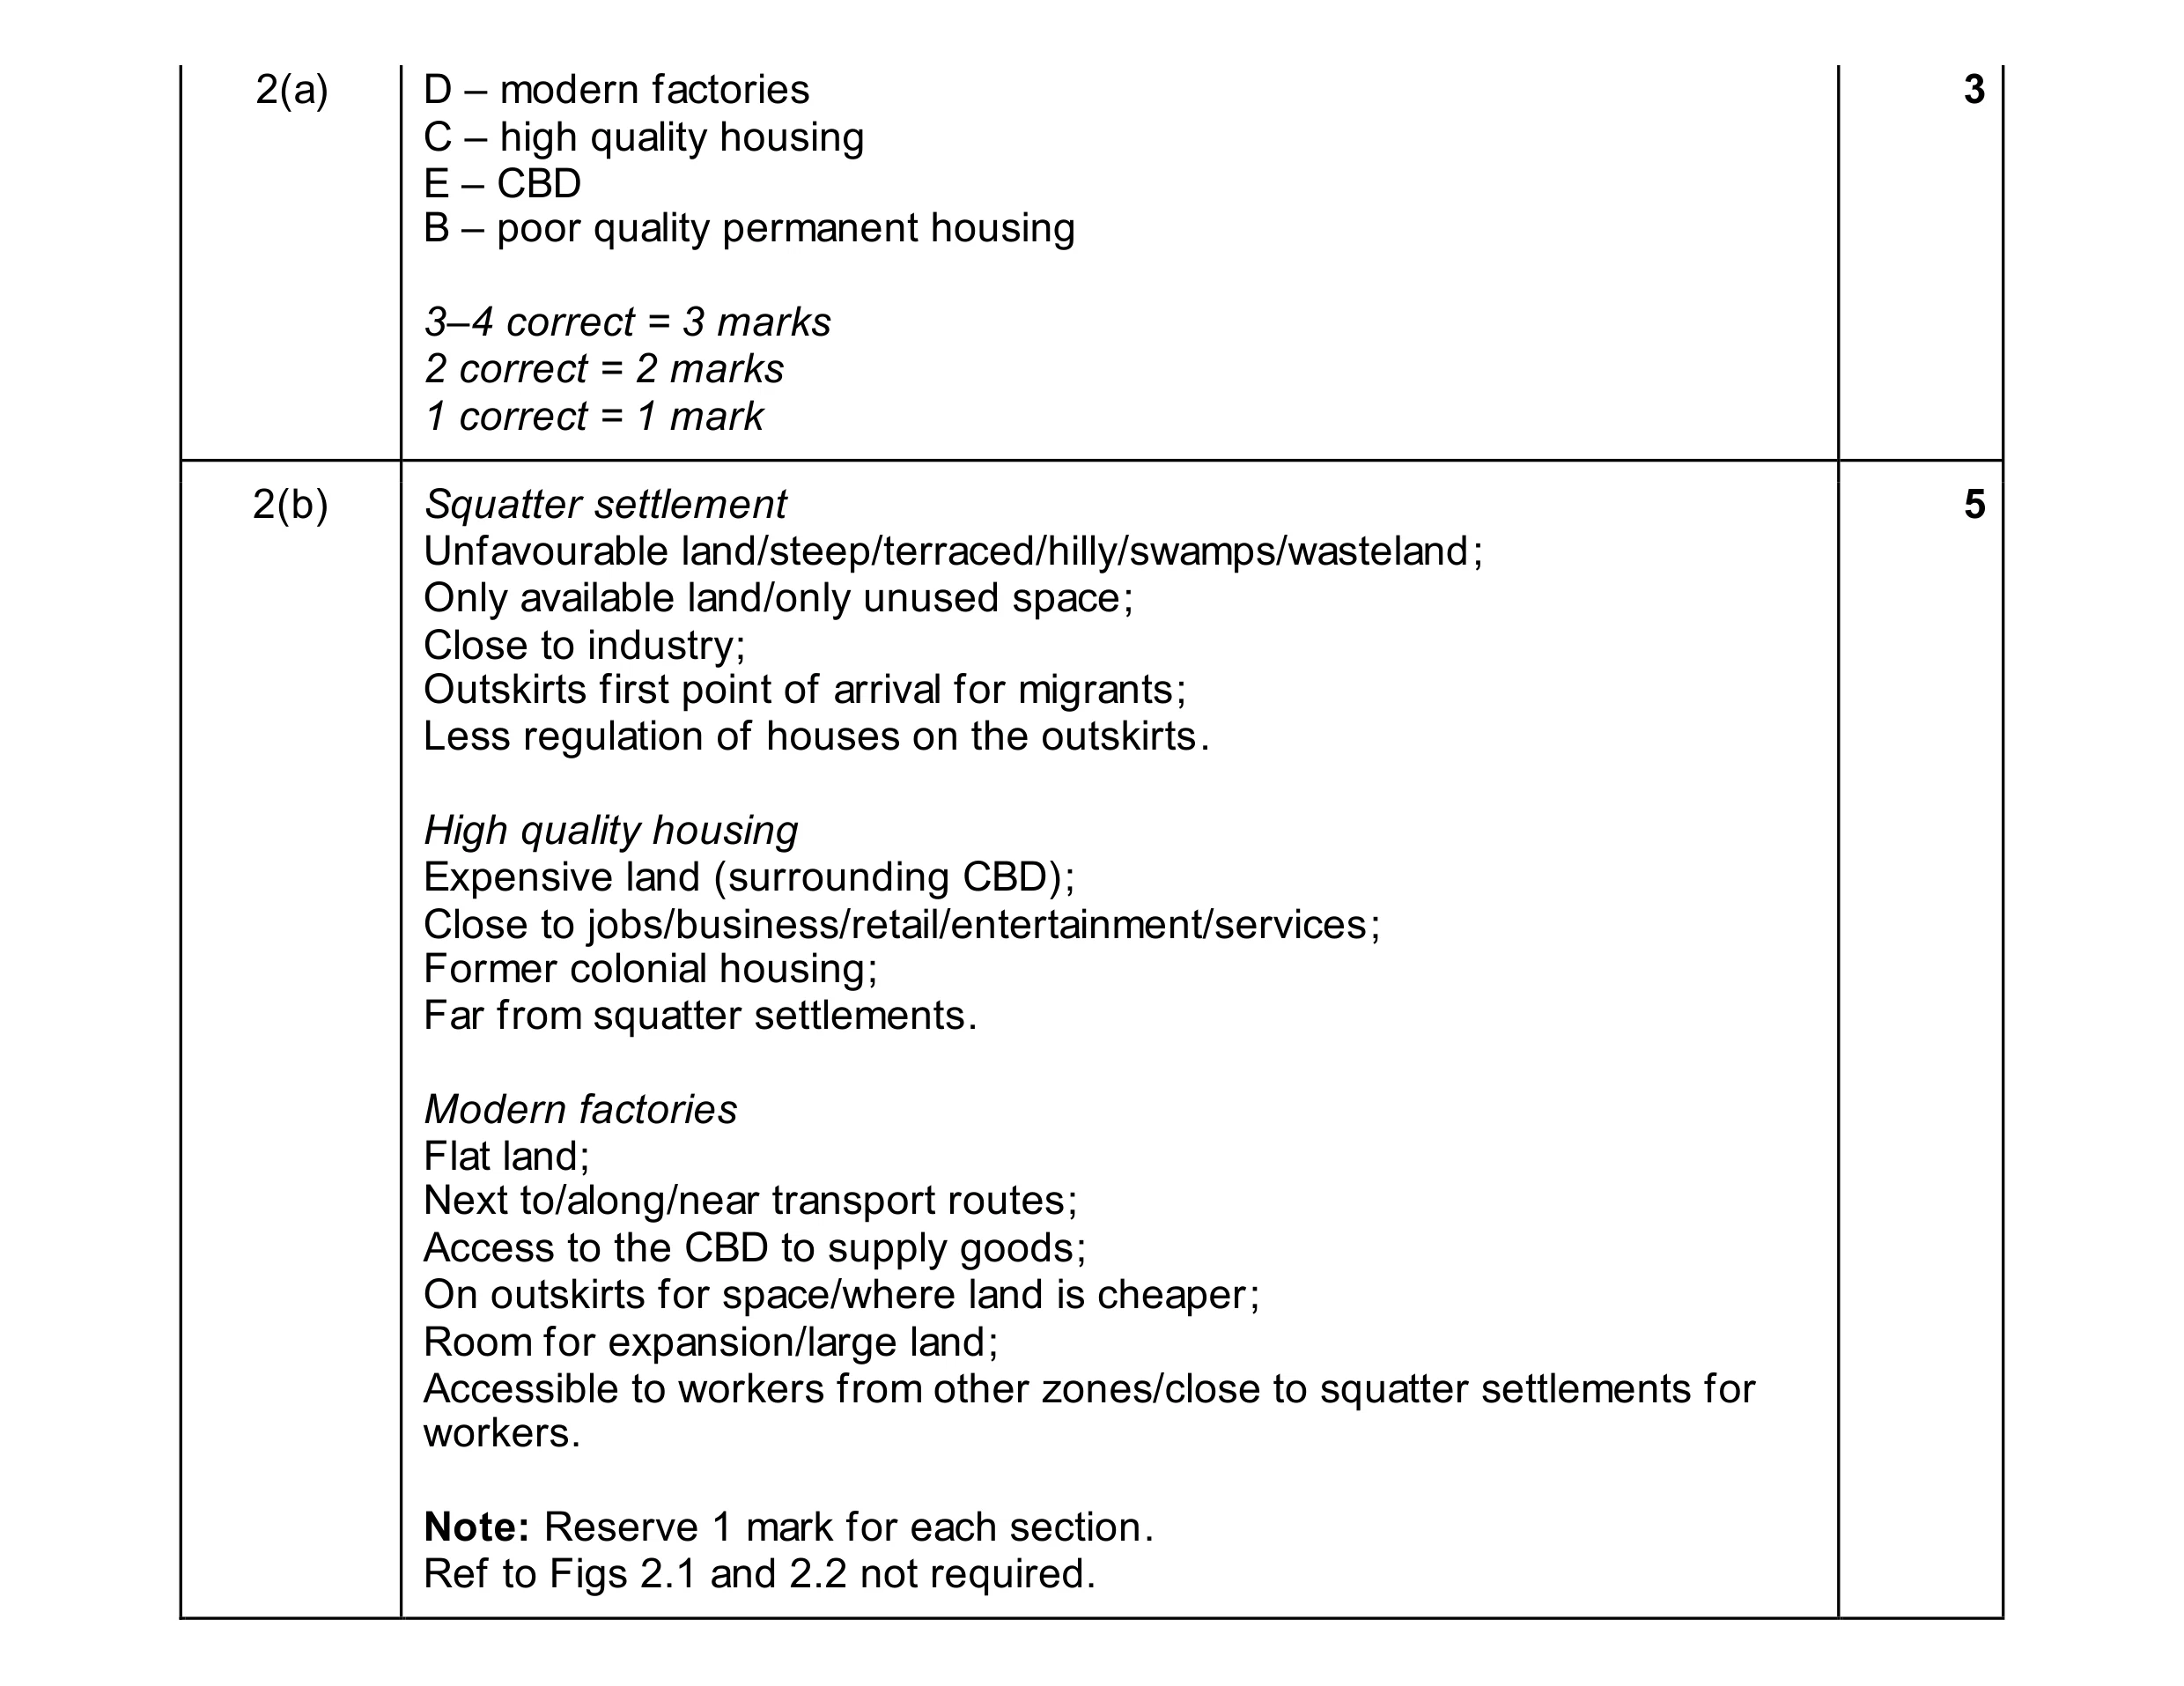 8
8