Cambridge IGCSE Geography 0460 — 2020 Oct/Nov Paper 2 · Variant 2
0460/22/O/N/20 · 6 questions · 60 marks · ≈68 min
The question paper and its mark scheme, free to read here and free to download. This is Cambridge’s own paper, exactly as it was sat.
Question paper20 pages



Mark scheme6 pages
Answers below. Sit the paper first if you are practising.

Questions as text
Q1 · Study the map extract for Biancavilla, Italy
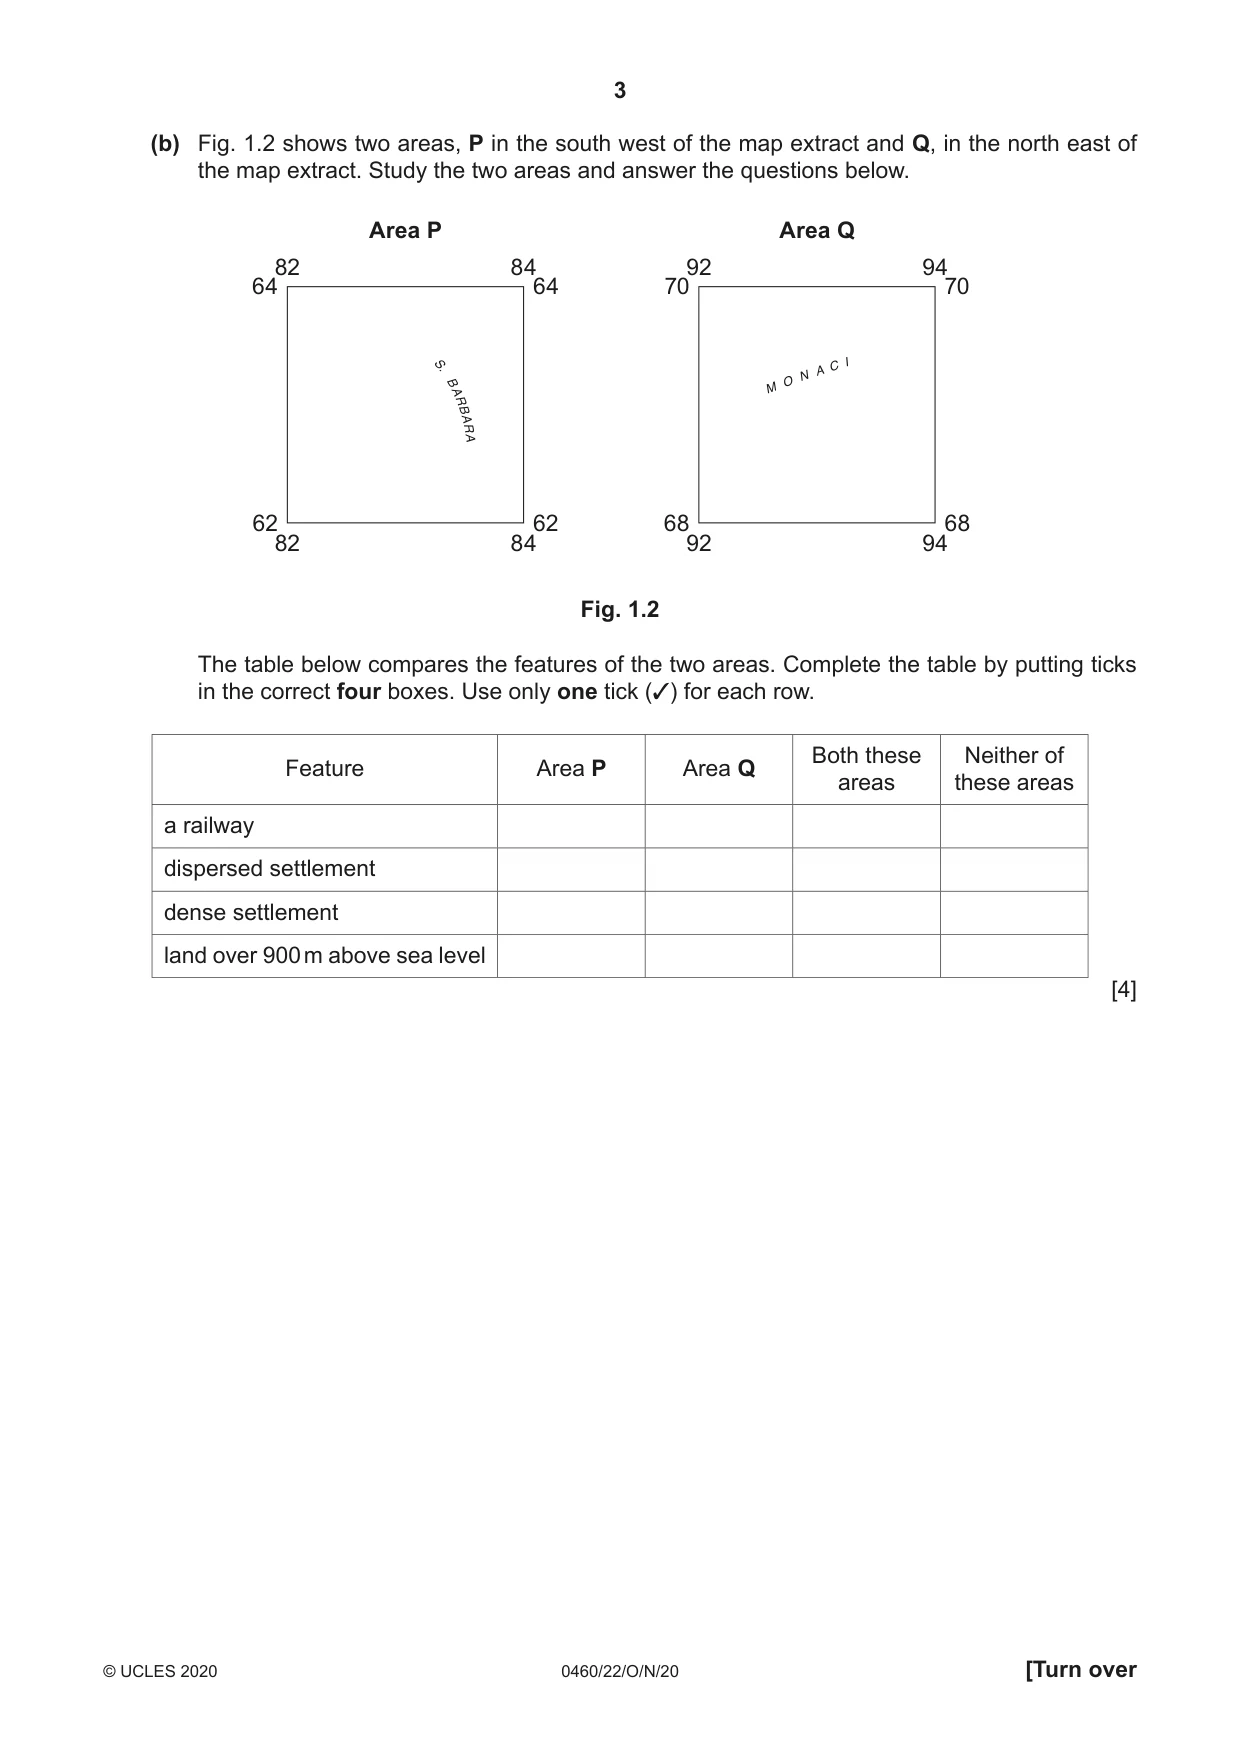
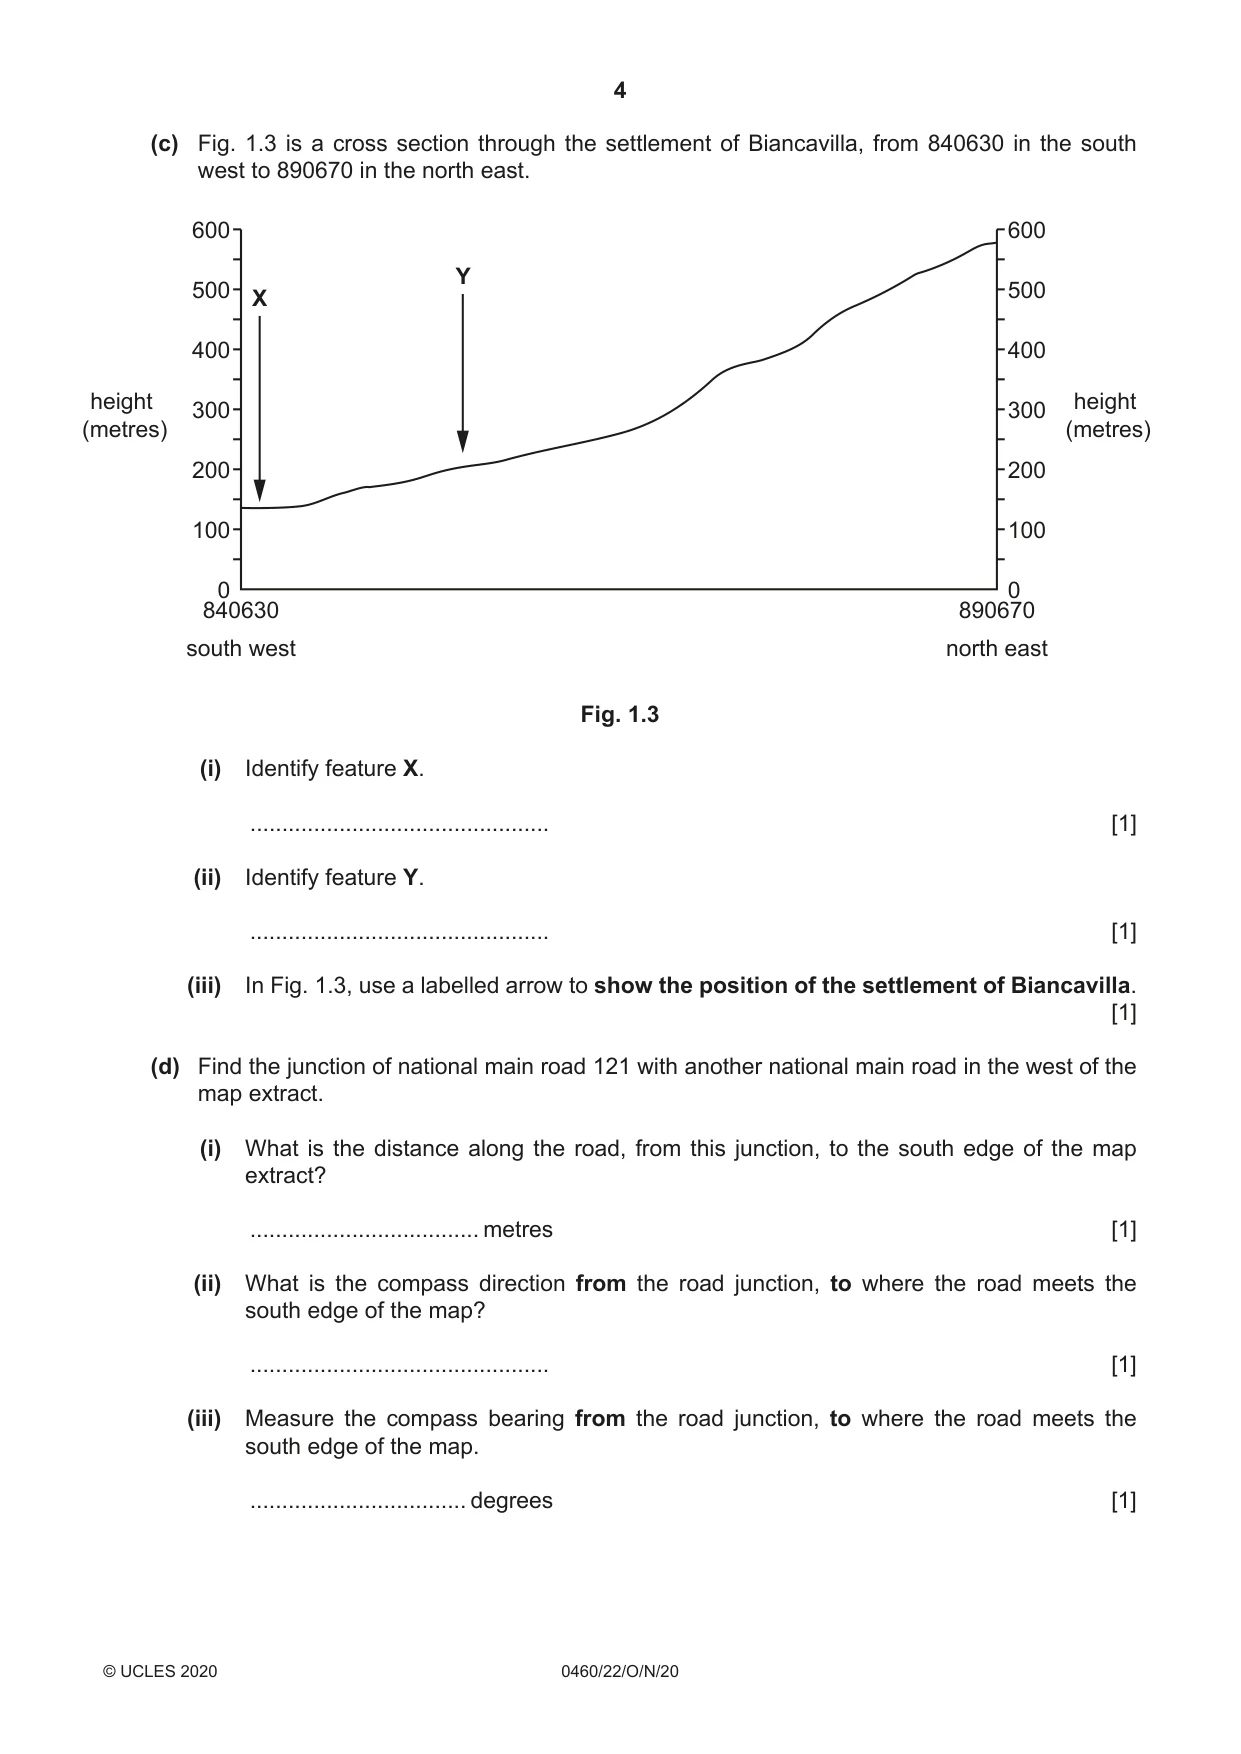
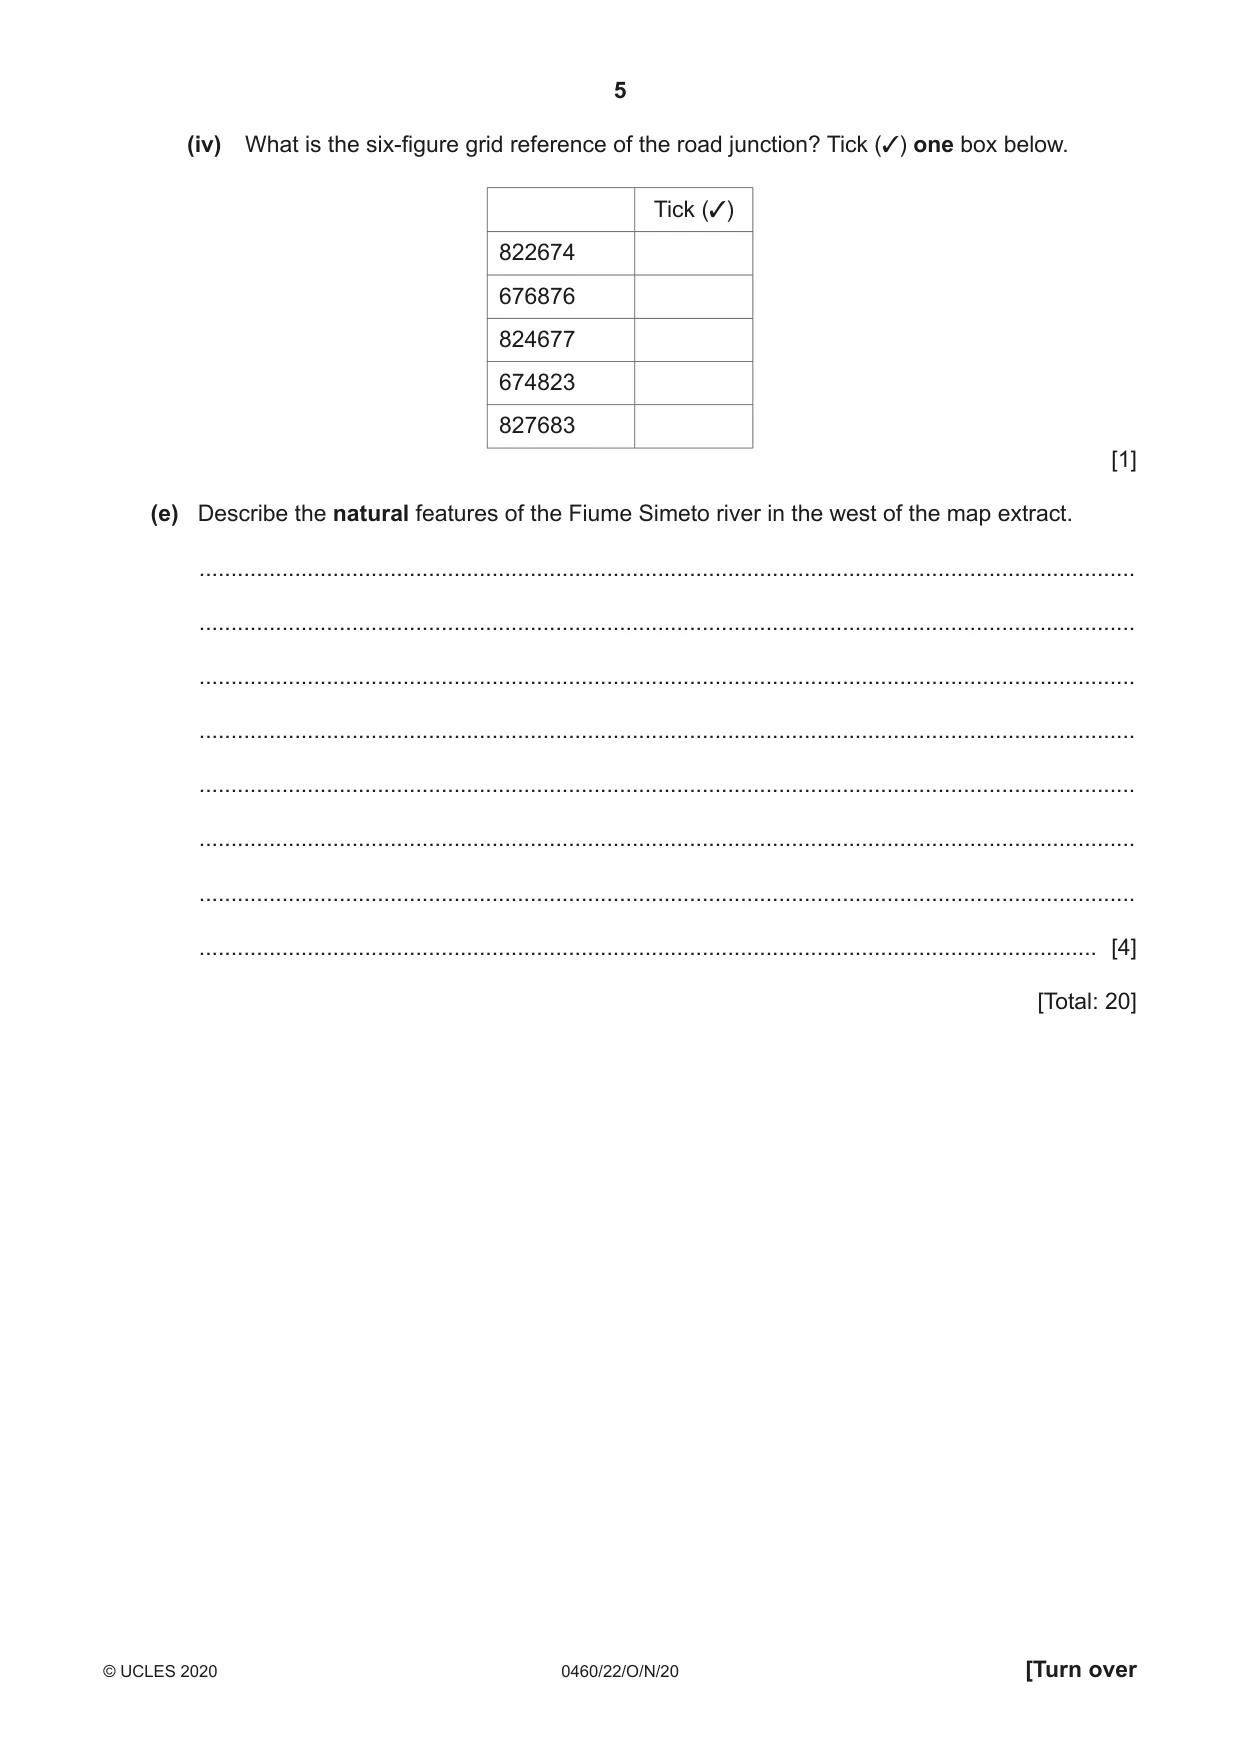
1 Study the map extract for Biancavilla, Italy. The scale is 1:50 000. (a) Fig. 1.1 shows some of the features around the settlement at S. Maria di Licodia in the south east of the map extract. Study Fig. 1.1 and the map extract, and answer the questions below. 87 88 89 90 91 92 93 64 64 S. Maria di Licodia B C 63 63 E D A 62 62 87 88 89 90 91 92 93 Fig. 1.1 Using the map extract, identify the following features shown in Fig. 1.1: (i) the name of river A ..................................................................................................................................... [1] (ii) the height above sea level of the spot height at B .................................... metres [1] (iii) feature C ..................................................................................................................................... [1] (iv) feature D ..................................................................................................................................... [1] (v) feature E. ..................................................................................................................................... [1] (b) Fig. 1.2 shows two areas, P in the south west of the map extract and Q, in the north east of the map extract. Study the two areas and answer the questions below. Area P Area Q 82 84 92 94 64 64 70 70 S. B O N AC I A M R B A R A 62 62 68 68 82 84 92 94 Fig. 1.2 The table below compares the features of the two areas. Complete the table by putting ticks in the correct four boxes. Use only one tick (3) for each row. Both these Neither of Feature Area P Area Q areas these areas a railway dispersed settlement dense settlement land over 900 m above sea level [4] (c) Fig. 1.3 is a cross section through the settlement of Biancavilla, from 840630 in the south west to 890670 in the north east. 600 600 Y 500 500 X 400 400 height height 300 300 (metres) (metres) 200 200 100 100 0 0 840630 890670 south west north east Fig. 1.3 (i) Identify feature X. ............................................... [1] (ii) Identify feature Y. ............................................... [1] (iii) In Fig. 1.3, use a labelled arrow to show the position of the settlement of Biancavilla. [1] (d) Find the junction of national main road 121 with another national main road in the west of the map extract. (i) What is the distance along the road, from this junction, to the south edge of the map extract? .................................... metres [1] (ii) What is the compass direction from the road junction, to where the road meets the south edge of the map? ............................................... [1] (iii) Measure the compass bearing from the road junction, to where the road meets the south edge of the map. .................................. degrees [1] (iv) What is the six-figure grid reference of the road junction? Tick (3) one box below. Tick (3) 822674 676876 824677 674823 827683 [1] (e) Describe the natural features of the Fiume Simeto river in the west of the map extract. ................................................................................................................................................... ................................................................................................................................................... ................................................................................................................................................... ................................................................................................................................................... ................................................................................................................................................... ................................................................................................................................................... ................................................................................................................................................... ............................................................................................................................................. [4] [Total: 20]
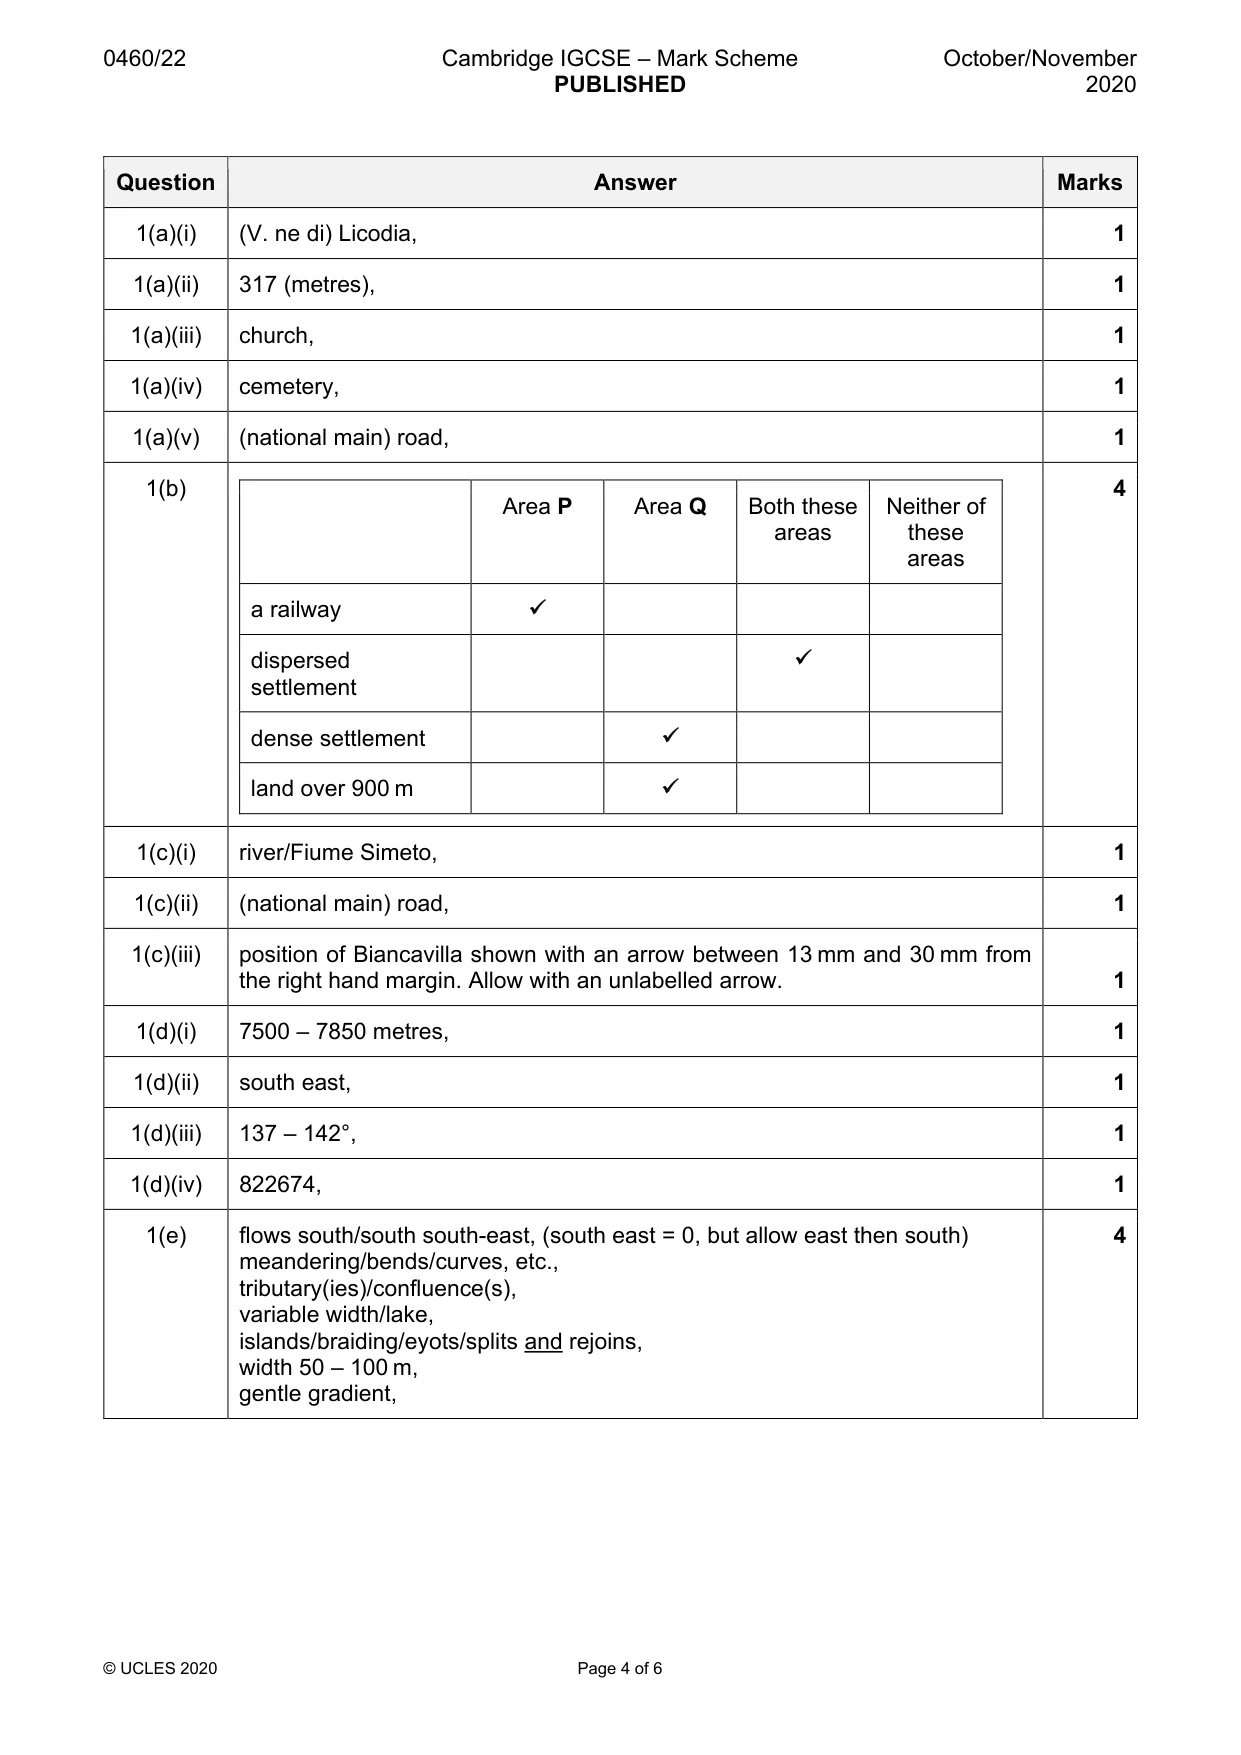
Mark scheme: Question Answer Marks 1(a)(i) (V. ne di) Licodia, 1 1(a)(ii) 317 (metres), 1 1(a)(iii) church, 1 1(a)(iv) cemetery, 1 1(a)(v) (national main) road, 1 1(b) 4 Area P Area Q Both these Neither of areas these areas a railway dispersed settlement dense settlement land over 900 m 1(c)(i) river/Fiume Simeto, 1 1(c)(ii) (national main) road, 1 1(c)(iii) position of Biancavilla shown with an arrow between 13 mm and 30 mm from the right hand margin. Allow with an unlabelled arrow. 1 1(d)(i) 7500 – 7850 metres, 1 1(d)(ii) south east, 1 1(d)(iii) 137 – 142°, 1 1(d)(iv) 822674, 1 1(e) flows south/south south-east, (south east = 0, but allow east then south) 4 meandering/bends/curves, etc., tributary(ies)/confluence(s), variable width/lake, islands/braiding/eyots/splits and rejoins, width 50 – 100 m, gentle gradient,
Q2 · The population of the world in 2017 and Fig
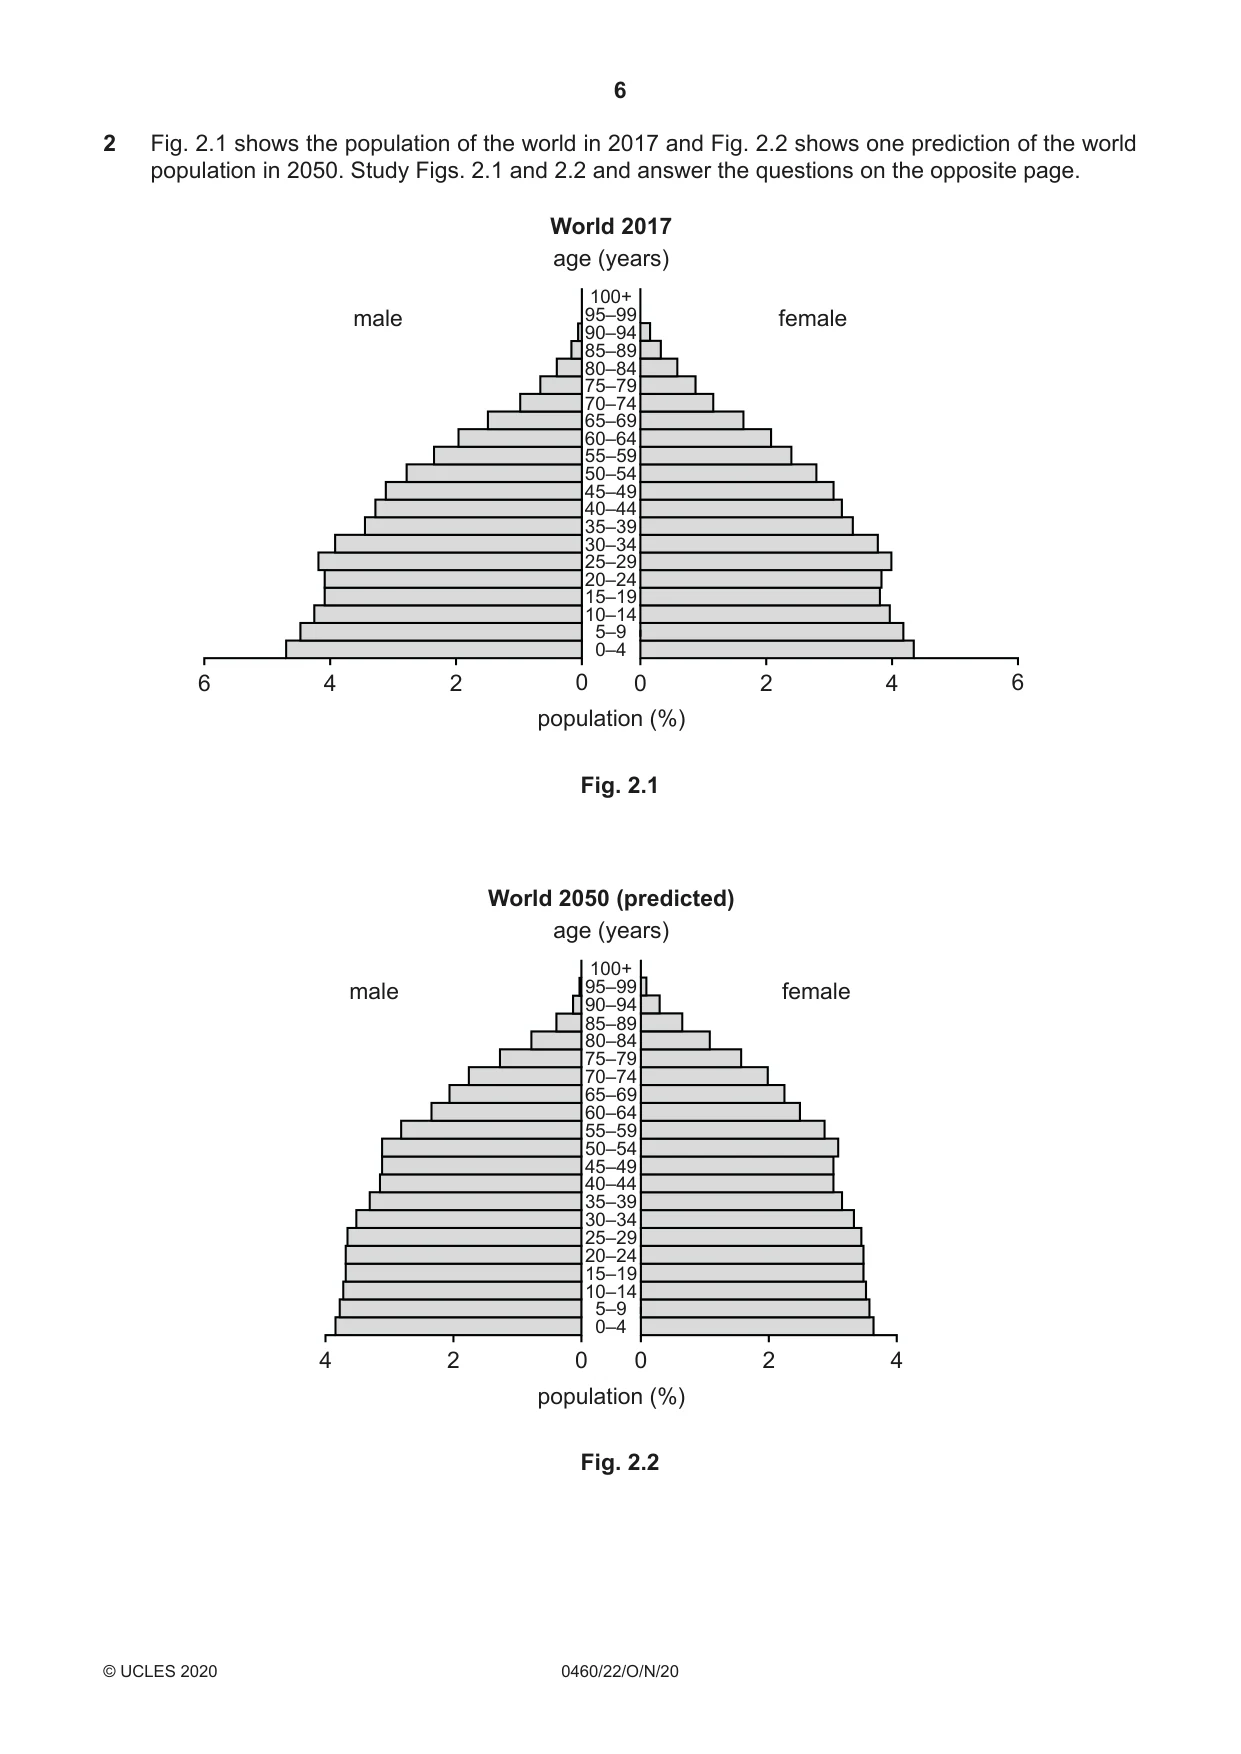
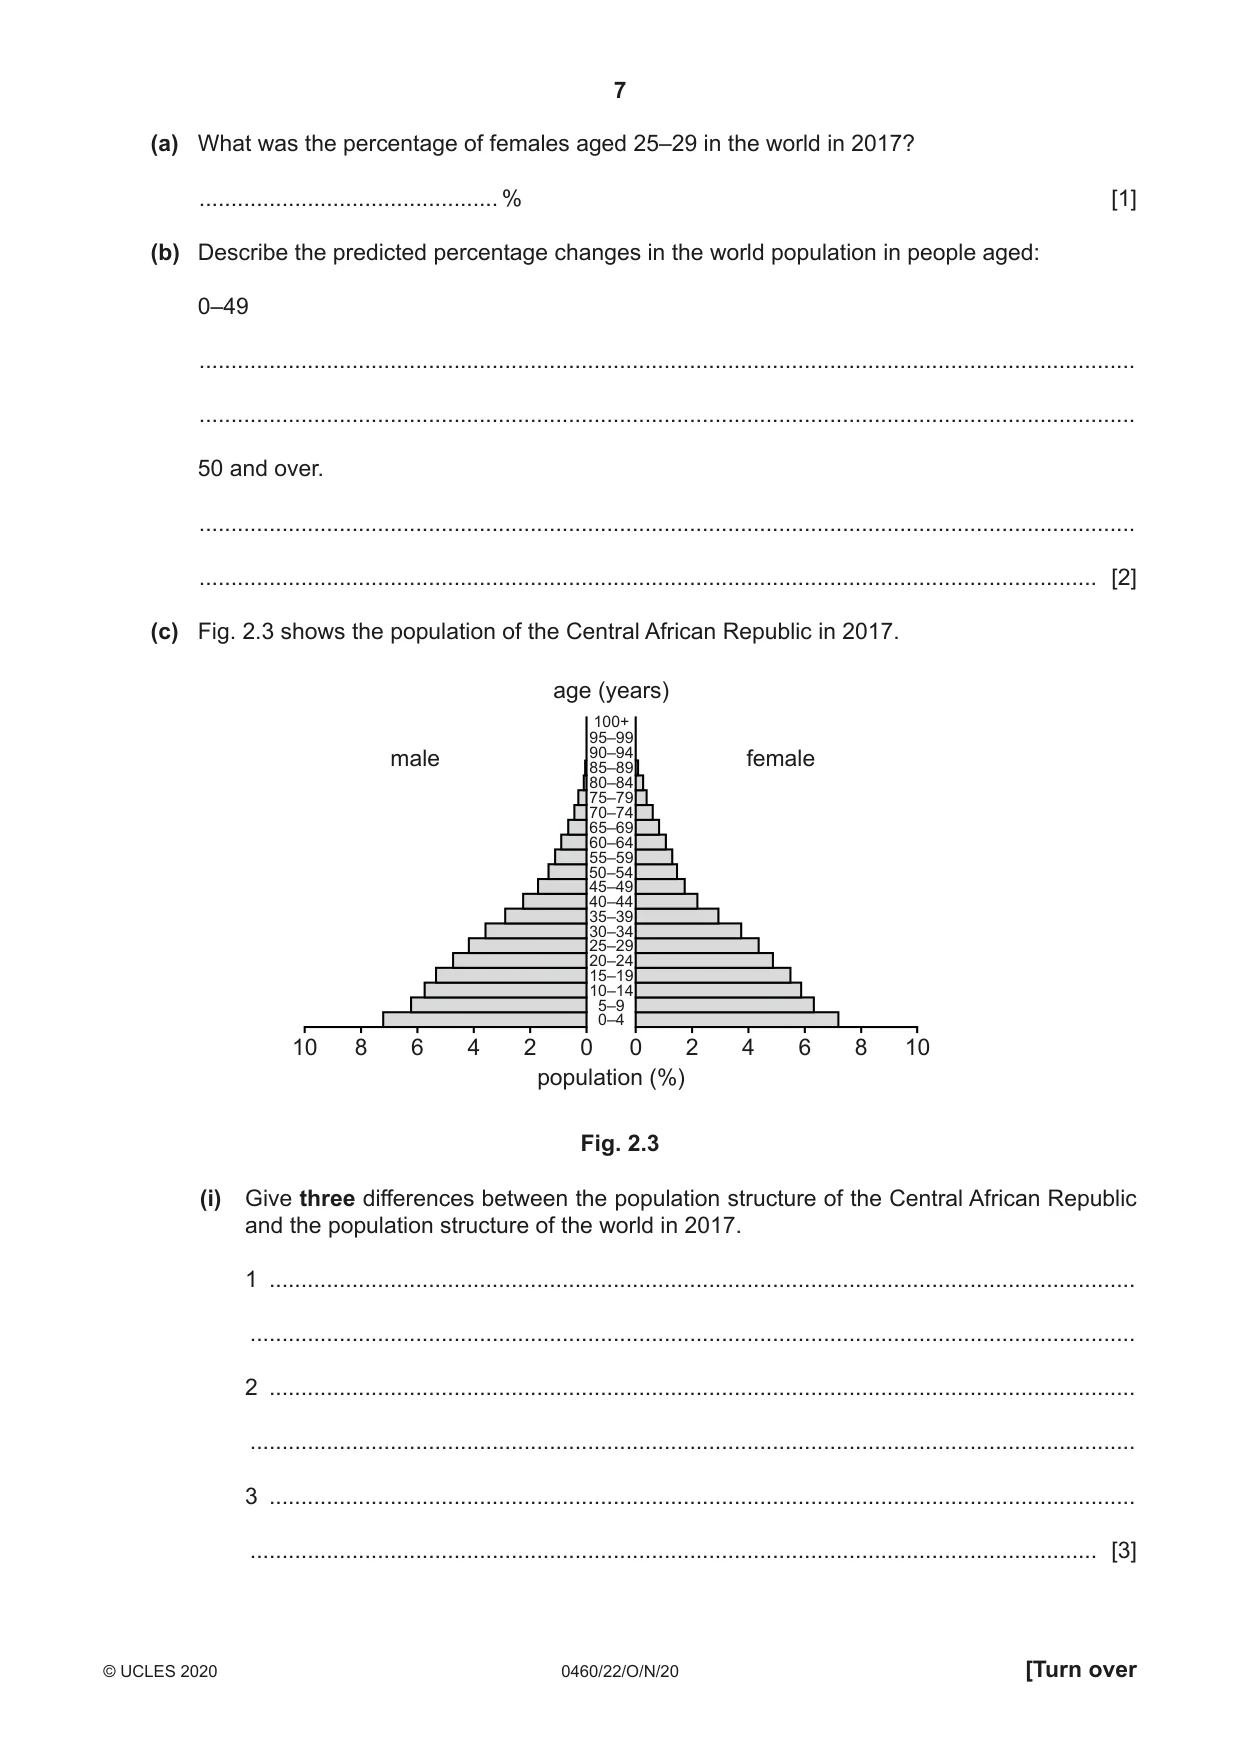
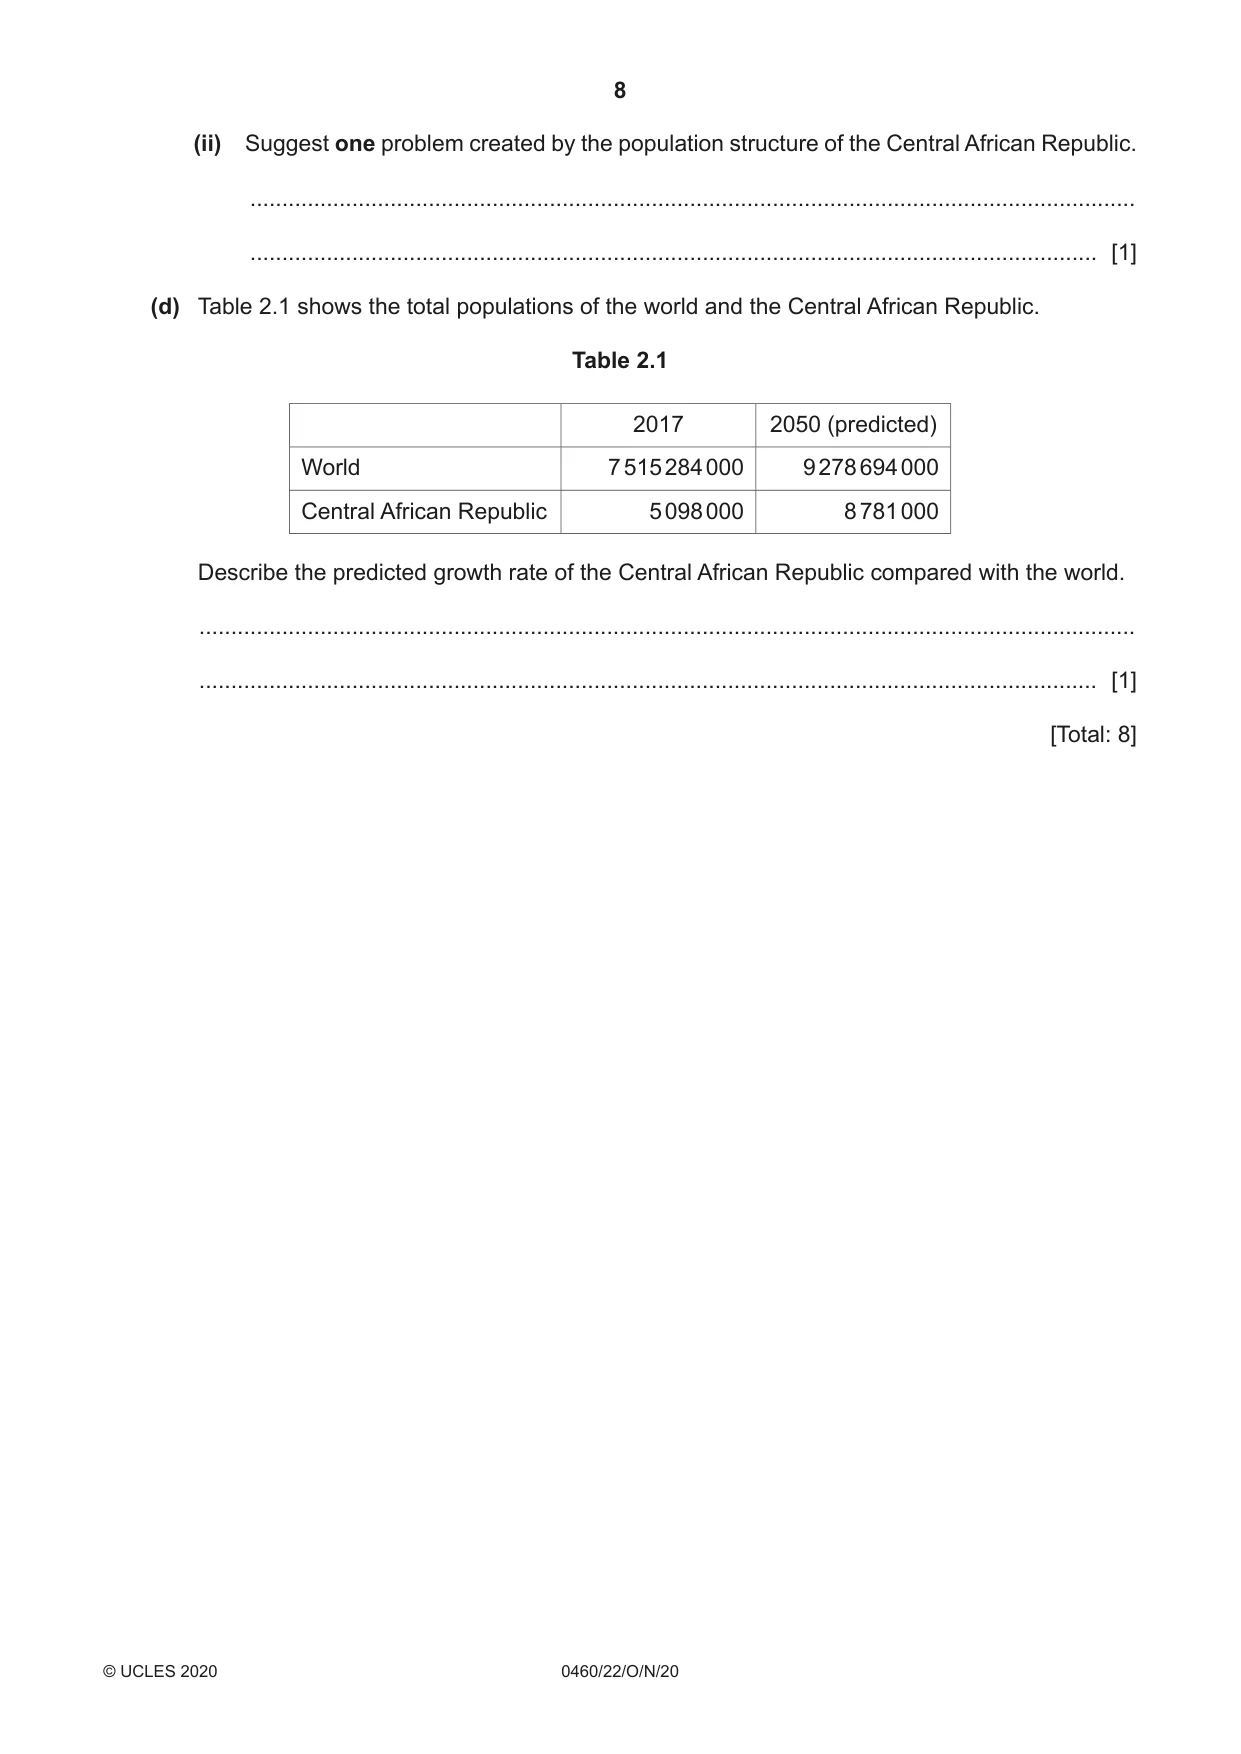
2 Fig. 2.1 shows the population of the world in 2017 and Fig. 2.2 shows one prediction of the world population in 2050. Study Figs. 2.1 and 2.2 and answer the questions on the opposite page. World 2017 age (years) 100+ male 95–99 female 90–94 85–89 80–84 75–79 70–74 65–69 60–64 55–59 50–54 45–49 40–44 35–39 30–34 25–29 20–24 15–19 10–14 5–9 0–4 6 4 2 0 0 2 4 6 population (%) Fig. 2.1 World 2050 (predicted) age (years) 100+ male 95–99 female 90–94 85–89 80–84 75–79 70–74 65–69 60–64 55–59 50–54 45–49 40–44 35–39 30–34 25–29 20–24 15–19 10–14 5–9 0–4 4 2 0 0 2 4 population (%) Fig. 2.2 (a) What was the percentage of females aged 25–29 in the world in 2017? ............................................... % [1] (b) Describe the predicted percentage changes in the world population in people aged: 0–49 ................................................................................................................................................... ................................................................................................................................................... 50 and over. ................................................................................................................................................... ............................................................................................................................................. [2] (c) Fig. 2.3 shows the population of the Central African Republic in 2017. age (years) 100+ 95–99 male 90–9485–89 female 80–84 75–79 70–74 65–69 60–64 55–59 50–54 45–49 40–44 35–39 30–34 25–29 20–24 15–19 10–14 5–9 0–4 10 8 6 4 2 0 0 2 4 6 8 10 population (%) Fig. 2.3 (i) Give three differences between the population structure of the Central African Republic and the population structure of the world in 2017. 1 ........................................................................................................................................ ........................................................................................................................................... 2 ........................................................................................................................................ ........................................................................................................................................... 3 ........................................................................................................................................ ..................................................................................................................................... [3] (ii) Suggest one problem created by the population structure of the Central African Republic. ........................................................................................................................................... ..................................................................................................................................... [1] (d) Table 2.1 shows the total populations of the world and the Central African Republic. Table 2.1 2017 2050 (predicted) World 7 515 284 000 9 278 694 000 Central African Republic 5 098 000 8 781 000 Describe the predicted growth rate of the Central African Republic compared with the world. ................................................................................................................................................... ............................................................................................................................................. [1] [Total: 8]
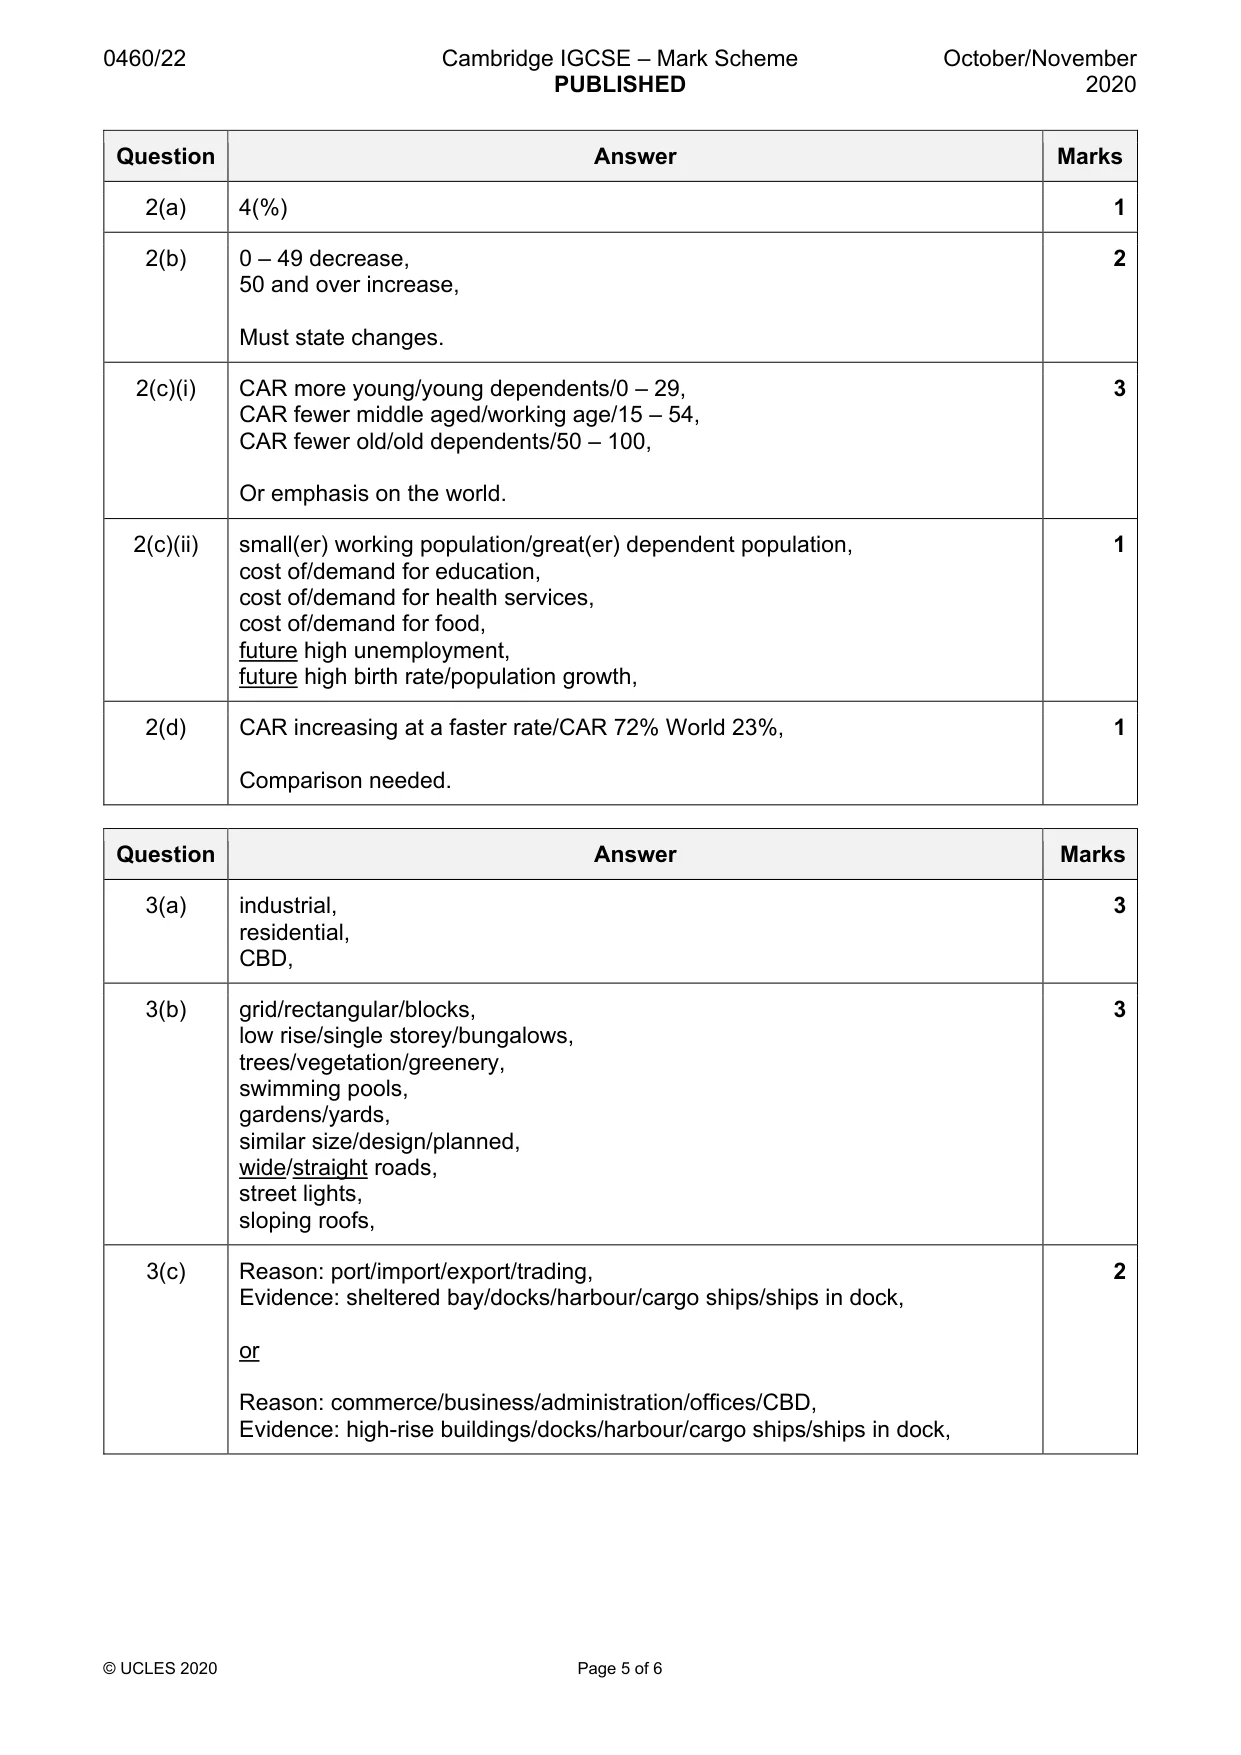
Mark scheme: 2(a) 4(%) 1 2(b) 0 – 49 decrease, 2 50 and over increase, Must state changes. 2(c)(i) CAR more young/young dependents/0 – 29, 3 CAR fewer middle aged/working age/15 – 54, CAR fewer old/old dependents/50 – 100, Or emphasis on the world. 2(c)(ii) small(er) working population/great(er) dependent population, 1 cost of/demand for education, cost of/demand for health services, cost of/demand for food, future high unemployment, future high birth rate/population growth, 2(d) CAR increasing at a faster rate/CAR 72% World 23%, 1 Comparison needed.
Question 3
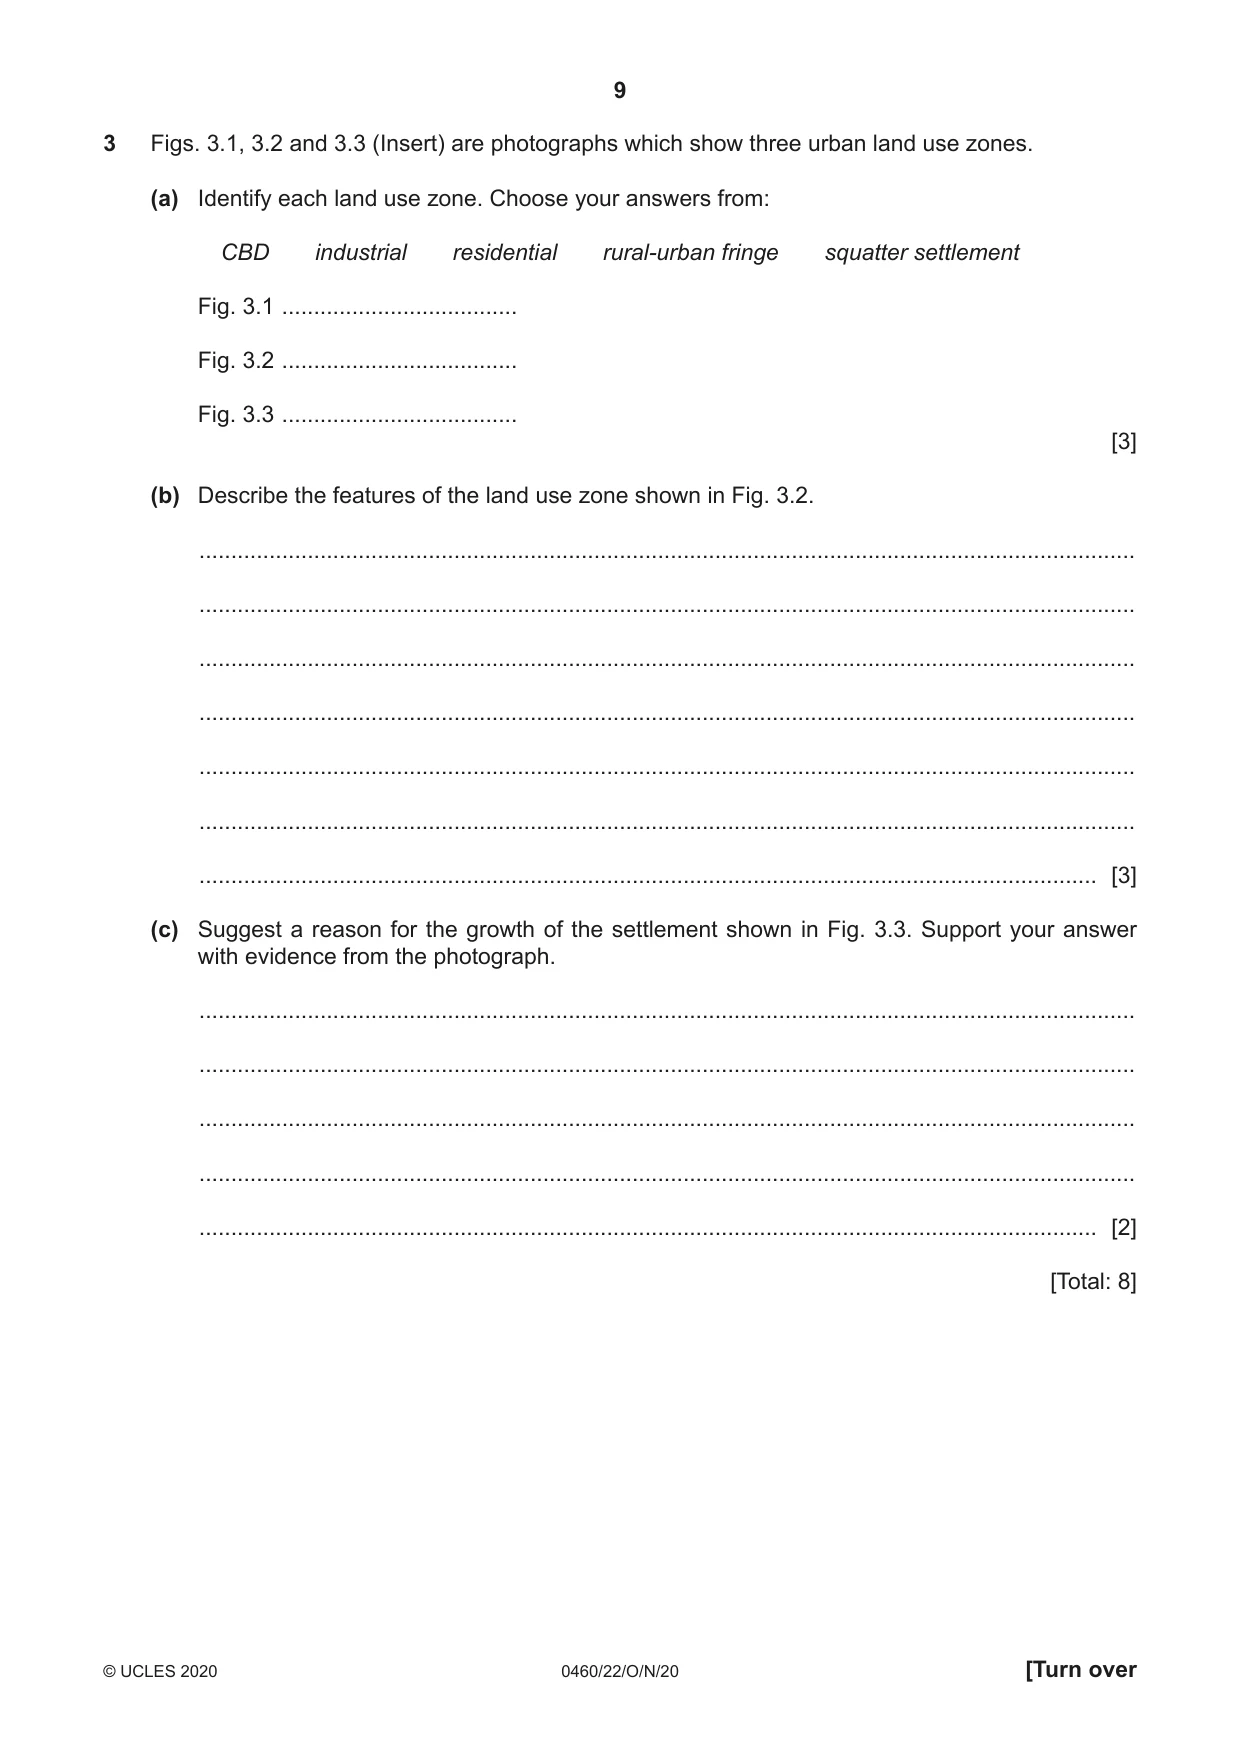
3 Figs. 3.1, 3.2 and 3.3 (Insert) are photographs which show three urban land use zones. (a) Identify each land use zone. Choose your answers from: CBD industrial residential rural-urban fringe squatter settlement Fig. 3.1 ..................................... Fig. 3.2 ..................................... Fig. 3.3 ..................................... [3] (b) Describe the features of the land use zone shown in Fig. 3.2. ................................................................................................................................................... ................................................................................................................................................... ................................................................................................................................................... ................................................................................................................................................... ................................................................................................................................................... ................................................................................................................................................... ............................................................................................................................................. [3] (c) Suggest a reason for the growth of the settlement shown in Fig. 3.3. Support your answer with evidence from the photograph. ................................................................................................................................................... ................................................................................................................................................... ................................................................................................................................................... ................................................................................................................................................... ............................................................................................................................................. [2] [Total: 8]
Mark scheme: 3(a) industrial, 3 residential, CBD, 3(b) grid/rectangular/blocks, 3 low rise/single storey/bungalows, trees/vegetation/greenery, swimming pools, gardens/yards, similar size/design/planned, wide/straight roads, street lights, sloping roofs, 3(c) Reason: port/import/export/trading, 2 Evidence: sheltered bay/docks/harbour/cargo ships/ships in dock, or Reason: commerce/business/administration/offices/CBD, Evidence: high-rise buildings/docks/harbour/cargo ships/ships in dock,
Question 4
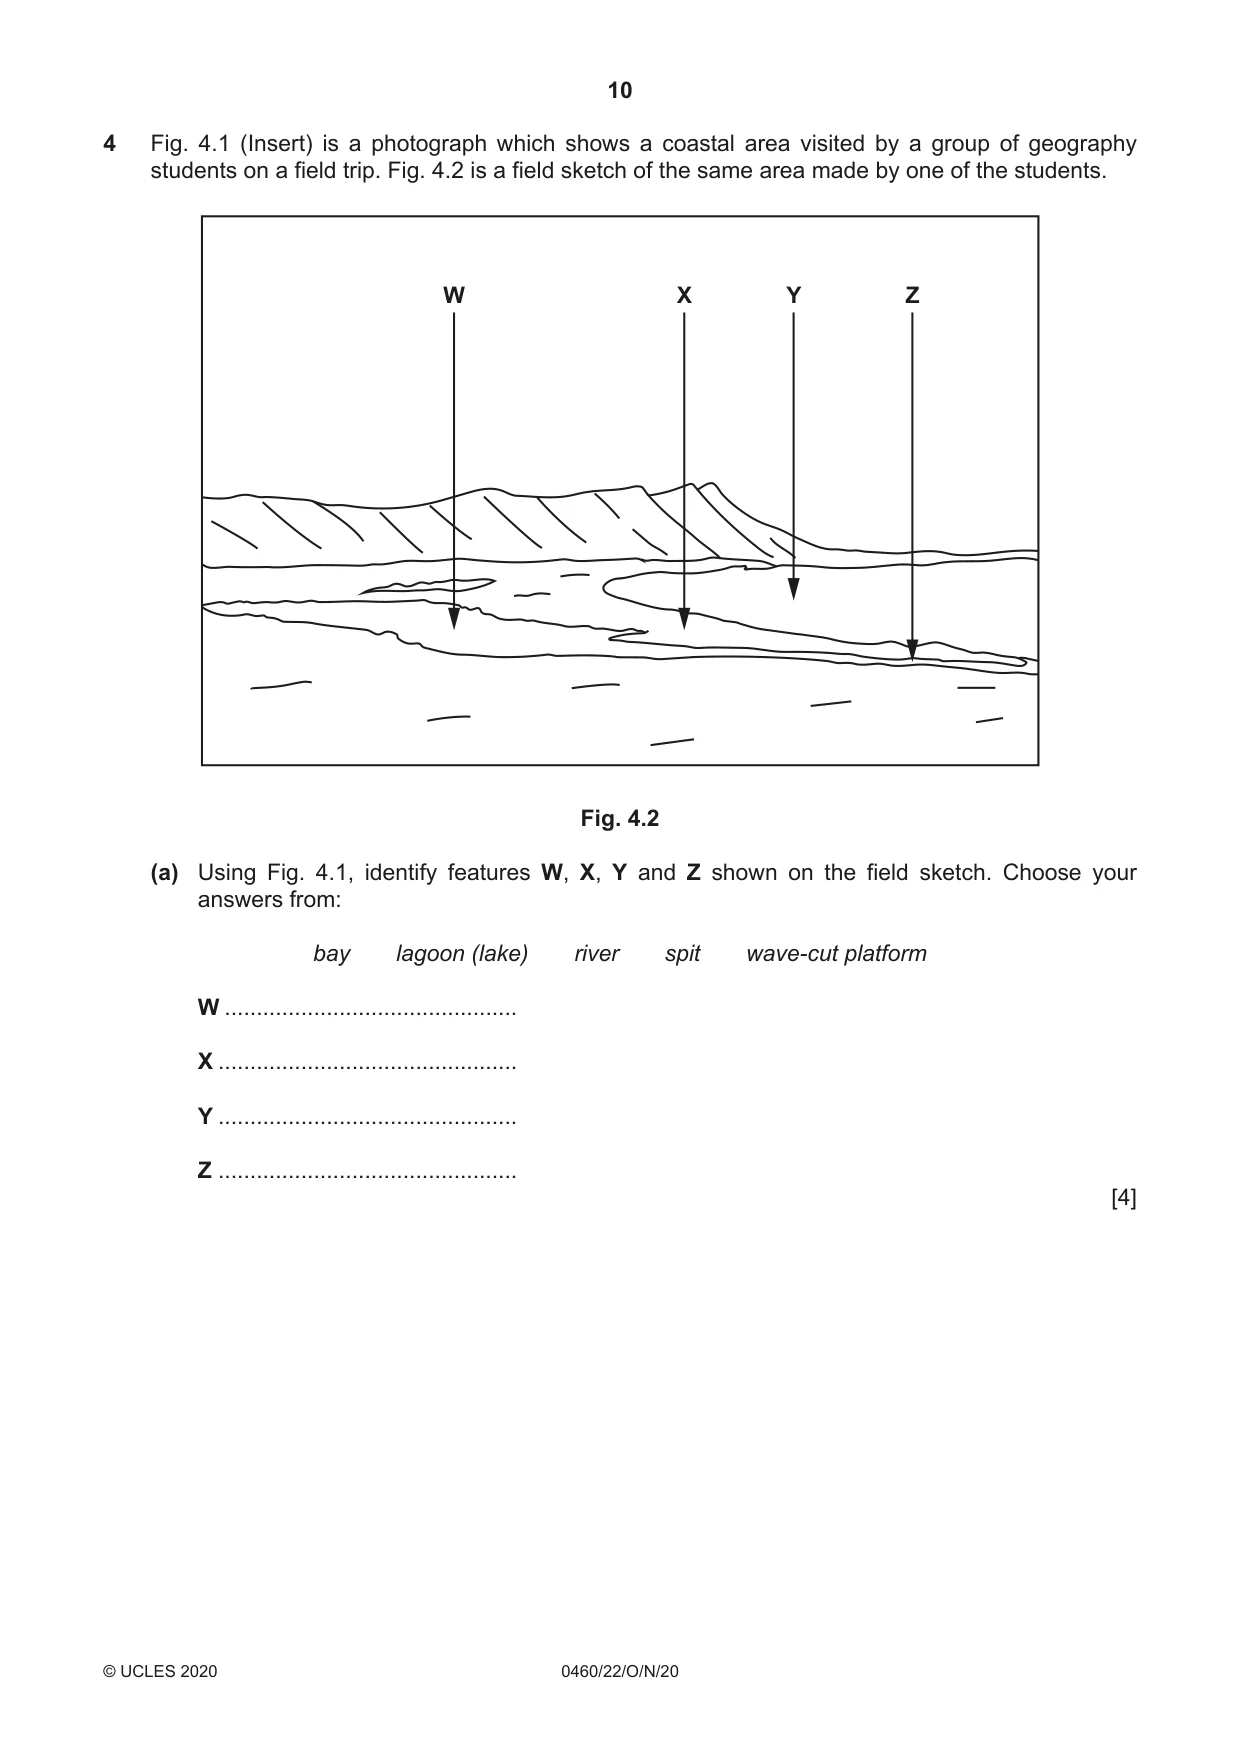
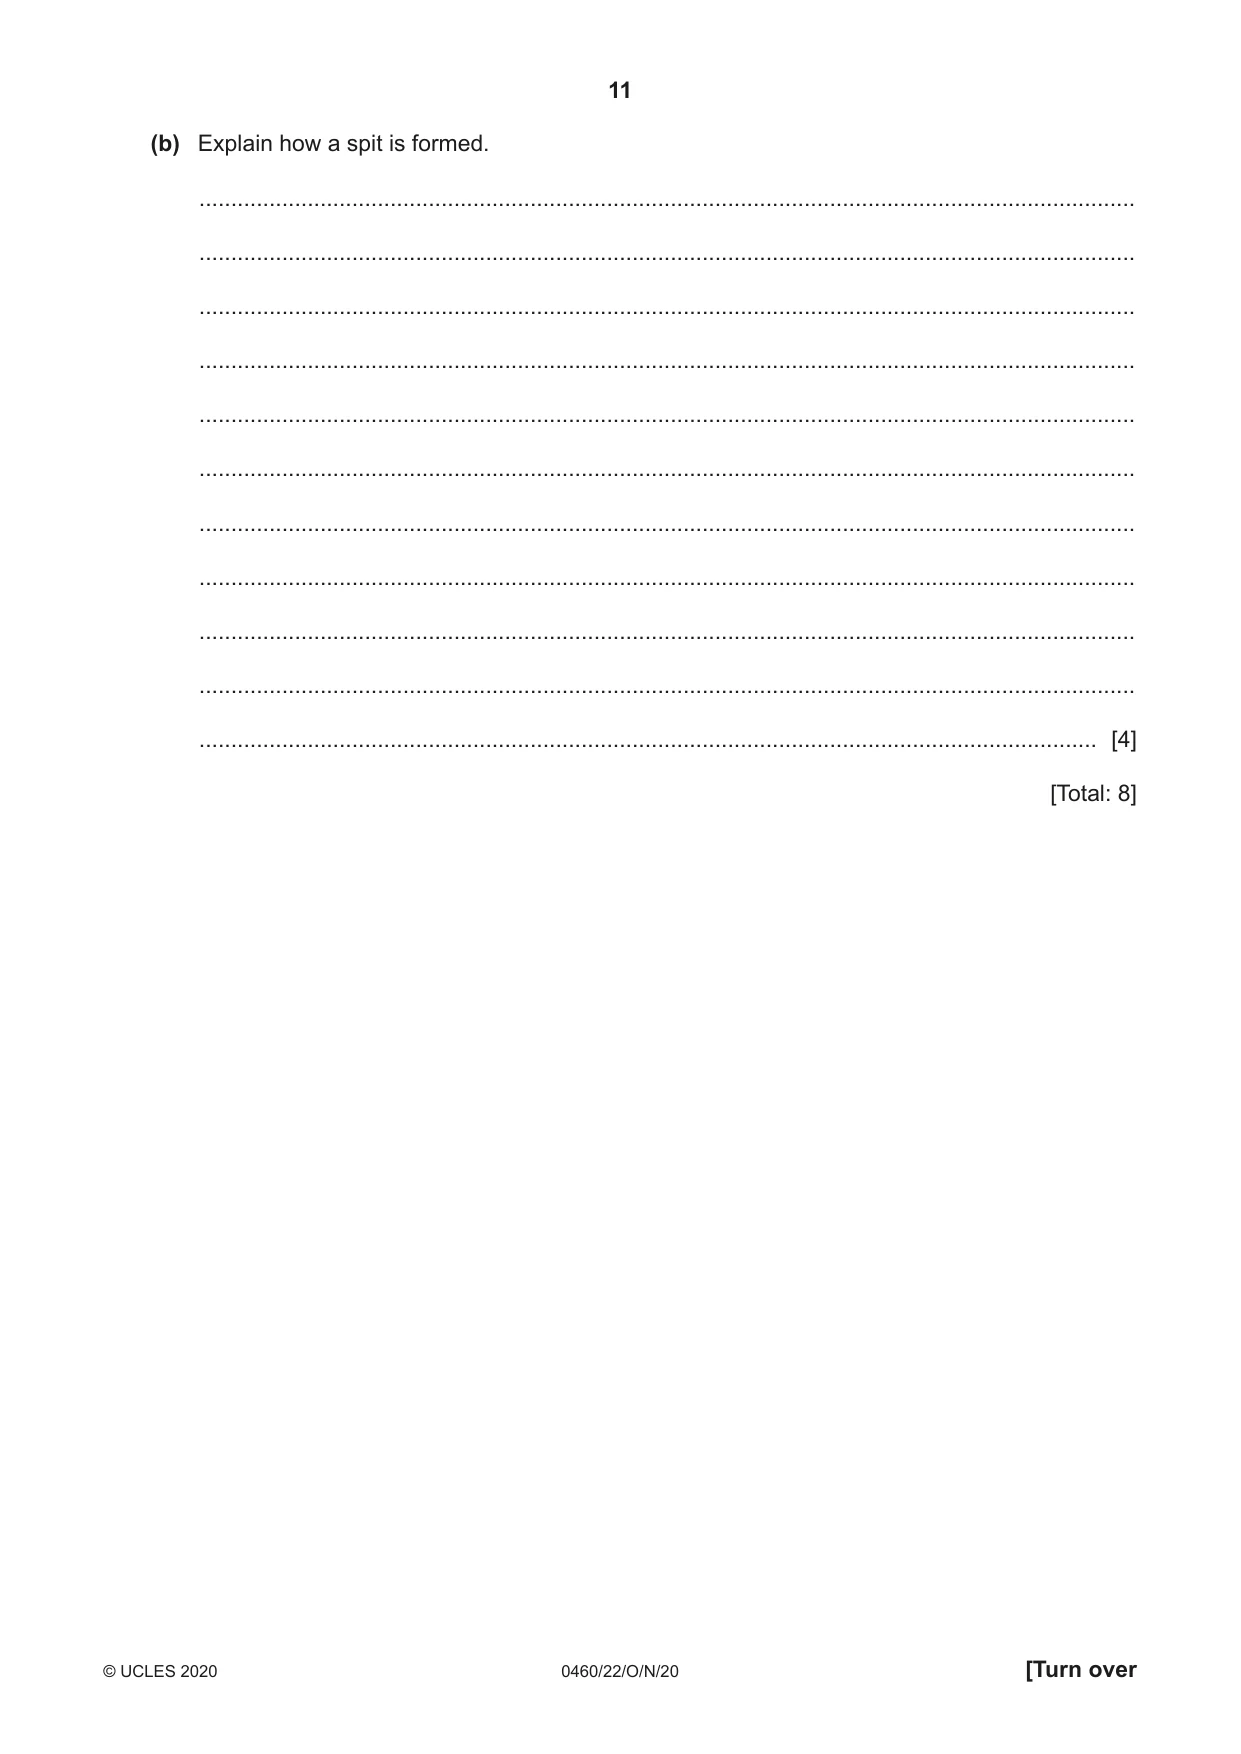
4 Fig. 4.1 (Insert) is a photograph which shows a coastal area visited by a group of geography students on a field trip. Fig. 4.2 is a field sketch of the same area made by one of the students. W X Y Z Fig. 4.2 (a) Using Fig. 4.1, identify features W, X, Y and Z shown on the field sketch. Choose your answers from: bay lagoon (lake) river spit wave-cut platform W .............................................. X ............................................... Y ............................................... Z ............................................... [4] (b) Explain how a spit is formed. ................................................................................................................................................... ................................................................................................................................................... ................................................................................................................................................... ................................................................................................................................................... ................................................................................................................................................... ................................................................................................................................................... ................................................................................................................................................... ................................................................................................................................................... ................................................................................................................................................... ................................................................................................................................................... ............................................................................................................................................. [4] [Total: 8]
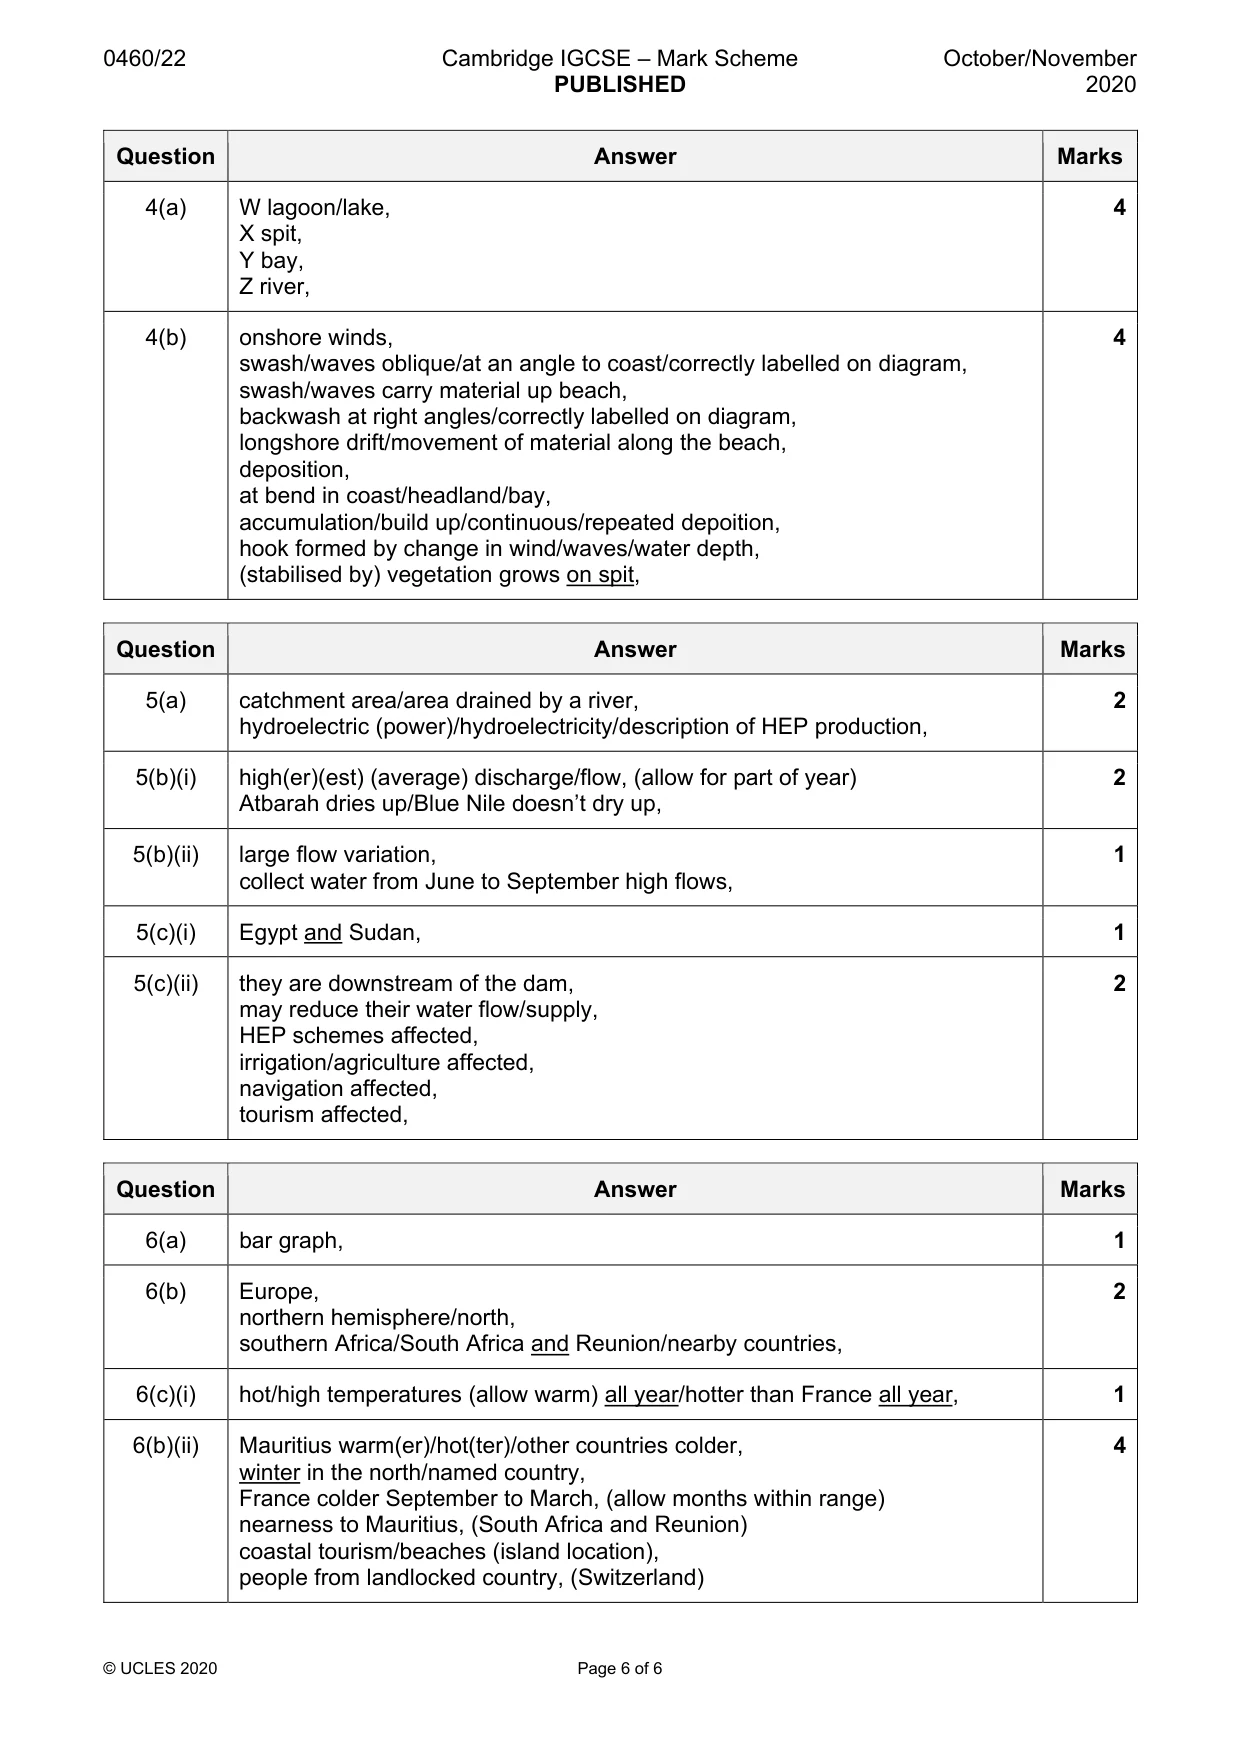
Mark scheme: 4(a) W lagoon/lake, 4 X spit, Y bay, Z river, 4(b) onshore winds, 4 swash/waves oblique/at an angle to coast/correctly labelled on diagram, swash/waves carry material up beach, backwash at right angles/correctly labelled on diagram, longshore drift/movement of material along the beach, deposition, at bend in coast/headland/bay, accumulation/build up/continuous/repeated depoition, hook formed by change in wind/waves/water depth, (stabilised by) vegetation grows on spit,
Q5 · The drainage basin of the Nile River and its tributaries
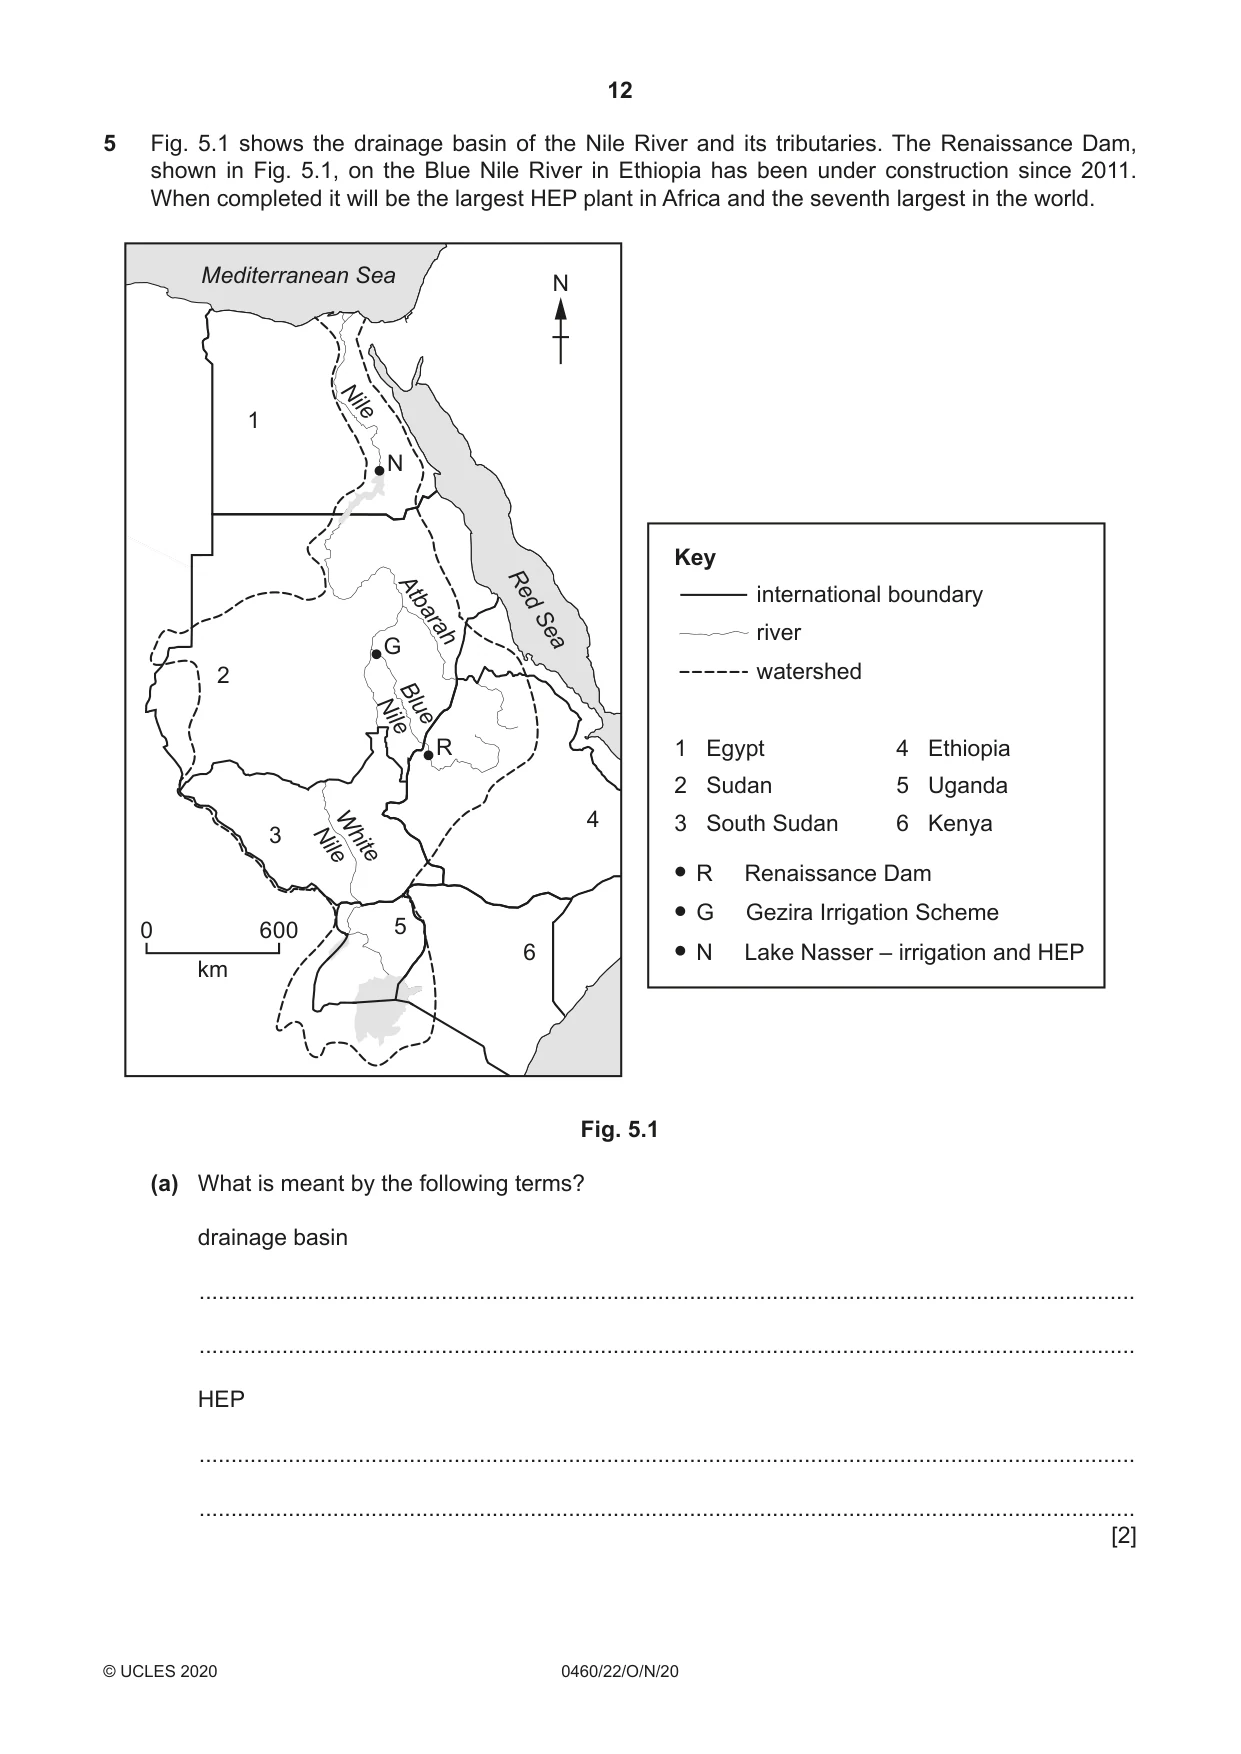
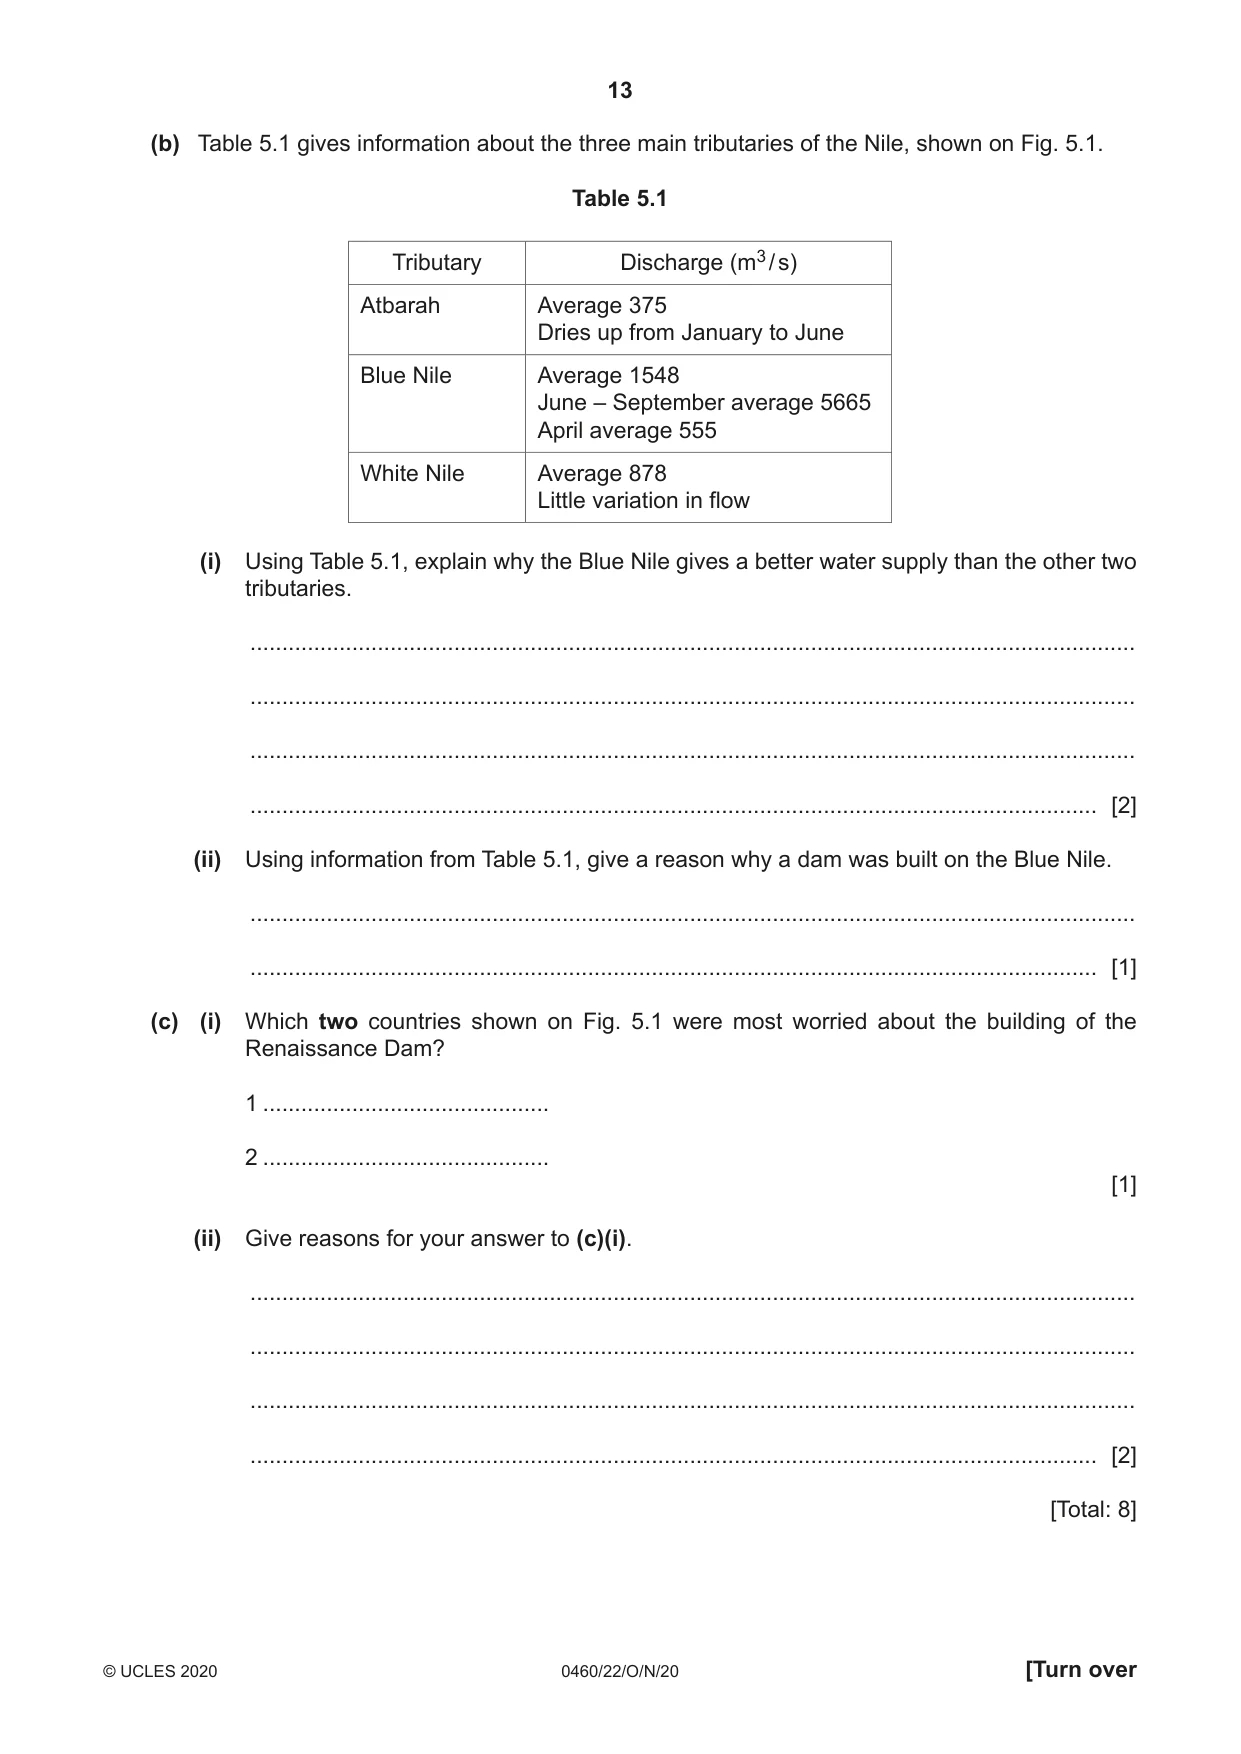
5 Fig. 5.1 shows the drainage basin of the Nile River and its tributaries. The Renaissance Dam, shown in Fig. 5.1, on the Blue Nile River in Ethiopia has been under construction since 2011. When completed it will be the largest HEP plant in Africa and the seventh largest in the world. Mediterranean Sea N Nile 1 N Key river Atbarah RedSea international boundary G 2 watershed Blue Nile R 1 Egypt 4 Ethiopia 2 Sudan 5 Uganda 4 3 South Sudan 6 Kenya 3 NileWhite R Renaissance Dam G Gezira Irrigation Scheme 0 600 5 6 N Lake Nasser – irrigation and HEP km Fig. 5.1 (a) What is meant by the following terms? drainage basin ................................................................................................................................................... ................................................................................................................................................... HEP ................................................................................................................................................... ................................................................................................................................................... [2] (b) Table 5.1 gives information about the three main tributaries of the Nile, shown on Fig. 5.1. Table 5.1 Tributary Discharge (m3 / s) Atbarah Average 375 Dries up from January to June Blue Nile Average 1548 June – September average 5665 April average 555 White Nile Average 878 Little variation in flow (i) Using Table 5.1, explain why the Blue Nile gives a better water supply than the other two tributaries. ........................................................................................................................................... ........................................................................................................................................... ........................................................................................................................................... ..................................................................................................................................... [2] (ii) Using information from Table 5.1, give a reason why a dam was built on the Blue Nile. ........................................................................................................................................... ..................................................................................................................................... [1] (c) (i) Which two countries shown on Fig. 5.1 were most worried about the building of the Renaissance Dam? 1 ............................................. 2 ............................................. [1] (ii) Give reasons for your answer to (c)(i). ........................................................................................................................................... ........................................................................................................................................... ........................................................................................................................................... ..................................................................................................................................... [2] [Total: 8]
Mark scheme: 5(a) catchment area/area drained by a river, 2 hydroelectric (power)/hydroelectricity/description of HEP production, 5(b)(i) high(er)(est) (average) discharge/flow, (allow for part of year) 2 Atbarah dries up/Blue Nile doesn’t dry up, 5(b)(ii) large flow variation, 1 collect water from June to September high flows, 5(c)(i) Egypt and Sudan, 1 5(c)(ii) they are downstream of the dam, 2 may reduce their water flow/supply, HEP schemes affected, irrigation/agriculture affected, navigation affected, tourism affected,
Q6 · The island of Mauritius in the Indian Ocean has an important tourist industry
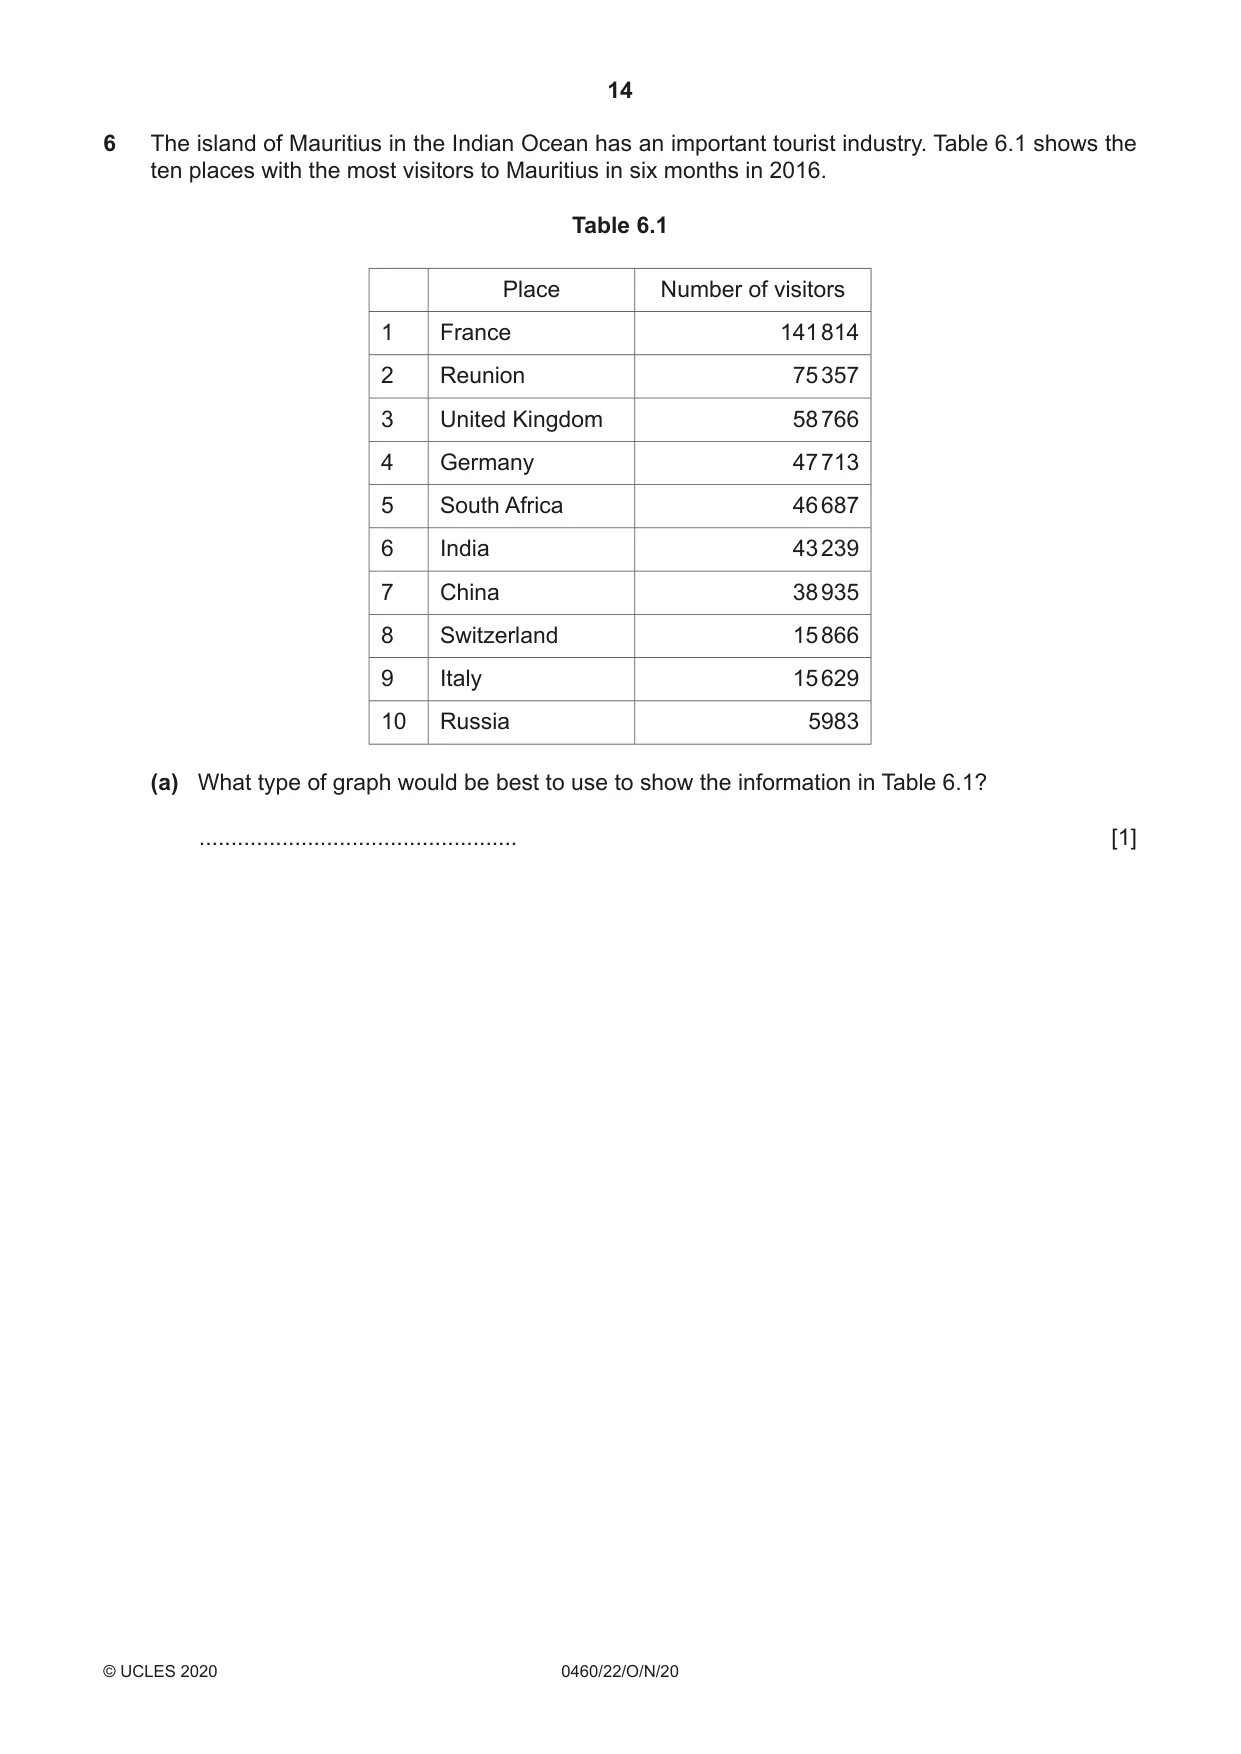
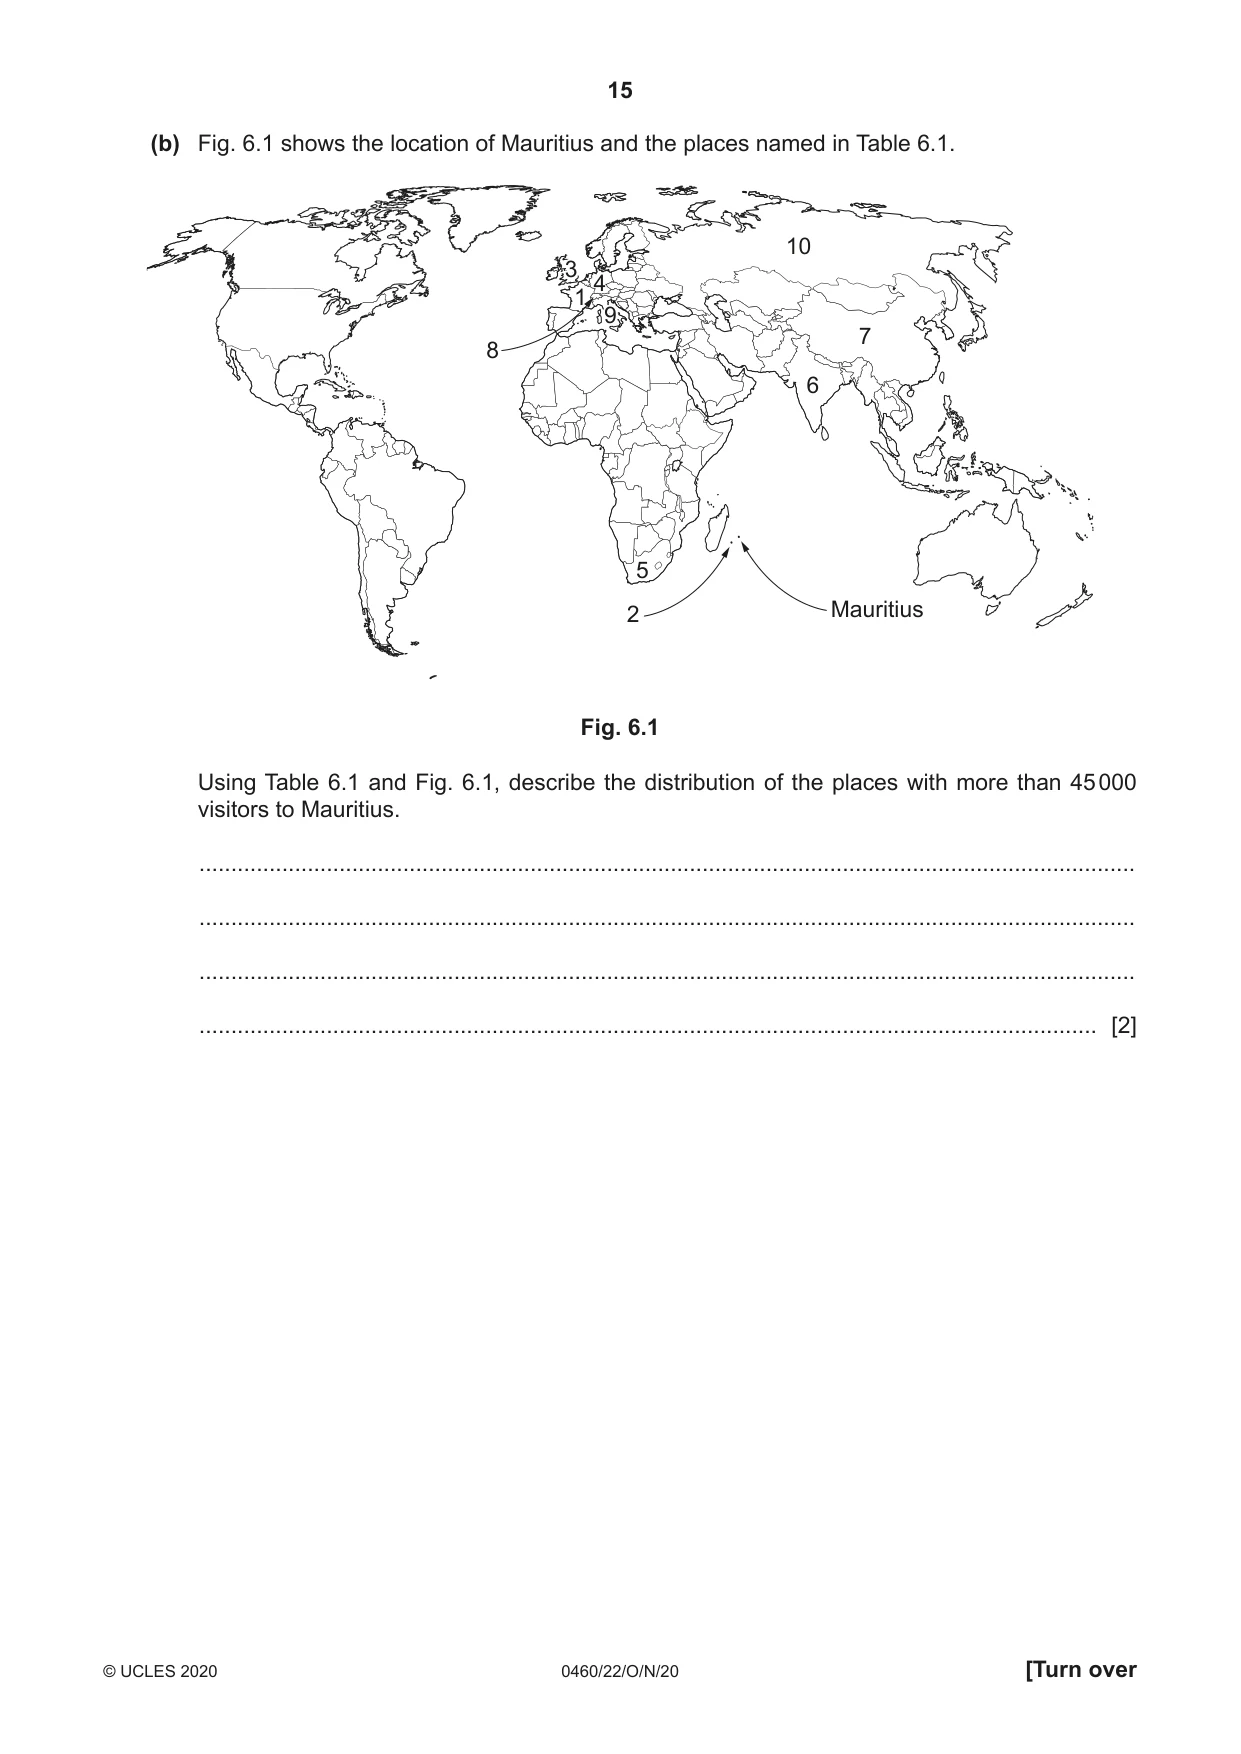
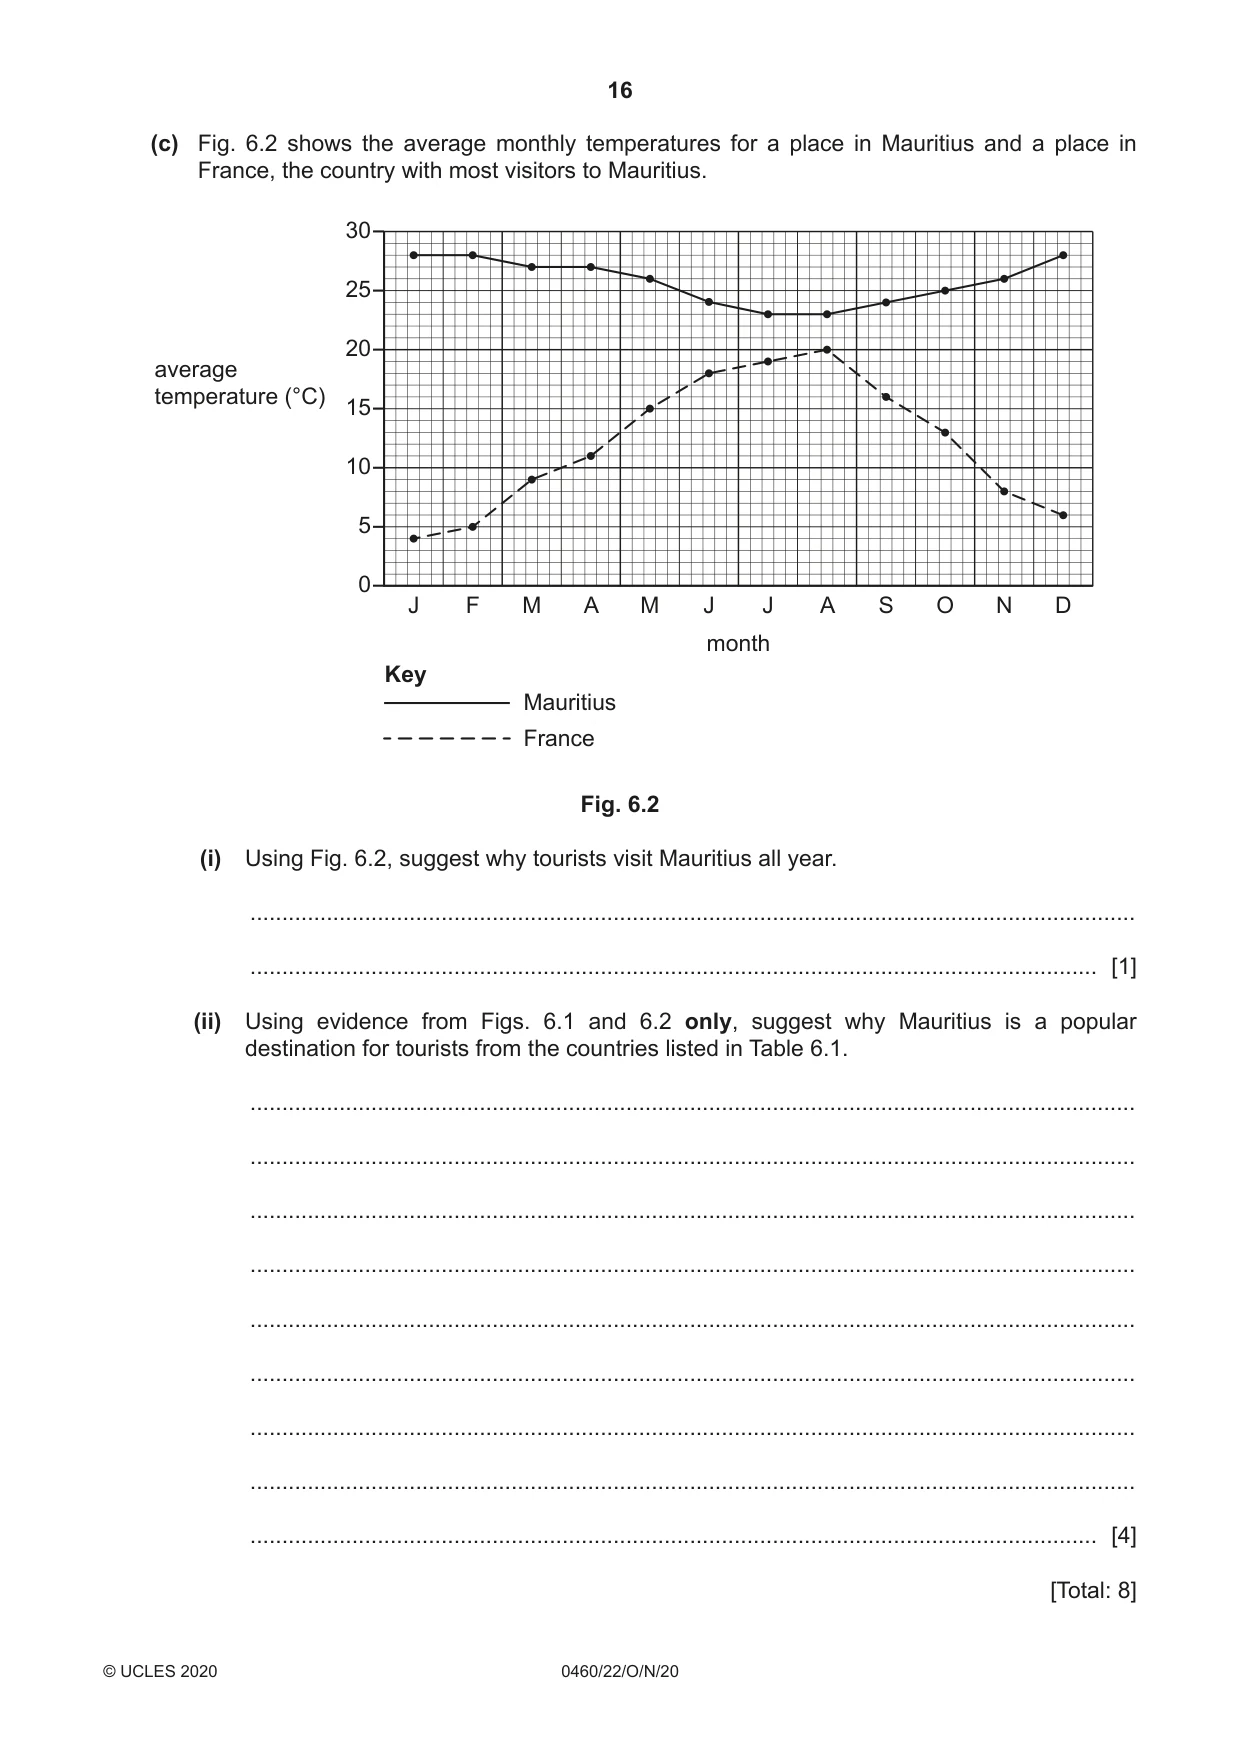
6 The island of Mauritius in the Indian Ocean has an important tourist industry. Table 6.1 shows the ten places with the most visitors to Mauritius in six months in 2016. Table 6.1 Place Number of visitors 1 France 141 814 2 Reunion 75 357 3 United Kingdom 58 766 4 Germany 47 713 5 South Africa 46 687 6 India 43 239 7 China 38 935 8 Switzerland 15 866 9 Italy 15 629 10 Russia 5983 (a) What type of graph would be best to use to show the information in Table 6.1? .................................................. [1] (b) Fig. 6.1 shows the location of Mauritius and the places named in Table 6.1. 10 3 4 1 9 7 8 6 5 2 Mauritius Fig. 6.1 Using Table 6.1 and Fig. 6.1, describe the distribution of the places with more than 45 000 visitors to Mauritius. ................................................................................................................................................... ................................................................................................................................................... ................................................................................................................................................... ............................................................................................................................................. [2] (c) Fig. 6.2 shows the average monthly temperatures for a place in Mauritius and a place in France, the country with most visitors to Mauritius. 30 25 20 average temperature (°C) 15 10 5 0 J F M A M J J A S O N D month Key Mauritius France Fig. 6.2 (i) Using Fig. 6.2, suggest why tourists visit Mauritius all year. ........................................................................................................................................... ..................................................................................................................................... [1] (ii) Using evidence from Figs. 6.1 and 6.2 only, suggest why Mauritius is a popular destination for tourists from the countries listed in Table 6.1. ........................................................................................................................................... ........................................................................................................................................... ........................................................................................................................................... ........................................................................................................................................... ........................................................................................................................................... ........................................................................................................................................... ........................................................................................................................................... ........................................................................................................................................... ..................................................................................................................................... [4] [Total: 8]
Mark scheme: 6(a) bar graph, 1 6(b) Europe, 2 northern hemisphere/north, southern Africa/South Africa and Reunion/nearby countries, 6(c)(i) hot/high temperatures (allow warm) all year/hotter than France all year, 1 6(b)(ii) Mauritius warm(er)/hot(ter)/other countries colder, 4 winter in the north/named country, France colder September to March, (allow months within range) nearness to Mauritius, (South Africa and Reunion) coastal tourism/beaches (island location), people from landlocked country, (Switzerland)
What was in this paper
The subtopics covered by these 6 questions, and how many questions each got. Open one in a new tab to see every Cambridge question on it.
What you needed in this session
Cambridge’s own grade thresholds for 2020 Oct/Nov, Paper 2 · Variant 2. A higher threshold means an easier paper — the bar moves with how the cohort did.