Questions as text
Q1 · What could cause a perfectly competitive firm’s marginal revenue product of labour curve… 9708/31 Oct/Nov 2009
5 What could cause a perfectly competitive firm’s marginal revenue product of labour curve to shift to the right? A an increase in wages B a higher rate of sales tax C an increase in labour supply D a rise in the price of the final product
1 marks
Answer: D
This question in 9708/31 Oct/Nov 2009
Q2 · In the diagram, MRPL is a firm’s marginal revenue product of labour curve, S is its… 9708/31 Oct/Nov 2009
6 In the diagram, MRPL is a firm’s marginal revenue product of labour curve, S is its supply of labour curve, and MCL its marginal cost of labour curve. MCL W4 S $ W3 W2 W1 MRPL O N1 N2 labour Assuming profit maximisation, how many workers will the firm employ and what wage will it pay? number wage employed A N1 W3 B N1 W1 C N2 W2 D N2 W4
1 marks
Answer: B
This question in 9708/31 Oct/Nov 2009
Q3 · What is an example of a wage differential that compensates for the disadvantages… 9708/31 Oct/Nov 2009
7 What is an example of a wage differential that compensates for the disadvantages associated with particular jobs? A male workers earning more than female workers in the same job B the tendency for wage rates negotiated by trade unions to exceed those for non-unionised labour C labourers on off-shore oil rigs earning more than those employed on-shore D government office workers being paid more than private sector office workers
1 marks
Answer: C
This question in 9708/31 Oct/Nov 2009
Q4 · The diagram shows the initial position of a labour market 9708/31 Oct/Nov 2009
8 The diagram shows the initial position of a labour market. D S weekly wage O number of workers The government introduces a law reducing the statutory working week from 39 hours to 36 hours. How will this affect the supply and demand curves in the diagram? employers’ workers’ supply demand curve curve A shifts to right shifts to left B shifts to right shifts to right C shifts to left shifts to left D shifts to left shifts to right
1 marks
Answer: D
This question in 9708/31 Oct/Nov 2009
Q5 · What could cause a perfectly competitive firm’s marginal revenue product of labour curve… 9708/32 Oct/Nov 2009
4 What could cause a perfectly competitive firm’s marginal revenue product of labour curve to shift to the right? A an increase in wages B a higher rate of sales tax C an increase in labour supply D a rise in the price of the final product
1 marks
Answer: D
This question in 9708/32 Oct/Nov 2009
Q6 · In the diagram, MRPL is a firm’s marginal revenue product of labour curve, S is its… 9708/32 Oct/Nov 2009
5 In the diagram, MRPL is a firm’s marginal revenue product of labour curve, S is its supply of labour curve, and MCL its marginal cost of labour curve. MCL W4 S $ W3 W2 W1 MRPL O N1 N2 labour Assuming profit maximisation, how many workers will the firm employ and what wage will it pay? number wage employed A N1 W3 B N1 W1 C N2 W2 D N2 W4
1 marks
Answer: B
This question in 9708/32 Oct/Nov 2009
Q7 · What is an example of a wage differential that compensates for the disadvantages… 9708/32 Oct/Nov 2009
6 What is an example of a wage differential that compensates for the disadvantages associated with particular jobs? A male workers earning more than female workers in the same job B the tendency for wage rates negotiated by trade unions to exceed those for non-unionised labour C labourers on off-shore oil rigs earning more than those employed on-shore D government office workers being paid more than private sector office workers
1 marks
Answer: C
This question in 9708/32 Oct/Nov 2009
Q8 · The diagram shows the initial position of a labour market 9708/32 Oct/Nov 2009
7 The diagram shows the initial position of a labour market. D S weekly wage O number of workers The government introduces a law reducing the statutory working week from 39 hours to 36 hours. How will this affect the supply and demand curves in the diagram? employers’ workers’ supply demand curve curve A shifts to right shifts to left B shifts to right shifts to right C shifts to left shifts to left D shifts to left shifts to right
1 marks
Answer: D
This question in 9708/32 Oct/Nov 2009
Q9 · What could cause the demand curve for labour to shift to the left? 9708/31 May/June 2010
4 What could cause the demand curve for labour to shift to the left? A a decrease in immigration B a decrease in labour productivity C a fall in real wages D a rise in the money wage rate
1 marks
Answer: B
This question in 9708/31 May/June 2010
Q10 · In the diagram S1 is an individual worker’s supply of labour curve 9708/31 May/June 2010
5 In the diagram S1 is an individual worker’s supply of labour curve. S1 S2 wage rate O hours of work What could cause the curve to shift from S1 to S2? A a decrease in the hourly wage rate B a decrease in work satisfaction C a decrease in the opportunity cost of leisure D a decreased preference for leisure
1 marks
Answer: D
This question in 9708/31 May/June 2010
Q11 · A firm’s workers join a trade union which negotiates an increase in the workers’ wage rate 9708/31 May/June 2010
6 A firm’s workers join a trade union which negotiates an increase in the workers’ wage rate. The increase in the wage rate results in an increase in the number employed by the firm. What could explain this? A The demand for the firm’s product is price-elastic. B The firm is a monopsonist within its local labour market. C The firm operates in a perfectly competitive labour market. D There is a high degree of substitutability between capital and labour.
1 marks
Answer: B
This question in 9708/31 May/June 2010
Q12 · Which is most likely to result in an increase in the natural rate of unemployment? 9708/31 May/June 2010
28 Which is most likely to result in an increase in the natural rate of unemployment? A a decrease in government expenditure on goods and services B a decrease in the level of government payments to the unemployed C an increase in trade union membership D an increase in interest rates
1 marks
Answer: C
This question in 9708/31 May/June 2010
Q13 · What could cause the demand curve for labour to shift to the left? 9708/32 May/June 2010
3 What could cause the demand curve for labour to shift to the left? A a decrease in immigration B a decrease in labour productivity C a fall in real wages D a rise in the money wage rate
1 marks
Answer: B
This question in 9708/32 May/June 2010
Q14 · In the diagram S1 is an individual worker’s supply of labour curve 9708/32 May/June 2010
4 In the diagram S1 is an individual worker’s supply of labour curve. S1 S2 wage rate O hours of work What could cause the curve to shift from S1 to S2? A a decrease in the hourly wage rate B a decrease in work satisfaction C a decrease in the opportunity cost of leisure D a decreased preference for leisure
1 marks
Answer: D
This question in 9708/32 May/June 2010
Q15 · A firm’s workers join a trade union which negotiates an increase in the workers’ wage rate 9708/32 May/June 2010
5 A firm’s workers join a trade union which negotiates an increase in the workers’ wage rate. The increase in the wage rate results in an increase in the number employed by the firm. What could explain this? A The demand for the firm’s product is price-elastic. B The firm is a monopsonist within its local labour market. C The firm operates in a perfectly competitive labour market. D There is a high degree of substitutability between capital and labour.
1 marks
Answer: B
This question in 9708/32 May/June 2010
Q16 · Which is most likely to result in an increase in the natural rate of unemployment? 9708/32 May/June 2010
27 Which is most likely to result in an increase in the natural rate of unemployment? A a decrease in government expenditure on goods and services B a decrease in the level of government payments to the unemployed C an increase in trade union membership D an increase in interest rates
1 marks
Answer: C
This question in 9708/32 May/June 2010
Q17 · What could cause the demand curve for labour to shift to the left? 9708/33 May/June 2010
3 What could cause the demand curve for labour to shift to the left? A a decrease in immigration B a decrease in labour productivity C a fall in real wages D a rise in the money wage rate
1 marks
Answer: B
This question in 9708/33 May/June 2010
Q18 · In the diagram S1 is an individual worker’s supply of labour curve 9708/33 May/June 2010
4 In the diagram S1 is an individual worker’s supply of labour curve. S1 S2 wage rate O hours of work What could cause the curve to shift from S1 to S2? A a decrease in the hourly wage rate B a decrease in work satisfaction C a decrease in the opportunity cost of leisure D a decreased preference for leisure
1 marks
Answer: D
This question in 9708/33 May/June 2010
Q19 · A firm’s workers join a trade union which negotiates an increase in the workers’ wage rate 9708/33 May/June 2010
5 A firm’s workers join a trade union which negotiates an increase in the workers’ wage rate. The increase in the wage rate results in an increase in the number employed by the firm. What could explain this? A The demand for the firm’s product is price-elastic. B The firm is a monopsonist within its local labour market. C The firm operates in a perfectly competitive labour market. D There is a high degree of substitutability between capital and labour.
1 marks
Answer: B
This question in 9708/33 May/June 2010
Q20 · To increase its labour force from 100 to 101 workers, a firm has to increase the daily… 9708/31 Oct/Nov 2010
6 To increase its labour force from 100 to 101 workers, a firm has to increase the daily wage rate from $300 to $302. What is the marginal cost of labour per day? A $2 B $202 C $302 D $502
1 marks
Answer: D
This question in 9708/31 Oct/Nov 2010
Q21 · The diagram shows a worker’s supply of labour curve 9708/31 Oct/Nov 2010
7 The diagram shows a worker’s supply of labour curve. S wage rate per hour y W x z 0 10 20 30 40 hours per week The worker is required to work a minimum of 40 hours a week at the hourly wage, 0W. Which area measures the economic rent obtained by the worker? A x – y B x + y C y – x D y + z
1 marks
Answer: A
This question in 9708/31 Oct/Nov 2010
Q22 · Which is not a policy designed to correct market failure? 9708/31 Oct/Nov 2010
14 Which is not a policy designed to correct market failure? A competition policy B free inoculation against infectious diseases C minimum wage policy D regulations to limit river pollution
1 marks
Answer: C
This question in 9708/31 Oct/Nov 2010
Q23 · A firm in a perfectly competitive industry employs two factors of production, X and Y 9708/32 Oct/Nov 2010
4 A firm in a perfectly competitive industry employs two factors of production, X and Y. The table shows the factor price and the current marginal physical product of these two factors. factor X factor Y factor price $2.50 $6.00 marginal physical product 2 8 If the firm sells its product for $1 and aims to maximise profits, what should it do? A employ less of both X and Y B employ less of X and more of Y C employ more of both X and Y D employ more of X and less of Y
1 marks
Answer: B
This question in 9708/32 Oct/Nov 2010
Q24 · To increase its labour force from 100 to 101 workers, a firm has to increase the daily… 9708/32 Oct/Nov 2010
6 To increase its labour force from 100 to 101 workers, a firm has to increase the daily wage rate from $300 to $302. What is the marginal cost of labour per day? A $2 B $202 C $302 D $502
1 marks
Answer: D
This question in 9708/32 Oct/Nov 2010
Q25 · The diagram shows a worker’s supply of labour curve 9708/32 Oct/Nov 2010
7 The diagram shows a worker’s supply of labour curve. S wage rate per hour y W x z 0 10 20 30 40 hours per week The worker is required to work a minimum of 40 hours a week at the hourly wage, 0W. Which area measures the economic rent obtained by the worker? A x – y B x + y C y – x D y + z
1 marks
Answer: A
This question in 9708/32 Oct/Nov 2010
Q26 · Which is not a policy designed to correct market failure? 9708/32 Oct/Nov 2010
14 Which is not a policy designed to correct market failure? A competition policy B free inoculation against infectious diseases C minimum wage policy D regulations to limit river pollution
1 marks
Answer: C
This question in 9708/32 Oct/Nov 2010
Q27 · A firm in a perfectly competitive industry employs two factors of production, X and Y 9708/33 Oct/Nov 2010
3 A firm in a perfectly competitive industry employs two factors of production, X and Y. The table shows the factor price and the current marginal physical product of these two factors. factor X factor Y factor price $2.50 $6.00 marginal physical product 2 8 If the firm sells its product for $1 and aims to maximise profits, what should it do? A employ less of both X and Y B employ less of X and more of Y C employ more of both X and Y D employ more of X and less of Y
1 marks
Answer: B
This question in 9708/33 Oct/Nov 2010
Q28 · To increase its labour force from 100 to 101 workers, a firm has to increase the daily… 9708/33 Oct/Nov 2010
5 To increase its labour force from 100 to 101 workers, a firm has to increase the daily wage rate from $300 to $302. What is the marginal cost of labour per day? A $2 B $202 C $302 D $502
1 marks
Answer: D
This question in 9708/33 Oct/Nov 2010
Q29 · The diagram shows a worker’s supply of labour curve 9708/33 Oct/Nov 2010
6 The diagram shows a worker’s supply of labour curve. S wage rate per hour y W x z 0 10 20 30 40 hours per week The worker is required to work a minimum of 40 hours a week at the hourly wage, 0W. Which area measures the economic rent obtained by the worker? A x – y B x + y C y – x D y + z
1 marks
Answer: A
This question in 9708/33 Oct/Nov 2010
Q30 · What is meant by ‘real wages’? 9708/33 Oct/Nov 2010
14 What is meant by ‘real wages’? A the marginal physical product of labour B the opportunity cost of labour C the purchasing power of money wages D wages net of tax
1 marks
Answer: C
This question in 9708/33 Oct/Nov 2010
Q31 · The government of a country decides to increase the proportion of its tax revenue it… 9708/33 Oct/Nov 2010
28 The government of a country decides to increase the proportion of its tax revenue it obtains from direct taxes and to reduce the proportion it obtains from indirect taxes. What is likely to be the impact on the distribution of income and on work incentives? distribution of work incentives income A less equal decrease B less equal increase C more equal decrease D more equal increase
1 marks
Answer: C
This question in 9708/33 Oct/Nov 2010
Q32 · The table shows the main characteristics of employment in two occupations 9708/31 May/June 2011
4 The table shows the main characteristics of employment in two occupations. occupation X occupation Y average annual wage $100 000 $60 000 number of weeks annual leave 5 weeks 10 weeks average length of working week 48 hours 44 hours job security low high length of training course to obtain job qualification 1 year 2 years What can definitely be deduced from the table? A Those employed in occupation Y attach greater importance to job security. B Those employed in occupation X attach less importance to leisure activities. C There will be more competition for places on training courses to enter occupation X than occupation Y. D Occupation Y has greater non-pecuniary advantages than occupation X.
1 marks
Answer: D
This question in 9708/31 May/June 2011
Q33 · The diagram shows the supply and demand for labour in an industry 9708/31 May/June 2011
7 The diagram shows the supply and demand for labour in an industry. S W wage rate D O L M N employment Initially the industry’s labour market is in equilibrium. What effect will the introduction of a minimum wage OW have on the level of employment in the industry? A It will decrease by an amount LM. B It will decrease by an amount LN. C It will increase by an amount LN. D It will increase by an amount MN.
1 marks
Answer: A
This question in 9708/31 May/June 2011
Q34 · The table shows the main characteristics of employment in two occupations 9708/32 May/June 2011
3 The table shows the main characteristics of employment in two occupations. occupation X occupation Y average annual wage $100 000 $60 000 number of weeks annual leave 5 weeks 10 weeks average length of working week 48 hours 44 hours job security low high length of training course to obtain job qualification 1 year 2 years What can definitely be deduced from the table? A Those employed in occupation Y attach greater importance to job security. B Those employed in occupation X attach less importance to leisure activities. C There will be more competition for places on training courses to enter occupation X than occupation Y. D Occupation Y has greater non-pecuniary advantages than occupation X.
1 marks
Answer: D
This question in 9708/32 May/June 2011
Q35 · The diagram shows the supply and demand for labour in an industry 9708/32 May/June 2011
6 The diagram shows the supply and demand for labour in an industry. S W wage rate D O L M N employment Initially the industry’s labour market is in equilibrium. What effect will the introduction of a minimum wage OW have on the level of employment in the industry? A It will decrease by an amount LM. B It will decrease by an amount LN. C It will increase by an amount LN. D It will increase by an amount MN.
1 marks
Answer: A
This question in 9708/32 May/June 2011
Q36 · The table shows the main characteristics of employment in two occupations 9708/33 May/June 2011
3 The table shows the main characteristics of employment in two occupations. occupation X occupation Y average annual wage $100 000 $60 000 number of weeks annual leave 5 weeks 10 weeks average length of working week 48 hours 44 hours job security low high length of training course to obtain job qualification 1 year 2 years What can definitely be deduced from the table? A Those employed in occupation Y attach greater importance to job security. B Those employed in occupation X attach less importance to leisure activities. C There will be more competition for places on training courses to enter occupation X than occupation Y. D Occupation Y has greater non-pecuniary advantages than occupation X.
1 marks
Answer: D
This question in 9708/33 May/June 2011
Q37 · The diagram shows the supply and demand for labour in an industry 9708/33 May/June 2011
6 The diagram shows the supply and demand for labour in an industry. S W wage rate D O L M N employment Initially the industry’s labour market is in equilibrium. What effect will the introduction of a minimum wage OW have on the level of employment in the industry? A It will decrease by an amount LM. B It will decrease by an amount LN. C It will increase by an amount LN. D It will increase by an amount MN.
1 marks
Answer: A
This question in 9708/33 May/June 2011
Q38 · What will cause the supply curve of labour in a particular industry to shift to the left? 9708/31 Oct/Nov 2011
5 What will cause the supply curve of labour in a particular industry to shift to the left? A a fall in demand for the industry’s product B a greater use of machinery in the production of the industry’s output C a rise in wages paid in similar occupations in other industries D a weakening of trade union influence in the industry
1 marks
Answer: C
This question in 9708/31 Oct/Nov 2011
Q39 · The diagram illustrates the working of a negative income tax system (NIT), where… 9708/31 Oct/Nov 2011
10 The diagram illustrates the working of a negative income tax system (NIT), where households with incomes above Yt pay tax and those with incomes below Yt receive a tax credit. + NIT1 tax NIT2 paid O Yt household income _ What would be the effects of decreasing the effective tax rate, thereby causing the NIT schedule to shift from NIT1 to NIT2? effect on work incentives effect on net tax revenue A decrease increase B decrease uncertain C increase increase D increase uncertain
1 marks
Answer: D
This question in 9708/31 Oct/Nov 2011
Q40 · An actor is paid $100 000 a year 9708/32 Oct/Nov 2011
5 An actor is paid $100 000 a year. The next best paid job he could get is as a lecturer at $60 000 a year. What are his transfer earnings and his economic rent? transfer earnings economic rent A $60 000 $40 000 B $60 000 zero C $40 000 $60 000 D $40 000 zero
1 marks
Answer: A
This question in 9708/32 Oct/Nov 2011
Q41 · The table shows the labour market for an economy in four separate years 9708/32 Oct/Nov 2011
6 The table shows the labour market for an economy in four separate years. In which year was there excess demand in the labour market? working population unemployment job vacancies (millions) rate (%) (thousands) A 19 1.0 180 B 19 2.0 80 C 20 1.1 240 D 20 1.5 100
1 marks
Answer: C
This question in 9708/32 Oct/Nov 2011
Q42 · The government of a country decides to increase the proportion of its tax revenue that it… 9708/32 Oct/Nov 2011
14 The government of a country decides to increase the proportion of its tax revenue that it obtains from indirect taxes and to reduce the proportion it obtains from income tax. Total tax revenue is left unchanged. What is likely to be the impact on the distribution of income and on work incentives? distribution work of income incentives A less equal decrease B less equal increase C more equal decrease D more equal increase
1 marks
Answer: B
This question in 9708/32 Oct/Nov 2011
Q43 · What will cause the supply curve of labour in a particular industry to shift to the left? 9708/33 Oct/Nov 2011
4 What will cause the supply curve of labour in a particular industry to shift to the left? A a fall in demand for the industry’s product B a greater use of machinery in the production of the industry’s output C a rise in wages paid in similar occupations in other industries D a weakening of trade union influence in the industry
1 marks
Answer: C
This question in 9708/33 Oct/Nov 2011
Q44 · The diagram illustrates the working of a negative income tax system (NIT), where… 9708/33 Oct/Nov 2011
9 The diagram illustrates the working of a negative income tax system (NIT), where households with incomes above Yt pay tax and those with incomes below Yt receive a tax credit. + NIT1 tax NIT2 paid O Yt household income _ What would be the effects of decreasing the effective tax rate, thereby causing the NIT schedule to shift from NIT1 to NIT2? effect on work incentives effect on net tax revenue A decrease increase B decrease uncertain C increase increase D increase uncertain
1 marks
Answer: D
This question in 9708/33 Oct/Nov 2011
Q45 · The diagram shows a perfectly competitive firm’s average product of labour (APL) and… 9708/31 May/June 2012
4 The diagram shows a perfectly competitive firm’s average product of labour (APL) and marginal product of labour (MPL) curves. wage ($), labour W product (units) APL MPL O N1 N2 N3 N4 workers employed The market price of the firm’s product is $1. How many workers will the firm employ at a wage of OW? A ON1 B ON2 C ON3 D ON4
1 marks
Answer: C
This question in 9708/31 May/June 2012
Q46 · There is an increase in the supply of female labour 9708/31 May/June 2012
7 There is an increase in the supply of female labour. What will be the likely effect on male and female wages? male wages female wages A decrease decrease B decrease increase C increase decrease D increase increase
1 marks
Answer: A
This question in 9708/31 May/June 2012
Q47 · A government’s priority is to reduce the natural rate of unemployment (NAIRU) 9708/31 May/June 2012
27 A government’s priority is to reduce the natural rate of unemployment (NAIRU). Which policy would be most likely to help it achieve this objective? A an increase in interest rates B an increase in rates of unemployment benefit C the introduction of minimum wage rates D the introduction of subsidised travel for unemployed workers to search for jobs
1 marks
Answer: D
This question in 9708/31 May/June 2012
Q48 · The diagram shows a perfectly competitive firm’s average product of labour (APL) and… 9708/32 May/June 2012
4 The diagram shows a perfectly competitive firm’s average product of labour (APL) and marginal product of labour (MPL) curves. wage ($), labour W product (units) APL MPL O N1 N2 N3 N4 workers employed The market price of the firm’s product is $1. How many workers will the firm employ at a wage of OW? A ON1 B ON2 C ON3 D ON4
1 marks
Answer: C
This question in 9708/32 May/June 2012
Q49 · A worker responds to an increase in his hourly wage rate by reducing the number of hours… 9708/33 May/June 2012
6 A worker responds to an increase in his hourly wage rate by reducing the number of hours he works per week. What would explain this? A The income effect of the wage rate increase outweighs the substitution effect. B The substitution effect of the wage rate increase outweighs the income effect. C The worker’s supply of labour is wage elastic. D The worker’s supply of labour is wage inelastic.
1 marks
Answer: A
This question in 9708/33 May/June 2012
Q50 · There is an increase in the supply of female labour 9708/33 May/June 2012
7 There is an increase in the supply of female labour. What will be the likely effect on male and female wages? male wages female wages A decrease decrease B decrease increase C increase decrease D increase increase
1 marks
Answer: A
This question in 9708/33 May/June 2012
Q51 · In the diagram, MRPL is a firm’s marginal revenue product of labour curve, S is its… 9708/32 Oct/Nov 2012
4 In the diagram, MRPL is a firm’s marginal revenue product of labour curve, S is its supply of labour curve, and MCL its marginal cost of labour curve. MCL W4 S W3 $ W2 W1 MRPL O N1 N2 labour Assuming profit maximisation, how many workers will the firm employ and what wage will it pay? number wage employed A N1 W1 B N1 W3 C N2 W2 D N2 W4
1 marks
Answer: A
This question in 9708/32 Oct/Nov 2012
Q52 · The diagram shows a backward sloping supply curve of labour 9708/32 Oct/Nov 2012
5 The diagram shows a backward sloping supply curve of labour. S real wage W rate O hours worked per week What is correct about the substitution effect and the income effect when the real wage rises above OW? substitution effect income effect A negative negative B negative positive C positive negative D positive positive
1 marks
Answer: C
This question in 9708/32 Oct/Nov 2012
Q53 · In the diagram D1 and S are the initial demand and supply curves for building workers 9708/32 Oct/Nov 2012
6 In the diagram D1 and S are the initial demand and supply curves for building workers. S Y Z U wage T X D2 R D1 O V W quantity of labour If the demand for building workers increases to D2 by how much does the economic rent earned by building workers rise? A RZU B TXZU C VWZX D XZY
1 marks
Answer: B
This question in 9708/32 Oct/Nov 2012
Q54 · The diagram shows a perfectly competitive firm’s average product of labour and marginal… 9708/33 Oct/Nov 2012
4 The diagram shows a perfectly competitive firm’s average product of labour and marginal product of labour curves. J K wage ($), labour product (units) M L APL MPL O number employed The market price of the firm’s product is $1. Which segment of the curves represents the firm’s demand for labour curve? A OJ B JK C KL D KM
1 marks
This question in 9708/33 Oct/Nov 2012
Q55 · To increase its labour force from 30 to 31 workers, a firm has to increase the daily wage… 9708/33 Oct/Nov 2012
5 To increase its labour force from 30 to 31 workers, a firm has to increase the daily wage rate from $50 to $52. What is the marginal cost of labour per day? A $52 B $62 C $112 D $1612
1 marks
This question in 9708/33 Oct/Nov 2012
Q56 · A trade union seeks to increase the wages a firm pays to its workers while at the same… 9708/33 Oct/Nov 2012
6 A trade union seeks to increase the wages a firm pays to its workers while at the same time preserving jobs. What will strengthen the union’s negotiating position? A Capital and labour are close substitutes. B The demand for the good produced by the firm is price elastic. C The supply of labour to the firm is perfectly elastic. D The firm operates in a monopsonistic labour market.
1 marks
This question in 9708/33 Oct/Nov 2012
Q57 · The introduction of equal pay legislation in a country increases the wages of female… 9708/31 May/June 2013
1 The introduction of equal pay legislation in a country increases the wages of female workers. What will be the most likely effect of this increase? A a reduction of the rate of female unemployment B a reduction in the wages of male workers C an expansion in the supply of female workers D substitution of male workers by female workers
1 marks
Answer: C
This question in 9708/31 May/June 2013
Q58 · The table shows the current position of a firm in a perfectly competitive industry 9708/32 May/June 2013
4 The table shows the current position of a firm in a perfectly competitive industry. factor X factor Y marginal physical product 3 12 factor price $5.00 $10.00 If the firm sells its product for $1 and aims to maximise profits, what should it employ? A more of both X and Y B more of X and less of Y C more of Y and less of X D less of both X and Y
1 marks
Answer: C
This question in 9708/32 May/June 2013
Q59 · A firm operates under perfect competition in both product and factor markets with labour… 9708/32 May/June 2013
5 A firm operates under perfect competition in both product and factor markets with labour as the only variable factor input. In the diagram, the line JK shows the relationship between the marginal physical product of labour and the man-hours hired. J 10 8 marginal physical 6 product of labour (units) 4 2 K 0 0 1 2 3 4 5 thousand man-hours When the hourly wage is $3.20, the firm employs 4000 man-hours per day. What is the price of the product? A $1.60 B $2.00 C $3.20 D $6.40
1 marks
Answer: A
This question in 9708/32 May/June 2013
Q60 · A fashion model is paid $100 000 a year 9708/32 May/June 2013
6 A fashion model is paid $100 000 a year. The next best paid job she could get is as a teacher at $60 000 a year. What are her transfer earnings and her economic rent? transfer earnings economic rent $ $ A 60 000 zero B 60 000 40 000 C 100 000 zero D 100 000 40 000
1 marks
Answer: B
This question in 9708/32 May/June 2013
Q61 · The introduction of equal pay legislation in a country increases the wages of female… 9708/33 May/June 2013
1 The introduction of equal pay legislation in a country increases the wages of female workers. What will be the most likely effect of this increase? A a reduction of the rate of female unemployment B a reduction in the wages of male workers C an expansion in the supply of female workers D substitution of male workers by female workers
1 marks
Answer: C
This question in 9708/33 May/June 2013
Q62 · A firm in an initial profit maximising position employs two factors, X and Y, to produce… 9708/31 Oct/Nov 2013
4 A firm in an initial profit maximising position employs two factors, X and Y, to produce a good which is sold for $3. Factor prices and productivities change. The new values are given in the table. marginal physical price factor product ($) X 2 4 Y 5 20 What should the firm employ to achieve equilibrium? A less of both X and Y B more of X and less of Y C more of Y and less of X D more of both X and Y
1 marks
Answer: B
This question in 9708/31 Oct/Nov 2013
Q63 · The diagram shows an individual worker’s supply curve of labour 9708/31 Oct/Nov 2013
5 The diagram shows an individual worker’s supply curve of labour. S x W hourly z wage O 40 number of hours The hourly wage is OW and the worker is compelled to work a 40-hour week. Which area measures the worker’s economic rent? A x B z C z – x D x + z
1 marks
Answer: C
This question in 9708/31 Oct/Nov 2013
Q64 · A country has a negative tax income regime 9708/31 Oct/Nov 2013
13 A country has a negative tax income regime. The curve NT in the diagram shows the country’s initial tax schedule. + NT tax NT1 O income – A change in the tax rate causes the schedule to shift to NT1. How will this affect work incentives and the after-tax distribution of income? work distribution incentives of income A strengthen less equal B strengthen more equal C weaken less equal D weaken more equal
1 marks
Answer: A
This question in 9708/31 Oct/Nov 2013
Q65 · A firm operates under perfect competition in both product and factor markets with labour… 9708/32 Oct/Nov 2013
4 A firm operates under perfect competition in both product and factor markets with labour as the only variable factor input. In the diagram, the line JK shows the relationship between the marginal physical product of labour and the man hours hired. J 10 8 marginal physical 6 product of labour (units) 4 2 K 0 0 1 2 3 4 5 thousand man-hours The price of the product is $1.60. What will be the number of man-hours hired by the firm if the hourly wage is $6.40? A 1000 B 2000 C 3000 D 4000
1 marks
Answer: C
This question in 9708/32 Oct/Nov 2013
Q66 · The diagram shows the initial position of a labour market 9708/32 Oct/Nov 2013
5 The diagram shows the initial position of a labour market. S weekly wage D O number of workers The government increases the number of statutory paid holidays to which workers are entitled from 10 days a year to 15 days a year. How will this affect the supply and demand curves in the diagram? employers’ workers’ demand curve supply curve A shifts to left shifts to right B shifts to left shifts to left C shifts to right shifts to right D shifts to right shifts to left
1 marks
Answer: A
This question in 9708/32 Oct/Nov 2013
Q67 · In the diagram, HN is the initial supply of labour curve faced by a firm, and RM is its… 9708/32 Oct/Nov 2013
6 In the diagram, HN is the initial supply of labour curve faced by a firm, and RM is its initial marginal cost of labour curve. M N wage, cost of J K W X labour R H O quantity of labour What will be the firm’s new labour supply curve, if the workers join a trade union and achieve a union negotiated wage, OW? A RJX B HKX C WJM D WKN
1 marks
Answer: D
This question in 9708/32 Oct/Nov 2013
Q68 · A firm operates under perfect competition in both product and factor markets with labour… 9708/33 Oct/Nov 2013
5 A firm operates under perfect competition in both product and factor markets with labour as the only variable factor input. In the diagram, the line JK shows the relationship between the marginal physical product of labour and the man hours hired. J 10 8 marginal physical 6 product of labour (units) 4 2 K 0 0 1 2 3 4 5 thousand man-hours How many man-hours will the firm hire if the price of the product is $1.60 and the hourly wage is $3.20? A 1000 B 2000 C 3000 D 4000
1 marks
Answer: D
This question in 9708/33 Oct/Nov 2013
Q69 · The diagram shows an individual’s supply of labour curve 9708/33 Oct/Nov 2013
6 The diagram shows an individual’s supply of labour curve. S 80 70 60 50 hourly wage ($) 40 30 20 10 0 20 40 number of hours The hourly wage is $60 and the worker is compelled to work a 40-hour week. What is the value of the worker’s economic rent? A $0 B $200 C $400 D $2400
1 marks
Answer: A
This question in 9708/33 Oct/Nov 2013
Q70 · What is an example of a wage differential that compensates for the disadvantages… 9708/31 Oct/Nov 2014
5 What is an example of a wage differential that compensates for the disadvantages associated with particular jobs? A a tendency for wage rates negotiated by trade unions to exceed those for non-unionised labour B government office workers being paid more than private sector office workers C labourers on off-shore oil rigs earning more than those employed on-shore D male workers earning more than female workers in the same job
1 marks
Answer: C
This question in 9708/31 Oct/Nov 2014
Q71 · To increase the labour force from 30 to 31 workers, an entrepreneur is forced to increase… 9708/31 Oct/Nov 2014
6 To increase the labour force from 30 to 31 workers, an entrepreneur is forced to increase the daily wage rate from $40 to $41. What is the marginal cost of labour per day? A $1 B $31 C $71 D $1271
1 marks
Answer: C
This question in 9708/31 Oct/Nov 2014
Q72 · The workers in a firm have not previously belonged to a trade union but now join one 9708/31 Oct/Nov 2014
7 The workers in a firm have not previously belonged to a trade union but now join one. In which circumstance is this most likely to raise their wages? A Capital is highly substitutable for labour. B Labour costs constitute a large fraction of the firm’s costs. C The demand for the firm’s product is price-inelastic. D The firm operates in a perfectly competitive labour market.
1 marks
Answer: C
This question in 9708/31 Oct/Nov 2014
Q73 · If the unemployment that exists in a country is judged to be mainly structural, which is… 9708/31 Oct/Nov 2014
30 If the unemployment that exists in a country is judged to be mainly structural, which is the most effective policy the government could implement? A increase subsidies for training B increase the money supply C reduce tax rates D raise interest rates
1 marks
Answer: A
This question in 9708/31 Oct/Nov 2014
Q74 · Night shift workers are often paid more than day shift workers performing the same tasks 9708/33 Oct/Nov 2014
4 Night shift workers are often paid more than day shift workers performing the same tasks. What could explain this observed wage differential? A higher productivity of day shift workers B non-pecuniary disadvantages of working night shifts C the absence of competition between the two groups of workers D the inclusion of economic rent in the wages paid to night shift workers
1 marks
Answer: B
This question in 9708/33 Oct/Nov 2014
Q75 · The curve SS1 in the diagram is the supply of labour curve facing a firm before the… 9708/33 Oct/Nov 2014
6 The curve SS1 in the diagram is the supply of labour curve facing a firm before the unionisation of its workforce. S1 wage W W1 rate M S O number of workers The union negotiates a wage equal to W. What does the labour supply curve now become? A MS1 B SMW1 C WW1 D WMS1
1 marks
Answer: D
This question in 9708/33 Oct/Nov 2014
Q76 · The diagram shows a worker’s supply of labour curve 9708/33 Oct/Nov 2014
7 The diagram shows a worker’s supply of labour curve. S wage rate per hour y W x z 0 10 20 30 40 hours per week The worker is required to work a minimum of 40 hours a week at the hourly wage, 0W. Which area measures the economic rent obtained by the worker? A x – y B x + y C y – x D y + z
1 marks
Answer: A
This question in 9708/33 Oct/Nov 2014
Q77 · The diagram shows a perfectly competitive firm’s average product of labour (APL) and… 9708/31 May/June 2015
4 The diagram shows a perfectly competitive firm’s average product of labour (APL) and marginal product of labour (MPL) curves. J K wage, labour product M L APL MPL O number of workers employed The market price of the firm’s product is $1. Which segment of the curves represents the firm’s demand for labour curve? A OJ B JK C KL D KM
1 marks
Answer: C
This question in 9708/31 May/June 2015
Q78 · The table shows the main characteristics of employment in two alternative occupations 9708/31 May/June 2015
5 The table shows the main characteristics of employment in two alternative occupations. occupation X occupation Y average annual wage $80 000 $100 000 number of weeks annual leave 10 weeks 5 weeks average length of working week 44 hours 48 hours job security low high length of training course to obtain job qualification 2 years 1 year What can definitely be deduced from the table? A Occupation Y has greater non-financial advantages than occupation X. B There will be more competition for places on training courses to enter occupation X than occupation Y. C Those who choose occupation X attach more importance to leisure activities than those who choose occupation Y. D Those who choose occupation Y attach greater importance to job security than those who choose occupation X.
1 marks
Answer: C
This question in 9708/31 May/June 2015
Q79 · A trade union seeks to increase the wages a firm pays to its workers while at the same… 9708/31 May/June 2015
6 A trade union seeks to increase the wages a firm pays to its workers while at the same time preserving jobs. What will strengthen the union’s negotiating position? A Capital and labour are close substitutes. B The demand for the good produced by the firm is price elastic. C The supply of labour to the firm is perfectly elastic. D The trade union operates in a monopsonistic labour market.
1 marks
Answer: D
This question in 9708/31 May/June 2015
Q80 · A firm operates under perfect competition in both product and factor markets with labour… 9708/32 May/June 2015
5 A firm operates under perfect competition in both product and factor markets with labour as the only variable factor input. In the diagram, the line JK shows the relationship between the marginal physical product of labour and the hours worked: J 10 8 marginal physical 6 product of labour (units) 4 2 K 0 0 1 2 3 4 5 thousand hours When the price of the product is $1.60, the firm uses 3000 hours of labour. What is the hourly wage? A $0.40 B $2.40 C $5.60 D $6.40
1 marks
Answer: D
This question in 9708/32 May/June 2015
Q81 · The diagram shows an individual’s supply of labour curve 9708/32 May/June 2015
6 The diagram shows an individual’s supply of labour curve. S 80 w x 60 z hourly wage ($) 40 y 20 0 40 number of hours He is offered a job which would require him to work a standard 40-hour week. Which area measures the lowest amount he would have to be paid per week to get him to accept this job offer? A w + z B x + y C x + y - z D w + x + z + y
1 marks
Answer: B
This question in 9708/32 May/June 2015
Q82 · The government introduces a minimum wage above the equilibrium market wage rate 9708/32 May/June 2015
15 The government introduces a minimum wage above the equilibrium market wage rate. How will this affect low-paid workers? A All those initially in employment will receive the new guaranteed minimum wage. B Fewer of those not already in employment will enter the labour force. C There will be an increase in the number of low-paid workers in employment. D Some low-paid workers will lose their job.
1 marks
Answer: D
This question in 9708/32 May/June 2015
Q83 · The diagram shows a firm’s initial marginal revenue product of labour curve (MRP1) 9708/31 Oct/Nov 2015
4 The diagram shows a firm’s initial marginal revenue product of labour curve (MRP1). marginal revenue product of labour MRP1 MRP2 O labour hours What could cause the curve to shift to MRP2? A an increase in labour productivity B an increase in the wage rate C a reduction in labour hours D a reduction in the price of the firm’s product
1 marks
This question in 9708/31 Oct/Nov 2015
Q84 · A worker decides to work fewer hours when there is a rise in her real wage 9708/31 Oct/Nov 2015
5 A worker decides to work fewer hours when there is a rise in her real wage. How is this explained by income and substitution effects? income effect substitution effect balance of effects A negative positive income effect outweighs substitution effect B negative positive substitution effect outweighs income effect C positive negative substitution effect outweighs income effect D positive positive income effect outweighs substitution effect
1 marks
This question in 9708/31 Oct/Nov 2015
Q85 · The diagram shows what happens when the employees of a profit maximising monopsonist… 9708/31 Oct/Nov 2015
6 The diagram shows what happens when the employees of a profit maximising monopsonist employer form a trade union and successfully negotiate a wage rate of OWT. MCL SL wage rate W2 WT W1 MRPL = DL O Q1 Q3 Q2 Q4 employment What is the effect of the new wage rate on employment? A It falls from OQ2 to OQ1. B It falls from OQ2 to OQ3. C It rises from OQ1 to OQ3. D It rises from OQ1 to OQ4.
1 marks
This question in 9708/31 Oct/Nov 2015
Q86 · What will result from the differences in the non-pecuniary advantages of various… 9708/32 Oct/Nov 2015
4 What will result from the differences in the non-pecuniary advantages of various occupations? A disequilibrium in the labour market B long-term differentials in wage rates C monopsony in particular labour markets D shortages of labour in particular occupations
1 marks
Answer: B
This question in 9708/32 Oct/Nov 2015
Q87 · A firm currently pays its employees on an hourly basis 9708/32 Oct/Nov 2015
6 A firm currently pays its employees on an hourly basis. Even though the management acknowledges that its employees work to the best of their ability and could not work any harder, the firm decides to switch to a piece-rate system of remuneration whereby the wage paid to each employee depends on their level of output. Why might this new system of remuneration result in a significant improvement in labour productivity? A It will dispense with the need for management to monitor the actions of its employees. B It will increase the losses that workers will incur if they are dismissed for not working hard enough. C It will lead to the recruitment and retention of more highly talented workers. D It will strengthen the incentives for workers to increase their earnings.
1 marks
Answer: C
This question in 9708/32 Oct/Nov 2015
Q88 · A fashion model is paid $500 000 a year 9708/32 Oct/Nov 2015
7 A fashion model is paid $500 000 a year. If the next best paid job he could get is as a teacher at $100 000 a year, what are his transfer earnings and his economic rent? transfer earnings economic rent $ $ A zero 400 000 B 100 000 400 000 C 400 000 zero D 400 000 100 000
1 marks
Answer: B
This question in 9708/32 Oct/Nov 2015
Q89 · The diagram shows a firm’s initial marginal revenue product of labour curve (MRP) 9708/33 Oct/Nov 2015
4 The diagram shows a firm’s initial marginal revenue product of labour curve (MRP). marginal revenue product of labour MRP MRP1 O labour hours What could cause the curve to shift to MRP1? A a cut in the wage rate B a fall in the price of the final product C an increase in the wage rate D a rise in the price of the final product
1 marks
Answer: B
This question in 9708/33 Oct/Nov 2015
Q90 · The diagram shows a perfectly competitive firm’s average product of labour (APL) and… 9708/33 Oct/Nov 2015
5 The diagram shows a perfectly competitive firm’s average product of labour (APL) and marginal product of labour (MPL) curves. wage ($), average W product, marginal product APL (units) MPL O N1 N2 N3 N4 workers employed How many workers will the firm employ at a wage of W? A ON1 B ON2 C ON3 D ON4
1 marks
Answer: C
This question in 9708/33 Oct/Nov 2015
Q91 · To increase its labour force from 20 to 21 workers, a firm has to increase the daily wage… 9708/33 Oct/Nov 2015
6 To increase its labour force from 20 to 21 workers, a firm has to increase the daily wage rate from $50 to $52. What is the marginal cost of labour per day? A $42 B $52 C $92 D $1092
1 marks
Answer: C
This question in 9708/33 Oct/Nov 2015
Q92 · To increase the number of cleaners at a local school from 10 to 11, the employer has to… 9708/32 May/June 2016
15 To increase the number of cleaners at a local school from 10 to 11, the employer has to raise the hourly rate of pay from $8.00 to $8.50. What is the marginal cost of labour per hour to the employer? A $0.50 B $13.50 C $88.50 D $93.50
1 marks
Answer: B
This question in 9708/32 May/June 2016
Q93 · For a firm in imperfect competition, the marginal revenue product of labour at any given… 9708/32 May/June 2016
16 For a firm in imperfect competition, the marginal revenue product of labour at any given level of employment is equal to A marginal revenue divided by the number employed. B marginal revenue divided by the wage rate. C the marginal physical product of labour multiplied by marginal revenue. D the marginal physical product of labour multiplied by the wage rate.
1 marks
Answer: C
This question in 9708/32 May/June 2016
Q94 · A firm is operating in a perfectly competitive market 9708/33 May/June 2016
14 A firm is operating in a perfectly competitive market. Why does the marginal revenue product of a factor of production employed by the firm fall as more of the factor is employed? A Its average revenue falls. B Its marginal physical product falls. C Its marginal revenue falls. D The supply price of the factor rises.
1 marks
Answer: B
This question in 9708/33 May/June 2016
Q95 · What would cause a perfectly competitive firm’s marginal revenue product of labour curve… 9708/33 May/June 2016
16 What would cause a perfectly competitive firm’s marginal revenue product of labour curve to shift to the right? A a higher rate of sales tax B a rise in the price of the final product C an increase in labour supply D an increase in wages
1 marks
Answer: B
This question in 9708/33 May/June 2016
Q96 · ‘The addition to revenue which results from employing one additional unit of a factor of… 9708/32 Oct/Nov 2016
17 ‘The addition to revenue which results from employing one additional unit of a factor of production, the quantities of all other factors of production remaining constant’. What does this define? A marginal factor cost B marginal revenue C marginal revenue product D the law of diminishing returns
1 marks
Answer: C
This question in 9708/32 Oct/Nov 2016
Q97 · The diagrams show the demand for and supply of labour 9708/32 Oct/Nov 2016
18 The diagrams show the demand for and supply of labour. S S wage wage wage rate rate S rate 1 3 4 2 D D D O quantity of labour O quantity of labour O quantity of labour Which two areas represent economic rent? A 1 and 3 B 1 and 4 C 2 and 3 D 2 and 4
1 marks
Answer: B
This question in 9708/32 Oct/Nov 2016
Q98 · The table shows the short-run production function of a firm with labour as the variable… 9708/32 Oct/Nov 2016
19 The table shows the short-run production function of a firm with labour as the variable factor of production. number of total output workers per day employed 1 10 2 20 3 40 4 50 5 60 If workers are hired in a perfectly competitive labour market at a wage rate of $50 per day, when will the labour cost per unit of output be at its lowest? A 2 workers B 3 workers C 4 workers D 5 workers
1 marks
Answer: B
This question in 9708/32 Oct/Nov 2016
Q99 · Over a given period the amount of overtime worked in manufacturing industry increases 9708/32 Oct/Nov 2016
20 Over a given period the amount of overtime worked in manufacturing industry increases. What is likely to be a consequence of this? A a decrease in employment B a decrease in the rate of inflation C a more rapid growth in average earnings than in hourly wage rates D a more rapid growth in manufacturing output than in productivity
1 marks
Answer: C
This question in 9708/32 Oct/Nov 2016
Q100 · The diagrams show the demand for and supply of labour in four markets 9708/33 Oct/Nov 2016
16 The diagrams show the demand for and supply of labour in four markets. 1 2 3 4 S S wage S wage wage wage rate rate rate rate S D D D D O number of O number of O number of O number of workers workers workers workers In which markets would labour’s transfer earnings exceed its economic rent? A 1 and 2 B 1 and 4 C 2 and 3 D 3 and 4
1 marks
Answer: B
This question in 9708/33 Oct/Nov 2016
Q101 · In the diagram, the ARPL curve is the average revenue product curve of labour of a… 9708/33 Oct/Nov 2016
17 In the diagram, the ARPL curve is the average revenue product curve of labour of a profit- maximising monopsonist and the MRPL is the marginal revenue product of labour curve. The curves AFCL and MFCL are the firm’s average and marginal factor cost curves. MFCL W3 AFCL W2 $ W1 ARPL MRPL O number of workers What is a likely outcome if a trade union negotiated a different wage from the original market wage? original possible range effect on market wage of new wage employment A W1 W1–W2 increase B W1 W2–W3 increase C W2 W2–W3 decrease D W3 W1–W3 decrease
1 marks
Answer: A
This question in 9708/33 Oct/Nov 2016
Q102 · What would be likely to reduce the mobility of labour between a depressed and a… 9708/33 Oct/Nov 2016
18 What would be likely to reduce the mobility of labour between a depressed and a prosperous region of a country? A a developed market in rented accommodation in the prosperous region B a high rate of job turnover in the prosperous region C the setting of wages at a national level D the withdrawal of a statutory minimum wage
1 marks
Answer: C
This question in 9708/33 Oct/Nov 2016
Q103 · The diagram shows the supply and demand situation in a particular labour market 9708/32 May/June 2017
17 The diagram shows the supply and demand situation in a particular labour market. supply wage rate N L M J demand O K quantity of labour When the market is in equilibrium, which areas measure the economic rent and transfer earnings received by employees? economic rent transfer earnings A JLN OKLJ B JML OKLJ C NML OKLM D OKLM NML
1 marks
Answer: B
This question in 9708/32 May/June 2017
Q104 · In 2015 a company drilling for oil wished to reduce its workforce because of a fall in… 9708/32 May/June 2017
18 In 2015 a company drilling for oil wished to reduce its workforce because of a fall in the price of oil. The workers’ trade union opposed the proposal. Which situation would have helped the trade union in the negotiations? A Capital and labour were close substitutes. B The cost of labour had been a small percentage of total cost. C The demand for oil had been price inelastic. D There had been a large supply of labour.
1 marks
Answer: B
This question in 9708/32 May/June 2017
Q105 · A shopkeeper earns $75 per week, but he would be willing to carry on working in his shop… 9708/33 May/June 2017
16 A shopkeeper earns $75 per week, but he would be willing to carry on working in his shop for up to $25 per week less. Therefore, $50 is his level of A marginal revenue product. B producer’s surplus. C economic rent. D transfer earnings.
1 marks
Answer: D
This question in 9708/33 May/June 2017
Q106 · The diagram shows the supply and demand for labour in an industry 9708/33 May/June 2017
17 The diagram shows the supply and demand for labour in an industry. S wage rate W D O L M N employment Initially the industry’s labour market is in equilibrium. What effect will the introduction of a minimum wage OW have on the level of employment in the industry? A It will decrease by LM. B It will decrease by LN. C It will increase by LN. D It will increase by MN.
1 marks
Answer: A
This question in 9708/33 May/June 2017
Q107 · Immigrants are awarded entry points according to their ability to fulfil criteria set by… 9708/33 May/June 2017
18 Immigrants are awarded entry points according to their ability to fulfil criteria set by the Canadian Government. A new Express Entry system for the immigration of skilled workers was introduced. The diagram shows the change in the relative importance or weighting given to these criteria between the old and new systems. Criteria weighting (%) for skilled worker immigration skill transferability 100 work experience % adaptability 80 age 60 education 40 language 20 job offer 0 old Express system Entry system What can be concluded from the diagram? A Canada intended to maintain the same level of skilled immigrants under both systems. B Canada wanted a smaller number of highly educated skilled immigrants. C Certainty of employment for skilled immigrants was made the main criterion. D Skilled immigrants needed to have fewer years of work experience than previously.
1 marks
Answer: C
This question in 9708/33 May/June 2017
Q108 · What would help to explain why there was a reduction in wage inequality in a country… 9708/32 Oct/Nov 2018
14 What would help to explain why there was a reduction in wage inequality in a country during the post-2008 economic recession? A a decline in the share of wages in national output B a decline in trade union bargaining power C the existence of a minimum wage D the trend towards later retirement
1 marks
Answer: C
This question in 9708/32 Oct/Nov 2018
Q109 · How is marginal revenue product calculated? 9708/32 Oct/Nov 2018
15 How is marginal revenue product calculated? A marginal physical product × marginal revenue B marginal physical product ÷ price C total physical product × marginal cost D total physical product ÷ marginal cost
1 marks
Answer: A
This question in 9708/32 Oct/Nov 2018
Q110 · A firm currently employs 30 workers at a daily wage of $50 each 9708/32 Oct/Nov 2018
16 A firm currently employs 30 workers at a daily wage of $50 each. The marginal cost of employing one extra worker is $112 per day. By how much will the firm have to increase the daily wage in order to increase its labour force from 30 to 31 workers? A $2 B $4 C $62 D $112
1 marks
Answer: A
This question in 9708/32 Oct/Nov 2018
Q111 · In the diagram, HN is the initial supply of labour curve faced by a firm, and RM is its… 9708/32 Oct/Nov 2018
17 In the diagram, HN is the initial supply of labour curve faced by a firm, and RM is its initial marginal cost of labour curve. wage, M N cost of labour J K W X R H O quantity of labour What will be the firm’s new labour supply curve if the workers join a trade union and achieve a union negotiated wage, OW? A RJX B HKX C WJM D WKN
1 marks
Answer: D
This question in 9708/32 Oct/Nov 2018
Q112 · A country has a negative income tax 9708/32 Feb/March 2019
13 A country has a negative income tax. The curve NT in the diagram shows the country’s initial tax schedule. + NT1 tax NT O income – A change in the tax rate causes the schedule to shift to NT1. How will this affect work incentives and the after-tax distribution of income? work distribution incentives of income A strengthen more equal B strengthen less equal C weaken less equal D weaken more equal
1 marks
Answer: D
This question in 9708/32 Feb/March 2019
Q113 · In which labour market diagram is the economic rent of workers greatest? 9708/32 Feb/March 2019
14 In which labour market diagram is the economic rent of workers greatest? A B wage wage SL W* SL W* MRPL MRPL O L* O L* labour labour C D SL wage wage SL W* W* MRPL MRPL O L* O L* labour labour
1 marks
Answer: C
This question in 9708/32 Feb/March 2019
Q114 · The government introduces a minimum wage above the equilibrium market wage rate 9708/32 Feb/March 2019
16 The government introduces a minimum wage above the equilibrium market wage rate. How will this affect low-paid workers according to marginal revenue product (MRP) theory? A All those initially in employment will receive the new guaranteed minimum wage. B Fewer of those not already in employment will enter the labour force. C There will be an increase in the number of low-paid workers in employment. D Some low-paid workers will lose their job.
1 marks
Answer: D
This question in 9708/32 Feb/March 2019
Q115 · The chart gives information about the average daily wage rate for all industries in India 9708/32 Oct/Nov 2019
14 The chart gives information about the average daily wage rate for all industries in India. 280 rupees 270 per day 260 250 240 230 220 210 200 2011 2012 2013 2014 What could have caused this trend in wage rates? A an increase in capital-intensive production B an increase in the number of industrial workers C an increase in the number of people unemployed D an increase in the productivity of labour
1 marks
Answer: D
This question in 9708/32 Oct/Nov 2019
Q116 · A country has a negative income tax regime 9708/32 Oct/Nov 2019
15 A country has a negative income tax regime. The curve NT in the diagram shows the country’s initial tax schedule. + NT tax NT1 O income – A change in the tax rate causes the schedule to shift to NT1. How will this affect work incentives and the after-tax distribution of income? work distribution incentives of income A strengthen less equal B strengthen more equal C weaken less equal D weaken more equal
1 marks
Answer: A
This question in 9708/32 Oct/Nov 2019
Q117 · There is a fixed supply of skilled workers in an industry 9708/32 Oct/Nov 2019
16 There is a fixed supply of skilled workers in an industry. Firms can no longer find enough workers to meet their demand for labour. What could be a solution to the problem? A Allow wage rates to fall as the market demands. B Introduce work-sharing and reduce working hours. C Make offices more attractive by adding air-conditioning. D Provide more training courses for new recruits.
1 marks
Answer: D
This question in 9708/32 Oct/Nov 2019
Q118 · A government is worried about the increasing monopsony power of employers in the wage… 9708/32 Oct/Nov 2019
17 A government is worried about the increasing monopsony power of employers in the wage bargaining process. Which policy combination is most likely to improve the wages and employment prospects of workers? trade union immigration national powers controls minimum wage A strengthen relax cut B strengthen strengthen raise C weaken relax cut D weaken strengthen raise
1 marks
Answer: B
This question in 9708/32 Oct/Nov 2019
Q119 · What is meant by ‘real wages’? 9708/32 Feb/March 2020
13 What is meant by ‘real wages’? A the marginal physical product of labour B the opportunity cost of labour C the purchasing power of money wages D wages net of tax
1 marks
Answer: C
This question in 9708/32 Feb/March 2020
Q120 · The graph shows the percentage growth in average earnings for the UK economy 9708/32 Feb/March 2020
14 The graph shows the percentage growth in average earnings for the UK economy. 2.8 2.8 UK average weekly earnings 2.6 2.6 growth (%) 2.4 2.3 2.2 2.2 2.2 2.1 2.0 Jan April 2017 2017 What is the most likely cause of the pattern shown in the graph? A a decrease in the supply of labour B a decrease in the interest rate C an increase in productivity D an increase in the size of the labour force
1 marks
Answer: D
This question in 9708/32 Feb/March 2020
Q121 · The diagram shows the impact on the labour market of the introduction of a national… 9708/32 Feb/March 2020
16 The diagram shows the impact on the labour market of the introduction of a national minimum wage (MW). wage rate supply X Y Z MW demand O labour What do the distances XY and YZ represent? XY YZ A increase in employed workers redundant existing workers B redundant existing workers unemployed new entrants C redundant existing workers increase in employed workers D unemployed new entrants redundant existing workers
1 marks
Answer: B
This question in 9708/32 Feb/March 2020
Q122 · What is likely to improve the occupational mobility of labour? 9708/31 Oct/Nov 2020
16 What is likely to improve the occupational mobility of labour? A a decrease in income tax that increases aggregate demand B a decrease in unemployment benefit C an increase in retraining schemes for the unemployed D more advertising of employment vacancies in the economy
1 marks
Answer: C
This question in 9708/31 Oct/Nov 2020
Q123 · The diagram represents a situation where a trade union has negotiated a wage, OW, for its… 9708/31 Oct/Nov 2020
17 The diagram represents a situation where a trade union has negotiated a wage, OW, for its members. The level of employment is OQ. real wage X W MRP ARP O Q quantity of labour What do the trade union members maximise in this situation? A their economic rent B their leisure hours C their level of employment D their total amount paid in wages
1 marks
Answer: D
This question in 9708/31 Oct/Nov 2020
Q124 · Which combination of policies is most likely to reduce the number of low-paid workers… 9708/32 Oct/Nov 2020
15 Which combination of policies is most likely to reduce the number of low-paid workers caught in the poverty trap? individual’s tax-free national minimum allowance for income tax wage in real terms A decrease increase B decrease unchanged C increase increase D increase unchanged
1 marks
Answer: C
This question in 9708/32 Oct/Nov 2020
Q125 · The diagram shows the effect of the introduction of a national minimum wage, WM, in an… 9708/32 Oct/Nov 2020
16 The diagram shows the effect of the introduction of a national minimum wage, WM, in an occupation where workers are employed by a profit-maximising monopsonist. wage MCL rate SL W2 Z V WM Y U W1 X MRPL = DL O Q1Q3Q2 employment What happened to total wages received by the workers in the occupation? A They decreased from OW2VQ2 to OWMUQ3. B They decreased from OW2ZQ1 to OWMUQ3. C They increased from OW1XQ1 to OWMYQ1. D They increased from OW1XQ1 to OWMUQ3.
1 marks
Answer: D
This question in 9708/32 Oct/Nov 2020
Q126 · A backward-sloping supply curve of labour is one where, beyond a certain point, the… 9708/32 Oct/Nov 2020
17 A backward-sloping supply curve of labour is one where, beyond a certain point, the supply of labour A decreases as the demand for labour rises. B increases as the demand for labour rises. C decreases as wages rise. D increases as wages rise.
1 marks
Answer: C
This question in 9708/32 Oct/Nov 2020
Q127 · The diagram illustrates a monopsony labour market in which the government has imposed a… 9708/33 Oct/Nov 2020
16 The diagram illustrates a monopsony labour market in which the government has imposed a minimum wage. MCL W4 wage rate S = ACL W3 W2 minimum wage W1 D = MRP O Q2 Q1 Q3 quantity of labour What is the difference between the wage the monopsonist wishes to pay and the wage received by labour? A W1W3 B W1W2 C W2W3 D W2W4
1 marks
Answer: B
This question in 9708/33 Oct/Nov 2020
Q128 · Labour is the only variable factor of a profit-maximising firm which is a price-taker in… 9708/33 Oct/Nov 2020
17 Labour is the only variable factor of a profit-maximising firm which is a price-taker in the labour market. From what is the firm’s demand curve for labour derived? A its marginal factor cost curve B its marginal revenue curve C its marginal revenue product of labour curve D its short-run marginal cost curve
1 marks
Answer: C
This question in 9708/33 Oct/Nov 2020
Q129 · In which circumstances is a poverty trap least likely to operate? 9708/32 Feb/March 2021
16 In which circumstances is a poverty trap least likely to operate? A A female worker is paid less than a male worker for doing the same job. B A worker is paid the minimum wage and refuses a higher paid job because net income is lower after tax. C A worker refuses higher paid work as it means more expensive travel and childcare costs. D An unemployed worker refuses a job because earnings are less than unemployment benefit.
1 marks
Answer: A
This question in 9708/32 Feb/March 2021
Q130 · What would be most likely to cause the demand for labour in an industry to be inelastic? 9708/32 Feb/March 2021
17 What would be most likely to cause the demand for labour in an industry to be inelastic? A Labour costs are a small percentage of total cost. B The demand for the final product has a price elasticity of demand that is greater than one. C The workforce belongs to a strong trade union. D There is a large pool of readily available labour.
1 marks
Answer: A
This question in 9708/32 Feb/March 2021
Q131 · What is meant by economic rent? 9708/31 May/June 2021
16 What is meant by economic rent? A any amount above the minimum earnings required to keep labour in its current job B the marginal physical product of labour multiplied by marginal revenue C the minimum amount required to keep labour in its current job D the regular payment to a property owner in exchange for the use of a building
1 marks
Answer: A
This question in 9708/31 May/June 2021
Q132 · A firm operates under perfect competition in both product and factor markets with labour… 9708/31 May/June 2021
17 A firm operates under perfect competition in both product and factor markets with labour as the only variable factor input. In the diagram, the line JK shows the relationship between the marginal physical product of labour and the hours worked. J 10 marginal physical product of labour 8 (units) 6 4 2 K 0 0 1 2 3 4 5 thousand hours When the marginal revenue of the product is $1.60, the firm uses 3000 hours of labour. What is the hourly wage? A $0.40 B $2.40 C $5.60 D $6.40
1 marks
Answer: D
This question in 9708/31 May/June 2021
Q133 · Which calculation would give the marginal revenue product (MRP) of labour for a firm… 9708/32 May/June 2021
16 Which calculation would give the marginal revenue product (MRP) of labour for a firm selling its product in an imperfectly competitive product market? A average output produced per worker employed marginal revenue of the product B average output produced per worker employed price of the product C extra product produced by an additional worker marginal revenue of the product D extra product produced by an additional worker price of the product
1 marks
Answer: C
This question in 9708/32 May/June 2021
Q134 · The diagrams show the demand for and supply of labour in four markets 9708/32 May/June 2021
17 The diagrams show the demand for and supply of labour in four markets. 1 2 3 4 S S wage wage wage wage rate rate rate rate S S D D D D O number of O number of O number of O number of workers workers workers workers In which markets would labour’s transfer earnings exceed its economic rent? A 1 and 2 B 1 and 4 C 2 and 3 D 3 and 4
1 marks
Answer: B
This question in 9708/32 May/June 2021
Q135 · What is meant by economic rent? 9708/33 May/June 2021
16 What is meant by economic rent? A any amount above the minimum earnings required to keep labour in its current job B the marginal physical product of labour multiplied by marginal revenue C the minimum amount required to keep labour in its current job D the regular payment to a property owner in exchange for the use of a building
1 marks
Answer: A
This question in 9708/33 May/June 2021
Q136 · A firm operates under perfect competition in both product and factor markets with labour… 9708/33 May/June 2021
17 A firm operates under perfect competition in both product and factor markets with labour as the only variable factor input. In the diagram, the line JK shows the relationship between the marginal physical product of labour and the hours worked. J 10 marginal physical product of labour 8 (units) 6 4 2 K 0 0 1 2 3 4 5 thousand hours When the marginal revenue of the product is $1.60, the firm uses 3000 hours of labour. What is the hourly wage? A $0.40 B $2.40 C $5.60 D $6.40
1 marks
Answer: D
This question in 9708/33 May/June 2021
Q137 · What will not shift the demand curve for labour to the right? 9708/31 Oct/Nov 2021
16 What will not shift the demand curve for labour to the right? A improvement in marginal productivity of labour B increase in demand for the product C increase in the price of the product D increase in the wage rate
1 marks
Answer: D
This question in 9708/31 Oct/Nov 2021
Q138 · The diagram shows an individual’s supply of labour curve 9708/31 Oct/Nov 2021
17 The diagram shows an individual’s supply of labour curve. S 80 hourly wage ($) w x 60 z 40 y 20 0 40 number of hours per week He is offered a job which would require him to work a standard 40-hour week. Which area measures the amount he would need to get him to accept this job offer? A w + z B x + y C x + y – z D w + x + z + y
1 marks
Answer: B
This question in 9708/31 Oct/Nov 2021
Q139 · In certain countries benefits are provided to individuals on low income 9708/32 Oct/Nov 2021
14 In certain countries benefits are provided to individuals on low income. As their income rises the benefits are reduced and income tax has to be paid. What can result from this? A price stabilisation B poverty trap C replacement ratio D unemployment trap
1 marks
Answer: B
This question in 9708/32 Oct/Nov 2021
Q140 · What happens to economic rent and transfer earnings if the supply of labour becomes… 9708/32 Oct/Nov 2021
16 What happens to economic rent and transfer earnings if the supply of labour becomes perfectly inelastic? A economic rent decreases; transfer earnings increase B economic rent decreases; transfer earnings stay the same C economic rent increases; transfer earnings decrease D economic rent stays the same; transfer earnings decrease
1 marks
Answer: C
This question in 9708/32 Oct/Nov 2021
Q141 · The diagram shows the effect of the introduction of a minimum wage (WM) in the labour… 9708/32 Oct/Nov 2021
17 The diagram shows the effect of the introduction of a minimum wage (WM) in the labour market. wage rate SL WM WL DL O QL quantity of labour When would such a minimum wage be least beneficial to workers who are currently employed? A if demand for the product increases B if the elasticity of demand for the workers were high C if the elasticity of supply for the workers were high D if the productivity of the workers were to increase
1 marks
Answer: B
This question in 9708/32 Oct/Nov 2021
Q142 · What would encourage industrial expansion in a region of high unemployment? 9708/32 Oct/Nov 2021
22 What would encourage industrial expansion in a region of high unemployment? A a rationing system for building development in that region B an increase in taxes on investment C a requirement that only local labour may be employed D an end to nationally negotiated wage rates
1 marks
Answer: D
This question in 9708/32 Oct/Nov 2021
Q143 · What is a definition of transfer earnings? 9708/31 May/June 2022
16 What is a definition of transfer earnings? A the amount of earnings above that needed to keep a worker in their current job B the minimum earnings needed to keep a worker in their current job C the social security benefits paid to workers whose earnings are below the poverty line D the amount of earnings needed to cause a worker to change to a different job
1 marks
Answer: B
This question in 9708/31 May/June 2022
Q144 · The chart gives information about the average daily wage rate for all industries in India 9708/31 May/June 2022
17 The chart gives information about the average daily wage rate for all industries in India. 280 rupees 270 per day 260 250 240 230 220 210 200 2011 2012 2013 2014 year What could have caused this trend in wage rates? A an increase in capital-intensive production B an increase in the number of industrial workers C an increase in the number of people unemployed D an increase in the productivity of labour
1 marks
Answer: D
This question in 9708/31 May/June 2022
Q145 · What is a definition of transfer earnings? 9708/33 May/June 2022
16 What is a definition of transfer earnings? A the amount of earnings above that needed to keep a worker in their current job B the minimum earnings needed to keep a worker in their current job C the social security benefits paid to workers whose earnings are below the poverty line D the amount of earnings needed to cause a worker to change to a different job
1 marks
Answer: B
This question in 9708/33 May/June 2022
Q146 · The chart gives information about the average daily wage rate for all industries in India 9708/33 May/June 2022
17 The chart gives information about the average daily wage rate for all industries in India. 280 rupees 270 per day 260 250 240 230 220 210 200 2011 2012 2013 2014 year What could have caused this trend in wage rates? A an increase in capital-intensive production B an increase in the number of industrial workers C an increase in the number of people unemployed D an increase in the productivity of labour
1 marks
Answer: D
This question in 9708/33 May/June 2022
Q147 · A government is worried about the increasing monopsony power of employers in the wage… 9708/31 Oct/Nov 2022
16 A government is worried about the increasing monopsony power of employers in the wage bargaining process. Which policy combination is most likely to improve the wages and employment prospects of workers? trade union immigration national powers controls minimum wage A strengthen relax cut B strengthen strengthen raise C weaken relax cut D weaken strengthen raise
1 marks
Answer: B
This question in 9708/31 Oct/Nov 2022
Q148 · The diagram shows the labour market for fruit pickers in country X 9708/31 Oct/Nov 2022
17 The diagram shows the labour market for fruit pickers in country X. wage marginal wage W average wage average revenue product marginal revenue product O quantity of labourers If the market was originally in equilibrium, what would happen to wages and employment if a minimum wage of W were imposed? wages employment A fall fall B fall rise C rise fall D rise rise
1 marks
Answer: D
This question in 9708/31 Oct/Nov 2022
Q149 · Which supply curve (S) indicates that eventually an individual will choose to spend more… 9708/32 Oct/Nov 2022
16 Which supply curve (S) indicates that eventually an individual will choose to spend more time on leisure rather than continue working for increased wages? A B S wage wage S O O hours worked hours worked C D S S wage wage O O hours worked hours worked
1 marks
Answer: D
This question in 9708/32 Oct/Nov 2022
Q150 · When is a trade union less likely to gain a large pay rise for its workers? 9708/32 Oct/Nov 2022
17 When is a trade union less likely to gain a large pay rise for its workers? A It represents a large proportion of the workforce in the company. B It represents a workforce that has an elastic demand for its labour. C It represents a workforce that is increasing its labour productivity. D It represents a workforce that works for a highly profitable monopoly firm.
1 marks
Answer: B
This question in 9708/32 Oct/Nov 2022
Q151 · A fashion model is paid $500 000 a year 9708/33 Oct/Nov 2022
16 A fashion model is paid $500 000 a year. If the next best paid job he could get is as a teacher at $100 000 a year, what are his transfer earnings and his economic rent? transfer earnings economic rent $ $ A zero 400 000 B 100 000 400 000 C 400 000 zero D 400 000 100 000
1 marks
Answer: B
This question in 9708/33 Oct/Nov 2022
Q152 · What would be the most likely effect of the imposition of a national maximum wage below… 9708/33 Oct/Nov 2022
17 What would be the most likely effect of the imposition of a national maximum wage below the market equilibrium on the labour market for famous television celebrities? A a reduction in the number of jobs for television celebrities B an increase in other methods of rewarding television celebrities C greater movement of celebrities between television channels D increased employment of foreign television celebrities
1 marks
Answer: B
This question in 9708/33 Oct/Nov 2022
Q153 · The diagram shows an industry’s demand for and supply of labour 9708/32 Feb/March 2023
11 The diagram shows an industry’s demand for and supply of labour. wage rate S W0 D O X Y Z number of workers Initially, the labour market is in equilibrium. The government introduces a minimum wage of OW0. What will be the effect on the level of employment in the industry? A a decrease equal to XY B a decrease equal to XZ C an increase equal to XY D an increase equal to YZ
1 marks
Answer: A
This question in 9708/32 Feb/March 2023
Q154 · The diagram shows the supply curve of labour for two separate markets, X and Y 9708/32 Feb/March 2023
12 The diagram shows the supply curve of labour for two separate markets, X and Y. X wage rate Y O quantity of labour What explains the difference in the gradients of the labour supply curves? A Market X has a higher marginal revenue product per worker than Y. B Market X has a higher percentage of its labour belonging to a trade union than Y. C Market X has higher labour costs as a percentage of total costs than X. D Market X has more specific skills and training requirements than Y.
1 marks
Answer: D
This question in 9708/32 Feb/March 2023
Q155 · The table shows the main characteristics of employment in two occupations 9708/32 Feb/March 2023
13 The table shows the main characteristics of employment in two occupations. occupation X occupation Y average annual wage $100 000 $60 000 number of weeks of annual leave 5 weeks 10 weeks average length of working week 48 hours 44 hours job security low high length of training course to obtain job qualification 1 year 2 years What can definitely be deduced from the table? A Those employed in occupation Y attach greater importance to job security. B Those employed in occupation X attach less importance to leisure activities. C There will be more competition for places on training courses to enter occupation X than occupation Y. D Occupation Y has more non-pecuniary advantages than occupation X.
1 marks
Answer: D
This question in 9708/32 Feb/March 2023
Q156 · The diagram illustrates a monopsony labour market in which the government has imposed a… 9708/31 May/June 2023
14 The diagram illustrates a monopsony labour market in which the government has imposed a minimum wage. MCL W4 wage rate S = ACL W3 W2 minimum wage W1 D = MRP O Q2 Q1 Q3 quantity of labour What is the difference between the wage the monopsonist wishes to pay and the wage received by labour? A W1W3 B W1W2 C W2W3 D W2W4
1 marks
Answer: B
This question in 9708/31 May/June 2023
Q157 · Economics textbooks state that labour is a derived demand for a firm in imperfect… 9708/31 May/June 2023
15 Economics textbooks state that labour is a derived demand for a firm in imperfect competition. How is the demand curve for labour derived? A by multiplying the average physical product by the average revenue B by multiplying the average physical product by the marginal revenue C by multiplying the marginal physical product by the marginal cost D by multiplying the marginal physical product by the marginal revenue
1 marks
Answer: D
This question in 9708/31 May/June 2023
Q158 · What will lead the demand curve for labour to shift to the right? 9708/32 May/June 2023
13 What will lead the demand curve for labour to shift to the right? A a decrease in the marginal productivity of labour B a decrease in the wage rate C an increase in the marginal productivity of labour D an increase in the wage rate
1 marks
Answer: C
This question in 9708/32 May/June 2023
Q159 · Immigrants are awarded entry points according to their ability to fulfil criteria set by… 9708/32 May/June 2023
16 Immigrants are awarded entry points according to their ability to fulfil criteria set by the Canadian Government. A new Express Entry system for the immigration of skilled workers was introduced. The diagram shows the change in the relative importance or weighting given to these criteria between the old and new systems. Criteria weighting (%) for skilled worker immigration skill transferability 100 work experience % adaptability 80 age 60 education 40 language 20 job offer 0 old Express system Entry system What can be concluded from the diagram? A Canada intended to maintain the same level of skilled immigrants under both systems. B Canada wanted a smaller number of highly educated skilled immigrants. C Certainty of employment for skilled immigrants was made the main criterion. D Skilled immigrants needed to have fewer years of work experience than previously.
1 marks
Answer: C
This question in 9708/32 May/June 2023
Q160 · The diagram illustrates a monopsony labour market in which the government has imposed a… 9708/33 May/June 2023
14 The diagram illustrates a monopsony labour market in which the government has imposed a minimum wage. MCL W4 wage rate S = ACL W3 W2 minimum wage W1 D = MRP O Q2 Q1 Q3 quantity of labour What is the difference between the wage the monopsonist wishes to pay and the wage received by labour? A W1W3 B W1W2 C W2W3 D W2W4
1 marks
Answer: B
This question in 9708/33 May/June 2023
Q161 · Economics textbooks state that labour is a derived demand for a firm in imperfect… 9708/33 May/June 2023
15 Economics textbooks state that labour is a derived demand for a firm in imperfect competition. How is the demand curve for labour derived? A by multiplying the average physical product by the average revenue B by multiplying the average physical product by the marginal revenue C by multiplying the marginal physical product by the marginal cost D by multiplying the marginal physical product by the marginal revenue
1 marks
Answer: D
This question in 9708/33 May/June 2023
Q162 · The diagram shows the demand for and supply of labour 9708/31 Oct/Nov 2023
12 The diagram shows the demand for and supply of labour. wage SL W1 X We Z Y DL O N2 N1 quantity of labour The government announces a minimum wage of W1. Which area represents the increase in the economic rent of workers who will continue to be employed at the minimum wage? A X B Y C X + Y D X + Y + Z
1 marks
Answer: A
This question in 9708/31 Oct/Nov 2023
Q163 · A firm is faced with a shortage of labour 9708/31 Oct/Nov 2023
13 A firm is faced with a shortage of labour. It decides to introduce its own training scheme for school leavers. Which effect is this most likely to have on the firm? A a decrease in the number of workers it employs B a decrease in the productivity of its workforce C an increase in the geographical mobility of its labour D a shift of the supply curve for its labour to the right
1 marks
Answer: D
This question in 9708/31 Oct/Nov 2023
Q164 · The diagram shows the short-run supply curve and long-run supply curve of labour 9708/33 Oct/Nov 2023
11 The diagram shows the short-run supply curve and long-run supply curve of labour. short run wage rate long run X Y Z D O quantity of labour Which area turns from economic rent in the short run to transfer earnings in the long run? A X B X + Y C Y D Y + Z
1 marks
Answer: C
This question in 9708/33 Oct/Nov 2023
Q165 · Which policies might a government introduce to increase the marginal productivity of… 9708/33 Oct/Nov 2023
12 Which policies might a government introduce to increase the marginal productivity of labour? tax allowances better for capital education goods A no no B no yes C yes no D yes yes
1 marks
Answer: D
This question in 9708/33 Oct/Nov 2023
Q166 · What will cause an outward shift in the demand for labour curve? 9708/31 May/June 2024
14 What will cause an outward shift in the demand for labour curve? A a decrease in the top rate of income tax B an increase in the demand for the final product C an increase in subsidies to firms D an increase in the size of the working population
1 marks
Answer: B
This question in 9708/31 May/June 2024
Q167 · The diagram shows what happens when the employees of a profit-maximising monopsonist… 9708/31 May/June 2024
15 The diagram shows what happens when the employees of a profit-maximising monopsonist employer form a trade union and successfully negotiate a wage rate of OWT. MCL wage rate SL W2 WT W1 MRPL = DL O Q1 Q3 Q2 Q4 employment What is the effect of the new wage rate on employment? A It falls from OQ2 to OQ1. B It falls from OQ2 to OQ3. C It rises from OQ1 to OQ3. D It rises from OQ1 to OQ4.
1 marks
Answer: C
This question in 9708/31 May/June 2024
Q168 · What will cause an outward shift in the demand for labour curve? 9708/33 May/June 2024
14 What will cause an outward shift in the demand for labour curve? A a decrease in the top rate of income tax B an increase in the demand for the final product C an increase in subsidies to firms D an increase in the size of the working population
1 marks
Answer: B
This question in 9708/33 May/June 2024
Q169 · The diagram shows what happens when the employees of a profit-maximising monopsonist… 9708/33 May/June 2024
15 The diagram shows what happens when the employees of a profit-maximising monopsonist employer form a trade union and successfully negotiate a wage rate of OWT. MCL wage rate SL W2 WT W1 MRPL = DL O Q1 Q3 Q2 Q4 employment What is the effect of the new wage rate on employment? A It falls from OQ2 to OQ1. B It falls from OQ2 to OQ3. C It rises from OQ1 to OQ3. D It rises from OQ1 to OQ4.
1 marks
Answer: C
This question in 9708/33 May/June 2024
Q170 · A government’s aim is to reduce real wage rates 9708/32 Feb/March 2025
12 A government’s aim is to reduce real wage rates. Which policy should be used to achieve this aim? A Award public sector workers pay increases below the rate of inflation. B Encourage private sector pay awards to be in line with company profits. C Introduce a minimum hourly wage for non-unionised, low-paid workers. D Remove any restrictions on trade unions to bargain for wages.
1 marks
Answer: A
This question in 9708/32 Feb/March 2025
Q171 · How is marginal revenue product calculated? 9708/32 Feb/March 2025
13 How is marginal revenue product calculated? A marginal physical product × marginal revenue B marginal physical product ÷ price C total physical product × marginal cost D total physical product ÷ marginal cost
1 marks
Answer: A
This question in 9708/32 Feb/March 2025
Q172 · A teacher currently earns $30000 9708/32 Feb/March 2025
14 A teacher currently earns $30000. She would be willing to continue in that teaching job, provided she earned at least $25000. Also, she would prefer to remain a teacher than change to her next best alternative employment as an accountant where she could earn $40000. Which statement is correct? A Her economic rent as a teacher is $5000. B Her economic rent as an accountant is $10000. C Her transfer earnings as a teacher are $30000. D Her transfer earnings as an accountant are $15000.
1 marks
Answer: A
This question in 9708/32 Feb/March 2025
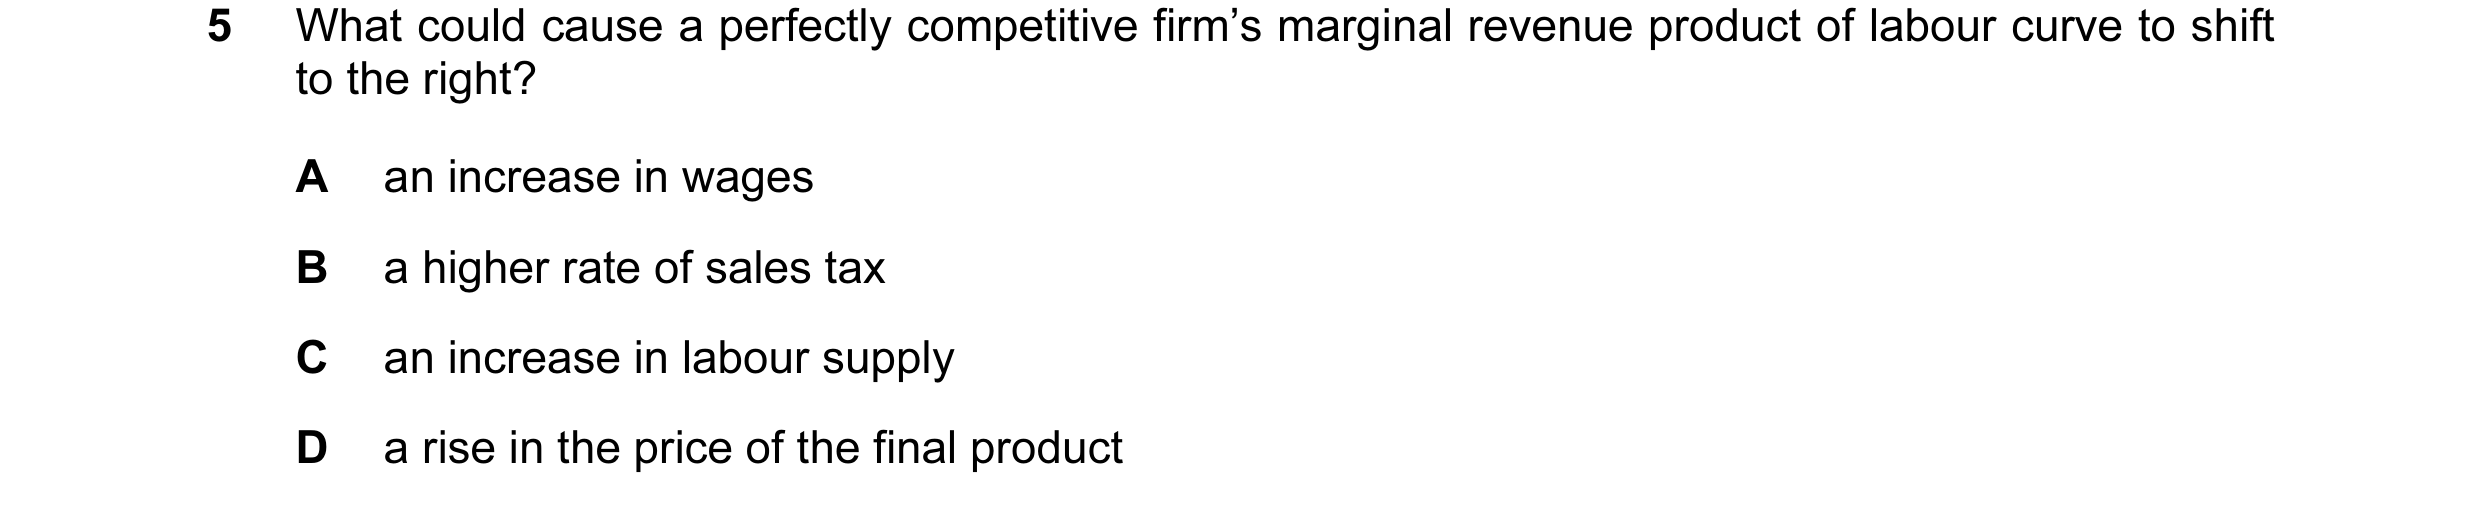
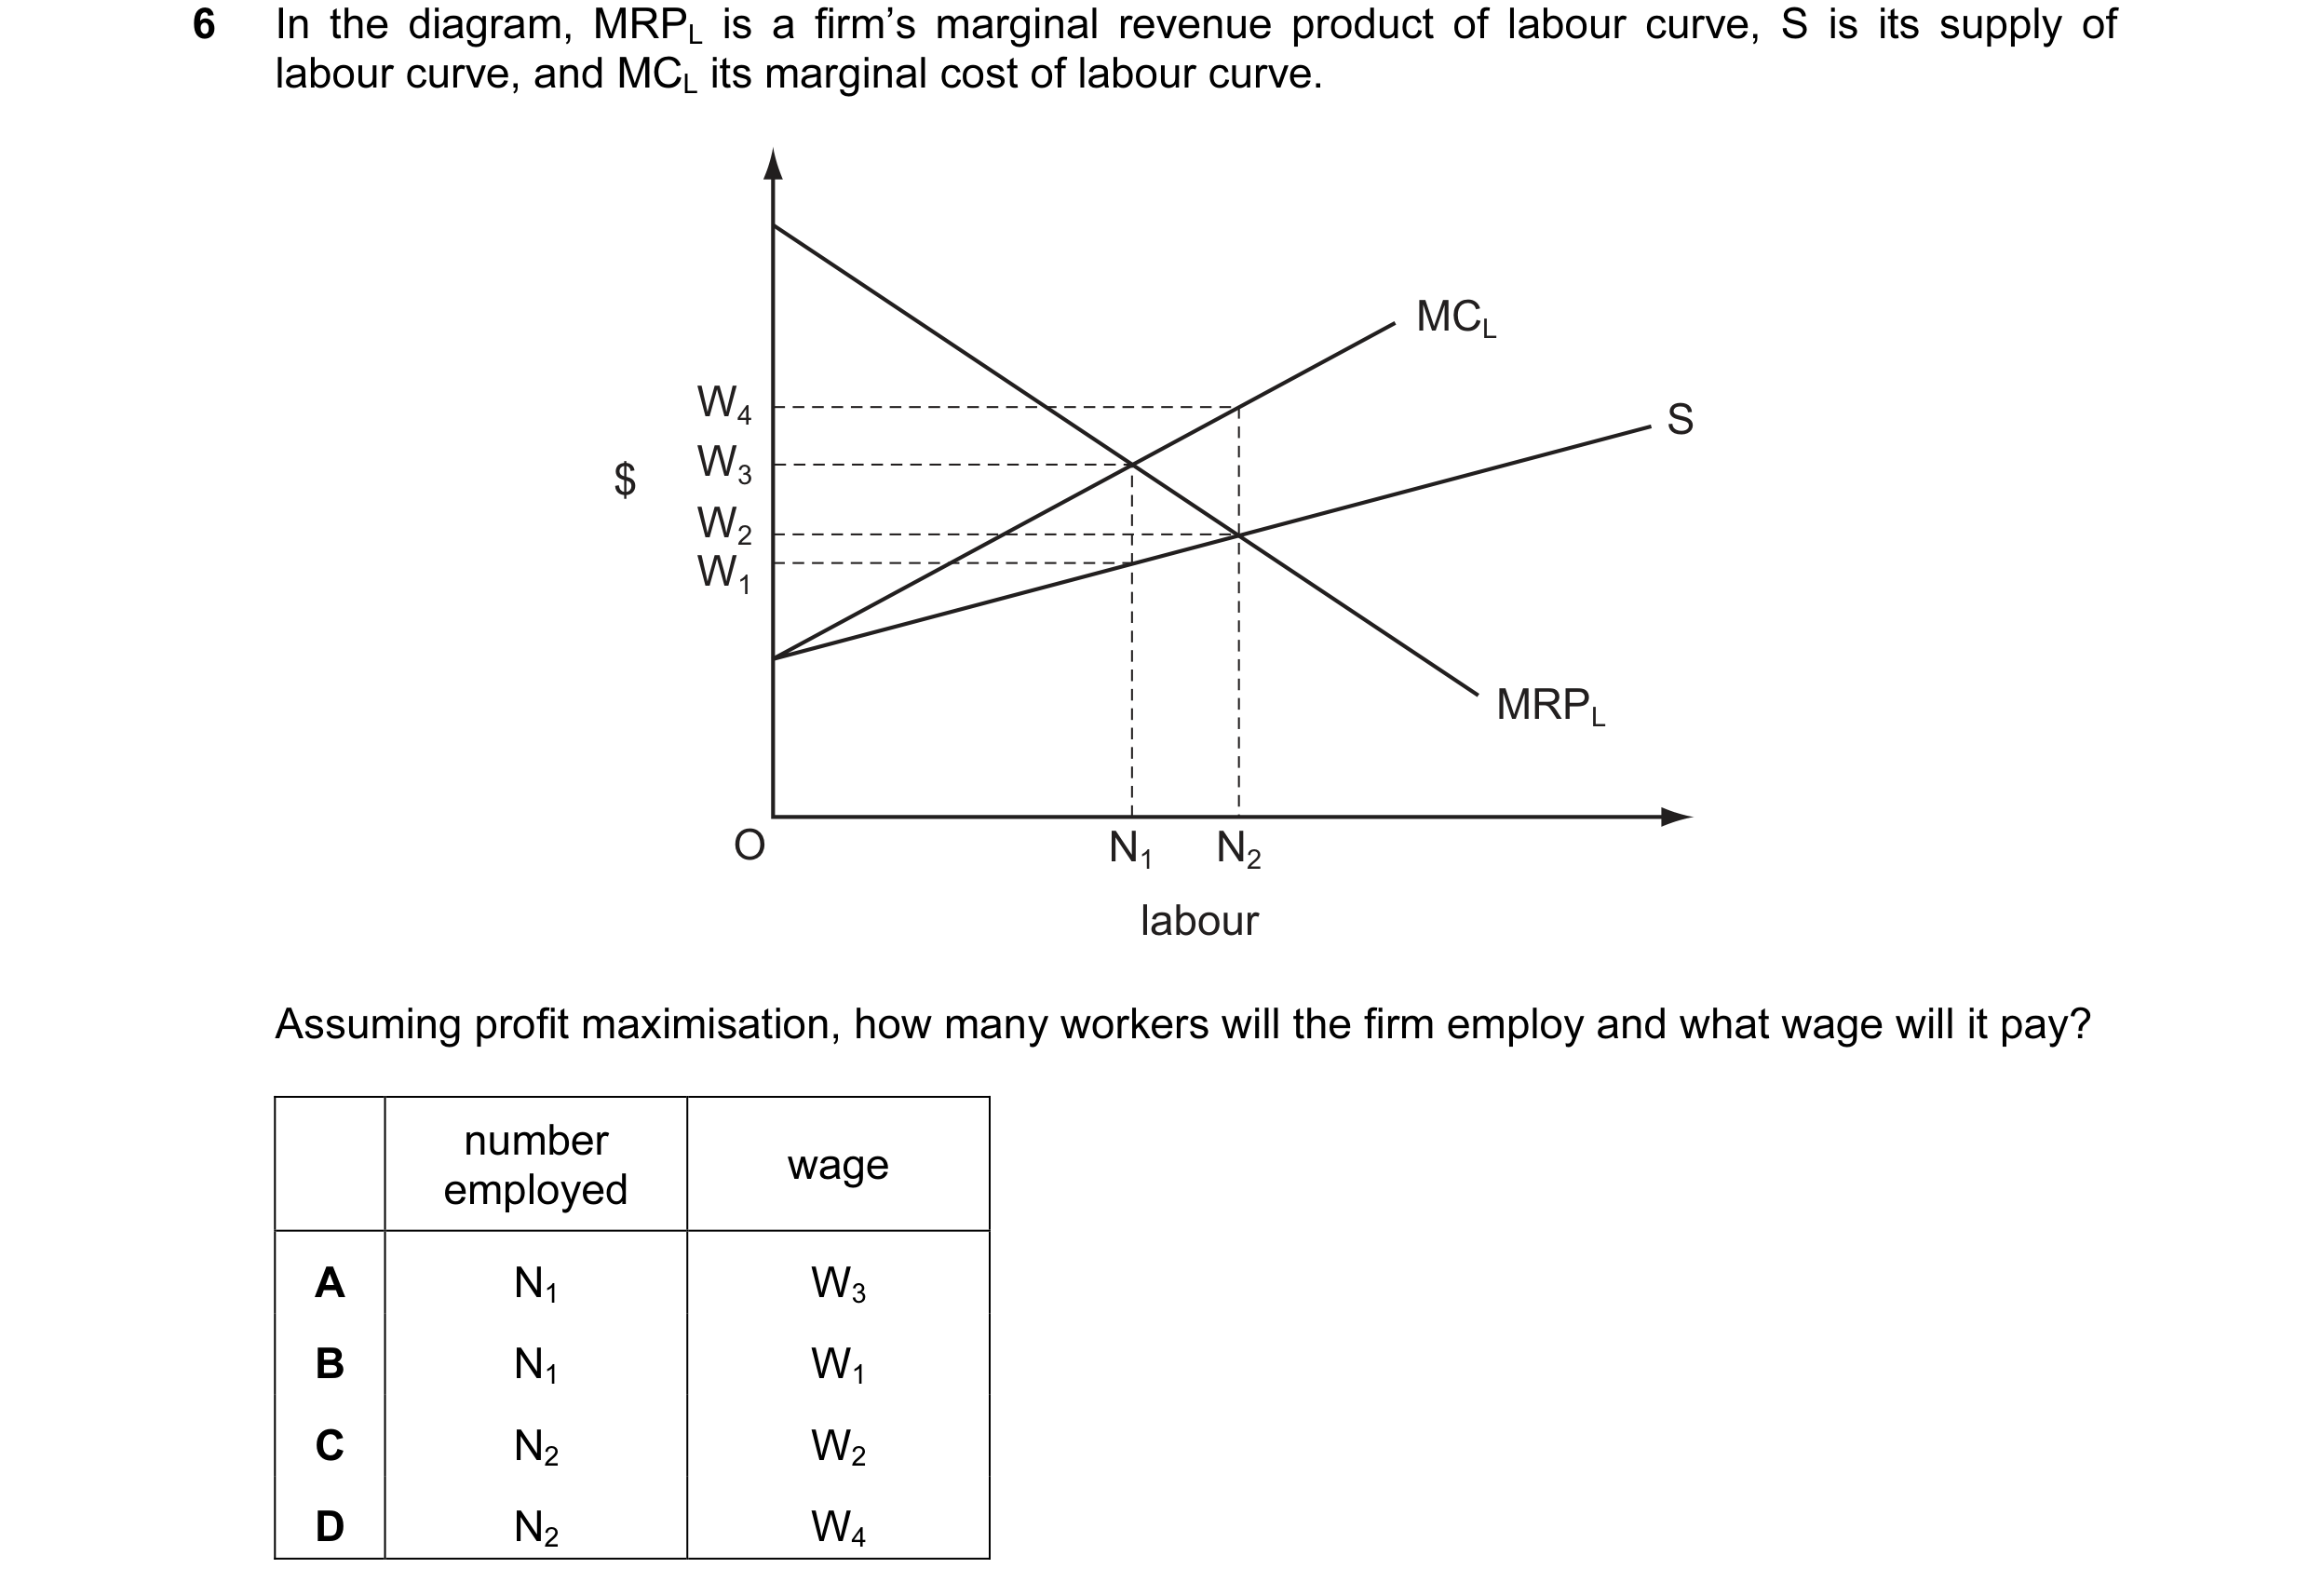
 1 / 58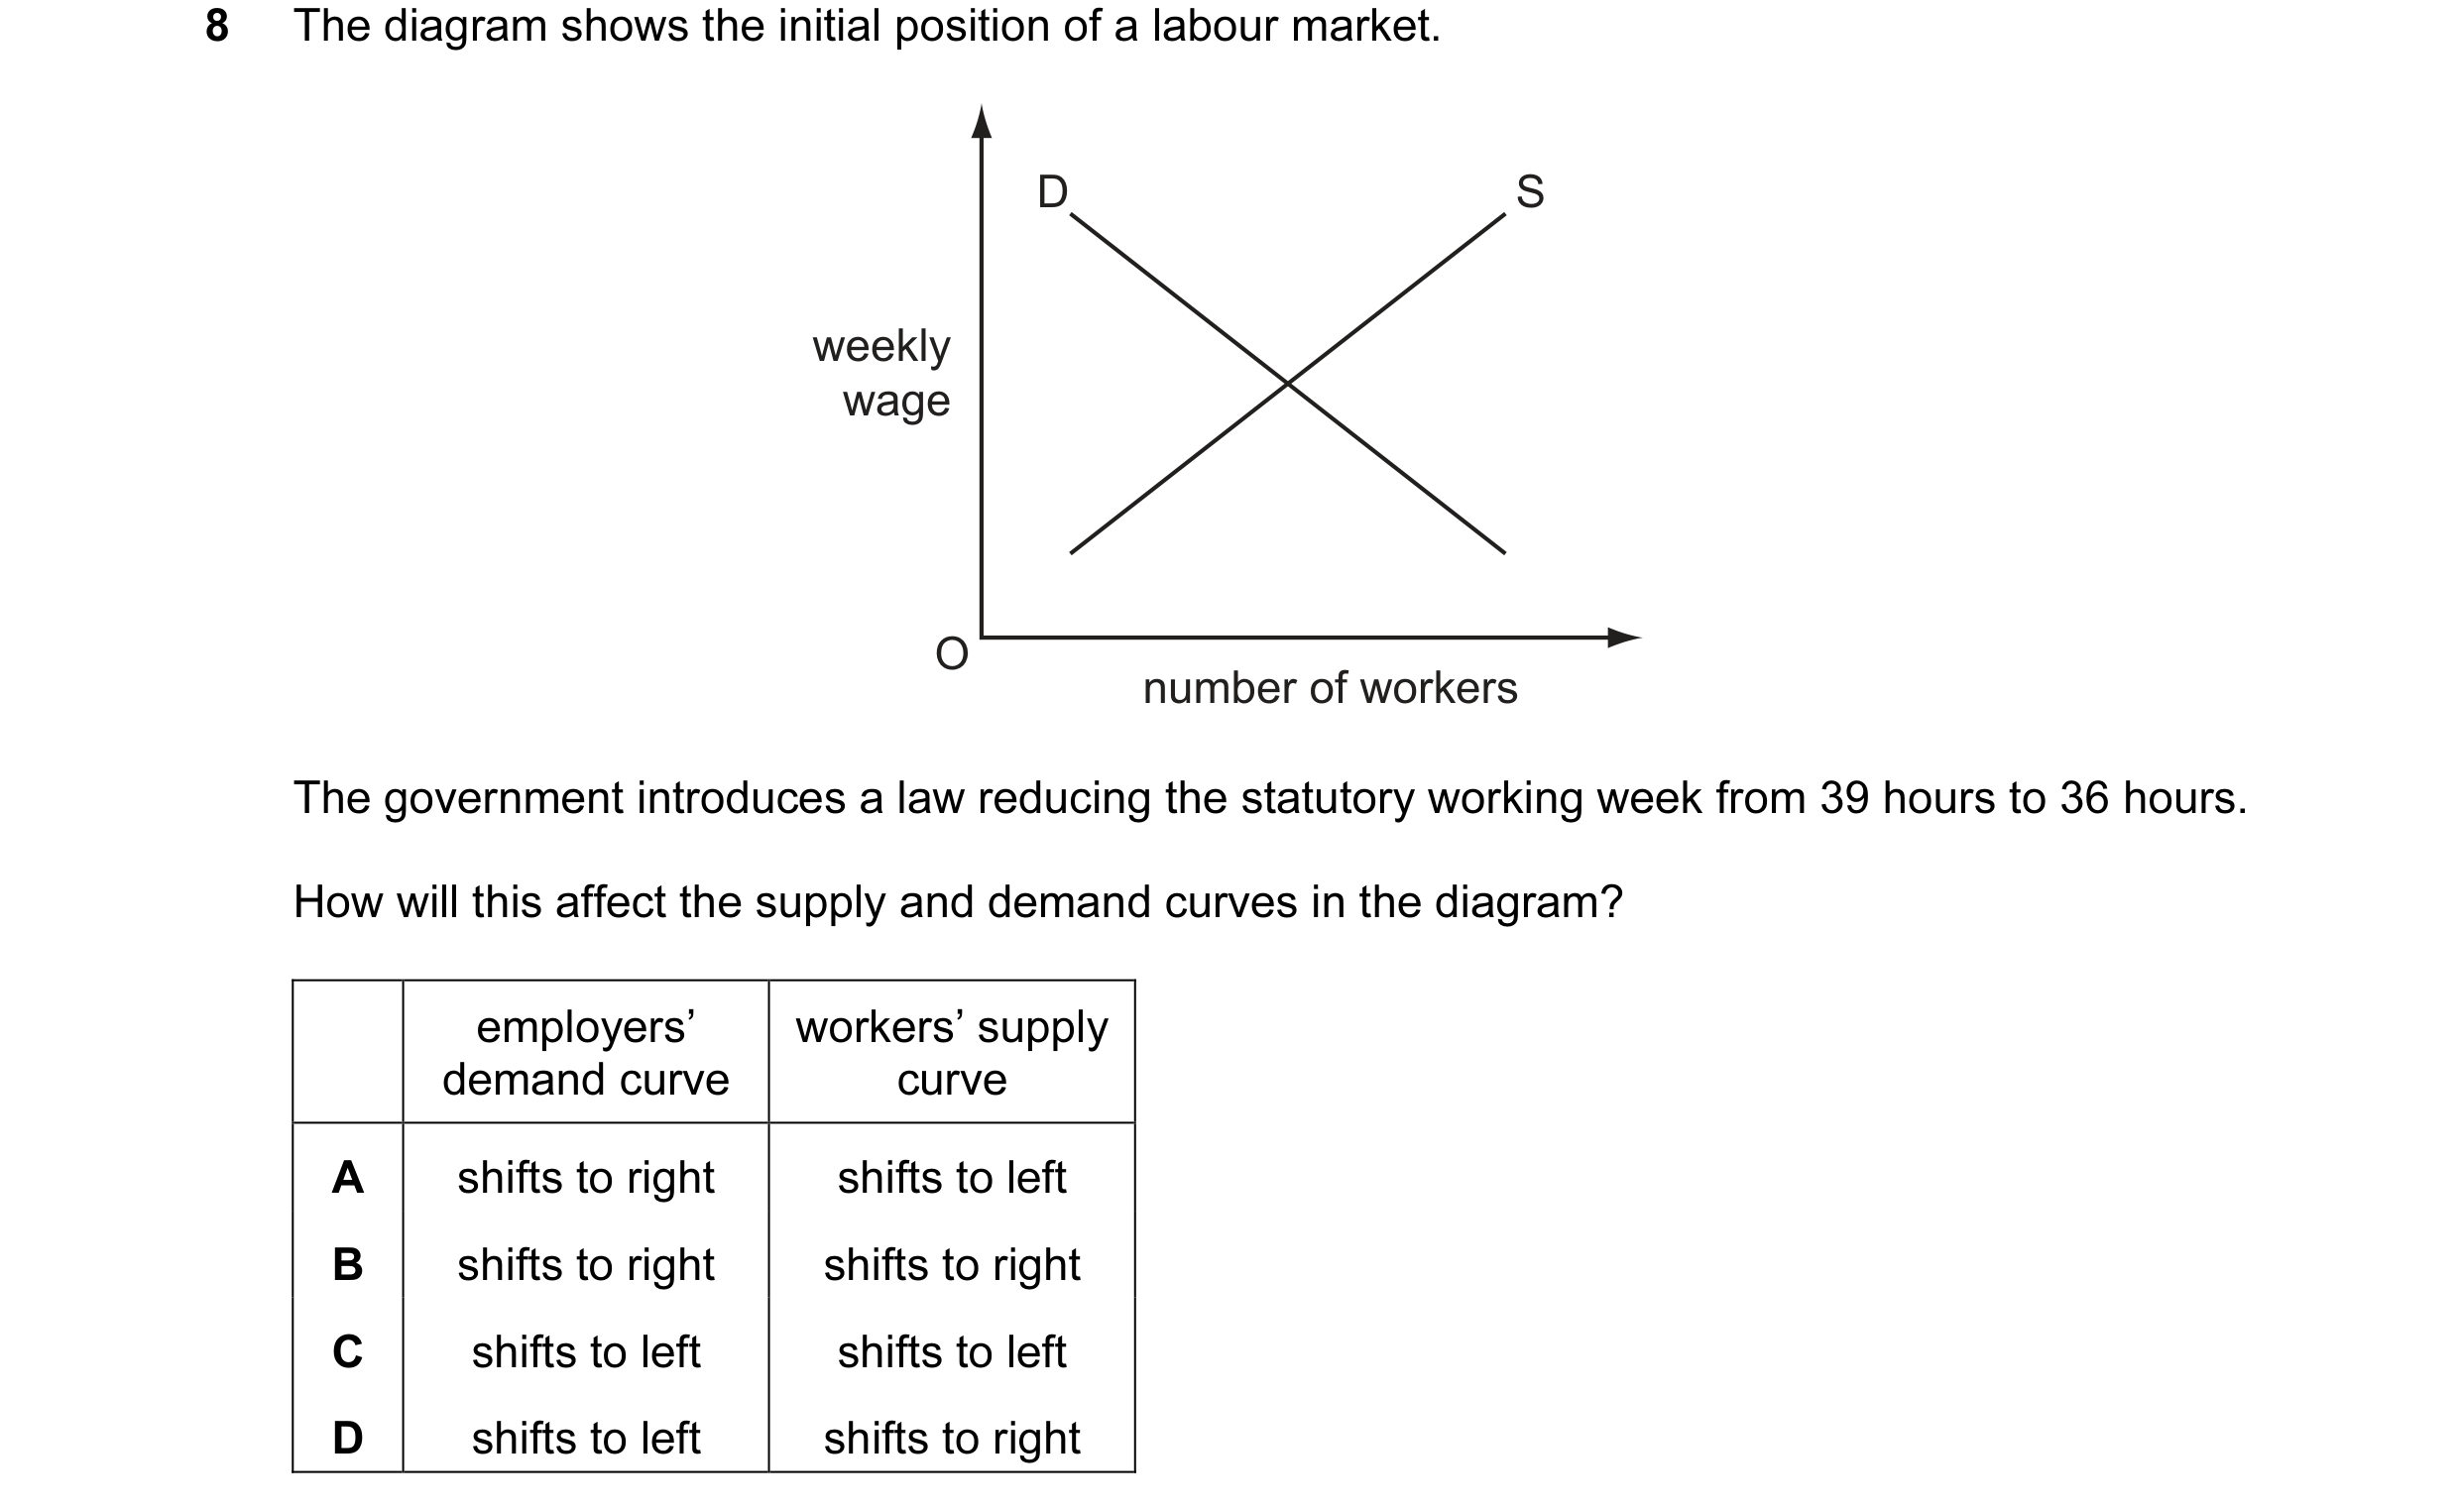
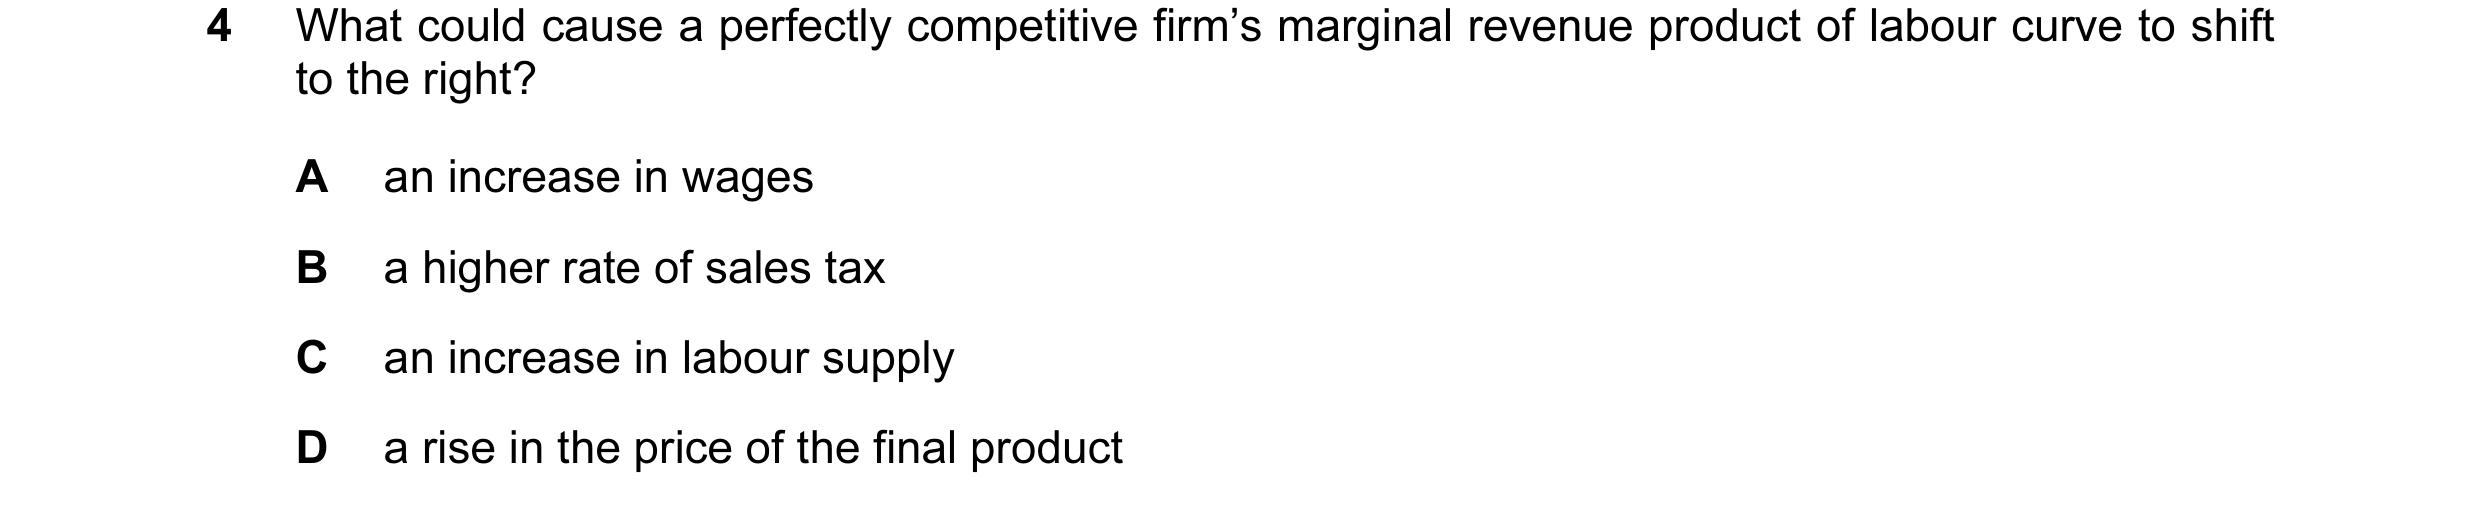 2 / 58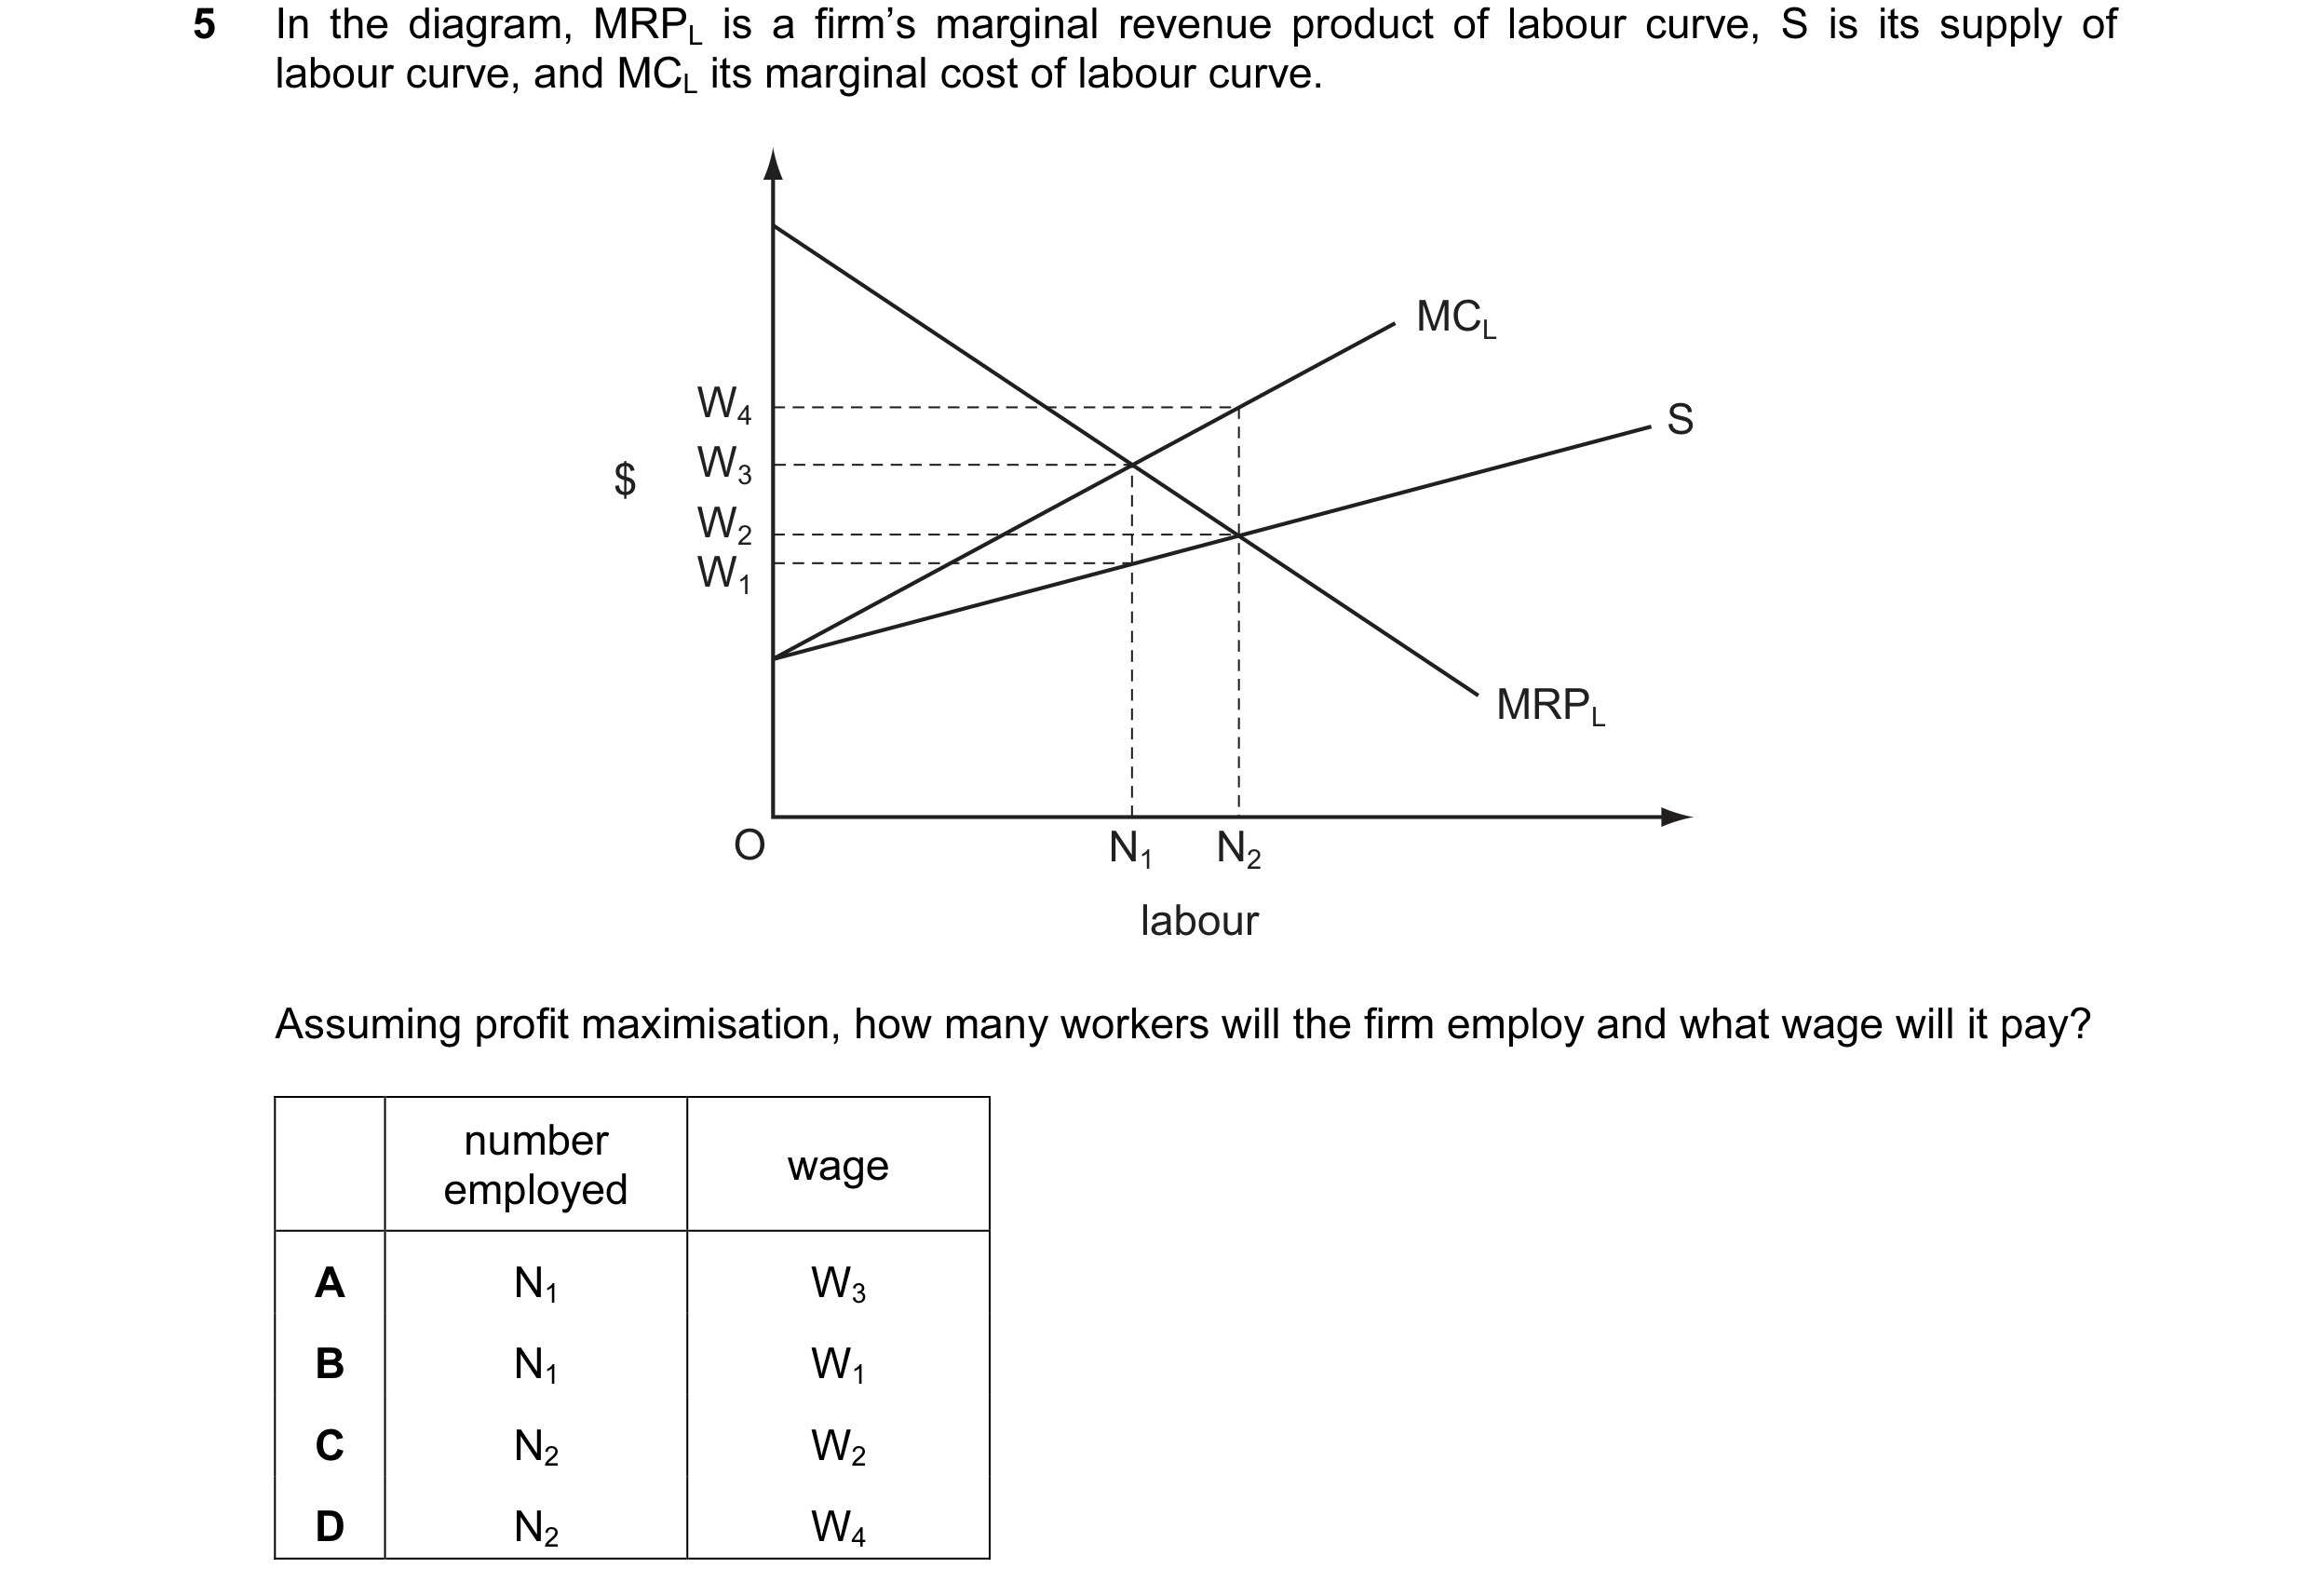
 3 / 58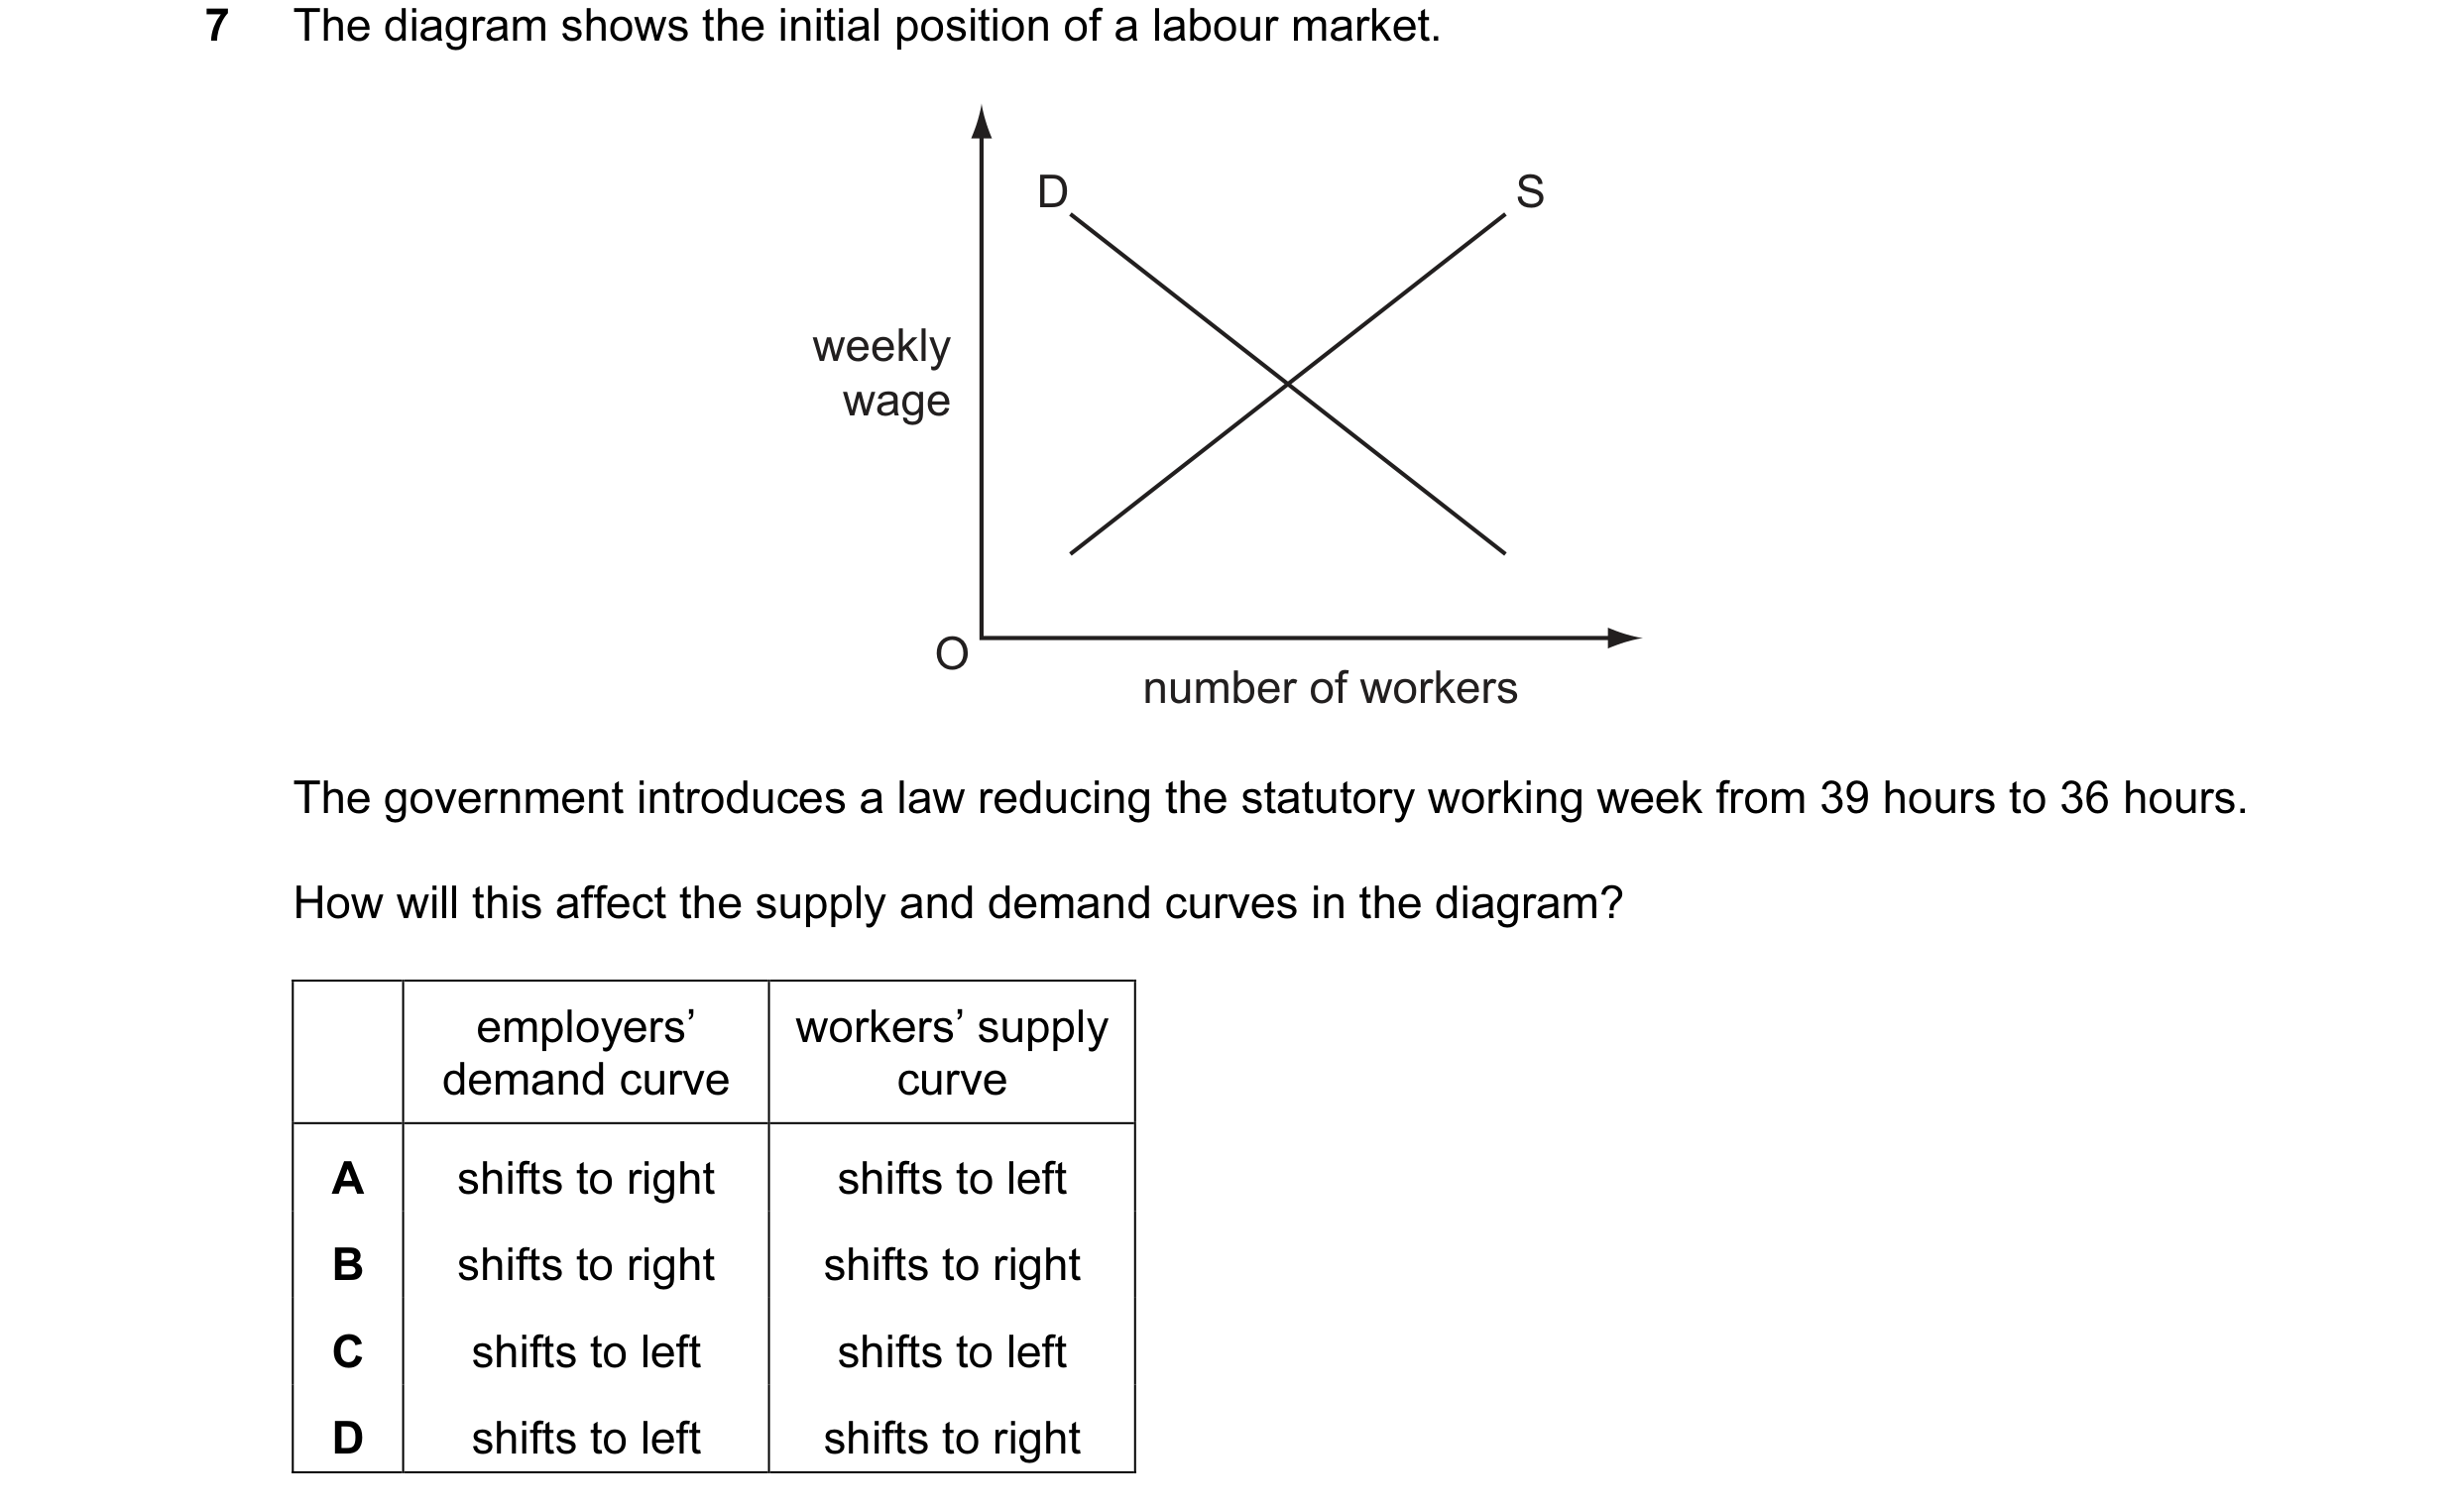

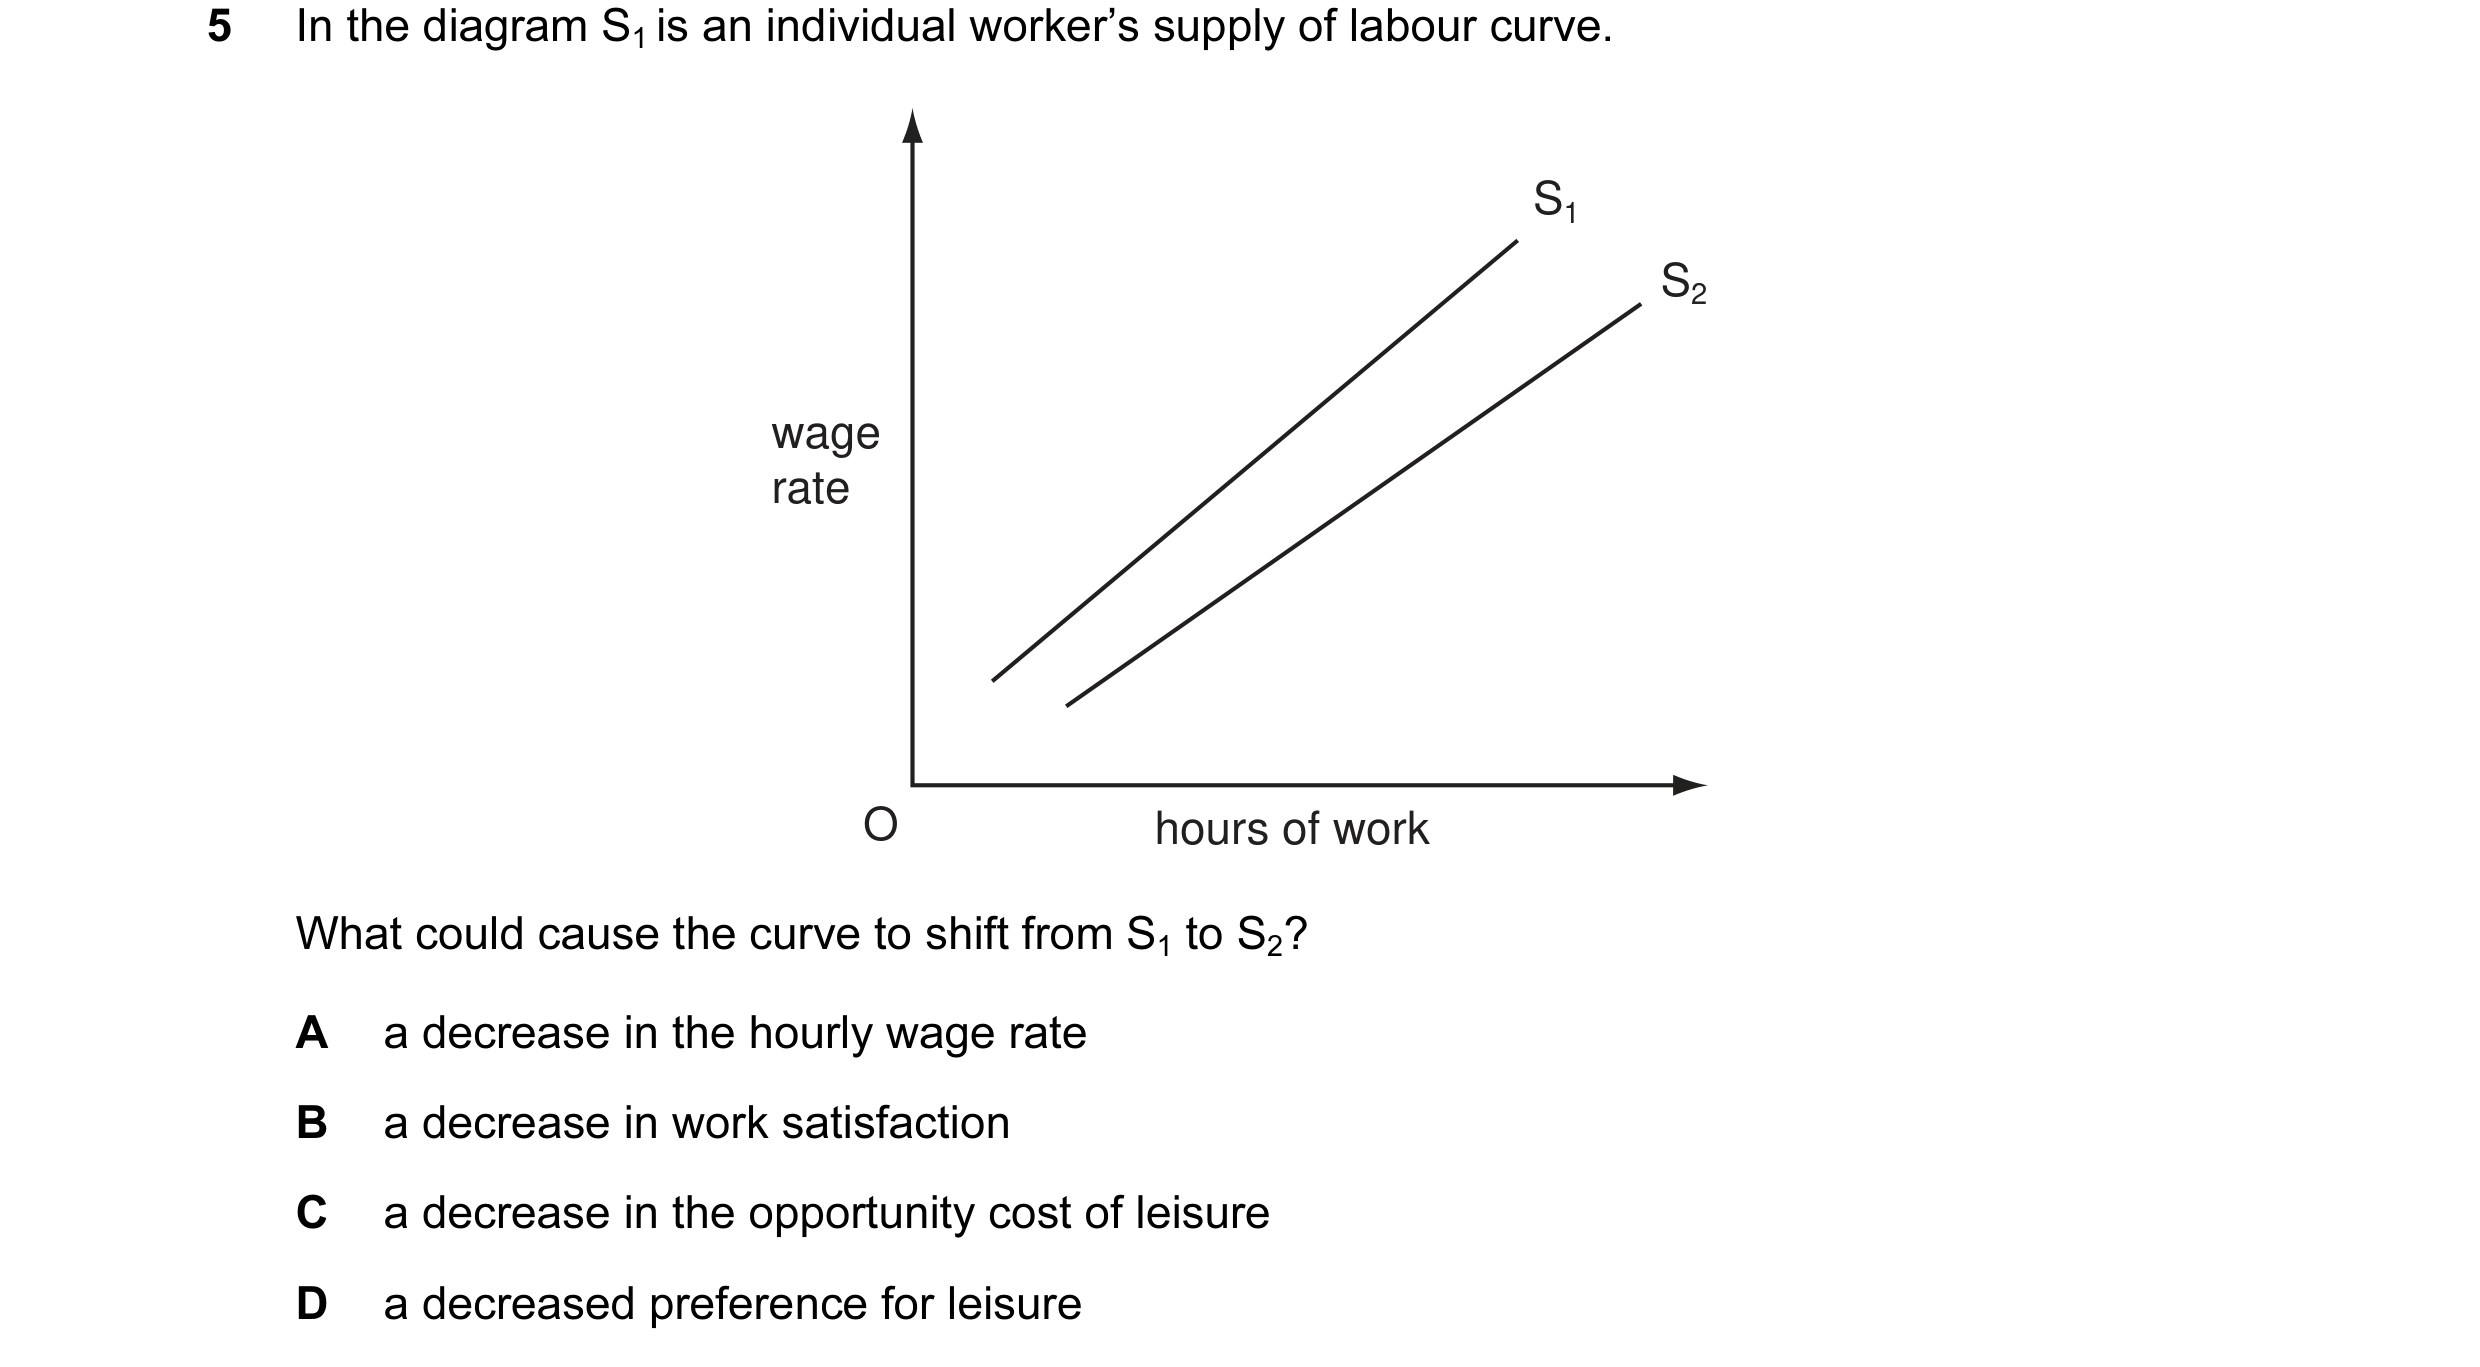 4 / 58


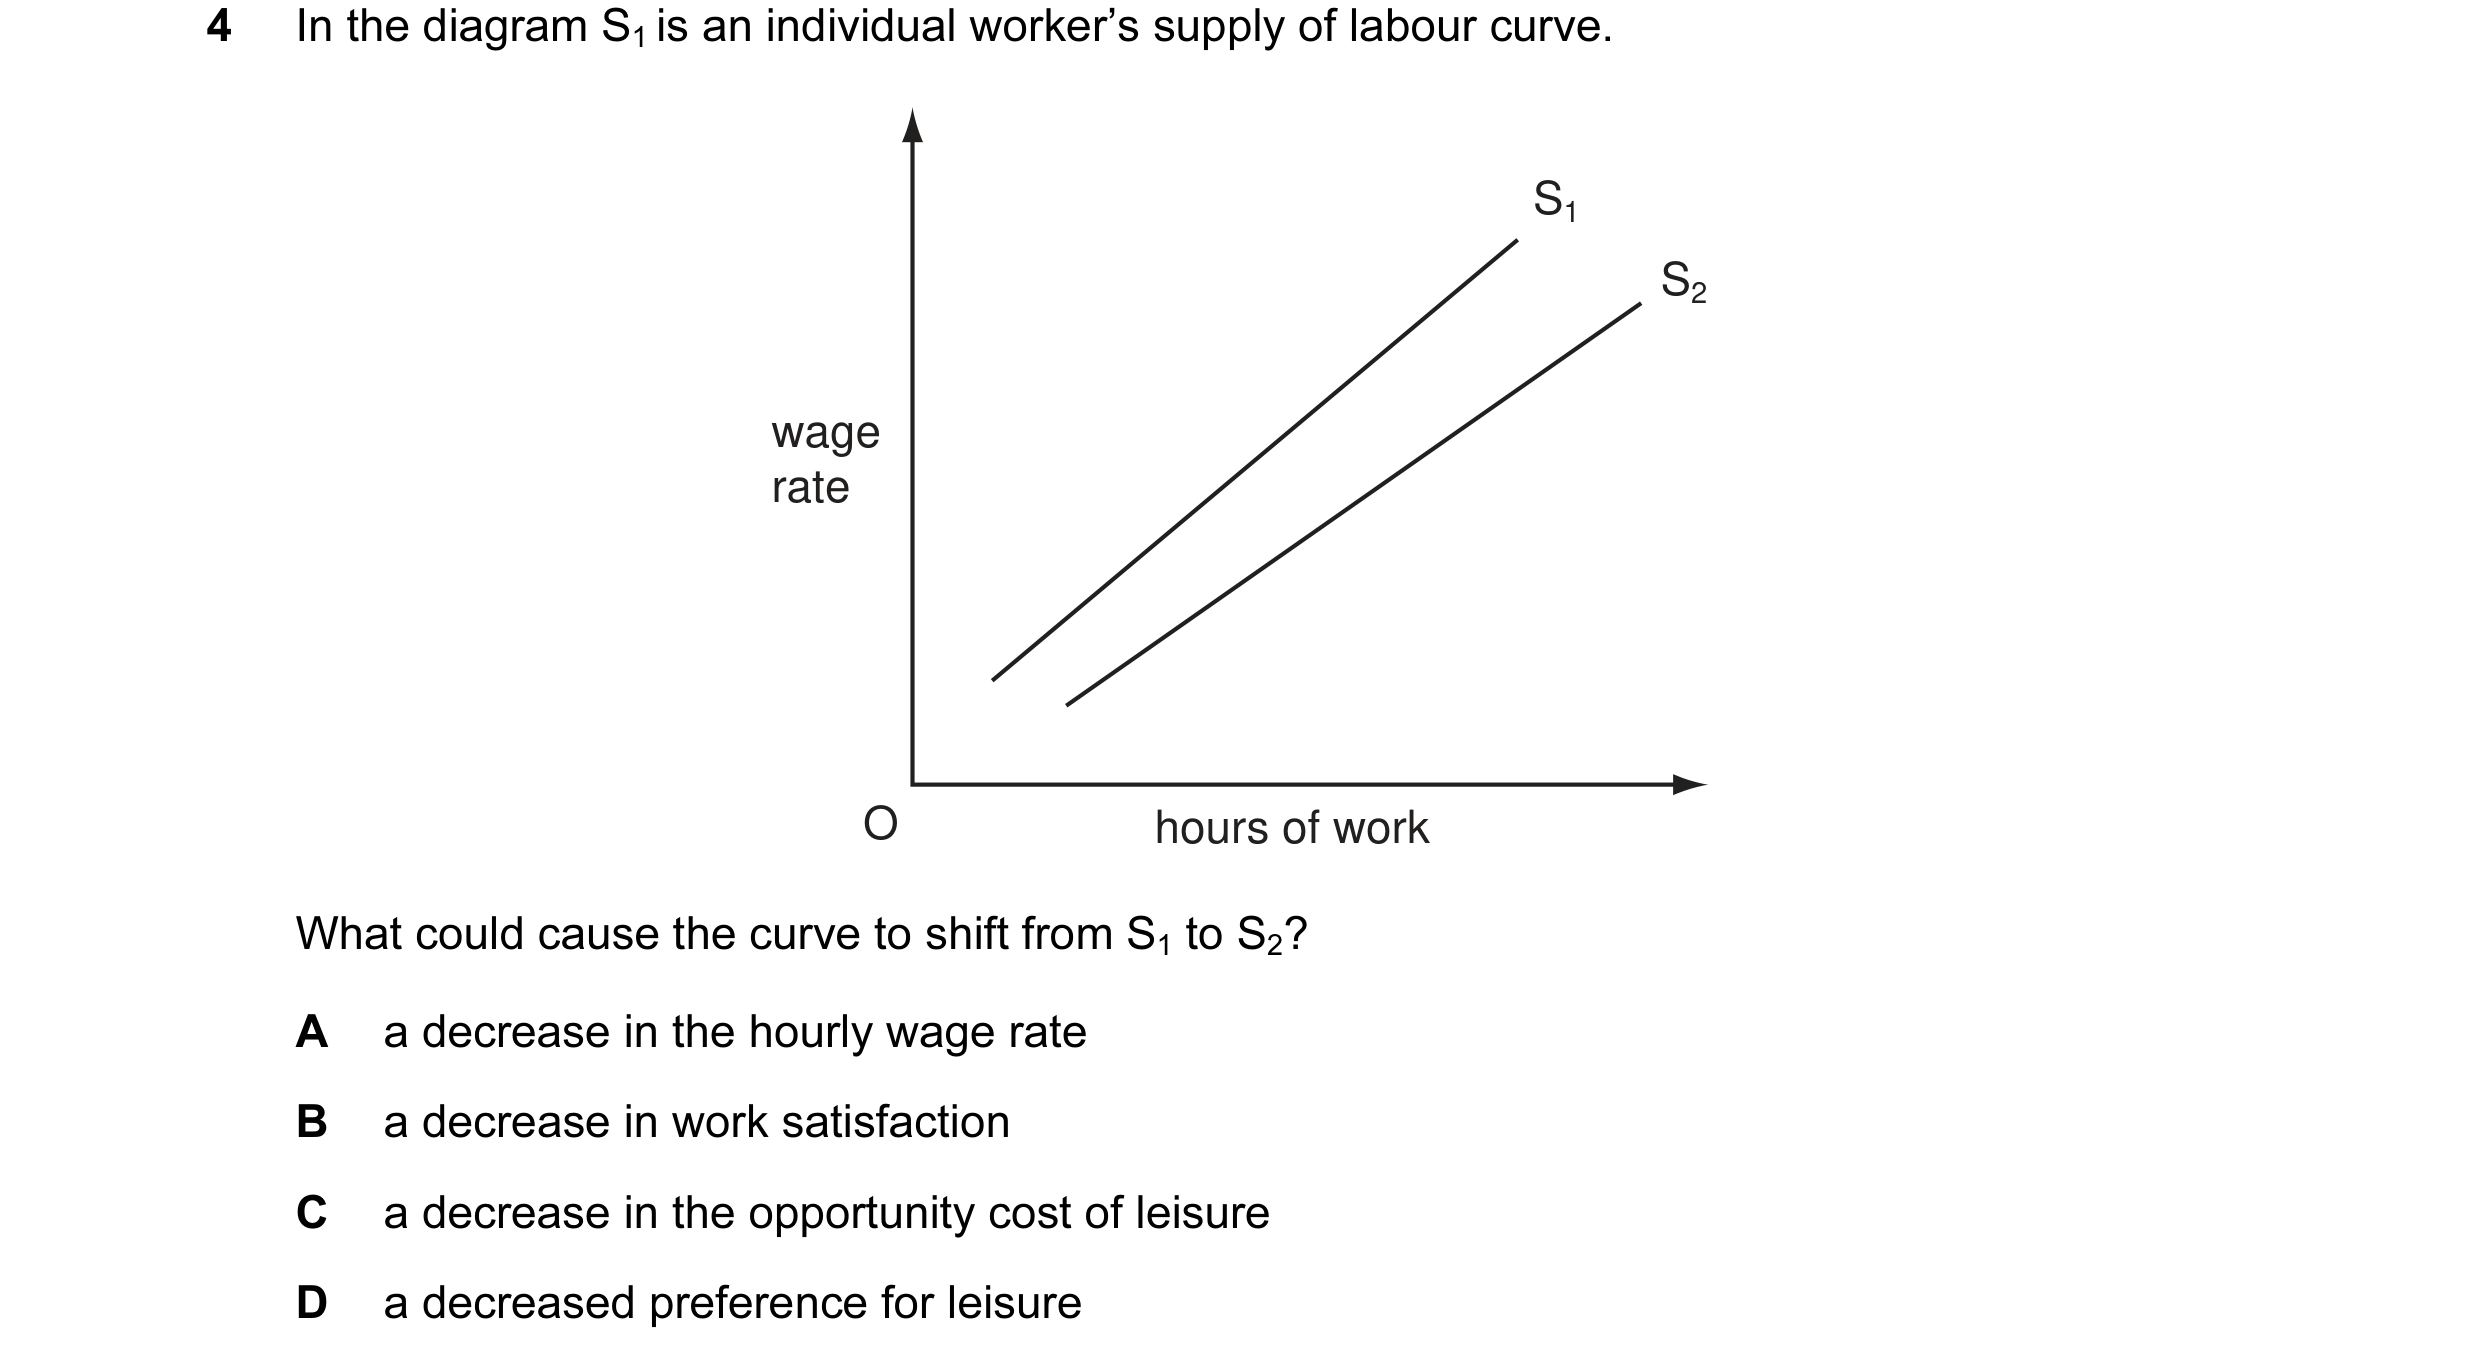 5 / 58


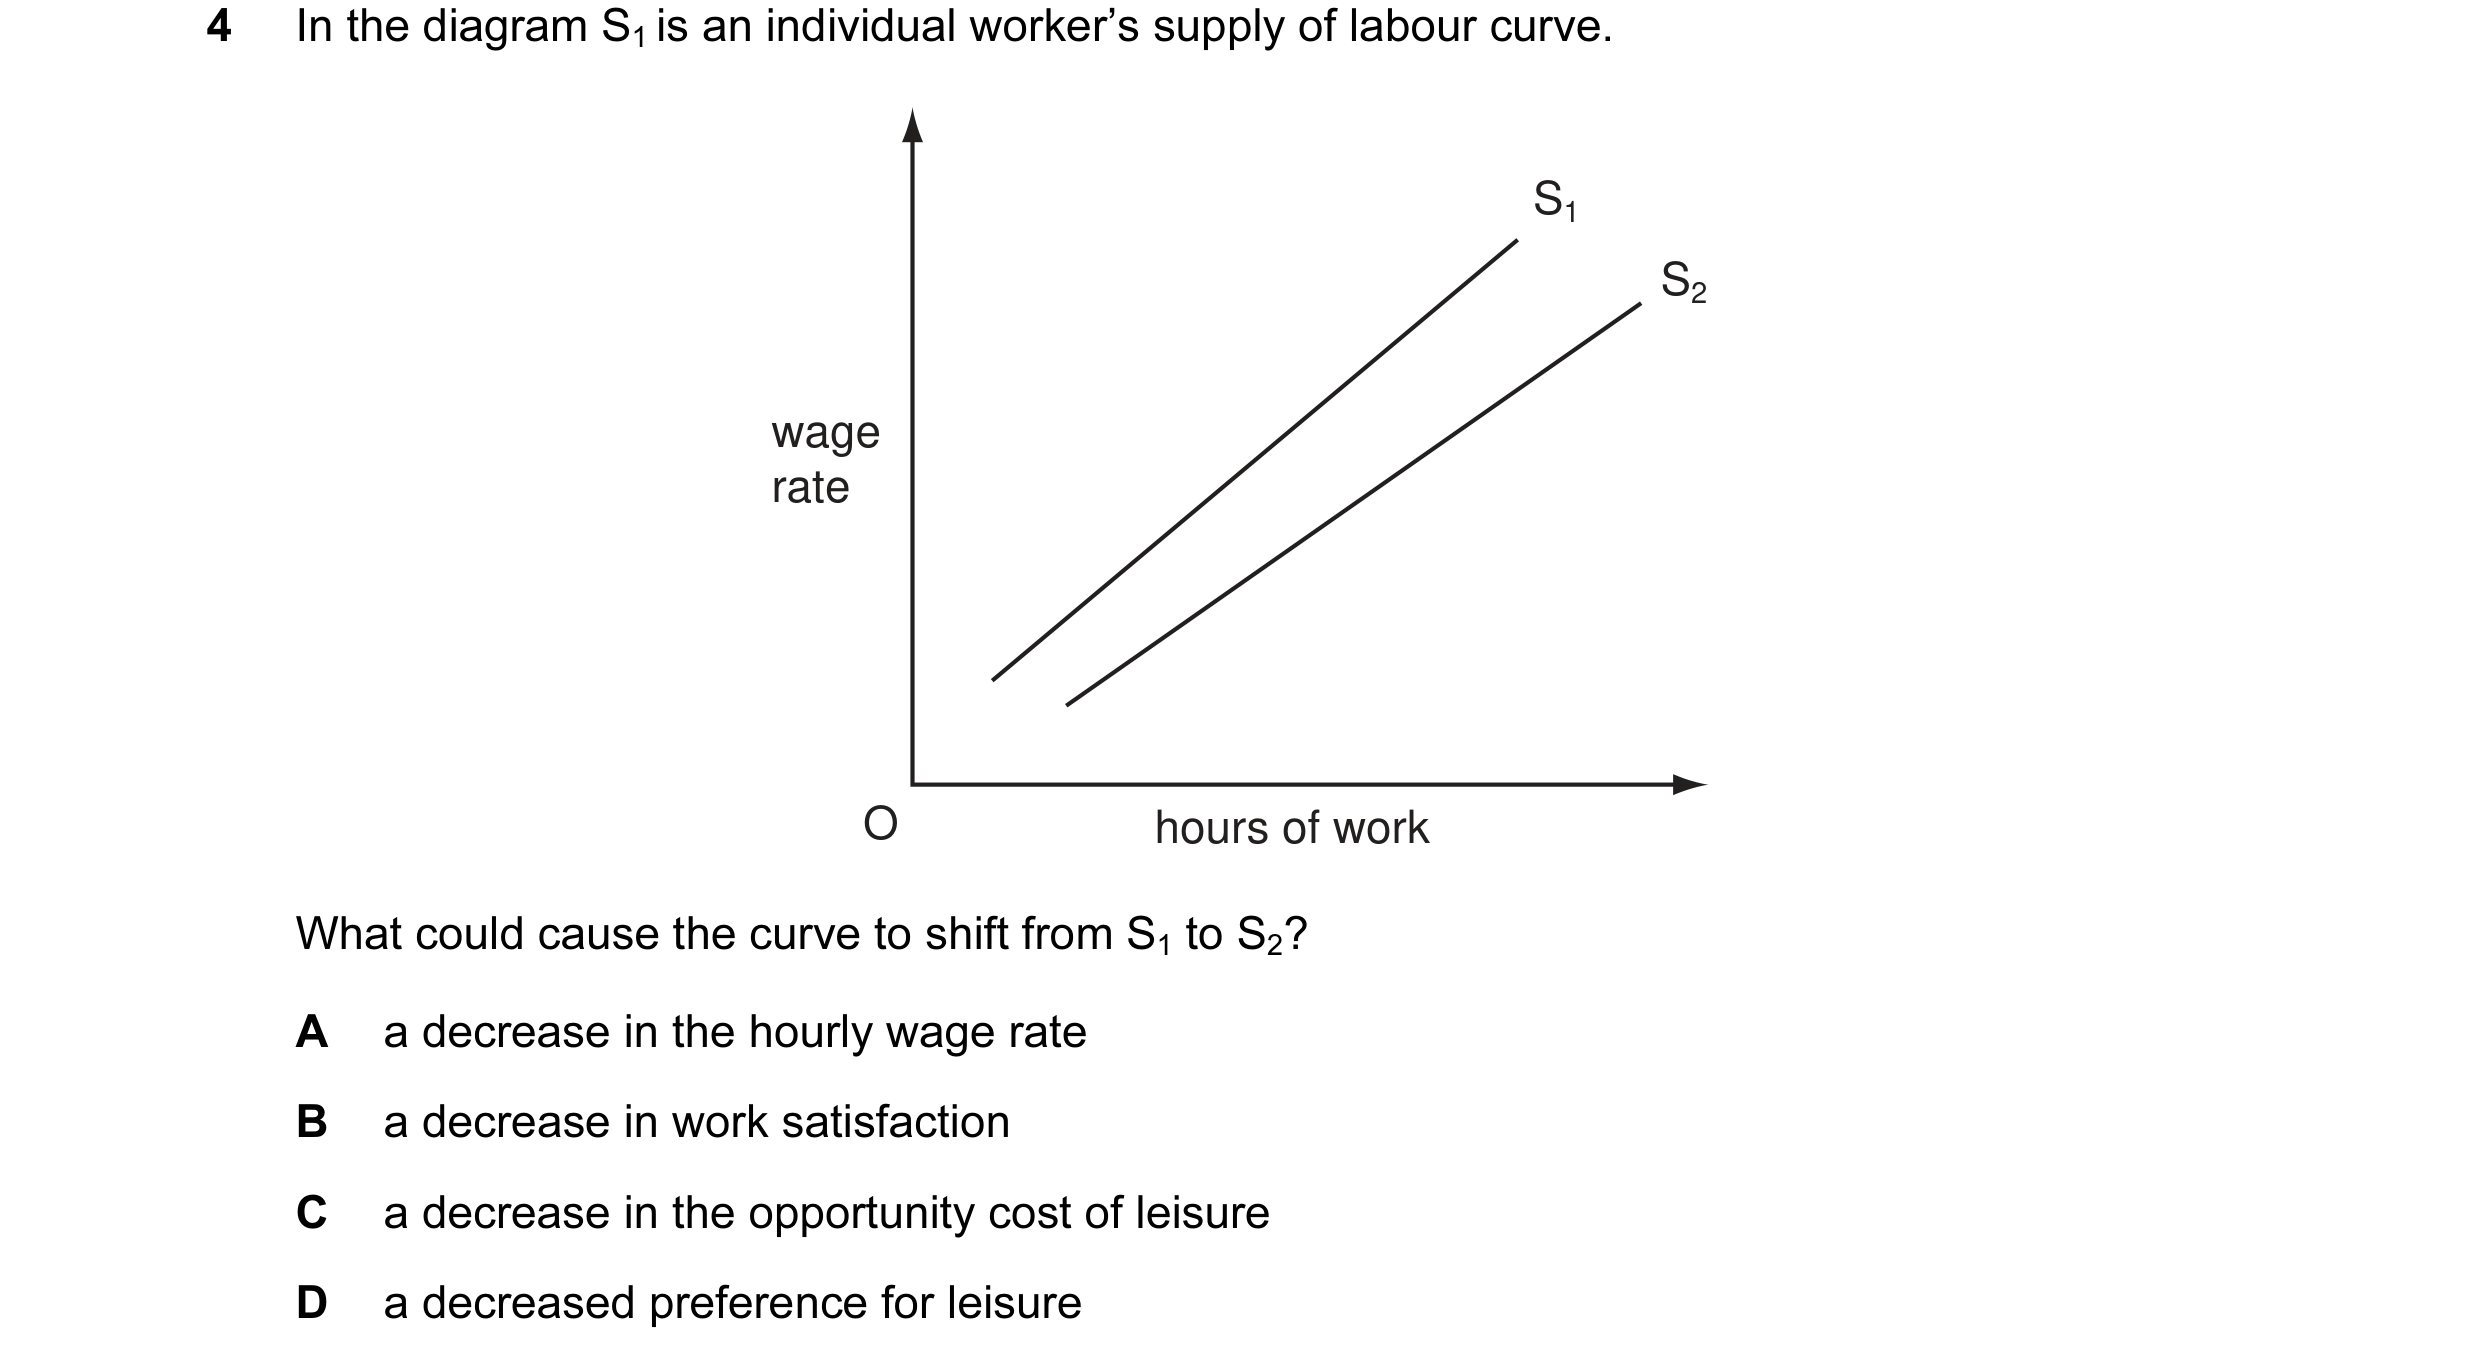 6 / 58

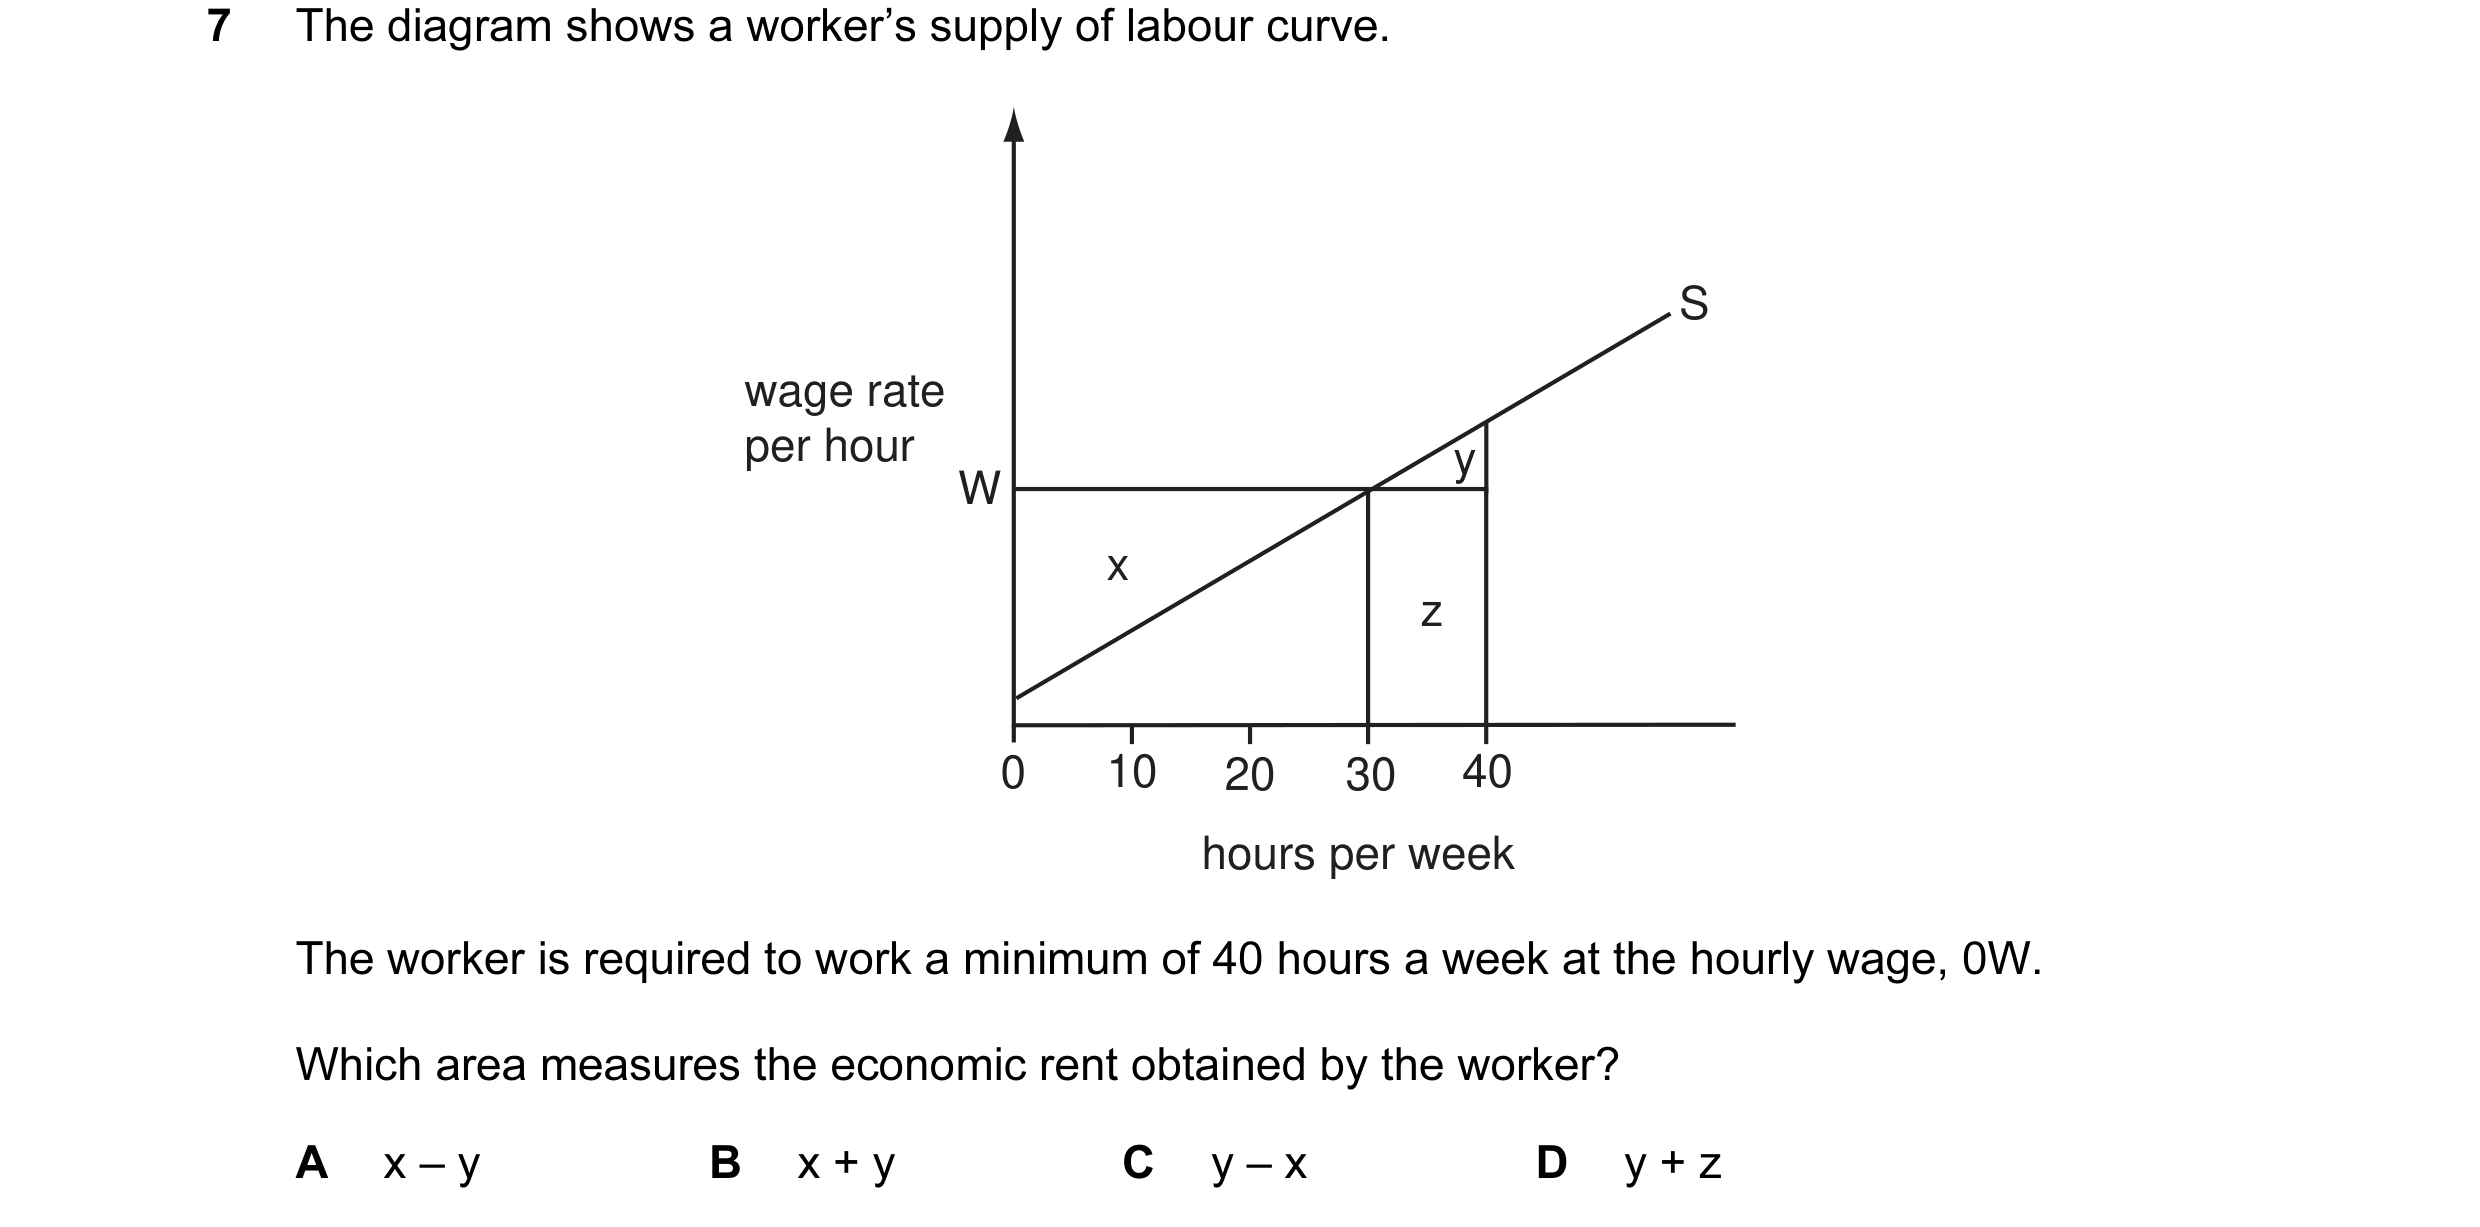
 7 / 58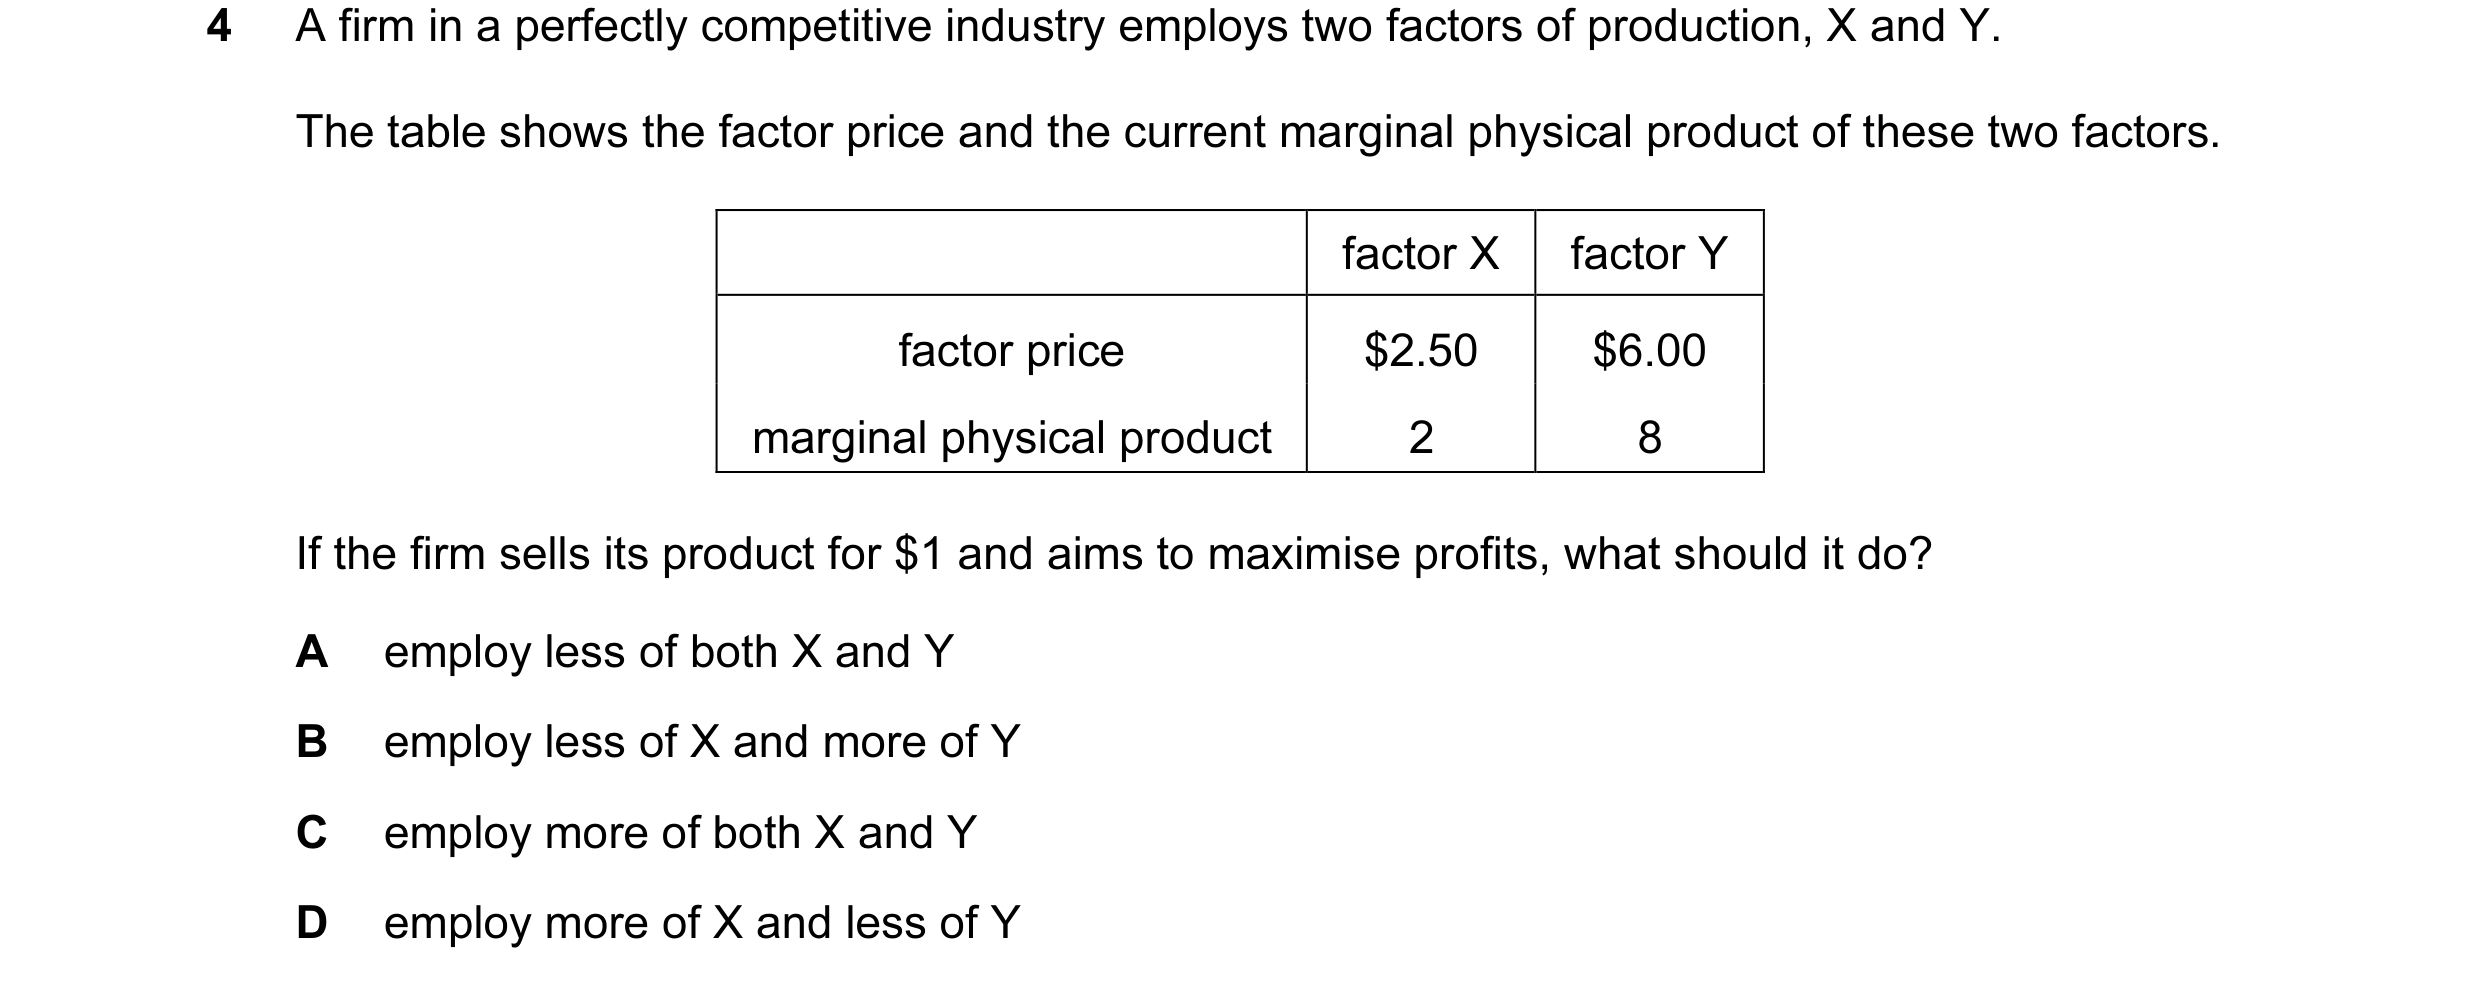

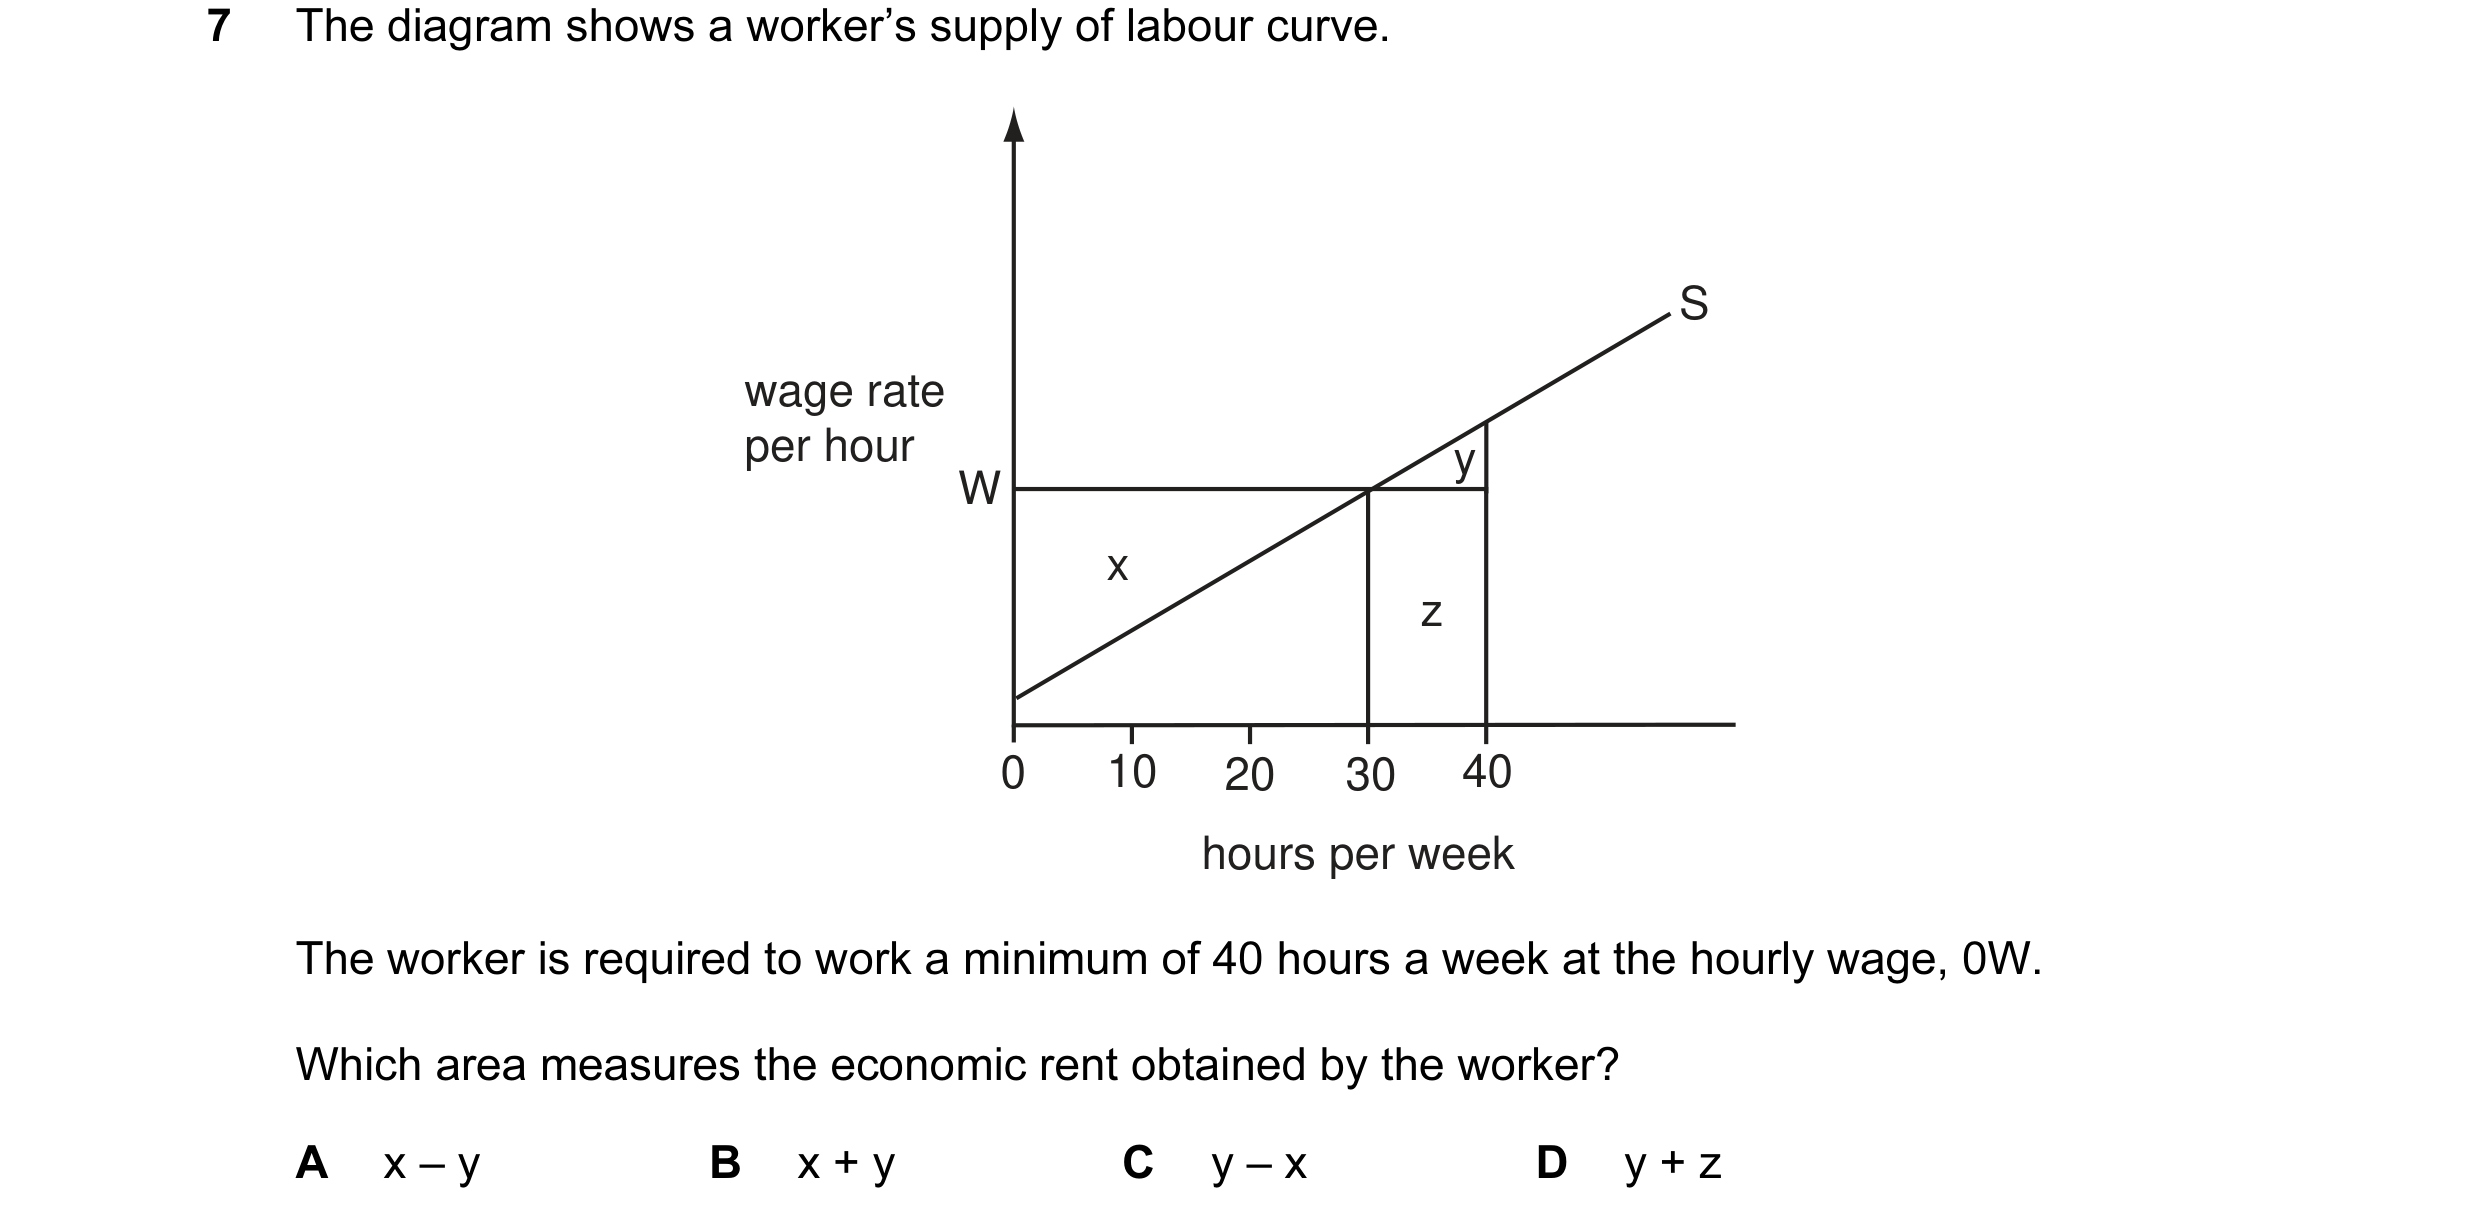
 8 / 58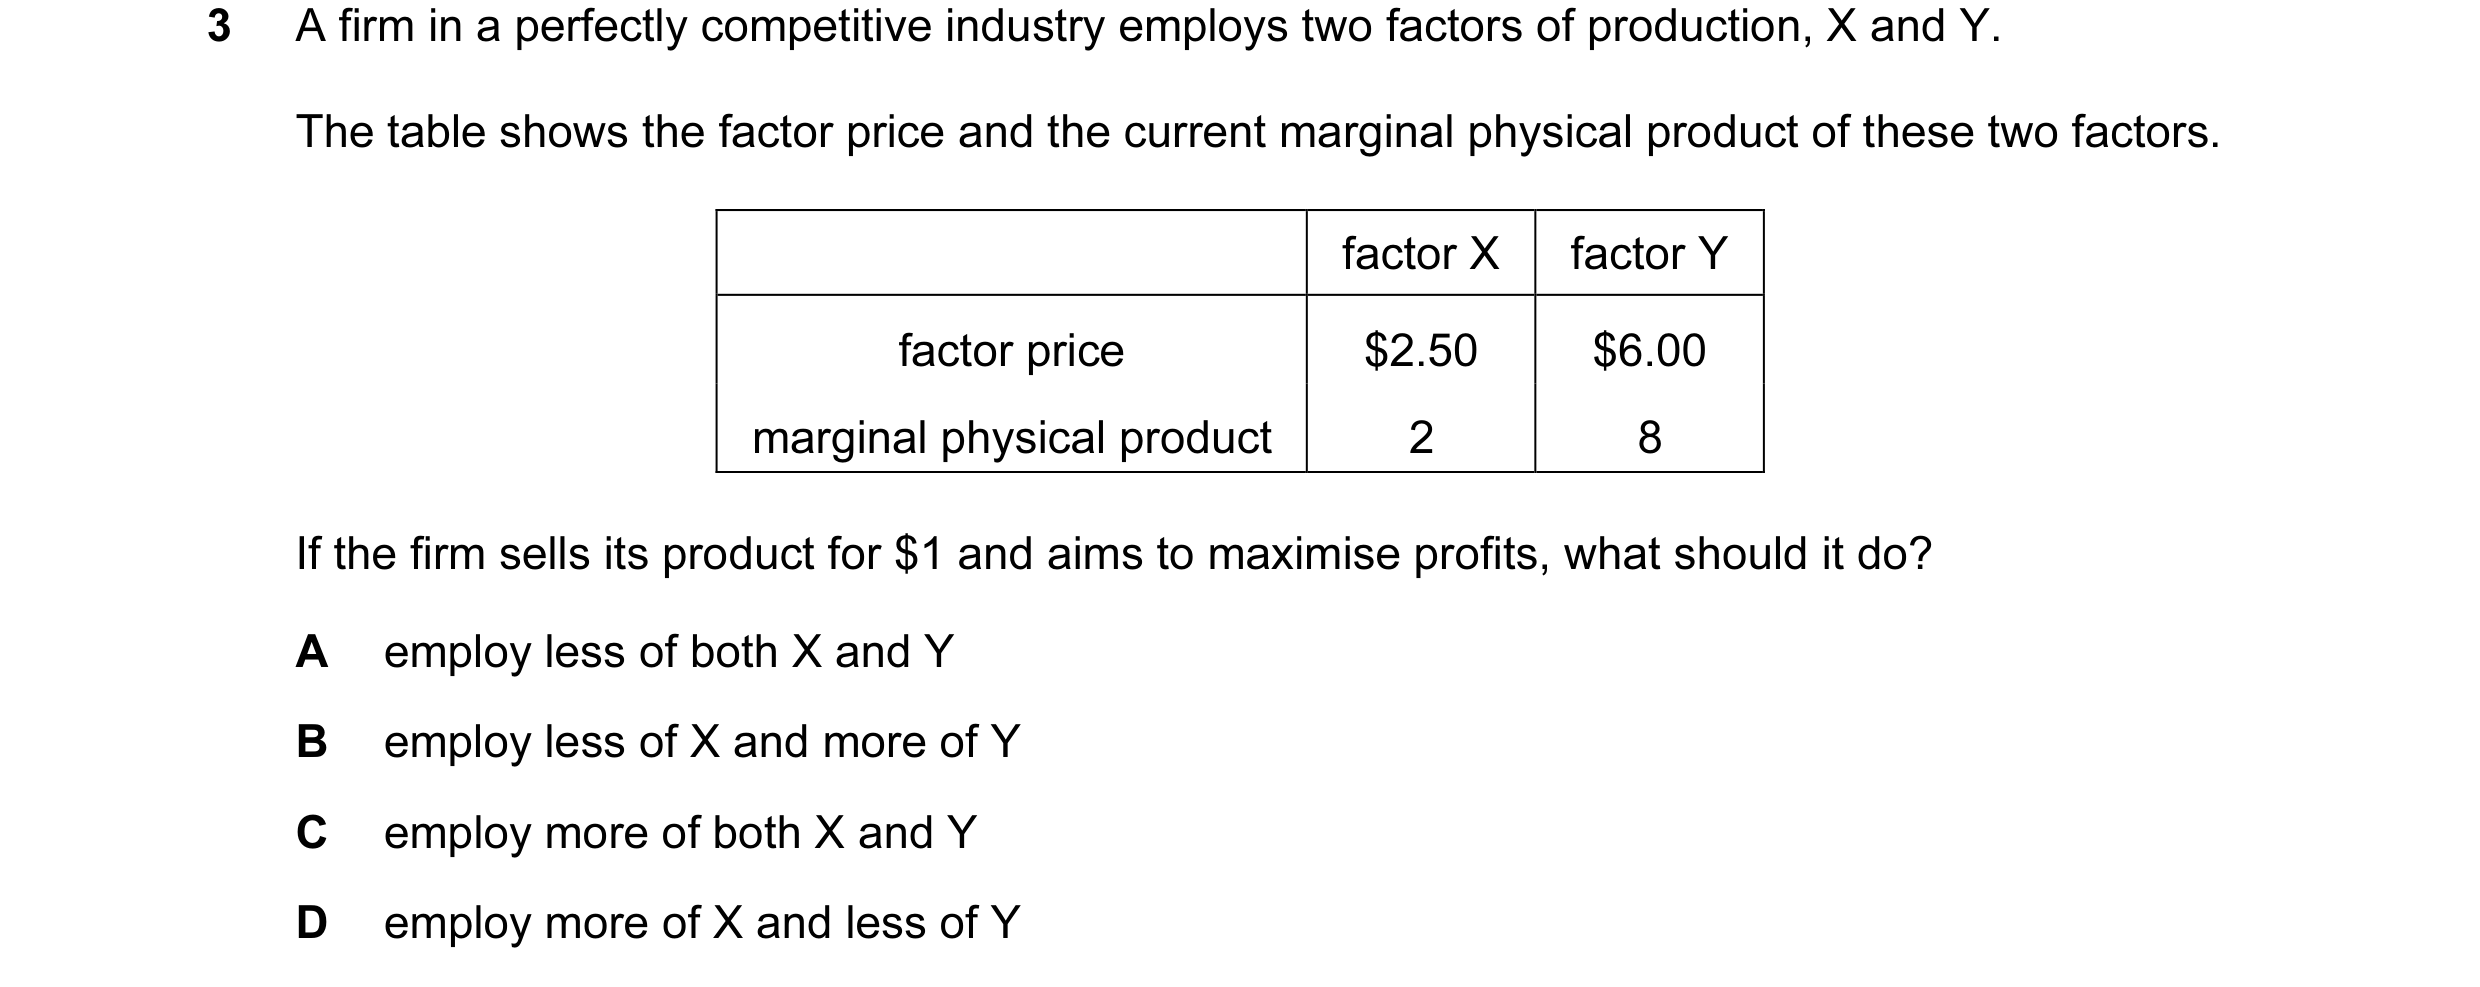

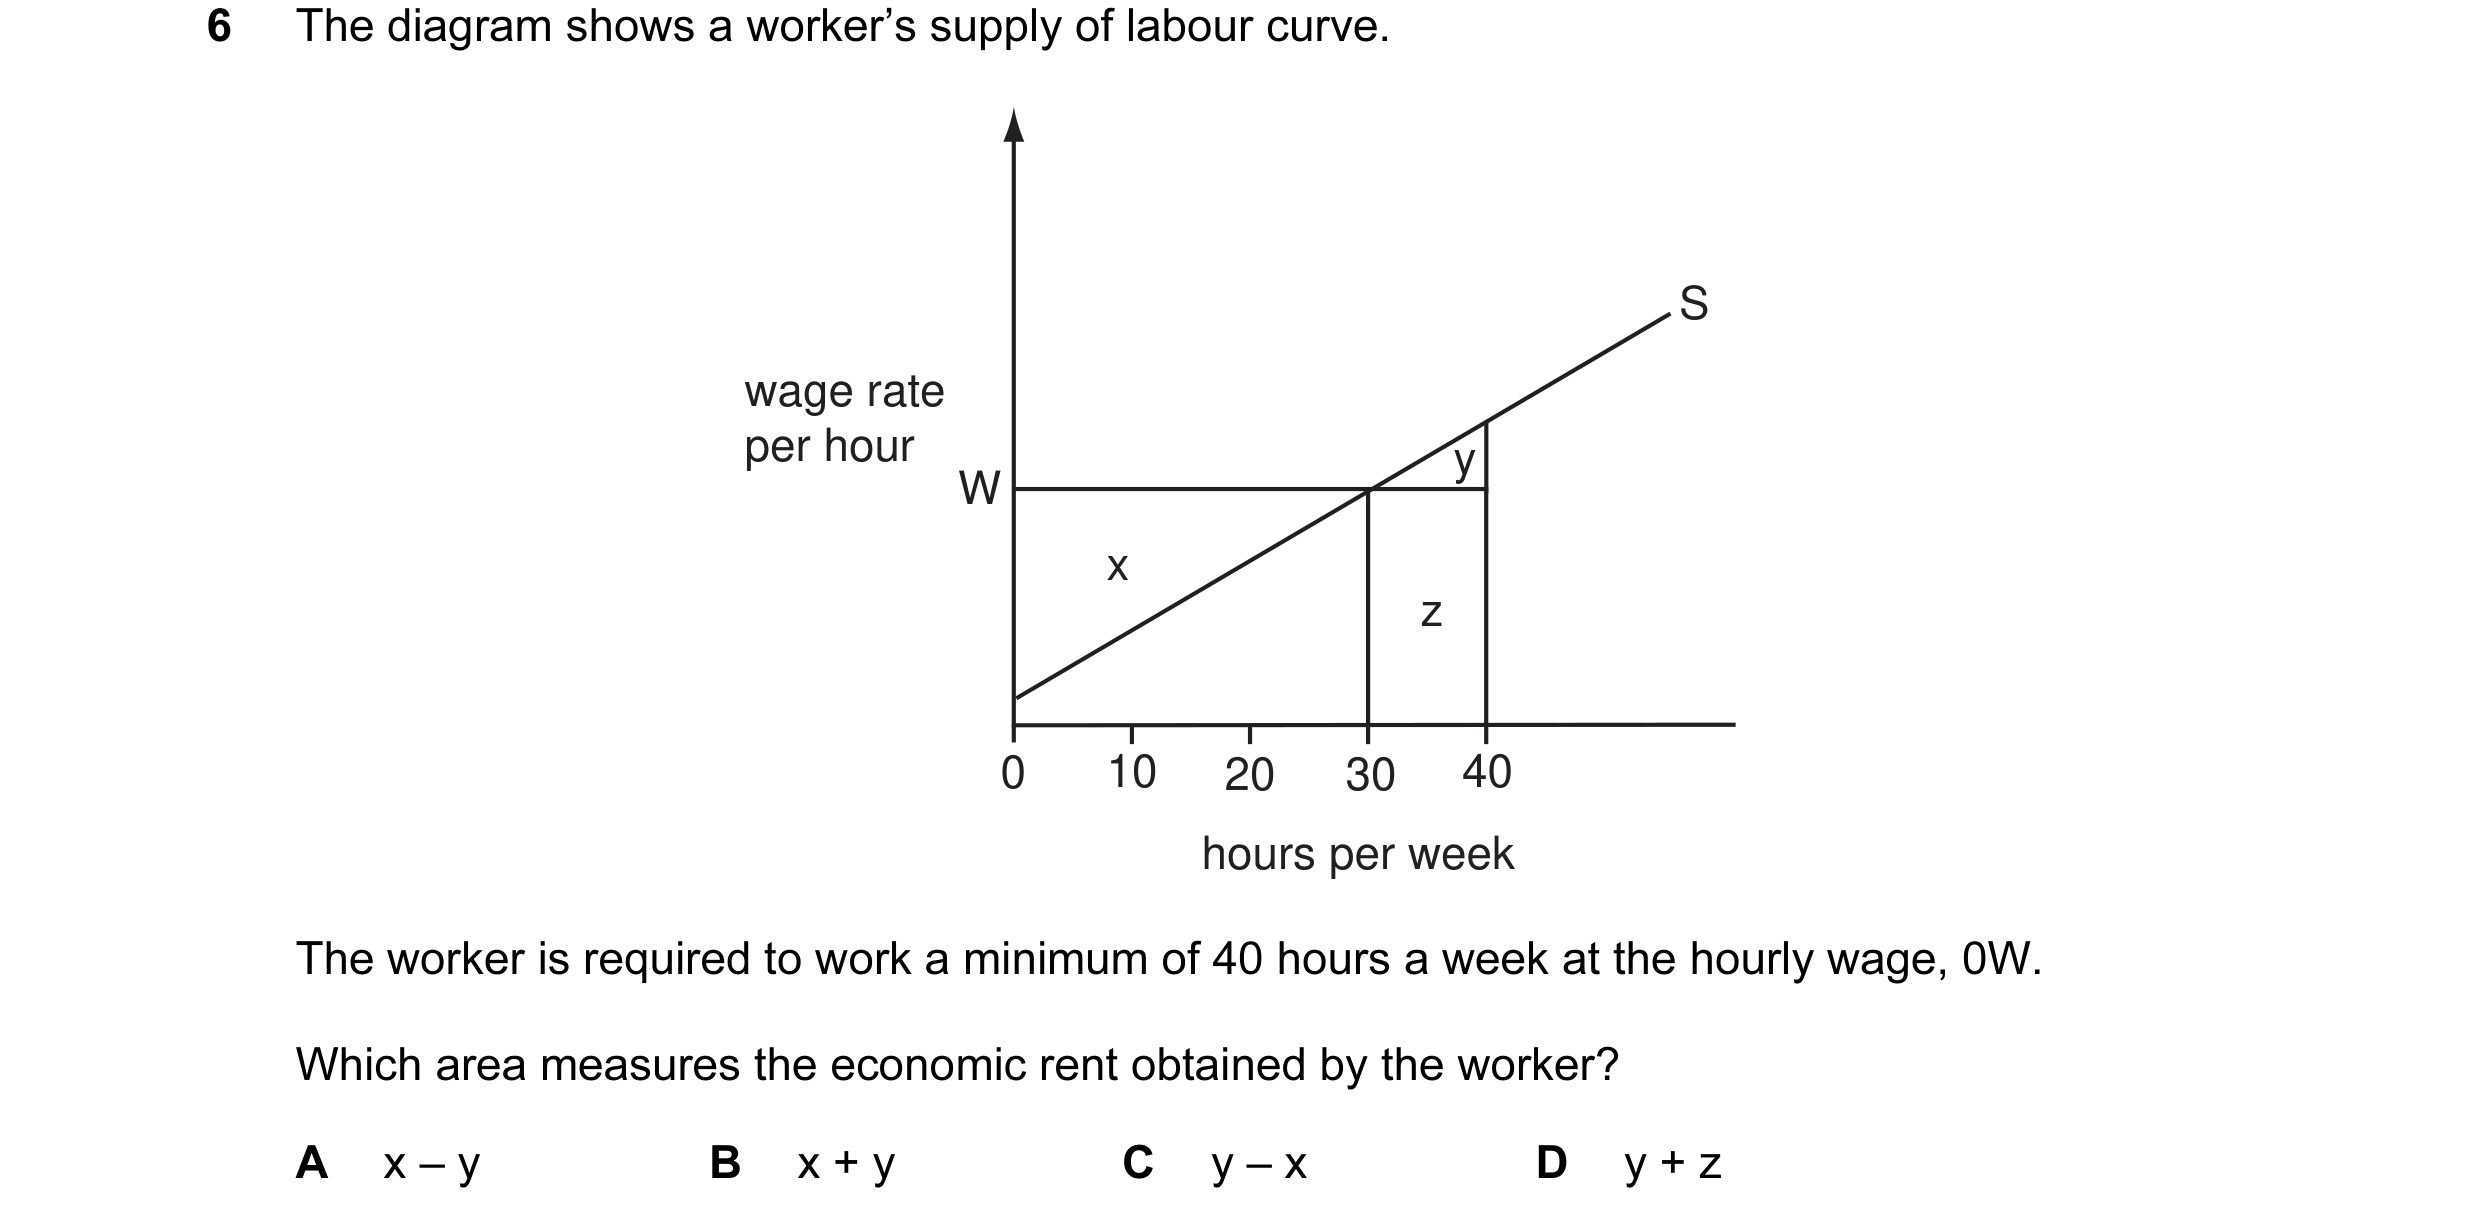
 9 / 58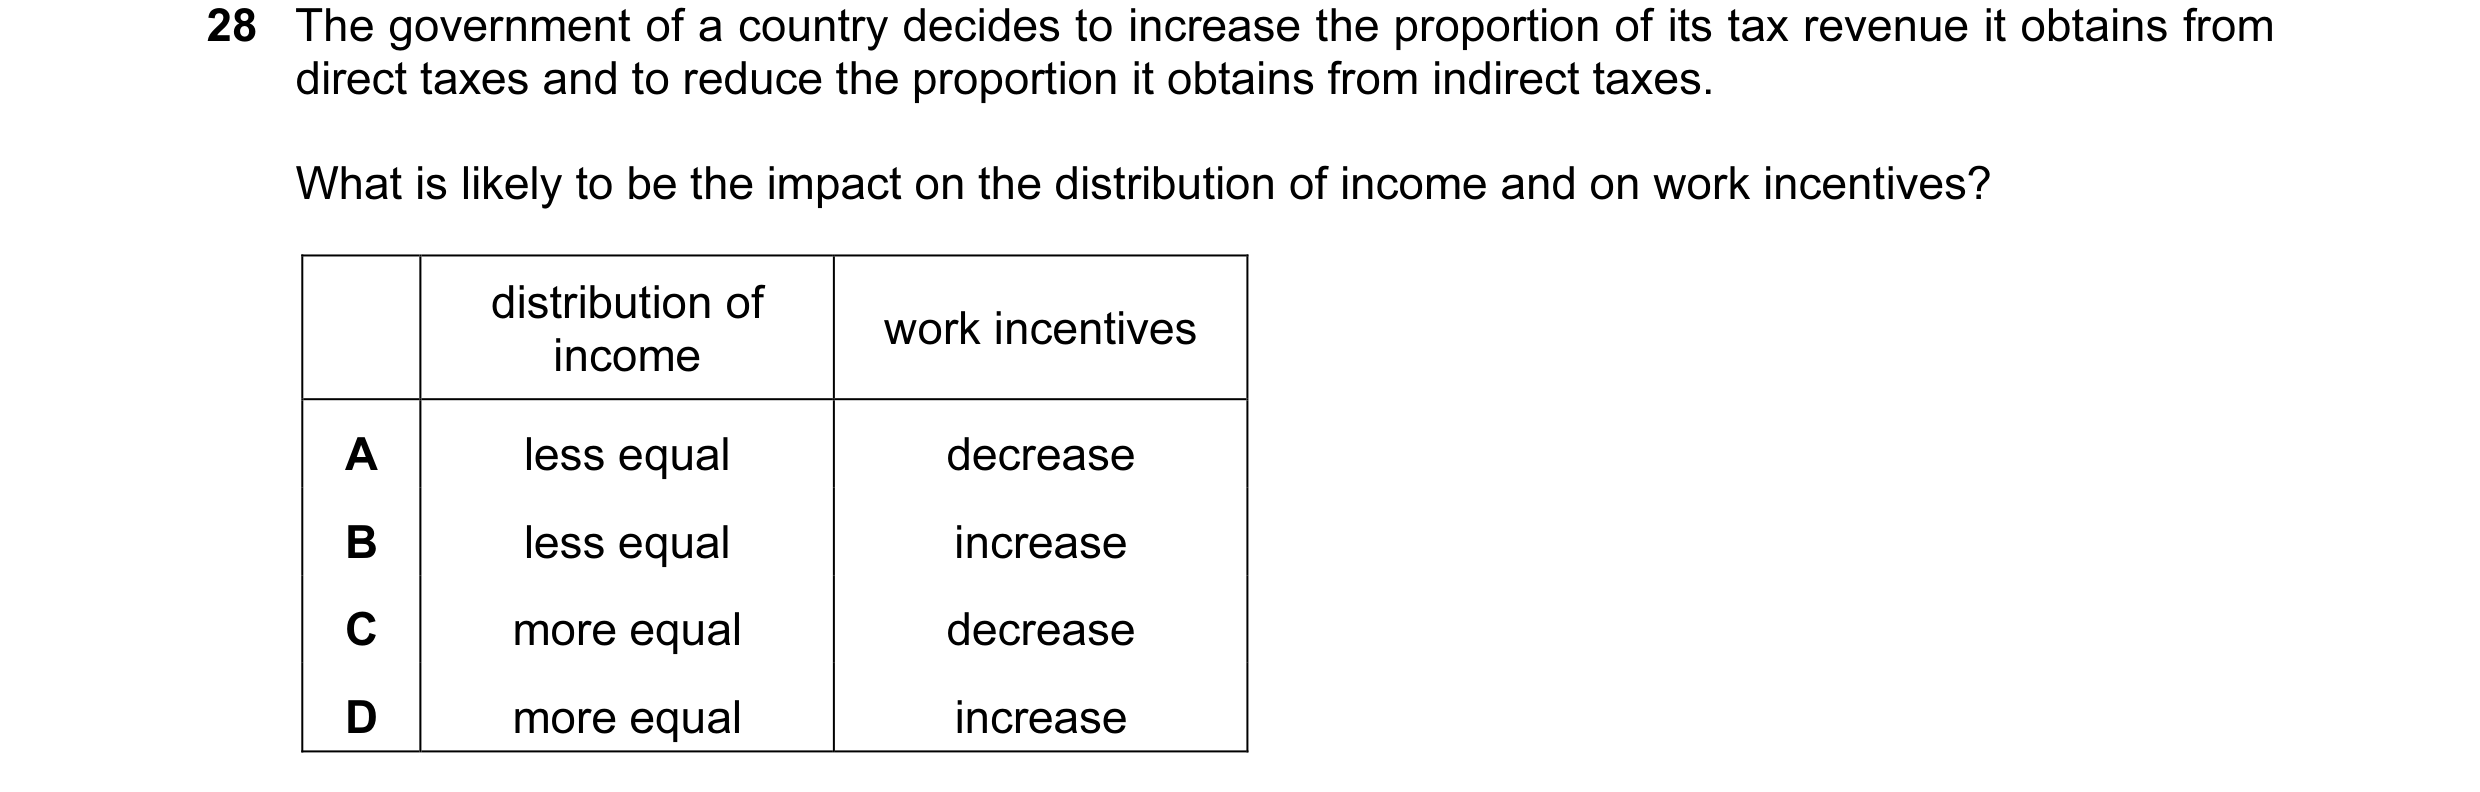
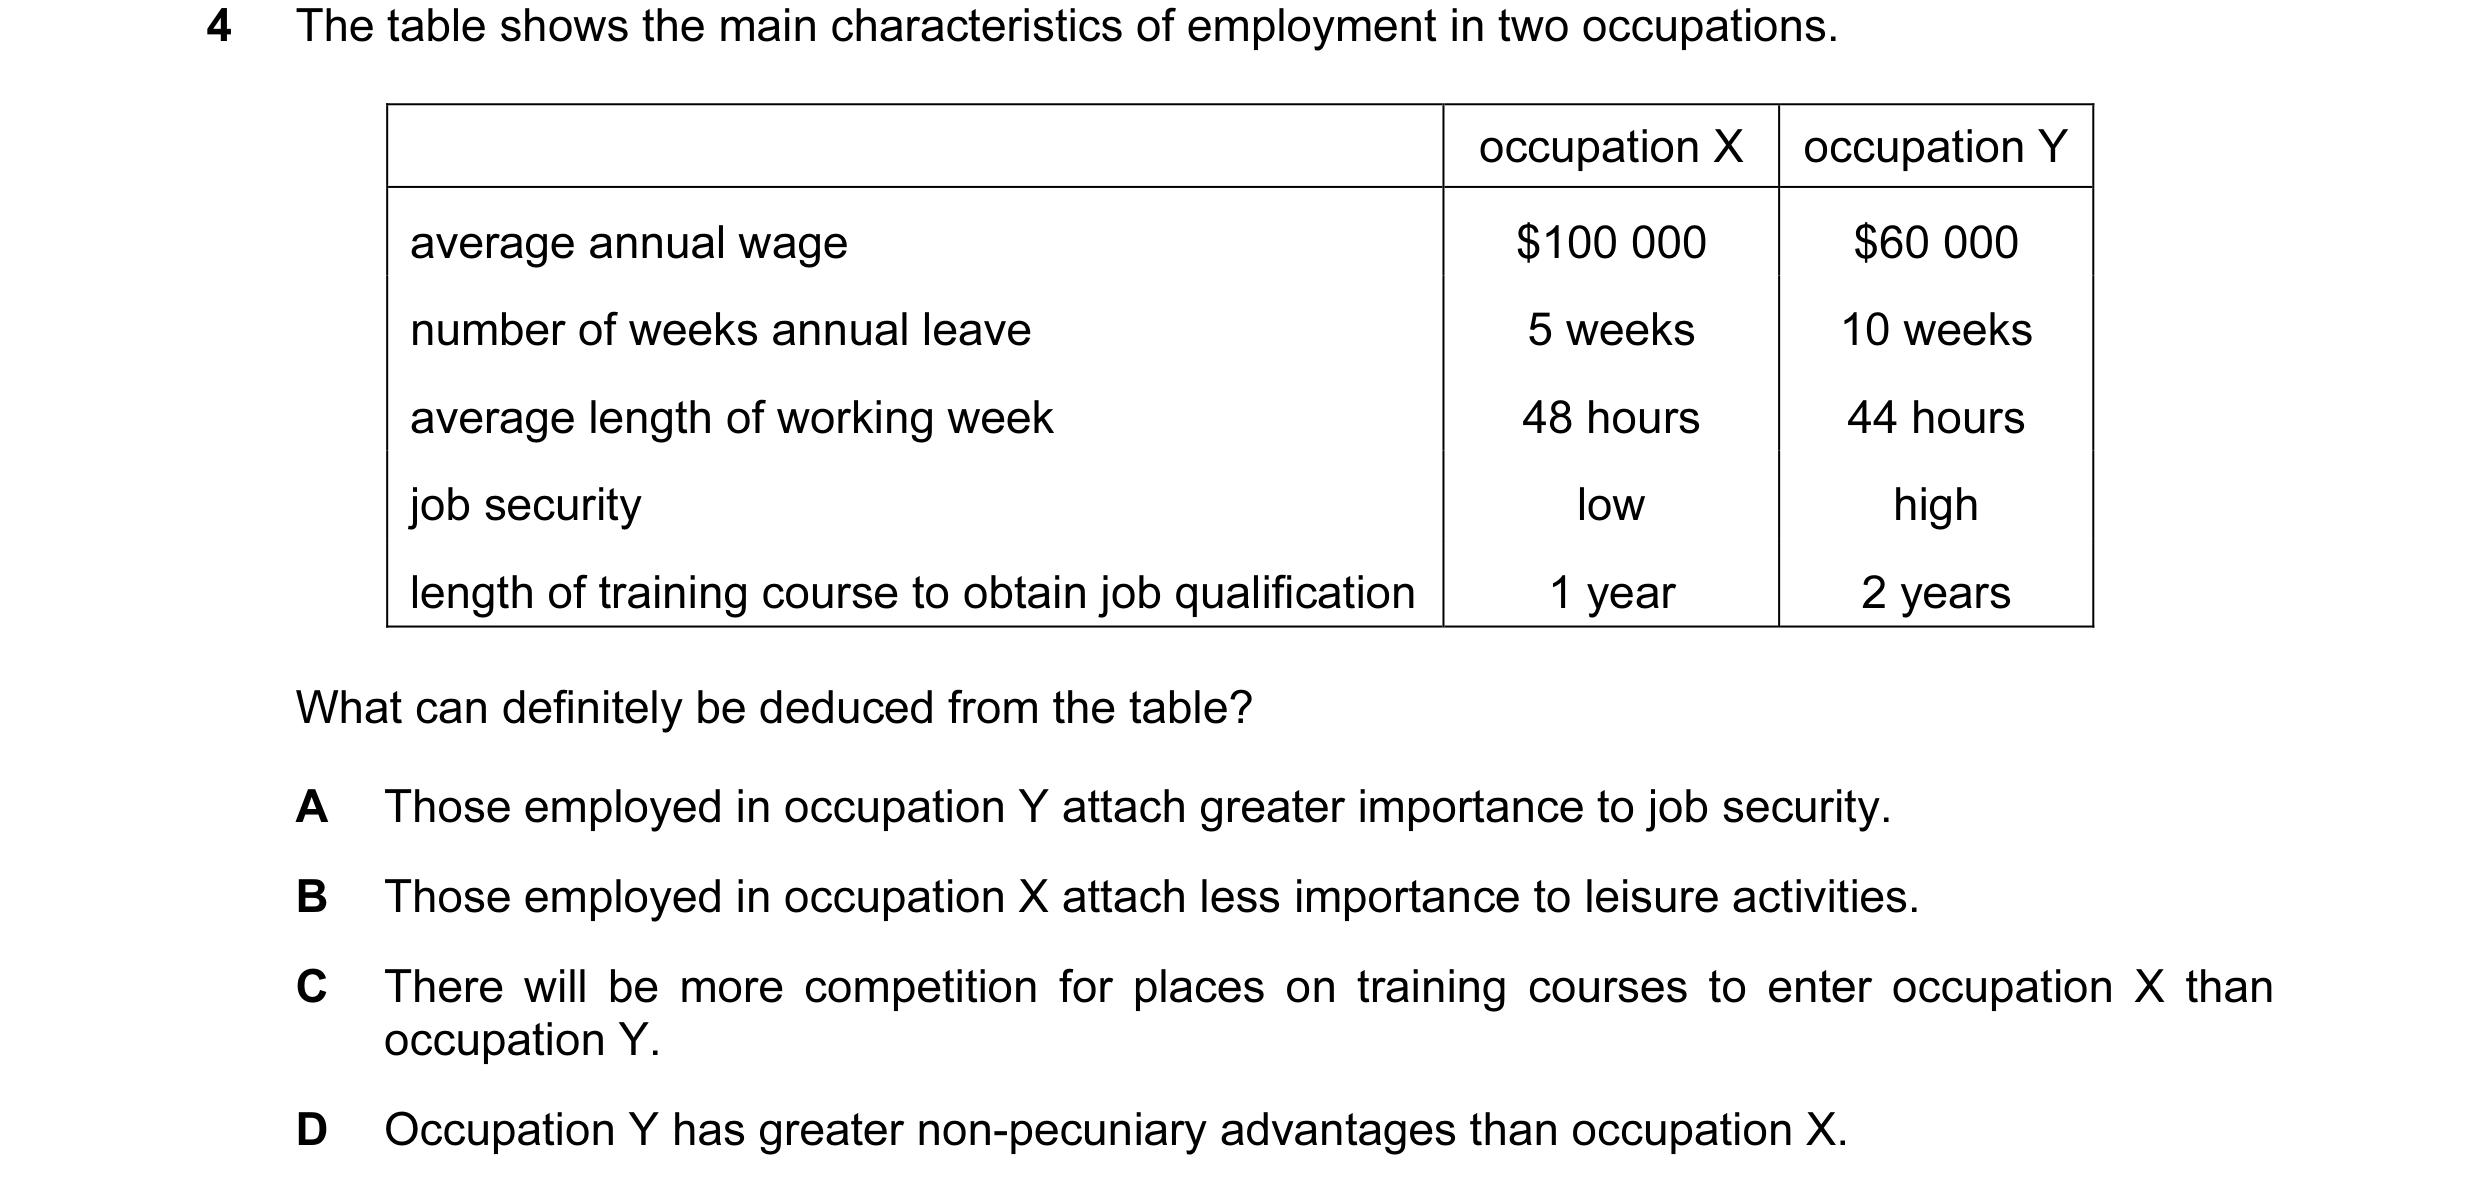 10 / 58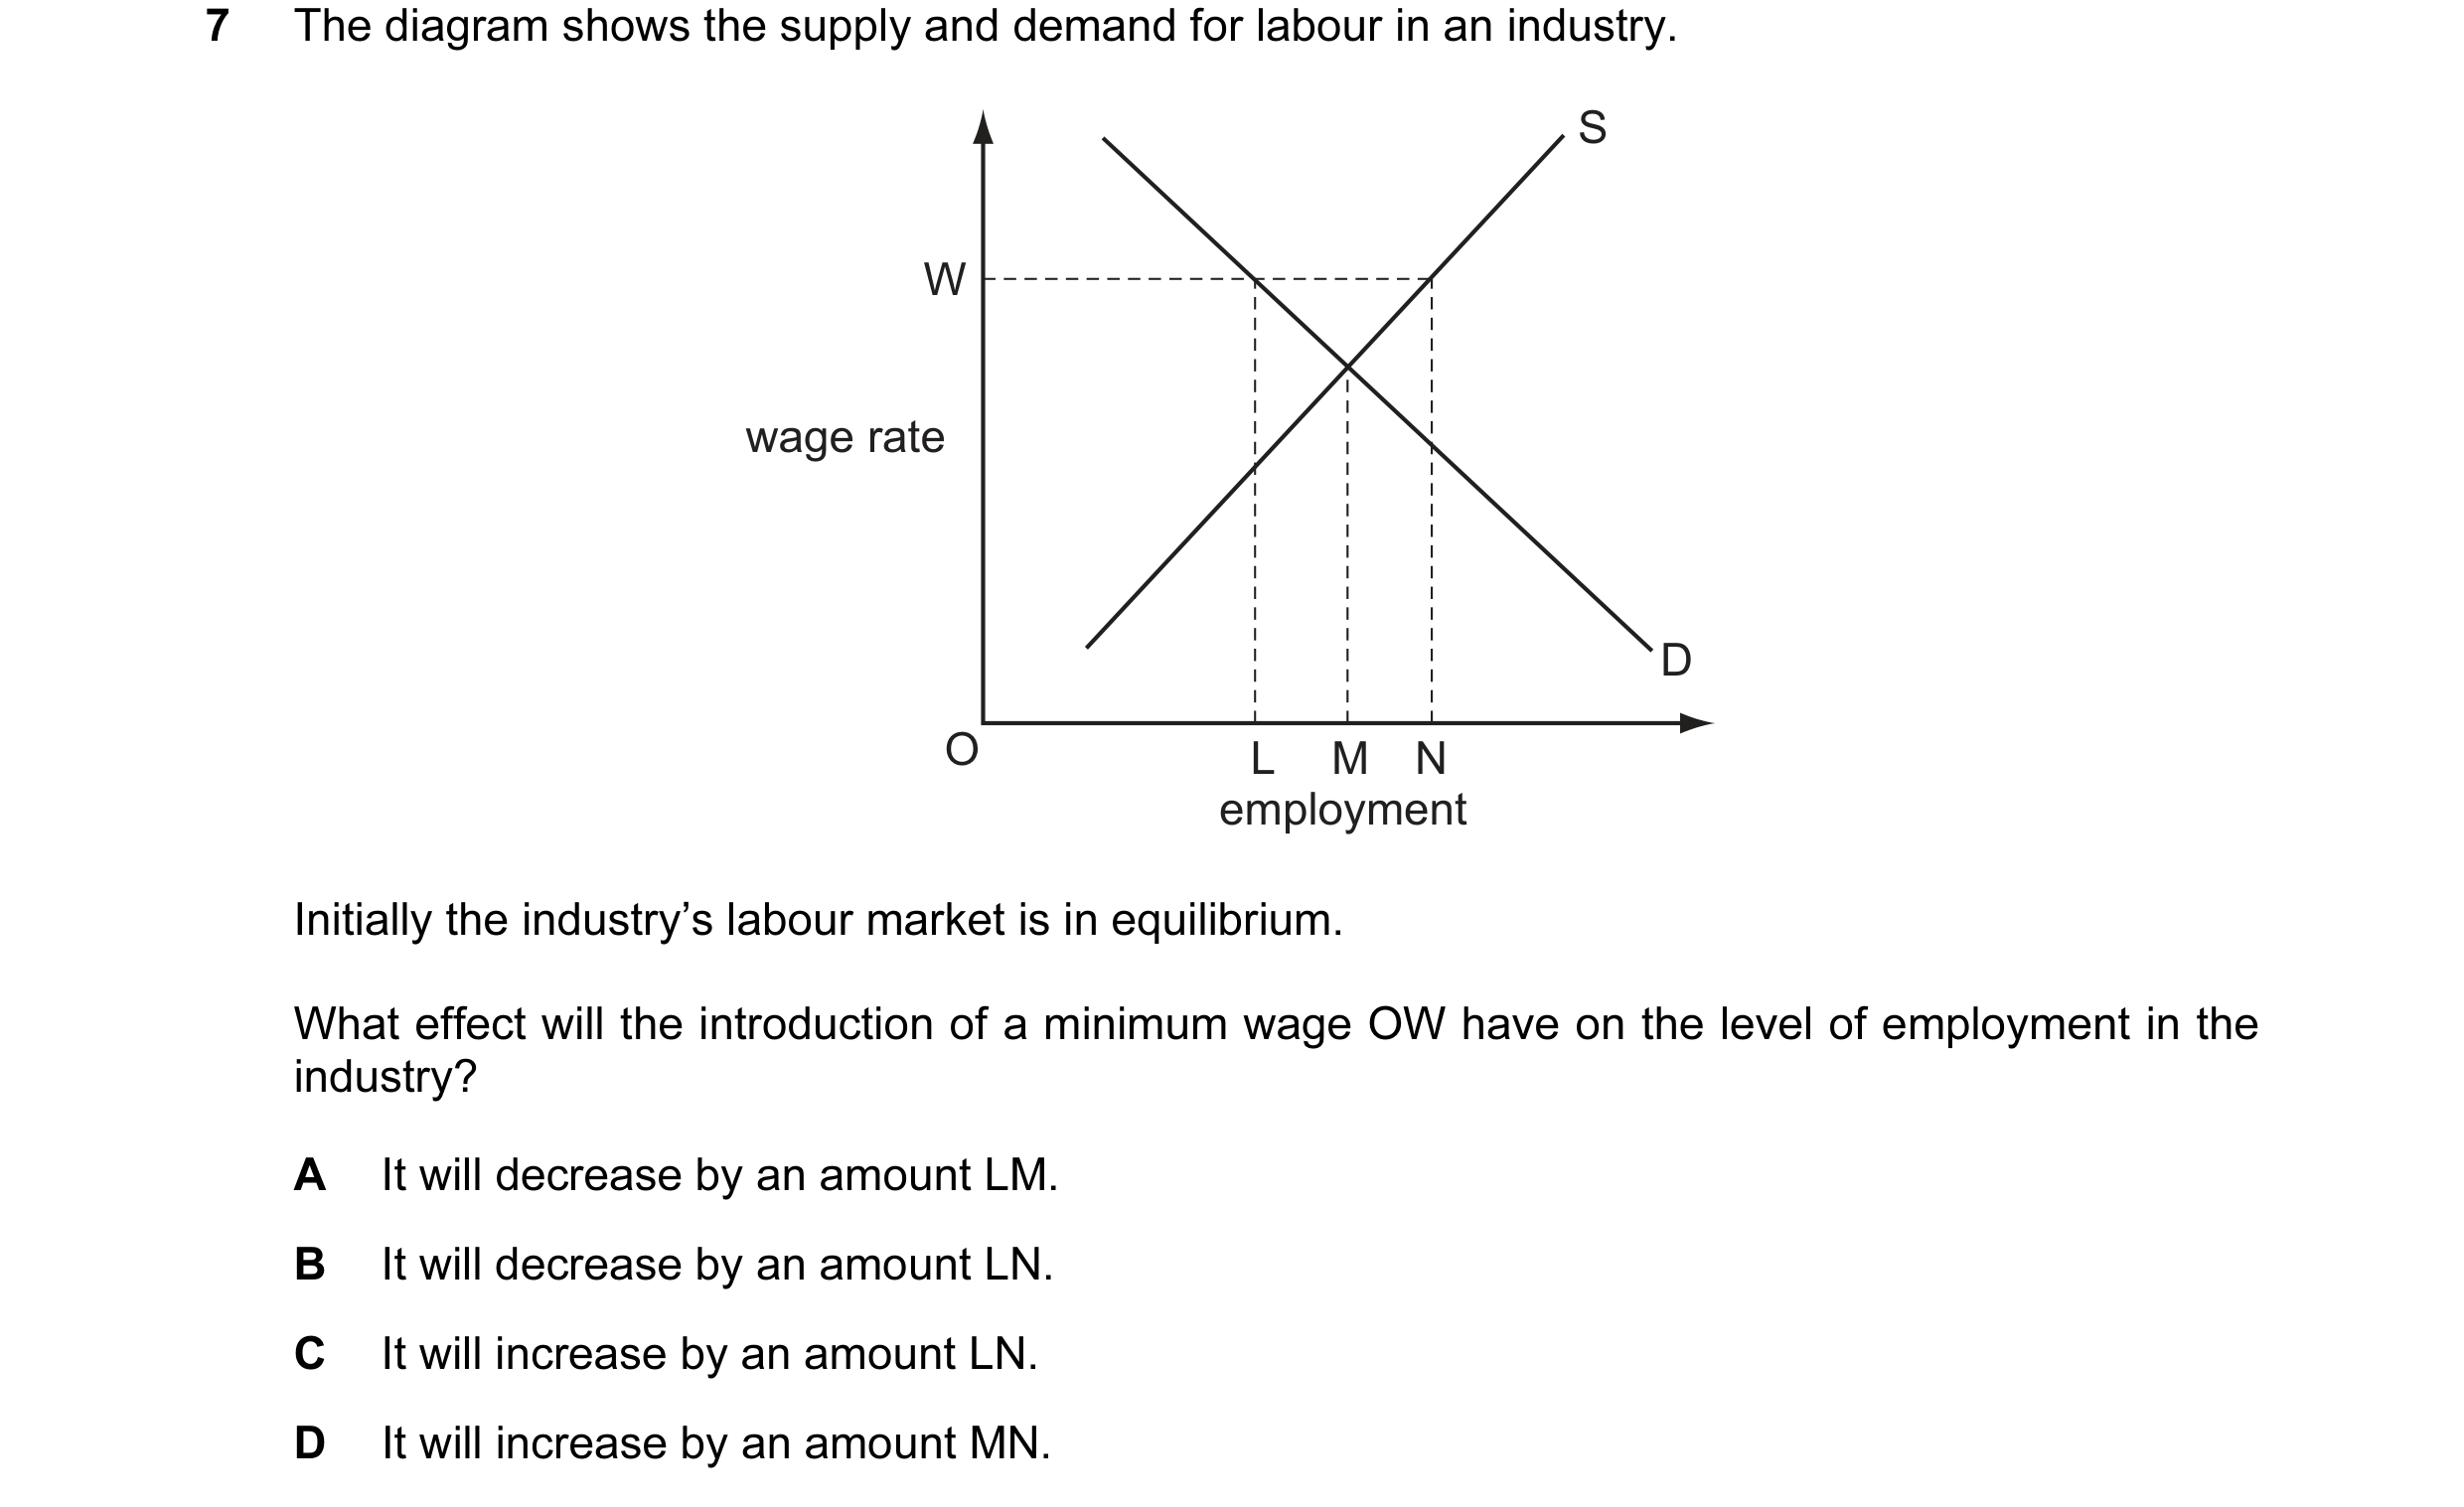
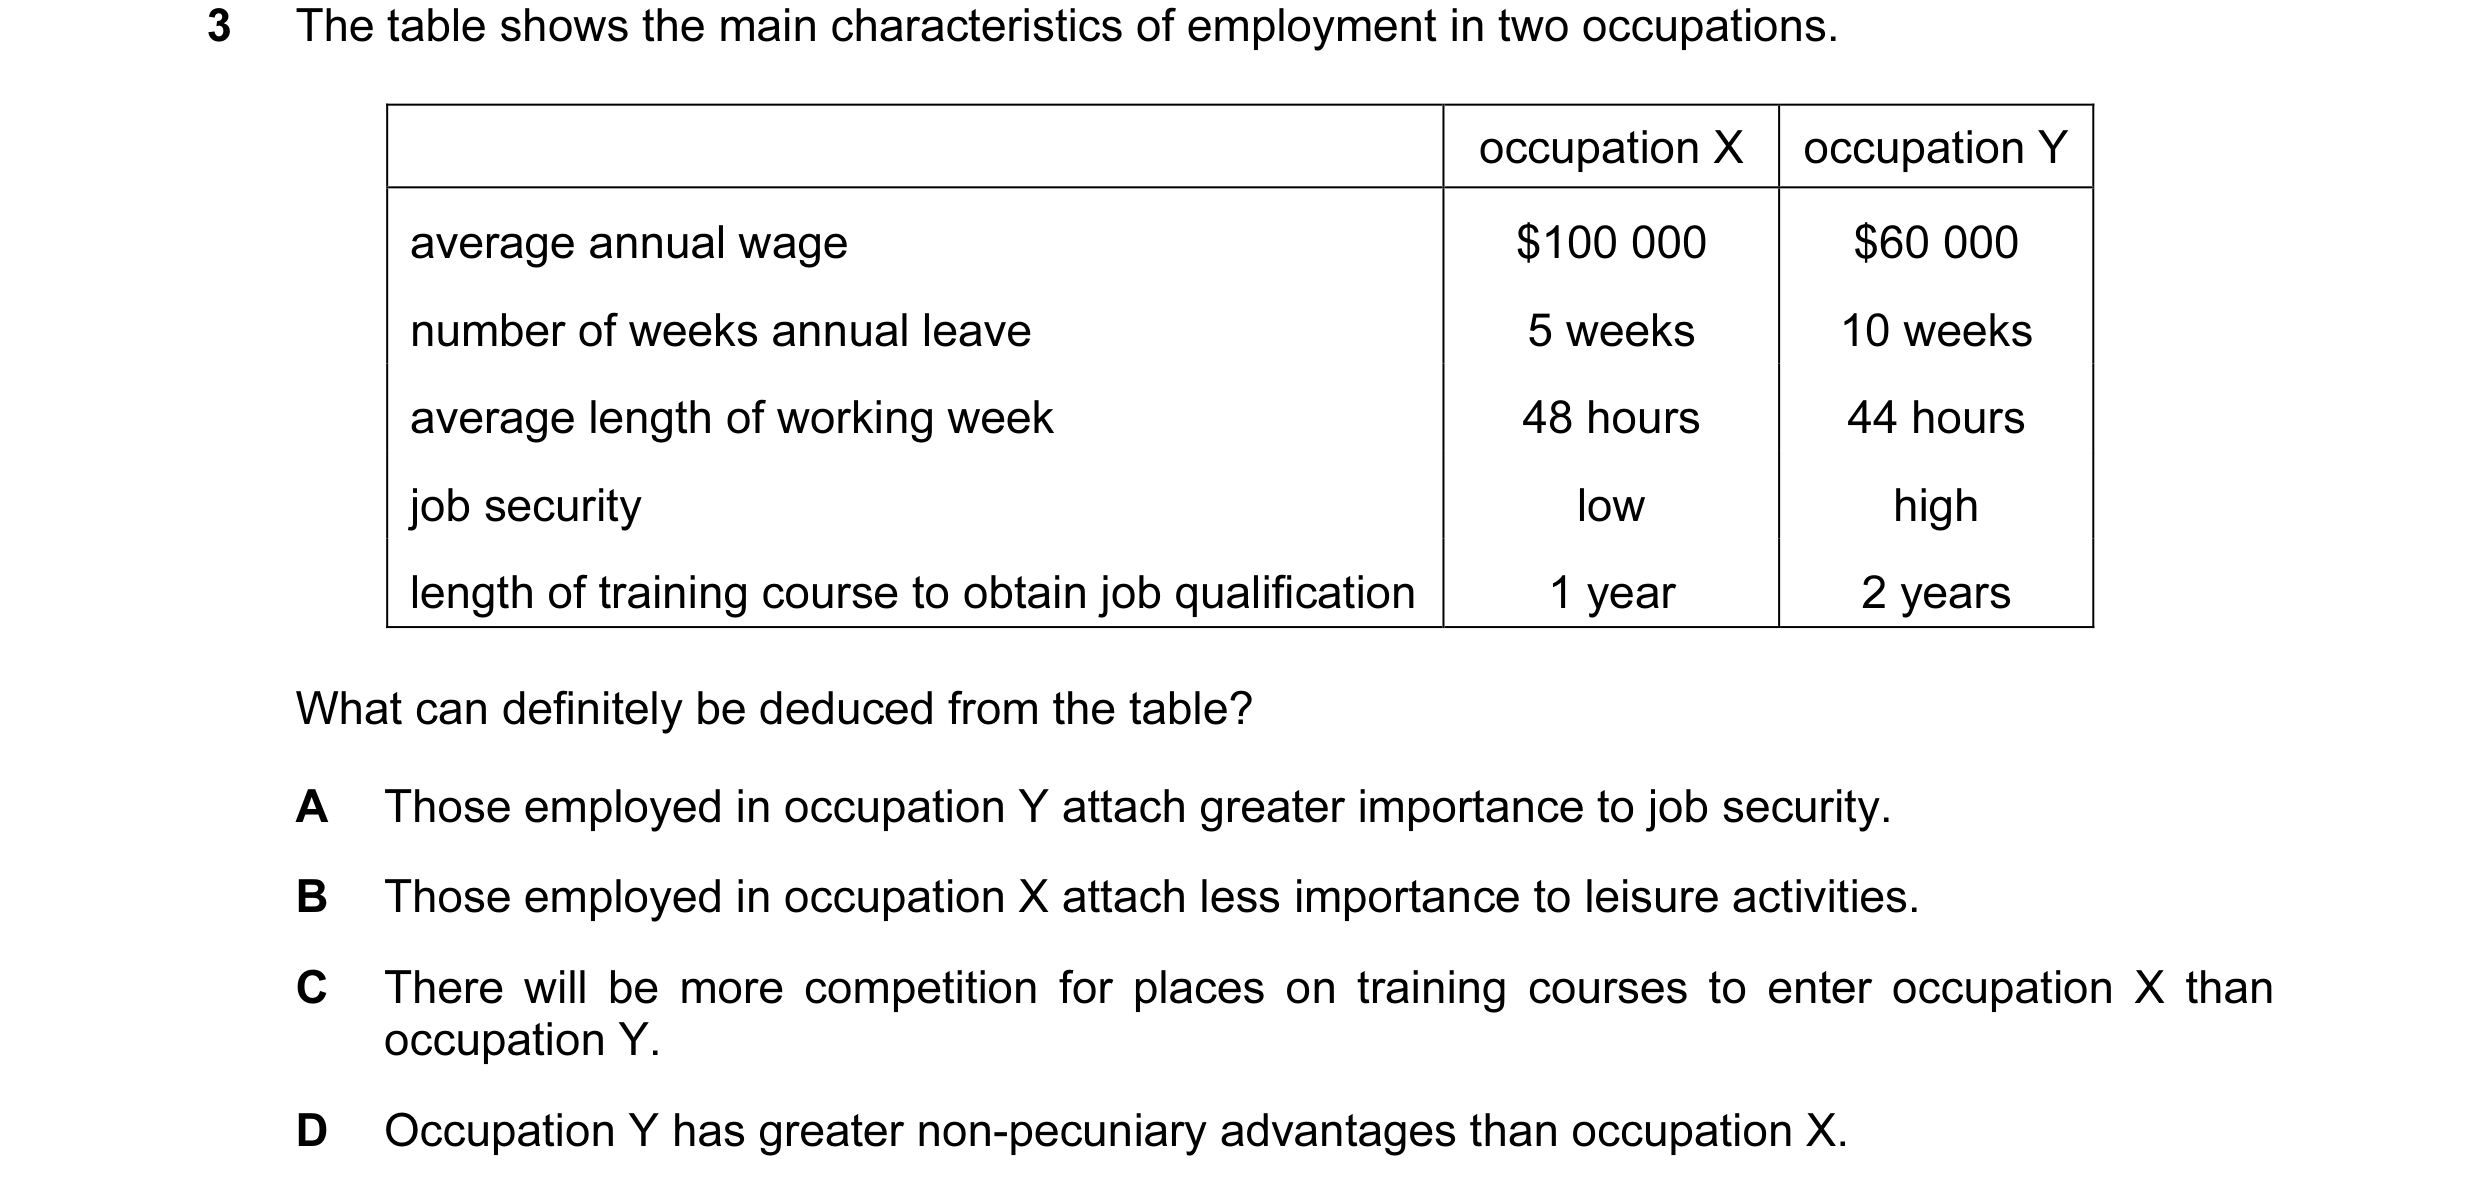 11 / 58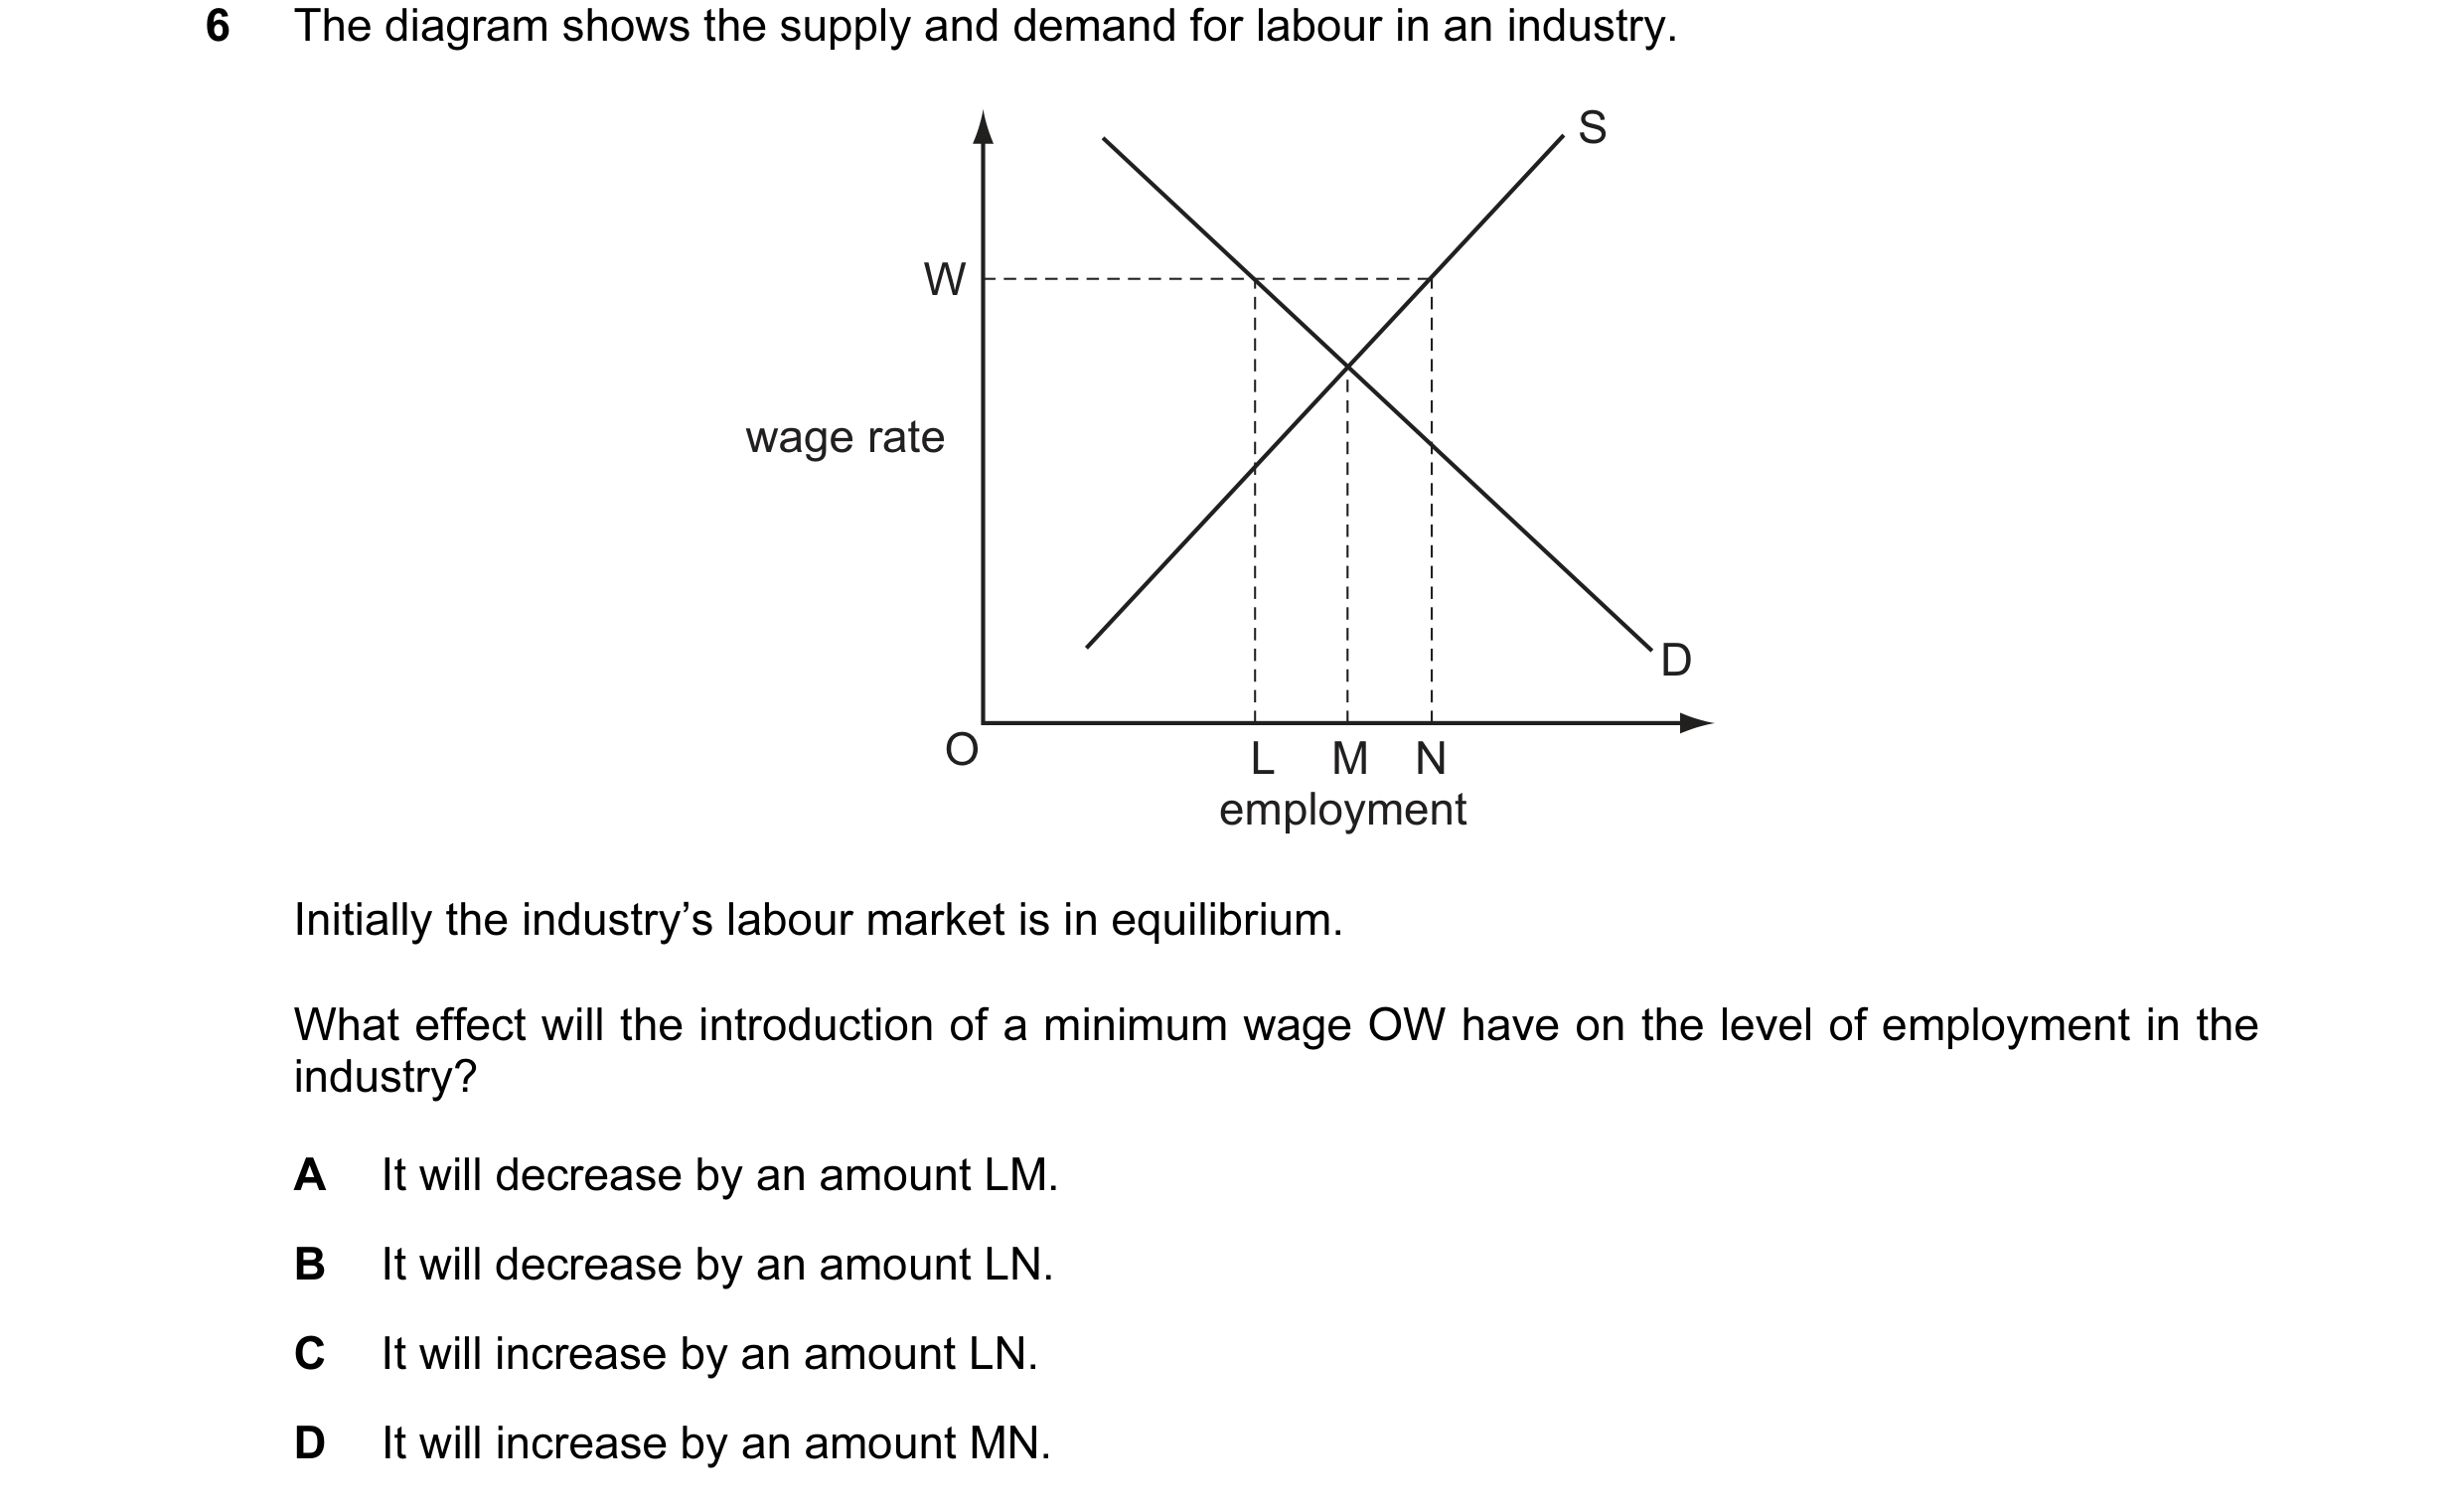
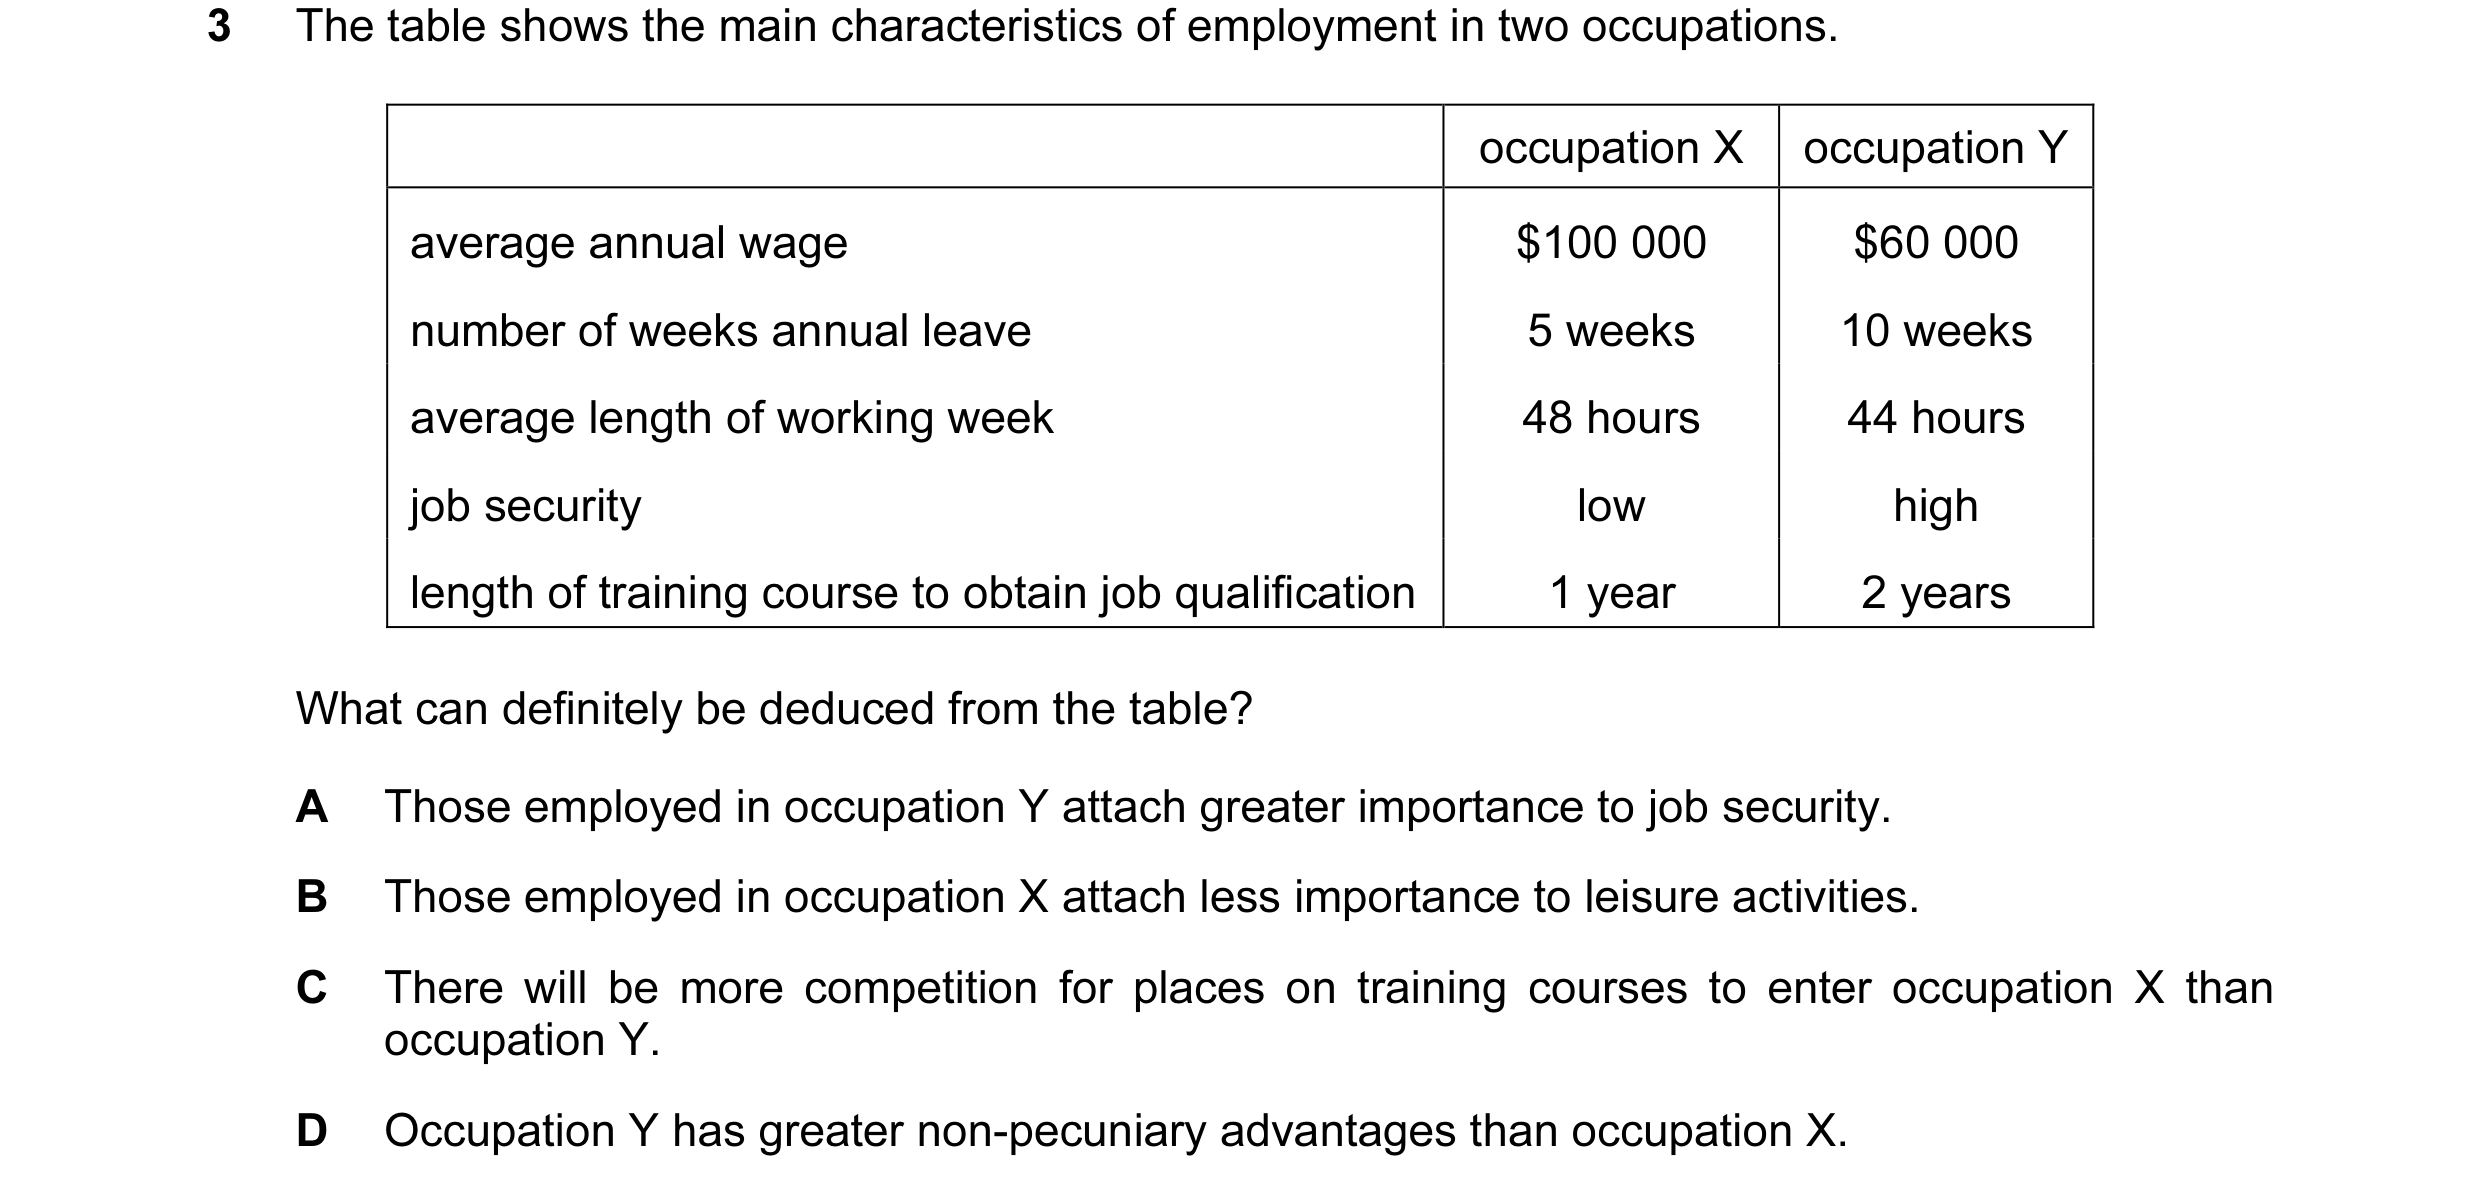 12 / 58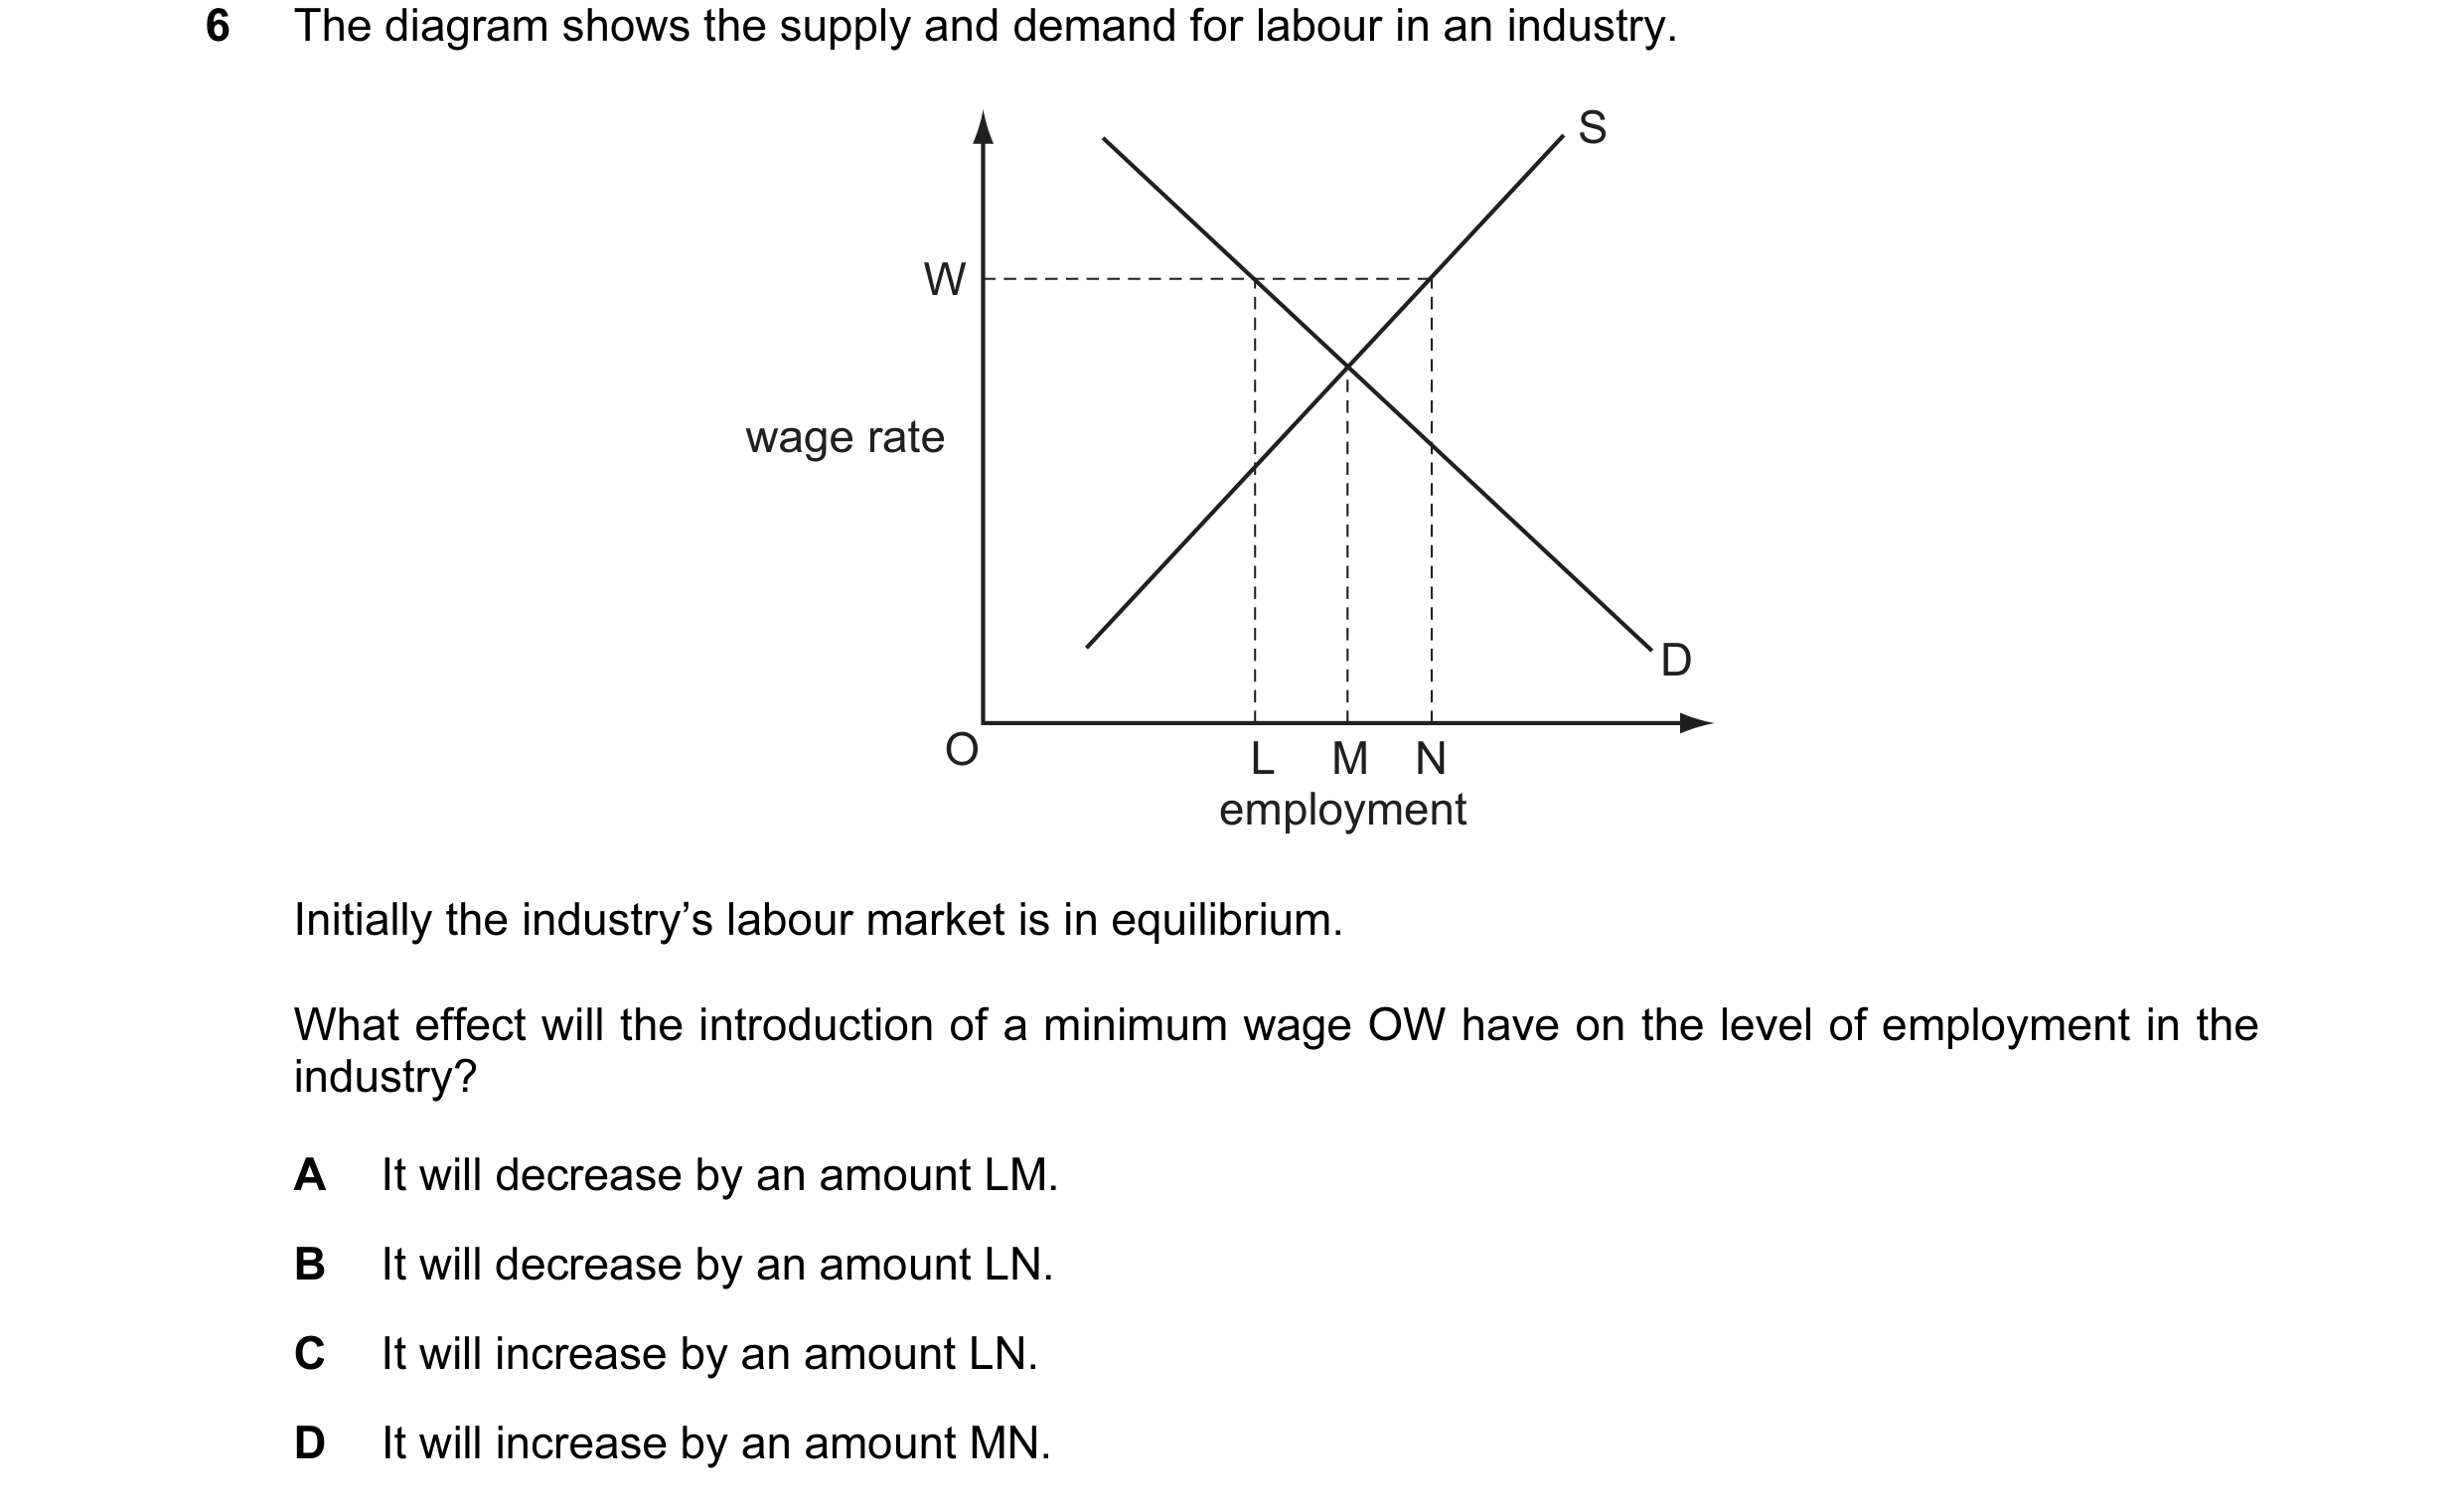

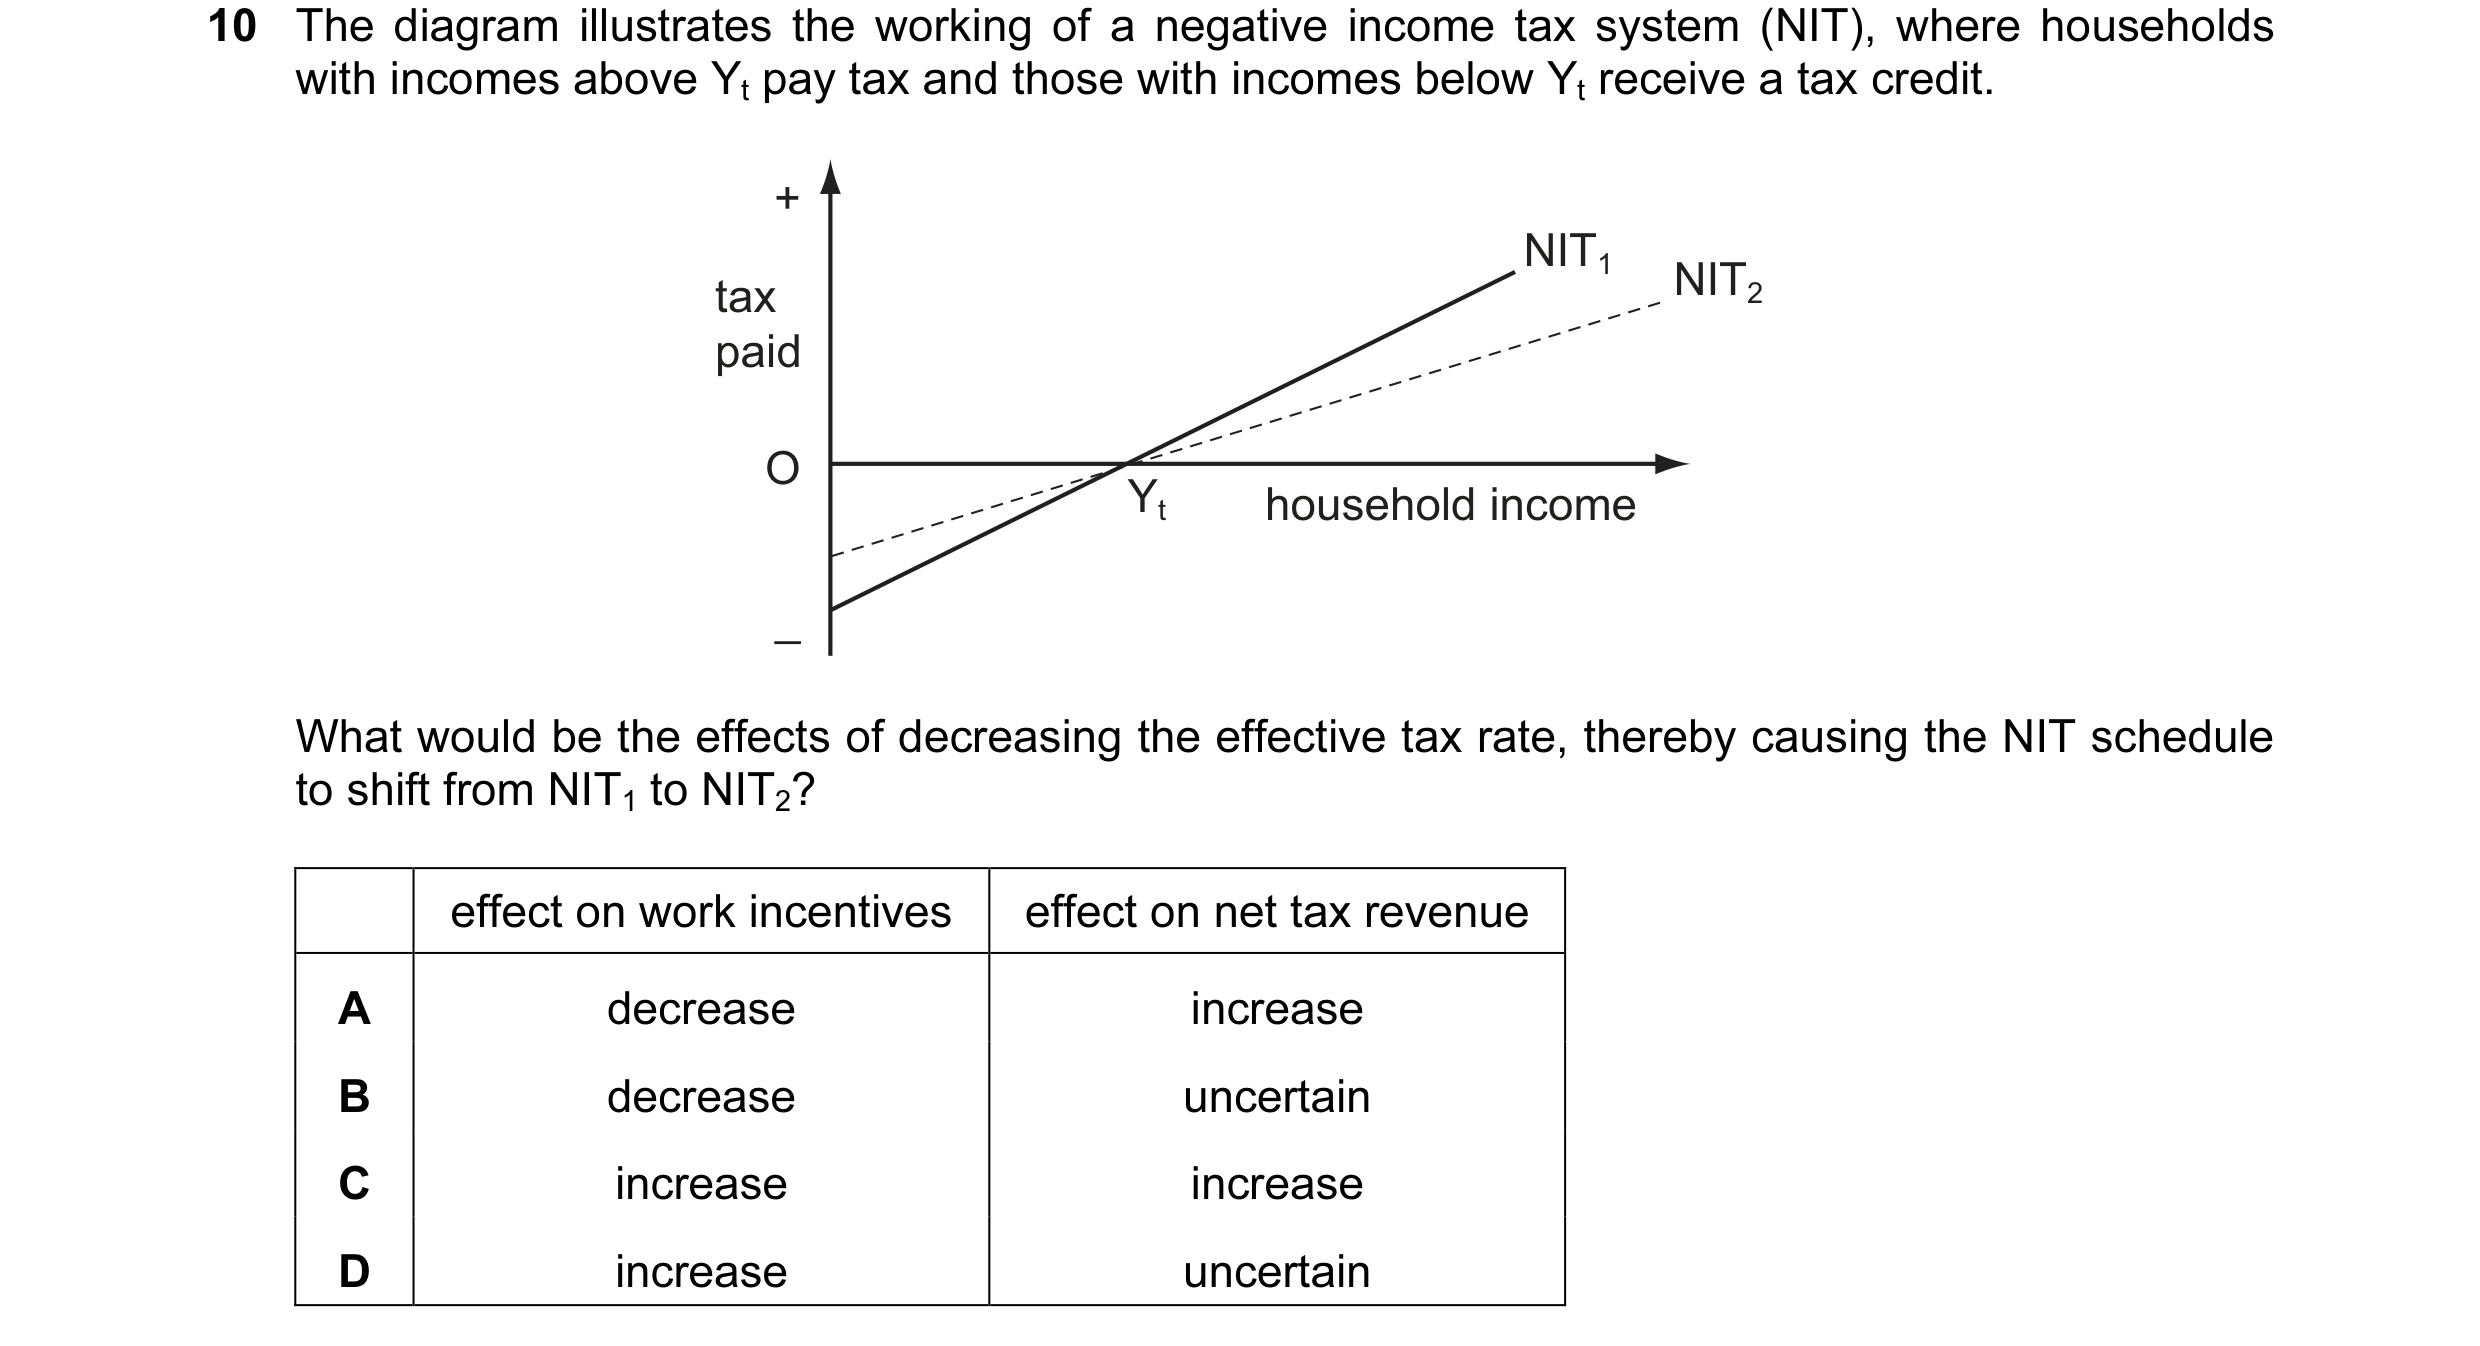 13 / 58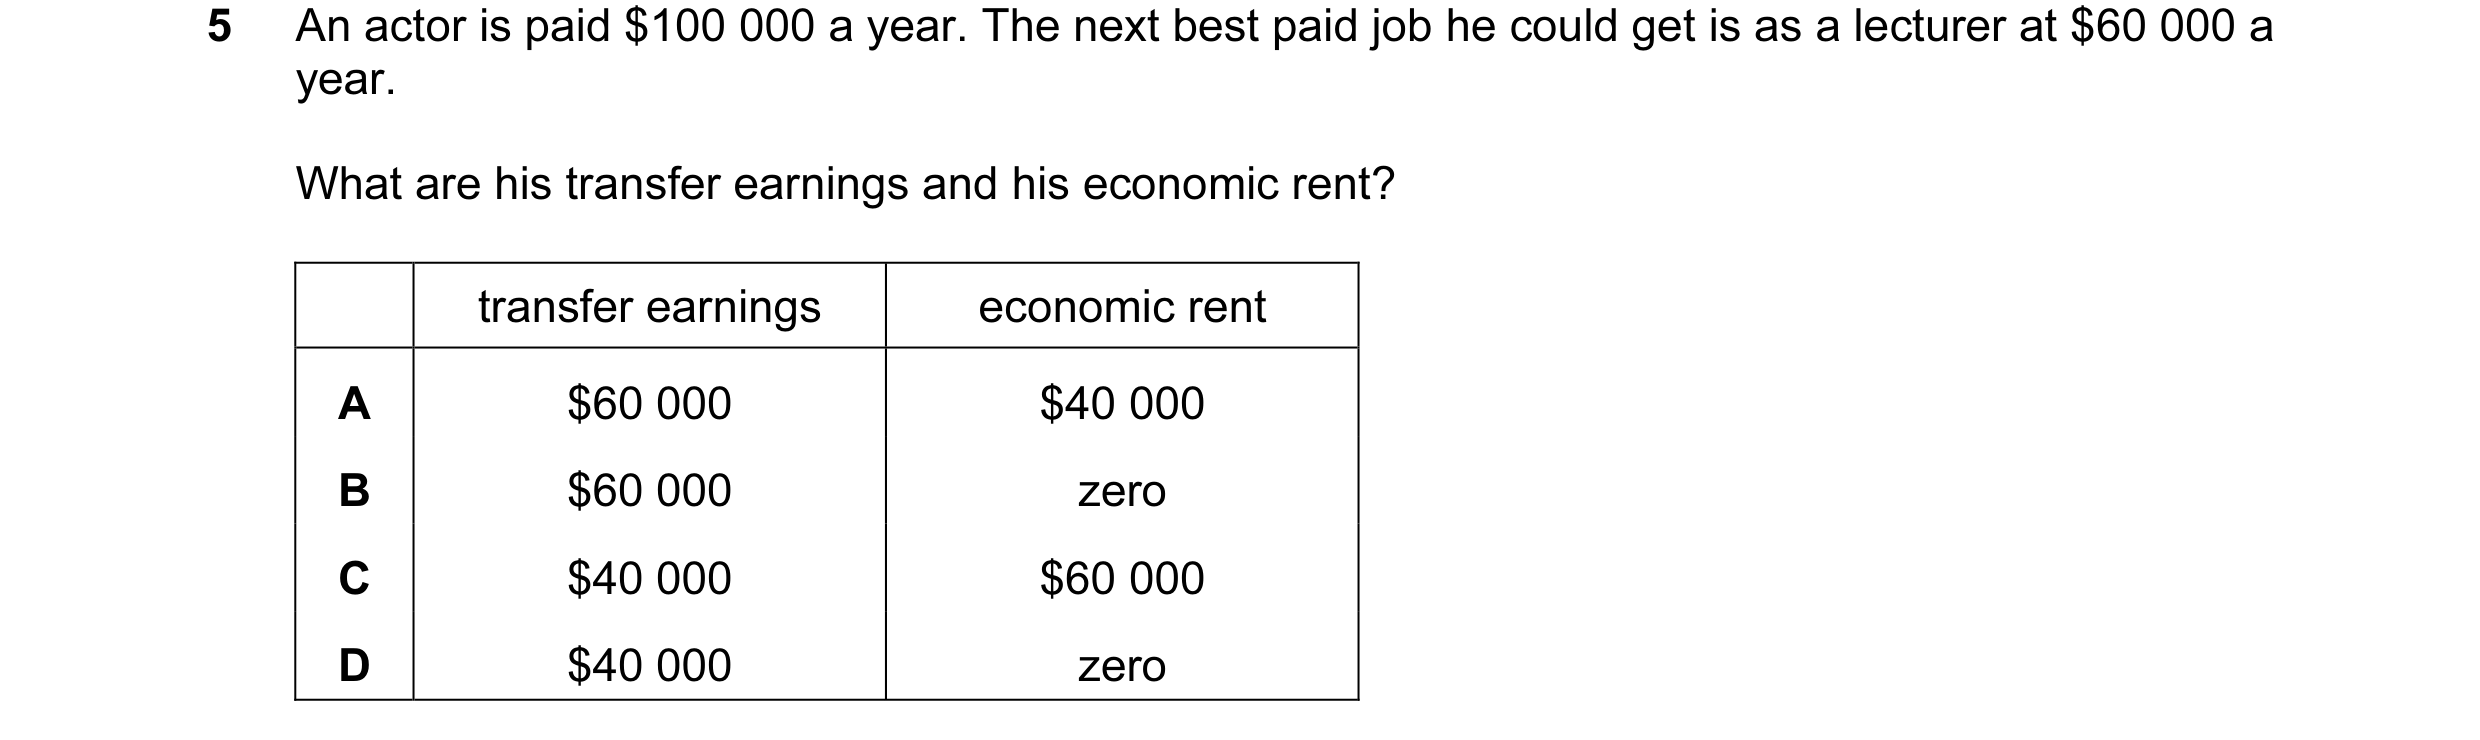
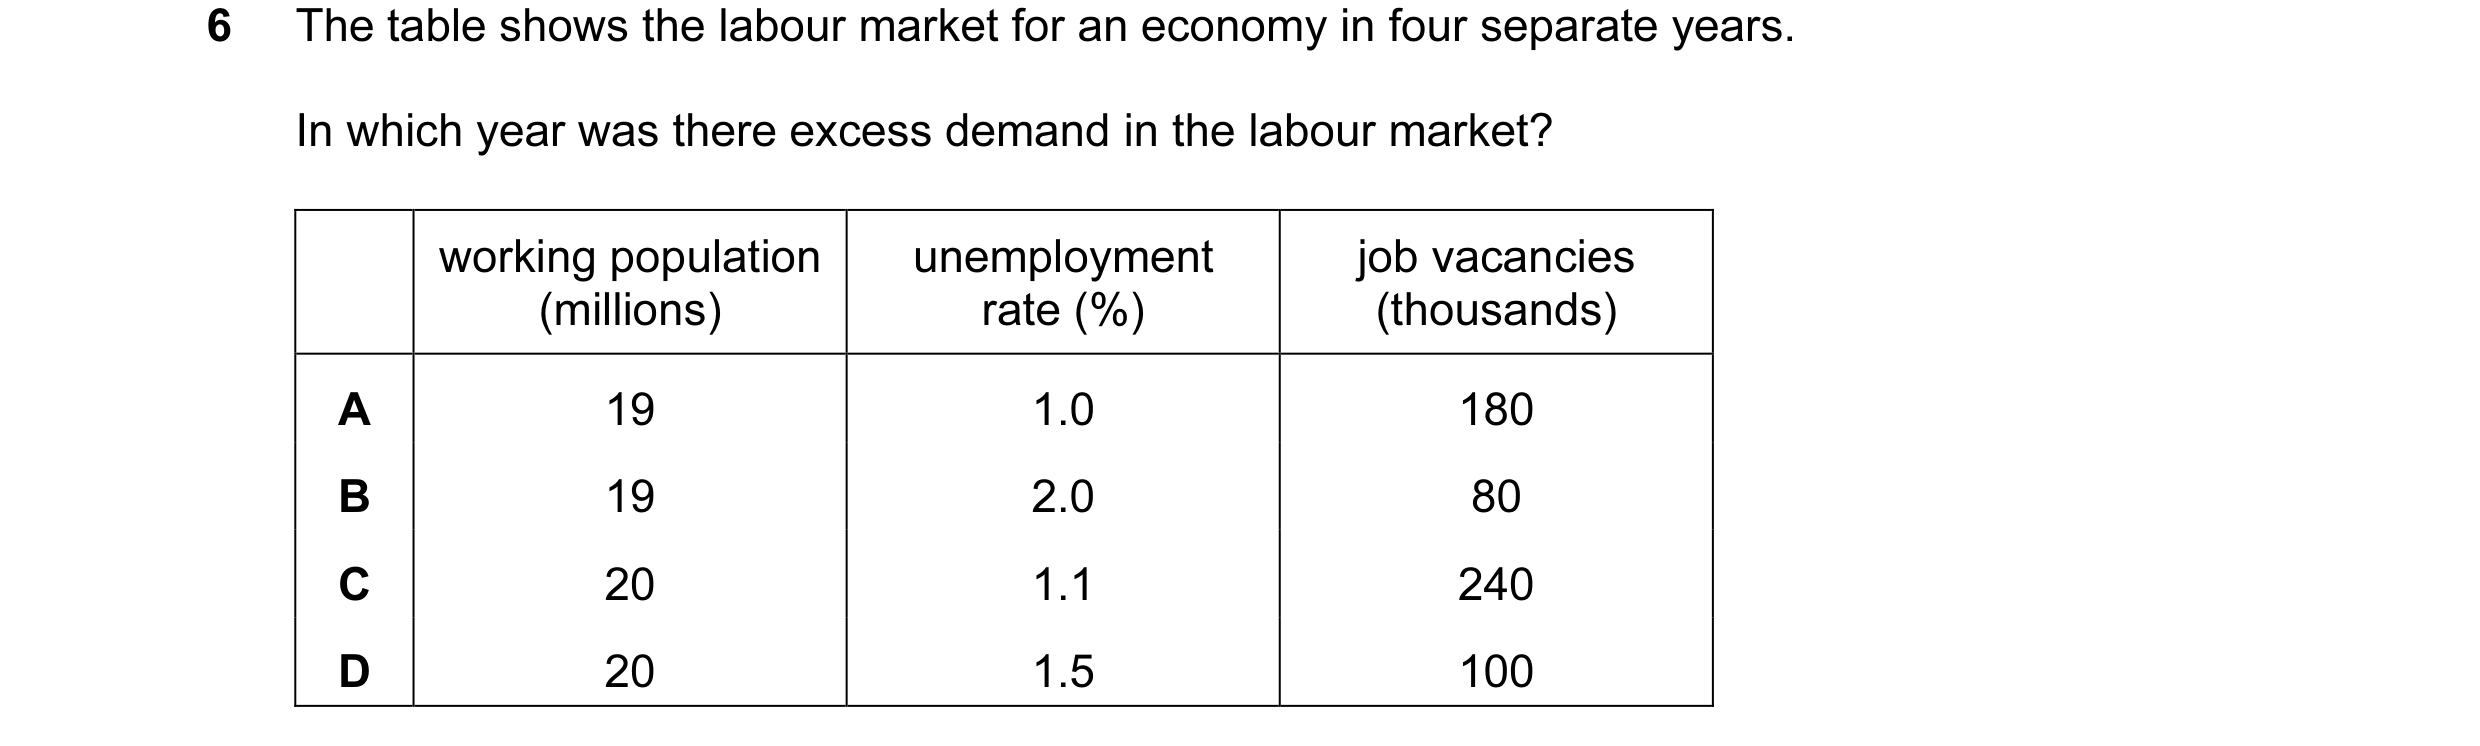
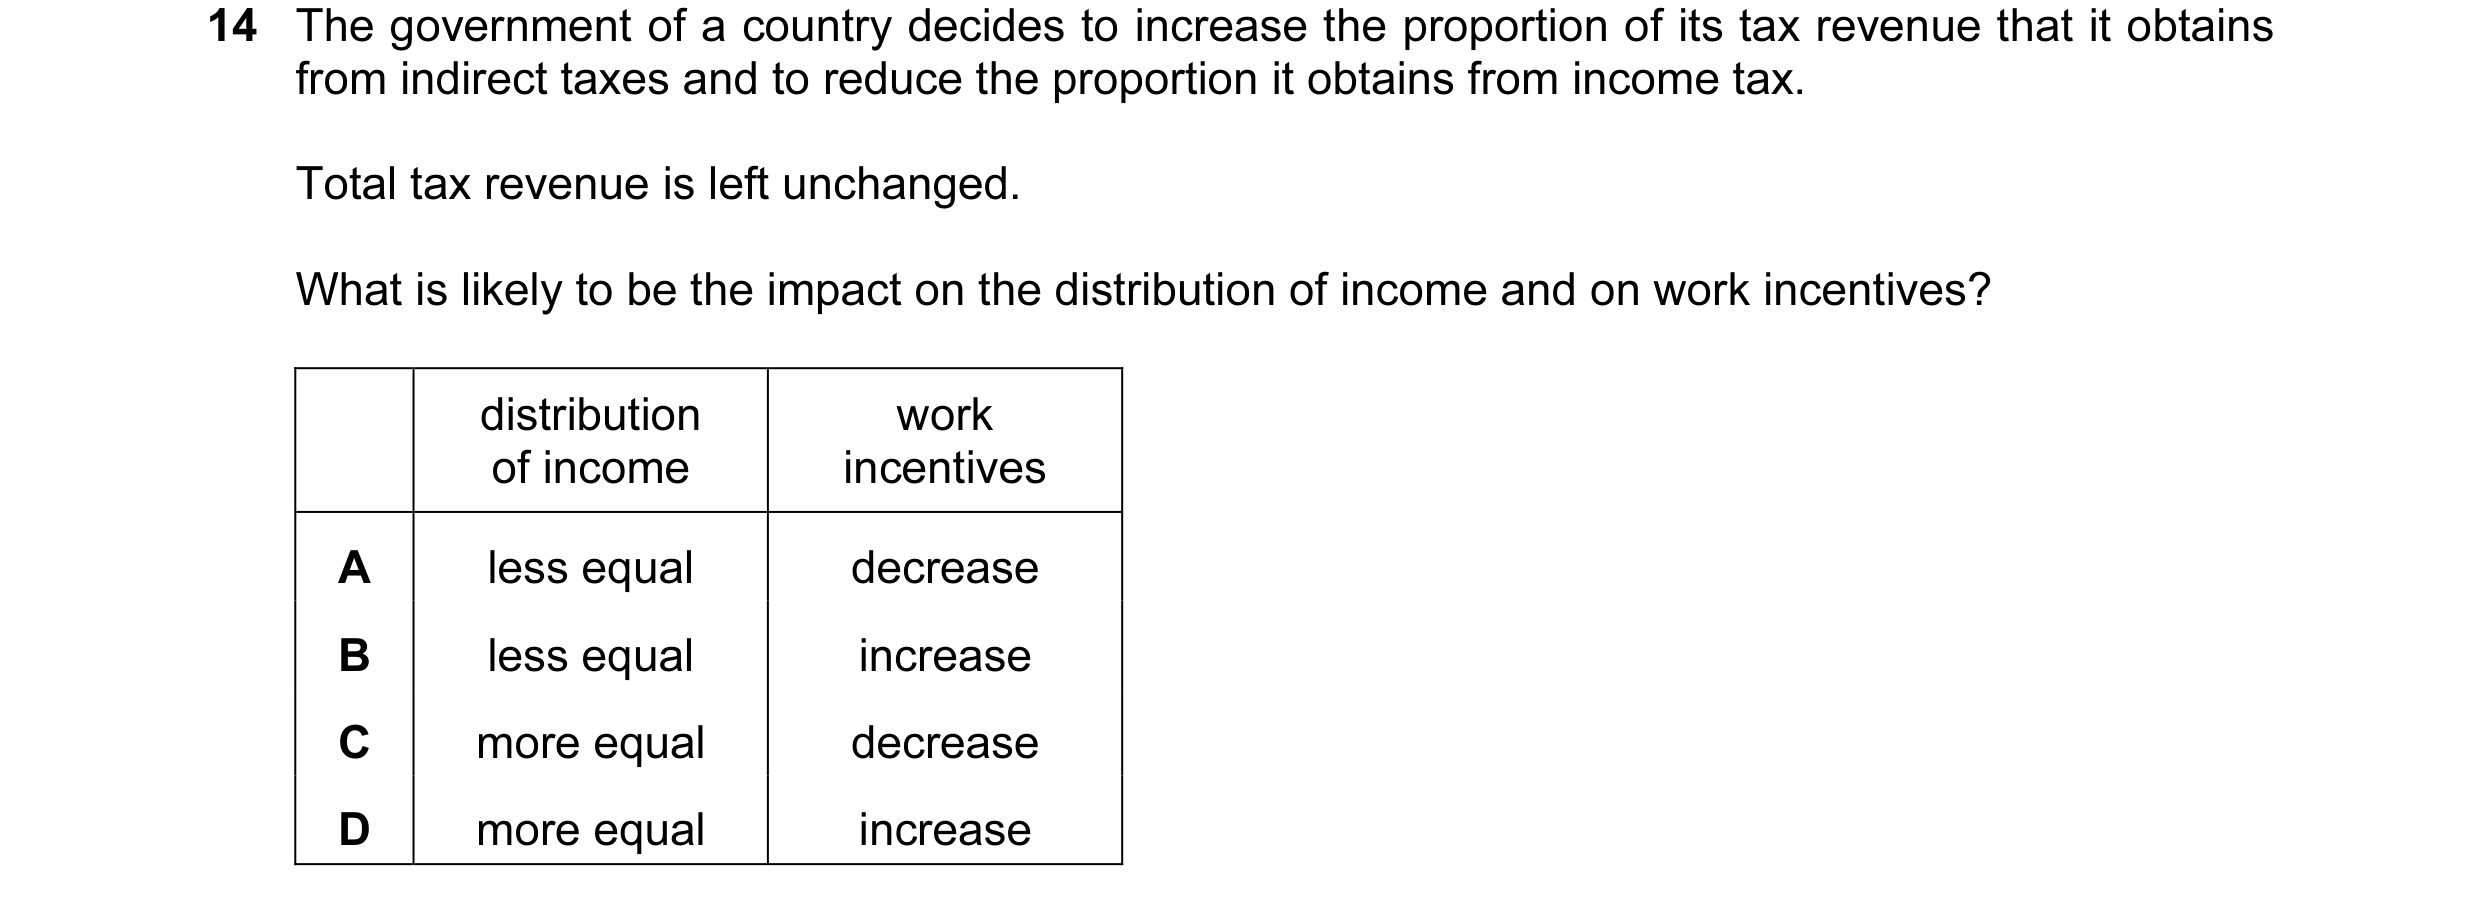
 14 / 58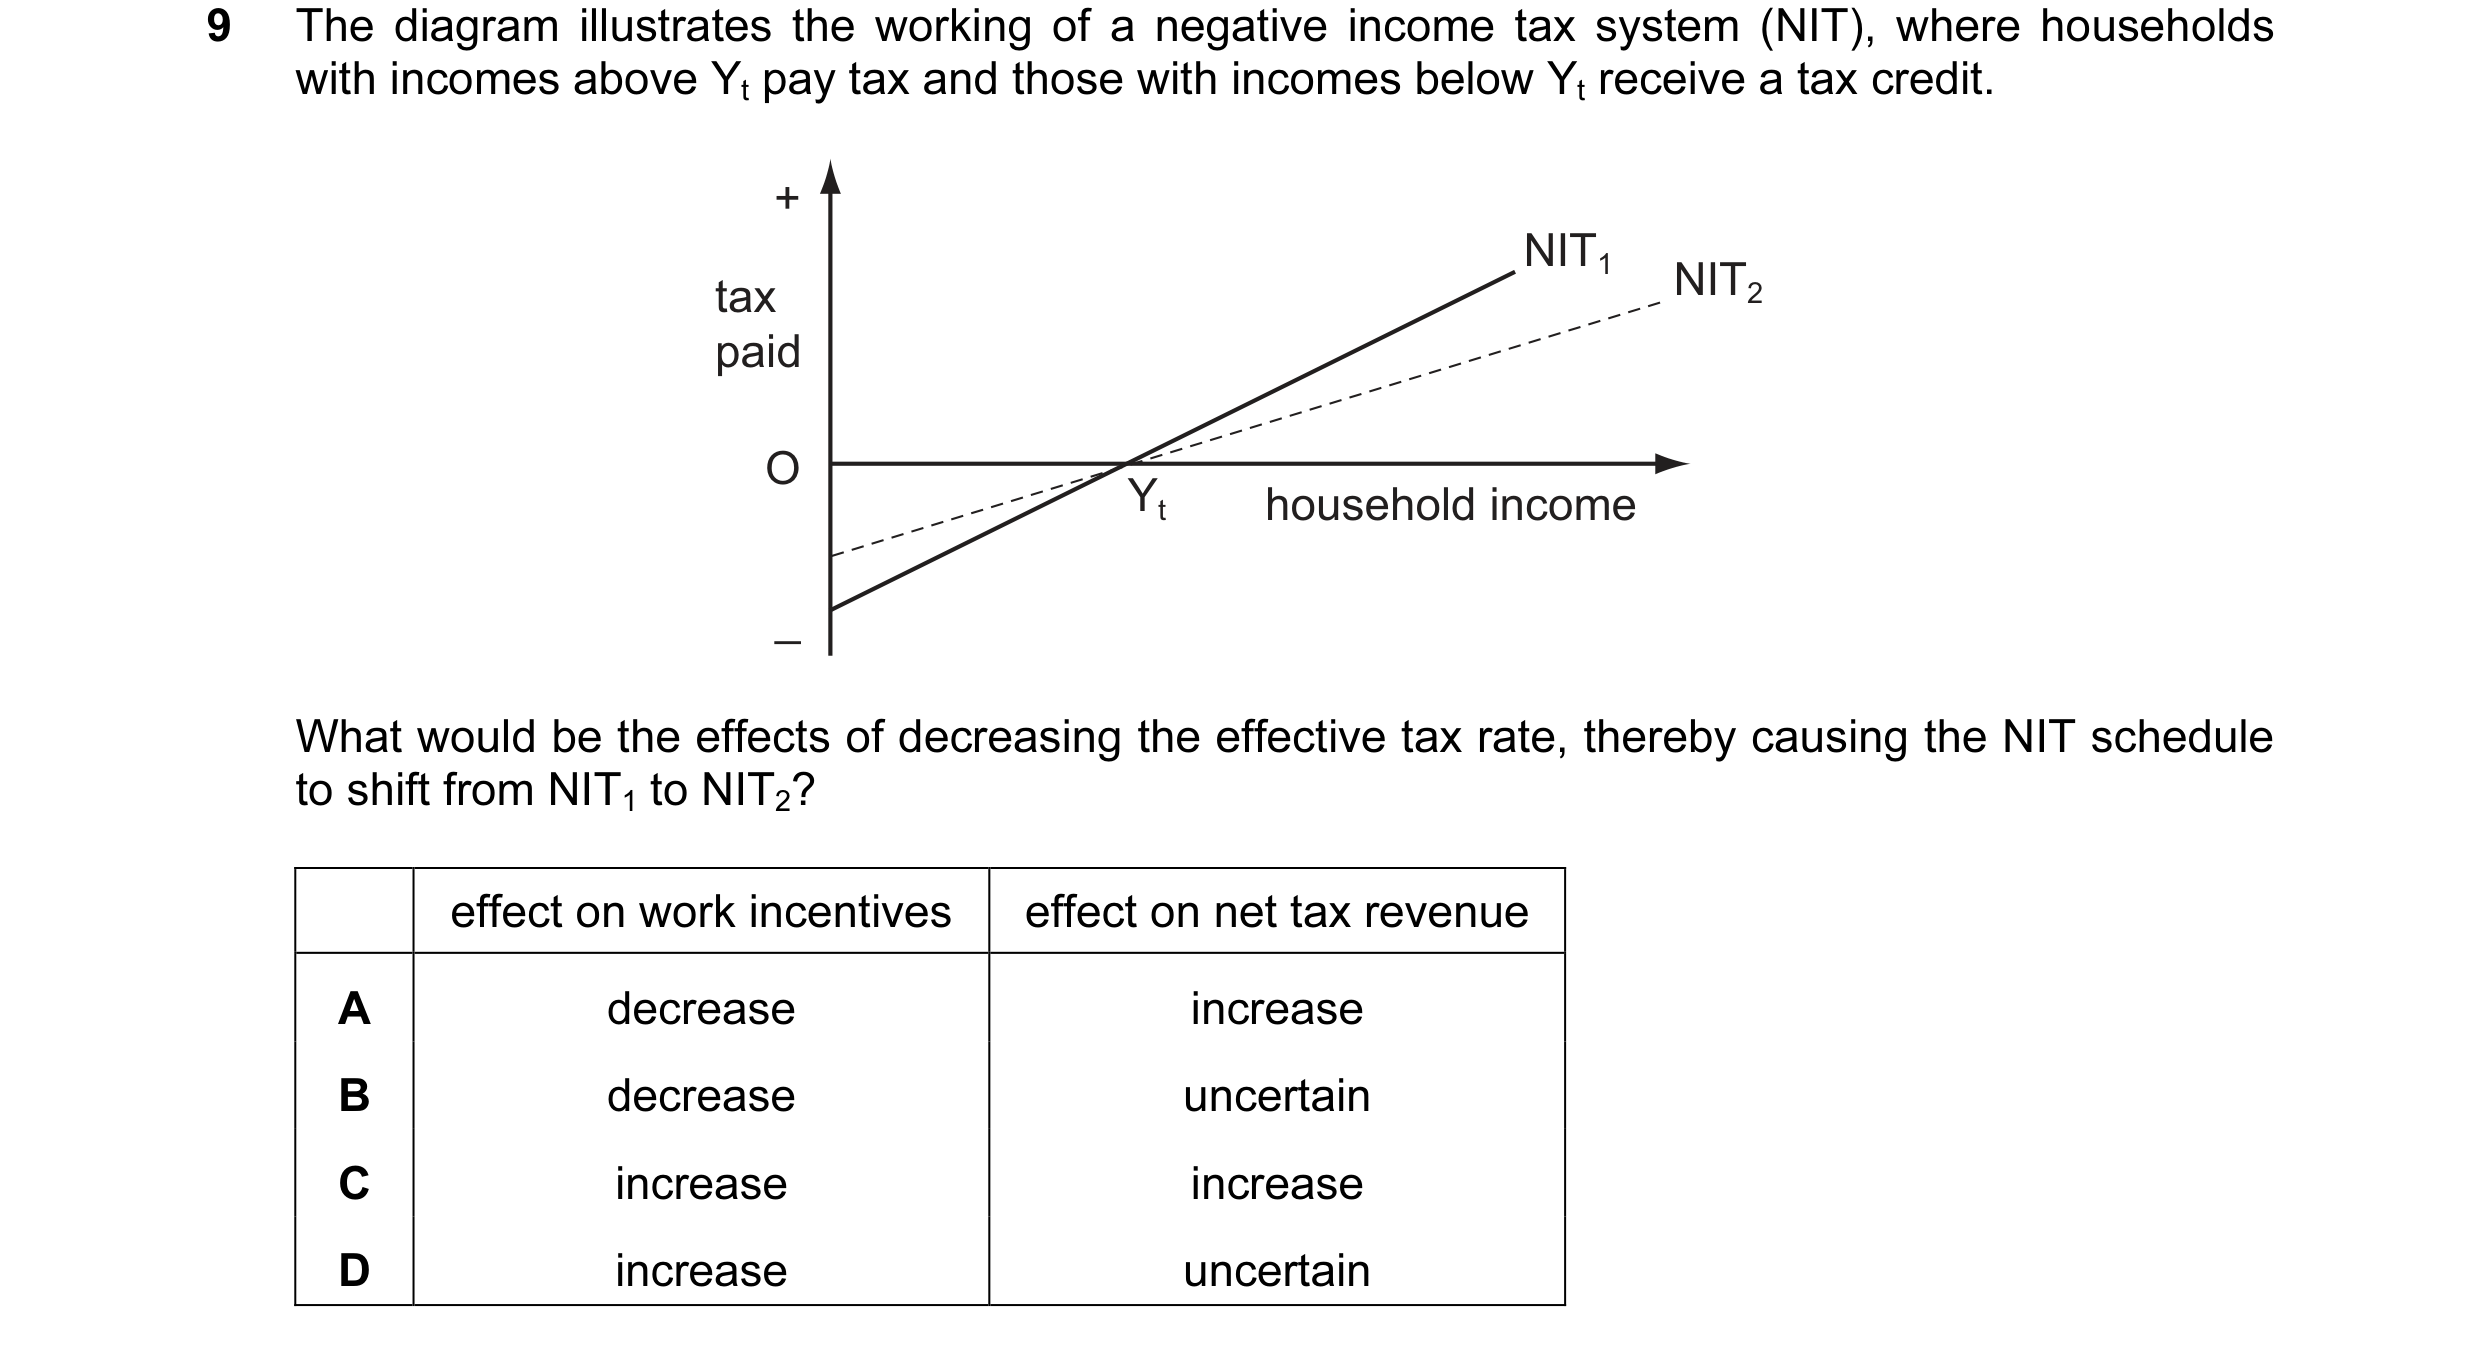
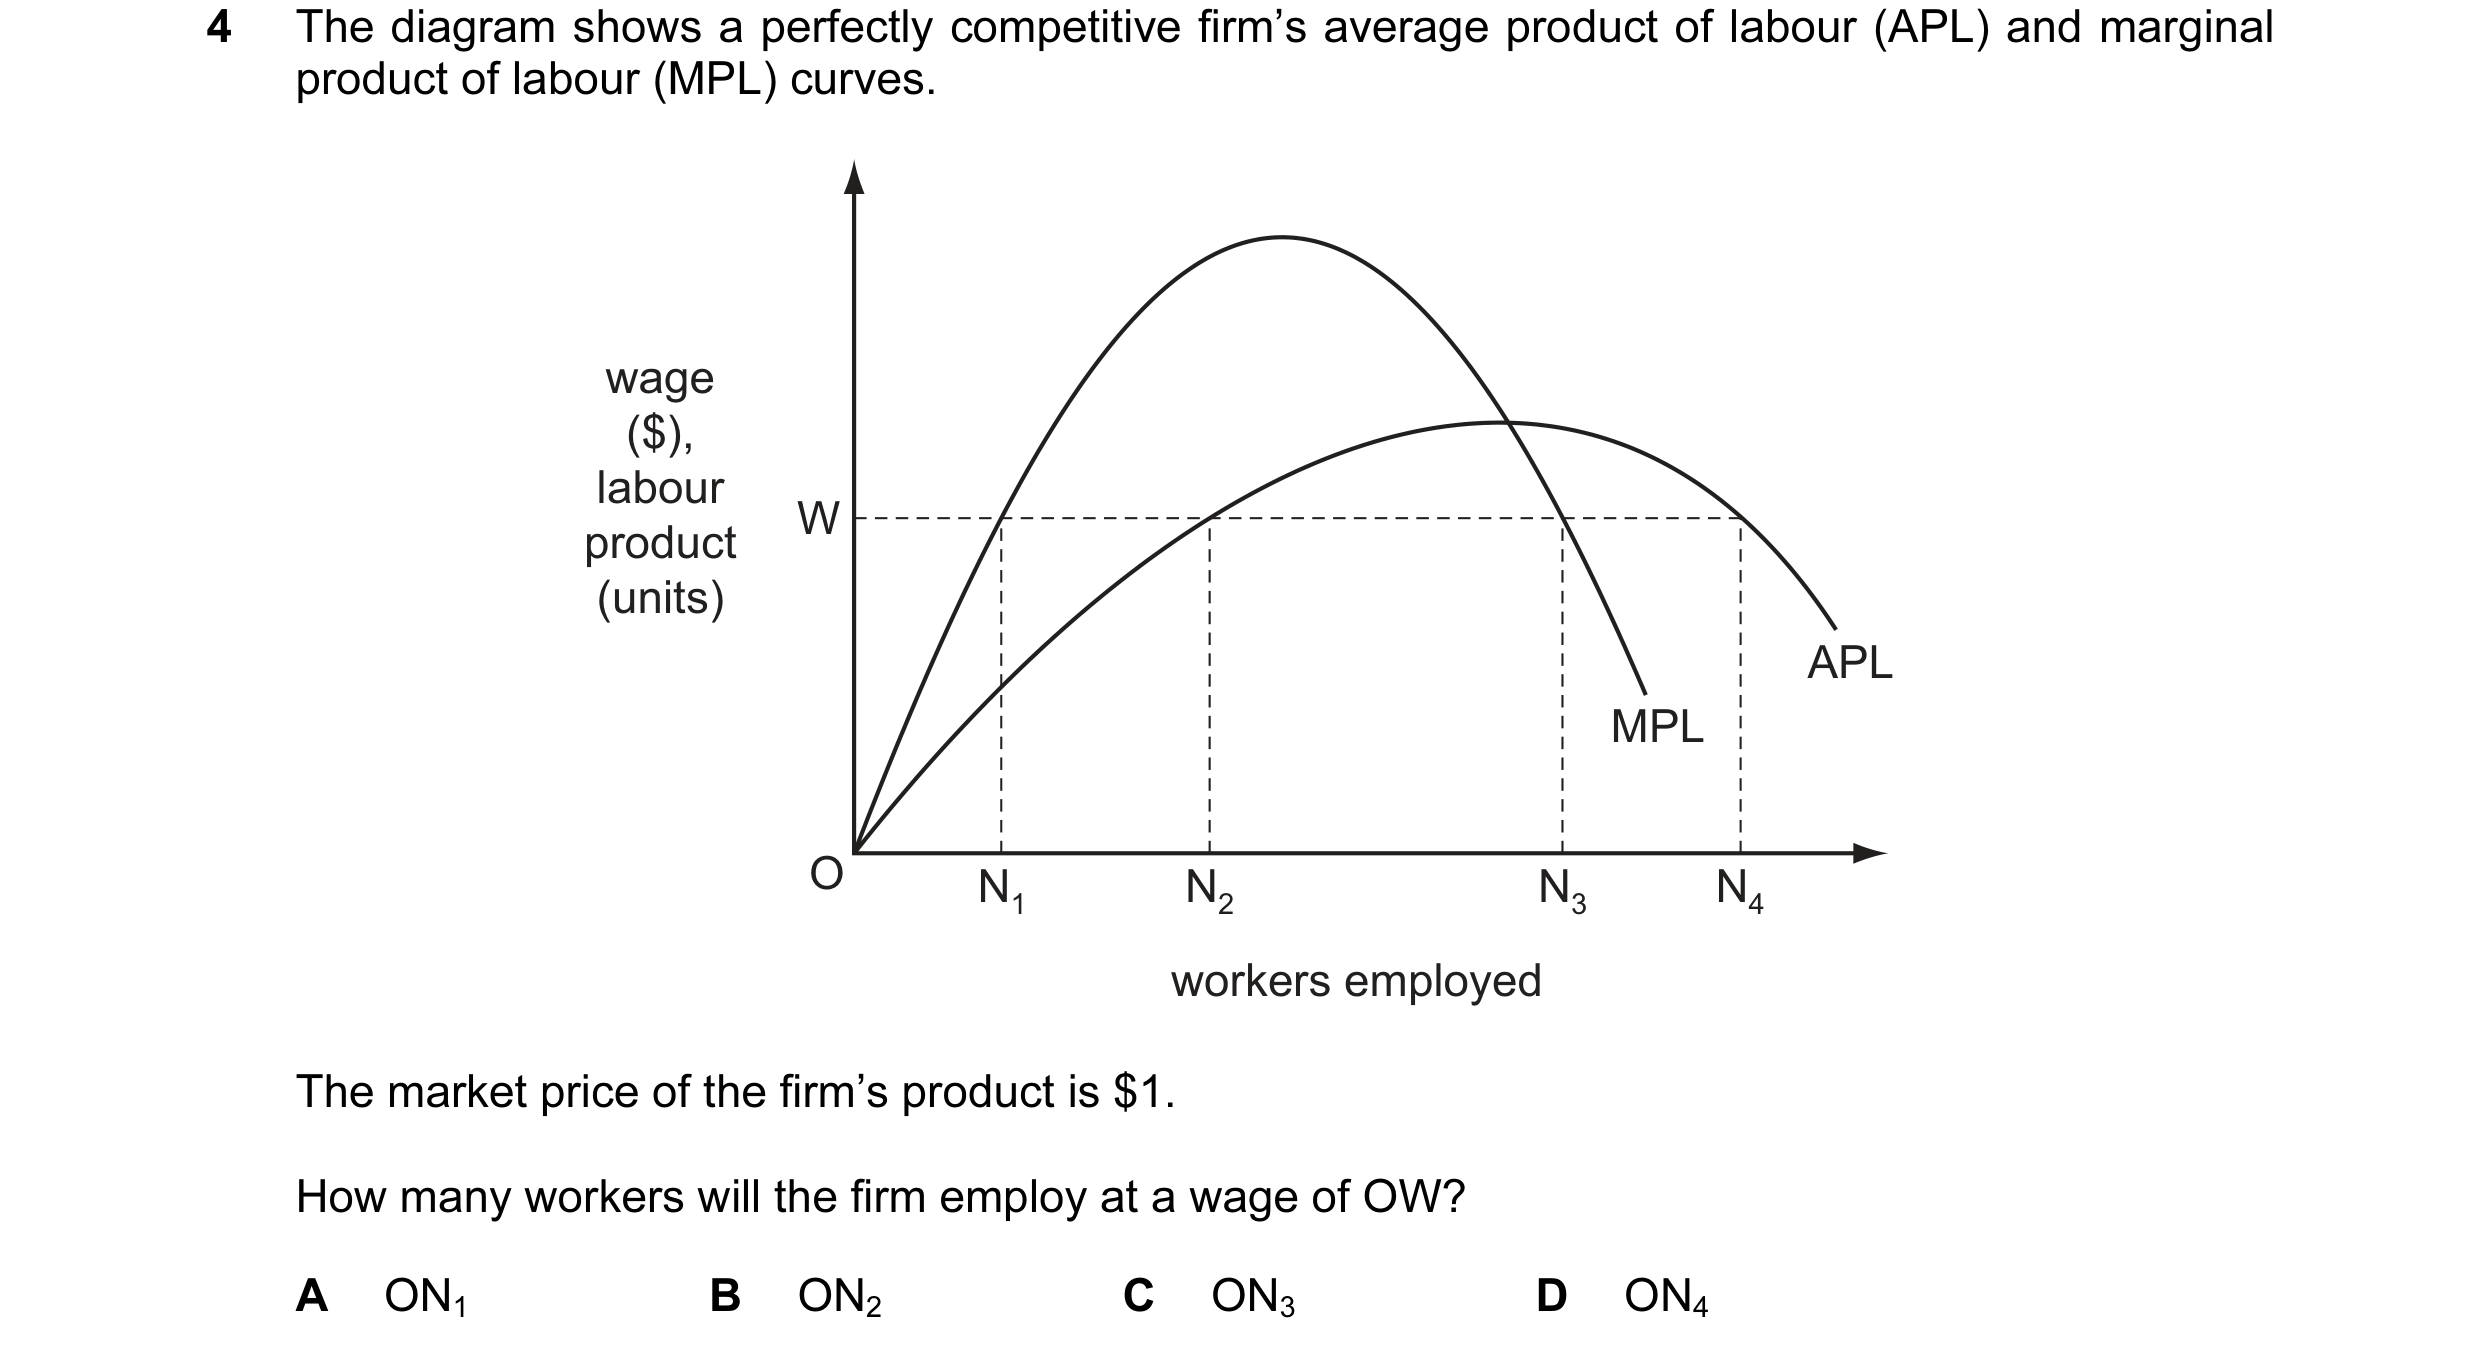
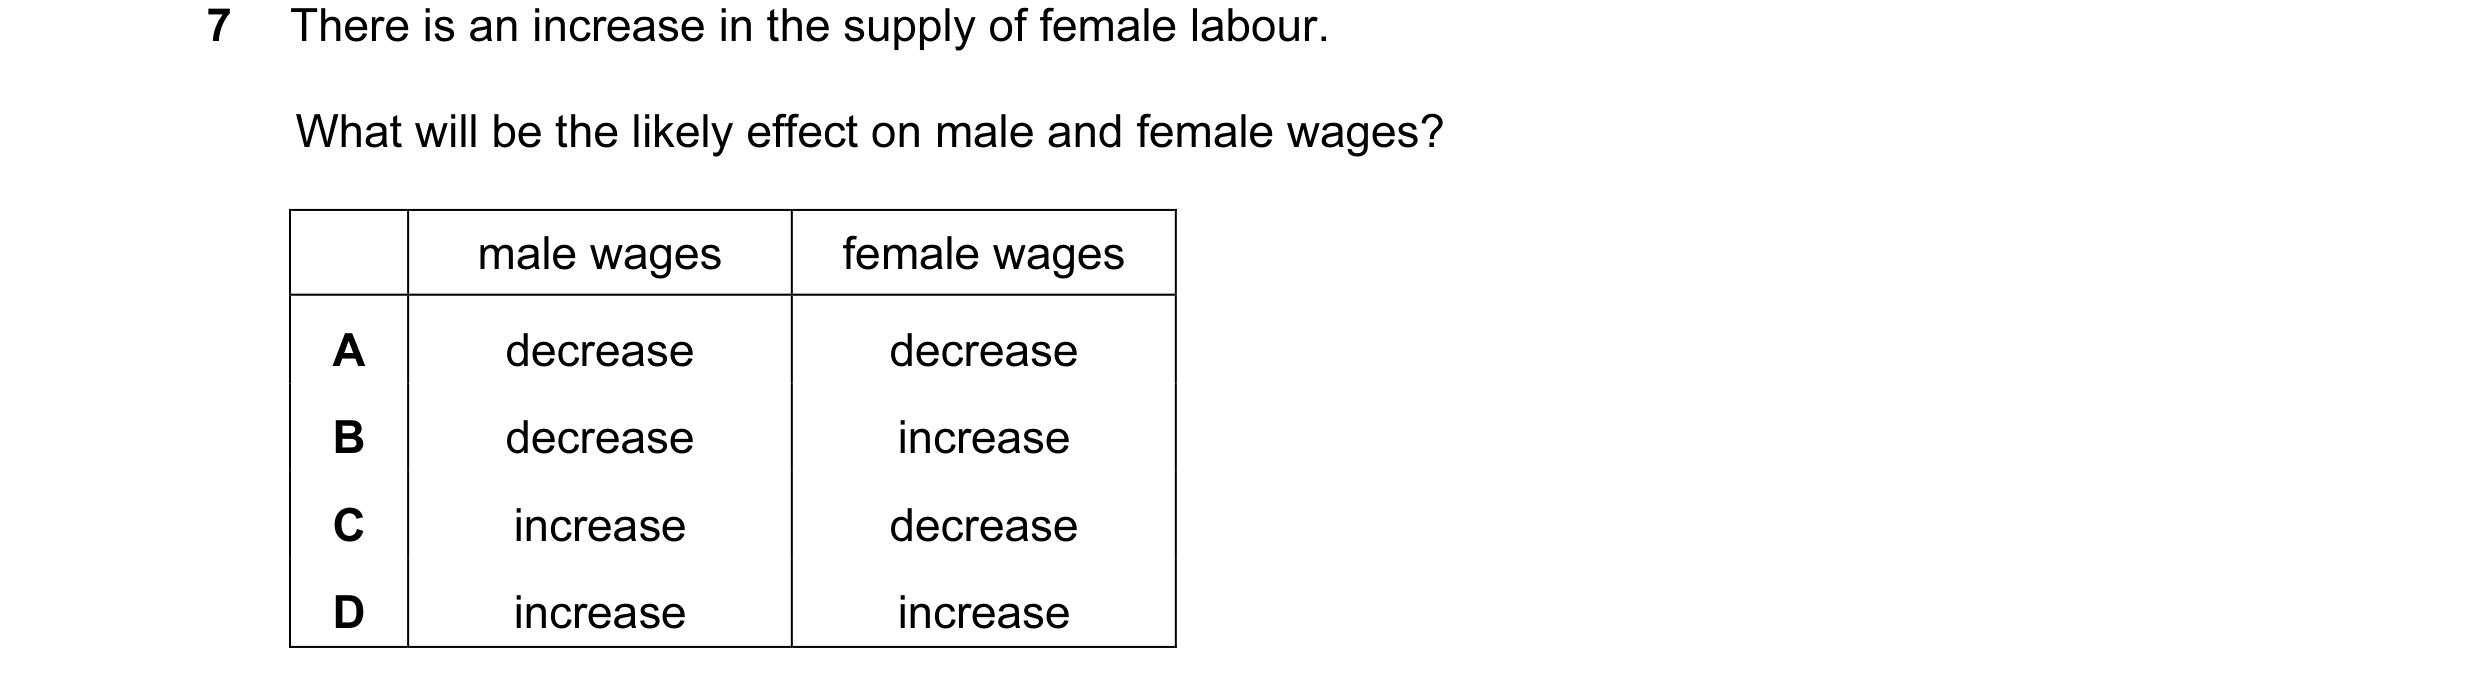 15 / 58
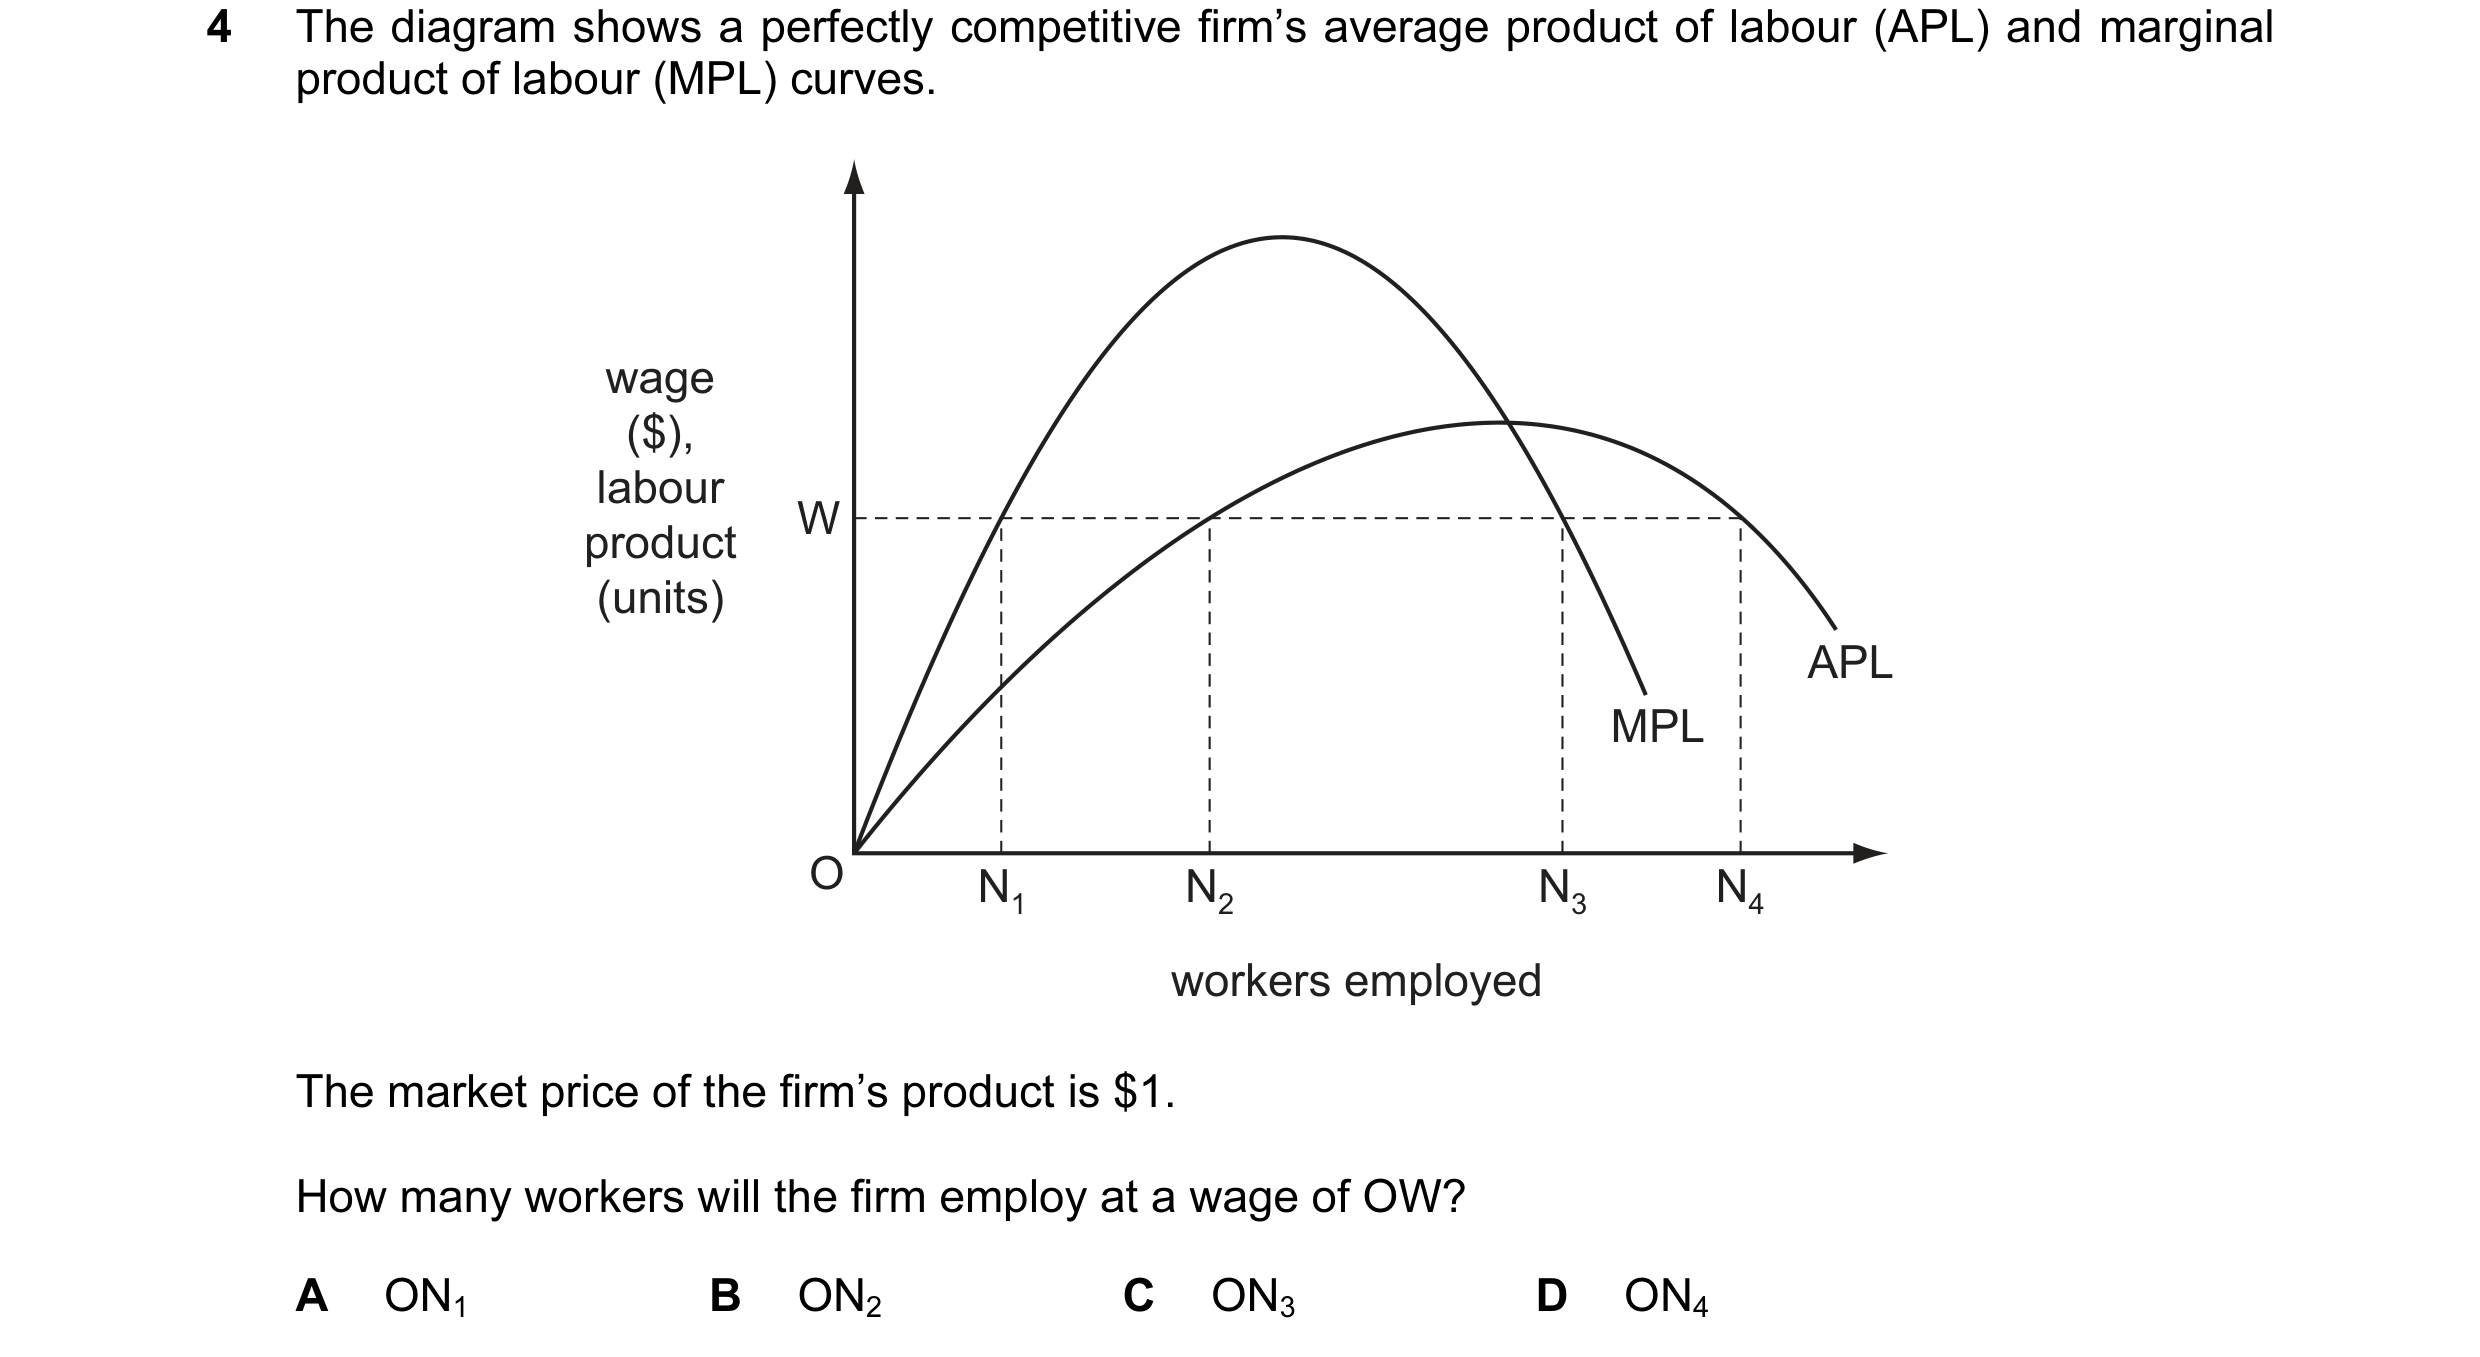
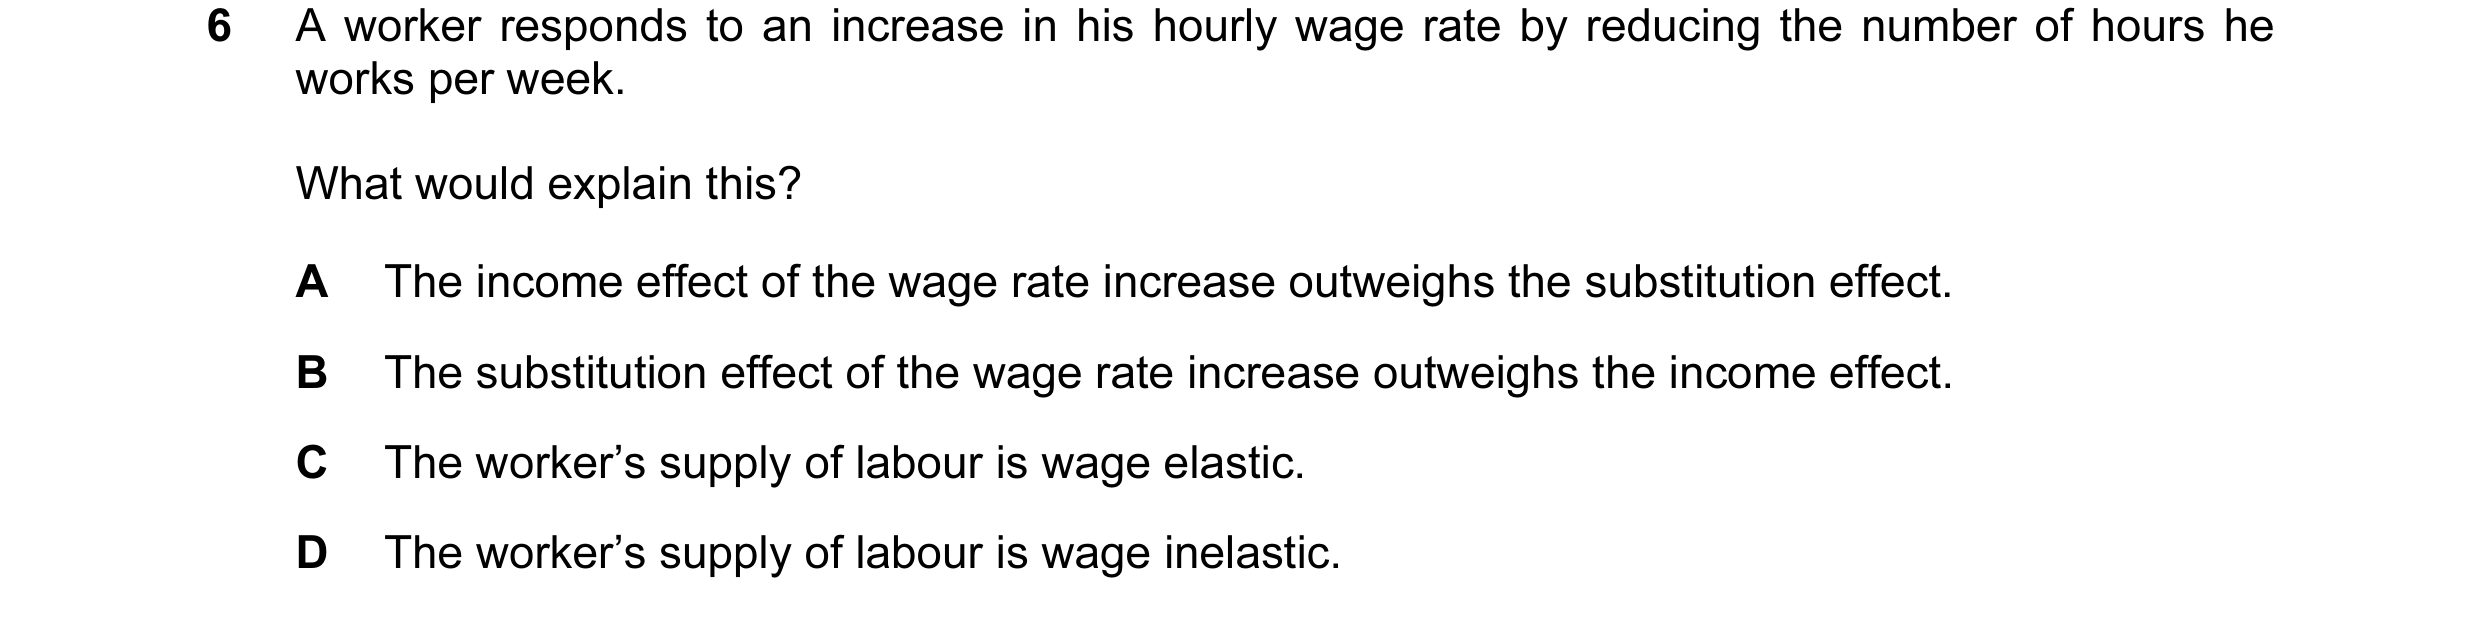
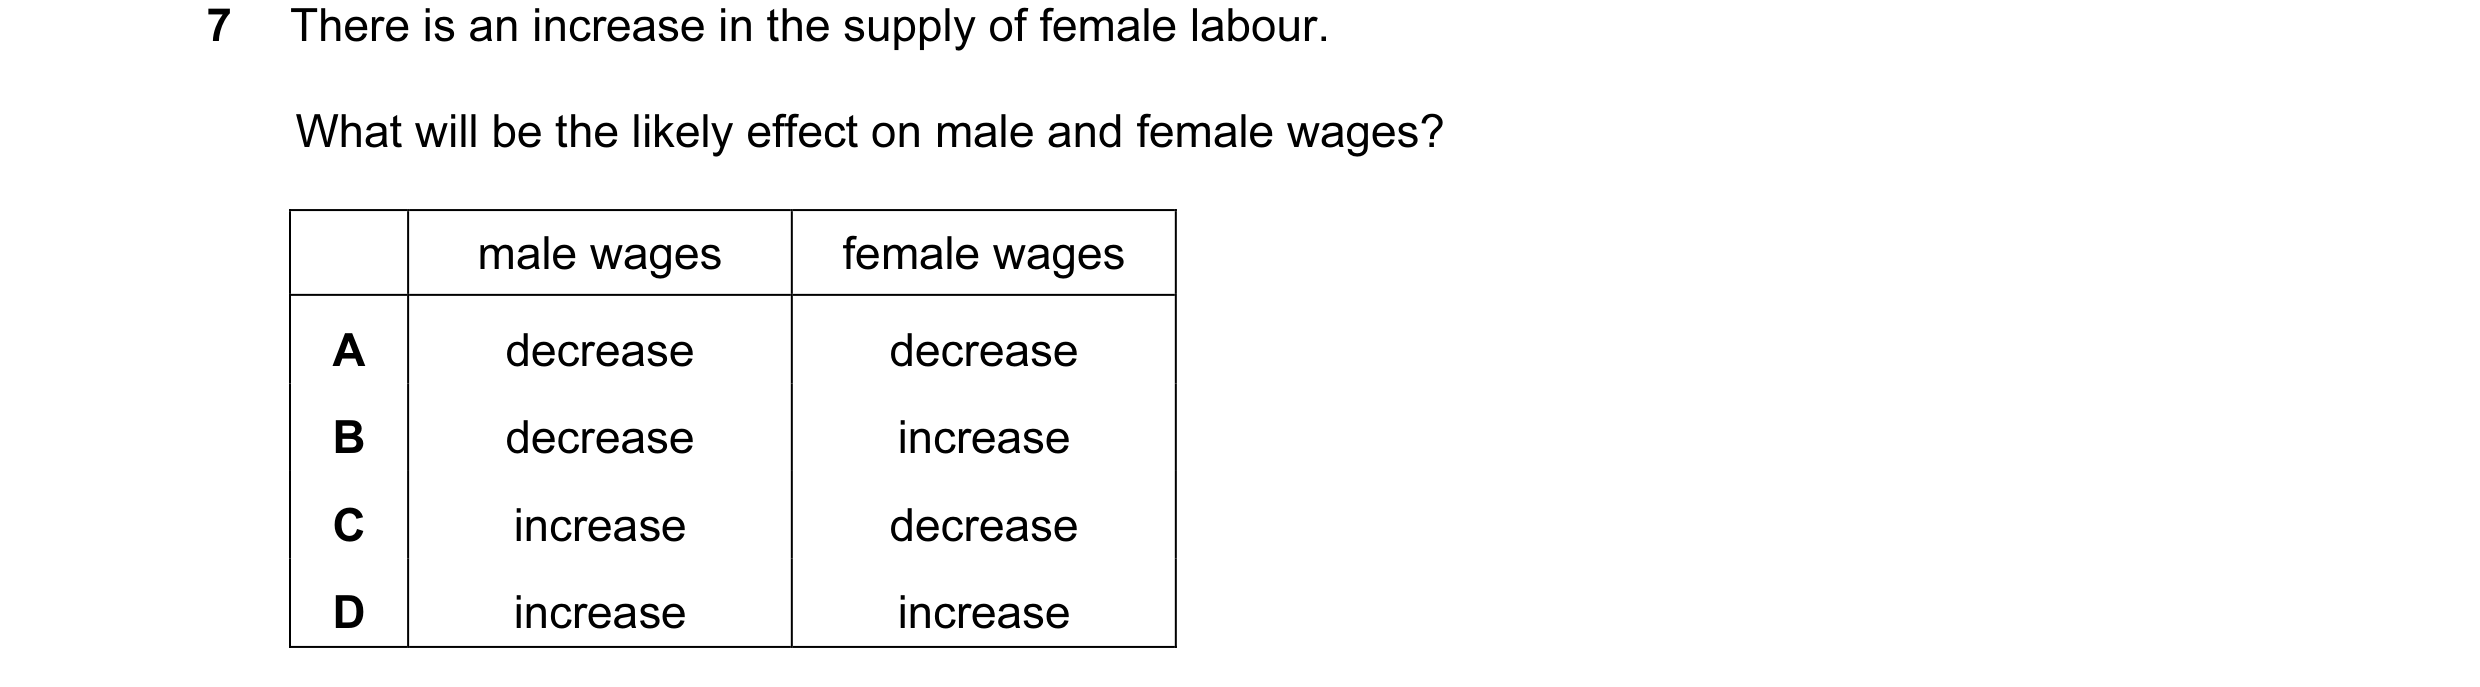 16 / 58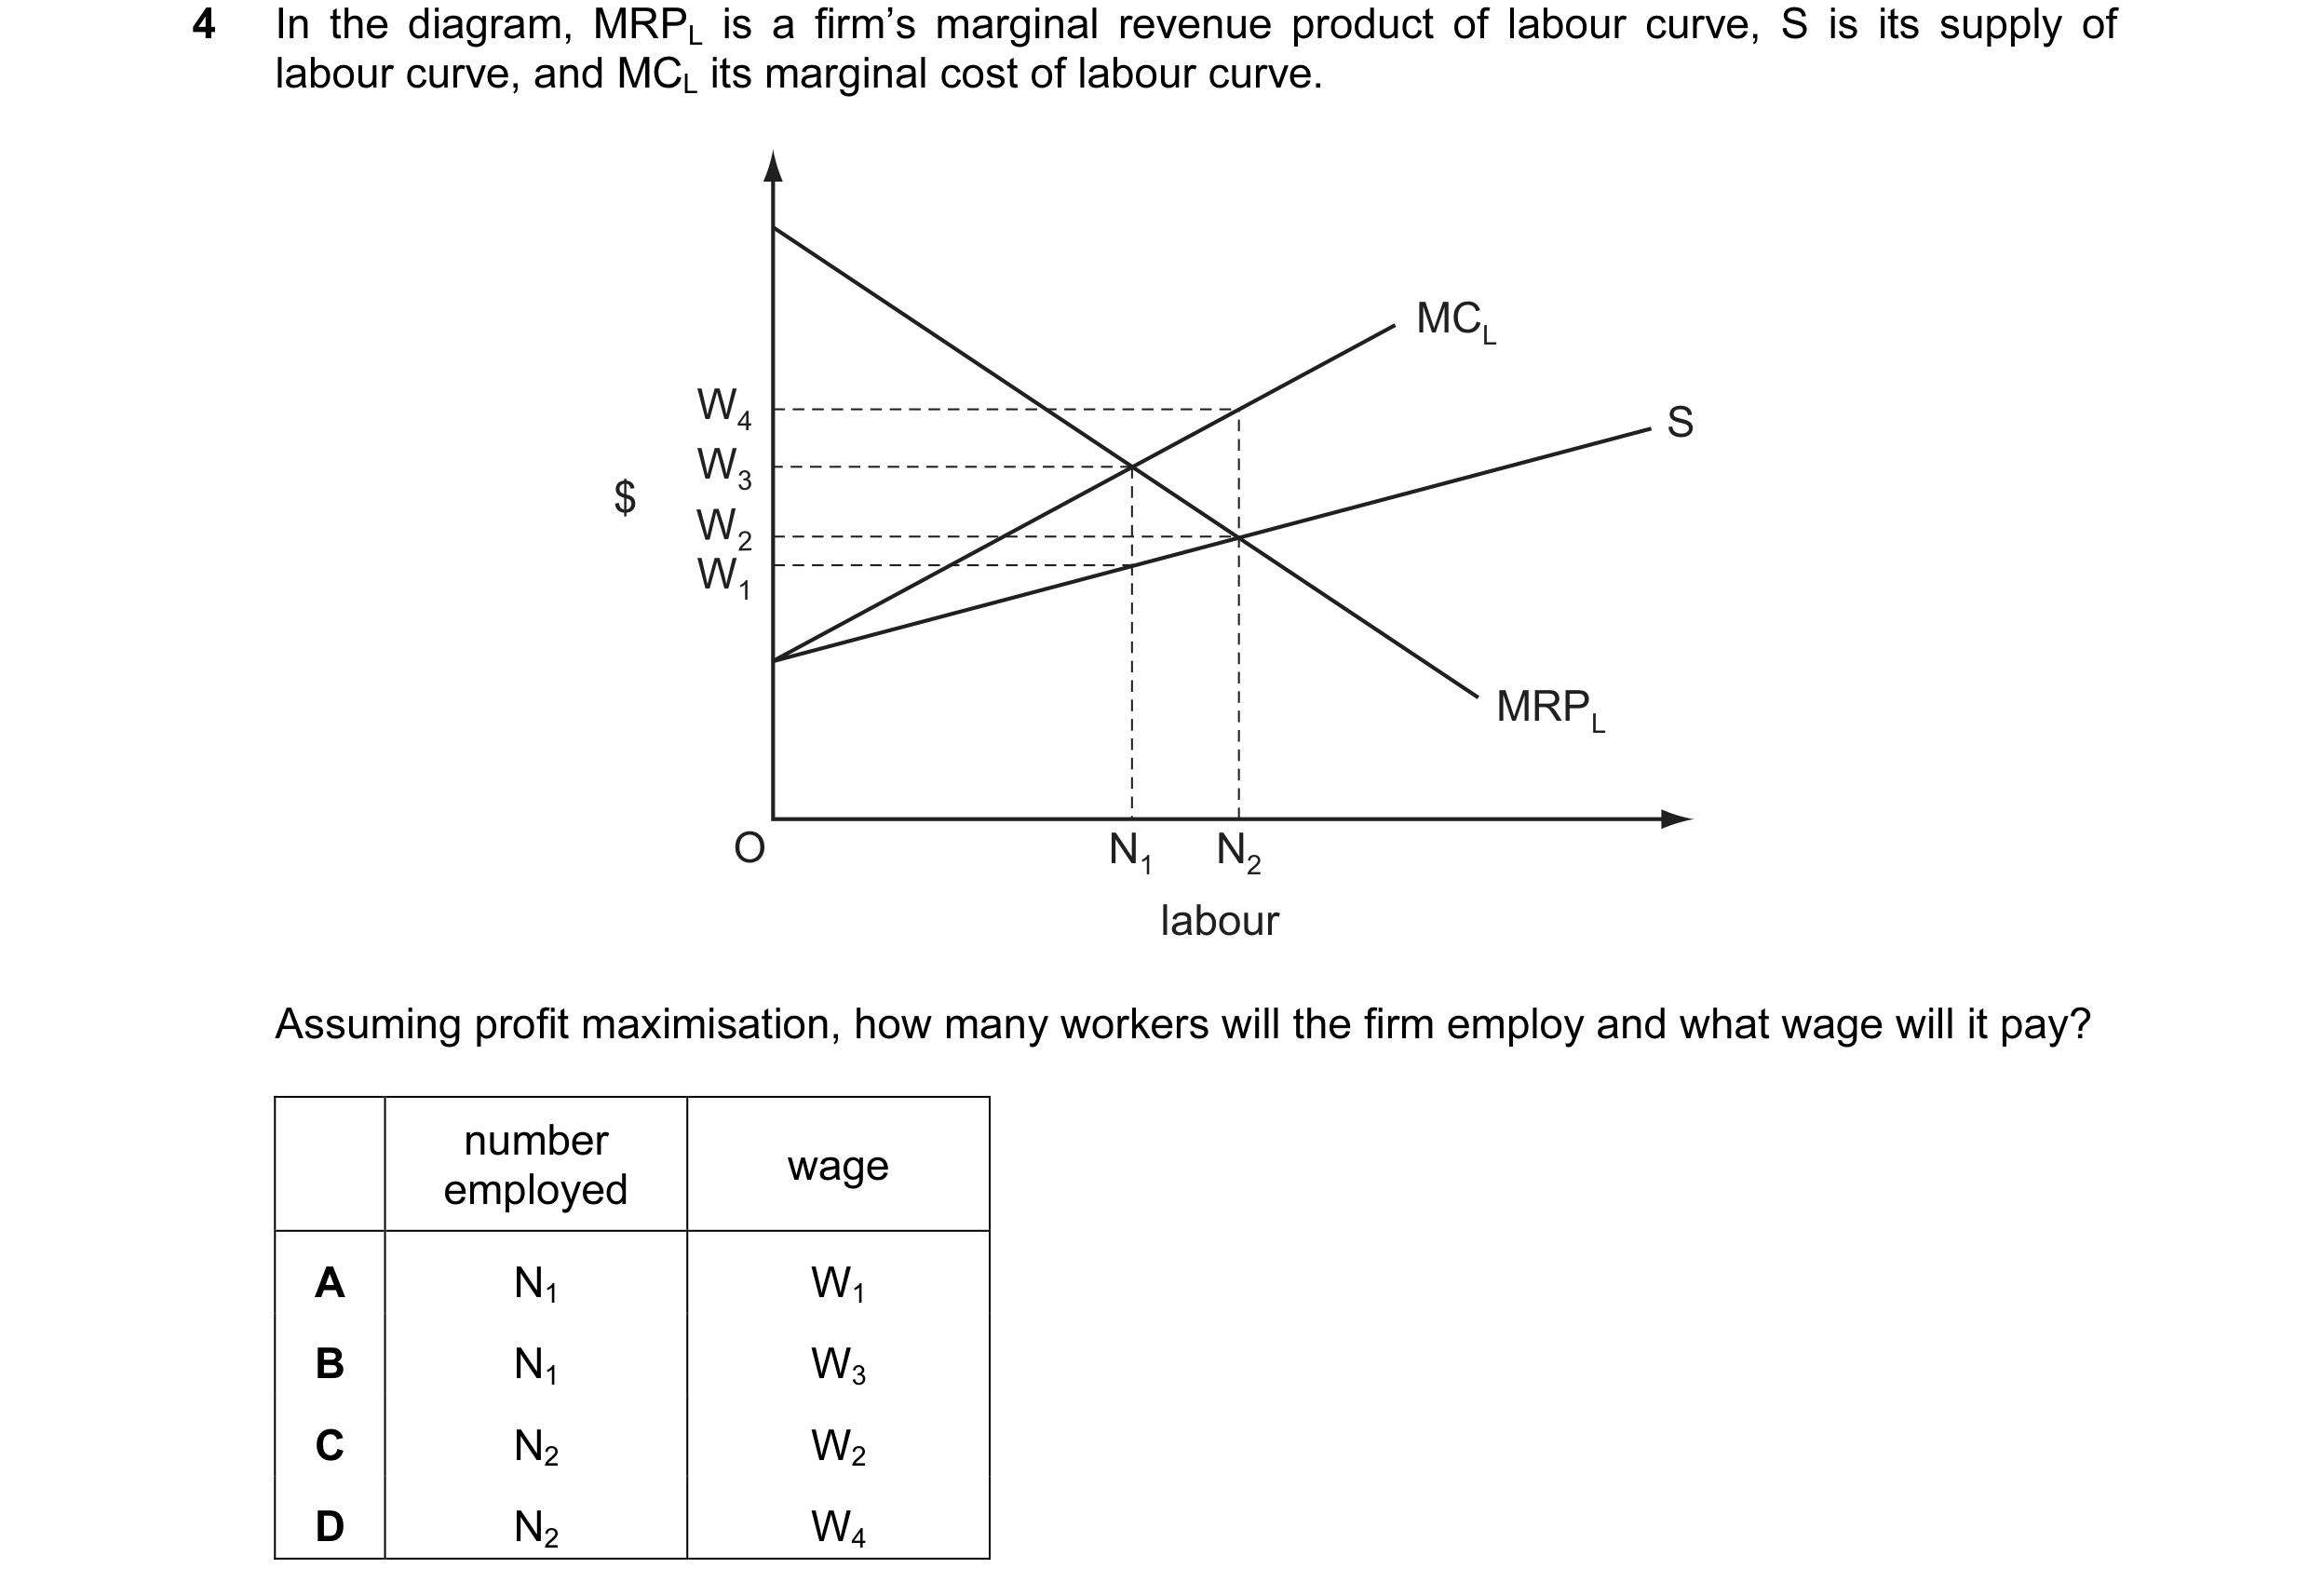
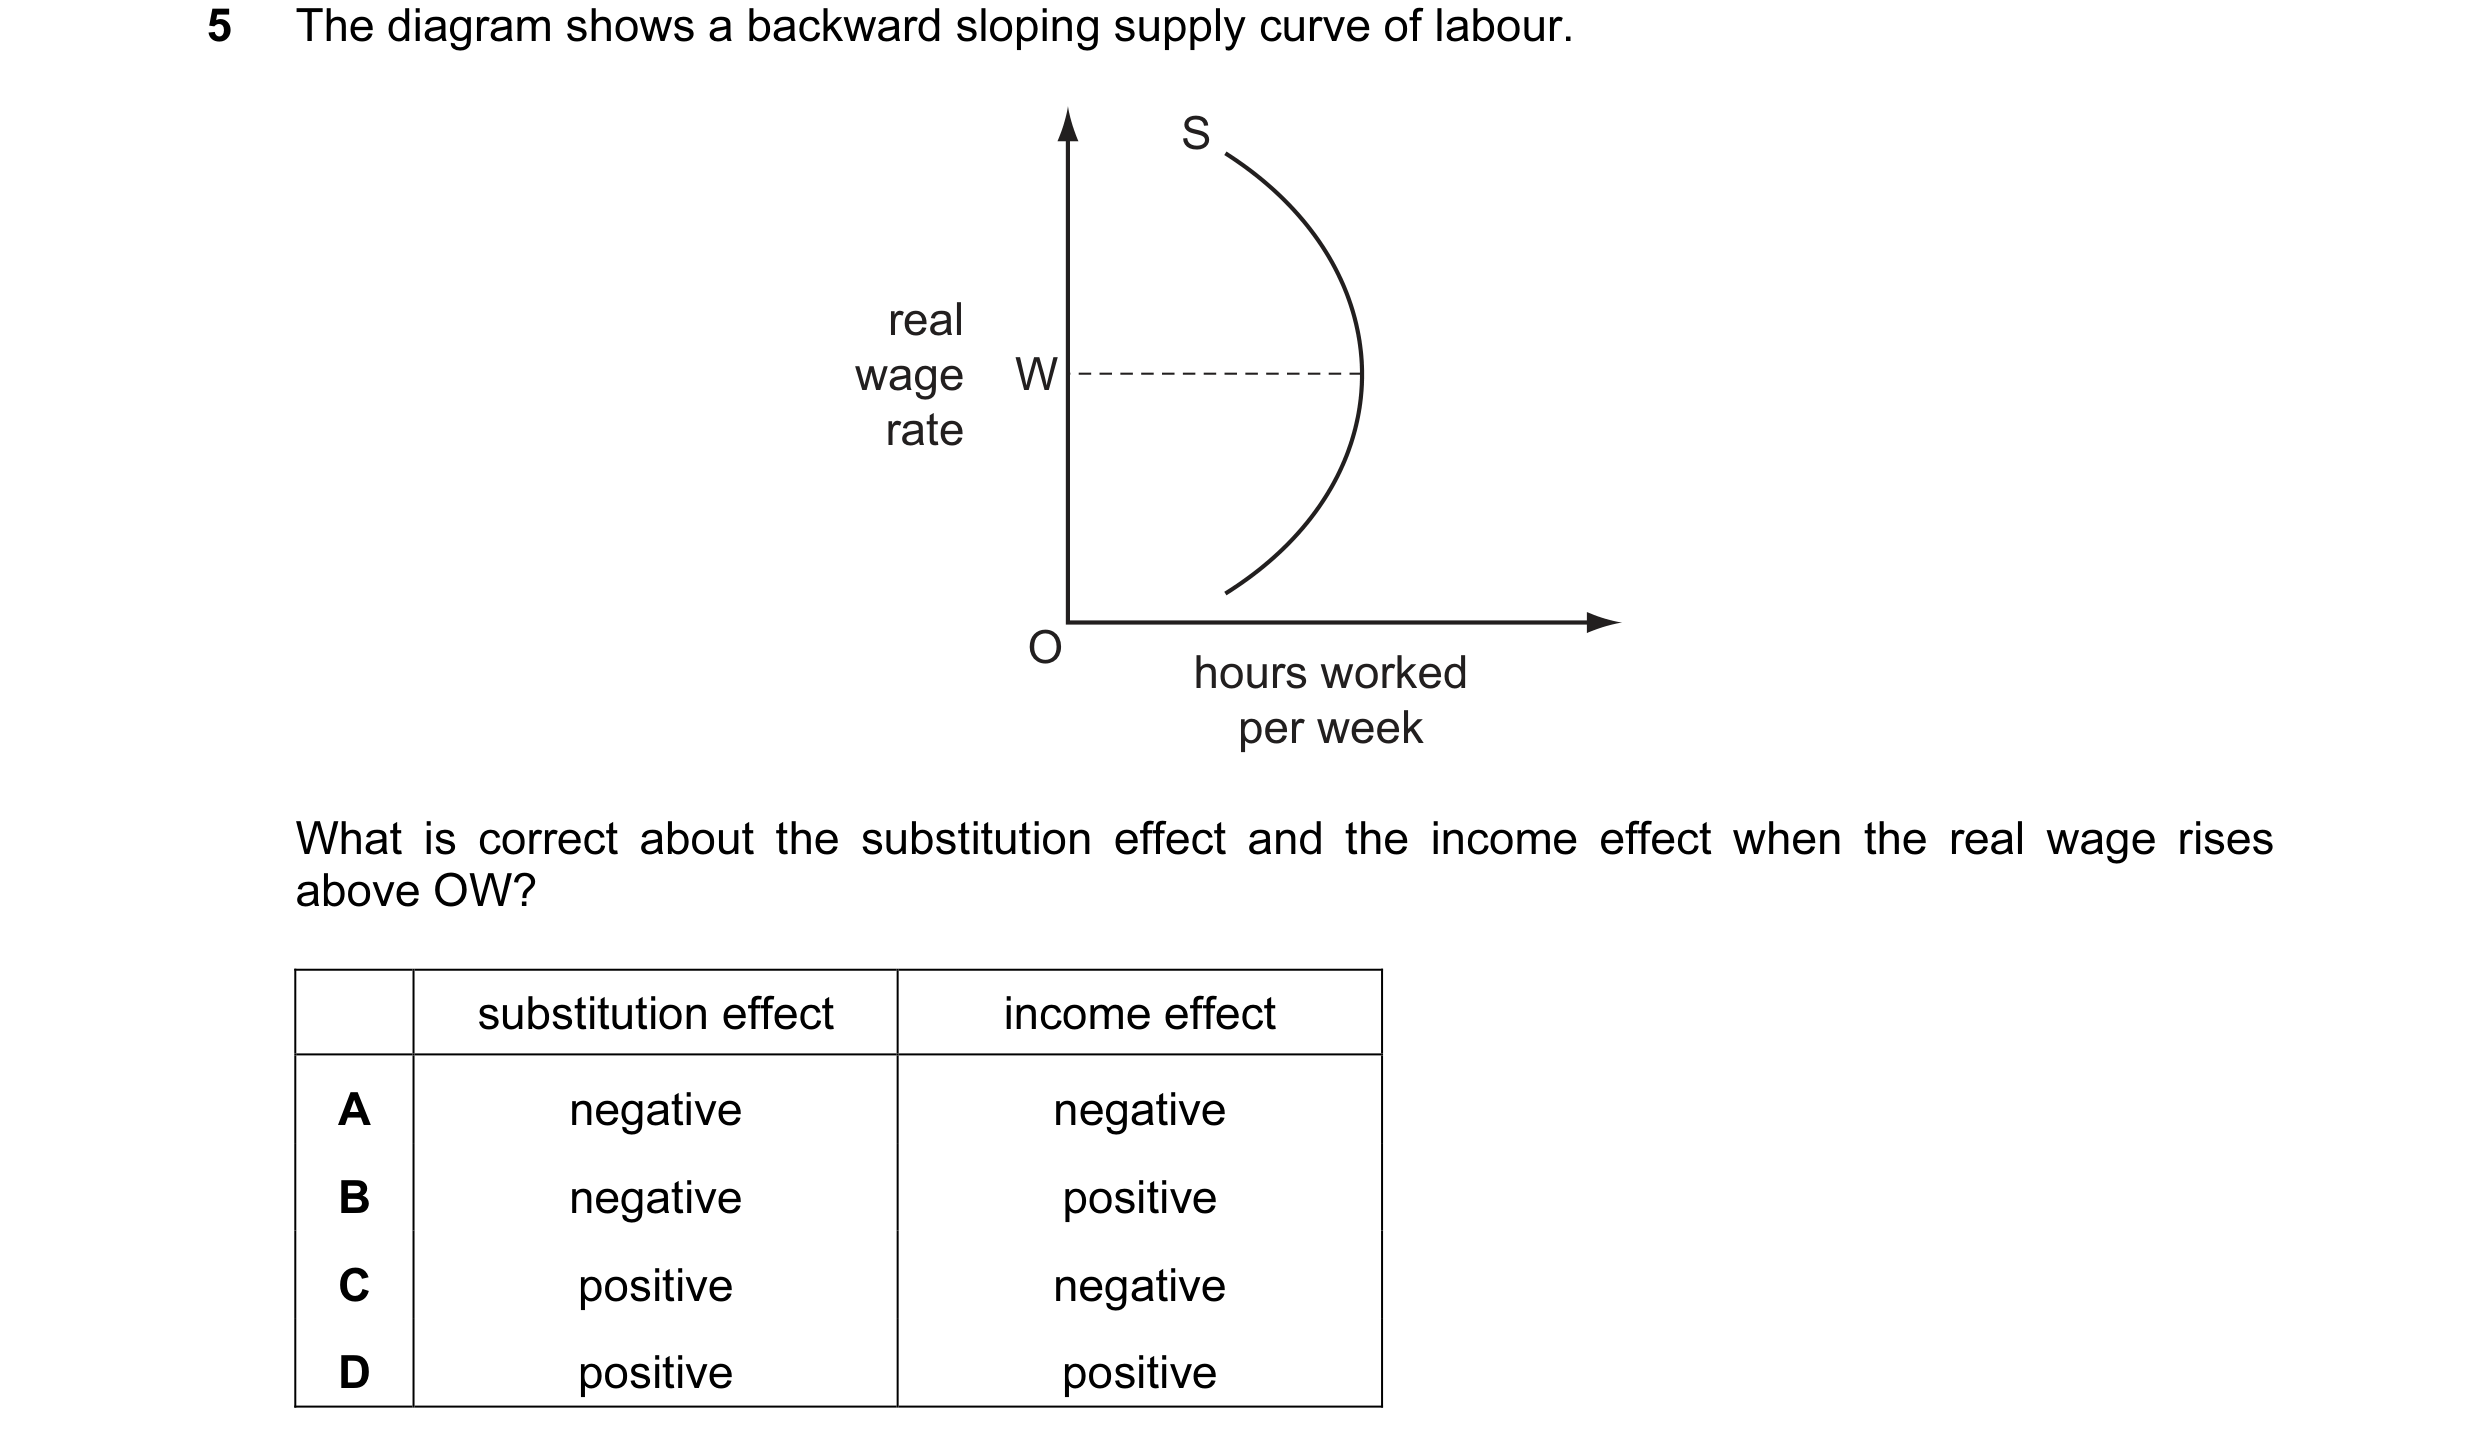 17 / 58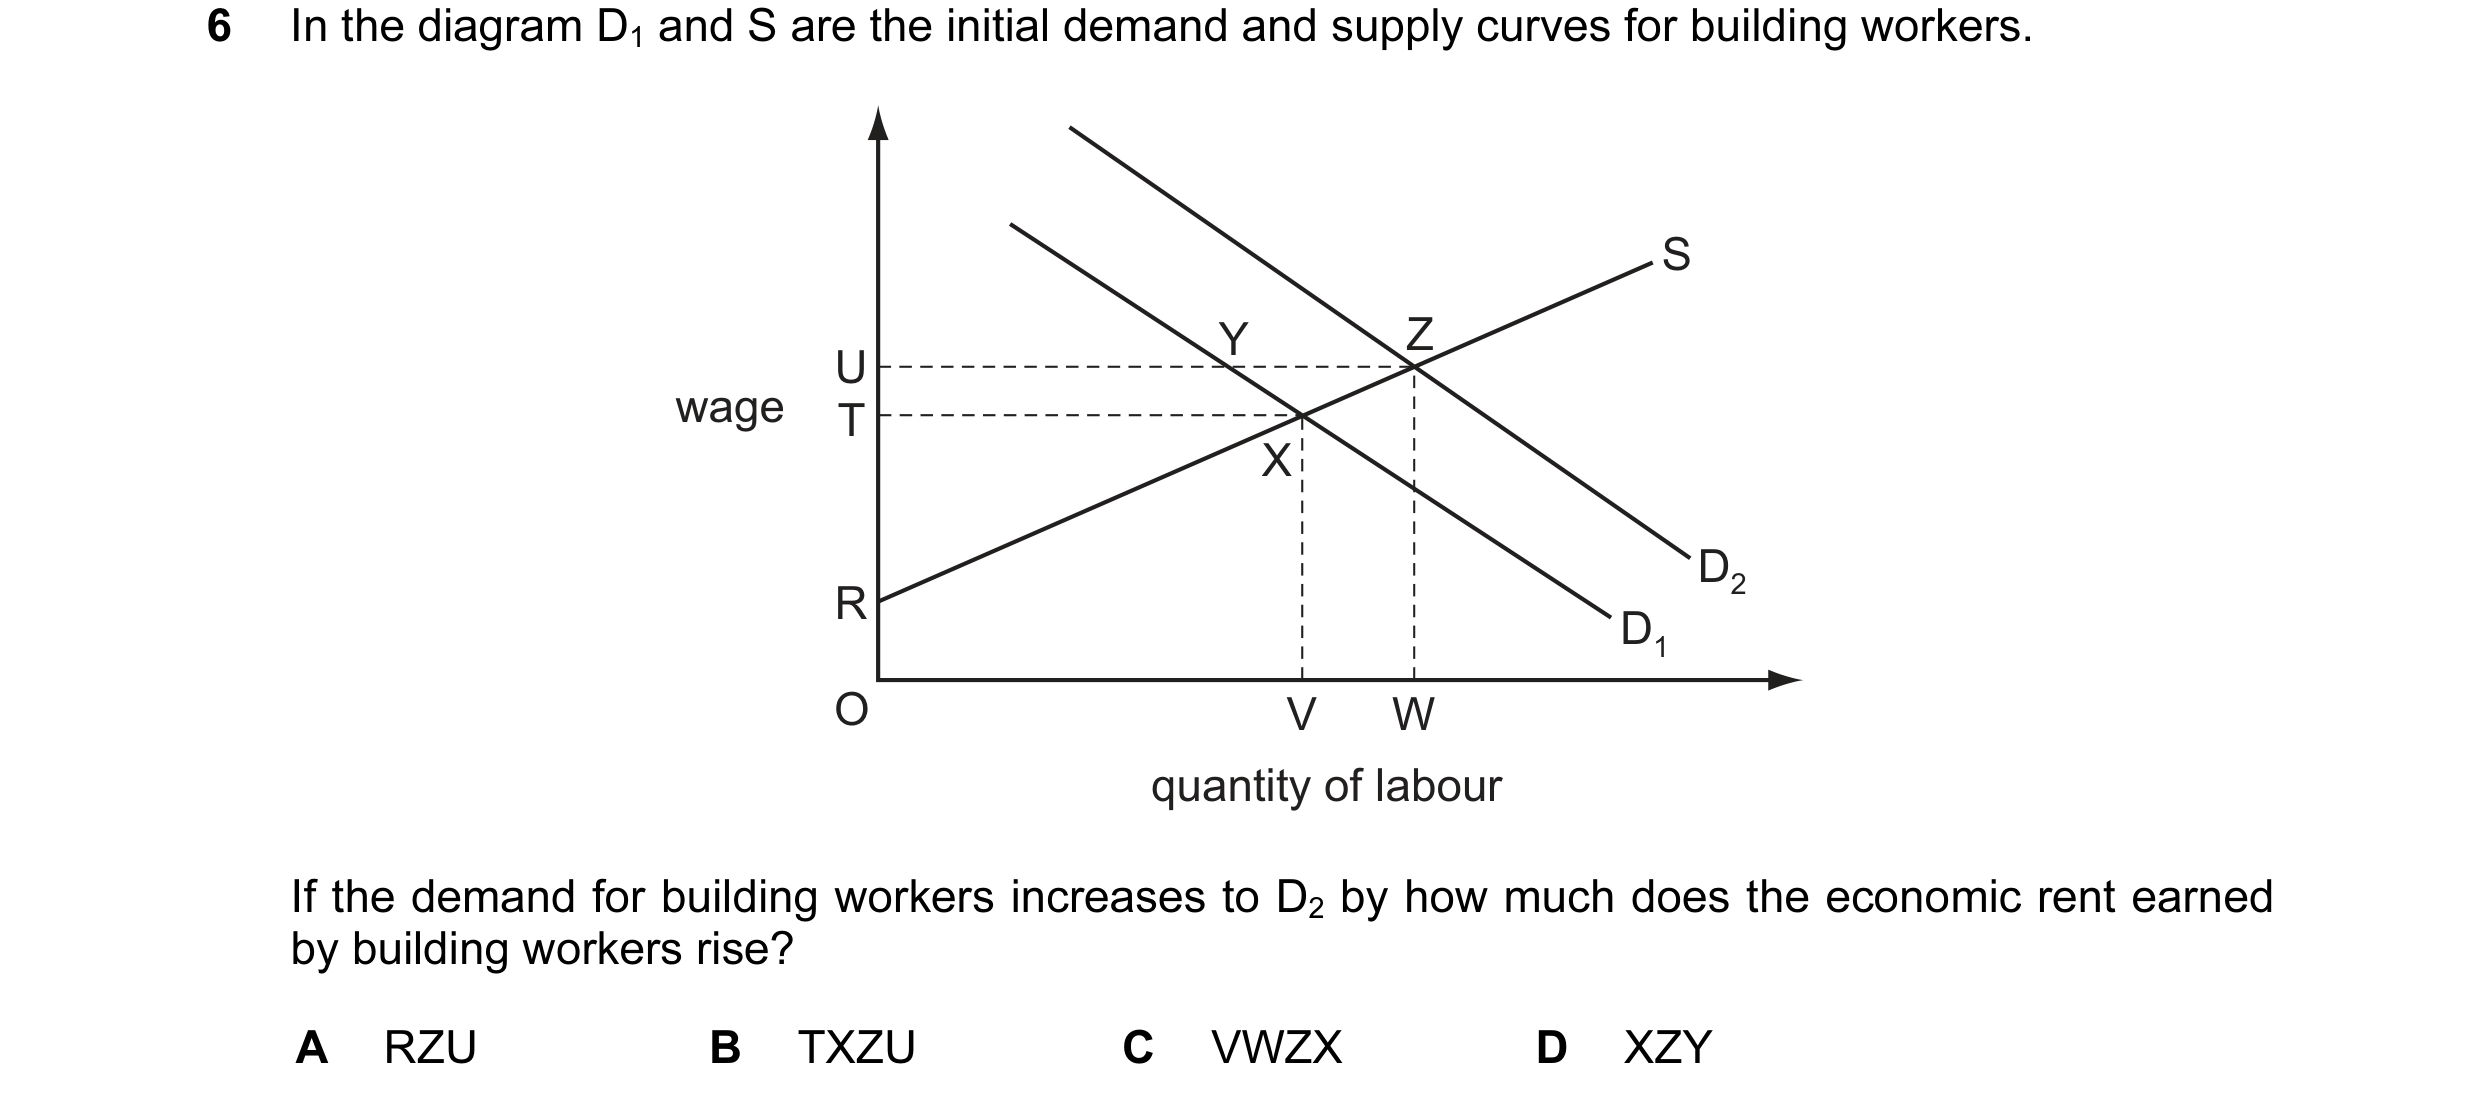
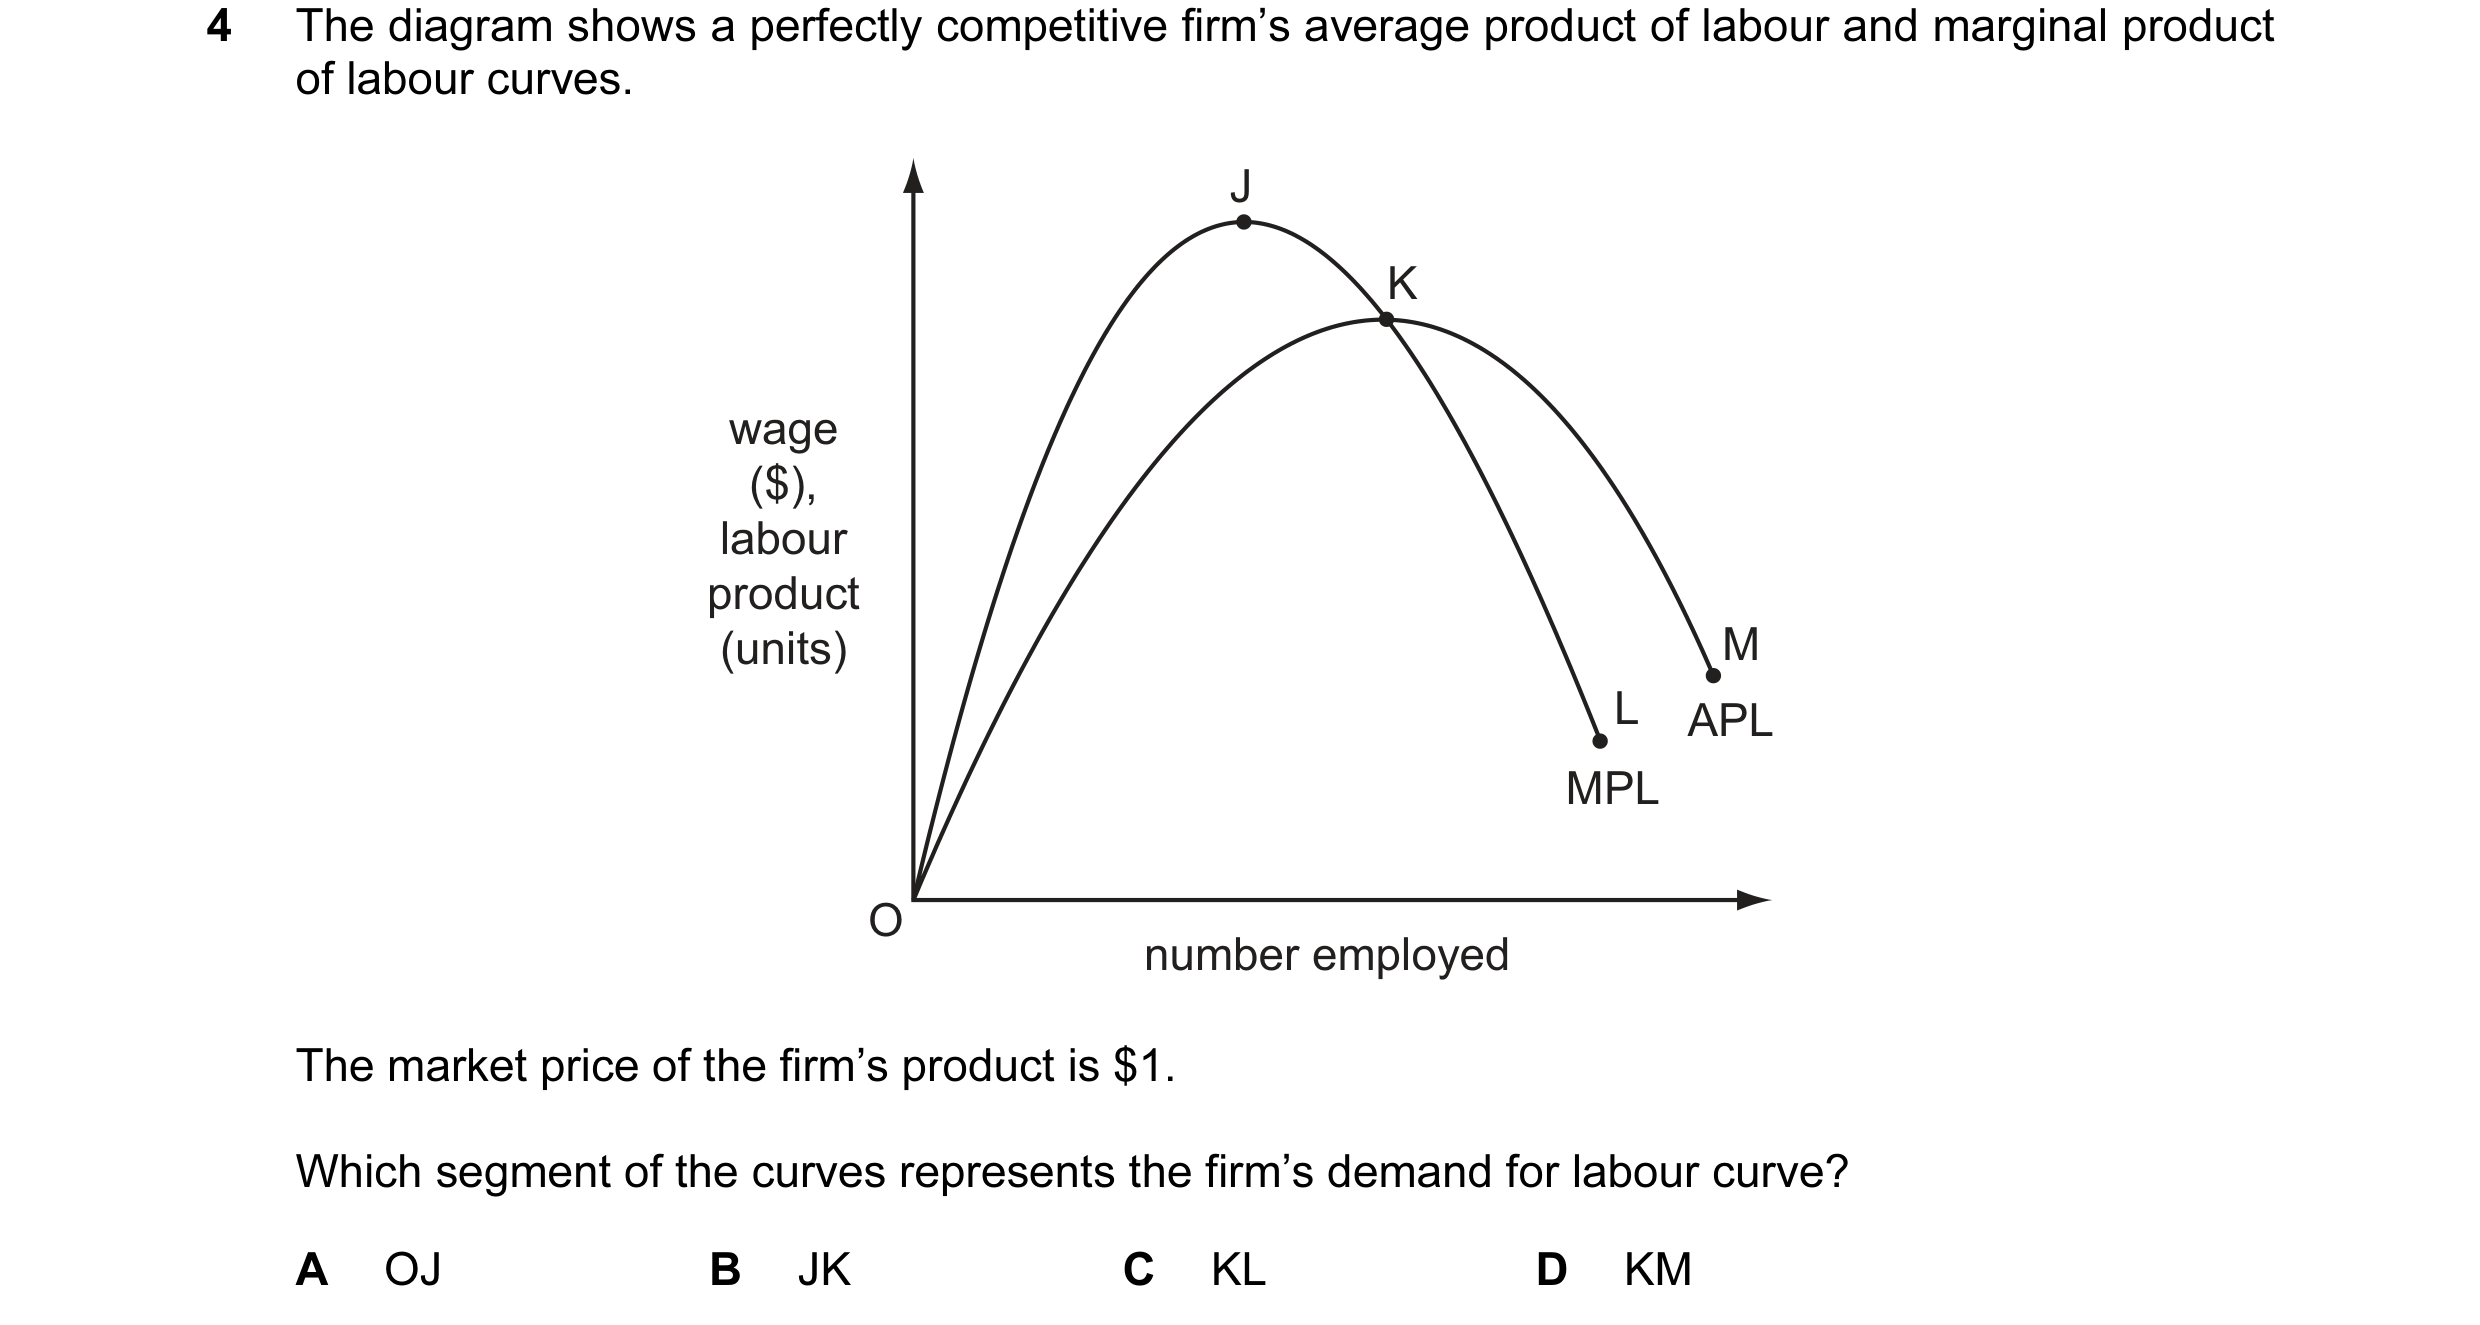
 18 / 58
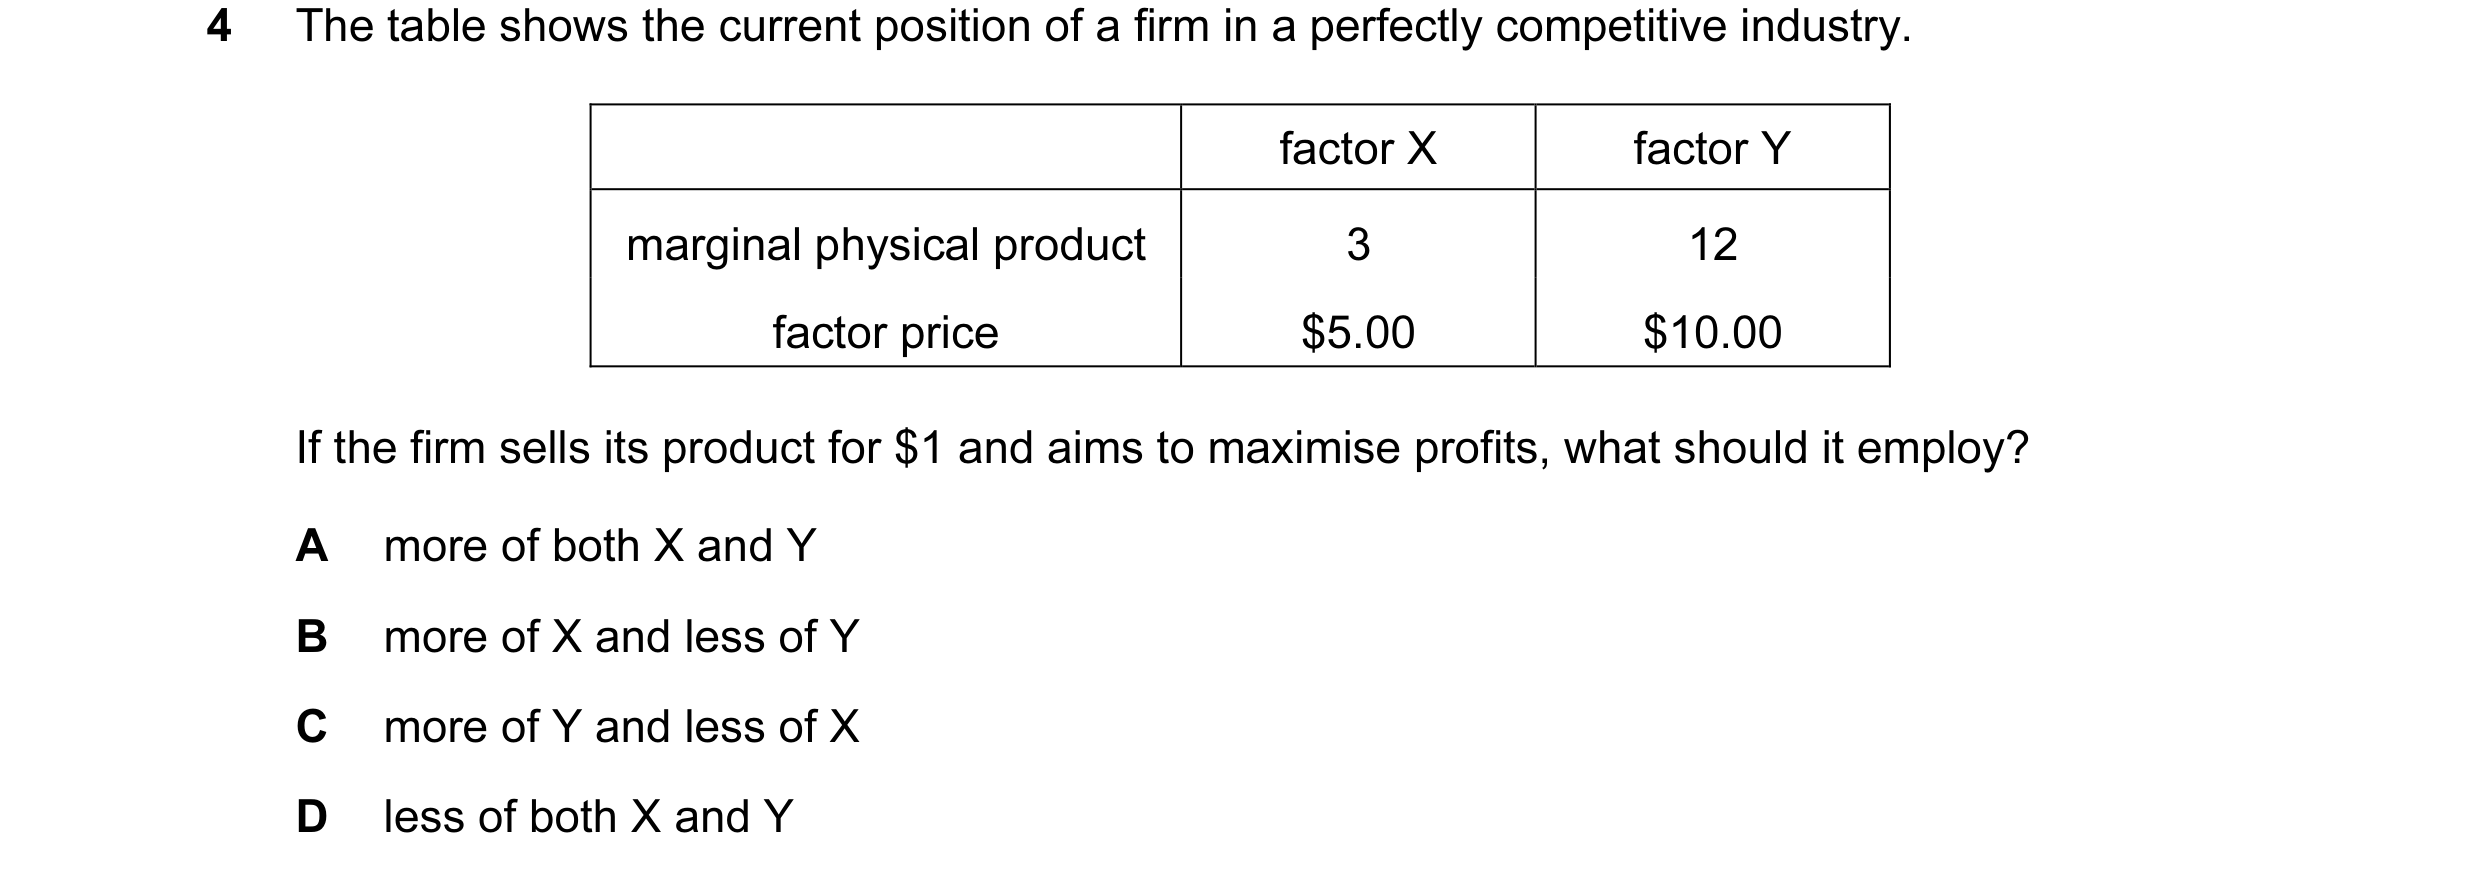 19 / 58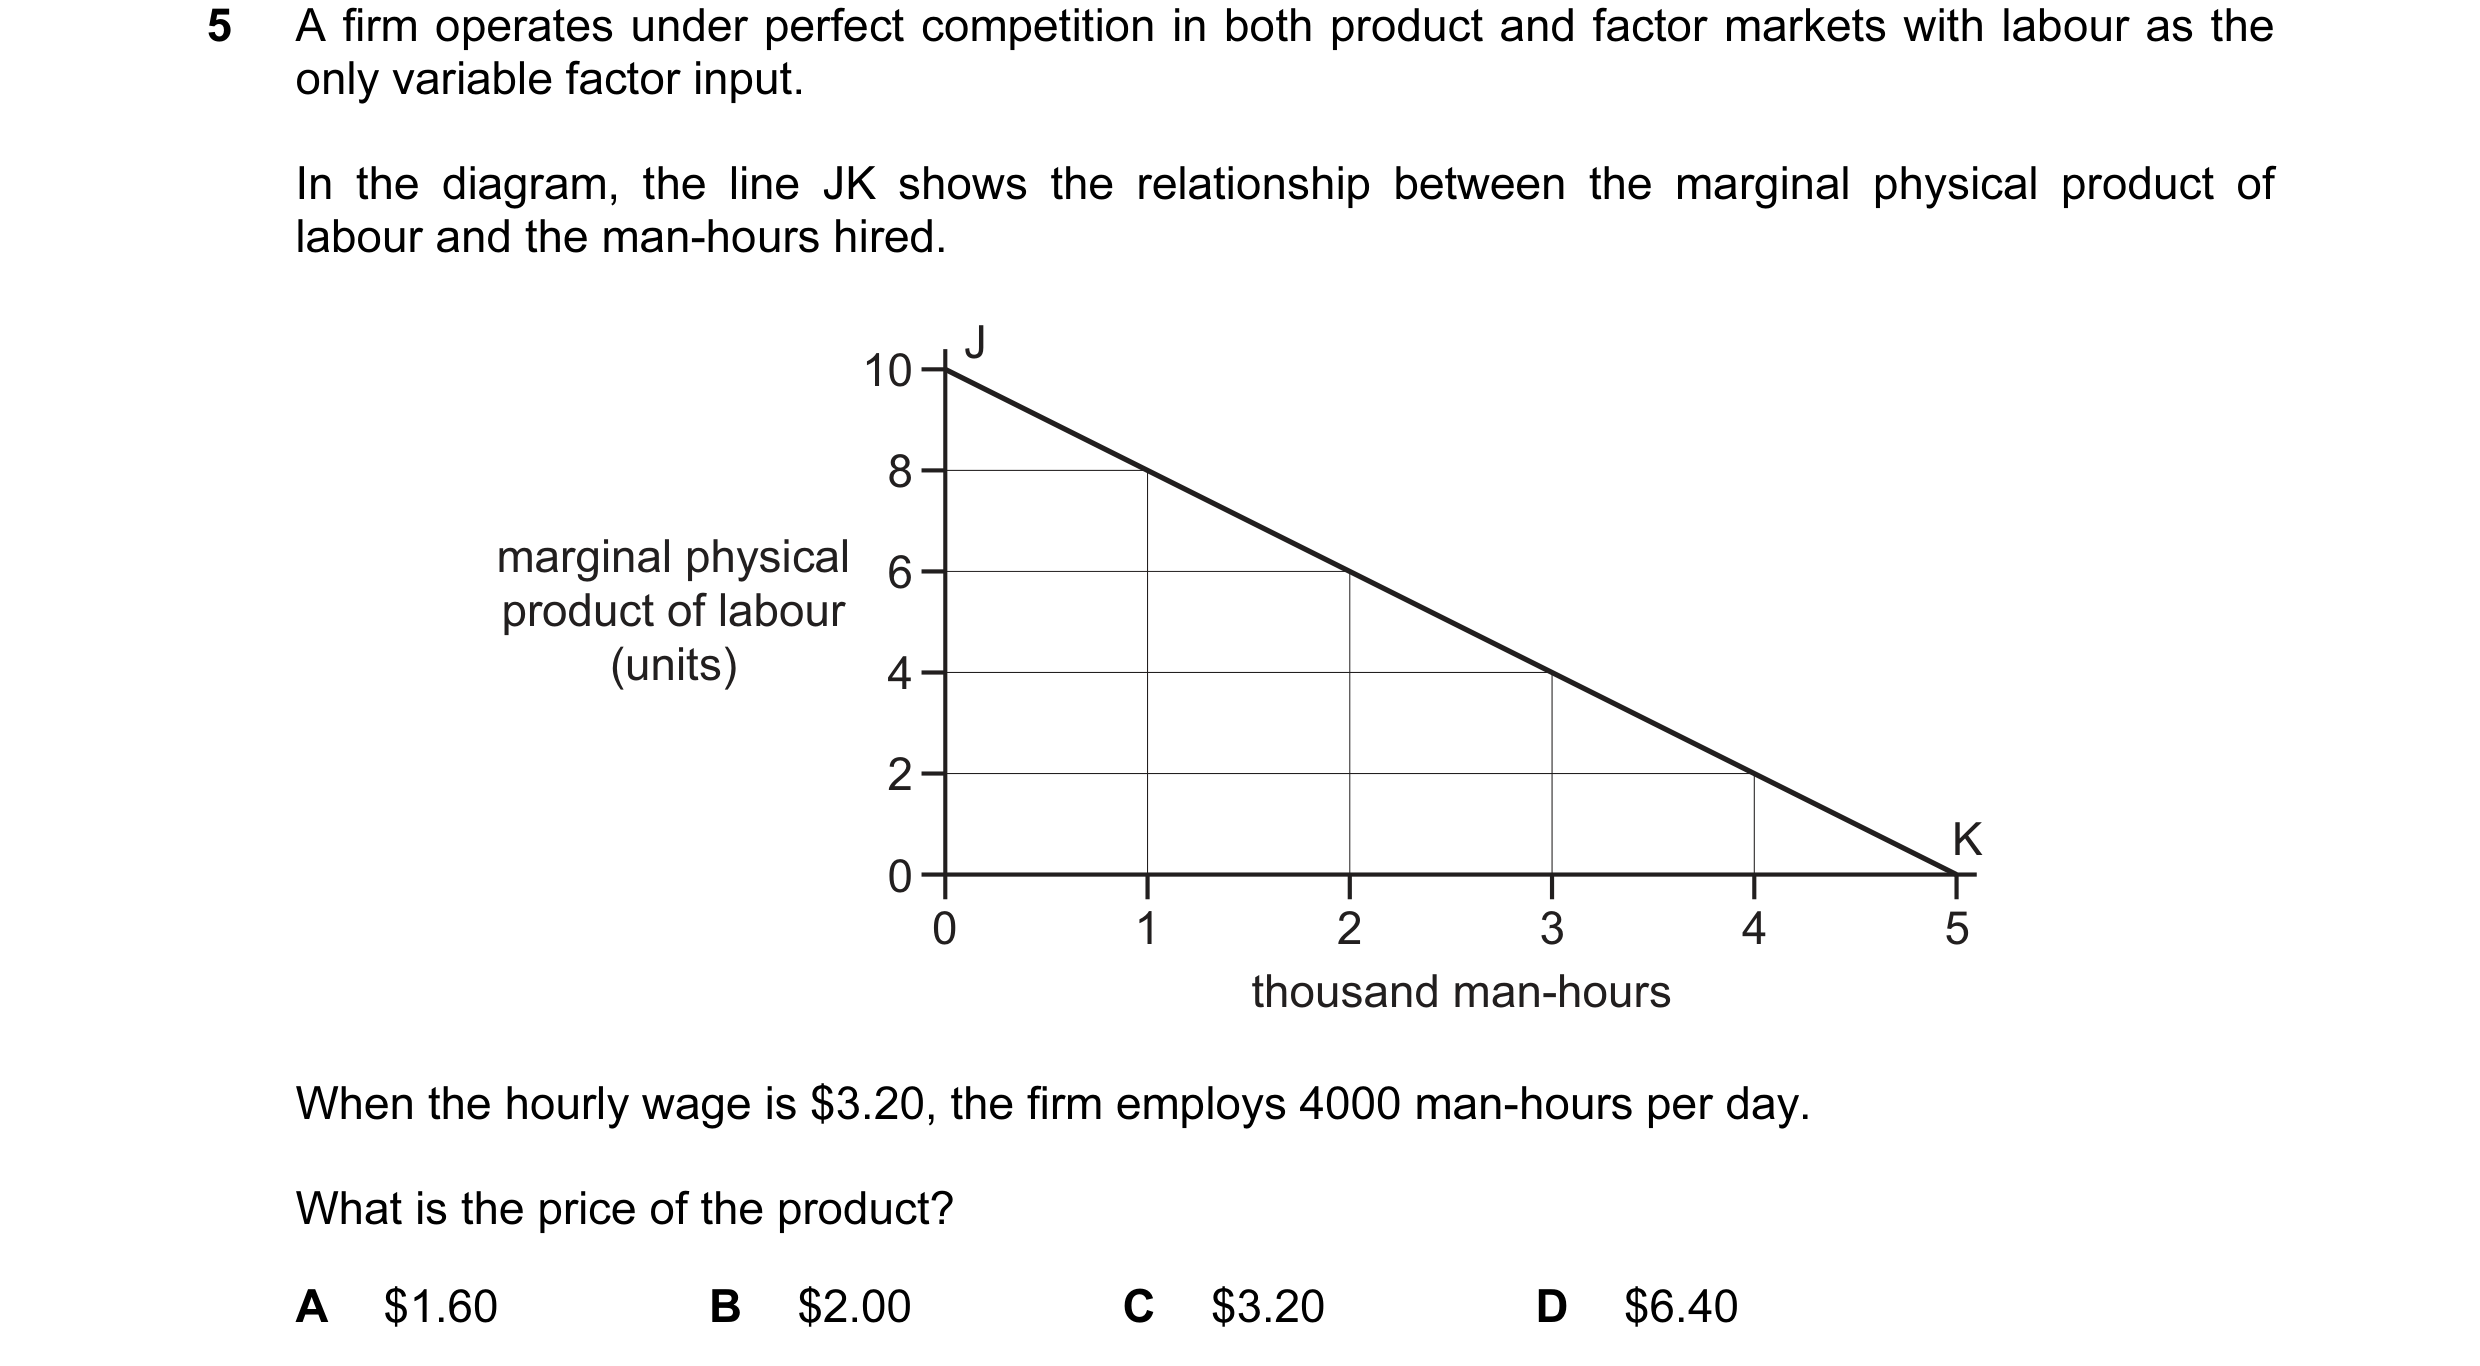
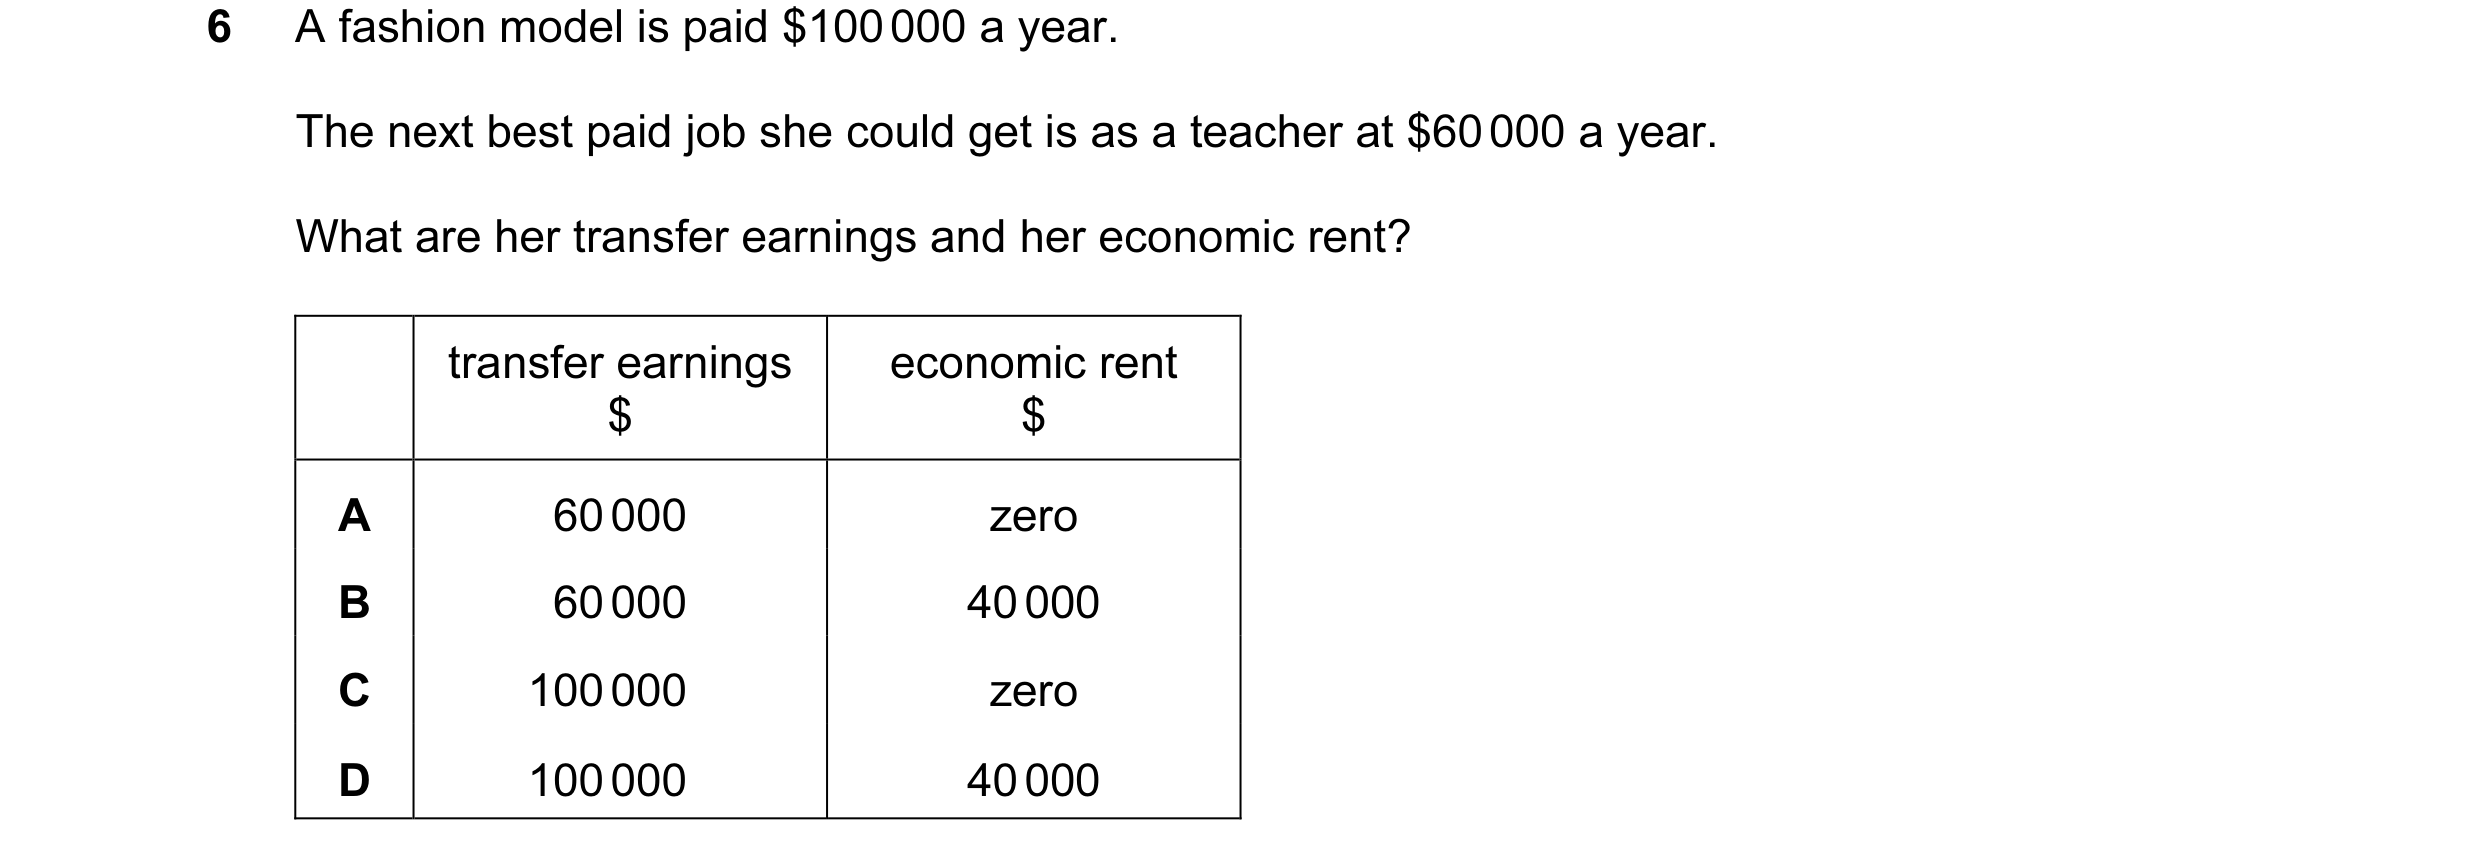
 20 / 58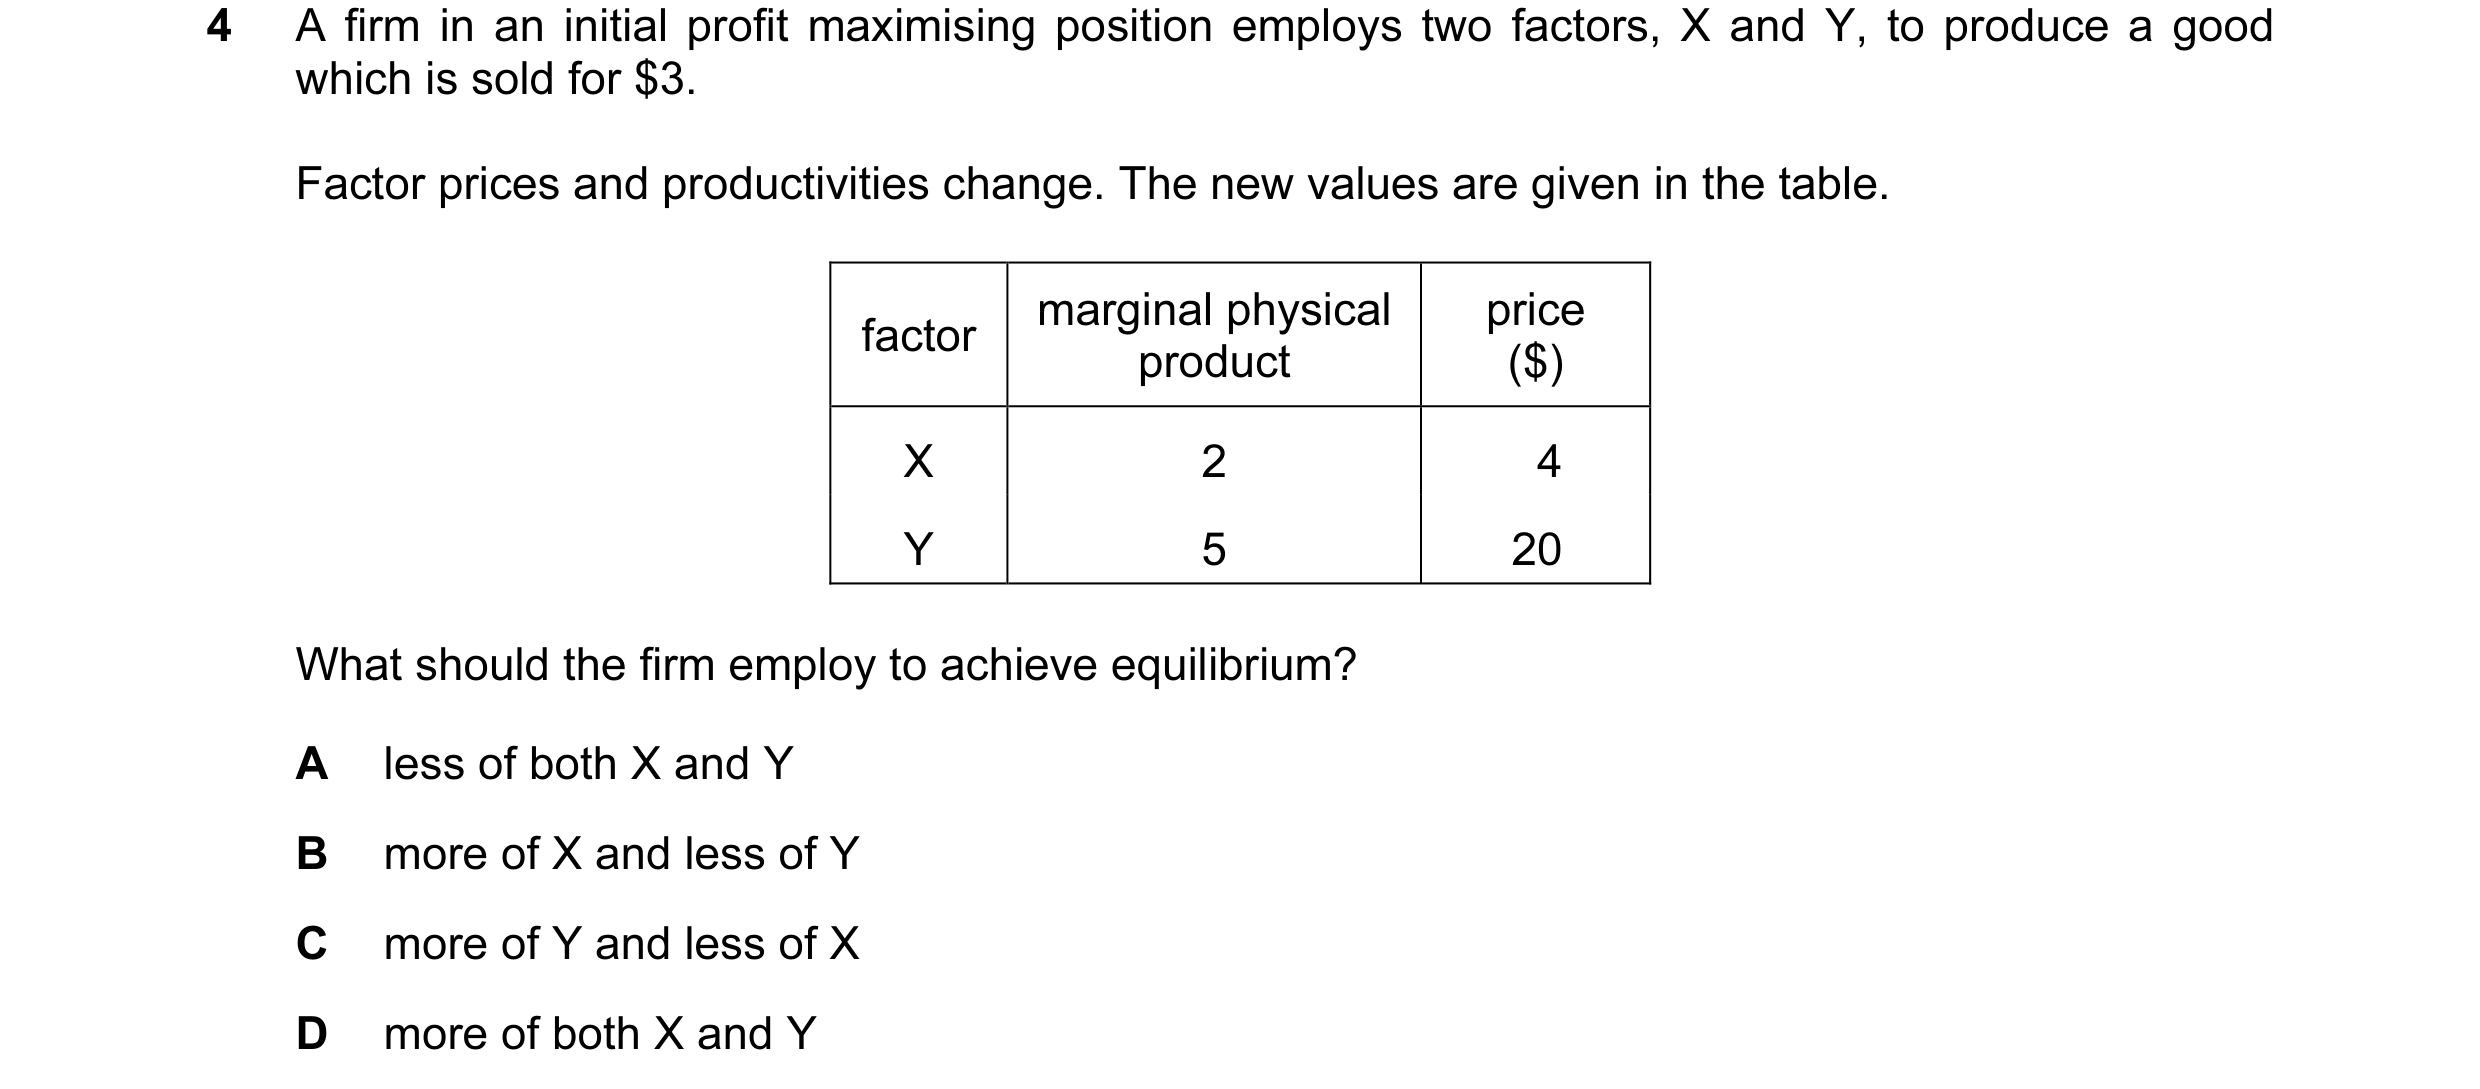
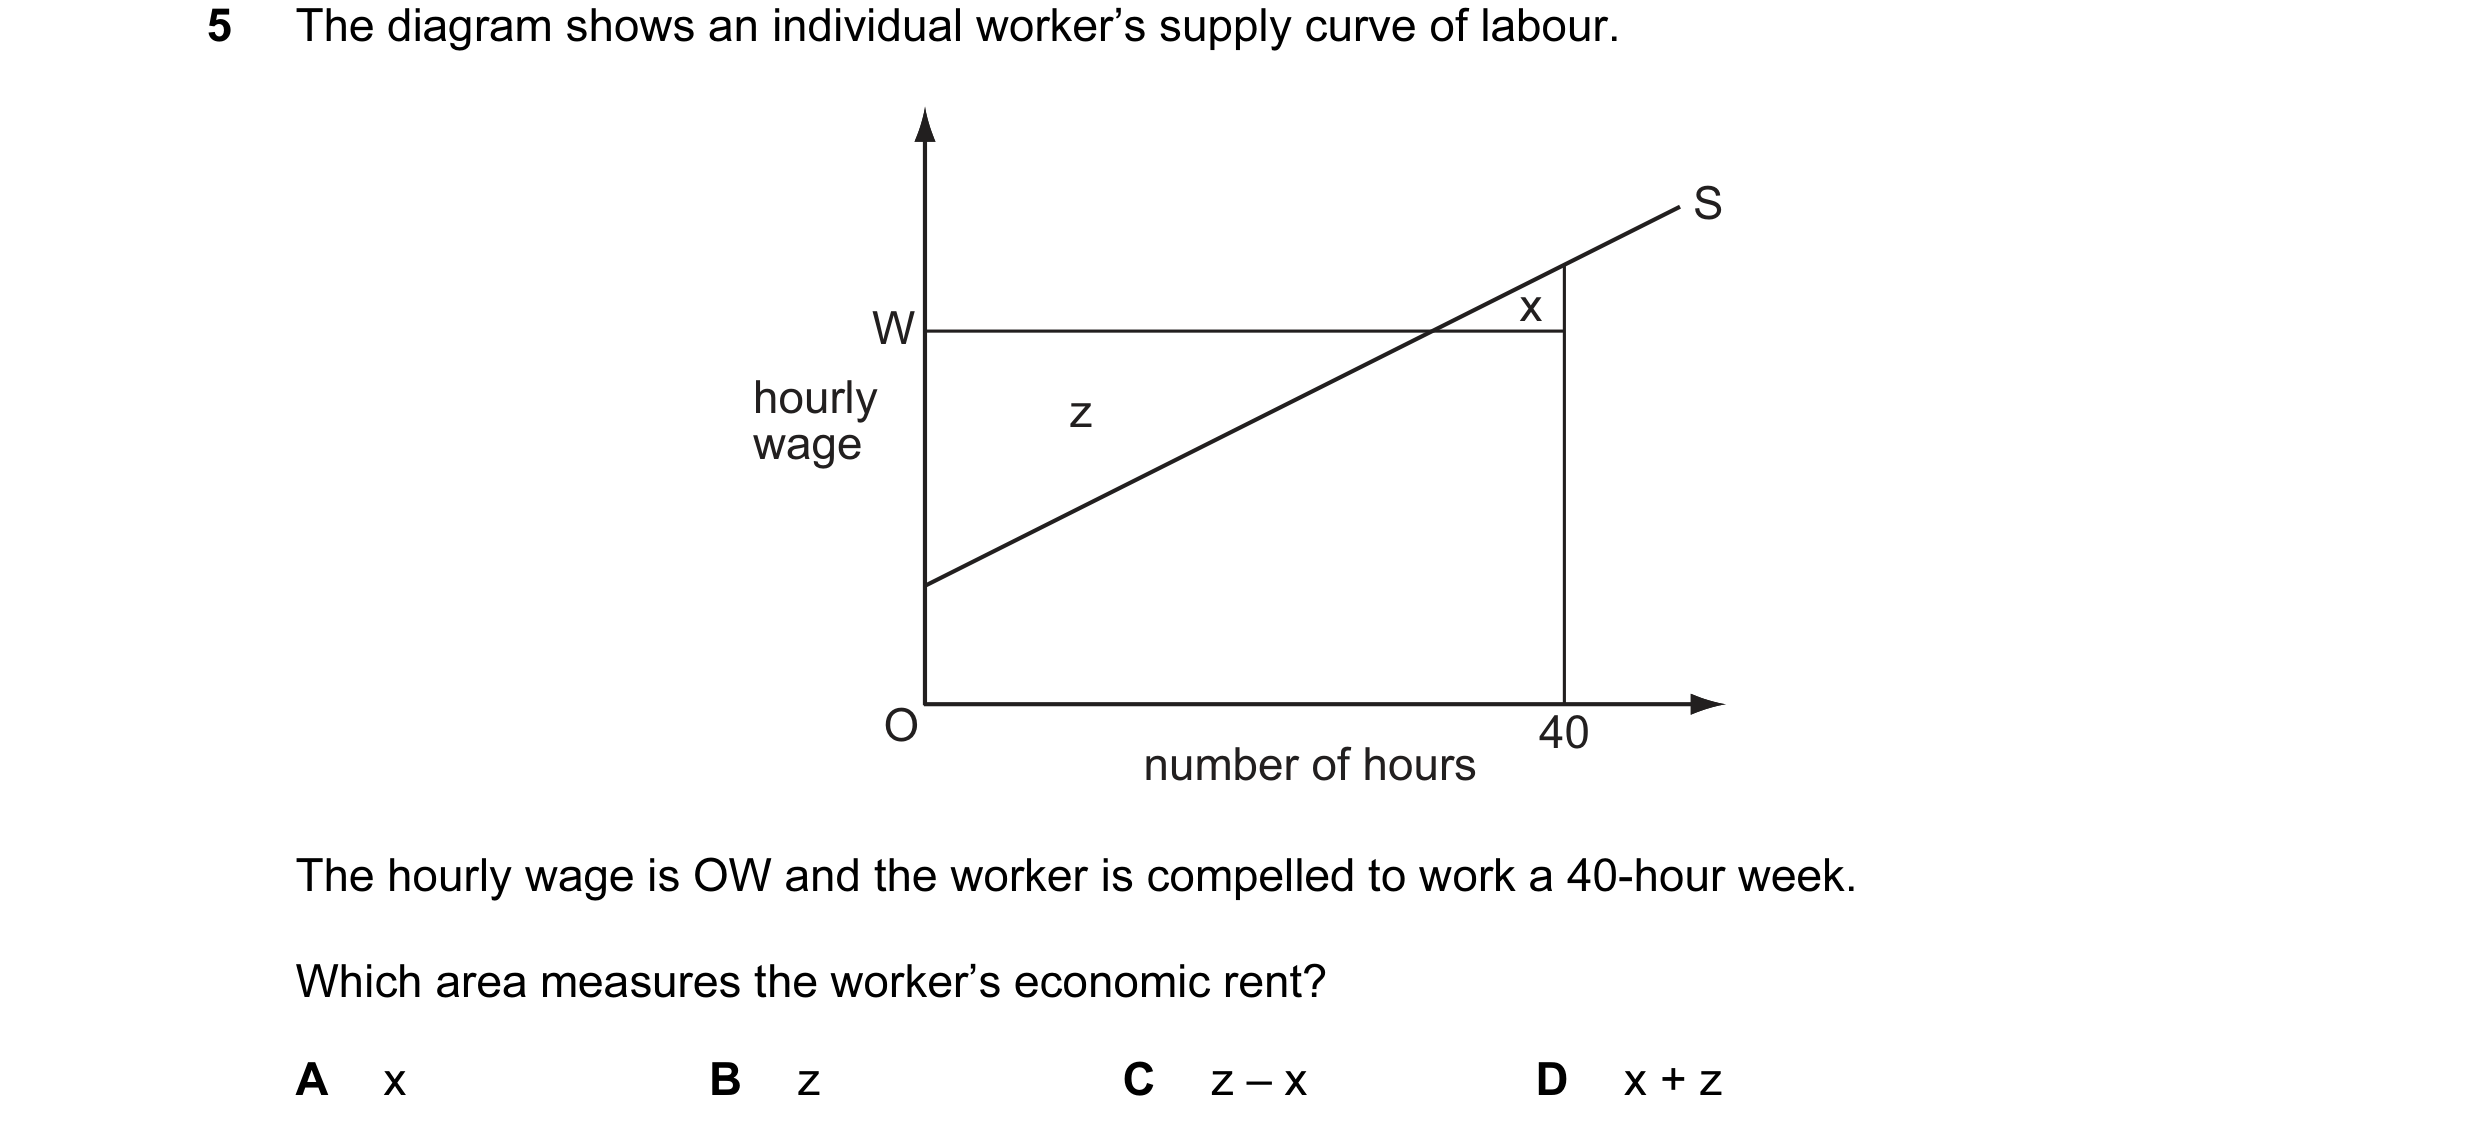 21 / 58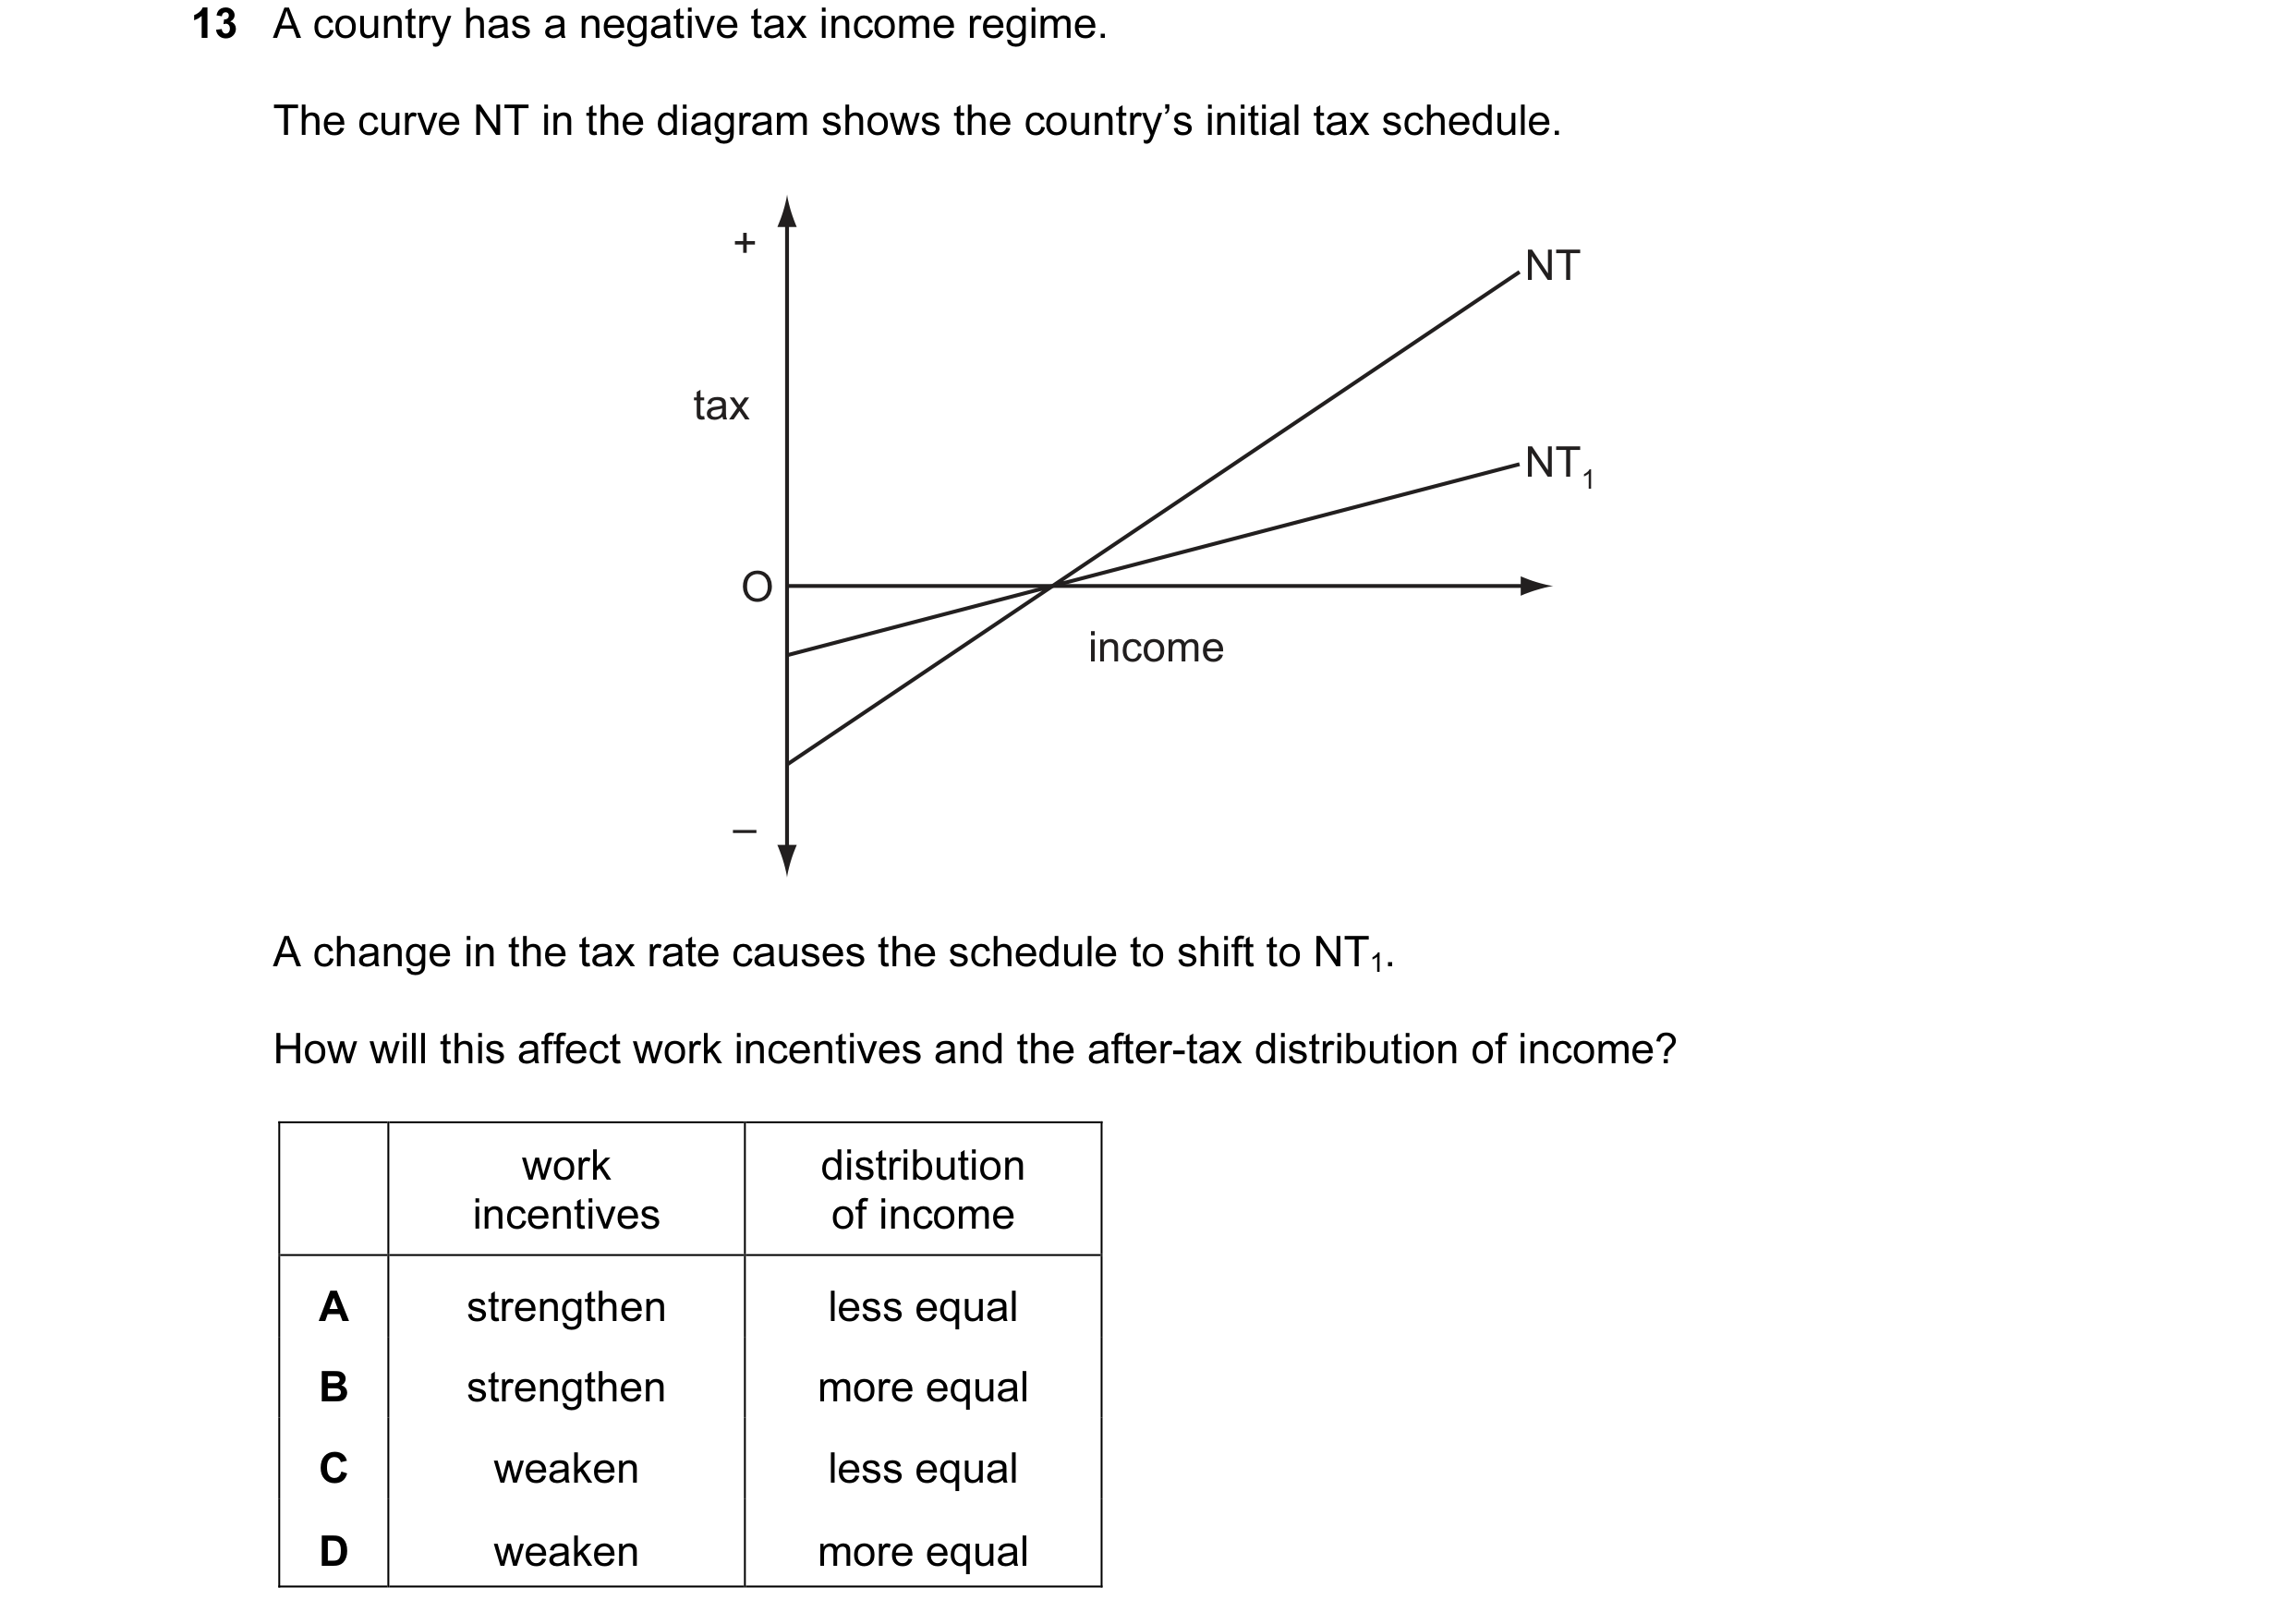
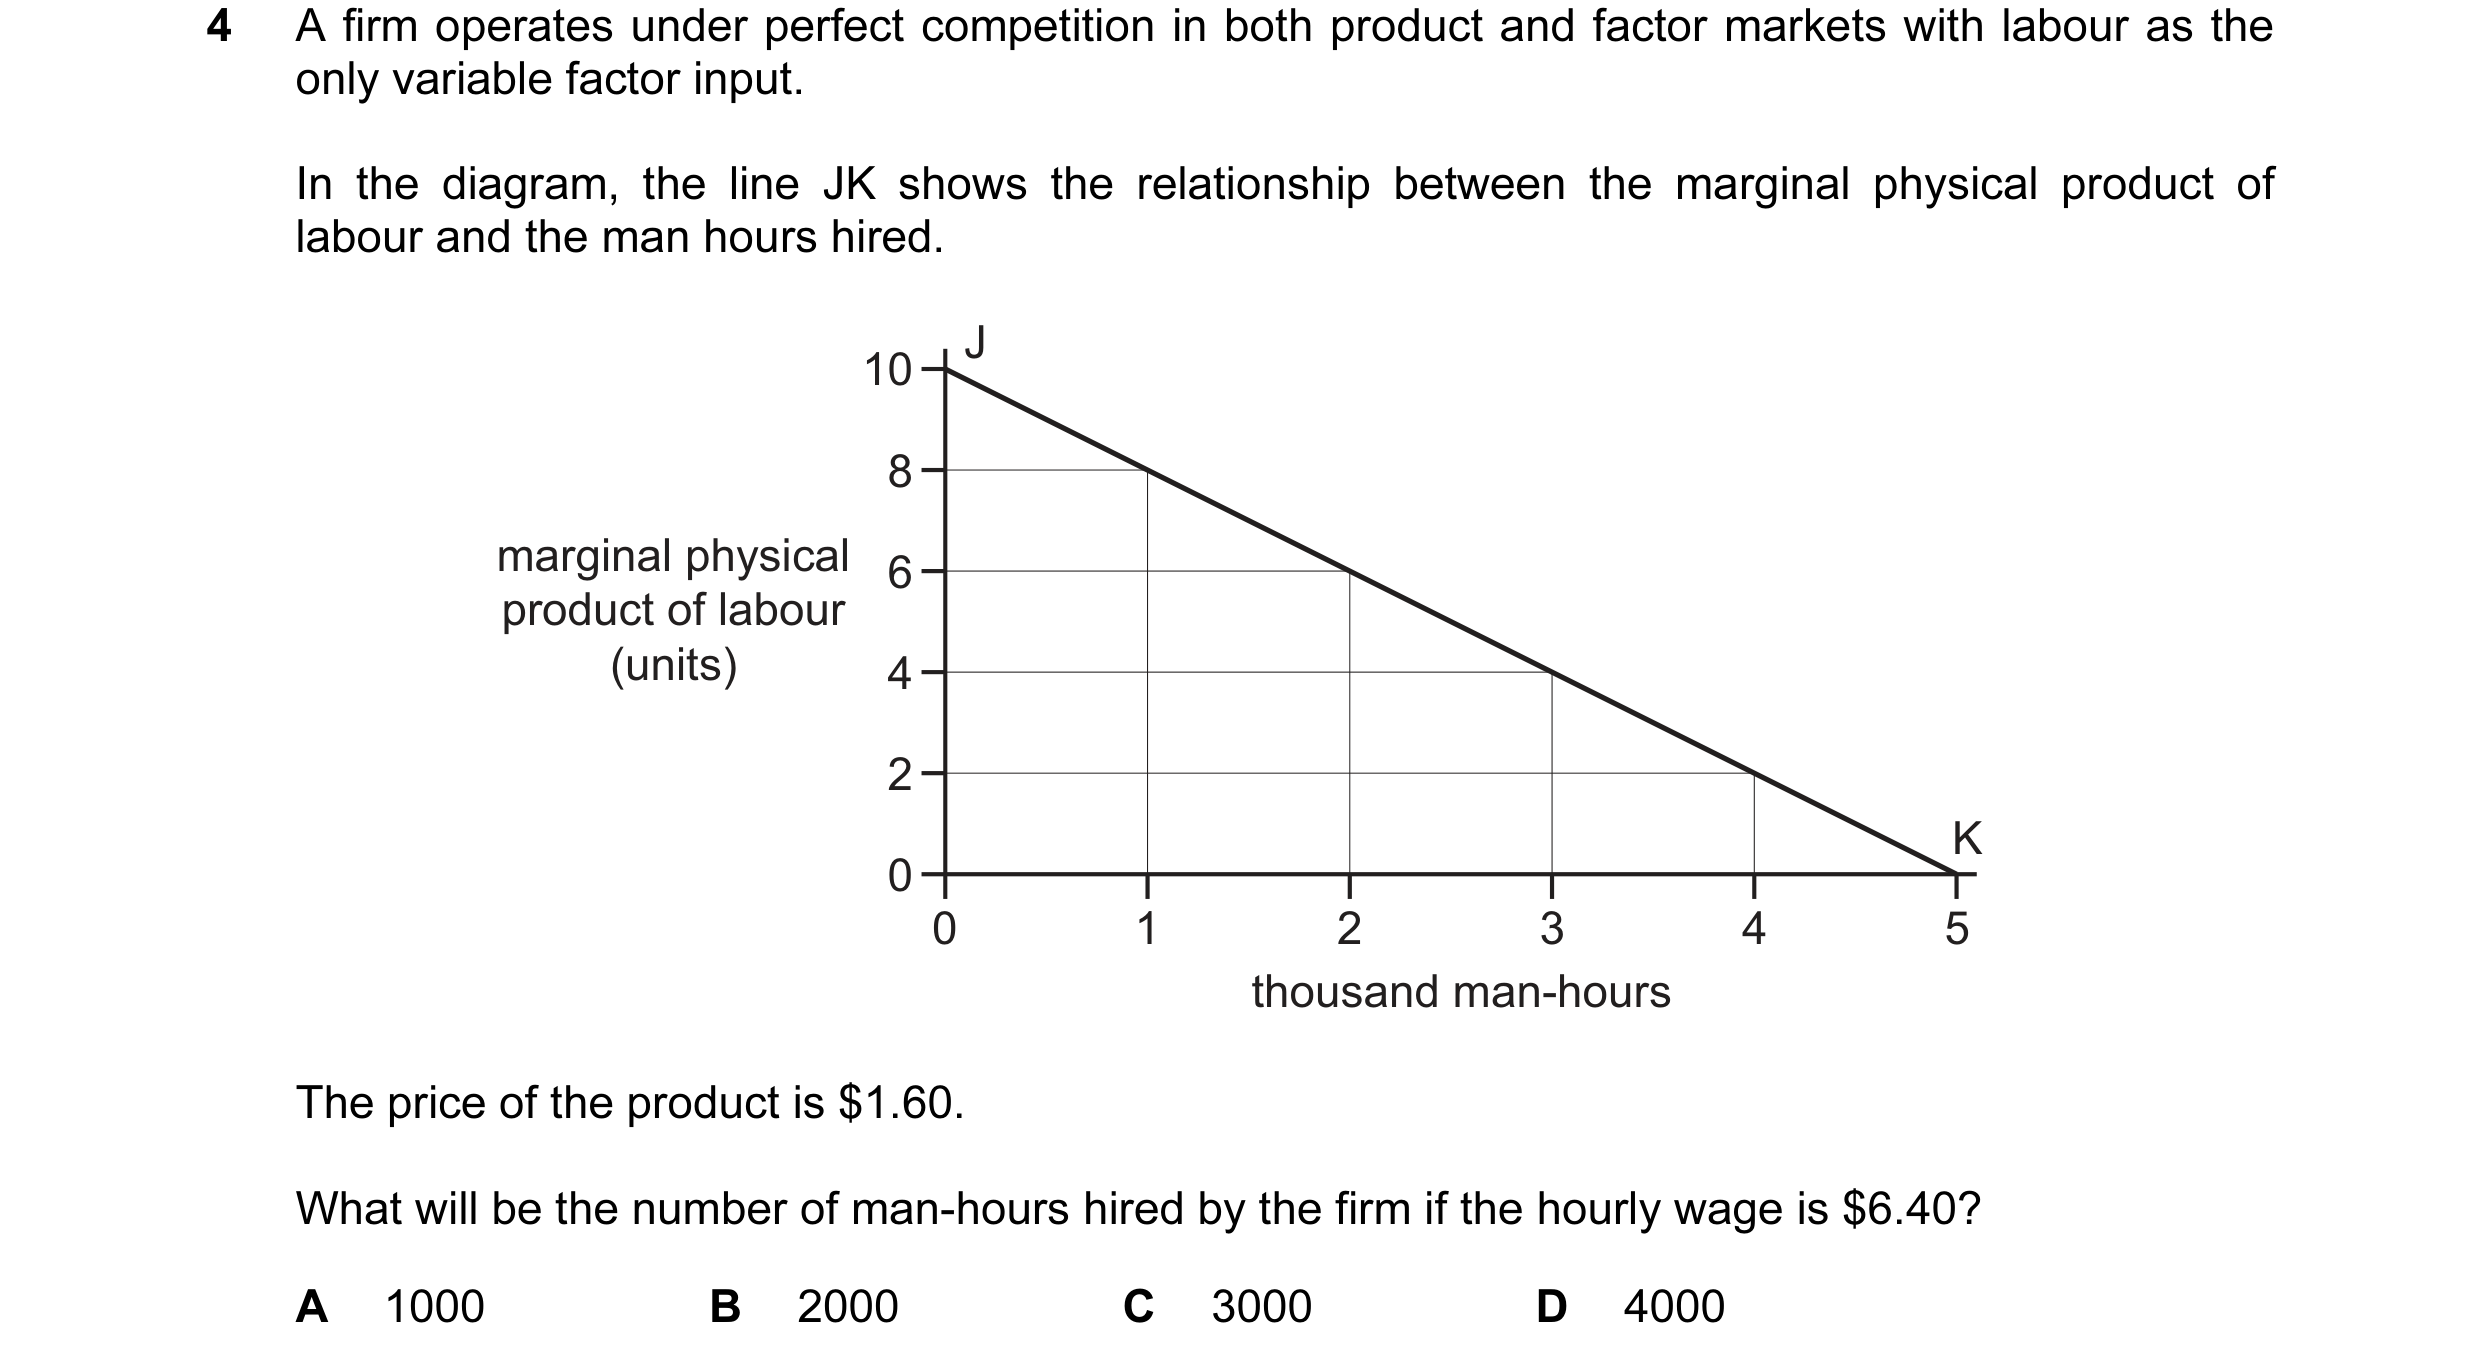 22 / 58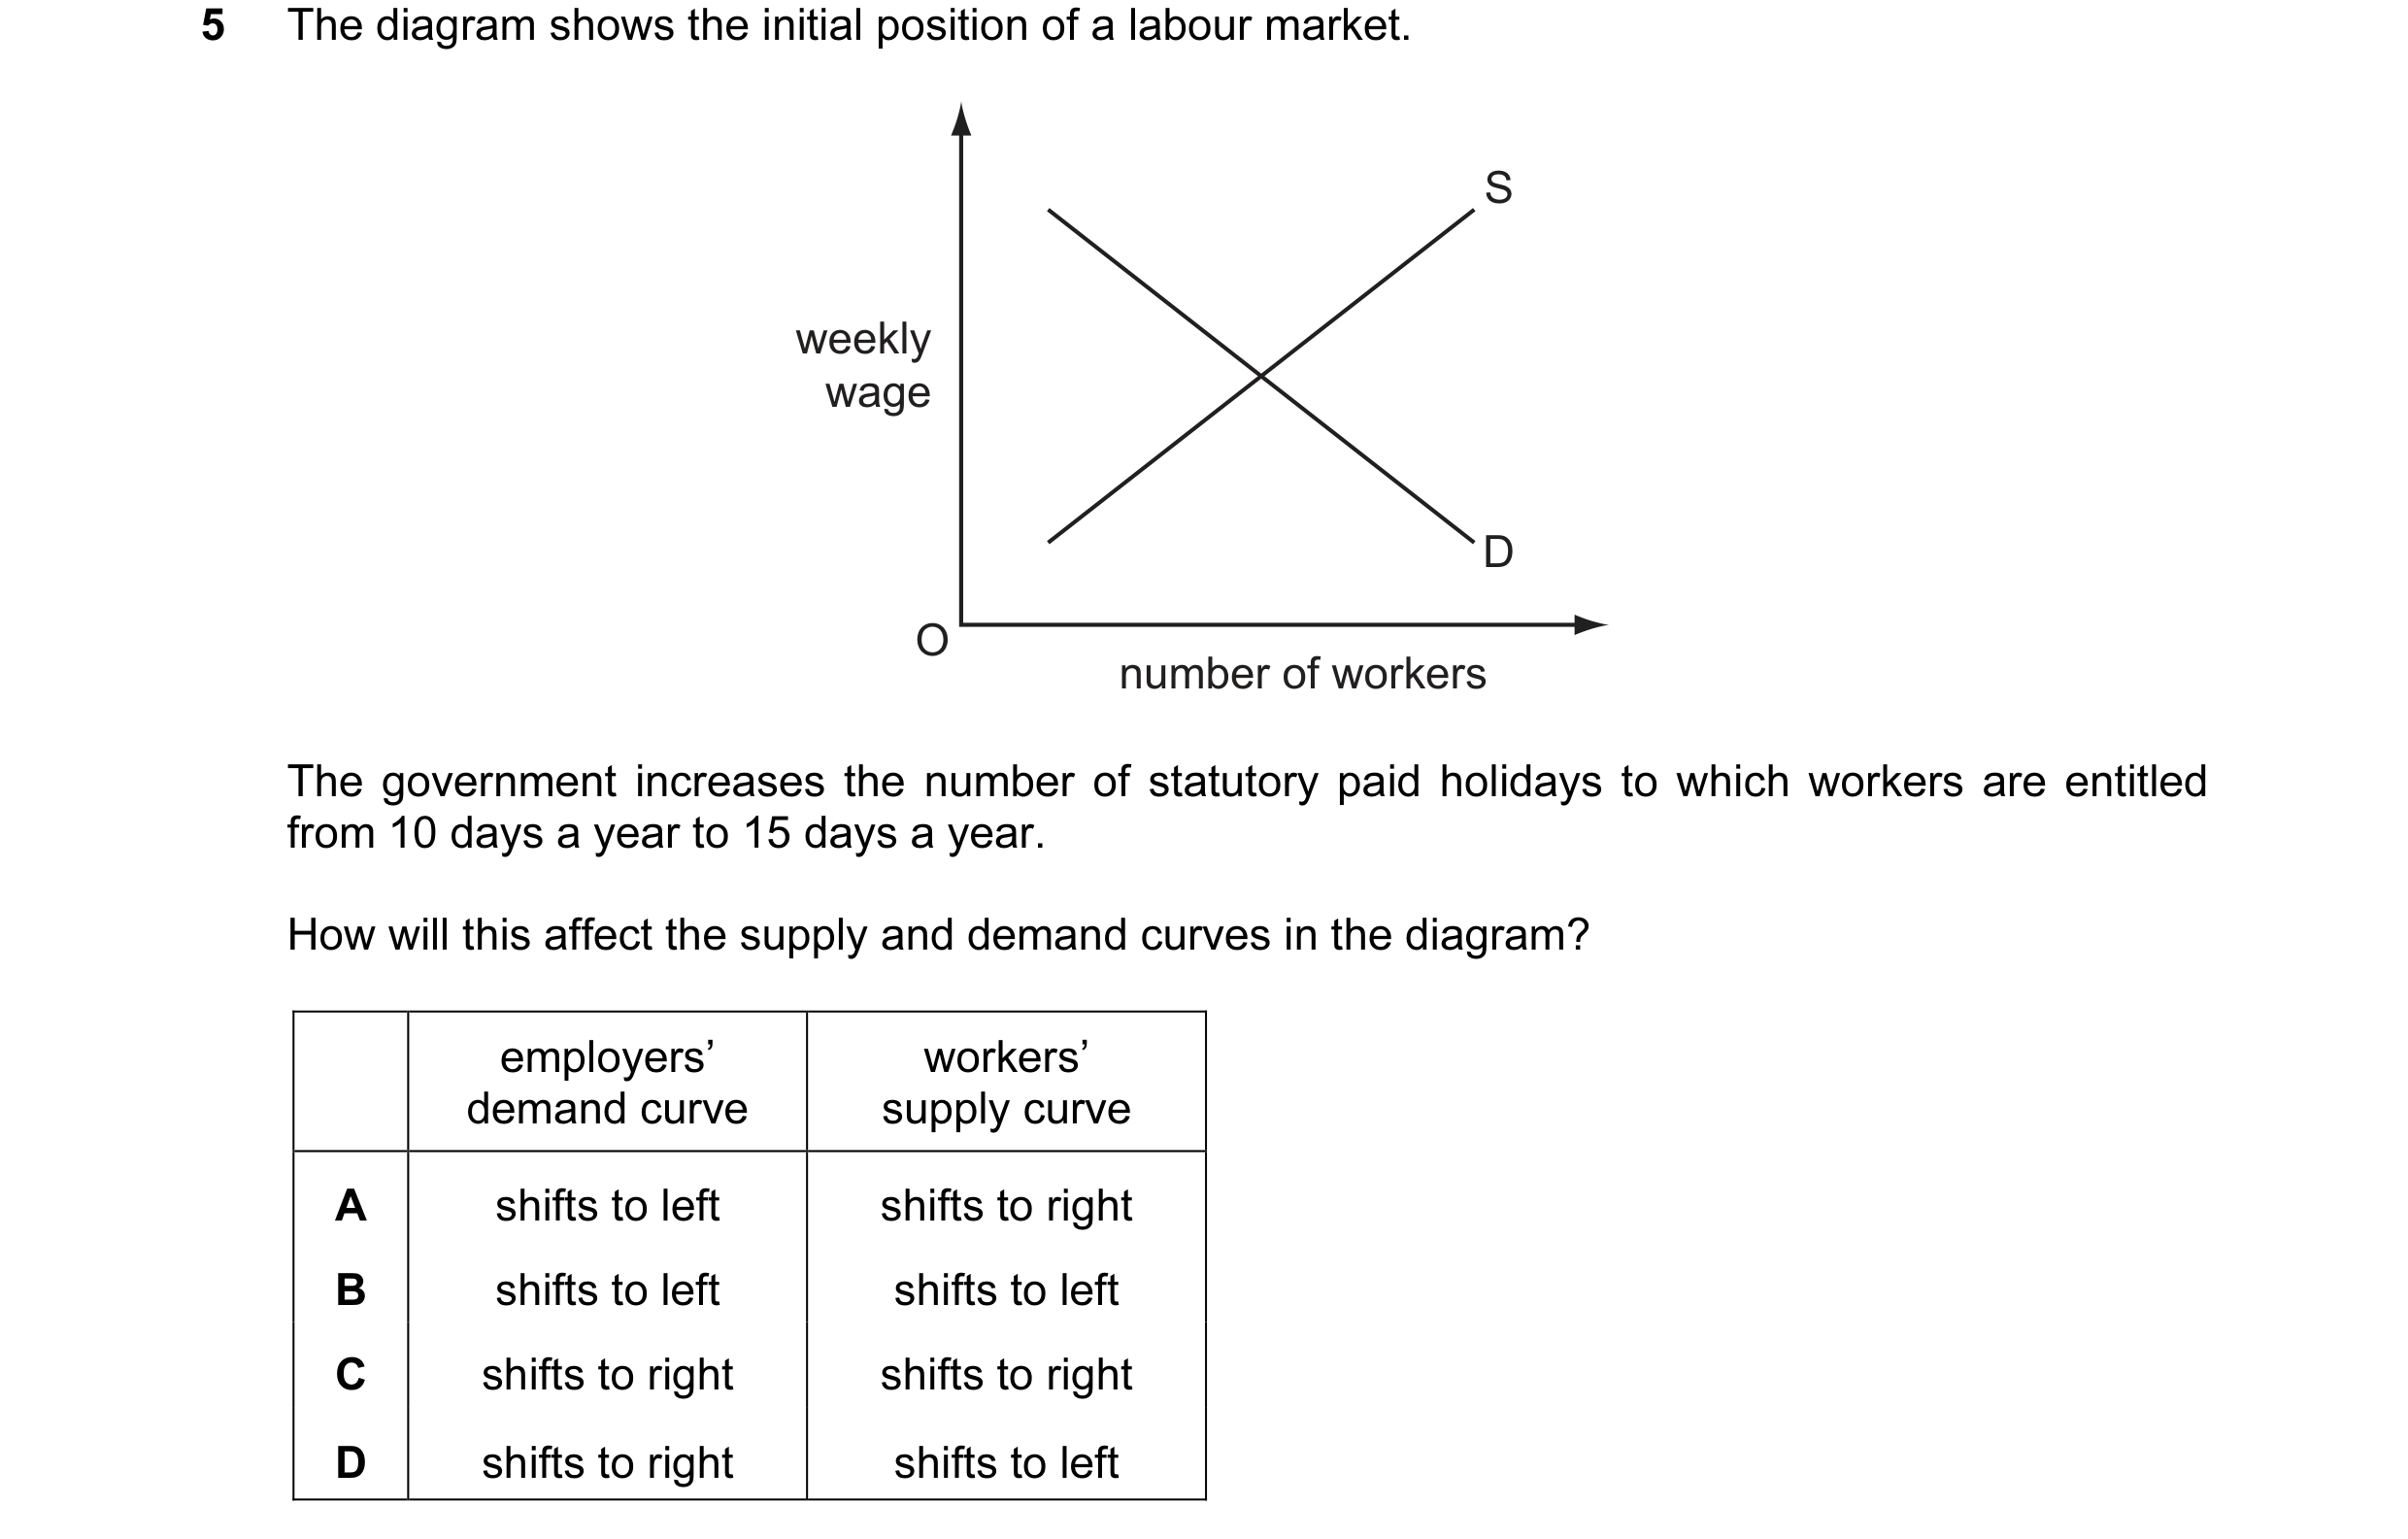
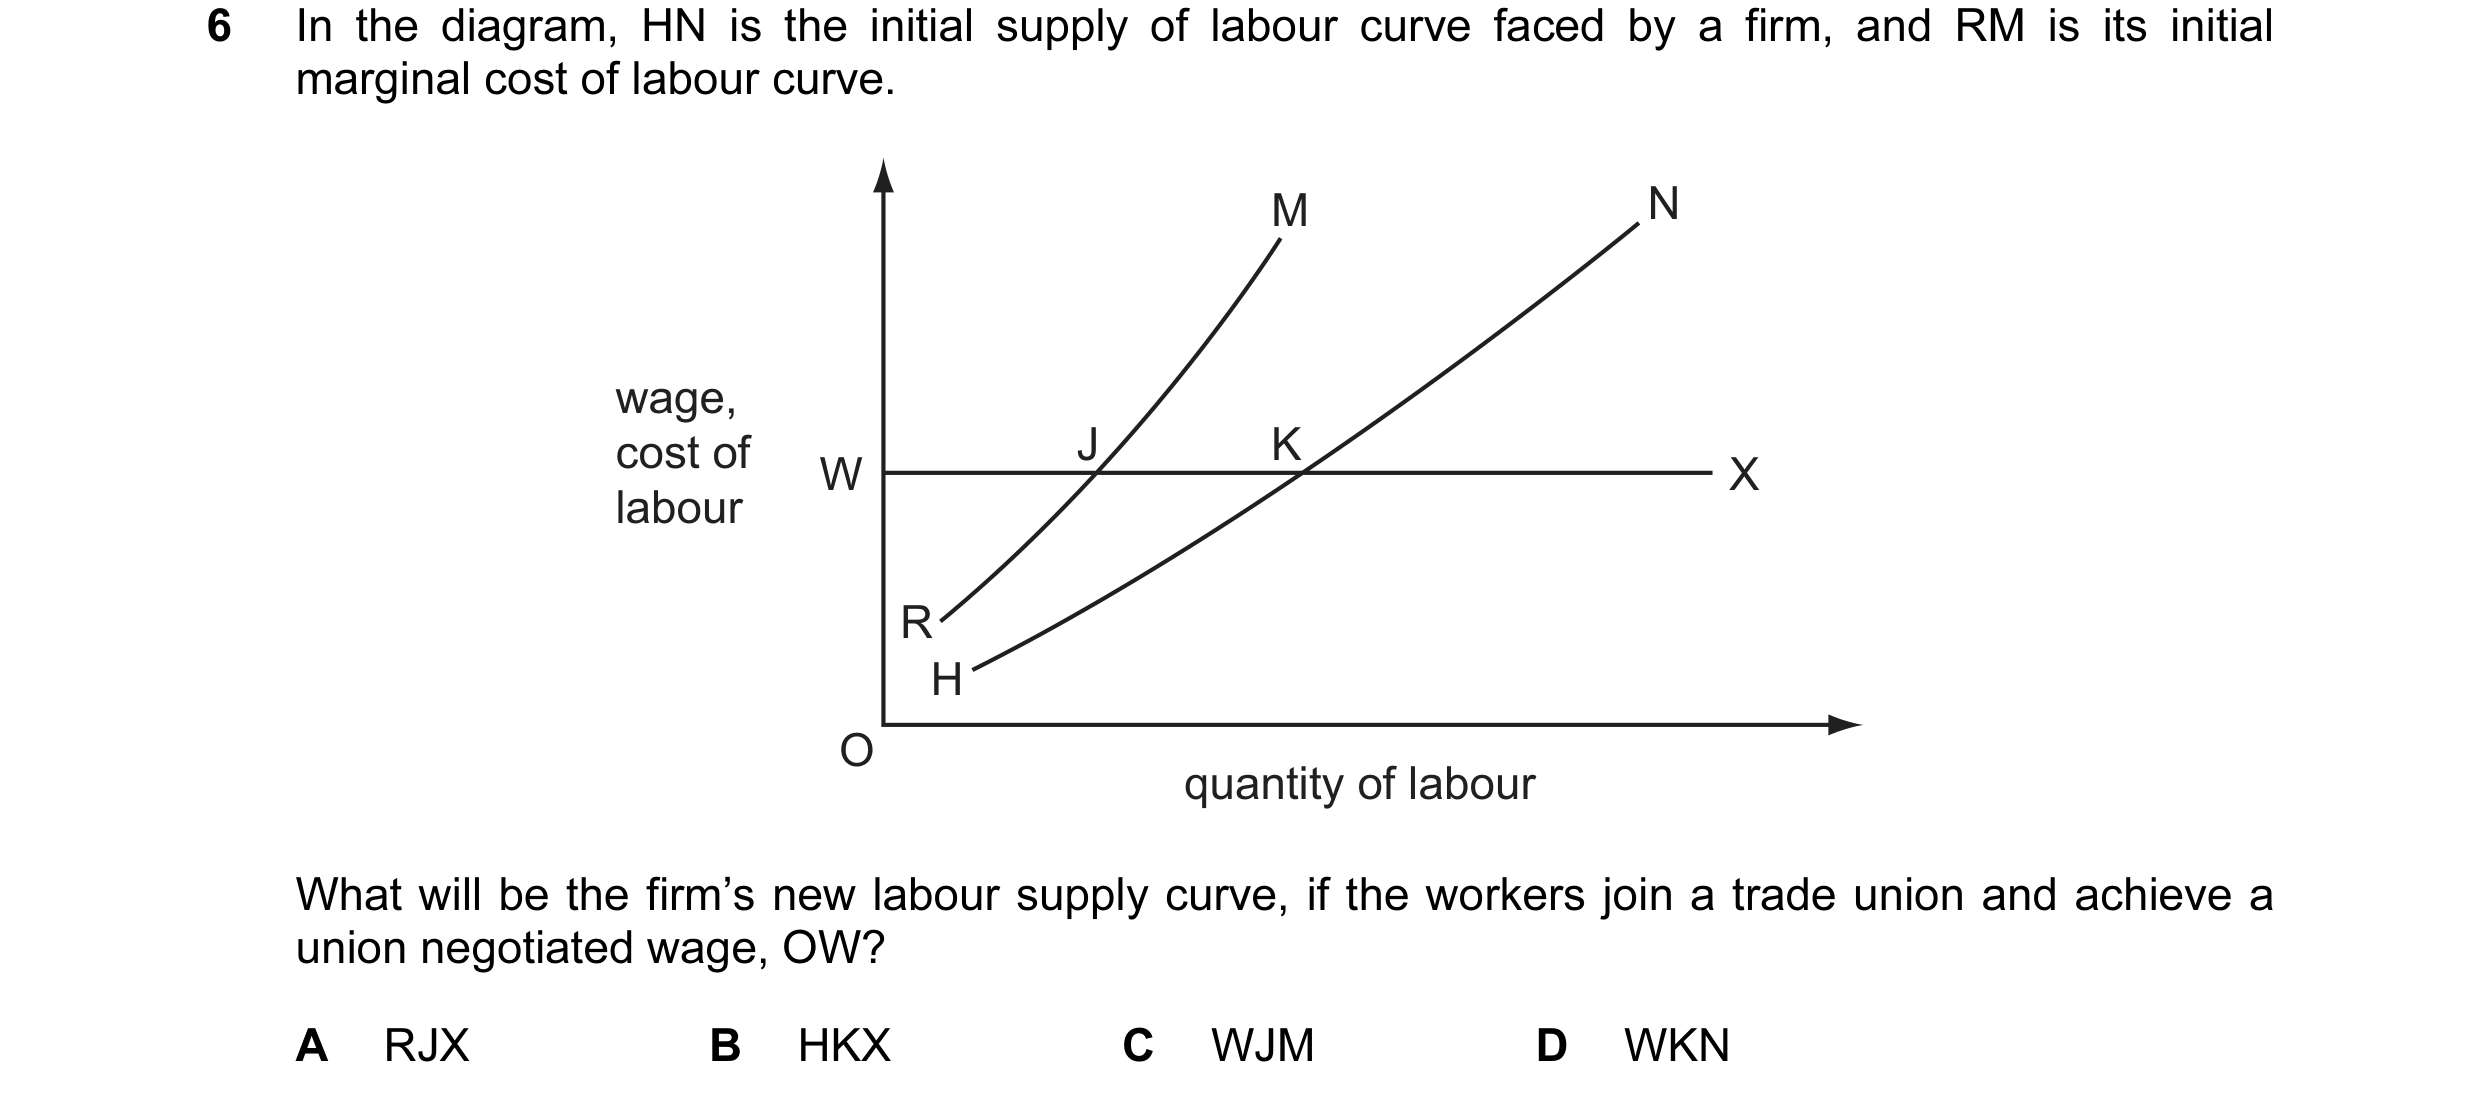 23 / 58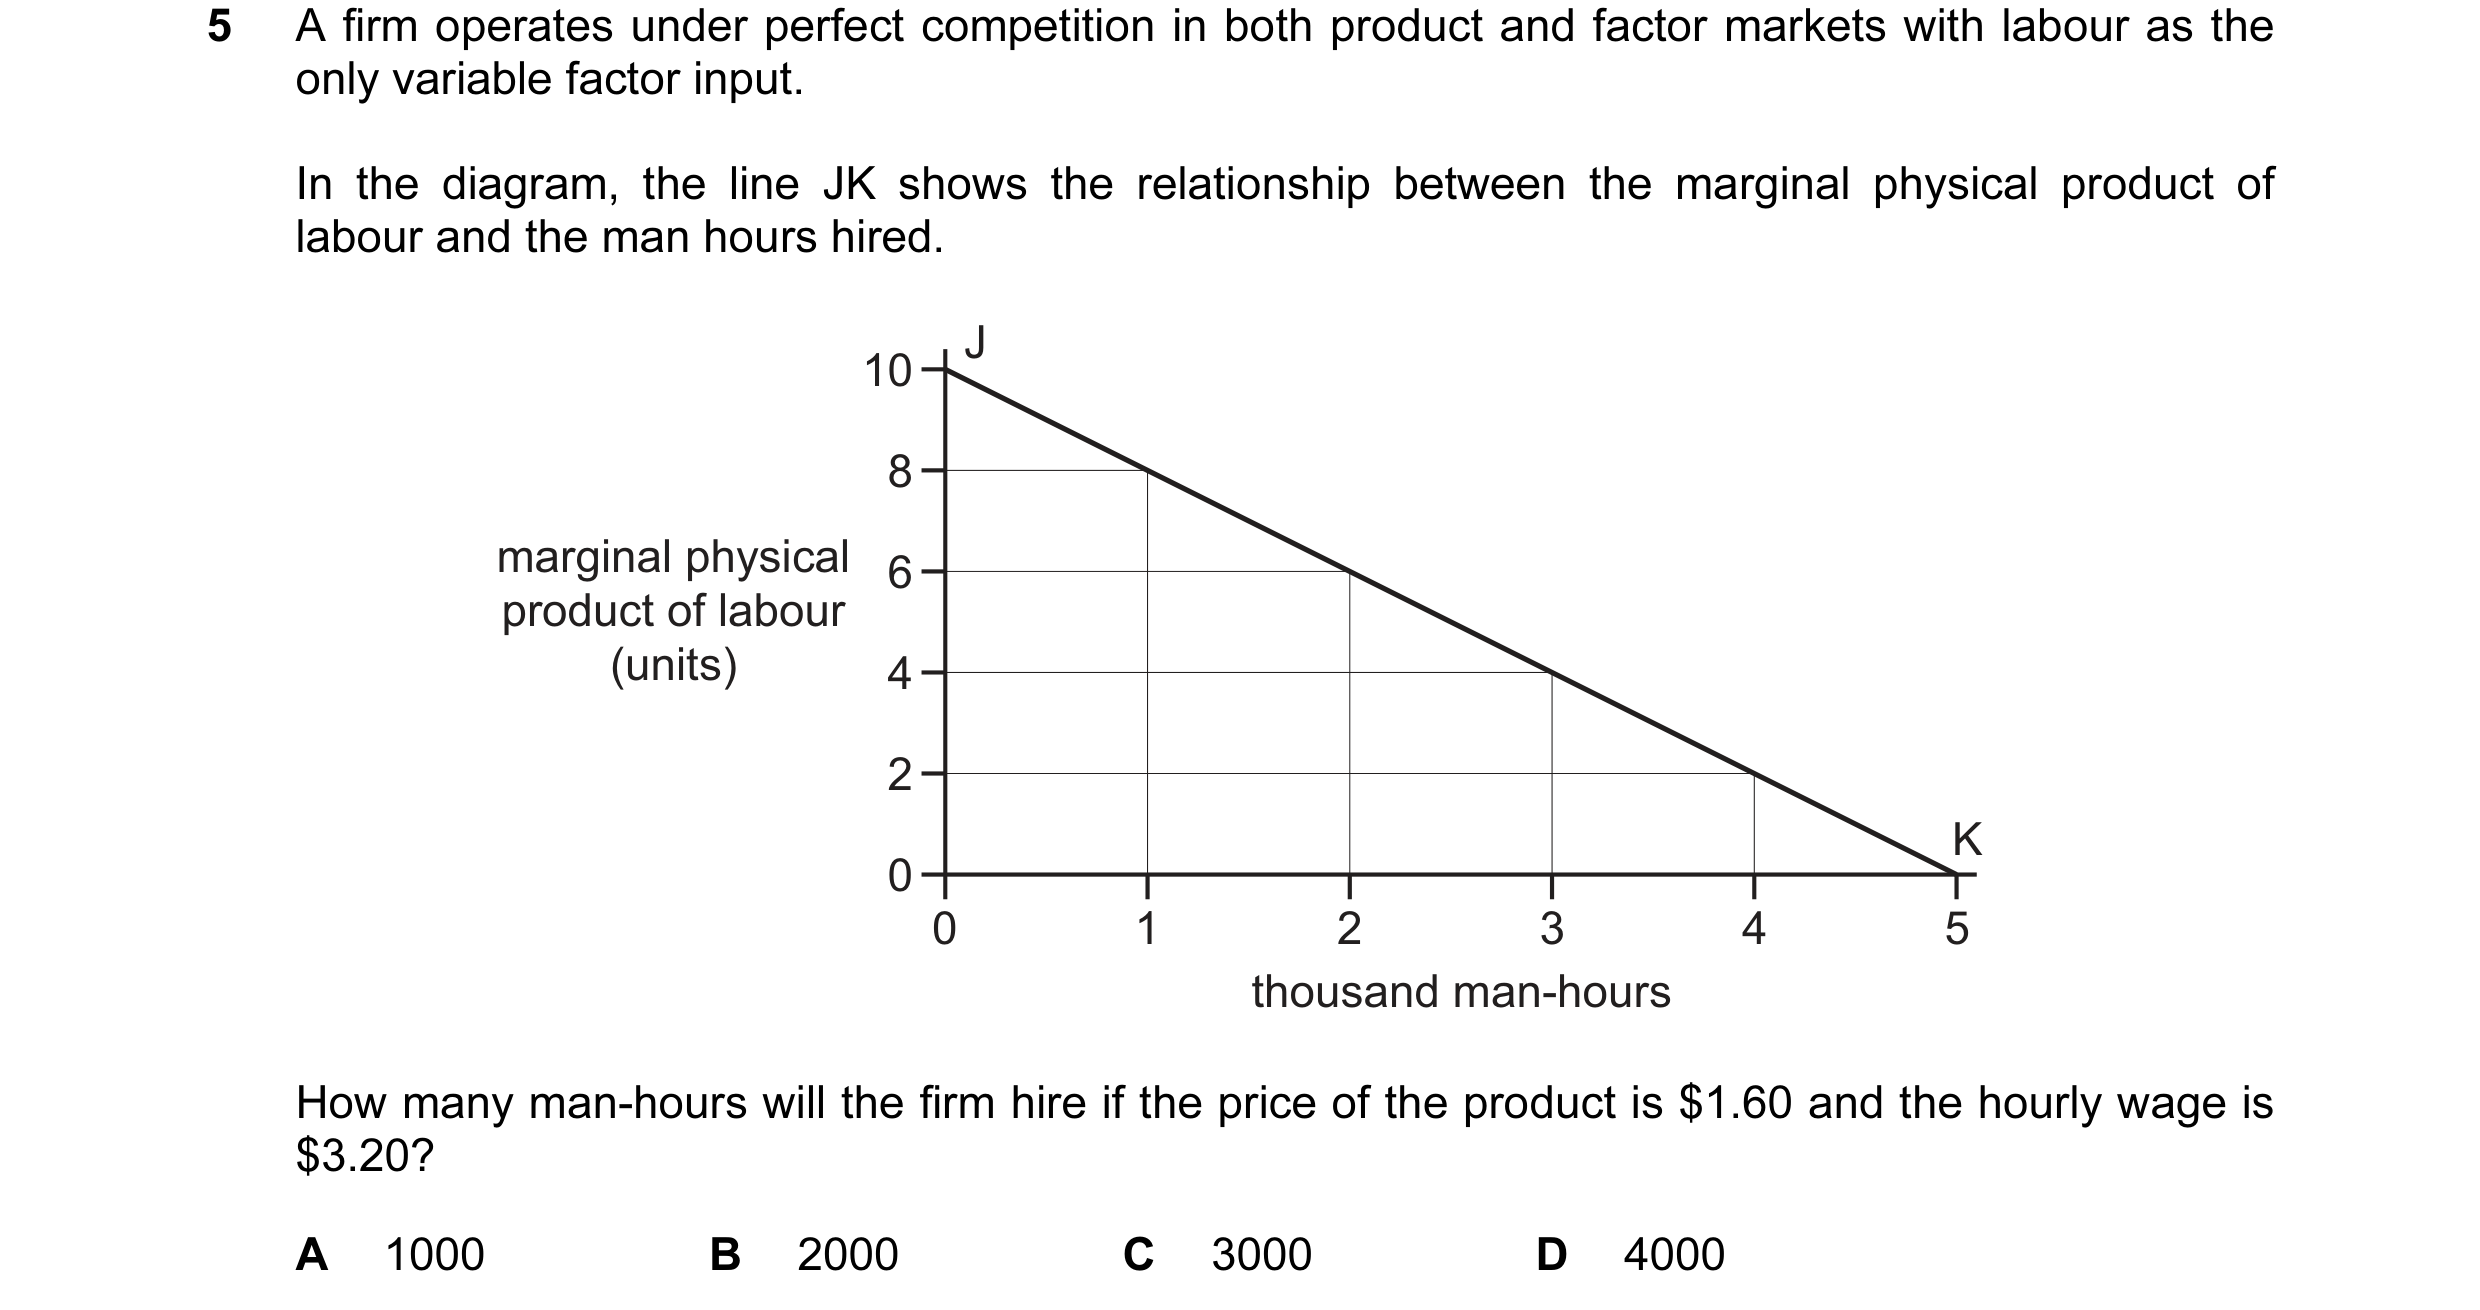
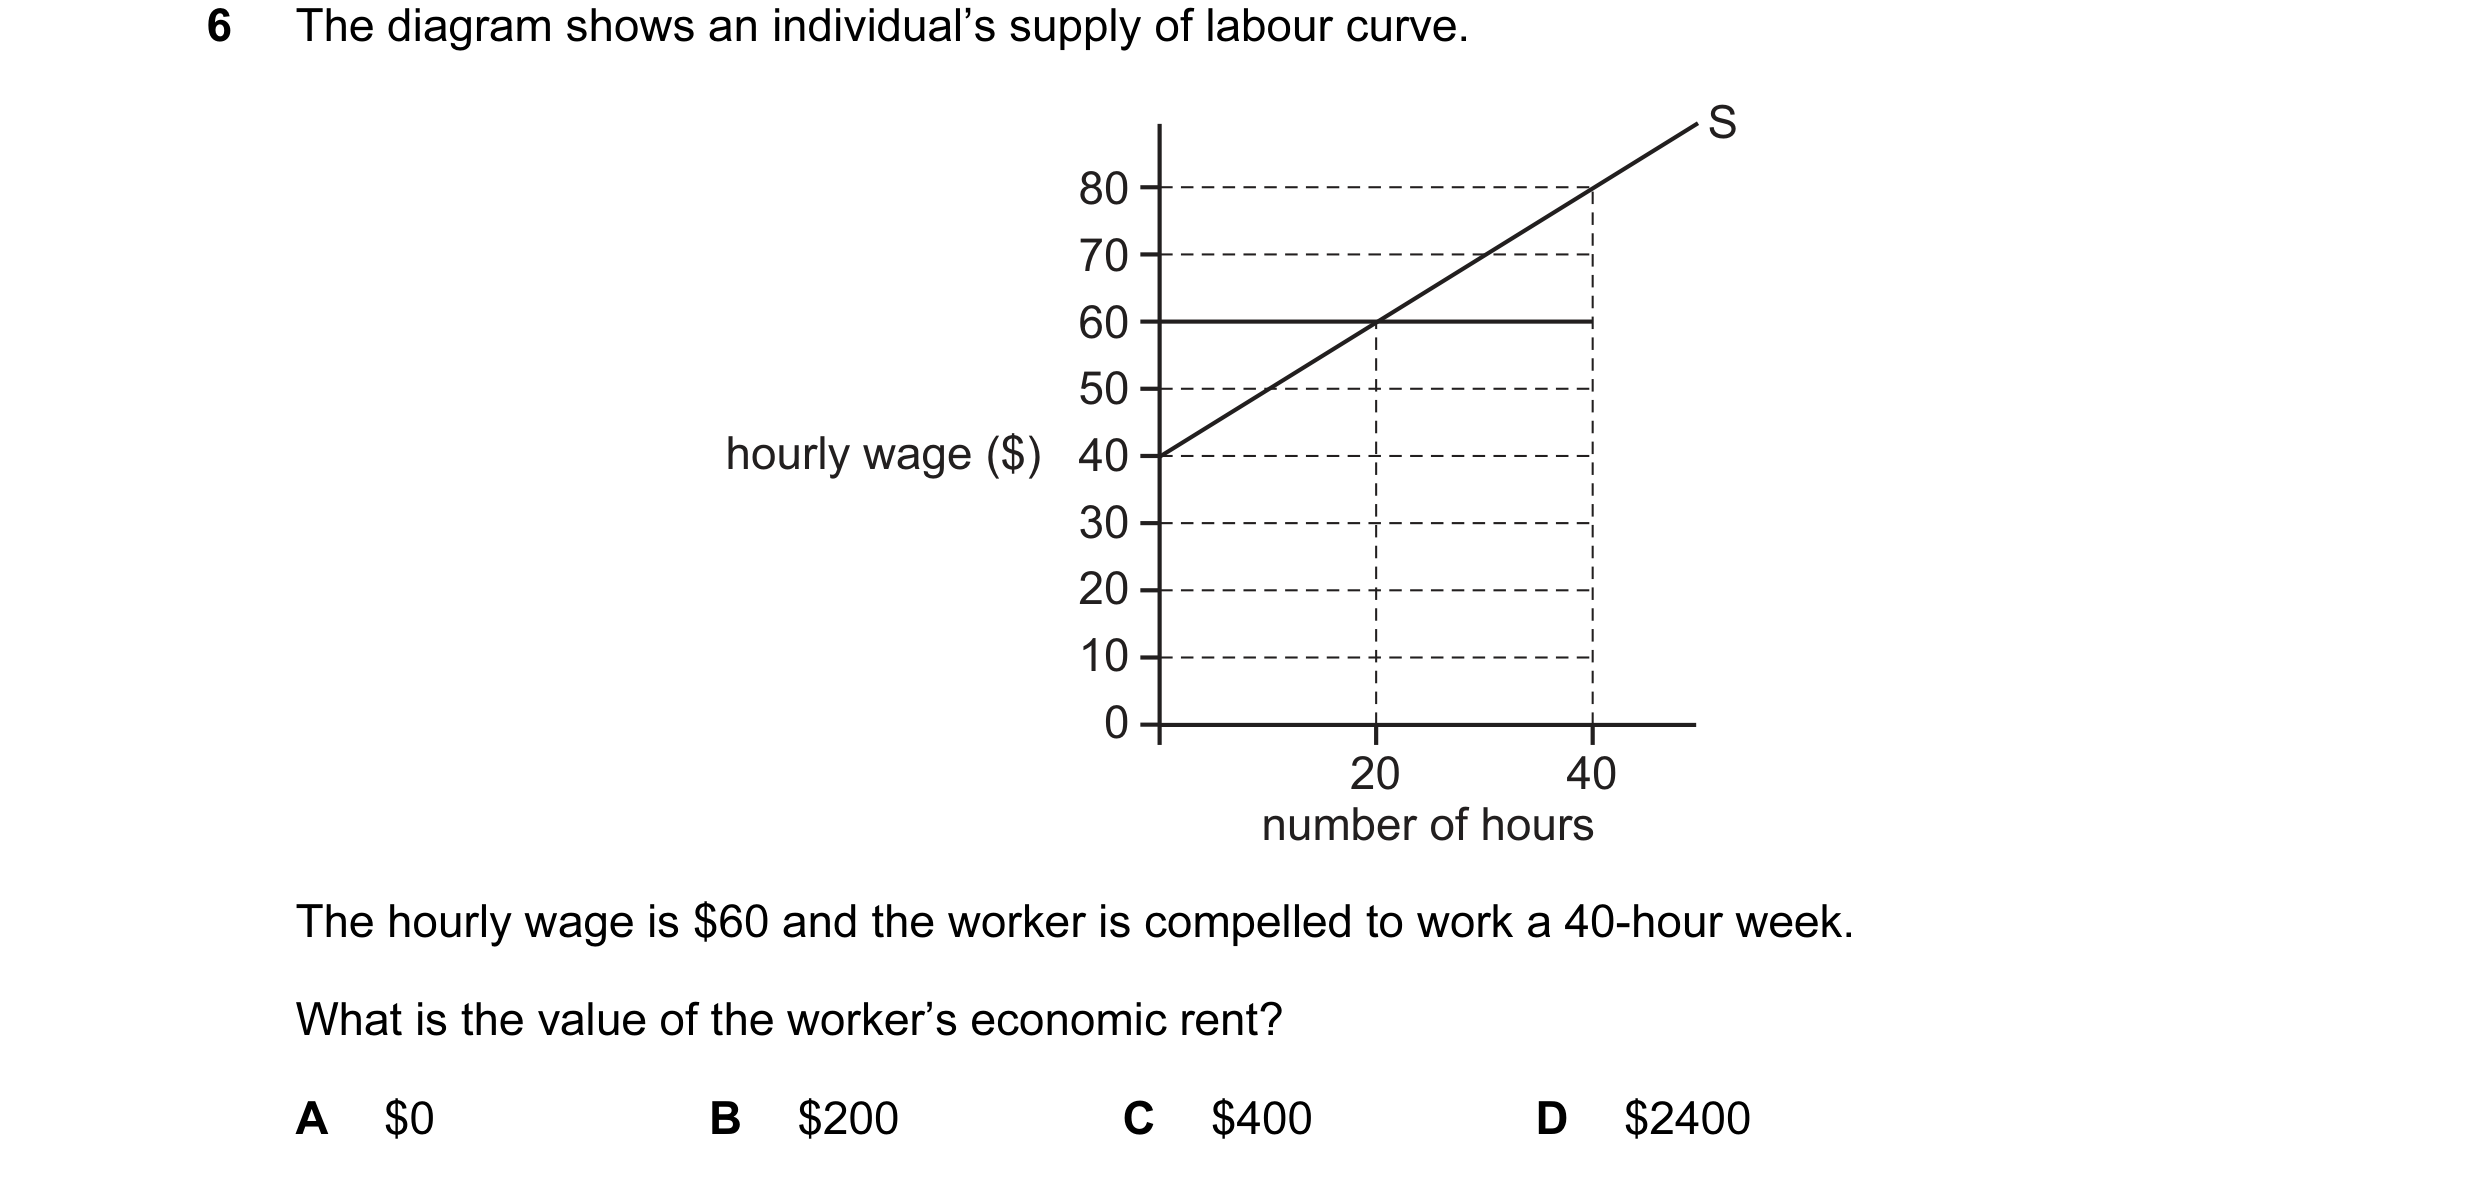
 24 / 58



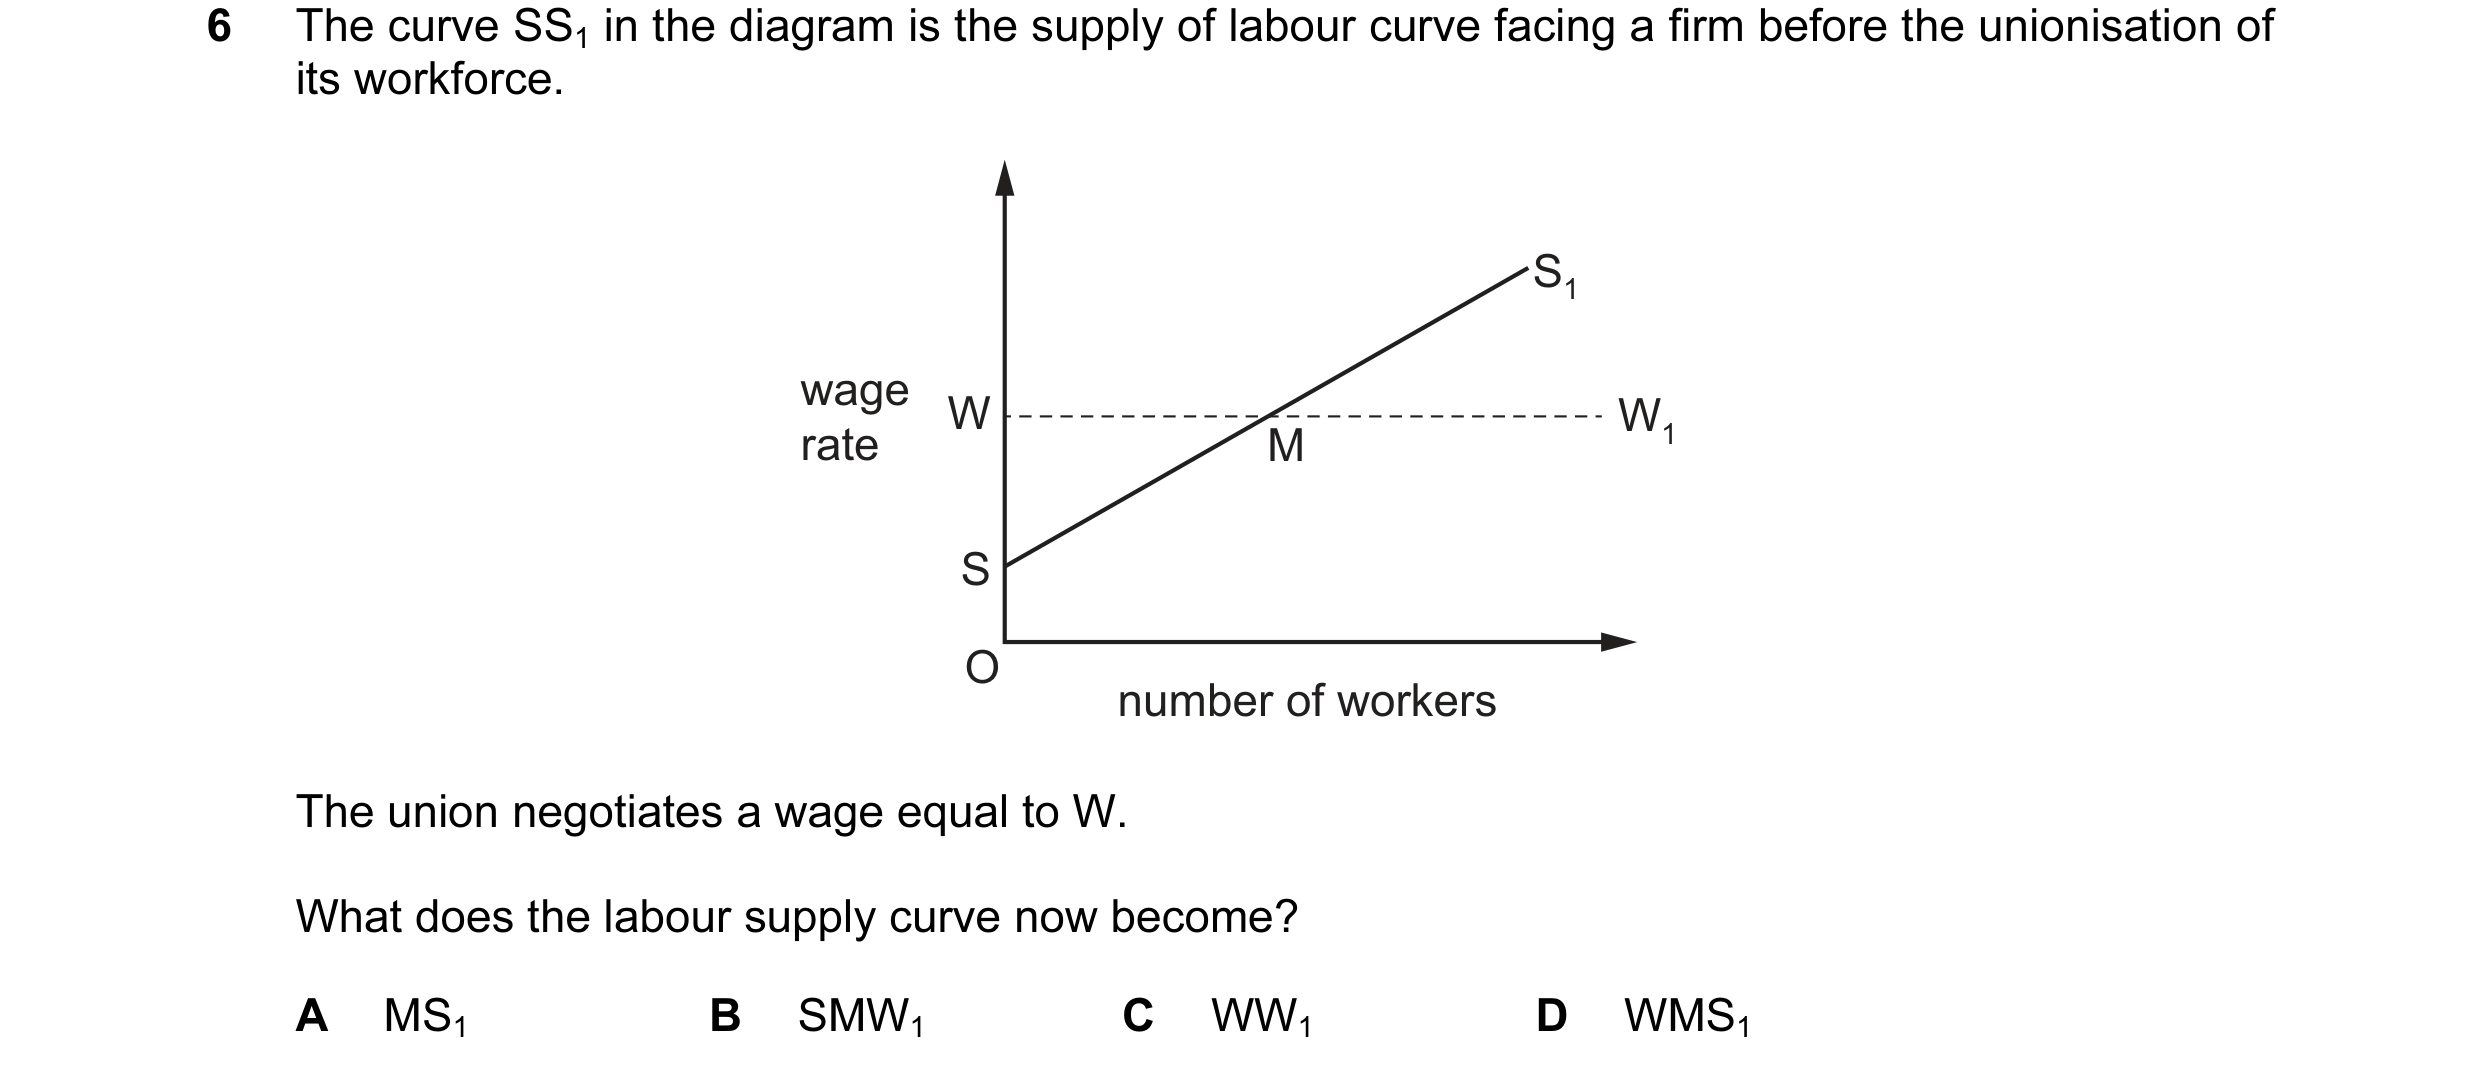 25 / 58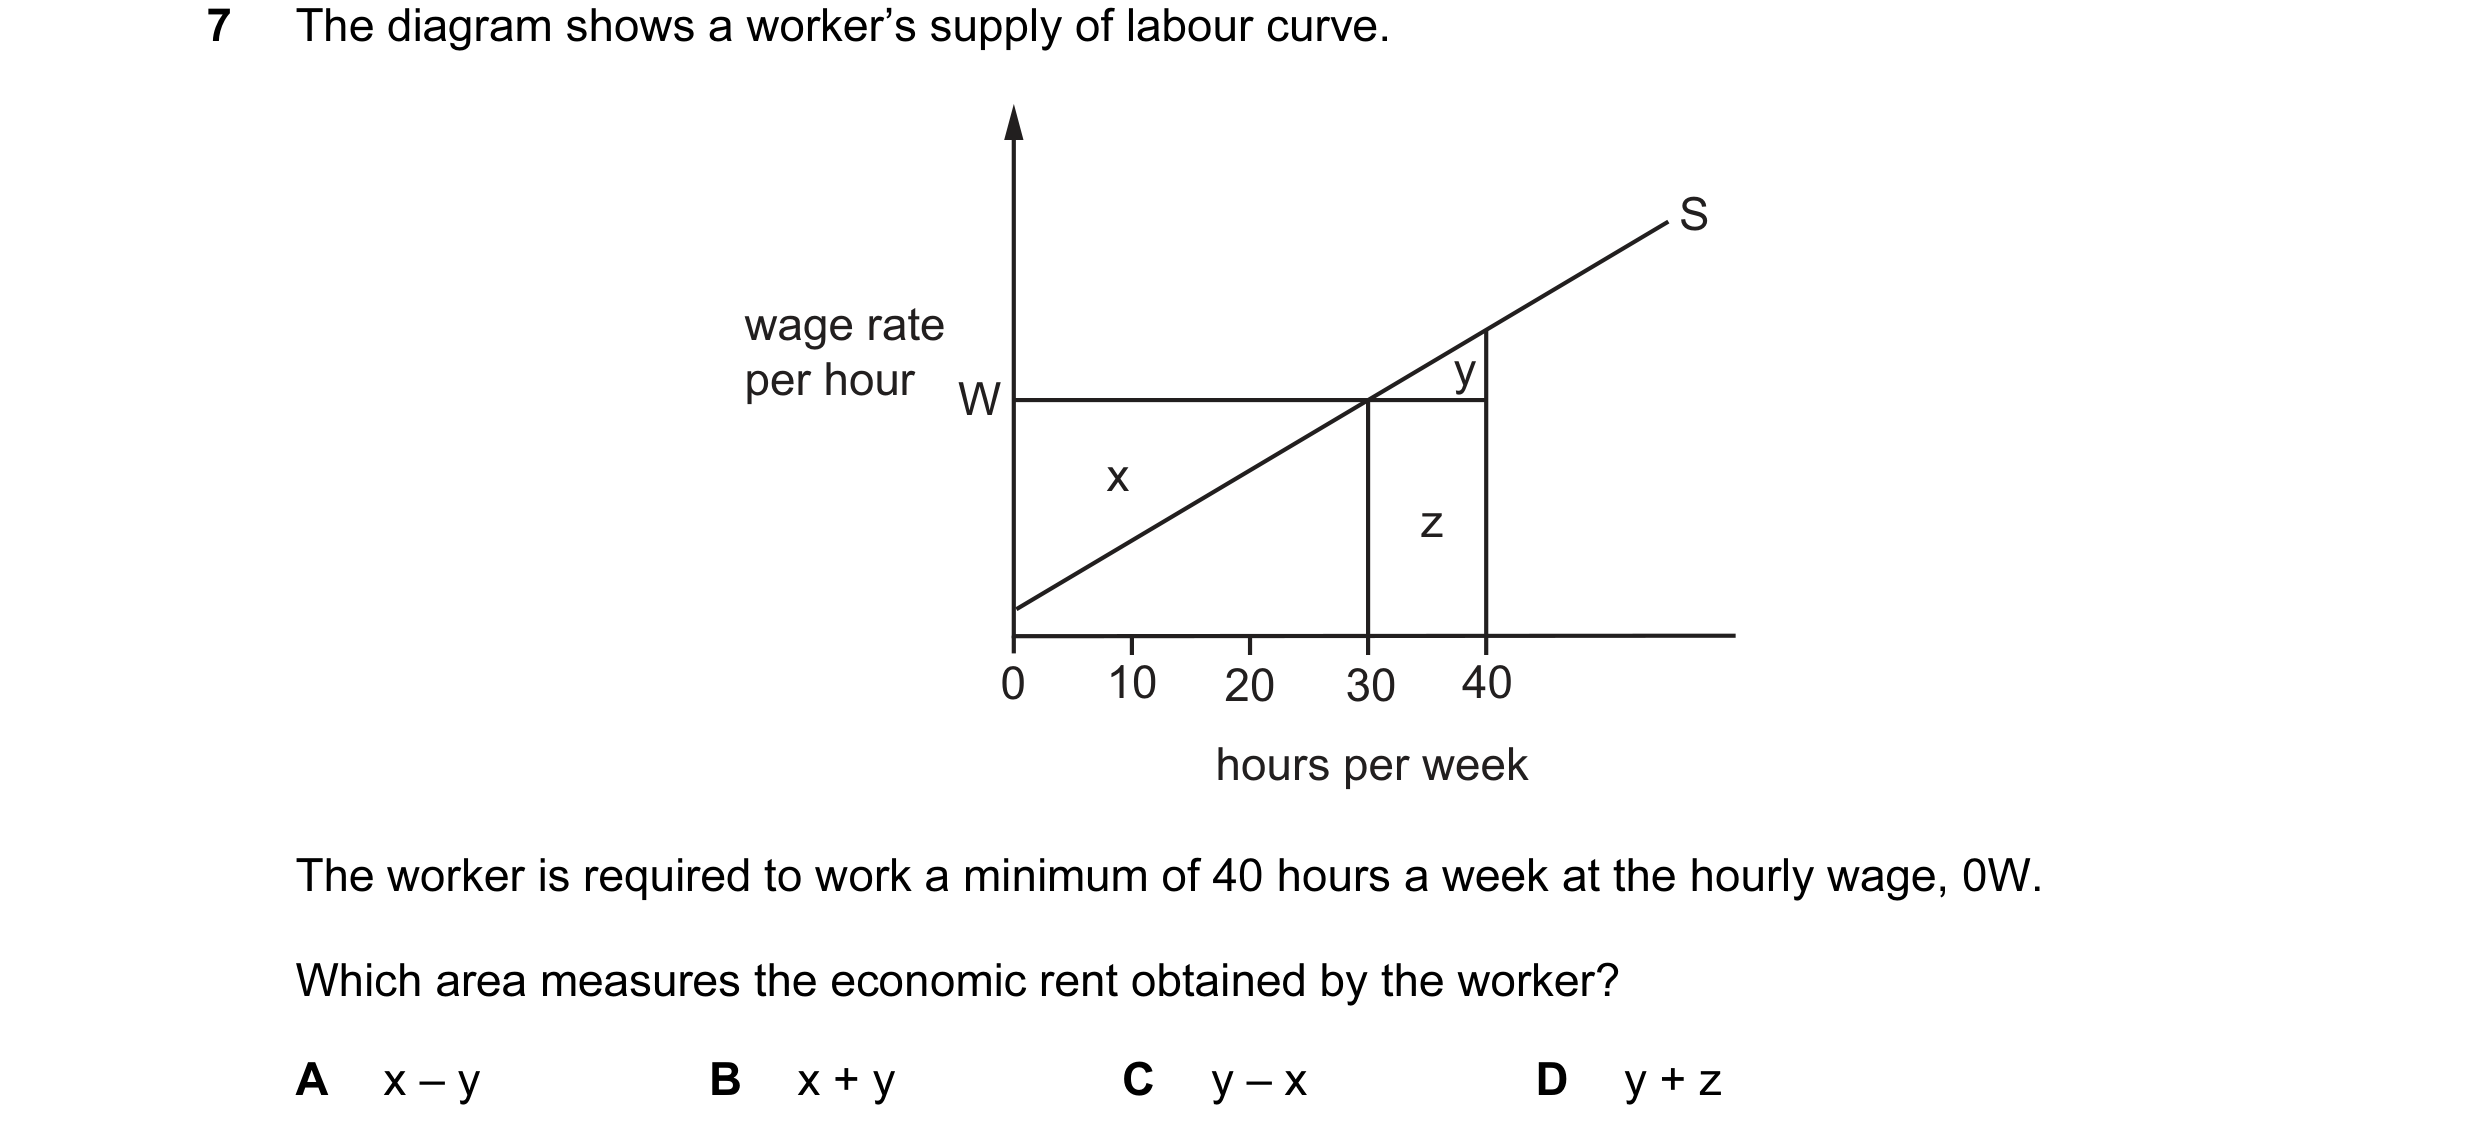
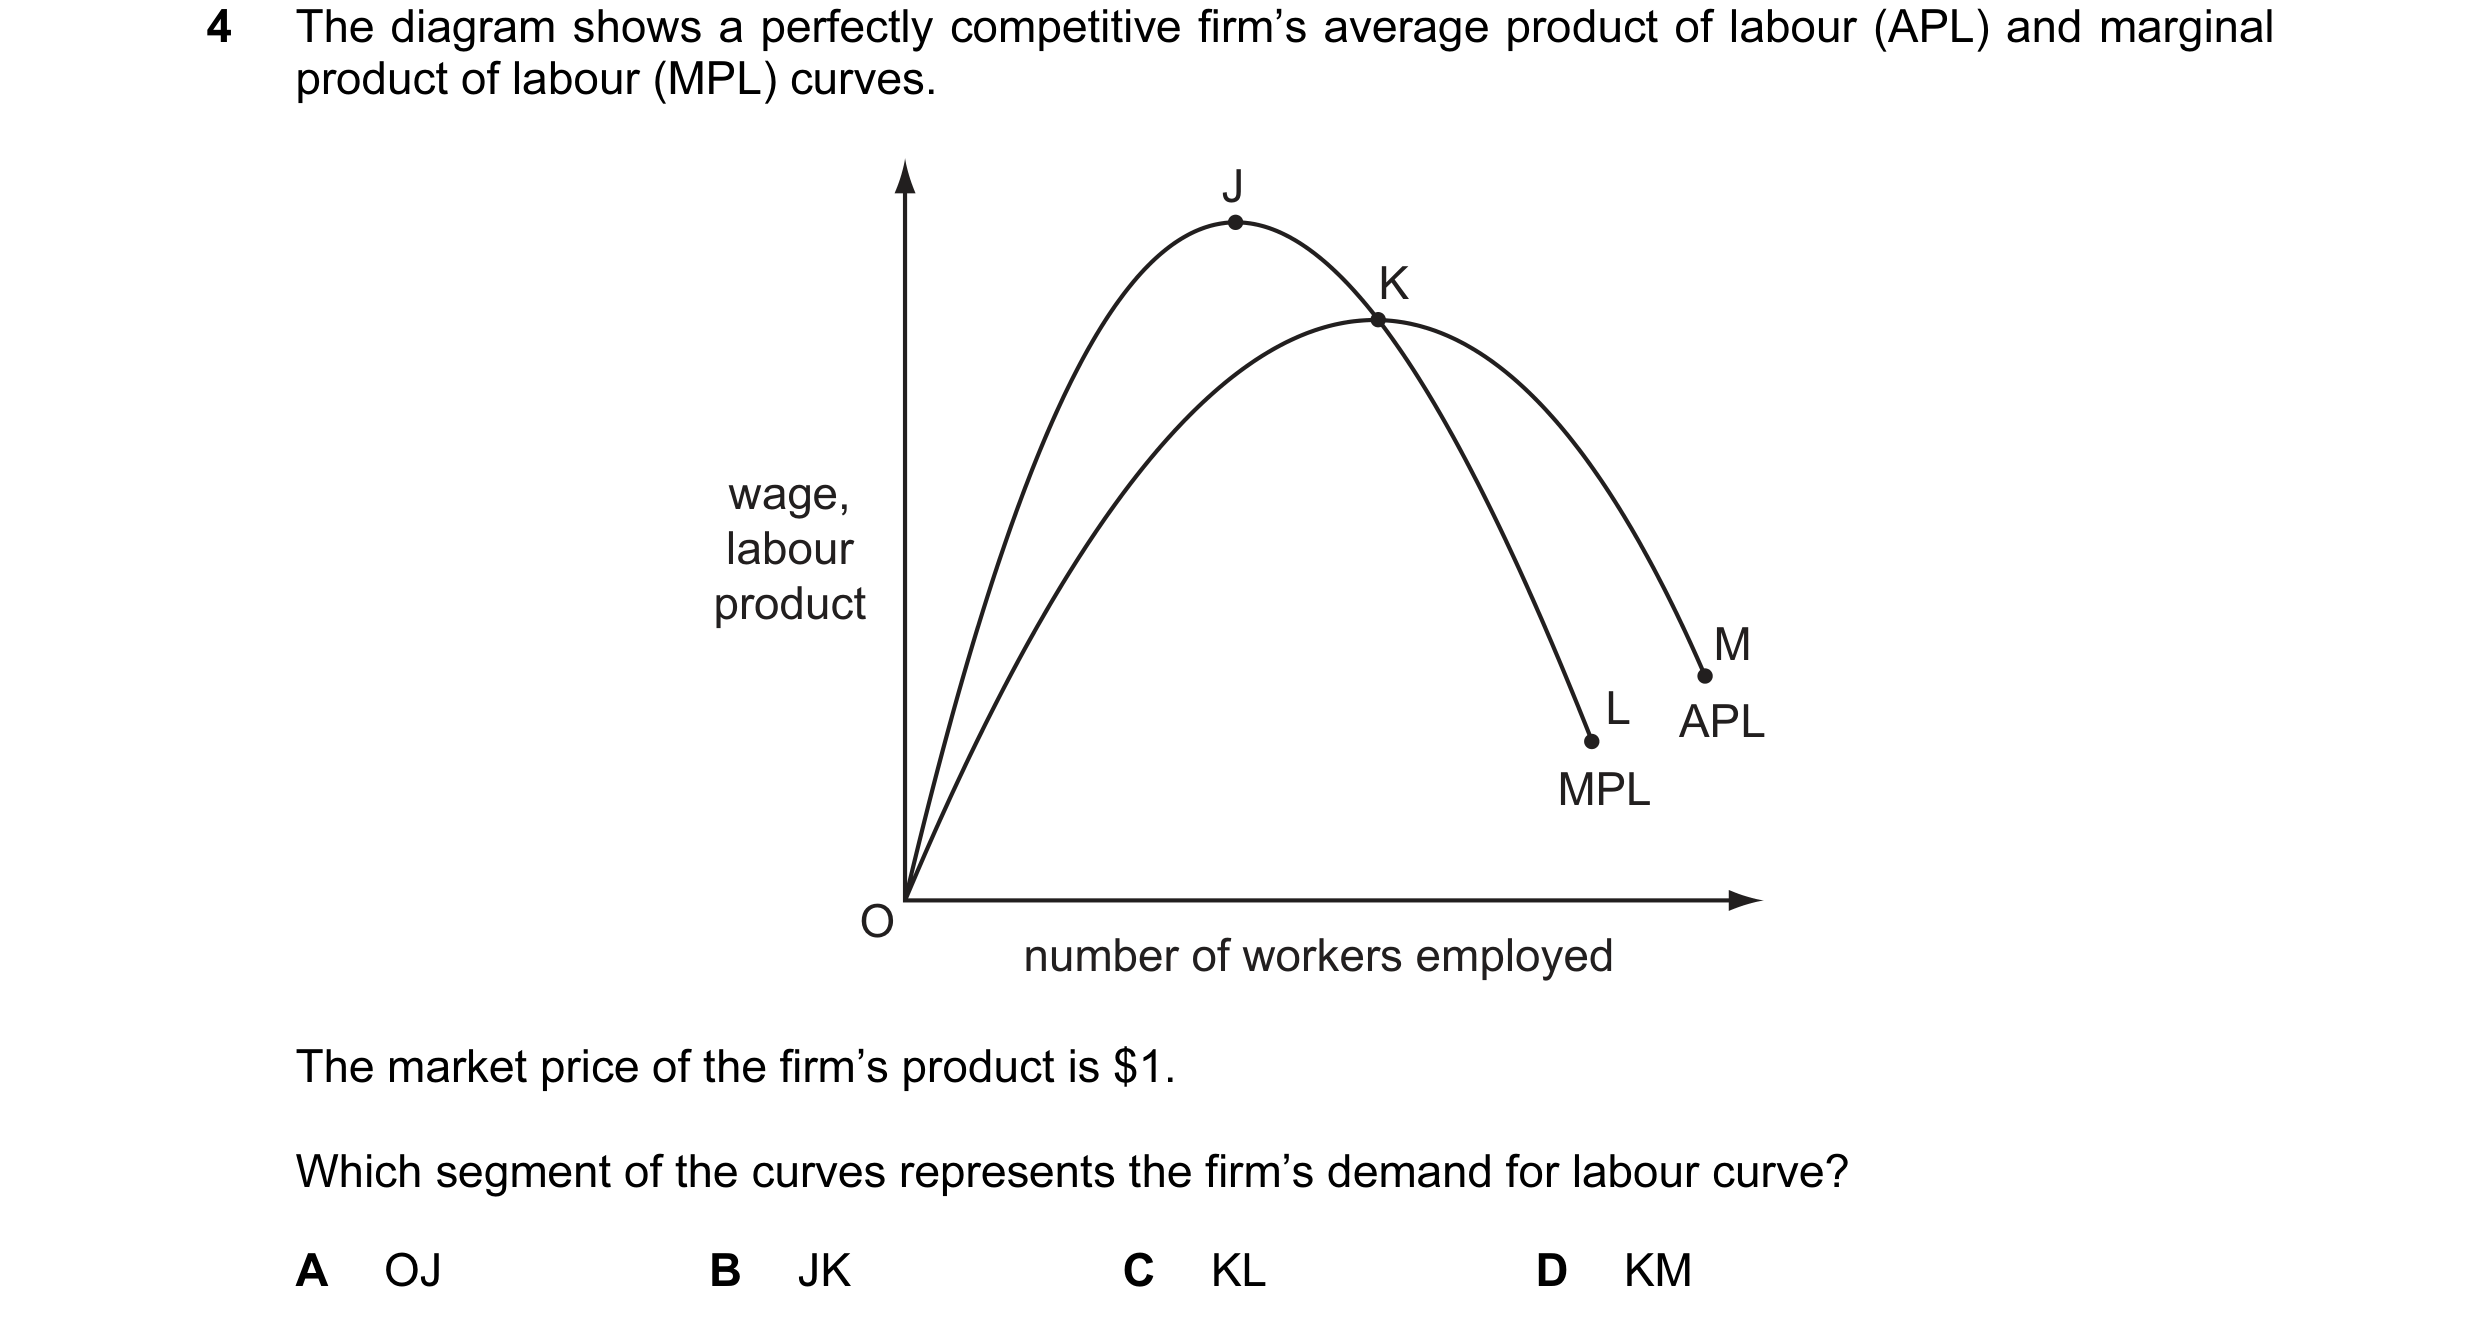 26 / 58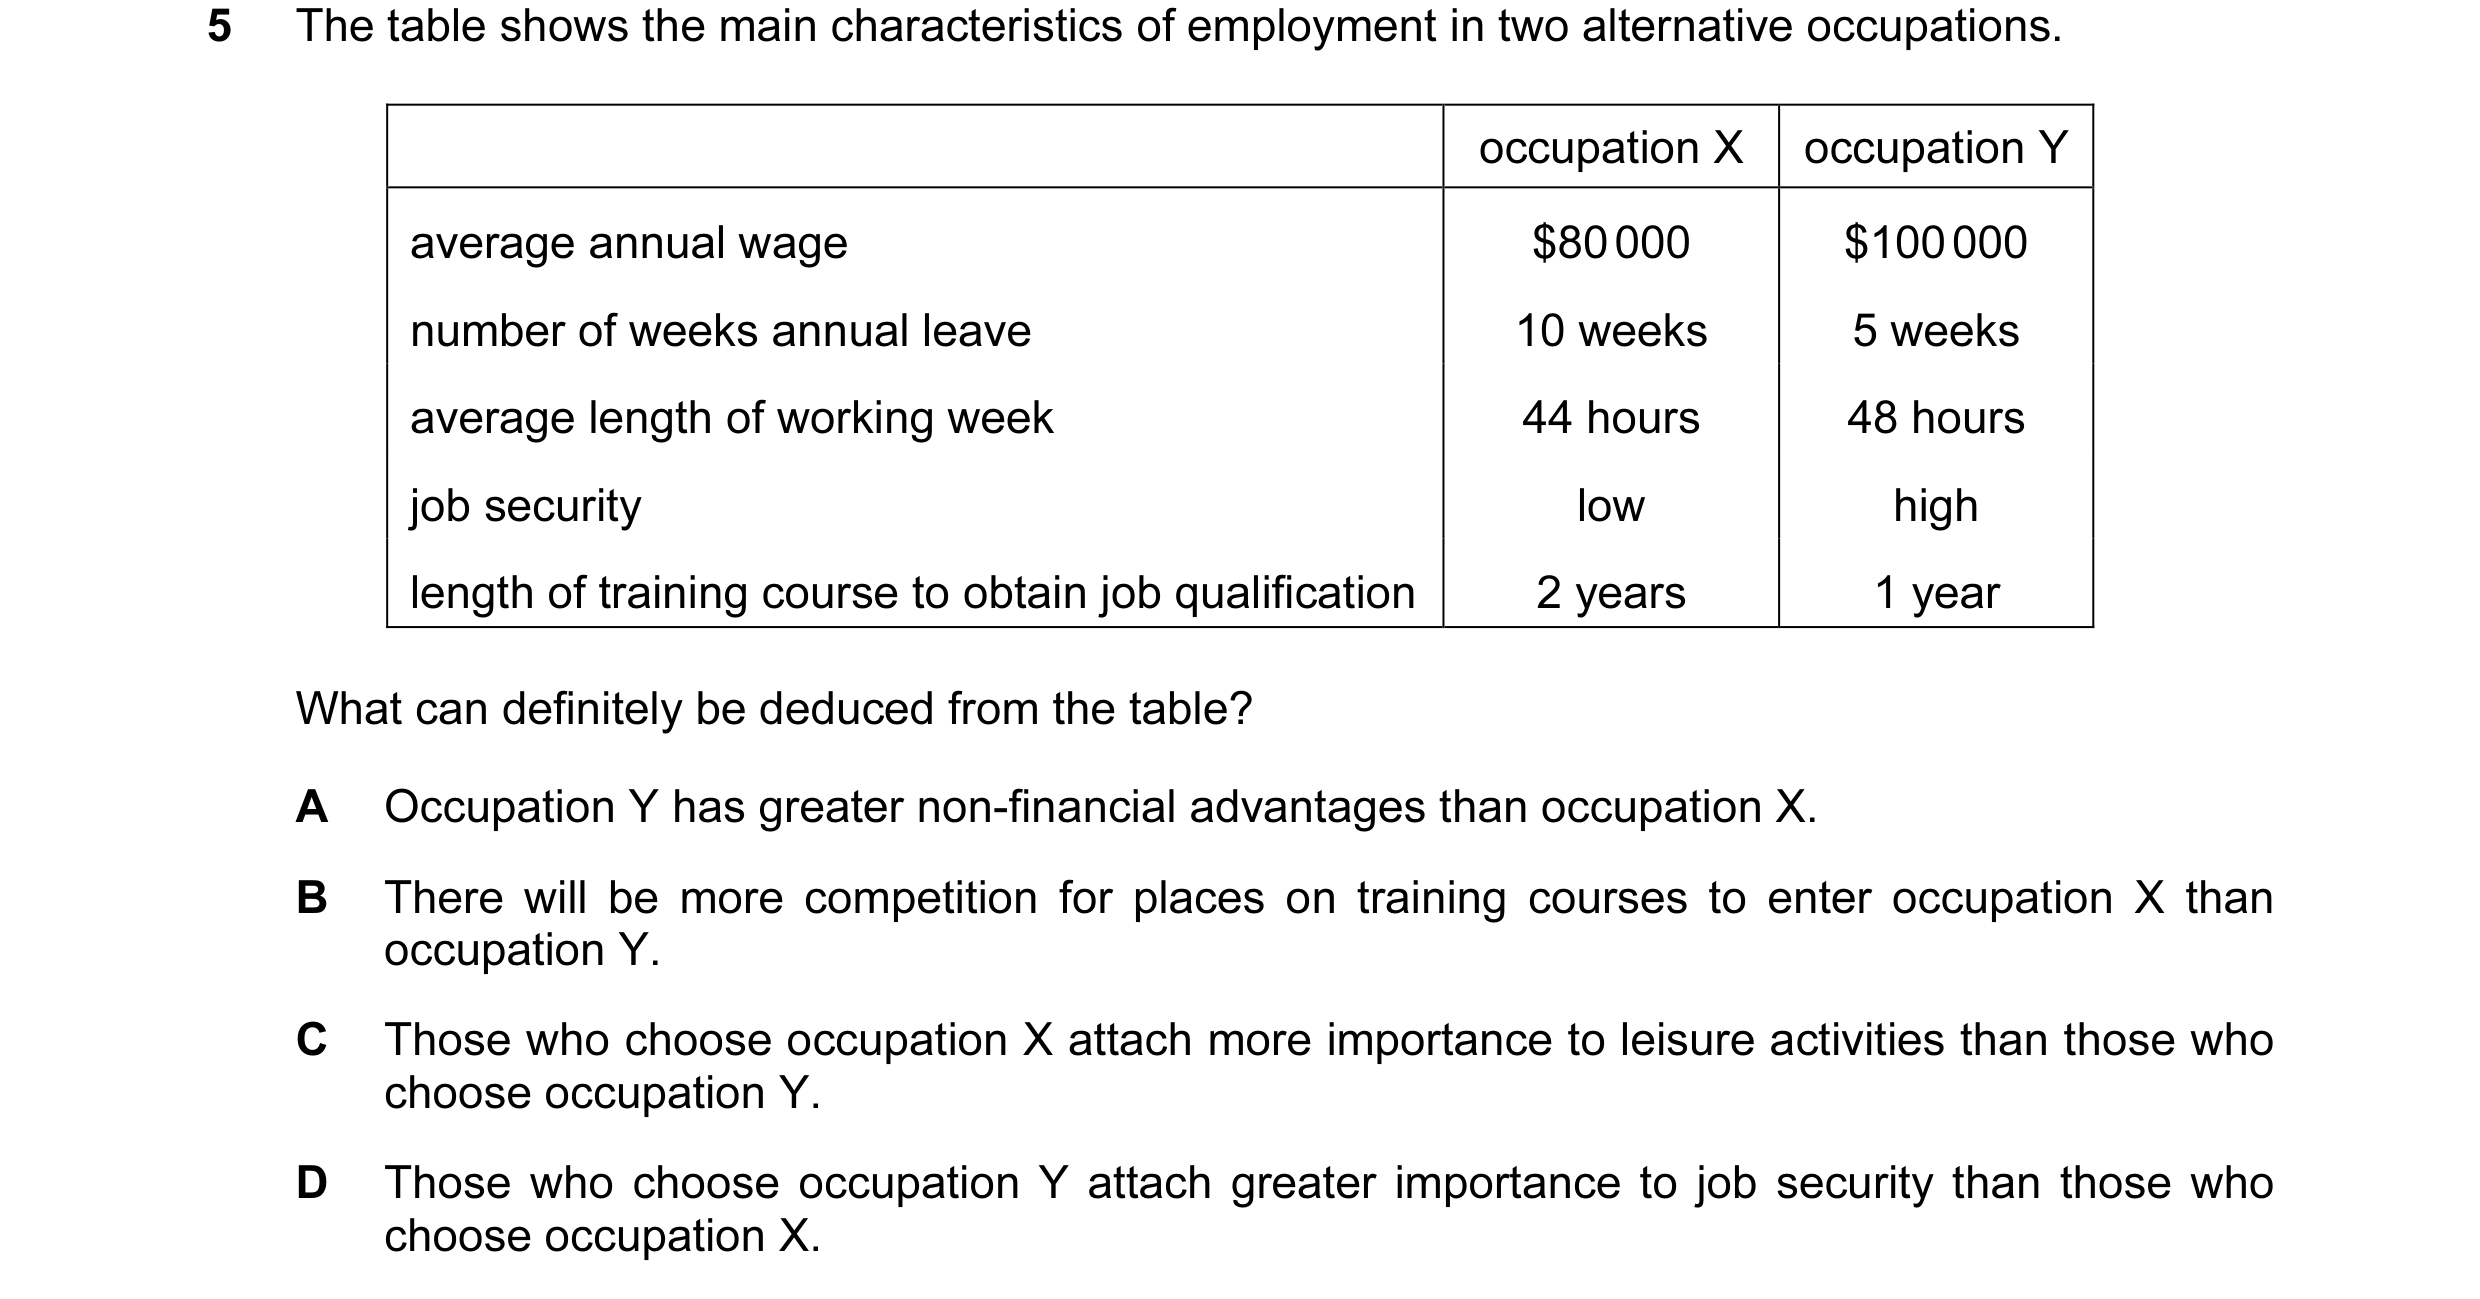

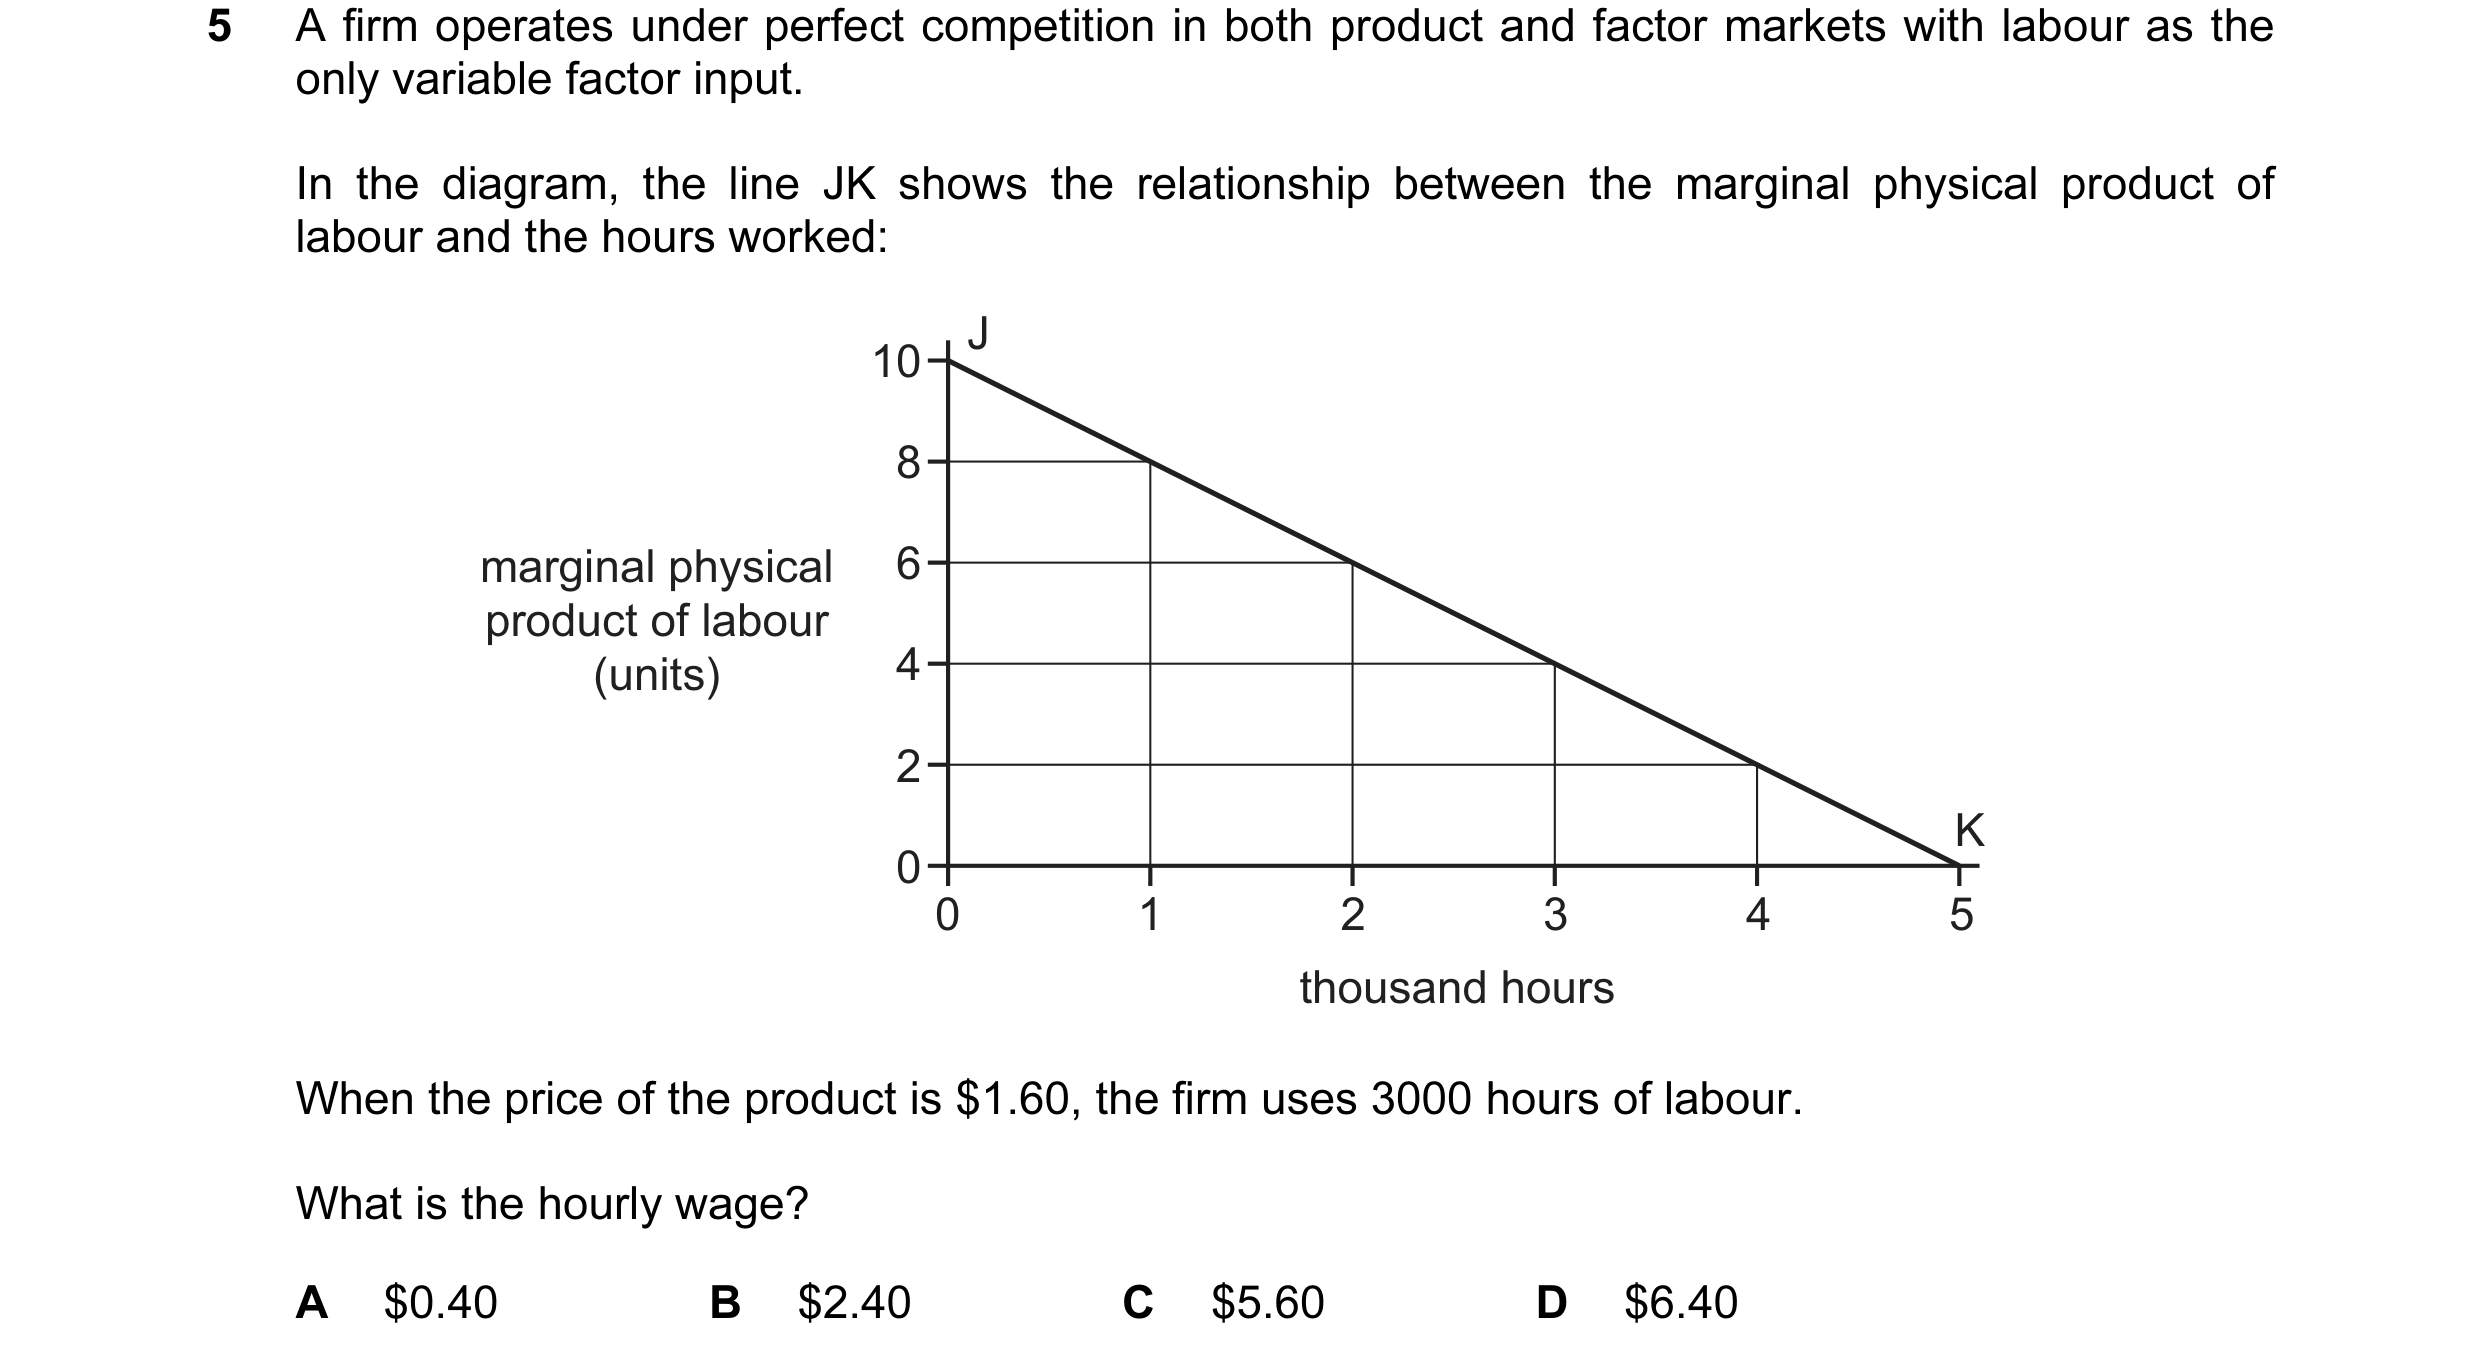 27 / 58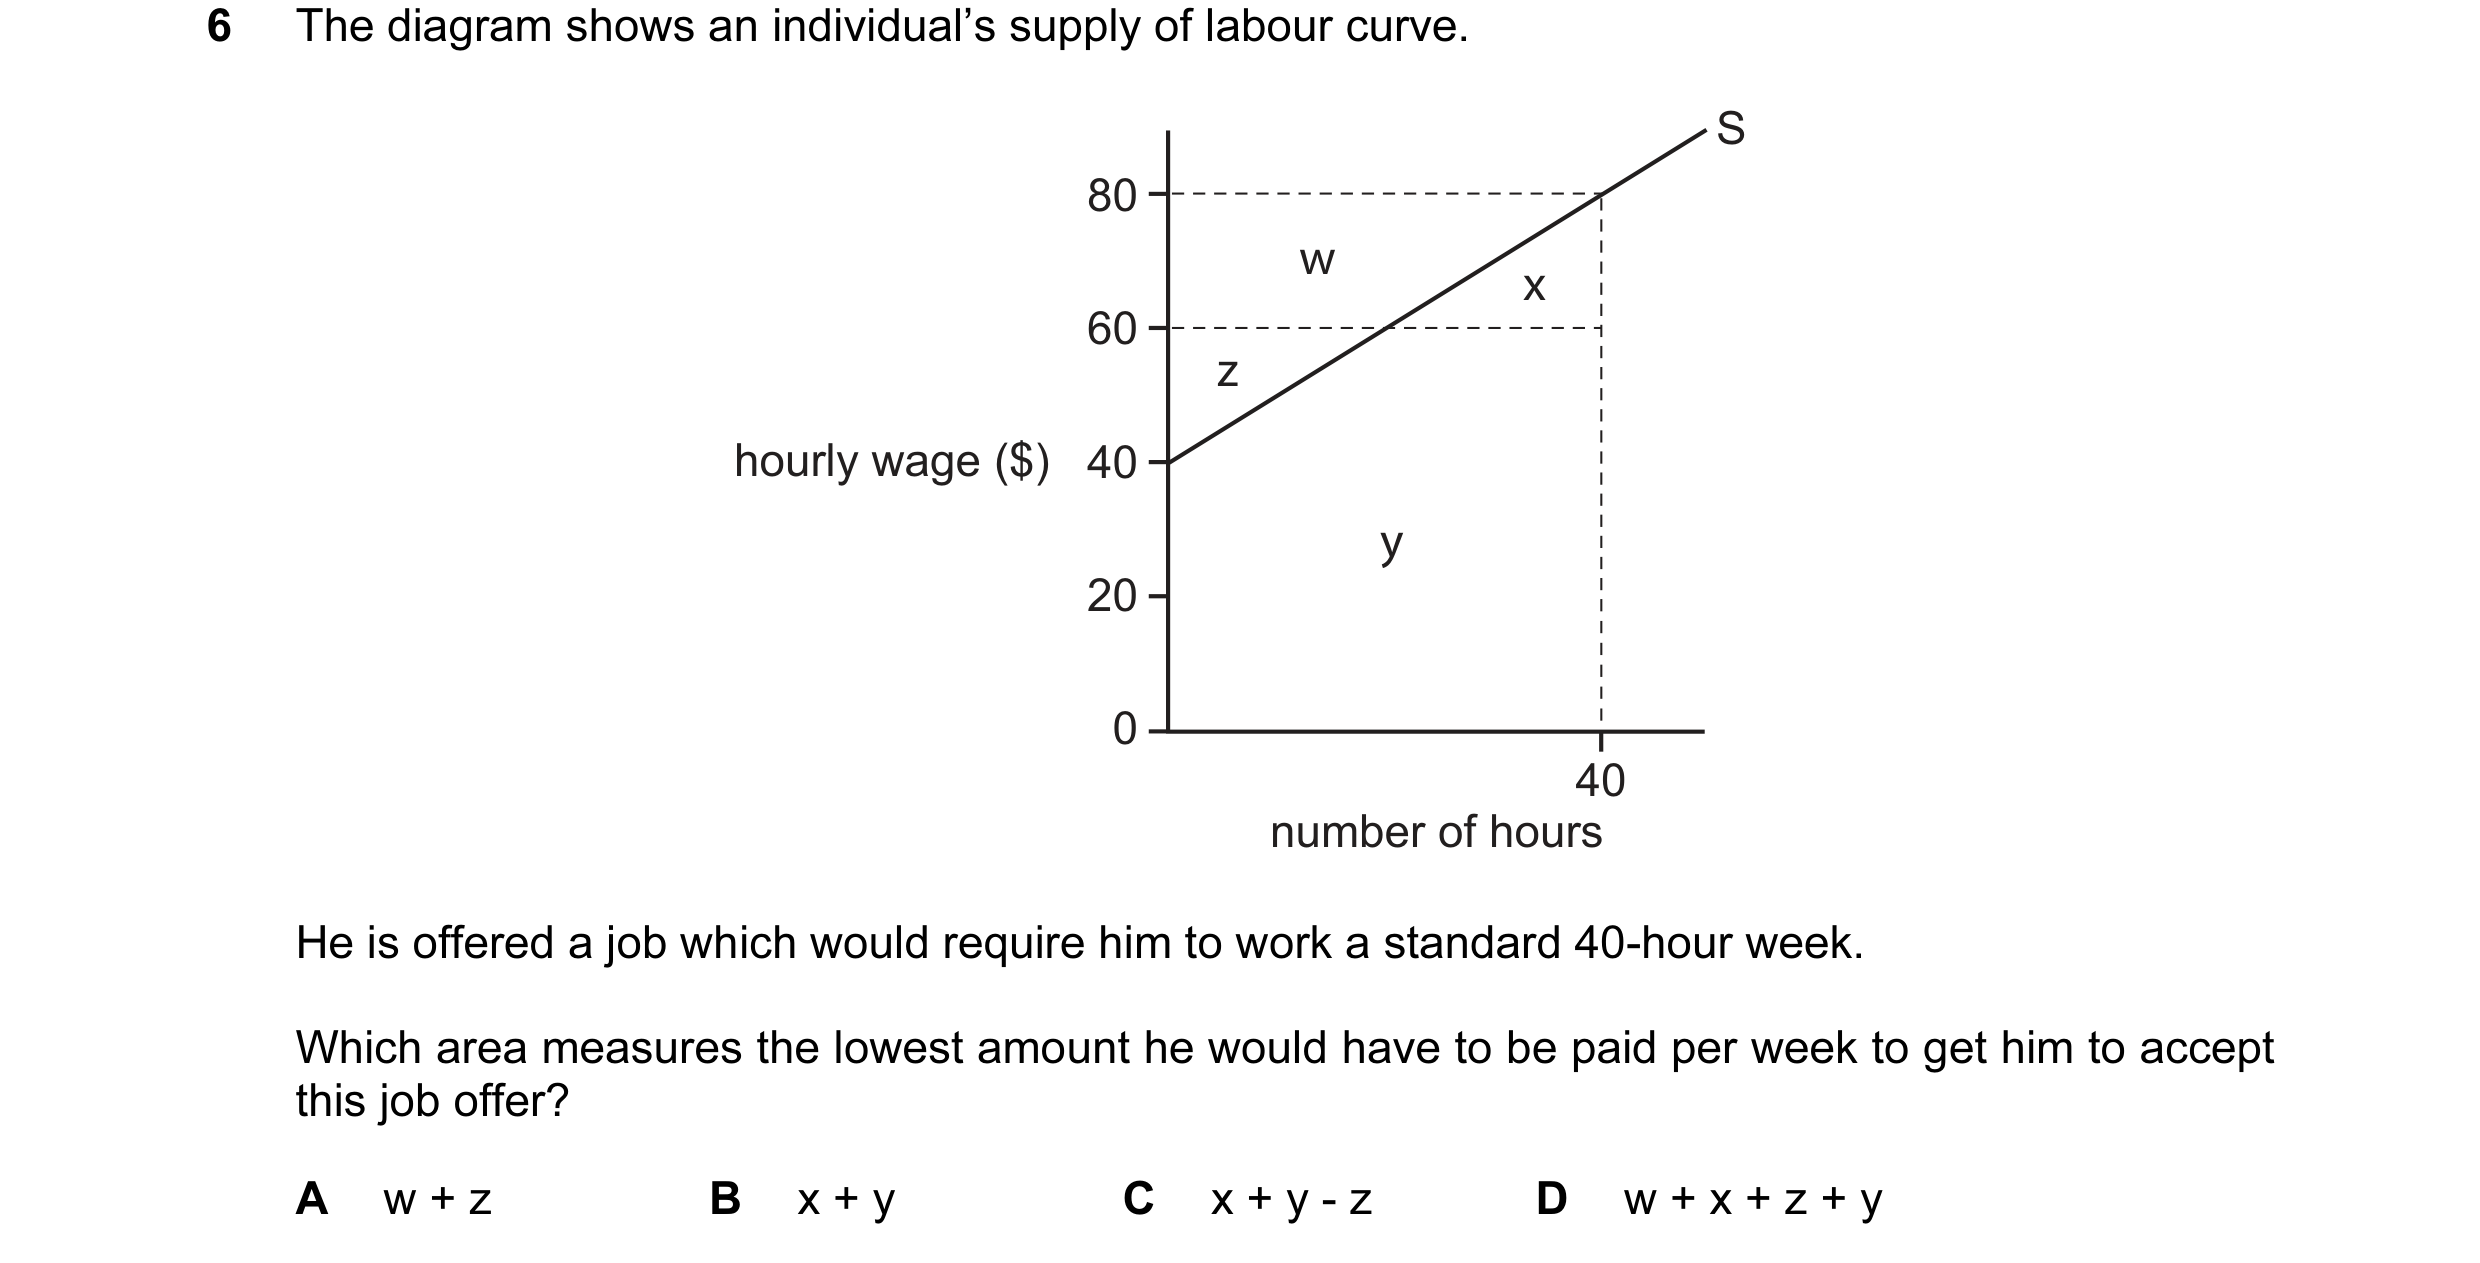

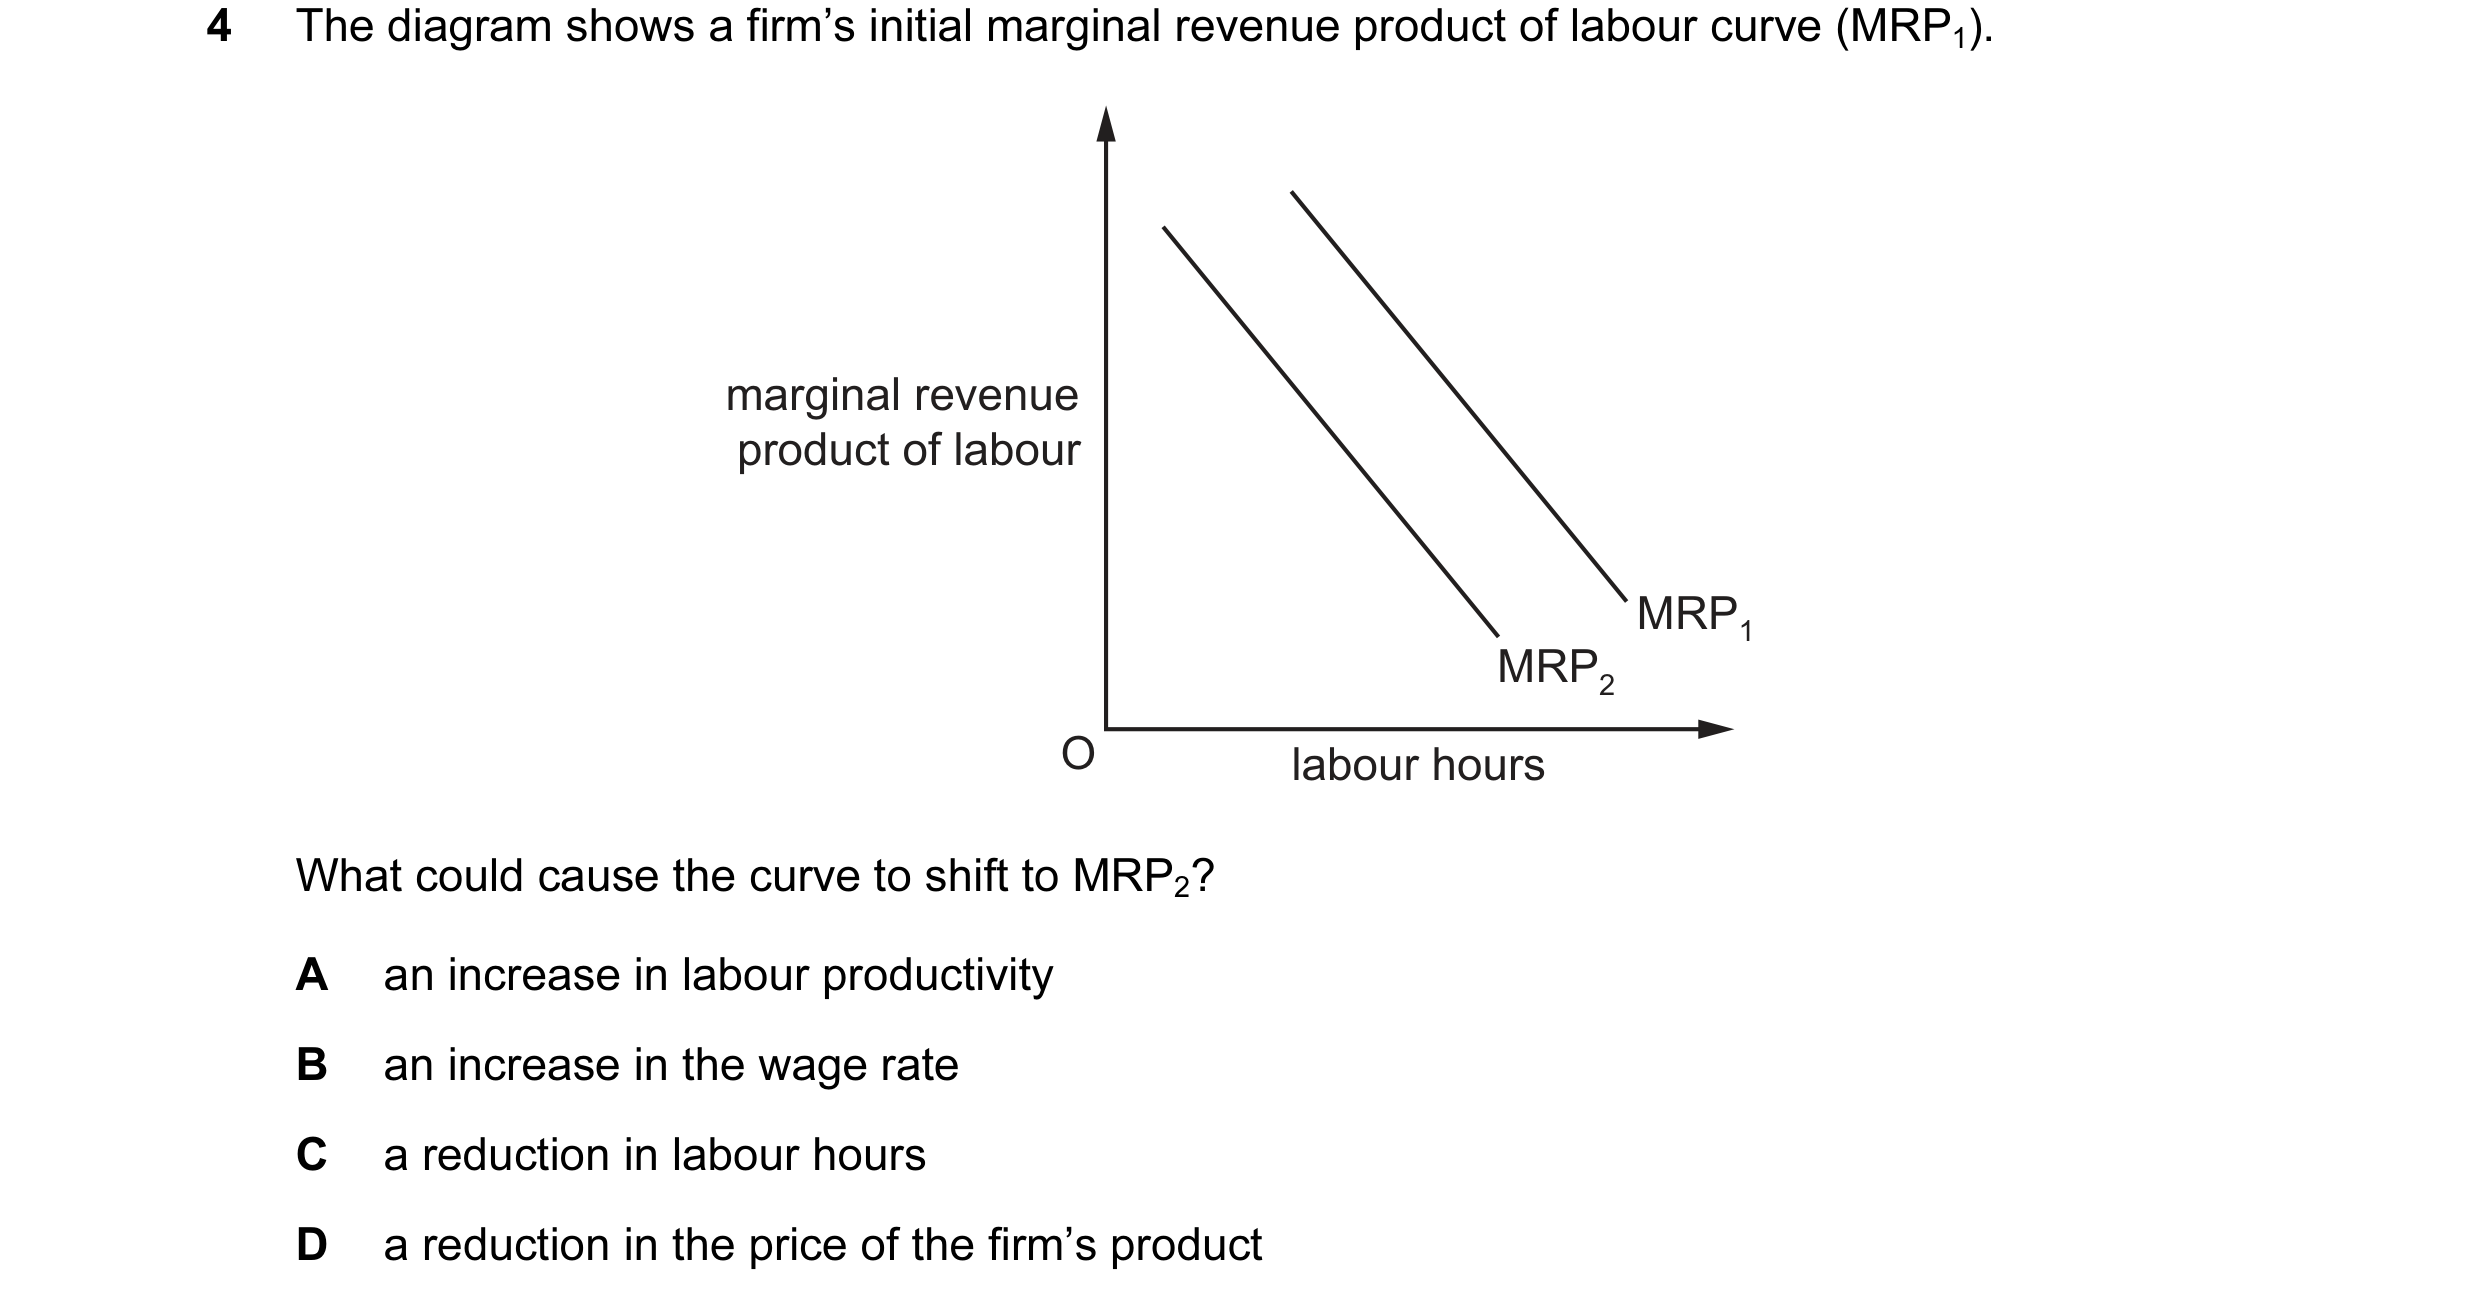 28 / 58
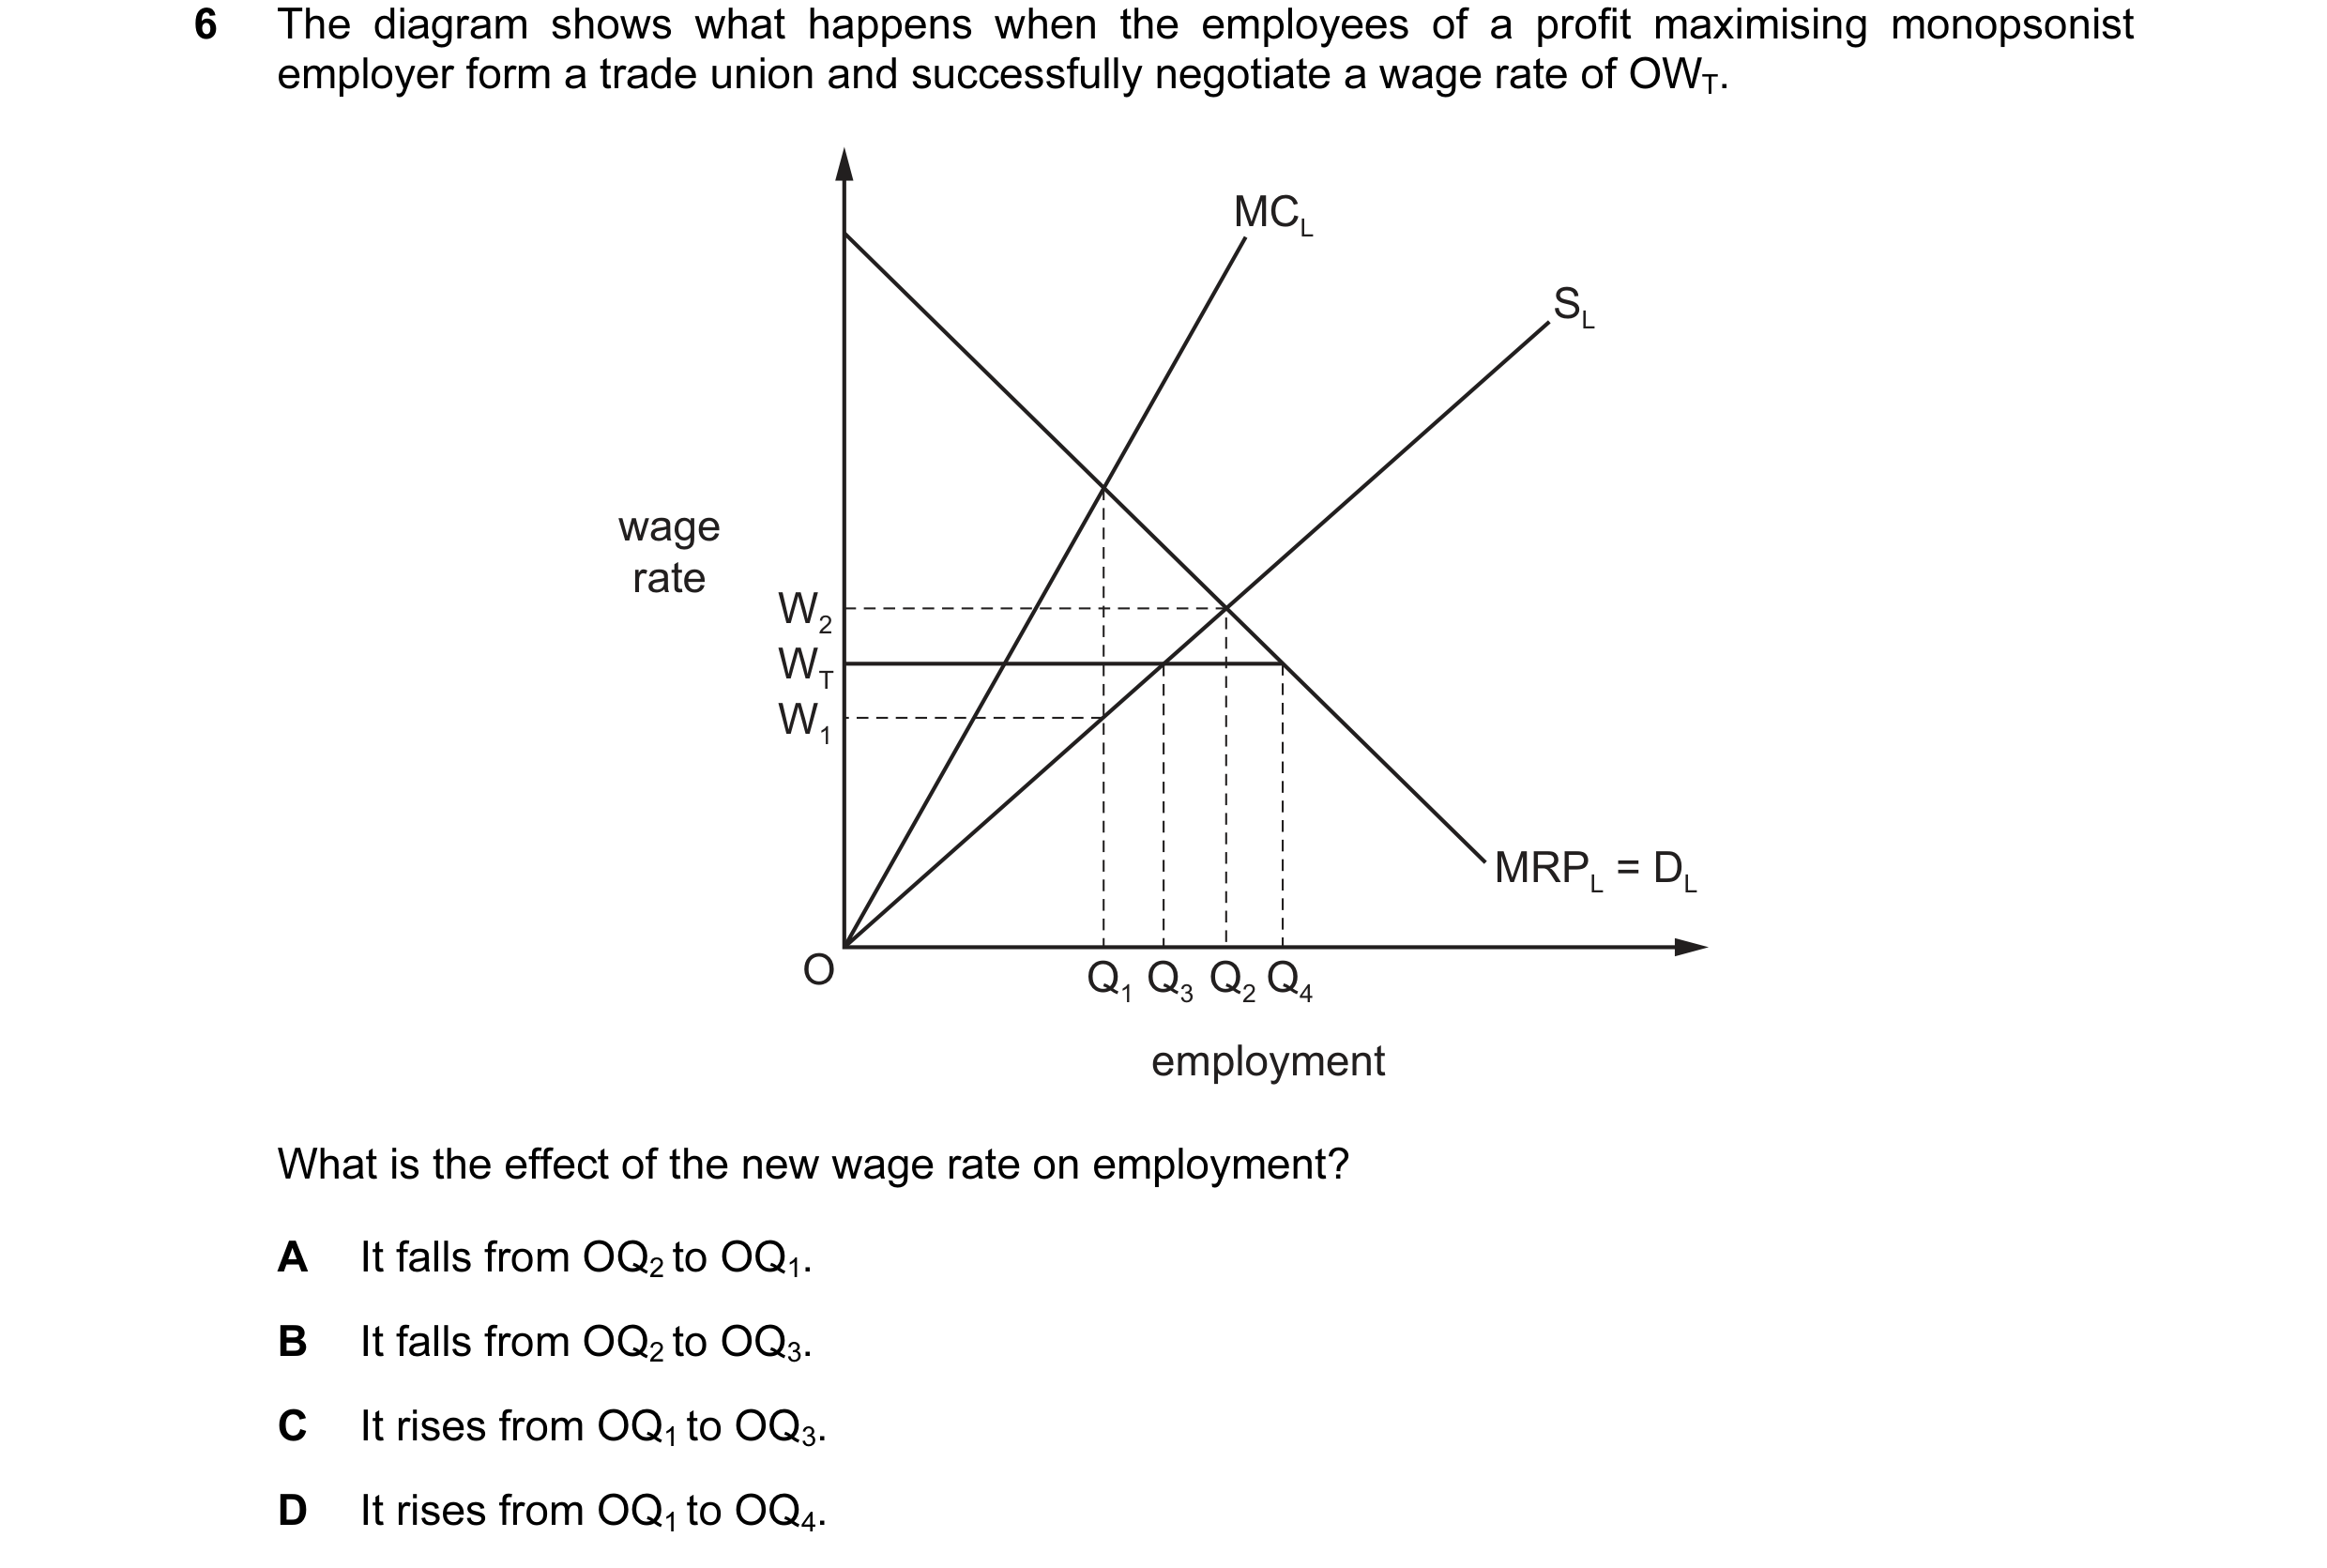
 29 / 58
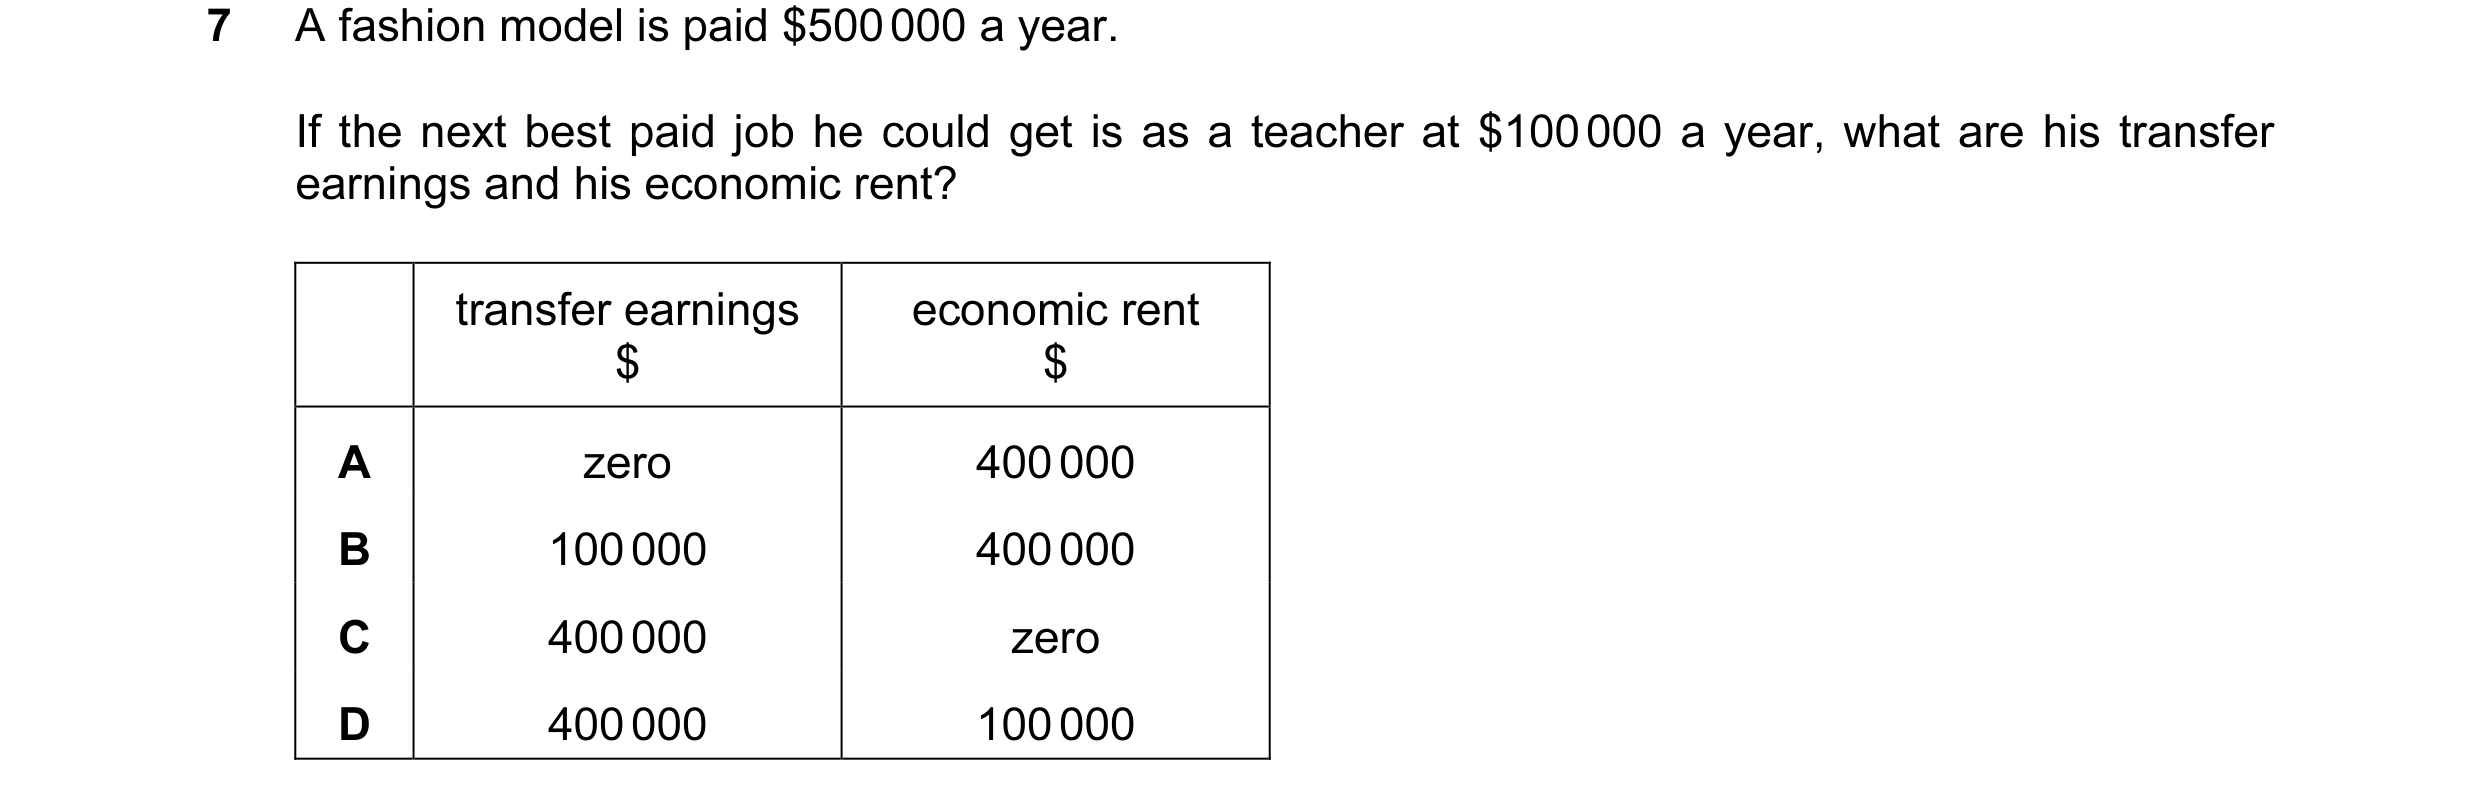
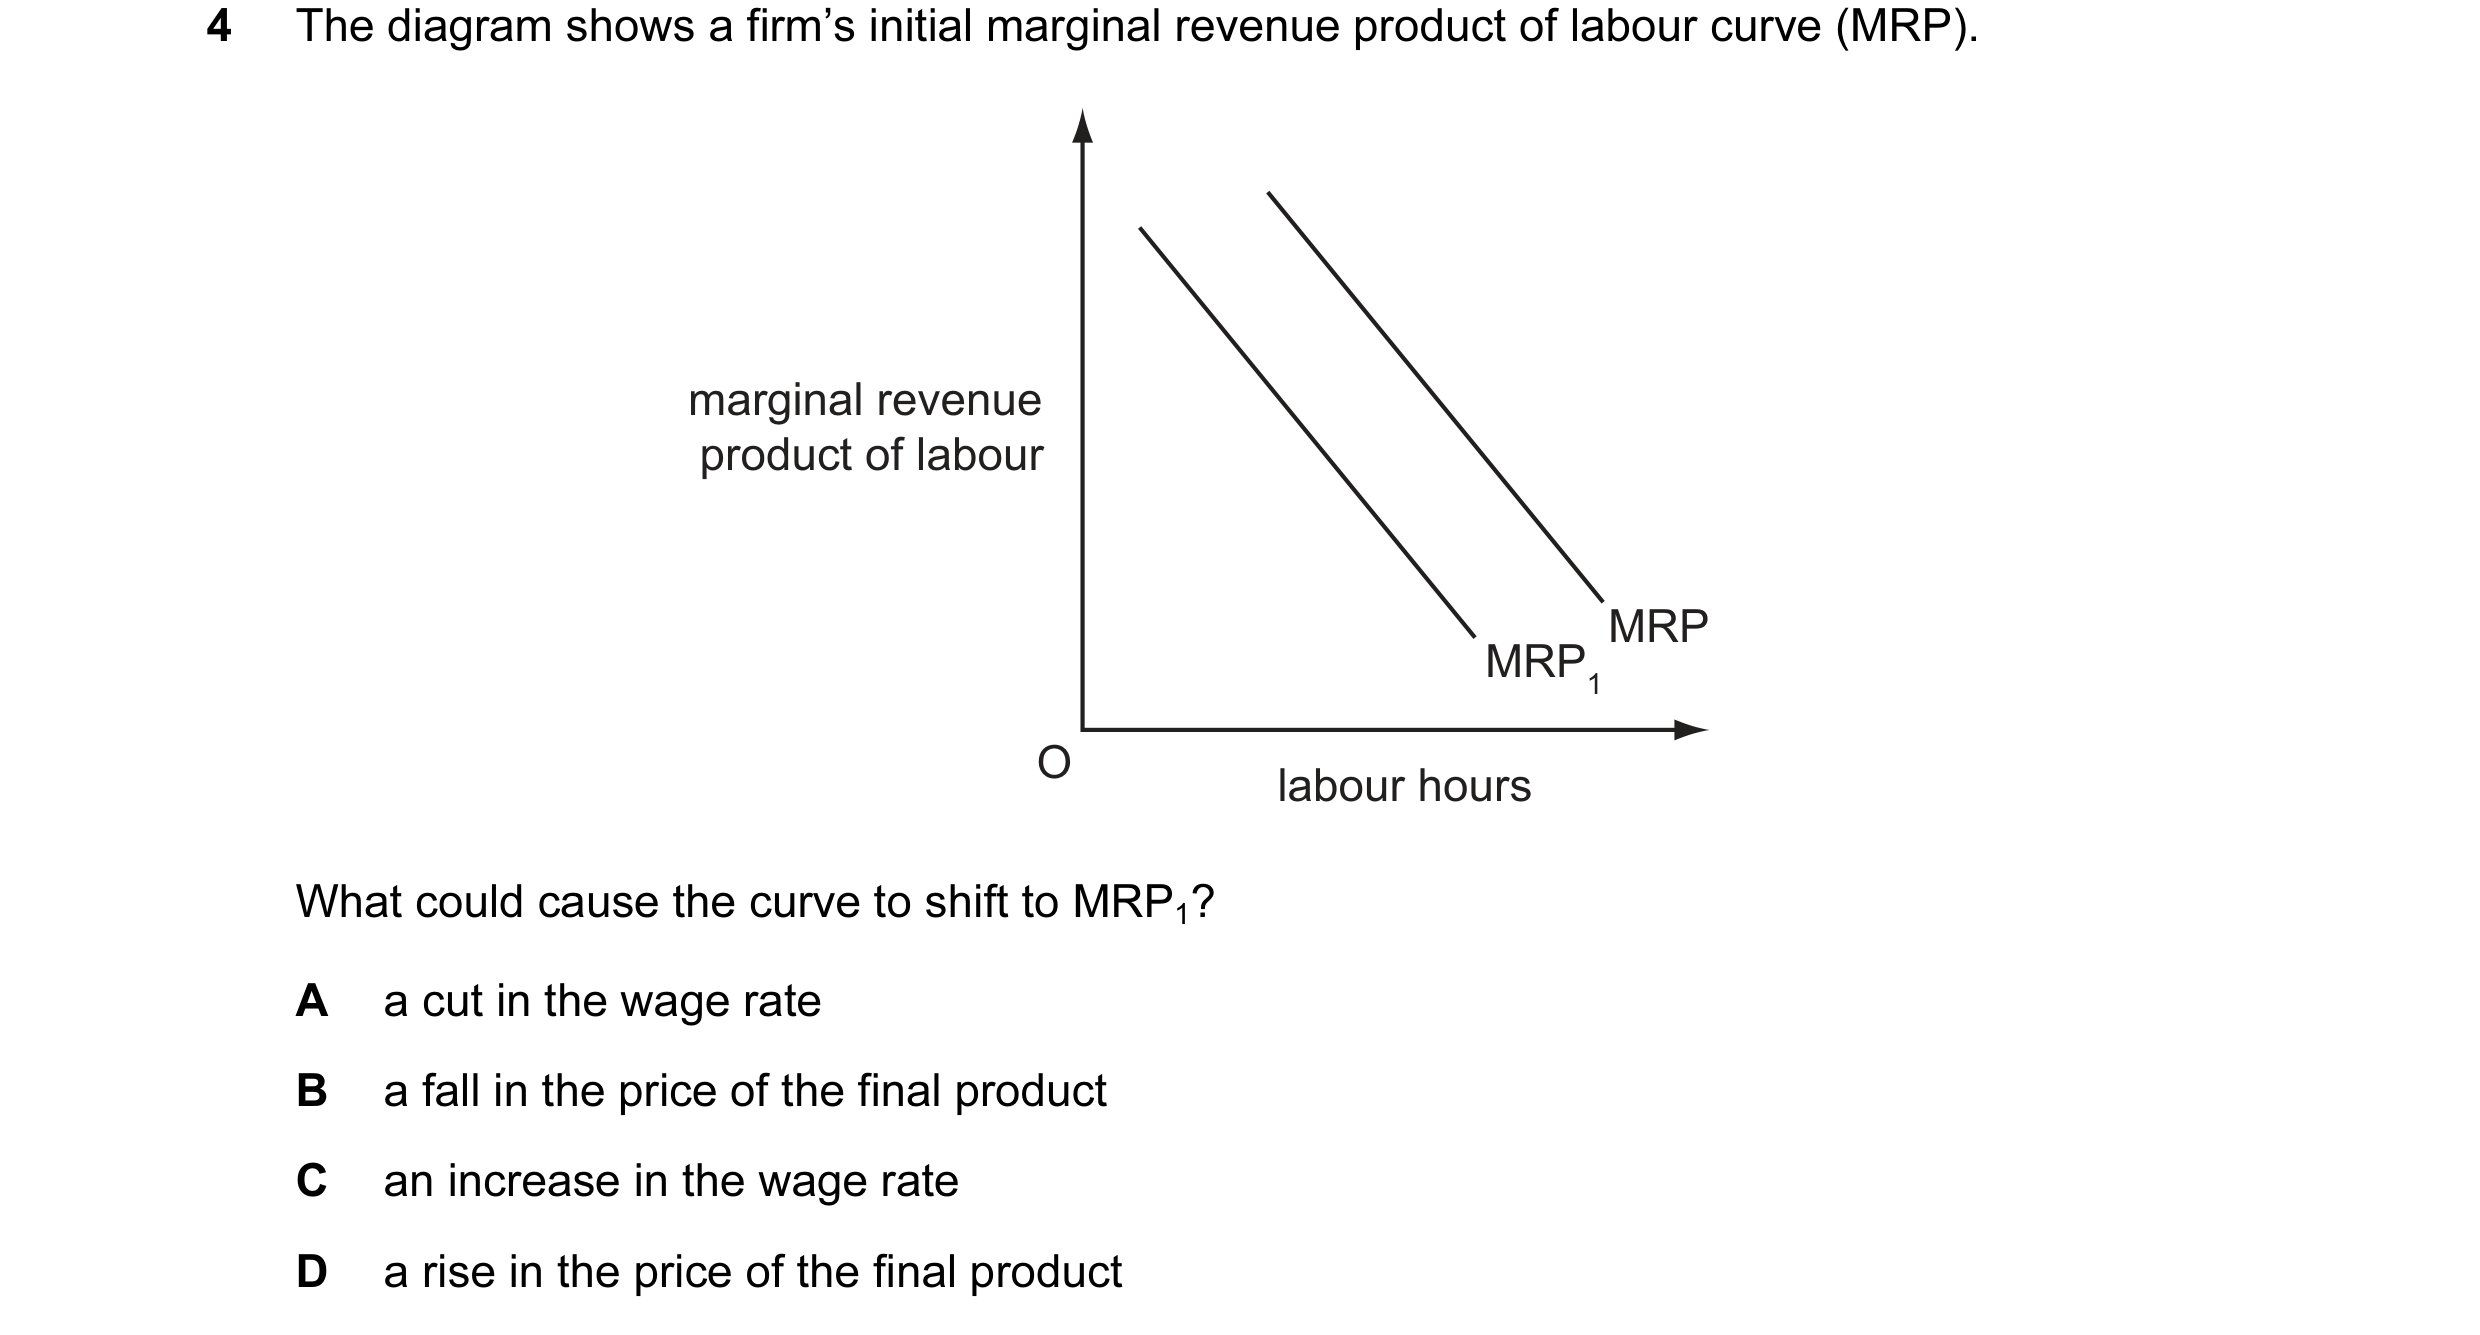 30 / 58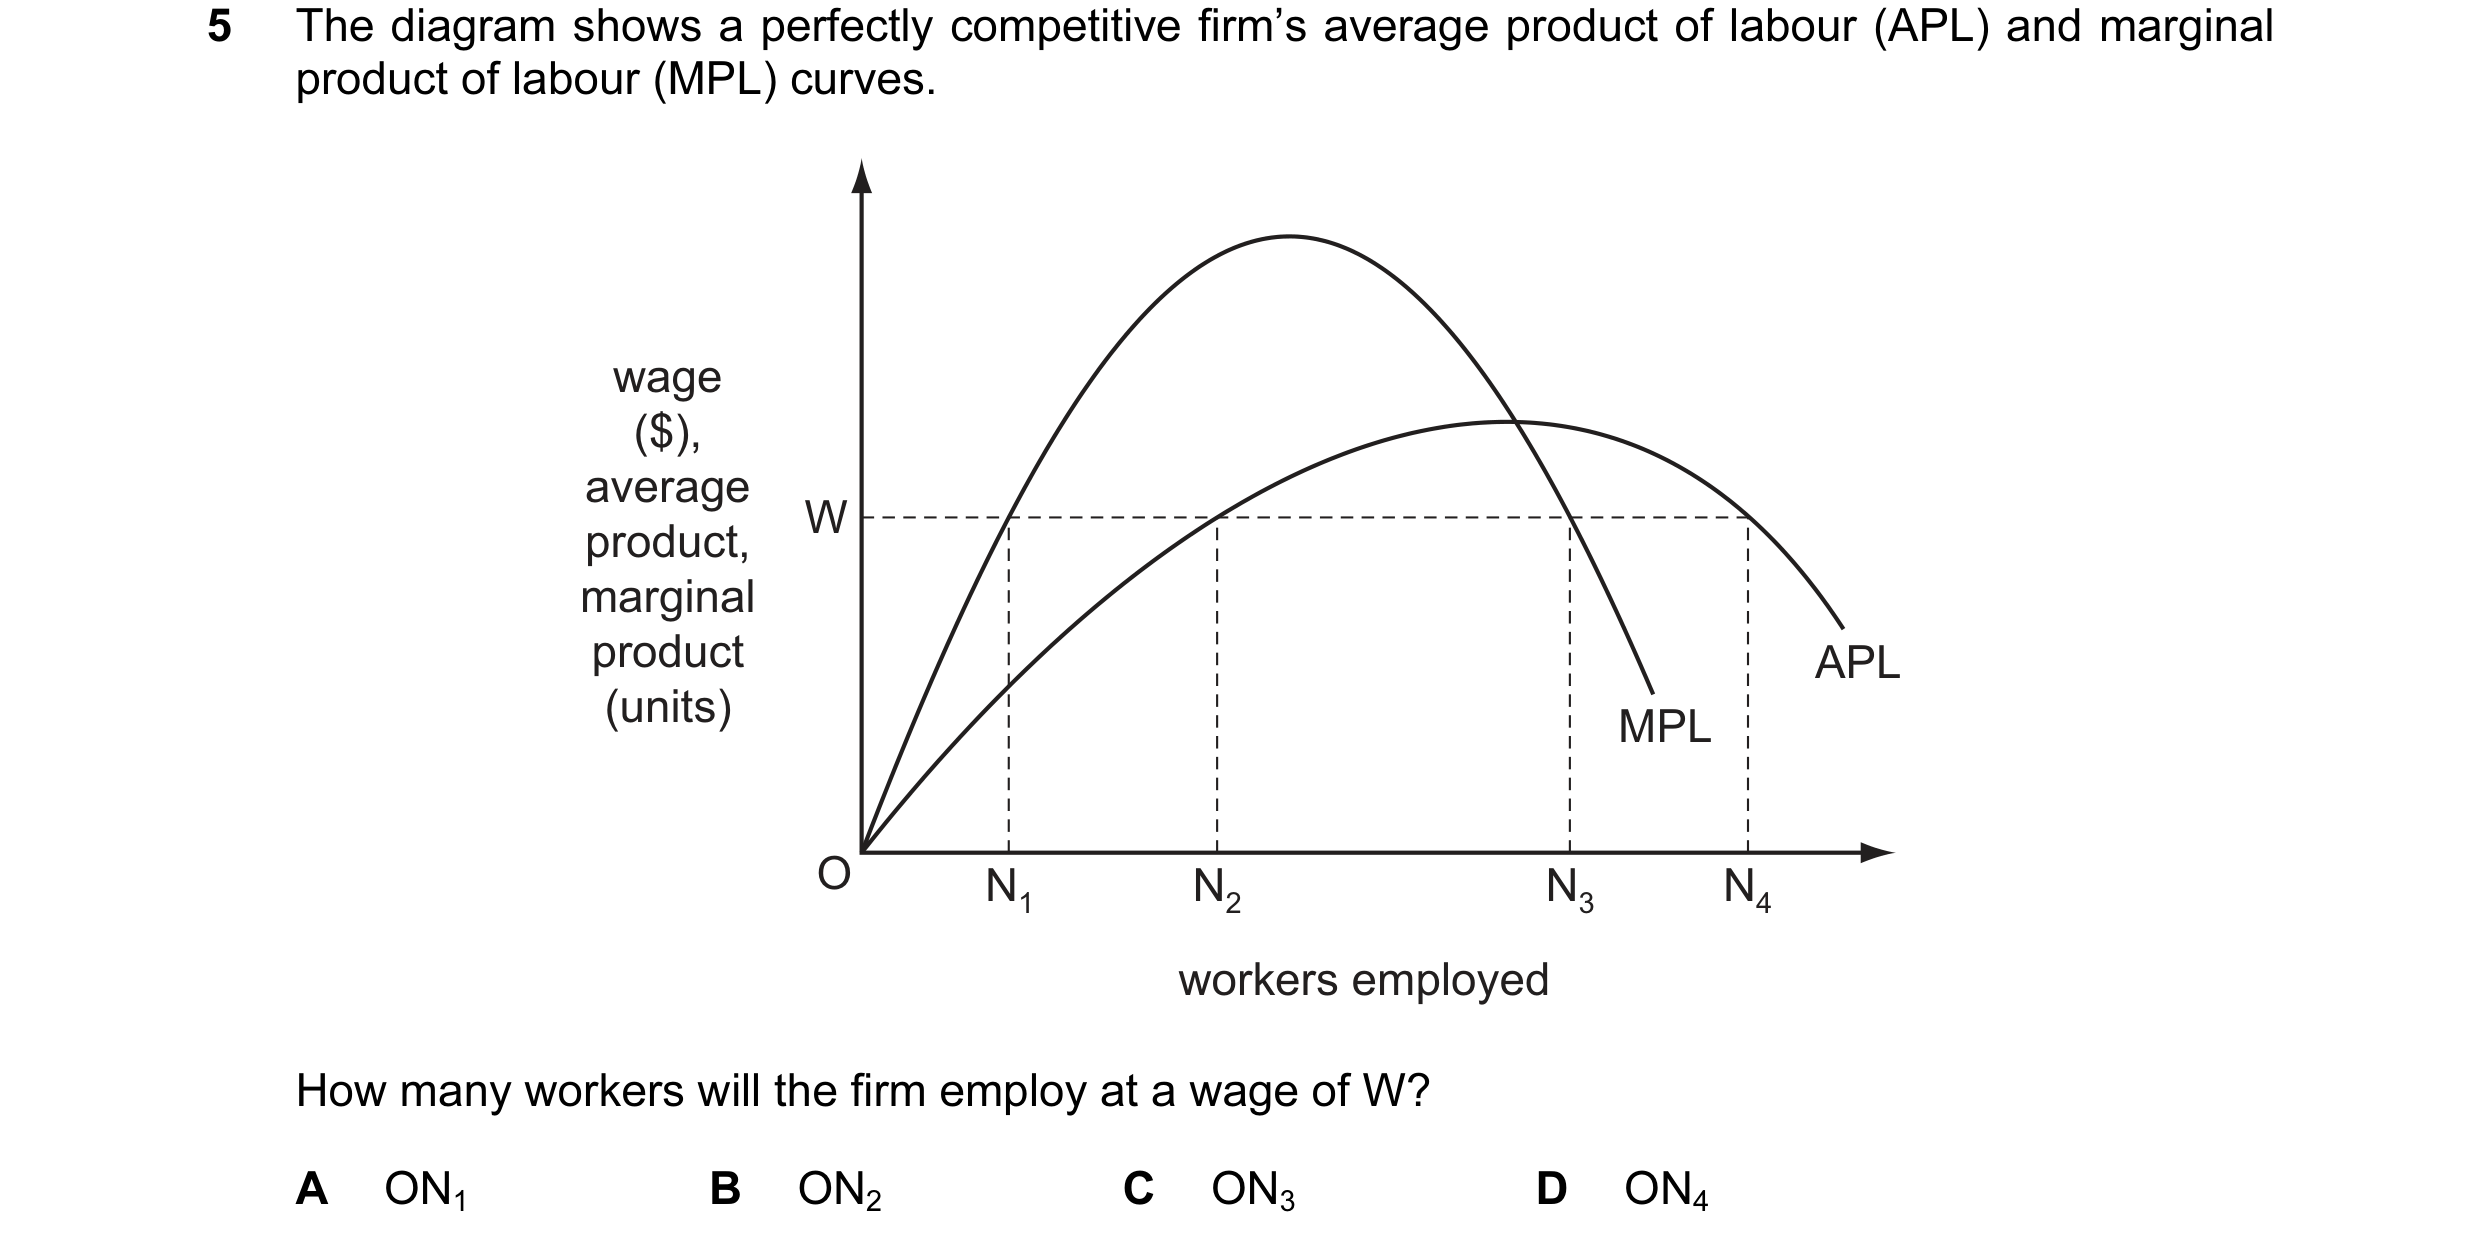



 31 / 58
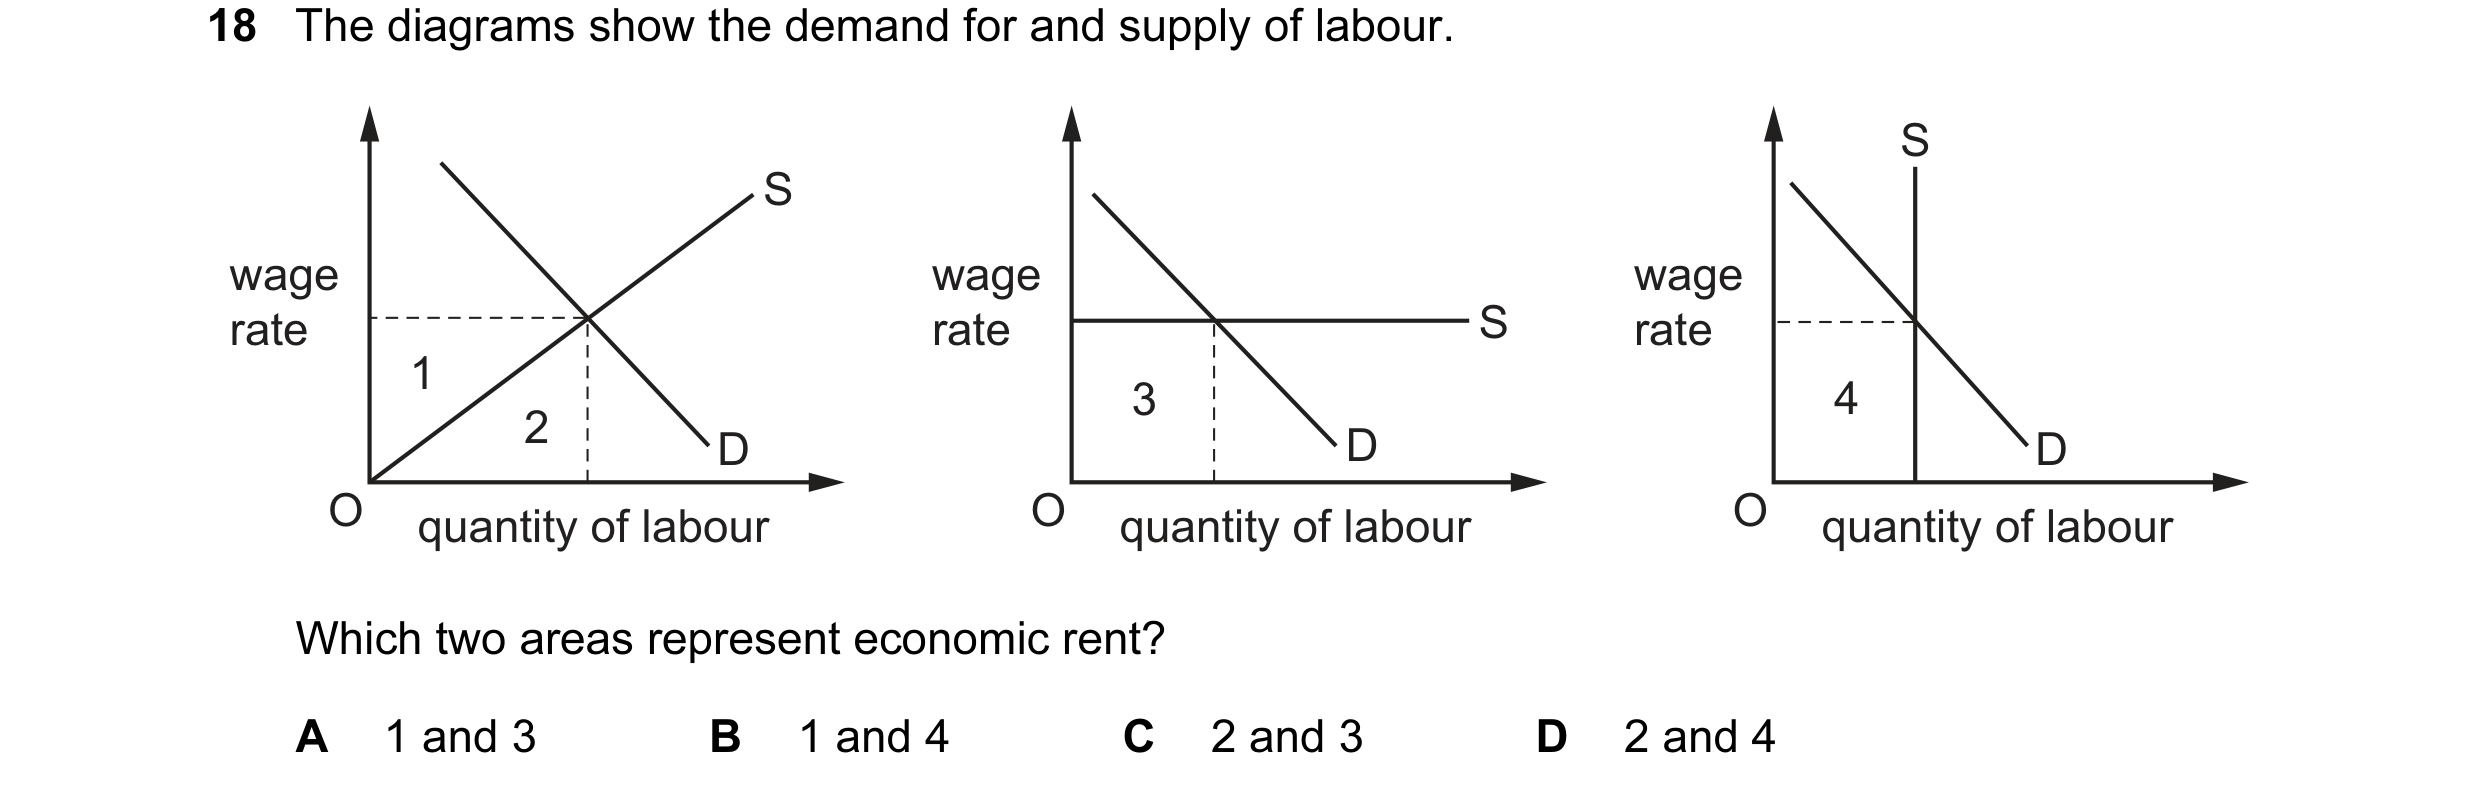
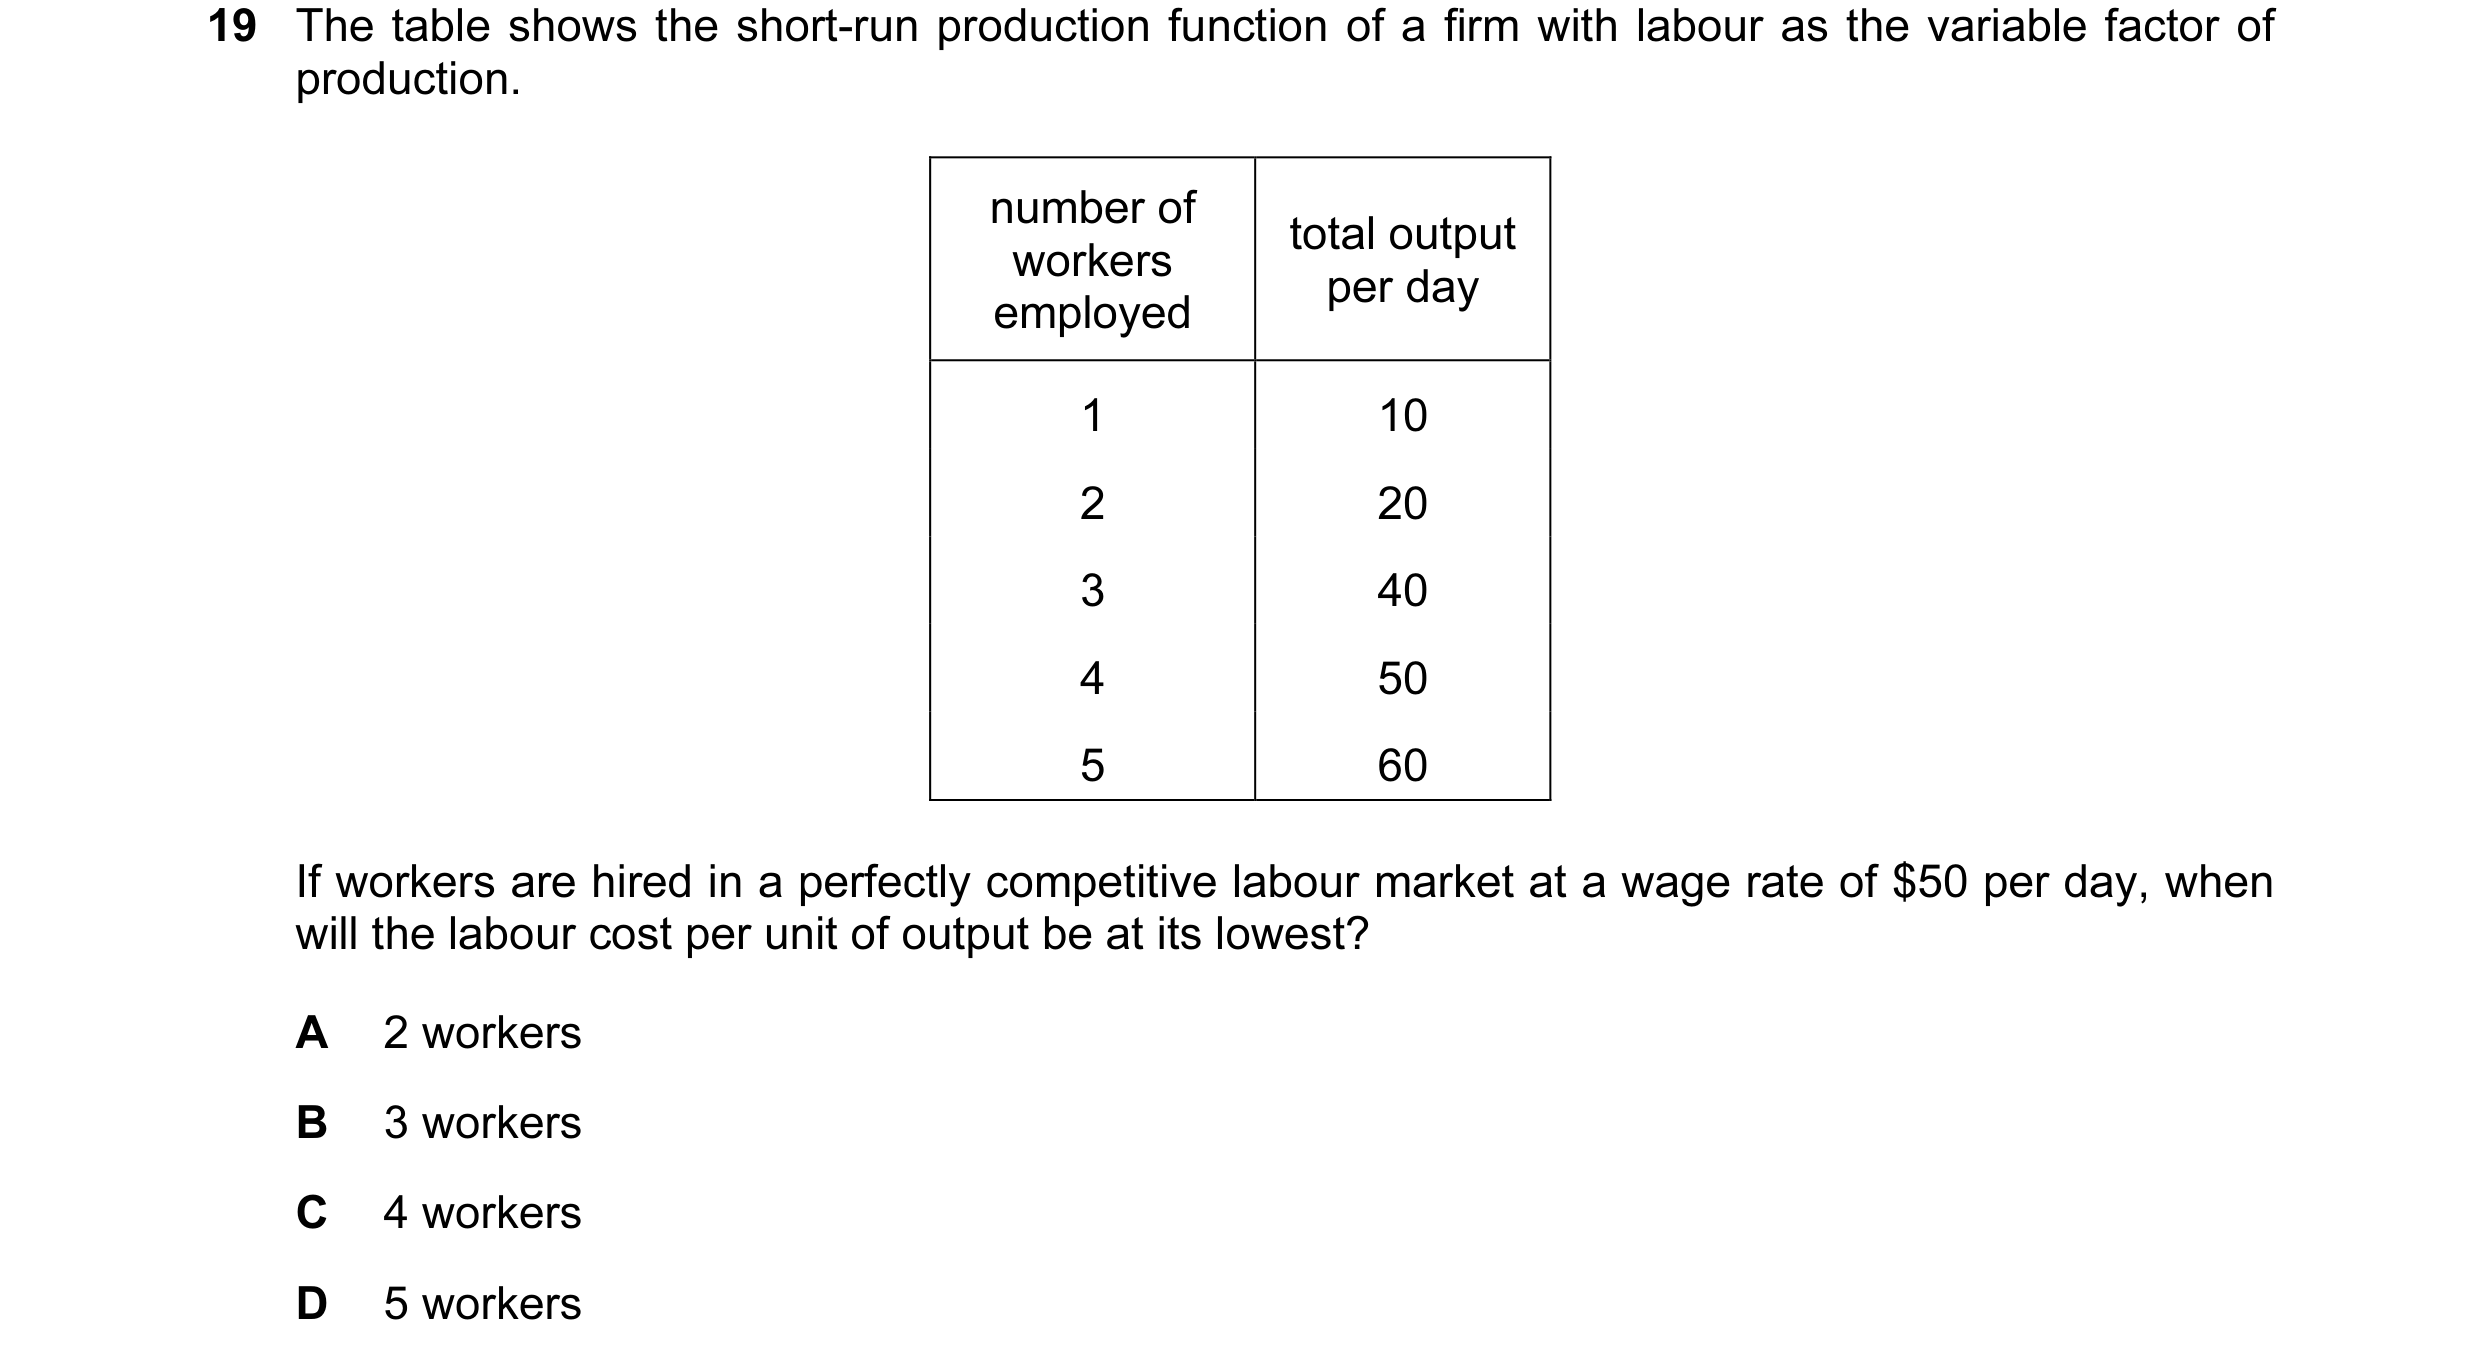 32 / 58
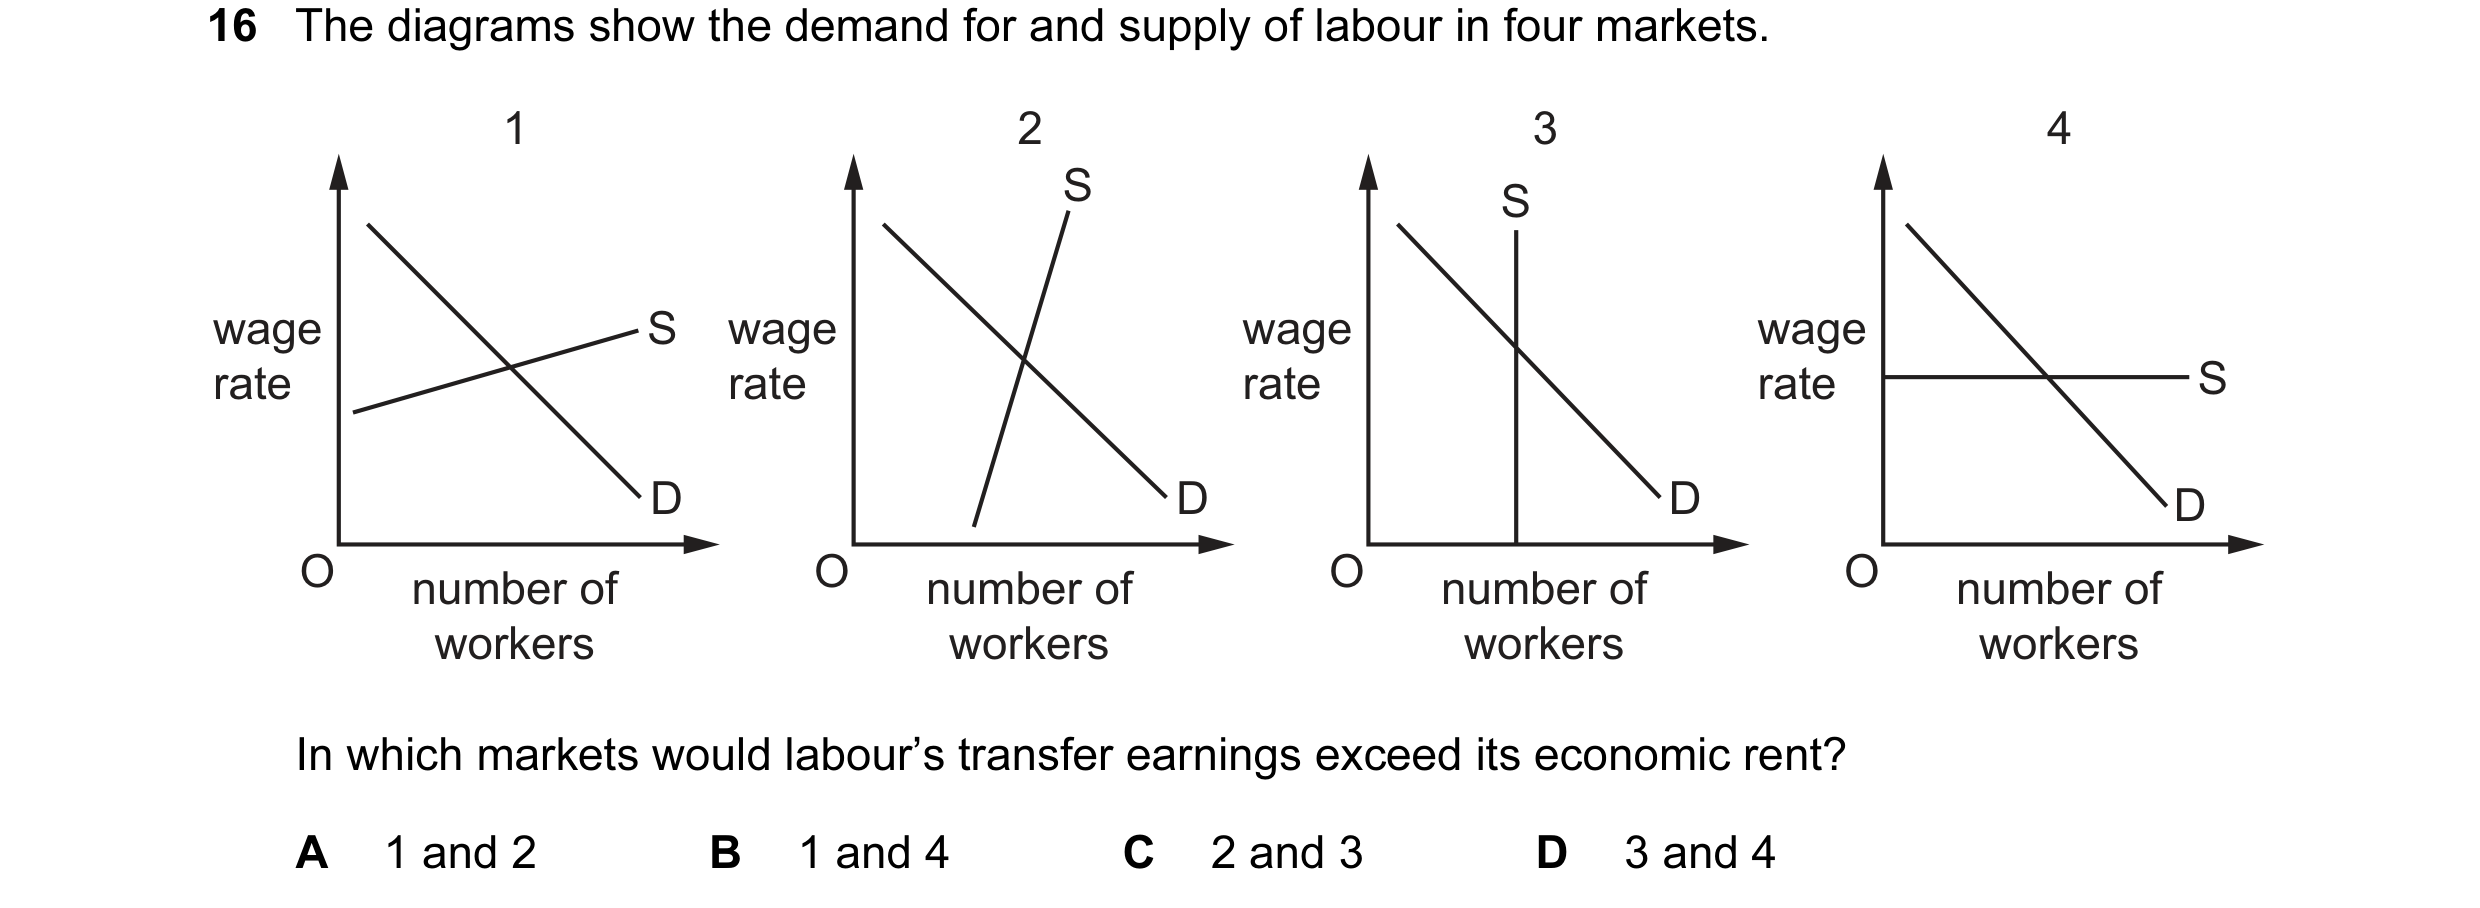
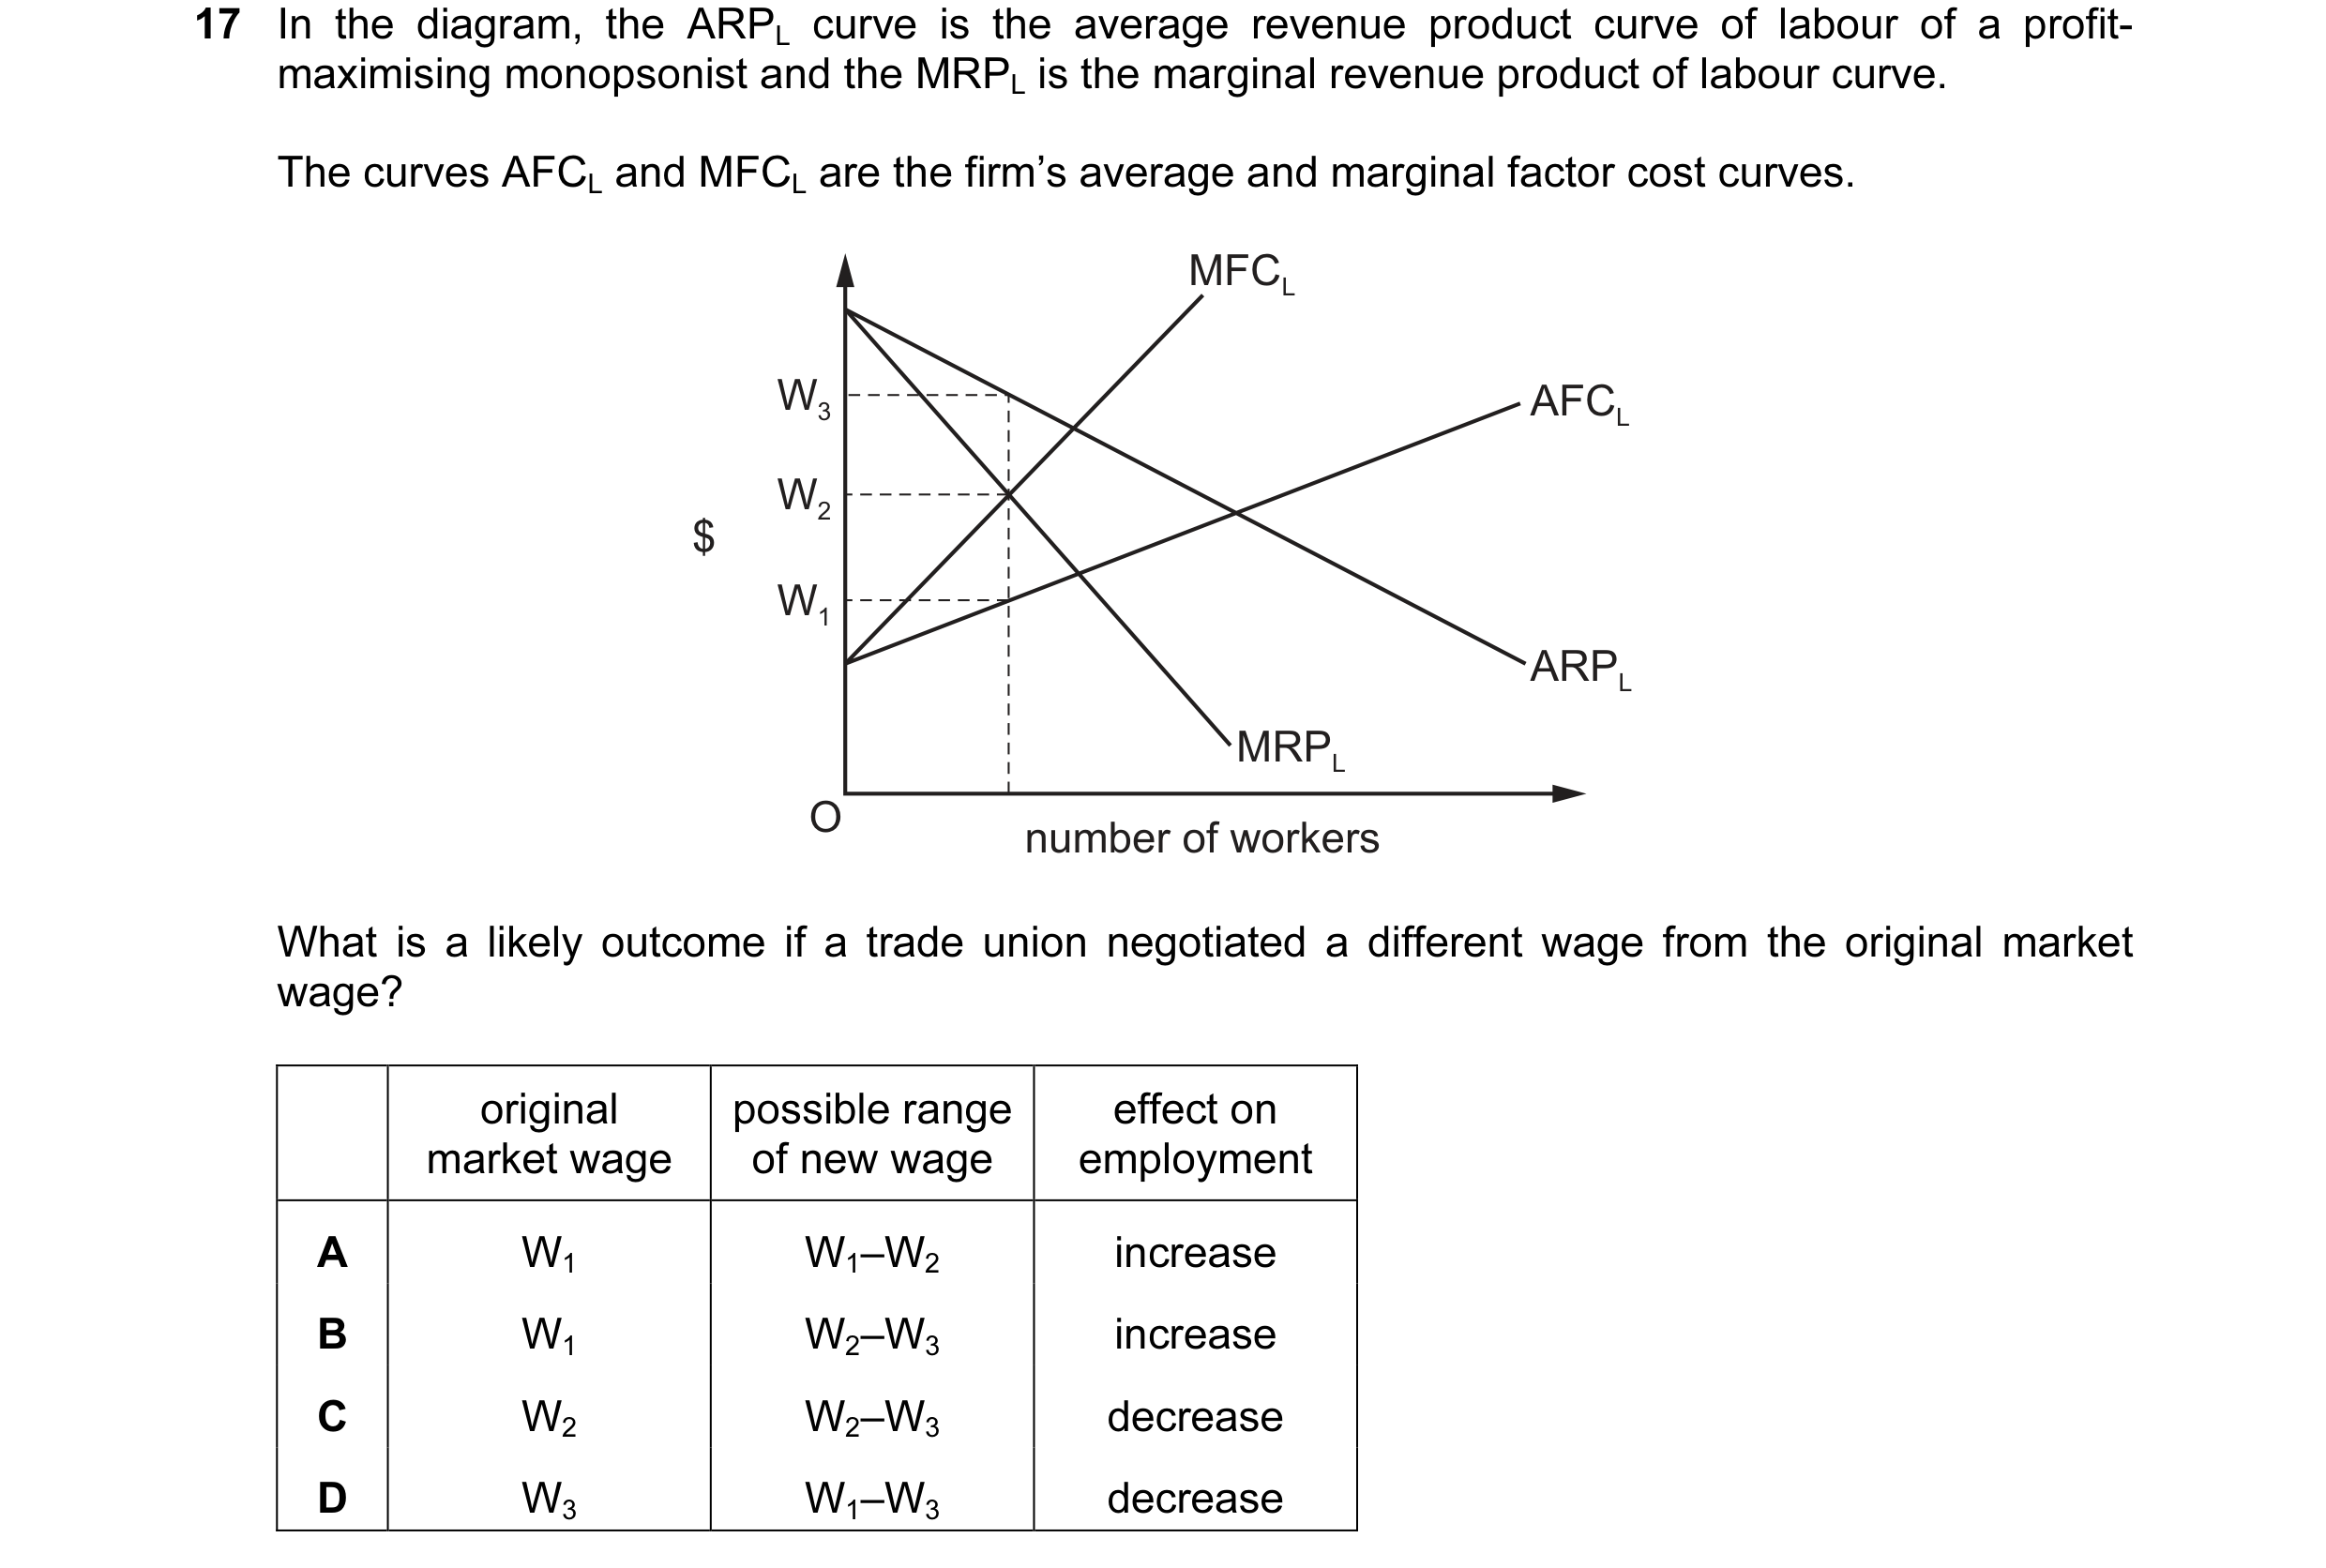 33 / 58
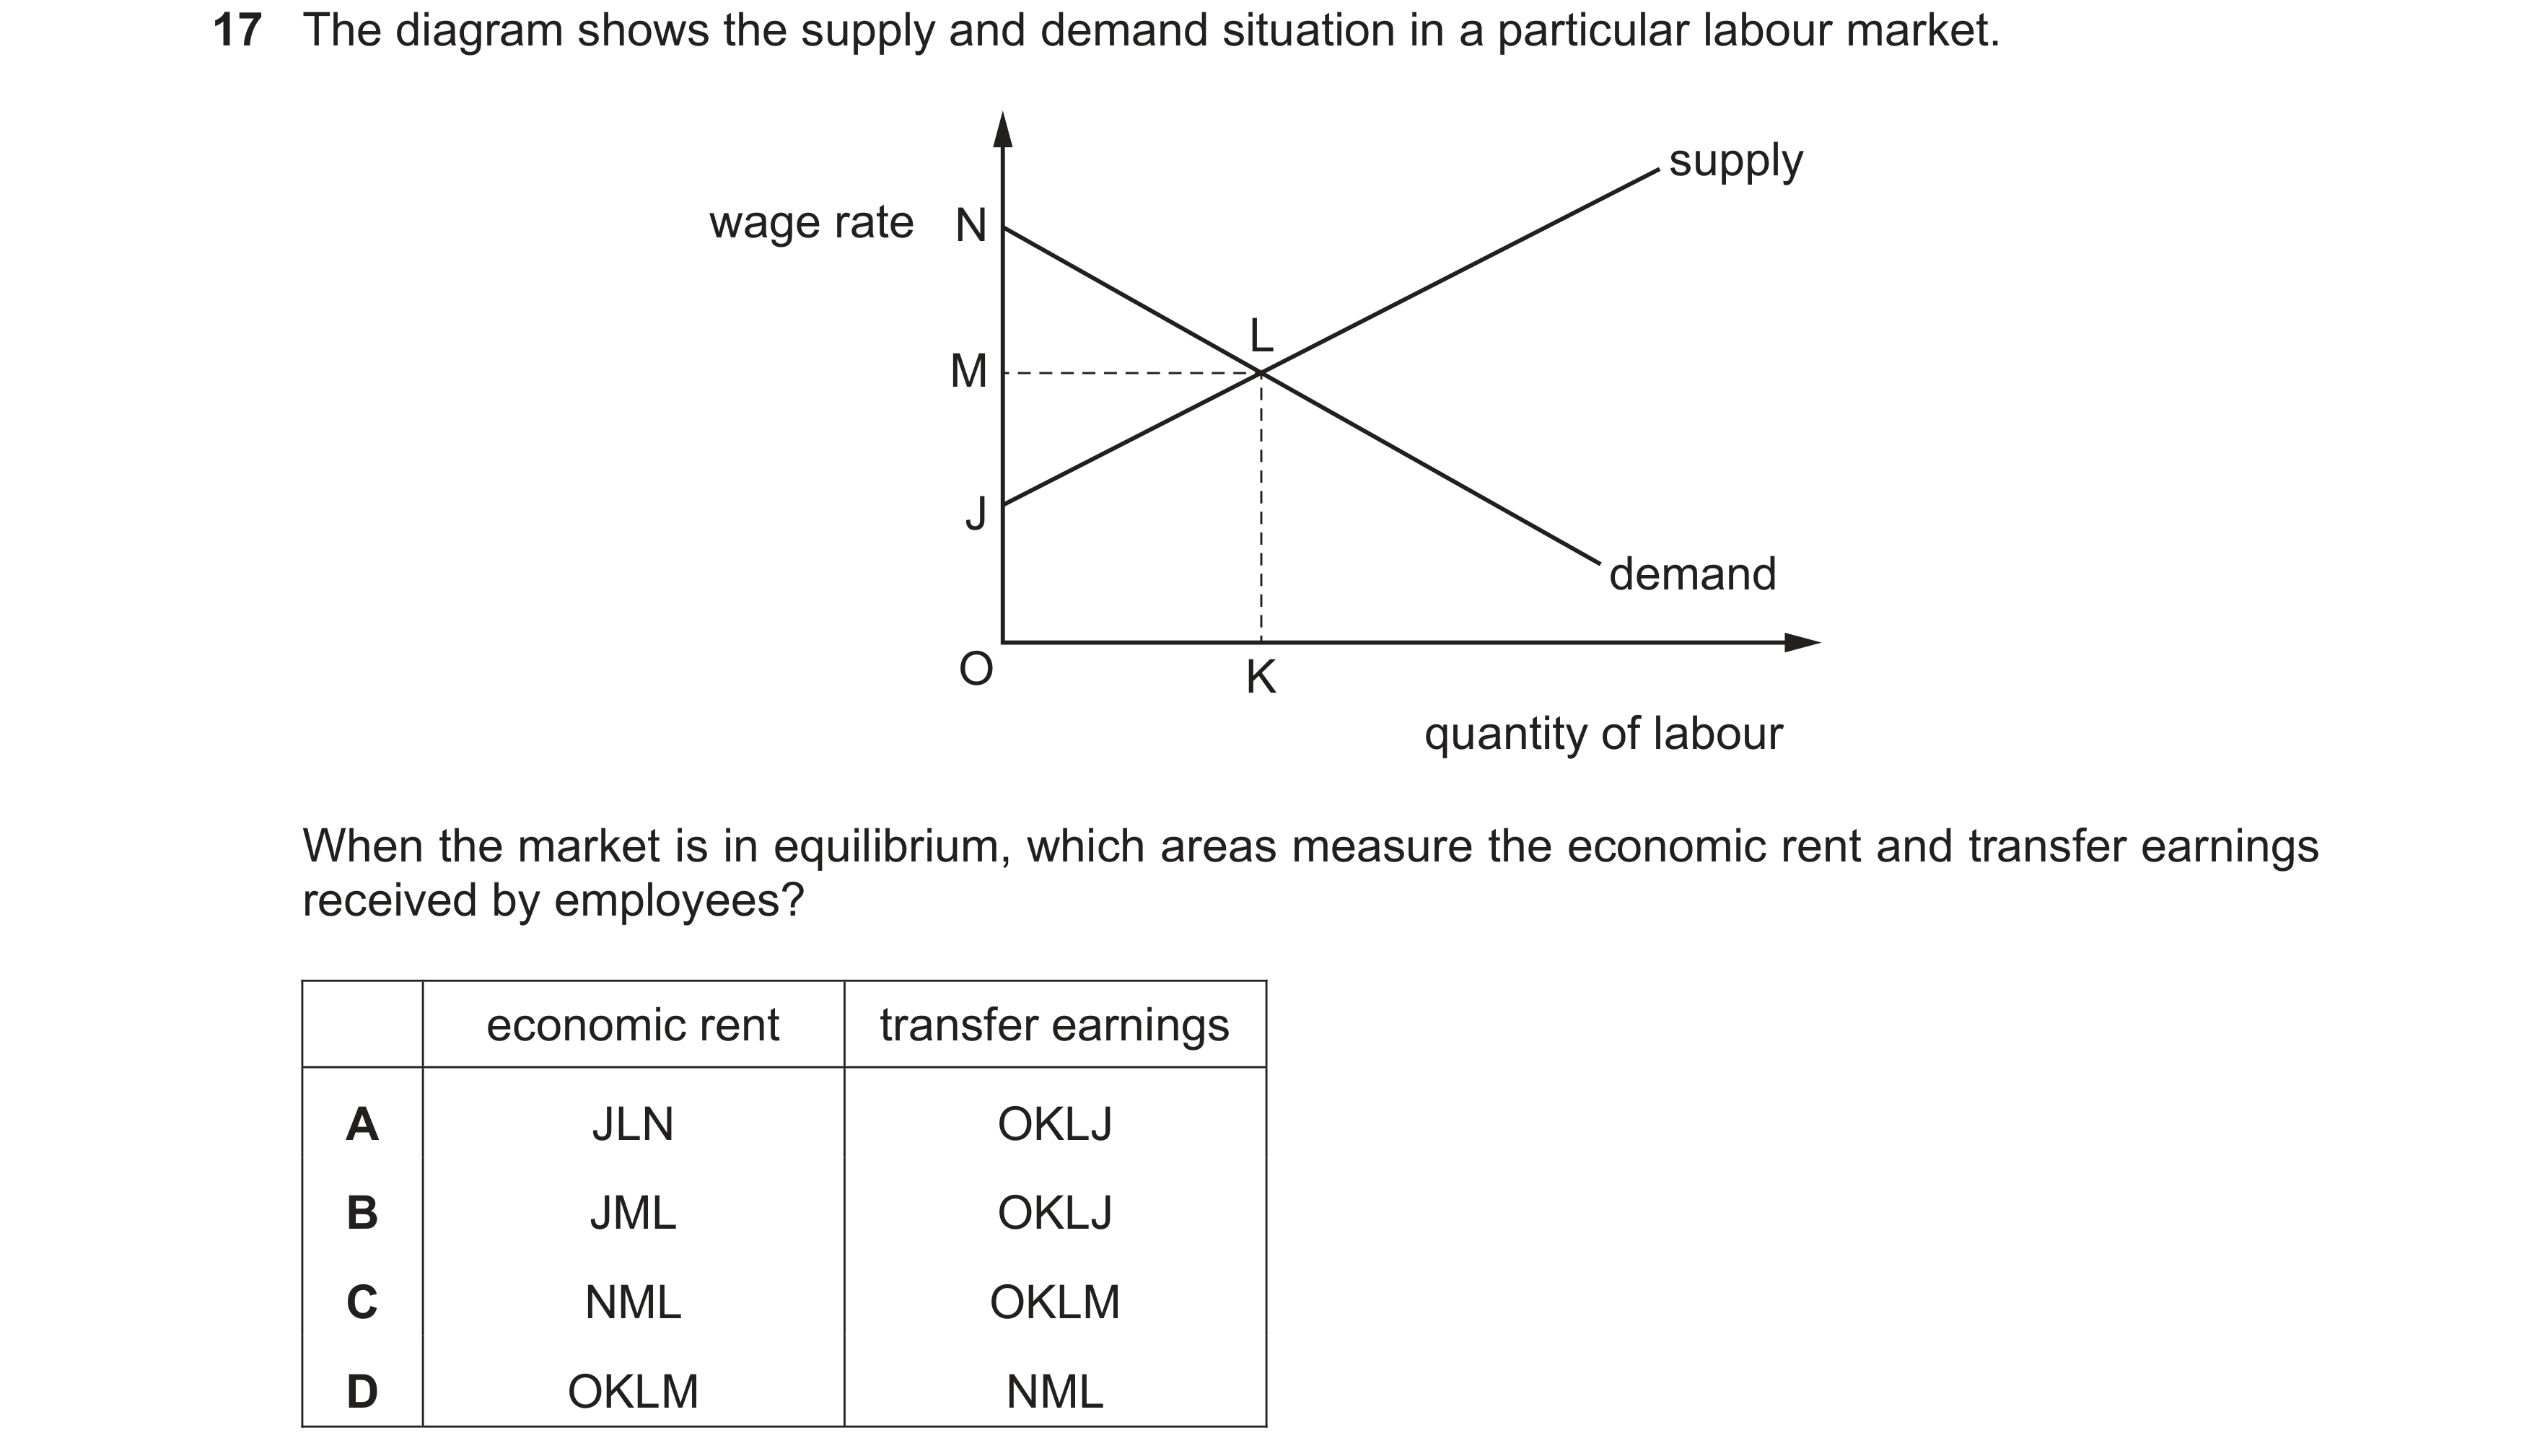
 34 / 58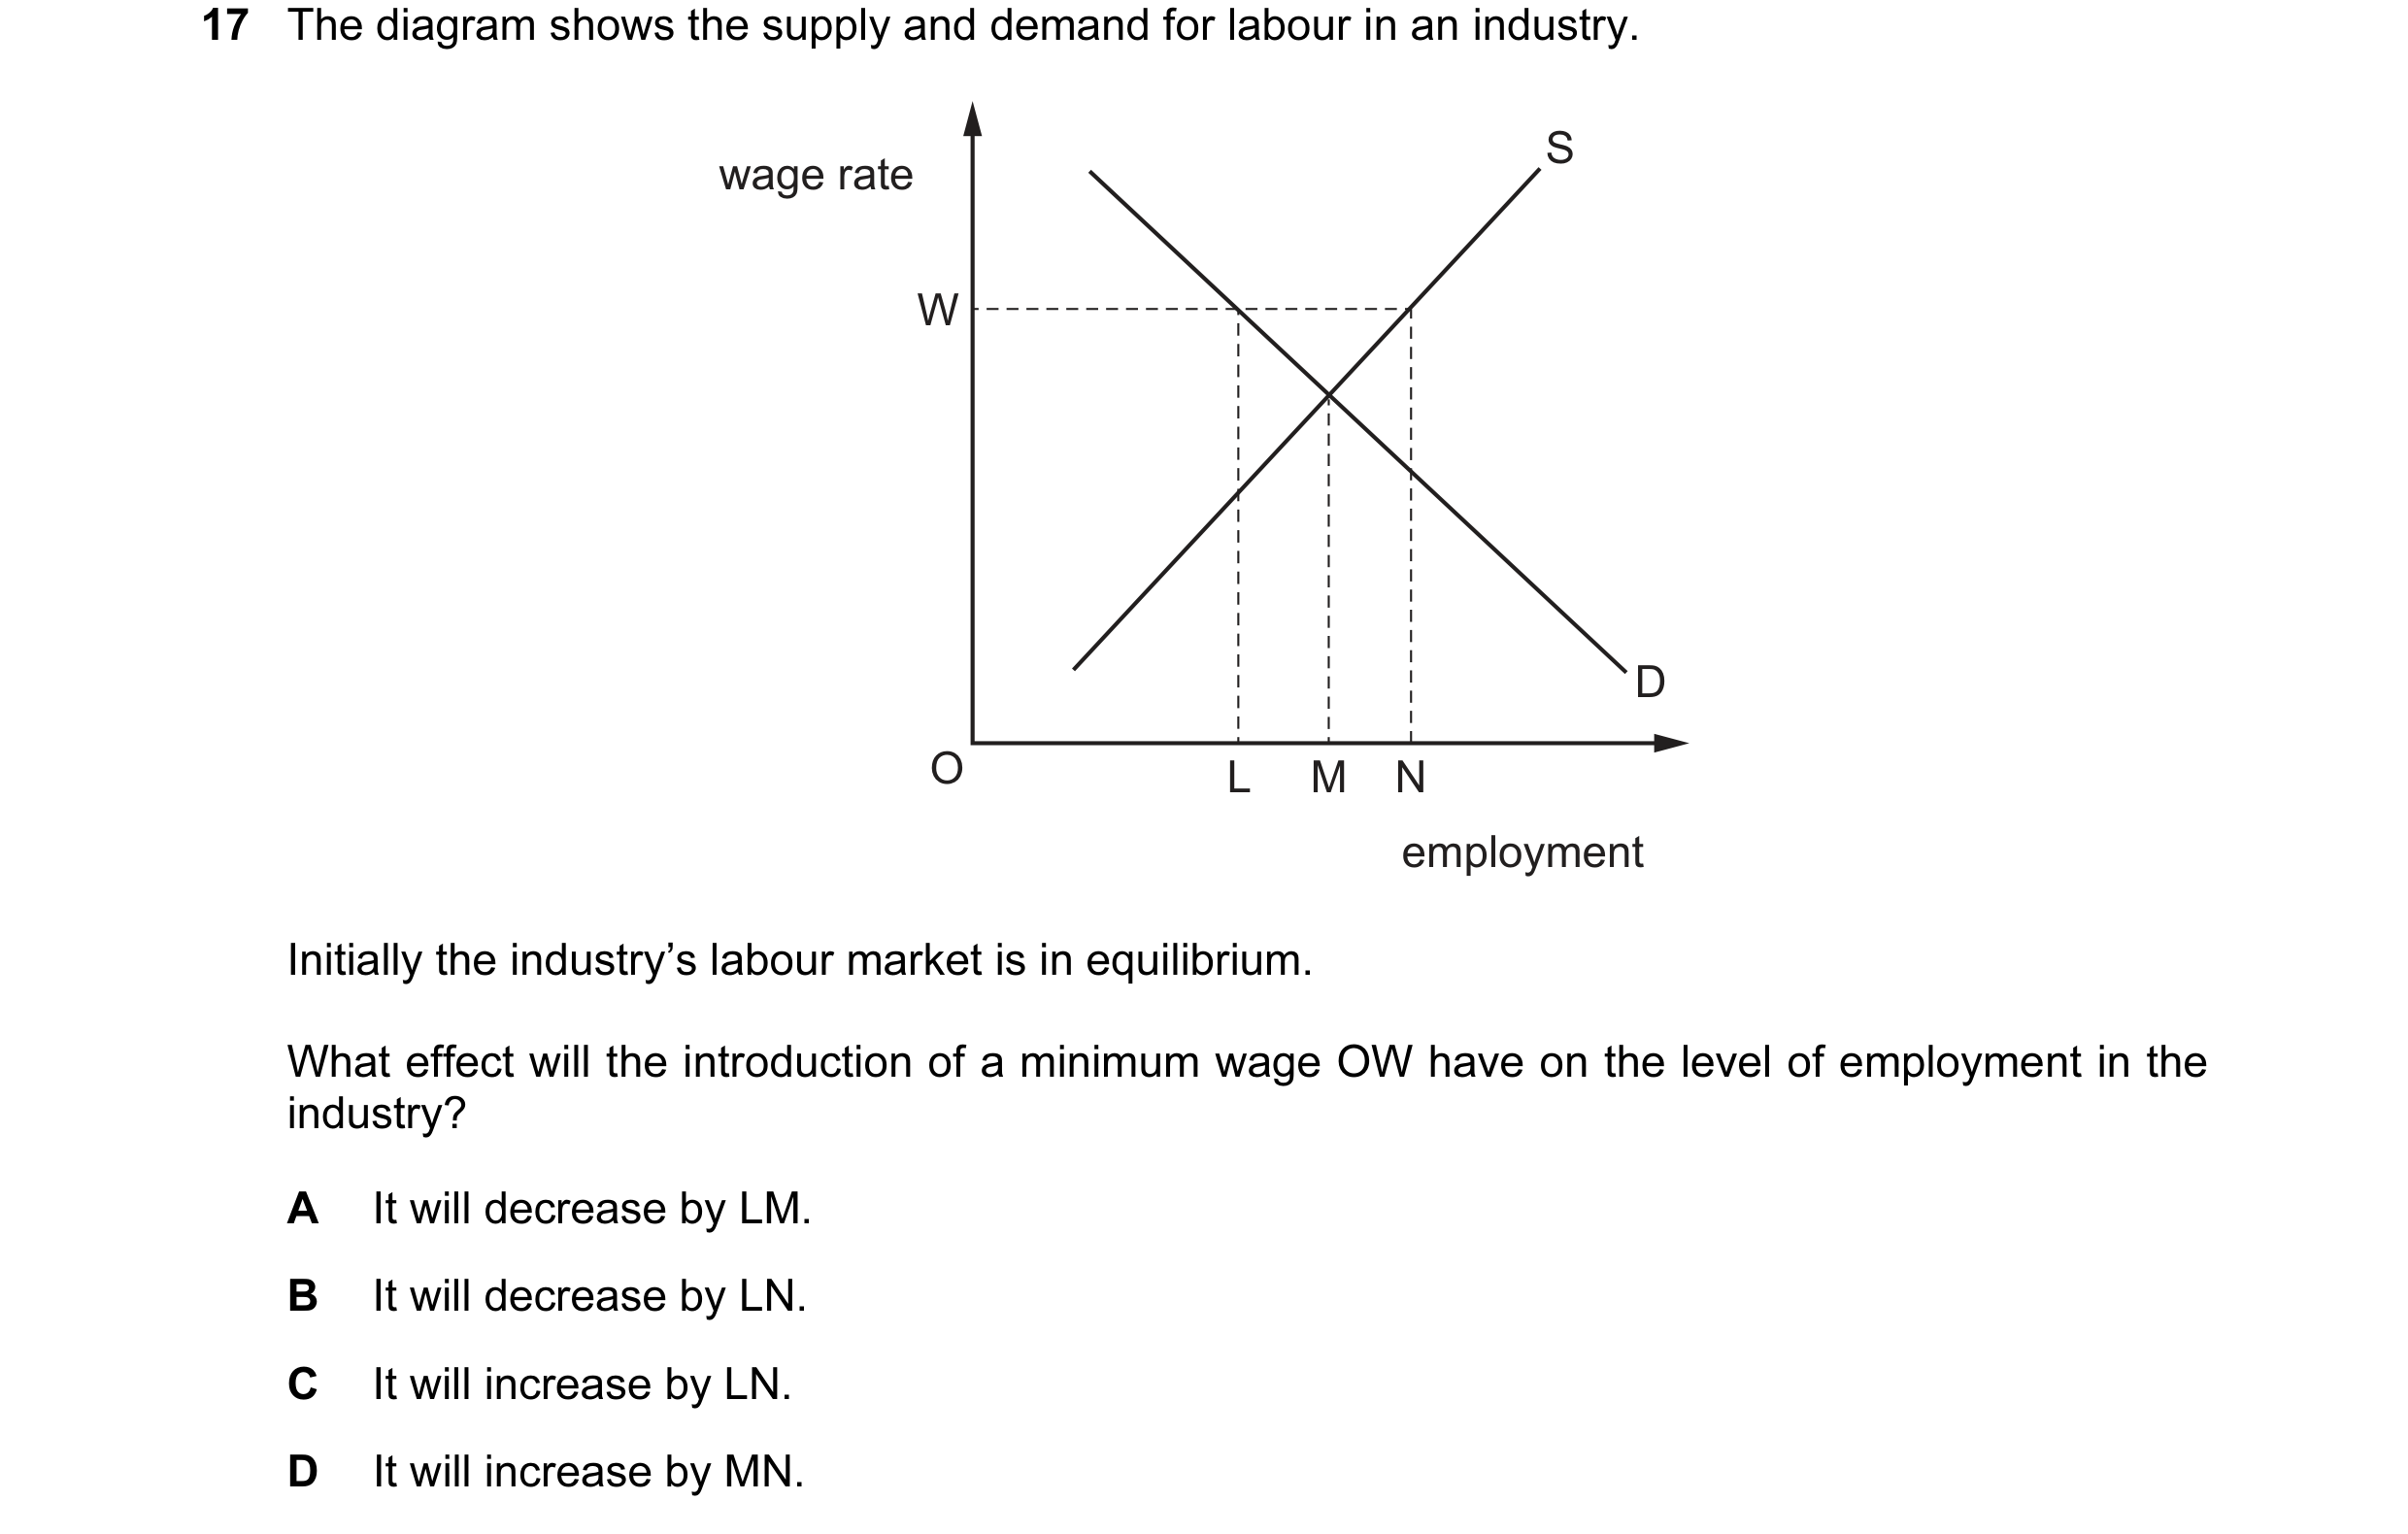
 35 / 58


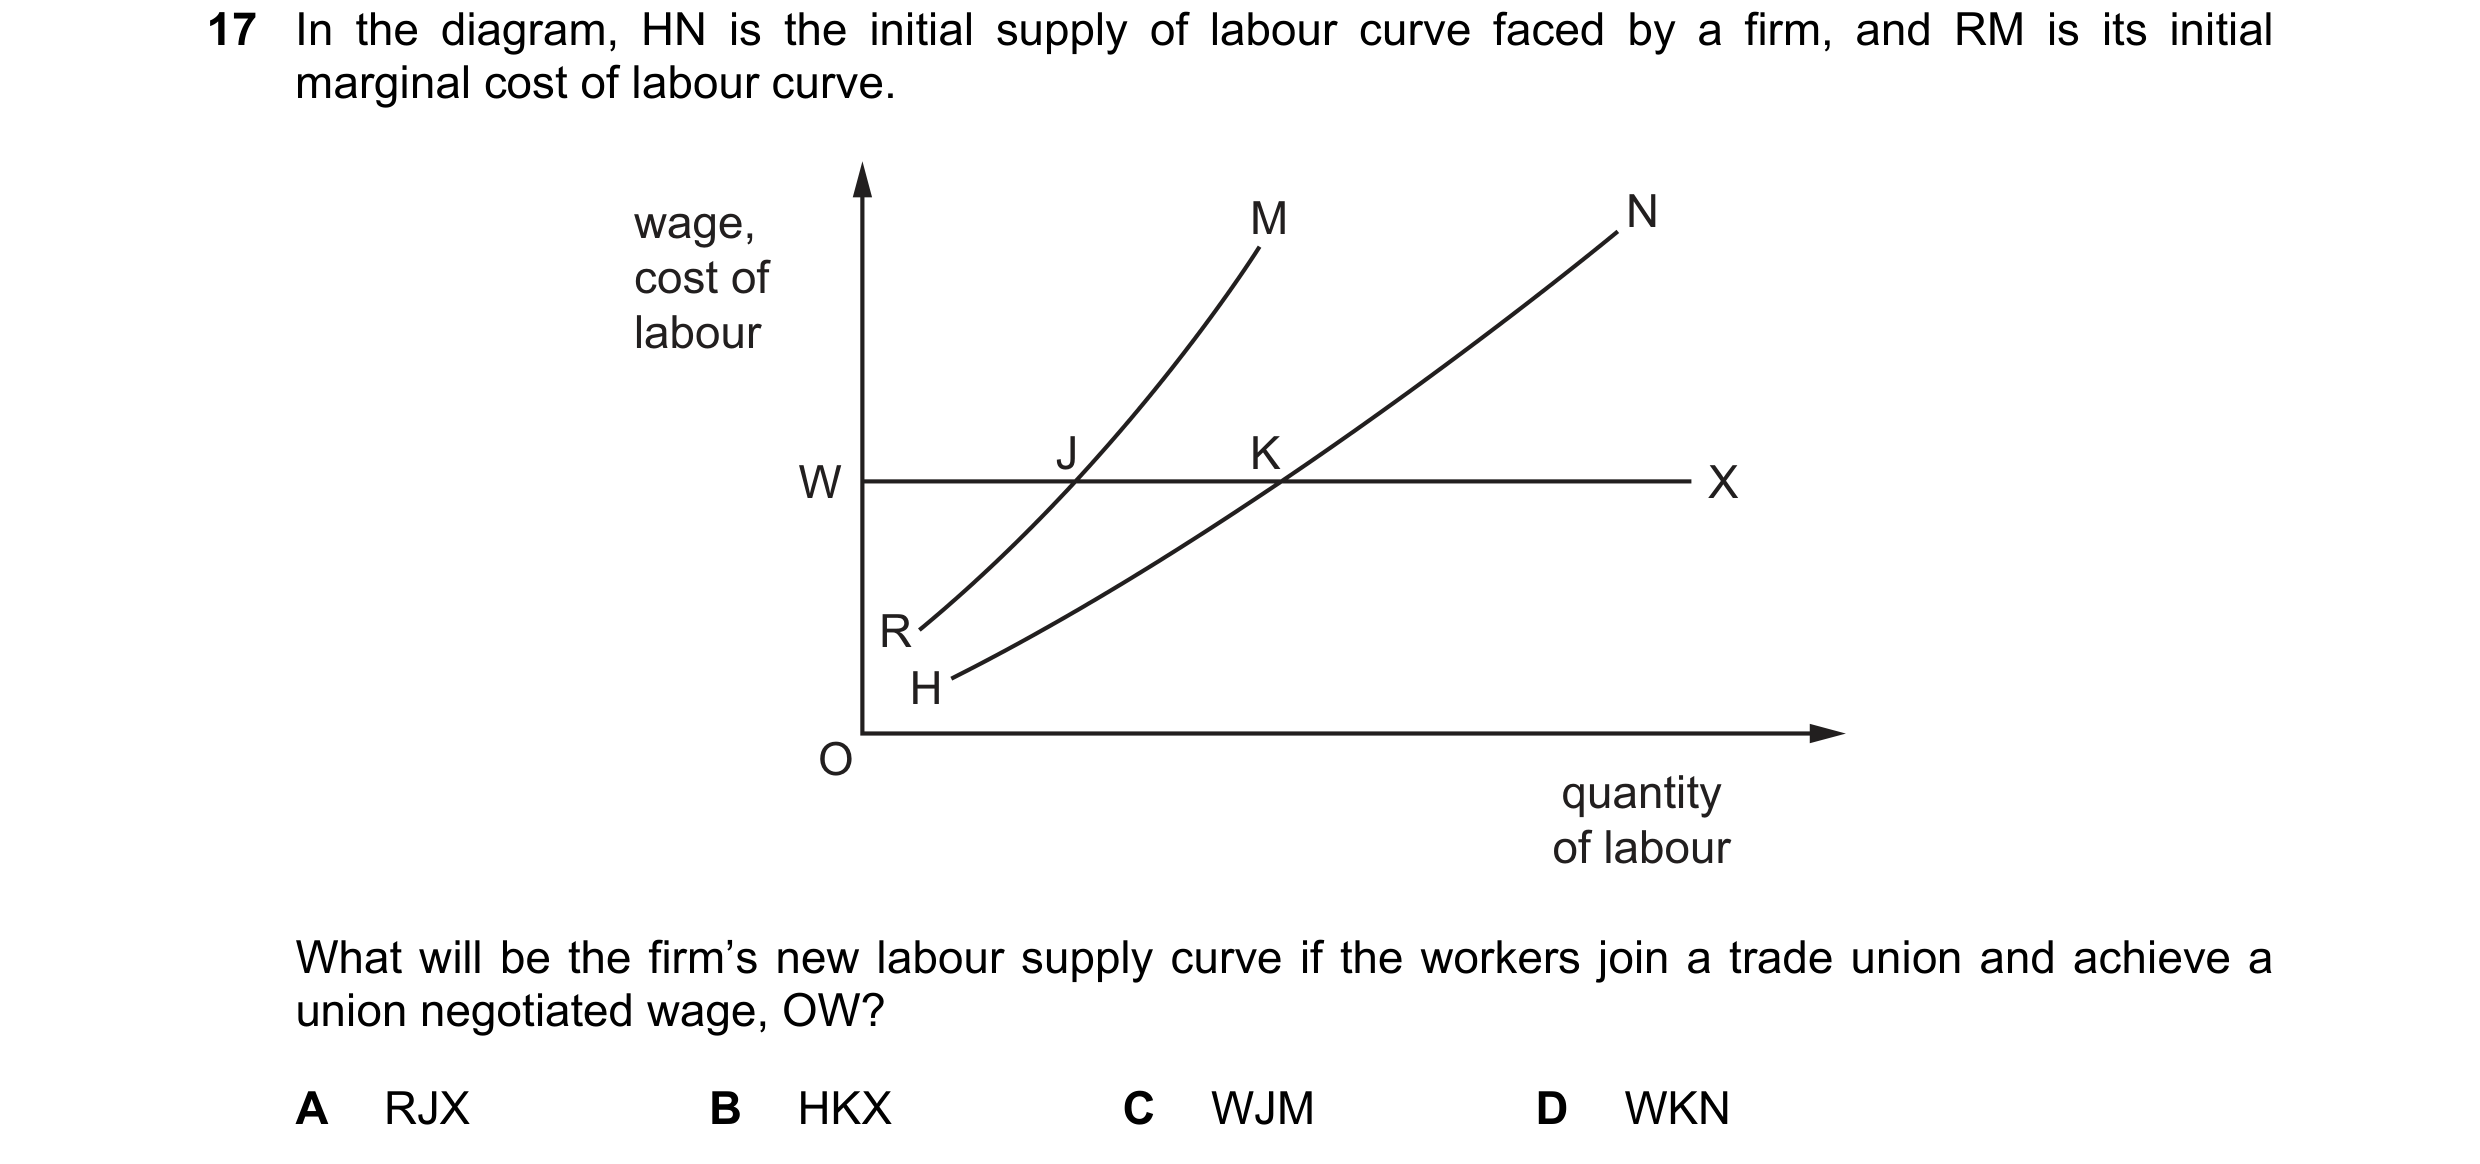 36 / 58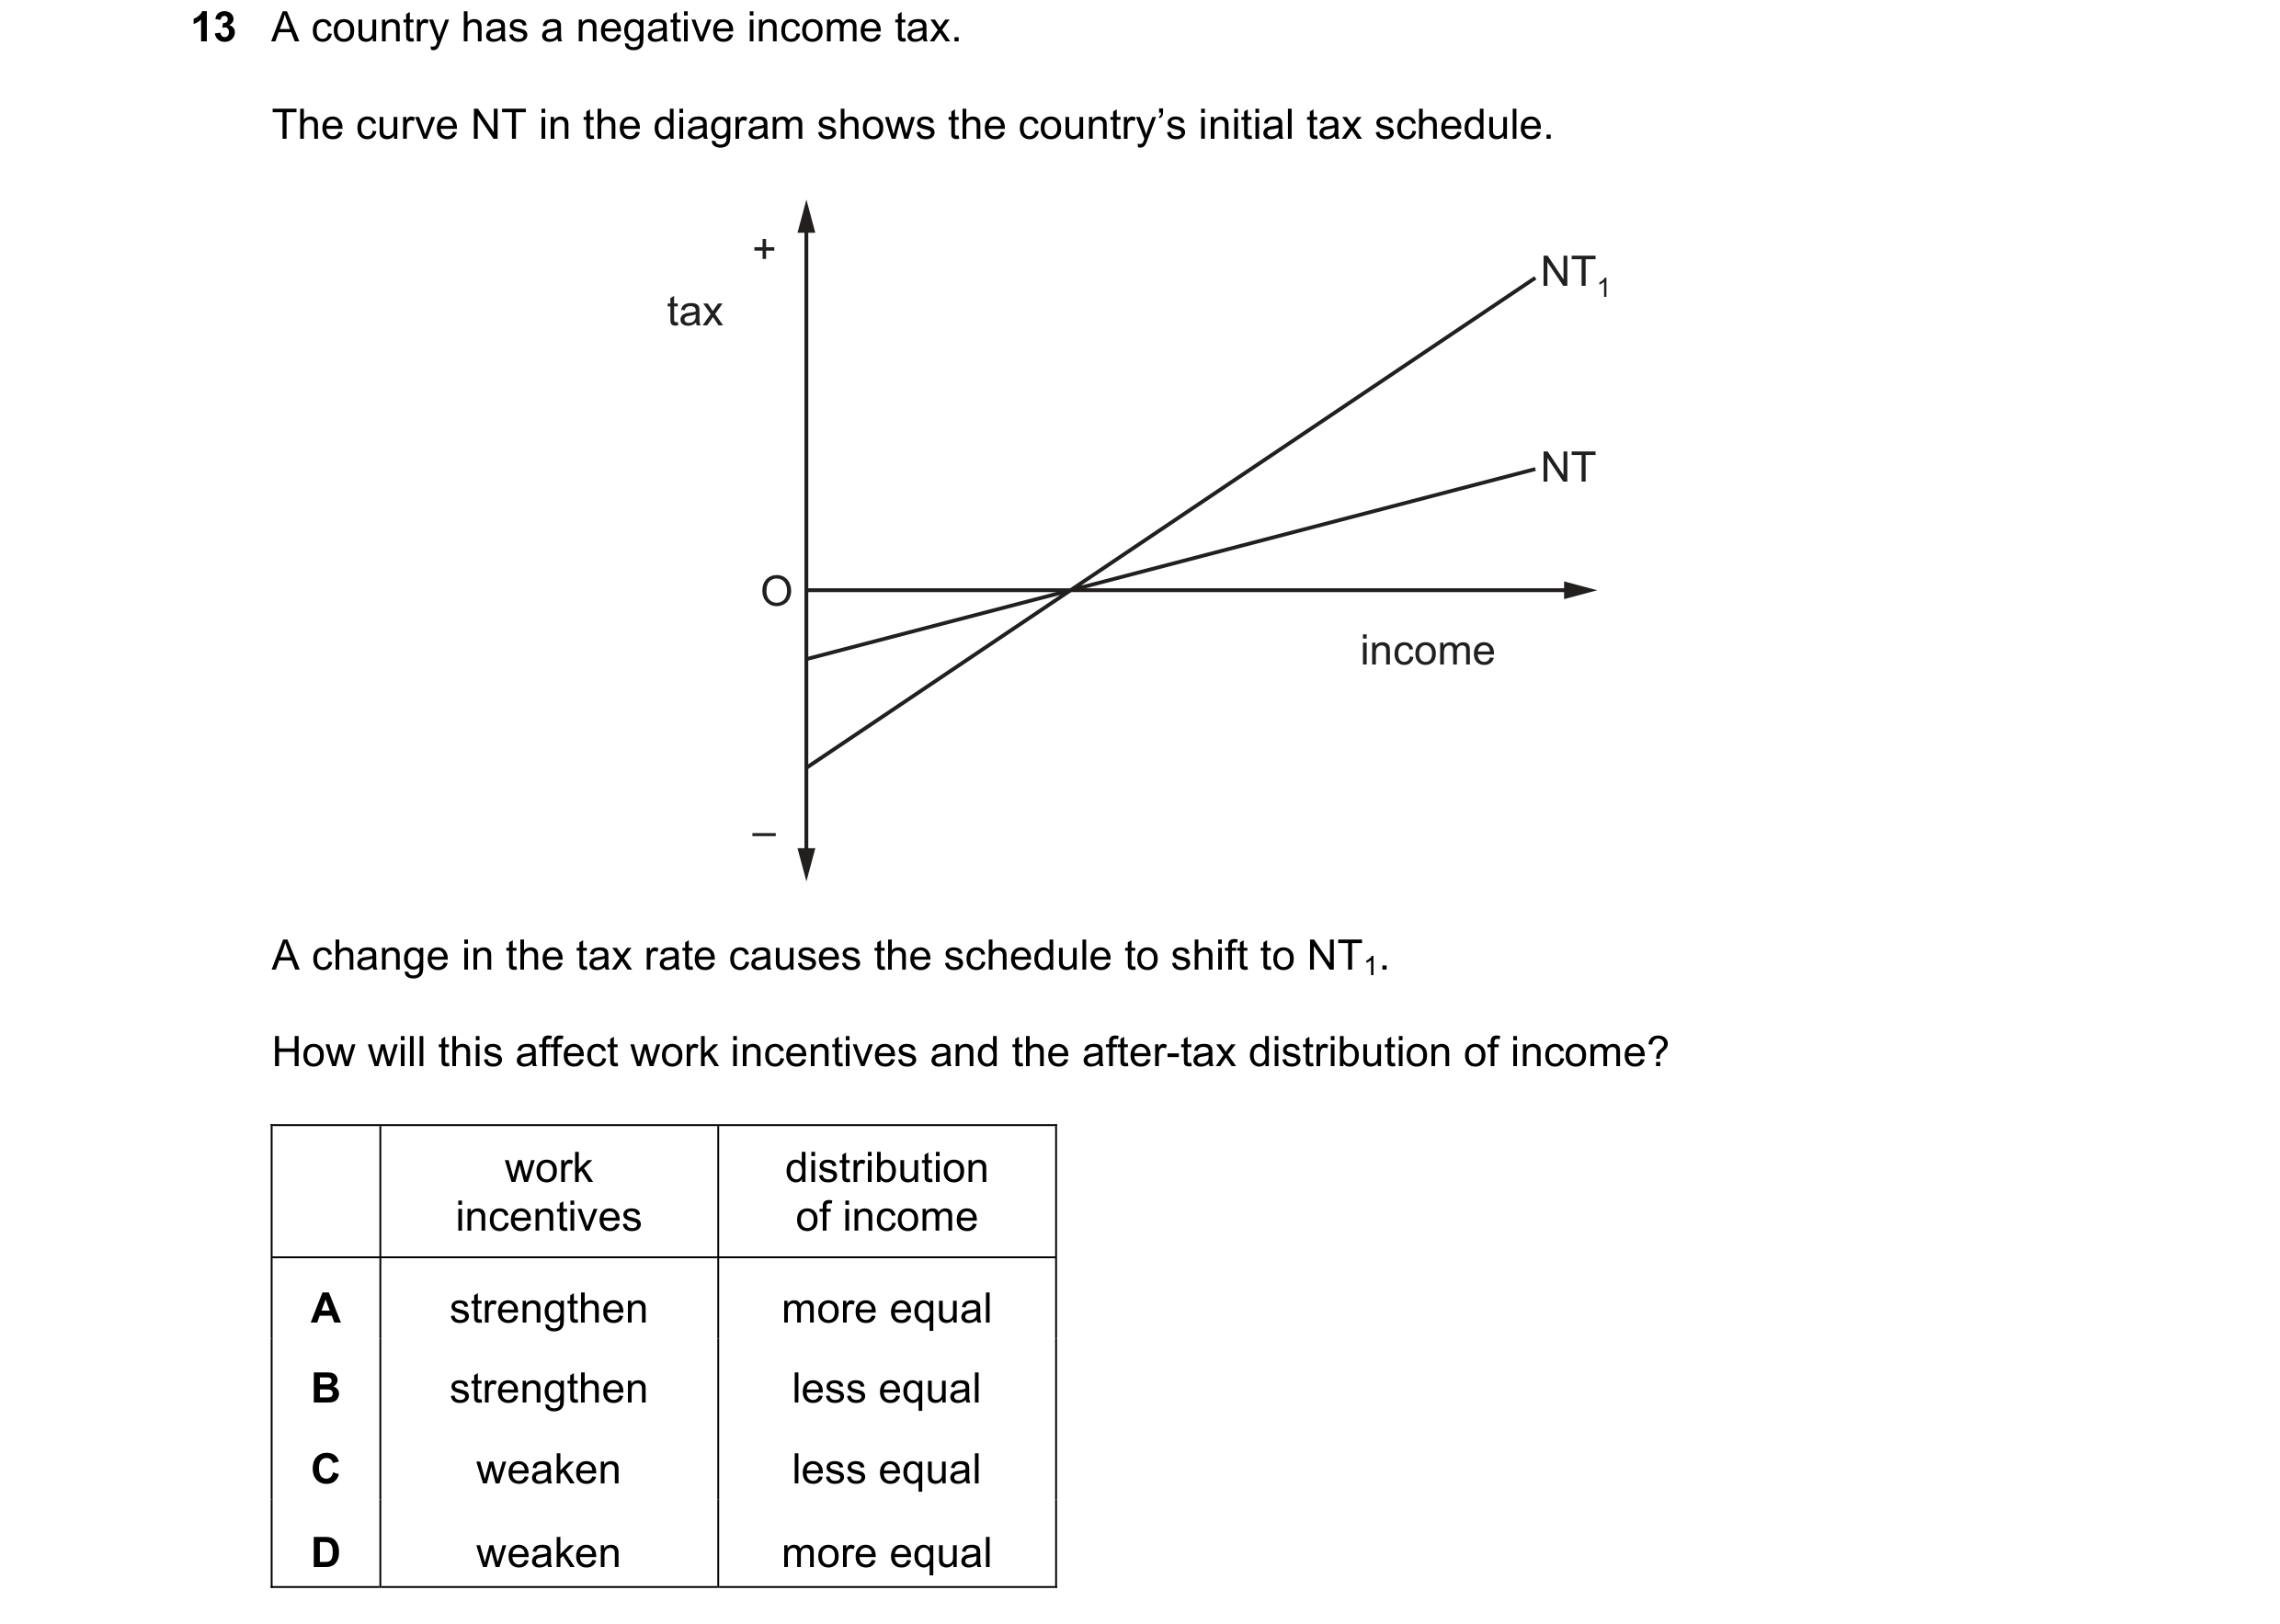
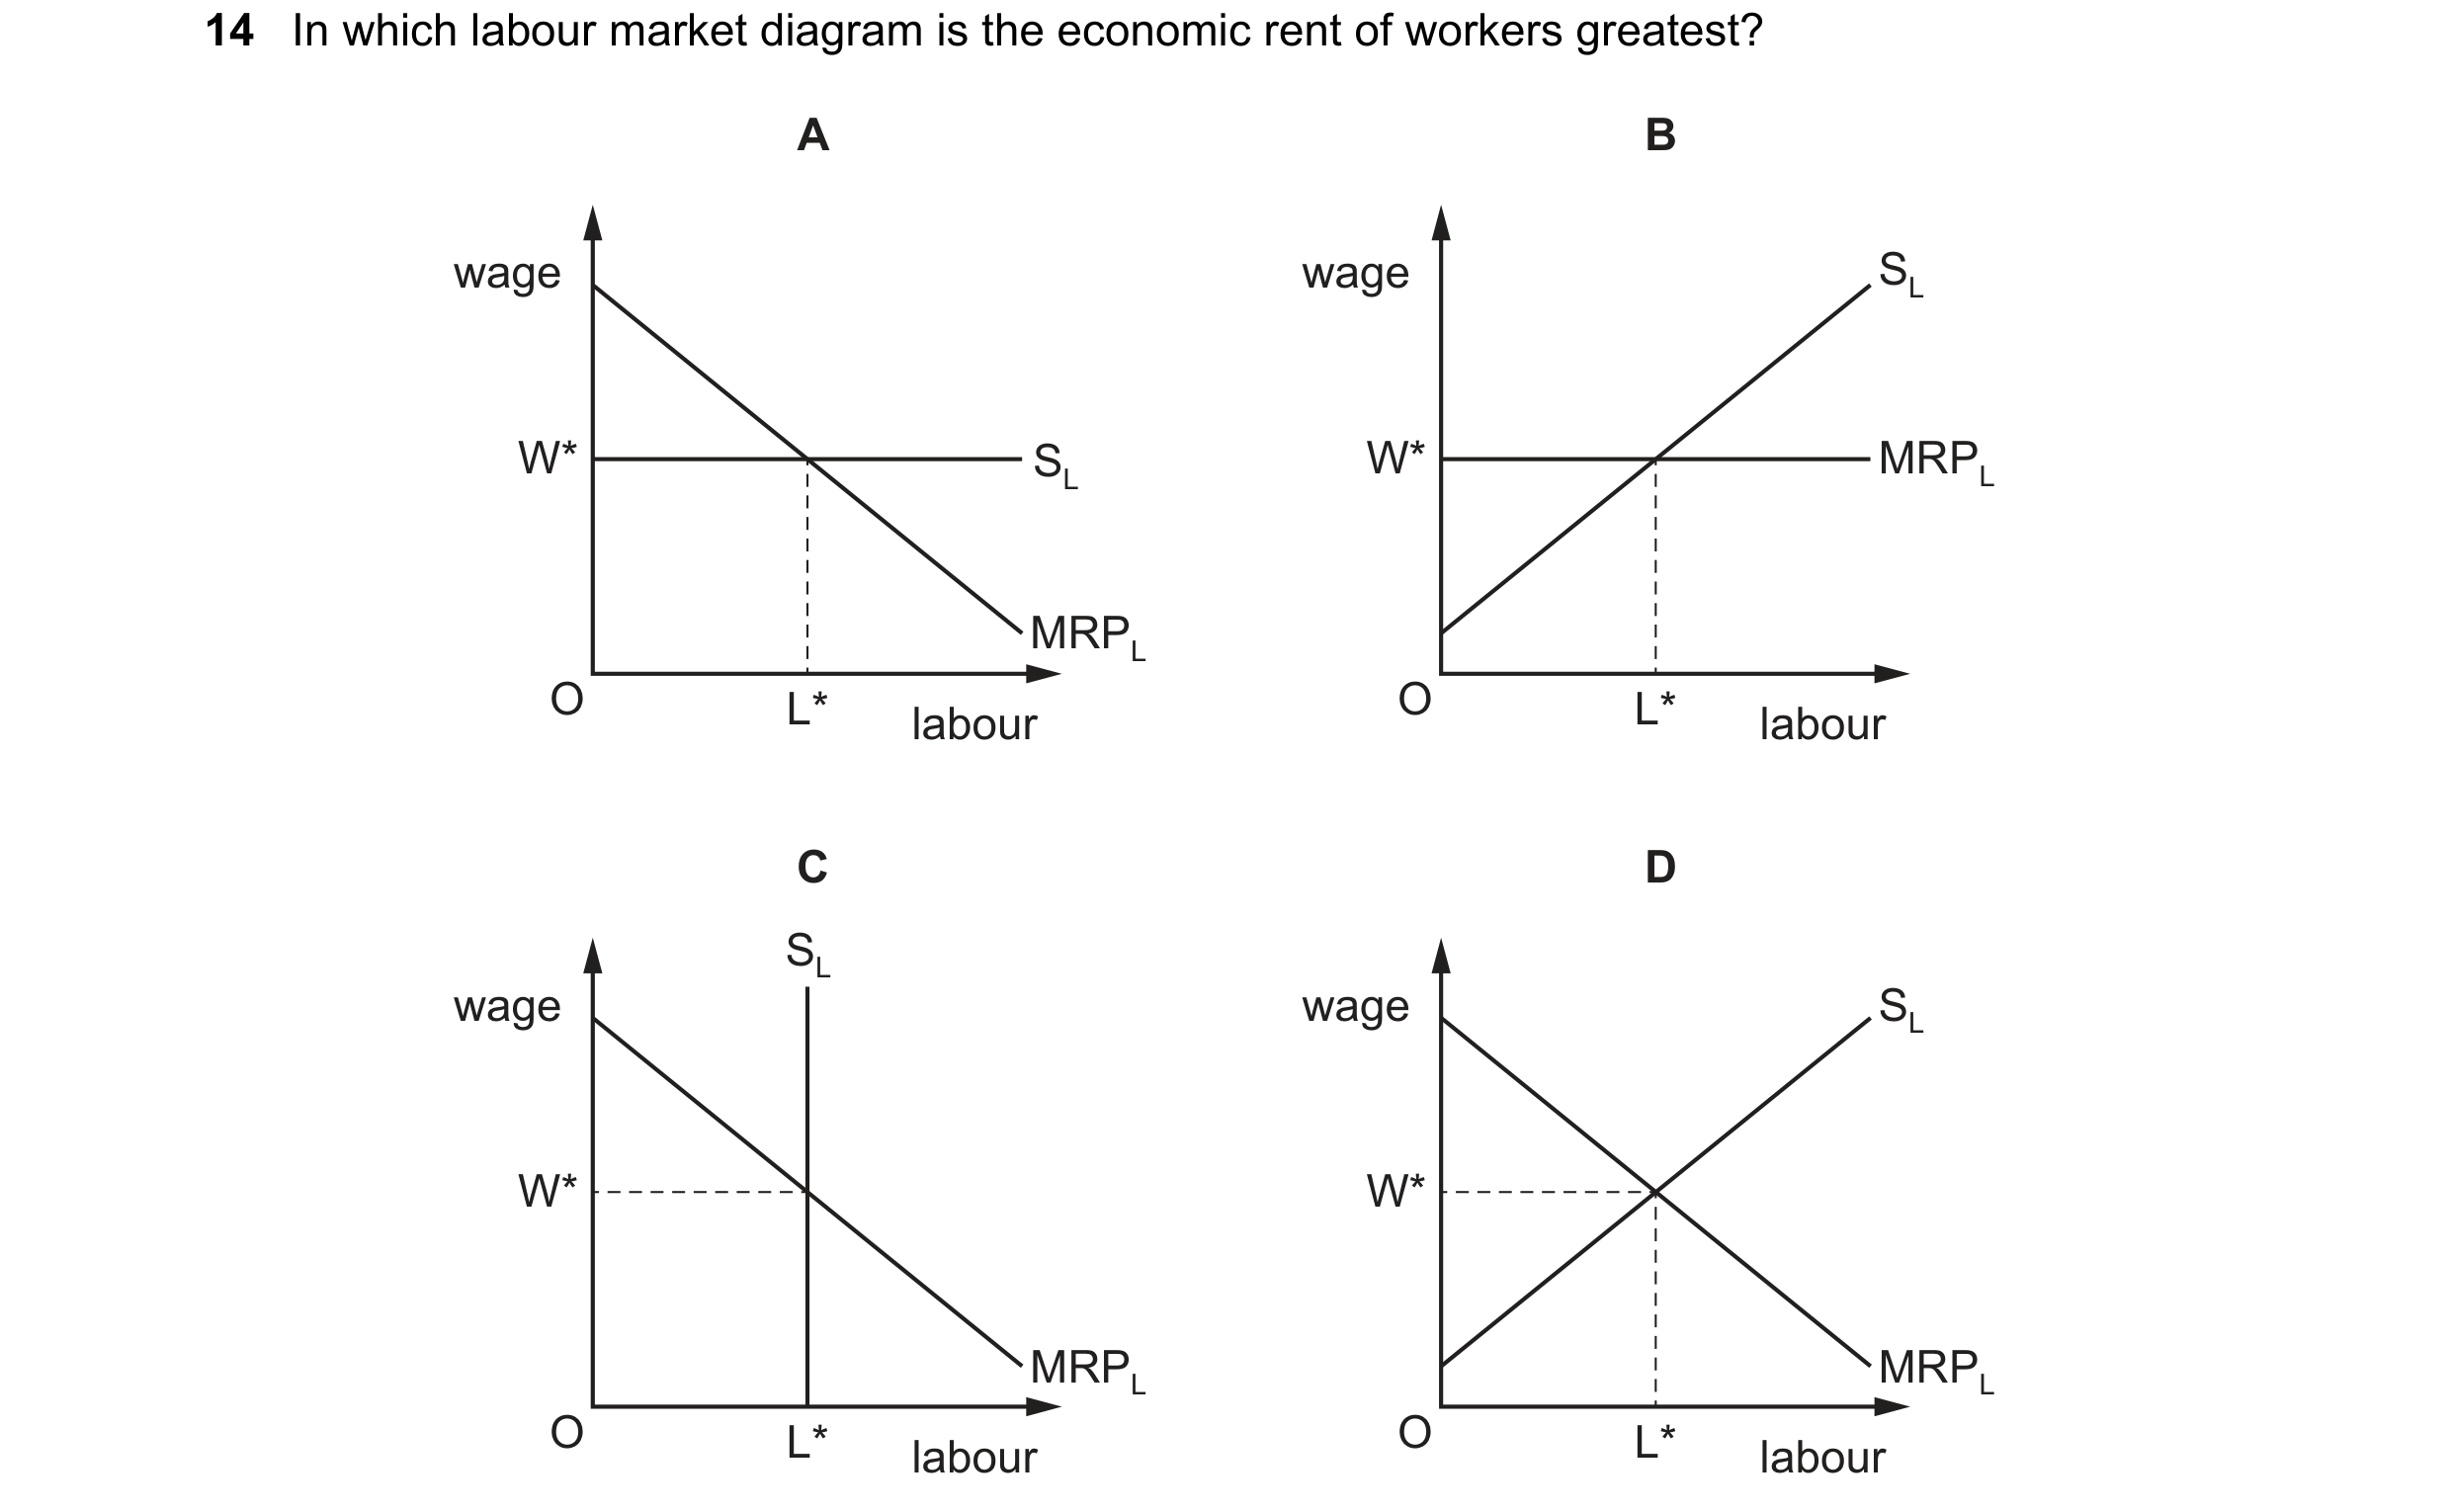 37 / 58
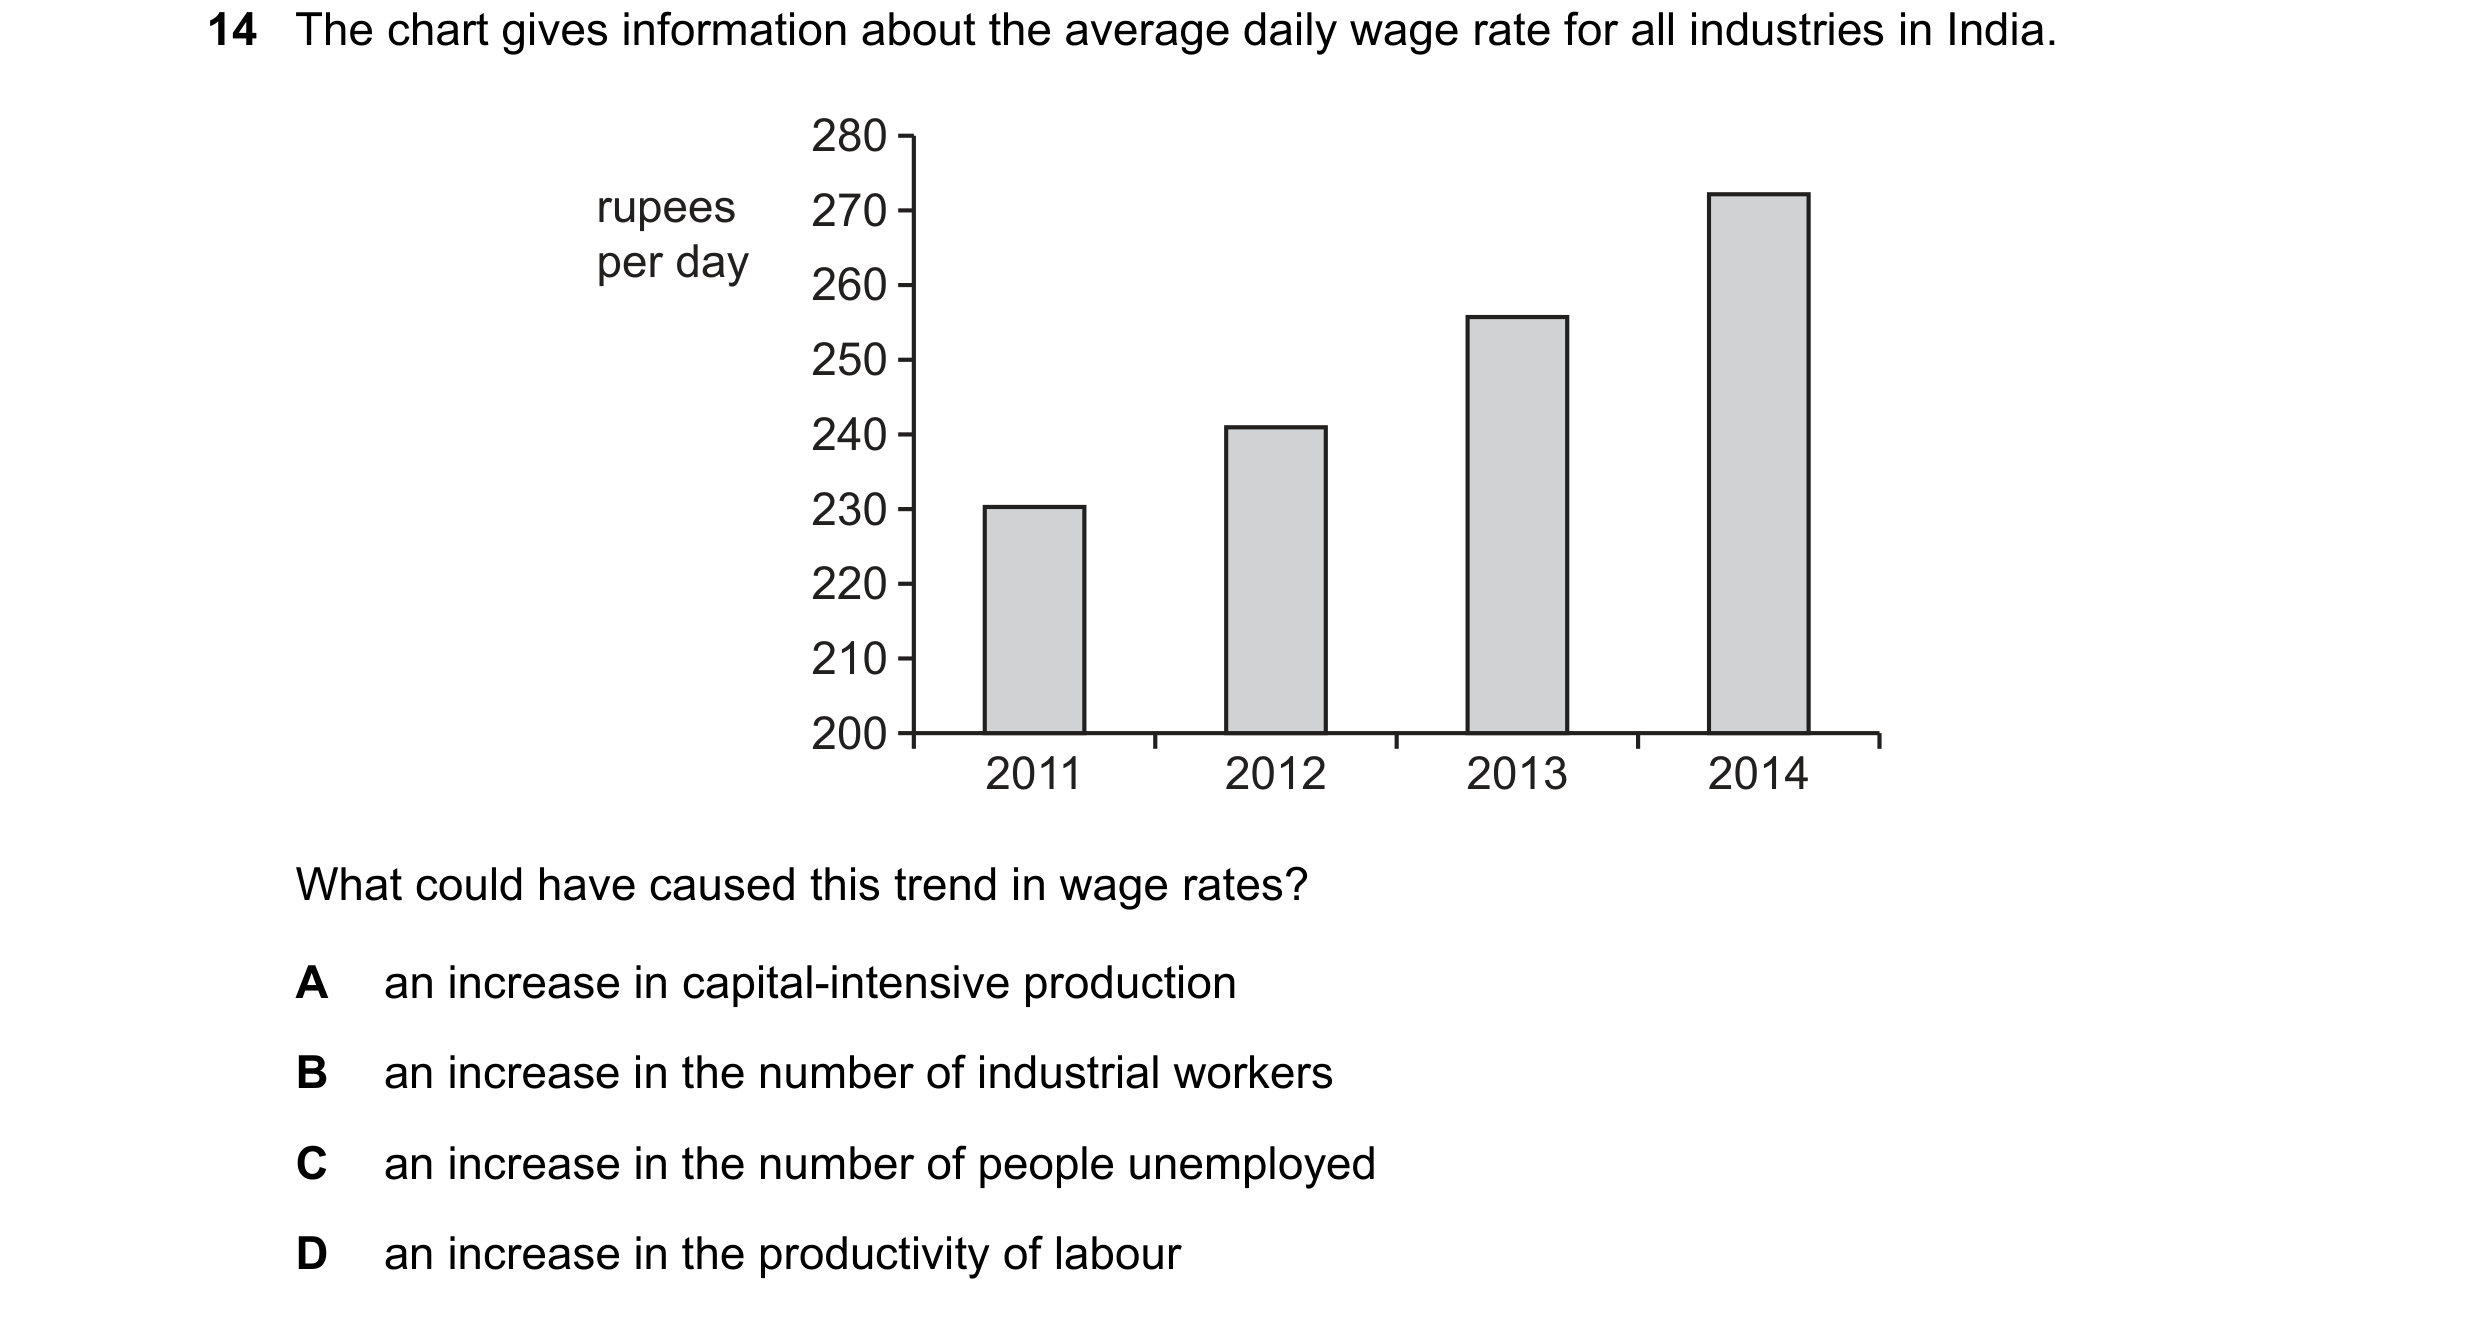 38 / 58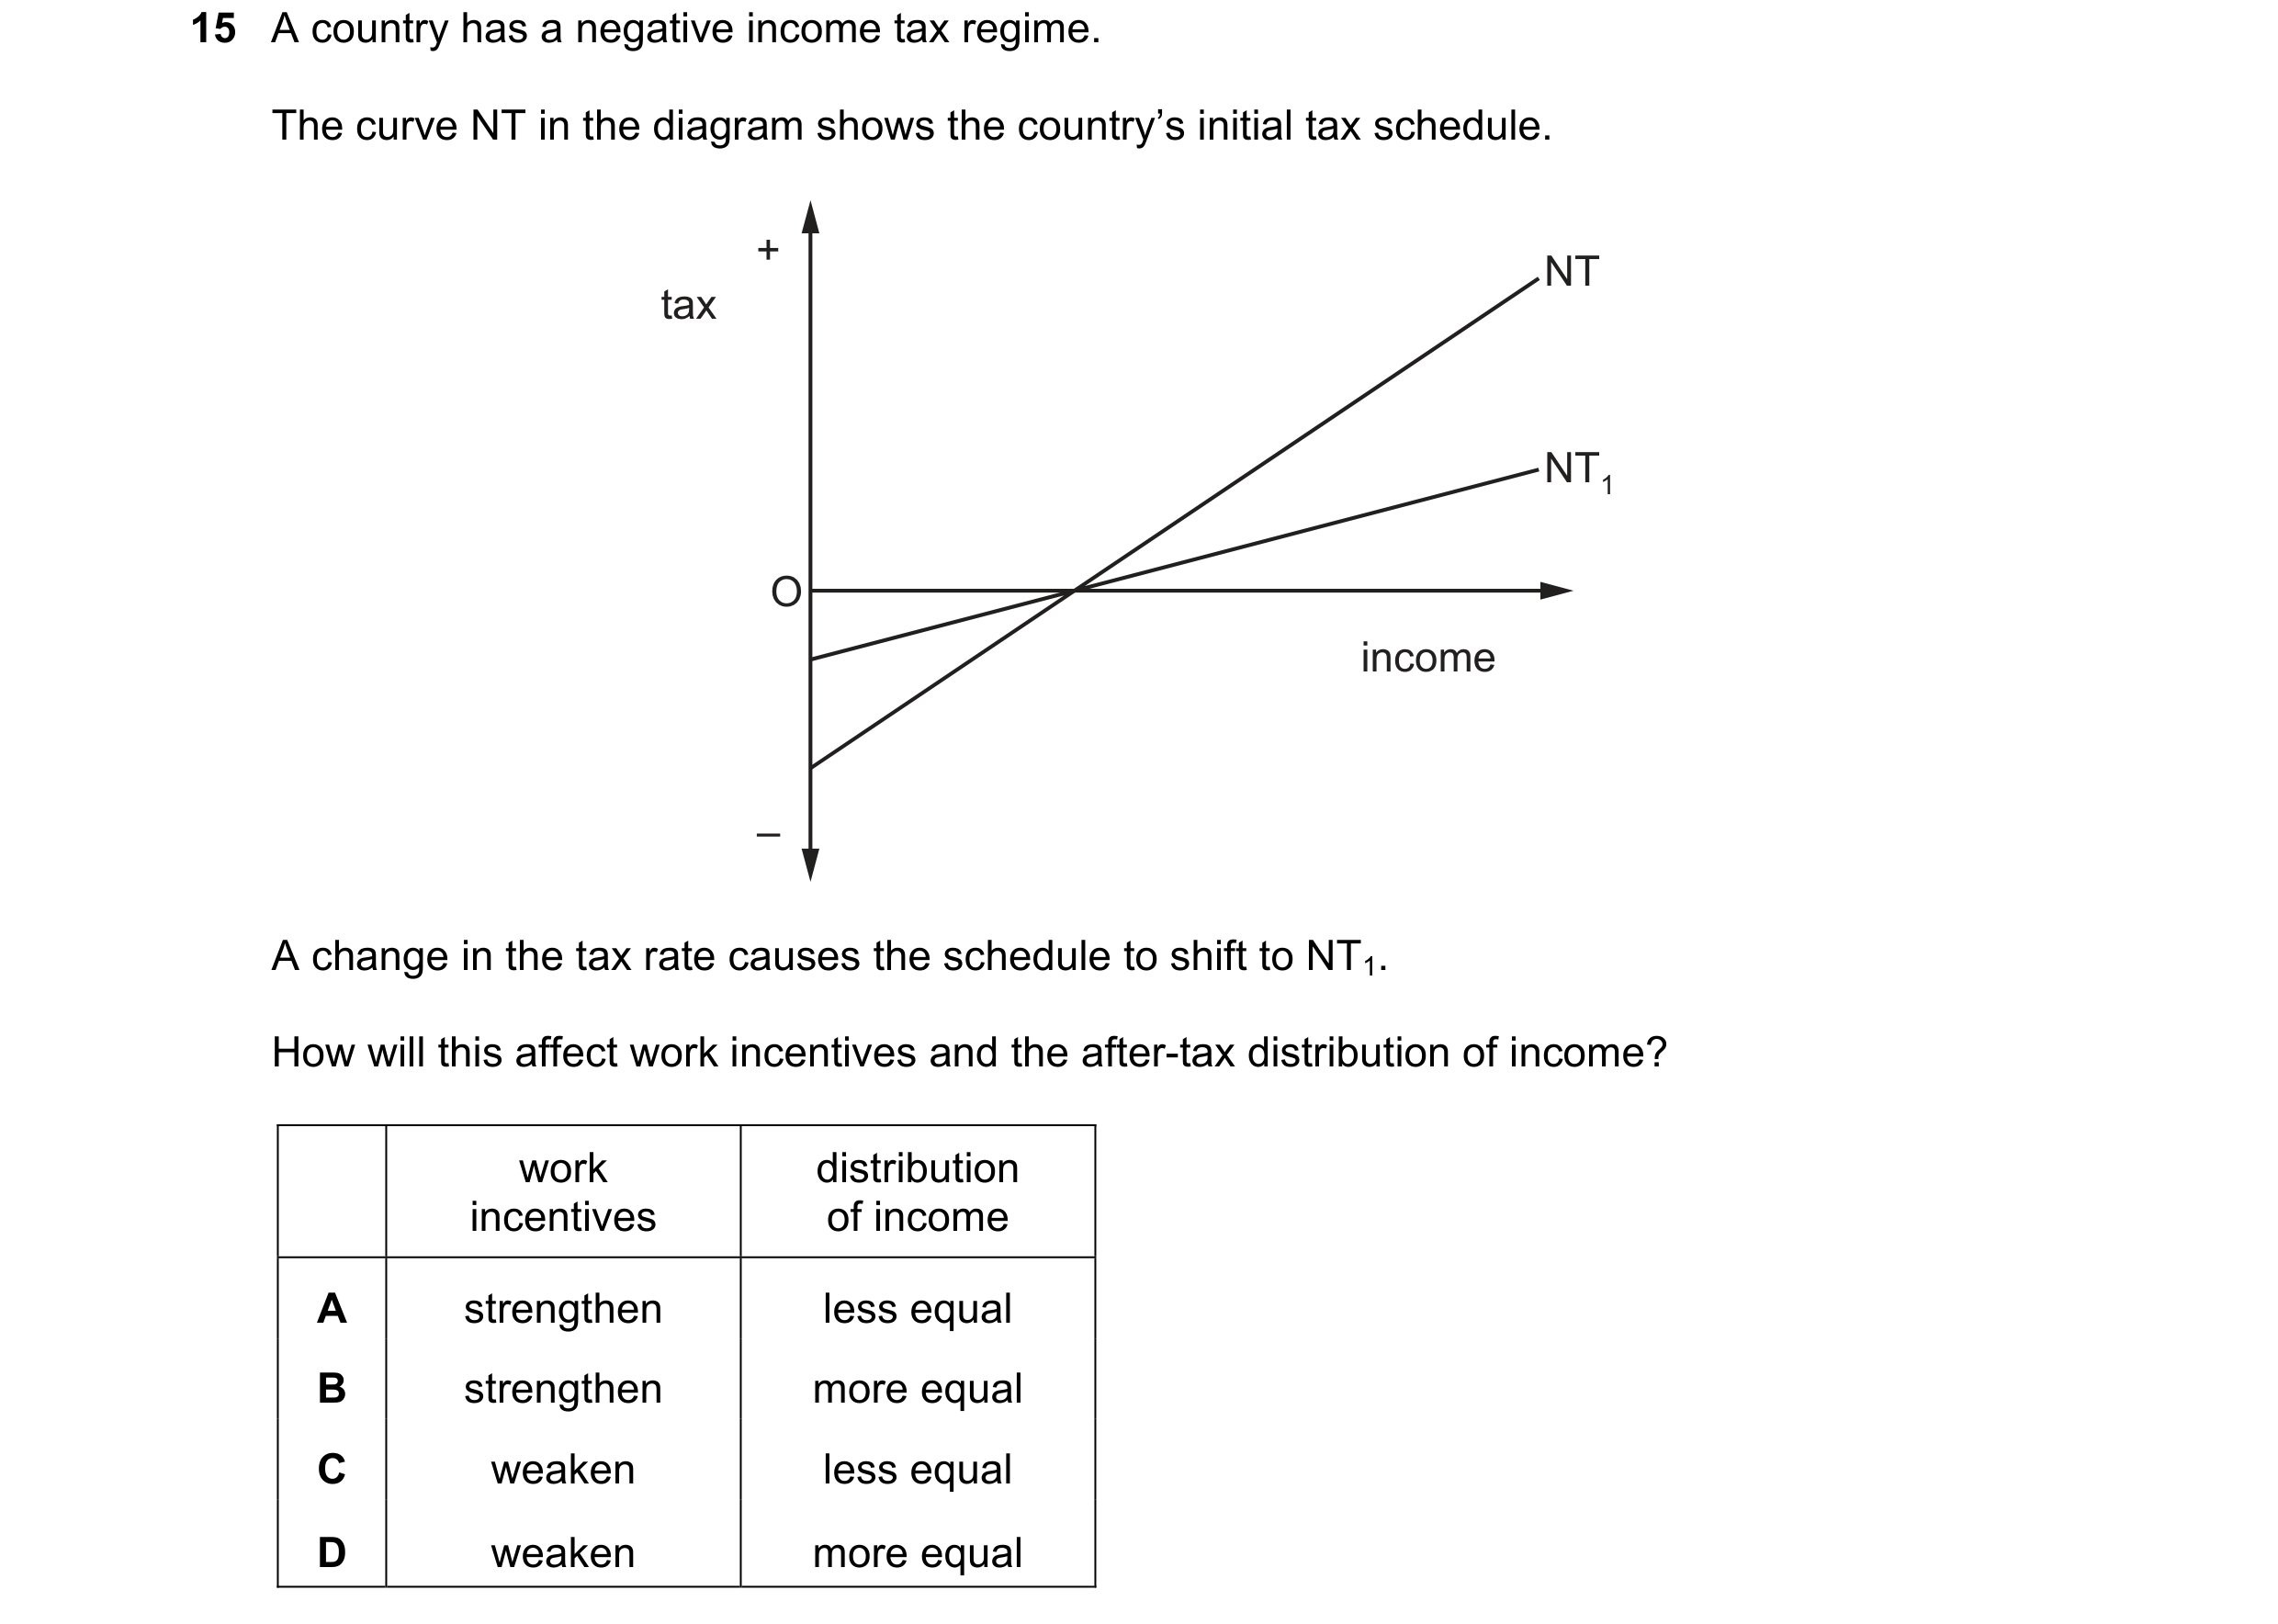

 39 / 58
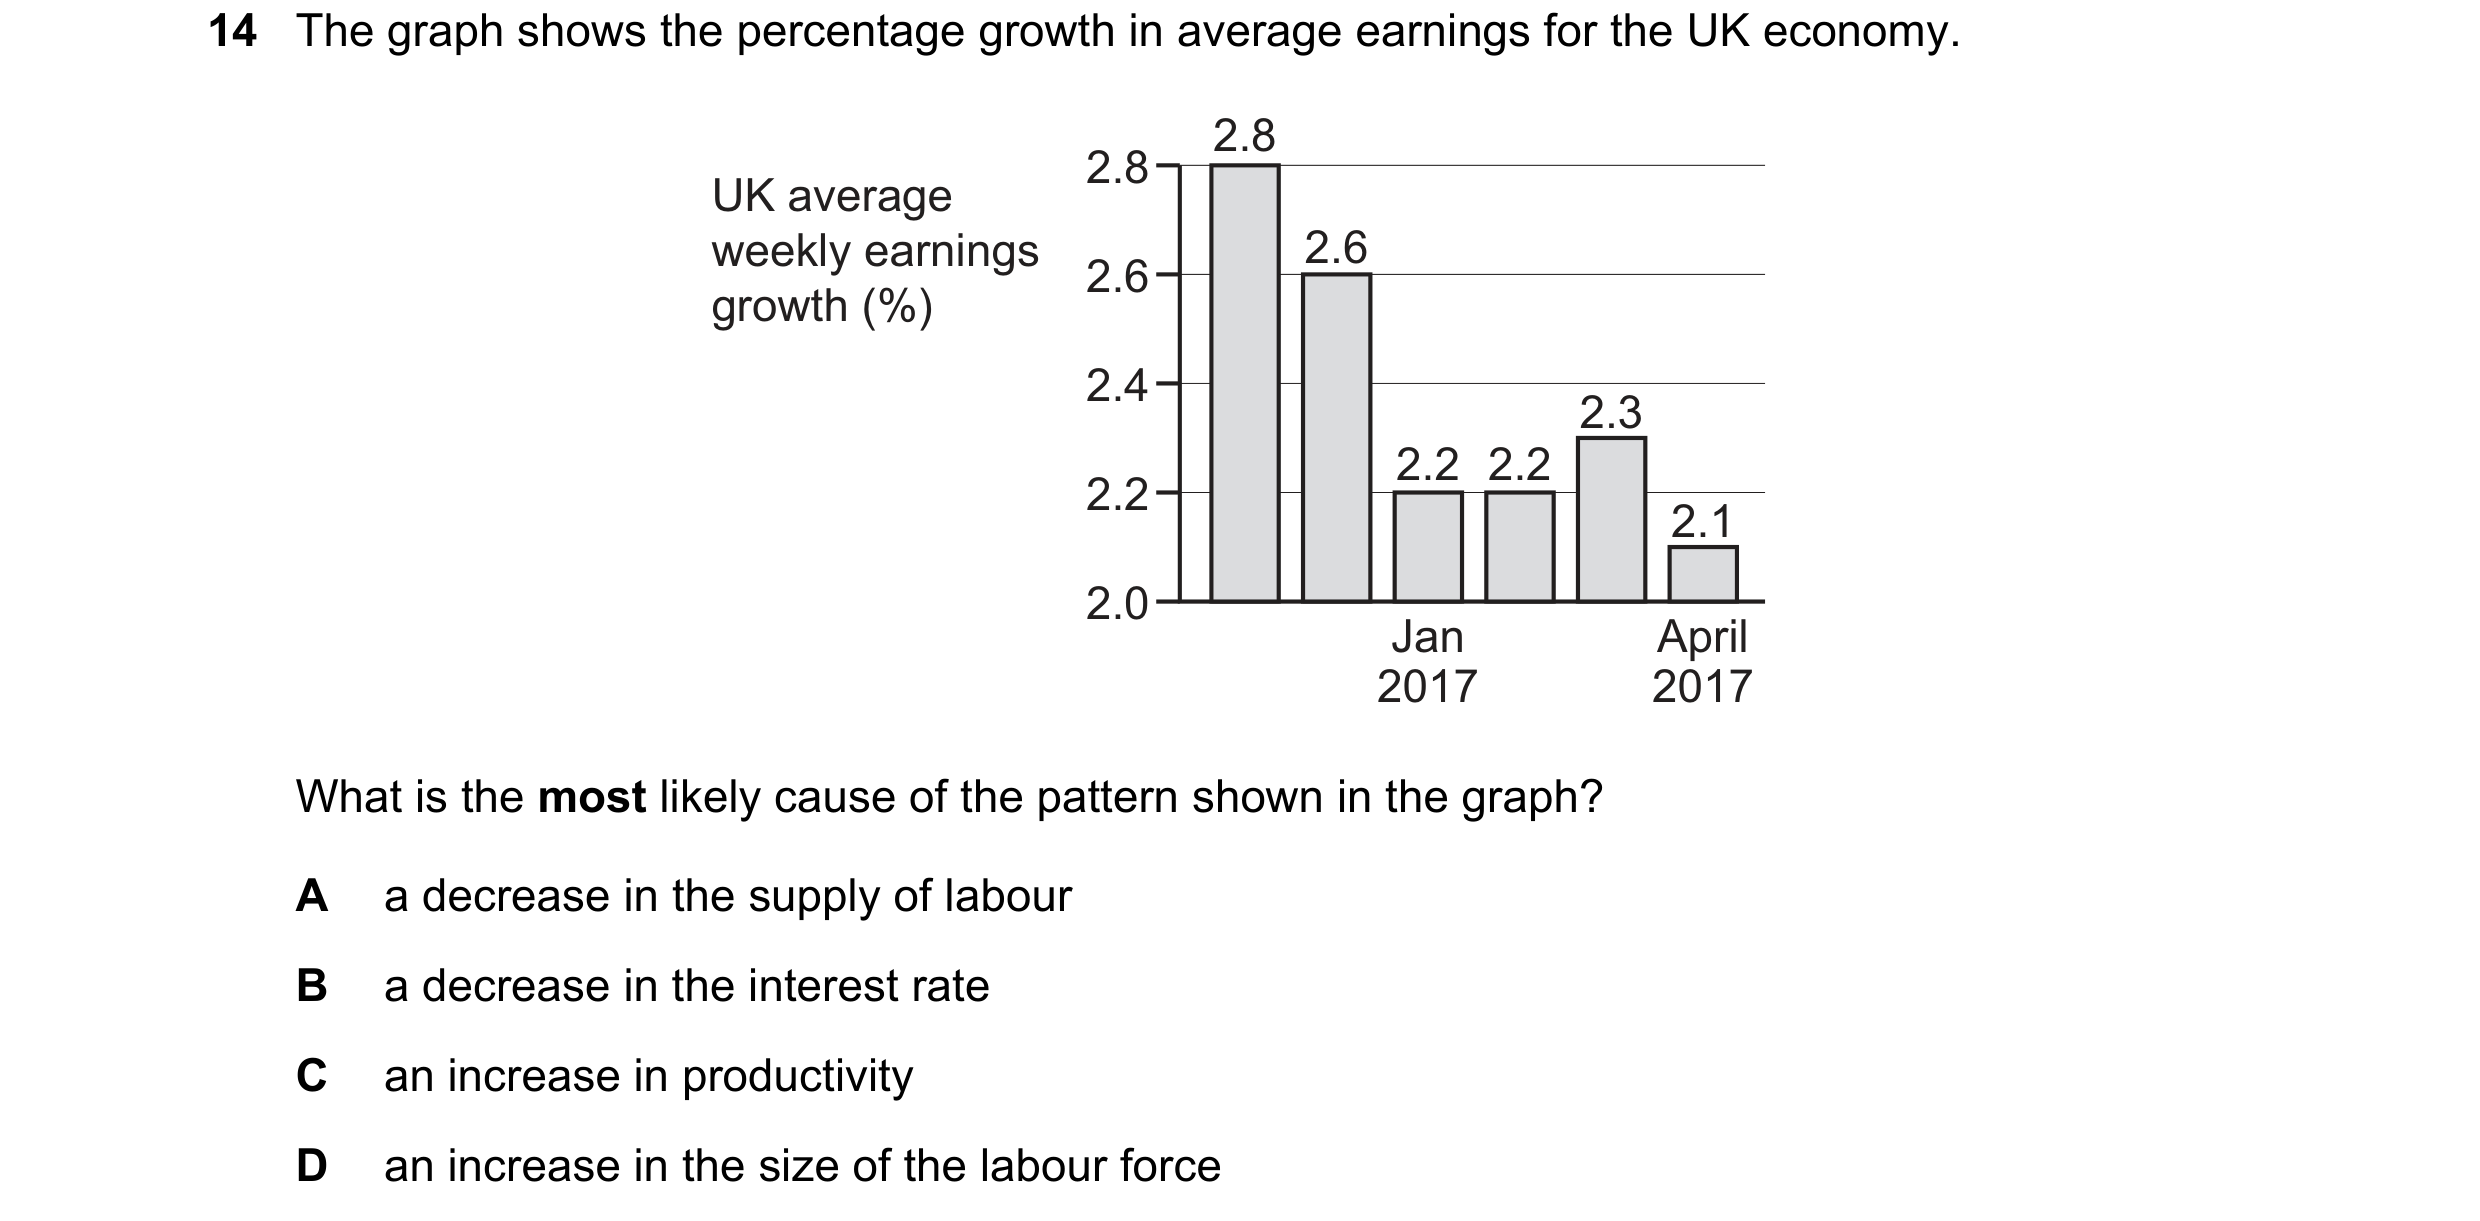
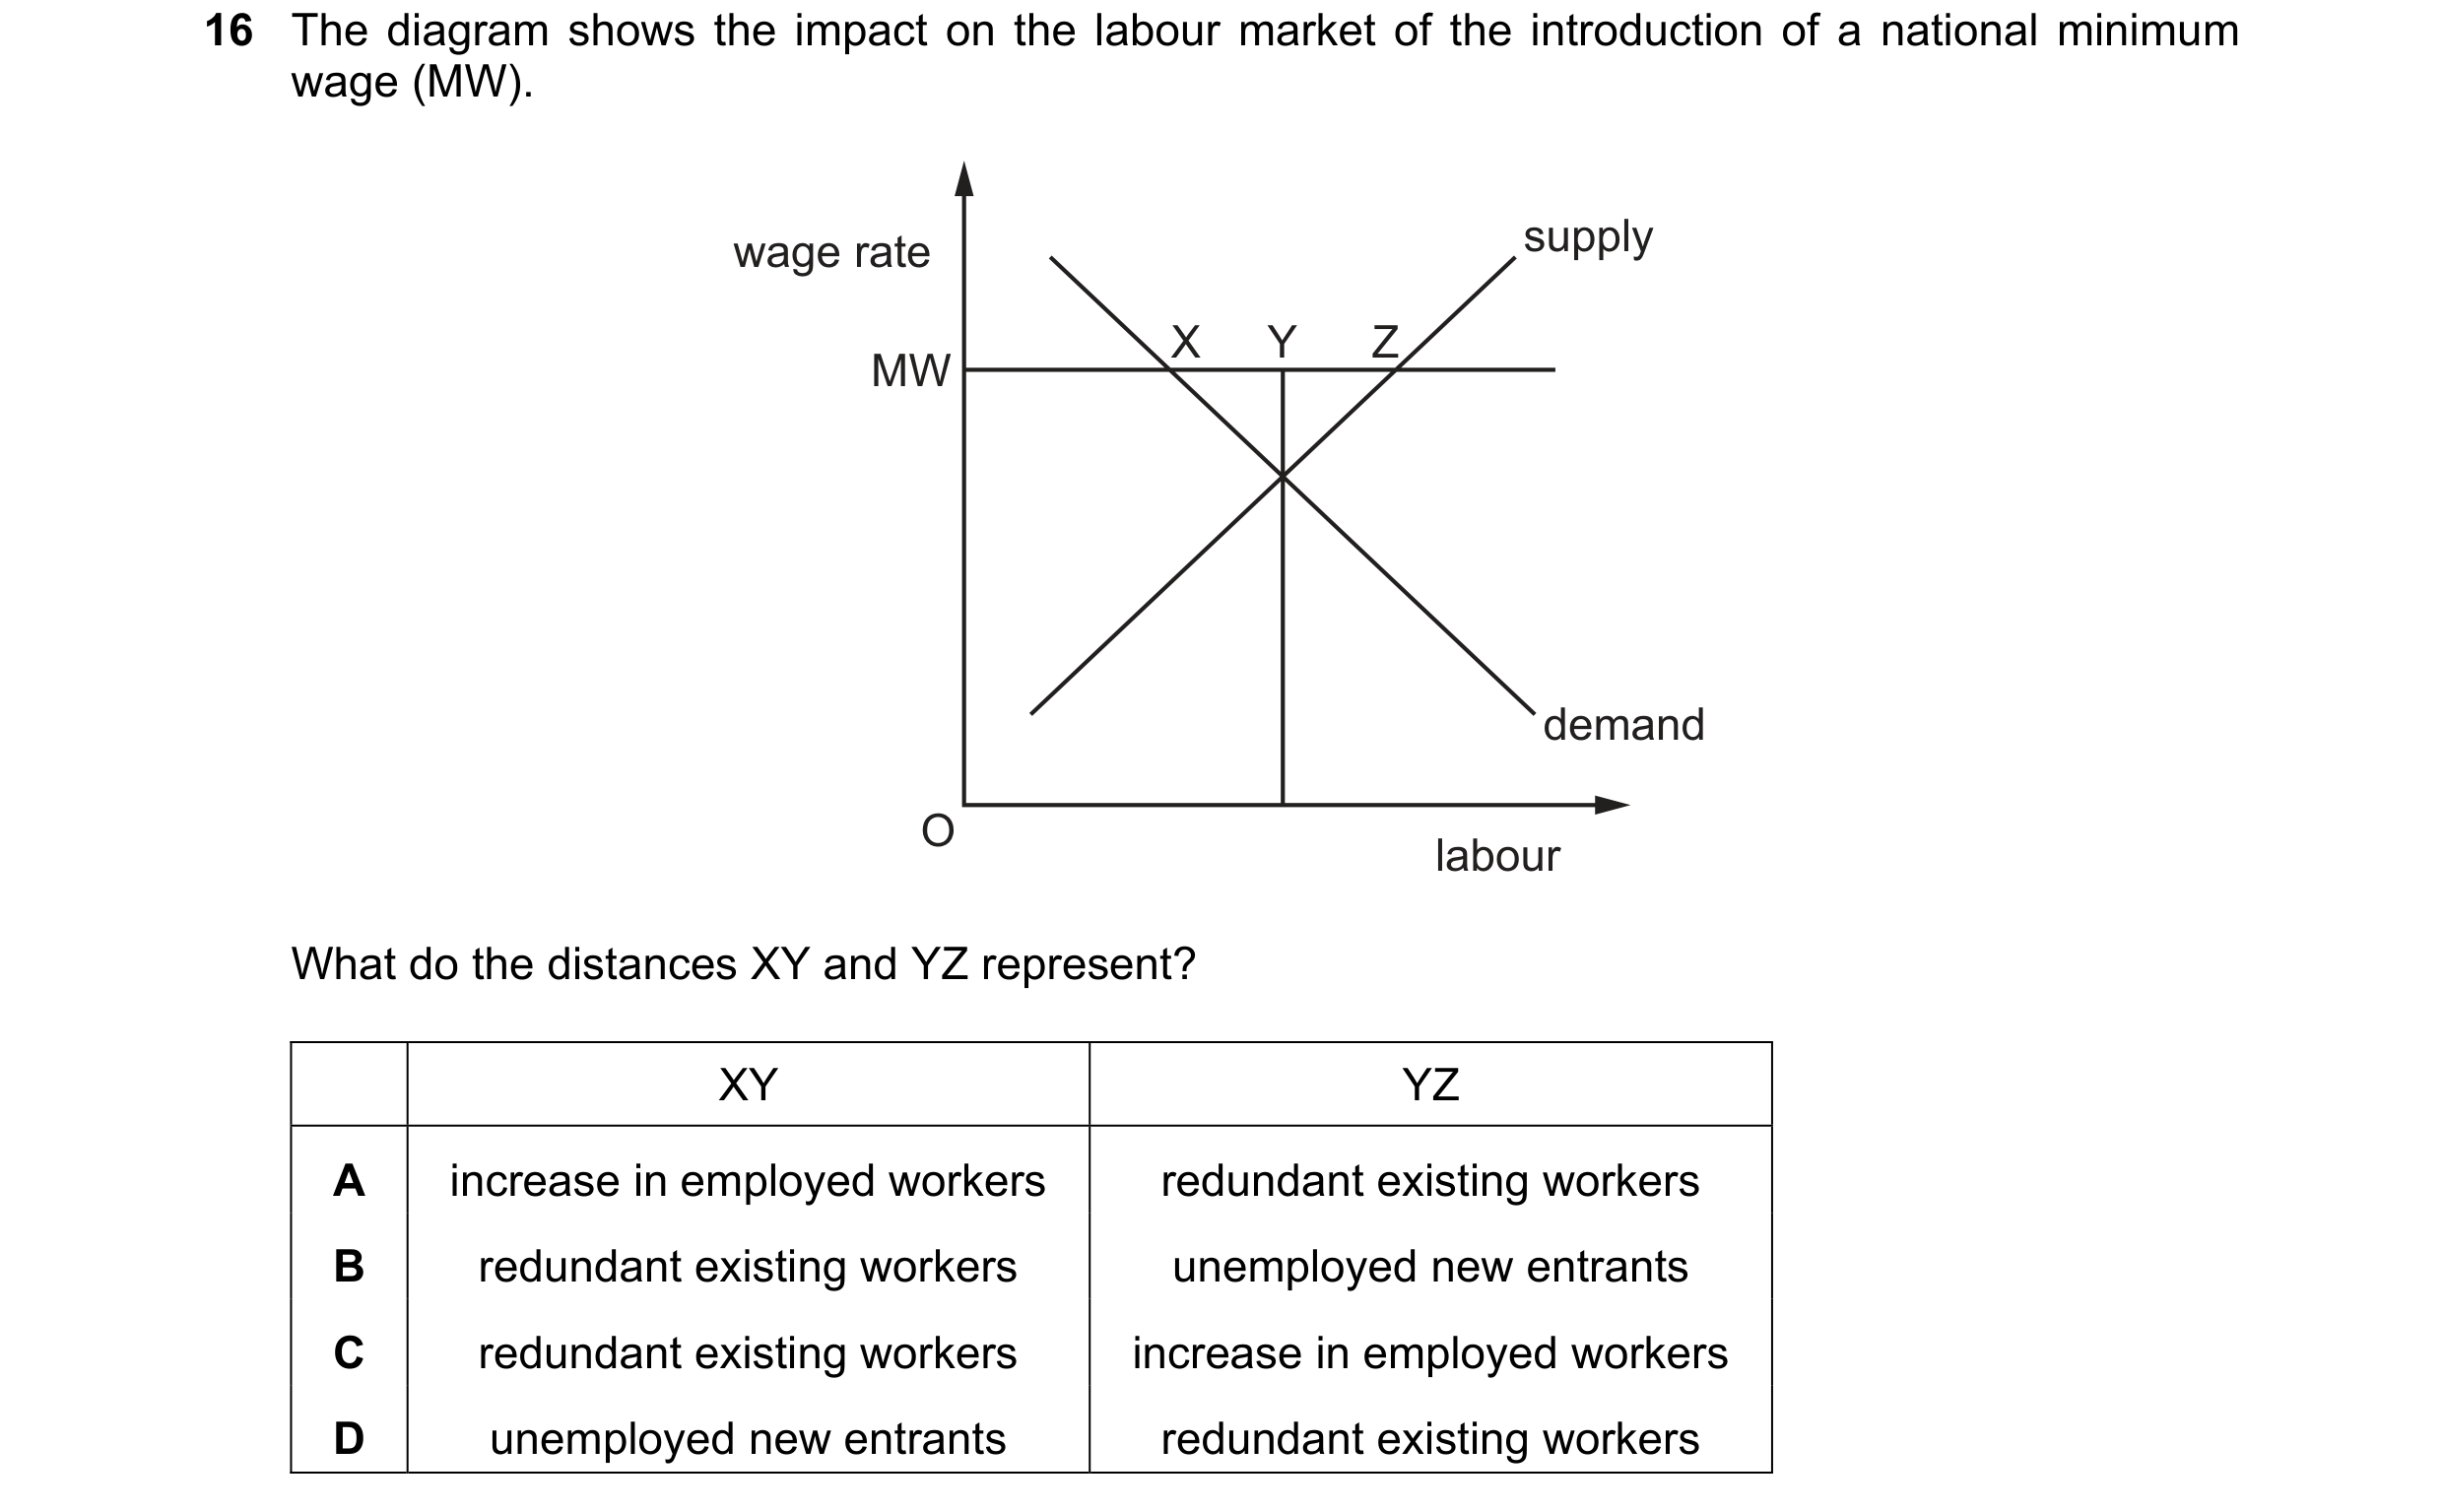 40 / 58
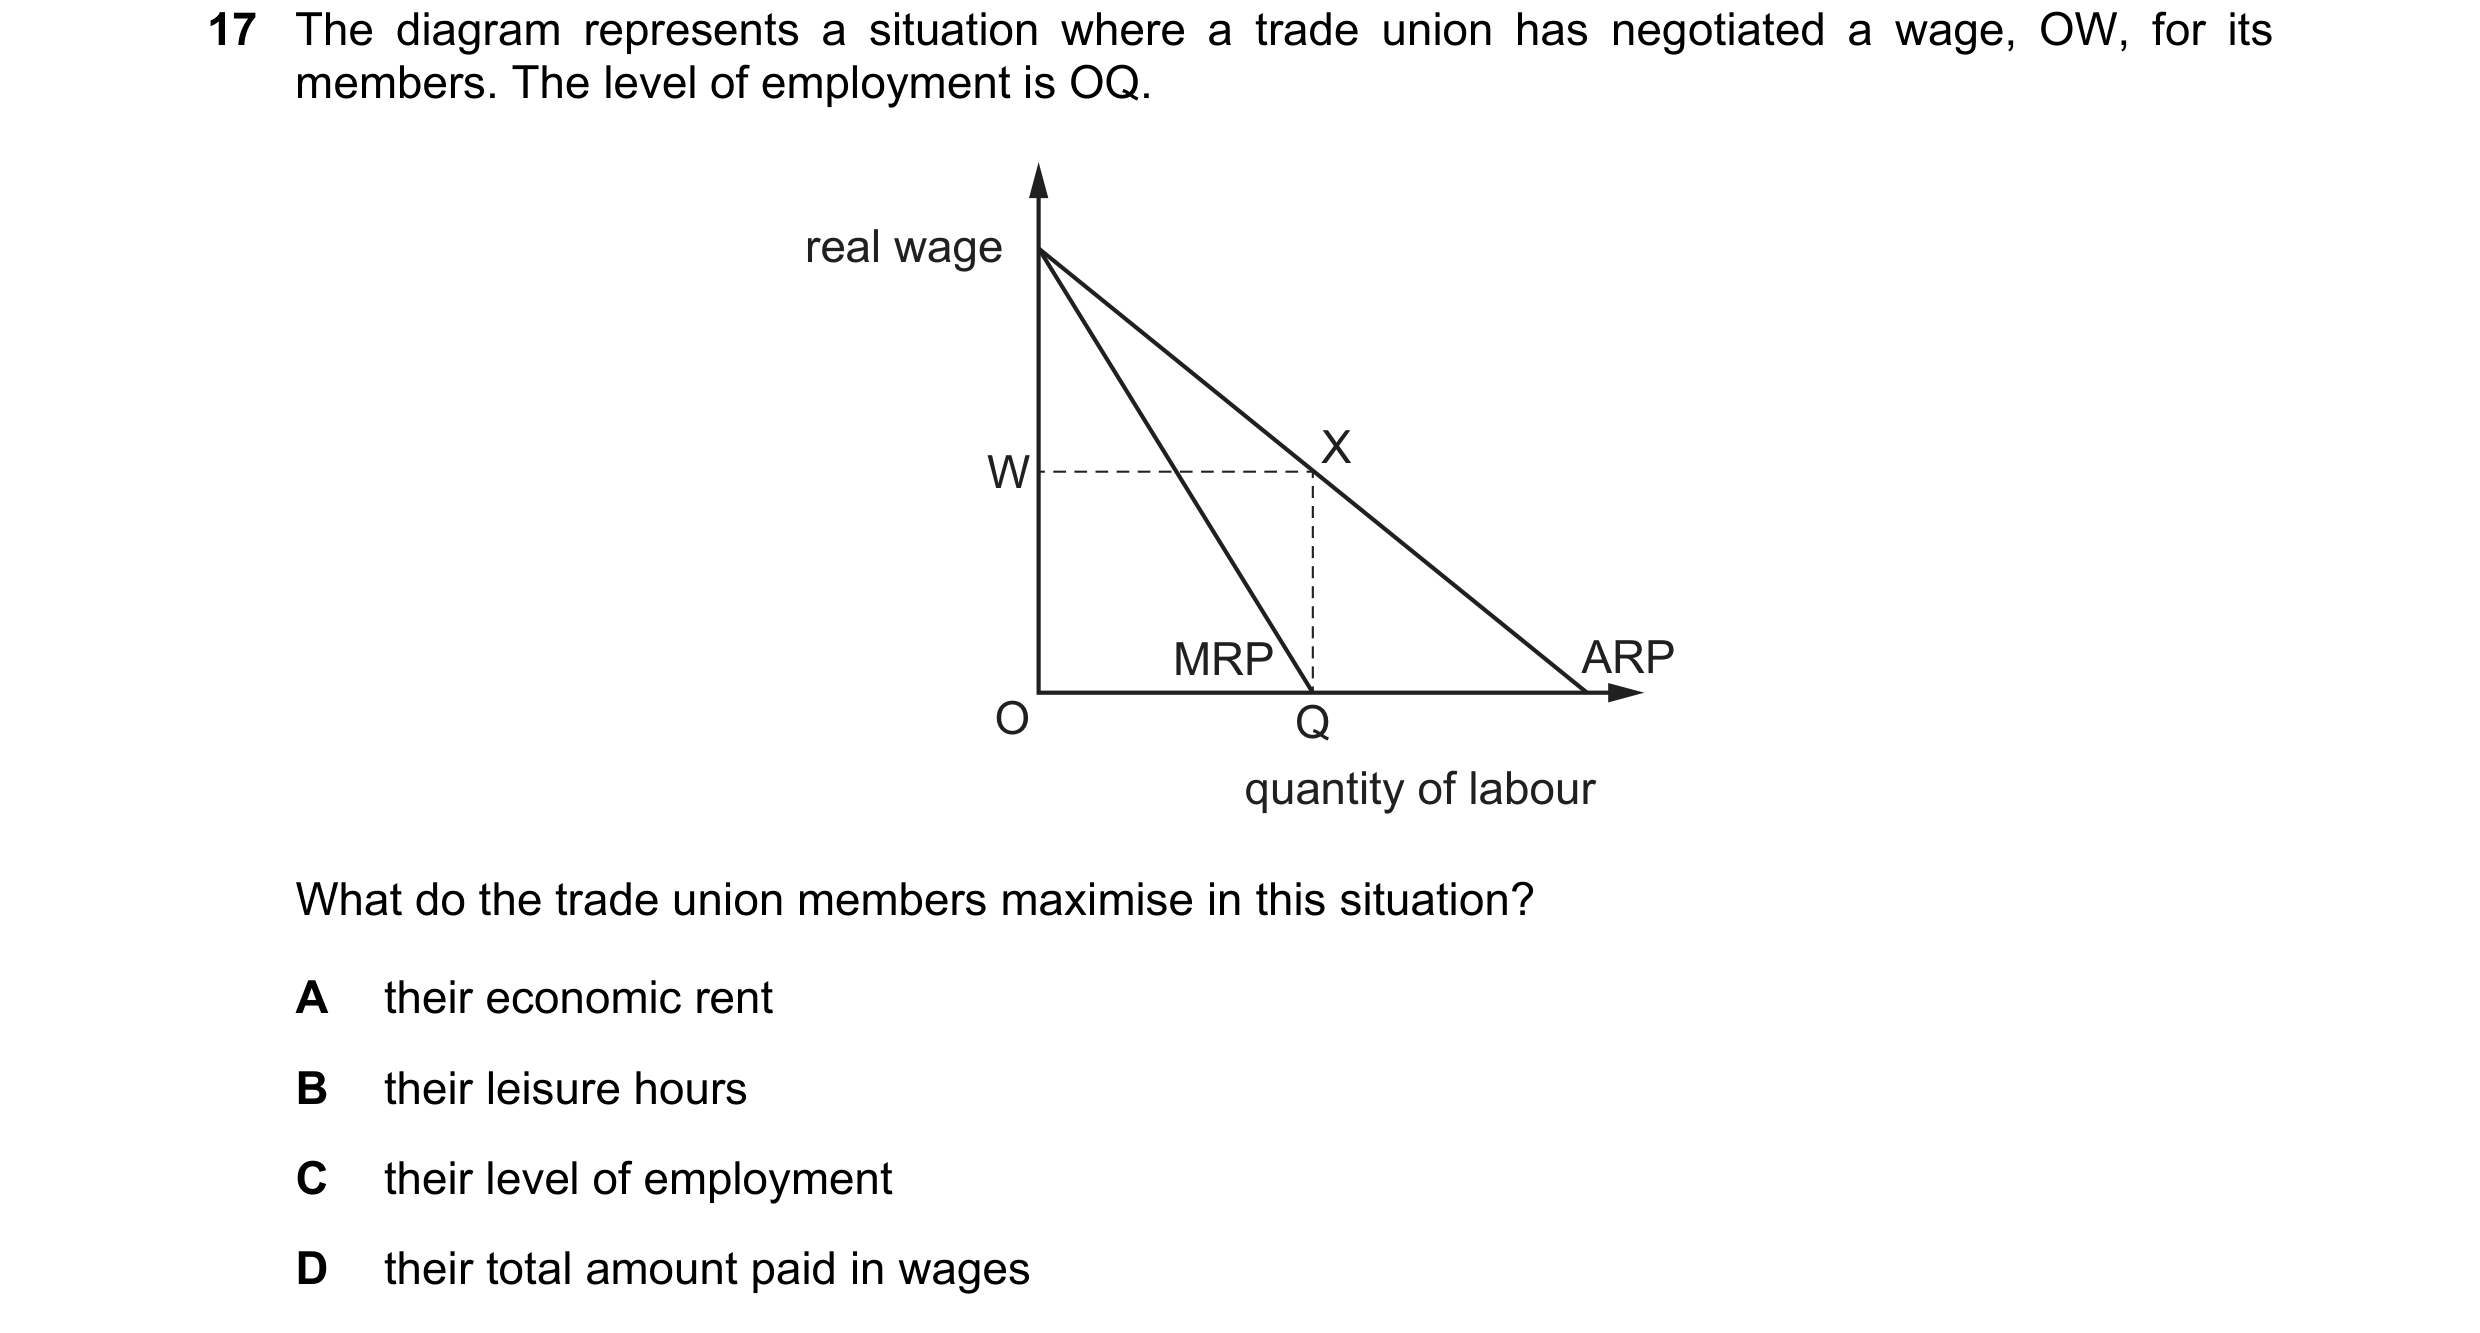
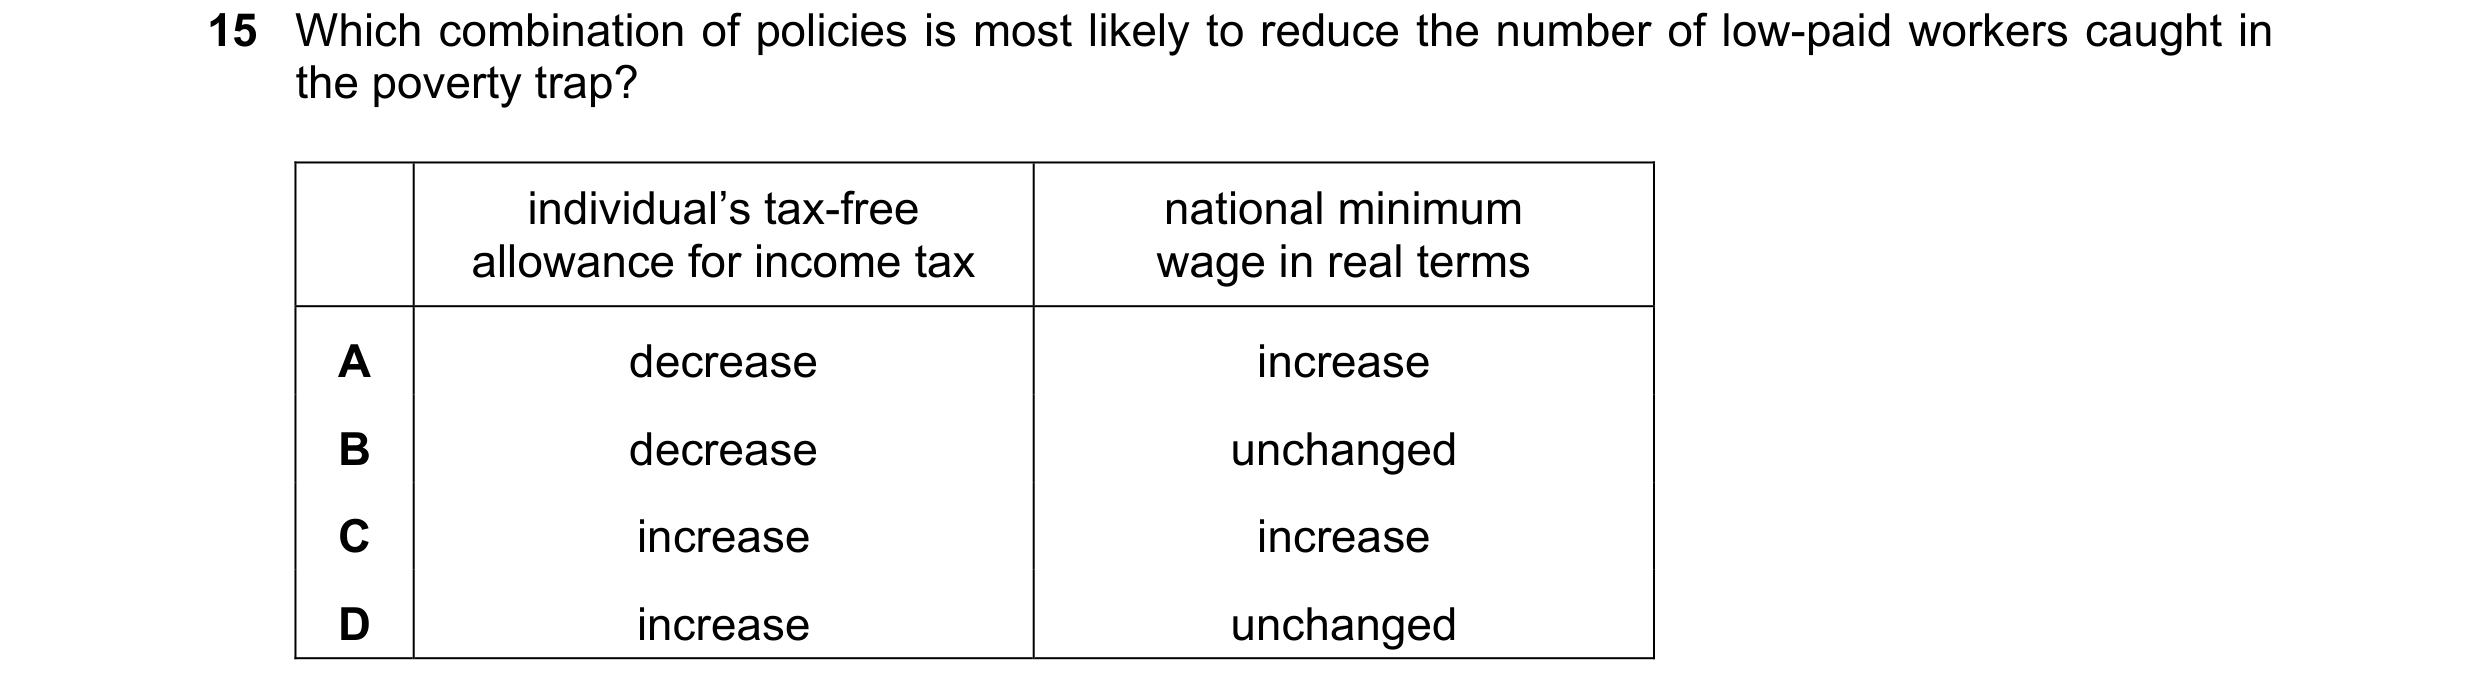 41 / 58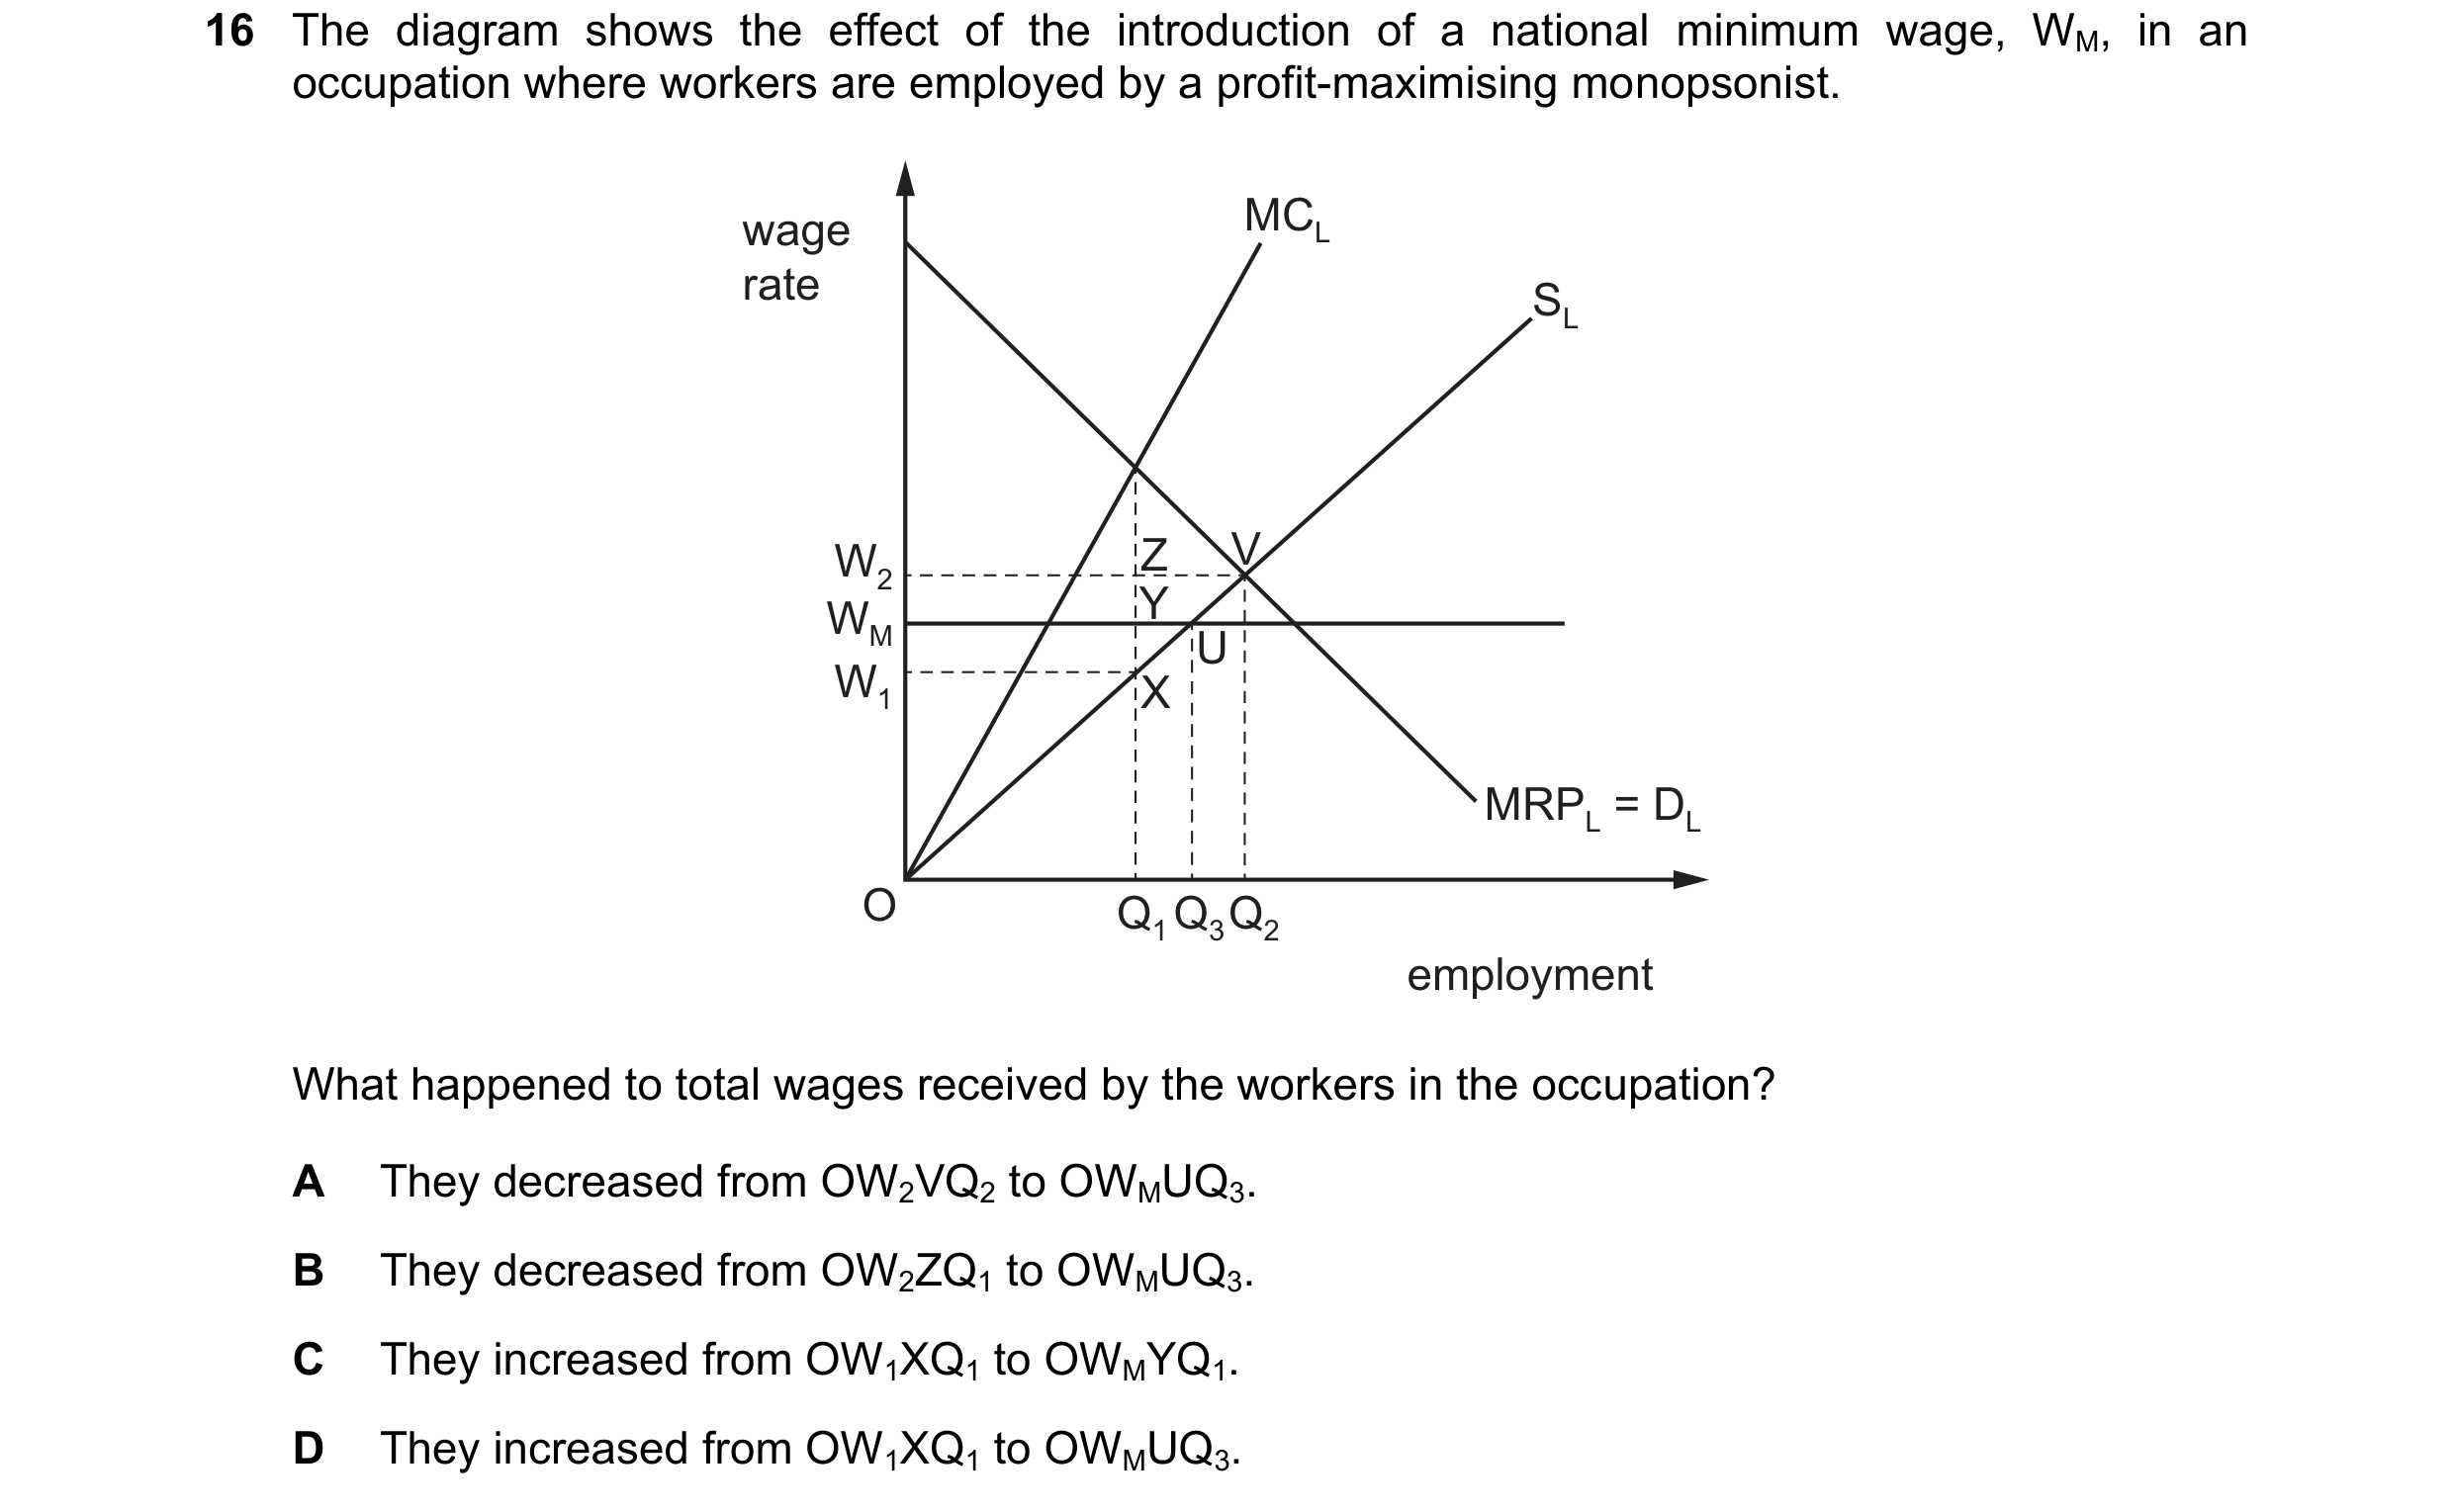
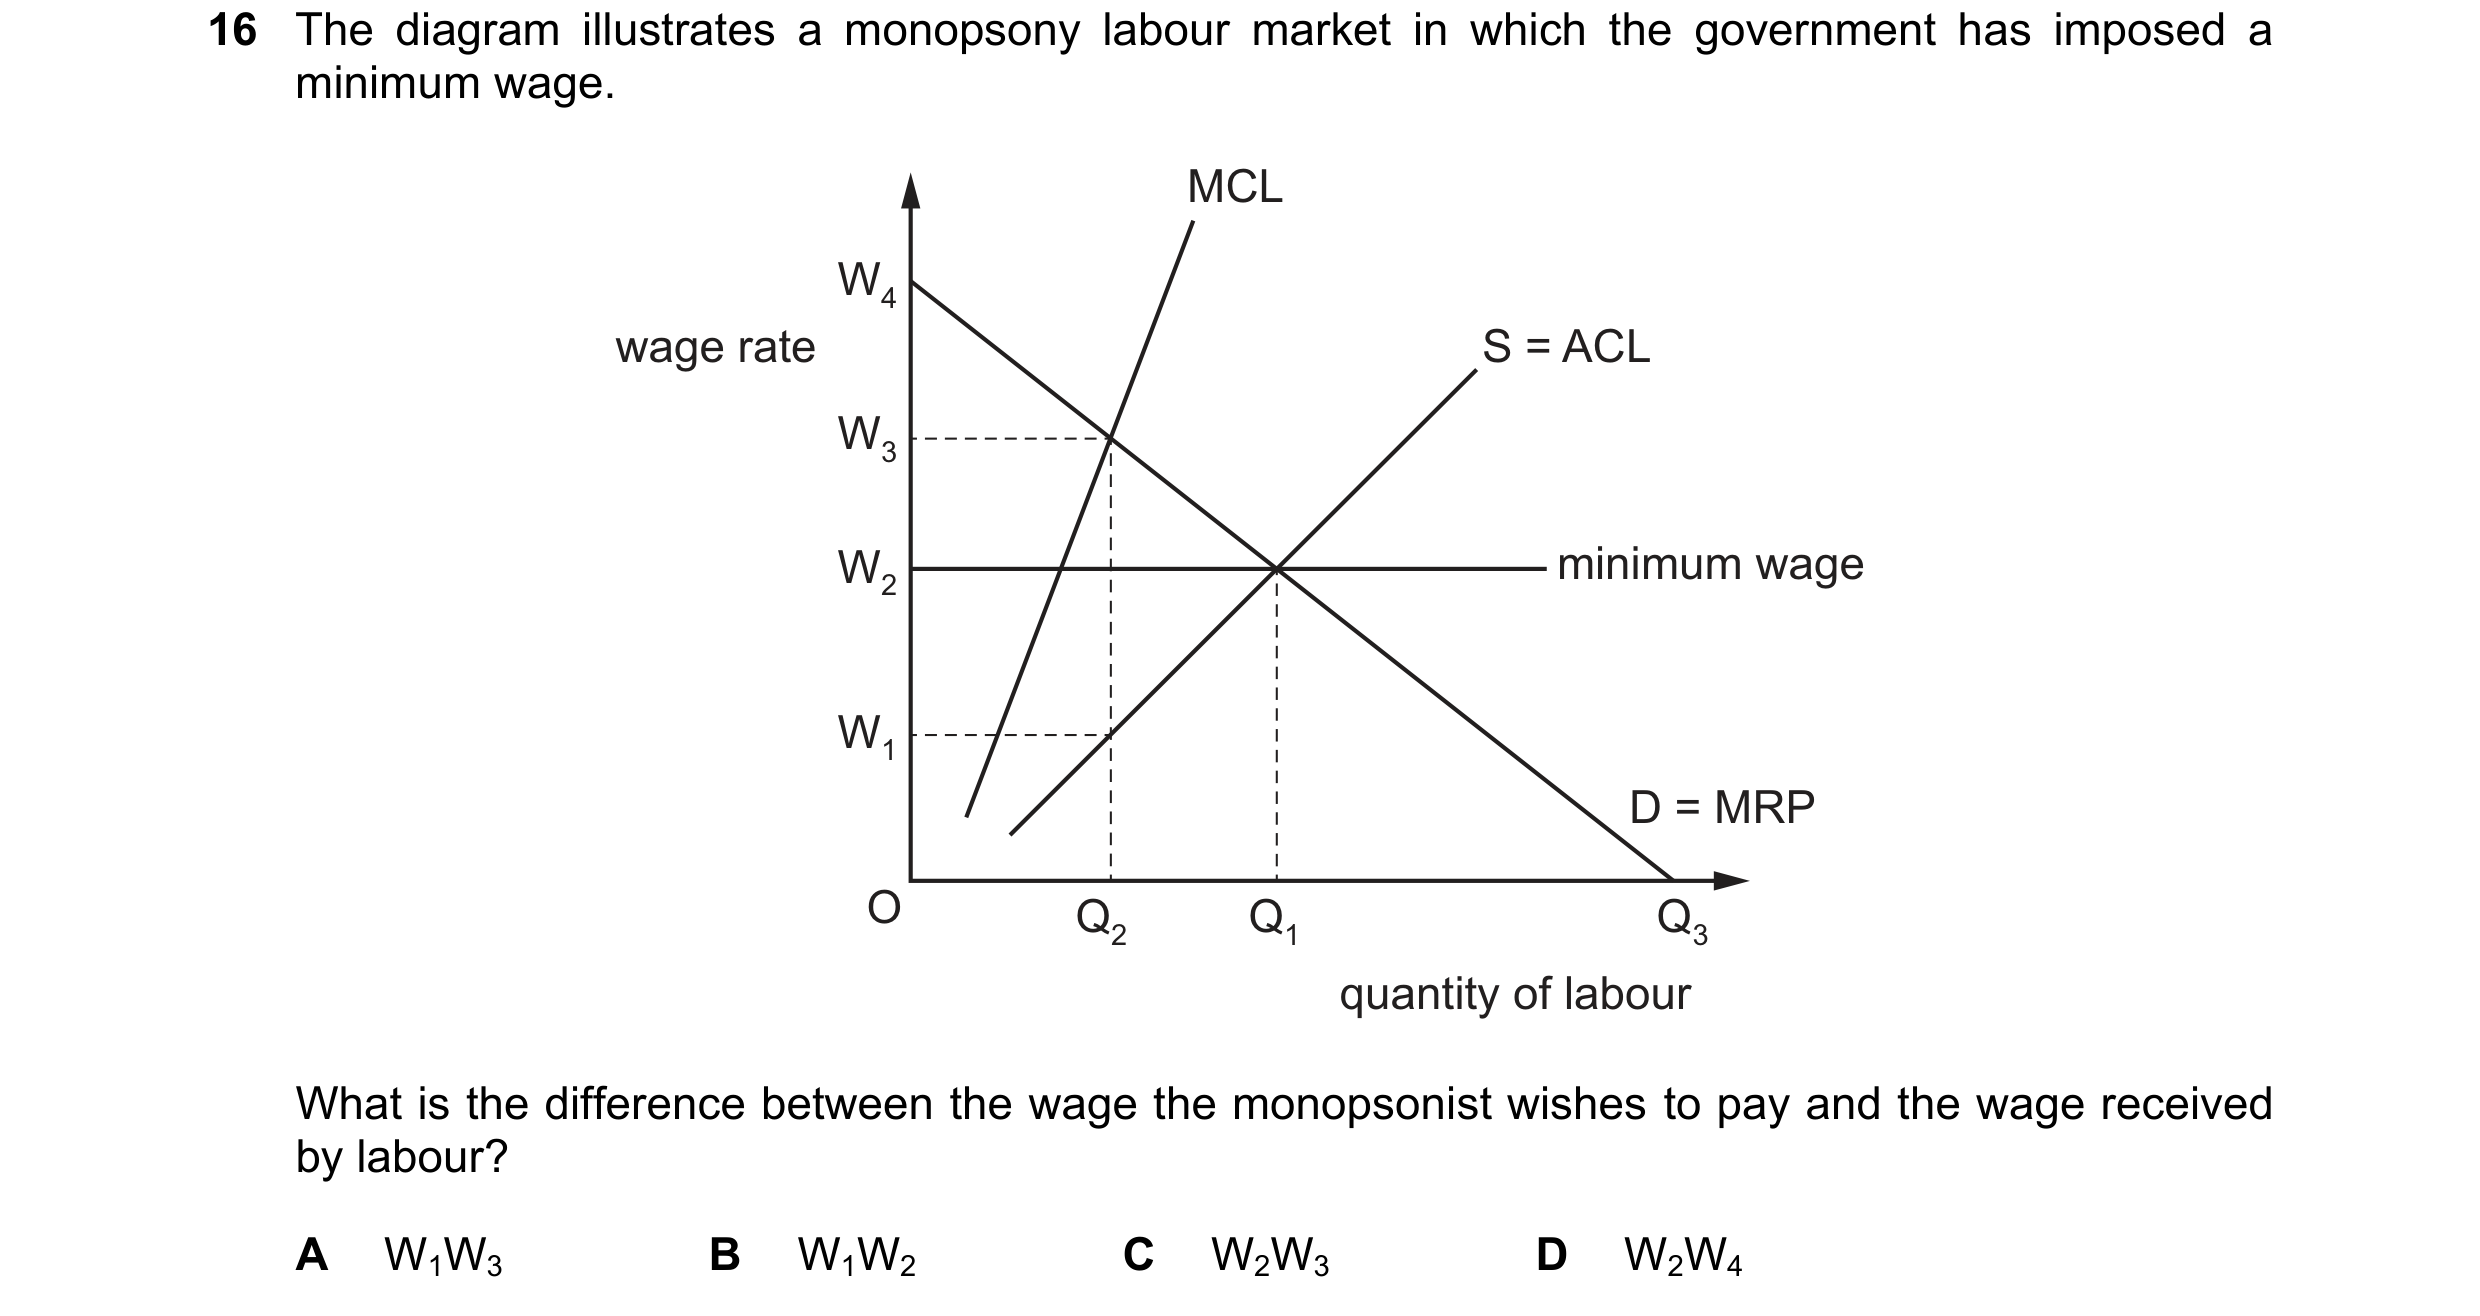 42 / 58

 43 / 58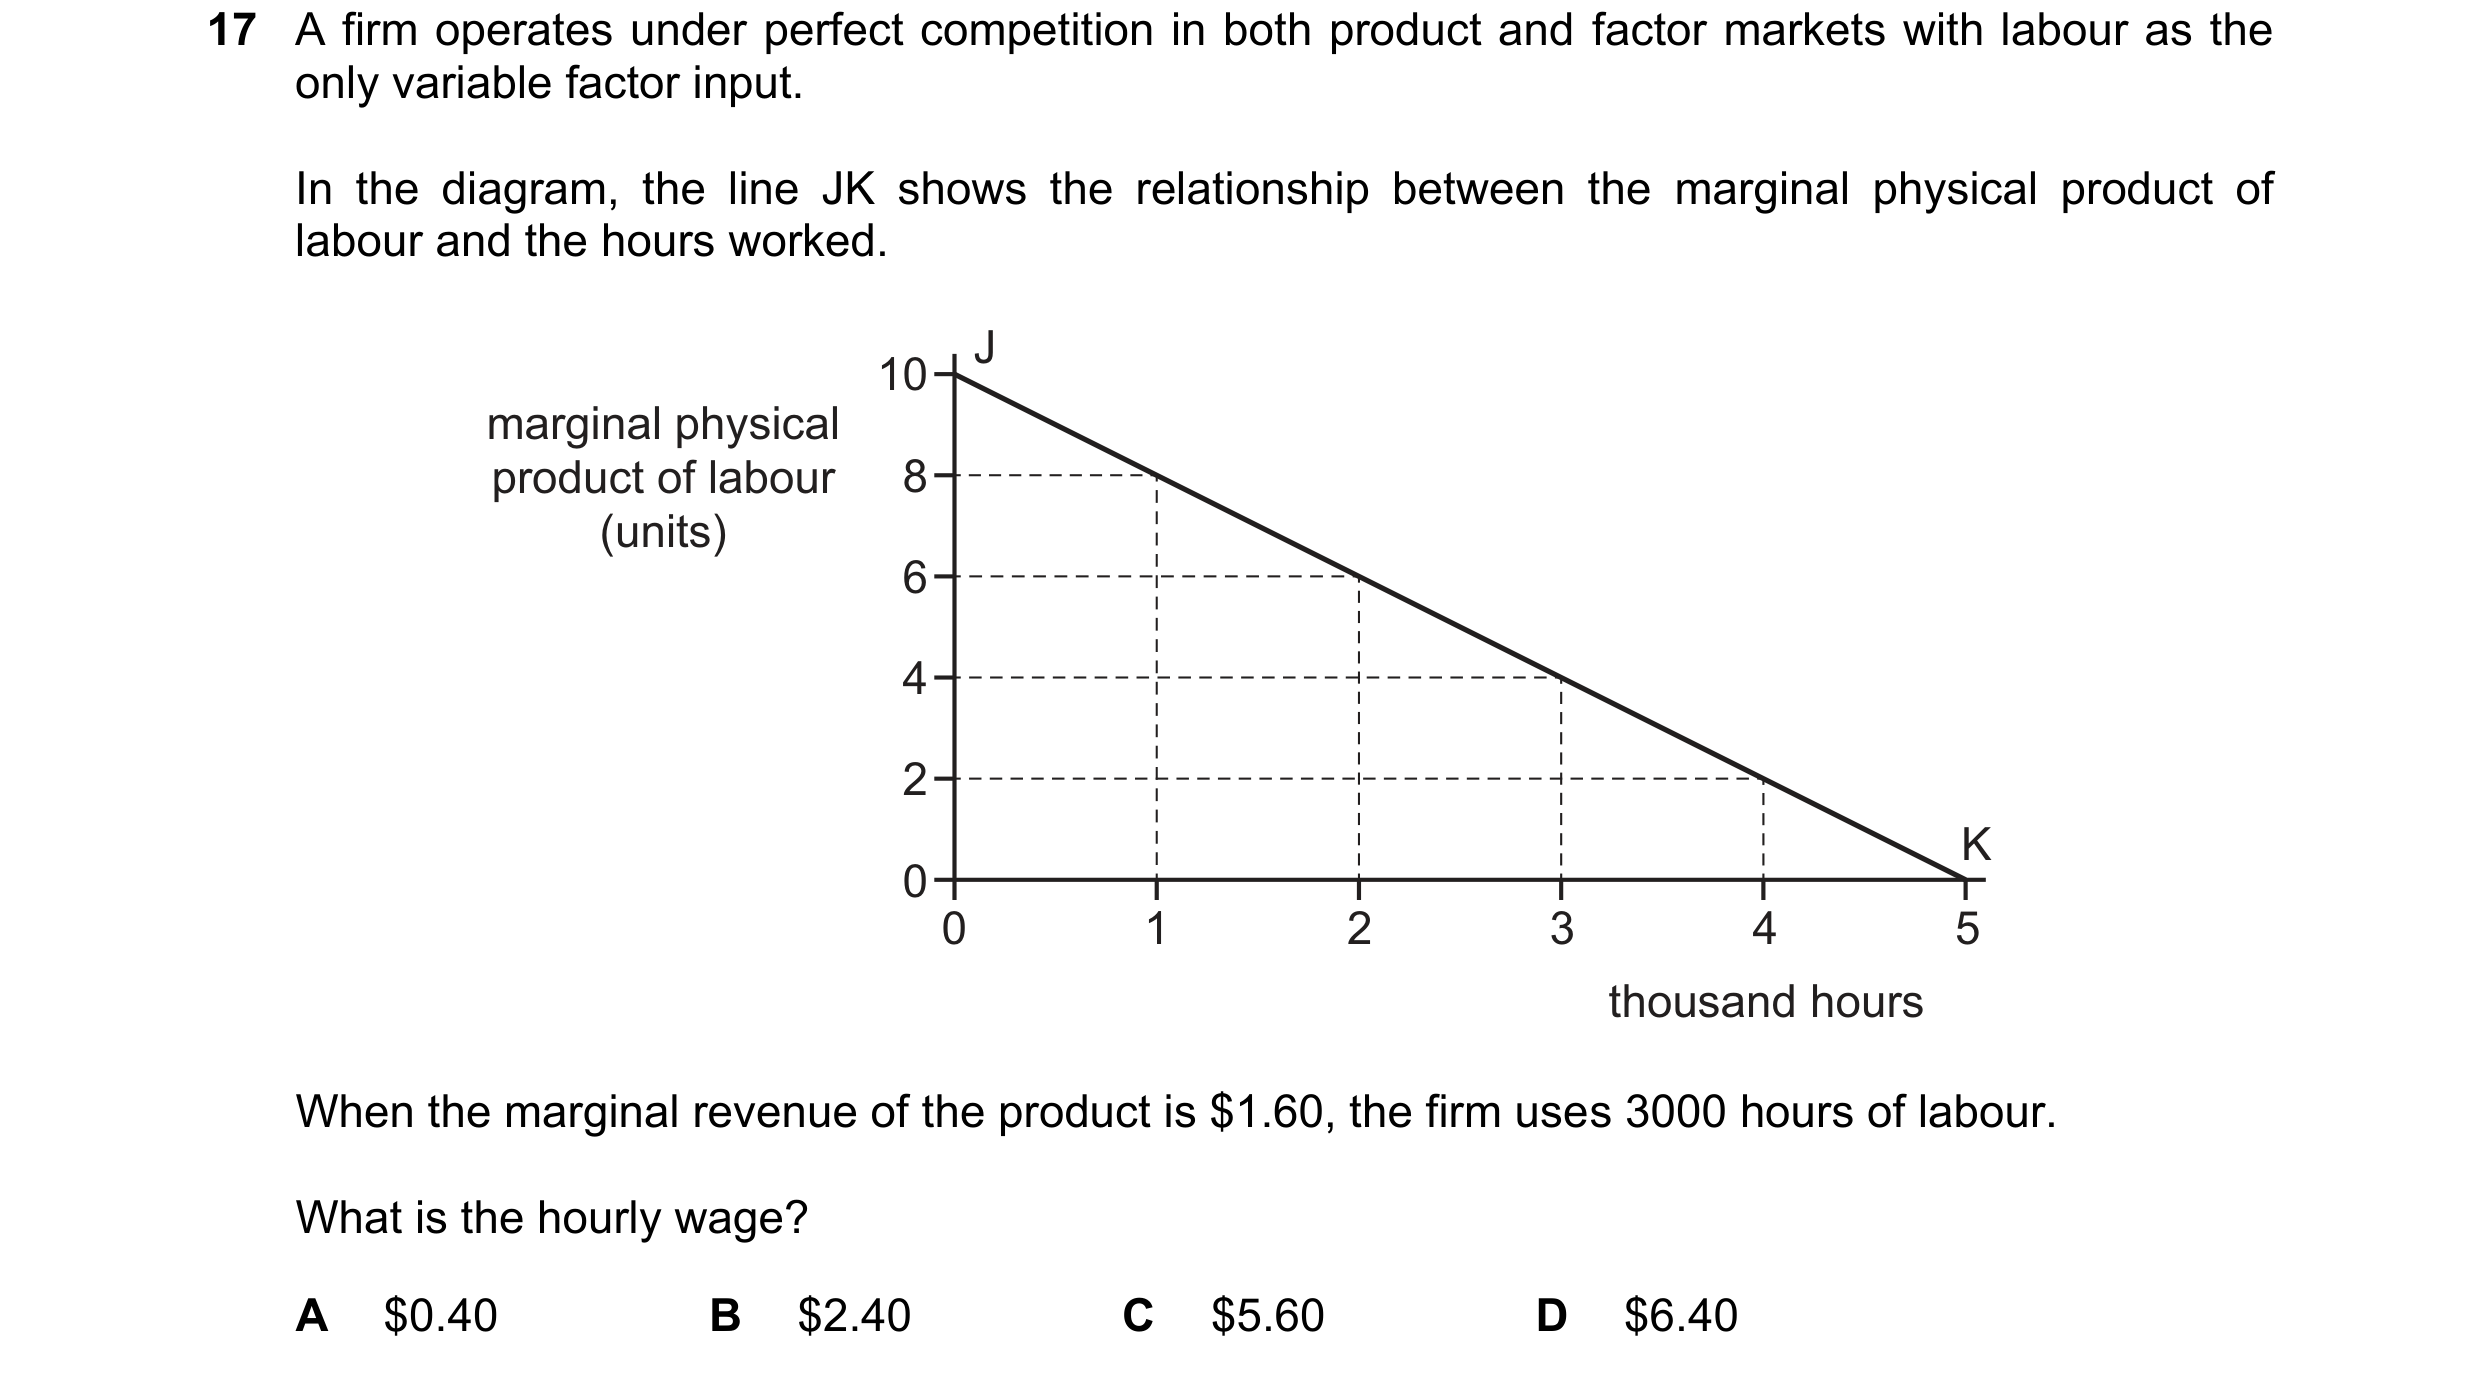
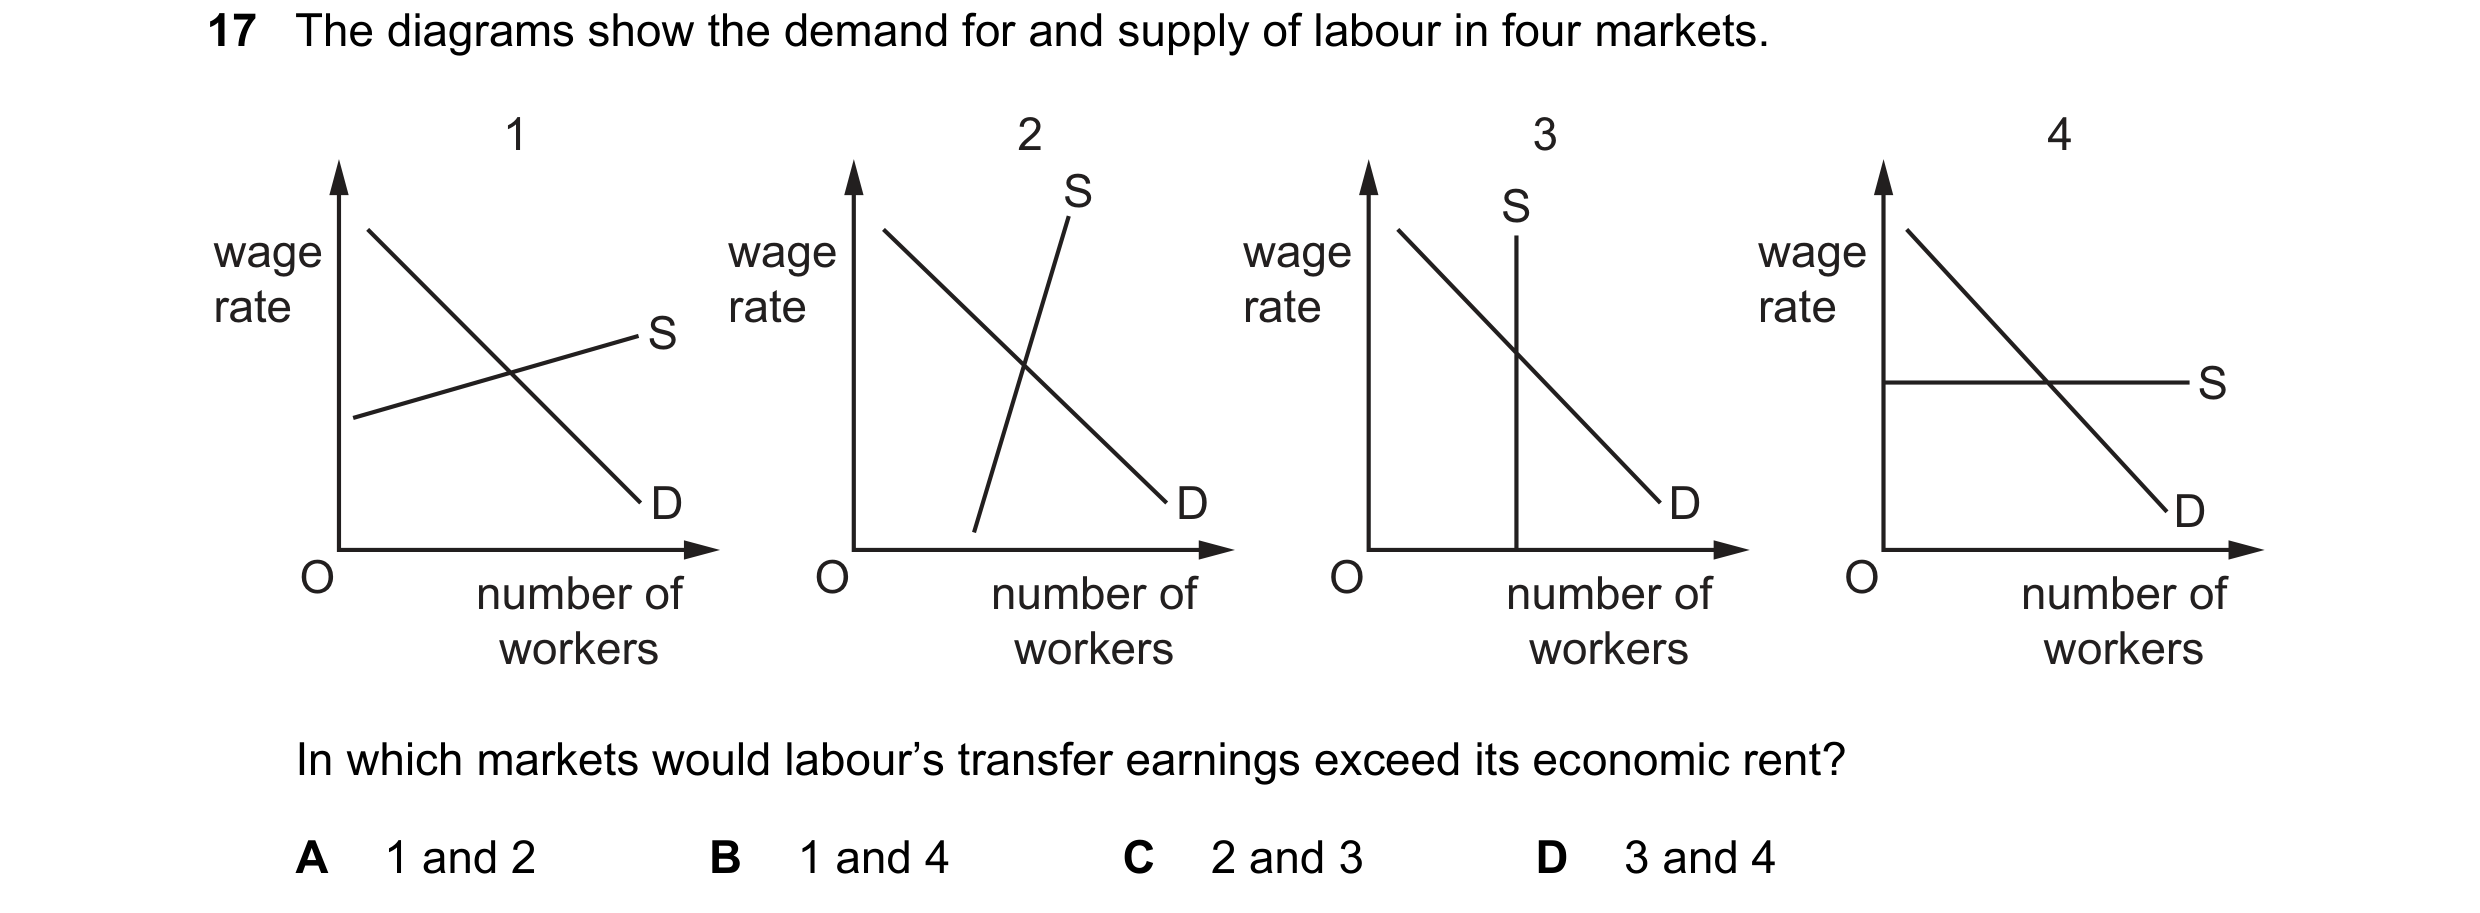
 44 / 58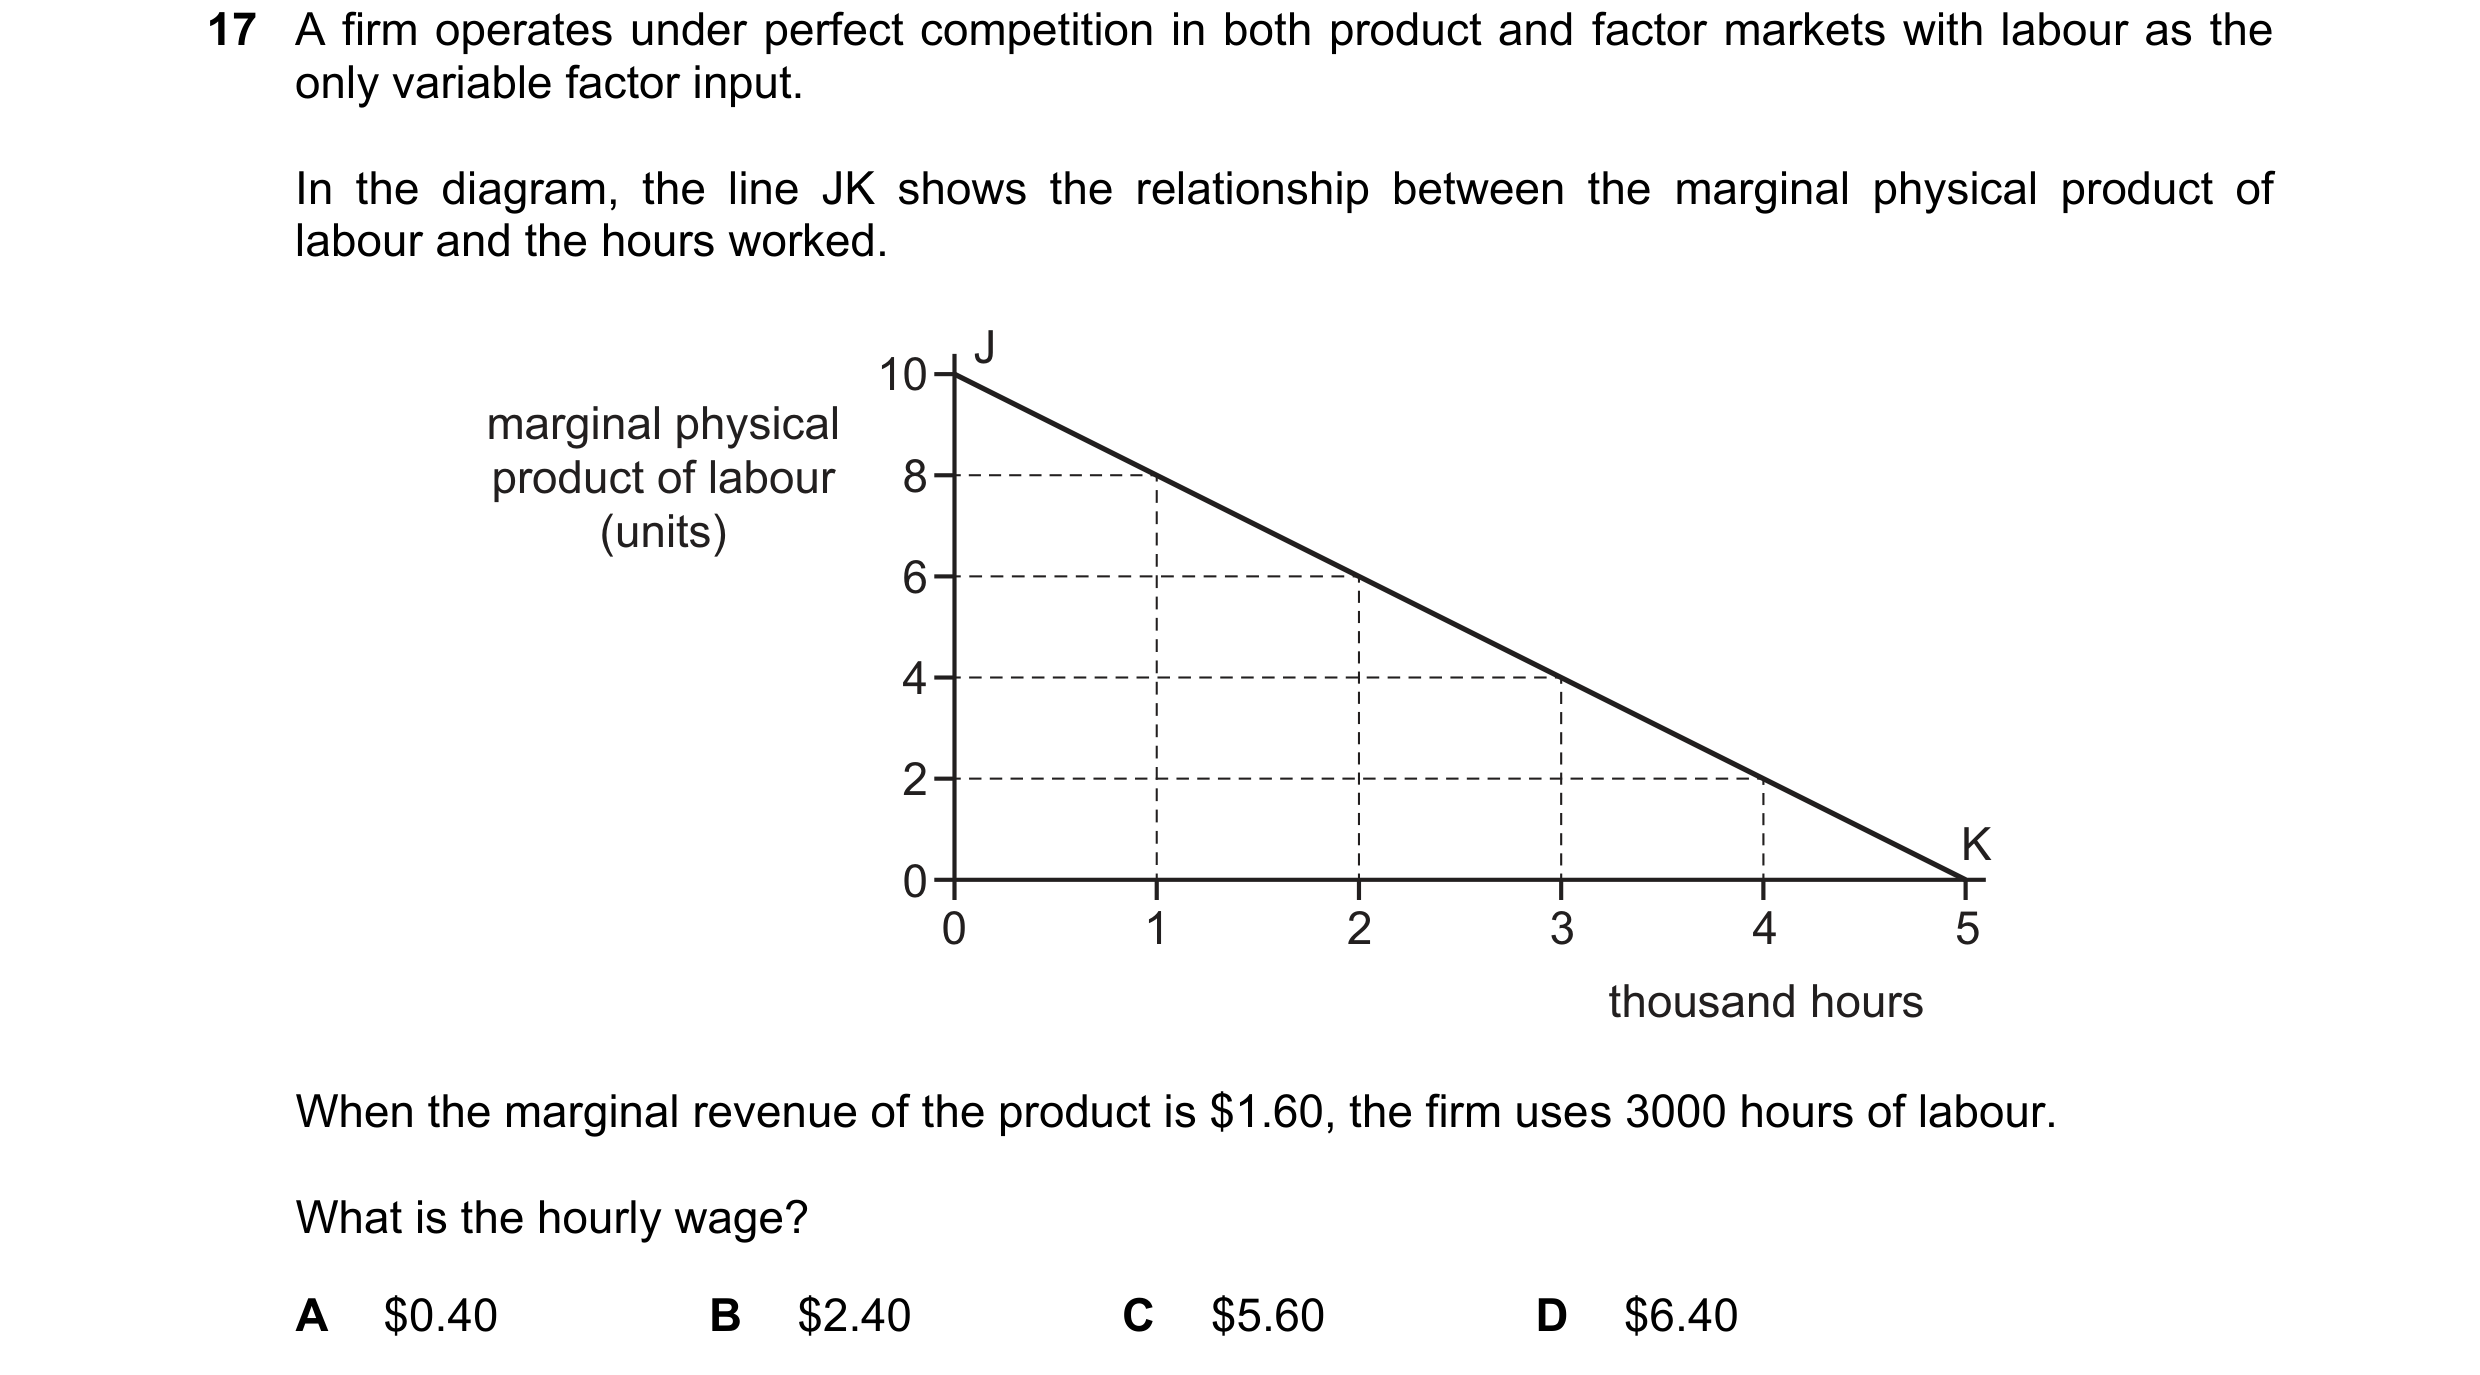

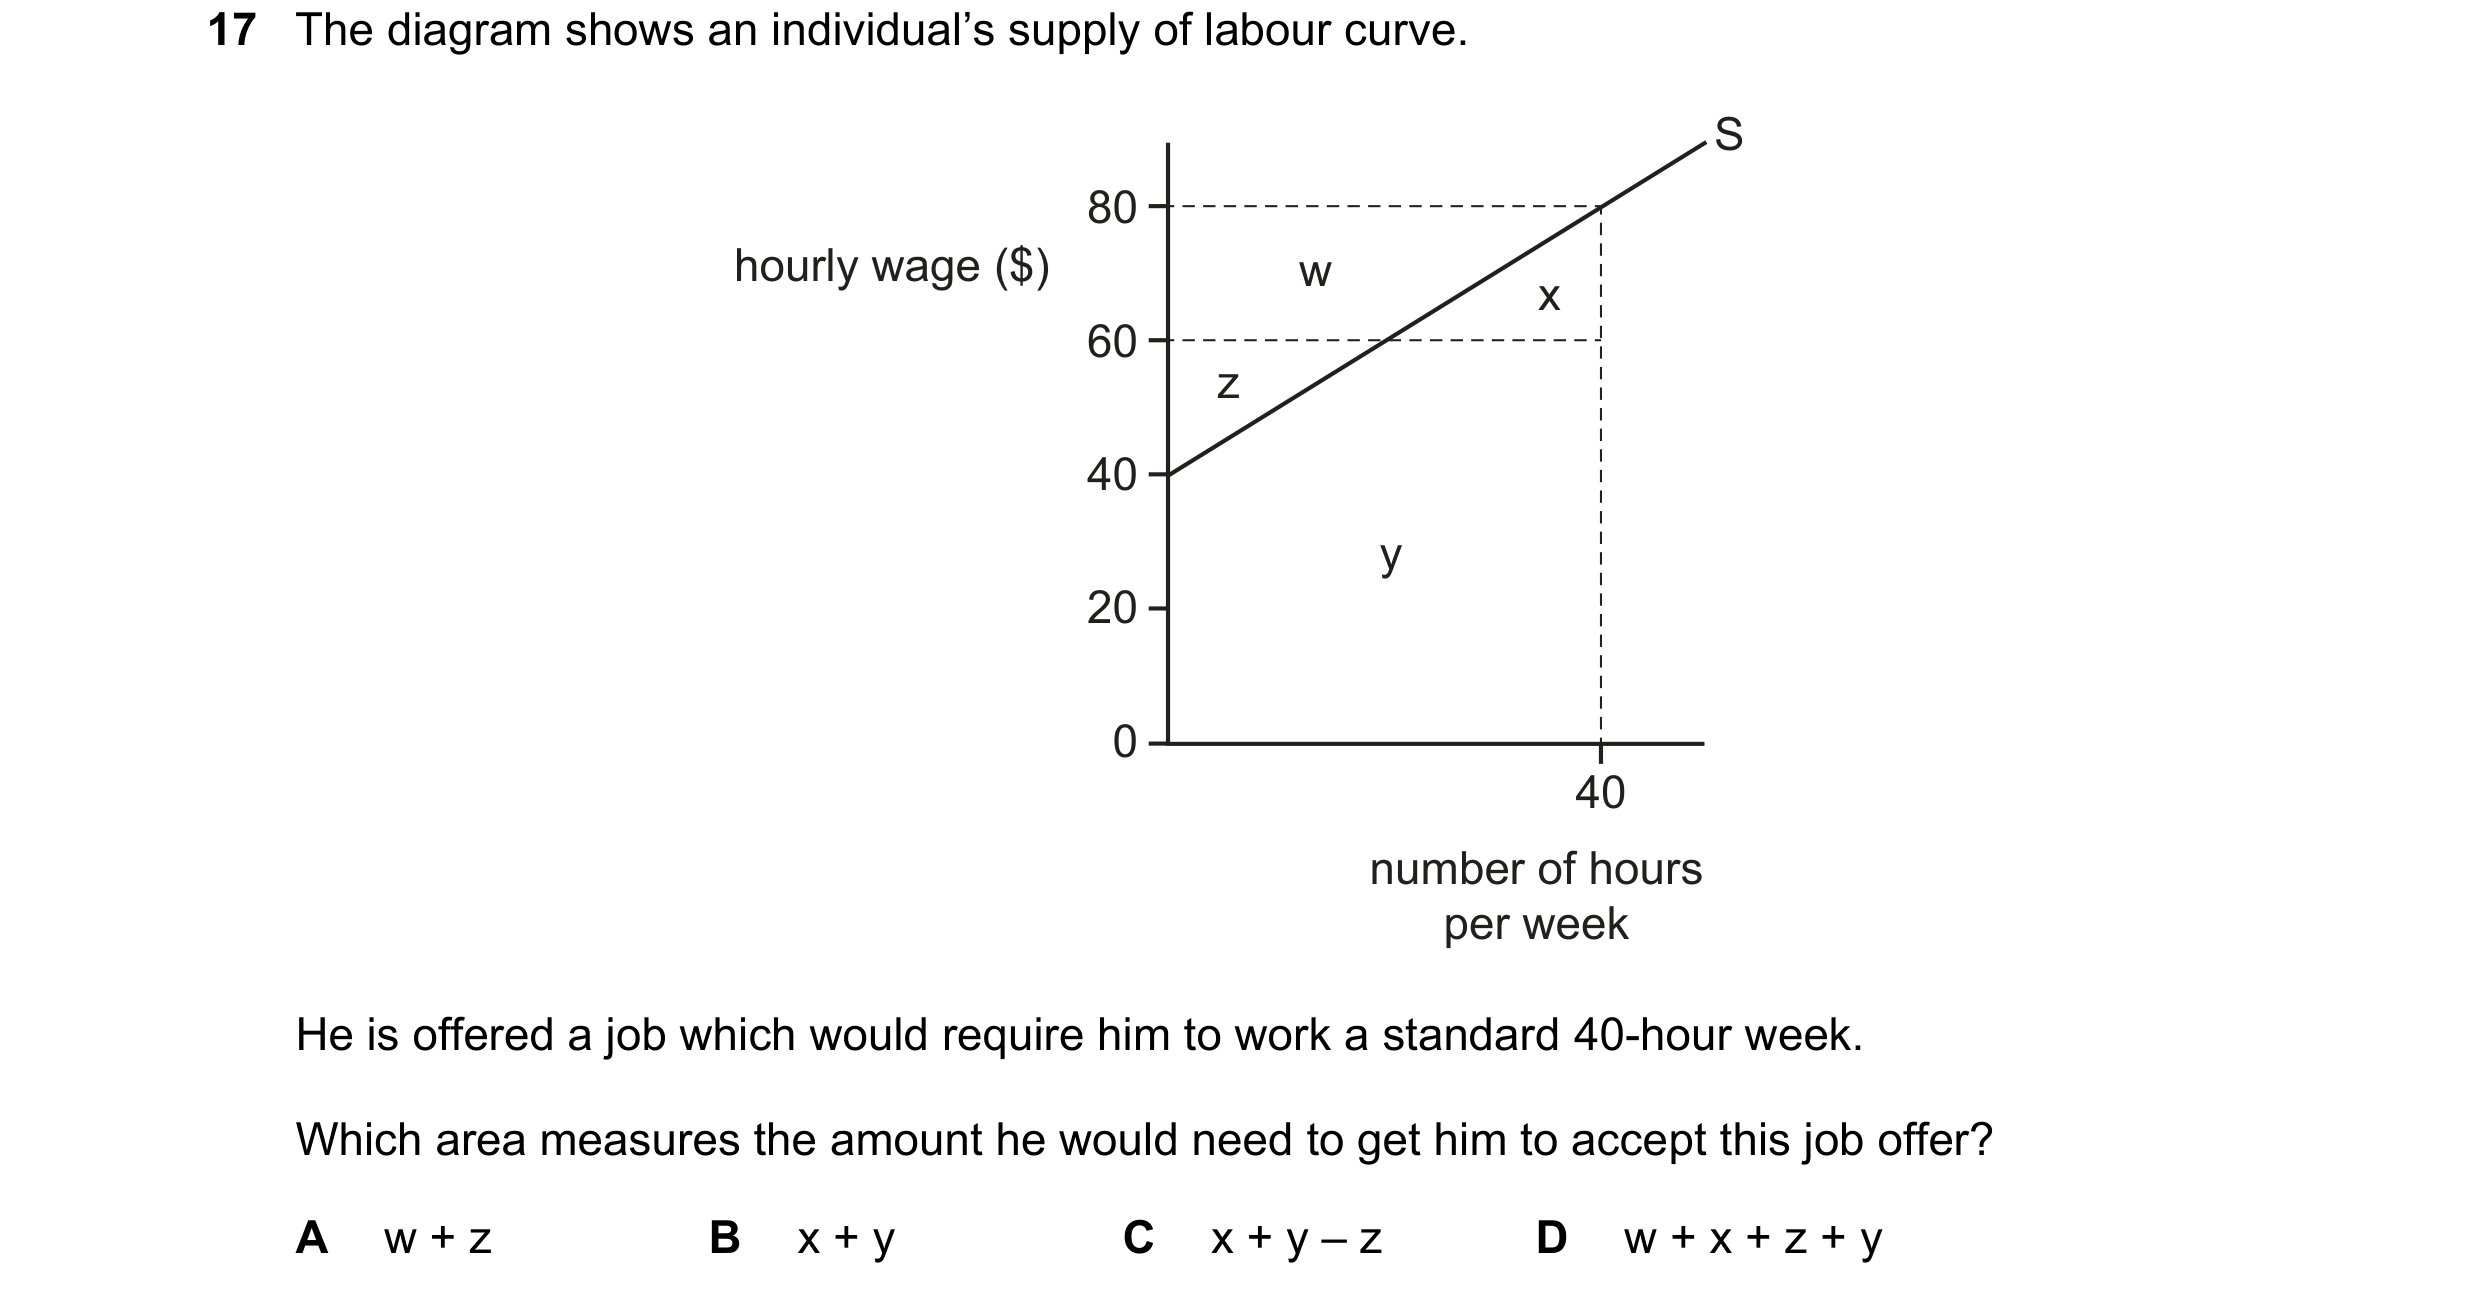 45 / 58

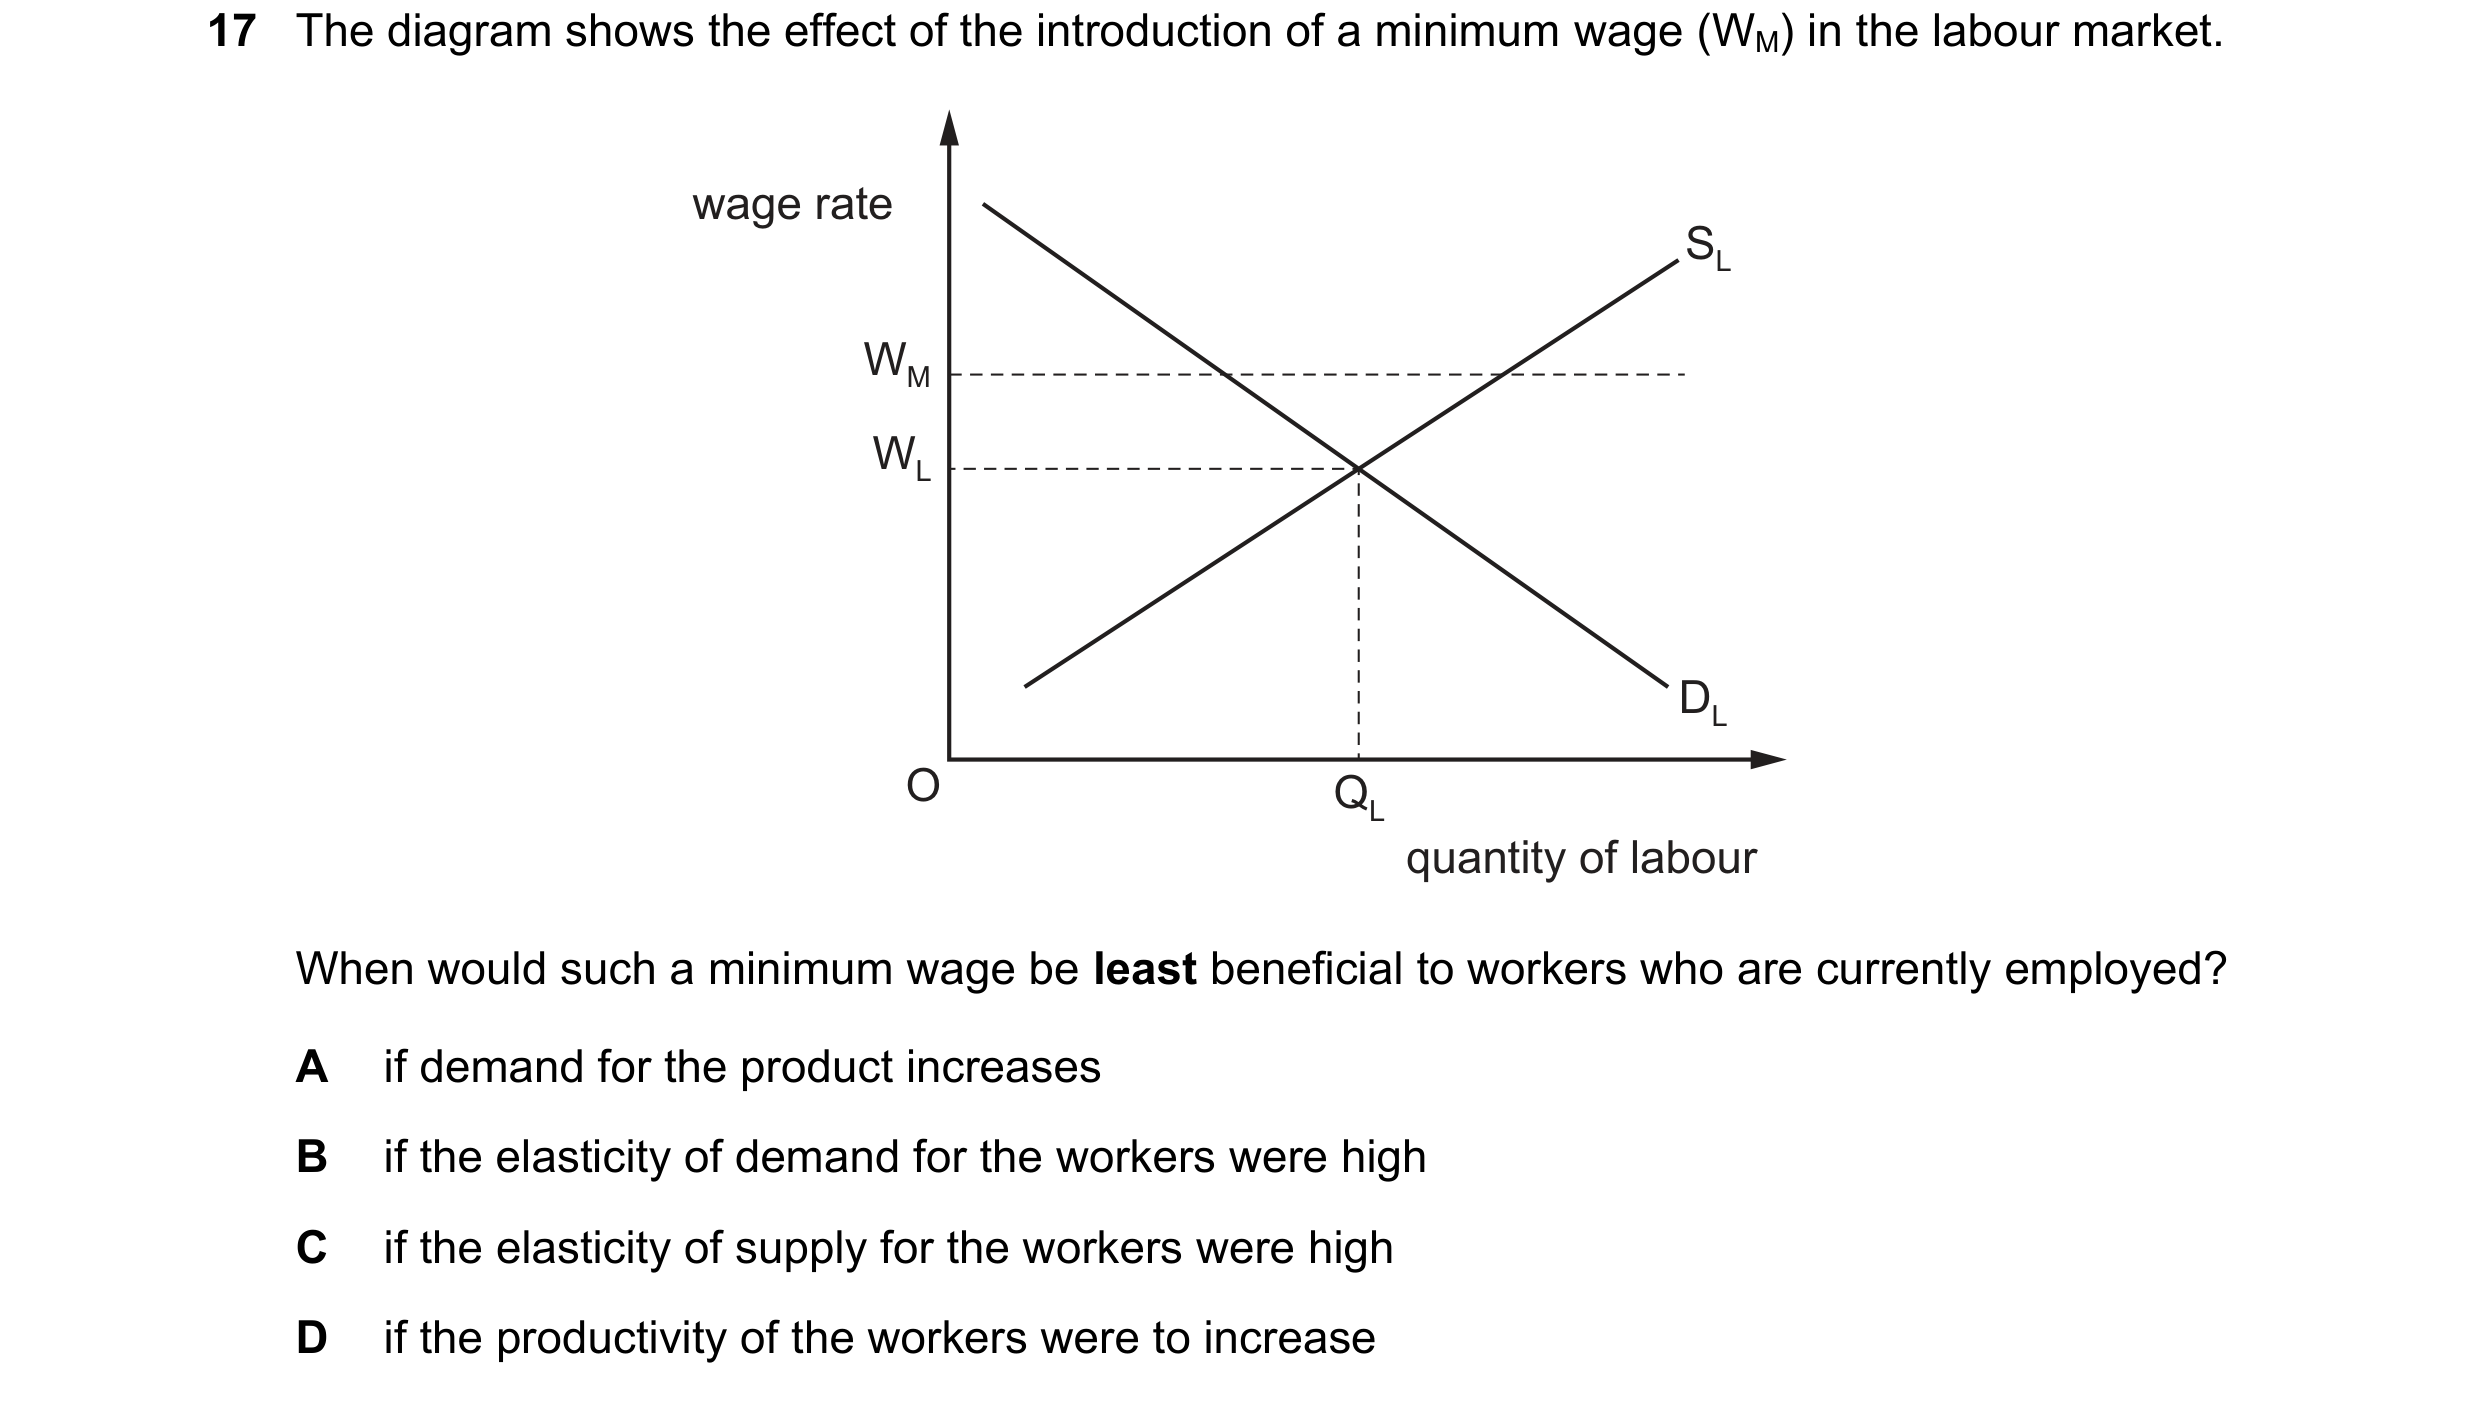
 46 / 58
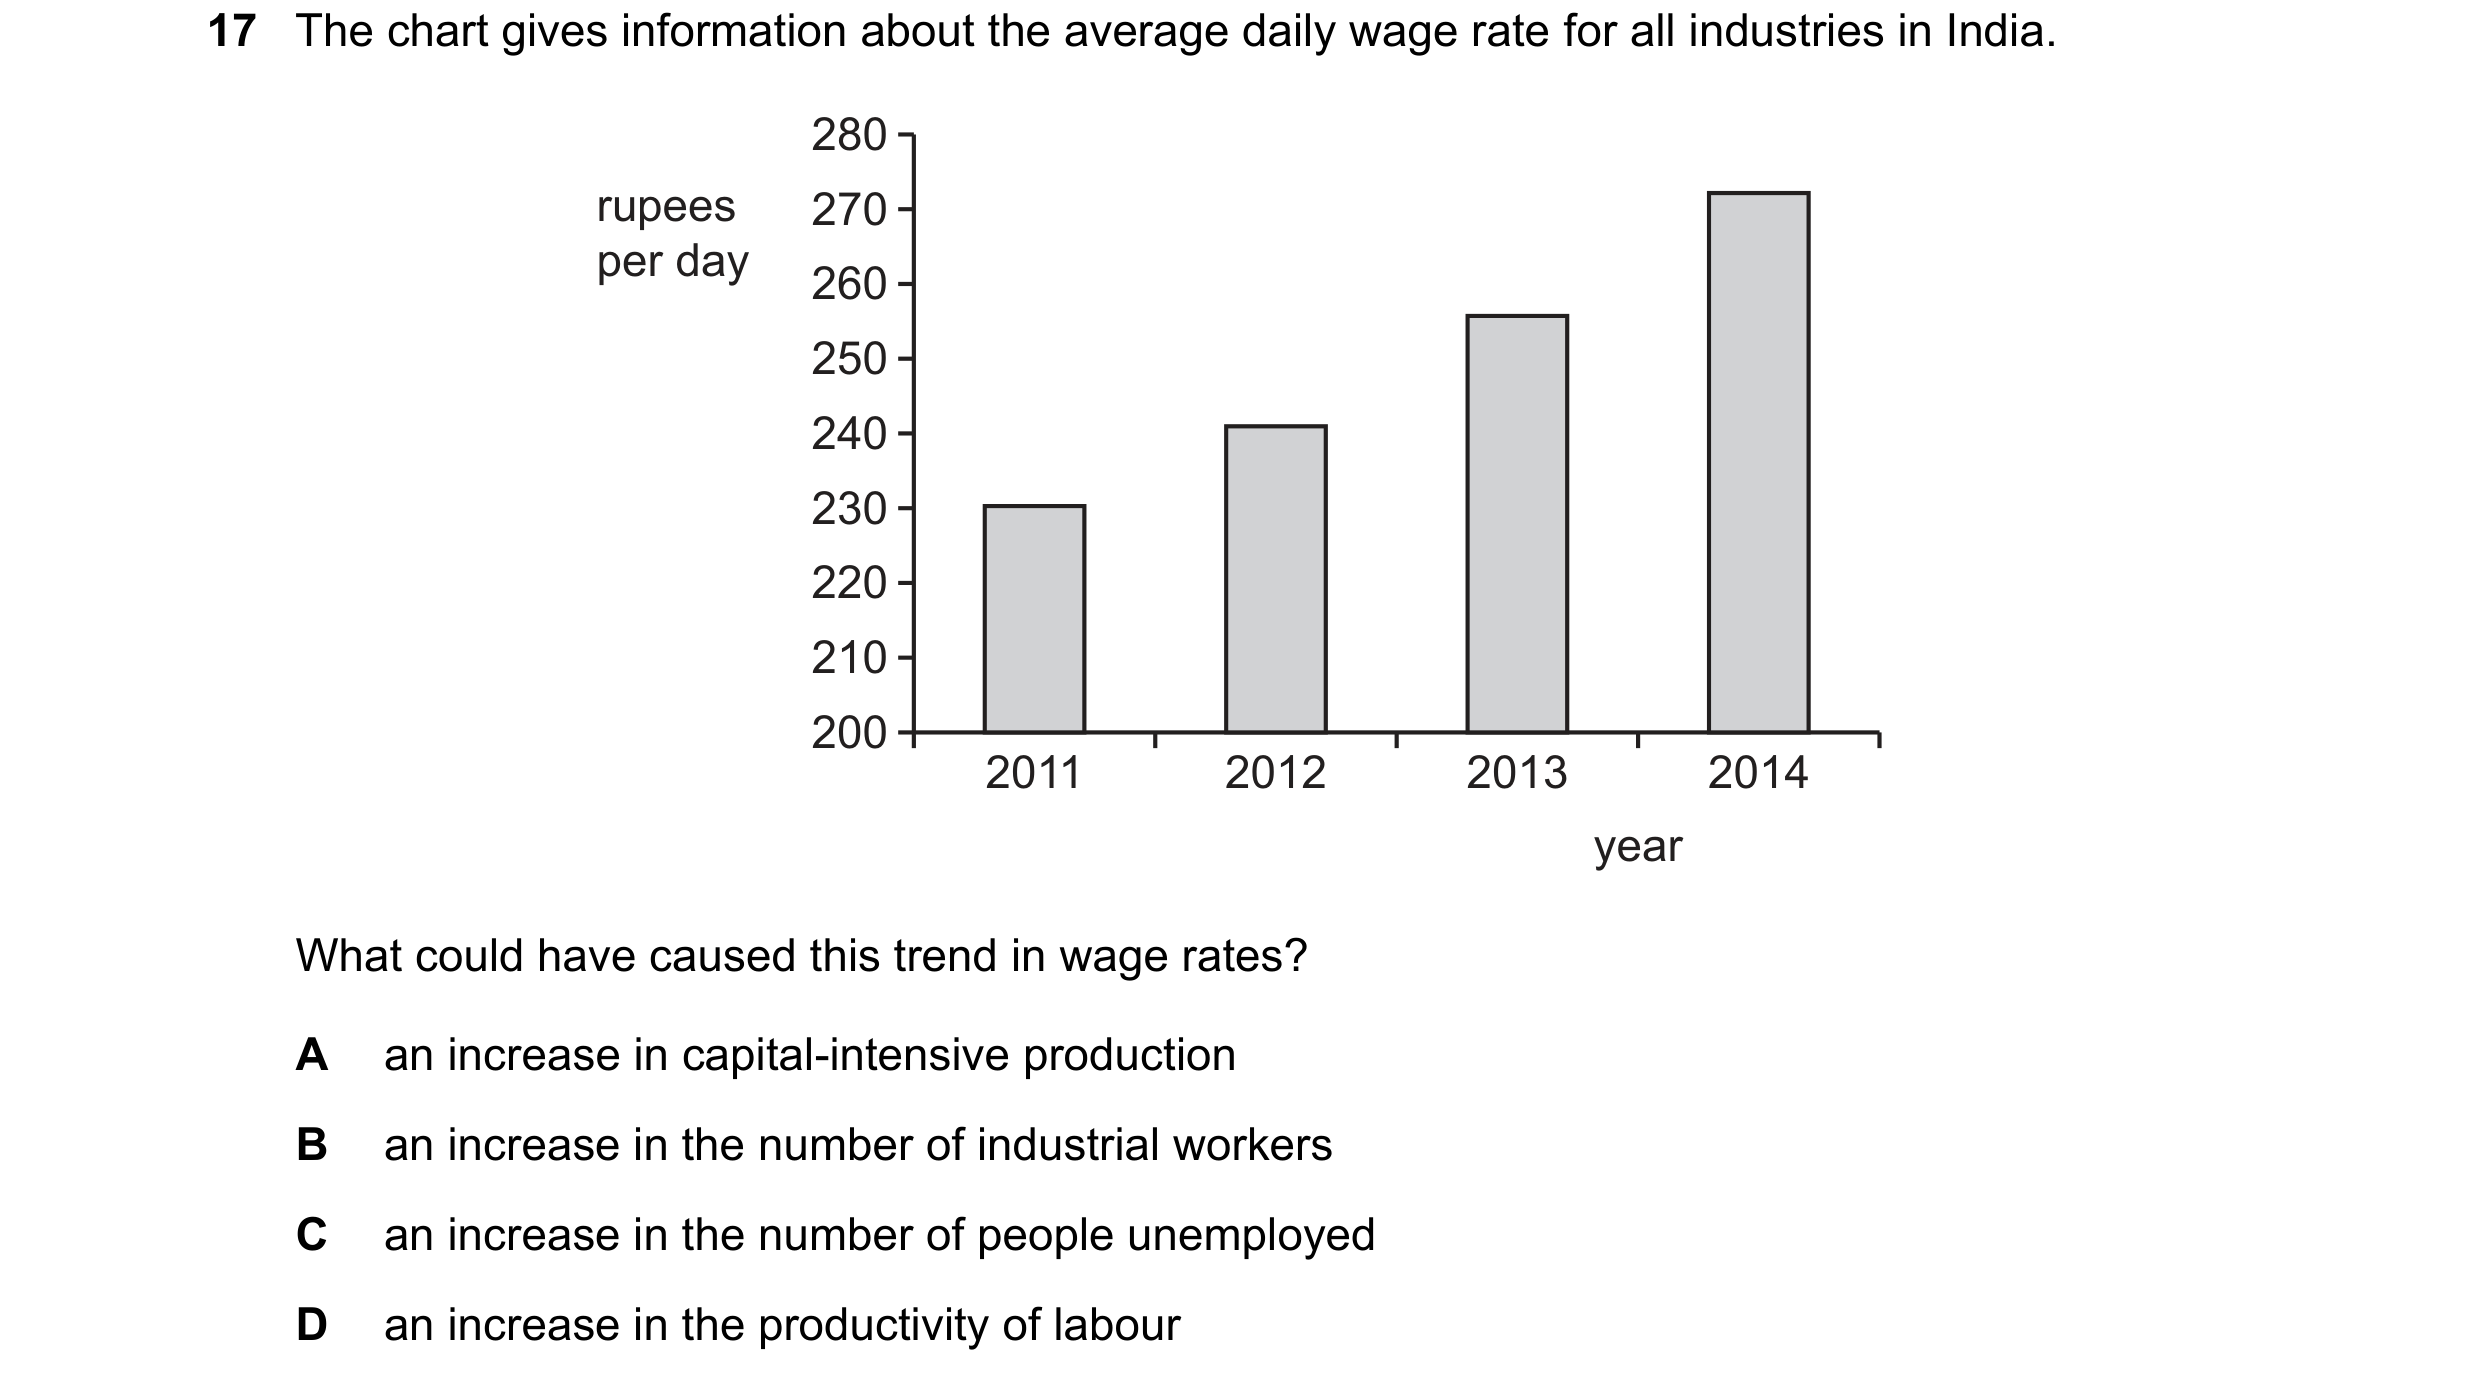
 47 / 58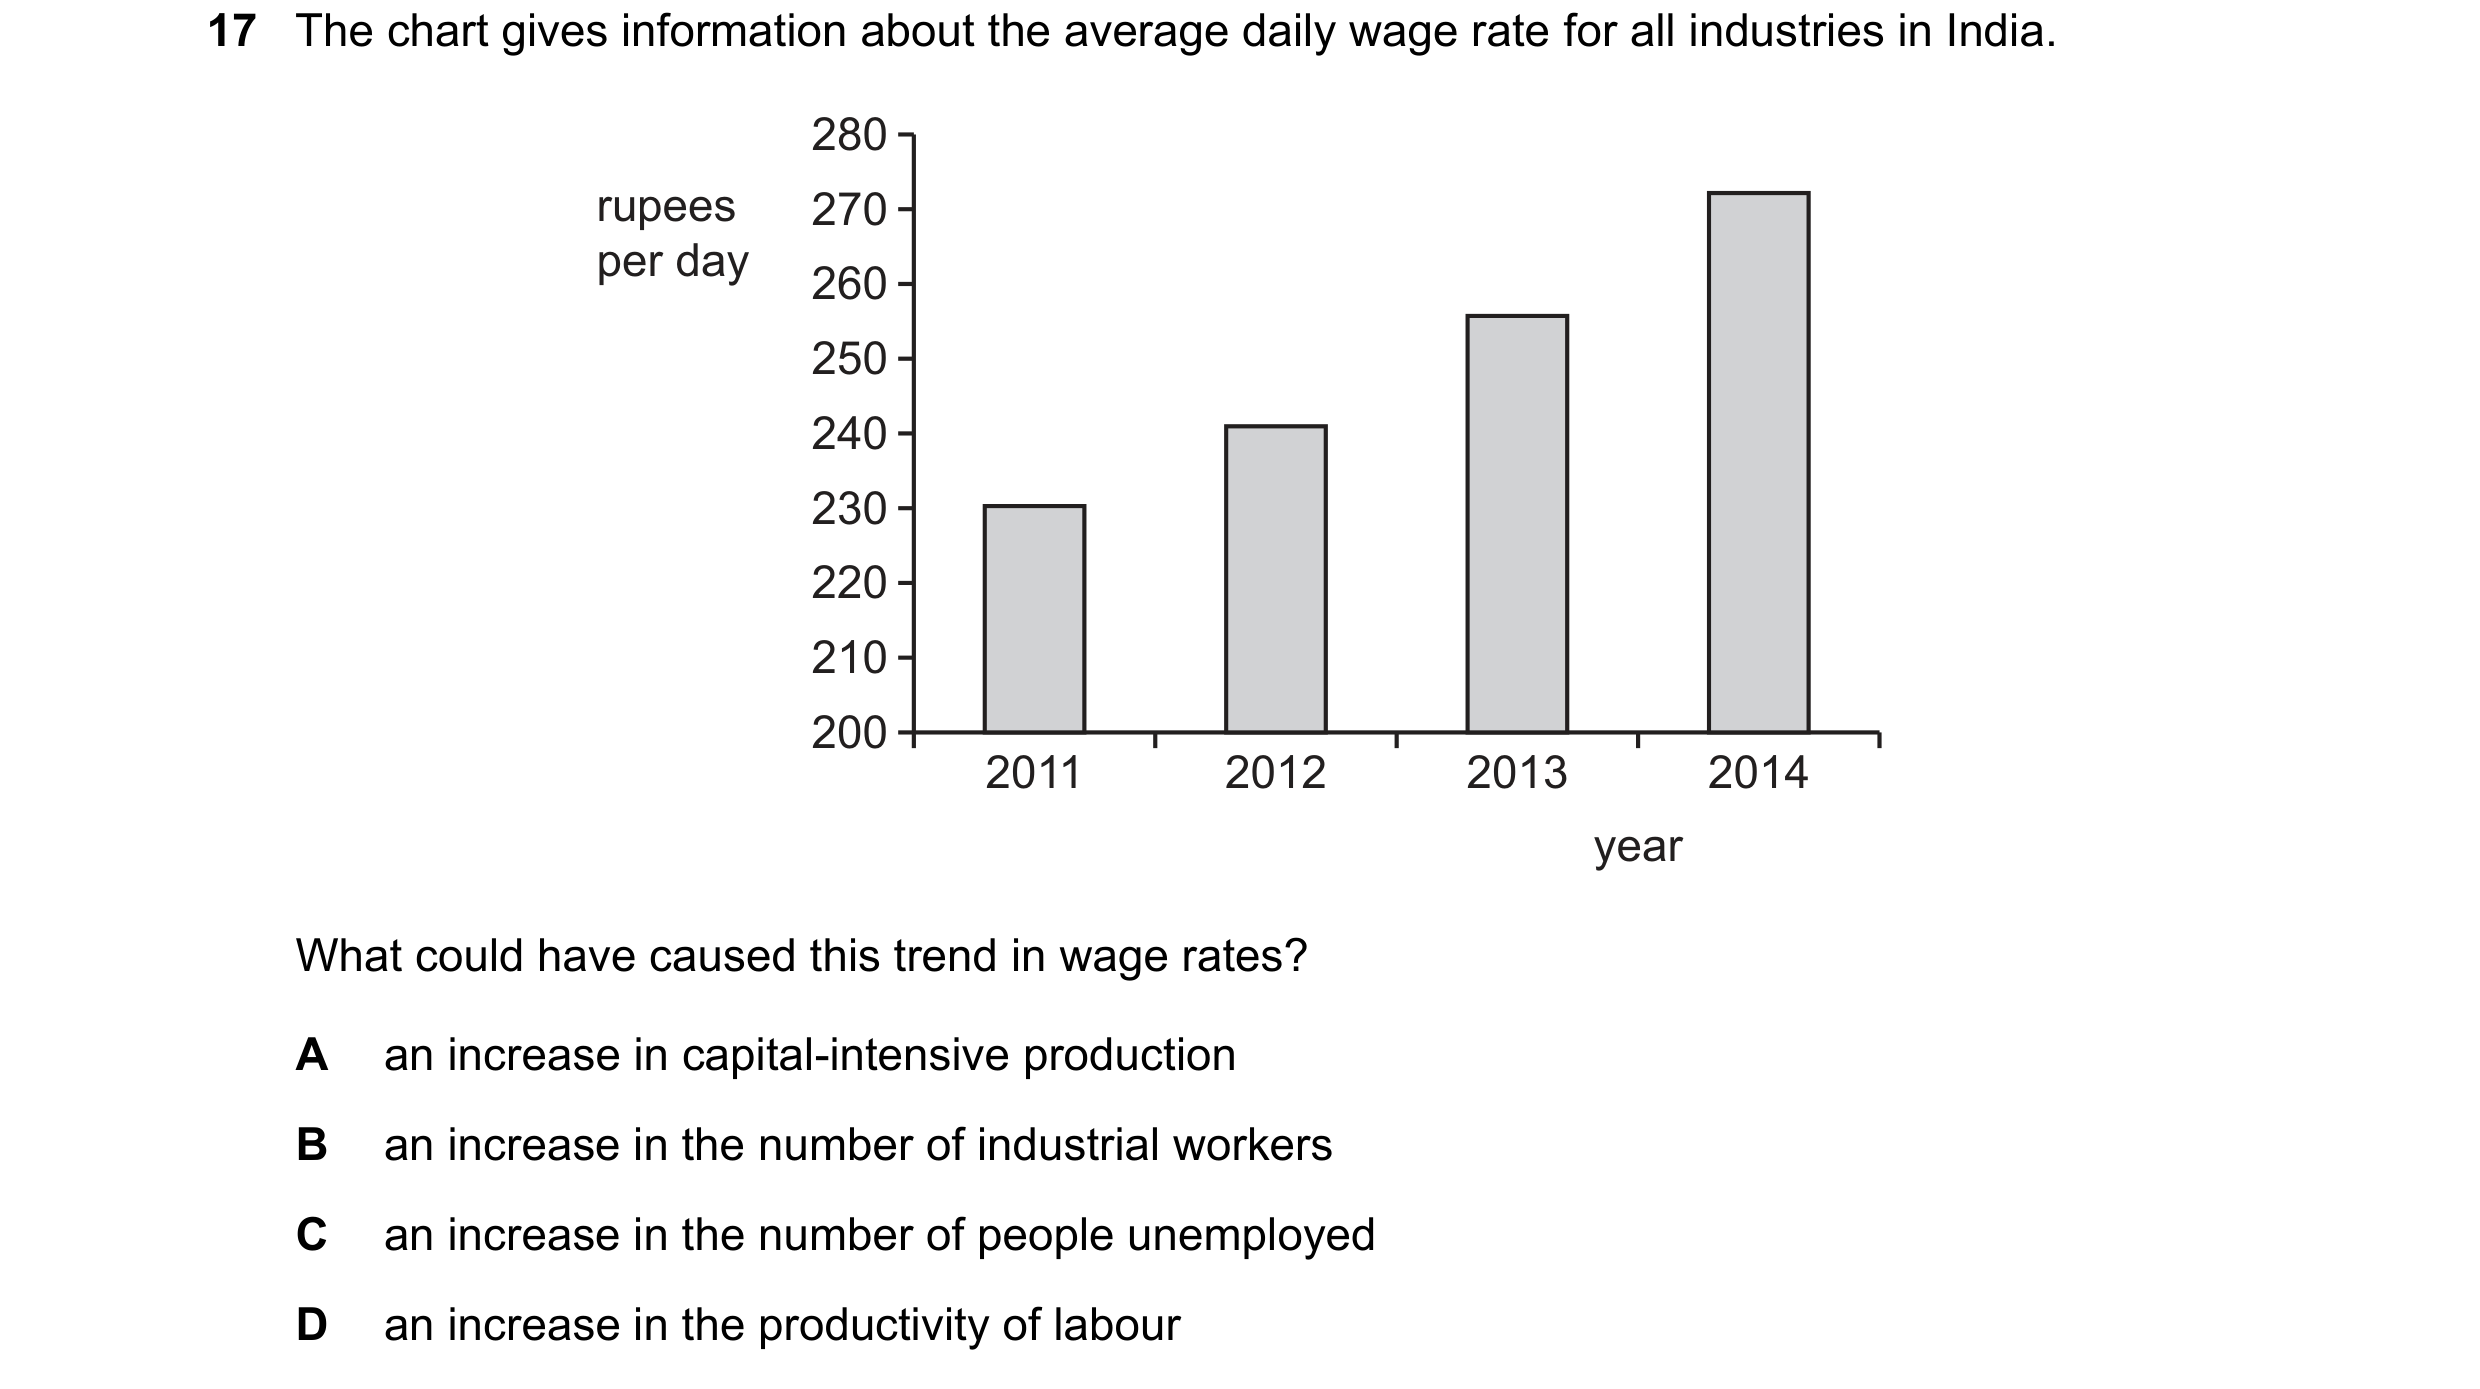
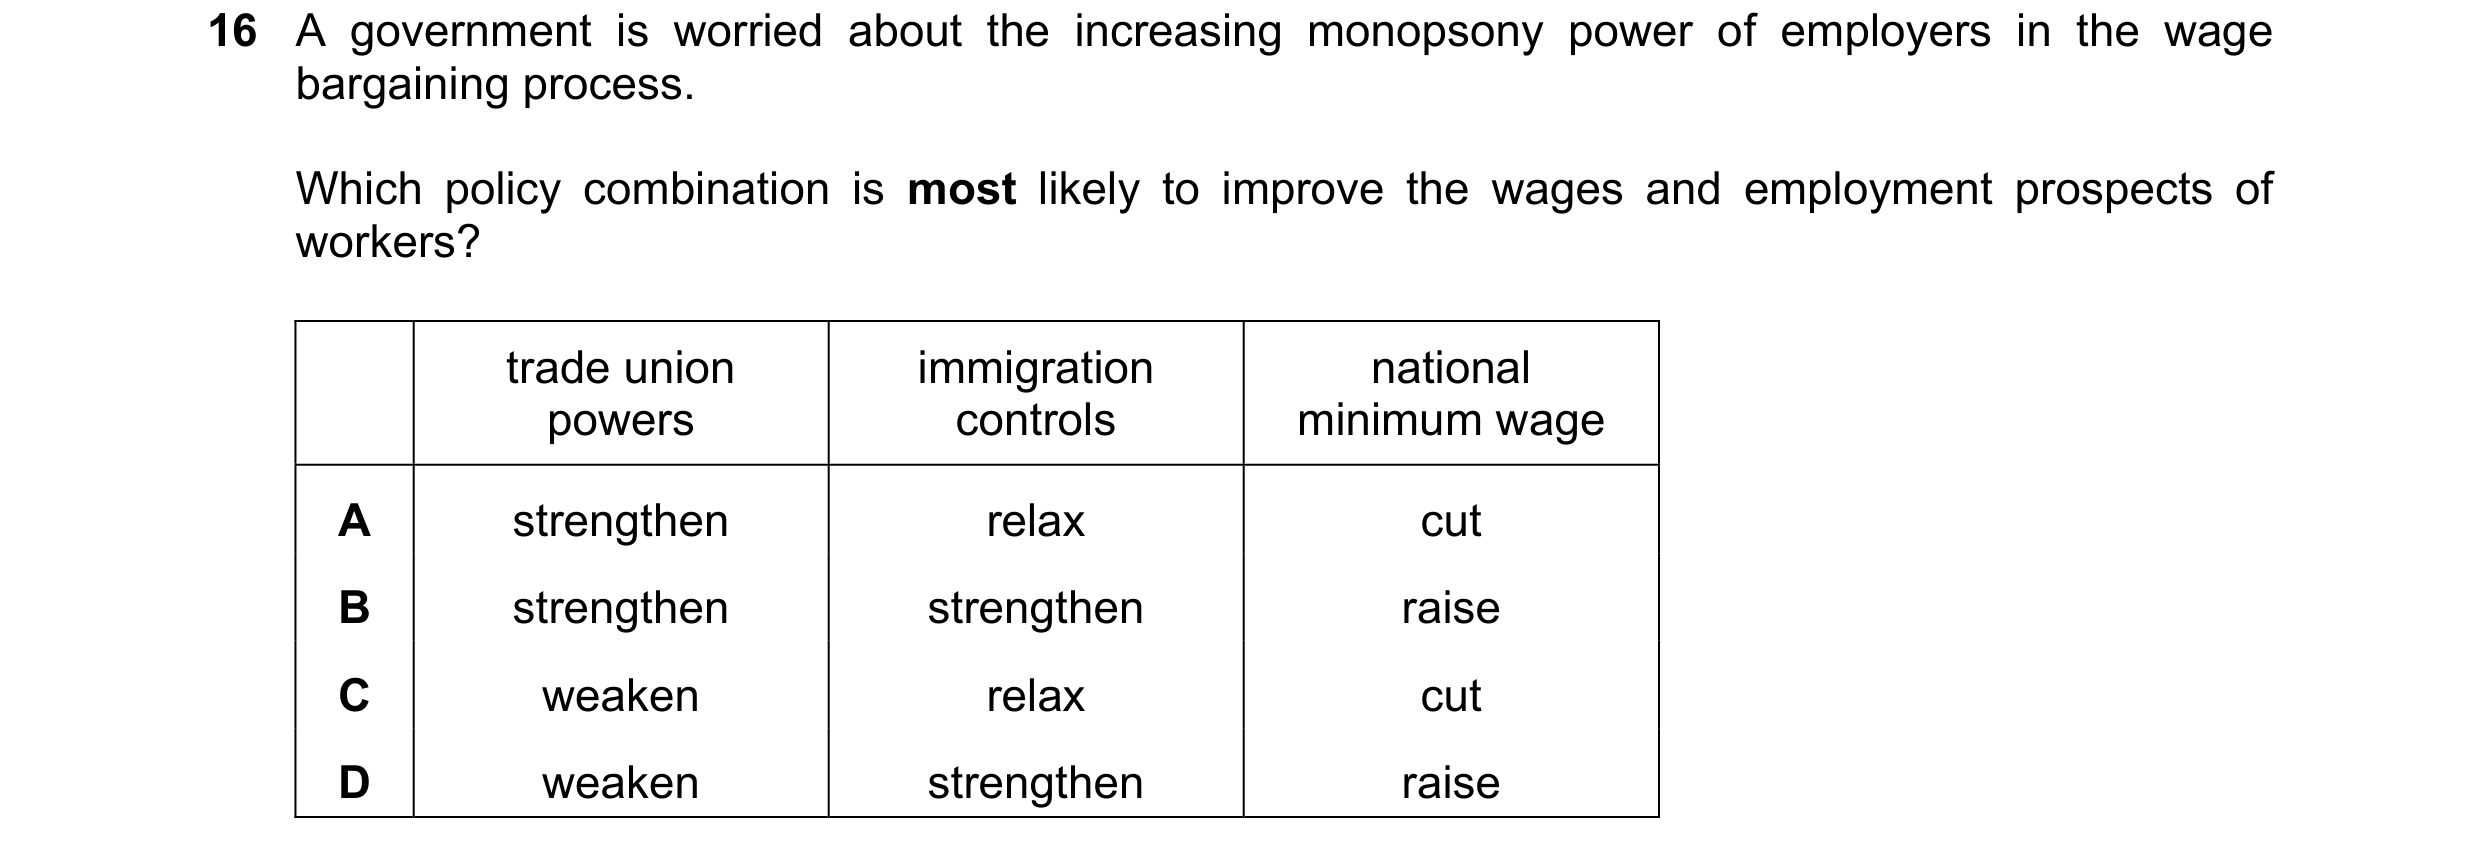 48 / 58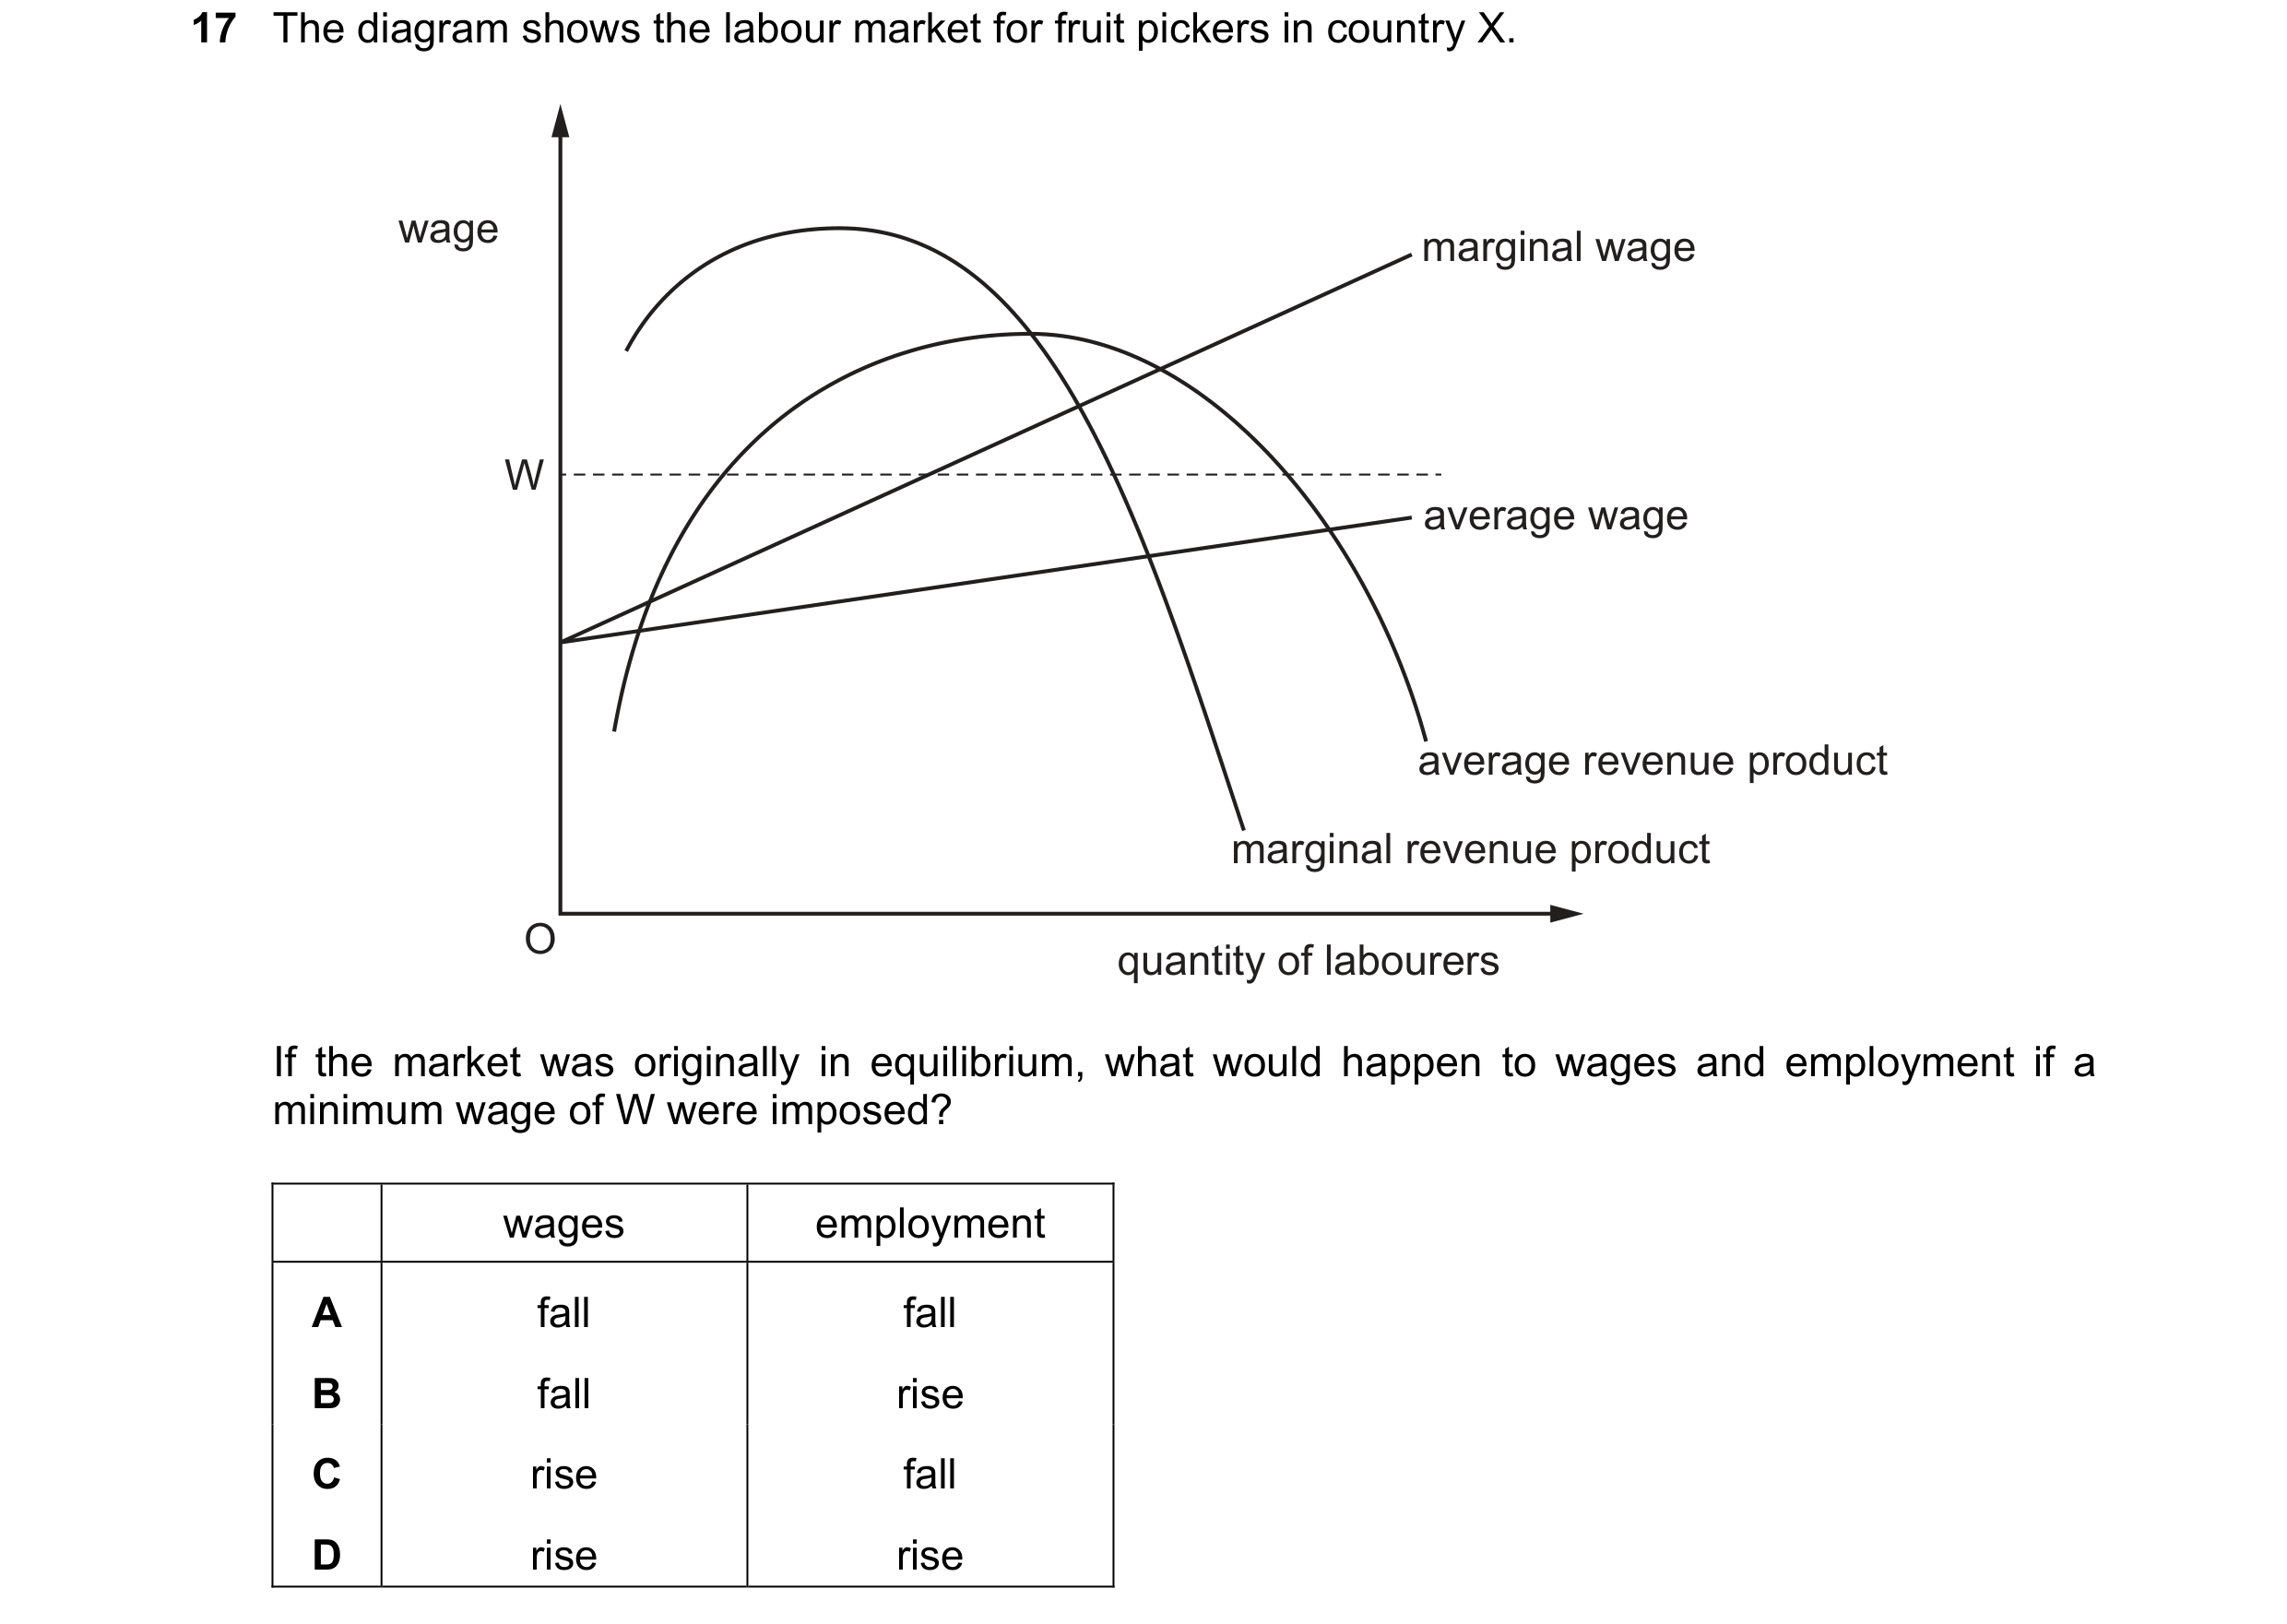
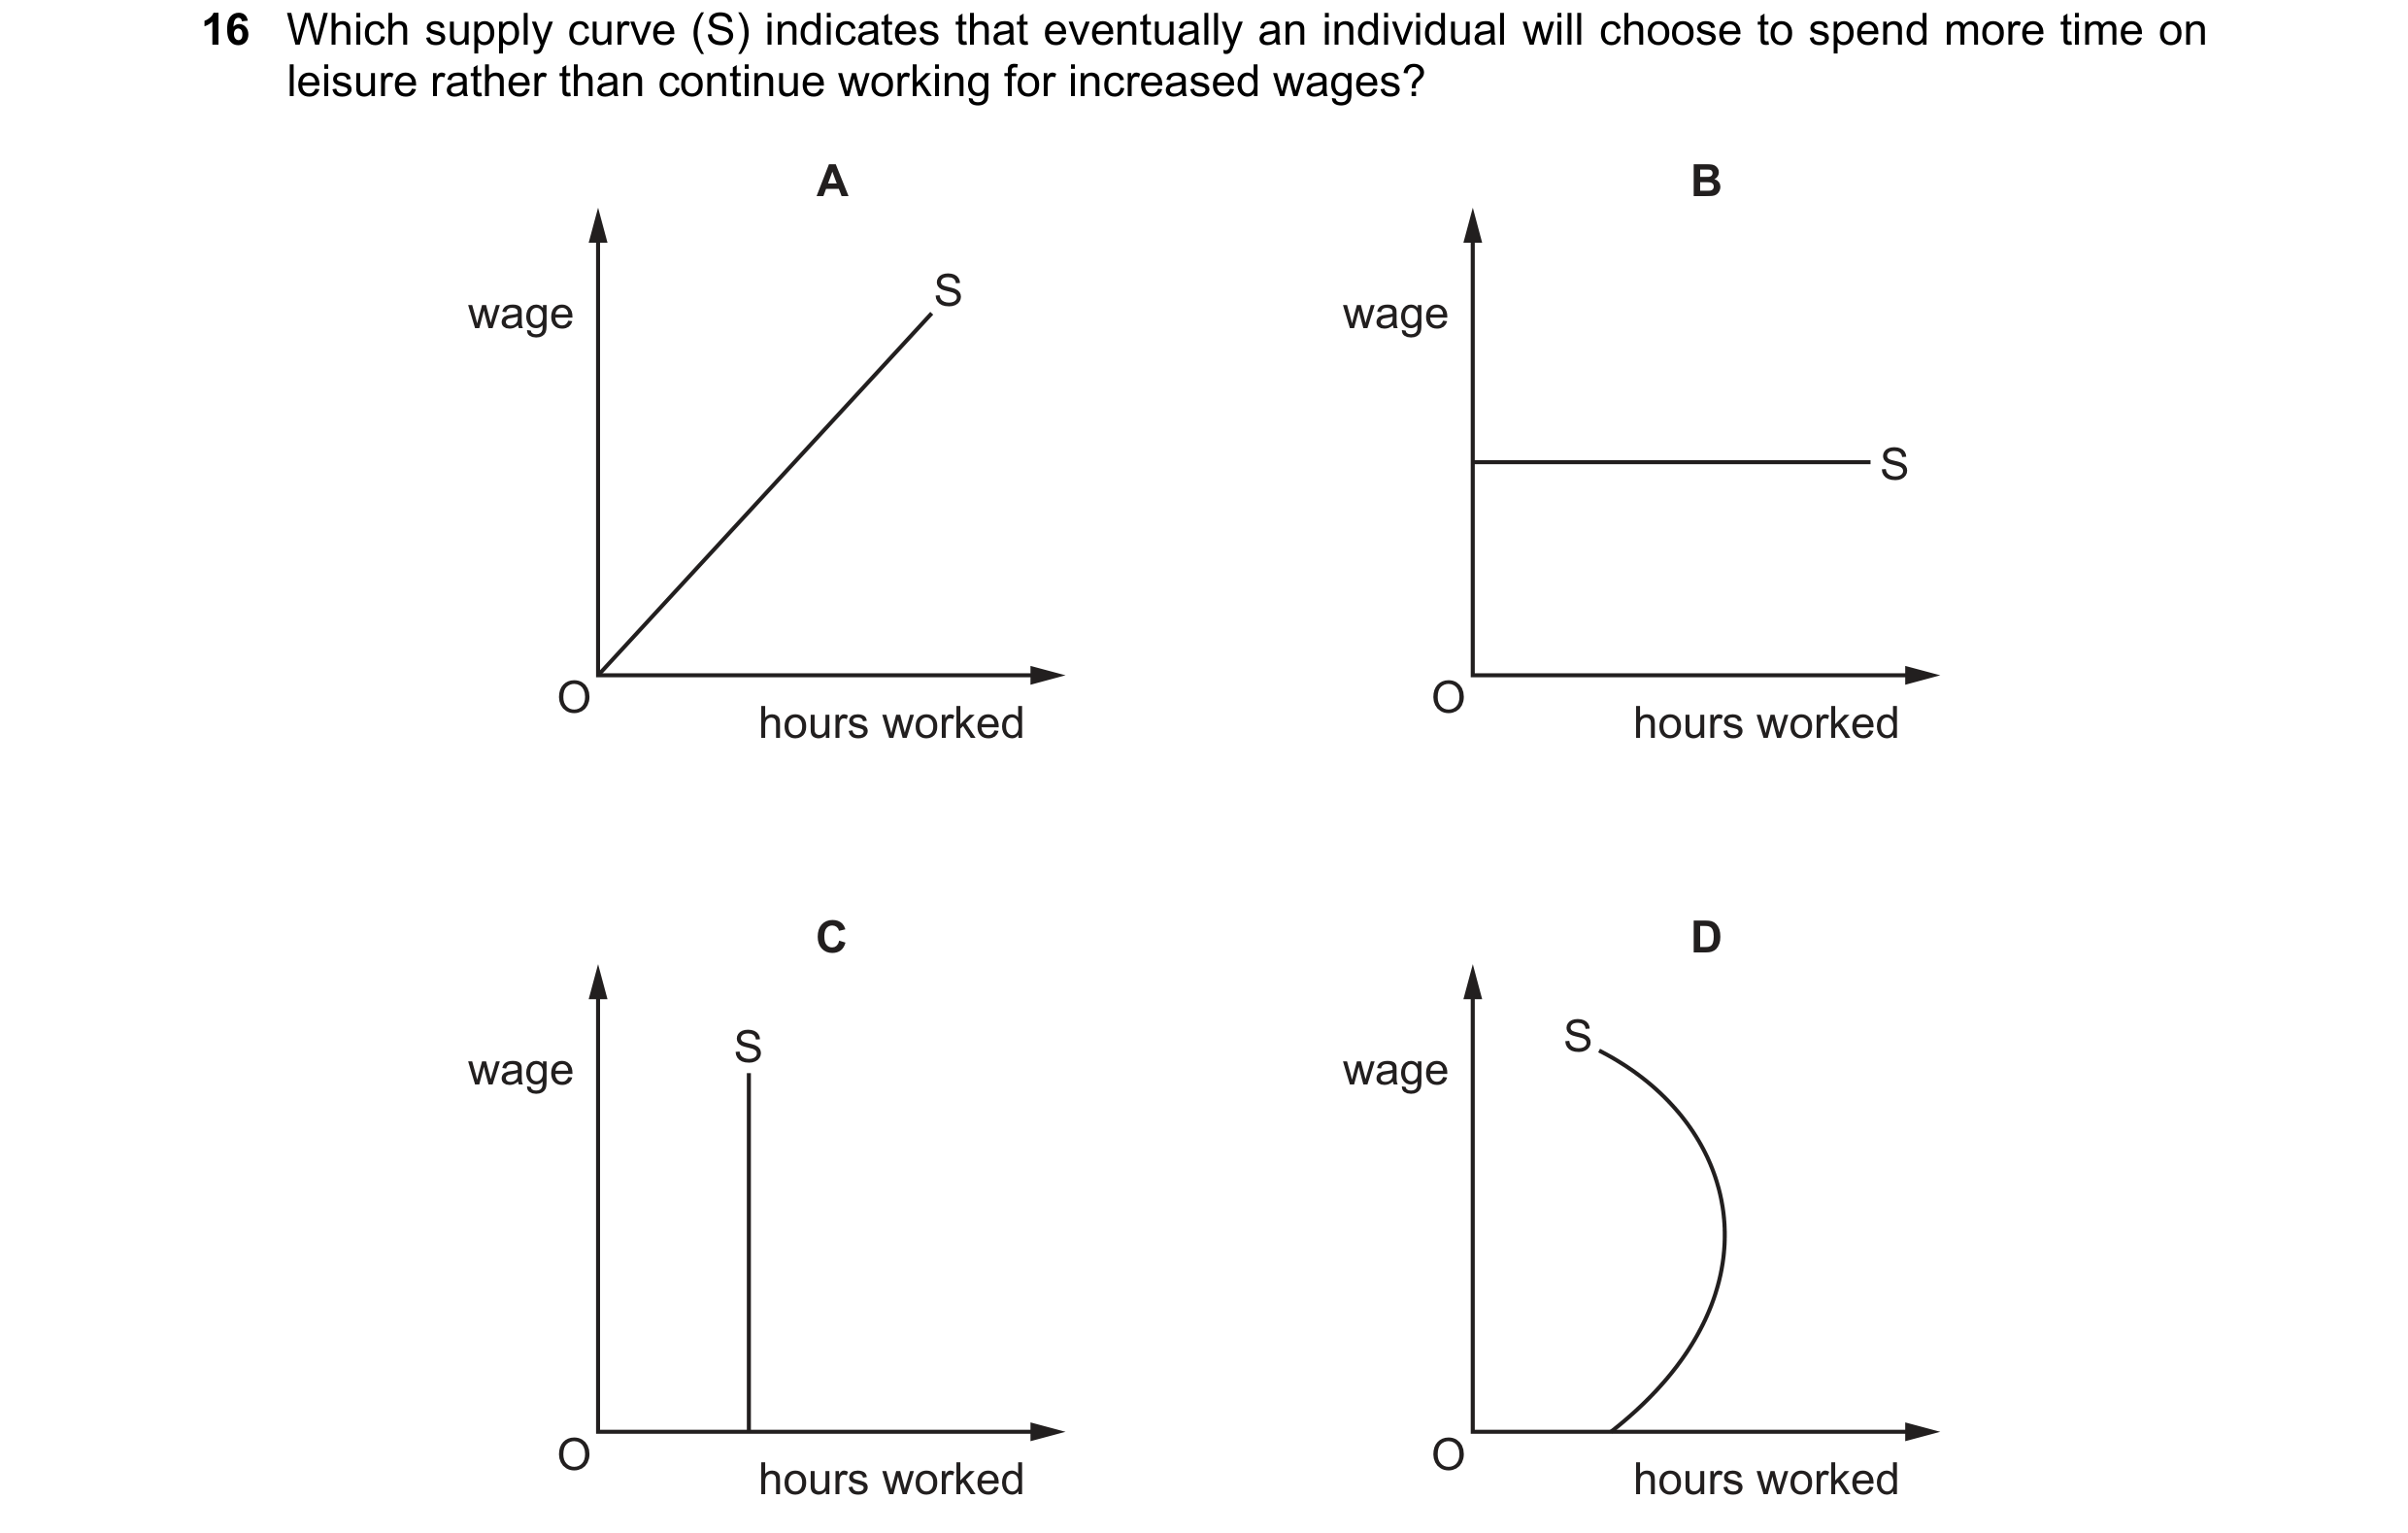 49 / 58
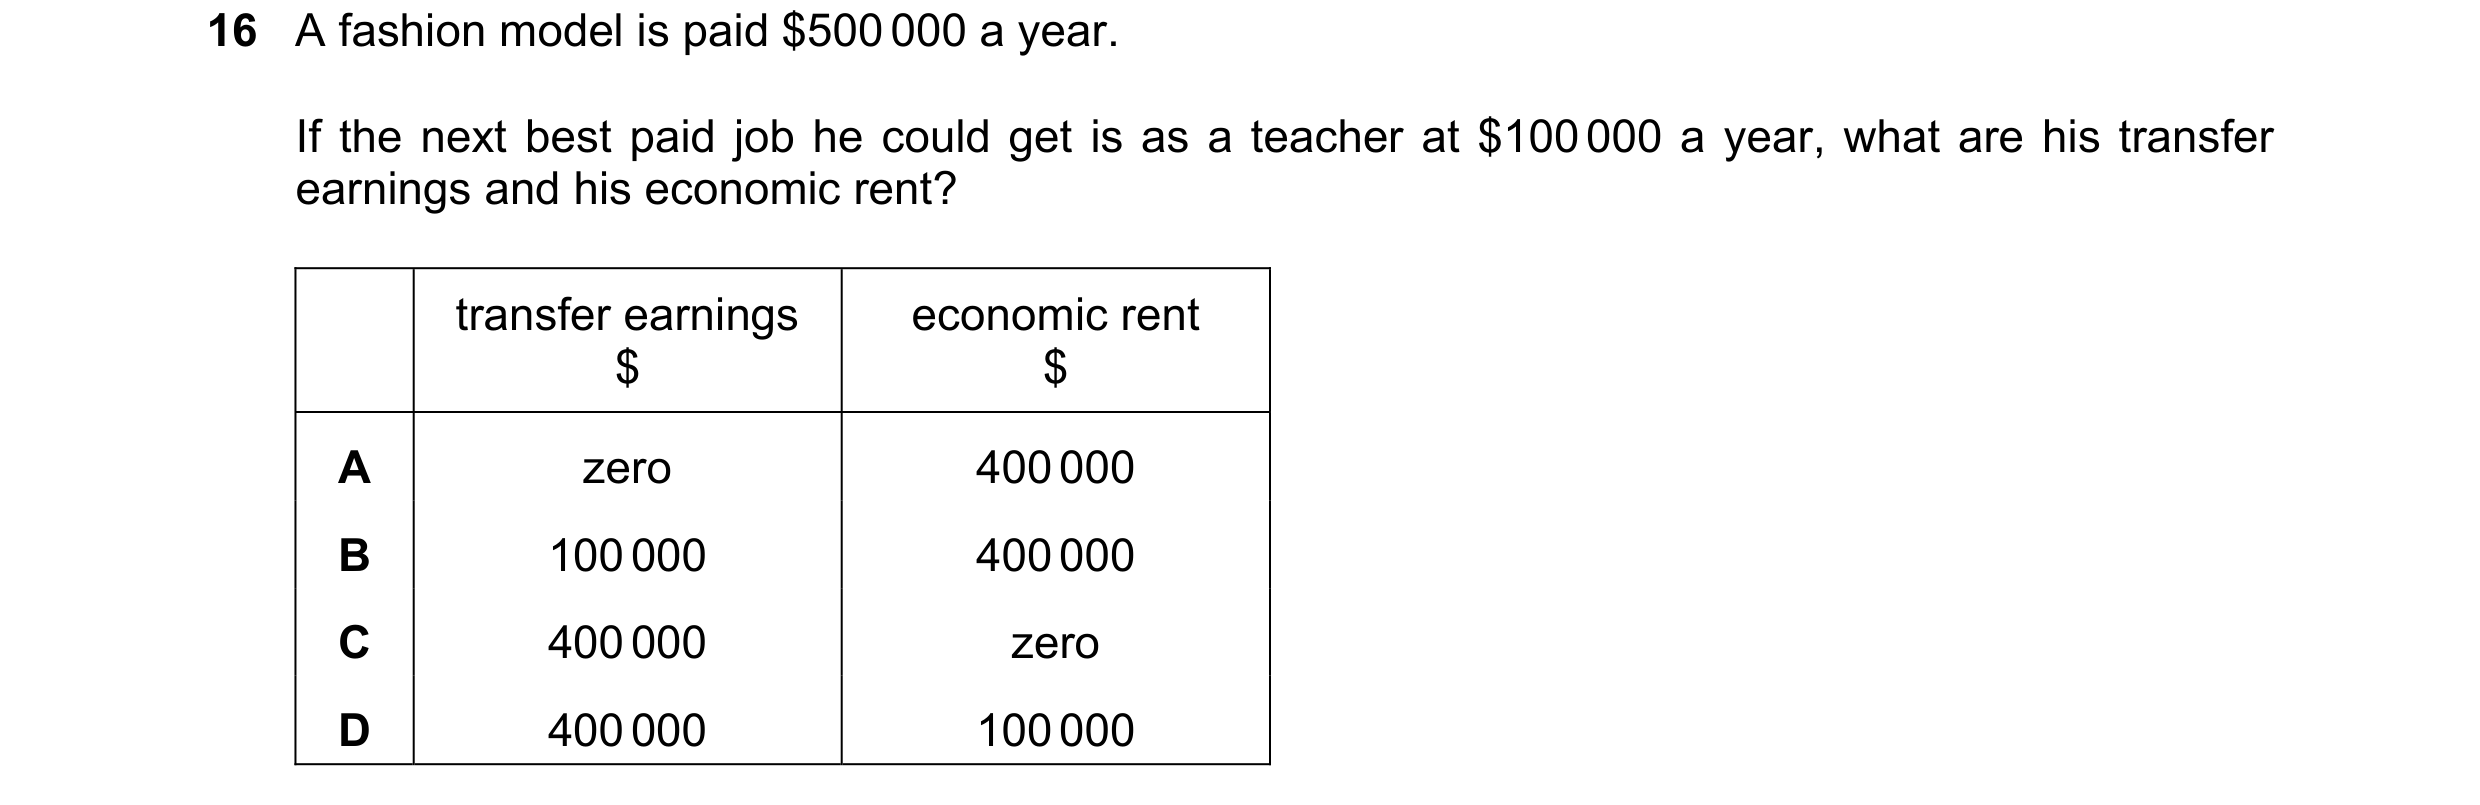
 50 / 58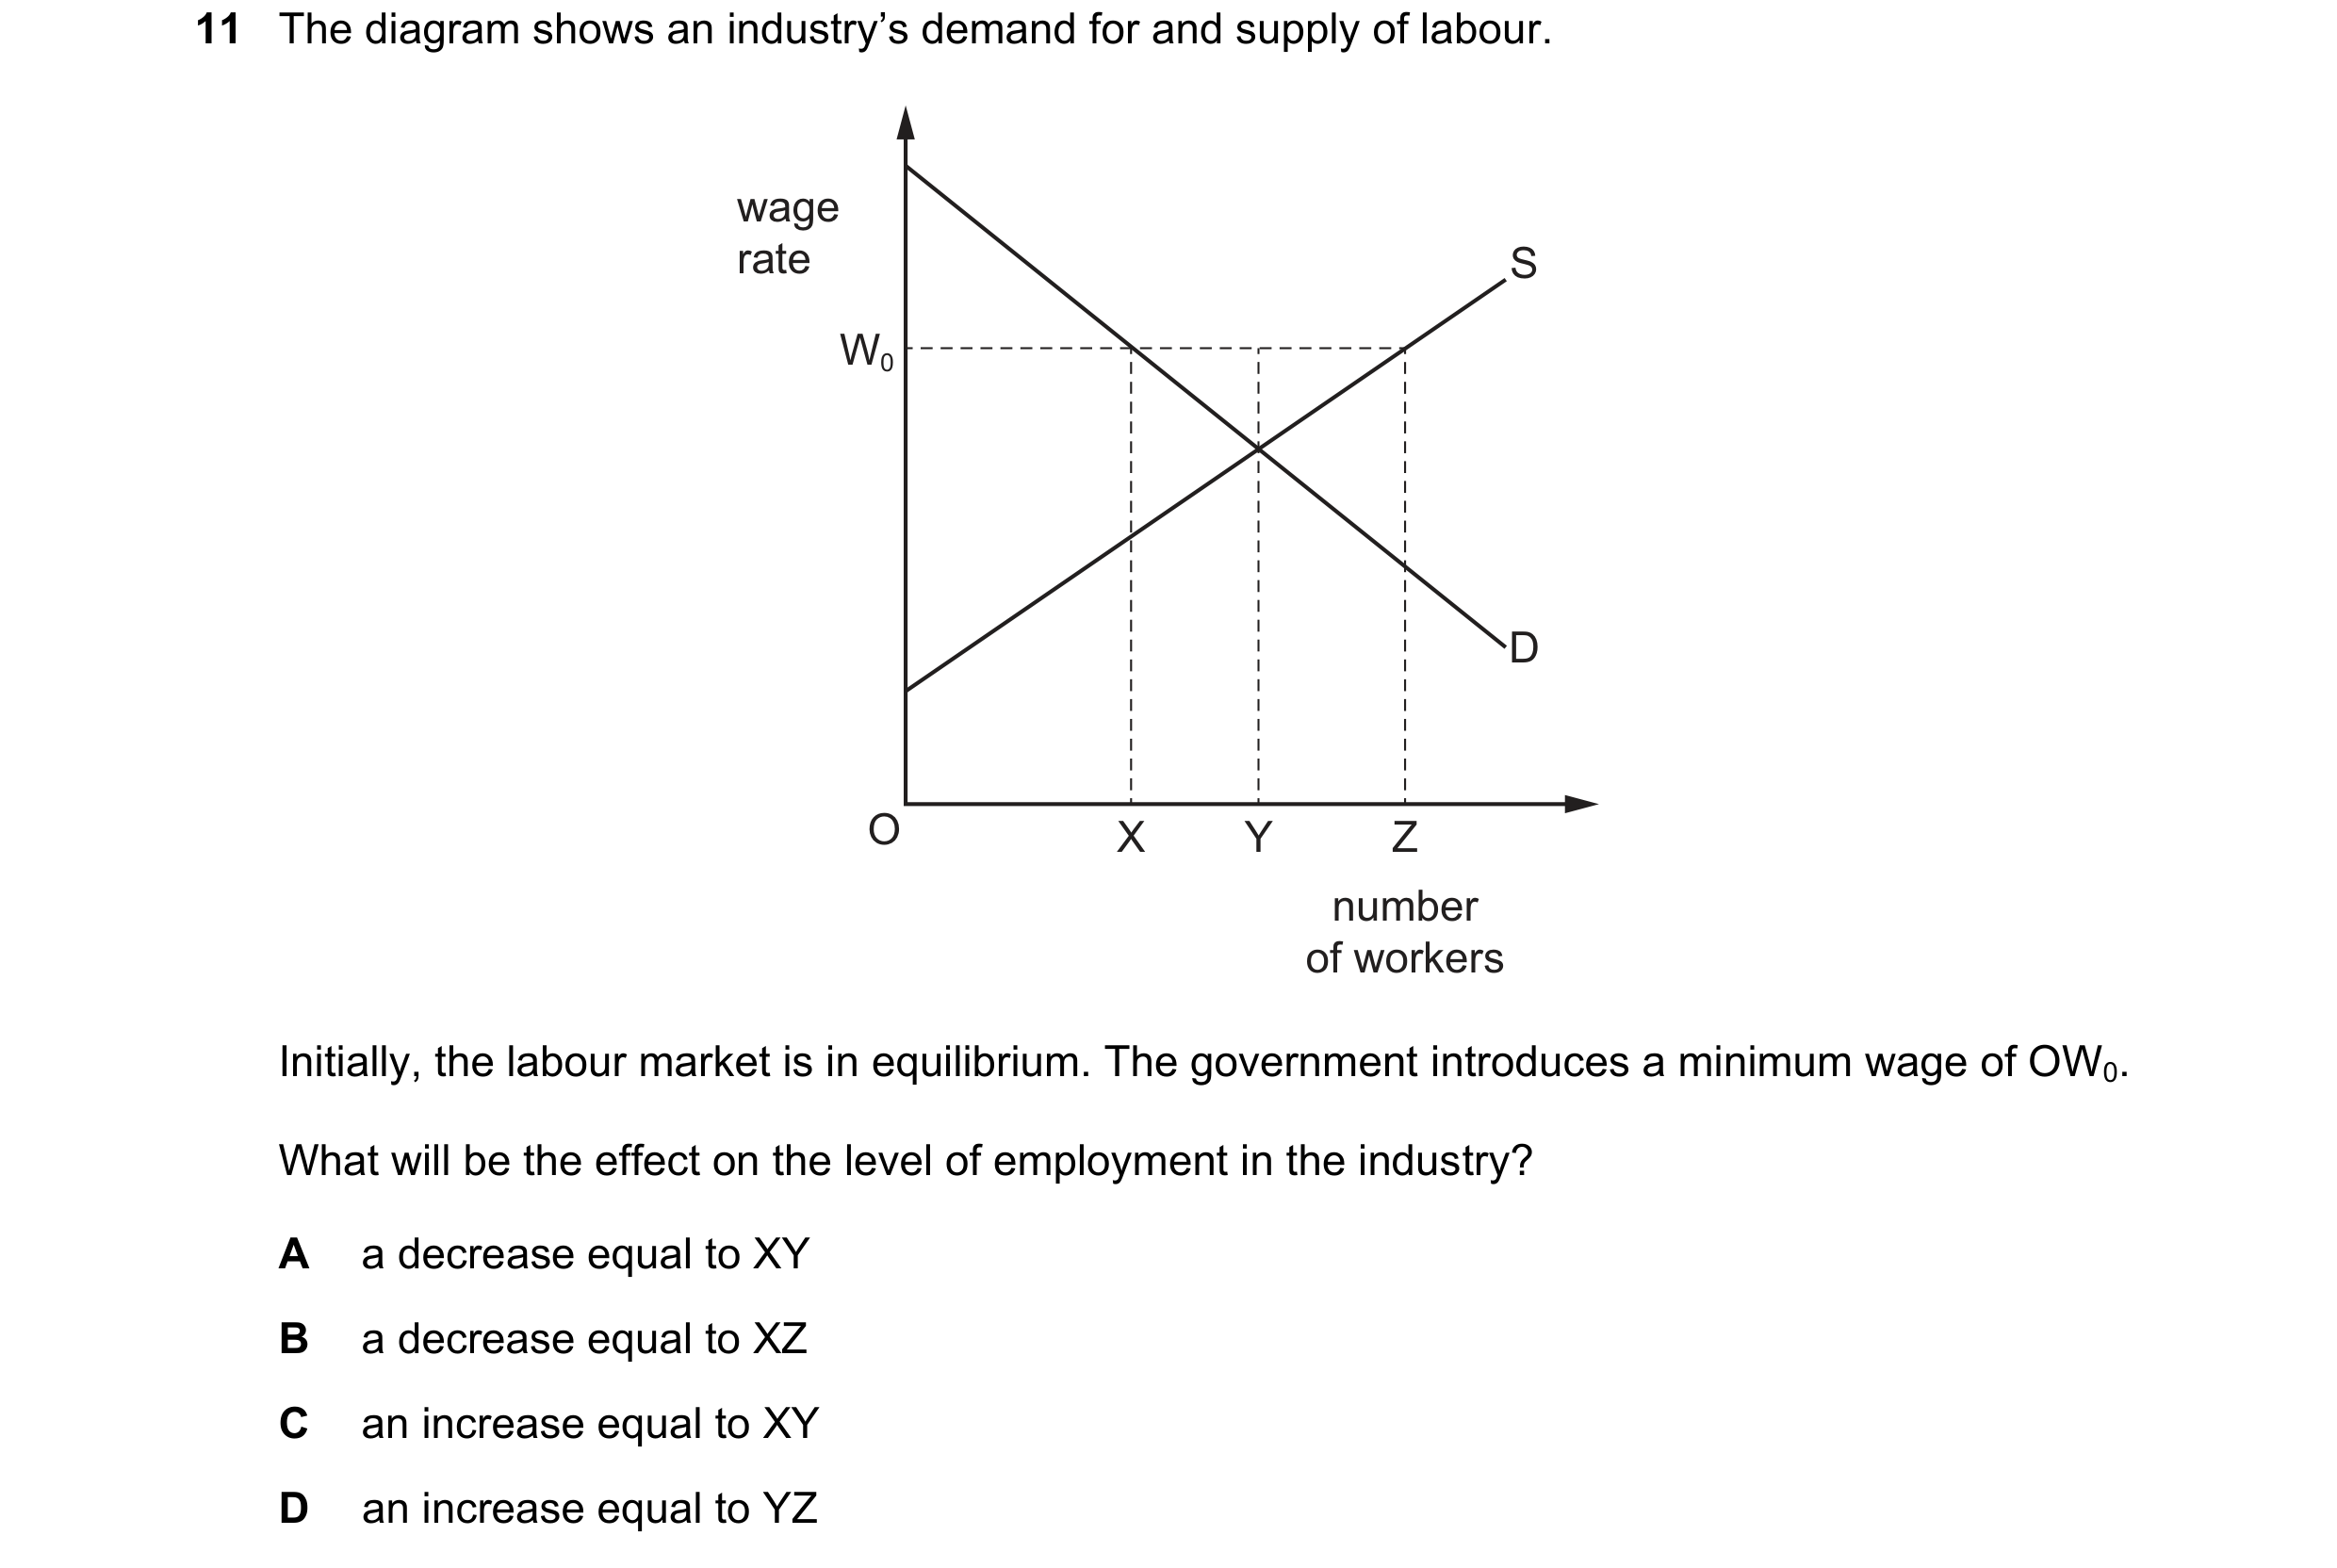
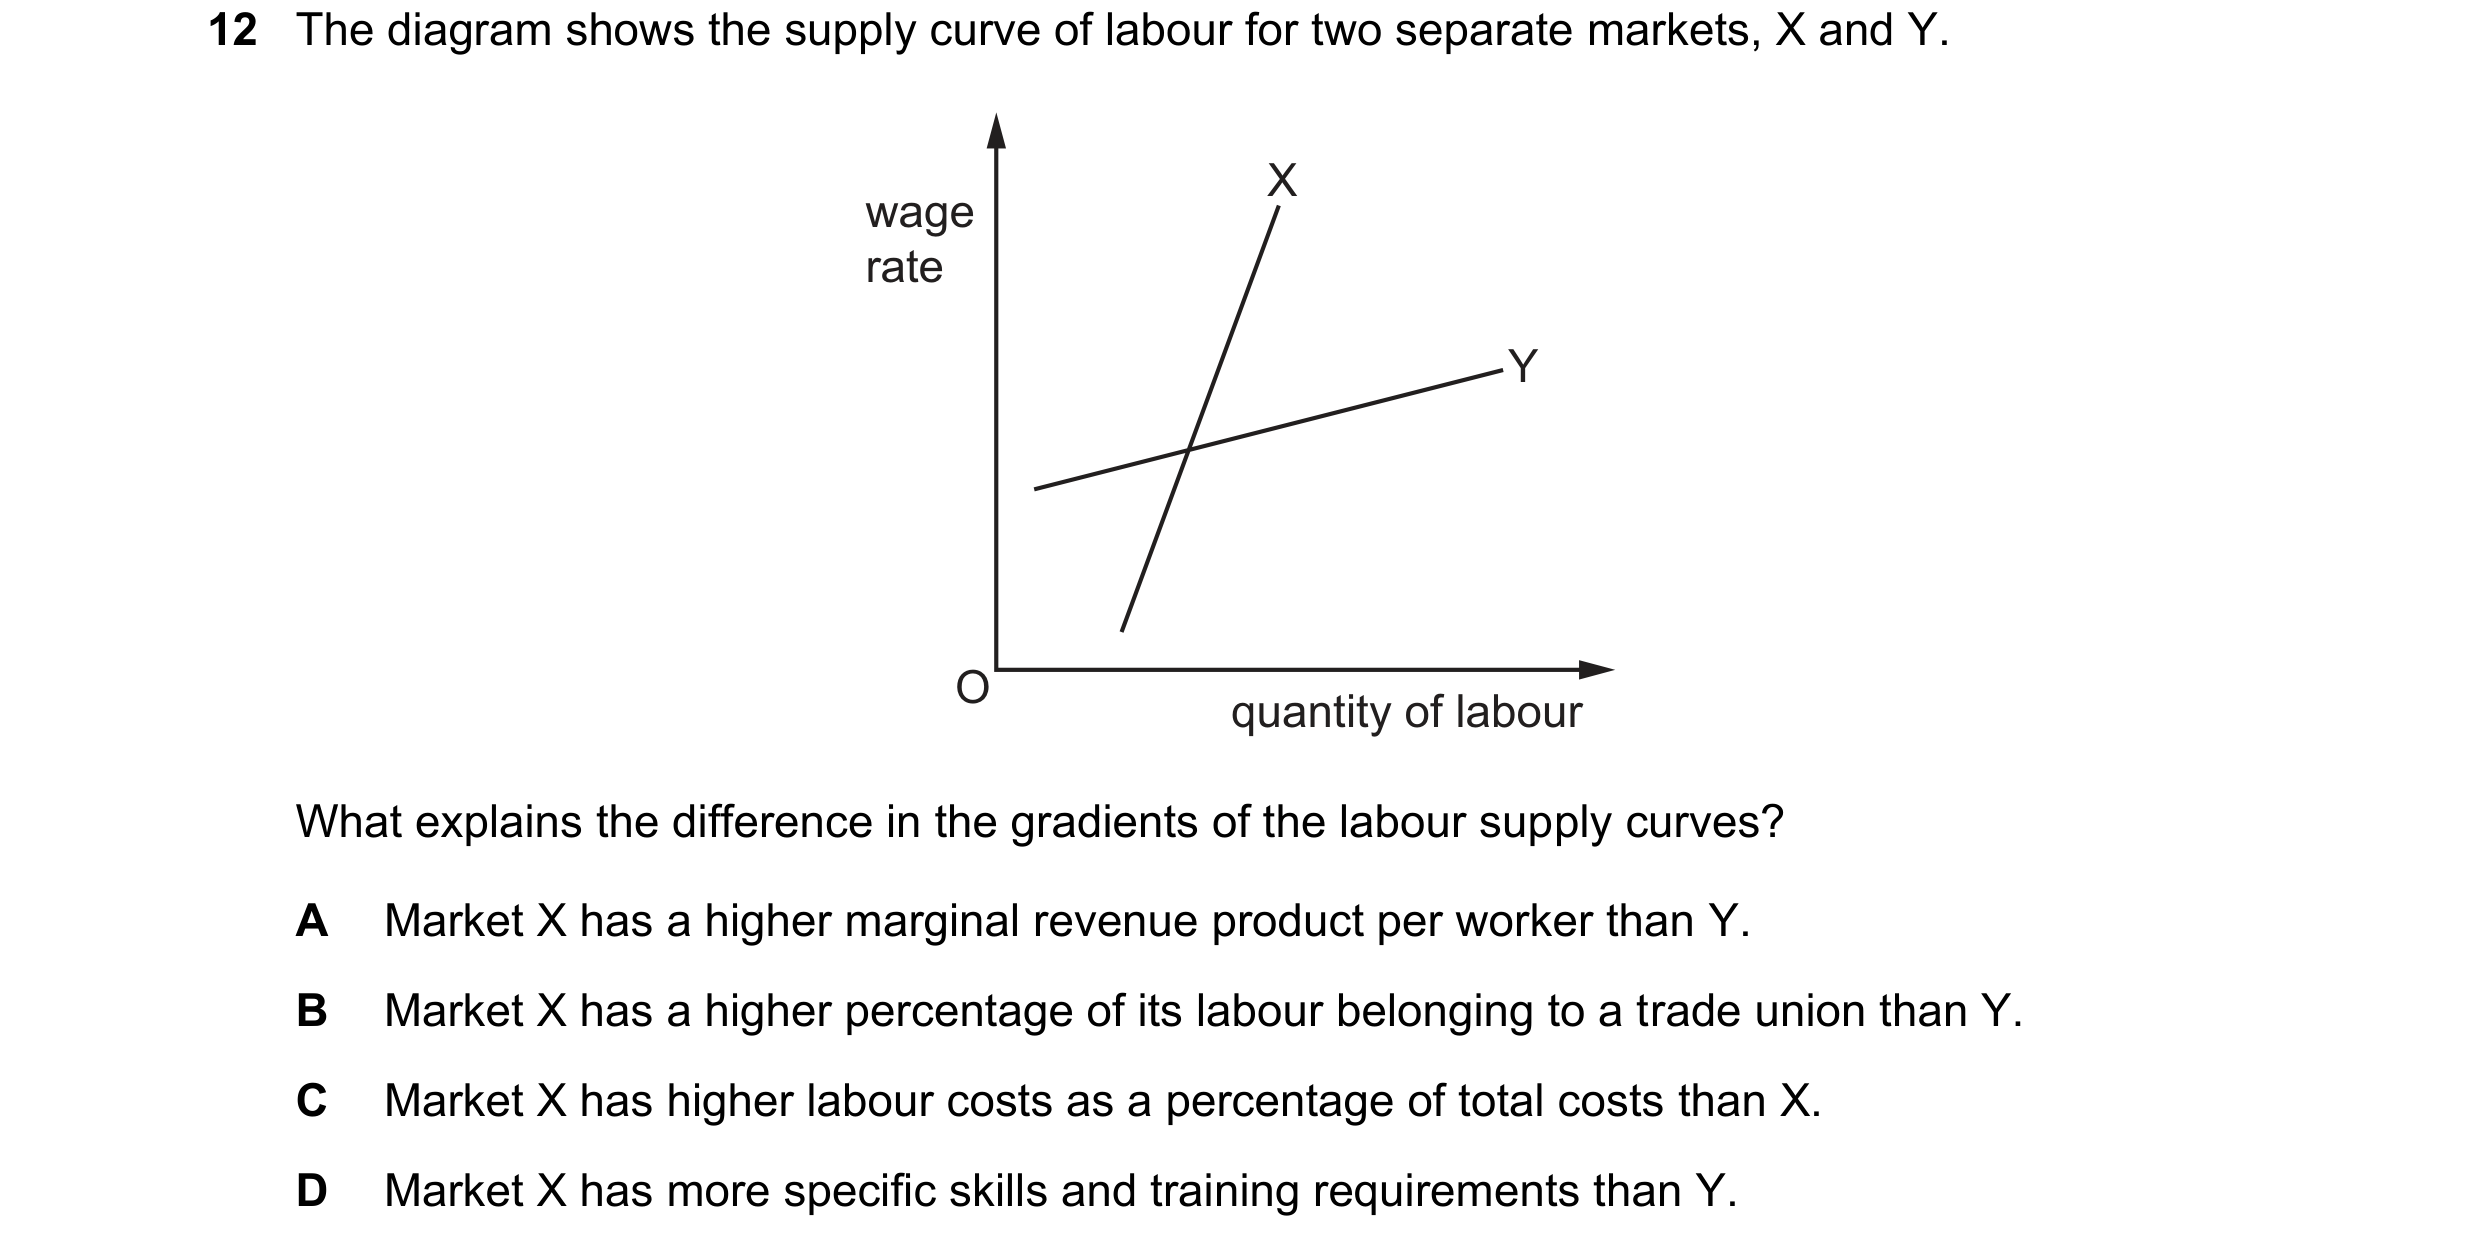 51 / 58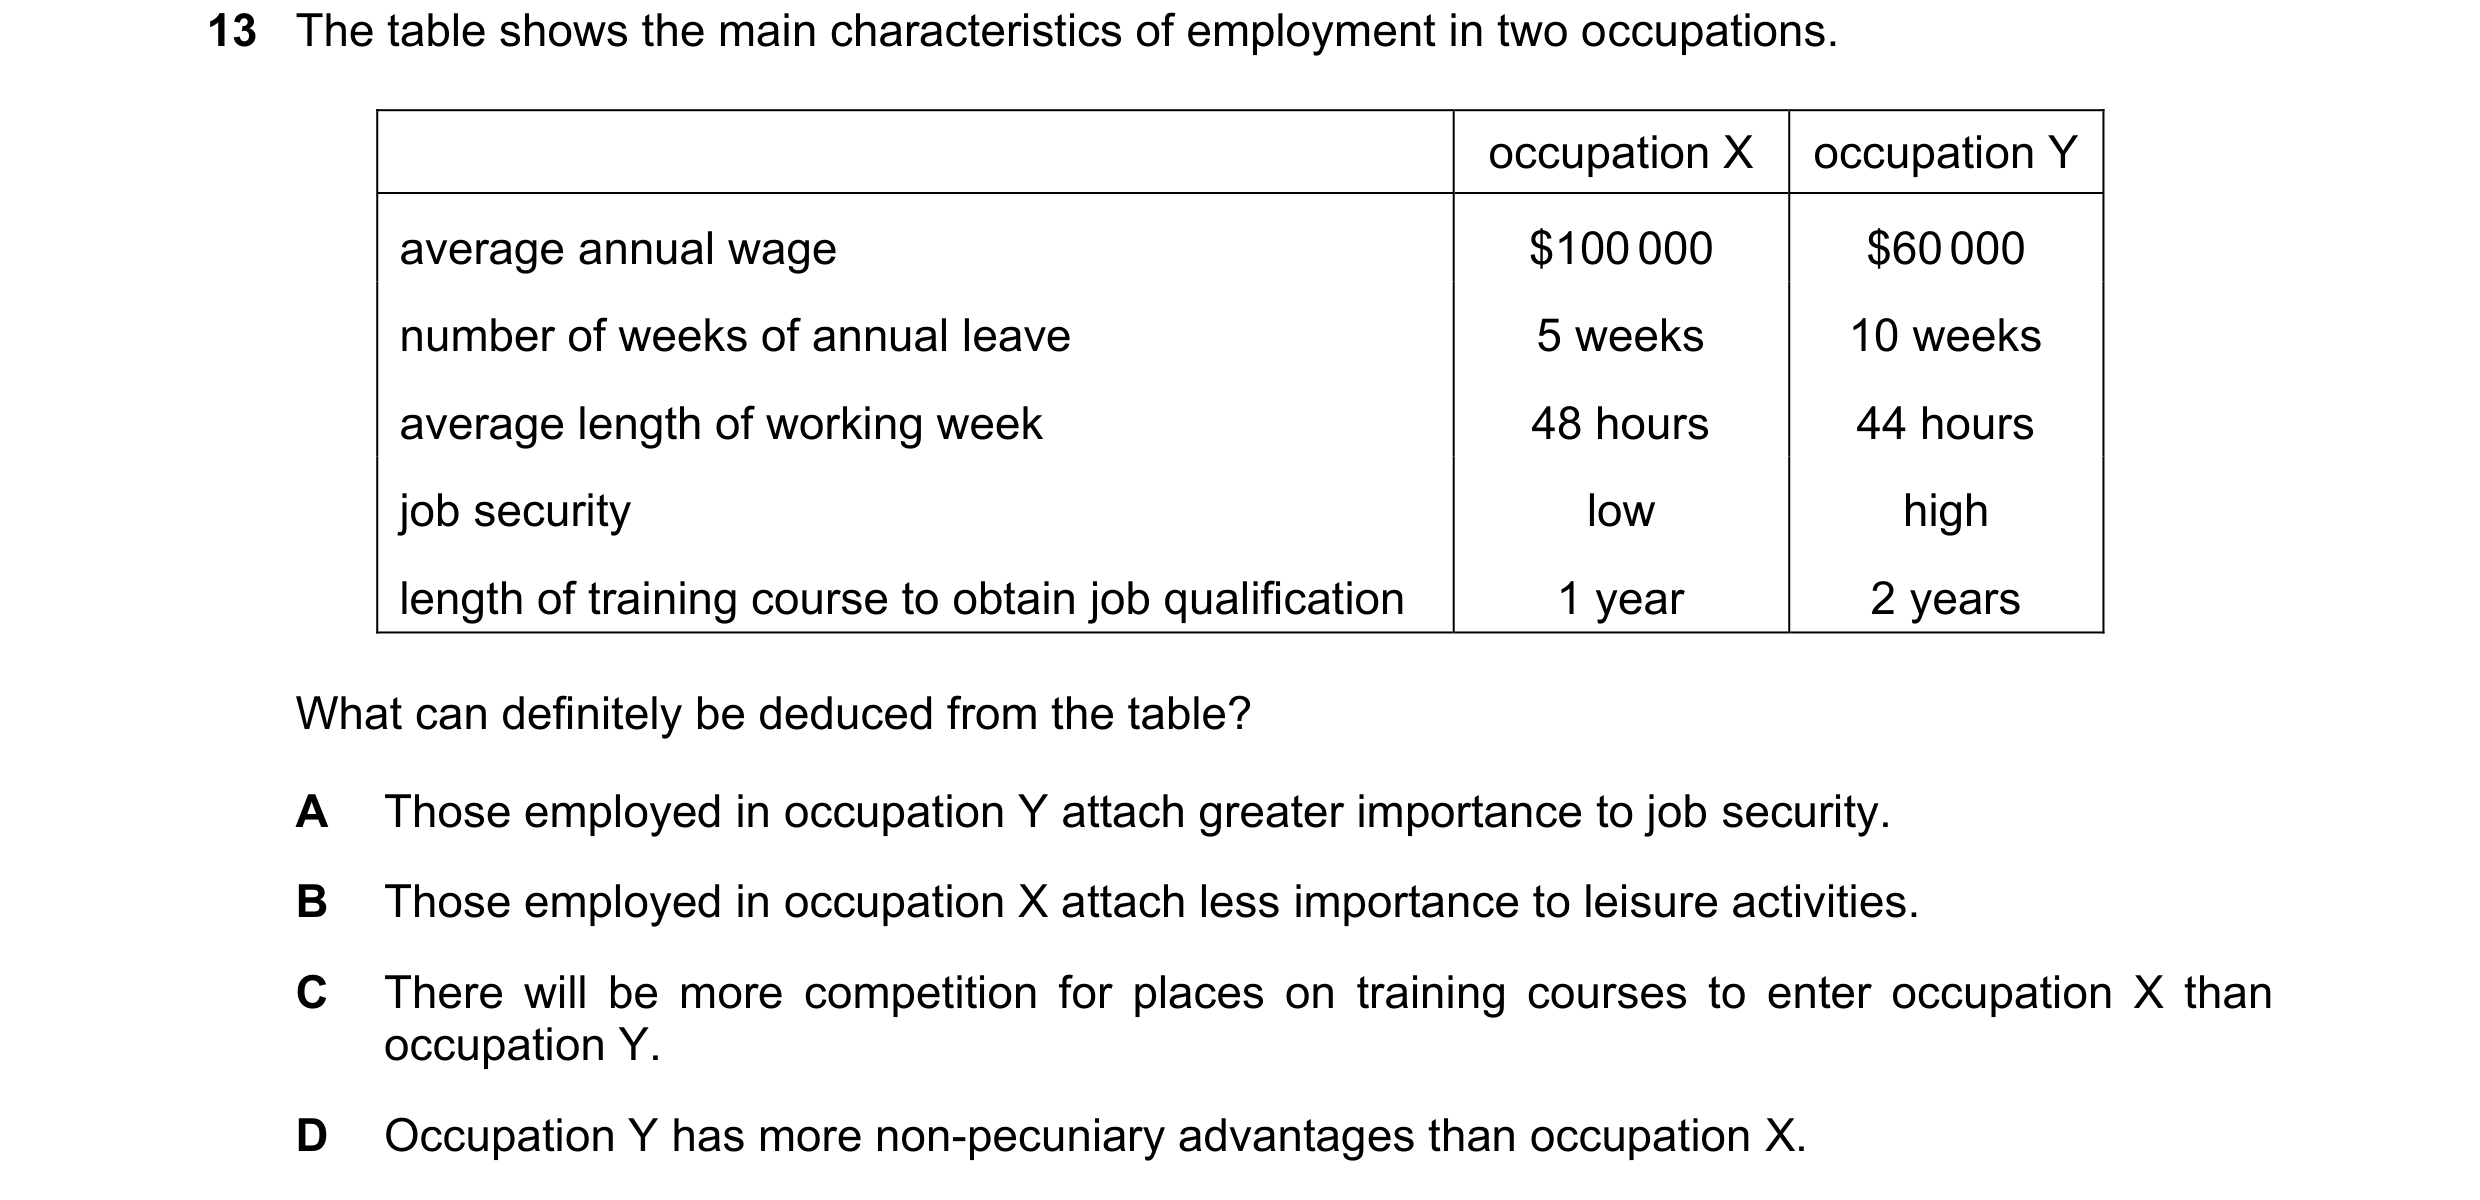
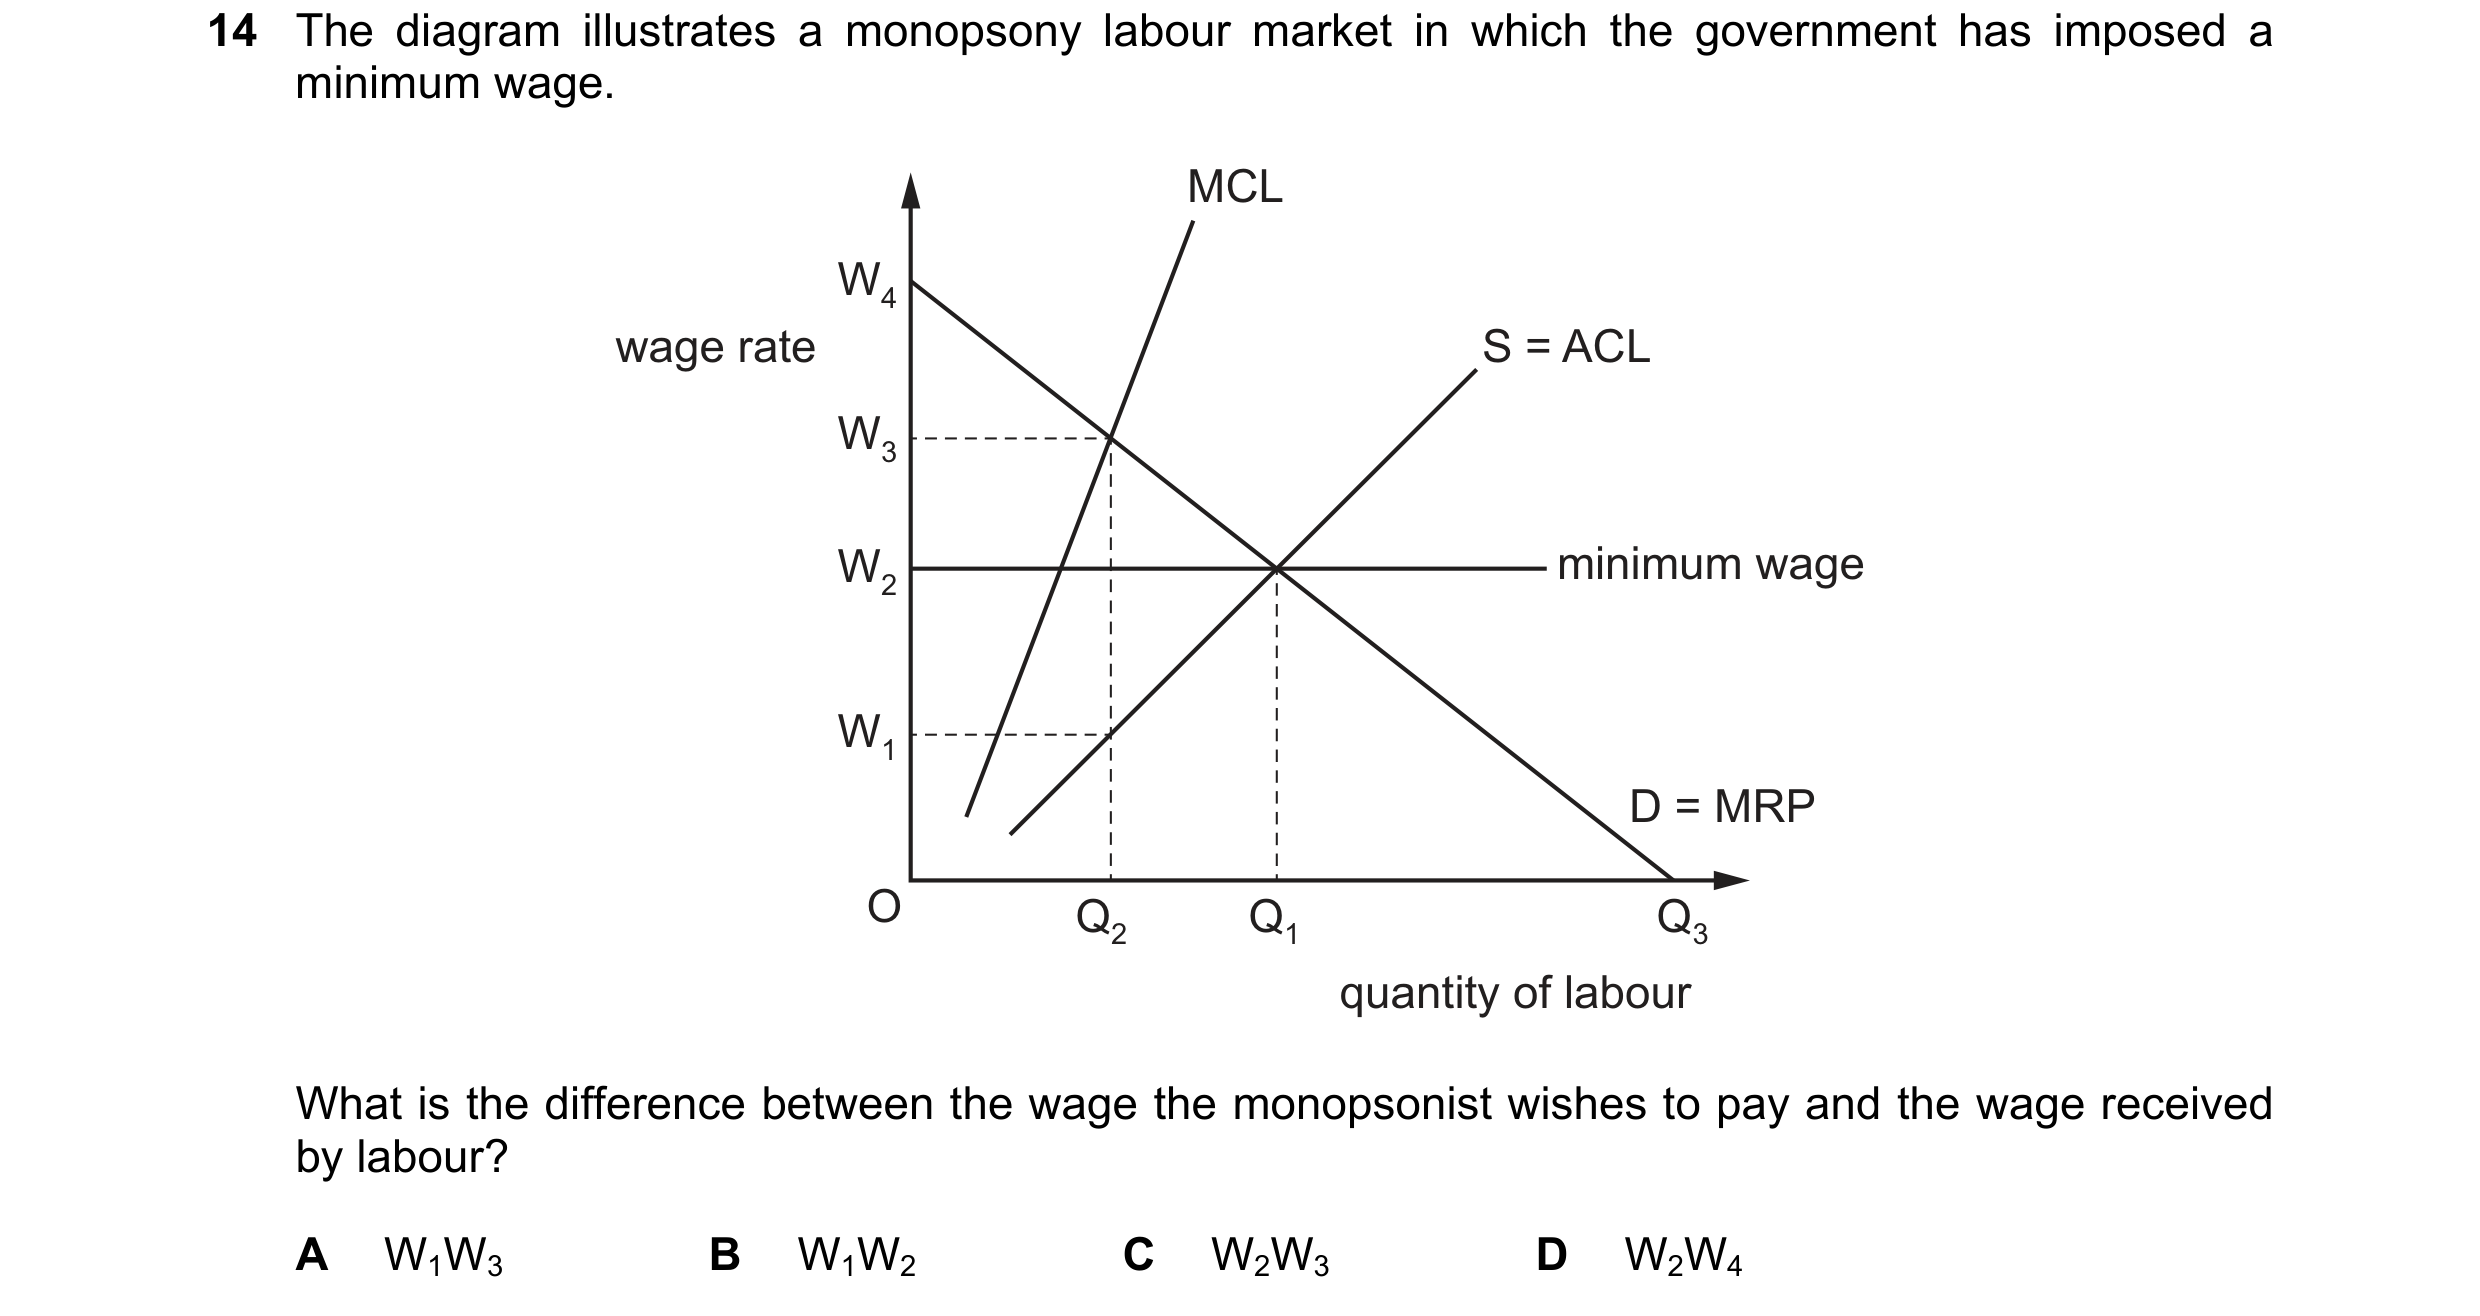
 52 / 58
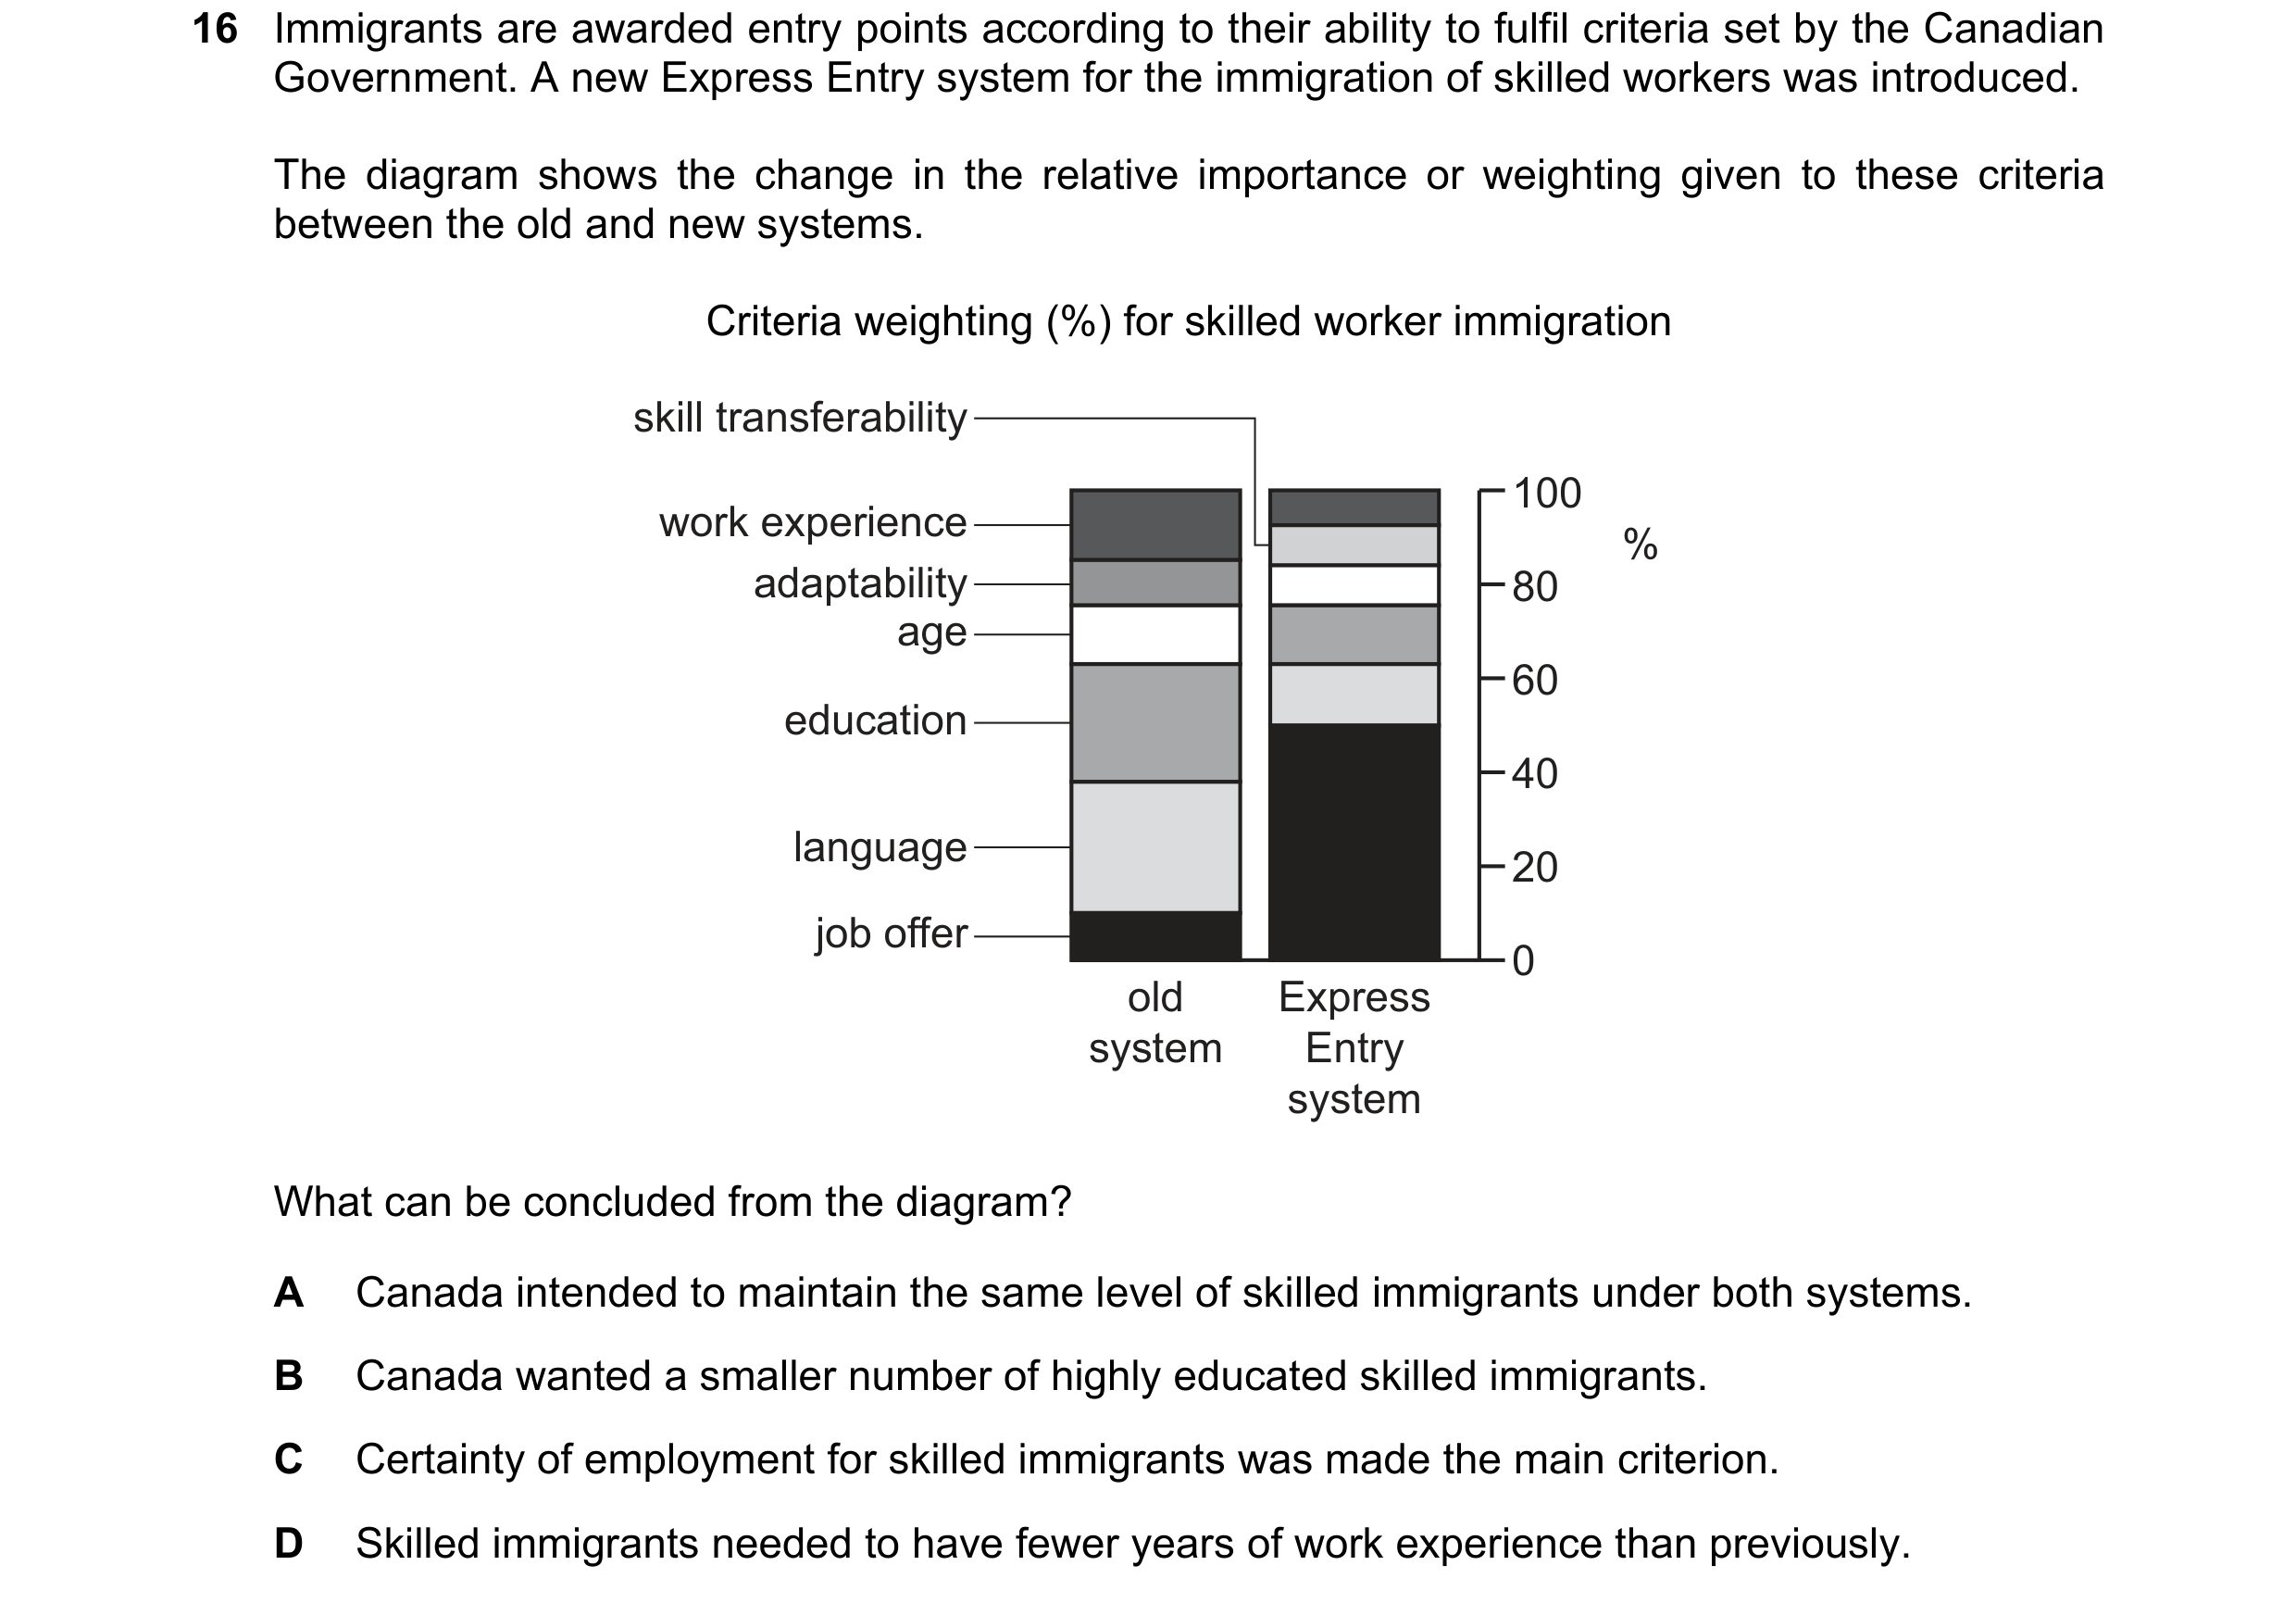 53 / 58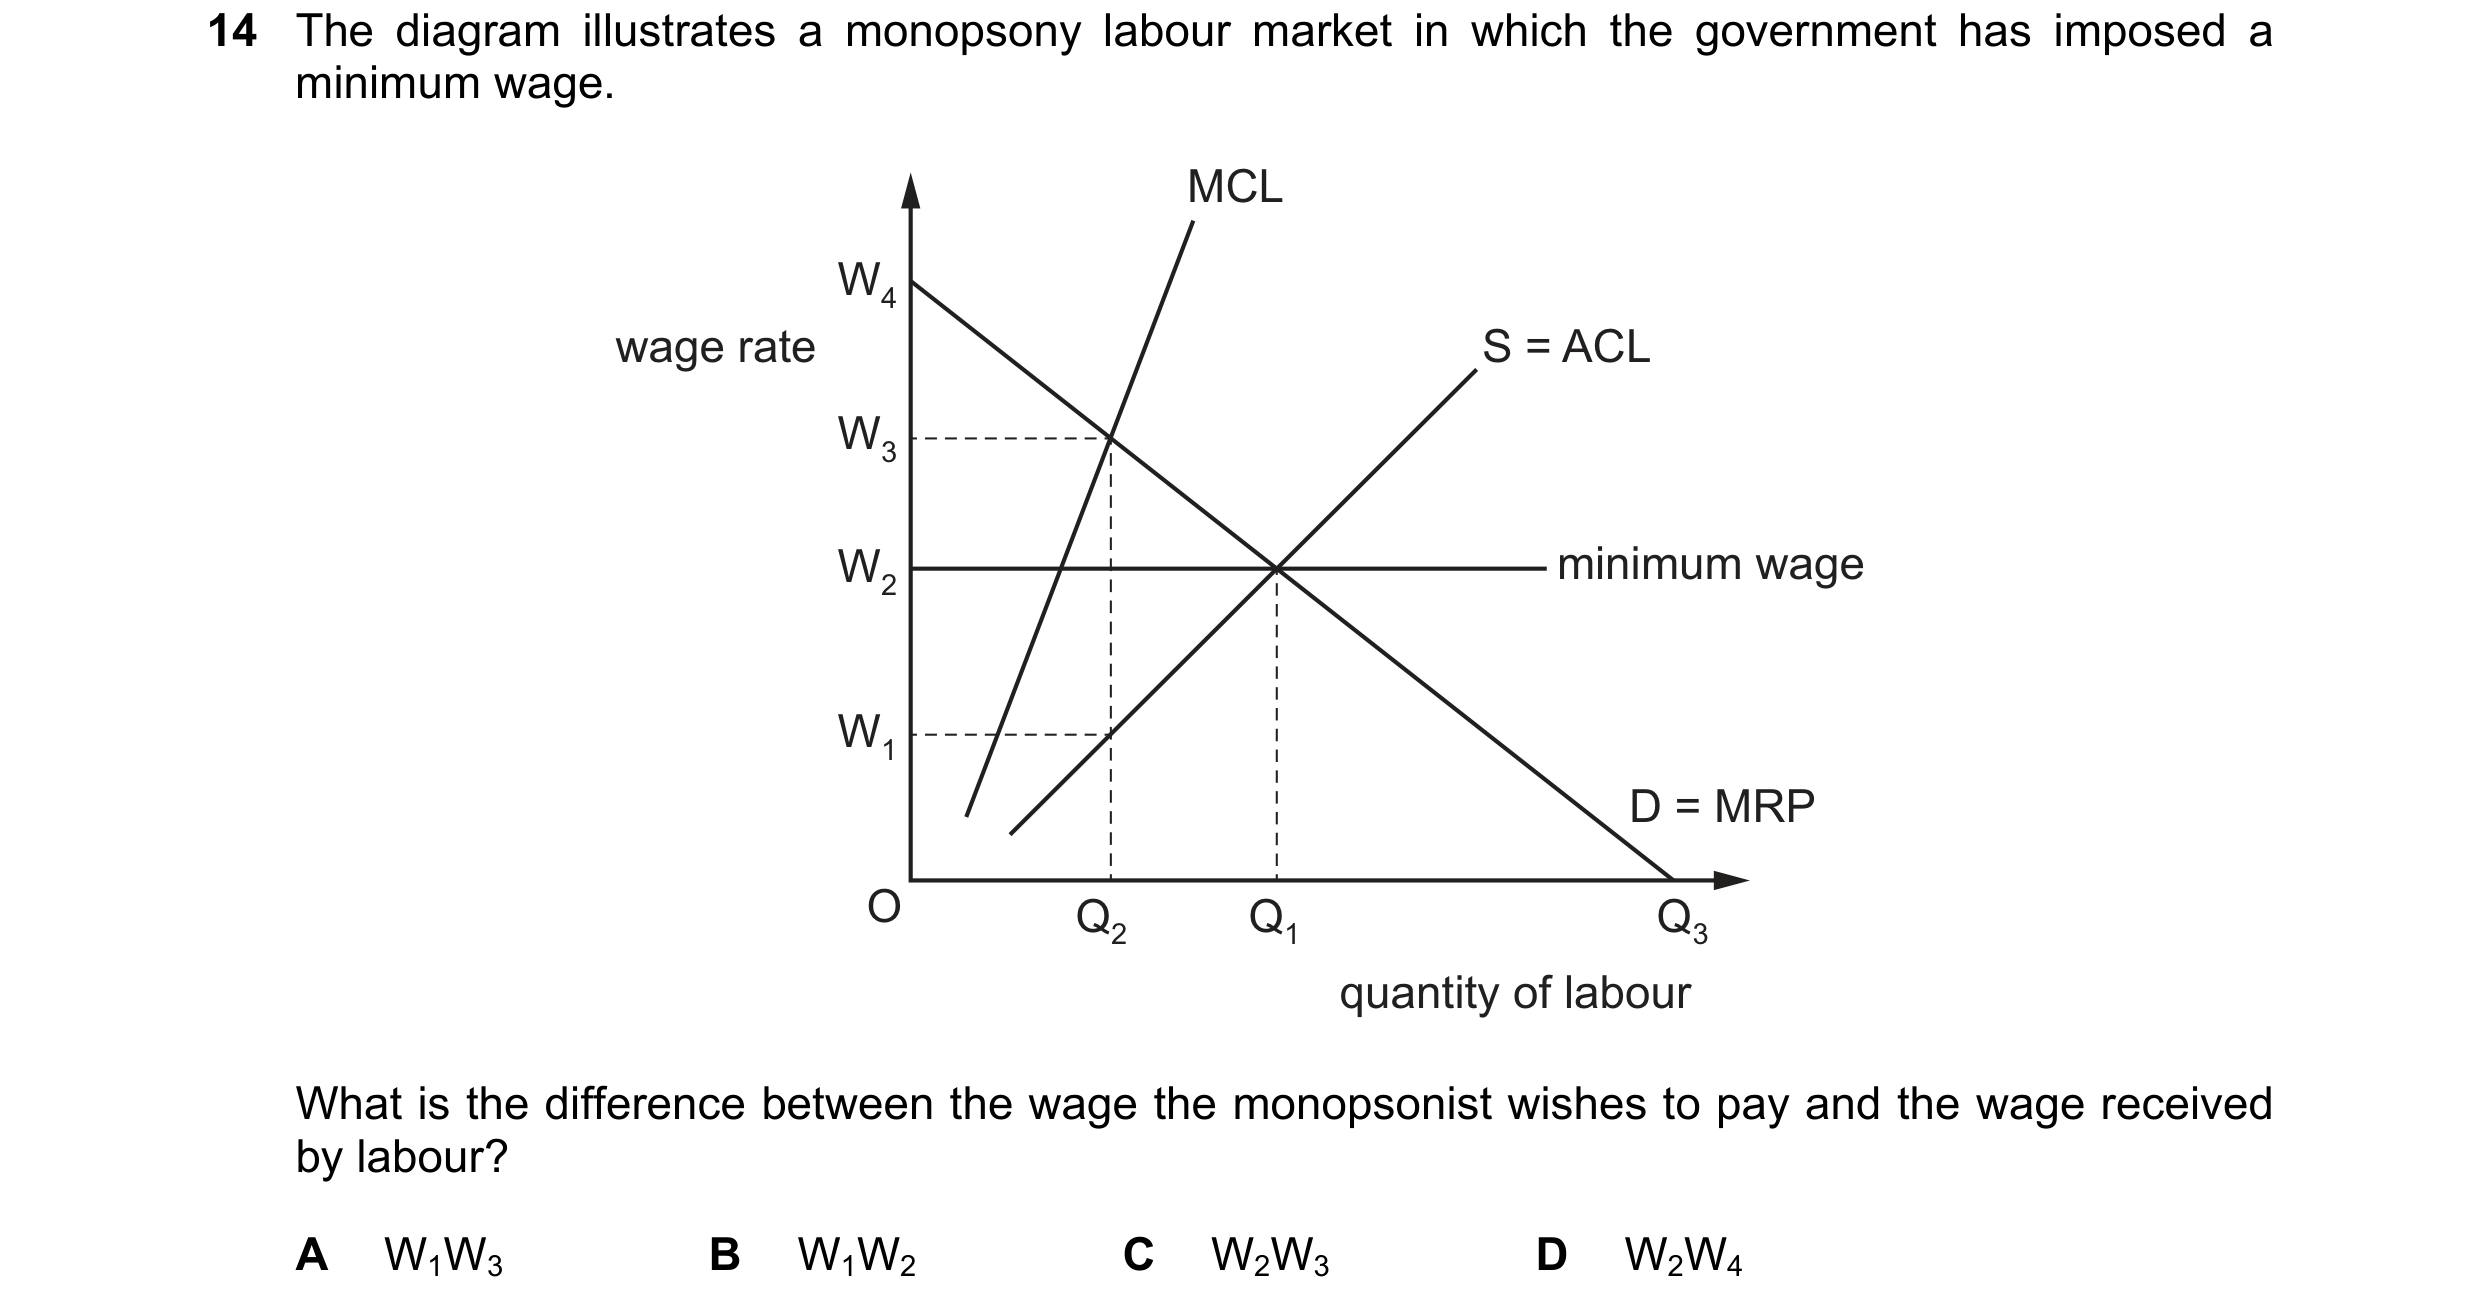
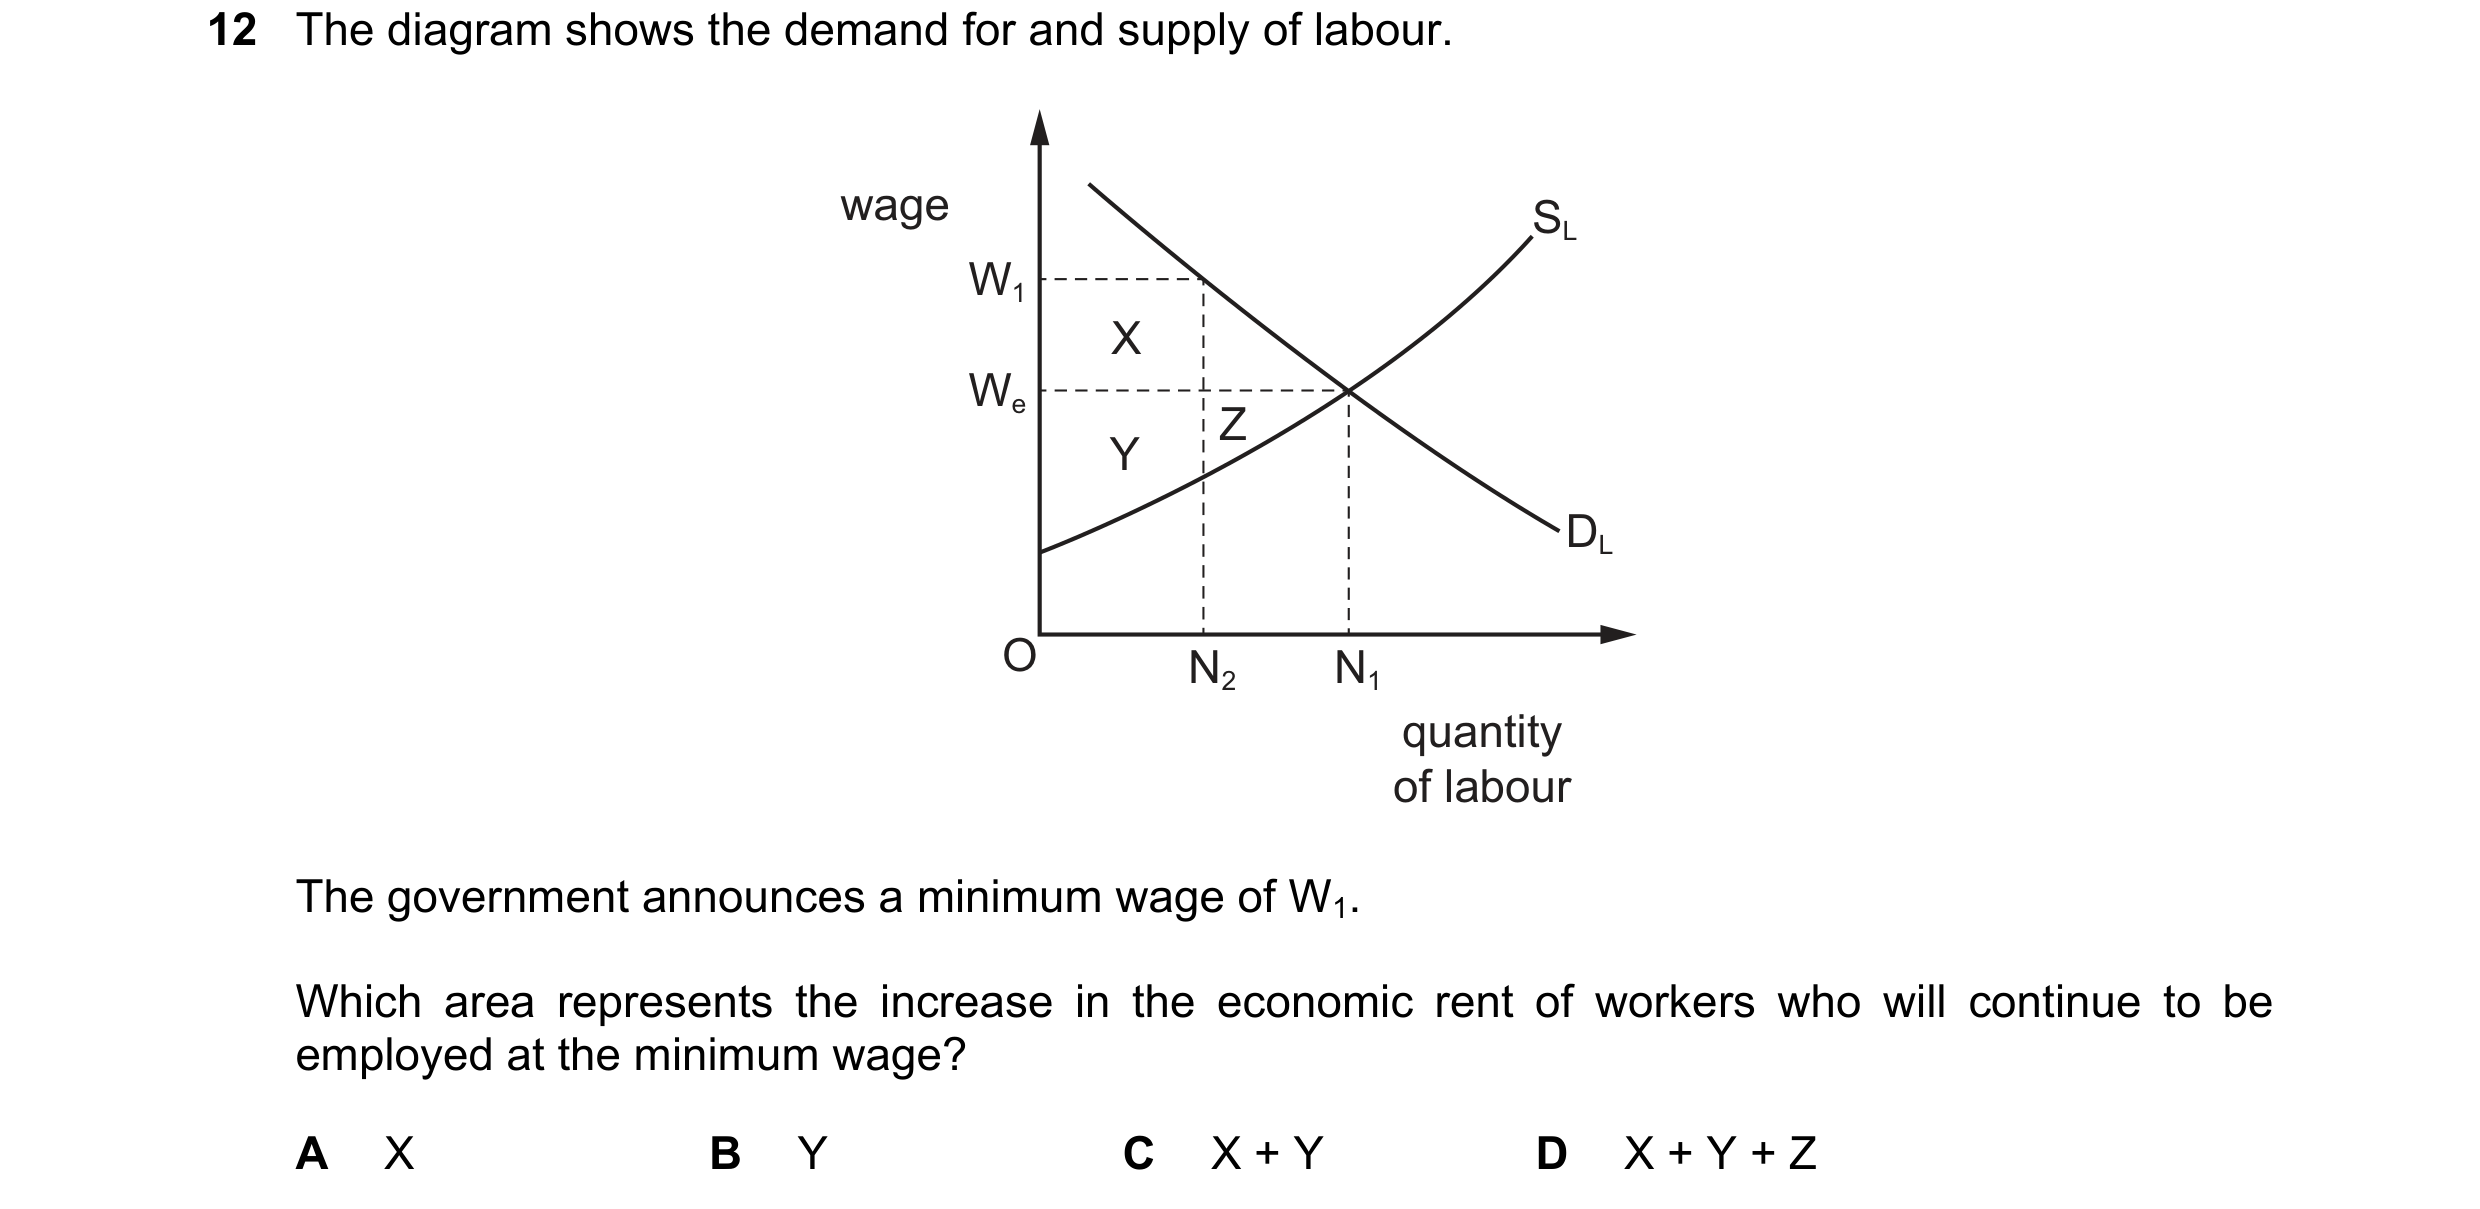 54 / 58
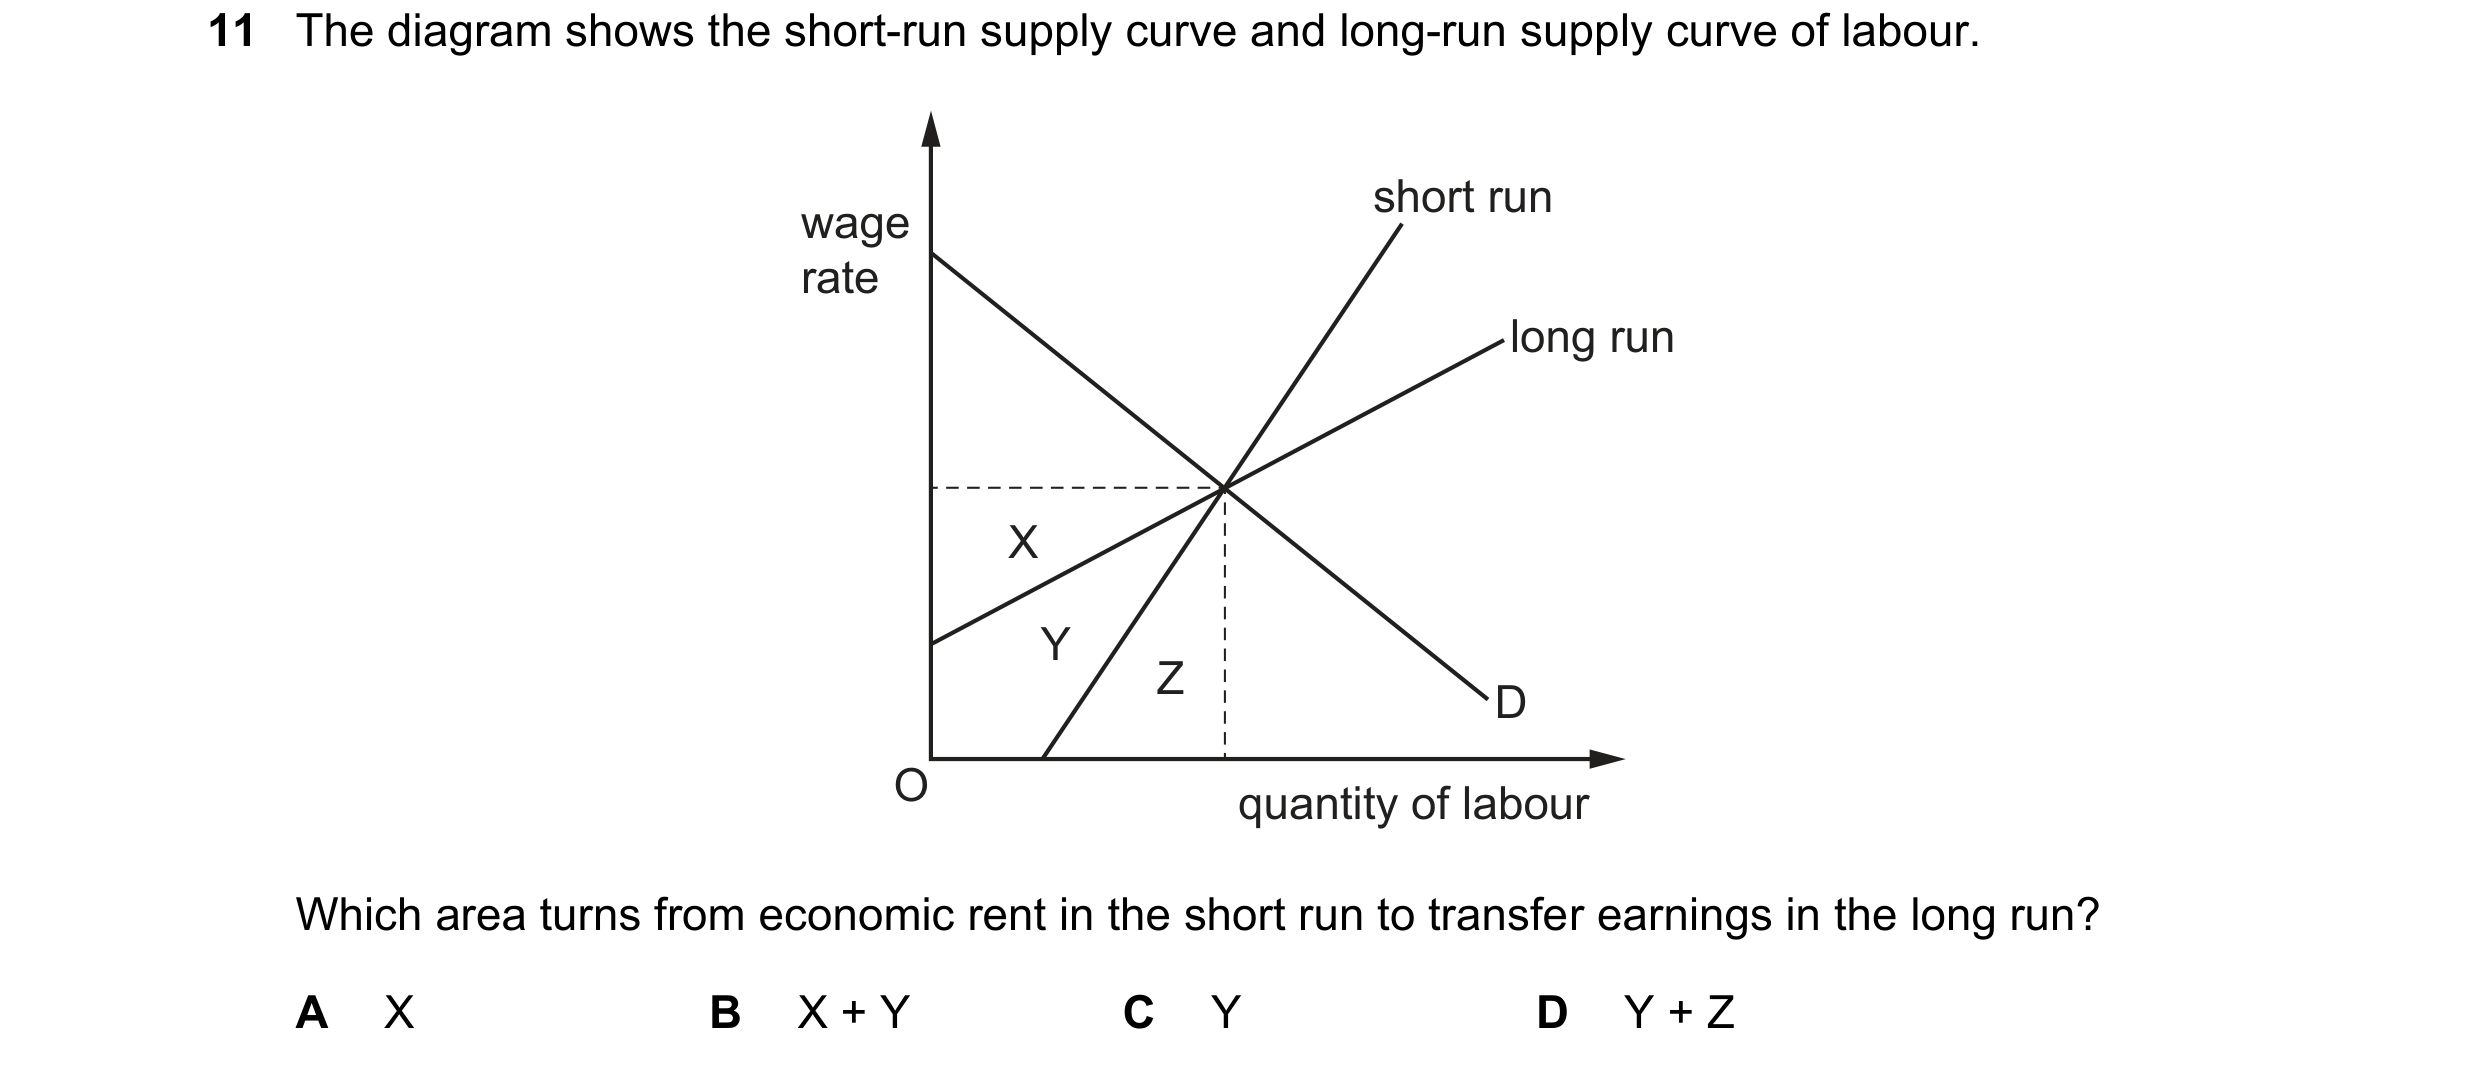

 55 / 58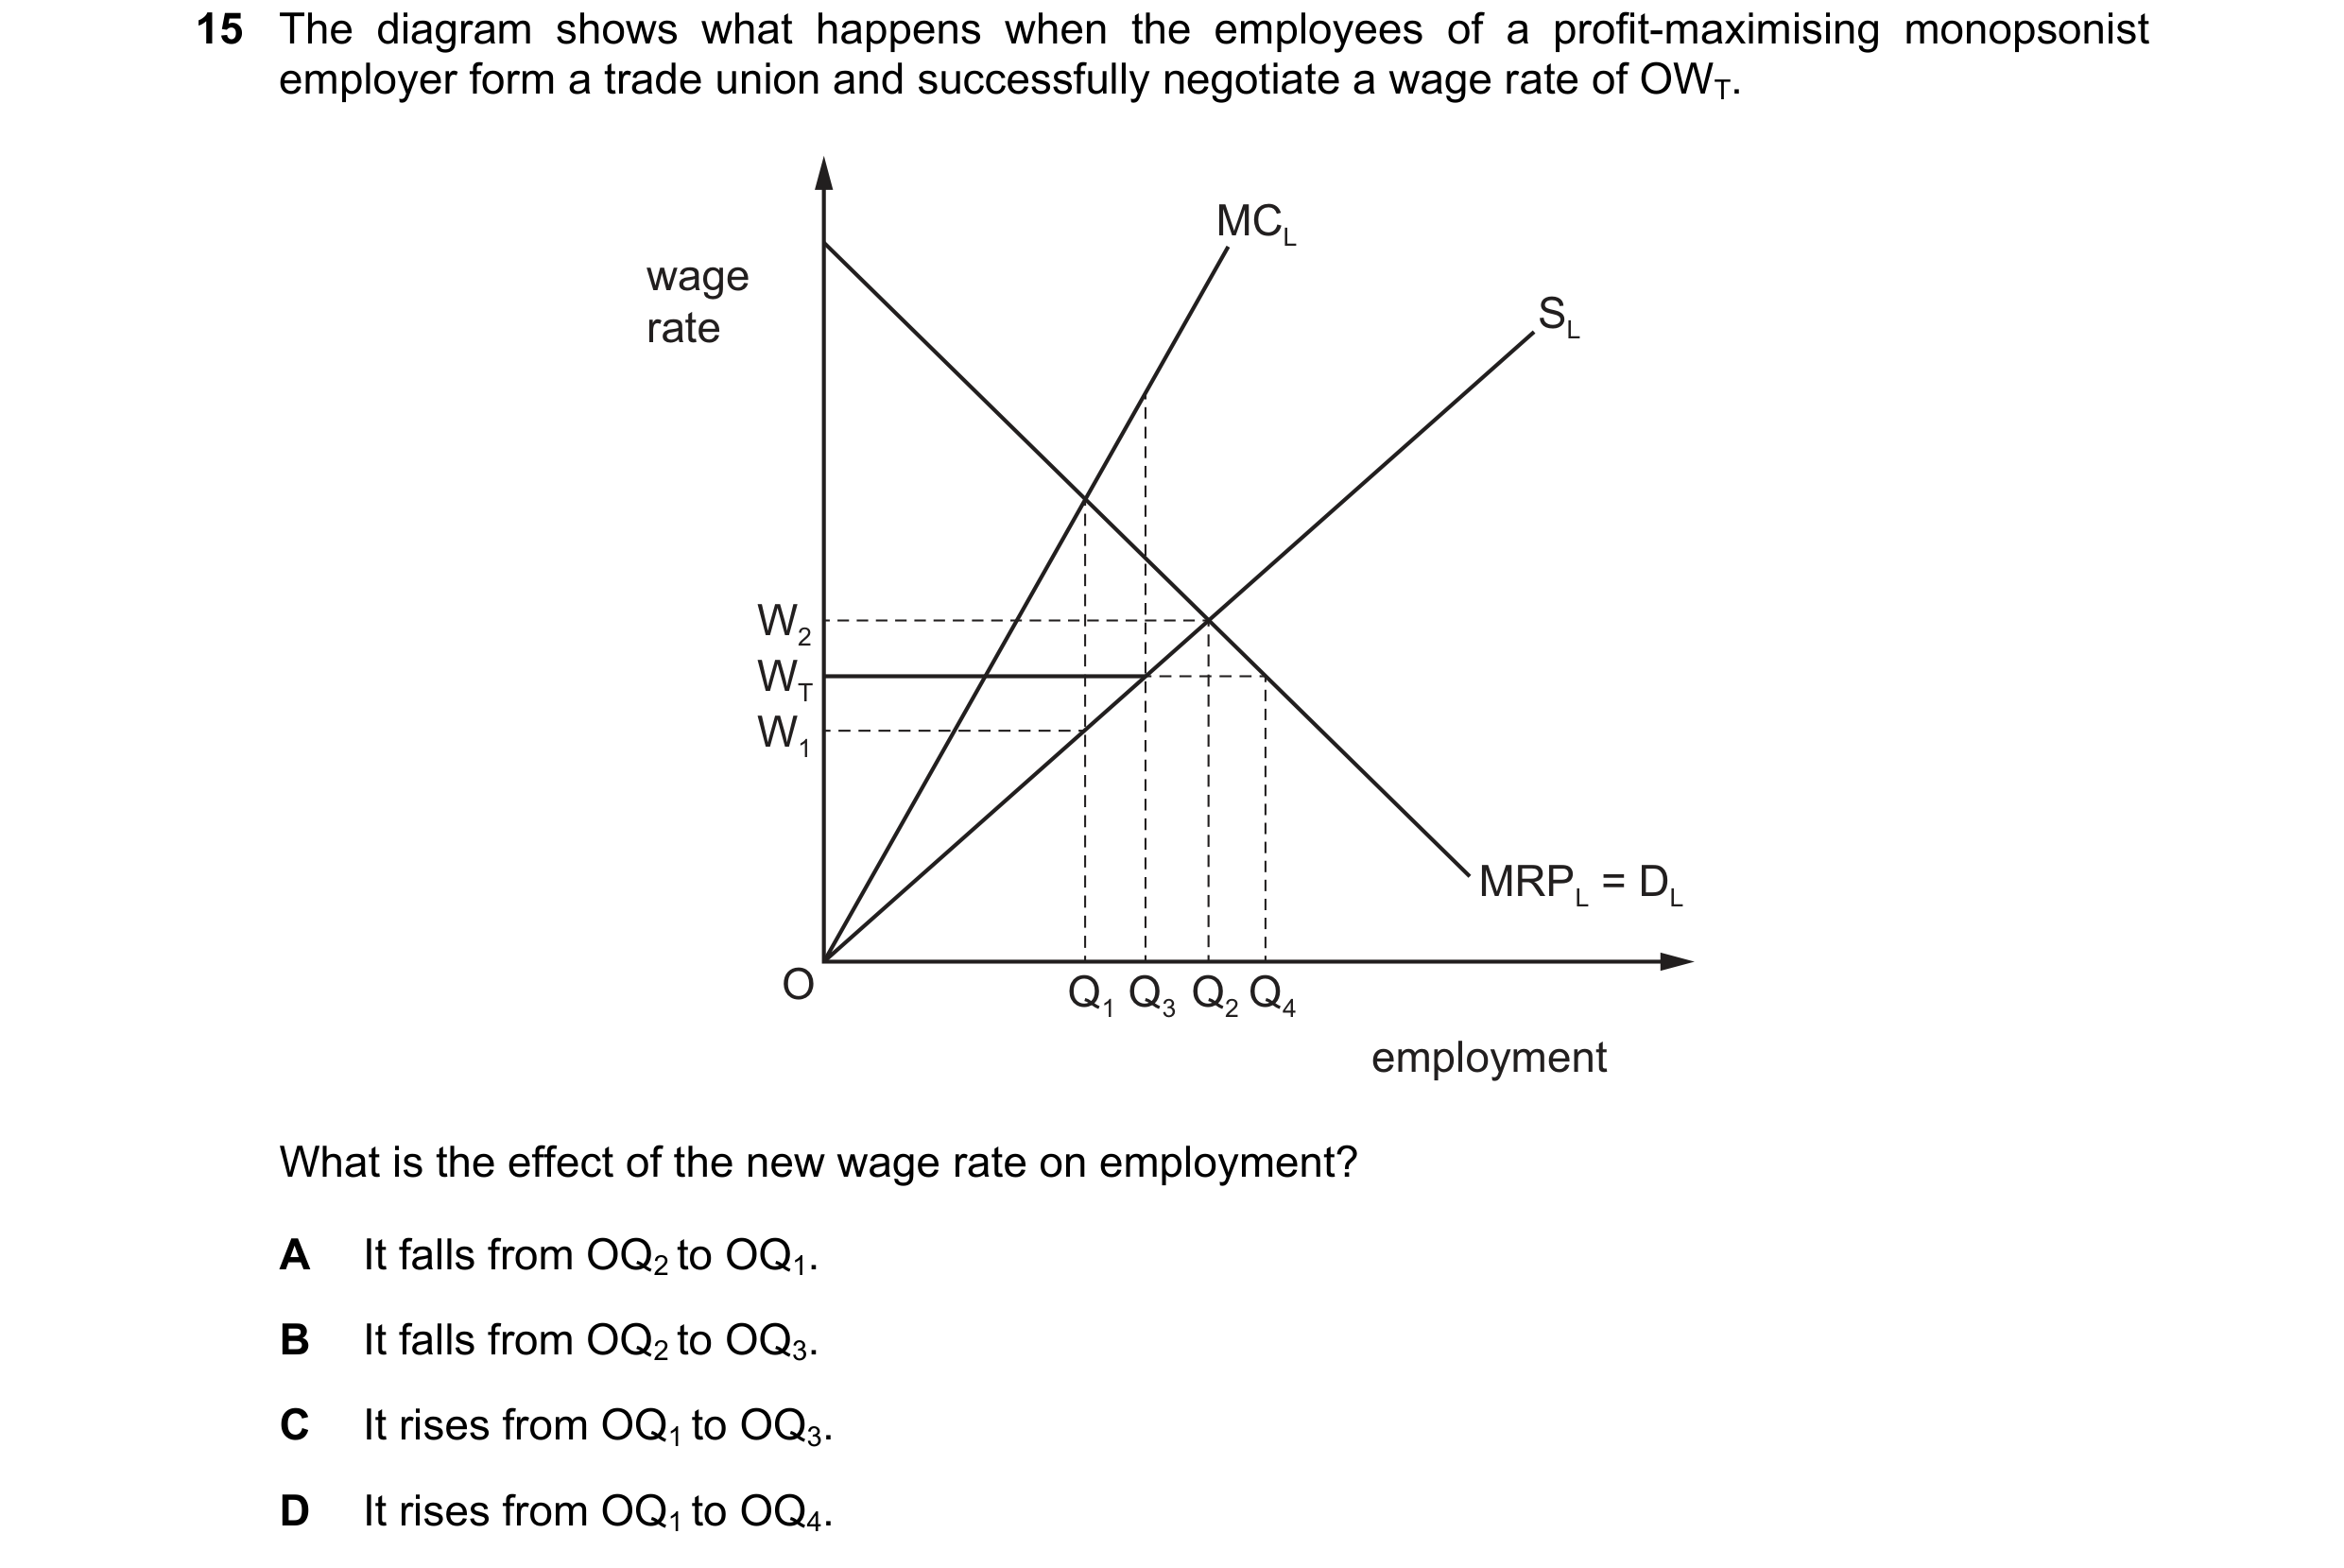
 56 / 58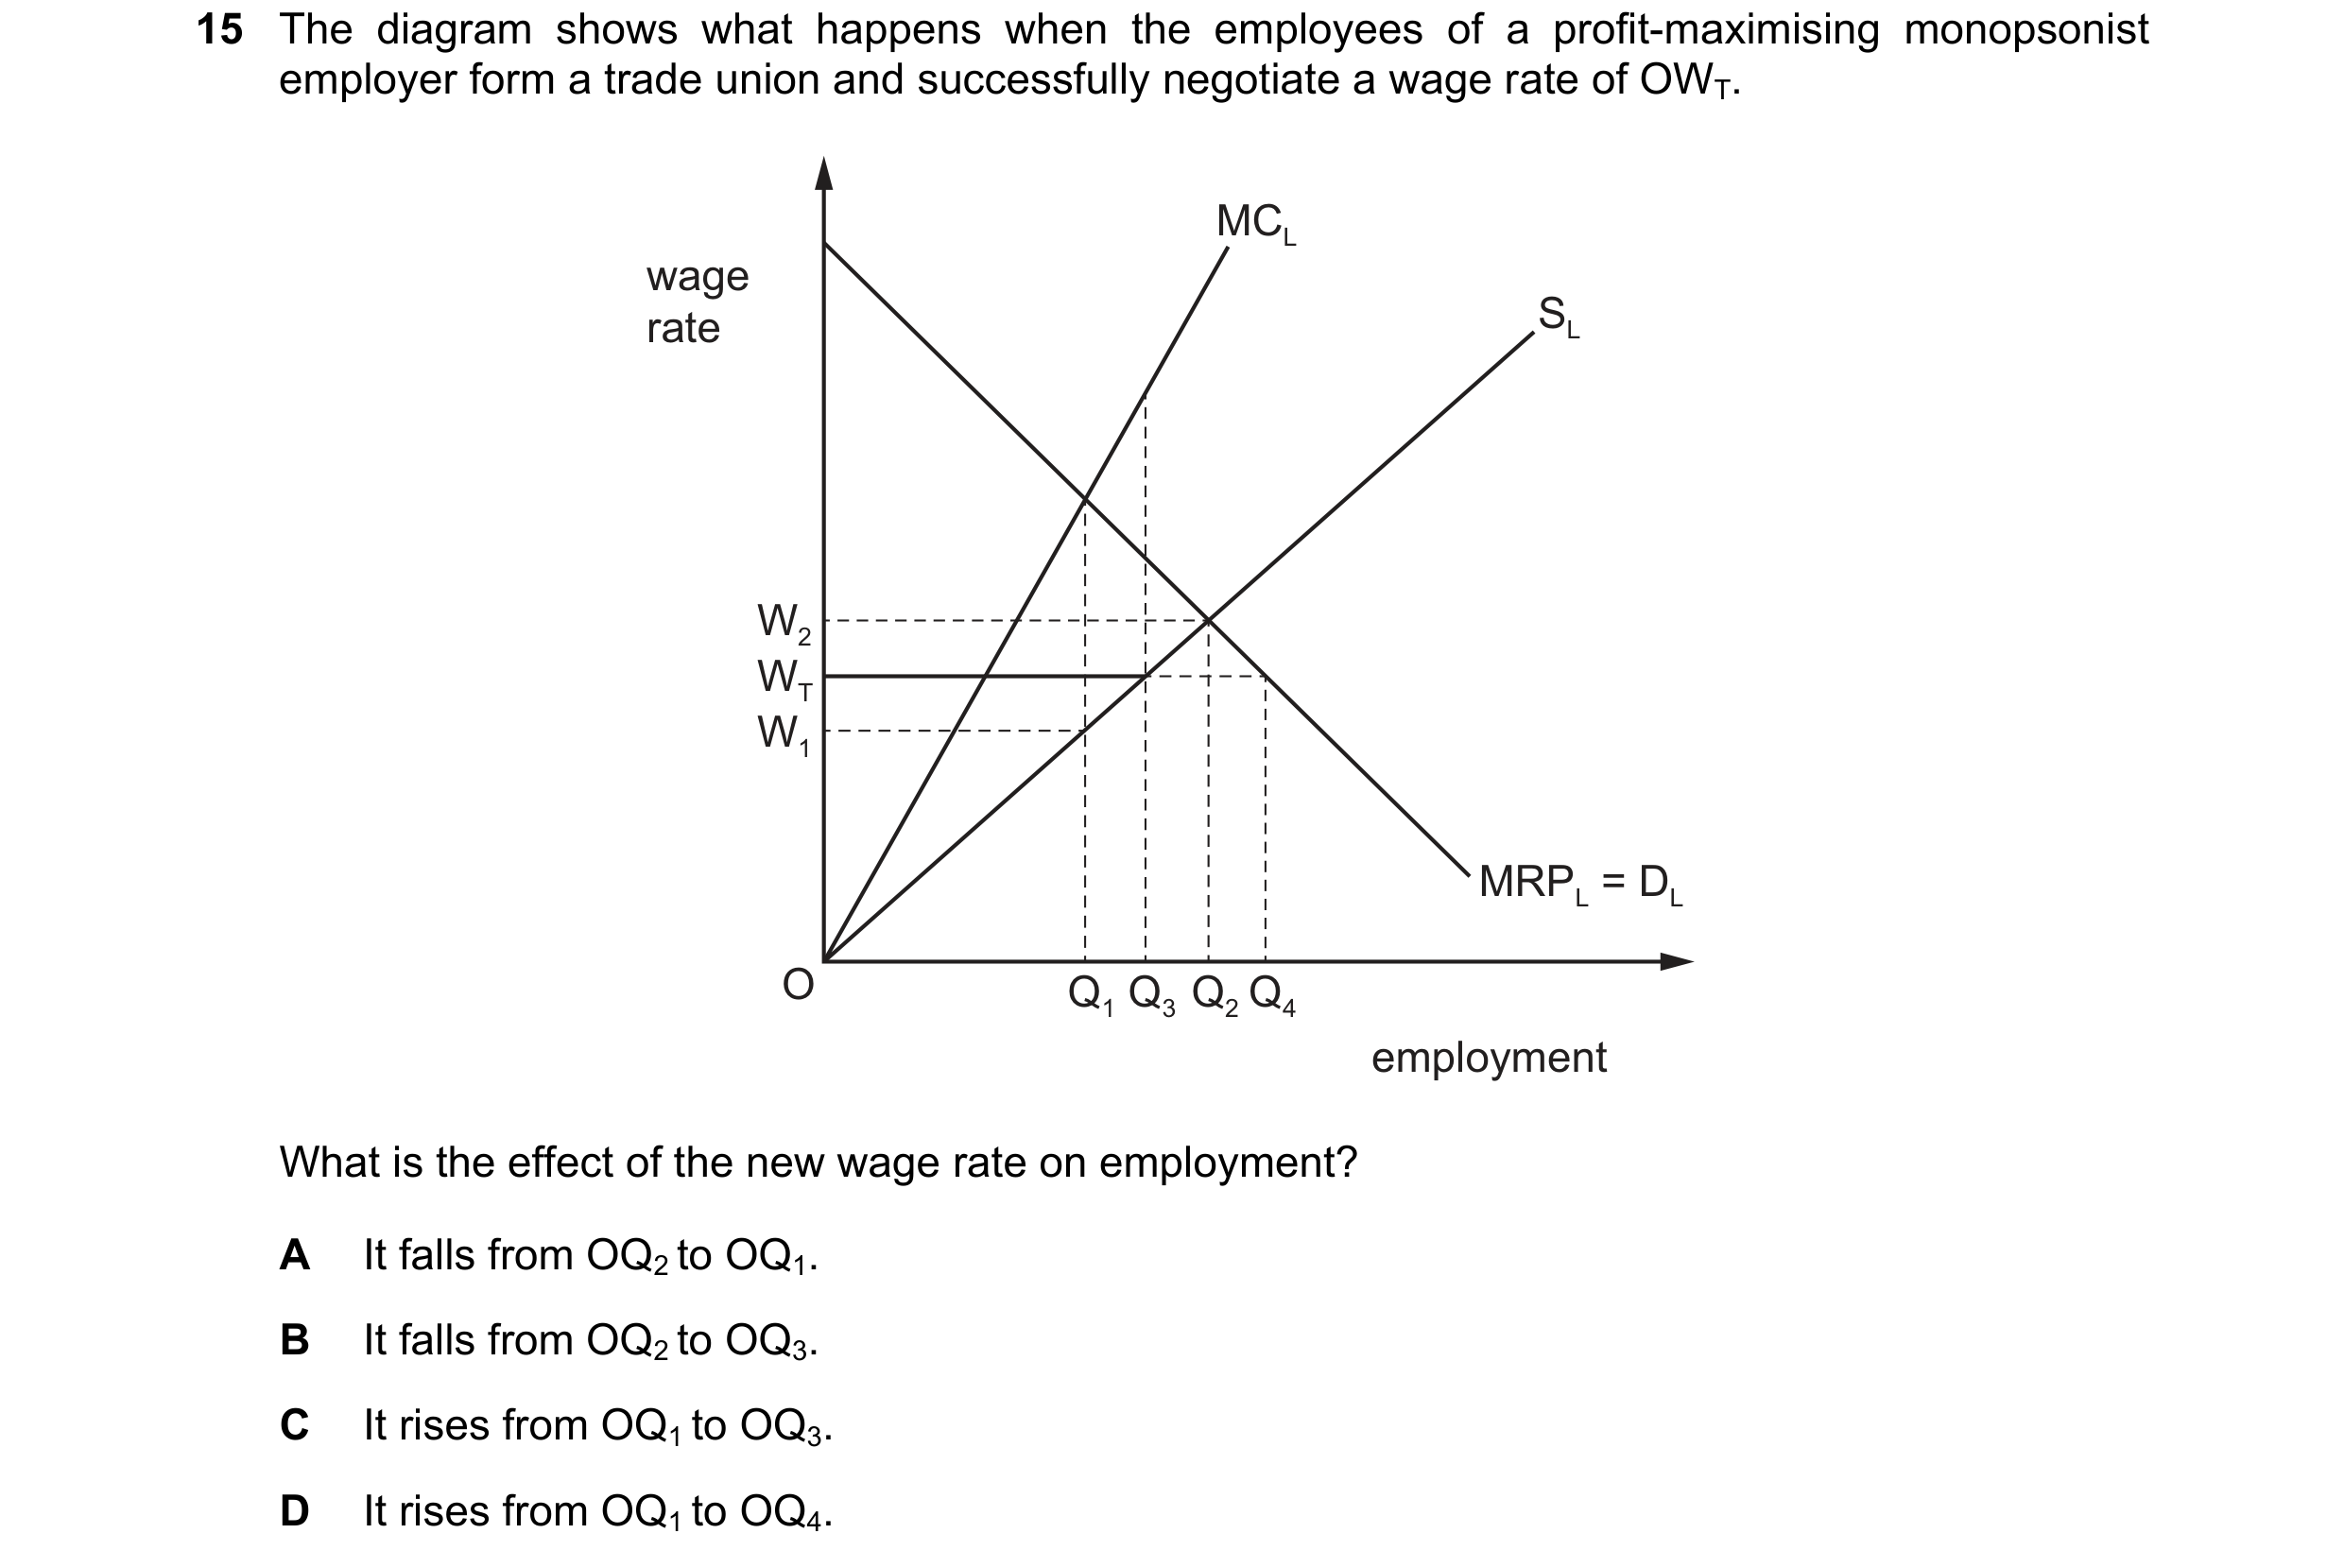

 57 / 58
 58 / 58