Cambridge A Level Economics 9708 — 2016 Oct/Nov Paper 3 · Variant 2
9708/32/O/N/16 · 30 questions · 30 marks · ≈34 min
The question paper and its mark scheme, free to read here and free to download. This is Cambridge’s own paper, exactly as it was sat.
Question paper12 pages
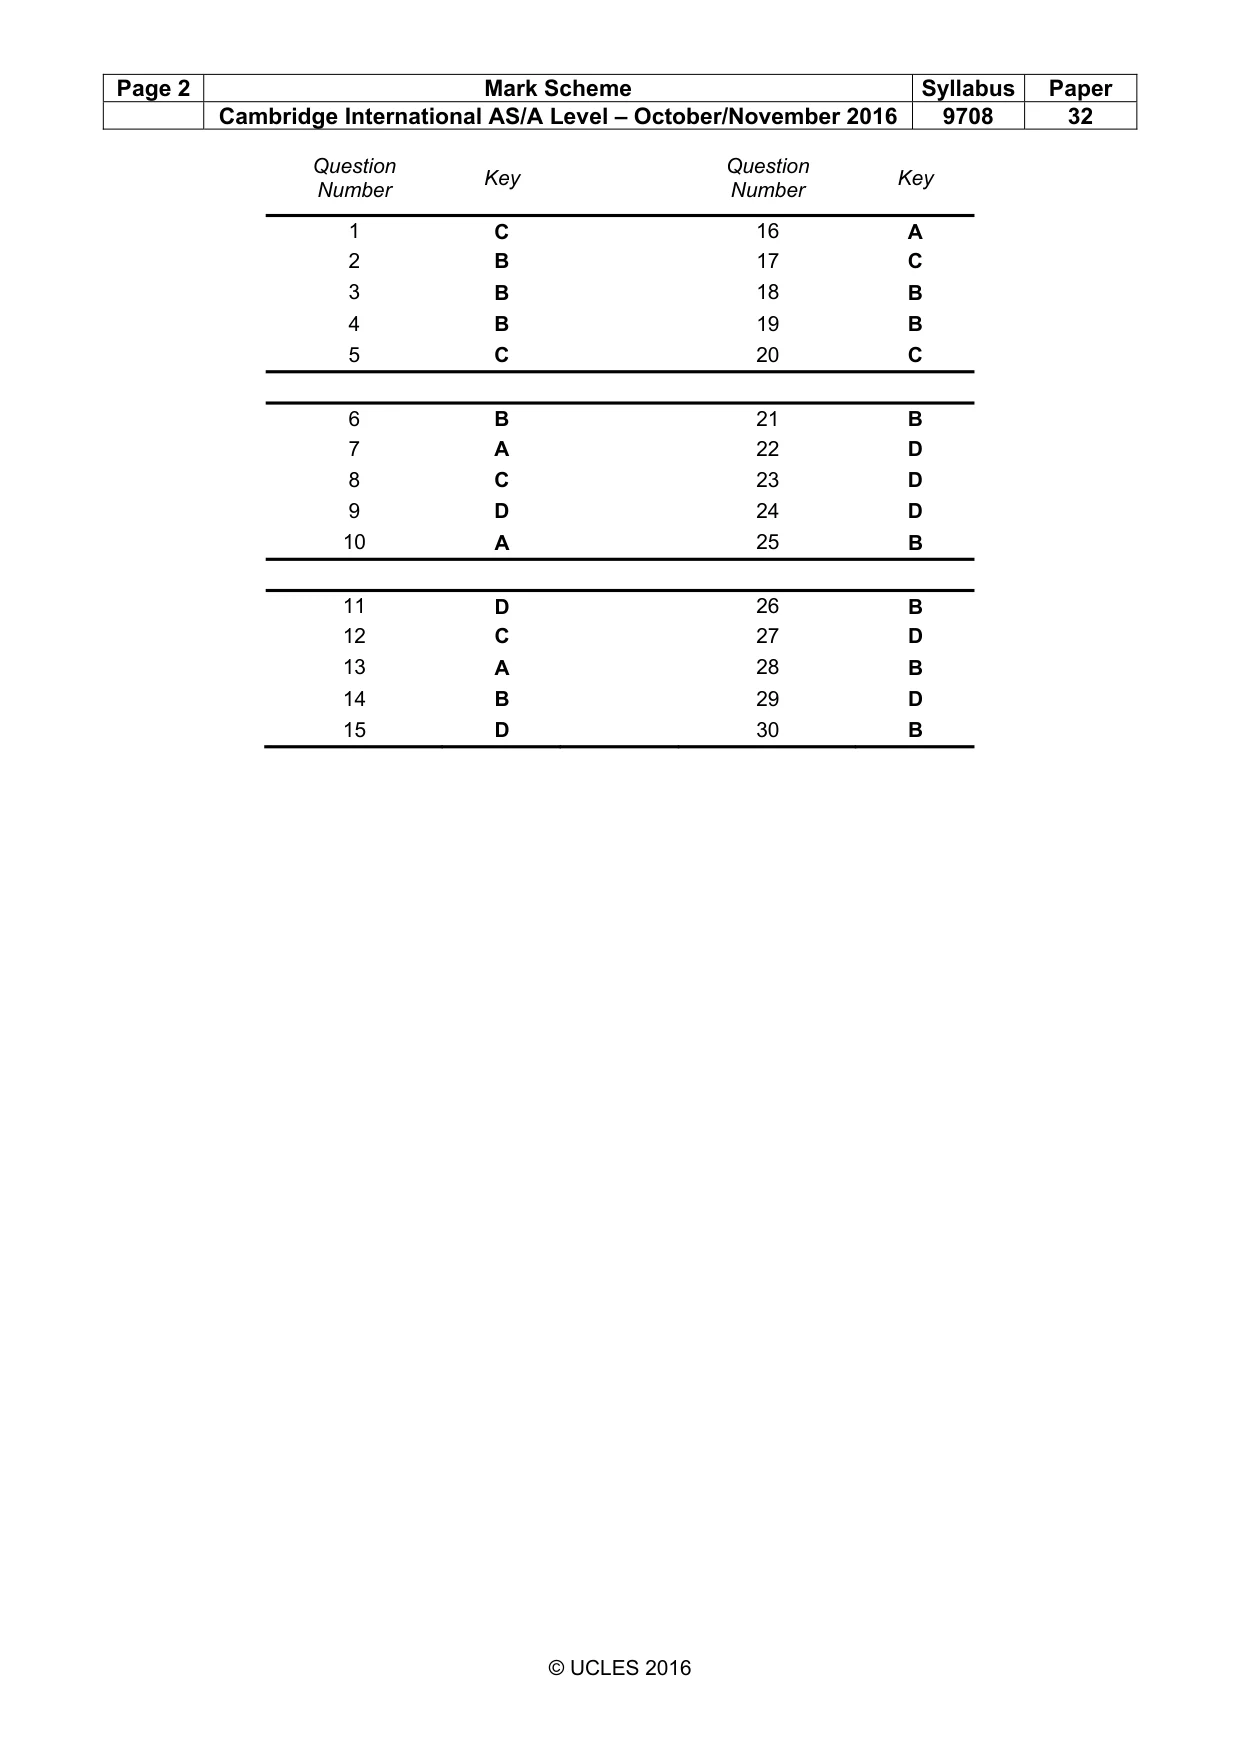
Mark scheme2 pages
Answers below. Sit the paper first if you are practising.
Questions as text
Q1 · What is the purpose of trying to achieve economic efficiency?
1 What is the purpose of trying to achieve economic efficiency? A to achieve full employment B to achieve the cheapest possible price for products C to ensure resources are not wasted D to use as many resources as possible
Mark scheme: C
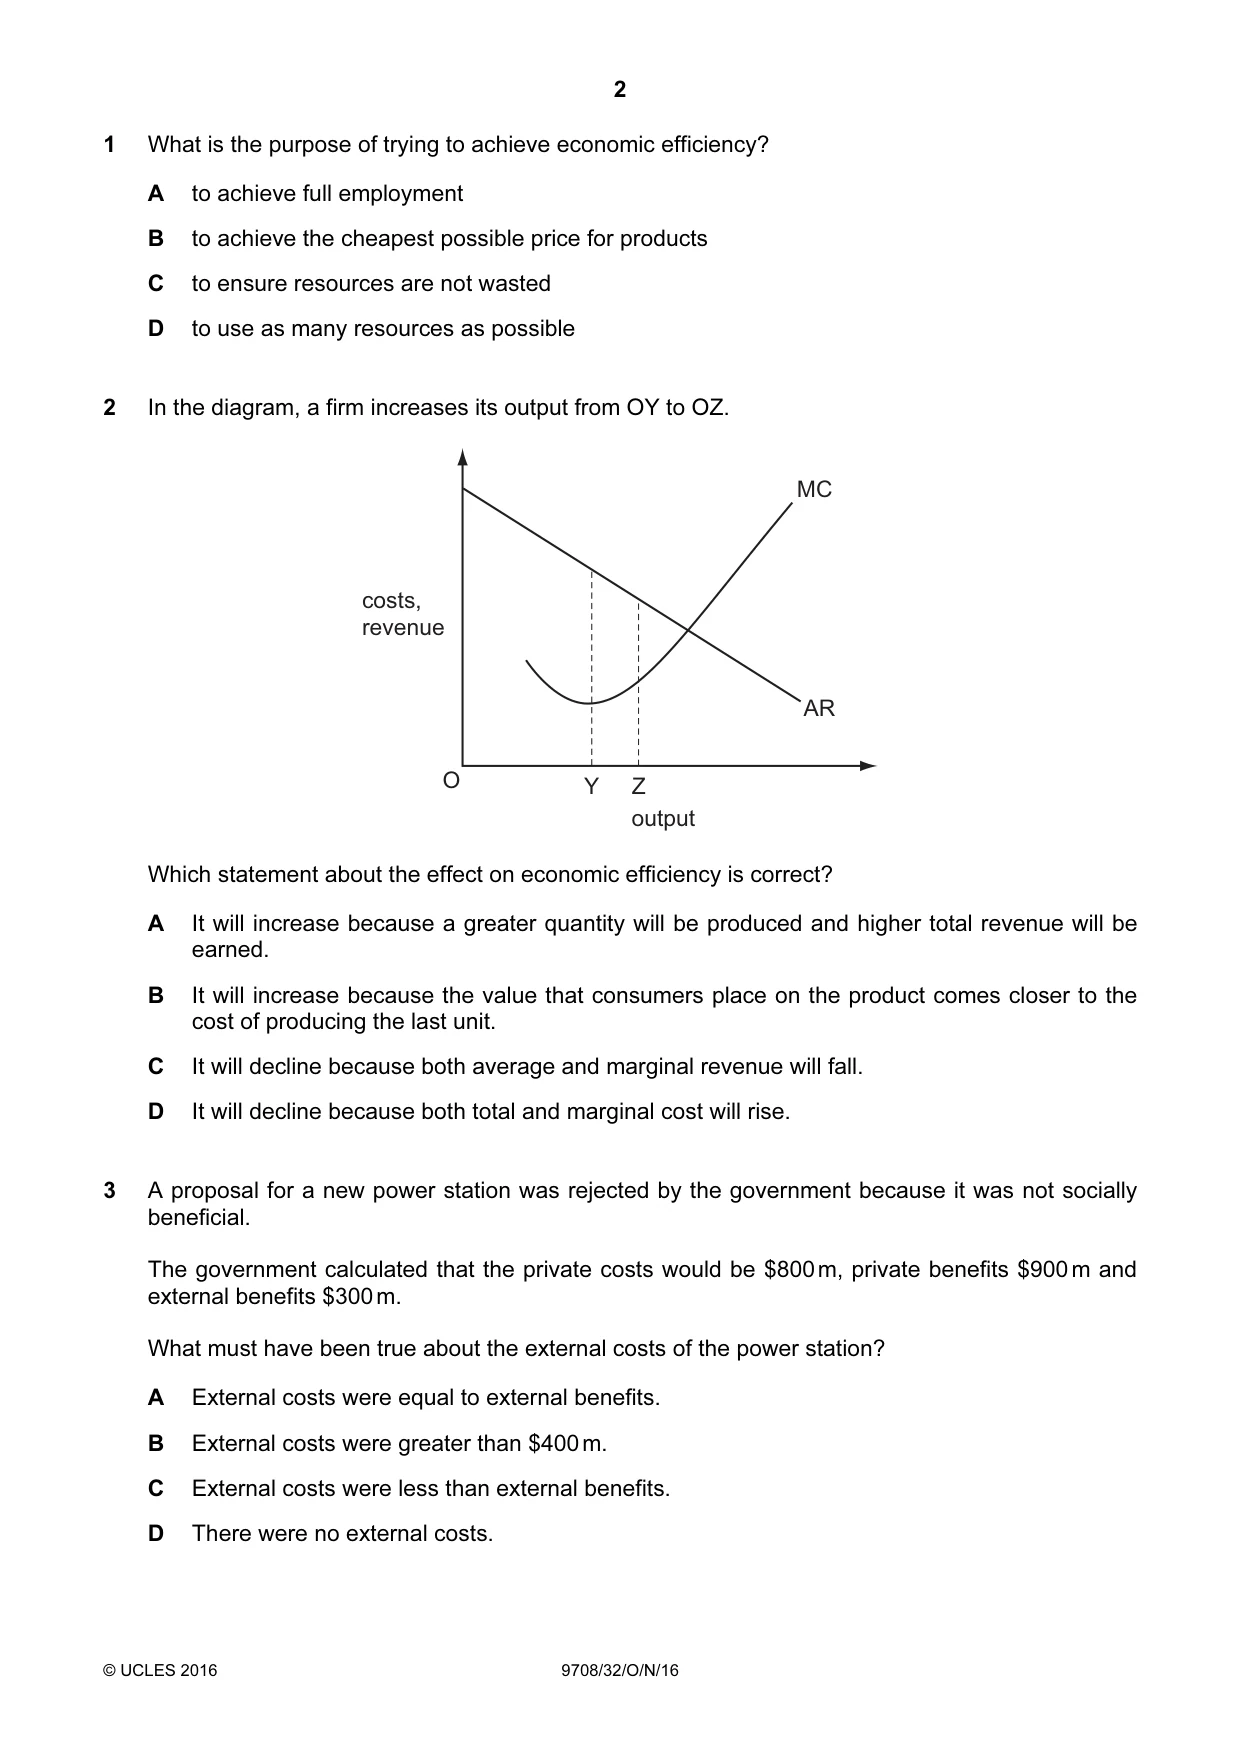
Q2 · In the diagram, a firm increases its output from OY to OZ
2 In the diagram, a firm increases its output from OY to OZ. MC costs, revenue AR O Y Z output Which statement about the effect on economic efficiency is correct? A It will increase because a greater quantity will be produced and higher total revenue will be earned. B It will increase because the value that consumers place on the product comes closer to the cost of producing the last unit. C It will decline because both average and marginal revenue will fall. D It will decline because both total and marginal cost will rise.
Mark scheme: B
Q3 · A proposal for a new power station was rejected by the government because it was not…
3 A proposal for a new power station was rejected by the government because it was not socially beneficial. The government calculated that the private costs would be $800 m, private benefits $900 m and external benefits $300 m. What must have been true about the external costs of the power station? A External costs were equal to external benefits. B External costs were greater than $400 m. C External costs were less than external benefits. D There were no external costs.
Mark scheme: B
More questions on Private costs and benefits, externalities and social costs and benefits
Q4 · What will happen if, in response to a fall in its price, a consumer buys more of a good?
4 What will happen if, in response to a fall in its price, a consumer buys more of a good? A a fall in the total utility derived from consuming the good B a movement along the consumer’s demand curve C a rise in the marginal utility derived from consuming the good D a shift in the consumer’s demand curve
Mark scheme: B
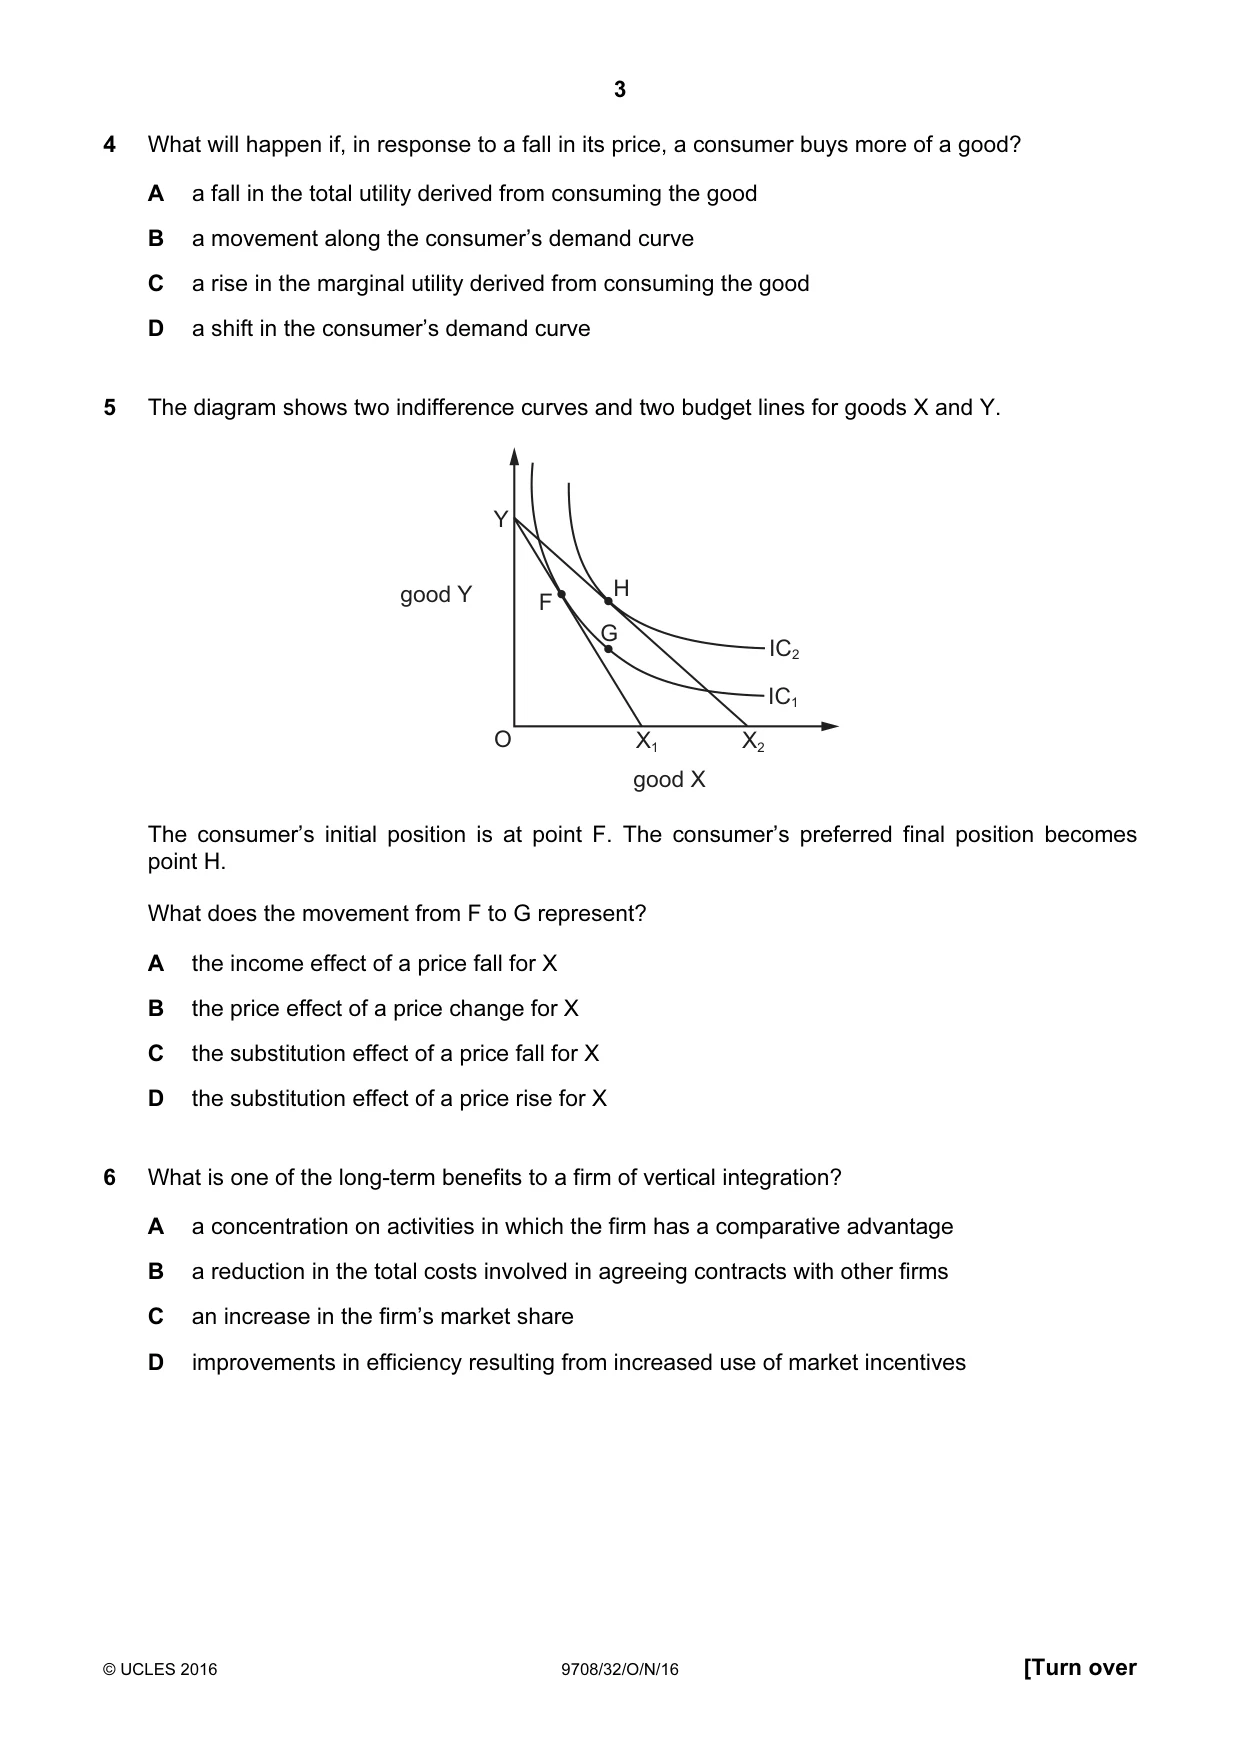
Q5 · The diagram shows two indifference curves and two budget lines for goods X and Y
5 The diagram shows two indifference curves and two budget lines for goods X and Y. Y good Y H F G IC2 IC1 O X1 X2 good X The consumer’s initial position is at point F. The consumer’s preferred final position becomes point H. What does the movement from F to G represent? A the income effect of a price fall for X B the price effect of a price change for X C the substitution effect of a price fall for X D the substitution effect of a price rise for X
Mark scheme: C
Q6 · What is one of the long-term benefits to a firm of vertical integration?
6 What is one of the long-term benefits to a firm of vertical integration? A a concentration on activities in which the firm has a comparative advantage B a reduction in the total costs involved in agreeing contracts with other firms C an increase in the firm’s market share D improvements in efficiency resulting from increased use of market incentives
Mark scheme: B
Q7 · The organisers of a major sporting event produce official souvenir products
7 The organisers of a major sporting event produce official souvenir products. Cheaper unofficial souvenirs are also produced by street traders who sell them to people walking to the event. Of what is this an example? A a contestable market B perfect competition C price discrimination D price leadership
Mark scheme: A
Q8 · Which assumption is made in calculating a firm’s short-run production function?
8 Which assumption is made in calculating a firm’s short-run production function? A All factors of production are fixed. B All factors of production are variable. C The state of technology is fixed. D The state of technology is variable.
Mark scheme: C
More questions on Types of cost, revenue and profit, short-run and long-run production
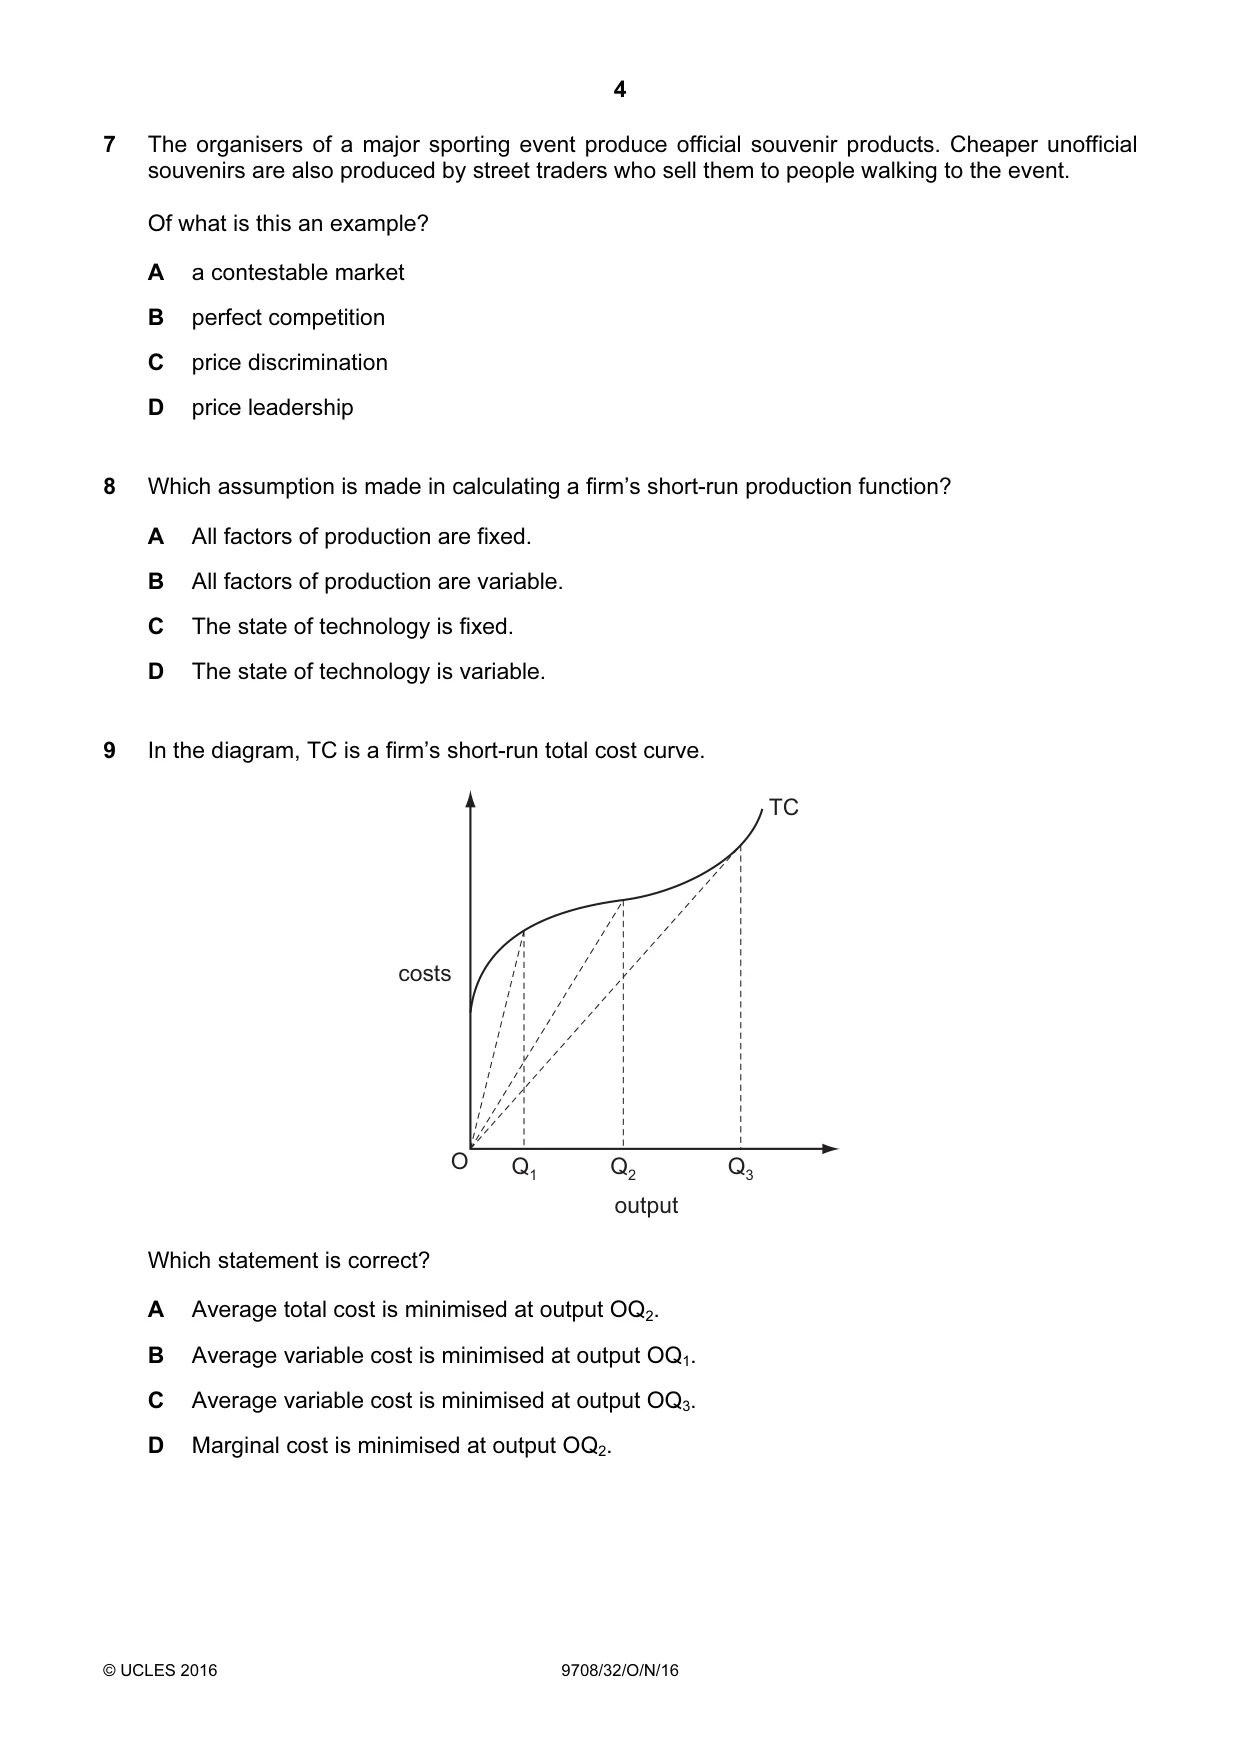
Q9 · In the diagram, TC is a firm’s short-run total cost curve
9 In the diagram, TC is a firm’s short-run total cost curve. TC costs O Q1 Q2 Q3 output Which statement is correct? A Average total cost is minimised at output OQ2. B Average variable cost is minimised at output OQ1. C Average variable cost is minimised at output OQ3. D Marginal cost is minimised at output OQ2.
Mark scheme: D
More questions on Types of cost, revenue and profit, short-run and long-run production
Q10 · The table shows the total cost of a firm
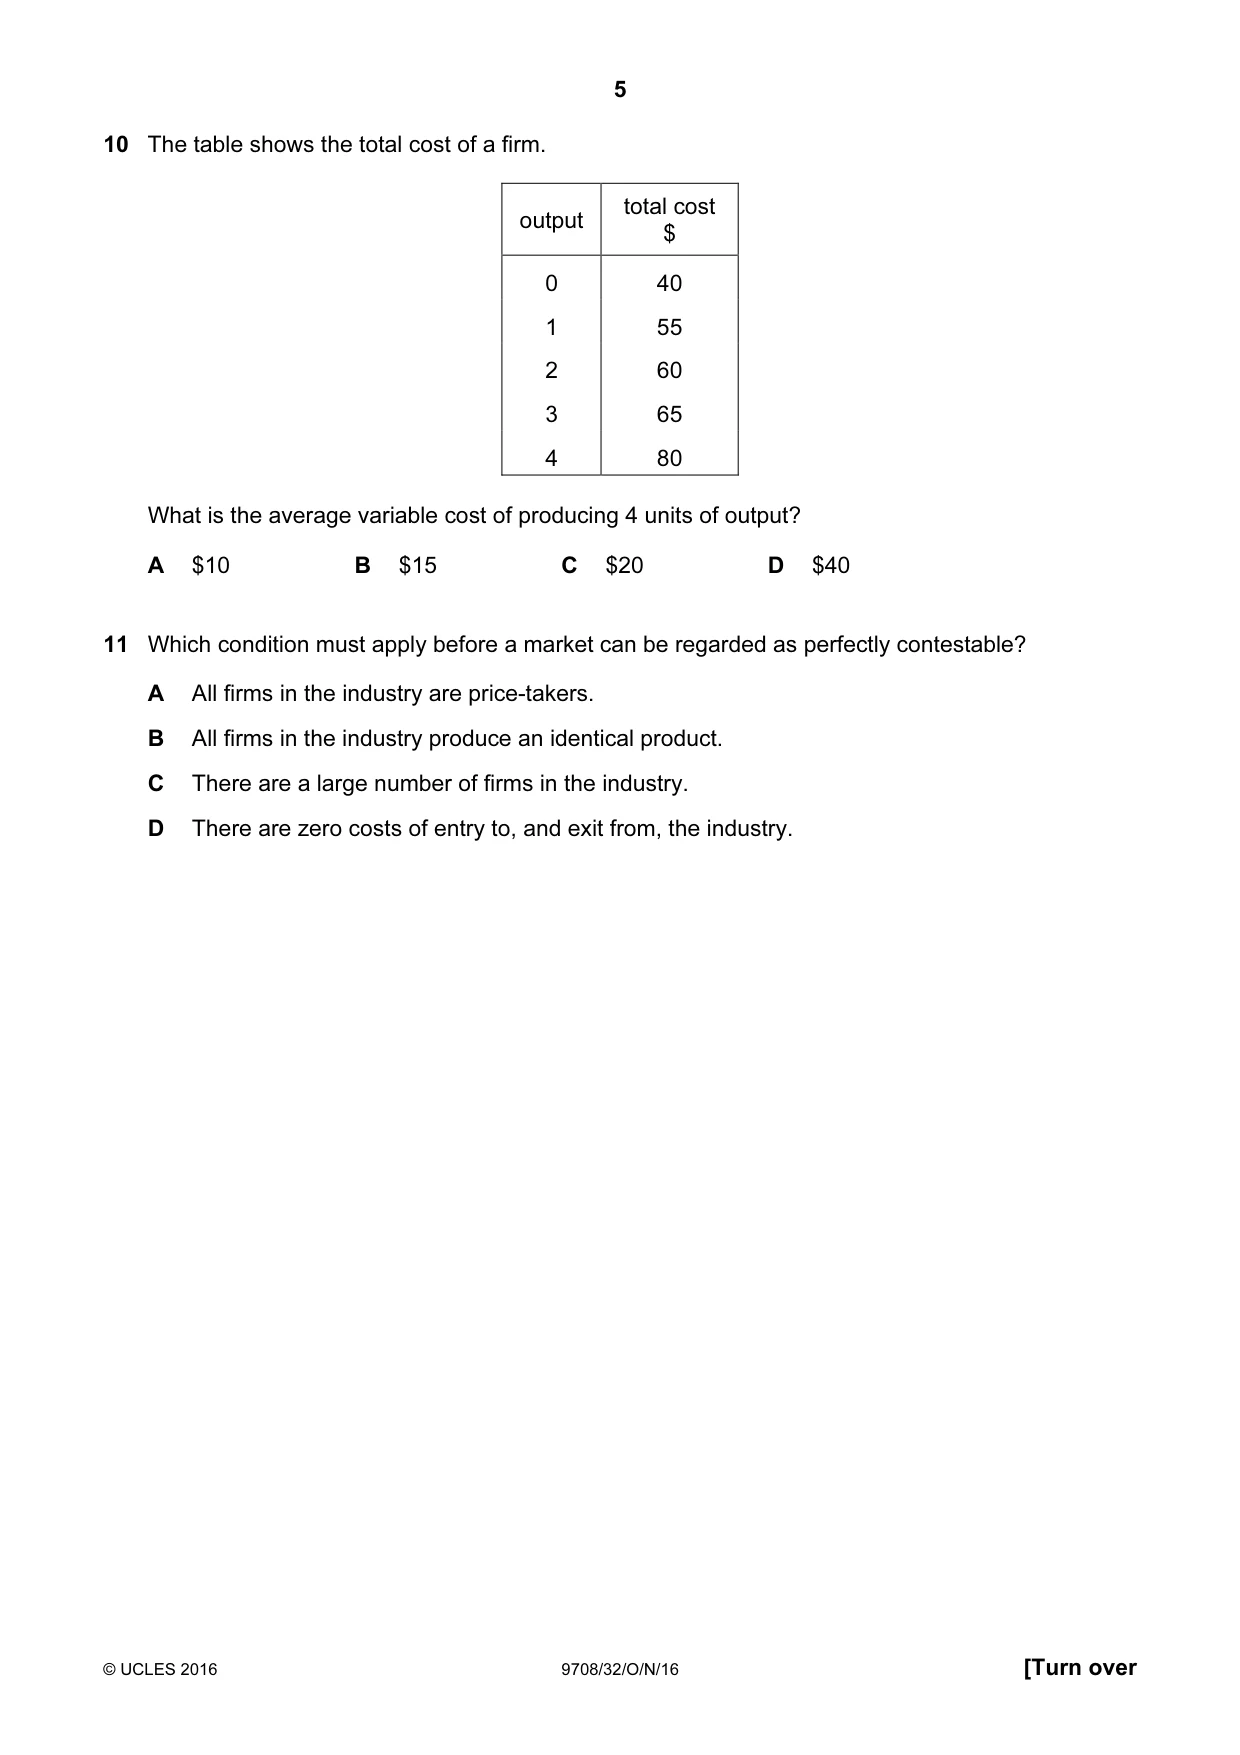
10 The table shows the total cost of a firm. total cost output $ 0 40 1 55 2 60 3 65 4 80 What is the average variable cost of producing 4 units of output? A $10 B $15 C $20 D $40
Mark scheme: A
More questions on Types of cost, revenue and profit, short-run and long-run production
Q11 · Which condition must apply before a market can be regarded as perfectly contestable?
11 Which condition must apply before a market can be regarded as perfectly contestable? A All firms in the industry are price-takers. B All firms in the industry produce an identical product. C There are a large number of firms in the industry. D There are zero costs of entry to, and exit from, the industry.
Mark scheme: D
Q12 · The diagram shows the average and marginal revenue curves of an oligopolistic firm
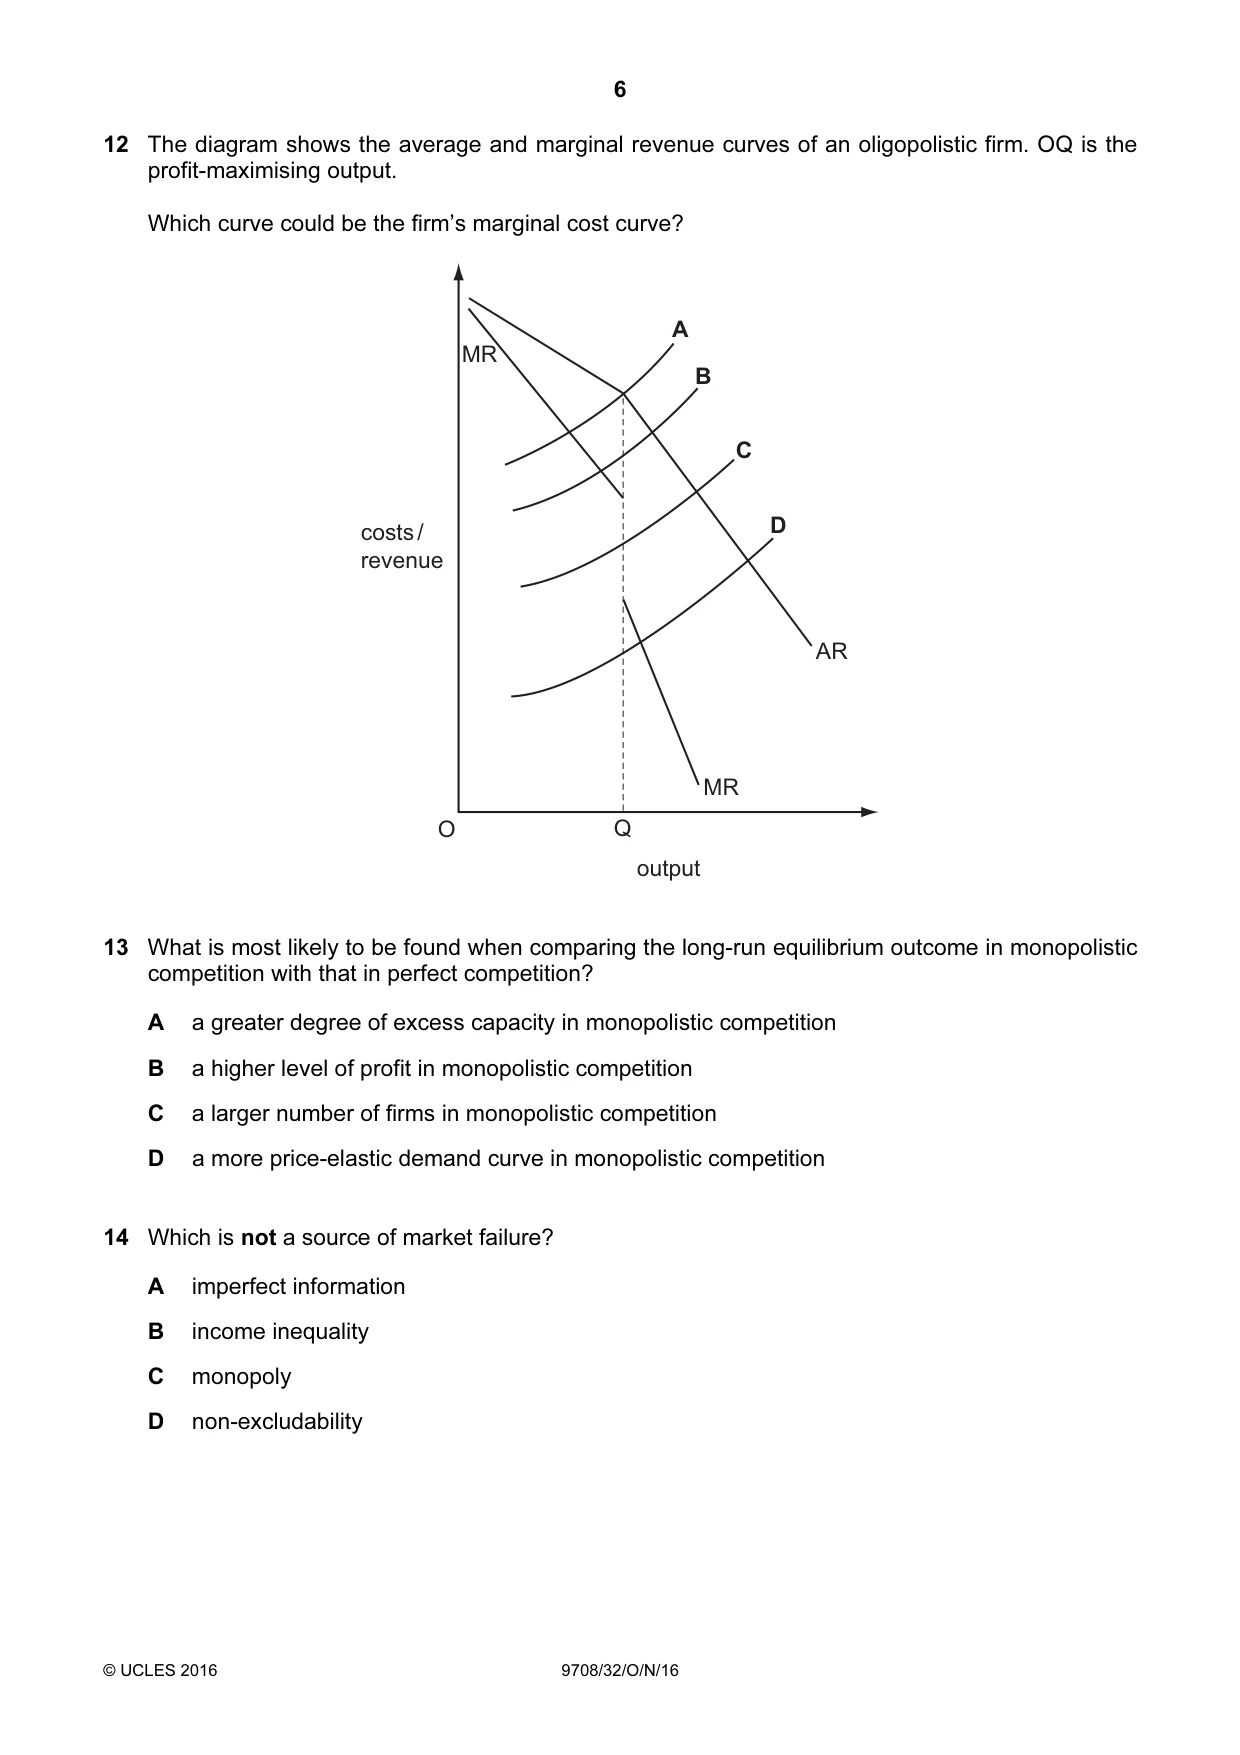
12 The diagram shows the average and marginal revenue curves of an oligopolistic firm. OQ is the profit-maximising output. Which curve could be the firm’s marginal cost curve? A MR B C costs / D revenue AR MR O Q output
Mark scheme: C
Q13 · What is most likely to be found when comparing the long-run equilibrium outcome in…
13 What is most likely to be found when comparing the long-run equilibrium outcome in monopolistic competition with that in perfect competition? A a greater degree of excess capacity in monopolistic competition B a higher level of profit in monopolistic competition C a larger number of firms in monopolistic competition D a more price-elastic demand curve in monopolistic competition
Mark scheme: A
Q14 · Which is not a source of market failure?
14 Which is not a source of market failure? A imperfect information B income inequality C monopoly D non-excludability
Mark scheme: B
Q15 · The government wants to regulate the consumption of a demerit good in order to increase…
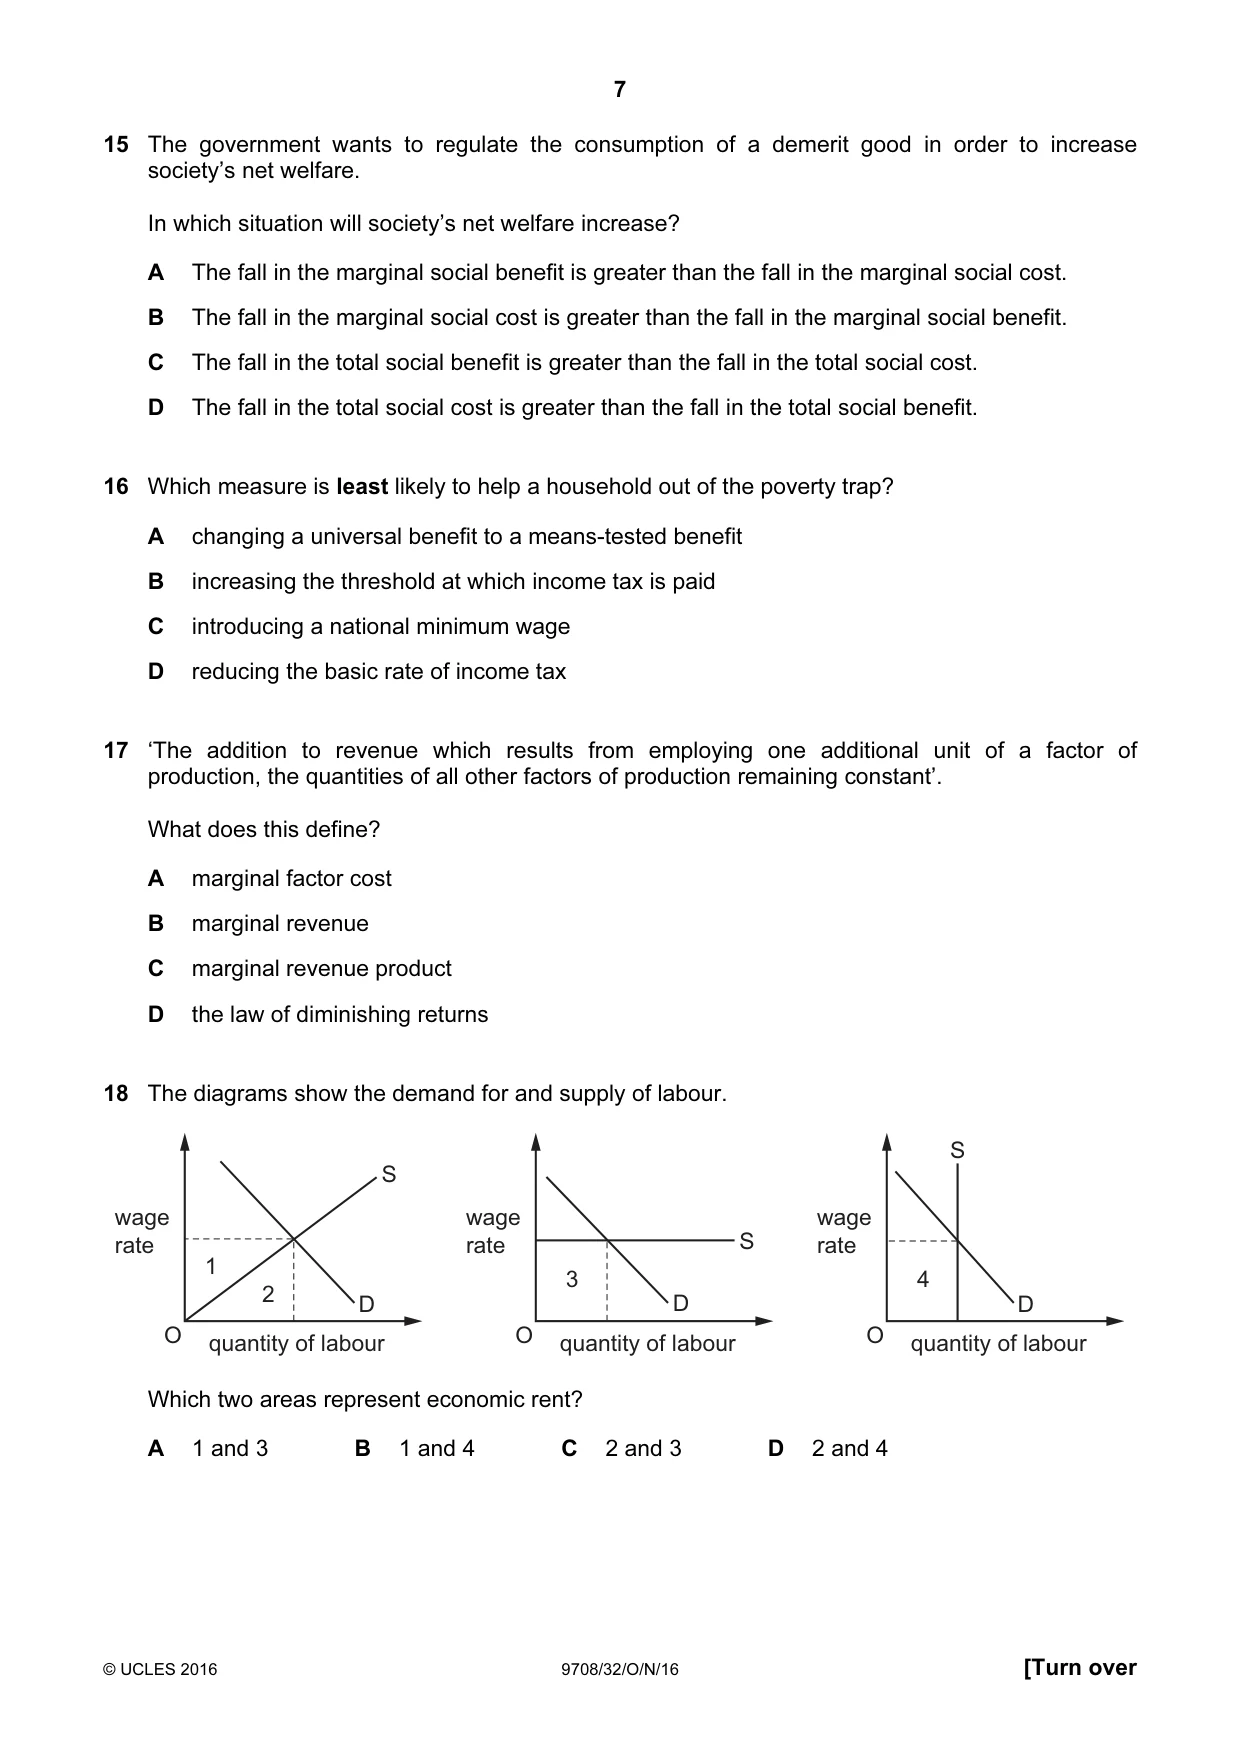
15 The government wants to regulate the consumption of a demerit good in order to increase society’s net welfare. In which situation will society’s net welfare increase? A The fall in the marginal social benefit is greater than the fall in the marginal social cost. B The fall in the marginal social cost is greater than the fall in the marginal social benefit. C The fall in the total social benefit is greater than the fall in the total social cost. D The fall in the total social cost is greater than the fall in the total social benefit.
Mark scheme: D
Q16 · Which measure is least likely to help a household out of the poverty trap?
16 Which measure is least likely to help a household out of the poverty trap? A changing a universal benefit to a means-tested benefit B increasing the threshold at which income tax is paid C introducing a national minimum wage D reducing the basic rate of income tax
Mark scheme: A
More questions on Equity and redistribution of income and wealth
Q17 · ‘The addition to revenue which results from employing one additional unit of a factor of…
17 ‘The addition to revenue which results from employing one additional unit of a factor of production, the quantities of all other factors of production remaining constant’. What does this define? A marginal factor cost B marginal revenue C marginal revenue product D the law of diminishing returns
Mark scheme: C
More questions on Labour market forces and government intervention
Q18 · The diagrams show the demand for and supply of labour
18 The diagrams show the demand for and supply of labour. S S wage wage wage rate rate S rate 1 3 4 2 D D D O quantity of labour O quantity of labour O quantity of labour Which two areas represent economic rent? A 1 and 3 B 1 and 4 C 2 and 3 D 2 and 4
Mark scheme: B
More questions on Labour market forces and government intervention
Q19 · The table shows the short-run production function of a firm with labour as the variable…
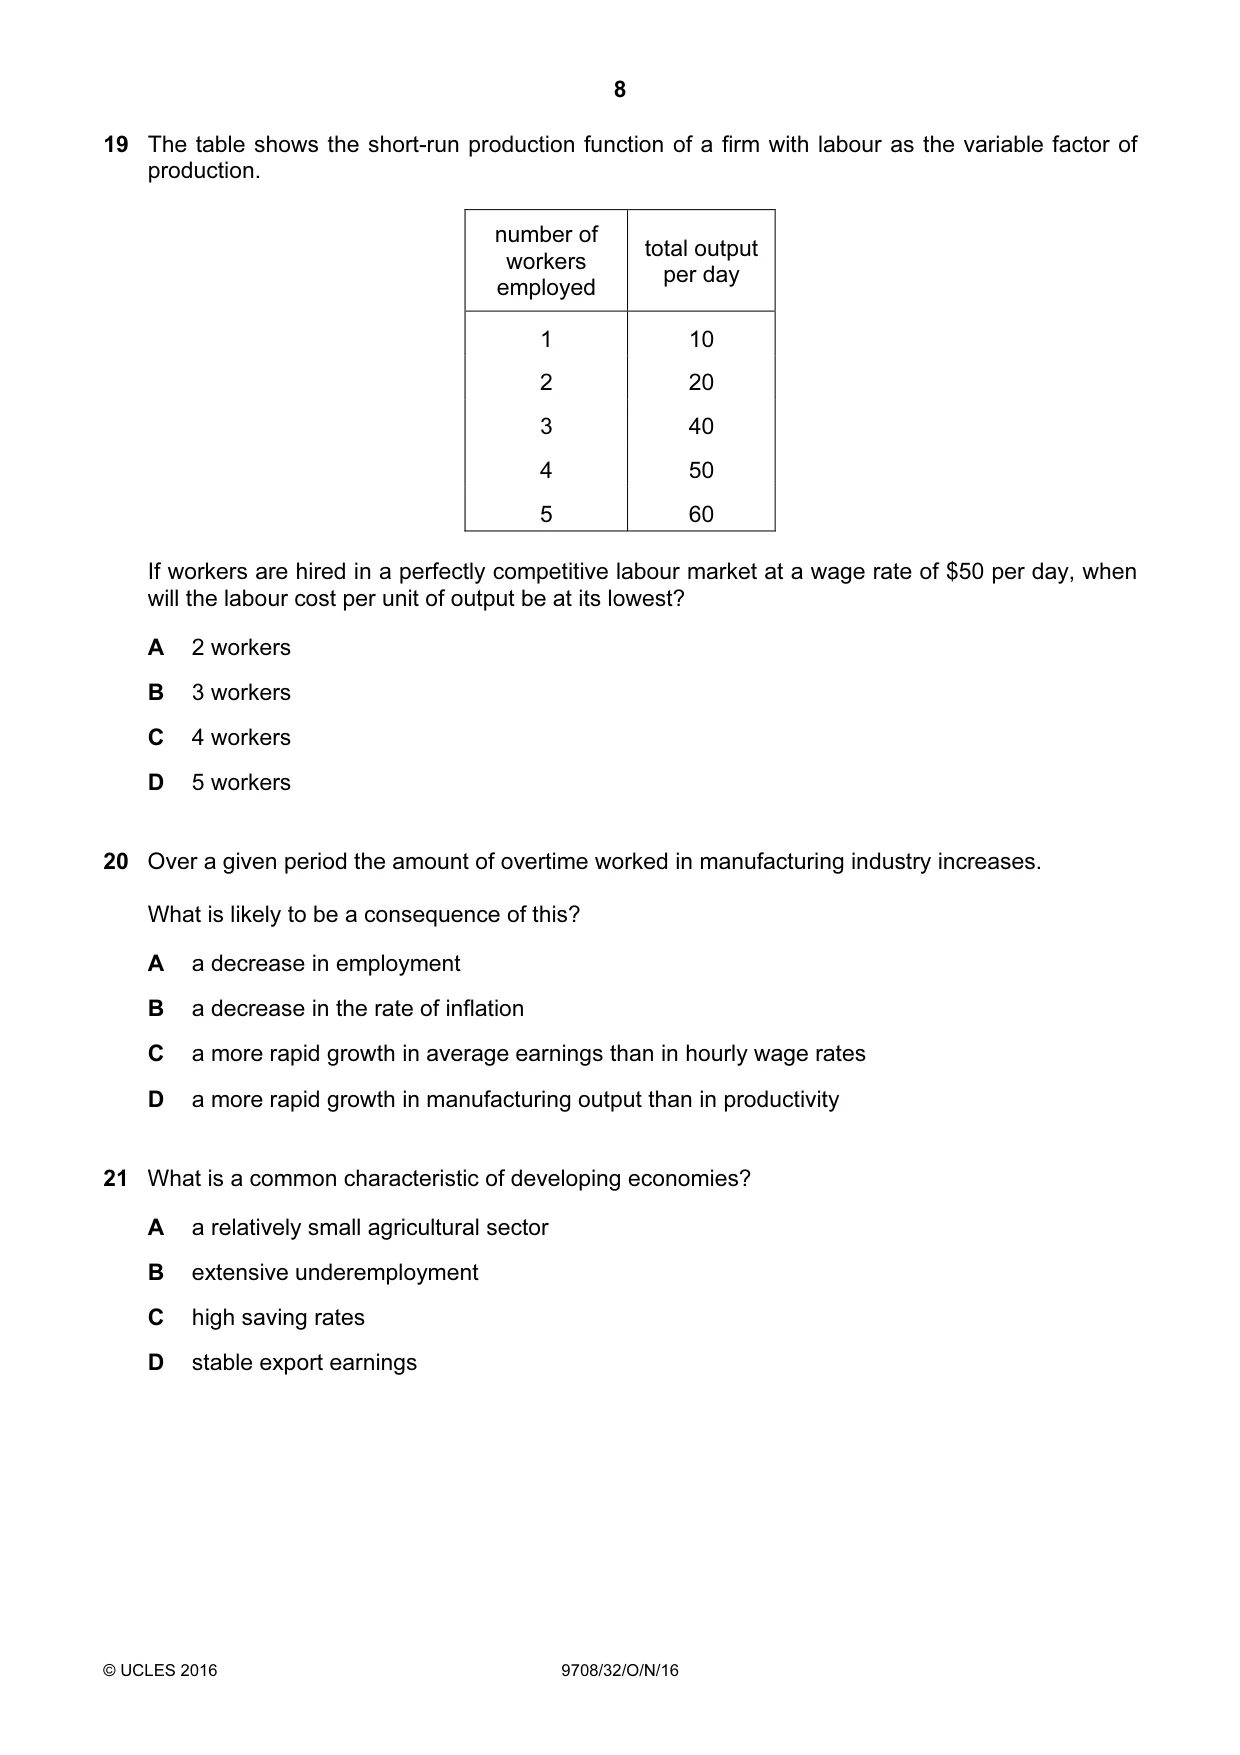
19 The table shows the short-run production function of a firm with labour as the variable factor of production. number of total output workers per day employed 1 10 2 20 3 40 4 50 5 60 If workers are hired in a perfectly competitive labour market at a wage rate of $50 per day, when will the labour cost per unit of output be at its lowest? A 2 workers B 3 workers C 4 workers D 5 workers
Mark scheme: B
More questions on Labour market forces and government intervention
Q20 · Over a given period the amount of overtime worked in manufacturing industry increases
20 Over a given period the amount of overtime worked in manufacturing industry increases. What is likely to be a consequence of this? A a decrease in employment B a decrease in the rate of inflation C a more rapid growth in average earnings than in hourly wage rates D a more rapid growth in manufacturing output than in productivity
Mark scheme: C
More questions on Labour market forces and government intervention
Q21 · What is a common characteristic of developing economies?
21 What is a common characteristic of developing economies? A a relatively small agricultural sector B extensive underemployment C high saving rates D stable export earnings
Mark scheme: B
More questions on Characteristics of countries at different levels of development
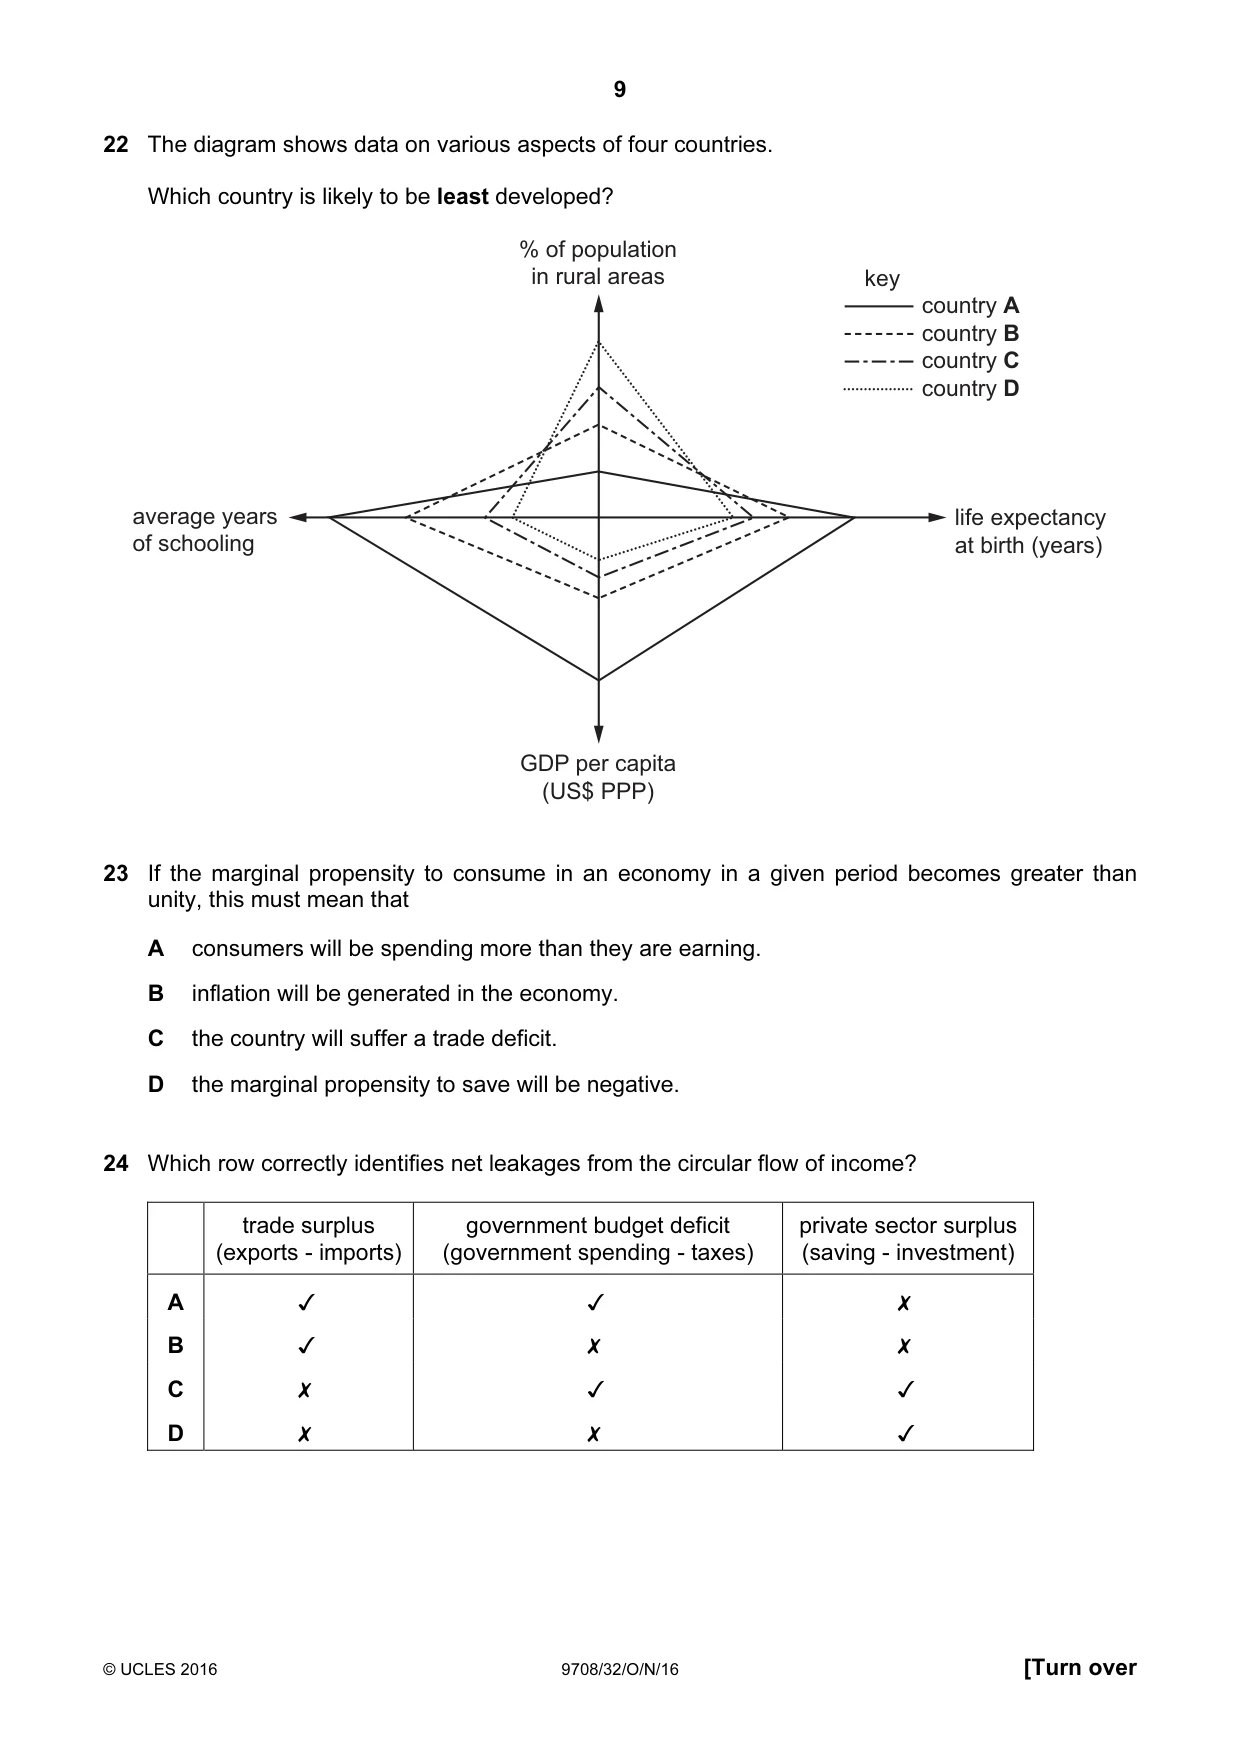
Q22 · The diagram shows data on various aspects of four countries
22 The diagram shows data on various aspects of four countries. Which country is likely to be least developed? % of population in rural areas key country A country B country C country D average years life expectancy of schooling at birth (years) GDP per capita (US$ PPP)
Mark scheme: D
More questions on Characteristics of countries at different levels of development
Q23 · If the marginal propensity to consume in an economy in a given period becomes greater…
23 If the marginal propensity to consume in an economy in a given period becomes greater than unity, this must mean that A consumers will be spending more than they are earning. B inflation will be generated in the economy. C the country will suffer a trade deficit. D the marginal propensity to save will be negative.
Mark scheme: D
Q24 · Which row correctly identifies net leakages from the circular flow of income?
24 Which row correctly identifies net leakages from the circular flow of income? trade surplus (exports - imports) government budget deficit (government spending - taxes) private sector surplus (saving - investment) 0 0O WwW D> v v x x v x v x \ <x x
Mark scheme: D
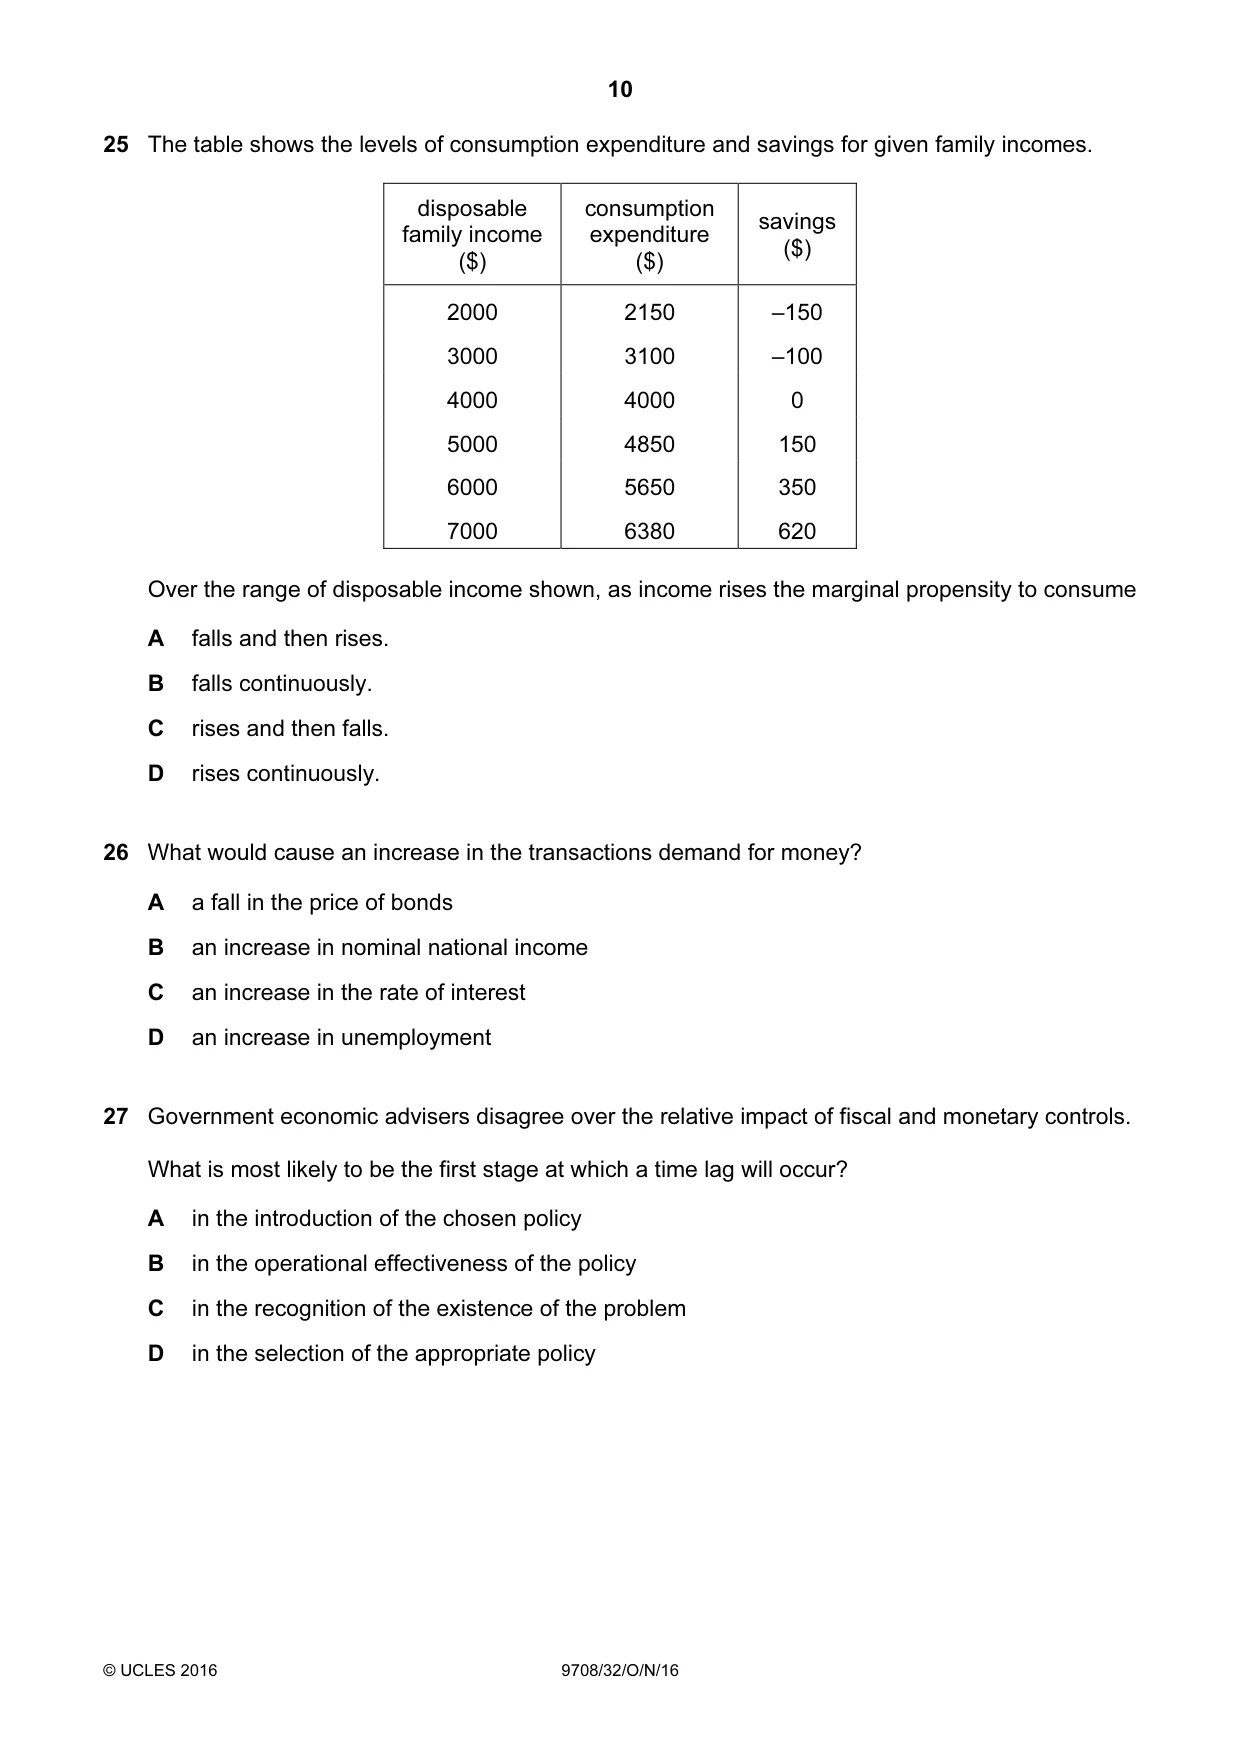
Q25 · The table shows the levels of consumption expenditure and savings for given family incomes
25 The table shows the levels of consumption expenditure and savings for given family incomes. disposable consumption savings family income expenditure ($) ($) ($) 2000 2150 –150 3000 3100 –100 4000 4000 0 5000 4850 150 6000 5650 350 7000 6380 620 Over the range of disposable income shown, as income rises the marginal propensity to consume A falls and then rises. B falls continuously. C rises and then falls. D rises continuously.
Mark scheme: B
Q26 · What would cause an increase in the transactions demand for money?
26 What would cause an increase in the transactions demand for money? A a fall in the price of bonds B an increase in nominal national income C an increase in the rate of interest D an increase in unemployment
Mark scheme: B
Q27 · Government economic advisers disagree over the relative impact of fiscal and monetary…
27 Government economic advisers disagree over the relative impact of fiscal and monetary controls. What is most likely to be the first stage at which a time lag will occur? A in the introduction of the chosen policy B in the operational effectiveness of the policy C in the recognition of the existence of the problem D in the selection of the appropriate policy
Mark scheme: D
More questions on Effectiveness of policy options to meet all macroeconomic objectives
Q28 · What has not accompanied global economic growth over the last twenty five years?
28 What has not accompanied global economic growth over the last twenty five years? A a depletion of non-renewable resources B decreased international trade C growing urbanisation D increased atmospheric pollution
Mark scheme: B
Q29 · Which policy pursued by a central bank represents a contractionary monetary policy?
29 Which policy pursued by a central bank represents a contractionary monetary policy? A a reduction in the interest rate at which it will lend to banks B a reduction in the minimum cash to deposit ratios of banks C the purchase of foreign currency to influence the country’s exchange rate D the sale of government bonds in the open market
Mark scheme: D
Q30 · Which policy’s principal aim is to ensure sound public finances?
30 Which policy’s principal aim is to ensure sound public finances? A environmental policy B fiscal policy C monetary policy D supply-side policy
Mark scheme: B
More questions on Government macroeconomic policy objectives
What was in this paper
The subtopics covered by these 30 questions, and how many questions each got. Open one in a new tab to see every Cambridge question on it.
4Labour market forces and government intervention4Efficiency and market failure3The circular flow of income3Types of cost, revenue and profit, short-run and long-run production3Characteristics of countries at different levels of development2Money and banking2Effectiveness of policy options to meet all macroeconomic objectives1Equity and redistribution of income and wealth1Globalisation1Government macroeconomic policy objectives1Government policies to achieve efficient resource allocation and correct market failure1Growth and survival of firms1Indifference curves and budget lines1Private costs and benefits, externalities and social costs and benefits1Utility1What you needed in this session
Cambridge’s own grade thresholds for 2016 Oct/Nov, Paper 3 · Variant 2. A higher threshold means an easier paper — the bar moves with how the cohort did.