Cambridge A Level Economics 9708 — 2011 Oct/Nov Paper 3 · Variant 2
9708/32/O/N/11 · 30 questions · 30 marks · ≈34 min
The question paper and its mark scheme, free to read here and free to download. This is Cambridge’s own paper, exactly as it was sat.
Question paper12 pages



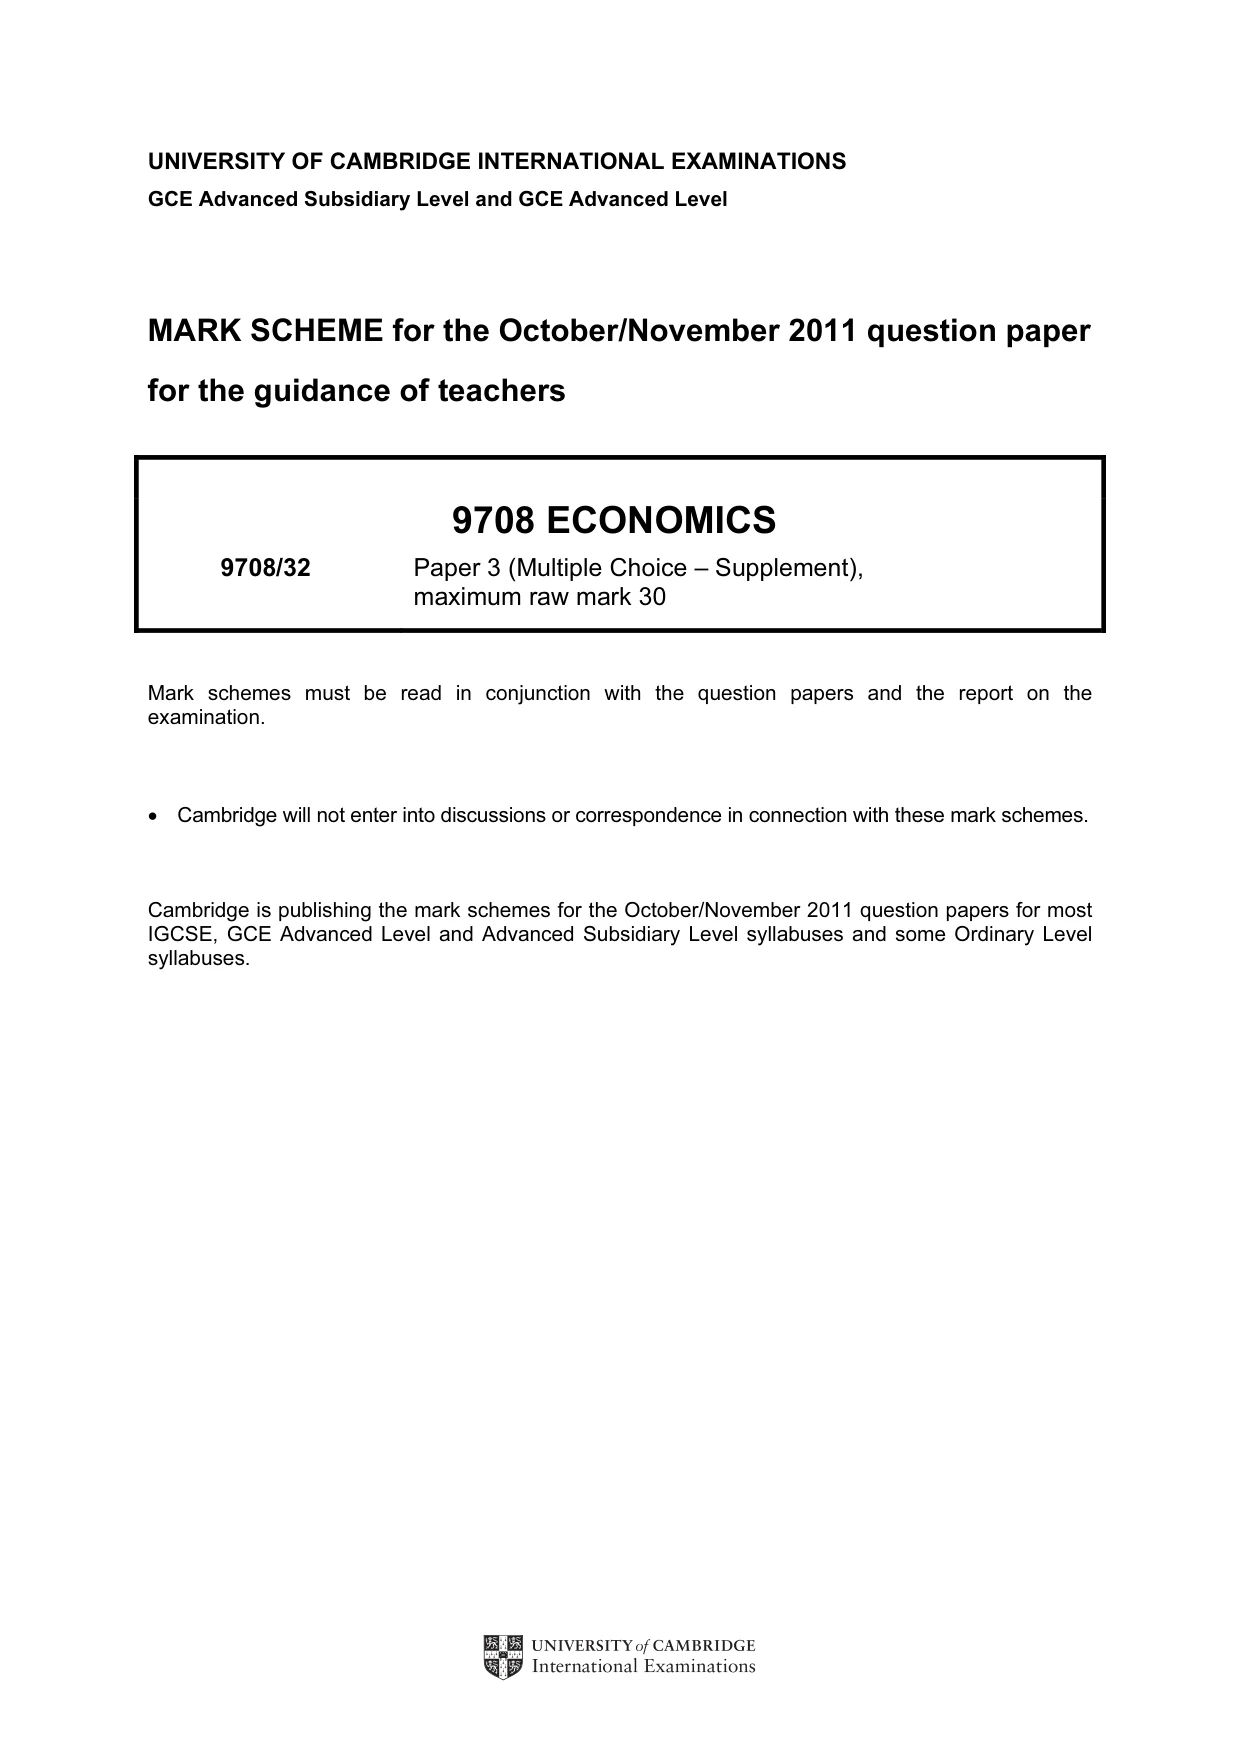
Mark scheme2 pages
Answers below. Sit the paper first if you are practising.
Questions as text
Q1 · Why does a normal demand curve for a product slope downwards from left to right?
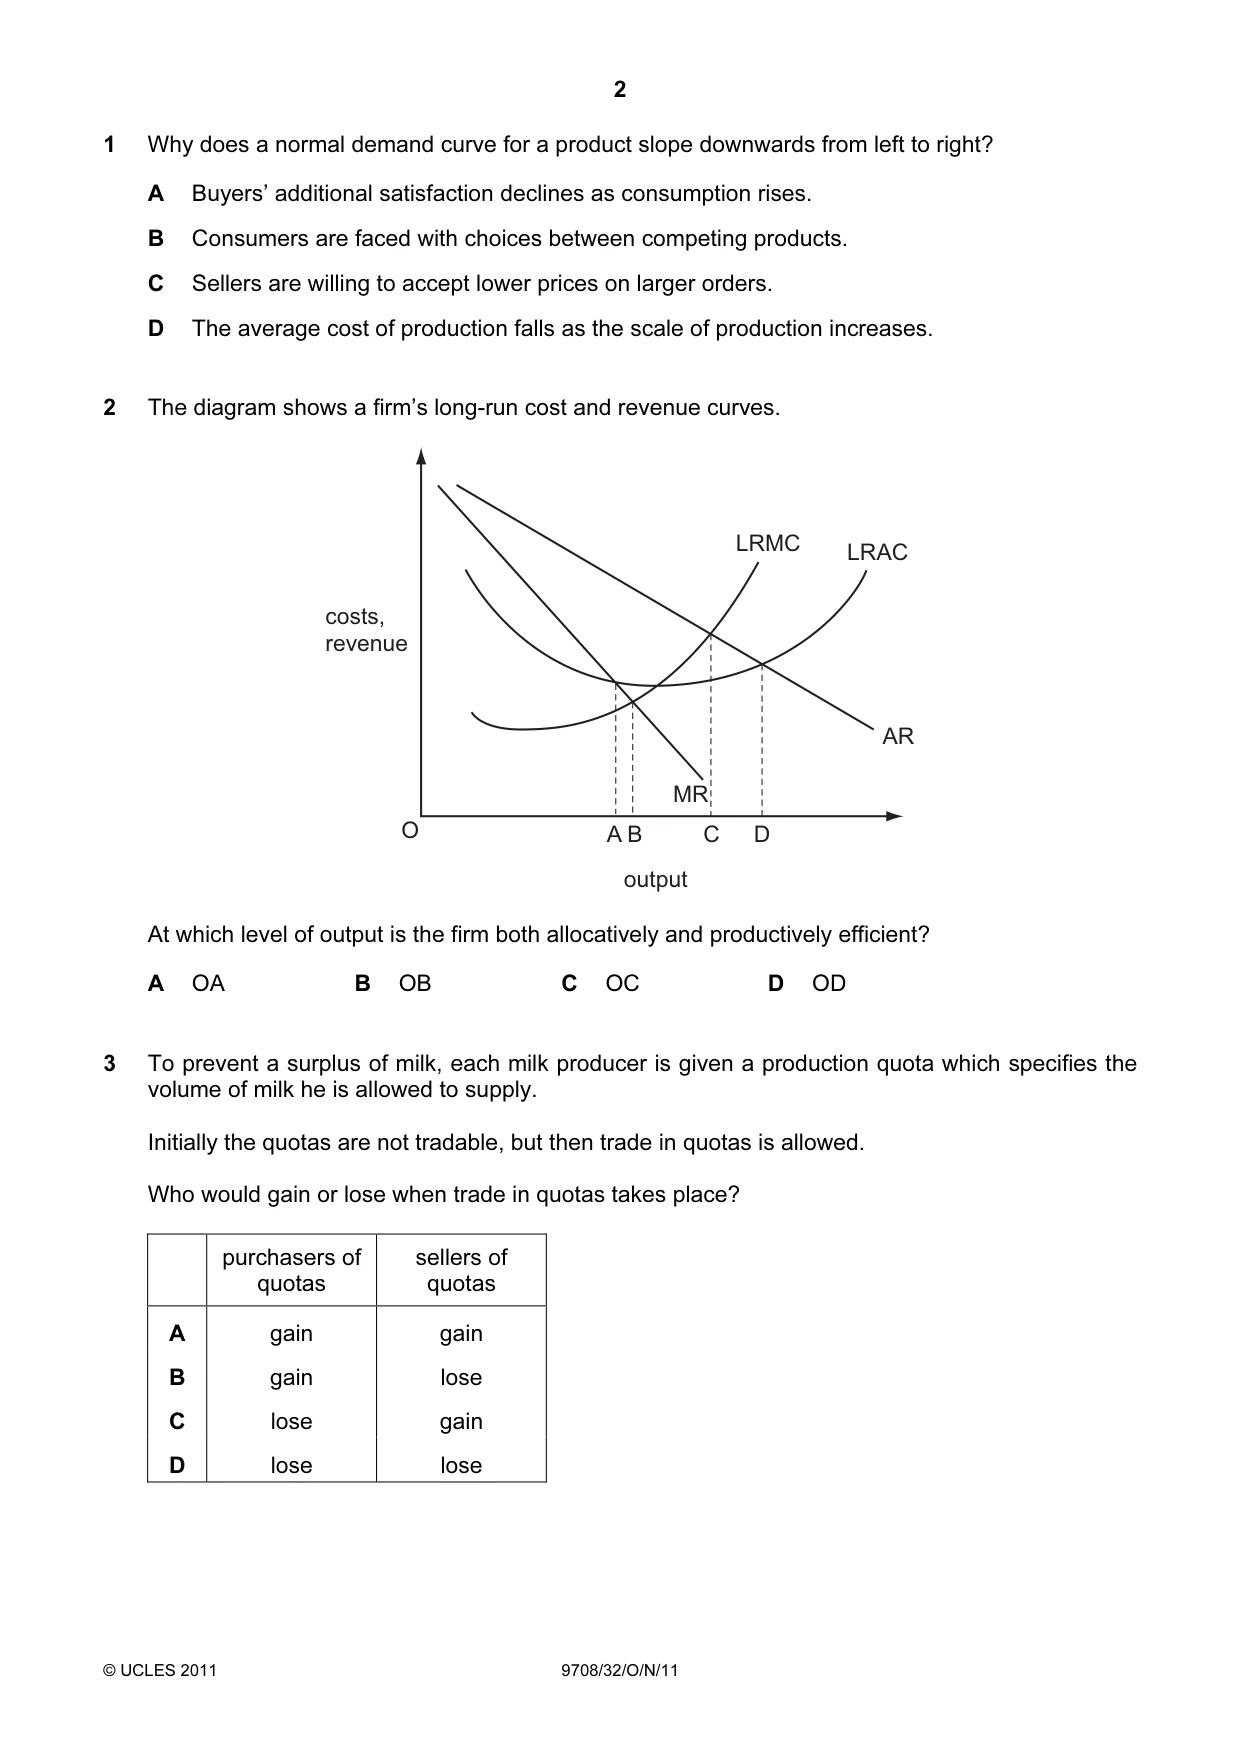
1 Why does a normal demand curve for a product slope downwards from left to right? A Buyers’ additional satisfaction declines as consumption rises. B Consumers are faced with choices between competing products. C Sellers are willing to accept lower prices on larger orders. D The average cost of production falls as the scale of production increases.
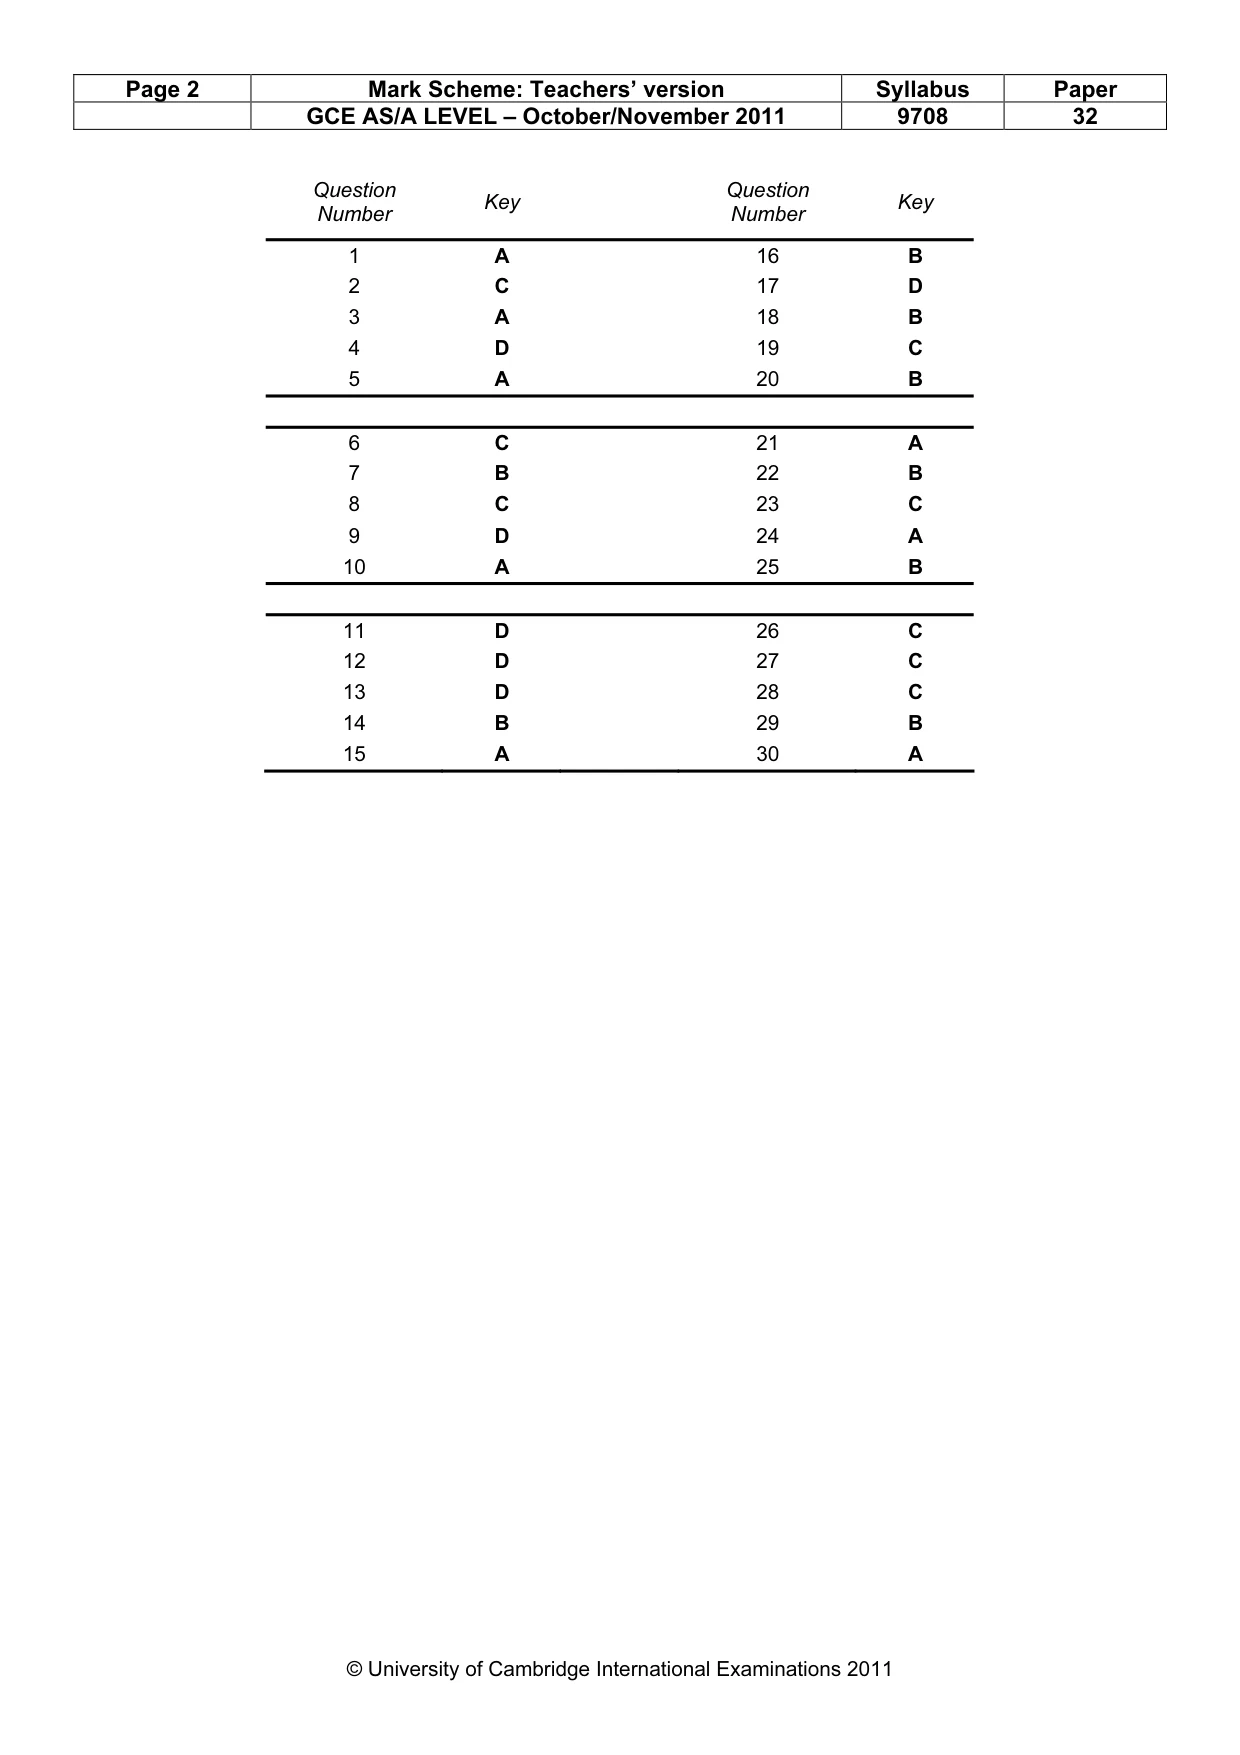
Mark scheme: A
Q2 · The diagram shows a firm’s long-run cost and revenue curves
2 The diagram shows a firm’s long-run cost and revenue curves. LRMC LRAC costs, revenue AR MR O A B C D output At which level of output is the firm both allocatively and productively efficient? A OA B OB C OC D OD
Mark scheme: C
Q3 · To prevent a surplus of milk, each milk producer is given a production quota which…
3 To prevent a surplus of milk, each milk producer is given a production quota which specifies the volume of milk he is allowed to supply. Initially the quotas are not tradable, but then trade in quotas is allowed. Who would gain or lose when trade in quotas takes place? purchasers of sellers of quotas quotas A gain gain B gain lose C lose gain D lose lose
Mark scheme: A
More questions on Methods and effects of government intervention in markets
Q4 · For the purposes of measuring the income effect of a change in the price of a good, what…
4 For the purposes of measuring the income effect of a change in the price of a good, what is not held constant? A consumer preferences B relative prices C the consumer’s money income D the consumer’s real income
Mark scheme: D
Q5 · An actor is paid $100 000 a year
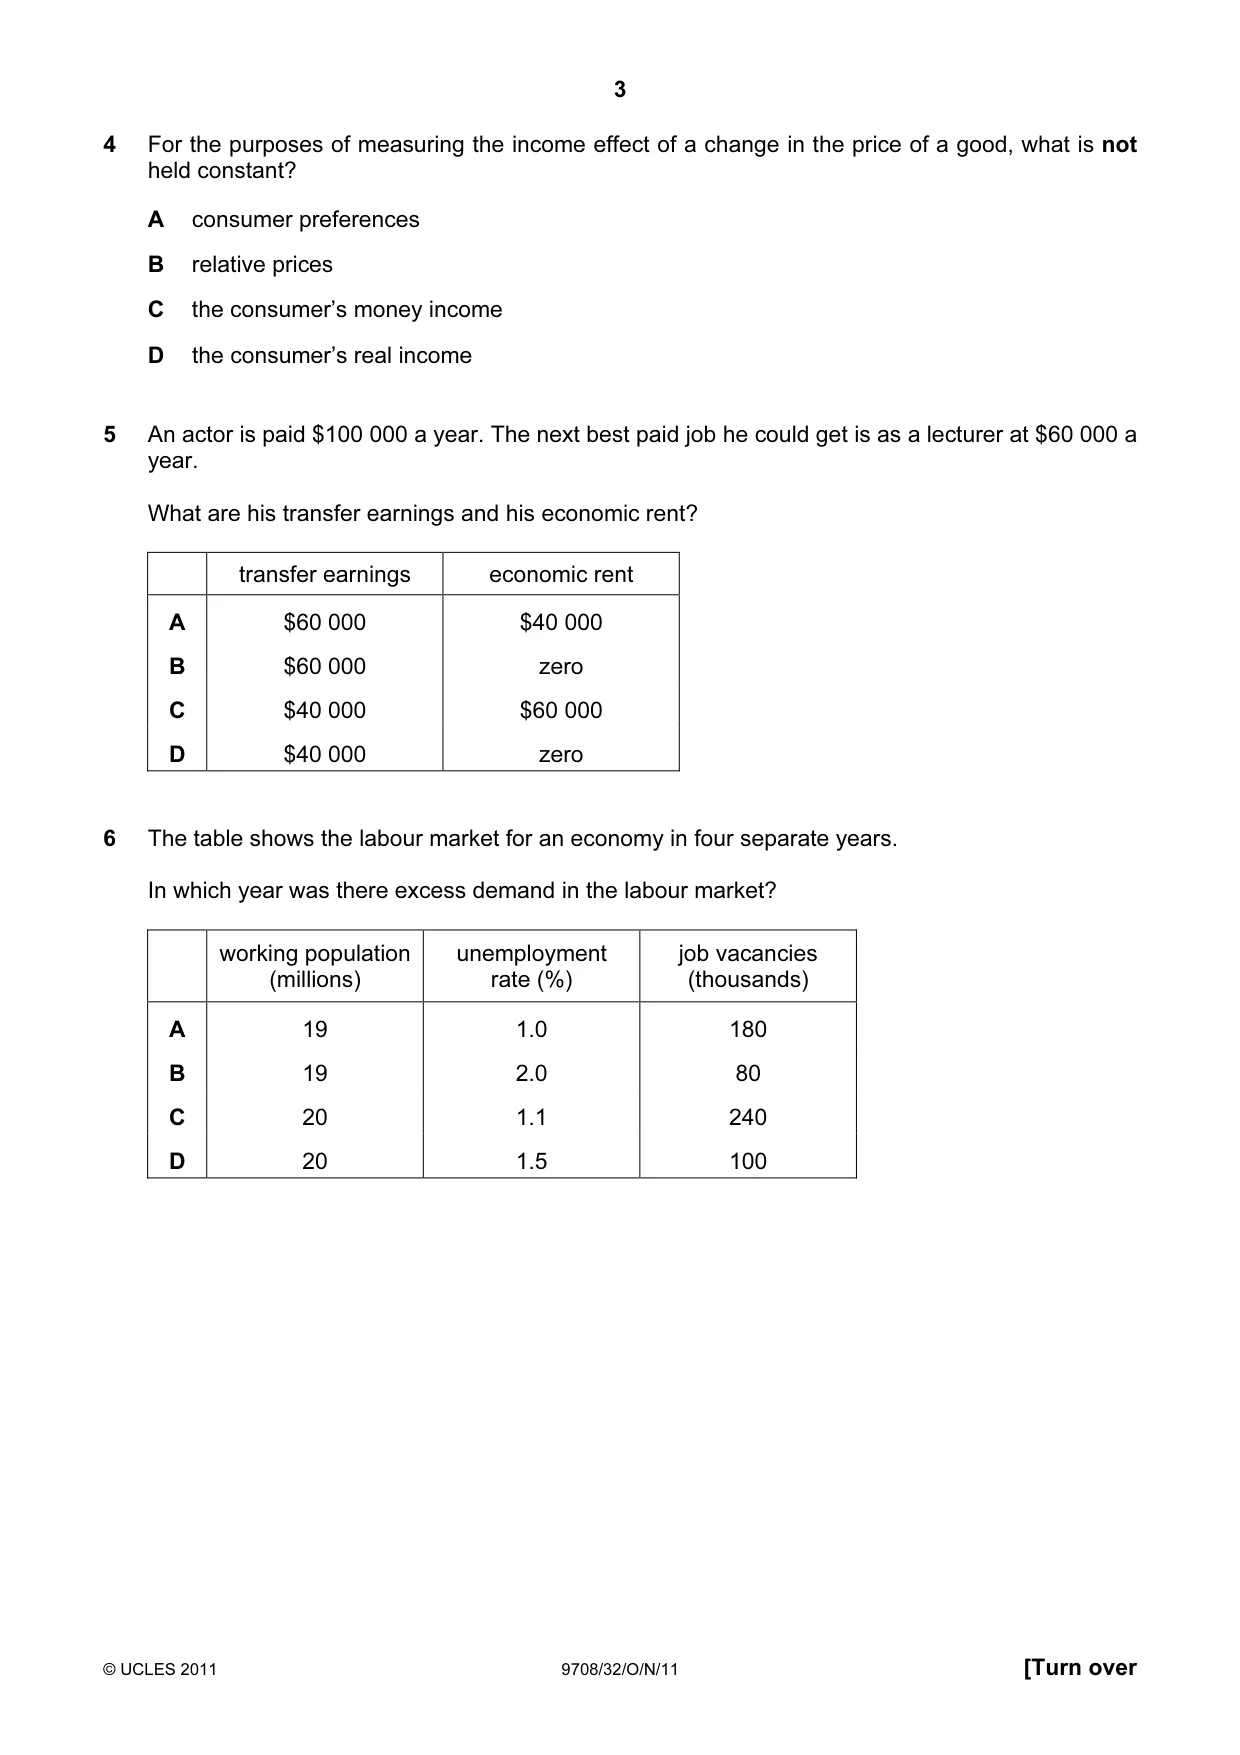
5 An actor is paid $100 000 a year. The next best paid job he could get is as a lecturer at $60 000 a year. What are his transfer earnings and his economic rent? transfer earnings economic rent A $60 000 $40 000 B $60 000 zero C $40 000 $60 000 D $40 000 zero
Mark scheme: A
More questions on Labour market forces and government intervention
Q6 · The table shows the labour market for an economy in four separate years
6 The table shows the labour market for an economy in four separate years. In which year was there excess demand in the labour market? working population unemployment job vacancies (millions) rate (%) (thousands) A 19 1.0 180 B 19 2.0 80 C 20 1.1 240 D 20 1.5 100
Mark scheme: C
More questions on Labour market forces and government intervention
Q7 · The table shows the levels of output of a good which can be produced with different…
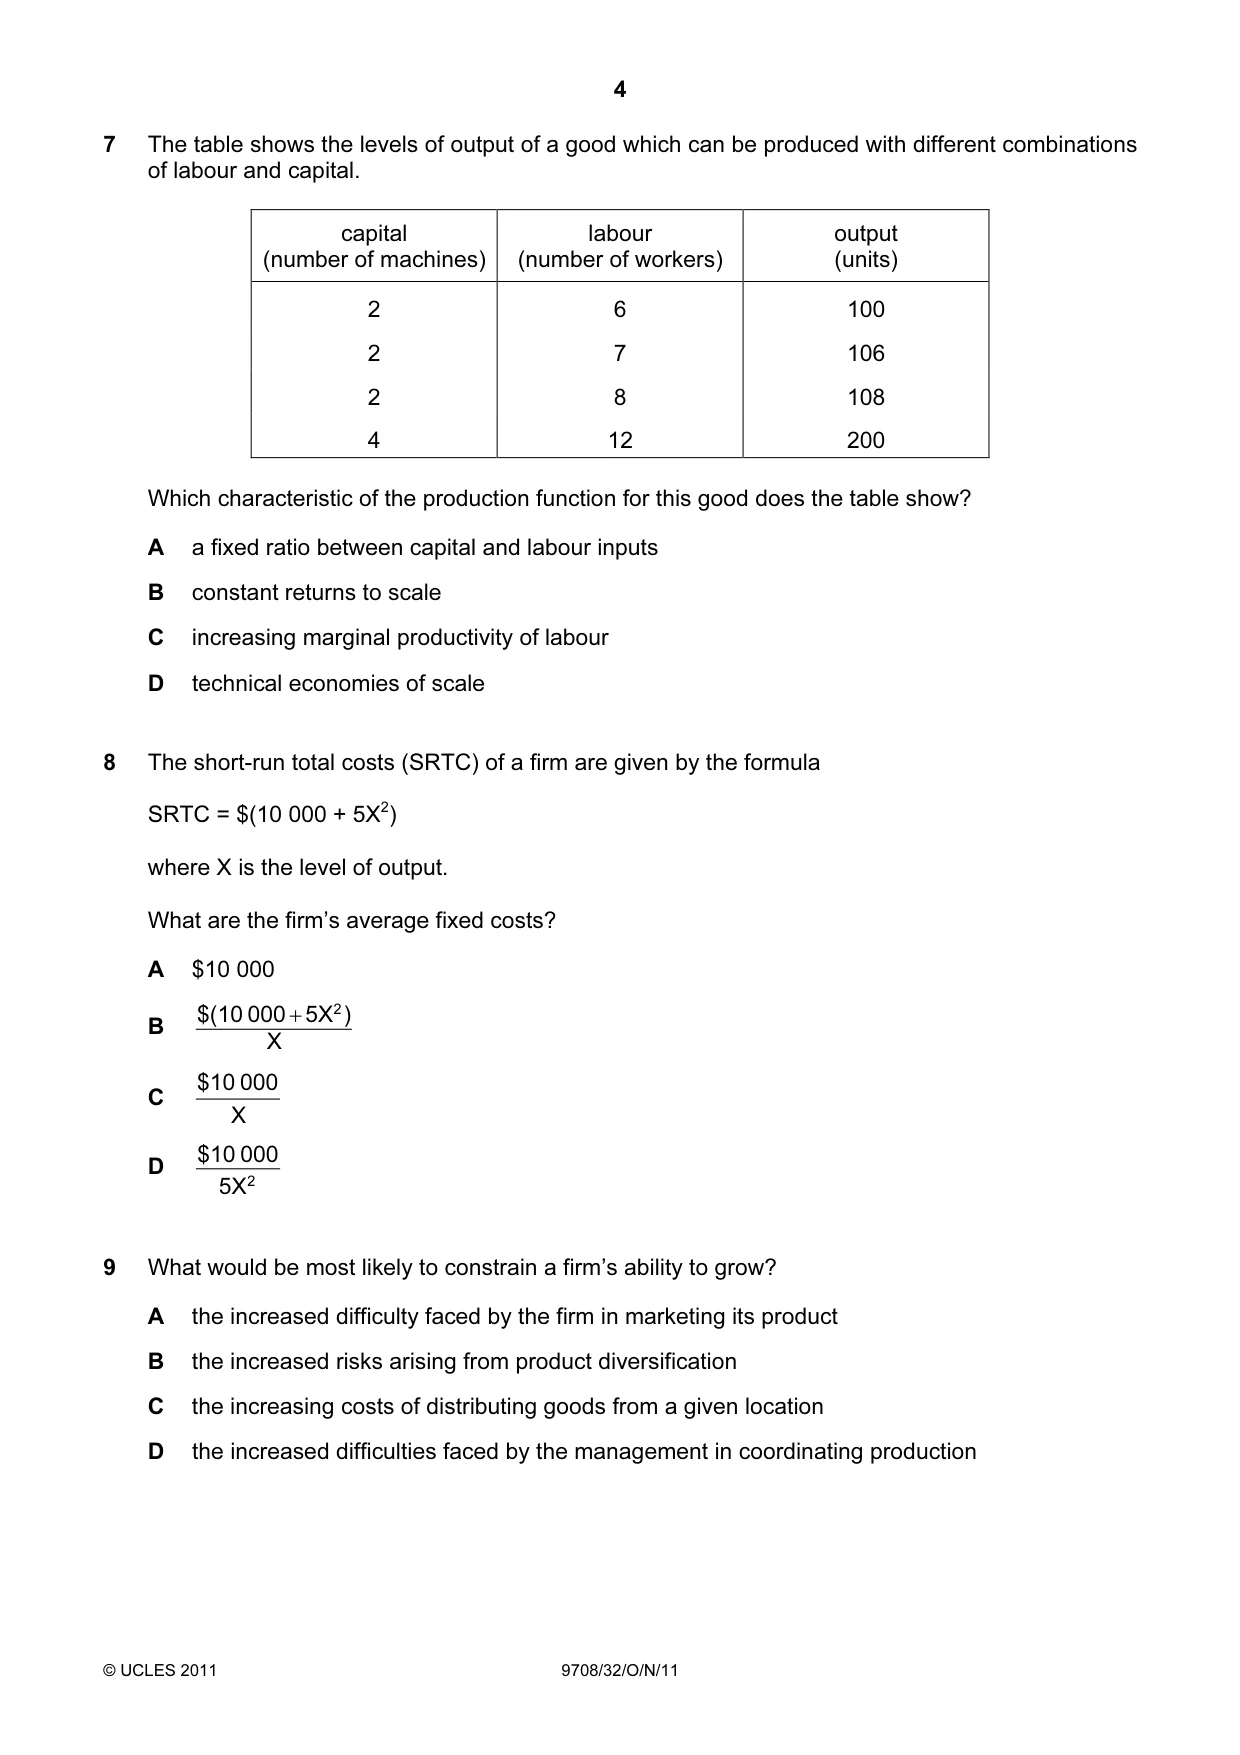
7 The table shows the levels of output of a good which can be produced with different combinations of labour and capital. capital labour output (number of machines) (number of workers) (units) 2 6 100 2 7 106 2 8 108 4 12 200 Which characteristic of the production function for this good does the table show? A a fixed ratio between capital and labour inputs B constant returns to scale C increasing marginal productivity of labour D technical economies of scale
Mark scheme: B
More questions on Types of cost, revenue and profit, short-run and long-run production
Q8 · The short-run total costs (SRTC) of a firm are given by the formula SRTC = $(10 000 +…
8 The short-run total costs (SRTC) of a firm are given by the formula SRTC = $(10 000 + 5X2) where X is the level of output. What are the firm’s average fixed costs? A $10 000 $(10 000 + 5X 2 ) B X $10 000 C X $10 000 D 5X 2
Mark scheme: C
More questions on Types of cost, revenue and profit, short-run and long-run production
Q9 · What would be most likely to constrain a firm’s ability to grow?
9 What would be most likely to constrain a firm’s ability to grow? A the increased difficulty faced by the firm in marketing its product B the increased risks arising from product diversification C the increasing costs of distributing goods from a given location D the increased difficulties faced by the management in coordinating production
Mark scheme: D
Q10 · Which would be least likely to practise price discrimination?
10 Which would be least likely to practise price discrimination? A a baker B a cinema C a hairdressing salon D a restaurant
Mark scheme: A
Q11 · The diagram shows the cost and revenue curves of a monopoly
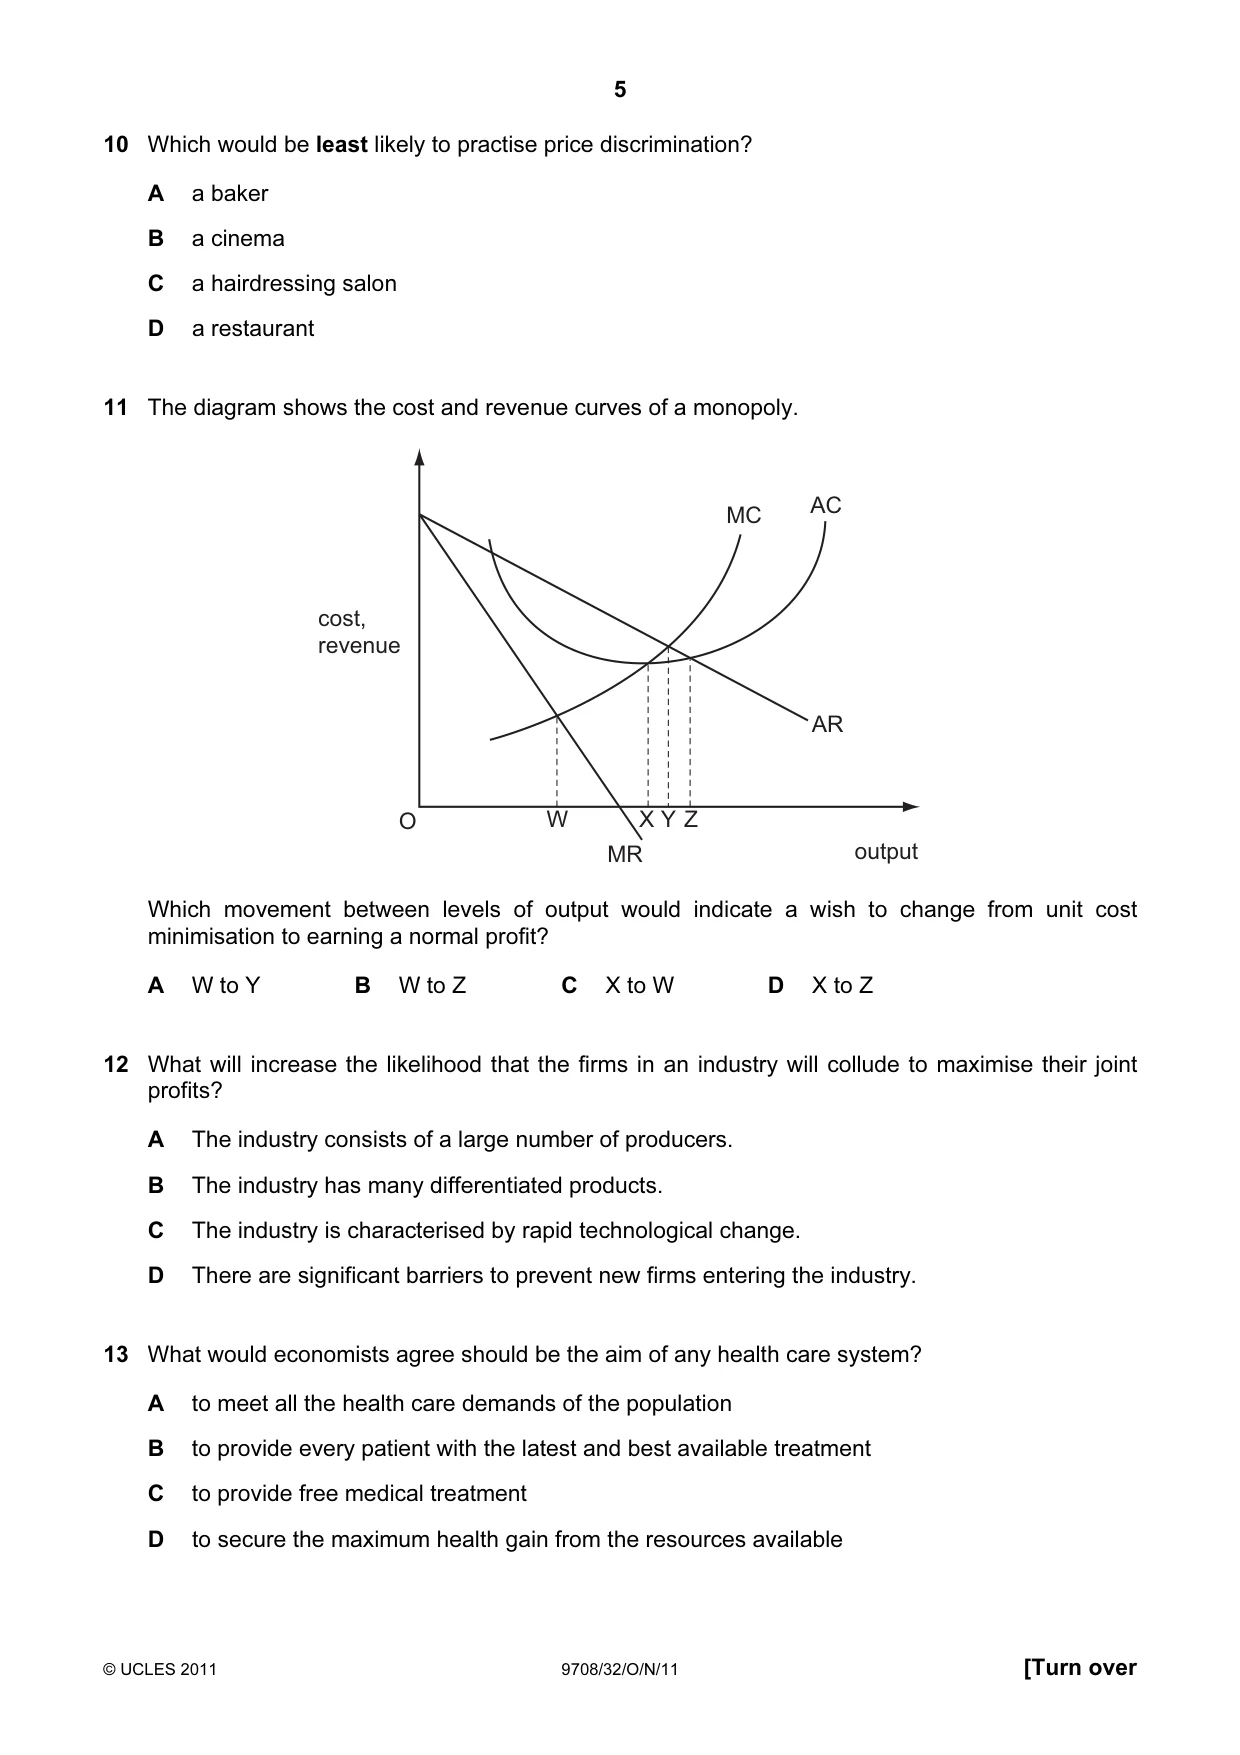
11 The diagram shows the cost and revenue curves of a monopoly. MC AC cost, revenue AR O W X Y Z MR output Which movement between levels of output would indicate a wish to change from unit cost minimisation to earning a normal profit? A W to Y B W to Z C X to W D X to Z
Mark scheme: D
More questions on Differing objectives and policies of firms
Q12 · What will increase the likelihood that the firms in an industry will collude to maximise…
12 What will increase the likelihood that the firms in an industry will collude to maximise their joint profits? A The industry consists of a large number of producers. B The industry has many differentiated products. C The industry is characterised by rapid technological change. D There are significant barriers to prevent new firms entering the industry.
Mark scheme: D
Q13 · What would economists agree should be the aim of any health care system?
13 What would economists agree should be the aim of any health care system? A to meet all the health care demands of the population B to provide every patient with the latest and best available treatment C to provide free medical treatment D to secure the maximum health gain from the resources available
Mark scheme: D
Q14 · The government of a country decides to increase the proportion of its tax revenue that it…
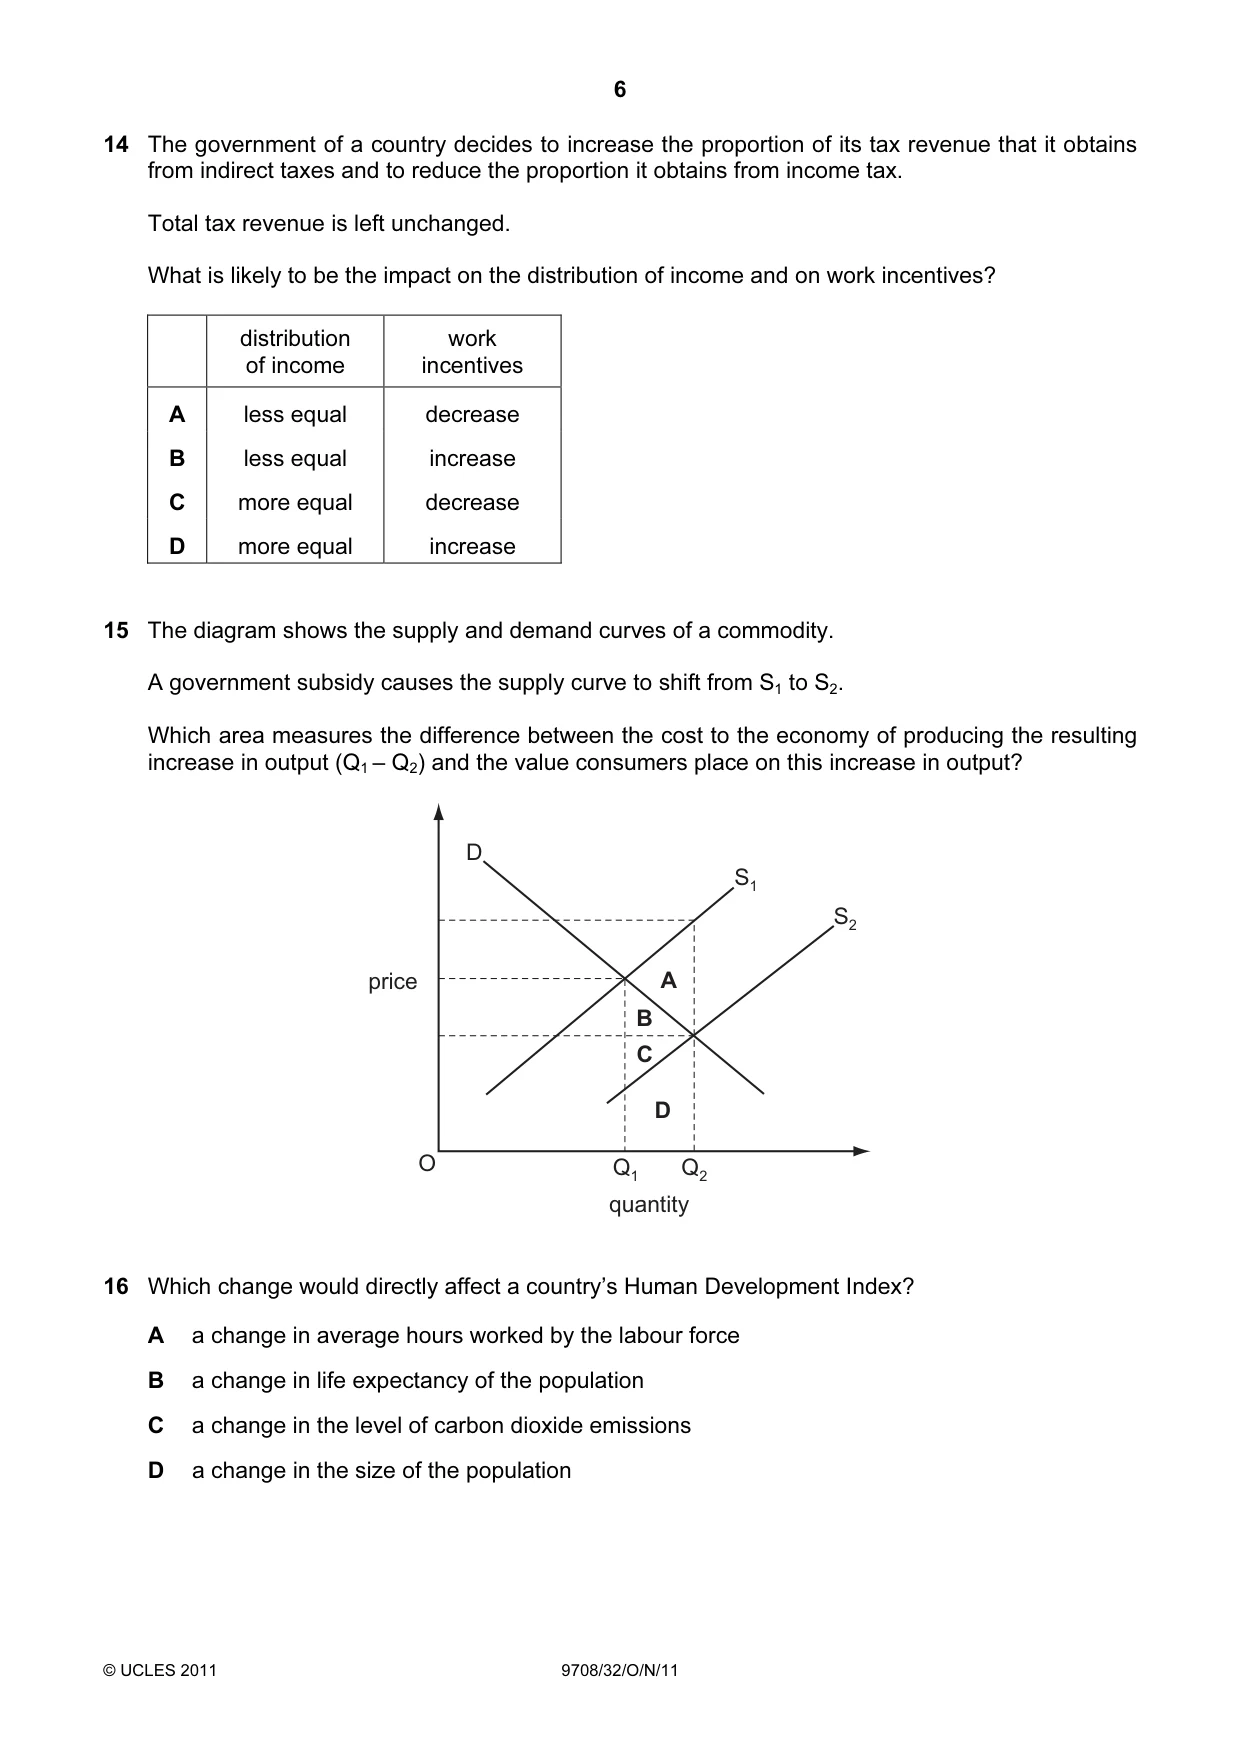
14 The government of a country decides to increase the proportion of its tax revenue that it obtains from indirect taxes and to reduce the proportion it obtains from income tax. Total tax revenue is left unchanged. What is likely to be the impact on the distribution of income and on work incentives? distribution work of income incentives A less equal decrease B less equal increase C more equal decrease D more equal increase
Mark scheme: B
More questions on Equity and redistribution of income and wealth
Q15 · The diagram shows the supply and demand curves of a commodity
15 The diagram shows the supply and demand curves of a commodity. A government subsidy causes the supply curve to shift from S1 to S2. Which area measures the difference between the cost to the economy of producing the resulting increase in output (Q1 – Q2) and the value consumers place on this increase in output? D S1 S2 price A B C D O Q1 Q2 quantity
Mark scheme: A
Q16 · Which change would directly affect a country’s Human Development Index?
16 Which change would directly affect a country’s Human Development Index? A a change in average hours worked by the labour force B a change in life expectancy of the population C a change in the level of carbon dioxide emissions D a change in the size of the population
Mark scheme: B
Q17 · Despite a government budget deficit, a country’s money supply remains unchanged
17 Despite a government budget deficit, a country’s money supply remains unchanged. What could explain this? A The country has a balance of payments surplus equal to the government budget deficit. B The country’s foreign exchange rate is fixed. C The government budget deficit is financed by borrowing from the central bank. D The government budget deficit is financed by selling government bonds to members of the public.
Mark scheme: D
Q18 · In a closed economy, households pay $0.10 in tax on every $1 increase in their gross…
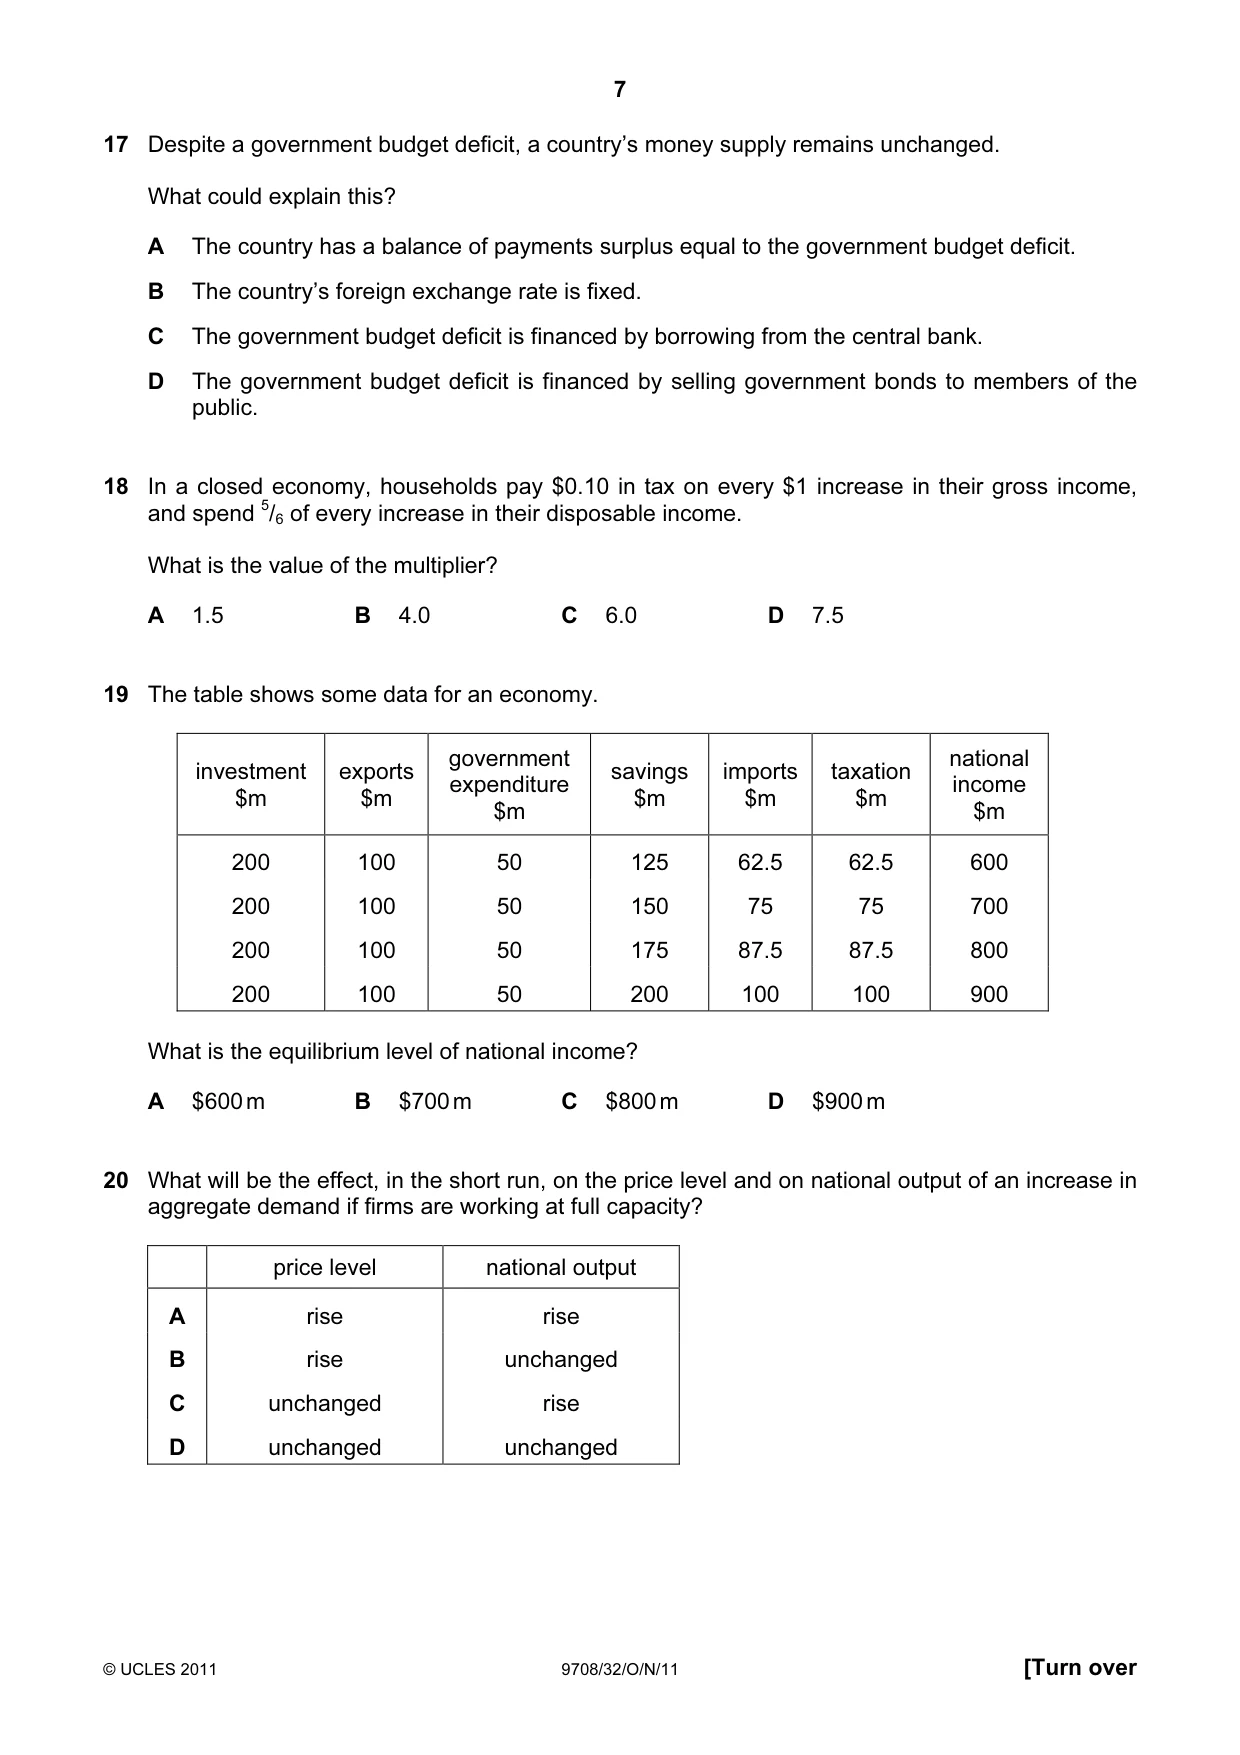
18 In a closed economy, households pay $0.10 in tax on every $1 increase in their gross income, and spend 5/6 of every increase in their disposable income. What is the value of the multiplier? A 1.5 B 4.0 C 6.0 D 7.5
Mark scheme: B
Q19 · The table shows some data for an economy
19 The table shows some data for an economy. government national investment exports savings imports taxation expenditure income $m $m $m $m $m $m $m 200 100 50 125 62.5 62.5 600 200 100 50 150 75 75 700 200 100 50 175 87.5 87.5 800 200 100 50 200 100 100 900 What is the equilibrium level of national income? A $600 m B $700 m C $800 m D $900 m
Mark scheme: C
Q20 · What will be the effect, in the short run, on the price level and on national output of…
20 What will be the effect, in the short run, on the price level and on national output of an increase in aggregate demand if firms are working at full capacity? price level national output A rise rise B rise unchanged C unchanged rise D unchanged unchanged
Mark scheme: B
More questions on Aggregate Demand and Aggregate Supply analysis
Q21 · The diagram shows an economy’s aggregate demand and aggregate supply curves
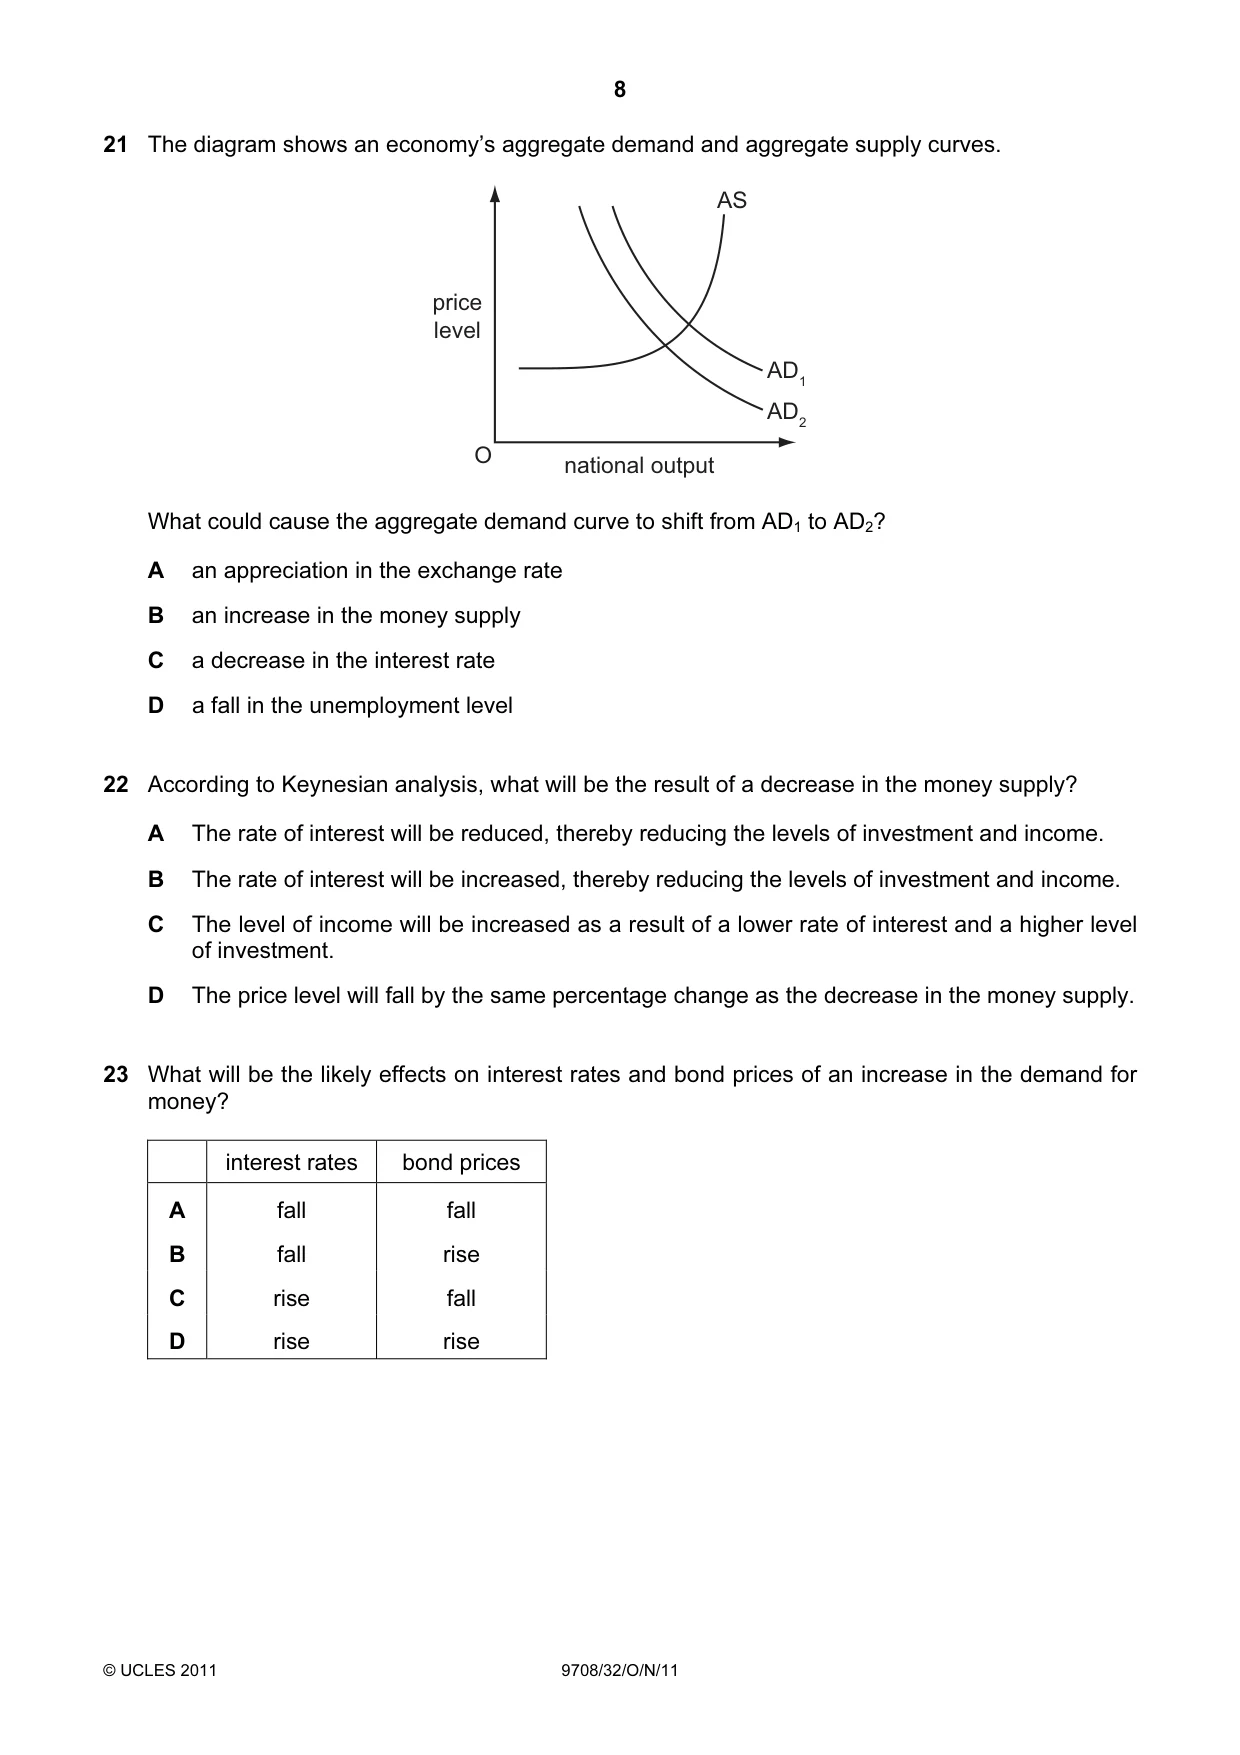
21 The diagram shows an economy’s aggregate demand and aggregate supply curves. AS price level AD1 AD2 O national output What could cause the aggregate demand curve to shift from AD1 to AD2? A an appreciation in the exchange rate B an increase in the money supply C a decrease in the interest rate D a fall in the unemployment level
Mark scheme: A
Q22 · According to Keynesian analysis, what will be the result of a decrease in the money…
22 According to Keynesian analysis, what will be the result of a decrease in the money supply? A The rate of interest will be reduced, thereby reducing the levels of investment and income. B The rate of interest will be increased, thereby reducing the levels of investment and income. C The level of income will be increased as a result of a lower rate of interest and a higher level of investment. D The price level will fall by the same percentage change as the decrease in the money supply.
Mark scheme: B
Q23 · What will be the likely effects on interest rates and bond prices of an increase in the…
23 What will be the likely effects on interest rates and bond prices of an increase in the demand for money? interest rates bond prices A fall fall B fall rise C rise fall D rise rise
Mark scheme: C
Q24 · A developing country experiences a rapid growth in labour productivity
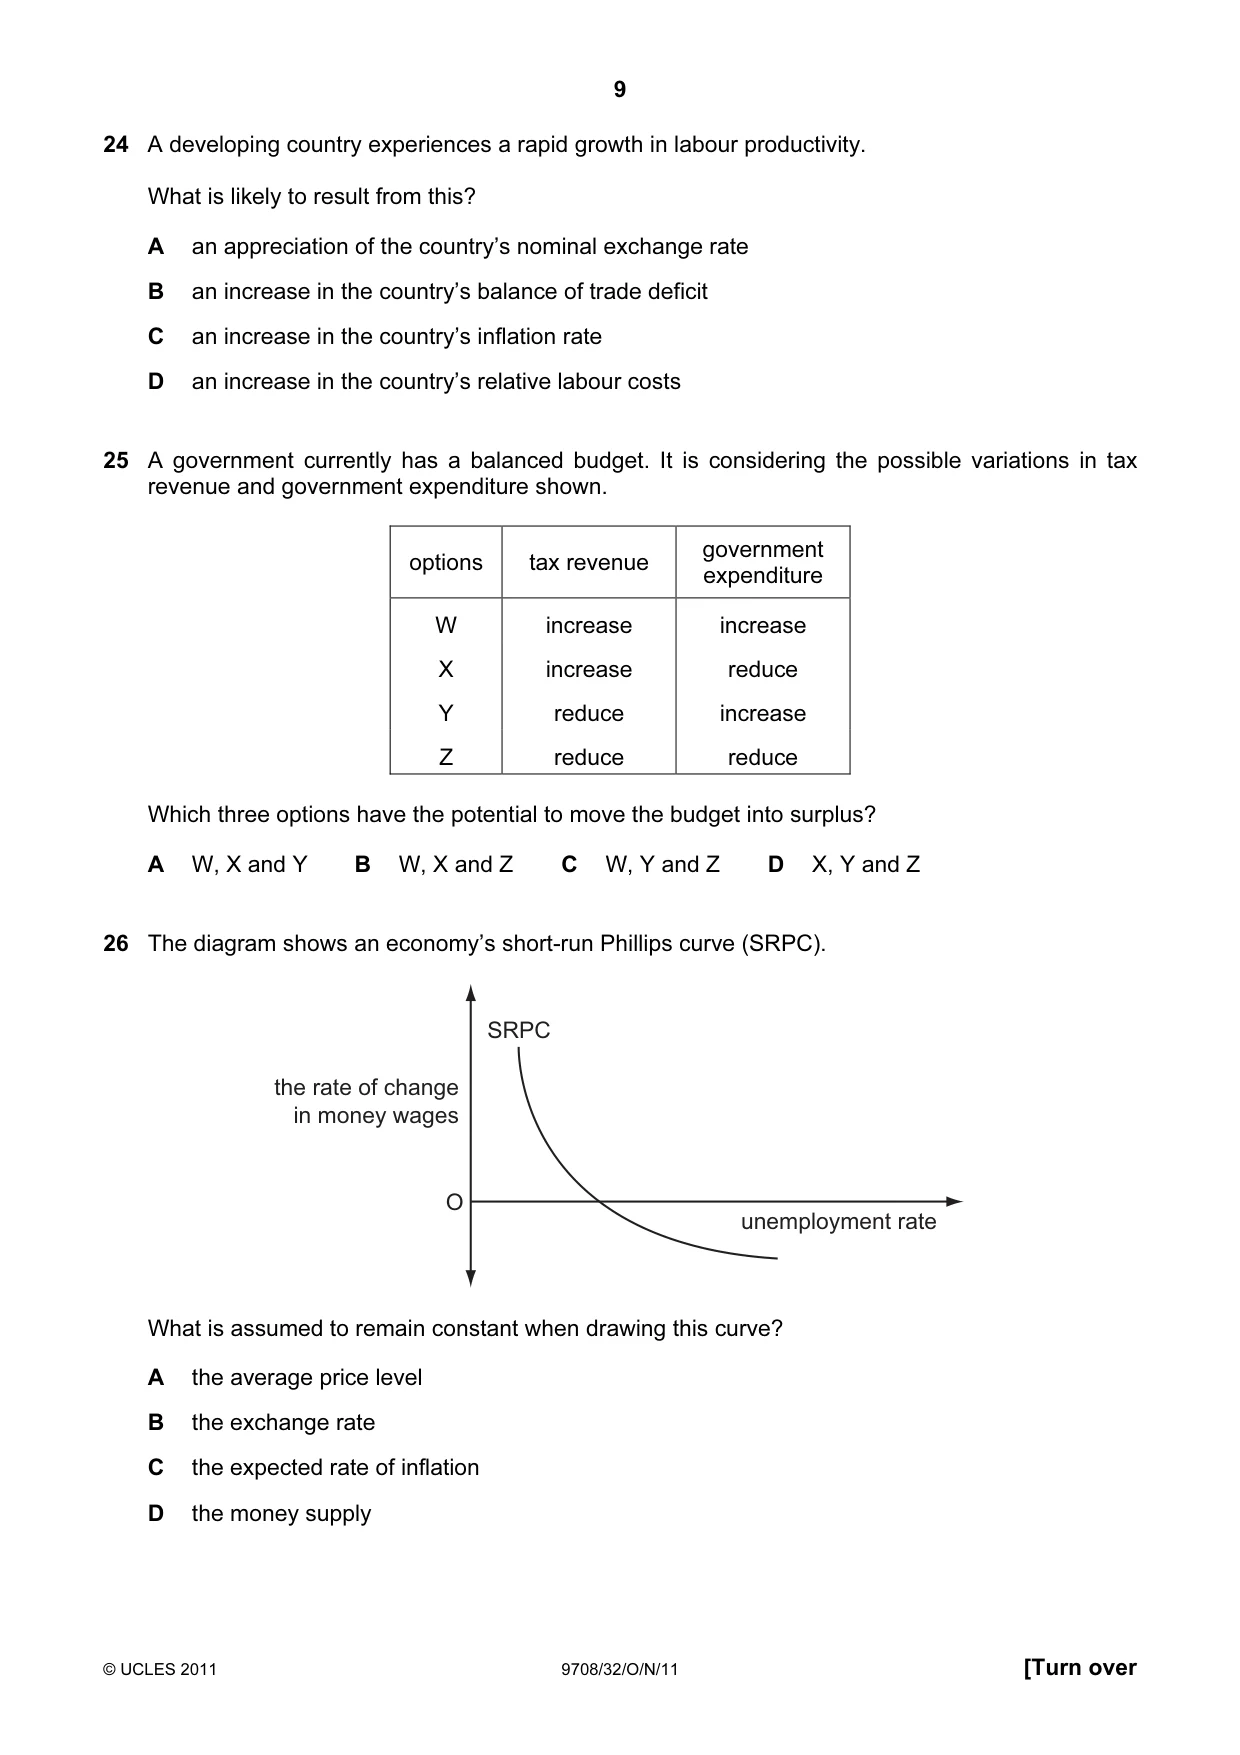
24 A developing country experiences a rapid growth in labour productivity. What is likely to result from this? A an appreciation of the country’s nominal exchange rate B an increase in the country’s balance of trade deficit C an increase in the country’s inflation rate D an increase in the country’s relative labour costs
Mark scheme: A
Q25 · A government currently has a balanced budget
25 A government currently has a balanced budget. It is considering the possible variations in tax revenue and government expenditure shown. government options tax revenue expenditure W increase increase X increase reduce Y reduce increase Z reduce reduce Which three options have the potential to move the budget into surplus? A W, X and Y B W, X and Z C W, Y and Z D X, Y and Z
Mark scheme: B
Q26 · The diagram shows an economy’s short-run Phillips curve (SRPC)
26 The diagram shows an economy’s short-run Phillips curve (SRPC). SRPC the rate of change in money wages O unemployment rate What is assumed to remain constant when drawing this curve? A the average price level B the exchange rate C the expected rate of inflation D the money supply
Mark scheme: C
Q27 · The economy of a country is simultaneously experiencing a balance of payments deficit, a…
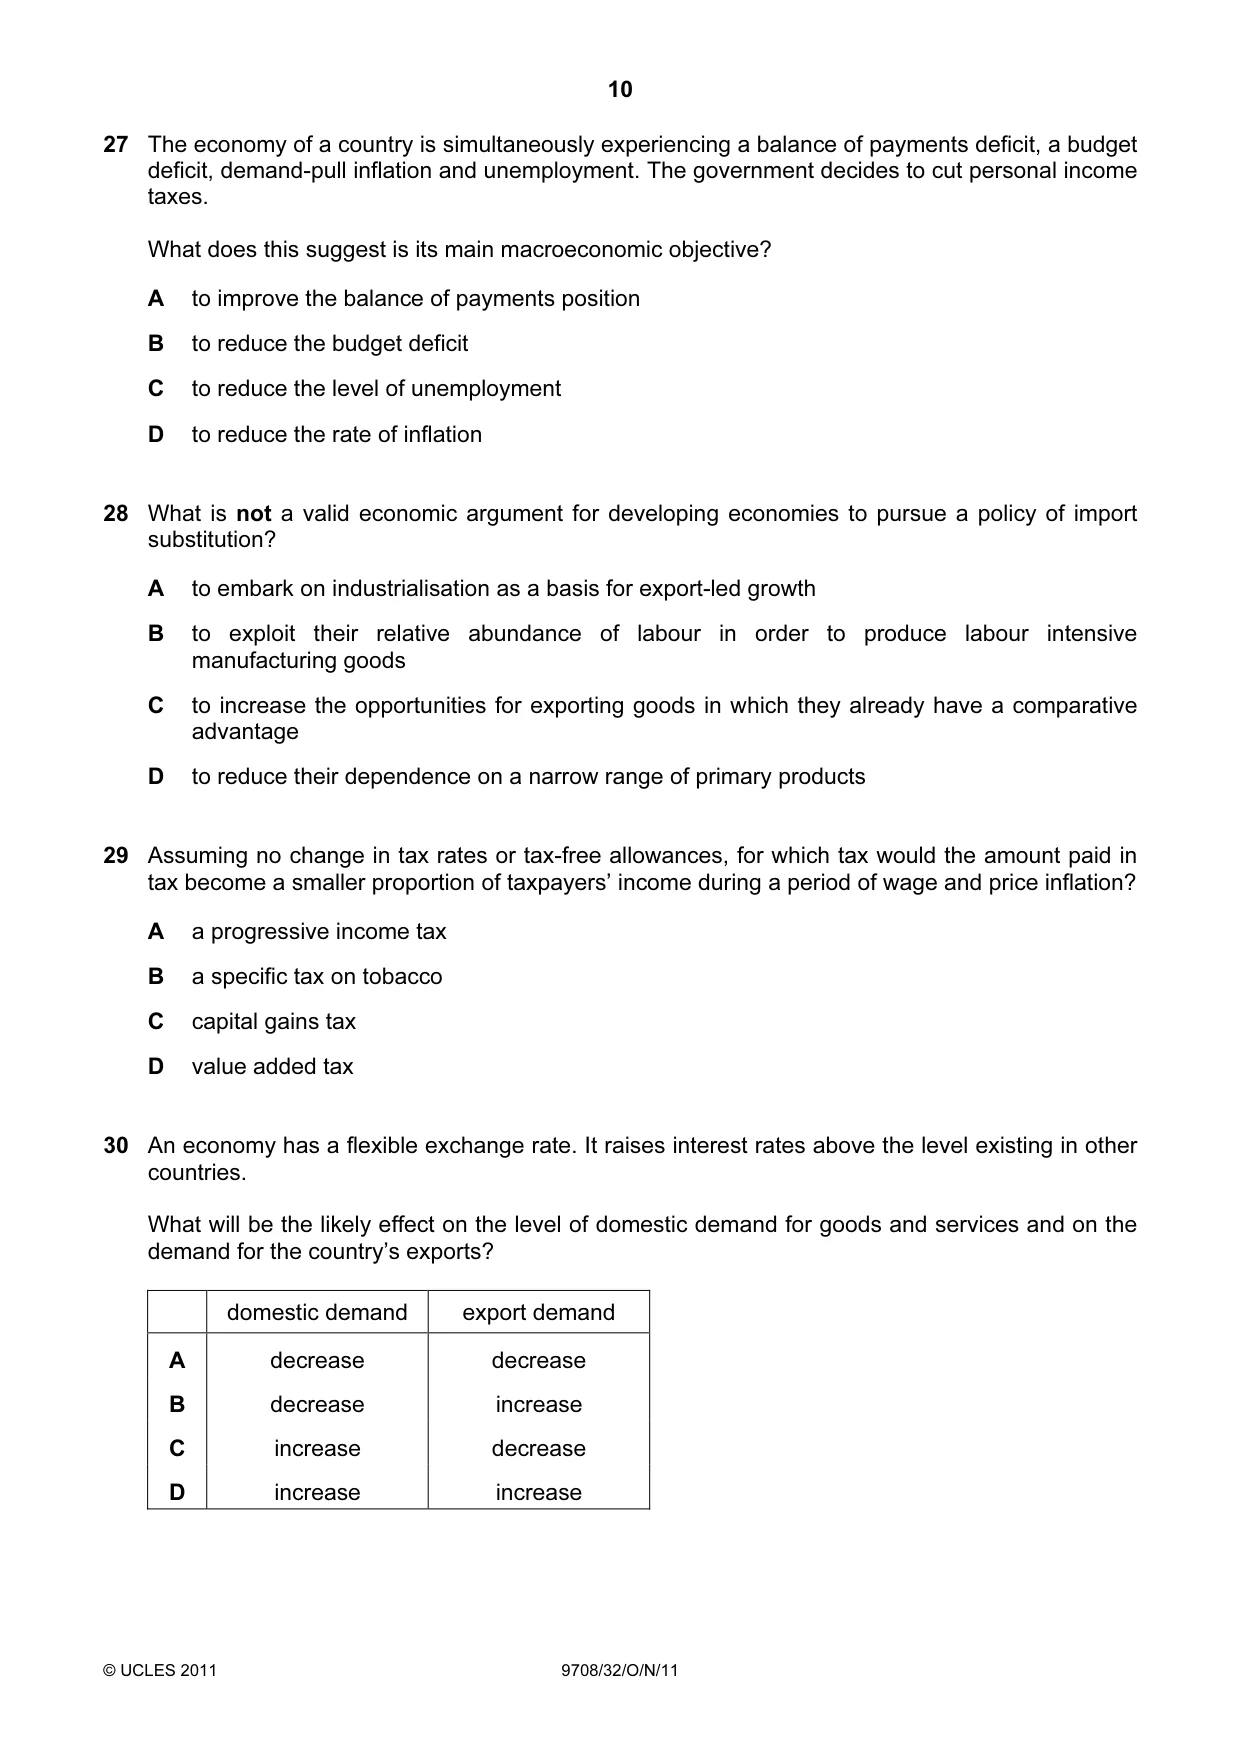
27 The economy of a country is simultaneously experiencing a balance of payments deficit, a budget deficit, demand-pull inflation and unemployment. The government decides to cut personal income taxes. What does this suggest is its main macroeconomic objective? A to improve the balance of payments position B to reduce the budget deficit C to reduce the level of unemployment D to reduce the rate of inflation
Mark scheme: C
More questions on Government macroeconomic policy objectives
Q28 · What is not a valid economic argument for developing economies to pursue a policy of…
28 What is not a valid economic argument for developing economies to pursue a policy of import substitution? A to embark on industrialisation as a basis for export-led growth B to exploit their relative abundance of labour in order to produce labour intensive manufacturing goods C to increase the opportunities for exporting goods in which they already have a comparative advantage D to reduce their dependence on a narrow range of primary products
Mark scheme: C
More questions on Relationship between countries at different levels of development
Q29 · Assuming no change in tax rates or tax-free allowances, for which tax would the amount…
29 Assuming no change in tax rates or tax-free allowances, for which tax would the amount paid in tax become a smaller proportion of taxpayers’ income during a period of wage and price inflation? A a progressive income tax B a specific tax on tobacco C capital gains tax D value added tax
Mark scheme: B
More questions on Equity and redistribution of income and wealth
Q30 · An economy has a flexible exchange rate
30 An economy has a flexible exchange rate. It raises interest rates above the level existing in other countries. What will be the likely effect on the level of domestic demand for goods and services and on the demand for the country’s exports? domestic demand export demand A decrease decrease B decrease increase C increase decrease D increase increase
Mark scheme: A
What was in this paper
The subtopics covered by these 30 questions, and how many questions each got. Open one in a new tab to see every Cambridge question on it.
3Utility3Different market structures2Economic development2Equity and redistribution of income and wealth2Labour market forces and government intervention2The circular flow of income2Types of cost, revenue and profit, short-run and long-run production2Aggregate Demand and Aggregate Supply analysis1Differing objectives and policies of firms1Efficiency and market failure1Employment/unemployment1Exchange rates1Fiscal policy1Government macroeconomic policy objectives1Government policies to achieve efficient resource allocation and correct market failure1Growth and survival of firms1Methods and effects of government intervention in markets1Monetary policy1Relationship between countries at different levels of development1What you needed in this session
Cambridge’s own grade thresholds for 2011 Oct/Nov, Paper 3 · Variant 2. A higher threshold means an easier paper — the bar moves with how the cohort did.