Cambridge A Level Economics 9708 — 2011 Oct/Nov Paper 3 · Variant 1
9708/31/O/N/11 · 30 questions · 30 marks · ≈34 min
The question paper and its mark scheme, free to read here and free to download. This is Cambridge’s own paper, exactly as it was sat.
Question paper16 pages



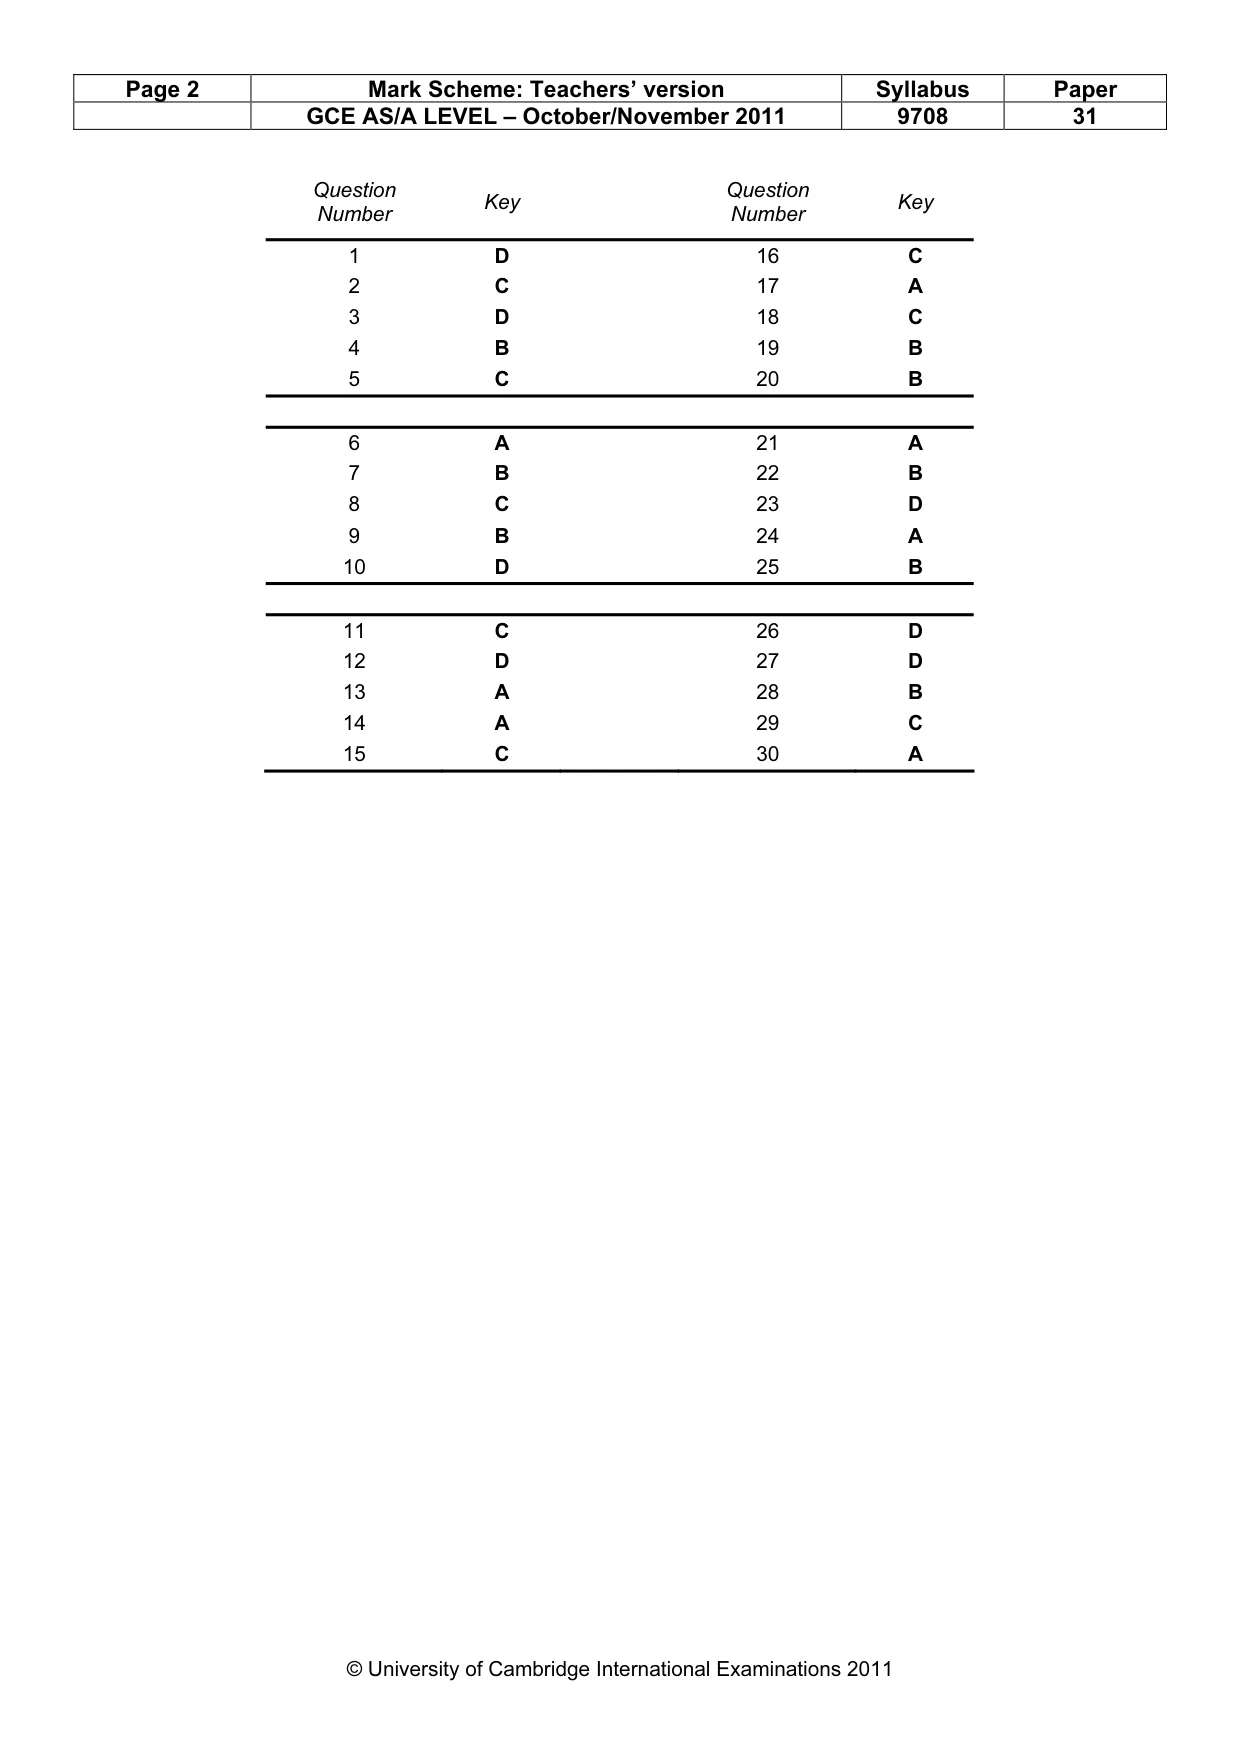
Mark scheme2 pages
Answers below. Sit the paper first if you are practising.
Questions as text
Q1 · Which statement describes the operation of the law of variable proportions?
1 Which statement describes the operation of the law of variable proportions? A As all factors are increased in proportion, the marginal cost of production increases. B As all factors are increased in proportion, total product rises at a diminishing rate. C As more of a variable factor is added to a fixed factor, the marginal cost of production diminishes. D As more of a variable factor is added to a fixed factor, total product rises at a diminishing rate.
Mark scheme: D
More questions on Types of cost, revenue and profit, short-run and long-run production
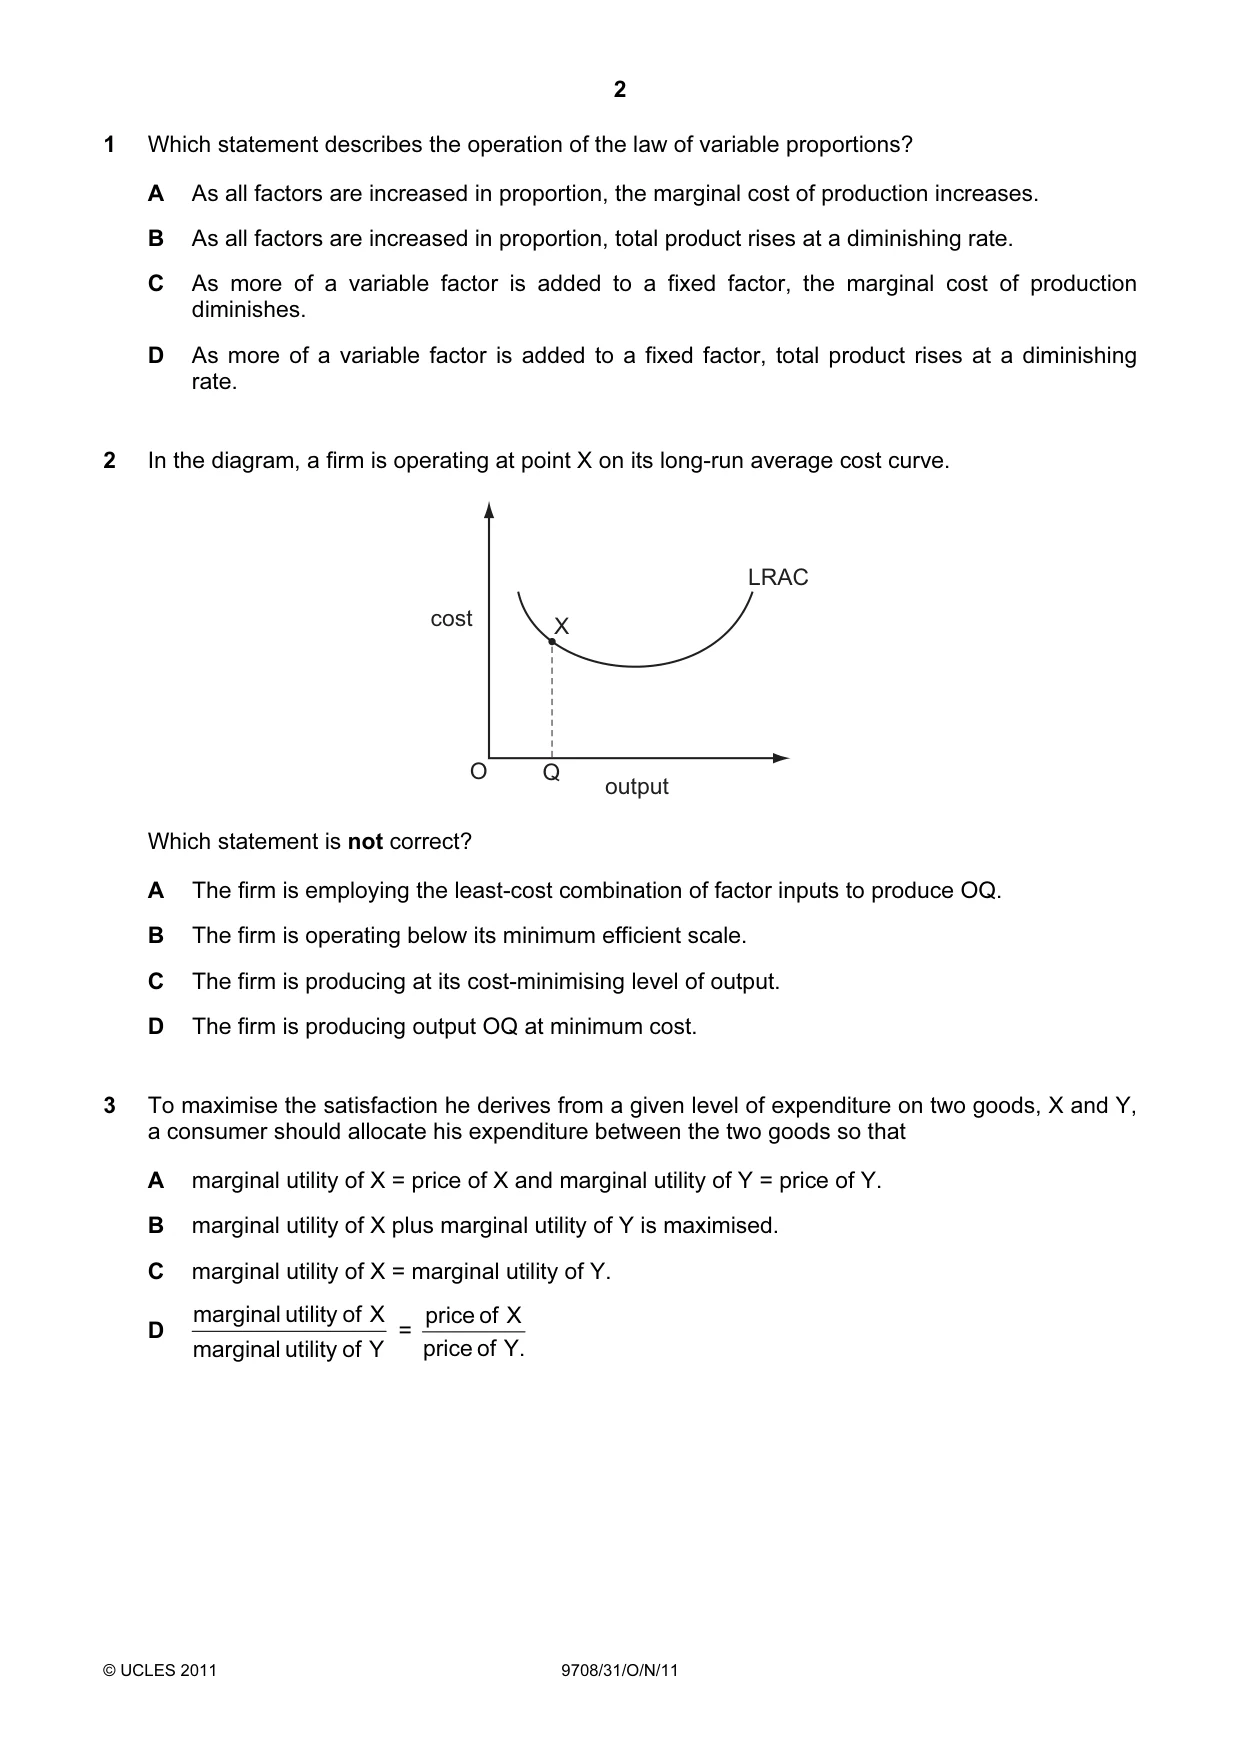
Q2 · In the diagram, a firm is operating at point X on its long-run average cost curve
2 In the diagram, a firm is operating at point X on its long-run average cost curve. LRAC cost X O Q output Which statement is not correct? A The firm is employing the least-cost combination of factor inputs to produce OQ. B The firm is operating below its minimum efficient scale. C The firm is producing at its cost-minimising level of output. D The firm is producing output OQ at minimum cost.
Mark scheme: C
Q3 · To maximise the satisfaction he derives from a given level of expenditure on two goods, X…
3 To maximise the satisfaction he derives from a given level of expenditure on two goods, X and Y, a consumer should allocate his expenditure between the two goods so that A marginal utility of X = price of X and marginal utility of Y = price of Y. B marginal utility of X plus marginal utility of Y is maximised. C marginal utility of X = marginal utility of Y. marginal utility of X price of X D = marginal utility of Y price of Y.
Mark scheme: D
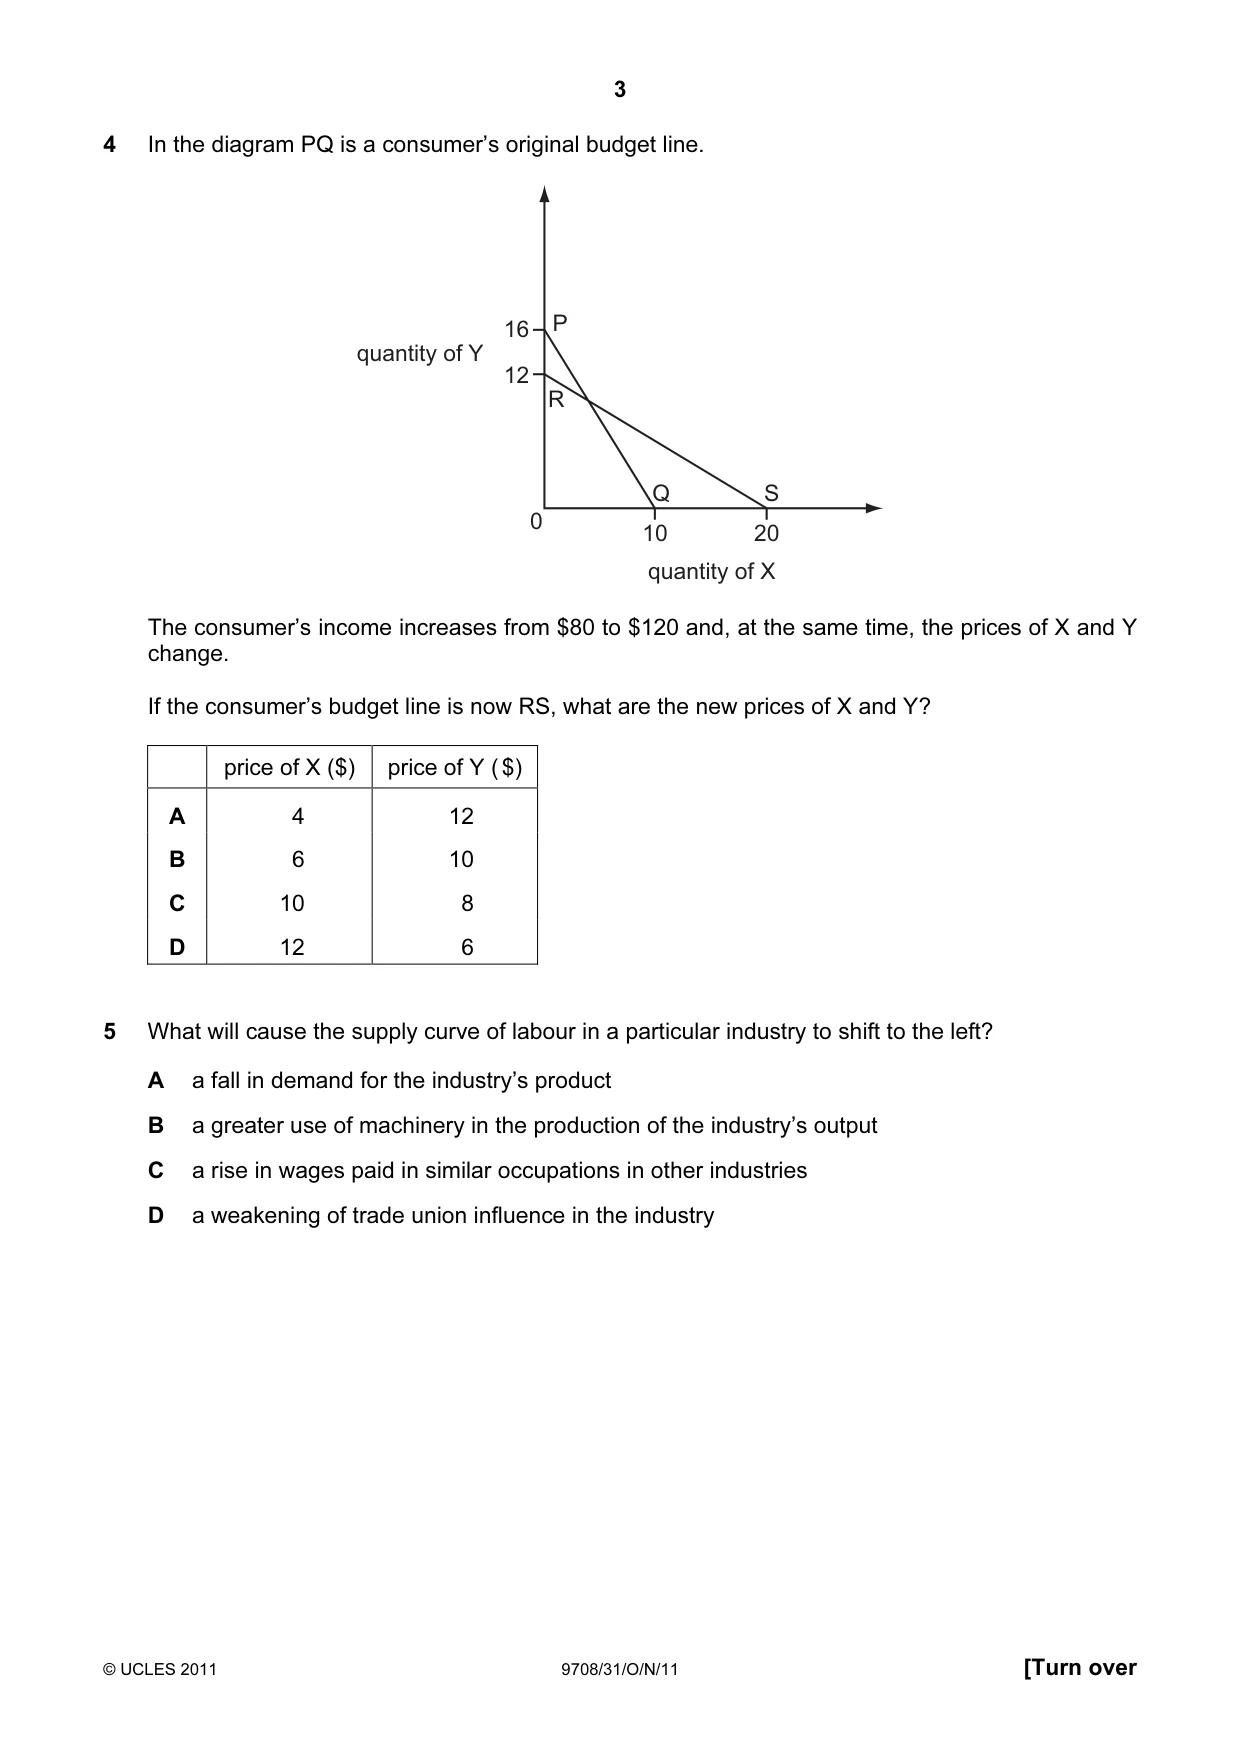
Q4 · In the diagram PQ is a consumer’s original budget line
4 In the diagram PQ is a consumer’s original budget line. 16 P quantity of Y 12 R Q S 0 10 20 quantity of X The consumer’s income increases from $80 to $120 and, at the same time, the prices of X and Y change. If the consumer’s budget line is now RS, what are the new prices of X and Y? price of X ($) price of Y ( $) A 4 12 B 6 10 C 10 8 D 12 6
Mark scheme: B
Q5 · What will cause the supply curve of labour in a particular industry to shift to the left?
5 What will cause the supply curve of labour in a particular industry to shift to the left? A a fall in demand for the industry’s product B a greater use of machinery in the production of the industry’s output C a rise in wages paid in similar occupations in other industries D a weakening of trade union influence in the industry
Mark scheme: C
More questions on Labour market forces and government intervention
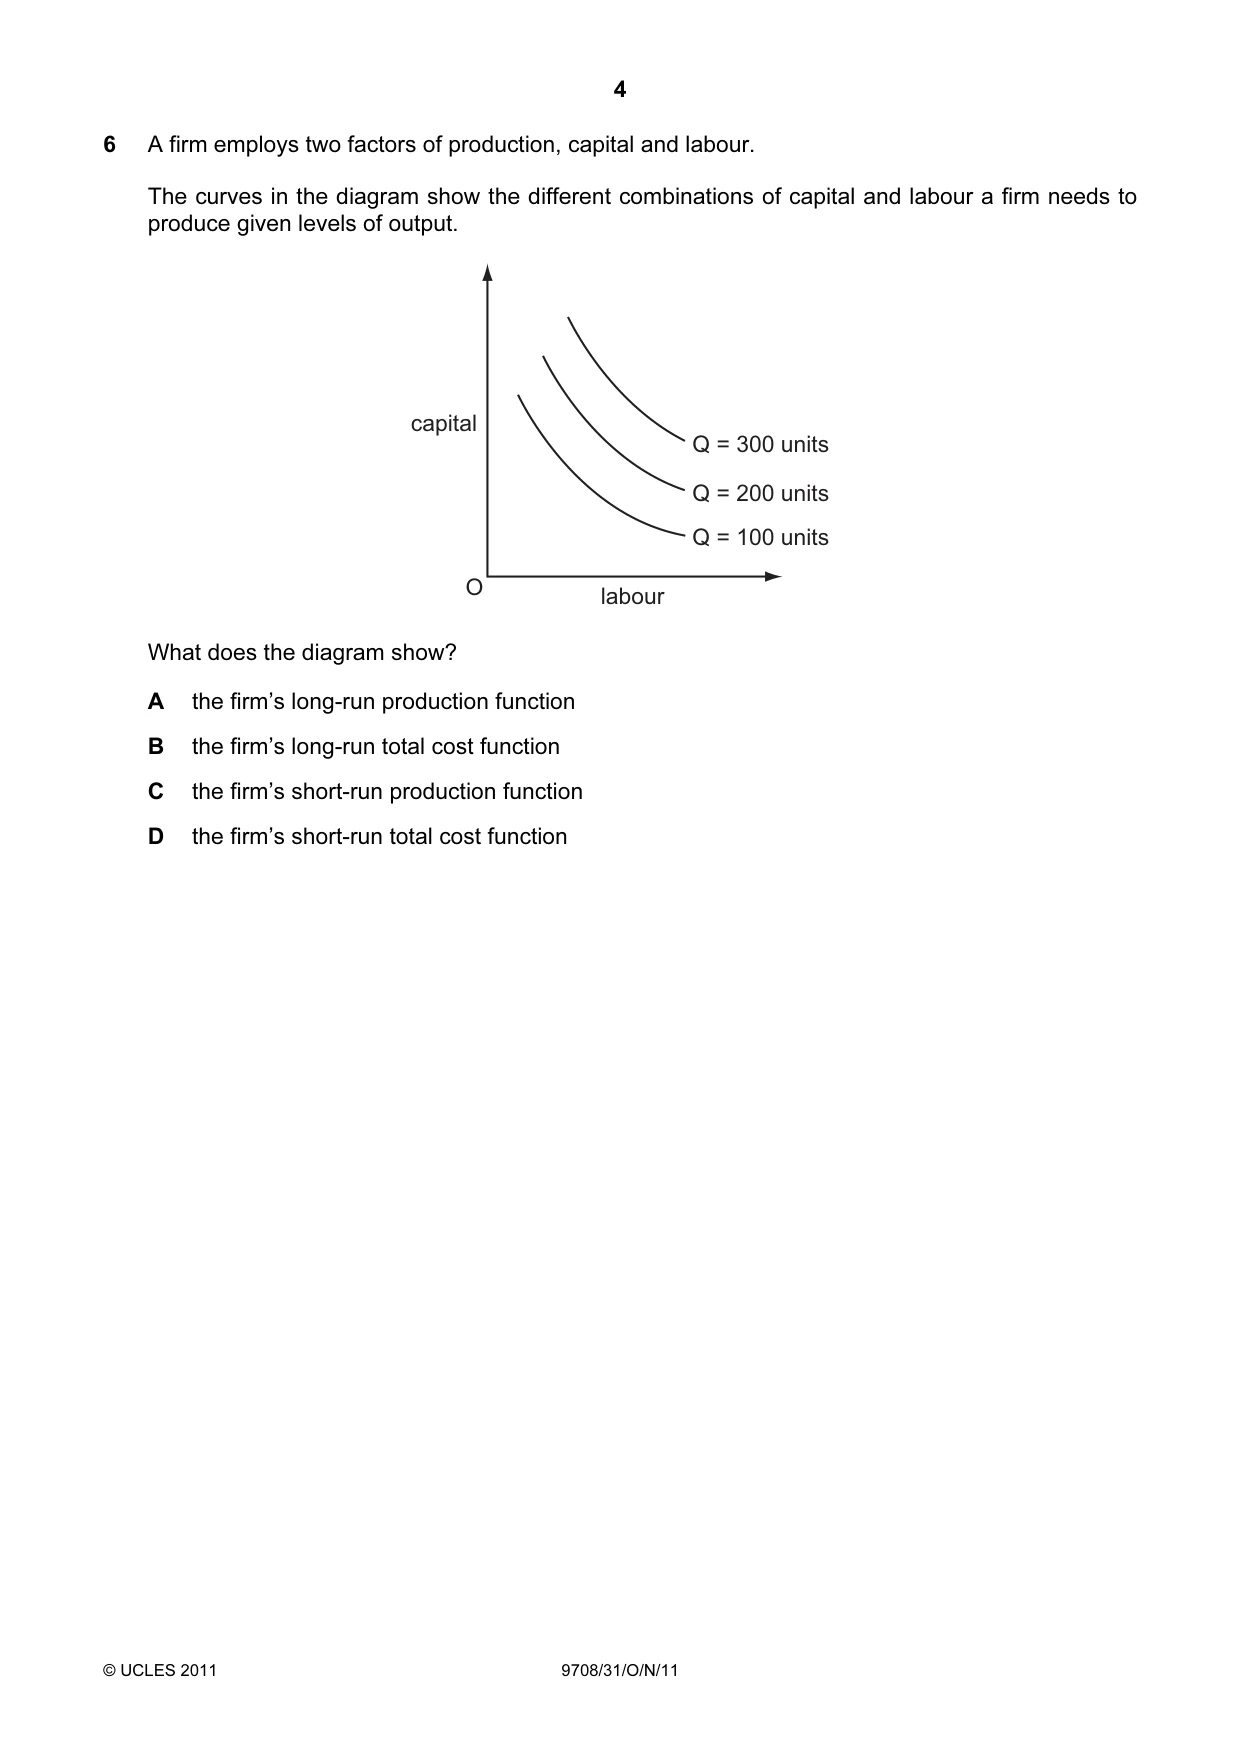
Q6 · A firm employs two factors of production, capital and labour
6 A firm employs two factors of production, capital and labour. The curves in the diagram show the different combinations of capital and labour a firm needs to produce given levels of output. capital Q = 300 units Q = 200 units Q = 100 units O labour What does the diagram show? A the firm’s long-run production function B the firm’s long-run total cost function C the firm’s short-run production function D the firm’s short-run total cost function
Mark scheme: A
More questions on Types of cost, revenue and profit, short-run and long-run production
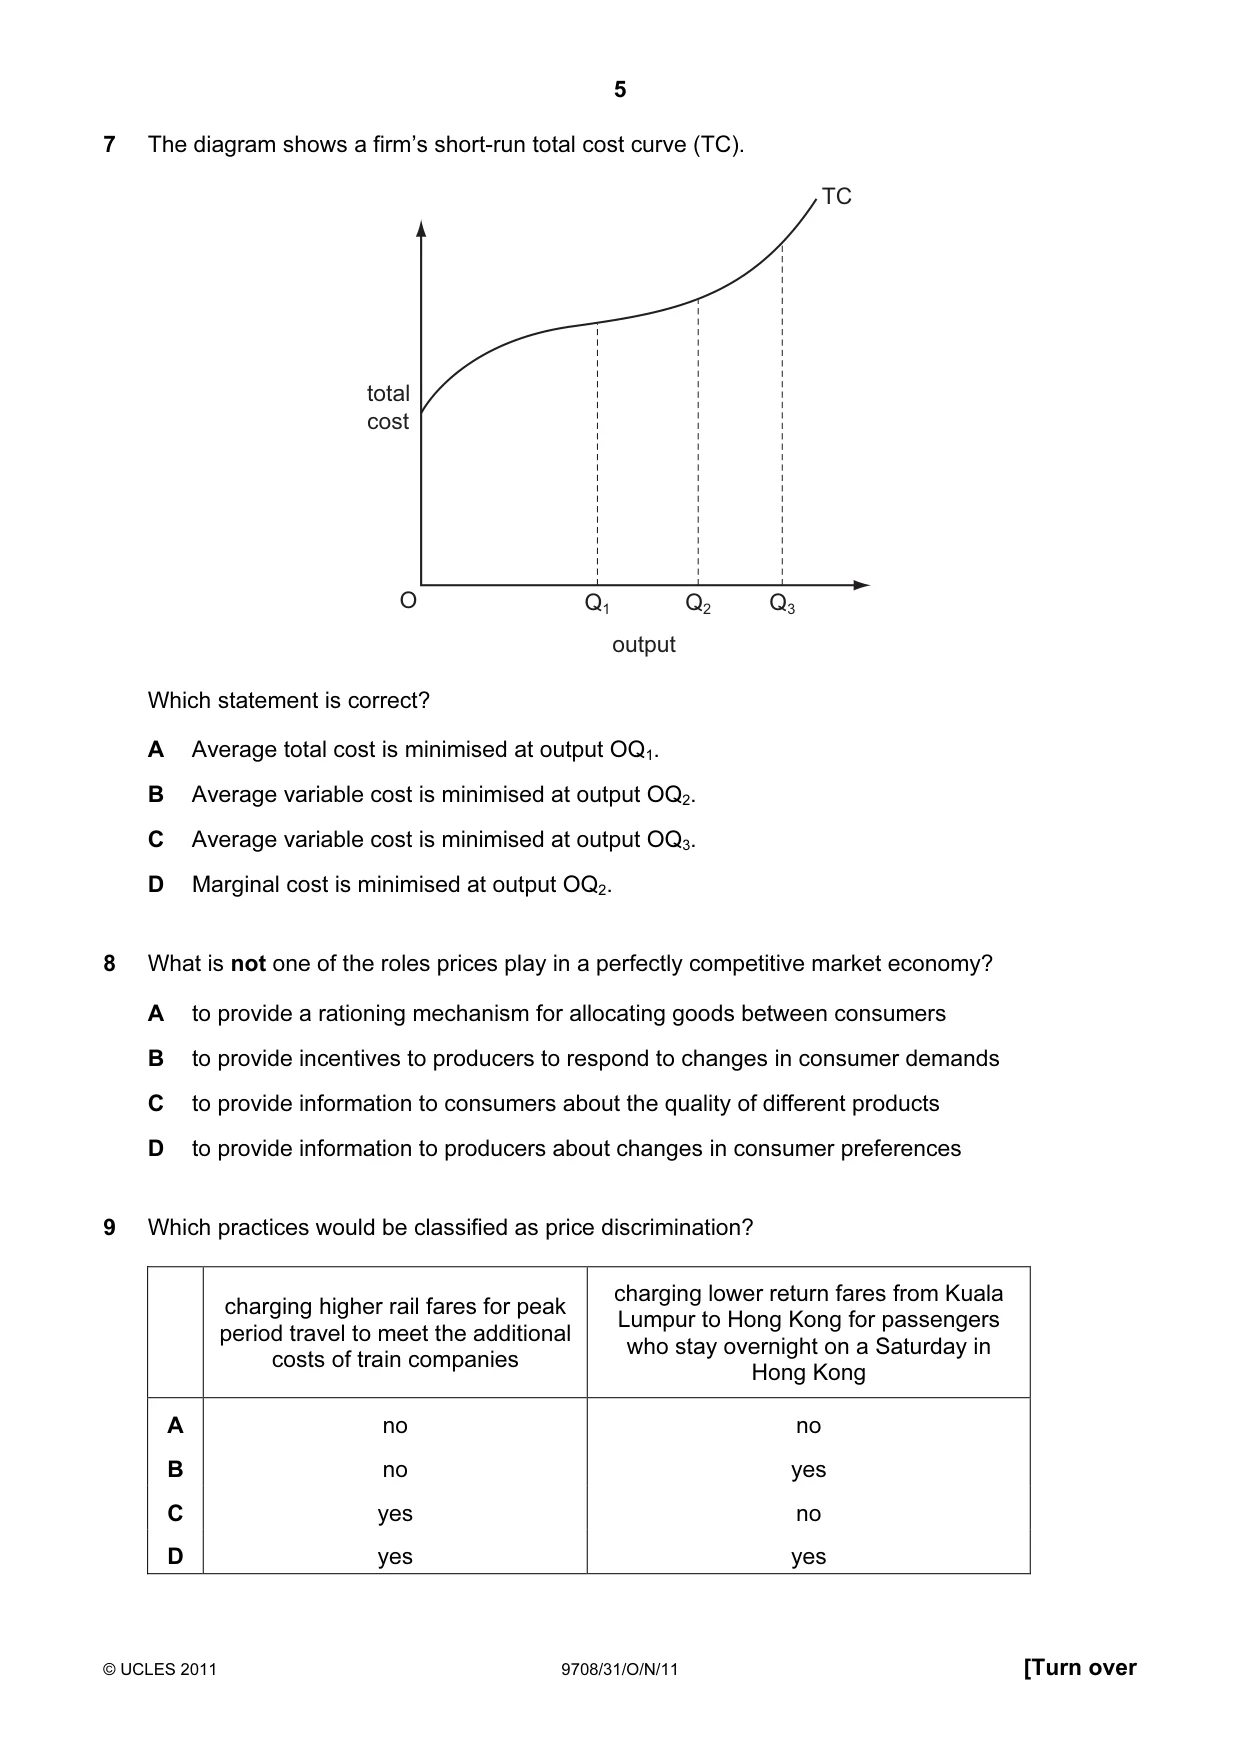
Q7 · The diagram shows a firm’s short-run total cost curve (TC)
7 The diagram shows a firm’s short-run total cost curve (TC). TC total cost O Q1 Q2 Q3 output Which statement is correct? A Average total cost is minimised at output OQ1. B Average variable cost is minimised at output OQ2. C Average variable cost is minimised at output OQ3. D Marginal cost is minimised at output OQ2.
Mark scheme: B
More questions on Types of cost, revenue and profit, short-run and long-run production
Q8 · What is not one of the roles prices play in a perfectly competitive market economy?
8 What is not one of the roles prices play in a perfectly competitive market economy? A to provide a rationing mechanism for allocating goods between consumers B to provide incentives to producers to respond to changes in consumer demands C to provide information to consumers about the quality of different products D to provide information to producers about changes in consumer preferences
Mark scheme: C
Q9 · Which practices would be classified as price discrimination?
9 Which practices would be classified as price discrimination? charging lower return fares from Kuala charging higher rail fares for peak Lumpur to Hong Kong for passengers period travel to meet the additional who stay overnight on a Saturday in costs of train companies Hong Kong A no no B no yes C yes no D yes yes
Mark scheme: B
Q10 · The diagram illustrates the working of a negative income tax system (NIT), where…
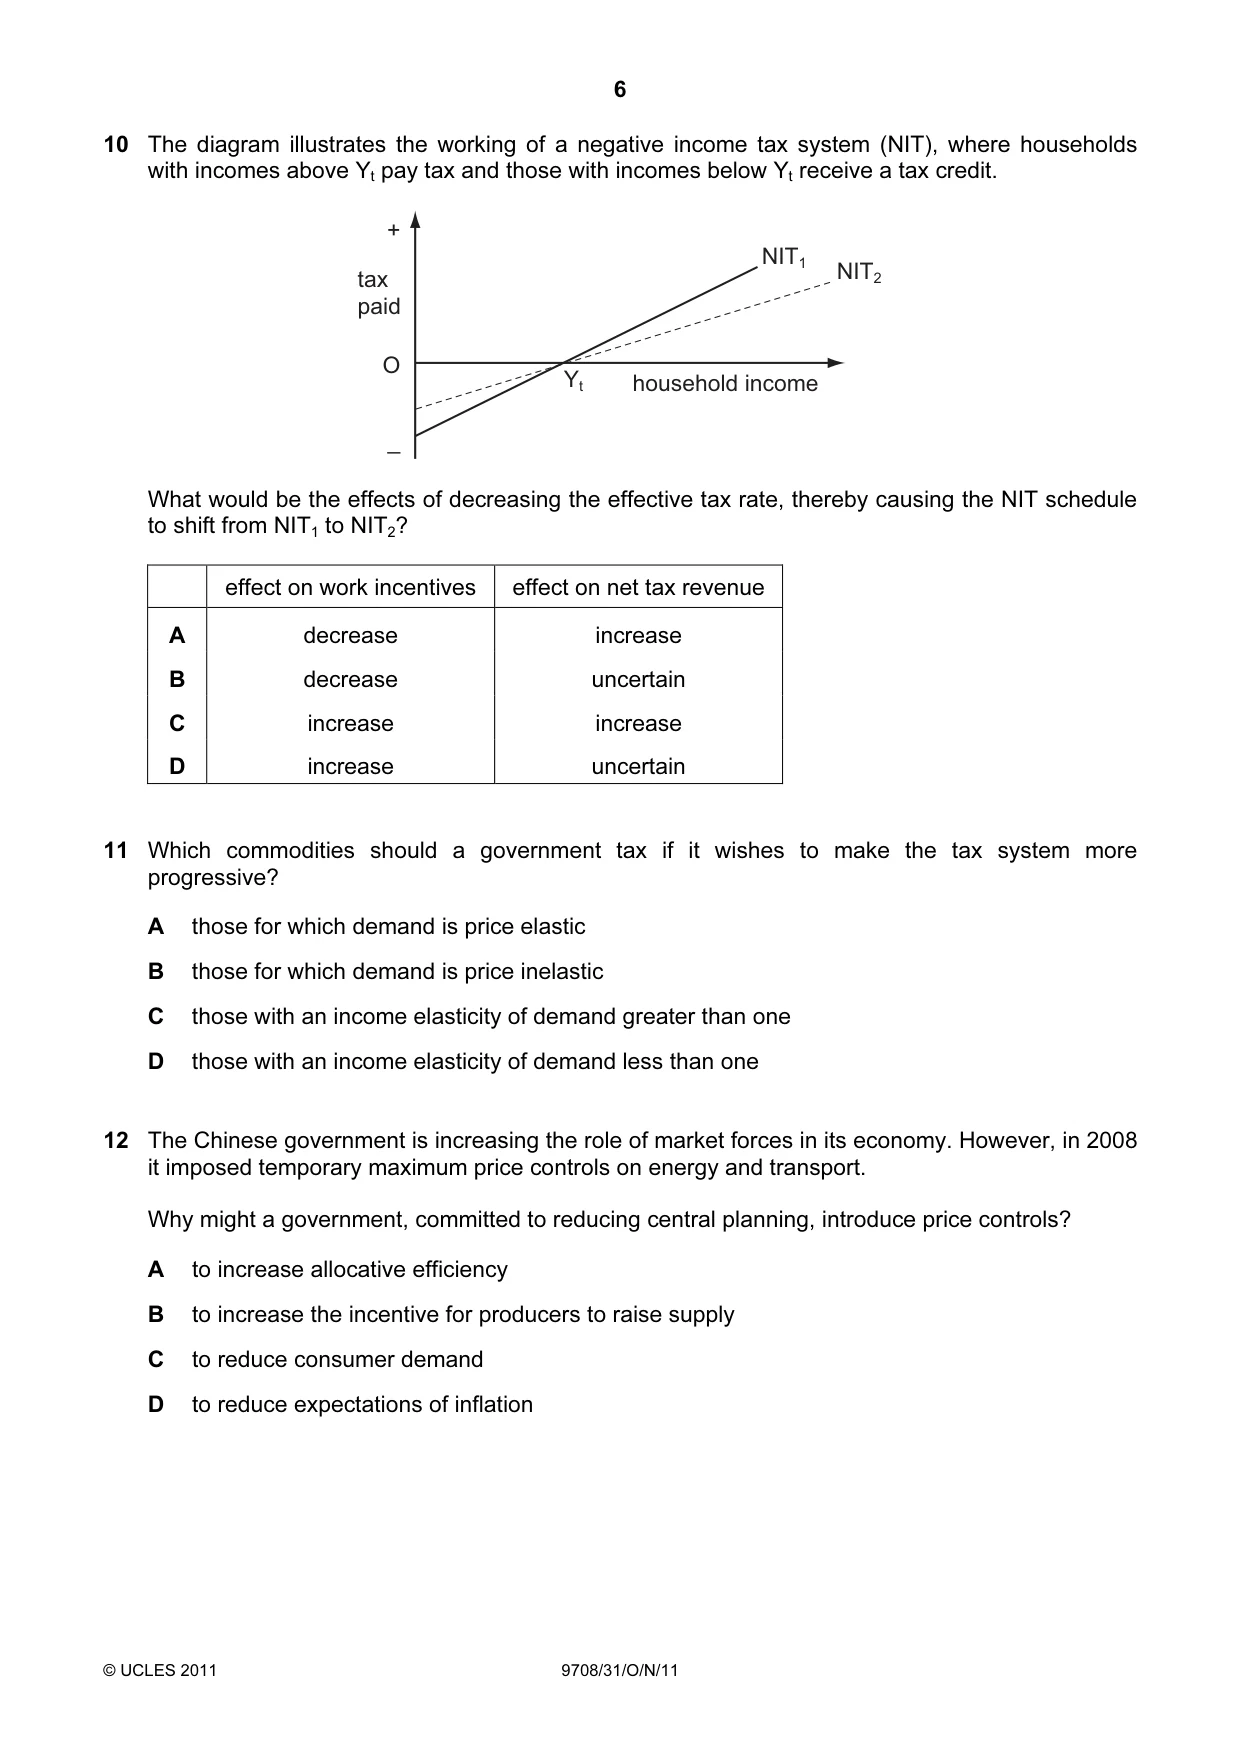
10 The diagram illustrates the working of a negative income tax system (NIT), where households with incomes above Yt pay tax and those with incomes below Yt receive a tax credit. + NIT1 tax NIT2 paid O Yt household income _ What would be the effects of decreasing the effective tax rate, thereby causing the NIT schedule to shift from NIT1 to NIT2? effect on work incentives effect on net tax revenue A decrease increase B decrease uncertain C increase increase D increase uncertain
Mark scheme: D
More questions on Equity and redistribution of income and wealth
Q11 · Which commodities should a government tax if it wishes to make the tax system more…
11 Which commodities should a government tax if it wishes to make the tax system more progressive? A those for which demand is price elastic B those for which demand is price inelastic C those with an income elasticity of demand greater than one D those with an income elasticity of demand less than one
Mark scheme: C
More questions on Equity and redistribution of income and wealth
Q12 · The Chinese government is increasing the role of market forces in its economy
12 The Chinese government is increasing the role of market forces in its economy. However, in 2008 it imposed temporary maximum price controls on energy and transport. Why might a government, committed to reducing central planning, introduce price controls? A to increase allocative efficiency B to increase the incentive for producers to raise supply C to reduce consumer demand D to reduce expectations of inflation
Mark scheme: D
More questions on Methods and effects of government intervention in markets
Q13 · The table gives information about two countries in 1994 and 2004
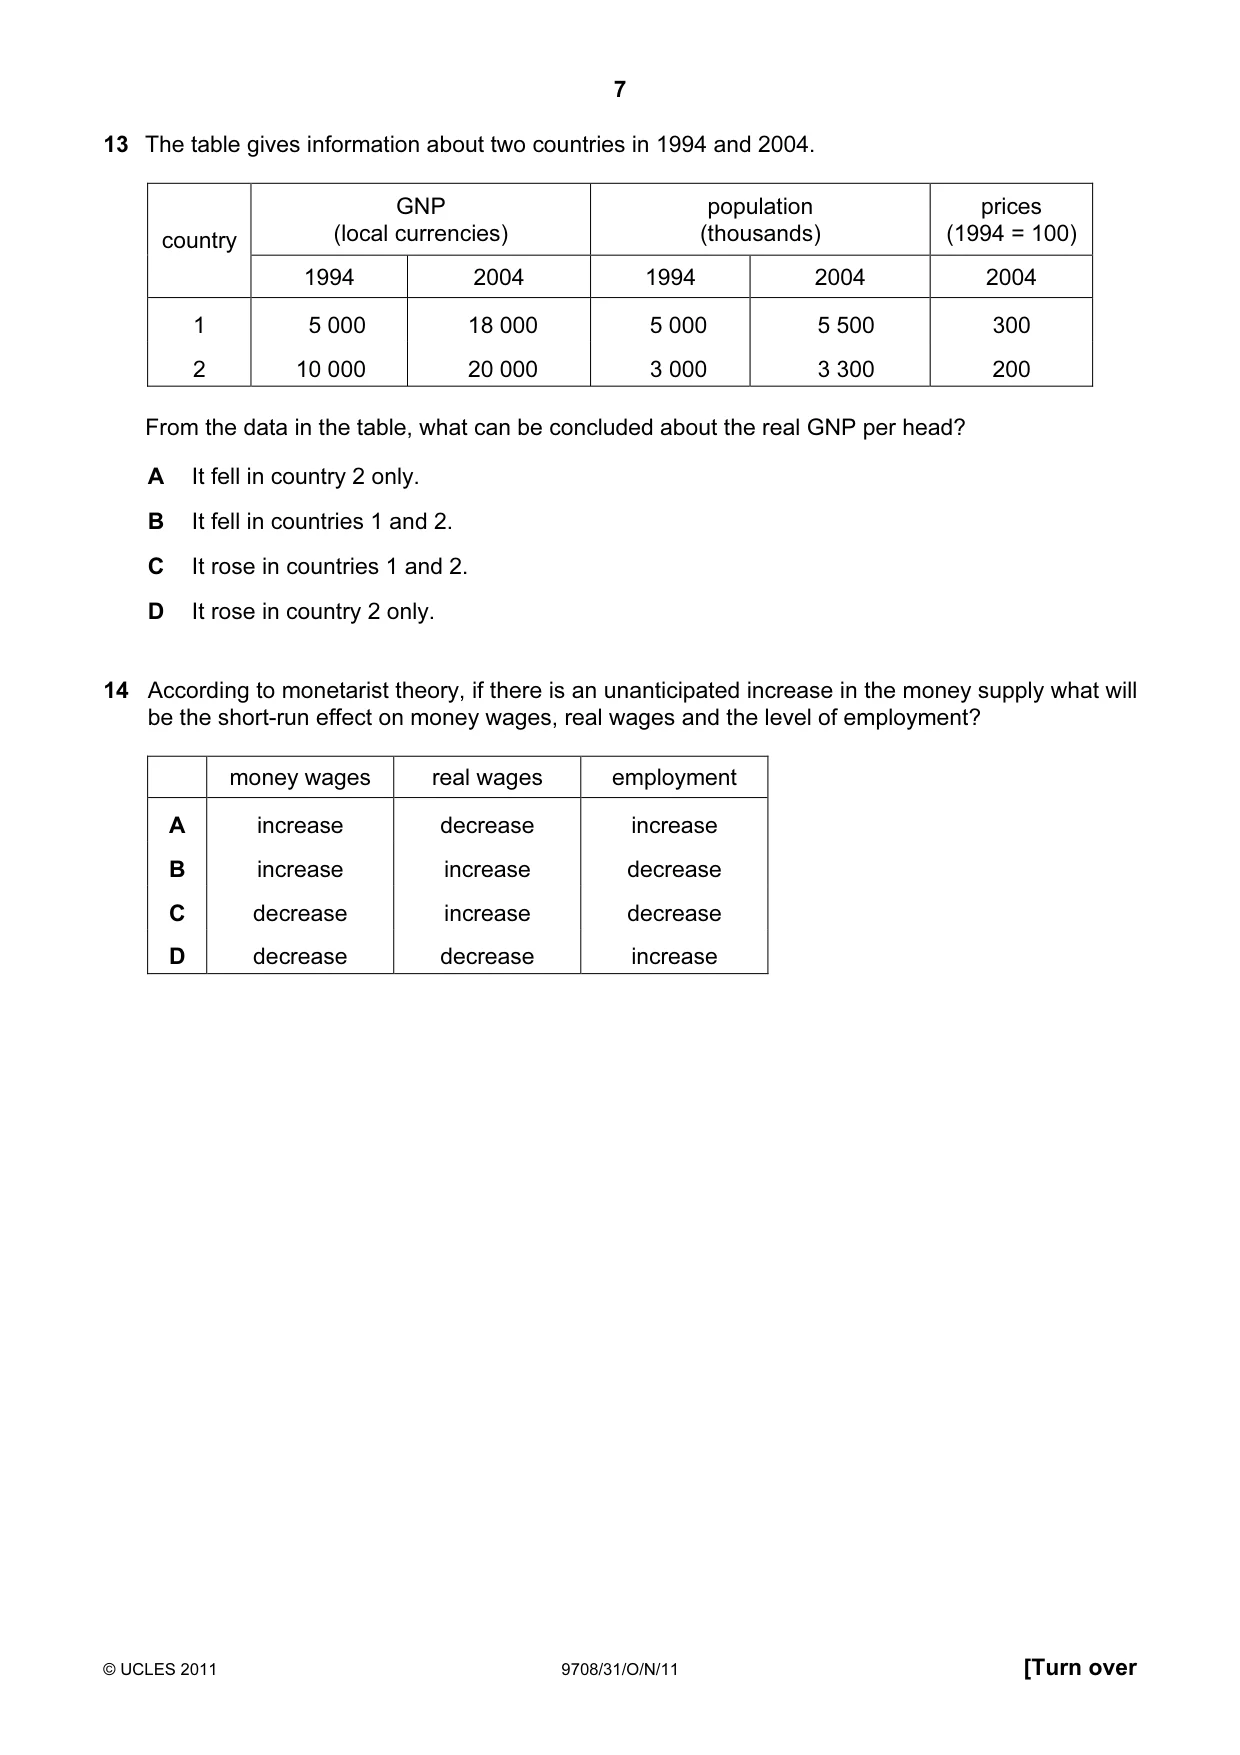
13 The table gives information about two countries in 1994 and 2004. GNP population prices country (local currencies) (thousands) (1994 = 100) 1994 2004 1994 2004 2004 1 5 000 18 000 5 000 5 500 300 2 10 000 20 000 3 000 3 300 200 From the data in the table, what can be concluded about the real GNP per head? A It fell in country 2 only. B It fell in countries 1 and 2. C It rose in countries 1 and 2. D It rose in country 2 only.
Mark scheme: A
Q14 · According to monetarist theory, if there is an unanticipated increase in the money supply…
14 According to monetarist theory, if there is an unanticipated increase in the money supply what will be the short-run effect on money wages, real wages and the level of employment? money wages real wages employment A increase decrease increase B increase increase decrease C decrease increase decrease D decrease decrease increase
Mark scheme: A
Q15 · In the diagram, C1 shows the relationship between consumption and national income
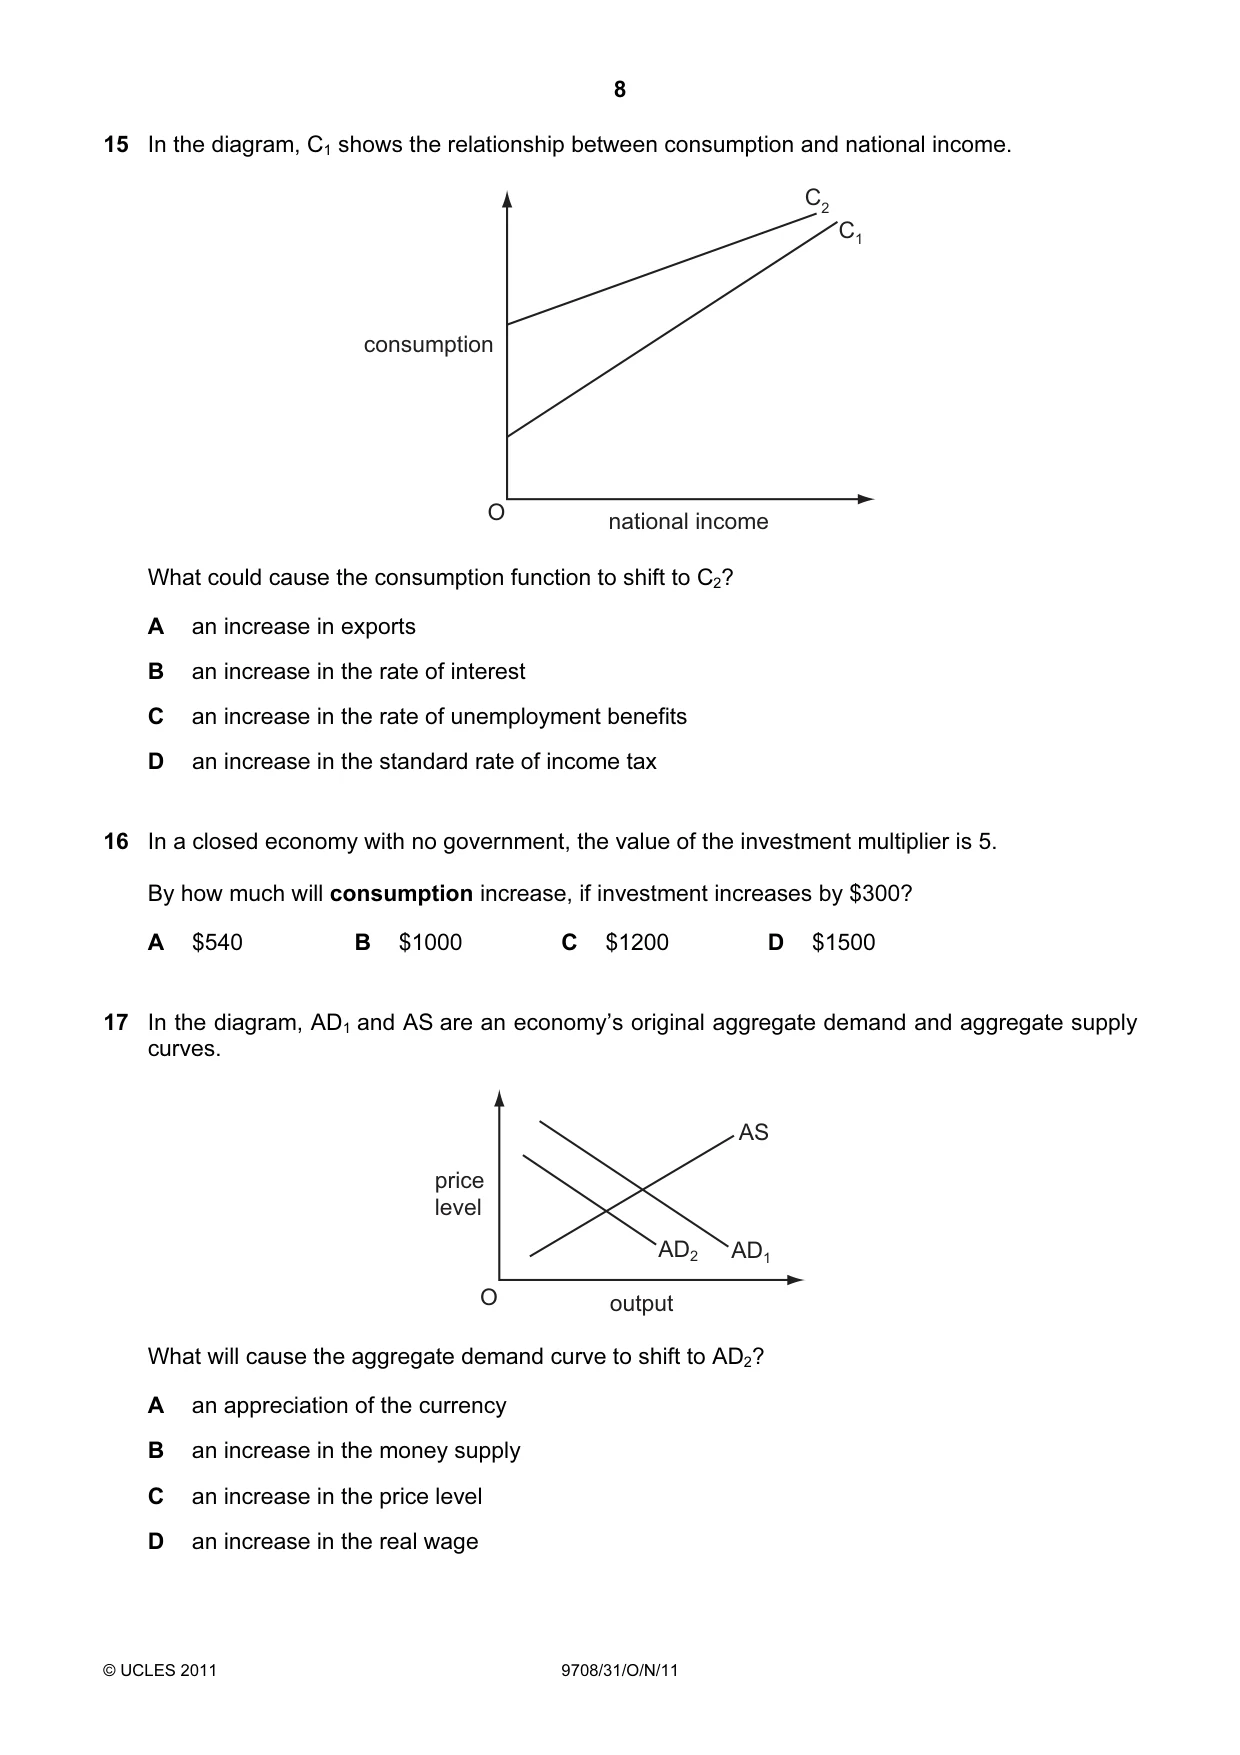
15 In the diagram, C1 shows the relationship between consumption and national income. C2 C1 consumption O national income What could cause the consumption function to shift to C2? A an increase in exports B an increase in the rate of interest C an increase in the rate of unemployment benefits D an increase in the standard rate of income tax
Mark scheme: C
Q16 · In a closed economy with no government, the value of the investment multiplier is 5
16 In a closed economy with no government, the value of the investment multiplier is 5. By how much will consumption increase, if investment increases by $300? A $540 B $1000 C $1200 D $1500
Mark scheme: C
Q17 · In the diagram, AD1 and AS are an economy’s original aggregate demand and aggregate…
17 In the diagram, AD1 and AS are an economy’s original aggregate demand and aggregate supply curves. AS price level AD2 AD1 O output What will cause the aggregate demand curve to shift to AD2? A an appreciation of the currency B an increase in the money supply C an increase in the price level D an increase in the real wage
Mark scheme: A
More questions on Aggregate Demand and Aggregate Supply analysis
Q18 · In an economy, the volume of output rises by 2 % in a year, while the quantity of money…
18 In an economy, the volume of output rises by 2 % in a year, while the quantity of money rises by 5 %. If the velocity of circulation of money remains the same, what will be the approximate increases in the price level and the money value of national income? increase in money increase in price level value of national income A 2 % 5 % B 2 % 7 % C 3 % 5 % D 3 % 7 %
Mark scheme: C
Q19 · The diagram shows three different levels of money supply (MS) and three different demand…
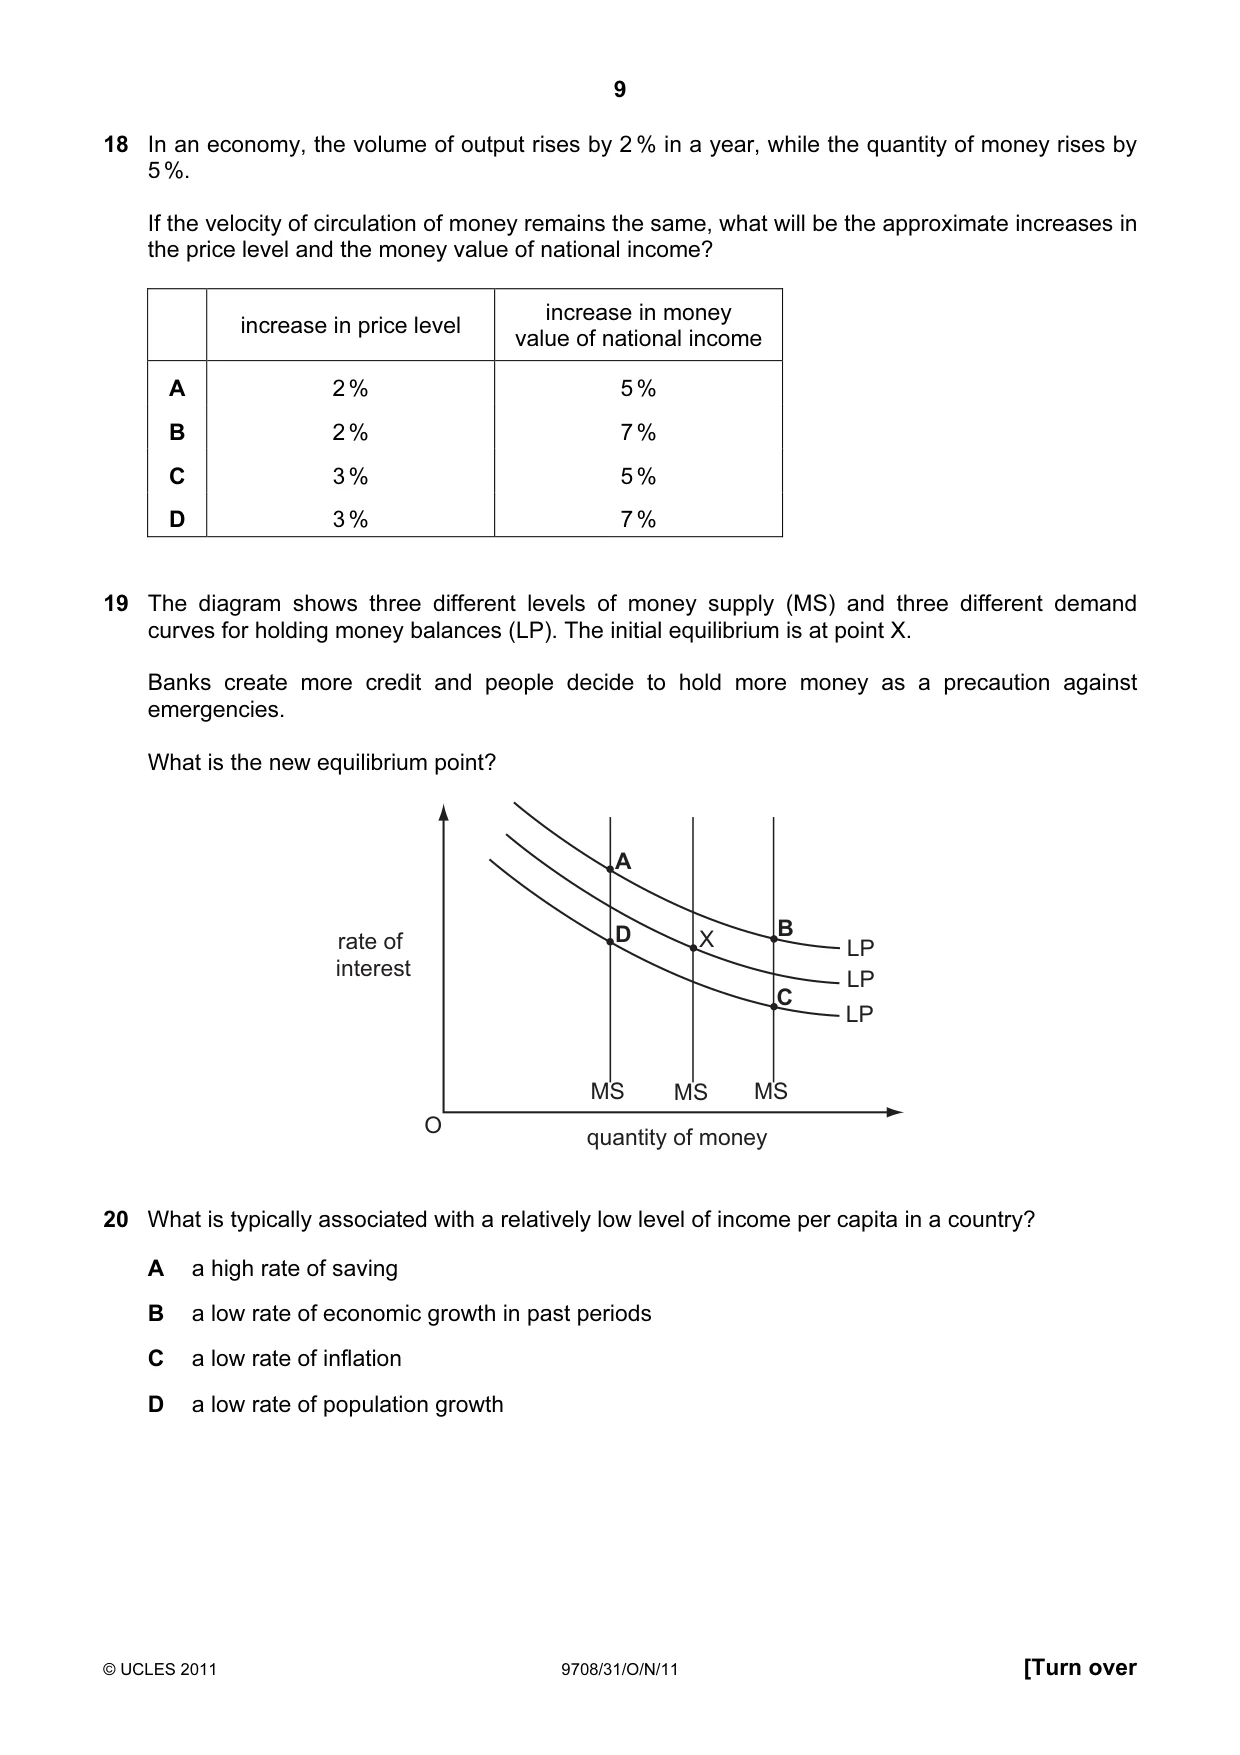
19 The diagram shows three different levels of money supply (MS) and three different demand curves for holding money balances (LP). The initial equilibrium is at point X. Banks create more credit and people decide to hold more money as a precaution against emergencies. What is the new equilibrium point? A D B rate of X LP interest LP C LP MS MS MS O quantity of money
Mark scheme: B
Q20 · What is typically associated with a relatively low level of income per capita in a…
20 What is typically associated with a relatively low level of income per capita in a country? A a high rate of saving B a low rate of economic growth in past periods C a low rate of inflation D a low rate of population growth
Mark scheme: B
More questions on Characteristics of countries at different levels of development
Q21 · What is likely to increase a country’s actual output in the short run but may reduce its…
21 What is likely to increase a country’s actual output in the short run but may reduce its long-run rate of growth of potential output? A an increase in the size of the government’s budget deficit B an increase in the size of the labour force C increased female participation in the labour force D increased government spending on education
Mark scheme: A
Q22 · What is a likely consequence of an increase in cyclical unemployment?
22 What is a likely consequence of an increase in cyclical unemployment? A a deficit on the current account of the balance of payments B a deterioration in the fiscal balance of the government C an increased rate of inflation D an increase in immigration
Mark scheme: B
More questions on Government macroeconomic policy objectives
Q23 · The chart shows the rates of economic growth and unemployment in a country for the period…
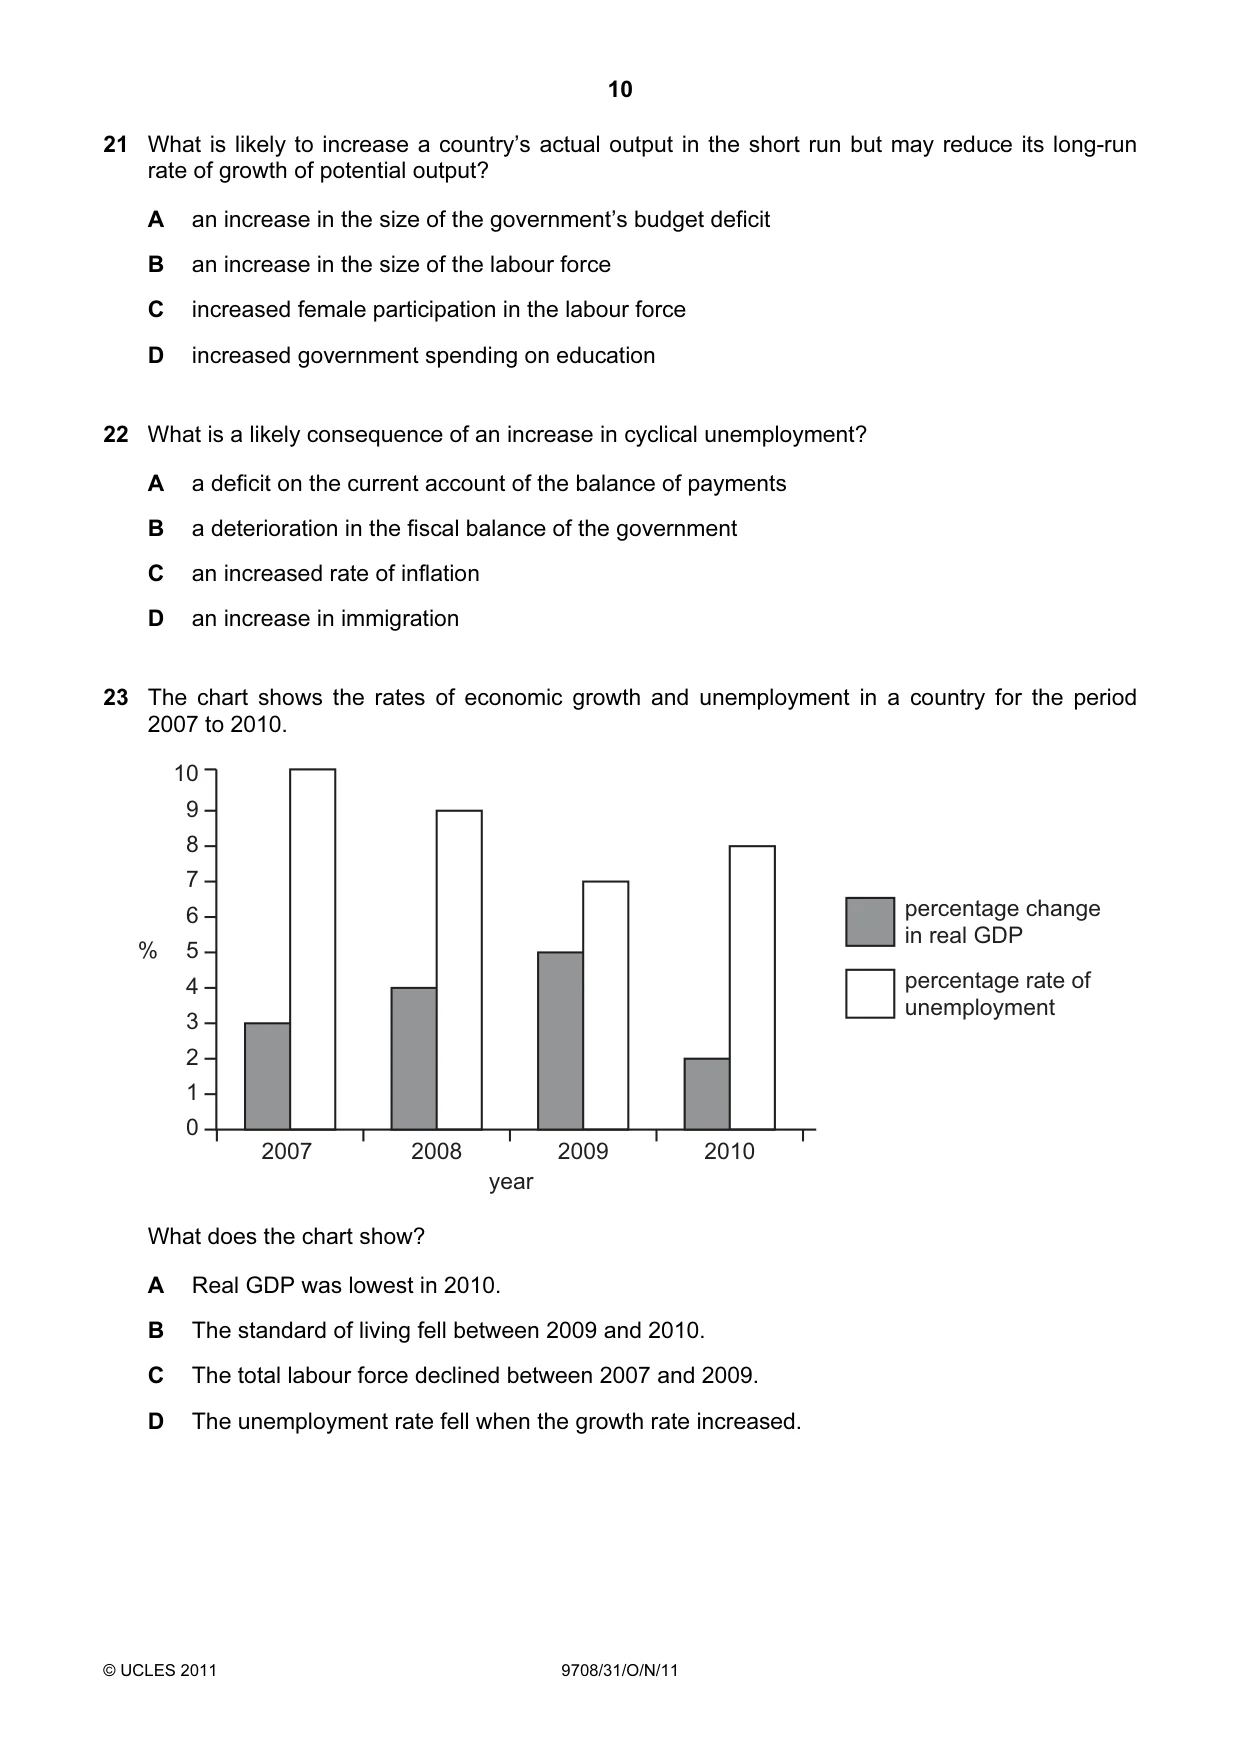
23 The chart shows the rates of economic growth and unemployment in a country for the period 2007 to 2010. 10 9 8 7 6 percentage change in real GDP % 5 4 percentage rate of unemployment 3 2 1 0 2007 2008 2009 2010 year What does the chart show? A Real GDP was lowest in 2010. B The standard of living fell between 2009 and 2010. C The total labour force declined between 2007 and 2009. D The unemployment rate fell when the growth rate increased.
Mark scheme: D
Q24 · Why are high and variable rates of inflation likely to be harmful to long-run economic…
24 Why are high and variable rates of inflation likely to be harmful to long-run economic growth? A They hide relative price changes leading to a misallocation of resources. B They increase the real burden of household debt leading to lower consumption. C They lead to an increase in the household saving ratio. D They result in an increase in real interest rates.
Mark scheme: A
Q25 · Economists have proposed that the best policy to promote development is ‘trade not aid’
25 Economists have proposed that the best policy to promote development is ‘trade not aid’. What is implied by this proposal? A Developing countries should become self-sufficient and not rely on aid. B Developing countries should be given greater access to markets in developed countries. C Developing countries should use foreign aid to invest in their export industries. D Developing countries should use trade barriers to promote import substitution.
Mark scheme: B
More questions on Relationship between countries at different levels of development
Q26 · What is likely to result from foreign direct investment in developing economies?
26 What is likely to result from foreign direct investment in developing economies? A a reduction in local wage levels B a reduction in tax revenues in developing economies C a reduction in the range of consumer goods available to the local population D a worsening of net income flows from investments
Mark scheme: D
More questions on Relationship between countries at different levels of development
Q27 · The graphs show the changes in the exchange rate of the £ sterling against the US $ and…
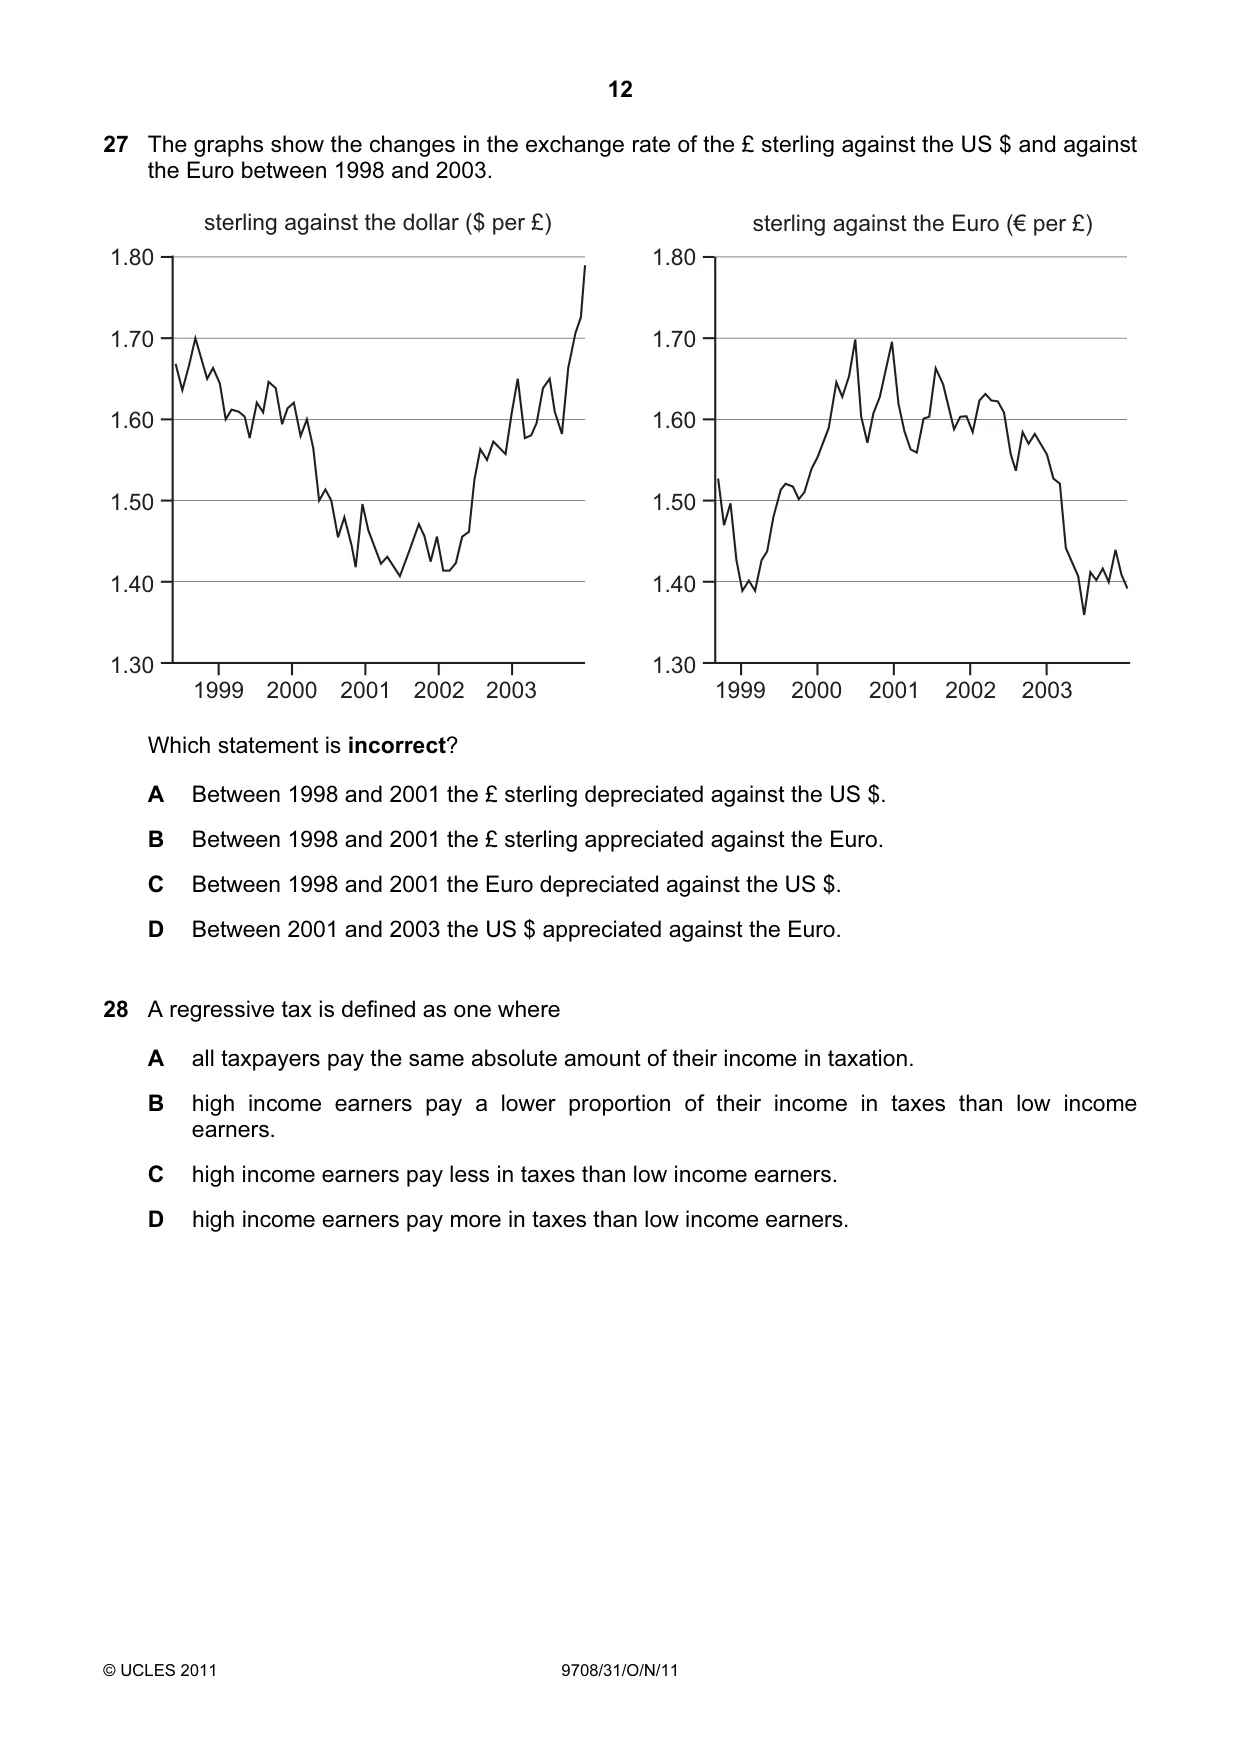
27 The graphs show the changes in the exchange rate of the £ sterling against the US $ and against the Euro between 1998 and 2003. sterling against the dollar ($ per £) sterling against the Euro (€ per £) 1.80 1.80 1.70 1.70 1.60 1.60 1.50 1.50 1.40 1.40 1.30 1.30 1999 2000 2001 2002 2003 1999 2000 2001 2002 2003 Which statement is incorrect? A Between 1998 and 2001 the £ sterling depreciated against the US $. B Between 1998 and 2001 the £ sterling appreciated against the Euro. C Between 1998 and 2001 the Euro depreciated against the US $. D Between 2001 and 2003 the US $ appreciated against the Euro.
Mark scheme: D
Q28 · A regressive tax is defined as one where A all taxpayers pay the same absolute amount of…
28 A regressive tax is defined as one where A all taxpayers pay the same absolute amount of their income in taxation. B high income earners pay a lower proportion of their income in taxes than low income earners. C high income earners pay less in taxes than low income earners. D high income earners pay more in taxes than low income earners.
Mark scheme: B
More questions on Equity and redistribution of income and wealth
Q29 · The diagram shows the time path of actual output and of long-term potential output of an…
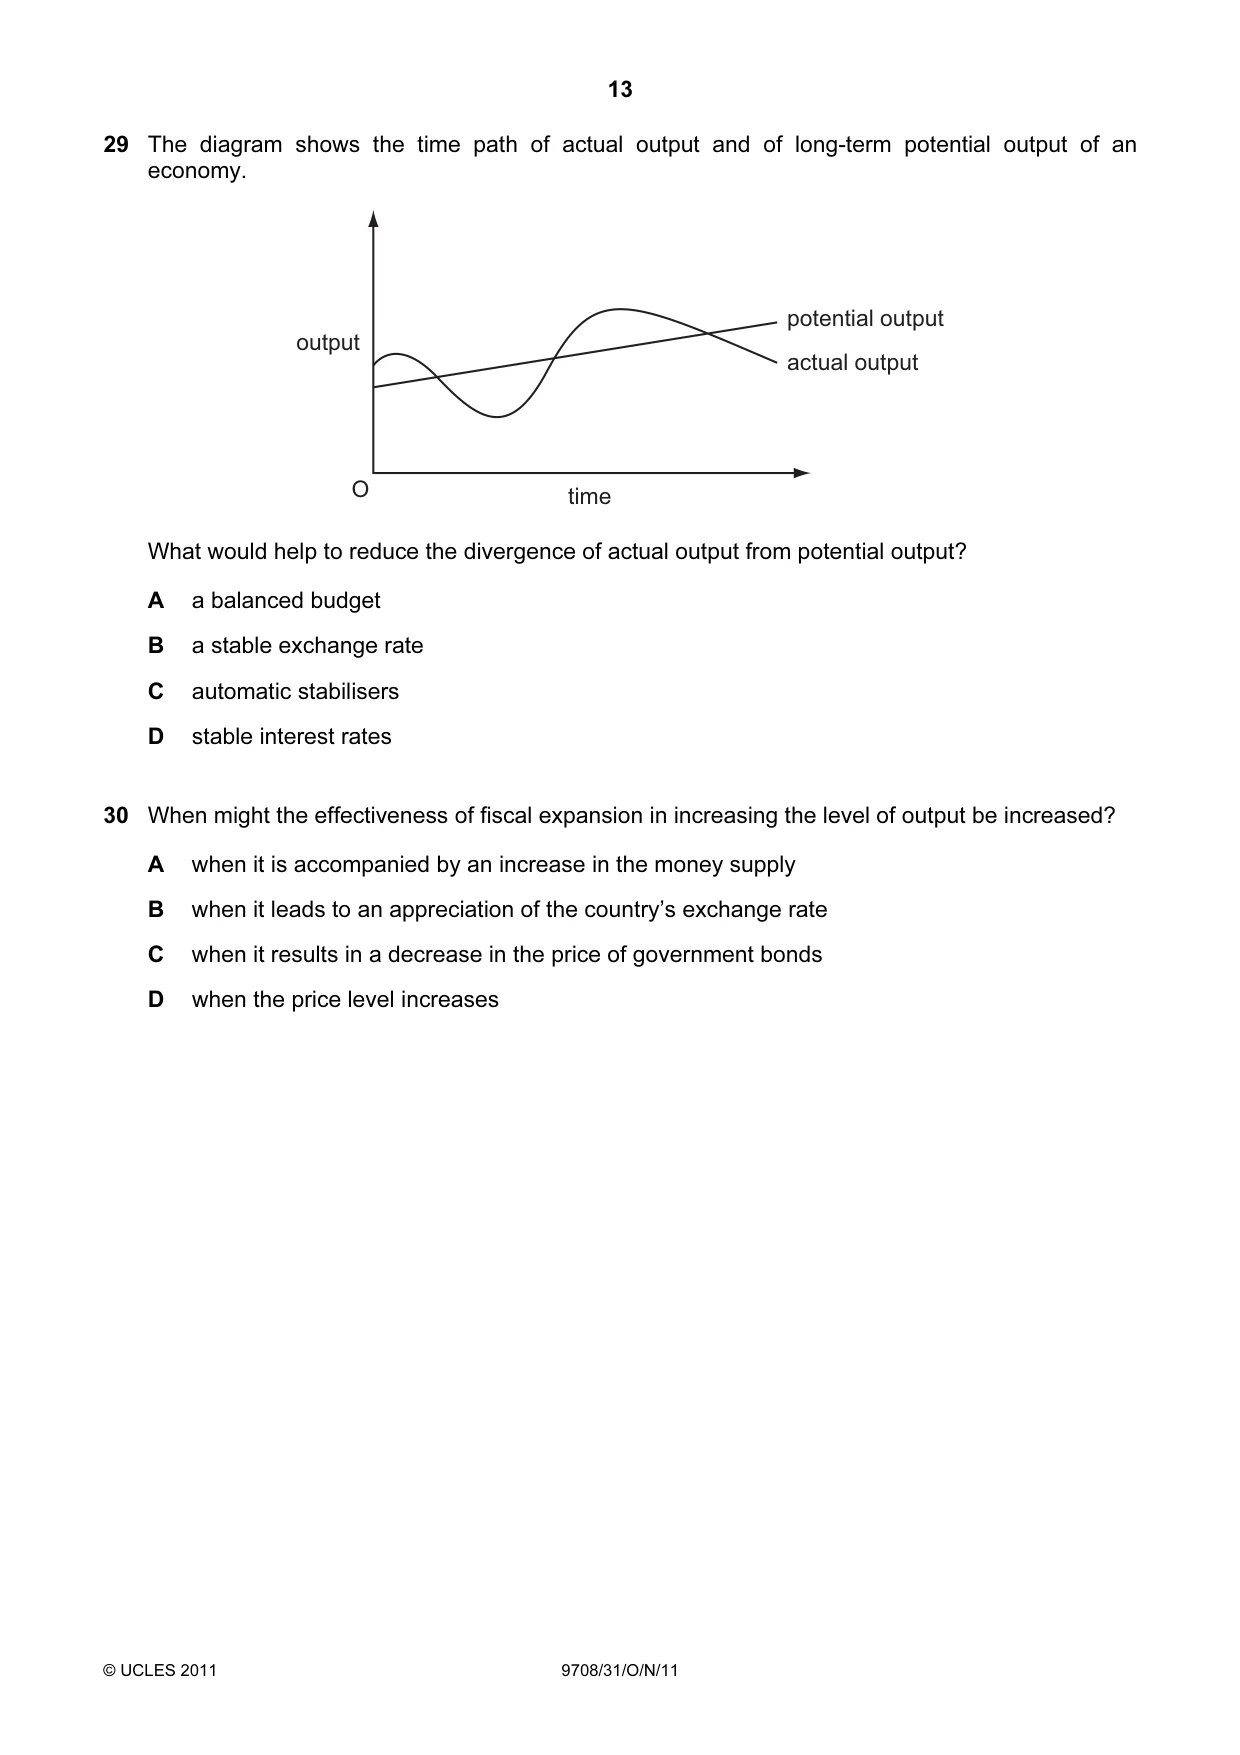
29 The diagram shows the time path of actual output and of long-term potential output of an economy. potential output output actual output O time What would help to reduce the divergence of actual output from potential output? A a balanced budget B a stable exchange rate C automatic stabilisers D stable interest rates
Mark scheme: C
More questions on Effectiveness of policy options to meet all macroeconomic objectives
Q30 · When might the effectiveness of fiscal expansion in increasing the level of output be…
30 When might the effectiveness of fiscal expansion in increasing the level of output be increased? A when it is accompanied by an increase in the money supply B when it leads to an appreciation of the country’s exchange rate C when it results in a decrease in the price of government bonds D when the price level increases
Mark scheme: A
More questions on Effectiveness of policy options to meet all macroeconomic objectives
What was in this paper
The subtopics covered by these 30 questions, and how many questions each got. Open one in a new tab to see every Cambridge question on it.
3Types of cost, revenue and profit, short-run and long-run production3Economic growth and sustainability2Effectiveness of policy options to meet all macroeconomic objectives2Employment/unemployment2Money and banking2Relationship between countries at different levels of development2The circular flow of income2Aggregate Demand and Aggregate Supply analysis1Characteristics of countries at different levels of development1Different market structures1Efficiency and market failure1Exchange rates1Government macroeconomic policy objectives1Indifference curves and budget lines1Labour market forces and government intervention1Methods and effects of government intervention in markets1National income statistics1The interaction of demand and supply1Utility1What you needed in this session
Cambridge’s own grade thresholds for 2011 Oct/Nov, Paper 3 · Variant 1. A higher threshold means an easier paper — the bar moves with how the cohort did.