Cambridge A Level Economics 9708 — 2019 Feb/March Paper 3 · Variant 2
9708/32/F/M/19 · 30 questions · 30 marks · ≈34 min
The question paper and its mark scheme, free to read here and free to download. This is Cambridge’s own paper, exactly as it was sat.
Question paper12 pages

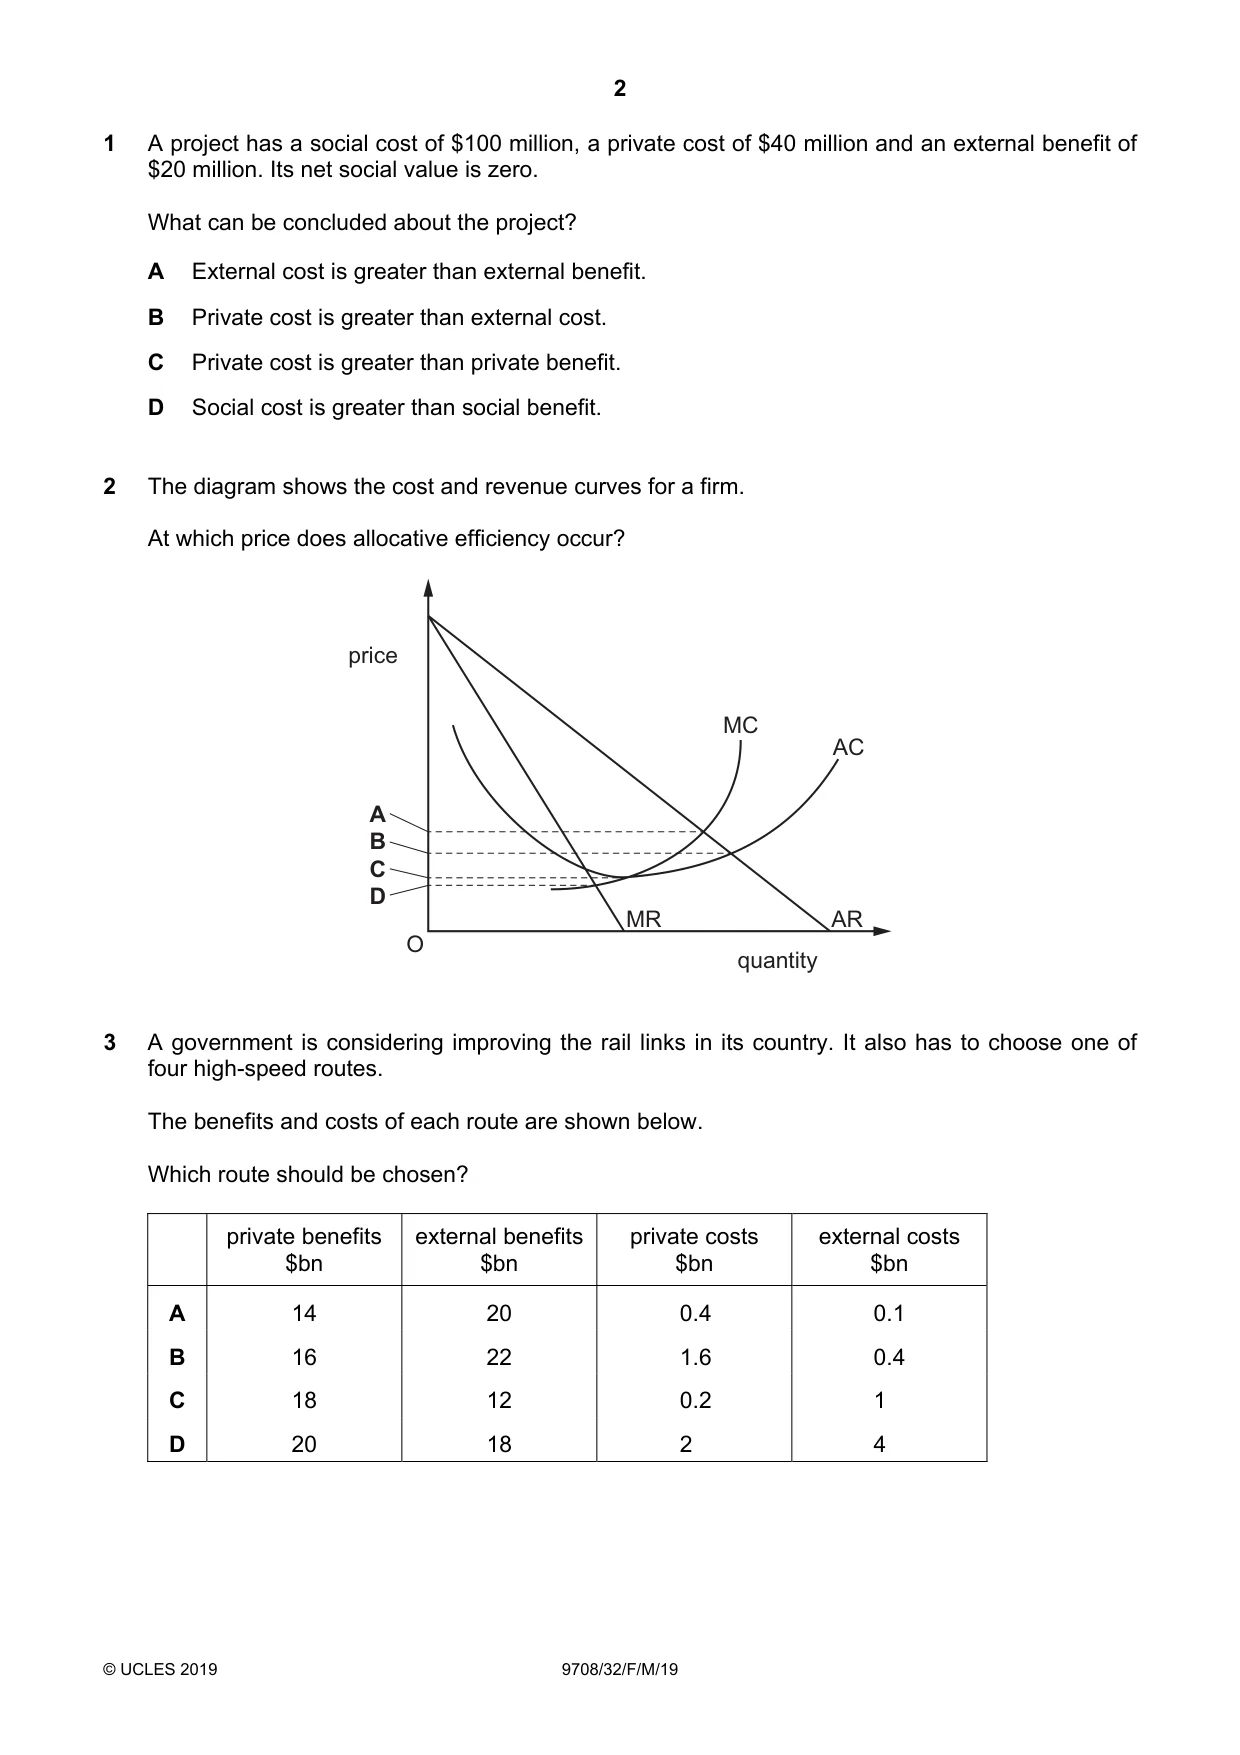
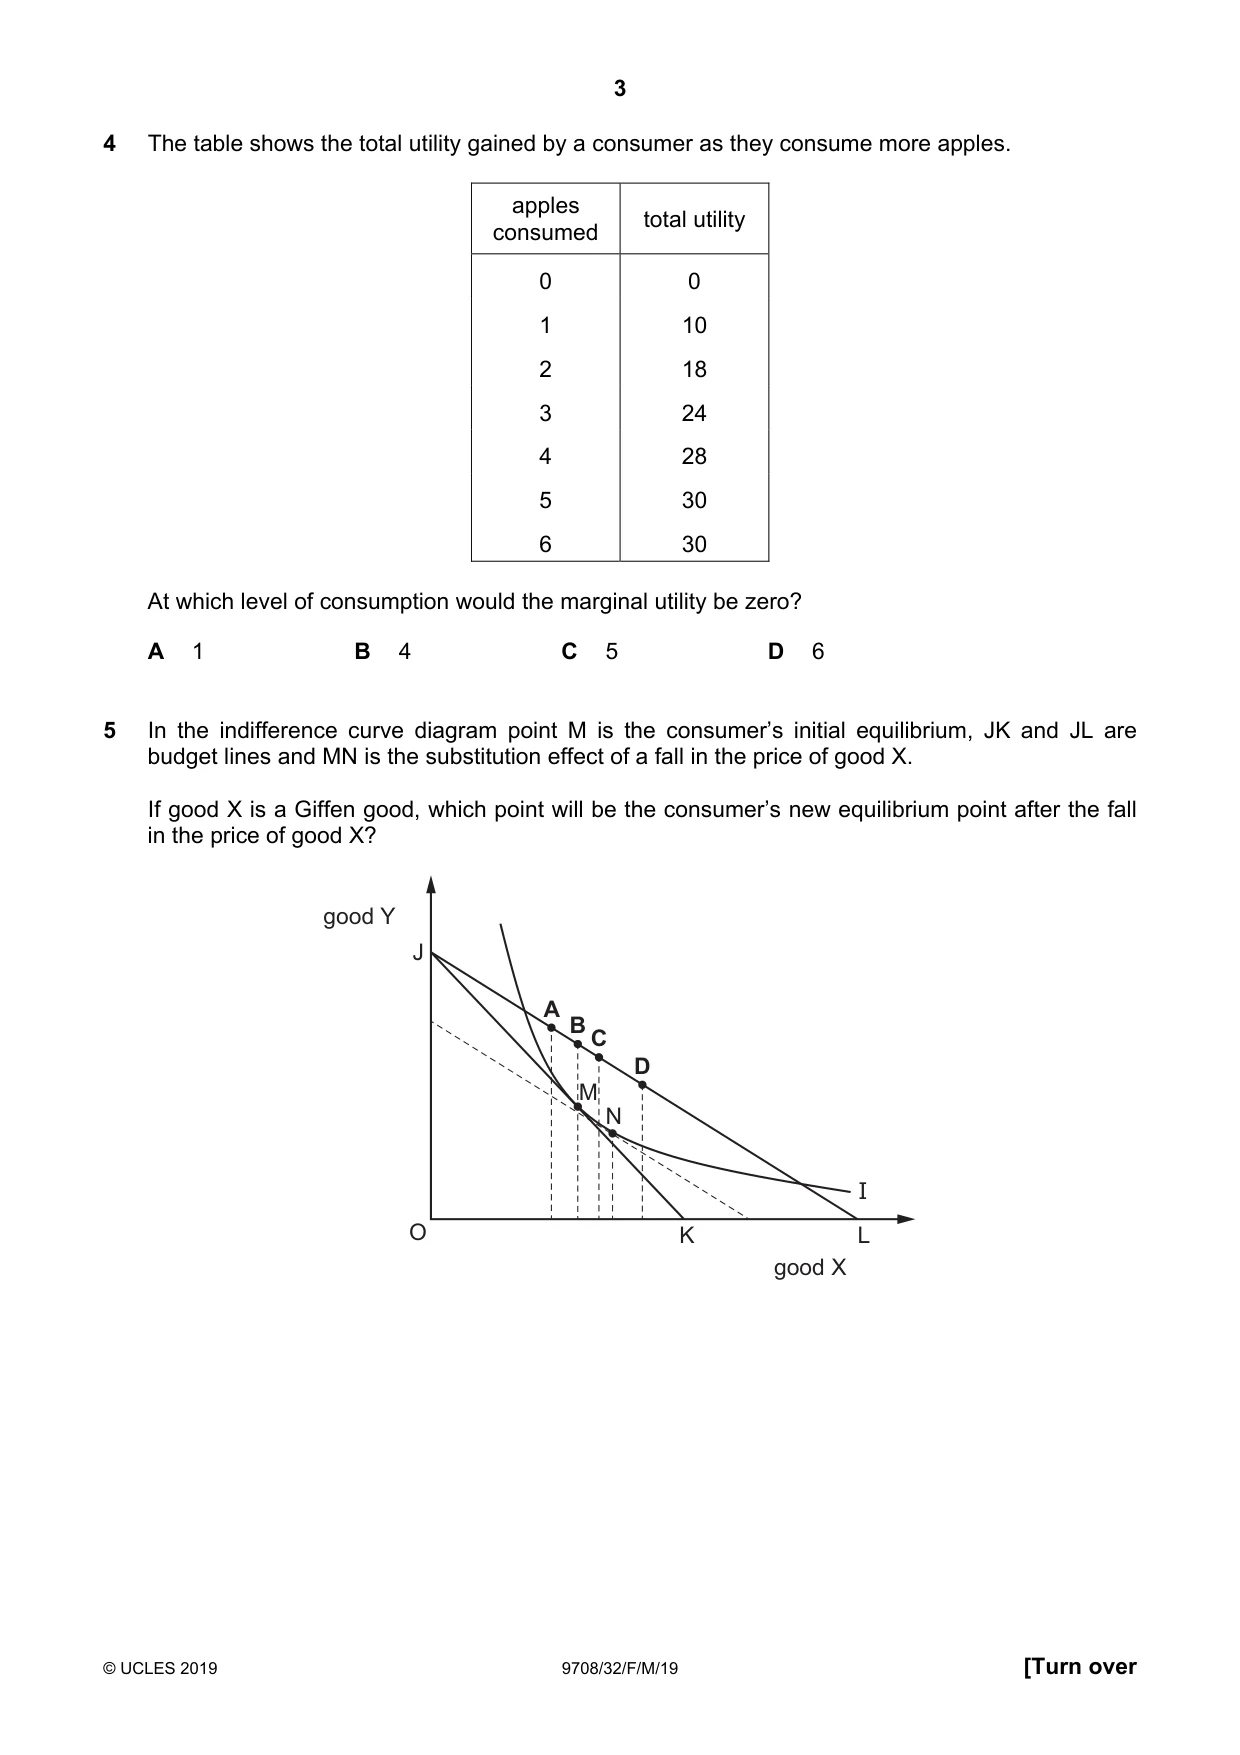
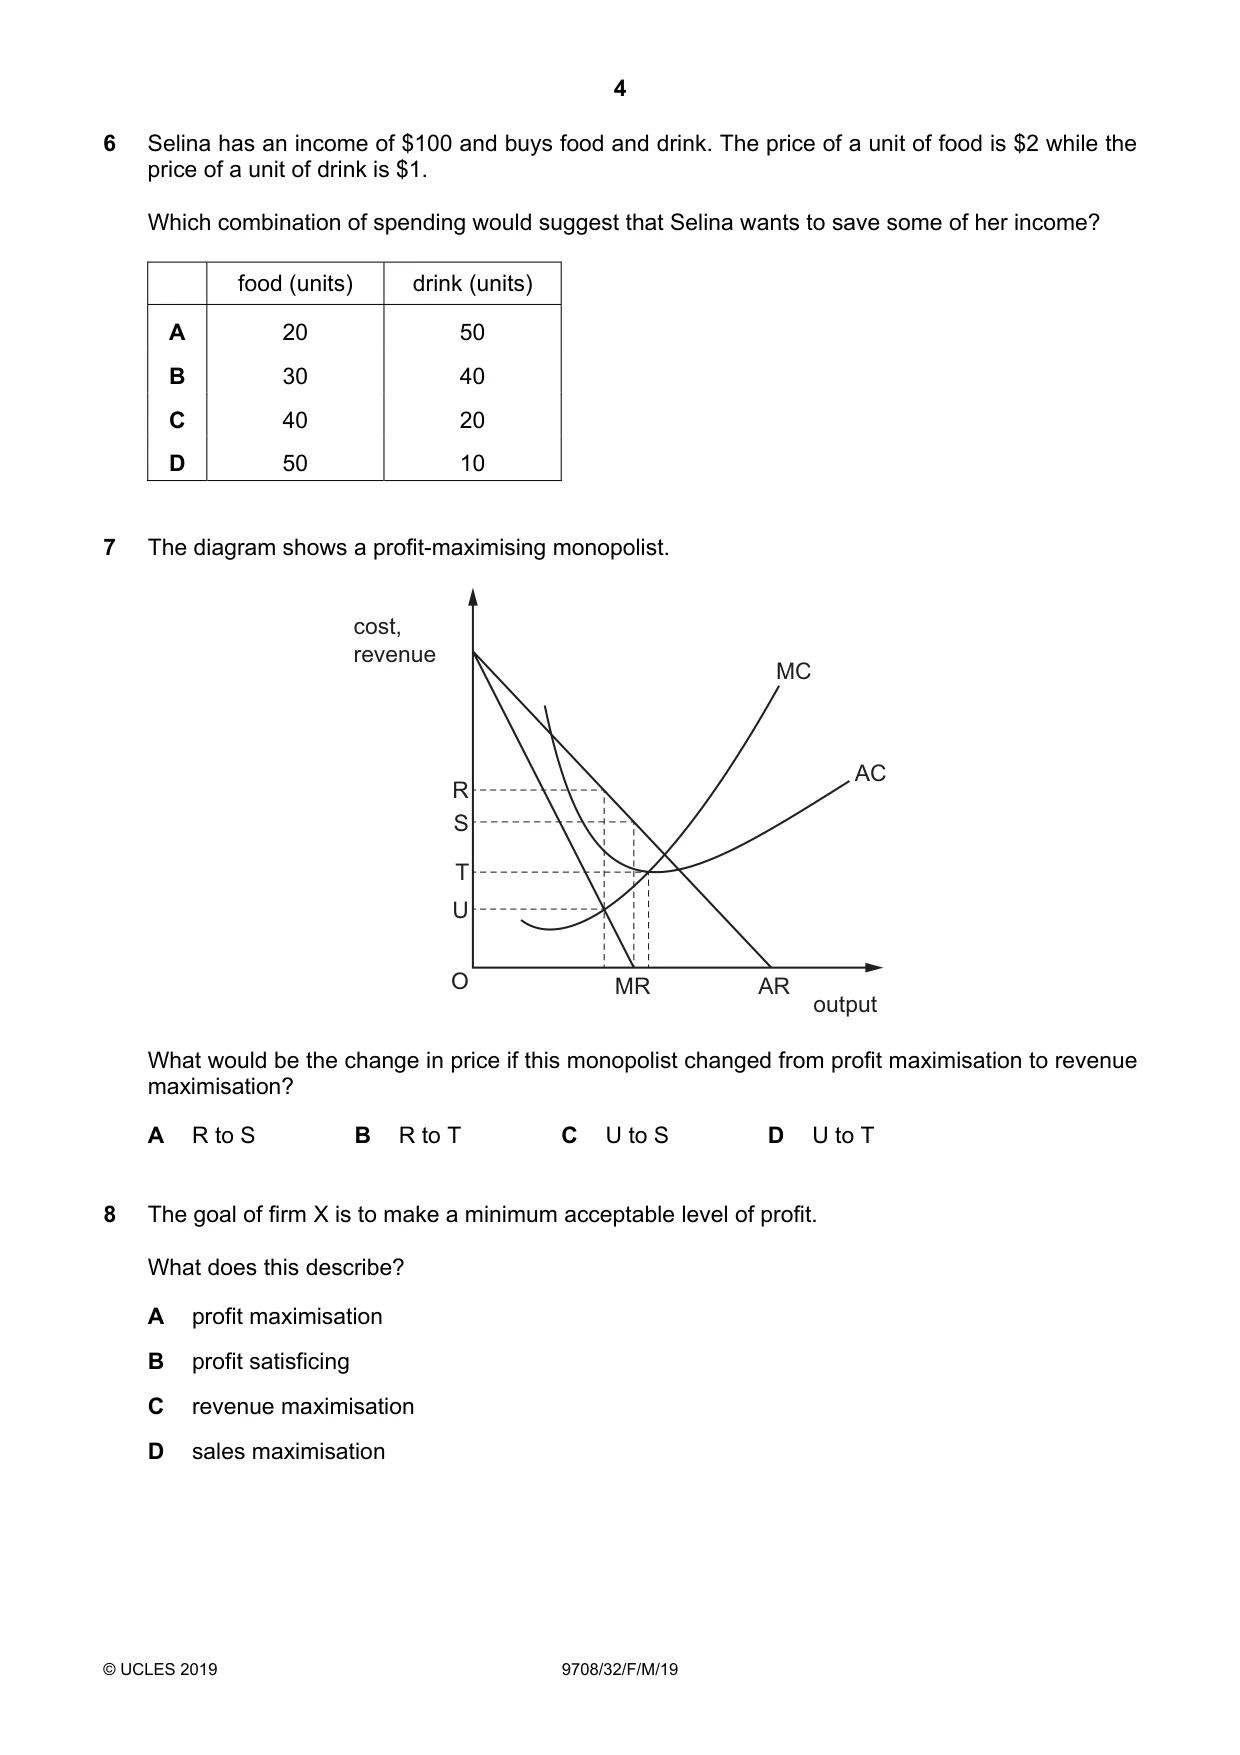
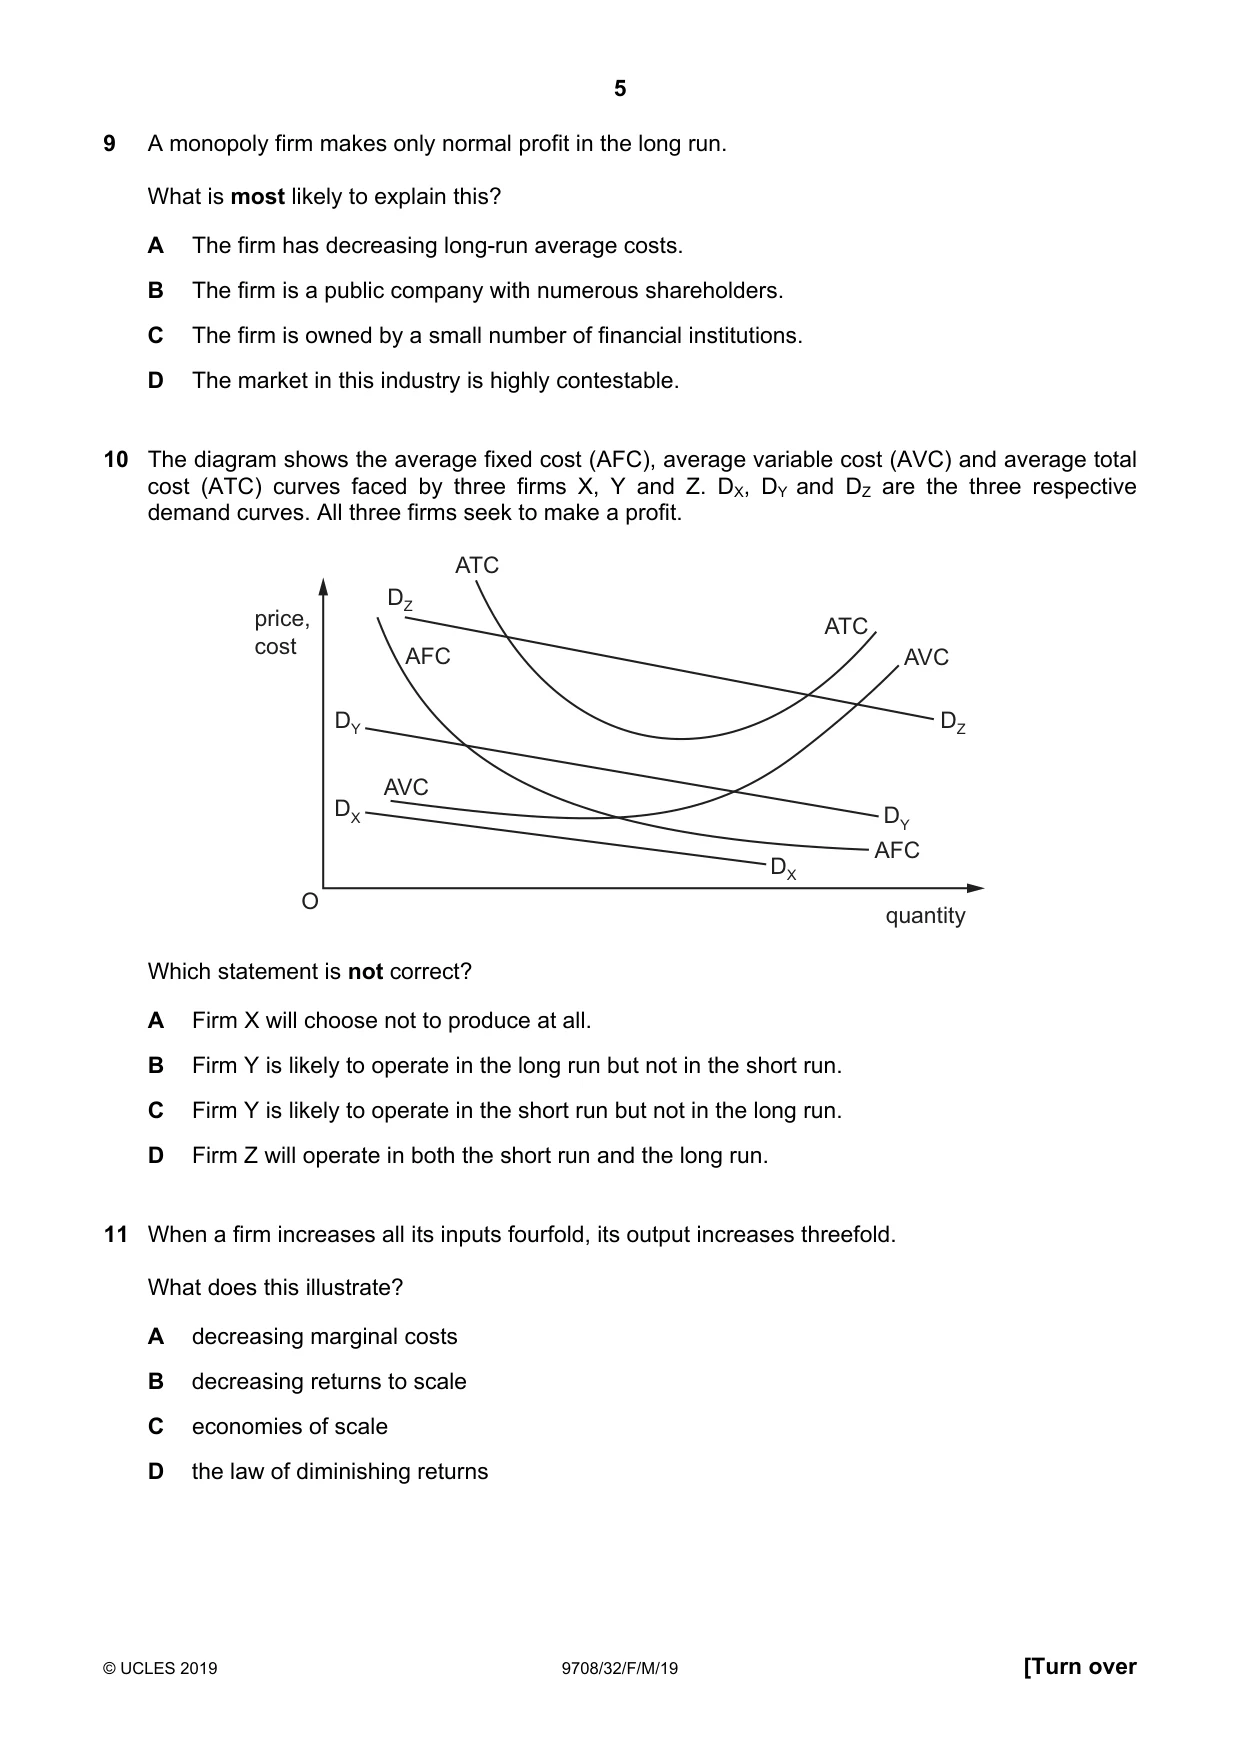
Mark scheme3 pages
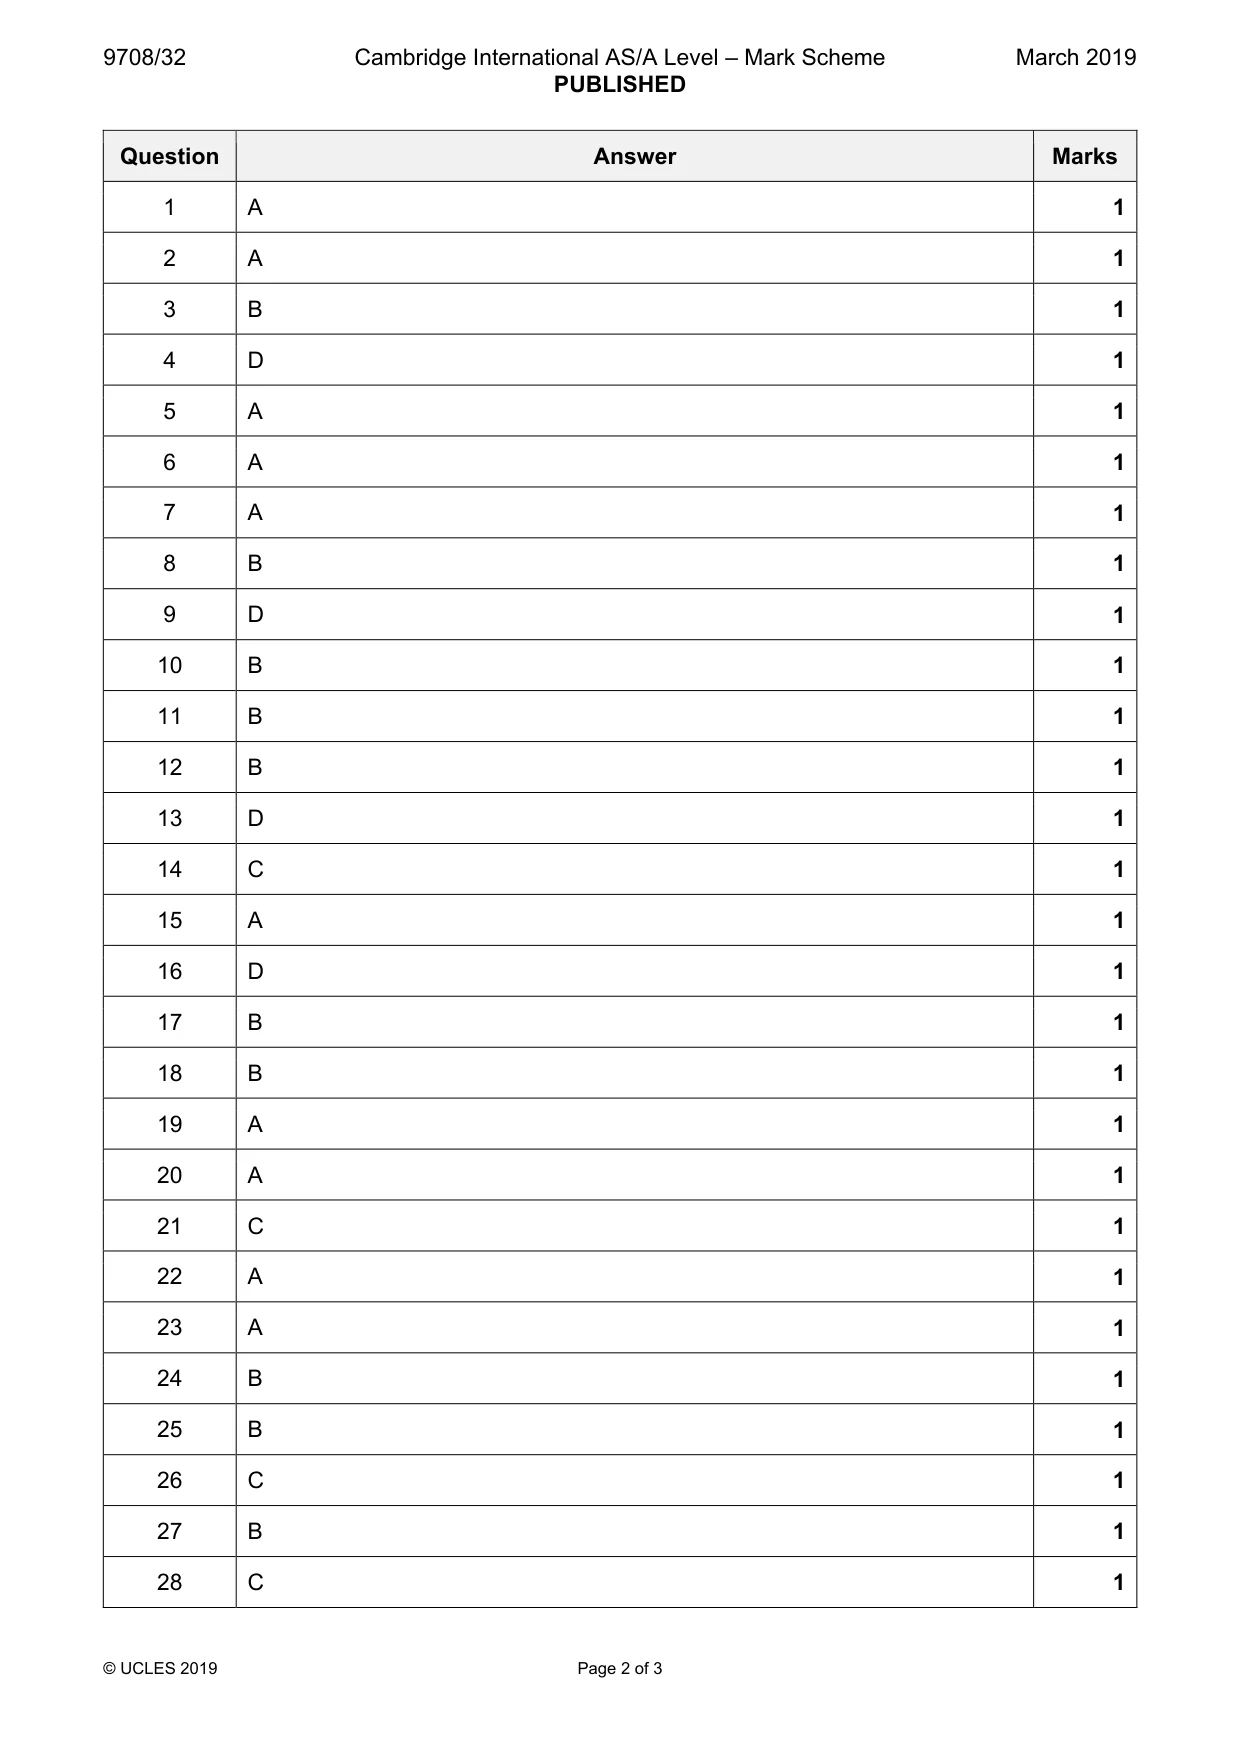
Answers below. Sit the paper first if you are practising.

Questions as text
Q1 · A project has a social cost of $100 million, a private cost of $40 million and an…
1 A project has a social cost of $100 million, a private cost of $40 million and an external benefit of $20 million. Its net social value is zero. What can be concluded about the project? A External cost is greater than external benefit. B Private cost is greater than external cost. C Private cost is greater than private benefit. D Social cost is greater than social benefit.
Mark scheme: A
More questions on Private costs and benefits, externalities and social costs and benefits
Q2 · The diagram shows the cost and revenue curves for a firm
2 The diagram shows the cost and revenue curves for a firm. At which price does allocative efficiency occur? price MC AC A B C D MR AR O quantity
Mark scheme: A
Q3 · A government is considering improving the rail links in its country
3 A government is considering improving the rail links in its country. It also has to choose one of four high-speed routes. The benefits and costs of each route are shown below. Which route should be chosen? private benefits external benefits private costs external costs $bn $bn $bn $bn A 14 20 0.4 0.1 B 16 22 1.6 0.4 C 18 12 0.2 1 D 20 18 2 4
Mark scheme: B
More questions on Private costs and benefits, externalities and social costs and benefits
Q4 · The table shows the total utility gained by a consumer as they consume more apples
4 The table shows the total utility gained by a consumer as they consume more apples. apples total utility consumed 0 0 1 10 2 18 3 24 4 28 5 30 6 30 At which level of consumption would the marginal utility be zero? A 1 B 4 C 5 D 6
Mark scheme: D
Q5 · In the indifference curve diagram point M is the consumer’s initial equilibrium, JK and…
5 In the indifference curve diagram point M is the consumer’s initial equilibrium, JK and JL are budget lines and MN is the substitution effect of a fall in the price of good X. If good X is a Giffen good, which point will be the consumer’s new equilibrium point after the fall in the price of good X? good Y J A B C D M N I O K L good X
Mark scheme: A
Q6 · Selina has an income of $100 and buys food and drink
6 Selina has an income of $100 and buys food and drink. The price of a unit of food is $2 while the price of a unit of drink is $1. Which combination of spending would suggest that Selina wants to save some of her income? food (units) drink (units) A 20 50 B 30 40 C 40 20 D 50 10
Mark scheme: A
Q7 · The diagram shows a profit-maximising monopolist
7 The diagram shows a profit-maximising monopolist. cost, revenue MC AC R S T U O MR AR output What would be the change in price if this monopolist changed from profit maximisation to revenue maximisation? A R to S B R to T C U to S D U to T
Mark scheme: A
Q8 · The goal of firm X is to make a minimum acceptable level of profit
8 The goal of firm X is to make a minimum acceptable level of profit. What does this describe? A profit maximisation B profit satisficing C revenue maximisation D sales maximisation
Mark scheme: B
More questions on Differing objectives and policies of firms
Q9 · A monopoly firm makes only normal profit in the long run
9 A monopoly firm makes only normal profit in the long run. What is most likely to explain this? A The firm has decreasing long-run average costs. B The firm is a public company with numerous shareholders. C The firm is owned by a small number of financial institutions. D The market in this industry is highly contestable.
Mark scheme: D
Q10 · The diagram shows the average fixed cost (AFC), average variable cost (AVC) and average…
10 The diagram shows the average fixed cost (AFC), average variable cost (AVC) and average total cost (ATC) curves faced by three firms X, Y and Z. DX, DY and DZ are the three respective demand curves. All three firms seek to make a profit. ATC DZ price, ATC cost AFC AVC DY DZ AVC DX DY AFC DX O quantity Which statement is not correct? A Firm X will choose not to produce at all. B Firm Y is likely to operate in the long run but not in the short run. C Firm Y is likely to operate in the short run but not in the long run. D Firm Z will operate in both the short run and the long run.
Mark scheme: B
More questions on Types of cost, revenue and profit, short-run and long-run production
Q11 · When a firm increases all its inputs fourfold, its output increases threefold
11 When a firm increases all its inputs fourfold, its output increases threefold. What does this illustrate? A decreasing marginal costs B decreasing returns to scale C economies of scale D the law of diminishing returns
Mark scheme: B
More questions on Types of cost, revenue and profit, short-run and long-run production
Q12 · What represents the transfer earnings of the factor enterprise?
12 What represents the transfer earnings of the factor enterprise? A excess profit B normal profit C return on capital D start-up costs
Mark scheme: B
More questions on Types of cost, revenue and profit, short-run and long-run production
Q13 · A country has a negative income tax
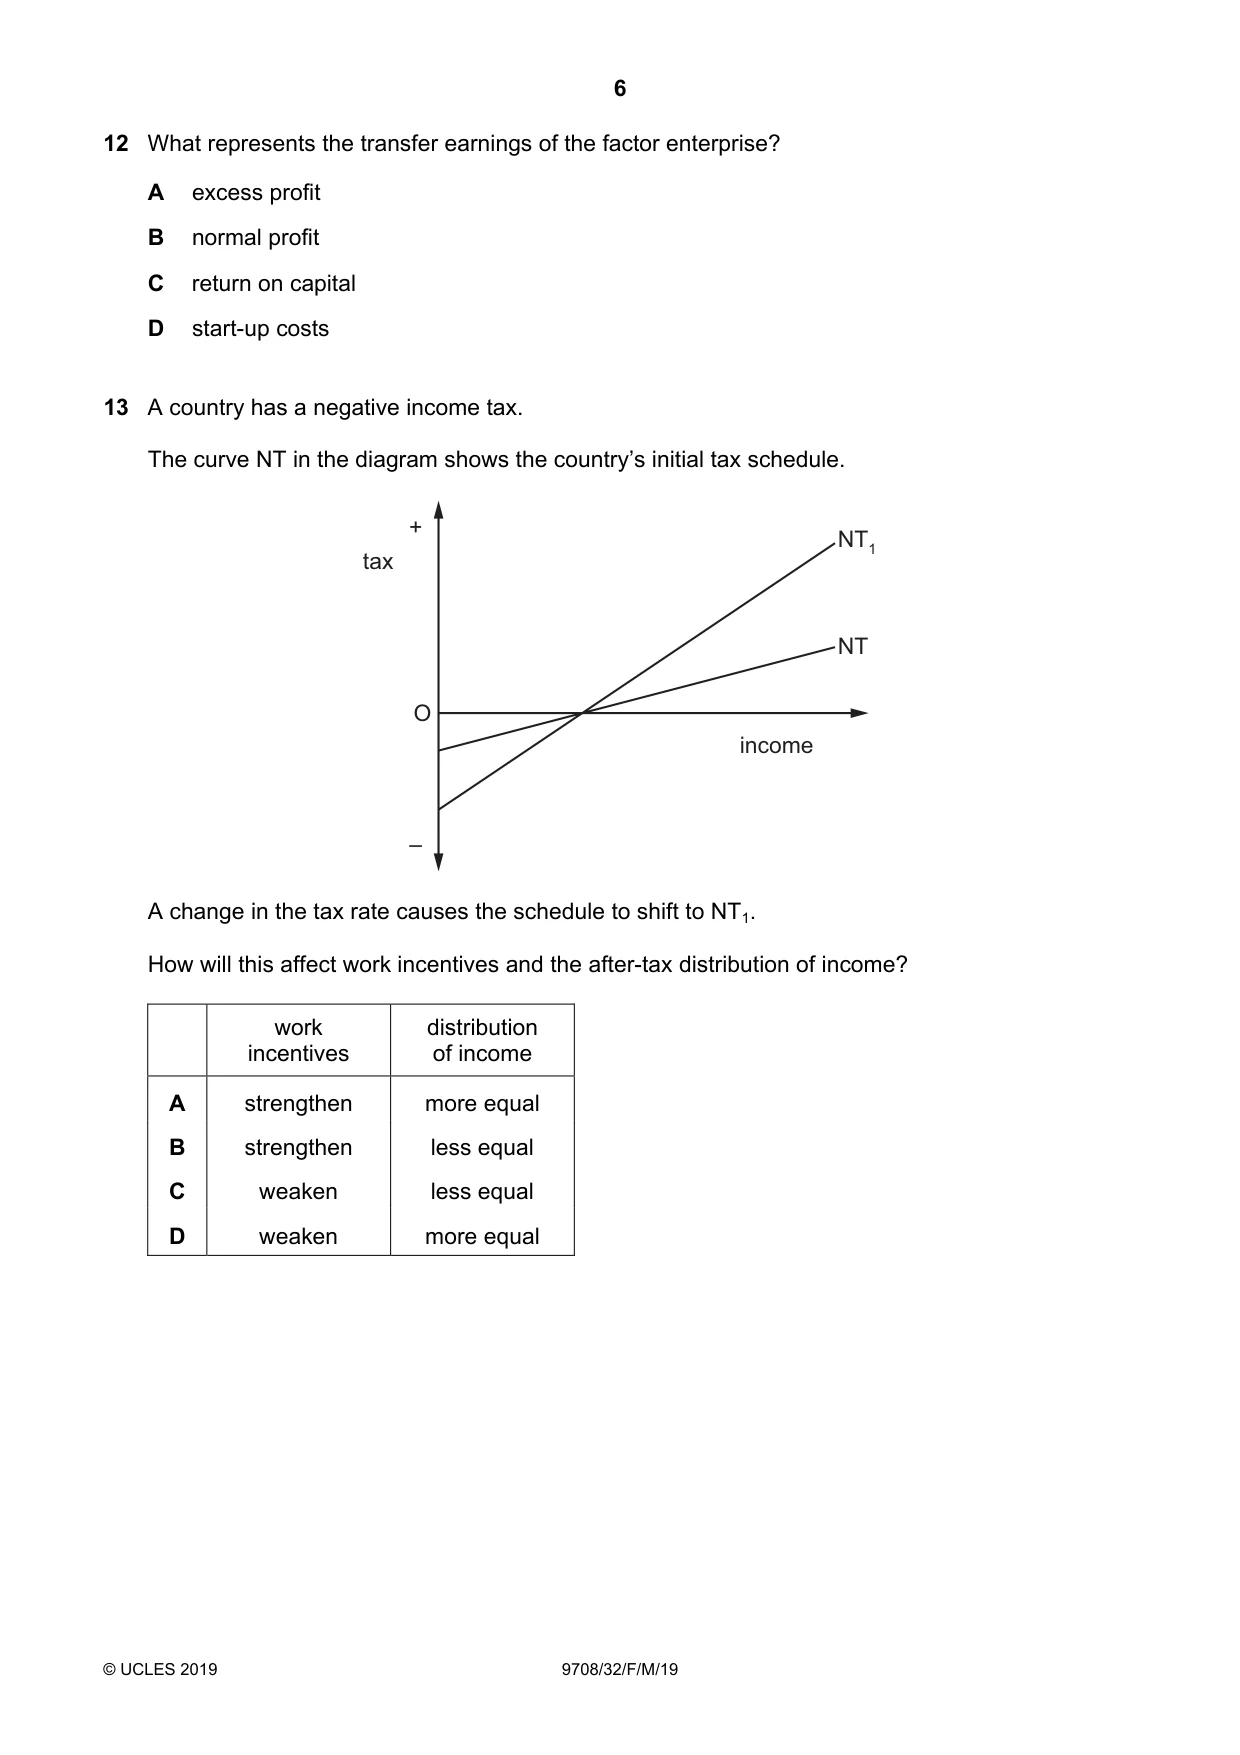
13 A country has a negative income tax. The curve NT in the diagram shows the country’s initial tax schedule. + NT1 tax NT O income – A change in the tax rate causes the schedule to shift to NT1. How will this affect work incentives and the after-tax distribution of income? work distribution incentives of income A strengthen more equal B strengthen less equal C weaken less equal D weaken more equal
Mark scheme: D
More questions on Equity and redistribution of income and wealth
Q14 · In which labour market diagram is the economic rent of workers greatest?
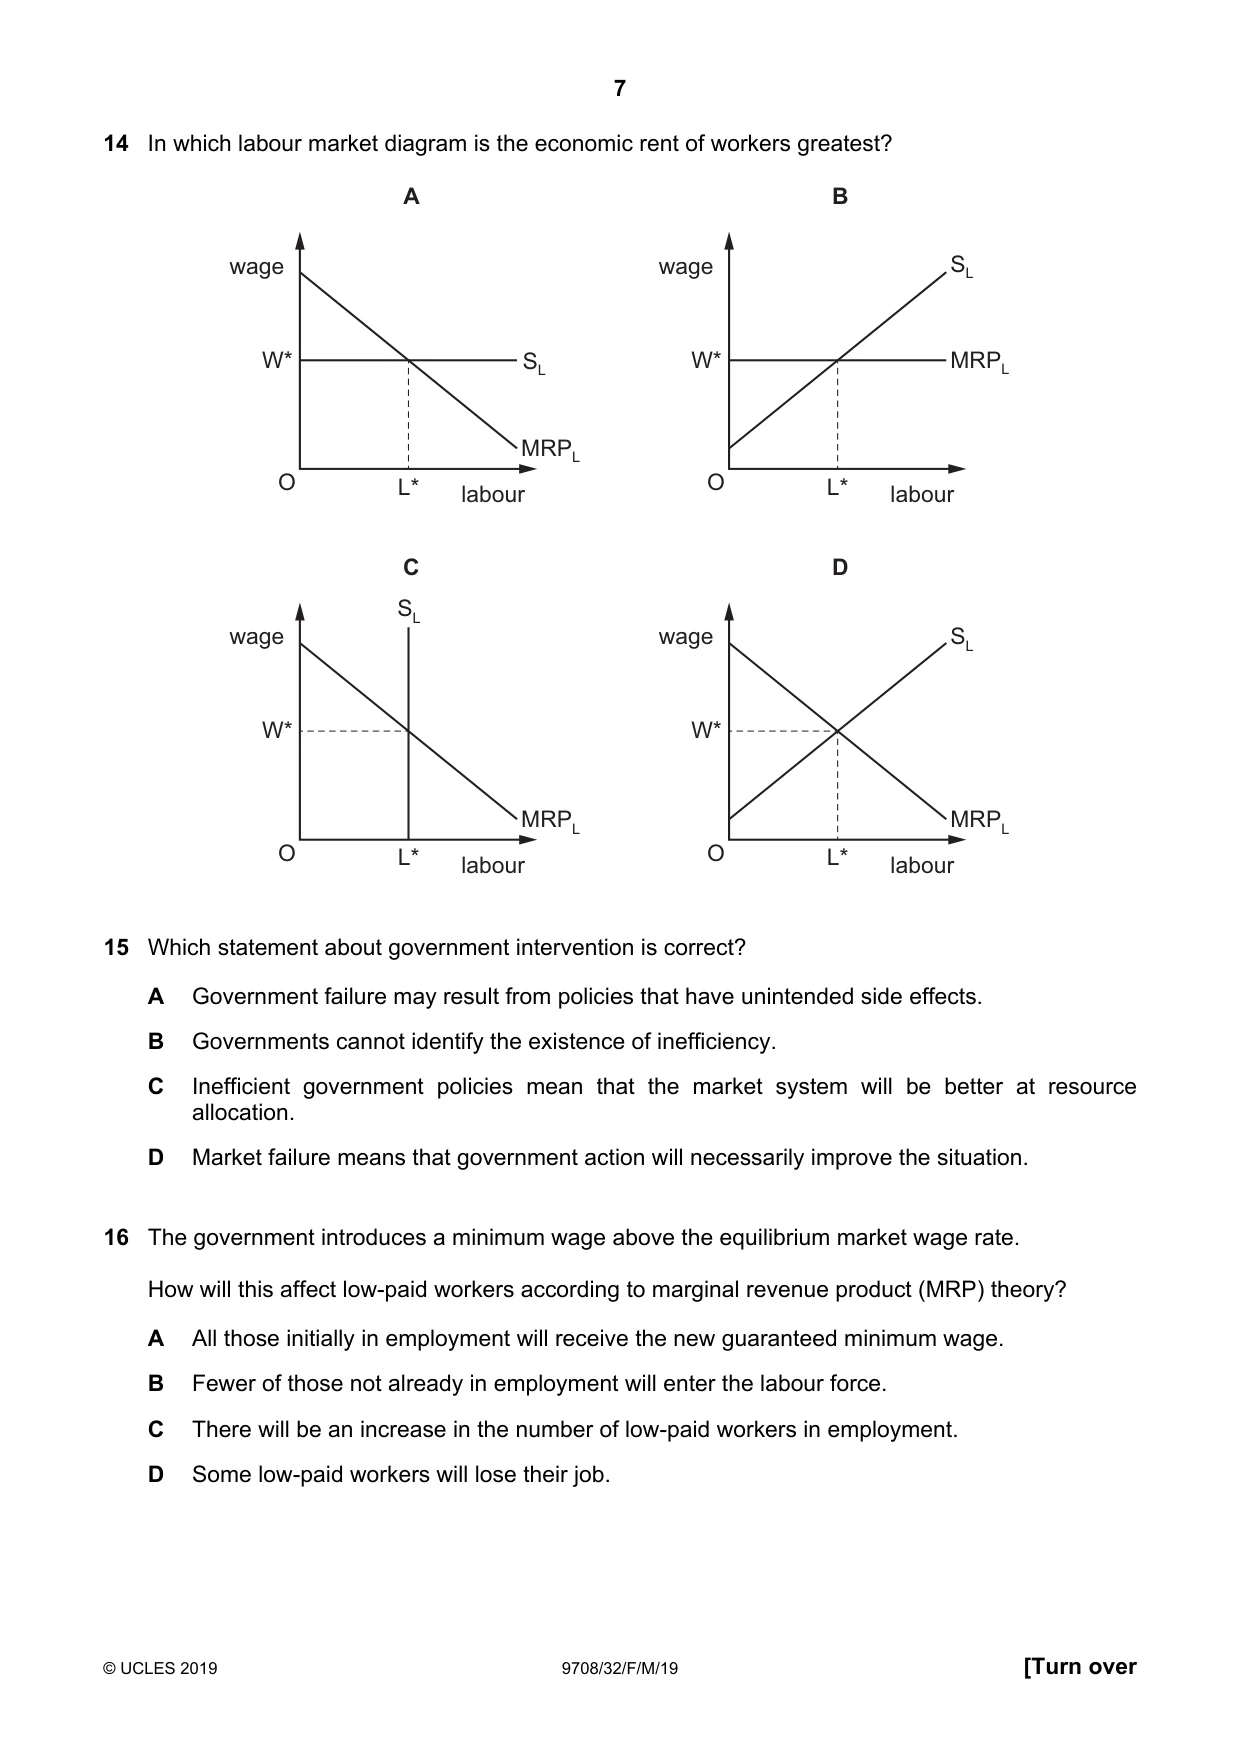
14 In which labour market diagram is the economic rent of workers greatest? A B wage wage SL W* SL W* MRPL MRPL O L* O L* labour labour C D SL wage wage SL W* W* MRPL MRPL O L* O L* labour labour
Mark scheme: C
More questions on Labour market forces and government intervention
Q15 · Which statement about government intervention is correct?
15 Which statement about government intervention is correct? A Government failure may result from policies that have unintended side effects. B Governments cannot identify the existence of inefficiency. C Inefficient government policies mean that the market system will be better at resource allocation. D Market failure means that government action will necessarily improve the situation.
Mark scheme: A
Q16 · The government introduces a minimum wage above the equilibrium market wage rate
16 The government introduces a minimum wage above the equilibrium market wage rate. How will this affect low-paid workers according to marginal revenue product (MRP) theory? A All those initially in employment will receive the new guaranteed minimum wage. B Fewer of those not already in employment will enter the labour force. C There will be an increase in the number of low-paid workers in employment. D Some low-paid workers will lose their job.
Mark scheme: D
More questions on Labour market forces and government intervention
Q17 · The diagram shows the market for a good that creates a negative externality in production…
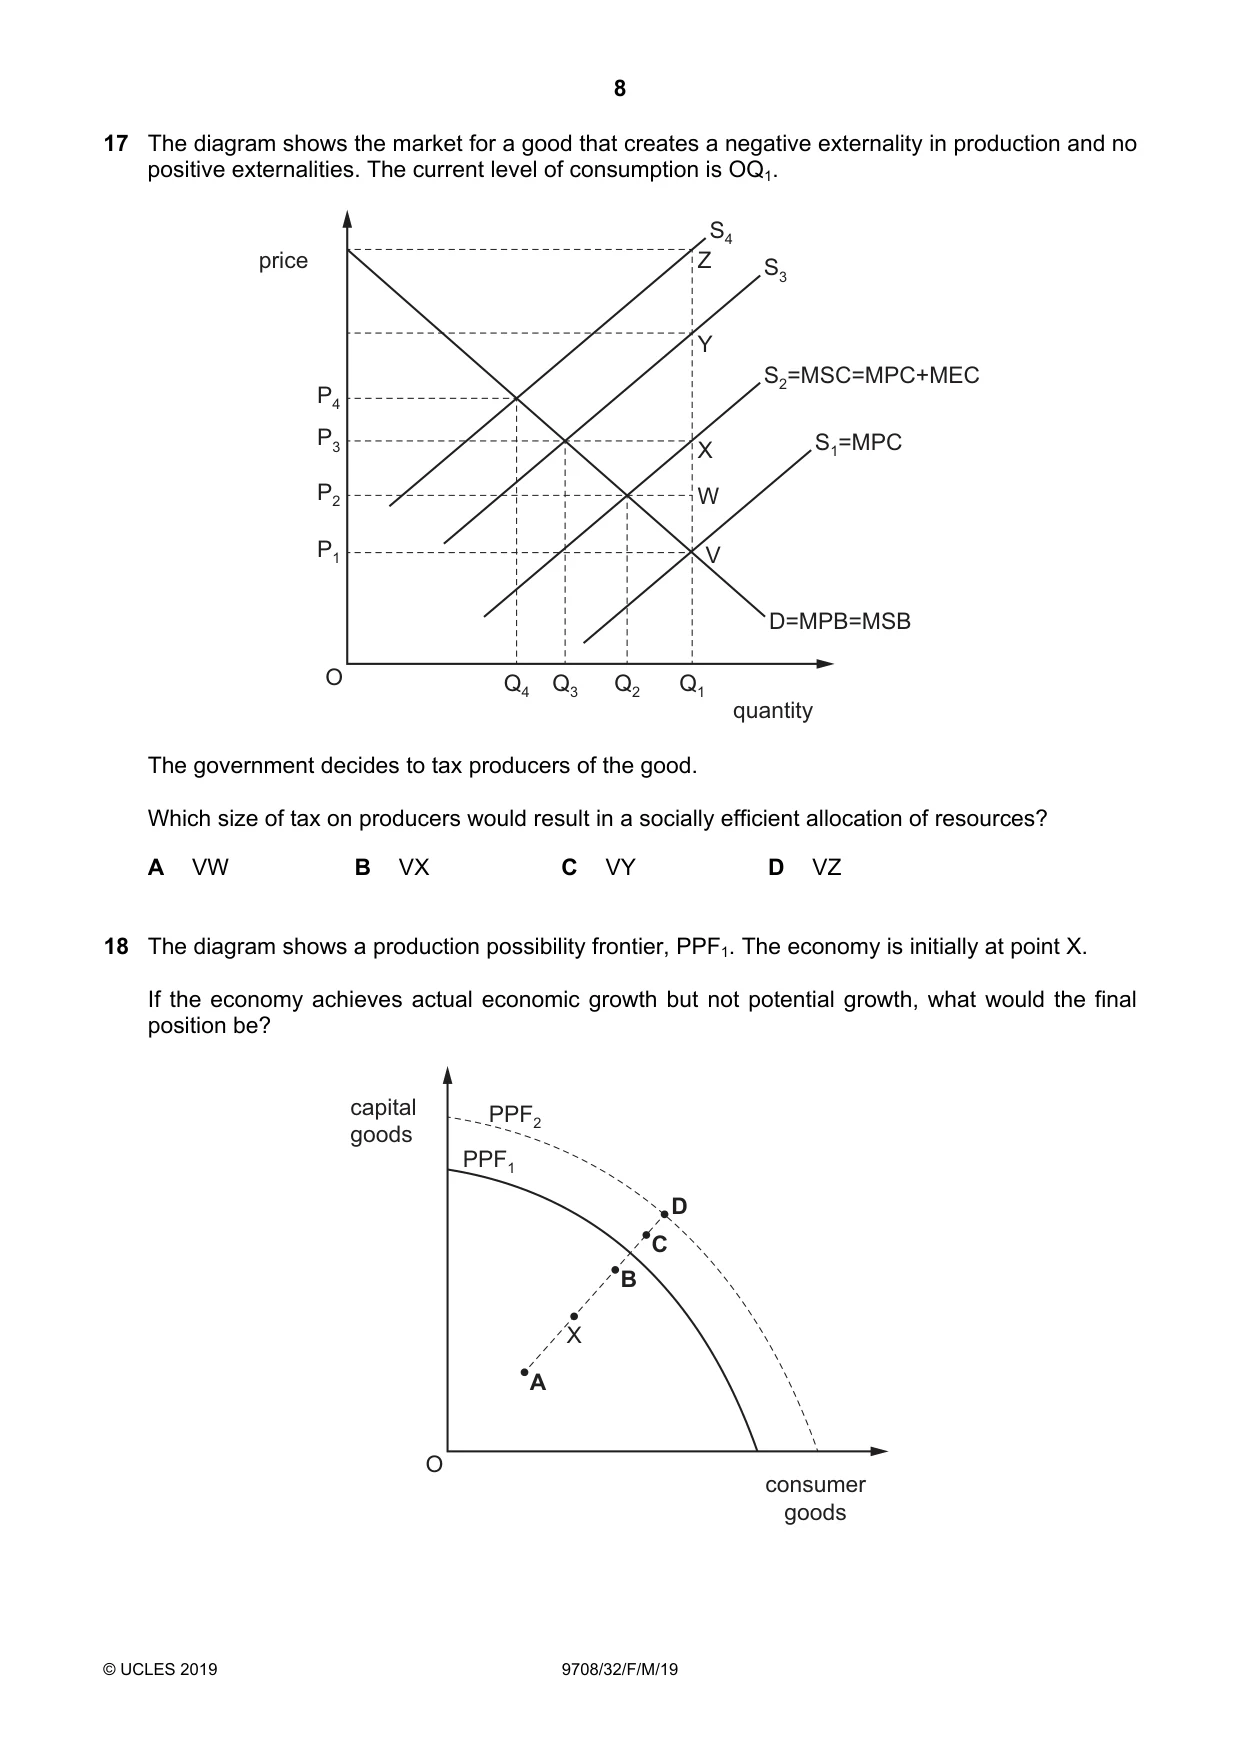
17 The diagram shows the market for a good that creates a negative externality in production and no positive externalities. The current level of consumption is OQ1. S4 price Z S3 Y S2=MSC=MPC+MEC P4 P3 S1=MPC X P2 W P1 V D=MPB=MSB O Q4 Q3 Q2 Q1 quantity The government decides to tax producers of the good. Which size of tax on producers would result in a socially efficient allocation of resources? A VW B VX C VY D VZ
Mark scheme: B
Q18 · The diagram shows a production possibility frontier, PPF1
18 The diagram shows a production possibility frontier, PPF1. The economy is initially at point X. If the economy achieves actual economic growth but not potential growth, what would the final position be? capital PPF2 goods PPF1 D C B X A O consumer goods
Mark scheme: B
Q19 · The information in the table is taken from a country’s national income accounts
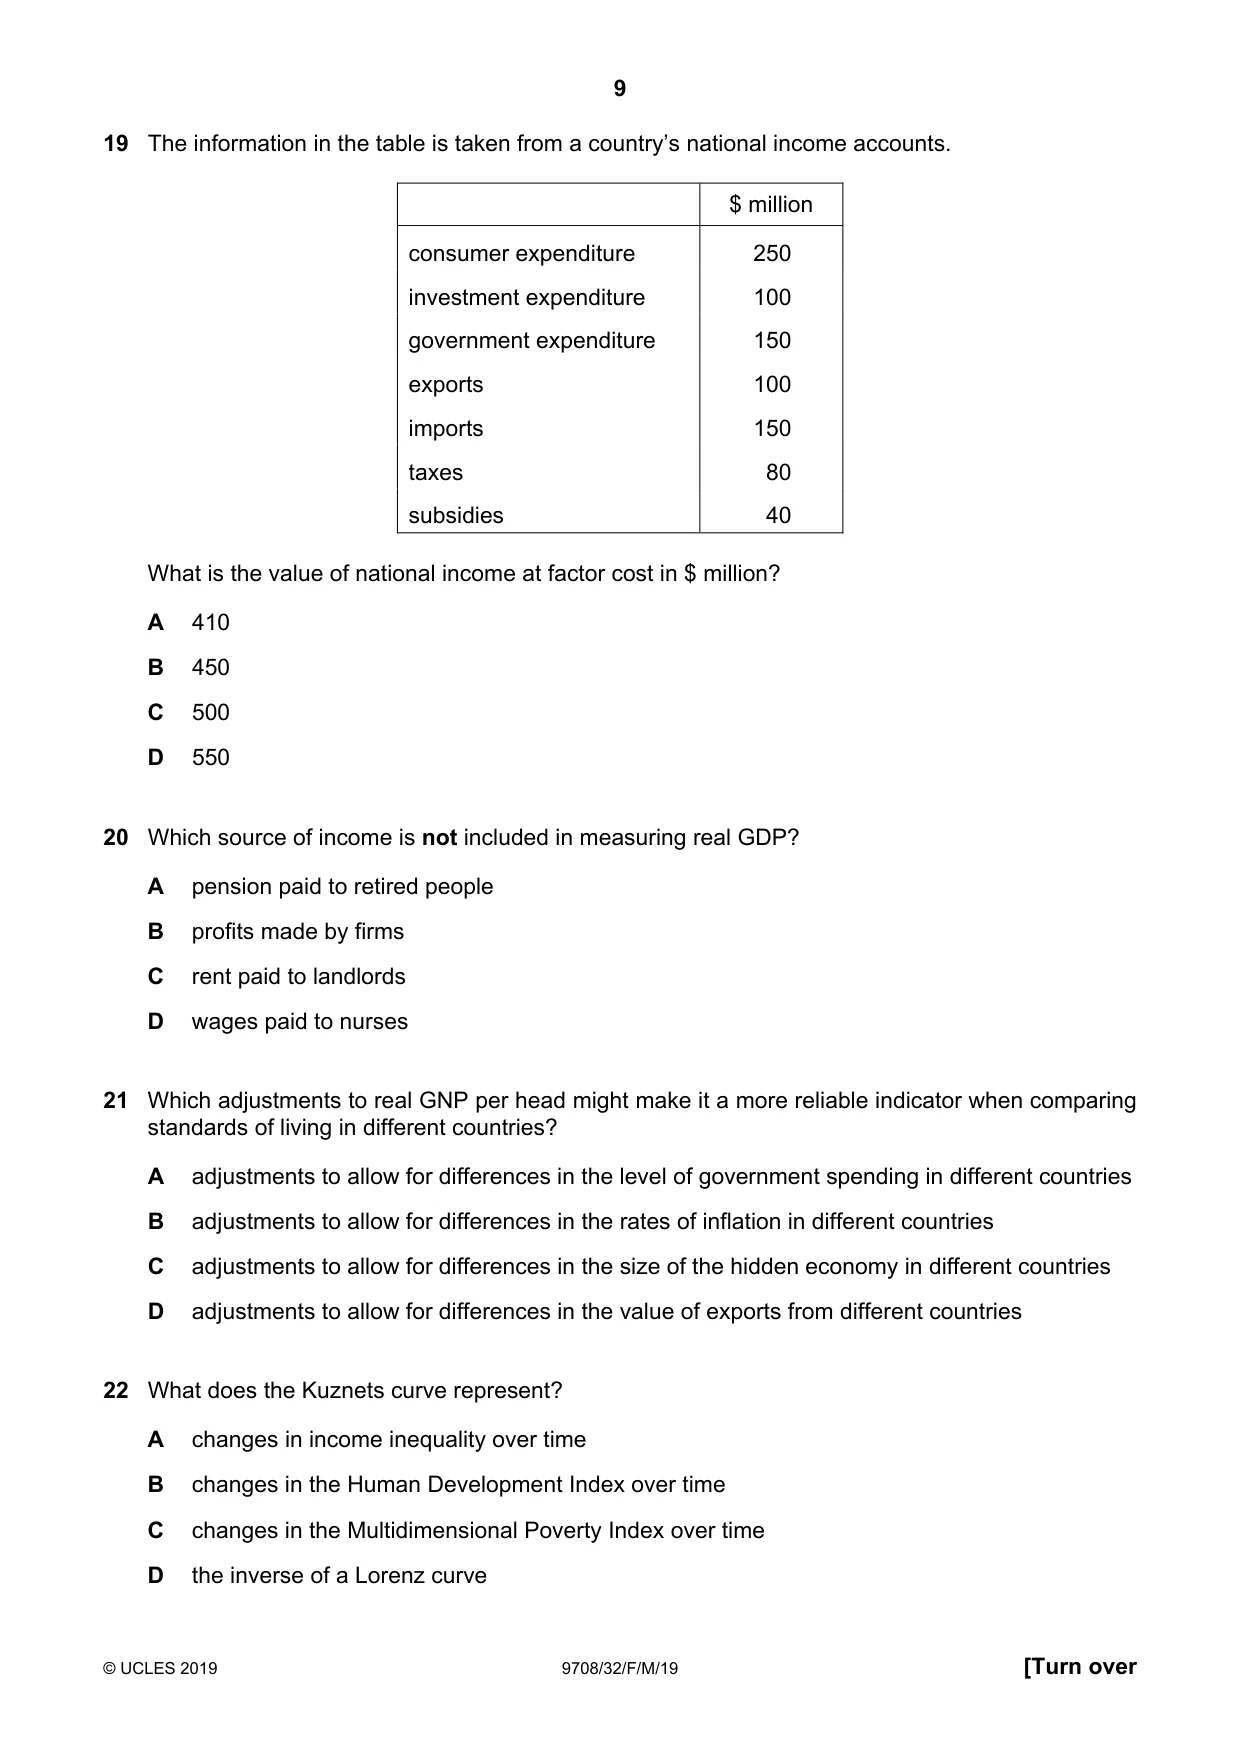
19 The information in the table is taken from a country’s national income accounts. $ million consumer expenditure 250 investment expenditure 100 government expenditure 150 exports 100 imports 150 taxes 80 subsidies 40 What is the value of national income at factor cost in $ million? A 410 B 450 C 500 D 550
Mark scheme: A
Q20 · Which source of income is not included in measuring real GDP?
20 Which source of income is not included in measuring real GDP? A pension paid to retired people B profits made by firms C rent paid to landlords D wages paid to nurses
Mark scheme: A
Q21 · Which adjustments to real GNP per head might make it a more reliable indicator when…
21 Which adjustments to real GNP per head might make it a more reliable indicator when comparing standards of living in different countries? A adjustments to allow for differences in the level of government spending in different countries B adjustments to allow for differences in the rates of inflation in different countries C adjustments to allow for differences in the size of the hidden economy in different countries D adjustments to allow for differences in the value of exports from different countries
Mark scheme: C
Q22 · What does the Kuznets curve represent?
22 What does the Kuznets curve represent? A changes in income inequality over time B changes in the Human Development Index over time C changes in the Multidimensional Poverty Index over time D the inverse of a Lorenz curve
Mark scheme: A
More questions on Characteristics of countries at different levels of development
Q23 · In an open economy with a government sector, the marginal propensity to import is 0.3…
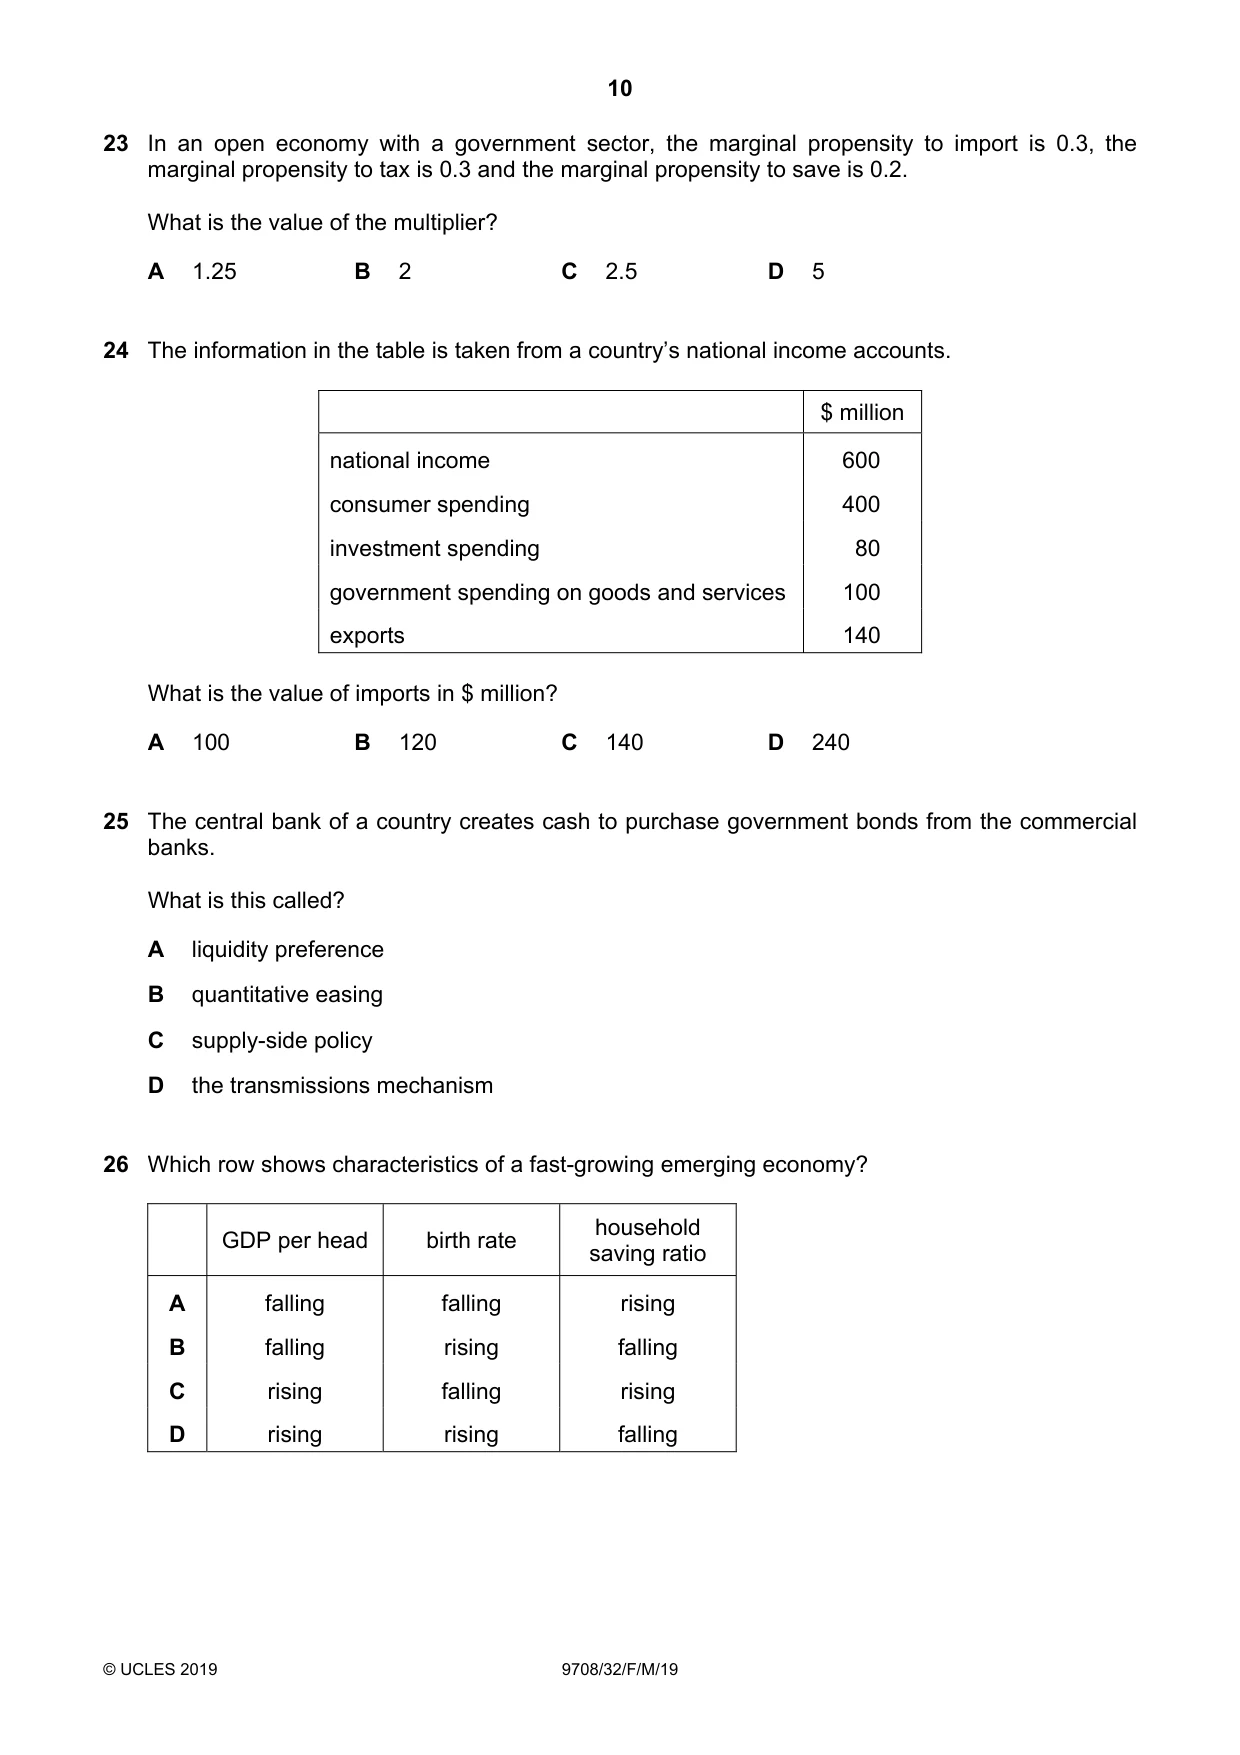
23 In an open economy with a government sector, the marginal propensity to import is 0.3, the marginal propensity to tax is 0.3 and the marginal propensity to save is 0.2. What is the value of the multiplier? A 1.25 B 2 C 2.5 D 5
Mark scheme: A
Q24 · The information in the table is taken from a country’s national income accounts
24 The information in the table is taken from a country’s national income accounts. $ million national income 600 consumer spending 400 investment spending 80 government spending on goods and services 100 exports 140 What is the value of imports in $ million? A 100 B 120 C 140 D 240
Mark scheme: B
More questions on Introduction to the circular flow of income
Q25 · The central bank of a country creates cash to purchase government bonds from the…
25 The central bank of a country creates cash to purchase government bonds from the commercial banks. What is this called? A liquidity preference B quantitative easing C supply-side policy D the transmissions mechanism
Mark scheme: B
Q26 · Which row shows characteristics of a fast-growing emerging economy?
26 Which row shows characteristics of a fast-growing emerging economy? household GDP per head birth rate saving ratio A falling falling rising B falling rising falling C rising falling rising D rising rising falling
Mark scheme: C
More questions on Characteristics of countries at different levels of development
Q27 · Which policy is likely to increase unemployment?
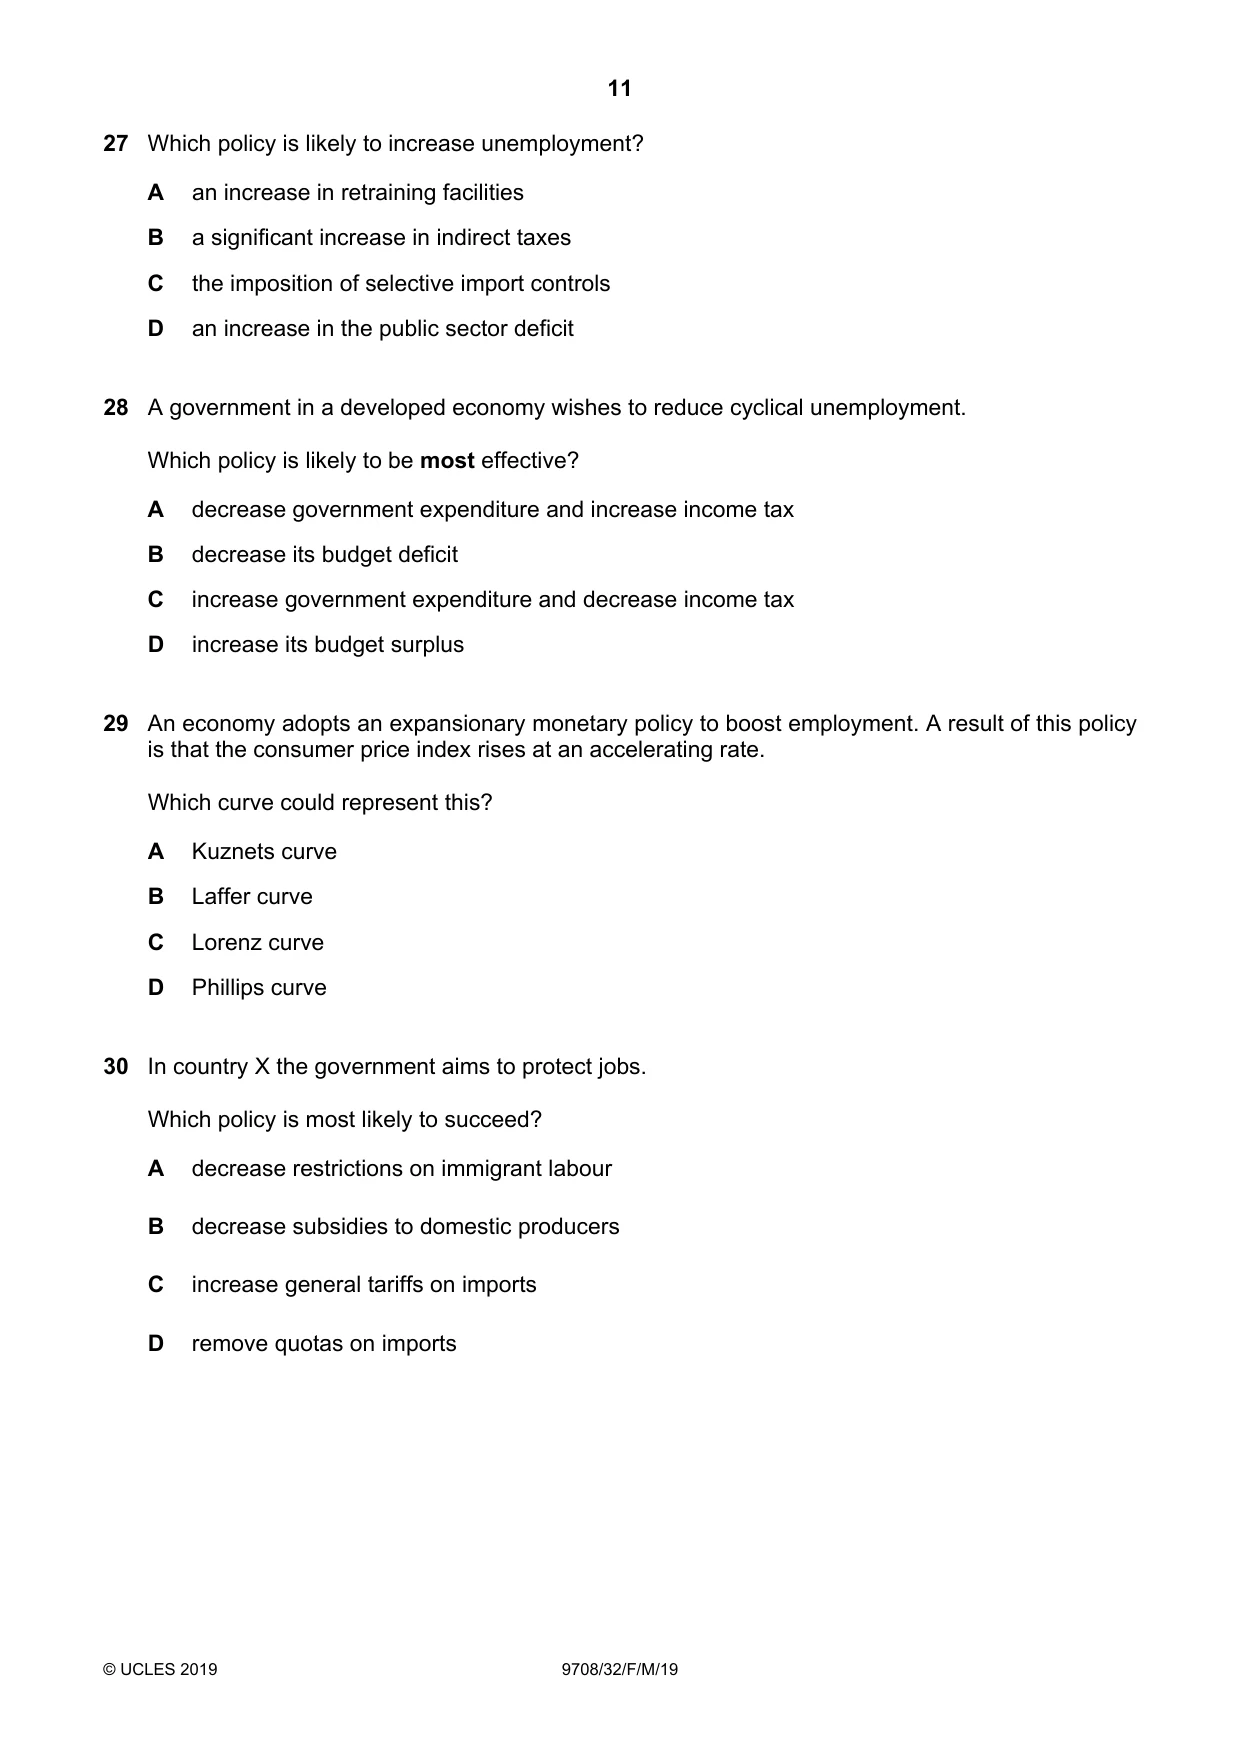
27 Which policy is likely to increase unemployment? A an increase in retraining facilities B a significant increase in indirect taxes C the imposition of selective import controls D an increase in the public sector deficit
Mark scheme: B
Q28 · A government in a developed economy wishes to reduce cyclical unemployment
28 A government in a developed economy wishes to reduce cyclical unemployment. Which policy is likely to be most effective? A decrease government expenditure and increase income tax B decrease its budget deficit C increase government expenditure and decrease income tax D increase its budget surplus
Mark scheme: C
Q29 · An economy adopts an expansionary monetary policy to boost employment
29 An economy adopts an expansionary monetary policy to boost employment. A result of this policy is that the consumer price index rises at an accelerating rate. Which curve could represent this? A Kuznets curve B Laffer curve C Lorenz curve D Phillips curve
Mark scheme: D
Q30 · In country X the government aims to protect jobs
30 In country X the government aims to protect jobs. Which policy is most likely to succeed? A decrease restrictions on immigrant labour B decrease subsidies to domestic producers C increase general tariffs on imports D remove quotas on imports
Mark scheme: C
What was in this paper
The subtopics covered by these 30 questions, and how many questions each got. Open one in a new tab to see every Cambridge question on it.
3Characteristics of countries at different levels of development2Different market structures2Government policies to achieve efficient resource allocation and correct market failure2Indifference curves and budget lines2Labour market forces and government intervention2National income statistics2Private costs and benefits, externalities and social costs and benefits2Differing objectives and policies of firms1Economic development1Economic growth1Efficiency and market failure1Employment/unemployment1Equity and redistribution of income and wealth1Fiscal policy1Introduction to the circular flow of income1Money and banking1Protectionism1The circular flow of income1Unemployment1Utility1What you needed in this session
Cambridge’s own grade thresholds for 2019 Feb/March, Paper 3 · Variant 2. A higher threshold means an easier paper — the bar moves with how the cohort did.