Cambridge A Level Economics 9708 — 2015 Oct/Nov Paper 3 · Variant 3
9708/33/O/N/15 · 30 questions · 30 marks · ≈34 min
The question paper and its mark scheme, free to read here and free to download. This is Cambridge’s own paper, exactly as it was sat.
Question paper12 pages
Mark scheme2 pages
Answers below. Sit the paper first if you are practising.
Questions as text
Q1 · In an economy, no one can be made better off without making someone else worse off
1 In an economy, no one can be made better off without making someone else worse off. What does not necessarily follow from this? A The conditions for allocative efficiency have been met. B The conditions for productive efficiency have been met. C The distribution of income is socially acceptable. D The economy is operating at a point on its production possibility frontier.
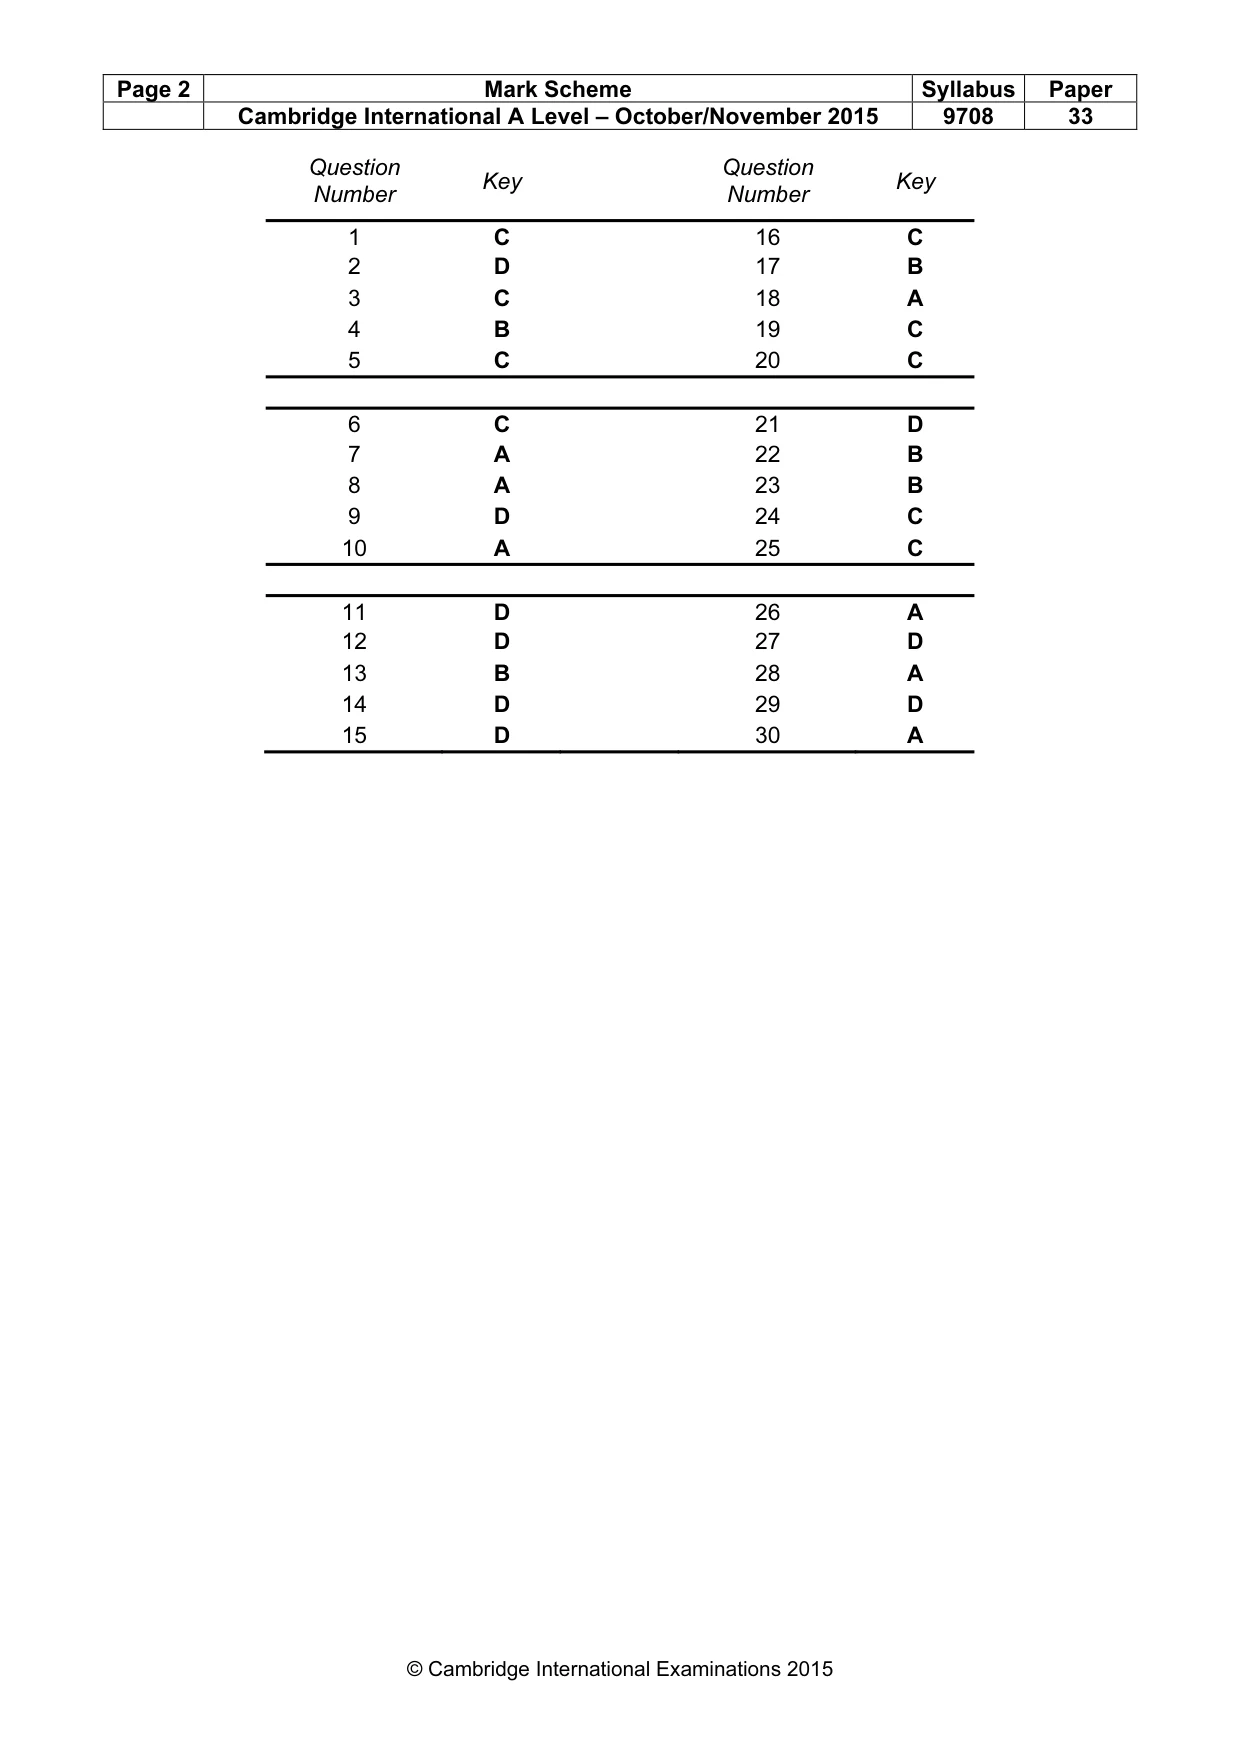
Mark scheme: C
Q2 · To maximise the satisfaction she derives from a given level of expenditure on two goods…
2 To maximise the satisfaction she derives from a given level of expenditure on two goods, X and Y, how should a consumer allocate her expenditure between the two goods? A marginal utility X = marginal utility Y B marginal utility X × price of X = marginal utility Y marginal utility X marginal utility Y C = price of Y price of X marginal utility X price of X D = marginal utility Y price of Y
Mark scheme: D
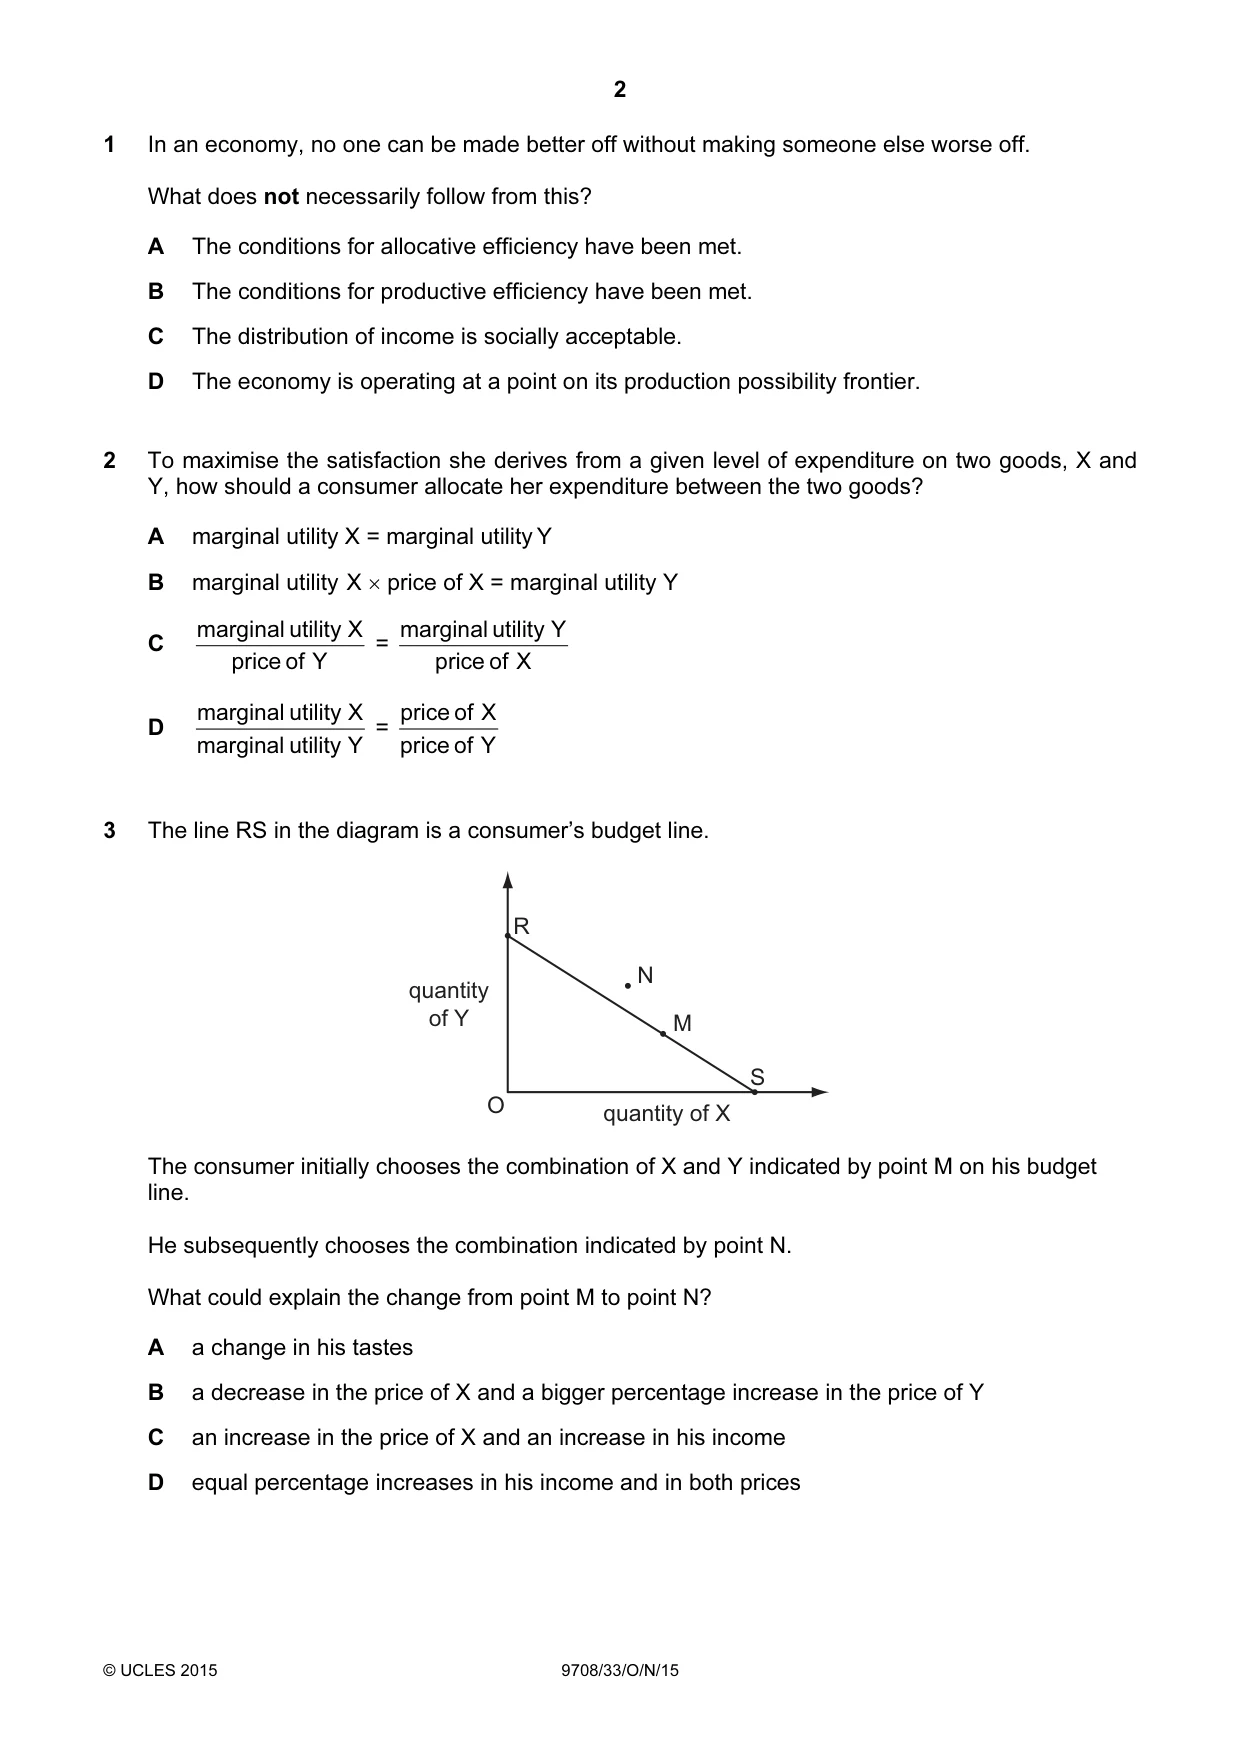
Q3 · The line RS in the diagram is a consumer’s budget line
3 The line RS in the diagram is a consumer’s budget line. R N quantity of Y M S O quantity of X The consumer initially chooses the combination of X and Y indicated by point M on his budget line. He subsequently chooses the combination indicated by point N. What could explain the change from point M to point N? A a change in his tastes B a decrease in the price of X and a bigger percentage increase in the price of Y C an increase in the price of X and an increase in his income D equal percentage increases in his income and in both prices
Mark scheme: C
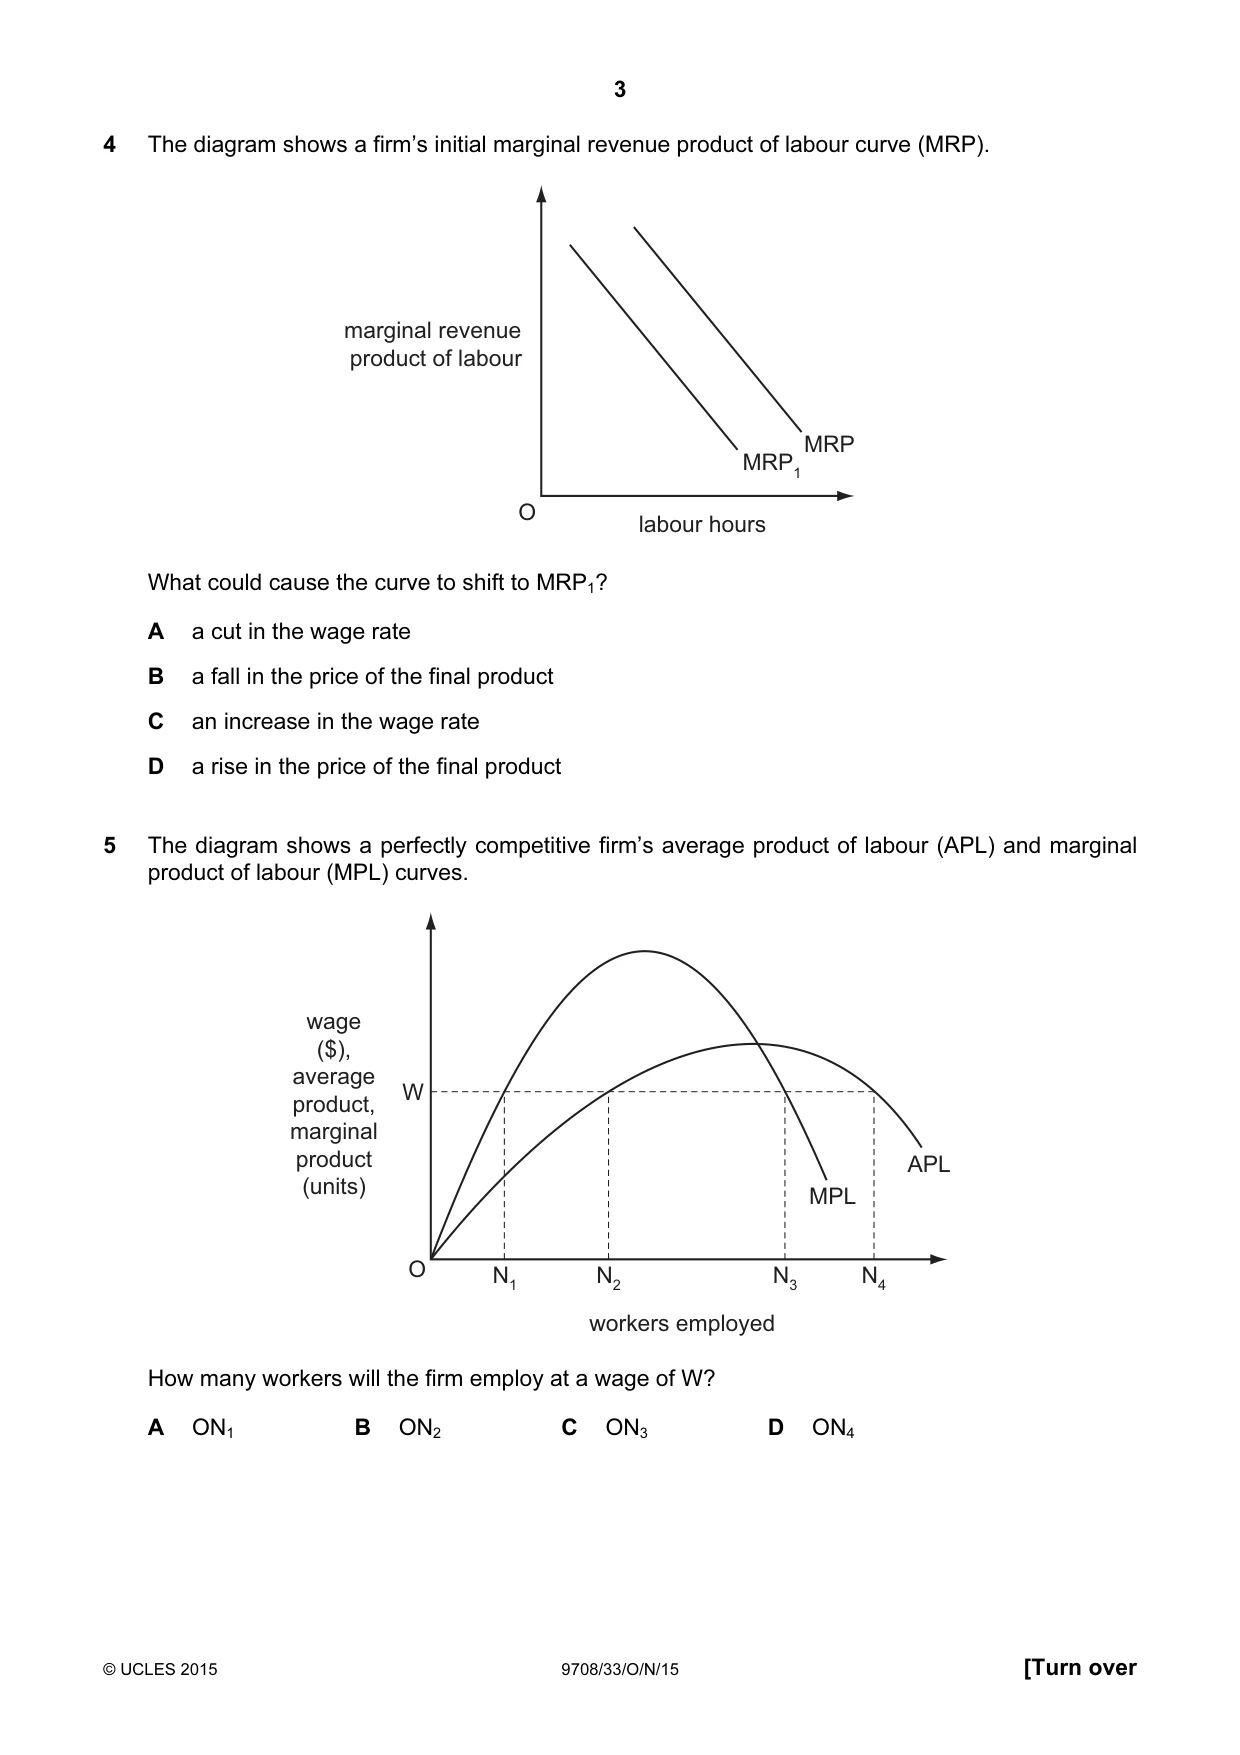
Q4 · The diagram shows a firm’s initial marginal revenue product of labour curve (MRP)
4 The diagram shows a firm’s initial marginal revenue product of labour curve (MRP). marginal revenue product of labour MRP MRP1 O labour hours What could cause the curve to shift to MRP1? A a cut in the wage rate B a fall in the price of the final product C an increase in the wage rate D a rise in the price of the final product
Mark scheme: B
More questions on Labour market forces and government intervention
Q5 · The diagram shows a perfectly competitive firm’s average product of labour (APL) and…
5 The diagram shows a perfectly competitive firm’s average product of labour (APL) and marginal product of labour (MPL) curves. wage ($), average W product, marginal product APL (units) MPL O N1 N2 N3 N4 workers employed How many workers will the firm employ at a wage of W? A ON1 B ON2 C ON3 D ON4
Mark scheme: C
More questions on Labour market forces and government intervention
Q6 · To increase its labour force from 20 to 21 workers, a firm has to increase the daily wage…
6 To increase its labour force from 20 to 21 workers, a firm has to increase the daily wage rate from $50 to $52. What is the marginal cost of labour per day? A $42 B $52 C $92 D $1092
Mark scheme: C
More questions on Labour market forces and government intervention
Q7 · A firm’s long-run production function shows that a 40% increase in its inputs leads to a…
7 A firm’s long-run production function shows that a 40% increase in its inputs leads to a 20% increase in output. What is the firm experiencing? A decreasing returns to scale B diminishing returns C increasing returns D increasing returns to scale
Mark scheme: A
More questions on Types of cost, revenue and profit, short-run and long-run production
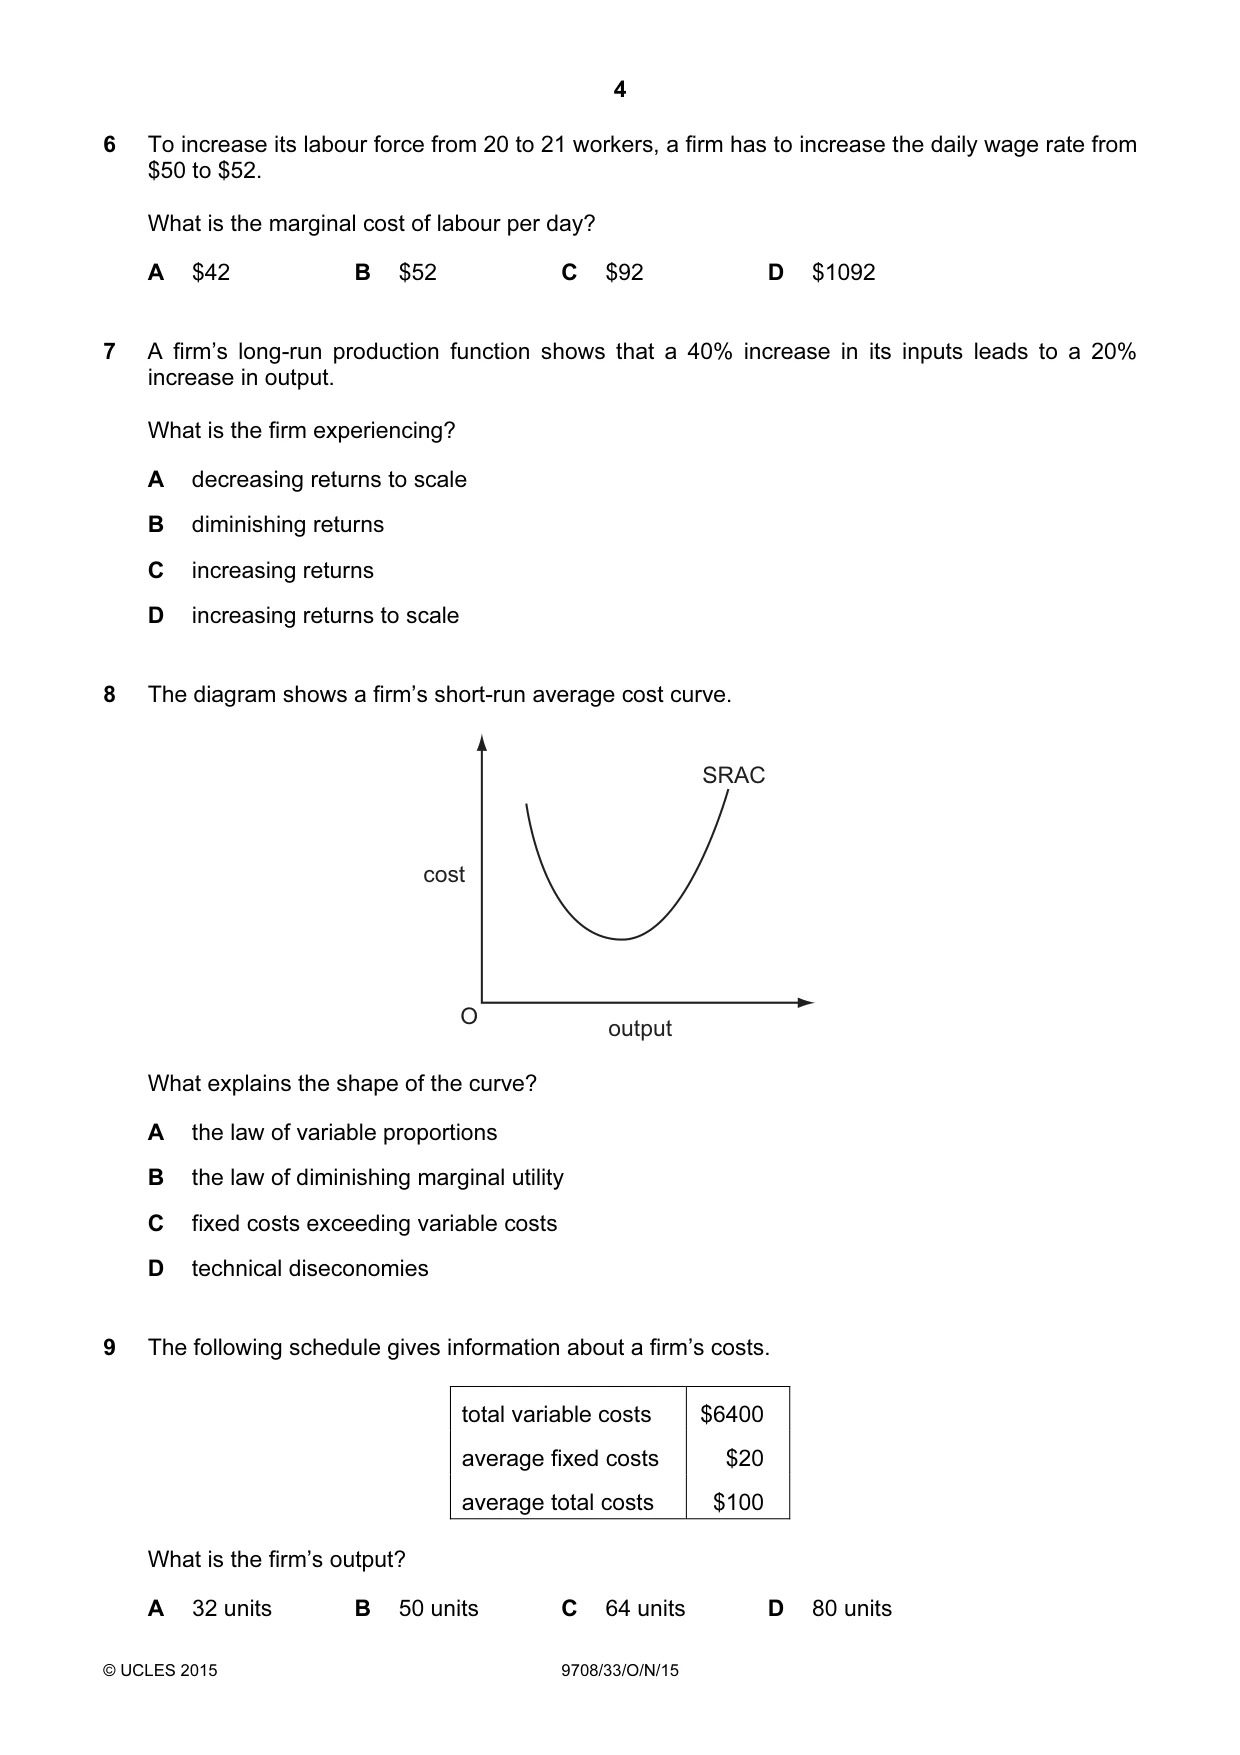
Q8 · The diagram shows a firm’s short-run average cost curve
8 The diagram shows a firm’s short-run average cost curve. SRAC cost O output What explains the shape of the curve? A the law of variable proportions B the law of diminishing marginal utility C fixed costs exceeding variable costs D technical diseconomies
Mark scheme: A
More questions on Types of cost, revenue and profit, short-run and long-run production
Q9 · The following schedule gives information about a firm’s costs
9 The following schedule gives information about a firm’s costs. total variable costs $6400 average fixed costs $20 average total costs $100 What is the firm’s output? A 32 units B 50 units C 64 units D 80 units
Mark scheme: D
More questions on Types of cost, revenue and profit, short-run and long-run production
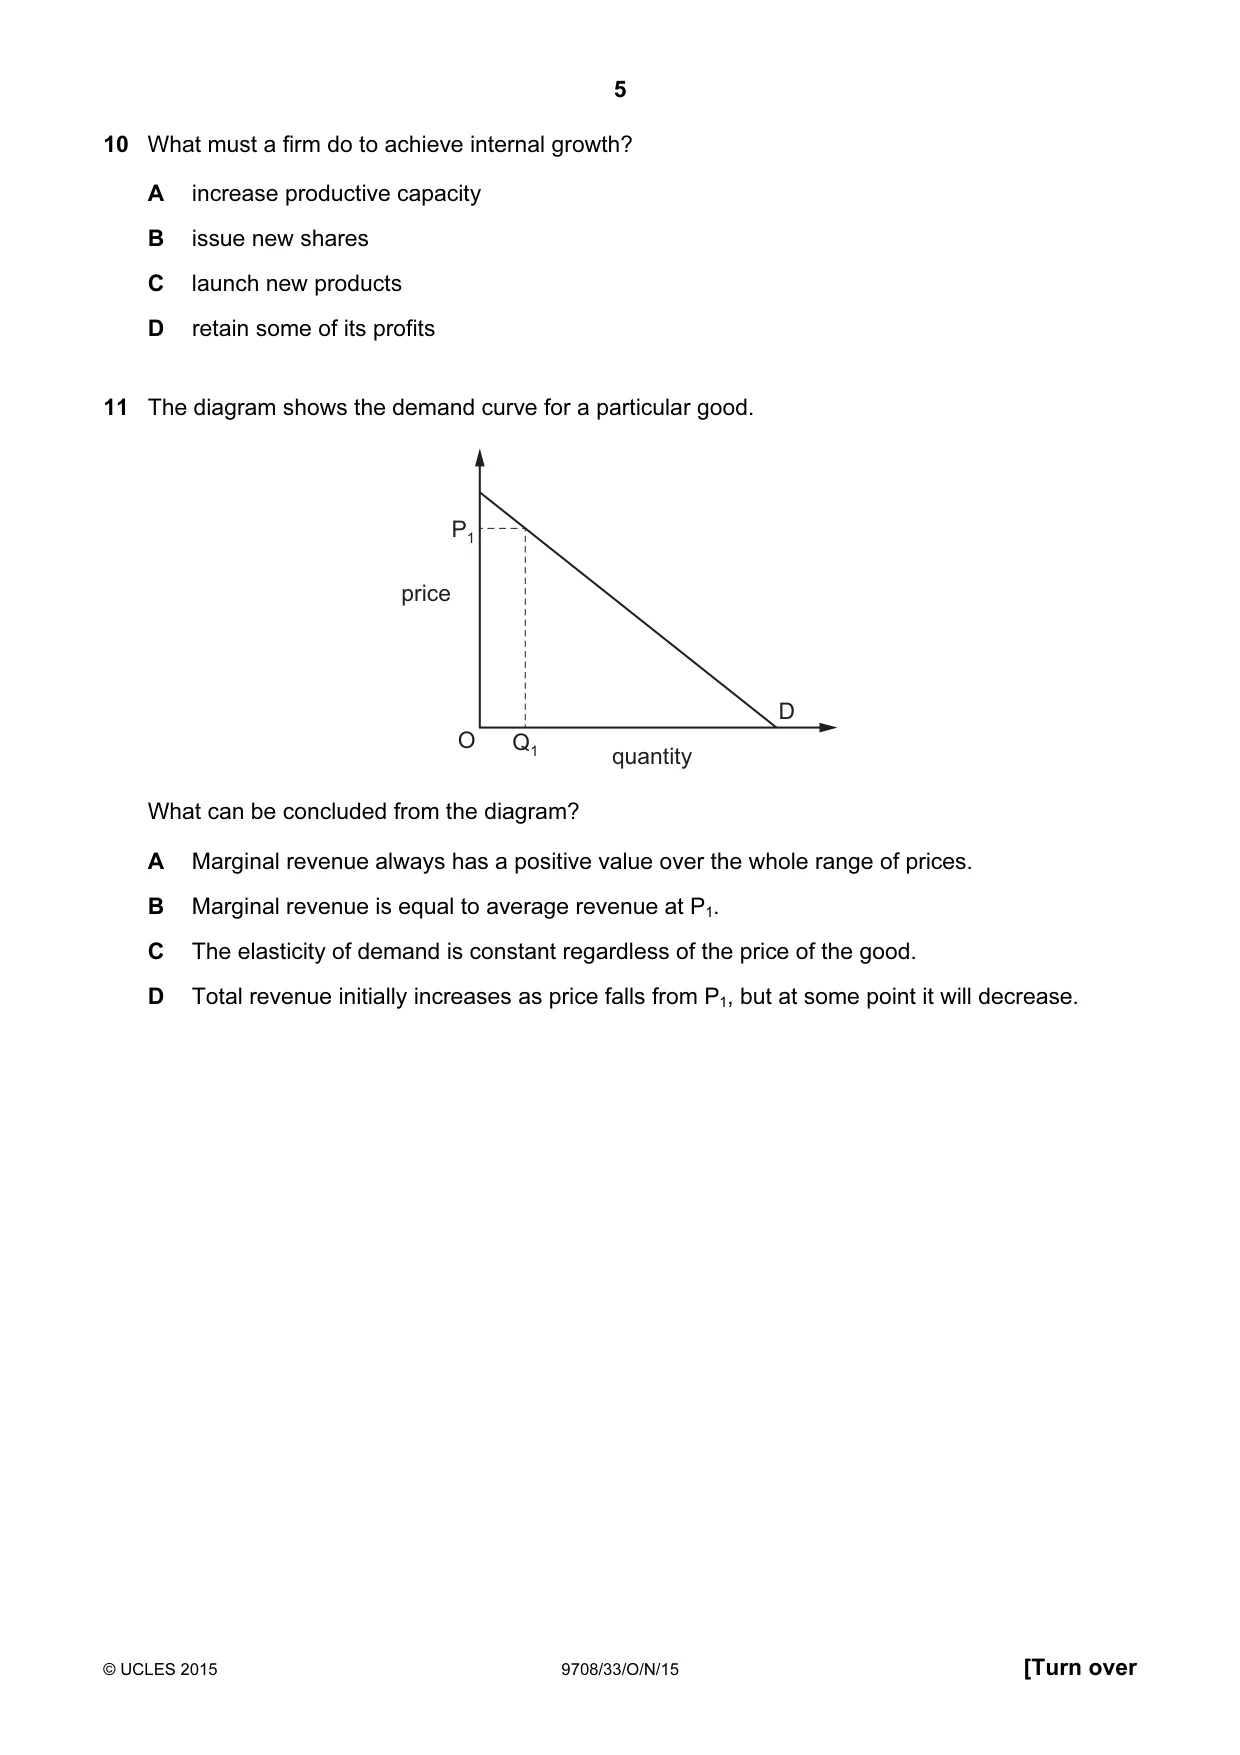
Q10 · What must a firm do to achieve internal growth?
10 What must a firm do to achieve internal growth? A increase productive capacity B issue new shares C launch new products D retain some of its profits
Mark scheme: A
Q11 · The diagram shows the demand curve for a particular good
11 The diagram shows the demand curve for a particular good. P1 price D O Q1 quantity What can be concluded from the diagram? A Marginal revenue always has a positive value over the whole range of prices. B Marginal revenue is equal to average revenue at P1. C The elasticity of demand is constant regardless of the price of the good. D Total revenue initially increases as price falls from P1, but at some point it will decrease.
Mark scheme: D
More questions on Price elasticity, income elasticity and cross elasticity of demand
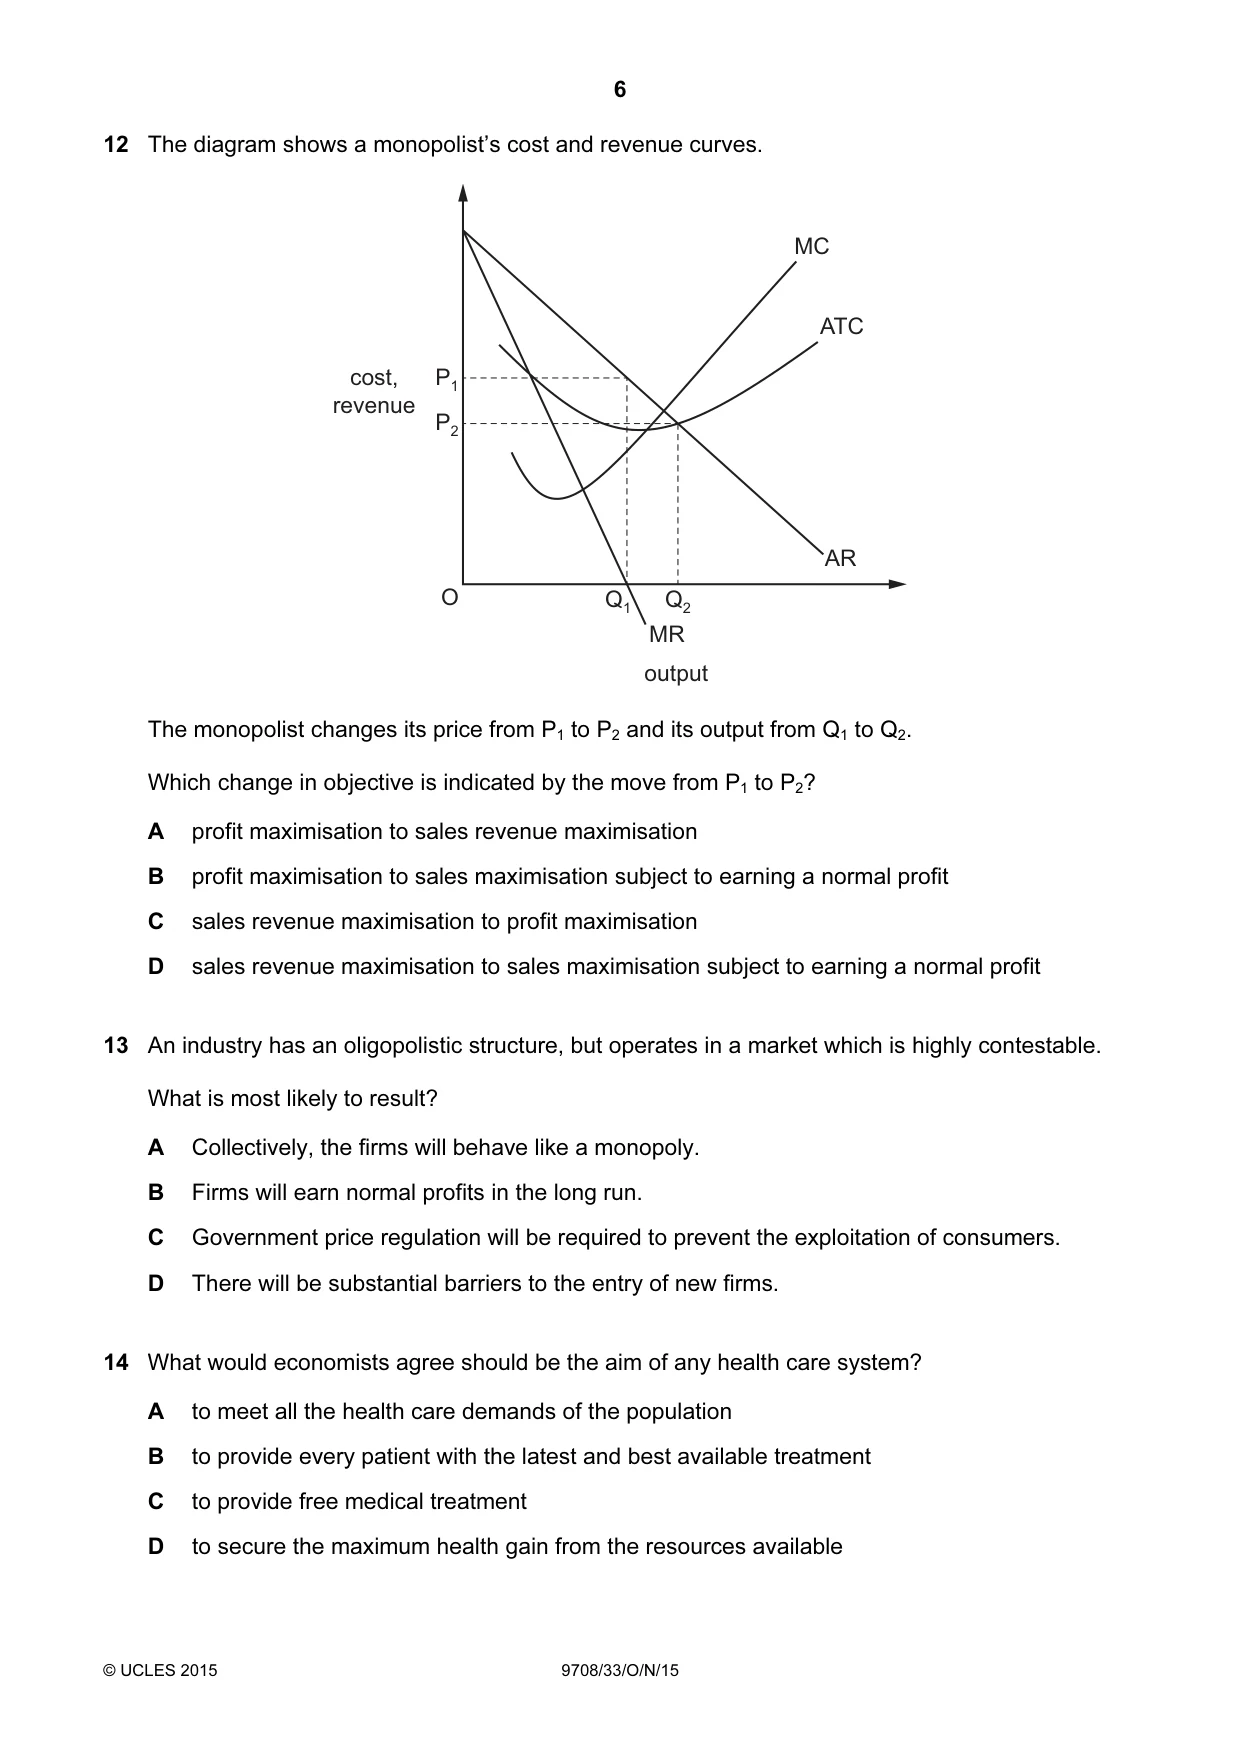
Q12 · The diagram shows a monopolist’s cost and revenue curves
12 The diagram shows a monopolist’s cost and revenue curves. MC ATC cost, P1 revenue P2 AR O Q1 Q2 MR output The monopolist changes its price from P1 to P2 and its output from Q1 to Q2. Which change in objective is indicated by the move from P1 to P2? A profit maximisation to sales revenue maximisation B profit maximisation to sales maximisation subject to earning a normal profit C sales revenue maximisation to profit maximisation D sales revenue maximisation to sales maximisation subject to earning a normal profit
Mark scheme: D
More questions on Differing objectives and policies of firms
Q13 · An industry has an oligopolistic structure, but operates in a market which is highly…
13 An industry has an oligopolistic structure, but operates in a market which is highly contestable. What is most likely to result? A Collectively, the firms will behave like a monopoly. B Firms will earn normal profits in the long run. C Government price regulation will be required to prevent the exploitation of consumers. D There will be substantial barriers to the entry of new firms.
Mark scheme: B
Q14 · What would economists agree should be the aim of any health care system?
14 What would economists agree should be the aim of any health care system? A to meet all the health care demands of the population B to provide every patient with the latest and best available treatment C to provide free medical treatment D to secure the maximum health gain from the resources available
Mark scheme: D
Q15 · What would be most likely to give rise to a conflict between efficiency and equity?
15 What would be most likely to give rise to a conflict between efficiency and equity? A an increase in government expenditure on health care B an increase in interest rates C an increase in subsidies to public transport in congested urban areas D an increase in the highest rate of income tax
Mark scheme: D
More questions on Equity and redistribution of income and wealth
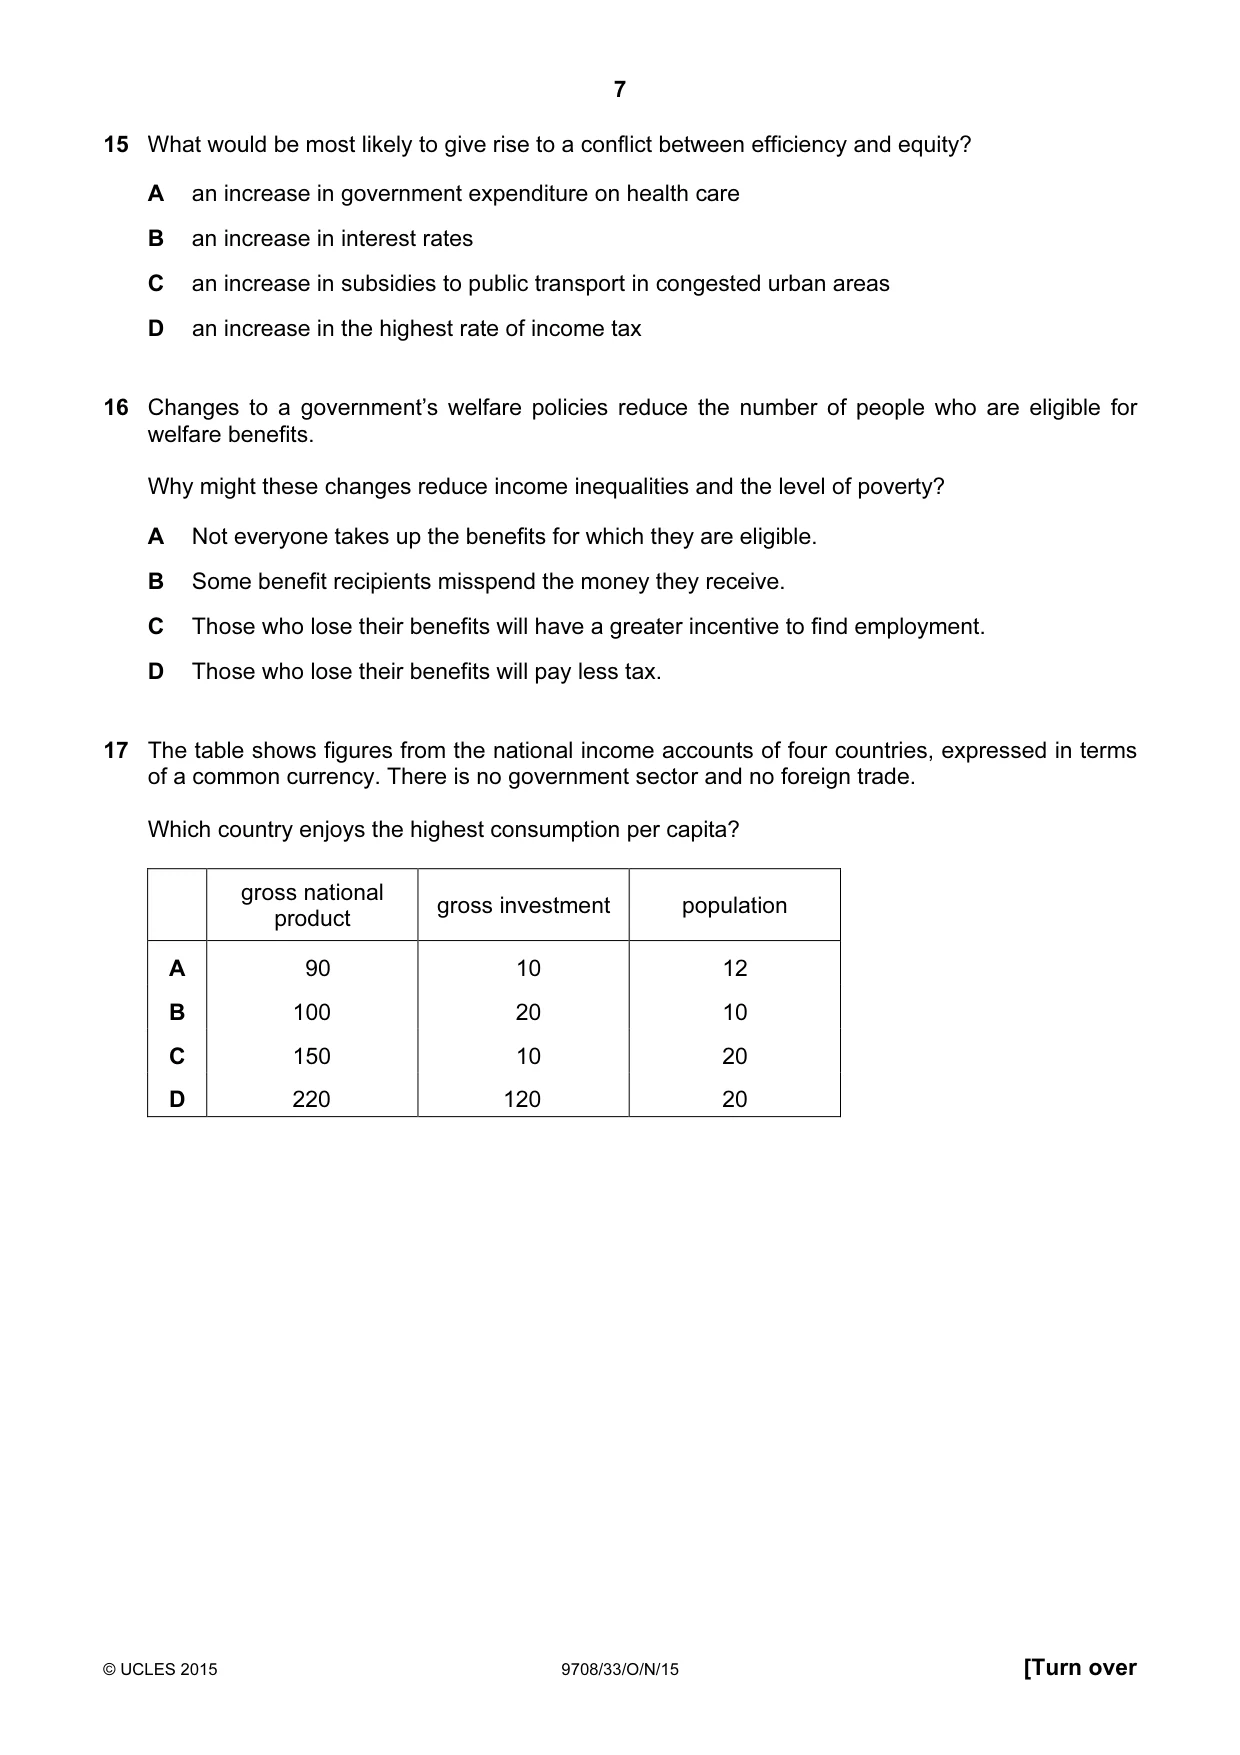
Q16 · Changes to a government’s welfare policies reduce the number of people who are eligible…
16 Changes to a government’s welfare policies reduce the number of people who are eligible for welfare benefits. Why might these changes reduce income inequalities and the level of poverty? A Not everyone takes up the benefits for which they are eligible. B Some benefit recipients misspend the money they receive. C Those who lose their benefits will have a greater incentive to find employment. D Those who lose their benefits will pay less tax.
Mark scheme: C
More questions on Equity and redistribution of income and wealth
Q17 · The table shows figures from the national income accounts of four countries, expressed in…
17 The table shows figures from the national income accounts of four countries, expressed in terms of a common currency. There is no government sector and no foreign trade. Which country enjoys the highest consumption per capita? gross national gross investment population product A 90 10 12 B 100 20 10 C 150 10 20 D 220 120 20
Mark scheme: B
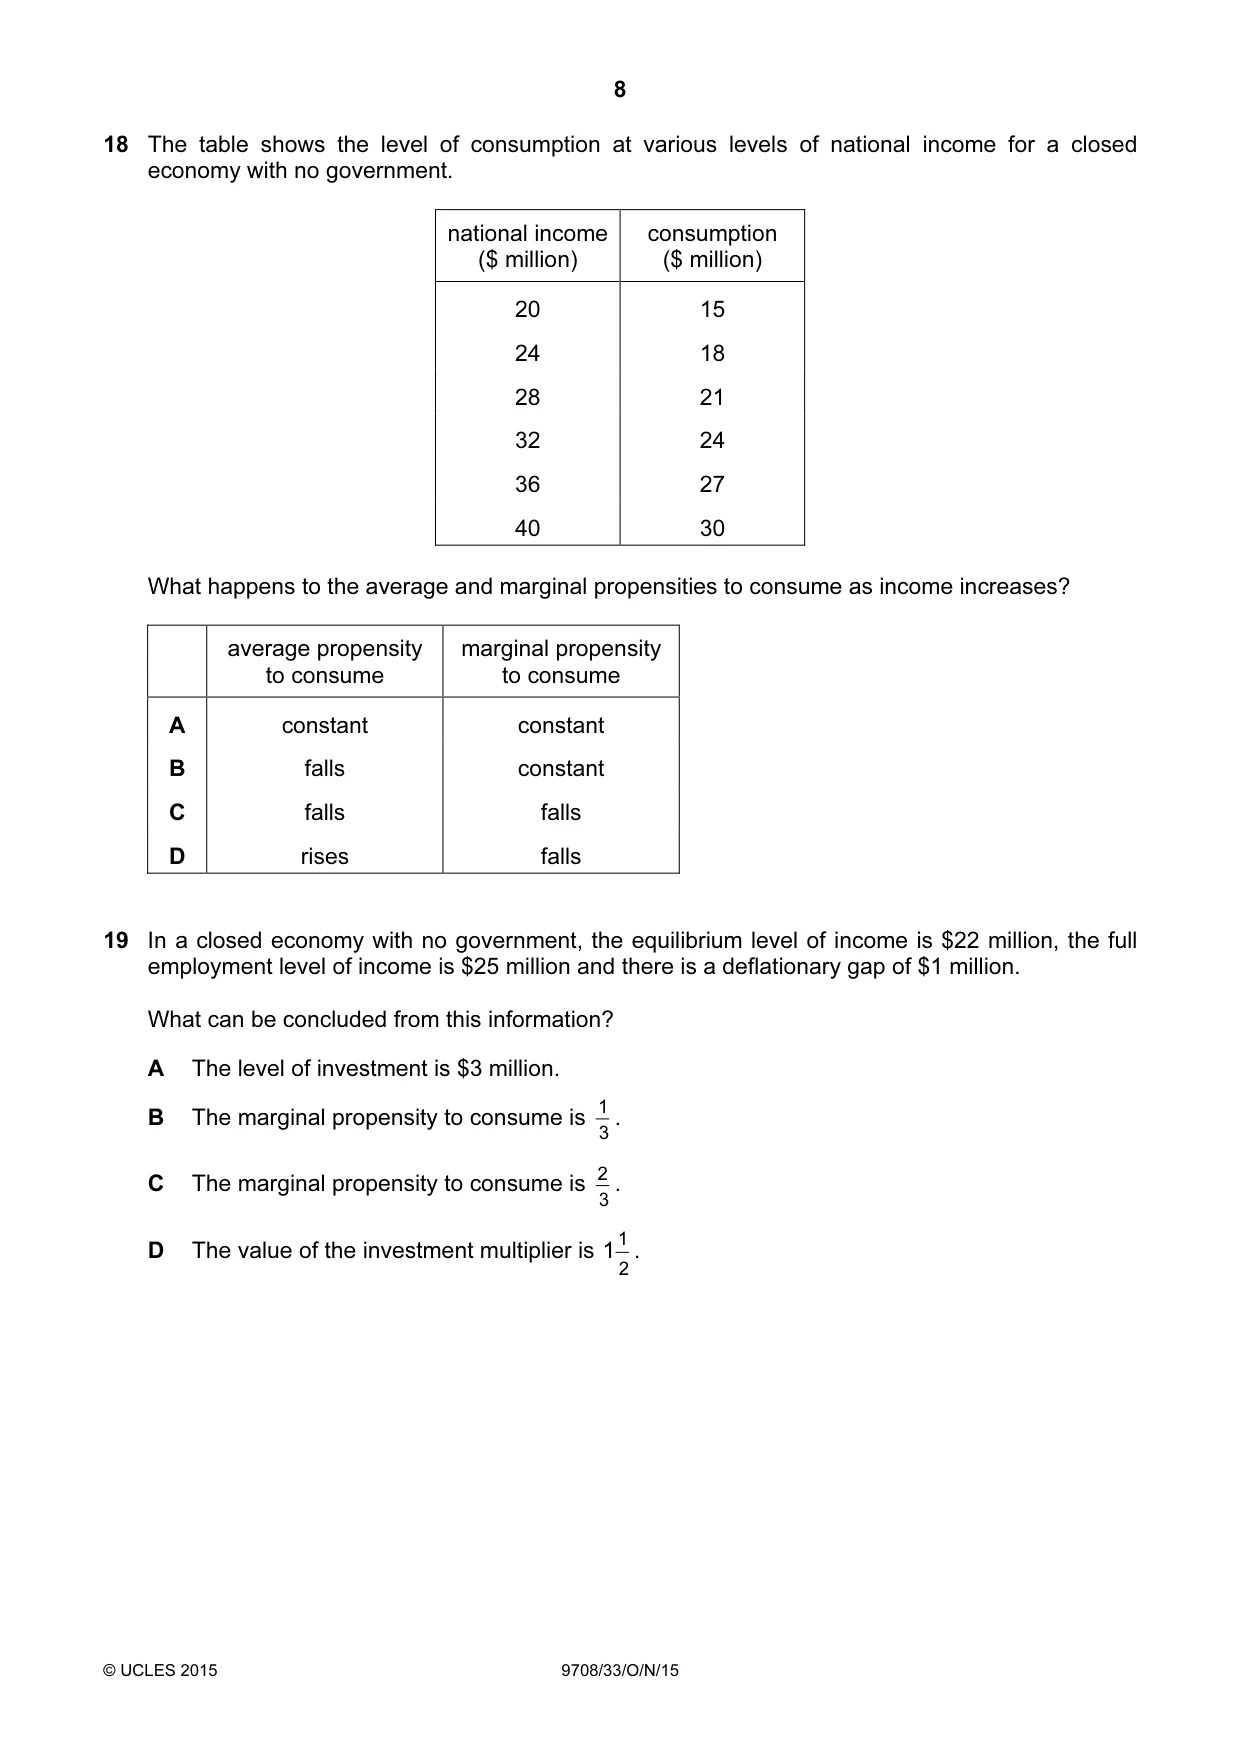
Q18 · The table shows the level of consumption at various levels of national income for a…
18 The table shows the level of consumption at various levels of national income for a closed economy with no government. national income consumption ($ million) ($ million) 20 15 24 18 28 21 32 24 36 27 40 30 What happens to the average and marginal propensities to consume as income increases? average propensity marginal propensity to consume to consume A constant constant B falls constant C falls falls D rises falls
Mark scheme: A
Q19 · In a closed economy with no government, the equilibrium level of income is $22 million…
19 In a closed economy with no government, the equilibrium level of income is $22 million, the full employment level of income is $25 million and there is a deflationary gap of $1 million. What can be concluded from this information? A The level of investment is $3 million. 1 . B The marginal propensity to consume is 3 2 . C The marginal propensity to consume is 3 D The value of the investment multiplier is 1 1 . 2
Mark scheme: C
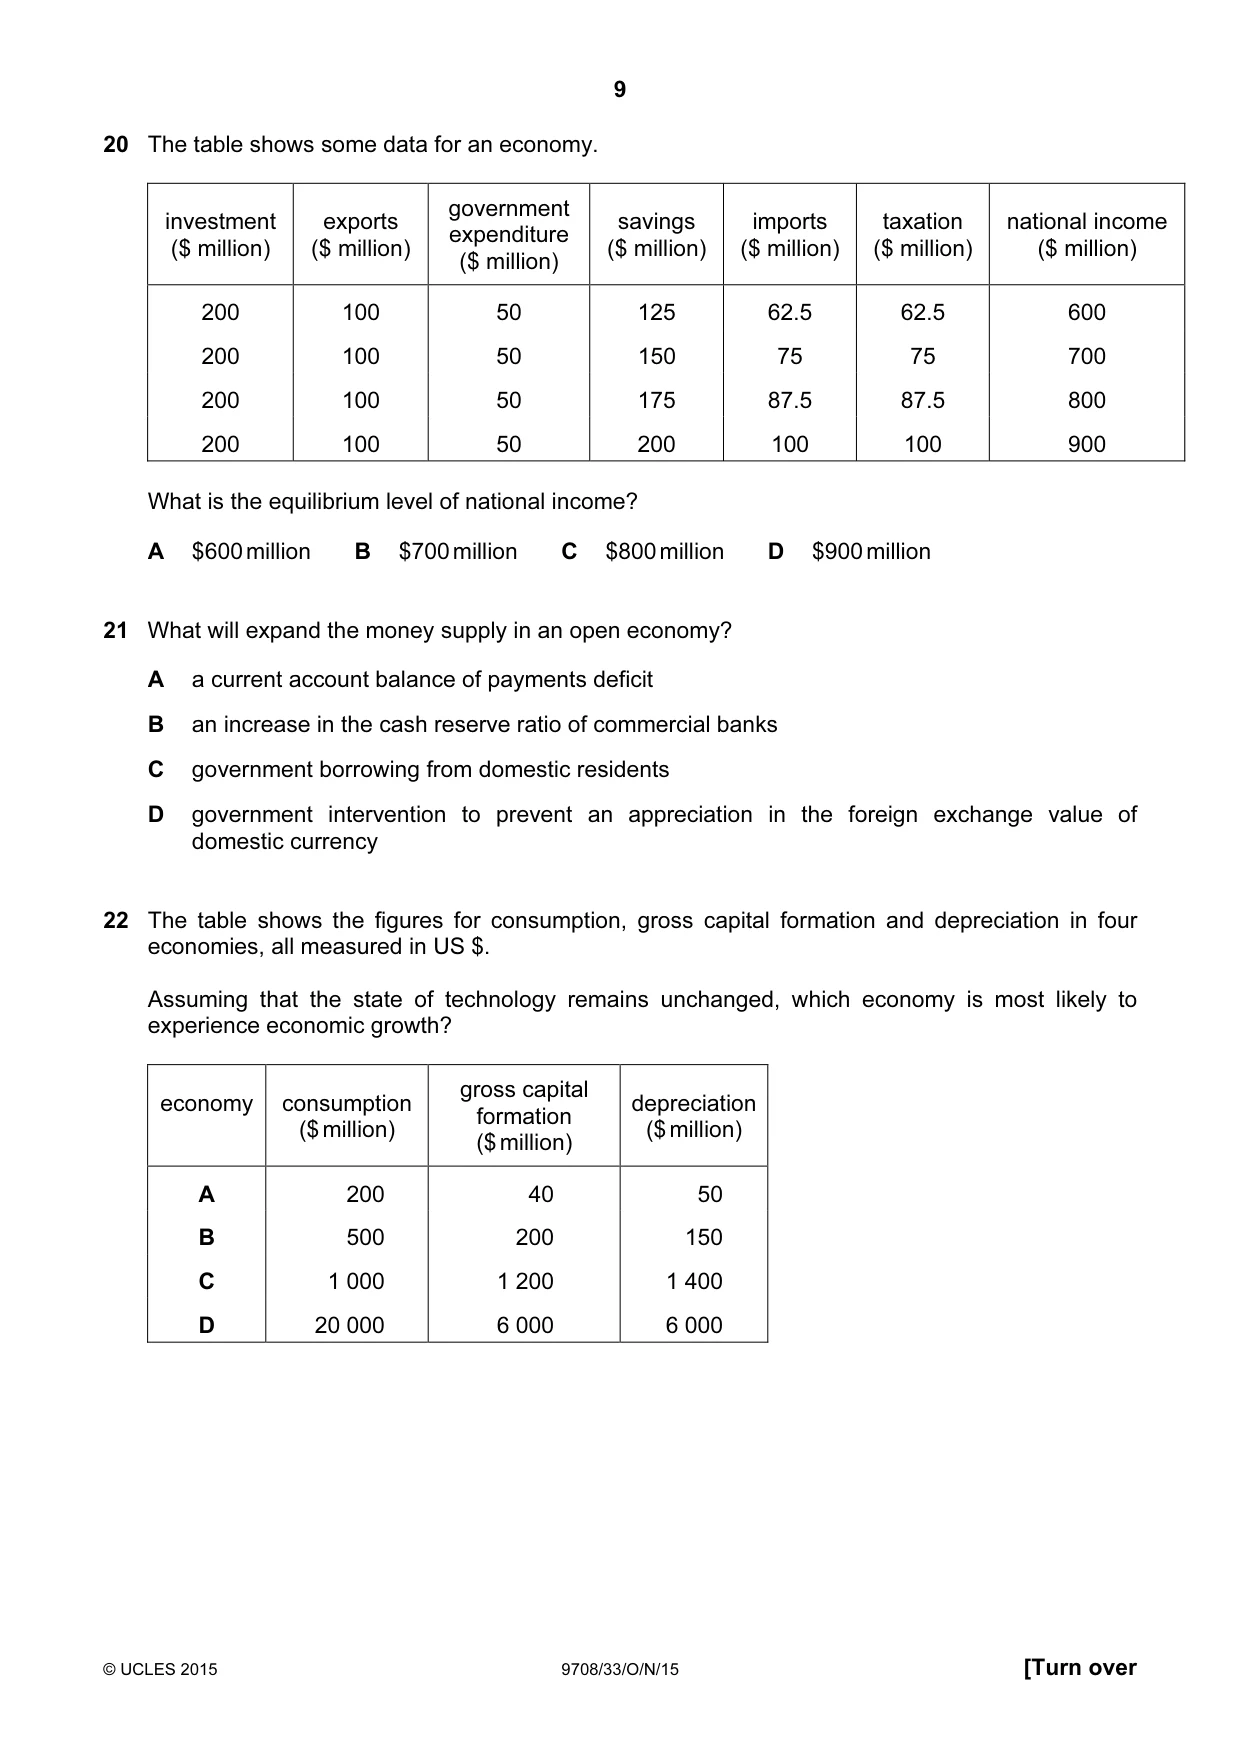
Q20 · The table shows some data for an economy
20 The table shows some data for an economy. government investment exports savings imports taxation national income expenditure ($ million) ($ million) ($ million) ($ million) ($ million) ($ million) ($ million) 200 100 50 125 62.5 62.5 600 200 100 50 150 75 75 700 200 100 50 175 87.5 87.5 800 200 100 50 200 100 100 900 What is the equilibrium level of national income? A $600 million B $700 million C $800 million D $900 million
Mark scheme: C
Q21 · What will expand the money supply in an open economy?
21 What will expand the money supply in an open economy? A a current account balance of payments deficit B an increase in the cash reserve ratio of commercial banks C government borrowing from domestic residents D government intervention to prevent an appreciation in the foreign exchange value of domestic currency
Mark scheme: D
Q22 · The table shows the figures for consumption, gross capital formation and depreciation in…
22 The table shows the figures for consumption, gross capital formation and depreciation in four economies, all measured in US $. Assuming that the state of technology remains unchanged, which economy is most likely to experience economic growth? gross capital economy consumption depreciation formation ($ million) ($ million) ($ million) A 200 40 50 B 500 200 150 C 1 000 1 200 1 400 D 20 000 6 000 6 000
Mark scheme: B
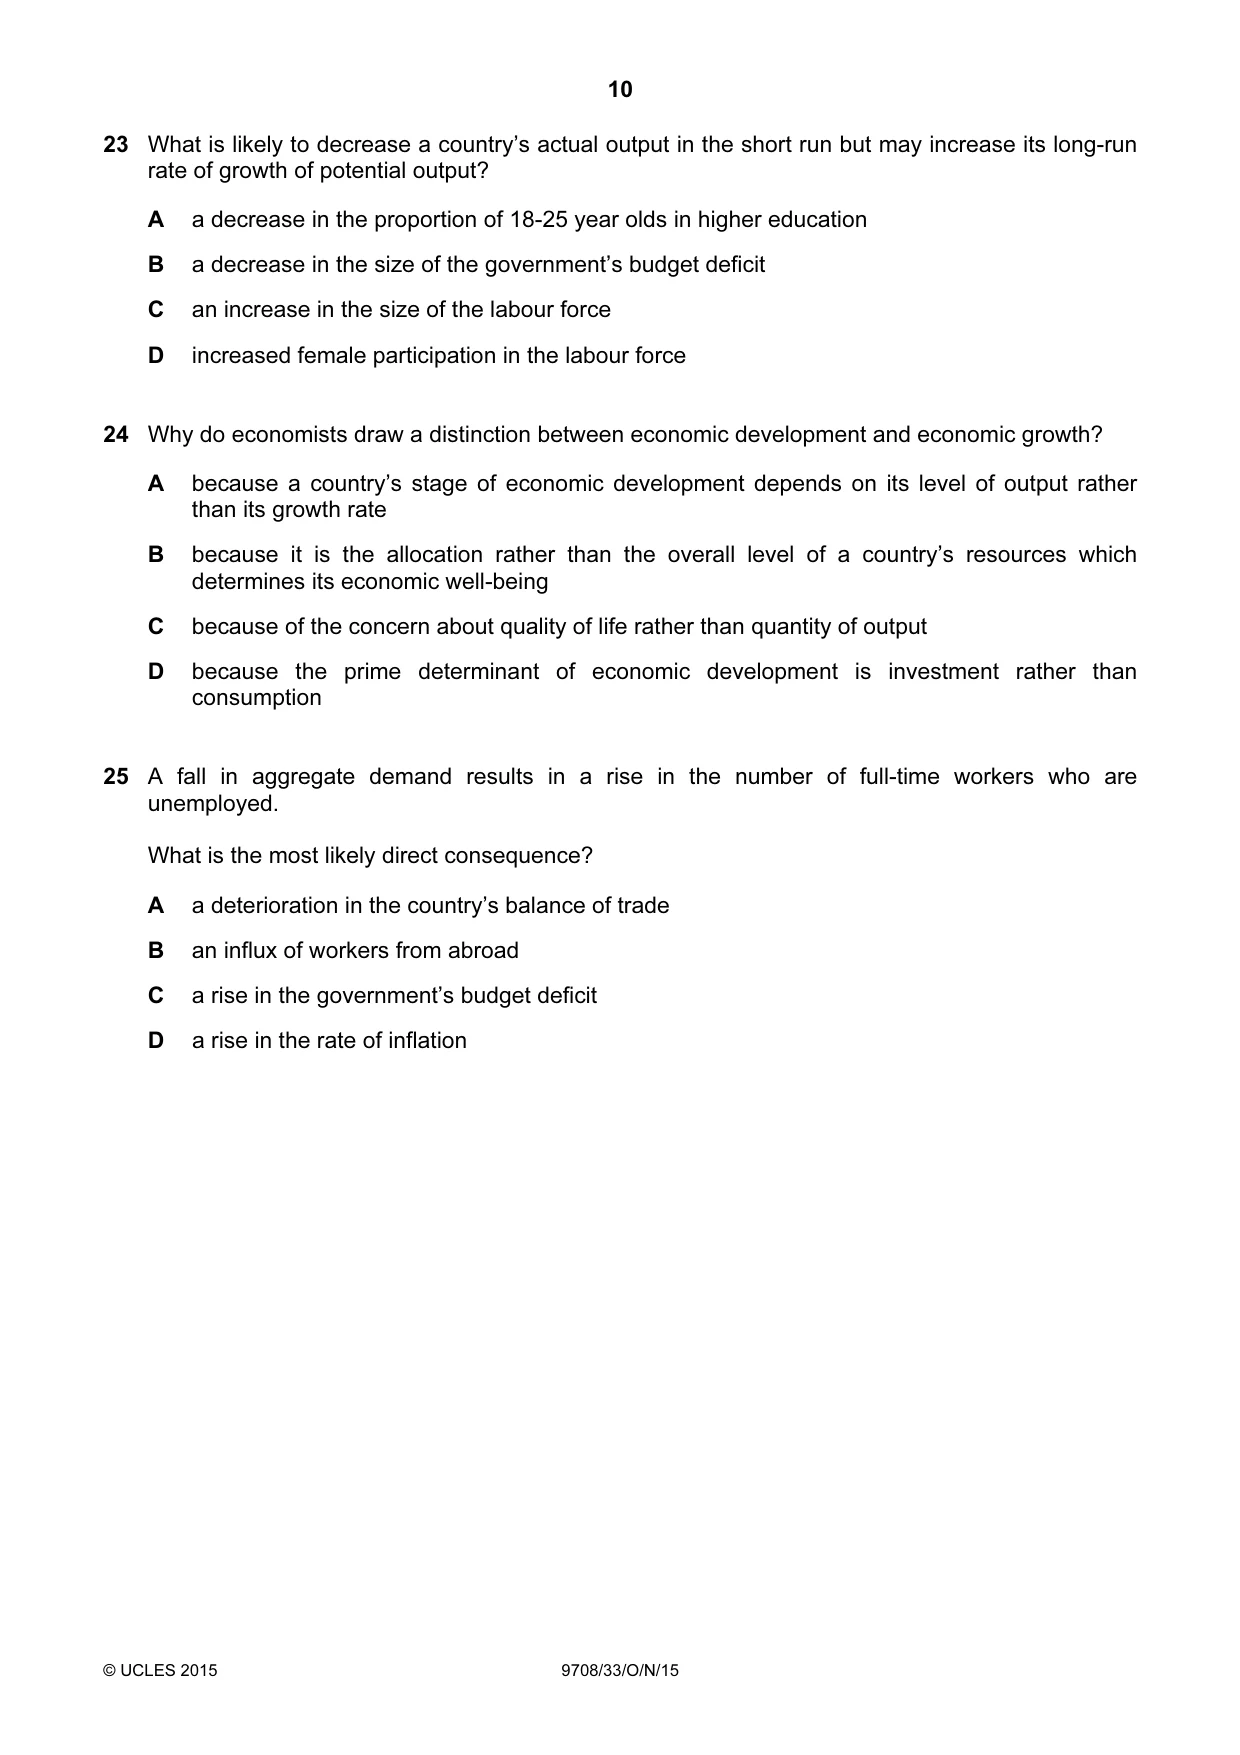
Q23 · What is likely to decrease a country’s actual output in the short run but may increase…
23 What is likely to decrease a country’s actual output in the short run but may increase its long-run rate of growth of potential output? A a decrease in the proportion of 18-25 year olds in higher education B a decrease in the size of the government’s budget deficit C an increase in the size of the labour force D increased female participation in the labour force
Mark scheme: B
Q24 · Why do economists draw a distinction between economic development and economic growth?
24 Why do economists draw a distinction between economic development and economic growth? A because a country’s stage of economic development depends on its level of output rather than its growth rate B because it is the allocation rather than the overall level of a country’s resources which determines its economic well-being C because of the concern about quality of life rather than quantity of output D because the prime determinant of economic development is investment rather than consumption
Mark scheme: C
Q25 · A fall in aggregate demand results in a rise in the number of full-time workers who are…
25 A fall in aggregate demand results in a rise in the number of full-time workers who are unemployed. What is the most likely direct consequence? A a deterioration in the country’s balance of trade B an influx of workers from abroad C a rise in the government’s budget deficit D a rise in the rate of inflation
Mark scheme: C
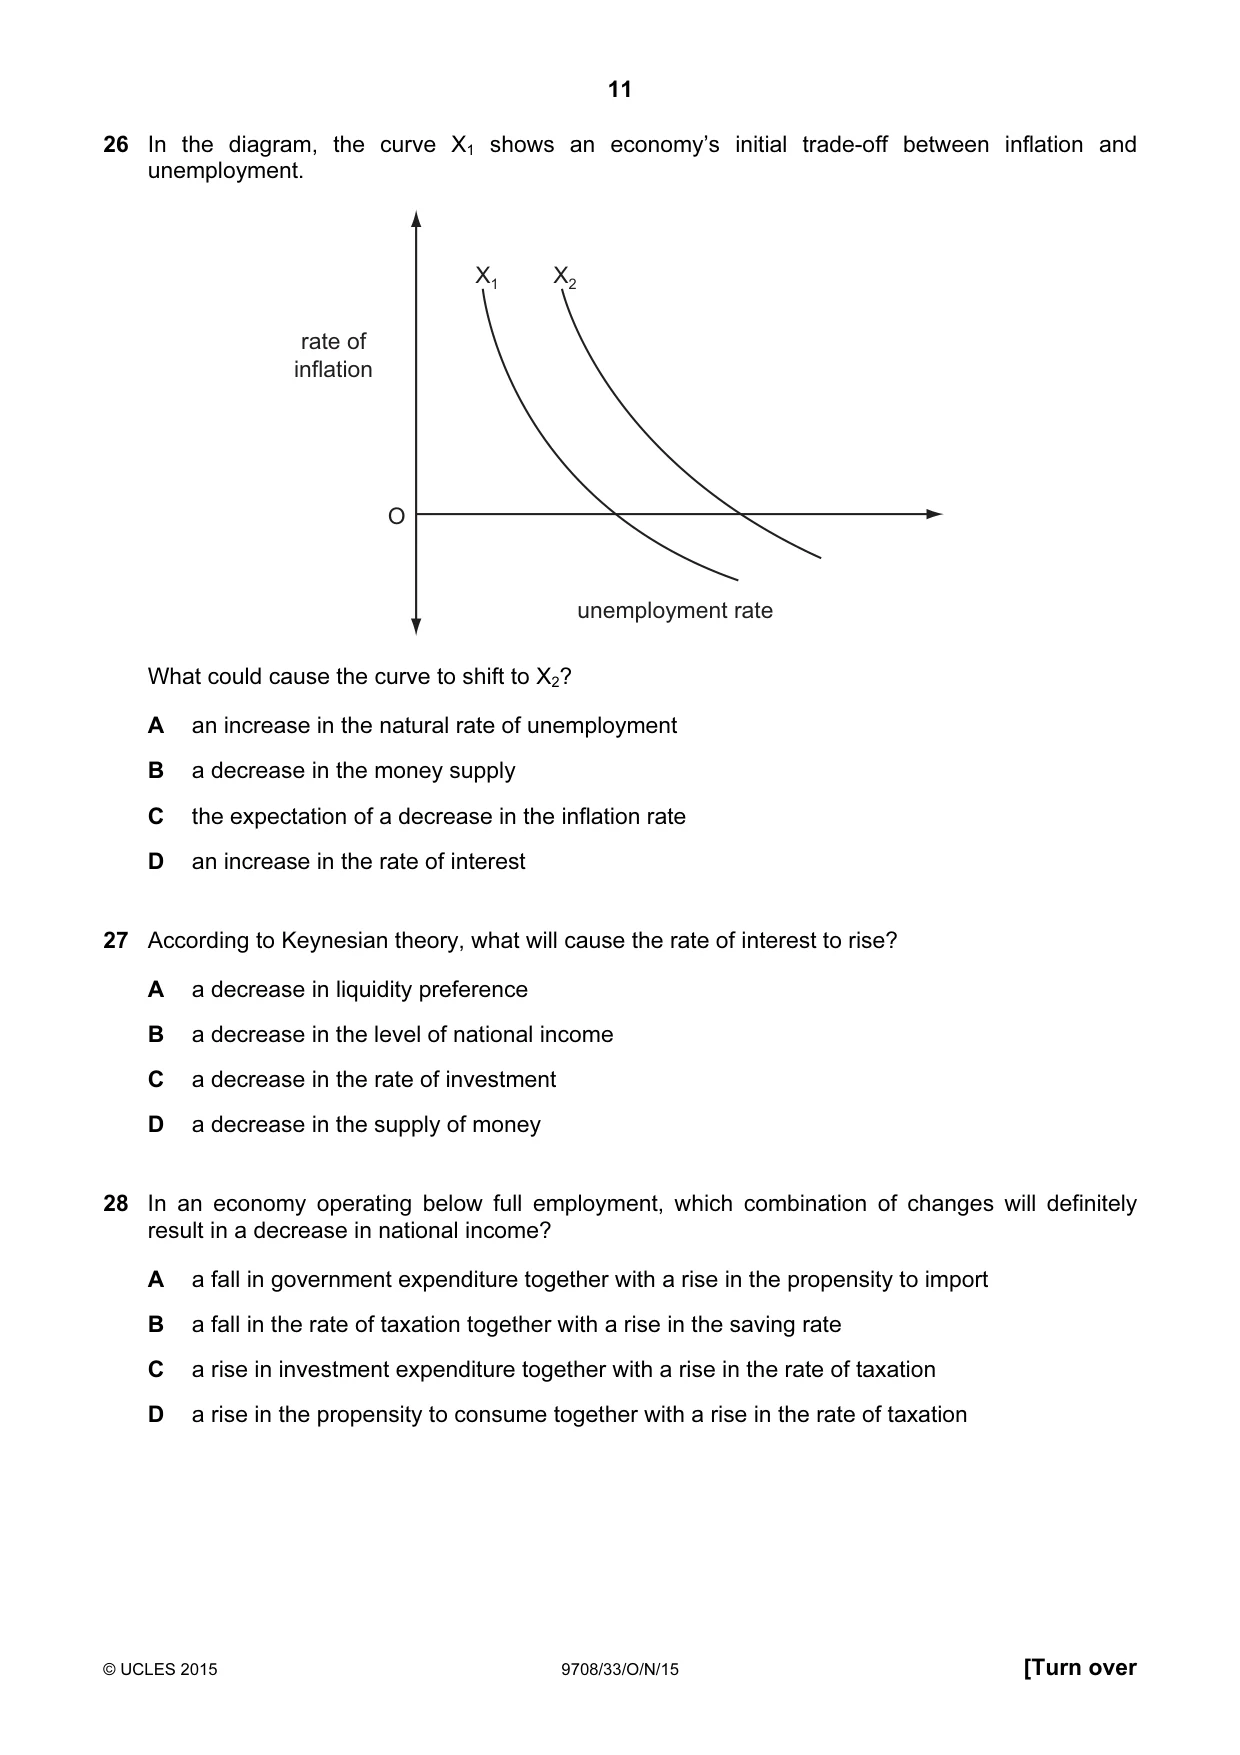
Q26 · In the diagram, the curve X1 shows an economy’s initial trade-off between inflation and…
26 In the diagram, the curve X1 shows an economy’s initial trade-off between inflation and unemployment. X1 X2 rate of inflation O unemployment rate What could cause the curve to shift to X2? A an increase in the natural rate of unemployment B a decrease in the money supply C the expectation of a decrease in the inflation rate D an increase in the rate of interest
Mark scheme: A
More questions on Links between macroeconomic problems and their interrelatedness
Q27 · According to Keynesian theory, what will cause the rate of interest to rise?
27 According to Keynesian theory, what will cause the rate of interest to rise? A a decrease in liquidity preference B a decrease in the level of national income C a decrease in the rate of investment D a decrease in the supply of money
Mark scheme: D
Q28 · In an economy operating below full employment, which combination of changes will…
28 In an economy operating below full employment, which combination of changes will definitely result in a decrease in national income? A a fall in government expenditure together with a rise in the propensity to import B a fall in the rate of taxation together with a rise in the saving rate C a rise in investment expenditure together with a rise in the rate of taxation D a rise in the propensity to consume together with a rise in the rate of taxation
Mark scheme: A
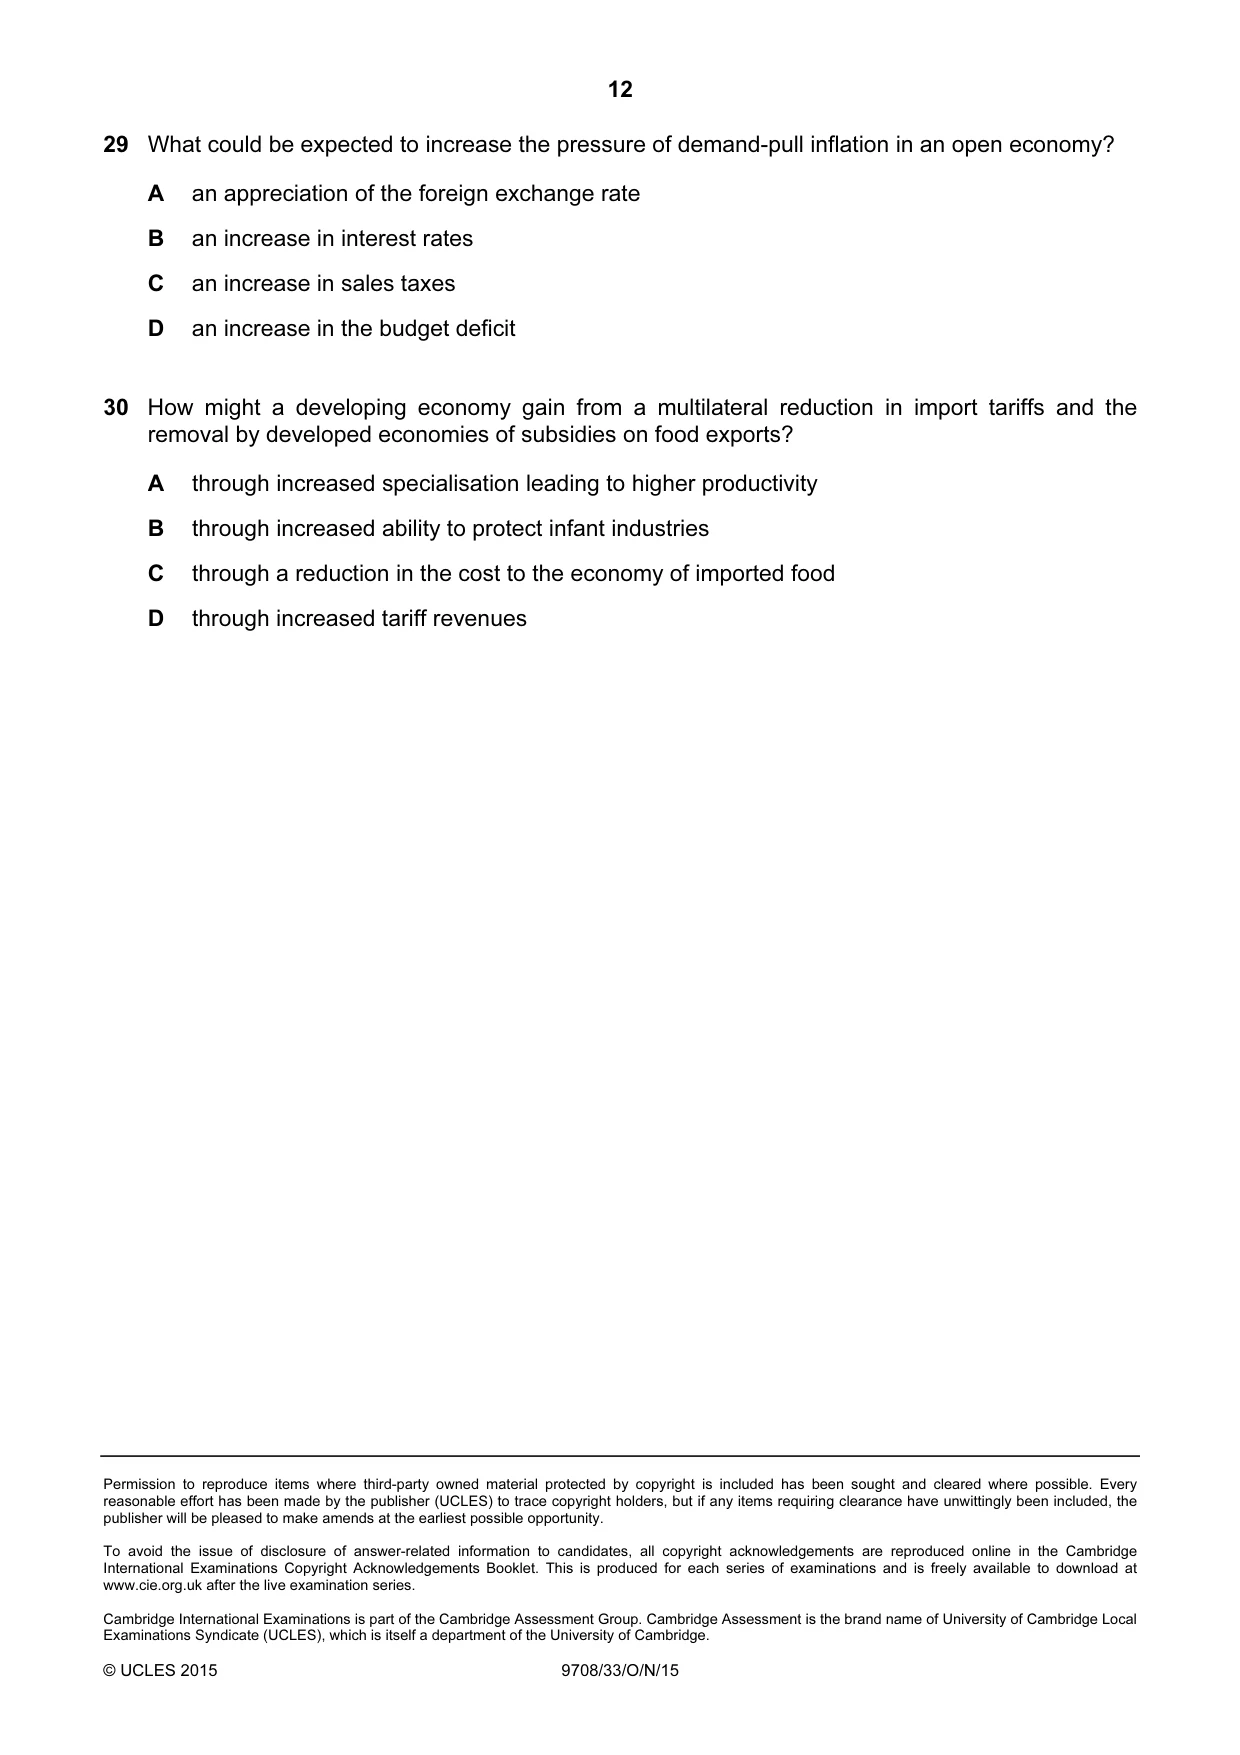
Q29 · What could be expected to increase the pressure of demand-pull inflation in an open…
29 What could be expected to increase the pressure of demand-pull inflation in an open economy? A an appreciation of the foreign exchange rate B an increase in interest rates C an increase in sales taxes D an increase in the budget deficit
Mark scheme: D
Q30 · How might a developing economy gain from a multilateral reduction in import tariffs and…
30 How might a developing economy gain from a multilateral reduction in import tariffs and the removal by developed economies of subsidies on food exports? A through increased specialisation leading to higher productivity B through increased ability to protect infant industries C through a reduction in the cost to the economy of imported food D through increased tariff revenues
Mark scheme: A
More questions on Relationship between countries at different levels of development
What was in this paper
The subtopics covered by these 30 questions, and how many questions each got. Open one in a new tab to see every Cambridge question on it.
4Labour market forces and government intervention3Types of cost, revenue and profit, short-run and long-run production3Equity and redistribution of income and wealth2Fiscal policy2Money and banking2Different market structures1Differing objectives and policies of firms1Economic development1Economic growth and sustainability1Efficiency and market failure1Growth and survival of firms1Indifference curves and budget lines1Links between macroeconomic problems and their interrelatedness1National income statistics1Price elasticity, income elasticity and cross elasticity of demand1Relationship between countries at different levels of development1Scarcity, choice and opportunity cost1Supply-side policy1Utility1