Cambridge A Level Economics 9708 — 2020 Oct/Nov Paper 3 · Variant 2
9708/32/O/N/20 · 30 questions · 30 marks · ≈34 min
The question paper and its mark scheme, free to read here and free to download. This is Cambridge’s own paper, exactly as it was sat.
Question paper12 pages
Mark scheme3 pages
Answers below. Sit the paper first if you are practising.
Questions as text
Q1 · What is necessary to achieve Pareto efficiency?
1 What is necessary to achieve Pareto efficiency? A Both consumers and producers must be made better off. B Everybody must be made equally better off. C One person must benefit without anyone else being worse off. D The welfare gains must exceed the welfare losses.
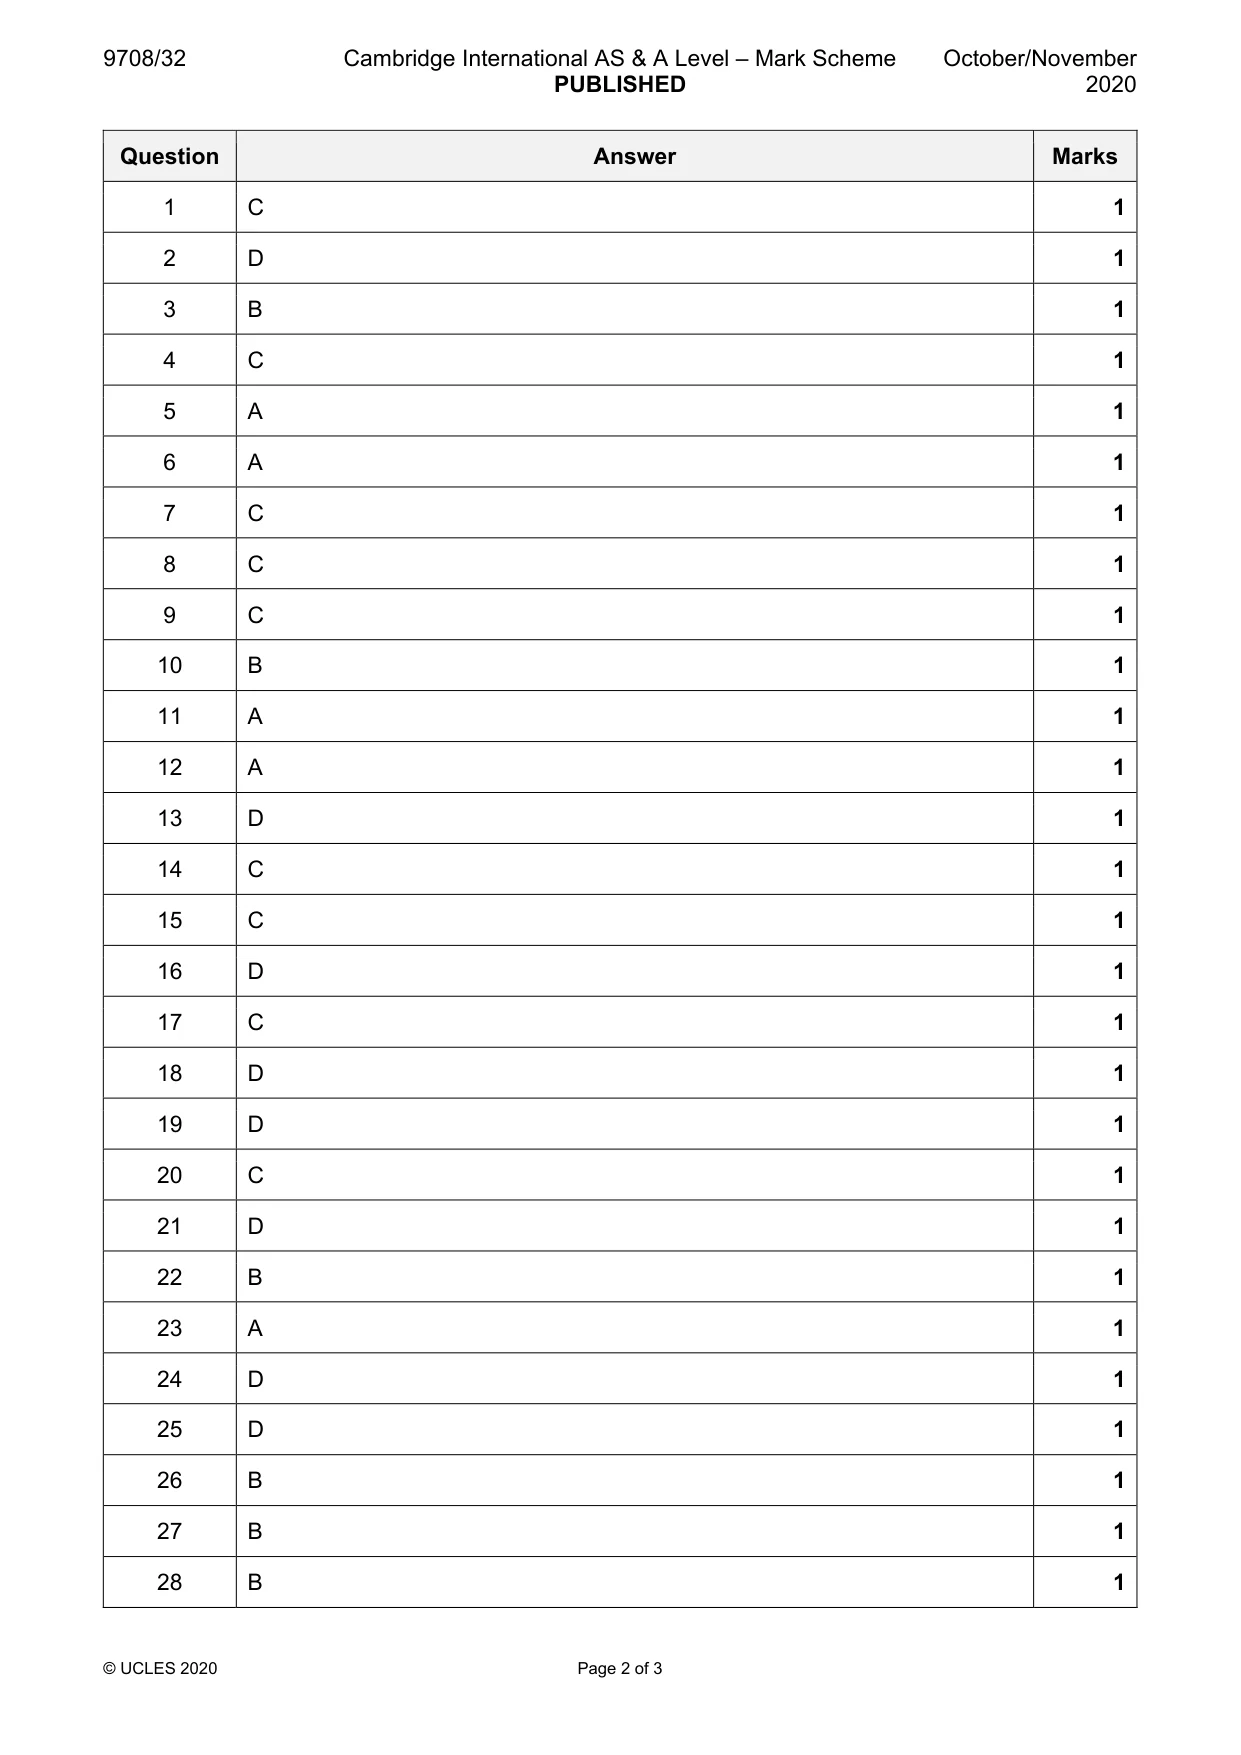
Mark scheme: C
Q2 · A local council is considering building a passenger terminal at a port so that it can…
2 A local council is considering building a passenger terminal at a port so that it can benefit the large cruise ships that dock there. It undertakes a cost–benefit analysis. What would be included as an external cost in the local council’s cost–benefit analysis? A the cost of a ticket for a passenger to travel on a cruise ship B the cost of fuel to operate the cruise ships C the costs paid by cruise ships when they dock at the port D the cost to a fishing fleet of relocating to another port
Mark scheme: D
More questions on Private costs and benefits, externalities and social costs and benefits
Q3 · The expected marginal private benefits (MPB), marginal social benefits (MSB), marginal…
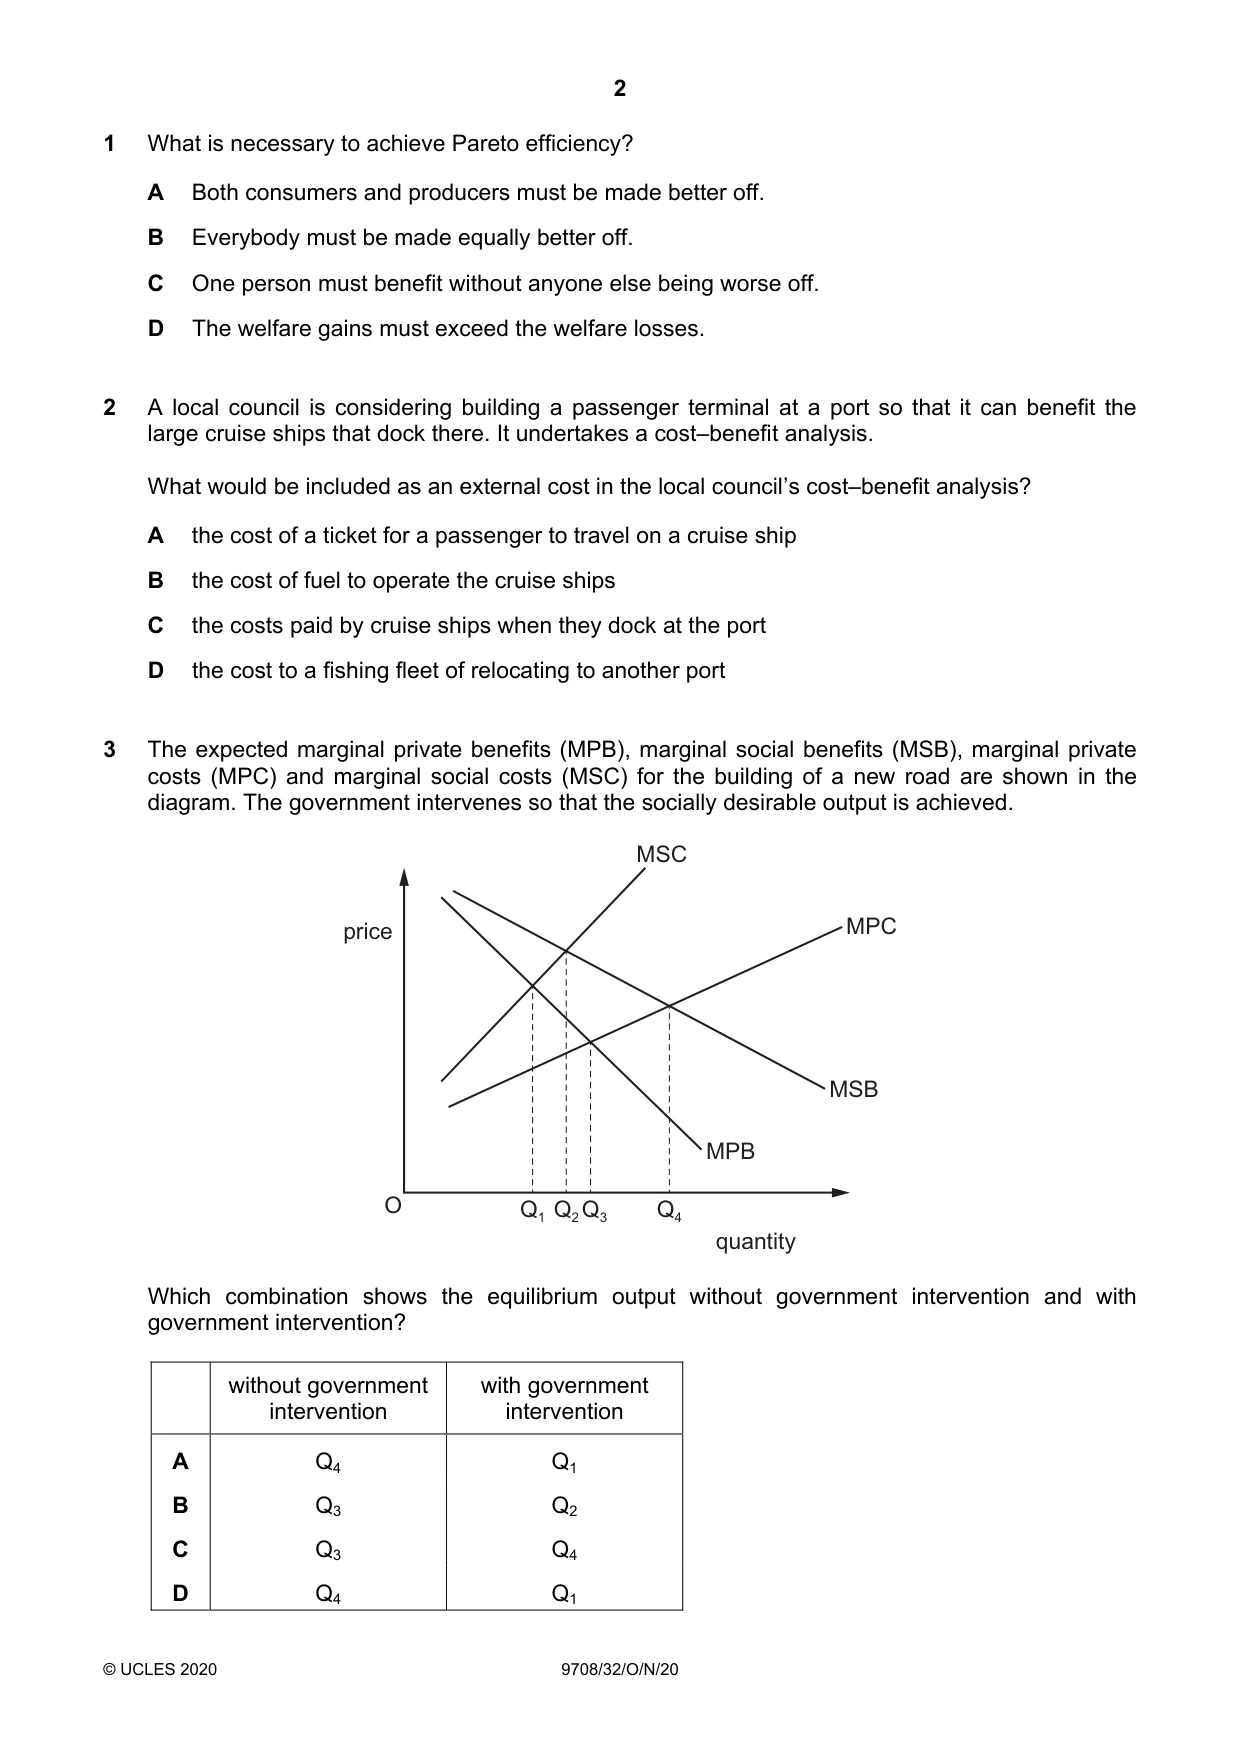
3 The expected marginal private benefits (MPB), marginal social benefits (MSB), marginal private costs (MPC) and marginal social costs (MSC) for the building of a new road are shown in the diagram. The government intervenes so that the socially desirable output is achieved. MSC price MPC MSB MPB O Q1 Q2Q3 Q4 quantity Which combination shows the equilibrium output without government intervention and with government intervention? without government with government intervention intervention A Q4 Q1 B Q3 Q2 C Q3 Q4 D Q4 Q1
Mark scheme: B
Q4 · A rational consumer chooses what quantities of two products Y and Z to purchase with a…
4 A rational consumer chooses what quantities of two products Y and Z to purchase with a given income. MUY and MUZ are the additions to total utility that would result if the consumer were to purchase an additional unit of each product. PY and PZ are the current prices of the two products. Which outcome would represent consumer equilibrium? A when MUY = MUZ B when MUY PY = MUZ PZ C when MUY PZ = MUZ PY D it is not possible to tell from the information available
Mark scheme: C
Q5 · The diagrams show a consumer’s indifference curves (IC) and budget lines (BL) for an…
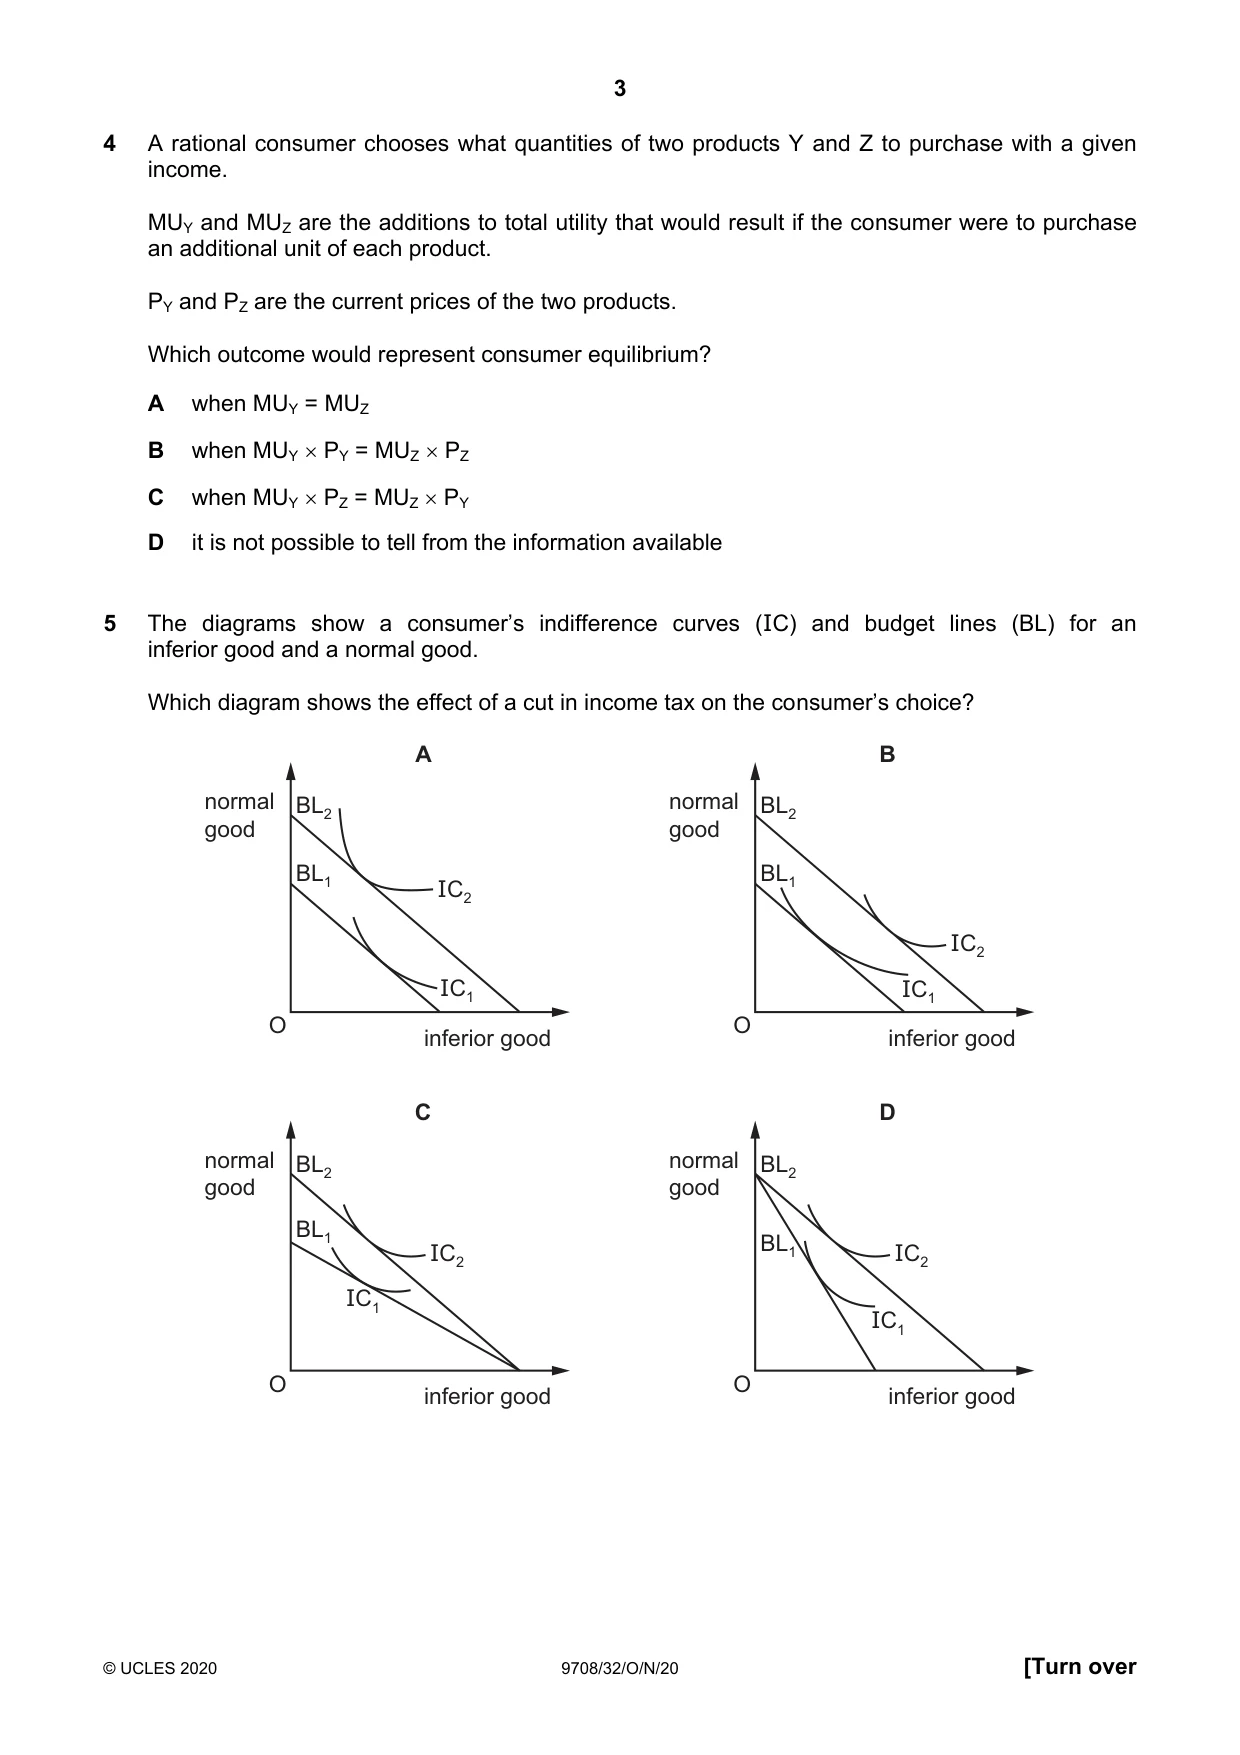
5 The diagrams show a consumer’s indifference curves (IC) and budget lines (BL) for an inferior good and a normal good. Which diagram shows the effect of a cut in income tax on the consumer’s choice? A B normal BL2 normal BL2 good good BL1 BL1 IC2 IC2 IC1 IC1 O O inferior good inferior good C D normal BL2 normal BL2 good good BL1 IC2 BL1 IC2 IC1 IC1 O O inferior good inferior good
Mark scheme: A
Q6 · What is marginal cost?
6 What is marginal cost? A the difference between the total cost of producing n units and n – 1 units of output B the difference between the average variable cost of producing n units and n – 1 units of output C the difference between the average total cost of producing n units and n – 1 units of output D the average fixed cost of producing one more unit of output
Mark scheme: A
More questions on Types of cost, revenue and profit, short-run and long-run production
Q7 · The table shows the production and total cost of a firm
7 The table shows the production and total cost of a firm. production (tonnes) total cost ($) 0 20 1 30 2 35 3 40 4 45 5 50 What is the average variable cost of producing 5 tonnes of output? A $4 B $5 C $6 D $10
Mark scheme: C
More questions on Types of cost, revenue and profit, short-run and long-run production
Q8 · The diagram shows the long-run total cost (LRTC) curve of a firm
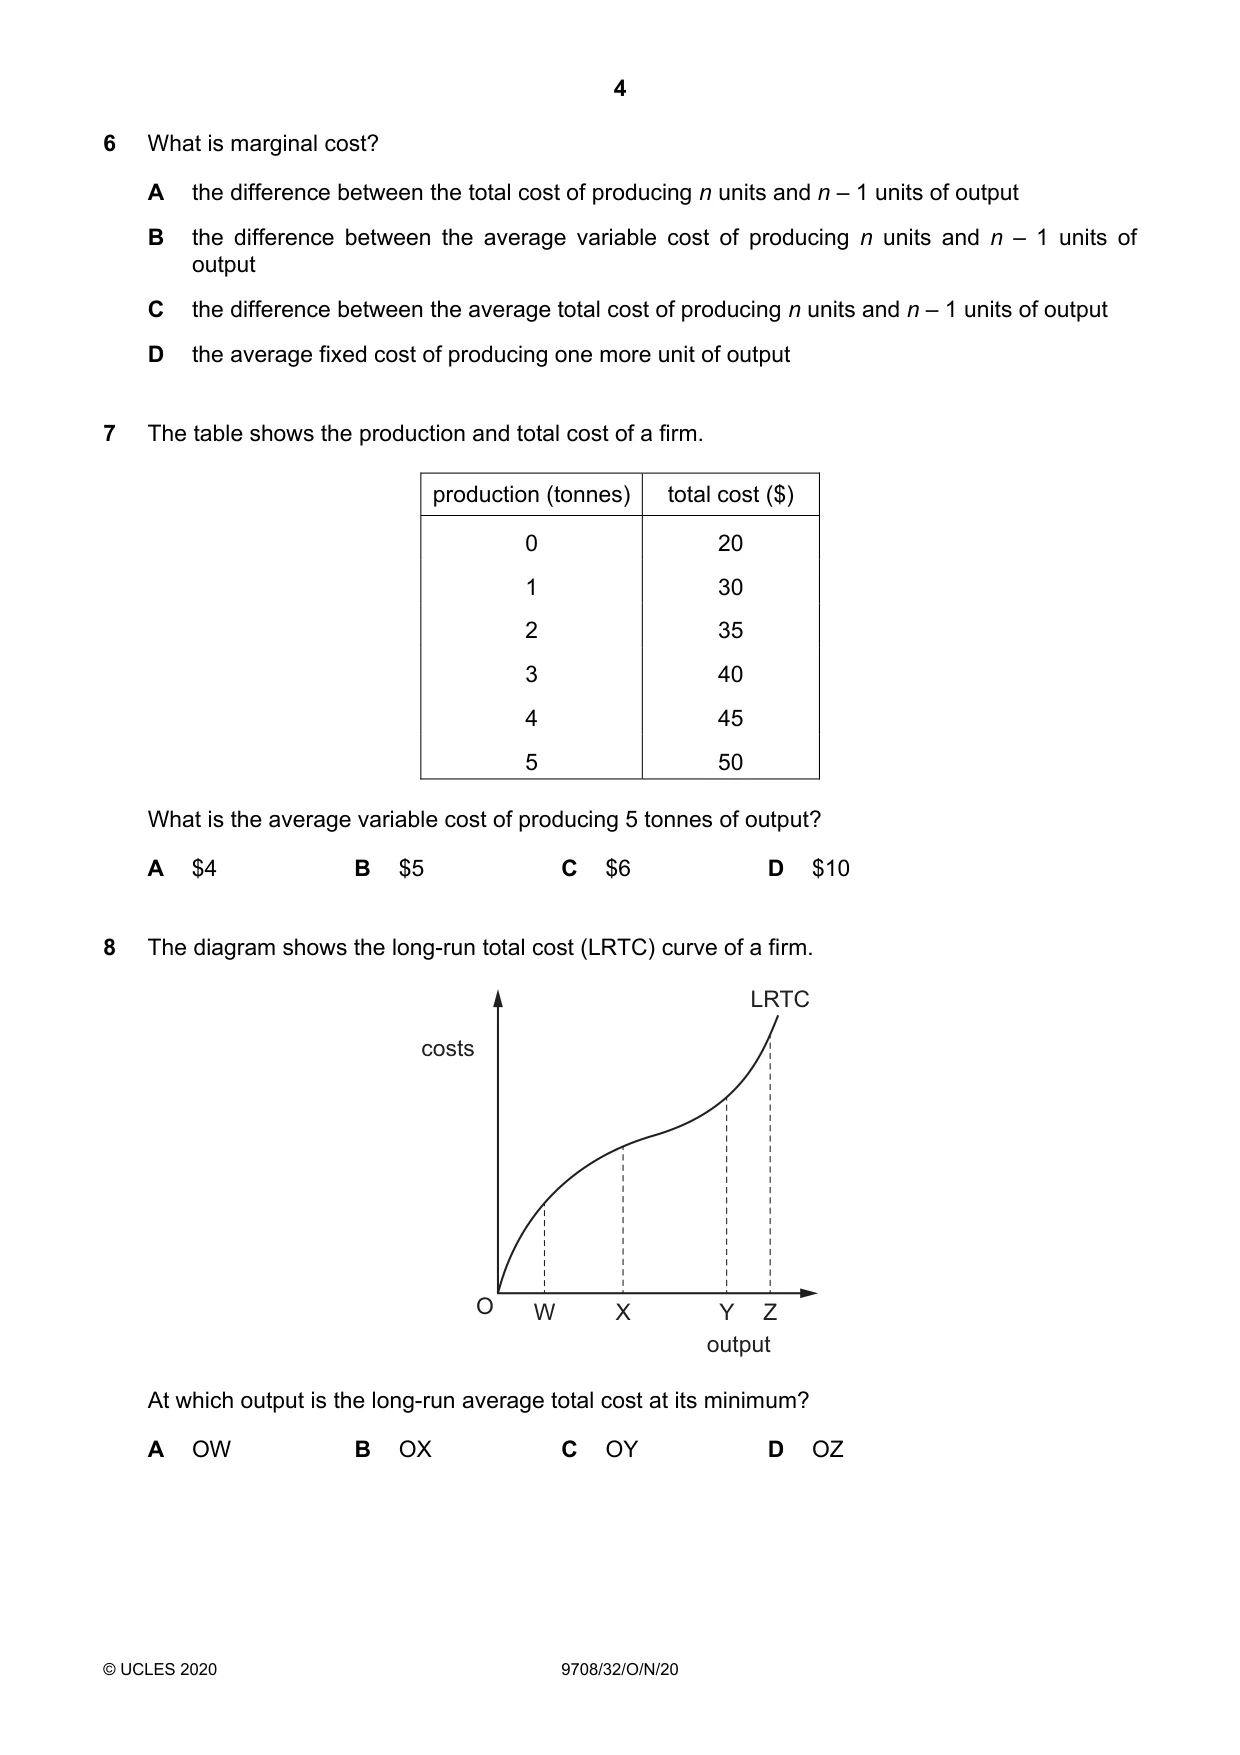
8 The diagram shows the long-run total cost (LRTC) curve of a firm. LRTC costs O W X Y Z output At which output is the long-run average total cost at its minimum? A OW B OX C OY D OZ
Mark scheme: C
More questions on Types of cost, revenue and profit, short-run and long-run production
Q9 · Which combination of statements about small firms and large firms is correct?
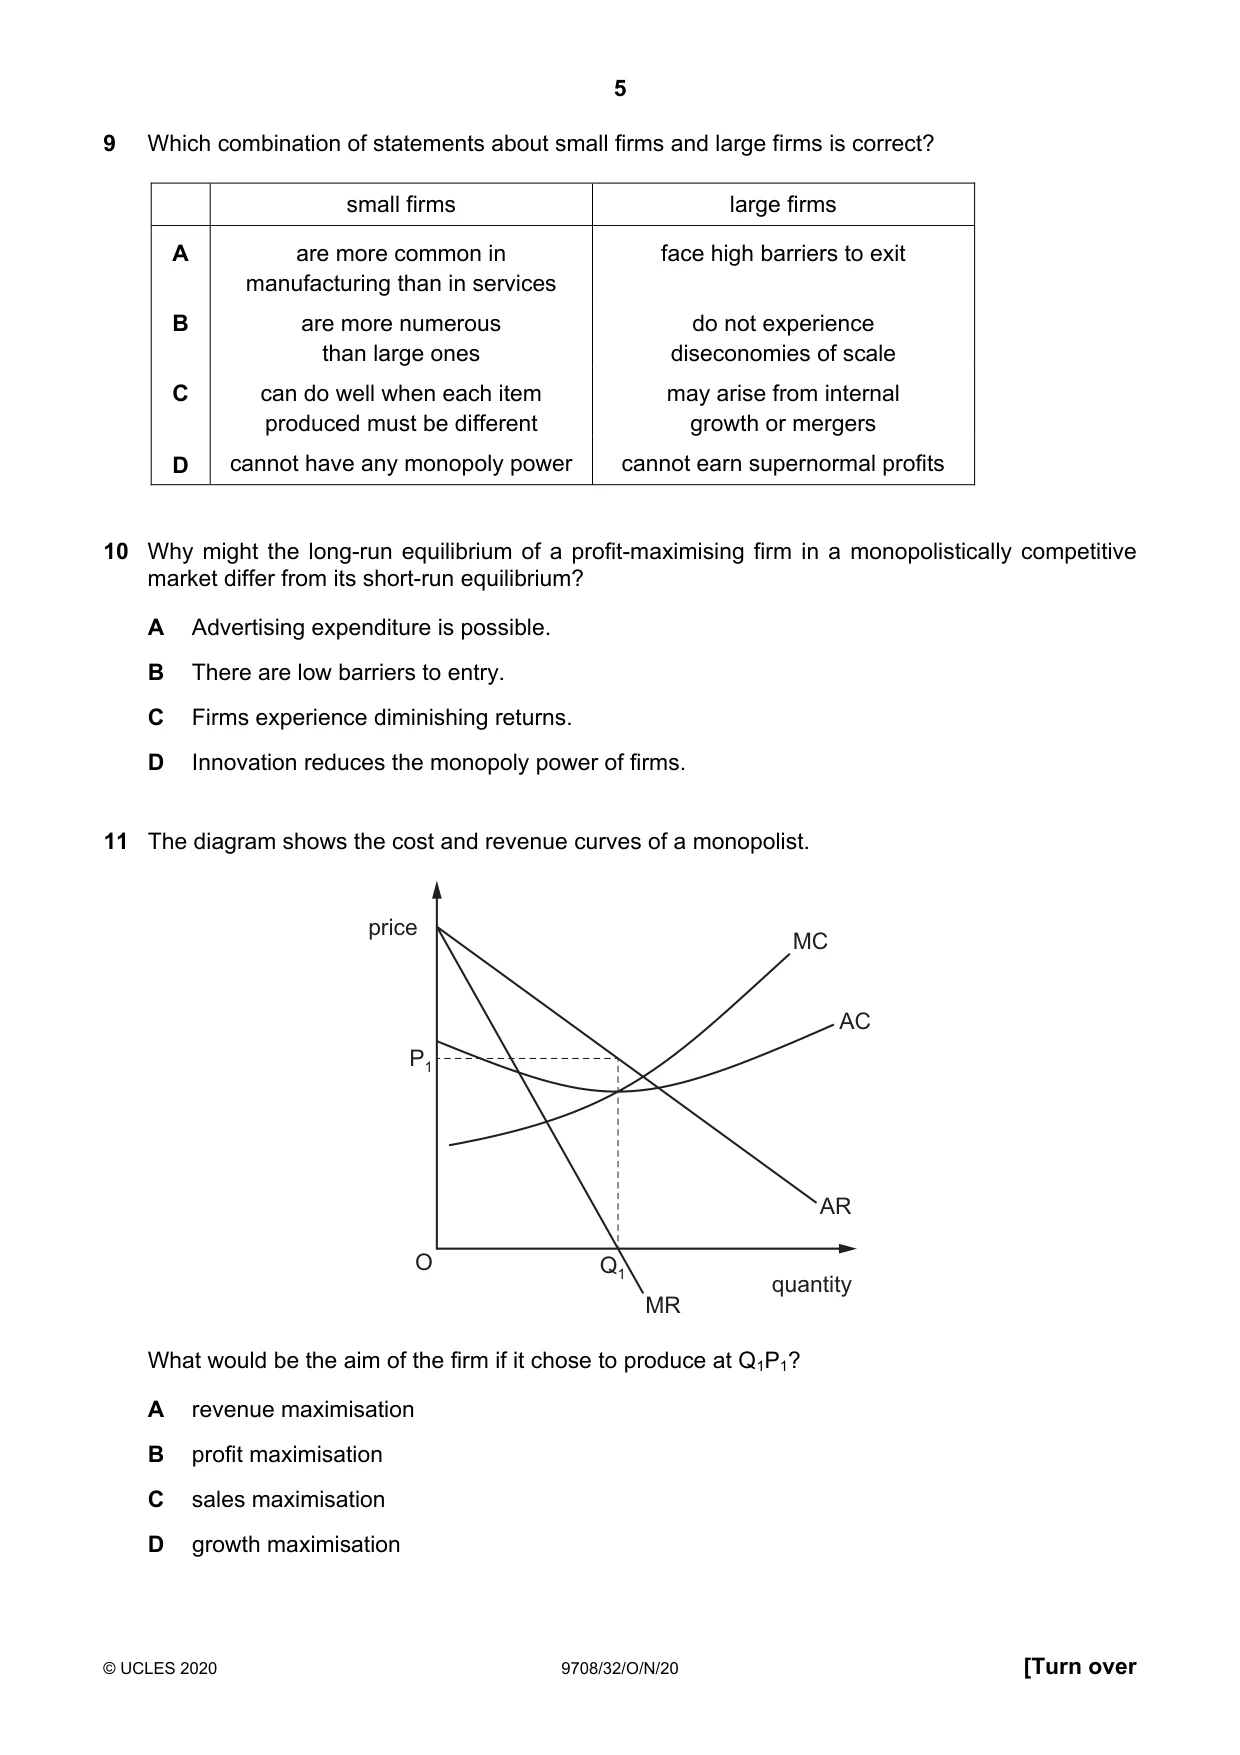
9 Which combination of statements about small firms and large firms is correct? small firms large firms A are more common in face high barriers to exit manufacturing than in services B are more numerous do not experience than large ones diseconomies of scale C can do well when each item may arise from internal produced must be different growth or mergers D cannot have any monopoly power cannot earn supernormal profits
Mark scheme: C
Q10 · Why might the long-run equilibrium of a profit-maximising firm in a monopolistically…
10 Why might the long-run equilibrium of a profit-maximising firm in a monopolistically competitive market differ from its short-run equilibrium? A Advertising expenditure is possible. B There are low barriers to entry. C Firms experience diminishing returns. D Innovation reduces the monopoly power of firms.
Mark scheme: B
Q11 · The diagram shows the cost and revenue curves of a monopolist
11 The diagram shows the cost and revenue curves of a monopolist. price MC AC P1 AR O Q1 quantity MR What would be the aim of the firm if it chose to produce at Q1P1? A revenue maximisation B profit maximisation C sales maximisation D growth maximisation
Mark scheme: A
More questions on Differing objectives and policies of firms
Q12 · What does the ‘kinked demand curve’ model suggest about the equilibrium price in an…
12 What does the ‘kinked demand curve’ model suggest about the equilibrium price in an oligopoly market? A It will be stable because there is little incentive for firms to change prices. B It will be stable because there is a lot of competition. C It will change frequently because there is a lot of competition. D It will change frequently because price is determined by demand and supply.
Mark scheme: A
Q13 · What is the essential feature of nudge theory?
13 What is the essential feature of nudge theory? A the aim of satisficing B the establishing of a legal requirement C the existence of a contestable market D the idea of persuasion
Mark scheme: D
More questions on Differing objectives and policies of firms
Q14 · What indicates that a more equal distribution of income has been achieved?
14 What indicates that a more equal distribution of income has been achieved? A a faster rate of economic growth B a higher Human Development Index C a lower Gini coefficient D a lower tax / GDP ratio
Mark scheme: C
More questions on Equity and redistribution of income and wealth
Q15 · Which combination of policies is most likely to reduce the number of low-paid workers…
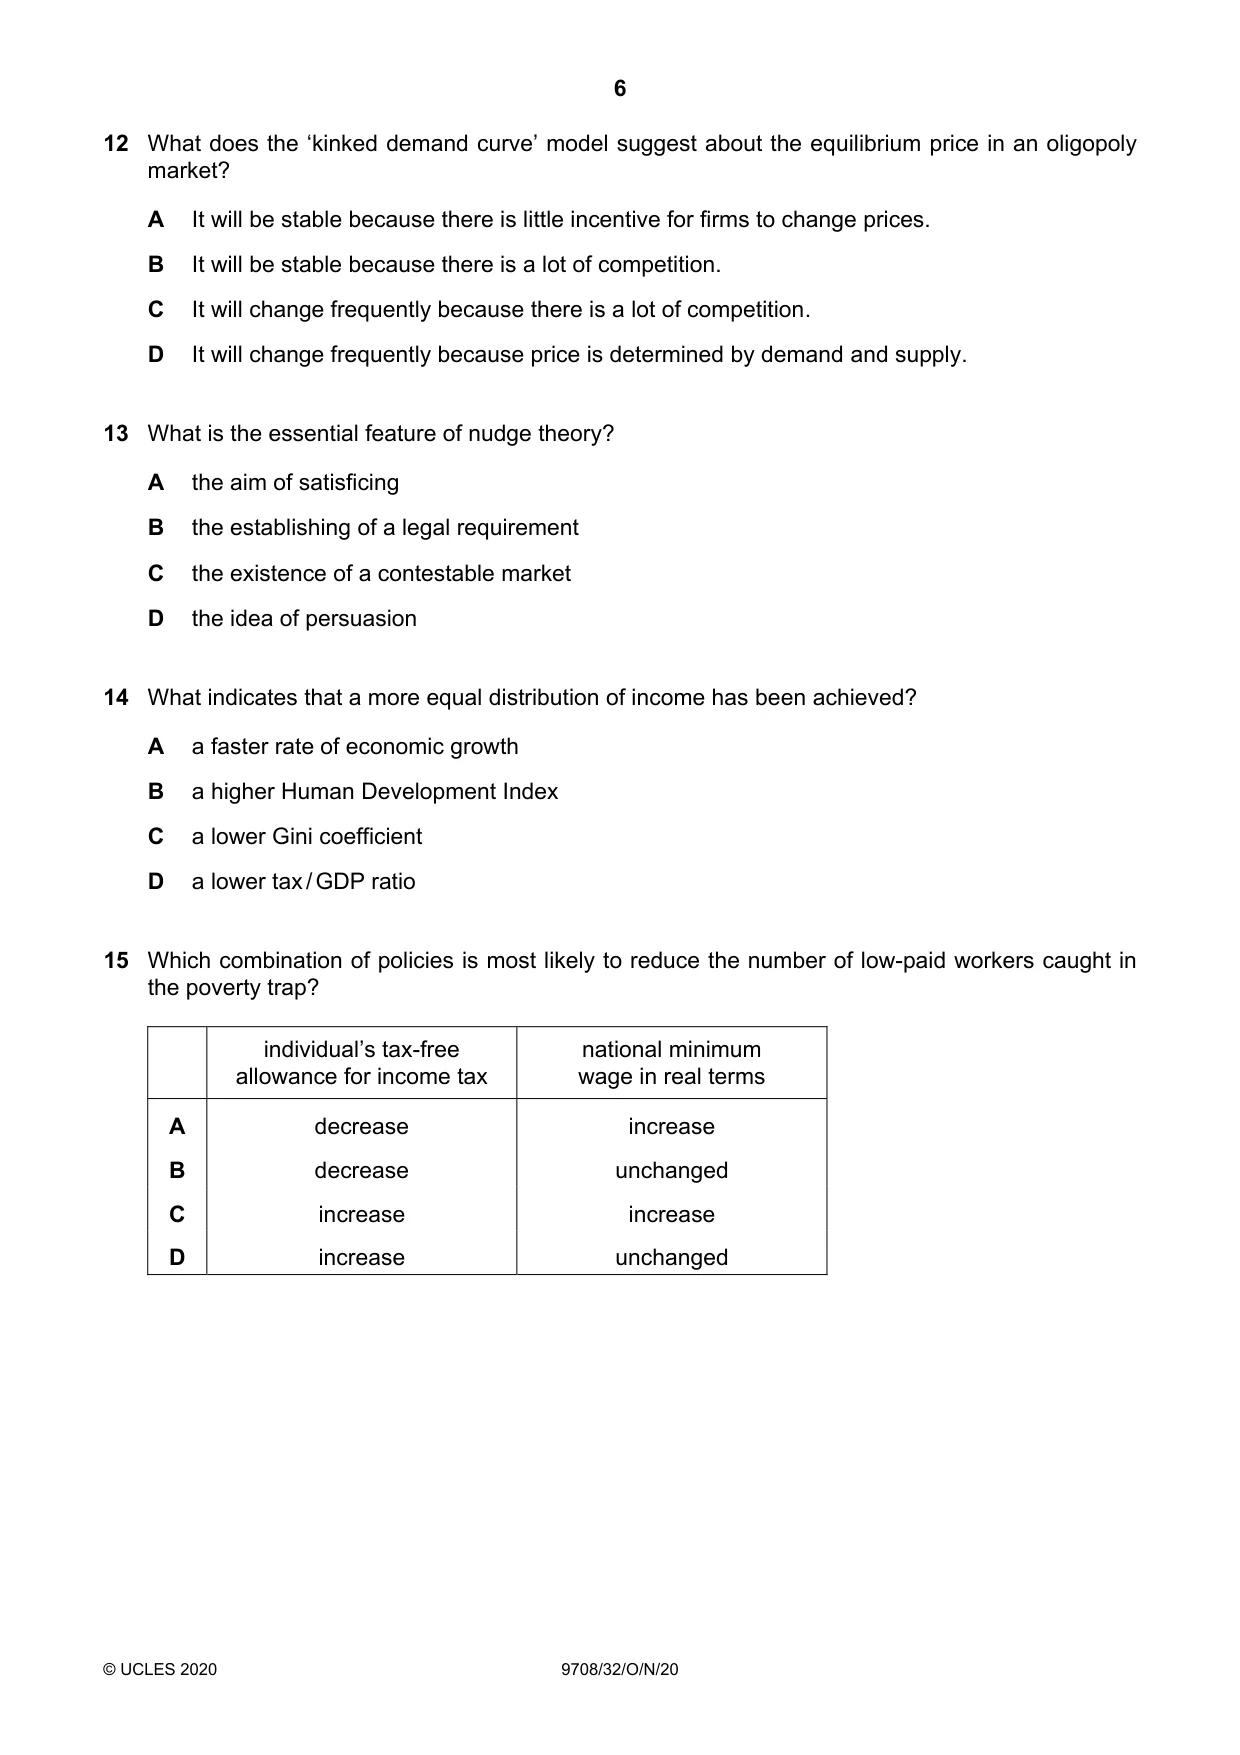
15 Which combination of policies is most likely to reduce the number of low-paid workers caught in the poverty trap? individual’s tax-free national minimum allowance for income tax wage in real terms A decrease increase B decrease unchanged C increase increase D increase unchanged
Mark scheme: C
More questions on Equity and redistribution of income and wealth
Q16 · The diagram shows the effect of the introduction of a national minimum wage, WM, in an…
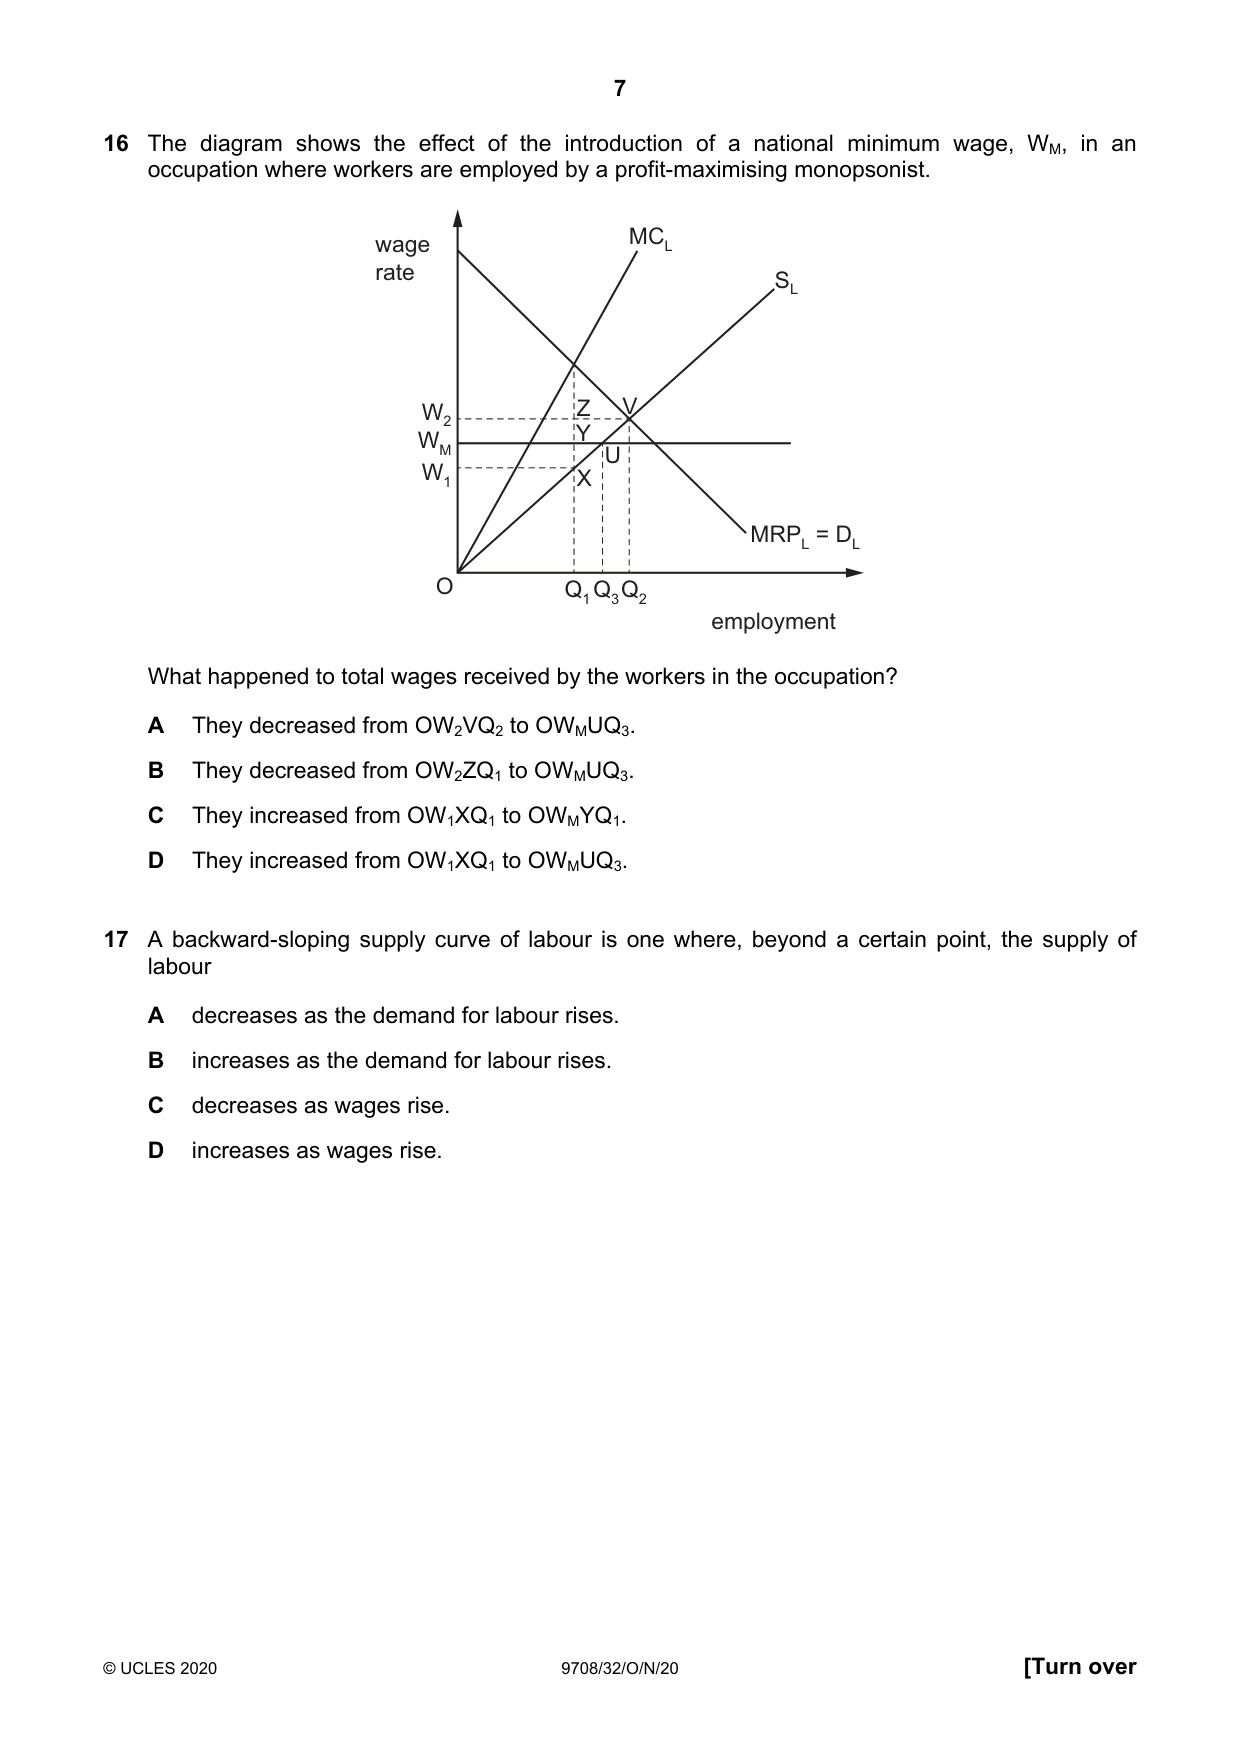
16 The diagram shows the effect of the introduction of a national minimum wage, WM, in an occupation where workers are employed by a profit-maximising monopsonist. wage MCL rate SL W2 Z V WM Y U W1 X MRPL = DL O Q1Q3Q2 employment What happened to total wages received by the workers in the occupation? A They decreased from OW2VQ2 to OWMUQ3. B They decreased from OW2ZQ1 to OWMUQ3. C They increased from OW1XQ1 to OWMYQ1. D They increased from OW1XQ1 to OWMUQ3.
Mark scheme: D
More questions on Labour market forces and government intervention
Q17 · A backward-sloping supply curve of labour is one where, beyond a certain point, the…
17 A backward-sloping supply curve of labour is one where, beyond a certain point, the supply of labour A decreases as the demand for labour rises. B increases as the demand for labour rises. C decreases as wages rise. D increases as wages rise.
Mark scheme: C
More questions on Labour market forces and government intervention
Q18 · The table shows factors that influence living standards
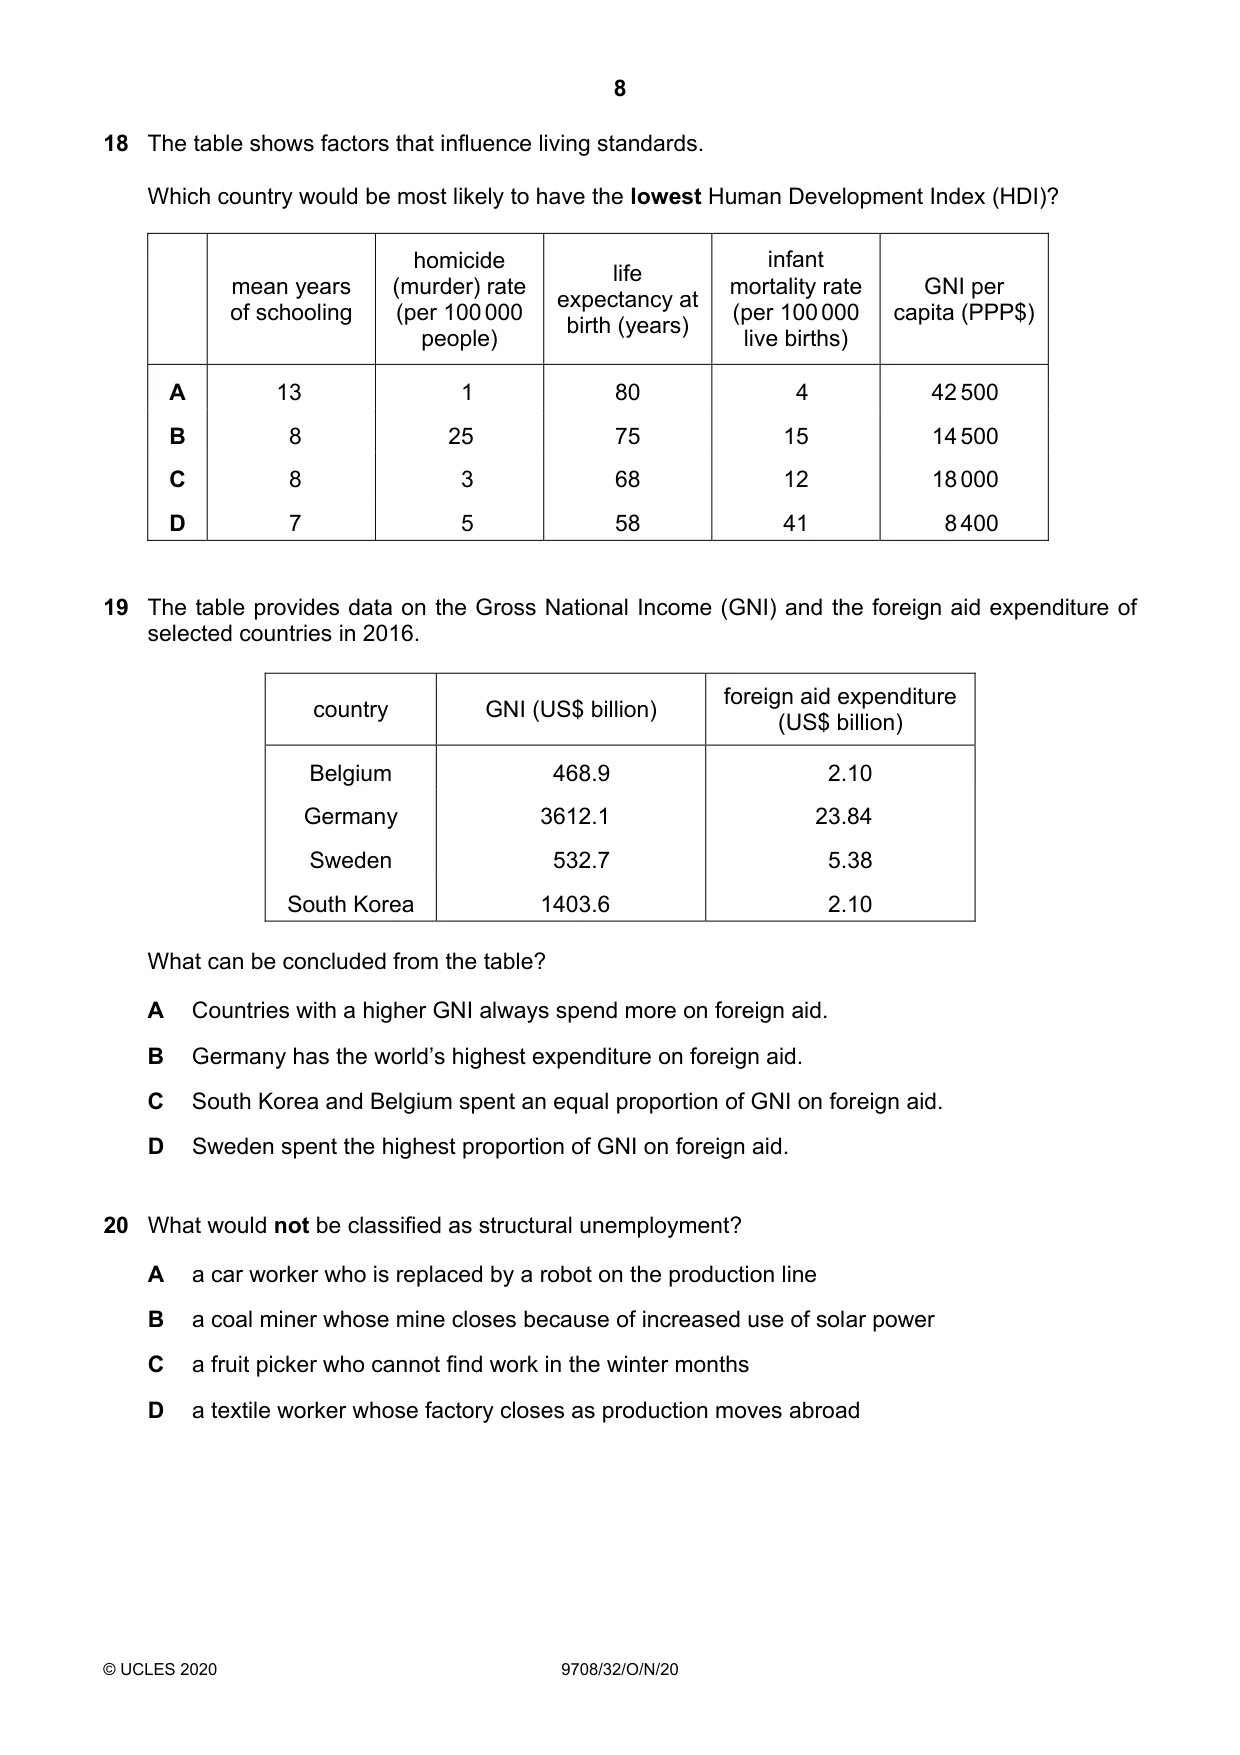
18 The table shows factors that influence living standards. Which country would be most likely to have the lowest Human Development Index (HDI)? homicide infant life mean years (murder) rate mortality rate GNI per expectancy at of schooling (per 100 000 (per 100 000 capita (PPP$) birth (years) people) live births) A 13 1 80 4 42 500 B 8 25 75 15 14 500 C 8 3 68 12 18 000 D 7 5 58 41 8 400
Mark scheme: D
More questions on Characteristics of countries at different levels of development
Q19 · The table provides data on the Gross National Income (GNI) and the foreign aid…
19 The table provides data on the Gross National Income (GNI) and the foreign aid expenditure of selected countries in 2016. foreign aid expenditure country GNI (US$ billion) (US$ billion) Belgium 468.9 2.10 Germany 3612.1 23.84 Sweden 532.7 5.38 South Korea 1403.6 2.10 What can be concluded from the table? A Countries with a higher GNI always spend more on foreign aid. B Germany has the world’s highest expenditure on foreign aid. C South Korea and Belgium spent an equal proportion of GNI on foreign aid. D Sweden spent the highest proportion of GNI on foreign aid.
Mark scheme: D
More questions on Relationship between countries at different levels of development
Q20 · What would not be classified as structural unemployment?
20 What would not be classified as structural unemployment? A a car worker who is replaced by a robot on the production line B a coal miner whose mine closes because of increased use of solar power C a fruit picker who cannot find work in the winter months D a textile worker whose factory closes as production moves abroad
Mark scheme: C
Q21 · The diagram shows the consumption function of a country
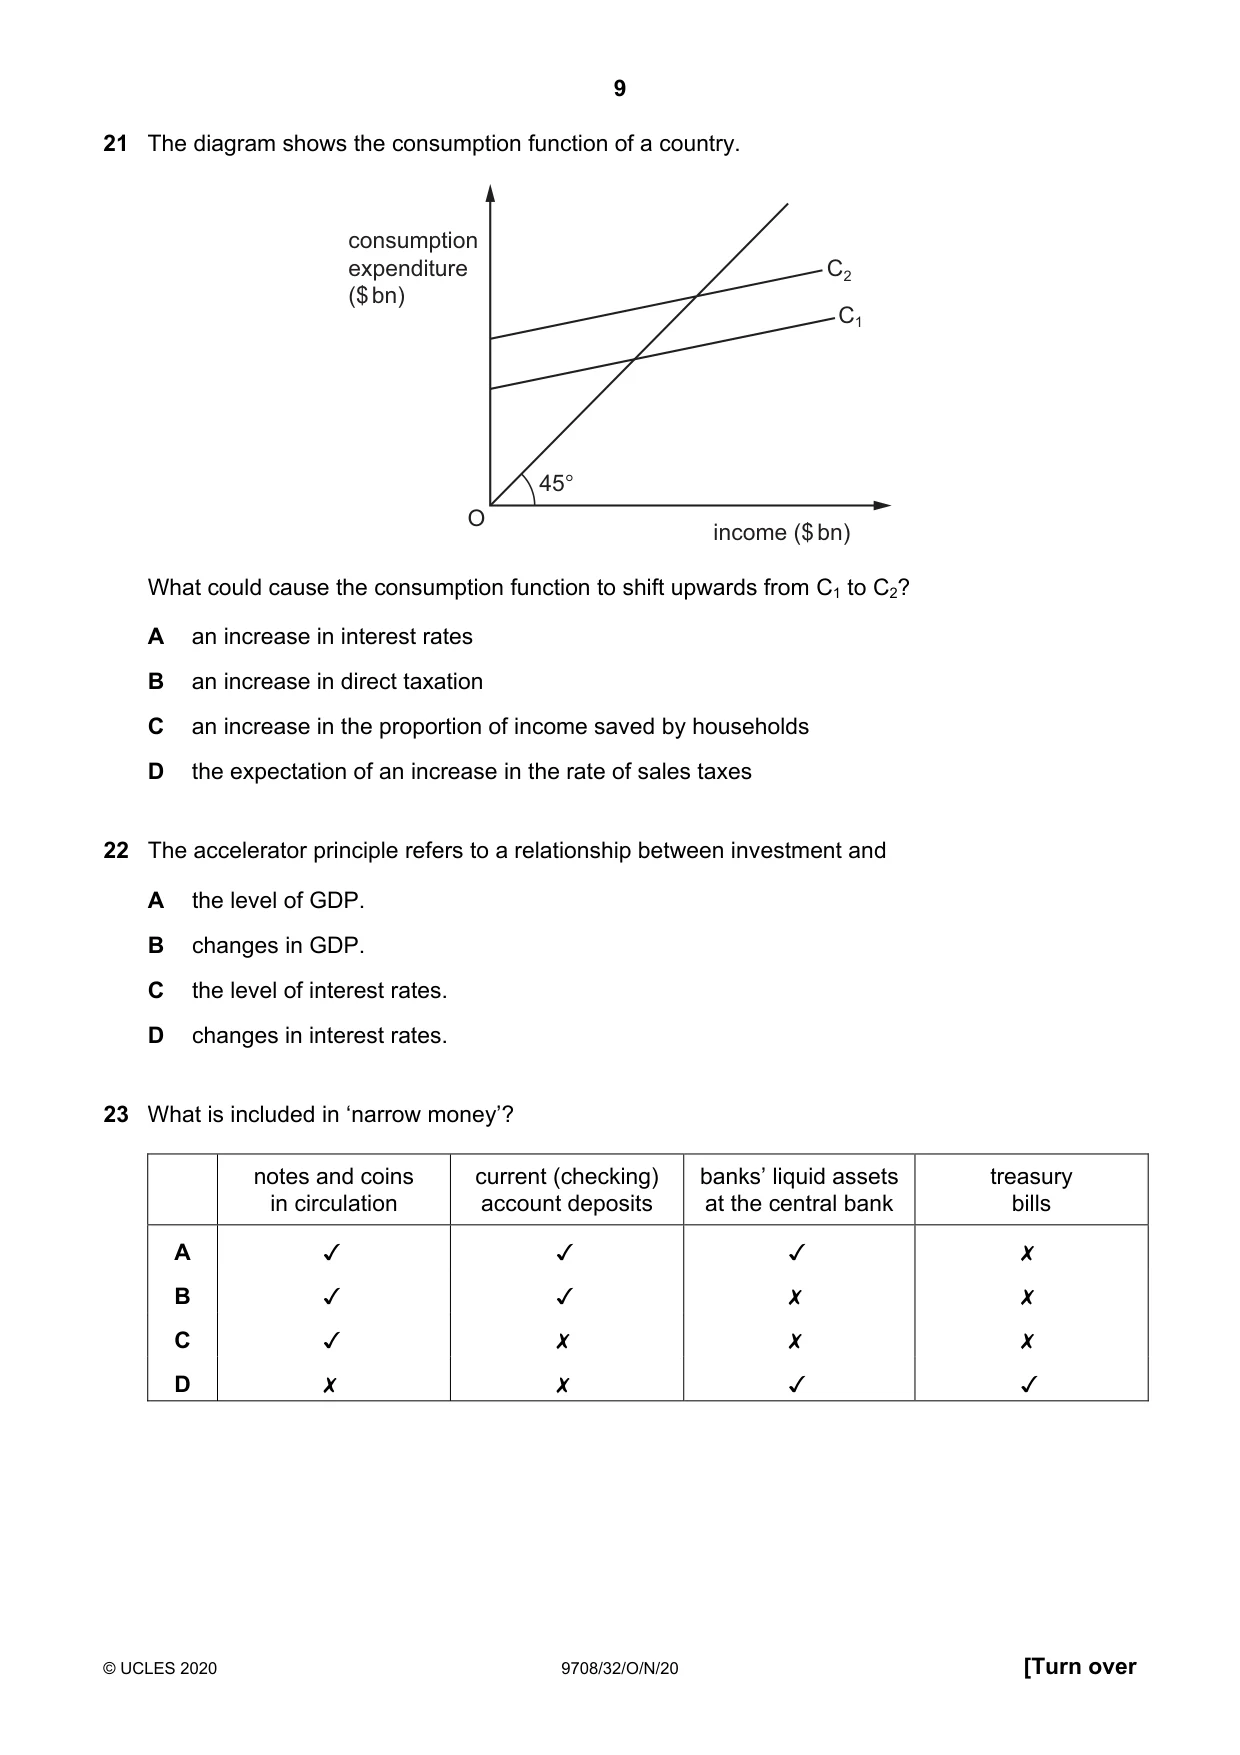
21 The diagram shows the consumption function of a country. consumption expenditure C2 ($ bn) C1 45° O income ($ bn) What could cause the consumption function to shift upwards from C1 to C2? A an increase in interest rates B an increase in direct taxation C an increase in the proportion of income saved by households D the expectation of an increase in the rate of sales taxes
Mark scheme: D
Q22 · The accelerator principle refers to a relationship between investment and A the level of…
22 The accelerator principle refers to a relationship between investment and A the level of GDP. B changes in GDP. C the level of interest rates. D changes in interest rates.
Mark scheme: B
Q23 · What is included in ‘narrow money’?
23 What is included in ‘narrow money’? notes and coins current (checking) banks’ liquid assets treasury in circulation account deposits at the central bank bills A JV JV Jv x B Jv Jv x x Cc Jv x x x D x x Jv JV
Mark scheme: A
Q24 · The diagram shows three levels of the money supply (MS) and three liquidity preference…
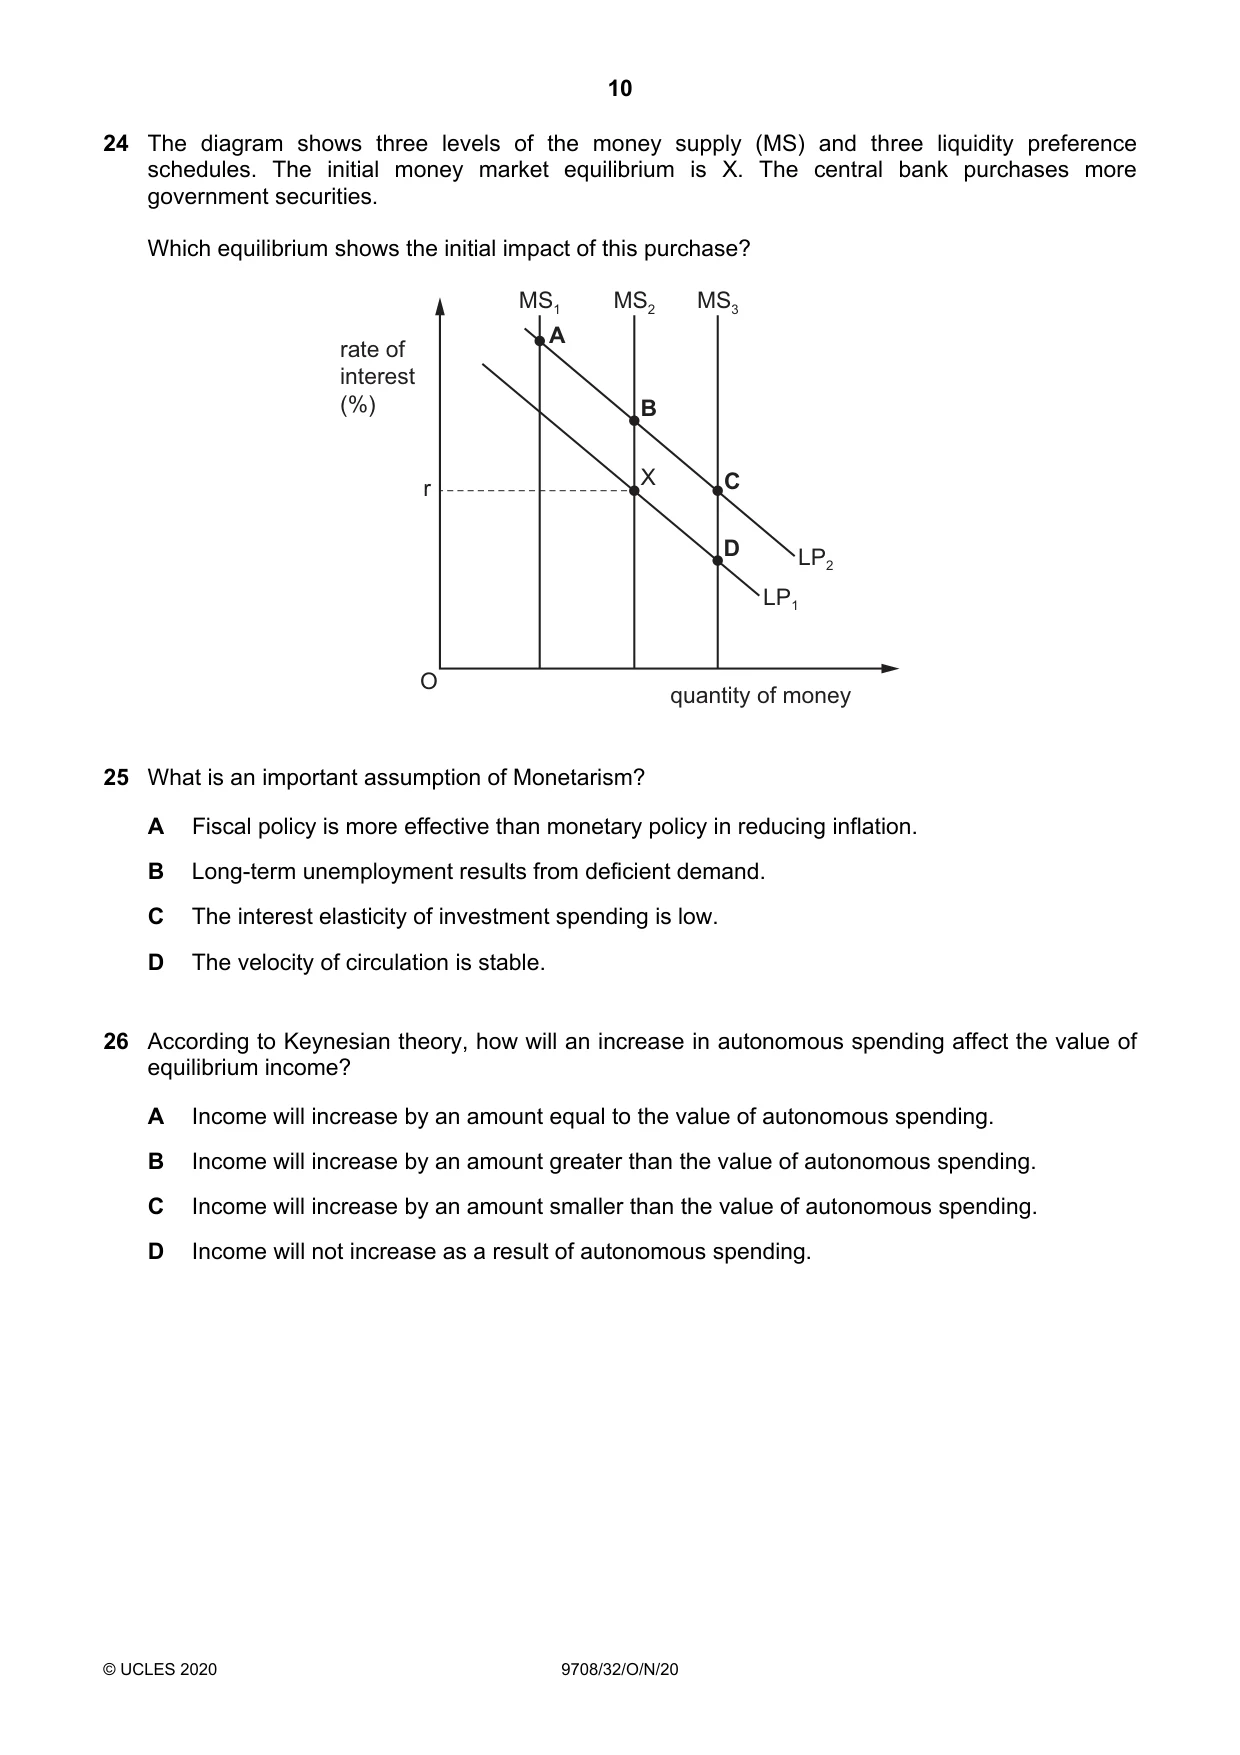
24 The diagram shows three levels of the money supply (MS) and three liquidity preference schedules. The initial money market equilibrium is X. The central bank purchases more government securities. Which equilibrium shows the initial impact of this purchase? MS1 MS2 MS3 A rate of interest (%) B X C r D LP2 LP1 O quantity of money
Mark scheme: D
Q25 · What is an important assumption of Monetarism?
25 What is an important assumption of Monetarism? A Fiscal policy is more effective than monetary policy in reducing inflation. B Long-term unemployment results from deficient demand. C The interest elasticity of investment spending is low. D The velocity of circulation is stable.
Mark scheme: D
Q26 · According to Keynesian theory, how will an increase in autonomous spending affect the…
26 According to Keynesian theory, how will an increase in autonomous spending affect the value of equilibrium income? A Income will increase by an amount equal to the value of autonomous spending. B Income will increase by an amount greater than the value of autonomous spending. C Income will increase by an amount smaller than the value of autonomous spending. D Income will not increase as a result of autonomous spending.
Mark scheme: B
Q27 · Statement 1: A market economy is inherently unstable and the government must play a…
27 Statement 1: A market economy is inherently unstable and the government must play a stabilising role through monetary policy and fiscal policy. Statement 2: The economy will always return to its equilibrium rate of output and unemployment and as a result long-run aggregate supply is vertical. Which row correctly attributes these statements to Keynesian and Monetarist theories? statement 1 statement 2 A Keynesian Keynesian B Keynesian Monetarist C Monetarist Keynesian D Monetarist Monetarist
Mark scheme: B
More questions on Effectiveness of policy options to meet all macroeconomic objectives
Q28 · The graphs below show percentage changes in money GDP and consumer prices in a country…
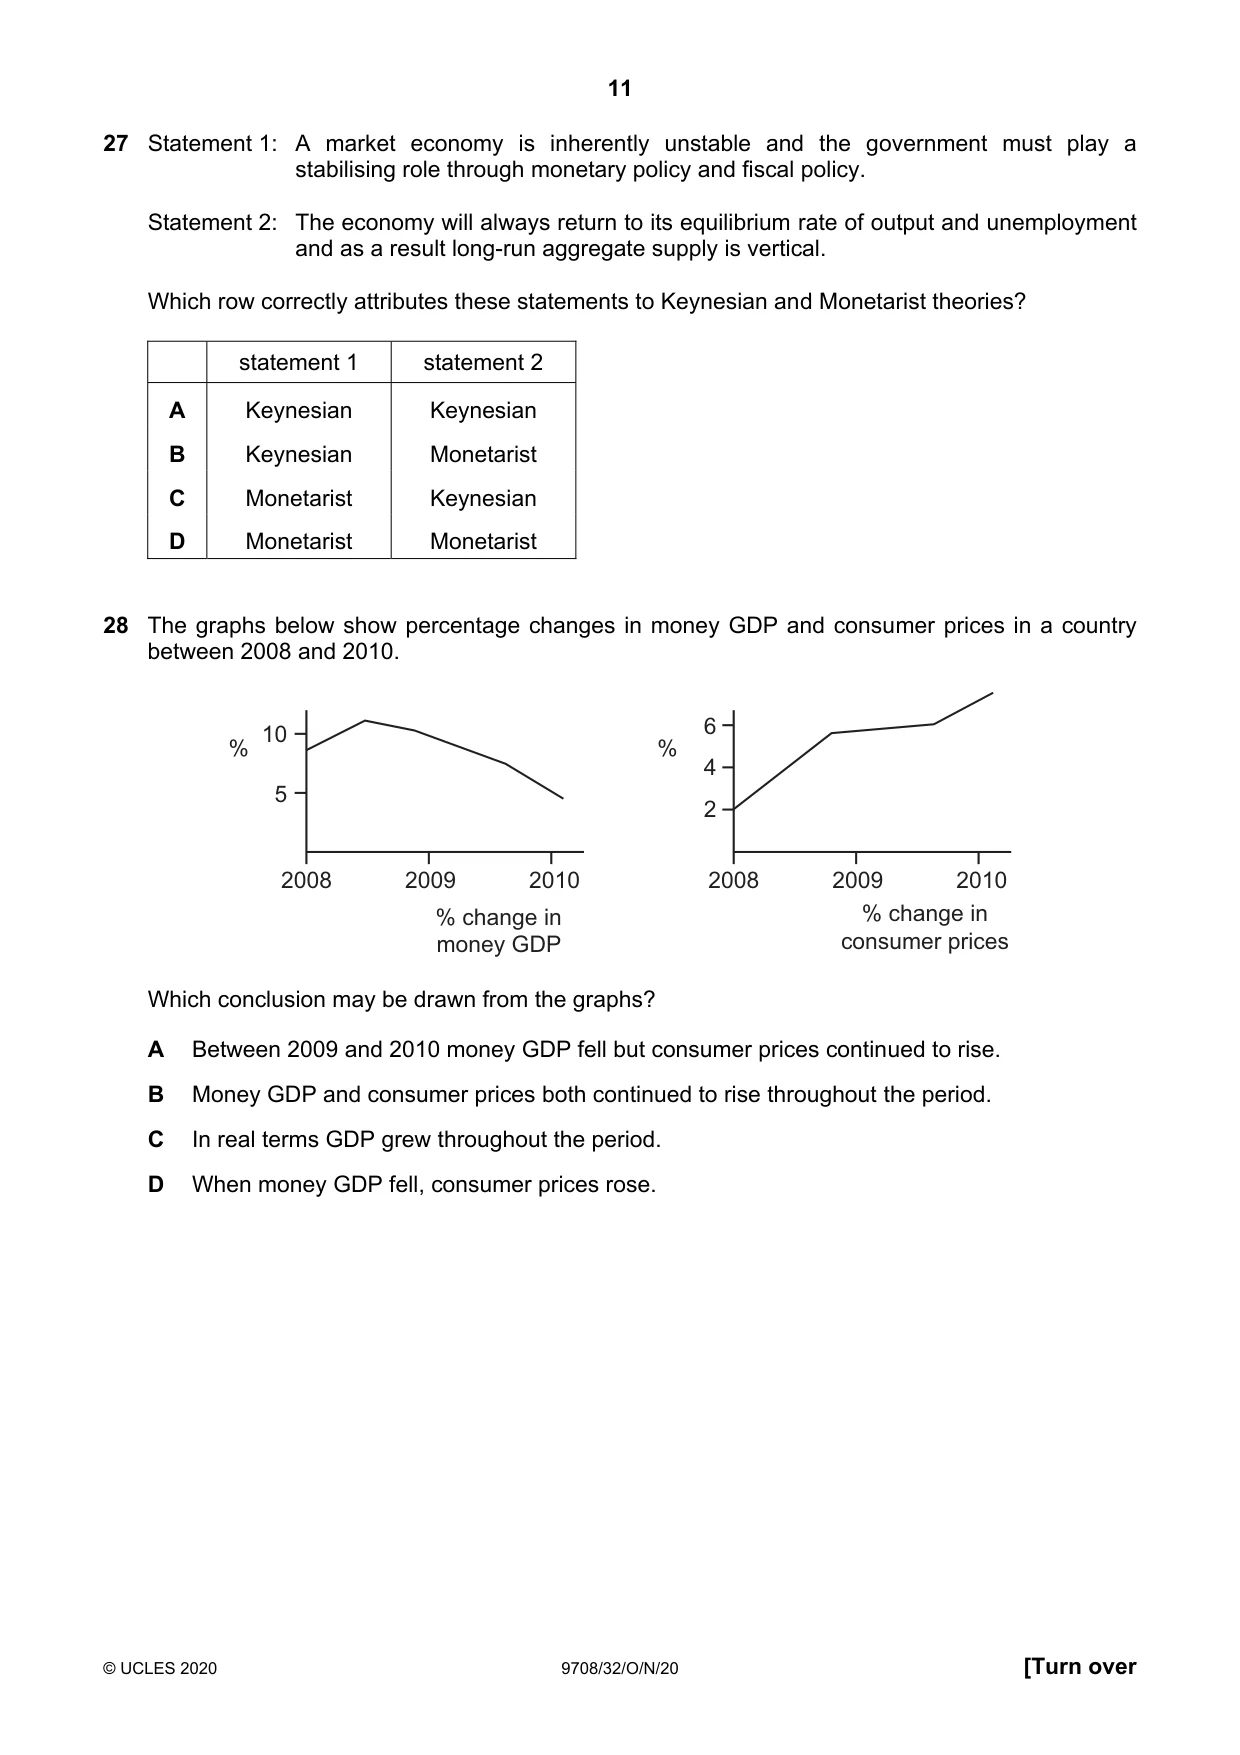
28 The graphs below show percentage changes in money GDP and consumer prices in a country between 2008 and 2010. 10 6 % % 4 5 2 2008 2009 2010 2008 2009 2010 % change in % change in money GDP consumer prices Which conclusion may be drawn from the graphs? A Between 2009 and 2010 money GDP fell but consumer prices continued to rise. B Money GDP and consumer prices both continued to rise throughout the period. C In real terms GDP grew throughout the period. D When money GDP fell, consumer prices rose.
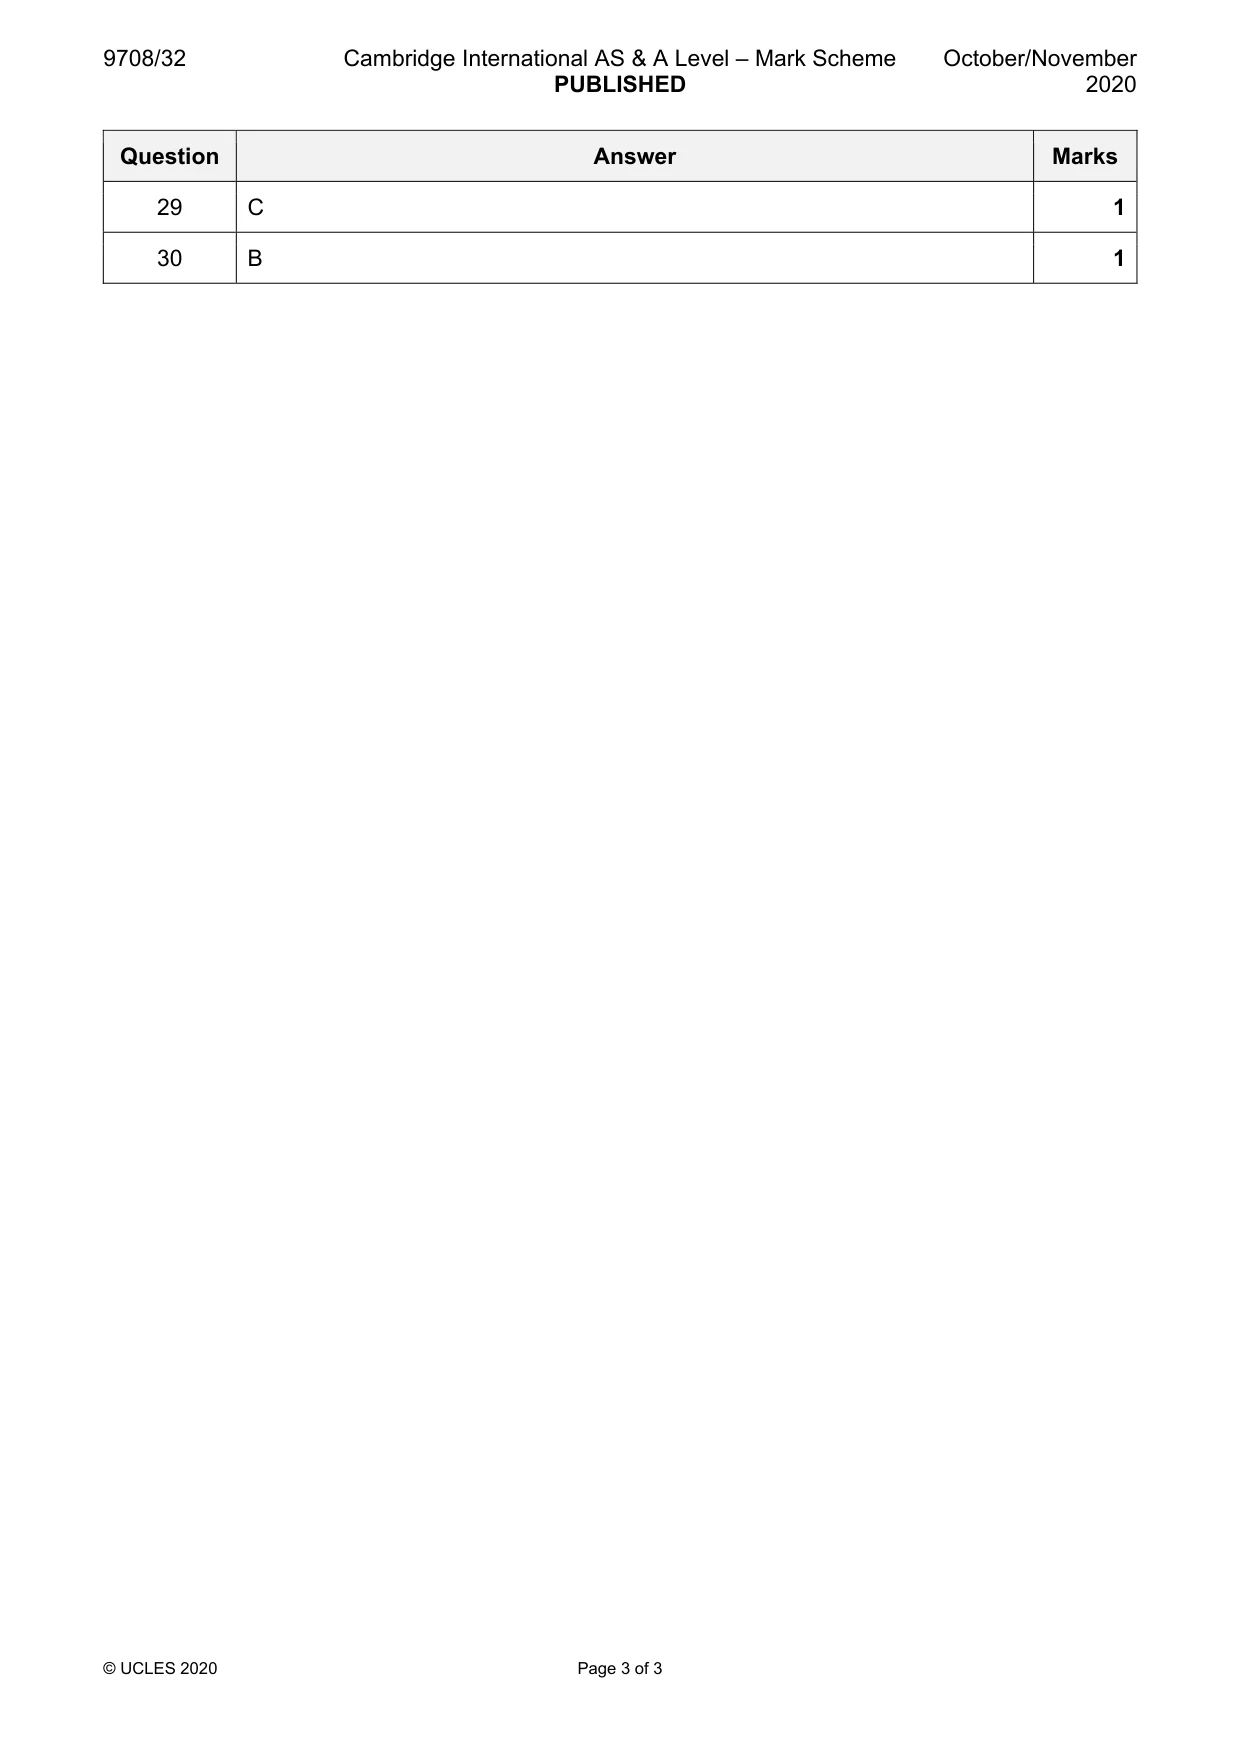
Mark scheme: B
Q29 · In an economy, the elasticity of demand for imported raw materials is 0.3 and the…
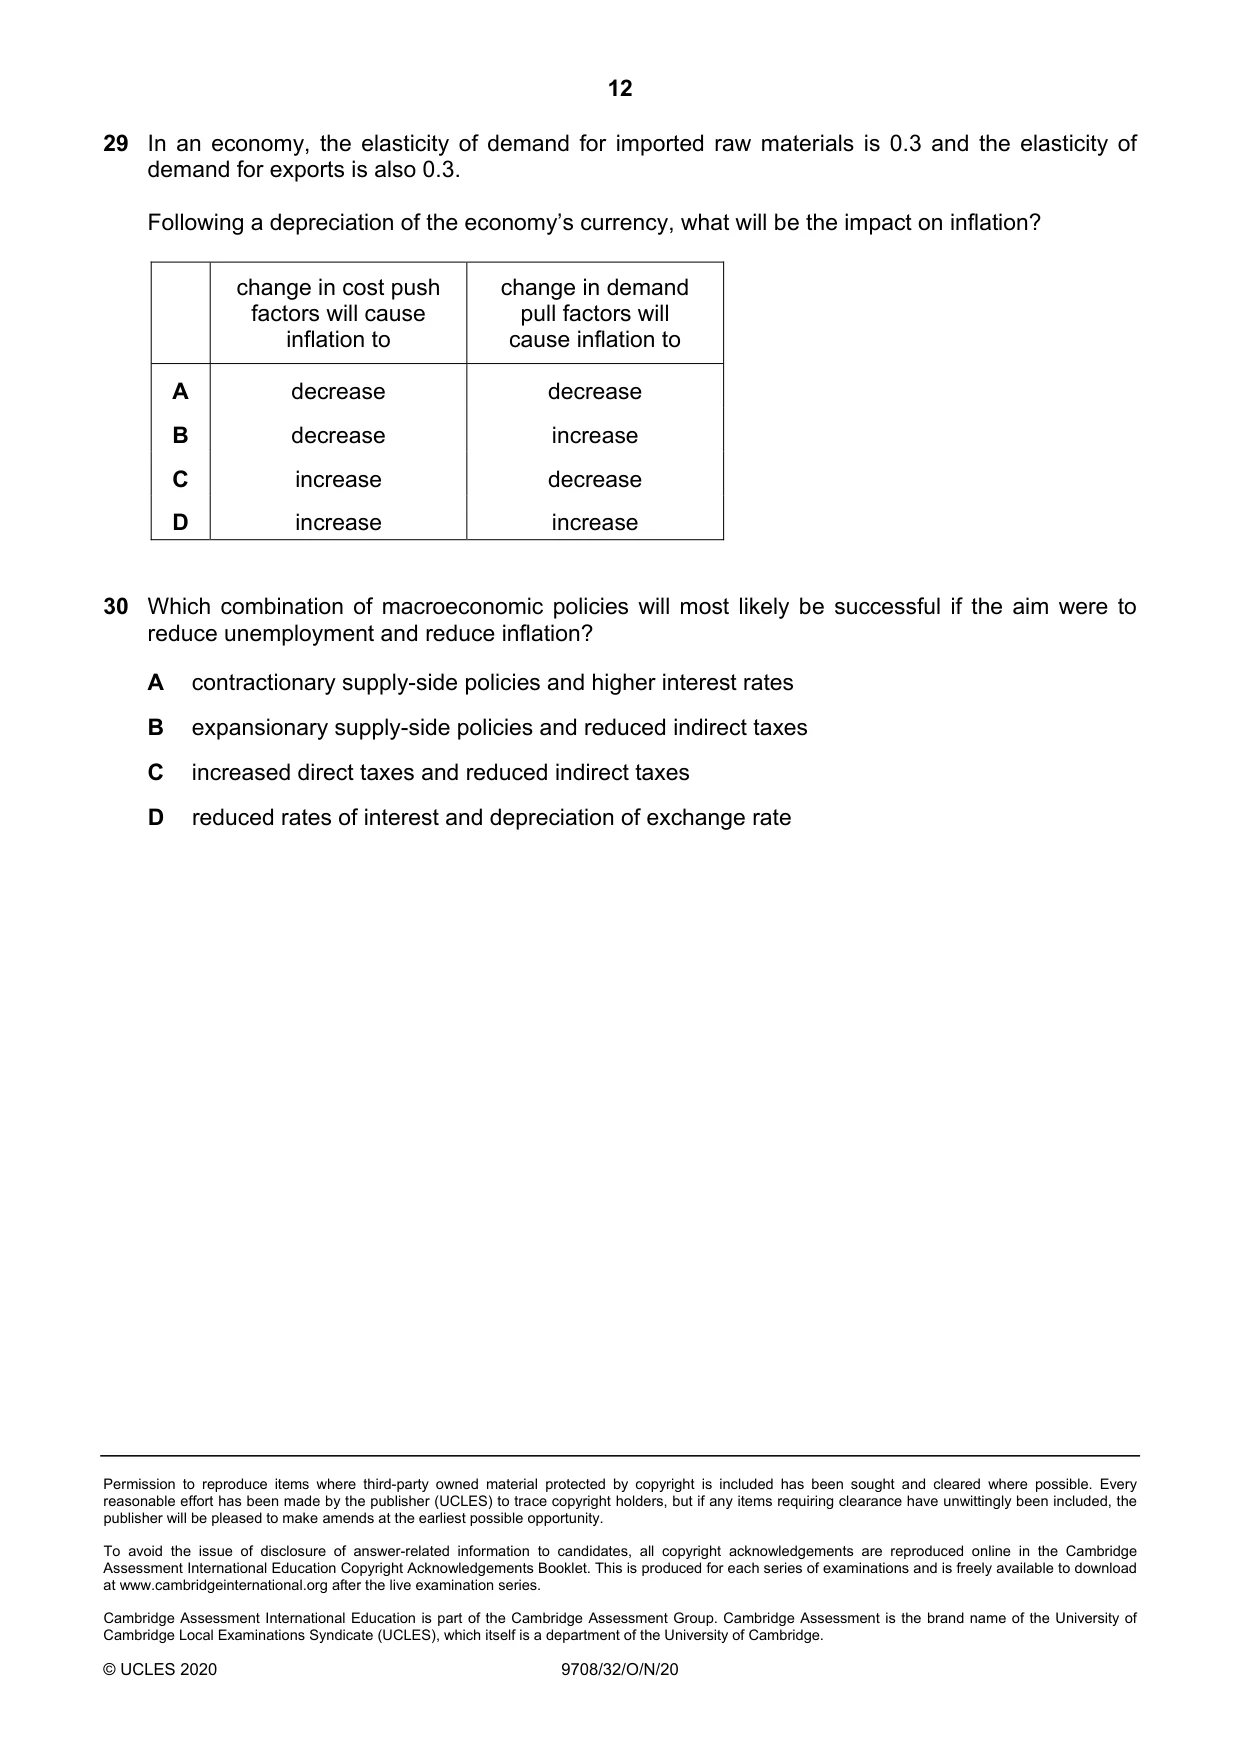
29 In an economy, the elasticity of demand for imported raw materials is 0.3 and the elasticity of demand for exports is also 0.3. Following a depreciation of the economy’s currency, what will be the impact on inflation? change in cost push change in demand factors will cause pull factors will inflation to cause inflation to A decrease decrease B decrease increase C increase decrease D increase increase
Mark scheme: C
Q30 · Which combination of macroeconomic policies will most likely be successful if the aim…
30 Which combination of macroeconomic policies will most likely be successful if the aim were to reduce unemployment and reduce inflation? A contractionary supply-side policies and higher interest rates B expansionary supply-side policies and reduced indirect taxes C increased direct taxes and reduced indirect taxes D reduced rates of interest and depreciation of exchange rate
Mark scheme: B
More questions on Effectiveness of policy options to meet all macroeconomic objectives
What was in this paper
The subtopics covered by these 30 questions, and how many questions each got. Open one in a new tab to see every Cambridge question on it.
3Money and banking3Types of cost, revenue and profit, short-run and long-run production3Differing objectives and policies of firms2Economic growth and sustainability2Effectiveness of policy options to meet all macroeconomic objectives2Equity and redistribution of income and wealth2Labour market forces and government intervention2The circular flow of income2Characteristics of countries at different levels of development1Efficiency and market failure1Employment/unemployment1Exchange rates1Government policies to achieve efficient resource allocation and correct market failure1Indifference curves and budget lines1Private costs and benefits, externalities and social costs and benefits1Relationship between countries at different levels of development1Utility1What you needed in this session
Cambridge’s own grade thresholds for 2020 Oct/Nov, Paper 3 · Variant 2. A higher threshold means an easier paper — the bar moves with how the cohort did.