Cambridge A Level Economics 9708 — 2025 Feb/March Paper 3 · Variant 2
9708/32/F/M/25 · 30 questions · 30 marks · ≈34 min
The question paper and its mark scheme, free to read here and free to download. This is Cambridge’s own paper, exactly as it was sat.
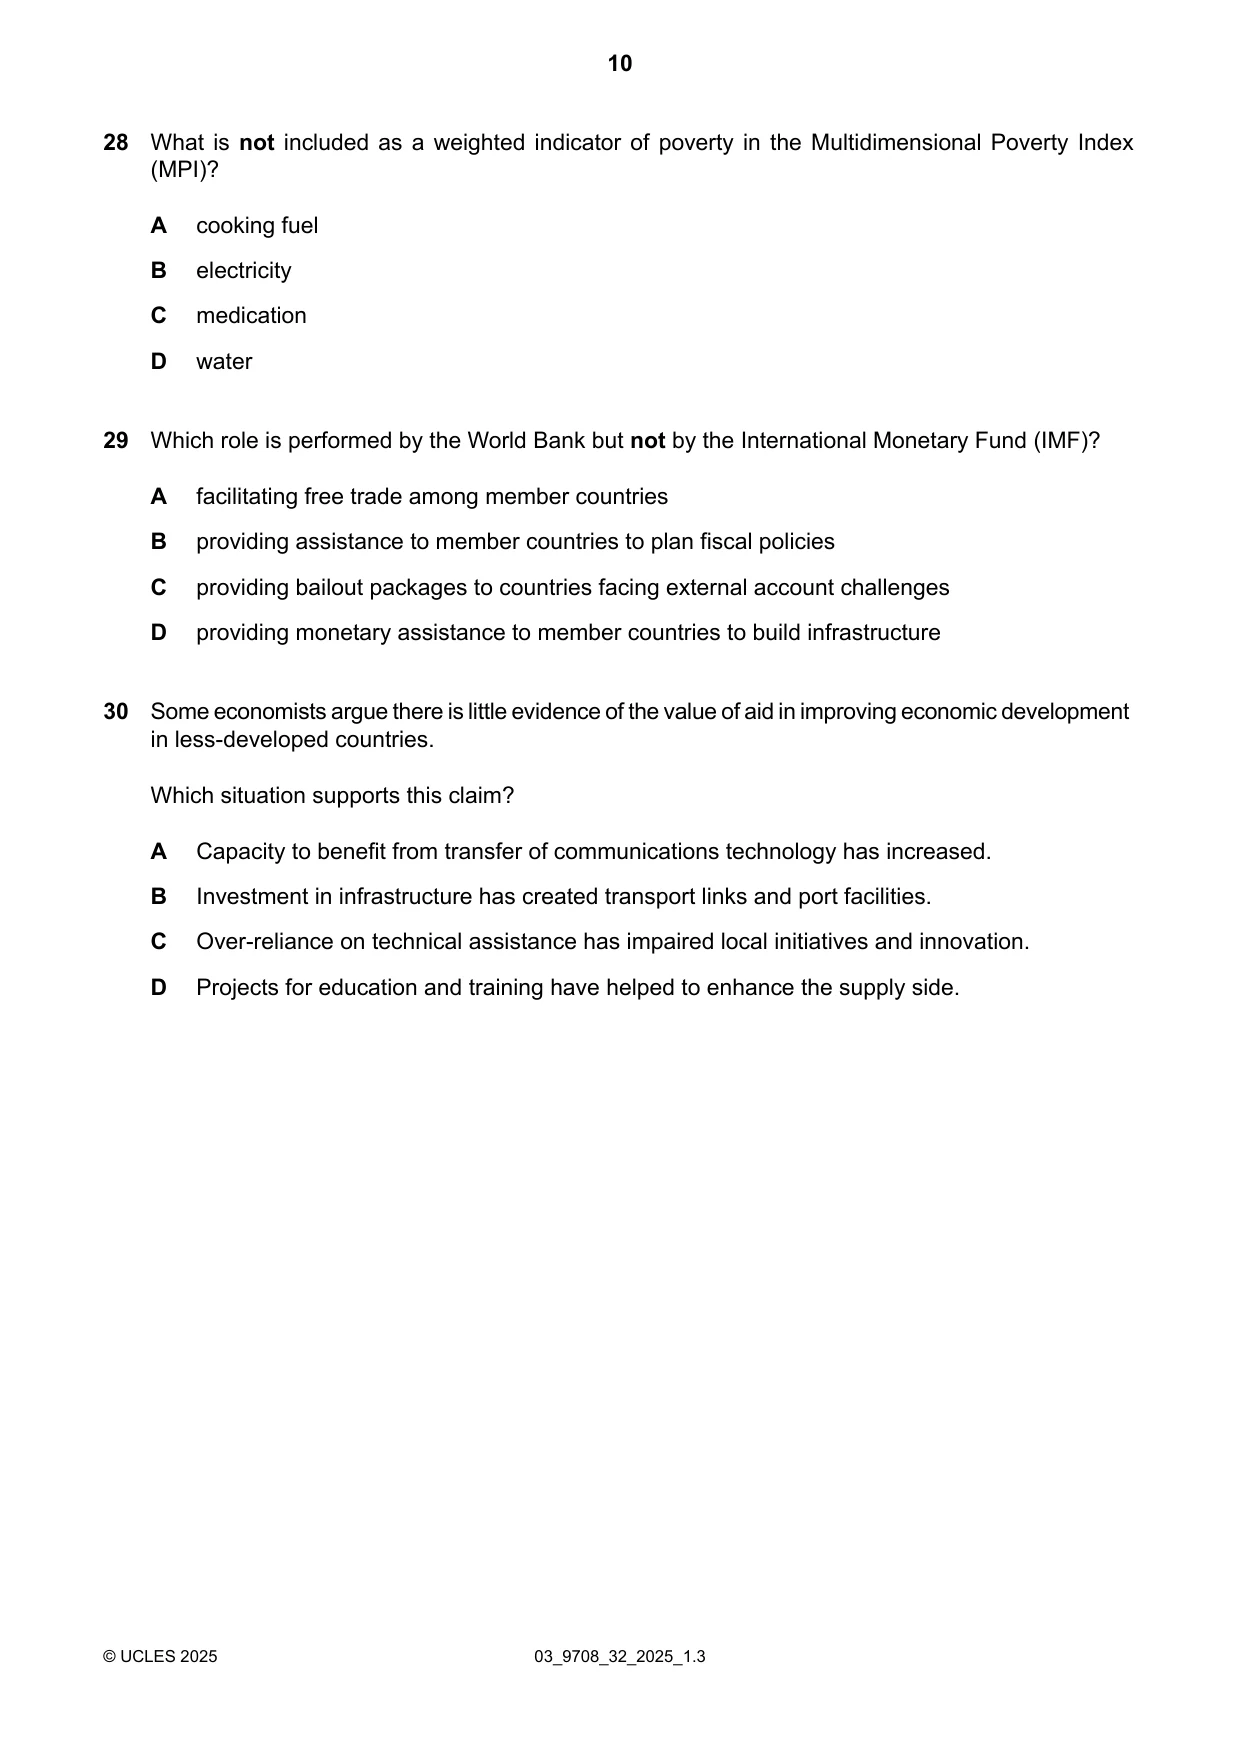
Question paper12 pages

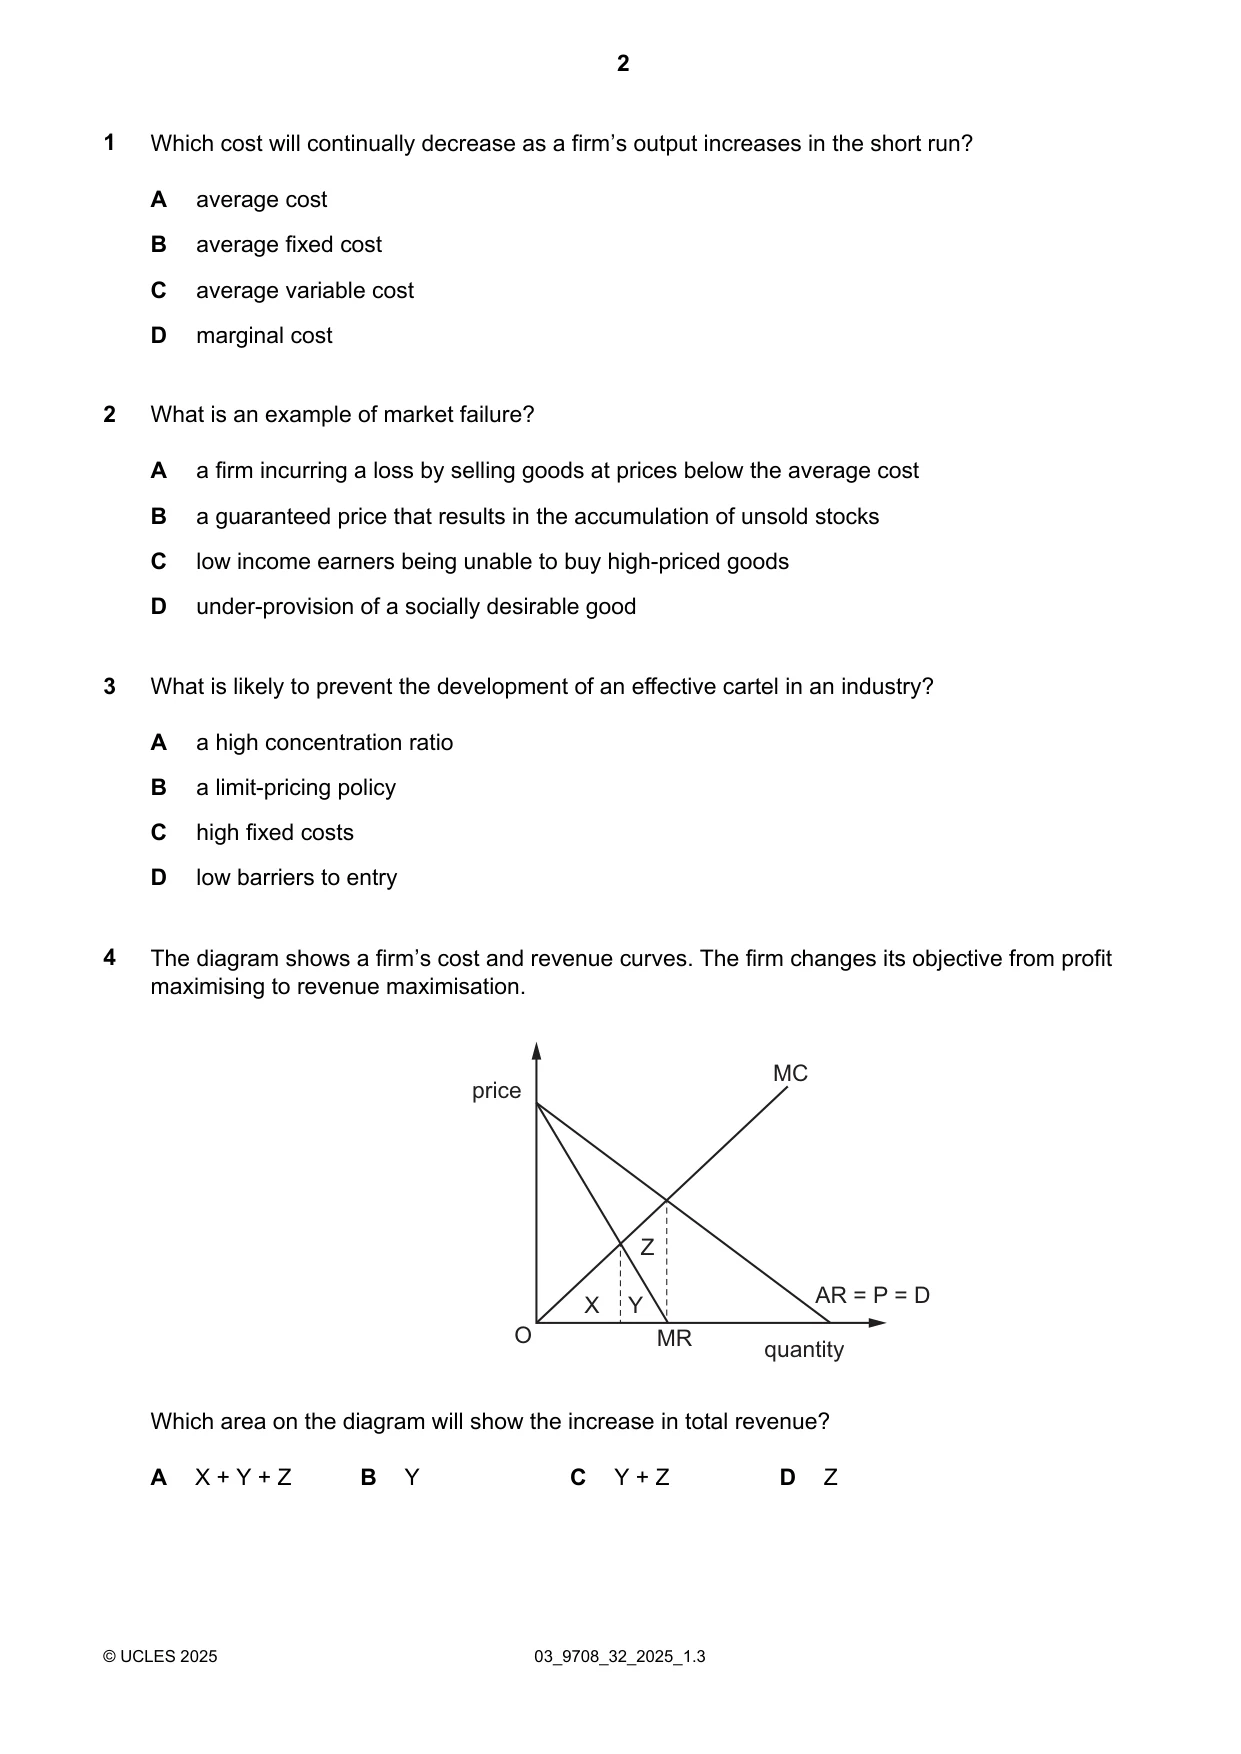
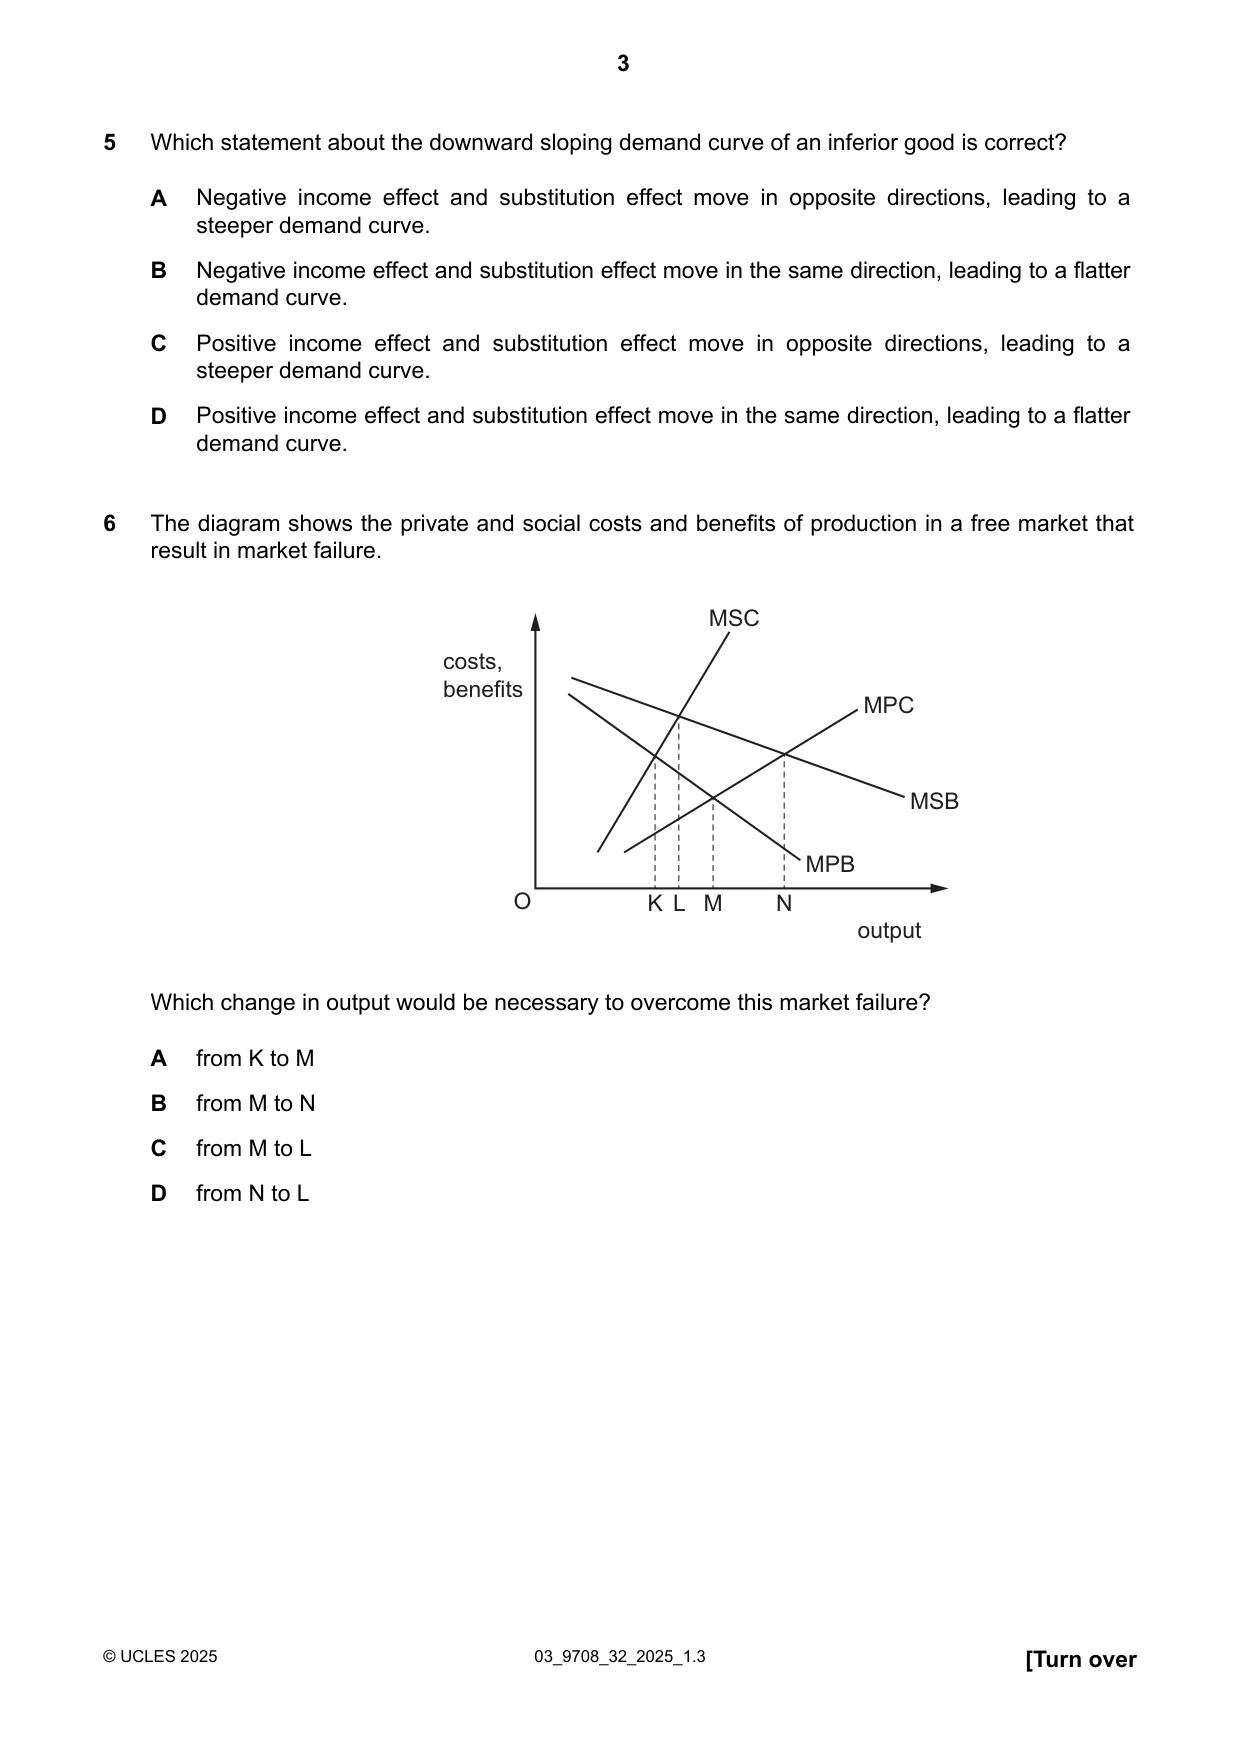
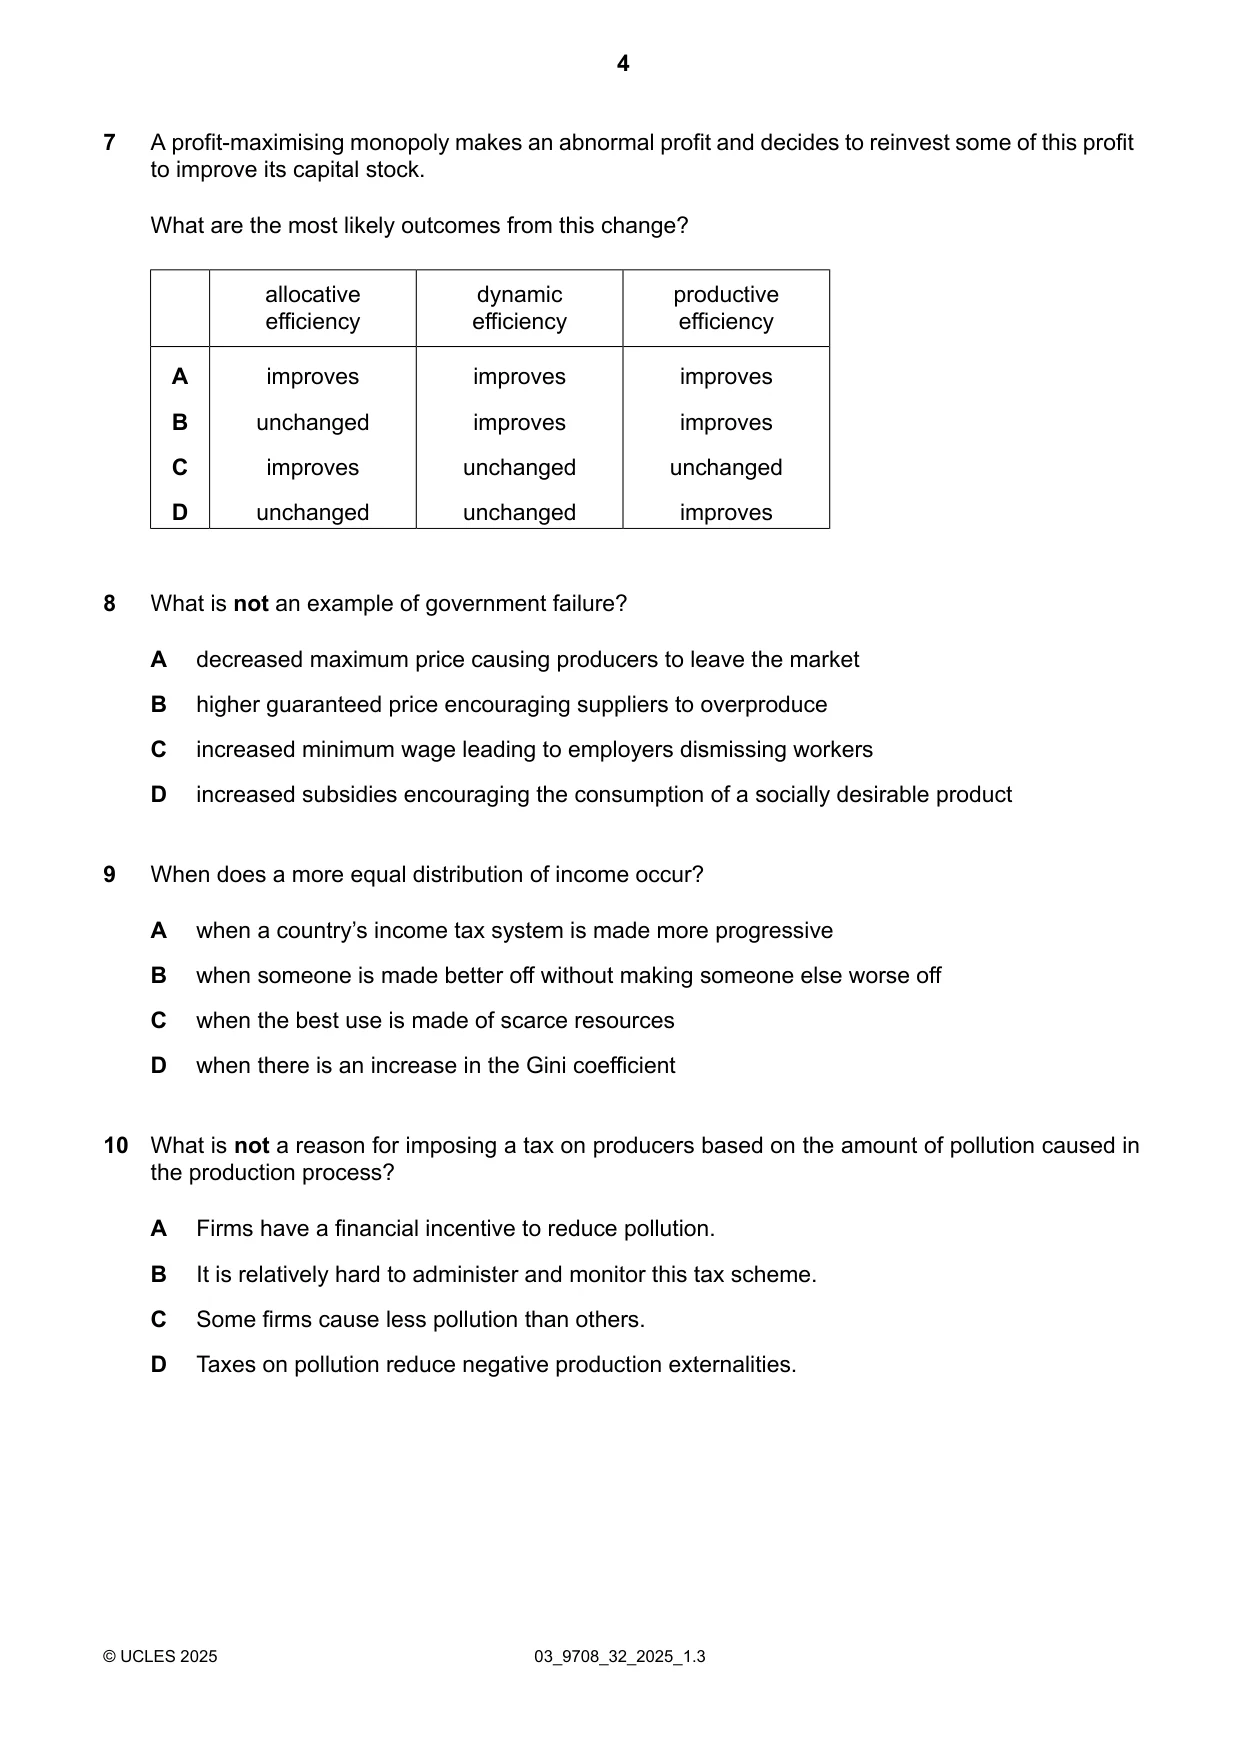
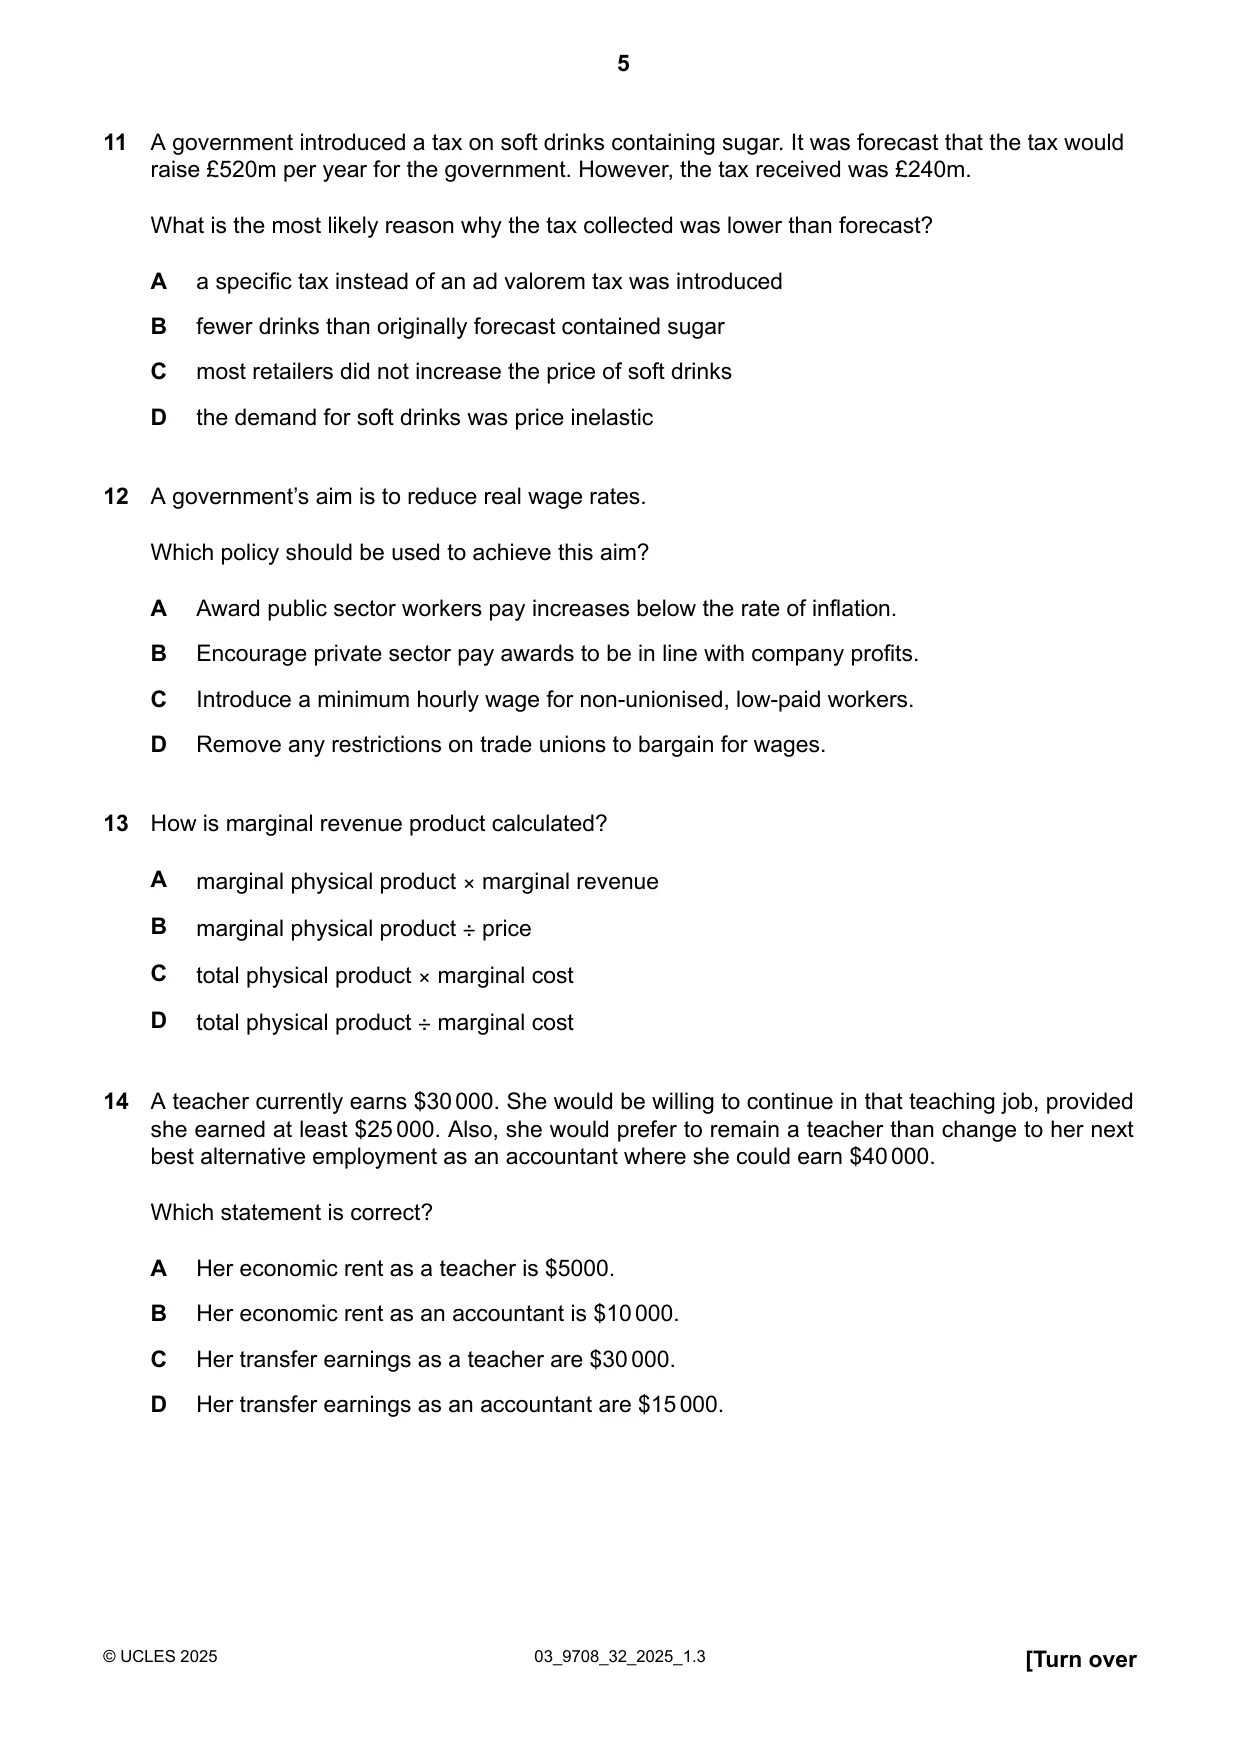


Mark scheme3 pages
Answers below. Sit the paper first if you are practising.

Questions as text
Q1 · Which cost will continually decrease as a firm’s output increases in the short run?
1 Which cost will continually decrease as a firm’s output increases in the short run? A average cost B average fixed cost C average variable cost D marginal cost
Mark scheme: B
More questions on Types of cost, revenue and profit, short-run and long-run production
Q2 · What is an example of market failure?
2 What is an example of market failure? A a firm incurring a loss by selling goods at prices below the average cost B a guaranteed price that results in the accumulation of unsold stocks C low income earners being unable to buy high-priced goods D under-provision of a socially desirable good
Mark scheme: D
Q3 · What is likely to prevent the development of an effective cartel in an industry?
3 What is likely to prevent the development of an effective cartel in an industry? A a high concentration ratio B a limit-pricing policy C high fixed costs D low barriers to entry
Mark scheme: D
Q4 · The diagram shows a firm’s cost and revenue curves
4 The diagram shows a firm’s cost and revenue curves. The firm changes its objective from profit maximising to revenue maximisation. MC price Z X Y AR = P = D O MR quantity Which area on the diagram will show the increase in total revenue? A X + Y + Z B Y C Y + Z D Z
Mark scheme: B
More questions on Differing objectives and policies of firms
Q5 · Which statement about the downward sloping demand curve of an inferior good is correct?
5 Which statement about the downward sloping demand curve of an inferior good is correct? A Negative income effect and substitution effect move in opposite directions, leading to a steeper demand curve. B Negative income effect and substitution effect move in the same direction, leading to a flatter demand curve. C Positive income effect and substitution effect move in opposite directions, leading to a steeper demand curve. D Positive income effect and substitution effect move in the same direction, leading to a flatter demand curve.
Mark scheme: A
More questions on Price elasticity, income elasticity and cross elasticity of demand
Q6 · The diagram shows the private and social costs and benefits of production in a free…
6 The diagram shows the private and social costs and benefits of production in a free market that result in market failure. MSC costs, benefits MPC MSB MPB O K L M N output Which change in output would be necessary to overcome this market failure? A from K to M B from M to N C from M to L D from N to L
Mark scheme: C
More questions on Private costs and benefits, externalities and social costs and benefits
Q7 · A profit-maximising monopoly makes an abnormal profit and decides to reinvest some of…
7 A profit-maximising monopoly makes an abnormal profit and decides to reinvest some of this profit to improve its capital stock. What are the most likely outcomes from this change? allocative dynamic productive efficiency efficiency efficiency A improves improves improves B unchanged improves improves C improves unchanged unchanged D unchanged unchanged improves
Mark scheme: B
Q8 · What is not an example of government failure?
8 What is not an example of government failure? A decreased maximum price causing producers to leave the market B higher guaranteed price encouraging suppliers to overproduce C increased minimum wage leading to employers dismissing workers D increased subsidies encouraging the consumption of a socially desirable product
Mark scheme: D
Q9 · When does a more equal distribution of income occur?
9 When does a more equal distribution of income occur? A when a country’s income tax system is made more progressive B when someone is made better off without making someone else worse off C when the best use is made of scarce resources D when there is an increase in the Gini coefficient
Mark scheme: A
More questions on Equity and redistribution of income and wealth
Q10 · What is not a reason for imposing a tax on producers based on the amount of pollution…
10 What is not a reason for imposing a tax on producers based on the amount of pollution caused in the production process? A Firms have a financial incentive to reduce pollution. B It is relatively hard to administer and monitor this tax scheme. C Some firms cause less pollution than others. D Taxes on pollution reduce negative production externalities.
Mark scheme: B
Q11 · A government introduced a tax on soft drinks containing sugar
11 A government introduced a tax on soft drinks containing sugar. It was forecast that the tax would raise £520m per year for the government. However, the tax received was £240m. What is the most likely reason why the tax collected was lower than forecast? A a specific tax instead of an ad valorem tax was introduced B fewer drinks than originally forecast contained sugar C most retailers did not increase the price of soft drinks D the demand for soft drinks was price inelastic
Mark scheme: B
More questions on Price elasticity, income elasticity and cross elasticity of demand
Q12 · A government’s aim is to reduce real wage rates
12 A government’s aim is to reduce real wage rates. Which policy should be used to achieve this aim? A Award public sector workers pay increases below the rate of inflation. B Encourage private sector pay awards to be in line with company profits. C Introduce a minimum hourly wage for non-unionised, low-paid workers. D Remove any restrictions on trade unions to bargain for wages.
Mark scheme: A
More questions on Labour market forces and government intervention
Q13 · How is marginal revenue product calculated?
13 How is marginal revenue product calculated? A marginal physical product × marginal revenue B marginal physical product ÷ price C total physical product × marginal cost D total physical product ÷ marginal cost
Mark scheme: A
More questions on Labour market forces and government intervention
Q14 · A teacher currently earns $30000
14 A teacher currently earns $30000. She would be willing to continue in that teaching job, provided she earned at least $25000. Also, she would prefer to remain a teacher than change to her next best alternative employment as an accountant where she could earn $40000. Which statement is correct? A Her economic rent as a teacher is $5000. B Her economic rent as an accountant is $10000. C Her transfer earnings as a teacher are $30000. D Her transfer earnings as an accountant are $15000.
Mark scheme: A
More questions on Labour market forces and government intervention
Q15 · What does the accelerator principle explain?
15 What does the accelerator principle explain? A how changes in consumption lead to changes in income B how changes in income lead to changes in consumption C how changes in income lead to changes in investment D how changes in investment lead to changes in income
Mark scheme: C
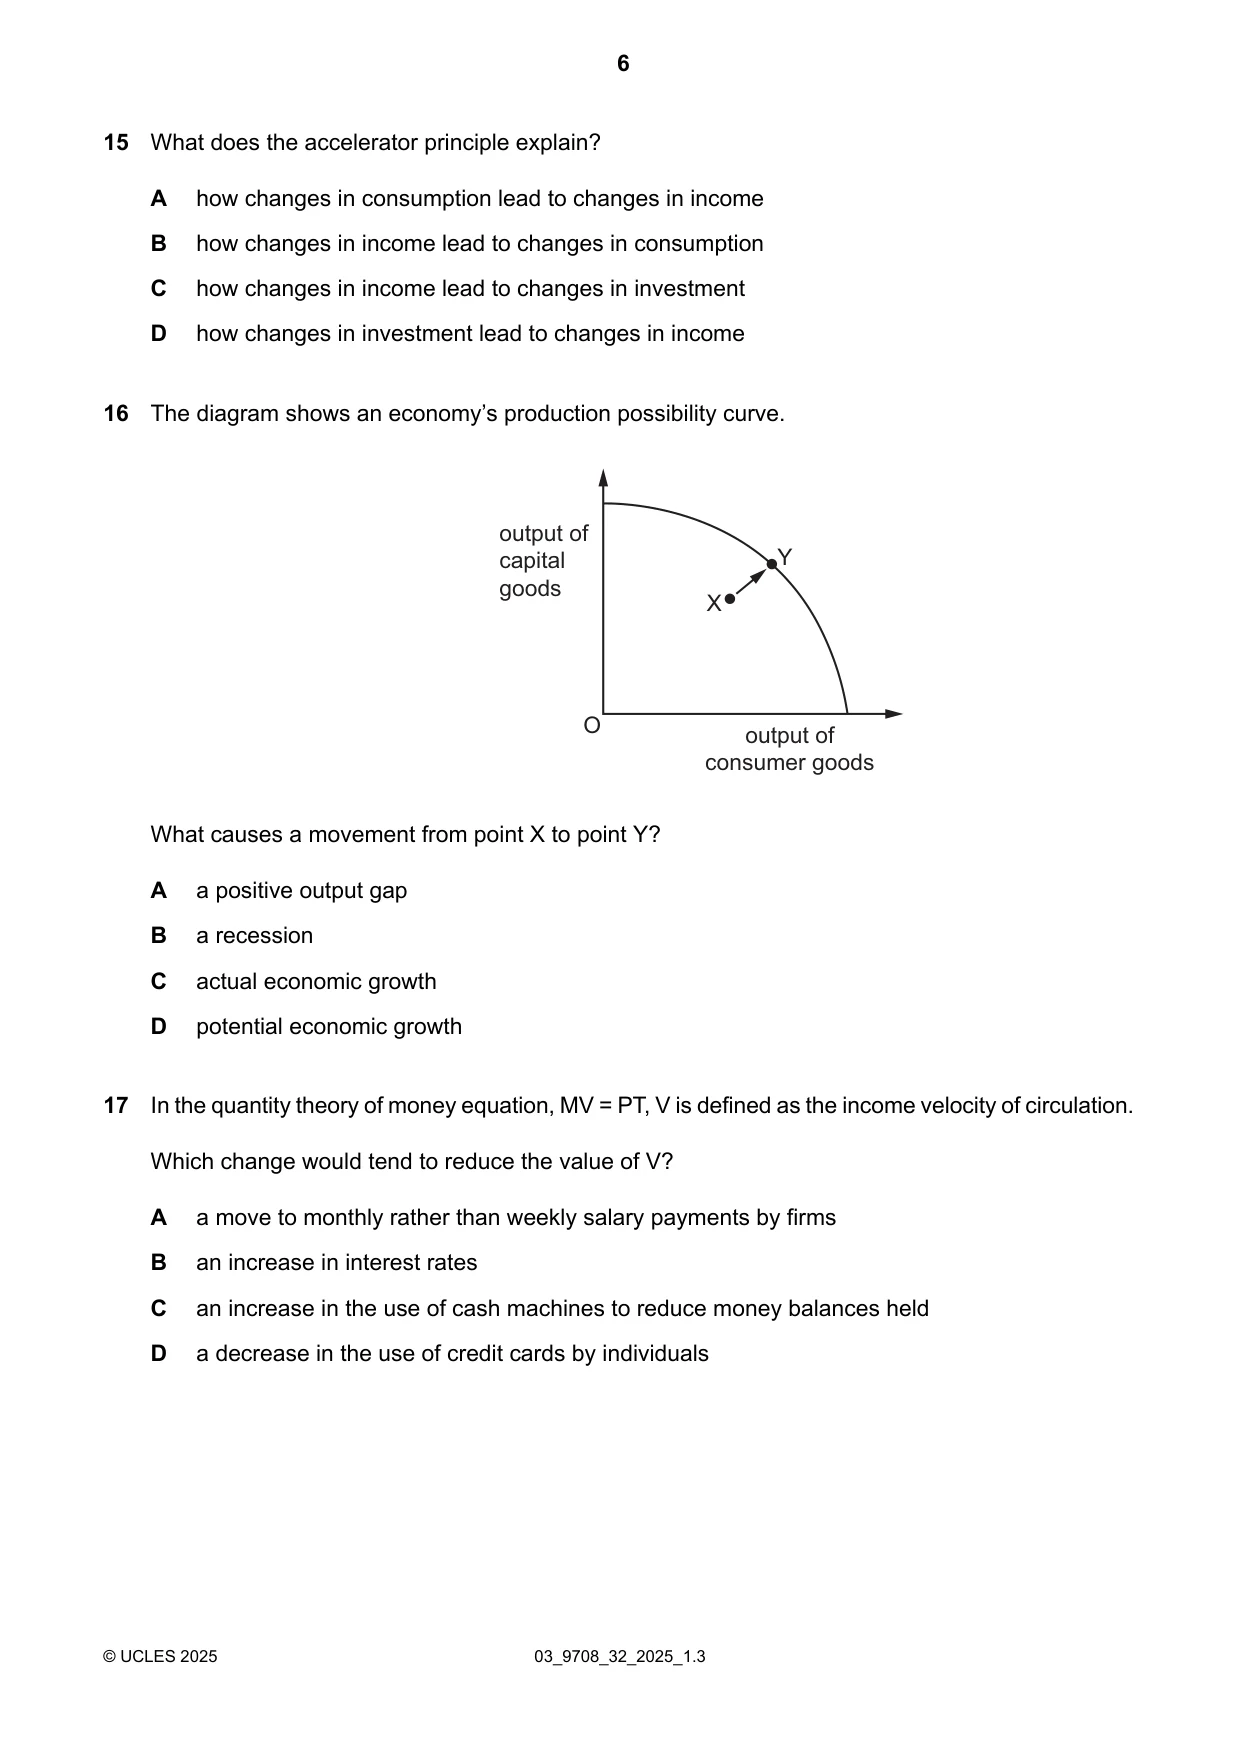
Q16 · The diagram shows an economy’s production possibility curve
16 The diagram shows an economy’s production possibility curve. output of capital Y goods X O output of consumer goods What causes a movement from point X to point Y? A a positive output gap B a recession C actual economic growth D potential economic growth
Mark scheme: C
Q17 · In the quantity theory of money equation, MV = PT, V is defined as the income velocity of…
17 In the quantity theory of money equation, MV = PT, V is defined as the income velocity of circulation. Which change would tend to reduce the value of V? A a move to monthly rather than weekly salary payments by firms B an increase in interest rates C an increase in the use of cash machines to reduce money balances held D a decrease in the use of credit cards by individuals
Mark scheme: A
Q18 · What is likely to improve the occupational mobility of labour?
18 What is likely to improve the occupational mobility of labour? A a decrease in income tax that increases aggregate demand B a decrease in unemployment benefit C an increase in retraining schemes for the unemployed D more advertising of employment vacancies in the economy
Mark scheme: C
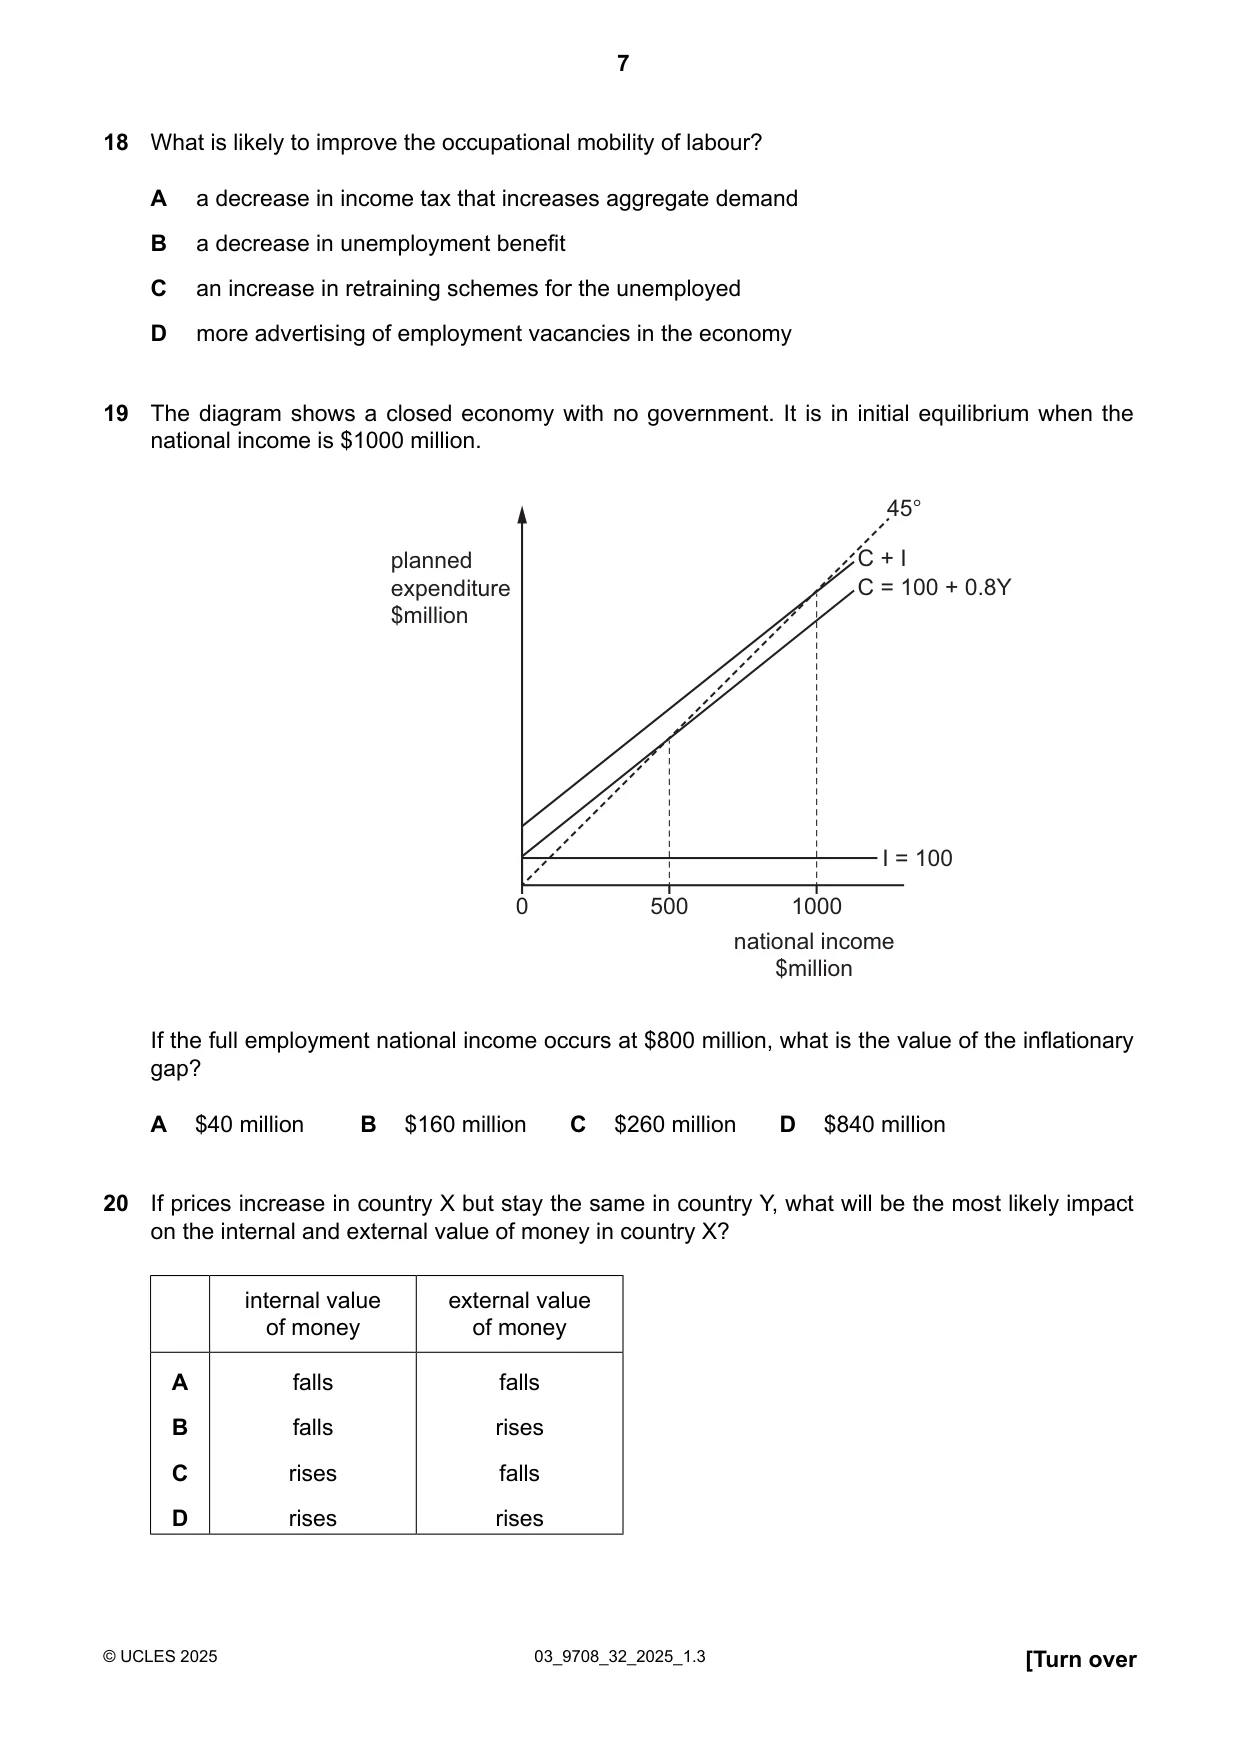
Q19 · The diagram shows a closed economy with no government
19 The diagram shows a closed economy with no government. It is in initial equilibrium when the national income is $1000 million. 45° planned C + I expenditure C = 100 + 0.8Y $million I = 100 0 500 1000 national income $million If the full employment national income occurs at $800 million, what is the value of the inflationary gap? A $40 million B $160 million C $260 million D $840 million
Mark scheme: A
Q20 · If prices increase in country X but stay the same in country Y, what will be the most…
20 If prices increase in country X but stay the same in country Y, what will be the most likely impact on the internal and external value of money in country X? internal value external value of money of money A falls falls B falls rises C rises falls D rises rises
Mark scheme: A
Q21 · Which policy may increase economic growth without causing inflation?
21 Which policy may increase economic growth without causing inflation? A giving subsidies to producers B increasing government spending C lowering direct taxes D lowering interest rates
Mark scheme: A
More questions on Effectiveness of policy options to meet all macroeconomic objectives
Q22 · The current account on the balance of payments moves into deficit
22 The current account on the balance of payments moves into deficit. What is a possible reason for this? A a decrease in tax revenue B export-led growth C repayment of debts to other countries D the import of new technology
Mark scheme: D
More questions on Current account of the balance of payments
Q23 · Which policy would not lead to an increase in the value of a country’s currency?
23 Which policy would not lead to an increase in the value of a country’s currency? A an increase in domestic inflation B an increase in domestic interest rates C an increase in incomes abroad D an increase in tourists visiting the country
Mark scheme: A
Q24 · In an economy with unemployed resources the marginal propensity to consume is 0.2
24 In an economy with unemployed resources the marginal propensity to consume is 0.2. The government increases its budget deficit and finances it by selling bonds to the non-bank private sector. What is the likely consequence of this? A The currency will depreciate, increasing exports and reducing the trade deficit. B The increase in real output will be limited as the value of the multiplier is low. C The money supply will fall, leading to a reduction in aggregate demand. D There will be a decrease in the rate of interest, causing demand-pull inflation.
Mark scheme: B
More questions on Effectiveness of policy options to meet all macroeconomic objectives
Q25 · Which components are included in the current account and financial account of the balance…
25 Which components are included in the current account and financial account of the balance of payments? current account financial account A official reserve assets and trade in services and transactions trade in goods in official reserve assets B primary income and official reserve assets and trade in goods secondary income C trade in goods and foreign direct investment and trade in services secondary income D trade in services and portfolio investment and secondary income official reserve assets
Mark scheme: D
More questions on Current account of the balance of payments
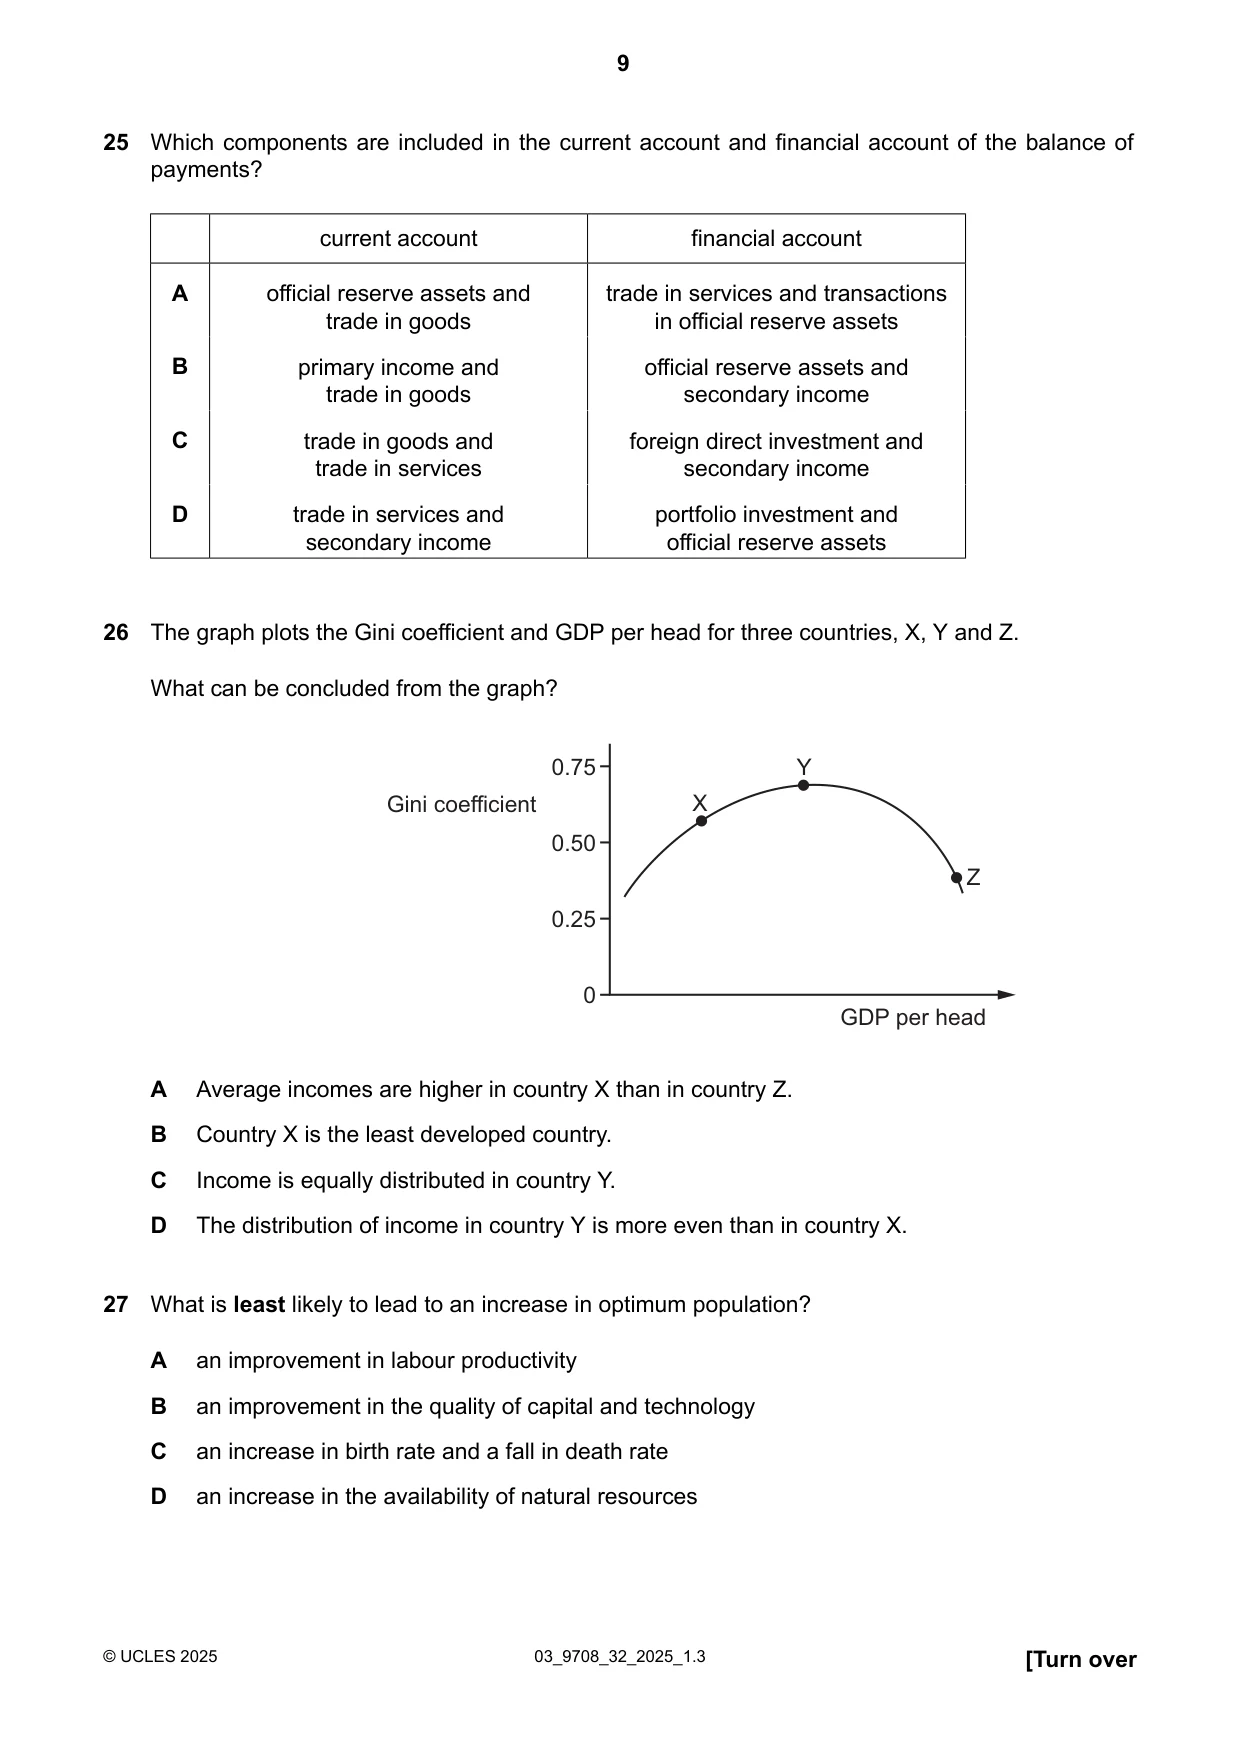
Q26 · The graph plots the Gini coefficient and GDP per head for three countries, X, Y and Z
26 The graph plots the Gini coefficient and GDP per head for three countries, X, Y and Z. What can be concluded from the graph? 0.75 Y Gini coefficient X 0.50 Z 0.25 0 GDP per head A Average incomes are higher in country X than in country Z. B Country X is the least developed country. C Income is equally distributed in country Y. D The distribution of income in country Y is more even than in country X.
Mark scheme: B
More questions on Characteristics of countries at different levels of development
Q27 · What is least likely to lead to an increase in optimum population?
27 What is least likely to lead to an increase in optimum population? A an improvement in labour productivity B an improvement in the quality of capital and technology C an increase in birth rate and a fall in death rate D an increase in the availability of natural resources
Mark scheme: C
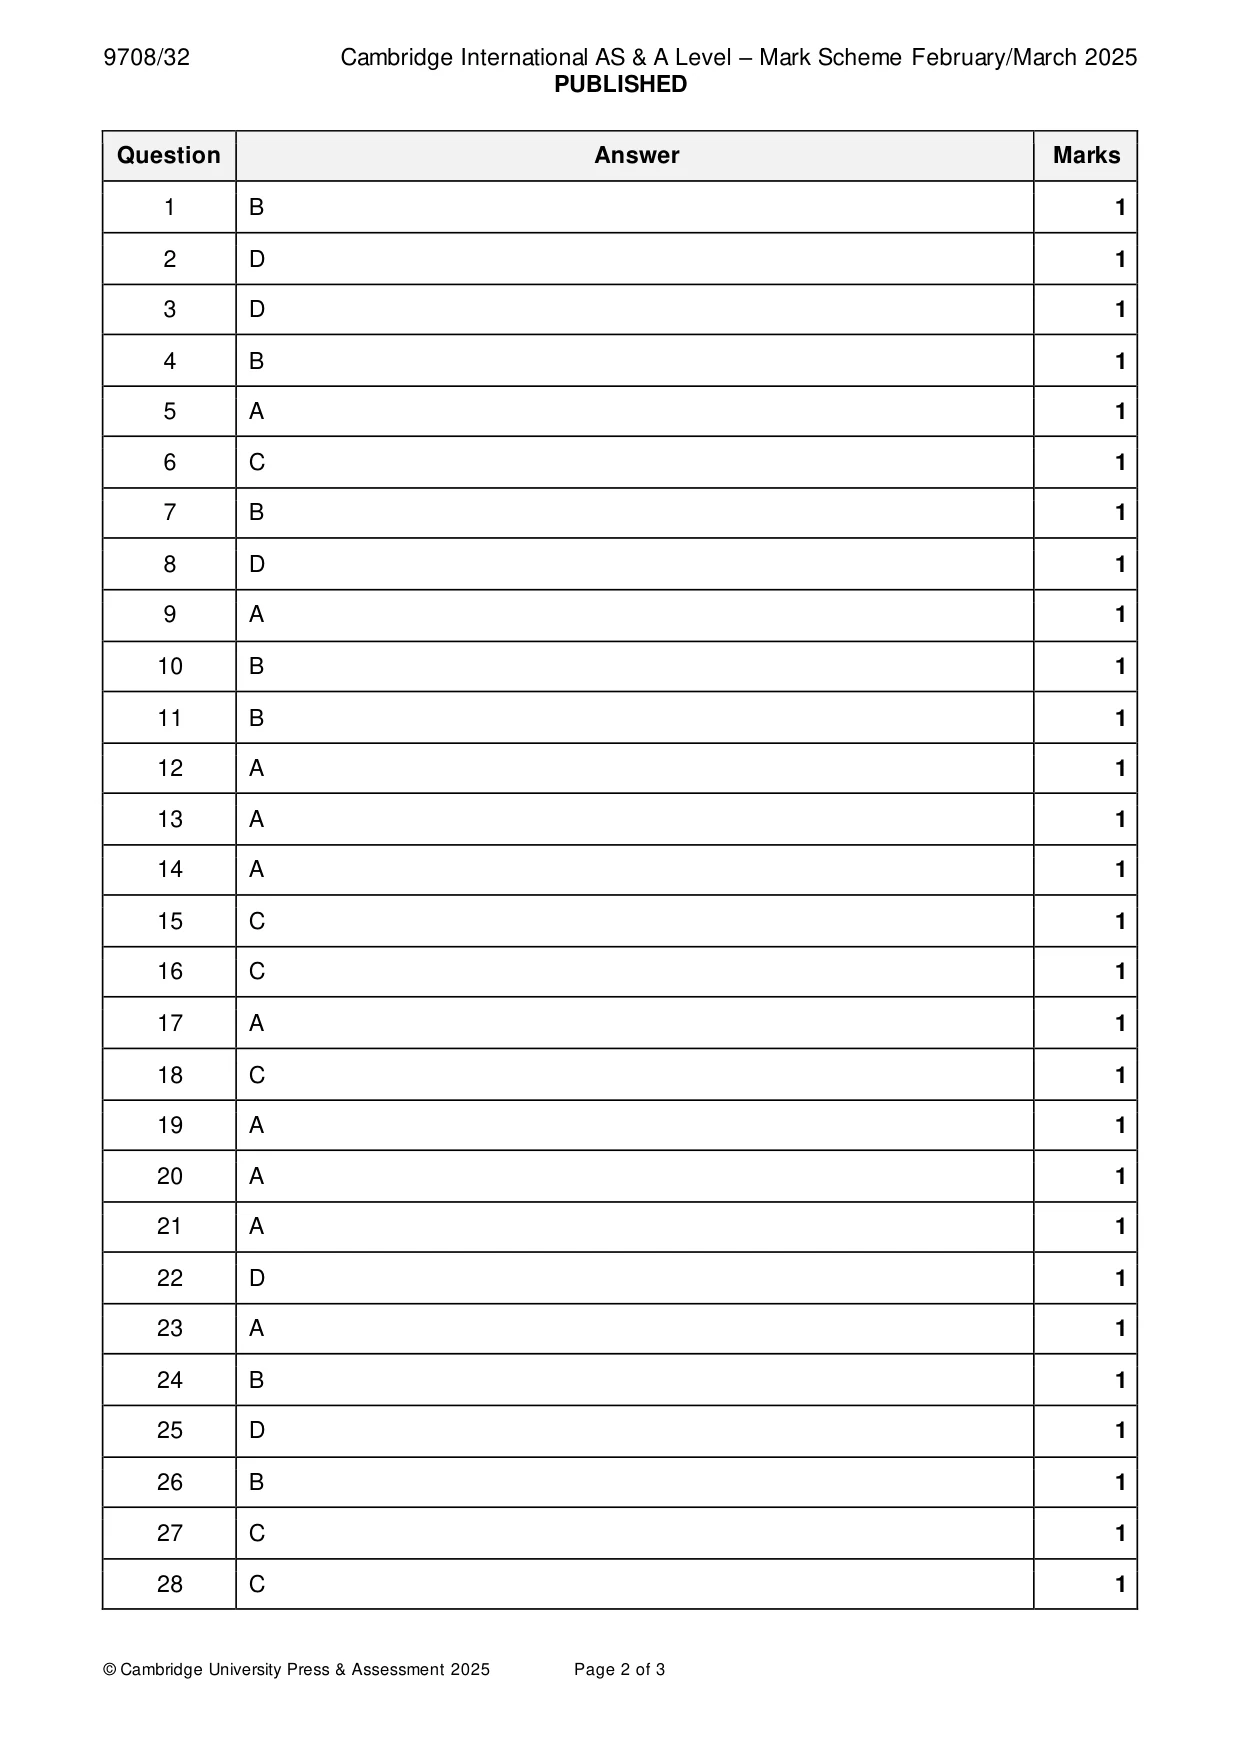
Q28 · What is not included as a weighted indicator of poverty in the Multidimensional Poverty…
28 What is not included as a weighted indicator of poverty in the Multidimensional Poverty Index (MPI)? A cooking fuel B electricity C medication D water
Mark scheme: C
More questions on Characteristics of countries at different levels of development
Q29 · Which role is performed by the World Bank but not by the International Monetary Fund…
29 Which role is performed by the World Bank but not by the International Monetary Fund (IMF)? A facilitating free trade among member countries B providing assistance to member countries to plan fiscal policies C providing bailout packages to countries facing external account challenges D providing monetary assistance to member countries to build infrastructure
Mark scheme: D
More questions on Relationship between countries at different levels of development
Q30 · Some economists argue there is little evidence of the value of aid in improving economic…
30 Some economists argue there is little evidence of the value of aid in improving economic development in less-developed countries. Which situation supports this claim? A Capacity to benefit from transfer of communications technology has increased. B Investment in infrastructure has created transport links and port facilities. C Over-reliance on technical assistance has impaired local initiatives and innovation. D Projects for education and training have helped to enhance the supply side.
Mark scheme: C
What was in this paper
The subtopics covered by these 30 questions, and how many questions each got. Open one in a new tab to see every Cambridge question on it.
3Characteristics of countries at different levels of development2Current account of the balance of payments2Different market structures2Economic development2Effectiveness of policy options to meet all macroeconomic objectives2Government policies to achieve efficient resource allocation and correct market failure2Money and banking2Price elasticity, income elasticity and cross elasticity of demand2The circular flow of income2Differing objectives and policies of firms1Economic growth and sustainability1Efficiency and market failure1Employment/unemployment1Equity and redistribution of income and wealth1Exchange rates1Private costs and benefits, externalities and social costs and benefits1Relationship between countries at different levels of development1Types of cost, revenue and profit, short-run and long-run production1What you needed in this session
Cambridge’s own grade thresholds for 2025 Feb/March, Paper 3 · Variant 2. A higher threshold means an easier paper — the bar moves with how the cohort did.