Cambridge A Level Economics 9708 — 2010 Oct/Nov Paper 3 · Variant 3
9708/33/O/N/10 · 30 questions · 30 marks · ≈34 min
The question paper and its mark scheme, free to read here and free to download. This is Cambridge’s own paper, exactly as it was sat.
Question paper12 pages

Mark scheme2 pages
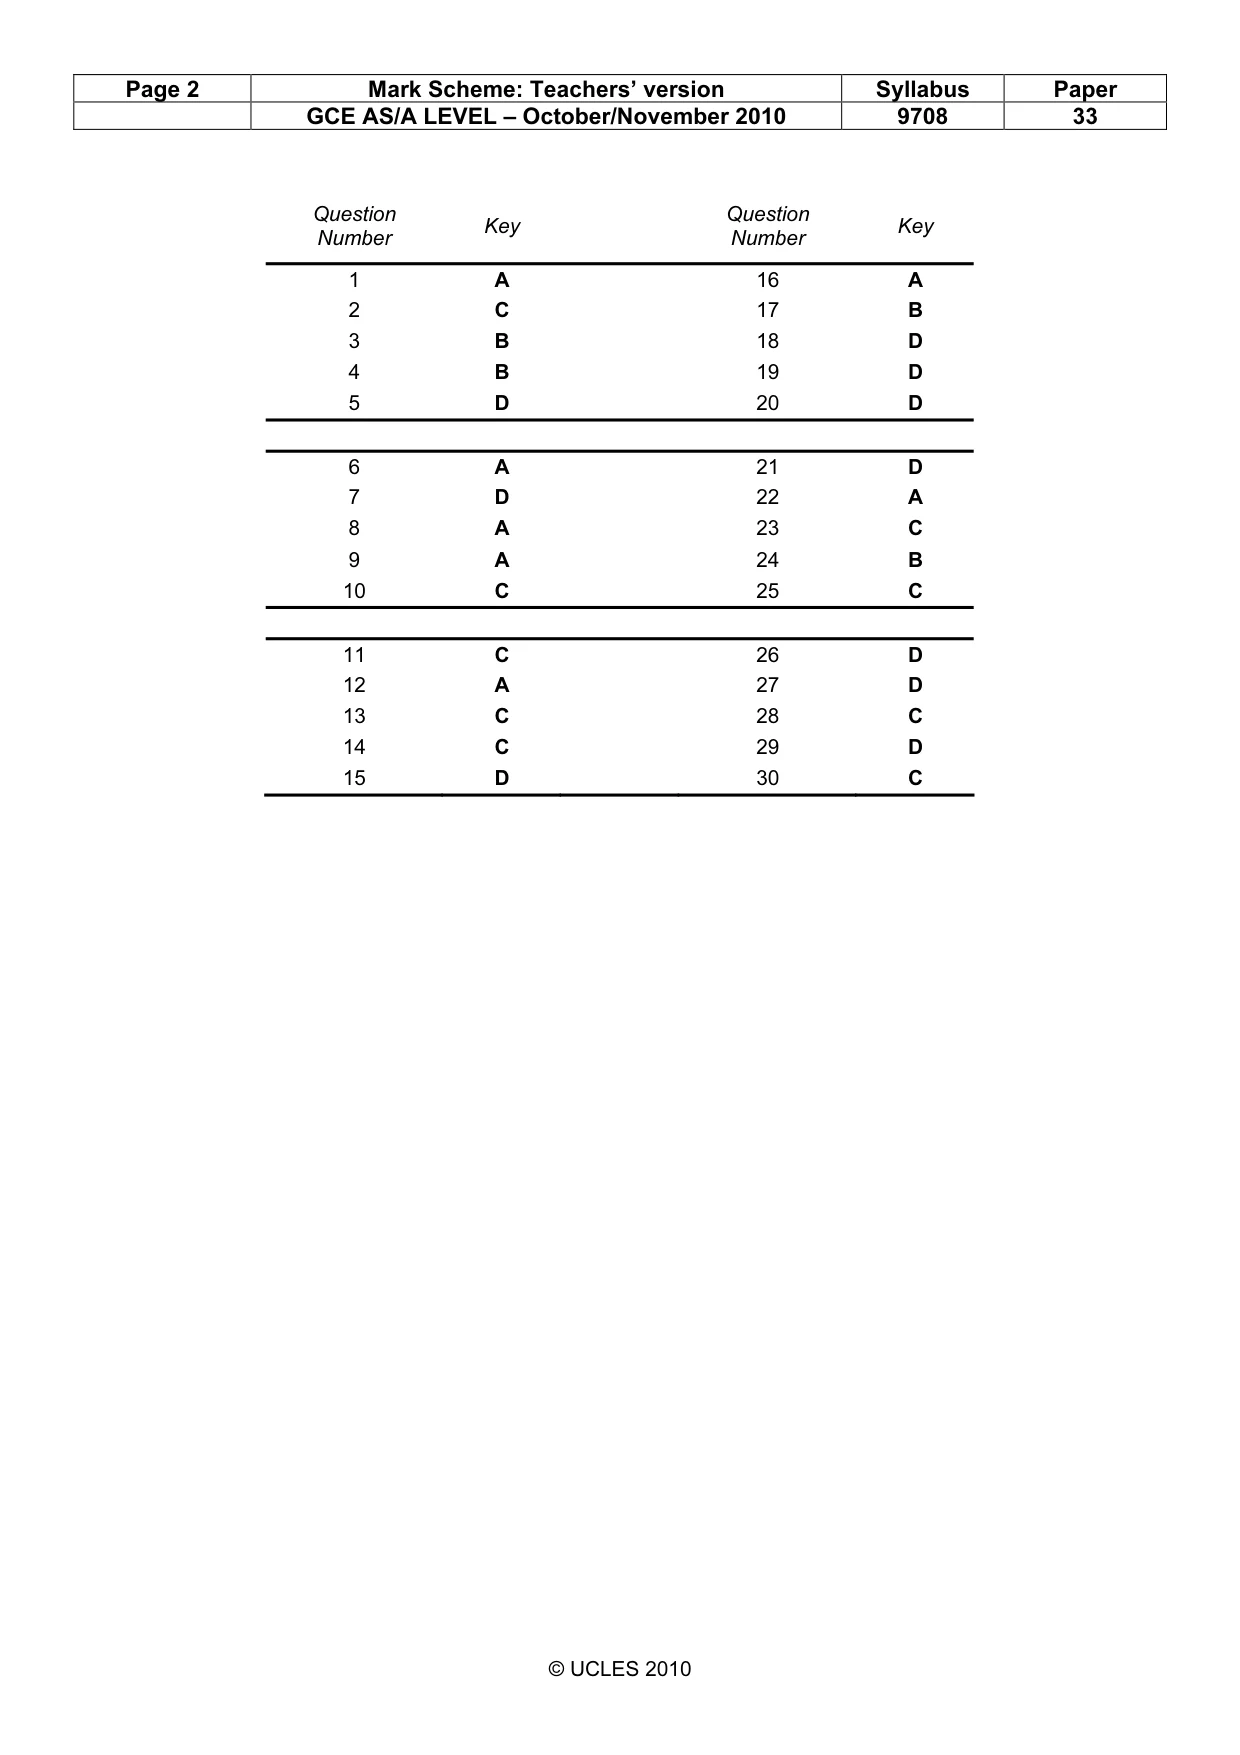
Answers below. Sit the paper first if you are practising.
Questions as text
Q1 · The schedule shows the total utility derived by a consumer of a good X at different…
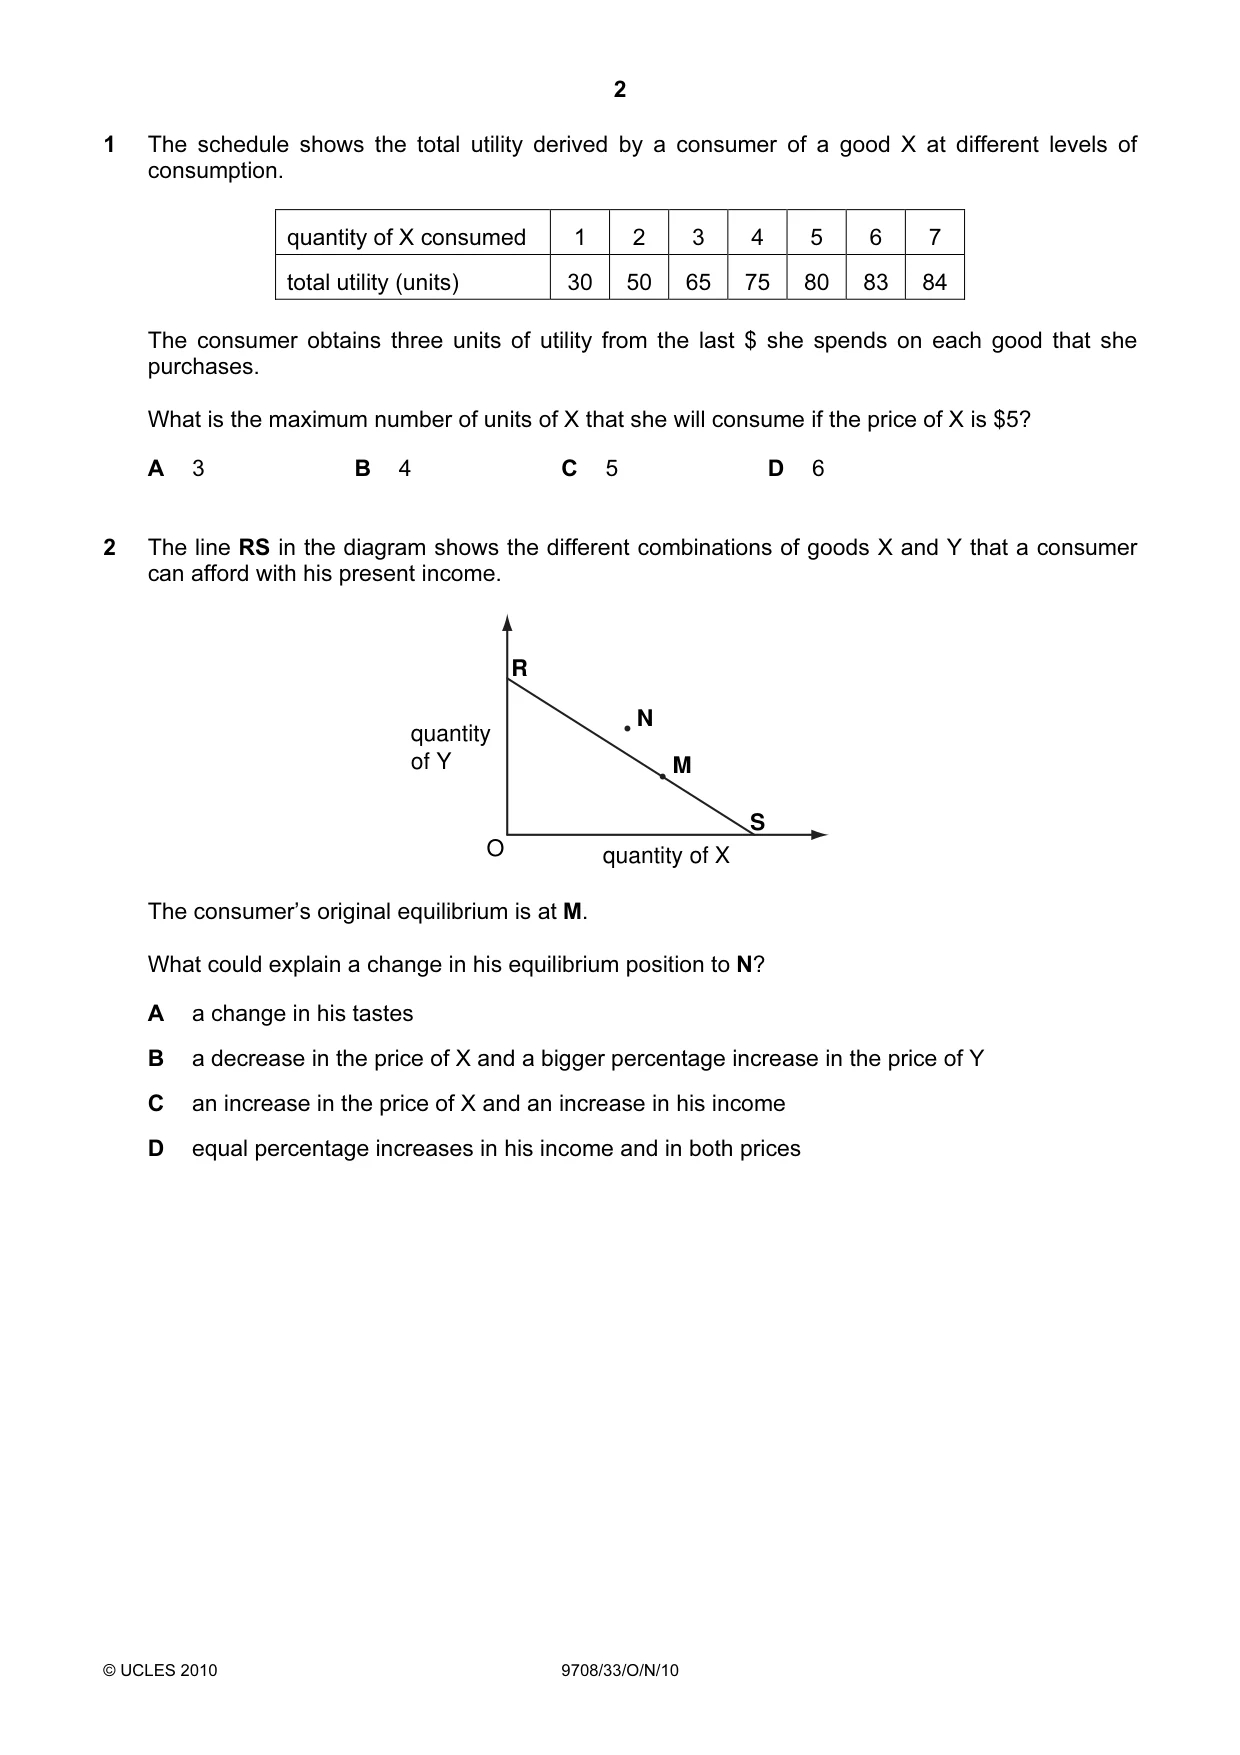
1 The schedule shows the total utility derived by a consumer of a good X at different levels of consumption. quantity of X consumed 1 2 3 4 5 6 7 total utility (units) 30 50 65 75 80 83 84 The consumer obtains three units of utility from the last $ she spends on each good that she purchases. What is the maximum number of units of X that she will consume if the price of X is $5? A 3 B 4 C 5 D 6
Mark scheme: A
Q2 · The line RS in the diagram shows the different combinations of goods X and Y that a…
2 The line RS in the diagram shows the different combinations of goods X and Y that a consumer can afford with his present income. R N quantity of Y M S O quantity of X The consumer’s original equilibrium is at M. What could explain a change in his equilibrium position to N? A a change in his tastes B a decrease in the price of X and a bigger percentage increase in the price of Y C an increase in the price of X and an increase in his income D equal percentage increases in his income and in both prices
Mark scheme: C
Q3 · A firm in a perfectly competitive industry employs two factors of production, X and Y
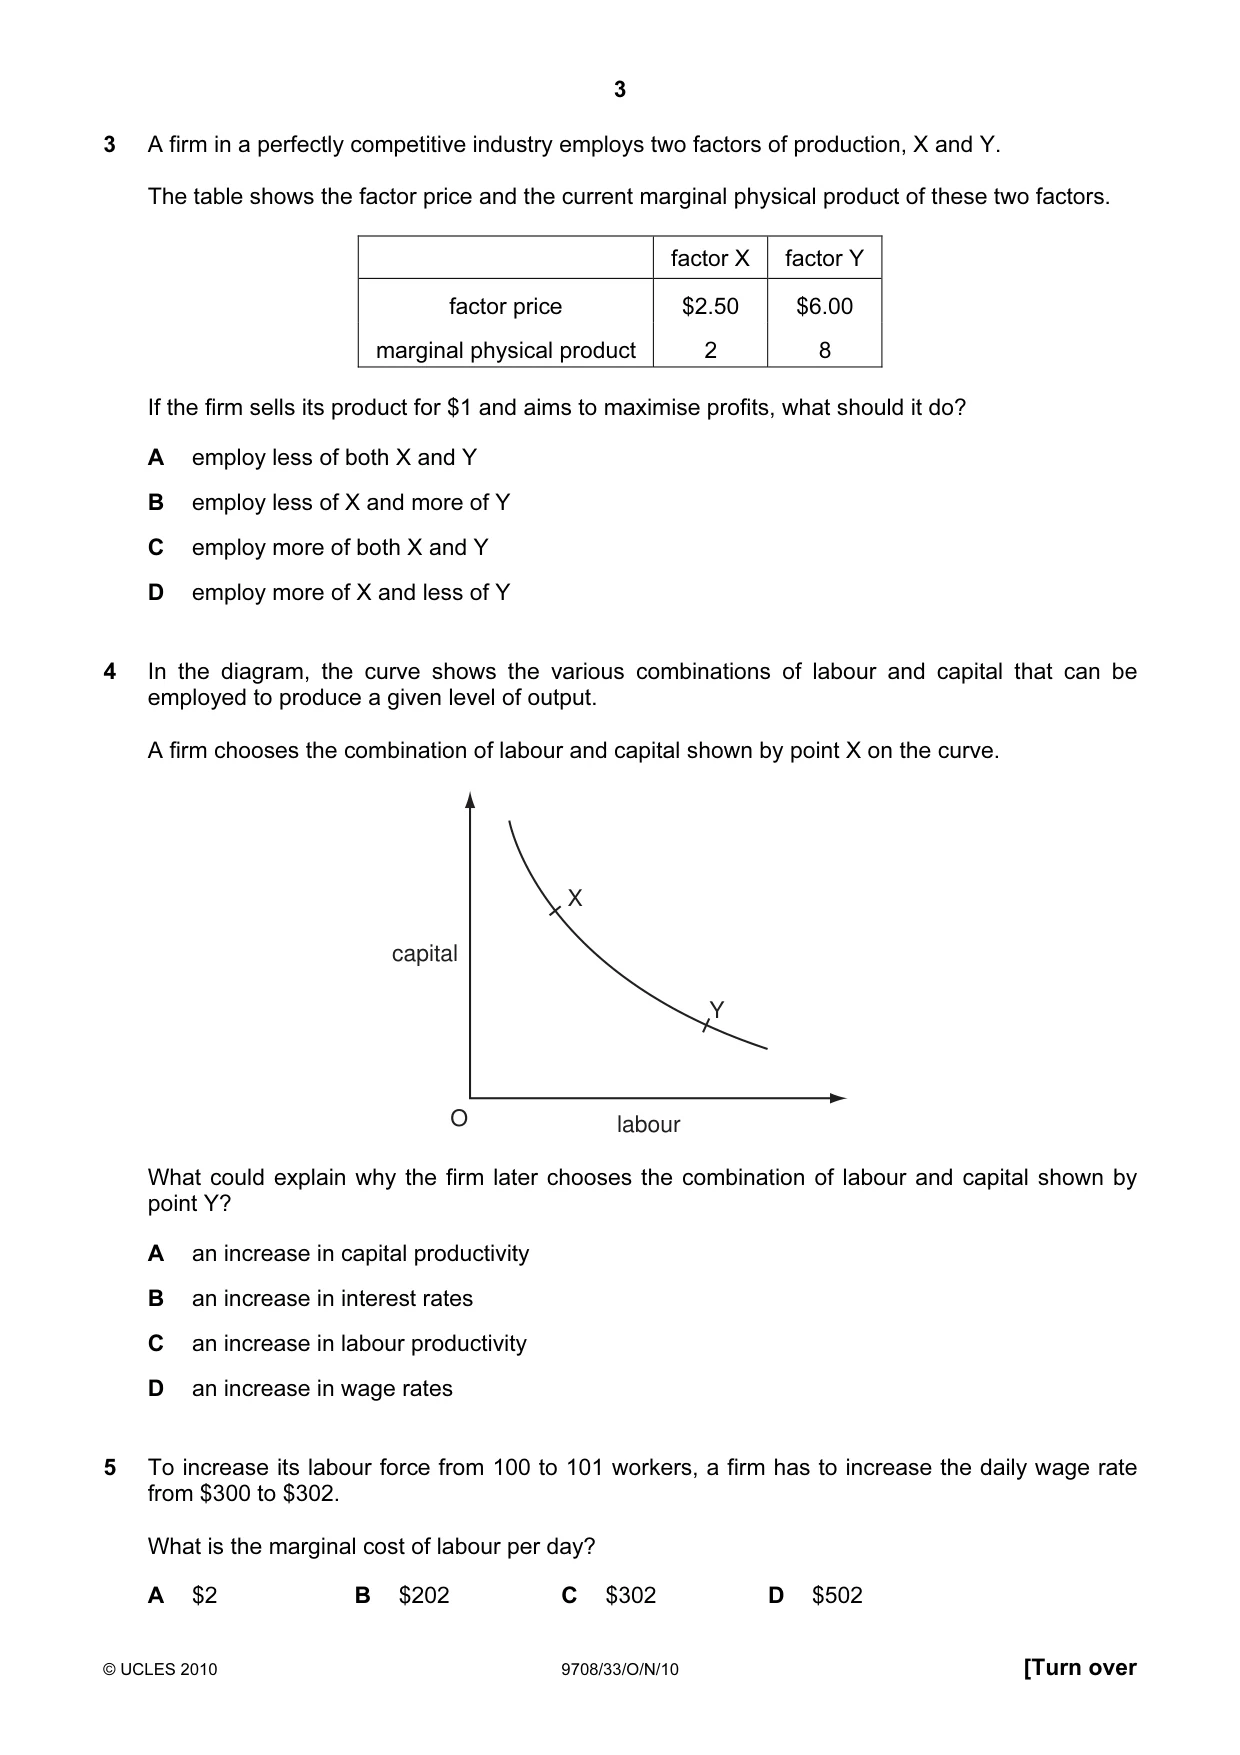
3 A firm in a perfectly competitive industry employs two factors of production, X and Y. The table shows the factor price and the current marginal physical product of these two factors. factor X factor Y factor price $2.50 $6.00 marginal physical product 2 8 If the firm sells its product for $1 and aims to maximise profits, what should it do? A employ less of both X and Y B employ less of X and more of Y C employ more of both X and Y D employ more of X and less of Y
Mark scheme: B
More questions on Types of cost, revenue and profit, short-run and long-run production
Q4 · In the diagram, the curve shows the various combinations of labour and capital that can…
4 In the diagram, the curve shows the various combinations of labour and capital that can be employed to produce a given level of output. A firm chooses the combination of labour and capital shown by point X on the curve. X capital Y O labour What could explain why the firm later chooses the combination of labour and capital shown by point Y? A an increase in capital productivity B an increase in interest rates C an increase in labour productivity D an increase in wage rates
Mark scheme: B
More questions on Types of cost, revenue and profit, short-run and long-run production
Q5 · To increase its labour force from 100 to 101 workers, a firm has to increase the daily…
5 To increase its labour force from 100 to 101 workers, a firm has to increase the daily wage rate from $300 to $302. What is the marginal cost of labour per day? A $2 B $202 C $302 D $502
Mark scheme: D
More questions on Labour market forces and government intervention
Q6 · The diagram shows a worker’s supply of labour curve
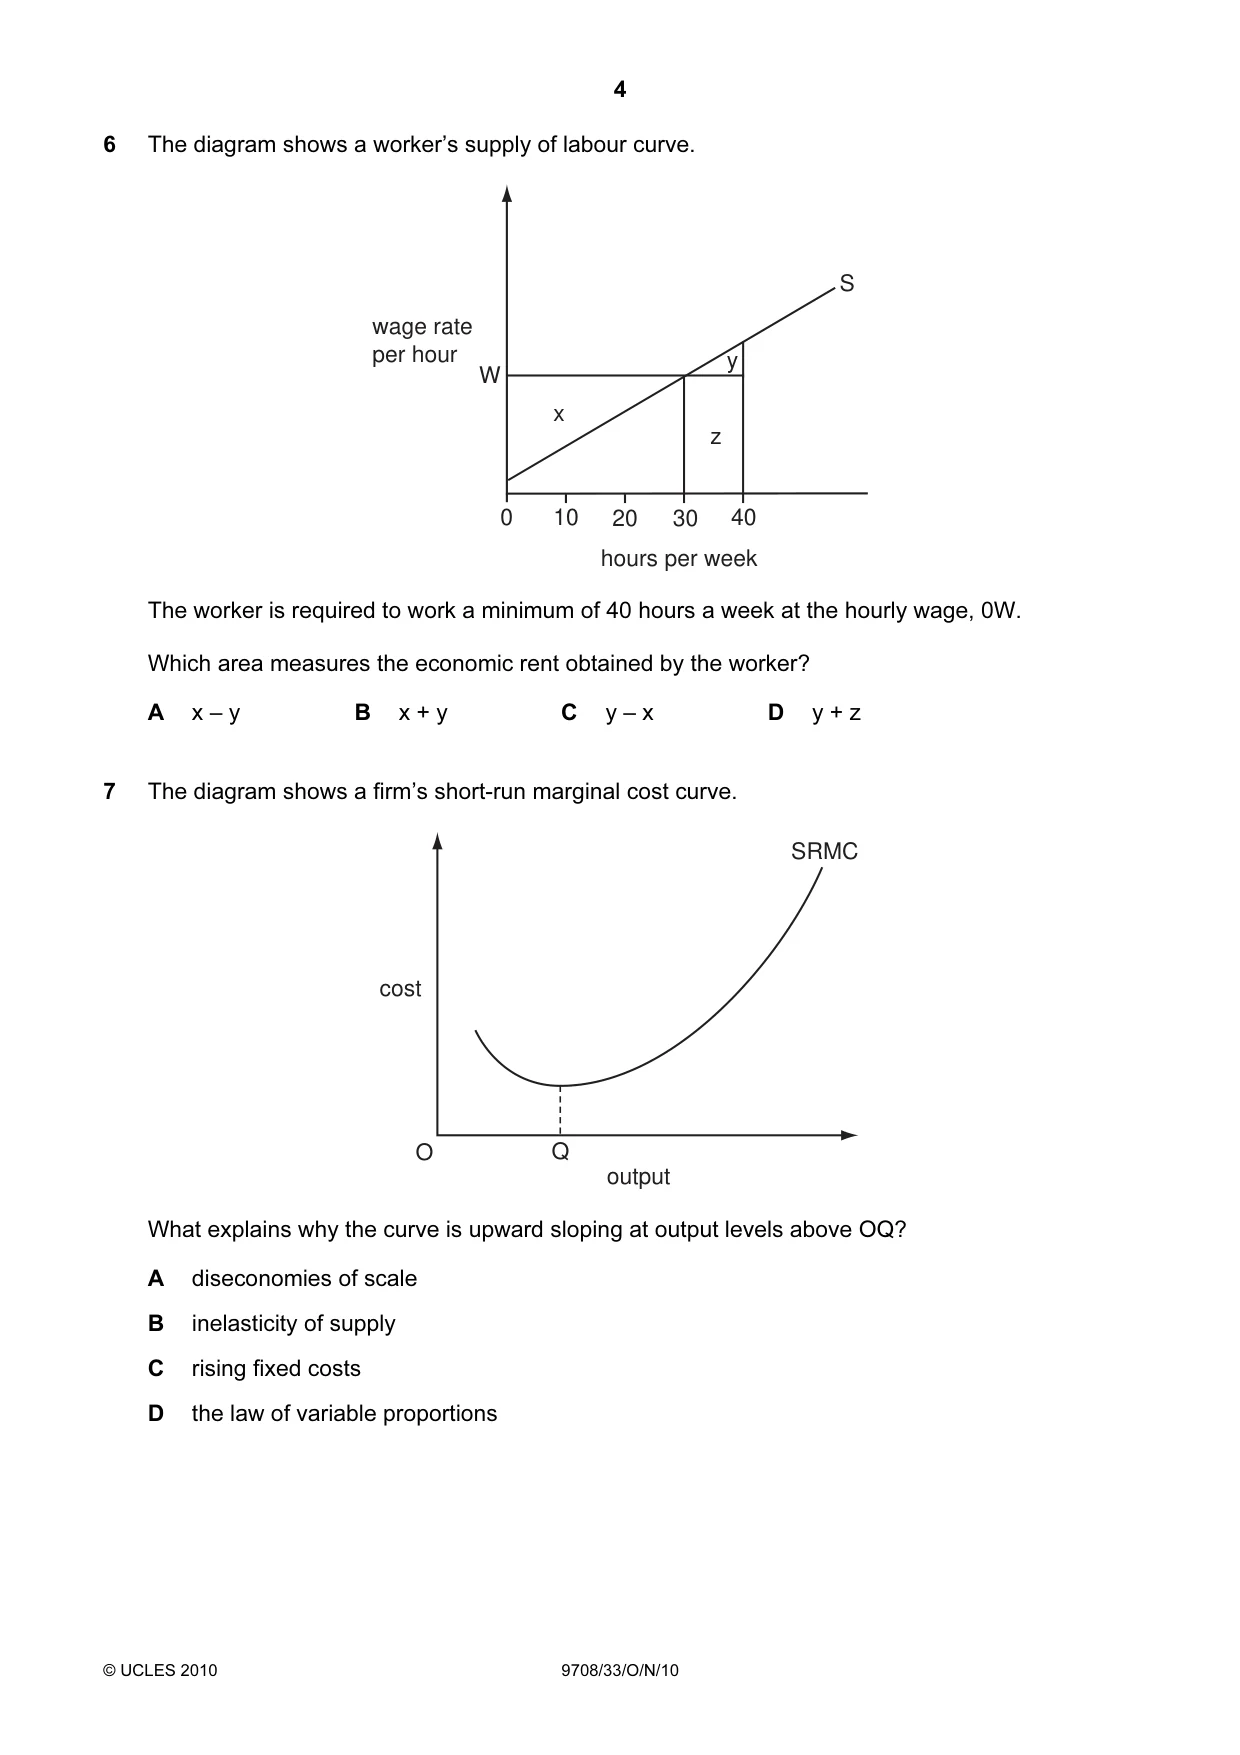
6 The diagram shows a worker’s supply of labour curve. S wage rate per hour y W x z 0 10 20 30 40 hours per week The worker is required to work a minimum of 40 hours a week at the hourly wage, 0W. Which area measures the economic rent obtained by the worker? A x – y B x + y C y – x D y + z
Mark scheme: A
More questions on Labour market forces and government intervention
Q7 · The diagram shows a firm’s short-run marginal cost curve
7 The diagram shows a firm’s short-run marginal cost curve. SRMC cost O Q output What explains why the curve is upward sloping at output levels above OQ? A diseconomies of scale B inelasticity of supply C rising fixed costs D the law of variable proportions
Mark scheme: D
More questions on Types of cost, revenue and profit, short-run and long-run production
Q8 · The diagram shows a firm’s cost and revenue curves
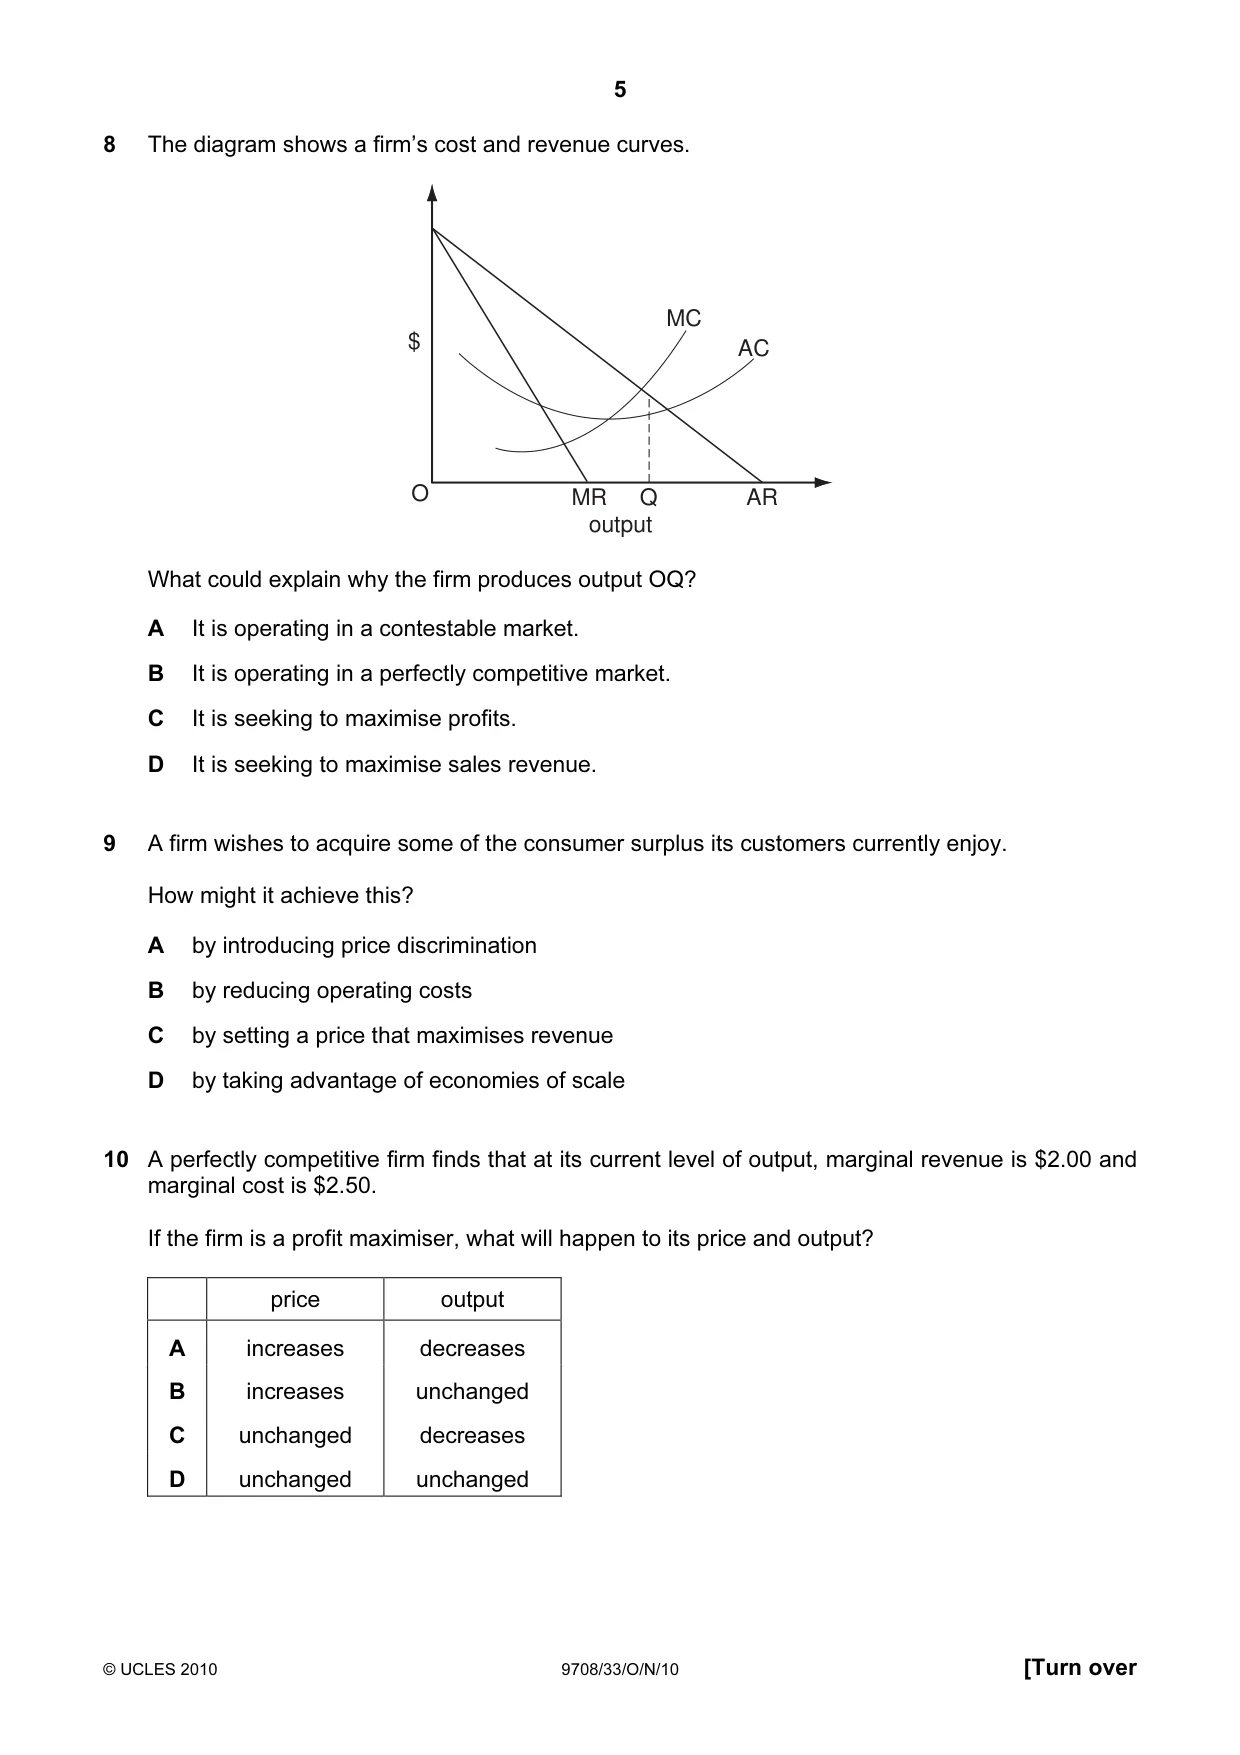
8 The diagram shows a firm’s cost and revenue curves. MC $ AC O MR Q AR output What could explain why the firm produces output OQ? A It is operating in a contestable market. B It is operating in a perfectly competitive market. C It is seeking to maximise profits. D It is seeking to maximise sales revenue.
Mark scheme: A
Q9 · A firm wishes to acquire some of the consumer surplus its customers currently enjoy
9 A firm wishes to acquire some of the consumer surplus its customers currently enjoy. How might it achieve this? A by introducing price discrimination B by reducing operating costs C by setting a price that maximises revenue D by taking advantage of economies of scale
Mark scheme: A
Q10 · A perfectly competitive firm finds that at its current level of output, marginal revenue…
10 A perfectly competitive firm finds that at its current level of output, marginal revenue is $2.00 and marginal cost is $2.50. If the firm is a profit maximiser, what will happen to its price and output? price output A increases decreases B increases unchanged C unchanged decreases D unchanged unchanged
Mark scheme: C
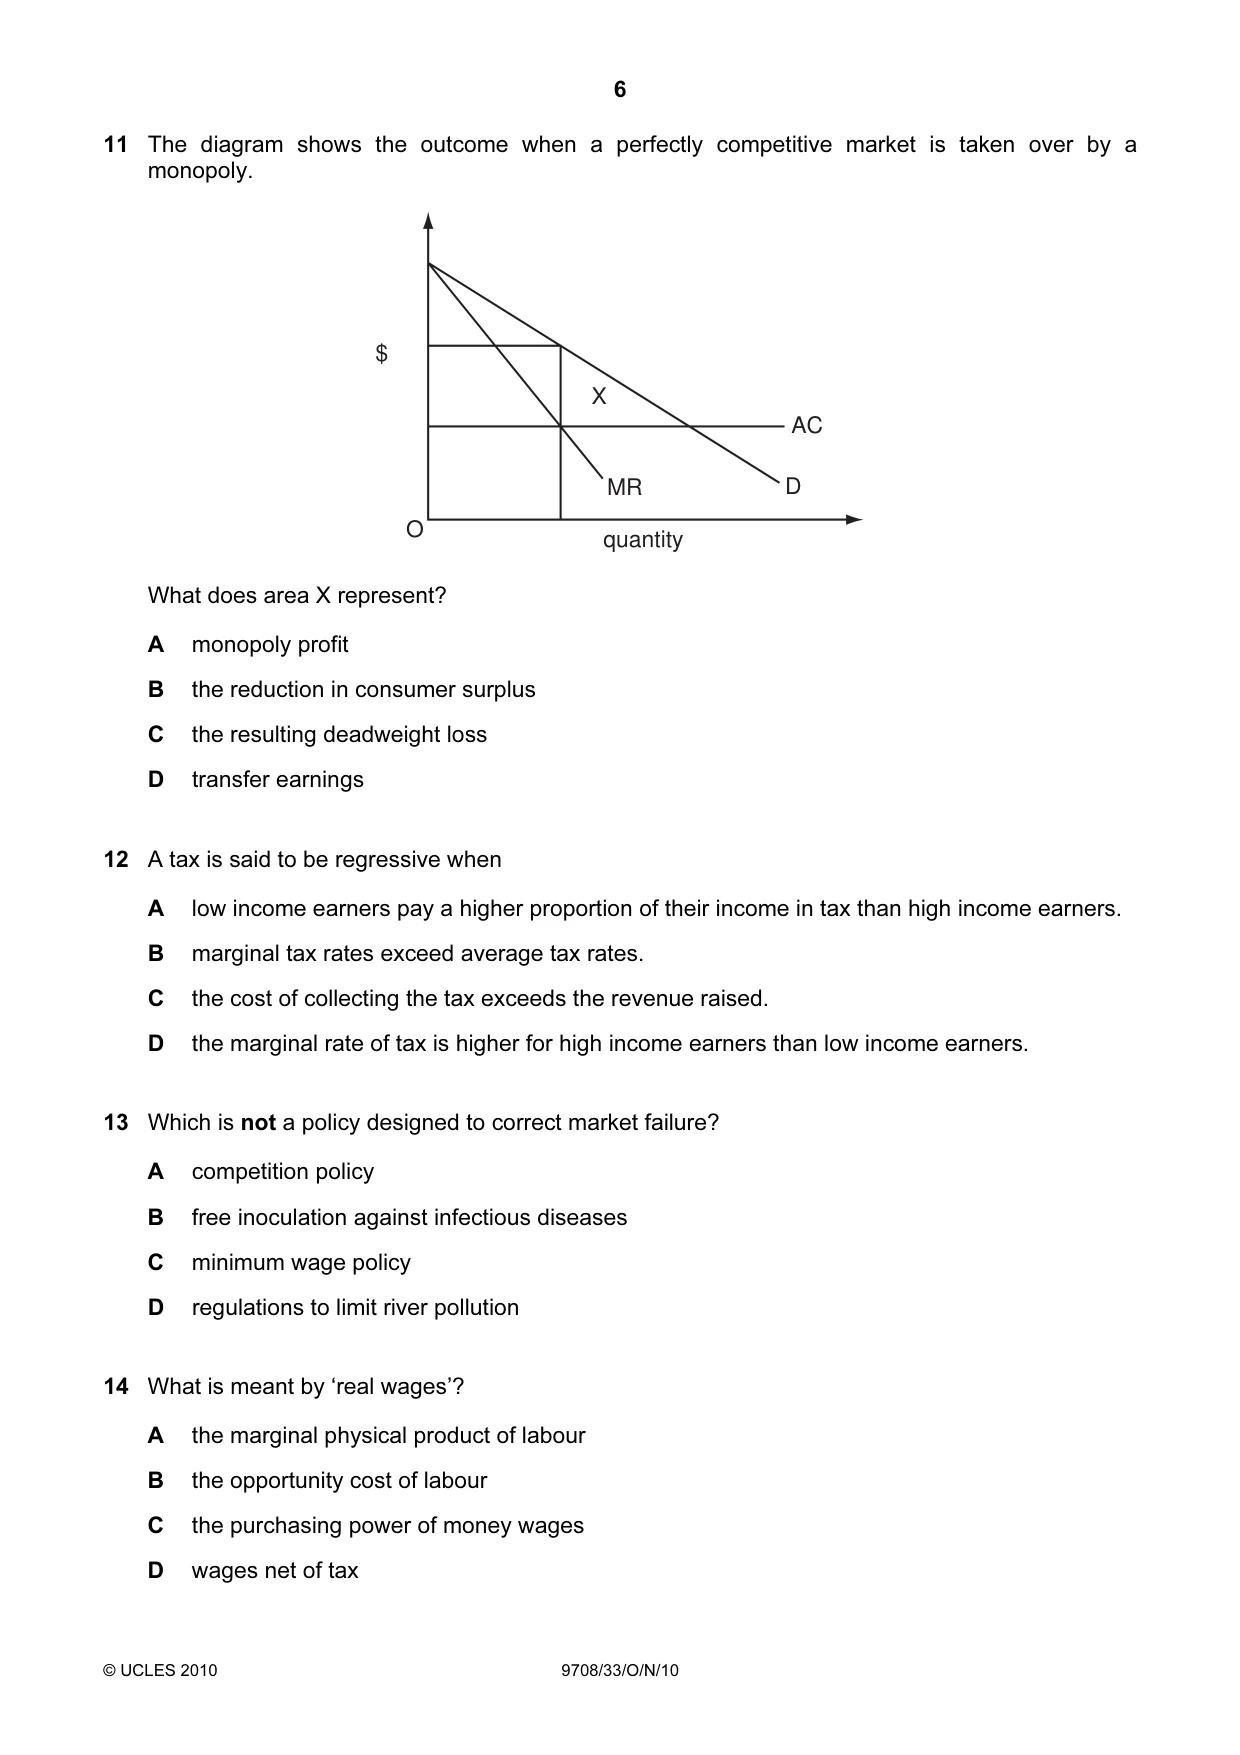
Q11 · The diagram shows the outcome when a perfectly competitive market is taken over by a…
11 The diagram shows the outcome when a perfectly competitive market is taken over by a monopoly. $ X AC MR D O quantity What does area X represent? A monopoly profit B the reduction in consumer surplus C the resulting deadweight loss D transfer earnings
Mark scheme: C
Q12 · A tax is said to be regressive when A low income earners pay a higher proportion of their…
12 A tax is said to be regressive when A low income earners pay a higher proportion of their income in tax than high income earners. B marginal tax rates exceed average tax rates. C the cost of collecting the tax exceeds the revenue raised. D the marginal rate of tax is higher for high income earners than low income earners.
Mark scheme: A
More questions on Equity and redistribution of income and wealth
Q13 · Which is not a policy designed to correct market failure?
13 Which is not a policy designed to correct market failure? A competition policy B free inoculation against infectious diseases C minimum wage policy D regulations to limit river pollution
Mark scheme: C
Q14 · What is meant by ‘real wages’?
14 What is meant by ‘real wages’? A the marginal physical product of labour B the opportunity cost of labour C the purchasing power of money wages D wages net of tax
Mark scheme: C
Q15 · What is not a leakage from the circular flow of income?
15 What is not a leakage from the circular flow of income? A expenditure on foreign goods B indirect taxes C undistributed profits D unemployment benefits
Mark scheme: D
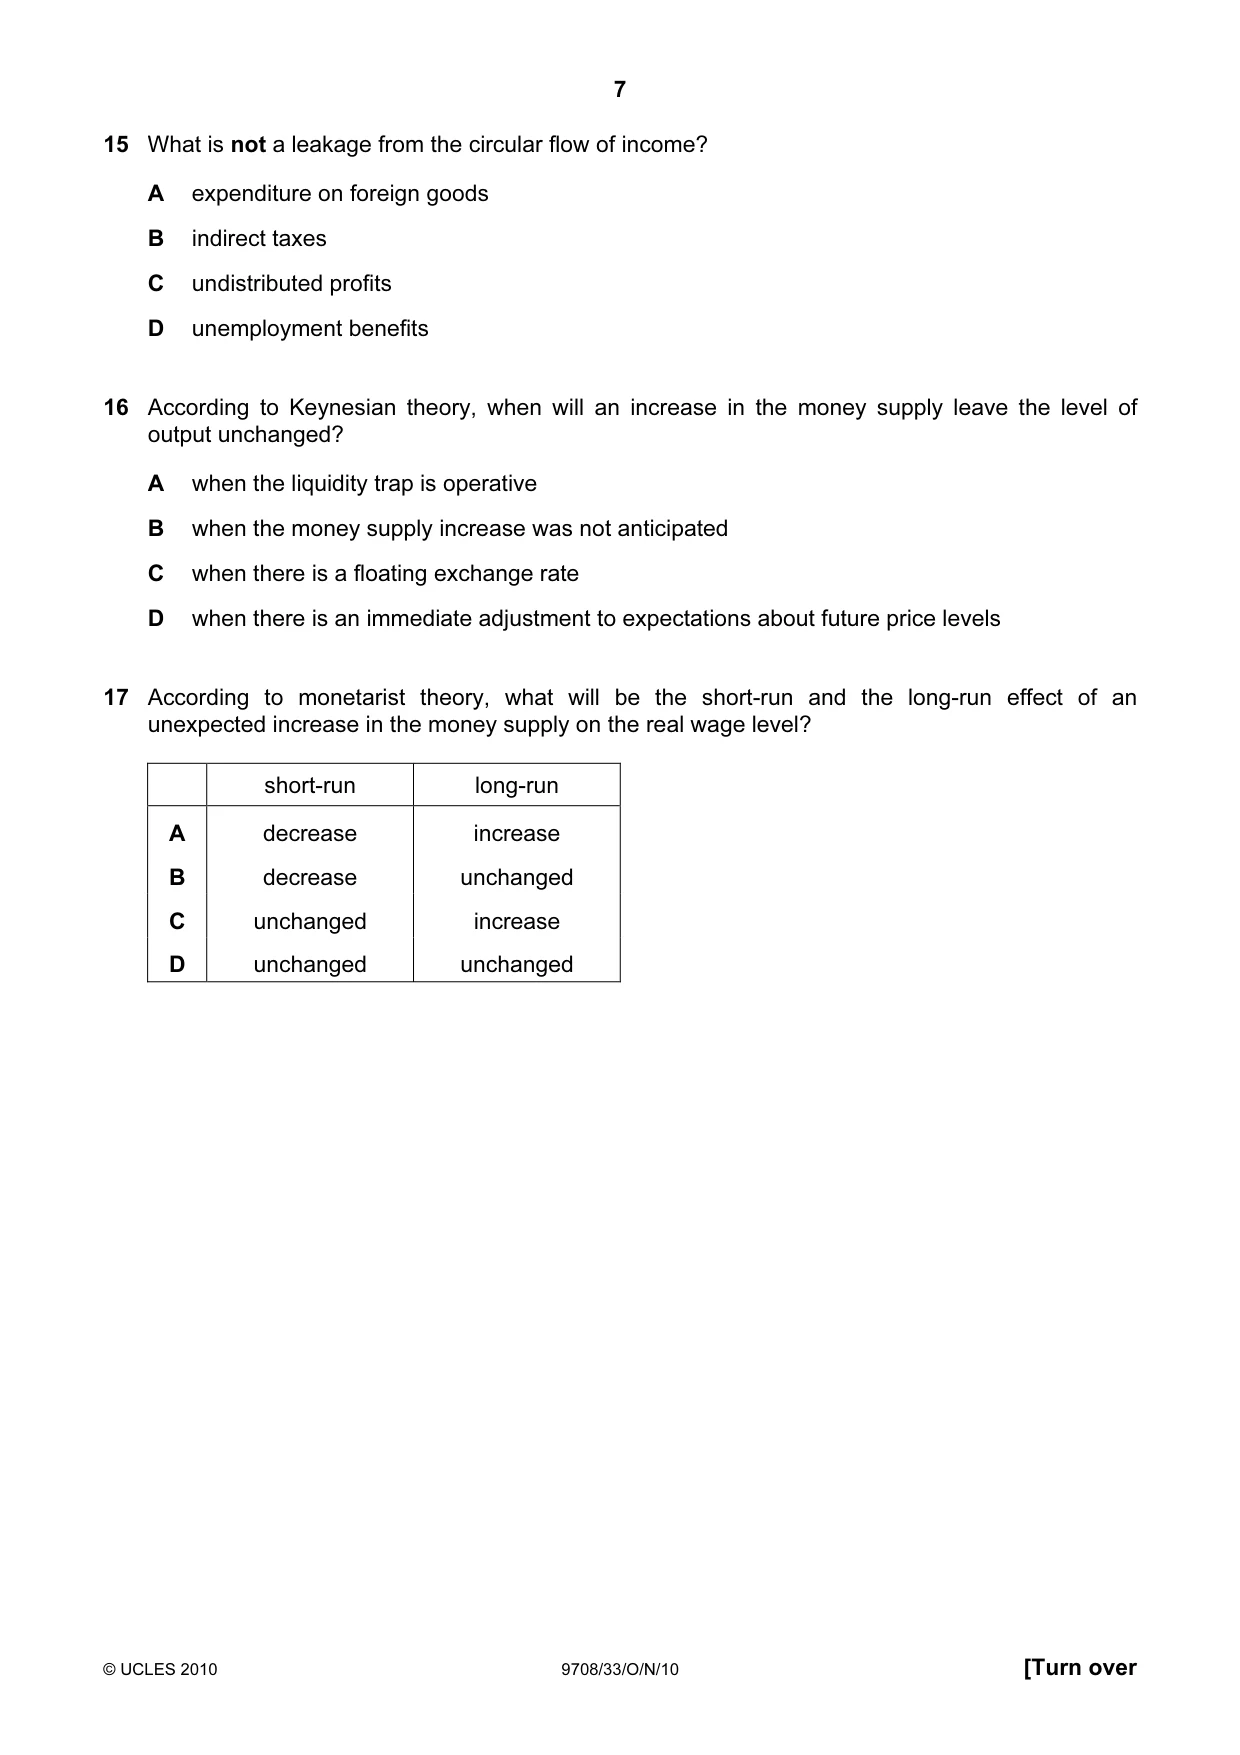
Q16 · According to Keynesian theory, when will an increase in the money supply leave the level…
16 According to Keynesian theory, when will an increase in the money supply leave the level of output unchanged? A when the liquidity trap is operative B when the money supply increase was not anticipated C when there is a floating exchange rate D when there is an immediate adjustment to expectations about future price levels
Mark scheme: A
Q17 · According to monetarist theory, what will be the short-run and the long-run effect of an…
17 According to monetarist theory, what will be the short-run and the long-run effect of an unexpected increase in the money supply on the real wage level? short-run long-run A decrease increase B decrease unchanged C unchanged increase D unchanged unchanged
Mark scheme: B
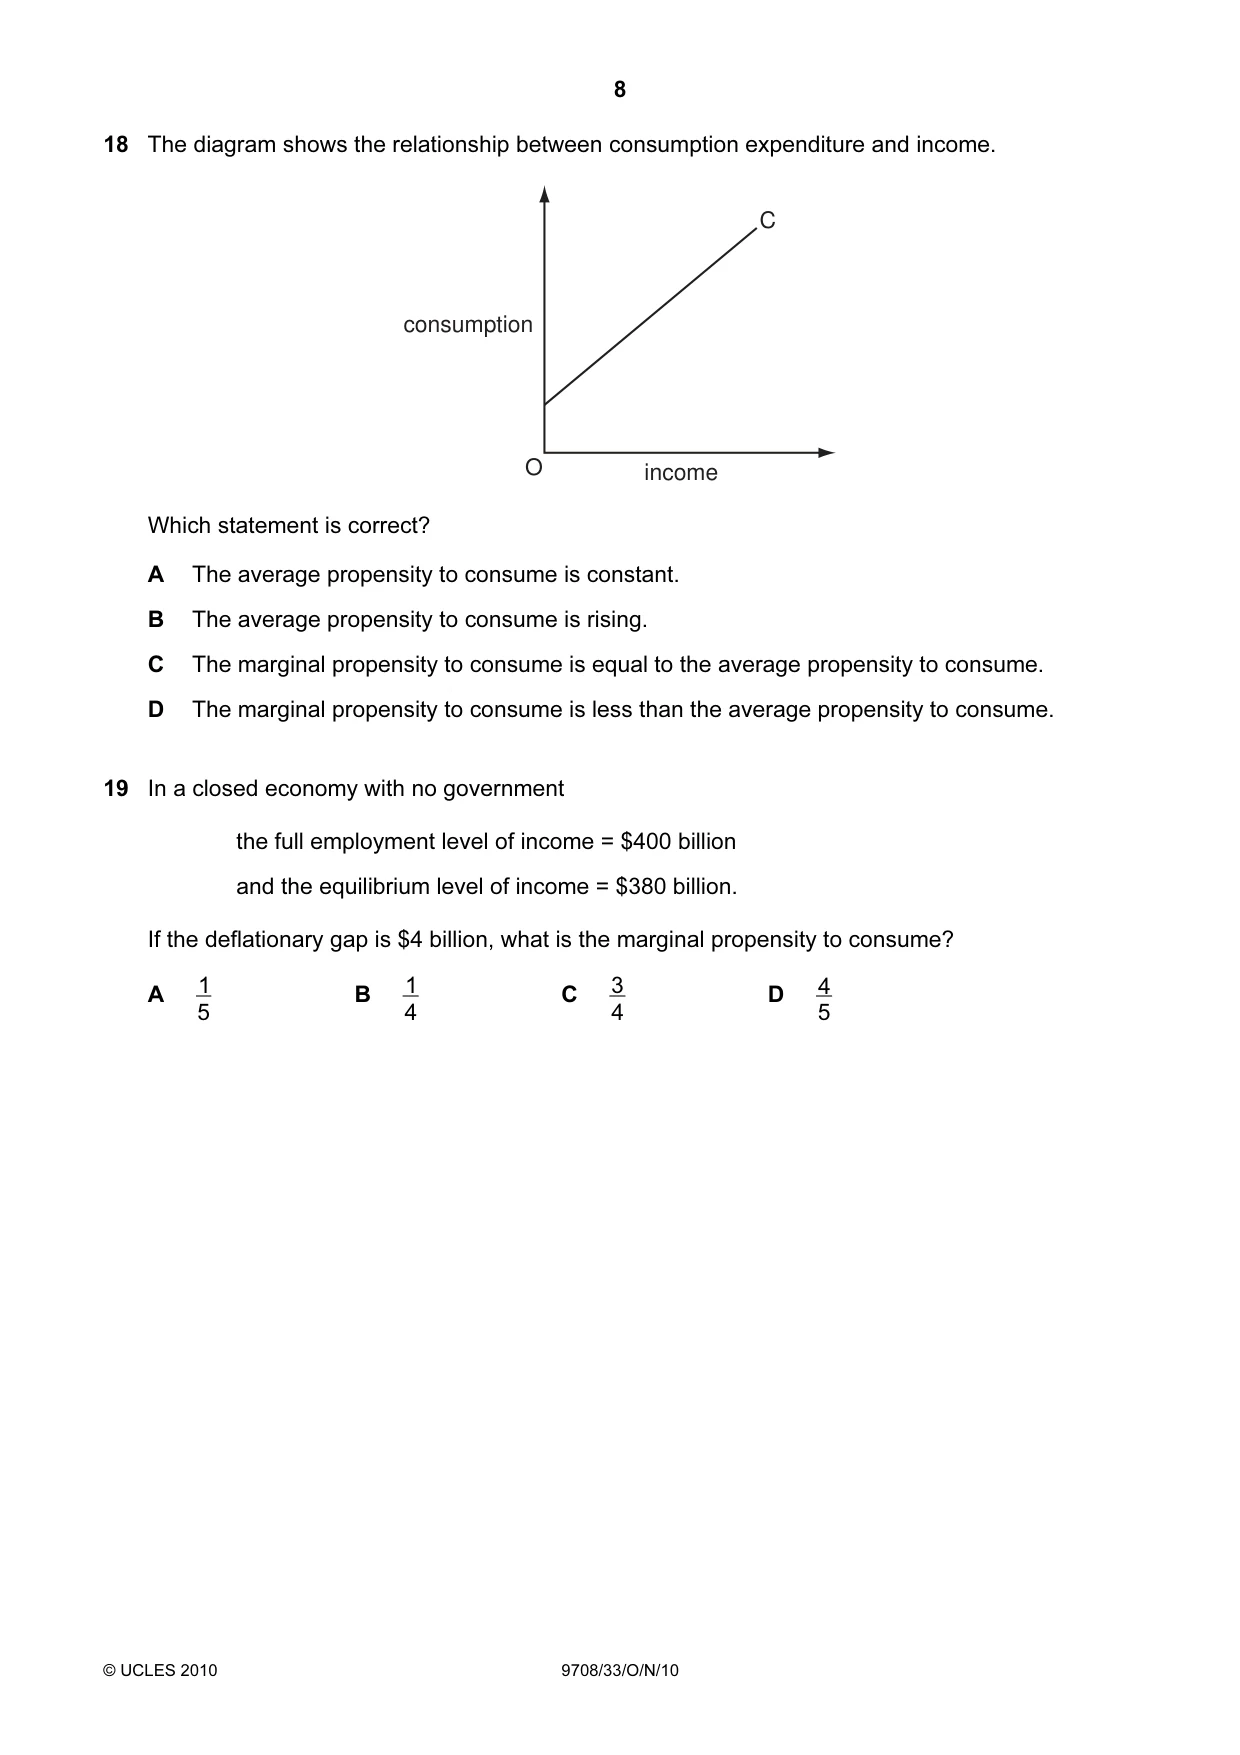
Q18 · The diagram shows the relationship between consumption expenditure and income
18 The diagram shows the relationship between consumption expenditure and income. C consumption O income Which statement is correct? A The average propensity to consume is constant. B The average propensity to consume is rising. C The marginal propensity to consume is equal to the average propensity to consume. D The marginal propensity to consume is less than the average propensity to consume.
Mark scheme: D
Q19 · In a closed economy with no government the full employment level of income = $400 billion…
19 In a closed economy with no government the full employment level of income = $400 billion and the equilibrium level of income = $380 billion. If the deflationary gap is $4 billion, what is the marginal propensity to consume? A 1 B 1 C 3 D 4 5 4 4 5
Mark scheme: D
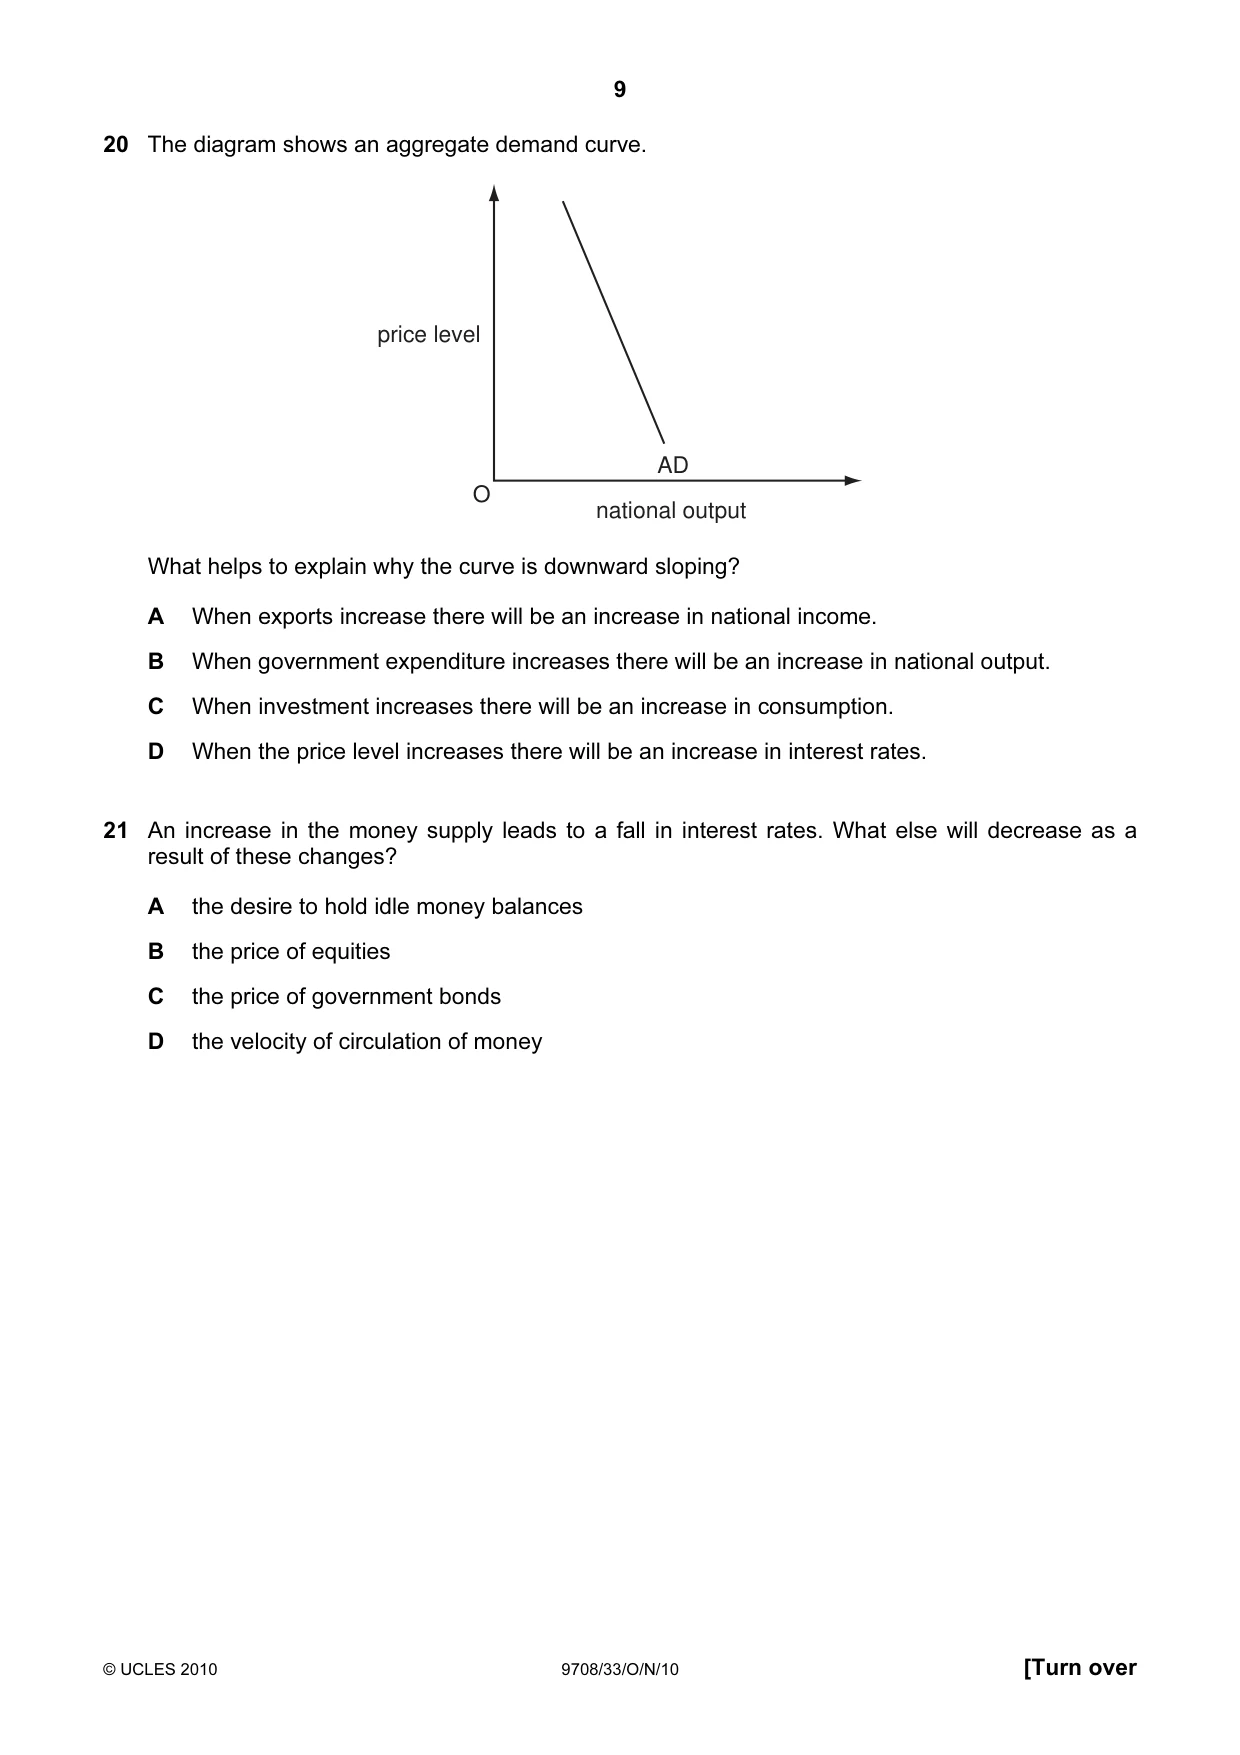
Q20 · The diagram shows an aggregate demand curve
20 The diagram shows an aggregate demand curve. price level AD O national output What helps to explain why the curve is downward sloping? A When exports increase there will be an increase in national income. B When government expenditure increases there will be an increase in national output. C When investment increases there will be an increase in consumption. D When the price level increases there will be an increase in interest rates.
Mark scheme: D
More questions on Aggregate Demand and Aggregate Supply analysis
Q21 · An increase in the money supply leads to a fall in interest rates
21 An increase in the money supply leads to a fall in interest rates. What else will decrease as a result of these changes? A the desire to hold idle money balances B the price of equities C the price of government bonds D the velocity of circulation of money
Mark scheme: D
Q22 · The diagram shows the market for loanable funds
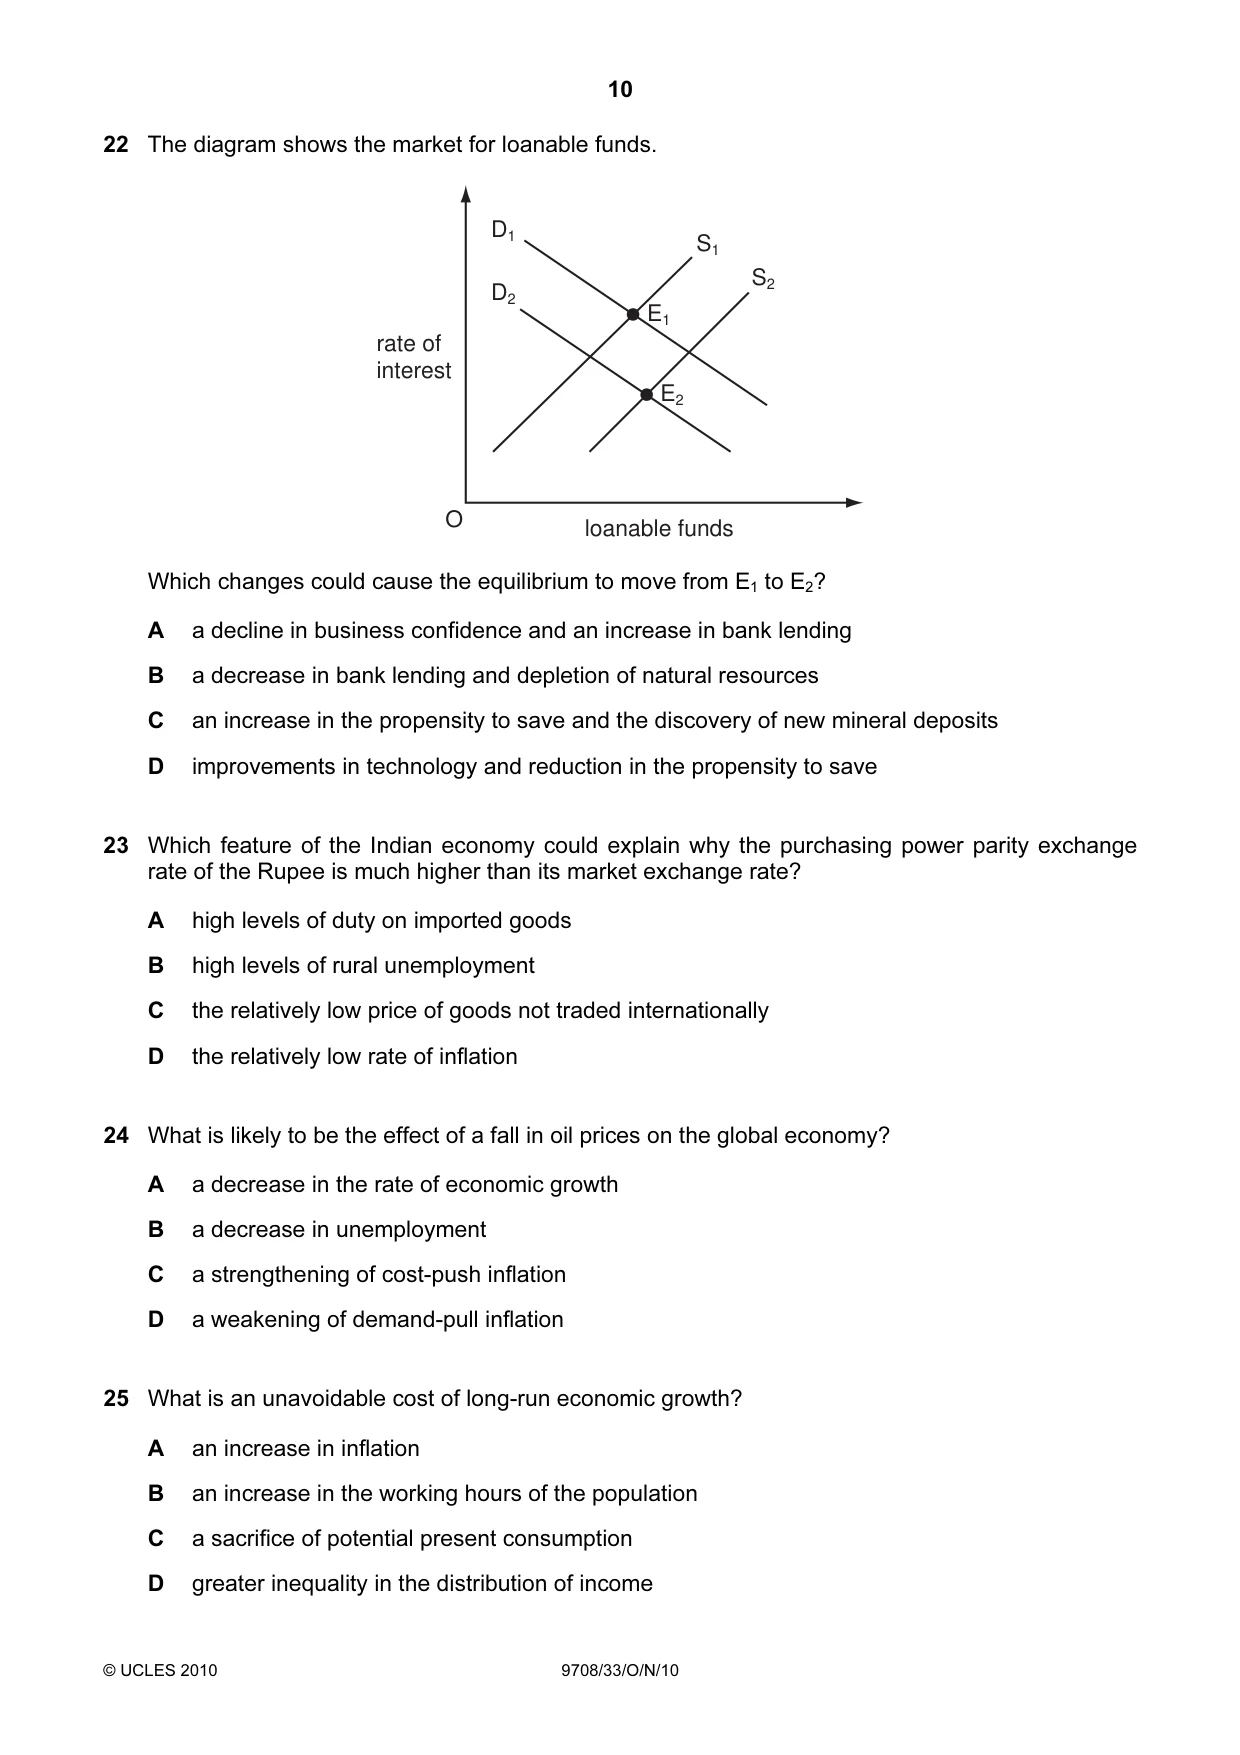
22 The diagram shows the market for loanable funds. D1 S1 S2 D2 E1 rate of interest E2 O loanable funds Which changes could cause the equilibrium to move from E1 to E2? A a decline in business confidence and an increase in bank lending B a decrease in bank lending and depletion of natural resources C an increase in the propensity to save and the discovery of new mineral deposits D improvements in technology and reduction in the propensity to save
Mark scheme: A
Q23 · Which feature of the Indian economy could explain why the purchasing power parity…
23 Which feature of the Indian economy could explain why the purchasing power parity exchange rate of the Rupee is much higher than its market exchange rate? A high levels of duty on imported goods B high levels of rural unemployment C the relatively low price of goods not traded internationally D the relatively low rate of inflation
Mark scheme: C
Q24 · What is likely to be the effect of a fall in oil prices on the global economy?
24 What is likely to be the effect of a fall in oil prices on the global economy? A a decrease in the rate of economic growth B a decrease in unemployment C a strengthening of cost-push inflation D a weakening of demand-pull inflation
Mark scheme: B
More questions on Links between macroeconomic problems and their interrelatedness
Q25 · What is an unavoidable cost of long-run economic growth?
25 What is an unavoidable cost of long-run economic growth? A an increase in inflation B an increase in the working hours of the population C a sacrifice of potential present consumption D greater inequality in the distribution of income
Mark scheme: C
Q26 · What could be expected to increase the pressure of demand-pull inflation in an open…
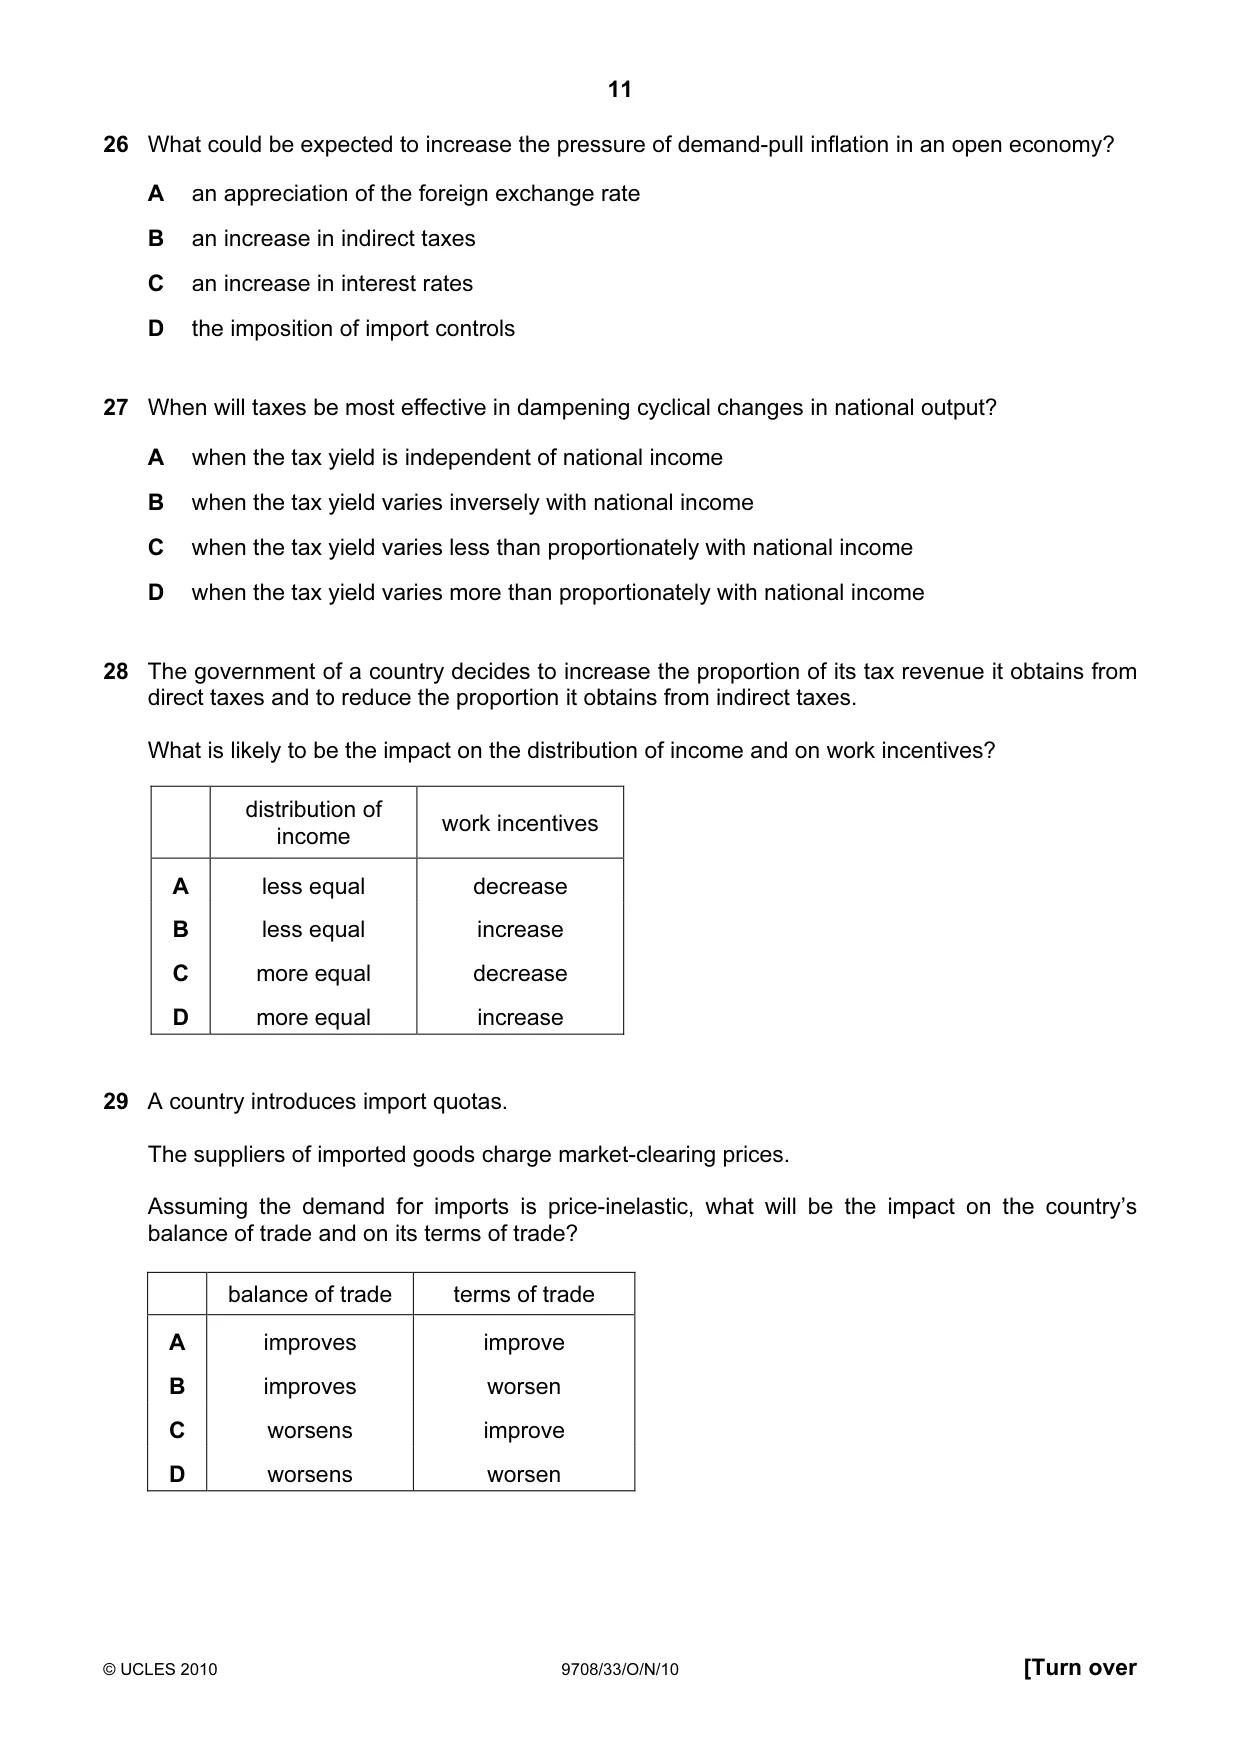
26 What could be expected to increase the pressure of demand-pull inflation in an open economy? A an appreciation of the foreign exchange rate B an increase in indirect taxes C an increase in interest rates D the imposition of import controls
Mark scheme: D
More questions on Government macroeconomic policy objectives
Q27 · When will taxes be most effective in dampening cyclical changes in national output?
27 When will taxes be most effective in dampening cyclical changes in national output? A when the tax yield is independent of national income B when the tax yield varies inversely with national income C when the tax yield varies less than proportionately with national income D when the tax yield varies more than proportionately with national income
Mark scheme: D
More questions on Effectiveness of policy options to meet all macroeconomic objectives
Q28 · The government of a country decides to increase the proportion of its tax revenue it…
28 The government of a country decides to increase the proportion of its tax revenue it obtains from direct taxes and to reduce the proportion it obtains from indirect taxes. What is likely to be the impact on the distribution of income and on work incentives? distribution of work incentives income A less equal decrease B less equal increase C more equal decrease D more equal increase
Mark scheme: C
More questions on Equity and redistribution of income and wealth
Q29 · A country introduces import quotas
29 A country introduces import quotas. The suppliers of imported goods charge market-clearing prices. Assuming the demand for imports is price-inelastic, what will be the impact on the country’s balance of trade and on its terms of trade? balance of trade terms of trade A improves improve B improves worsen C worsens improve D worsens worsen
Mark scheme: D
Q30 · In an economy no one can be made better off without making others worse off
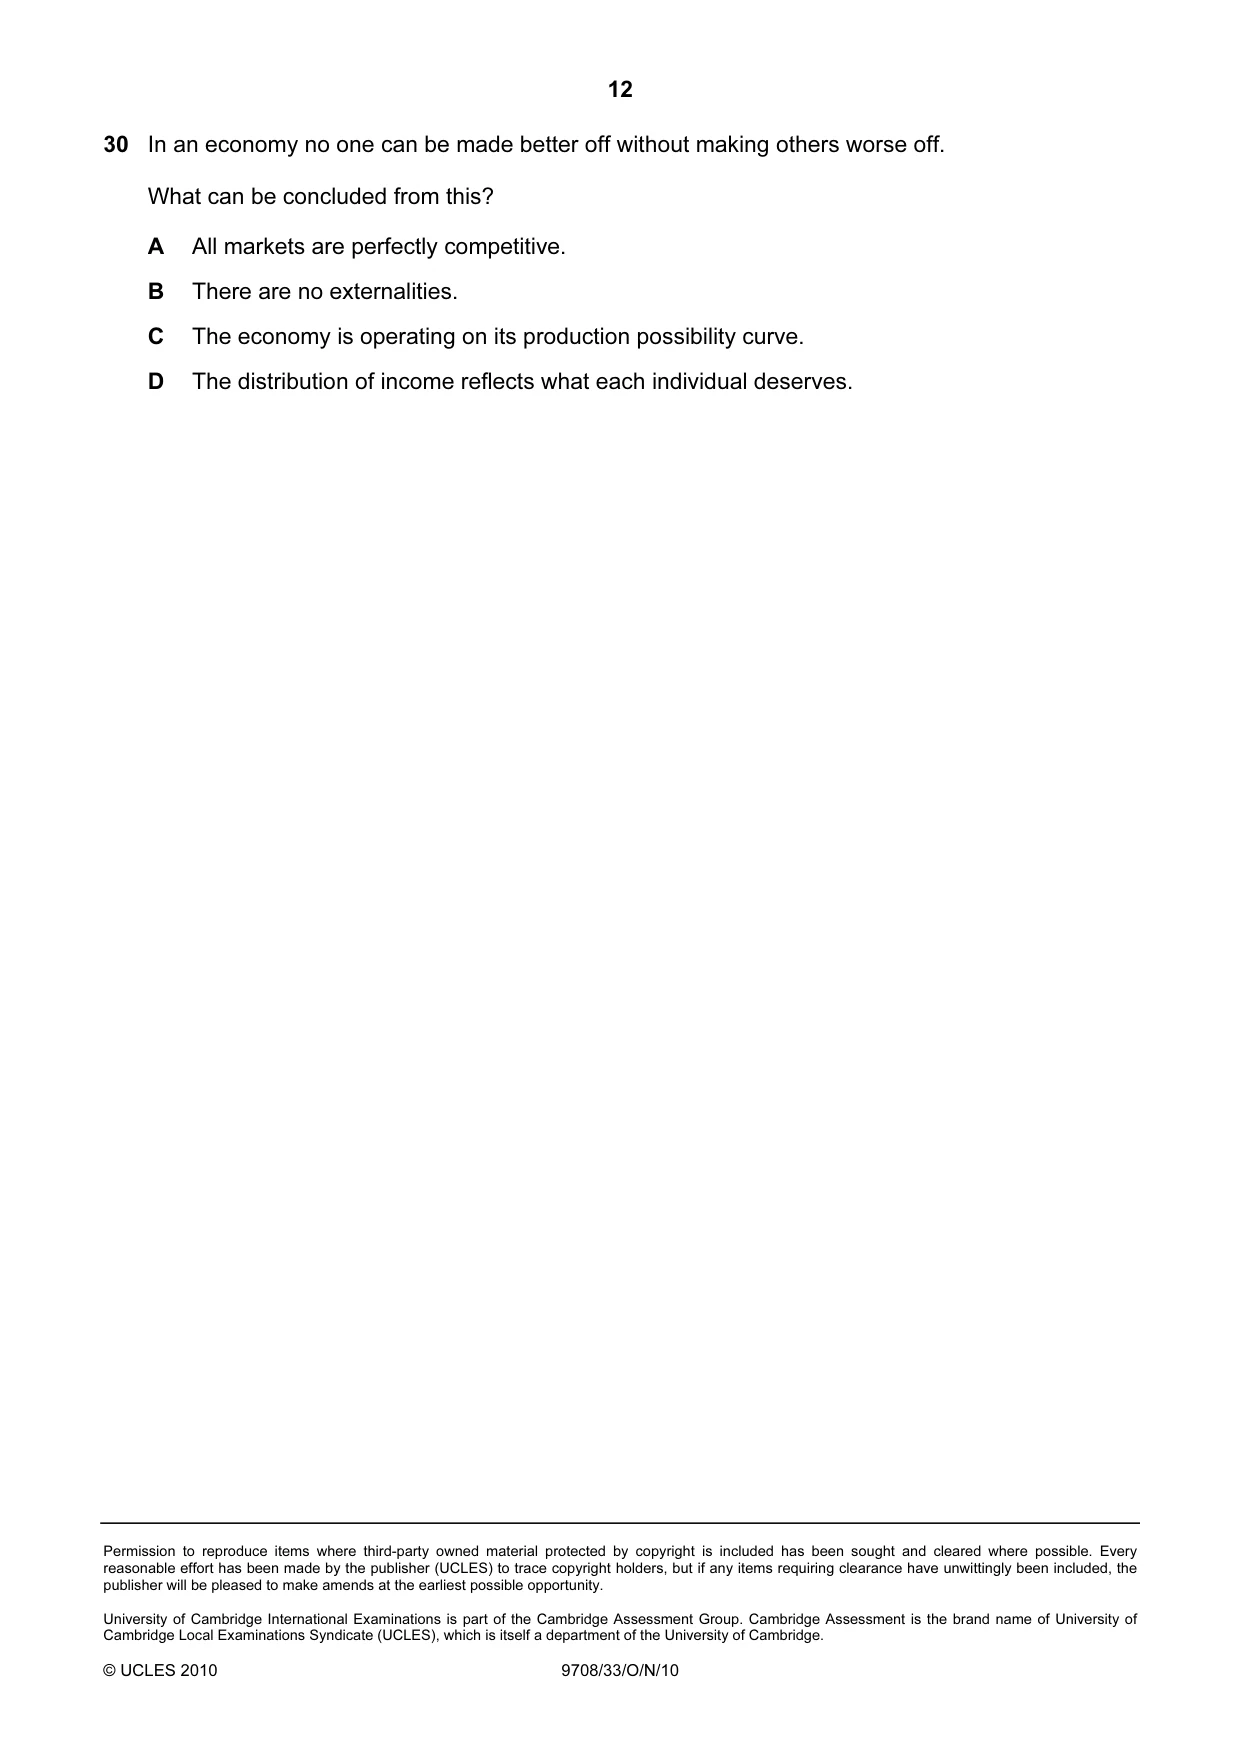
30 In an economy no one can be made better off without making others worse off. What can be concluded from this? A All markets are perfectly competitive. B There are no externalities. C The economy is operating on its production possibility curve. D The distribution of income reflects what each individual deserves.
Mark scheme: C
What was in this paper
The subtopics covered by these 30 questions, and how many questions each got. Open one in a new tab to see every Cambridge question on it.
4Money and banking4The circular flow of income3Types of cost, revenue and profit, short-run and long-run production3Equity and redistribution of income and wealth2Labour market forces and government intervention2Aggregate Demand and Aggregate Supply analysis1Economic growth and sustainability1Effectiveness of policy options to meet all macroeconomic objectives1Efficiency and market failure1Exchange rates1Government macroeconomic policy objectives1Government policies to achieve efficient resource allocation and correct market failure1Indifference curves and budget lines1Links between macroeconomic problems and their interrelatedness1Protectionism1Unemployment1Utility1What you needed in this session
Cambridge’s own grade thresholds for 2010 Oct/Nov, Paper 3 · Variant 3. A higher threshold means an easier paper — the bar moves with how the cohort did.