Cambridge A Level Economics 9708 — 2020 Feb/March Paper 3 · Variant 2
9708/32/F/M/20 · 30 questions · 30 marks · ≈34 min
The question paper and its mark scheme, free to read here and free to download. This is Cambridge’s own paper, exactly as it was sat.
Question paper12 pages







Mark scheme3 pages
Answers below. Sit the paper first if you are practising.



Questions as text
Q1 · Which statement about a product with external costs must be correct?
1 Which statement about a product with external costs must be correct? A The consumption of the product has positive effects on third parties. B The private costs of its production exceed the social costs of its production. C The production of the product has negative effects on third parties. D The social costs of its production exceed the social benefits of its production.
Mark scheme: C
More questions on Private costs and benefits, externalities and social costs and benefits
Q2 · What is correct if a firm in a perfectly competitive market is maximising its long-run…
2 What is correct if a firm in a perfectly competitive market is maximising its long-run profits? it is allocatively it is productively efficient efficient A no no B no yes C yes no D yes yes
Mark scheme: D
Q3 · The table shows the results of a cost-benefit analysis undertaken by a government when it…
3 The table shows the results of a cost-benefit analysis undertaken by a government when it was considering investing US$200 million in building a new airport. US$ million private benefits 230 private costs 200 external costs 50 The government will build the airport if the net social benefit creates a return of at least 10% on its investment. What will the minimum external benefit need to be in US$ million to achieve this? A 10 B 20 C 30 D 40
Mark scheme: D
More questions on Private costs and benefits, externalities and social costs and benefits
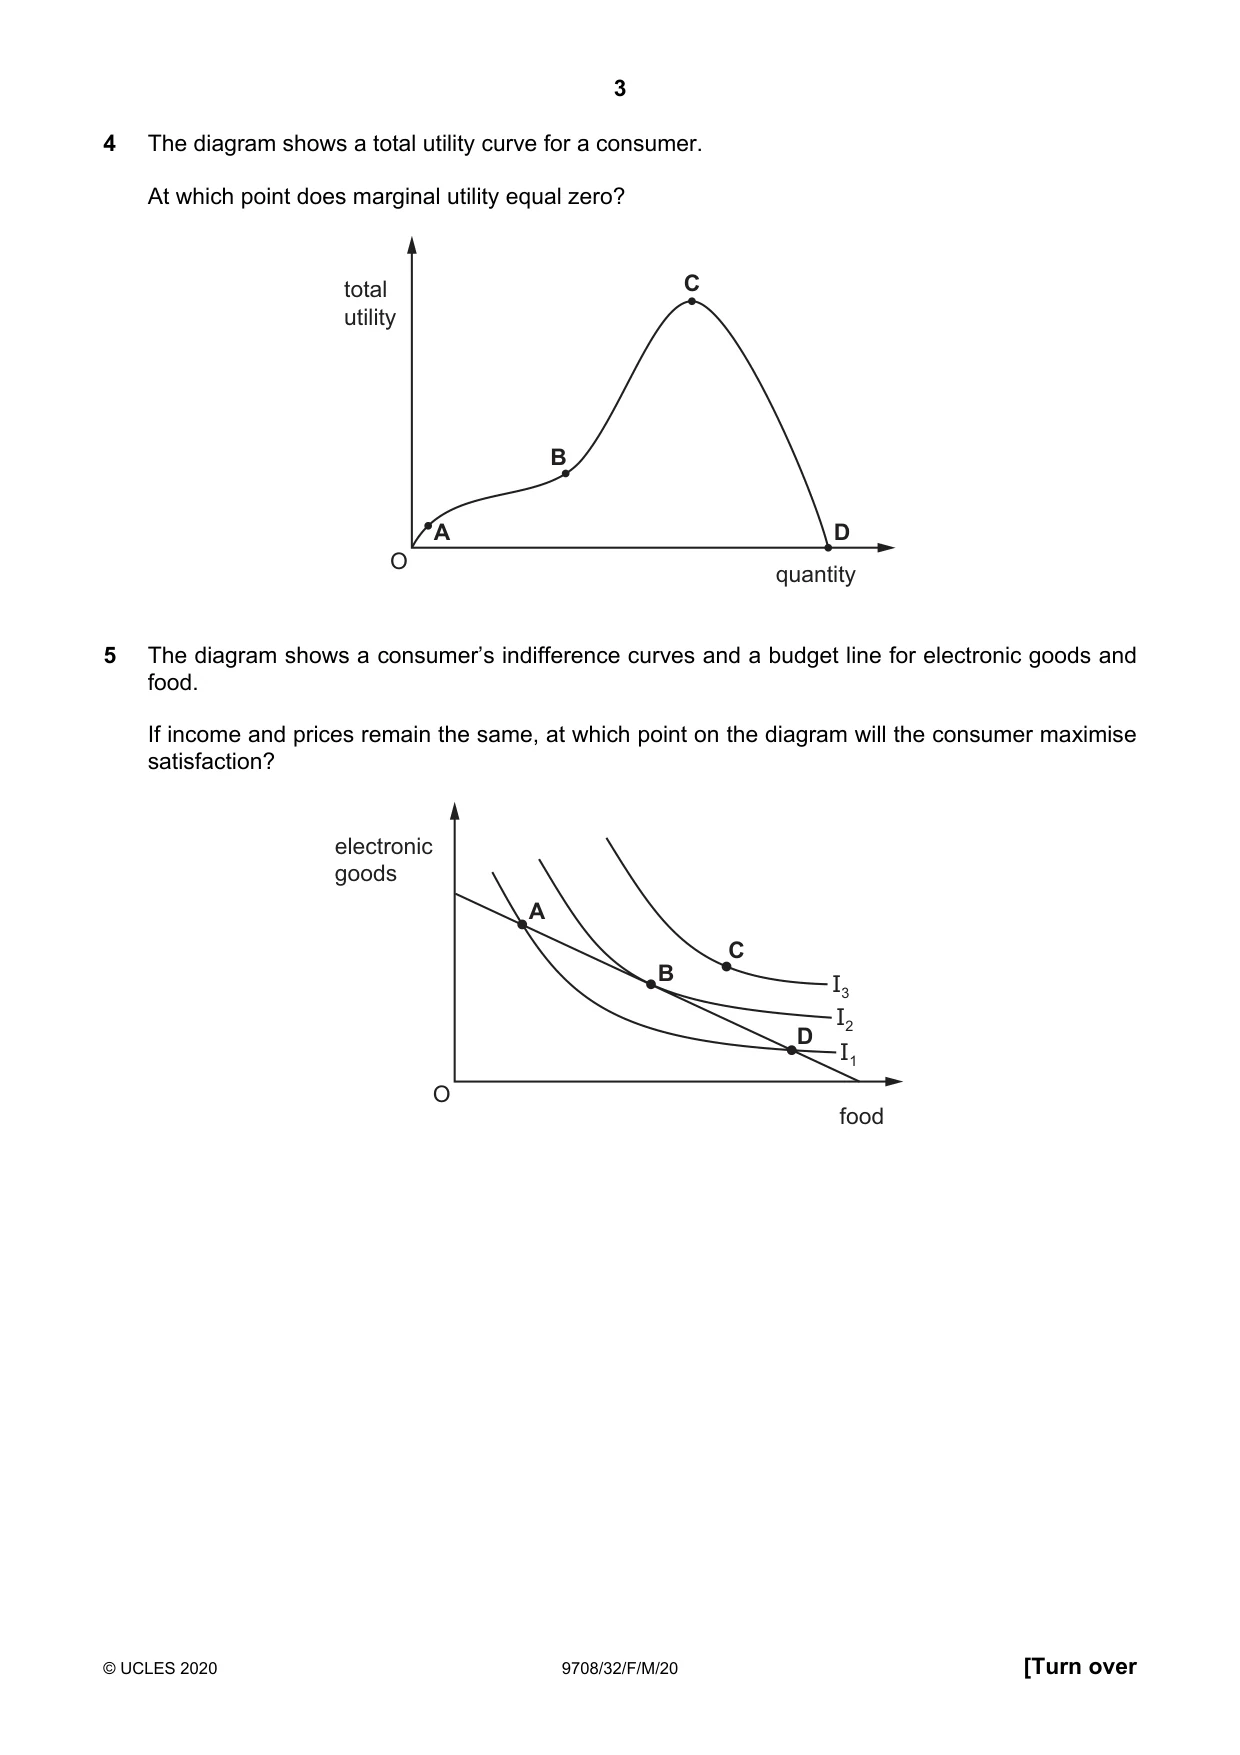
Q4 · The diagram shows a total utility curve for a consumer
4 The diagram shows a total utility curve for a consumer. At which point does marginal utility equal zero? total C utility B A D O quantity
Mark scheme: C
Q5 · The diagram shows a consumer’s indifference curves and a budget line for electronic goods…
5 The diagram shows a consumer’s indifference curves and a budget line for electronic goods and food. If income and prices remain the same, at which point on the diagram will the consumer maximise satisfaction? electronic goods A C B I3 I2 D I1 O food
Mark scheme: B
Q6 · The diagram shows a consumer’s total utility
6 The diagram shows a consumer’s total utility. total utility TU1 TU2 TU3 TU4 O quantity Which curve would mean that marginal utility is diminishing? A TU1 B TU2 C TU3 D TU4
Mark scheme: A
Q7 · Which is an internal economy of scale?
7 Which is an internal economy of scale? A cheaper loans from a local bank resulting from a merger B efficient local transport networks C specialist training facilities provided by a local college D the reputation of an area for a particular product
Mark scheme: A
More questions on Types of cost, revenue and profit, short-run and long-run production
Q8 · Why might a firm continue in production in the short run even though the price of its…
8 Why might a firm continue in production in the short run even though the price of its product has fallen below its average total costs of production? A It anticipates a rise in variable costs. B It expects the fall in price to be temporary. C It has large fixed costs of production. D It has no control over the price of its product.
Mark scheme: B
More questions on Types of cost, revenue and profit, short-run and long-run production
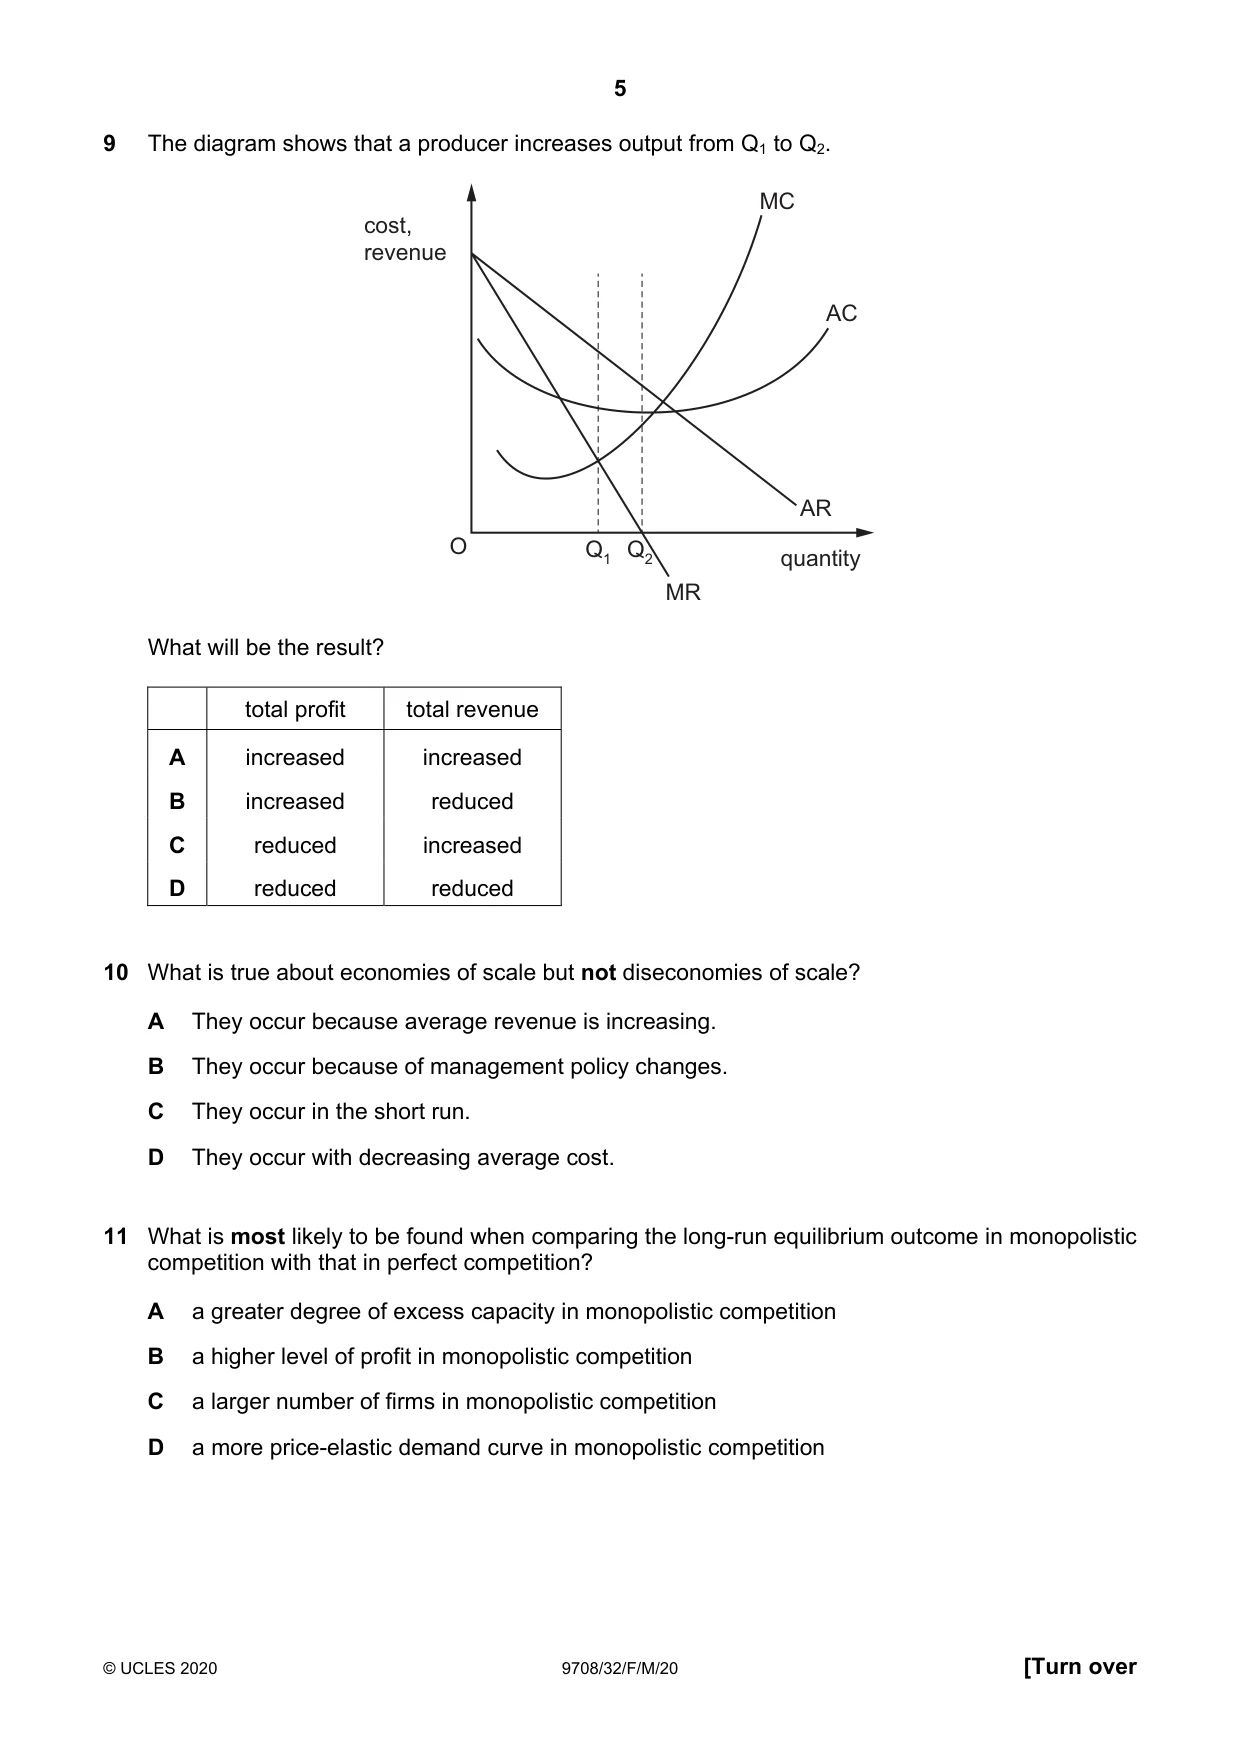
Q9 · The diagram shows that a producer increases output from Q1 to Q2
9 The diagram shows that a producer increases output from Q1 to Q2. MC cost, revenue AC AR O Q1 Q2 quantity MR What will be the result? total profit total revenue A increased increased B increased reduced C reduced increased D reduced reduced
Mark scheme: C
More questions on Types of cost, revenue and profit, short-run and long-run production
Q10 · What is true about economies of scale but not diseconomies of scale?
10 What is true about economies of scale but not diseconomies of scale? A They occur because average revenue is increasing. B They occur because of management policy changes. C They occur in the short run. D They occur with decreasing average cost.
Mark scheme: D
More questions on Types of cost, revenue and profit, short-run and long-run production
Q11 · What is most likely to be found when comparing the long-run equilibrium outcome in…
11 What is most likely to be found when comparing the long-run equilibrium outcome in monopolistic competition with that in perfect competition? A a greater degree of excess capacity in monopolistic competition B a higher level of profit in monopolistic competition C a larger number of firms in monopolistic competition D a more price-elastic demand curve in monopolistic competition
Mark scheme: A
Q12 · A government divides a nationalised rail service and sells it to five private companies
12 A government divides a nationalised rail service and sells it to five private companies. The largest of these companies dominates the four smaller companies. How will these changes affect the market structure for rail services? A It will change from monopoly to monopolistic competition. B It will create an oligopoly with the possibility of price leadership. C It will encourage freedom of entry due to lower capital costs. D It will guarantee ticket prices based on average costs.
Mark scheme: B
Q13 · What is meant by ‘real wages’?
13 What is meant by ‘real wages’? A the marginal physical product of labour B the opportunity cost of labour C the purchasing power of money wages D wages net of tax
Mark scheme: C
More questions on Labour market forces and government intervention
Q14 · The graph shows the percentage growth in average earnings for the UK economy
14 The graph shows the percentage growth in average earnings for the UK economy. 2.8 2.8 UK average weekly earnings 2.6 2.6 growth (%) 2.4 2.3 2.2 2.2 2.2 2.1 2.0 Jan April 2017 2017 What is the most likely cause of the pattern shown in the graph? A a decrease in the supply of labour B a decrease in the interest rate C an increase in productivity D an increase in the size of the labour force
Mark scheme: D
More questions on Labour market forces and government intervention
Q15 · Which combination of policy changes is most likely to redistribute income from the…
15 Which combination of policy changes is most likely to redistribute income from the richest households to the poorest households in an economy? means-tested benefits indirect taxes benefits for everyone A decrease increase decrease B decrease increase increase C increase decrease increase D increase decrease decrease
Mark scheme: A
More questions on Equity and redistribution of income and wealth
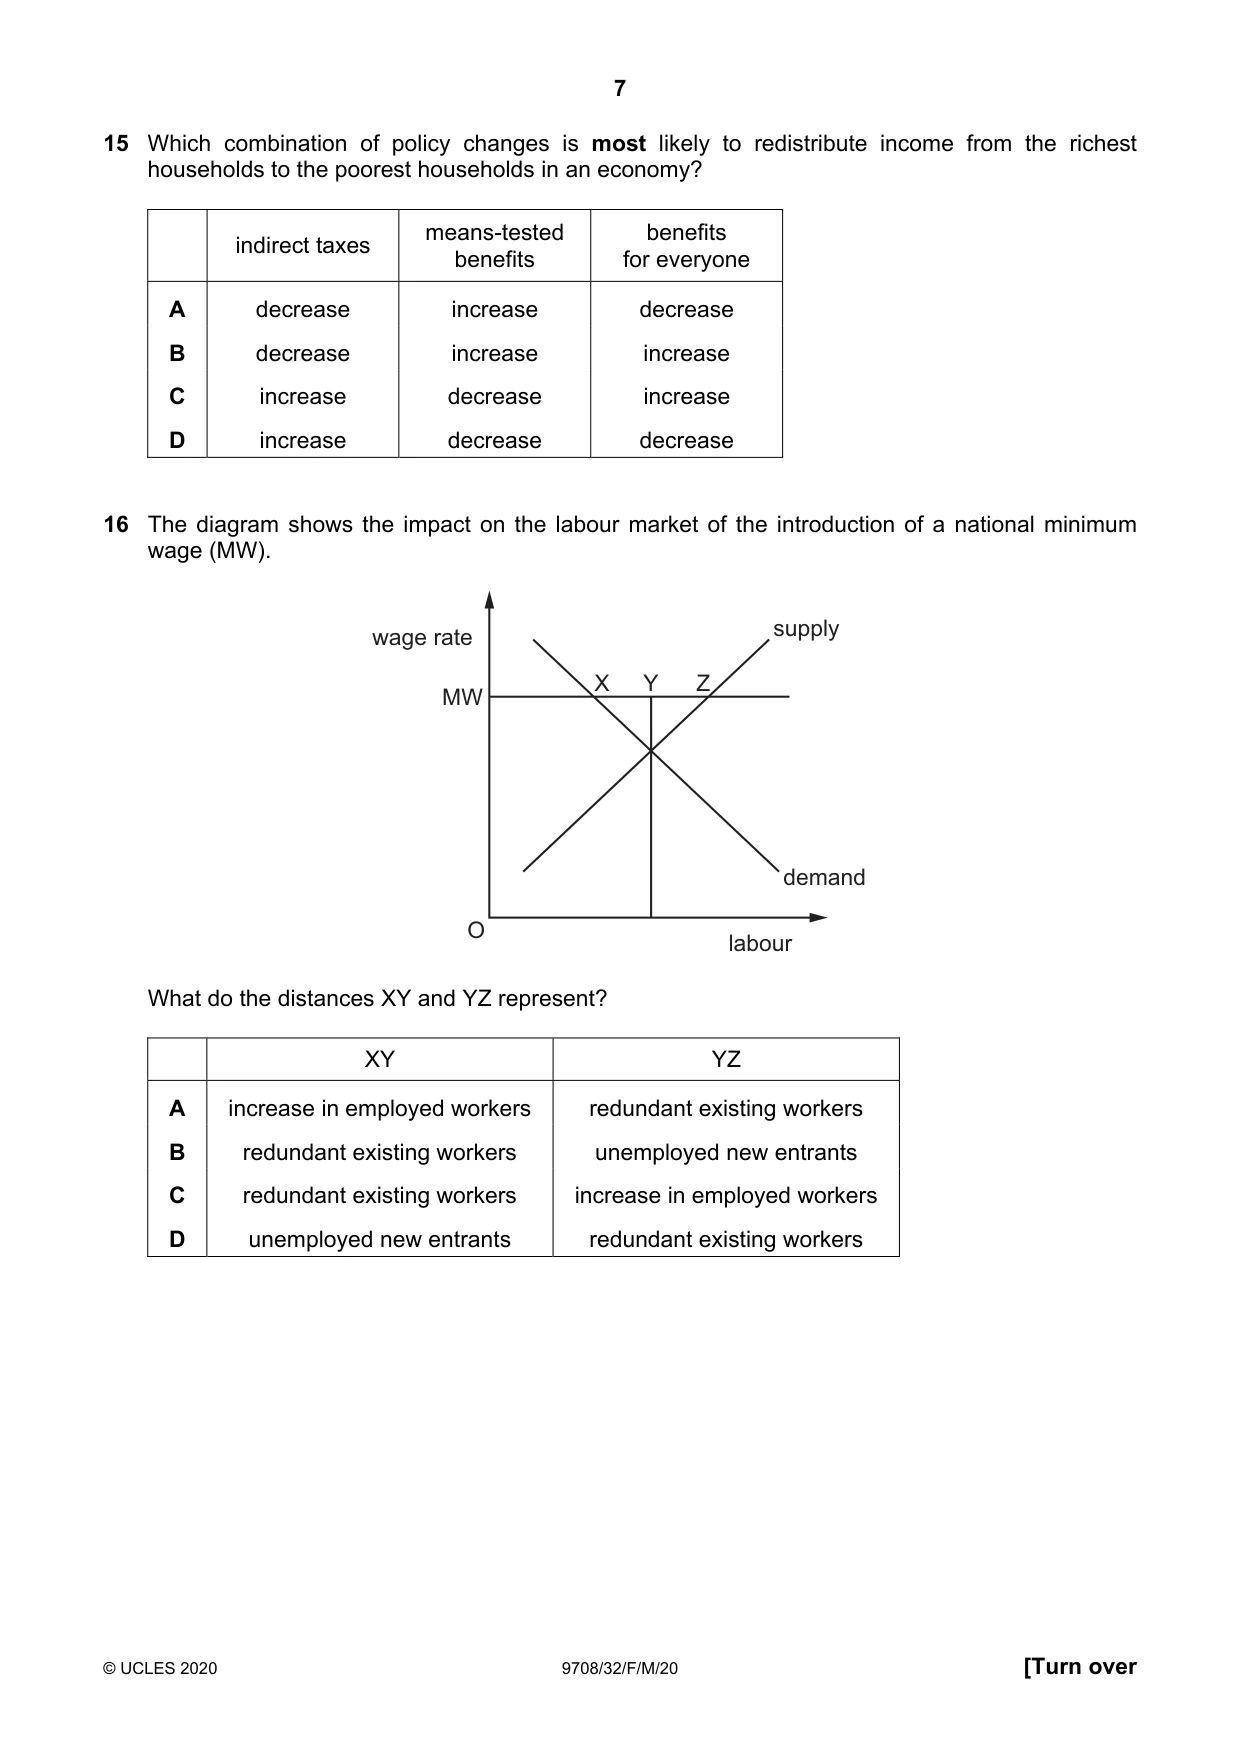
Q16 · The diagram shows the impact on the labour market of the introduction of a national…
16 The diagram shows the impact on the labour market of the introduction of a national minimum wage (MW). wage rate supply X Y Z MW demand O labour What do the distances XY and YZ represent? XY YZ A increase in employed workers redundant existing workers B redundant existing workers unemployed new entrants C redundant existing workers increase in employed workers D unemployed new entrants redundant existing workers
Mark scheme: B
More questions on Labour market forces and government intervention
Q17 · At present, motorists who drive their cars within area 1 on the map pay a daily…
17 At present, motorists who drive their cars within area 1 on the map pay a daily congestion charge of $8. X Y Y Z area 1 area 2 area 2 area 2 Which car journeys would decrease in number if the congestion charge area were extended to include area 2? A journeys from point X to point Z B journeys from point X to point Y C journeys from point Y to point Z D journeys from point Z to point Y
Mark scheme: B
Q18 · What is most likely to be the biggest contribution to sustainable economic growth in a…
18 What is most likely to be the biggest contribution to sustainable economic growth in a developed economy? A a movement of people from rural to urban areas B an increase in technical training C an increase in the size of the population D rising consumer credit levels
Mark scheme: B
Q19 · When calculating national income by the income method, what would not be included?
19 When calculating national income by the income method, what would not be included? A income from abroad B profits of private sector businesses C rent from the ownership of land D transfer payments
Mark scheme: D
Q20 · Which changes to basic income at points W and X might be included in the calculation to…
20 Which changes to basic income at points W and X might be included in the calculation to reach disposable income? basic income add W = gross income subtract X = disposable income W X A bonus payment direct taxes B bonus payment indirect taxes C cost of living direct taxes D cost of living indirect taxes
Mark scheme: A
Q21 · In a closed economy with no government sector, when will an increase in investment…
21 In a closed economy with no government sector, when will an increase in investment spending generate the largest increase in equilibrium national income? A when households have a high level of autonomous consumption B when households have a high level of compulsory saving C when households have a high marginal propensity to consume D when households have a high marginal propensity to save
Mark scheme: C
Q22 · The table shows economic data for four different countries for 2015
22 The table shows economic data for four different countries for 2015. Which country is most likely to be classed as ‘developed’? GDP per annum ($) HDI population A 10.9 trillion 0.727 1.37 billion B 2.4 trillion 0.897 66.8 million C 481 billion 0.527 182.2 million D 19 billion 0.516 15.6 million
Mark scheme: B
More questions on Characteristics of countries at different levels of development
Q23 · What is an example of a Keynesian macroeconomic policy that would reduce cyclical…
23 What is an example of a Keynesian macroeconomic policy that would reduce cyclical unemployment? A an increase in government spending on new infrastructure such as roads B an increase in government spending on retraining workers C a reduction in the rate of tax on imports D a reduction in the rate of tax on goods and services
Mark scheme: A
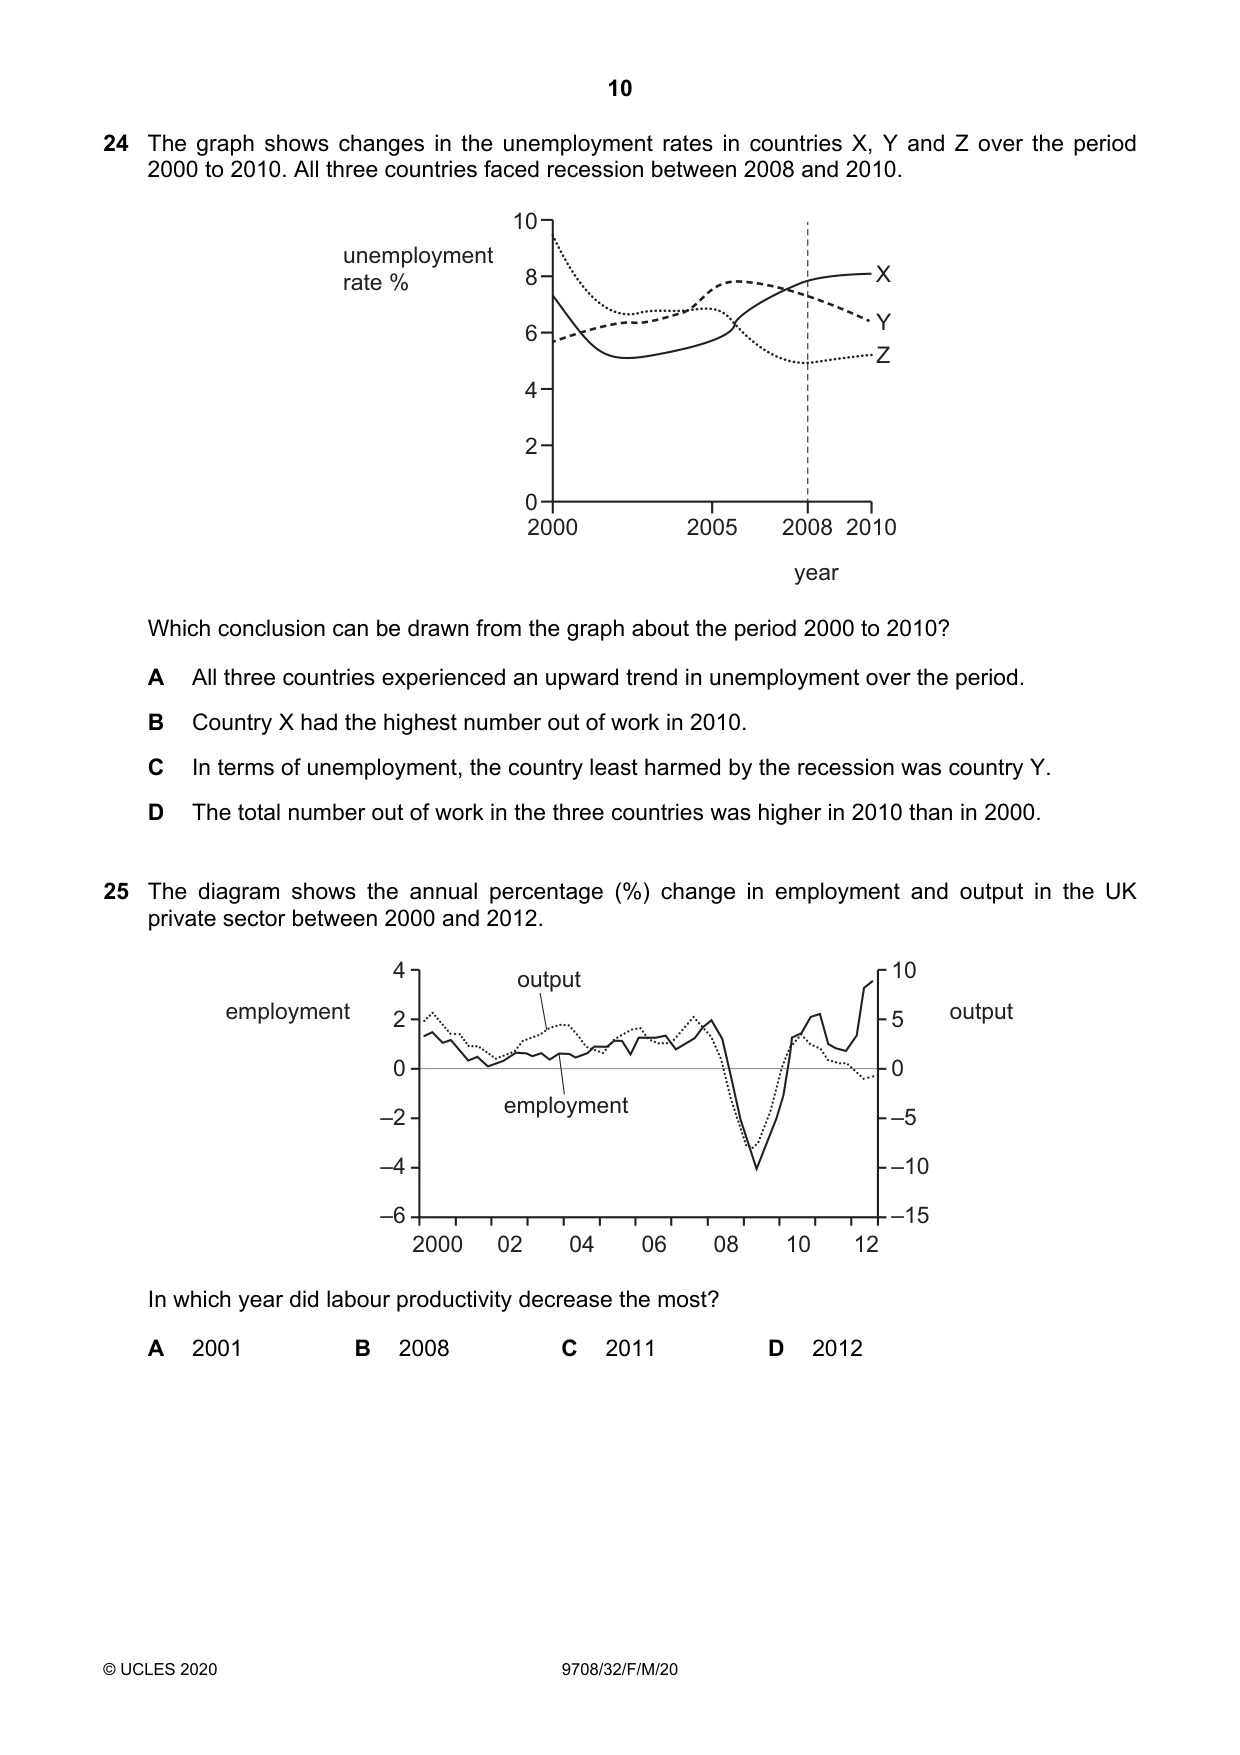
Q24 · The graph shows changes in the unemployment rates in countries X, Y and Z over the period…
24 The graph shows changes in the unemployment rates in countries X, Y and Z over the period 2000 to 2010. All three countries faced recession between 2008 and 2010. 10 unemployment rate % 8 X Y 6 Z 4 2 0 2000 2005 2008 2010 year Which conclusion can be drawn from the graph about the period 2000 to 2010? A All three countries experienced an upward trend in unemployment over the period. B Country X had the highest number out of work in 2010. C In terms of unemployment, the country least harmed by the recession was country Y. D The total number out of work in the three countries was higher in 2010 than in 2000.
Mark scheme: C
Q25 · The diagram shows the annual percentage (%) change in employment and output in the UK…
25 The diagram shows the annual percentage (%) change in employment and output in the UK private sector between 2000 and 2012. 4 output 10 employment 2 5 output 0 0 employment –2 –5 –4 –10 –6 –15 2000 02 04 06 08 10 12 In which year did labour productivity decrease the most? A 2001 B 2008 C 2011 D 2012
Mark scheme: D
Q26 · Recently, among European countries the Netherlands had the highest percentage of…
26 Recently, among European countries the Netherlands had the highest percentage of part-time employees and an average working week for all employees of 32 hours. Greece had a smaller percentage of part-time employees but an average working week for all employees of 41 hours. Which conclusion may be drawn from this information? A Greece has a higher percentage of its workforce in full-time employment than the Netherlands. B On average part-time employees work longer in Greece than in the Netherlands. C The average working week in Greece for full-time employees is longer than in the Netherlands. D There are more part-time employees in the Netherlands than in Greece.
Mark scheme: A
Q27 · In 2017 a report suggested that by 2030 automated robots could threaten 33% of existing…
27 In 2017 a report suggested that by 2030 automated robots could threaten 33% of existing jobs in the UK, compared with 38% in the US and 21% in Japan. Manufacturing and retail jobs faced the greatest threat. Which type of unemployment is illustrated in the above paragraph? A demand-deficient unemployment B frictional unemployment C seasonal unemployment D structural unemployment
Mark scheme: D
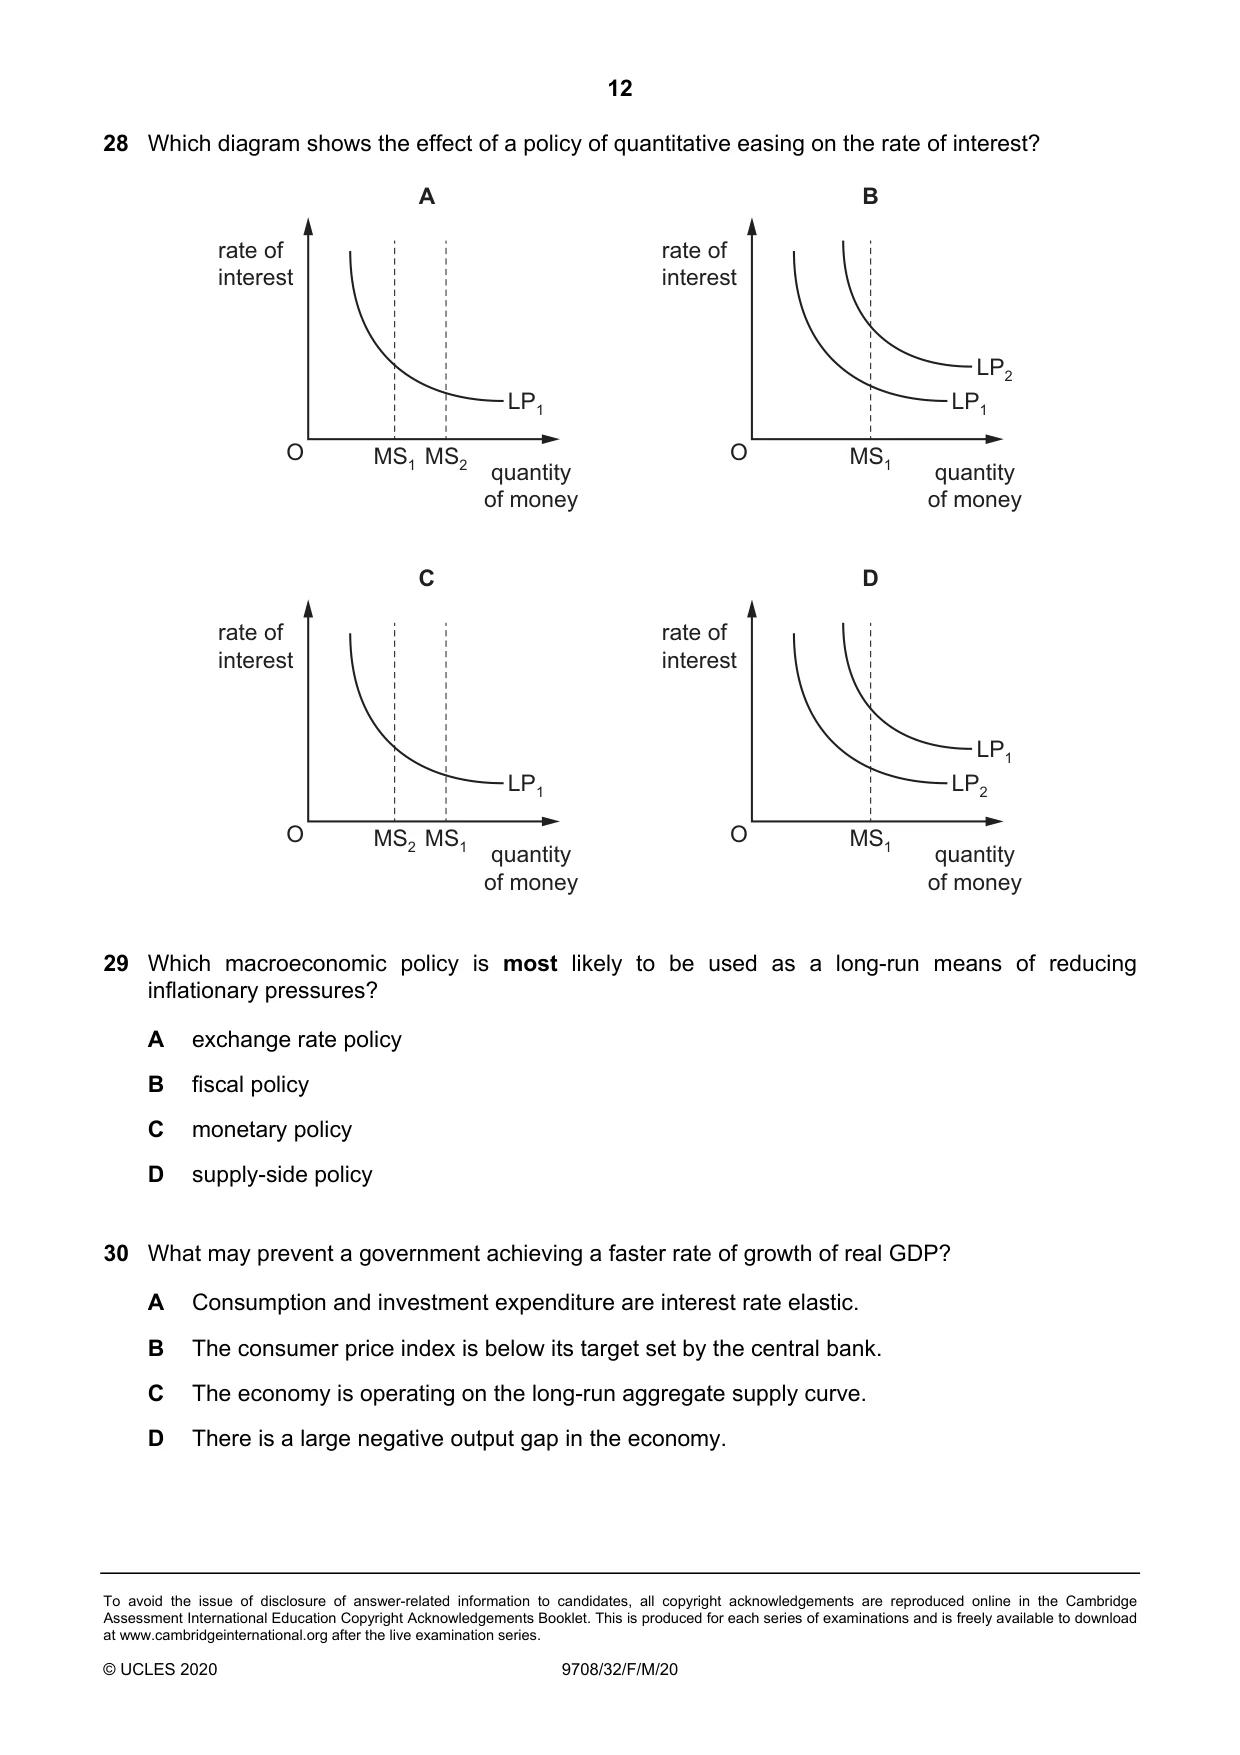
Q28 · Which diagram shows the effect of a policy of quantitative easing on the rate of interest?
28 Which diagram shows the effect of a policy of quantitative easing on the rate of interest? A B rate of rate of interest interest LP2 LP1 LP1 O MS1 MS2 O MS1 quantity quantity of money of money C D rate of rate of interest interest LP1 LP1 LP2 O MS2 MS1 O MS1 quantity quantity of money of money
Mark scheme: A
Q29 · Which macroeconomic policy is most likely to be used as a long-run means of reducing…
29 Which macroeconomic policy is most likely to be used as a long-run means of reducing inflationary pressures? A exchange rate policy B fiscal policy C monetary policy D supply-side policy
Mark scheme: D
Q30 · What may prevent a government achieving a faster rate of growth of real GDP?
30 What may prevent a government achieving a faster rate of growth of real GDP? A Consumption and investment expenditure are interest rate elastic. B The consumer price index is below its target set by the central bank. C The economy is operating on the long-run aggregate supply curve. D There is a large negative output gap in the economy.
Mark scheme: C
More questions on Aggregate Demand and Aggregate Supply analysis
What was in this paper
The subtopics covered by these 30 questions, and how many questions each got. Open one in a new tab to see every Cambridge question on it.
4Types of cost, revenue and profit, short-run and long-run production4Labour market forces and government intervention3Different market structures2National income statistics2Private costs and benefits, externalities and social costs and benefits2Utility2Aggregate Demand and Aggregate Supply analysis1Characteristics of countries at different levels of development1Economic growth and sustainability1Efficiency and market failure1Equity and redistribution of income and wealth1Fiscal policy1Government policies to achieve efficient resource allocation and correct market failure1Indifference curves and budget lines1Money and banking1Supply-side policy1The circular flow of income1What you needed in this session
Cambridge’s own grade thresholds for 2020 Feb/March, Paper 3 · Variant 2. A higher threshold means an easier paper — the bar moves with how the cohort did.