Cambridge A Level Economics 9708 — 2021 Oct/Nov Paper 3 · Variant 1
9708/31/O/N/21 · 30 questions · 30 marks · ≈34 min
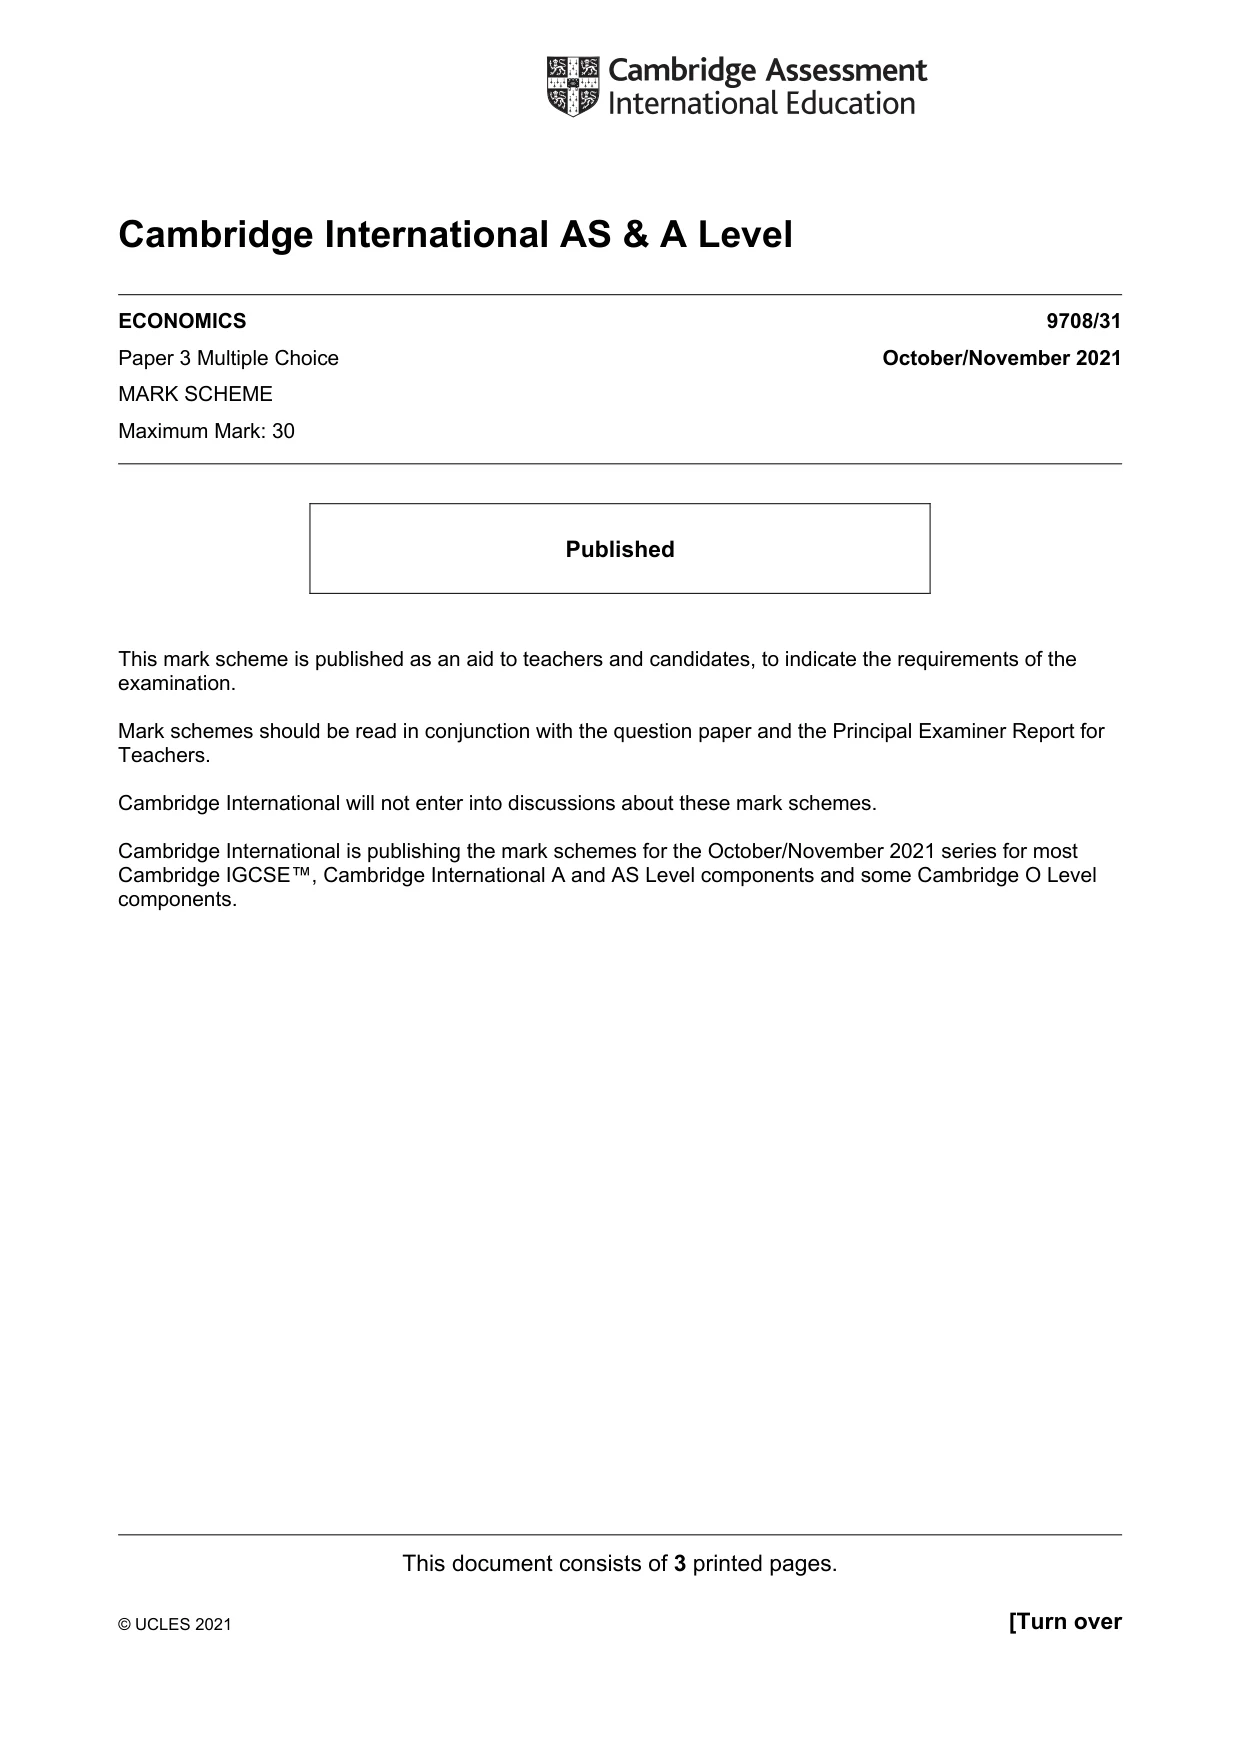
The question paper and its mark scheme, free to read here and free to download. This is Cambridge’s own paper, exactly as it was sat.
Question paper12 pages




Mark scheme3 pages
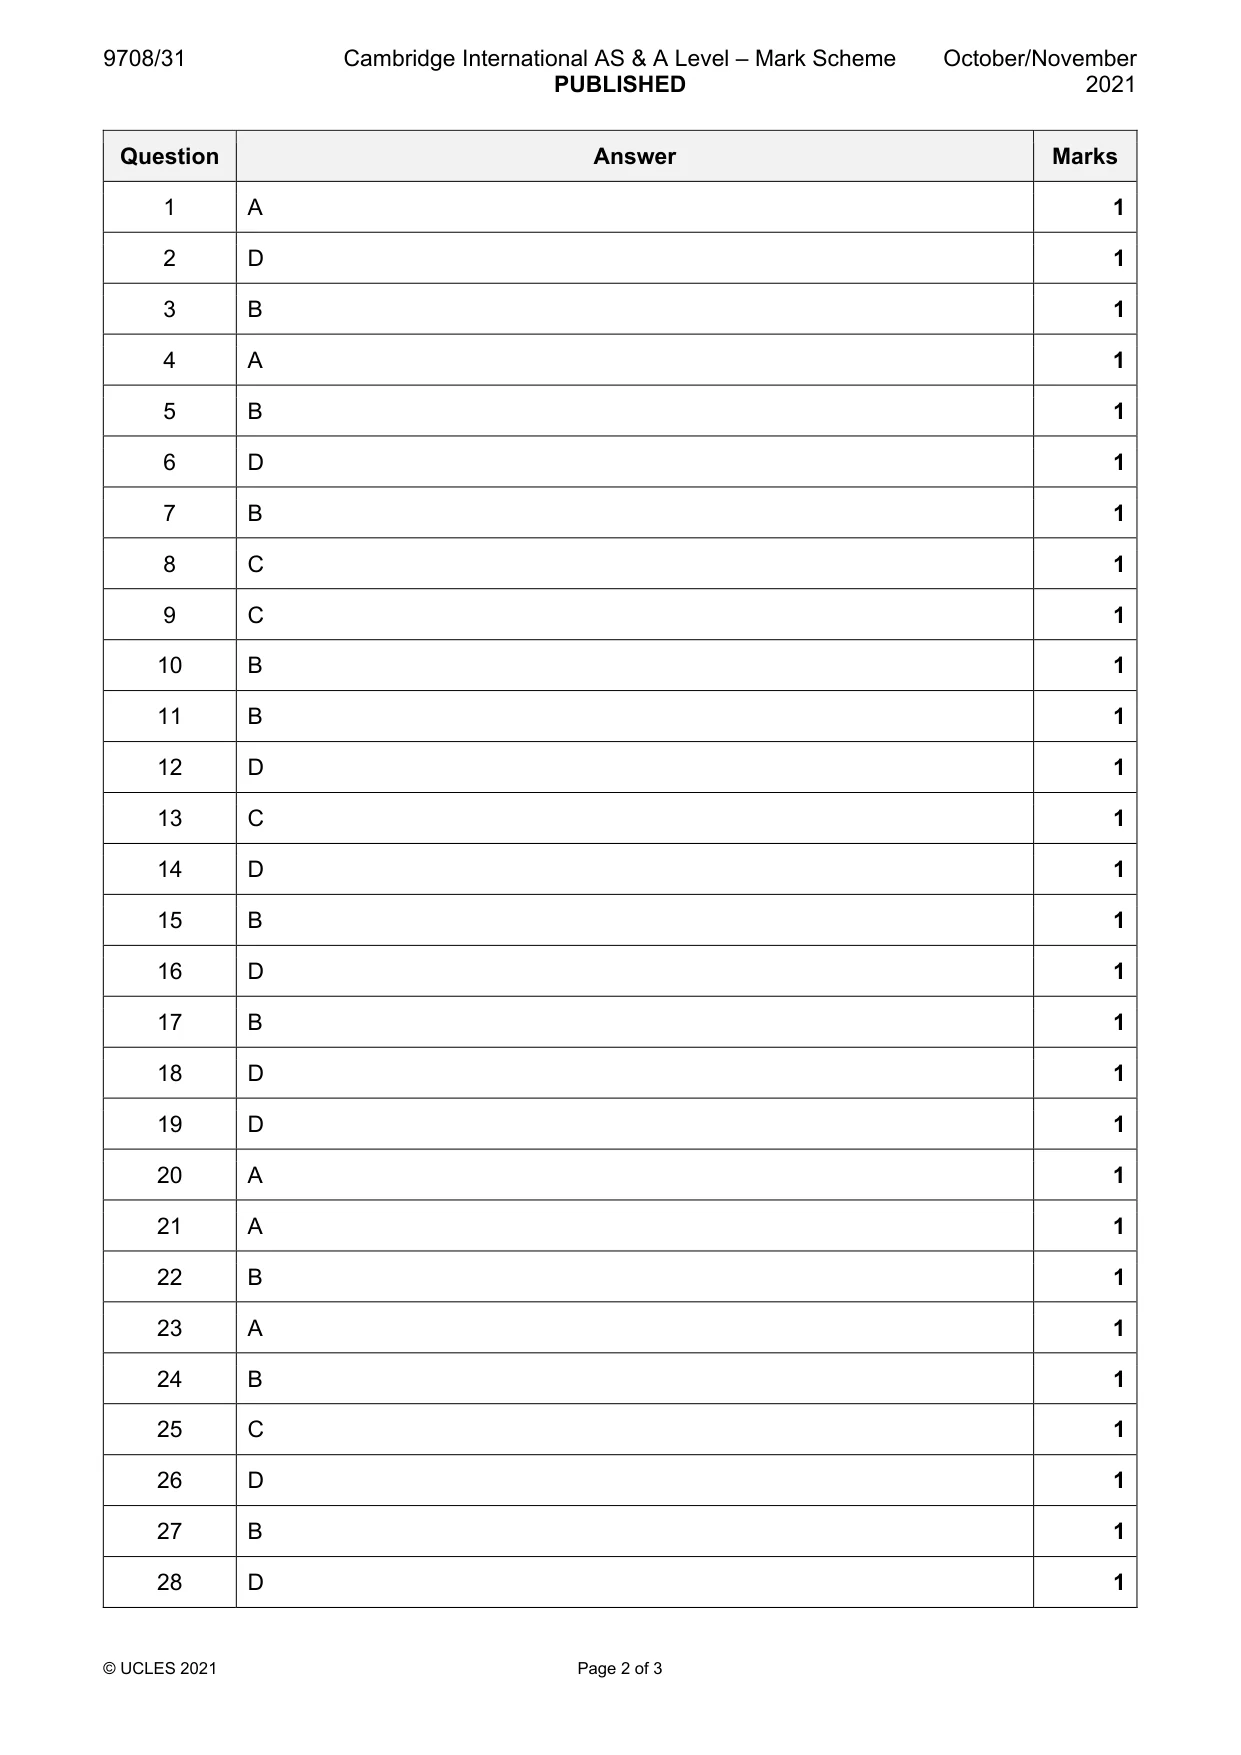
Answers below. Sit the paper first if you are practising.

Questions as text
Q1 · What is a necessary condition required to achieve Pareto efficiency?
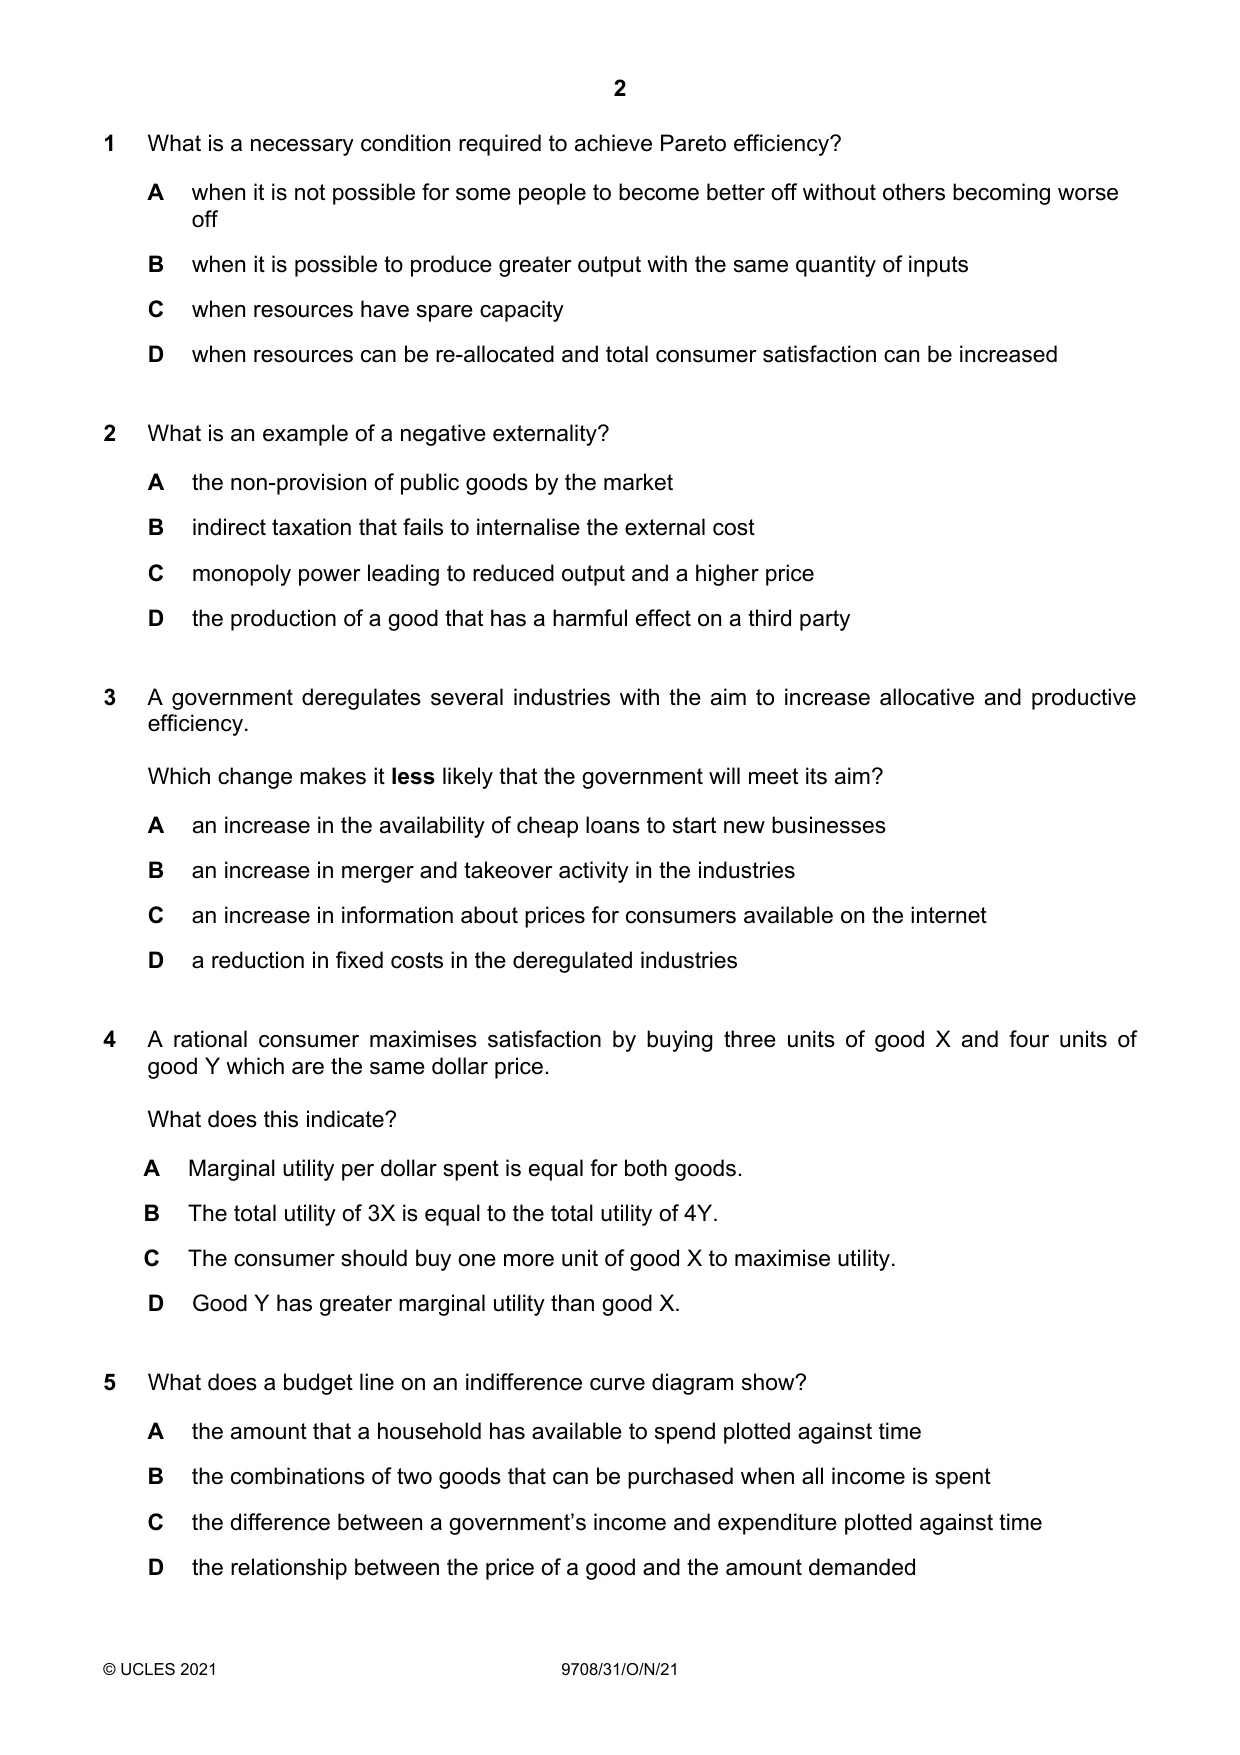
1 What is a necessary condition required to achieve Pareto efficiency? A when it is not possible for some people to become better off without others becoming worse off B when it is possible to produce greater output with the same quantity of inputs C when resources have spare capacity D when resources can be re-allocated and total consumer satisfaction can be increased
Mark scheme: A
Q2 · What is an example of a negative externality?
2 What is an example of a negative externality? A the non-provision of public goods by the market B indirect taxation that fails to internalise the external cost C monopoly power leading to reduced output and a higher price D the production of a good that has a harmful effect on a third party
Mark scheme: D
More questions on Private costs and benefits, externalities and social costs and benefits
Q3 · A government deregulates several industries with the aim to increase allocative and…
3 A government deregulates several industries with the aim to increase allocative and productive efficiency. Which change makes it less likely that the government will meet its aim? A an increase in the availability of cheap loans to start new businesses B an increase in merger and takeover activity in the industries C an increase in information about prices for consumers available on the internet D a reduction in fixed costs in the deregulated industries
Mark scheme: B
Q4 · A rational consumer maximises satisfaction by buying three units of good X and four units…
4 A rational consumer maximises satisfaction by buying three units of good X and four units of good Y which are the same dollar price. What does this indicate? A Marginal utility per dollar spent is equal for both goods. B The total utility of 3X is equal to the total utility of 4Y. C The consumer should buy one more unit of good X to maximise utility. D Good Y has greater marginal utility than good X.
Mark scheme: A
Q5 · What does a budget line on an indifference curve diagram show?
5 What does a budget line on an indifference curve diagram show? A the amount that a household has available to spend plotted against time B the combinations of two goods that can be purchased when all income is spent C the difference between a government’s income and expenditure plotted against time D the relationship between the price of a good and the amount demanded
Mark scheme: B
Q6 · Firm X, which currently specialises in producing cars, takes over firm Y, which owns a…
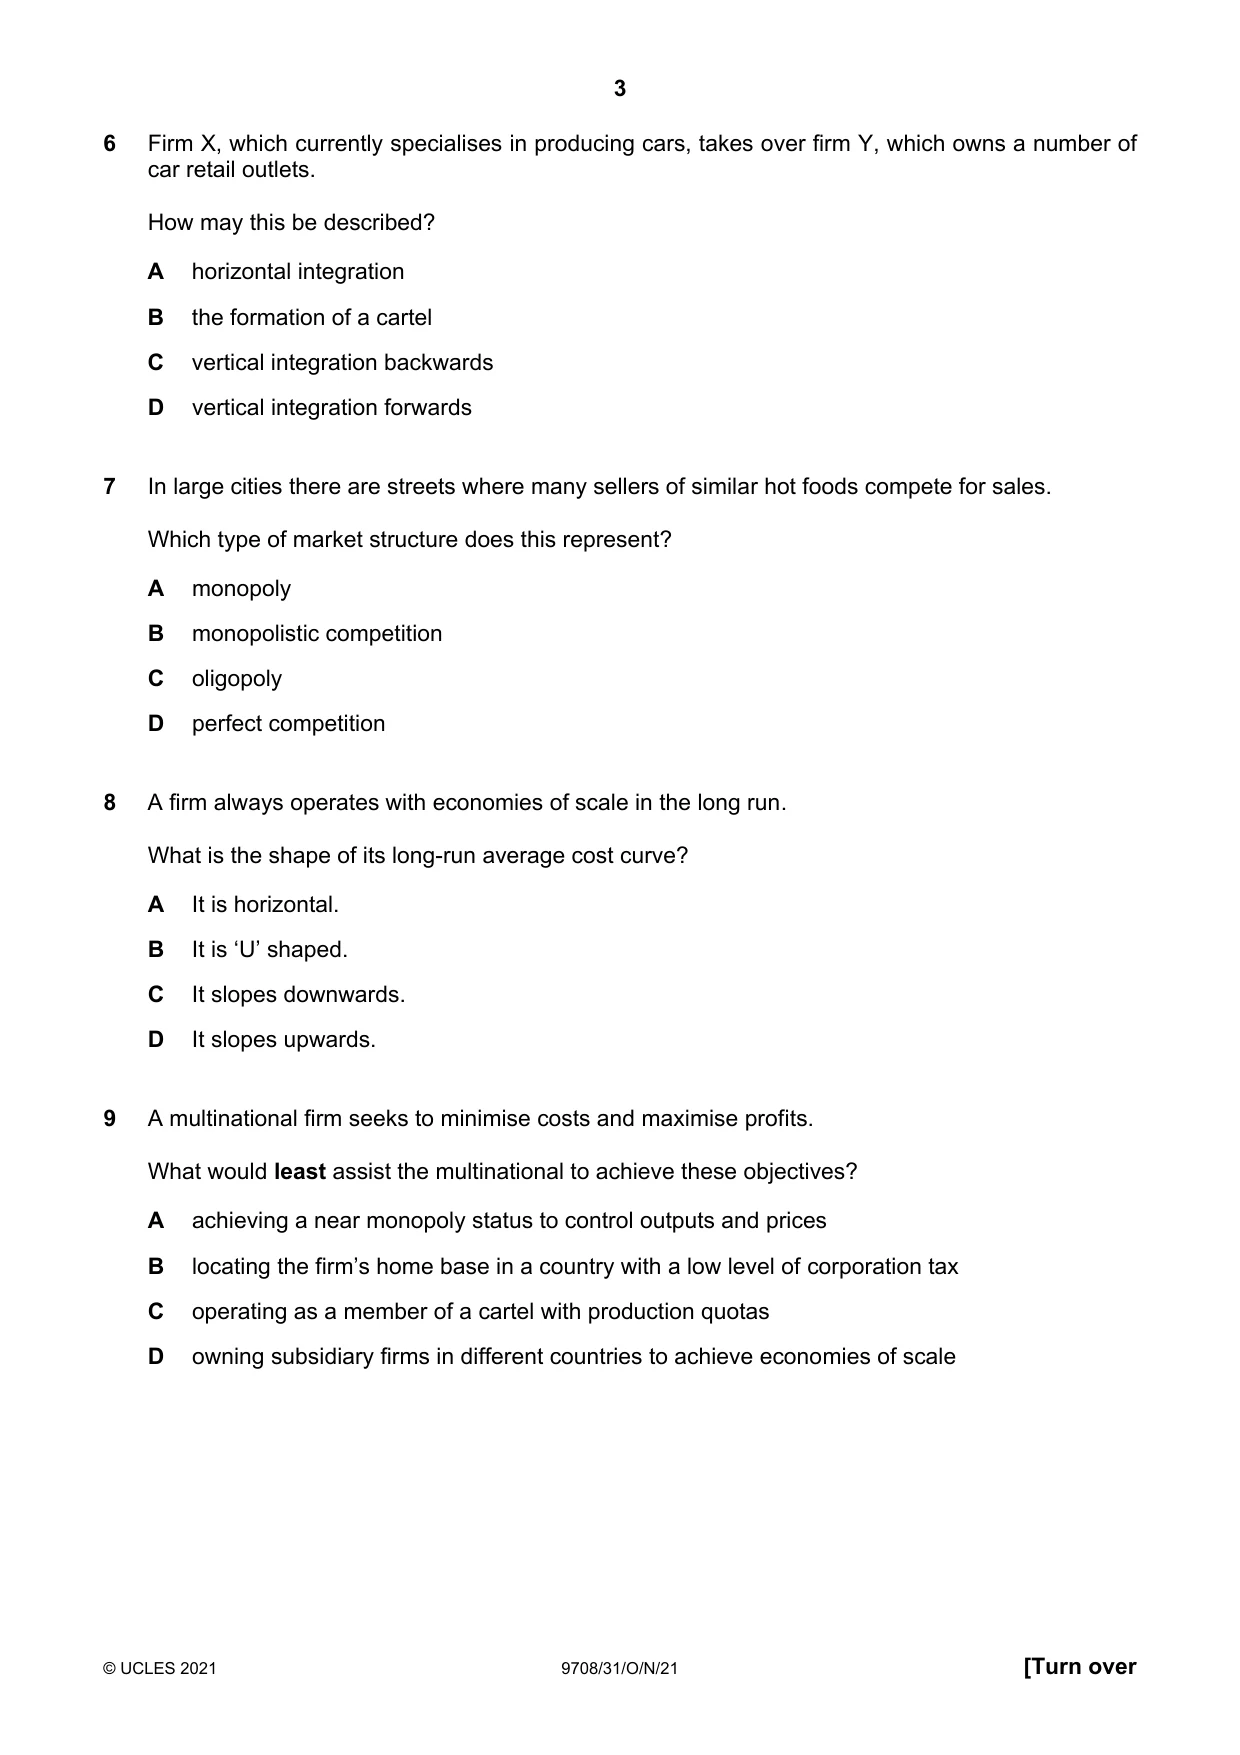
6 Firm X, which currently specialises in producing cars, takes over firm Y, which owns a number of car retail outlets. How may this be described? A horizontal integration B the formation of a cartel C vertical integration backwards D vertical integration forwards
Mark scheme: D
Q7 · In large cities there are streets where many sellers of similar hot foods compete for…
7 In large cities there are streets where many sellers of similar hot foods compete for sales. Which type of market structure does this represent? A monopoly B monopolistic competition C oligopoly D perfect competition
Mark scheme: B
Q8 · A firm always operates with economies of scale in the long run
8 A firm always operates with economies of scale in the long run. What is the shape of its long-run average cost curve? A It is horizontal. B It is ‘U’ shaped. C It slopes downwards. D It slopes upwards.
Mark scheme: C
More questions on Types of cost, revenue and profit, short-run and long-run production
Q9 · A multinational firm seeks to minimise costs and maximise profits
9 A multinational firm seeks to minimise costs and maximise profits. What would least assist the multinational to achieve these objectives? A achieving a near monopoly status to control outputs and prices B locating the firm’s home base in a country with a low level of corporation tax C operating as a member of a cartel with production quotas D owning subsidiary firms in different countries to achieve economies of scale
Mark scheme: C
More questions on Differing objectives and policies of firms
Q10 · What is the most likely combination of income elasticity of demand and price elasticity…
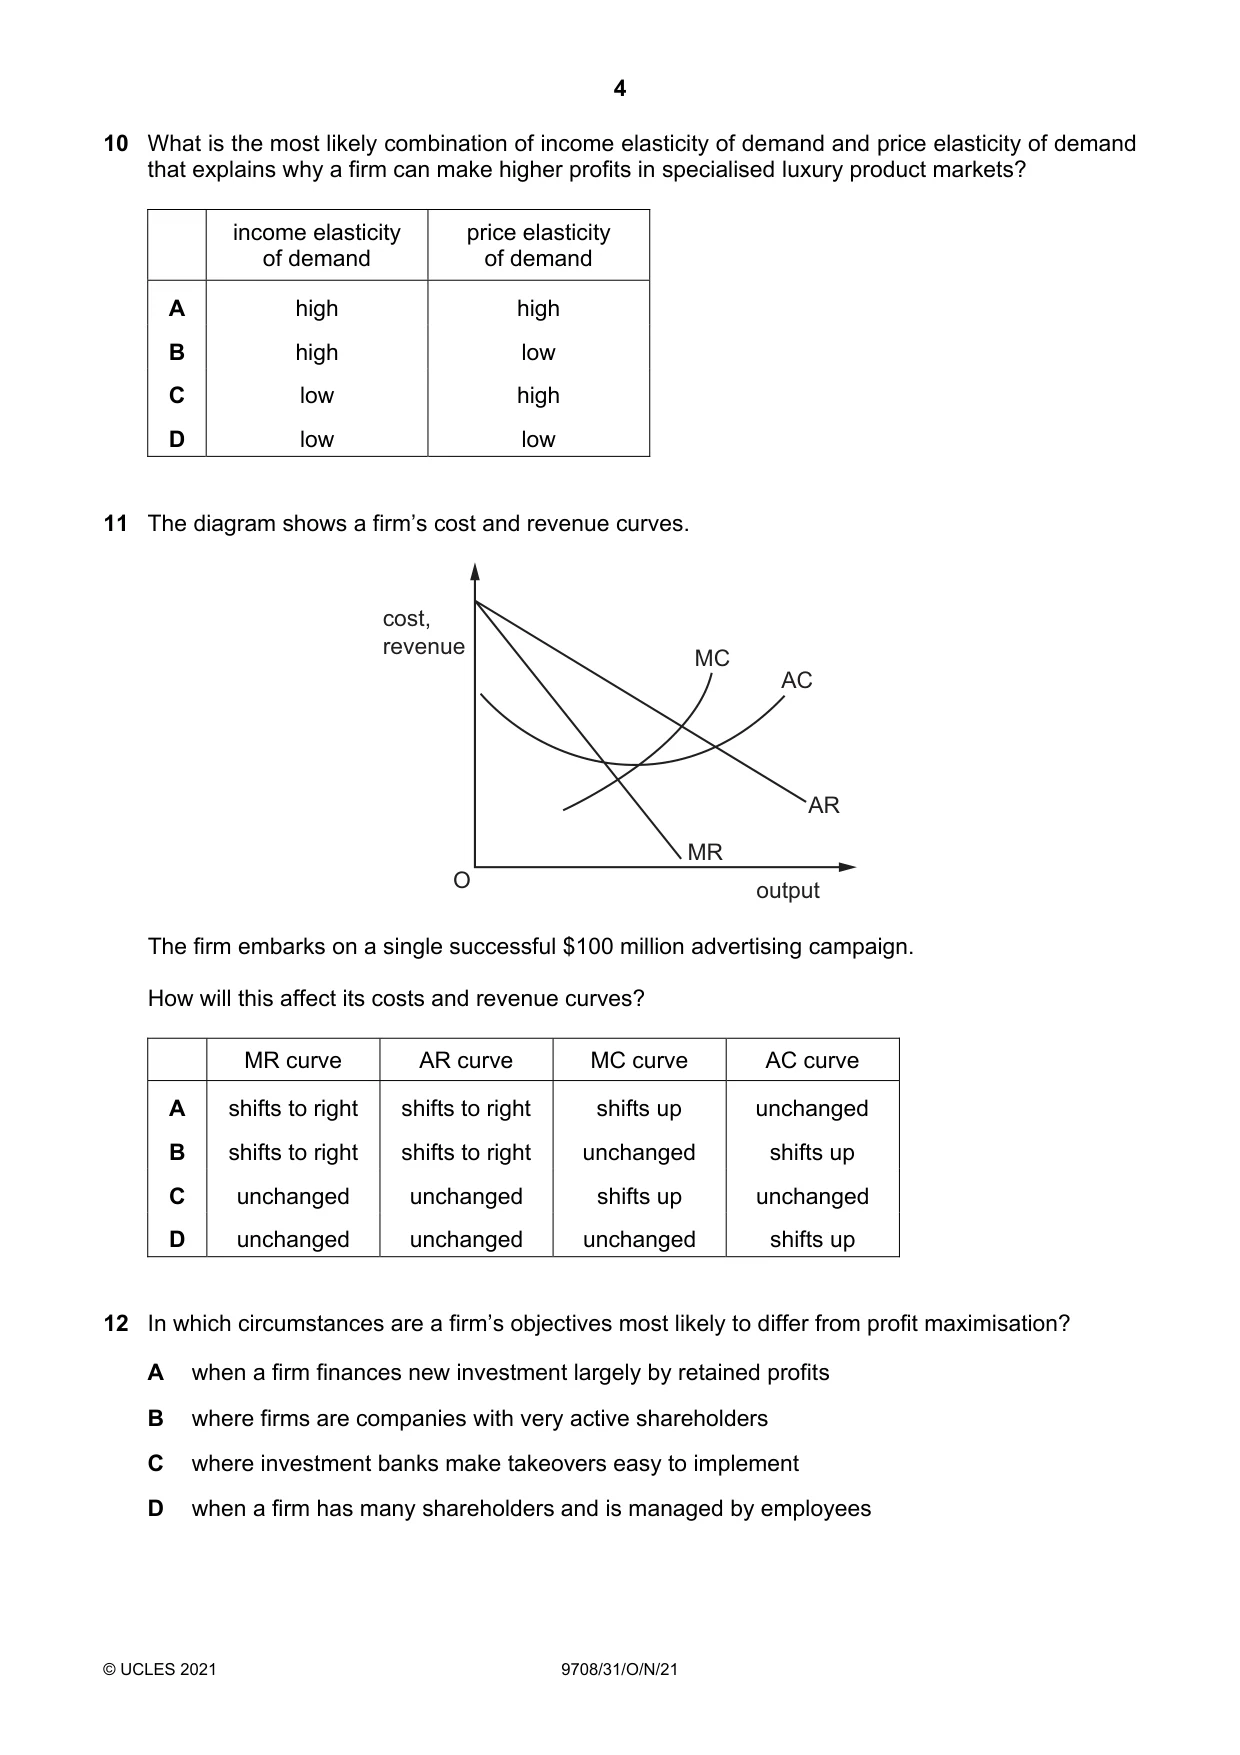
10 What is the most likely combination of income elasticity of demand and price elasticity of demand that explains why a firm can make higher profits in specialised luxury product markets? income elasticity price elasticity of demand of demand A high high B high low C low high D low low
Mark scheme: B
More questions on Price elasticity, income elasticity and cross elasticity of demand
Q11 · The diagram shows a firm’s cost and revenue curves
11 The diagram shows a firm’s cost and revenue curves. cost, revenue MC AC AR MR O output The firm embarks on a single successful $100 million advertising campaign. How will this affect its costs and revenue curves? MR curve AR curve MC curve AC curve A shifts to right shifts to right shifts up unchanged B shifts to right shifts to right unchanged shifts up C unchanged unchanged shifts up unchanged D unchanged unchanged unchanged shifts up
Mark scheme: B
More questions on Types of cost, revenue and profit, short-run and long-run production
Q12 · In which circumstances are a firm’s objectives most likely to differ from profit…
12 In which circumstances are a firm’s objectives most likely to differ from profit maximisation? A when a firm finances new investment largely by retained profits B where firms are companies with very active shareholders C where investment banks make takeovers easy to implement D when a firm has many shareholders and is managed by employees
Mark scheme: D
More questions on Differing objectives and policies of firms
Q13 · Which combination of policies is most likely to reduce the inequality of the income…
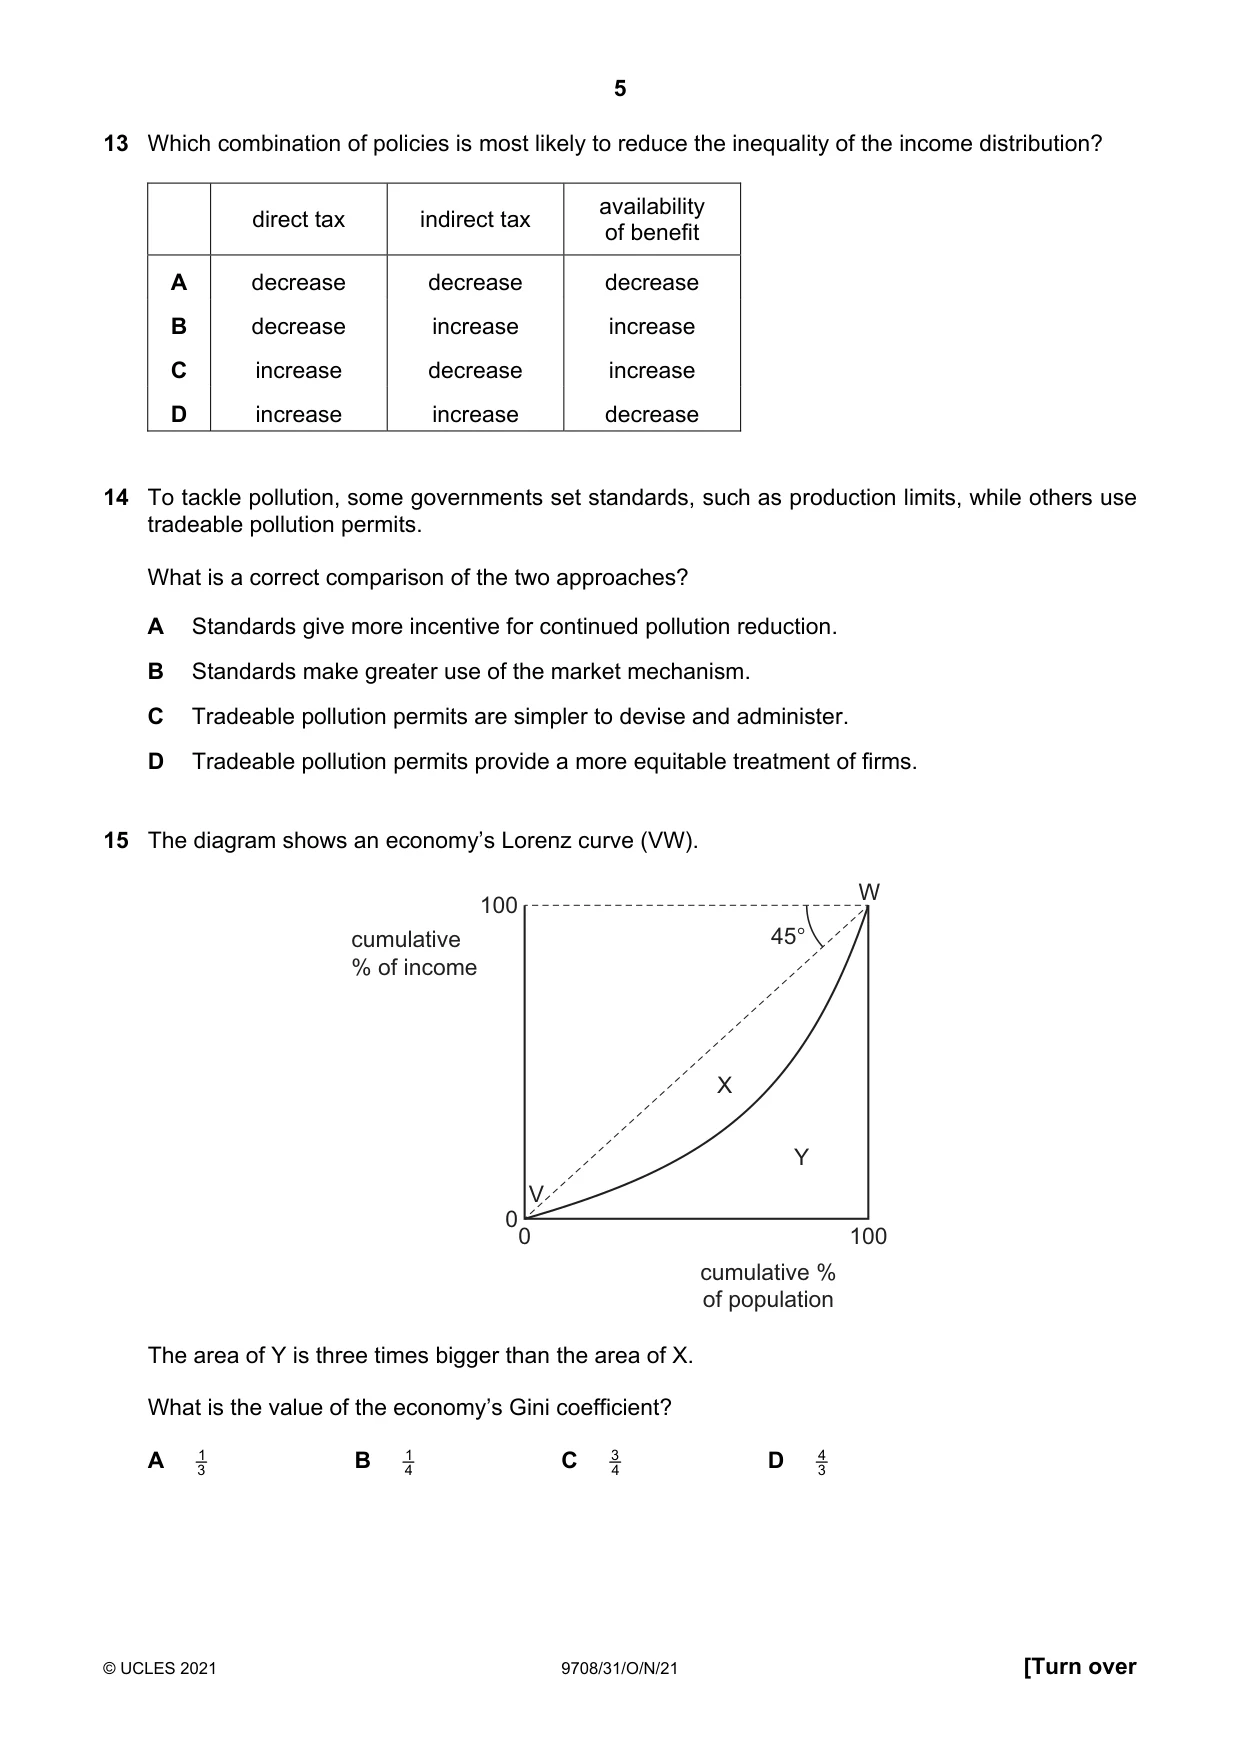
13 Which combination of policies is most likely to reduce the inequality of the income distribution? availability direct tax indirect tax of benefit A decrease decrease decrease B decrease increase increase C increase decrease increase D increase increase decrease
Mark scheme: C
More questions on Equity and redistribution of income and wealth
Q14 · To tackle pollution, some governments set standards, such as production limits, while…
14 To tackle pollution, some governments set standards, such as production limits, while others use tradeable pollution permits. What is a correct comparison of the two approaches? A Standards give more incentive for continued pollution reduction. B Standards make greater use of the market mechanism. C Tradeable pollution permits are simpler to devise and administer. D Tradeable pollution permits provide a more equitable treatment of firms.
Mark scheme: D
Q15 · The diagram shows an economy’s Lorenz curve (VW)
15 The diagram shows an economy’s Lorenz curve (VW). W 100 cumulative 45° % of income X Y V 00 100 cumulative % of population The area of Y is three times bigger than the area of X. What is the value of the economy’s Gini coefficient? A 3 1 B 4 1 C 3 4 D 3 4
Mark scheme: B
More questions on Equity and redistribution of income and wealth
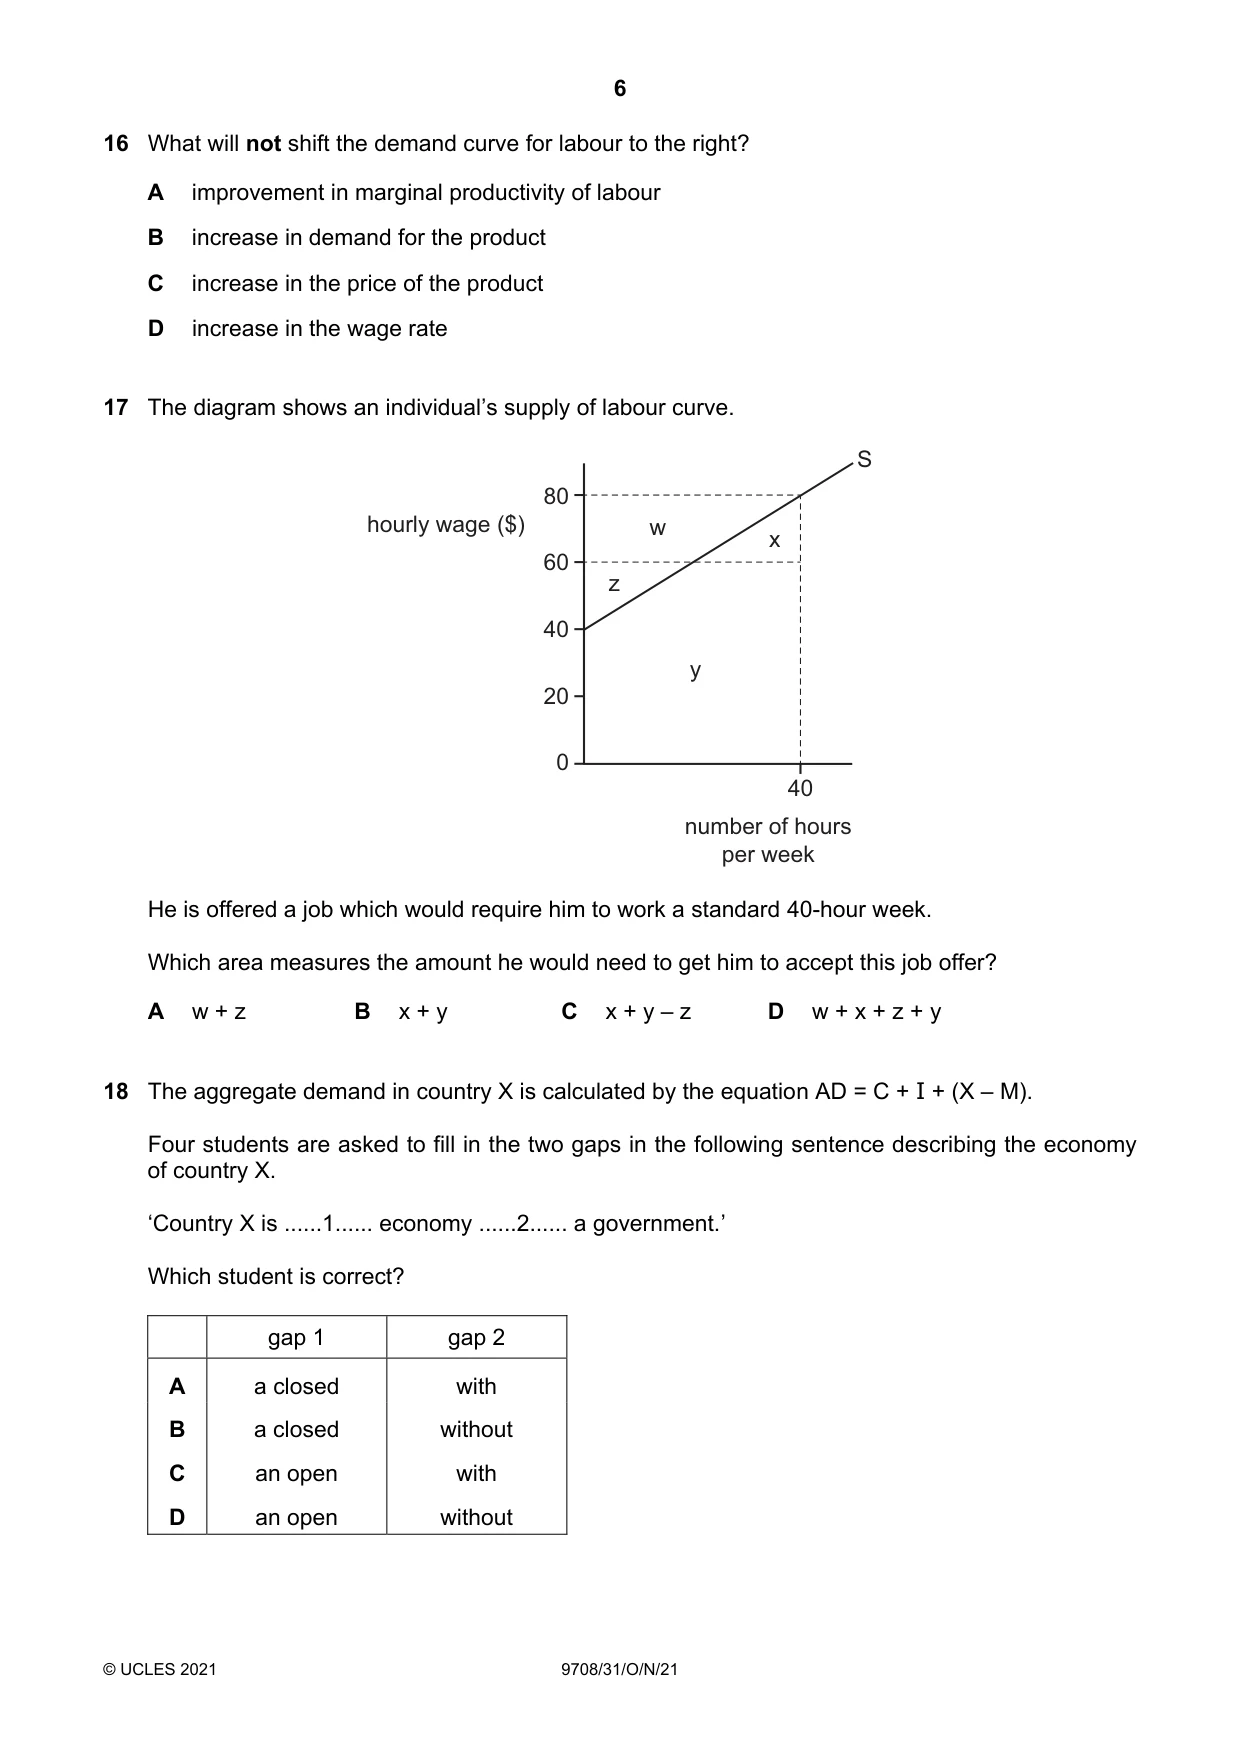
Q16 · What will not shift the demand curve for labour to the right?
16 What will not shift the demand curve for labour to the right? A improvement in marginal productivity of labour B increase in demand for the product C increase in the price of the product D increase in the wage rate
Mark scheme: D
More questions on Labour market forces and government intervention
Q17 · The diagram shows an individual’s supply of labour curve
17 The diagram shows an individual’s supply of labour curve. S 80 hourly wage ($) w x 60 z 40 y 20 0 40 number of hours per week He is offered a job which would require him to work a standard 40-hour week. Which area measures the amount he would need to get him to accept this job offer? A w + z B x + y C x + y – z D w + x + z + y
Mark scheme: B
More questions on Labour market forces and government intervention
Q18 · The aggregate demand in country X is calculated by the equation AD = C + I + (X – M)
18 The aggregate demand in country X is calculated by the equation AD = C + I + (X – M). Four students are asked to fill in the two gaps in the following sentence describing the economy of country X. ‘Country X is ......1...... economy ......2...... a government.’ Which student is correct? gap 1 gap 2 A a closed with B a closed without C an open with D an open without
Mark scheme: D
More questions on Introduction to the circular flow of income
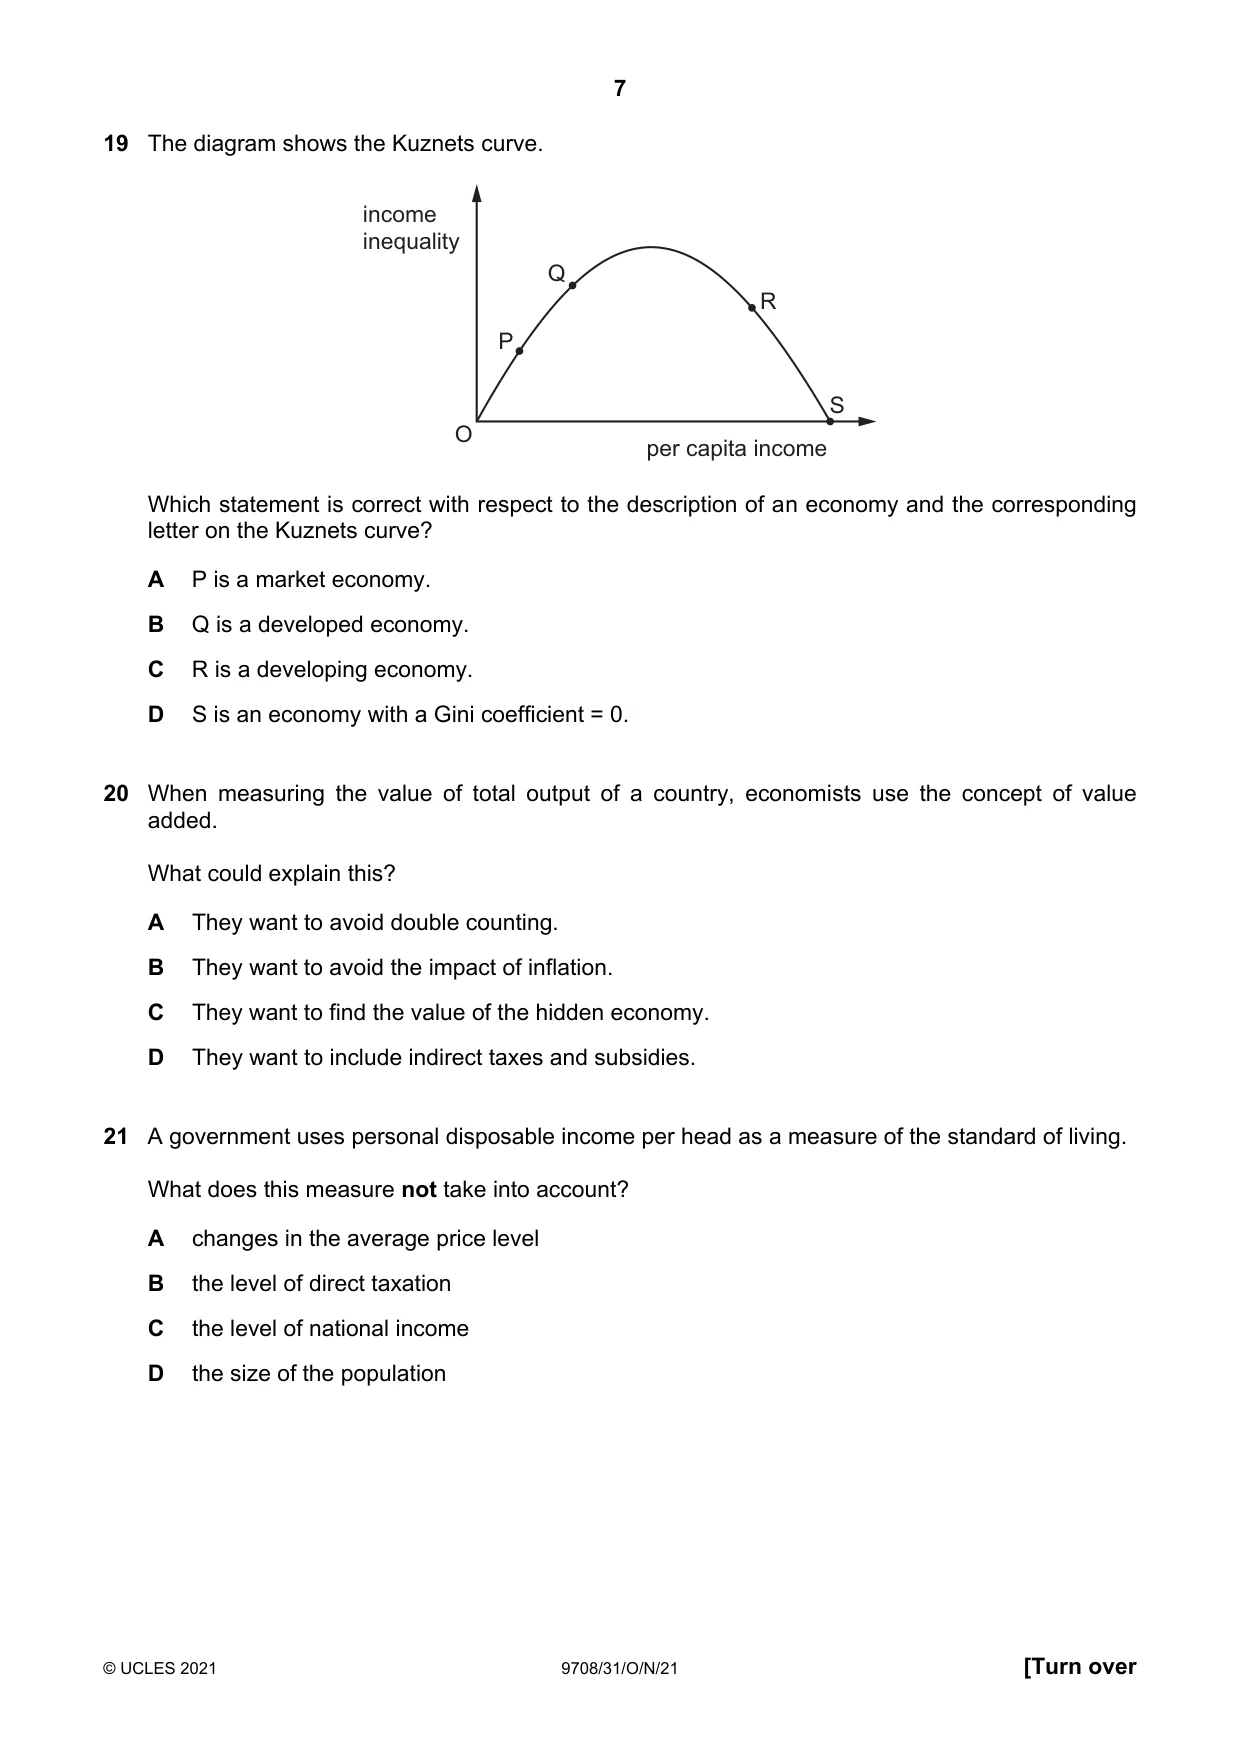
Q19 · The diagram shows the Kuznets curve
19 The diagram shows the Kuznets curve. income inequality Q R P S O per capita income Which statement is correct with respect to the description of an economy and the corresponding letter on the Kuznets curve? A P is a market economy. B Q is a developed economy. C R is a developing economy. D S is an economy with a Gini coefficient = 0.
Mark scheme: D
More questions on Characteristics of countries at different levels of development
Q20 · When measuring the value of total output of a country, economists use the concept of…
20 When measuring the value of total output of a country, economists use the concept of value added. What could explain this? A They want to avoid double counting. B They want to avoid the impact of inflation. C They want to find the value of the hidden economy. D They want to include indirect taxes and subsidies.
Mark scheme: A
Q21 · A government uses personal disposable income per head as a measure of the standard of…
21 A government uses personal disposable income per head as a measure of the standard of living. What does this measure not take into account? A changes in the average price level B the level of direct taxation C the level of national income D the size of the population
Mark scheme: A
Q22 · Which policy would be most likely to increase employment?
22 Which policy would be most likely to increase employment? A decreasing duties on imports B decreasing unemployment benefits C increasing income tax D increasing interest rates
Mark scheme: B
Q23 · Low income countries that approached the IMF for loan assistance were usually required to…
23 Low income countries that approached the IMF for loan assistance were usually required to introduce structural adjustment programmes (SAPs) which involve policies to promote a free-market economy. Which action would have been included in a SAP? A deregulation of agricultural markets B extension of food subsidies C nationalisation of water supply D restrictions and regulations on the flow of international capital
Mark scheme: A
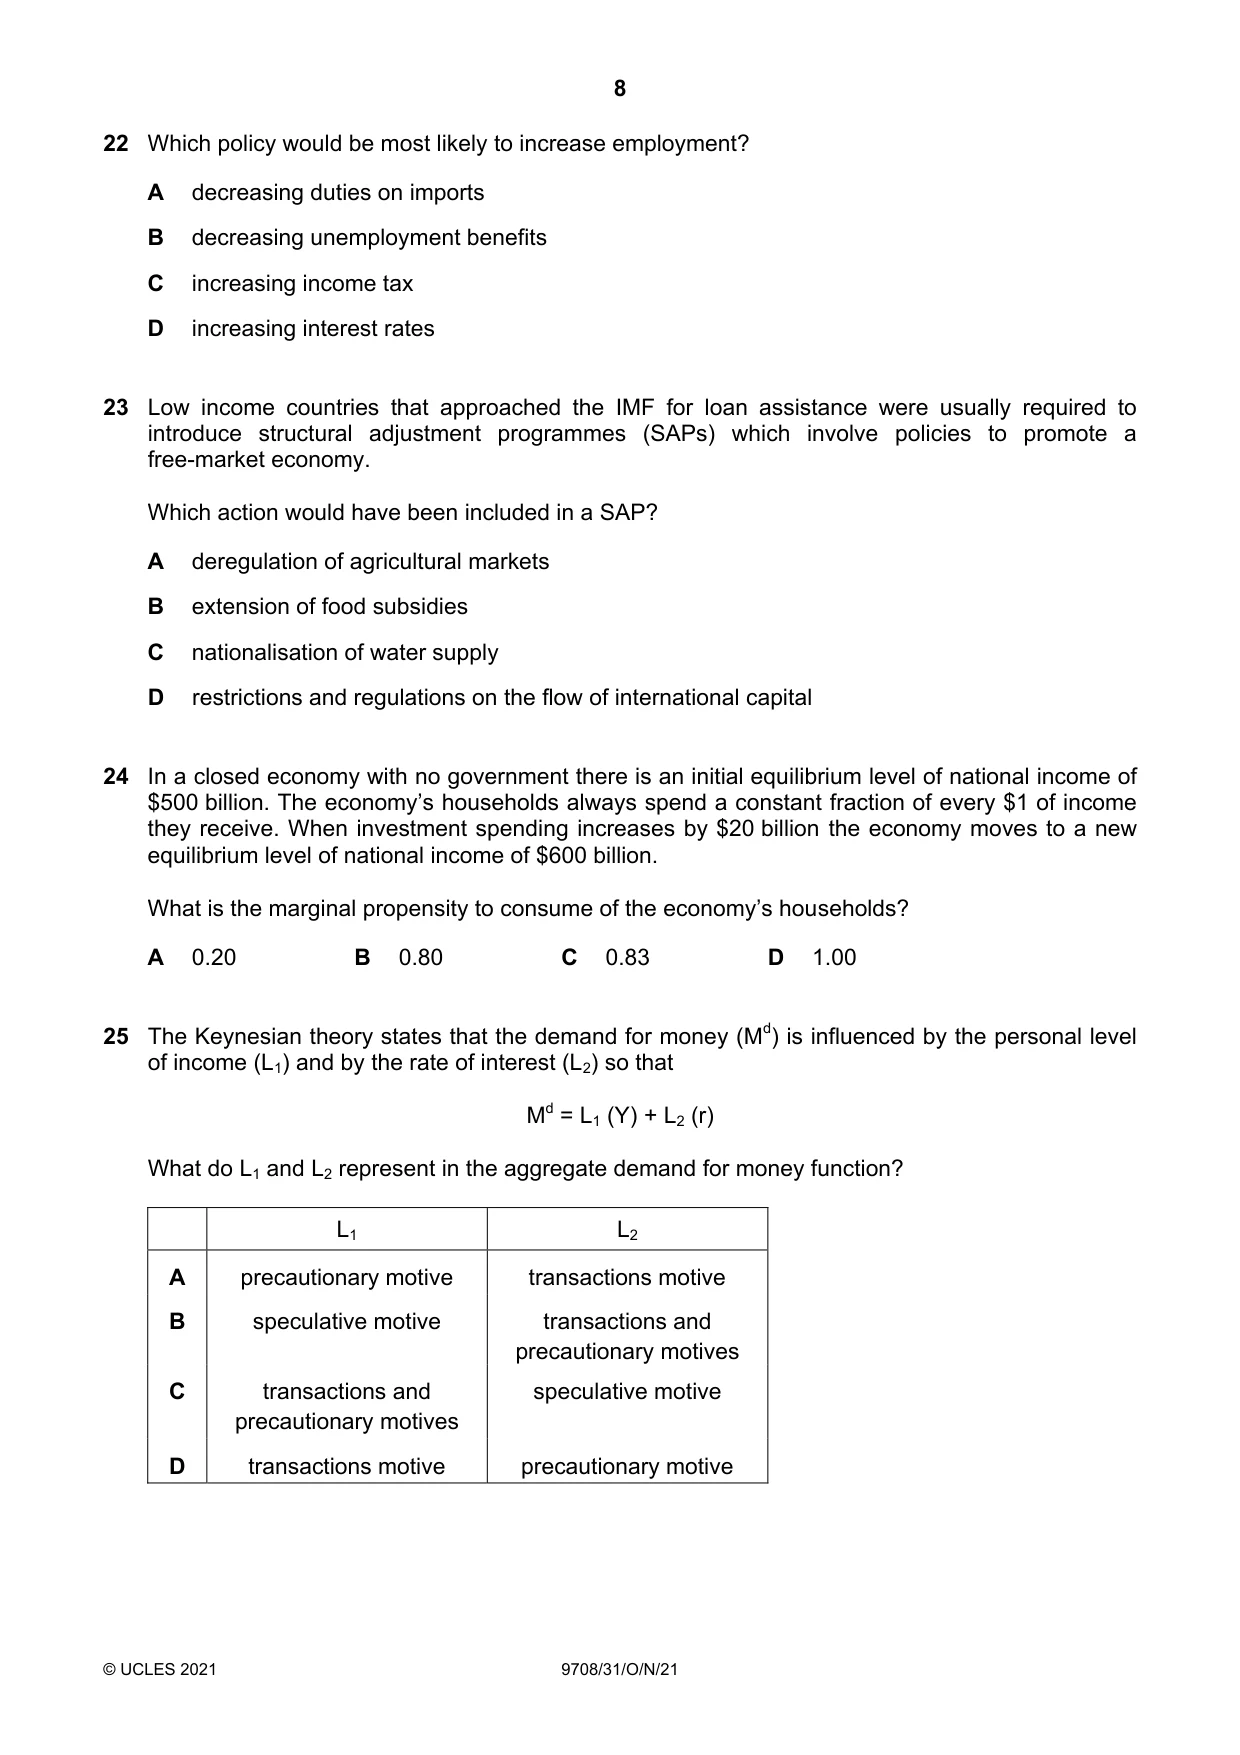
Q24 · In a closed economy with no government there is an initial equilibrium level of national…
24 In a closed economy with no government there is an initial equilibrium level of national income of $500 billion. The economy’s households always spend a constant fraction of every $1 of income they receive. When investment spending increases by $20 billion the economy moves to a new equilibrium level of national income of $600 billion. What is the marginal propensity to consume of the economy’s households? A 0.20 B 0.80 C 0.83 D 1.00
Mark scheme: B
Q25 · The Keynesian theory states that the demand for money (Md) is influenced by the personal…
25 The Keynesian theory states that the demand for money (Md) is influenced by the personal level of income (L1) and by the rate of interest (L2) so that Md = L1 (Y) + L2 (r) What do L1 and L2 represent in the aggregate demand for money function? L1 L2 A precautionary motive transactions motive B speculative motive transactions and precautionary motives C transactions and speculative motive precautionary motives D transactions motive precautionary motive
Mark scheme: C
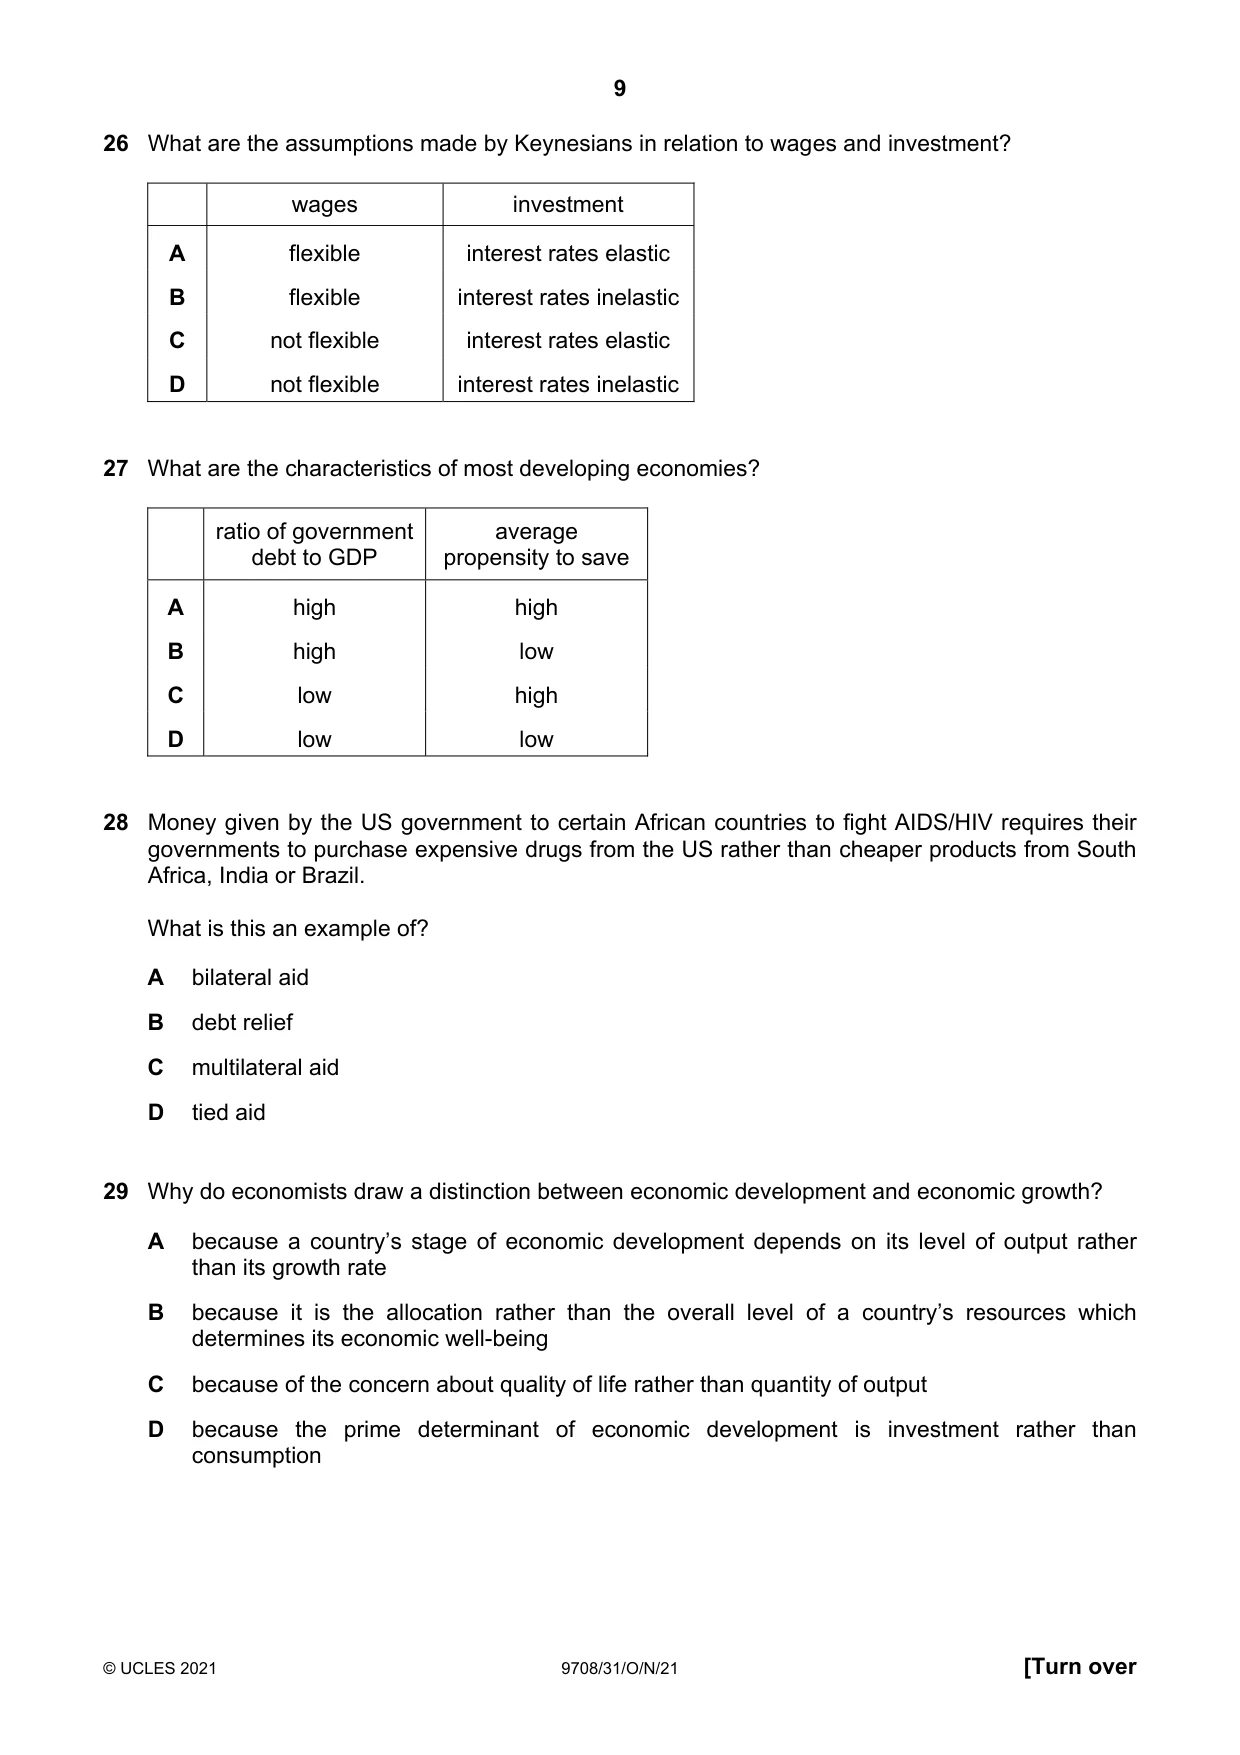
Q26 · What are the assumptions made by Keynesians in relation to wages and investment?
26 What are the assumptions made by Keynesians in relation to wages and investment? wages investment A flexible interest rates elastic B flexible interest rates inelastic C not flexible interest rates elastic D not flexible interest rates inelastic
Mark scheme: D
More questions on Aggregate Demand and Aggregate Supply analysis
Q27 · What are the characteristics of most developing economies?
27 What are the characteristics of most developing economies? ratio of government average debt to GDP propensity to save A high high B high low C low high D low low
Mark scheme: B
More questions on Characteristics of countries at different levels of development
Q28 · Money given by the US government to certain African countries to fight AIDS/HIV requires…
28 Money given by the US government to certain African countries to fight AIDS/HIV requires their governments to purchase expensive drugs from the US rather than cheaper products from South Africa, India or Brazil. What is this an example of? A bilateral aid B debt relief C multilateral aid D tied aid
Mark scheme: D
More questions on Relationship between countries at different levels of development
Q29 · Why do economists draw a distinction between economic development and economic growth?
29 Why do economists draw a distinction between economic development and economic growth? A because a country’s stage of economic development depends on its level of output rather than its growth rate B because it is the allocation rather than the overall level of a country’s resources which determines its economic well-being C because of the concern about quality of life rather than quantity of output D because the prime determinant of economic development is investment rather than consumption
Mark scheme: C
Q30 · In an economy operating below full employment, which combination of changes will…
30 In an economy operating below full employment, which combination of changes will definitely result in an increase in national income? A a fall in the rate of taxation together with a rise in the saving rate B a rise in government expenditure together with a fall in the propensity to import C a rise in investment expenditure together with a rise in the rate of taxation D a rise in the propensity to save together with a rise in exports
Mark scheme: B
More questions on Aggregate Demand and Aggregate Supply analysis
What was in this paper
The subtopics covered by these 30 questions, and how many questions each got. Open one in a new tab to see every Cambridge question on it.
3Aggregate Demand and Aggregate Supply analysis2Characteristics of countries at different levels of development2Different market structures2Differing objectives and policies of firms2Equity and redistribution of income and wealth2Government policies to achieve efficient resource allocation and correct market failure2Labour market forces and government intervention2Types of cost, revenue and profit, short-run and long-run production2Efficiency and market failure1Fiscal policy1Indifference curves and budget lines1Introduction to the circular flow of income1Money and banking1National income statistics1Price elasticity, income elasticity and cross elasticity of demand1Private costs and benefits, externalities and social costs and benefits1Relationship between countries at different levels of development1The circular flow of income1Utility1What you needed in this session
Cambridge’s own grade thresholds for 2021 Oct/Nov, Paper 3 · Variant 1. A higher threshold means an easier paper — the bar moves with how the cohort did.