Questions as text
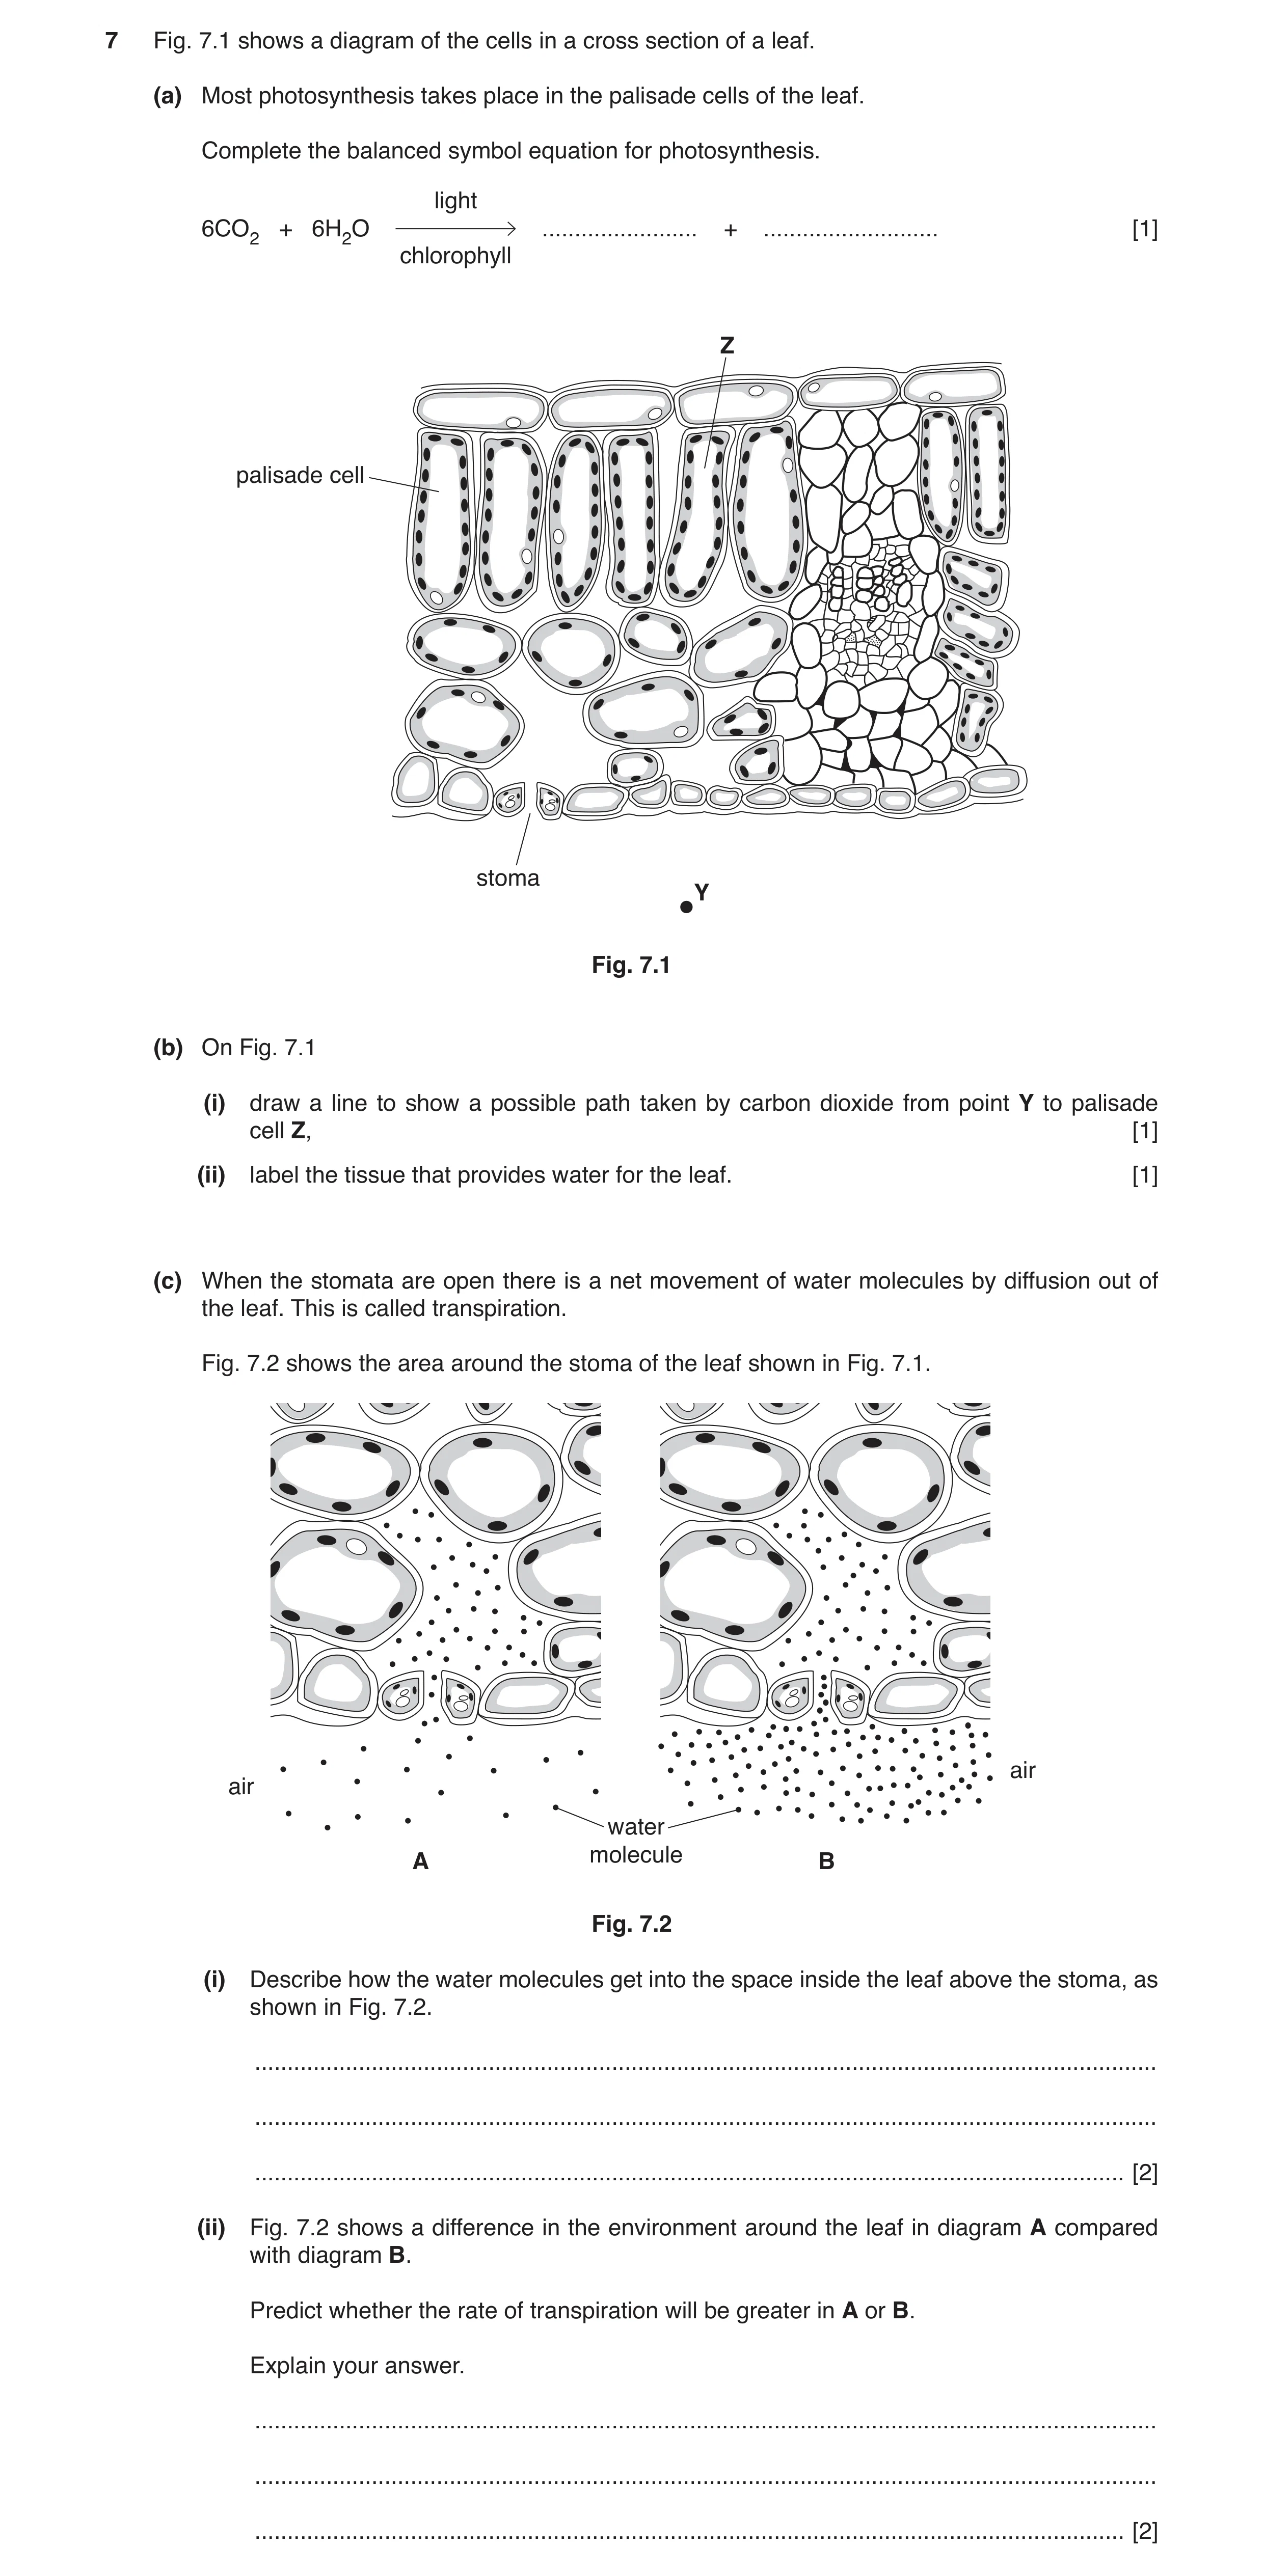
Q1 · A diagram of the cells in a cross section of a leaf 0653/43 May/June 2017
7 Fig. 7.1 shows a diagram of the cells in a cross section of a leaf. (a) Most photosynthesis takes place in the palisade cells of the leaf. Complete the balanced symbol equation for photosynthesis. light 6CO2 + 6H2O … + … [1] chlorophyll Z palisade cell stoma Y Fig. 7.1 (b) On Fig. 7.1 (i) draw a line to show a possible path taken by carbon dioxide from point Y to palisade cell Z, [1] (ii) label the tissue that provides water for the leaf. [1] (c) When the stomata are open there is a net movement of water molecules by diffusion out of the leaf. This is called transpiration. Fig. 7.2 shows the area around the stoma of the leaf shown in Fig. 7.1. air air water A molecule B Fig. 7.2 (i) Describe how the water molecules get into the space inside the leaf above the stoma, as shown in Fig. 7.2. … … … [2] (ii) Fig. 7.2 shows a difference in the environment around the leaf in diagram A compared with diagram B. Predict whether the rate of transpiration will be greater in A or B. Explain your answer. … … … [2]
7 marks
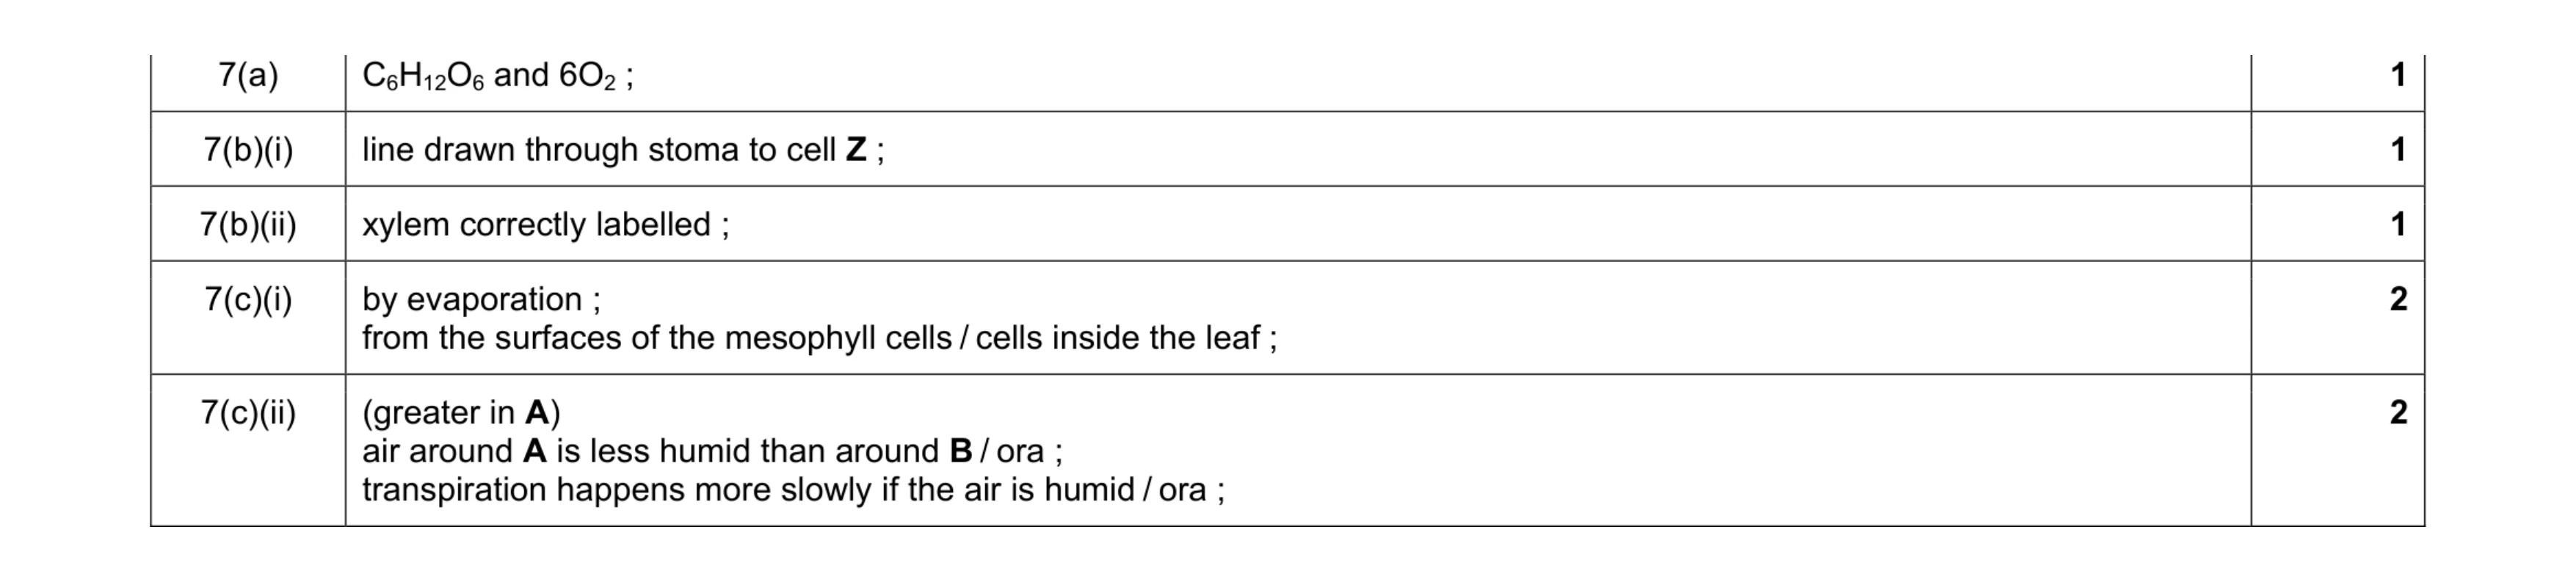
Mark scheme: 7(a) C6H12O6 and 6O2 ; 1 7(b)(i) line drawn through stoma to cell Z ; 1 7(b)(ii) xylem correctly labelled ; 1 7(c)(i) by evaporation ; from the surfaces of the mesophyll cells / cells inside the leaf ; 2 7(c)(ii) (greater in A) air around A is less humid than around B / ora ; transpiration happens more slowly if the air is humid / ora ; 2
This question in 0653/43 May/June 2017
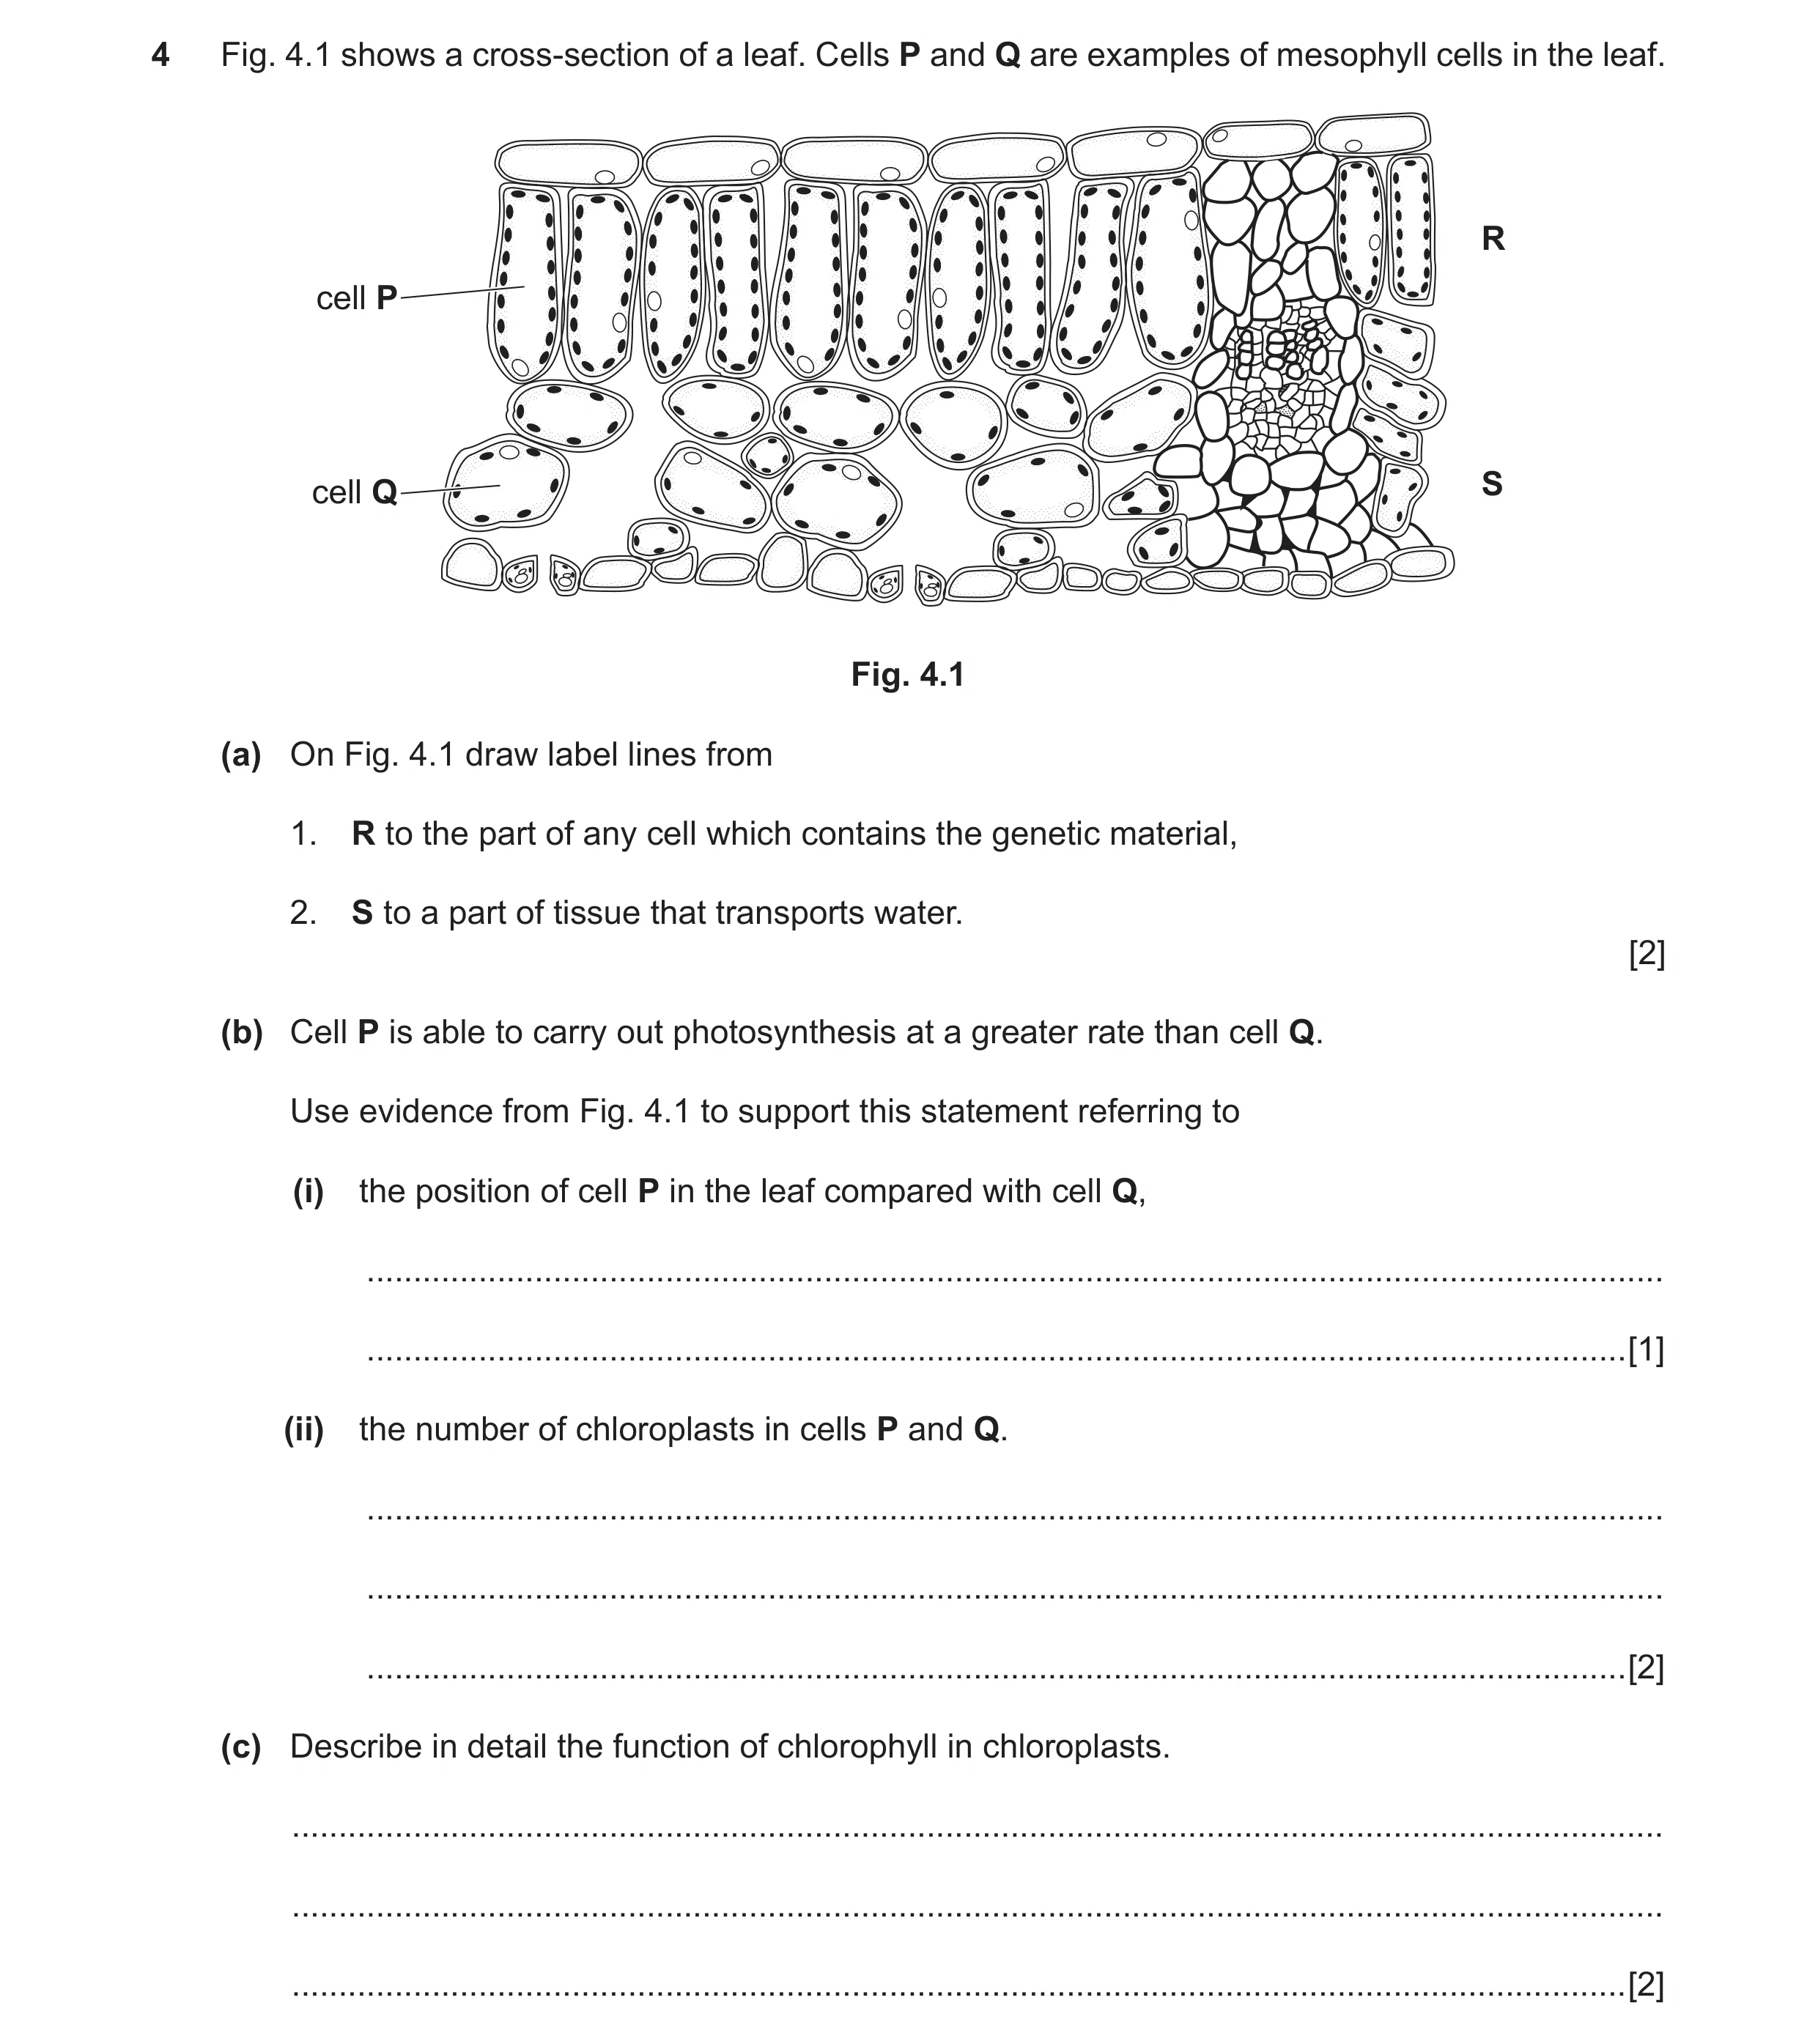
Q2 · A cross-section of a leaf 0653/42 Feb/March 2018
4 Fig. 4.1 shows a cross-section of a leaf. Cells P and Q are examples of mesophyll cells in the leaf. R cell P cell Q S Fig. 4.1 (a) On Fig. 4.1 draw label lines from 1. R to the part of any cell which contains the genetic material, 2. S to a part of tissue that transports water. [2] (b) Cell P is able to carry out photosynthesis at a greater rate than cell Q. Use evidence from Fig. 4.1 to support this statement referring to (i) the position of cell P in the leaf compared with cell Q, … … [1] (ii) the number of chloroplasts in cells P and Q. … … … [2] (c) Describe in detail the function of chlorophyll in chloroplasts. … … … [2]
7 marks
Mark scheme: 4(a) line drawn from R to any nucleus ; line drawn from S to any xylem tube cross section ; 2 4(b)(i) P is nearer to the surface / top so it captures more light ; 1 4(b)(ii) P has more chloroplasts than Q ; chloroplast is the site of photosynthesis ; reference to increased light absorption / increased amounts of chlorophyll ; max 2 4(c) traps light energy ; converts it to chemical energy / for formation of carbohydrates ; 2
This question in 0653/42 Feb/March 2018
Q3 · A diagram of a duckweed plant 0653/43 May/June 2018
1 (a) Fig. 1.1 shows a diagram of a duckweed plant. Duckweed is found in lakes. The green leaves float on the top of the water and the roots reach down into the water. leaves roots Fig. 1.1 (i) Photosynthesis takes place in the leaves of the duckweed. State the balanced symbol equation for photosynthesis. … [2] (ii) Air is trapped between the cells in the leaves of the duckweed. Suggest how this is an advantage to the survival of the duckweed. … … … [2] (b) An investigation is carried out to find the effect of increased concentration of nitrate ions on the growth of a duckweed population. At the start, dishes A and B each contain lake water and six duckweed plants. Nitrate ions are added to dish B and both dishes are left for five days. The results are shown in Fig. 1.2. duckweed plant dish A dish B at the start dish A dish B after five days Fig. 1.2 (i) Use the information in Fig. 1.2 to describe the difference between the results in dishes A and B after five days. … … … … [2] (ii) State a conclusion that can be drawn from the results seen in Fig. 1.2. … … [1] (c) Some fertiliser containing nitrate ions accidentally enters a lake which has a small number of duckweed plants on the surface. (i) Predict how the surface of the lake changes over the next few weeks. … … [1] (ii) The plants beneath the surface of the lake die. The fish in the lake die too. Describe the role of the lake bacteria in these events. … … … … … [3]
11 marks
Mark scheme: 1(a)(i) 6CO2 + 6H2O C6H12O6 + 6O2 ;; 2 1(a)(ii) makes the leaf float ; good light absorption ; 2 1(b)(i) more plants produced in B than A / greater increase in B than A ; use of supporting data e.g. increase of 5 in A and 19 in B ; 2 1(b)(ii) nitrate ions causes population to increase more rapidly ; 1 1(c)(i) becomes covered with duckweed / algae / plants ; 1 1(c)(ii) (bacteria) decompose the dead plants ; bacteria use up oxygen / oxygen concentration in pond decreases ; due to respiration of the bacteria ; fish die / suffocate due to lack of oxygen ; max 3
This question in 0653/43 May/June 2018
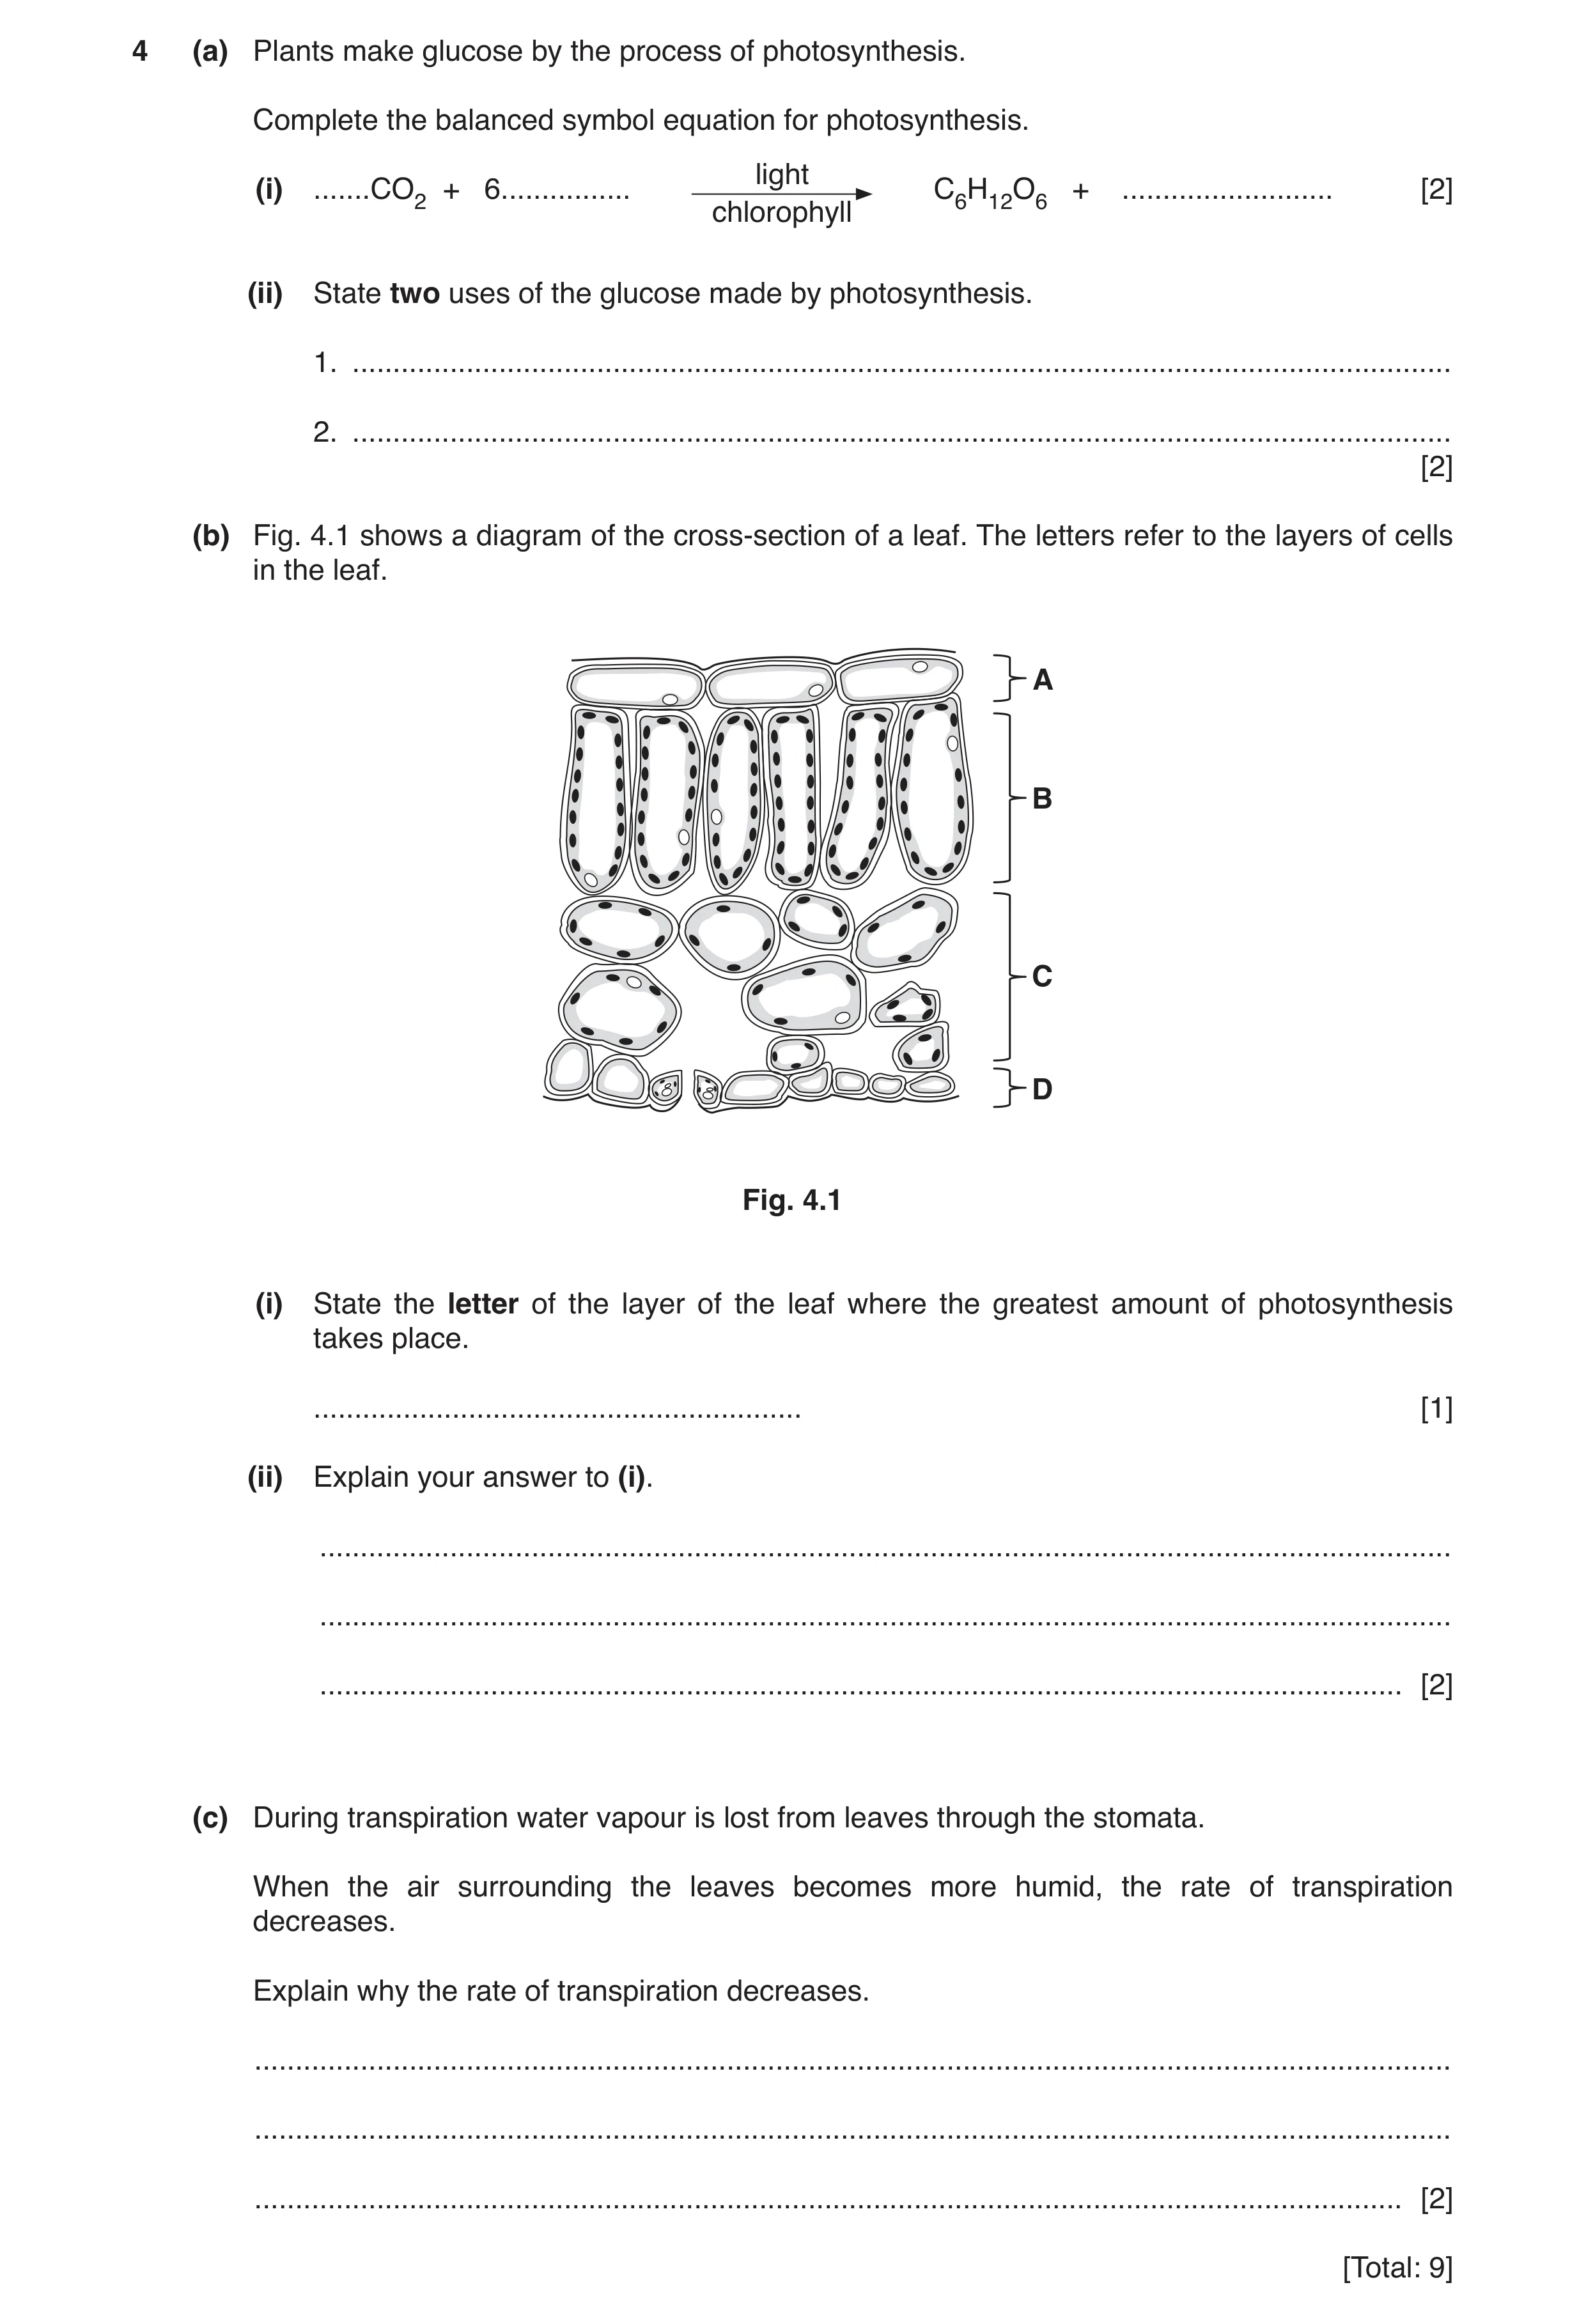
Q4 · Plants make glucose by the process of photosynthesis 0653/41 Oct/Nov 2019
4 (a) Plants make glucose by the process of photosynthesis. Complete the balanced symbol equation for photosynthesis. light (i) … CO2 + 6 … C6H12O6 + … [2] chlorophyll (ii) State two uses of the glucose made by photosynthesis. 1. … 2. … [2] (b) Fig. 4.1 shows a diagram of the cross-section of a leaf. The letters refer to the layers of cells in the leaf. A B C D Fig. 4.1 (i) State the letter of the layer of the leaf where the greatest amount of photosynthesis takes place. … [1] (ii) Explain your answer to (i). … … … [2] (c) During transpiration water vapour is lost from leaves through the stomata. When the air surrounding the leaves becomes more humid, the rate of transpiration decreases. Explain why the rate of transpiration decreases. … … … [2] [Total: 9]
9 marks
Mark scheme: 4(a)(i) LHS ; RHS ; 2 4(a)(ii) respiratory substrate / for respiration / to release energy ; to make starch (for storage) ; 2 4(b)(i) B ; 1 4(b)(ii) greatest number of chloroplasts / large amounts of chlorophyll present ; to absorb light / needed for photosynthesis ; 2 4(c) (less transpiration means) less diffusion of water (vapour through the stomata / out of leaf) ; due to increased concentration of water vapour in the air / due to reduced difference in water potential ; 2
This question in 0653/41 Oct/Nov 2019
Q5 · A cross-sectional diagram of a leaf 0653/42 Oct/Nov 2020
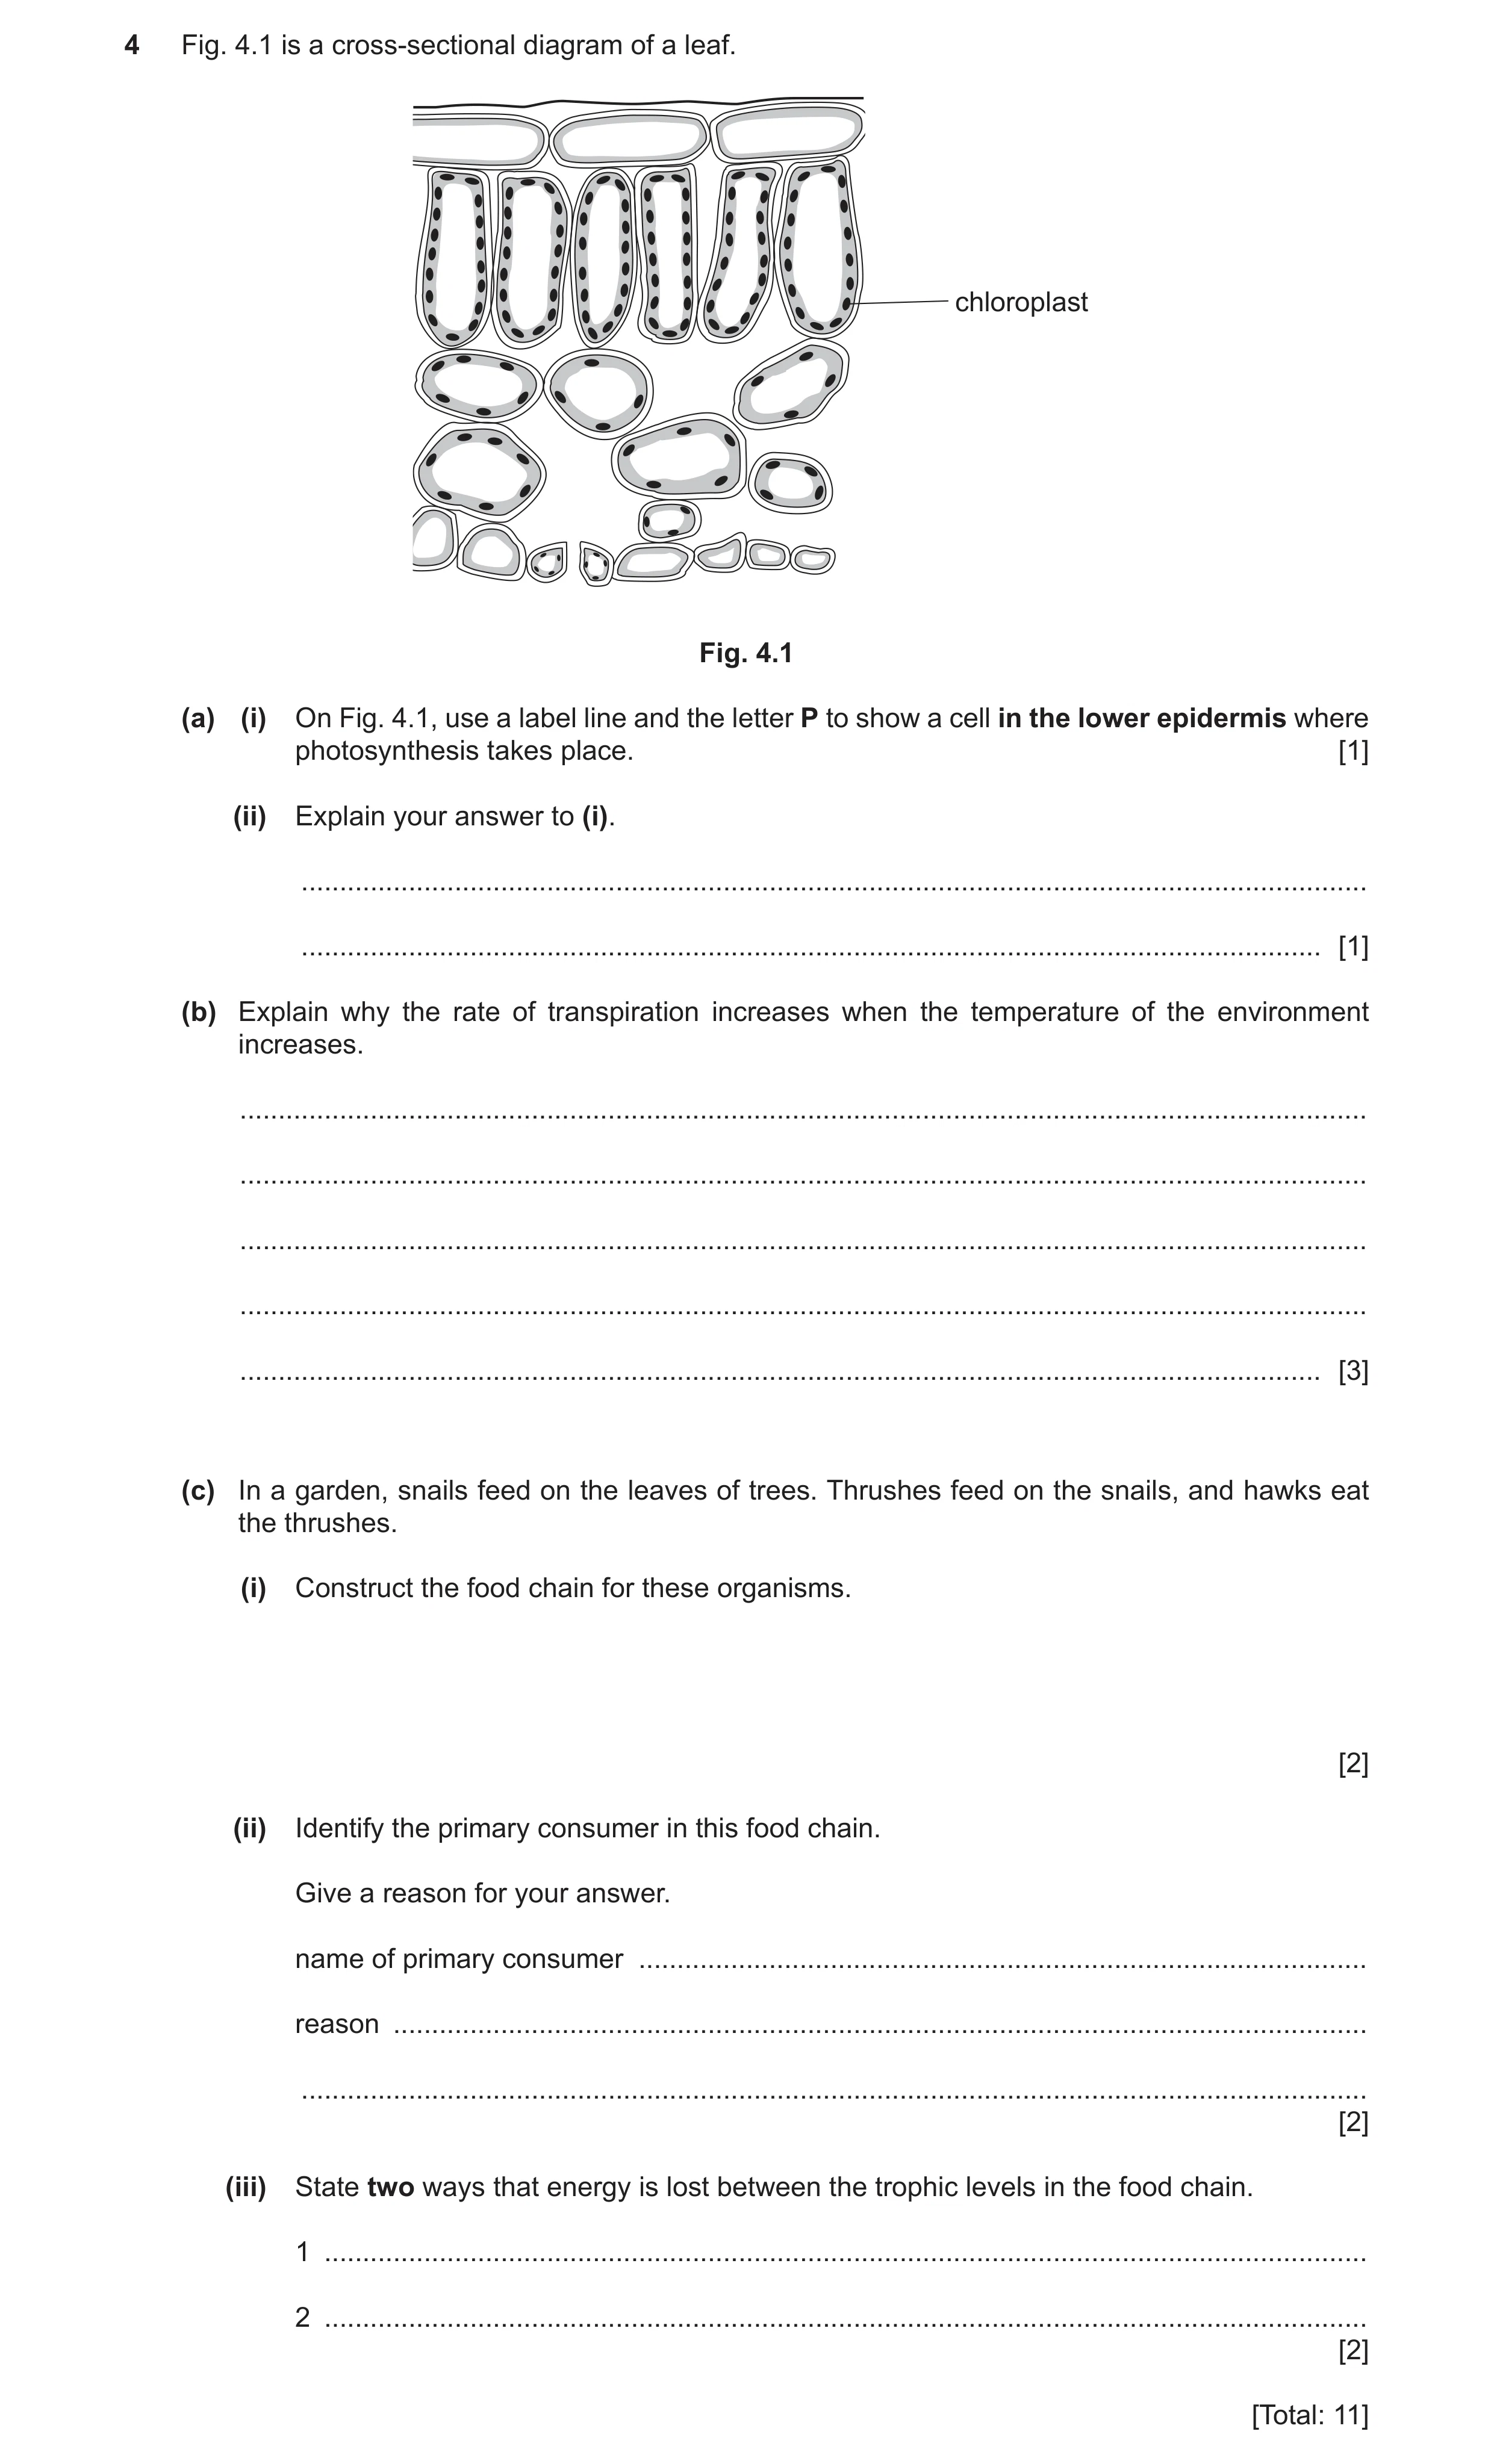
4 Fig. 4.1 is a cross-sectional diagram of a leaf. chloroplast Fig. 4.1 (a) (i) On Fig. 4.1, use a label line and the letter P to show a cell in the lower epidermis where photosynthesis takes place. [1] (ii) Explain your answer to (i). … … [1] (b) Explain why the rate of transpiration increases when the temperature of the environment increases. … … … … … [3] (c) In a garden, snails feed on the leaves of trees. Thrushes feed on the snails, and hawks eat the thrushes. (i) Construct the food chain for these organisms. [2] (ii) Identify the primary consumer in this food chain. Give a reason for your answer. name of primary consumer … reason … … [2] (iii) State two ways that energy is lost between the trophic levels in the food chain. 1 … 2 … [2] [Total: 11]
11 marks
Mark scheme: 4(a)(i) guard cell labelled with letter P ; 1 4(a)(ii) contains, chloroplasts / chlorophyll ; 1 4(b) any three from: water molecules have increased (kinetic) energy ; increased (rate of) evaporation (from surface of mesophyll cells) ; increased (rate of) diffusion, through stomata / out of leaves ; 3 4(c)(i) leaves / trees → snails → thrushes → hawks organisms in correct order ; arrows in correct direction ; 2 Question Answer Marks 4(c)(ii) snails ; herbivores / feed on producers / second trophic level ; 2 4(c)(iii) any two from: respiration / heat / movement ; death ; excretion (of waste / urine) / loss of solid waste / faeces ; not all organisms in the chain, eaten / digested ; 2
This question in 0653/42 Oct/Nov 2020
Q6 · The flowers of a wind-pollinated plant 0653/43 May/June 2021
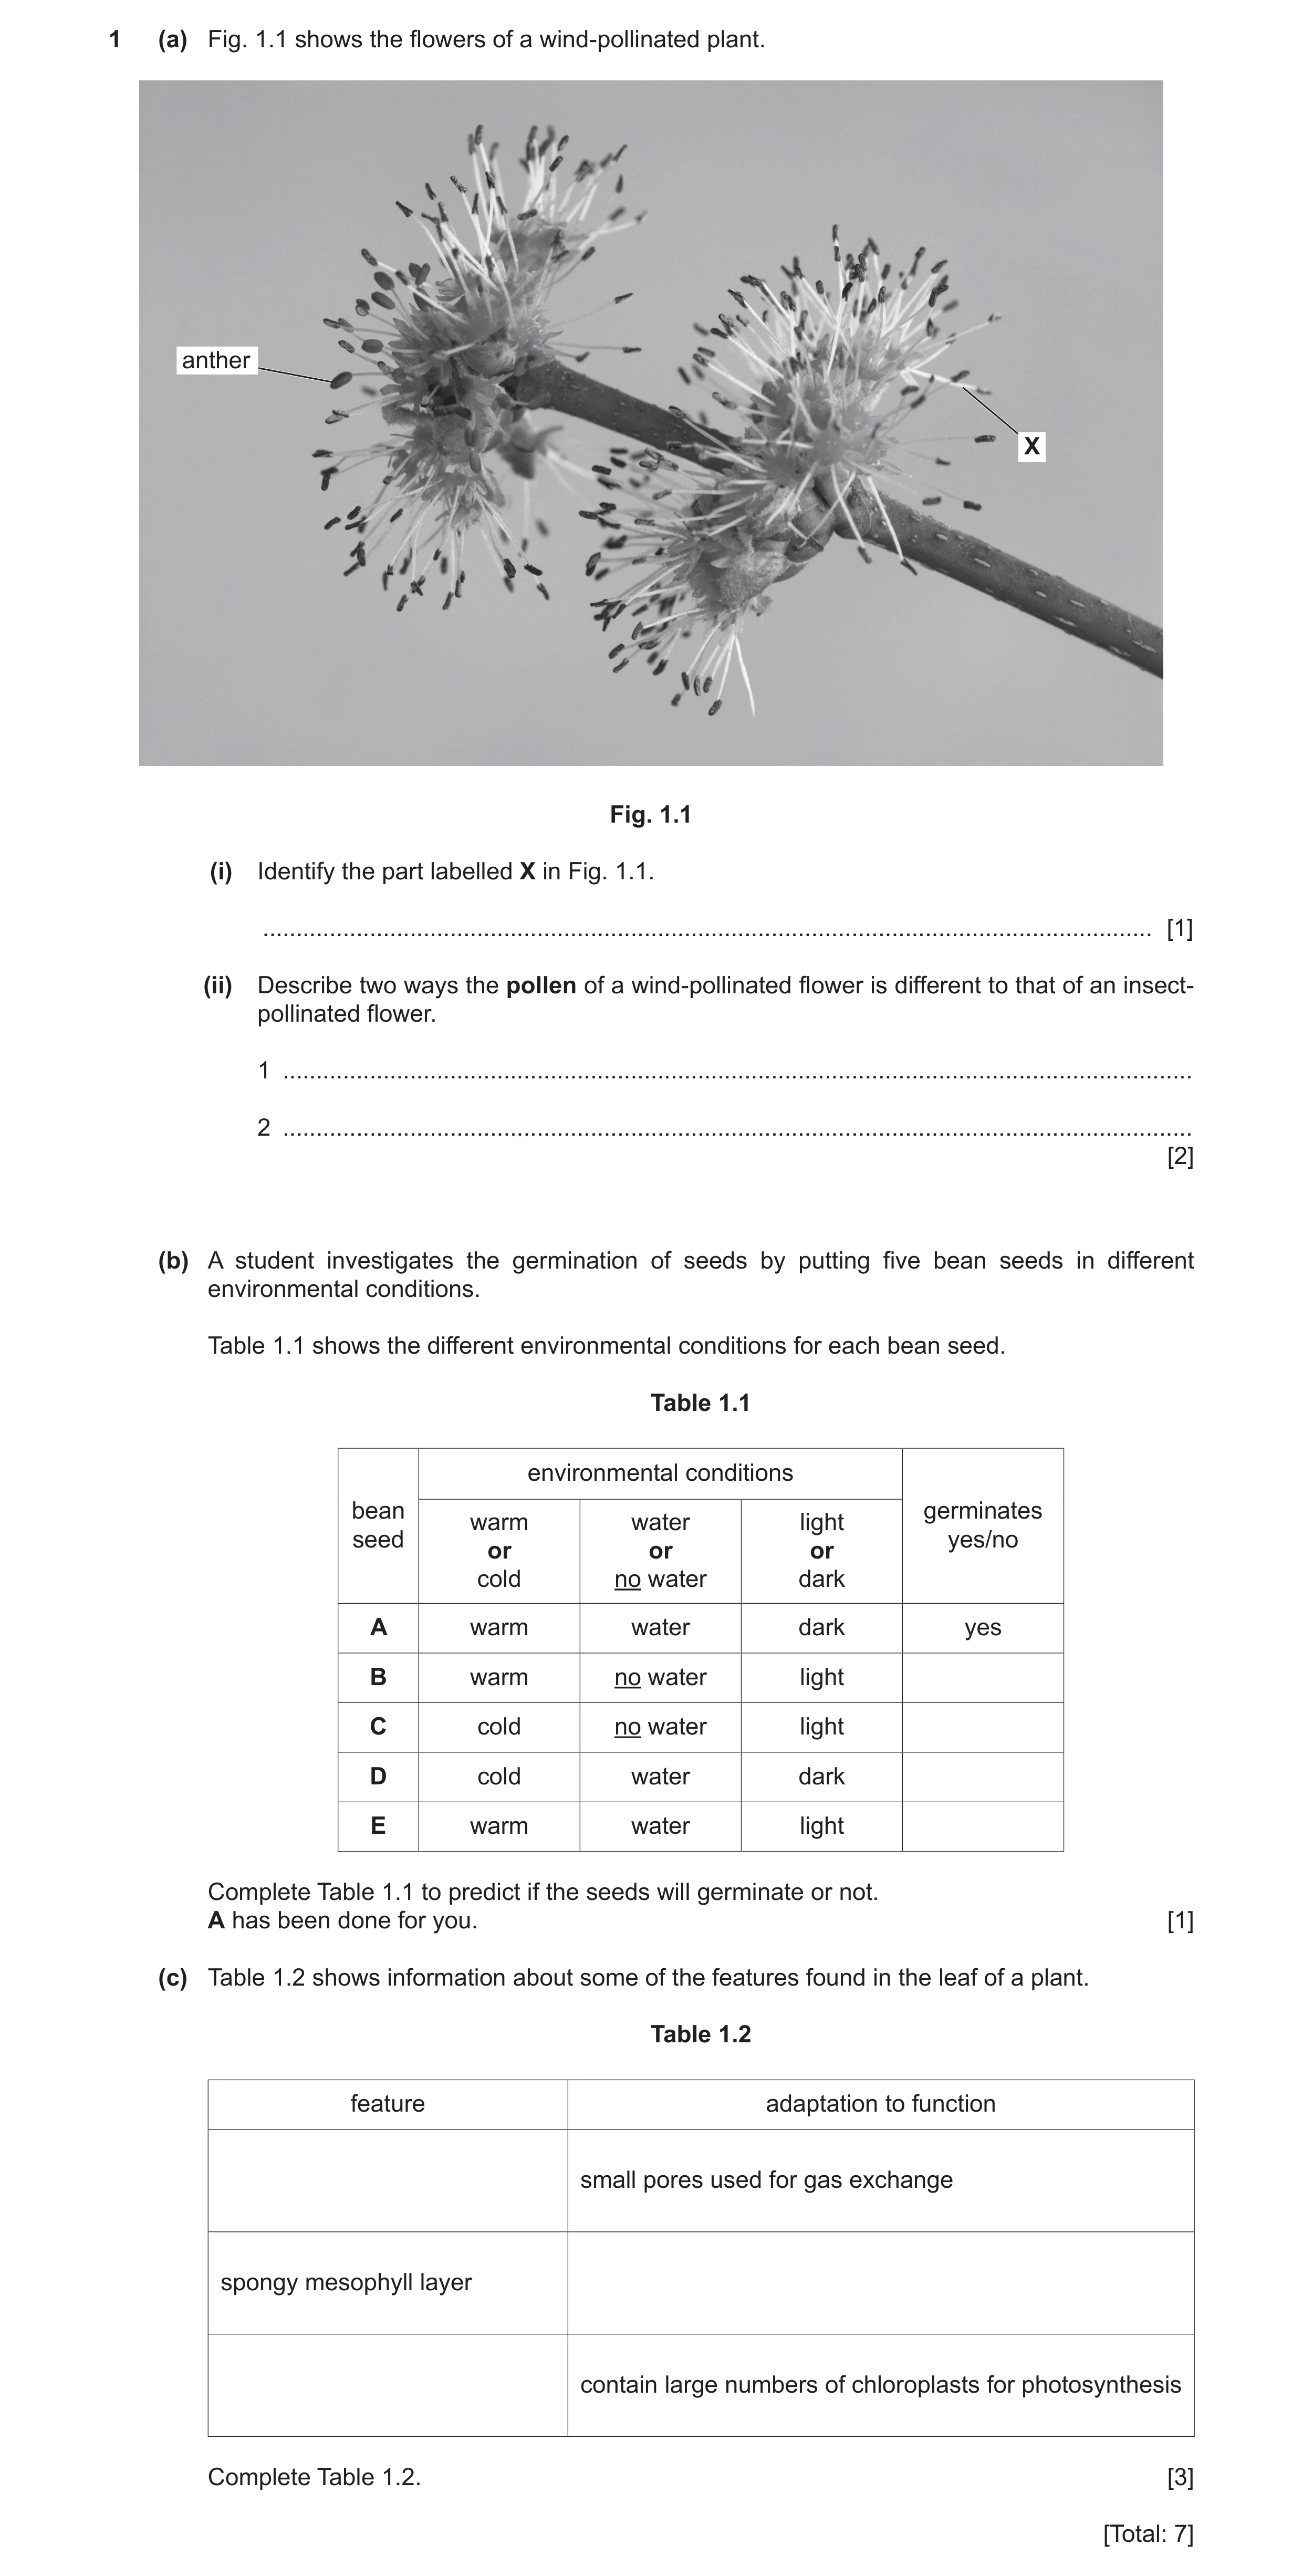
1 (a) Fig. 1.1 shows the flowers of a wind-pollinated plant. antheranther X Fig. 1.1 (i) Identify the part labelled X in Fig. 1.1. … [1] (ii) Describe two ways the pollen of a wind-pollinated flower is different to that of an insect- pollinated flower. 1 … 2 … [2] (b) A student investigates the germination of seeds by putting five bean seeds in different environmental conditions. Table 1.1 shows the different environmental conditions for each bean seed. Table 1.1 environmental conditions bean germinates warm water light seed yes/no or or or cold no water dark A warm water dark yes B warm no water light C cold no water light D cold water dark E warm water light Complete Table 1.1 to predict if the seeds will germinate or not. A has been done for you. [1] (c) Table 1.2 shows information about some of the features found in the leaf of a plant. Table 1.2 feature adaptation to function small pores used for gas exchange spongy mesophyll layer contain large numbers of chloroplasts for photosynthesis Complete Table 1.2. [3] [Total: 7]
7 marks
Mark scheme: 1(a)(i) filament ; 1 1(a)(ii) any two from: smaller ; lighter ; smooth / not spiky ; 2 1(b) germinates yes / no (yes) no no no yes ; all needed for 1 mark 1 1(c) feature adaptation to function stomata (small pores used for gas exchange) (spongy mesophyll layer) air spaces for gas exchange palisade (mesophyll cells) (contain large numbers of chloroplasts for photosynthesis) ;;; 3
This question in 0653/43 May/June 2021
Q7 · A student uses the apparatus in Fig 0653/43 Oct/Nov 2021
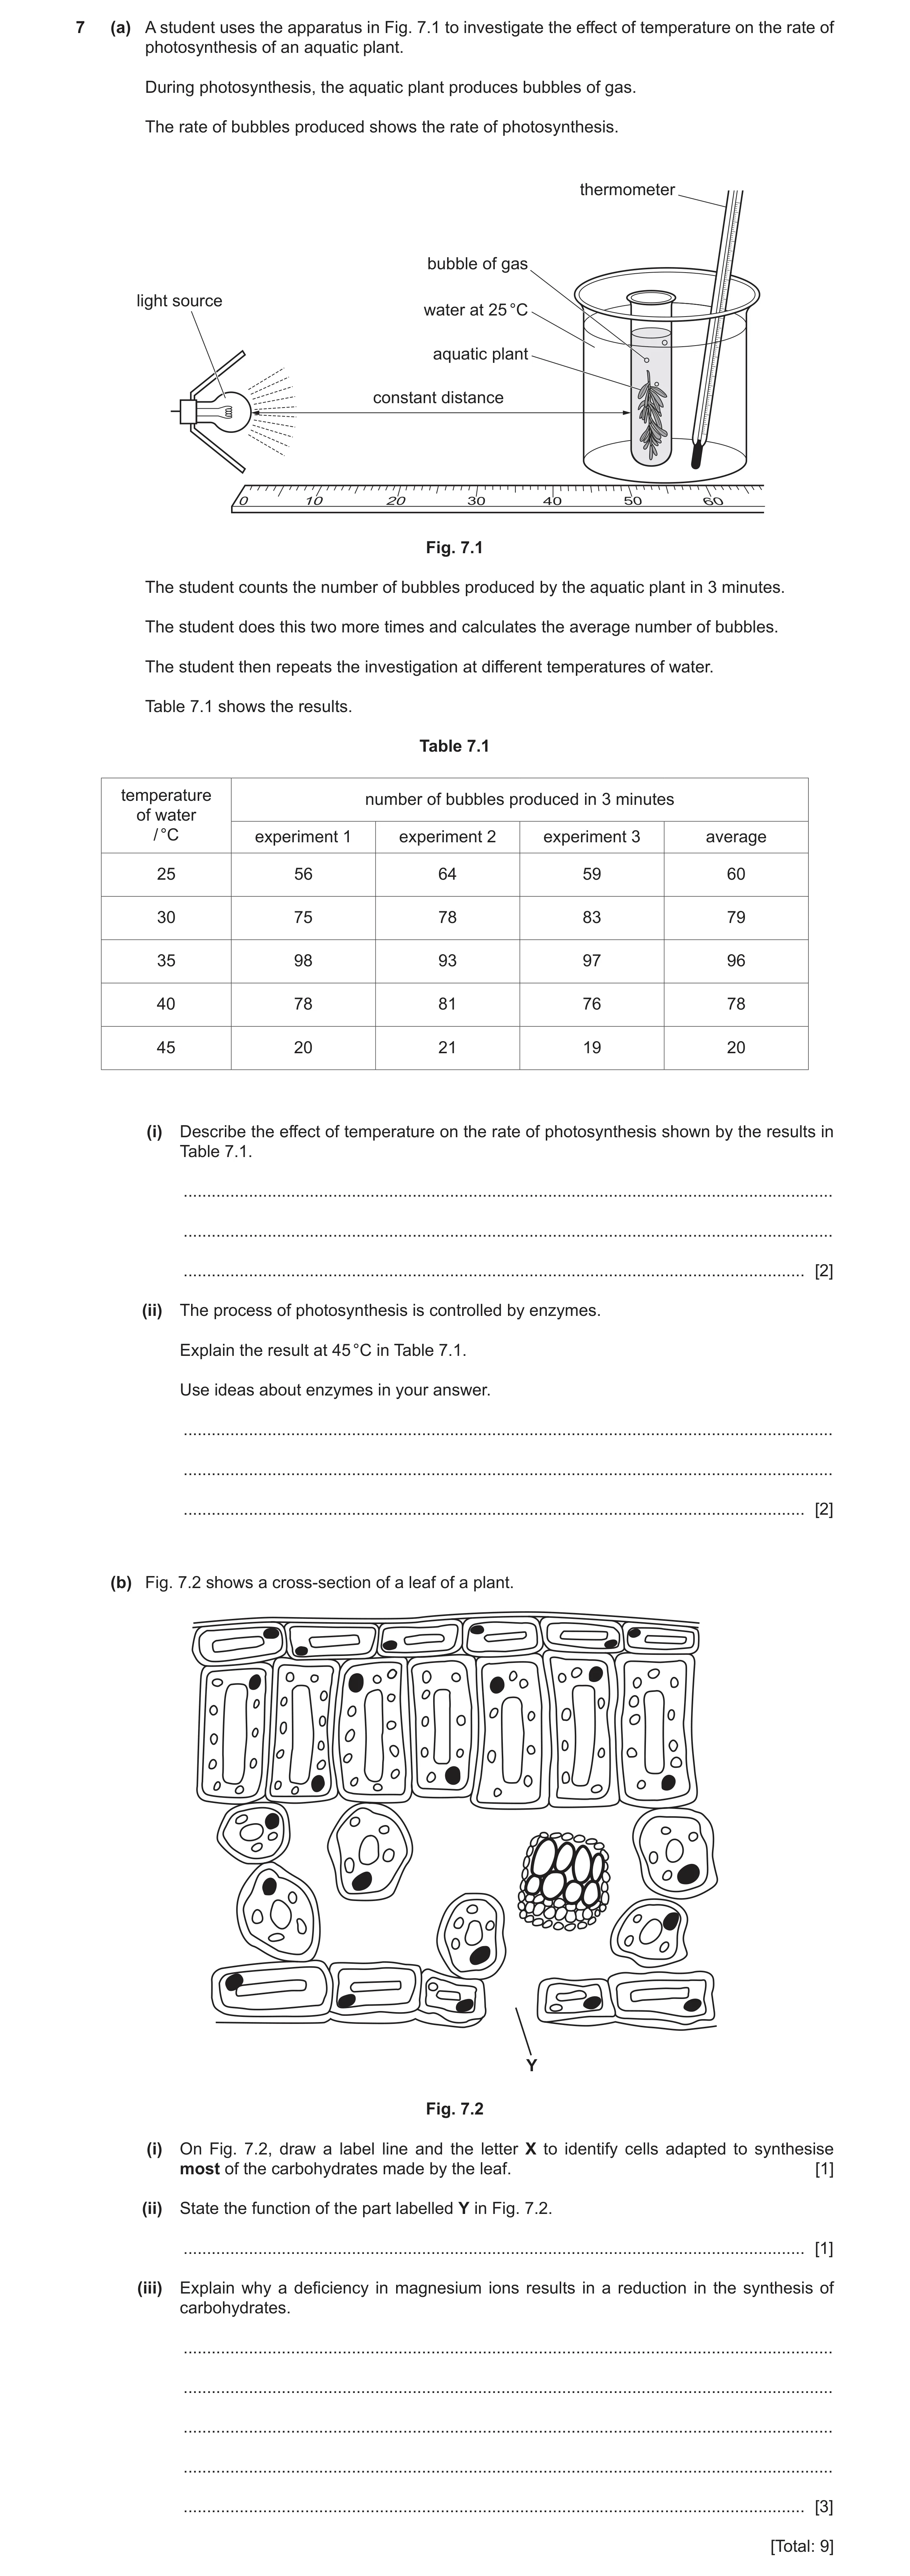
7 (a) A student uses the apparatus in Fig. 7.1 to investigate the effect of temperature on the rate of photosynthesis of an aquatic plant. During photosynthesis, the aquatic plant produces bubbles of gas. The rate of bubbles produced shows the rate of photosynthesis. thermometer bubble of gas light source water at 25 °C aquatic plant constant distance 0 10 20 30 40 50 60 Fig. 7.1 The student counts the number of bubbles produced by the aquatic plant in 3 minutes. The student does this two more times and calculates the average number of bubbles. The student then repeats the investigation at different temperatures of water. Table 7.1 shows the results. Table 7.1 temperature number of bubbles produced in 3 minutes of water / °C experiment 1 experiment 2 experiment 3 average 25 56 64 59 60 30 75 78 83 79 35 98 93 97 96 40 78 81 76 78 45 20 21 19 20 (i) Describe the effect of temperature on the rate of photosynthesis shown by the results in Table 7.1. … … … [2] (ii) The process of photosynthesis is controlled by enzymes. Explain the result at 45 °C in Table 7.1. Use ideas about enzymes in your answer. … … … [2] (b) Fig. 7.2 shows a cross-section of a leaf of a plant. Y Fig. 7.2 (i) On Fig. 7.2, draw a label line and the letter X to identify cells adapted to synthesise most of the carbohydrates made by the leaf. [1] (ii) State the function of the part labelled Y in Fig. 7.2. … [1] (iii) Explain why a deficiency in magnesium ions results in a reduction in the synthesis of carbohydrates. … … … … … [3] [Total: 9]
9 marks
Mark scheme: 7(a)(i) as temperature increases so does the rate ; rate decreases above 35 °C ; 2 7(a)(ii) enzymes denature / shape of active site changes ; substrate no longer fits into active site ; 2 7(b)(i) any palisade cell labelled ; 1 7(b)(ii) gas exchange ; 1 7(b)(iii) any three from: magnesium ions needed to make chlorophyll ; (deficiency means) less chlorophyll will be made ; (less chlorophyll means) less light energy transferred to chemical energy ; idea that the chemical energy is in the form of carbohydrates (so less are made) ; 3
This question in 0653/43 Oct/Nov 2021
Q8 · A diagram of a wind-pollinated flower 0653/41 May/June 2022
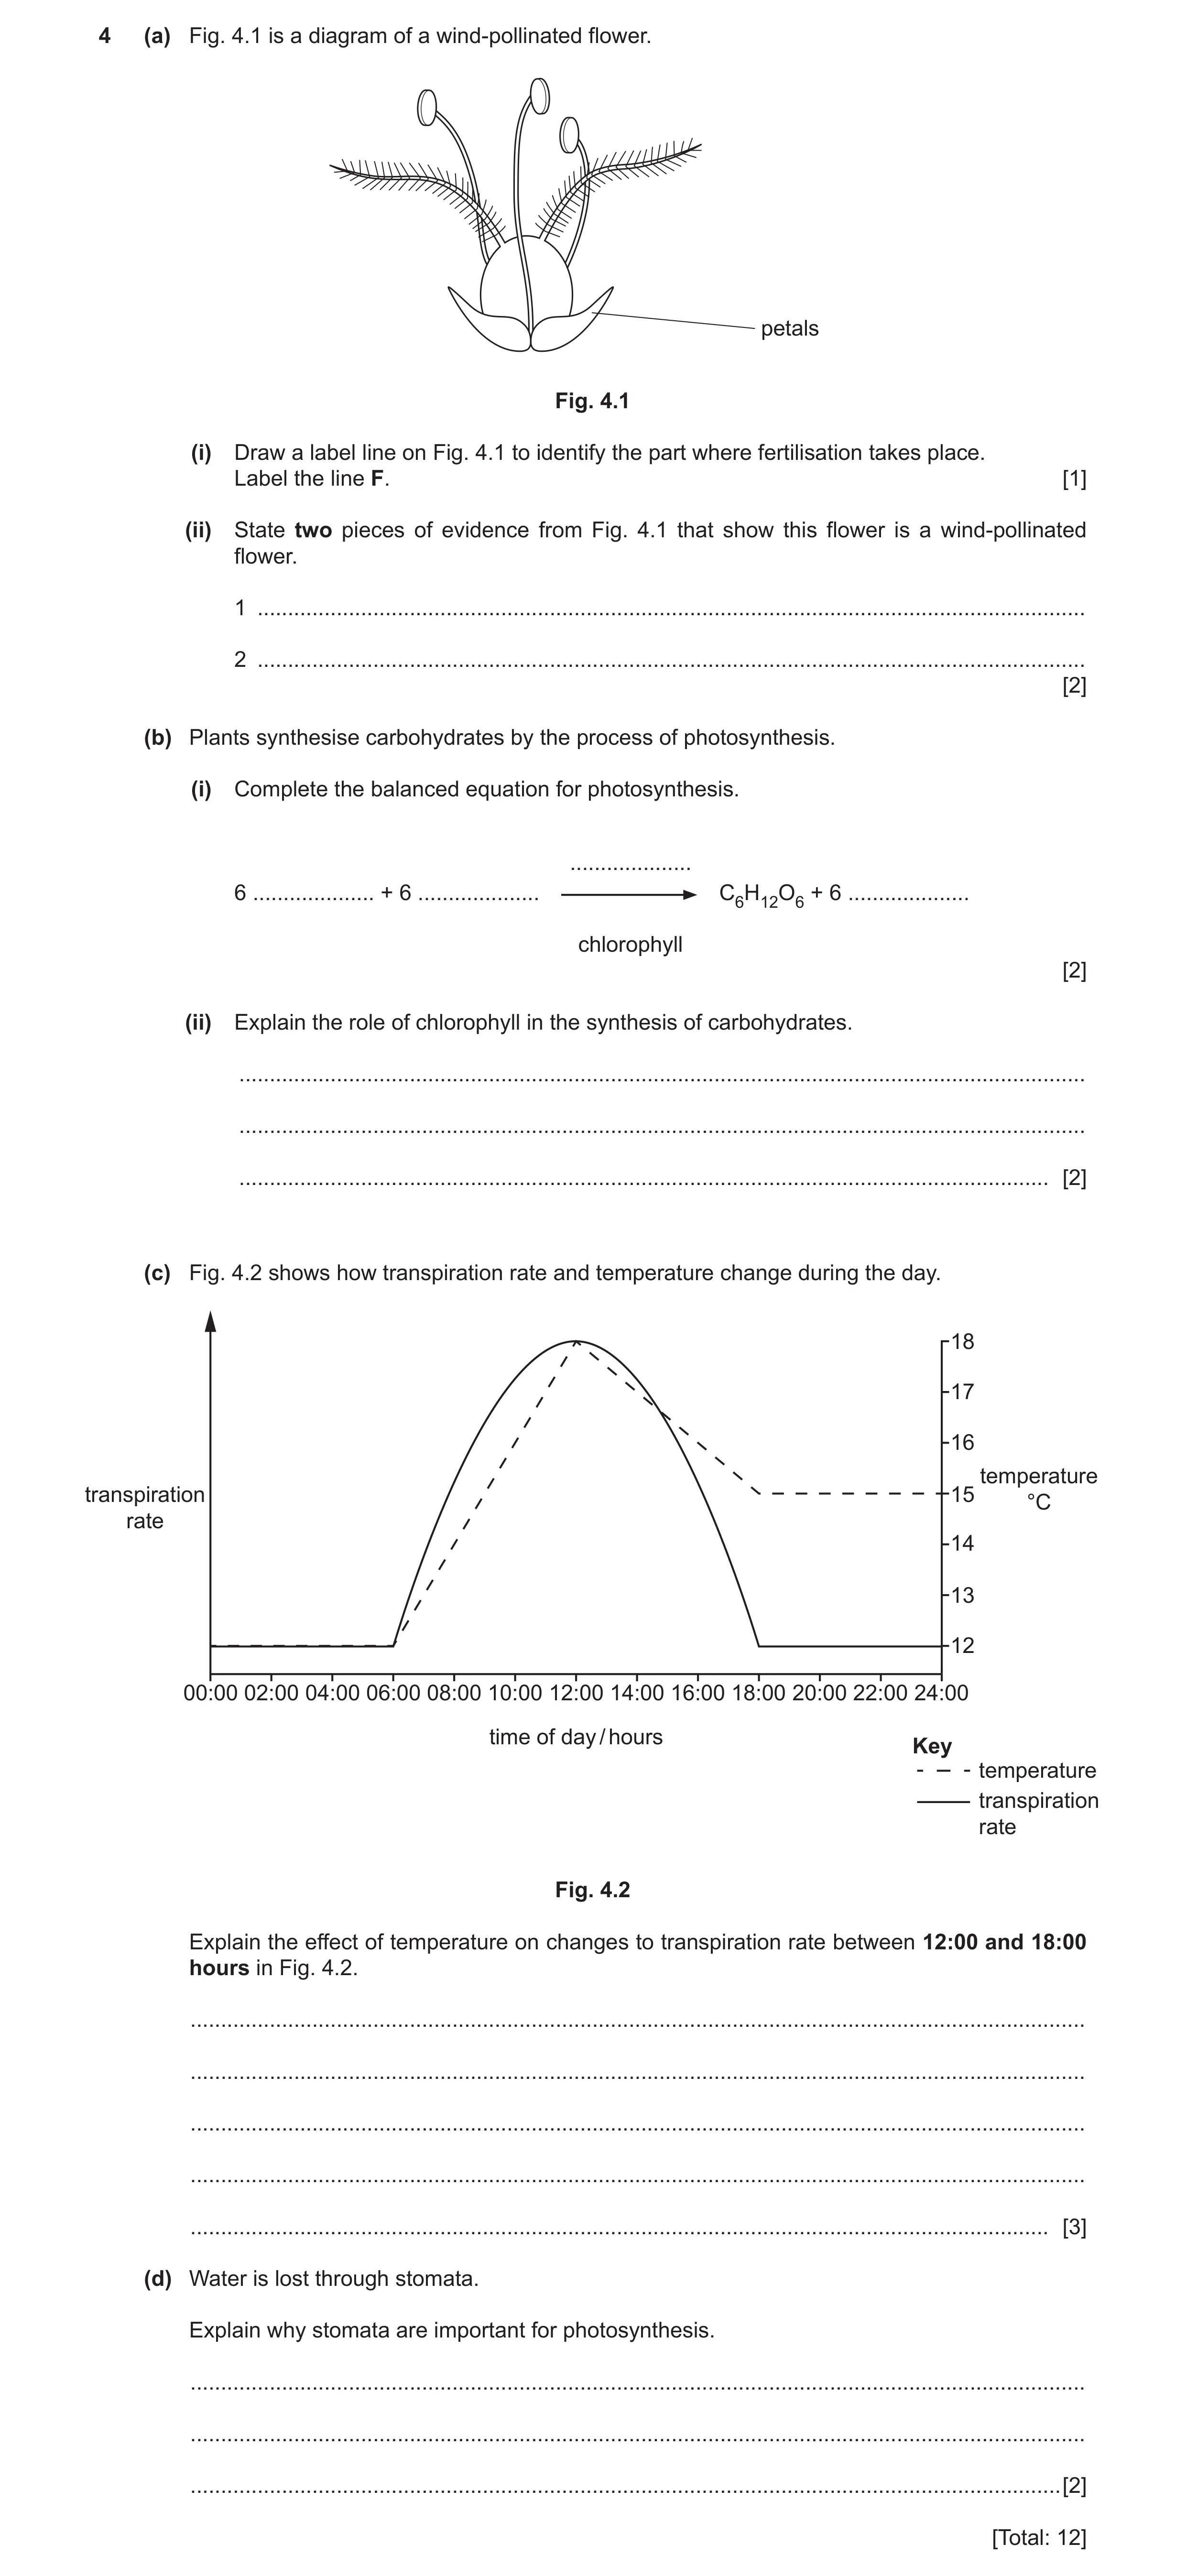
4 (a) Fig. 4.1 is a diagram of a wind-pollinated flower. petals Fig. 4.1 (i) Draw a label line on Fig. 4.1 to identify the part where fertilisation takes place. Label the line F. [1] (ii) State two pieces of evidence from Fig. 4.1 that show this flower is a wind-pollinated flower. 1 … 2 … [2] (b) Plants synthesise carbohydrates by the process of photosynthesis. (i) Complete the balanced equation for photosynthesis. … 6 … + 6 … C6H12O6 + 6 … chlorophyll [2] (ii) Explain the role of chlorophyll in the synthesis of carbohydrates. … … … [2] (c) Fig. 4.2 shows how transpiration rate and temperature change during the day. 18 17 16 temperature transpiration 15 °C rate 14 13 12 00:00 02:00 04:00 06:00 08:00 10:00 12:00 14:00 16:00 18:00 20:00 22:00 24:00 time of day / hours Key temperature transpiration rate Fig. 4.2 Explain the effect of temperature on changes to transpiration rate between 12:00 and 18:00 hours in Fig. 4.2. … … … … … [3] (d) Water is lost through stomata. Explain why stomata are important for photosynthesis. … … … [2] [Total: 12]
12 marks
Mark scheme: 4(a)(i) ovary labelled ; 1 4(a)(ii) any two from: small petals ; feathery stigma ; pollen / anther / filaments / stamens / stigma outside (flower) ; 2 4(b)(i) (6) CO2 + (6) H2O ; light and (6) O2 ; 2 4(b)(ii) absorbs / traps / uses light energy ; (light energy is) transferred / converted to chemical energy ; 2 4(c) any three from: (as temperature decreases) transpiration rate decreases ; so less water lost ; correct reference to evaporation from (mesophyll) cells ; correct reference to diffusion (of water vapour) from stomata ; 3 4(d) carbon dioxide enters leaf through stomata ; carbon dioxide is needed for photosynthesis ; 2
This question in 0653/41 May/June 2022
Q9 · A student’s diagram of a cross-section through a leaf 0653/42 May/June 2023
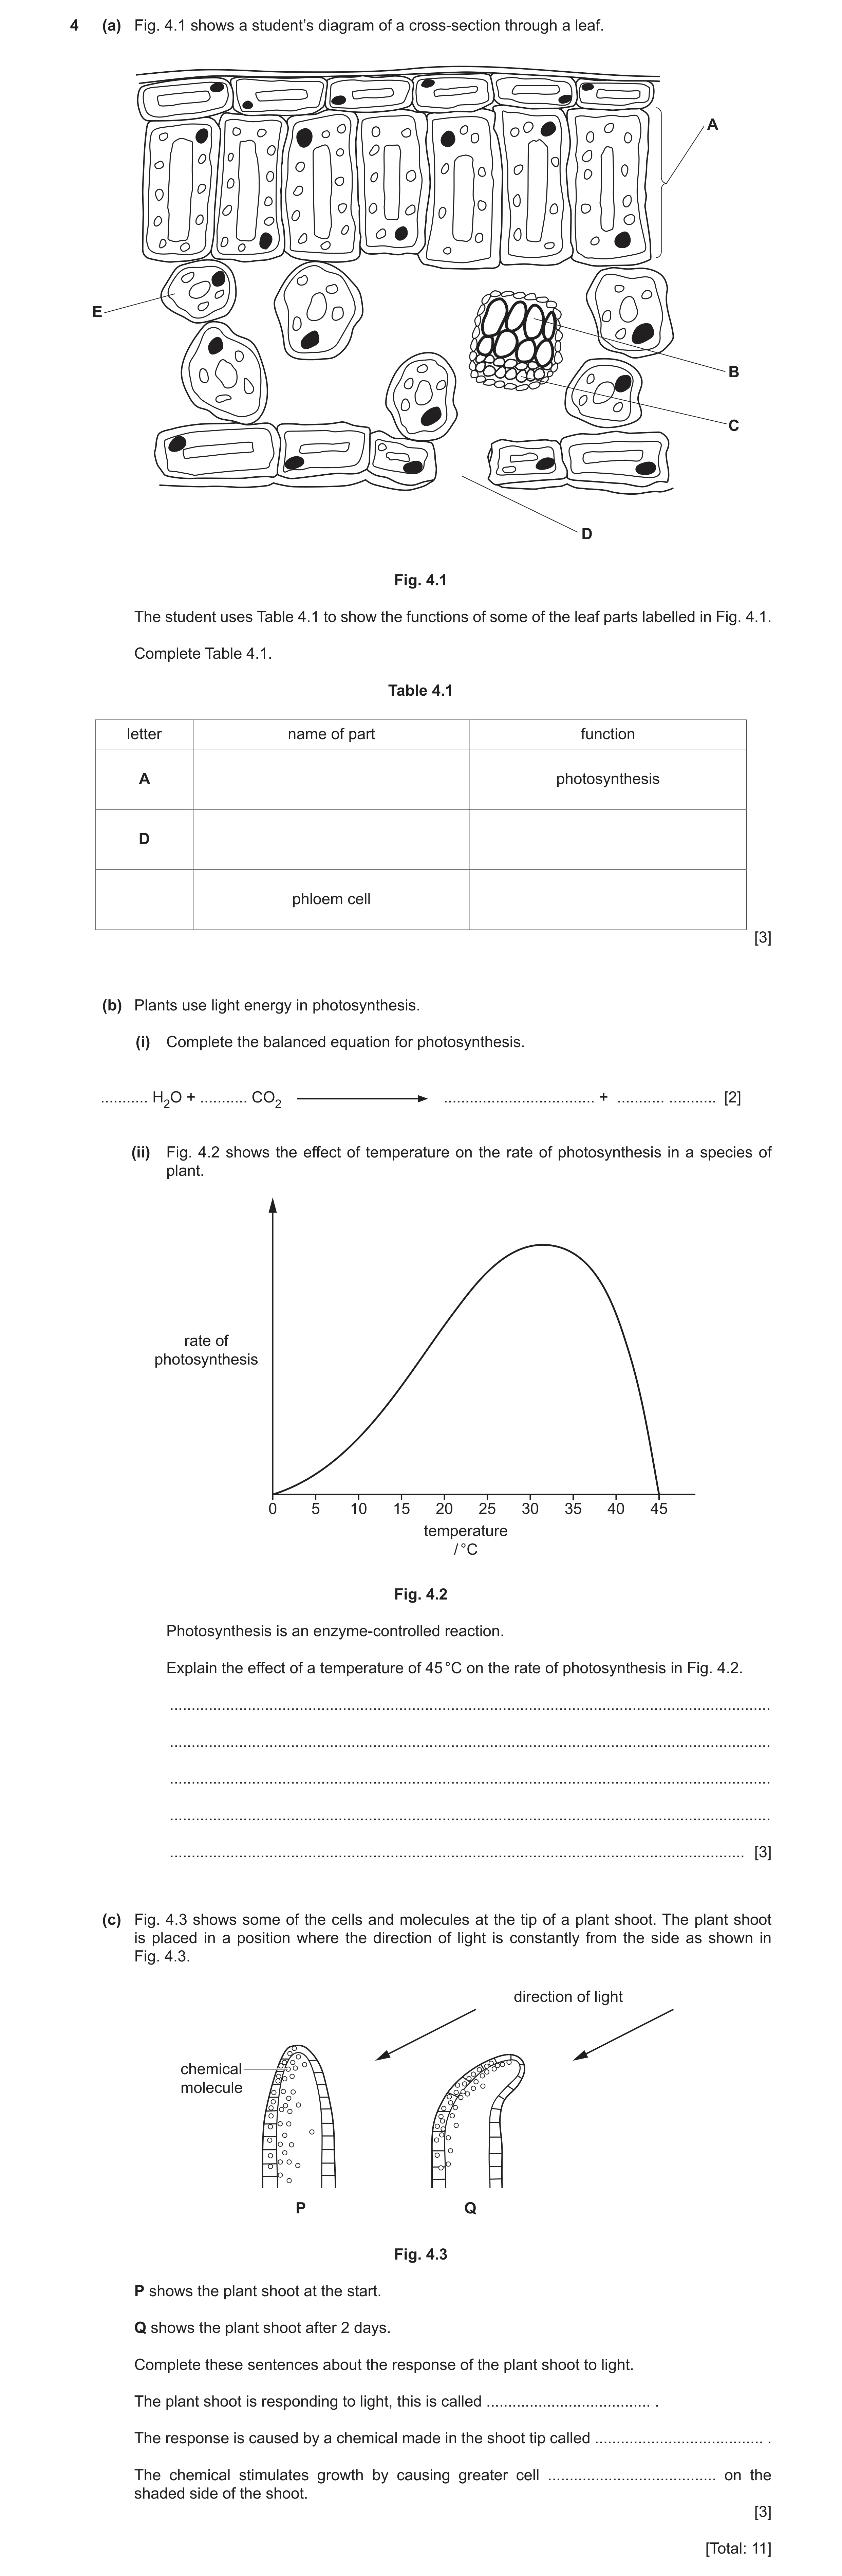
4 (a) Fig. 4.1 shows a student’s diagram of a cross-section through a leaf. A E B C D Fig. 4.1 The student uses Table 4.1 to show the functions of some of the leaf parts labelled in Fig. 4.1. Complete Table 4.1. Table 4.1 letter name of part function A photosynthesis D phloem cell [3] (b) Plants use light energy in photosynthesis. (i) Complete the balanced equation for photosynthesis. … H2O + … CO2 … + … … [2] (ii) Fig. 4.2 shows the effect of temperature on the rate of photosynthesis in a species of plant. rate of photosynthesis 0 5 10 15 20 25 30 35 40 45 temperature / °C Fig. 4.2 Photosynthesis is an enzyme-controlled reaction. Explain the effect of a temperature of 45 °C on the rate of photosynthesis in Fig. 4.2. … … … … … [3] (c) Fig. 4.3 shows some of the cells and molecules at the tip of a plant shoot. The plant shoot is placed in a position where the direction of light is constantly from the side as shown in Fig. 4.3. direction of light chemical molecule P Q Fig. 4.3 P shows the plant shoot at the start. Q shows the plant shoot after 2 days. Complete these sentences about the response of the plant shoot to light. The plant shoot is responding to light, this is called … . The response is caused by a chemical made in the shoot tip called … . The chemical stimulates growth by causing greater cell … on the shaded side of the shoot. [3] [Total: 11]
11 marks
Mark scheme: 4(a) letter name of part function (A) palisade (mesophyll cell / layer) (photosynthesis) (D) stoma / stomata to allow gas exchange C (phloem) transport (sucrose / amino acids) ;;; one mark for each correct row 4(b)(i) 6 (H2O) 6 (CO2) ; C6H12O6 6O2 ; 2 4(b)(ii) any three from: photosynthesis stops / slows down ; enzymes denature ; active site changes shape ; substrate no longer fits active site ; 3 4(c) phototropism ; auxin ; elongation ; 3
This question in 0653/42 May/June 2023
Q10 · The pathway taken by water through a plant 0653/41 May/June 2024
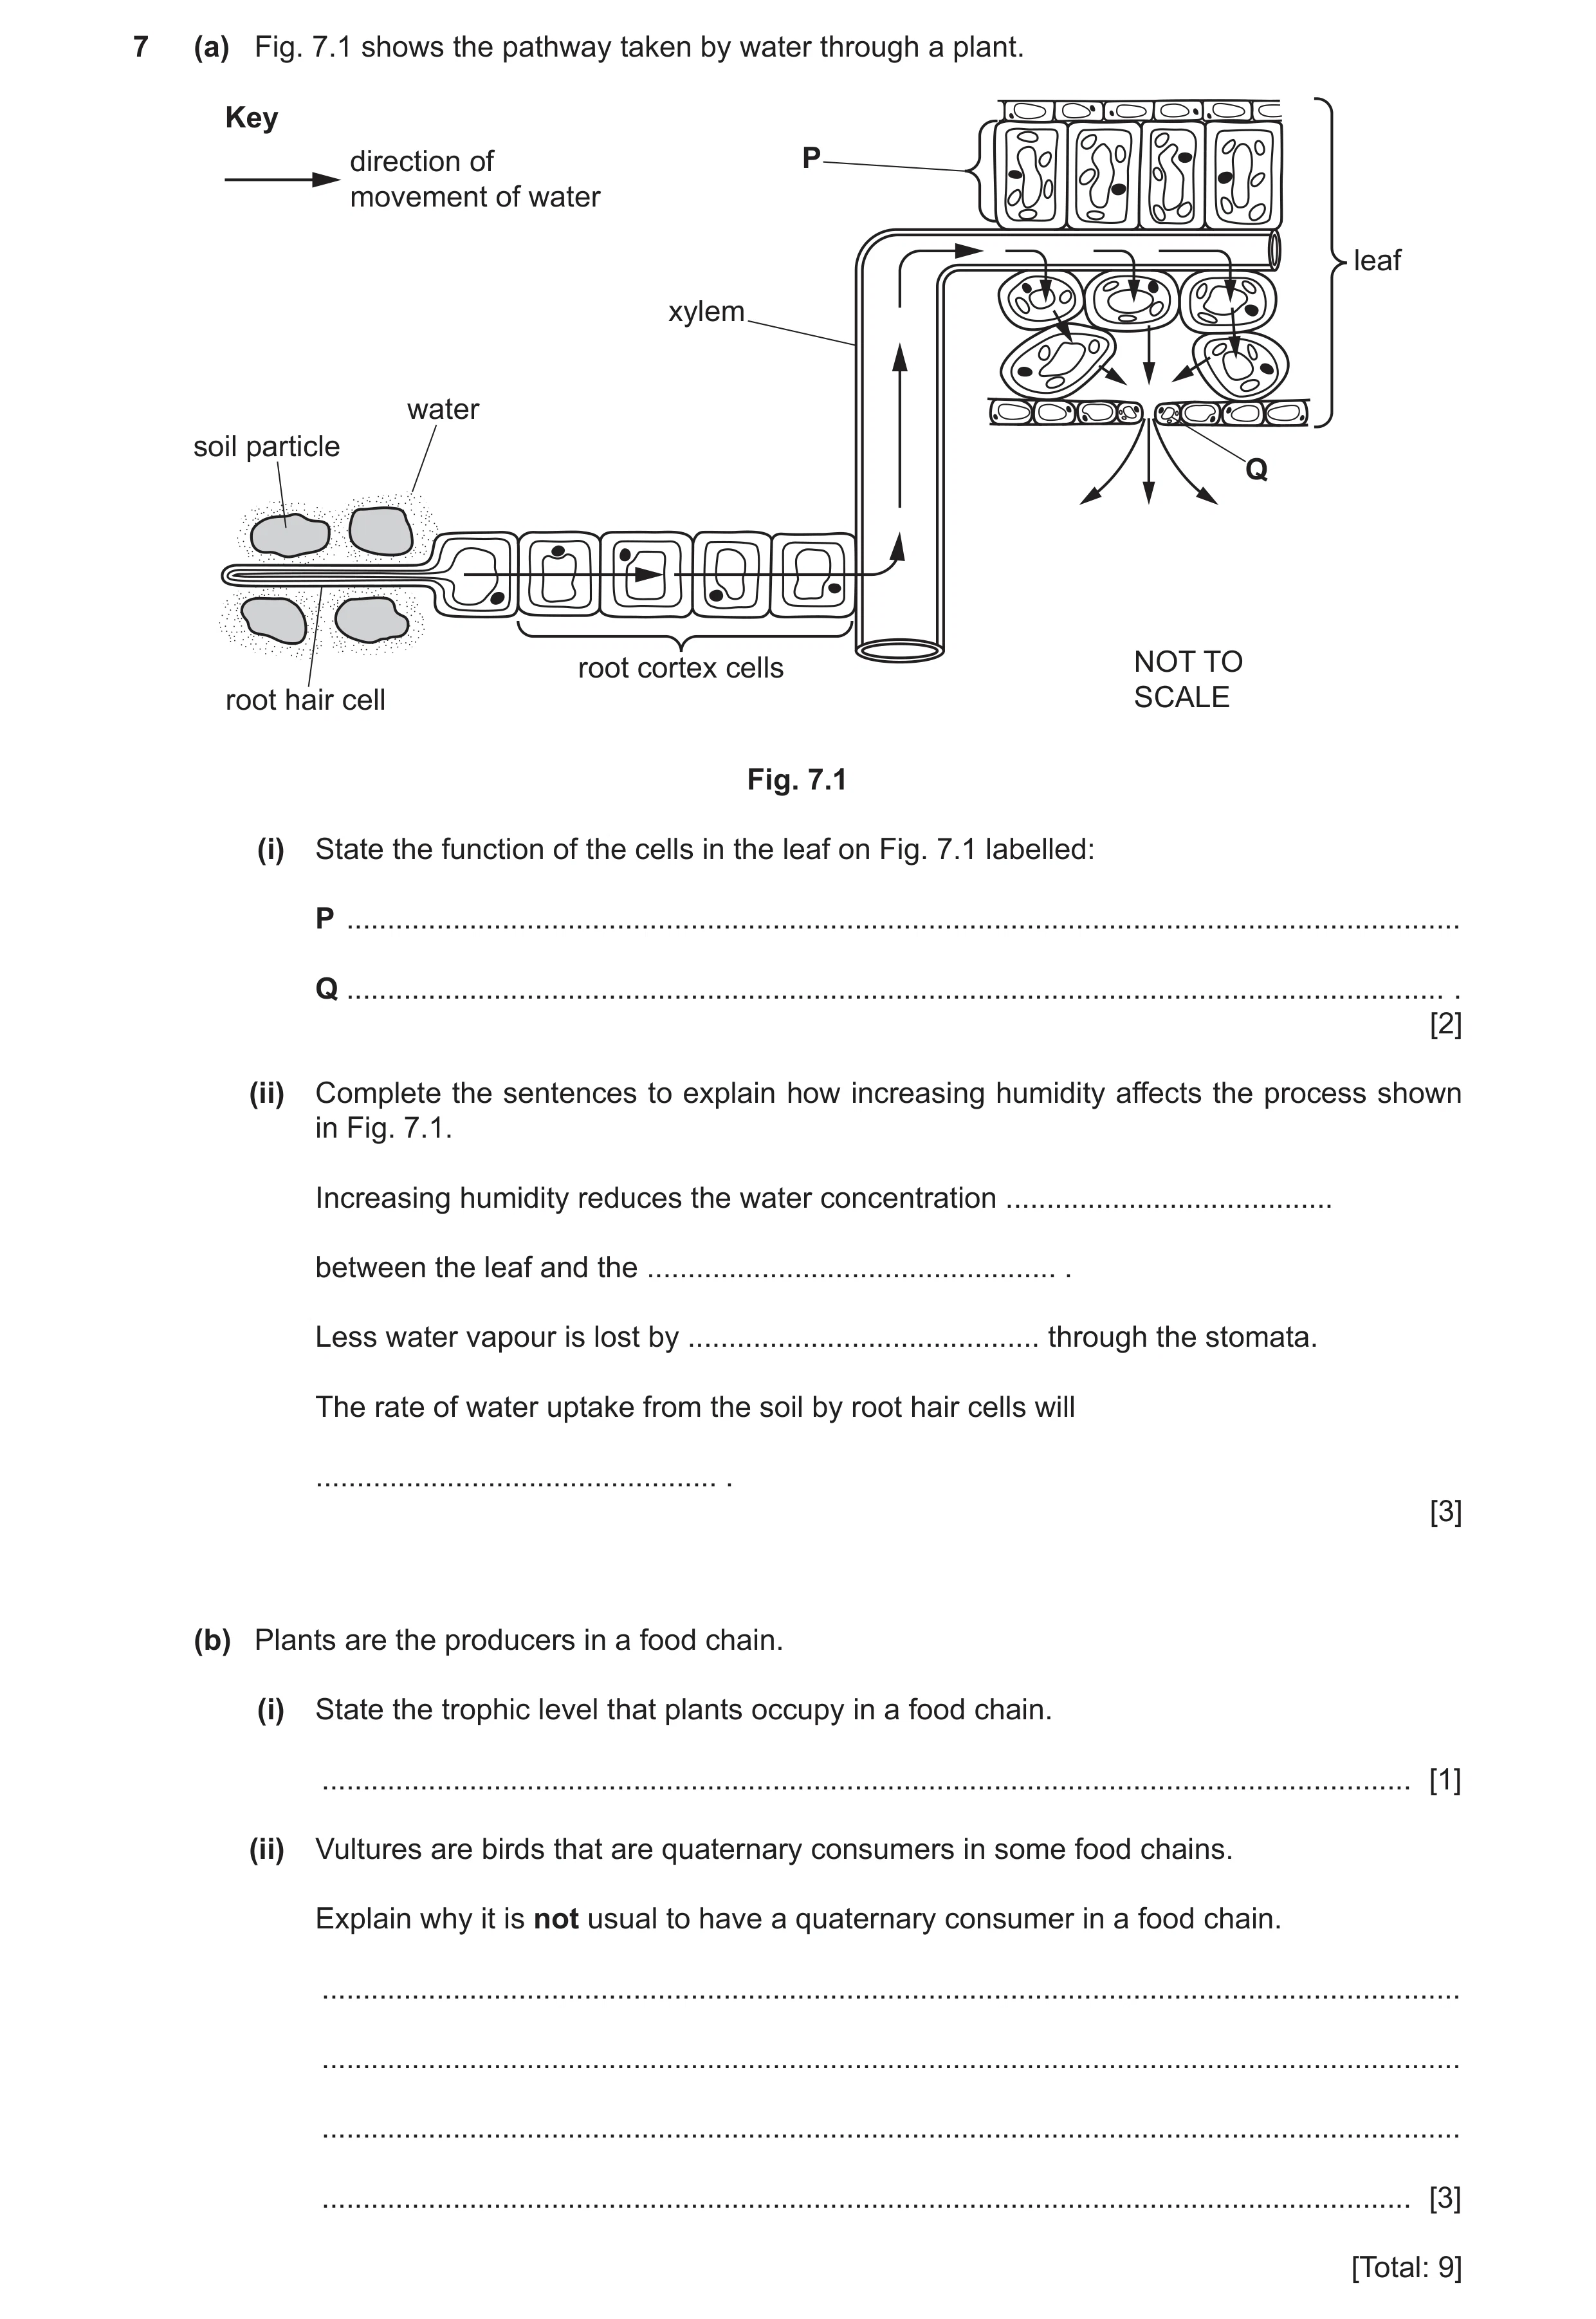
7 (a) Fig. 7.1 shows the pathway taken by water through a plant. Key direction of P movement of water leaf xylem water soil particle Q root cortex cells NOT TO root hair cell SCALE Fig. 7.1 (i) State the function of the cells in the leaf on Fig. 7.1 labelled: P … Q … . [2] (ii) Complete the sentences to explain how increasing humidity affects the process shown in Fig. 7.1. Increasing humidity reduces the water concentration … between the leaf and the … . Less water vapour is lost by … through the stomata. The rate of water uptake from the soil by root hair cells will … . [3] (b) Plants are the producers in a food chain. (i) State the trophic level that plants occupy in a food chain. … [1] (ii) Vultures are birds that are quaternary consumers in some food chains. Explain why it is not usual to have a quaternary consumer in a food chain. … … … … [3] [Total: 9]
9 marks
Mark scheme: 7(a)(i) P photosynthesis ; Q gas exchange ; 2 7(a)(ii) gradient and atmosphere ; diffusion ; decrease ; 3 7(b)(i) one / 1 ; 1 7(b)(ii) any three from: vulture is on trophic level 5 ; energy is lost at each trophic level ; named example of energy lost, e.g., heat / respiration / excretion / protein synthesis / metabolism / not all organism is eaten ; not enough energy (for quaternary consumer) ; 3
This question in 0653/41 May/June 2024
Q11 · A diagram of a cross‑section through a leaf 0653/43 May/June 2024
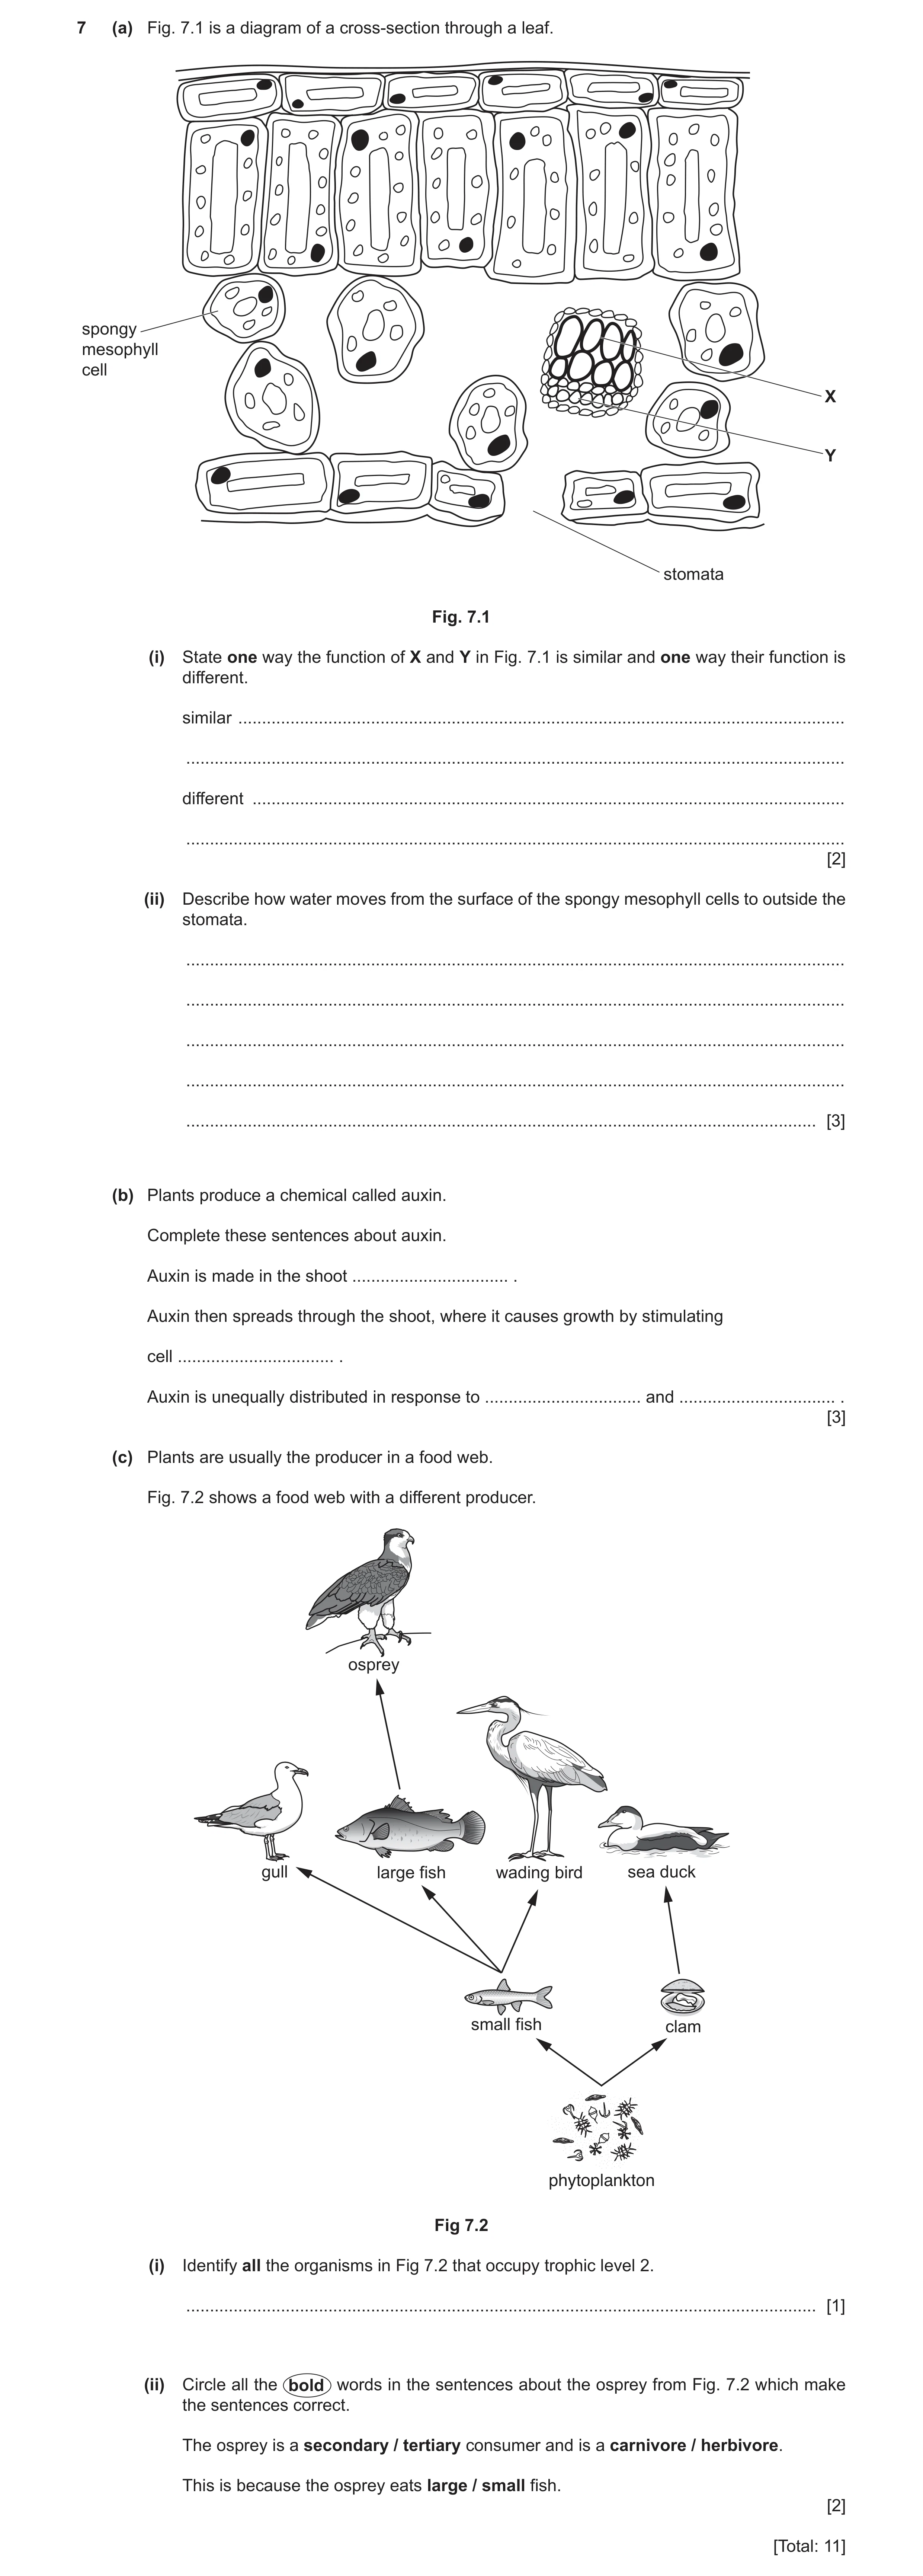
7 (a) Fig. 7.1 is a diagram of a cross‑section through a leaf. spongy mesophyll cell X Y stomata Fig. 7.1 (i) State one way the function of X and Y in Fig. 7.1 is similar and one way their function is different. similar … … different … … [2] (ii) Describe how water moves from the surface of the spongy mesophyll cells to outside the stomata. … … … … … [3] (b) Plants produce a chemical called auxin. Complete these sentences about auxin. Auxin is made in the shoot … . Auxin then spreads through the shoot, where it causes growth by stimulating cell … . Auxin is unequally distributed in response to … and … . [3] (c) Plants are usually the producer in a food web. Fig. 7.2 shows a food web with a different producer. osprey gull large fish wading bird sea duck small fish clam phytoplankton Fig 7.2 (i) Identify all the organisms in Fig 7.2 that occupy trophic level 2. … [1] (ii) Circle all the bold words in the sentences about the osprey from Fig. 7.2 which make the sentences correct. The osprey is a secondary / tertiary consumer and is a carnivore / herbivore. This is because the osprey eats large / small fish. [2] [Total: 11]
11 marks
Mark scheme: 7(a)(i) both / they, transport (substances) ; and either xylem / X, also provides support / transports mineral ions / transports up the stem ; or phloem / Y, transports sugars / amino acids / transports up and down the stem ; Question Answer Marks 7(a)(ii) by evaporation (from the surface) ; water vapour moves to / out of, stomata ; (water vapour passes through stomata) by diffusion ; 3 7(b) tip ; elongation ; gravity and light ; 3 7(c)(i) small fish and clam ; 1 7(c)(ii) tertiary carnivore large ;; all correct = 2 marks two correct = 1 mark 2
This question in 0653/43 May/June 2024
Q12 · Sections through two different flowers, X and Y 0653/42 Oct/Nov 2024
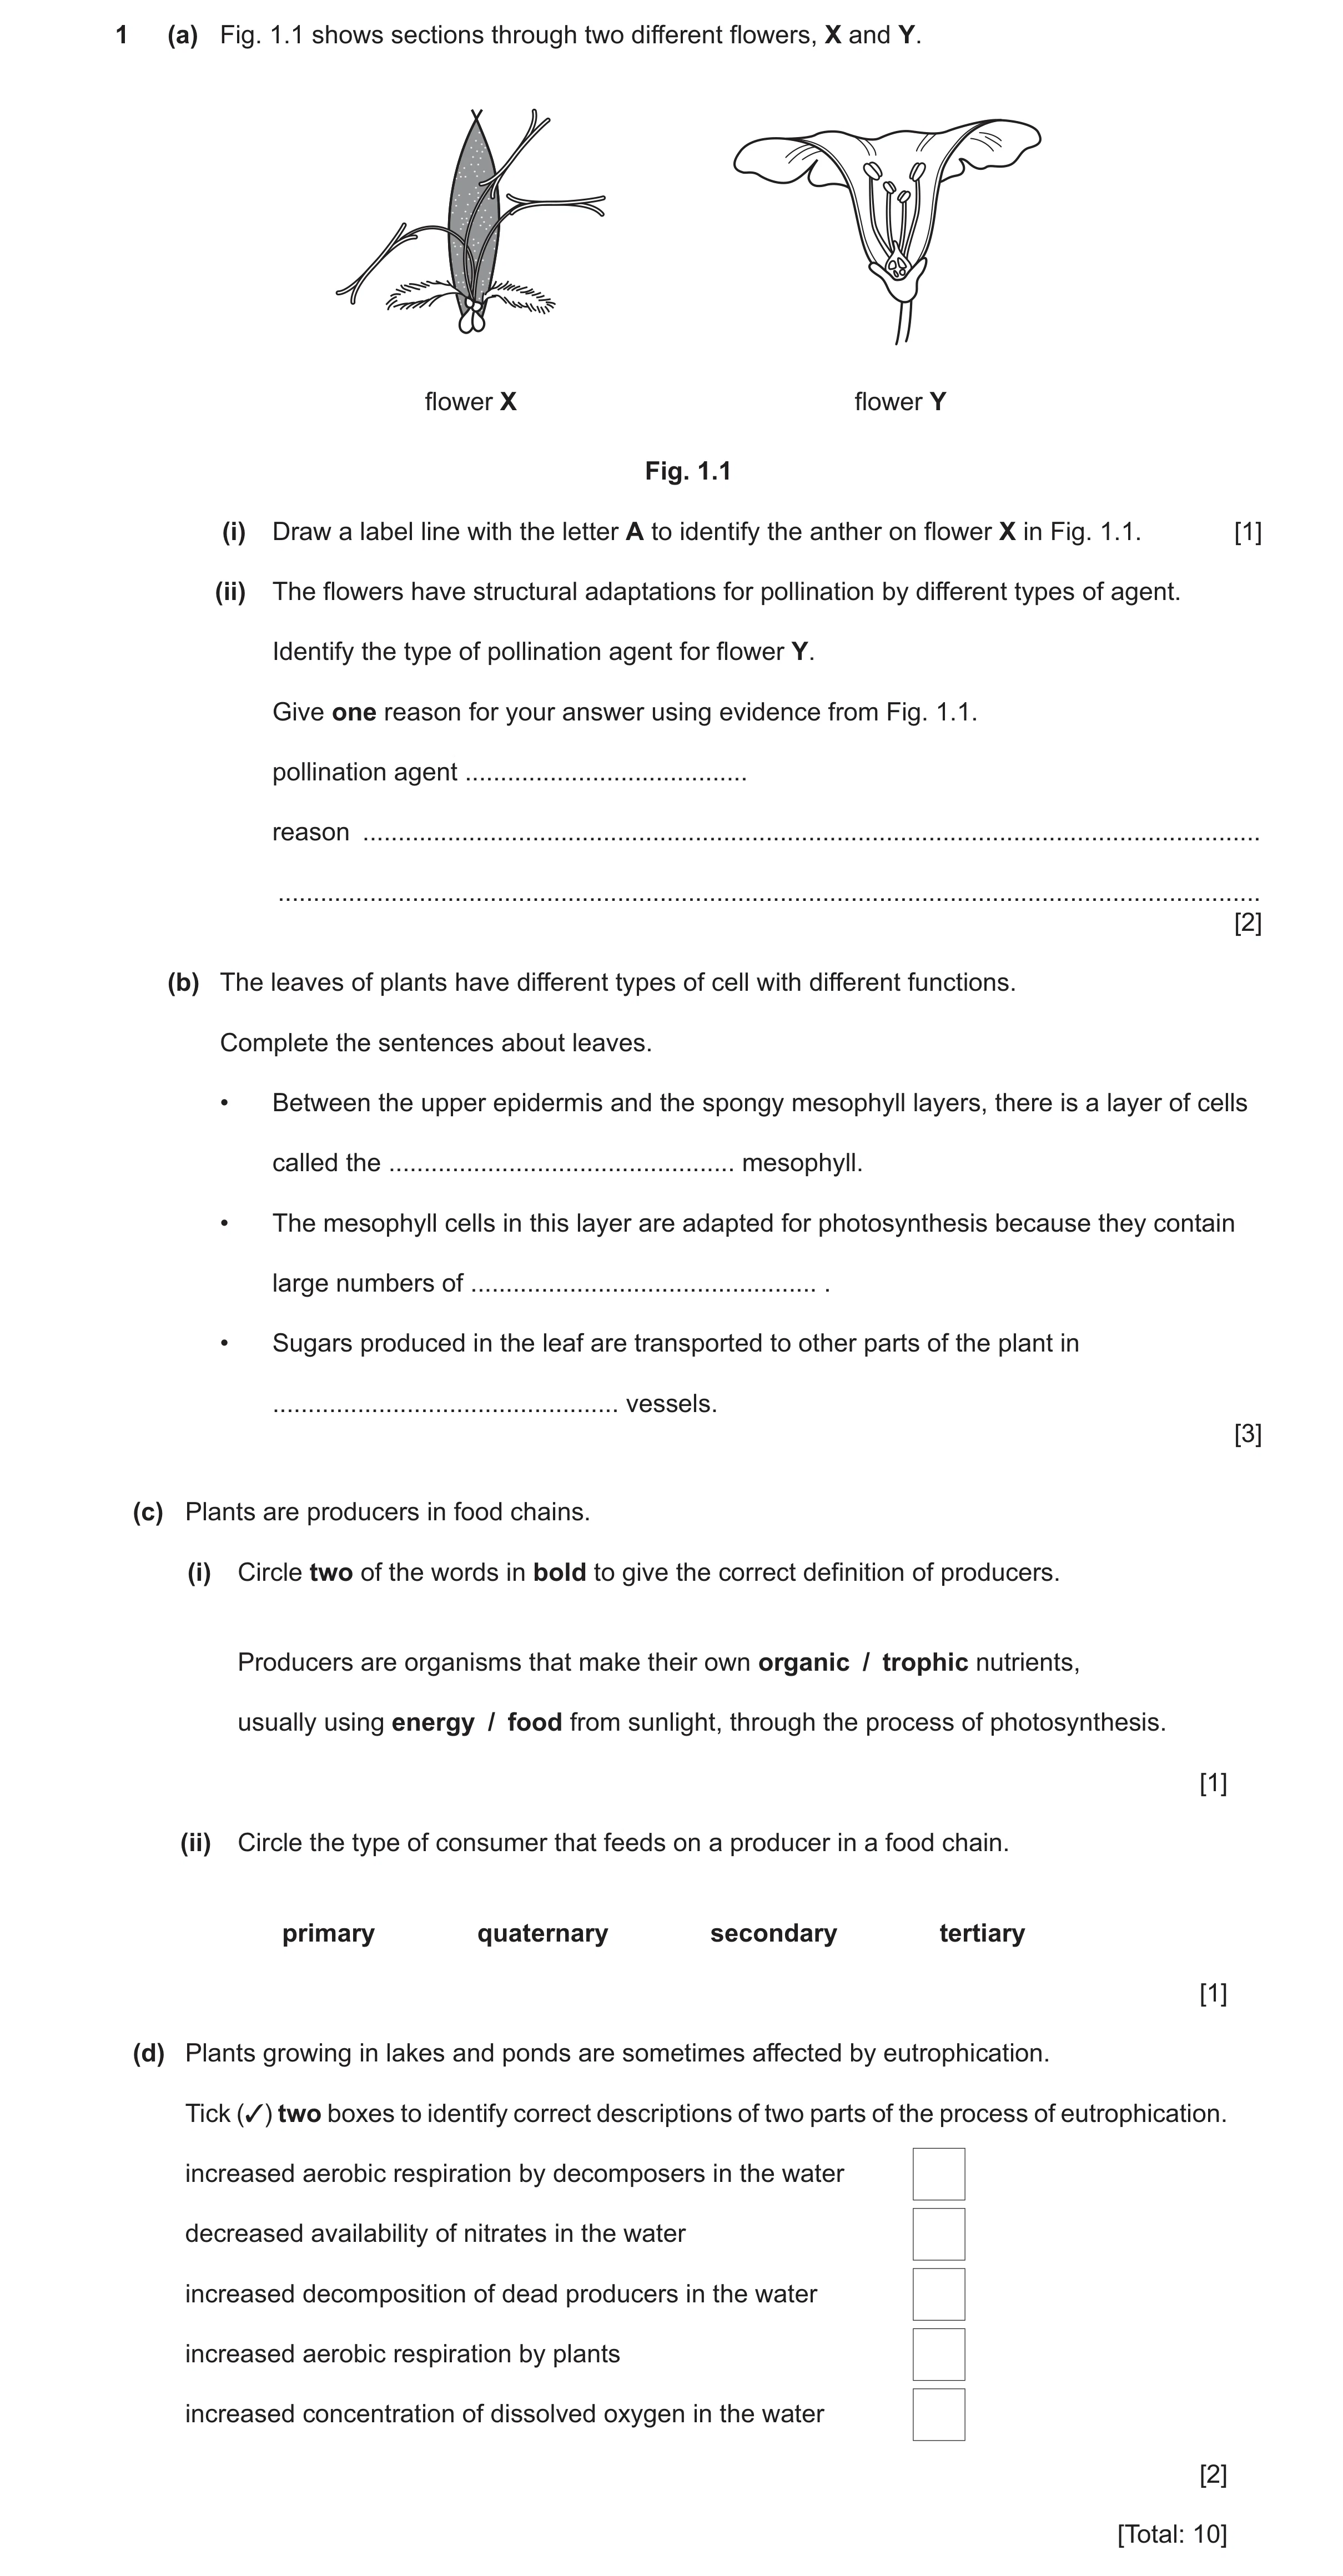
1 (a) Fig. 1.1 shows sections through two different flowers, X and Y. flower X flower Y Fig. 1.1 (i) Draw a label line with the letter A to identify the anther on flower X in Fig. 1.1. [1] (ii) The flowers have structural adaptations for pollination by different types of agent. Identify the type of pollination agent for flower Y. Give one reason for your answer using evidence from Fig. 1.1. pollination agent … reason … … [2] (b) The leaves of plants have different types of cell with different functions. Complete the sentences about leaves. • Between the upper epidermis and the spongy mesophyll layers, there is a layer of cells called the … mesophyll. • The mesophyll cells in this layer are adapted for photosynthesis because they contain large numbers of … . • Sugars produced in the leaf are transported to other parts of the plant in … vessels. [3] (c) Plants are producers in food chains. (i) Circle two of the words in bold to give the correct definition of producers. Producers are organisms that make their own organic / trophic nutrients, usually using energy / food from sunlight, through the process of photosynthesis. [1] (ii) Circle the type of consumer that feeds on a producer in a food chain. primary quaternary secondary tertiary [1] (d) Plants growing in lakes and ponds are sometimes affected by eutrophication. Tick (✓) two boxes to identify correct descriptions of two parts of the process of eutrophication. increased aerobic respiration by decomposers in the water decreased availability of nitrates in the water increased decomposition of dead producers in the water increased aerobic respiration by plants increased concentration of dissolved oxygen in the water [2] [Total: 10]
10 marks
Mark scheme: Question Answer Marks 1(a)(i) anther labelled A on flower X ; 1 1(a)(ii) insect / bird / animal ; 2 anthers inside flower / stigma inside flower ; 1(b) palisade ; 3 chloroplasts ; phloem ; 1(c)(i) organic AND energy ; 1 1(c)(ii) primary ; 1 1(d) increased aerobic respiration by decomposers in the water ; 2 increased decomposition of dead producers in the water ;
This question in 0653/42 Oct/Nov 2024
Q13 · A cross-section of a leaf 0653/42 Feb/March 2025
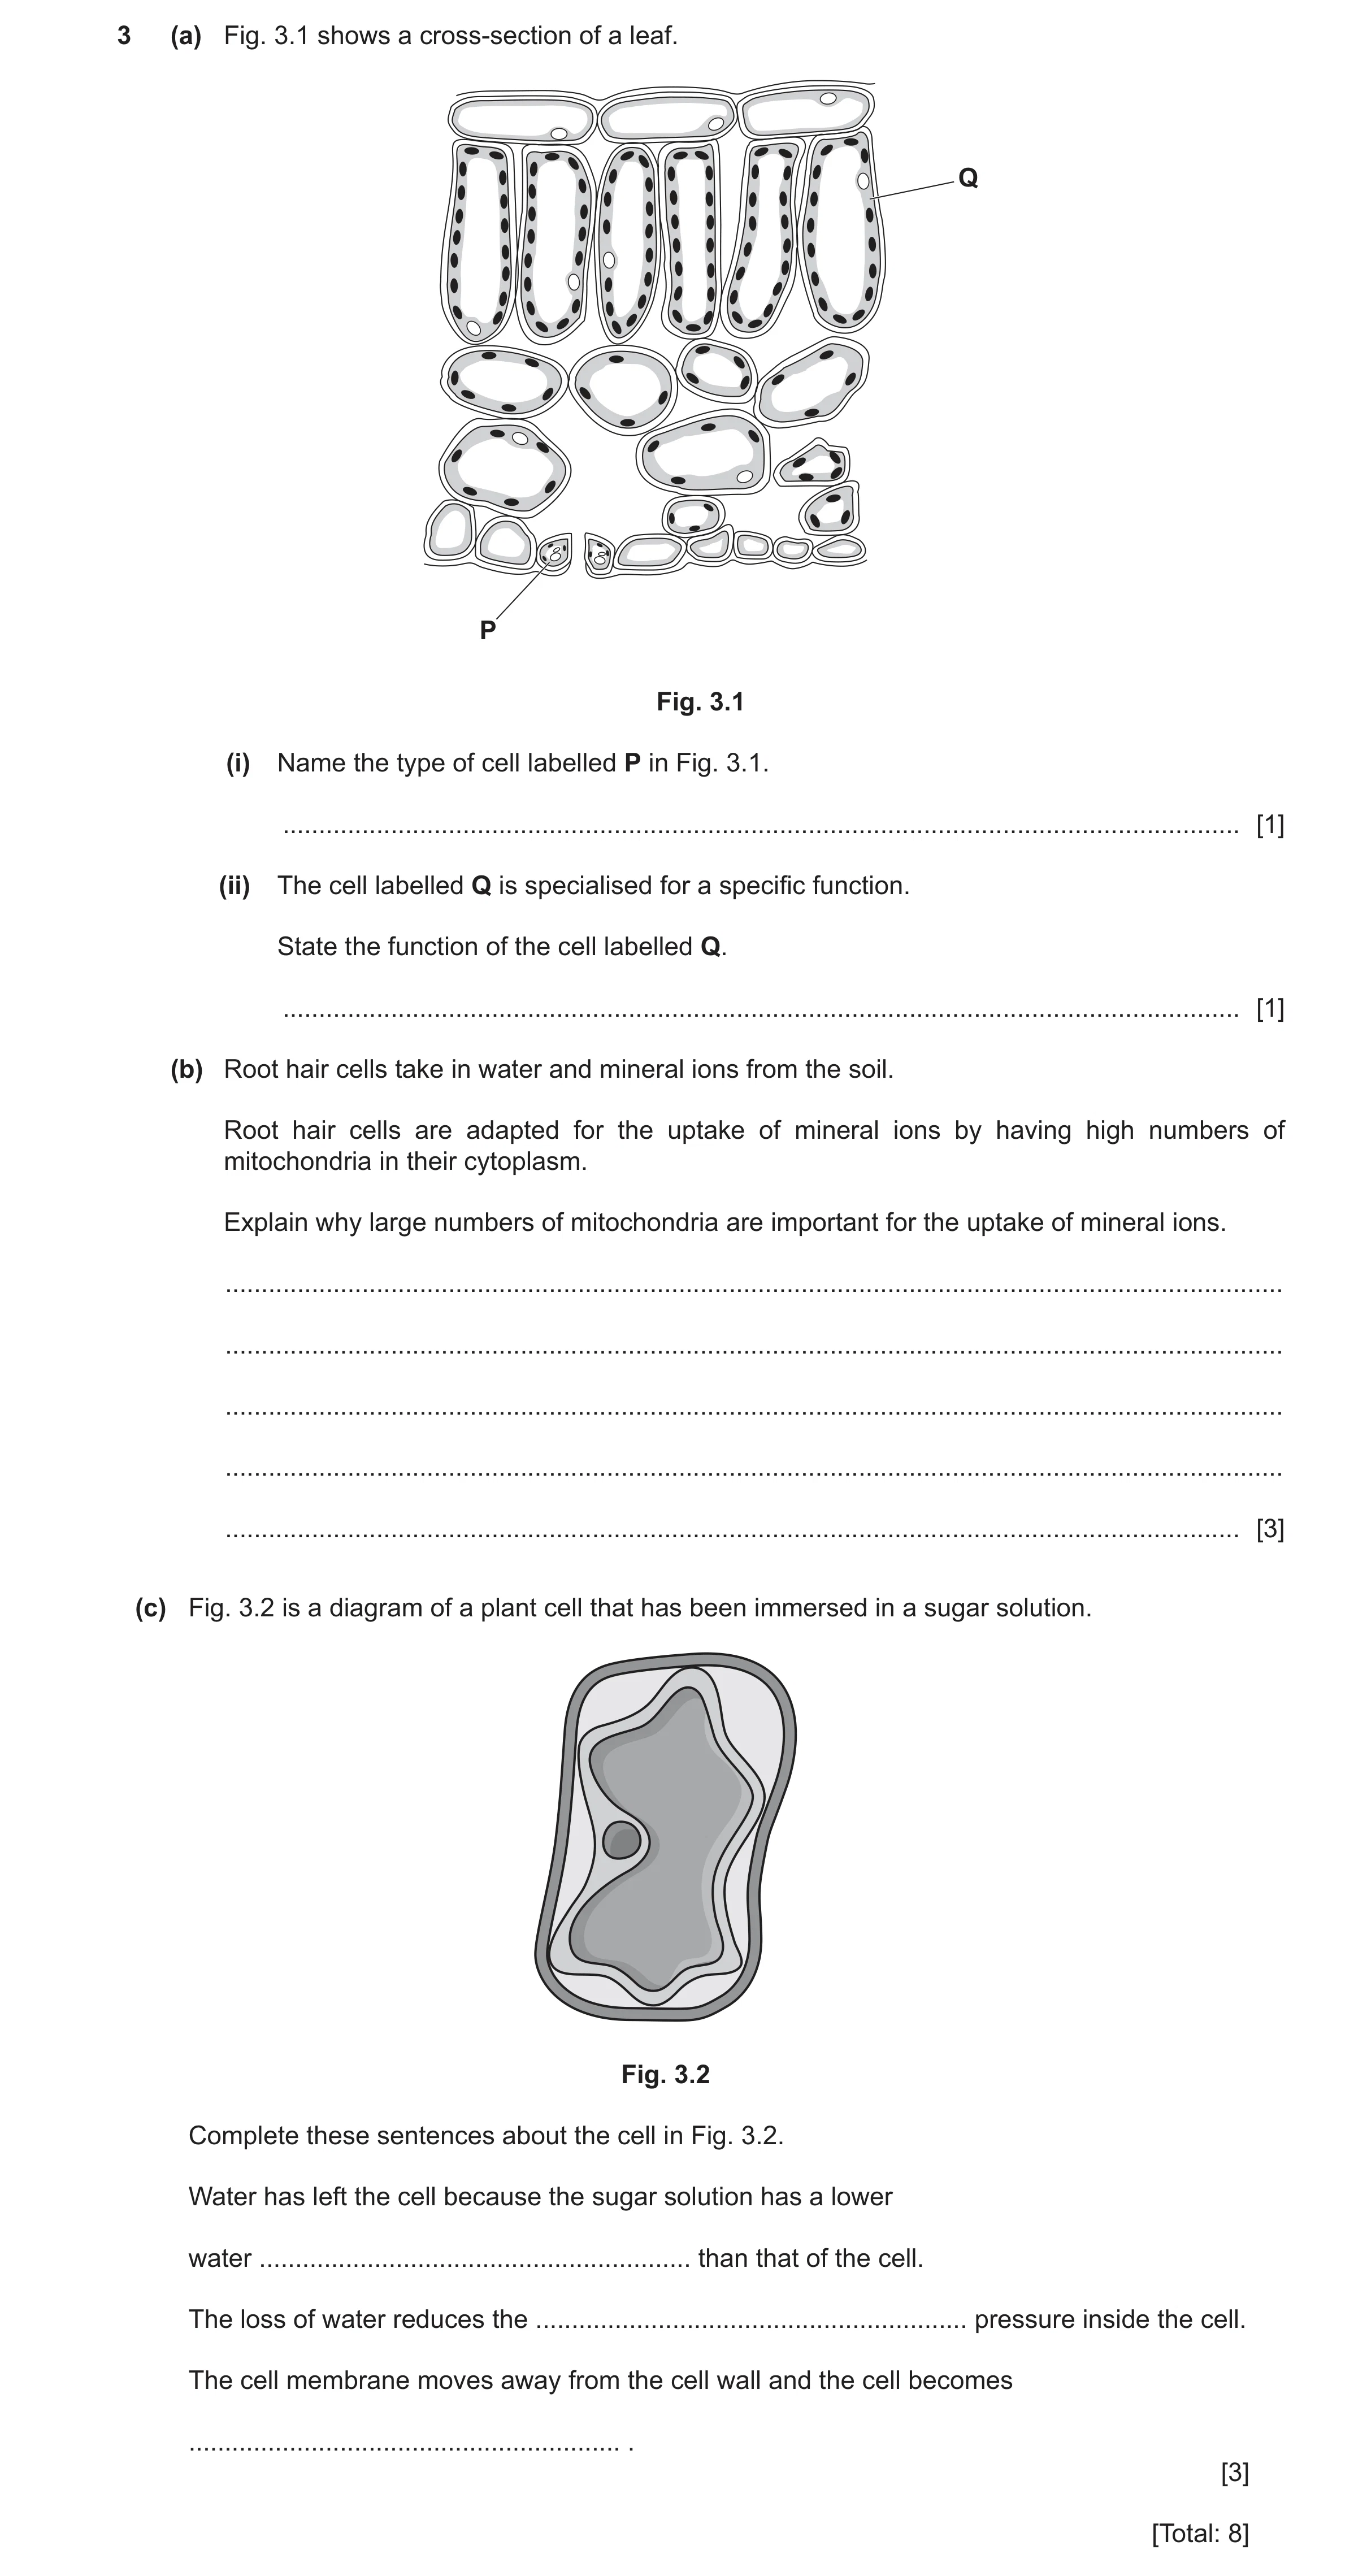
3 (a) Fig. 3.1 shows a cross-section of a leaf. Q P Fig. 3.1 (i) Name the type of cell labelled P in Fig. 3.1. … [1] (ii) The cell labelled Q is specialised for a specific function. State the function of the cell labelled Q. … [1] (b) Root hair cells take in water and mineral ions from the soil. Root hair cells are adapted for the uptake of mineral ions by having high numbers of mitochondria in their cytoplasm. Explain why large numbers of mitochondria are important for the uptake of mineral ions. … … … … … [3] (c) Fig. 3.2 is a diagram of a plant cell that has been immersed in a sugar solution. Fig. 3.2 Complete these sentences about the cell in Fig. 3.2. Water has left the cell because the sugar solution has a lower water … than that of the cell. The loss of water reduces the … pressure inside the cell. The cell membrane moves away from the cell wall and the cell becomes … . [3] [Total: 8]
8 marks
Mark scheme: 3(a)(i) guard (cell) ; 1 3(a)(ii) photosynthesis ; 1 3(b) any three from: 3 uptake of mineral ions is by active transport ; energy required for, active transport / uptake of mineral ions ; respiration releases energy ; (mitochondria are) site of (aerobic) respiration ; 3(c) potential ; 3 turgor ; plasmolysed ;
This question in 0653/42 Feb/March 2025
Q14 · A diagram of a cross-section through a leaf 0653/43 May/June 2025
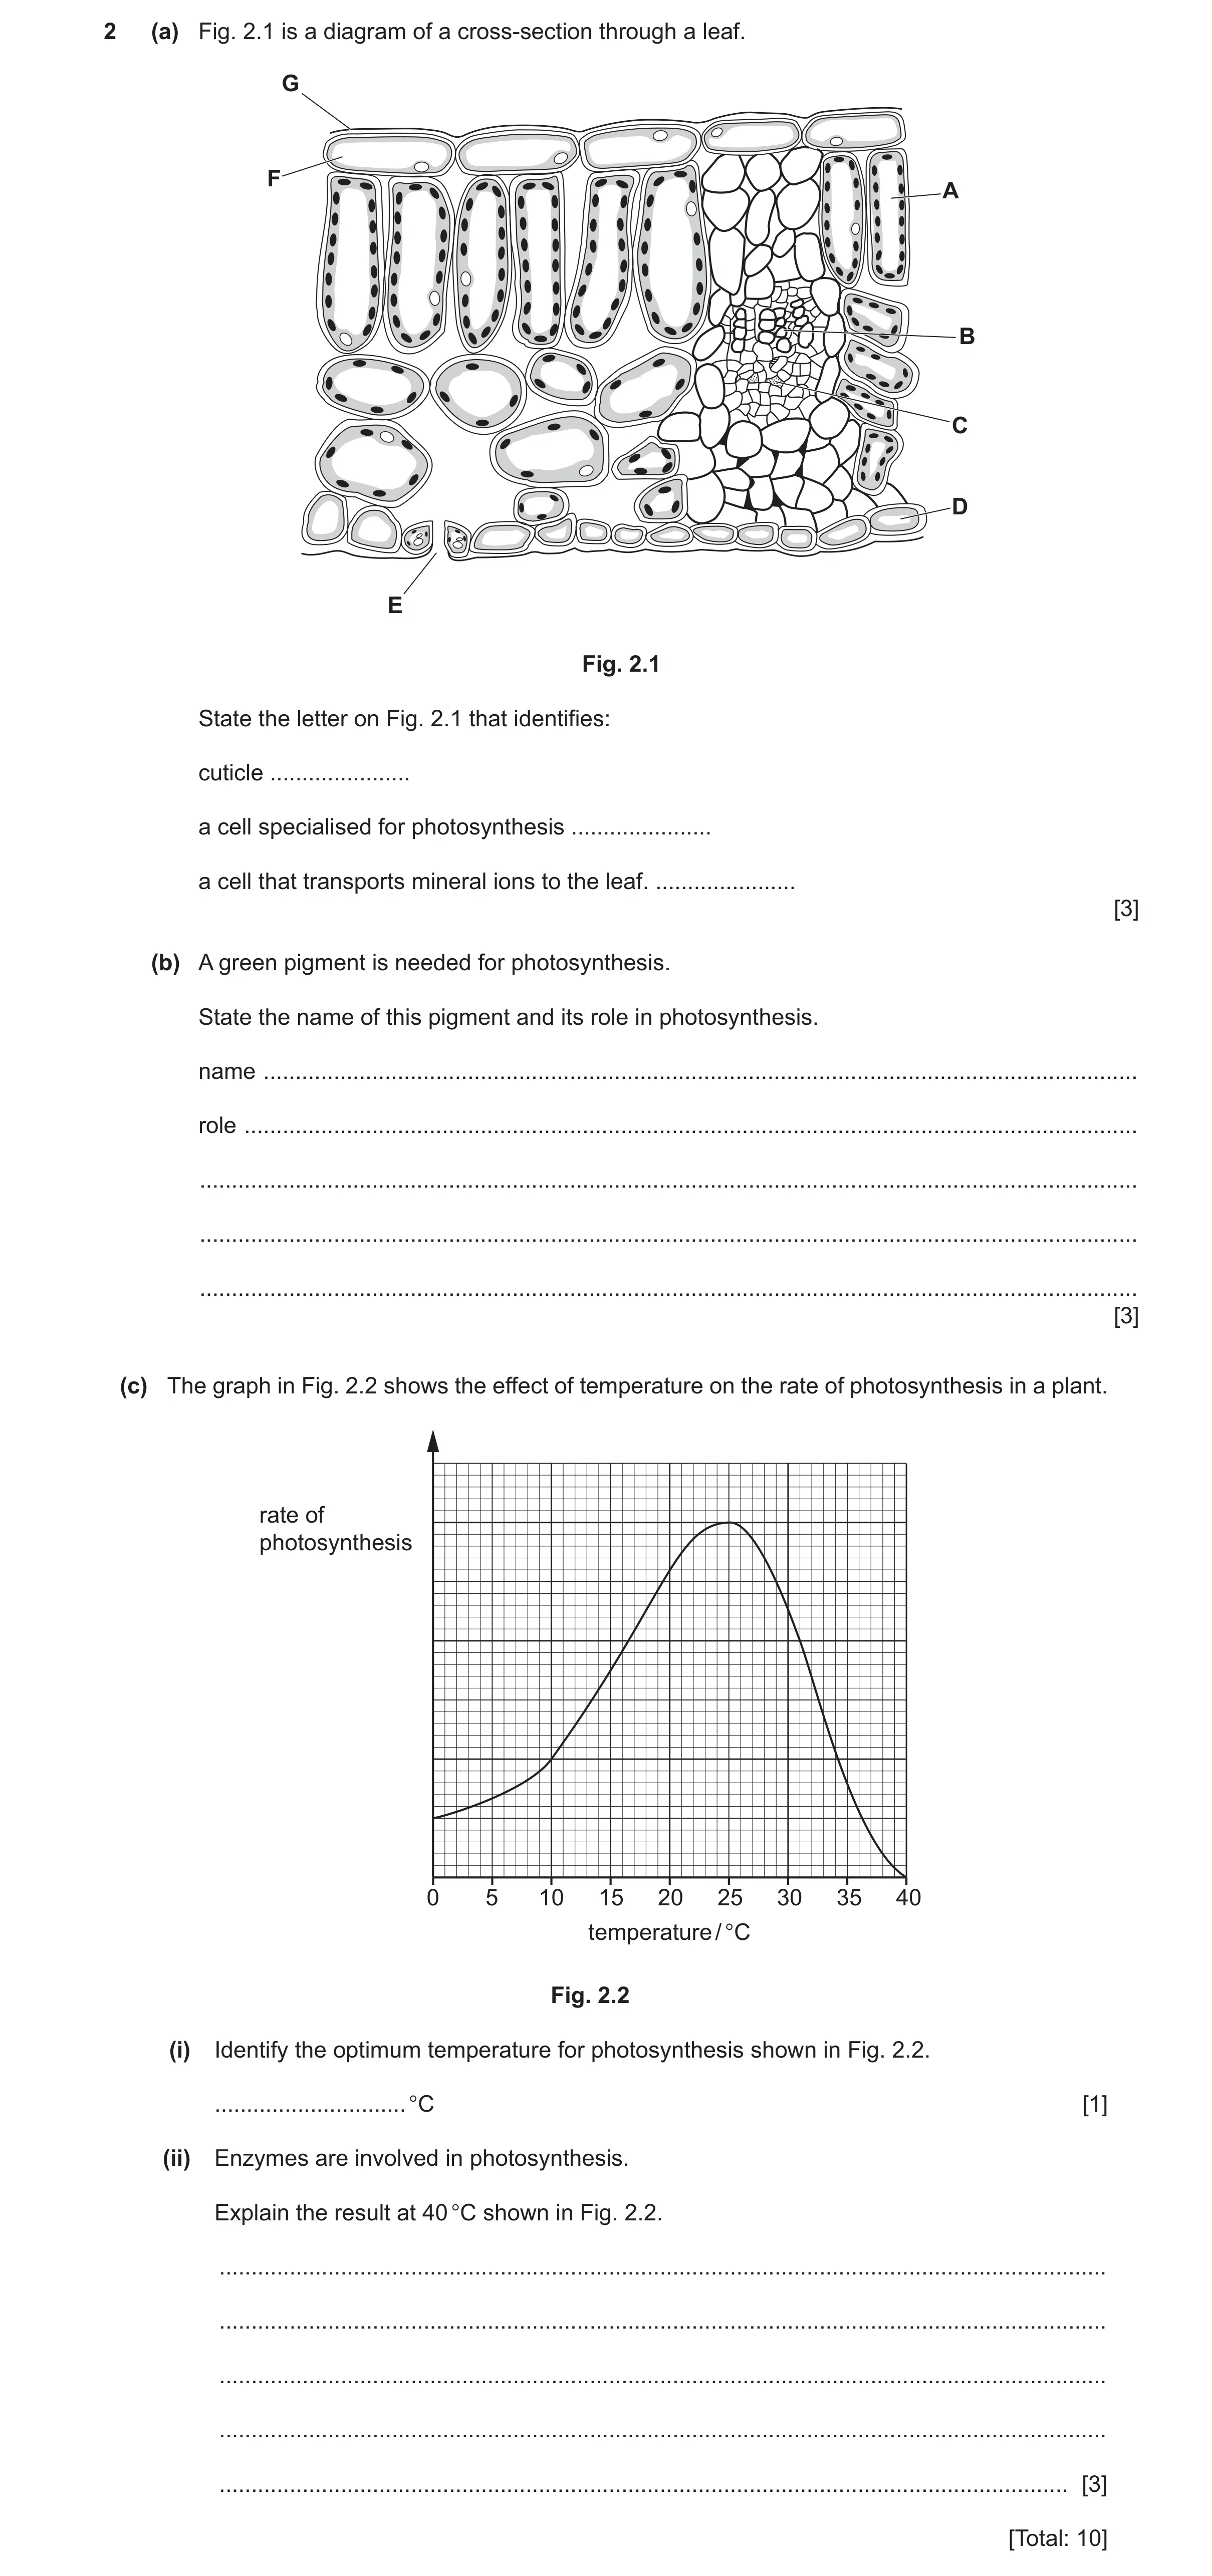
2 (a) Fig. 2.1 is a diagram of a cross-section through a leaf. G F A B C D E Fig. 2.1 State the letter on Fig. 2.1 that identifies: cuticle … a cell specialised for photosynthesis … a cell that transports mineral ions to the leaf. … [3] (b) A green pigment is needed for photosynthesis. State the name of this pigment and its role in photosynthesis. name … role … … … … [3] (c) The graph in Fig. 2.2 shows the effect of temperature on the rate of photosynthesis in a plant. rate of photosynthesis 0 5 10 15 20 25 30 35 40 temperature / °C Fig. 2.2 (i) Identify the optimum temperature for photosynthesis shown in Fig. 2.2. … °C [1] (ii) Enzymes are involved in photosynthesis. Explain the result at 40 °C shown in Fig. 2.2. … … … … … [3] [Total: 10]
10 marks
Mark scheme: 2(a) G ; 3 A ; B ; 2(b) chlorophyll ; 3 transfers light energy to chemical energy ; to synthesise / produce, carbohydrates / glucose ; 2(c)(i) 25 (°C) ; 1 2(c)(ii) enzymes denature (at high temperature) ; 3 active site changes shape ; active site no longer complementary to substrate / substrate no longer fits active site ;
This question in 0653/43 May/June 2025
Q15 · A diagram of a cross-section through a leaf 0653/42 Oct/Nov 2025
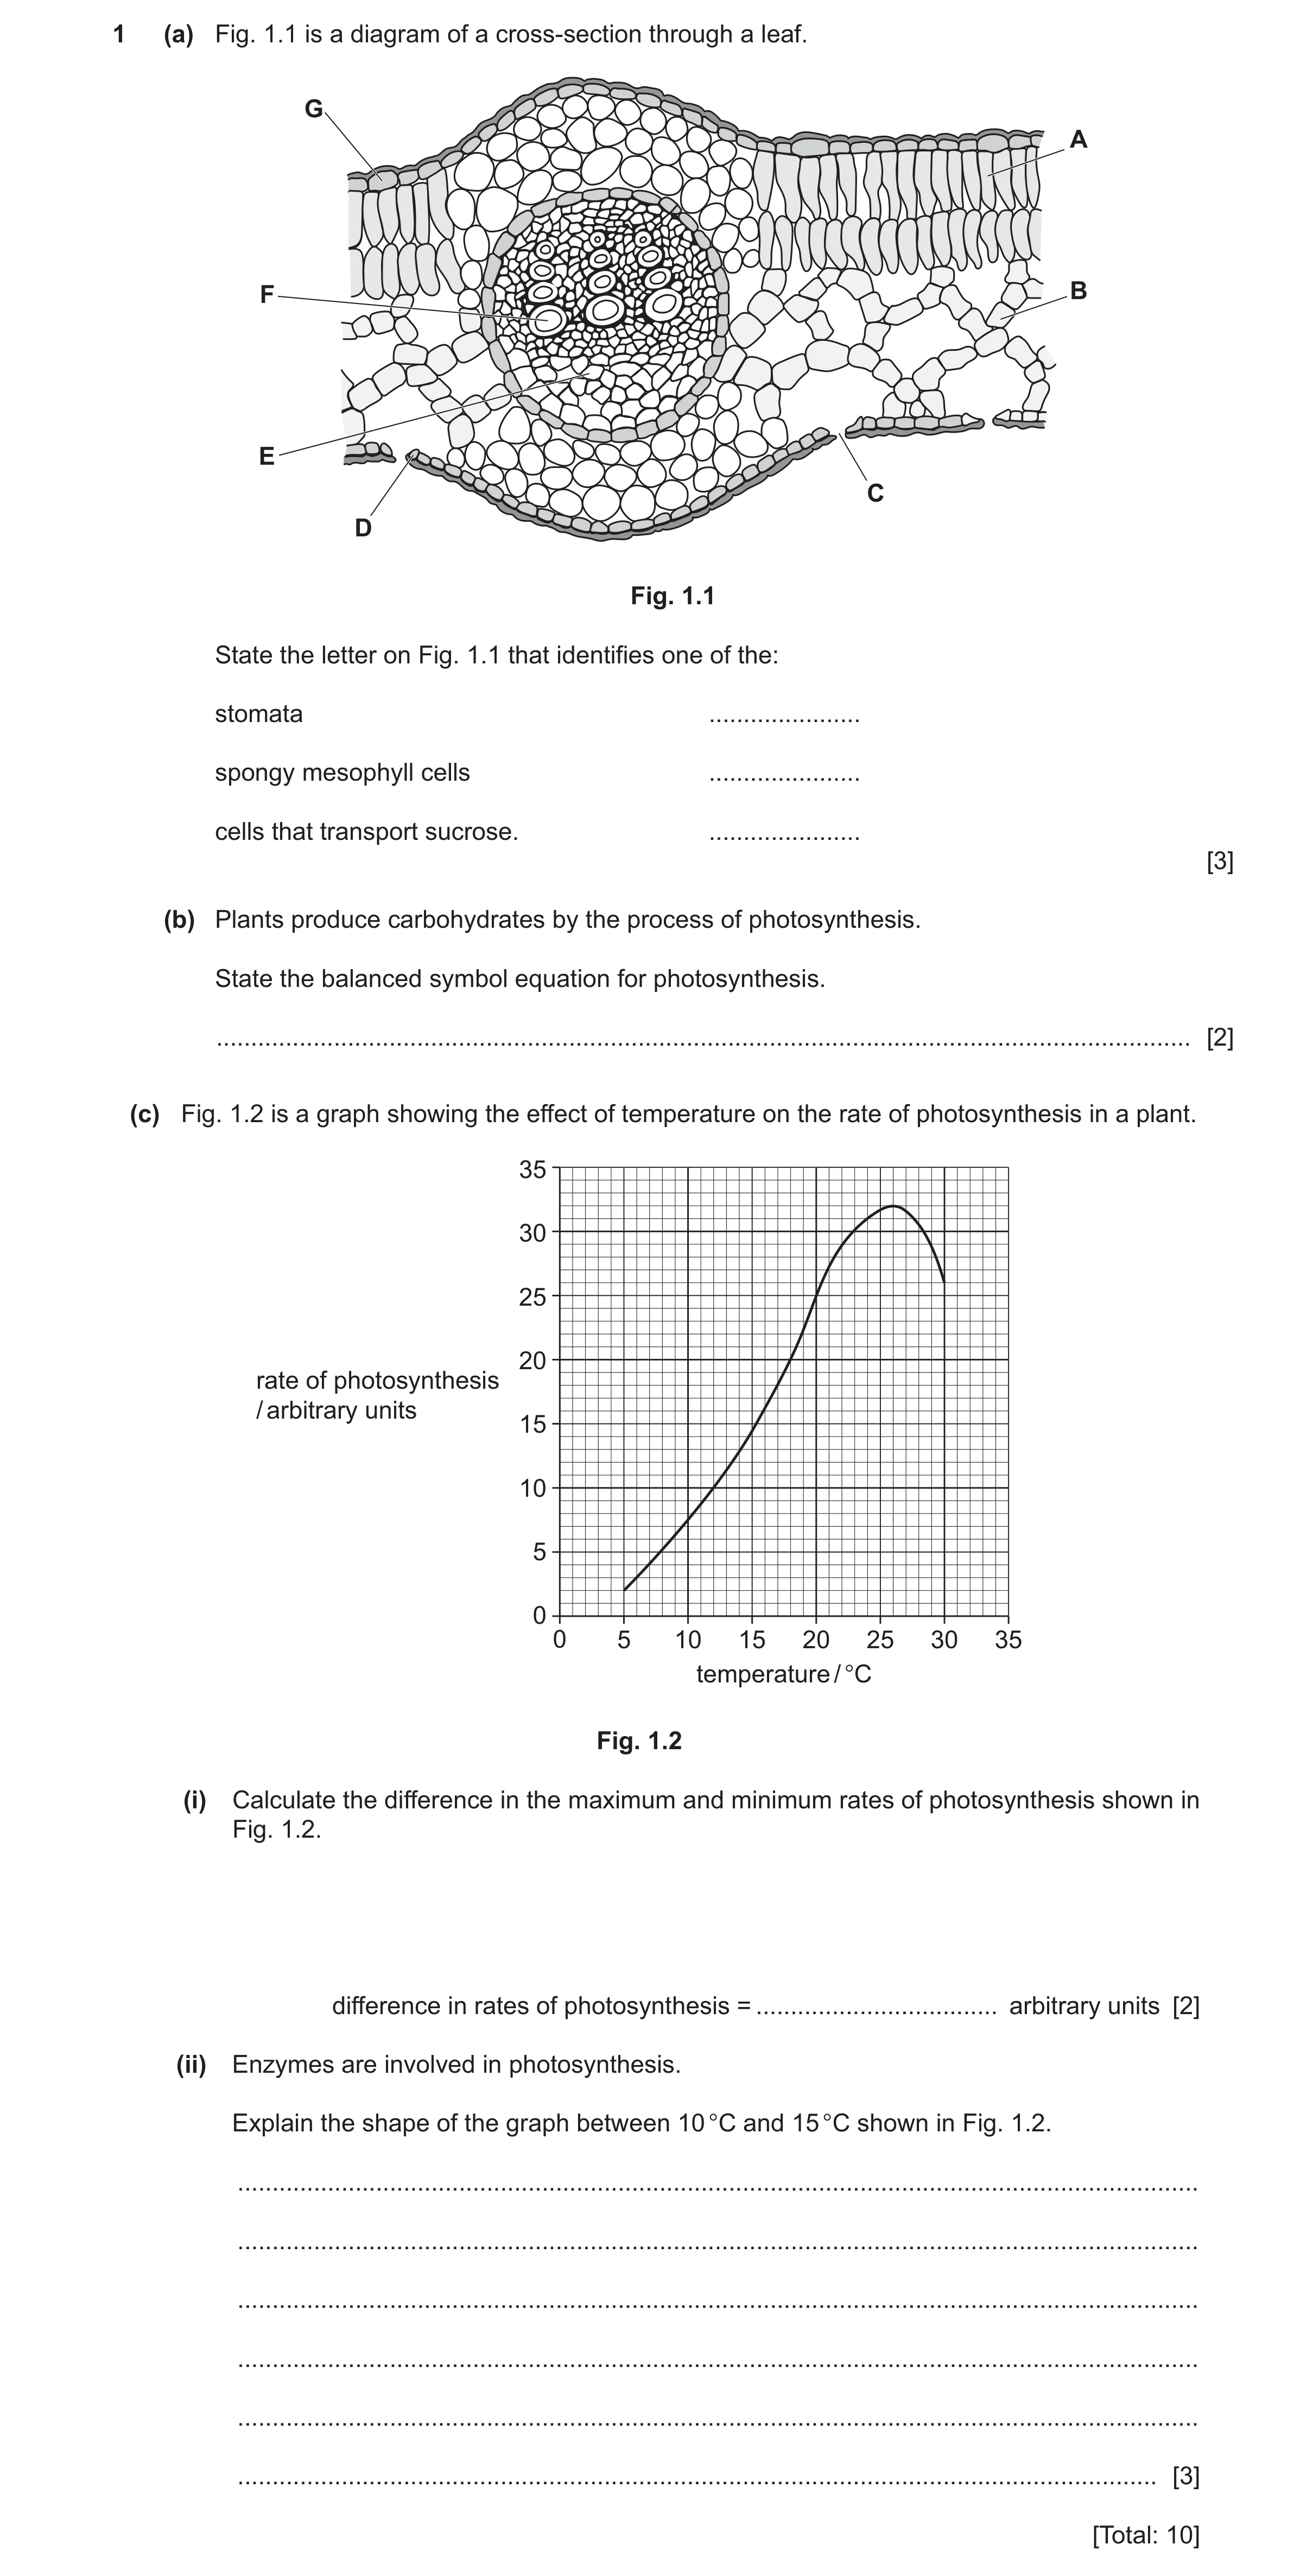
1 (a) Fig. 1.1 is a diagram of a cross-section through a leaf. G A F B E C D Fig. 1.1 State the letter on Fig. 1.1 that identifies one of the: stomata … spongy mesophyll cells … cells that transport sucrose. … [3] (b) Plants produce carbohydrates by the process of photosynthesis. State the balanced symbol equation for photosynthesis. … [2] (c) Fig. 1.2 is a graph showing the effect of temperature on the rate of photosynthesis in a plant. 35 30 25 20 rate of photosynthesis / arbitrary units 15 10 5 0 0 5 10 15 20 25 30 35 temperature / °C Fig. 1.2 (i) Calculate the difference in the maximum and minimum rates of photosynthesis shown in Fig. 1.2. difference in rates of photosynthesis = … arbitrary units [2] (ii) Enzymes are involved in photosynthesis. Explain the shape of the graph between 10 °C and 15 °C shown in Fig. 1.2. … … … … … … [3] [Total: 10]
10 marks
Mark scheme: Question Answer Marks 1(a) C ; 3 B ; E ; 1(b) 6CO2 + 6H2O ; 2 → C6H12O6 + 6O2 ; 1(c)(i) 32 – 2 or (max rate = ) 32 seen or (min rate =) 2 seen ; 2 (max difference = ) 30 (arbitrary units) ; 1(c)(ii) increasing temperature / from 10 °C to 15 °C and linked to 3 any three ;;; • increasing rate of photosynthesis • increasing enzyme activity ; • increasing kinetic energy / enzymes move faster ; • more frequency of (enzyme-substrate) collisions ; • more / faster formation of enzyme-substrate complexes ;
This question in 0653/42 Oct/Nov 2025
 3 / 26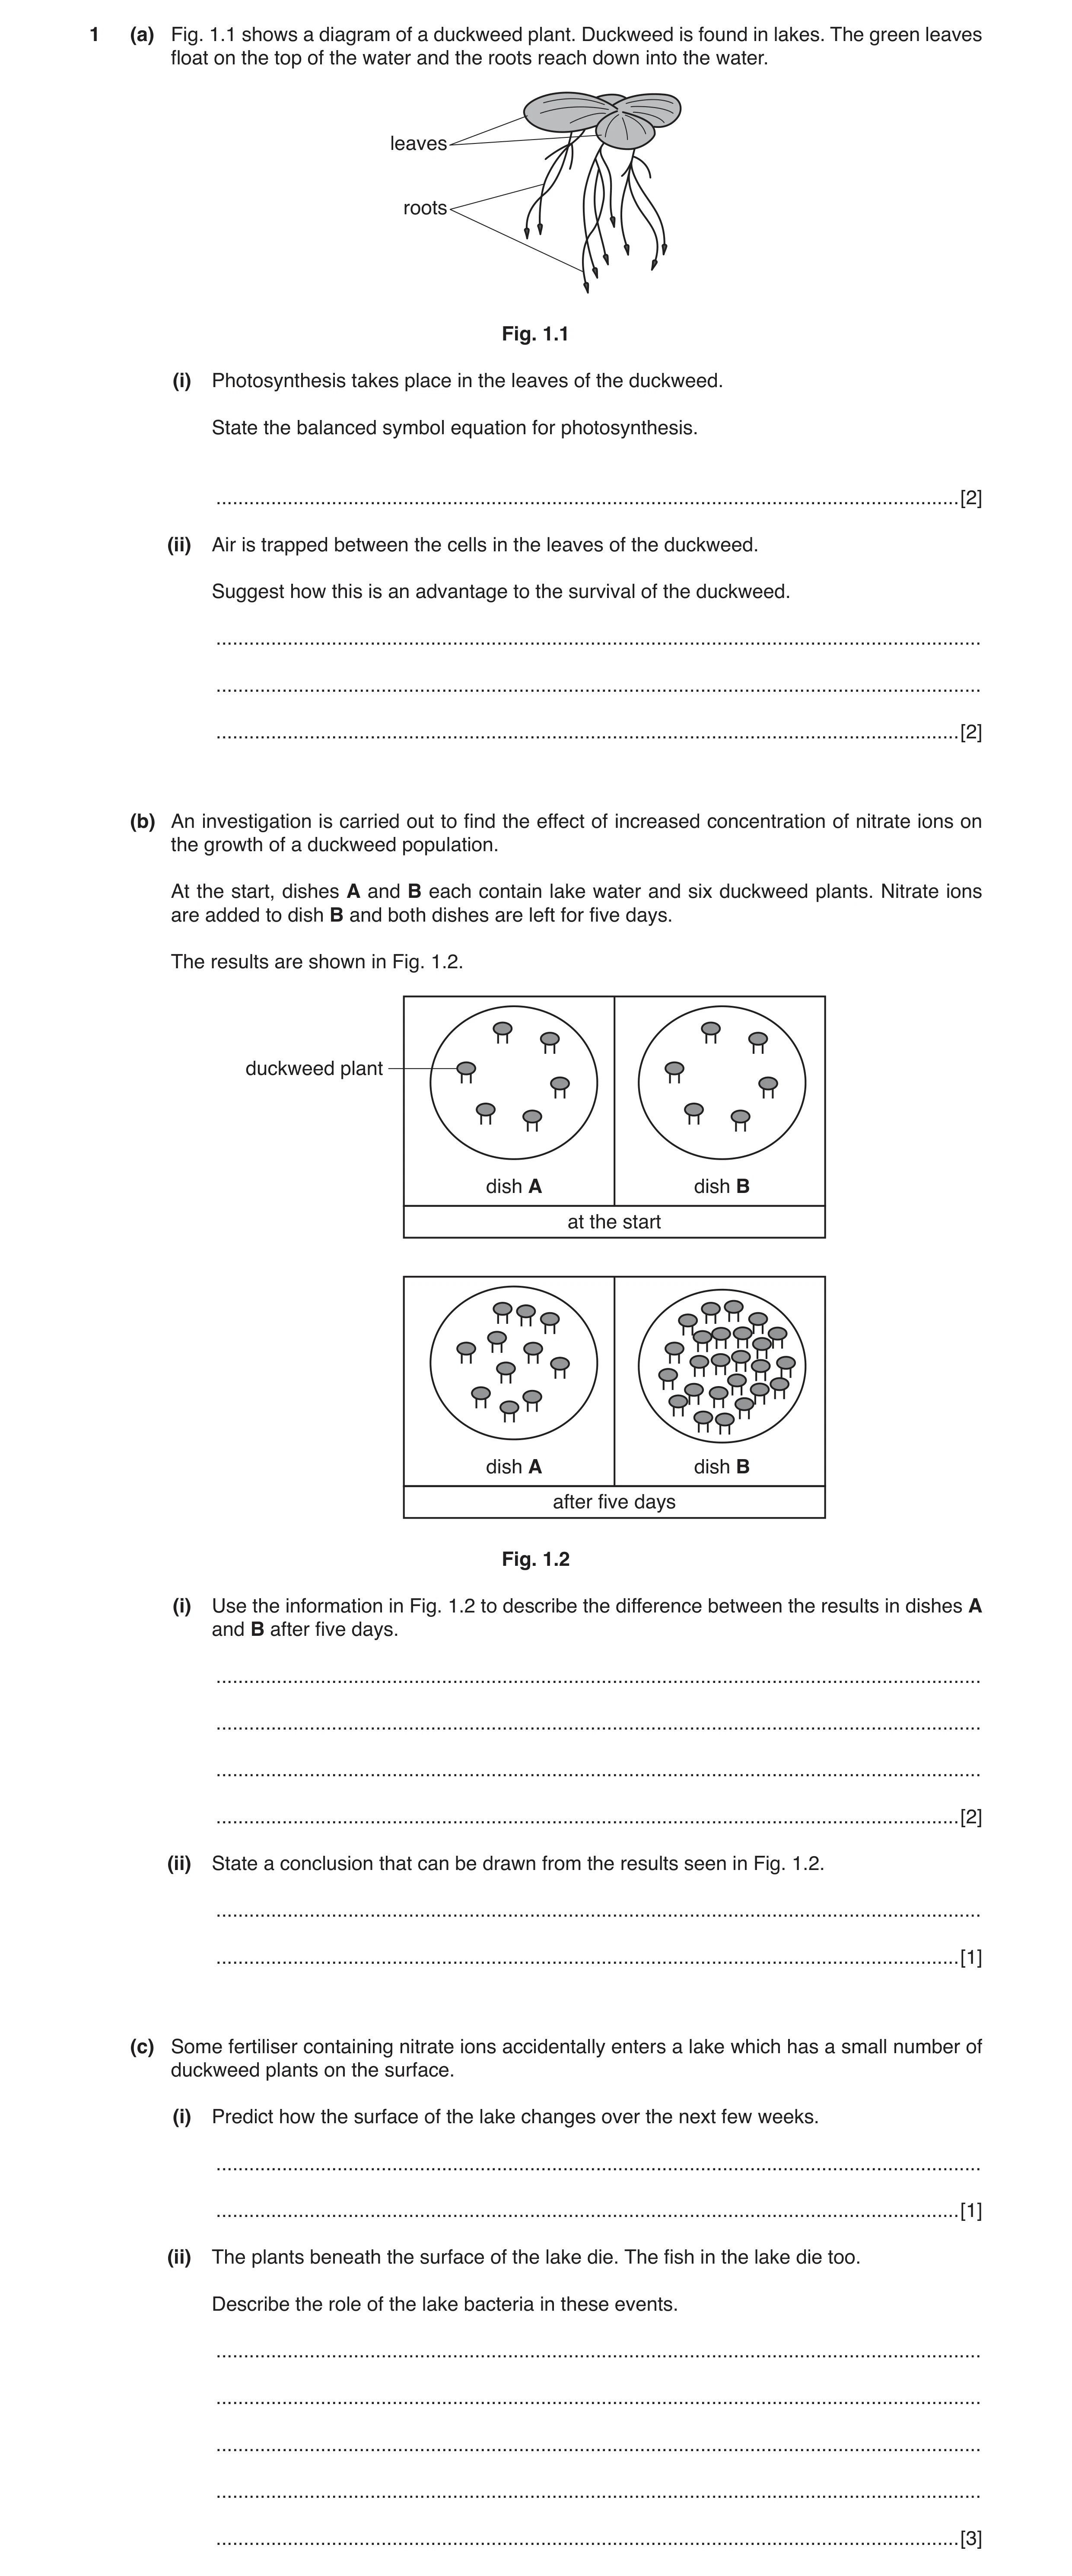
 7
7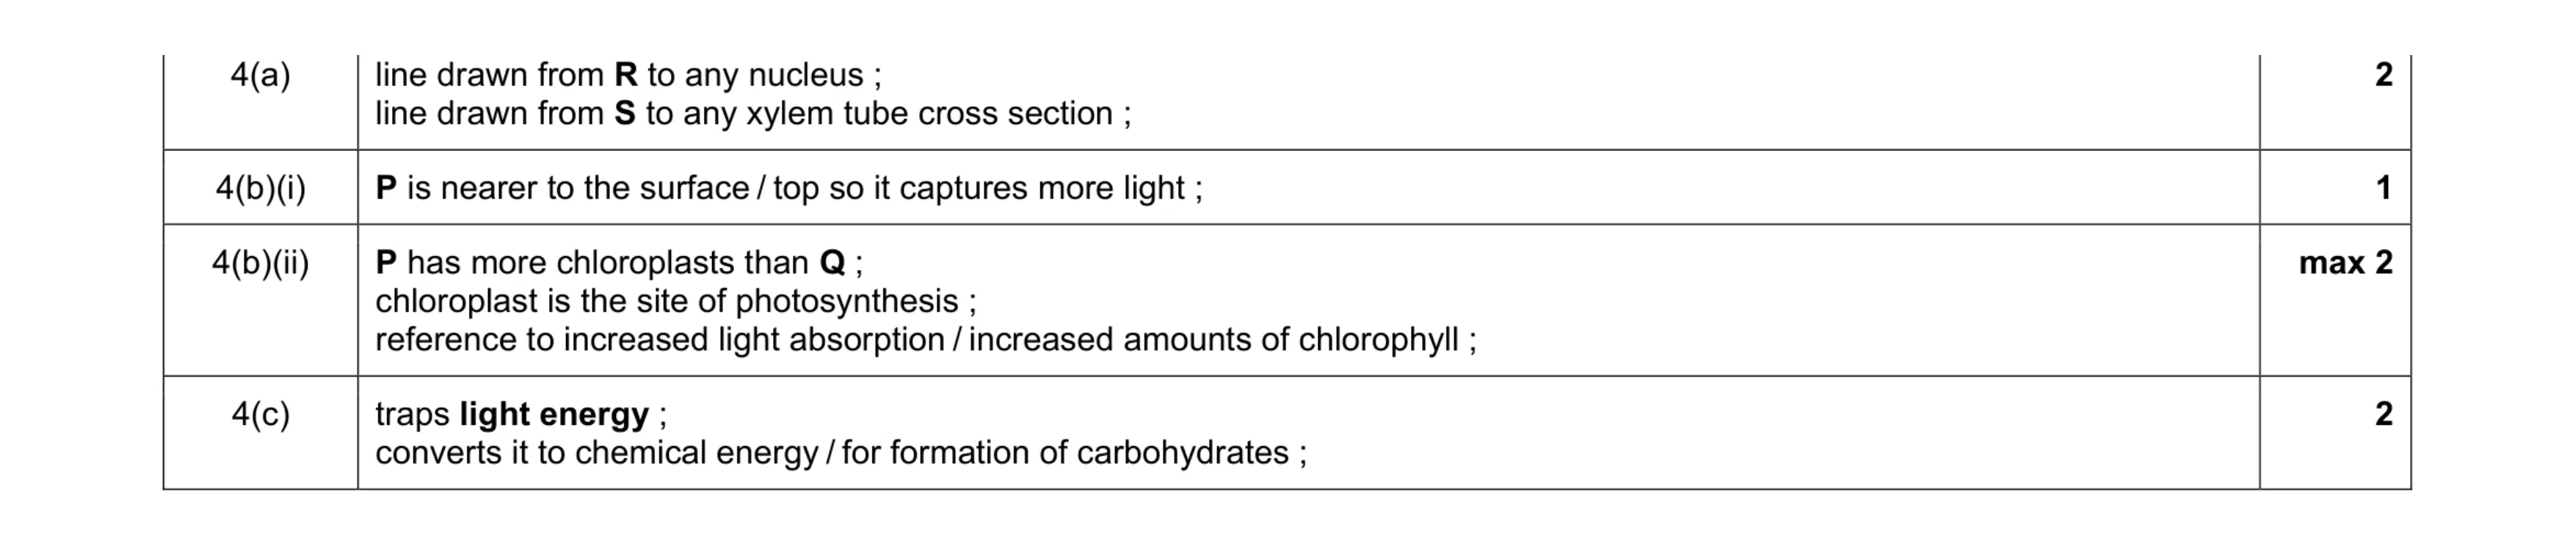 7
7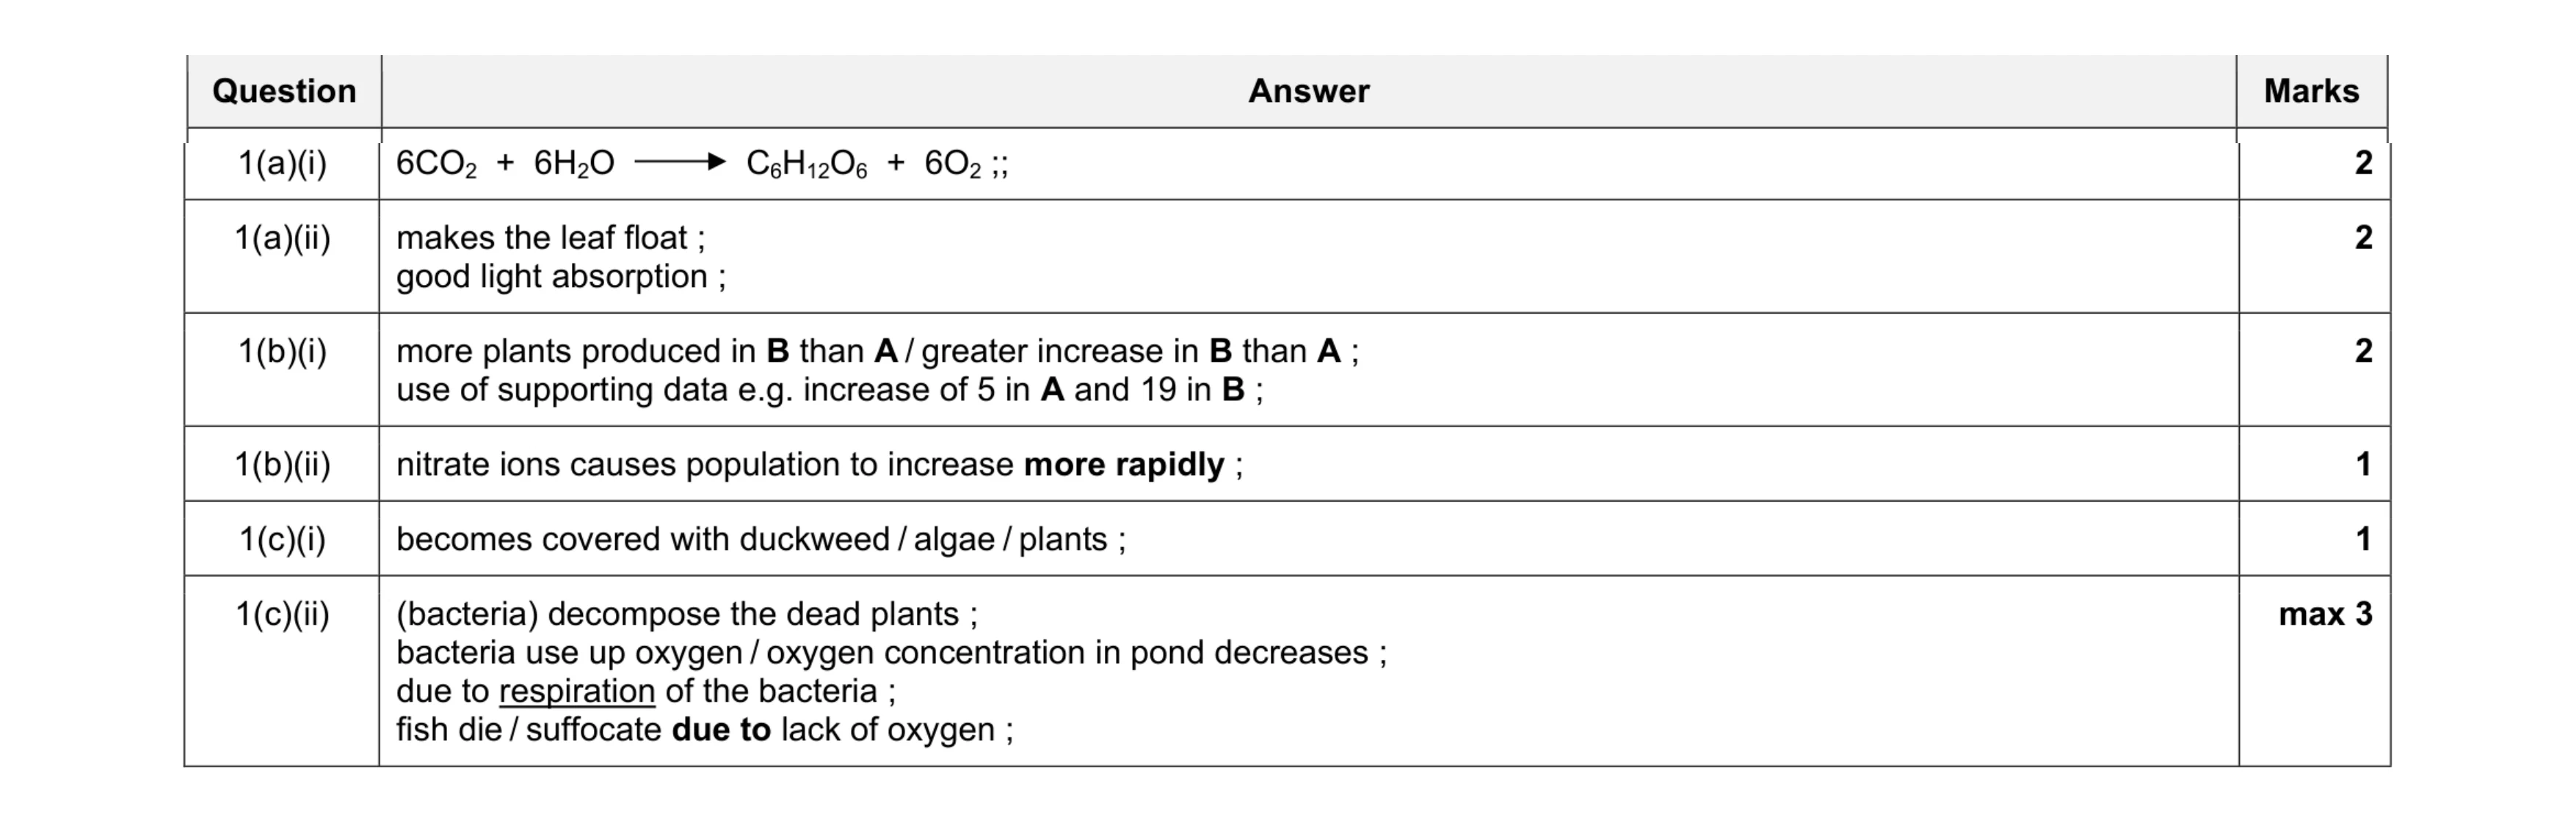 11
11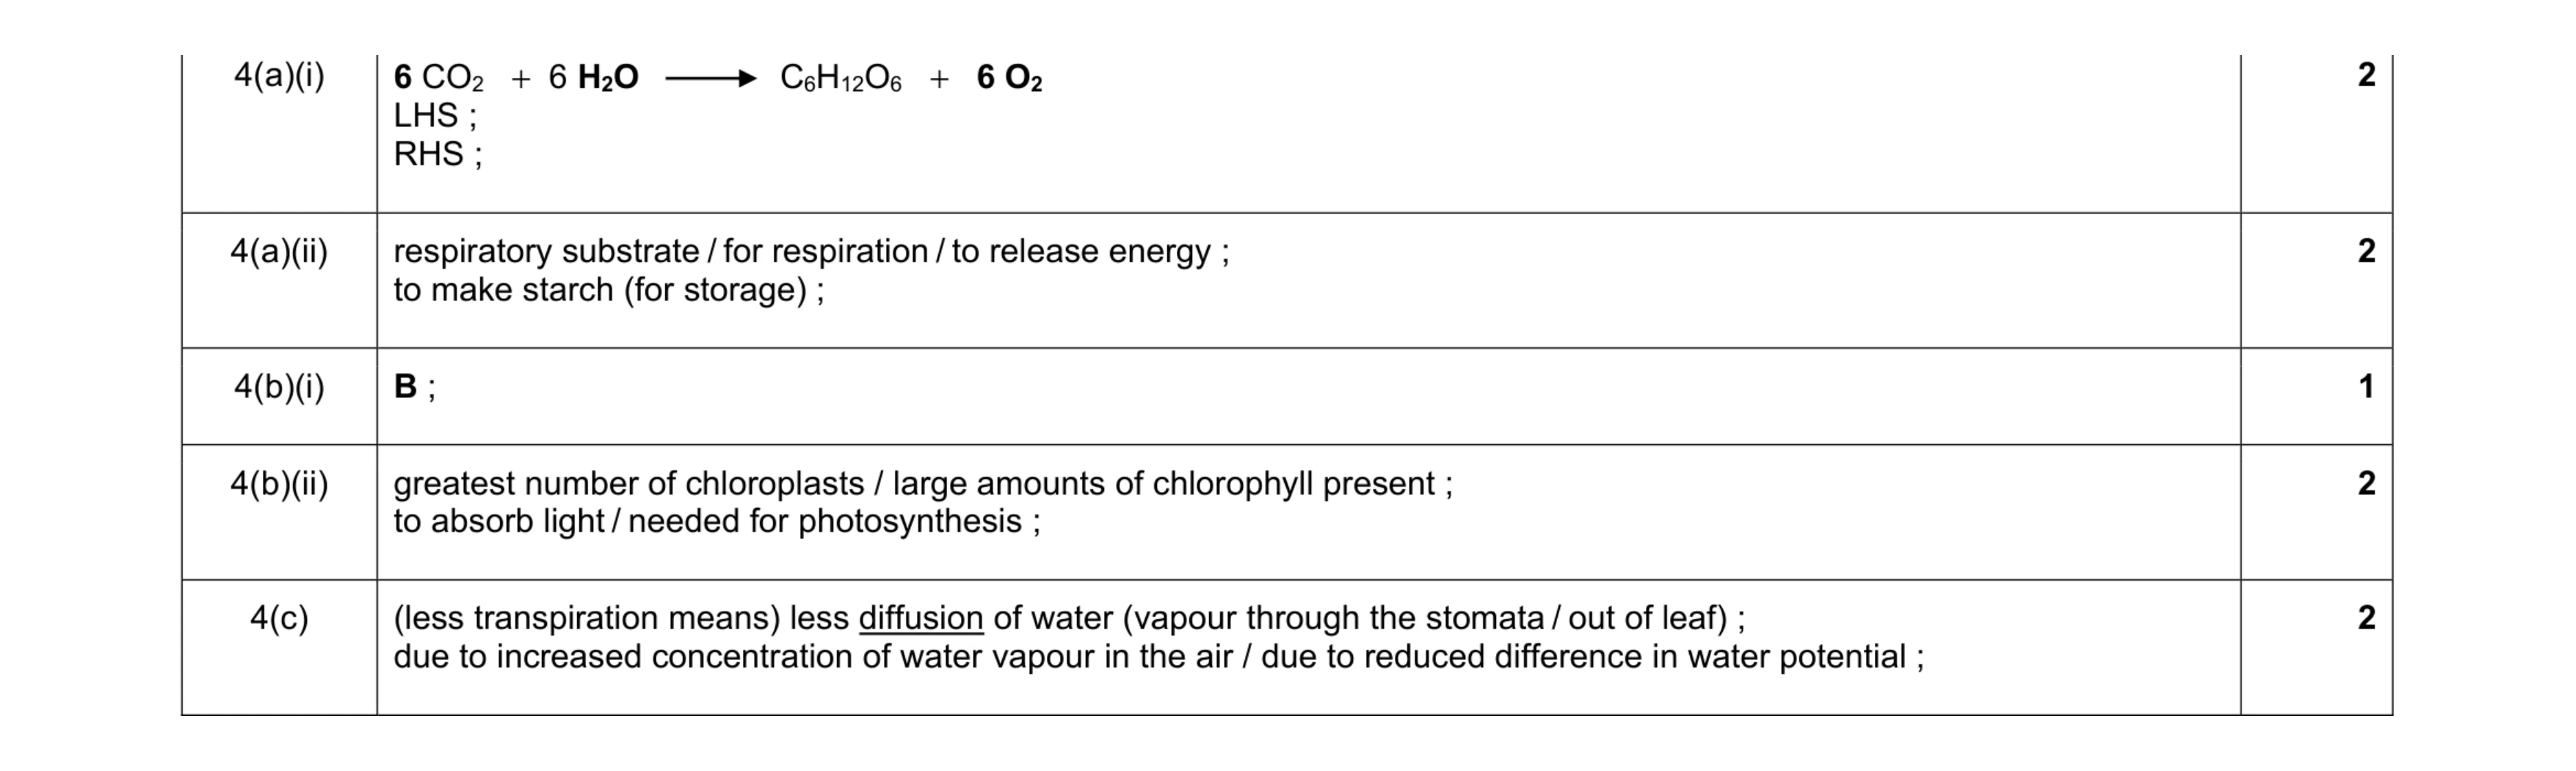 9
9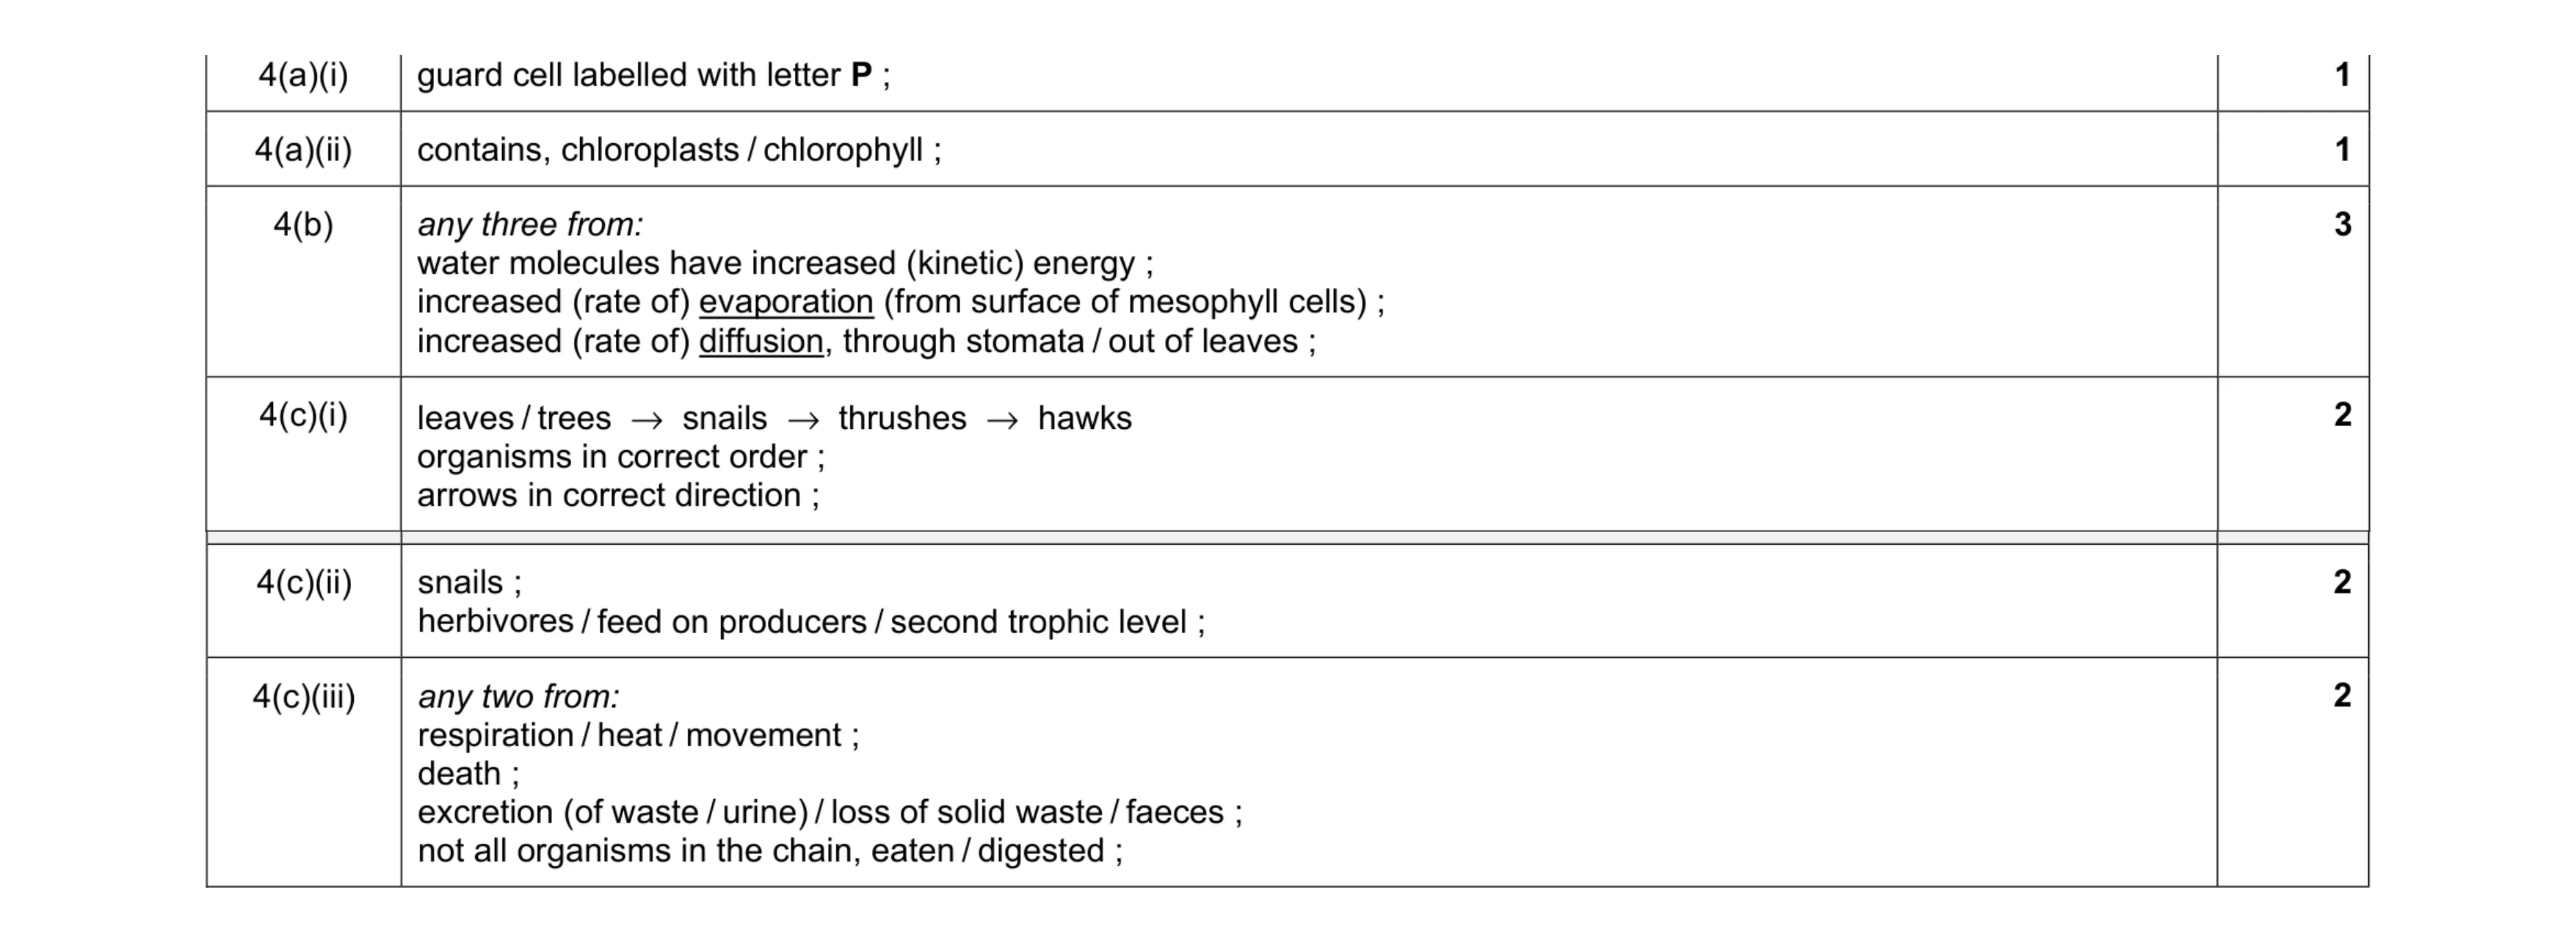 11
11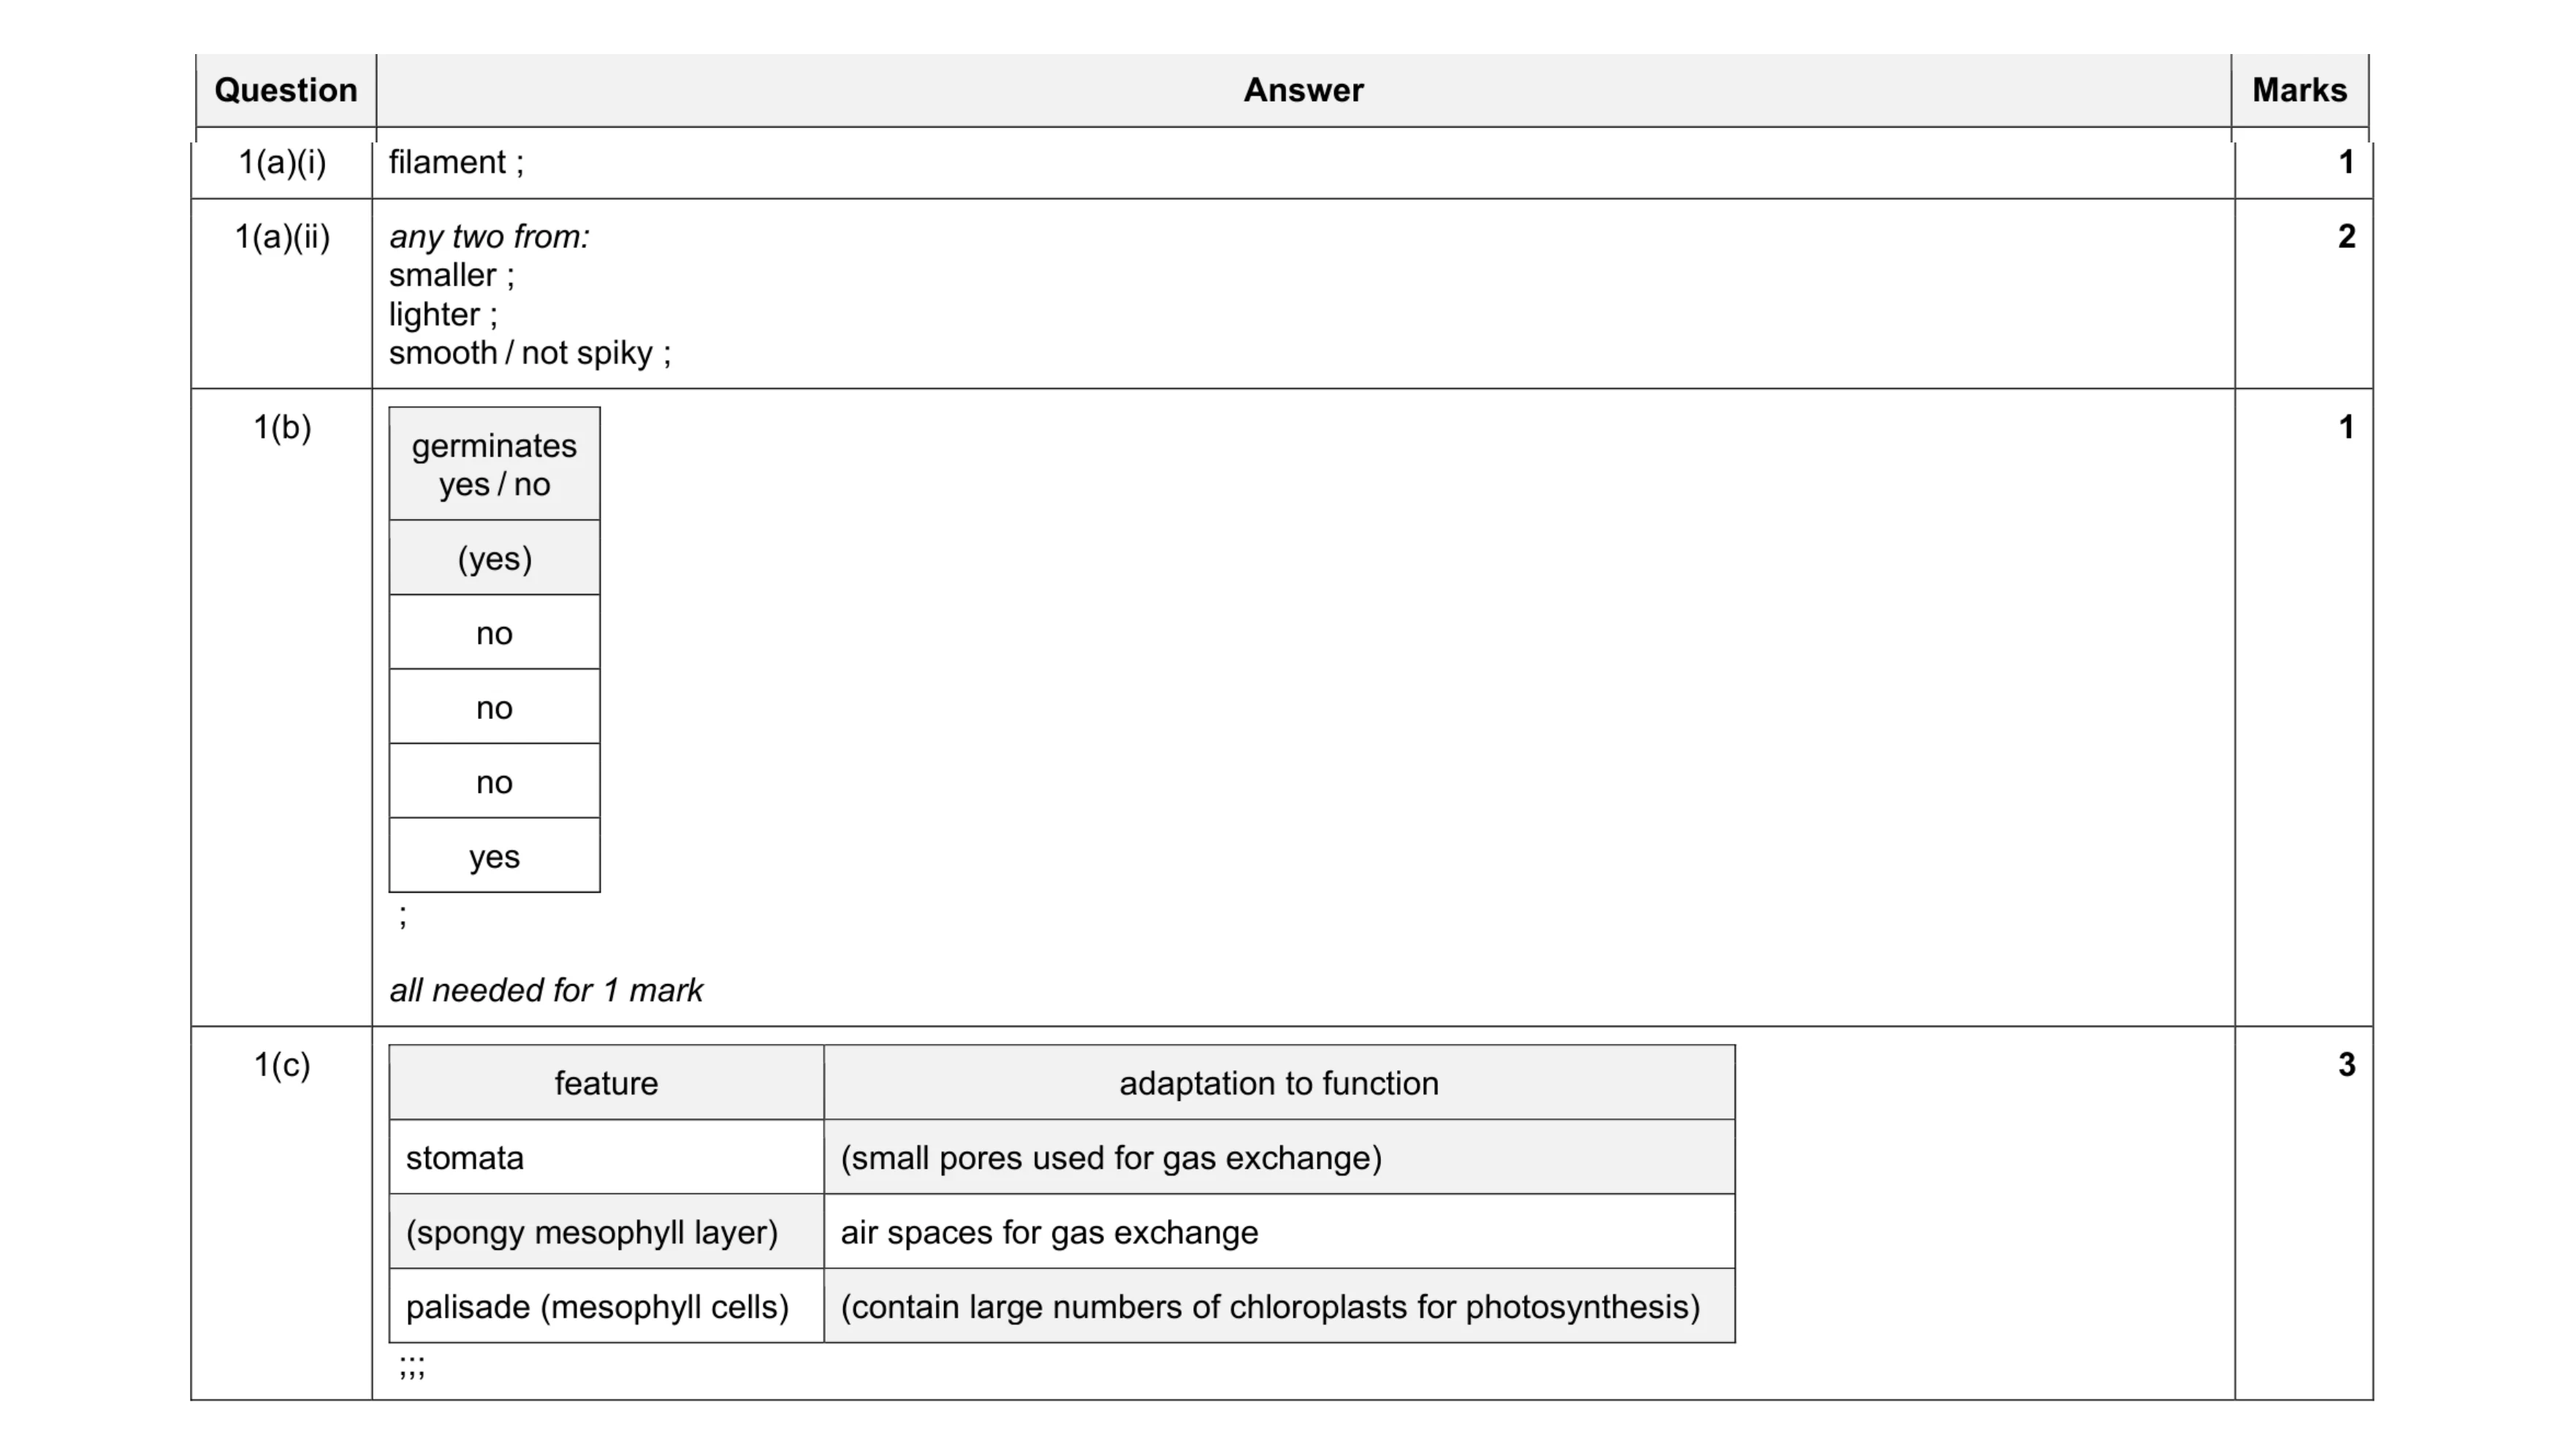 7
7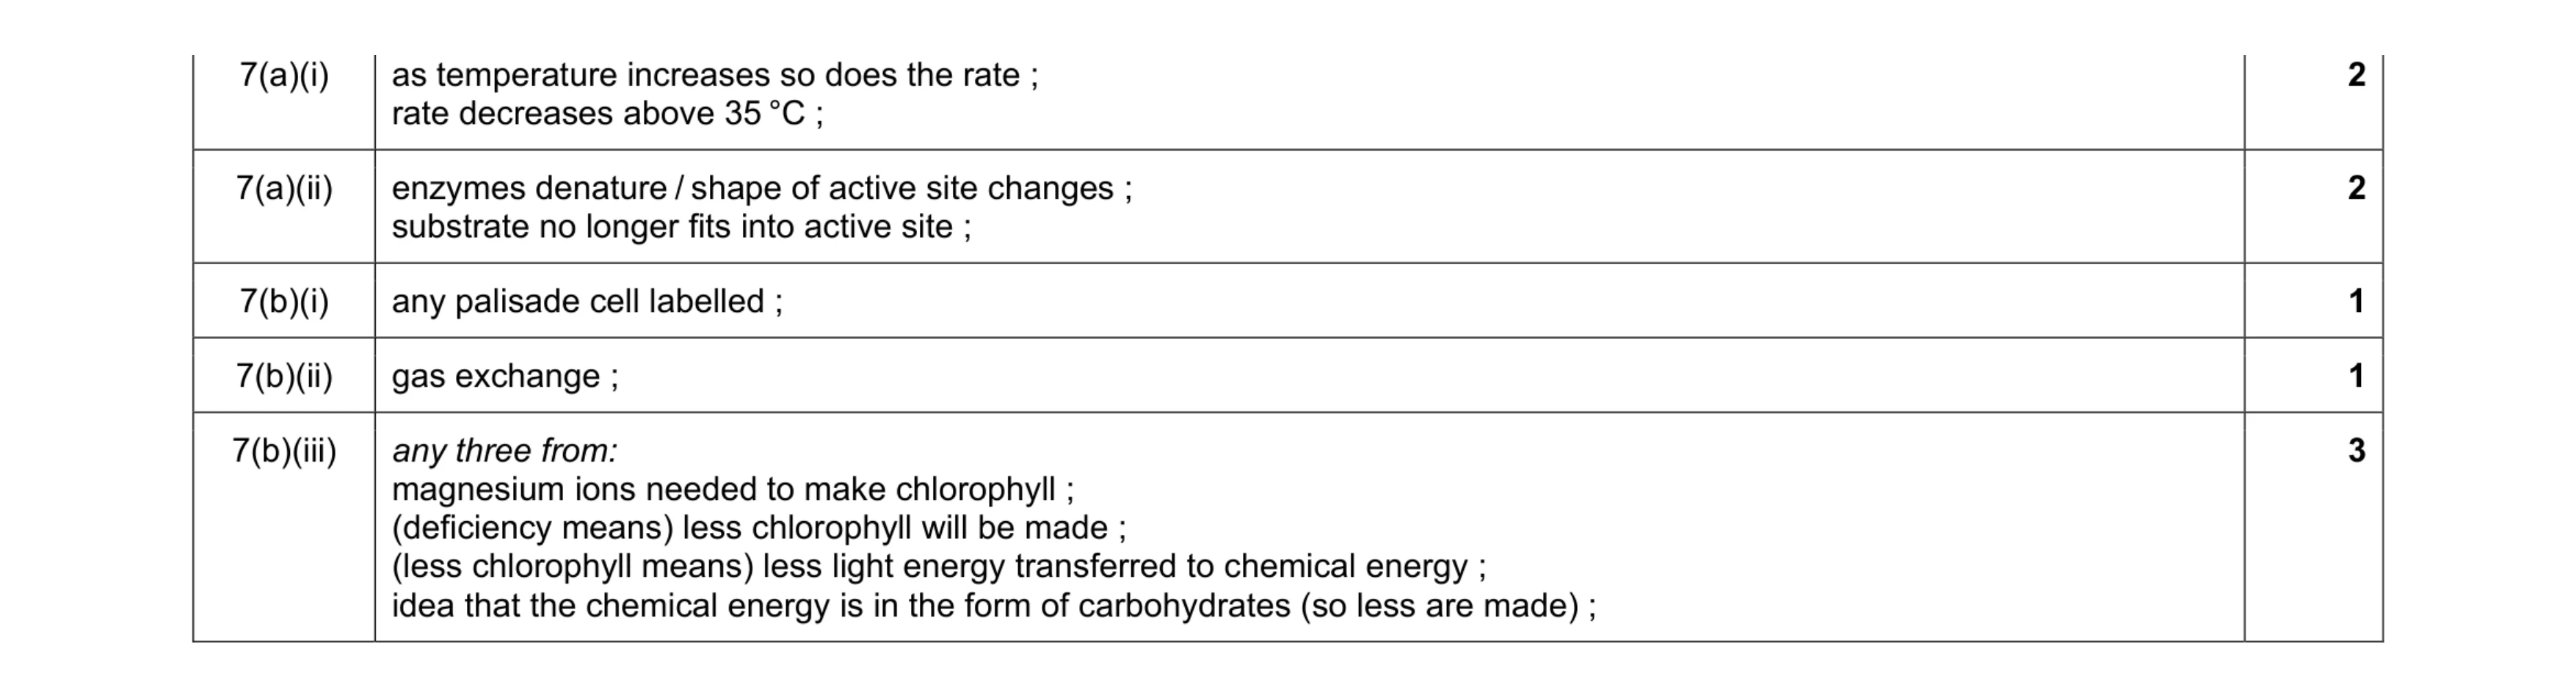 9
9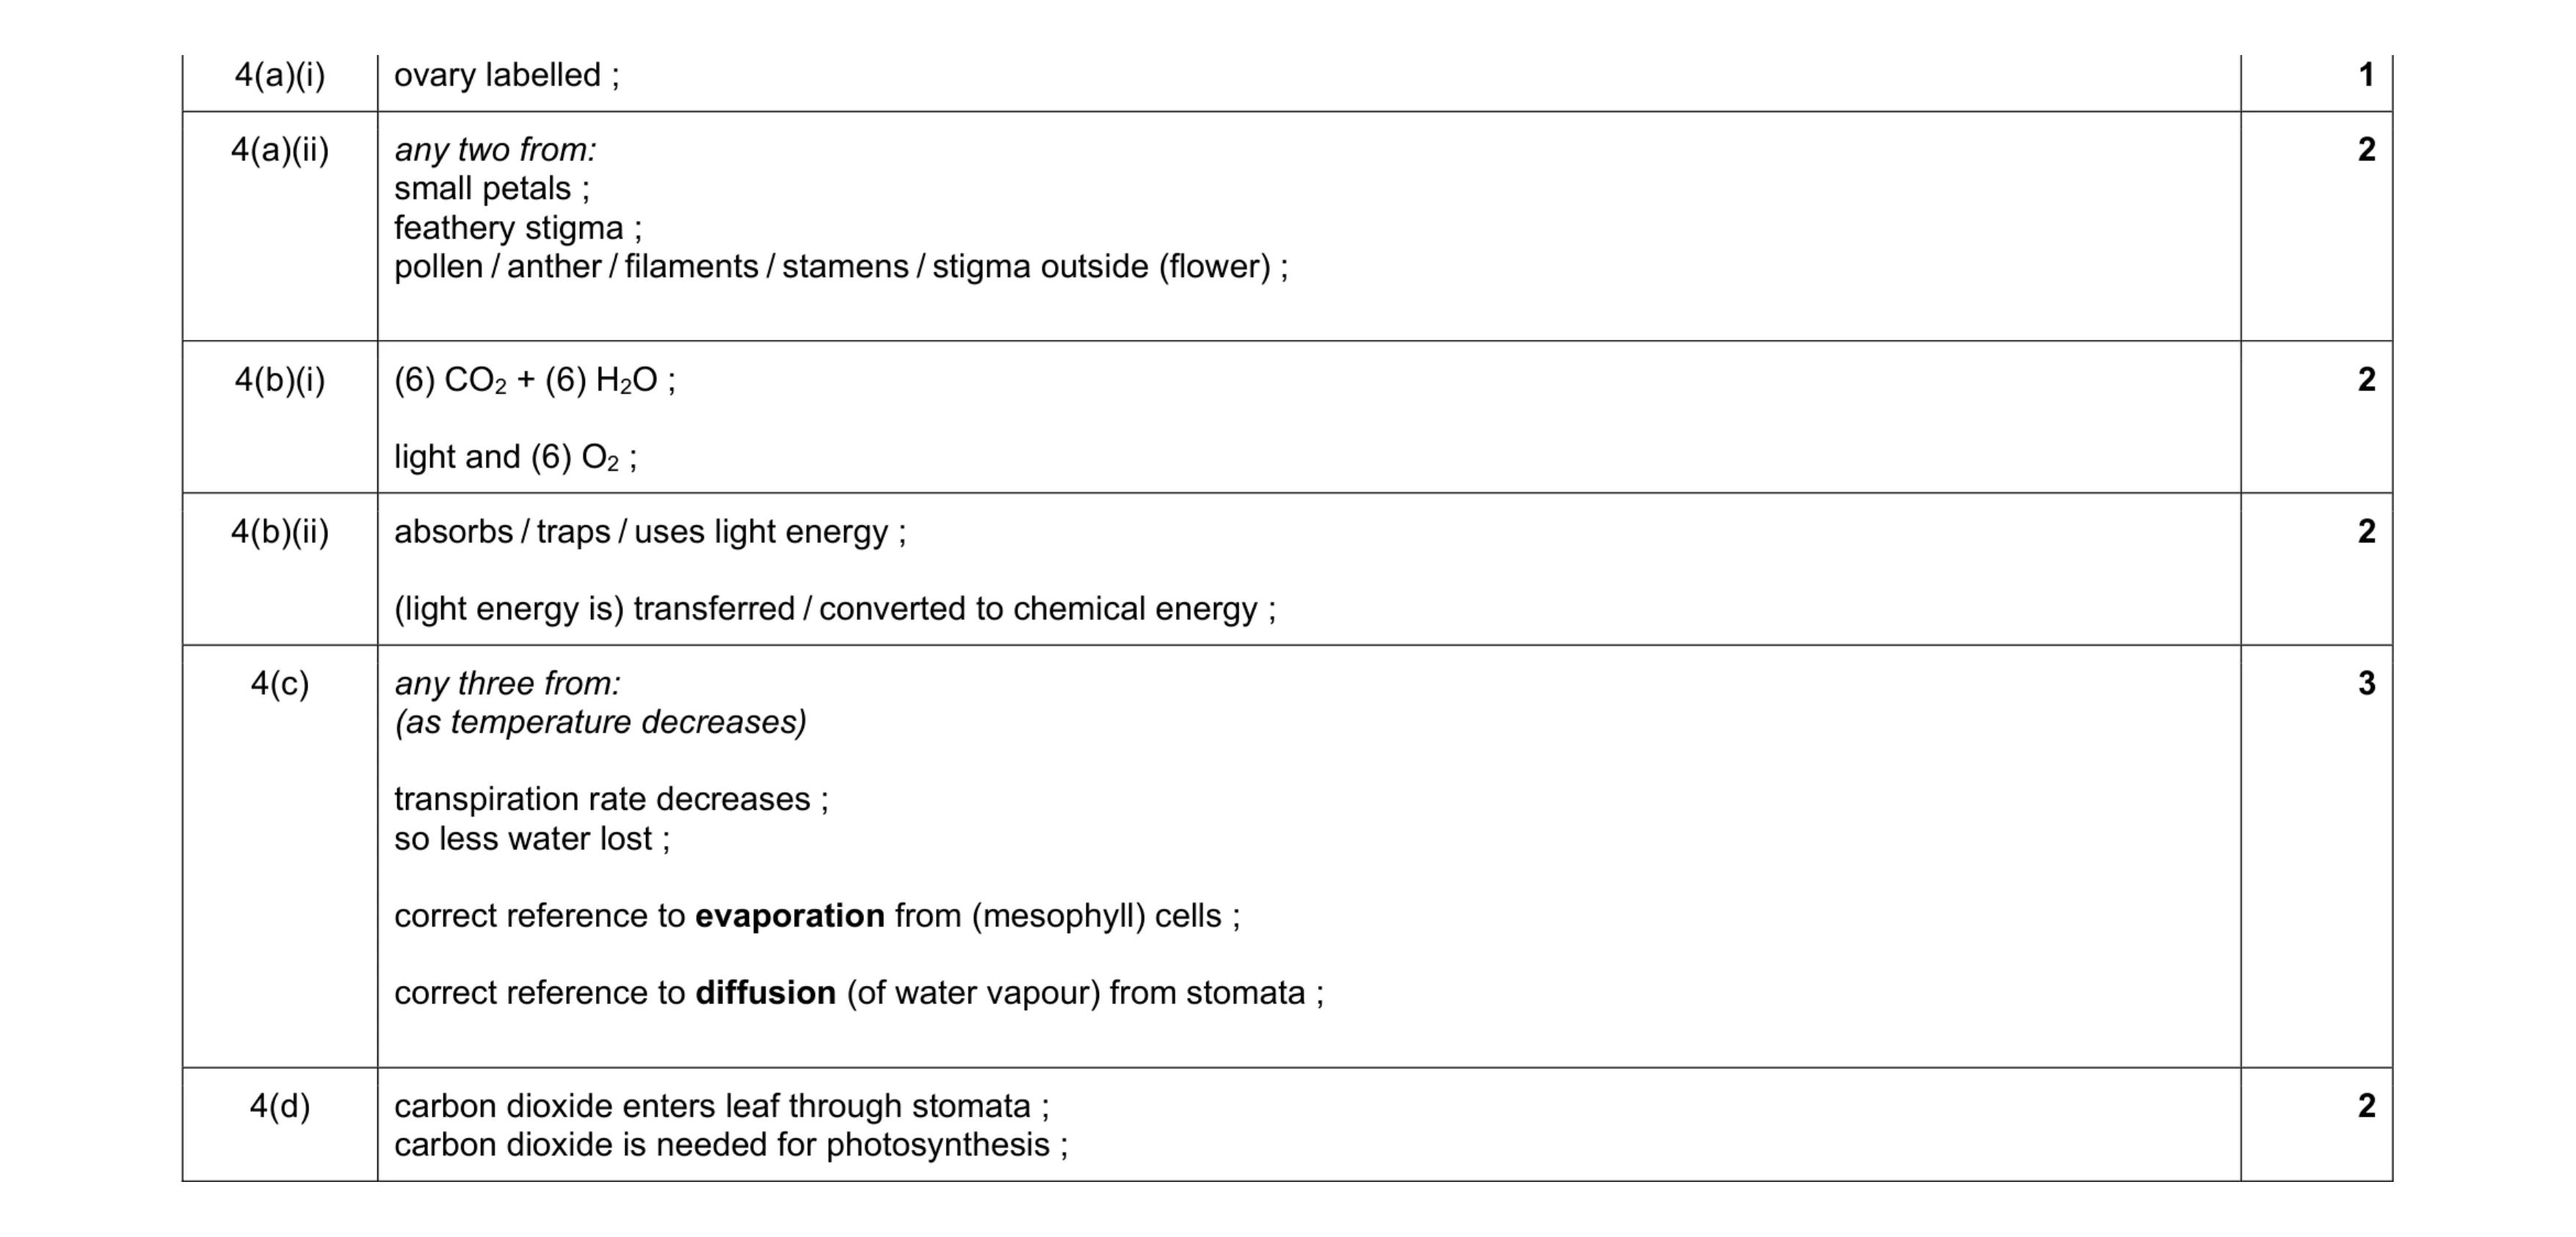 12
12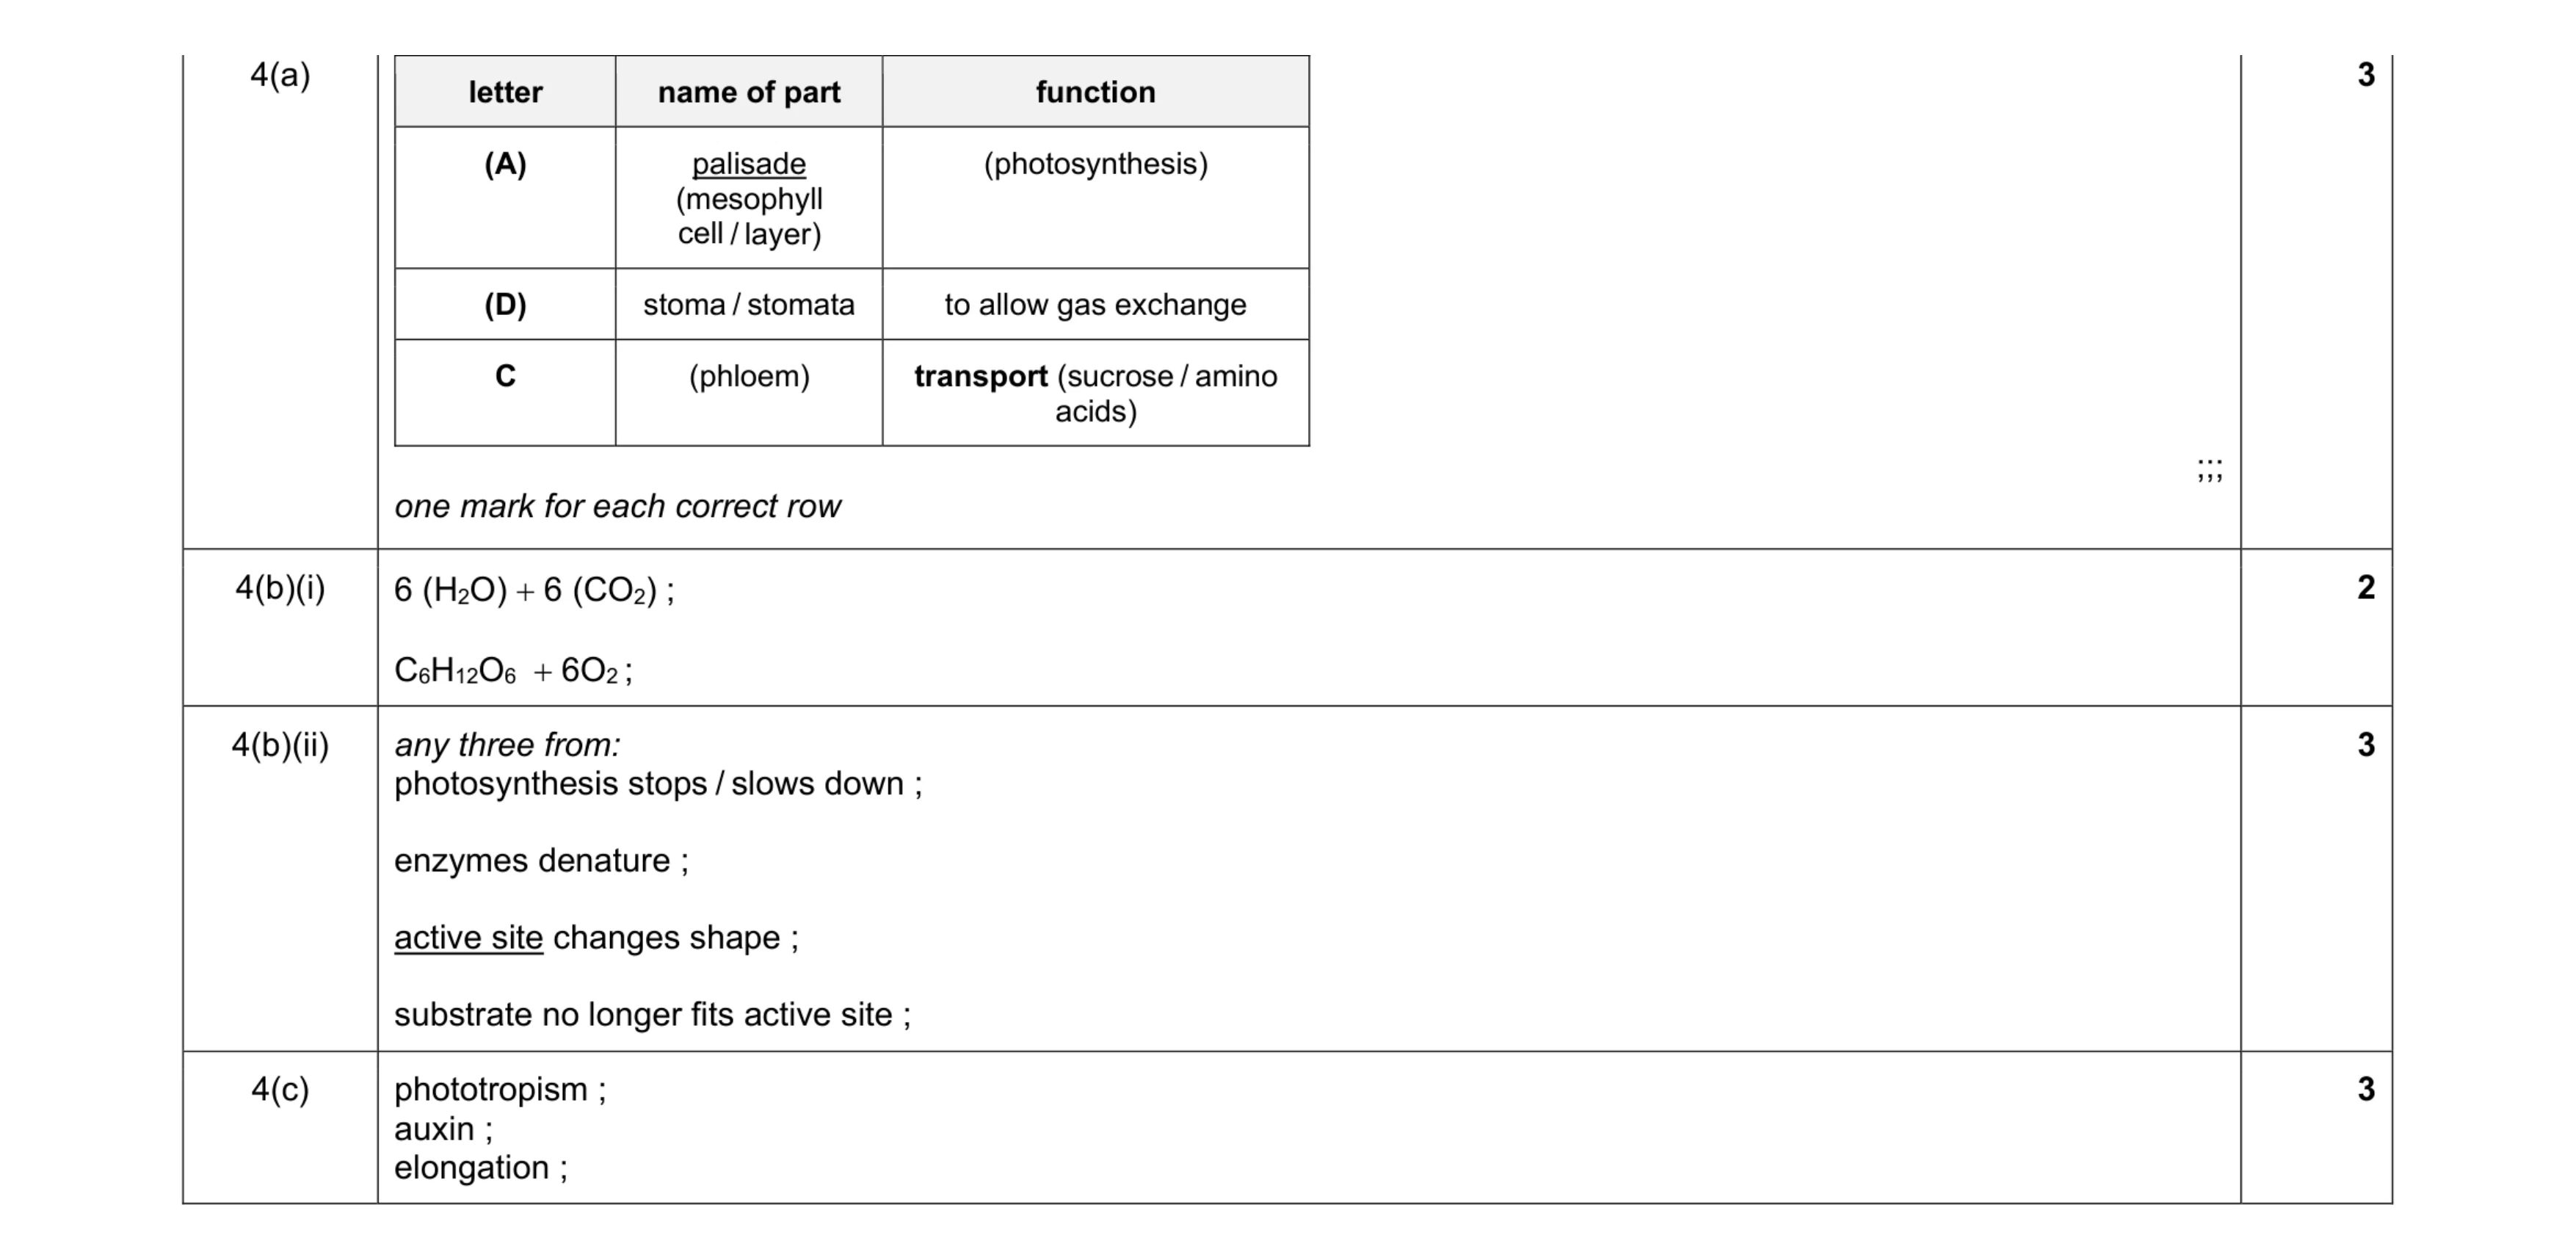 11
11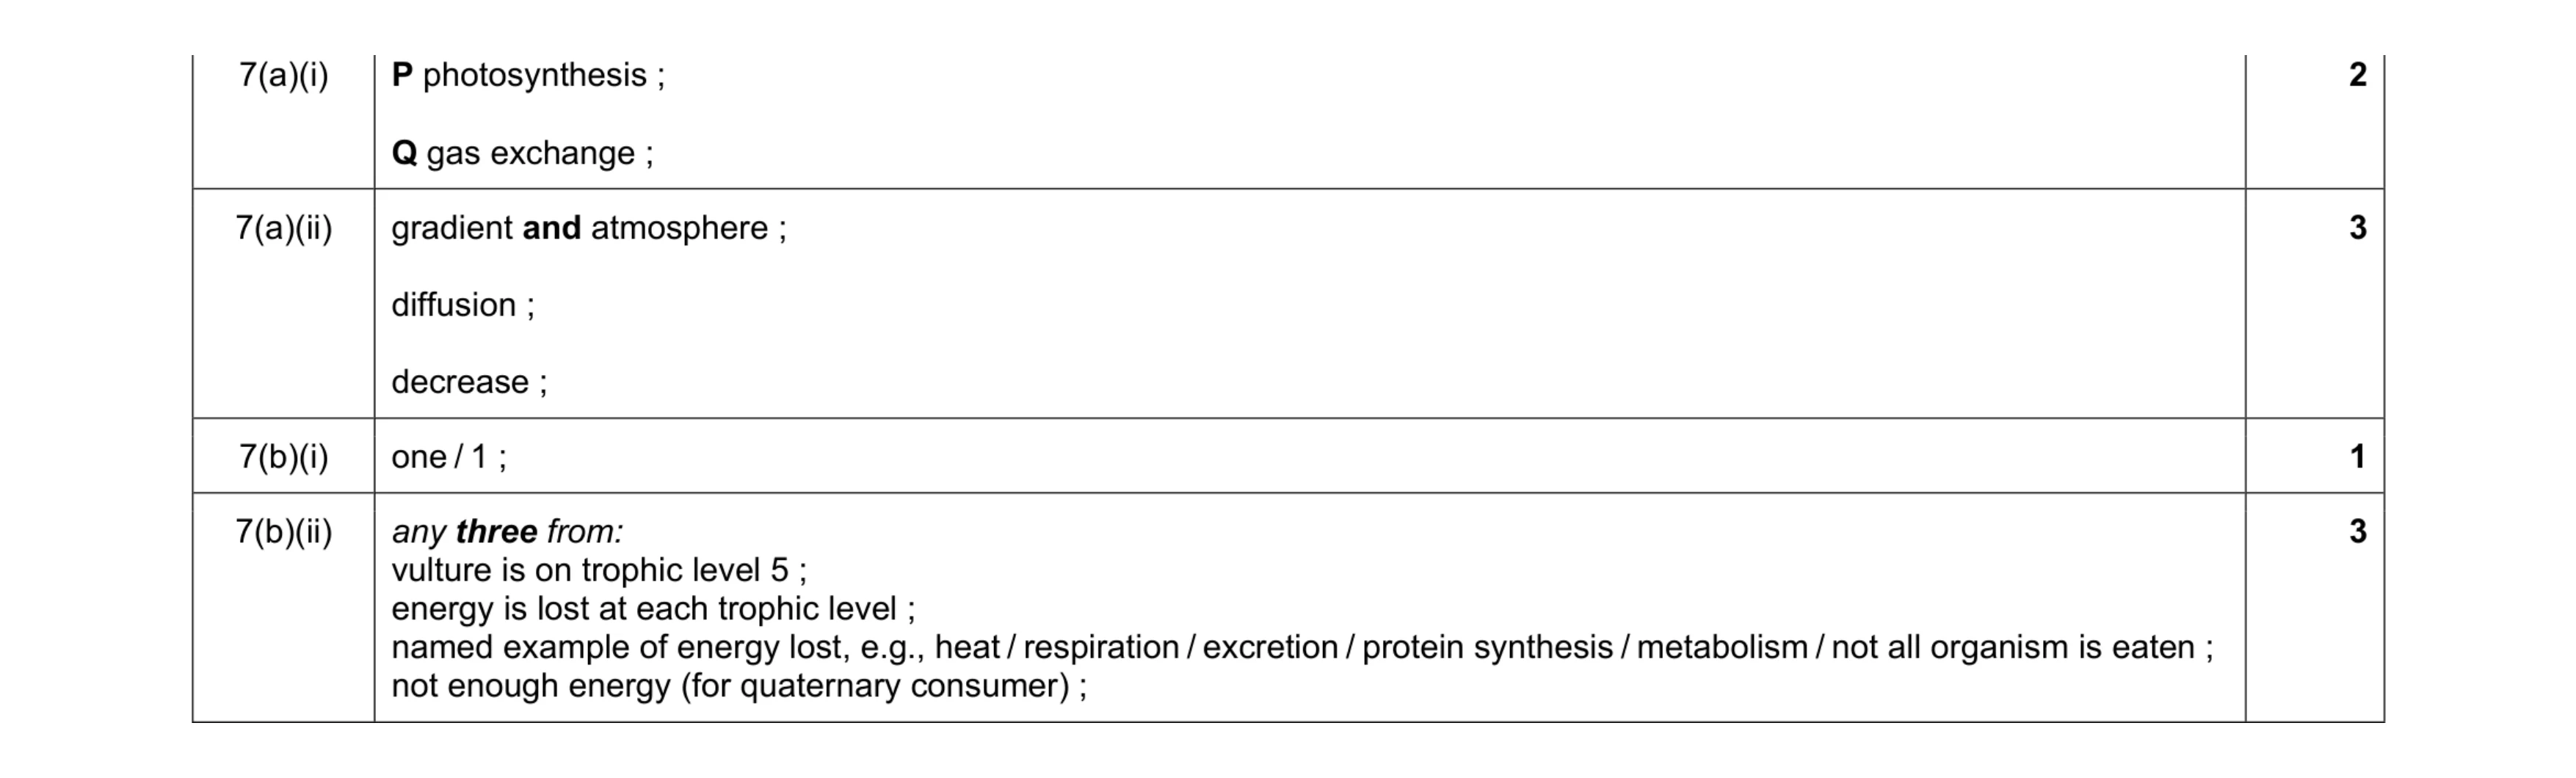 9
9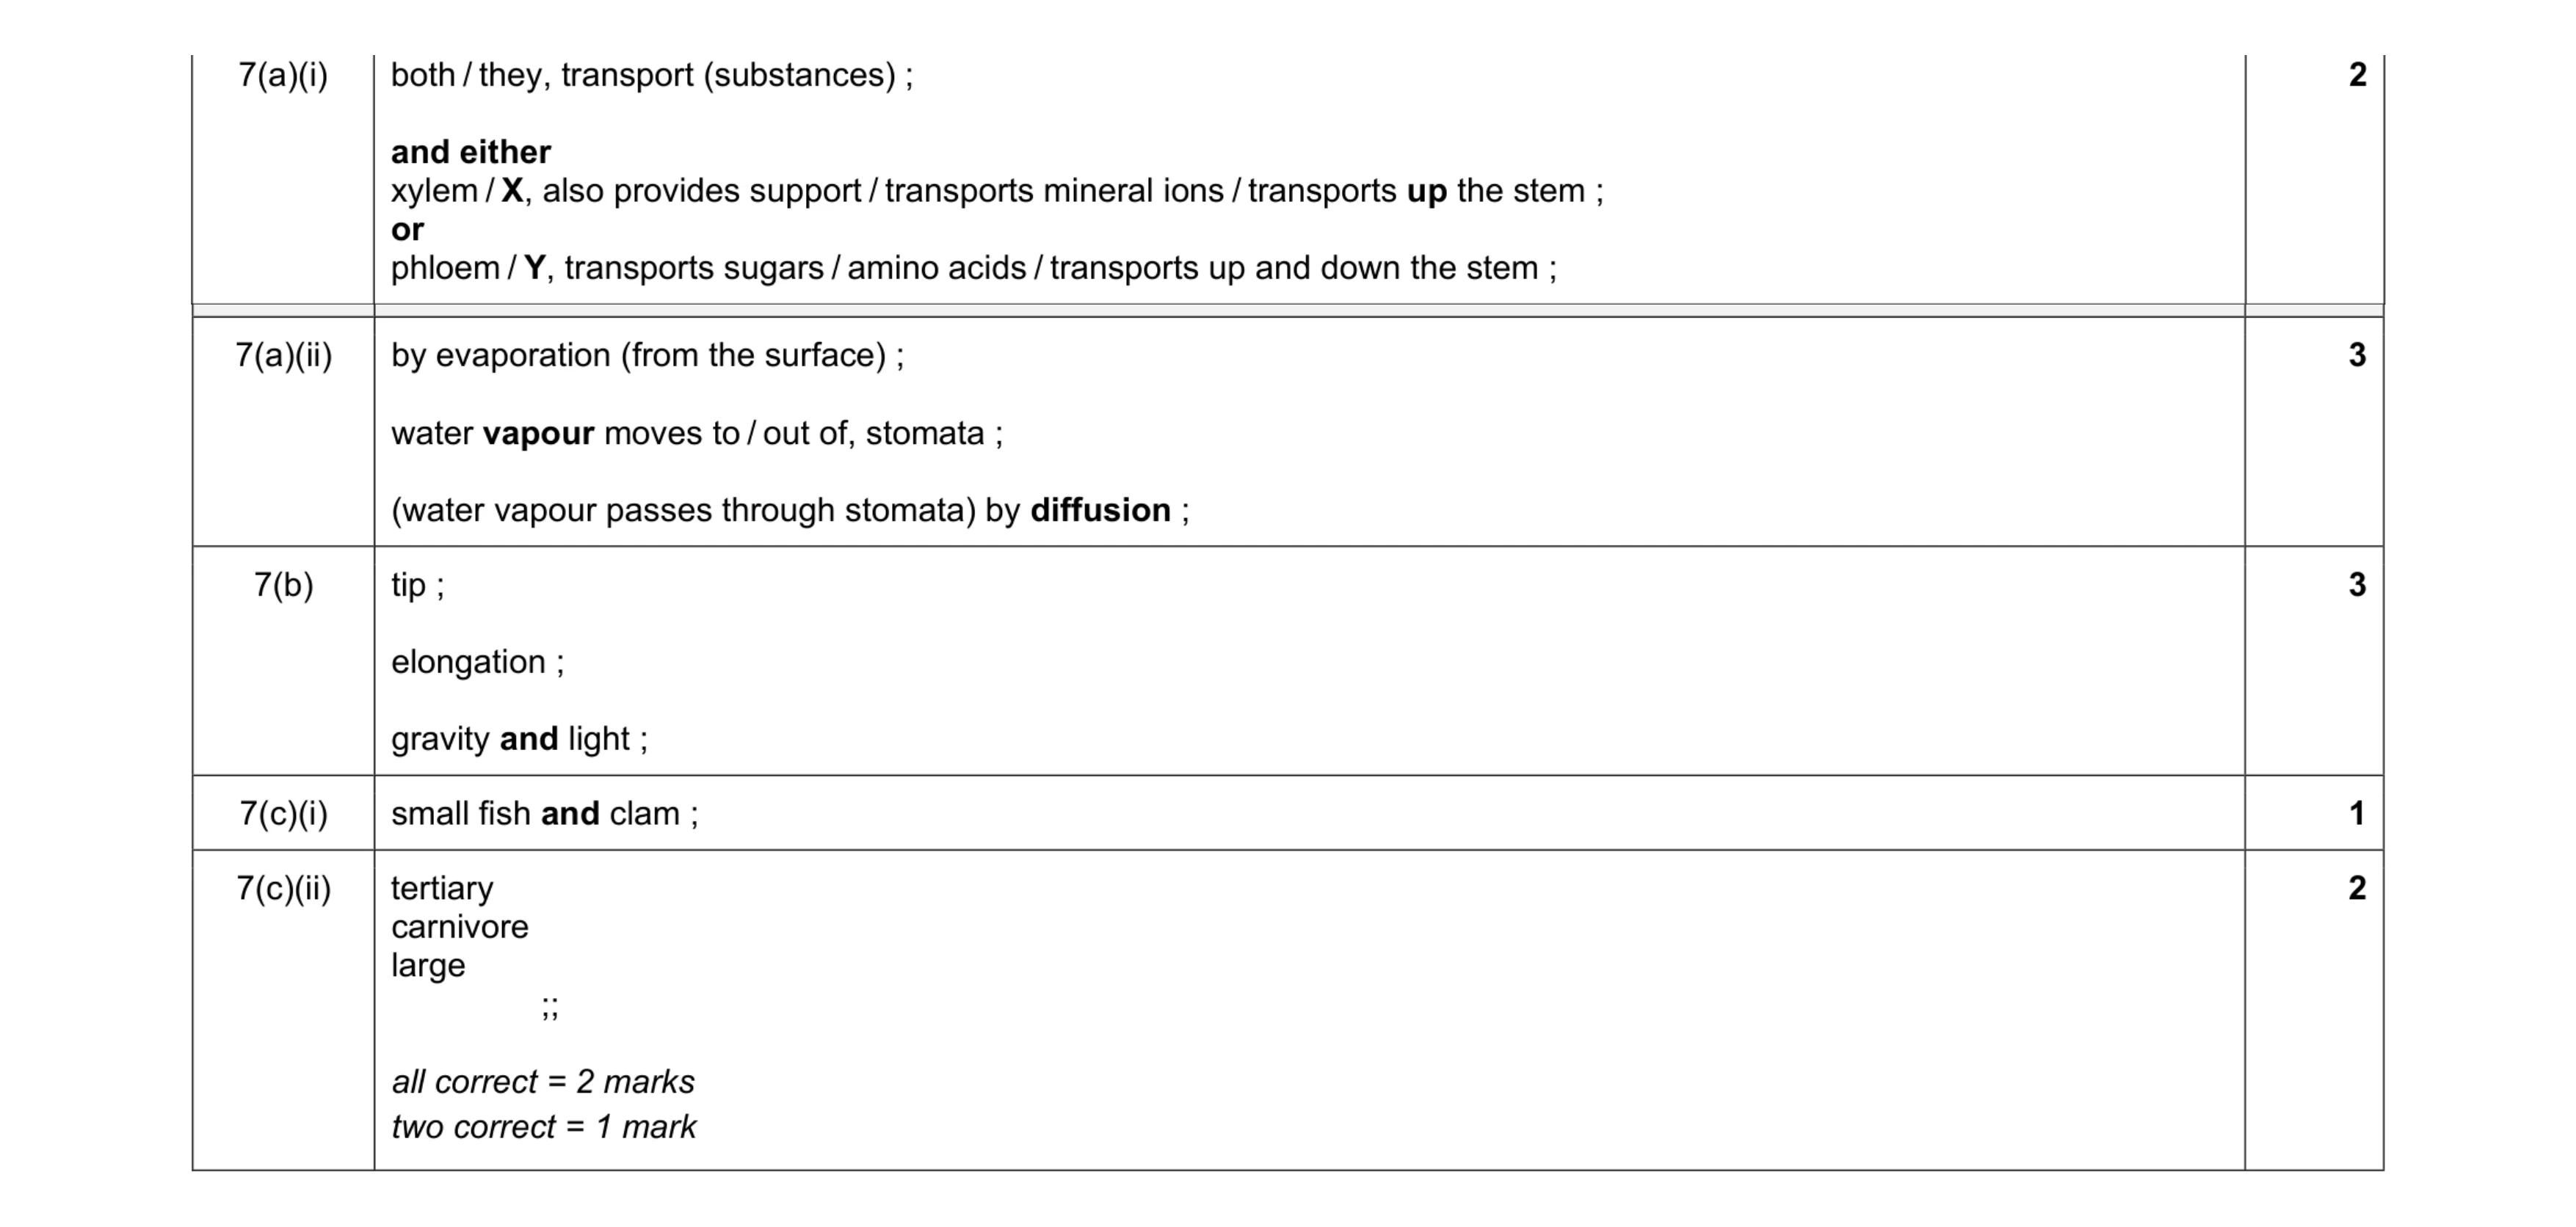 11
11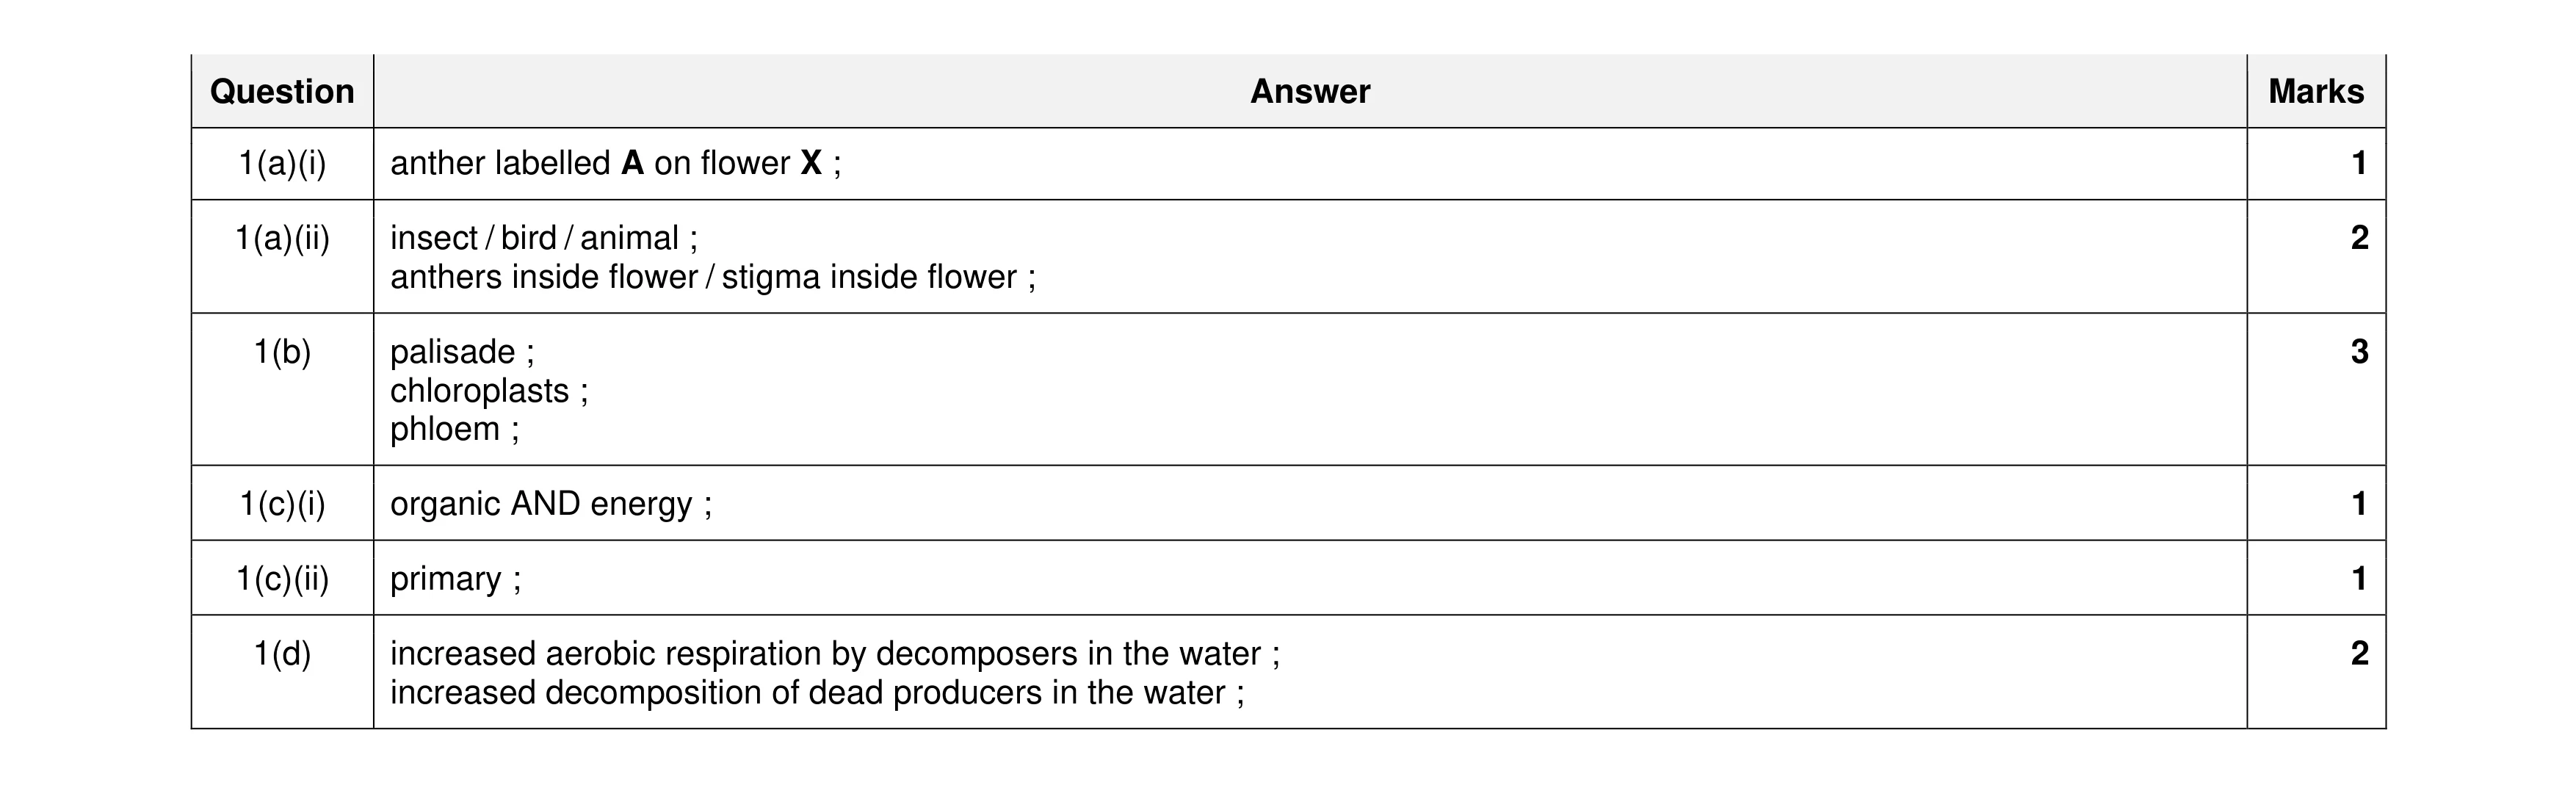 10
10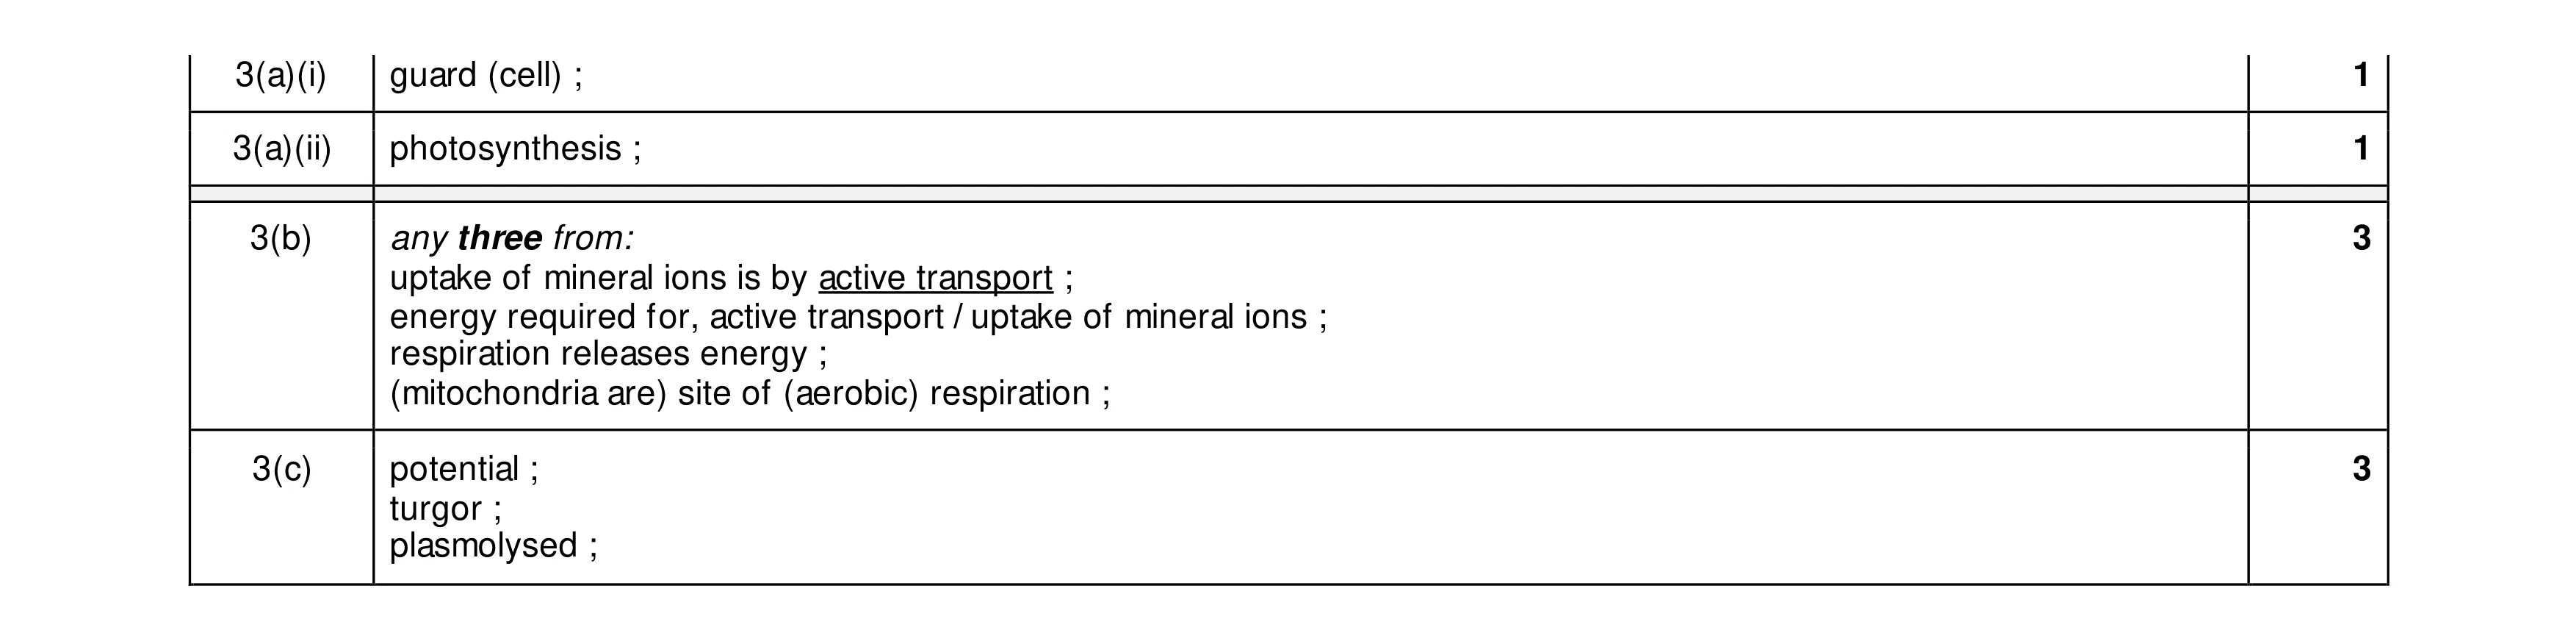 8
8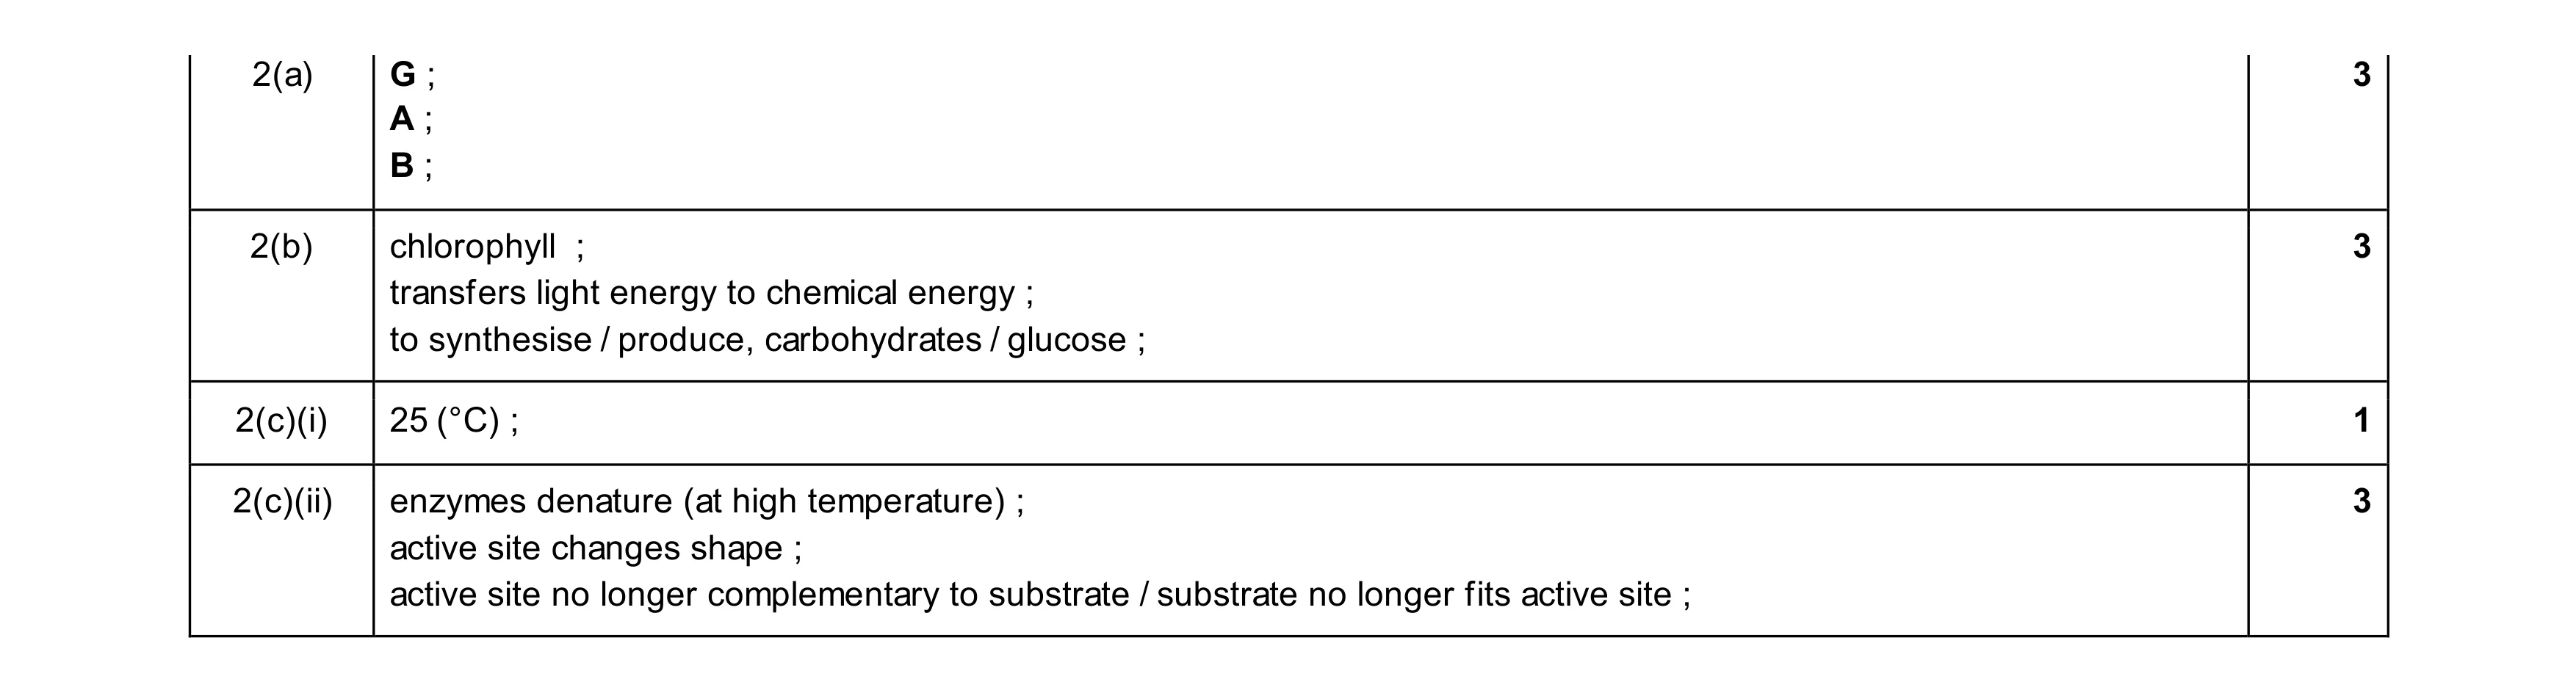 10
10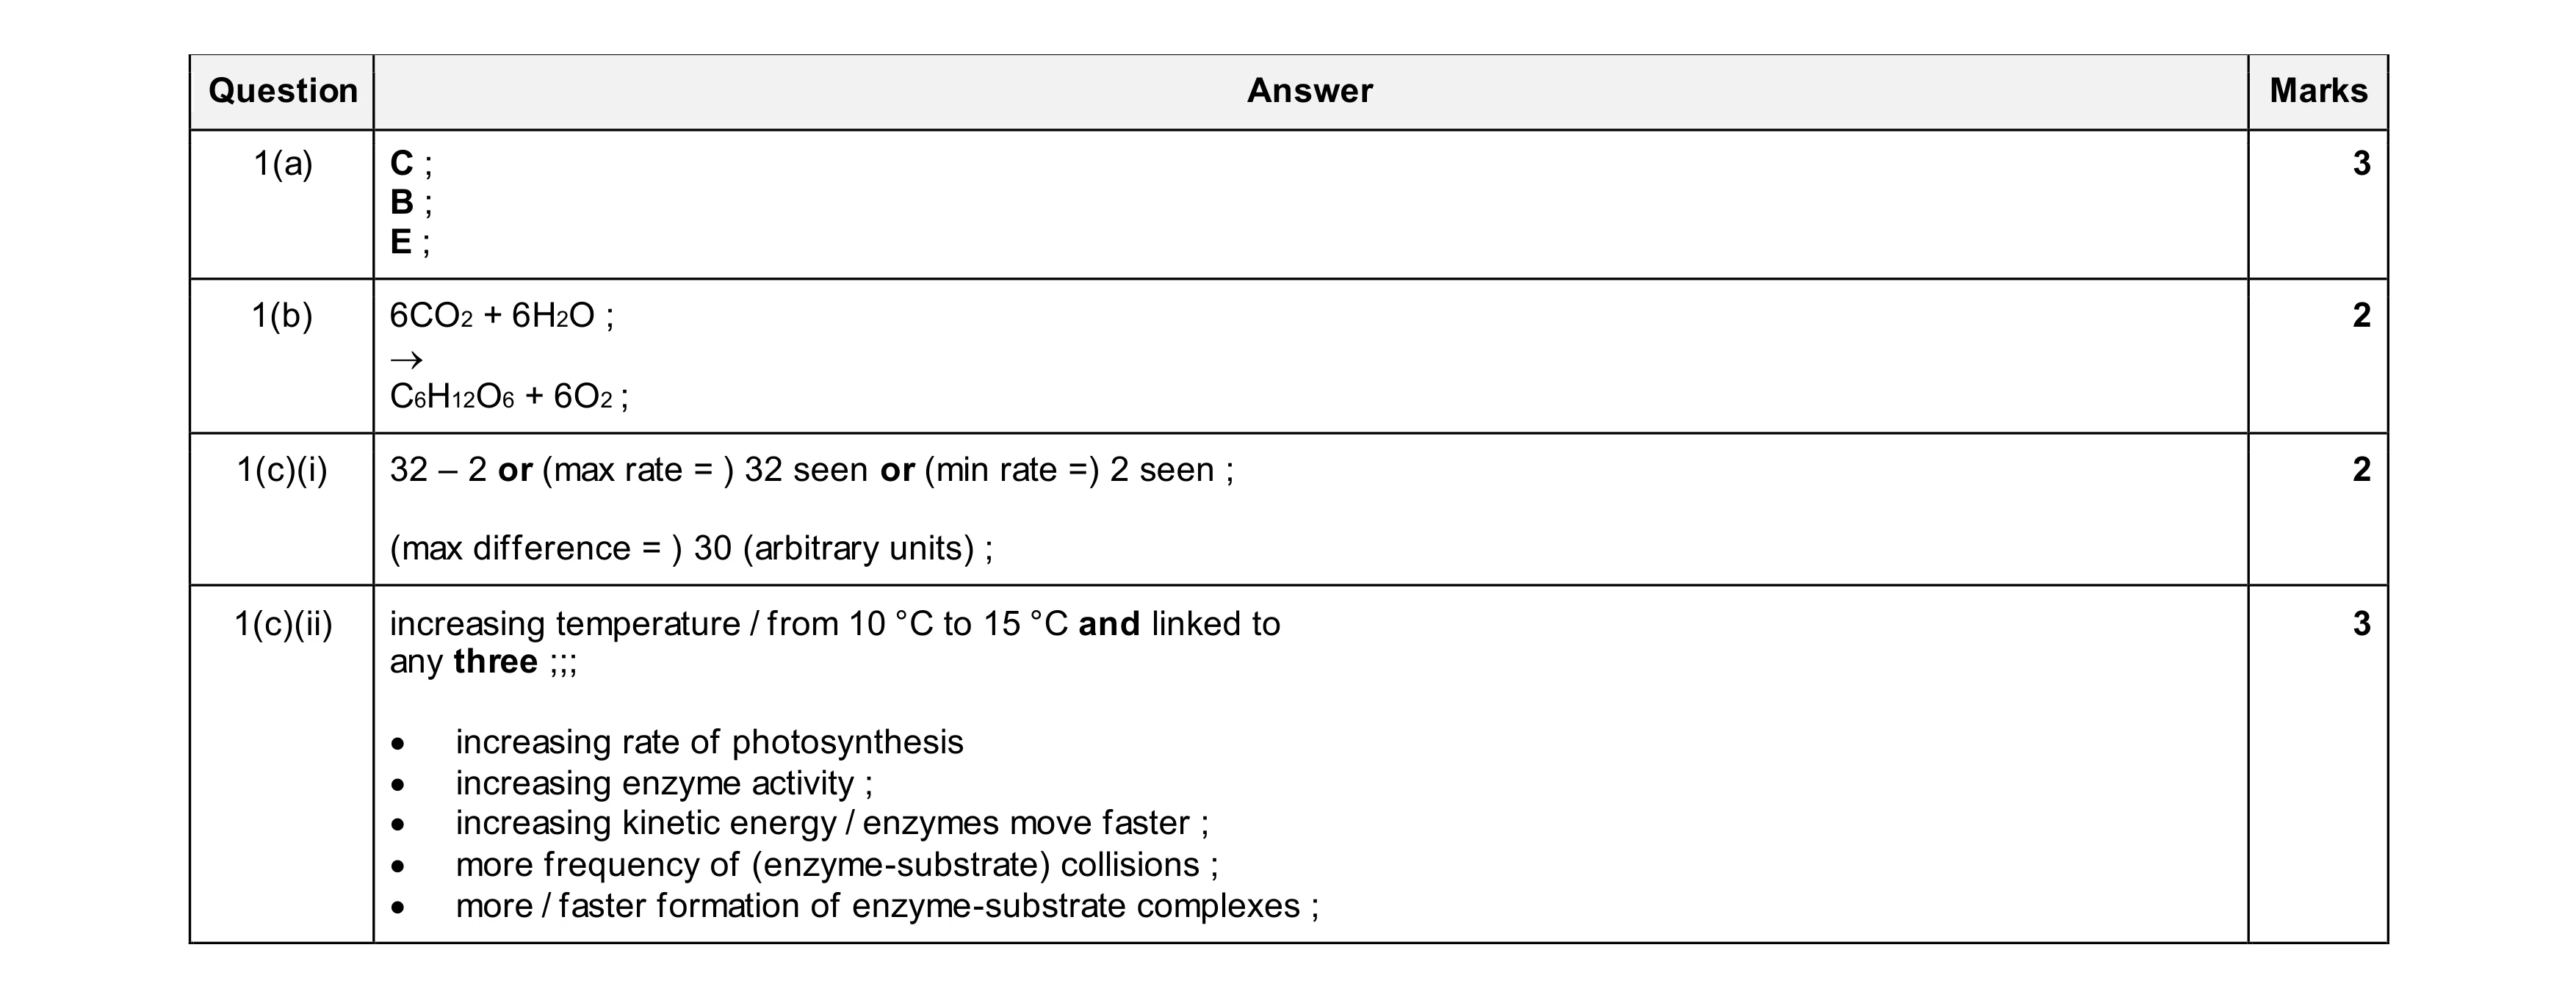 10
10