Questions as text
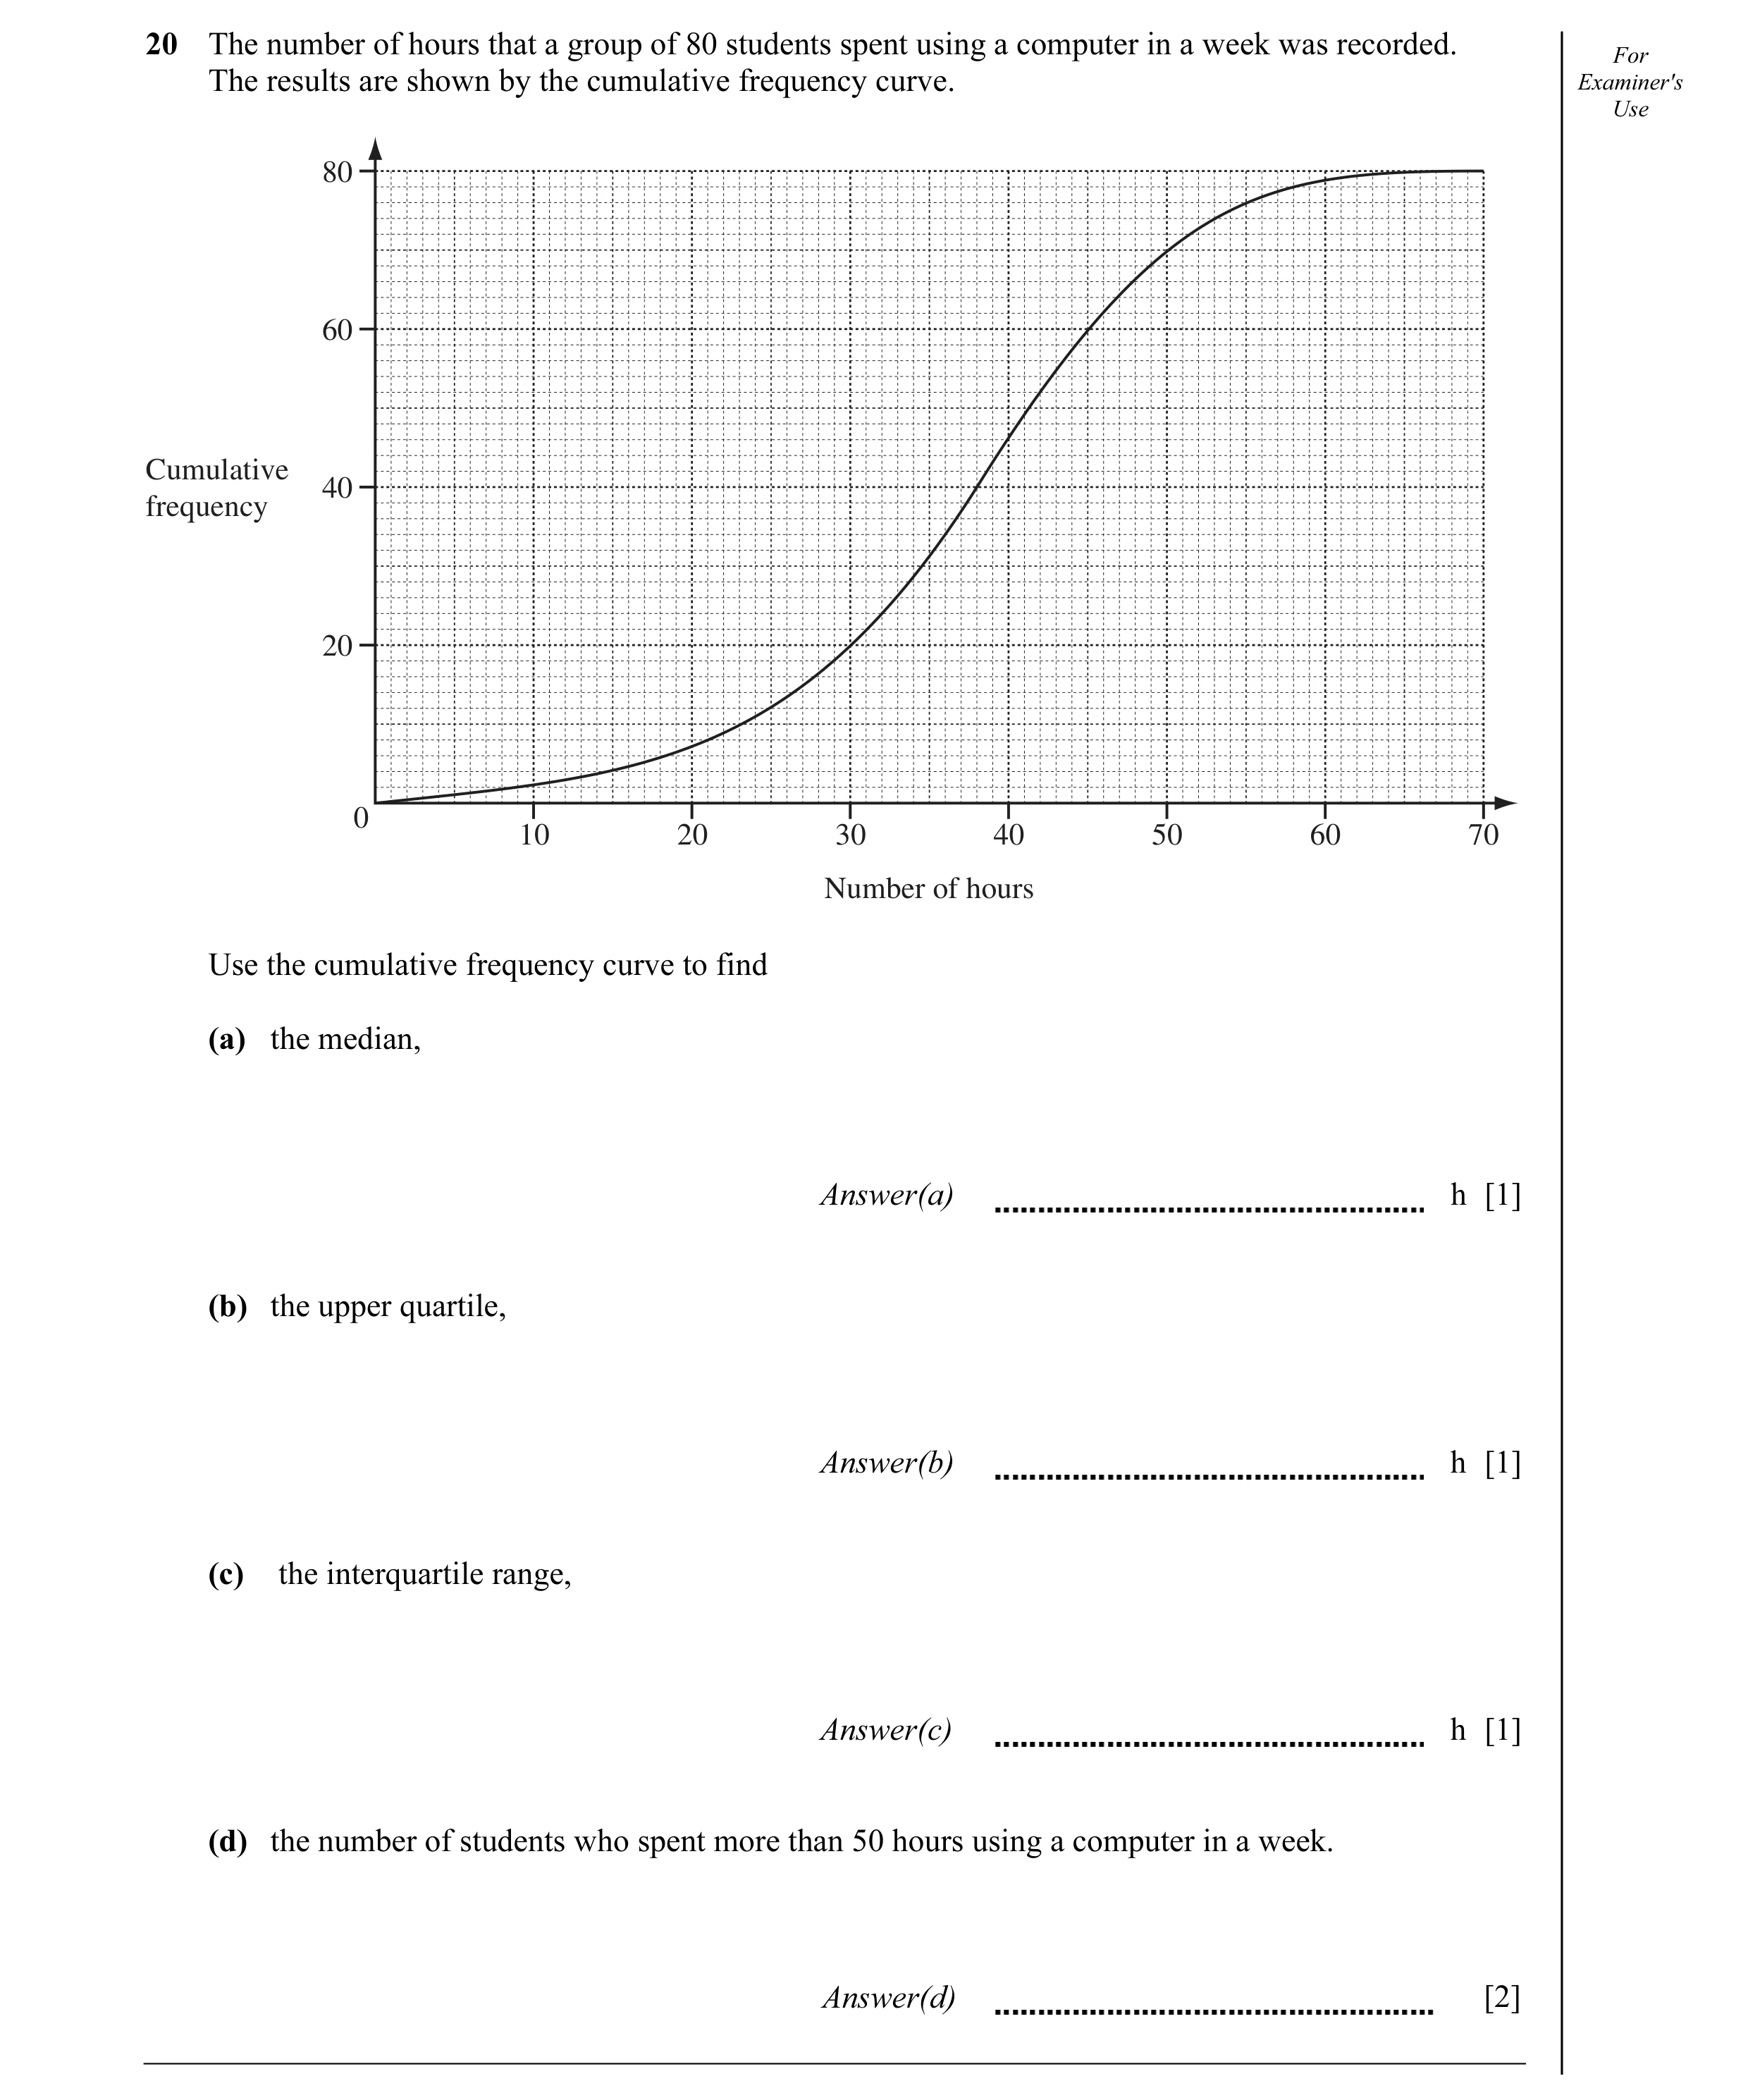
Q1 · The number of hours that a group of 80 students spent using a computer in a week was… 0580/21 Oct/Nov 2009
20 The number of hours that a group of 80 students spent using a computer in a week was recorded. For The results are shown by the cumulative frequency curve. Examiner's Use 80 60 Cumulative 40 frequency 20 0 10 20 30 40 50 60 70 Number of hours Use the cumulative frequency curve to find (a) the median, Answer(a) h [1] (b) the upper quartile, Answer(b) h [1] (c) the interquartile range, Answer(c) h [1] (d) the number of students who spent more than 50 hours using a computer in a week. Answer(d) [2]
5 marks
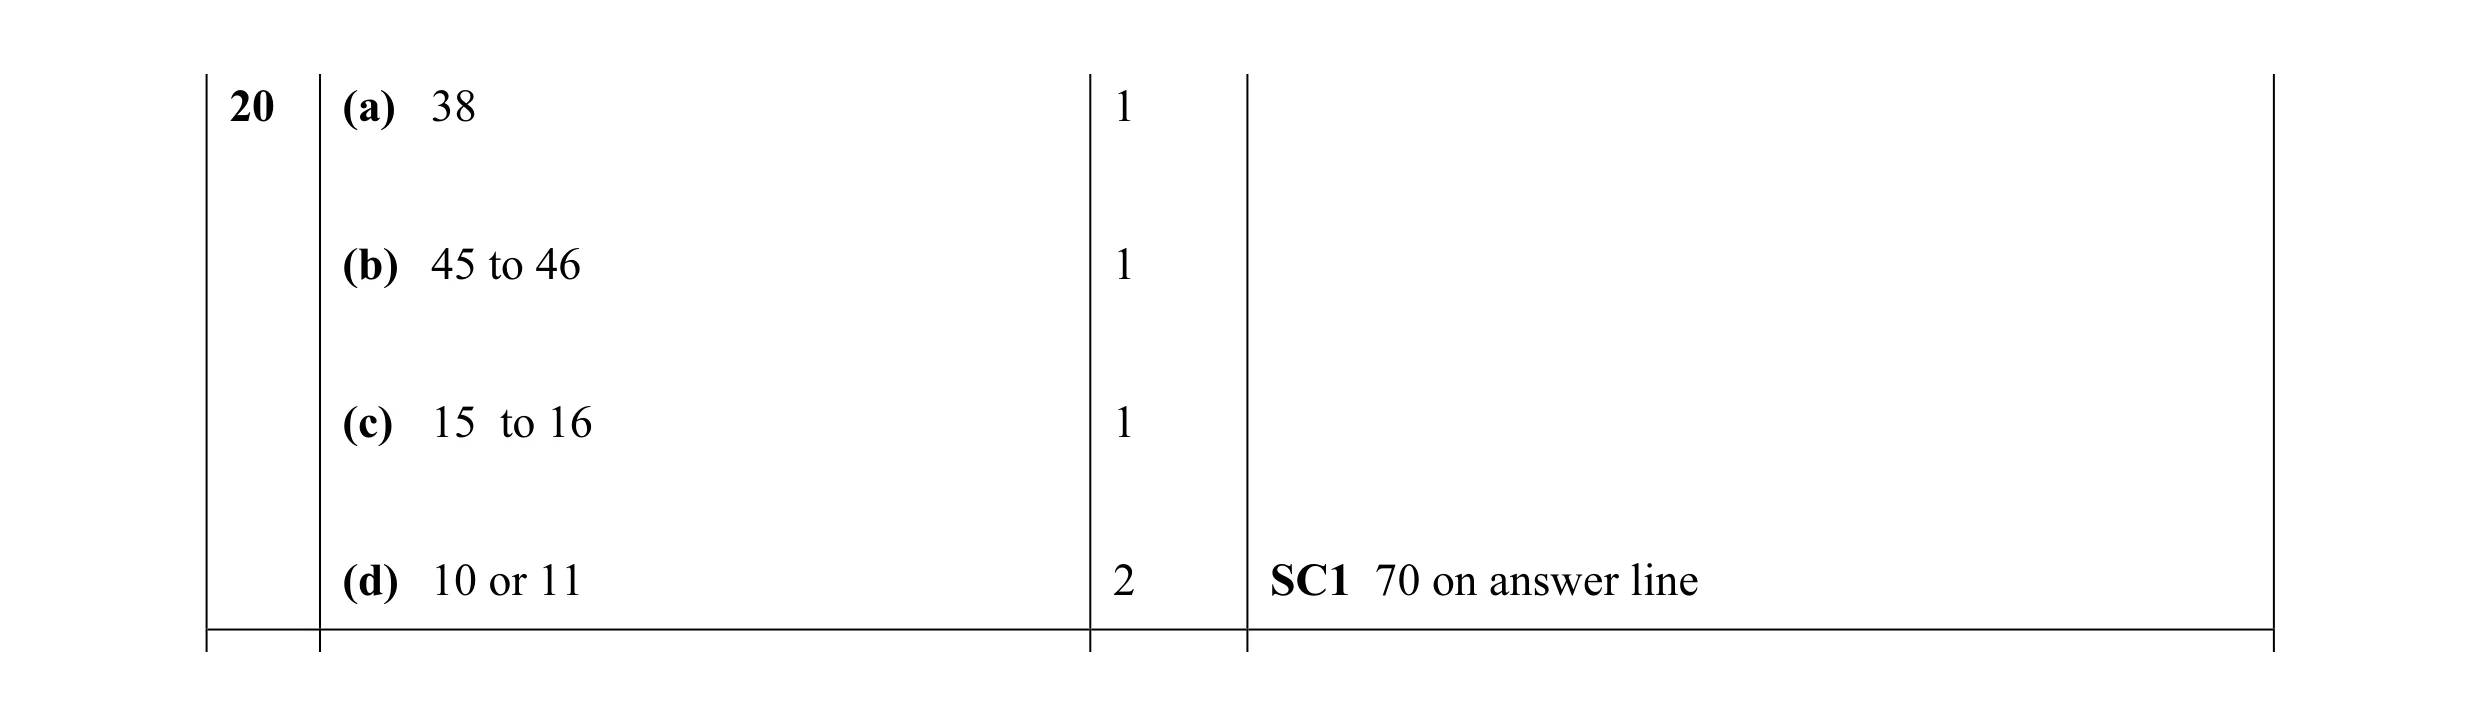
Mark scheme: 20 (a) 38 1 (b) 45 to 46 1 (c) 15 to 16 1 (d) 10 or 11 2 SC1 70 on answer line
This question in 0580/21 Oct/Nov 2009
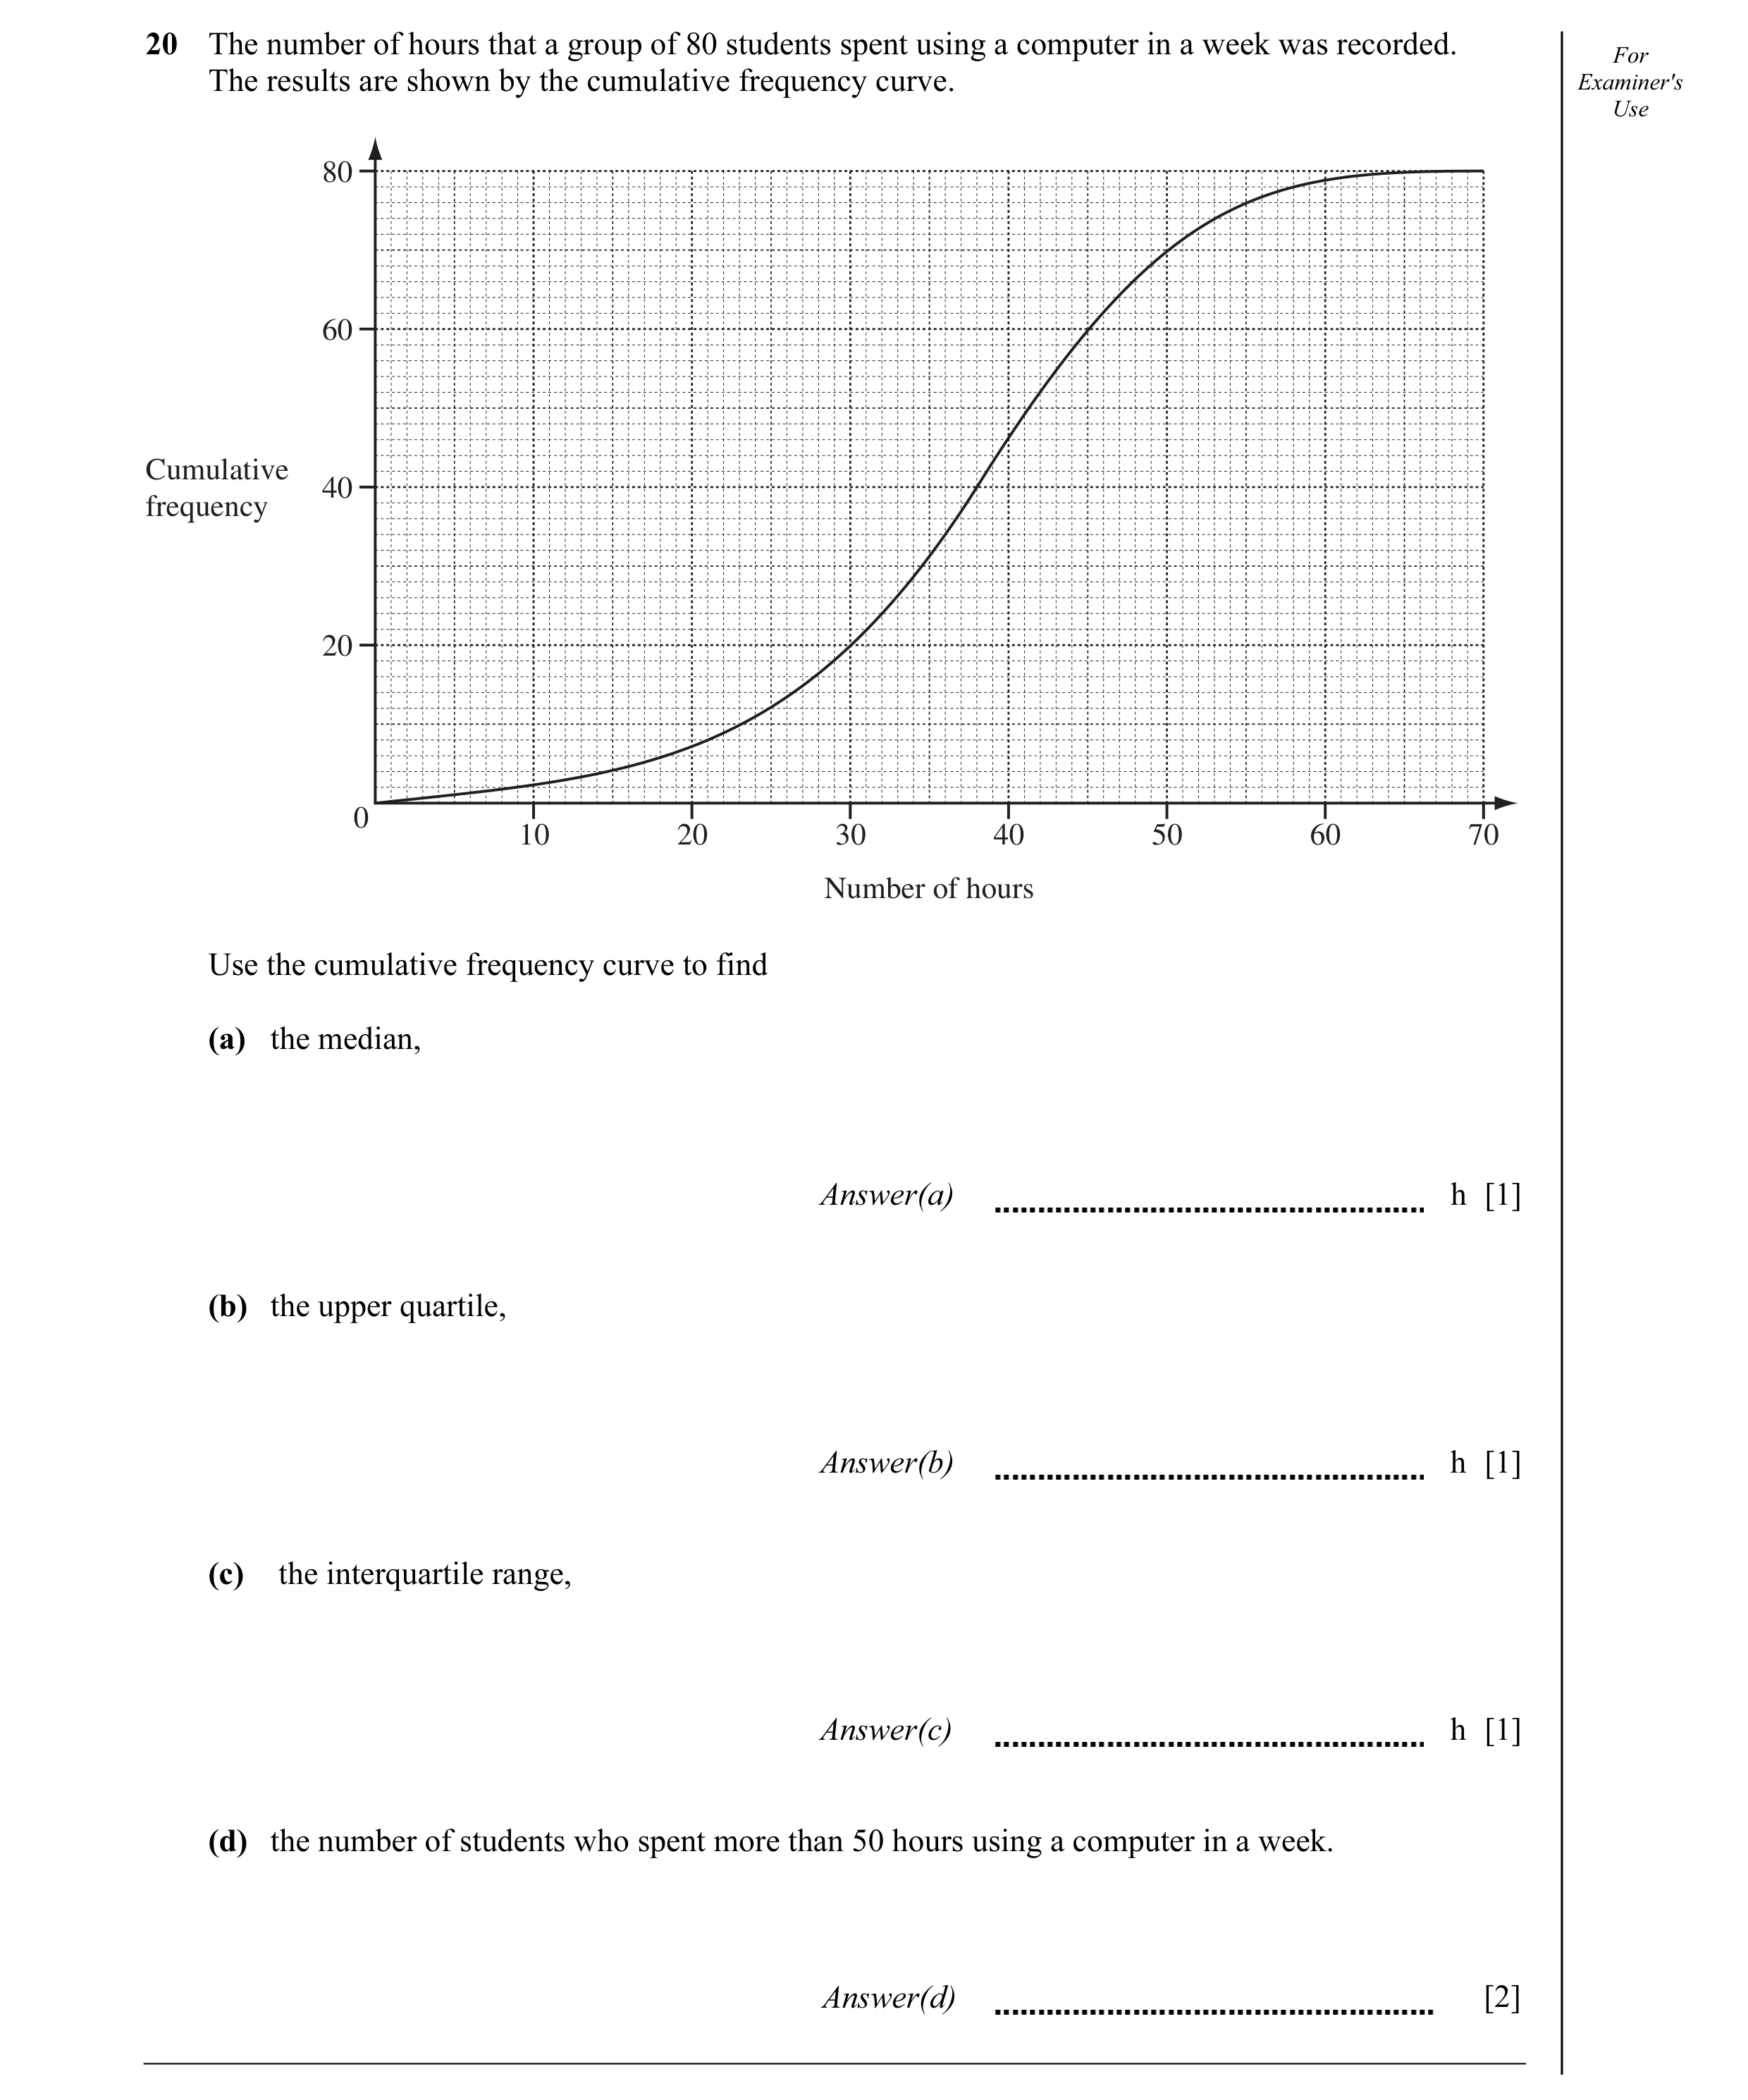
Q2 · The number of hours that a group of 80 students spent using a computer in a week was… 0580/22 Oct/Nov 2009
20 The number of hours that a group of 80 students spent using a computer in a week was recorded. For The results are shown by the cumulative frequency curve. Examiner's Use 80 60 Cumulative 40 frequency 20 0 10 20 30 40 50 60 70 Number of hours Use the cumulative frequency curve to find (a) the median, Answer(a) h [1] (b) the upper quartile, Answer(b) h [1] (c) the interquartile range, Answer(c) h [1] (d) the number of students who spent more than 50 hours using a computer in a week. Answer(d) [2]
5 marks
Mark scheme: 20 (a) 38 1 (b) 45 to 46 1 (c) 15 to 16 1 (d) 10 or 11 2 SC1 70 on answer line
This question in 0580/22 Oct/Nov 2009
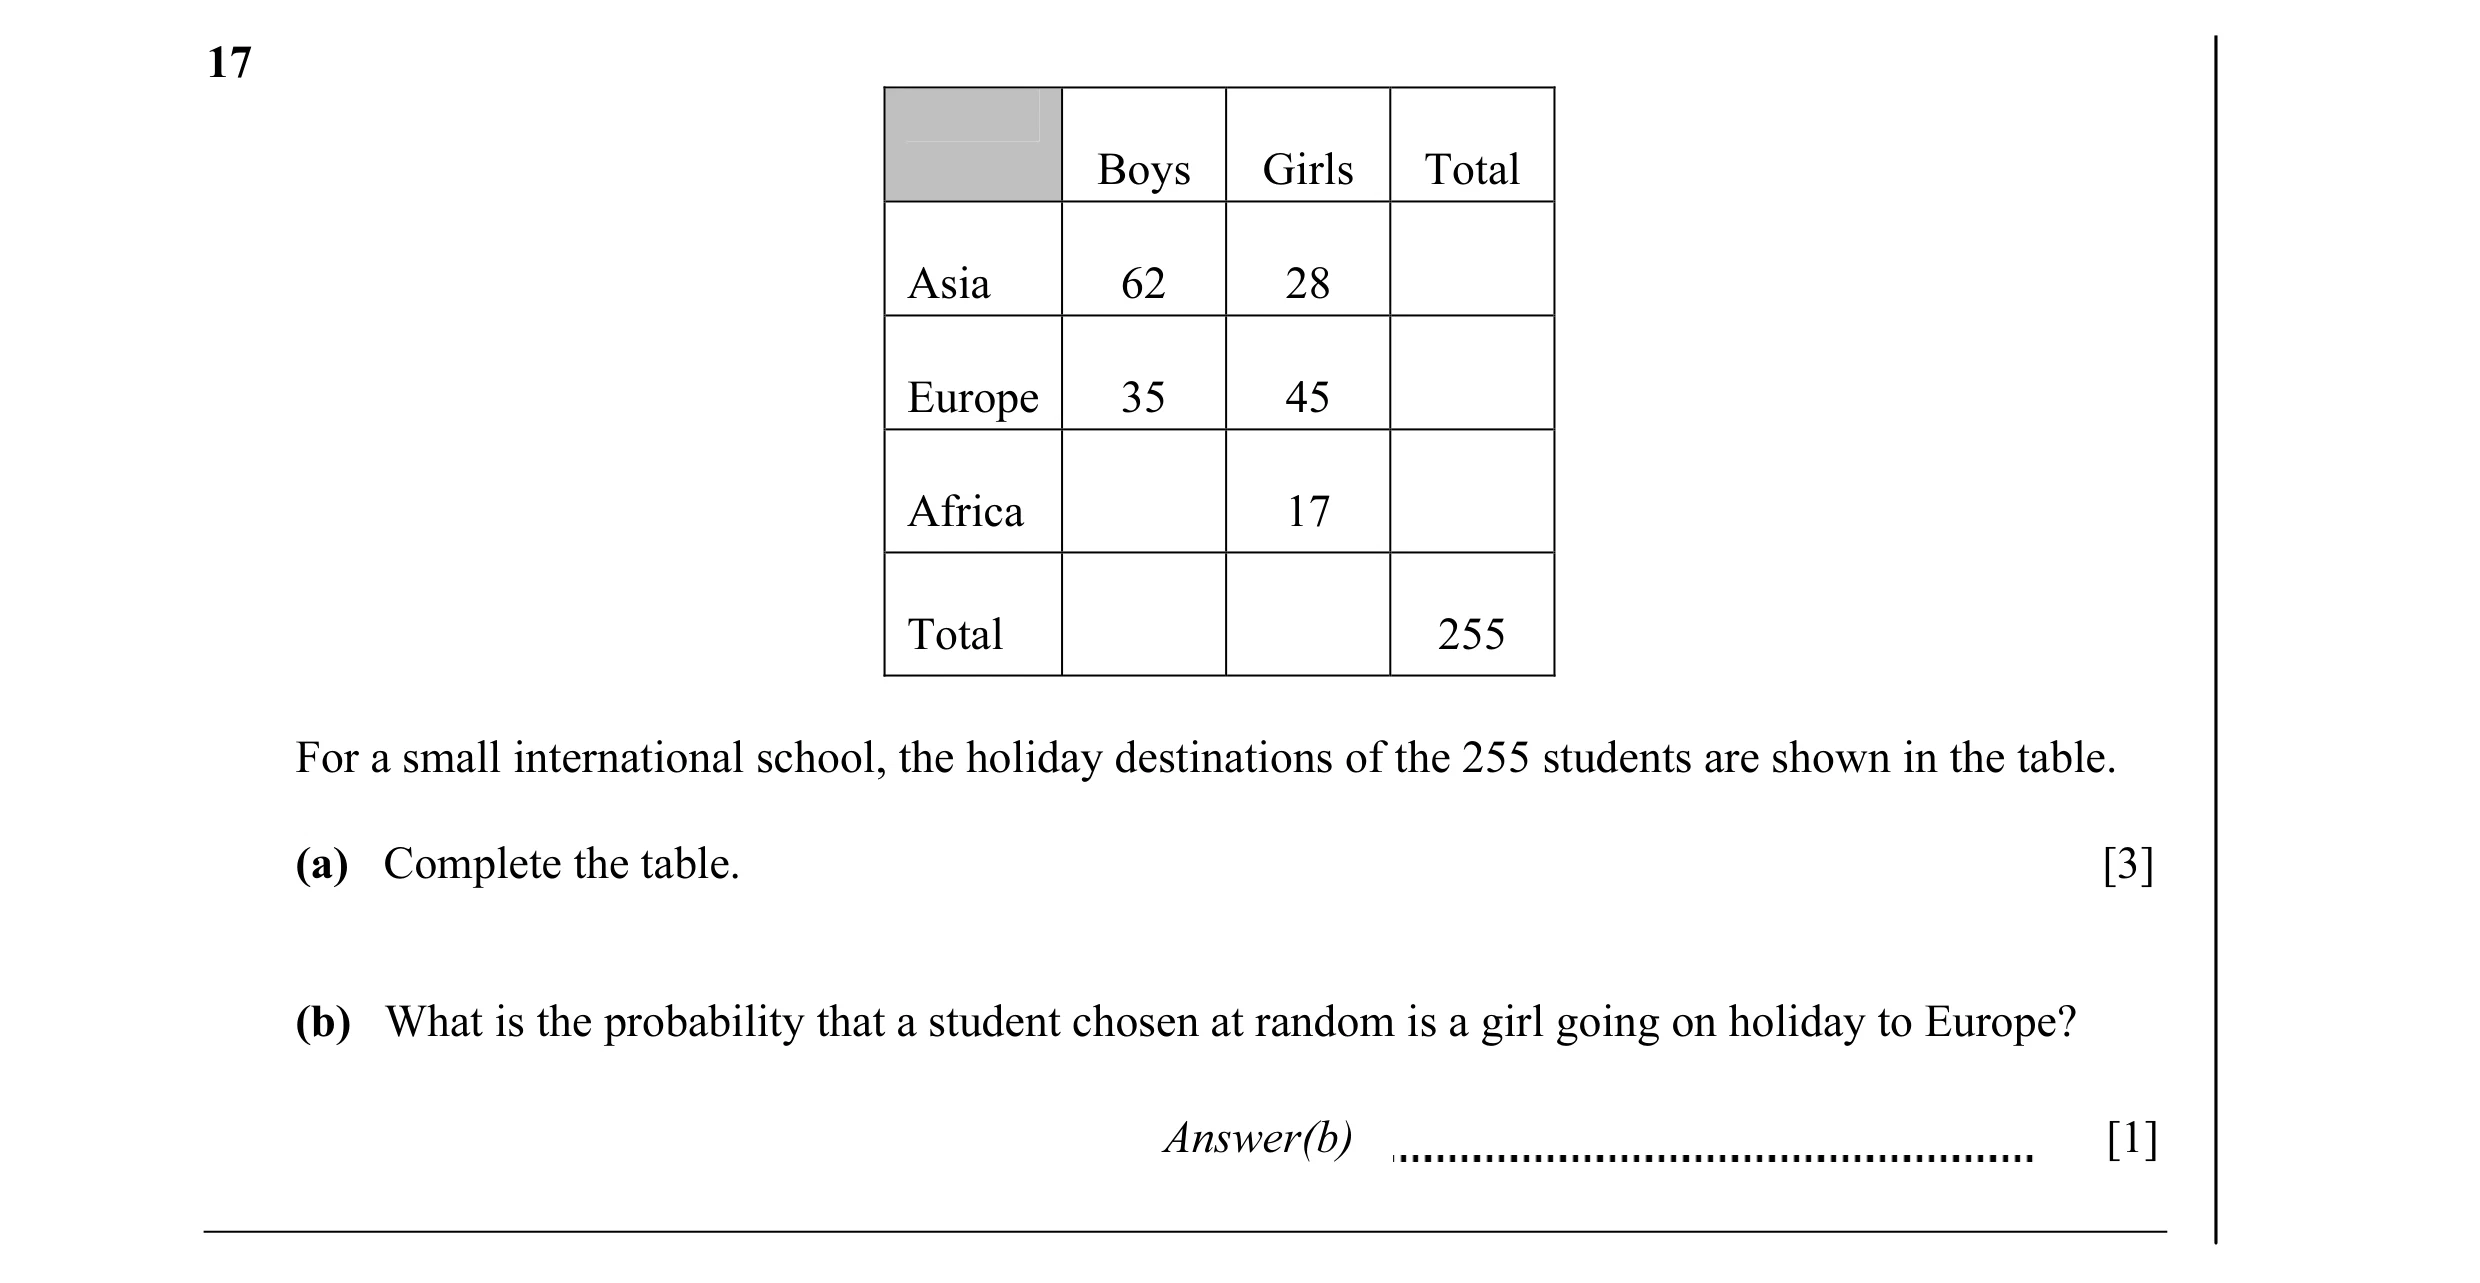
Q3 · Boys Girls Total Asia 62 28 Europe 35 45 Africa 17 Total 255 For a small international… 0580/22 Oct/Nov 2010
17 Boys Girls Total Asia 62 28 Europe 35 45 Africa 17 Total 255 For a small international school, the holiday destinations of the 255 students are shown in the table. (a) Complete the table. [3] (b) What is the probability that a student chosen at random is a girl going on holiday to Europe? Answer(b) [1]
4 marks
Mark scheme: 17 (a) 3 B1 two or three correct Boys Girls Total or B2 four or five correct Asia 62 28 90 Europe 35 45 80 Africa 68 17 85 Total 165 90 255 3 45 15 9 (b) or 0.176(47…) 1 Allow , , 17 255 85 51 14 0 ( ) −
This question in 0580/22 Oct/Nov 2010
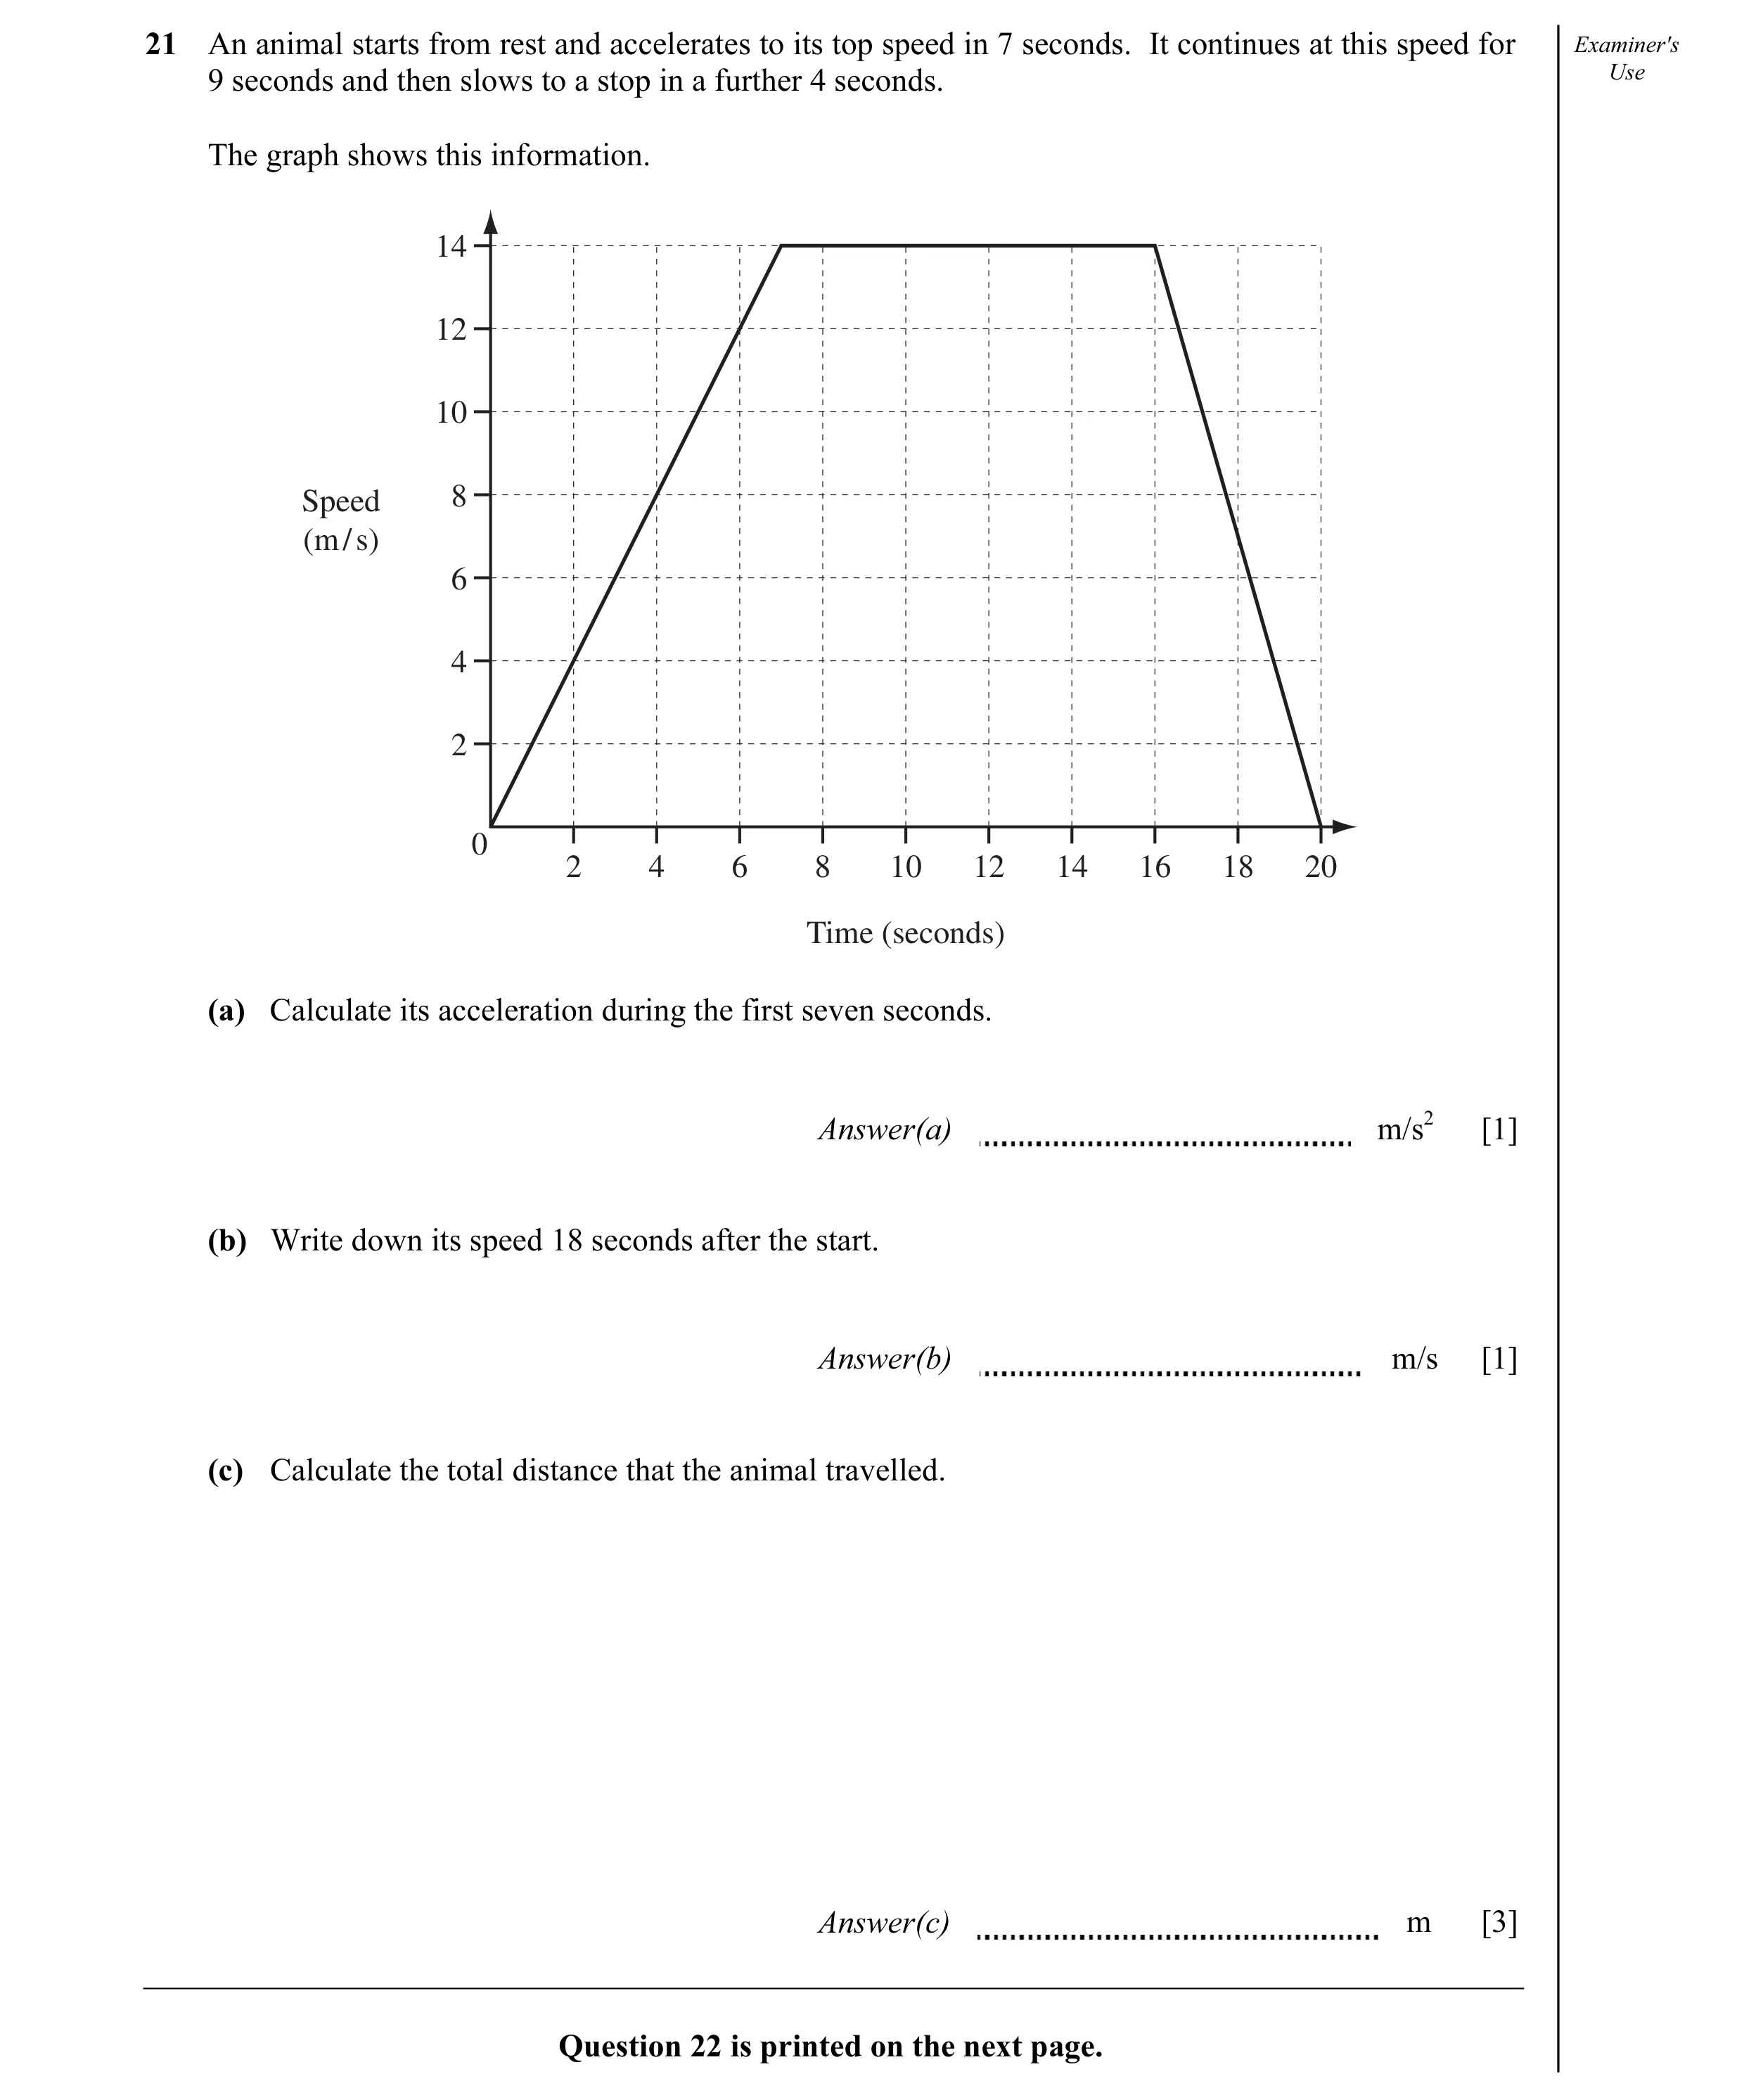
Q4 · An animal starts from rest and accelerates to its top speed in 7 seconds 0580/22 Oct/Nov 2010
21 An animal starts from rest and accelerates to its top speed in 7 seconds. It continues at this speed for Examiner's 9 seconds and then slows to a stop in a further 4 seconds. Use The graph shows this information. 14 12 10 Speed 8 (m / s) 6 4 2 0 2 4 6 8 10 12 14 16 18 20 Time (seconds) (a) Calculate its acceleration during the first seven seconds. Answer(a) m/s2 [1] (b) Write down its speed 18 seconds after the start. Answer(b) m/s [1] (c) Calculate the total distance that the animal travelled. Answer(c) m [3] Question 22 is printed on the next page.
5 marks
Mark scheme: 21 (a) 2 1 (b) 6.7 to 7.3 1 (c) 203 3 M1 intention to find area under the graph 1 1 M1 × 7 × 14 + 9 × 14 + × 4 × 14 oe 2 2
This question in 0580/22 Oct/Nov 2010
Q5 · For Examiner's 50 Use 40 30mark test 20English 10 0 10 20 30 40 50 60 70 80 Mathematics… 0580/21 Oct/Nov 2011
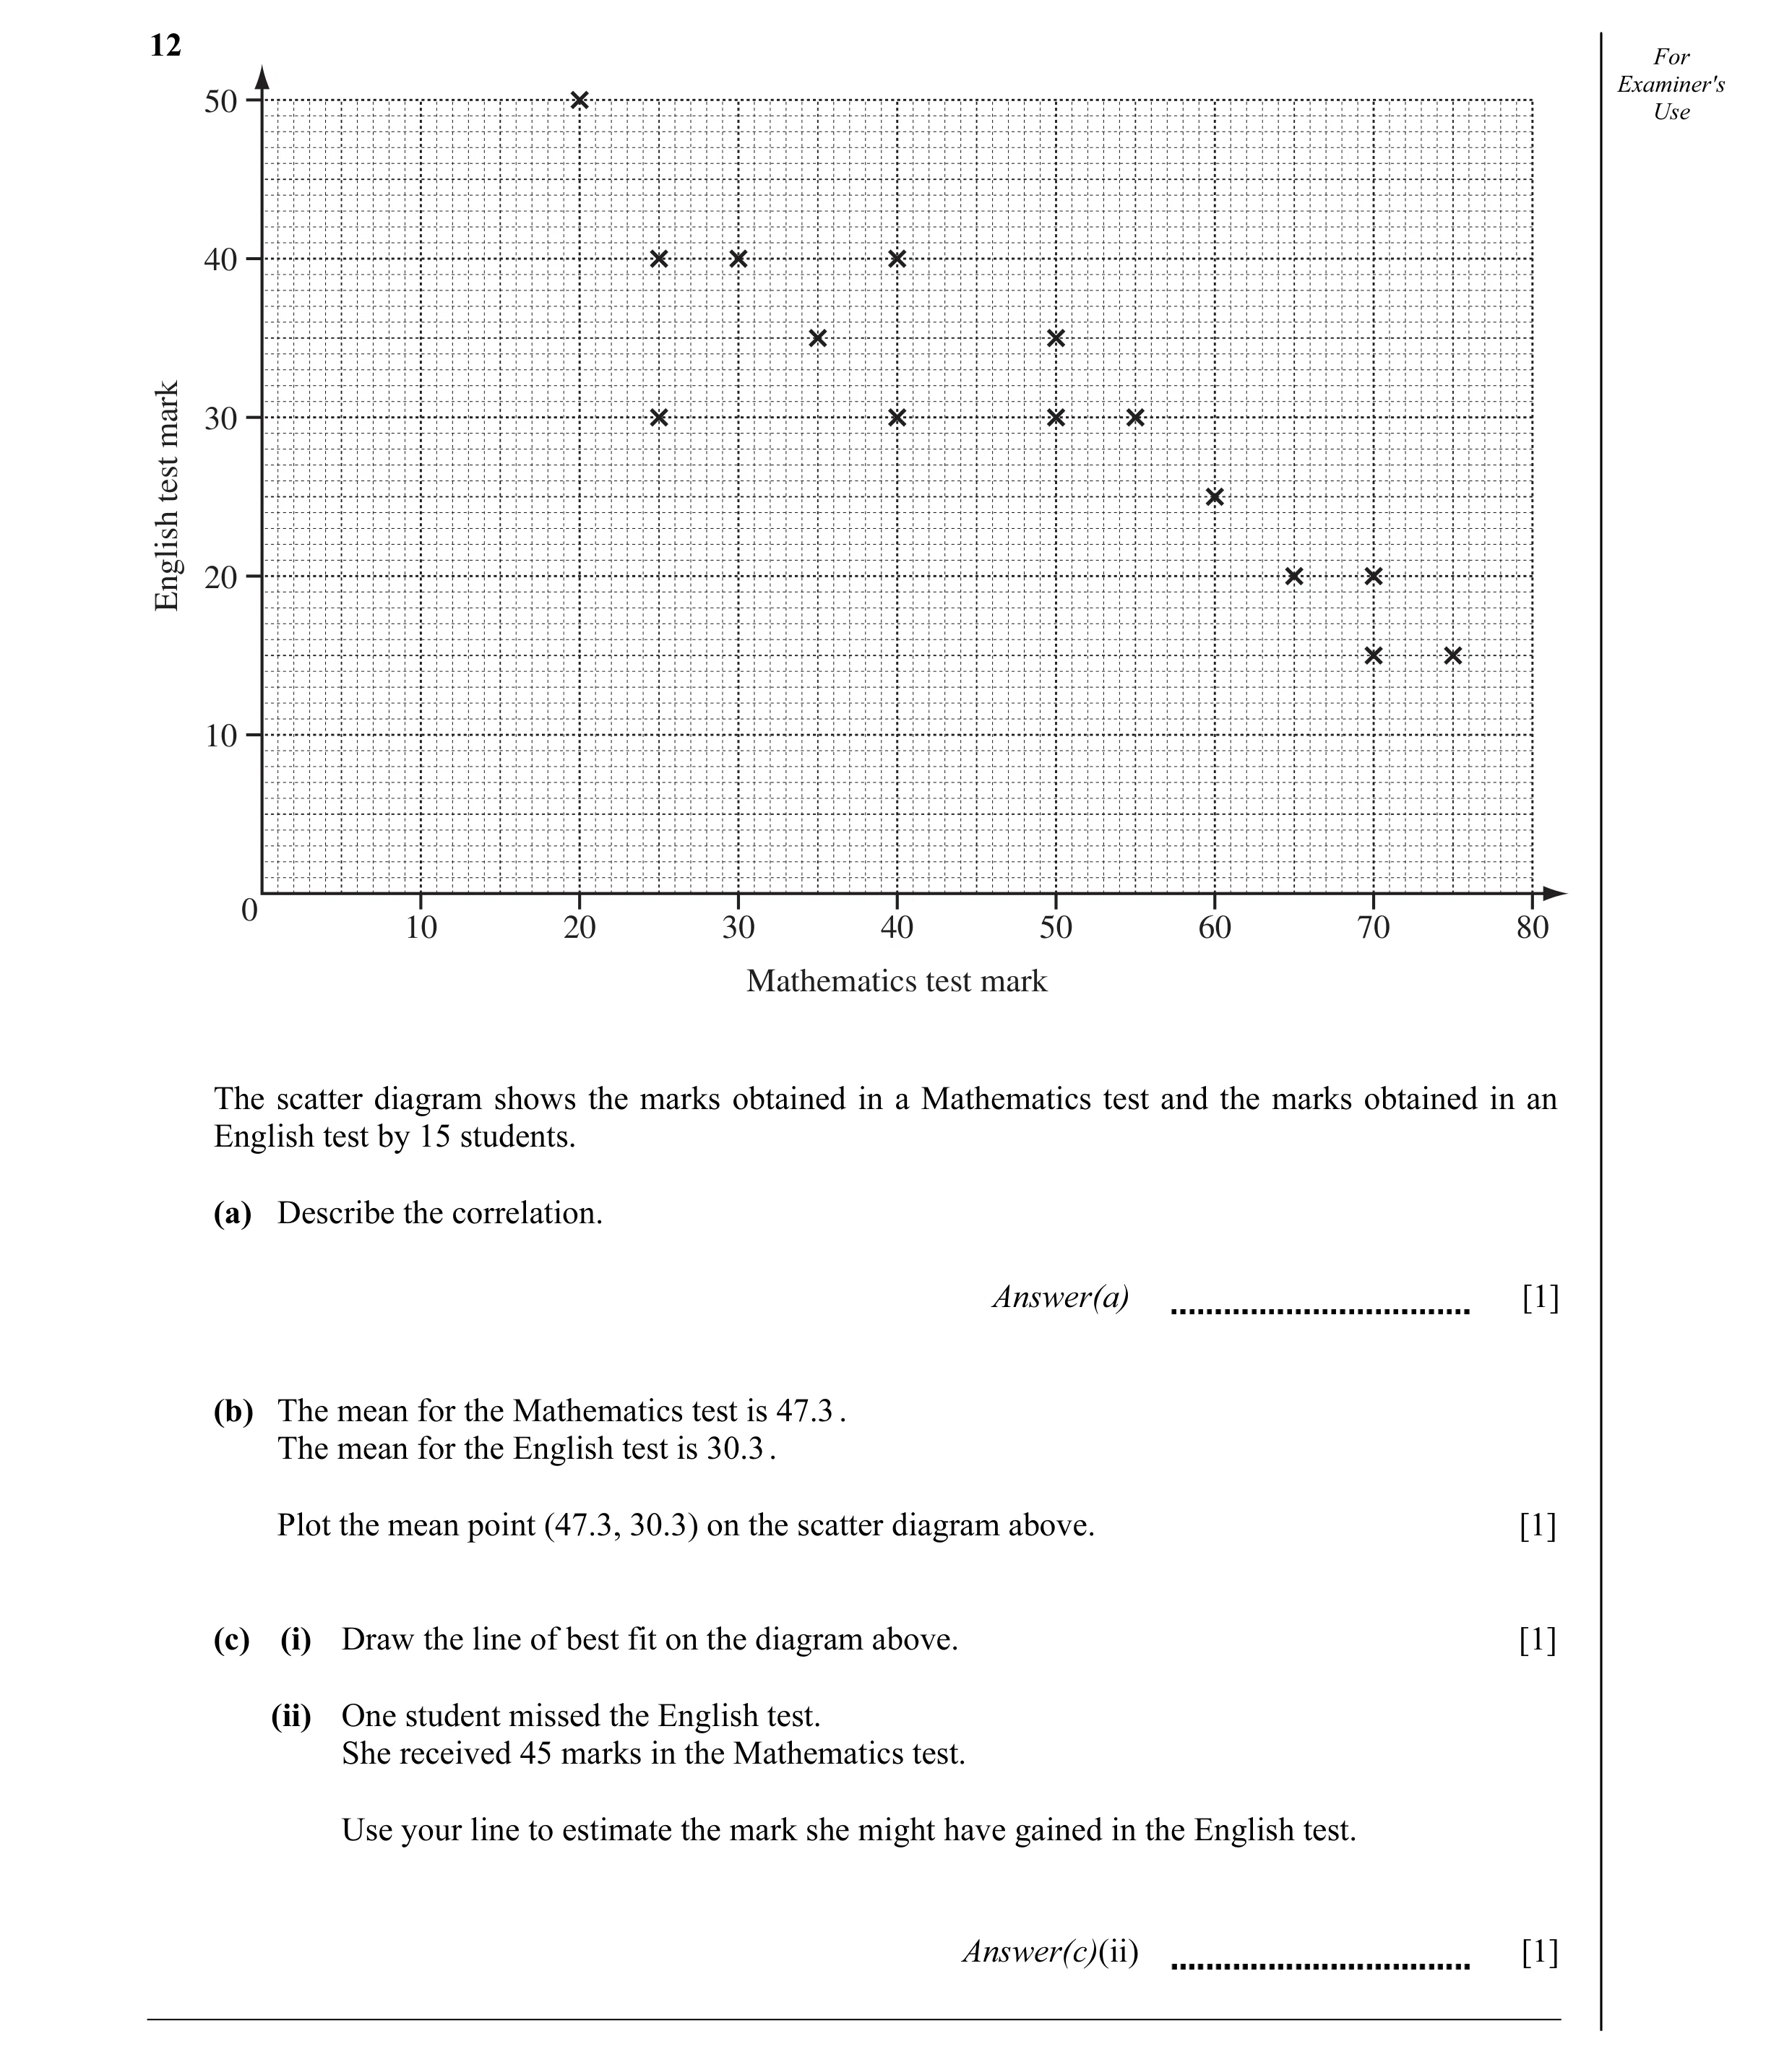
12 For Examiner's 50 Use 40 30mark test 20English 10 0 10 20 30 40 50 60 70 80 Mathematics test mark The scatter diagram shows the marks obtained in a Mathematics test and the marks obtained in an English test by 15 students. (a) Describe the correlation. Answer(a) [1] (b) The mean for the Mathematics test is 47.3 . The mean for the English test is 30.3 . Plot the mean point (47.3, 30.3) on the scatter diagram above. [1] (c) (i) Draw the line of best fit on the diagram above. [1] (ii) One student missed the English test. She received 45 marks in the Mathematics test. Use your line to estimate the mark she might have gained in the English test. Answer(c)(ii) [1]
4 marks
Mark scheme: 12 (a) Negative 1 Ignore embellishments (b) Correct point 1 (c) (i) Accurate ruled line 1 (ii) English mark 1ft Follow through their (c)(i) 1 1
This question in 0580/21 Oct/Nov 2011
Q6 · 40 30 Small car Speed 20 (m / s) Large car 10 0 1 2 3 4 5 6 7 8 9 10 Time (seconds) A… 0580/22 Oct/Nov 2011
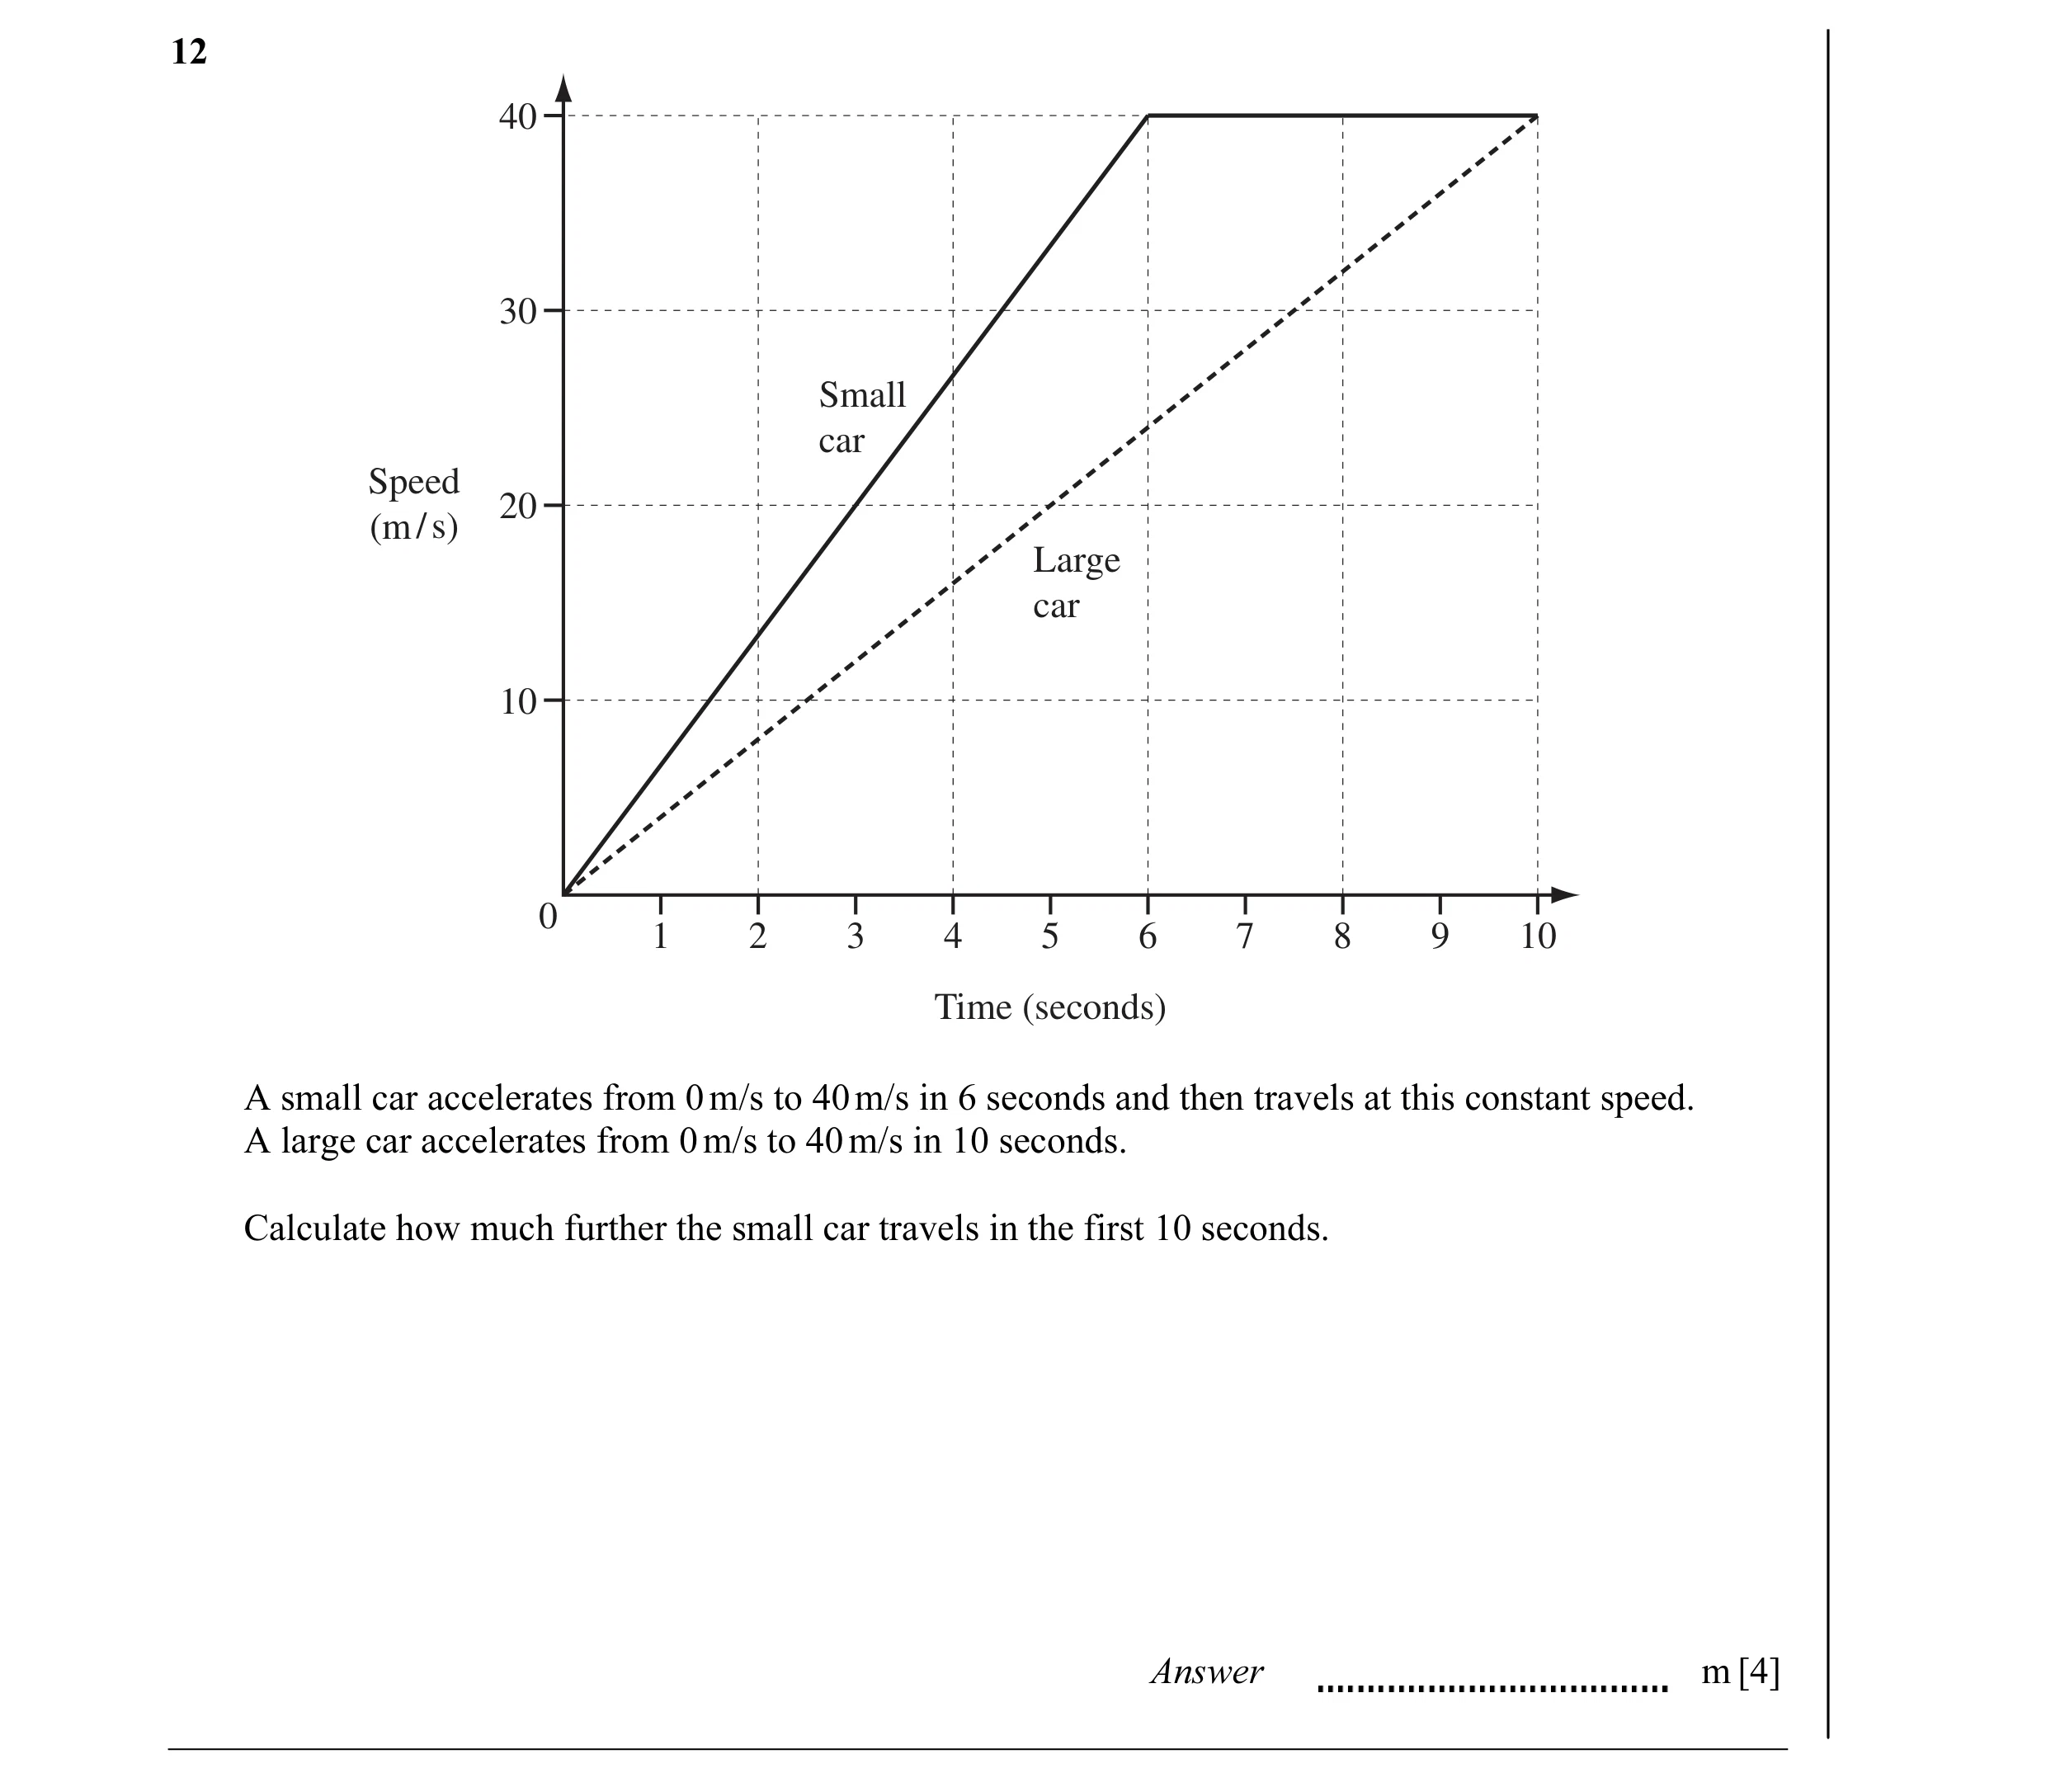
12 40 30 Small car Speed 20 (m / s) Large car 10 0 1 2 3 4 5 6 7 8 9 10 Time (seconds) A small car accelerates from 0 m/s to 40 m/s in 6 seconds and then travels at this constant speed. A large car accelerates from 0 m/s to 40 m/s in 10 seconds. Calculate how much further the small car travels in the first 10 seconds. Answer m [4]
4 marks
Mark scheme: 12 80 www 4 M1 attempting area under the graph M1 large or small car area found correctly Dep M1 correct final area statement
This question in 0580/22 Oct/Nov 2011
Q7 · Lauris records the mass and grade of 300 eggs 0580/21 Oct/Nov 2012
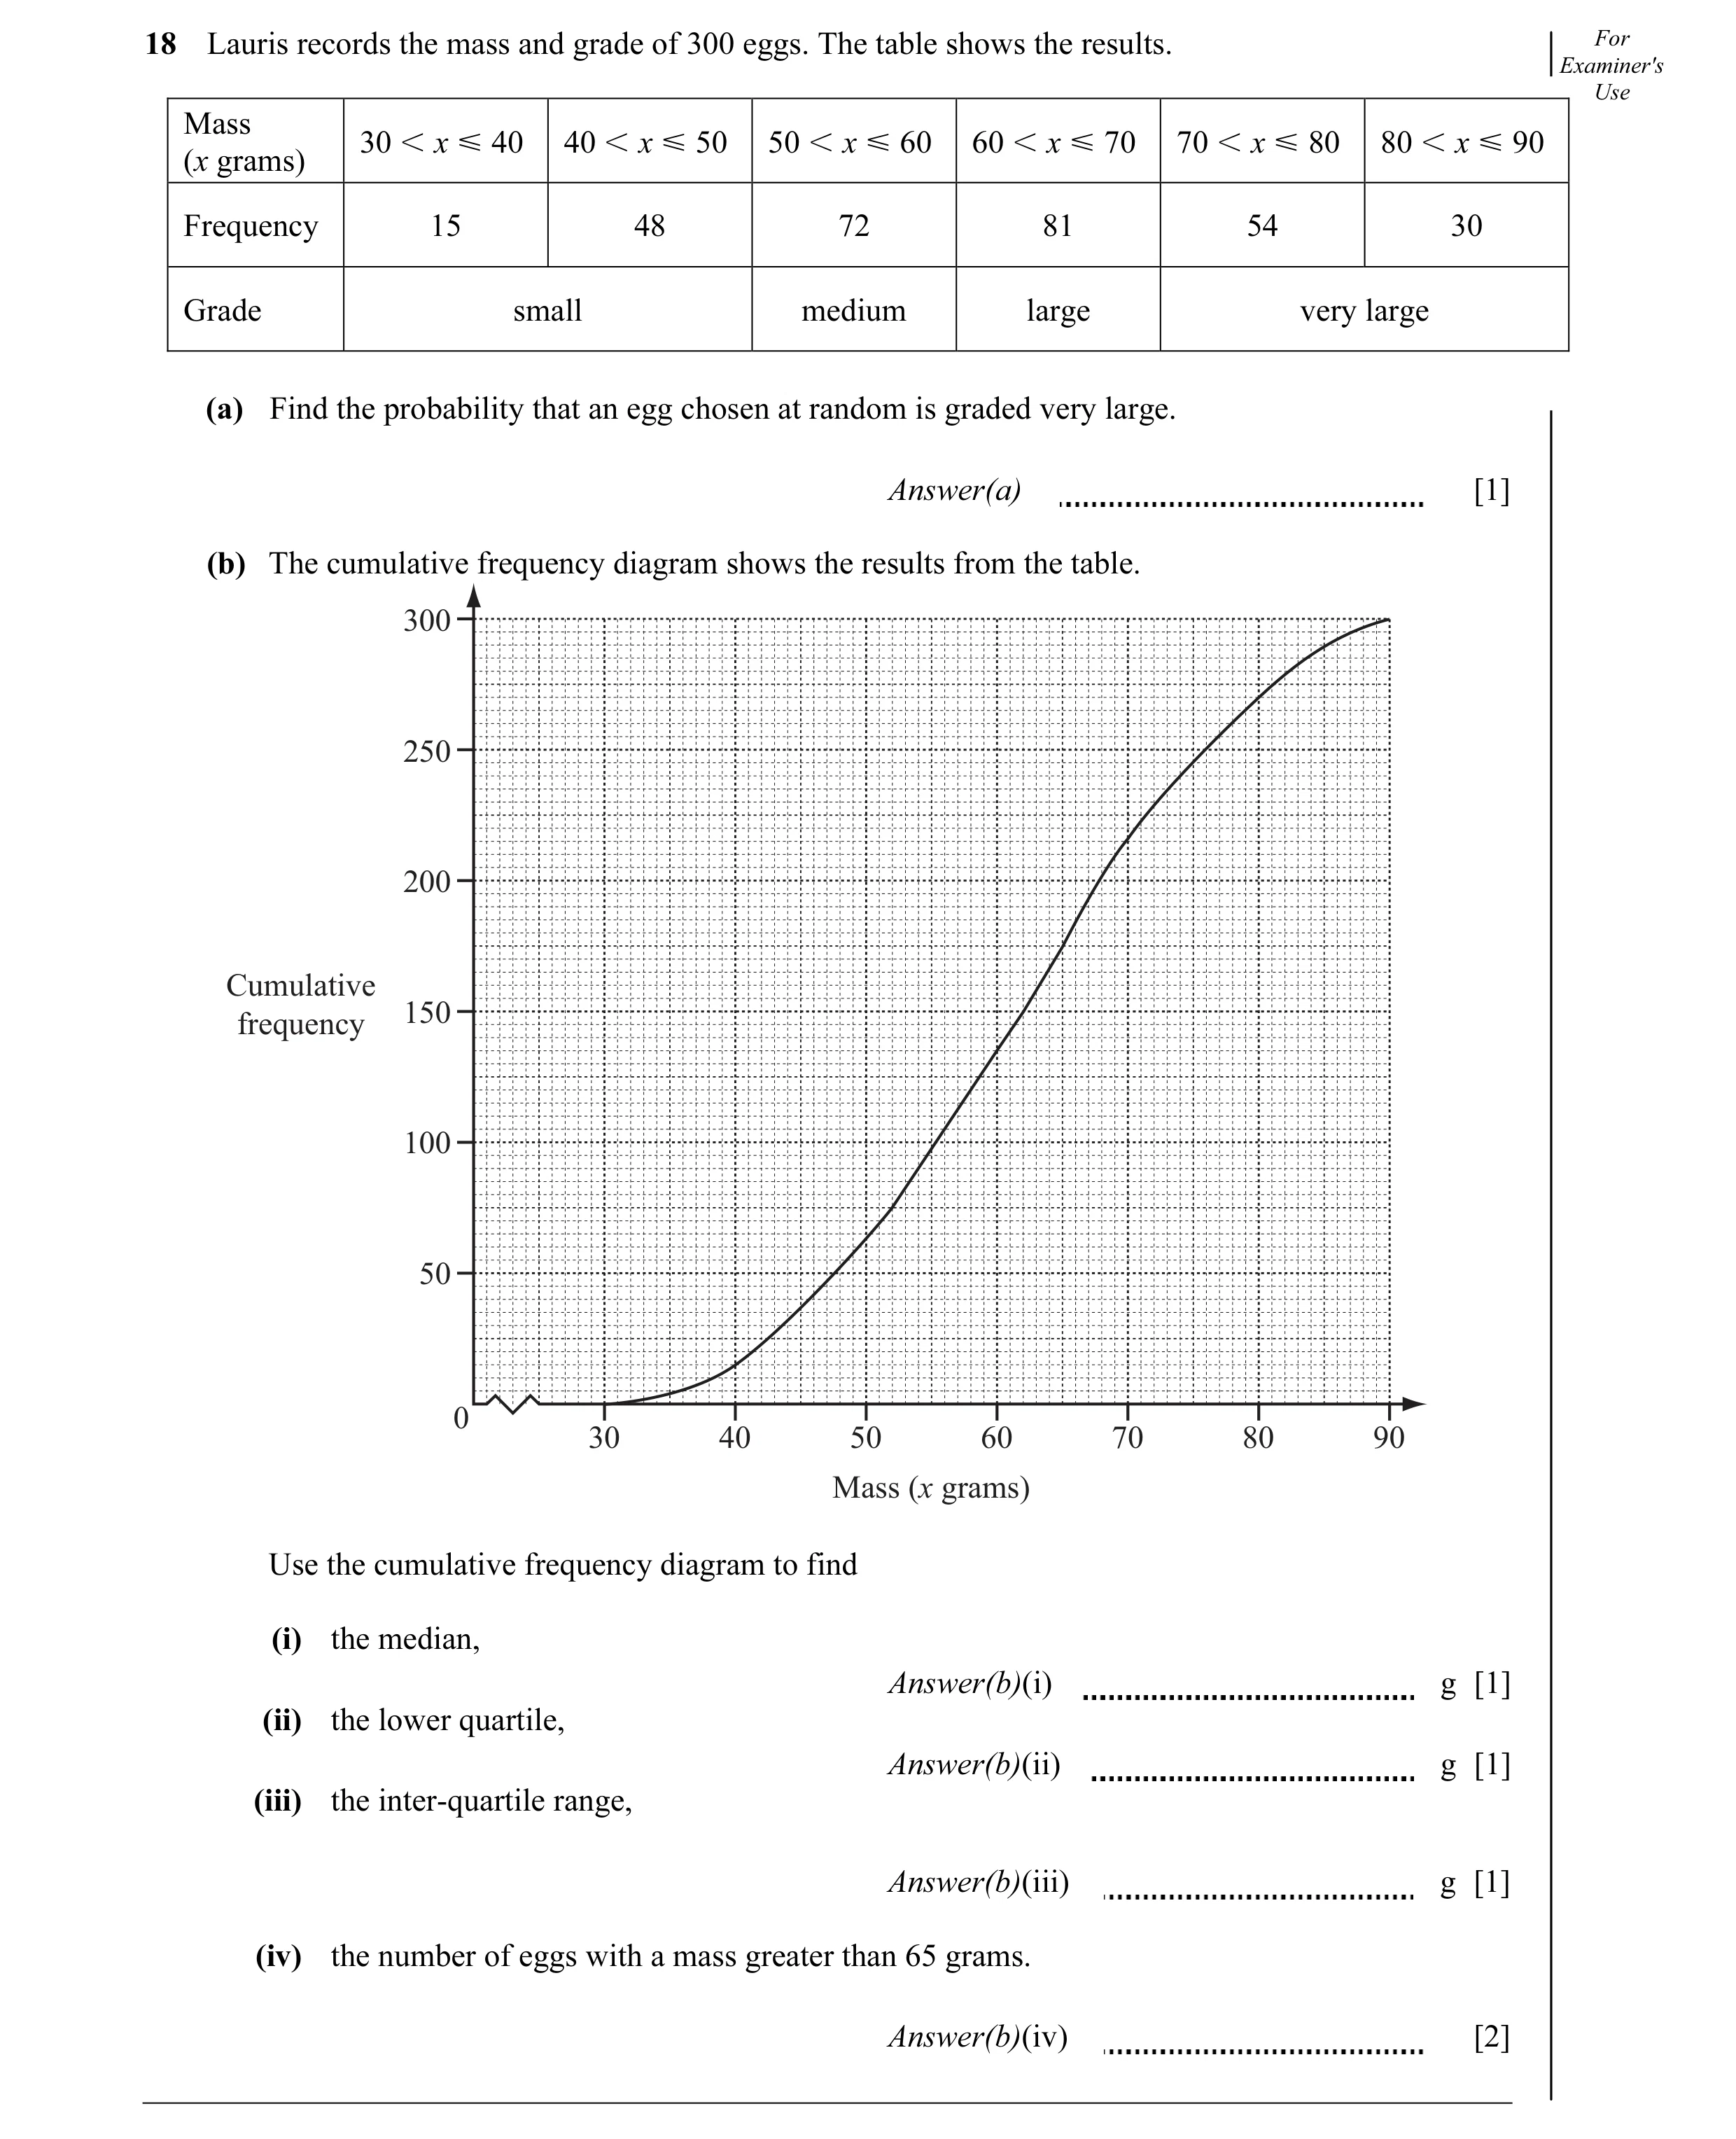
18 Lauris records the mass and grade of 300 eggs. The table shows the results. For Examiner's Use Mass 30 I x Y 40 40 I x Y 50 50 I x Y 60 60 I x Y 70 70 I x Y 80 80 I x Y 90 (x grams) Frequency 15 48 72 81 54 30 Grade small medium large very large (a) Find the probability that an egg chosen at random is graded very large. Answer(a) [1] (b) The cumulative frequency diagram shows the results from the table. 300 250 200 Cumulative 150 frequency 100 50 0 30 40 50 60 70 80 90 Mass (x grams) Use the cumulative frequency diagram to find (i) the median, Answer(b)(i) g [1] (ii) the lower quartile, Answer(b)(ii) g [1] (iii) the inter-quartile range, Answer(b)(iii) g [1] (iv) the number of eggs with a mass greater than 65 grams. Answer(b)(iv) [2]
6 marks
Mark scheme: 7 84 18 (a) or oe 1 25 300 (b) (i) 62 1 (ii) 52 1 (iii) 19 to 20 1 (iv) 125 2 B1 for 175 seen
This question in 0580/21 Oct/Nov 2012
Q8 · During one day 48 people visited a museum 0580/22 Oct/Nov 2013
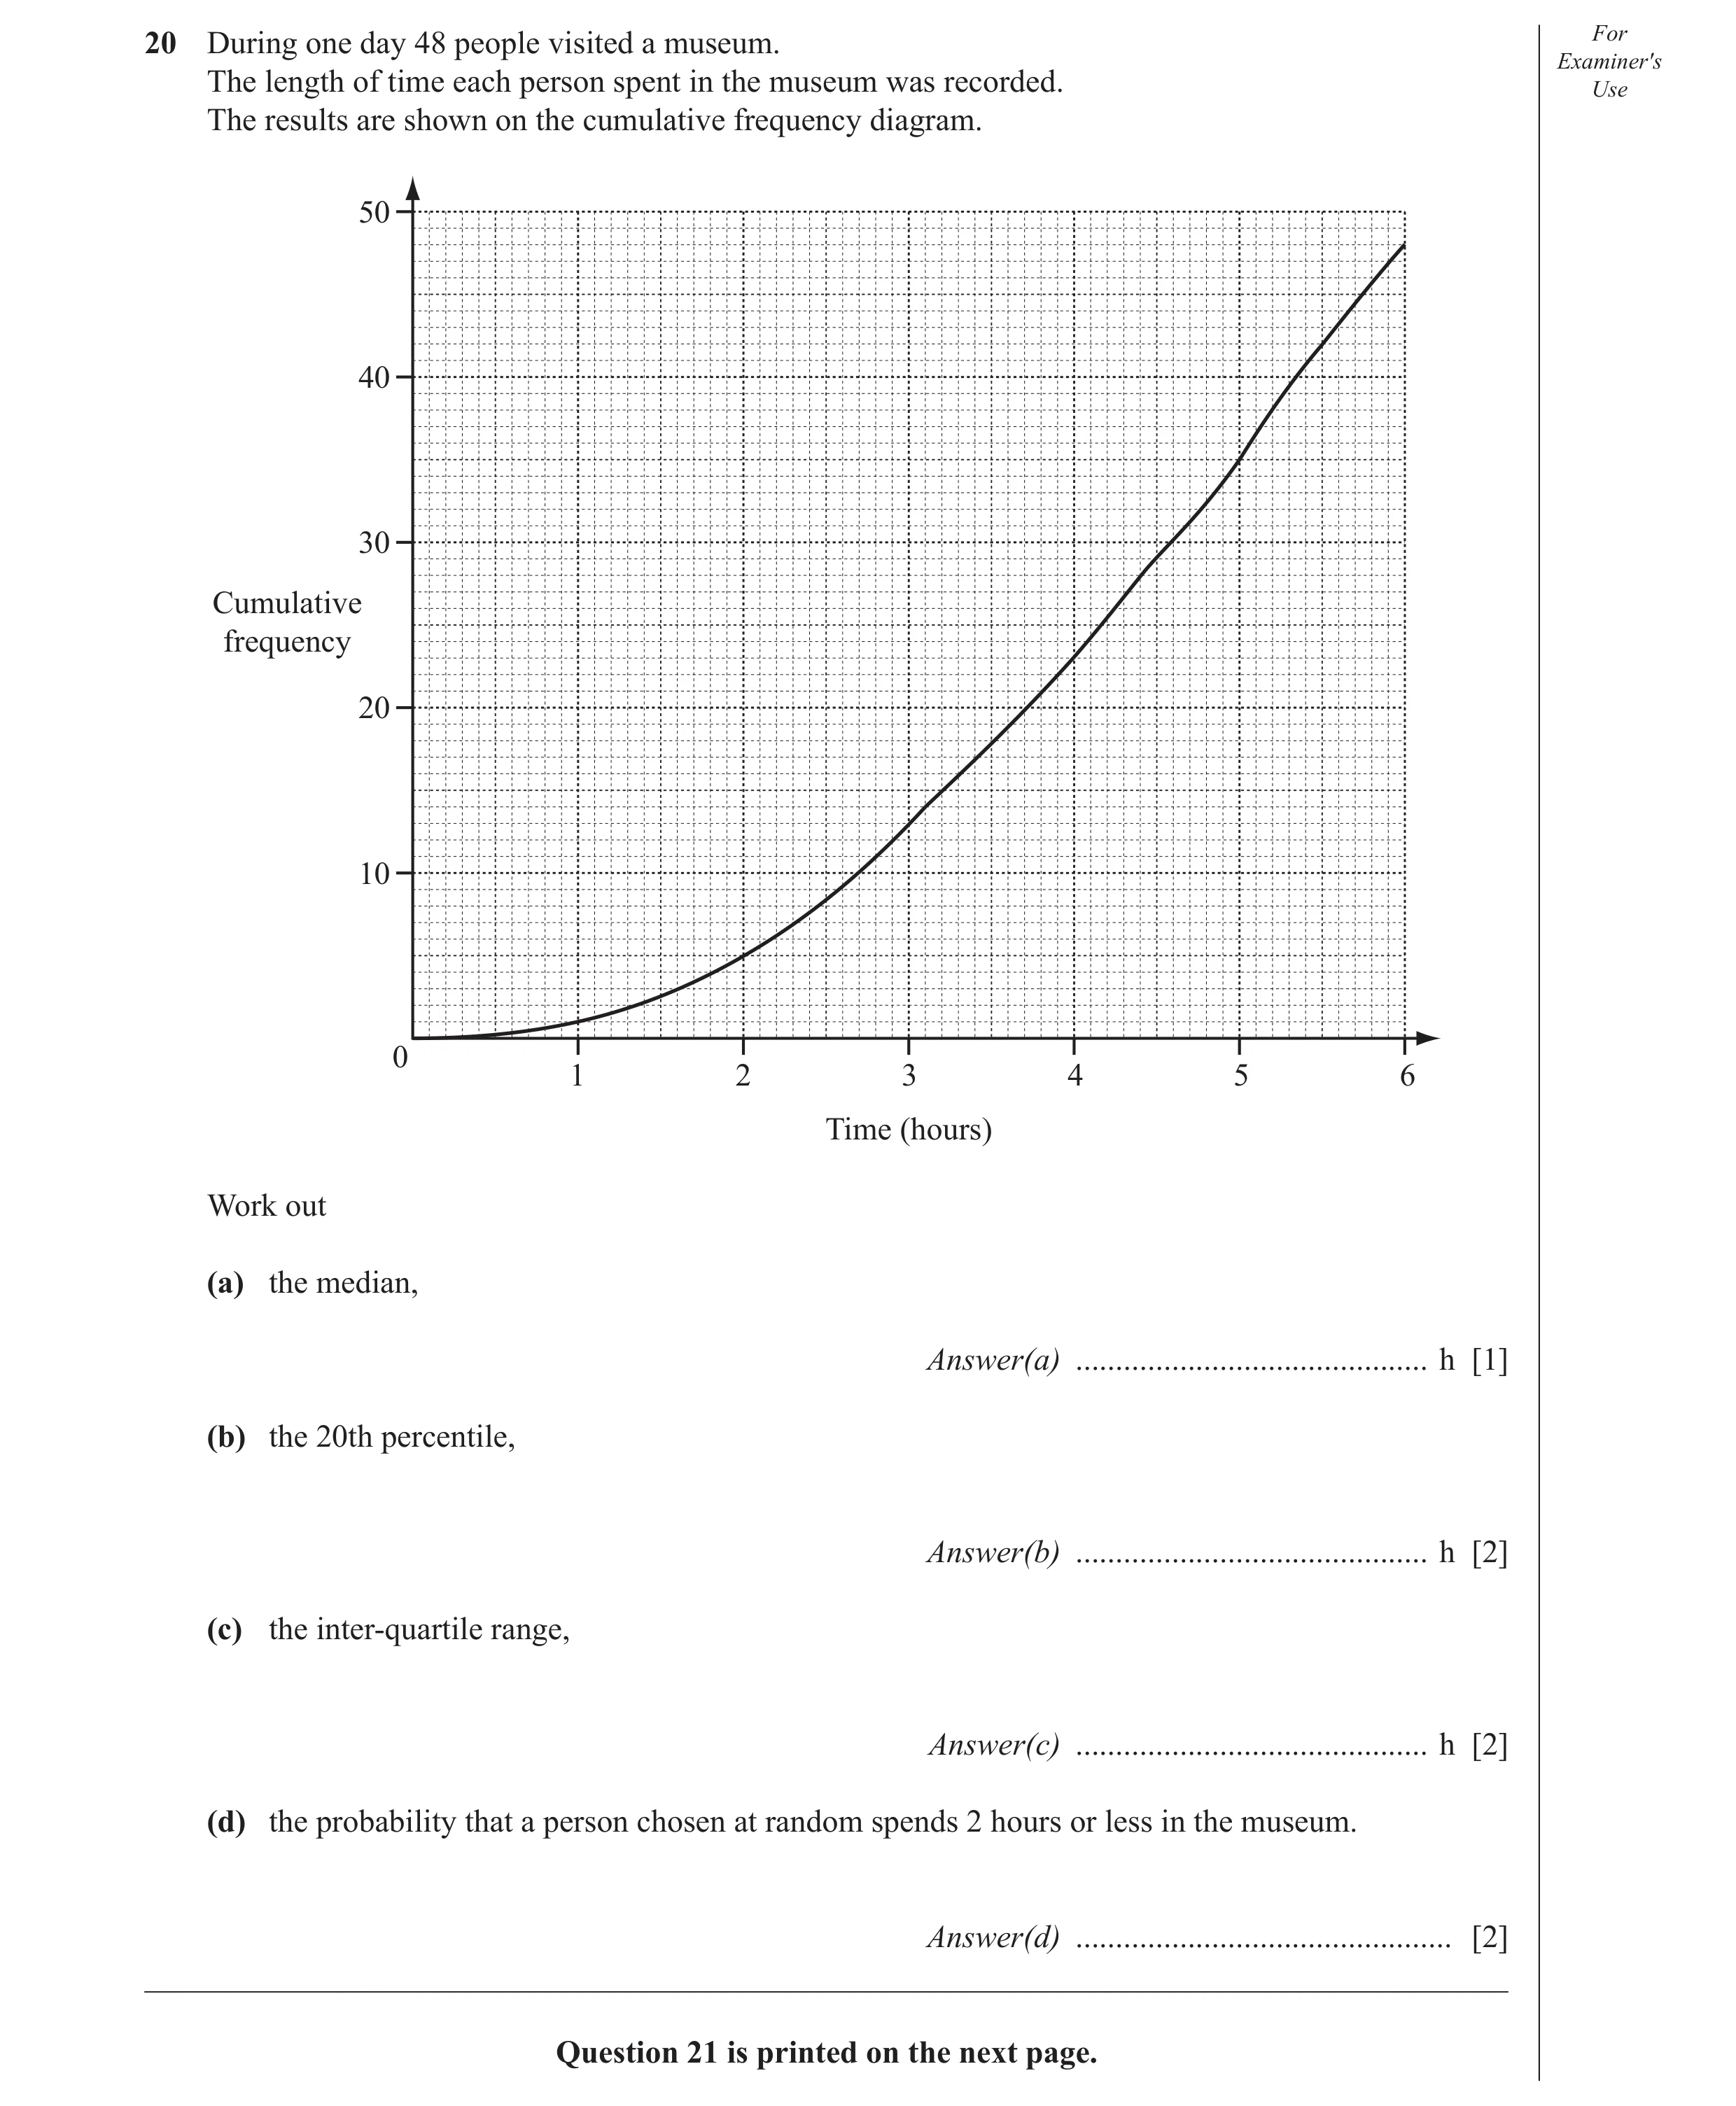
20 During one day 48 people visited a museum. For Examiner′s The length of time each person spent in the museum was recorded. Use The results are shown on the cumulative frequency diagram. 50 40 30 Cumulative frequency 20 10 0 1 2 3 4 5 6 Time (hours) Work out (a) the median, Answer(a) … h [1] (b) the 20th percentile, Answer(b) … h [2] (c) the inter-quartile range, Answer(c) … h [2] (d) the probability that a person chosen at random spends 2 hours or less in the museum. Answer(d) … [2] _____________________________________________________________________________________ Question 21 is printed on the next page.
7 marks
Mark scheme: 20 (a) 4.05 to 4.2 1 (b) 2.6 to 2.75 2 B1 for 9.6 seen (c) 2.05 to 2.25 2 B1 for [UQ] 5.0 to 5.1 and [LQ] 2.85 to 2.95 seen 5 (d) 2 M1 for 5 48 4× sin 65
This question in 0580/22 Oct/Nov 2013
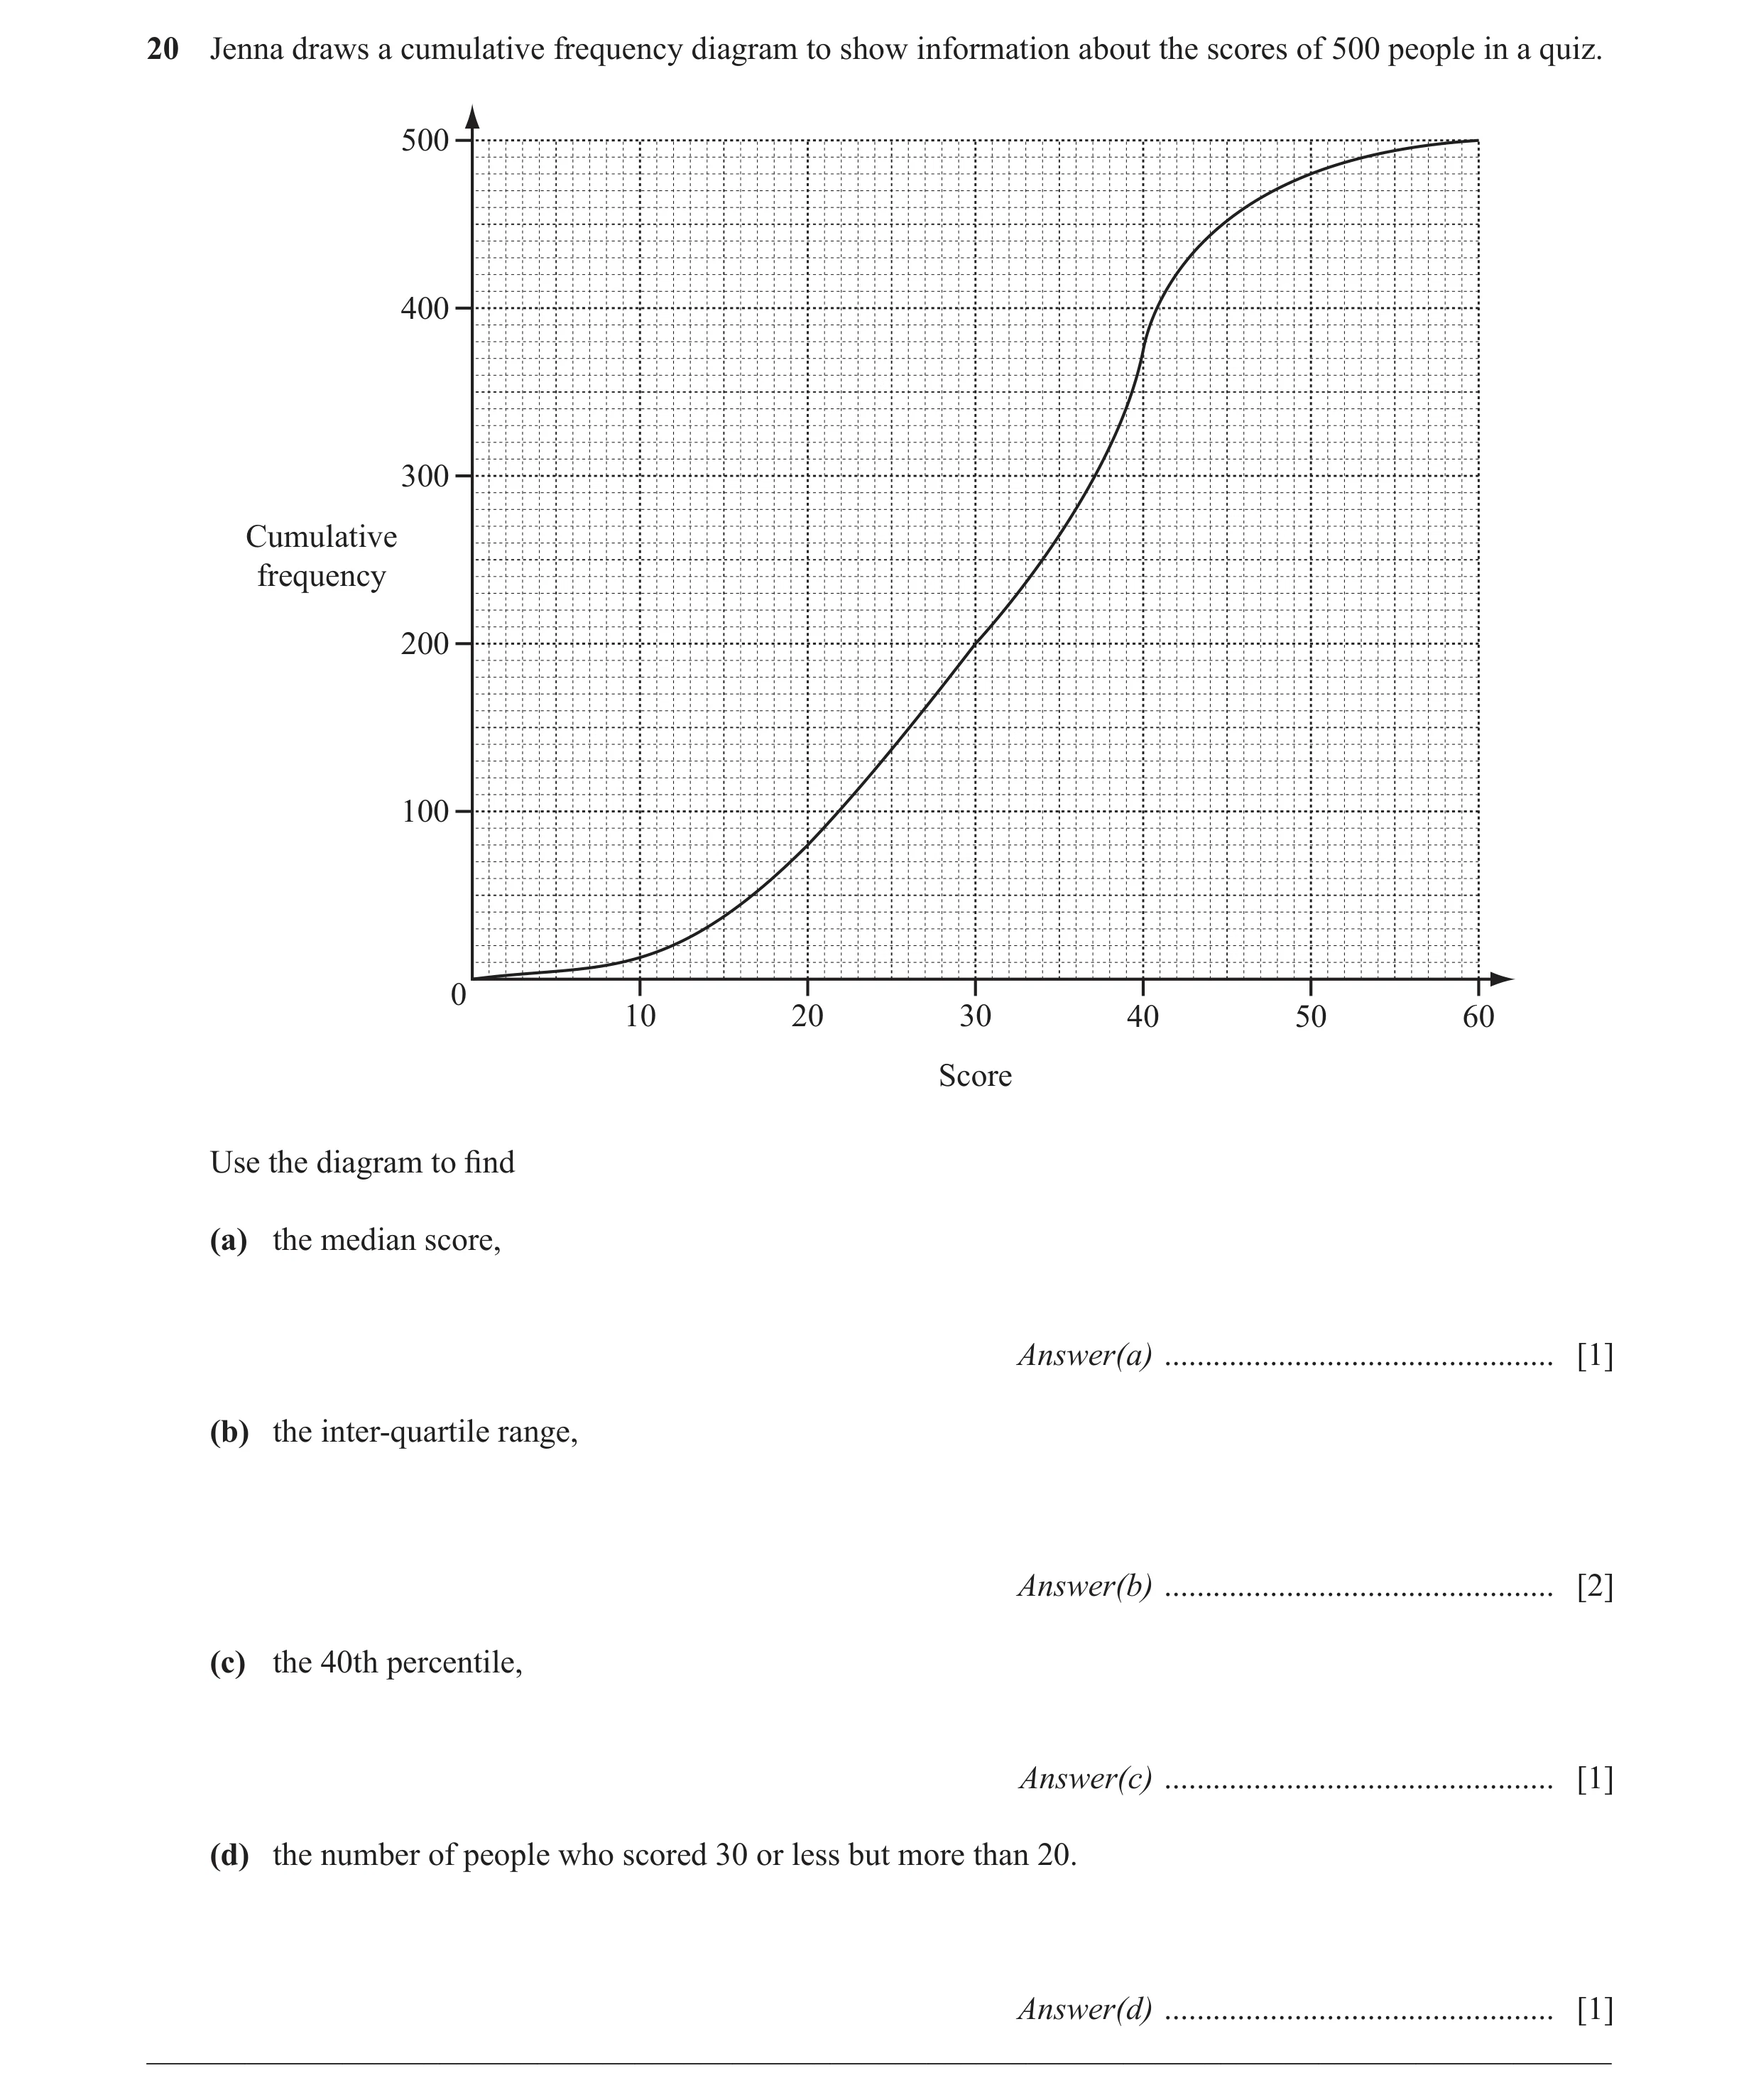
Q9 · Jenna draws a cumulative frequency diagram to show information about the scores of 500… 0580/23 May/June 2014
20 Jenna draws a cumulative frequency diagram to show information about the scores of 500 people in a quiz. 500 400 300 Cumulative frequency 200 100 0 10 20 30 40 50 60 Score Use the diagram to fi nd (a) the median score, Answer(a) … [1] (b) the inter-quartile range, Answer(b) … [2] (c) the 40th percentile, Answer(c) … [1] (d) the number of people who scored 30 or less but more than 20. Answer(d) … [1] __________________________________________________________________________________________
5 marks
Mark scheme: 20 (a) 34 1 (b) 16 2 B1 for 24 or 40 seen (c) 30 1 (d) 120 1 2
This question in 0580/23 May/June 2014
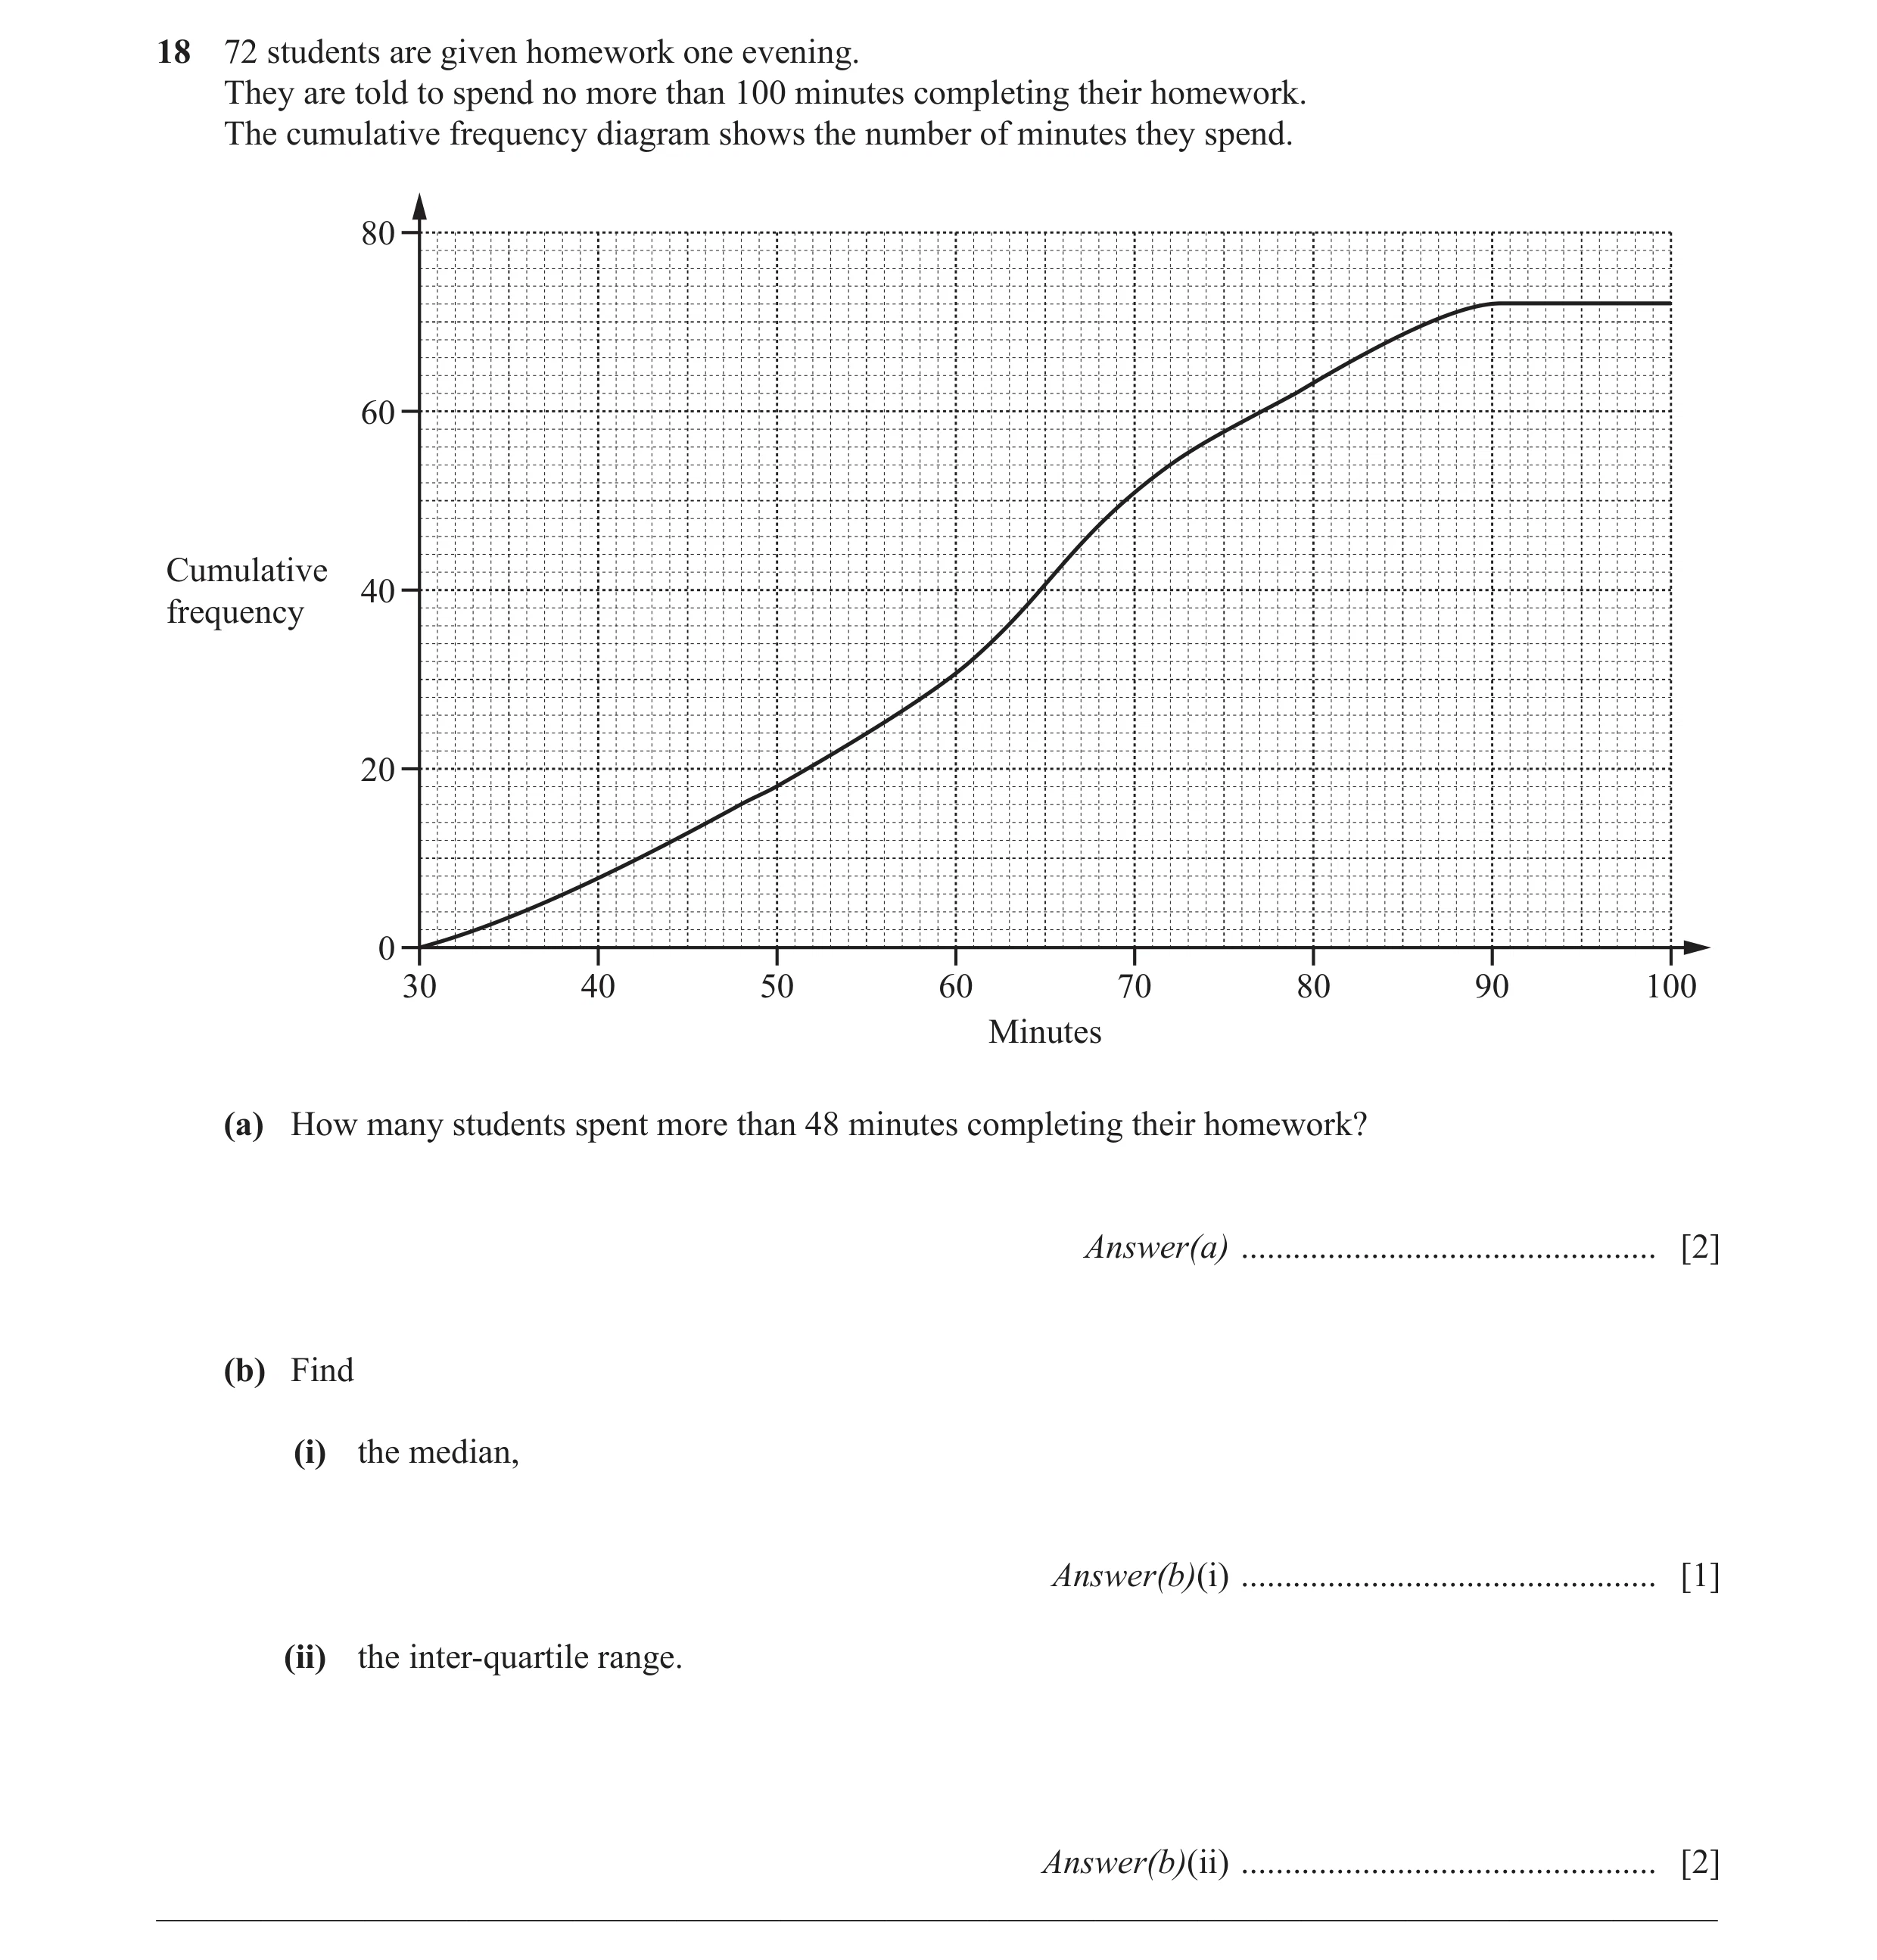
Q10 · 72 students are given homework one evening 0580/22 Oct/Nov 2014
18 72 students are given homework one evening. They are told to spend no more than 100 minutes completing their homework. The cumulative frequency diagram shows the number of minutes they spend. 80 60 Cumulative 40 frequency 20 0 30 40 50 60 70 80 90 100 Minutes (a) How many students spent more than 48 minutes completing their homework? Answer(a) … [2] (b) Find (i) the median, Answer(b)(i) … [1] (ii) the inter-quartile range. Answer(b)(ii) … [2] __________________________________________________________________________________________
5 marks
Mark scheme: 18 (a) 56 2 B1 for 16 soi or M1 for 72 – their 16 (b) (i) 63 or 63 to 63.5 1 (ii) 22 or 21.6 to 23 nfww 2 B1 for 49.8 to 50.2 seen or 71.8 to 72.8
This question in 0580/22 Oct/Nov 2014
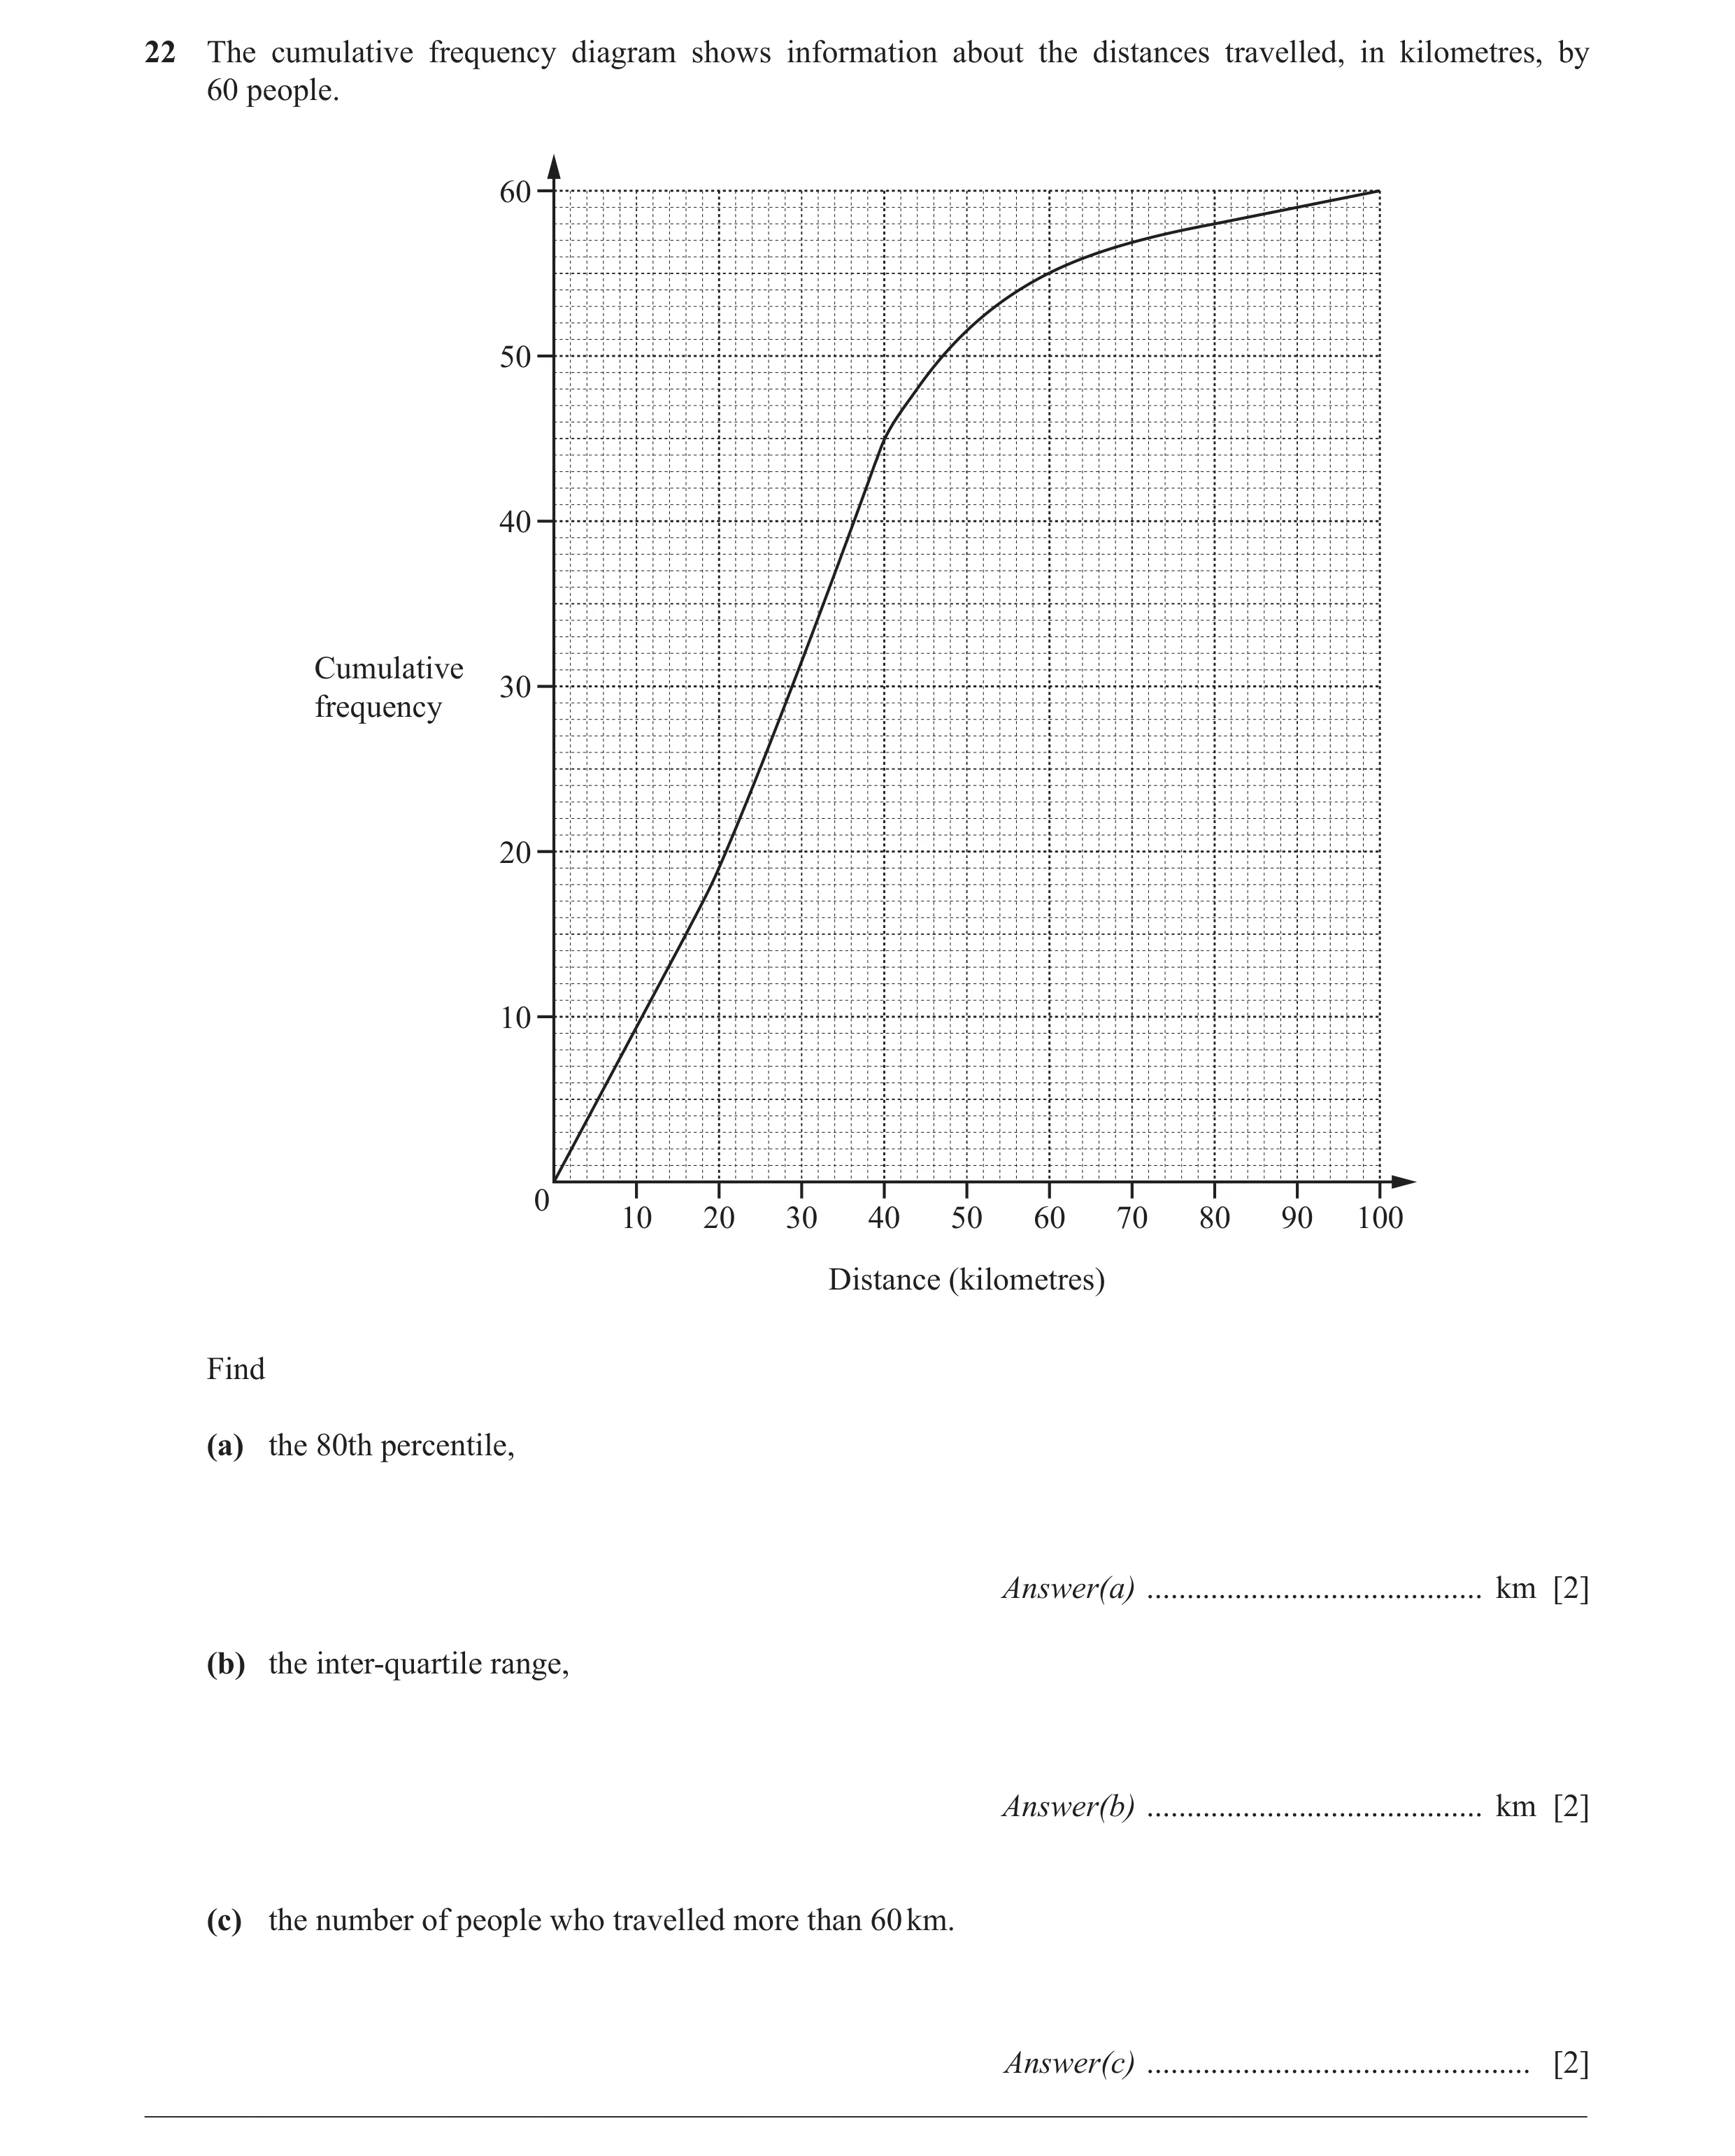
Q11 · The cumulative frequency diagram shows information about the distances travelled, in… 0580/22 May/June 2015
22 The cumulative frequency diagram shows information about the distances travelled, in kilometres, by 60 people. 60 50 40 Cumulative 30 frequency 20 10 0 10 20 30 40 50 60 70 80 90 100 Distance (kilometres) Find (a) the 80th percentile, Answer(a) … km [2] (b) the inter-quartile range, Answer(b) … km [2] (c) the number of people who travelled more than 60 km. Answer(c) … [2] __________________________________________________________________________________________
6 marks
Mark scheme: 22 (a) 44 2 M1 for 48 soi (b) 24 2 M1 for 40 or 16 or both lines drawn from 15 and 45 across and down to the horizontal axis (c) 5 2 M1 for answer 55 or line or mark on graph indicating 55 2
This question in 0580/22 May/June 2015
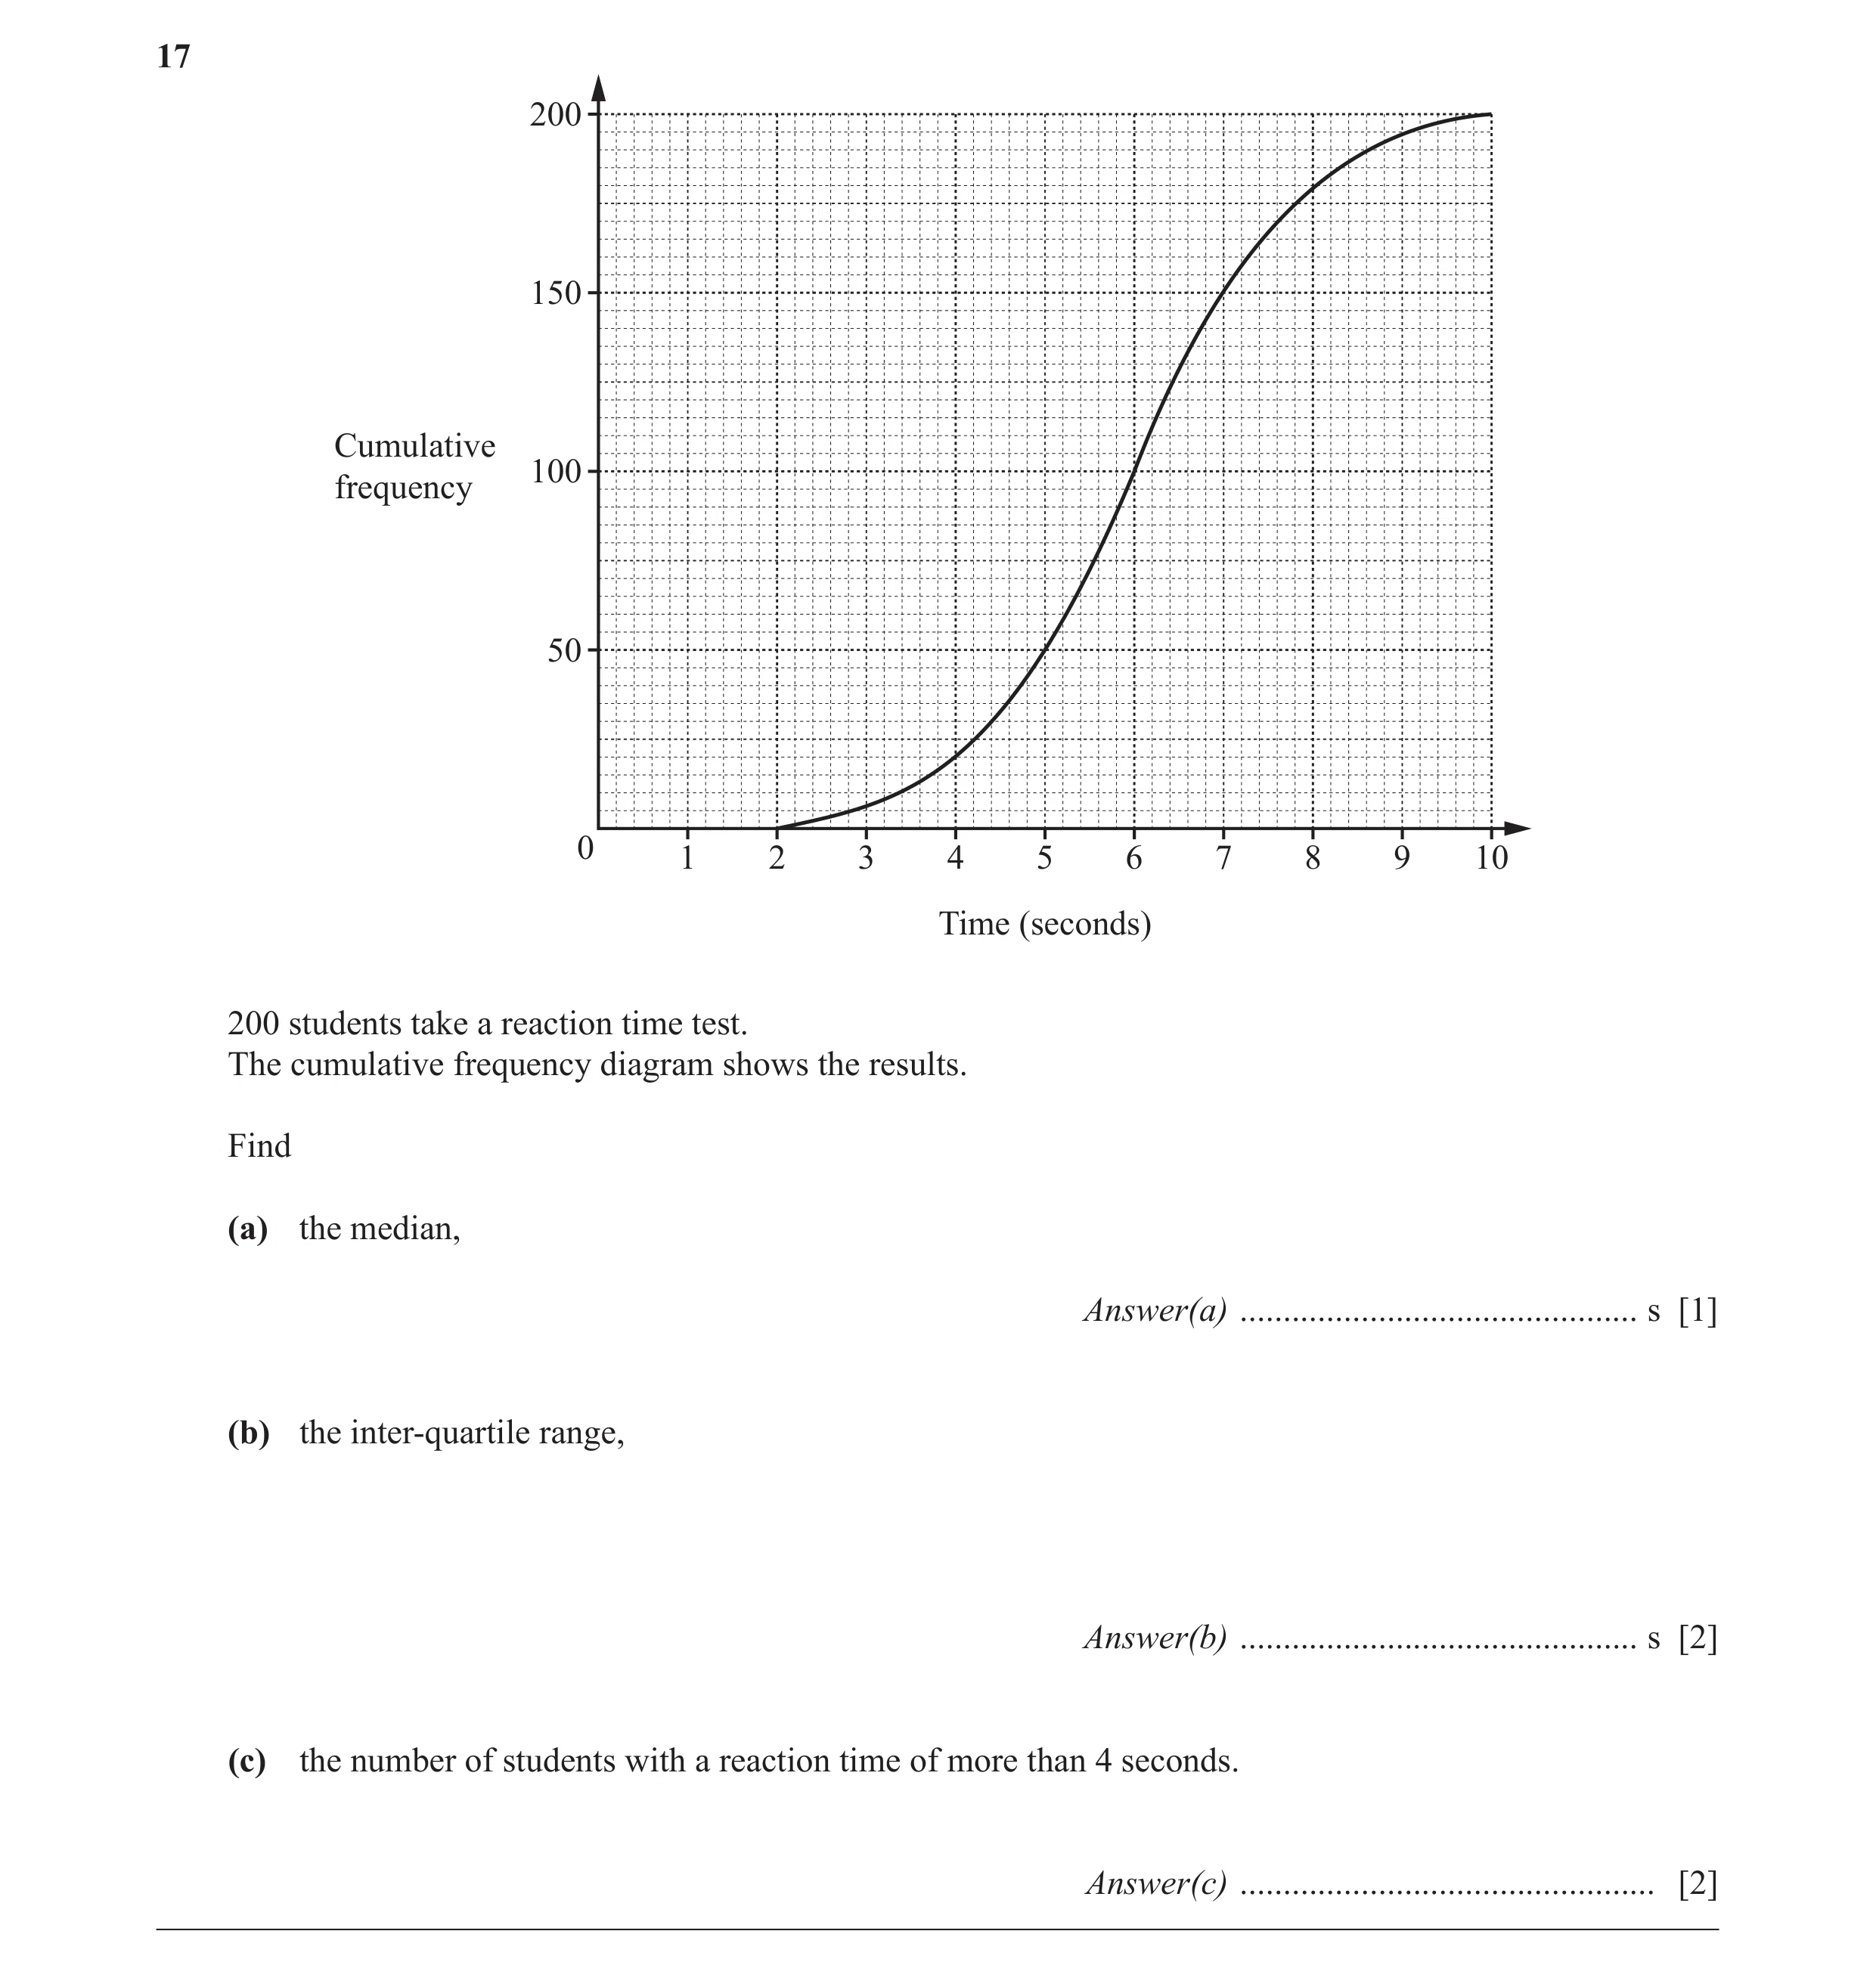
Q12 · 200 150 Cumulative 100 frequency 50 0 1 2 3 4 5 6 7 8 9 10 Time (seconds) 200 students… 0580/23 May/June 2015
17 200 150 Cumulative 100 frequency 50 0 1 2 3 4 5 6 7 8 9 10 Time (seconds) 200 students take a reaction time test. The cumulative frequency diagram shows the results. Find (a) the median, Answer(a) … s [1] (b) the inter-quartile range, Answer(b) … s [2] (c) the number of students with a reaction time of more than 4 seconds. Answer(c) … [2]
5 marks
Mark scheme: 17 (a) 6 1 (b) 2 2 M1 for 7 identified as the UQ or 5 identified as the LQ or both lines drawn from the 150 and 50 across and down to the horizontal axis (c) 180 2 M1 for answer 20 or line or mark on graph indicating 20
This question in 0580/23 May/June 2015
Q13 · 80 70 60 50 Cumulative 40 frequency 30 20 10 0 1 2 3 4 5 6 7 8 9 10 Time (minutes) The… 0580/23 Oct/Nov 2015
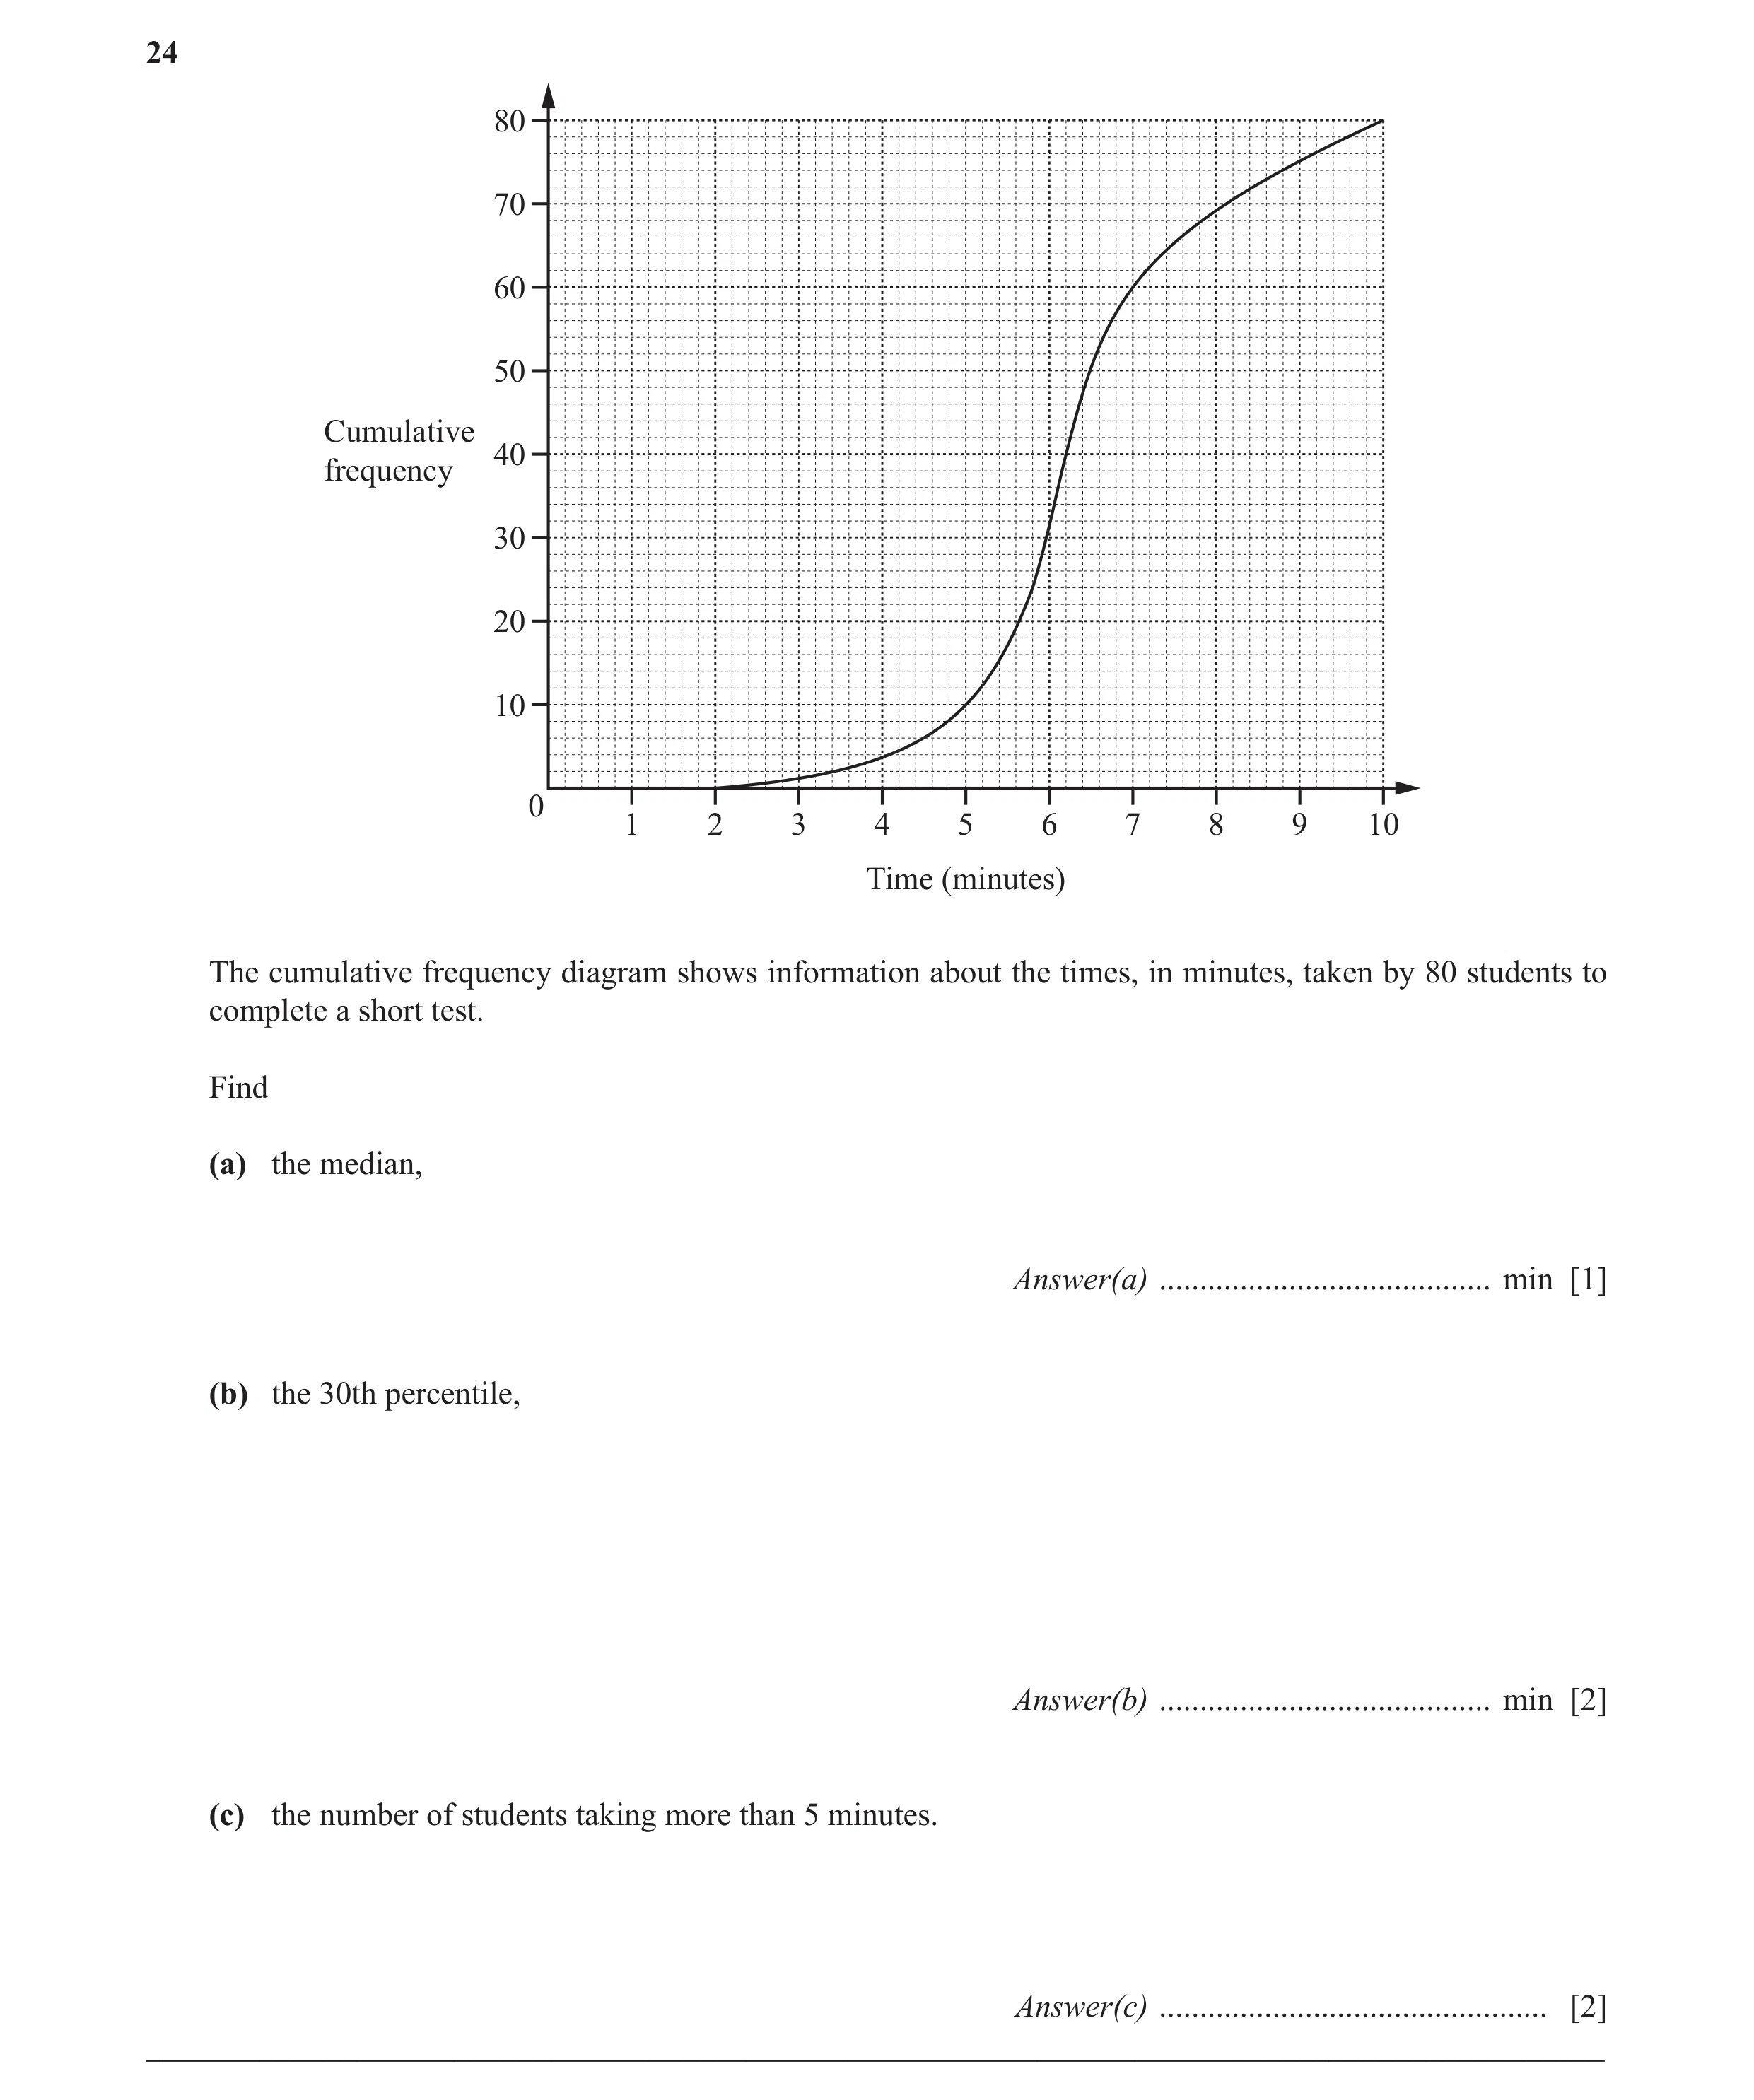
24 80 70 60 50 Cumulative 40 frequency 30 20 10 0 1 2 3 4 5 6 7 8 9 10 Time (minutes) The cumulative frequency diagram shows information about the times, in minutes, taken by 80 students to complete a short test. Find (a) the median, Answer(a) … min [1] (b) the 30th percentile, Answer(b) … min [2] (c) the number of students taking more than 5 minutes. Answer(c) … [2] __________________________________________________________________________________________
5 marks
Mark scheme: 24 (a) 6.2 1 (b) 5.8 2 M1 for 24 soi (c) 70 2 M1 for 10 soi 30
This question in 0580/23 Oct/Nov 2015
Q14 · James is an animal doctor 0580/23 Oct/Nov 2016
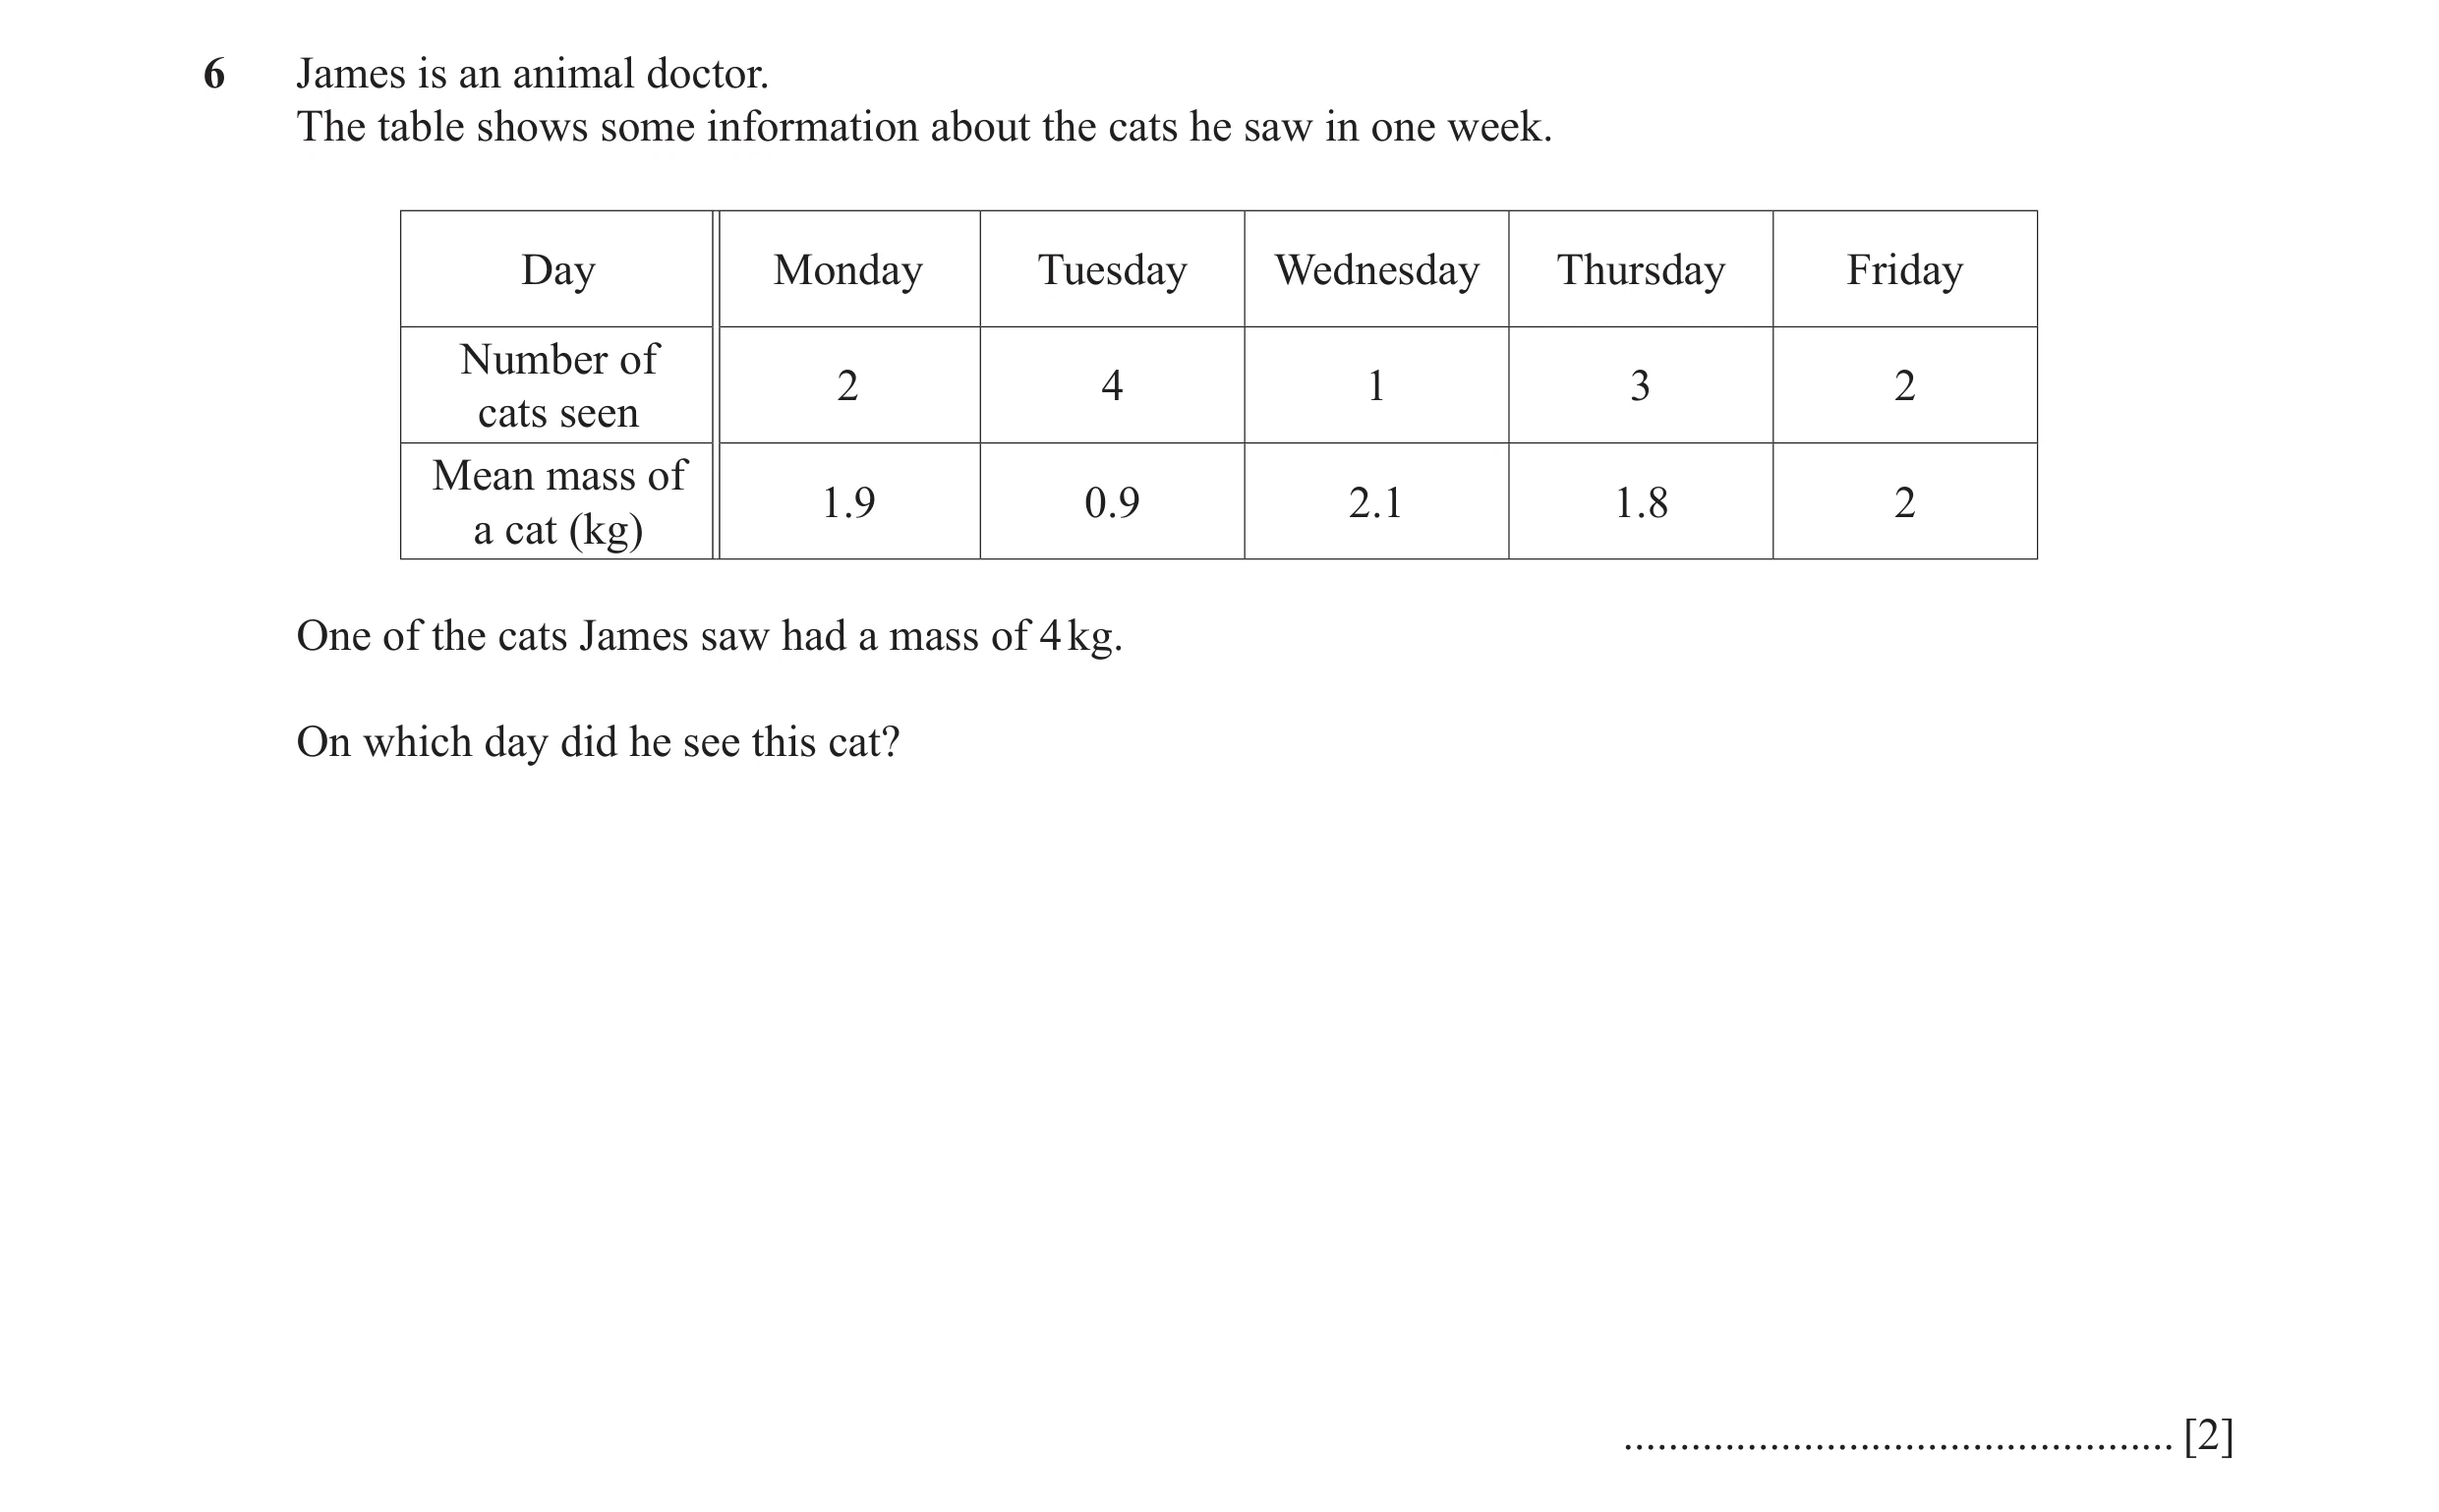
6 James is an animal doctor. The table shows some information about the cats he saw in one week. Day Monday Tuesday Wednesday Thursday Friday Number of 2 4 1 3 2 cats seen Mean mass of 1.9 0.9 2.1 1.8 2 a cat (kg) One of the cats James saw had a mass of 4 kg. On which day did he see this cat? … [2]
2 marks
Mark scheme: 6 Thursday 2 M1 for 5.4 found or at least two of: 3.8, 3.6 and 4 found 2 3
This question in 0580/23 Oct/Nov 2016
Q15 · Simon records the heights, h cm, of 200 sunflowers in his garden 0580/21 Oct/Nov 2017
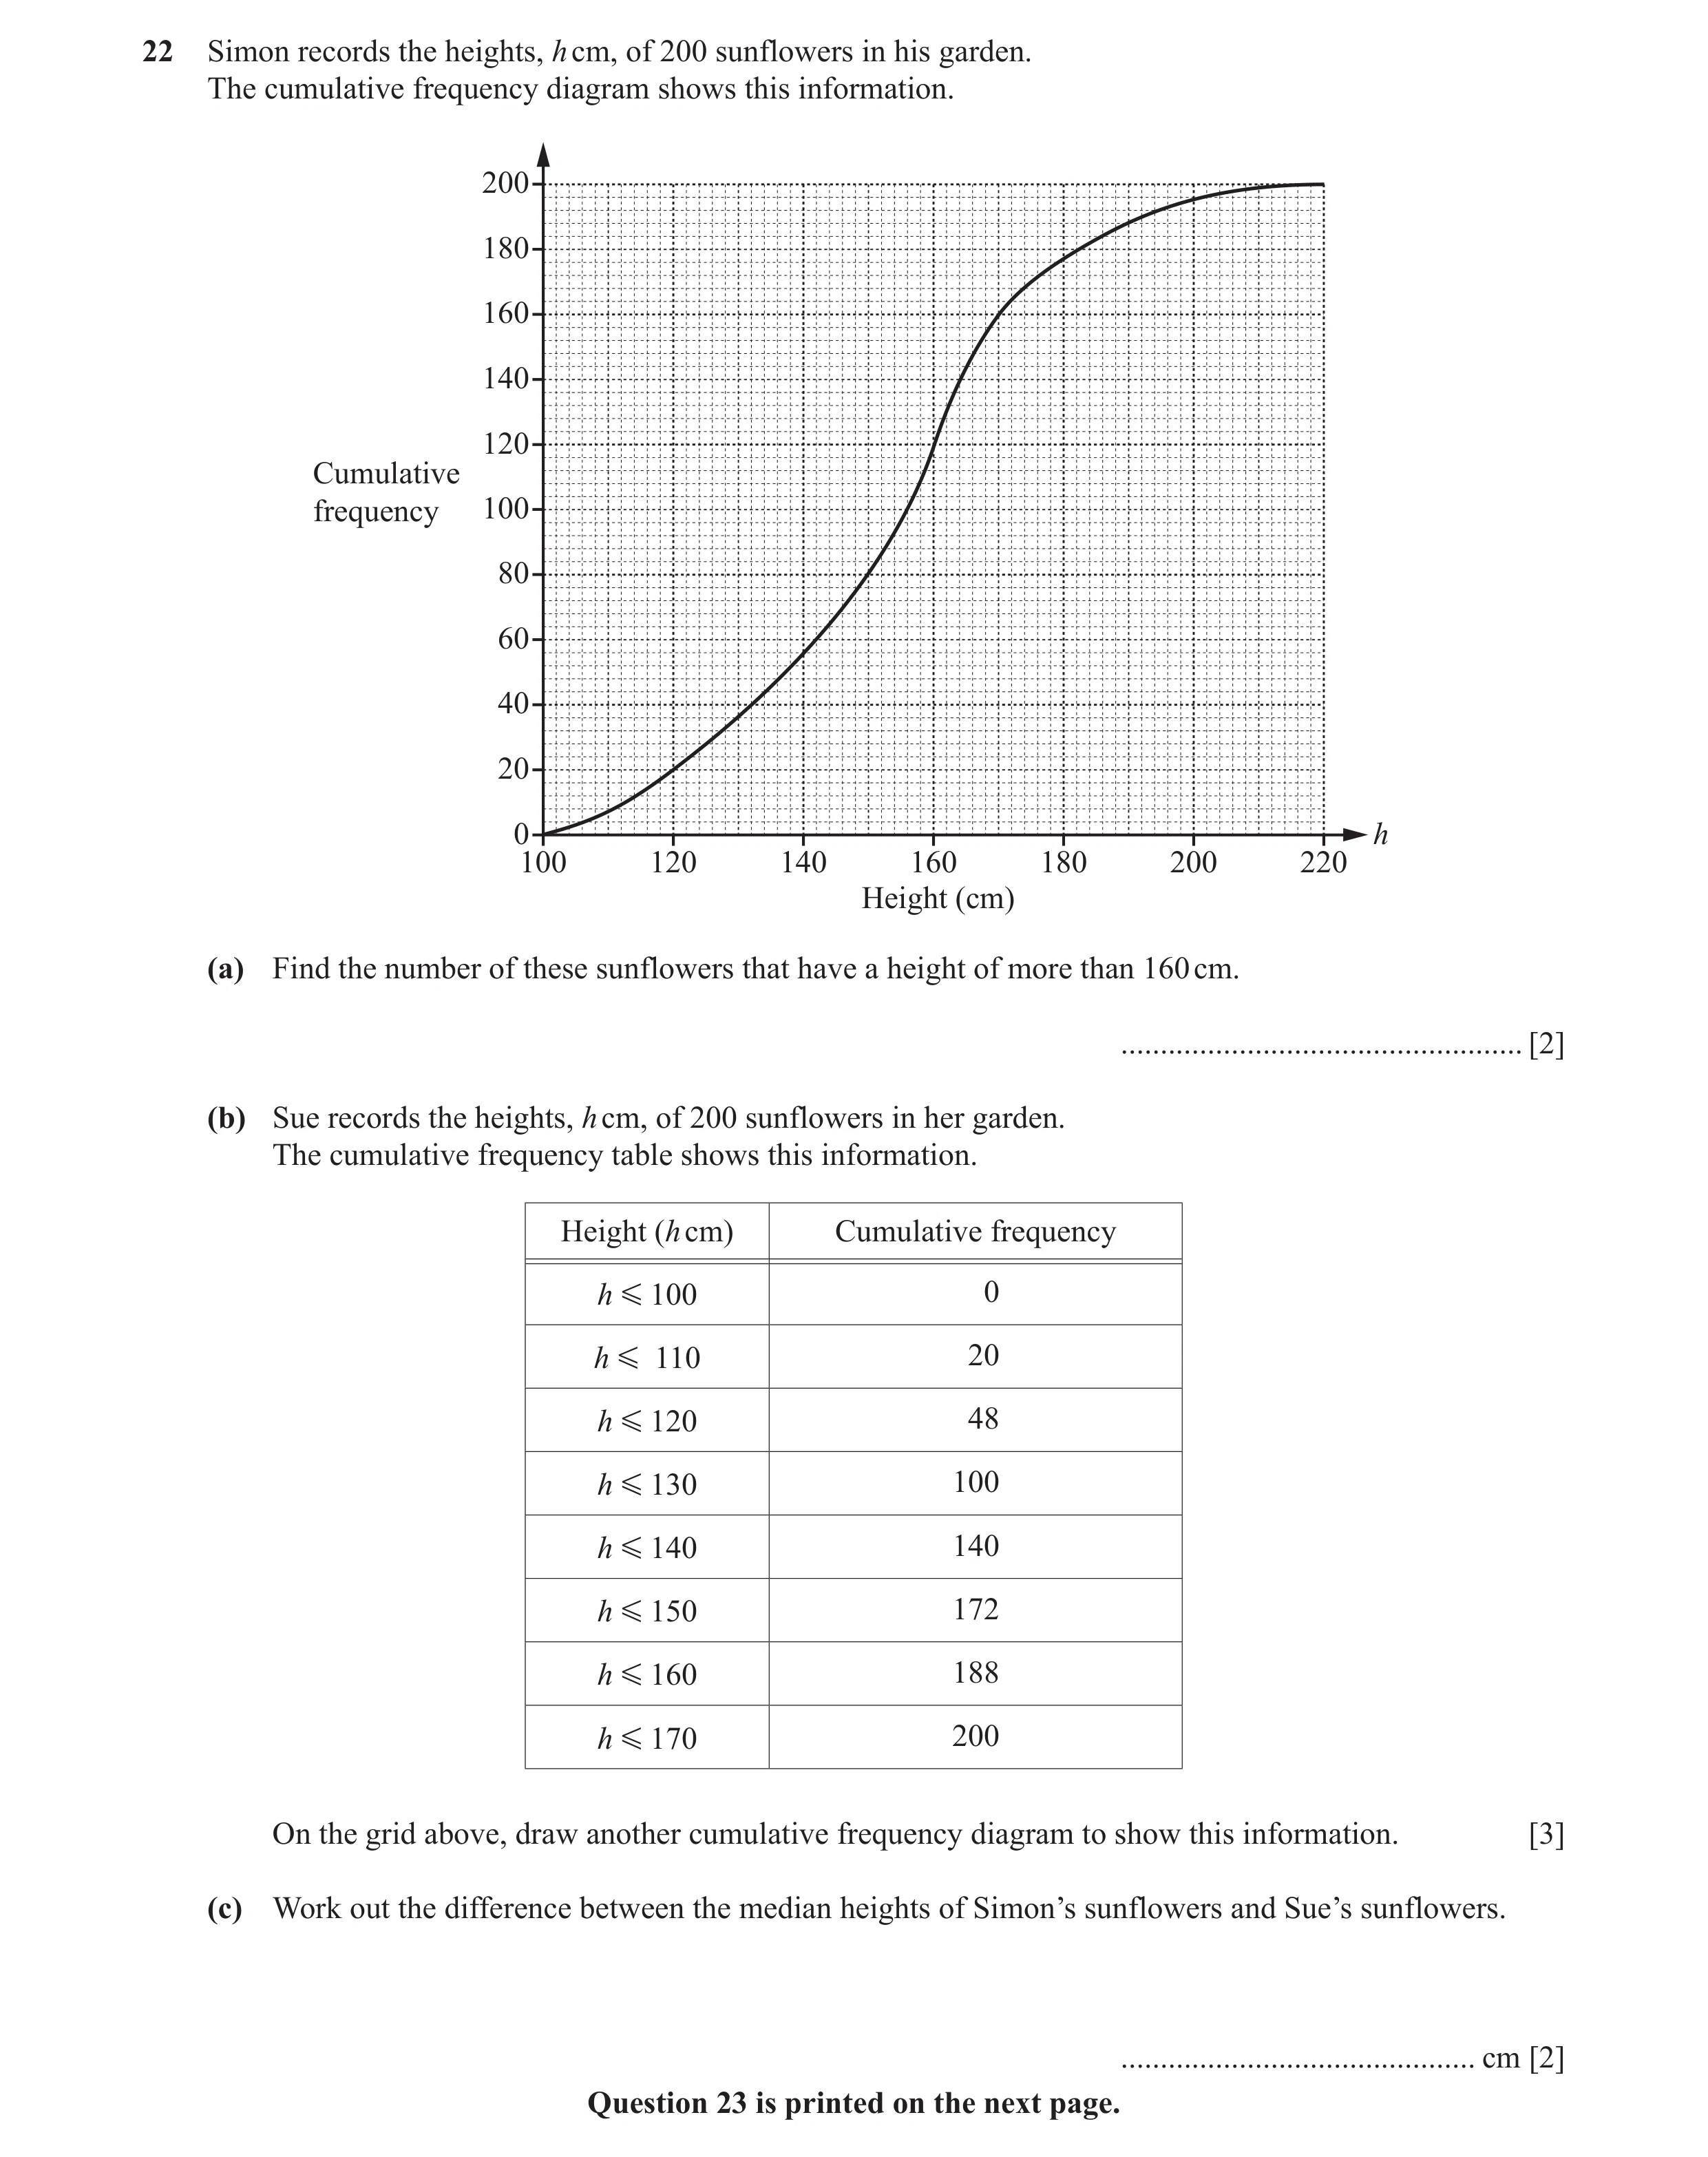
22 Simon records the heights, h cm, of 200 sunflowers in his garden. The cumulative frequency diagram shows this information. 200 180 160 140 120 Cumulative frequency 100 80 60 40 20 0 h 100 120 140 160 180 200 220 Height (cm) (a) Find the number of these sunflowers that have a height of more than 160 cm. … [2] (b) Sue records the heights, h cm, of 200 sunflowers in her garden. The cumulative frequency table shows this information. Height (h cm) Cumulative frequency h G 100 0 h G 110 20 h G 120 48 h G 130 100 h G 140 140 h G 150 172 h G 160 188 h G 170 200 On the grid above, draw another cumulative frequency diagram to show this information. [3] (c) Work out the difference between the median heights of Simon’s sunflowers and Sue’s sunflowers. … cm [2] Question 23 is printed on the next page.
7 marks
Mark scheme: 22(a) 80 to 84 2 M1 for 116 to 120 22(b) Correct curve or ruled lines 3 B2 for 7 or 8 correct points B1 for 5 or 6 correct points 22(c) 26 2 B1 for 156 or 130 or for their 130 from their increasing curve (or lines)
This question in 0580/21 Oct/Nov 2017
Q16 · The cumulative frequency diagram shows information about the time, m minutes, taken by… 0580/21 May/June 2018
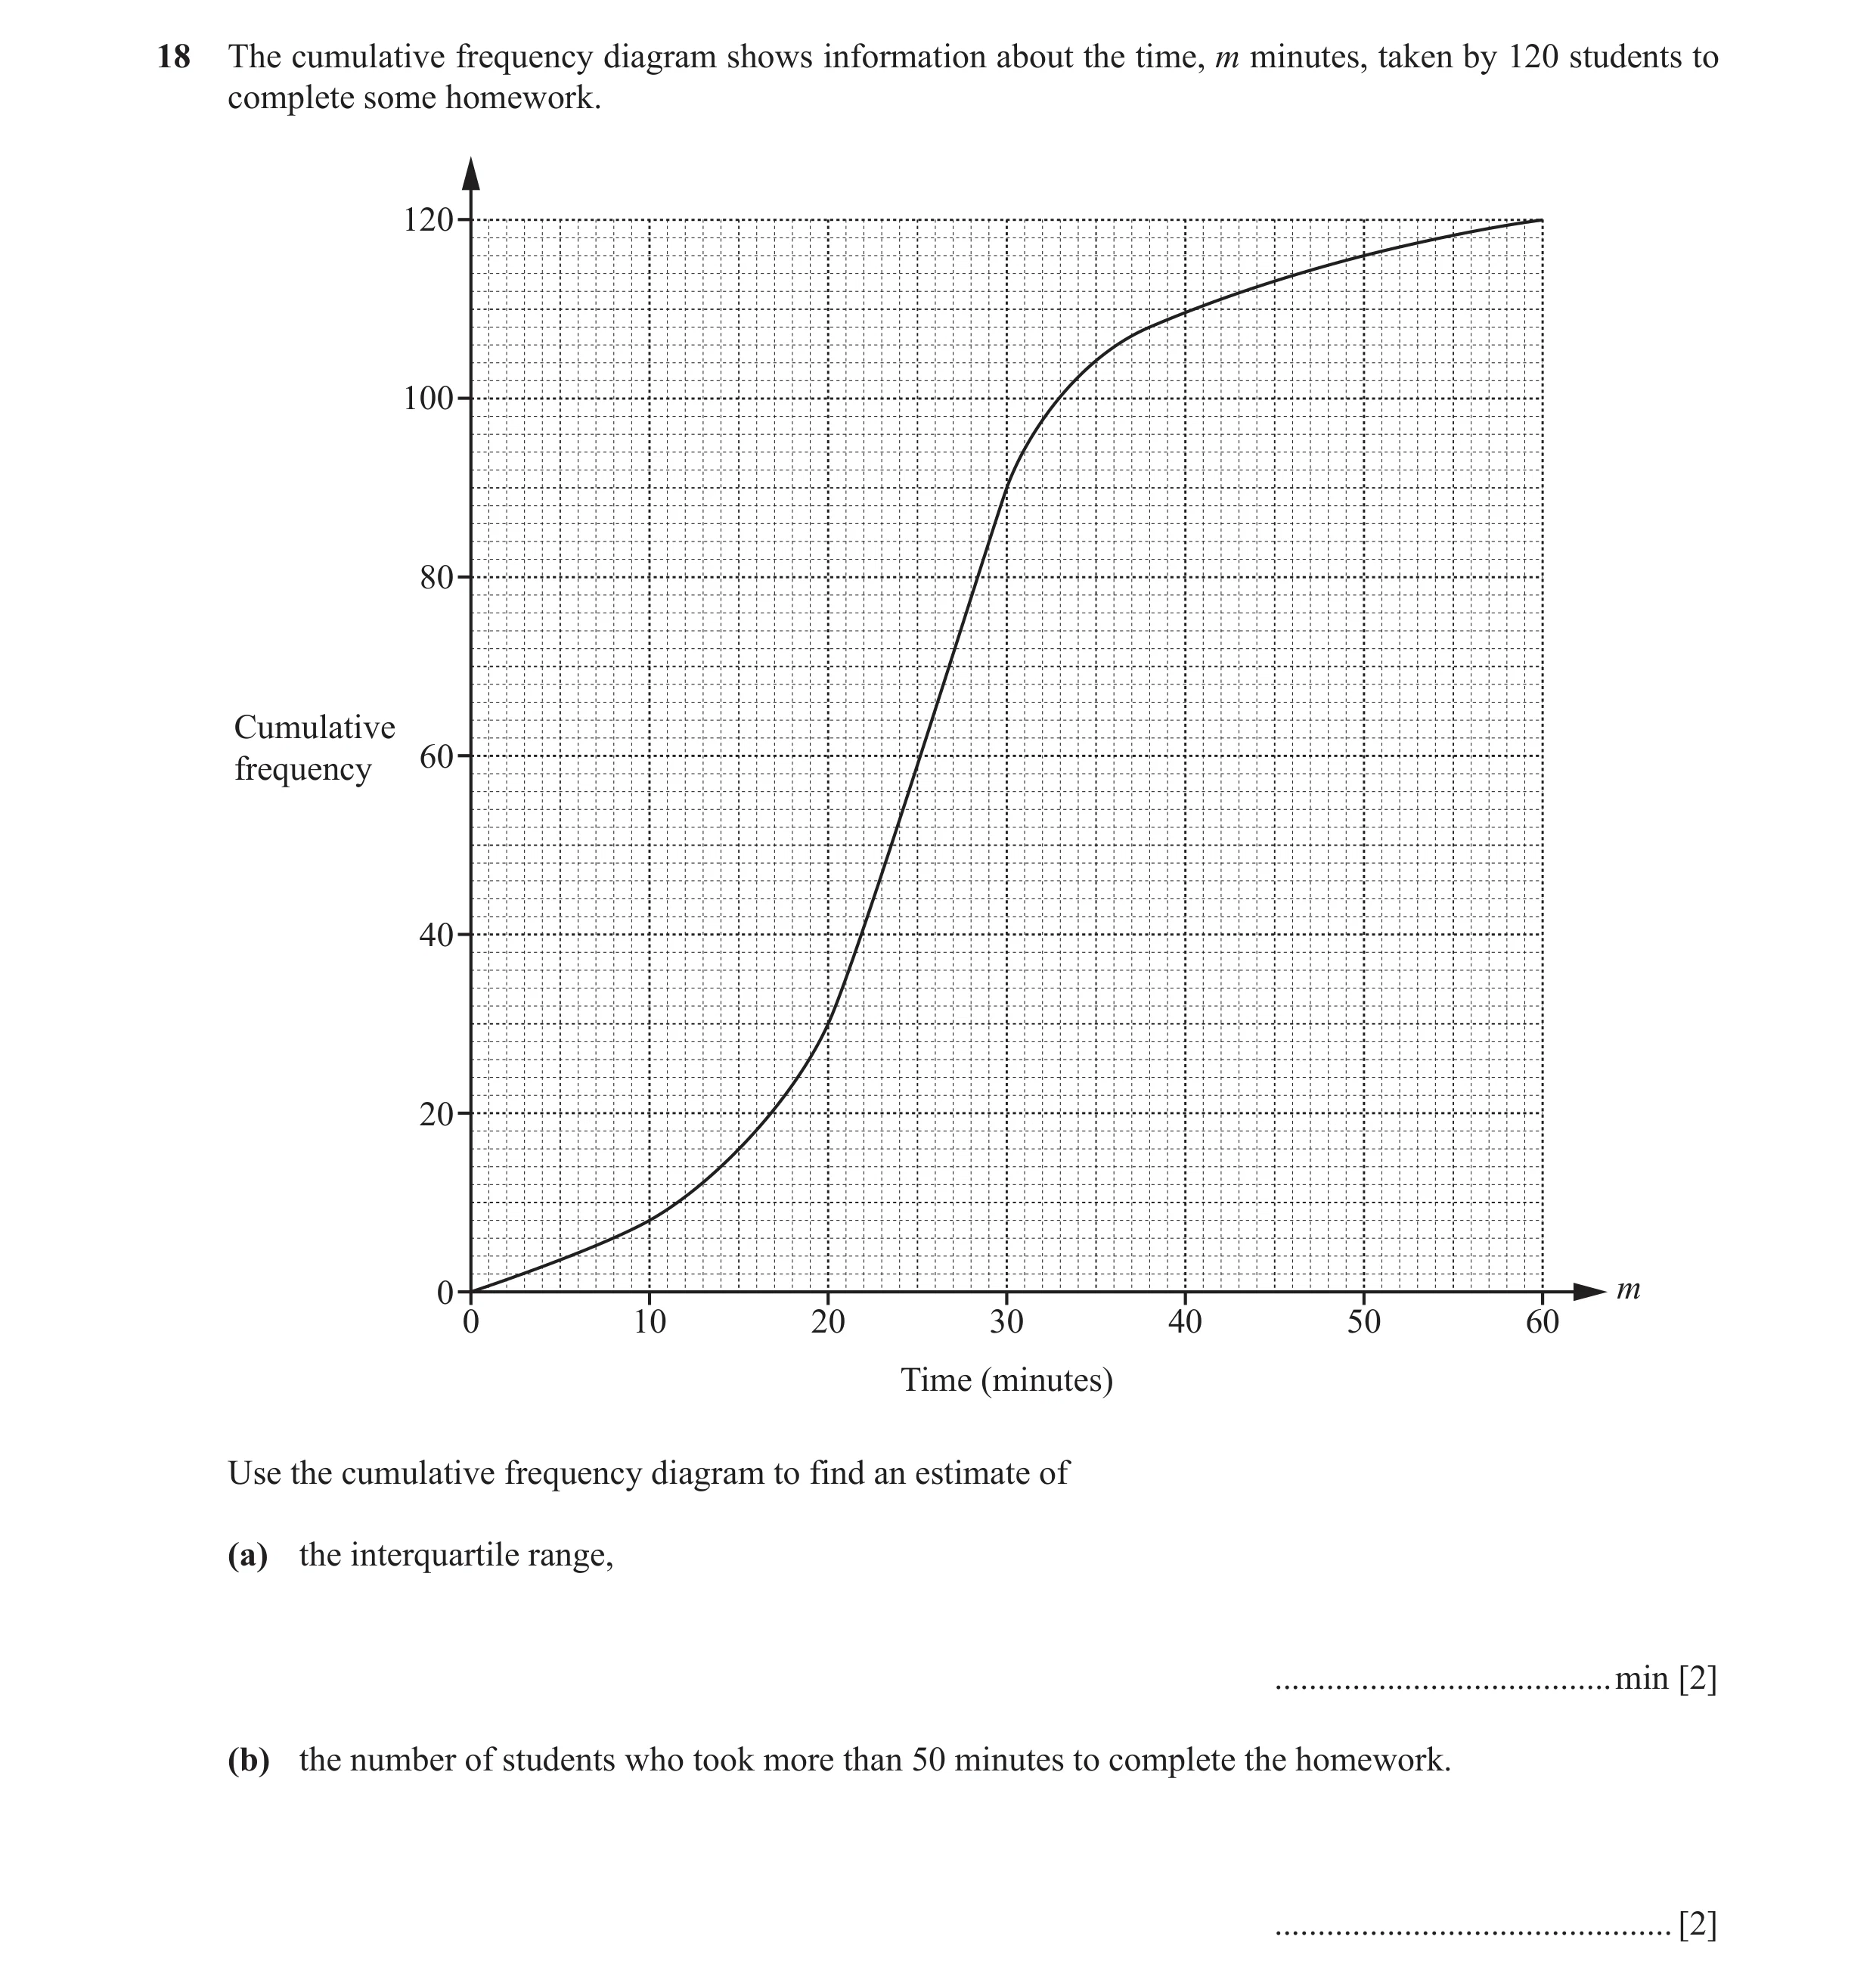
18 The cumulative frequency diagram shows information about the time, m minutes, taken by 120 students to complete some homework. 120 100 80 Cumulative 60 frequency 40 20 0 m 0 10 20 30 40 50 60 Time (minutes) Use the cumulative frequency diagram to find an estimate of (a) the interquartile range, … min [2] (b) the number of students who took more than 50 minutes to complete the homework. … [2]
4 marks
Mark scheme: 18(a) 10 nfww 2 B1 for UQ = 30 or LQ = 20 clearly identified 18(b) 4 2 B1 for 116 indicated
This question in 0580/21 May/June 2018
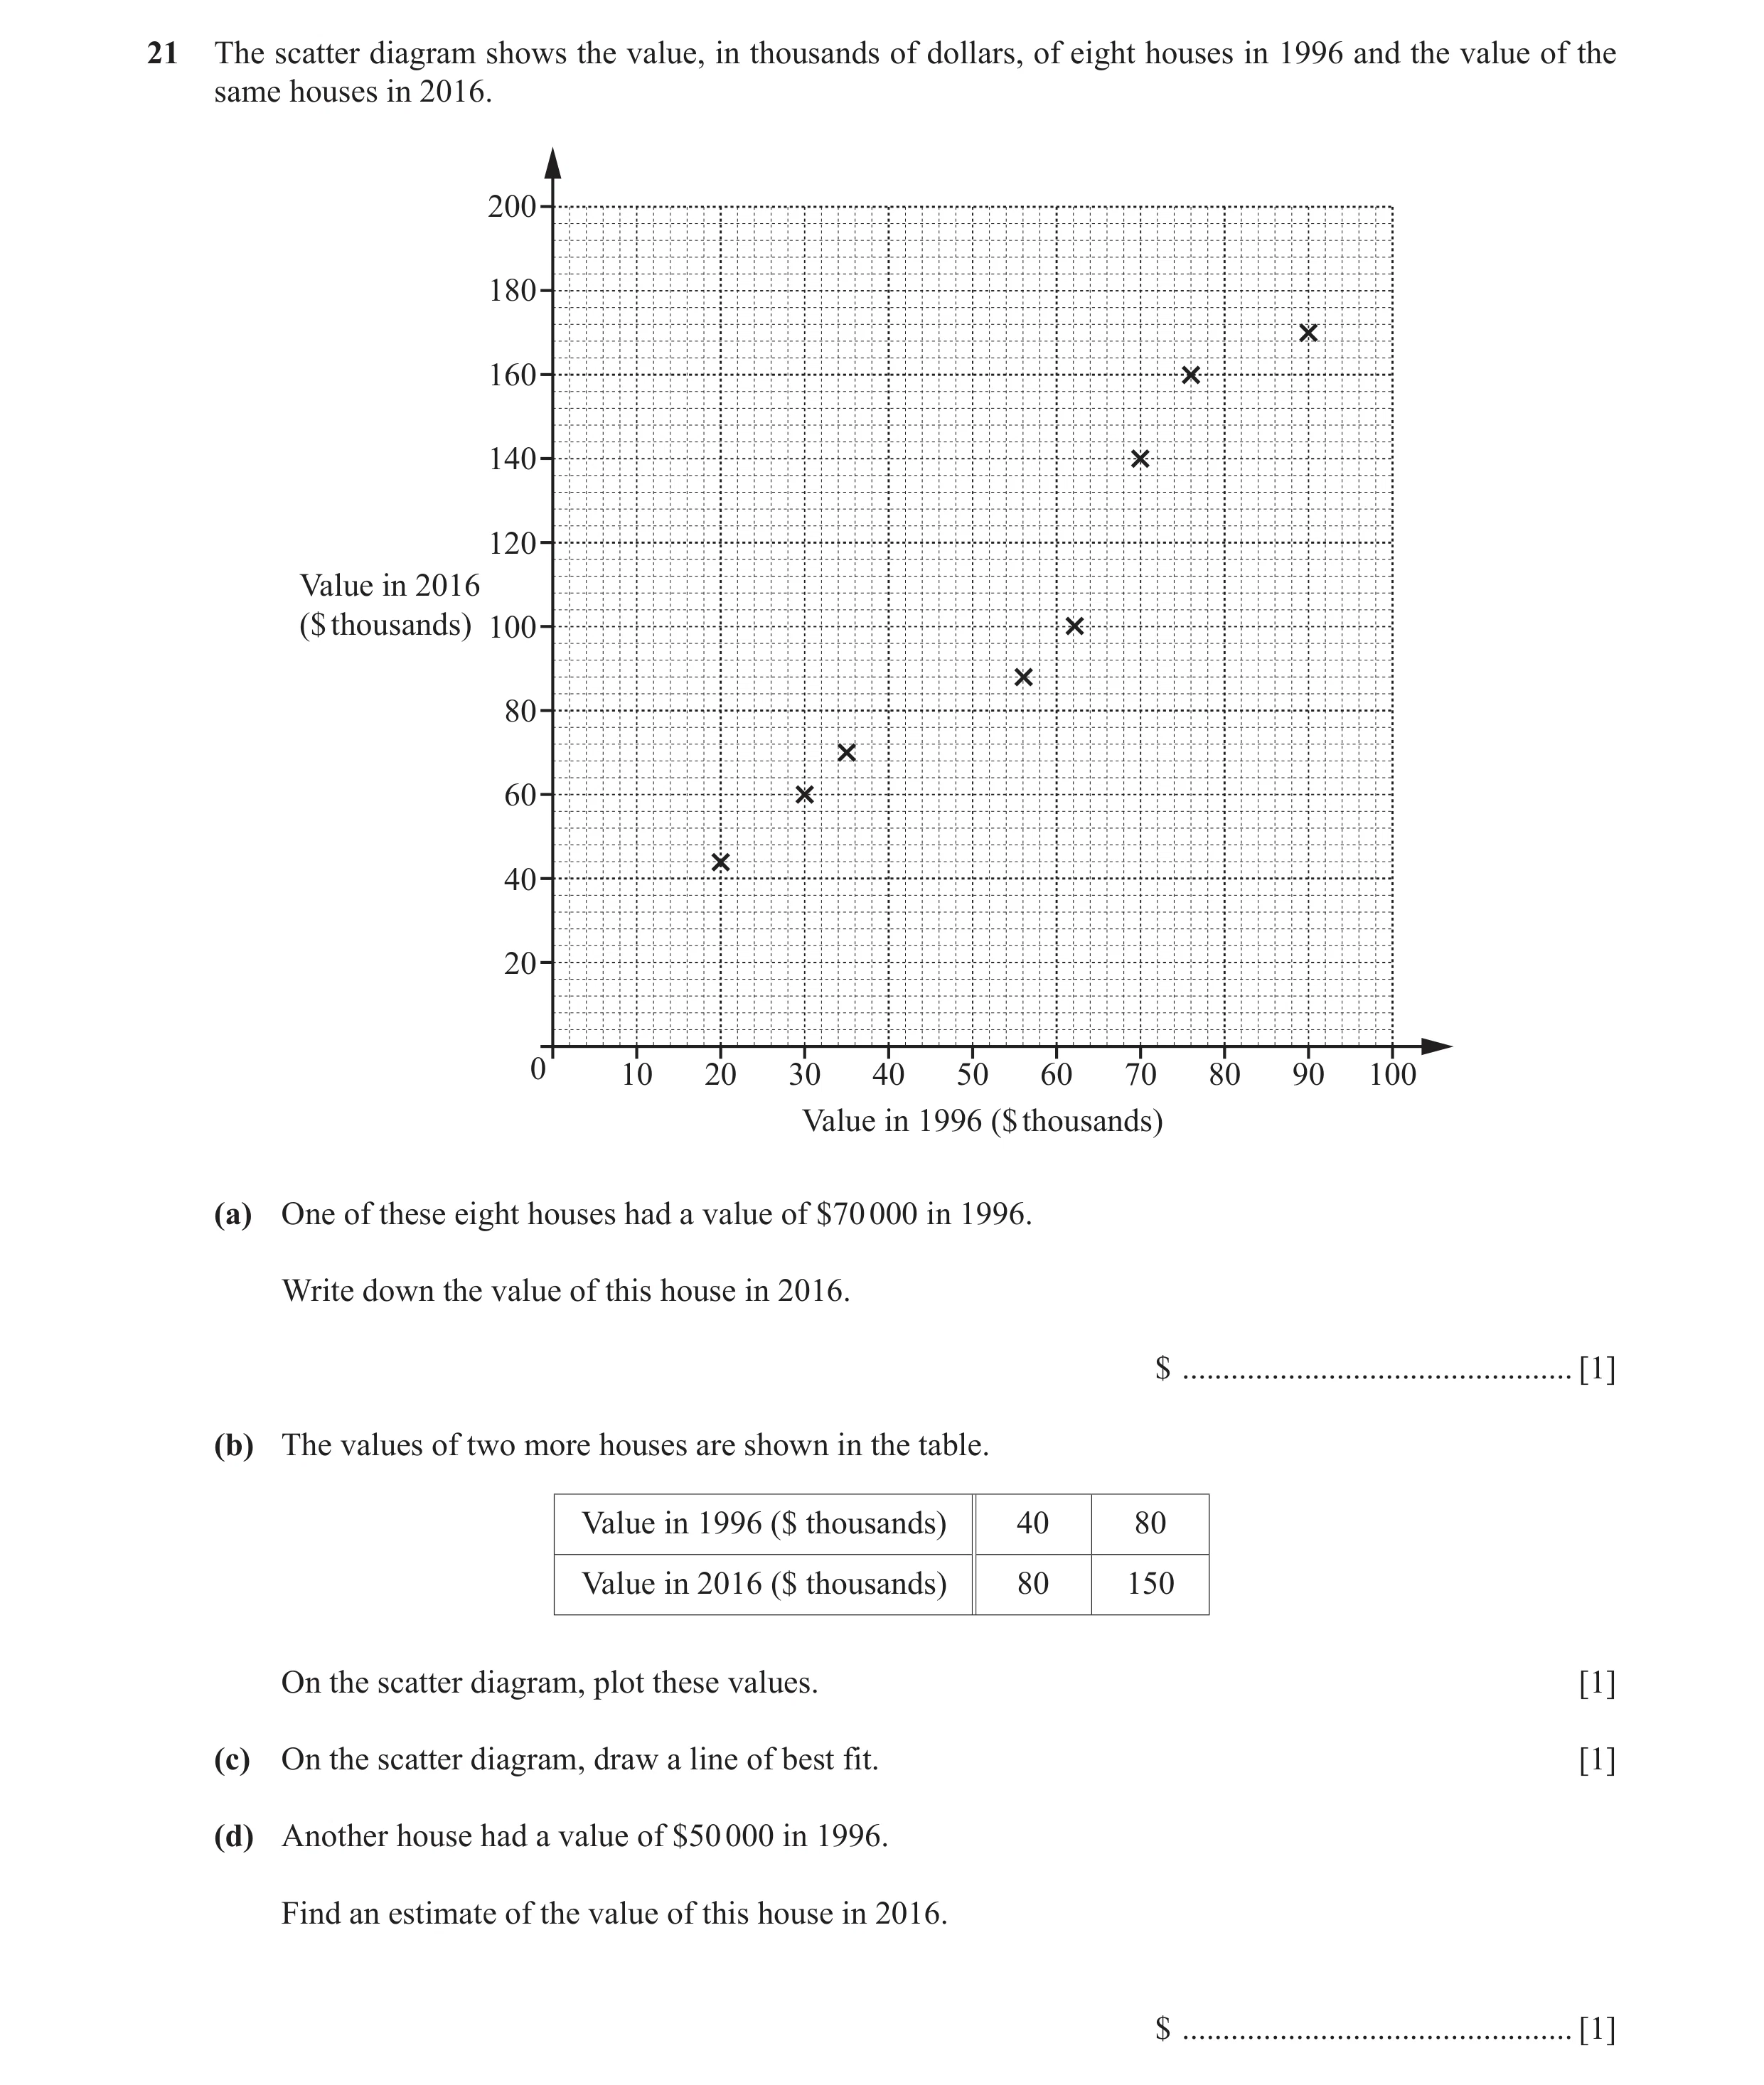
Q17 · The scatter diagram shows the value, in thousands of dollars, of eight houses in 1996 and… 0580/22 May/June 2018
21 The scatter diagram shows the value, in thousands of dollars, of eight houses in 1996 and the value of the same houses in 2016. 200 180 160 140 120 Value in 2016 ($ thousands) 100 80 60 40 20 0 10 20 30 40 50 60 70 80 90 100 Value in 1996 ($ thousands) (a) One of these eight houses had a value of $70 000 in 1996. Write down the value of this house in 2016. $ … [1] (b) The values of two more houses are shown in the table. Value in 1996 ($ thousands) 40 80 Value in 2016 ($ thousands) 80 150 On the scatter diagram, plot these values. [1] (c) On the scatter diagram, draw a line of best fit. [1] (d) Another house had a value of $50 000 in 1996. Find an estimate of the value of this house in 2016. $ … [1]
4 marks
Mark scheme: 21(a) 140 000 1 21(b) Points correctly plotted at 1 (40, 80) and (80, 150) 21(c) Correct ruled line of best fit 1 21(d) 80 000 to 110 000 1 FT their straight line provided it has positive gradient
This question in 0580/22 May/June 2018
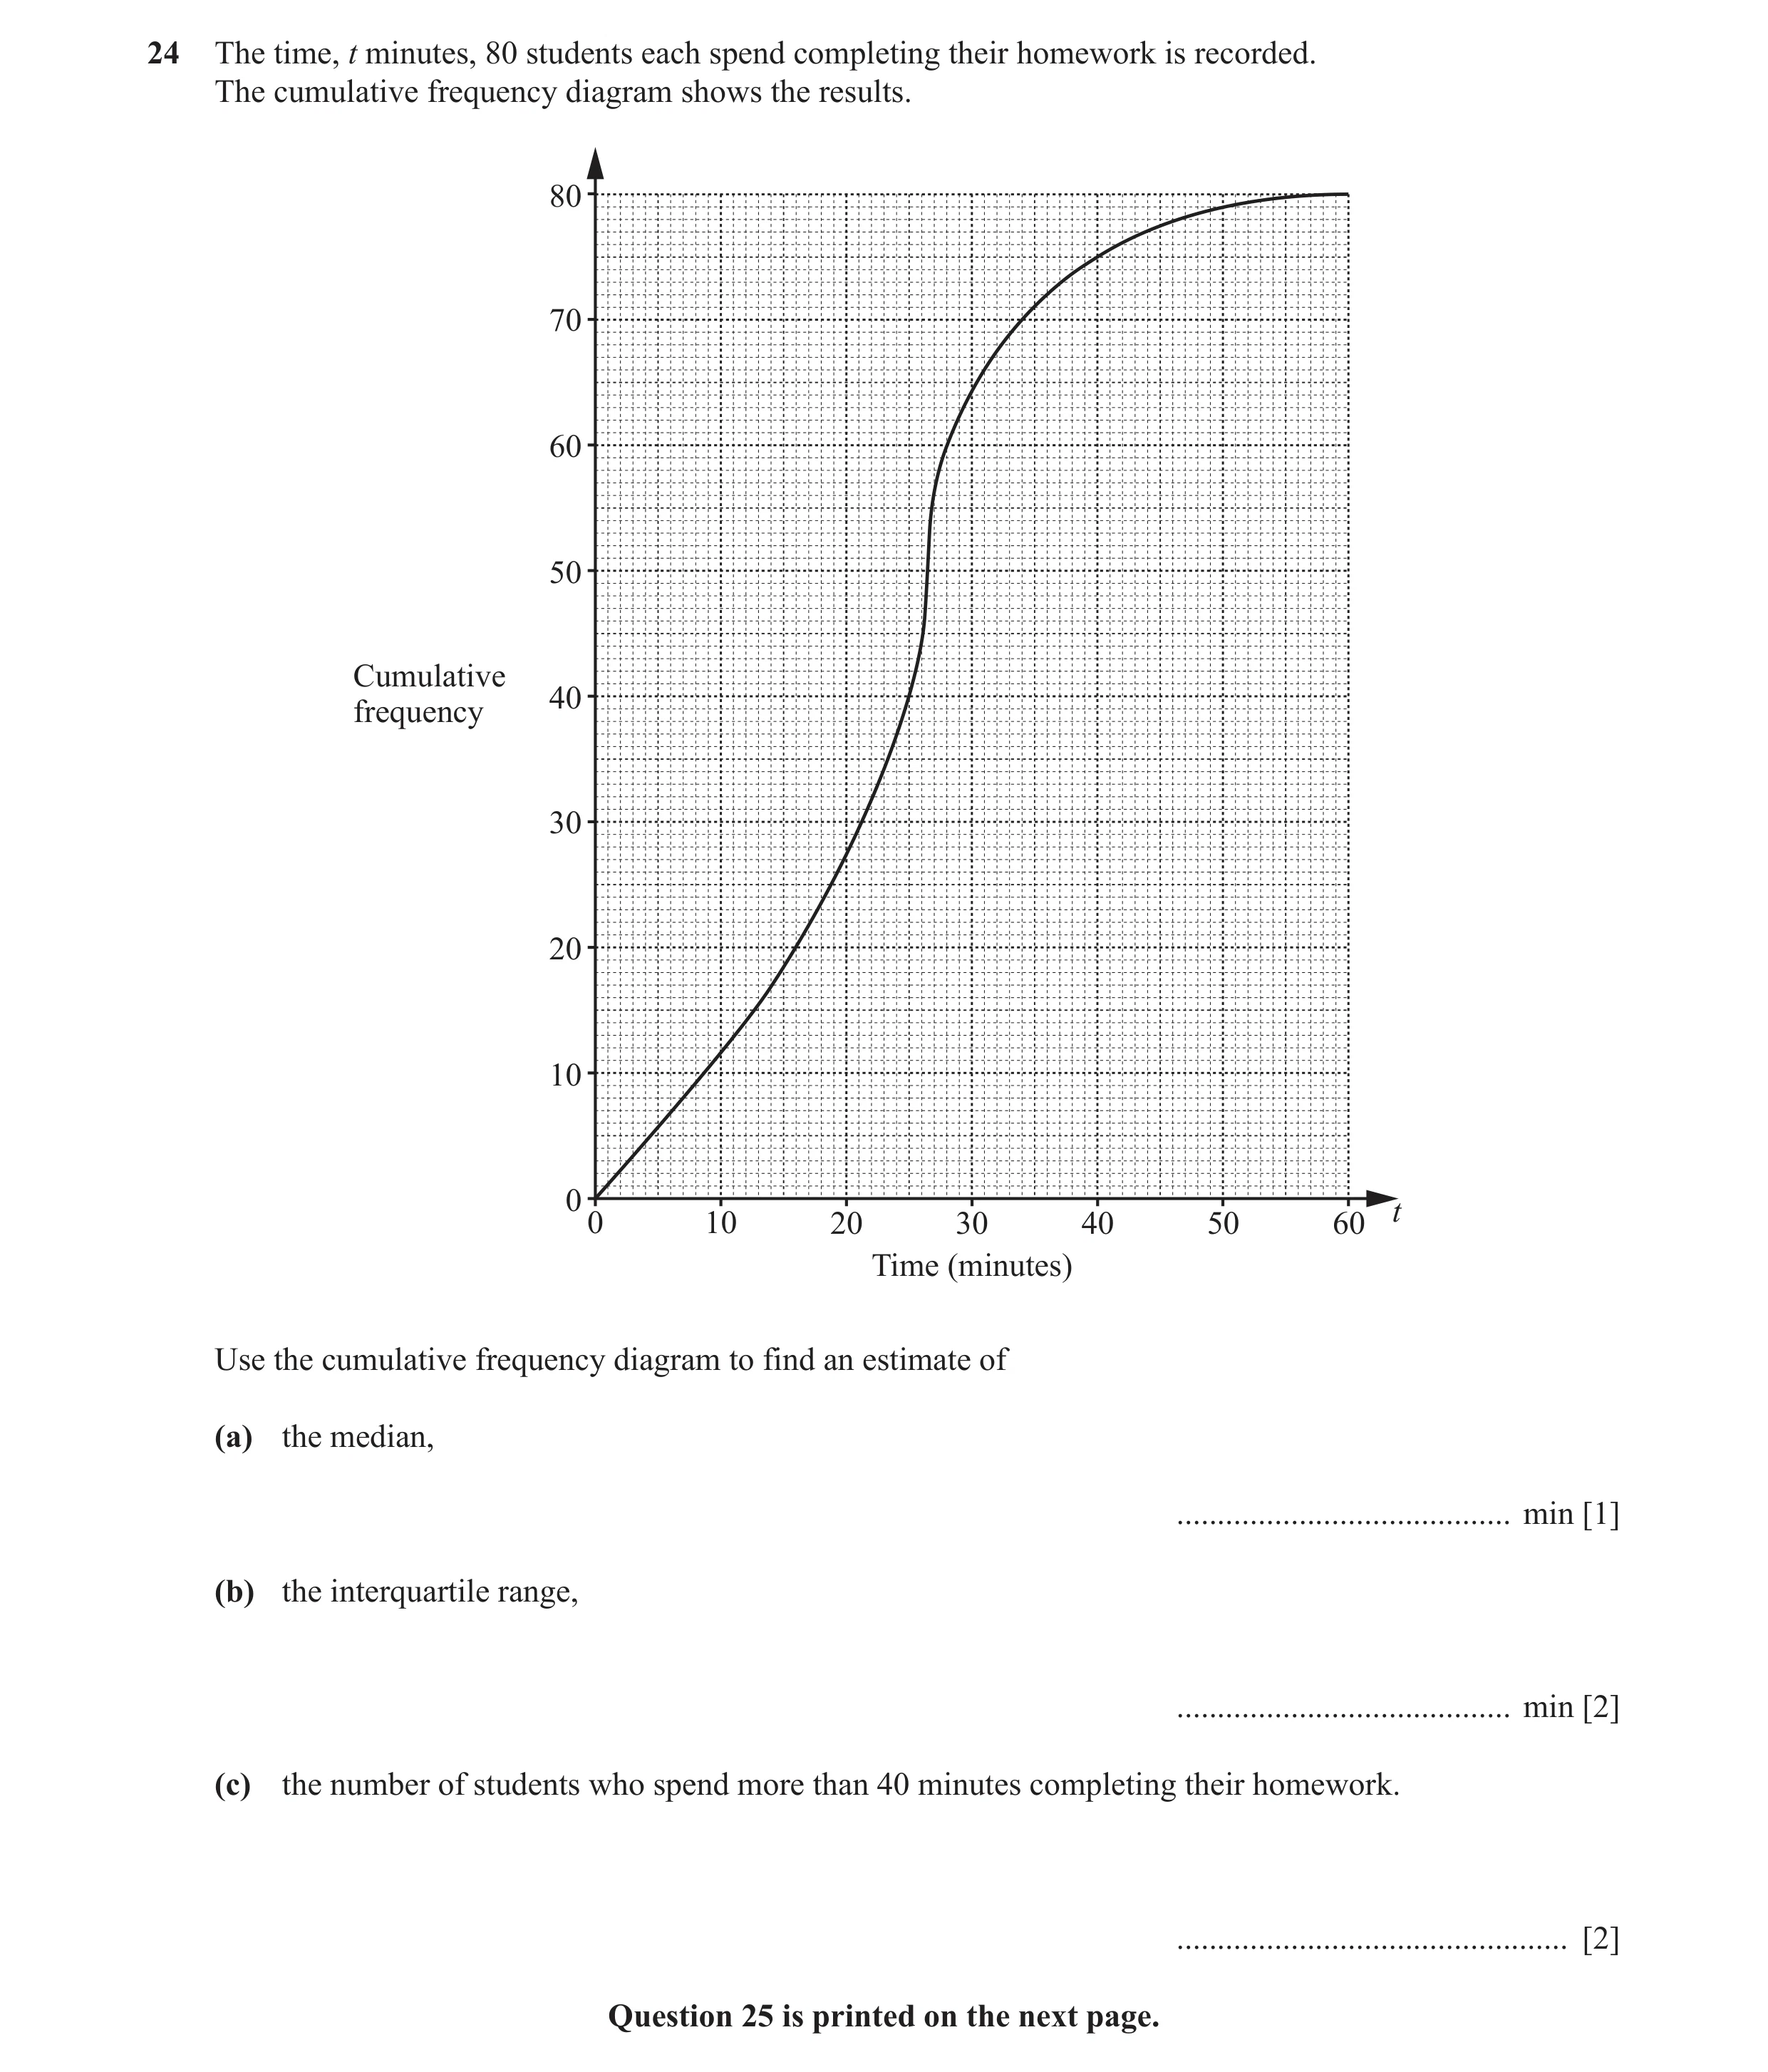
Q18 · The time, t minutes, 80 students each spend completing their homework is recorded 0580/22 Oct/Nov 2018
24 The time, t minutes, 80 students each spend completing their homework is recorded. The cumulative frequency diagram shows the results. 80 70 60 50 Cumulative 40 frequency 30 20 10 0 t 0 10 20 30 40 50 60 Time (minutes) Use the cumulative frequency diagram to find an estimate of (a) the median, … min [1] (b) the interquartile range, … min [2] (c) the number of students who spend more than 40 minutes completing their homework. … [2] Question 25 is printed on the next page.
5 marks
Mark scheme: 24(a) 25 1 24(b) 12 2 B1 for 16 or 28 24(c) 5 2 B1 for 75
This question in 0580/22 Oct/Nov 2018
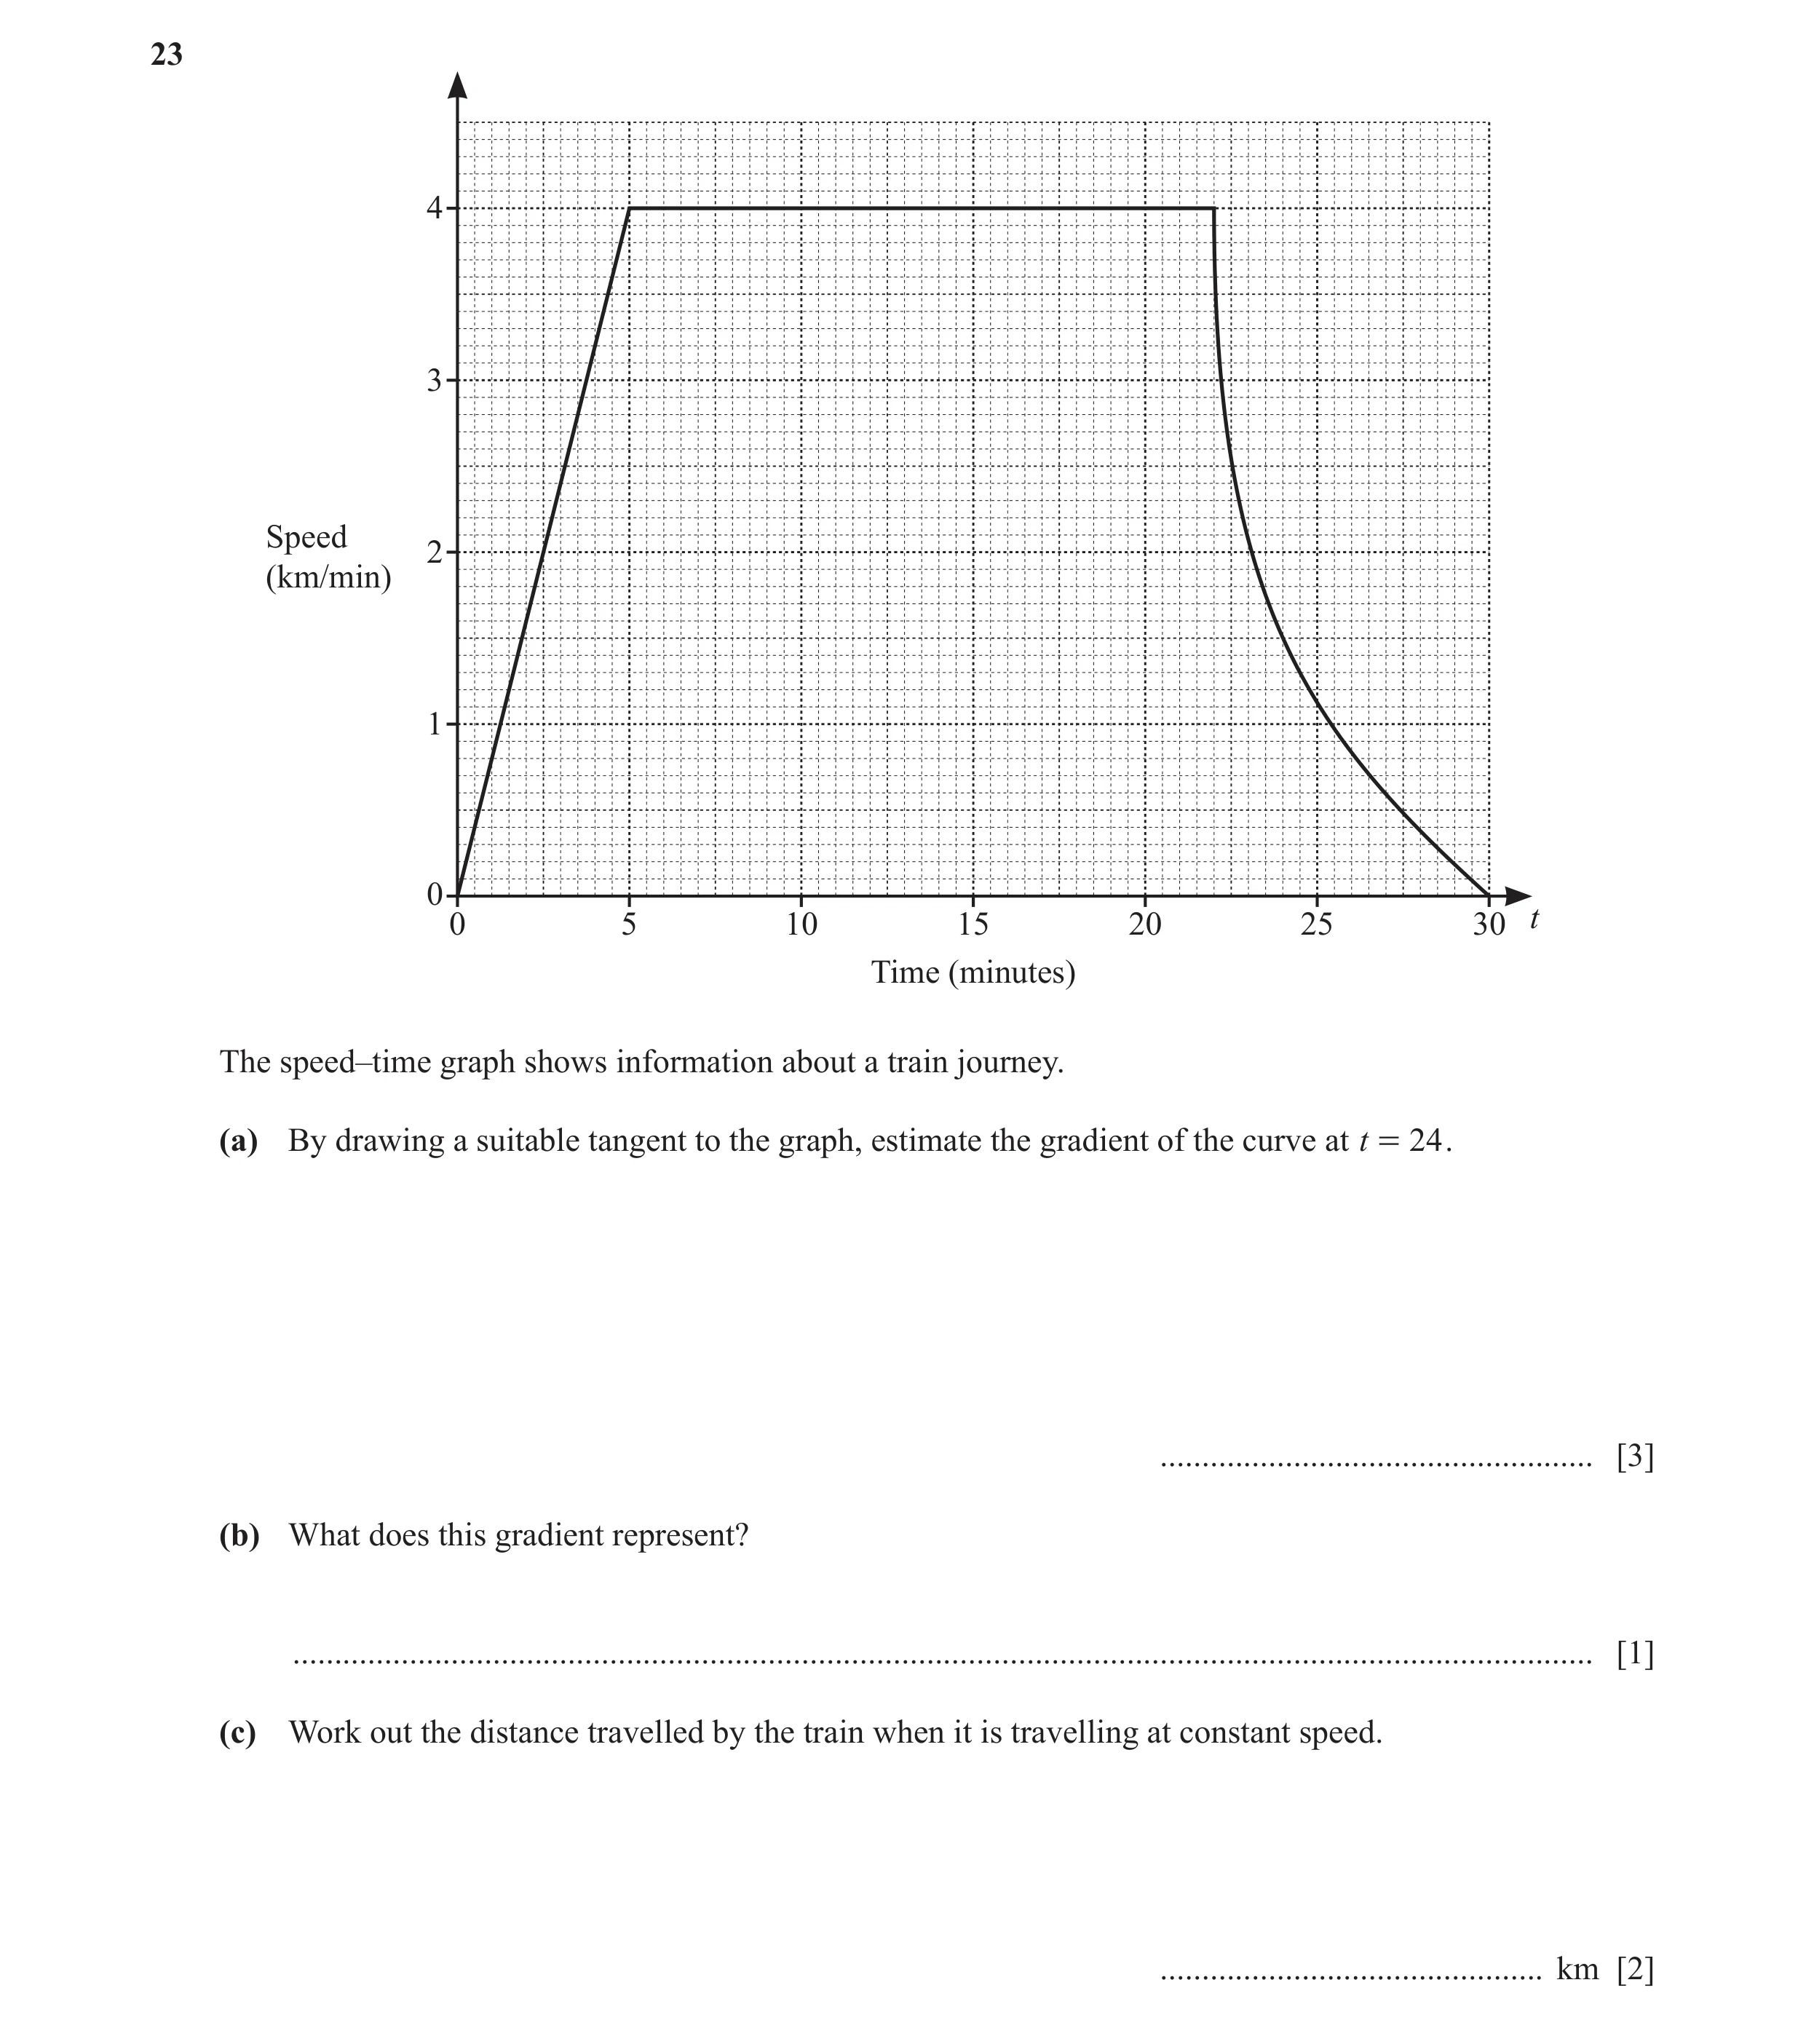
Q19 · 4 3 Speed 2 (km/min) 1 0 0 5 10 15 20 25 30 t Time (minutes) The speed–time graph shows… 0580/22 Oct/Nov 2019
23 4 3 Speed 2 (km/min) 1 0 0 5 10 15 20 25 30 t Time (minutes) The speed–time graph shows information about a train journey. (a) By drawing a suitable tangent to the graph, estimate the gradient of the curve at t = 24 . … [3] (b) What does this gradient represent? … [1] (c) Work out the distance travelled by the train when it is travelling at constant speed. … km [2]
6 marks
Mark scheme: 23(a) Tangent ruled at t = 24 B1 – 0.7 to – 0.3 B2 B2 dep on correct tangent or close attempt at tangent M1 for rise/run also dep on correct tangent drawn or close attempt at tangent. Must see correct or implied calculation from a drawn tangent. 23(b) acceleration or deceleration oe 1 23(c) 68 2 M1 for (22 – 5) × 4
This question in 0580/22 Oct/Nov 2019
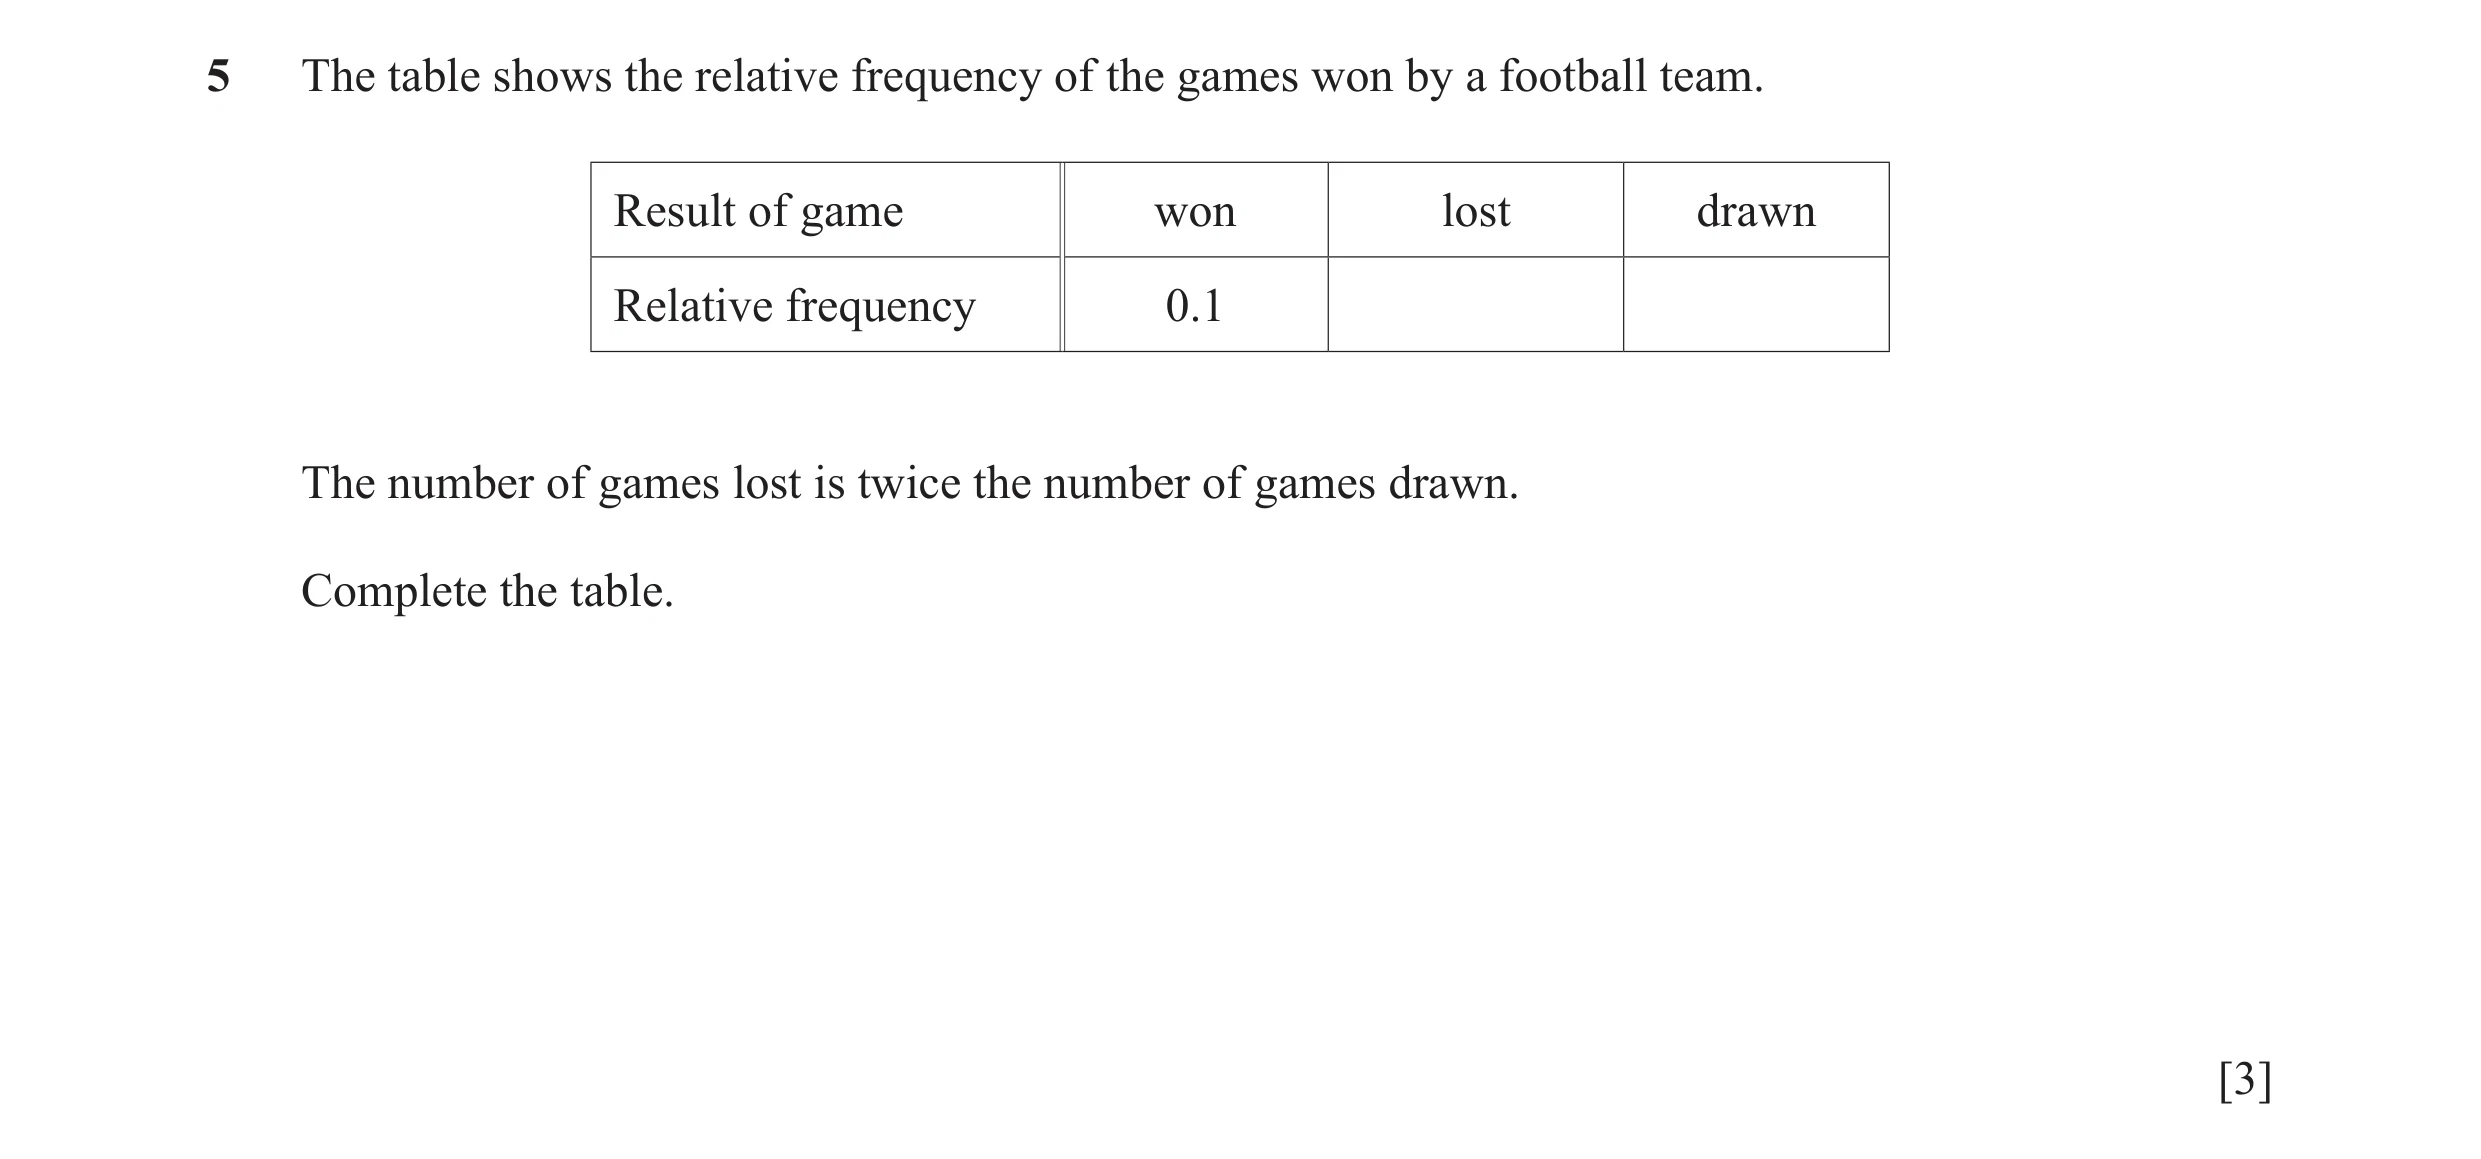
Q20 · The table shows the relative frequency of the games won by a football team 0580/21 Oct/Nov 2021
5 The table shows the relative frequency of the games won by a football team. Result of game won lost drawn Relative frequency 0.1 The number of games lost is twice the number of games drawn. Complete the table. [3]
3 marks
Mark scheme: 5 3 B2 for 0.6 oe or 0.3 oe lost drawn or M1 for 1 – 0.1 or 0.9 seen 0.6 oe 0.3 oe
This question in 0580/21 Oct/Nov 2021
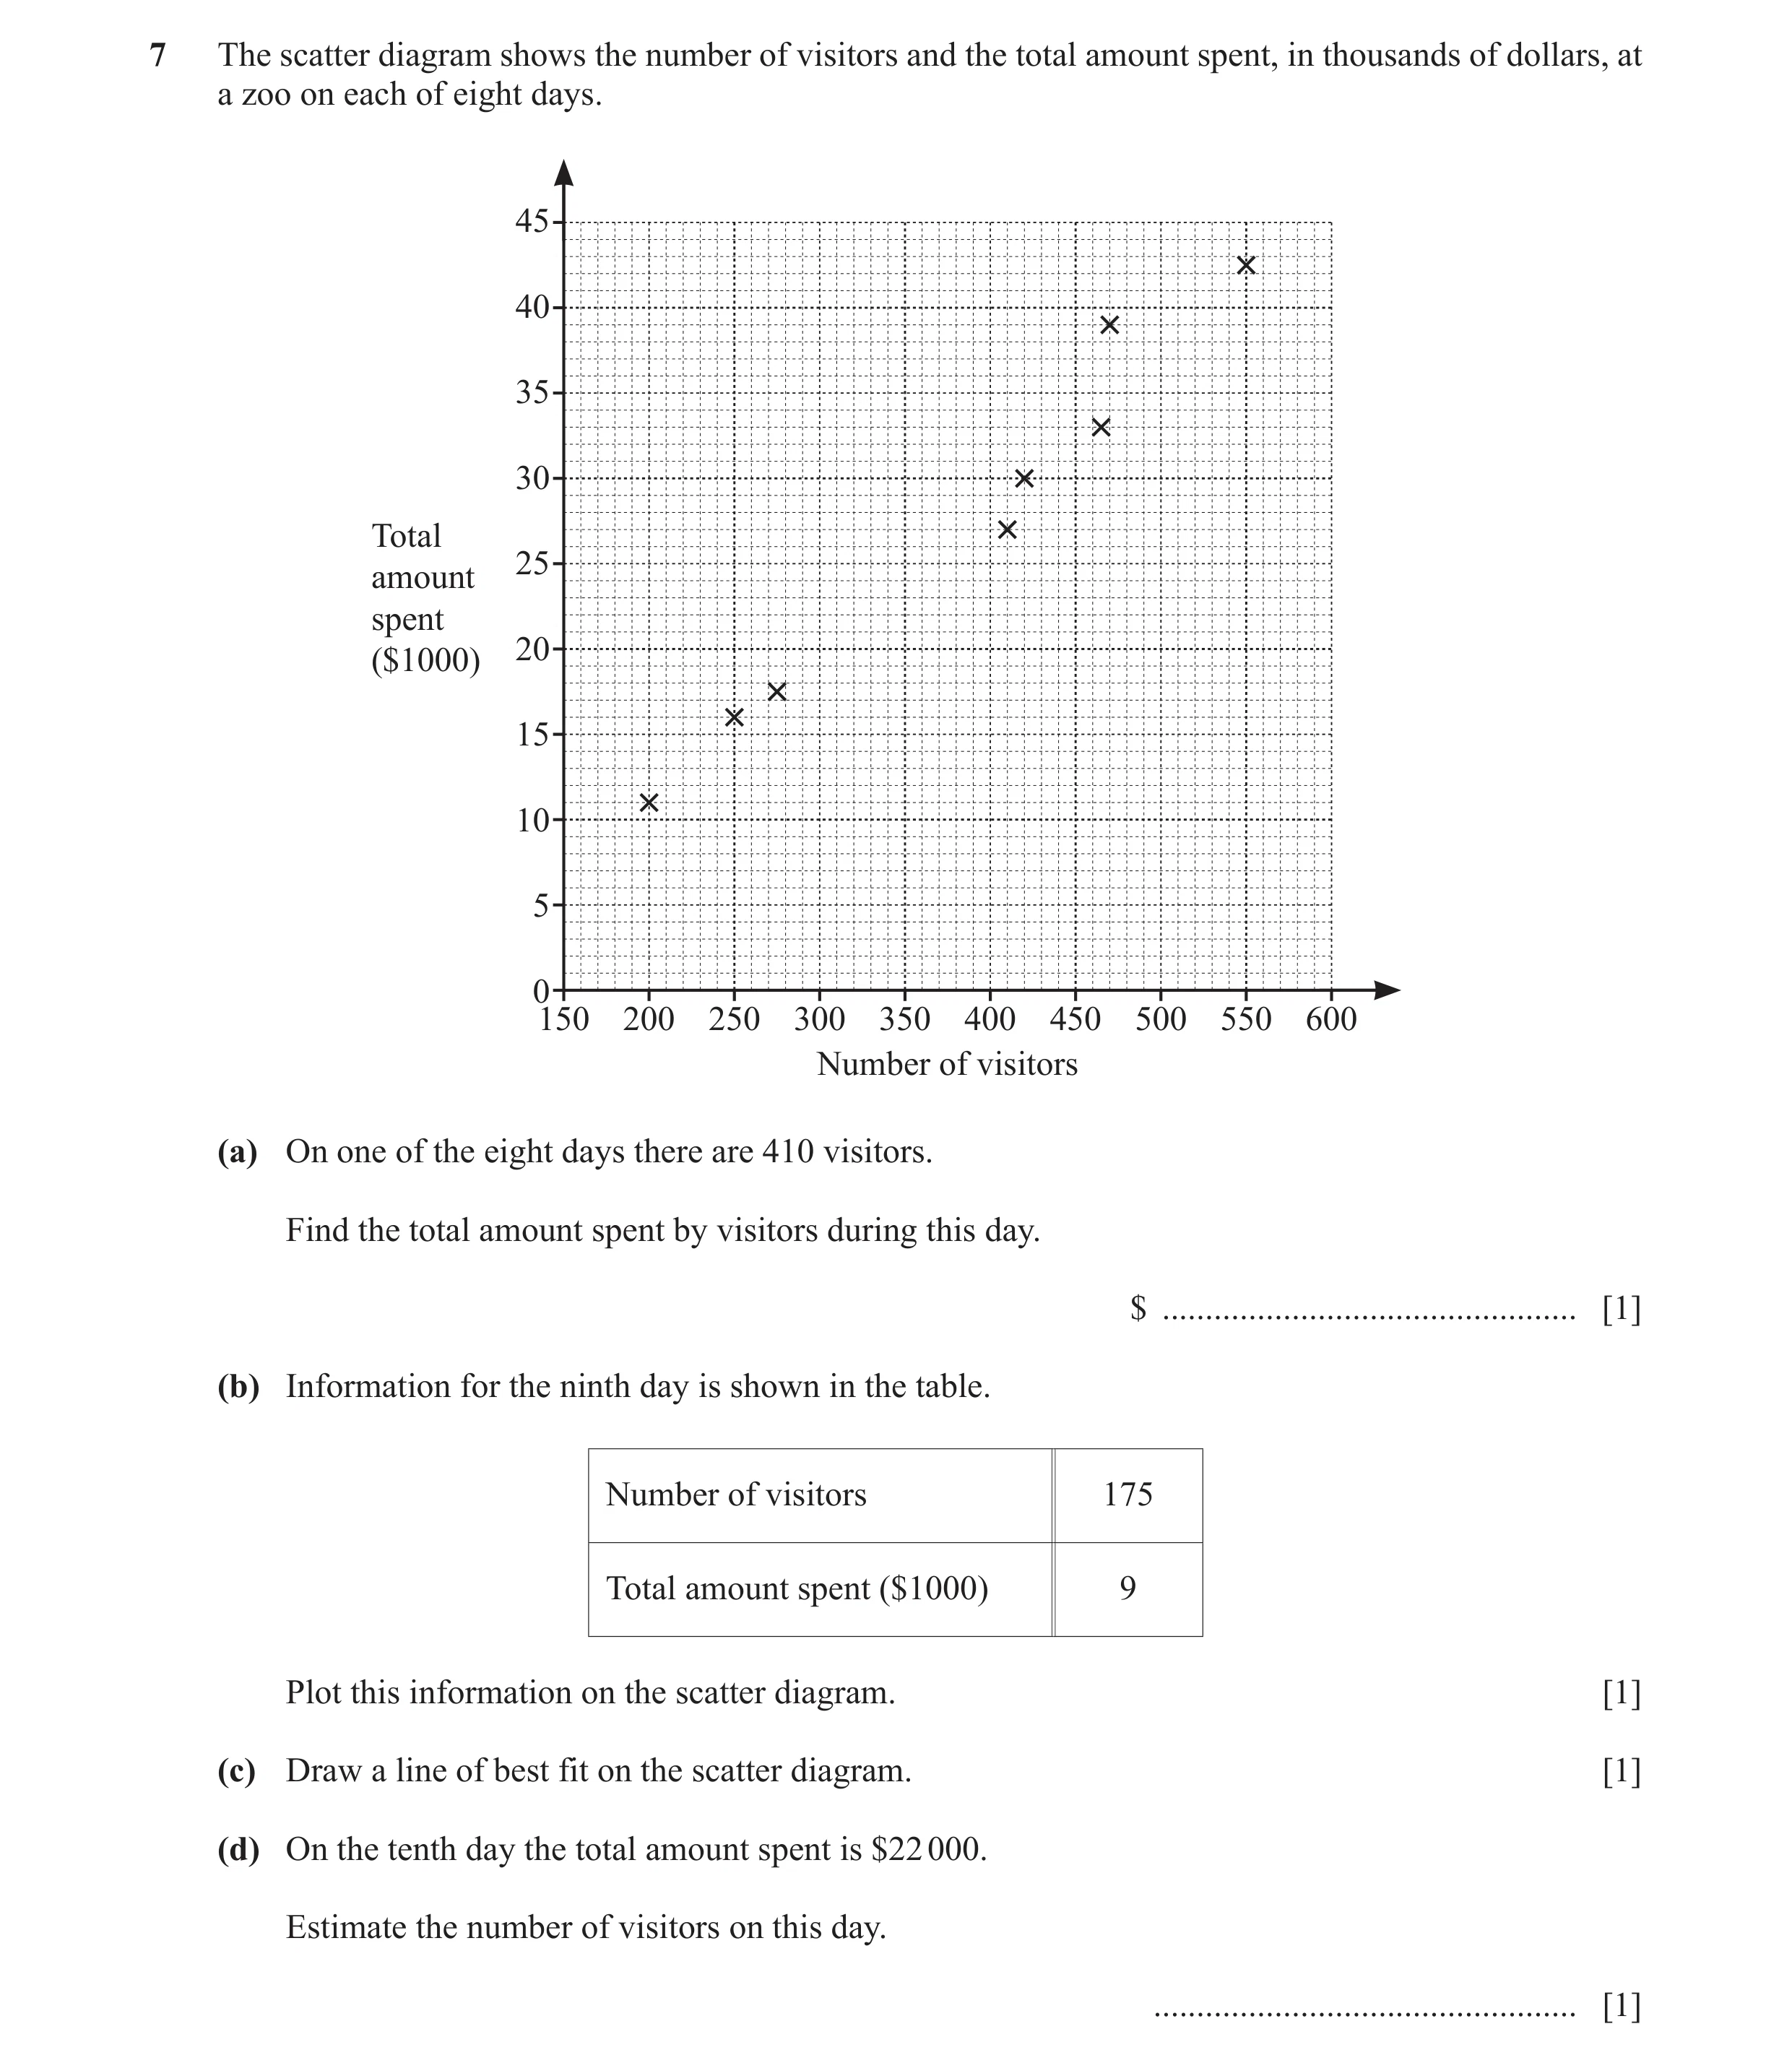
Q21 · The scatter diagram shows the number of visitors and the total amount spent, in thousands… 0580/23 May/June 2022
7 The scatter diagram shows the number of visitors and the total amount spent, in thousands of dollars, at a zoo on each of eight days. 45 40 35 30 Total 25 amount spent 20 ($1000) 15 10 5 0150 200 250 300 350 400 450 500 550 600 Number of visitors (a) On one of the eight days there are 410 visitors. Find the total amount spent by visitors during this day. $ … [1] (b) Information for the ninth day is shown in the table. Number of visitors 175 Total amount spent ($1000) 9 Plot this information on the scatter diagram. [1] (c) Draw a line of best fit on the scatter diagram. [1] (d) On the tenth day the total amount spent is $22 000. Estimate the number of visitors on this day. … [1]
4 marks
Mark scheme: 7(a) 27 000 1 7(b) Point plotted at (175, 9) 1 7(c) Correct single ruled line of best fit 1 7(d) 300 to 350 1 FT their straight line of best fit provided positive gradient
This question in 0580/23 May/June 2022
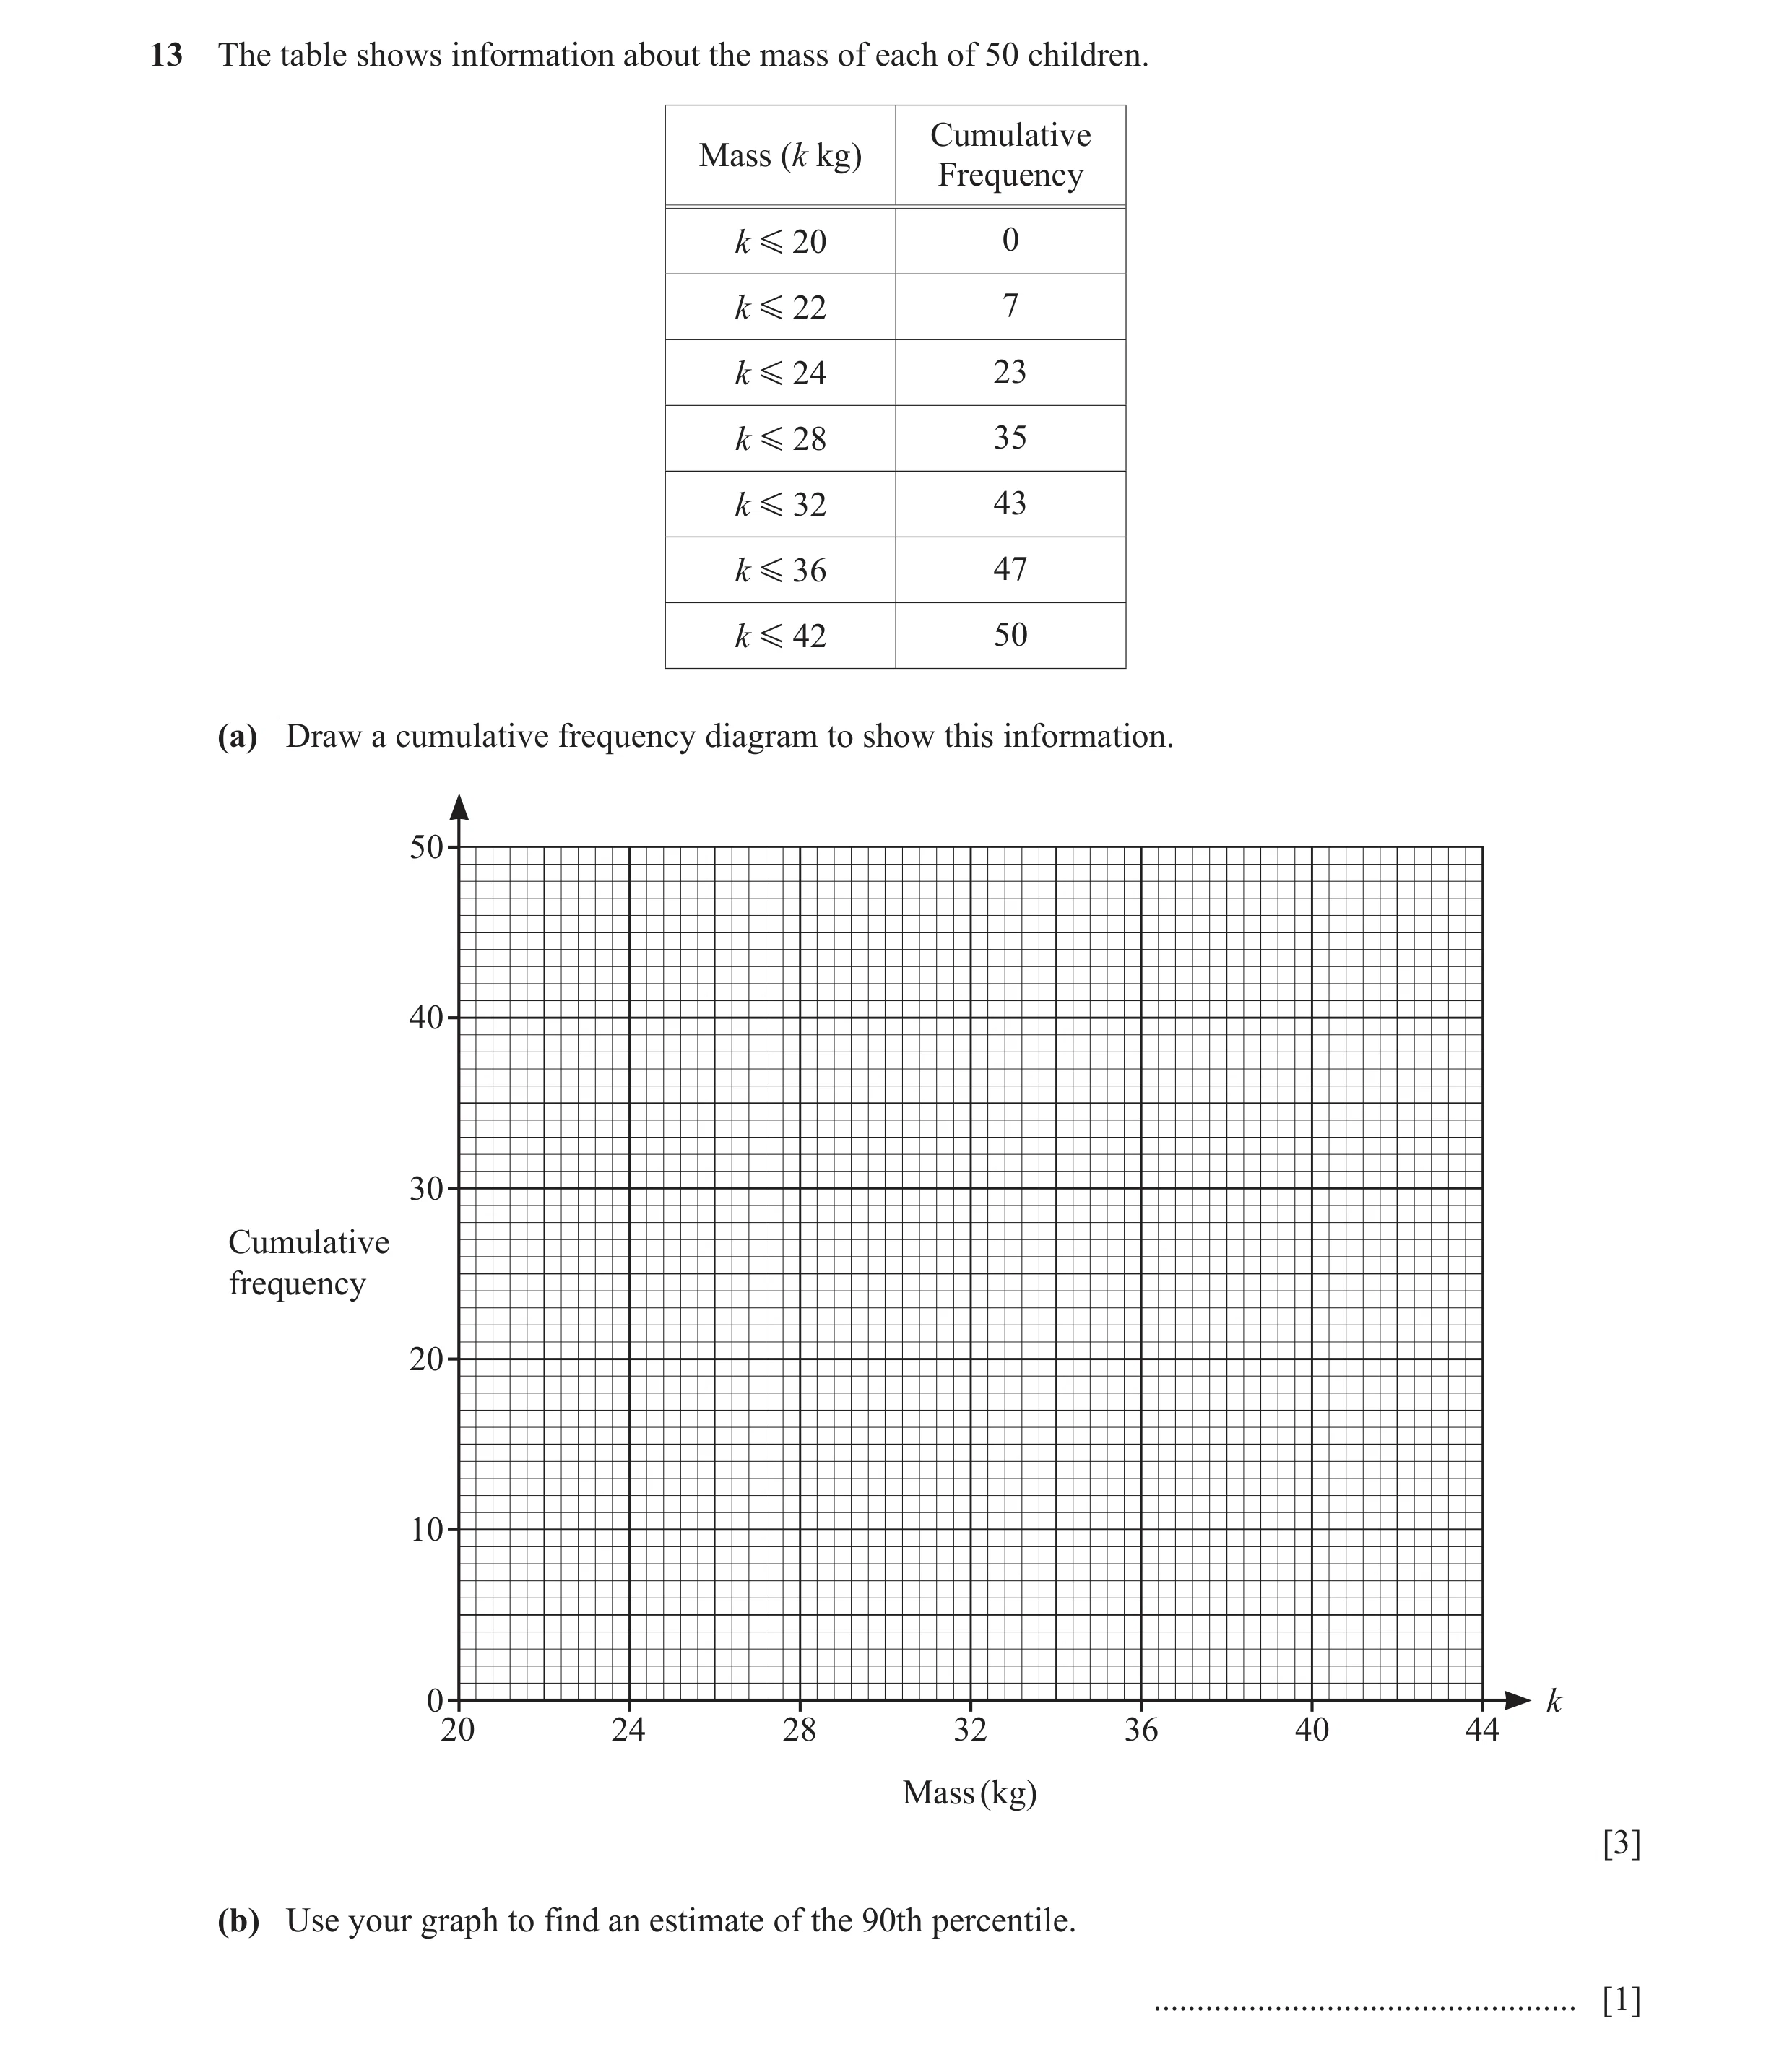
Q22 · The table shows information about the mass of each of 50 children 0580/22 Oct/Nov 2022
13 The table shows information about the mass of each of 50 children. Cumulative Mass (k kg) Frequency k G 20 0 k G 22 7 k G 24 23 k G 28 35 k G 32 43 k G 36 47 k G 42 50 (a) Draw a cumulative frequency diagram to show this information. 50 40 30 Cumulative frequency 20 10 0 k 20 24 28 32 36 40 44 Mass (kg) [3] (b) Use your graph to find an estimate of the 90th percentile. … [1]
4 marks
Mark scheme: 13(a) A correct cumulative frequency diagram 3 B1 for correct horizontal placement for 7 plots B1 for correct vertical placement for 7 plots B1FT dep on at least B1 for reasonable increasing curve or polygon through their 7 points If 0 scored SC1 FT for 6 out of 7 points correctly plotted 13(b) 33 to 34.5 1 FT their increasing cumulative frequency graph
This question in 0580/22 Oct/Nov 2022
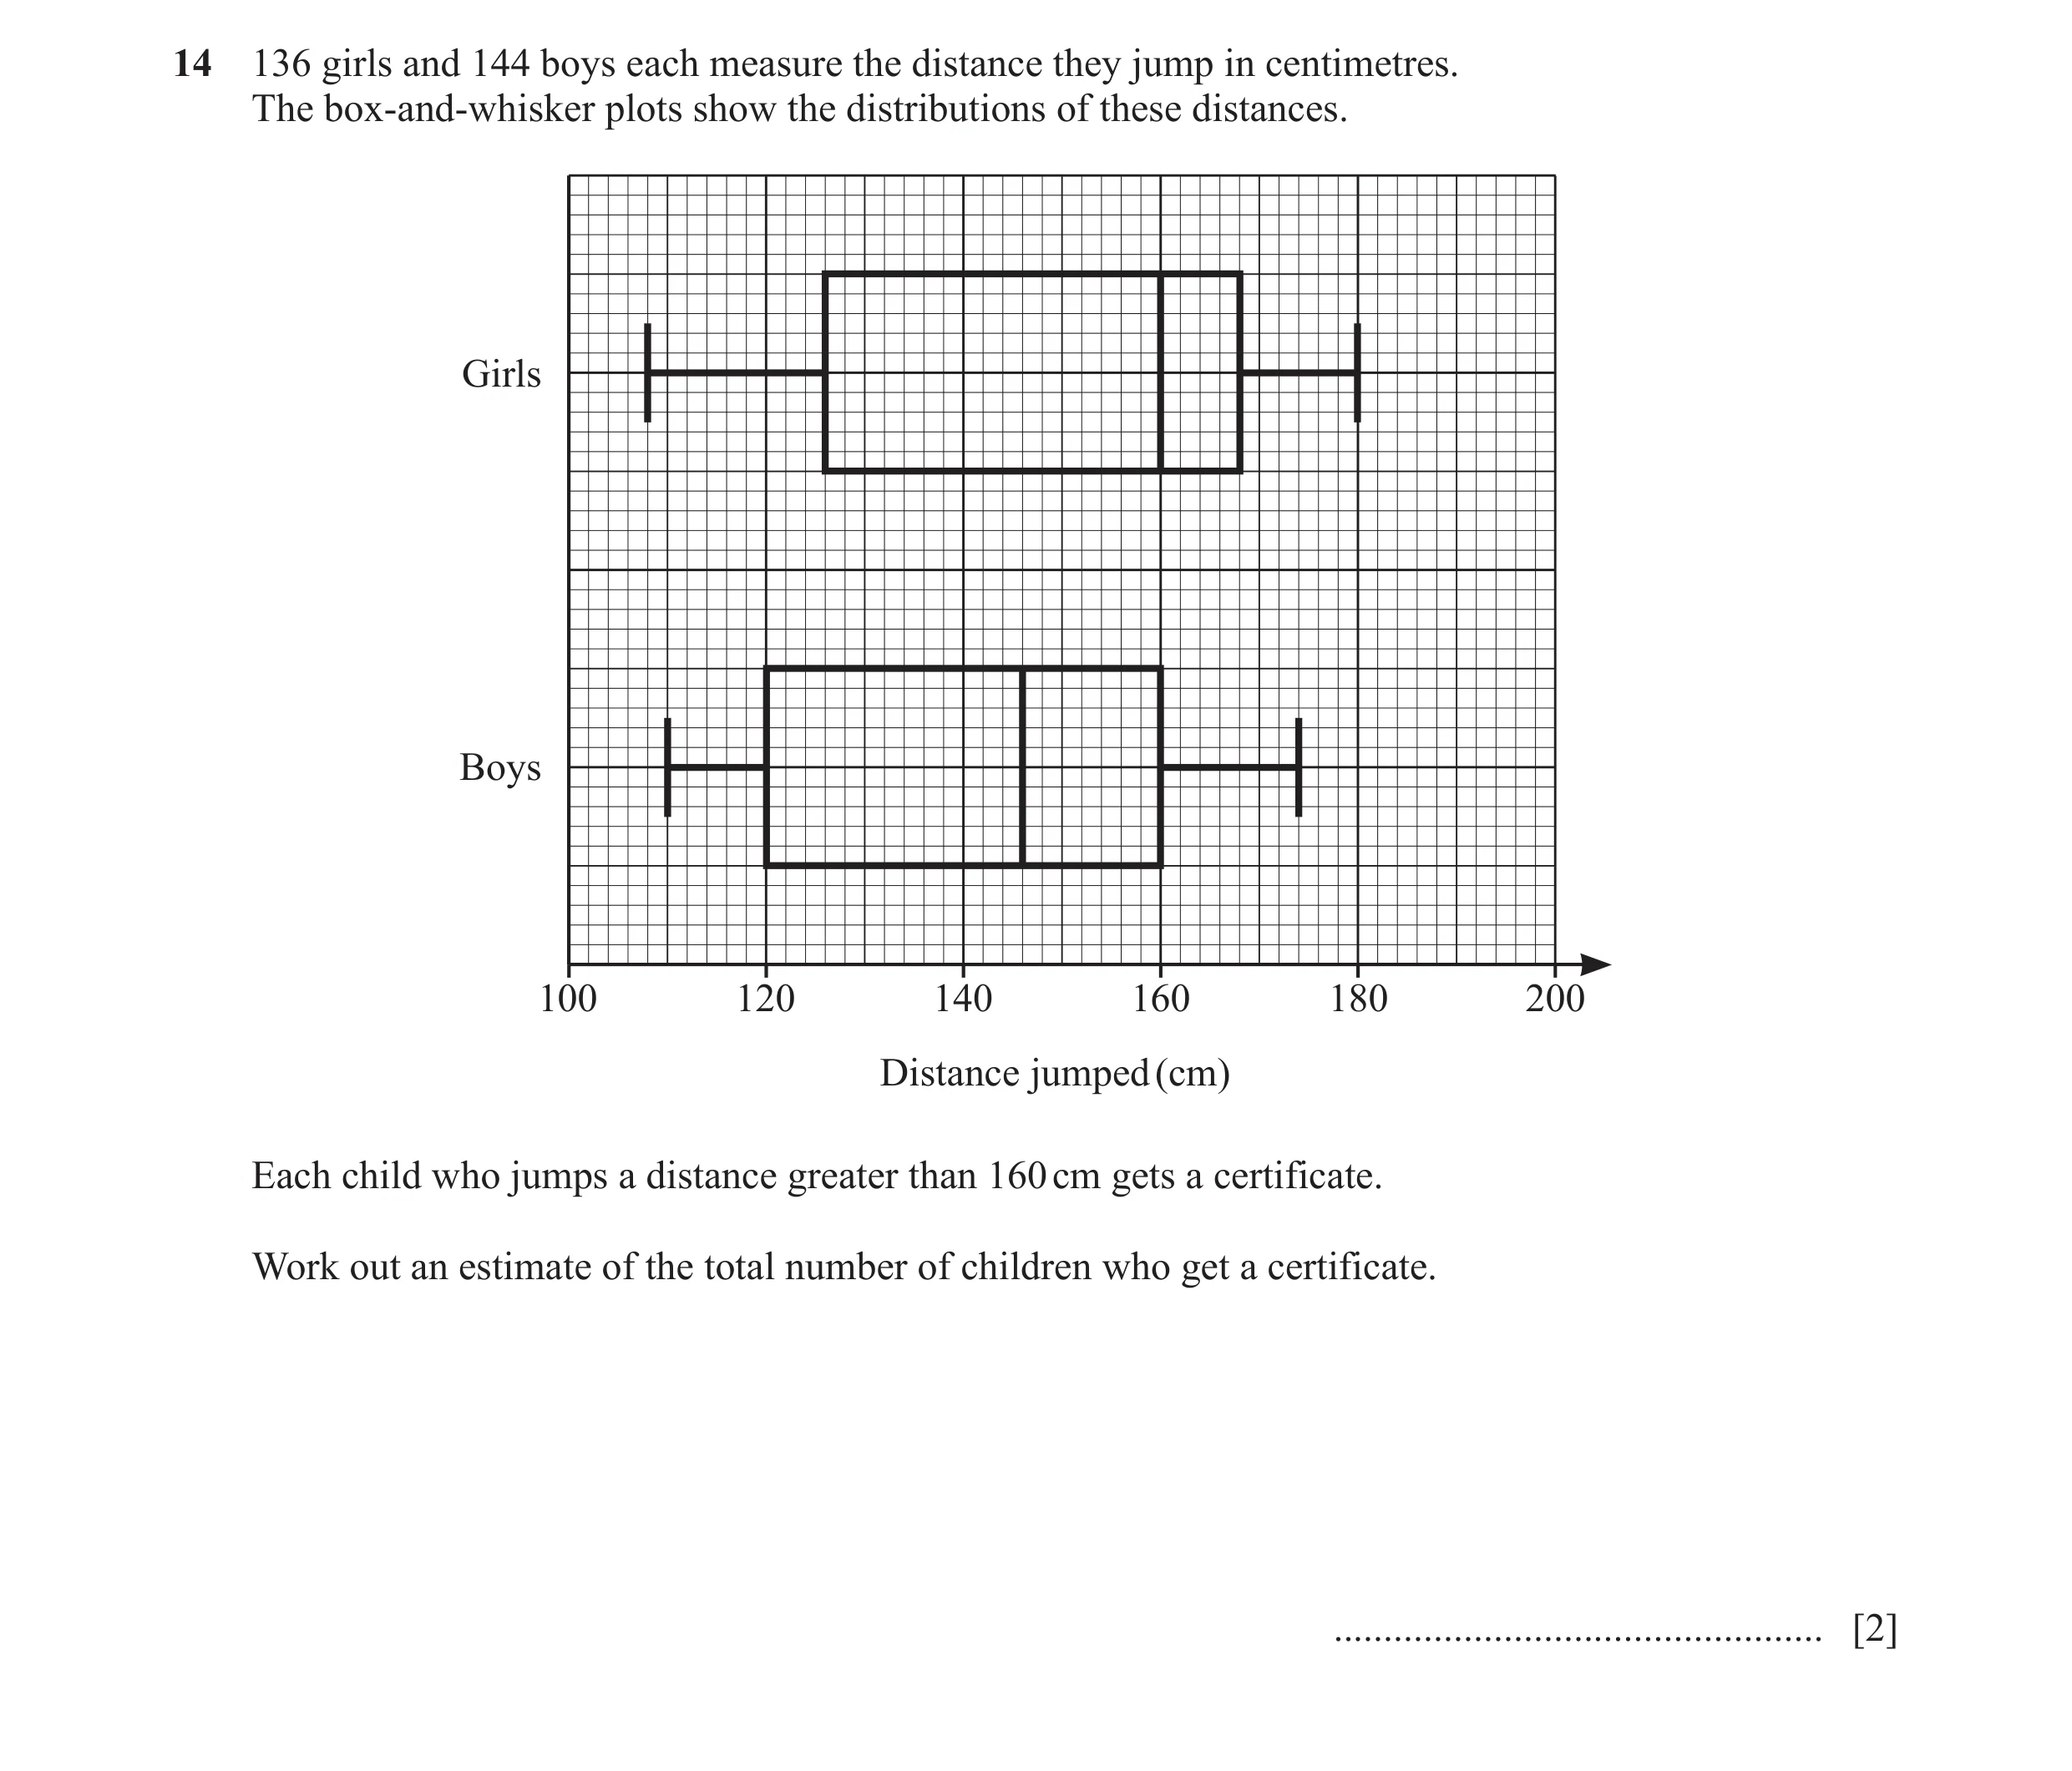
Q23 · 136 girls and 144 boys each measure the distance they jump in centimetres 0580/22 Oct/Nov 2022
14 136 girls and 144 boys each measure the distance they jump in centimetres. The box-and-whisker plots show the distributions of these distances. Girls Boys 100 120 140 160 180 200 Distance jumped (cm) Each child who jumps a distance greater than 160 cm gets a certificate. Work out an estimate of the total number of children who get a certificate. … [2]
2 marks
Mark scheme: 14 104 2 M1 for 0.5 136 oe or 0.25 144 oe
This question in 0580/22 Oct/Nov 2022
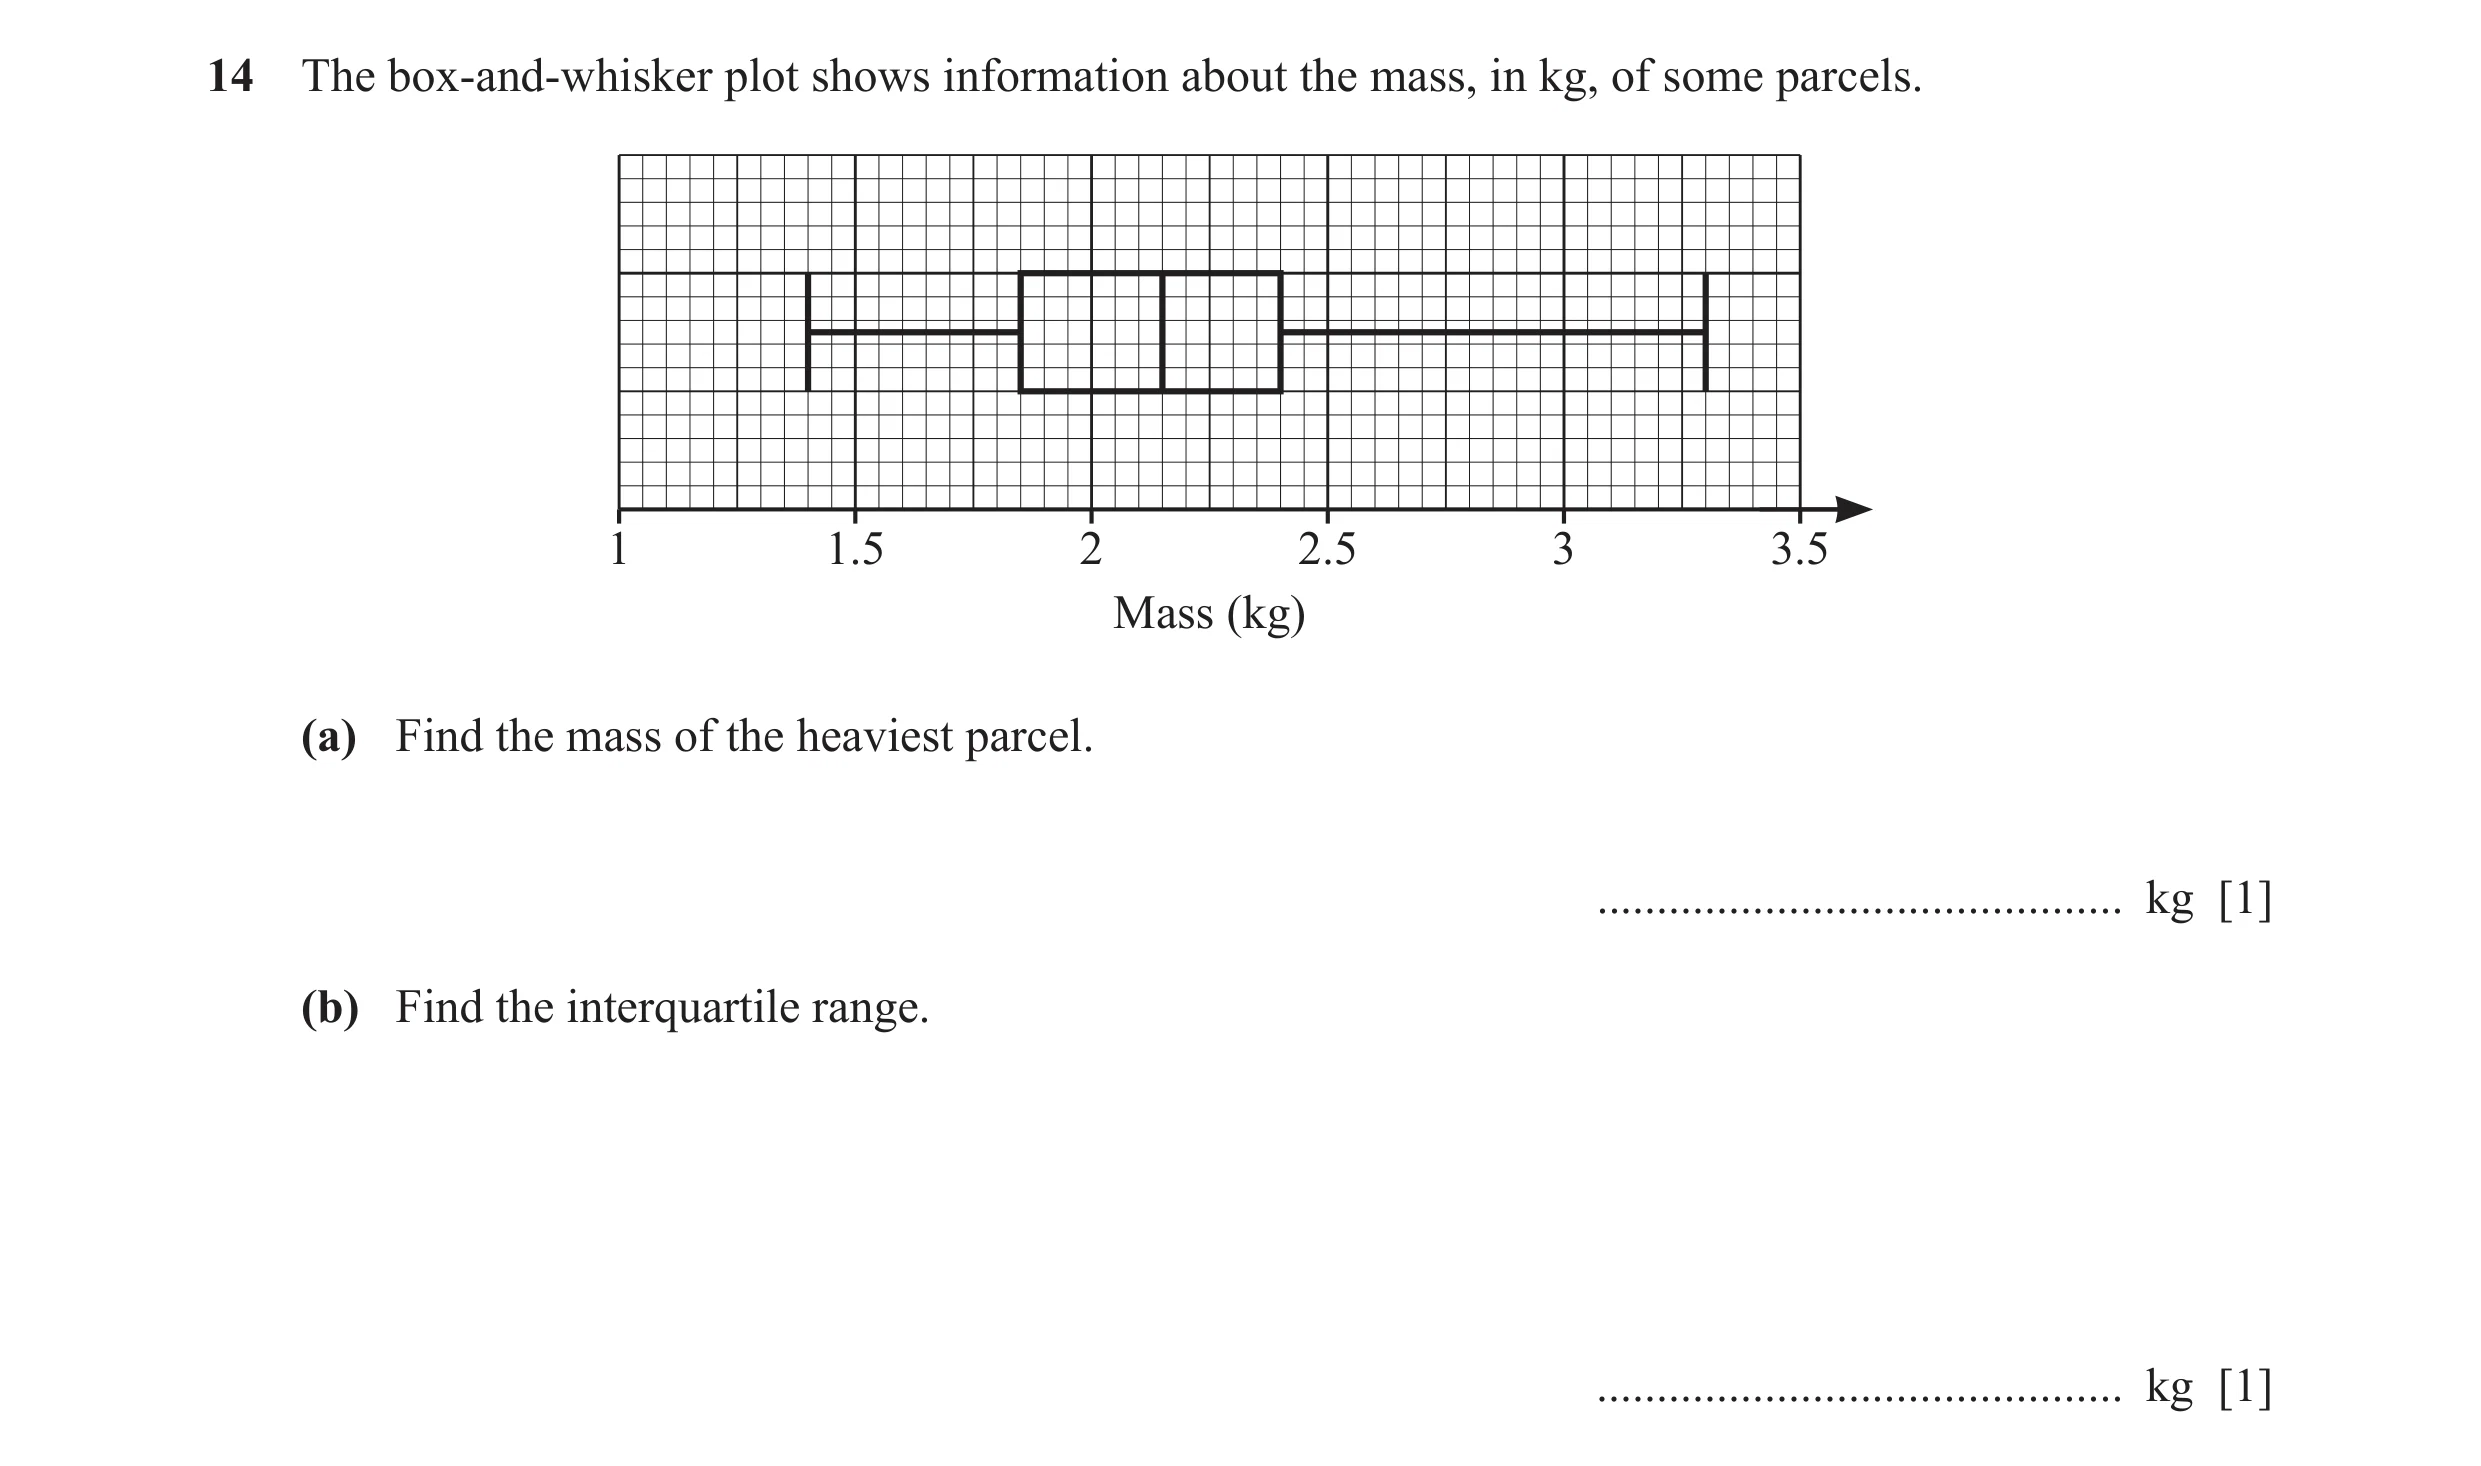
Q24 · The box-and-whisker plot shows information about the mass, in kg, of some parcels 0580/23 Oct/Nov 2023
14 The box-and-whisker plot shows information about the mass, in kg, of some parcels. 1 1.5 2 2.5 3 3.5 Mass (kg) (a) Find the mass of the heaviest parcel. … kg [1] (b) Find the interquartile range. … kg [1]
2 marks
Mark scheme: 14(a) 3.3 1 14(b) 0.55 1
This question in 0580/23 Oct/Nov 2023
Q25 · 200 180 160 140 120 Cumulative 100 frequency 80 60 40 20 0 0 10 20 30 40 50 Time… 0580/23 May/June 2024
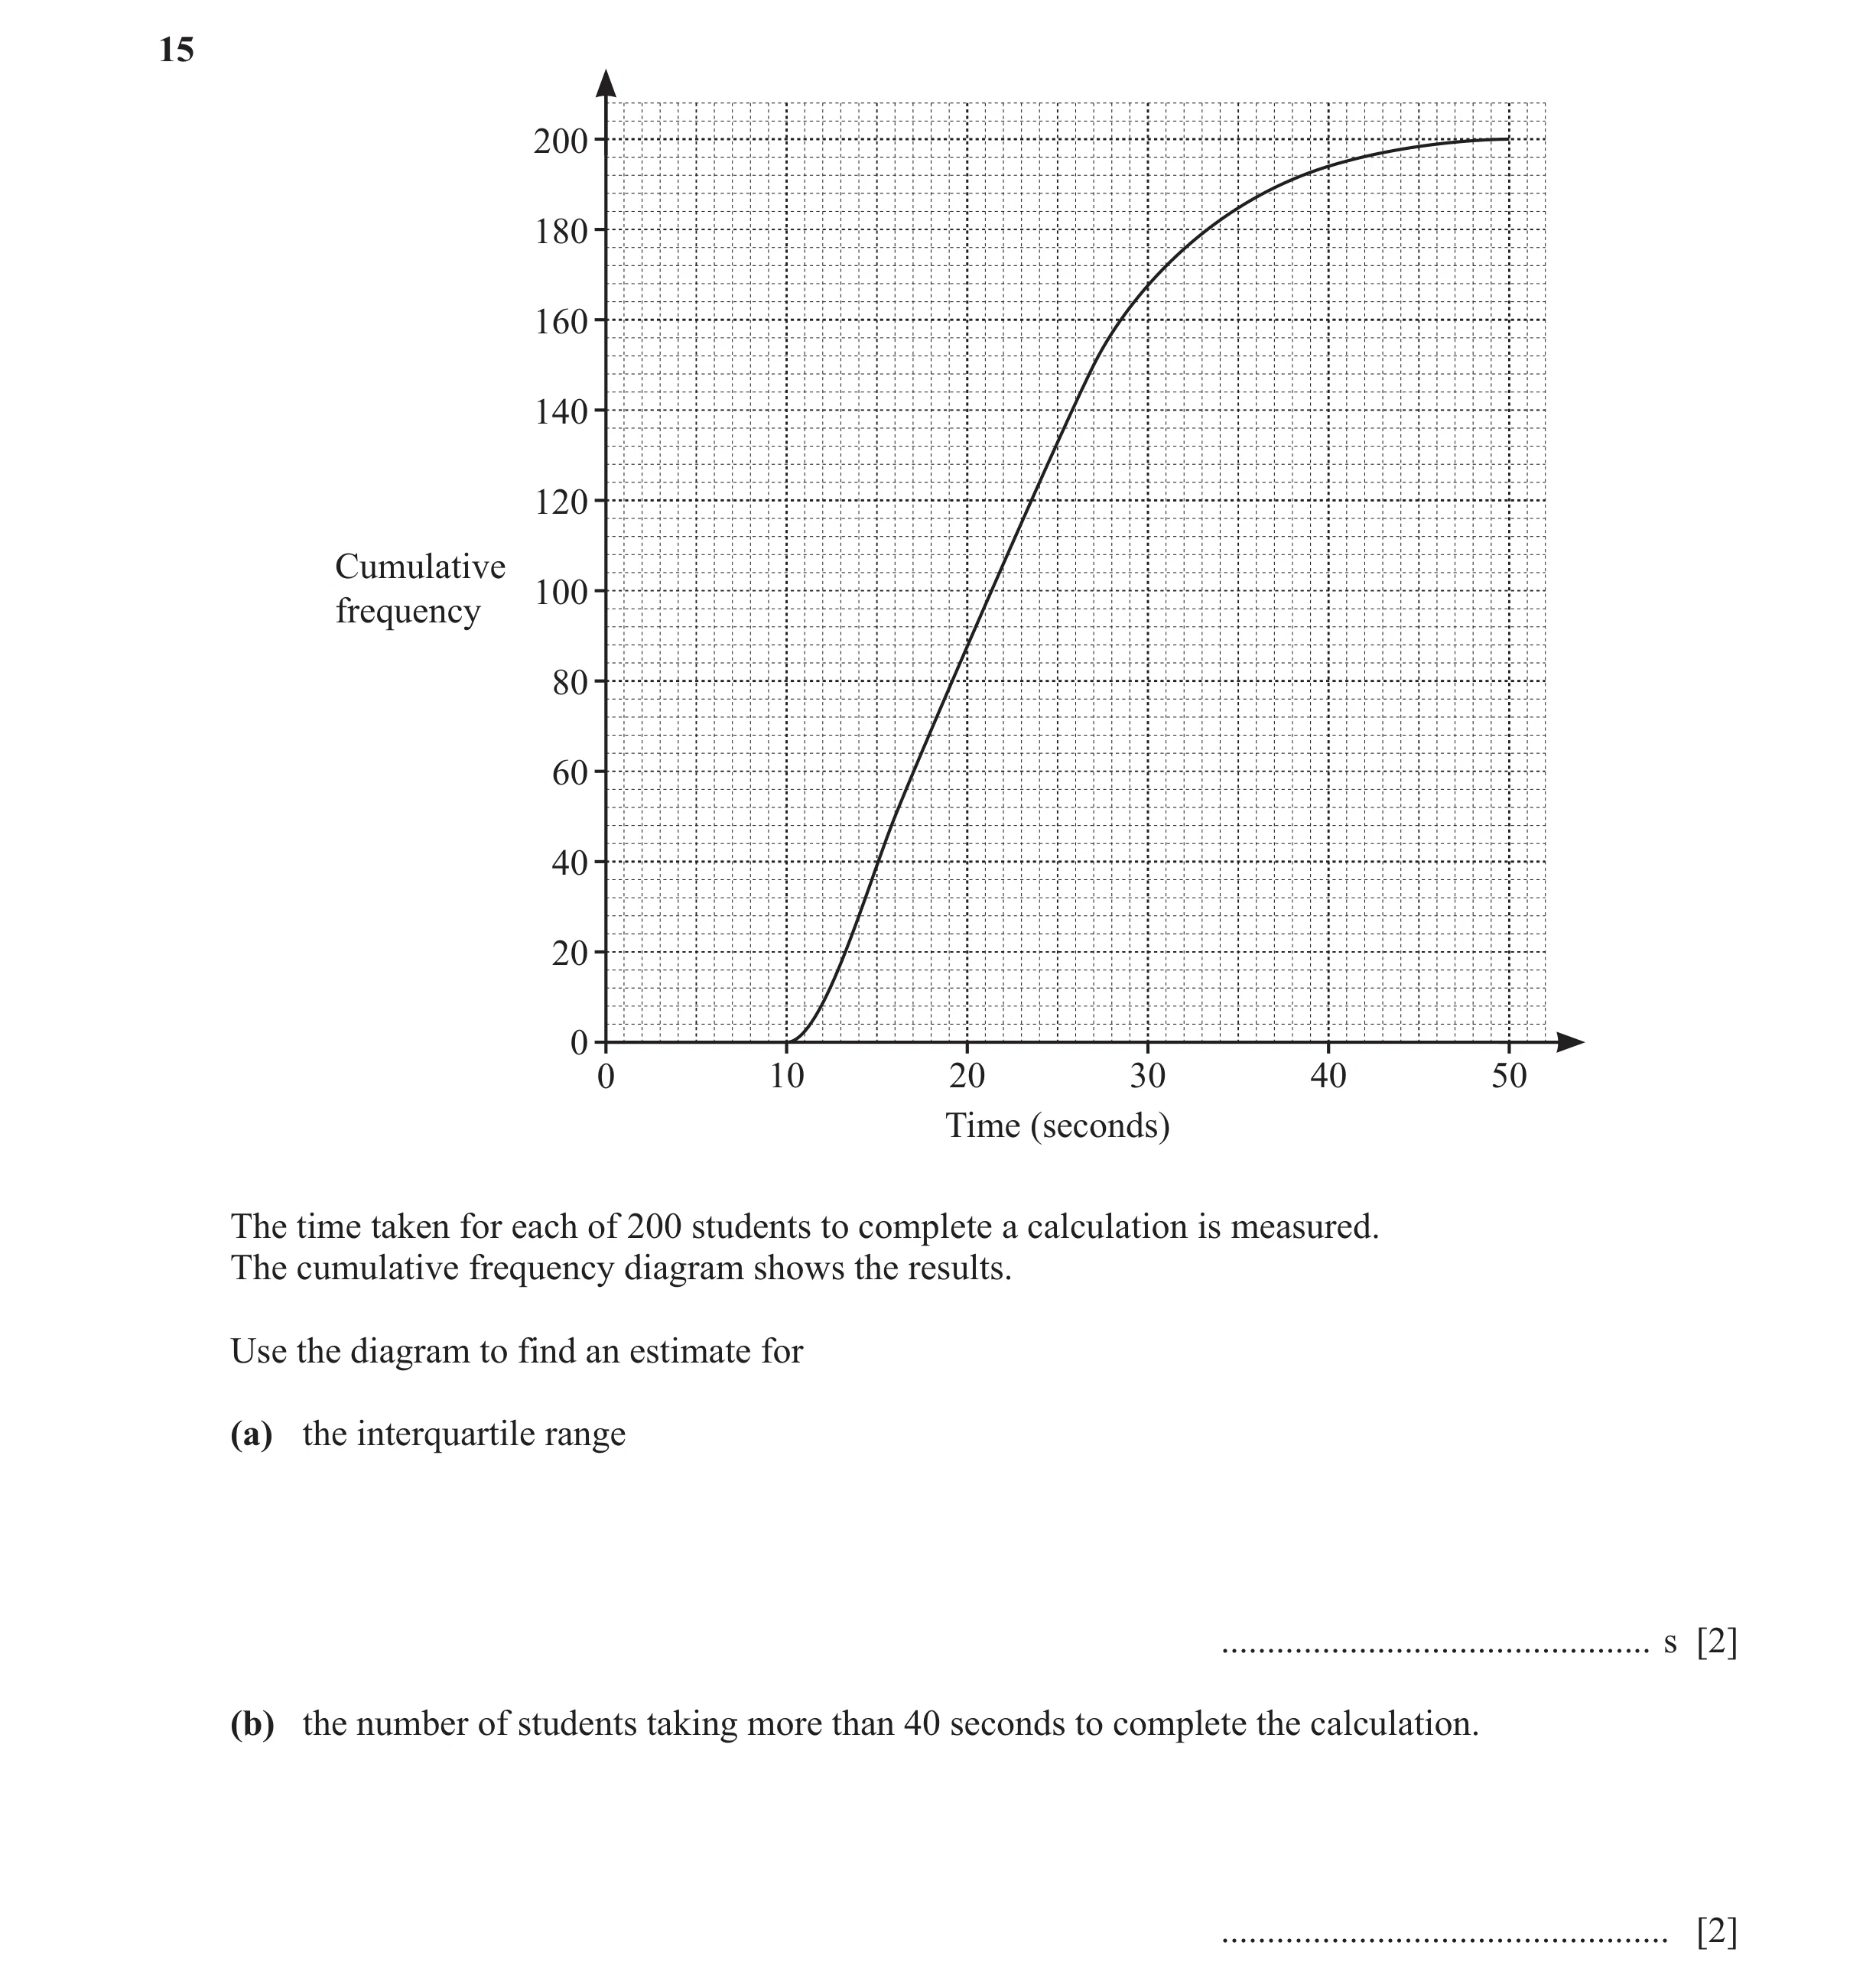
15 200 180 160 140 120 Cumulative 100 frequency 80 60 40 20 0 0 10 20 30 40 50 Time (seconds) The time taken for each of 200 students to complete a calculation is measured. The cumulative frequency diagram shows the results. Use the diagram to find an estimate for (a) the interquartile range … s [2] (b) the number of students taking more than 40 seconds to complete the calculation. … [2]
4 marks
Mark scheme: 15(a) 11 2 B1 for 16 or 27 seen 15(b) 6 2 M1 for 194 seen
This question in 0580/23 May/June 2024
Q26 · Students in class P take a test 0580/21 Oct/Nov 2024
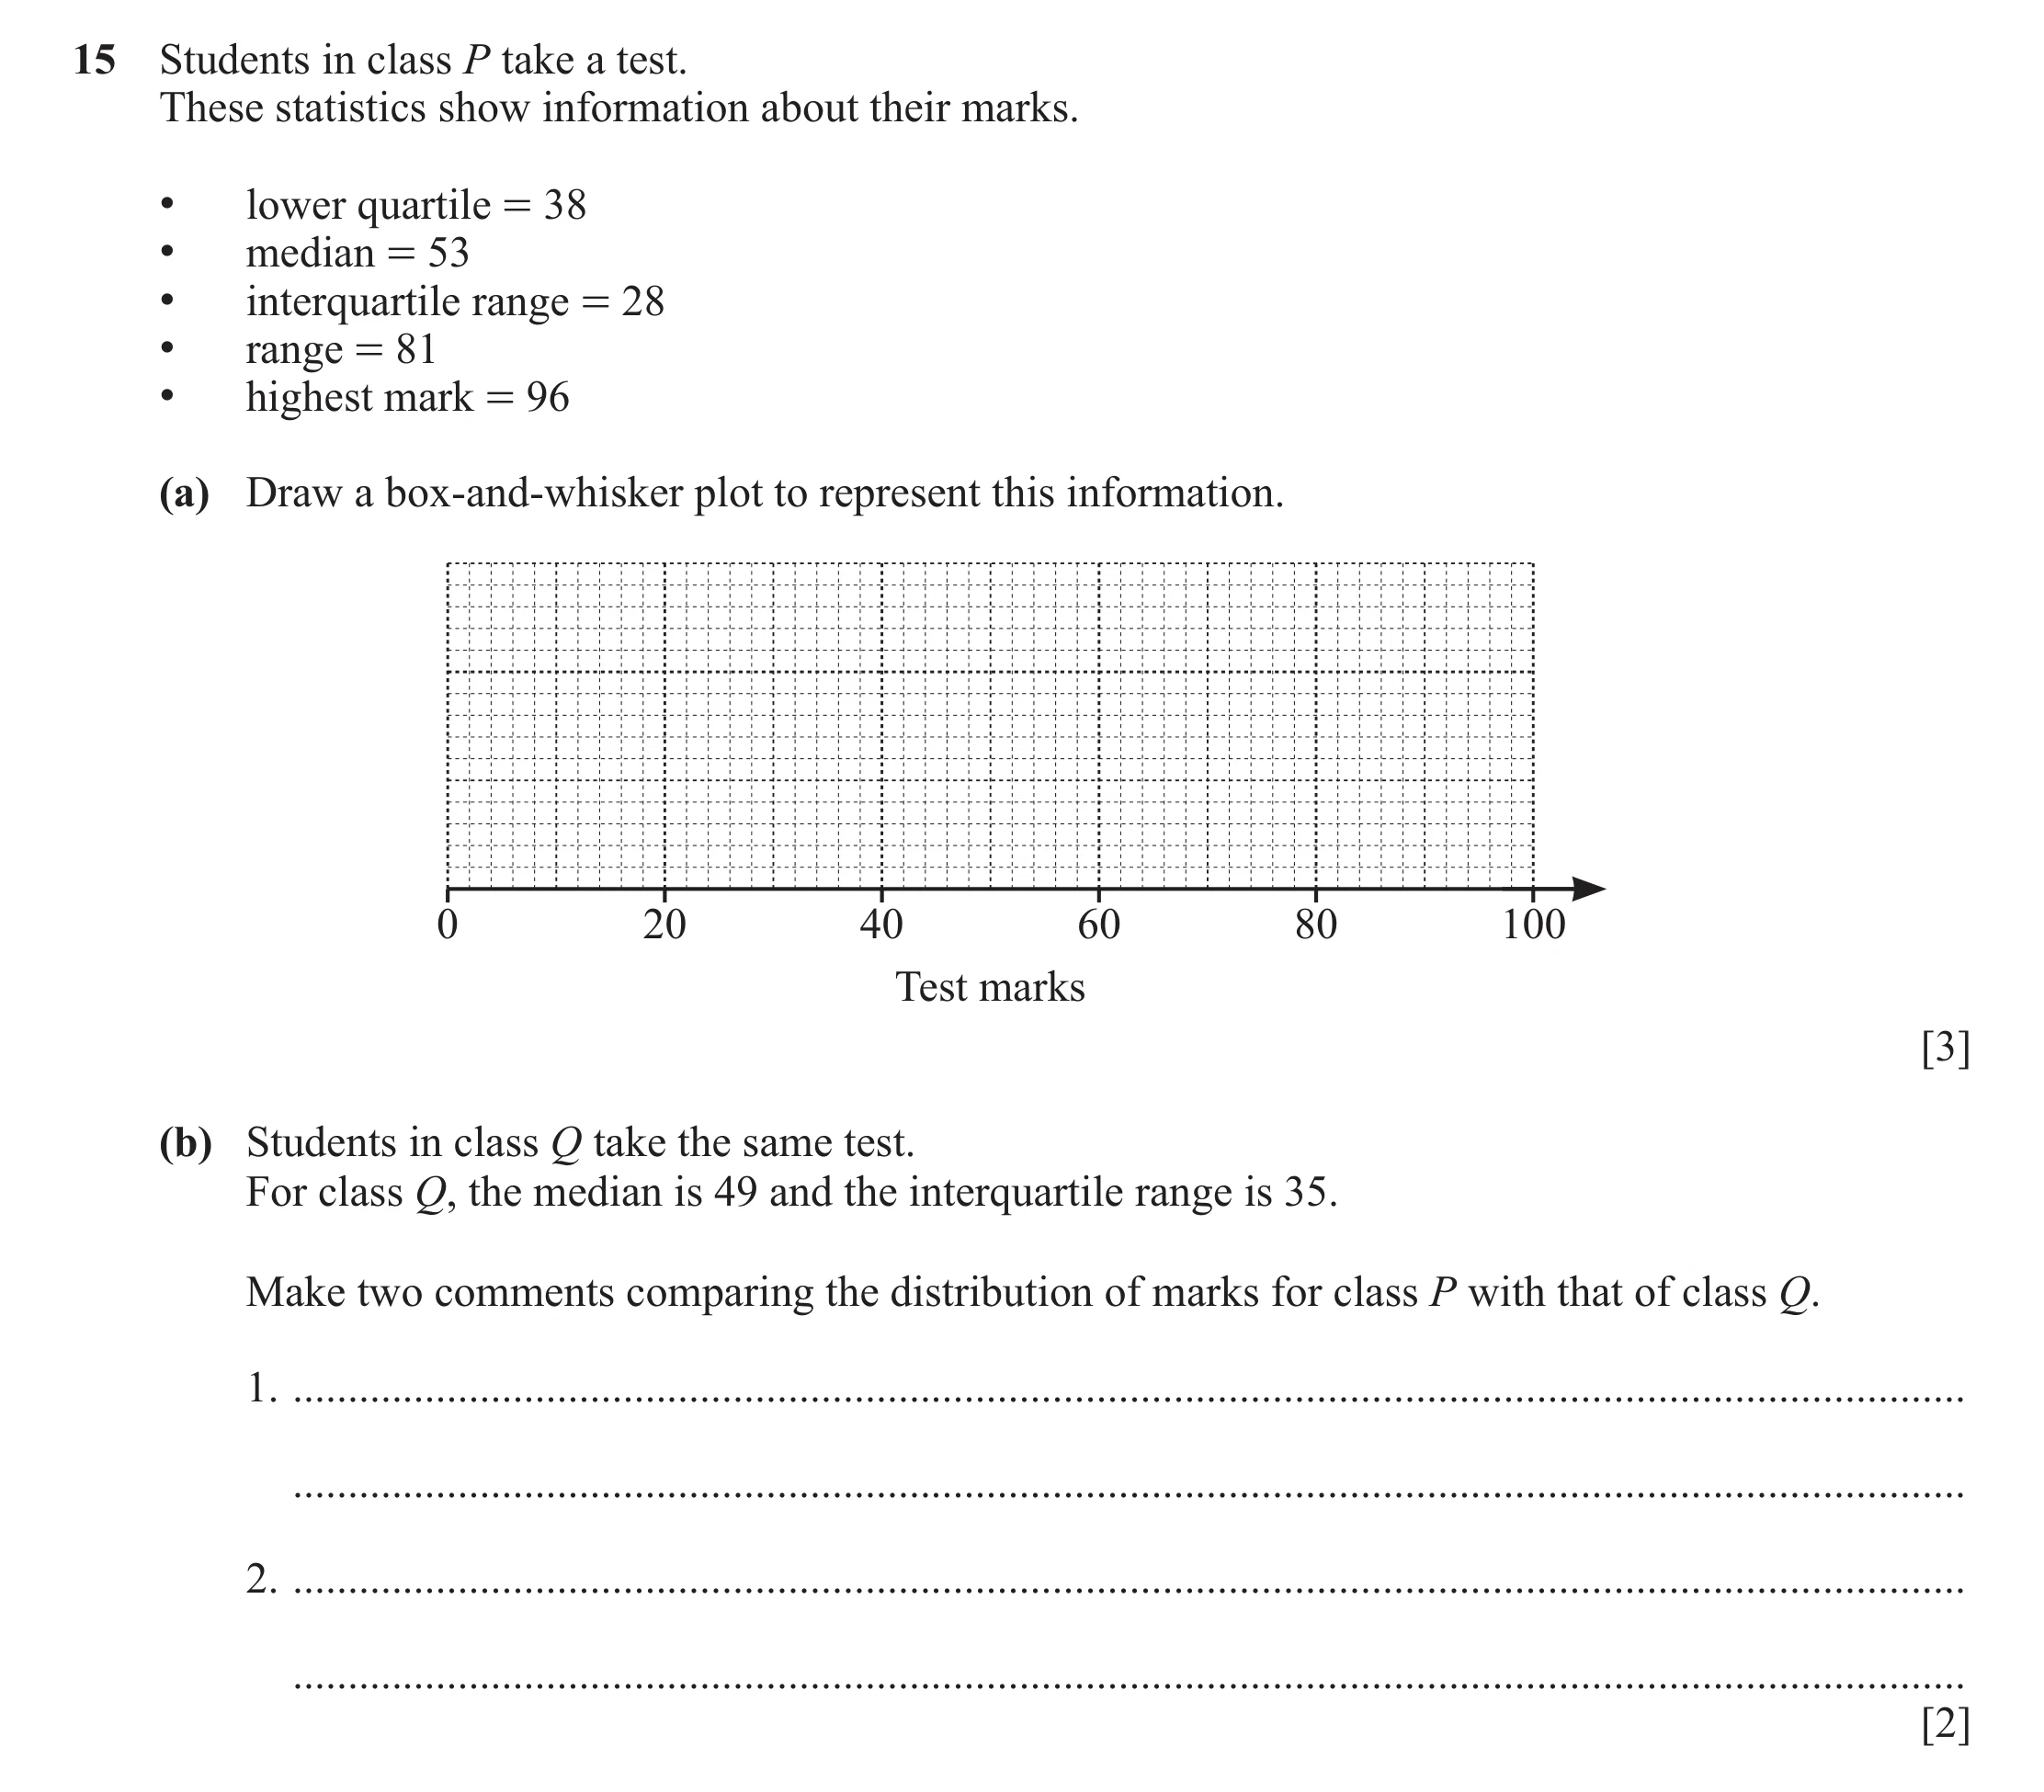
15 Students in class P take a test. These statistics show information about their marks. • lower quartile = 38 • median = 53 • interquartile range = 28 • range = 81 • highest mark = 96 (a) Draw a box-and-whisker plot to represent this information. 0 20 40 60 80 100 Test marks [3] (b) Students in class Q take the same test. For class Q, the median is 49 and the interquartile range is 35. Make two comments comparing the distribution of marks for class P with that of class Q. 1. … … 2. … … [2]
5 marks
Mark scheme: 15(a) Correct box-and-whisker plot 3 B1 for UQ = 66 or Lowest = 15 soi L = 15 M1 for at least 3 values correct within box and LQ = 38 whisker plot Median = 53 UQ = 66 H = 96 15(b) Class Q scored fewer marks on 2 B1 for each average [as median is lower] oe Class Q have a larger spread of marks [as IQR is higher] oe
This question in 0580/21 Oct/Nov 2024
Q27 · The scatter diagram shows the number of rooms and the number of people in each of eight… 0580/22 Oct/Nov 2024
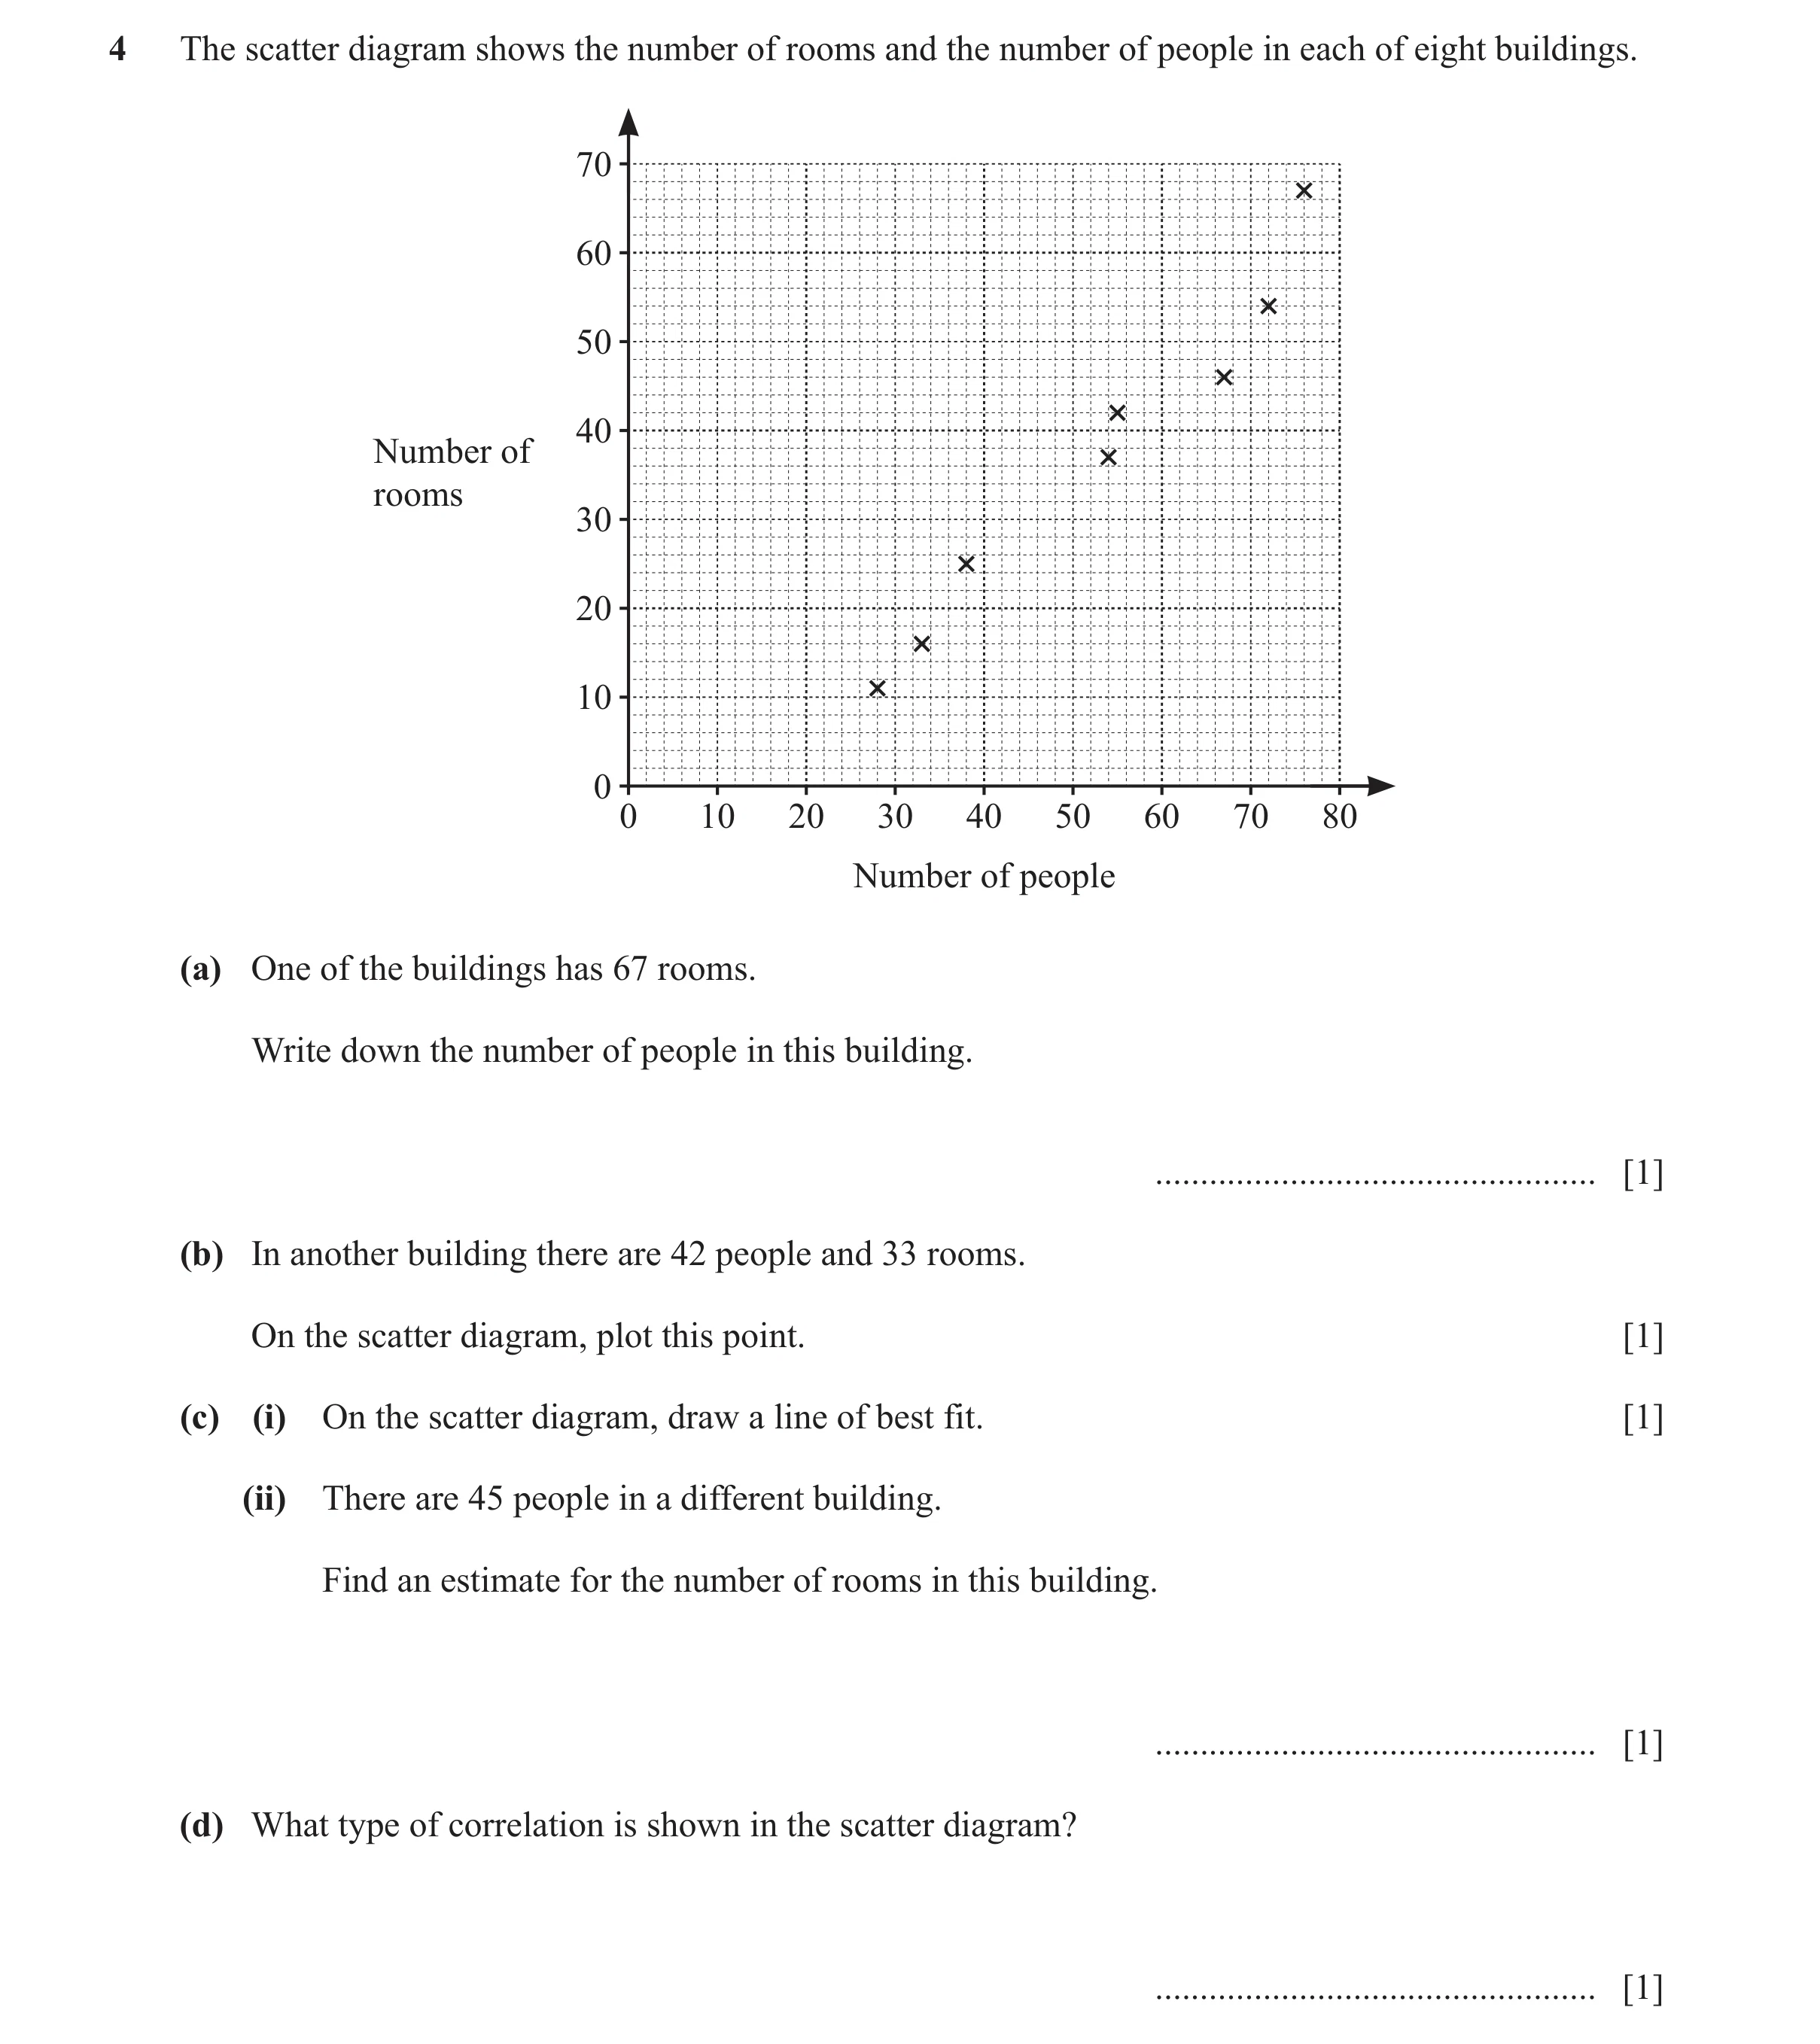
4 The scatter diagram shows the number of rooms and the number of people in each of eight buildings. 70 60 50 40 Number of rooms 30 20 10 0 0 10 20 30 40 50 60 70 80 Number of people (a) One of the buildings has 67 rooms. Write down the number of people in this building. … [1] (b) In another building there are 42 people and 33 rooms. On the scatter diagram, plot this point. [1] (c) (i) On the scatter diagram, draw a line of best fit. [1] (ii) There are 45 people in a different building. Find an estimate for the number of rooms in this building. … [1] (d) What type of correlation is shown in the scatter diagram? … [1]
5 marks
Mark scheme: 4(a) 76 1 4(b) Point correctly plotted at 1 (42, 33) 4(c)(i) Correct ruled line of best fit 1 4(c)(ii) An integer in the range 1 27 to 33 FT their line of best fit provided line shows positive correlation and answer is an integer 4(d) Positive 1
This question in 0580/22 Oct/Nov 2024
Q28 · The time spent on the internet by each of 120 adults is recorded for one day 0580/21 May/June 2025
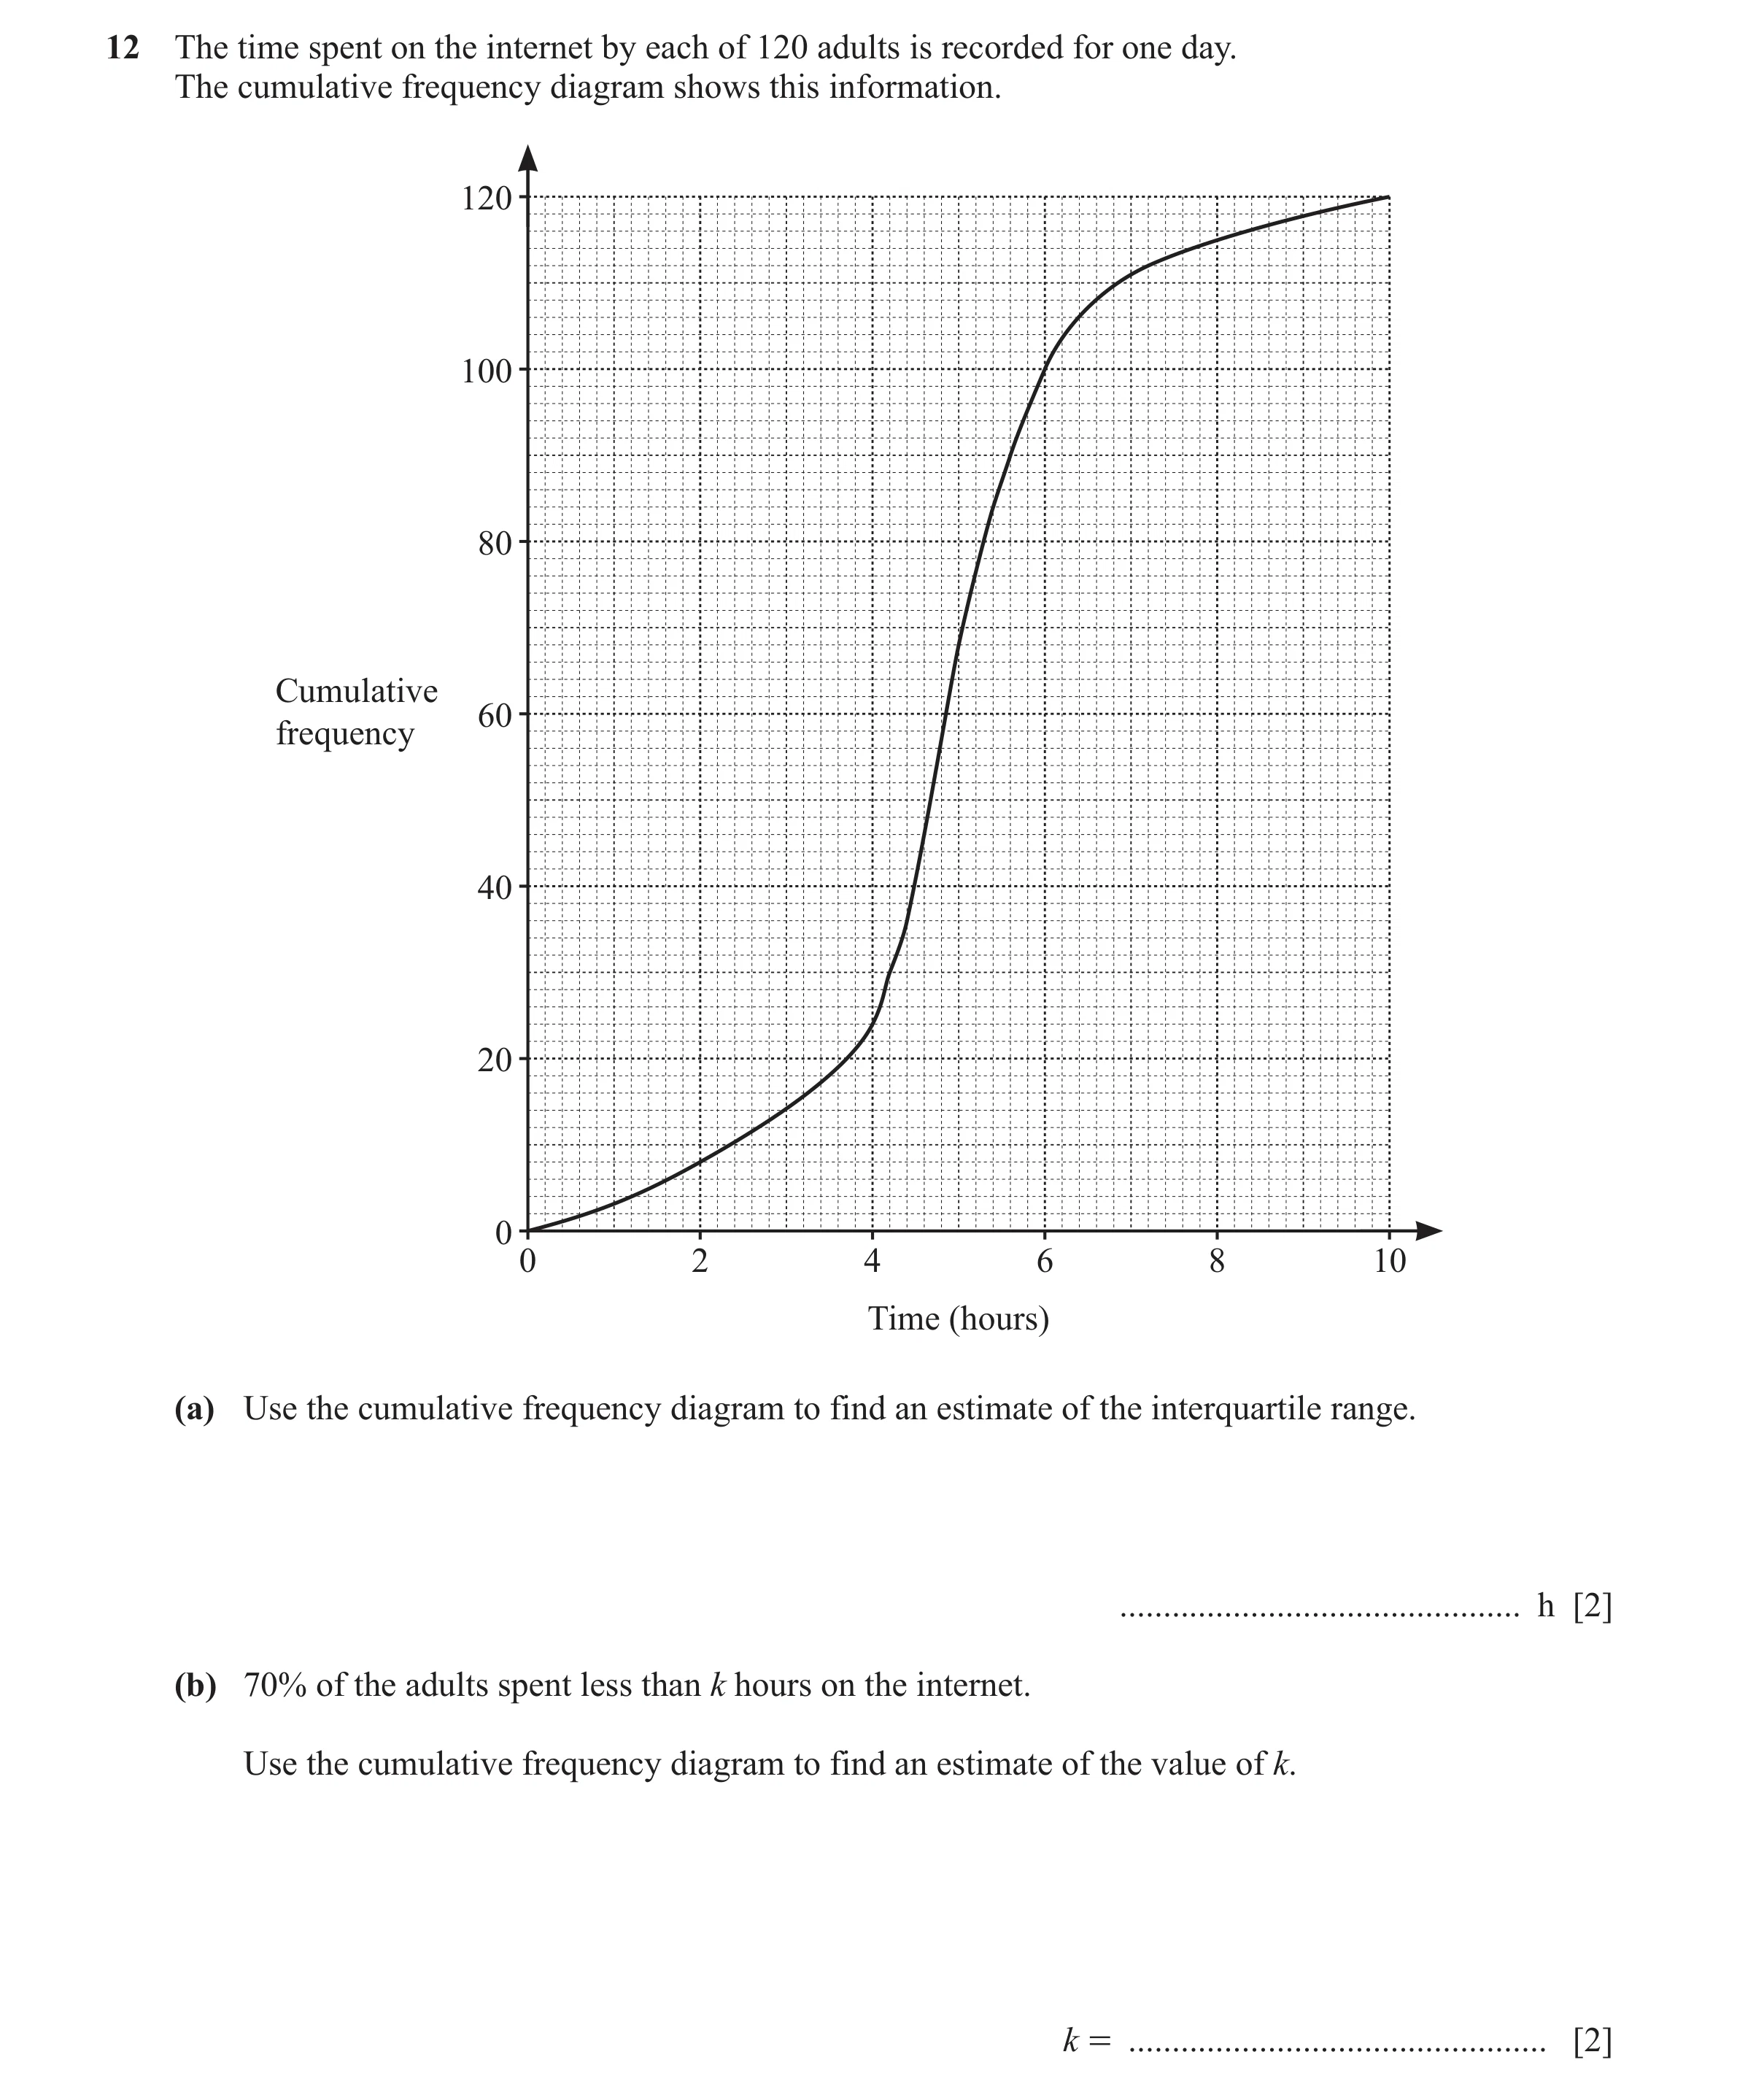
12 The time spent on the internet by each of 120 adults is recorded for one day. The cumulative frequency diagram shows this information. 120 100 80 Cumulative 60 frequency 40 20 0 0 2 4 6 8 10 Time (hours) (a) Use the cumulative frequency diagram to find an estimate of the interquartile range. … h [2] (b) 70% of the adults spent less than k hours on the internet. Use the cumulative frequency diagram to find an estimate of the value of k. k = … [2]
4 marks
Mark scheme: 12(a) 1.4 2 B1 for [UQ =] 5.6 or for [LQ =] 4.2 or SC1 for 0.7 12(b) 5.4 2 B1 for 84 seen
This question in 0580/21 May/June 2025
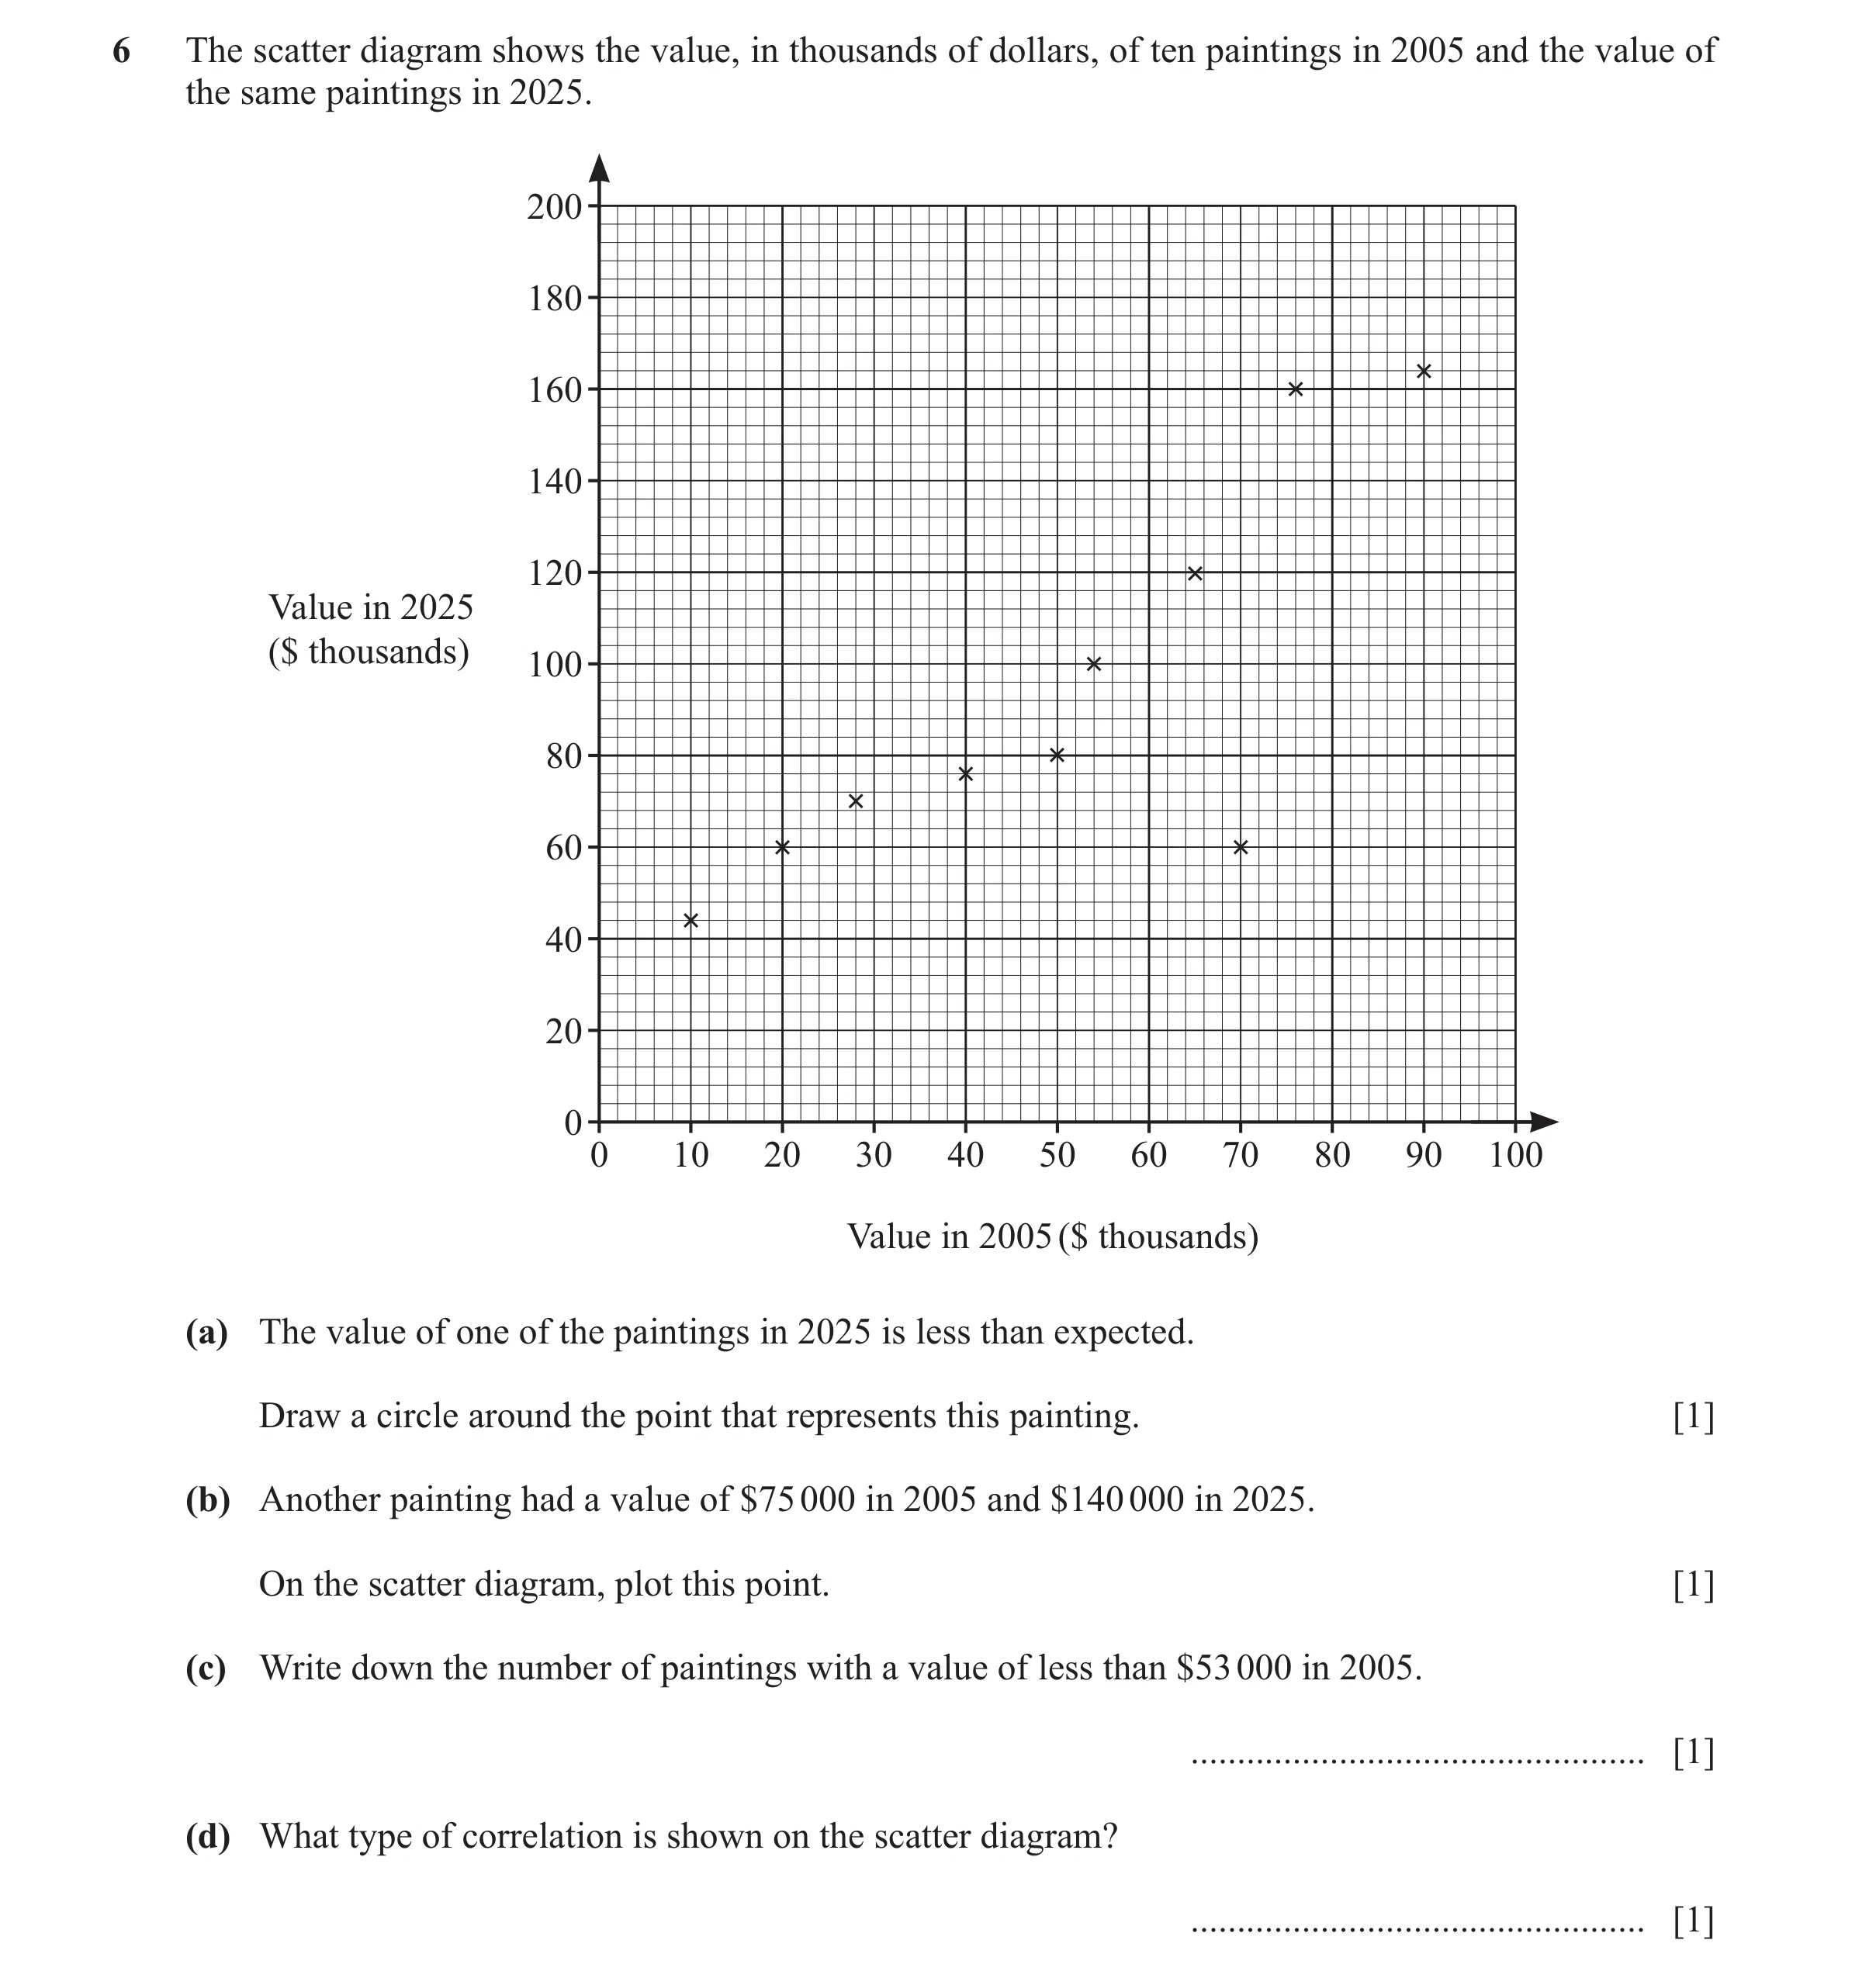
Q29 · The scatter diagram shows the value, in thousands of dollars, of ten paintings in 2005… 0580/23 Oct/Nov 2025
6 The scatter diagram shows the value, in thousands of dollars, of ten paintings in 2005 and the value of the same paintings in 2025. 200 180 160 140 120 Value in 2025 ($ thousands) 100 80 60 40 20 0 0 10 20 30 40 50 60 70 80 90 100 Value in 2005 ($ thousands) (a) The value of one of the paintings in 2025 is less than expected. Draw a circle around the point that represents this painting. [1] (b) Another painting had a value of $75 000 in 2005 and $140 000 in 2025. On the scatter diagram, plot this point. [1] (c) Write down the number of paintings with a value of less than $53 000 in 2005. … [1] (d) What type of correlation is shown on the scatter diagram? … [1]
4 marks
Mark scheme: 6(a) A ring around the point (70, 60) 1 6(b) Point correctly plotted at (75, 140) 1 6(c) 5 1 6(d) Positive 1
This question in 0580/23 Oct/Nov 2025
 1 / 29
 2 / 29
 3 / 29
 4 / 29
 5 / 29
 6 / 29
 7 / 29
 8 / 29
 9 / 29
 10 / 29
 11 / 29
 12 / 29
 13 / 29
 14 / 29
 15 / 29
 16 / 29
 17 / 29
 18 / 29
 19 / 29
 20 / 29
 21 / 29
 22 / 29
 23 / 29
 24 / 29
 25 / 29
 26 / 29
 27 / 29
 28 / 29
 29 / 29
 5
5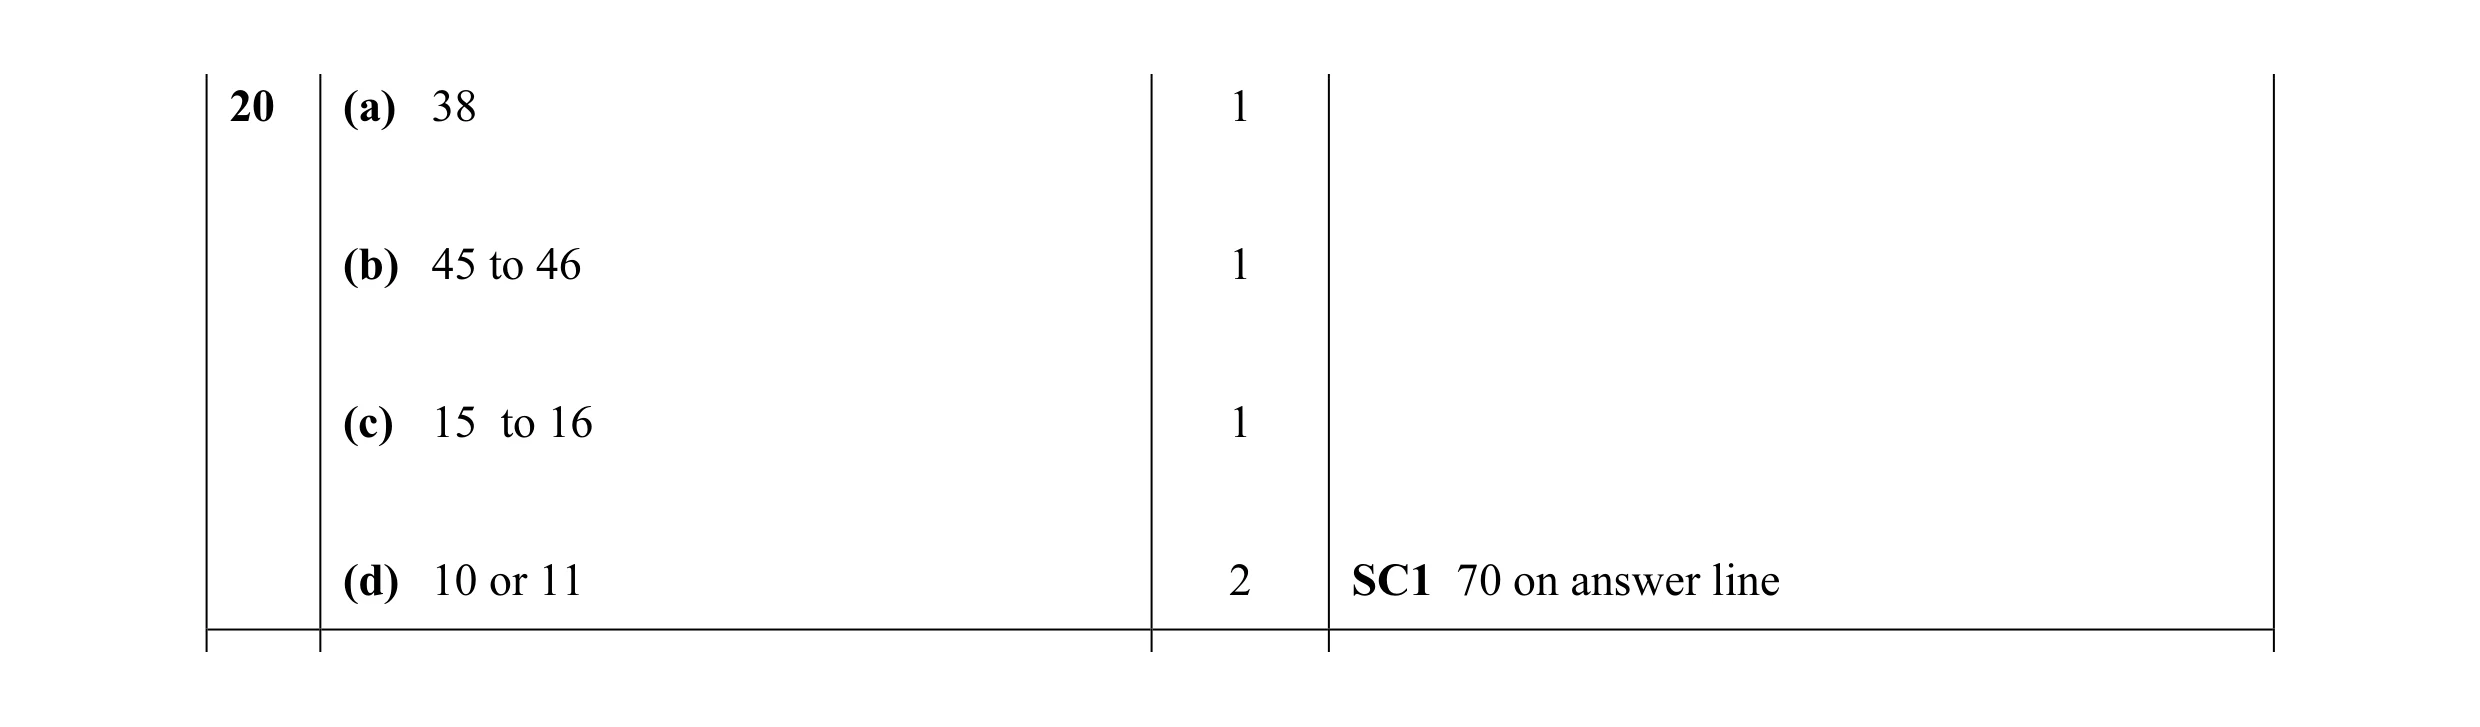 5
5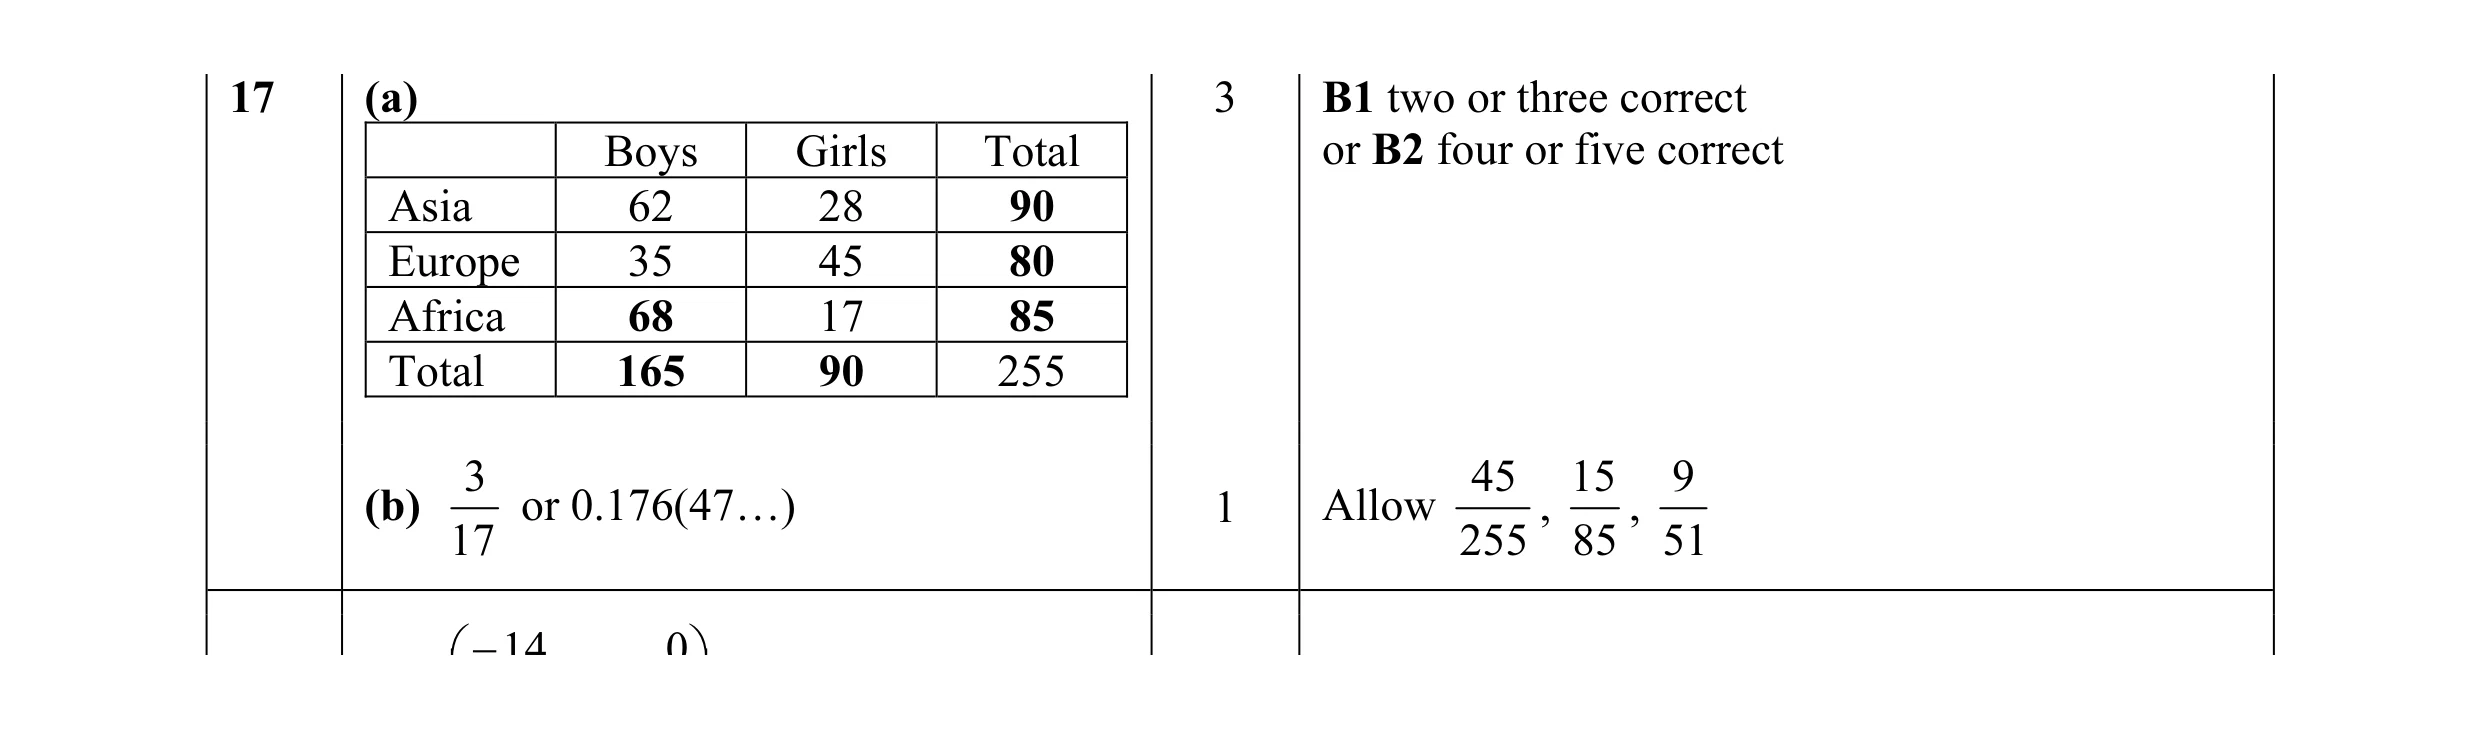 4
4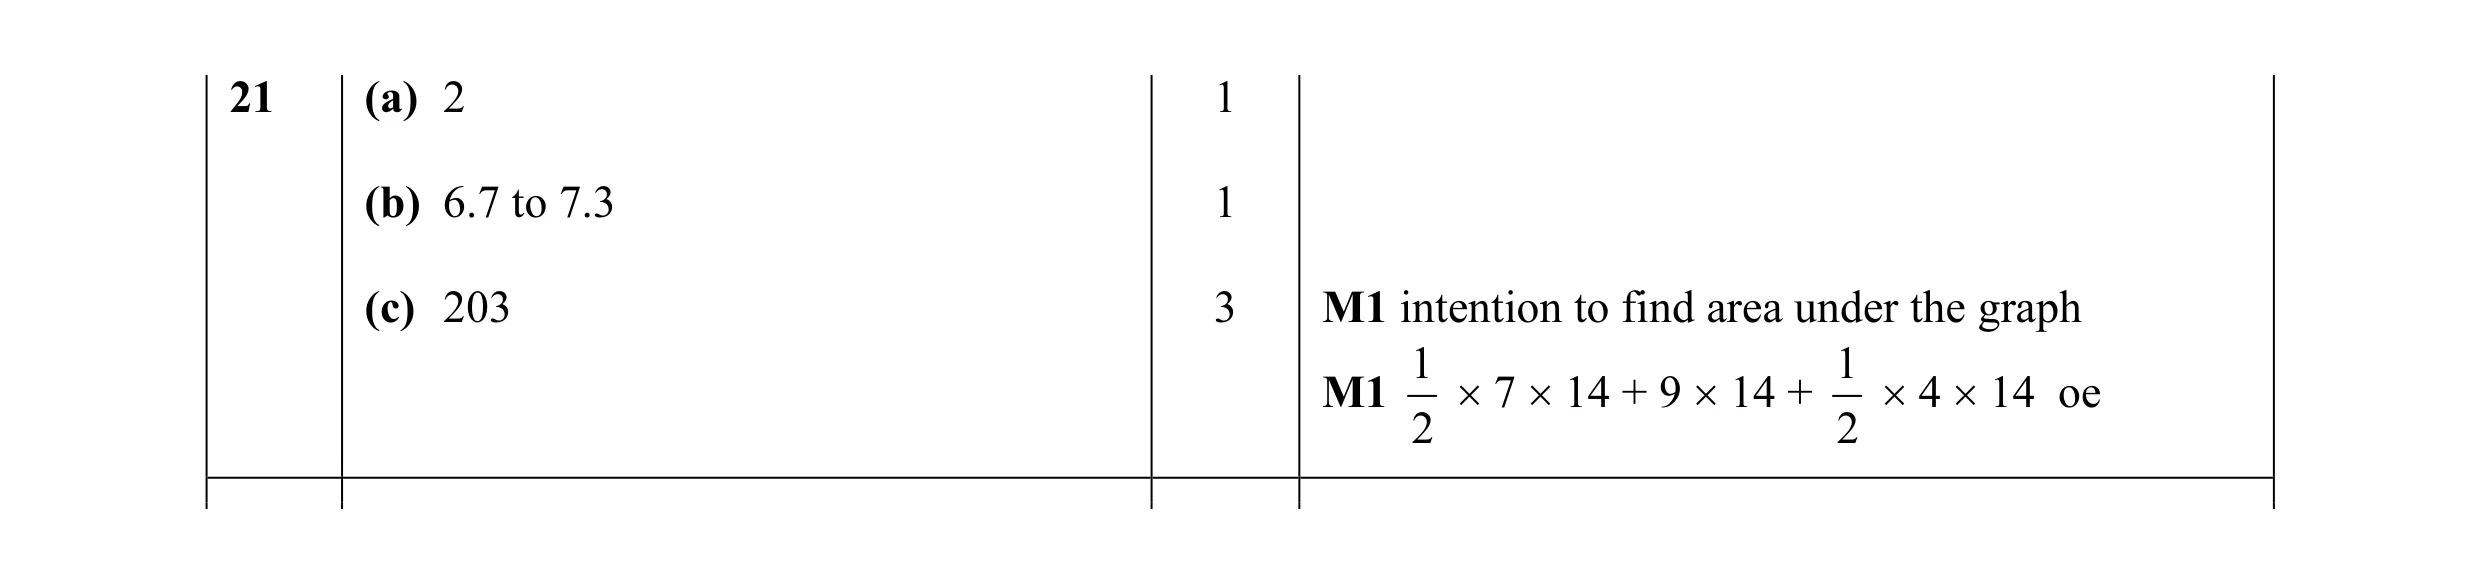 5
5 4
4 4
4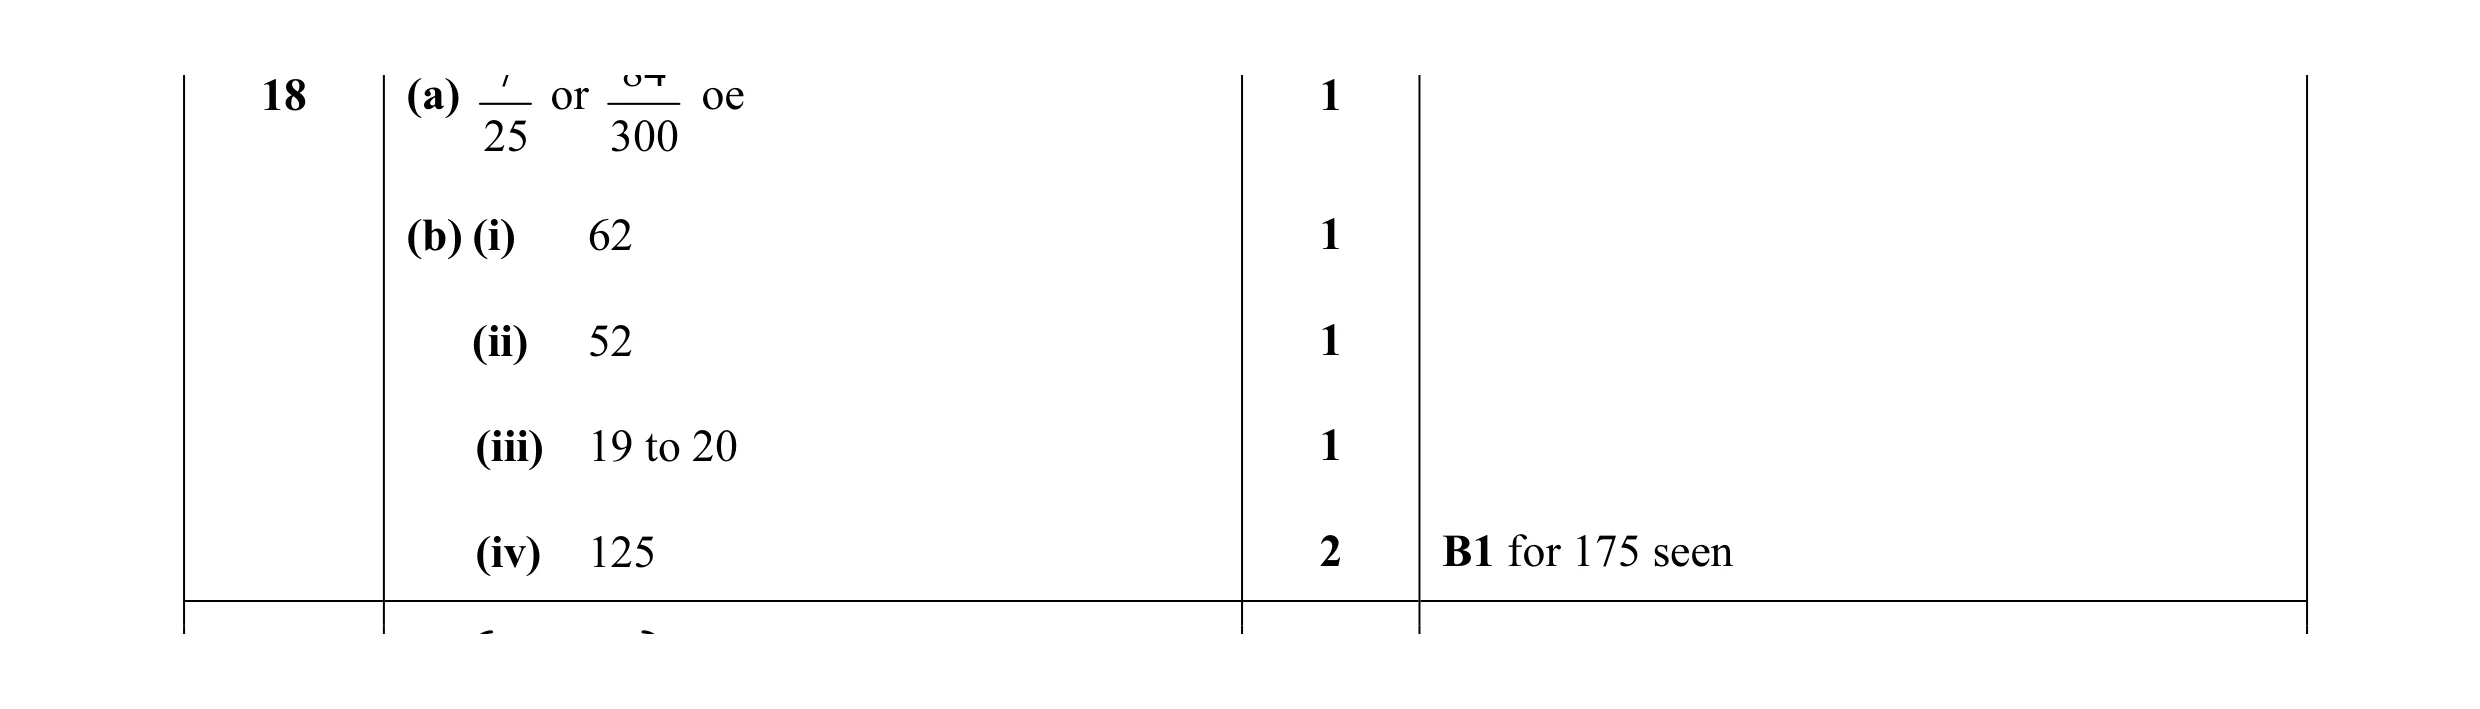 6
6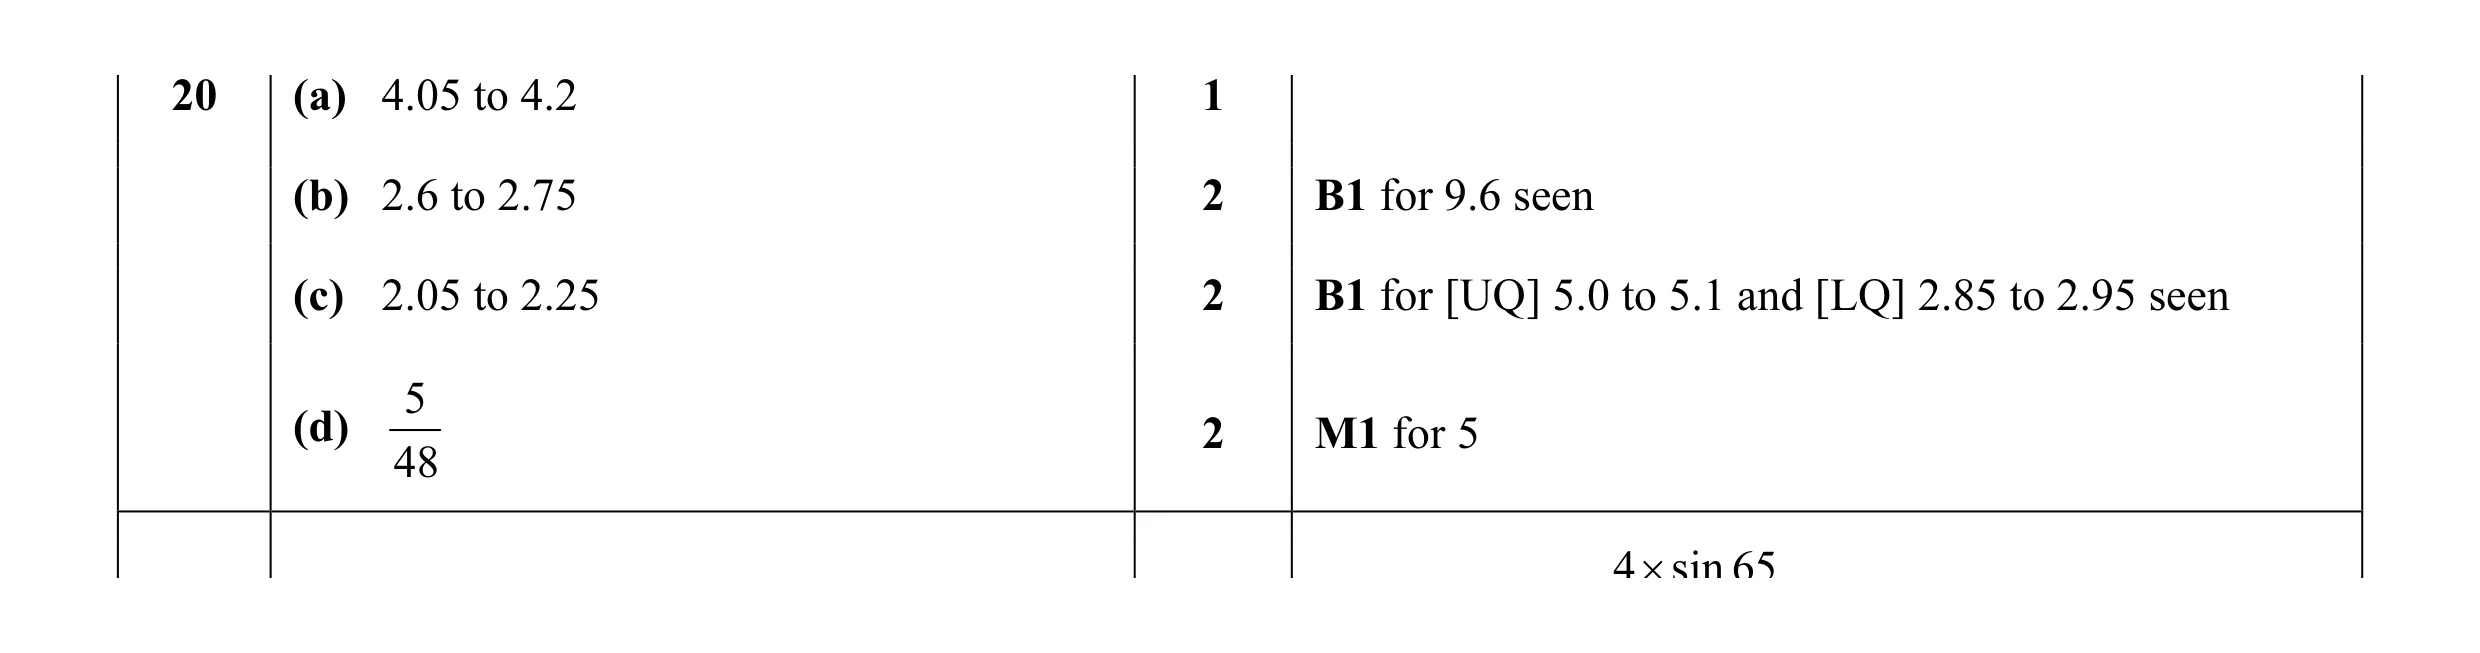 7
7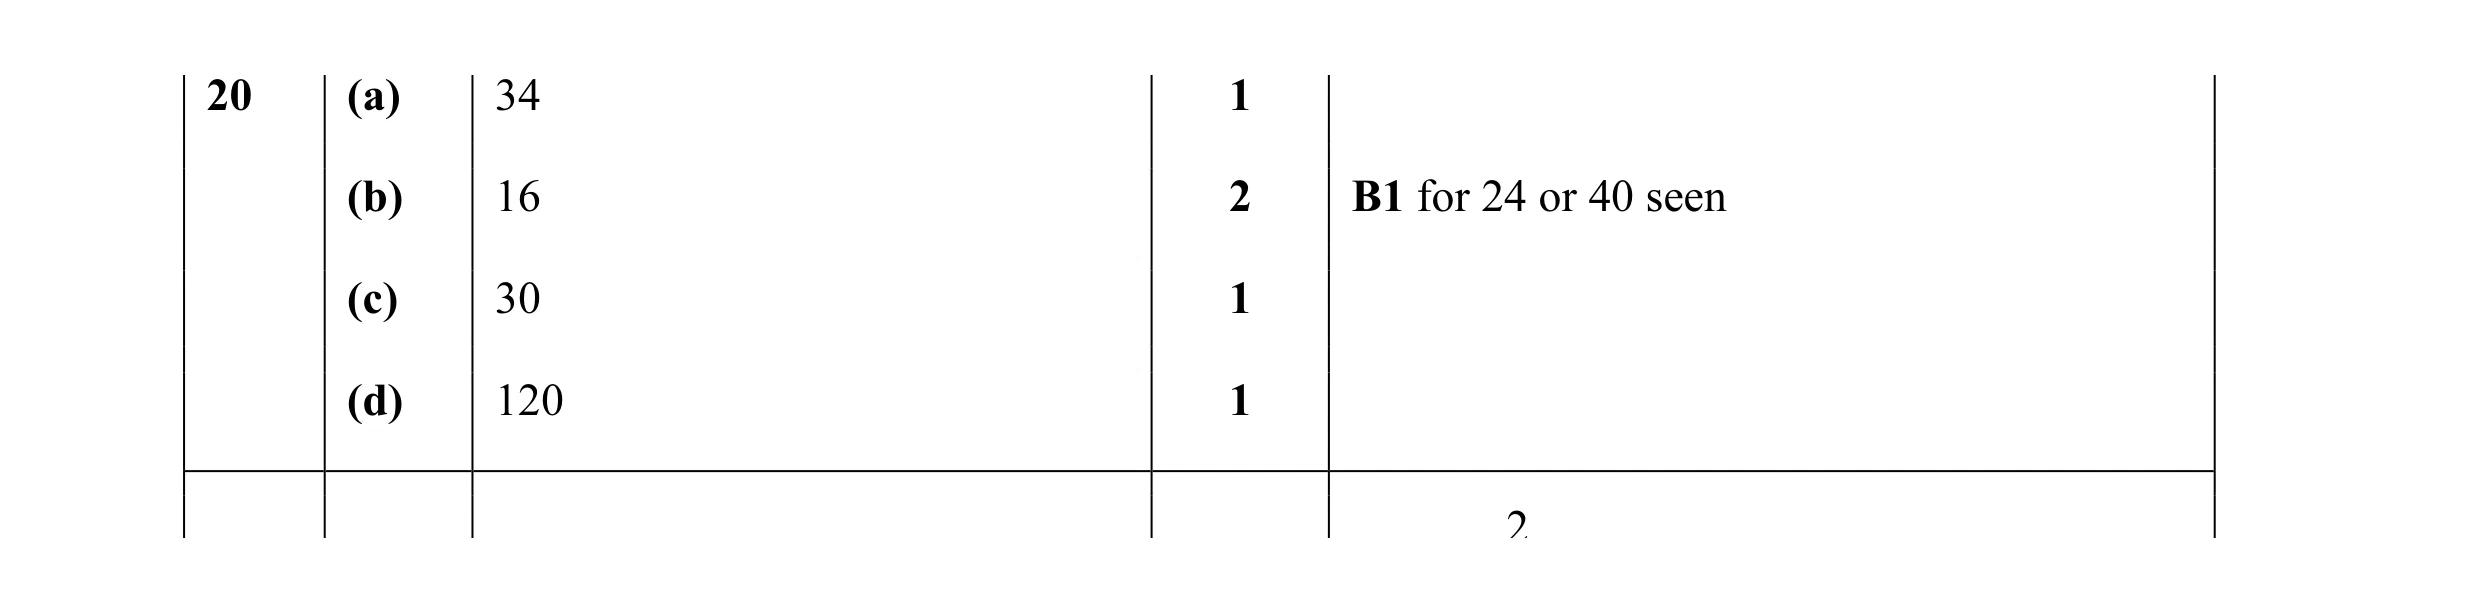 5
5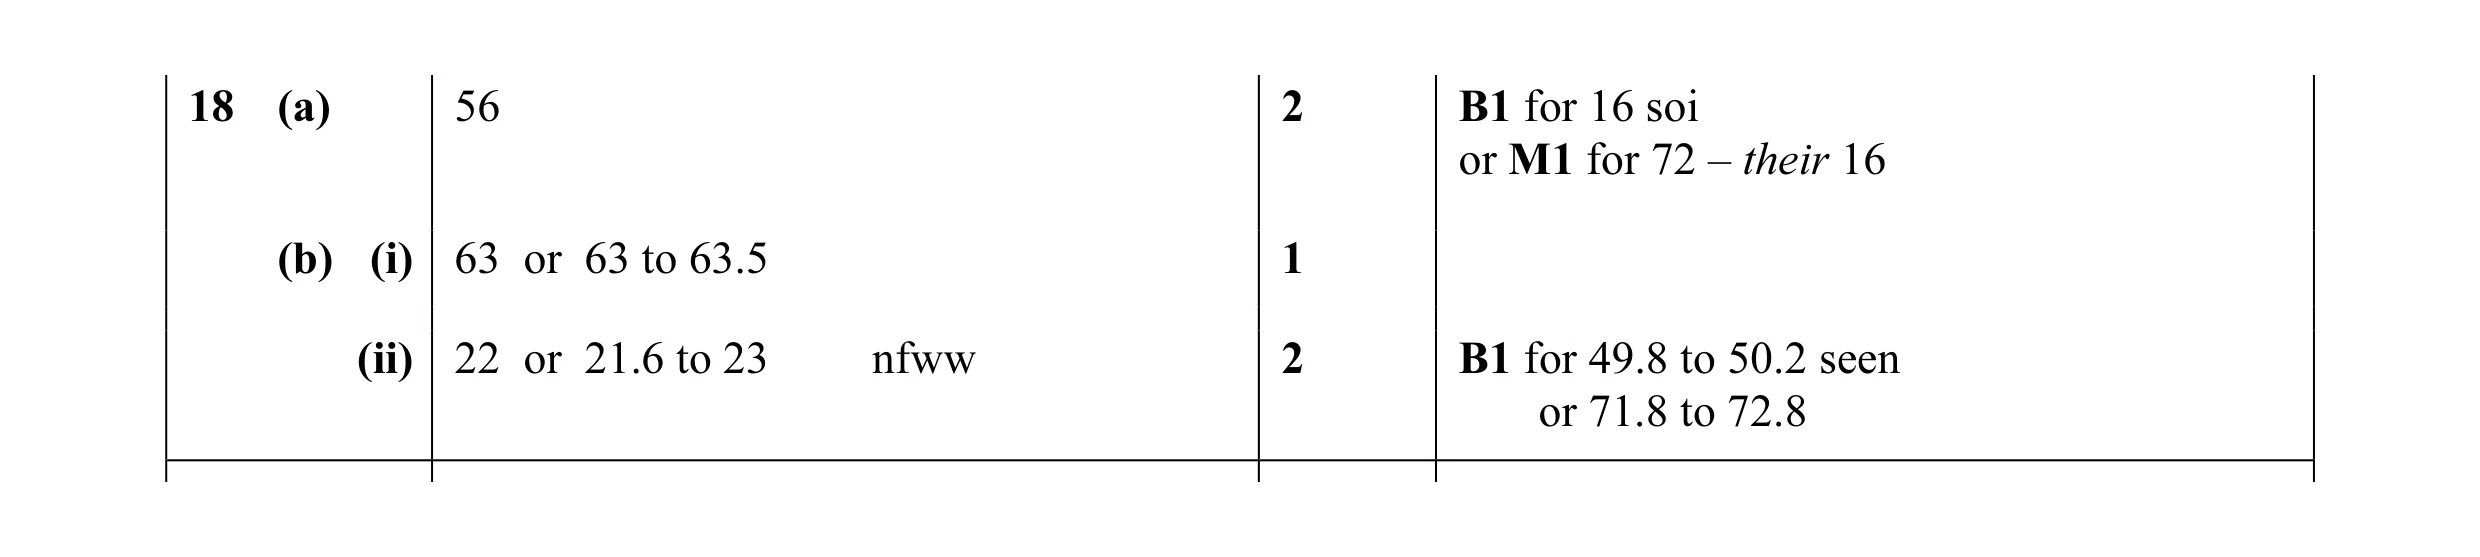 5
5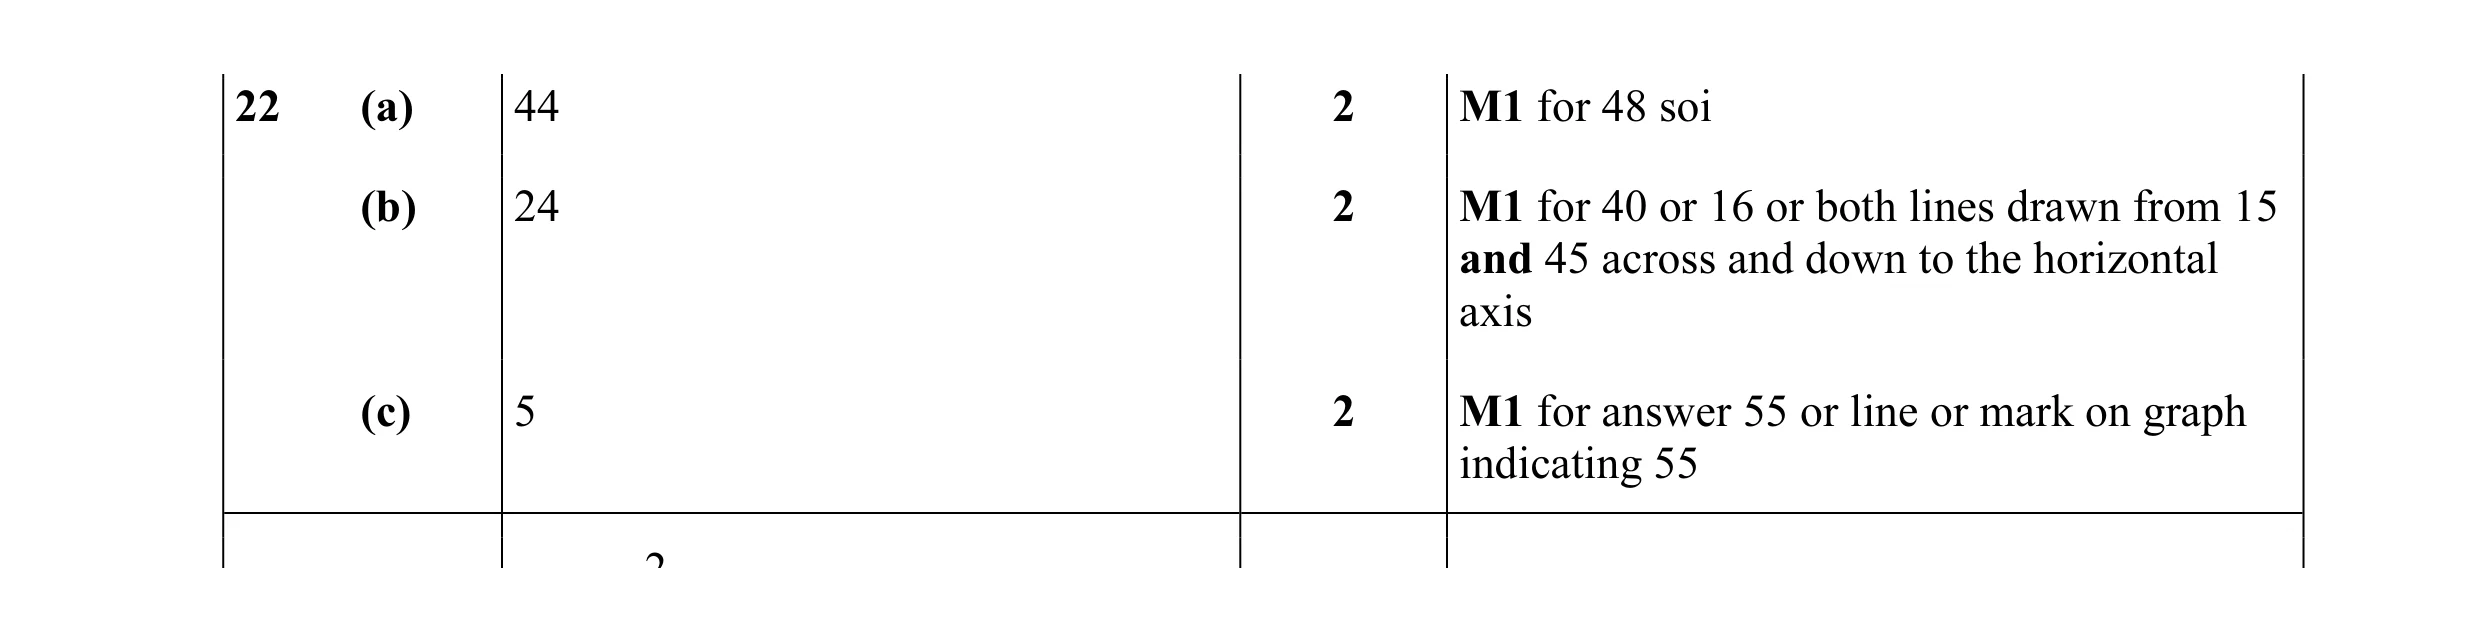 6
6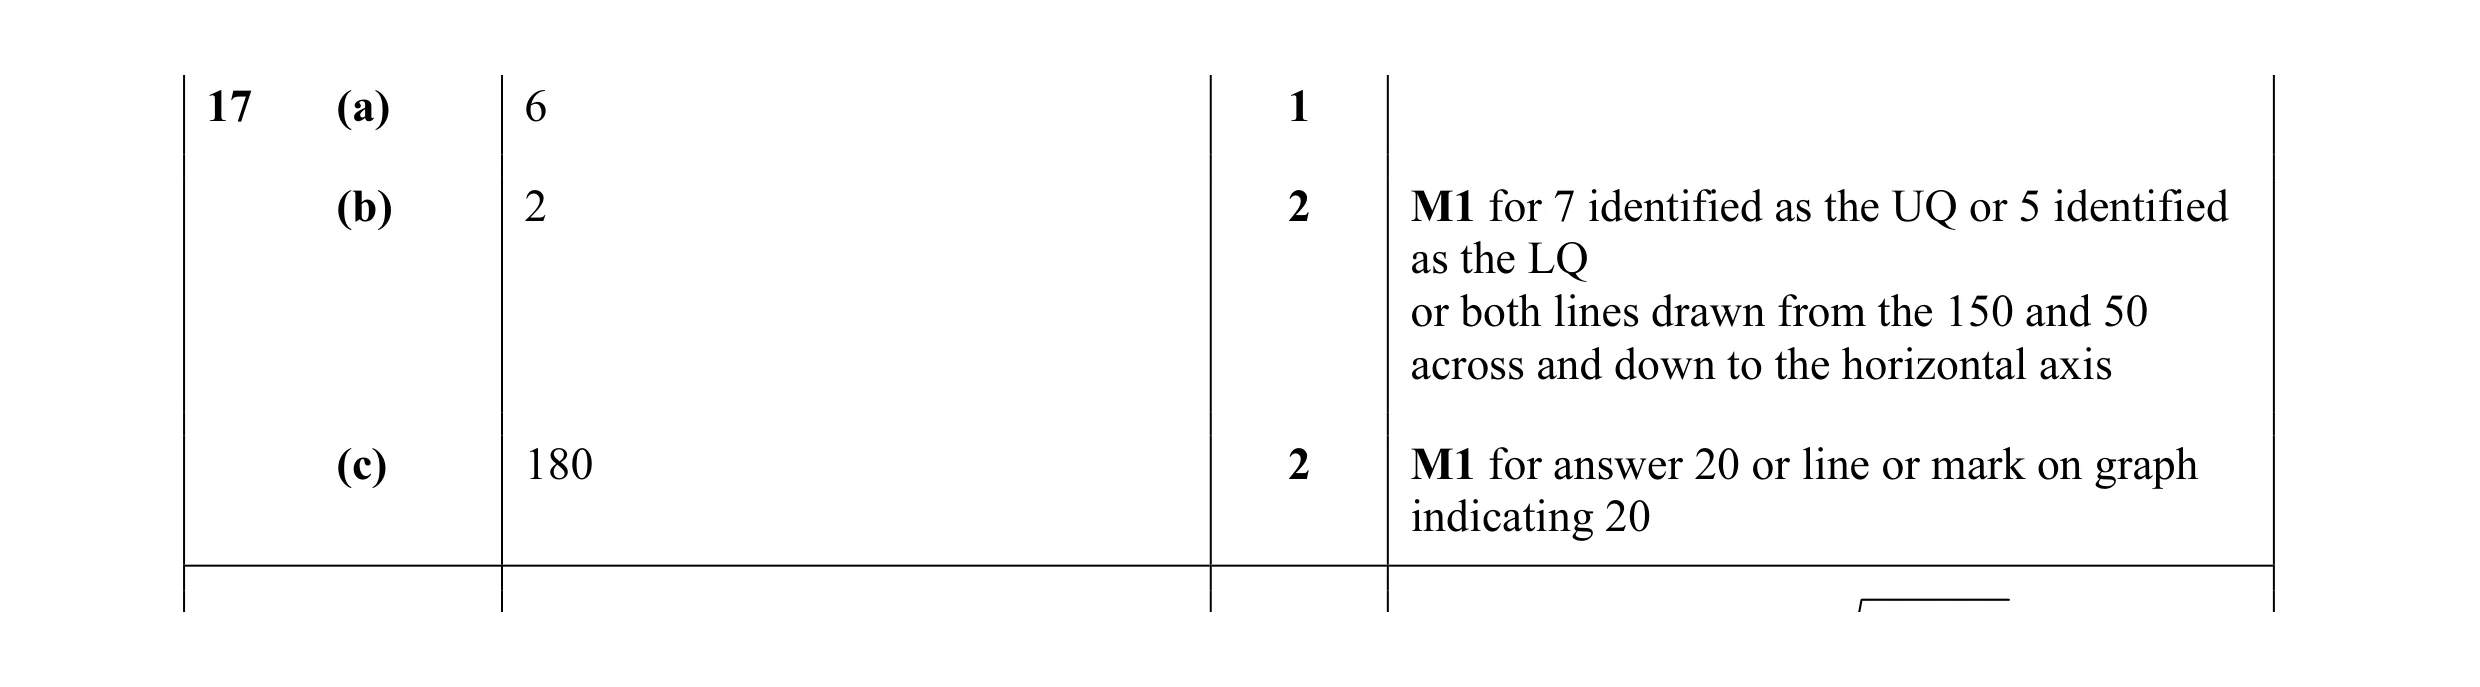 5
5 5
5 2
2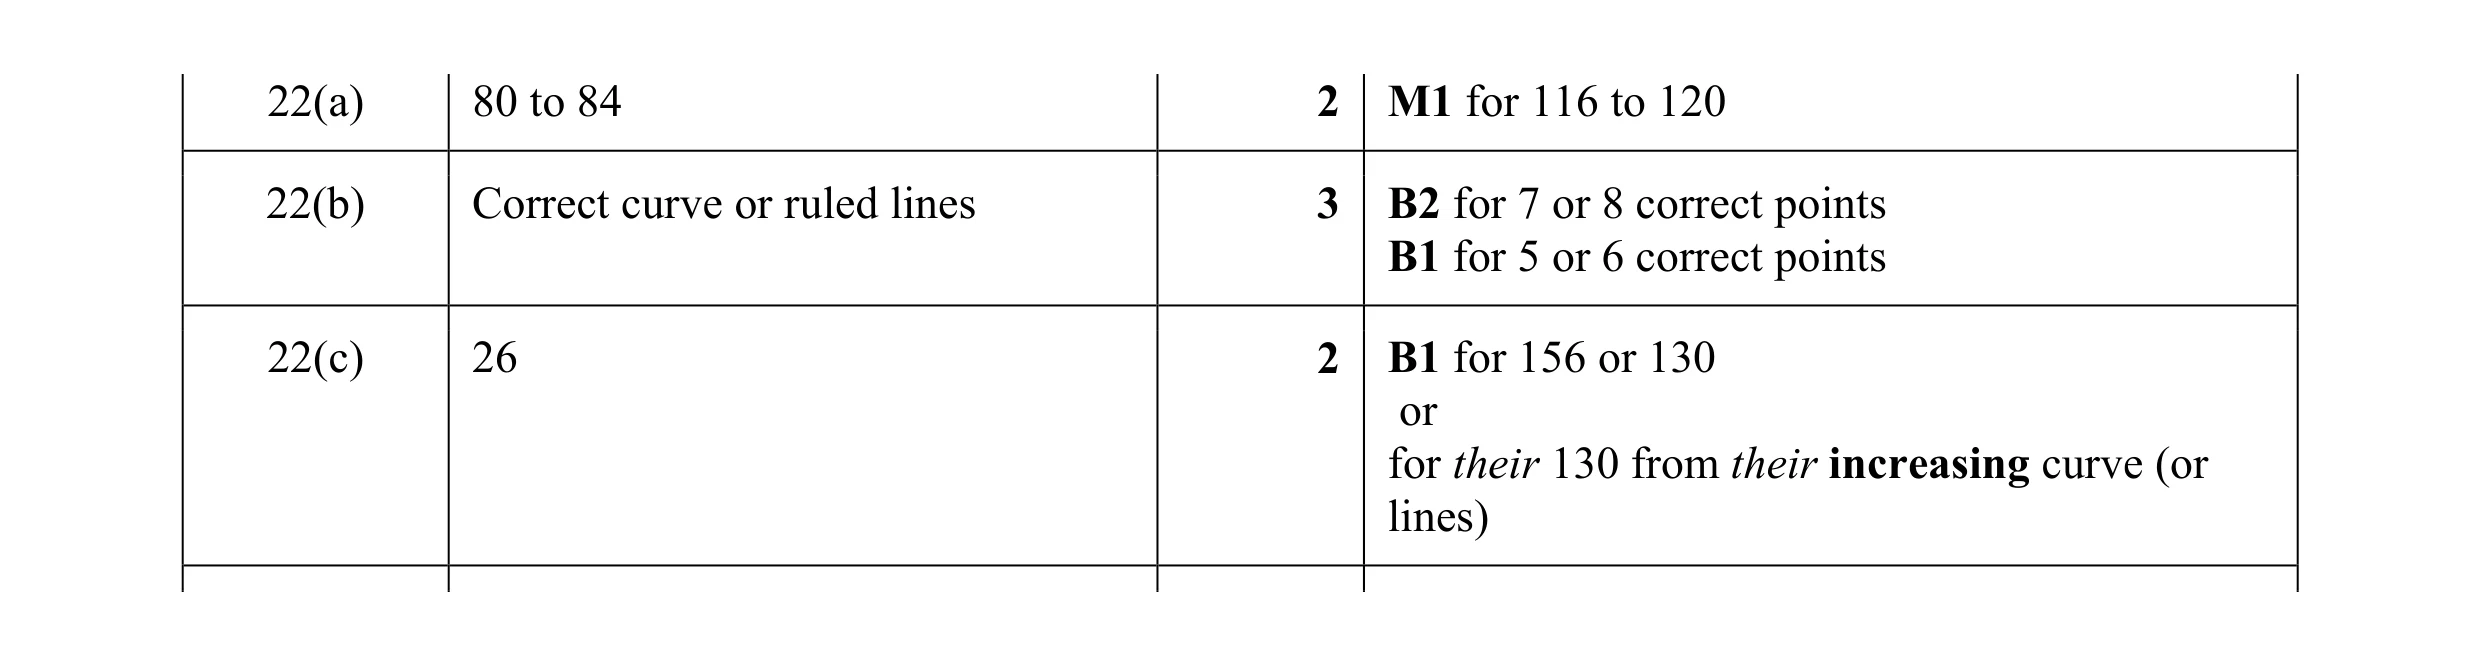 7
7 4
4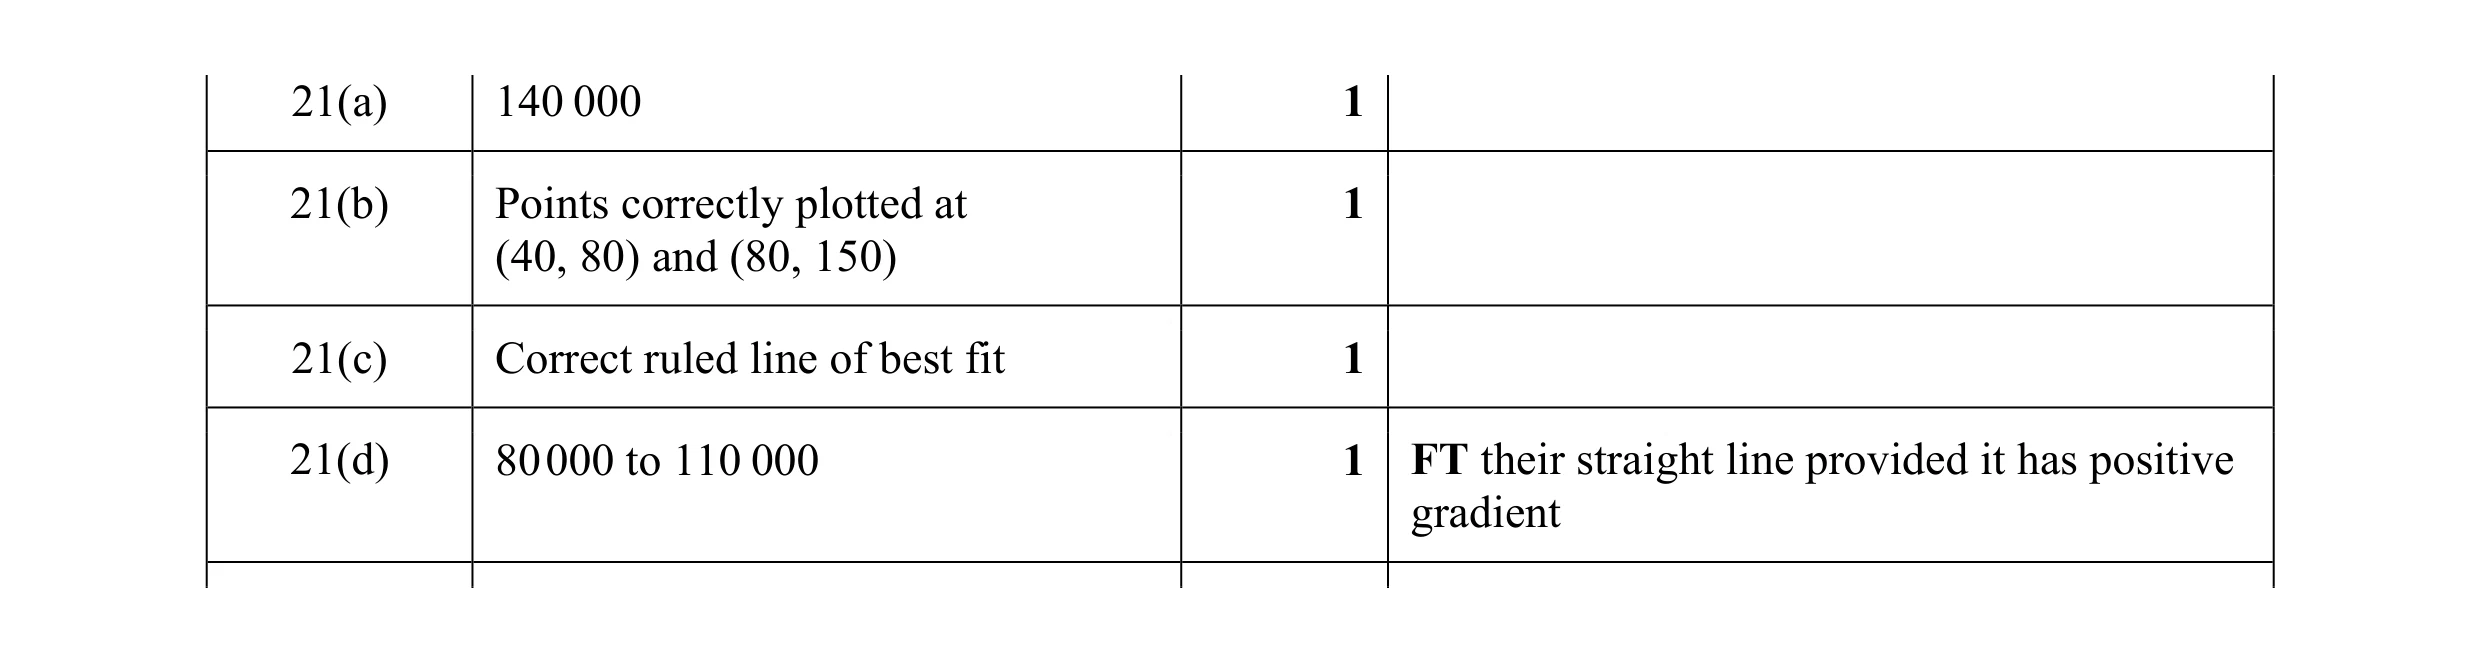 4
4 5
5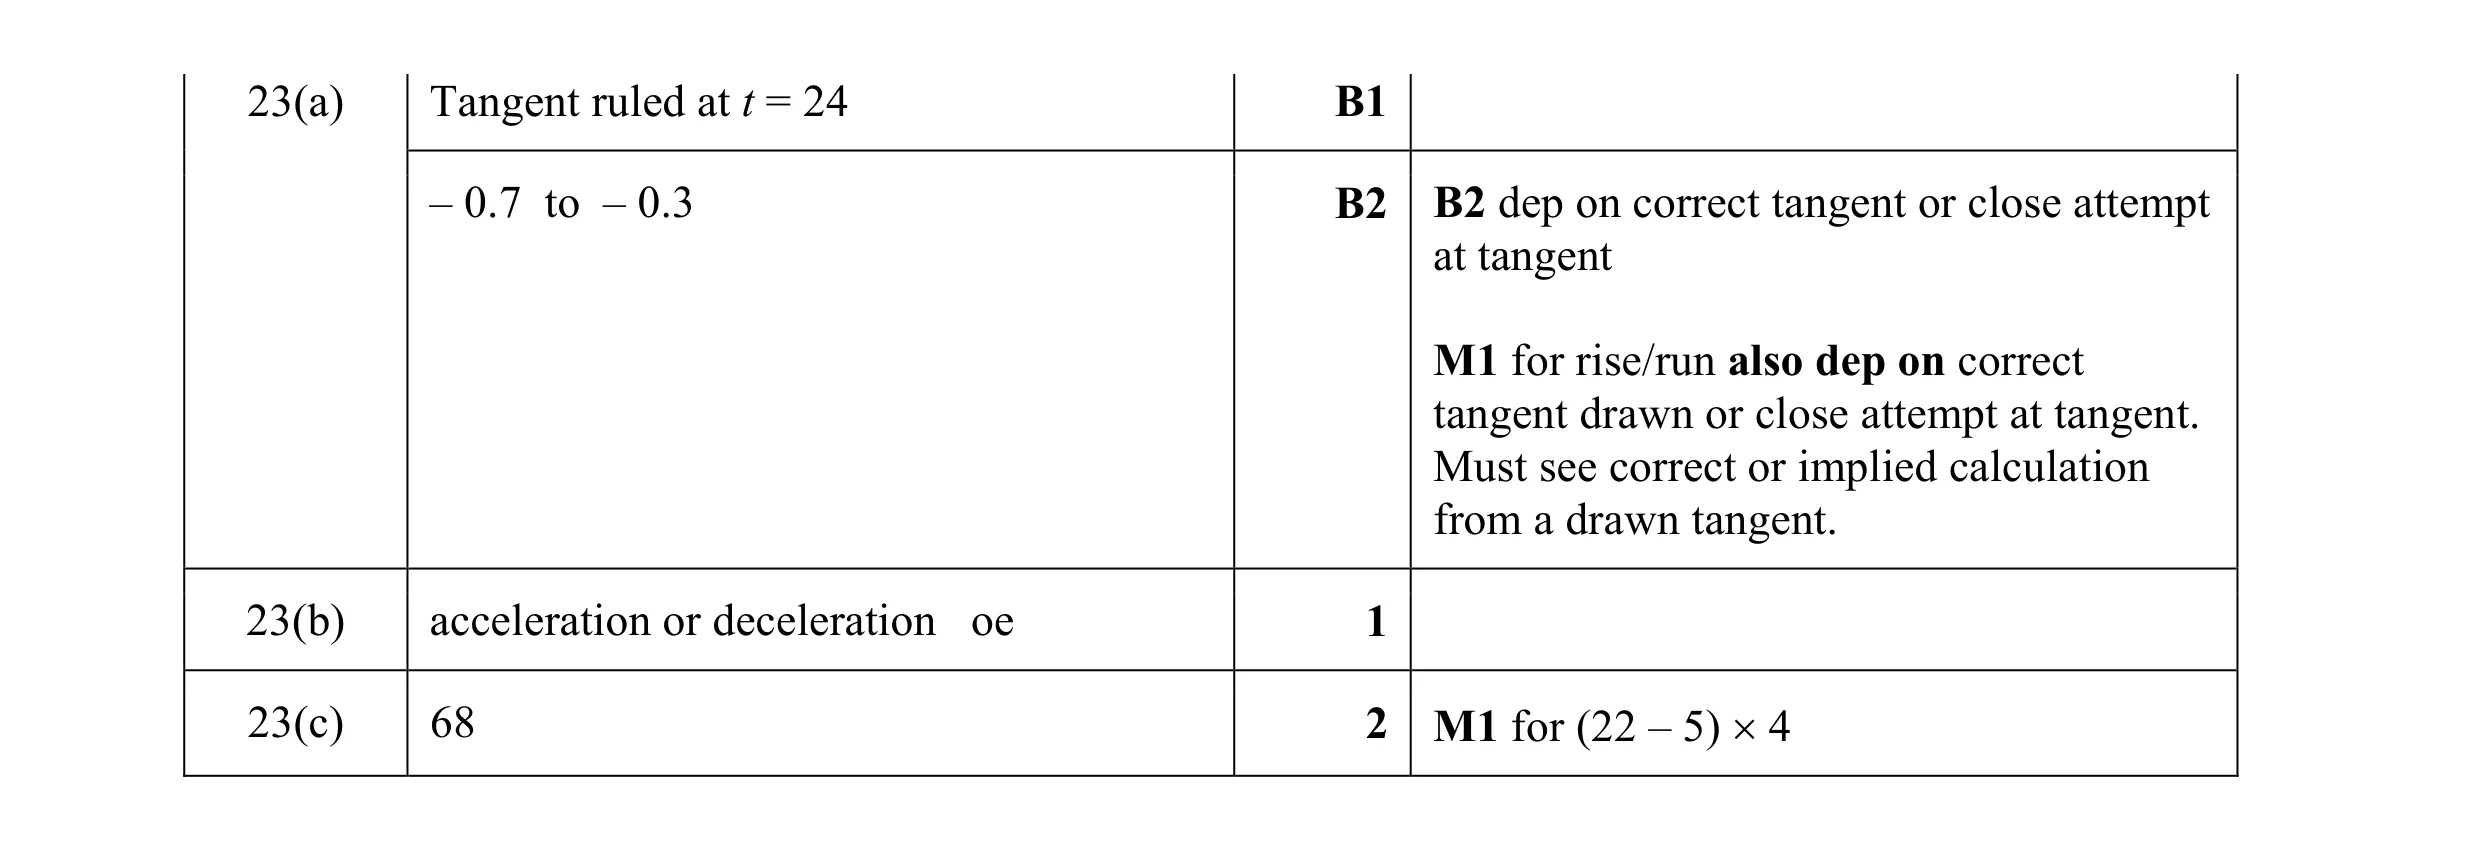 6
6 3
3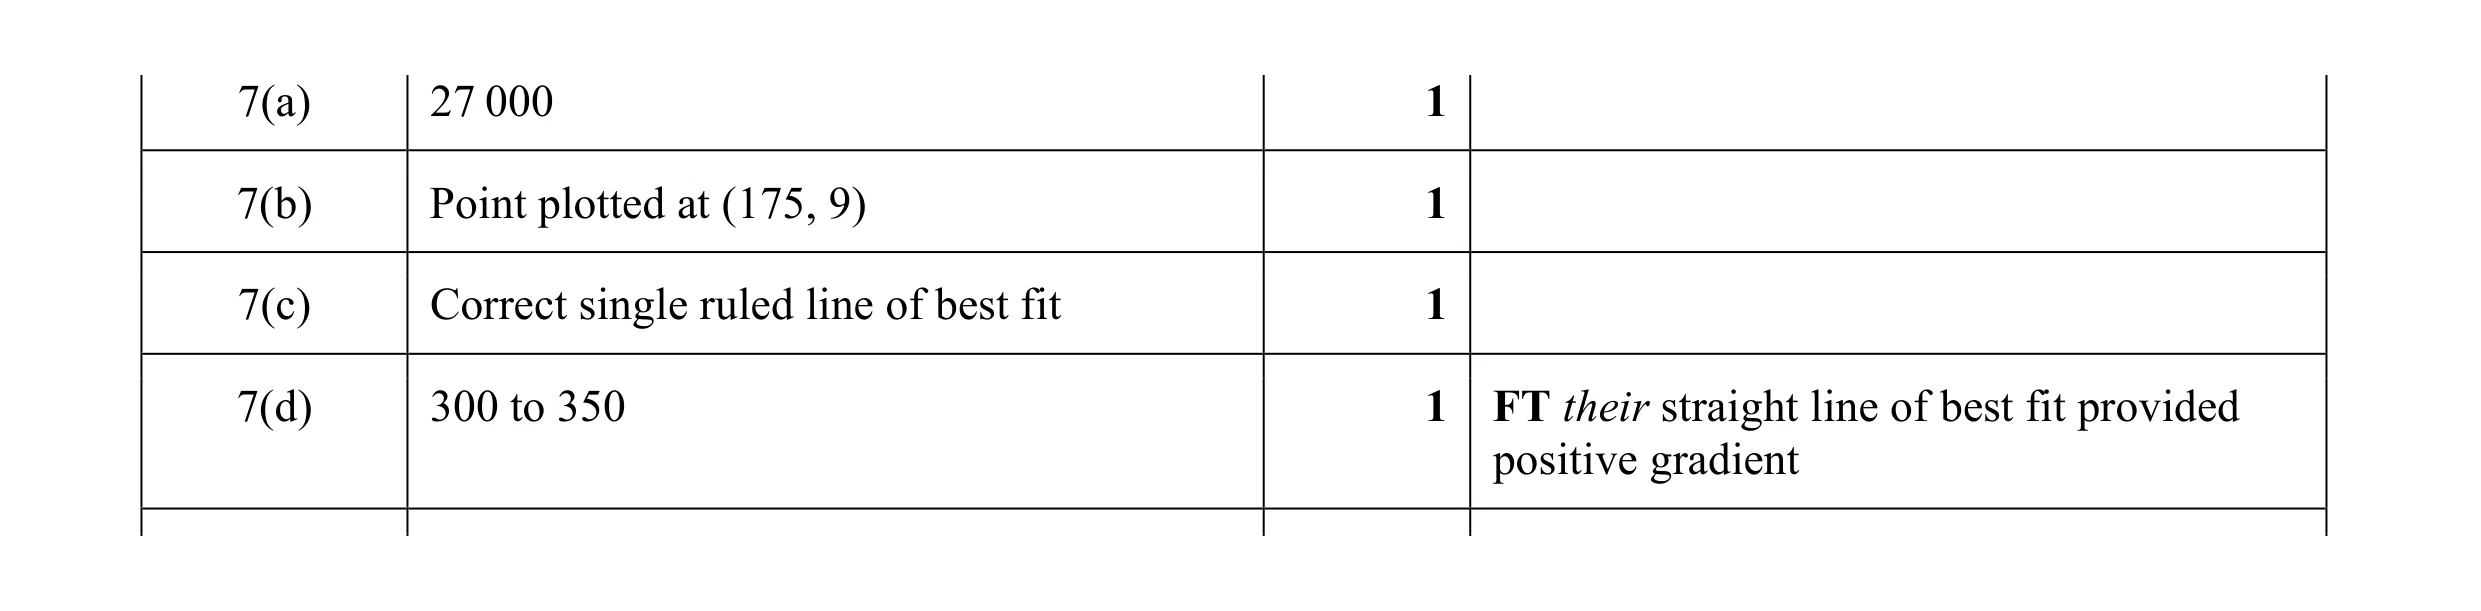 4
4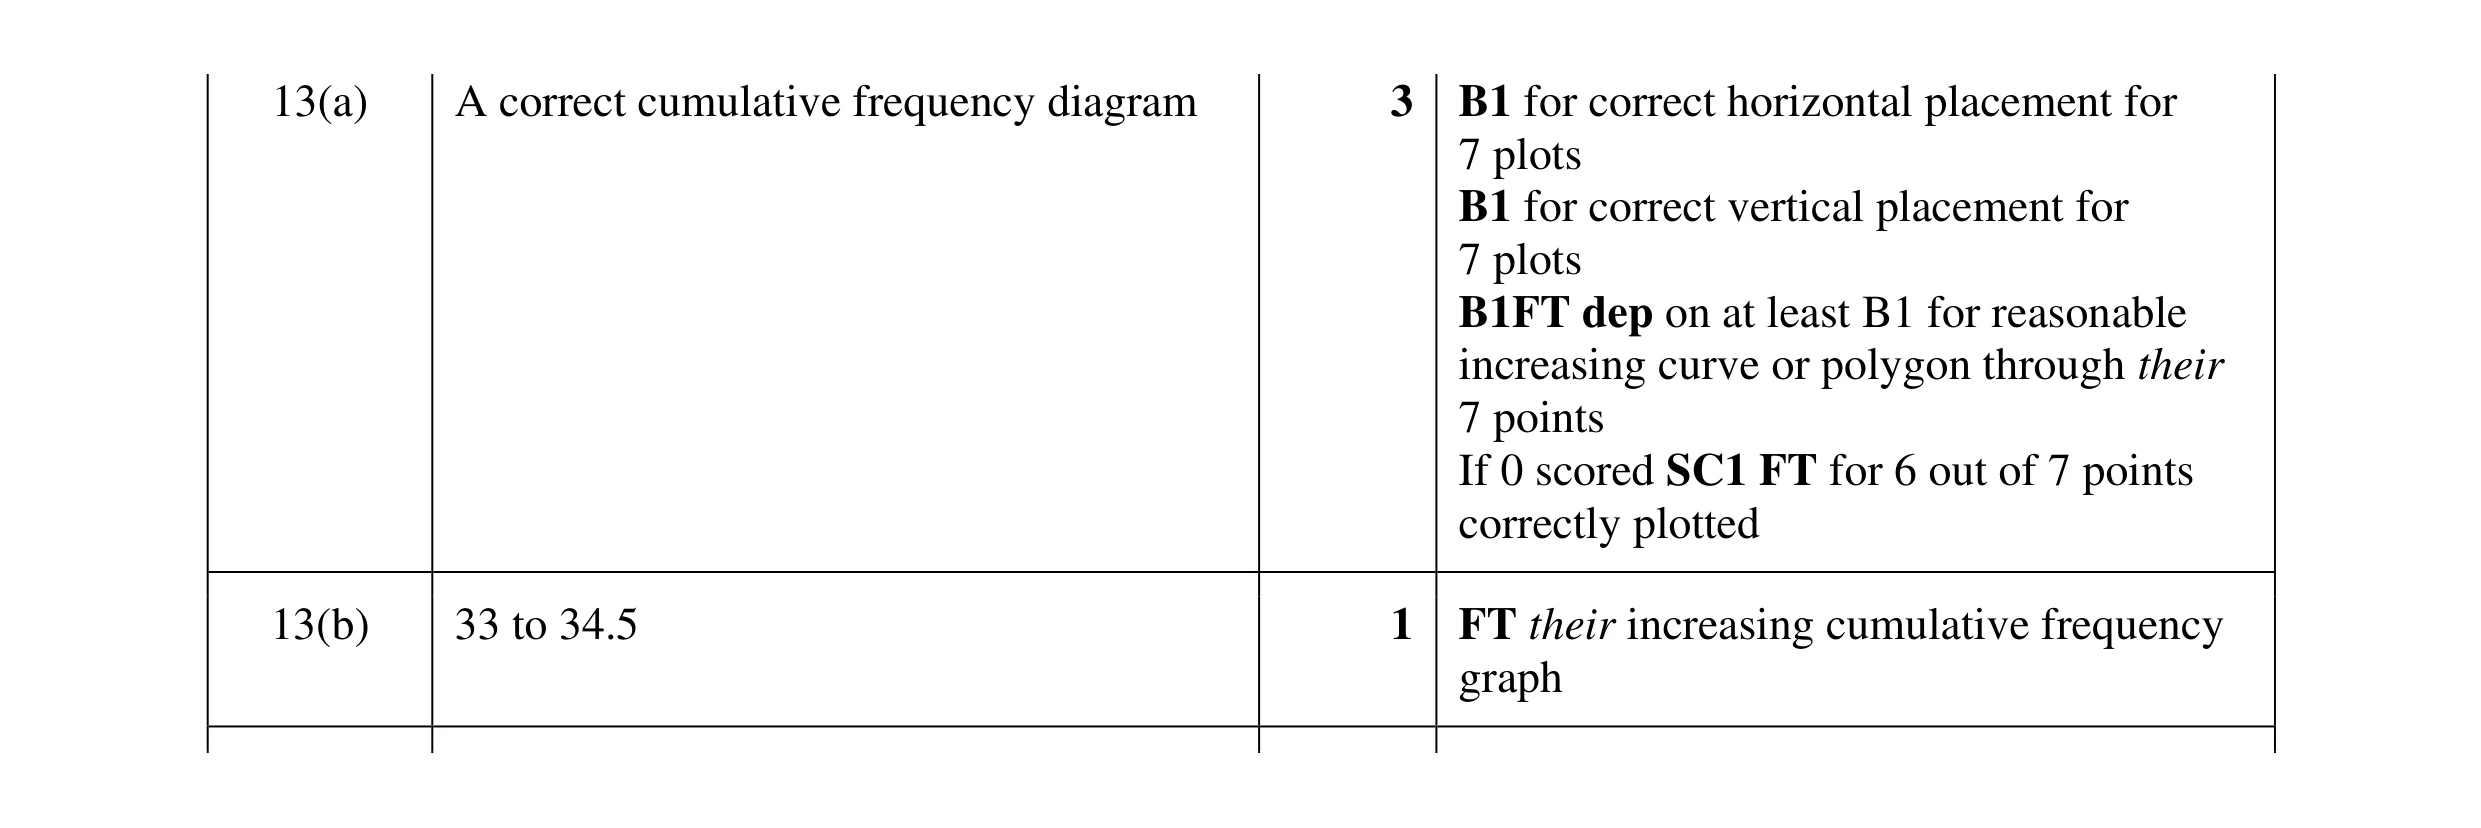 4
4 2
2 2
2 4
4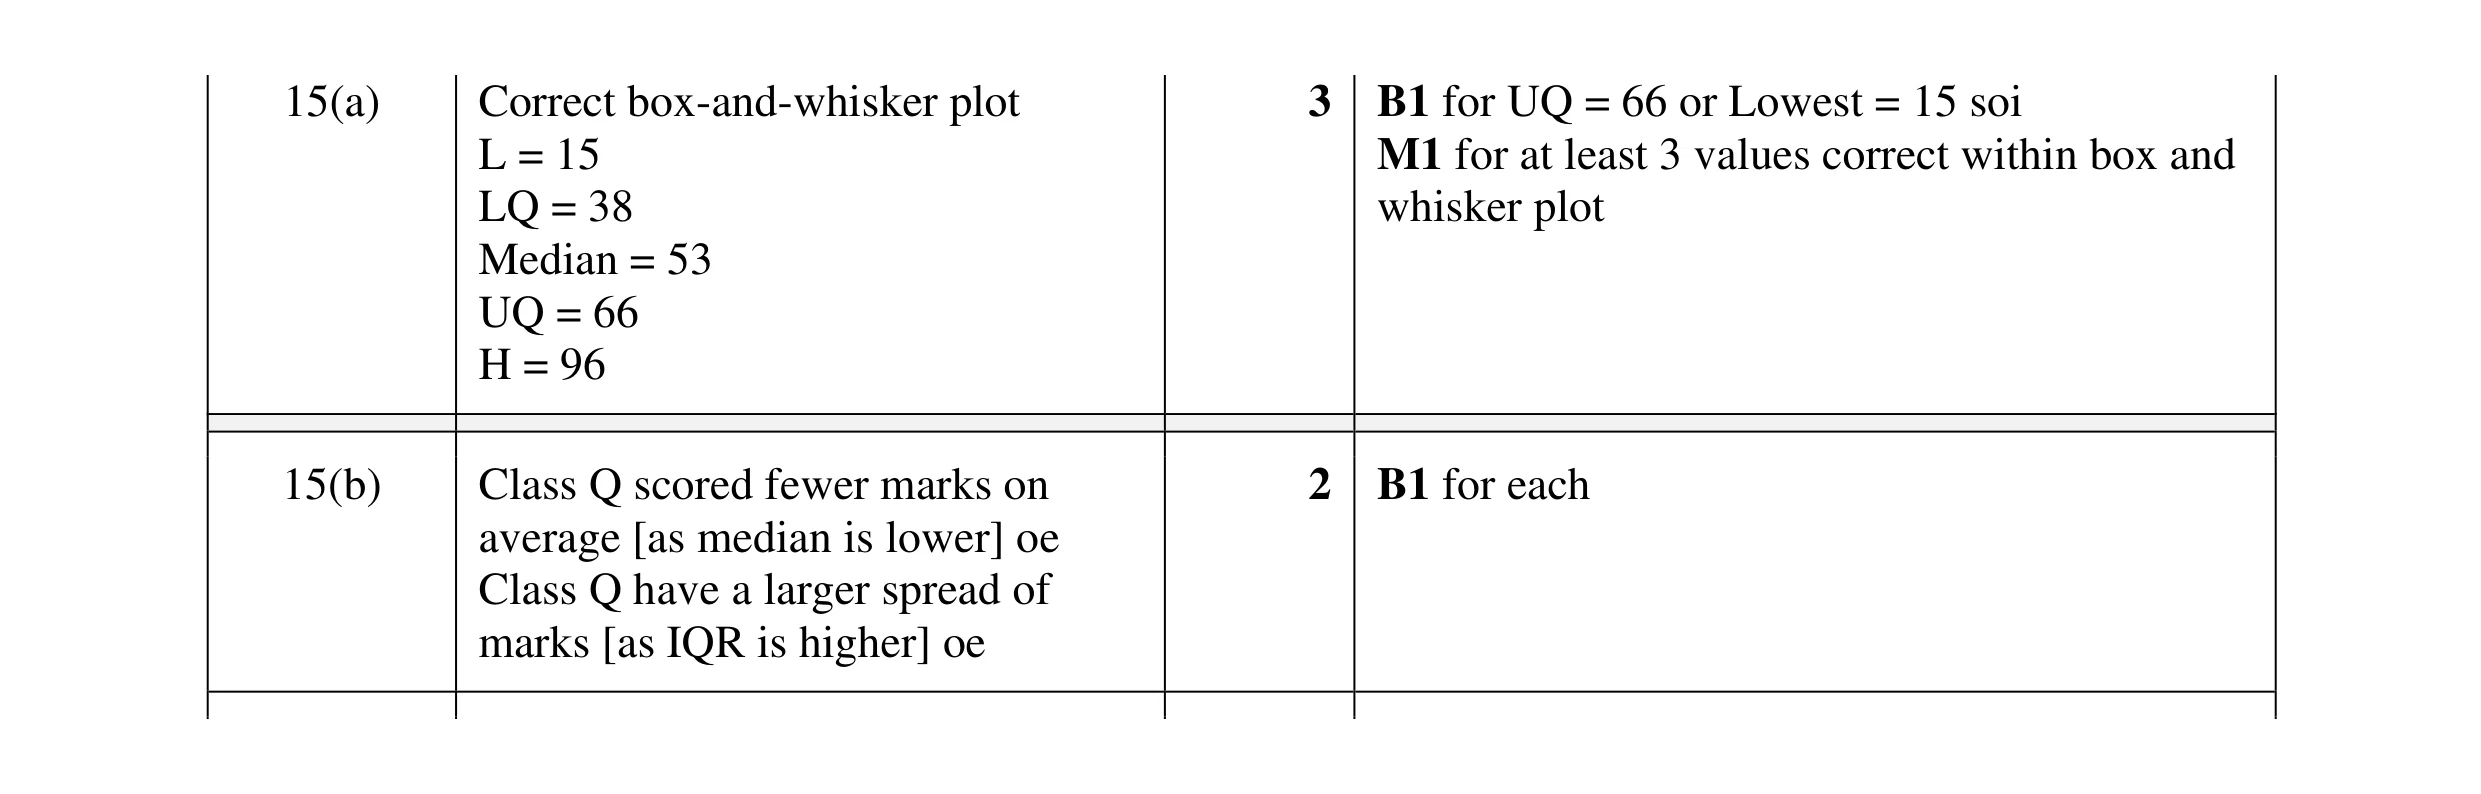 5
5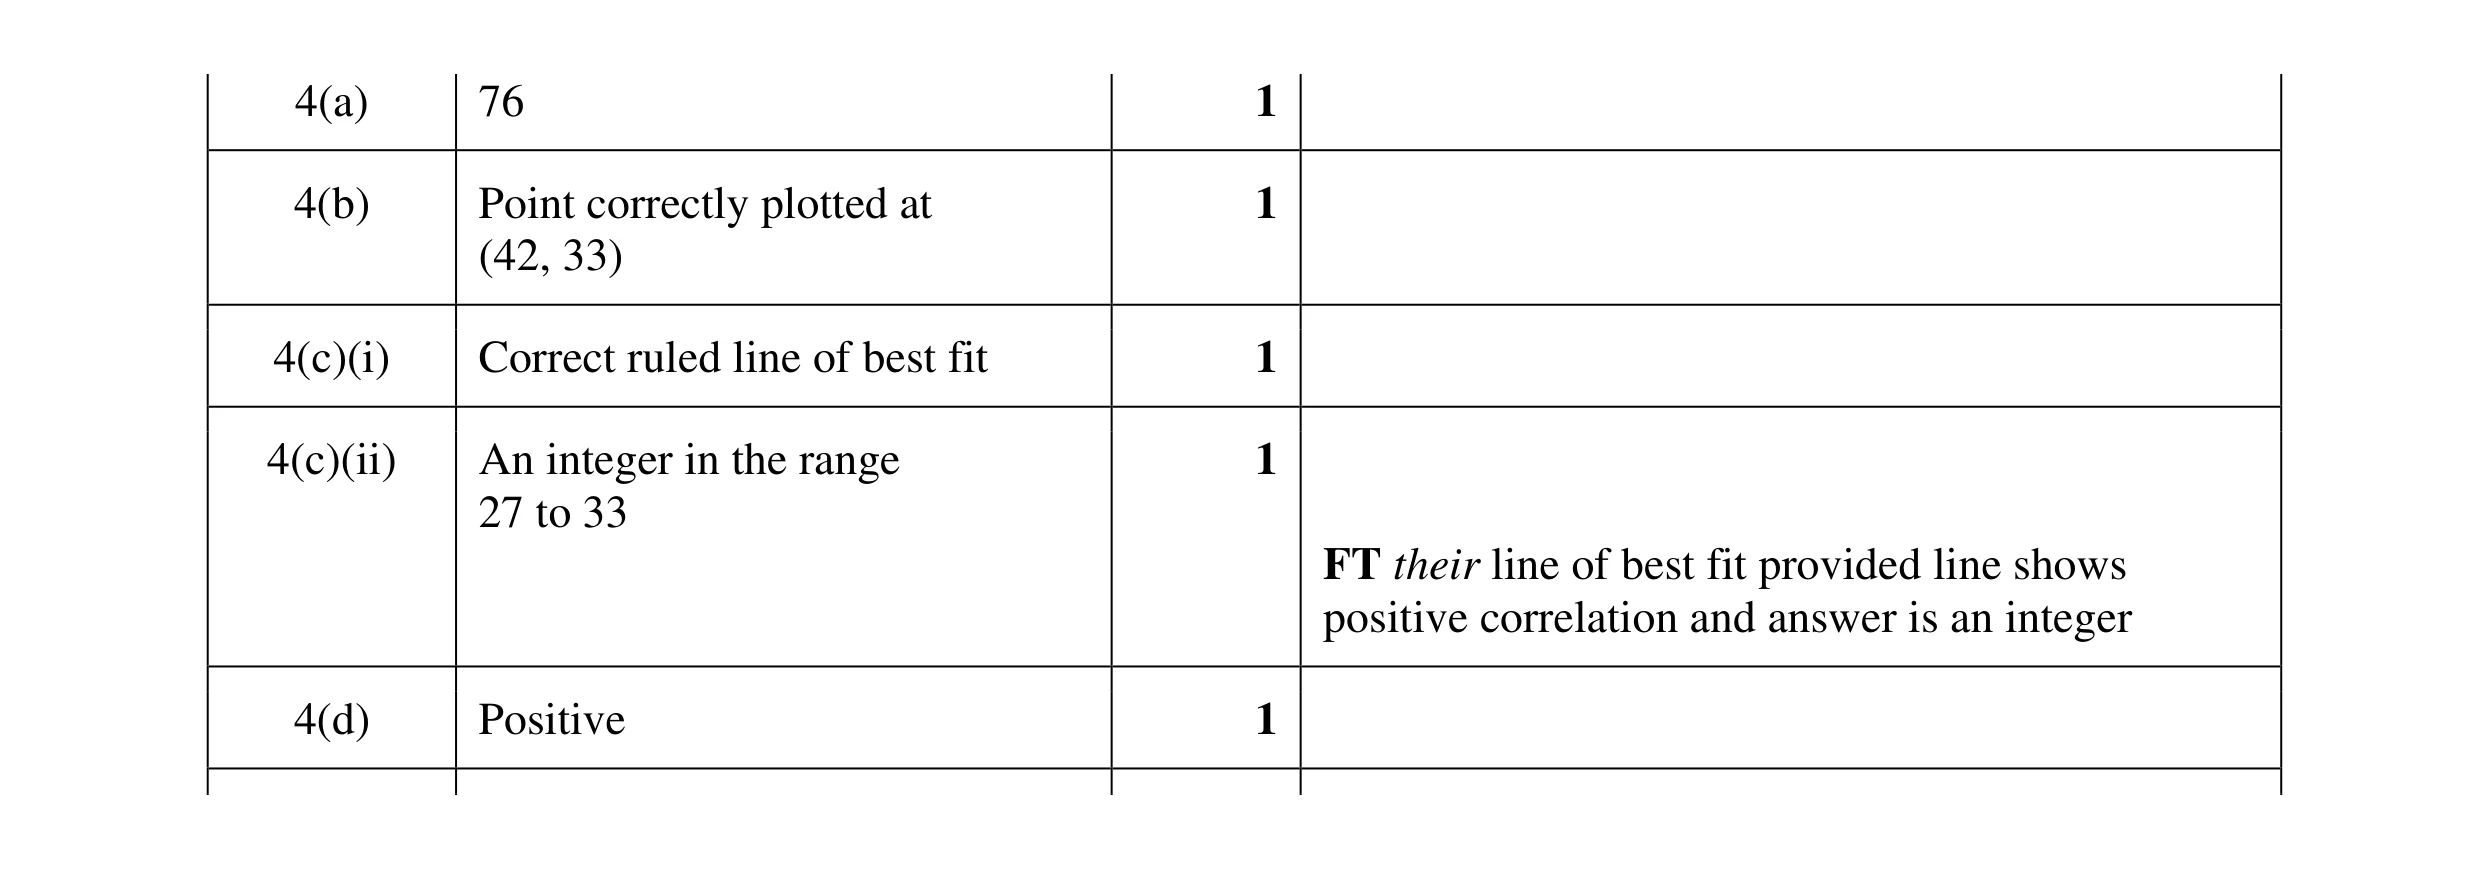 5
5 4
4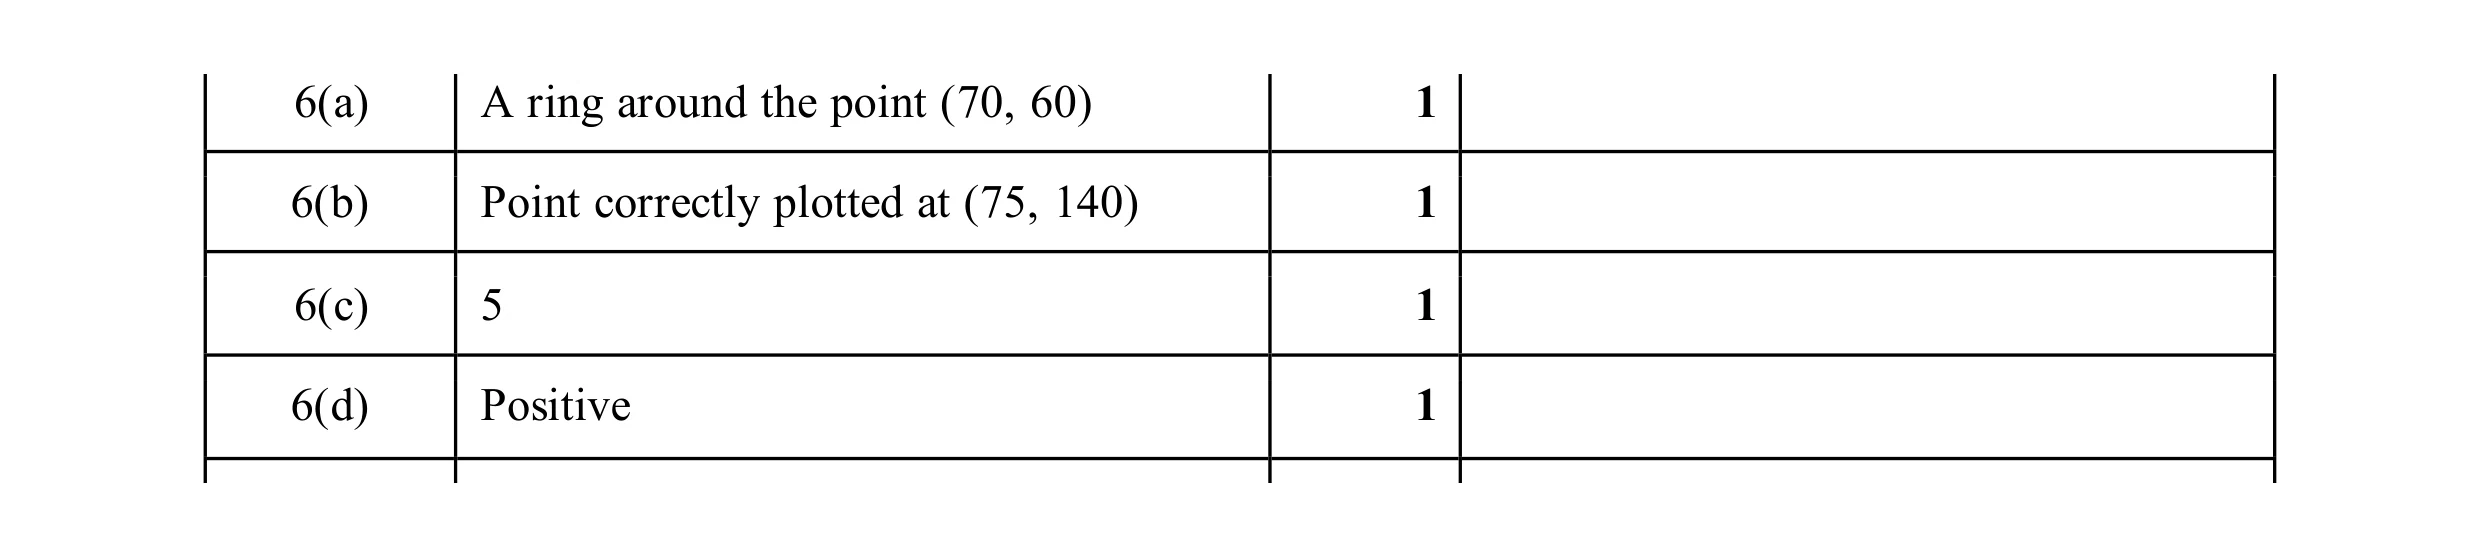 4
4