Questions as text
Q1 · State what is meant by acoustic impedance 9702/41 Oct/Nov 2007
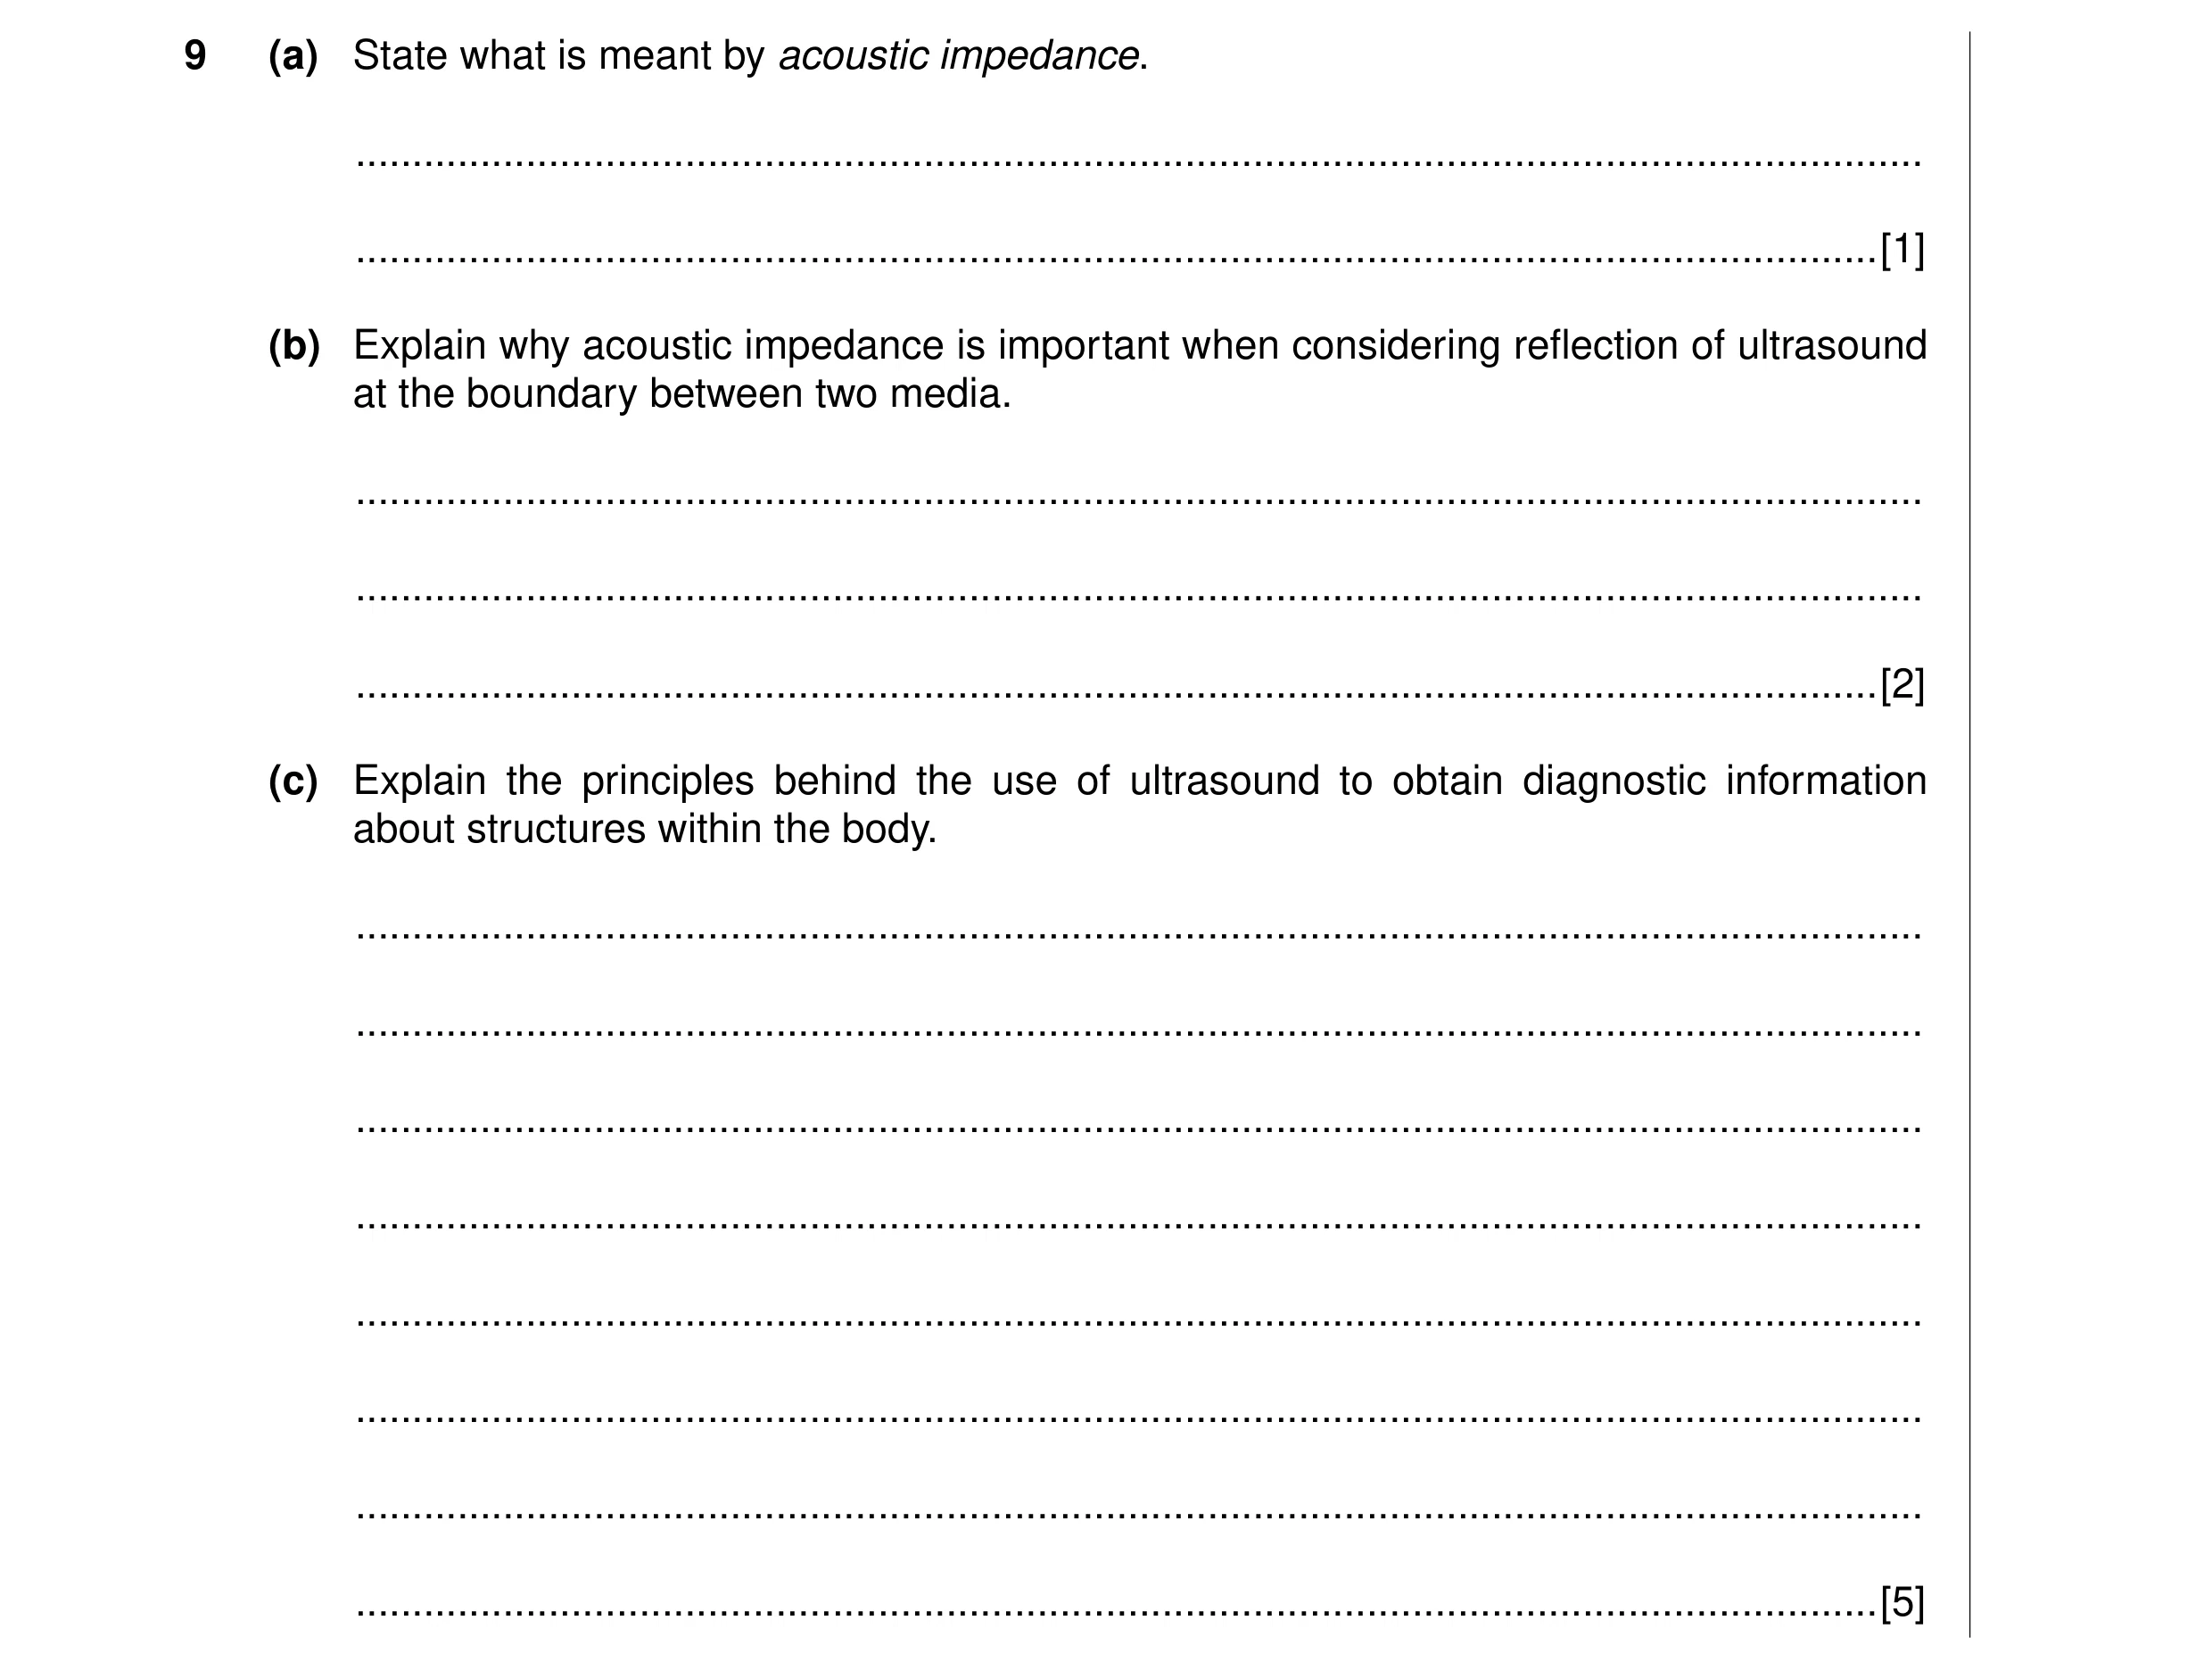
9 (a) State what is meant by acoustic impedance. … … [1] (b) Explain why acoustic impedance is important when considering reflection of ultrasound at the boundary between two media. … … … [2] (c) Explain the principles behind the use of ultrasound to obtain diagnostic information about structures within the body. … … … … … … … … [5]
8 marks
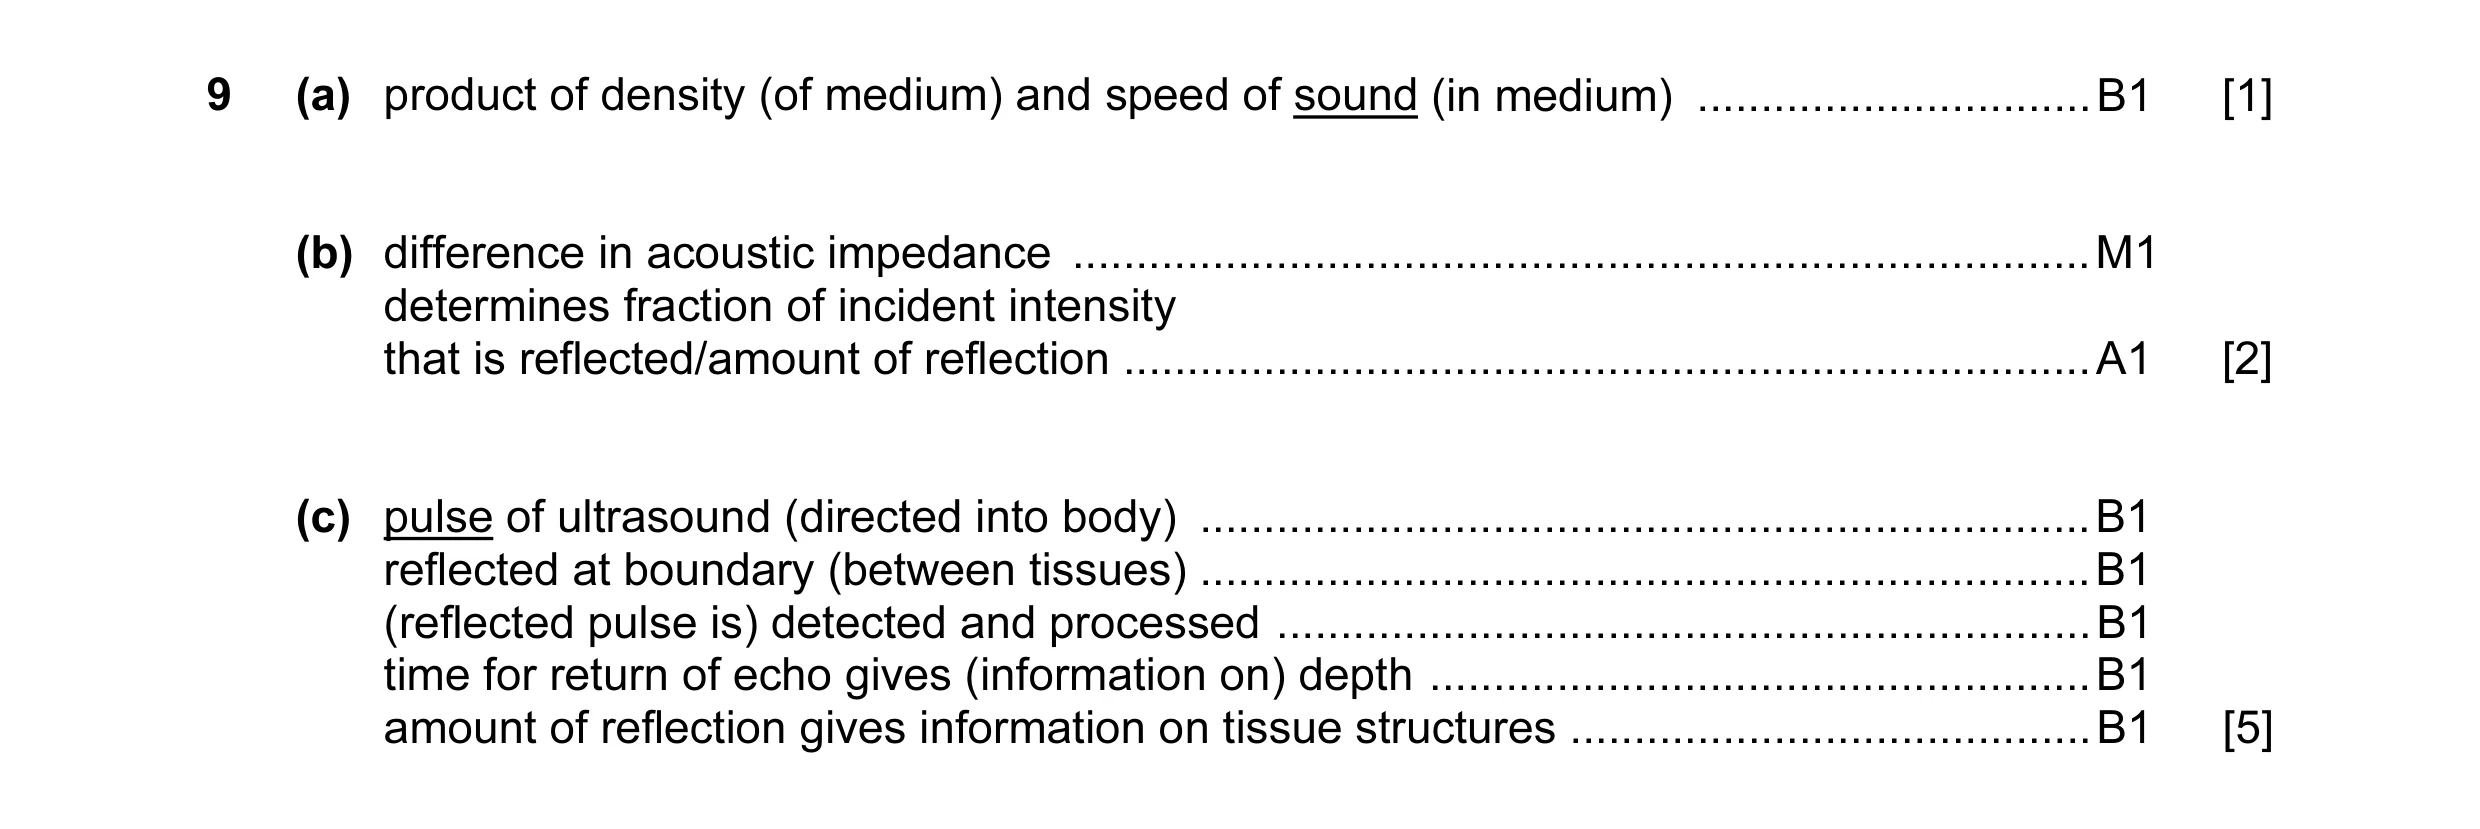
Mark scheme: 9 (a) product of density (of medium) and speed of sound (in medium) … B1 [1] (b) difference in acoustic impedance … M1 determines fraction of incident intensity that is reflected/amount of reflection … A1 [2] (c) pulse of ultrasound (directed into body) … B1 reflected at boundary (between tissues) … B1 (reflected pulse is) detected and processed … B1 time for return of echo gives (information on) depth … B1 amount of reflection gives information on tissue structures … B1 [5]
This question in 9702/41 Oct/Nov 2007
Q2 · Describe what is meant by frequency modulation 9702/41 May/June 2008
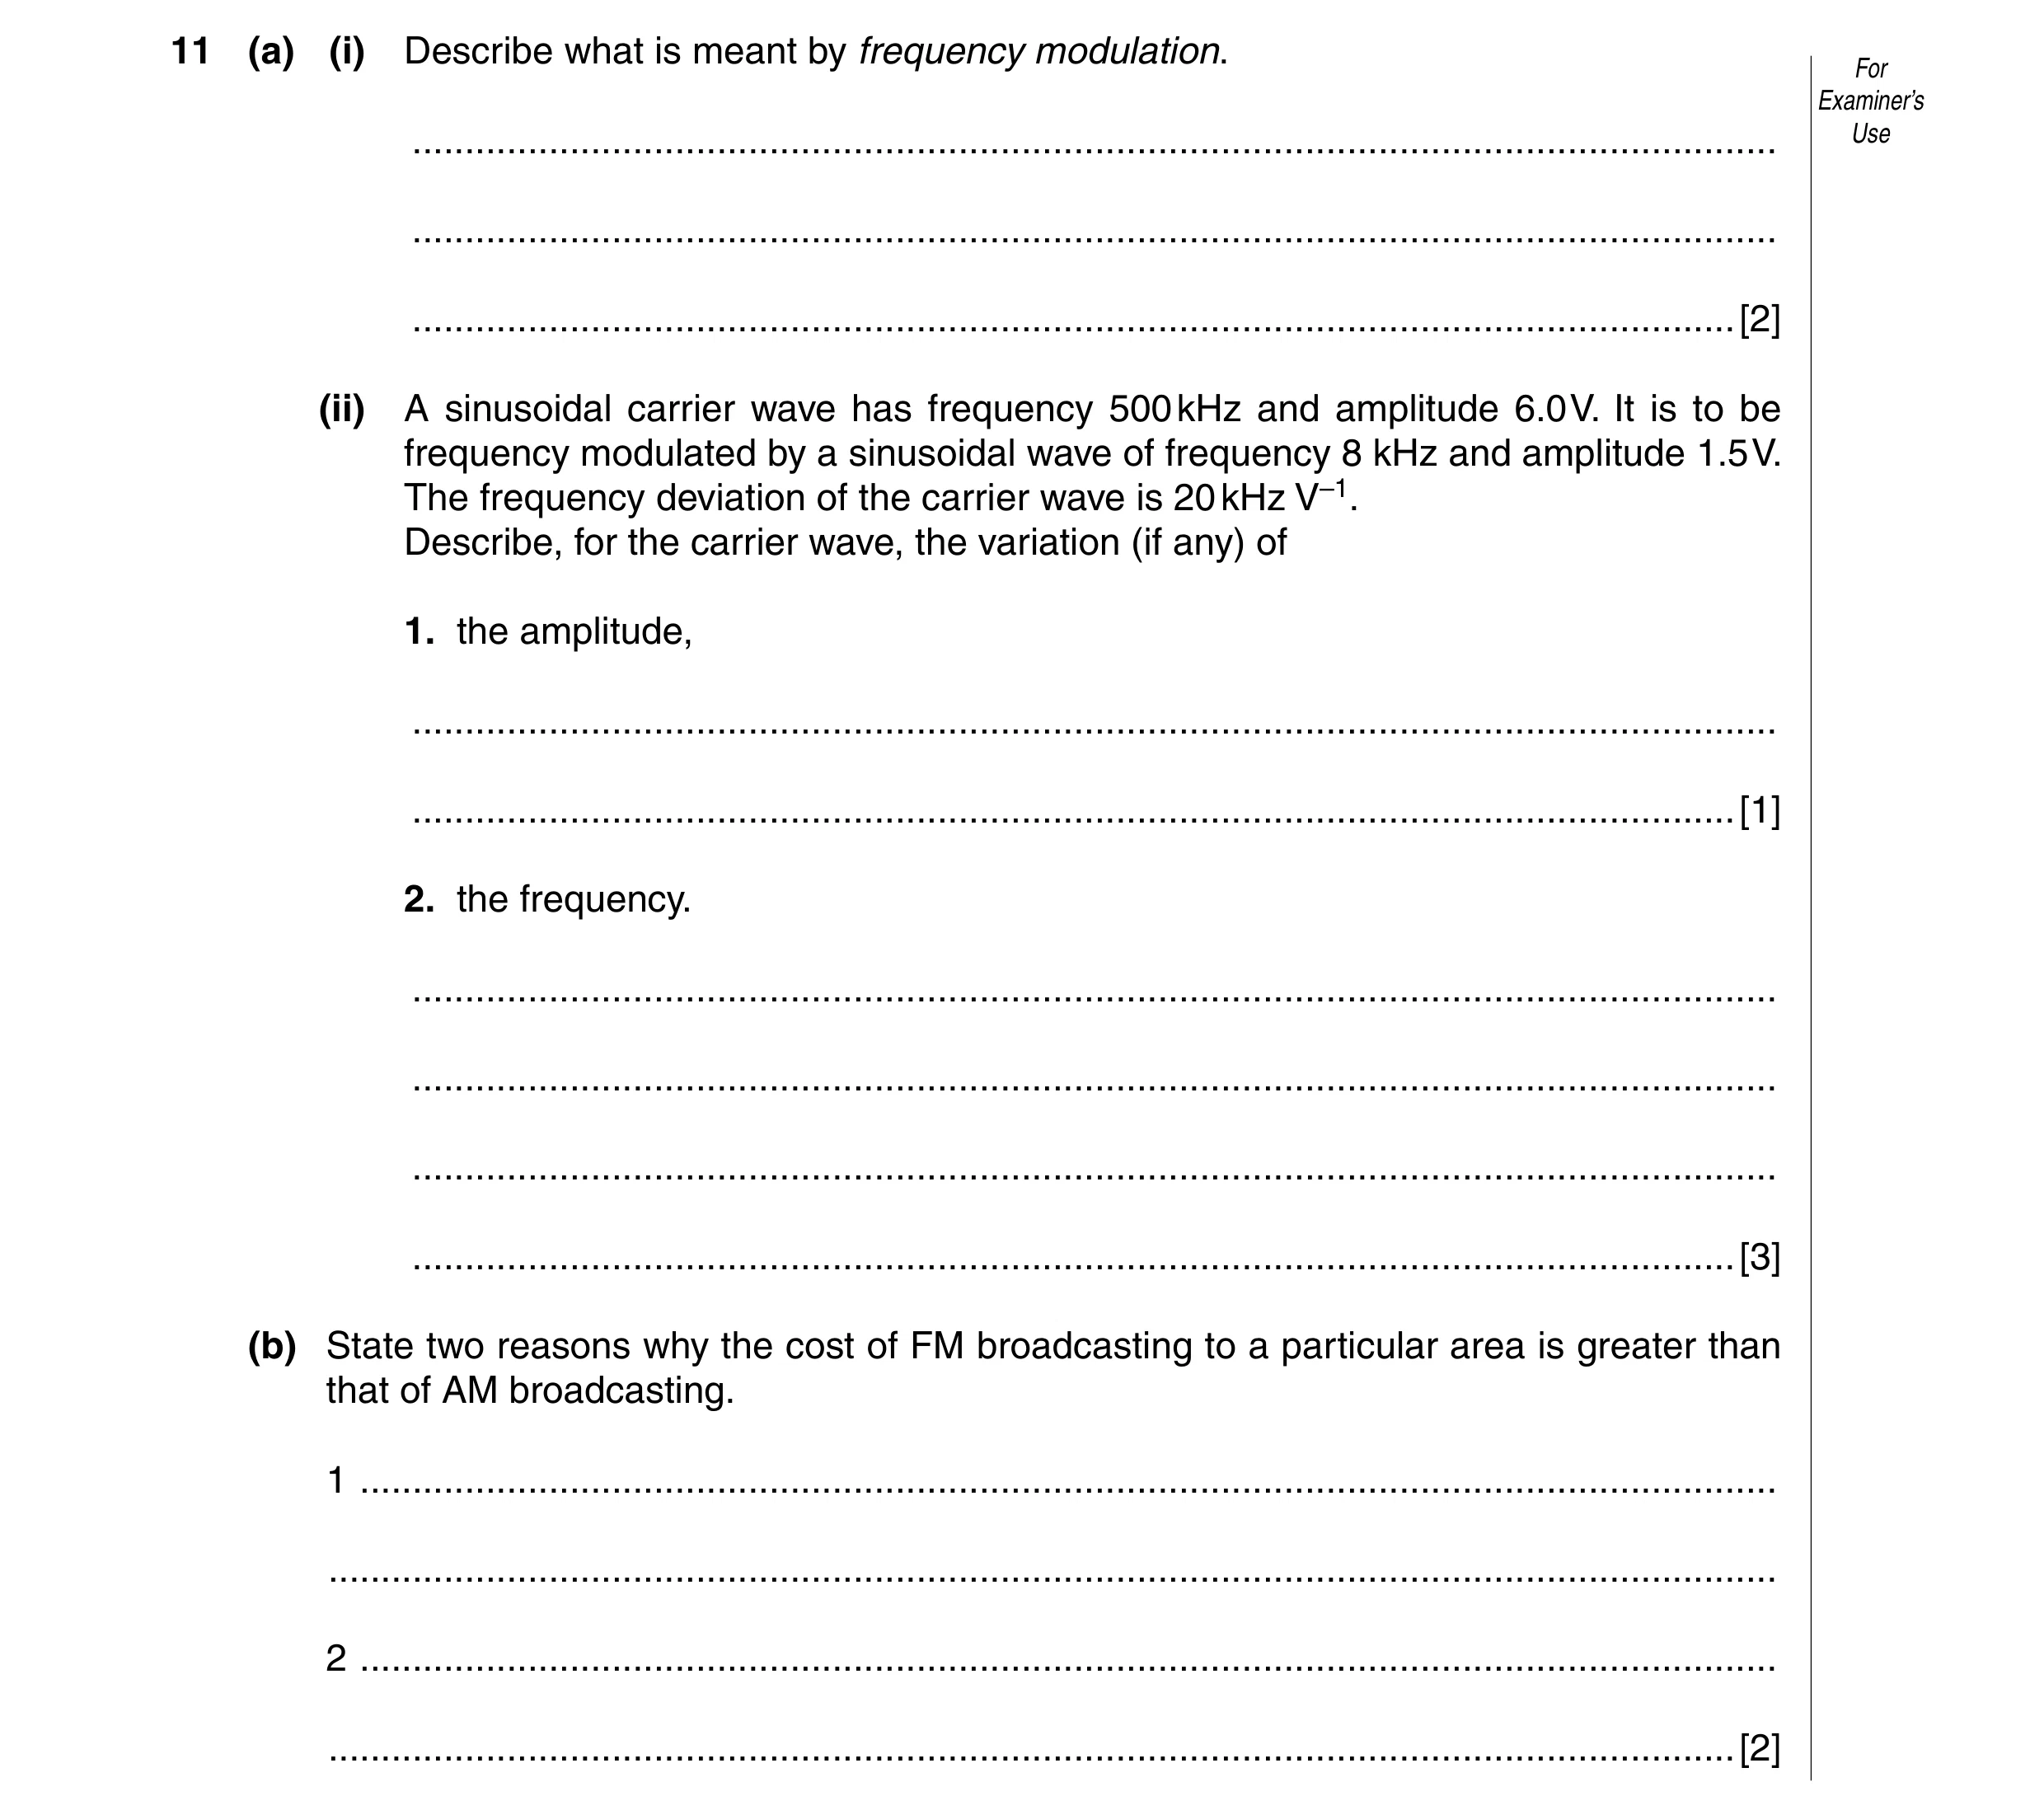
11 (a) (i) Describe what is meant by frequency modulation. For Examiner’s … Use … … [2] (ii) A sinusoidal carrier wave has frequency 500 kHz and amplitude 6.0 V. It is to be frequency modulated by a sinusoidal wave of frequency 8 kHz and amplitude 1.5 V. The frequency deviation of the carrier wave is 20 kHz V–1. Describe, for the carrier wave, the variation (if any) of 1. the amplitude, … … [1] 2. the frequency. … … … … [3] (b) State two reasons why the cost of FM broadcasting to a particular area is greater than that of AM broadcasting. 1 … … 2 … … [2]
8 marks
Mark scheme: 11 (a) (i) frequency of carrier wave varies M1 in synchrony with displacement of information signal A1 [2] (ii) 1. zero (accept constant) B1 [1] 2. upper limit 530 kHz B1 lower limit 470 kHz B1 changes upper limit → lower limit → upper limit at 8000 s–1 B1 [3] (b) e.g. more radio stations required / shorter range more complex electronics larger bandwidth required (any two sensible suggestions, 1 each) B2 [2]
This question in 9702/41 May/June 2008
Q3 · Optic fibre transmission has, in some instances, replaced transmission using co-axial For… 9702/41 May/June 2008
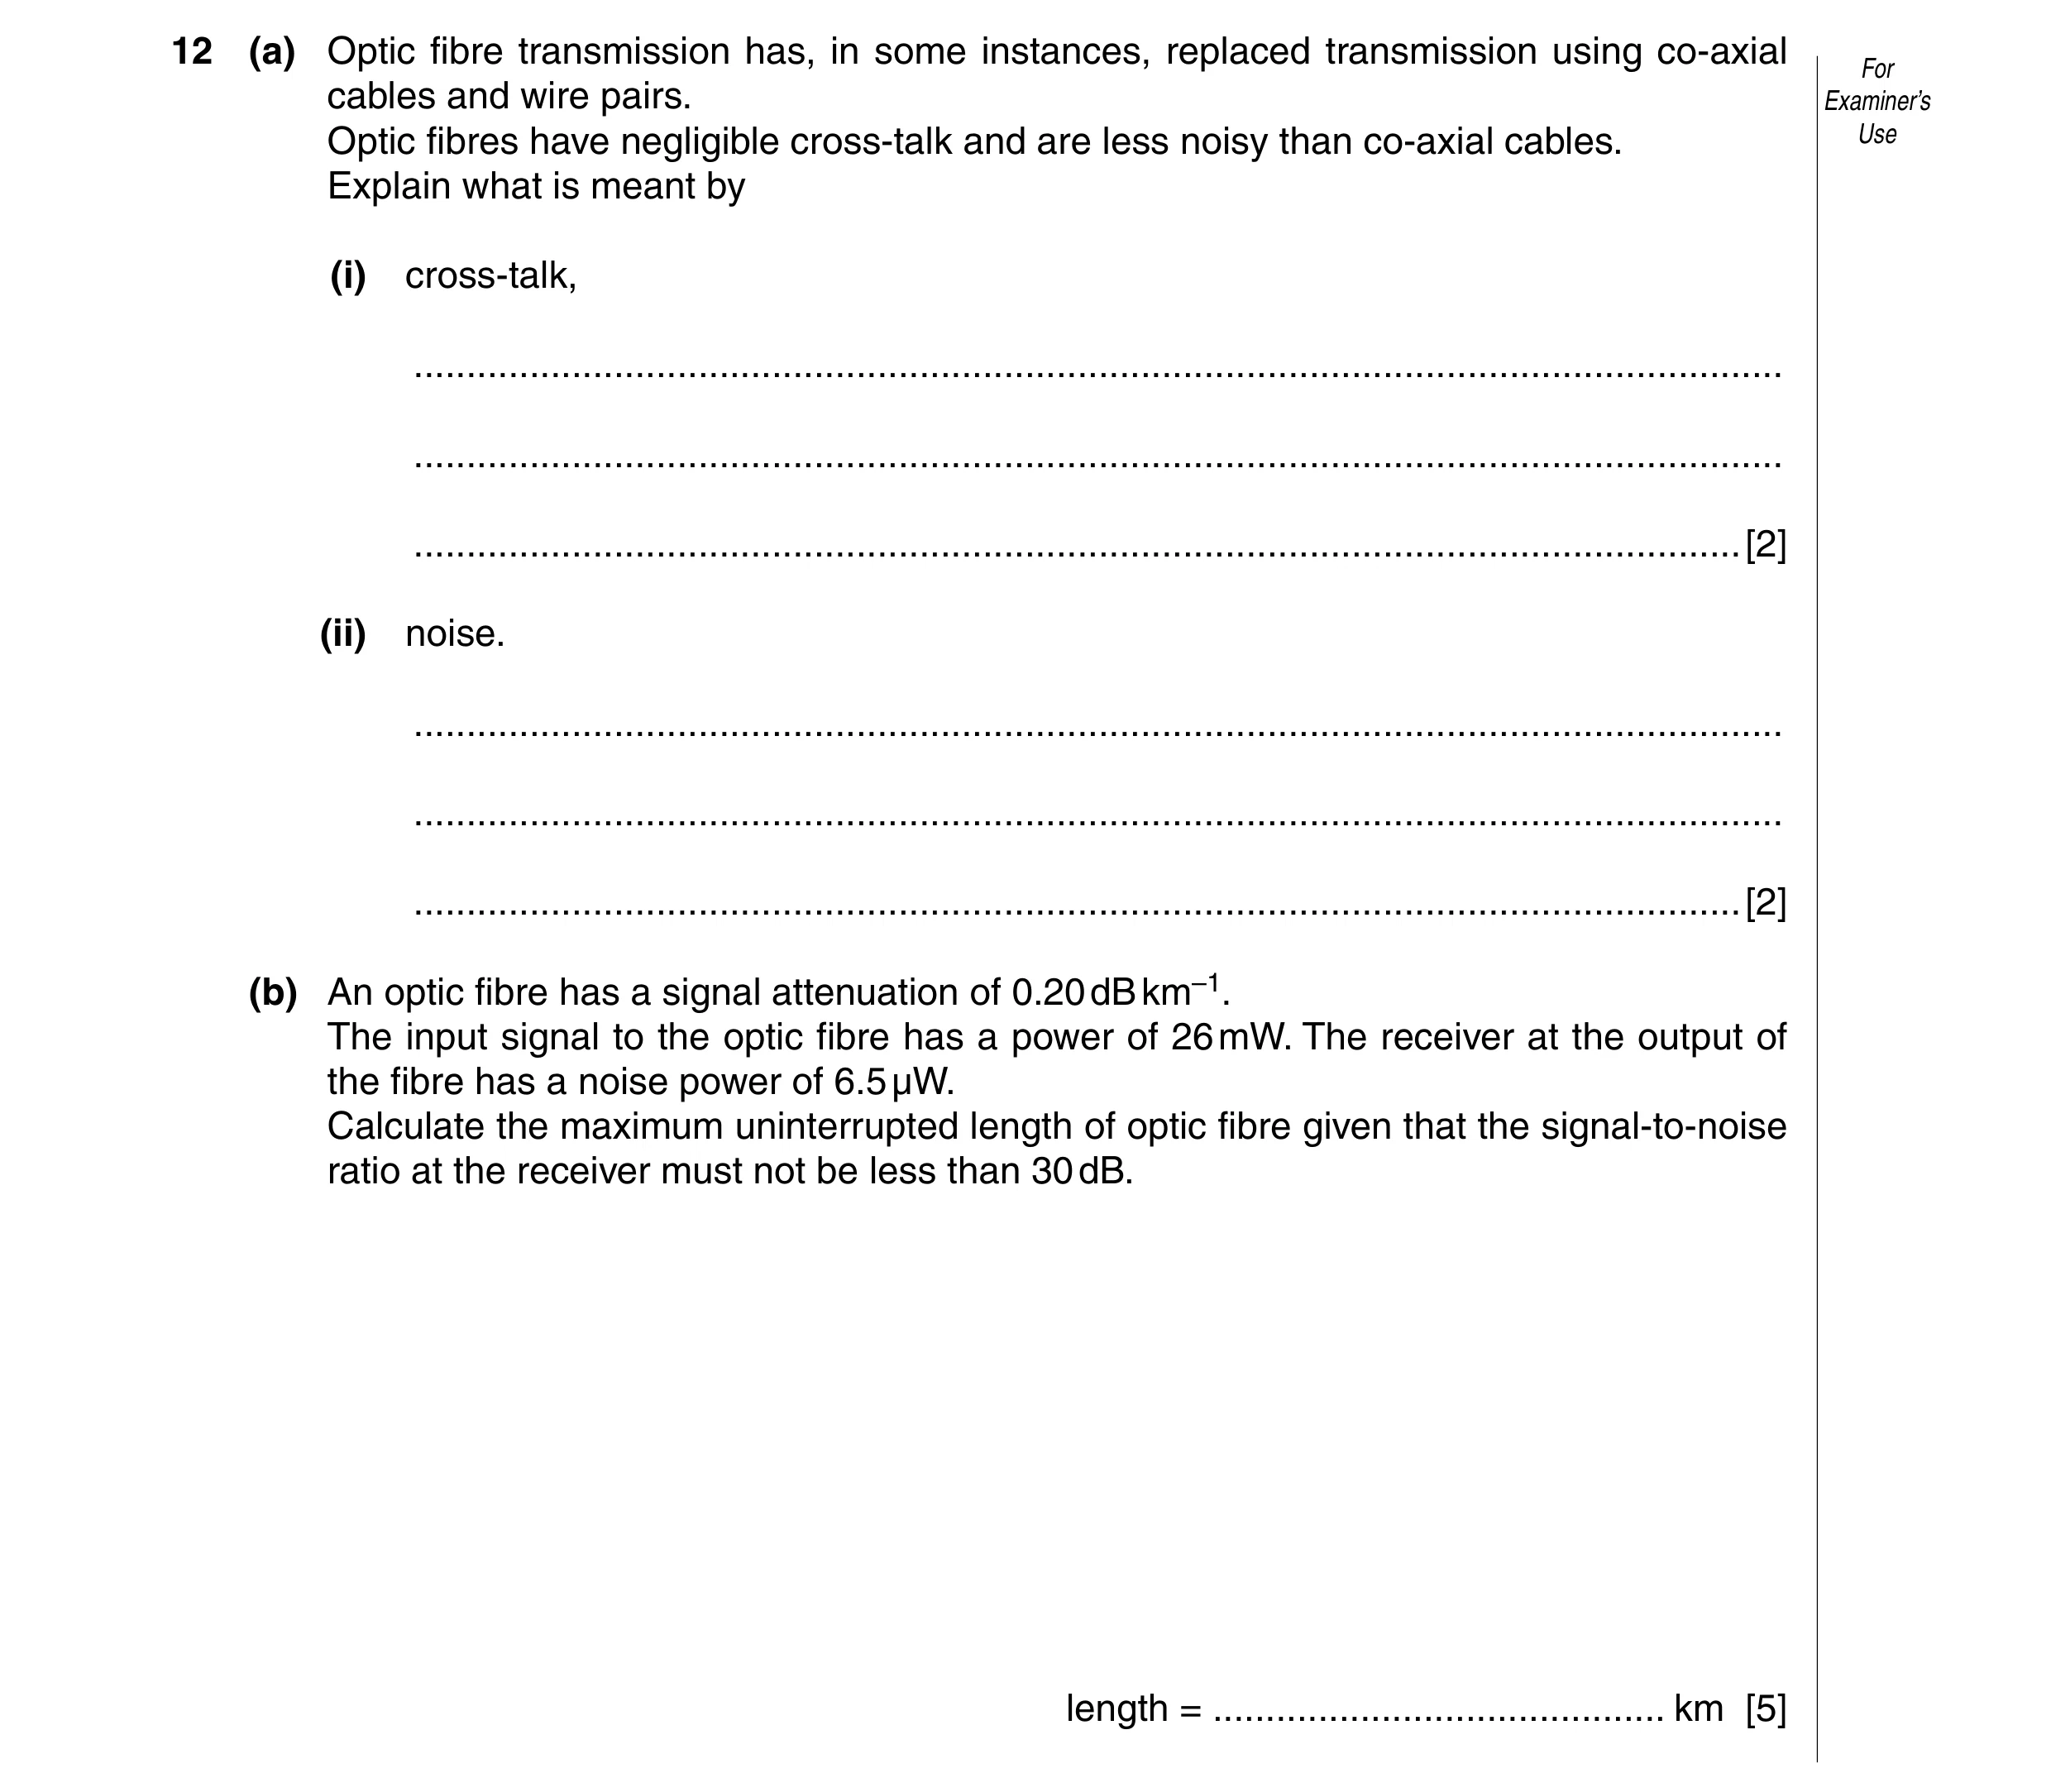
12 (a) Optic fibre transmission has, in some instances, replaced transmission using co-axial For cables and wire pairs. Examiner’s Optic fibres have negligible cross-talk and are less noisy than co-axial cables. Use Explain what is meant by (i) cross-talk, … … … [2] (ii) noise. … … … [2] (b) An optic fibre has a signal attenuation of 0.20 dB km–1. The input signal to the optic fibre has a power of 26 mW. The receiver at the output of the fibre has a noise power of 6.5 µW. Calculate the maximum uninterrupted length of optic fibre given that the signal-to-noise ratio at the receiver must not be less than 30 dB. length = … km [5]
9 marks
Mark scheme: 12 (a) (i) picking up of signal in one cable M1 from a second (nearby) cable A1 [2] (ii) random (unwanted) signal / power B1 that masks / added to / interferes with / distorts transmitted signal B1 [2] (allow this mark in (i) or (ii)) (b) if P is power at receiver, 30 = 10lg(P / (6.5 × 10⁻⁶) C1 P = 6.5 × 10⁻³ W C1 loss along cable = 10lg({26 × 10–3} / {6.5 × 10⁻³}) C1 = 6.0 dB C1 length = 6.0 / 0.2 = 30 km A1 [5]
This question in 9702/41 May/June 2008
Q4 · A signal is to be transmitted along a cable system of total length 125 km 9702/41 May/June 2009
12 A signal is to be transmitted along a cable system of total length 125 km. For The cable has an attenuation of 7 dB km–1. Amplifiers, each having a gain of 43 dB, are placed Examiner’s at 6 km intervals along the cable, as illustrated in Fig. 12.1. Use amplifier 6km 6km 6km gain 43dB input output signal signal 450 mW 125km Fig. 12.1 (a) State what is meant by the attenuation of a signal. … … [1] (b) Calculate (i) the total attenuation caused by the transmission of the signal along the cable, attenuation = … dB [1] (ii) the total signal gain as a result of amplification by all of the amplifiers along the cable. gain = … dB [1] (c) The input signal has a power of 450 mW. Use your answers in (b) to calculate the output For power of the signal as it leaves the cable system. Examiner’s Use power = … mW [3]
6 marks
Mark scheme: 12 (a) loss / reduction in power / energy / voltage/ amplitude (of the signal) B1 [1] (b) (i) attenuation = 125 × 7 = 875 dB A1 [1] (ii) 20 amplifiers gain = 20 × 43 = 860 dB A1 [1] (c) gain = 10 lg(P1/P2) C1 overall gain = –15 dB / attenuation is 15 dB C1 –15 = 10 lg(P / 450) P = 14 mW A1 [3] GCE A/AS LEVEL – May/June 2009 9702 04
This question in 9702/41 May/June 2009
Q5 · The variation with time of the signal transmitted from an aerial is shown in Fig 9702/42 Oct/Nov 2009
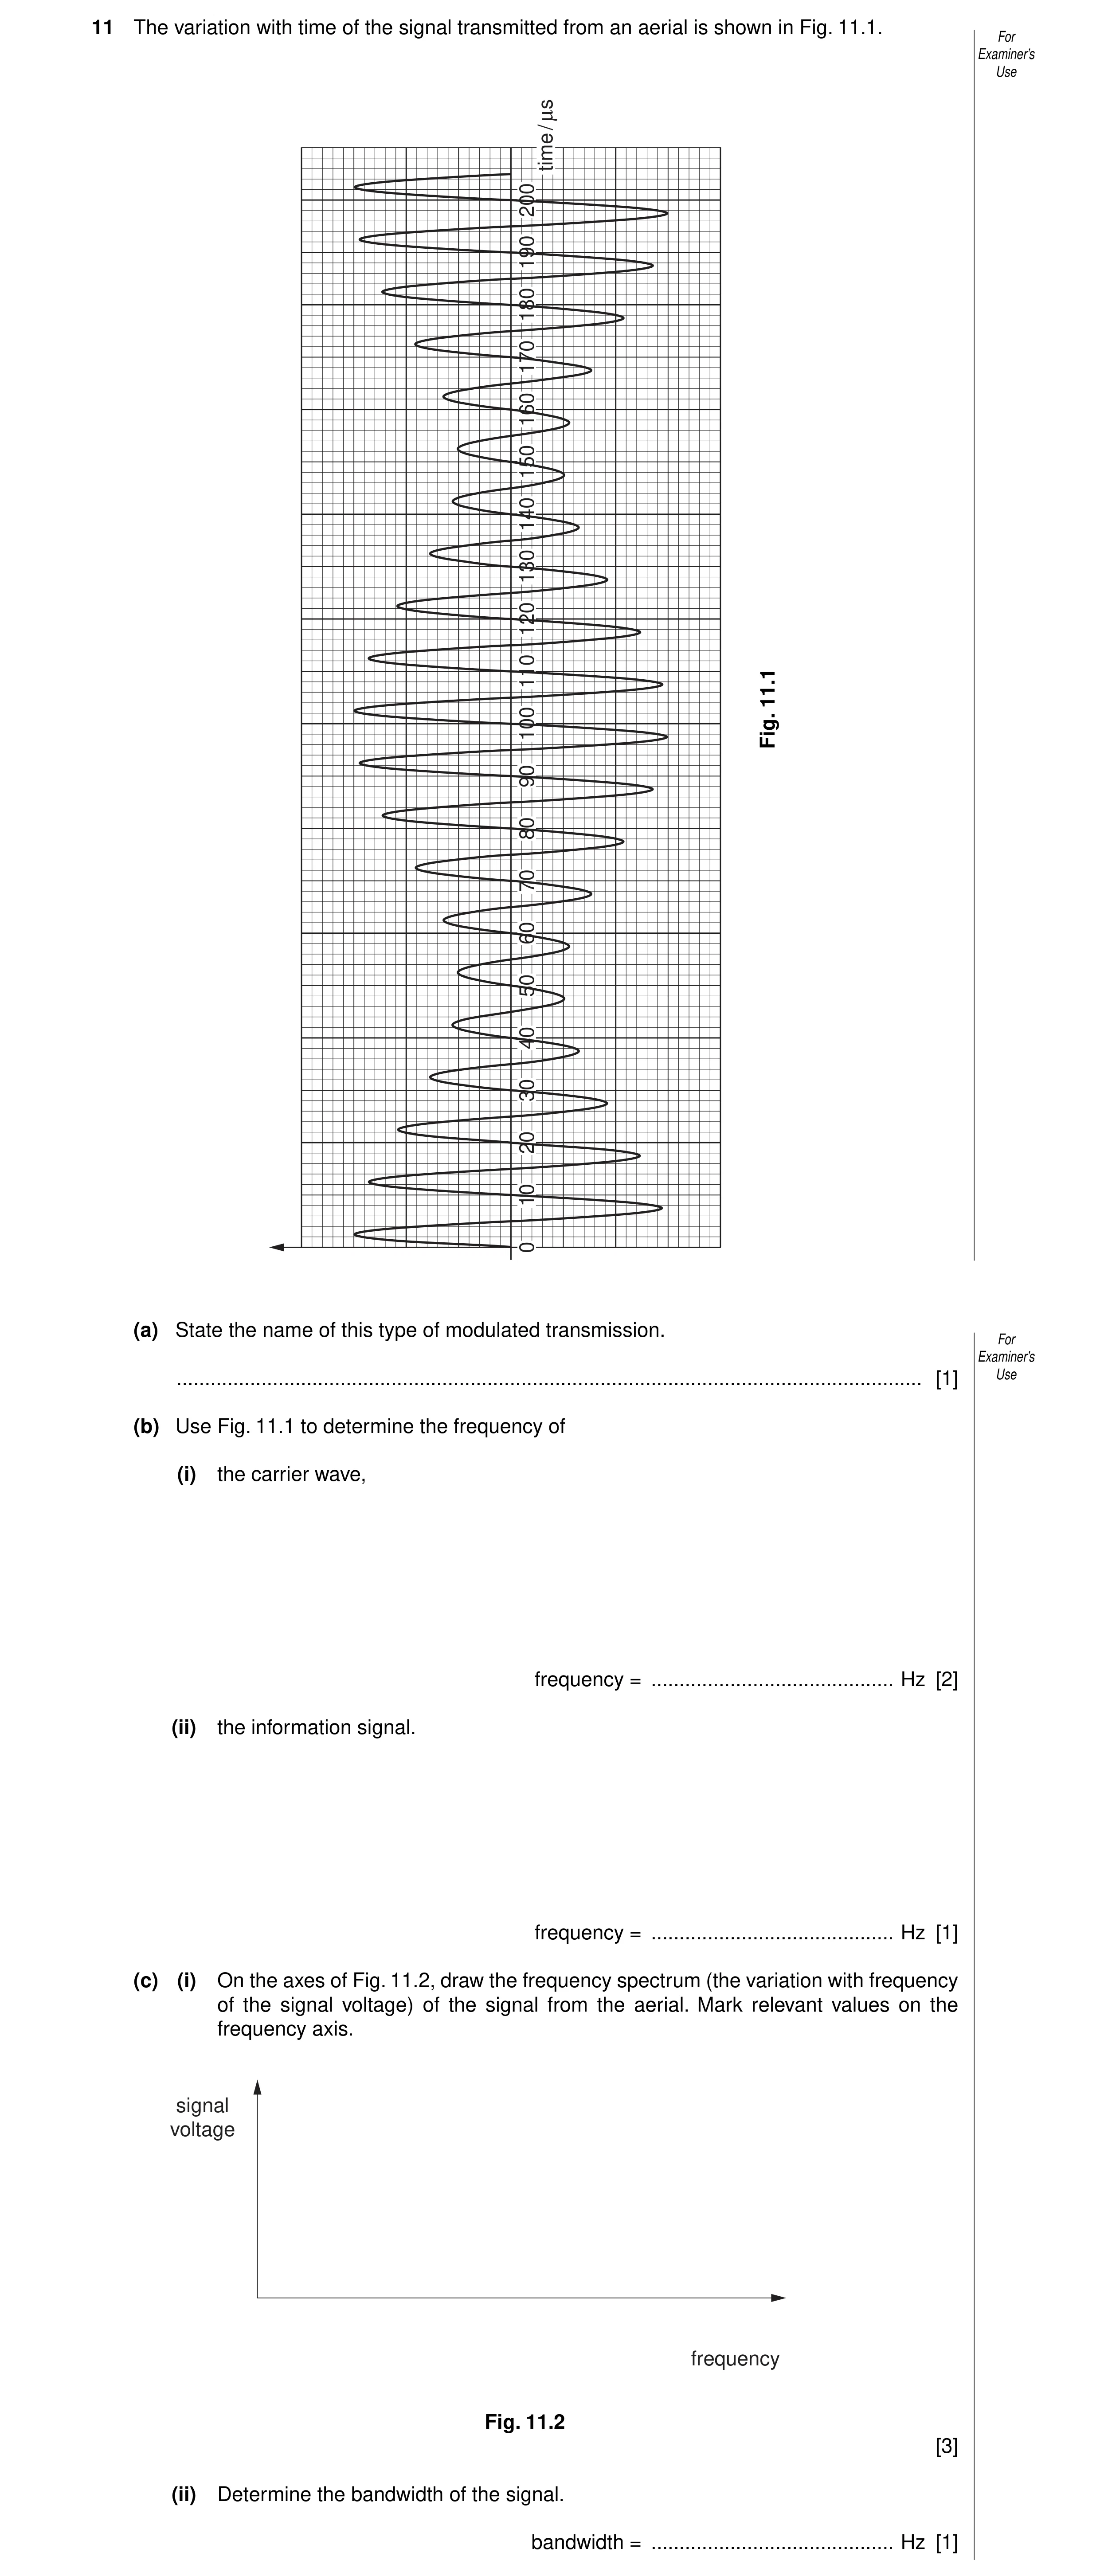
11 The variation with time of the signal transmitted from an aerial is shown in Fig. 11.1. For Examiner’s Use ls / time 200 190 180 170 160 150 140 130 120 110 11.1 100 Fig. 90 80 70 60 50 40 30 20 10 0 (a) State the name of this type of modulated transmission. For Examiner’s … [1] Use (b) Use Fig. 11.1 to determine the frequency of (i) the carrier wave, frequency = … Hz [2] (ii) the information signal. frequency = … Hz [1] (c) (i) On the axes of Fig. 11.2, draw the frequency spectrum (the variation with frequency of the signal voltage) of the signal from the aerial. Mark relevant values on the frequency axis. signal voltage frequency Fig. 11.2 [3] (ii) Determine the bandwidth of the signal. bandwidth = … Hz [1]
8 marks
Mark scheme: 11 (a) amplitude modulation ……(allow AM) … B1 [1] (b) (i) frequency = 1 / period … C1 = 100 kHz … A1 [2] (ii) frequency = 10 kHz … A1 [1] (c) (i) vertical line at 100 kHz … B1 vertical lines at 90 kHz and 110 kHz … B1 lines at 90 kHz and 110 kHz same length and shorter than at 100 kHz … B1 [3] (ii) 20 kHz … B1 [1] [Total: 8]
This question in 9702/42 Oct/Nov 2009
Q6 · A telephone link between two towns is to be provided using an optic fibre 9702/42 May/June 2010
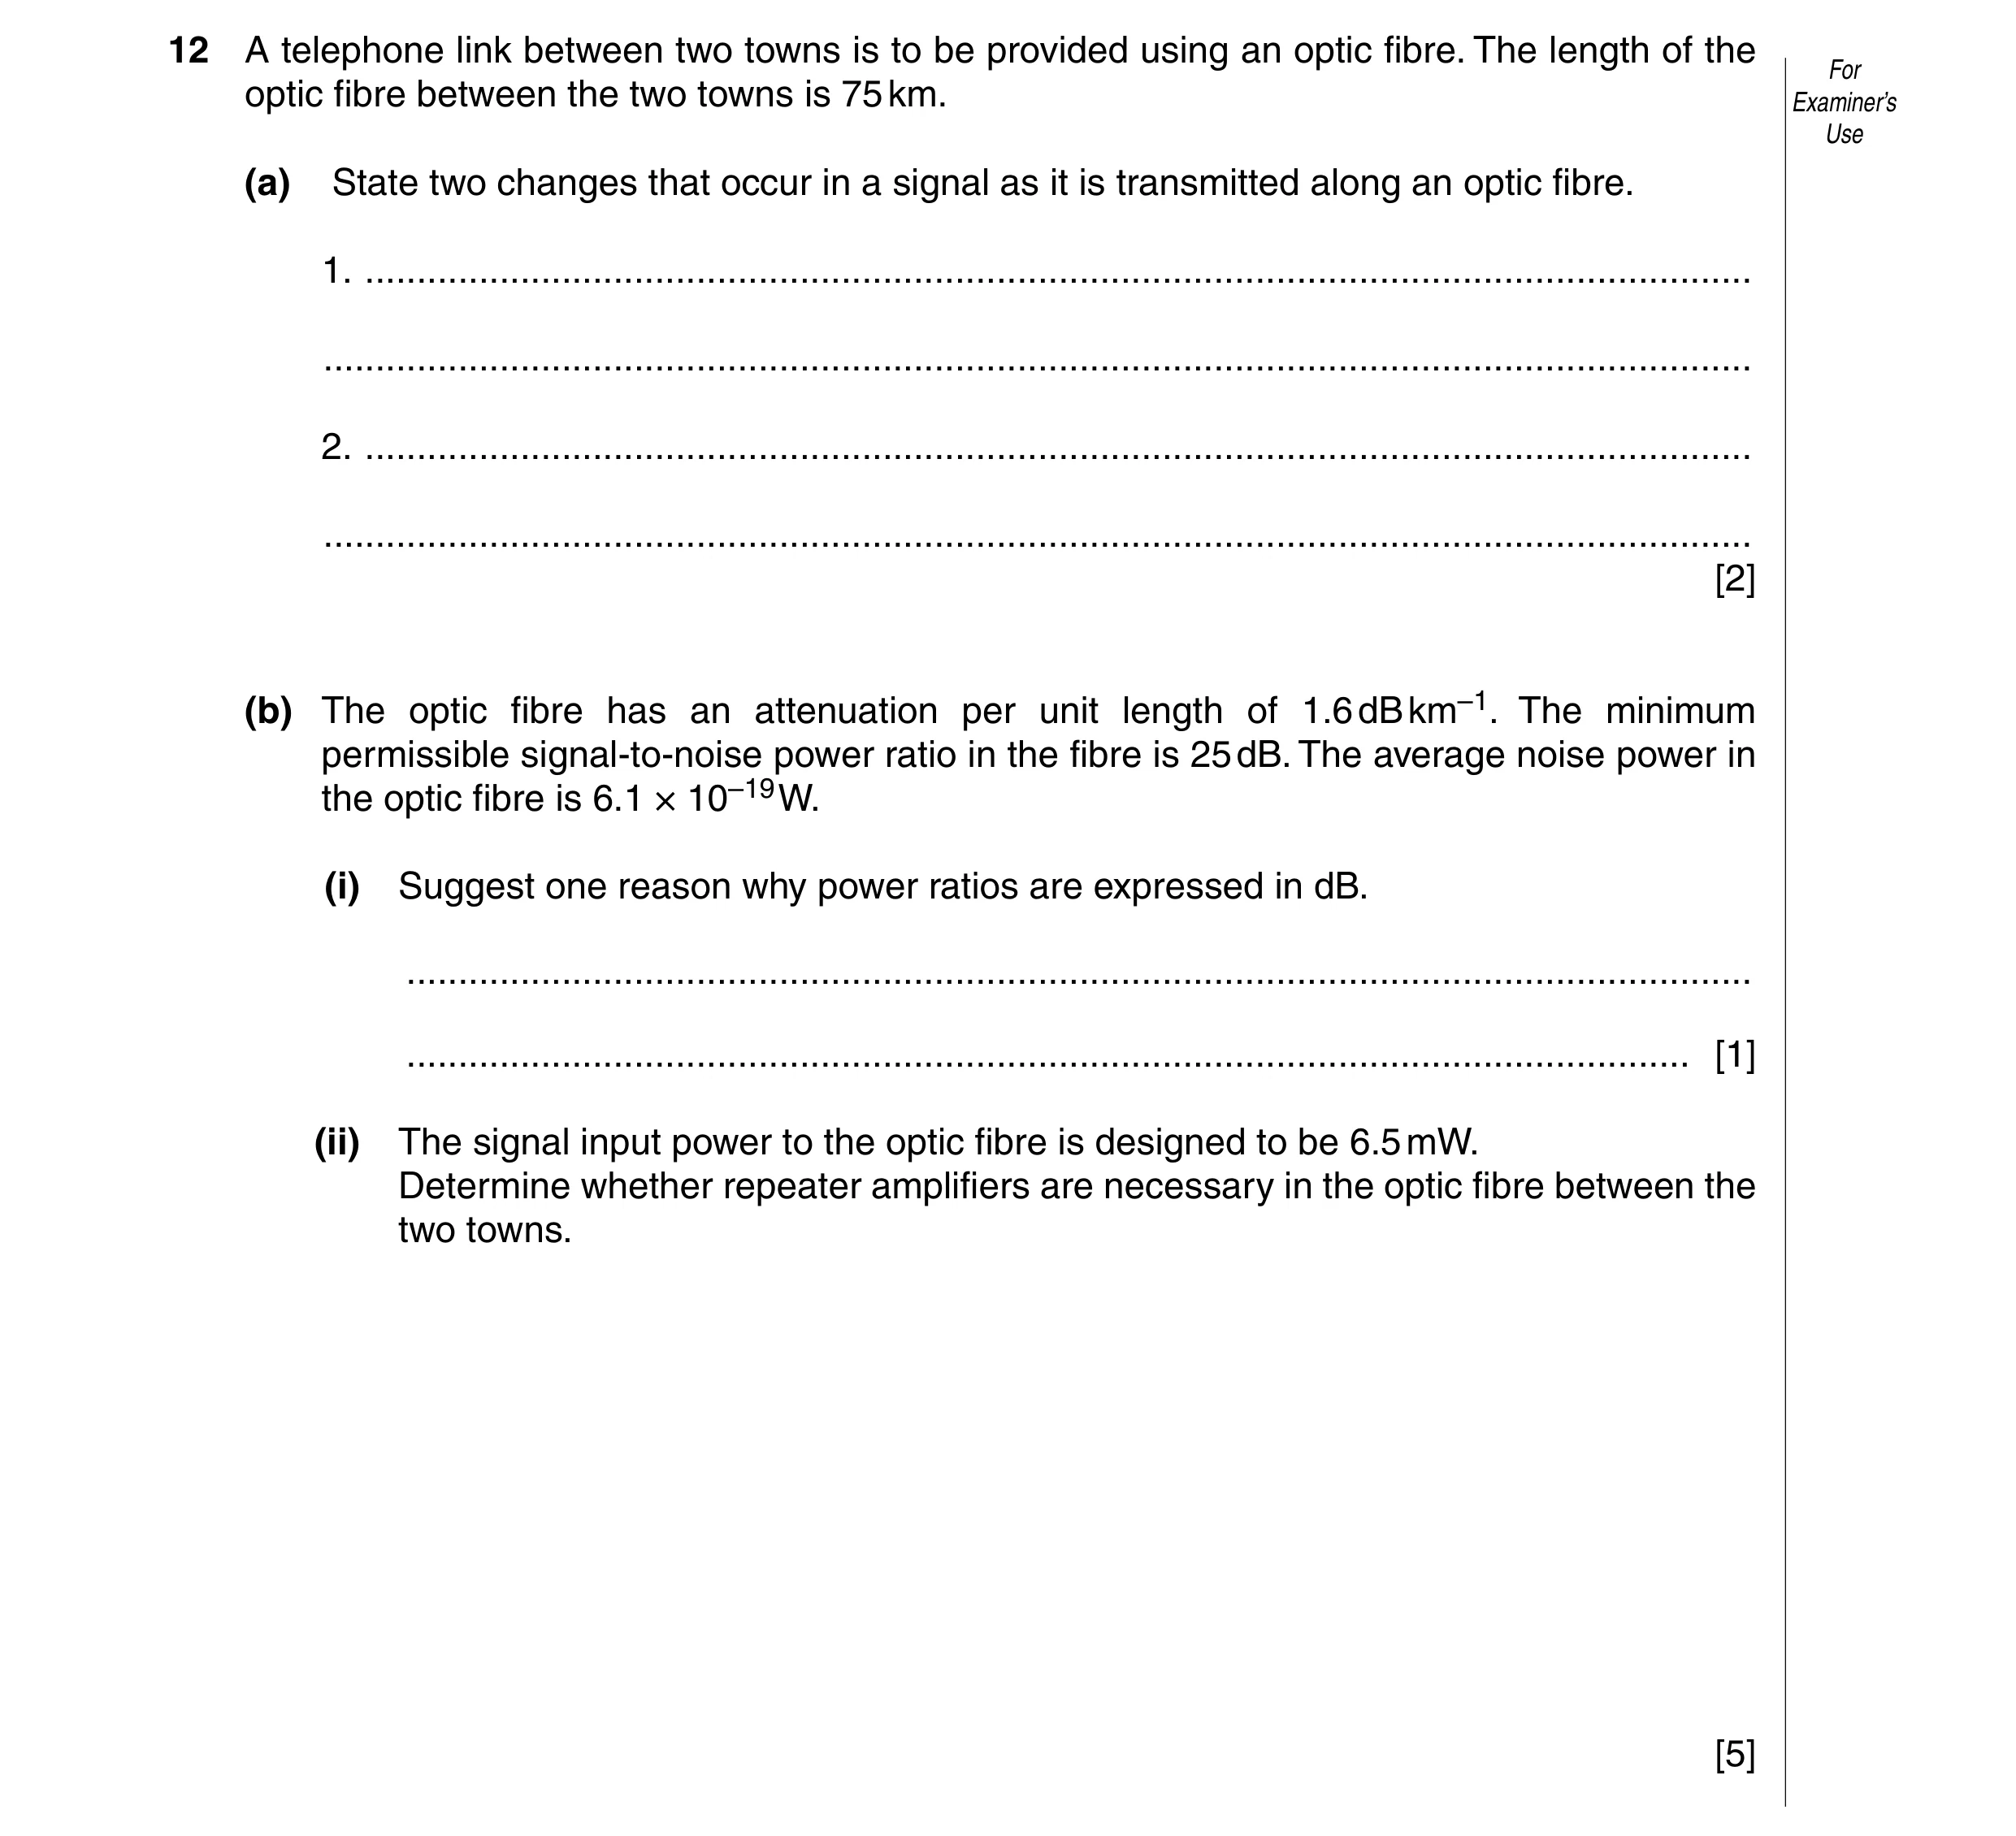
12 A telephone link between two towns is to be provided using an optic fibre. The length of the For optic fibre between the two towns is 75 km. Examiner’s Use (a) State two changes that occur in a signal as it is transmitted along an optic fibre. 1. … … 2. … … [2] (b) The optic fibre has an attenuation per unit length of 1.6 dB km–1. The minimum permissible signal-to-noise power ratio in the fibre is 25 dB. The average noise power in the optic fibre is 6.1 × 10⁻¹⁹ W. (i) Suggest one reason why power ratios are expressed in dB. … … [1] (ii) The signal input power to the optic fibre is designed to be 6.5 mW. Determine whether repeater amplifiers are necessary in the optic fibre between the two towns. [5]
8 marks
Mark scheme: 12 (a) signal becomes distorted / noisy B1 signal loses power / energy / intensity / is attenuated B1 [2] (b) (i) either numbers involved are smaller / more manageable / cover wider range or calculations involve addition & subtraction rather than multiplication and division B1 [1] (ii) 25 = 10 lg(Pmin / (6.1 × 10⁻¹⁹)) C1 minimum signal power = 1.93 × 10⁻¹⁶ W C1 signal loss = 10 lg(6.5 × 10⁻³)/(1.93 × 10–16) = 135 dB C1 maximum cable length = 135 / 1.6 C1 = 85 km so no repeaters necessary A1 [5]
This question in 9702/42 May/June 2010
Q7 · A telephone link between two towns is to be provided using an optic fibre 9702/43 May/June 2010
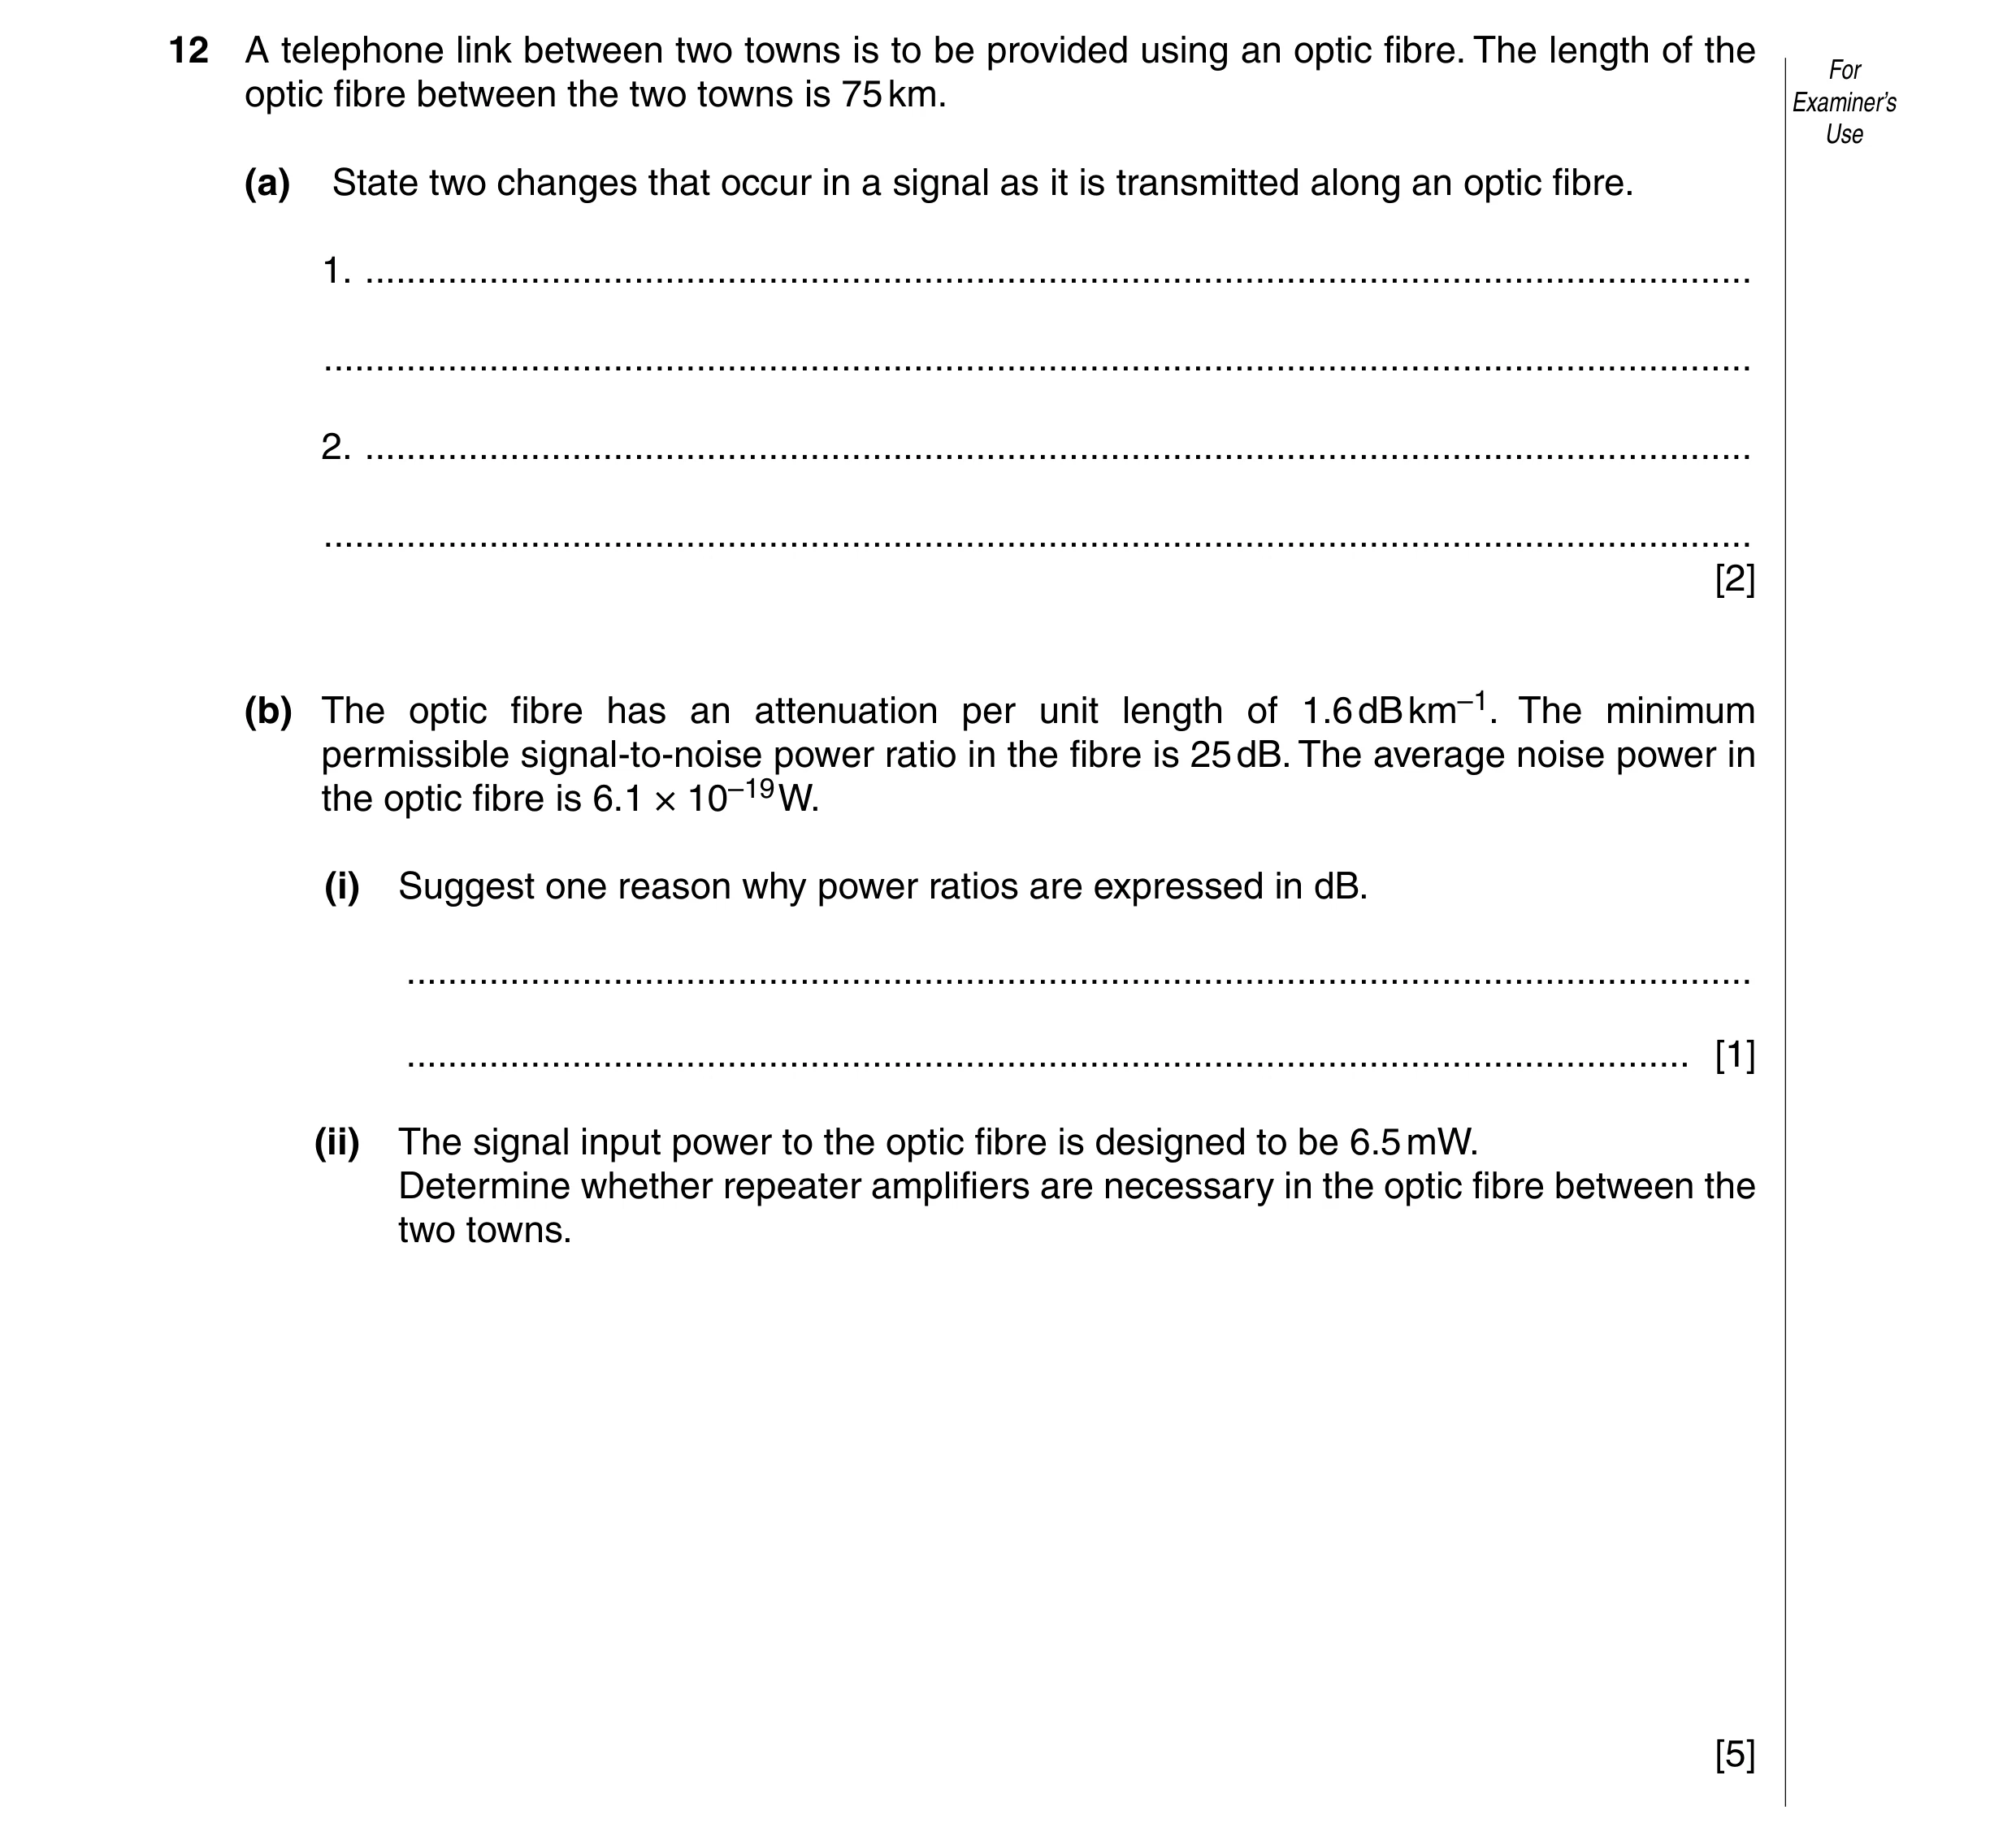
12 A telephone link between two towns is to be provided using an optic fibre. The length of the For optic fibre between the two towns is 75 km. Examiner’s Use (a) State two changes that occur in a signal as it is transmitted along an optic fibre. 1. … … 2. … … [2] (b) The optic fibre has an attenuation per unit length of 1.6 dB km–1. The minimum permissible signal-to-noise power ratio in the fibre is 25 dB. The average noise power in the optic fibre is 6.1 × 10⁻¹⁹ W. (i) Suggest one reason why power ratios are expressed in dB. … … [1] (ii) The signal input power to the optic fibre is designed to be 6.5 mW. Determine whether repeater amplifiers are necessary in the optic fibre between the two towns. [5]
8 marks
Mark scheme: 12 (a) signal becomes distorted / noisy B1 signal loses power / energy / intensity / is attenuated B1 [2] (b) (i) either numbers involved are smaller / more manageable / cover wider range or calculations involve addition & subtraction rather than multiplication and division B1 [1] (ii) 25 = 10 lg(Pmin / (6.1 × 10⁻¹⁹)) C1 minimum signal power = 1.93 × 10⁻¹⁶ W C1 signal loss = 10 lg(6.5 × 10⁻³)/(1.93 × 10–16) = 135 dB C1 maximum cable length = 135 / 1.6 C1 = 85 km so no repeaters necessary A1 [5]
This question in 9702/43 May/June 2010
Q8 · Wire pairs provide one means of communication but they are subject to high levels of For… 9702/41 Oct/Nov 2010
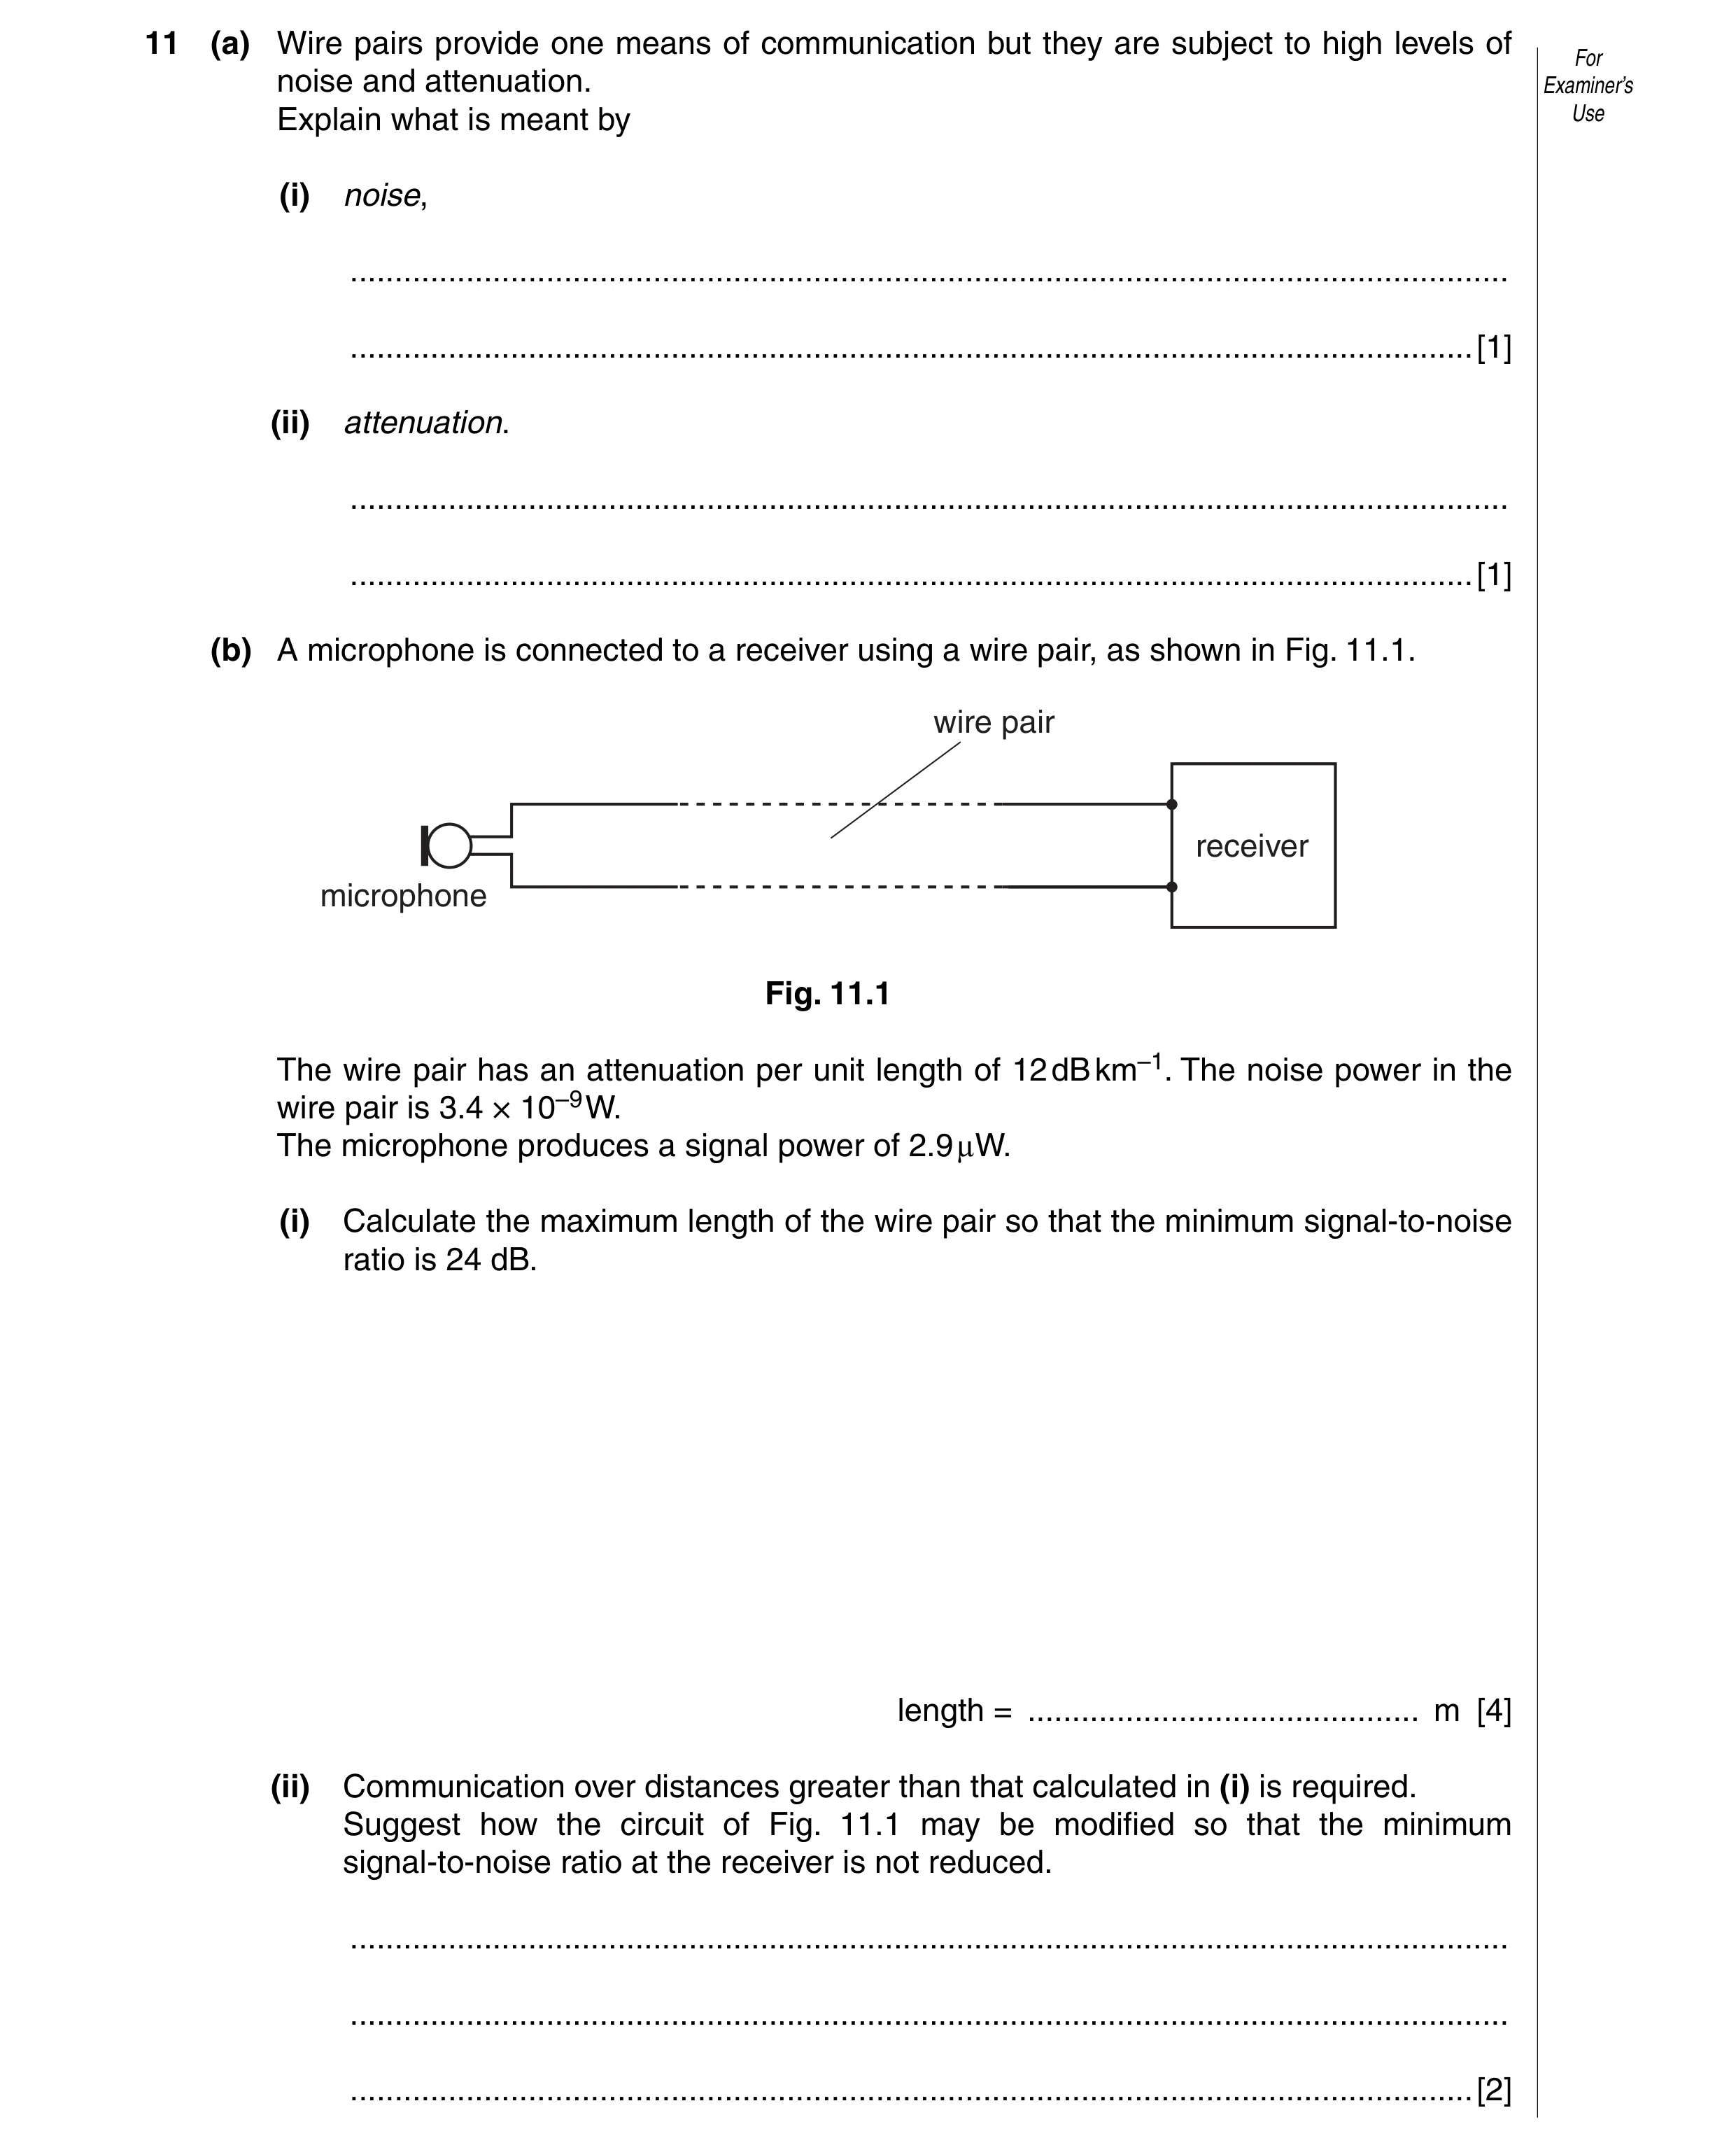
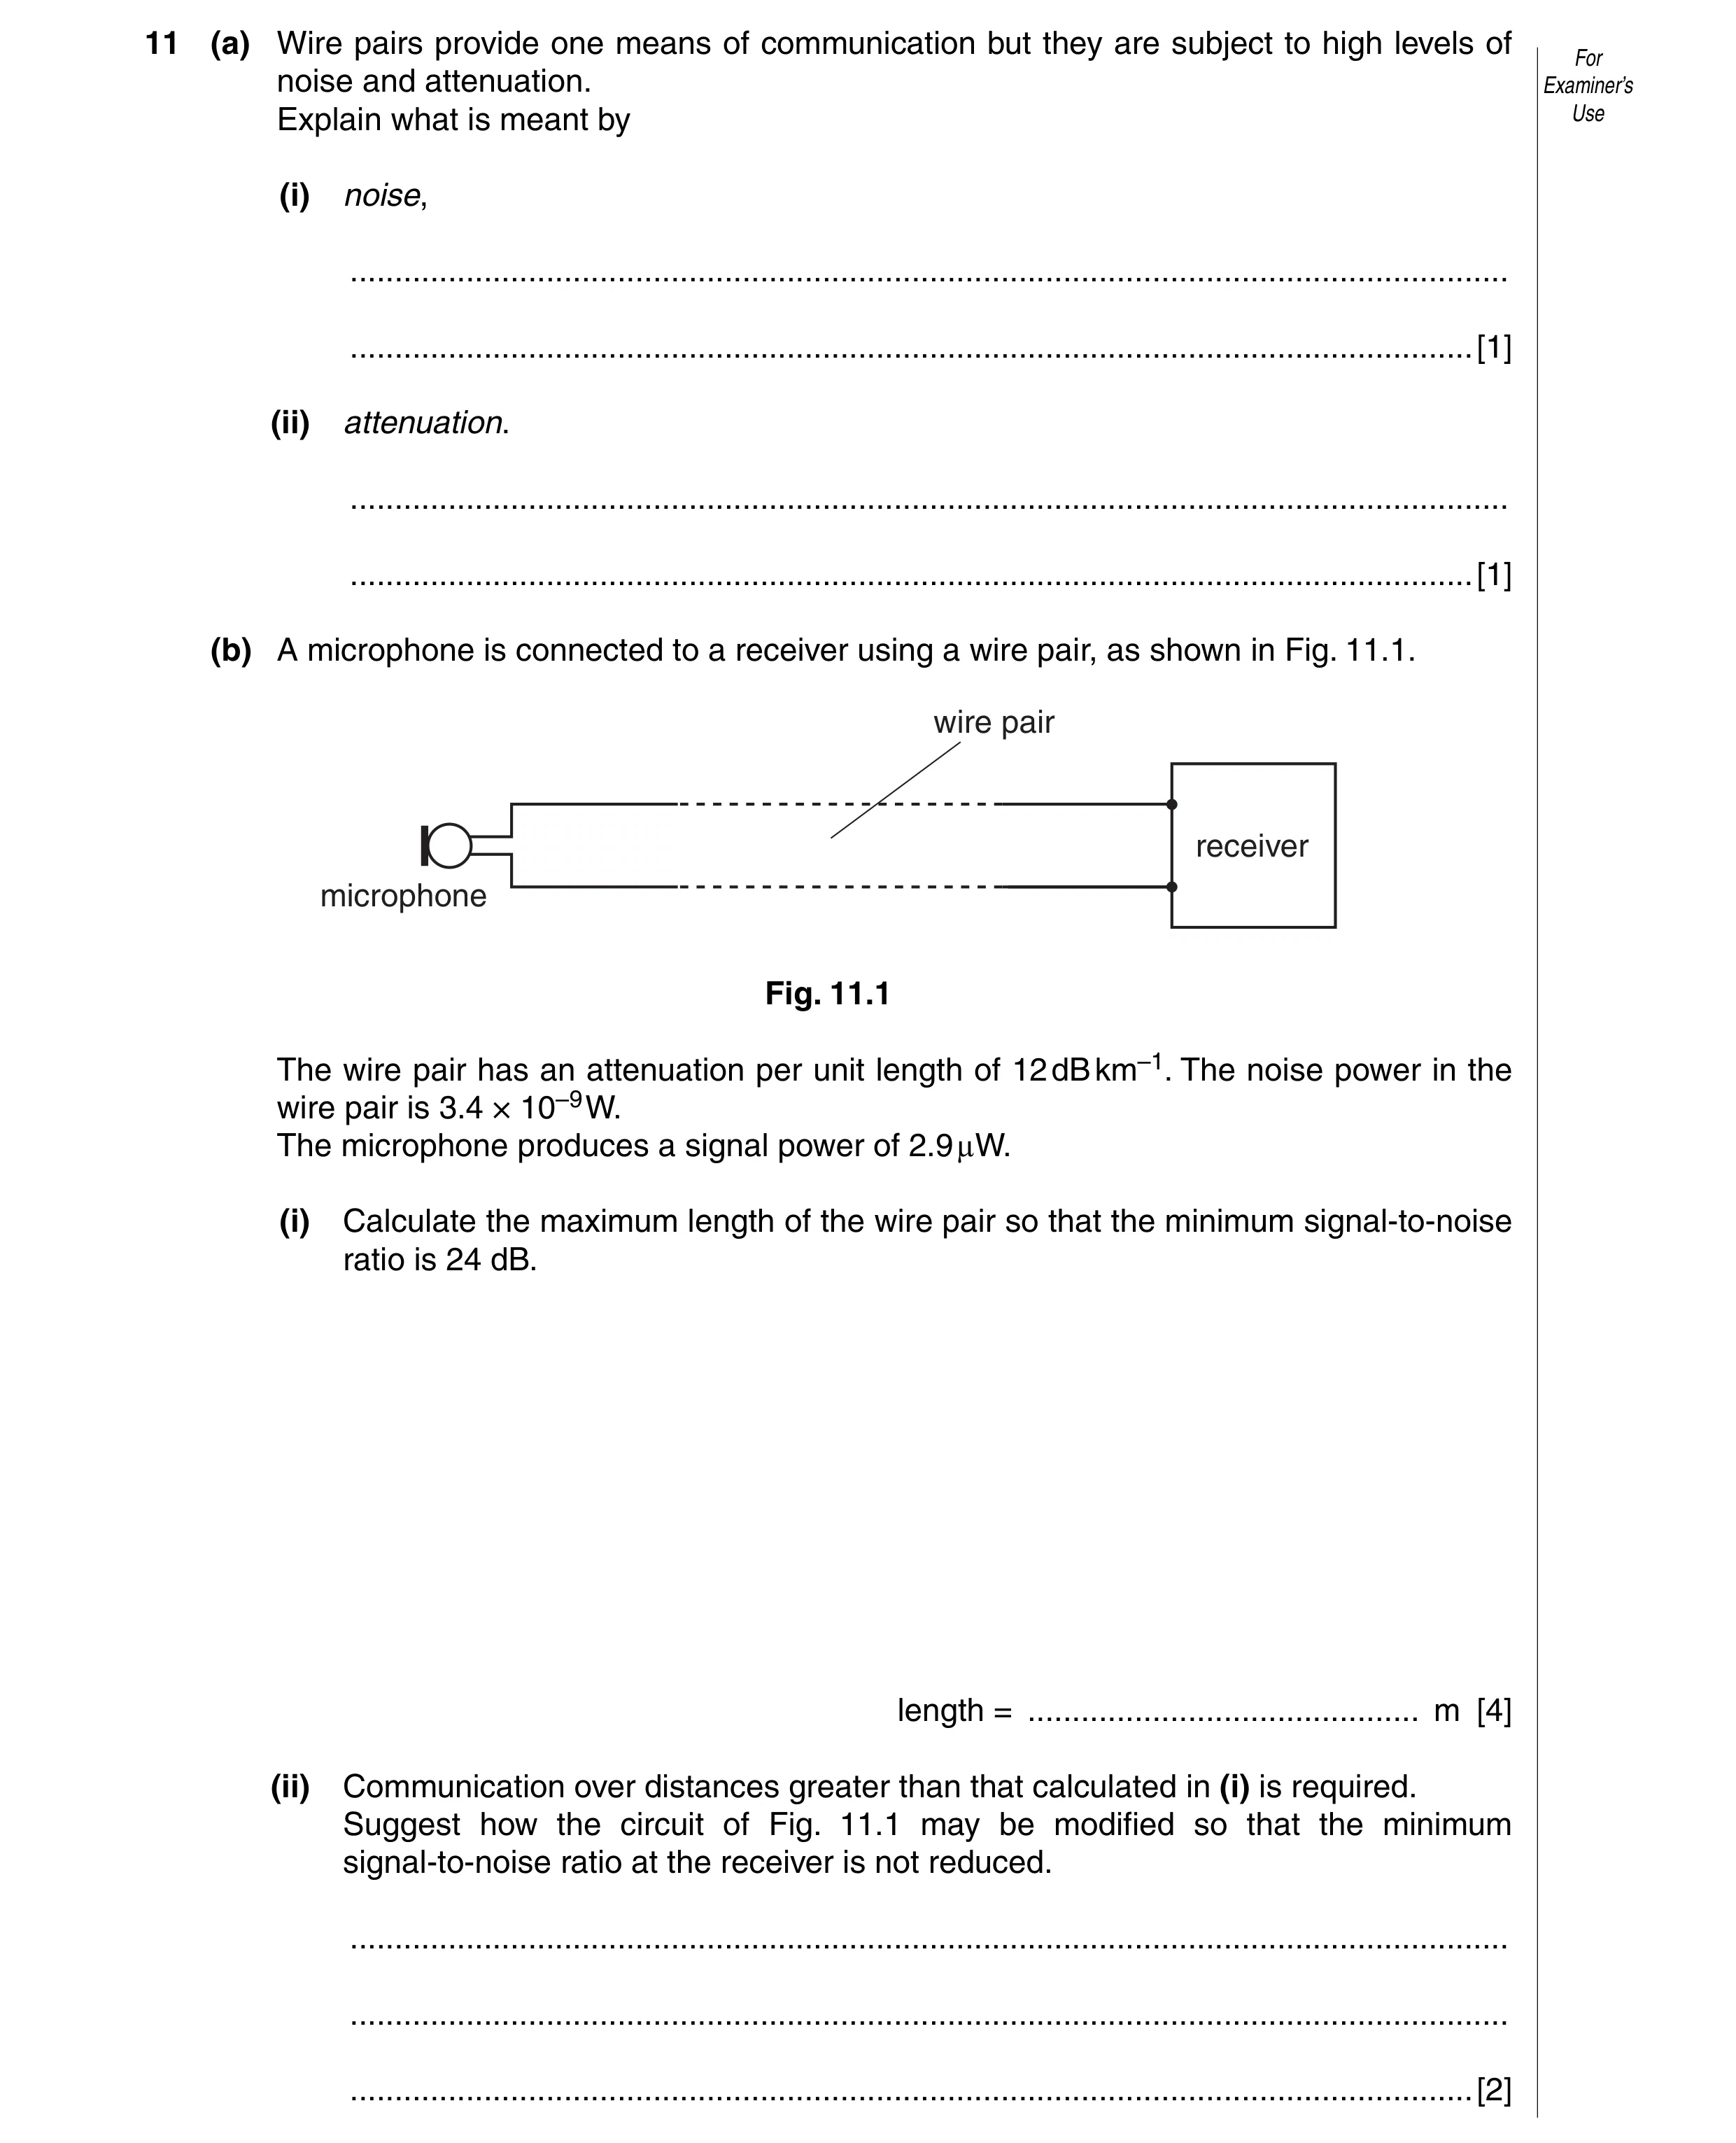
11 (a) Wire pairs provide one means of communication but they are subject to high levels of For noise and attenuation. Examiner’s Explain what is meant by Use (i) noise, … … [1] (ii) attenuation. … … [1] (b) A microphone is connected to a receiver using a wire pair, as shown in Fig. 11.1. wire pair receiver microphone Fig. 11.1 The wire pair has an attenuation per unit length of 12 dB km–1. The noise power in the wire pair is 3.4 × 10⁻⁹ W. The microphone produces a signal power of 2.9 lW. (i) Calculate the maximum length of the wire pair so that the minimum signal-to-noise ratio is 24 dB. length = … m [4] (ii) Communication over distances greater than that calculated in (i) is required. Suggest how the circuit of Fig. 11.1 may be modified so that the minimum signal-to-noise ratio at the receiver is not reduced. … … … [2]
8 marks
Mark scheme: 11 (a) (i) unwanted random power / signal / energy B1 [1] (ii) loss of (signal) power / energy B1 [1] (b) (i) either signal-to-noise ratio at mic. = 10 lg (P2 / P1) C1 = 10 lg ({2.9 × 10⁻⁶} / {3.4 × 10⁻⁹}) = 29 dB A1 maximum length = (29 – 24) / 12 C1 = 0.42 km = 420 m A1 [4] or signal-to-noise ratio at receiver = 10 lg (P2 / P1) (C1) at receiver, 24 = 10 lg(P / {3.4 × 10⁻⁹}) P = 8.54 × 10⁻⁷ W (A1) power loss in cables = 10 lg({2.9 × 10⁻⁶} / {8.54 × 10⁻⁷}) (C1) = 5.3 dB length = 5.3 / 12 km = 440 m (A1) GCE AS/A LEVEL – October/November 2010 9702 41 (ii) use an amplifier M1 coupled to the microphone A1 [2] (repeater amplifiers scores no mark)
This question in 9702/41 Oct/Nov 2010
Q9 · Wire pairs provide one means of communication but they are subject to high levels of For… 9702/42 Oct/Nov 2010
11 (a) Wire pairs provide one means of communication but they are subject to high levels of For noise and attenuation. Examiner’s Explain what is meant by Use (i) noise, … … [1] (ii) attenuation. … … [1] (b) A microphone is connected to a receiver using a wire pair, as shown in Fig. 11.1. wire pair receiver microphone Fig. 11.1 The wire pair has an attenuation per unit length of 12 dB km–1. The noise power in the wire pair is 3.4 × 10⁻⁹ W. The microphone produces a signal power of 2.9 lW. (i) Calculate the maximum length of the wire pair so that the minimum signal-to-noise ratio is 24 dB. length = … m [4] (ii) Communication over distances greater than that calculated in (i) is required. Suggest how the circuit of Fig. 11.1 may be modified so that the minimum signal-to-noise ratio at the receiver is not reduced. … … … [2]
8 marks
Mark scheme: 11 (a) (i) unwanted random power / signal / energy B1 [1] (ii) loss of (signal) power / energy B1 [1] (b) (i) either signal-to-noise ratio at mic. = 10 lg (P2 / P1) C1 = 10 lg ({2.9 × 10⁻⁶} / {3.4 × 10⁻⁹}) = 29 dB A1 maximum length = (29 – 24) / 12 C1 = 0.42 km = 420 m A1 [4] or signal-to-noise ratio at receiver = 10 lg (P2 / P1) (C1) at receiver, 24 = 10 lg(P / {3.4 × 10⁻⁹}) P = 8.54 × 10⁻⁷ W (A1) power loss in cables = 10 lg({2.9 × 10⁻⁶} / {8.54 × 10⁻⁷}) (C1) = 5.3 dB length = 5.3 / 12 km = 440 m (A1) GCE AS/A LEVEL – October/November 2010 9702 42 (ii) use an amplifier M1 coupled to the microphone A1 [2] (repeater amplifiers scores no mark)
This question in 9702/42 Oct/Nov 2010
Q10 · Data may be transmitted as an analogue signal or as a digital signal 9702/43 Oct/Nov 2010
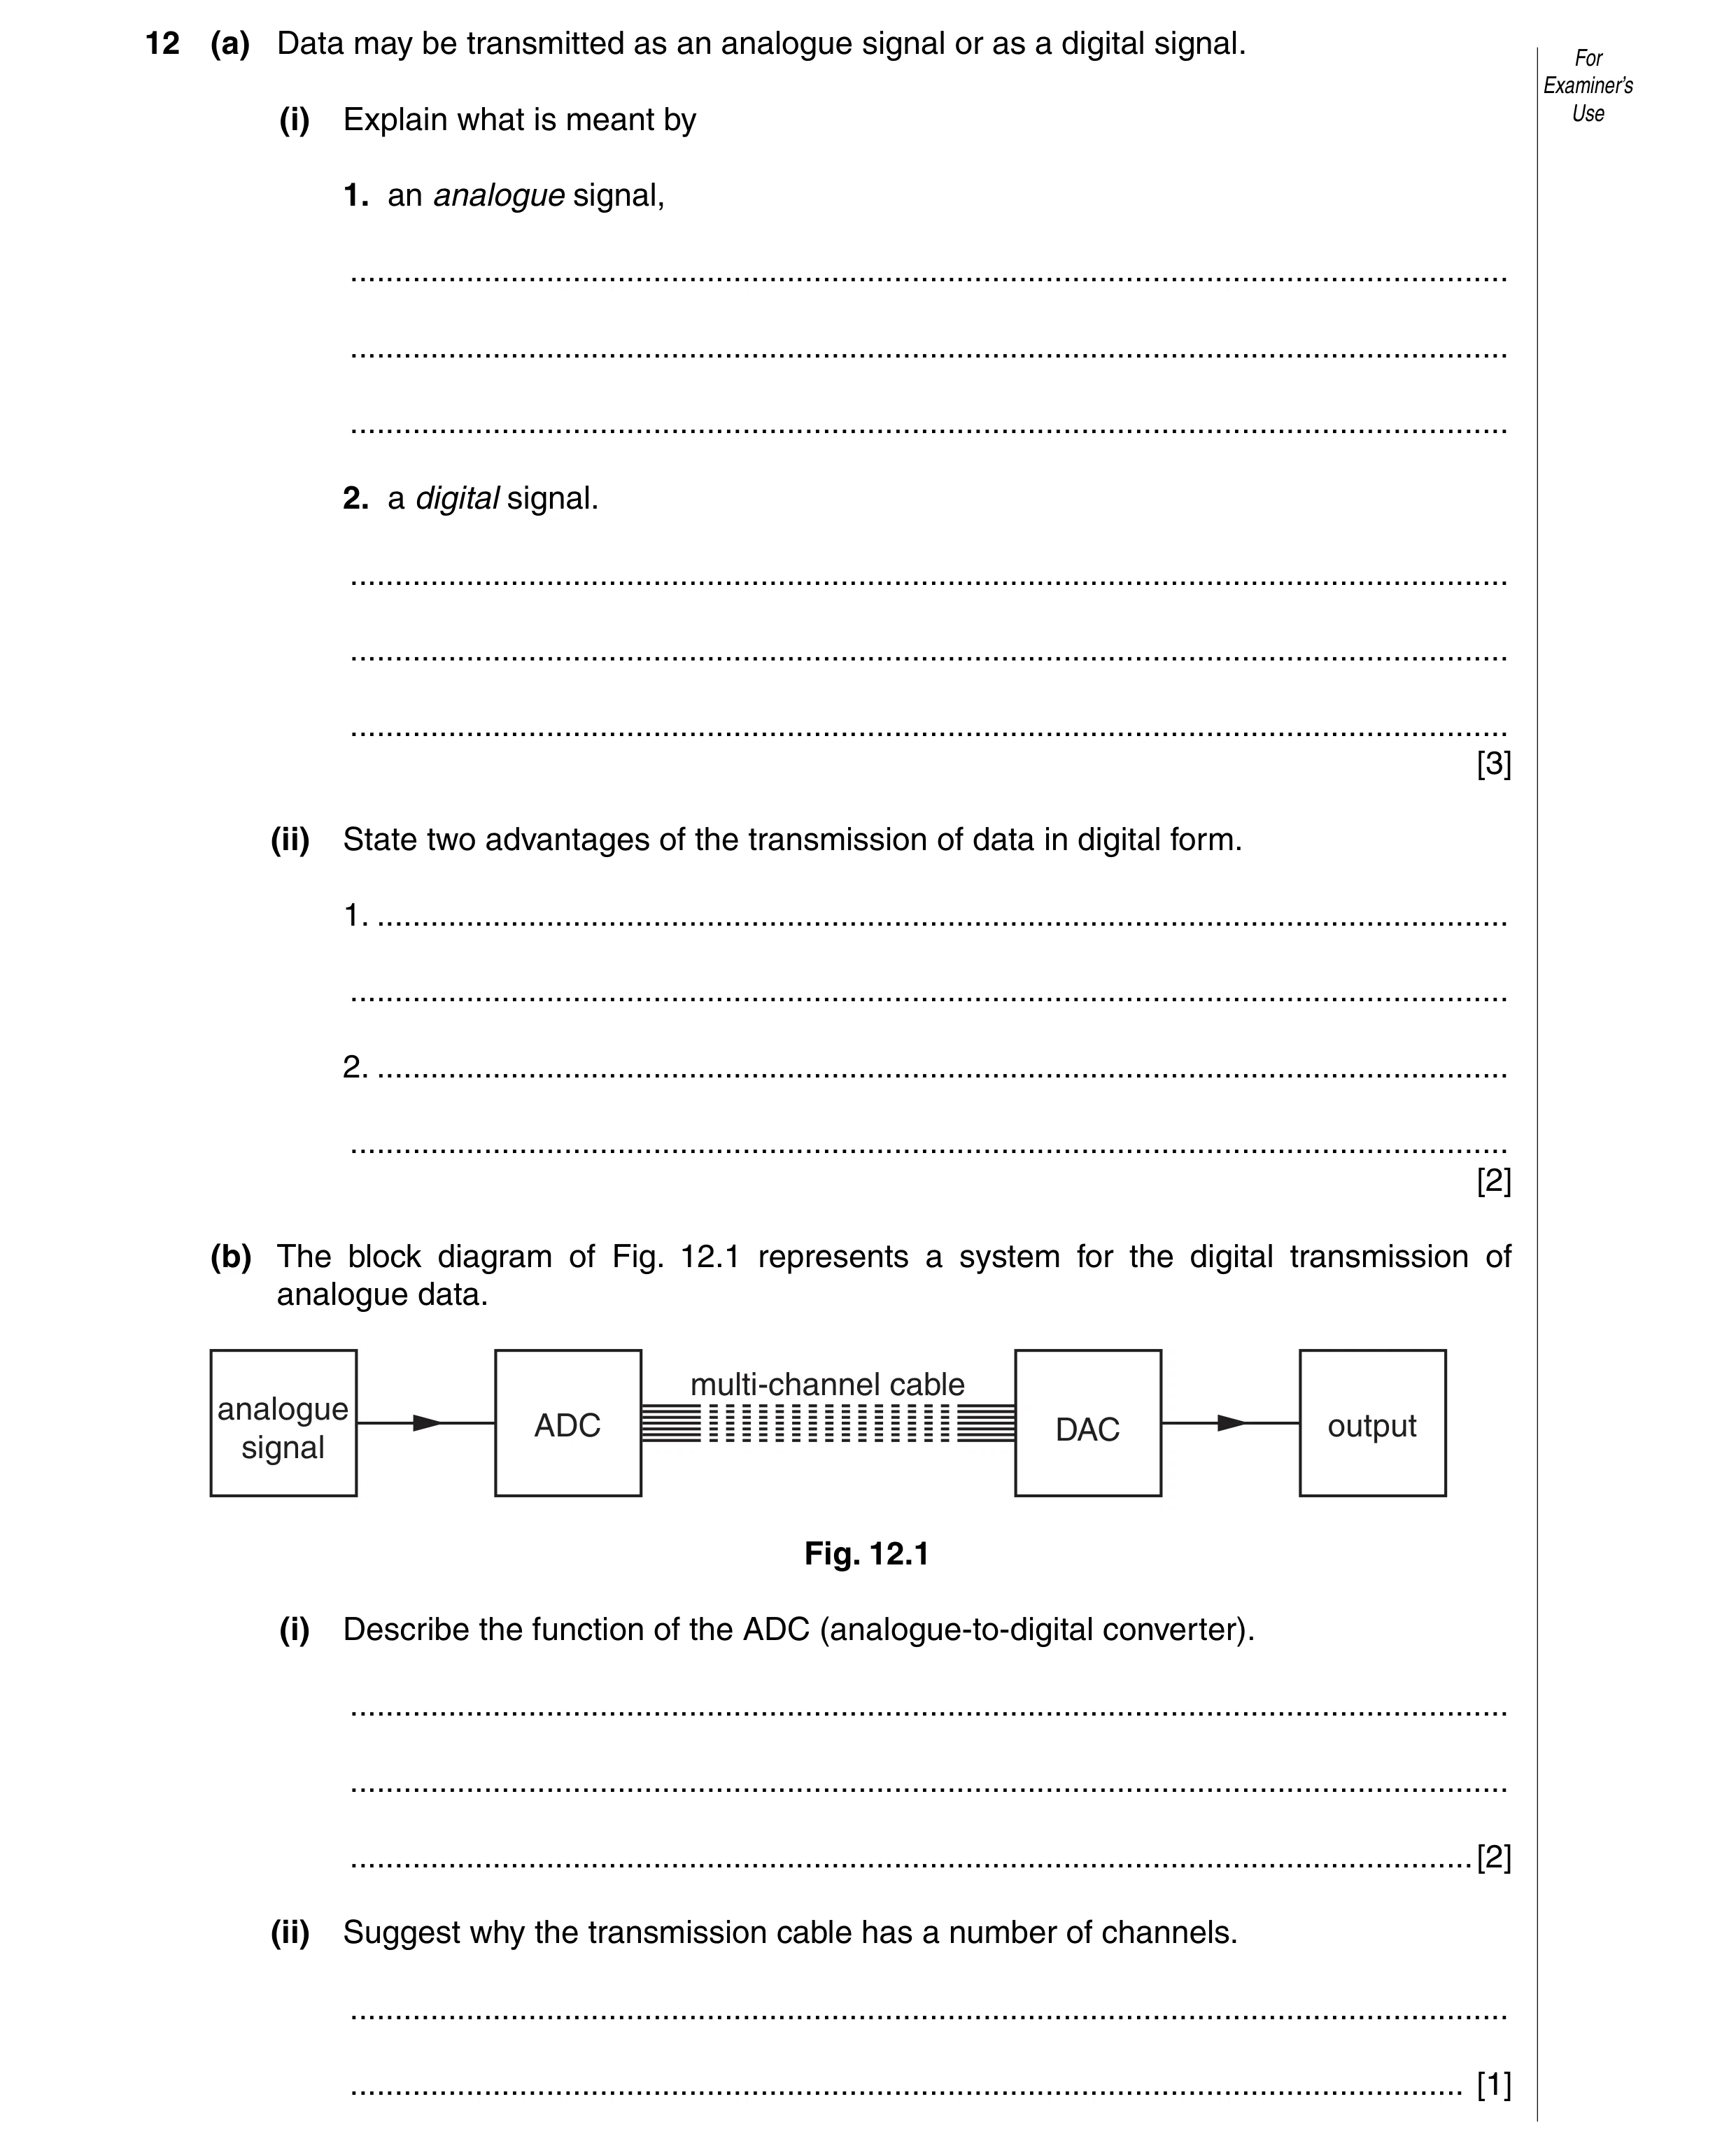
12 (a) Data may be transmitted as an analogue signal or as a digital signal. For Examiner’s (i) Explain what is meant by Use 1. an analogue signal, … … … 2. a digital signal. … … … [3] (ii) State two advantages of the transmission of data in digital form. 1. … … 2. … … [2] (b) The block diagram of Fig. 12.1 represents a system for the digital transmission of analogue data. multi-channel cable analogue ADC DAC output signal Fig. 12.1 (i) Describe the function of the ADC (analogue-to-digital converter). … … … [2] (ii) Suggest why the transmission cable has a number of channels. … … [1]
8 marks
Mark scheme: 12 (a) (i) 1. signal has same variation (with time) as the data B1 2. consists of (a series of) ‘highs’ and ‘lows’ B1 either analogue is continuously variable (between limits) or digital has no intermediate values B1 [3] (ii) e.g. can be regenerated / noise can be eliminated extra data can be added to check / correct transmitted signal (any two reasonable suggestions, 1 each) B2 [2] (b) (i) analogue signal is sampled at (regular time) intervals B1 sampled signal is converted into a binary number B1 [2] (ii) one channel is required for each bit (of the digital number) B1 [1]
This question in 9702/43 Oct/Nov 2010
Q11 · State what is meant by the acoustic impedance Z of a medium 9702/41 May/June 2011
10 (a) State what is meant by the acoustic impedance Z of a medium. For Examiner’s … Use … [1] (b) Two media have acoustic impedances Z1 and Z2. The intensity reflection coefficient α for the boundary between the two media is given by (Z2 – Z1)2 α = . (Z2 + Z1)2 Describe the effect on the transmission of ultrasound through a boundary where there is a large difference between the acoustic impedances of the two media. … … … … [3] (c) Data for the acoustic impedance Z and the absorption coefficient μ for fat and for muscle are shown in Fig. 10.1. Z / kg m–2 s–1 μ / m–1 fat 1.3 × 10⁶ 48 muscle 1.7 × 10⁶ 23 Fig. 10.1 The thickness x of the layer of fat on an animal, as illustrated in Fig. 10.2, is to be investigated using ultrasound. surface S fat muscle incident ultrasound x Fig. 10.2 The intensity of the parallel ultrasound beam entering the surface S of the layer of fat is I. For The beam is reflected from the boundary between fat and muscle. Examiner’s The intensity of the reflected ultrasound detected at the surface S of the fat is 0.012 I. Use Calculate (i) the intensity reflection coefficient at the boundary between the fat and the muscle, coefficient = … [2] (ii) the thickness x of the layer of fat. x = … cm [3]
9 marks
Mark scheme: 10 (a) product of density (of medium) and speed of sound (in the medium) B1 [1] (b) α would be nearly equal to 1 M1 either reflected intensity would be nearly equal to incident intensity or coefficient for transmitted intensity = (1 – α) M1 transmitted intensity would be small A1 [3] (c) (i) α = (1.7 – 1.3)2 / (1.7 + 1.3)2 C1 = 0.018 A1 [2] (ii) attenuation in fat = exp(–48 × 2x × 10–2) C1 0.012 = 0.018 exp(–48 × 2x × 10–2) C1 x = 0.42 cm A1 [3]
This question in 9702/41 May/June 2011
Q12 · A sinusoidal alternating voltage supply is connected to a bridge rectifier consisting of… 9702/41 May/June 2012
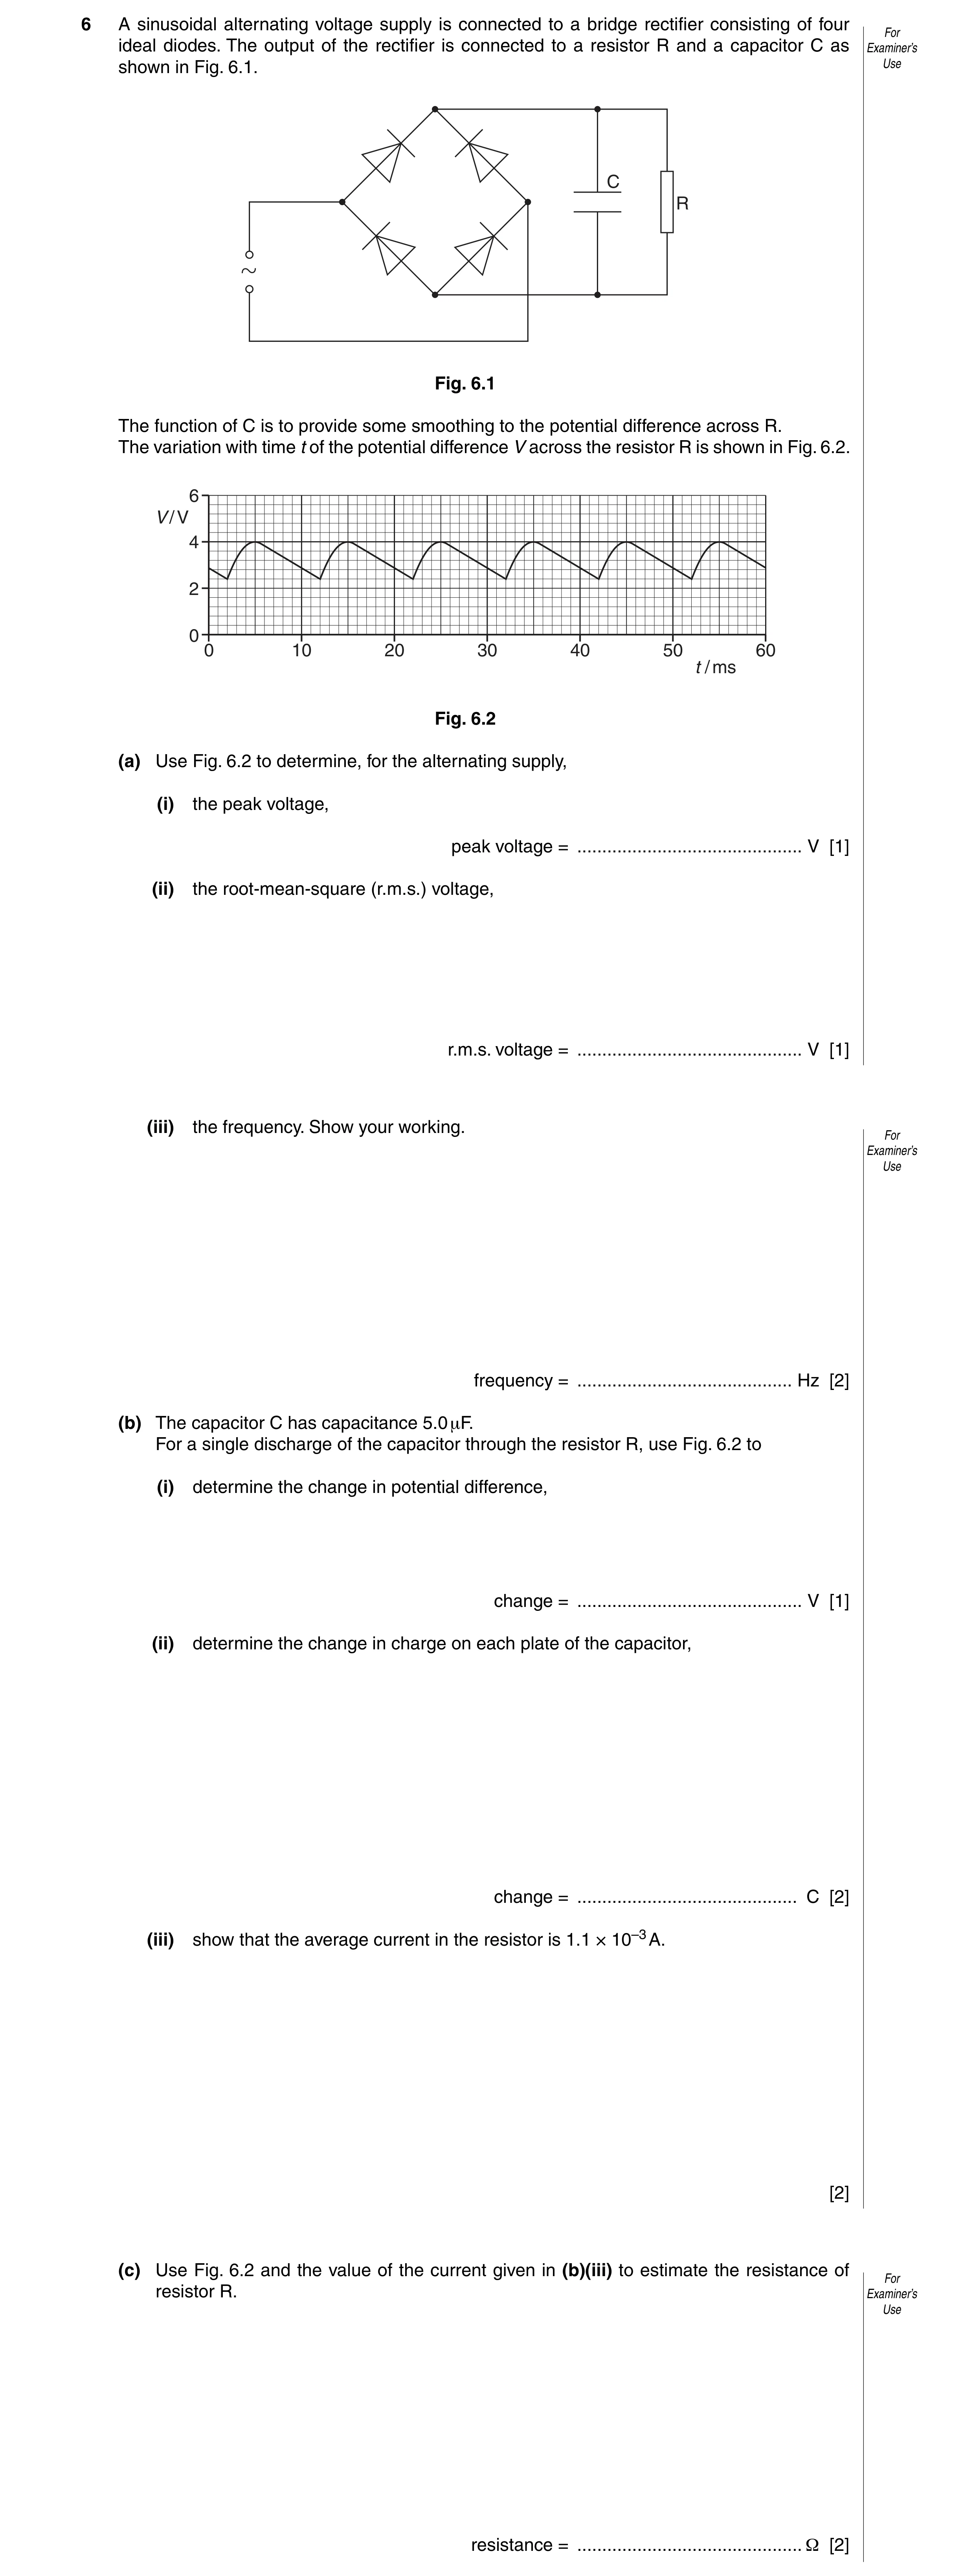
6 A sinusoidal alternating voltage supply is connected to a bridge rectifier consisting of four For ideal diodes. The output of the rectifier is connected to a resistor R and a capacitor C as Examiner’s shown in Fig. 6.1. Use C R Fig. 6.1 The function of C is to provide some smoothing to the potential difference across R. The variation with time t of the potential difference V across the resistor R is shown in Fig. 6.2. 6 V / V 4 2 0 0 10 20 30 40 50 60 t / ms Fig. 6.2 (a) Use Fig. 6.2 to determine, for the alternating supply, (i) the peak voltage, peak voltage = … V [1] (ii) the root-mean-square (r.m.s.) voltage, r.m.s. voltage = … V [1] (iii) the frequency. Show your working. For Examiner’s Use frequency = … Hz [2] (b) The capacitor C has capacitance 5.0 μF. For a single discharge of the capacitor through the resistor R, use Fig. 6.2 to (i) determine the change in potential difference, change = … V [1] (ii) determine the change in charge on each plate of the capacitor, change = … C [2] (iii) show that the average current in the resistor is 1.1 × 10⁻³ A. [2] (c) Use Fig. 6.2 and the value of the current given in (b)(iii) to estimate the resistance of For resistor R. Examiner’s Use resistance = … Ω [2]
11 marks
Mark scheme: 6 (a) (i) peak voltage = 4.0 V A1 [1] (ii) r.m.s. voltage (= 4.0/√2) = 2.8 V A1 [1] (iii) period T = 20 ms M1 frequency = 1 / (20 × 10–3) M1 frequency = 50 Hz A0 [2] (b) (i) change = 4.0 – 2.4 = 1.6 V A1 [1] (ii) ∆Q = C∆V or Q = CV C1 = 5.0 × 10–6 × 1.6 = 8.0 × 10⁻⁶ C A1 [2] (iii) discharge time = 7 ms C1 current = (8.0 × 10⁻⁶) / (7.0 × 10⁻³) M1 = 1.1(4) × 10–3 A A0 [2] (c) average p.d. = 3.2 V C1 resistance = 3.2 / (1.1 × 10⁻³) = 2900 Ω (allow 2800 Ω) A1 [2]
This question in 9702/41 May/June 2012
Q13 · A signal that is transmitted over a long distance will be attenuated and it will pick up… 9702/42 May/June 2012
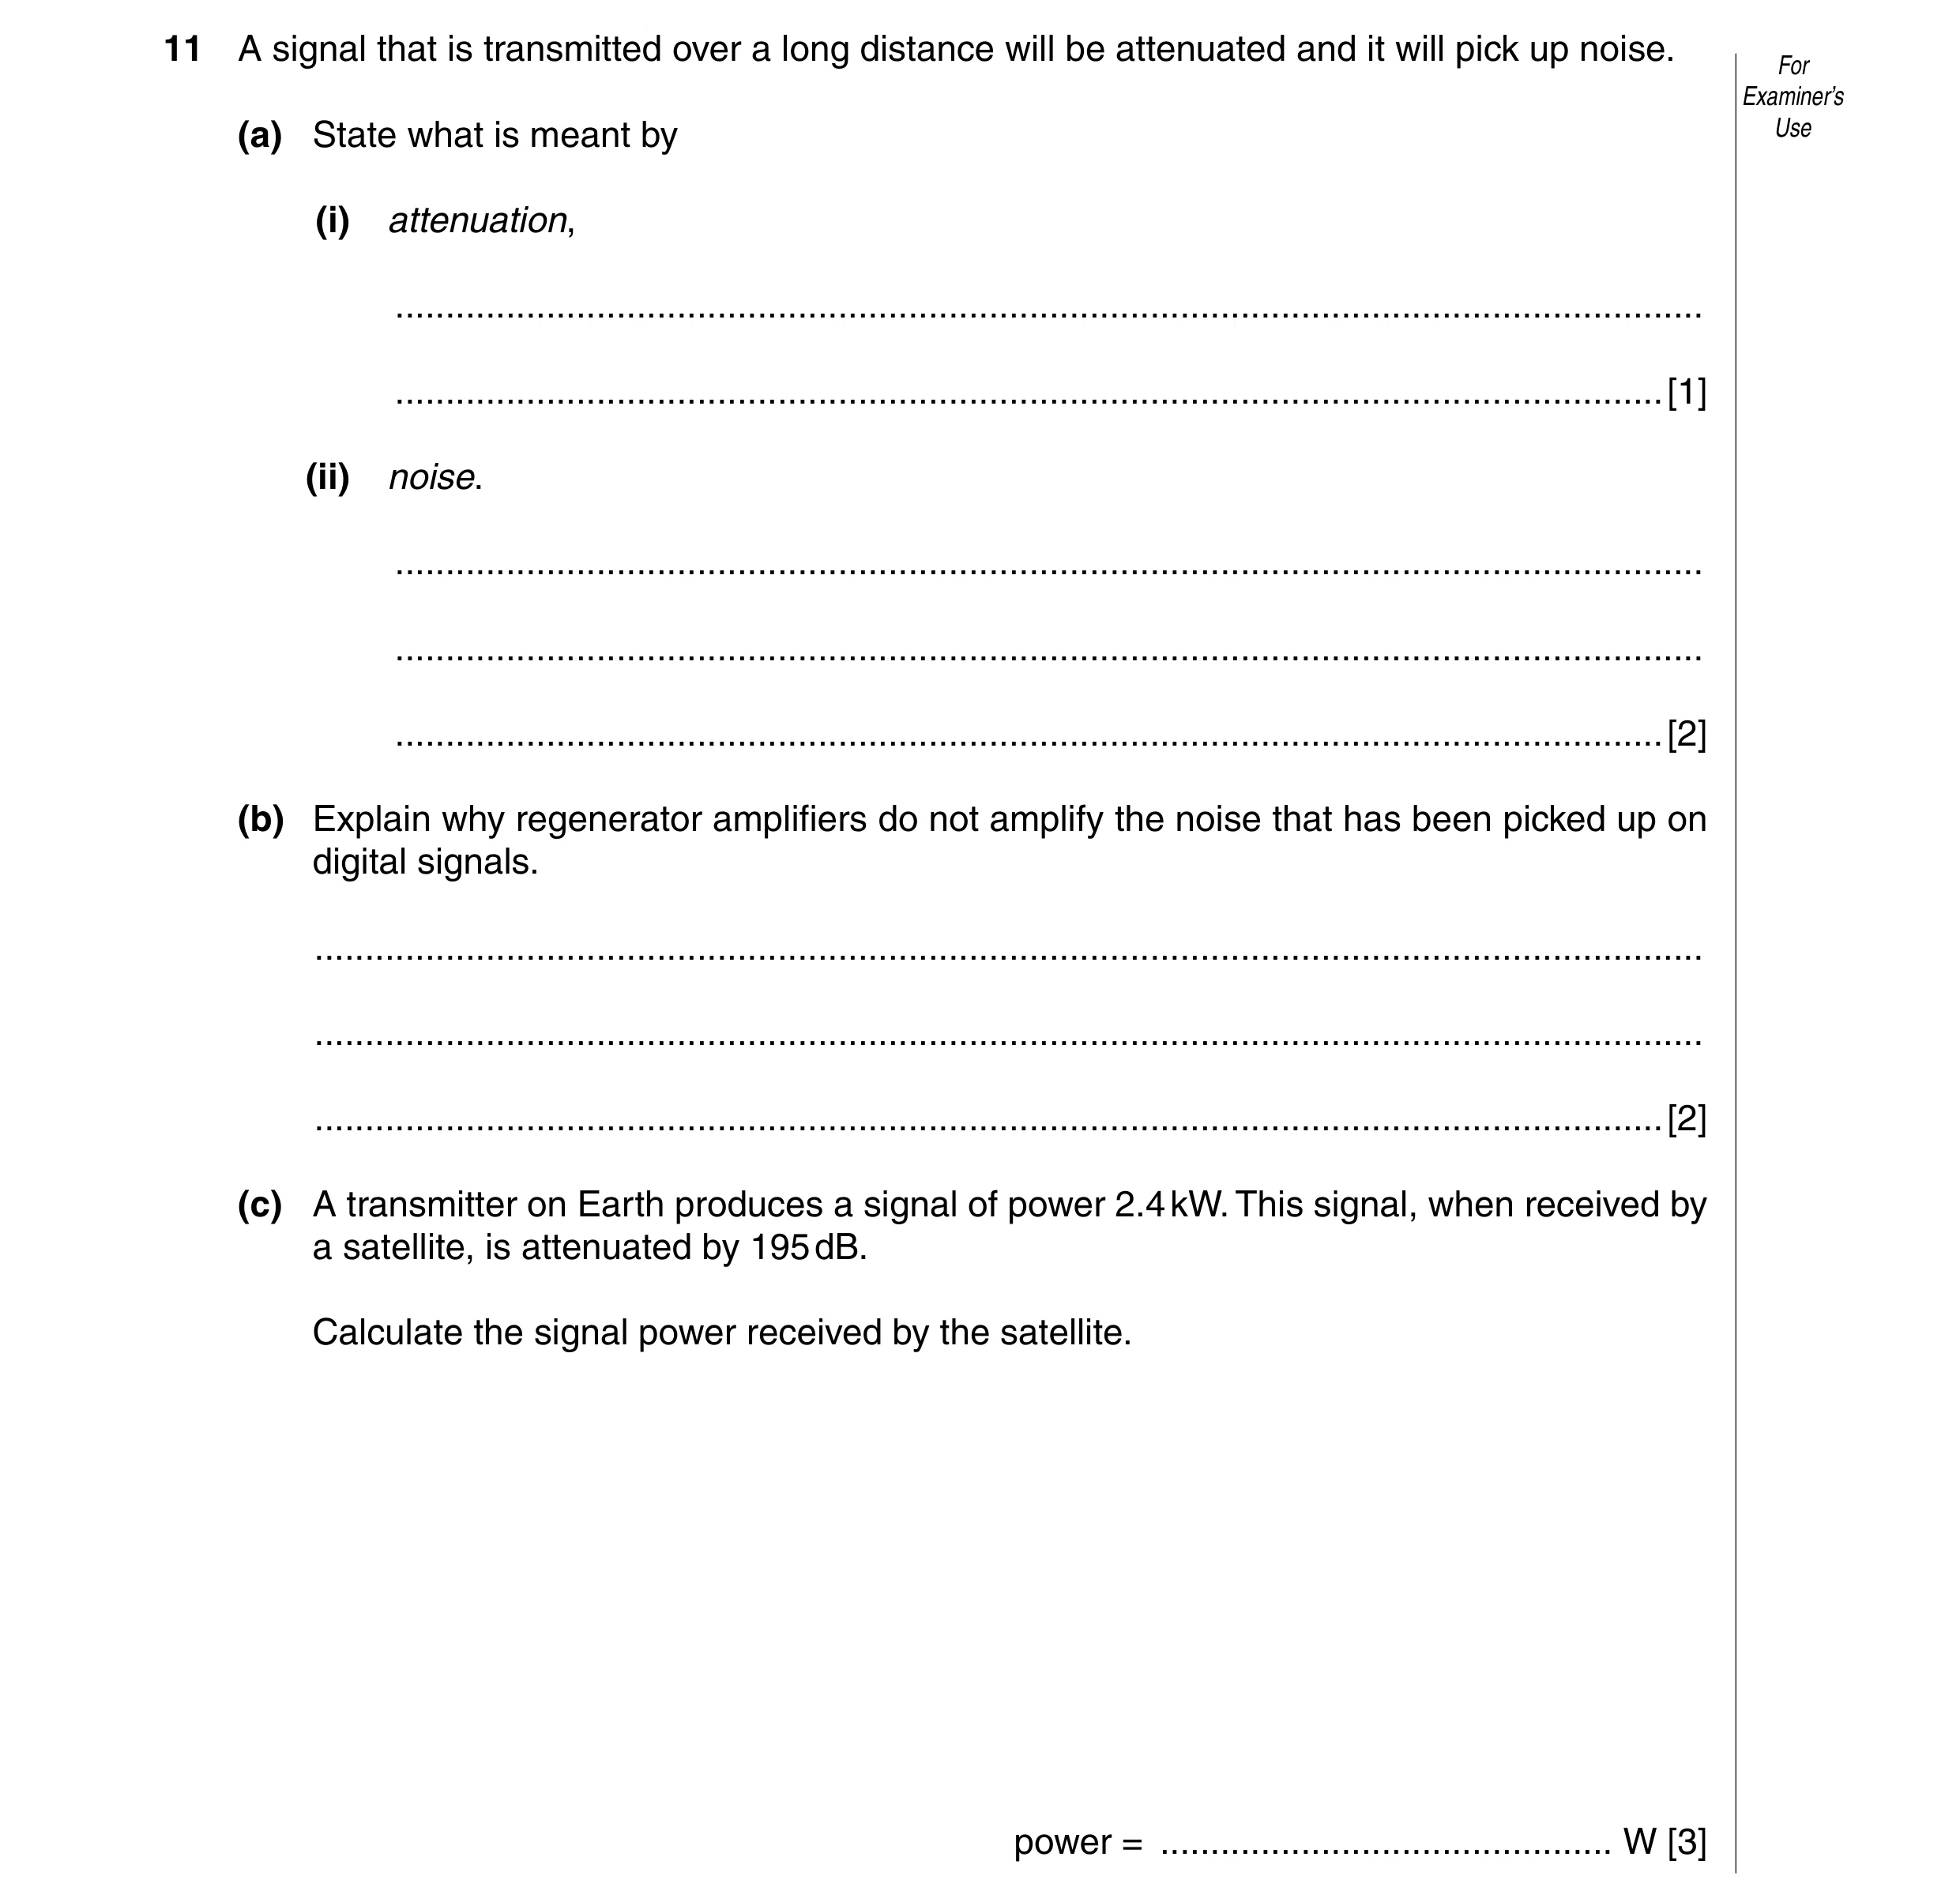
11 A signal that is transmitted over a long distance will be attenuated and it will pick up noise. For Examiner’s (a) State what is meant by Use (i) attenuation, … … [1] (ii) noise. … … … [2] (b) Explain why regenerator amplifiers do not amplify the noise that has been picked up on digital signals. … … … [2] (c) A transmitter on Earth produces a signal of power 2.4 kW. This signal, when received by a satellite, is attenuated by 195 dB. Calculate the signal power received by the satellite. power = … W [3]
8 marks
Mark scheme: 11 (a) (i) loss of (signal) power B1 [1] (ii) unwanted power (on signal) M1 that is random A1 [2] (b) for digital, only the ‘high’ and the ‘low’ / 1 and 0 are necessary M1 variation between ‘highs’ and ‘lows’ caused by noise not required A1 [2] (c) attenuation = 10 lg(P2 / P1) C1 either 195 = 10 lg({2.4 × 10³} / P) or –195 = 10 lg(P / 2.4 × 10³) C1 P = 7.6 × 10⁻¹⁷ W A1 [3] GCE AS/A LEVEL – May/June 2012 9702 42
This question in 9702/42 May/June 2012
Q14 · A sinusoidal alternating voltage supply is connected to a bridge rectifier consisting of… 9702/43 May/June 2012
6 A sinusoidal alternating voltage supply is connected to a bridge rectifier consisting of four For ideal diodes. The output of the rectifier is connected to a resistor R and a capacitor C as Examiner’s shown in Fig. 6.1. Use C R Fig. 6.1 The function of C is to provide some smoothing to the potential difference across R. The variation with time t of the potential difference V across the resistor R is shown in Fig. 6.2. 6 V / V 4 2 0 0 10 20 30 40 50 60 t / ms Fig. 6.2 (a) Use Fig. 6.2 to determine, for the alternating supply, (i) the peak voltage, peak voltage = … V [1] (ii) the root-mean-square (r.m.s.) voltage, r.m.s. voltage = … V [1] (iii) the frequency. Show your working. For Examiner’s Use frequency = … Hz [2] (b) The capacitor C has capacitance 5.0 μF. For a single discharge of the capacitor through the resistor R, use Fig. 6.2 to (i) determine the change in potential difference, change = … V [1] (ii) determine the change in charge on each plate of the capacitor, change = … C [2] (iii) show that the average current in the resistor is 1.1 × 10⁻³ A. [2] (c) Use Fig. 6.2 and the value of the current given in (b)(iii) to estimate the resistance of For resistor R. Examiner’s Use resistance = … Ω [2]
11 marks
Mark scheme: 6 (a) (i) peak voltage = 4.0 V A1 [1] (ii) r.m.s. voltage (= 4.0/√2) = 2.8 V A1 [1] (iii) period T = 20 ms M1 frequency = 1 / (20 × 10–3) M1 frequency = 50 Hz A0 [2] (b) (i) change = 4.0 – 2.4 = 1.6 V A1 [1] (ii) ∆Q = C∆V or Q = CV C1 = 5.0 × 10–6 × 1.6 = 8.0 × 10⁻⁶ C A1 [2] (iii) discharge time = 7 ms C1 current = (8.0 × 10⁻⁶) / (7.0 × 10⁻³) M1 = 1.1(4) × 10–3 A A0 [2] (c) average p.d. = 3.2 V C1 resistance = 3.2 / (1.1 × 10⁻³) = 2900 Ω (allow 2800 Ω) A1 [2]
This question in 9702/43 May/June 2012
Q15 · Wire pairs used for the transmission of telephone signals are subject to cross-linking 9702/41 Oct/Nov 2012
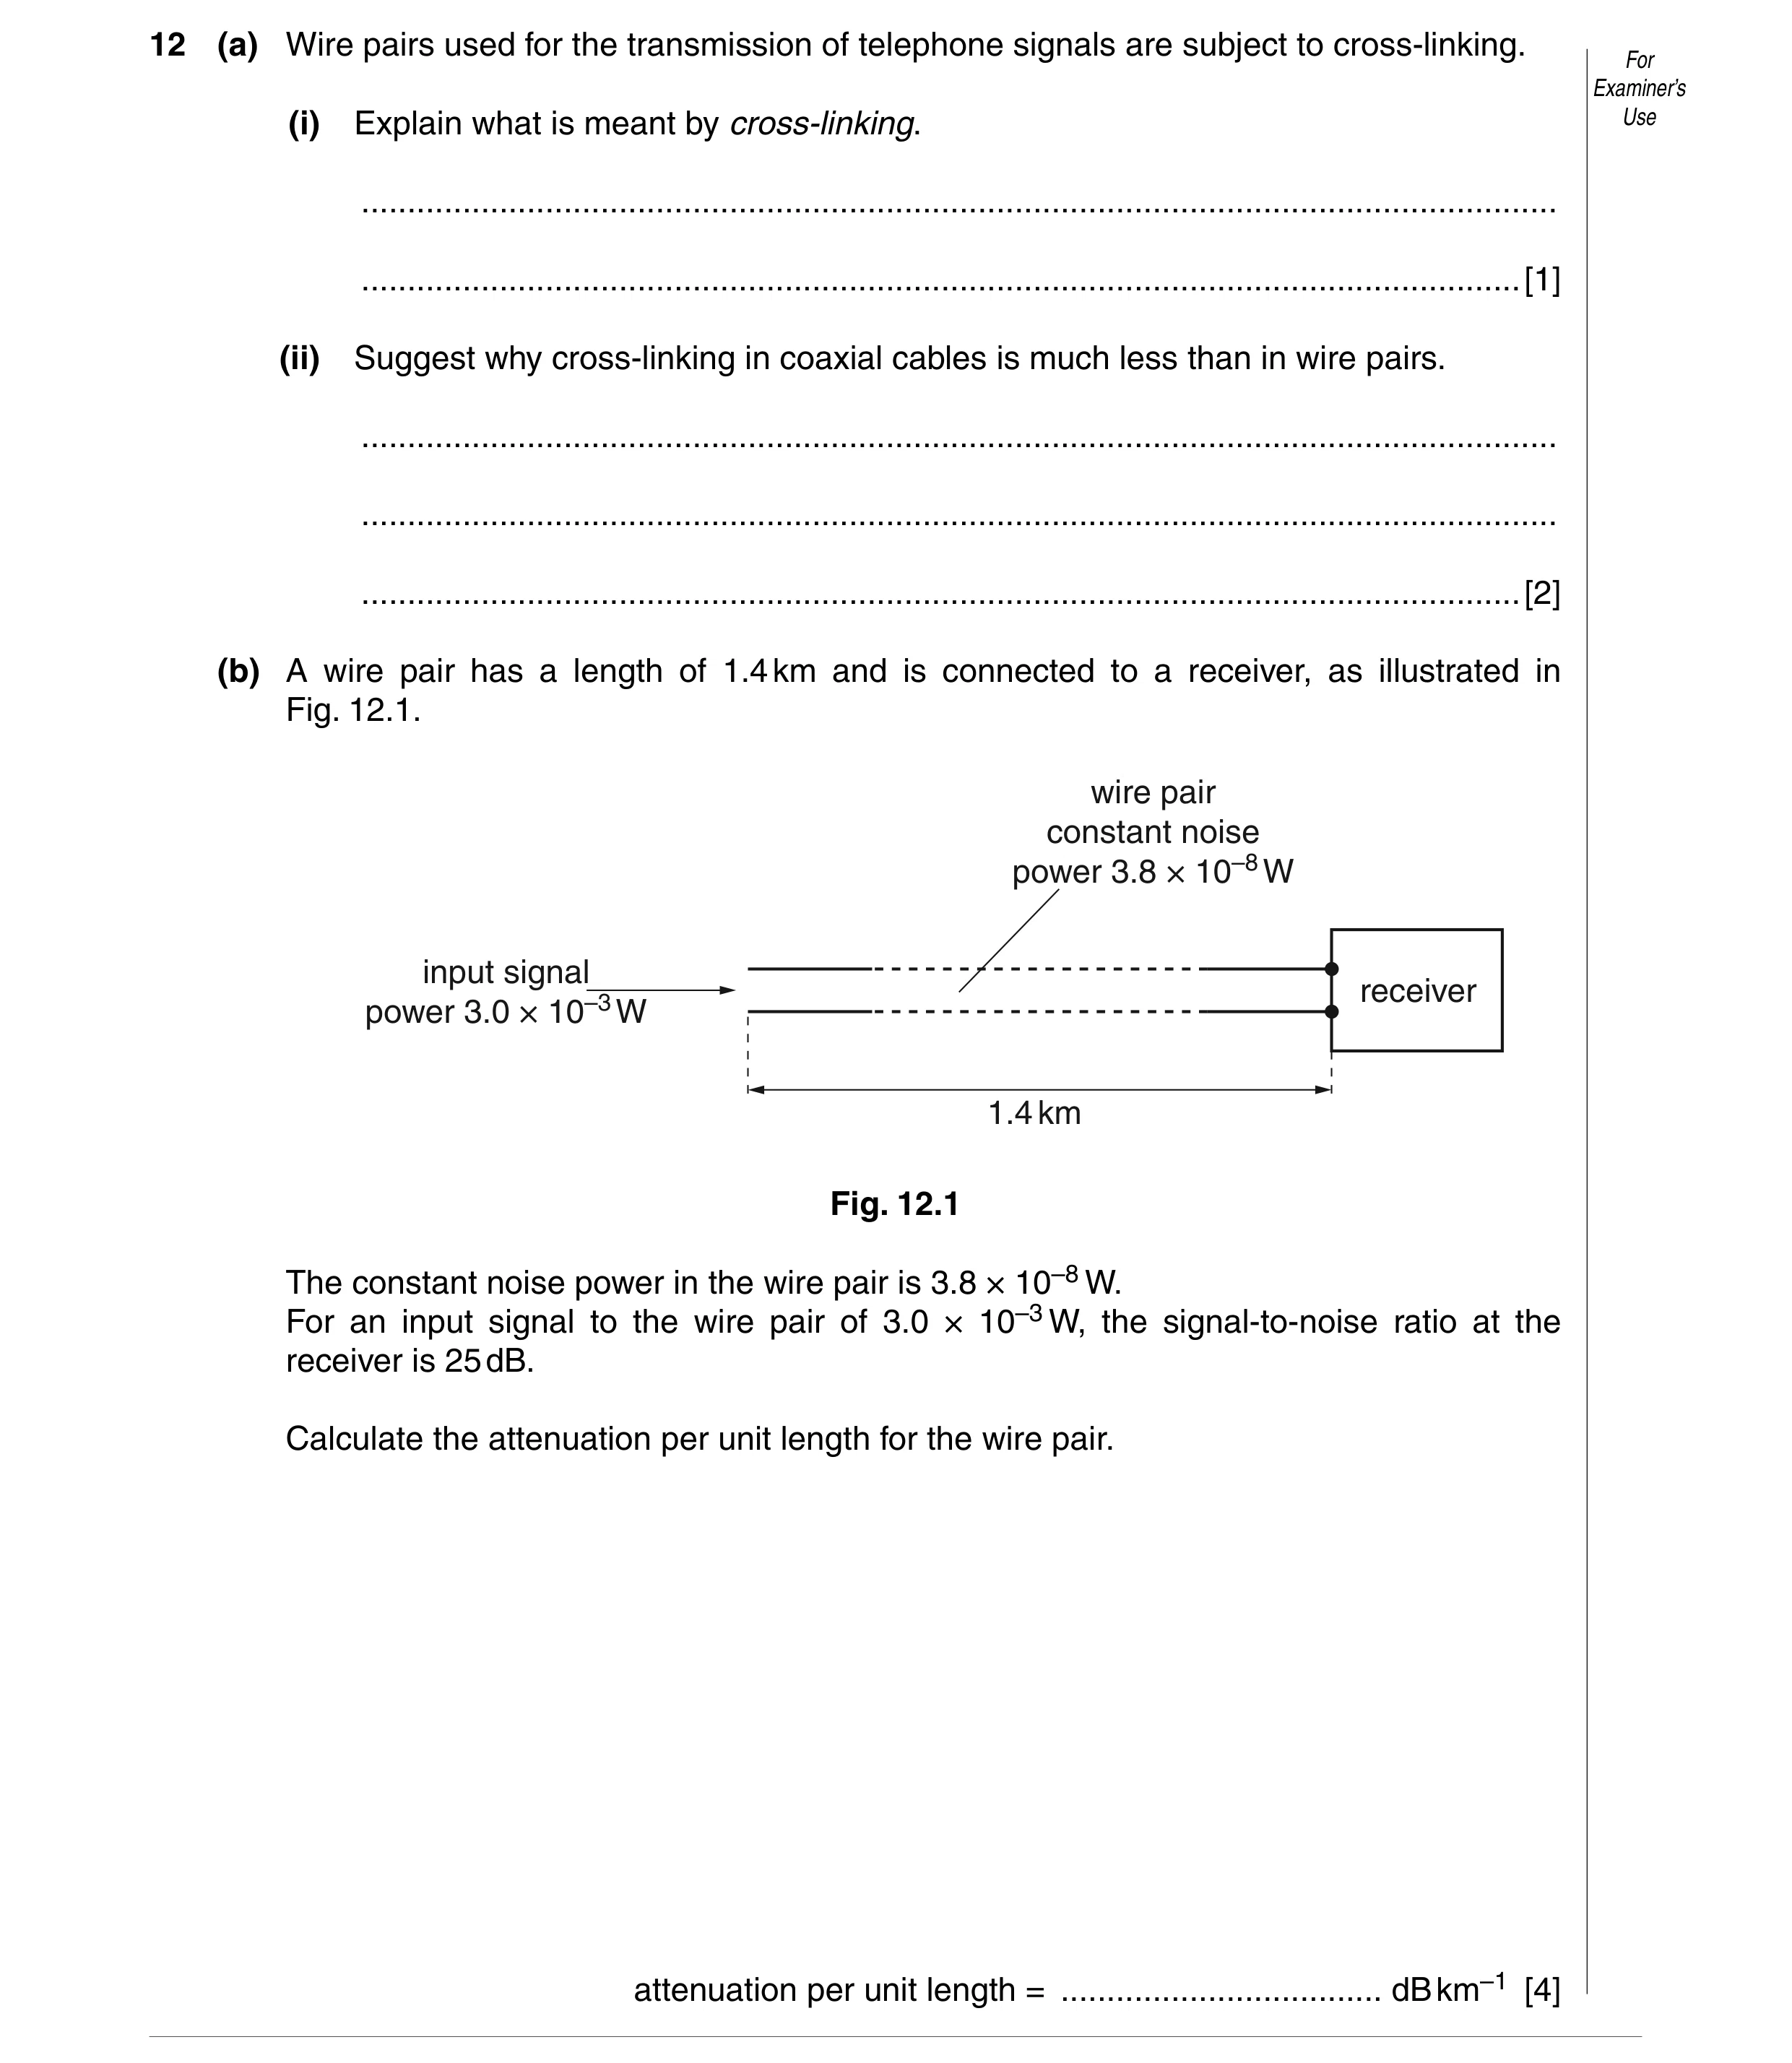
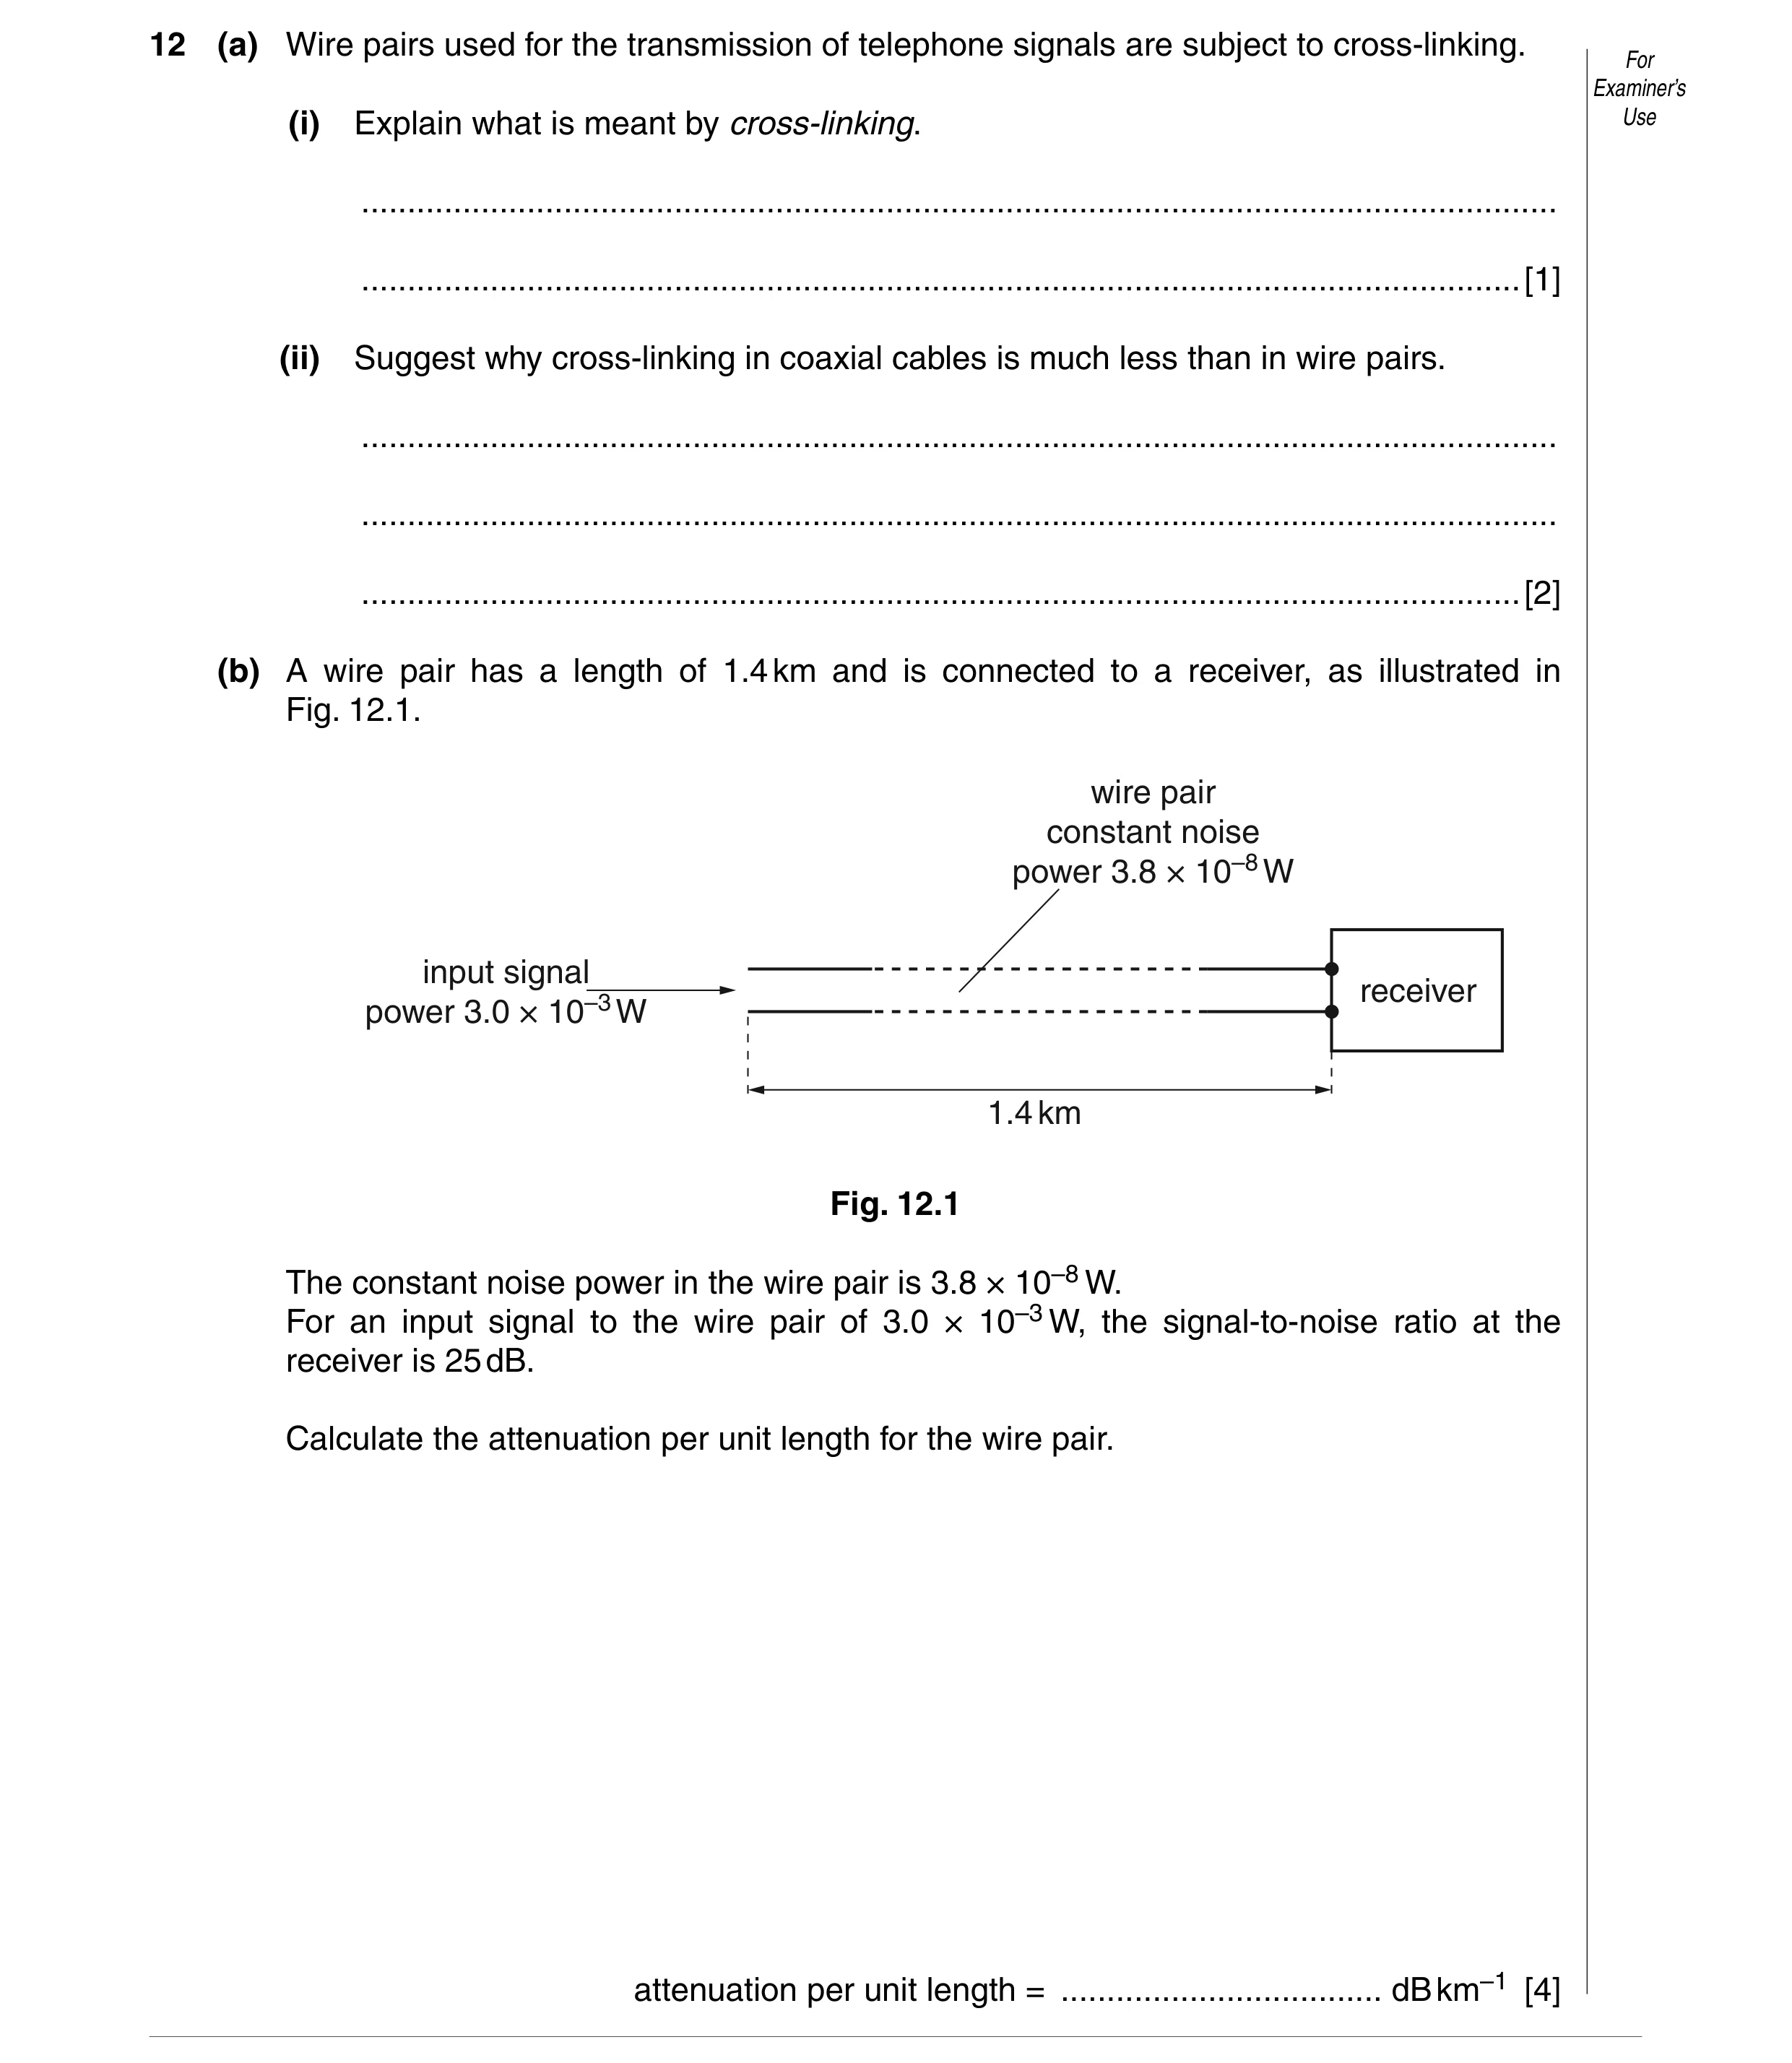
12 (a) Wire pairs used for the transmission of telephone signals are subject to cross-linking. For Examiner’s (i) Explain what is meant by cross-linking. Use … … [1] (ii) Suggest why cross-linking in coaxial cables is much less than in wire pairs. … … … [2] (b) A wire pair has a length of 1.4 km and is connected to a receiver, as illustrated in Fig. 12.1. wire pair constant noise power 3.8 × 10⁻⁸ W input signal receiver power 3.0 × 10⁻³ W 1.4 km Fig. 12.1 The constant noise power in the wire pair is 3.8 × 10⁻⁸ W. For an input signal to the wire pair of 3.0 × 10⁻³ W, the signal-to-noise ratio at the receiver is 25 dB. Calculate the attenuation per unit length for the wire pair. attenuation per unit length = … dB km–1 [4]
7 marks
Mark scheme: 12 (a) (i) signal in one wire (pair) is picked up by a neighbouring wire (pair) B1 [1] (ii) outer of coaxial cable is earthed B1 outer shields the core from noise / external signals B1 [2] GCE AS/A LEVEL – October/November 2012 9702 41 (b) attenuation per unit length = 1/L × 10 lg(P2/P1) C1 signal power at receiver = 102.5 × 3.8 × 10–8 = 1.2 × 10⁻⁵ W C1 attenuation in wire pair = 10 lg({3.0 × 10⁻³} / {1.2 × 10⁻⁵}) = 24 dB C1 attenuation per unit length = 24 / 1.4 = 17 dB km–1 A1 [4] (other correct methods of calculation are possible)
This question in 9702/41 Oct/Nov 2012
Q16 · Wire pairs used for the transmission of telephone signals are subject to cross-linking 9702/42 Oct/Nov 2012
12 (a) Wire pairs used for the transmission of telephone signals are subject to cross-linking. For Examiner’s (i) Explain what is meant by cross-linking. Use … … [1] (ii) Suggest why cross-linking in coaxial cables is much less than in wire pairs. … … … [2] (b) A wire pair has a length of 1.4 km and is connected to a receiver, as illustrated in Fig. 12.1. wire pair constant noise power 3.8 × 10⁻⁸ W input signal receiver power 3.0 × 10⁻³ W 1.4 km Fig. 12.1 The constant noise power in the wire pair is 3.8 × 10⁻⁸ W. For an input signal to the wire pair of 3.0 × 10⁻³ W, the signal-to-noise ratio at the receiver is 25 dB. Calculate the attenuation per unit length for the wire pair. attenuation per unit length = … dB km–1 [4]
7 marks
Mark scheme: 12 (a) (i) signal in one wire (pair) is picked up by a neighbouring wire (pair) B1 [1] (ii) outer of coaxial cable is earthed B1 outer shields the core from noise / external signals B1 [2] GCE AS/A LEVEL – October/November 2012 9702 42 (b) attenuation per unit length = 1/L × 10 lg(P2/P1) C1 signal power at receiver = 102.5 × 3.8 × 10–8 = 1.2 × 10⁻⁵ W C1 attenuation in wire pair = 10 lg({3.0 × 10⁻³} / {1.2 × 10⁻⁵}) = 24 dB C1 attenuation per unit length = 24 / 1.4 = 17 dB km–1 A1 [4] (other correct methods of calculation are possible)
This question in 9702/42 Oct/Nov 2012
Q17 · Data may be transmitted in either analogue or digital form 9702/43 Oct/Nov 2013
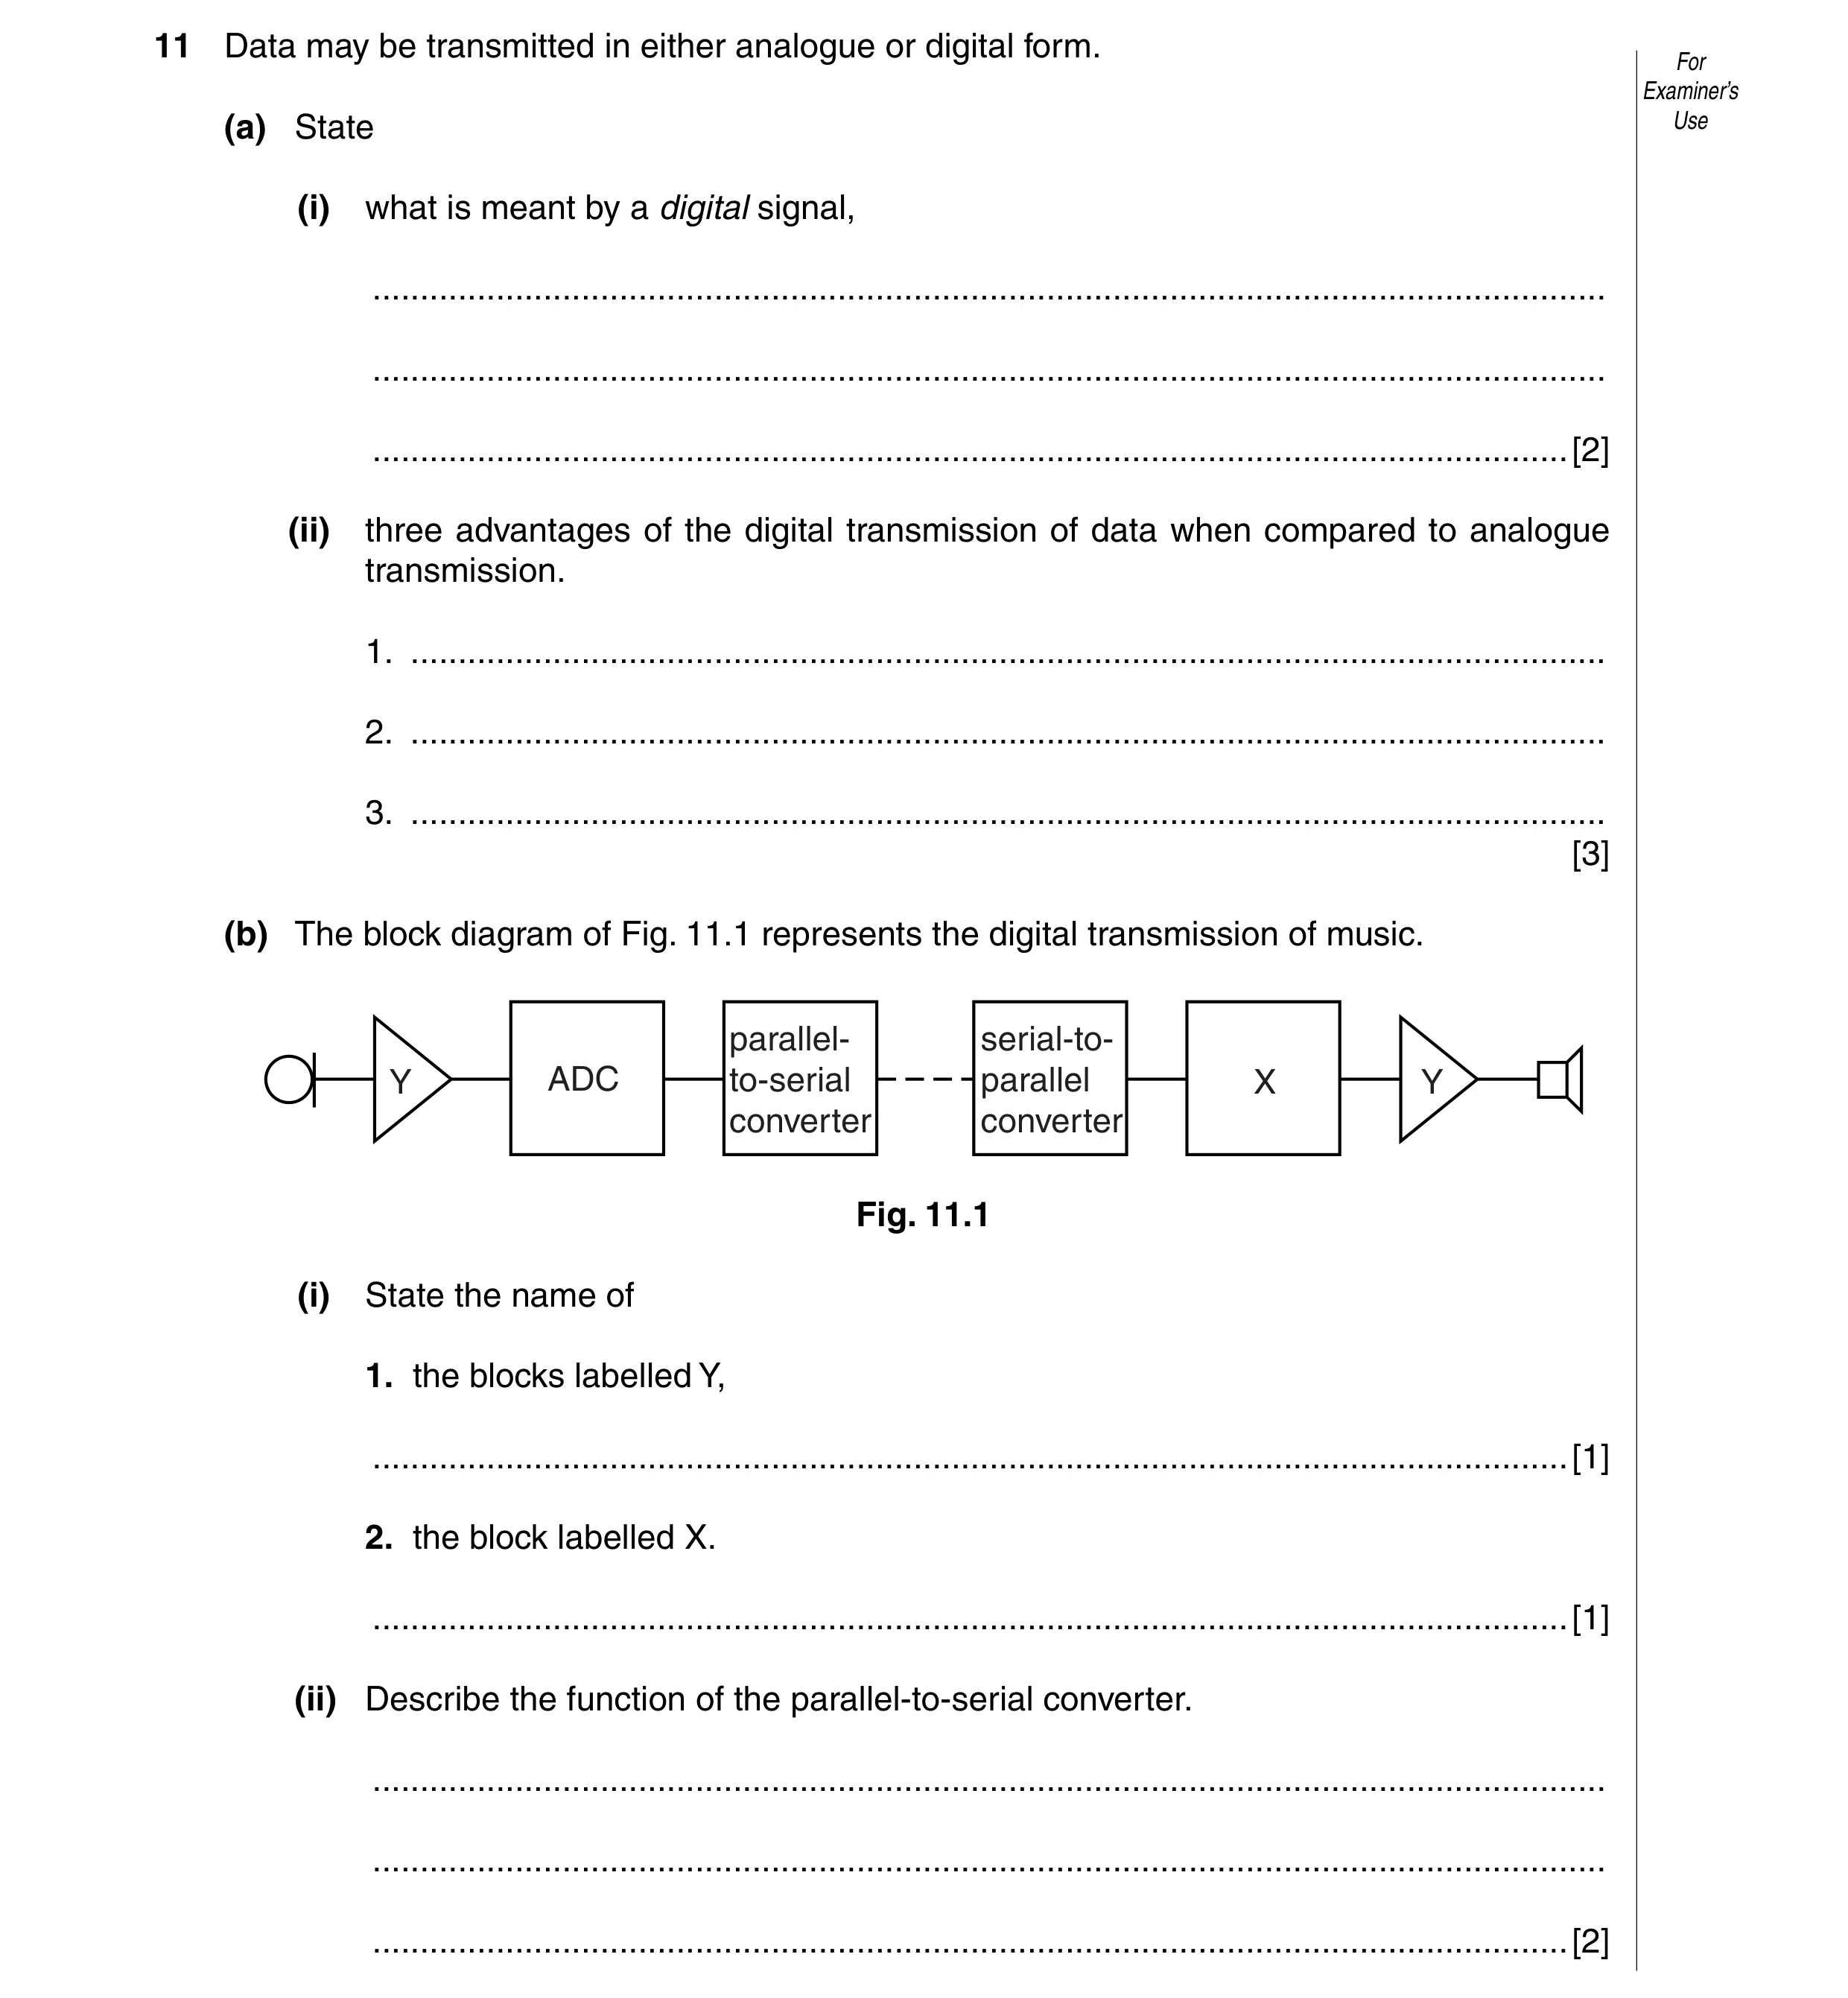
11 Data may be transmitted in either analogue or digital form. For Examiner’s (a) State Use (i) what is meant by a digital signal, … … … [2] (ii) three advantages of the digital transmission of data when compared to analogue transmission. 1. … 2. … 3. … [3] (b) The block diagram of Fig. 11.1 represents the digital transmission of music. parallel- serial-to- Y ADC to-serial parallel X Y converter converter Fig. 11.1 (i) State the name of 1. the blocks labelled Y, … [1] 2. the block labelled X. … [1] (ii) Describe the function of the parallel-to-serial converter. … … … [2]
9 marks
Mark scheme: 11 (a) (i) either series of ‘highs’ and ‘lows’ or two discrete values M1 with no intermediate values A1 [2] (ii) e.g. noise can be eliminated (NOT ‘no noise’) signal can be regenerated addition of extra data to check for errors larger data carrying capacity cheaper circuits more reliable circuits (any three, 1 each) B3 [3] GCE A LEVEL – October/November 2013 9702 43 (b) (i) 1. amplifier B1 [1] 2. digital-to-analogue converter (allow DAC) B1 [1] (ii) output of ADC is number of digits all at one time B1 parallel-to-serial sends digits one after another B1 [2]
This question in 9702/43 Oct/Nov 2013
Q18 · Distinguish between an analogue signal and a digital signal 9702/43 Oct/Nov 2014
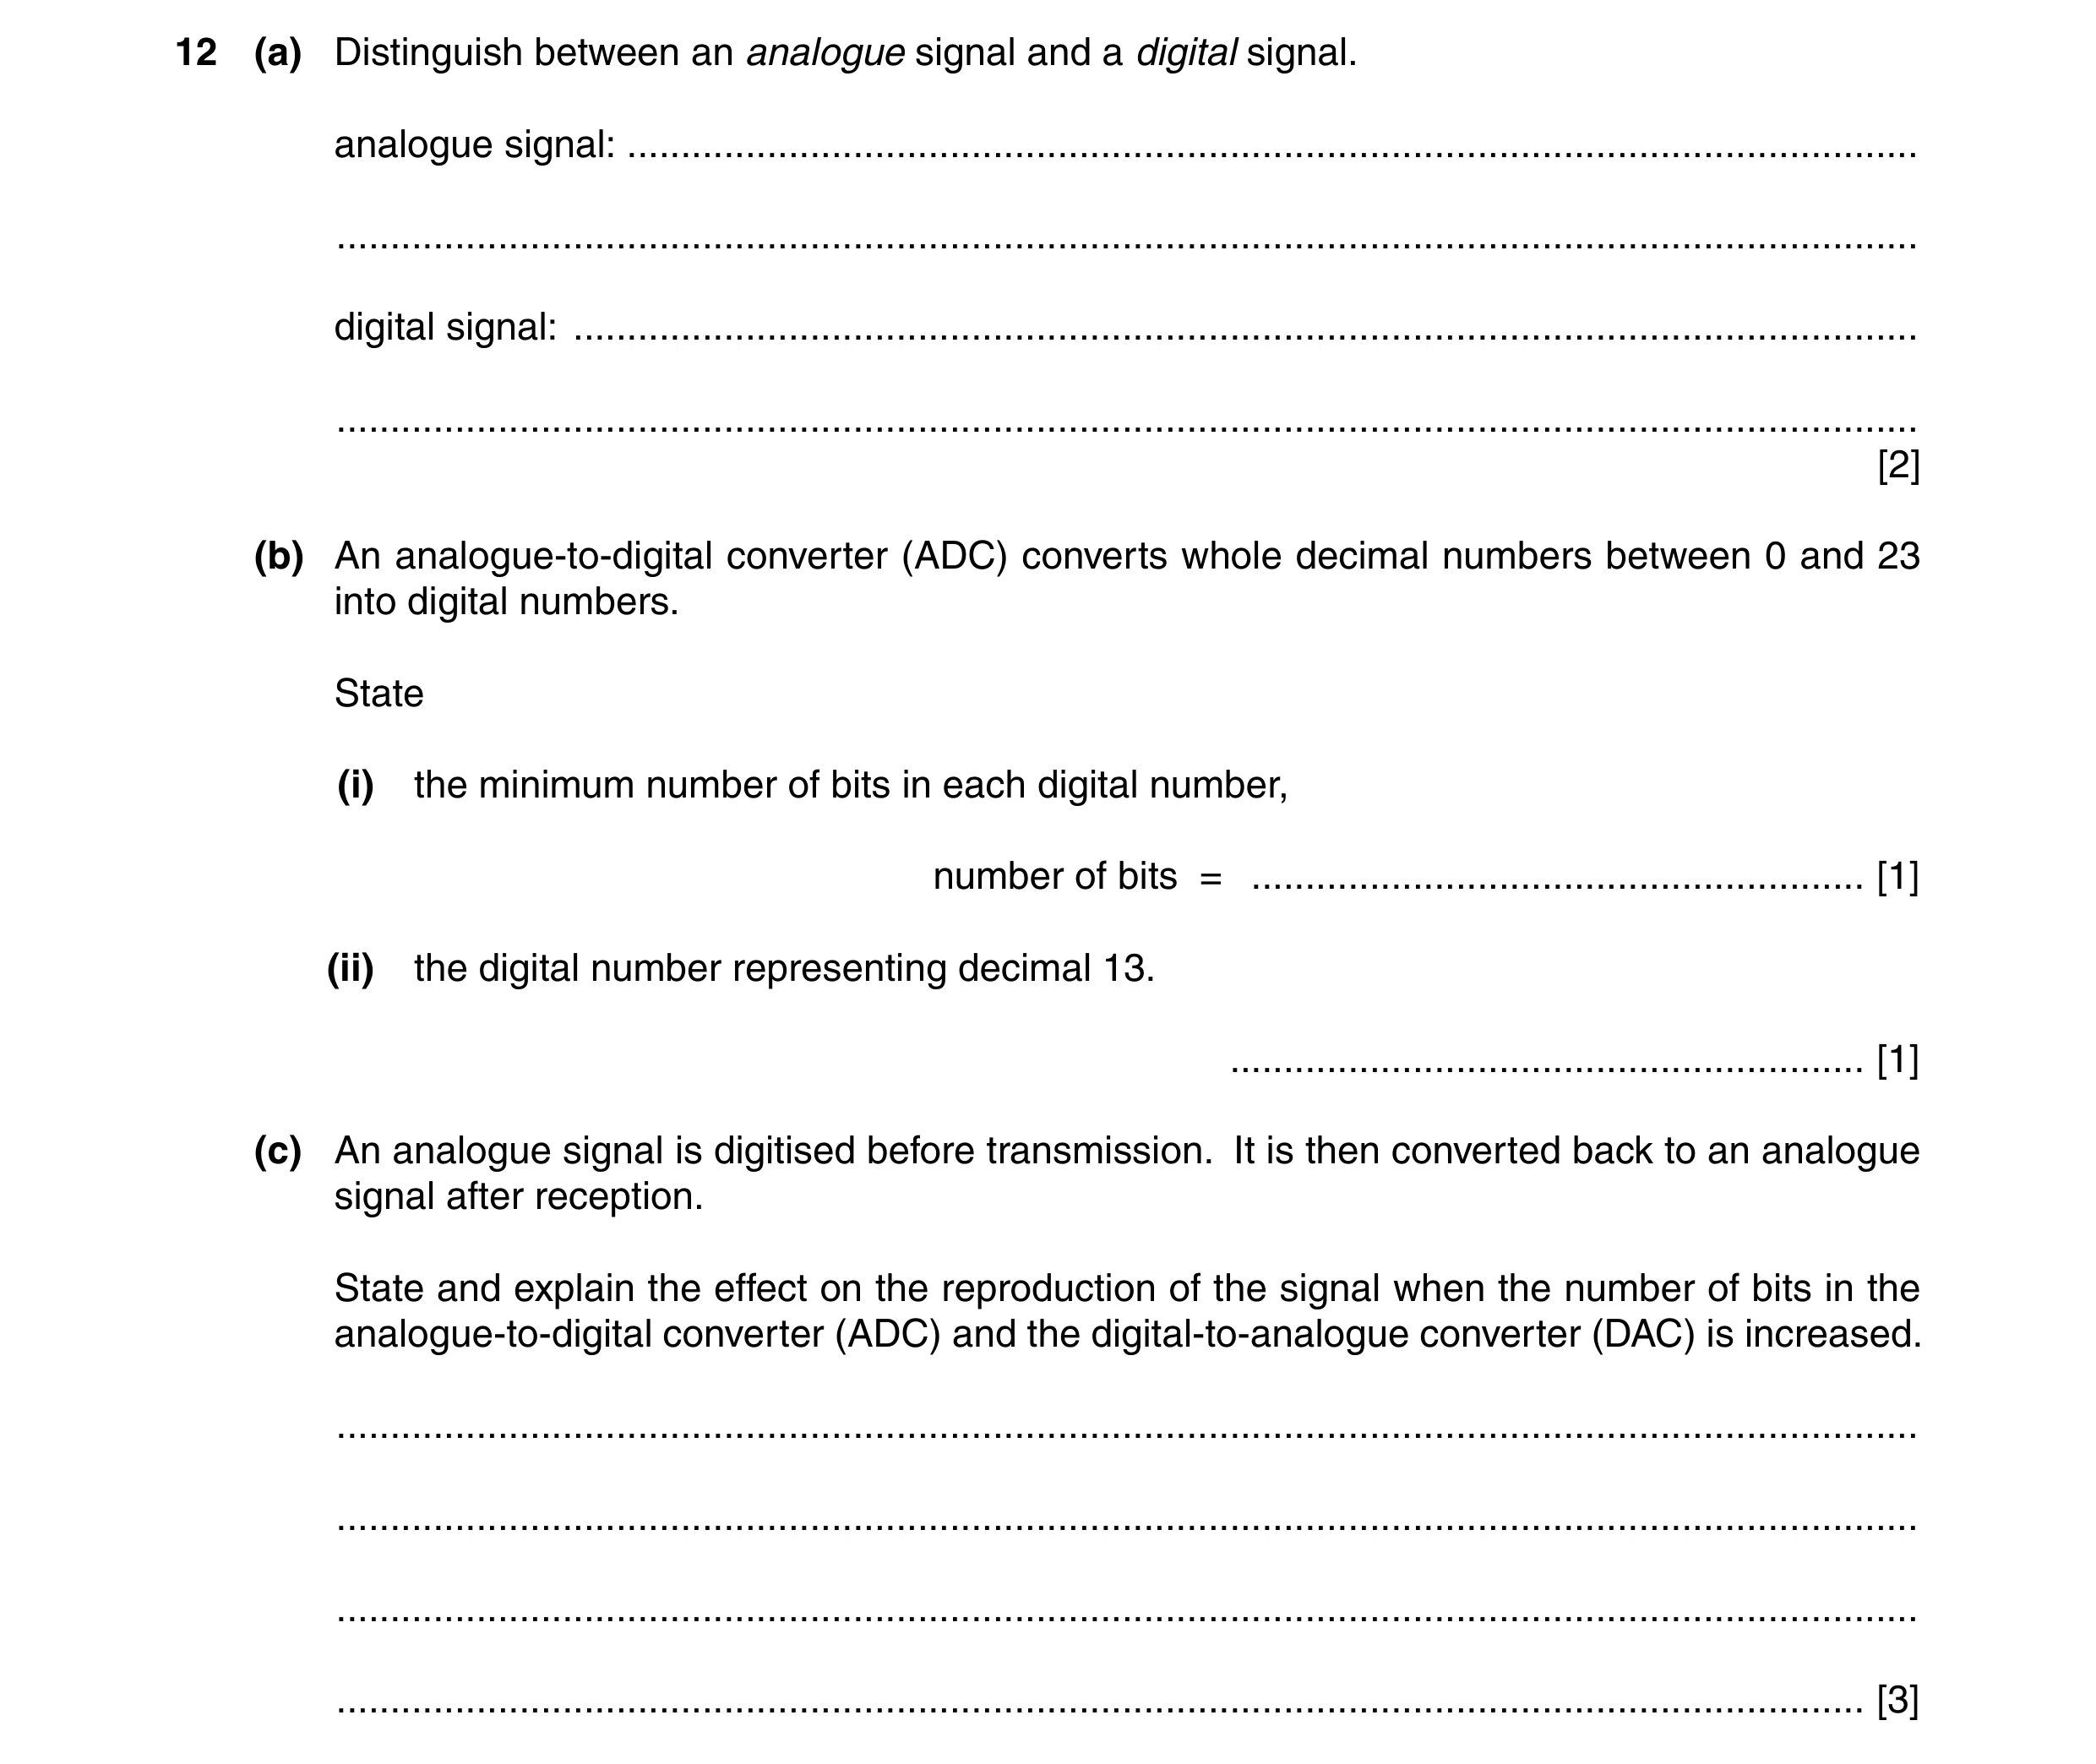
12 (a) Distinguish between an analogue signal and a digital signal. analogue signal: … … digital signal: … … [2] (b) An analogue-to-digital converter (ADC) converts whole decimal numbers between 0 and 23 into digital numbers. State (i) the minimum number of bits in each digital number, number of bits = … [1] (ii) the digital number representing decimal 13. … [1] (c) An analogue signal is digitised before transmission. It is then converted back to an analogue signal after reception. State and explain the effect on the reproduction of the signal when the number of bits in the analogue-to-digital converter (ADC) and the digital-to-analogue converter (DAC) is increased. … … … … [3]
7 marks
Mark scheme: 12 (a) analogue: continuously variable B1 digital: two / distinct levels only or 1 s and 0 s or highs and lows B1 [2] (b) (i) 5 A1 [1] (ii) 1 1 0 1 A1 [1] (c) greater number of voltage / signal levels B1 smaller step heights in reproduced signal B1 smaller voltage / signal changes can be seen B1 [3]
This question in 9702/43 Oct/Nov 2014
Q19 · A carrier wave is frequency modulated 9702/41 Oct/Nov 2015
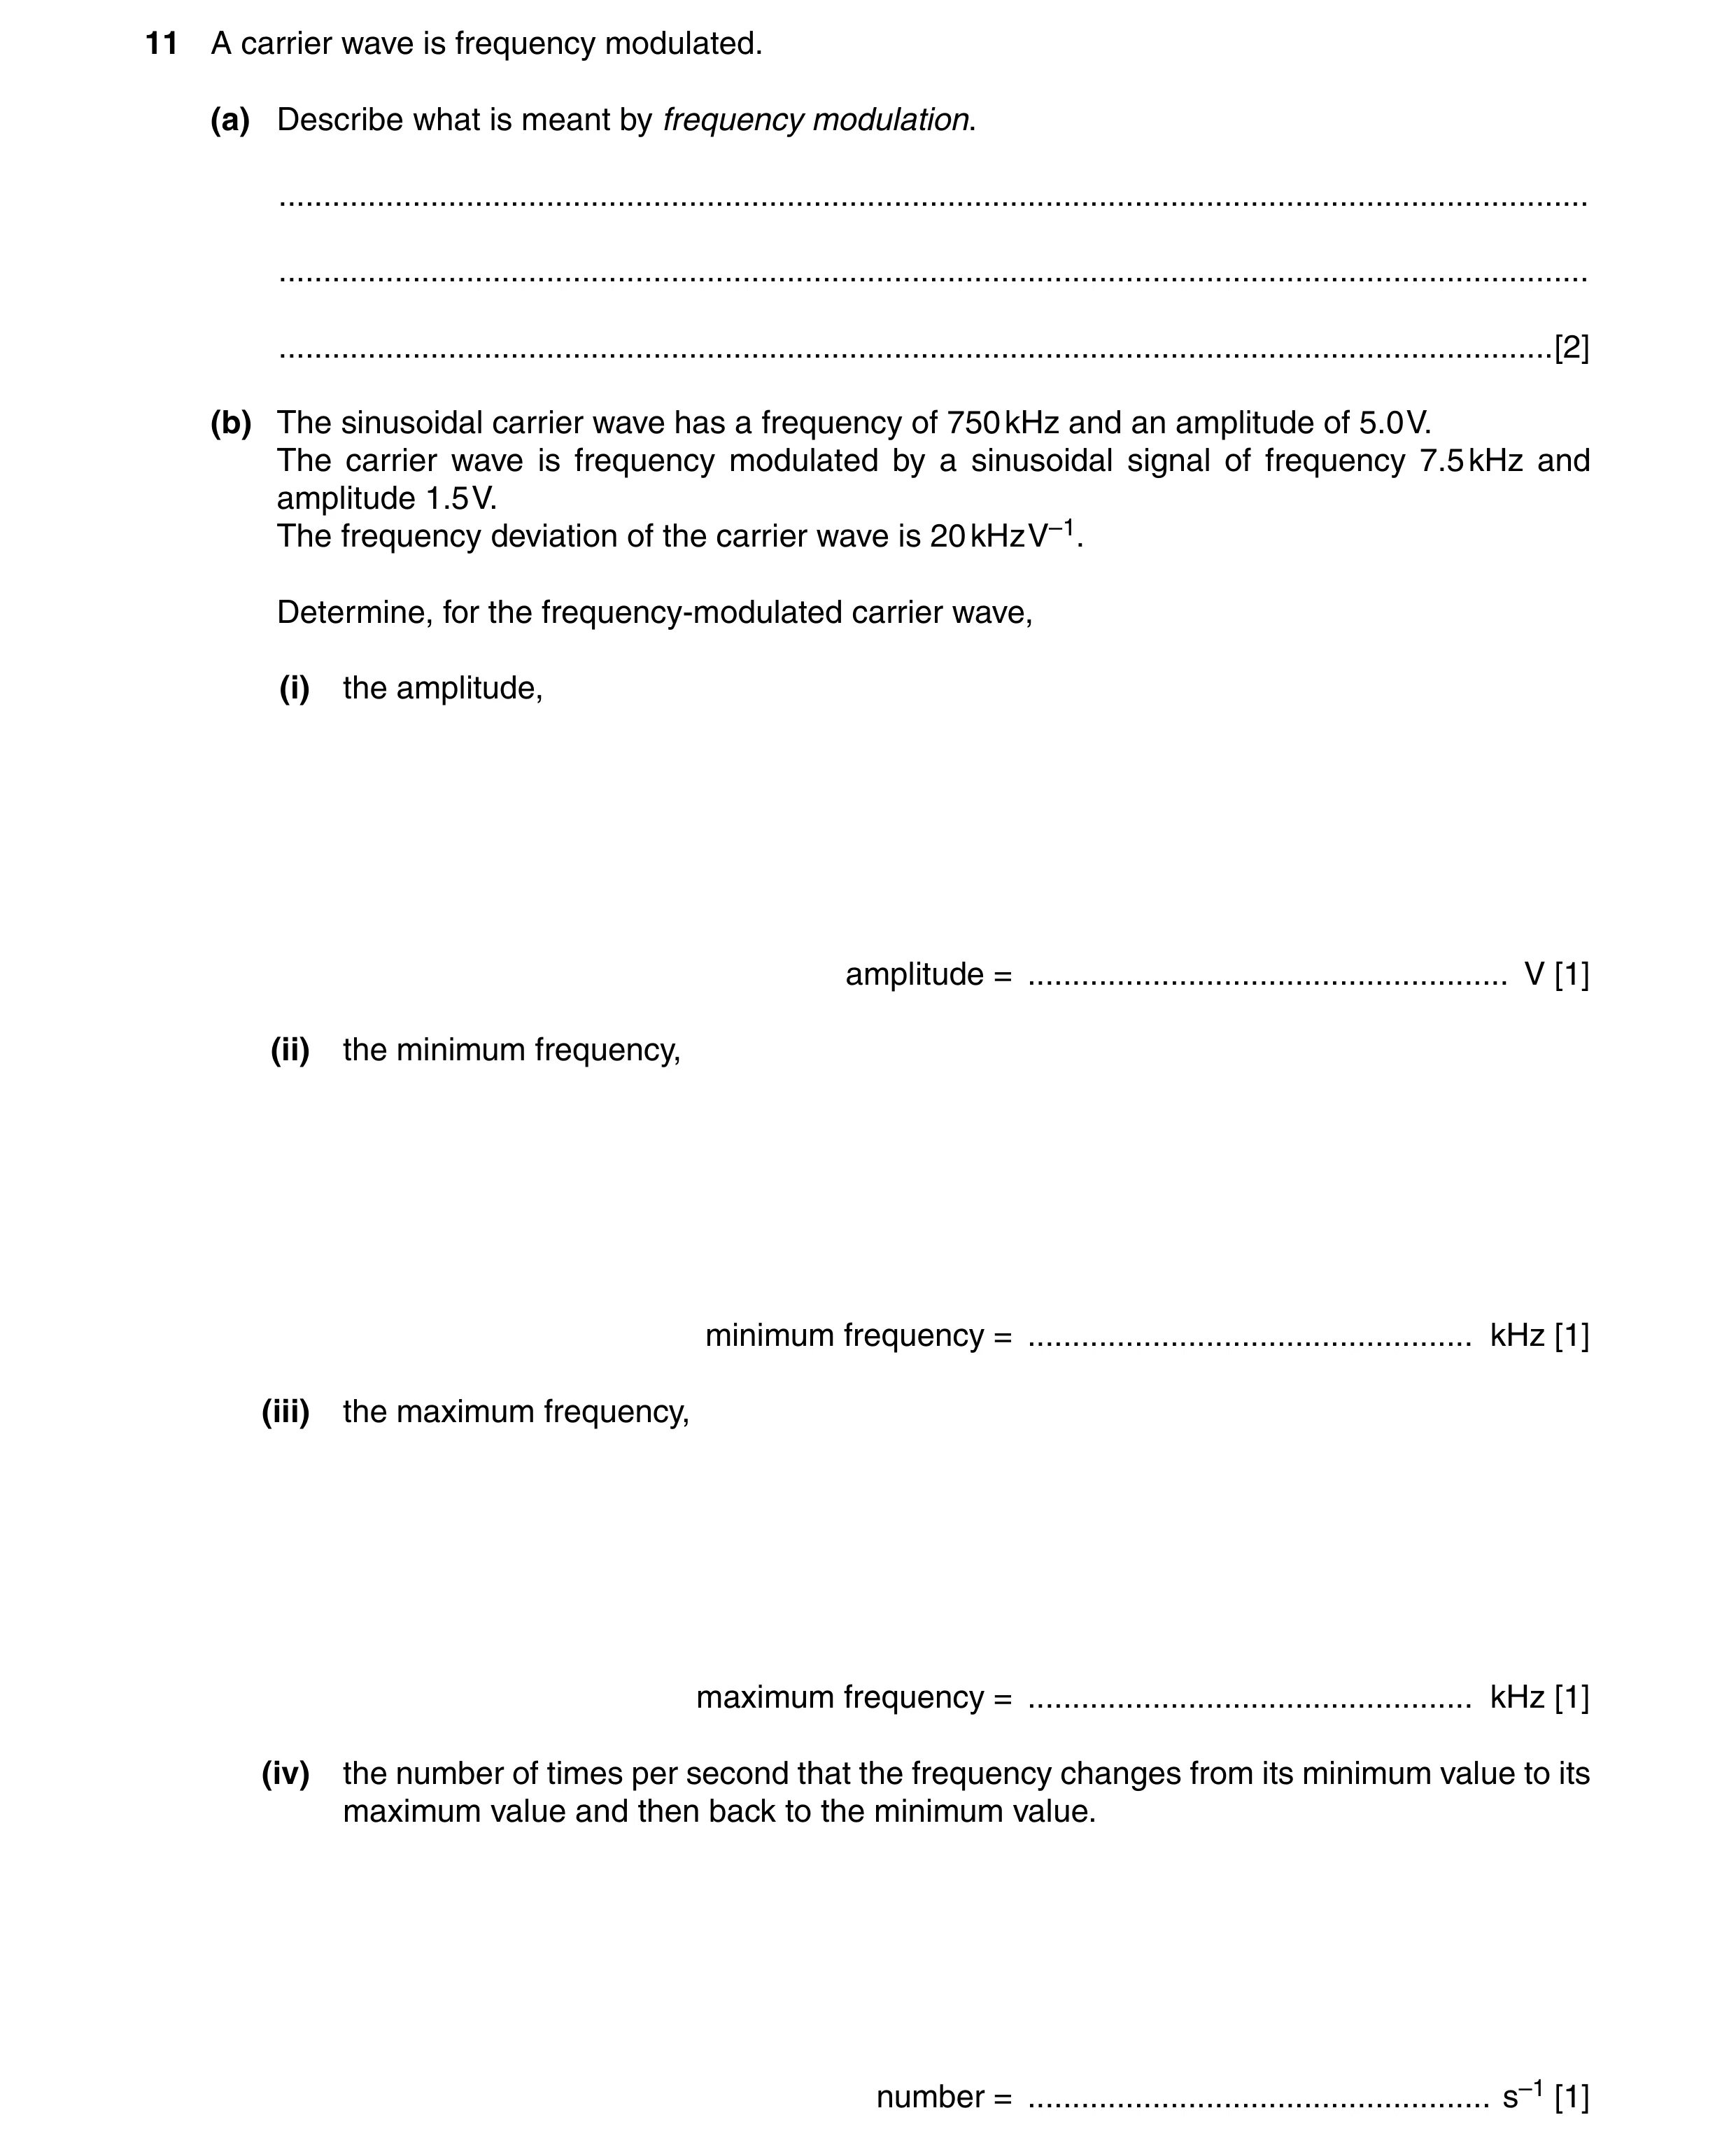
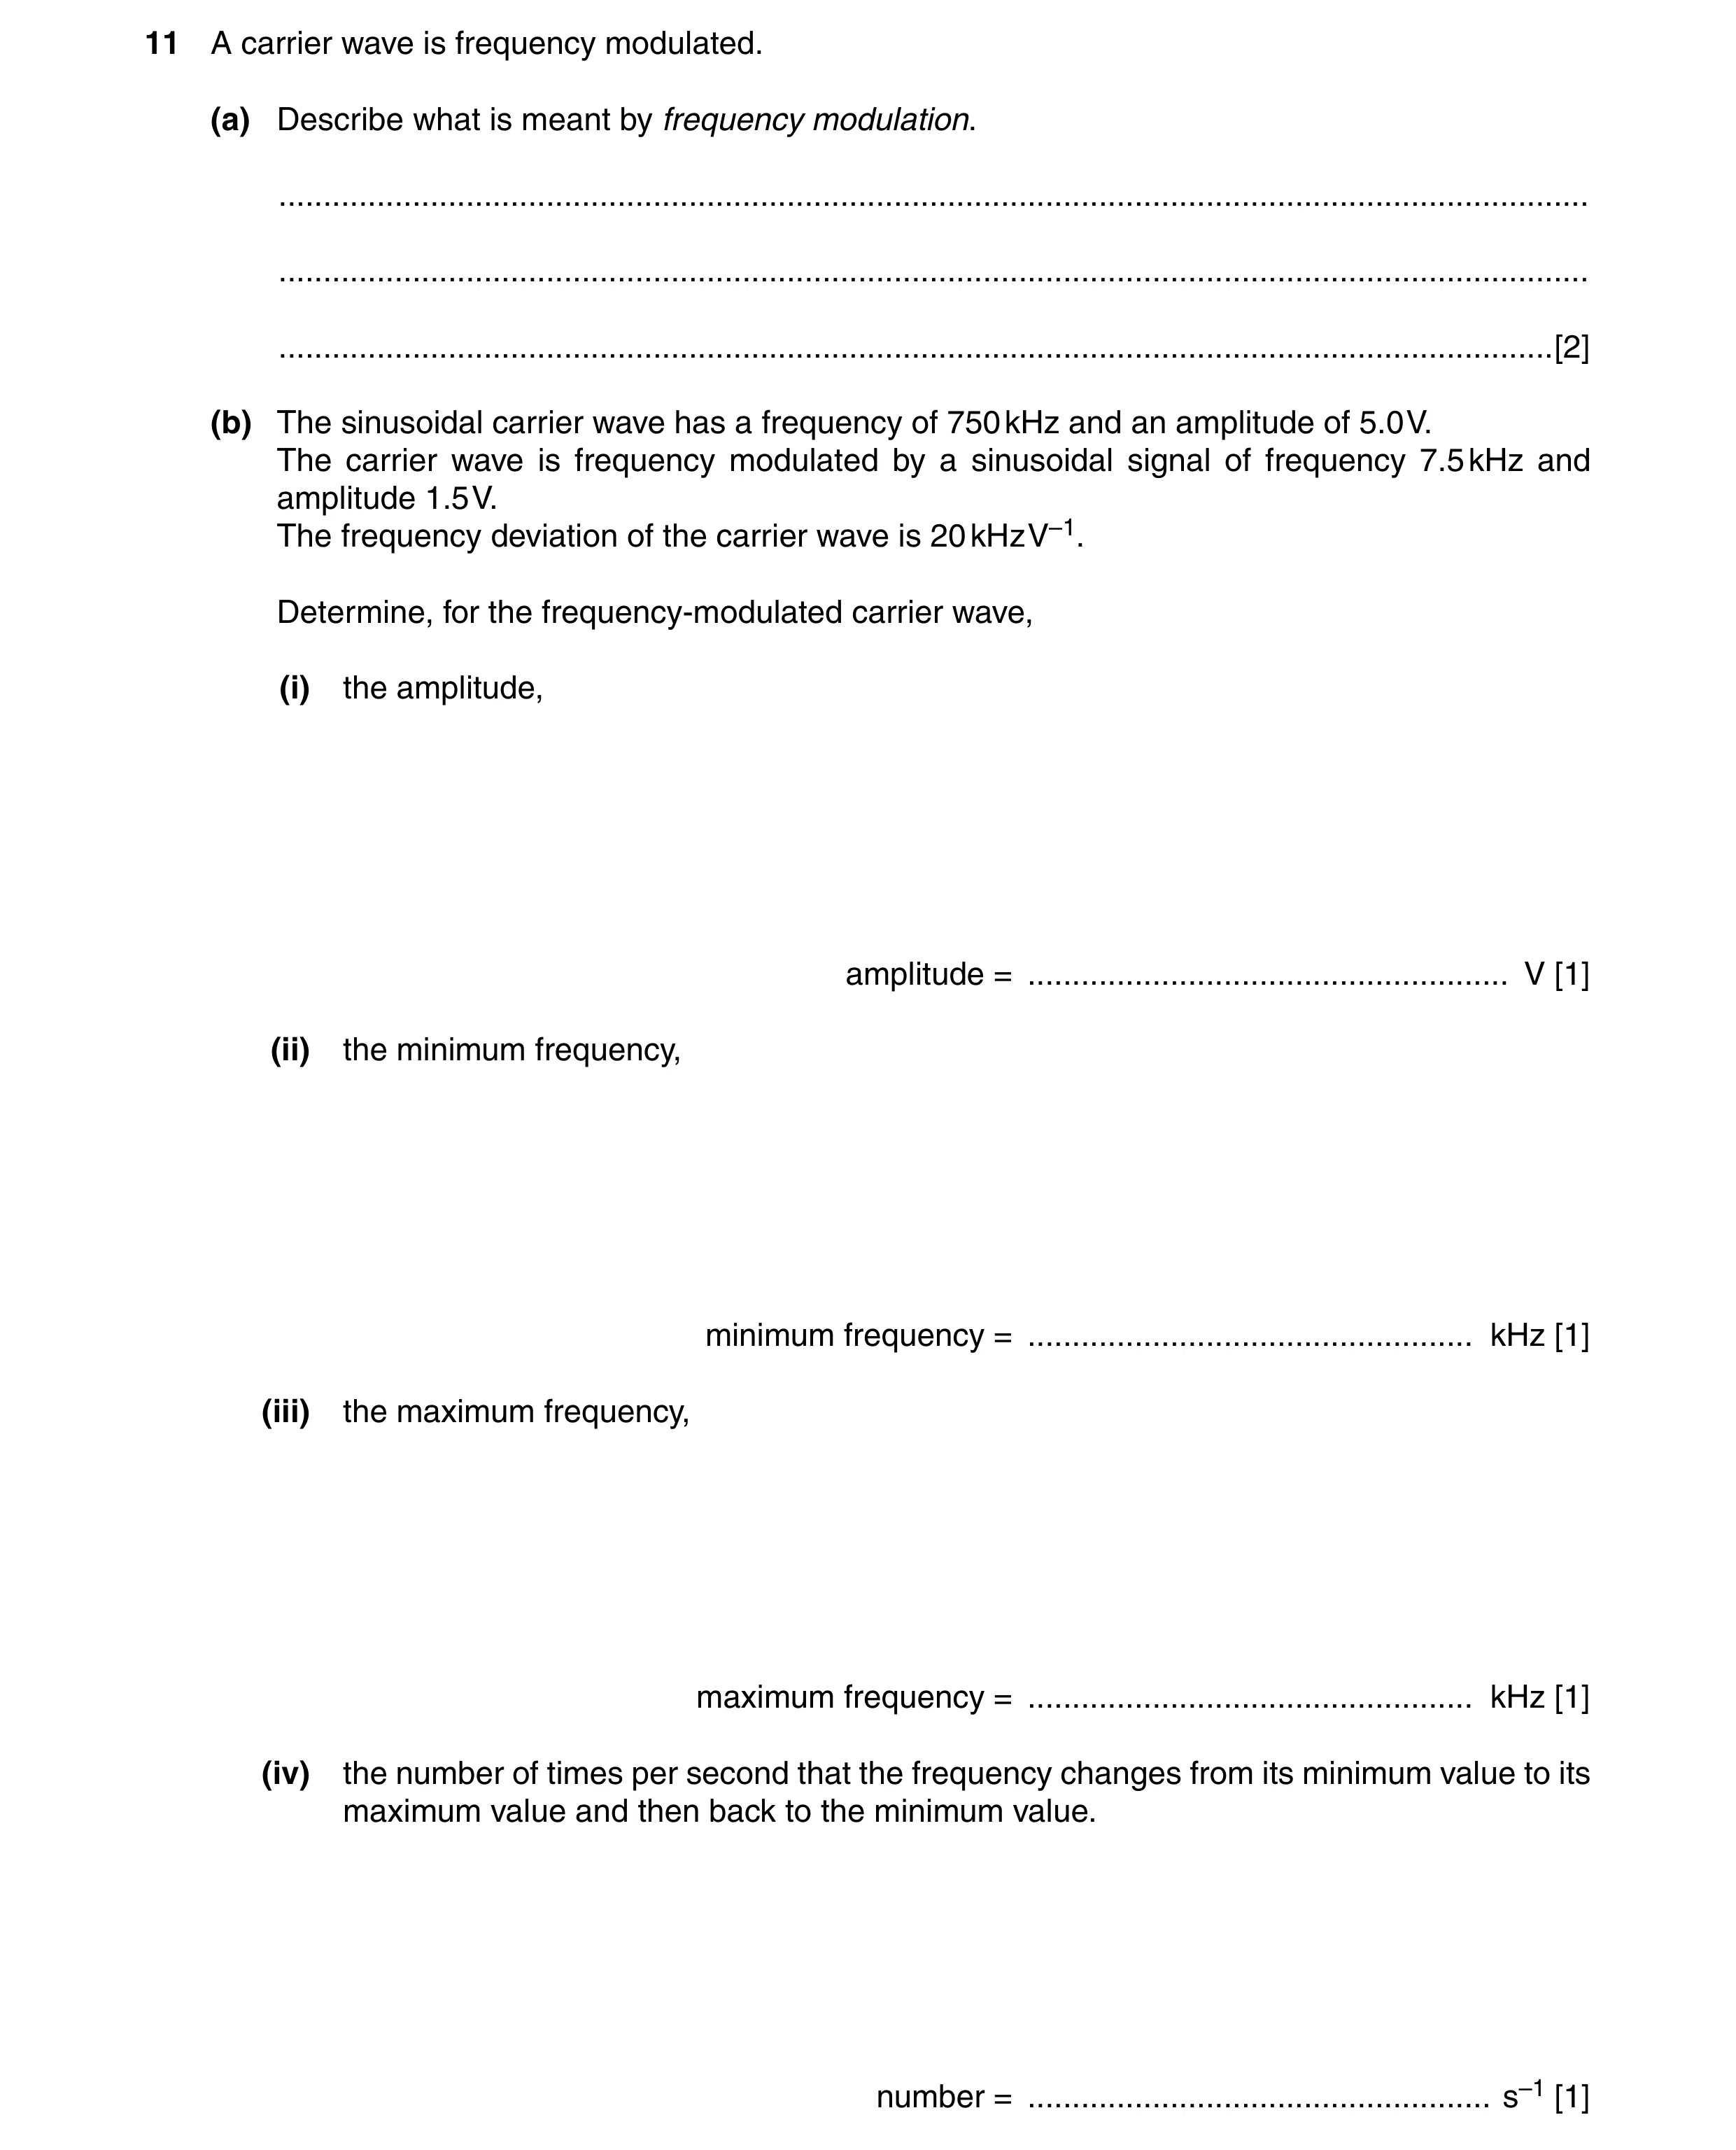
11 A carrier wave is frequency modulated. (a) Describe what is meant by frequency modulation. … … … [2] (b) The sinusoidal carrier wave has a frequency of 750 kHz and an amplitude of 5.0 V. The carrier wave is frequency modulated by a sinusoidal signal of frequency 7.5 kHz and amplitude 1.5 V. The frequency deviation of the carrier wave is 20 kHz V–1. Determine, for the frequency-modulated carrier wave, (i) the amplitude, amplitude = … V [1] (ii) the minimum frequency, minimum frequency = … kHz [1] (iii) the maximum frequency, maximum frequency = … kHz [1] (iv) the number of times per second that the frequency changes from its minimum value to its maximum value and then back to the minimum value. number = … s–1 [1]
6 marks
Mark scheme: 11 (a) frequency of carrier wave varies M1 in synchrony with the displacement of the signal/information wave A1 [2] (b) (i) 5.0 V A1 [1] (ii) 720 kHz A1 [1] (iii) 780 kHz A1 [1] (iv) 7500 A1 [1]
This question in 9702/41 Oct/Nov 2015
Q20 · When infra-red radiation passes along an optic fibre, it is attenuated 9702/41 Oct/Nov 2015
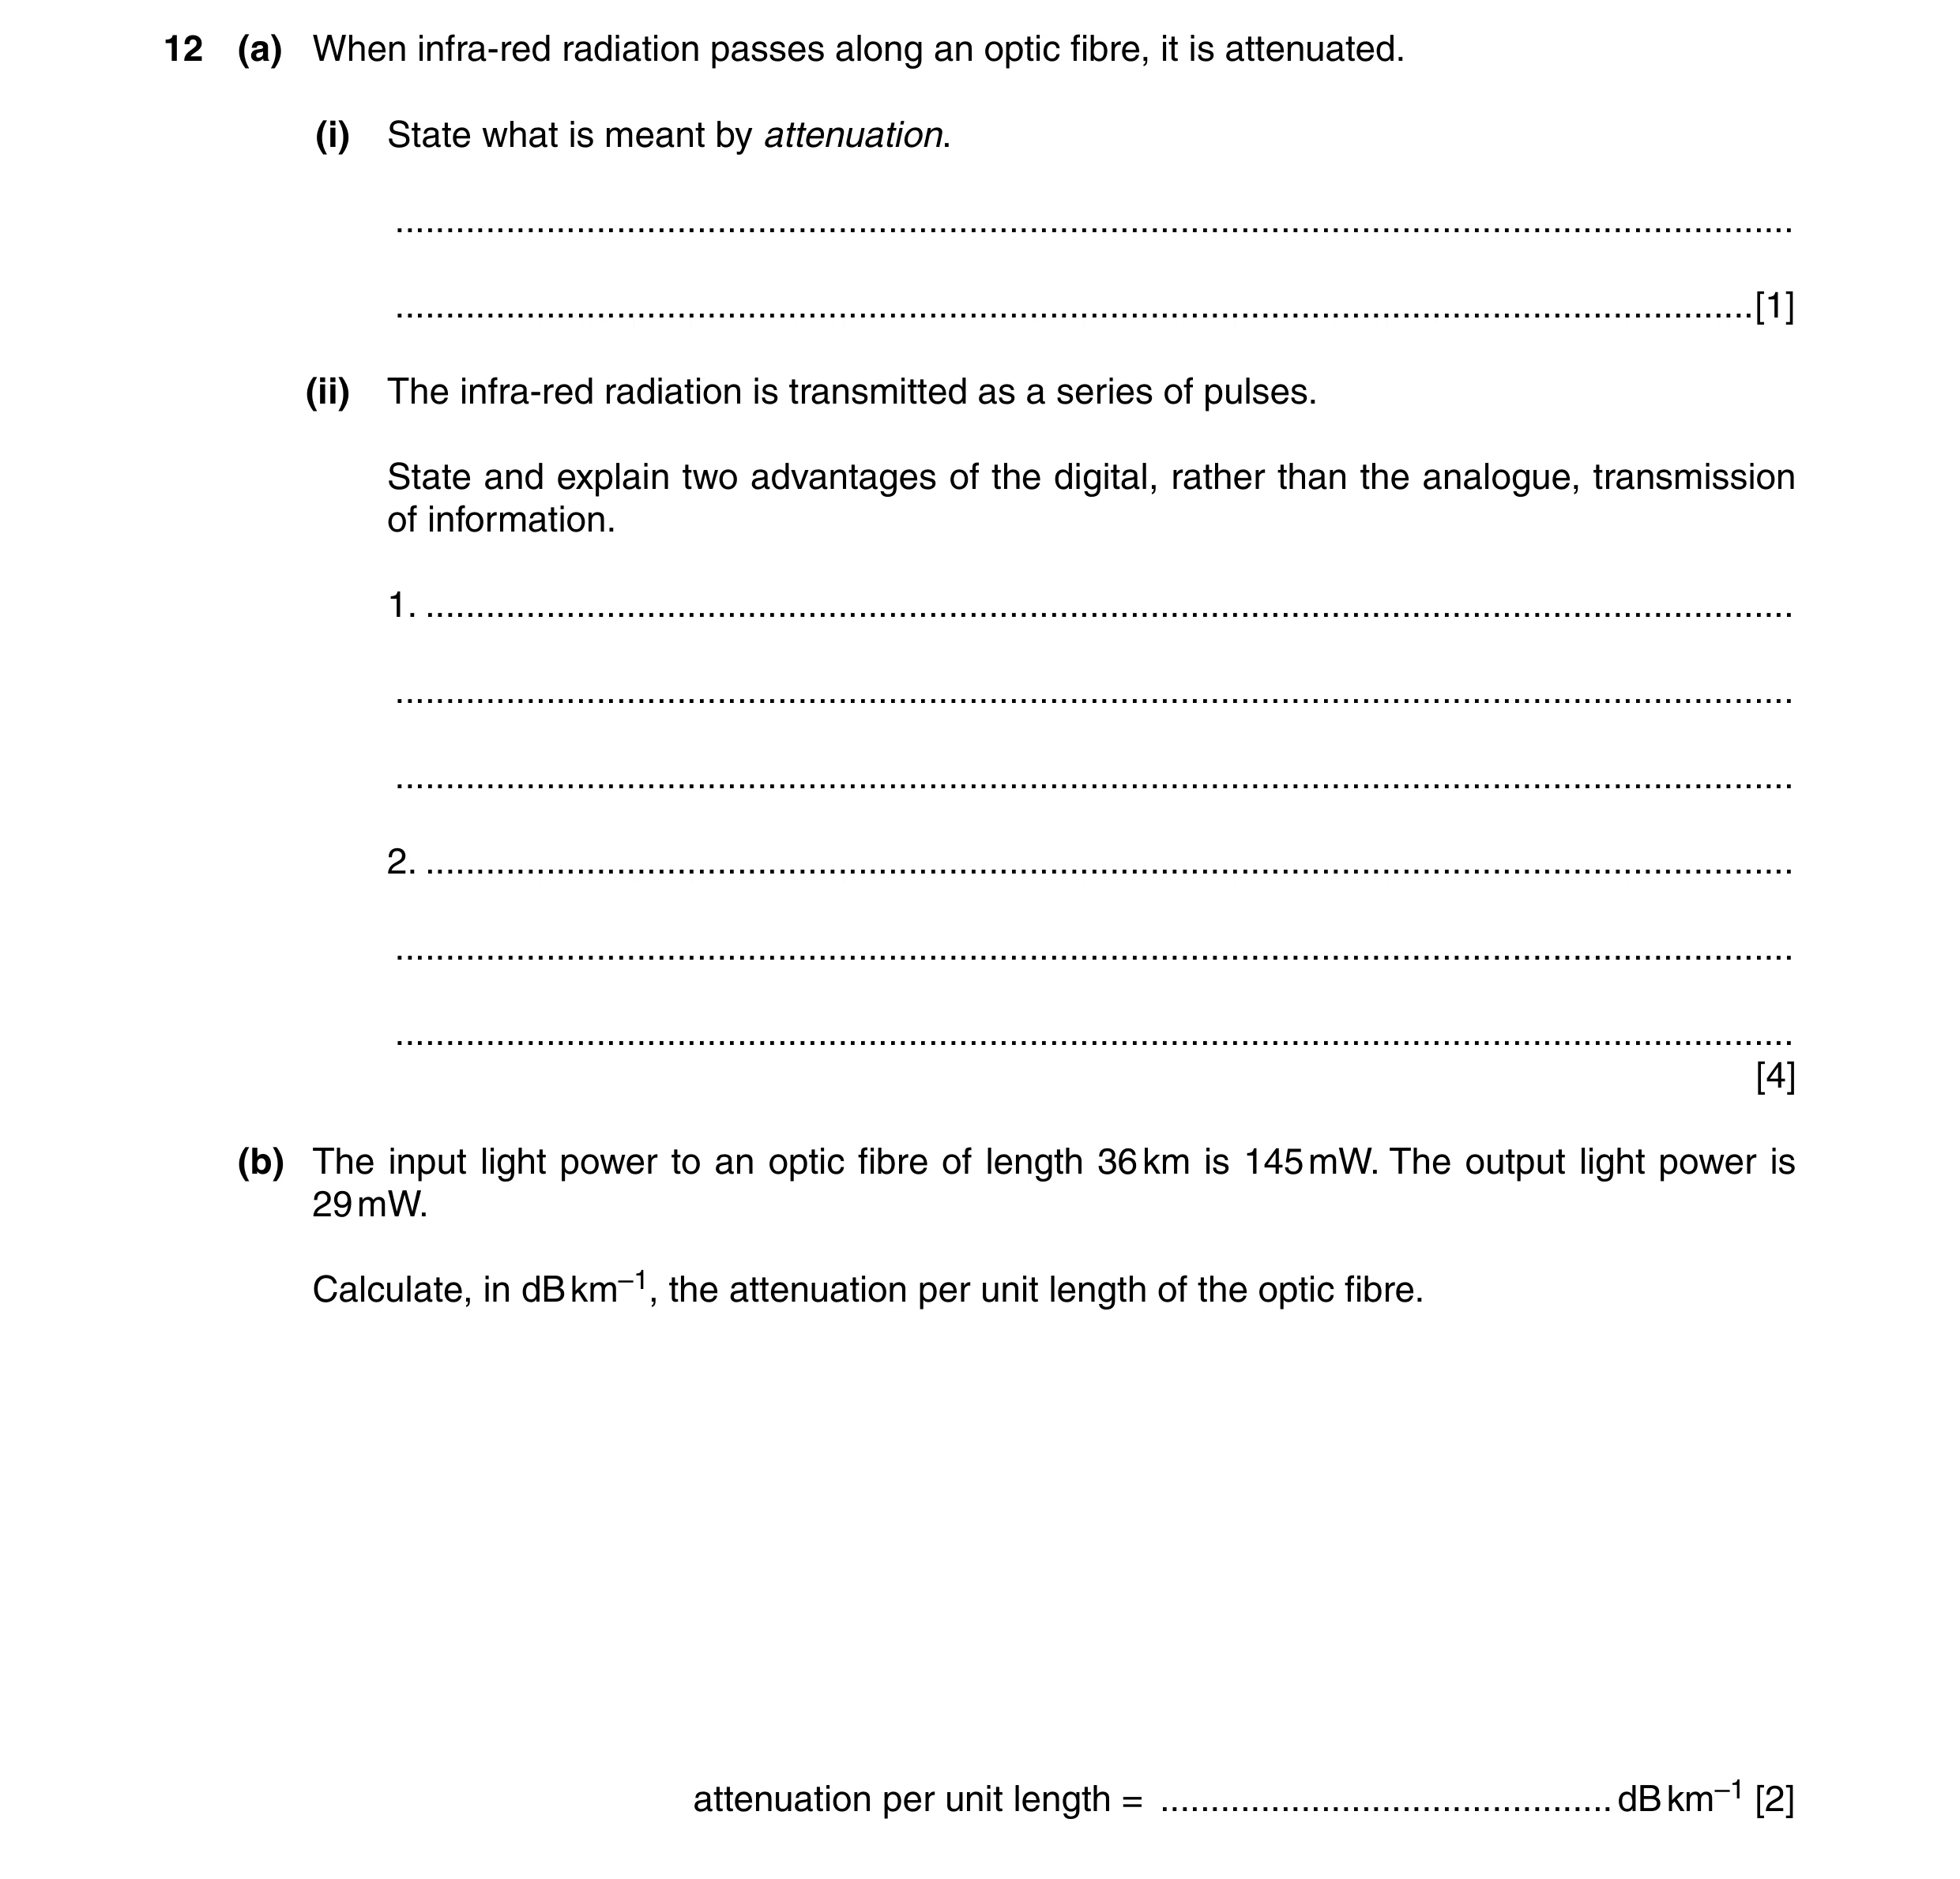
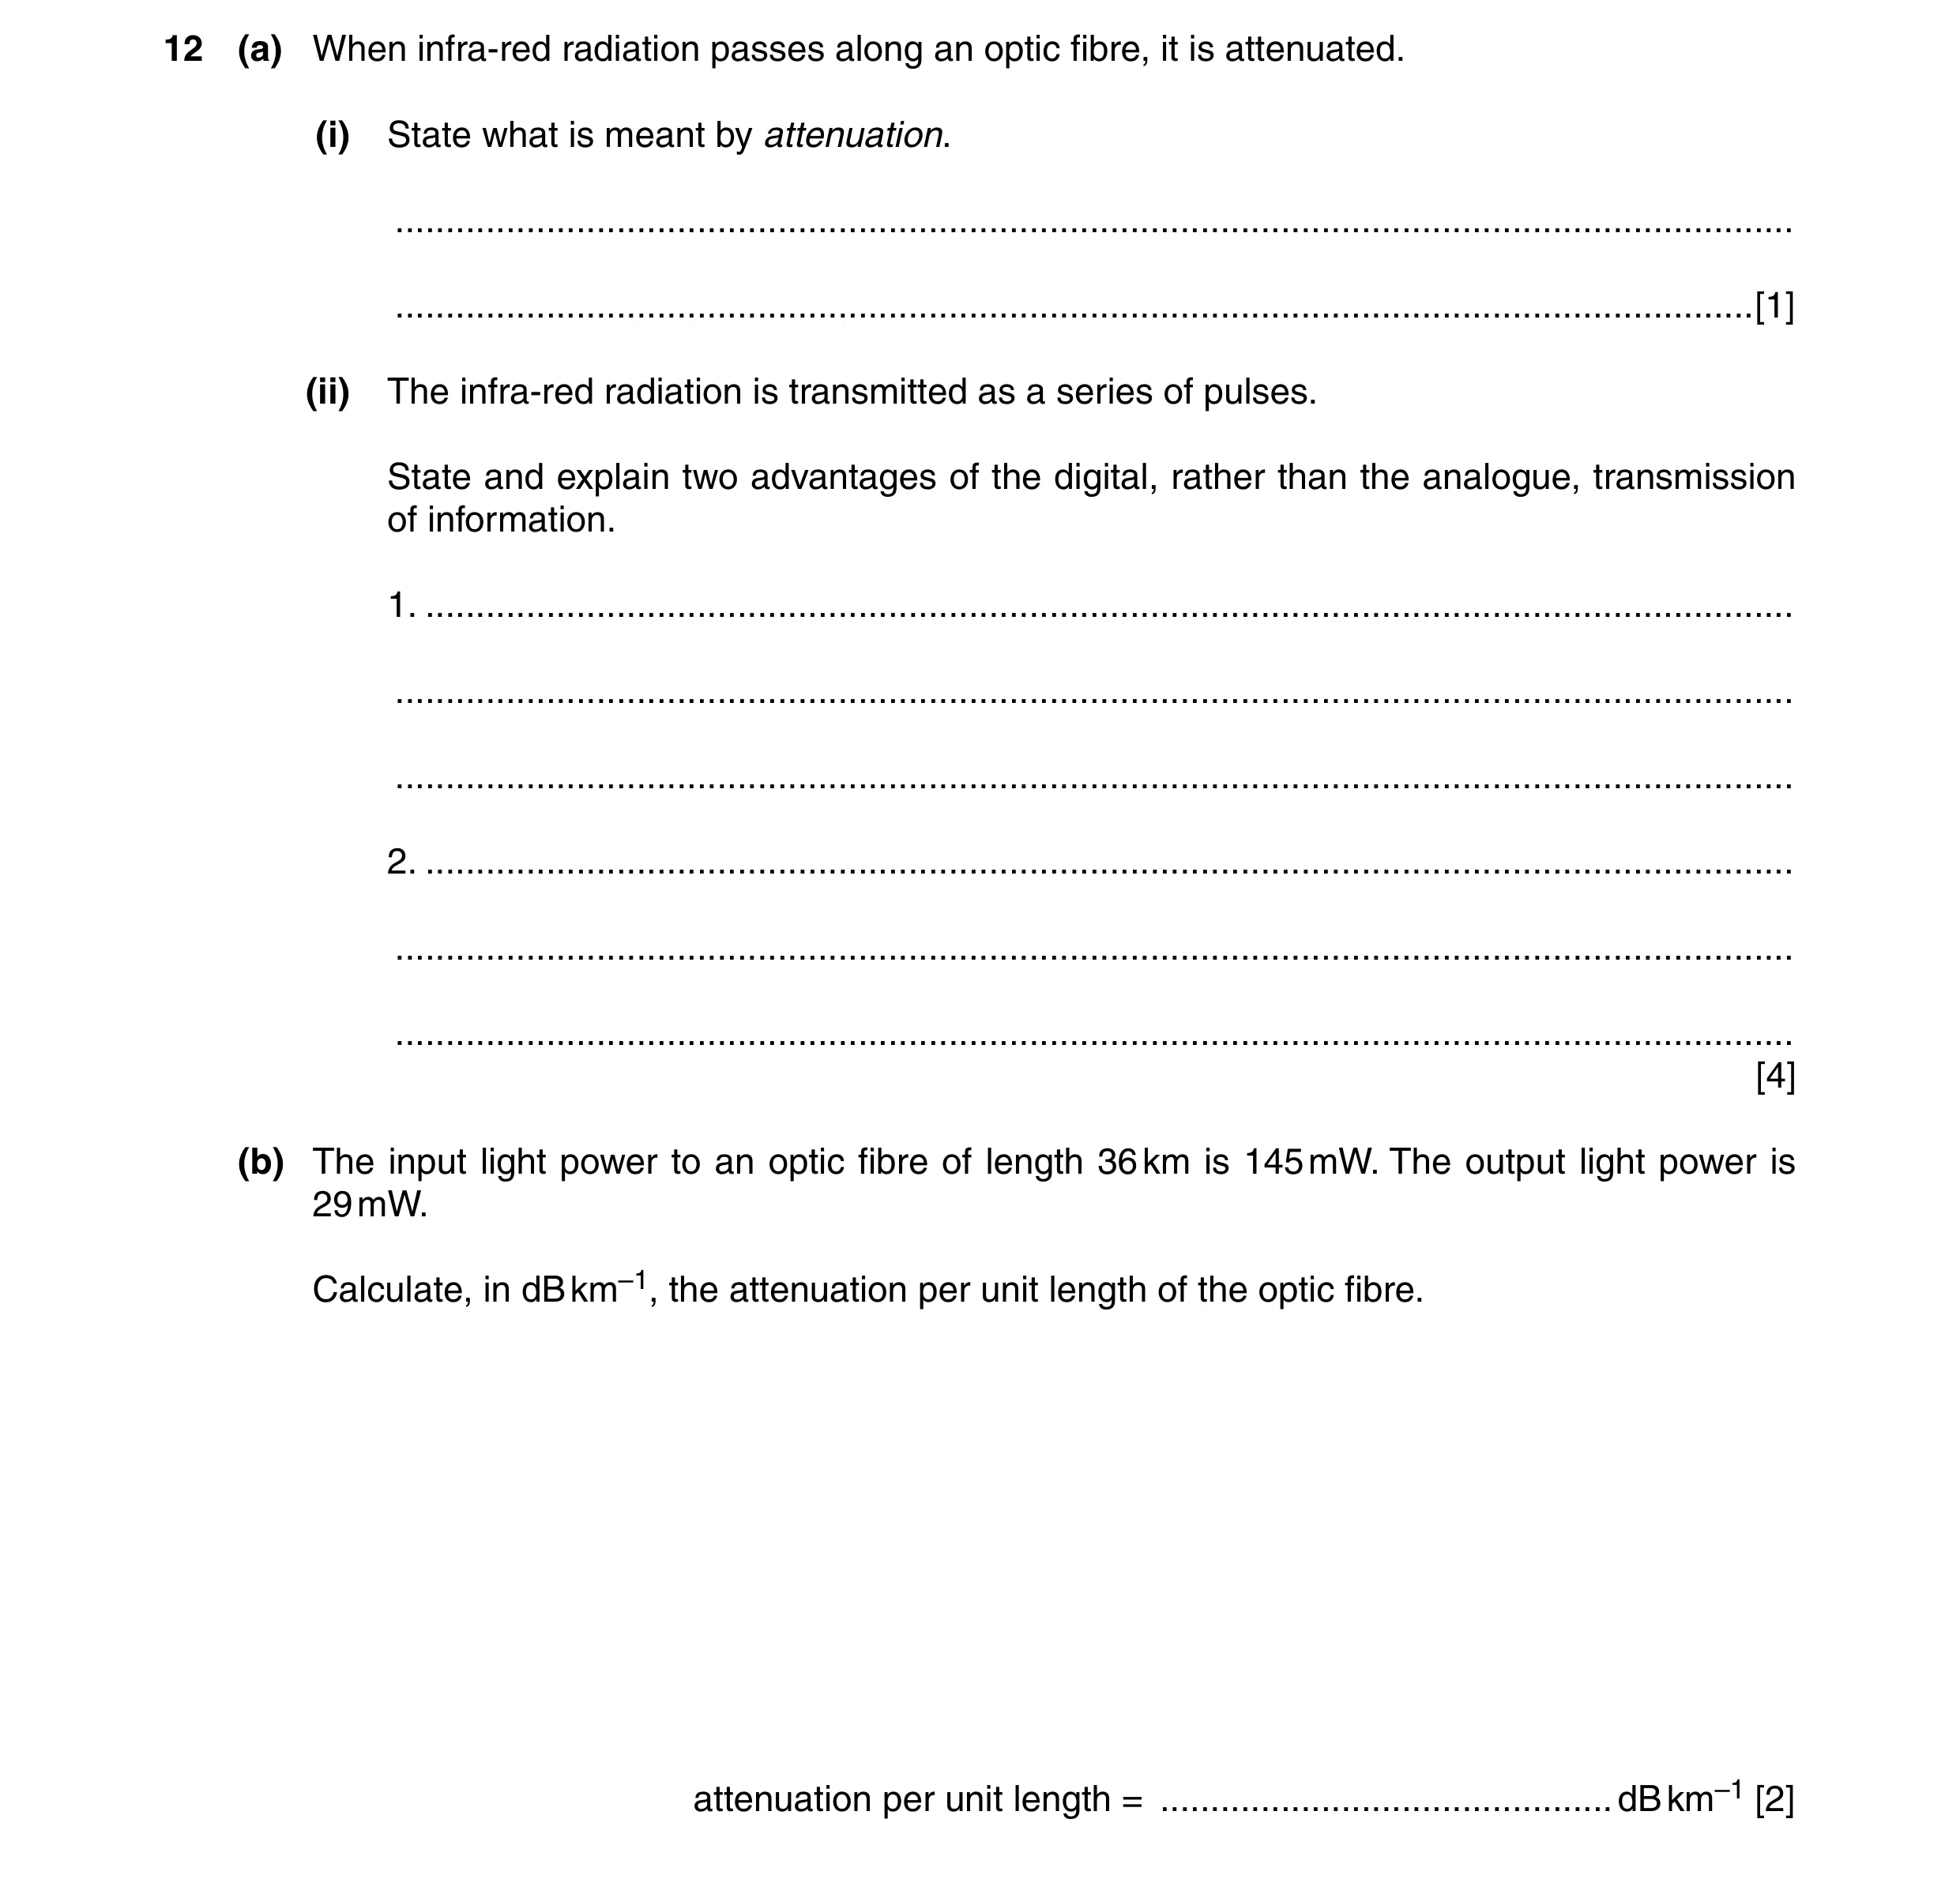
12 (a) When infra-red radiation passes along an optic fibre, it is attenuated. (i) State what is meant by attenuation. … … [1] (ii) The infra-red radiation is transmitted as a series of pulses. State and explain two advantages of the digital, rather than the analogue, transmission of information. 1. … … … 2. … … … [4] (b) The input light power to an optic fibre of length 36 km is 145 mW. The output light power is 29 mW. Calculate, in dB km–1, the attenuation per unit length of the optic fibre. attenuation per unit length = … dB km–1 [2]
7 marks
Mark scheme: 12 (a) (i) (gradual) loss of power/intensity/amplitude (not “signal”) B1 [1] (ii) e.g. noise can be eliminated (not “there is no noise”) M1 because pulses can be regenerated A1 e.g. much greater data handling/carrying capacity M1 because many messages can be carried at the same time/greater bandwidth A1 e.g. more secure (M1) because it can be encrypted (A1) e.g. error checking (M1) because extra information/parity bit can be added (A1) [4] (allow any two sensible suggestions with ‘state’ M1 and ‘explain’ A1) (b) attenuation = 10 lg (145 / 29) (= 7.0) C1 attenuation per unit length = 7.0 / 36 = 0.19 dB km–1 A1 [2]
This question in 9702/41 Oct/Nov 2015
Q21 · A carrier wave is frequency modulated 9702/42 Oct/Nov 2015
11 A carrier wave is frequency modulated. (a) Describe what is meant by frequency modulation. … … … [2] (b) The sinusoidal carrier wave has a frequency of 750 kHz and an amplitude of 5.0 V. The carrier wave is frequency modulated by a sinusoidal signal of frequency 7.5 kHz and amplitude 1.5 V. The frequency deviation of the carrier wave is 20 kHz V–1. Determine, for the frequency-modulated carrier wave, (i) the amplitude, amplitude = … V [1] (ii) the minimum frequency, minimum frequency = … kHz [1] (iii) the maximum frequency, maximum frequency = … kHz [1] (iv) the number of times per second that the frequency changes from its minimum value to its maximum value and then back to the minimum value. number = … s–1 [1]
6 marks
Mark scheme: 11 (a) frequency of carrier wave varies M1 in synchrony with the displacement of the signal/information wave A1 [2] (b) (i) 5.0 V A1 [1] (ii) 720 kHz A1 [1] (iii) 780 kHz A1 [1] (iv) 7500 A1 [1]
This question in 9702/42 Oct/Nov 2015
Q22 · When infra-red radiation passes along an optic fibre, it is attenuated 9702/42 Oct/Nov 2015
12 (a) When infra-red radiation passes along an optic fibre, it is attenuated. (i) State what is meant by attenuation. … … [1] (ii) The infra-red radiation is transmitted as a series of pulses. State and explain two advantages of the digital, rather than the analogue, transmission of information. 1. … … … 2. … … … [4] (b) The input light power to an optic fibre of length 36 km is 145 mW. The output light power is 29 mW. Calculate, in dB km–1, the attenuation per unit length of the optic fibre. attenuation per unit length = … dB km–1 [2]
7 marks
Mark scheme: 12 (a) (i) (gradual) loss of power/intensity/amplitude (not “signal”) B1 [1] (ii) e.g. noise can be eliminated (not “there is no noise”) M1 because pulses can be regenerated A1 e.g. much greater data handling/carrying capacity M1 because many messages can be carried at the same time/greater bandwidth A1 e.g. more secure (M1) because it can be encrypted (A1) e.g. error checking (M1) because extra information/parity bit can be added (A1) [4] (allow any two sensible suggestions with ‘state’ M1 and ‘explain’ A1) (b) attenuation = 10 lg (145 / 29) (= 7.0) C1 attenuation per unit length = 7.0 / 36 = 0.19 dB km–1 A1 [2]
This question in 9702/42 Oct/Nov 2015
Q23 · Signals may be transmitted in either analogue or digital form 9702/43 Oct/Nov 2016
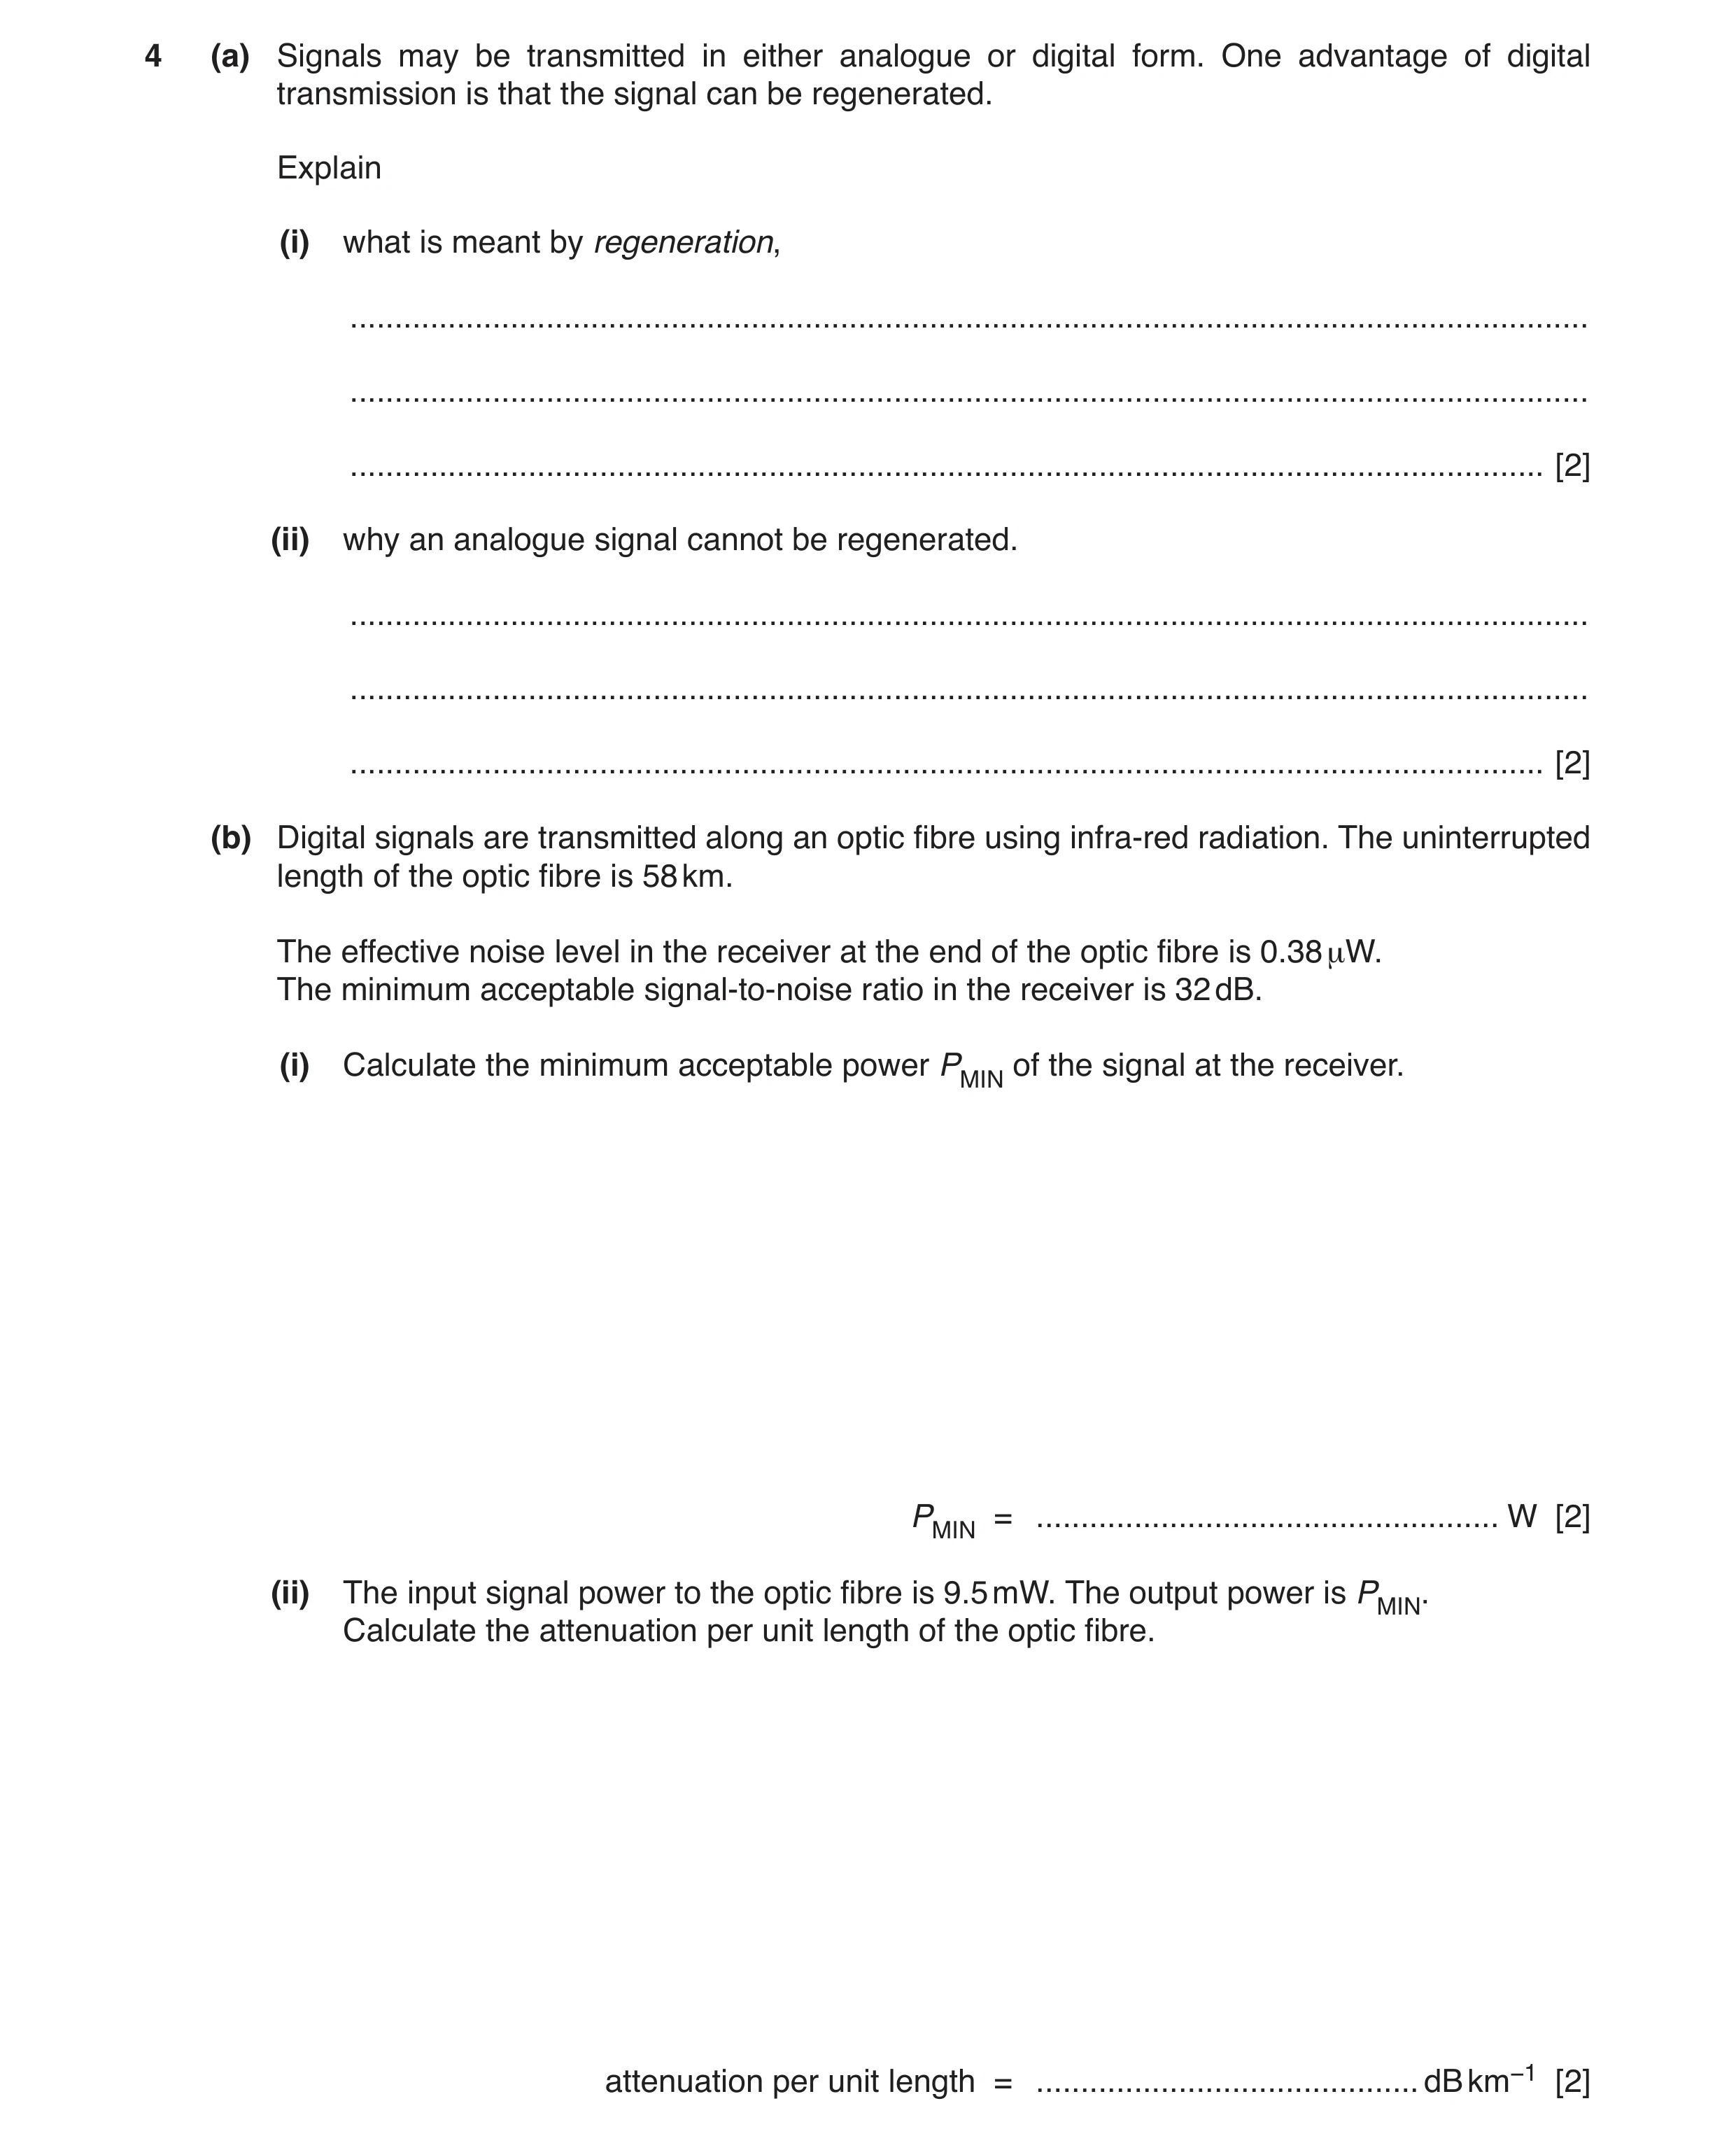
4 (a) Signals may be transmitted in either analogue or digital form. One advantage of digital transmission is that the signal can be regenerated. Explain (i) what is meant by regeneration, … … … [2] (ii) why an analogue signal cannot be regenerated. … … … [2] (b) Digital signals are transmitted along an optic fibre using infra-red radiation. The uninterrupted length of the optic fibre is 58 km. The effective noise level in the receiver at the end of the optic fibre is 0.38 μW. The minimum acceptable signal-to-noise ratio in the receiver is 32 dB. (i) Calculate the minimum acceptable power PMIN of the signal at the receiver. PMIN = … W [2] (ii) The input signal power to the optic fibre is 9.5 mW. The output power is PMIN. Calculate the attenuation per unit length of the optic fibre. attenuation per unit length = … dB km−1 [2]
8 marks
Mark scheme: 4 (a) (i) noise/distortion is removed (from the signal) B1 the (original) signal is reformed/reproduced/recovered/restored B1 [2] or signal detected above/below a threshold creates new signal (B1) of 1s and 0s (B1) (ii) noise is superposed on the (displacement of the) signal/cannot be distinguished or analogue/signal is continuous (so cannot be regenerated) or analogue/signal is not discrete (so cannot be regenerated) B1 noise is amplified with the signal B1 [2] (b) (i) gain/dB = 10 lg (P2 / P1) 32 = 10 lg [PMIN / (0.38 × 10⁻⁶)] or –32 = 10 lg (0.38 × 10⁻⁶ / PMIN) C1 PMIN = 6.0 × 10⁻⁴ W A1 [2] (ii) attenuation = 10 lg [(9.5 × 10⁻³) / (6.02 × 10⁻⁴)] C1 = 12 dB attenuation per unit length (= 12/58) = 0.21 dB km–1 A1 [2]
This question in 9702/43 Oct/Nov 2016
Q24 · State three advantages of an optic fibre compared to a metal wire for the transmission of… 9702/42 Feb/March 2017
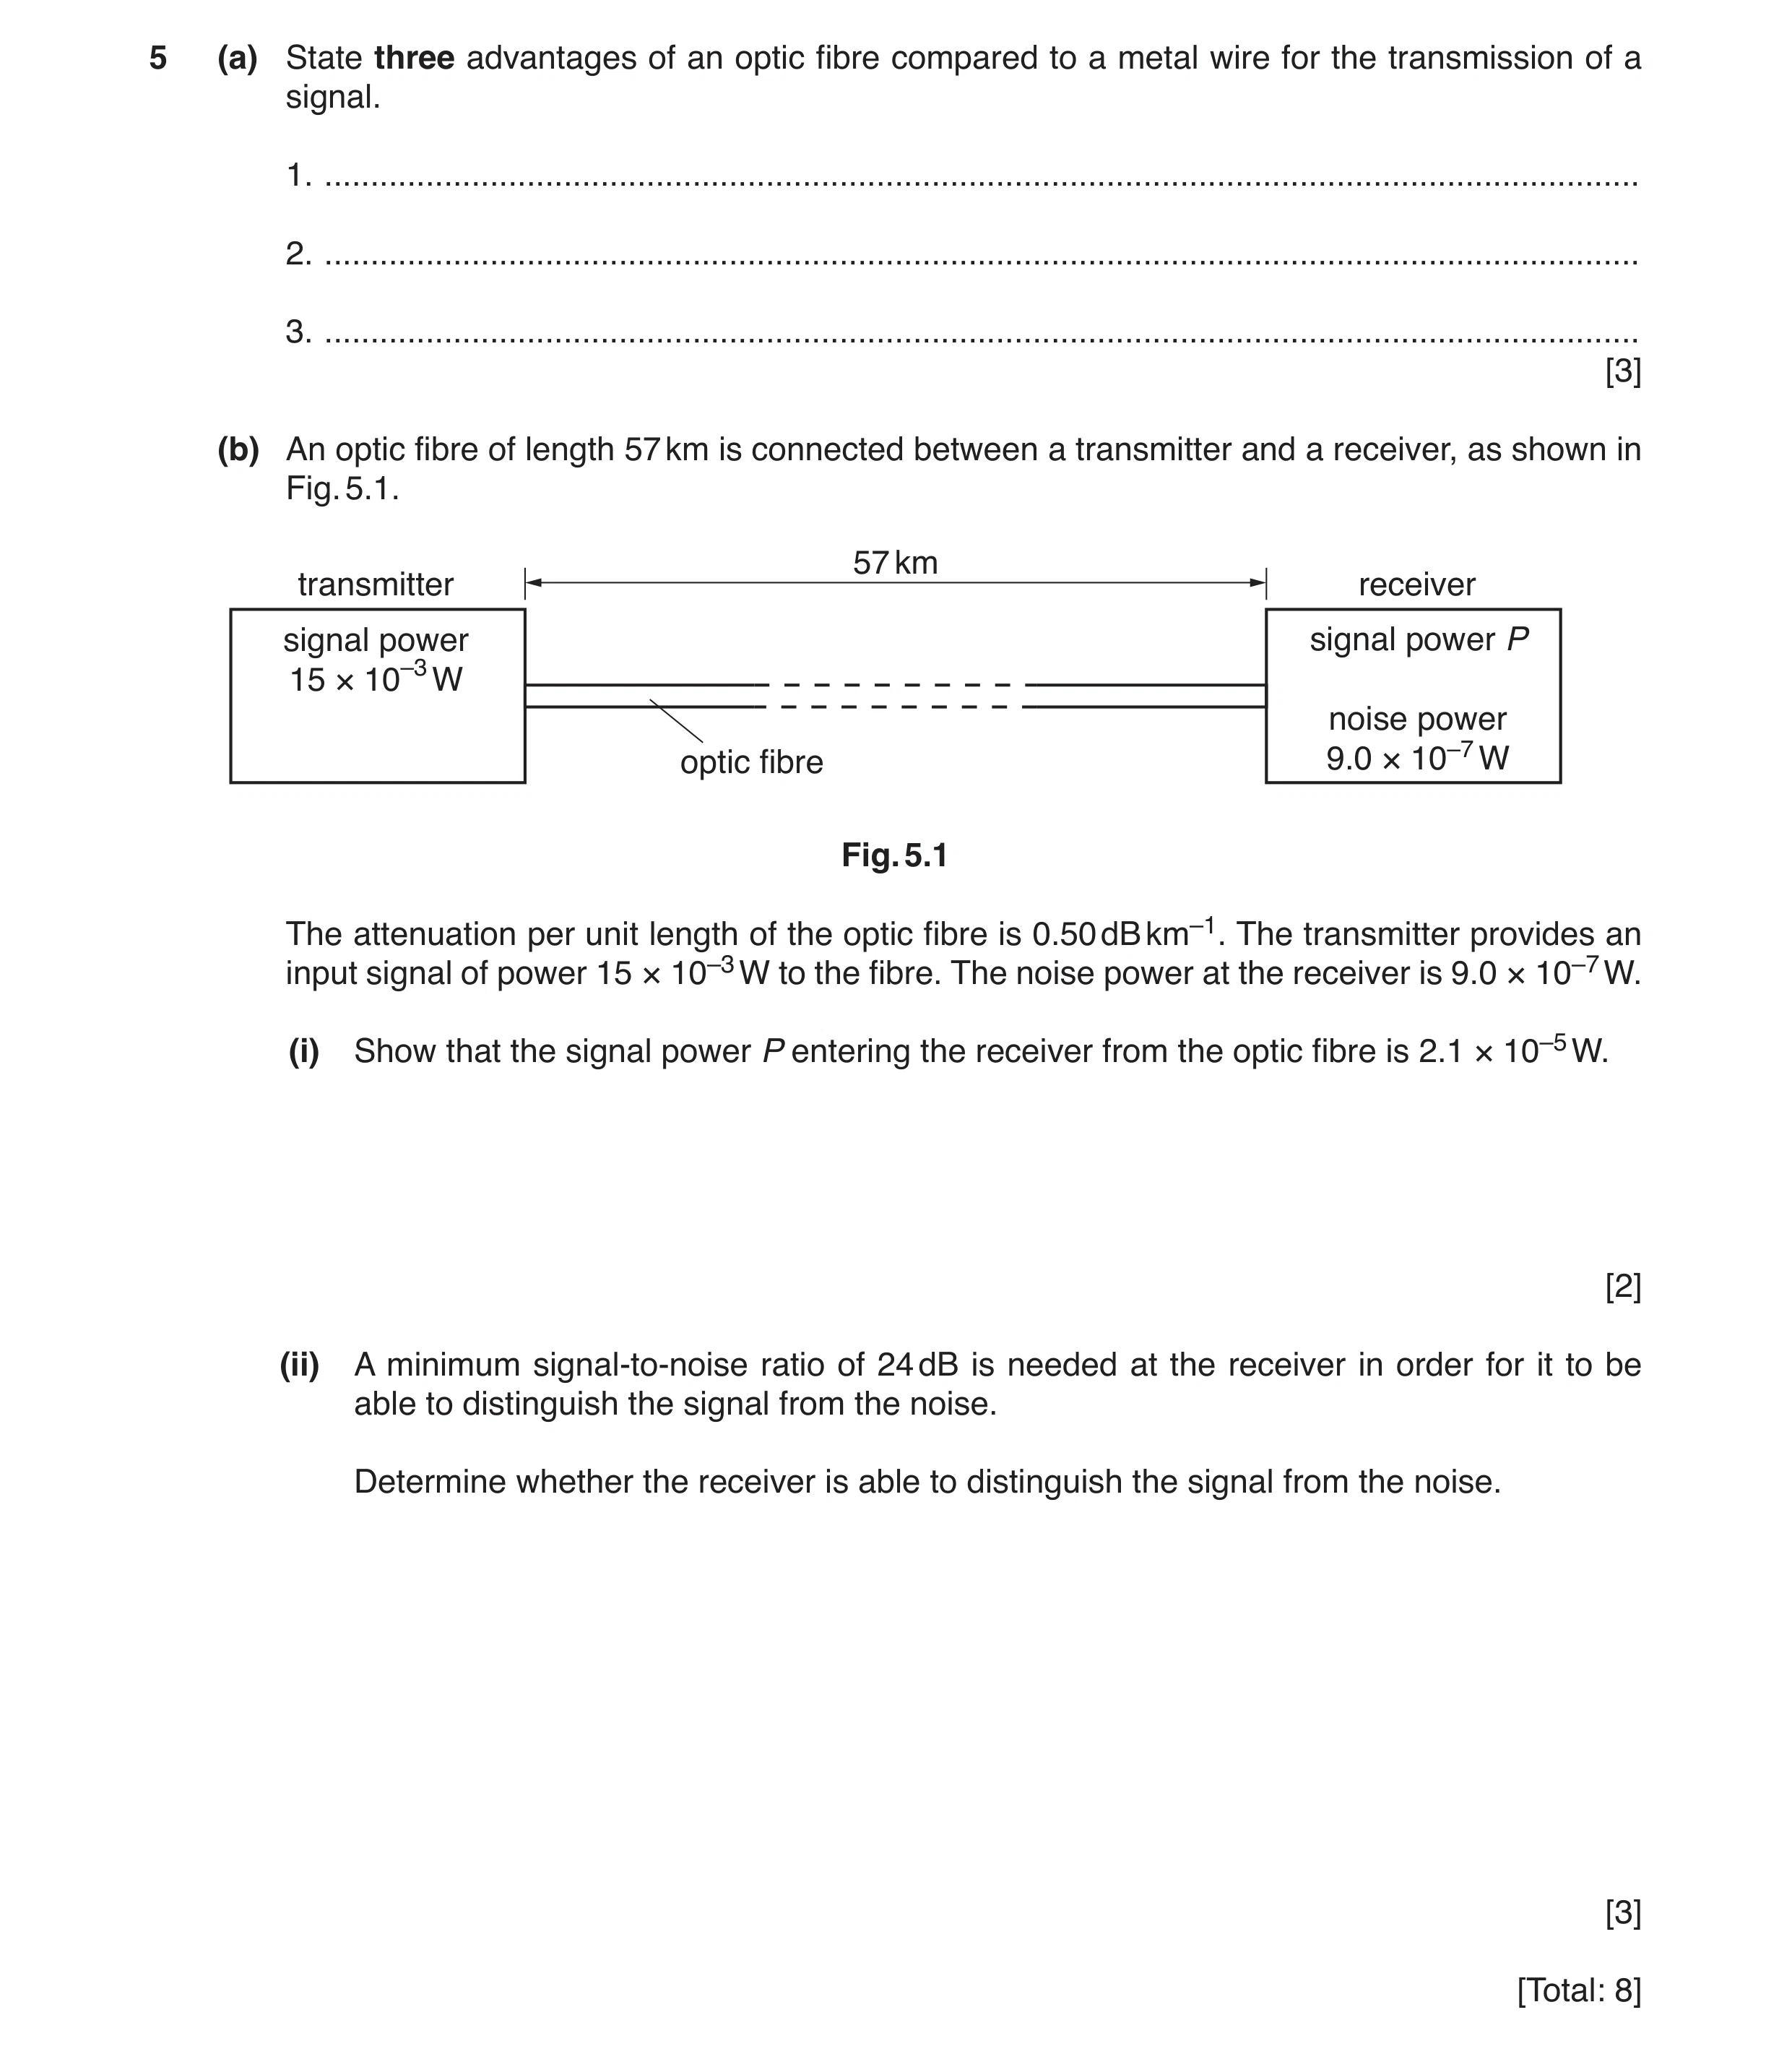
5 (a) State three advantages of an optic fibre compared to a metal wire for the transmission of a signal. 1. … 2. … 3. … [3] (b) An optic fibre of length 57 km is connected between a transmitter and a receiver, as shown in Fig. 5.1. 57 km transmitter receiver signal power signal power P 15 × 10–3 W noise power optic fibre 9.0 × 10⁻⁷ W Fig. 5.1 The attenuation per unit length of the optic fibre is 0.50 dB km–1. The transmitter provides an input signal of power 15 × 10–3 W to the fibre. The noise power at the receiver is 9.0 × 10⁻⁷ W. (i) Show that the signal power P entering the receiver from the optic fibre is 2.1 × 10⁻⁵ W. [2] (ii) A minimum signal-to-noise ratio of 24 dB is needed at the receiver in order for it to be able to distinguish the signal from the noise. Determine whether the receiver is able to distinguish the signal from the noise. [3] [Total: 8]
8 marks
Mark scheme: 5(a) any three from: • greater bandwidth • does not suffer from (e.m.) interference / can be used in (e.m.) ‘noisy’ environments • no / less power / energy radiated / better security / less cross-talk • less attenuation / fewer repeaters / amplifiers needed • less weight / easier to handle / cheaper / occupy less space B3 5(b)(i) attenuation / gain = 10 log P1 / P2 C1 0.50 × 57 = 10 log (15 × 10–3/P) so P = 2.1 × 10⁻⁵ W or – (0.50 × 57) = 10 log (P/15 × 10–3) so P = 2.1 × 10⁻⁵ W A1 5(b)(ii) either (calculation of S / N ratio at receiver) S / N ratio = 10 log (2.1 × 10⁻⁵ / 9.0 × 10⁻⁷) or S/N ratio = 14 M1 14 < 24 or S/N ratio < minimum S/N ratio A1 so not able to distinguish signal from noise A1 or (calculation of minimum acceptable power at receiver) 24 = 10 log (P / 9.0 × 10⁻⁷) or P = 2.3 × 10⁻⁴ (M1) 2.1 × 10⁻⁵ < 2.3 × 10⁻⁴ or power < minimum power (A1) so not able to distinguish signal from noise (A1)
This question in 9702/42 Feb/March 2017
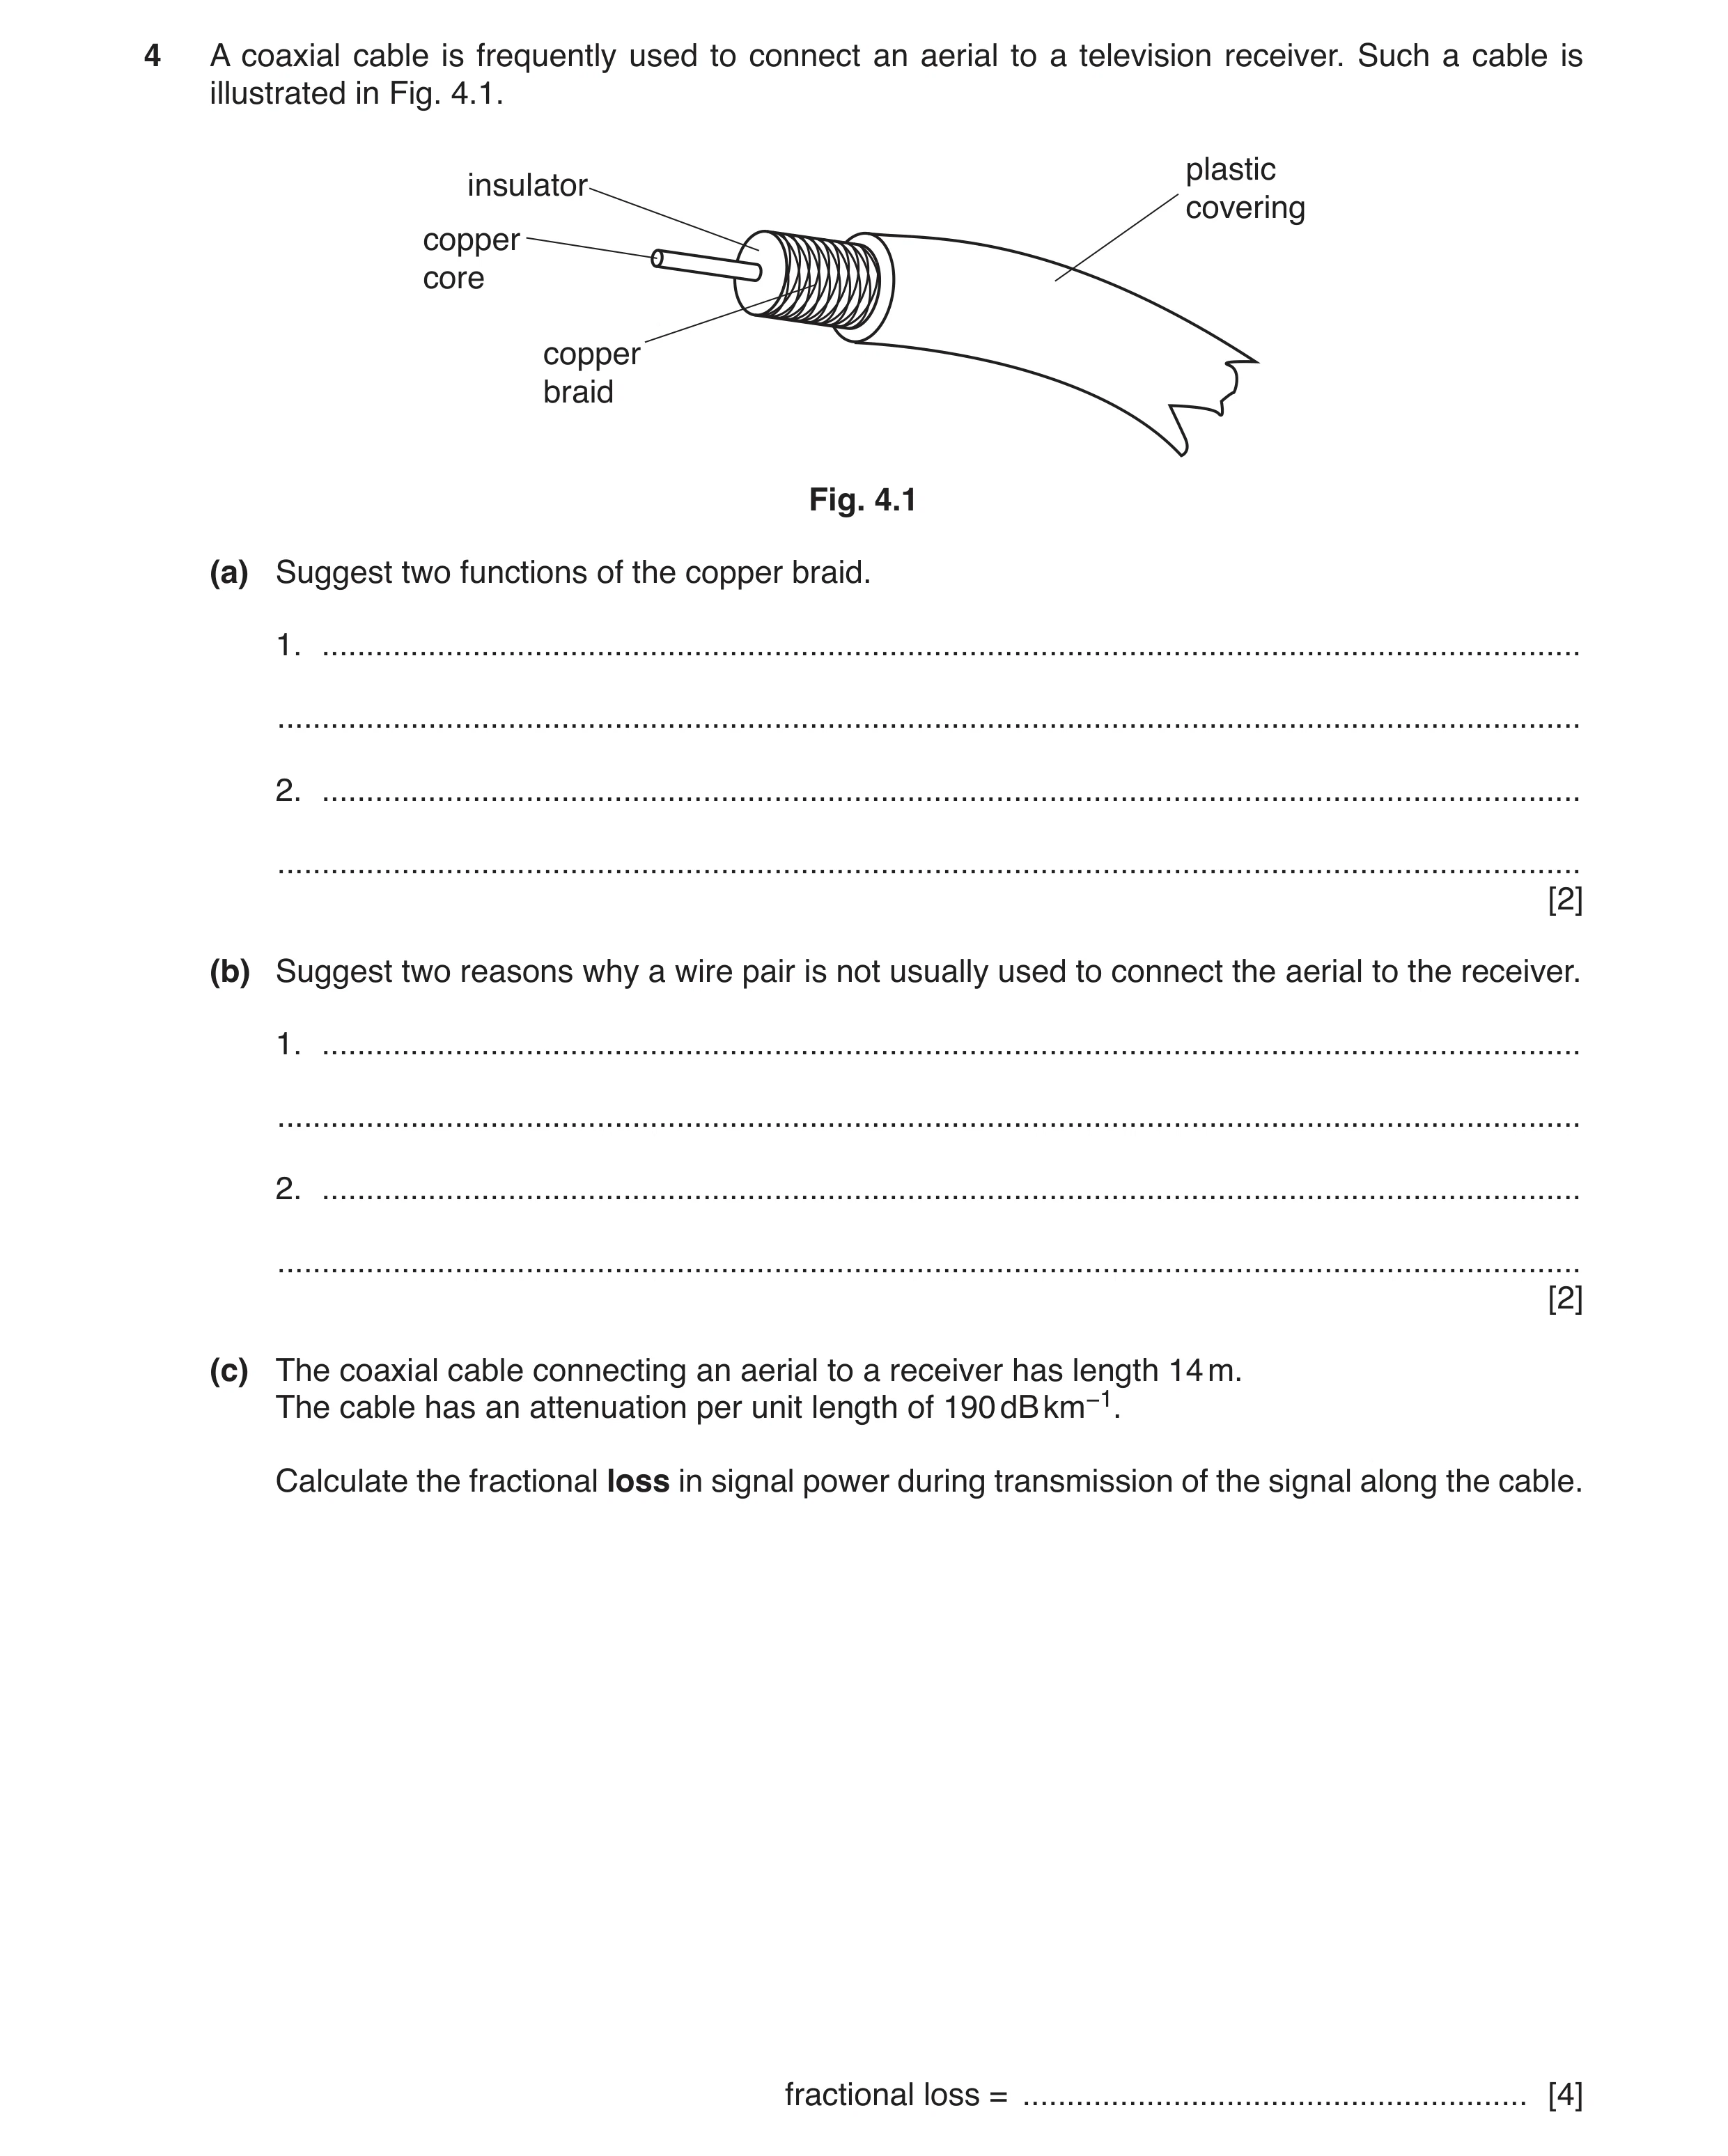
Q25 · A coaxial cable is frequently used to connect an aerial to a television receiver 9702/41 Oct/Nov 2017
4 A coaxial cable is frequently used to connect an aerial to a television receiver. Such a cable is illustrated in Fig. 4.1. plastic insulator covering copper core copper braid Fig. 4.1 (a) Suggest two functions of the copper braid. 1. … … 2. … … [2] (b) Suggest two reasons why a wire pair is not usually used to connect the aerial to the receiver. 1. … … 2. … … [2] (c) The coaxial cable connecting an aerial to a receiver has length 14 m. The cable has an attenuation per unit length of 190 dB km−1. Calculate the fractional loss in signal power during transmission of the signal along the cable. fractional loss = … [4]
8 marks
Mark scheme: 4(a) acts as ‘return’ (conductor) for signal • shielding from noise/crosstalk/interference Two sensible suggestions, 1 mark each. B2 4(b) • small bandwidth • (there is) noise/interference/crosstalk • large attenuation/energy loss • reflections due to poor impedance matching Two sensible suggestions, 1 mark each. B2 4(c) attenuation = 190 × 14 × 10–3 (= 2.66 dB) C1 ratio / dB = (–)10 lg(P2 / P1) C1 2.66 = –10 lg (POUT / PIN) POUT/ PIN = 0.54 C1 fractional loss = 1 – (POUT / PIN) = 1 – 0.54 = 0.46 A1 or 2.66 = 10 lg (PIN / POUT) PIN/ POUT = 1.85 (C1) fractional loss = (PIN – POUT) / PIN = (1.85 – 1) / 1.85 = 0.46 (A1)
This question in 9702/41 Oct/Nov 2017
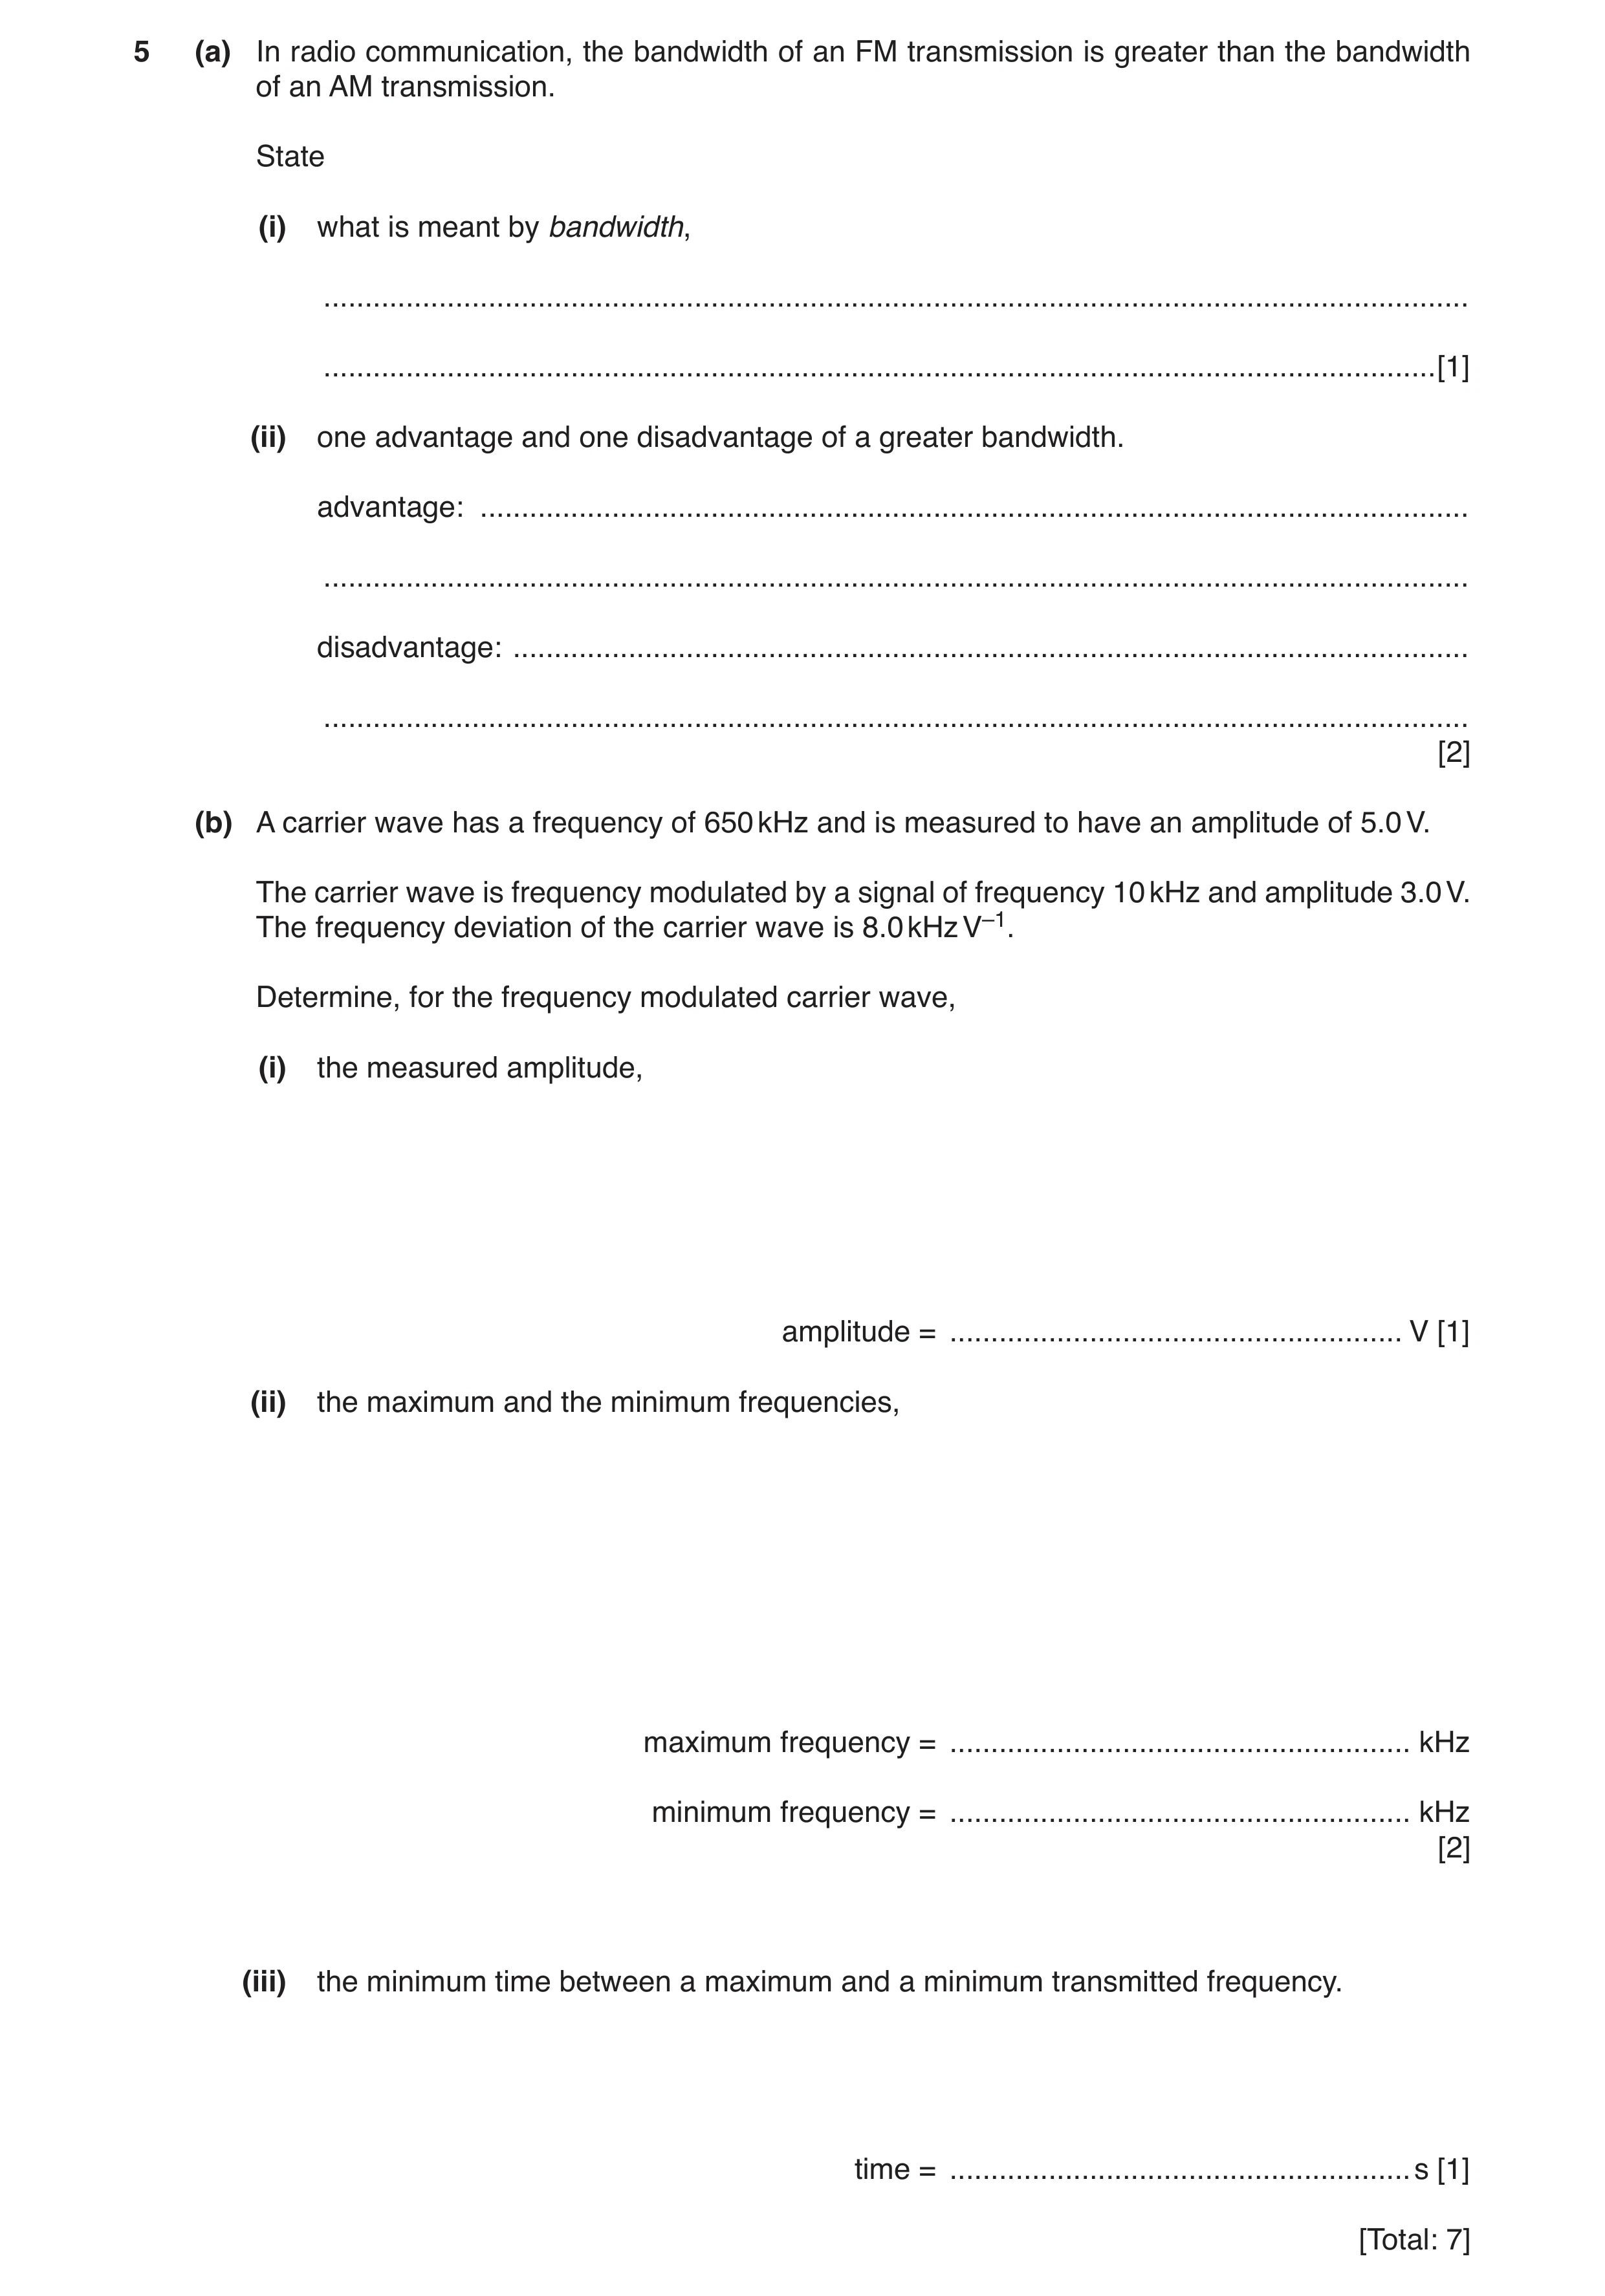
Q26 · In radio communication, the bandwidth of an FM transmission is greater than the bandwidth… 9702/42 May/June 2018
5 (a) In radio communication, the bandwidth of an FM transmission is greater than the bandwidth of an AM transmission. State (i) what is meant by bandwidth, … … [1] (ii) one advantage and one disadvantage of a greater bandwidth. advantage: … … disadvantage: … … [2] (b) A carrier wave has a frequency of 650 kHz and is measured to have an amplitude of 5.0 V. The carrier wave is frequency modulated by a signal of frequency 10 kHz and amplitude 3.0 V. The frequency deviation of the carrier wave is 8.0 kHz V–1. Determine, for the frequency modulated carrier wave, (i) the measured amplitude, amplitude = … V [1] (ii) the maximum and the minimum frequencies, maximum frequency = … kHz minimum frequency = … kHz [2] (iii) the minimum time between a maximum and a minimum transmitted frequency. time = … s [1] [Total: 7]
7 marks
Mark scheme: 5(a)(i) range of frequencies (of signal) B1 5(a)(ii) advantage: e.g. better quality (of reproduction) greater rate of transfer of data less distortion B1 disadvantage: e.g. fewer stations (in any frequency range) B1 5(b)(i) 5.0 V A1 5(b)(ii) maximum: 674 kHz A1 minimum: 626 kHz A1 5(b)(iii) T = 1 / (10 × 103) = 1.0 × 10⁻⁴s minimum time = T / 2 = 5.0 × 10⁻⁵ s A1
This question in 9702/42 May/June 2018
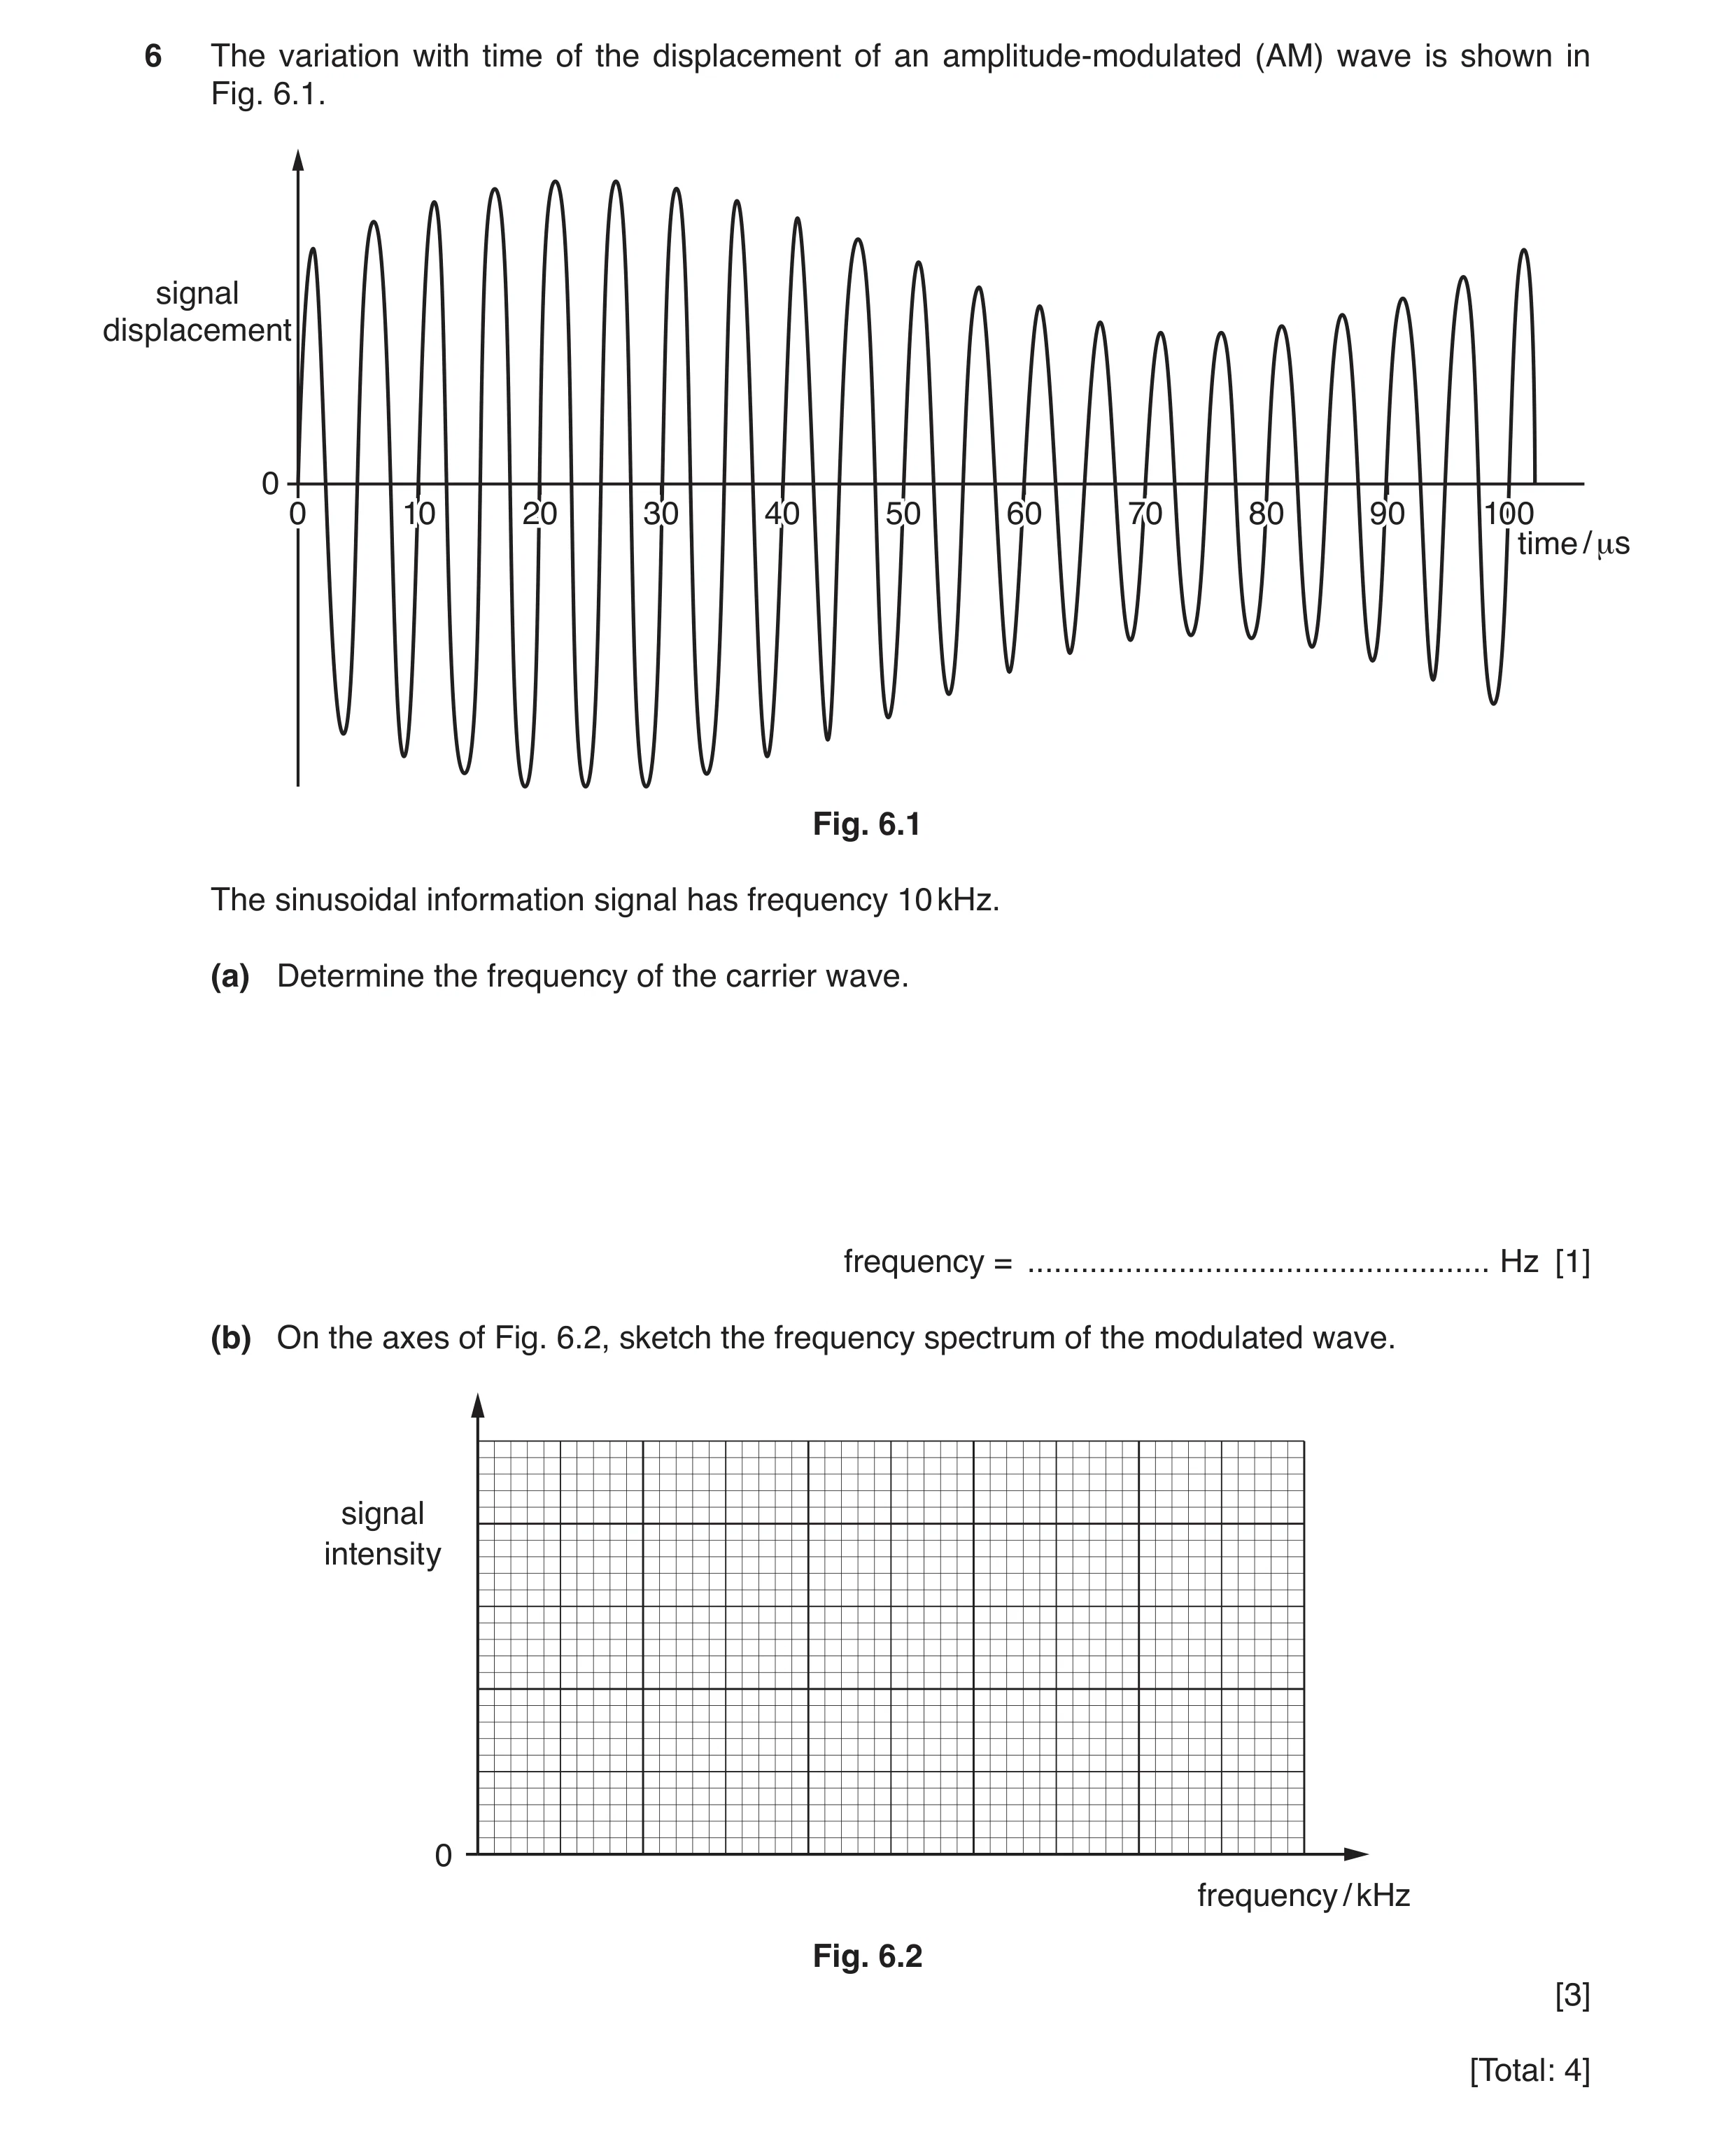
Q27 · The variation with time of the displacement of an amplitude-modulated (AM) wave is shown… 9702/42 Oct/Nov 2019
6 The variation with time of the displacement of an amplitude-modulated (AM) wave is shown in Fig. 6.1. signal displacement 0 0 10 20 30 40 50 60 70 80 90 100 time / μs Fig. 6.1 The sinusoidal information signal has frequency 10 kHz. (a) Determine the frequency of the carrier wave. frequency = … Hz [1] (b) On the axes of Fig. 6.2, sketch the frequency spectrum of the modulated wave. signal intensity 0 frequency / kHz Fig. 6.2 [3] [Total: 4]
4 marks
Mark scheme: 6(a) frequency = 2.0 × 10⁵ Hz A1 6(b) sketch: three equally spaced vertical lines sitting on f-axis B1 two outer vertical lines of equal length and central line longer B1 three vertical lines (and no others) shown at frequencies 190 kHz, 200 kHz and 210 kHz B1
This question in 9702/42 Oct/Nov 2019
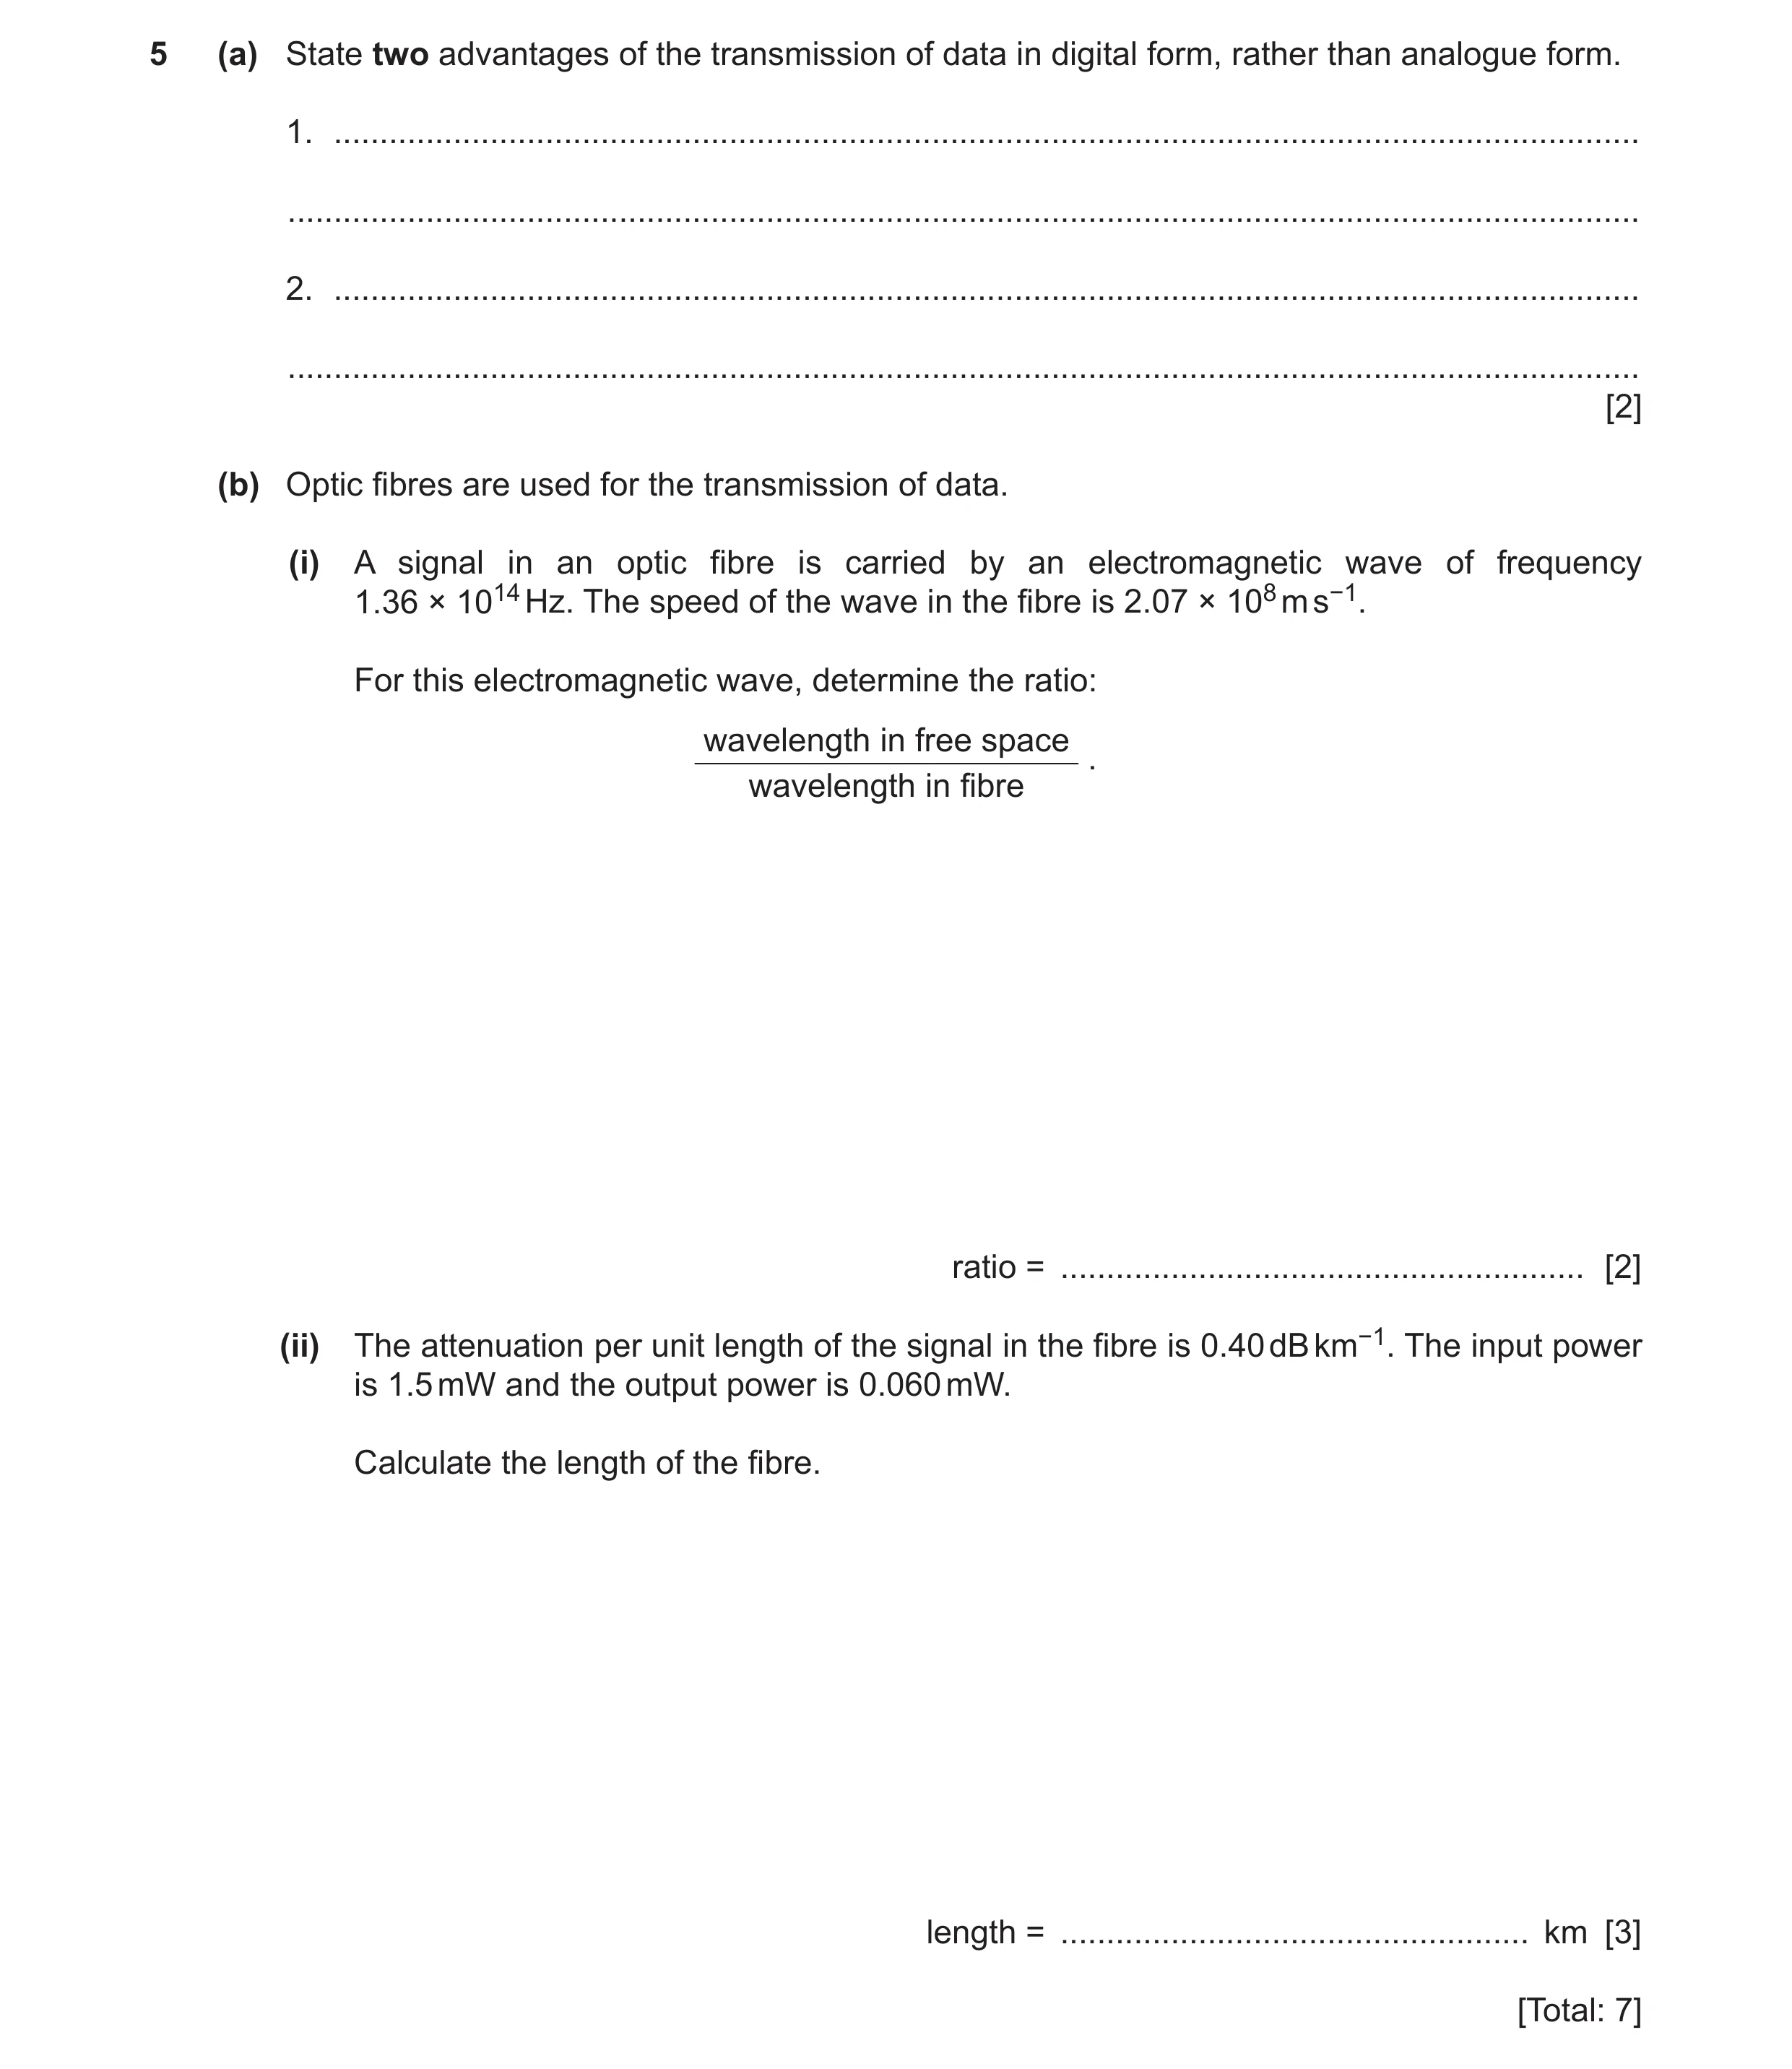
Q28 · State two advantages of the transmission of data in digital form, rather than analogue… 9702/42 Feb/March 2020
5 (a) State two advantages of the transmission of data in digital form, rather than analogue form. 1. … … 2. … … [2] (b) Optic fibres are used for the transmission of data. (i) A signal in an optic fibre is carried by an electromagnetic wave of frequency 1.36 × 10¹⁴ Hz. The speed of the wave in the fibre is 2.07 × 10⁸ m s−1. For this electromagnetic wave, determine the ratio: wavelength in free space . wavelength in fibre ratio = … [2] (ii) The attenuation per unit length of the signal in the fibre is 0.40 dB km−1. The input power is 1.5 mW and the output power is 0.060 mW. Calculate the length of the fibre. length = … km [3] [Total: 7]
7 marks
Mark scheme: 5(a) Any 2 from: • noise can be filtered out / noise can be removed / signal can be regenerated • can carry more information per unit time / greater rate of transmission of data • can have extra bits of data to check for errors • can be encrypted B2 5(b)(i) v ∝ λ C1 ratio = vair / vfibre = 3.00 × 10⁸ / 2.07 × 108 = 1.45 A1 5(b)(ii) attenuation = 10 log (P2/P1) C1 0.40 × L = 10 log (1.5 / 0.06) 0.40 × L = 13.979 C1 L = 35 km A1
This question in 9702/42 Feb/March 2020
 1 / 34
 2 / 34
 3 / 34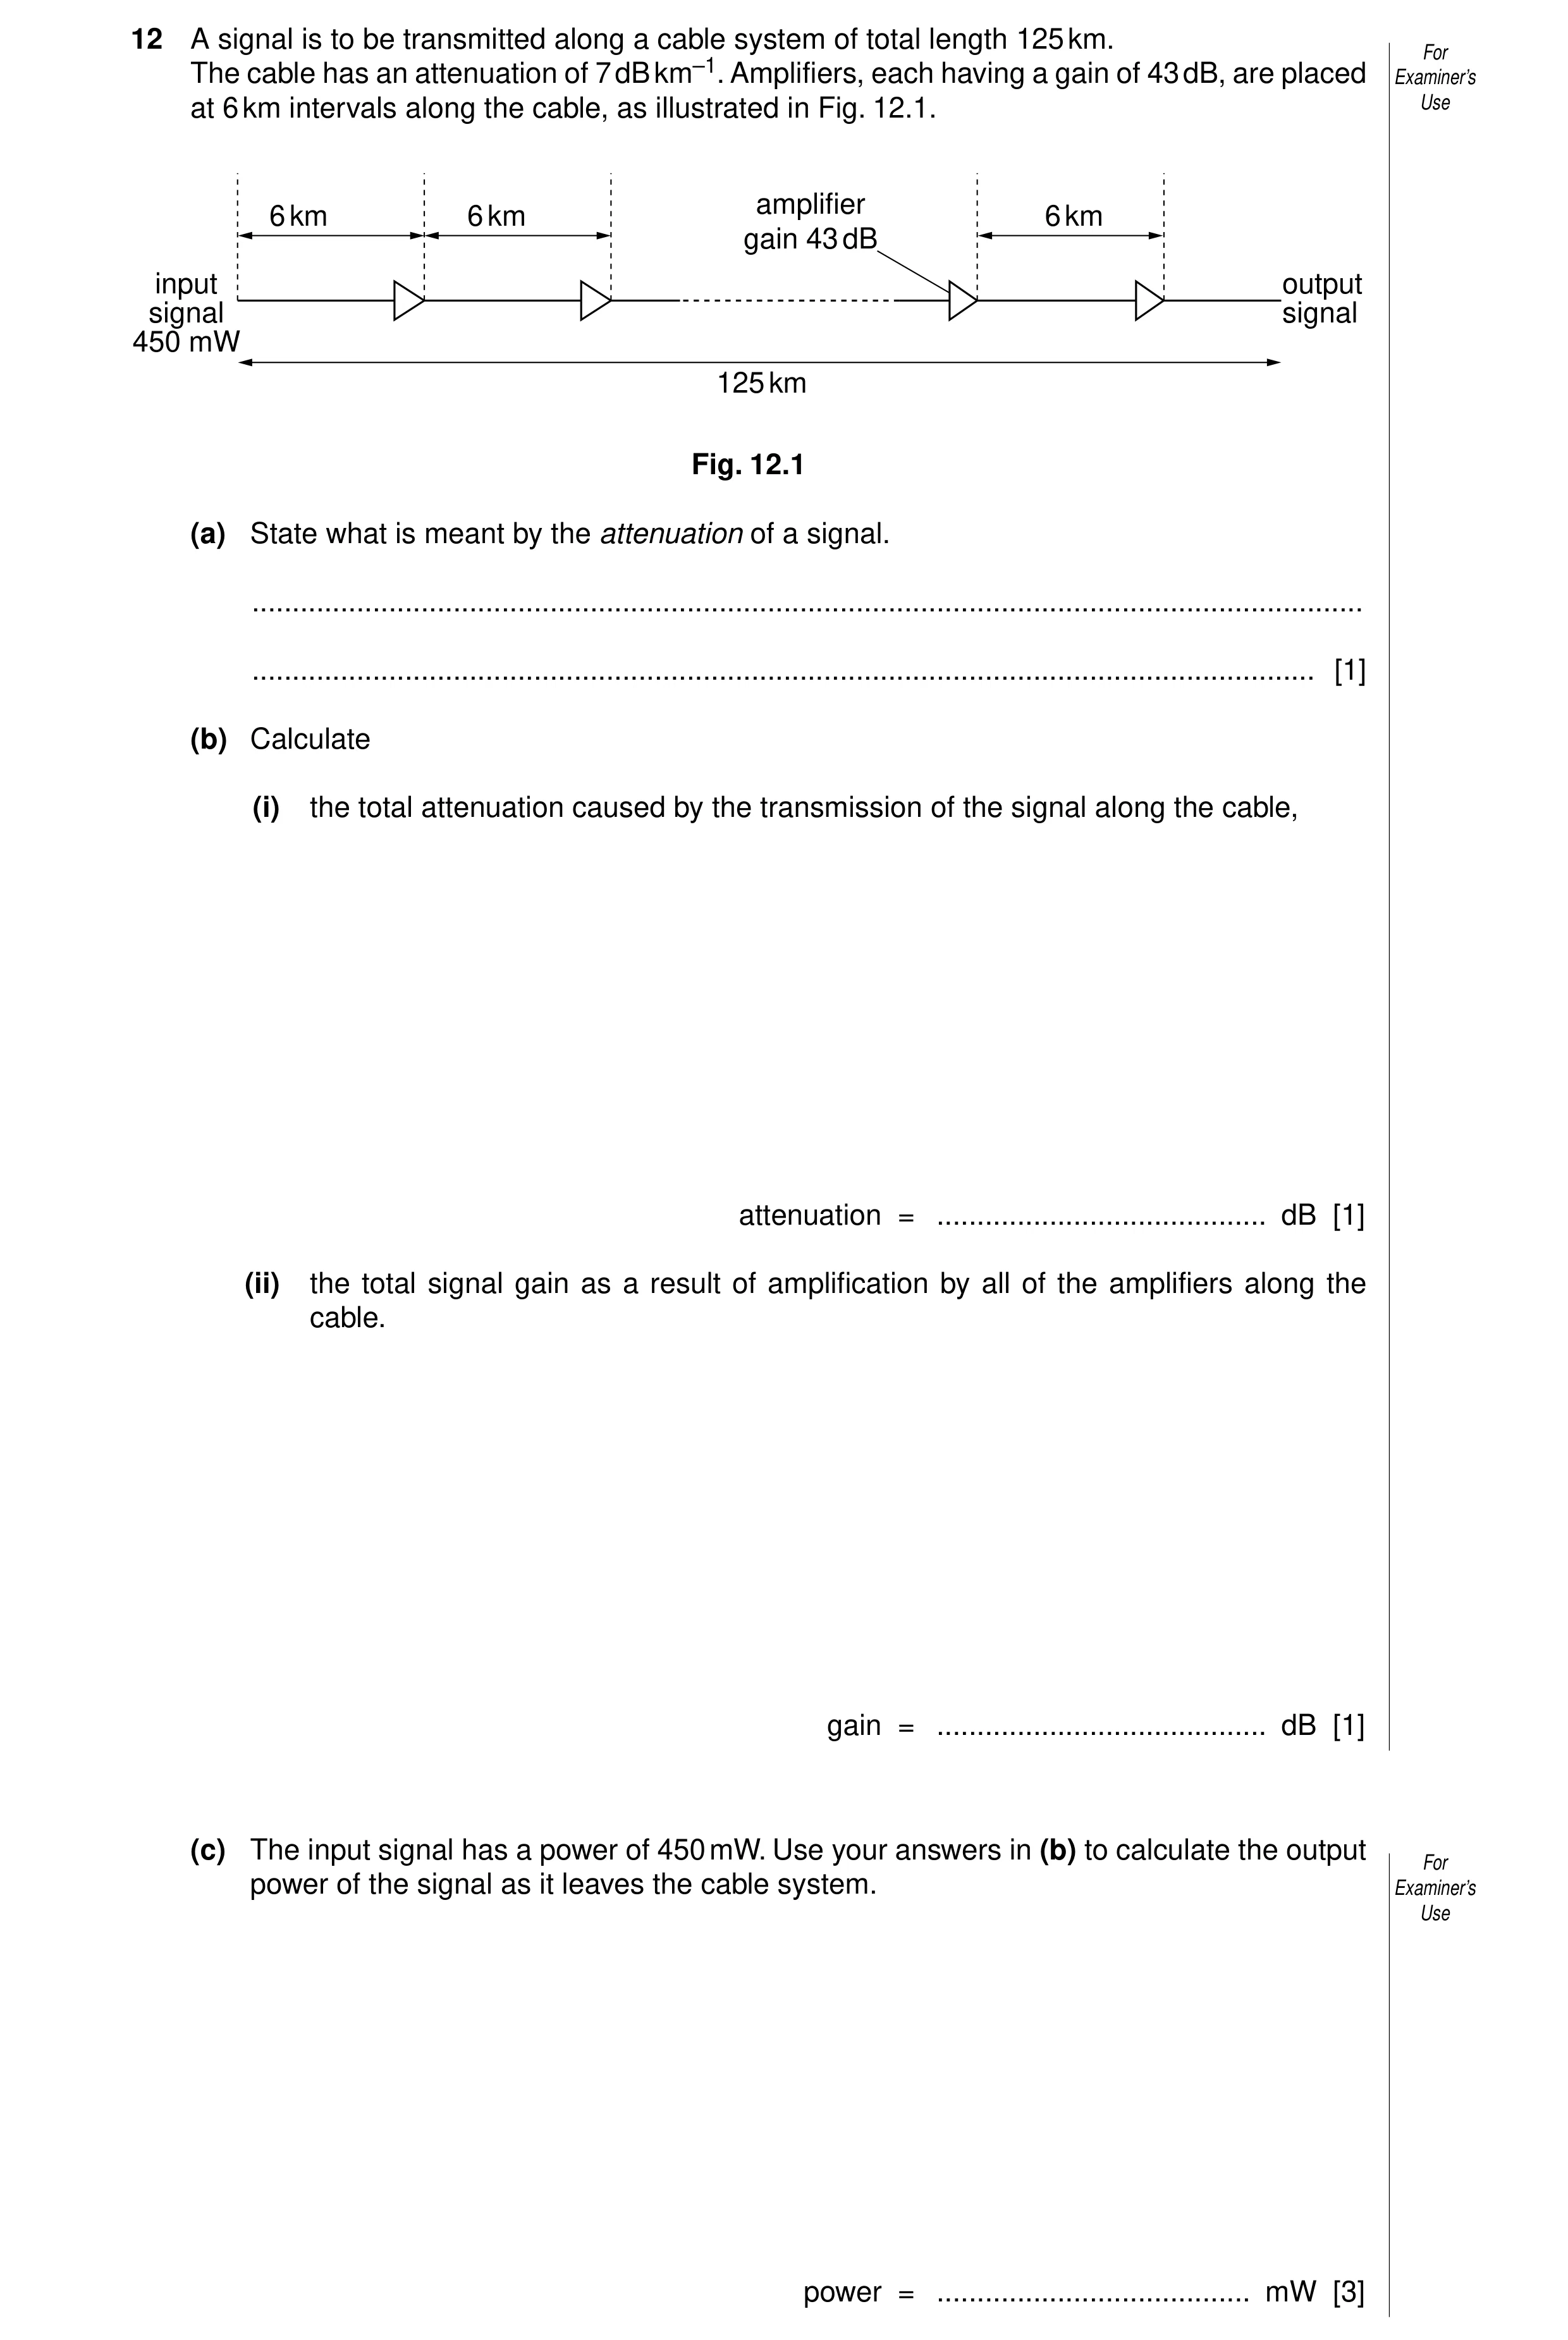
 8 / 34
 9 / 34
 10 / 34
 11 / 34
 12 / 34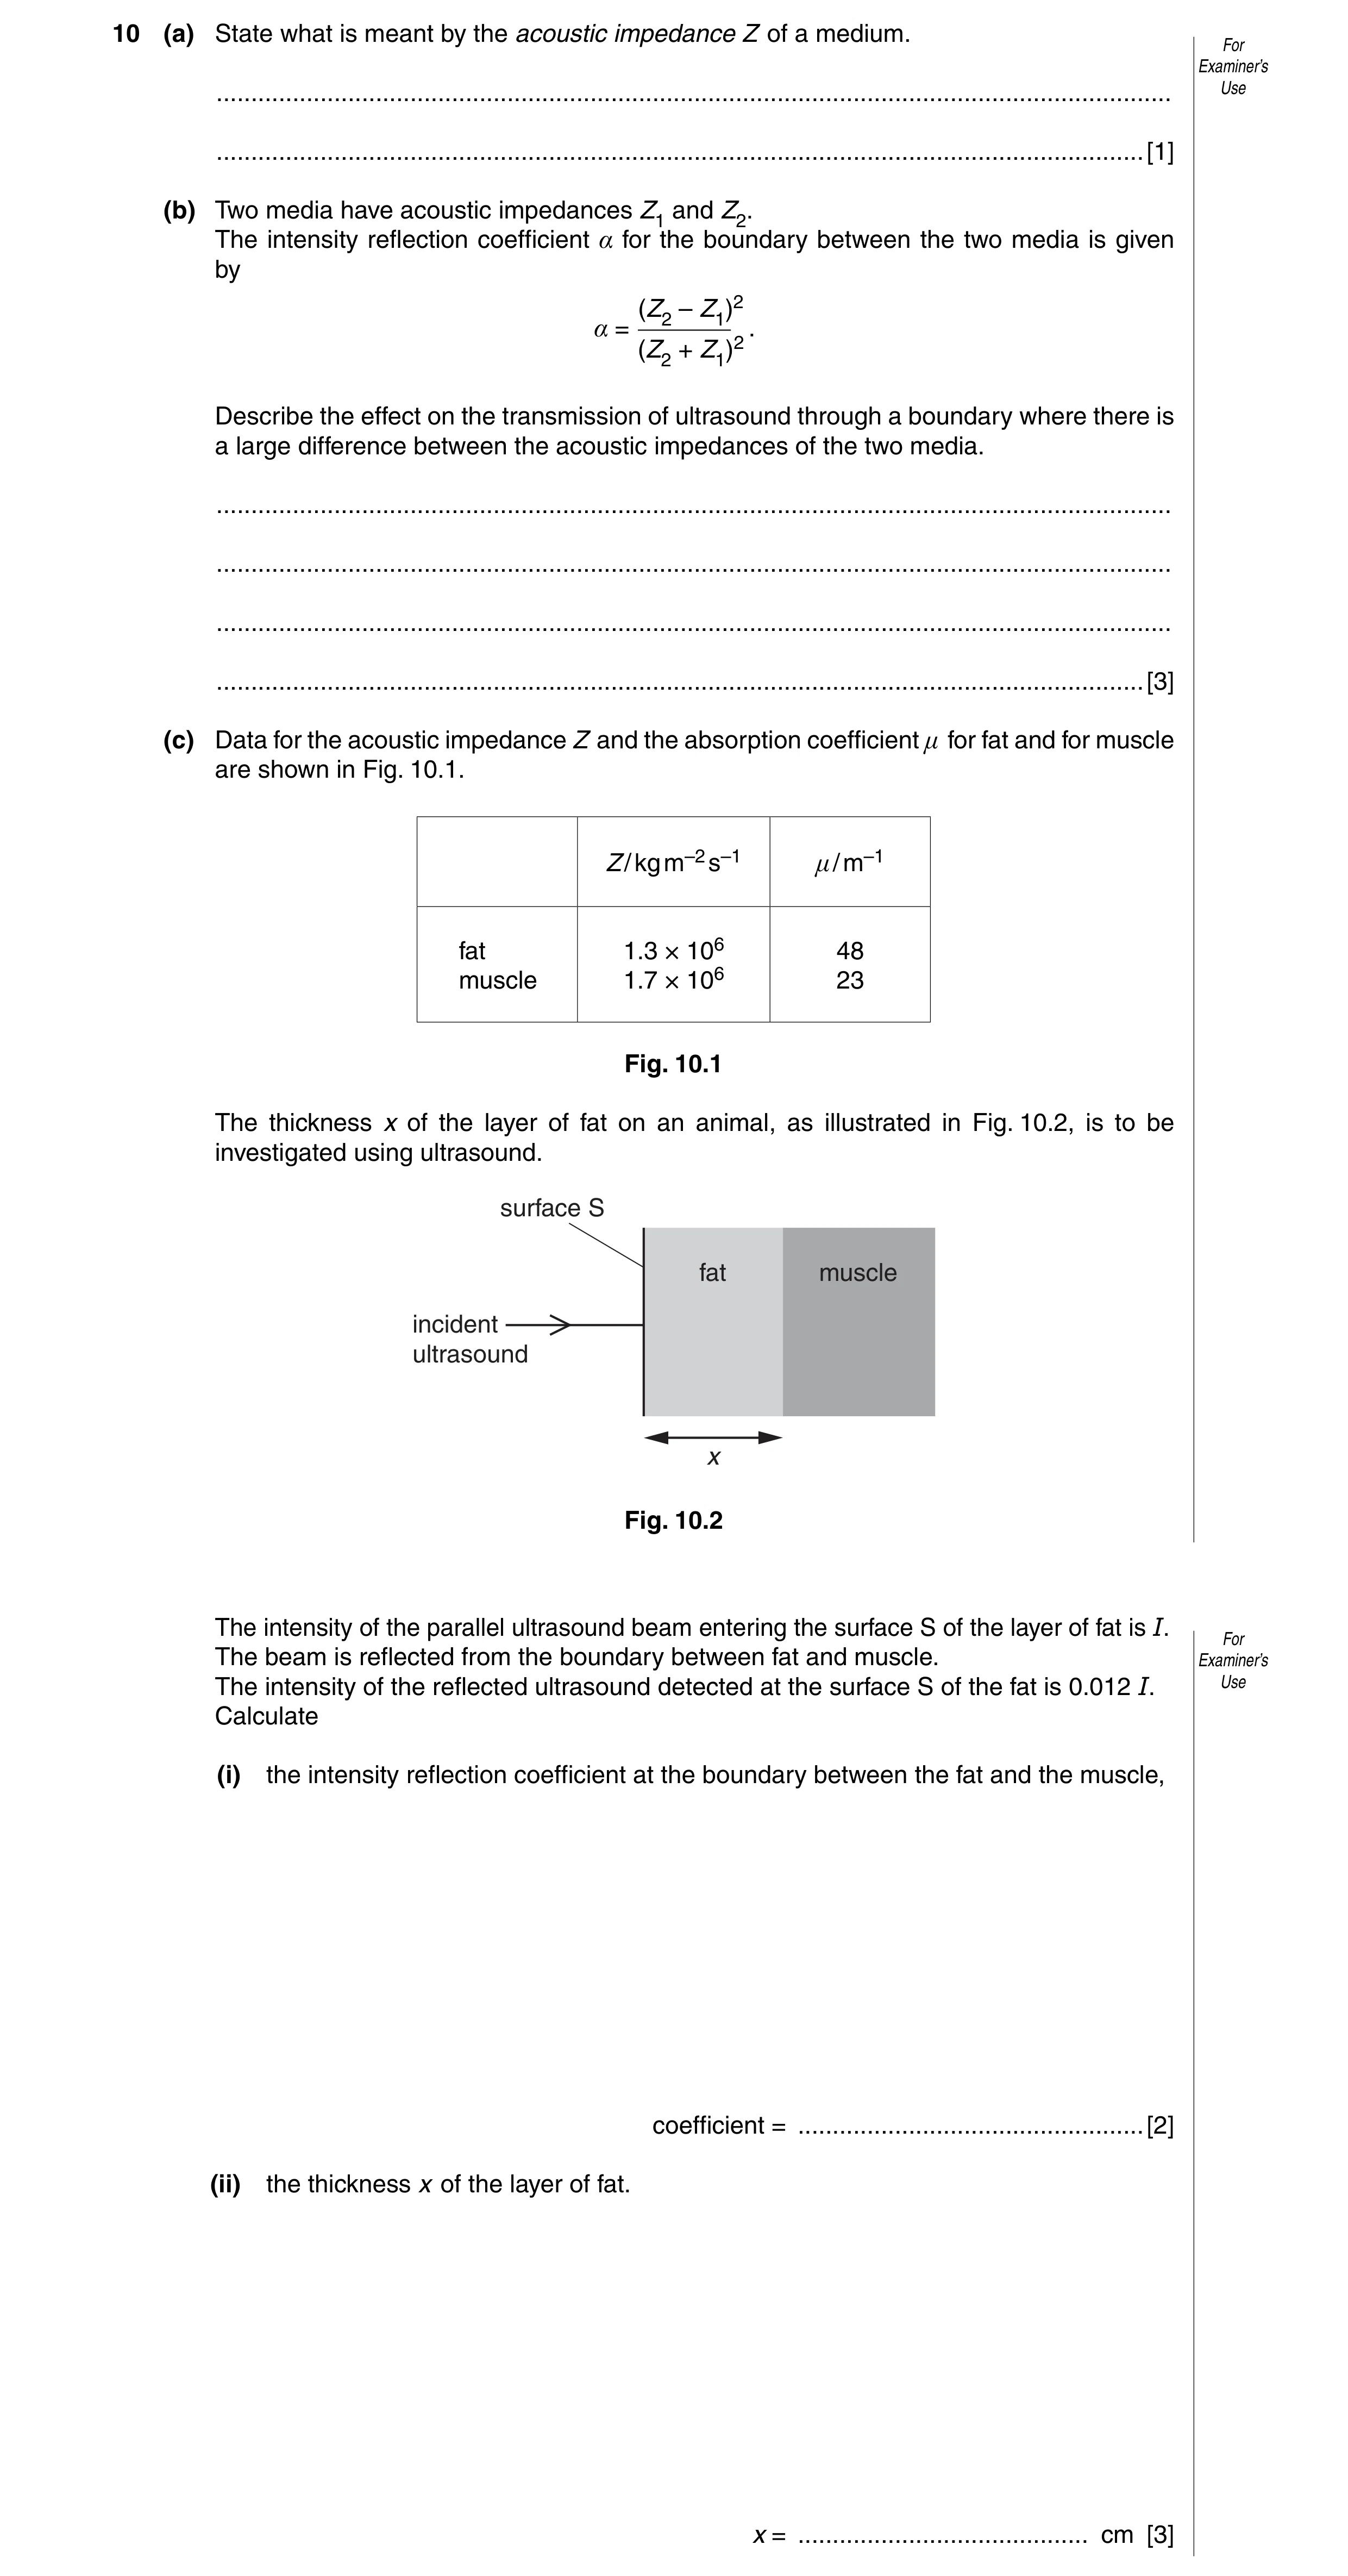
 17 / 34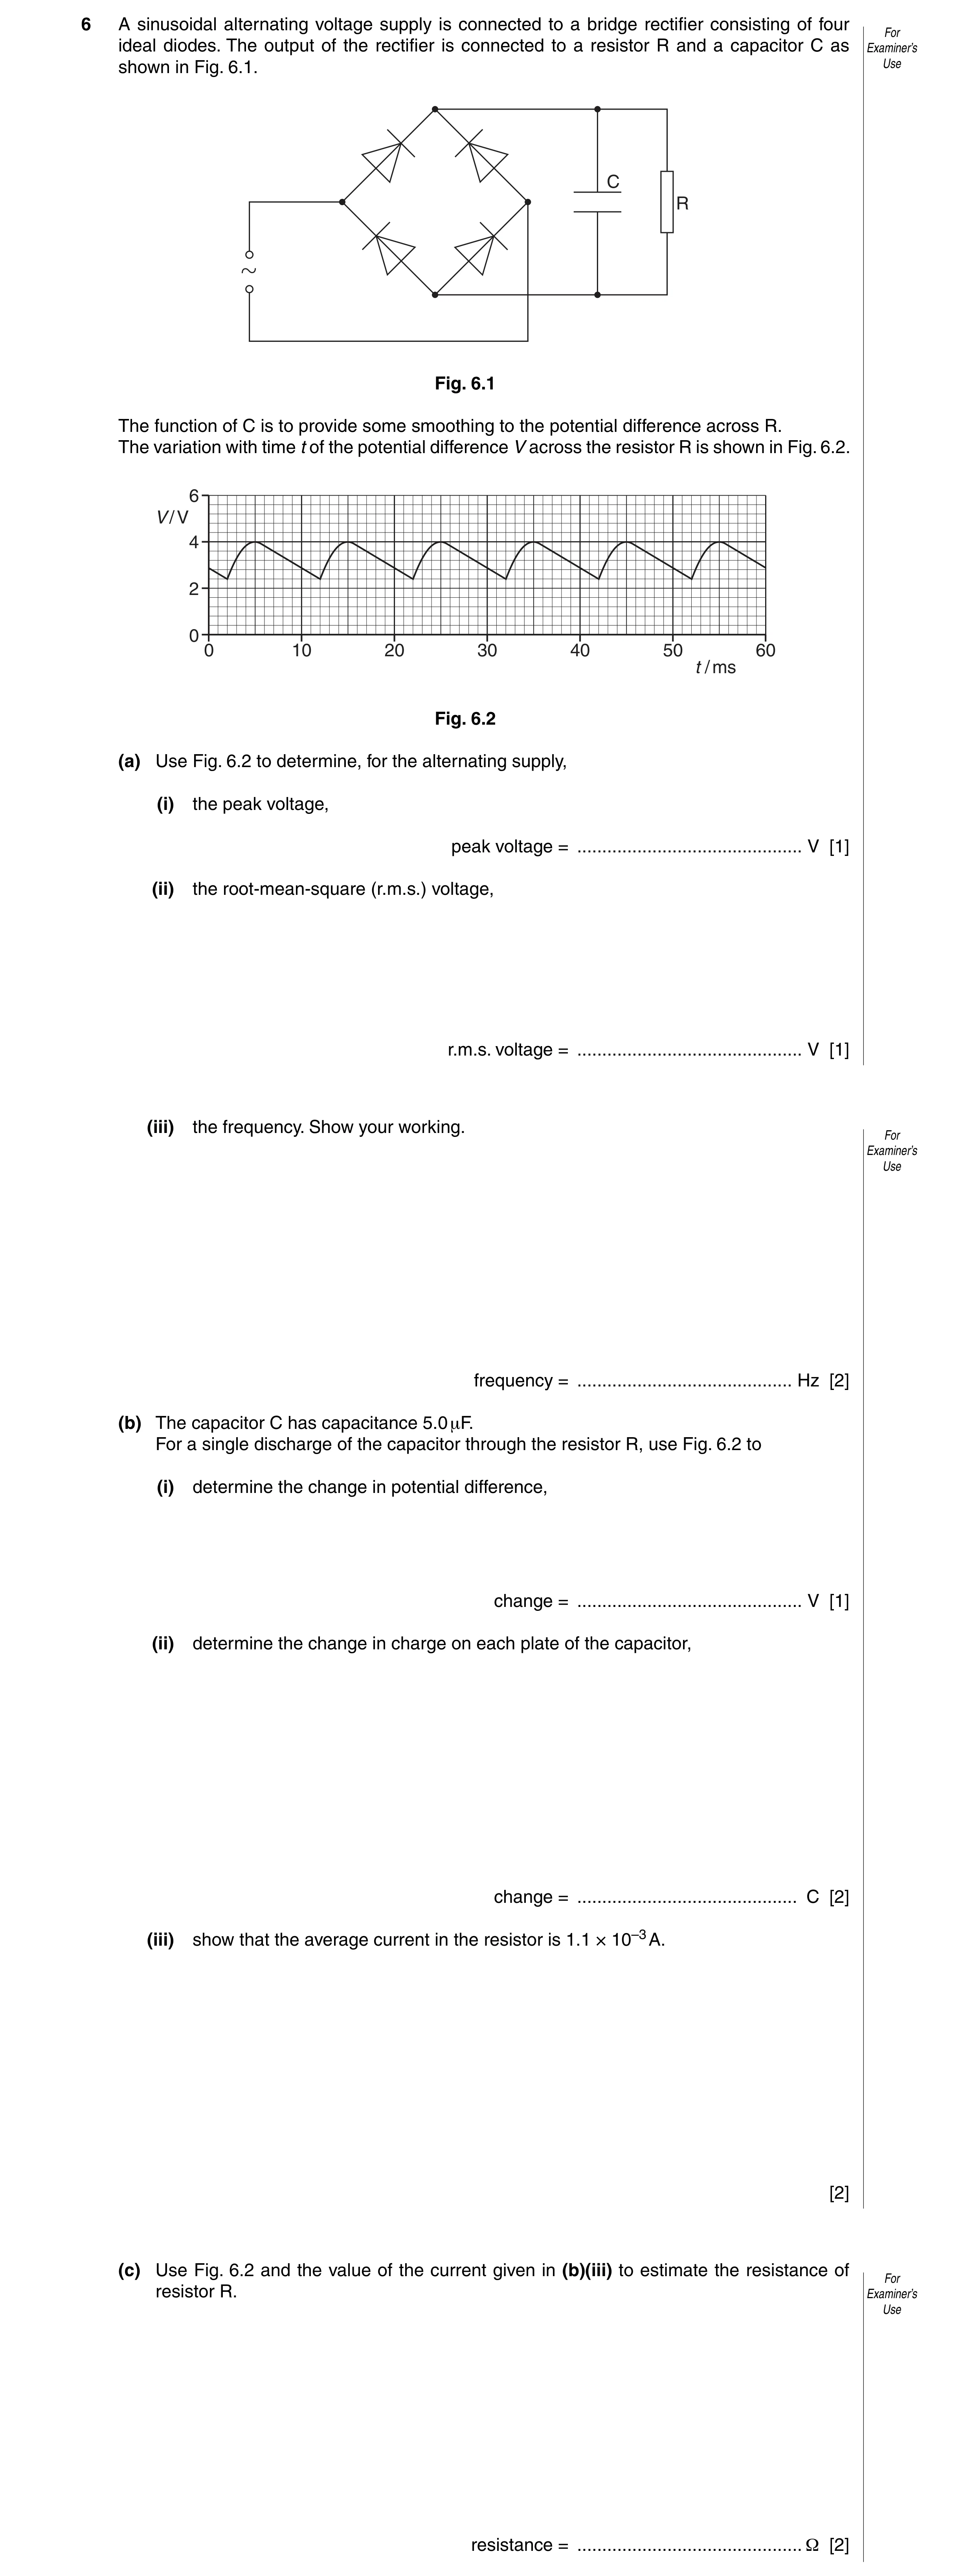
 21 / 34
 22 / 34
 23 / 34
 24 / 34
 25 / 34
 26 / 34
 27 / 34
 28 / 34
 29 / 34
 30 / 34
 31 / 34
 32 / 34
 33 / 34
 34 / 34
 8
8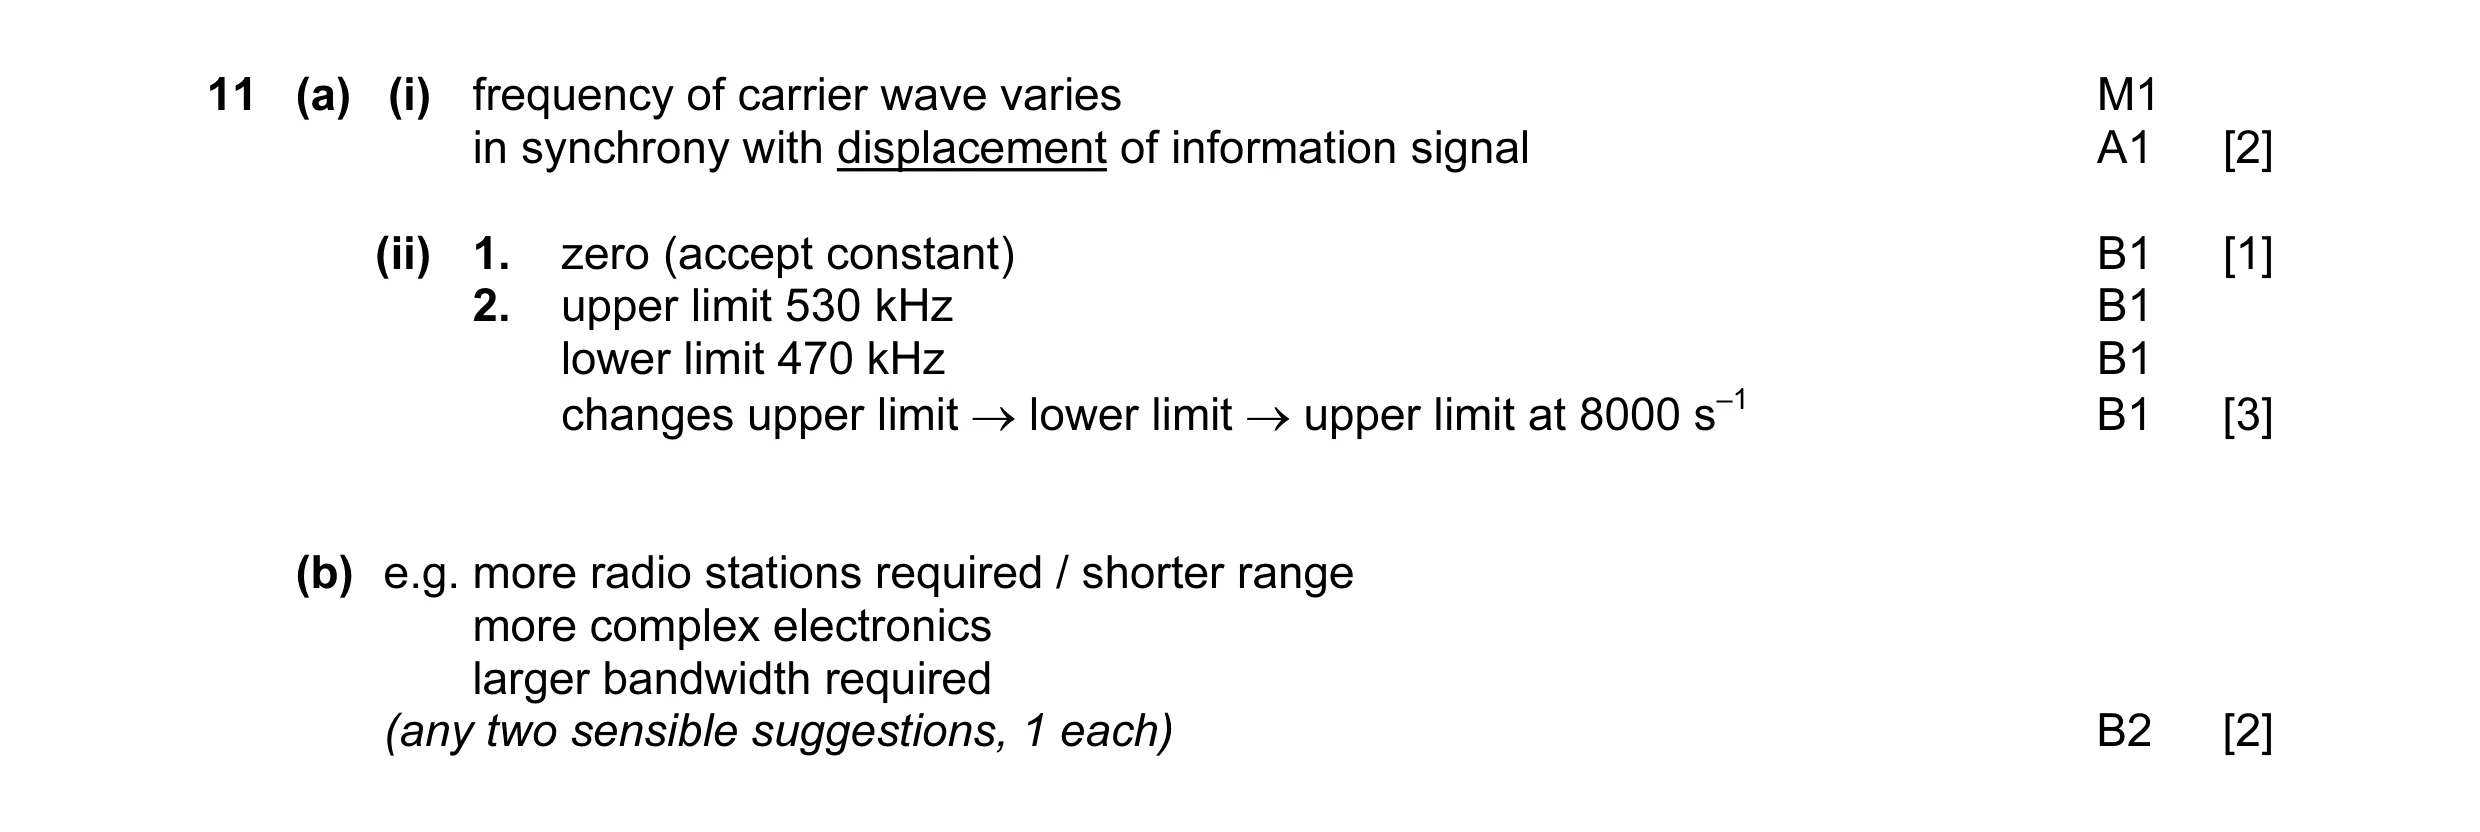 8
8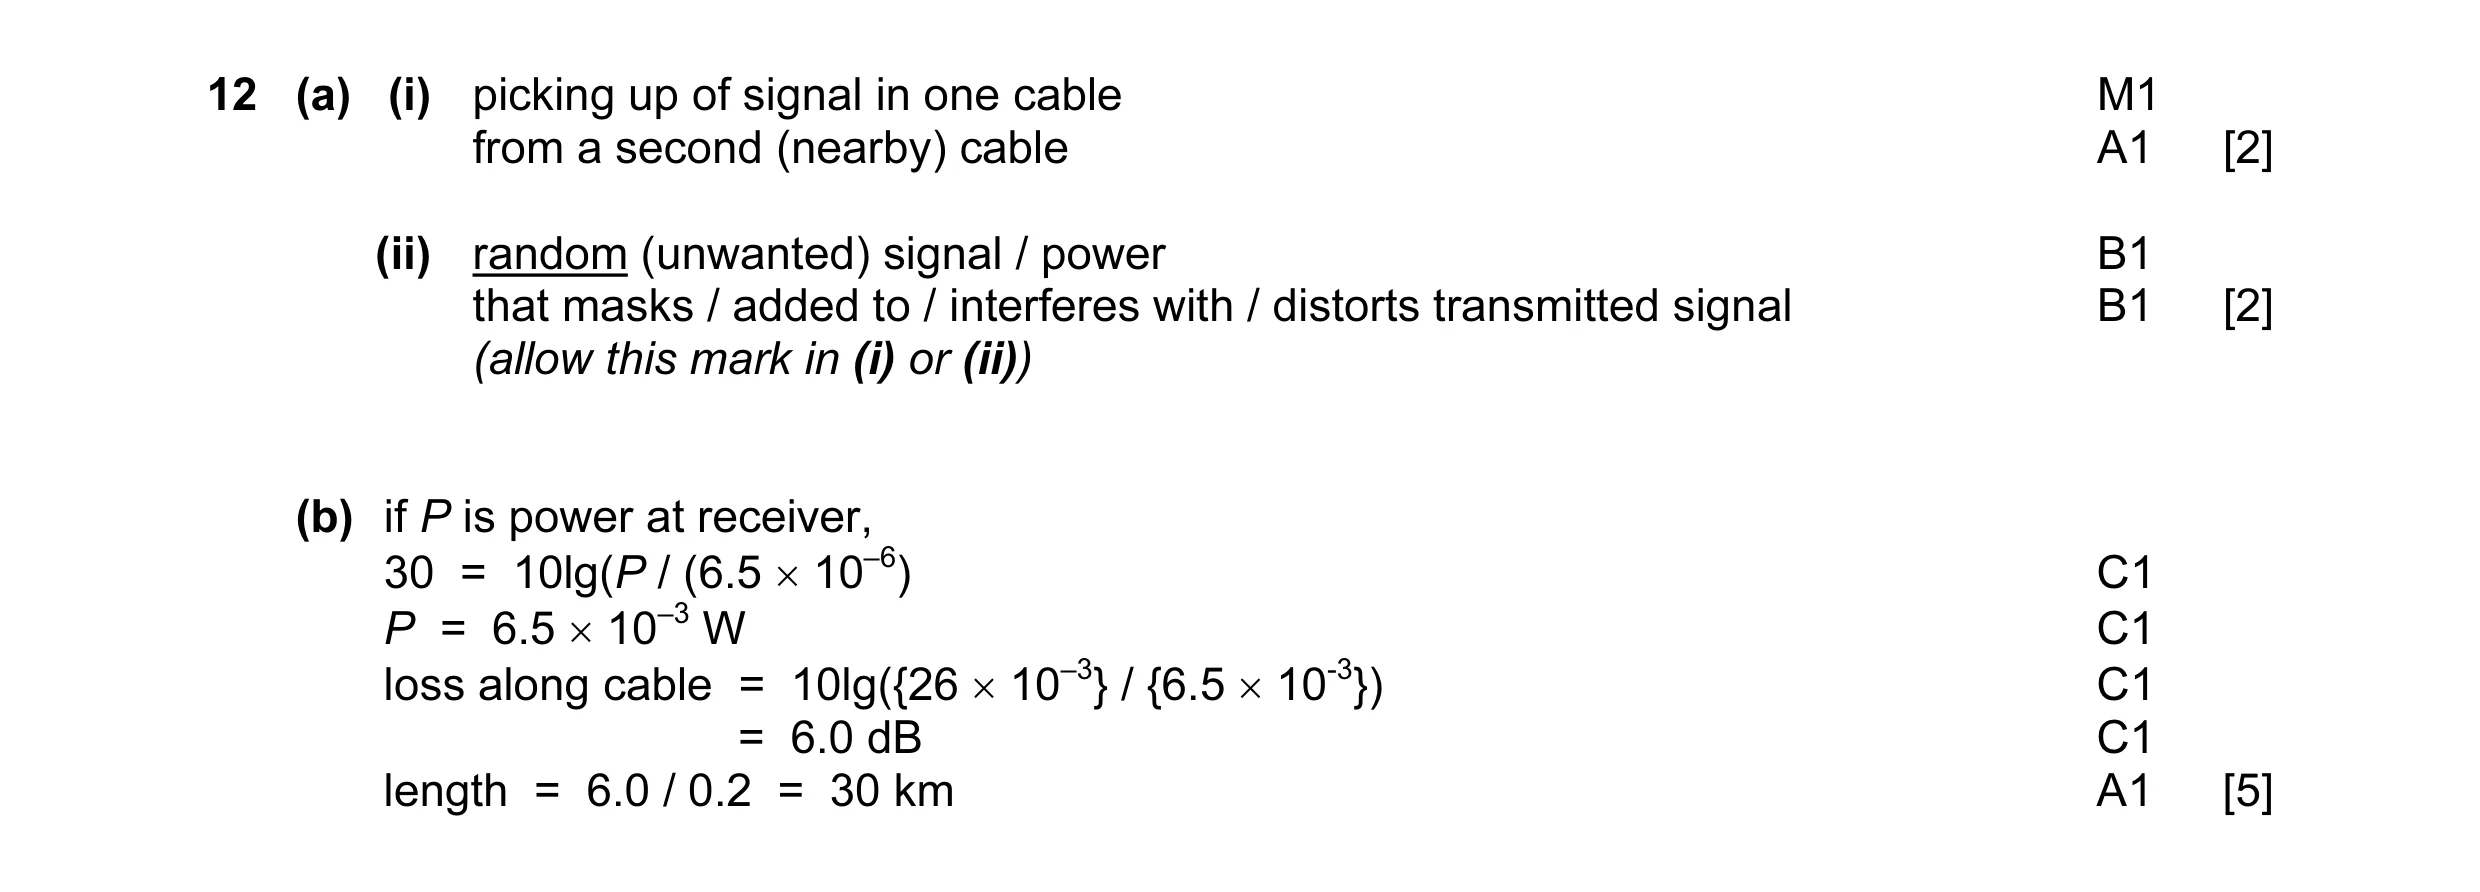 9
9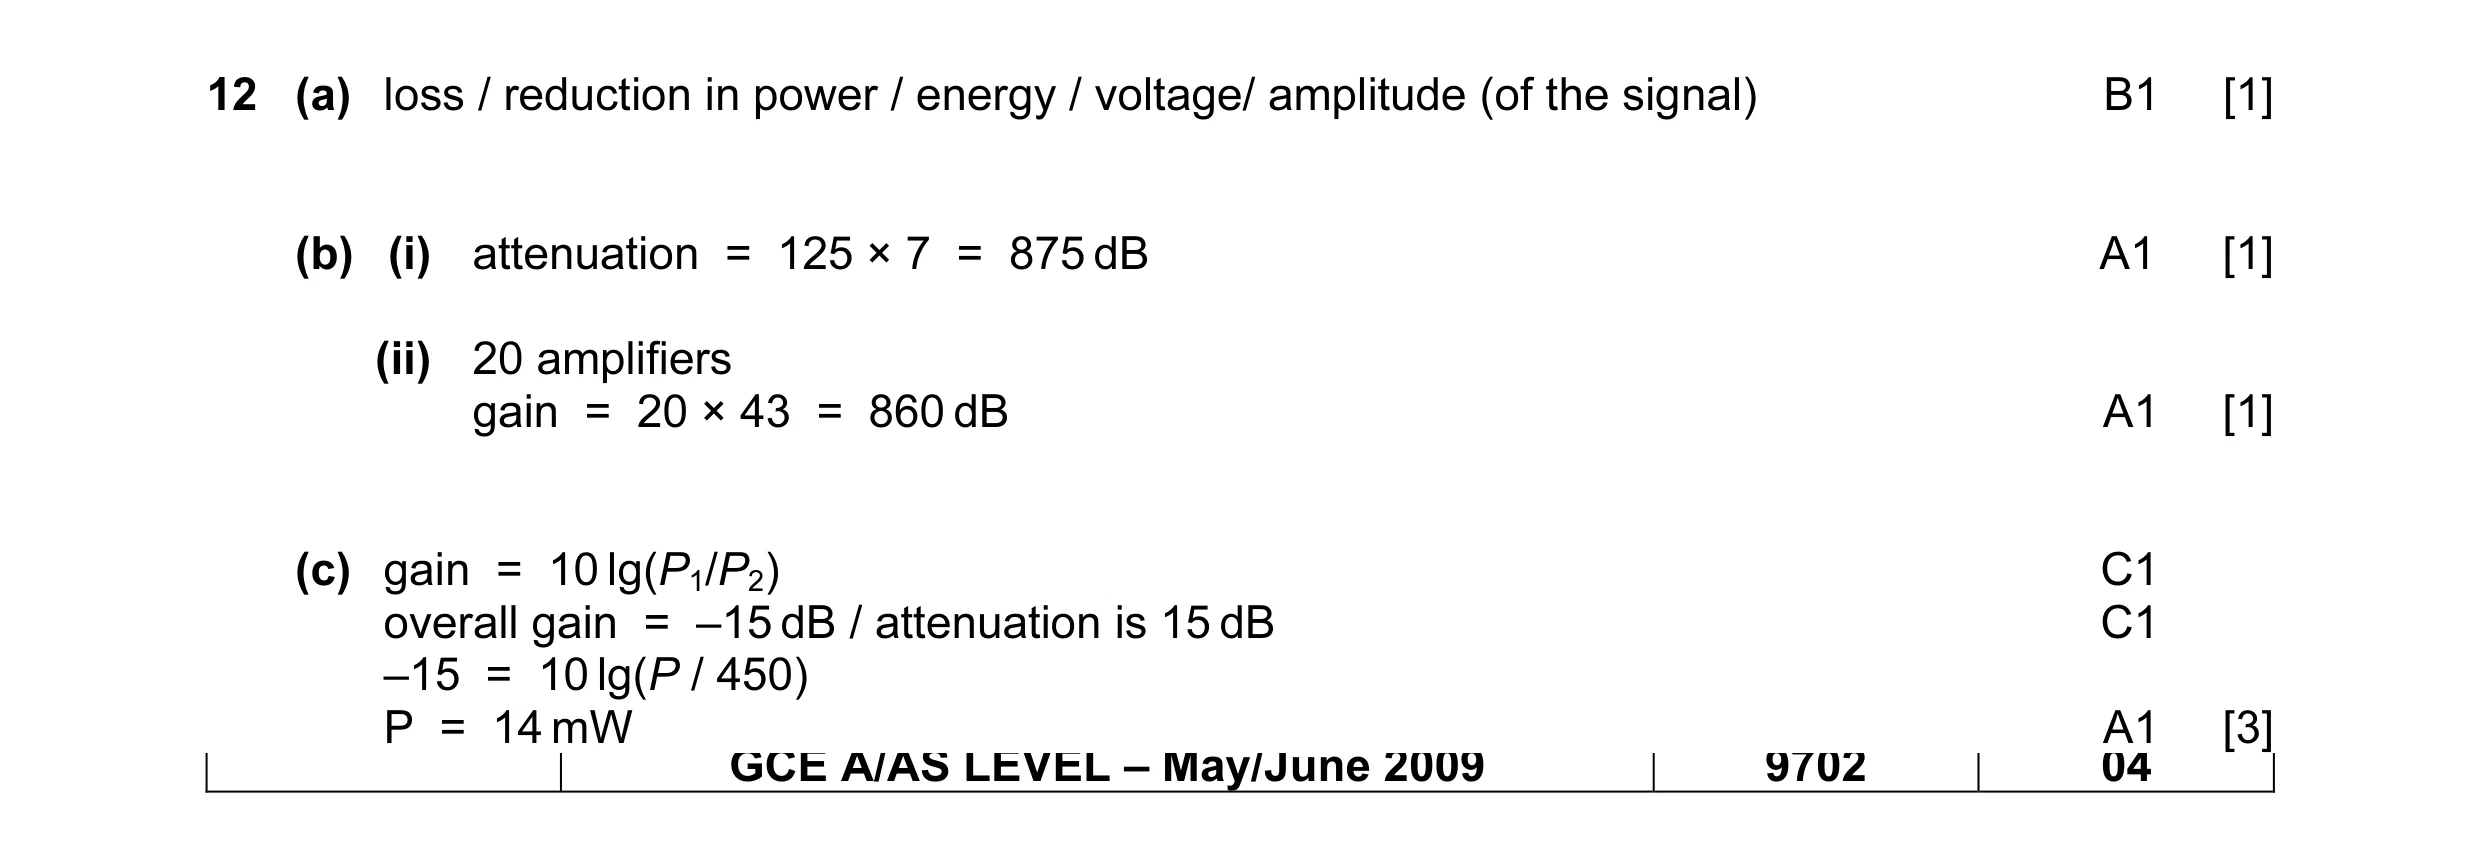 6
6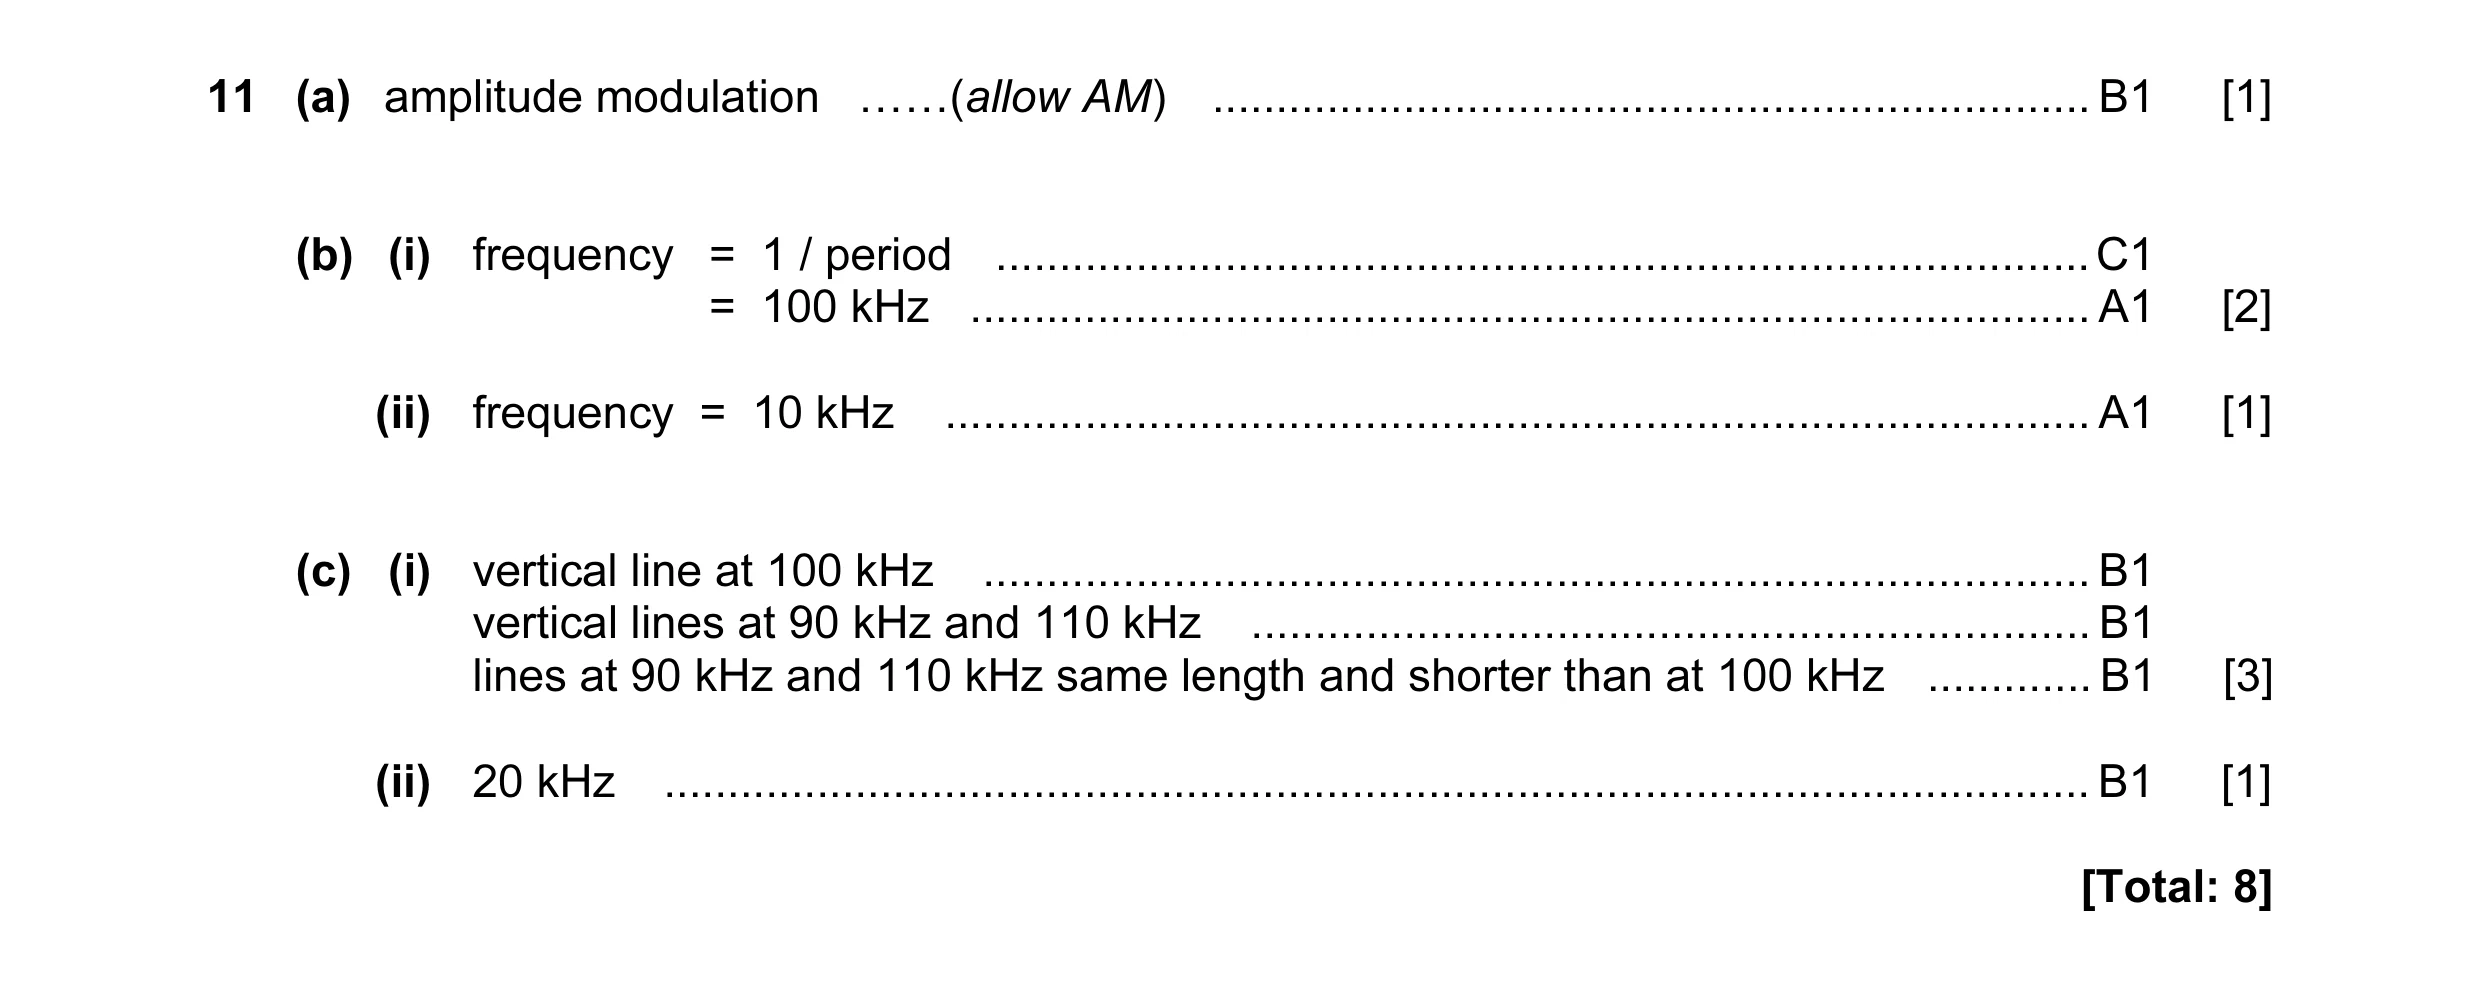 8
8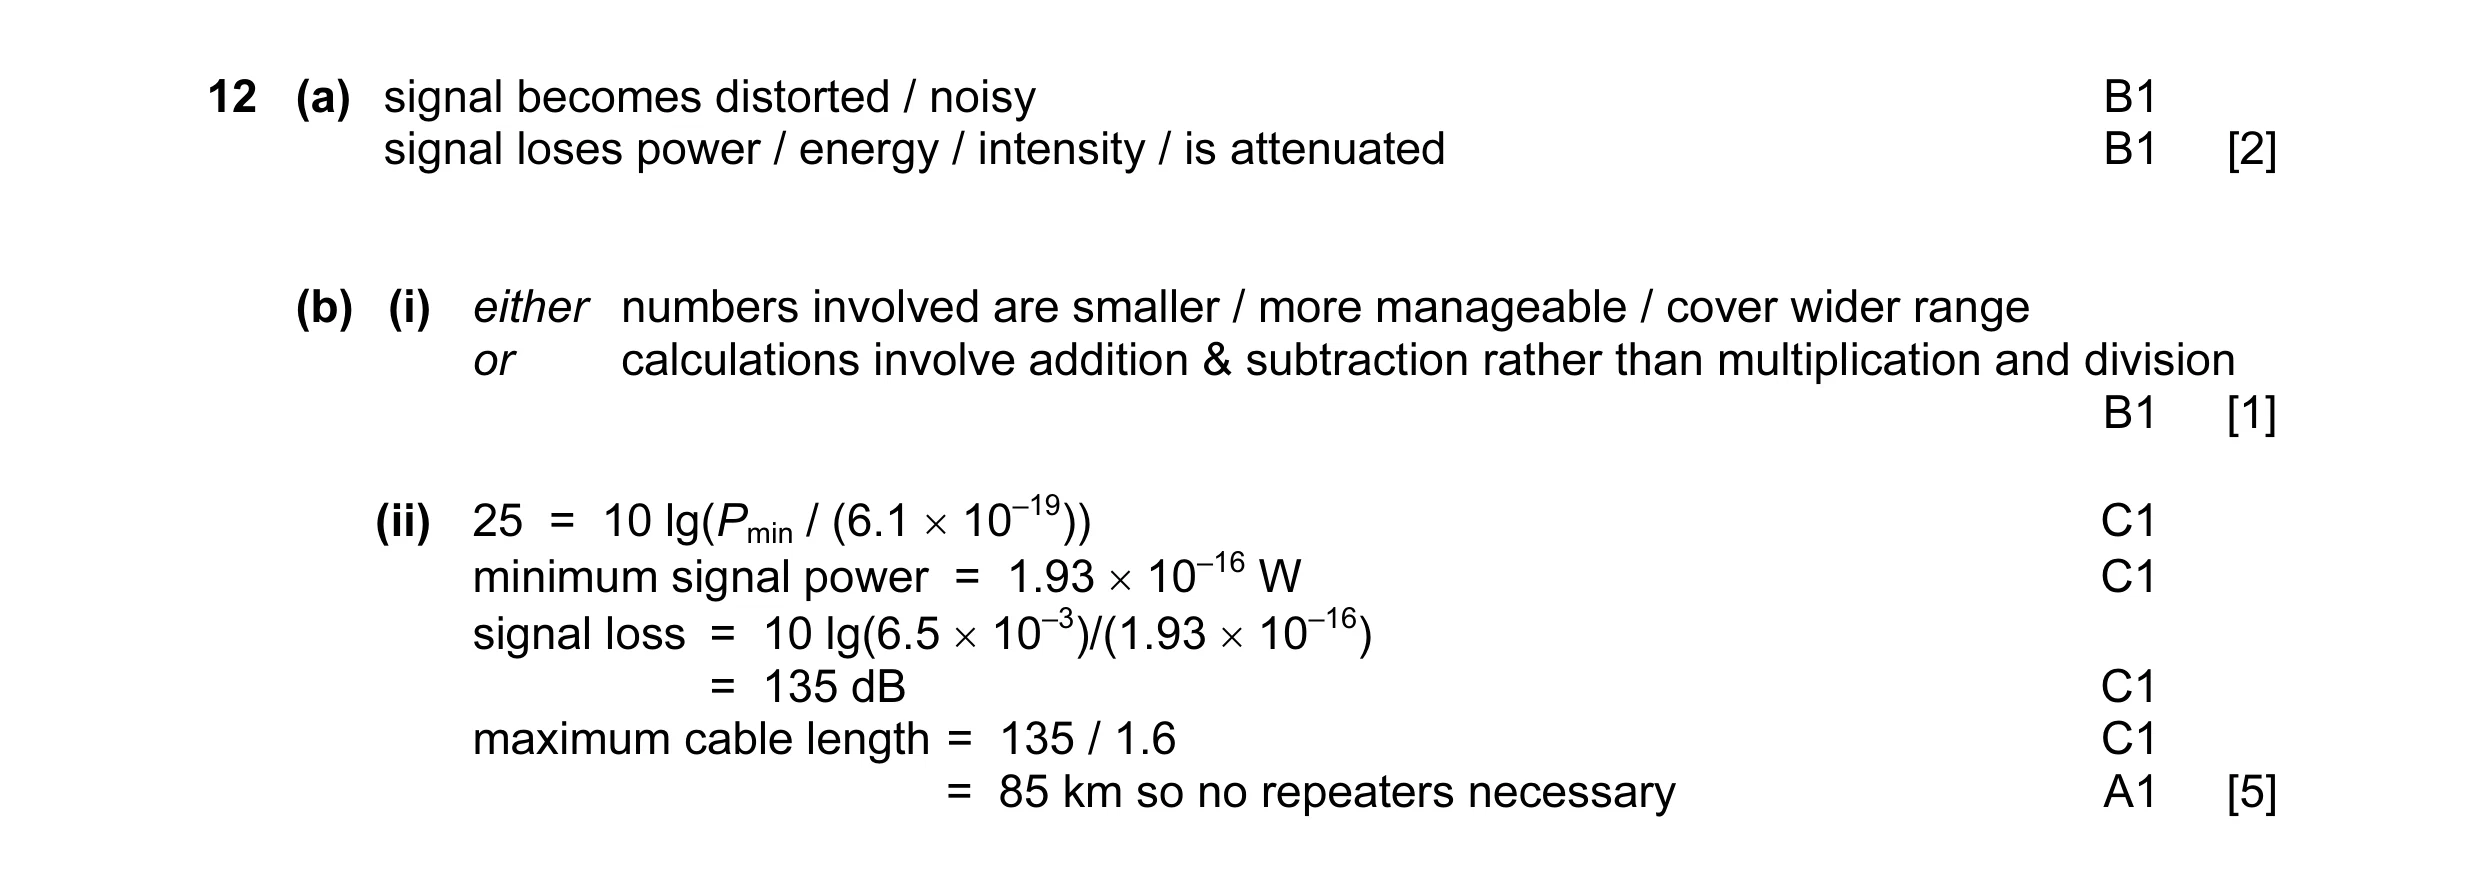 8
8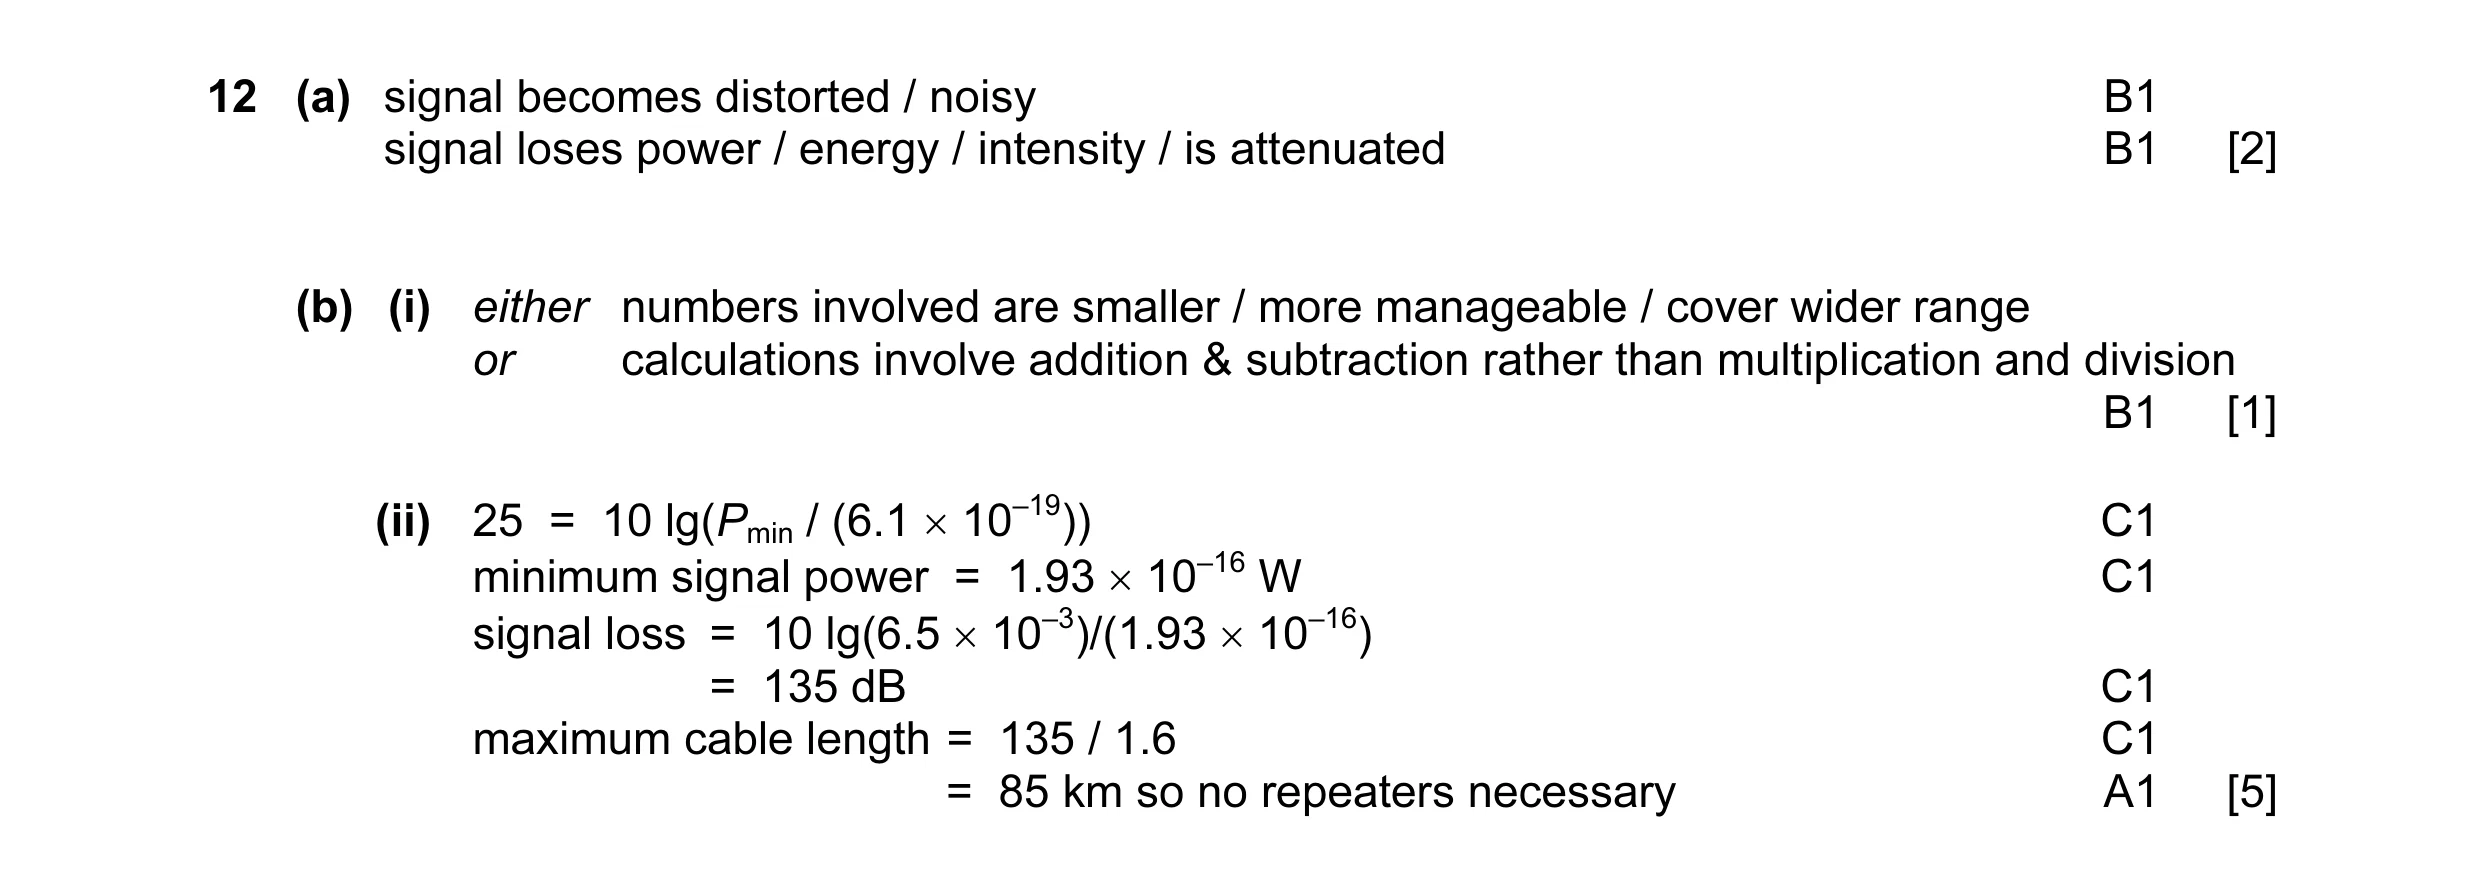 8
8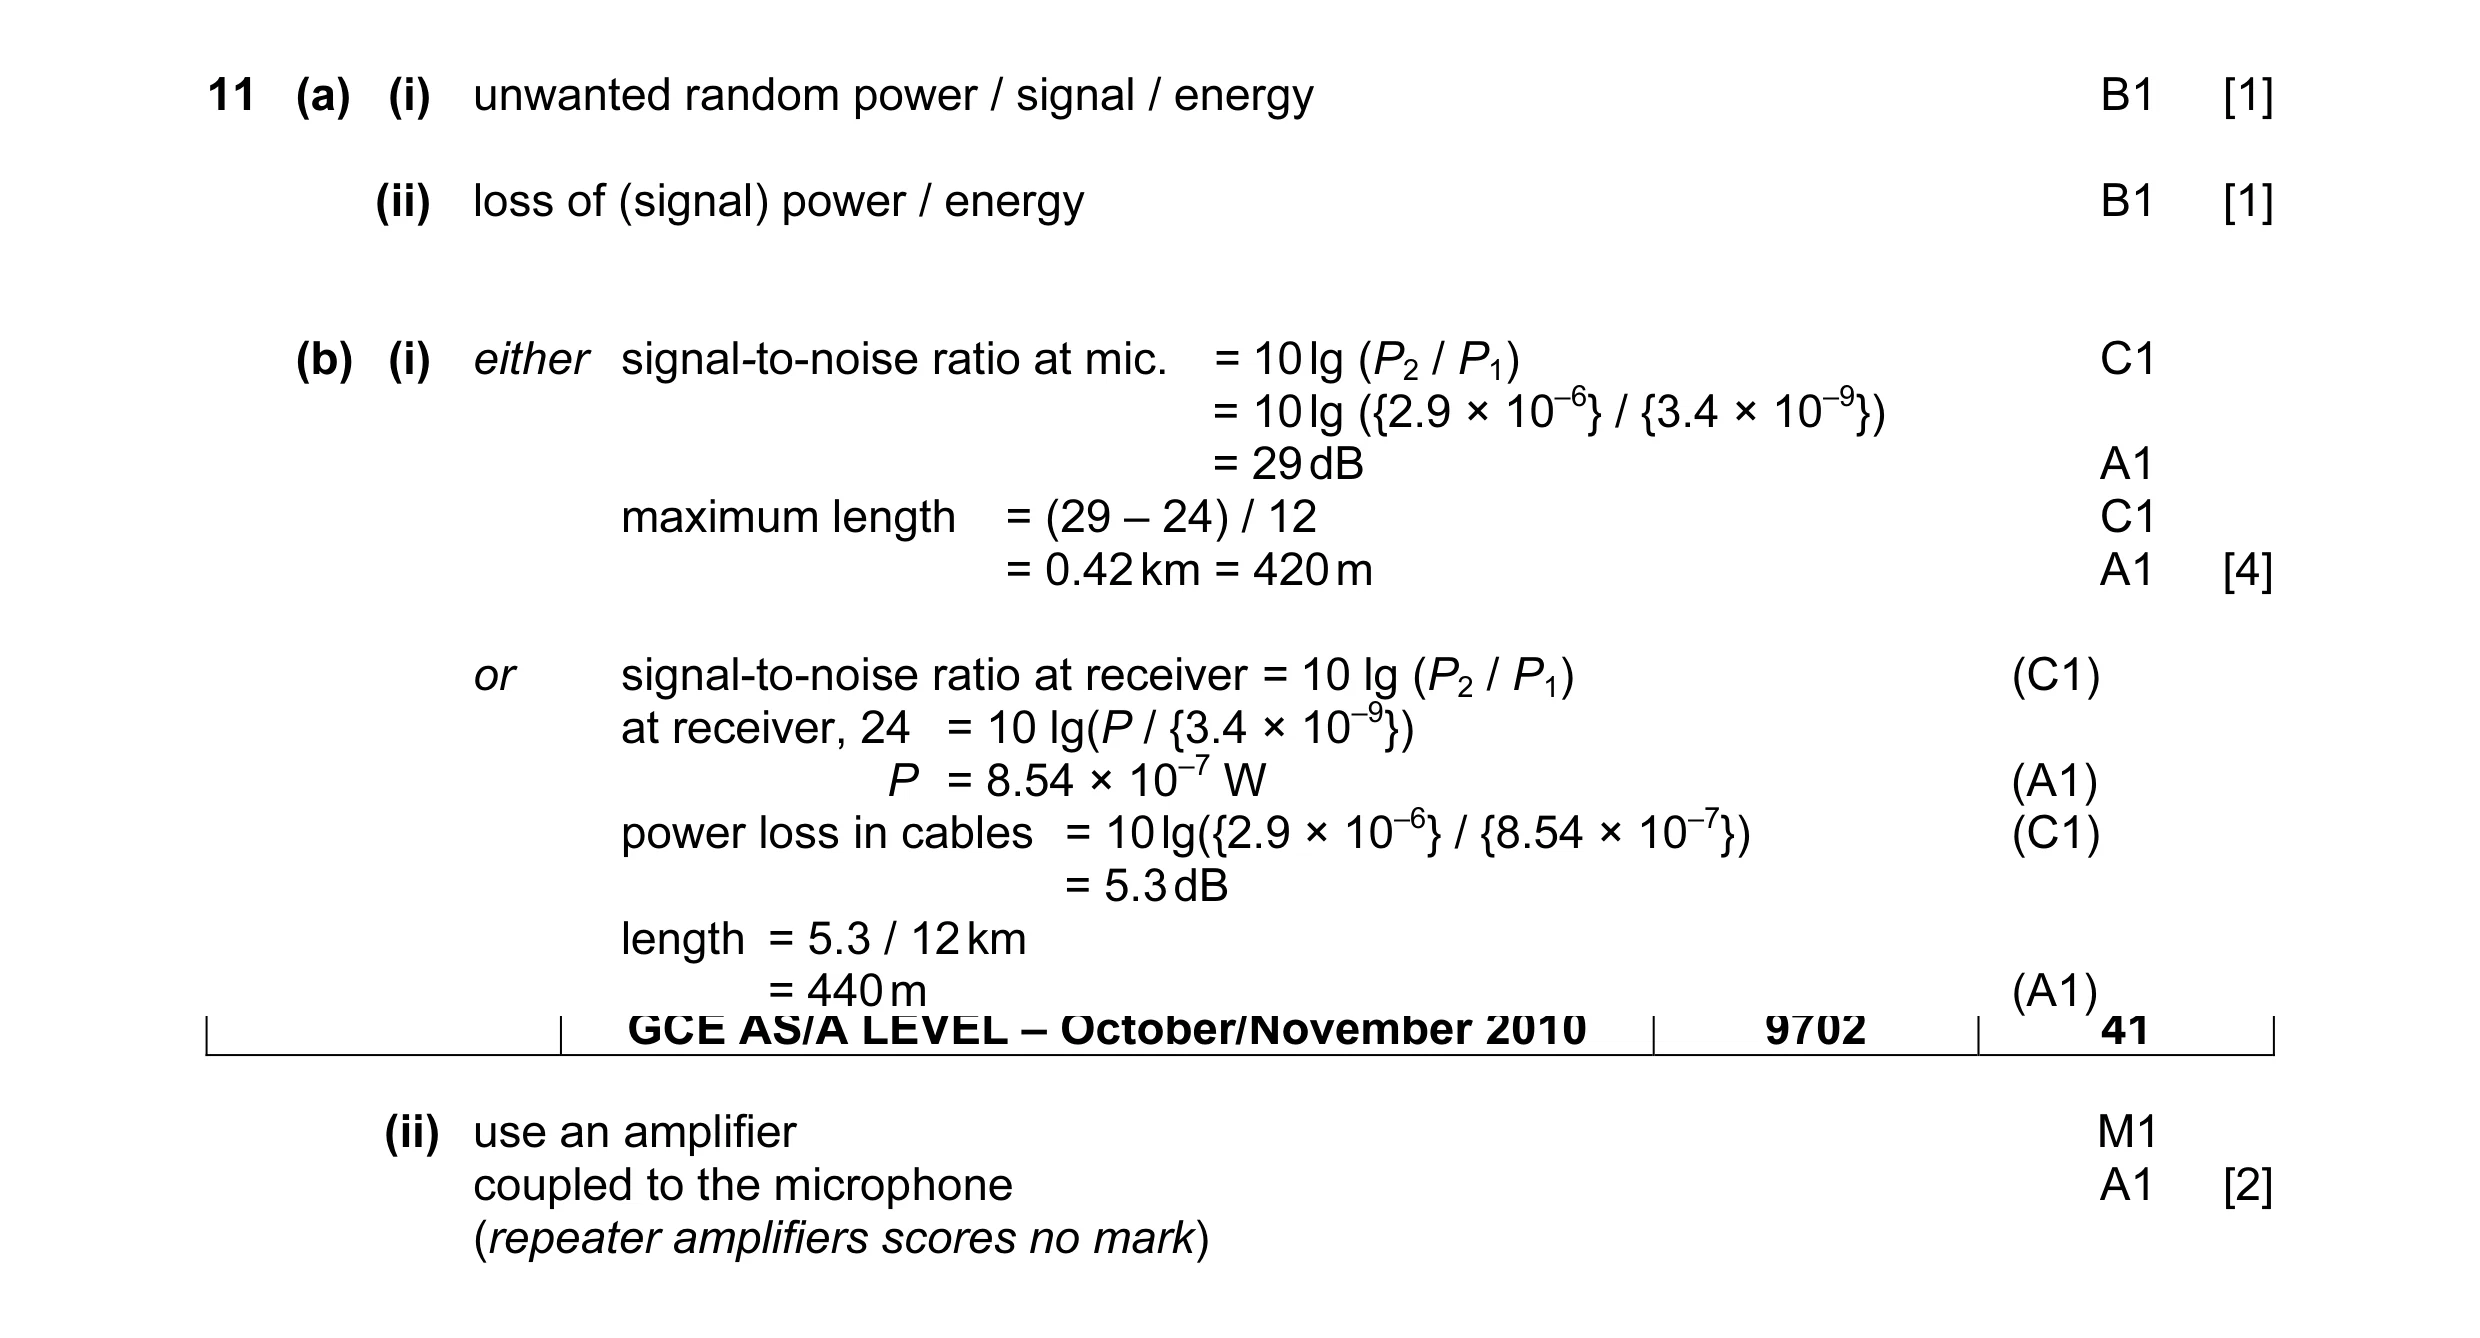 8
8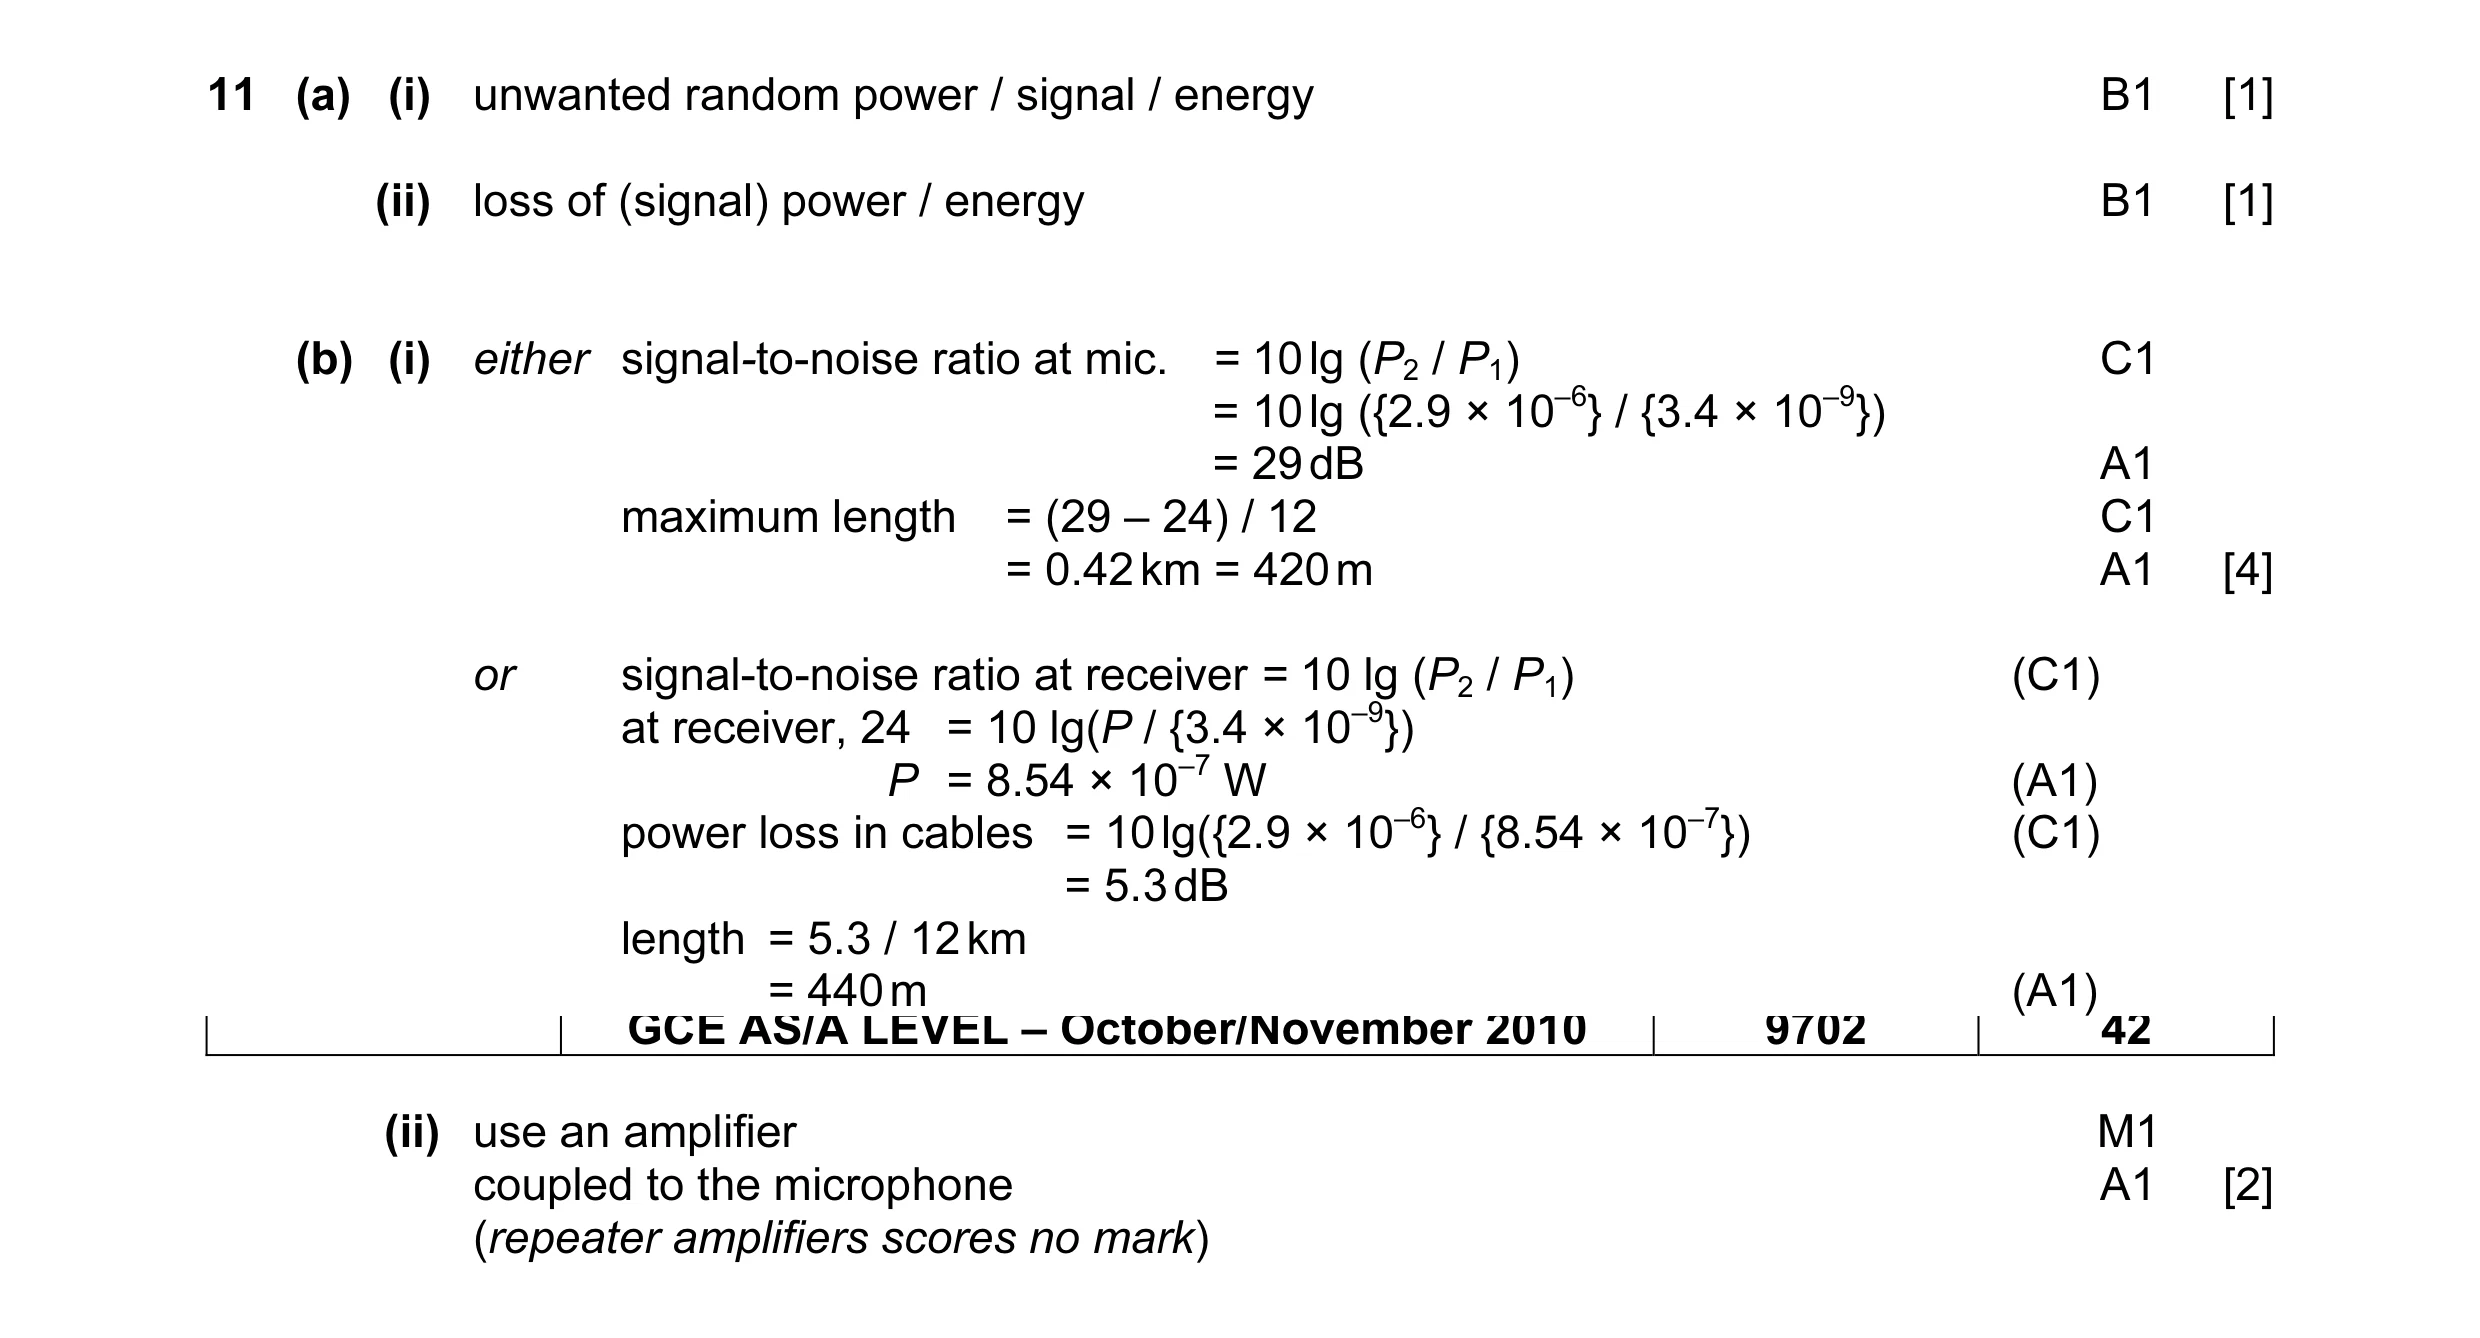 8
8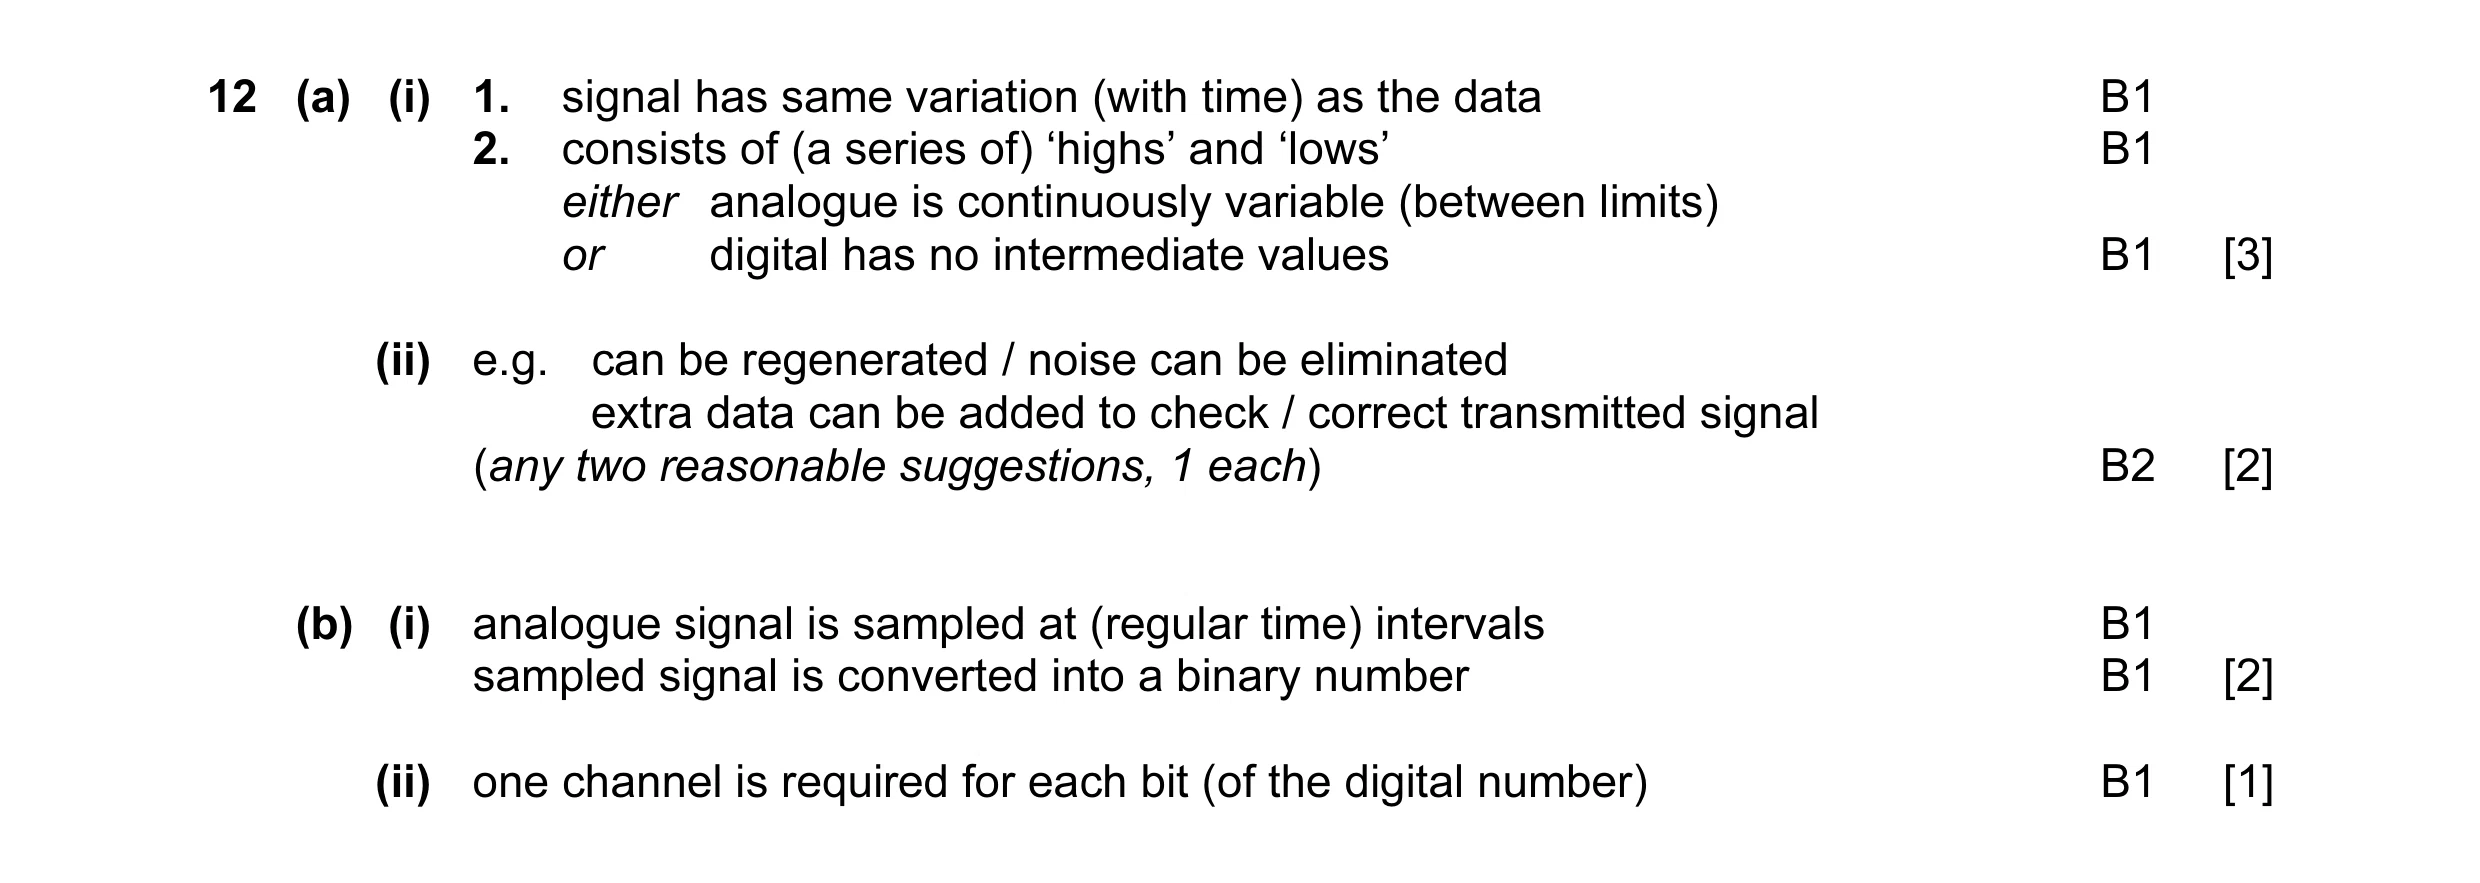 8
8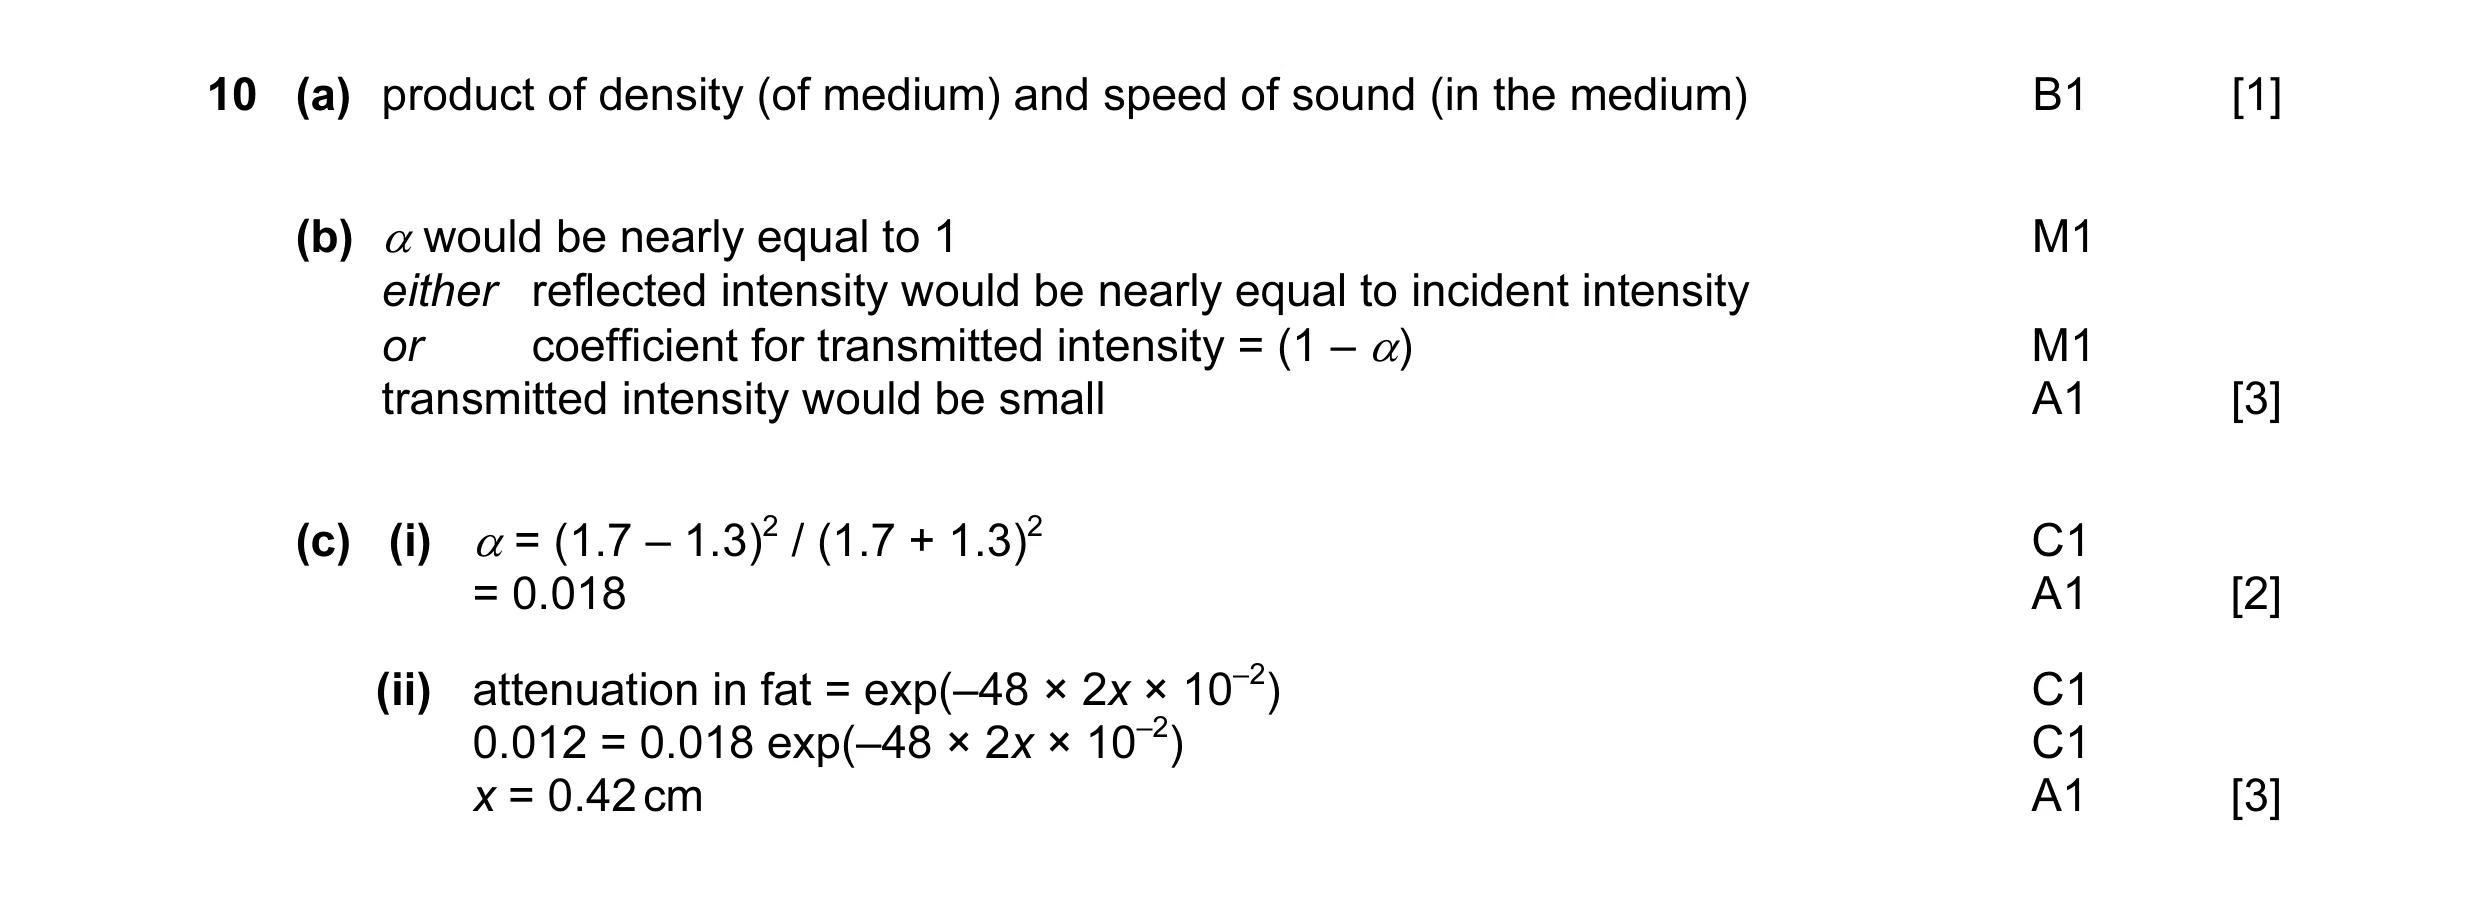 9
9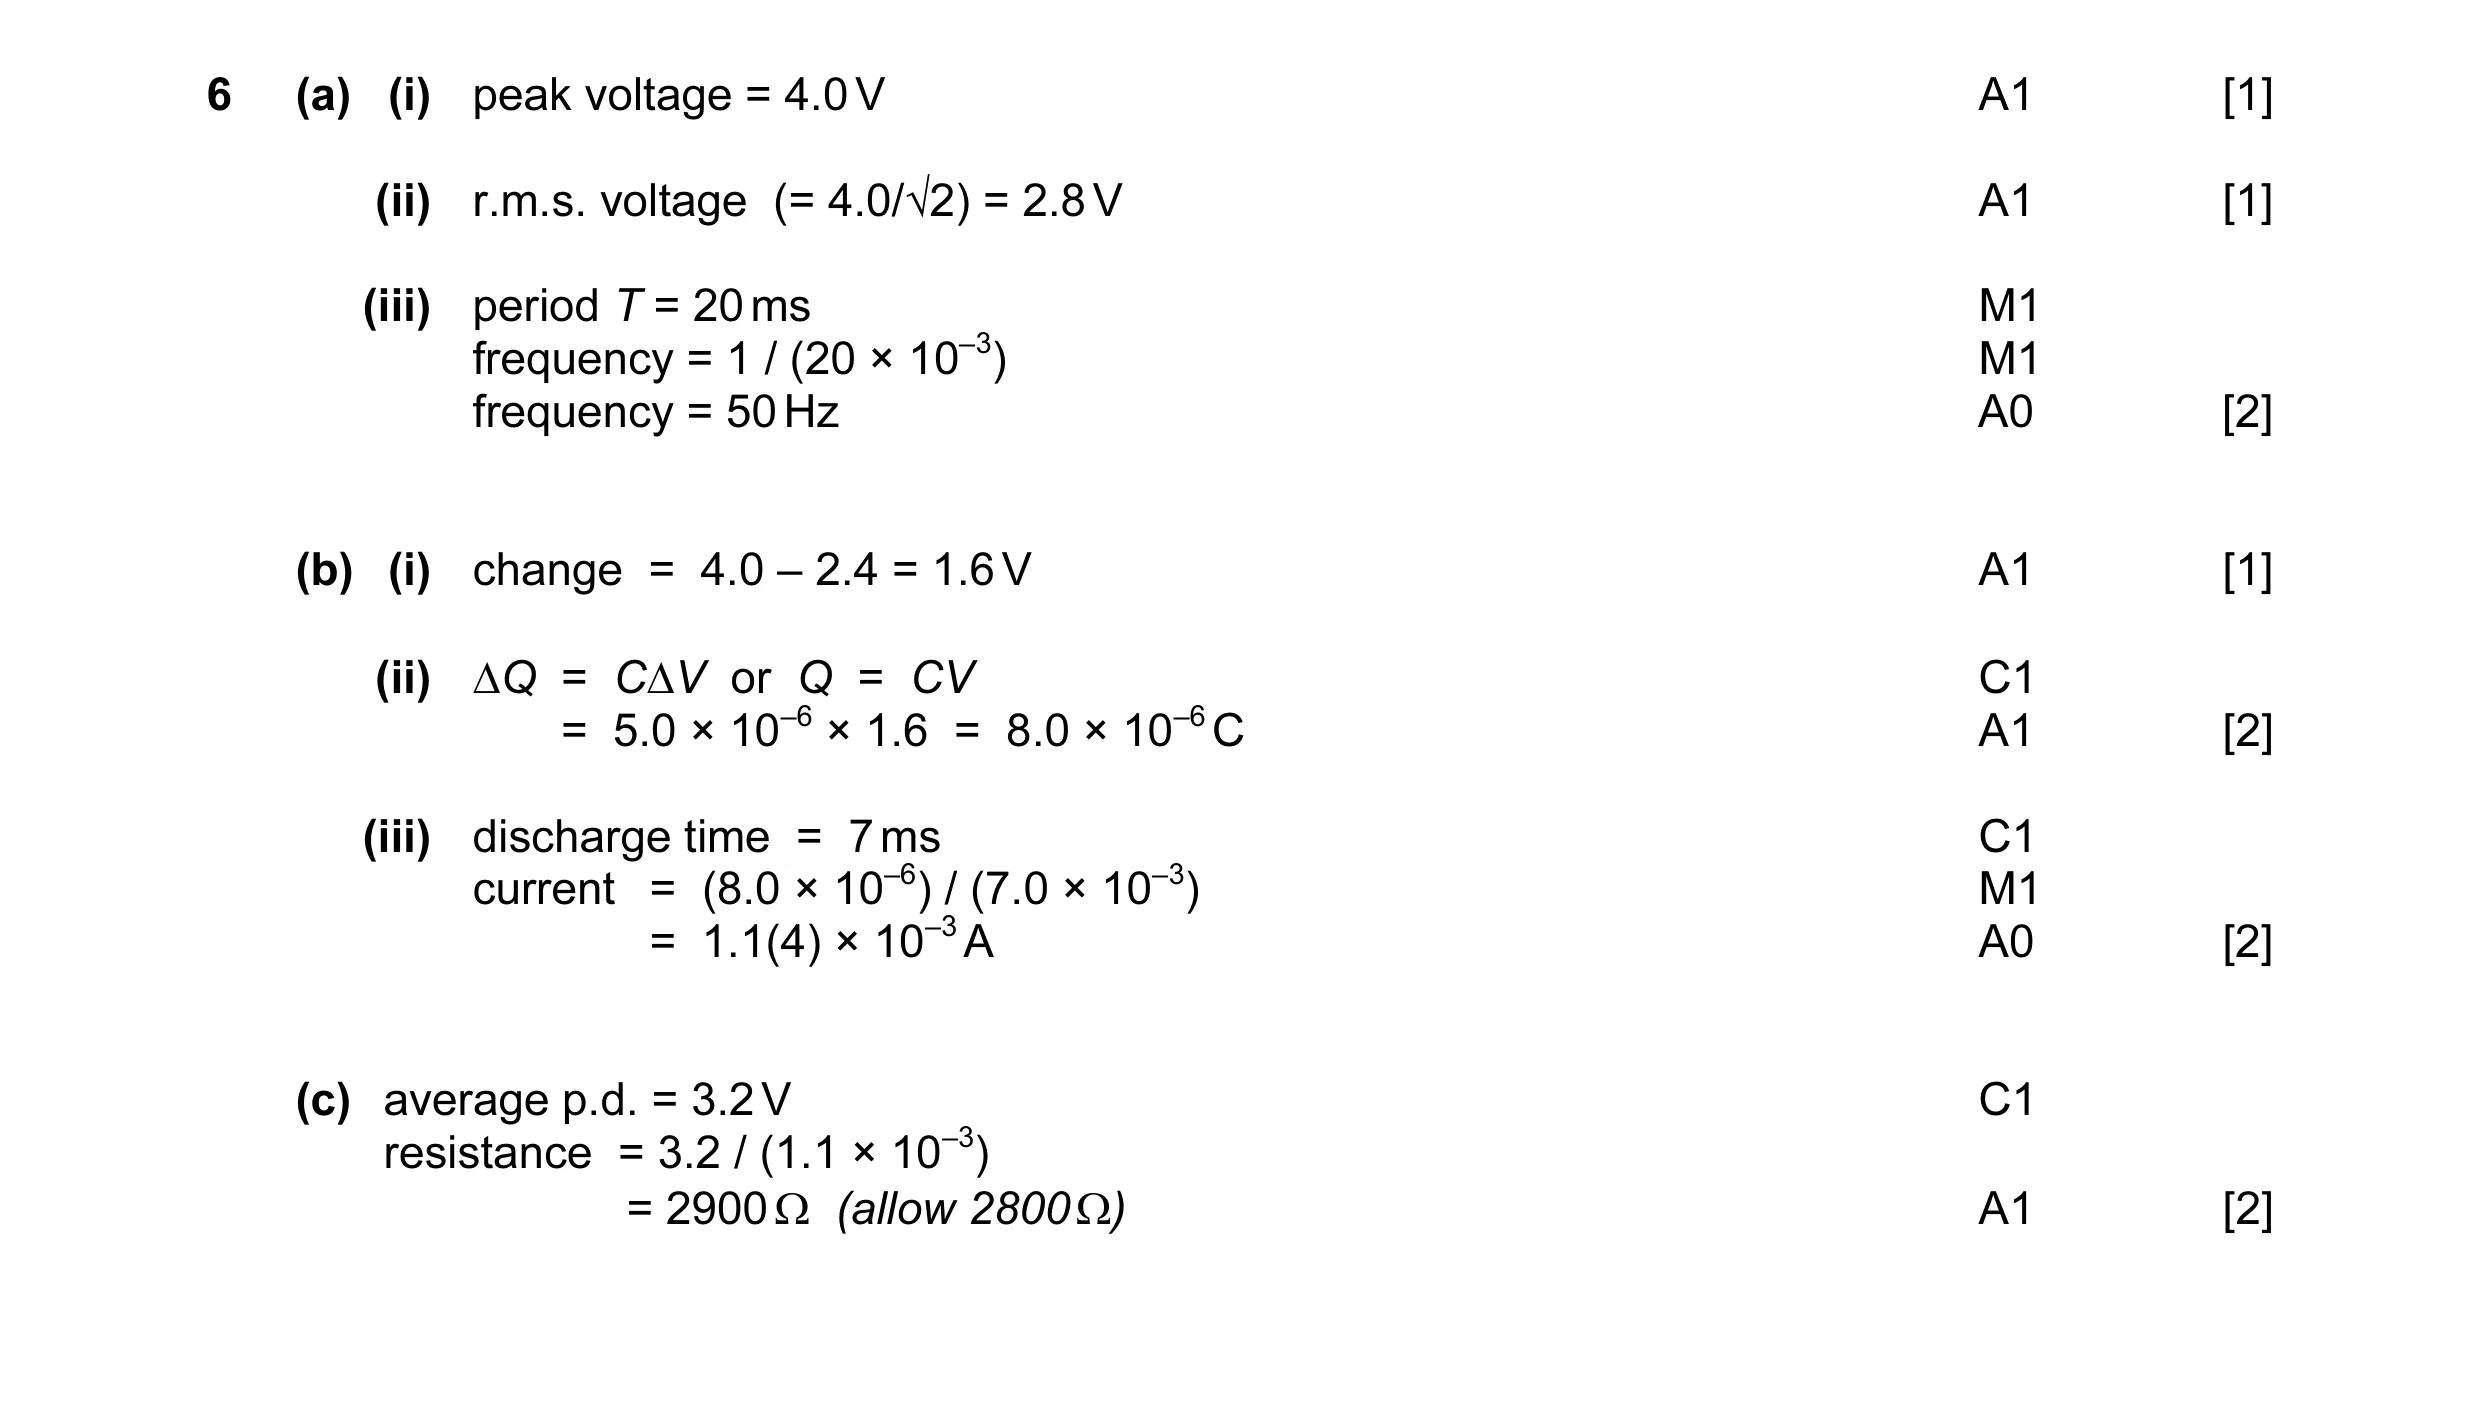 11
11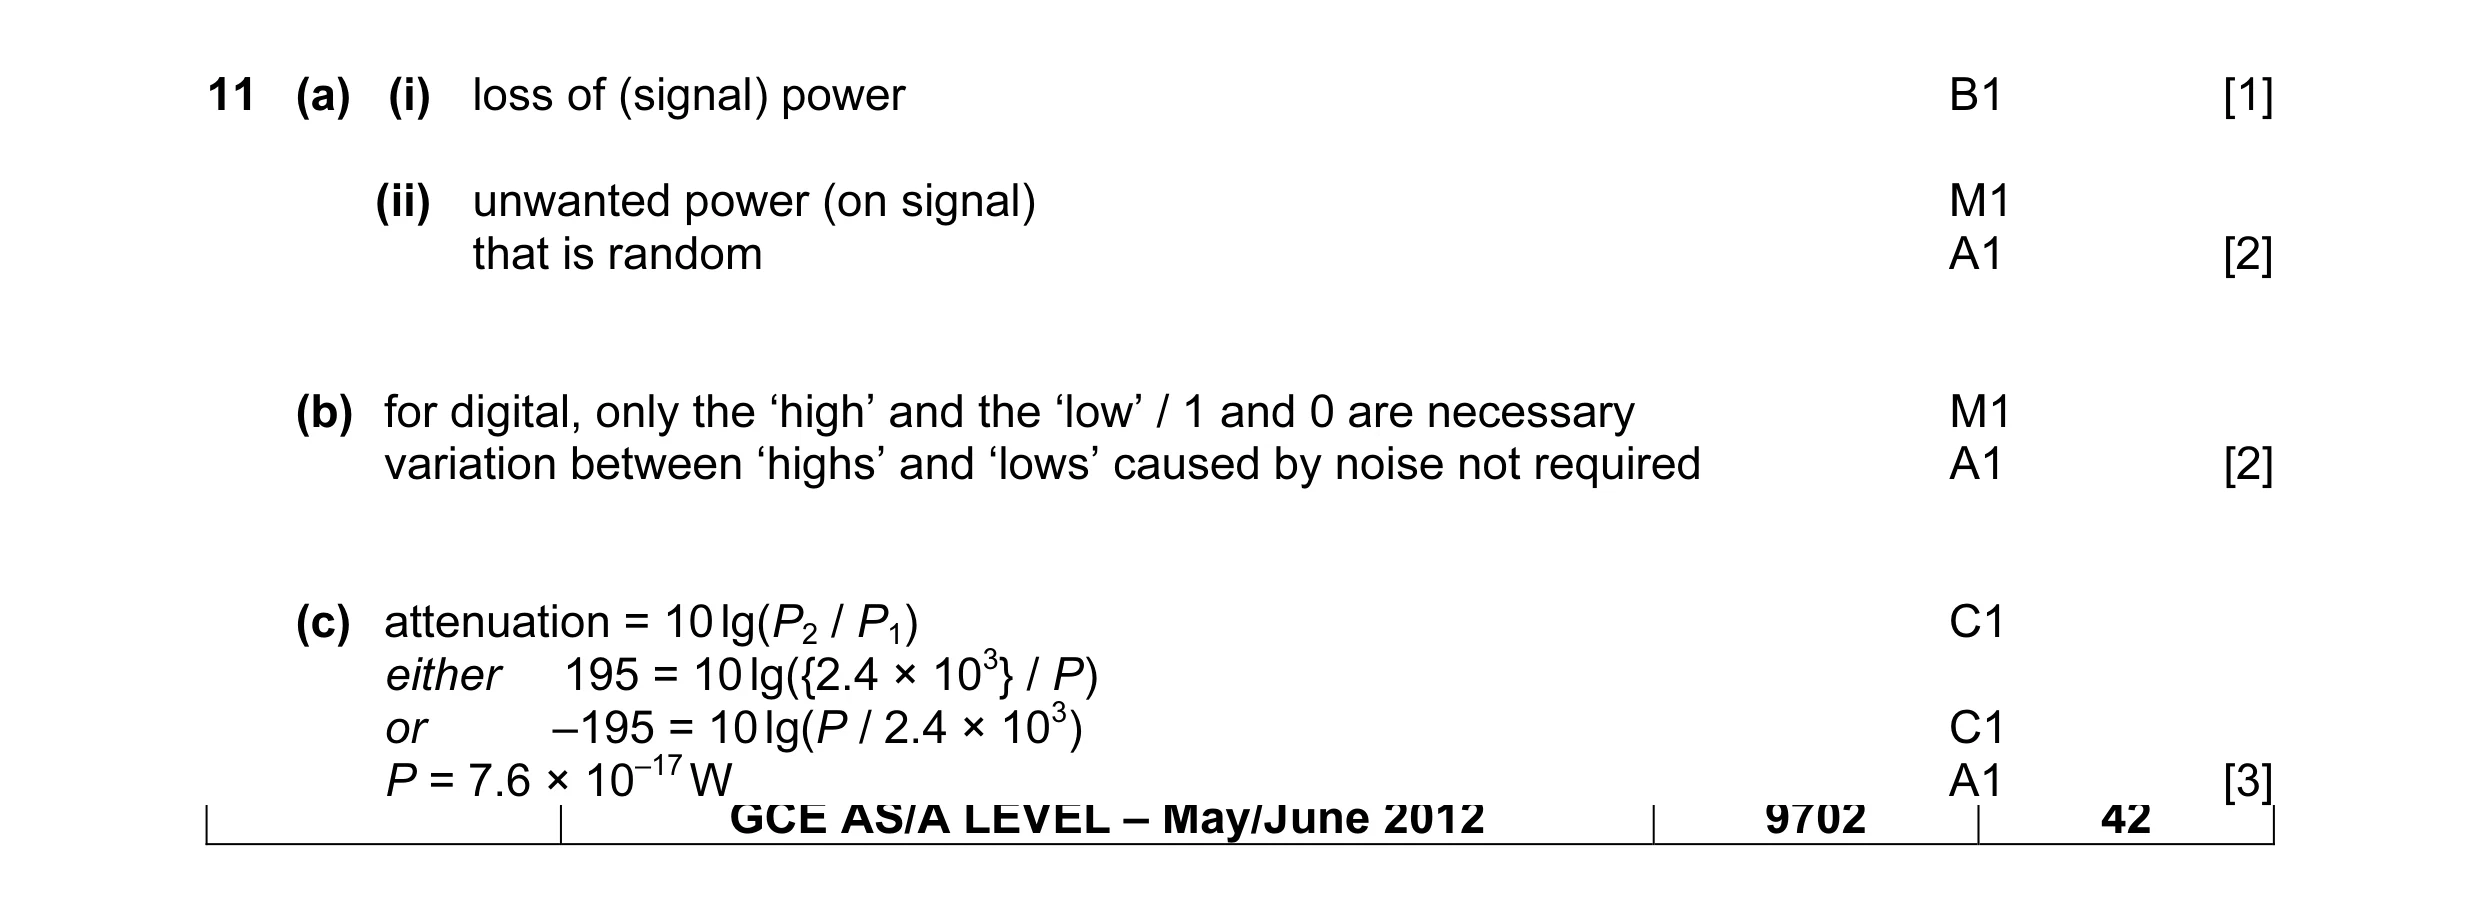 8
8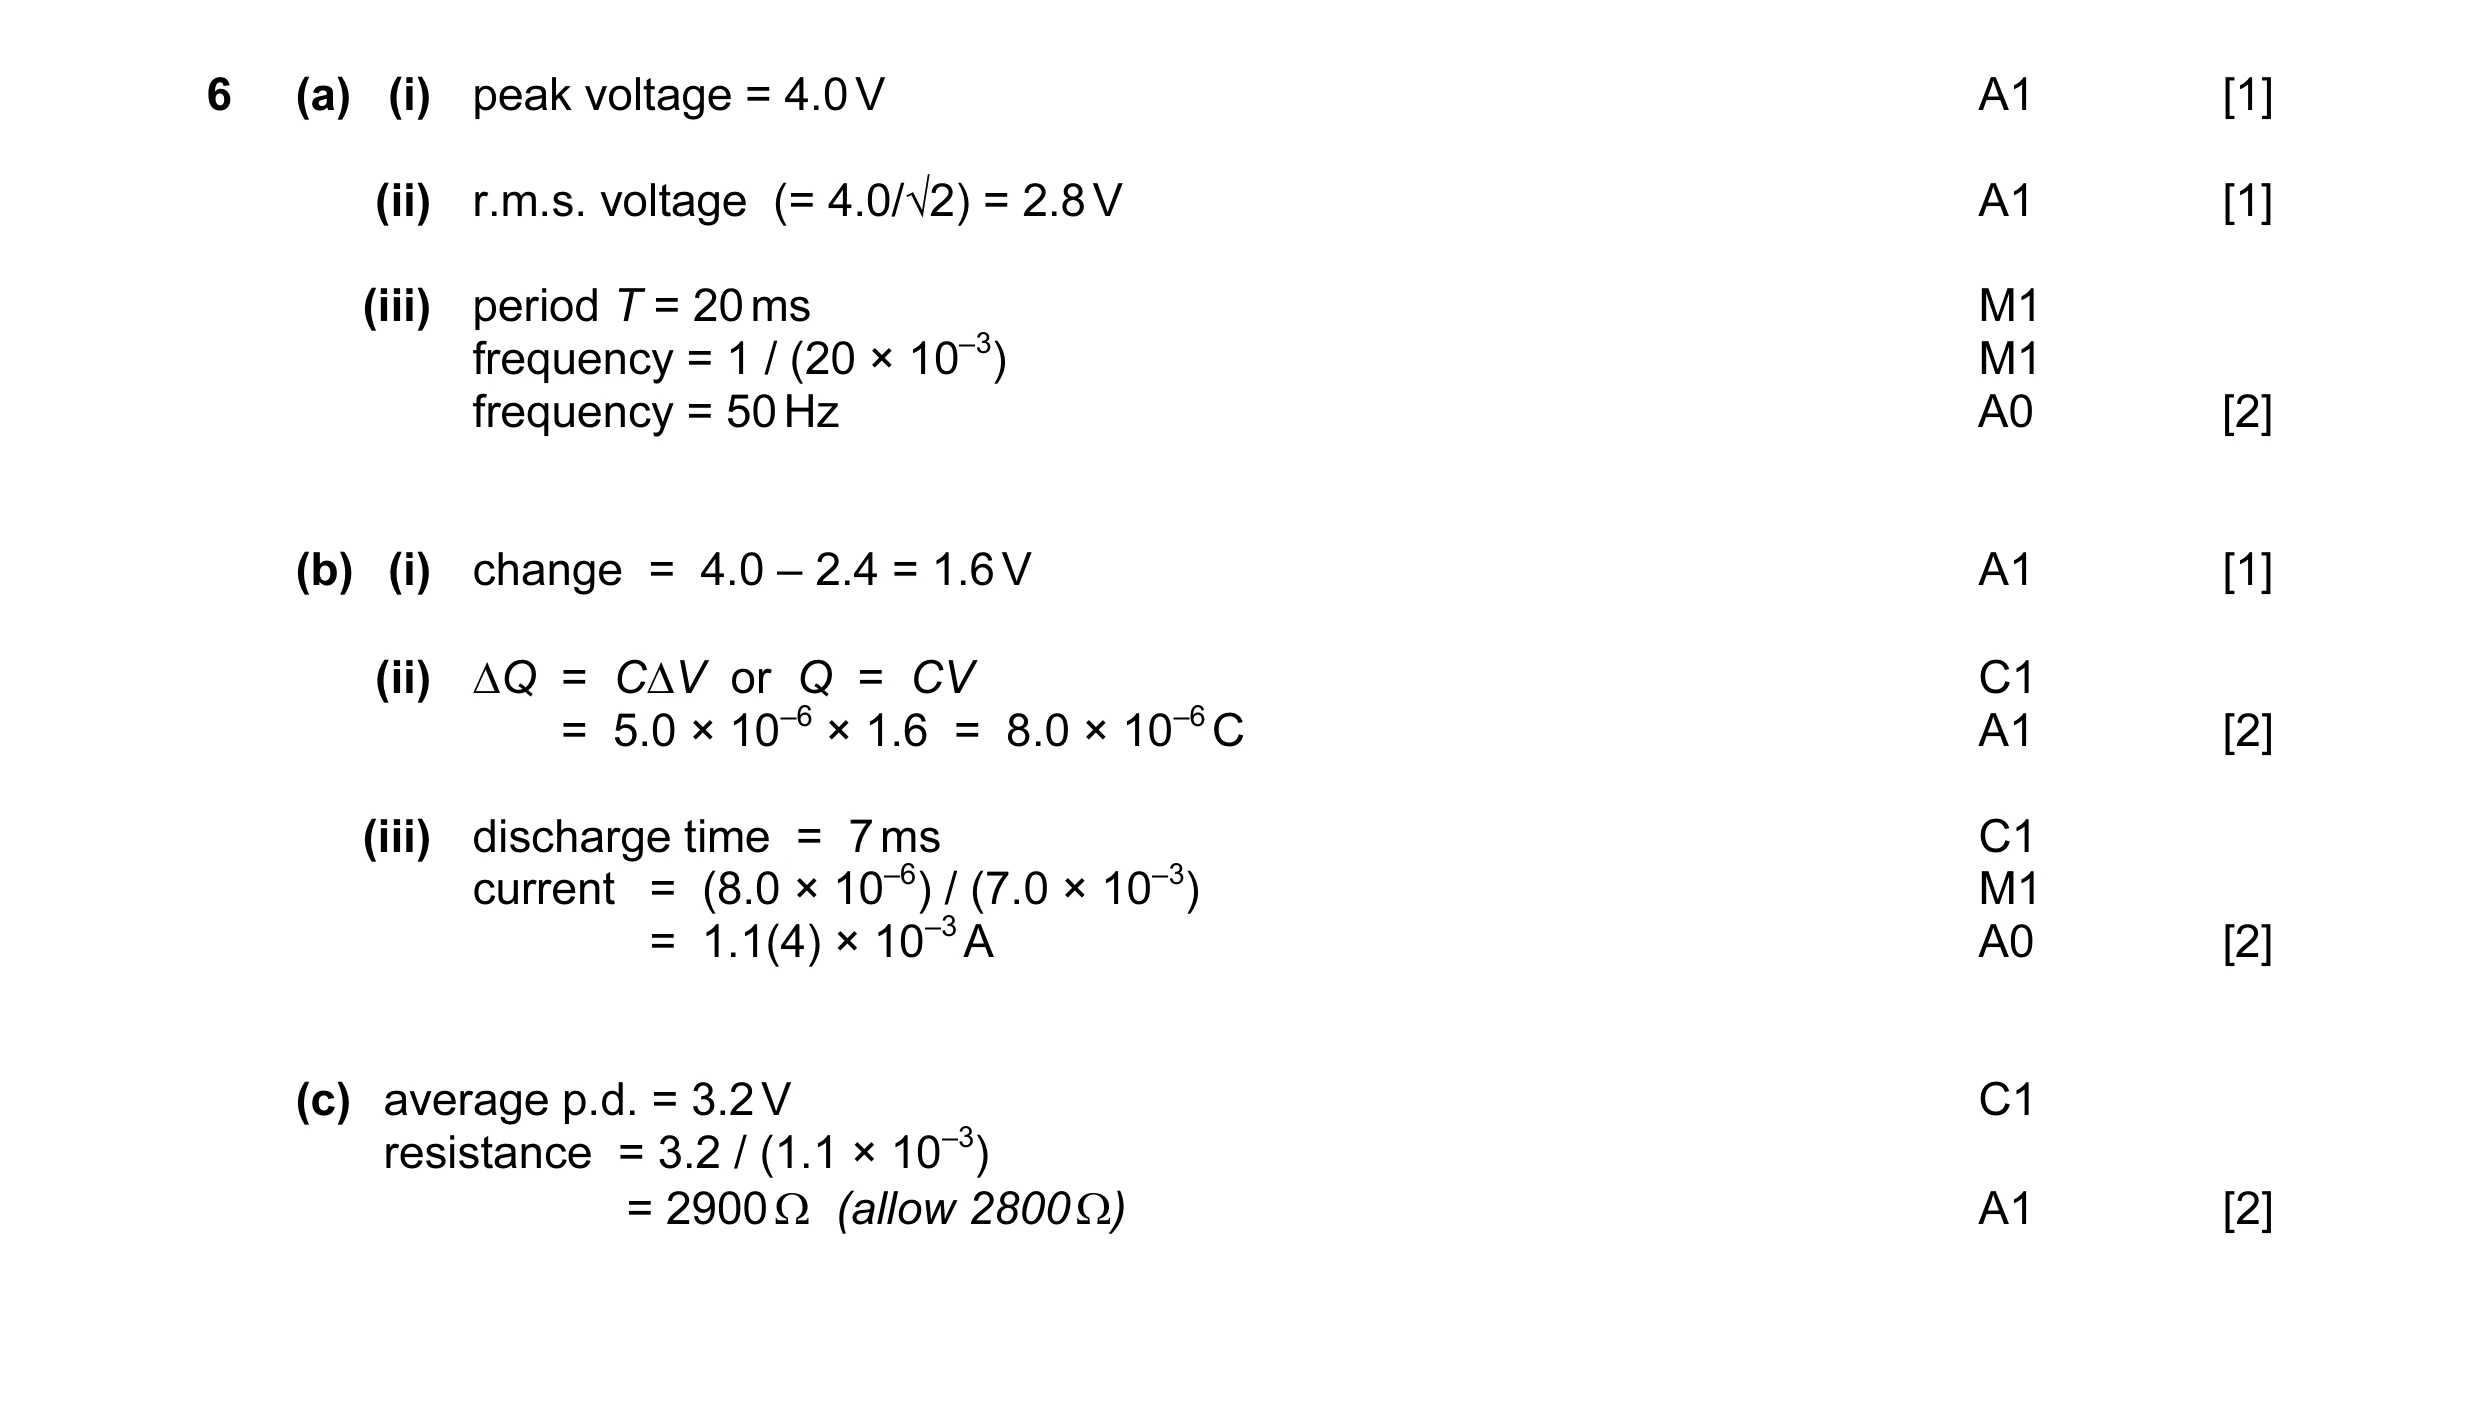 11
11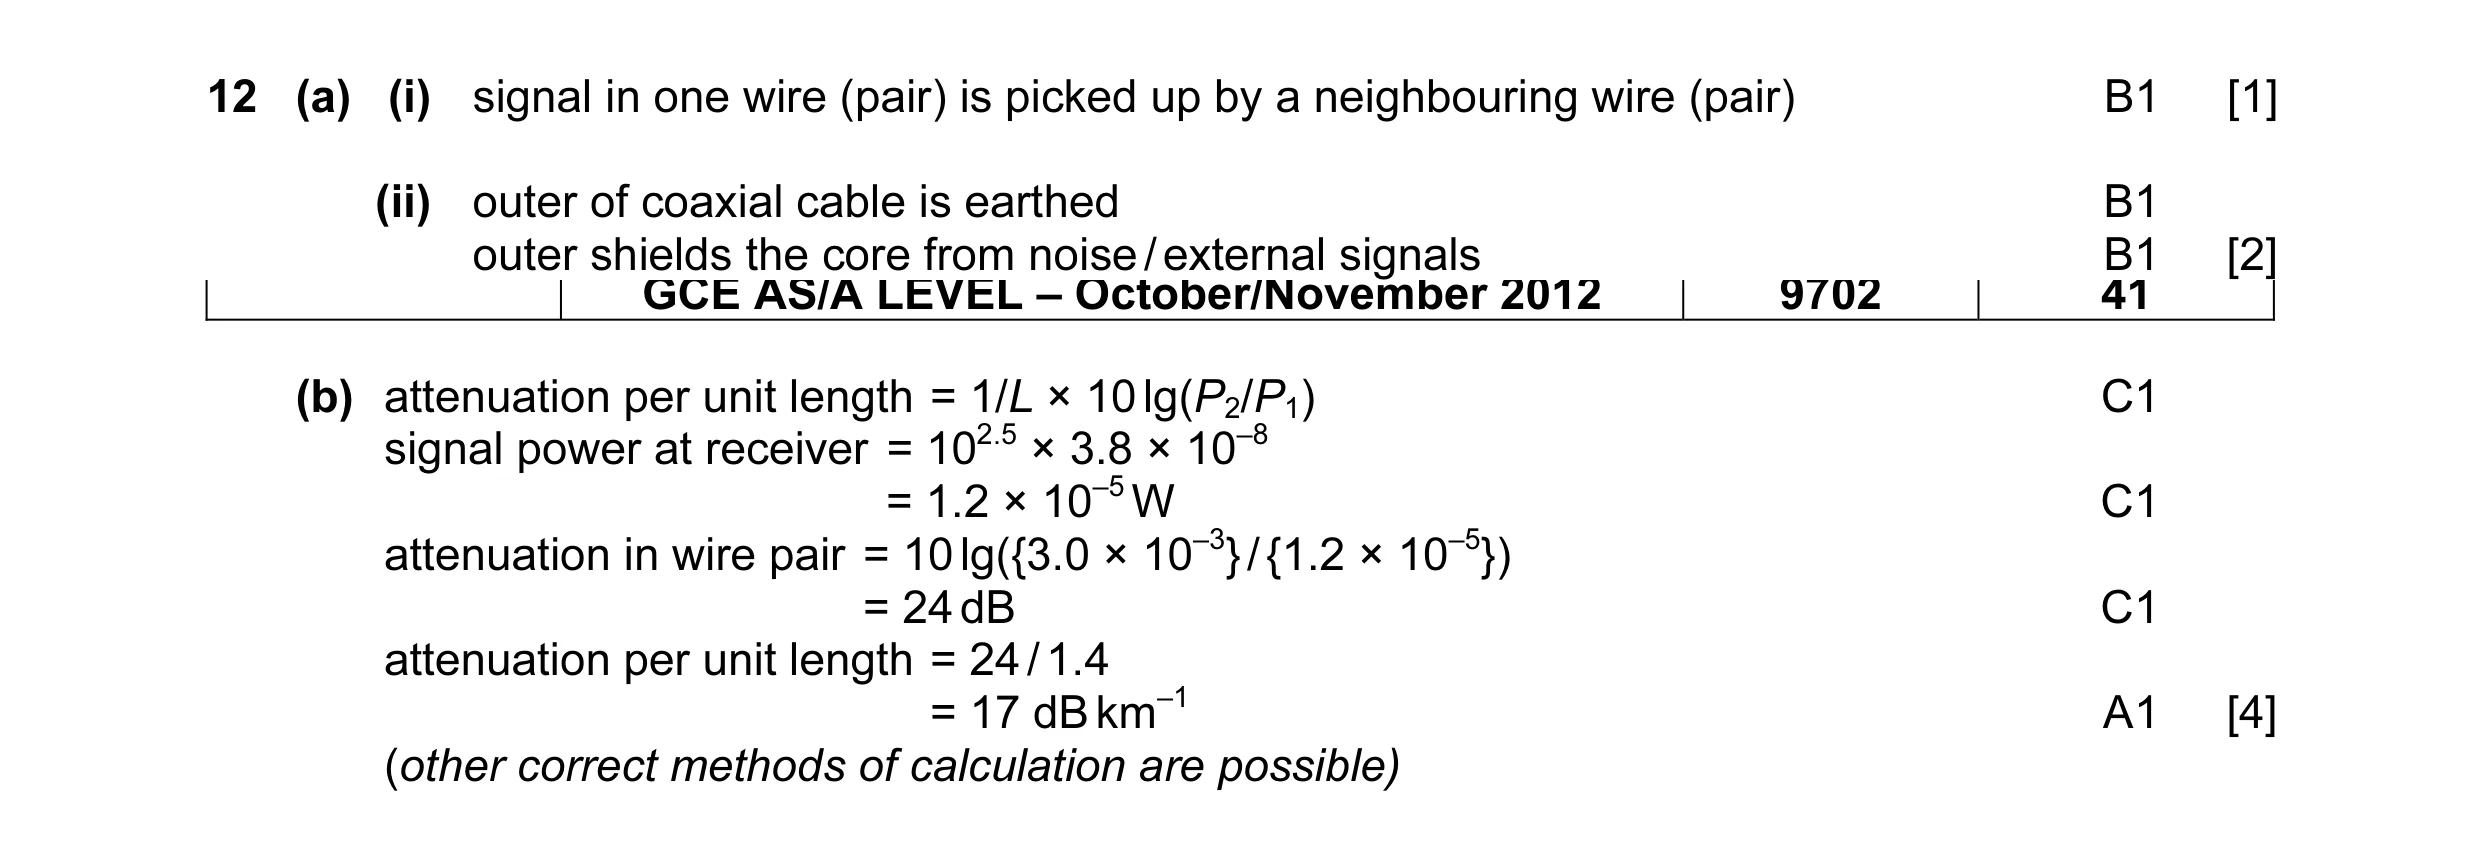 7
7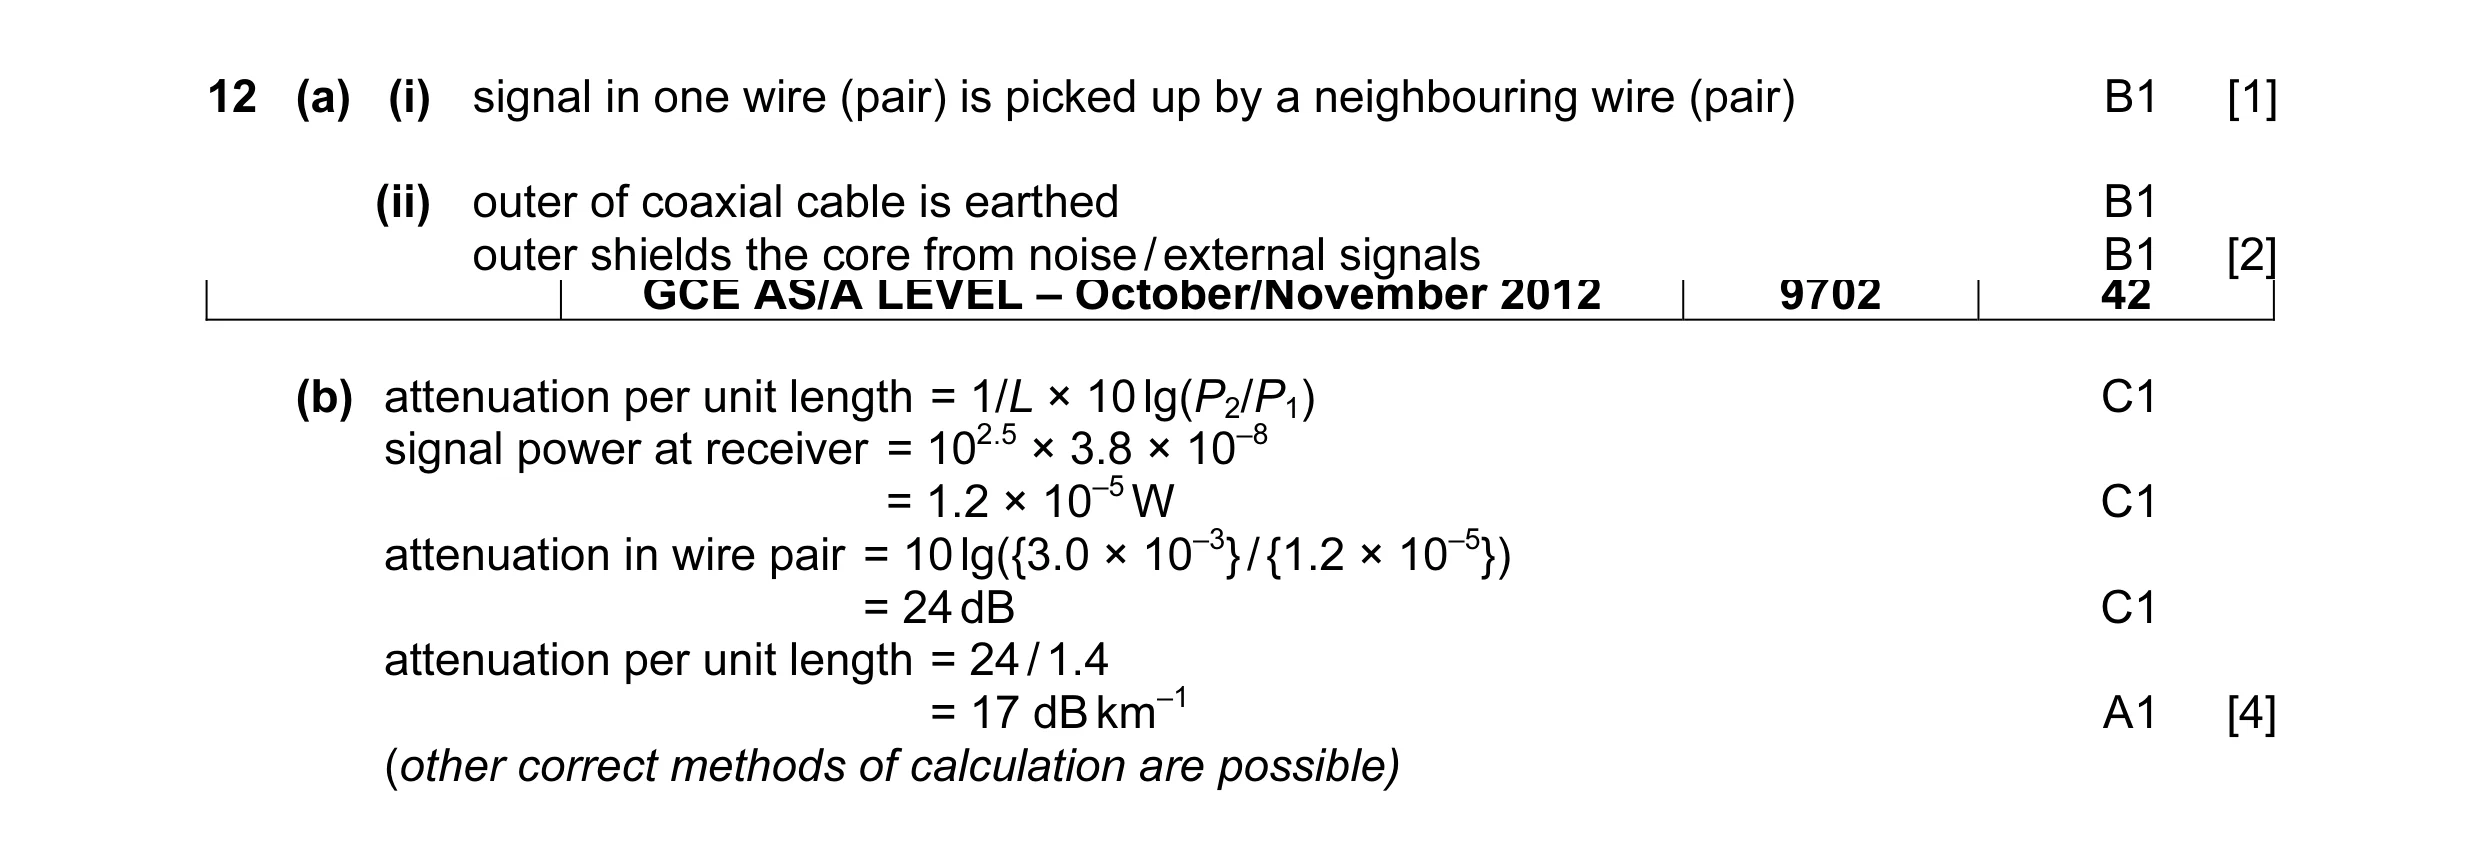 7
7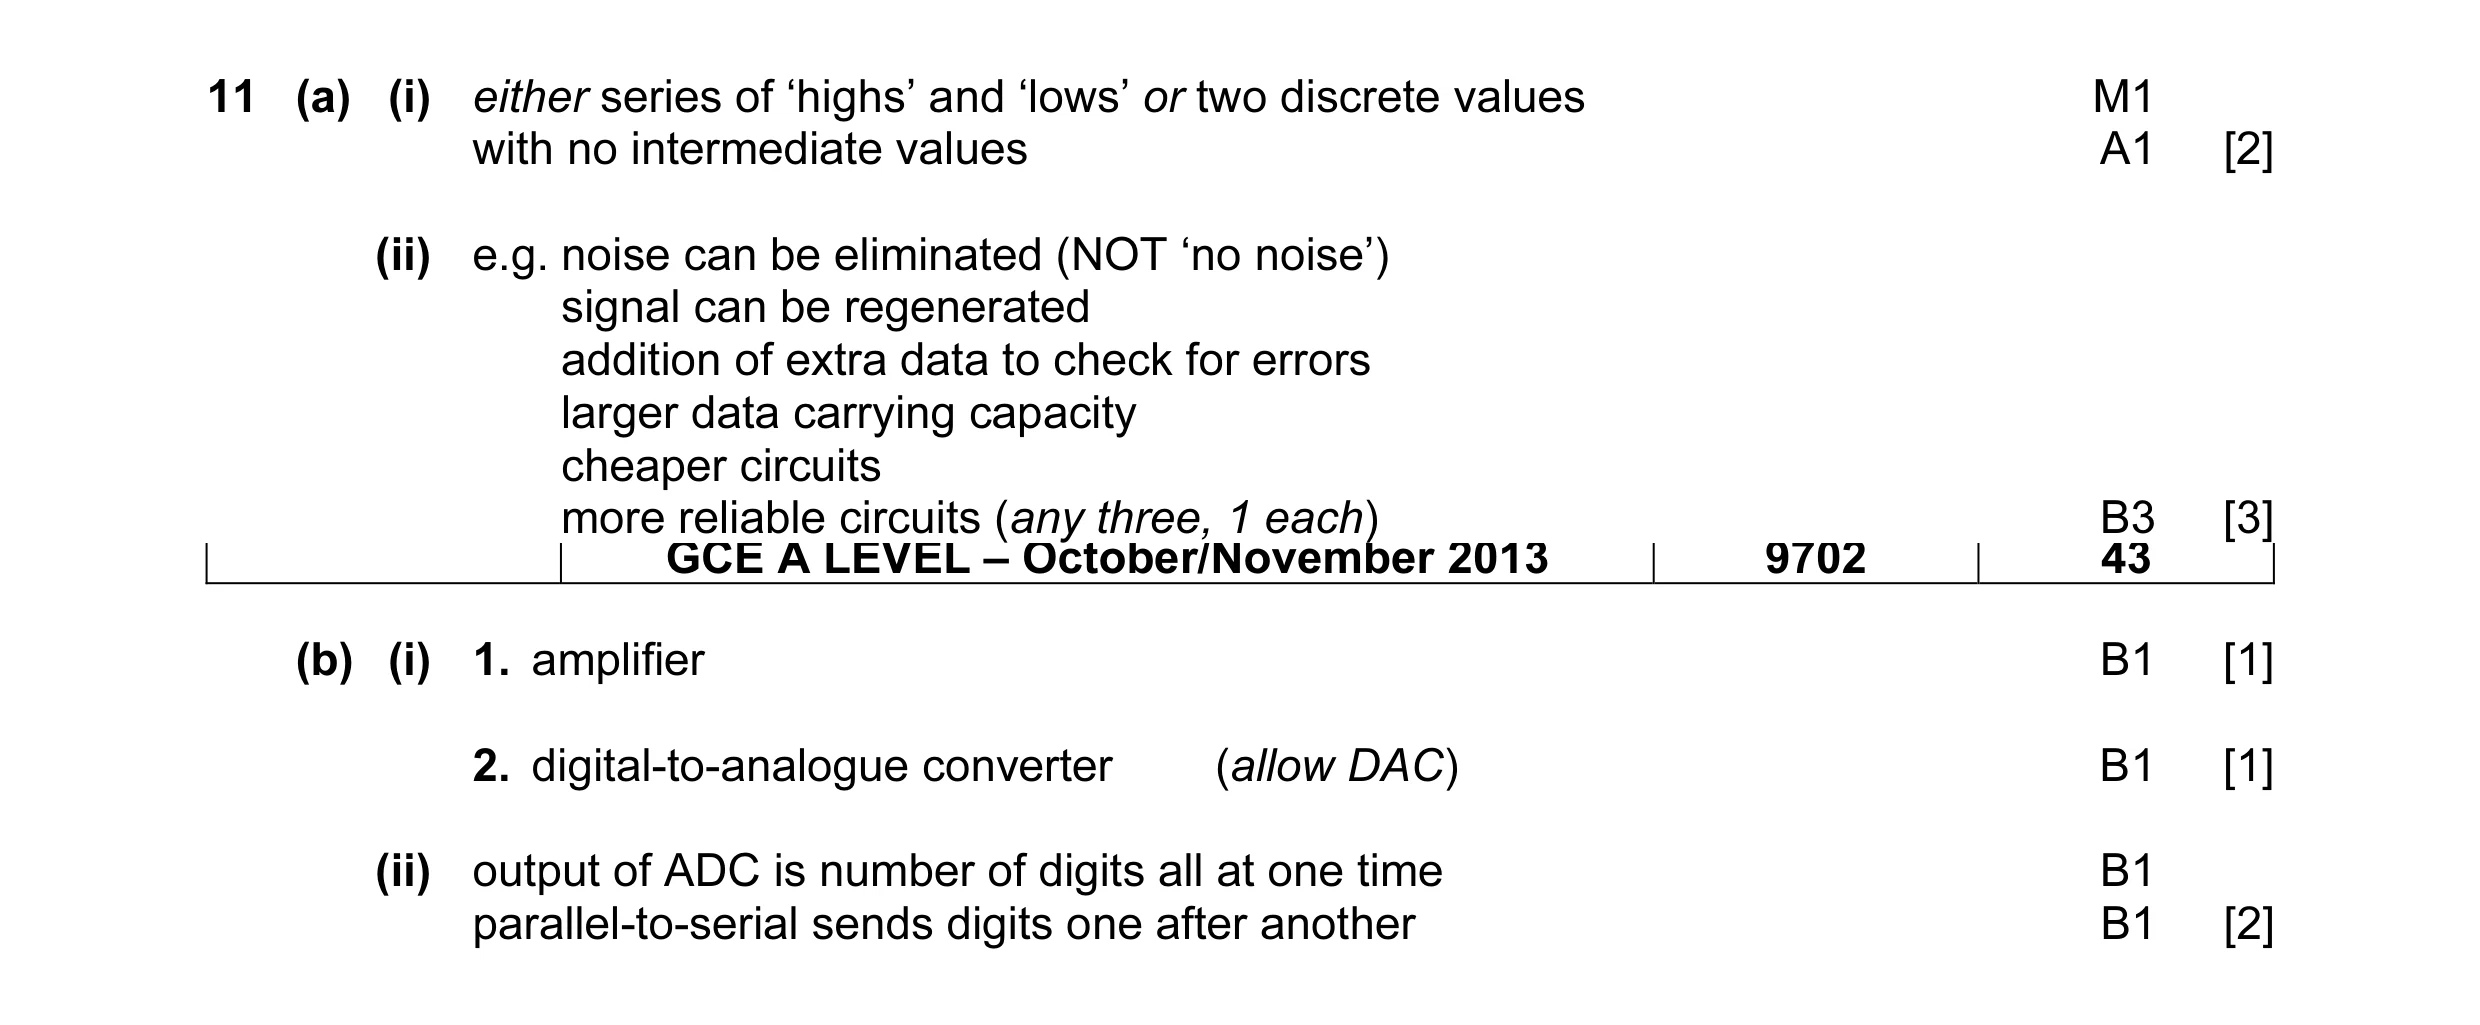 9
9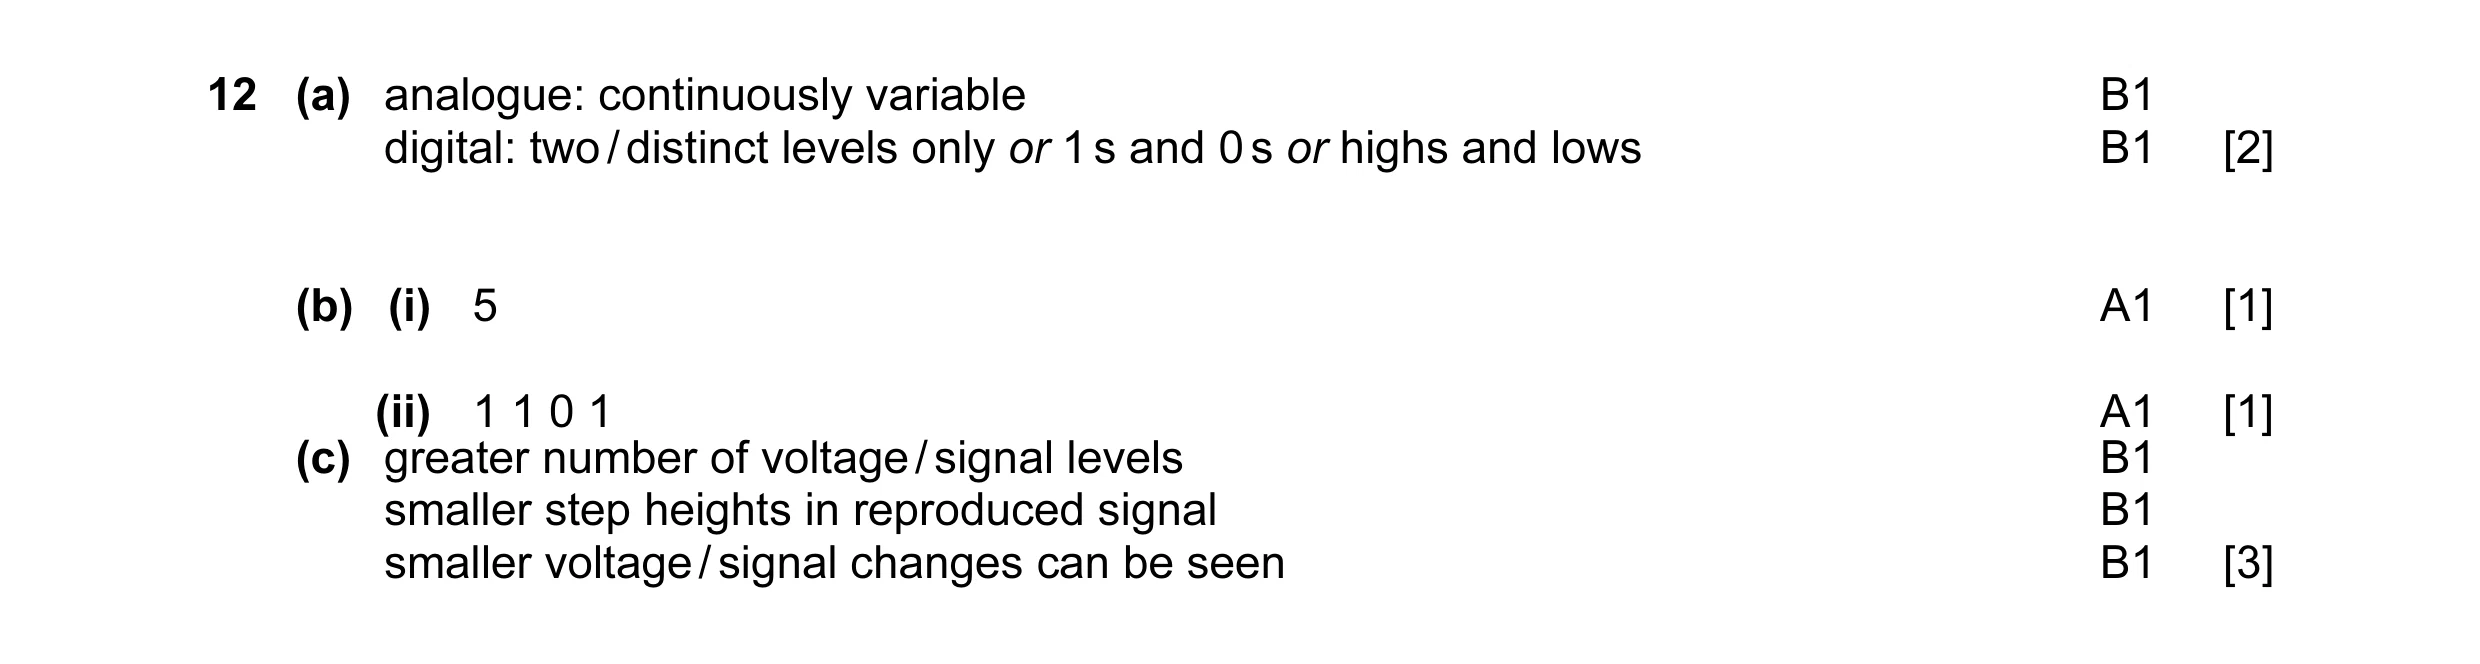 7
7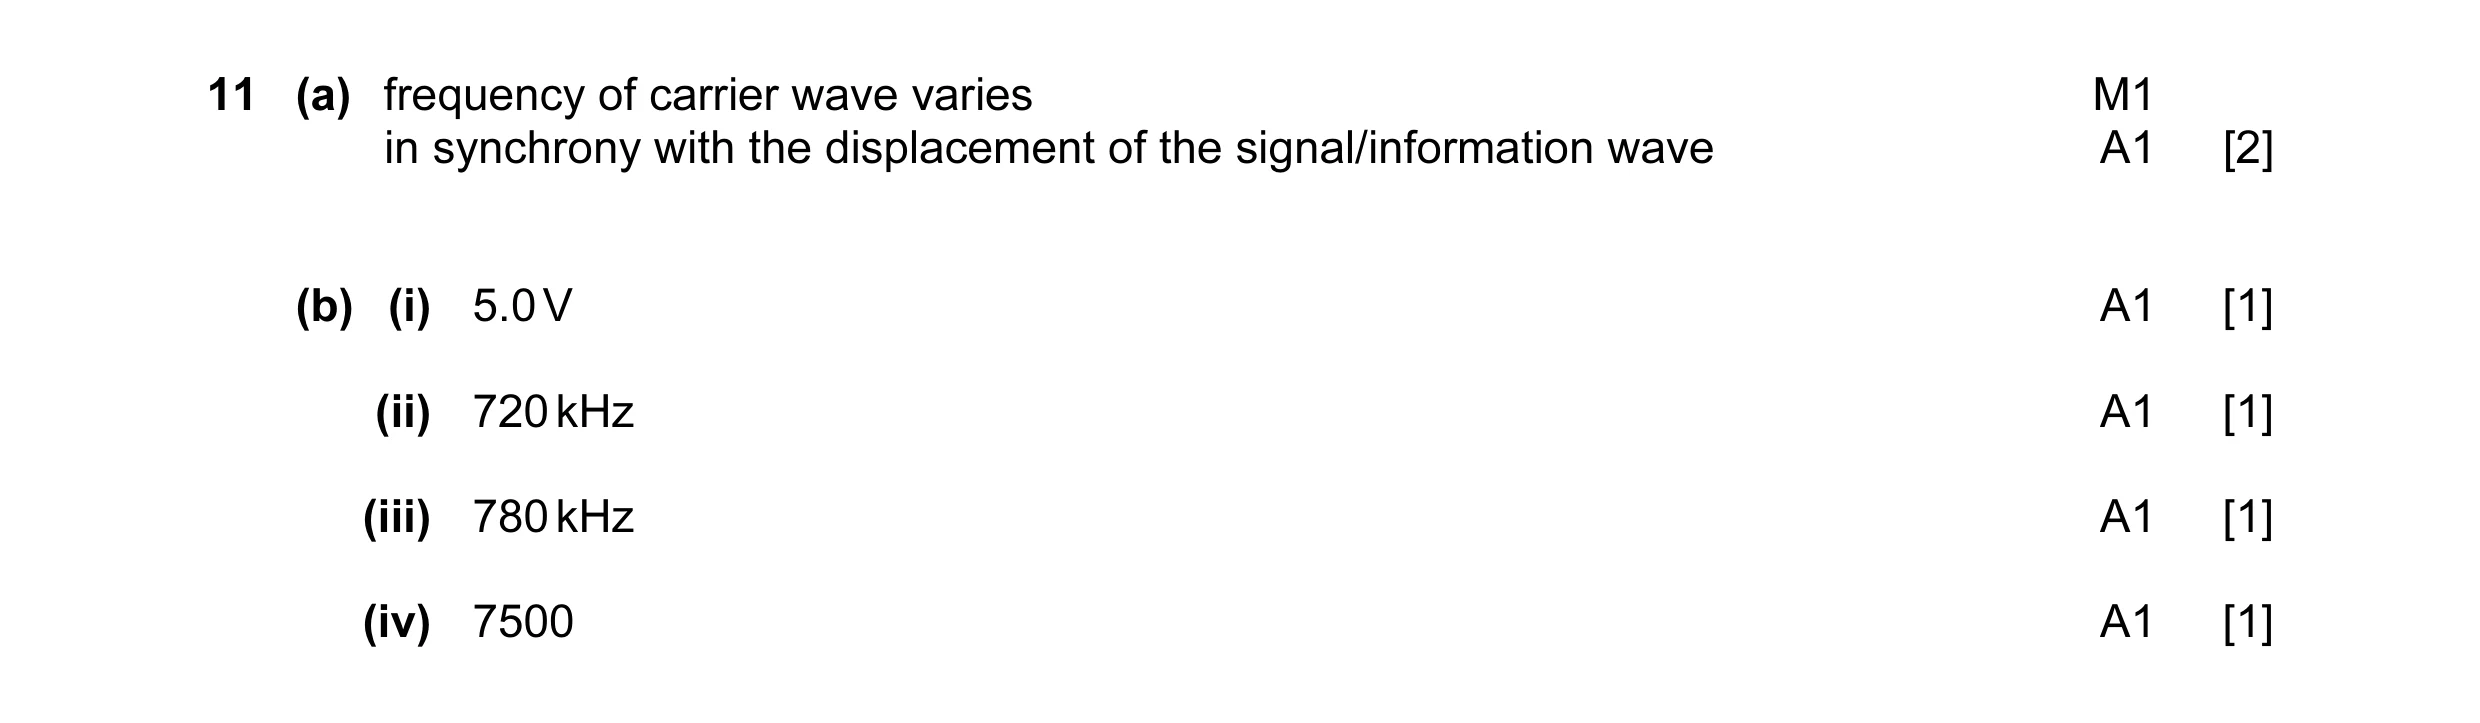 6
6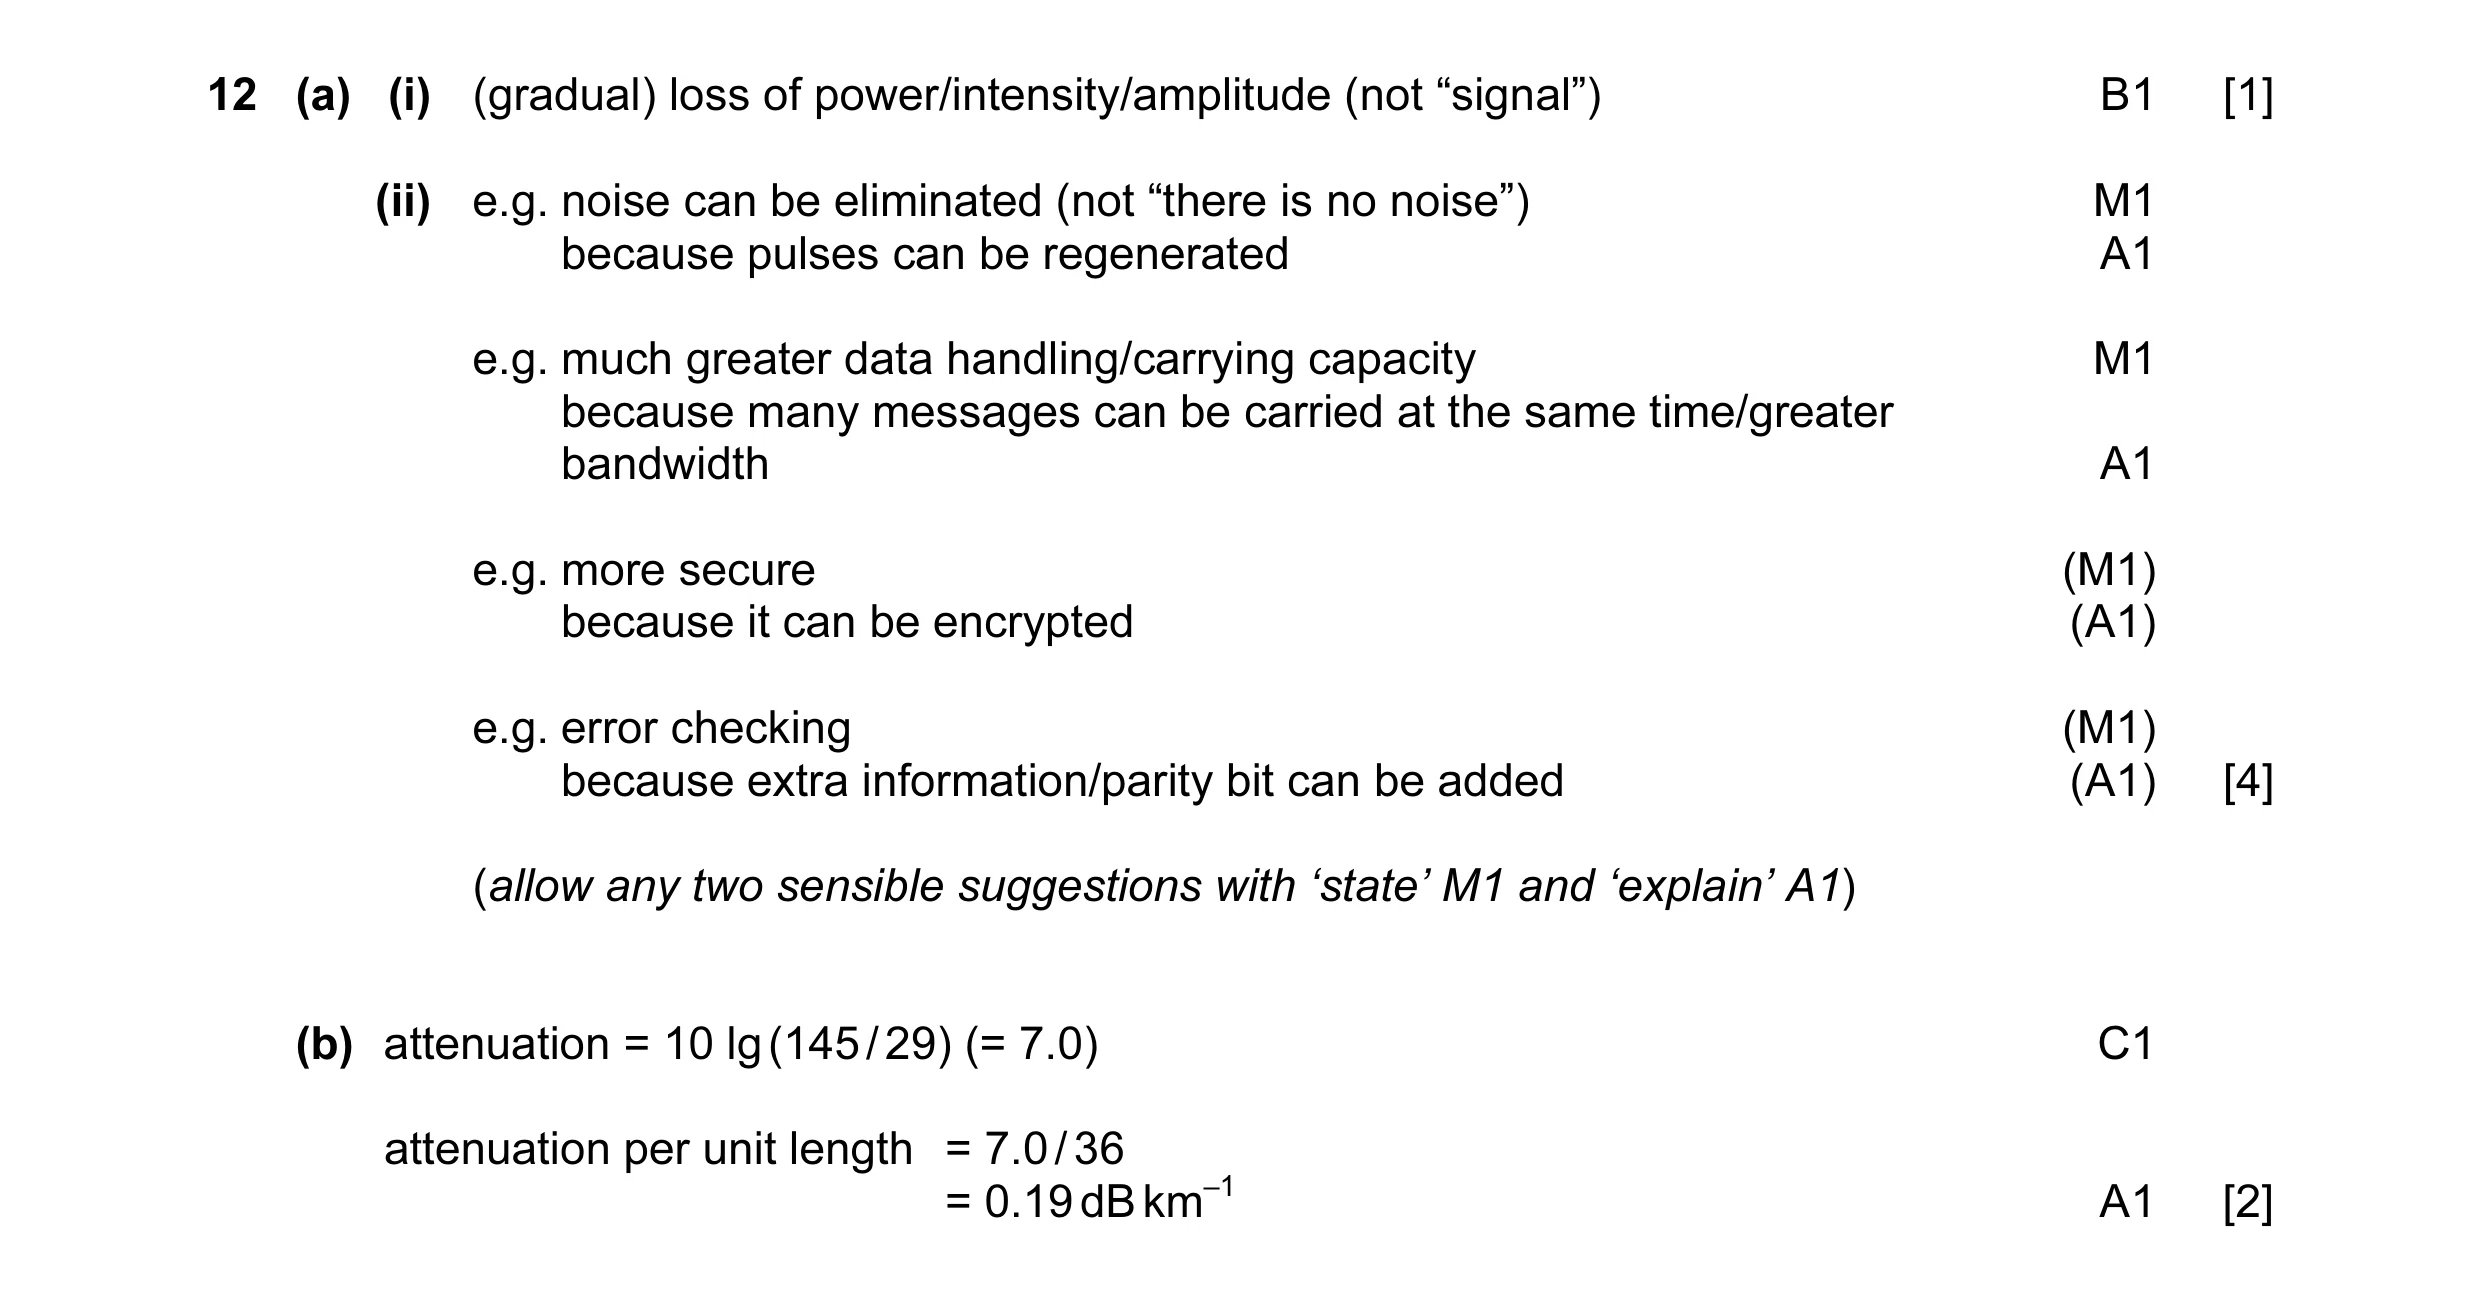 7
7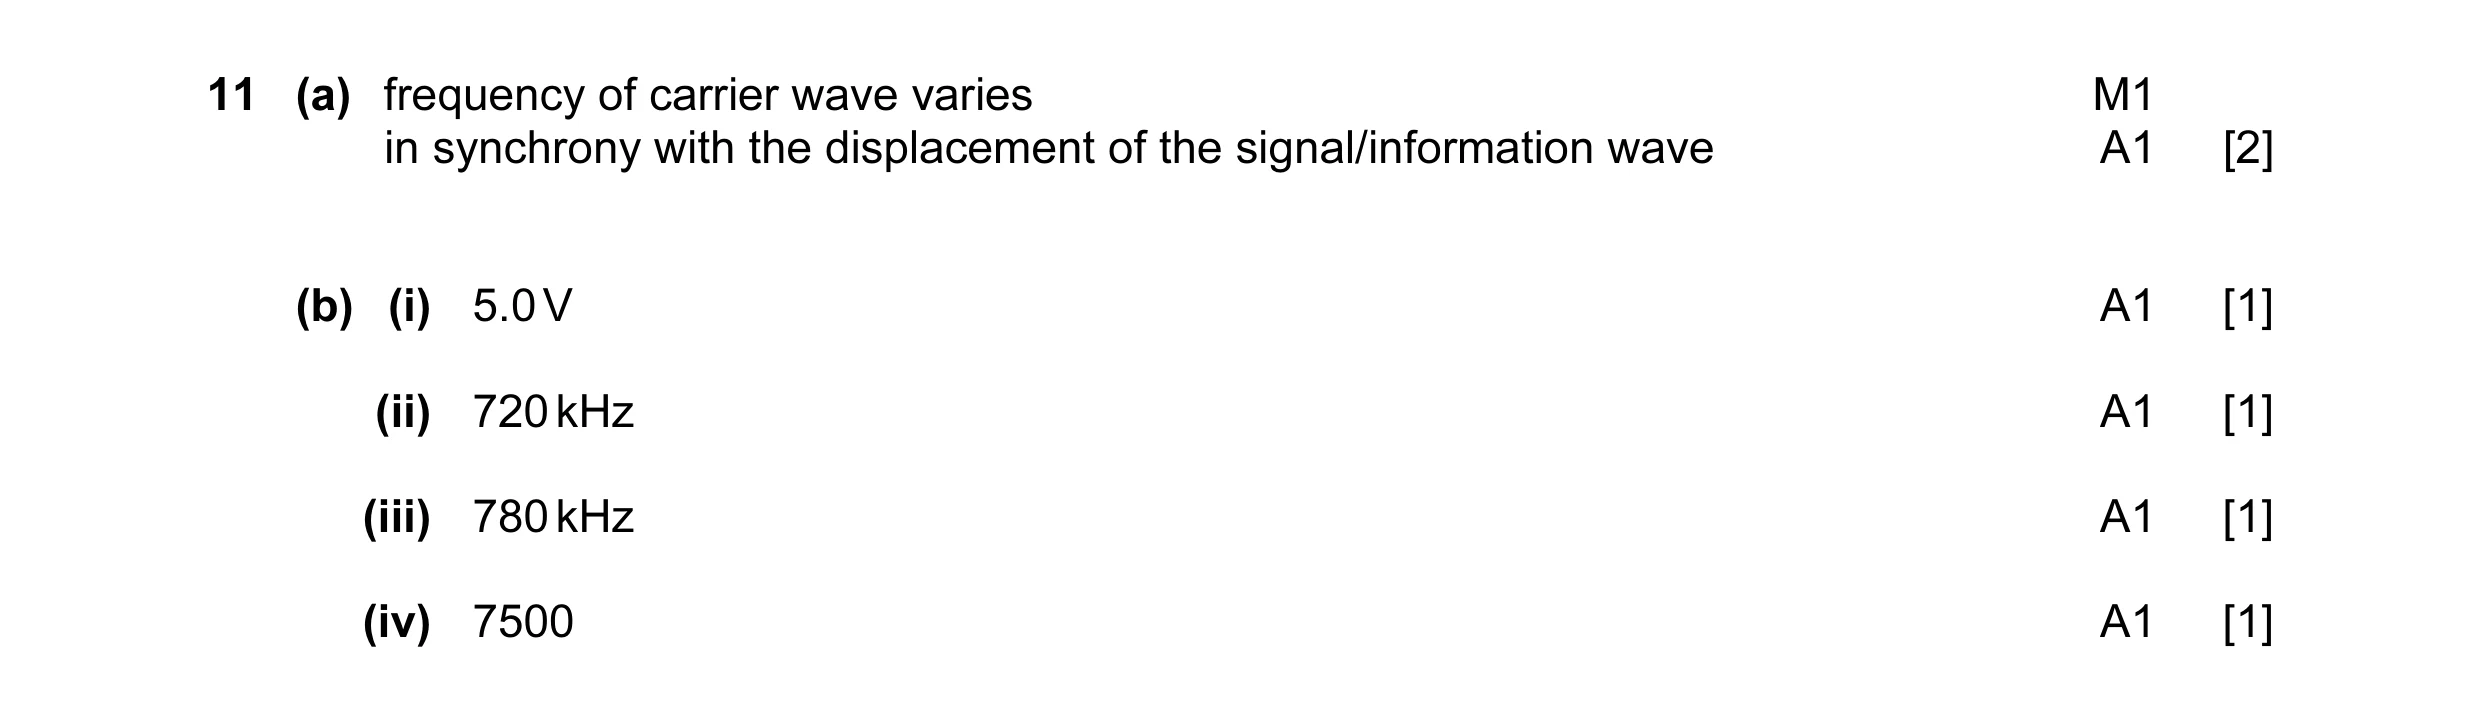 6
6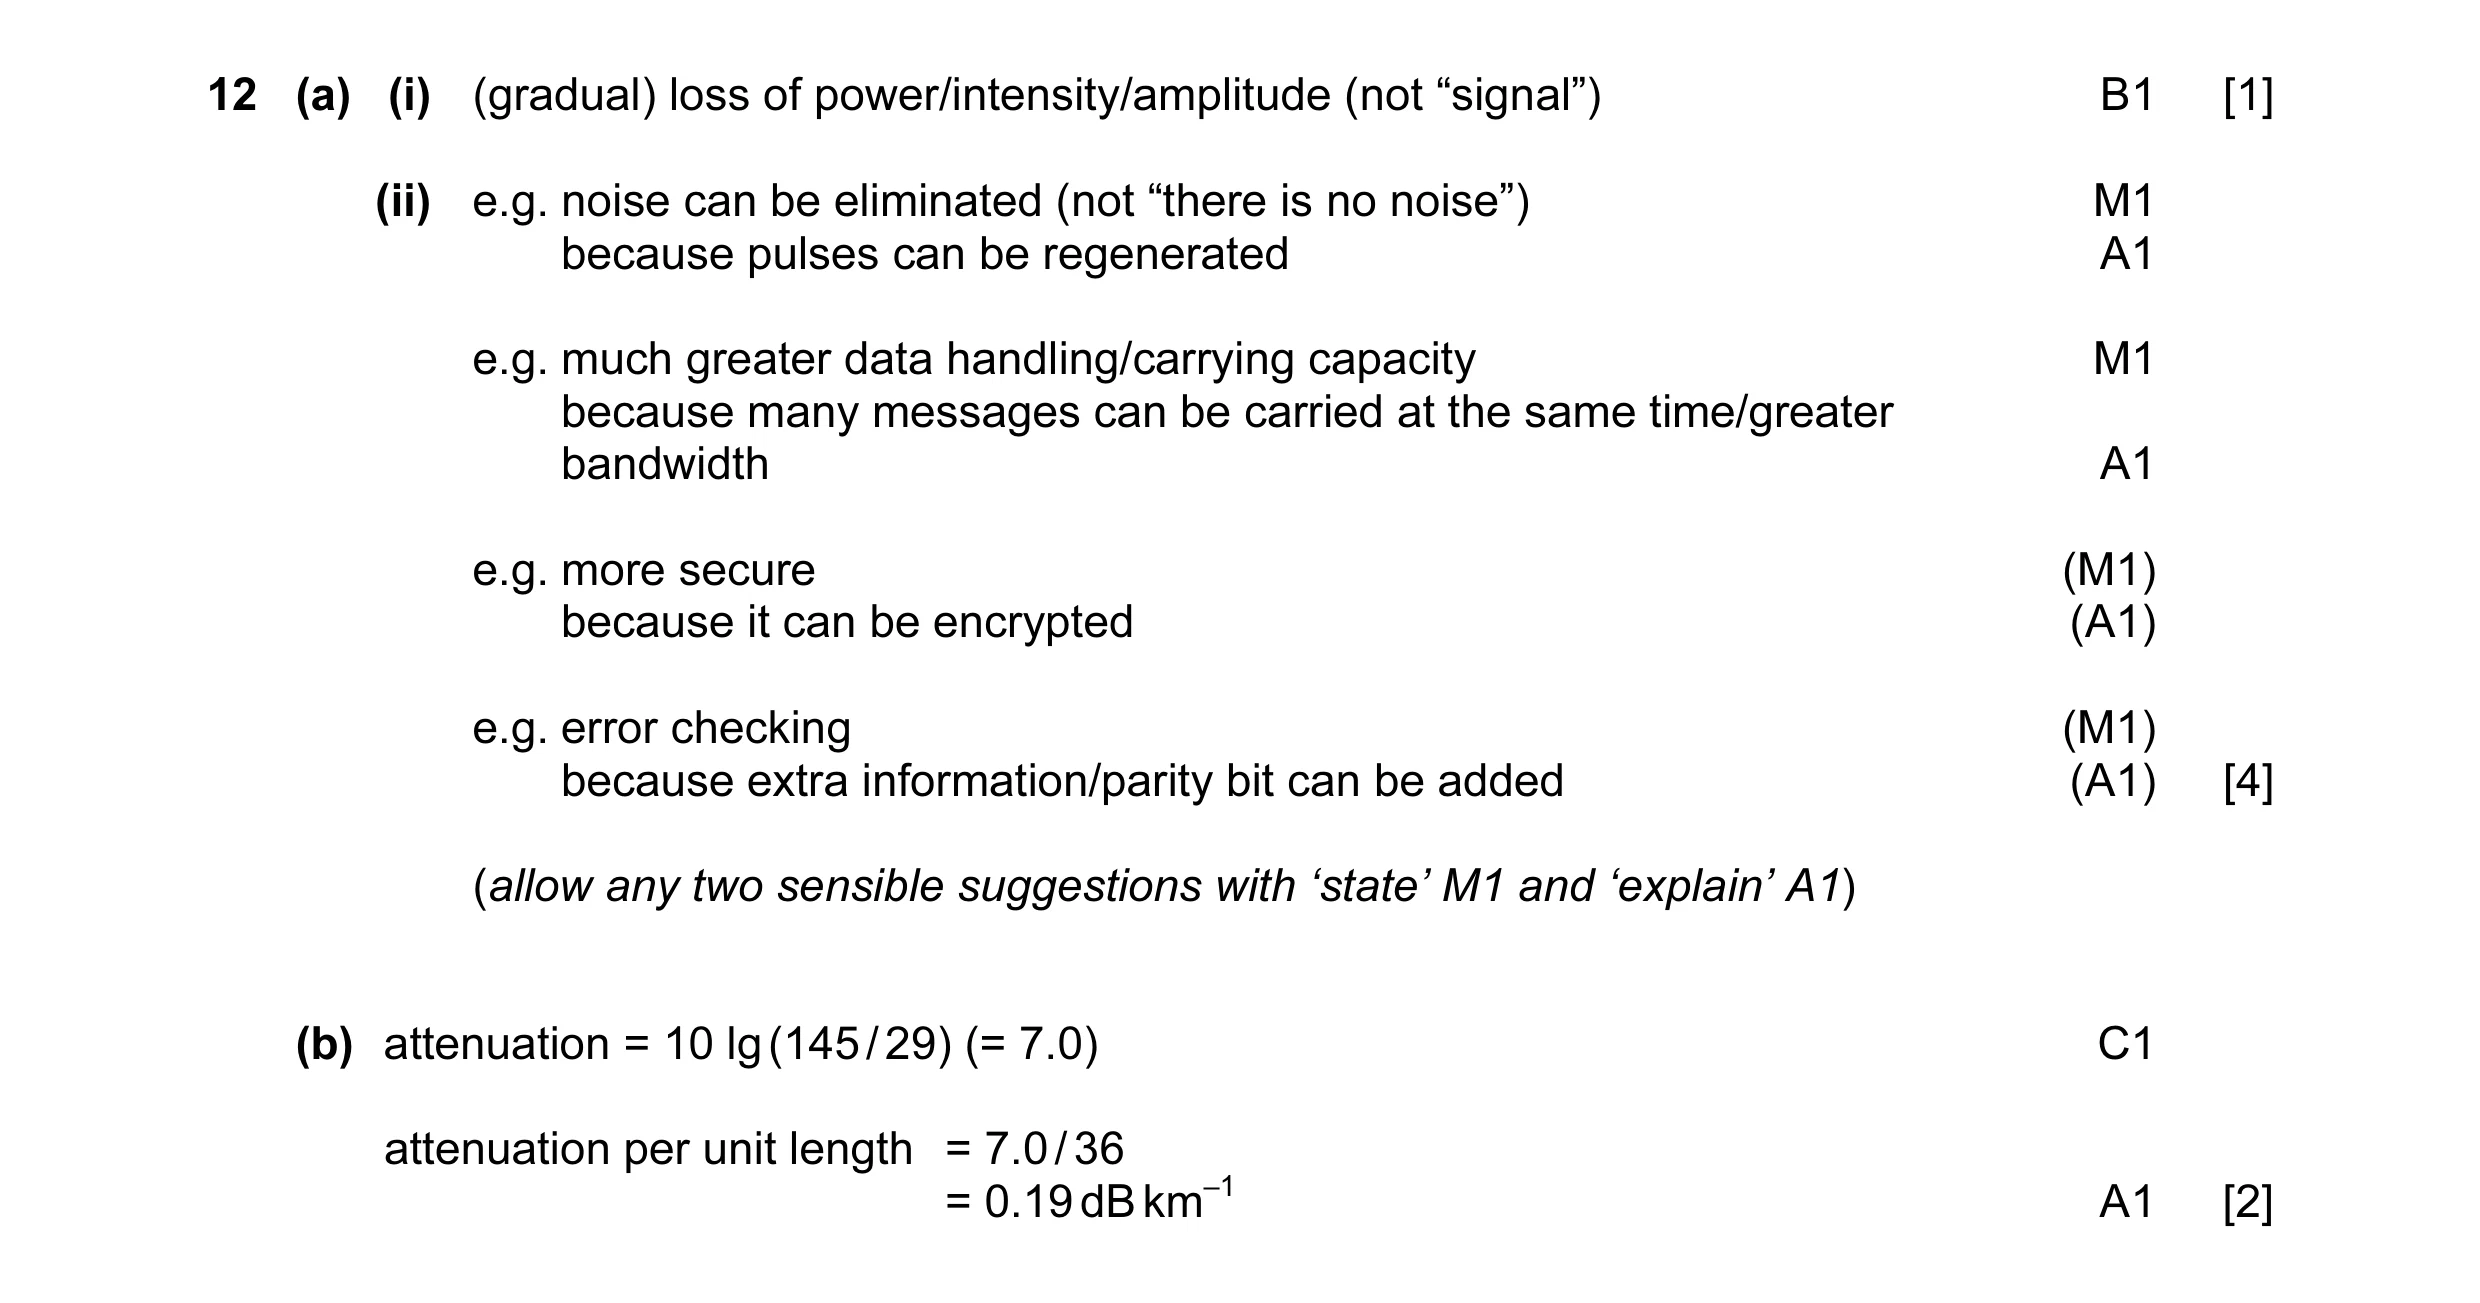 7
7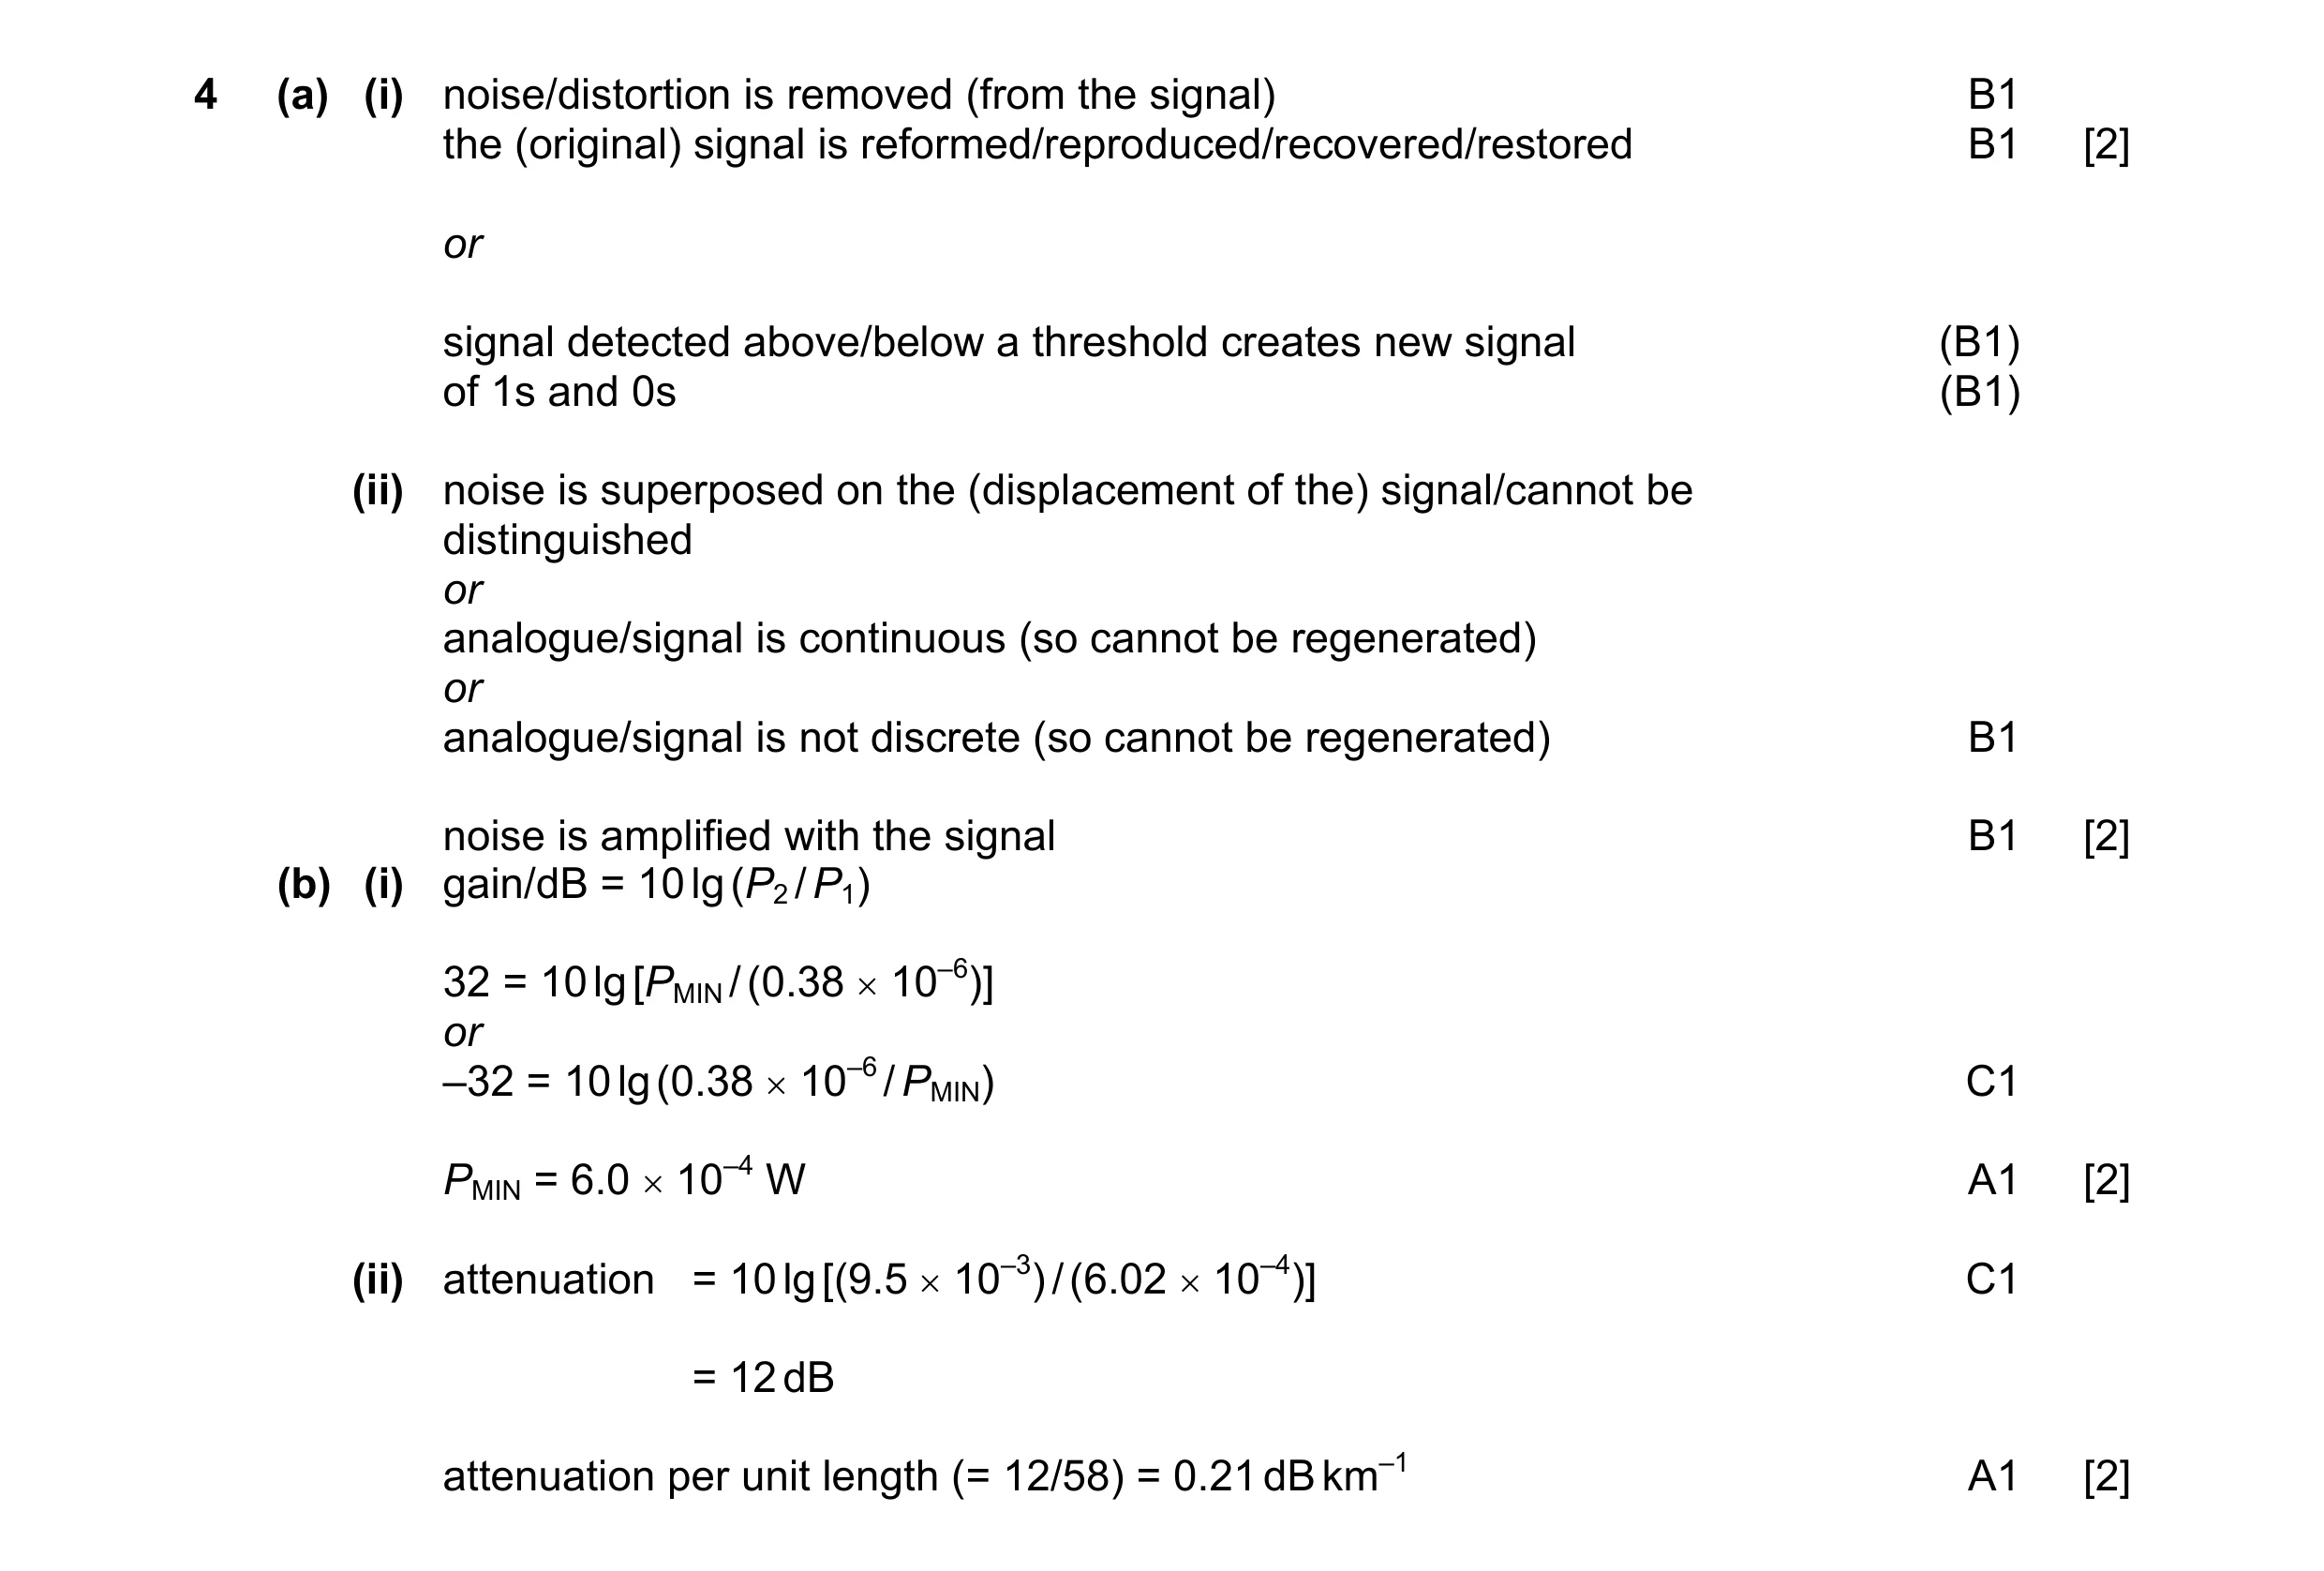 8
8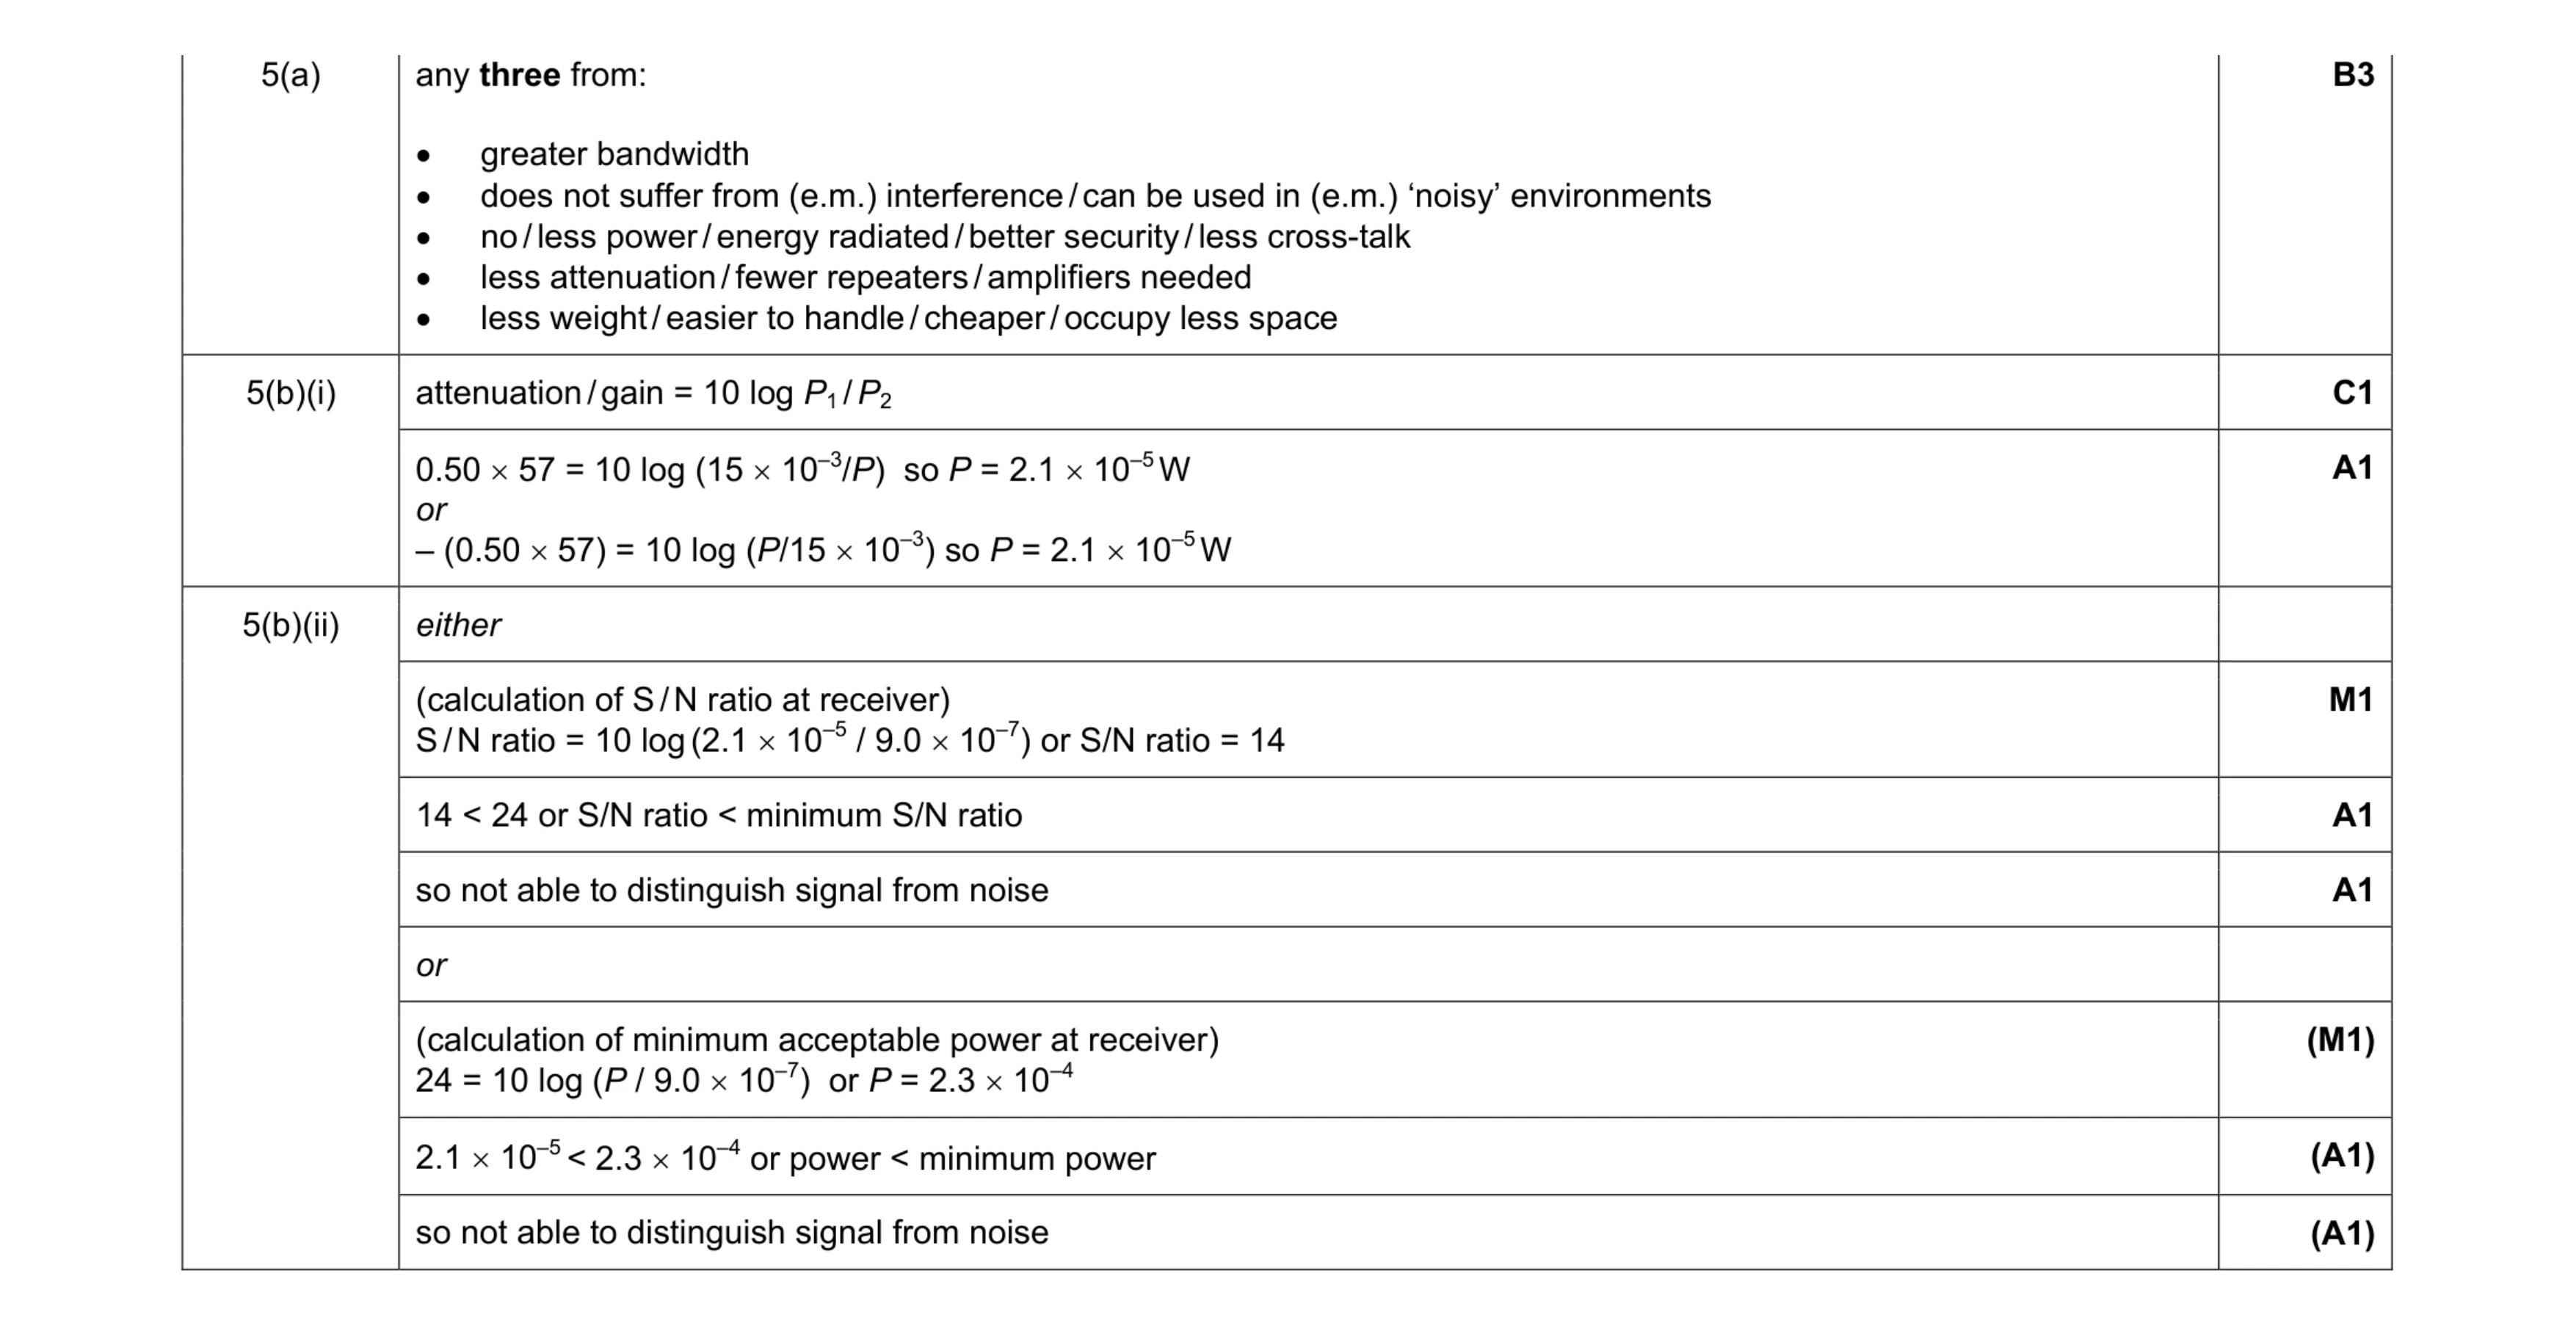 8
8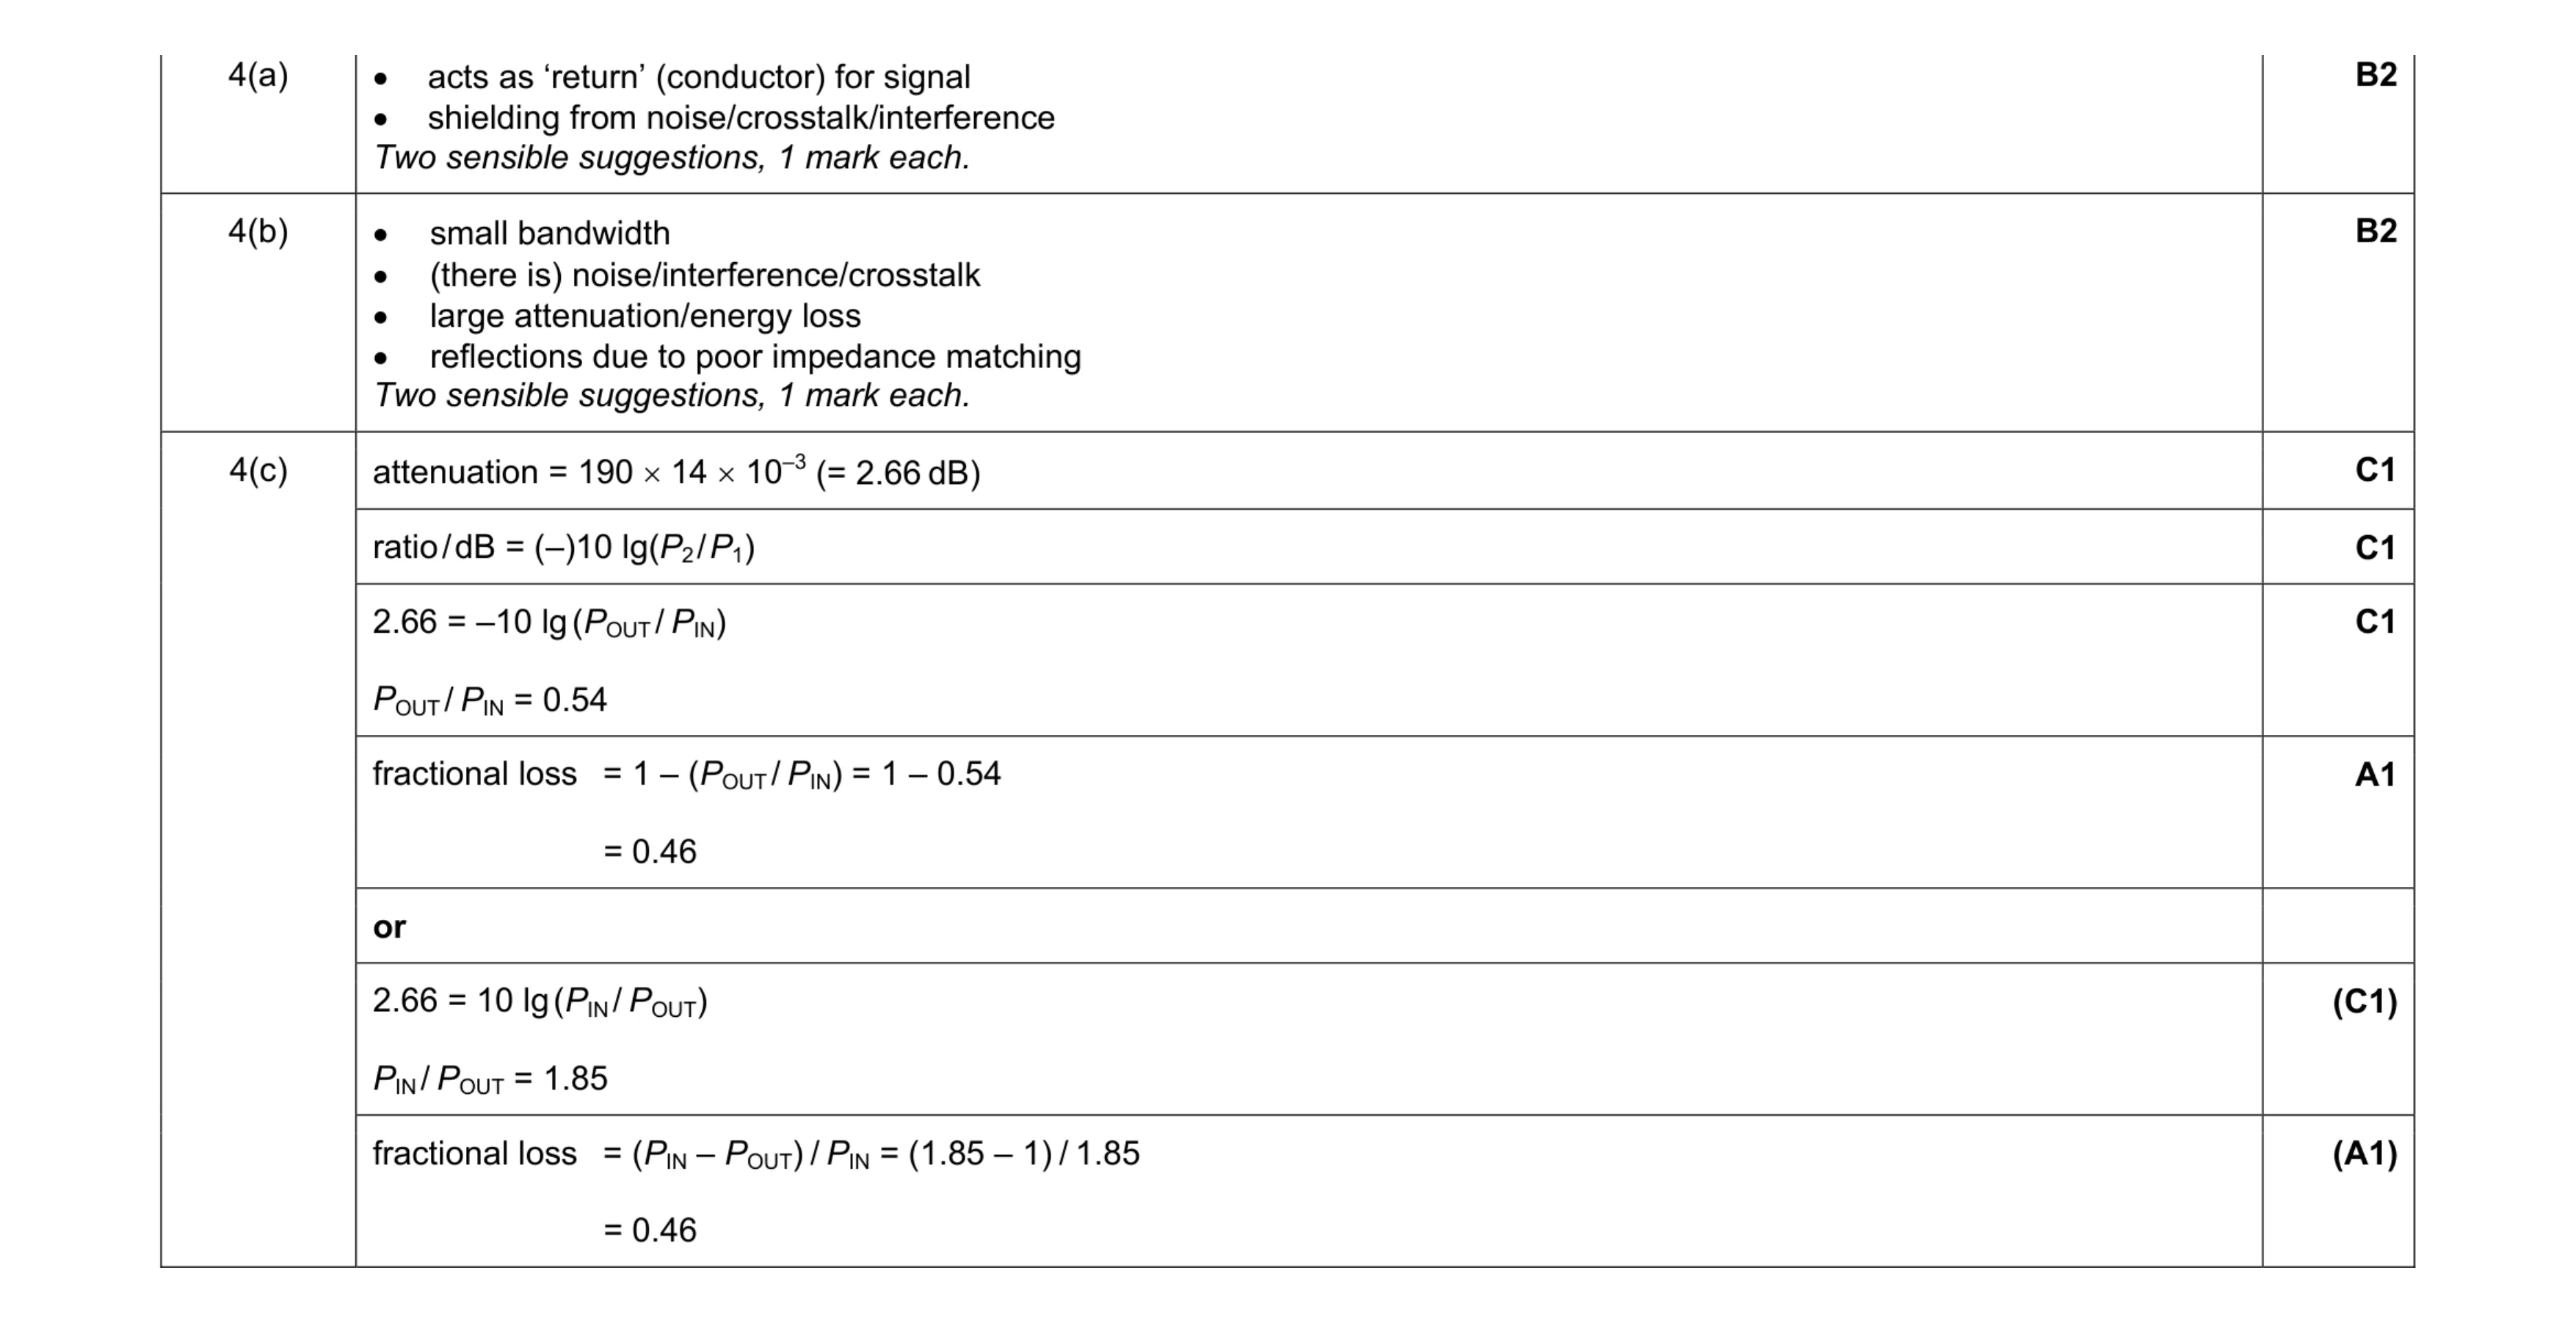 8
8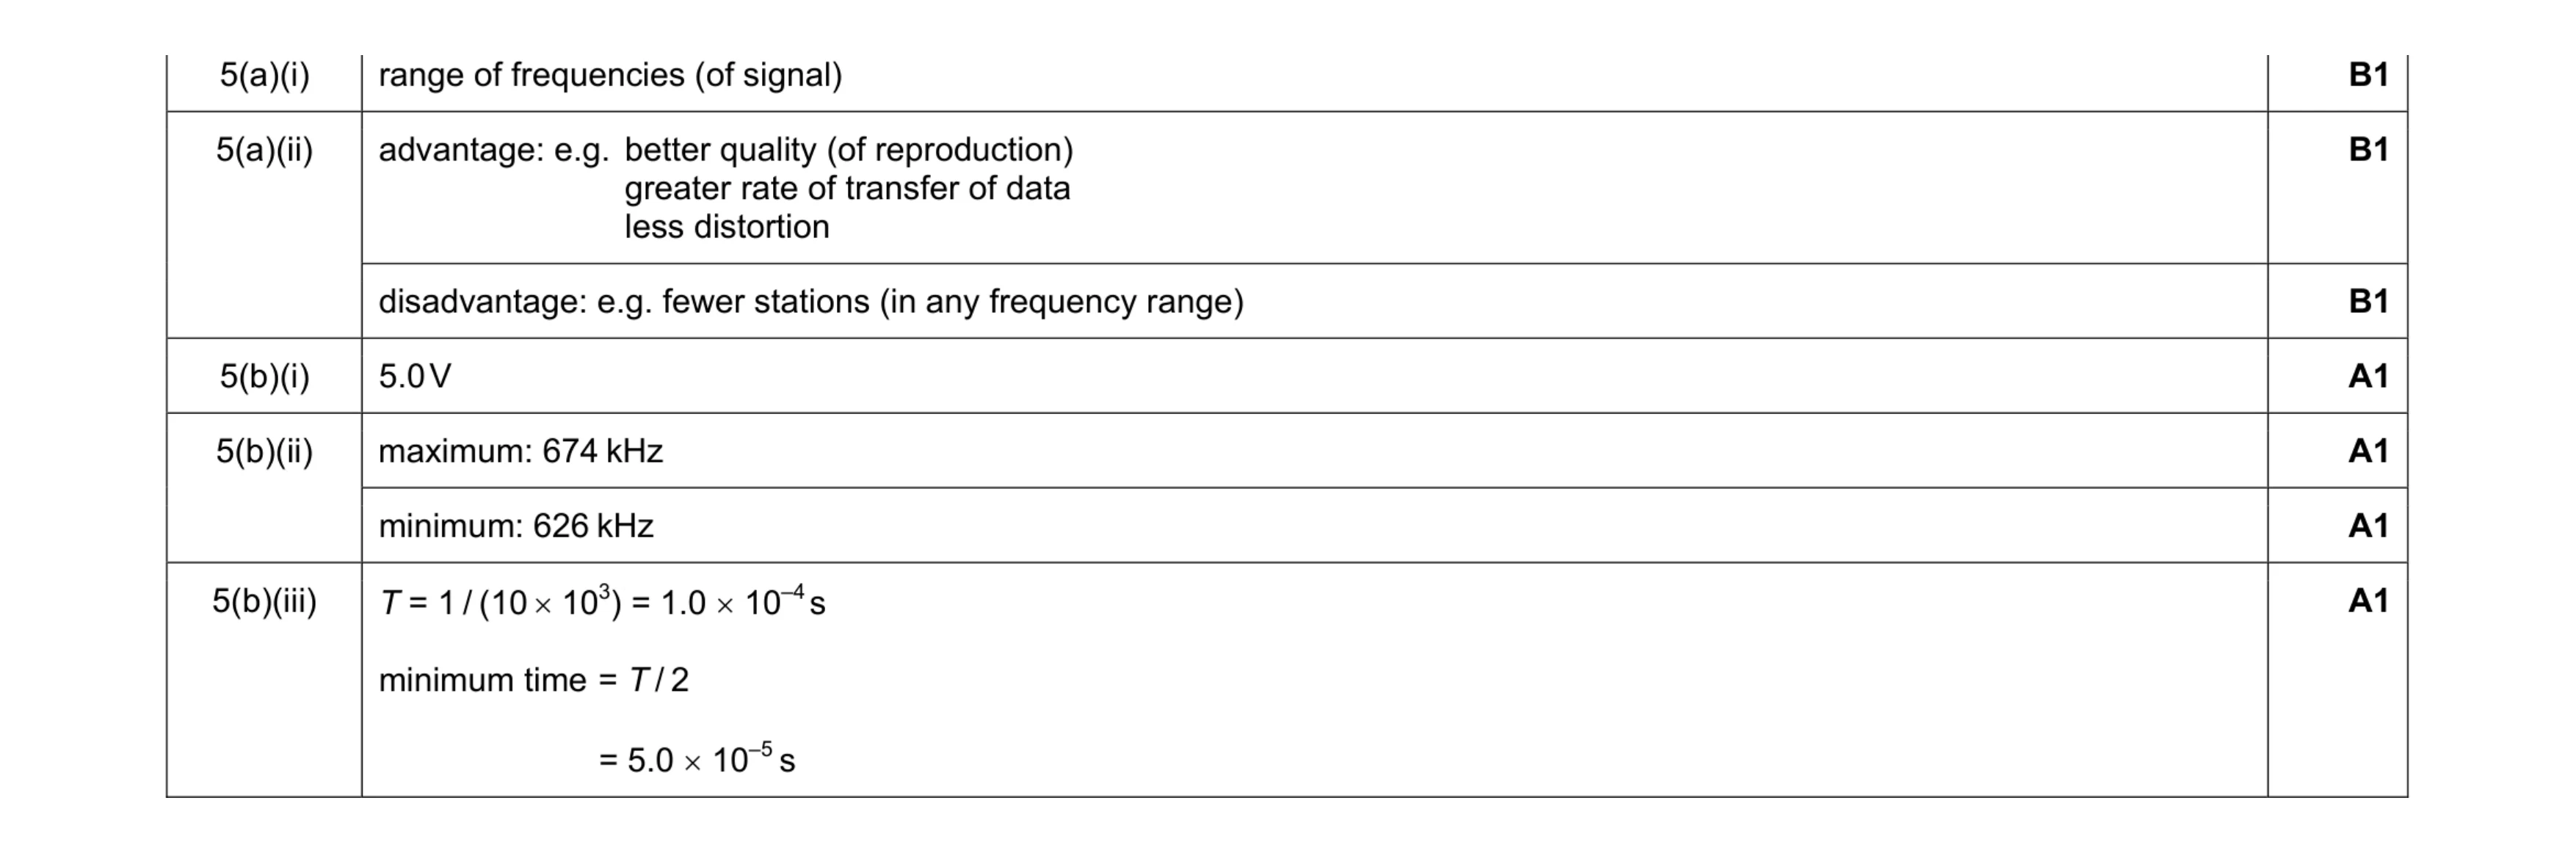 7
7 4
4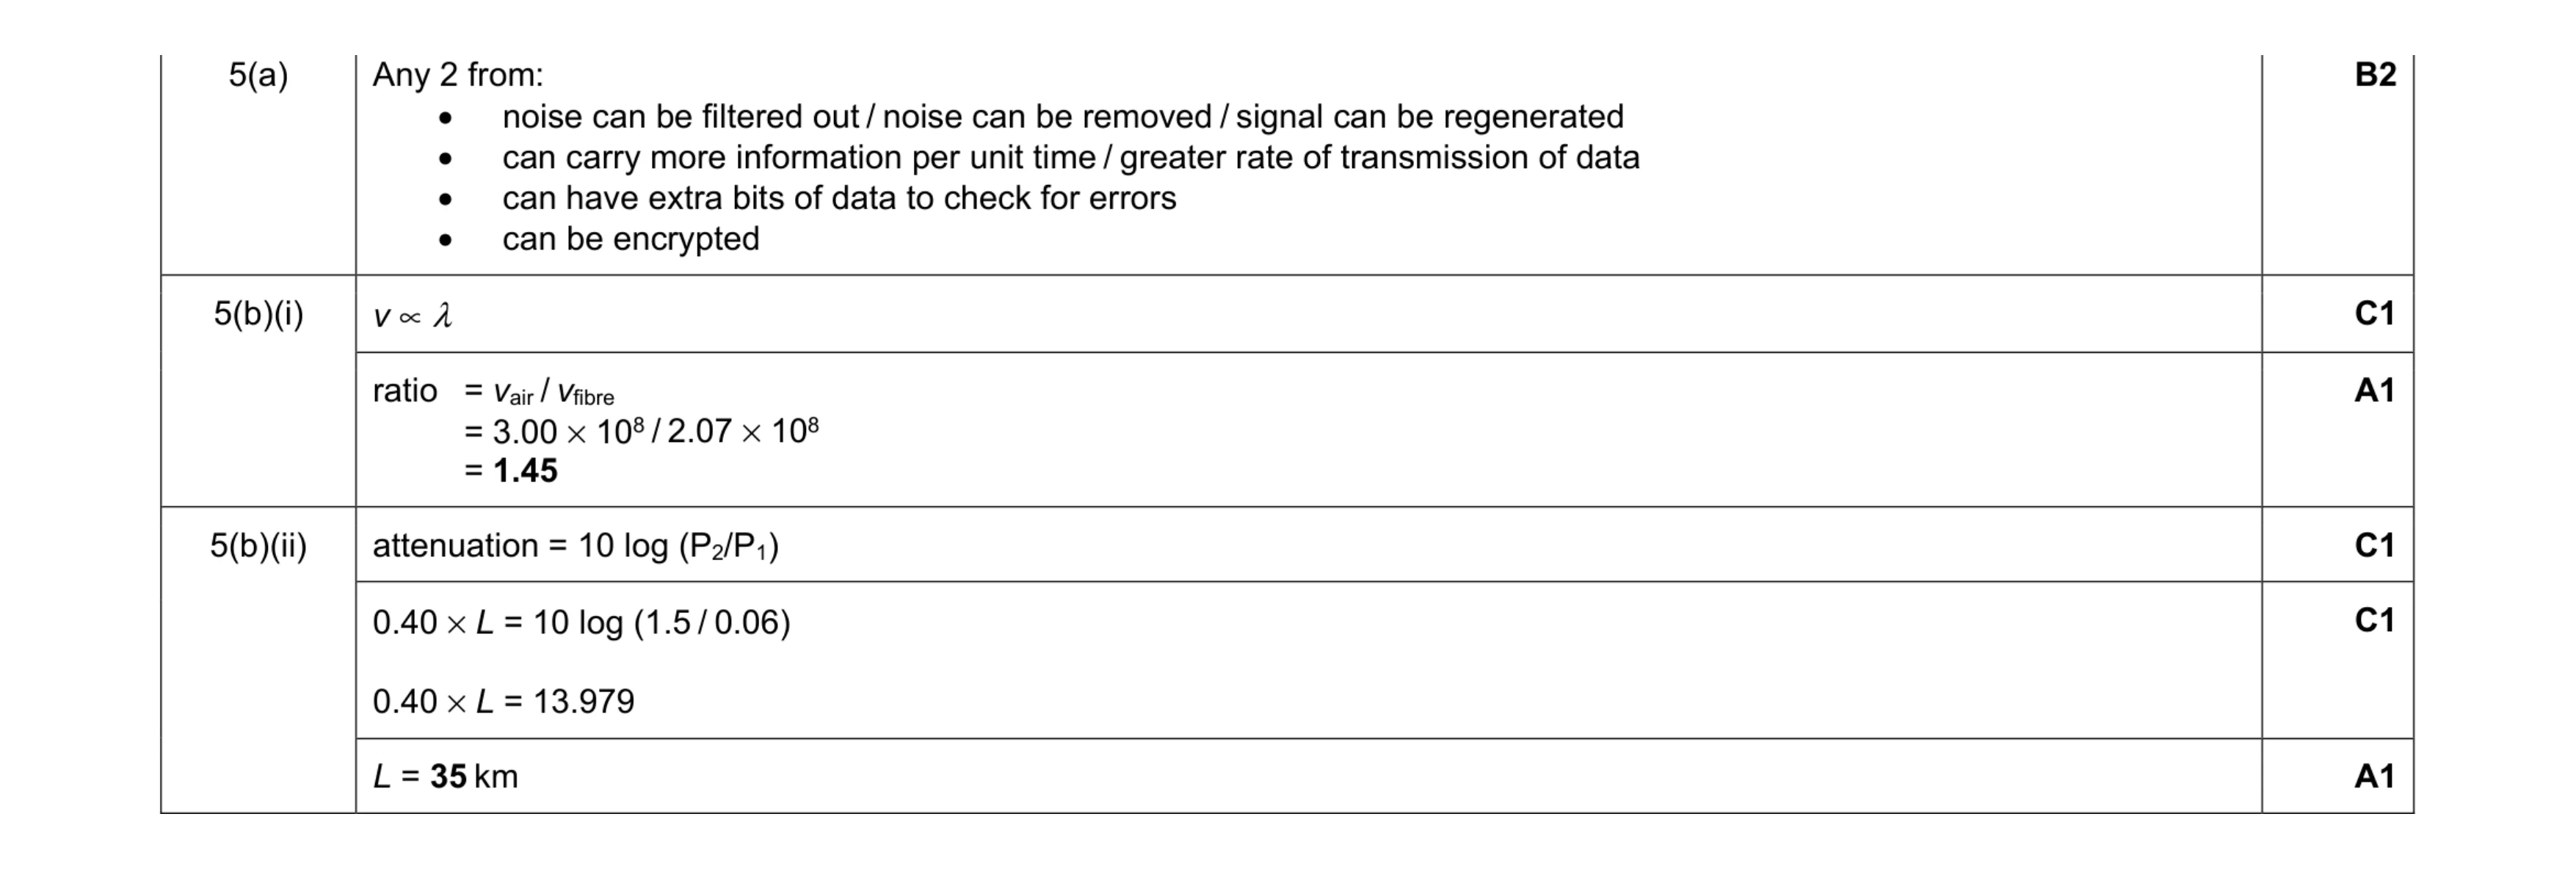 7
7