Questions as text
Q1 · Explain what is meant by the term succession and give one example from the marine… 9693/21 May/June 2017
3 (a) Explain what is meant by the term succession and give one example from the marine environment. … … … … … … [3] (b) Explain how the processes of erosion and sedimentation give rise to the formation of muddy shores and rocky shores. … … … … … … … … … … … … [6] (c) Discuss the factors that can lead to a transition from the growth of a coral reef to reef erosion. … … … … … … … … … … … … … … [6] [Total: 15]
15 marks
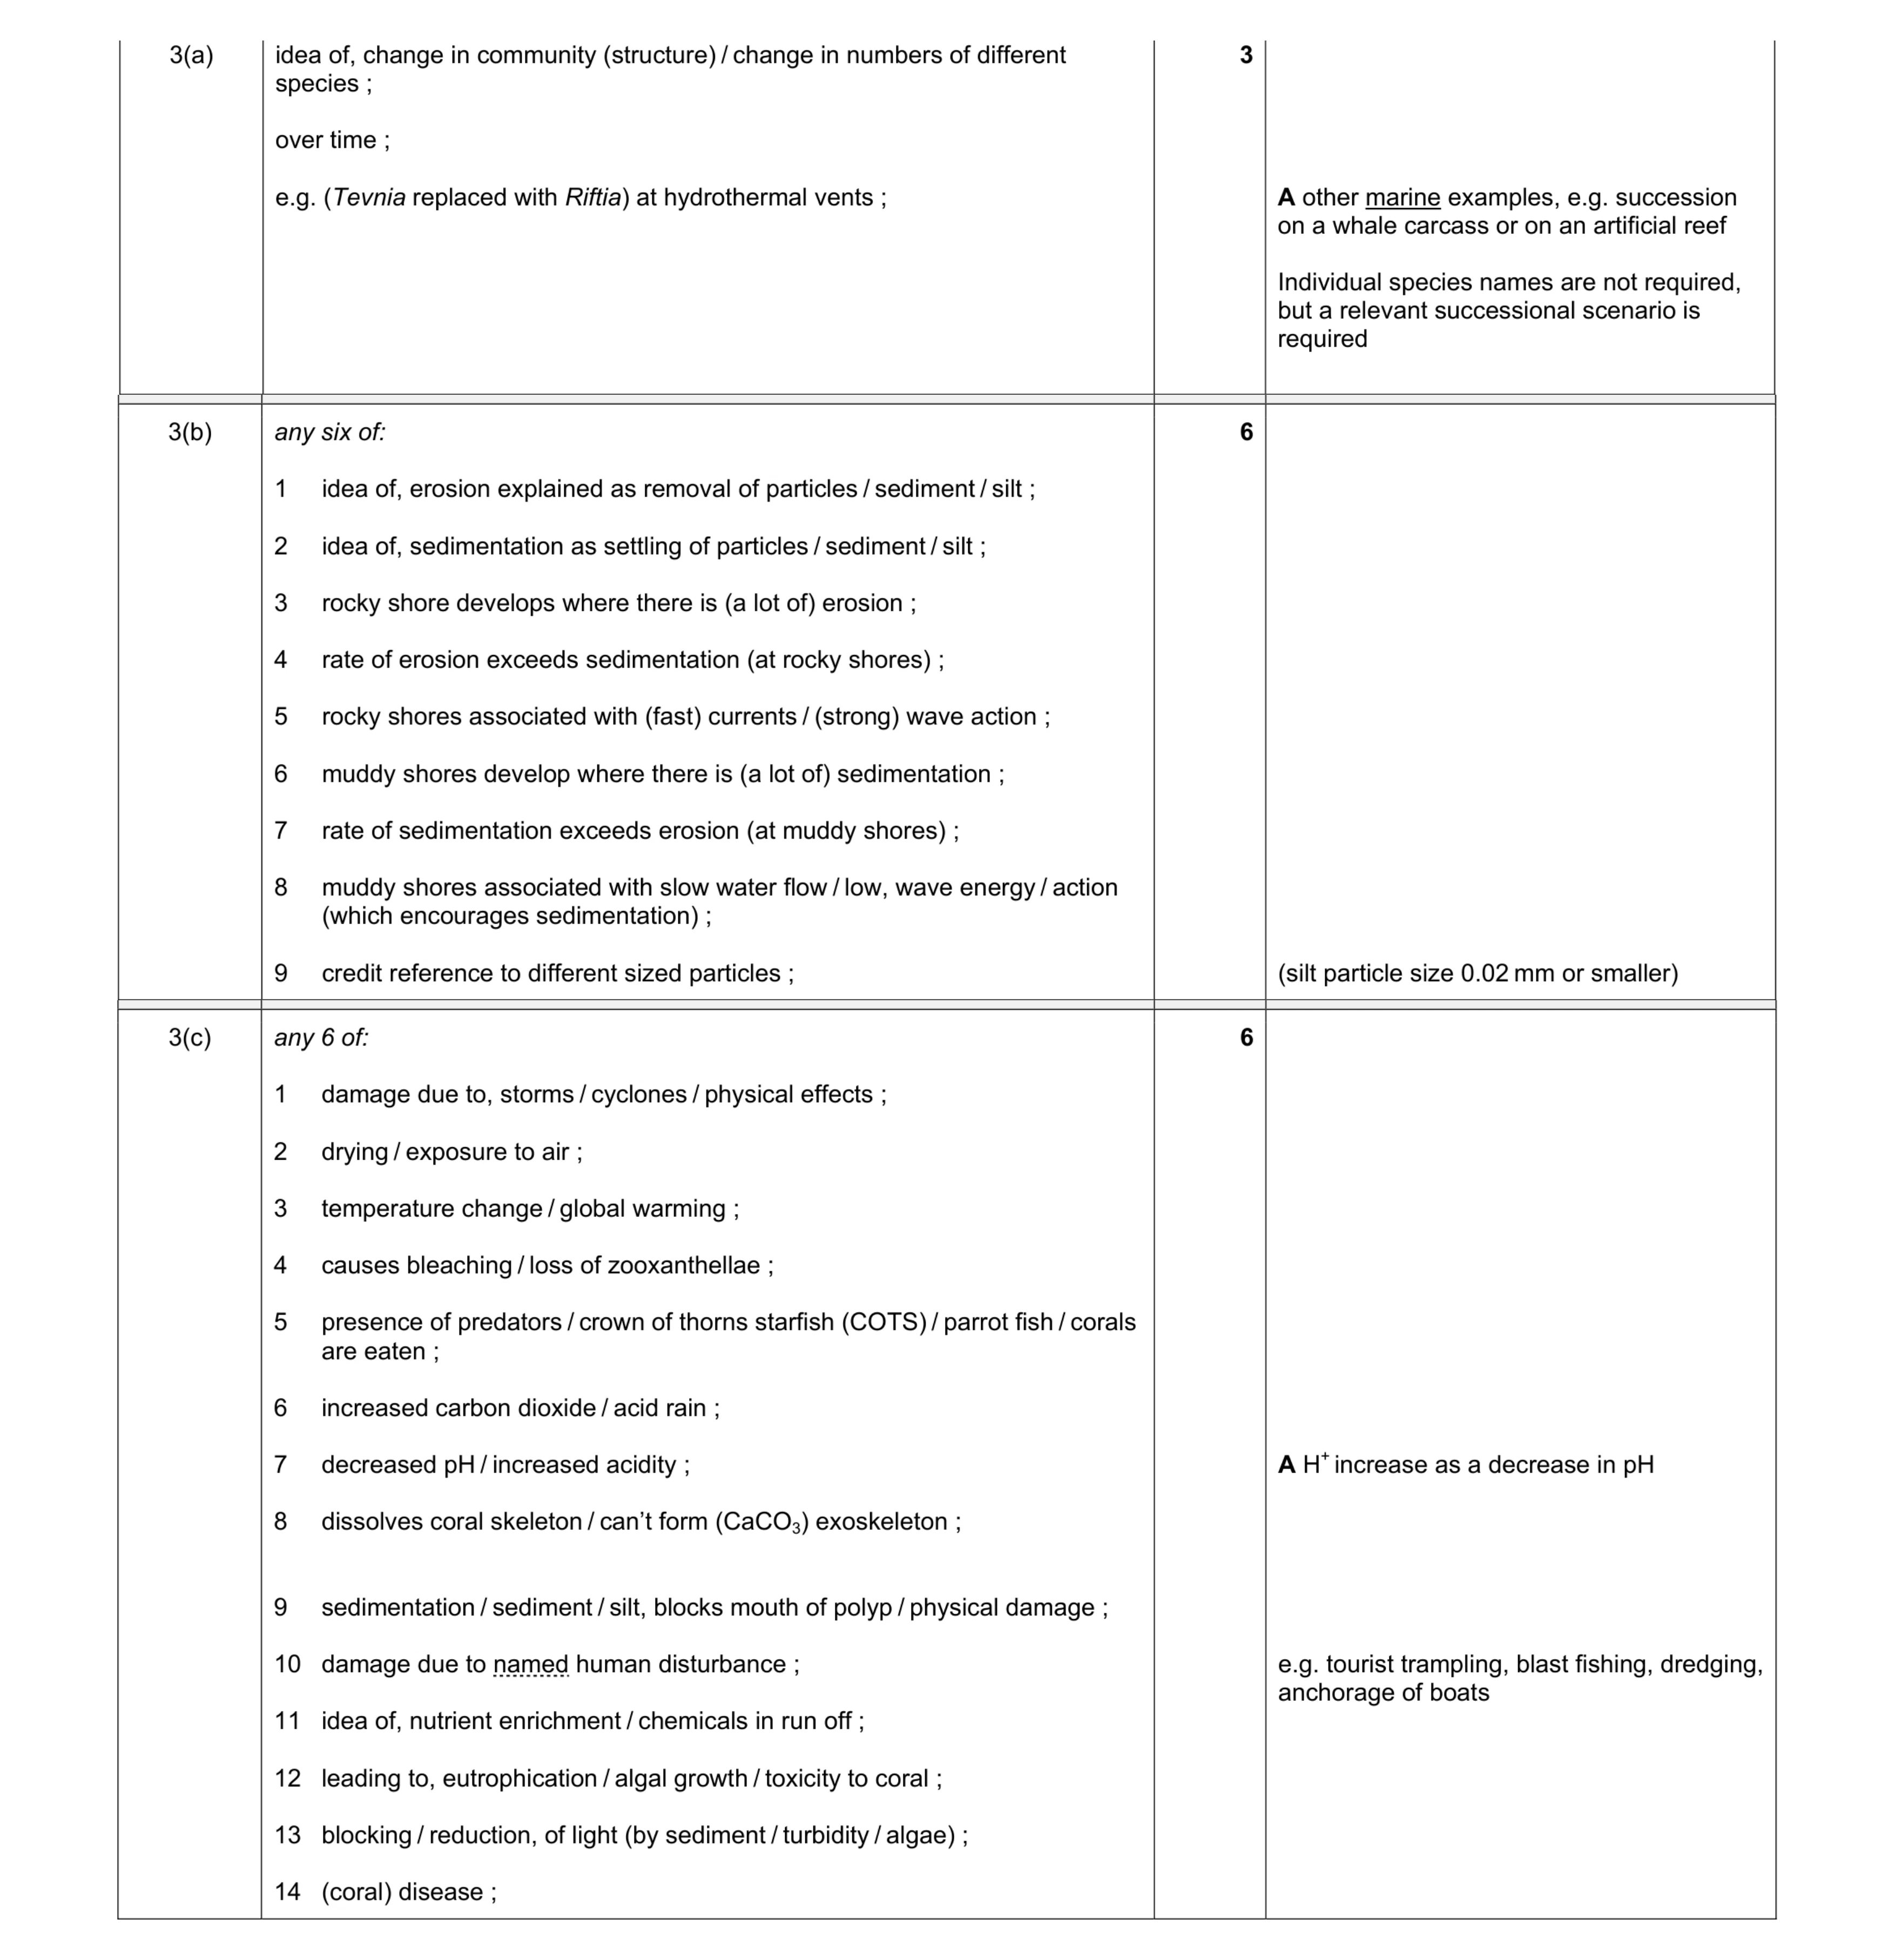
Mark scheme: 3(a) idea of, change in community (structure) / change in numbers of different species ; over time ; e.g. (Tevnia replaced with Riftia) at hydrothermal vents ; 3 A other marine examples, e.g. succession on a whale carcass or on an artificial reef Individual species names are not required, but a relevant successional scenario is required Question Answer Marks Guidance 3(b) any six of: 1 idea of, erosion explained as removal of particles / sediment / silt ; 2 idea of, sedimentation as settling of particles / sediment / silt ; 3 rocky shore develops where there is (a lot of) erosion ; 4 rate of erosion exceeds sedimentation (at rocky shores) ; 5 rocky shores associated with (fast) currents / (strong) wave action ; 6 muddy shores develop where there is (a lot of) sedimentation ; 7 rate of sedimentation exceeds erosion (at muddy shores) ; 8 muddy shores associated with slow water flow / low, wave energy / action (which encourages sedimentation) ; 9 credit reference to different sized particles ; 6 (silt particle size 0.02 mm or smaller) Question Answer Marks Guidance 3(c) any 6 of: 1 damage due to, storms / cyclones / physical effects ; 2 drying / exposure to air ; 3 temperature change / global warming ; 4 causes bleaching / loss of zooxanthellae ; 5 presence of predators / crown of thorns starfish (COTS) / parrot fish / corals are eaten ; 6 increased carbon dioxide / acid rain ; 7 decreased pH / increased acidity ; 8 dissolves coral skeleton / can’t form (CaCO3) exoskeleton ; 9 sedimentation / sediment / silt, blocks mouth of polyp / physical damage ; 10 damage due to named human disturbance ; 11 idea of, nutrient enrichment / chemicals in run off ; 12 leading to, eutrophication / algal growth / toxicity to coral ; 13 blocking / reduction, of light (by sediment / turbidity / algae) ; 14 (coral) disease ; 6 A H+ increase as a decrease in pH e.g. tourist trampling, blast fishing, dredging, anchorage of boats
This question in 9693/21 May/June 2017
Q2 · The concentration of dissolved oxygen in sea water is affected by a number of different… 9693/21 Oct/Nov 2017
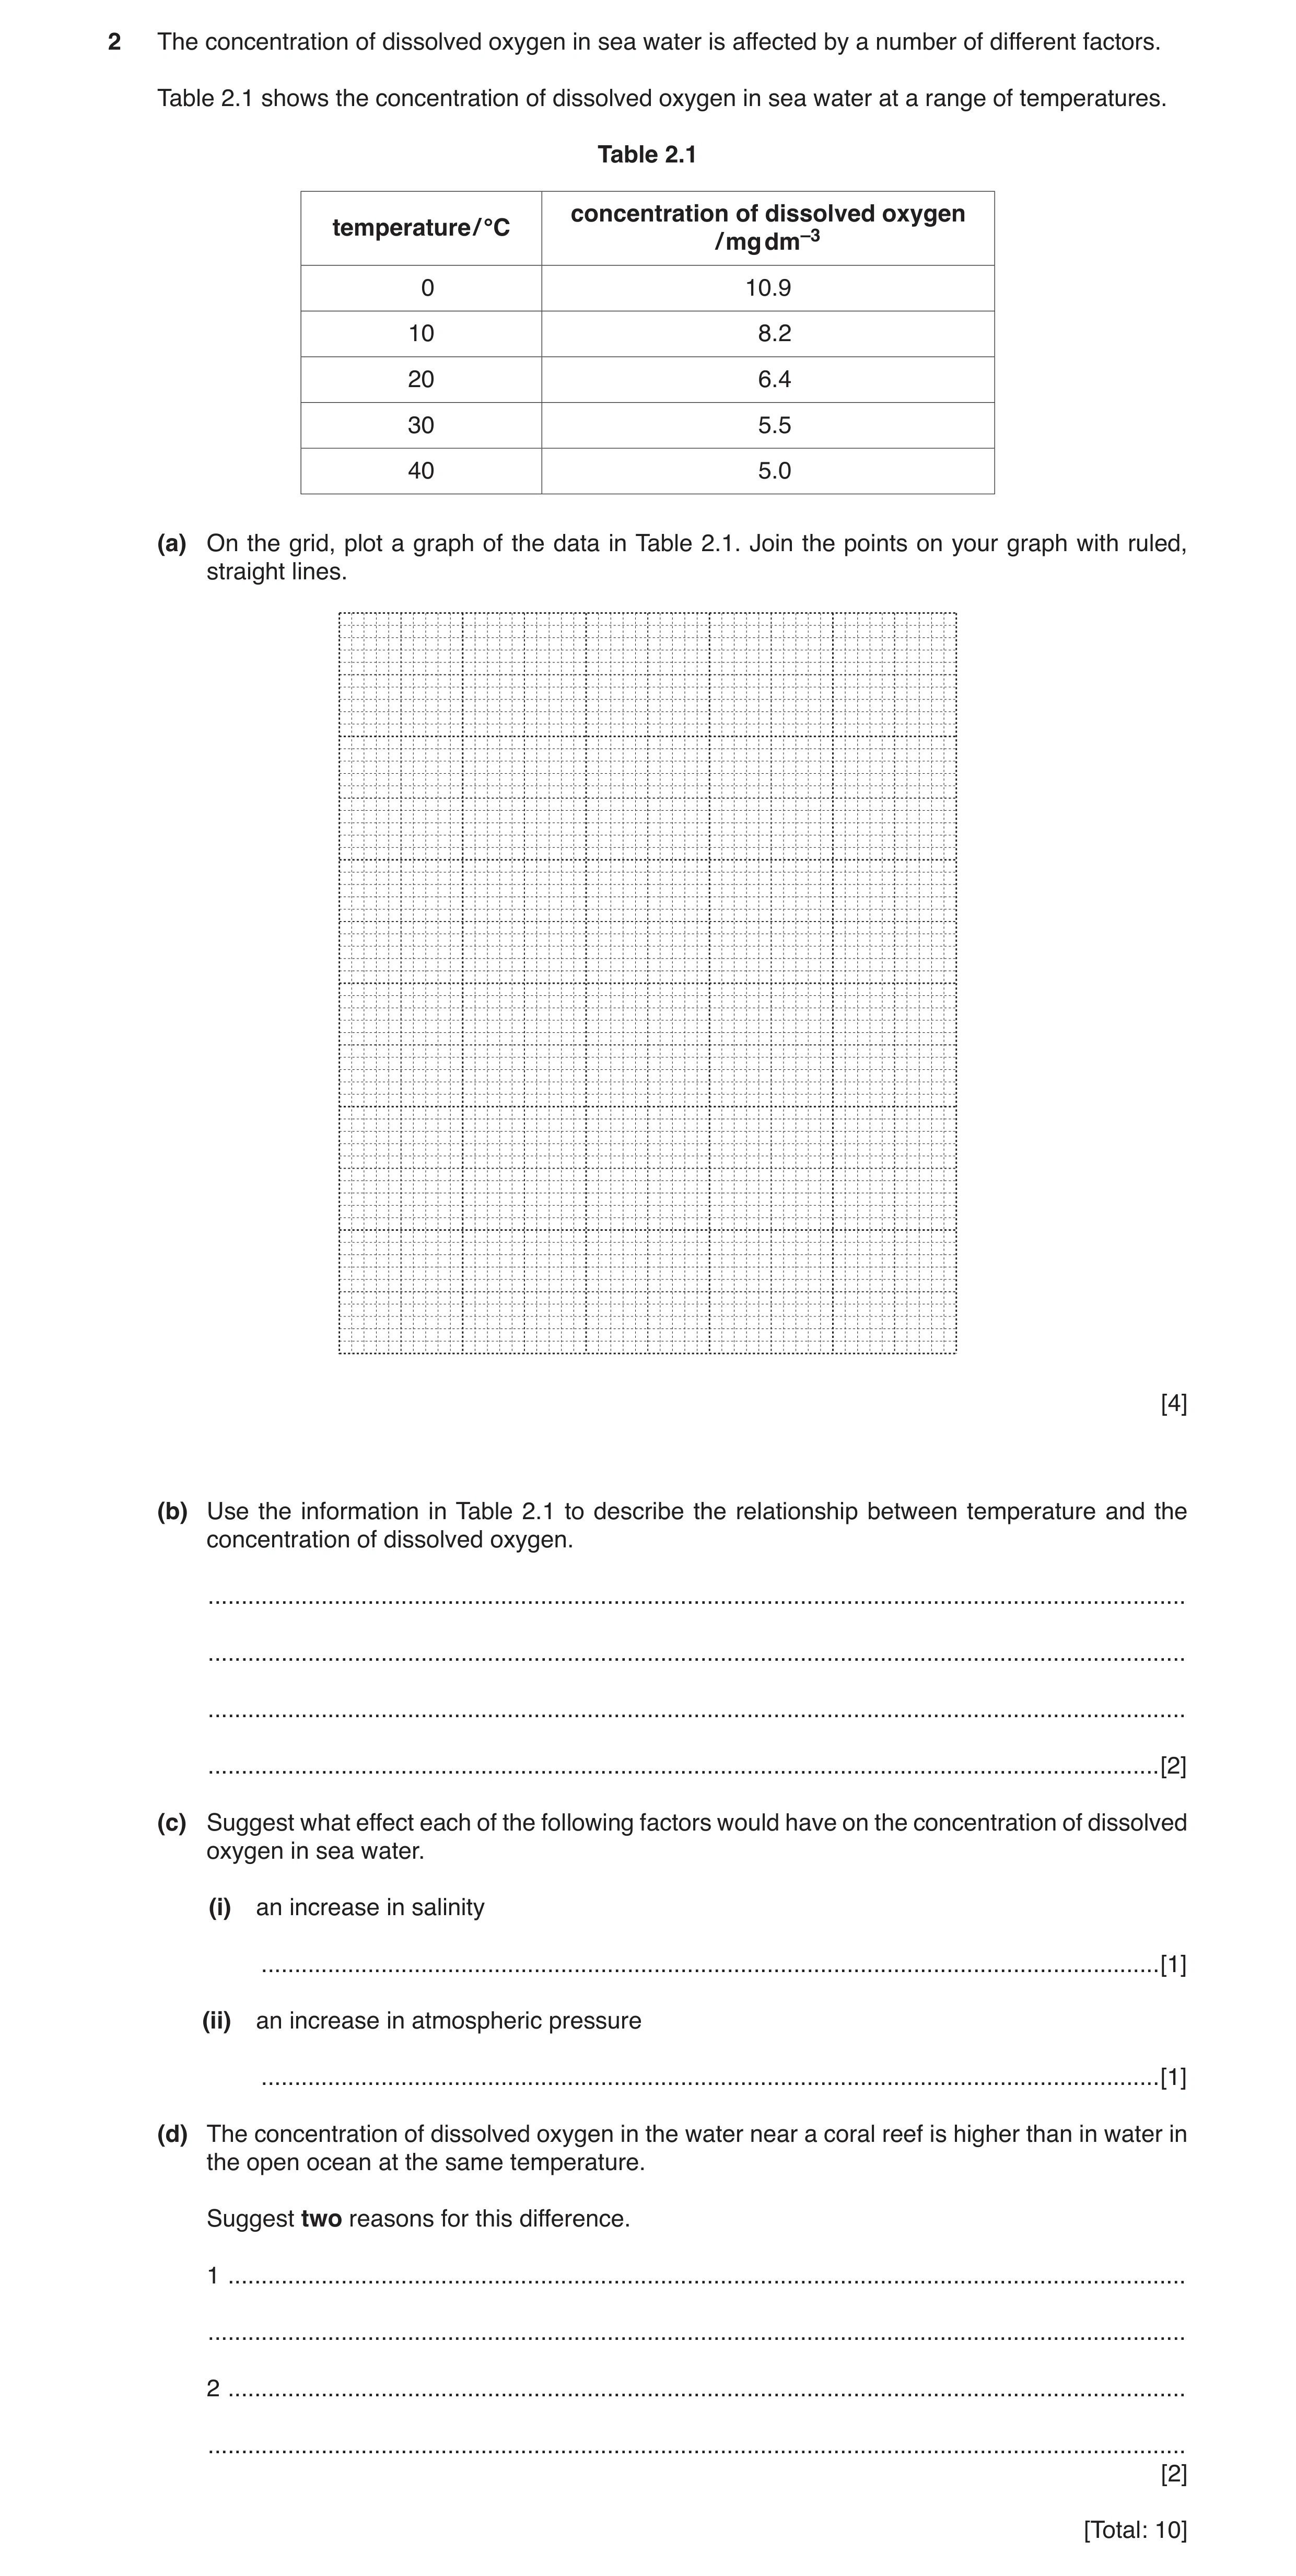
2 The concentration of dissolved oxygen in sea water is affected by a number of different factors. Table 2.1 shows the concentration of dissolved oxygen in sea water at a range of temperatures. Table 2.1 concentration of dissolved oxygen temperature / °C / mg dm–3 0 10.9 10 8.2 20 6.4 30 5.5 40 5.0 (a) On the grid, plot a graph of the data in Table 2.1. Join the points on your graph with ruled, straight lines. [4] (b) Use the information in Table 2.1 to describe the relationship between temperature and the concentration of dissolved oxygen. … … … … [2] (c) Suggest what effect each of the following factors would have on the concentration of dissolved oxygen in sea water. (i) an increase in salinity … [1] (ii) an increase in atmospheric pressure … [1] (d) The concentration of dissolved oxygen in the water near a coral reef is higher than in water in the open ocean at the same temperature. Suggest two reasons for this difference. 1 … … 2 … … [2] [Total: 10]
10 marks
Mark scheme: 2(a) appropriate linear scale for both axes ; both axes labelled including units ; all points plotted correctly (± ½ small square) ; points joined with ruled lines ; 4 the grid 2(b) as temperature increases, concentration of dissolved oxygen decreases ; use of manipulated figures ; 2 2(c)(i) concentration of dissolved oxygen decreases ; 1 2(c)(ii) concentration of dissolved oxygen increases ; 1 2(d) more, photosynthesis / producers / productivity ; due to, wave action / turbulence ; 2
This question in 9693/21 Oct/Nov 2017
Q3 · Explain what is meant by each of the following terms used in ecology 9693/21 Oct/Nov 2017
3 (a) Explain what is meant by each of the following terms used in ecology. (i) community … … … … [2] (ii) productivity … … … … [2] (b) Explain why sandy shores tend to have a relatively low biodiversity. … … … … … … … … … … [5] (c) Discuss the role of coral reefs in protecting coasts. … … … … … … … … … … … … [6] [Total: 15]
15 marks
Mark scheme: 3(a)(i) all the different, species of organisms / populations ; in a particular, habitat / ecosystem, at the same time ; 2 3(a)(ii) rate ; at which, organic material / biomass, is produced ; 2 3(b) any 5 of: 1 sandy shores are unstable / continuously shifting / longshore drift / AW ; 2 subject to erosion ; 3 sand has a high porosity / dries out quickly / AW ; 4 lack of suitable substrate for attachment ; 5 no / few, producers for food / lack of photosynthesis / low primary productivity ; 6 no shelter / exposure to predators ; 7 only burrowing animals can live there / idea of, only a small number of species are adapted to live there ; 8 few niches available ; 5 Question Answer Marks Guidance 3(c) any 6 of: 1 reefs, dissipate / reduce, wave energy ; 2 slow down / reduce, wave action ; 3 protect shores from flooding ; 4 reduce coastal erosion ; 5 provide protection for (named) coastal habitats ; 6 provide protection for coastal, properties / infrastructure ; 7 idea of providing safe anchorages ; 6
This question in 9693/21 Oct/Nov 2017
Q4 · Divers carried out a survey to test the following hypothesis: Each species of coral has… 9693/21 May/June 2018
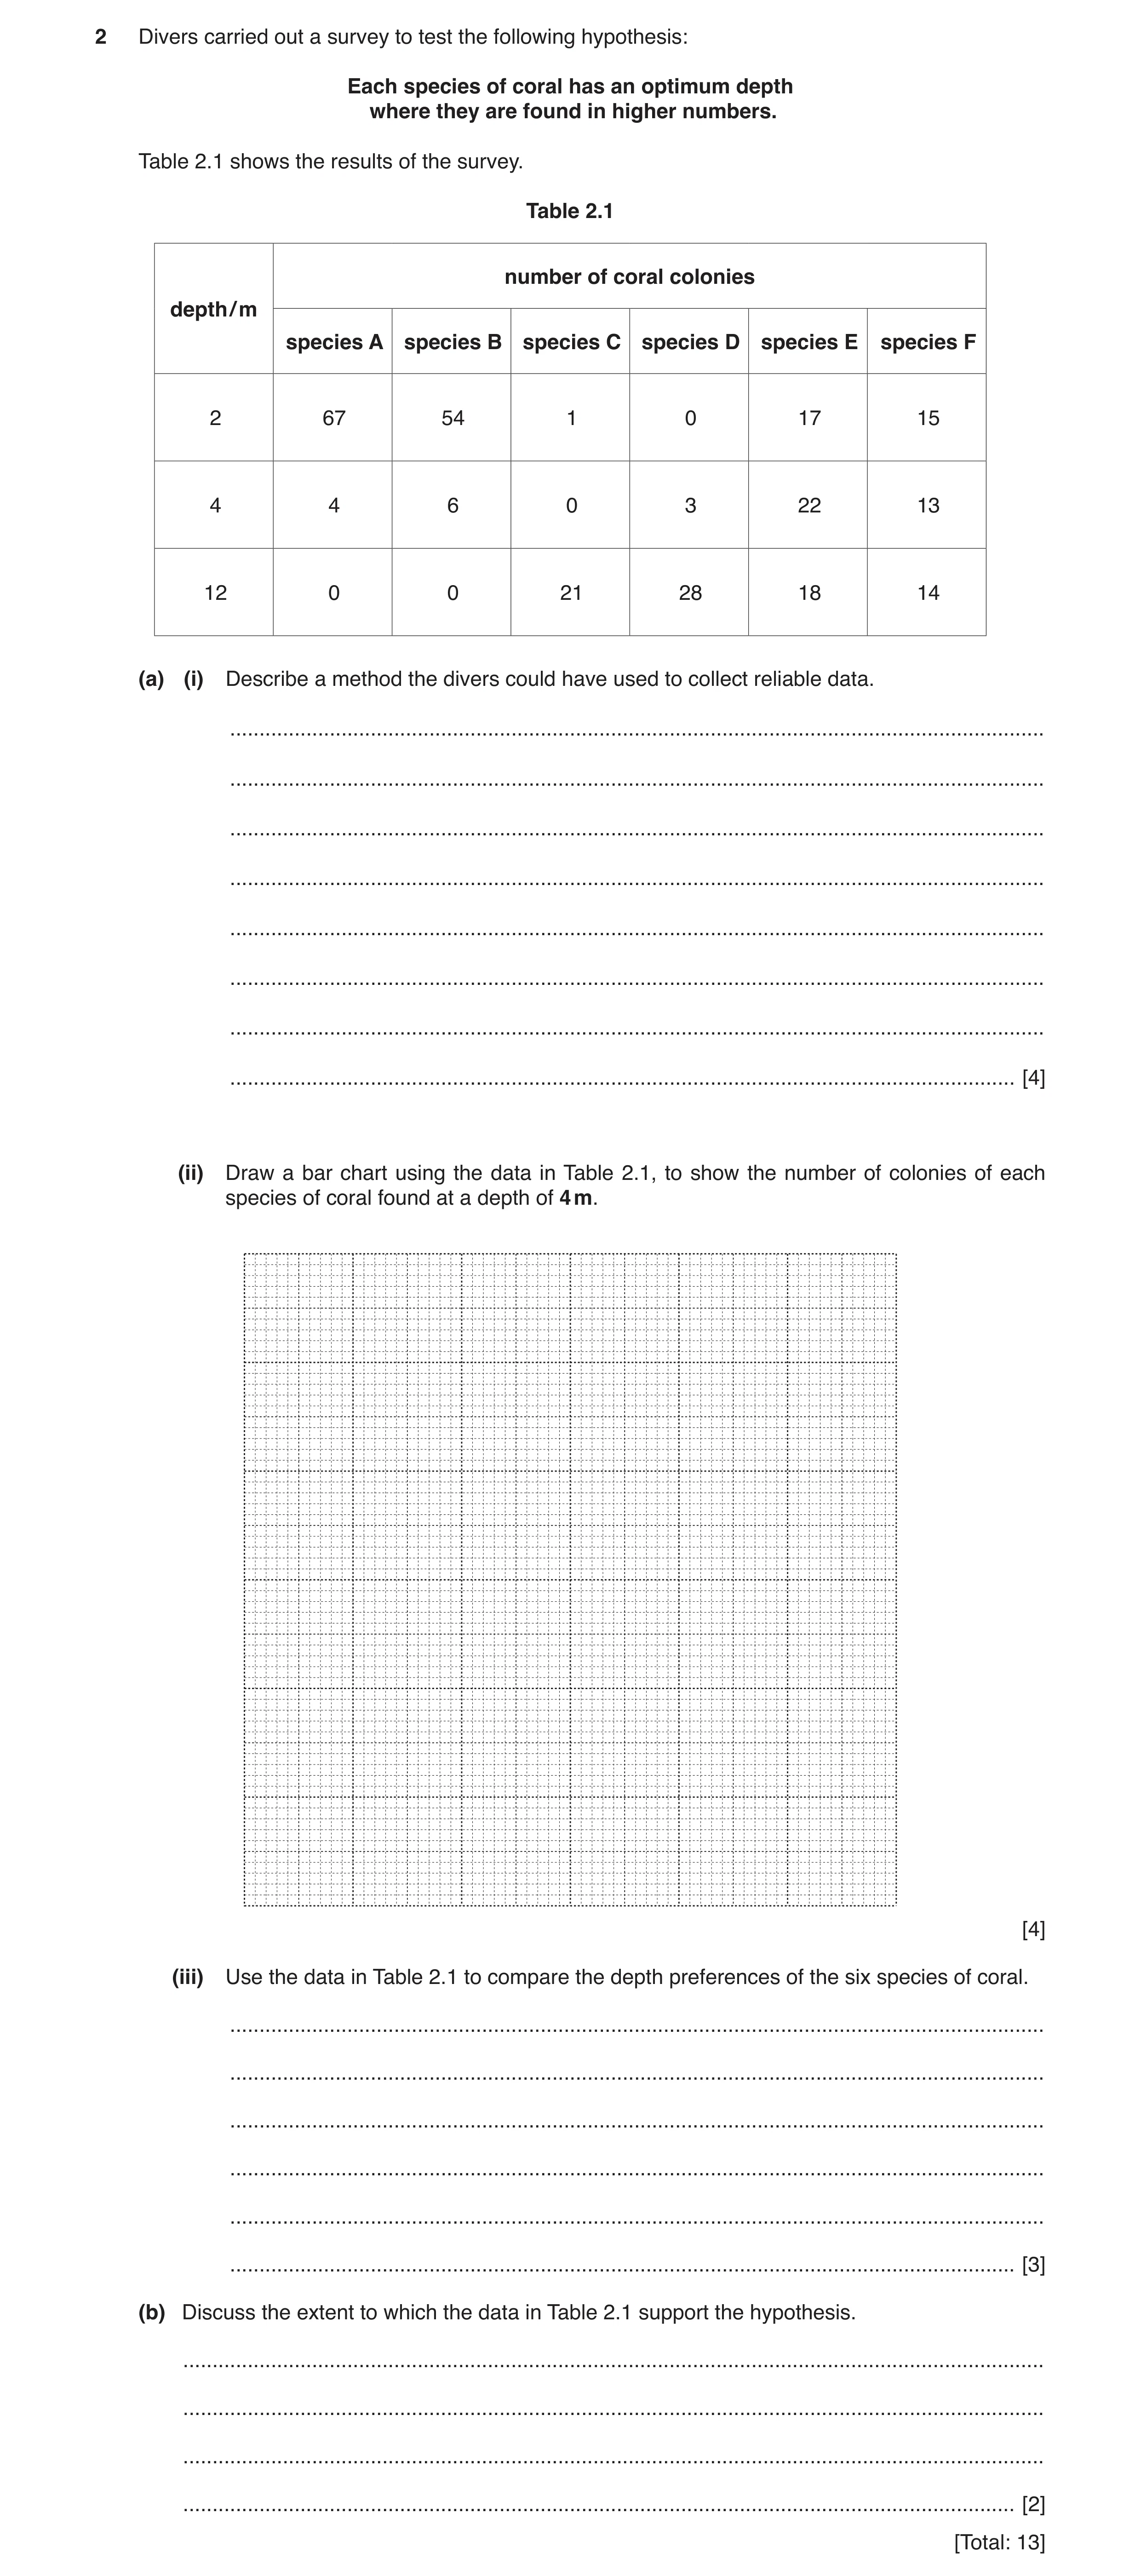
2 Divers carried out a survey to test the following hypothesis: Each species of coral has an optimum depth where they are found in higher numbers. Table 2.1 shows the results of the survey. Table 2.1 number of coral colonies depth / m species A species B species C species D species E species F 2 67 54 1 0 17 15 4 4 6 0 3 22 13 12 0 0 21 28 18 14 (a) (i) Describe a method the divers could have used to collect reliable data. … … … … … … … … [4] (ii) Draw a bar chart using the data in Table 2.1, to show the number of colonies of each species of coral found at a depth of 4 m. [4] (iii) Use the data in Table 2.1 to compare the depth preferences of the six species of coral. … … … … … … [3] (b) Discuss the extent to which the data in Table 2.1 support the hypothesis. … … … … [2] [Total: 13]
13 marks
Mark scheme: 2(a)(i) Any 4 of: count total number of, each / different, species ; at each depth / 2 m, 4 m and 12 m / idea of, different depths ; idea of, sample every 2 m / smaller intervals of depth ; how to count / estimate (quadrat / belt or line transect) ; control variable ; repeat / find, mean / average ; do not damage coral ; 4 A ‘types’ to mean species A ‘at these depths’ A idea of a grid, take photos (to analyse later) e.g. (suitable) size of area sample / ref. to suitable time period / same reef ; 2(a)(ii) both axes correctly labelled ; linear scale on y axis ; data for 4 m plotted ± ½ square ; bars not touching + of equal width ; 4 plots must take up at least half the grid max 3 for other type of graph – MP4 not available 2(a)(iii) species E + F show even distribution with depth / survive at any depth tested ; species A + B prefer 2 m / shallow water / higher / highest at 2 m; species C + D prefer 12 m / deeper water / higher / highest at 12 m ; 3 R other stated depths / lower/ lowest at 2 m R other stated depths / lower / lowest at 12 m Question Answer Marks Guidance 2(b) species A–D do support (the hypothesis), as narrow range / optimum depth with high numbers AW ; species E and F do not support (the hypothesis), as similar numbers at all depths / E and F can live in both deep and shallow water ; if no other marks awarded, all for 1 mark ‘A to D do support AND E and F do not’ 2 A in terms of just one species A in terms of just one species
This question in 9693/21 May/June 2018
Q5 · Coral bleaching, in which coral polyps expel their zooxanthellae, can be caused by… 9693/22 May/June 2018
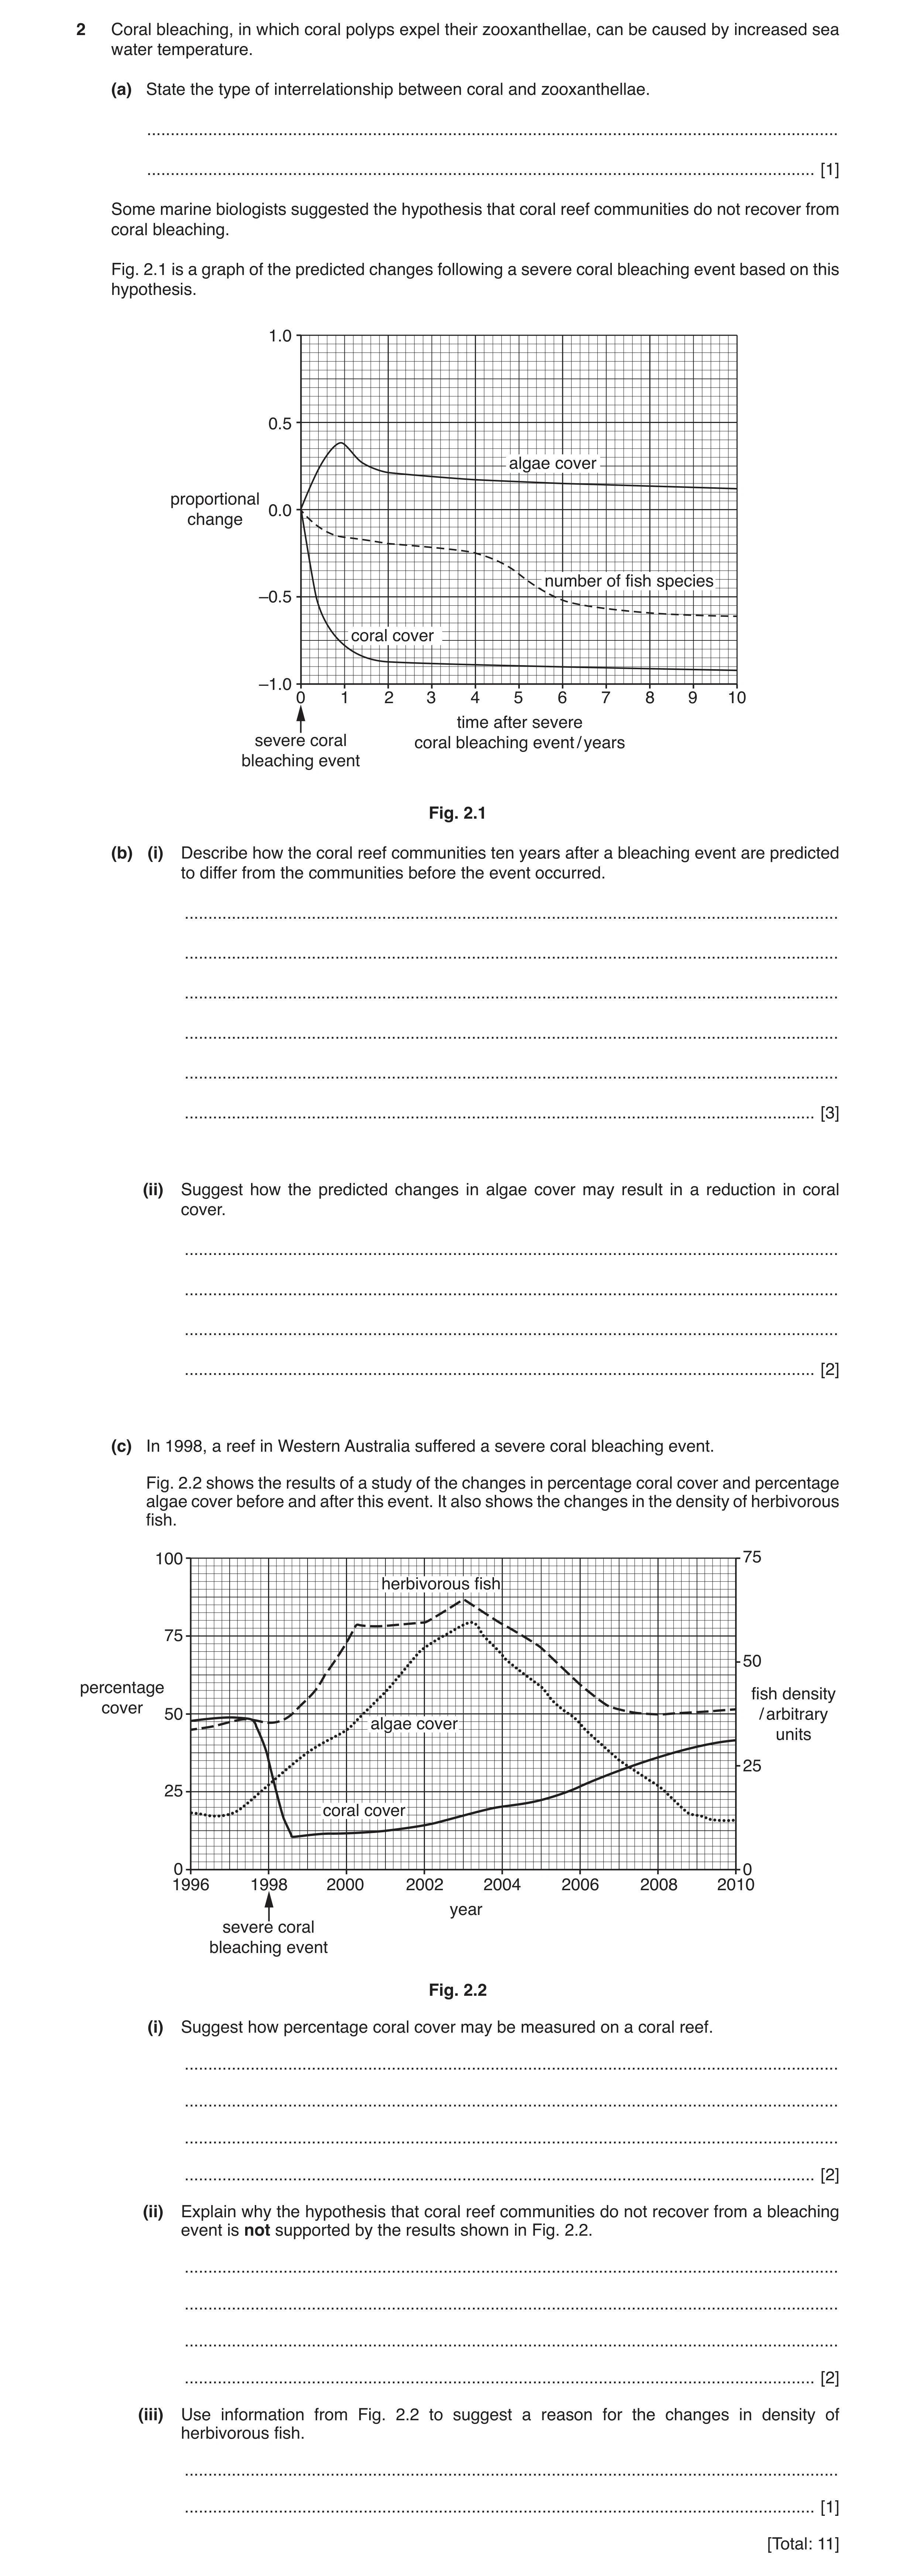
2 Coral bleaching, in which coral polyps expel their zooxanthellae, can be caused by increased sea water temperature. (a) State the type of interrelationship between coral and zooxanthellae. … … [1] Some marine biologists suggested the hypothesis that coral reef communities do not recover from coral bleaching. Fig. 2.1 is a graph of the predicted changes following a severe coral bleaching event based on this hypothesis. 1.0 0.5 algae cover proportional 0.0 change number of fish species –0.5 coral cover –1.0 0 1 2 3 4 5 6 7 8 9 10 time after severe severe coral coral bleaching event / years bleaching event Fig. 2.1 (b) (i) Describe how the coral reef communities ten years after a bleaching event are predicted to differ from the communities before the event occurred. … … … … … … [3] (ii) Suggest how the predicted changes in algae cover may result in a reduction in coral cover. … … … … [2] (c) In 1998, a reef in Western Australia suffered a severe coral bleaching event. Fig. 2.2 shows the results of a study of the changes in percentage coral cover and percentage algae cover before and after this event. It also shows the changes in the density of herbivorous fish. 100 75 herbivorous fish 75 50 percentage fish density cover 50 / arbitrary algae cover units 25 25 coral cover 0 0 1996 1998 2000 2002 2004 2006 2008 2010 year severe coral bleaching event Fig. 2.2 (i) Suggest how percentage coral cover may be measured on a coral reef. … … … … [2] (ii) Explain why the hypothesis that coral reef communities do not recover from a bleaching event is not supported by the results shown in Fig. 2.2. … … … … [2] (iii) Use information from Fig. 2.2 to suggest a reason for the changes in density of herbivorous fish. … … [1] [Total: 11]
11 marks
Mark scheme: 2(a) mutualistic / mutualism ; 1 2(b)(i) increase in algae (cover) ; decrease in coral (cover) ; decrease in number of fish (species) ; 3 2(b)(ii) any two of algae block light (to zooxanthellae) ; (which) prevents photosynthesis ; prevent settlement of new coral ; prevent polyps from feeding / blocks mouths of polyps ; 2 2(c)(i) idea of, counting / estimate / calculate (%) cover ; any one of idea of, quadrats ; appropriate sample area (e.g. per m2) ; ref. to how placed – transect / random ; idea of, repeats + calculating mean ; 2 2(c)(ii) idea of, species present is similar to previous levels / AW ; idea of, coral cover returns to (nearly) previous levels / AW ; idea of, fish returns to (nearly) previous levels / AW ; idea of, algae cover returns to previous levels / AW ; 2 2(c)(iii) fish eat algae (so as algae changes, fish density changes) ; 1 A clear description that shows the data of fish and algae are correlated
This question in 9693/22 May/June 2018
Q6 · Coral bleaching, in which coral polyps expel their zooxanthellae, can be caused by… 9693/23 May/June 2018
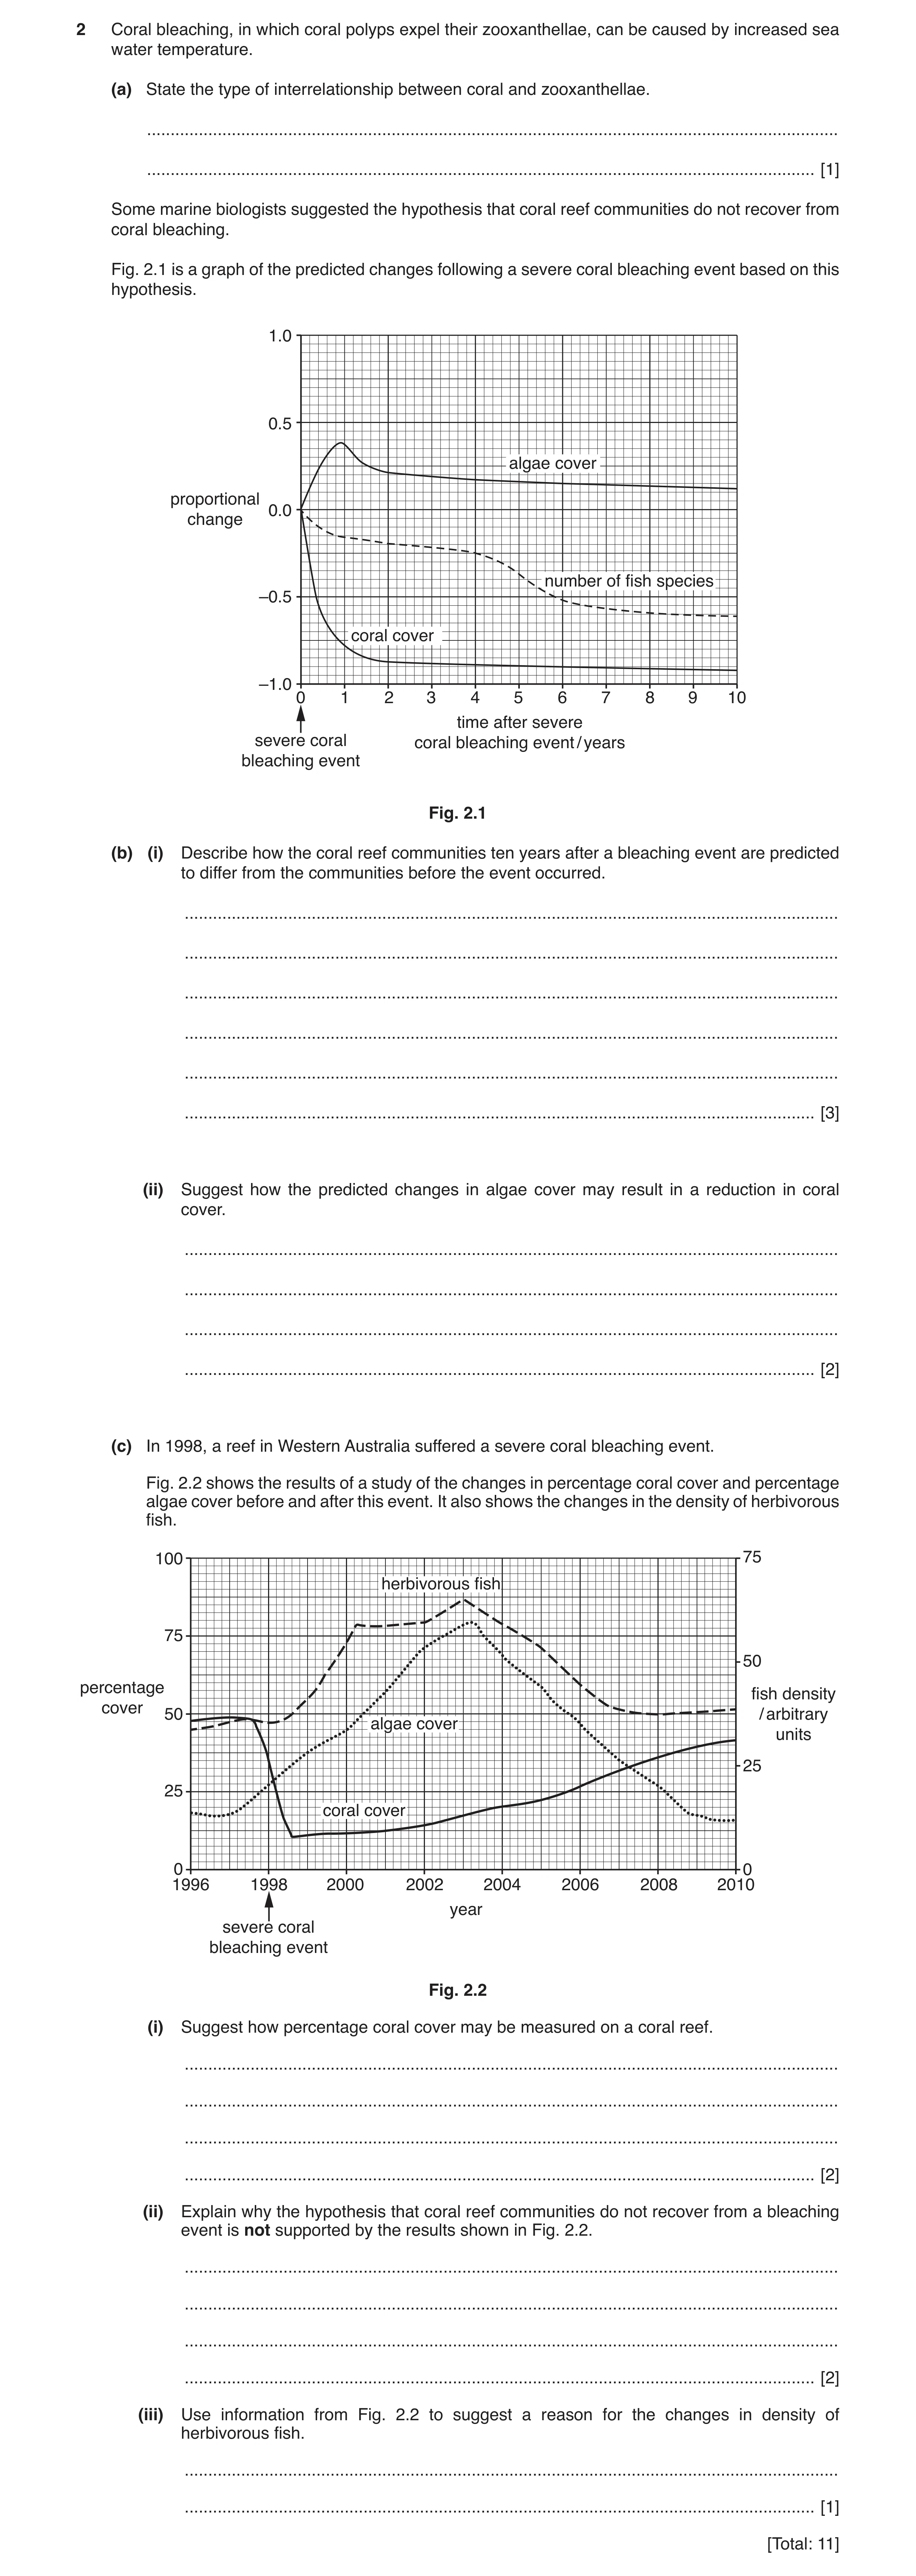
2 Coral bleaching, in which coral polyps expel their zooxanthellae, can be caused by increased sea water temperature. (a) State the type of interrelationship between coral and zooxanthellae. … … [1] Some marine biologists suggested the hypothesis that coral reef communities do not recover from coral bleaching. Fig. 2.1 is a graph of the predicted changes following a severe coral bleaching event based on this hypothesis. 1.0 0.5 algae cover proportional 0.0 change number of fish species –0.5 coral cover –1.0 0 1 2 3 4 5 6 7 8 9 10 time after severe severe coral coral bleaching event / years bleaching event Fig. 2.1 (b) (i) Describe how the coral reef communities ten years after a bleaching event are predicted to differ from the communities before the event occurred. … … … … … … [3] (ii) Suggest how the predicted changes in algae cover may result in a reduction in coral cover. … … … … [2] (c) In 1998, a reef in Western Australia suffered a severe coral bleaching event. Fig. 2.2 shows the results of a study of the changes in percentage coral cover and percentage algae cover before and after this event. It also shows the changes in the density of herbivorous fish. 100 75 herbivorous fish 75 50 percentage fish density cover 50 / arbitrary algae cover units 25 25 coral cover 0 0 1996 1998 2000 2002 2004 2006 2008 2010 year severe coral bleaching event Fig. 2.2 (i) Suggest how percentage coral cover may be measured on a coral reef. … … … … [2] (ii) Explain why the hypothesis that coral reef communities do not recover from a bleaching event is not supported by the results shown in Fig. 2.2. … … … … [2] (iii) Use information from Fig. 2.2 to suggest a reason for the changes in density of herbivorous fish. … … [1] [Total: 11]
11 marks
Mark scheme: 2(a) mutualistic / mutualism ; 1 2(b)(i) increase in algae (cover) ; decrease in coral (cover) ; decrease in number of fish (species) ; 3 2(b)(ii) any two of algae block light (to zooxanthellae) ; (which) prevents photosynthesis ; prevent settlement of new coral ; prevent polyps from feeding / blocks mouths of polyps ; 2 2(c)(i) idea of, counting / estimate / calculate (%) cover ; any one of idea of, quadrats ; appropriate sample area (e.g. per m2) ; ref. to how placed – transect / random ; idea of, repeats + calculating mean ; 2 2(c)(ii) idea of, species present is similar to previous levels / AW ; idea of, coral cover returns to (nearly) previous levels / AW ; idea of, fish returns to (nearly) previous levels / AW ; idea of, algae cover returns to previous levels / AW ; 2 2(c)(iii) fish eat algae (so as algae changes, fish density changes) ; 1 A clear description that shows the data of fish and algae are correlated
This question in 9693/23 May/June 2018
Q7 · The cold-water coral species, Lophelia pertusa, lives at depths of between 39 m and 3000 m 9693/20 Oct/Nov 2018
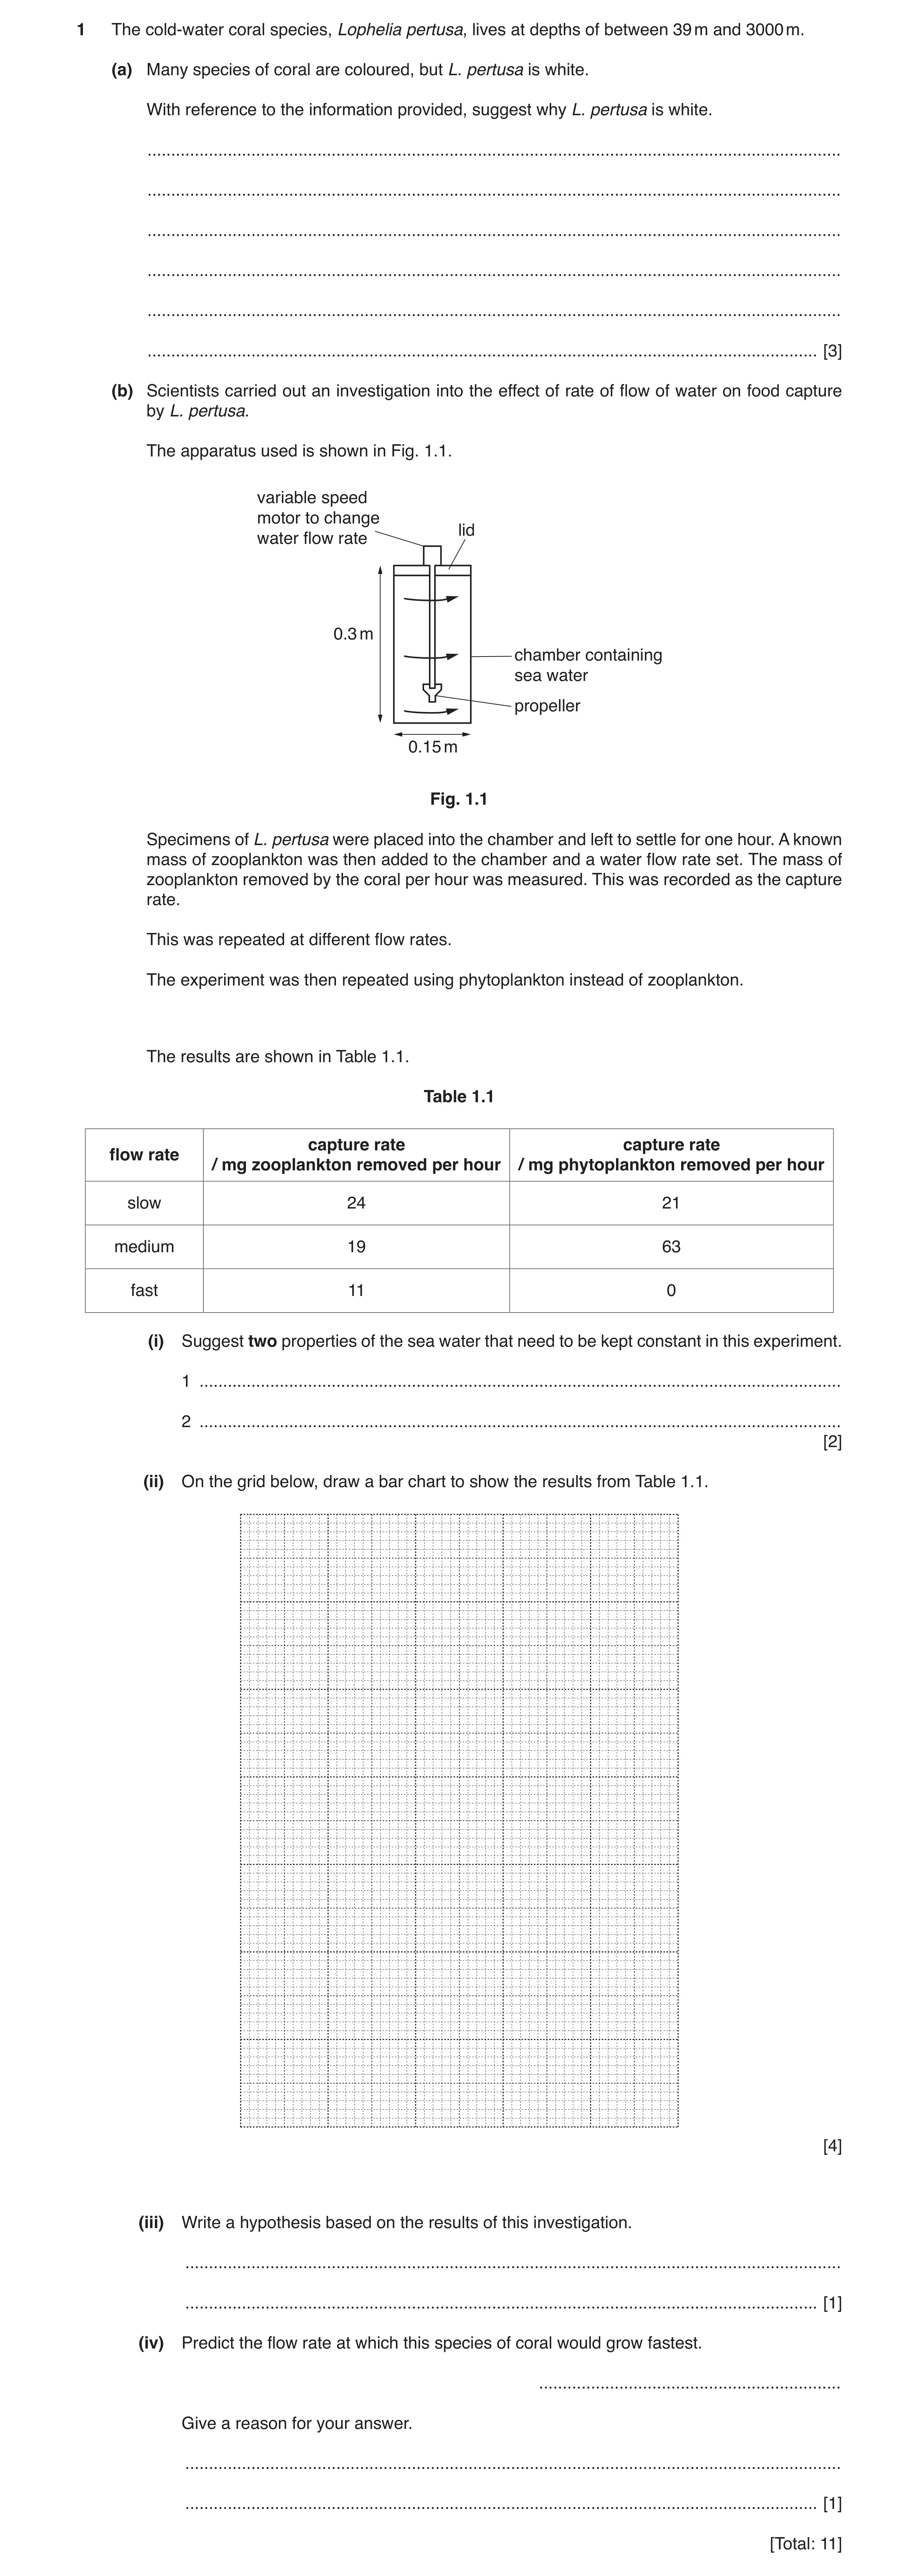
1 The cold-water coral species, Lophelia pertusa, lives at depths of between 39 m and 3000 m. (a) Many species of coral are coloured, but L. pertusa is white. With reference to the information provided, suggest why L. pertusa is white. … … … … … … [3] (b) Scientists carried out an investigation into the effect of rate of flow of water on food capture by L. pertusa. The apparatus used is shown in Fig. 1.1. variable speed motor to change lid water flow rate 0.3 m chamber containing sea water propeller 0.15 m Fig. 1.1 Specimens of L. pertusa were placed into the chamber and left to settle for one hour. A known mass of zooplankton was then added to the chamber and a water flow rate set. The mass of zooplankton removed by the coral per hour was measured. This was recorded as the capture rate. This was repeated at different flow rates. The experiment was then repeated using phytoplankton instead of zooplankton. The results are shown in Table 1.1. Table 1.1 capture rate capture rateflow rate / mg zooplankton removed per hour / mg phytoplankton removed per hour slow 24 21 medium 19 63 fast 11 0 (i) Suggest two properties of the sea water that need to be kept constant in this experiment. 1 … 2 … [2] (ii) On the grid below, draw a bar chart to show the results from Table 1.1. [4] (iii) Write a hypothesis based on the results of this investigation. … … [1] (iv) Predict the flow rate at which this species of coral would grow fastest. … Give a reason for your answer. … … [1] [Total: 11]
11 marks
This question in 9693/20 Oct/Nov 2018
Q8 · Some coral reefs form atolls 9693/20 Oct/Nov 2018
3 (a) Some coral reefs form atolls. Explain the Darwin-Dana-Daly theory of atoll formation. You may include diagrams to aid your explanation. … … … … … … … … … … … … … … … … … … … … … … … … [6] (b) Discuss the factors that can lead to a transition from coral reef growth to coral reef erosion. … … … … … … … … … … … … [6] (c) Explain how coral reefs help to protect shores from the effects of storm surges. … … … … … … [3] [Total: 15]
15 marks
This question in 9693/20 Oct/Nov 2018
Q9 · Explain how tectonic processes can lead to a tsunami 9693/21 May/June 2019
4 (a) Explain how tectonic processes can lead to a tsunami. … … … … … … … … [4] (b) Outline the Darwin-Dana-Daly theory of atoll formation. … … … … … … … … … … [5] (c) Tidal range is affected by the relative positions of the Earth, Moon and Sun. Describe how other factors can affect the tidal range. … … … … … … … … … … … … [6] [Total: 15]
15 marks
Mark scheme: 4(a) any 4 of: movement of convergent / transform (plate) boundaries ; build-up of pressure / tension ; sudden release / sudden slippage; (of) large amounts of energy ; (from) earthquake below seabed / underwater earthquake ; (causing) vertical displacement of seabed ; large displacement of (sea)water ; 4 Question Answer Marks Guidance 4(b) any 5 of: 1 oceanic volcano emerges / volcanic island ; 2 colonised / settling, by, reef-building / hermatypic, coral OR colonised / settling, by coral polyps / coral larvae ; 3 so, fringing reef develops ; 4 volcano becomes dormant / extinct ; 5 volcano / island, begins to sink / subside ; 6 so, barrier reef develops ; 7 lagoon / description of, forms between reef and island ; 8 volcano / island, eventually sinks below sea level / disappears ; 5 Accept marking points from well labelled / annotated diagrams. I coral unqualified R if answer implies barrier formed before fringing 4(c) any 6 of: 1 shape / morphology / configuration / geomorphology, of coastline ; 2 funnelling / channelling, of water into small area increases range ; 3 slope / relief of shore ; 4 lower range on shallower relief ; 5 size / volume, of water body ; 6 larger body has greater range; 7 air / atmospheric pressure ; 8 lower pressure causes greater range / higher tide ; 9 speed / strength of wind; 10 greater wind speed increases range / higher tide ; 11 wind direction (onshore / offshore) ; 12 correct description e.g. onshore causing higher tide ; 6
This question in 9693/21 May/June 2019
Q10 · Outline the environmental factors of shorelines that are required for the development of… 9693/20 Oct/Nov 2019
3 (a) (i) Outline the environmental factors of shorelines that are required for the development of mangrove forests. … … … … … … … … [4] (ii) Explain how the tidal cycle would affect the salinity in a mangrove forest in an estuary over the period of a single day. … … … … … … … … [4] (iii) Suggest two impacts of removing mangrove forests from a shoreline. 1 … … 2 … … [2] (b) Coral reefs are rarely found near river estuaries or deltas. Explain the reasons for this. … … … … … … … … … … [5] [Total: 15]
15 marks
This question in 9693/20 Oct/Nov 2019
Q11 · A species of butterfly fish, Chaetodon austriacus, which inhabits coral reefs in the Red… 9693/21 May/June 2020
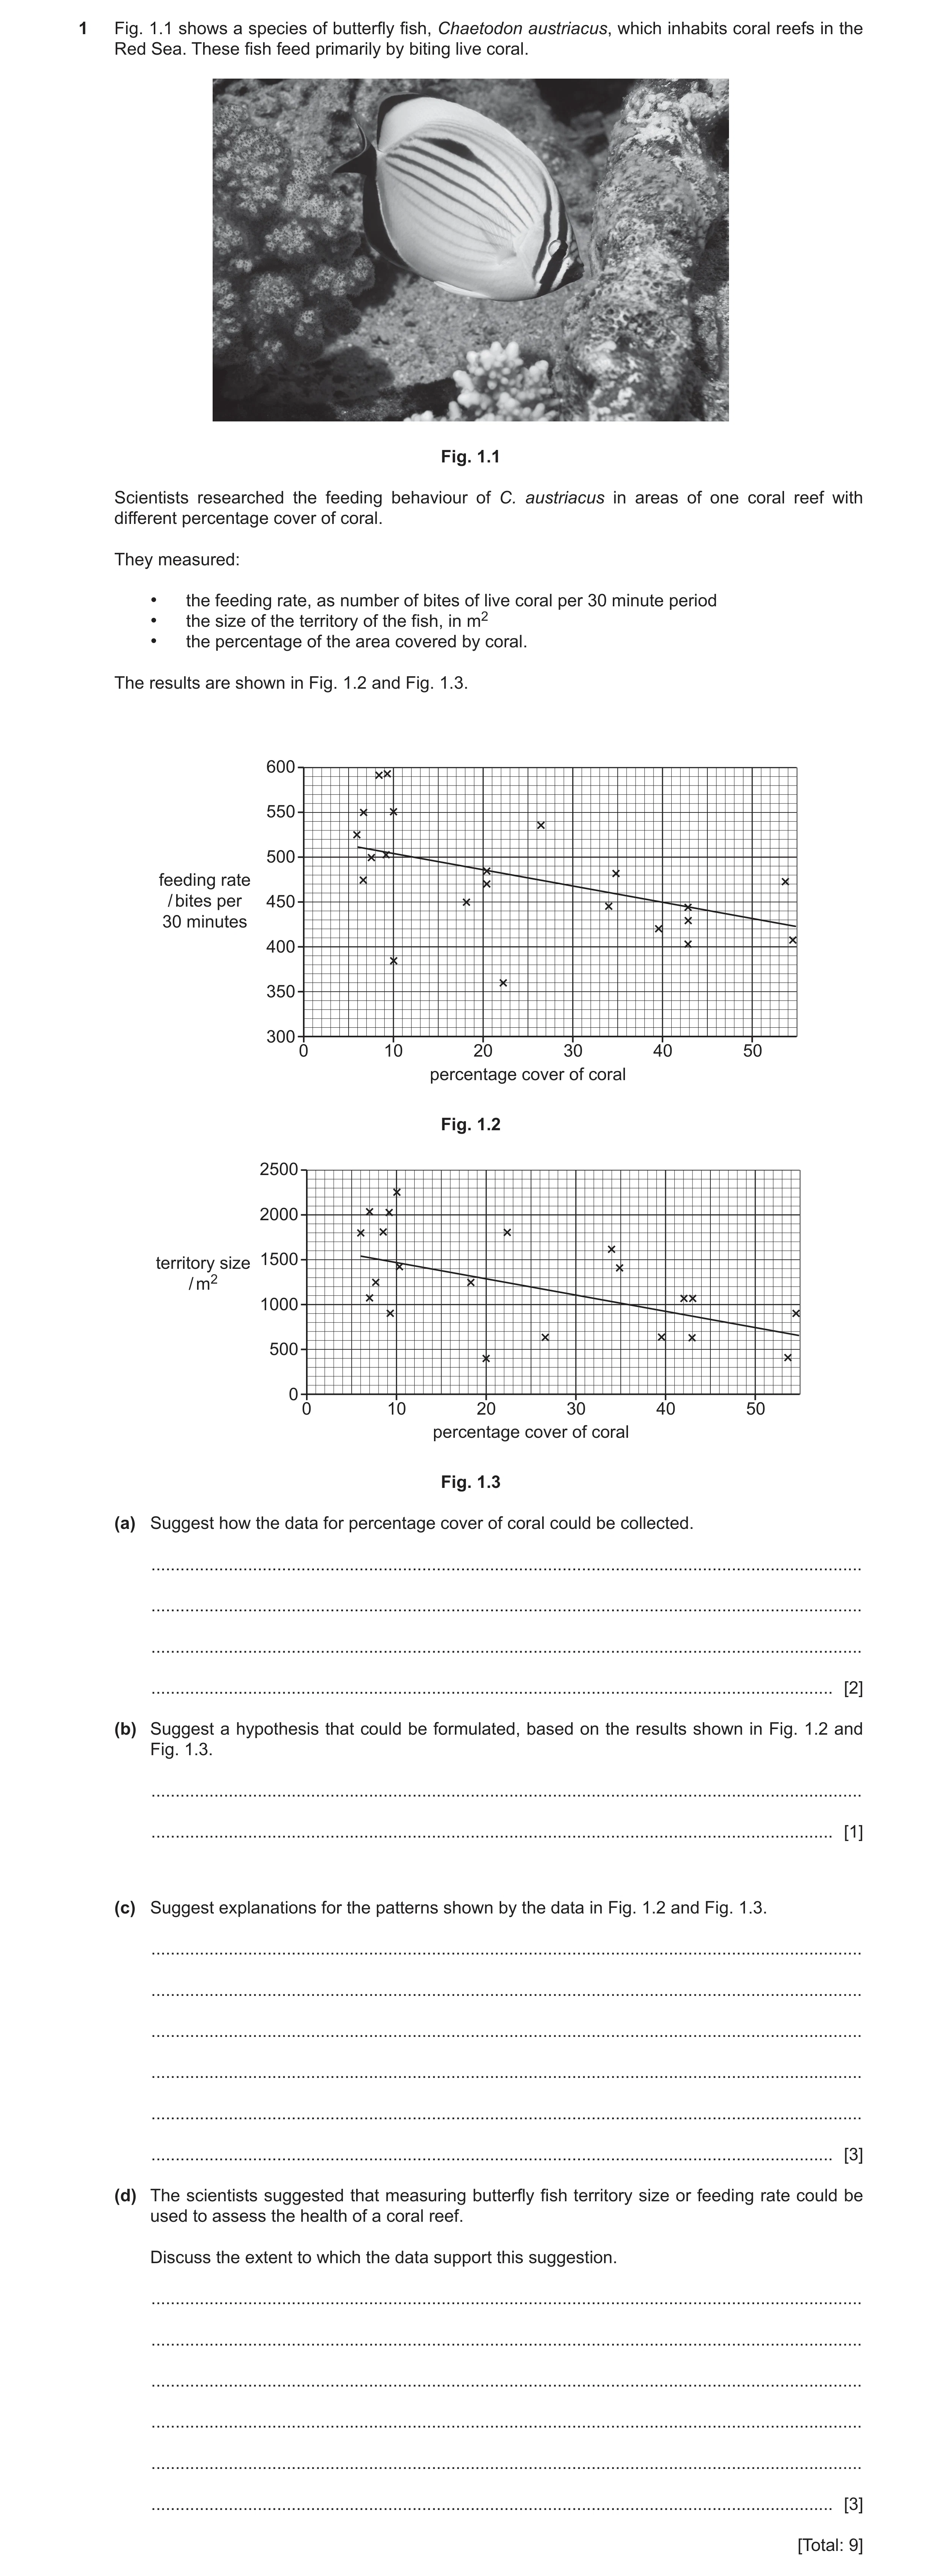
1 Fig. 1.1 shows a species of butterfly fish, Chaetodon austriacus, which inhabits coral reefs in the Red Sea. These fish feed primarily by biting live coral. Fig. 1.1 Scientists researched the feeding behaviour of C. austriacus in areas of one coral reef with different percentage cover of coral. They measured: • the feeding rate, as number of bites of live coral per 30 minute period • the size of the territory of the fish, in m2 • the percentage of the area covered by coral. The results are shown in Fig. 1.2 and Fig. 1.3. 600 550 500 feeding rate / bites per 450 30 minutes 400 350 300 0 10 20 30 40 50 percentage cover of coral Fig. 1.2 2500 2000 territory size 1500 / m2 1000 500 0 0 10 20 30 40 50 percentage cover of coral Fig. 1.3 (a) Suggest how the data for percentage cover of coral could be collected. … … … … [2] (b) Suggest a hypothesis that could be formulated, based on the results shown in Fig. 1.2 and Fig. 1.3. … … [1] (c) Suggest explanations for the patterns shown by the data in Fig. 1.2 and Fig. 1.3. … … … … … … [3] (d) The scientists suggested that measuring butterfly fish territory size or feeding rate could be used to assess the health of a coral reef. Discuss the extent to which the data support this suggestion. … … … … … … [3] [Total: 9]
9 marks
Mark scheme: 1(a) any 2 of: use of measured area / use of quadrat ; idea of subdivisions within, area / quadrat ; to record coral coverage (in territory of each fish) ; use of photograph for subsequent analysis ; repeat process ; 2 1(b) any suitable suggestion: increased percentage cover of coral will decrease feeding rate AND / OR territory size ; percentage cover of coral affects feeding rate AND territory size ; there is a (positive) correlation between feeding rate and territory size ; 1 1(c) any 3 of: (territory size will increase with decreased percentage cover) as fish will need to forage further / move around more to find sufficient food ORA ; (feeding rate may increase with decreased percentage cover) as fish will expend more energy seeking food ORA ; (feeding rate may increase with increased cover) as fish can take more bites in one place ; ref. to reasons for increased feeding rate in increased territory size ; AVP ; 3 Question Answer Marks 1(d) any 3 of: (clear) correlation between the variables ; only one species of fish studied ; only one reef studied ; relatively small sample size ; spread of data is high ; credit suitable supporting examples from data ; territory size correlation is stronger ; errors in collection of data e.g. missing a bite ; 3
This question in 9693/21 May/June 2020
Q12 · Small sections of coral can be grown attached to steel frames 9693/22 May/June 2020
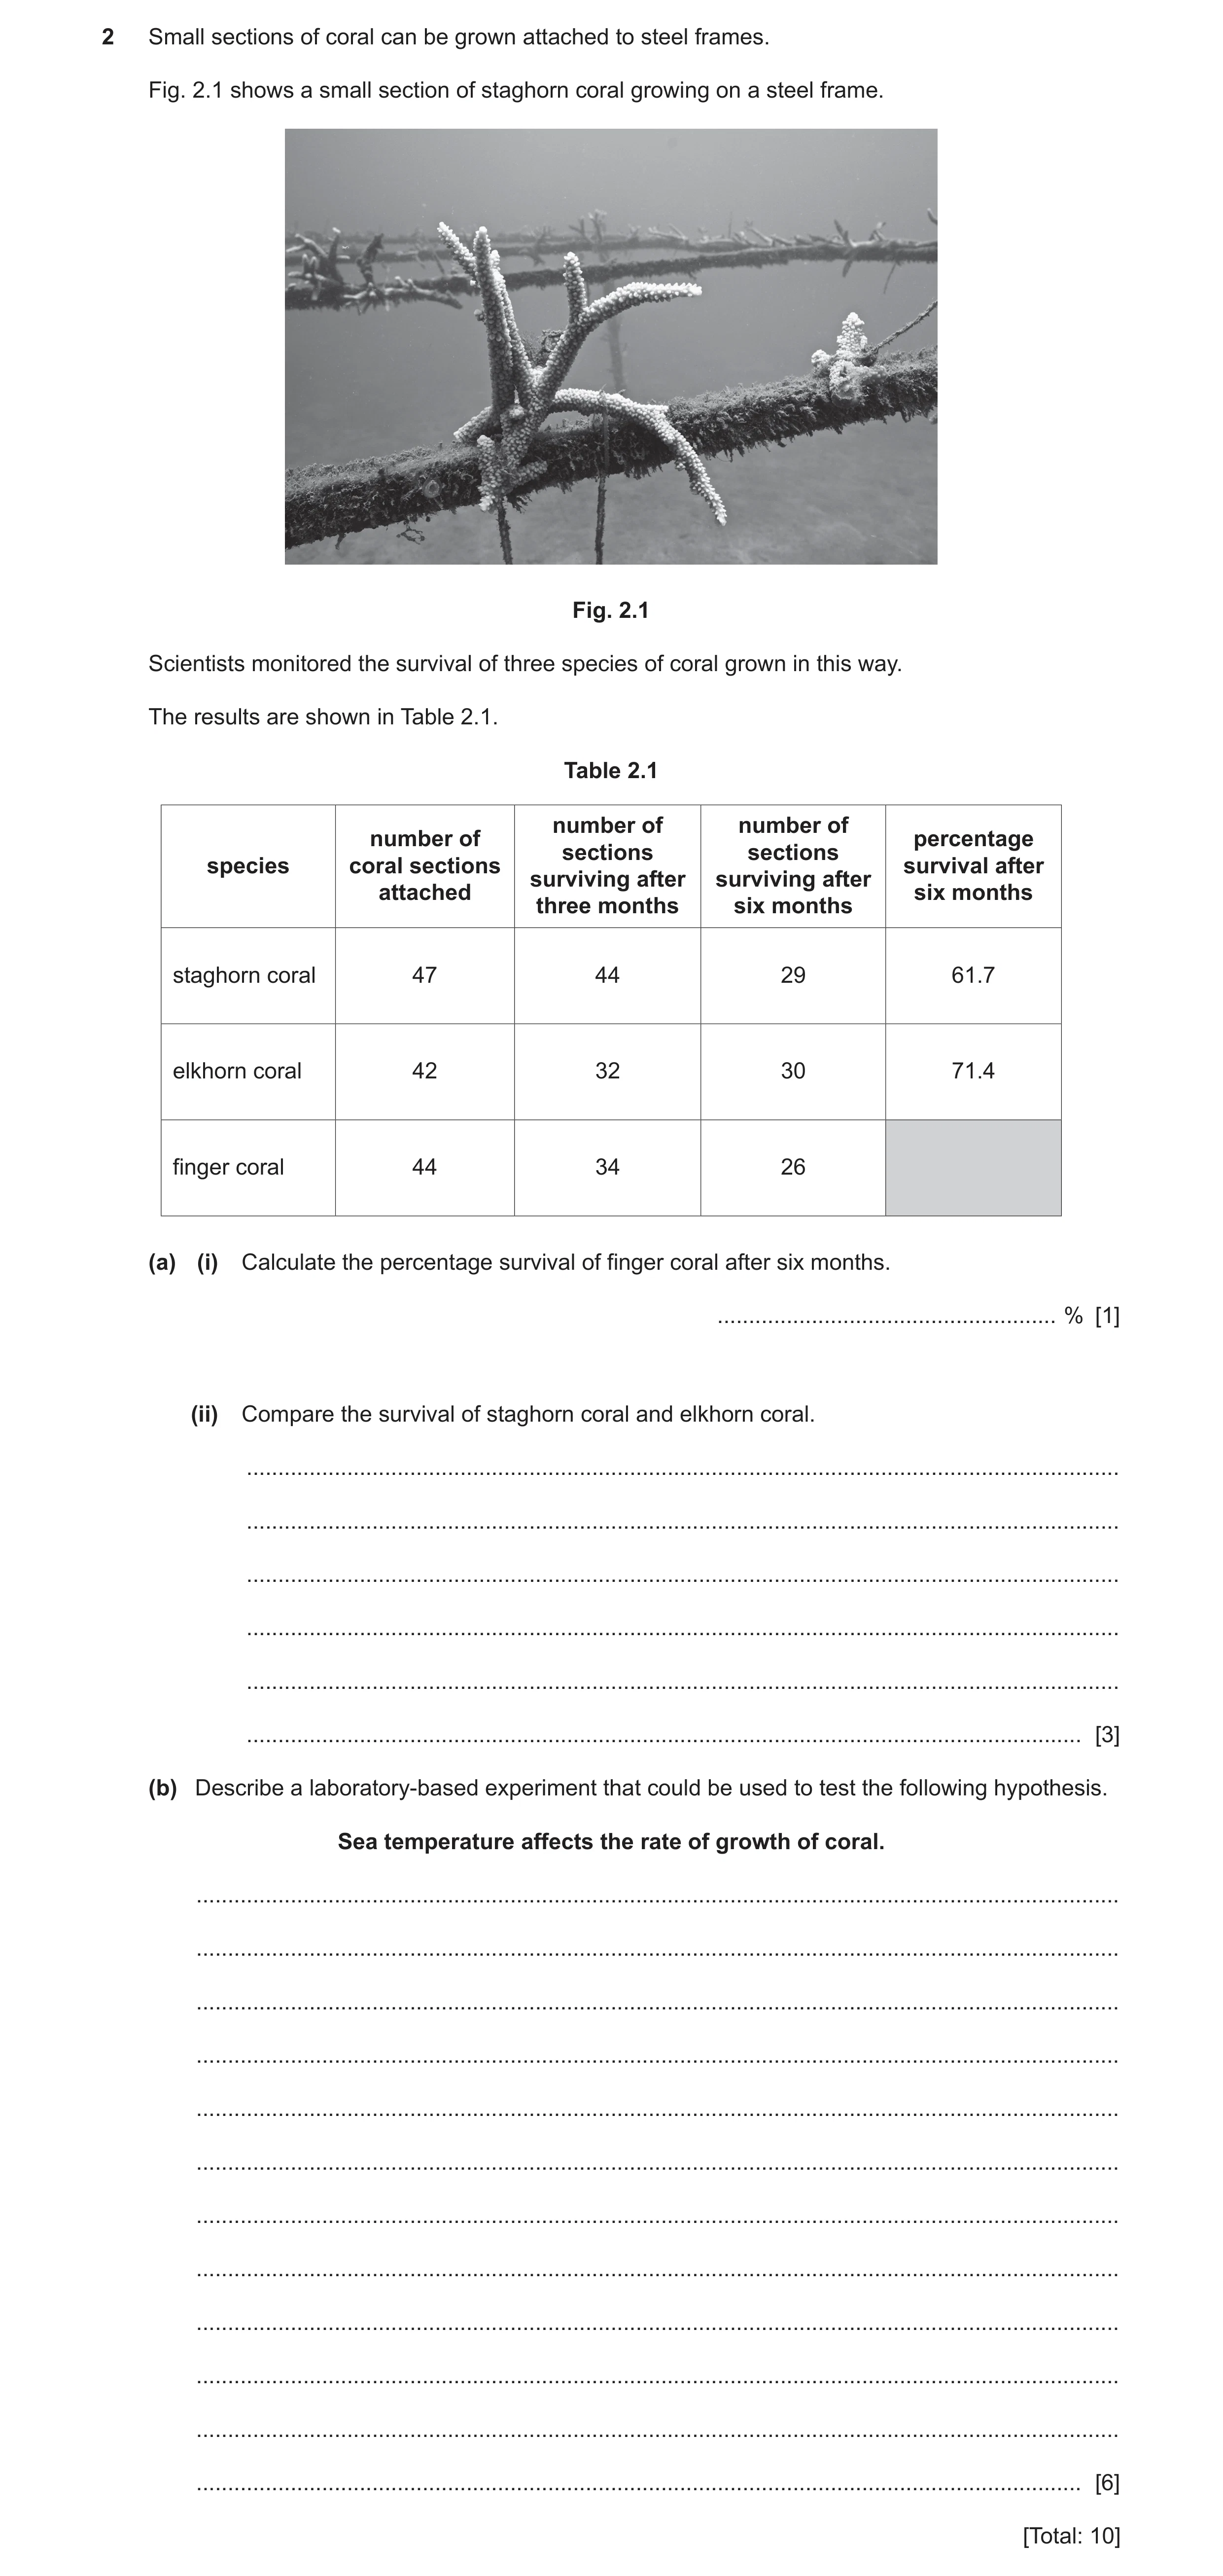
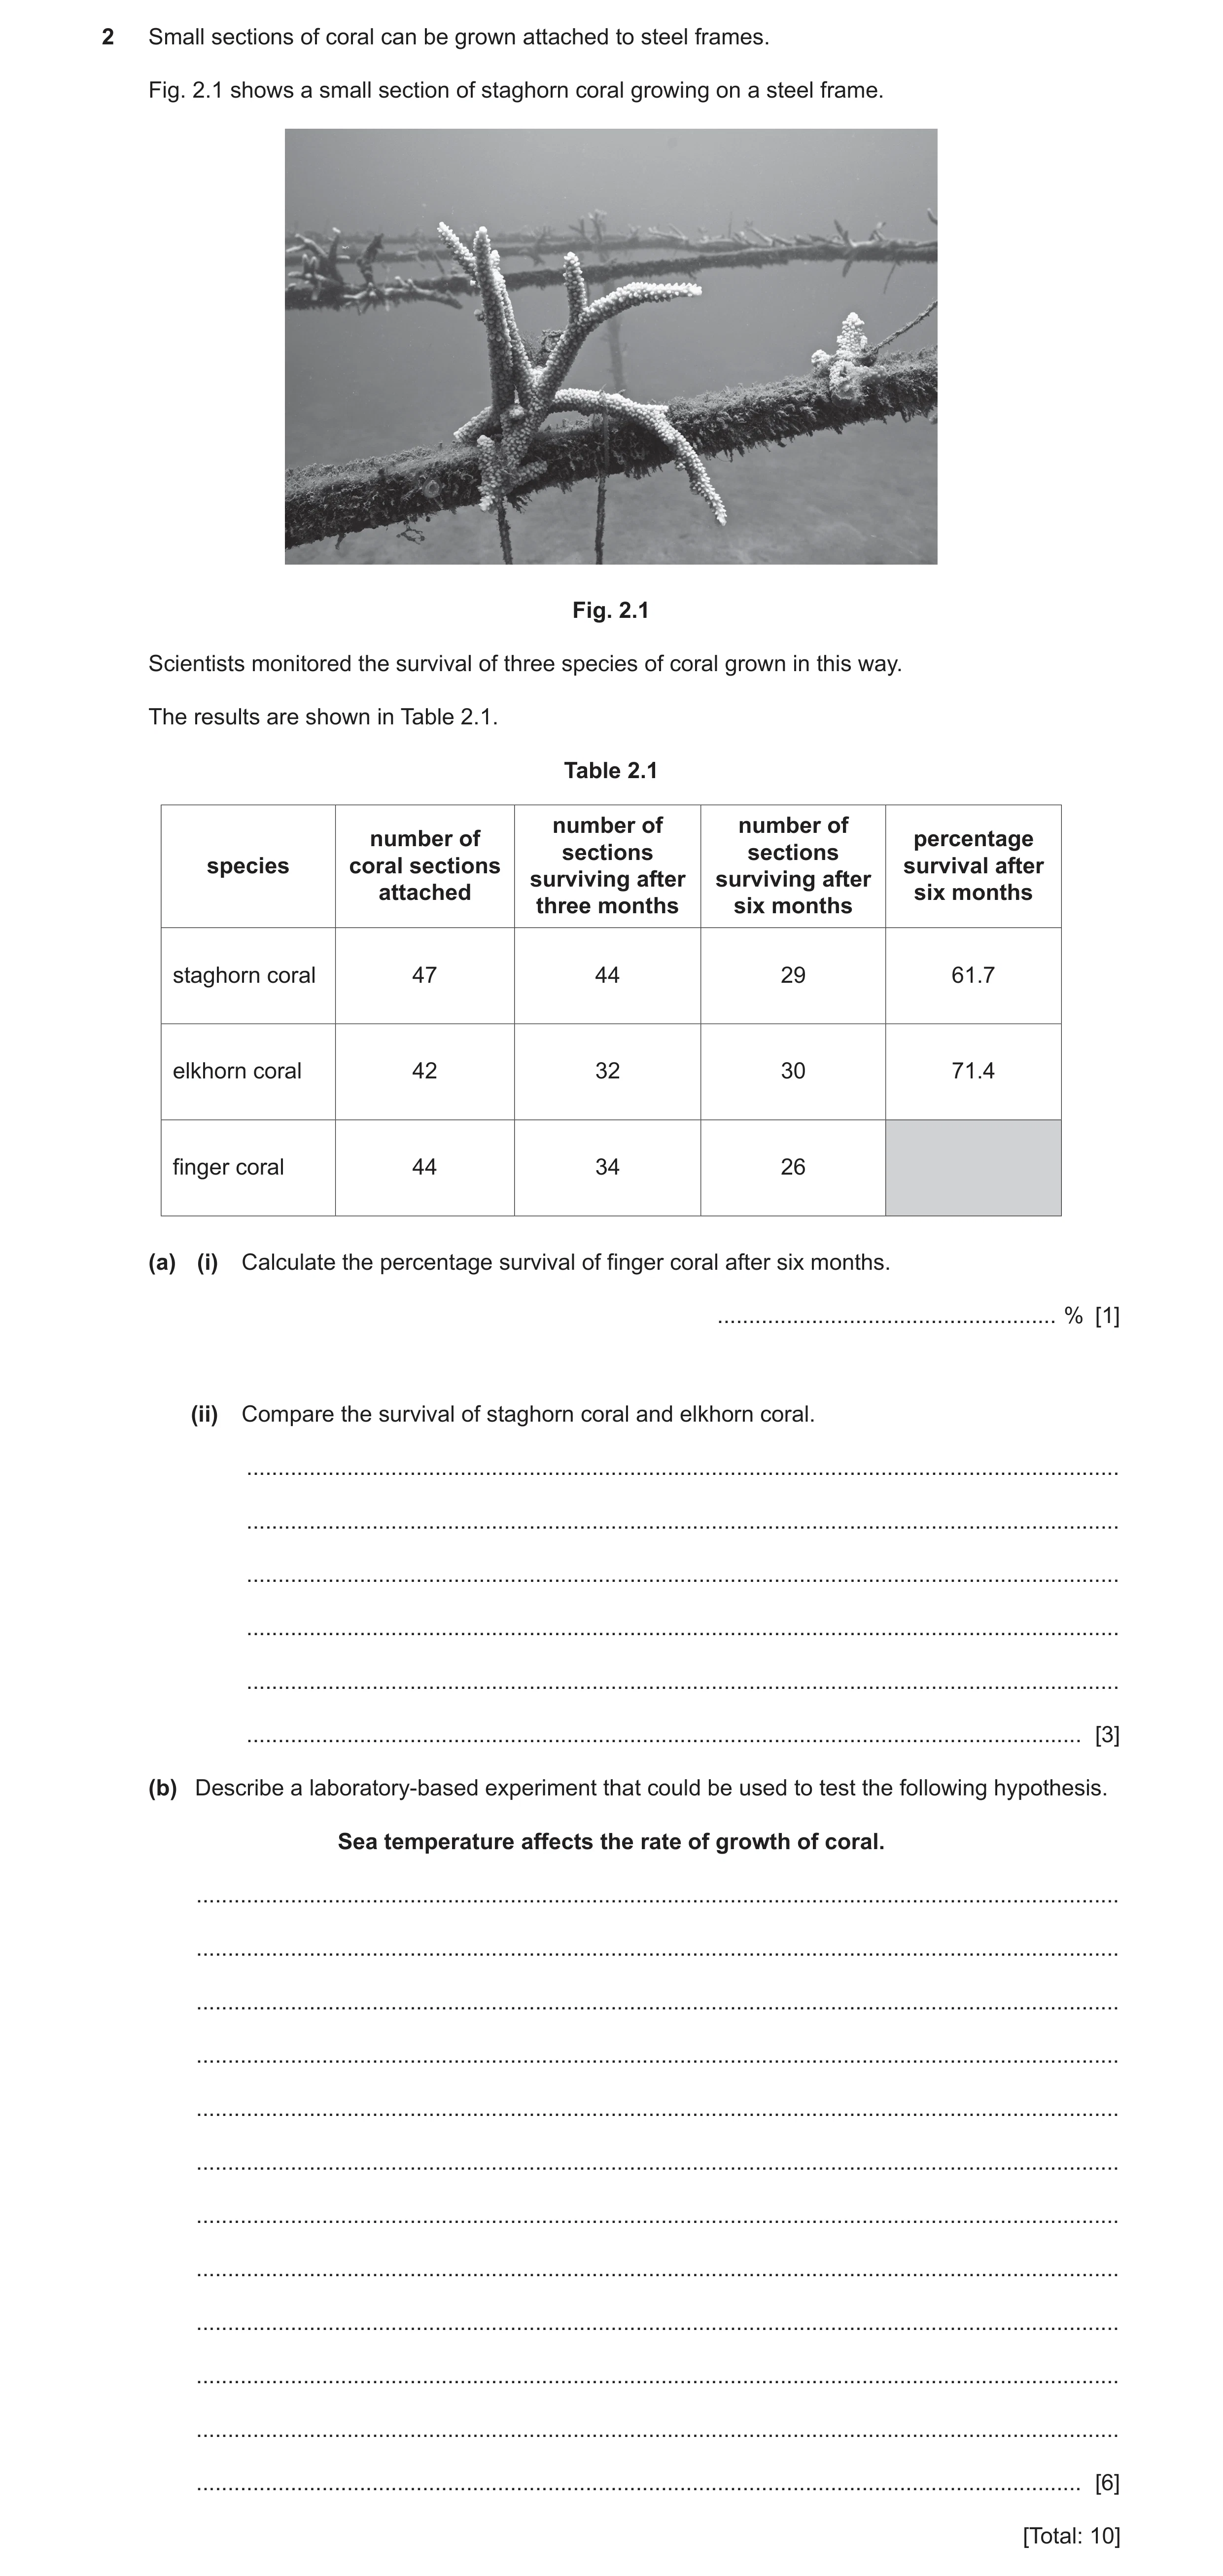
2 Small sections of coral can be grown attached to steel frames. Fig. 2.1 shows a small section of staghorn coral growing on a steel frame. Fig. 2.1 Scientists monitored the survival of three species of coral grown in this way. The results are shown in Table 2.1. Table 2.1 number of number of number of percentage sections sections species coral sections survival after surviving after surviving after attached six months three months six months staghorn coral 47 44 29 61.7 elkhorn coral 42 32 30 71.4 finger coral 44 34 26 (a) (i) Calculate the percentage survival of finger coral after six months. … % [1] (ii) Compare the survival of staghorn coral and elkhorn coral. … … … … … … [3] (b) Describe a laboratory-based experiment that could be used to test the following hypothesis. Sea temperature affects the rate of growth of coral. … … … … … … … … … … … … [6] [Total: 10]
10 marks
Mark scheme: 2(a)(i) 59.1 (59) 1 2(a)(ii) any 3 from: elkhorn has higher % survival after 6 months ; staghorn has higher initial survival ; greater drop in staghorn number surviving between 3–6 months ; only slight drop in elkhorn coral numbers between 3–6 months ; credit manipulation of numbers ; 3 2(b) any 6 from: 1 (how vary independent) reference to (a) container(s) of (sea) water ; 2 (range independent) each at a stated temperature / suitable temperature range suggested ; 3 (control variables) at least two stated variables controlled, e.g. species of coral, salinity of sea water, light intensity, dissolved oxygen concentration, pH, nutrient/food content of water ; 4 (how dependent) known original mass or area or branch length of coral ; 5 (how dependent) leave for suitable stated time ; 6 (how dependent) measure change in mass / area / length of coral (at each temperature) ; 7 (how dependent) reference to calculation of rate of growth ; 8 (repeats and means) reference to replicates (at each temperature) + calculation of means / average ; 9 (ethical / safety) e.g. care handling coral as living organism / not extreme values of independent variable that could kill coral ; 6
This question in 9693/22 May/June 2020
Q13 · Hunga Tonga is an underwater volcano in the tropical South Pacific Ocean near Tonga 9693/22 May/June 2020
4 Hunga Tonga is an underwater volcano in the tropical South Pacific Ocean near Tonga. (a) Use the theory of plate tectonics to describe how the Hunga Tonga volcano formed. … … … … … … … … [4] (b) In January 2015 the Hunga Tonga volcano created a new island. It measured 500 m across and 250 m high. Use the Darwin-Dana-Daly theory to suggest what might eventually happen to the new island over time. … … … … … … … … [4] (c) Describe and explain how volcanic activity and other factors can affect the concentration of dissolved gases in sea water. … … … … … … … … … … … … … … [7] [Total: 15]
15 marks
Mark scheme: 4(a) any 4 from: volcano will have formed at plate boundary ; named plate boundary, convergent or divergent ; magma / lava / molten rock, released from below Earth’s crust / from mantle ; (lava) cools AND solidifies ; forms new igneous rock ; ref. to formation in subduction zone ; Question Answer Marks 4(b) any 4 from: 1 colonised / settling, by, reef-building / hermatypic, coral OR colonised / settling, by coral polyps / coral larvae ; 2 so, fringing reef develops ; 3 volcano becomes dormant / extinct ; 4 volcano / island, begins to sink / subside ; 5 so, barrier reef develops ; 6 lagoon / description of, forms between reef and island ; 7 volcano / island, eventually sinks below sea level / disappears ; 4 Question Answer Marks 4(c) any 7 from: 1 gases from volcanic action dissolve ; 2 named volcanic gas ; 3 change in temperature ; 4 higher temperature decreases solubility / ORA ; 5 suggested cause for change e.g. vent / volcano / glacial melt / global warming ; 6 wave action ; 7 (increased turbulence) increases dissolution ; 8 salinity ; 9 increased salinity decreases solubility / ORA ; 10 pressure ; 11 increased pressure increases solubility / ORA ; 12 ref to photosynthesis, increasing O2 / decreasing CO2 ; 13 ref to respiration, decreasing O2 / increasing CO2 ; 7
This question in 9693/22 May/June 2020
Q14 · Small sections of coral can be grown attached to steel frames 9693/23 May/June 2020
2 Small sections of coral can be grown attached to steel frames. Fig. 2.1 shows a small section of staghorn coral growing on a steel frame. Fig. 2.1 Scientists monitored the survival of three species of coral grown in this way. The results are shown in Table 2.1. Table 2.1 number of number of number of percentage sections sections species coral sections survival after surviving after surviving after attached six months three months six months staghorn coral 47 44 29 61.7 elkhorn coral 42 32 30 71.4 finger coral 44 34 26 (a) (i) Calculate the percentage survival of finger coral after six months. … % [1] (ii) Compare the survival of staghorn coral and elkhorn coral. … … … … … … [3] (b) Describe a laboratory-based experiment that could be used to test the following hypothesis. Sea temperature affects the rate of growth of coral. … … … … … … … … … … … … [6] [Total: 10]
10 marks
Mark scheme: 2(a)(i) 59.1 (59) 1 2(a)(ii) any 3 from: 3 elkhorn has higher % survival after 6 months ; staghorn has higher initial survival ; greater drop in staghorn number surviving between 3–6 months ; only slight drop in elkhorn coral numbers between 3–6 months ; credit manipulation of numbers ; 2(b) any 6 from: 6 1 (how vary independent) reference to (a) container(s) of (sea) water ; 2 (range independent) each at a stated temperature / suitable temperature range suggested ; 3 (control variables) at least two stated variables controlled, e.g. species of coral, salinity of sea water, light intensity, dissolved oxygen concentration, pH, nutrient/food content of water ; 4 (how dependent) known original mass or area or branch length of coral ; 5 (how dependent) leave for suitable stated time ; 6 (how dependent) measure change in mass / area / length of coral (at each temperature) ; 7 (how dependent) reference to calculation of rate of growth ; 8 (repeats and means) reference to replicates (at each temperature) + calculation of means / average ; 9 (ethical / safety) e.g. care handling coral as living organism / not extreme values of independent variable that could kill coral ;
This question in 9693/23 May/June 2020
Q15 · Hunga Tonga is an underwater volcano in the tropical South Pacific Ocean near Tonga 9693/23 May/June 2020
4 Hunga Tonga is an underwater volcano in the tropical South Pacific Ocean near Tonga. (a) Use the theory of plate tectonics to describe how the Hunga Tonga volcano formed. … … … … … … … … [4] (b) In January 2015 the Hunga Tonga volcano created a new island. It measured 500 m across and 250 m high. Use the Darwin-Dana-Daly theory to suggest what might eventually happen to the new island over time. … … … … … … … … [4] (c) Describe and explain how volcanic activity and other factors can affect the concentration of dissolved gases in sea water. … … … … … … … … … … … … … … [7] [Total: 15]
15 marks
Mark scheme: 4(a) any 4 from: 4 volcano will have formed at plate boundary ; named plate boundary, convergent or divergent ; magma / lava / molten rock, released from below Earth’s crust / from mantle ; (lava) cools AND solidifies ; forms new igneous rock ; ref. to formation in subduction zone ; 4(b) any 4 from: 4 1 colonised / settling, by, reef-building / hermatypic, coral OR colonised / settling, by coral polyps / coral larvae ; 2 so, fringing reef develops ; 3 volcano becomes dormant / extinct ; 4 volcano / island, begins to sink / subside ; 5 so, barrier reef develops ; 6 lagoon / description of, forms between reef and island ; 7 volcano / island, eventually sinks below sea level / disappears ; 4(c) any 7 from: 7 1 gases from volcanic action dissolve ; 2 named volcanic gas ; 3 change in temperature ; 4 higher temperature decreases solubility / ORA ; 5 suggested cause for change e.g. vent / volcano / glacial melt / global warming ; 6 wave action ; 7 (increased turbulence) increases dissolution ; 8 salinity ; 9 increased salinity decreases solubility / ORA ; 10 pressure ; 11 increased pressure increases solubility / ORA ; 12 ref to photosynthesis, increasing O2 / decreasing CO2 ; 13 ref to respiration, decreasing O2 / increasing CO2 ;
This question in 9693/23 May/June 2020
Q16 · Describe the factors needed for tropical coral reef growth 9693/22 May/June 2021
3 (a) Describe the factors needed for tropical coral reef growth. … … … … … … [3] (b) Describe the scientific methods that can be used to reconstruct the history of a coral reef. … … … … … … … … … … [5] (c) Discuss the impacts that tropical coral reef destruction can have on human coastal communities. … … … … … … … … … … … … … … [7] [Total: 15]
15 marks
Mark scheme: 3(a) any 3 from: warm water temperature ; suitable depth / within 20 m of surface ; suitable substrate for attachment of coral larvae ; high / sufficient, light intensity ; ref. to clarity / turbidity of water ; suitable pH ; Question Answer Marks 3(b) any 5 from: geomorphological analysis ; drilling for cores of reef substrate ; from different depths in reef ; analysis of / studying bands in core samples ; (idea of) radiocarbon / 14C dating ; ref. to 14C incorporated into carbonate ; ref. to half life / decay of 14C ; ref. to ratio of 14C to 12C indicates age of coral ; 5 3(c) any 7 from: (coral reefs) absorb wave energy / dissipate wave energy ; reefs reduce wave action / reduce size or strength of waves / slow down waves ; increased erosion of shores AW ; reduced protection for coastal properties ; reduced protection of coastal anchorages / boats ; reduced protection of ecosystems ; reduced tourism; reduced, food from, (harvesting / fishing) ; reduced income / profit ; reduced protection from extreme weather effects e.g. cyclones / hurricanes ; cost of building breakwaters / sea walls ; AVP ; 7
This question in 9693/22 May/June 2021
Q17 · Describe the factors needed for tropical coral reef growth 9693/23 May/June 2021
3 (a) Describe the factors needed for tropical coral reef growth. … … … … … … [3] (b) Describe the scientific methods that can be used to reconstruct the history of a coral reef. … … … … … … … … … … [5] (c) Discuss the impacts that tropical coral reef destruction can have on human coastal communities. … … … … … … … … … … … … … … [7] [Total: 15]
15 marks
Mark scheme: 3(a) any 3 from: warm water temperature ; suitable depth / within 20 m of surface ; suitable substrate for attachment of coral larvae ; high / sufficient, light intensity ; ref. to clarity / turbidity of water ; suitable pH ; Question Answer Marks 3(b) any 5 from: geomorphological analysis ; drilling for cores of reef substrate ; from different depths in reef ; analysis of / studying bands in core samples ; (idea of) radiocarbon / 14C dating ; ref. to 14C incorporated into carbonate ; ref. to half life / decay of 14C ; ref. to ratio of 14C to 12C indicates age of coral ; 5 3(c) any 7 from: (coral reefs) absorb wave energy / dissipate wave energy ; reefs reduce wave action / reduce size or strength of waves / slow down waves ; increased erosion of shores AW ; reduced protection for coastal properties ; reduced protection of coastal anchorages / boats ; reduced protection of ecosystems ; reduced tourism; reduced, food from, (harvesting / fishing) ; reduced income / profit ; reduced protection from extreme weather effects e.g. cyclones / hurricanes ; cost of building breakwaters / sea walls ; AVP ; 7
This question in 9693/23 May/June 2021
Q18 · Coral polyps have a symbiotic relationship with zooxanthellae 9693/20 Oct/Nov 2021
4 (a) Coral polyps have a symbiotic relationship with zooxanthellae. Name and describe this relationship. … … … … … … … … [4] (b) Productivity is the rate of production of biomass in an ecosystem. Explain why coral reefs typically have a high productivity. … … … … … … … … … … [5] (c) Many fish living on coral reefs are shoaling fish. Explain why shoaling is a successful strategy for fish. … … … … … … … … … … … … [6] [Total: 15]
15 marks
This question in 9693/20 Oct/Nov 2021
Q19 · Artificial reefs are widely used to regenerate coral reef ecosystems 9693/21 May/June 2022
1 Artificial reefs are widely used to regenerate coral reef ecosystems. Artificial reefs can be made using 3D printing technology. This technology makes exact copies of the shape and structure of real coral skeletons. Fig. 1.1 shows an artificial coral skeleton made using this technology. Fig. 1.1 (a) Scientists investigated how damselfish (small reef fish) behave when introduced to artificial coral skeletons made of different types of material. Four different types of material were used, A–D, in addition to natural coral as a control. Individual damselfish were introduced to tanks containing all five types of coral skeletons. A total of 44 fish were used. They were able to move freely between the different types of coral skeleton, and the time spent associating with each was recorded. (i) Suggest two variables that the scientists need to control to obtain reliable results. 1 … … 2 … … [2] (ii) Fig. 1.2 shows the percentage of time the damselfish spent associating with each type of coral skeleton. 20 15 percentage of time damselfish 10 associate with coral skeleton 5 0 natural A B C D type of coral material Fig. 1.2 State a conclusion regarding the behaviour of the fish around the coral skeletons. Use the information in Fig. 1.2 to support your answer. … … … … … … [3] (iii) Suggest reasons why small reef fish such as damselfish are dependent on coral for their survival. … … … … [2] (b) Scientists then investigated the settlement and growth of coral polyp larvae on artificial coral skeletons. Equal numbers of coral polyp larvae were introduced into separate tanks containing each type of artificial coral skeleton. The percentage of larvae attached to each type of coral skeleton was recorded over a 14-day period, and the growth rate of those that attached was calculated. Fig. 1.3 shows the percentage of larvae attached to each type of coral skeleton material. 30 Key A B 25 C D 20 percentage of larvae attached 15 10 5 1 2 3 4 5 6 7 8 9 10 11 12 13 14 day Fig. 1.3 Table 1.1 shows the mean growth rate of attached coral polyp larvae. Table 1.1 coral skeleton mean growth rate of material coral polyp larvae / mm2 per week A 0.078 B 0.201 C 0.211 D 0.162 Discuss which of the materials A–D is best to use for the growth of coral polyp larvae. Use the results shown in Fig. 1.3 and Table 1.1 to support your answer. … … … … … … [3] (c) The scientists concluded that 3D-printed coral skeletons can be used for regenerating coral reef ecosystems. Evaluate the extent to which the results from this investigation support this conclusion. … … … … … … [3] (d) Fig. 1.4 shows a damselfish similar to those used in the investigation. Fig. 1.4 (i) Make a large drawing of the damselfish in the space below. [4] (ii) Label the caudal fin and the dorsal fin on your drawing. [1] [Total: 18]
18 marks
Mark scheme: 1(a)(i) any 2 from: length of time (observed for) ; size of (coral) samples ; spacing of (coral) samples ; any water quality factor, e.g. pH / temperature / salinity / nutrients ;; (idea of) illumination / light intensity / sunlight ; size of tank ; same, size / age / species fish ; colour of coral ; (idea of avoiding bias towards a sample) distance fish introduced / released, to the coral ; 1(a)(ii) any 2 from: samples A, B or C have higher (association) time than natural sample ; sample (B and) C have greatest (increase in association) time / spend largest amount of time with coral C (and B) ; sample D has same, effect / (association) time as natural sample ; AND correct use of data from graph to support answer ; 3 1(a)(iii) any 2 from: food source / eat zooxanthellae ; shelter / protection (from, predators / water movement) ; (idea of) reproductive site / nursery ; 2 Question Answer Marks 1(b) any 3 from: (from day 7) material D has the greatest percentage of larvae attaching… ; …but does not have the highest mean growth rate / relatively high growth rate ; sample(s) (B and) C have the highest growth rate(s) ; sample A has lowest percentage settling and lowest growth rate ; materials B and/or D (greatest percentage of larvae attaching) and are stable / C or D are the lowest percentage of larvae attaching and are decreasing ; insufficient length of time of investigation because percentage of C settling is decreasing ; correct use of manipulated data from table or graph to support answer ; 3 1(c) any 3 from: (supports conclusion) as fish associate with artificial coral at least as much as natural ; (supports conclusion) as some samples allow larvae to, settle / grow ; 44 individual fish used is a high number of repeats ; (however) coral polyps may grow faster / attach better, on natural coral / no data on natural coral growth rate ; (however) larvae survival only monitored for 14 days ; (however) only one species / type of fish studied ; (however) no information on number / type of coral larvae used ; should conduct further research in natural habitat rather than tanks ; (idea of longer time period needed) research for longer than two weeks (idea of) research required on natural (bleached) coral to compare (settlement / growth rates) ; AVP ; 3 Question Answer Marks 1(d)(i) clear outline ; suitable size ; in proportion ; detail – must include all visible fins and outline of three black vertical areas in approximately correct positions and the eye ; 4 1(d)(ii) both fins labelled correctly either on the drawing or photograph ; 1
This question in 9693/21 May/June 2022
Q20 · Scientists investigated the effect of sea water pH on the change in mass of a species of… 9693/21 May/June 2023
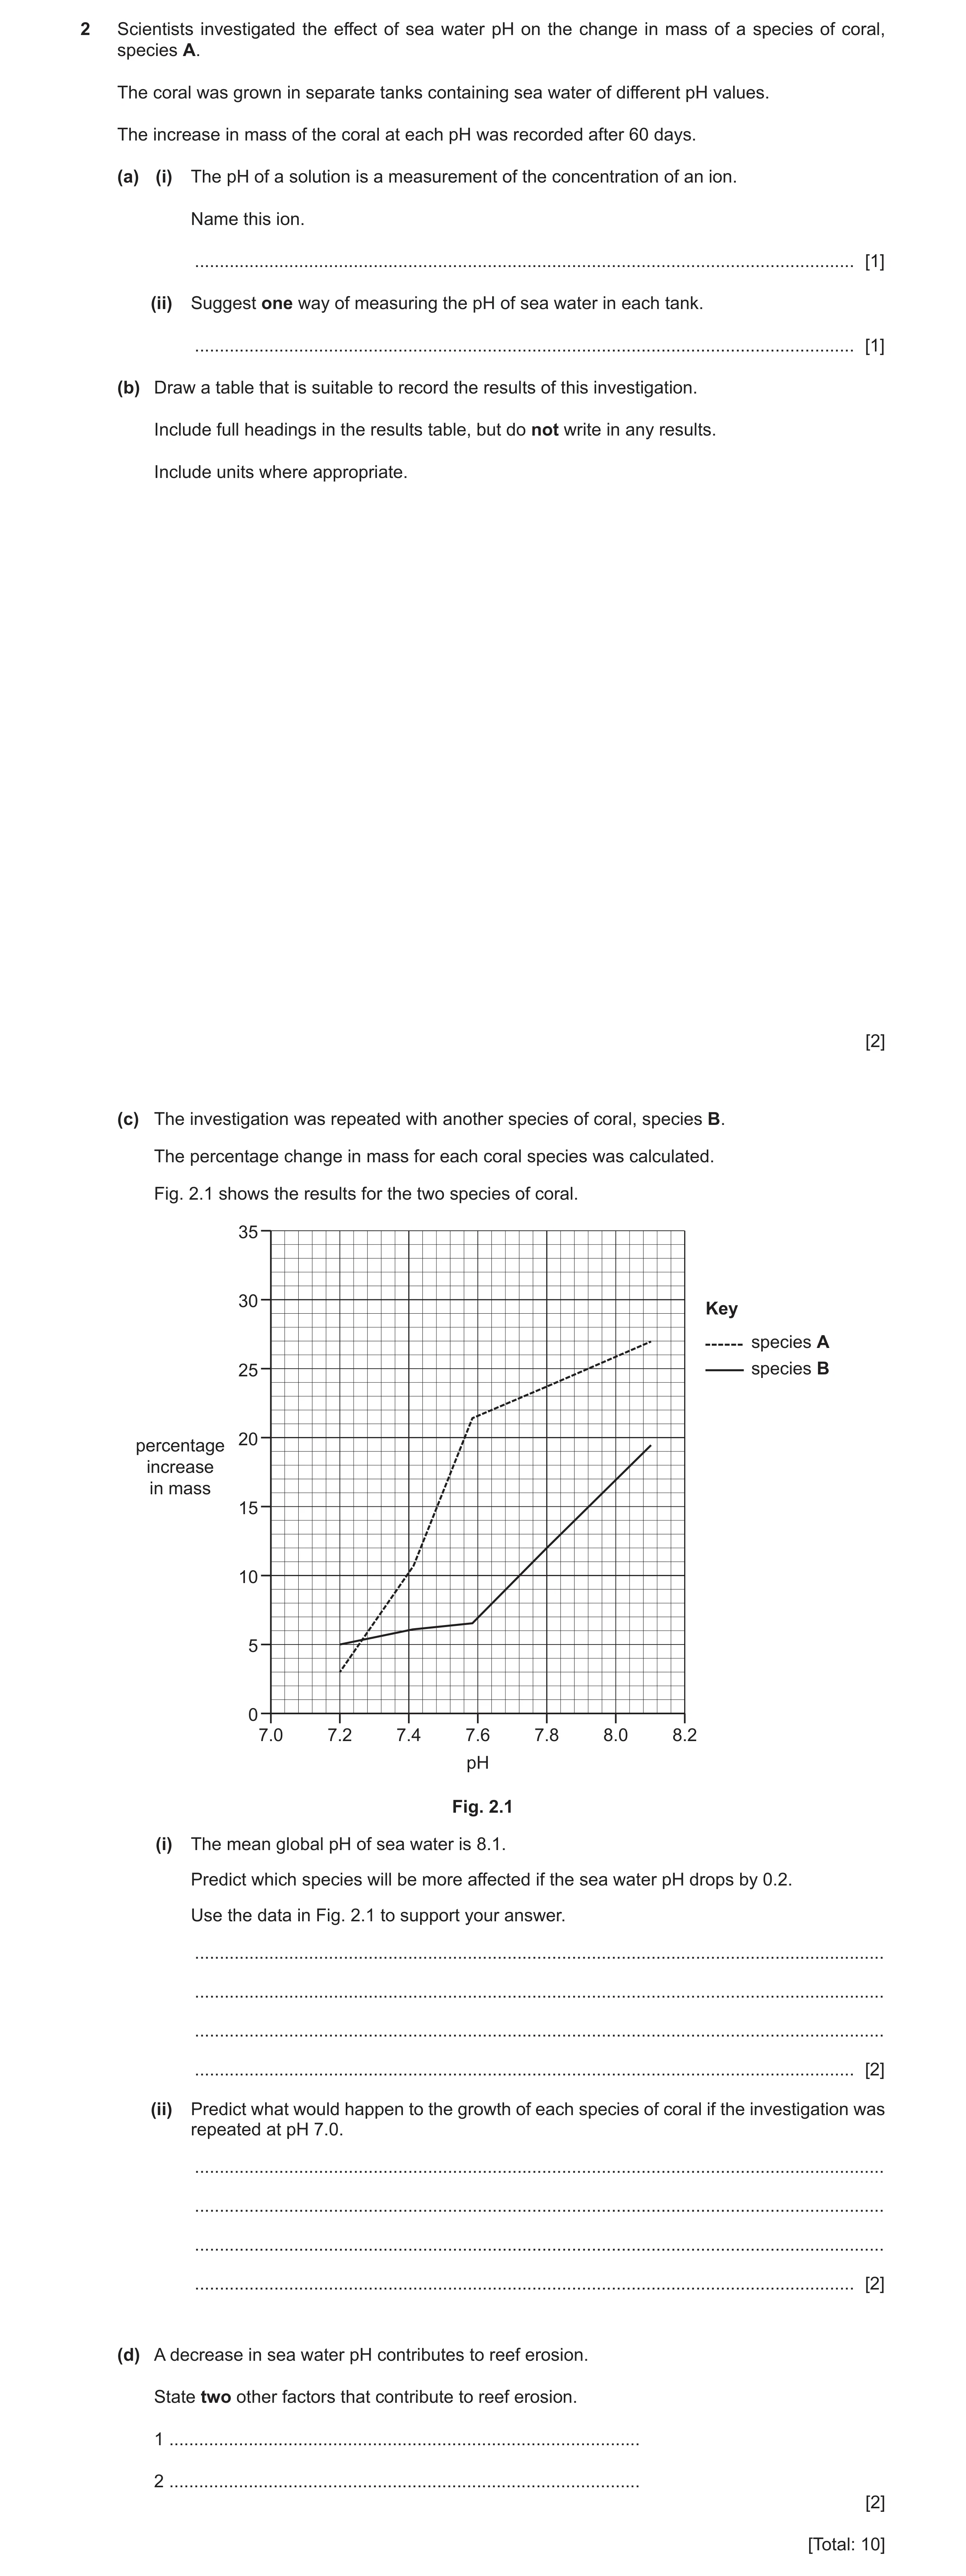
2 Scientists investigated the effect of sea water pH on the change in mass of a species of coral, species A. The coral was grown in separate tanks containing sea water of different pH values. The increase in mass of the coral at each pH was recorded after 60 days. (a) (i) The pH of a solution is a measurement of the concentration of an ion. Name this ion. … [1] (ii) Suggest one way of measuring the pH of sea water in each tank. … [1] (b) Draw a table that is suitable to record the results of this investigation. Include full headings in the results table, but do not write in any results. Include units where appropriate. [2] (c) The investigation was repeated with another species of coral, species B. The percentage change in mass for each coral species was calculated. Fig. 2.1 shows the results for the two species of coral. 35 30 Key species A 25 species B 20 percentage increase in mass 15 10 5 0 7.0 7.2 7.4 7.6 7.8 8.0 8.2 pH Fig. 2.1 (i) The mean global pH of sea water is 8.1. Predict which species will be more affected if the sea water pH drops by 0.2. Use the data in Fig. 2.1 to support your answer. … … … … [2] (ii) Predict what would happen to the growth of each species of coral if the investigation was repeated at pH 7.0. … … … … [2] (d) A decrease in sea water pH contributes to reef erosion. State two other factors that contribute to reef erosion. 1 … 2 … [2] [Total: 10]
10 marks
Mark scheme: 2(a)(i) hydrogen (ion) ; 1 2(a)(ii) universal indicator / pH probe ; 1 2(b) table with columns / rows headed ‘pH’ AND ‘increase in mass (of coral) OR 3 or 4 columns ‘pH’, ‘initial mass’ and final mass (and increase in mass) ; pH increase in mass / g / kg / % g / kg / mg / % increase in mass ; 2 2(c)(i) (greater impact on) species B (line on graph) shows a steeper line / gradient / the level of decrease is faster / higher rate of change / greater difference ; B, has a difference of / falls by, 5 % A, has a difference of / falls by, 2 % ; 2 2(c)(ii) species B will show, some / slow, growth OR B grows, more / faster, than A ; species A will show, no growth / reef erosion ; 2 Question Answer Marks 2(d) any 2 of: 1 temperature (change) / global warming / climate change / coral bleaching ; 2 (idea of natural physical damage) (tropical) storm / hurricane damage / high wave energy / tsunami ; 3 (idea of human physical damage) description of damage by boats / anchors / trawling / dredging / drag net fishing / damage by divers / dynamite fishing / human harvesting ; 4 (increased) feeding damage by parrot fish / bioerosion / predation (by named organisms) ; 5 algal bloom or over / excessive, algal growth / eutrophication ; 6 disease ; 7 presence of sediment / abrasive action of sediment ; 8 named pollution / sun cream washing into the (sea)water ; 9 removal of, nearby / associated, seagrass / mangrove, systems ; 2
This question in 9693/21 May/June 2023
Q21 · In 2016 scientists located a previously unknown coral reef near the mouth of the Amazon… 9693/21 Oct/Nov 2023
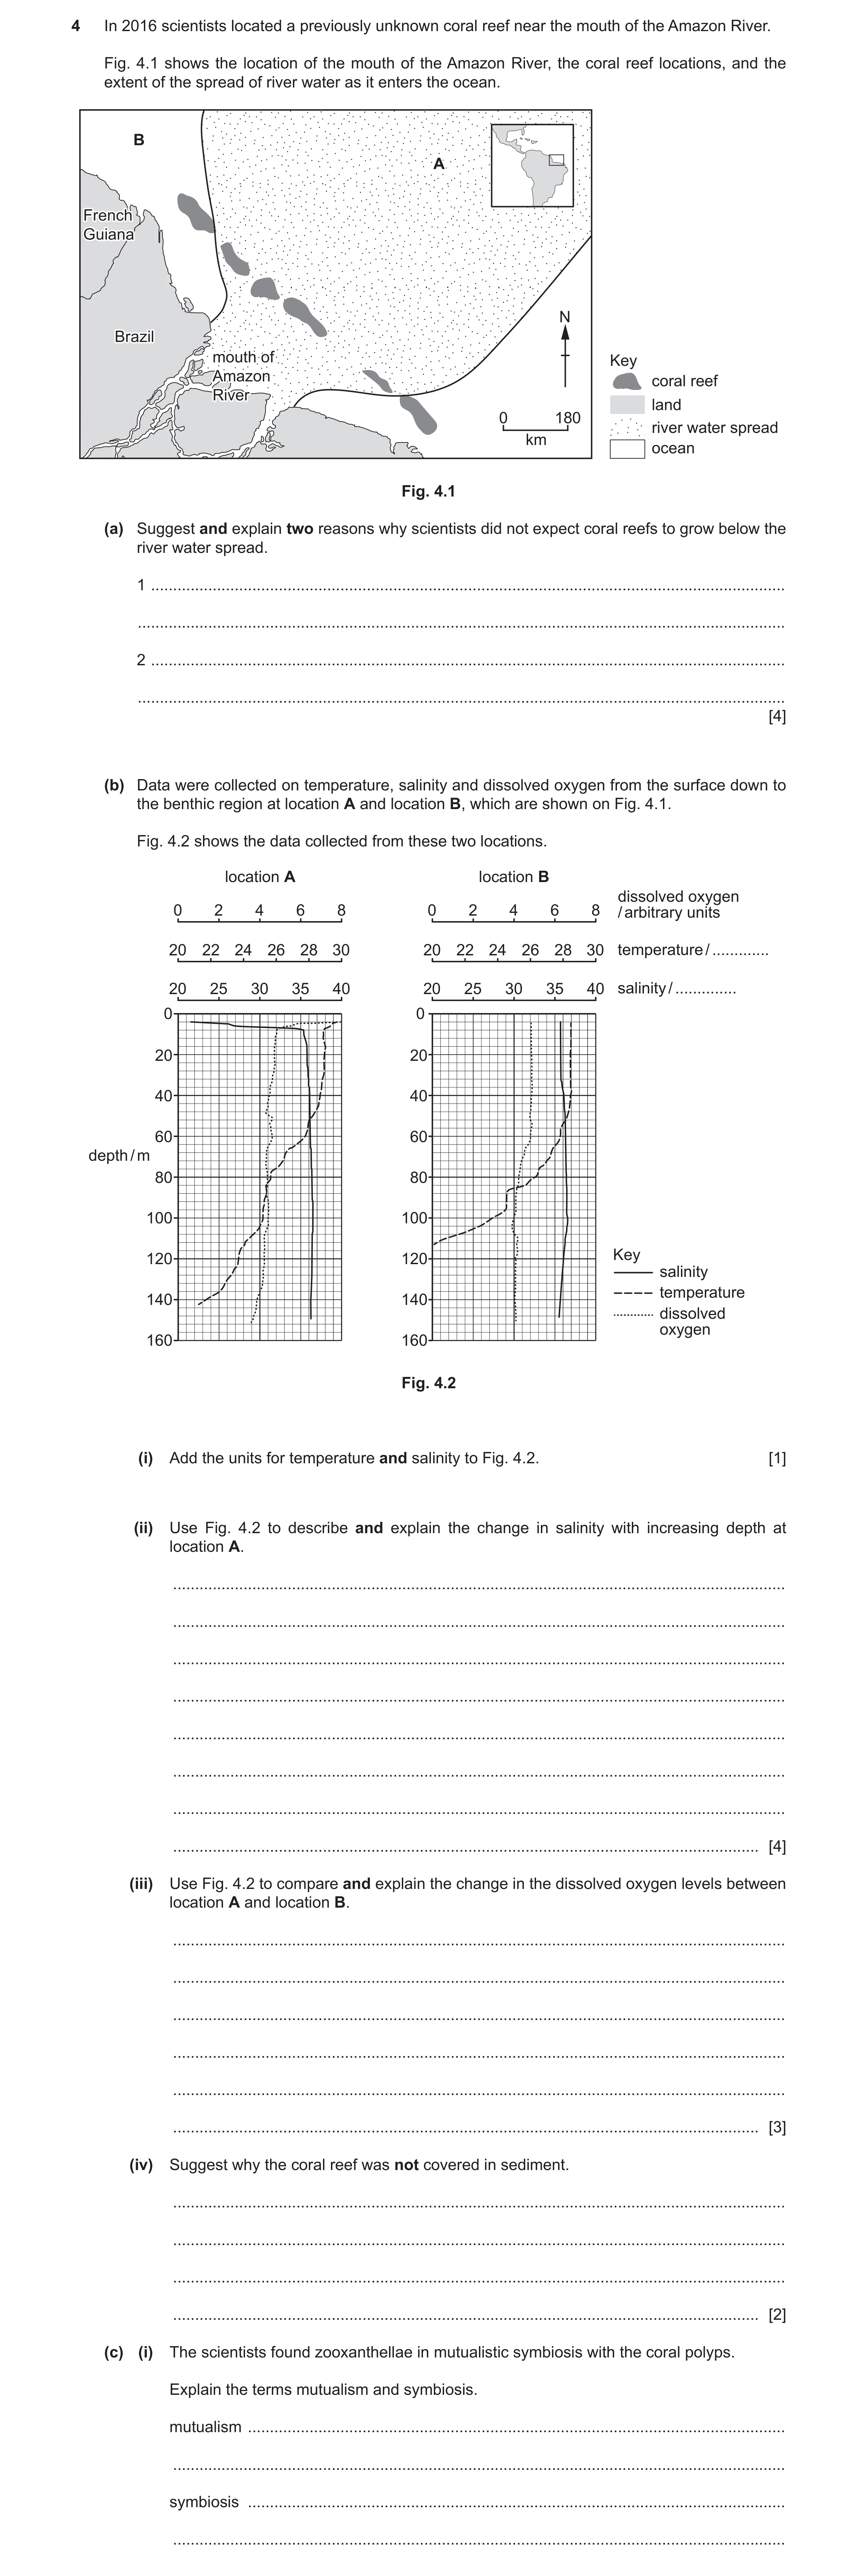
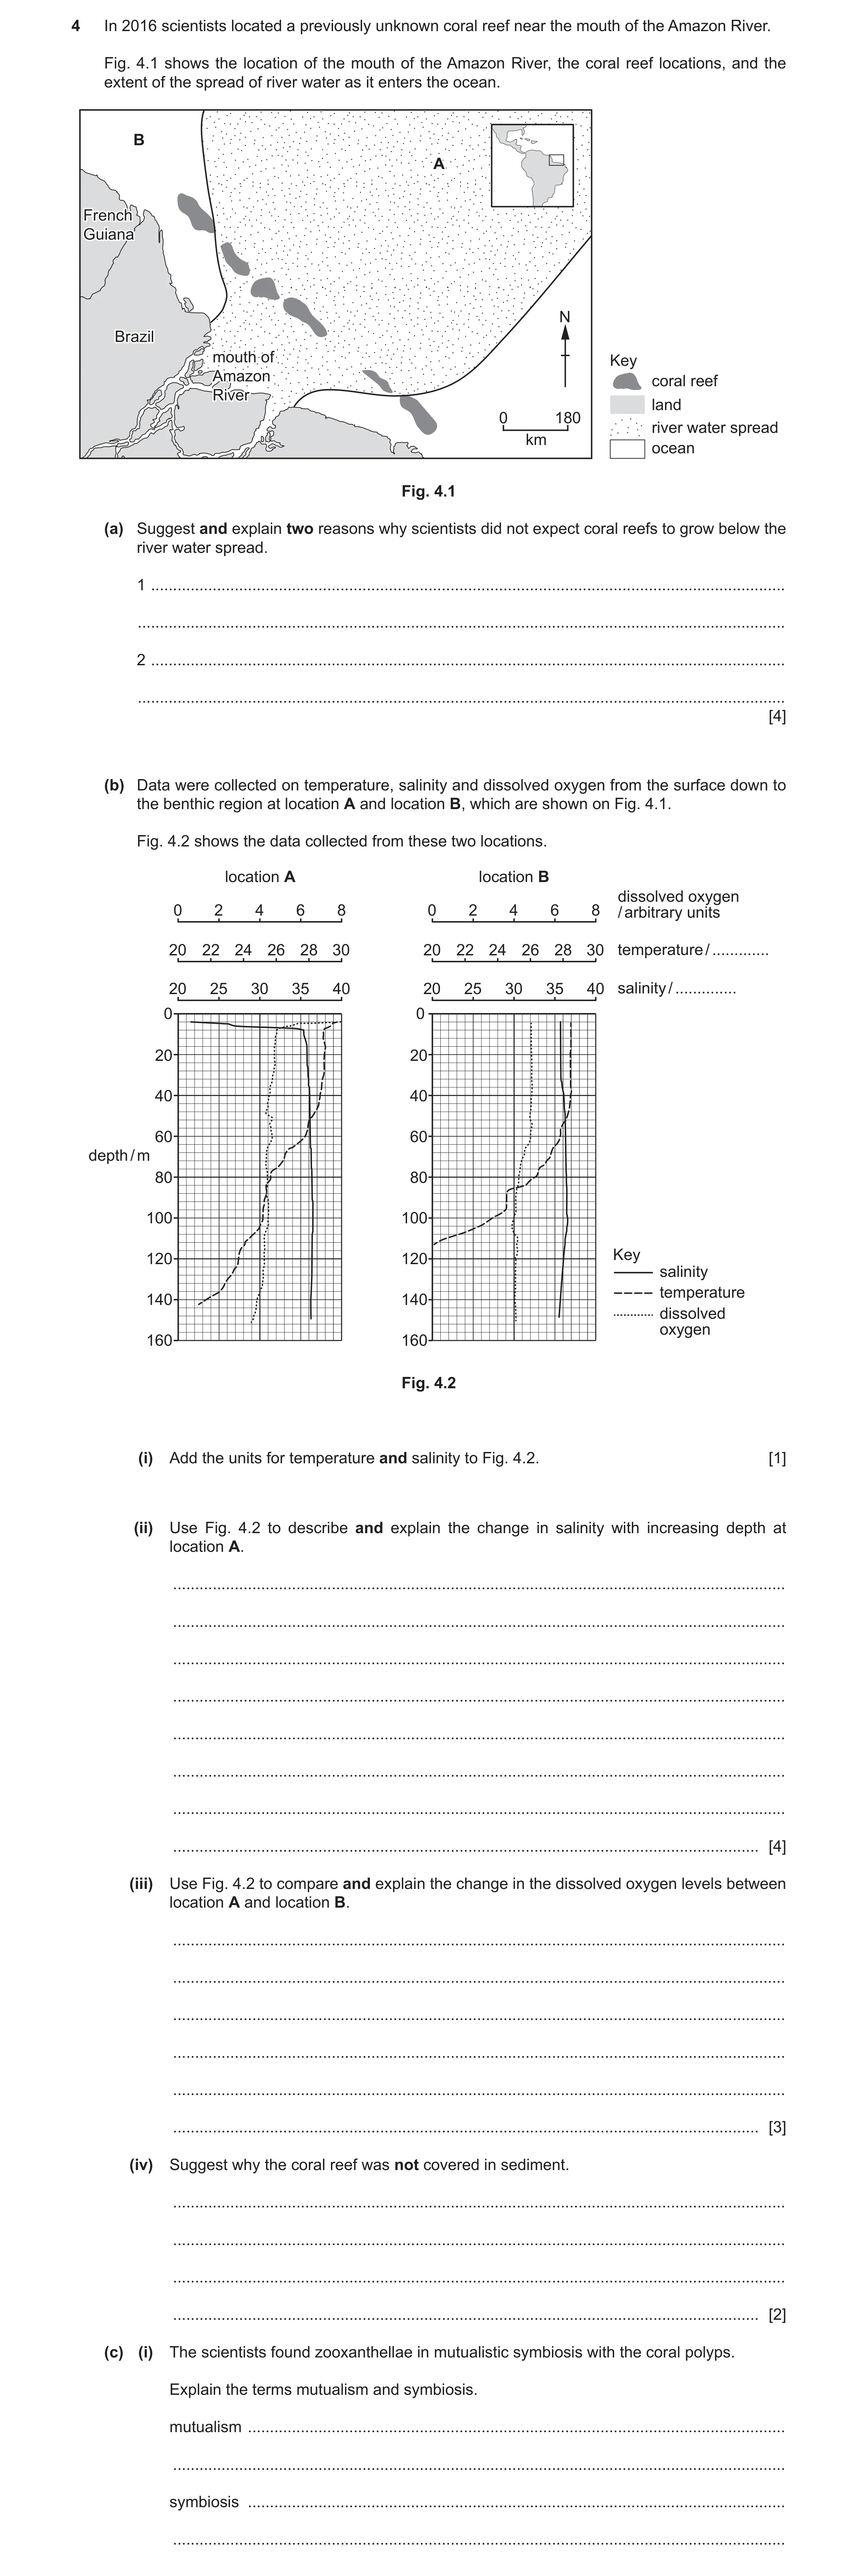
4 In 2016 scientists located a previously unknown coral reef near the mouth of the Amazon River. Fig. 4.1 shows the location of the mouth of the Amazon River, the coral reef locations, and the extent of the spread of river water as it enters the ocean. B A FrenchFrench GuianaGuiana N BrazilBrazil mouthmouth ofof Key AmazonAmazon coral reef RiverRiver land 0 180 river water spread km ocean Fig. 4.1 (a) Suggest and explain two reasons why scientists did not expect coral reefs to grow below the river water spread. 1 … … 2 … … [4] (b) Data were collected on temperature, salinity and dissolved oxygen from the surface down to the benthic region at location A and location B, which are shown on Fig. 4.1. Fig. 4.2 shows the data collected from these two locations. location A location B dissolved oxygen 0 2 4 6 8 0 2 4 6 8 / arbitrary units 20 22 24 26 28 30 20 22 24 26 28 30 temperature / … 20 25 30 35 40 20 25 30 35 40 salinity / … 0 0 20 20 40 40 60 60 depth / m 80 80 100 100 120 120 Key salinity temperature 140 140 dissolved oxygen 160 160 Fig. 4.2 (i) Add the units for temperature and salinity to Fig. 4.2. [1] (ii) Use Fig. 4.2 to describe and explain the change in salinity with increasing depth at location A. … … … … … … … … [4] (iii) Use Fig. 4.2 to compare and explain the change in the dissolved oxygen levels between location A and location B. … … … … … … [3] (iv) Suggest why the coral reef was not covered in sediment. … … … … [2] (c) (i) The scientists found zooxanthellae in mutualistic symbiosis with the coral polyps. Explain the terms mutualism and symbiosis. mutualism … … symbiosis … …
16 marks
Mark scheme: 4(a) any 2 pairs from: 4 freshwater input / reduced salinity ; so coral / polyps not able to survive ; increases turbidity / sediment (caried) in river ; coral / polyps, smothered or light intensity too low / prevents photosynthesis (by zooxanthellae) ; temperature change or stated ; may not be suitable range for coral / polyp growth ; (fine) sediment on seabed ; does not allow coral / polyp attachment ; pH of freshwater is closer to 7 / more acidic (than seawater) ; reducing growth of corals / polyps ; named pollution from runoff into river ; may cause eutrophication / toxicity to the corals / polyps ; high current flow rate from river ; may be too fast for corals / polyps to capture food ; 4(b)(i) (temperature) °C and (salinity) ppt / % ; 1 4(b)(ii) (low salinity at surface) salinity rapidly increases (over a small depth) / halocline + then remains steady (with increasing 4 depth) ; PLUS any 3 from: (because) fresh water enters from the river ; with a low salinity ORA ; this causes lower density ORA ; so it floats above the sea water ORA ; freshwater mixes with sea water ; until 35–36 (ppt) ; over 8–10 m (depth) the water is sea water and it does not mix with the (floating) fresh water 4(b)(iii) any 3 from: 3 (at location A) at the surface / top 4–8 m, dissolved oxygen (concentration) is higher (than B) ORA ; (because) fresh water can dissolve more oxygen (than sea water) ORA ; (at location B) below 8 m, dissolved oxygen / oxygen concentrations, are similar to location A; (because) mixing has occurred at location A / salinity and temperature of both similar below 12 m, so will hold similar dissolved oxygen / oxygen concentrations ; 4(b)(iv) Any 2 from: 2 fine particulates / silt / sediment, were not able to, cross / mix with, lower, more saline water ; due to density differences in surface water and sea water ; (idea of) sediment deposited further out than the coral reef due to the strong currents from the Amazon river ; (idea of) movement of water keeping sediment in suspension / fine particulates need low flow rate to settle ; (idea of) sediment deposited between the mouth of the river and the coral reef / mangroves caused sediment to deposit in estuary ; 4(c)(i) (mutualism) both benefit ; 2 (symbiosis) different species living in, close contact / long-term association ; 4(c)(ii) Any 1 from: 1 less light available for, photosynthesis ; increased turbidity ; salinity too low ; temperature out of range ; (presence of) freshwater ; 4(c)(iii) any 3 from: 3 use nematocysts ; to catch passing, zooplankton / small fish ; tentacles draw them into mouth ; pass to stomach (for digestion) ;
This question in 9693/21 Oct/Nov 2023
Q22 · In 2016 scientists located a previously unknown coral reef near the mouth of the Amazon… 9693/22 Oct/Nov 2023
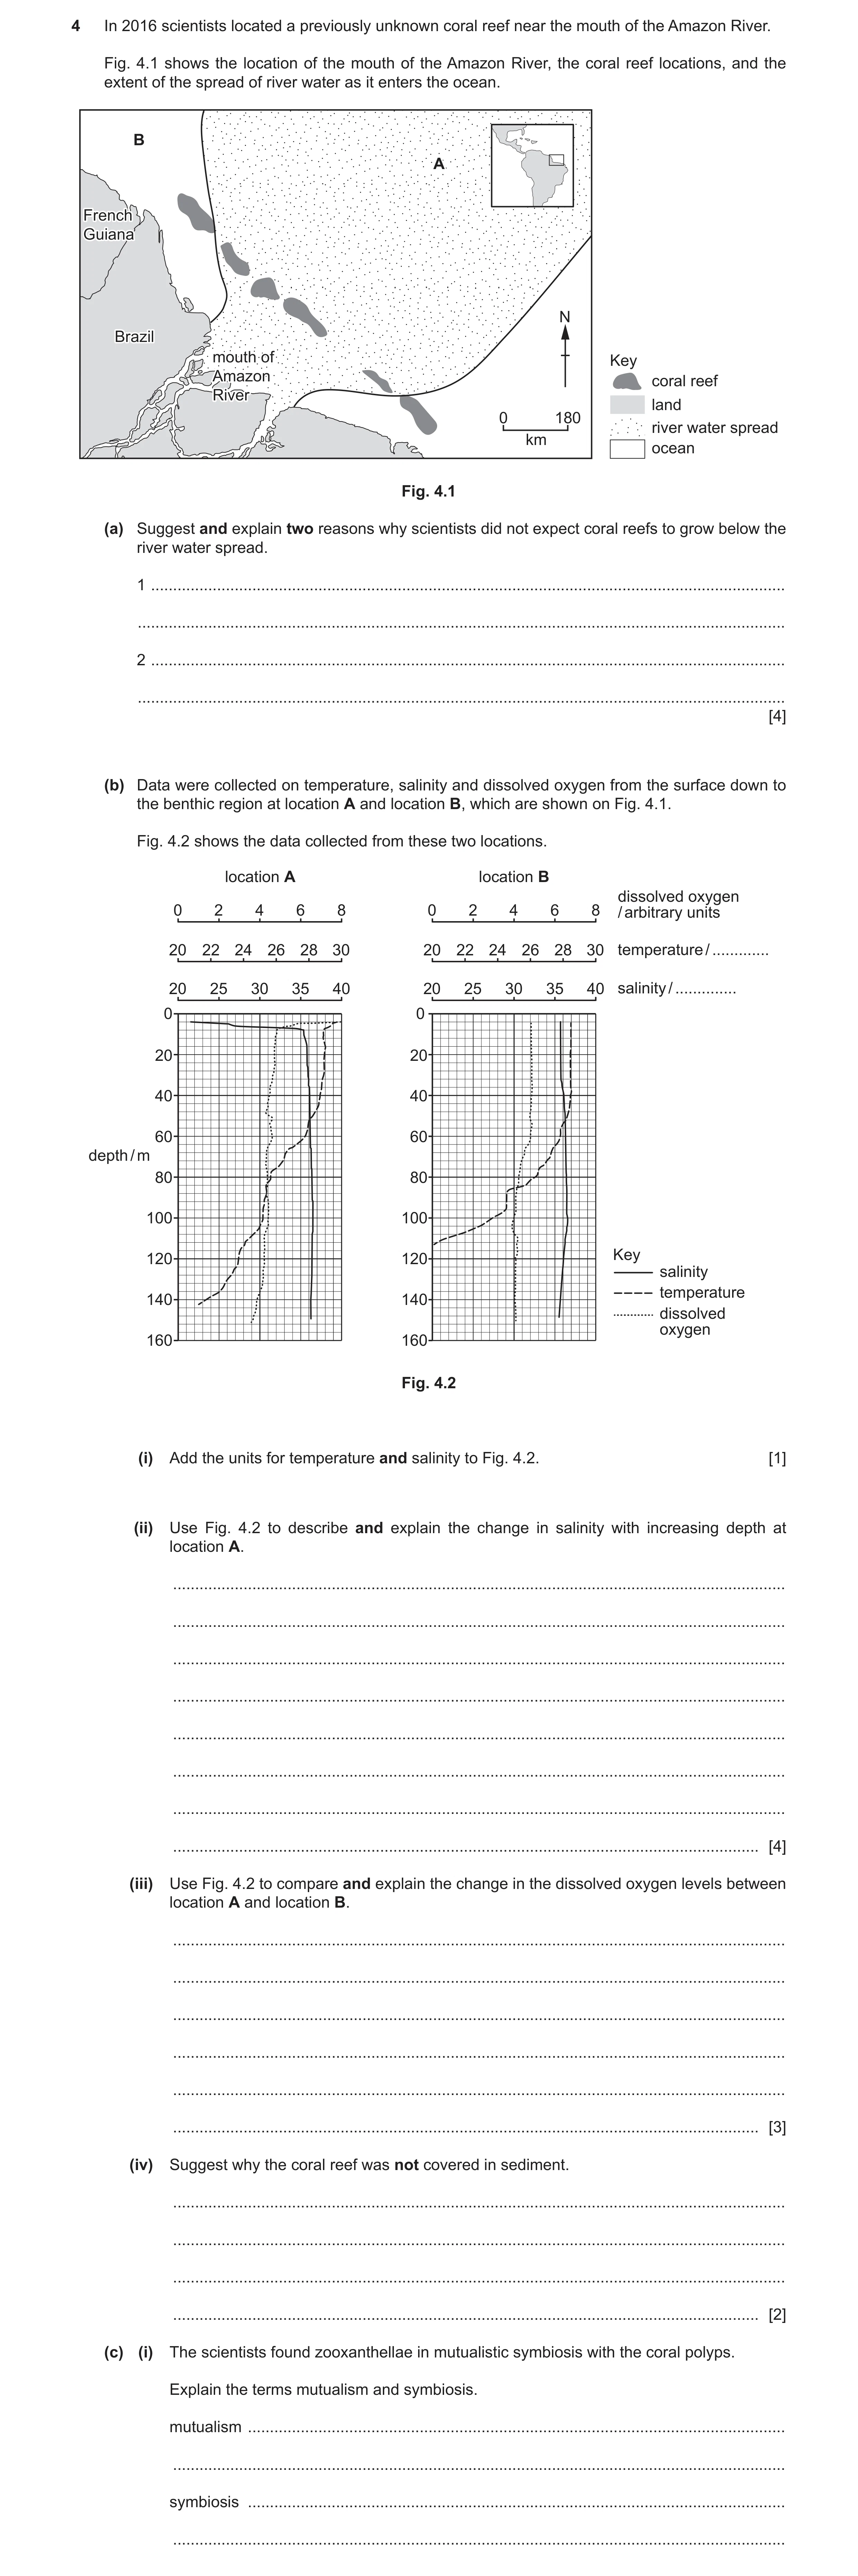
4 In 2016 scientists located a previously unknown coral reef near the mouth of the Amazon River. Fig. 4.1 shows the location of the mouth of the Amazon River, the coral reef locations, and the extent of the spread of river water as it enters the ocean. B A FrenchFrench GuianaGuiana N BrazilBrazil mouthmouth ofof Key AmazonAmazon coral reef RiverRiver land 0 180 river water spread km ocean Fig. 4.1 (a) Suggest and explain two reasons why scientists did not expect coral reefs to grow below the river water spread. 1 … … 2 … … [4] (b) Data were collected on temperature, salinity and dissolved oxygen from the surface down to the benthic region at location A and location B, which are shown on Fig. 4.1. Fig. 4.2 shows the data collected from these two locations. location A location B dissolved oxygen 0 2 4 6 8 0 2 4 6 8 / arbitrary units 20 22 24 26 28 30 20 22 24 26 28 30 temperature / … 20 25 30 35 40 20 25 30 35 40 salinity / … 0 0 20 20 40 40 60 60 depth / m 80 80 100 100 120 120 Key salinity temperature 140 140 dissolved oxygen 160 160 Fig. 4.2 (i) Add the units for temperature and salinity to Fig. 4.2. [1] (ii) Use Fig. 4.2 to describe and explain the change in salinity with increasing depth at location A. … … … … … … … … [4] (iii) Use Fig. 4.2 to compare and explain the change in the dissolved oxygen levels between location A and location B. … … … … … … [3] (iv) Suggest why the coral reef was not covered in sediment. … … … … [2] (c) (i) The scientists found zooxanthellae in mutualistic symbiosis with the coral polyps. Explain the terms mutualism and symbiosis. mutualism … … symbiosis … …
16 marks
Mark scheme: 4(a) any 2 pairs from: 4 freshwater input / reduced salinity ; so coral / polyps not able to survive ; increases turbidity / sediment (caried) in river ; coral / polyps, smothered or light intensity too low / prevents photosynthesis (by zooxanthellae) ; temperature change or stated ; may not be suitable range for coral / polyp growth ; (fine) sediment on seabed ; does not allow coral / polyp attachment ; pH of freshwater is closer to 7 / more acidic (than seawater) ; reducing growth of corals / polyps ; named pollution from runoff into river ; may cause eutrophication / toxicity to the corals / polyps ; high current flow rate from river ; may be too fast for corals / polyps to capture food ; 4(b)(i) (temperature) °C and (salinity) ppt / % ; 1 4(b)(ii) (low salinity at surface) salinity rapidly increases (over a small depth) / halocline + then remains steady (with increasing 4 depth) ; PLUS any 3 from: (because) fresh water enters from the river ; with a low salinity ORA ; this causes lower density ORA ; so it floats above the sea water ORA ; freshwater mixes with sea water ; until 35–36 (ppt) ; over 8–10 m (depth) the water is sea water and it does not mix with the (floating) fresh water 4(b)(iii) any 3 from: 3 (at location A) at the surface / top 4–8 m, dissolved oxygen (concentration) is higher (than B) ORA ; (because) fresh water can dissolve more oxygen (than sea water) ORA ; (at location B) below 8 m, dissolved oxygen / oxygen concentrations, are similar to location A; (because) mixing has occurred at location A / salinity and temperature of both similar below 12 m, so will hold similar dissolved oxygen / oxygen concentrations ; 4(b)(iv) Any 2 from: 2 fine particulates / silt / sediment, were not able to, cross / mix with, lower, more saline water ; due to density differences in surface water and sea water ; (idea of) sediment deposited further out than the coral reef due to the strong currents from the Amazon river ; (idea of) movement of water keeping sediment in suspension / fine particulates need low flow rate to settle ; (idea of) sediment deposited between the mouth of the river and the coral reef / mangroves caused sediment to deposit in estuary ; 4(c)(i) (mutualism) both benefit ; 2 (symbiosis) different species living in, close contact / long-term association ; 4(c)(ii) Any 1 from: 1 less light available for, photosynthesis ; increased turbidity ; salinity too low ; temperature out of range ; (presence of) freshwater ; 4(c)(iii) any 3 from: 3 use nematocysts ; to catch passing, zooplankton / small fish ; tentacles draw them into mouth ; pass to stomach (for digestion) ;
This question in 9693/22 Oct/Nov 2023
Q23 · In 2016 scientists located a previously unknown coral reef near the mouth of the Amazon… 9693/23 Oct/Nov 2023
4 In 2016 scientists located a previously unknown coral reef near the mouth of the Amazon River. Fig. 4.1 shows the location of the mouth of the Amazon River, the coral reef locations, and the extent of the spread of river water as it enters the ocean. B A FrenchFrench GuianaGuiana N BrazilBrazil mouthmouth ofof Key AmazonAmazon coral reef RiverRiver land 0 180 river water spread km ocean Fig. 4.1 (a) Suggest and explain two reasons why scientists did not expect coral reefs to grow below the river water spread. 1 … … 2 … … [4] (b) Data were collected on temperature, salinity and dissolved oxygen from the surface down to the benthic region at location A and location B, which are shown on Fig. 4.1. Fig. 4.2 shows the data collected from these two locations. location A location B dissolved oxygen 0 2 4 6 8 0 2 4 6 8 / arbitrary units 20 22 24 26 28 30 20 22 24 26 28 30 temperature / … 20 25 30 35 40 20 25 30 35 40 salinity / … 0 0 20 20 40 40 60 60 depth / m 80 80 100 100 120 120 Key salinity temperature 140 140 dissolved oxygen 160 160 Fig. 4.2 (i) Add the units for temperature and salinity to Fig. 4.2. [1] (ii) Use Fig. 4.2 to describe and explain the change in salinity with increasing depth at location A. … … … … … … … … [4] (iii) Use Fig. 4.2 to compare and explain the change in the dissolved oxygen levels between location A and location B. … … … … … … [3] (iv) Suggest why the coral reef was not covered in sediment. … … … … [2] (c) (i) The scientists found zooxanthellae in mutualistic symbiosis with the coral polyps. Explain the terms mutualism and symbiosis. mutualism … … symbiosis … …
16 marks
Mark scheme: 4(a) any 2 pairs from: 4 freshwater input / reduced salinity ; so coral / polyps not able to survive ; increases turbidity / sediment (caried) in river ; coral / polyps, smothered or light intensity too low / prevents photosynthesis (by zooxanthellae) ; temperature change or stated ; may not be suitable range for coral / polyp growth ; (fine) sediment on seabed ; does not allow coral / polyp attachment ; pH of freshwater is closer to 7 / more acidic (than seawater) ; reducing growth of corals / polyps ; named pollution from runoff into river ; may cause eutrophication / toxicity to the corals / polyps ; high current flow rate from river ; may be too fast for corals / polyps to capture food ; 4(b)(i) (temperature) °C and (salinity) ppt / % ; 1 4(b)(ii) (low salinity at surface) salinity rapidly increases (over a small depth) / halocline + then remains steady (with increasing 4 depth) ; PLUS any 3 from: (because) fresh water enters from the river ; with a low salinity ORA ; this causes lower density ORA ; so it floats above the sea water ORA ; freshwater mixes with sea water ; until 35–36 (ppt) ; over 8–10 m (depth) the water is sea water and it does not mix with the (floating) fresh water 4(b)(iii) any 3 from: 3 (at location A) at the surface / top 4–8 m, dissolved oxygen (concentration) is higher (than B) ORA ; (because) fresh water can dissolve more oxygen (than sea water) ORA ; (at location B) below 8 m, dissolved oxygen / oxygen concentrations, are similar to location A; (because) mixing has occurred at location A / salinity and temperature of both similar below 12 m, so will hold similar dissolved oxygen / oxygen concentrations ; 4(b)(iv) Any 2 from: 2 fine particulates / silt / sediment, were not able to, cross / mix with, lower, more saline water ; due to density differences in surface water and sea water ; (idea of) sediment deposited further out than the coral reef due to the strong currents from the Amazon river ; (idea of) movement of water keeping sediment in suspension / fine particulates need low flow rate to settle ; (idea of) sediment deposited between the mouth of the river and the coral reef / mangroves caused sediment to deposit in estuary ; 4(c)(i) (mutualism) both benefit ; 2 (symbiosis) different species living in, close contact / long-term association ; 4(c)(ii) Any 1 from: 1 less light available for, photosynthesis ; increased turbidity ; salinity too low ; temperature out of range ; (presence of) freshwater ; 4(c)(iii) any 3 from: 3 use nematocysts ; to catch passing, zooplankton / small fish ; tentacles draw them into mouth ; pass to stomach (for digestion) ;
This question in 9693/23 Oct/Nov 2023
Q24 · Damselfish and wrasse are two types of small predatory fish found on tropical coral… 9693/21 May/June 2024
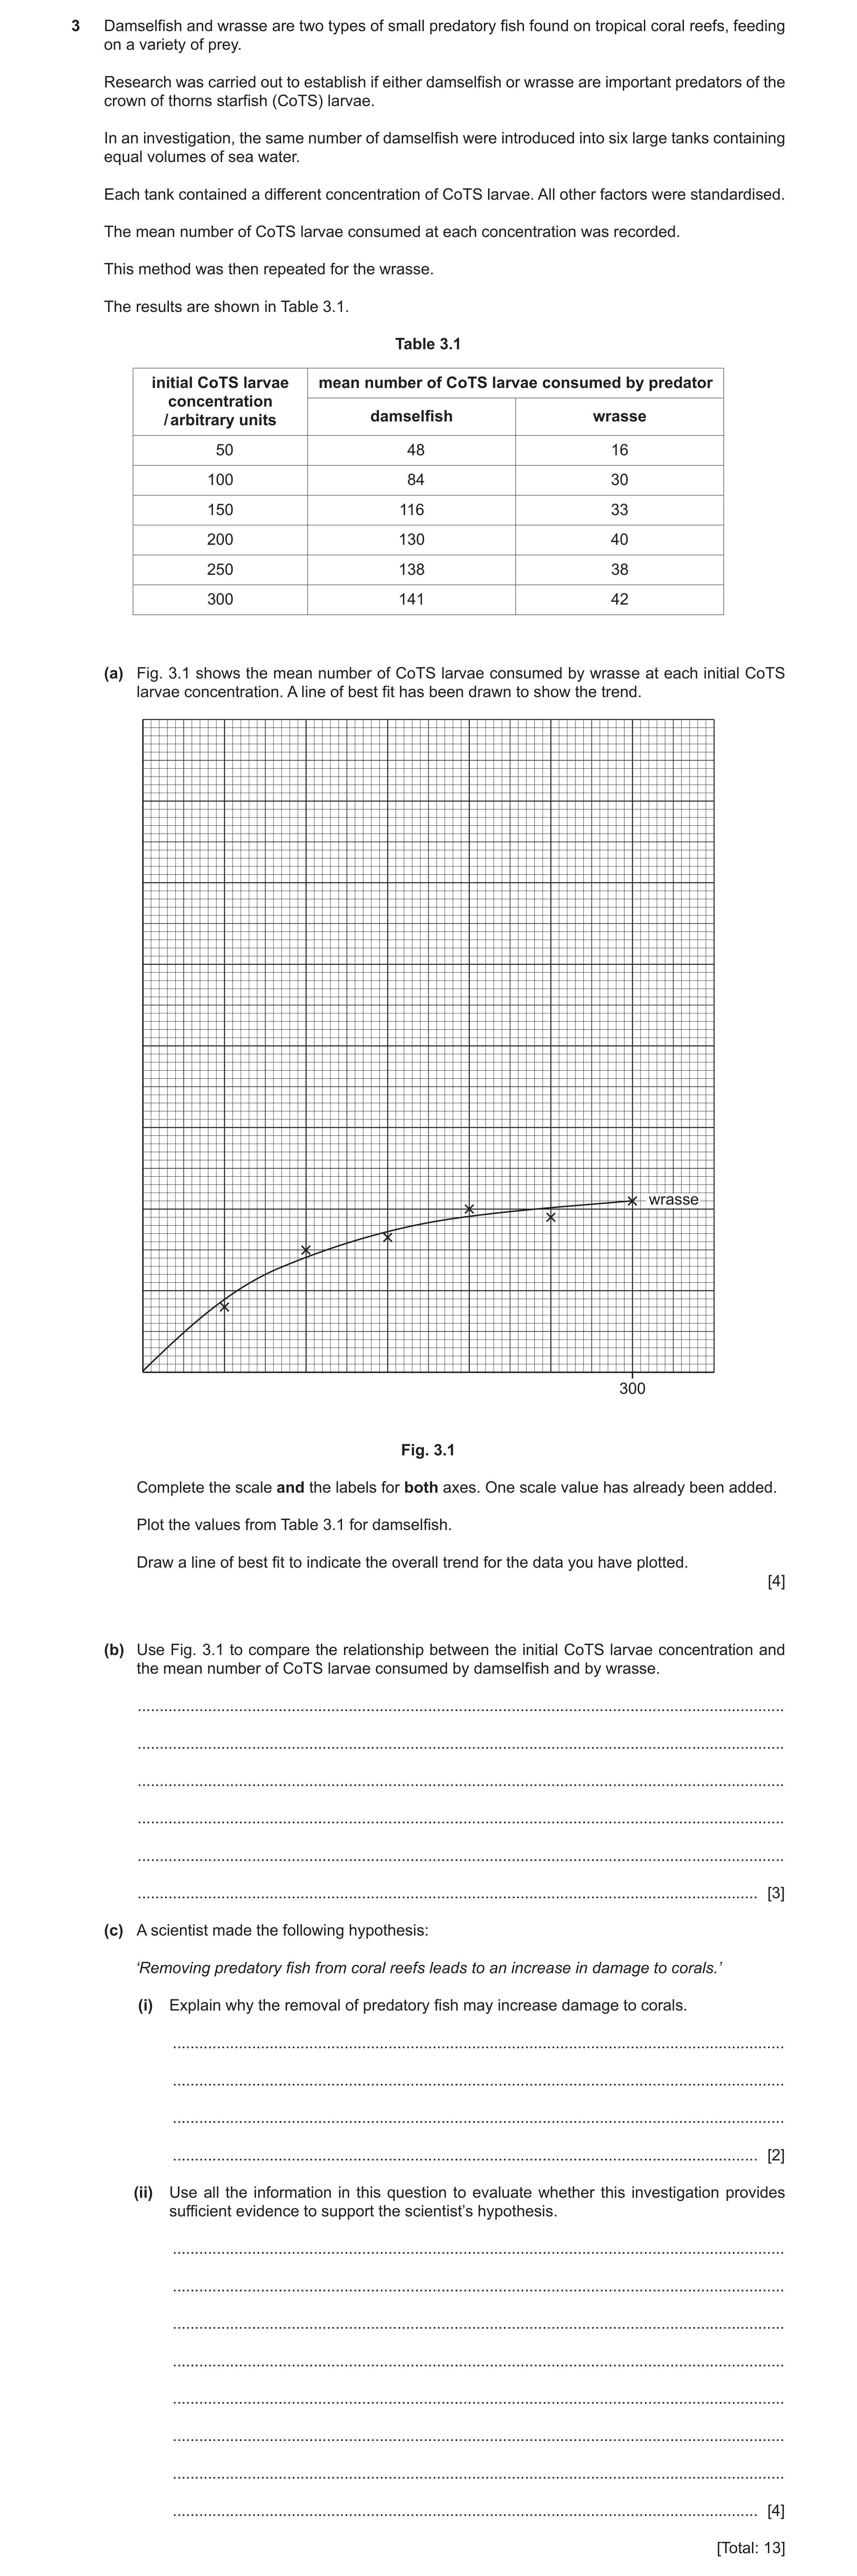
3 Damselfish and wrasse are two types of small predatory fish found on tropical coral reefs, feeding on a variety of prey. Research was carried out to establish if either damselfish or wrasse are important predators of the crown of thorns starfish (CoTS) larvae. In an investigation, the same number of damselfish were introduced into six large tanks containing equal volumes of sea water. Each tank contained a different concentration of CoTS larvae. All other factors were standardised. The mean number of CoTS larvae consumed at each concentration was recorded. This method was then repeated for the wrasse. The results are shown in Table 3.1. Table 3.1 initial CoTS larvae mean number of CoTS larvae consumed by predator concentration / arbitrary units damselfish wrasse 50 48 16 100 84 30 150 116 33 200 130 40 250 138 38 300 141 42 (a) Fig. 3.1 shows the mean number of CoTS larvae consumed by wrasse at each initial CoTS larvae concentration. A line of best fit has been drawn to show the trend. wrasse 300 Fig. 3.1 Complete the scale and the labels for both axes. One scale value has already been added. Plot the values from Table 3.1 for damselfish. Draw a line of best fit to indicate the overall trend for the data you have plotted. [4] (b) Use Fig. 3.1 to compare the relationship between the initial CoTS larvae concentration and the mean number of CoTS larvae consumed by damselfish and by wrasse. … … … … … … [3] (c) A scientist made the following hypothesis: ‘Removing predatory fish from coral reefs leads to an increase in damage to corals.’ (i) Explain why the removal of predatory fish may increase damage to corals. … … … … [2] (ii) Use all the information in this question to evaluate whether this investigation provides sufficient evidence to support the scientist’s hypothesis. … … … … … … … … [4] [Total: 13]
13 marks
Mark scheme: 3(a) correct labels for both axes and units for x-axis ; correct scale added to both axes ; all plots correct 1 mm / ½ small square ; appropriate line of best fit ; 4 3(b) any 3 from ; idea that both have positive relationship ; idea that rate of increase, levels off / plateaus, for both ; idea that predation by damselfish is (always) greater OR rate of increase in damselfish is greater ; correct use of manipulated data to support comparison ; 3 Question Answer Marks 3(c)(i) any 2 from ; (fewer predatory fish will lead to) decreased predation of (CoTS) larvae OR increased abundance / overpopulation, of (CoTS) larvae ; Idea of more larvae will become, adults / starfish ; ref. to increased population of CoTS feeding on coral ; idea of less predation of other coral consuming organisms if predators removed / predatory fish eat the fish that feed on the corals / prey of these predators that use coral overpopulate, could damage corals / removal of predatory fish damages the coral because there is no hunting of invasive species which eat coral ; AVP ; 2 Question Answer Marks 3(c)(ii) any 4 from: 1 ref. to no data on damage to corals OR investigation did not look at corals OR no evidence of CoTS impact on corals shown ; 2 idea that coral reefs provide hiding places for larvae / more difficult to predate larvae ; 3 graph suggests not all predatory species will have significant impact on CoTS larvae AW ; 4 idea that investigation is lab based and might not replicate on coral reefs ; 5 fish may not consume as many larvae if other food sources are available ; 6 fish numbers on reef may not be high enough to have an impact / investigation did not look at effect of (predatory) fish population ; 7 CoTS larvae density on reef may be too high for damselfish to have impact ; 8 other, fish / predator, species, may have an impact / need to be investigated ; 9 idea of need for peer review / other Scientists obtaining similar results / reference to lack of repeats / use of statistical methods ; 10 coral damage may be due to, other factors / pH / temperature ; 4
This question in 9693/21 May/June 2024
Q25 · When sea water temperature increases, coral polyps release zooxanthellae 9693/22 May/June 2024
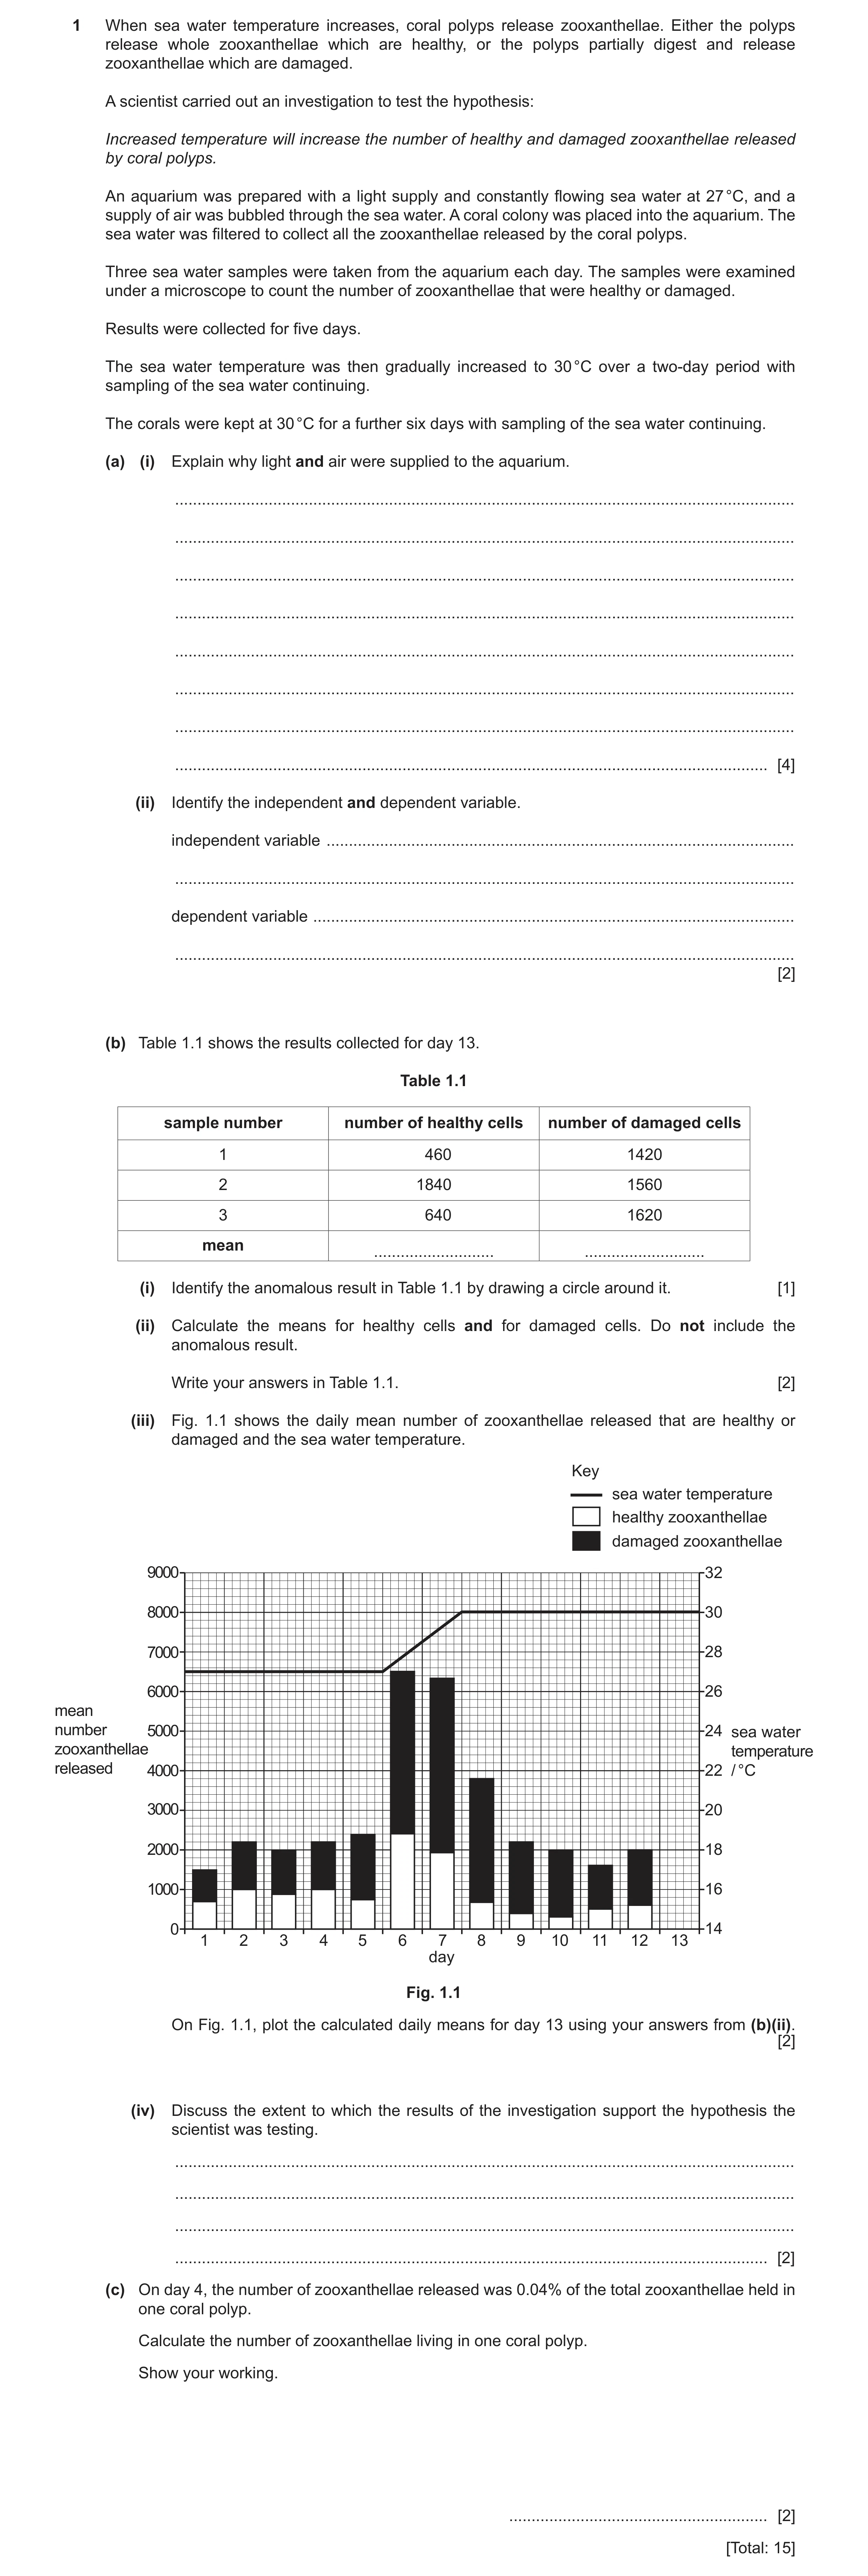
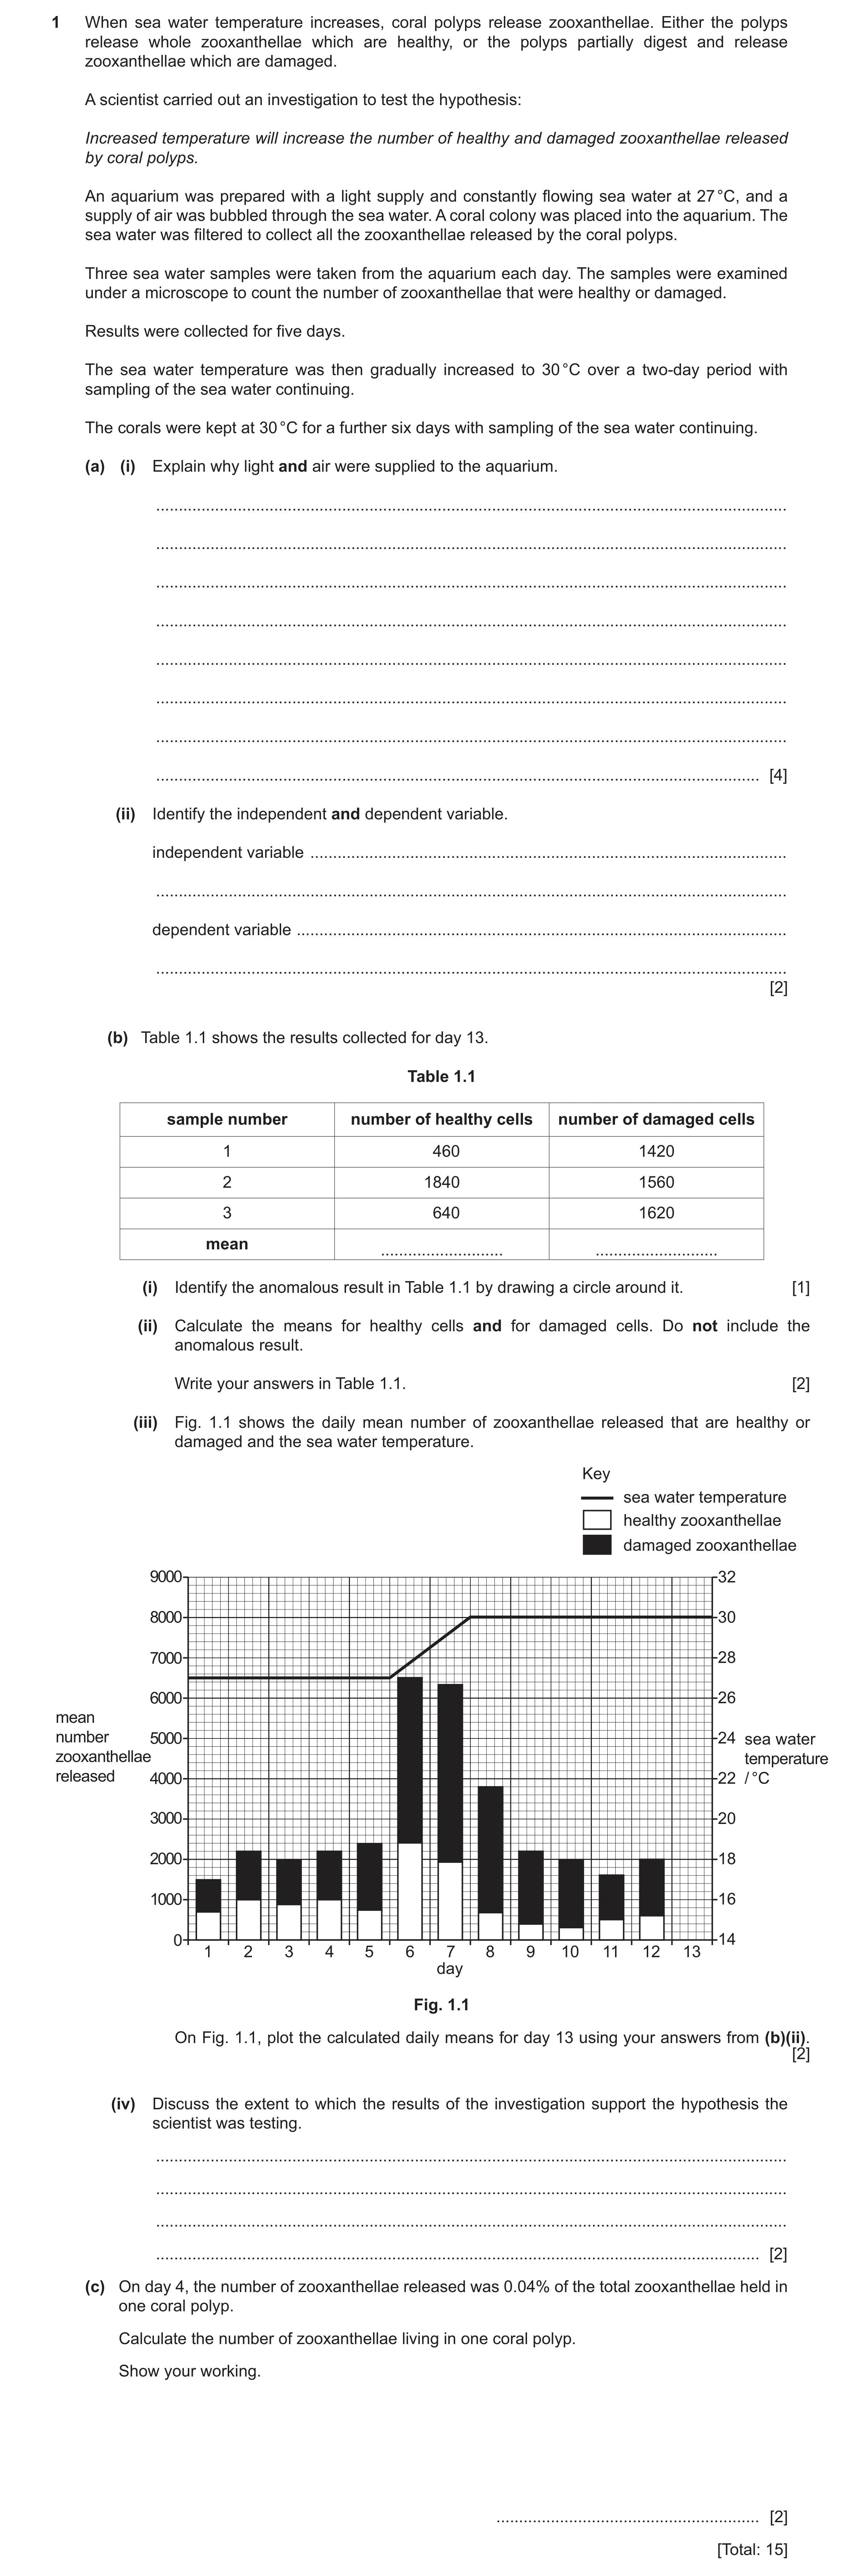
1 When sea water temperature increases, coral polyps release zooxanthellae. Either the polyps release whole zooxanthellae which are healthy, or the polyps partially digest and release zooxanthellae which are damaged. A scientist carried out an investigation to test the hypothesis: Increased temperature will increase the number of healthy and damaged zooxanthellae released by coral polyps. An aquarium was prepared with a light supply and constantly flowing sea water at 27 °C, and a supply of air was bubbled through the sea water. A coral colony was placed into the aquarium. The sea water was filtered to collect all the zooxanthellae released by the coral polyps. Three sea water samples were taken from the aquarium each day. The samples were examined under a microscope to count the number of zooxanthellae that were healthy or damaged. Results were collected for five days. The sea water temperature was then gradually increased to 30 °C over a two-day period with sampling of the sea water continuing. The corals were kept at 30 °C for a further six days with sampling of the sea water continuing. (a) (i) Explain why light and air were supplied to the aquarium. … … … … … … … … [4] (ii) Identify the independent and dependent variable. independent variable … … dependent variable … … [2] (b) Table 1.1 shows the results collected for day 13. Table 1.1 sample number number of healthy cells number of damaged cells 1 460 1420 2 1840 1560 3 640 1620 mean … … (i) Identify the anomalous result in Table 1.1 by drawing a circle around it. [1] (ii) Calculate the means for healthy cells and for damaged cells. Do not include the anomalous result. Write your answers in Table 1.1. [2] (iii) Fig. 1.1 shows the daily mean number of zooxanthellae released that are healthy or damaged and the sea water temperature. Key sea water temperature healthy zooxanthellae damaged zooxanthellae 9000 32 8000 30 7000 28 6000 26 mean number 5000 24 sea water zooxanthellae temperature released 4000 22 / °C 3000 20 2000 18 1000 16 0 14 1 2 3 4 5 6 7 8 9 10 11 12 13 day Fig. 1.1 On Fig. 1.1, plot the calculated daily means for day 13 using your answers from (b)(ii). [2] (iv) Discuss the extent to which the results of the investigation support the hypothesis the scientist was testing. … … … … [2] (c) On day 4, the number of zooxanthellae released was 0.04% of the total zooxanthellae held in one coral polyp. Calculate the number of zooxanthellae living in one coral polyp. Show your working. … [2] [Total: 15]
15 marks
Mark scheme: 1(a)(i) zooxanthellae need light + carbon dioxide (from air) ; (for) photosynthesis ; coral polyp / zooxanthellae, requires oxygen (from air) ; (for) respiration ; 4 1(a)(ii) independent: temperature ; dependent: number of (healthy / damaged) zooxanthellae (released) ; 2 1(b)(i) 1840 indicated ; 1 1(b)(ii) 550 ; 1530 / 1533 ; 2 1(b)(iii) total height of the bar correct at 2080, same width as other bars / drawn with ruler ; shaded black bar starting at 550 ; 2 1(b)(iv) any 2 from: (before and after change) mean total released similar, so does not support ; after change, more damaged cells released / fewer healthy cells released, which partially supports ; idea of it is the change in temperature which causes the release / during transition more of both types are released, which supports ; data manipulation ; 2 1(c) (read from graph = 2200) (2200 / 0.04) ; 100 = 5.5 106 / 5 500 000 ; 2
This question in 9693/22 May/June 2024
Q26 · When sea water temperature increases, coral polyps release zooxanthellae 9693/23 May/June 2024
1 When sea water temperature increases, coral polyps release zooxanthellae. Either the polyps release whole zooxanthellae which are healthy, or the polyps partially digest and release zooxanthellae which are damaged. A scientist carried out an investigation to test the hypothesis: Increased temperature will increase the number of healthy and damaged zooxanthellae released by coral polyps. An aquarium was prepared with a light supply and constantly flowing sea water at 27 °C, and a supply of air was bubbled through the sea water. A coral colony was placed into the aquarium. The sea water was filtered to collect all the zooxanthellae released by the coral polyps. Three sea water samples were taken from the aquarium each day. The samples were examined under a microscope to count the number of zooxanthellae that were healthy or damaged. Results were collected for five days. The sea water temperature was then gradually increased to 30 °C over a two-day period with sampling of the sea water continuing. The corals were kept at 30 °C for a further six days with sampling of the sea water continuing. (a) (i) Explain why light and air were supplied to the aquarium. … … … … … … … … [4] (ii) Identify the independent and dependent variable. independent variable … … dependent variable … … [2] (b) Table 1.1 shows the results collected for day 13. Table 1.1 sample number number of healthy cells number of damaged cells 1 460 1420 2 1840 1560 3 640 1620 mean … … (i) Identify the anomalous result in Table 1.1 by drawing a circle around it. [1] (ii) Calculate the means for healthy cells and for damaged cells. Do not include the anomalous result. Write your answers in Table 1.1. [2] (iii) Fig. 1.1 shows the daily mean number of zooxanthellae released that are healthy or damaged and the sea water temperature. Key sea water temperature healthy zooxanthellae damaged zooxanthellae 9000 32 8000 30 7000 28 6000 26 mean number 5000 24 sea water zooxanthellae temperature released 4000 22 / °C 3000 20 2000 18 1000 16 0 14 1 2 3 4 5 6 7 8 9 10 11 12 13 day Fig. 1.1 On Fig. 1.1, plot the calculated daily means for day 13 using your answers from (b)(ii). [2] (iv) Discuss the extent to which the results of the investigation support the hypothesis the scientist was testing. … … … … [2] (c) On day 4, the number of zooxanthellae released was 0.04% of the total zooxanthellae held in one coral polyp. Calculate the number of zooxanthellae living in one coral polyp. Show your working. … [2] [Total: 15]
15 marks
Mark scheme: 1(a)(i) zooxanthellae need light + carbon dioxide (from air) ; (for) photosynthesis ; coral polyp / zooxanthellae, requires oxygen (from air) ; (for) respiration ; 4 1(a)(ii) independent: temperature ; dependent: number of (healthy / damaged) zooxanthellae (released) ; 2 1(b)(i) 1840 indicated ; 1 1(b)(ii) 550 ; 1530 / 1533 ; 2 1(b)(iii) total height of the bar correct at 2080, same width as other bars / drawn with ruler ; shaded black bar starting at 550 ; 2 1(b)(iv) any 2 from: (before and after change) mean total released similar, so does not support ; after change, more damaged cells released / fewer healthy cells released, which partially supports ; idea of it is the change in temperature which causes the release / during transition more of both types are released, which supports ; data manipulation ; 2 1(c) (read from graph = 2200) (2200 / 0.04) ; 100 = 5.5 106 / 5 500 000 ; 2
This question in 9693/23 May/June 2024
Q27 · Scientists investigated the relationship between corals and their symbionts 9693/21 Oct/Nov 2025
2 Scientists investigated the relationship between corals and their symbionts. They investigated if nitrogen and phosphorus are provided by the symbiont to the coral. (a) (i) State and explain the type of symbiotic relationship between coral polyps and zooxanthellae. type of symbiotic relationship … explanation … … … … [3] (ii) State one function of phosphorus in corals. … [1] (iii) Describe how the structure of coral polyps enables them to obtain nutrients from fish larvae. … … … … … [2] (b) The scientists investigated the growth of one species of coral in sea water with different concentrations of nitrate ions (NO3–) and phosphate ions (PO43–). Two tanks of sea water were used: • tank one was maintained at a normal concentration of nitrate and phosphate ions • tank two was maintained at a low concentration of nitrate and phosphate ions. Ten samples of the coral were placed into each tank. The tanks contained no other organisms. The sea water was constantly filtered to remove any small particles and food sources. The scientists measured the growth of coral in both tanks for six months. (i) Identify the independent variable and the dependent variable in this investigation. independent variable … … dependent variable … … [2] (ii) Use the information given above to identify one variable that was standardised. … … [1] (iii) Suggest two other variables not described above that need to be standardised to ensure the data collected is valid. 1 … 2 … [2] (c) Table 2.1 shows the mean data the scientists collected. Table 2.1 mean percentage change in mass of the corals time / months normal concentration of low concentration of nitrate and phosphate nitrate and phosphate ions ions 0 0 0 1 15 24 2 33 32 3 54 35 4 91 41 5 158 62 6 212 80 (i) The graph in Fig. 2.1 shows the mean percentage change in mass of the corals in the normal concentration of nitrate and phosphate ions. A line of best fit has been drawn to show the trend. Complete the scale and the labels for both axes. One scale value has already been added. Plot the values from Table 2.1 for the mean percentage change in mass of the corals in the low concentration of nitrate and phosphate ions on Fig. 2.1. Draw a line of best fit to indicate the overall trend for the data you have plotted. (ii) Compare the growth rates of the corals in normal concentrations and in low concentrations of nitrate and phosphate ions shown in Table 2.1. … … … … [2] (d) In further investigations, the scientists found that the growth of the coral was linked to digestion of some of the symbionts hosted in the coral tissues. The number of zooxanthellae per cm2 in the coral tissue: • remained constant in the tank with the normal concentration of nitrate and phosphate ions • decreased in the tank with the low concentration of nitrate and phosphate ions. The colour of the coral is due to the presence of zooxanthellae. The coral in the sea water with the low concentration of nitrate and phosphate ions gradually changed to white during the investigation. Suggest reasons for the change in appearance and growth of the coral in the sea water with the low concentration of nitrate and phosphate ions. … … … … … … … … … … [5] (e) A student formed the following conclusion based on the results. ‘Zooxanthellae are essential for all corals to obtain nutrients and grow faster.’ Use the information provided throughout Question 2 to evaluate this conclusion. … … … … … … [3] [Total: 25]
25 marks
Mark scheme: 2(a)(i) type of symbiotic relationship 3 mutualism ; explanation coral / host, gains energy / carbohydrate / glucose (from zooxanthellae) ORA ; zooxanthellae / symbiont, gains shelter / protection / carbon dioxide (from coral) ORA ; 2(a)(ii) (to make) DNA 1 2(a)(iii) any two from: 2 nematocysts, sting / stun / kill, larvae ; tentacles move larvae, into/through, the mouth ; stomach digests larvae ; 2(b)(i) independent variable: 2 idea of concentration of nitrate (NO3-) AND phosphate (PO43-) dependent variable: idea of growth of coral 2(b)(ii) any one from: 1 no other organisms were present in the tanks ; water filtered (to remove particles) ; no additional food provided ; time results recorded for (six months) ; coral species used ; 2(b)(iii) any two from: 2 temperature ; pH ; salinity ; concentration of other nutrients ; light availability ; starting, mass / volume, of coral ; volume of tank / volume of water ; 2(c)(i) both axes labelled with units 4 scale added correctly ; points, plotted correctly ½ small square ; suitable line of best fit ; 2(c)(ii) any two from: 2 corals grow, faster, in low phosphate and nitrate in first 1 (to 2) months ; (from 2 months) the corals grow, faster, in normal concentration of phosphate and nitrate ; increase (in mass) in normal concentration increases at greater rate with time ; 2(d) any five from: 5 1 idea of greater number of zooxanthellae the more intense the colour / ORA ; 2 nitrate / nitrogen stated use e.g. protein, amino acids, etc. ; 3 reduced, nitrate / phosphate, reduces availability of, nitrogen / phosphorus, to zooxanthellae / ORA ; 4 zooxanthellae, rate of reproduction / growth, is reduced (in low conc. water) / ORA ; 5 digested zooxanthellae cannot be replaced (as quickly) / ORA ; 6 less nutrients passed on to the corals ; 7 organic nutrient example stated e.g. glucose ; 2(e) any three from: 3 1 data shows clear difference after first two months ; 2 data only for 6 months / no longer term data ; 3 data only for the 1 species / many other species not investigated / limited range of species ; 4 no indication of the range in the results ; 5 not all species host zooxanthallae ; 6 coral polyps also consume animals / obtain nutrients from other sources ; AVP ; ;
This question in 9693/21 Oct/Nov 2025


 15
15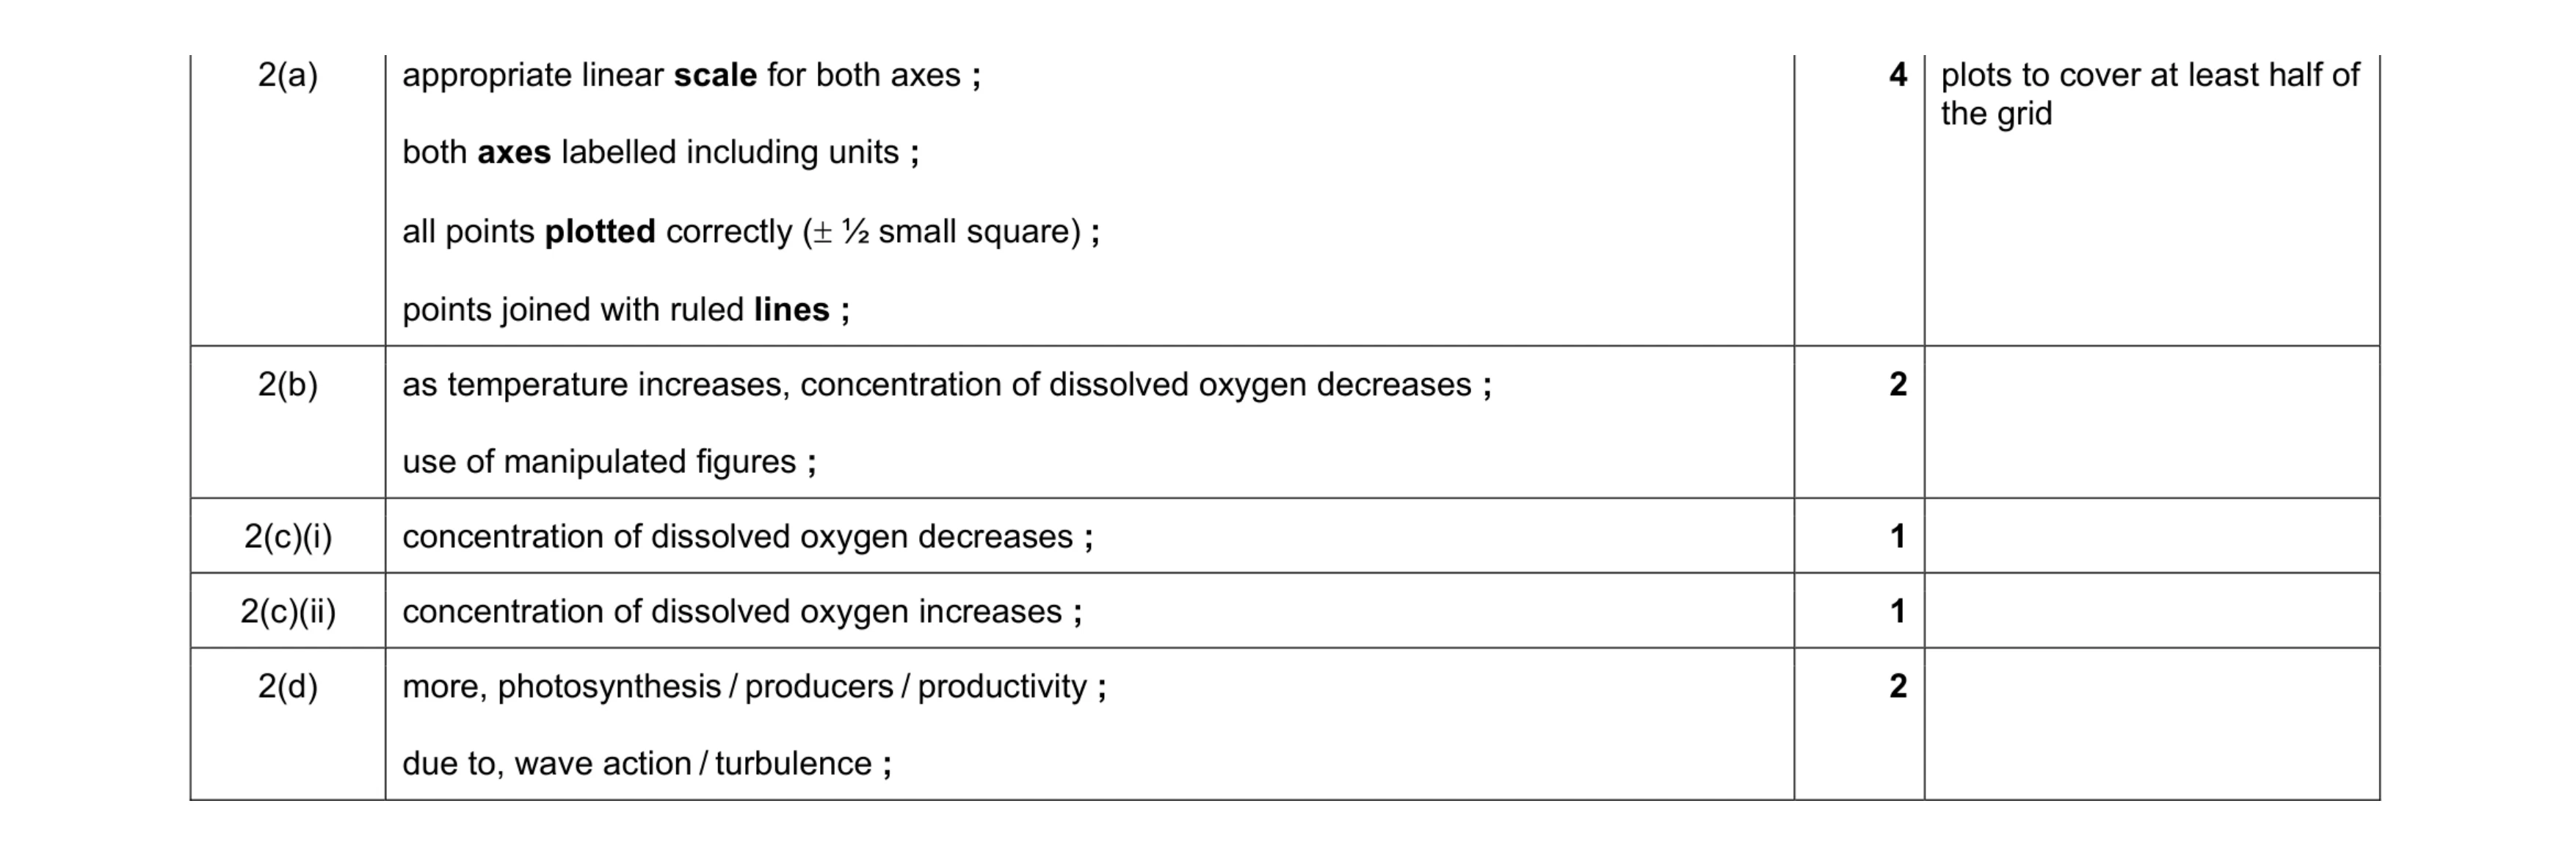 10
10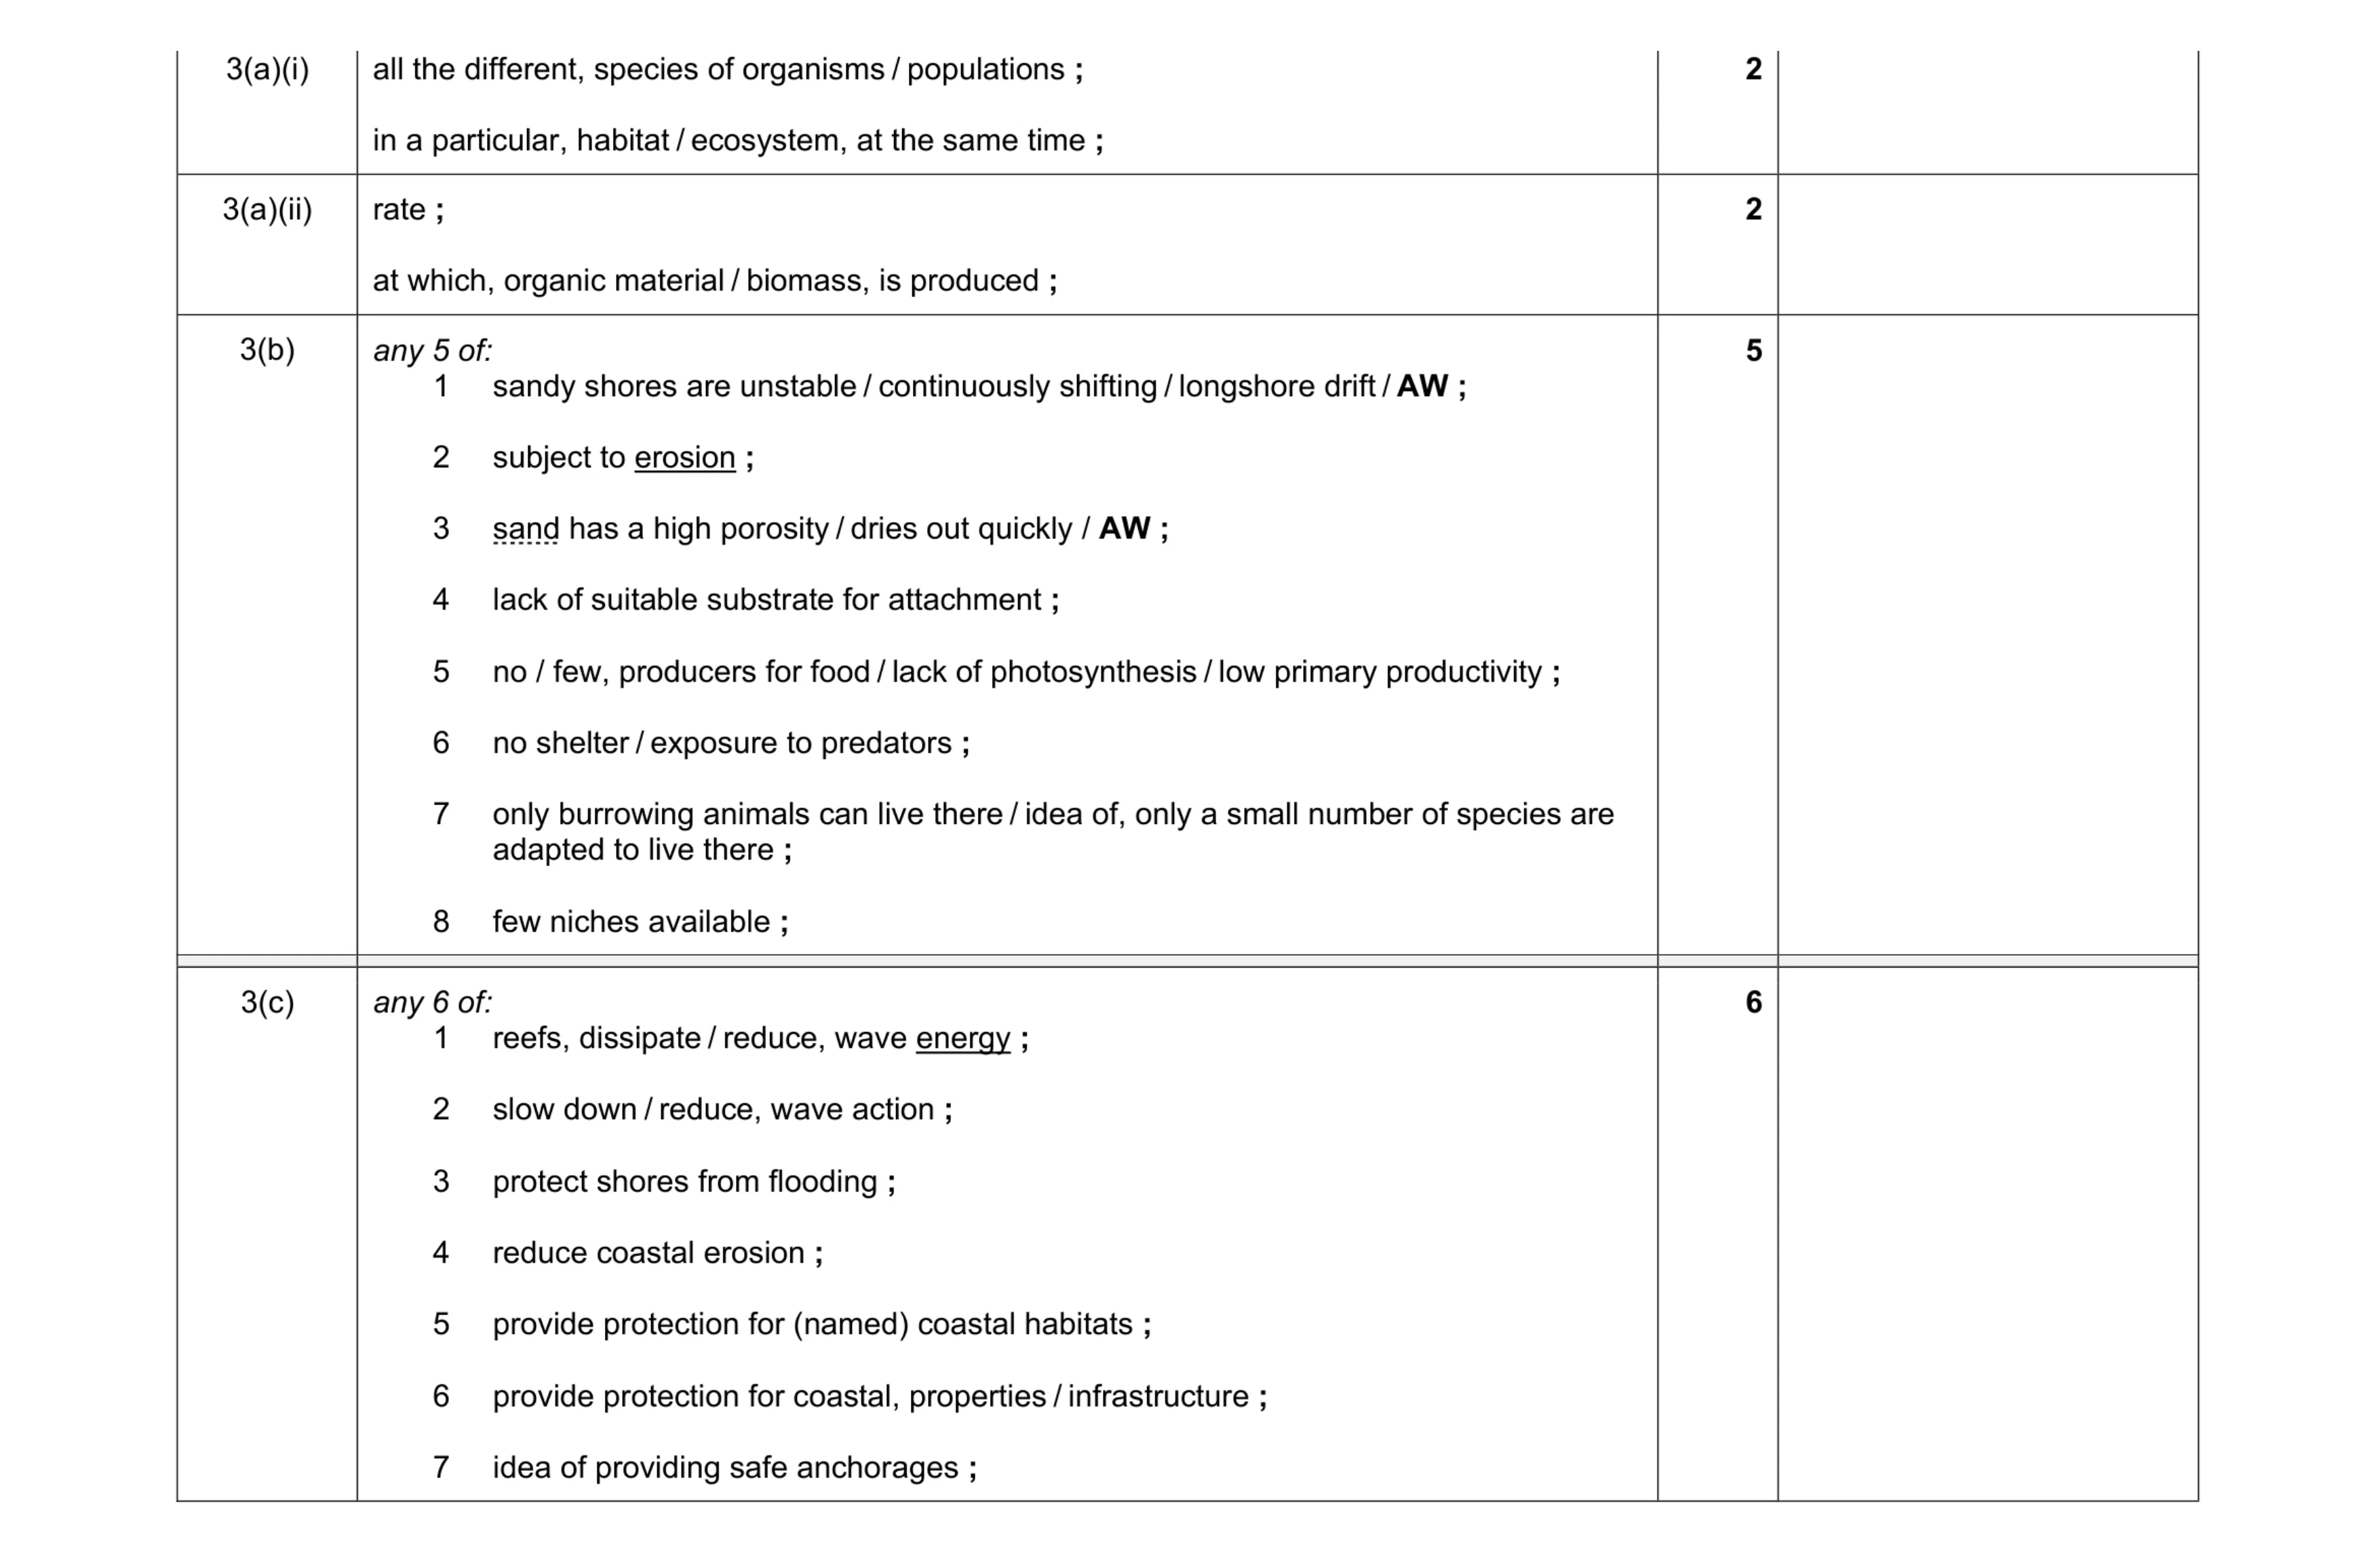 15
15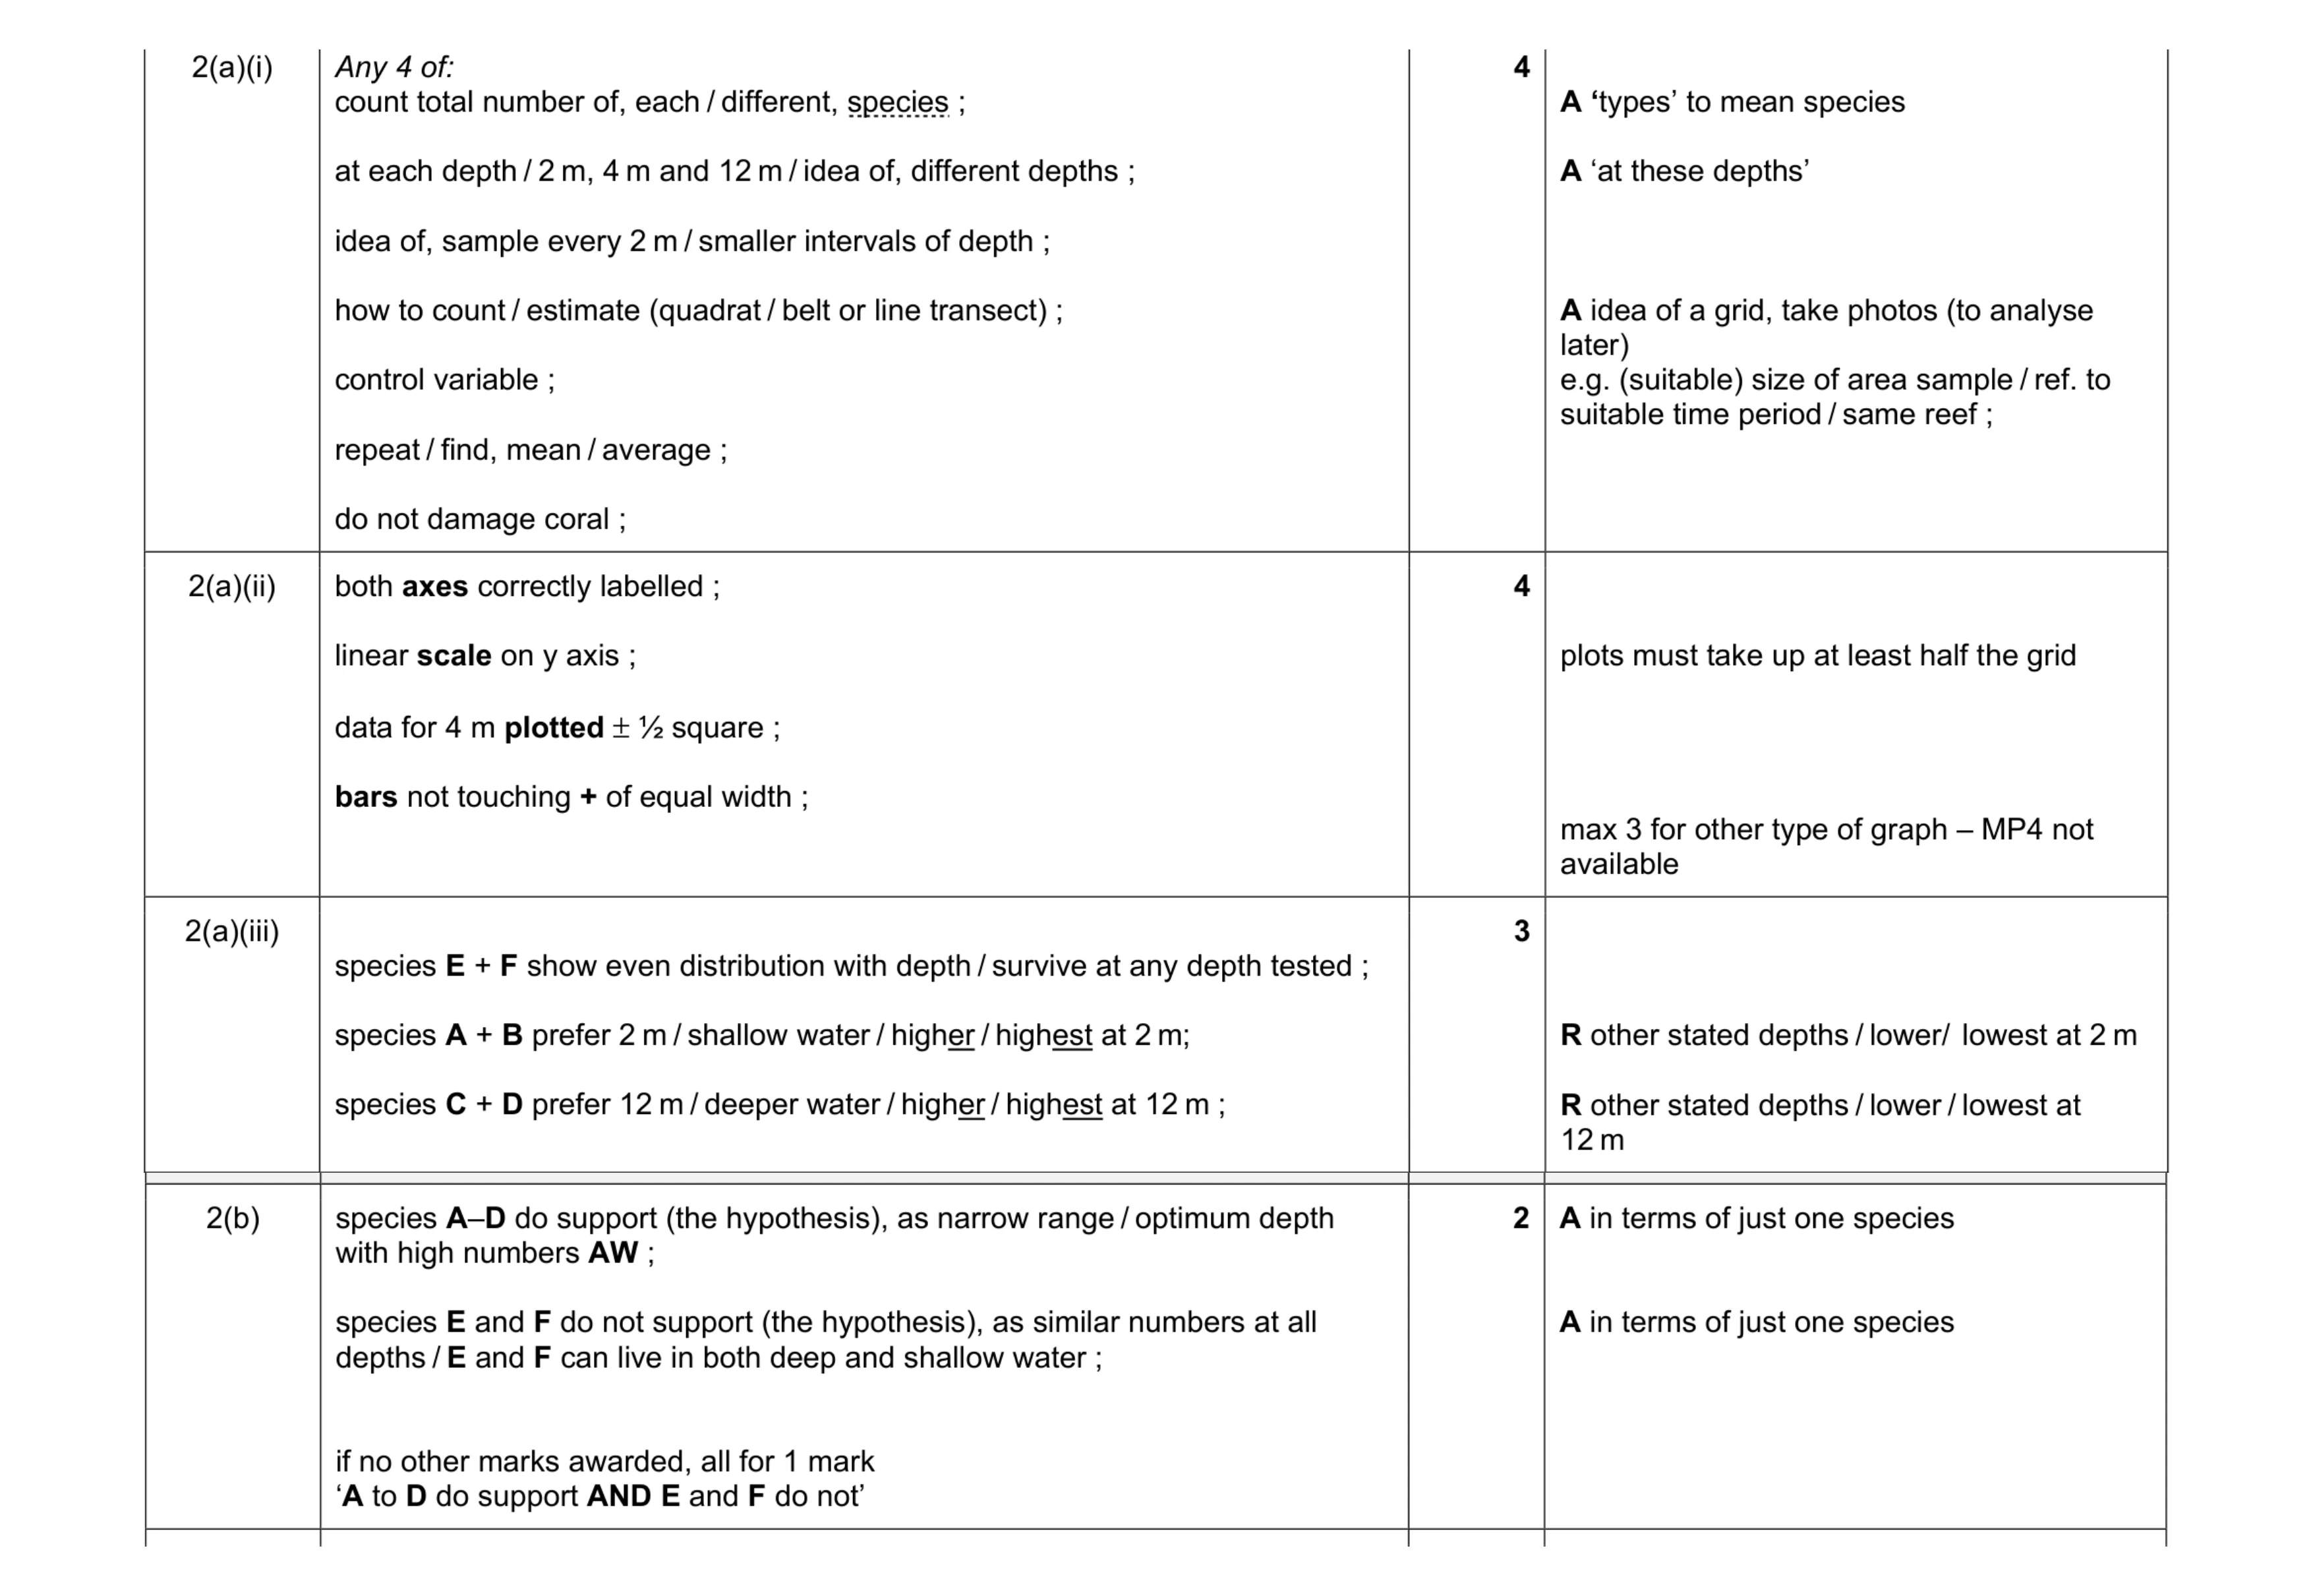 13
13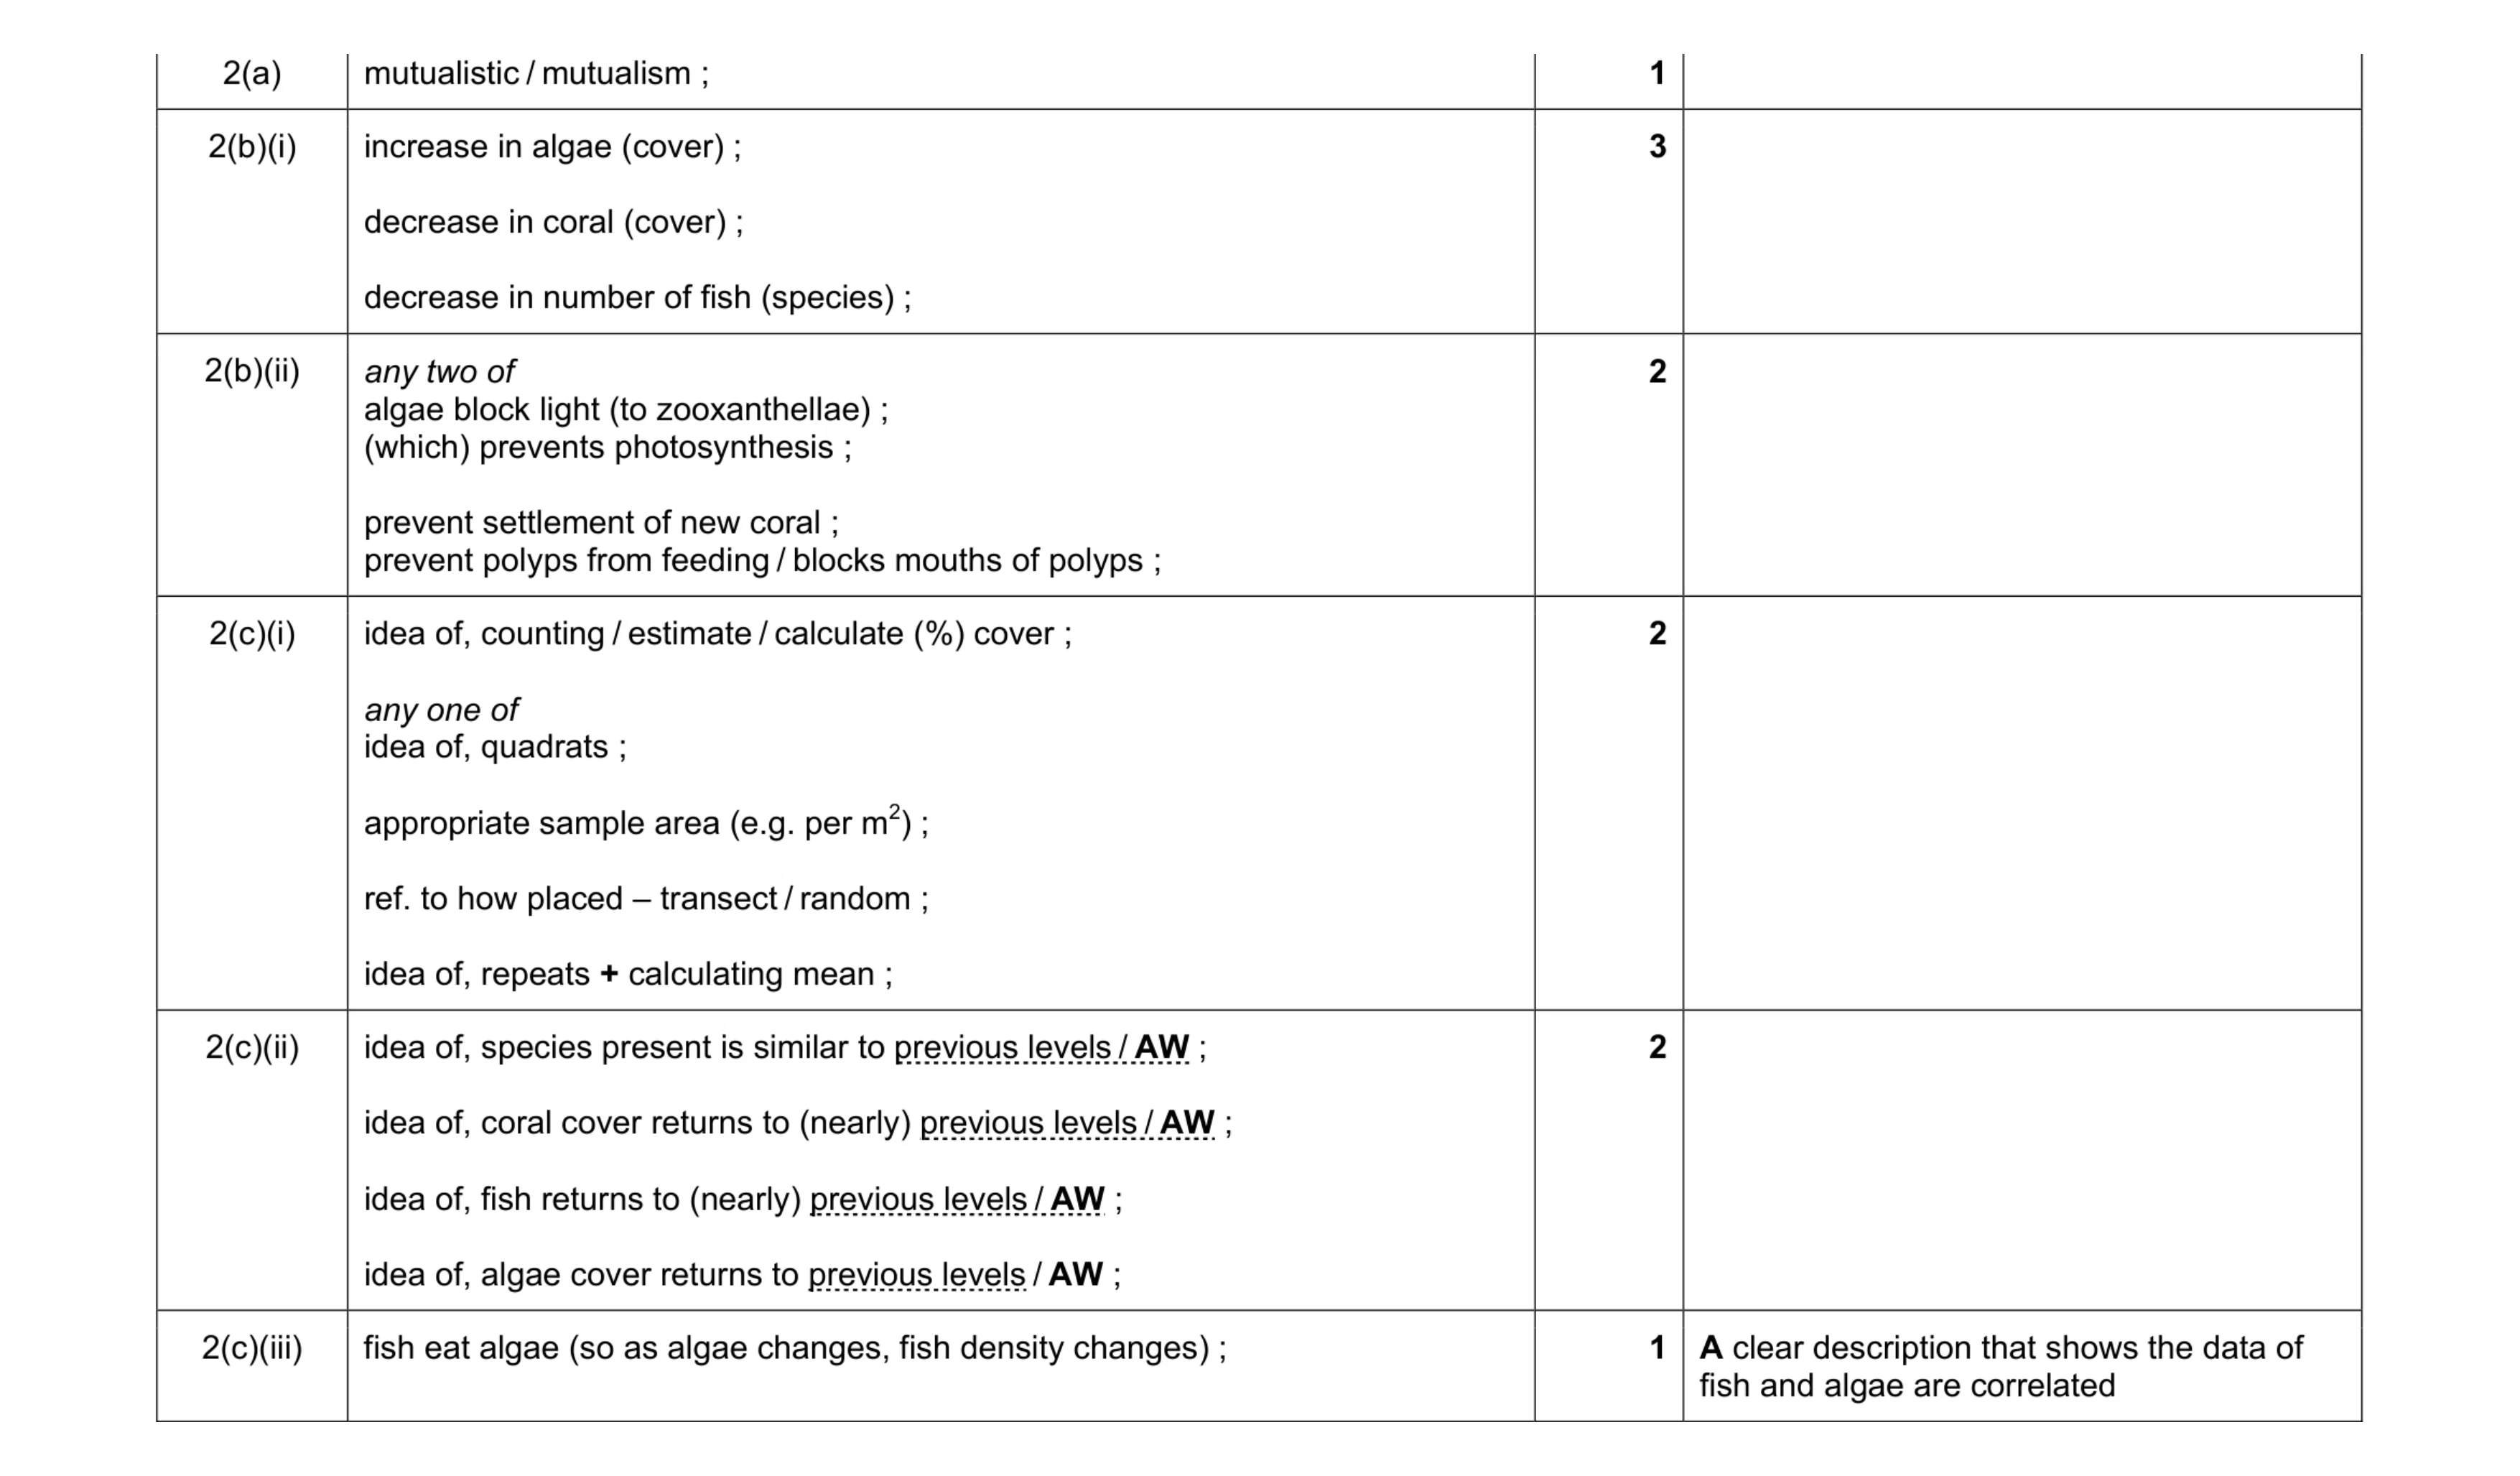 11
11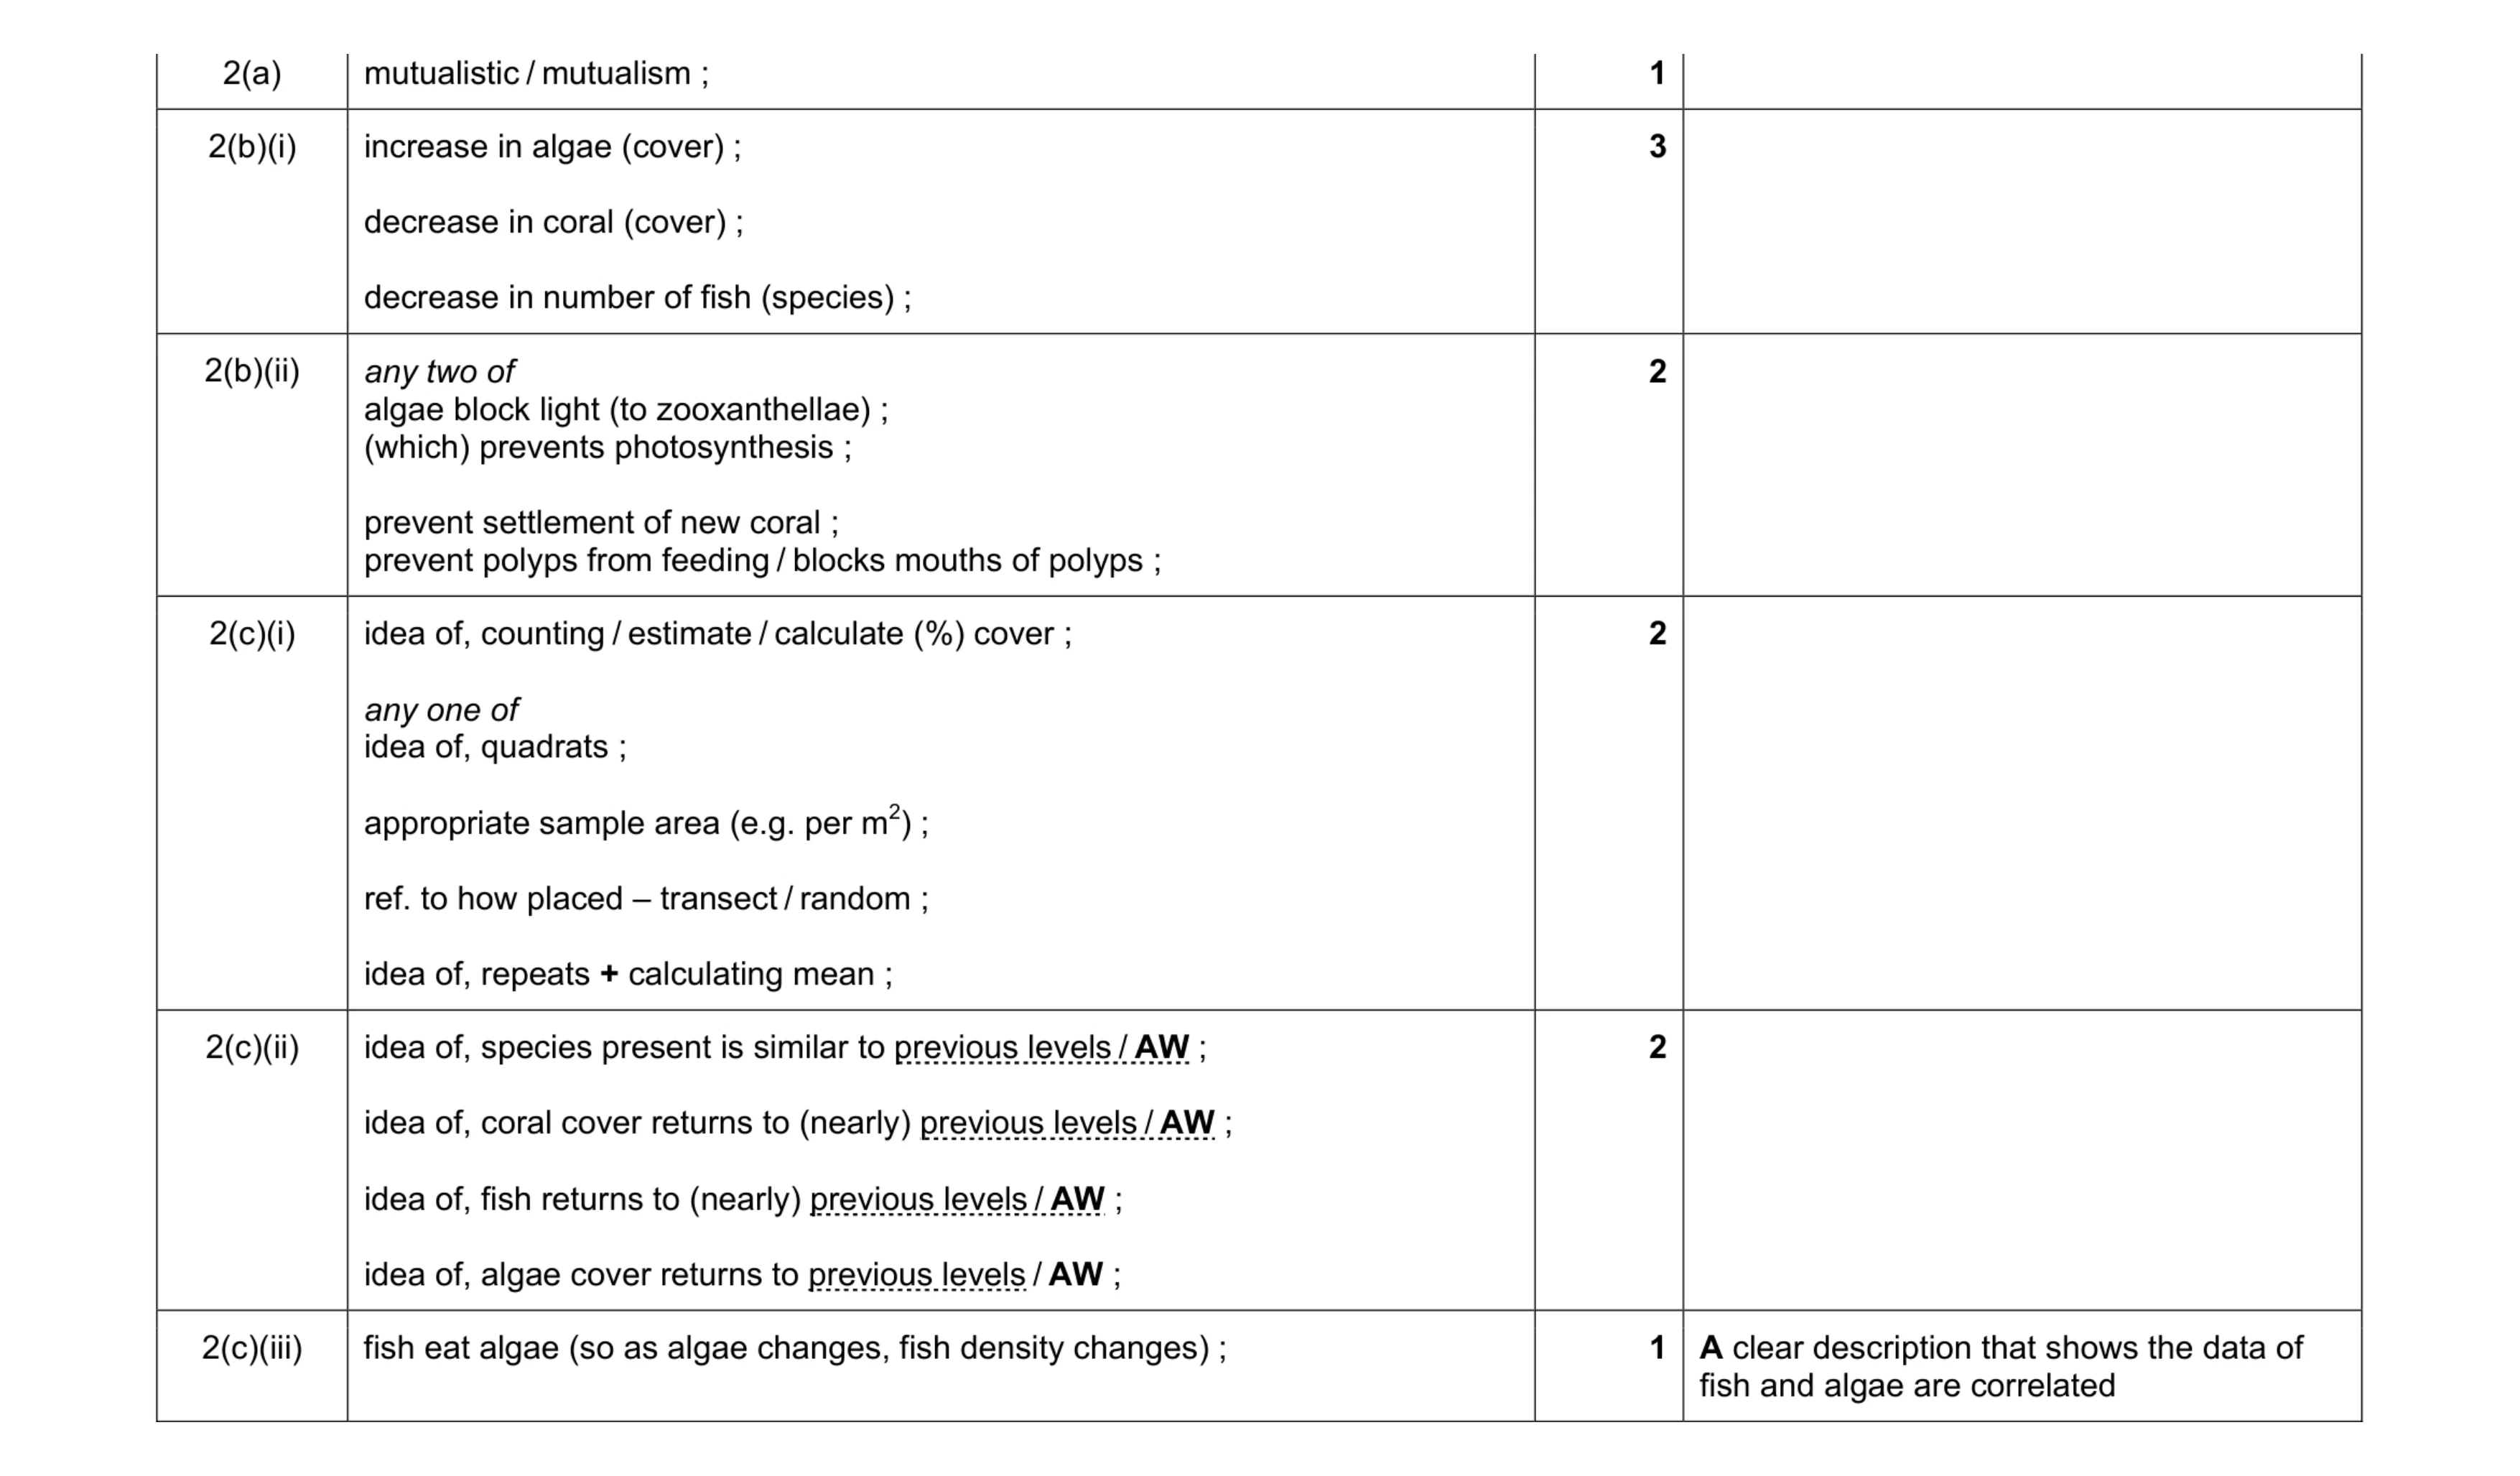 11
11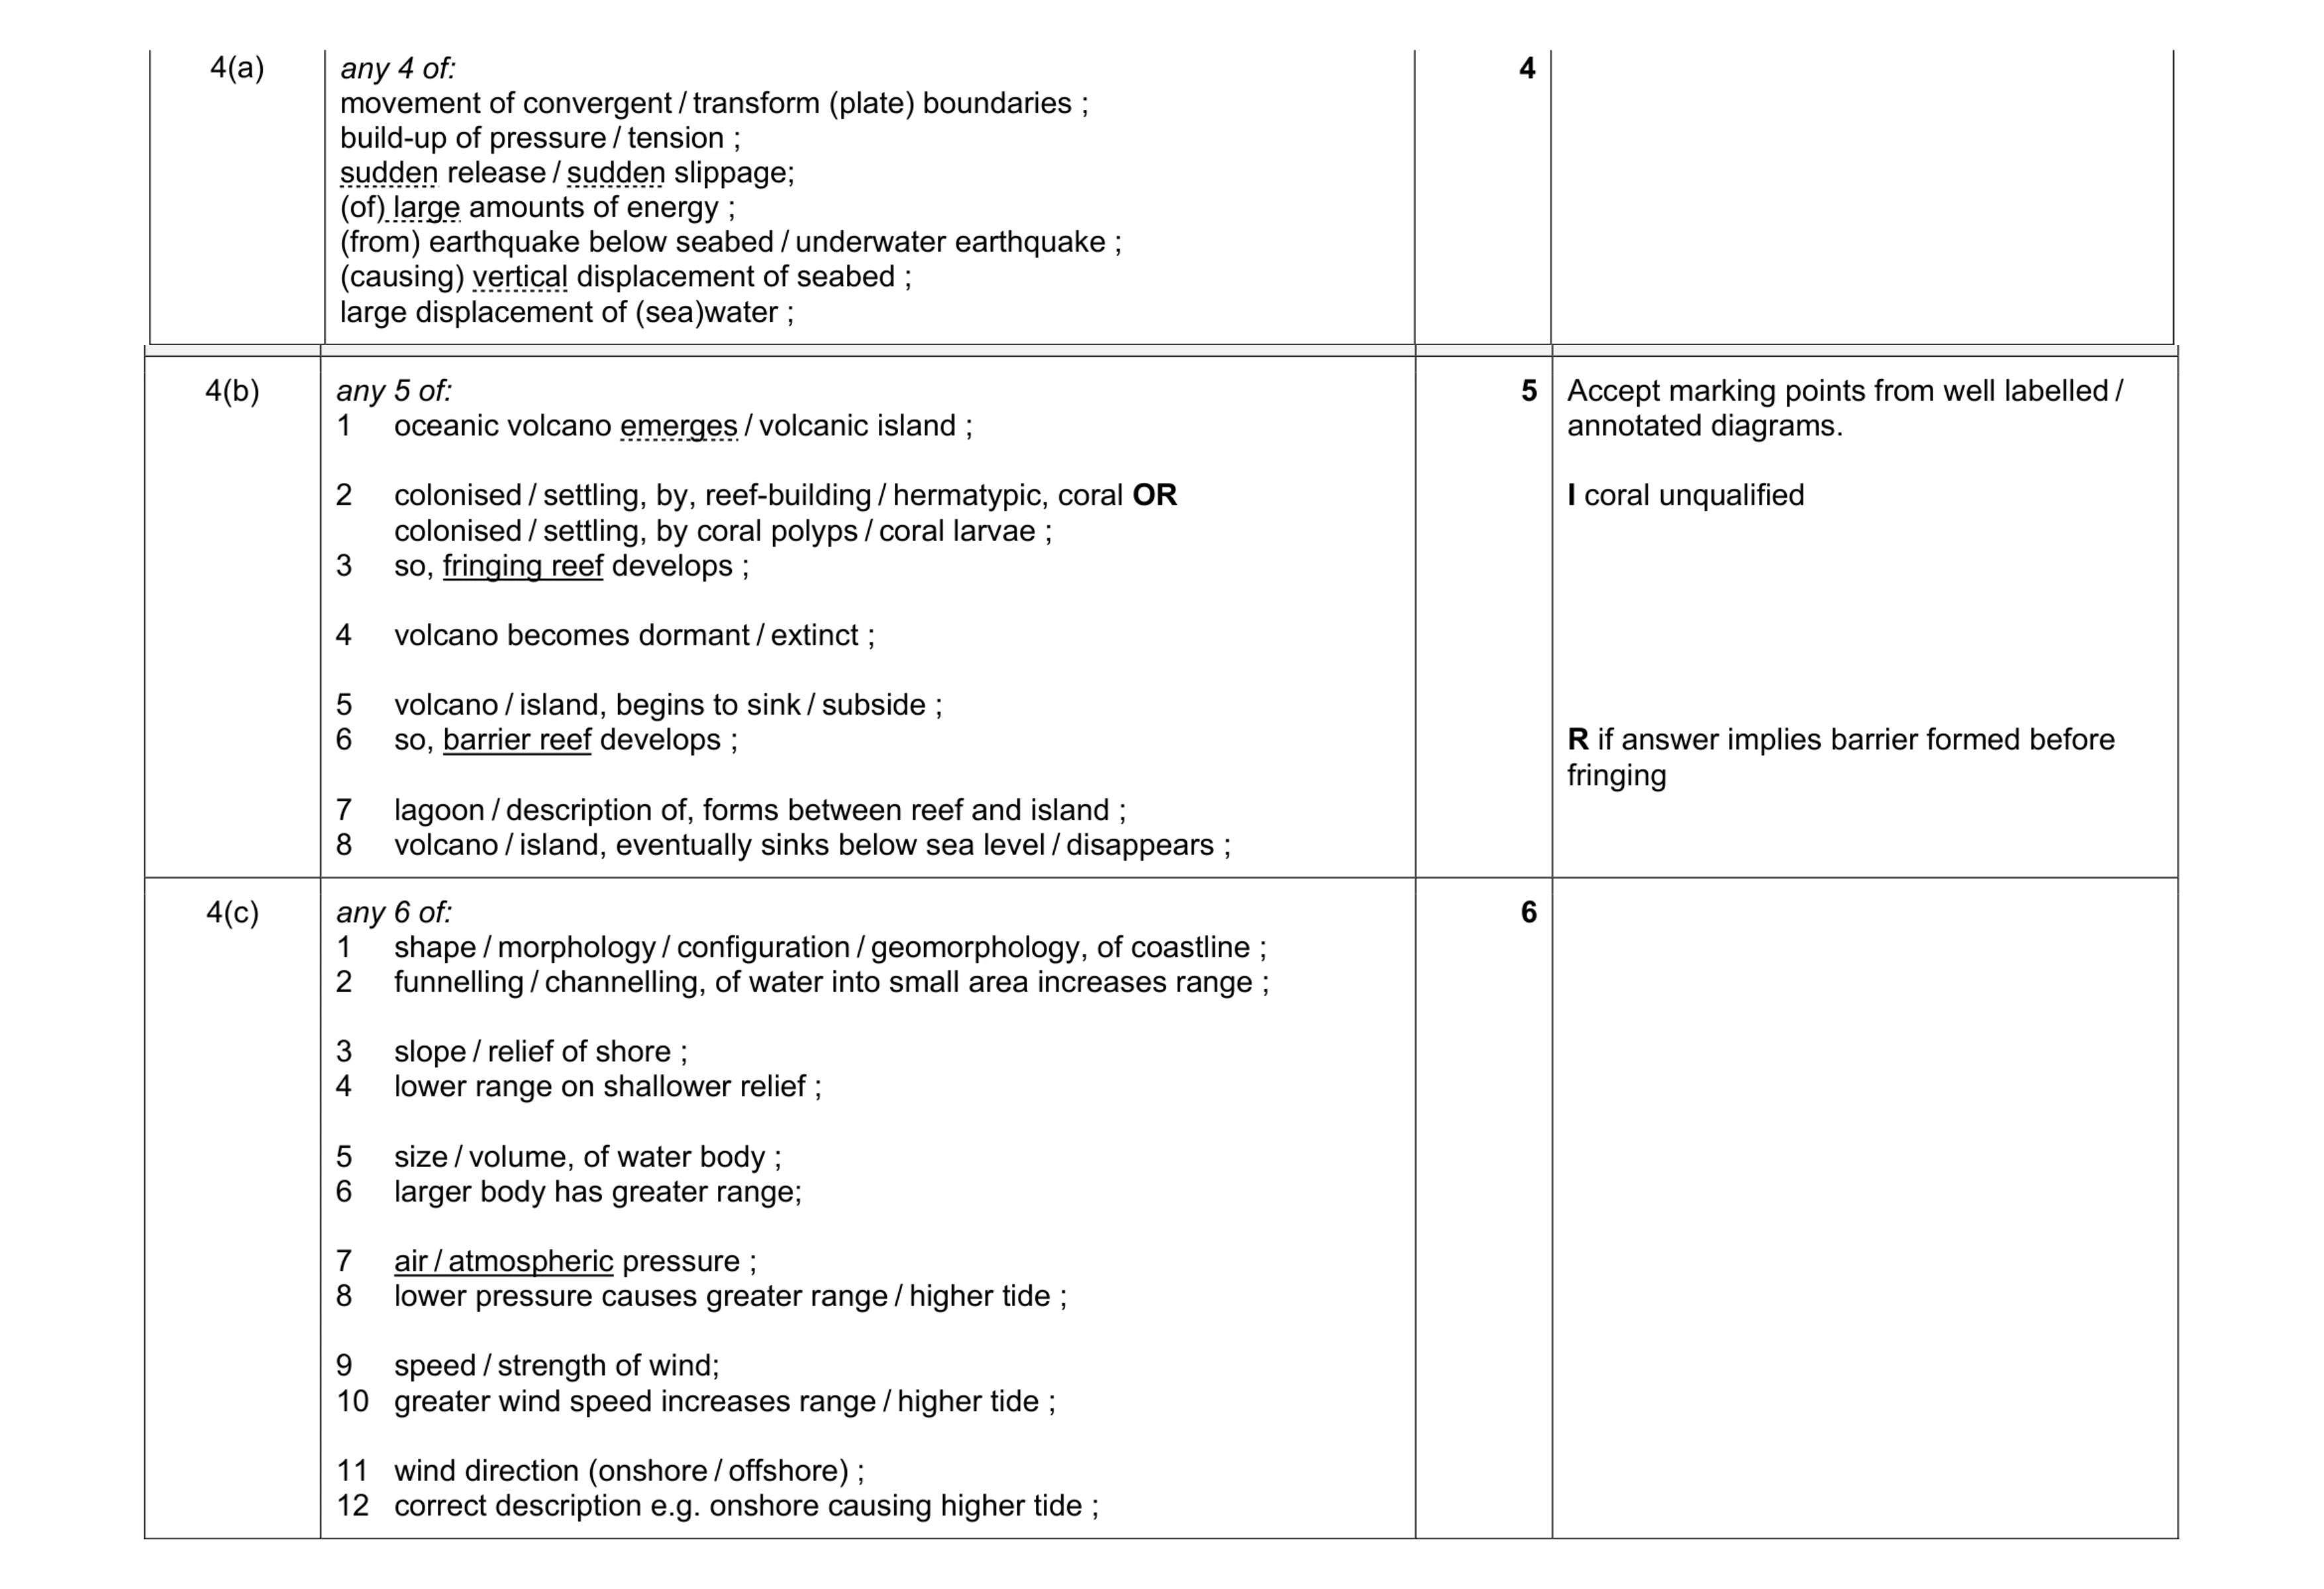 15
15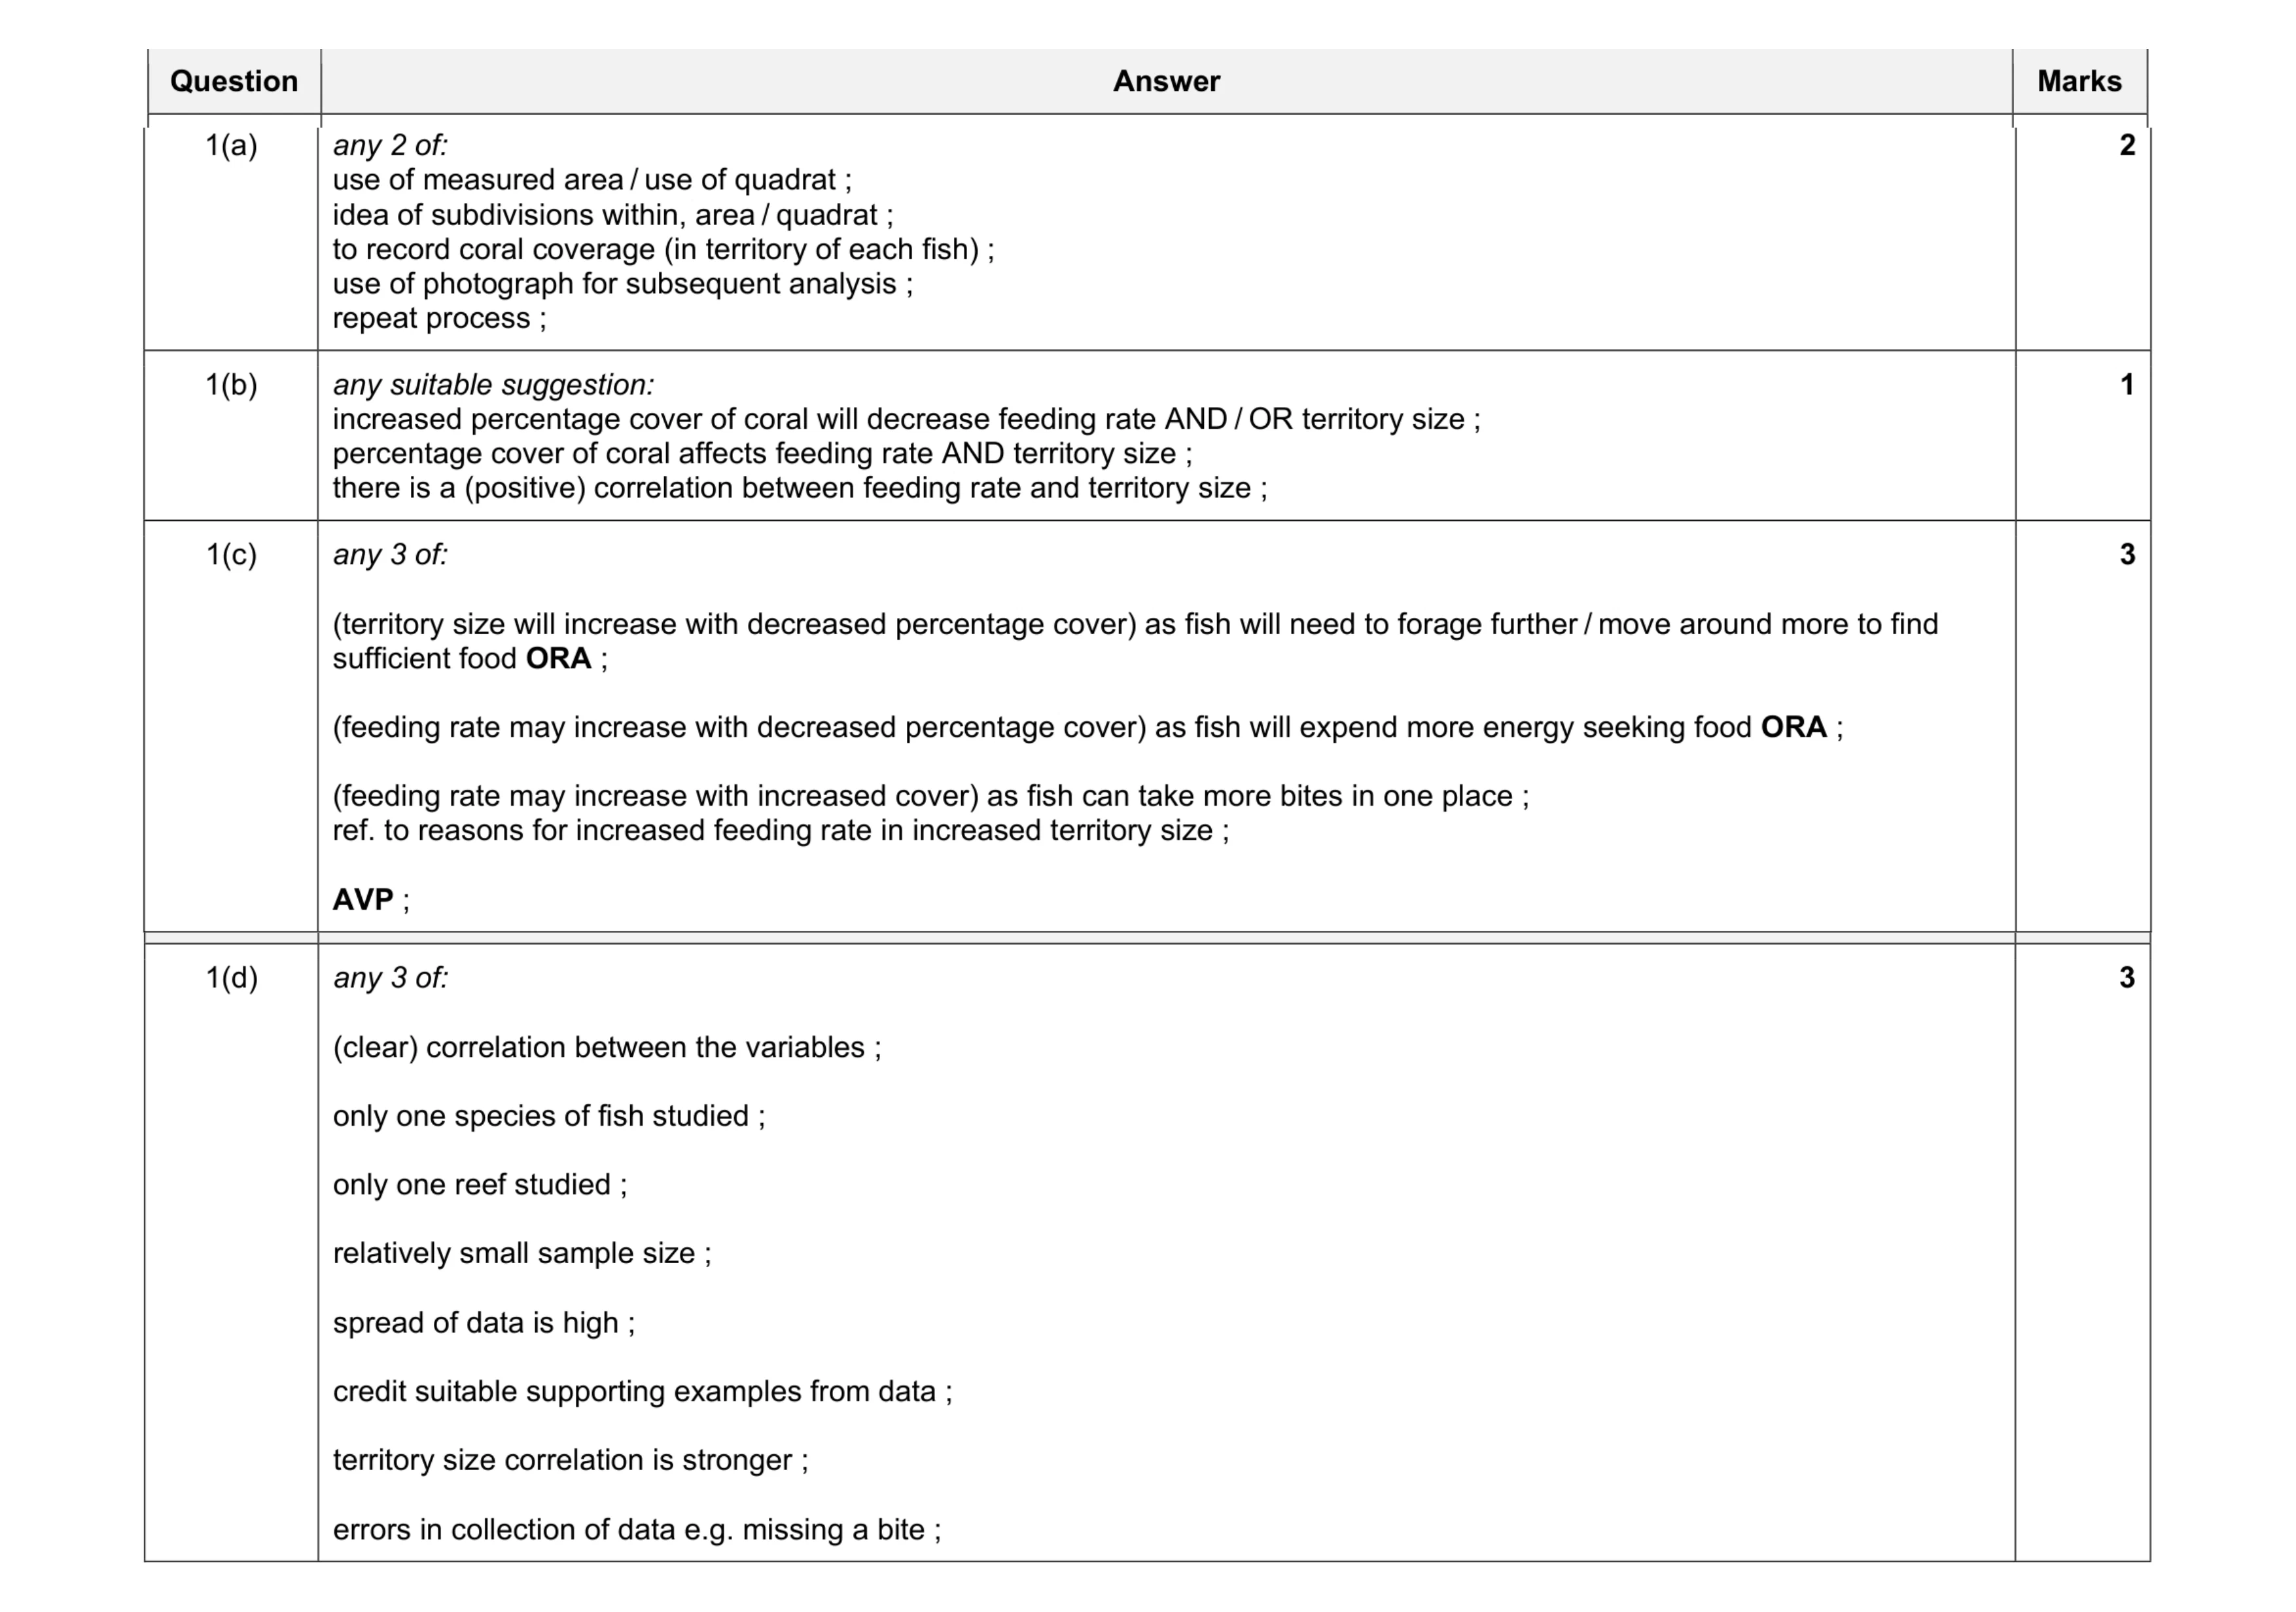 9
9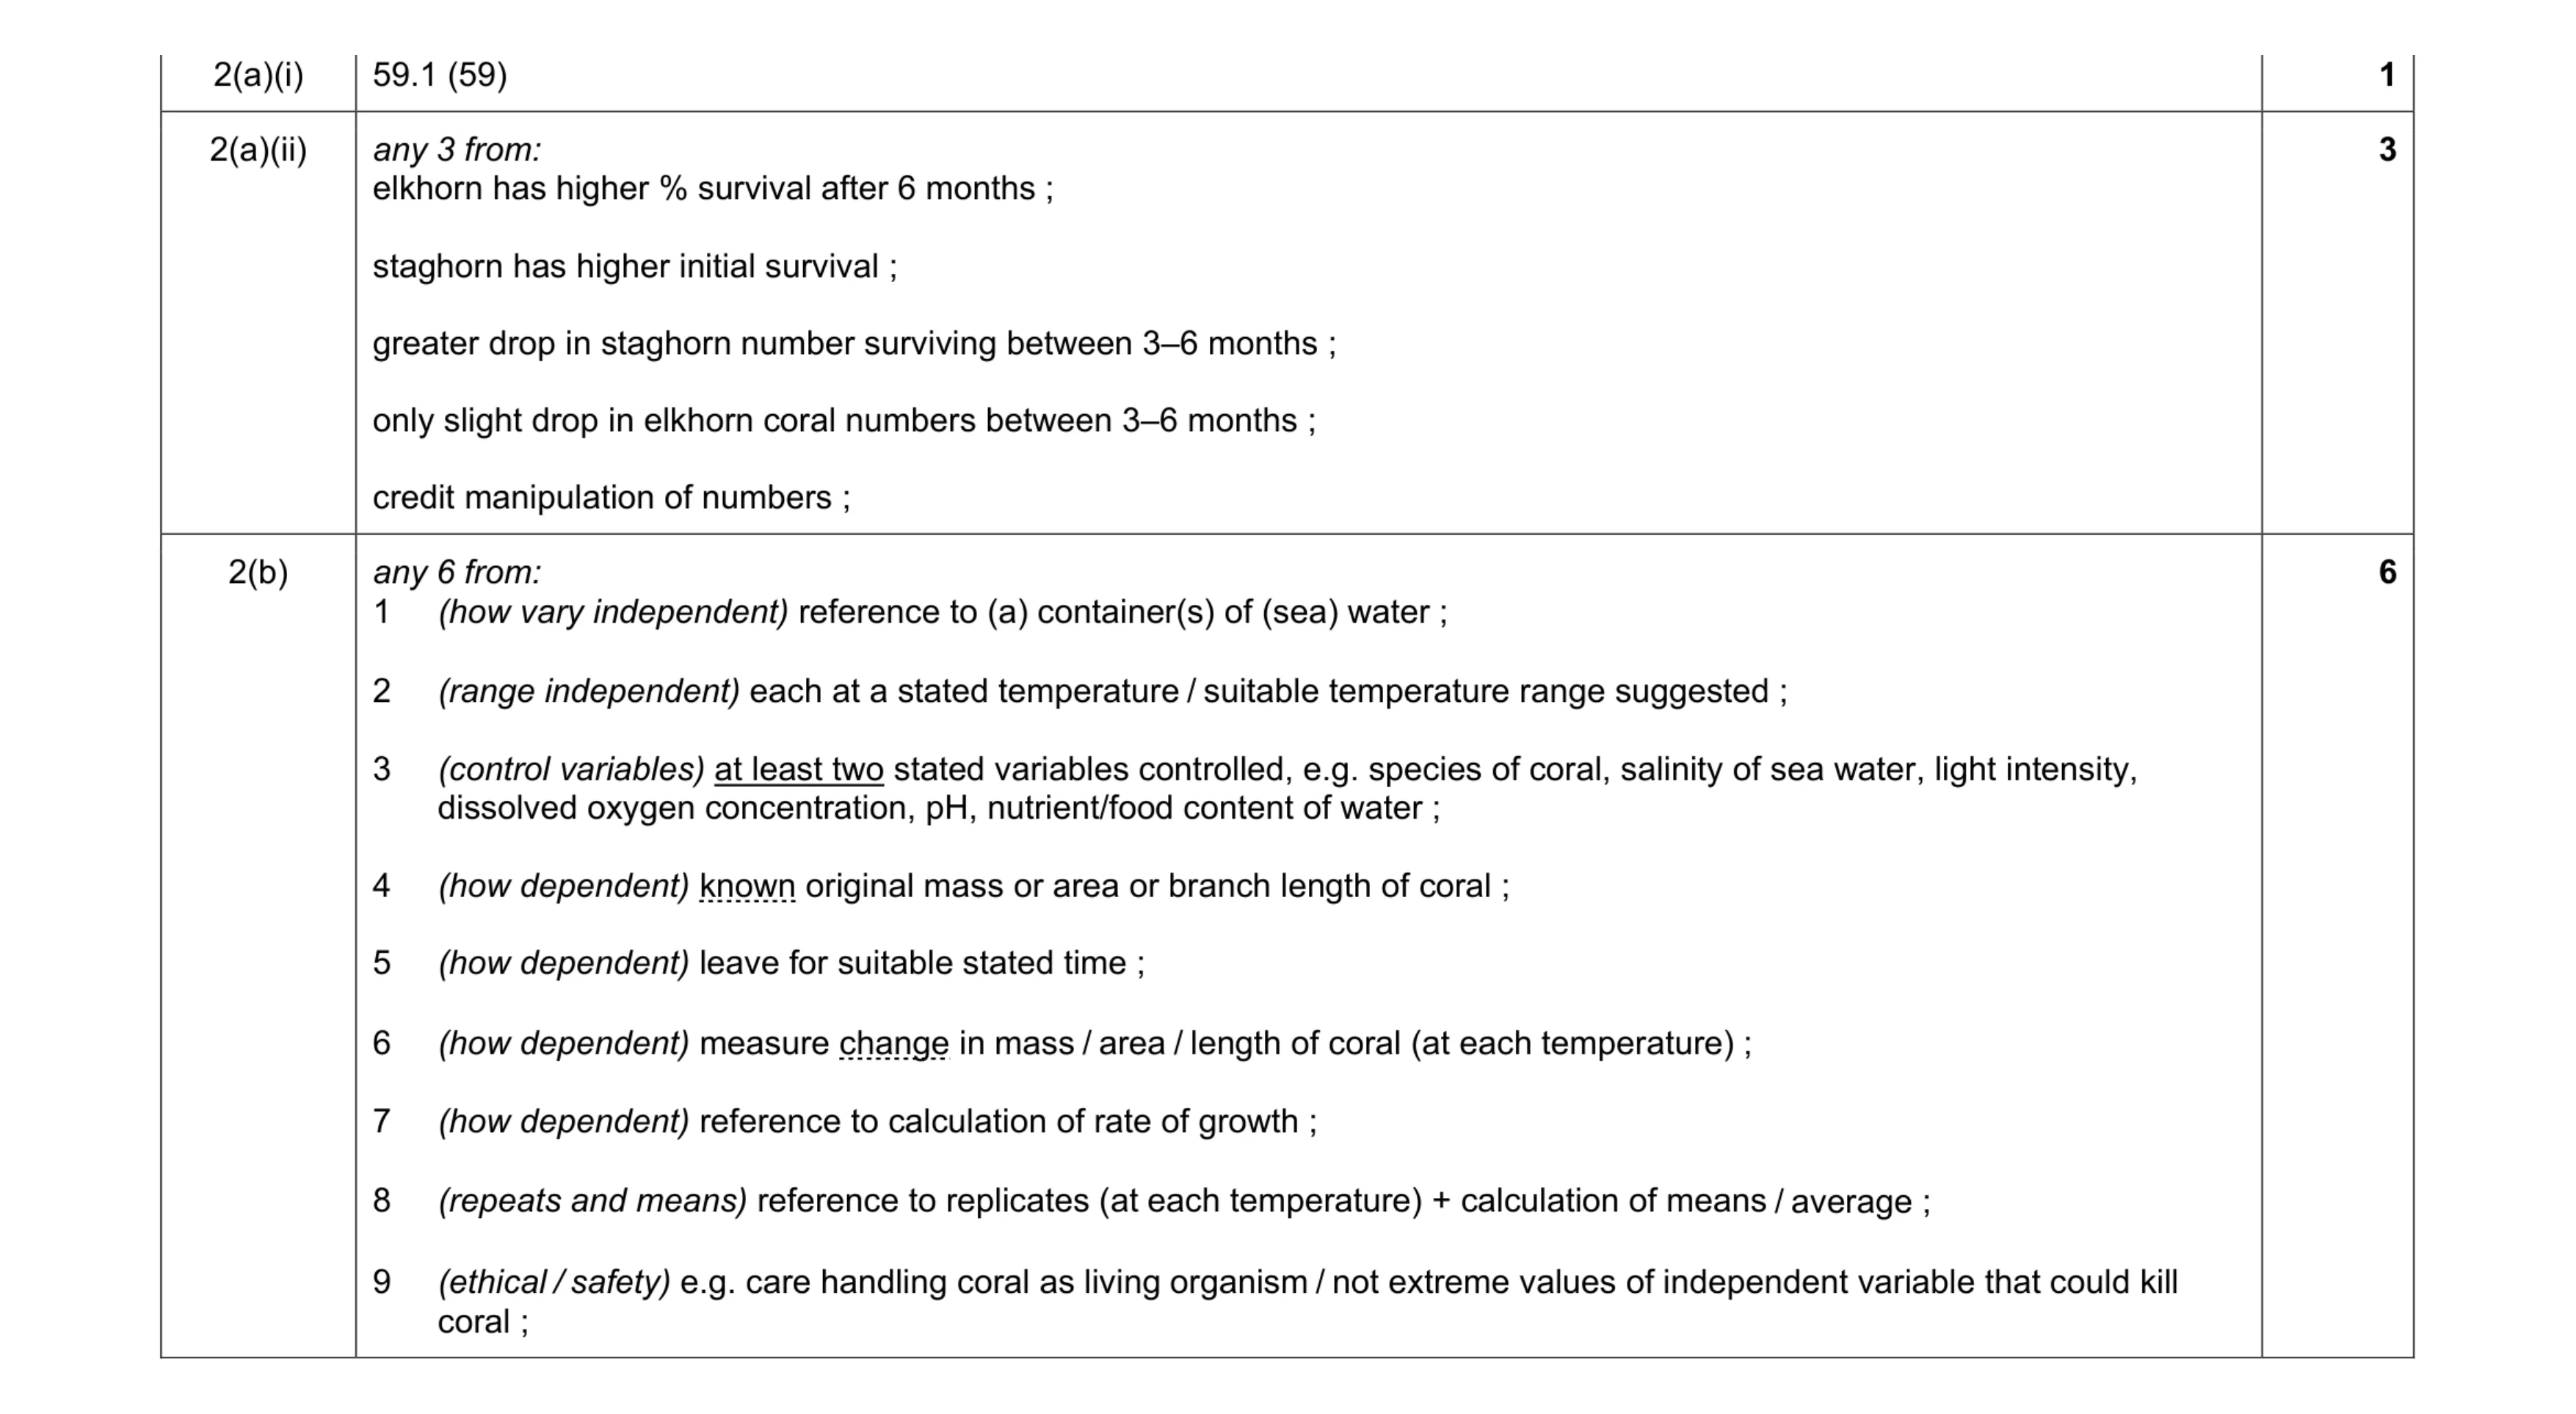 10
10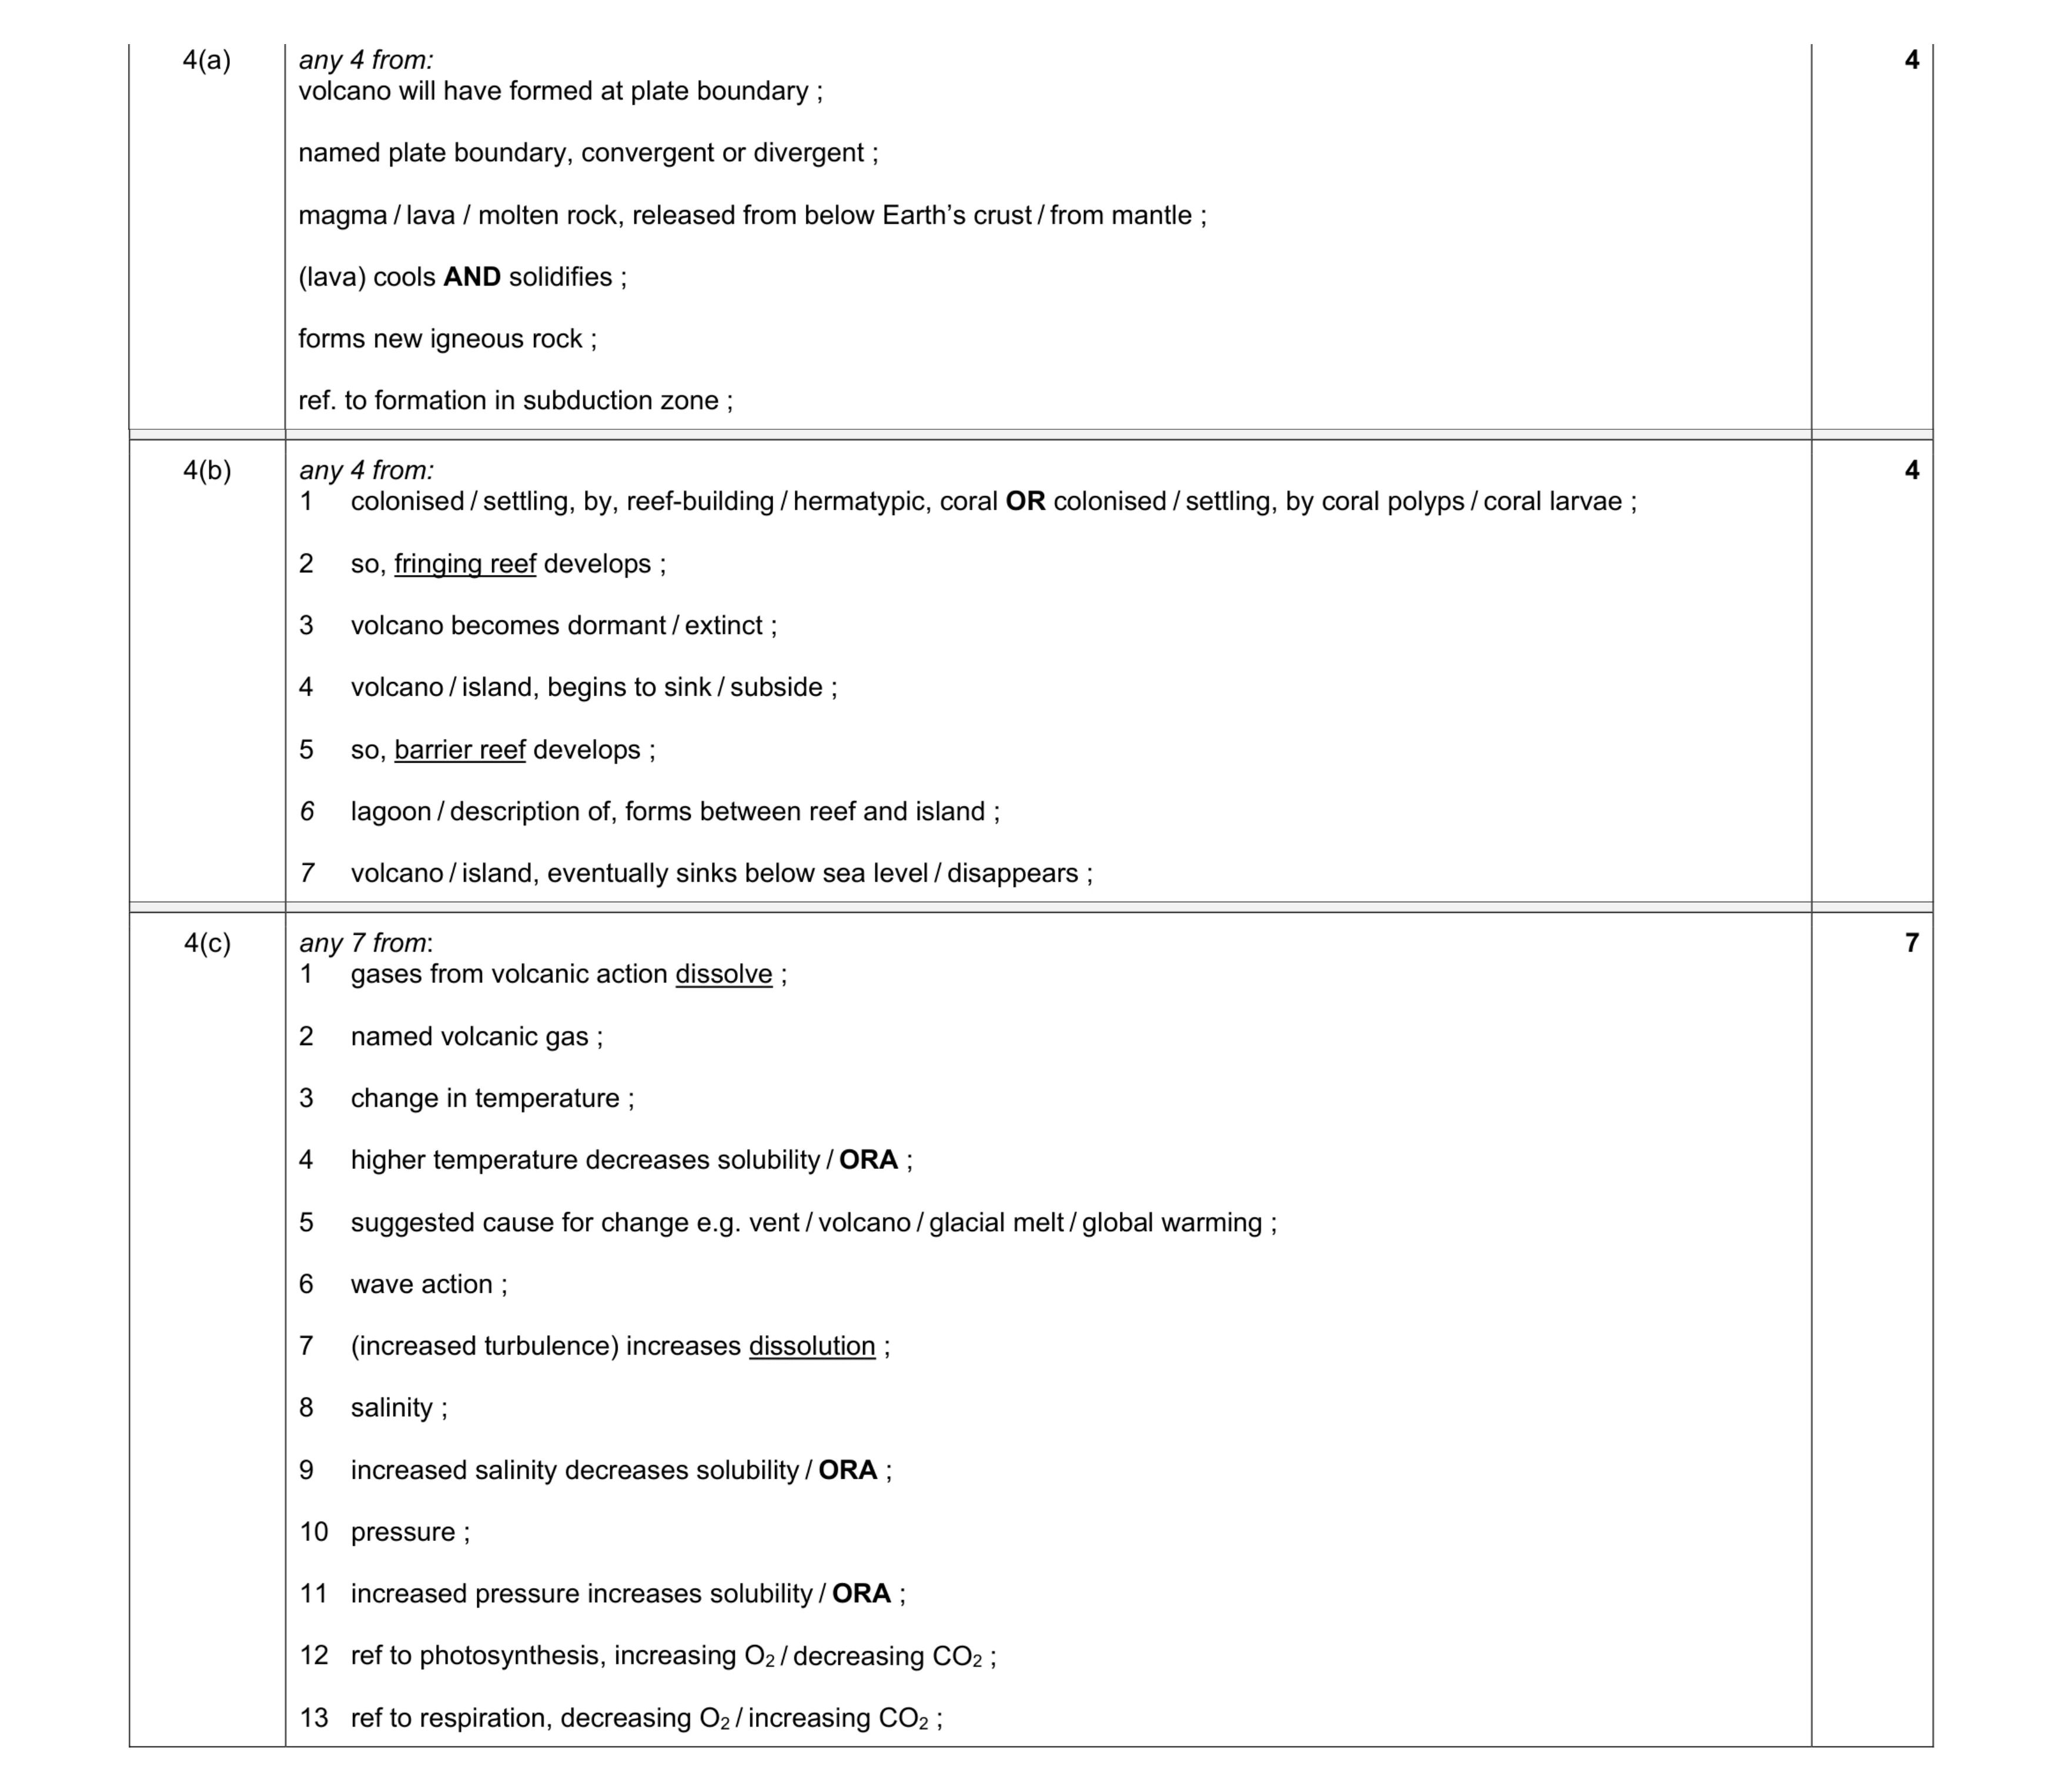 15
15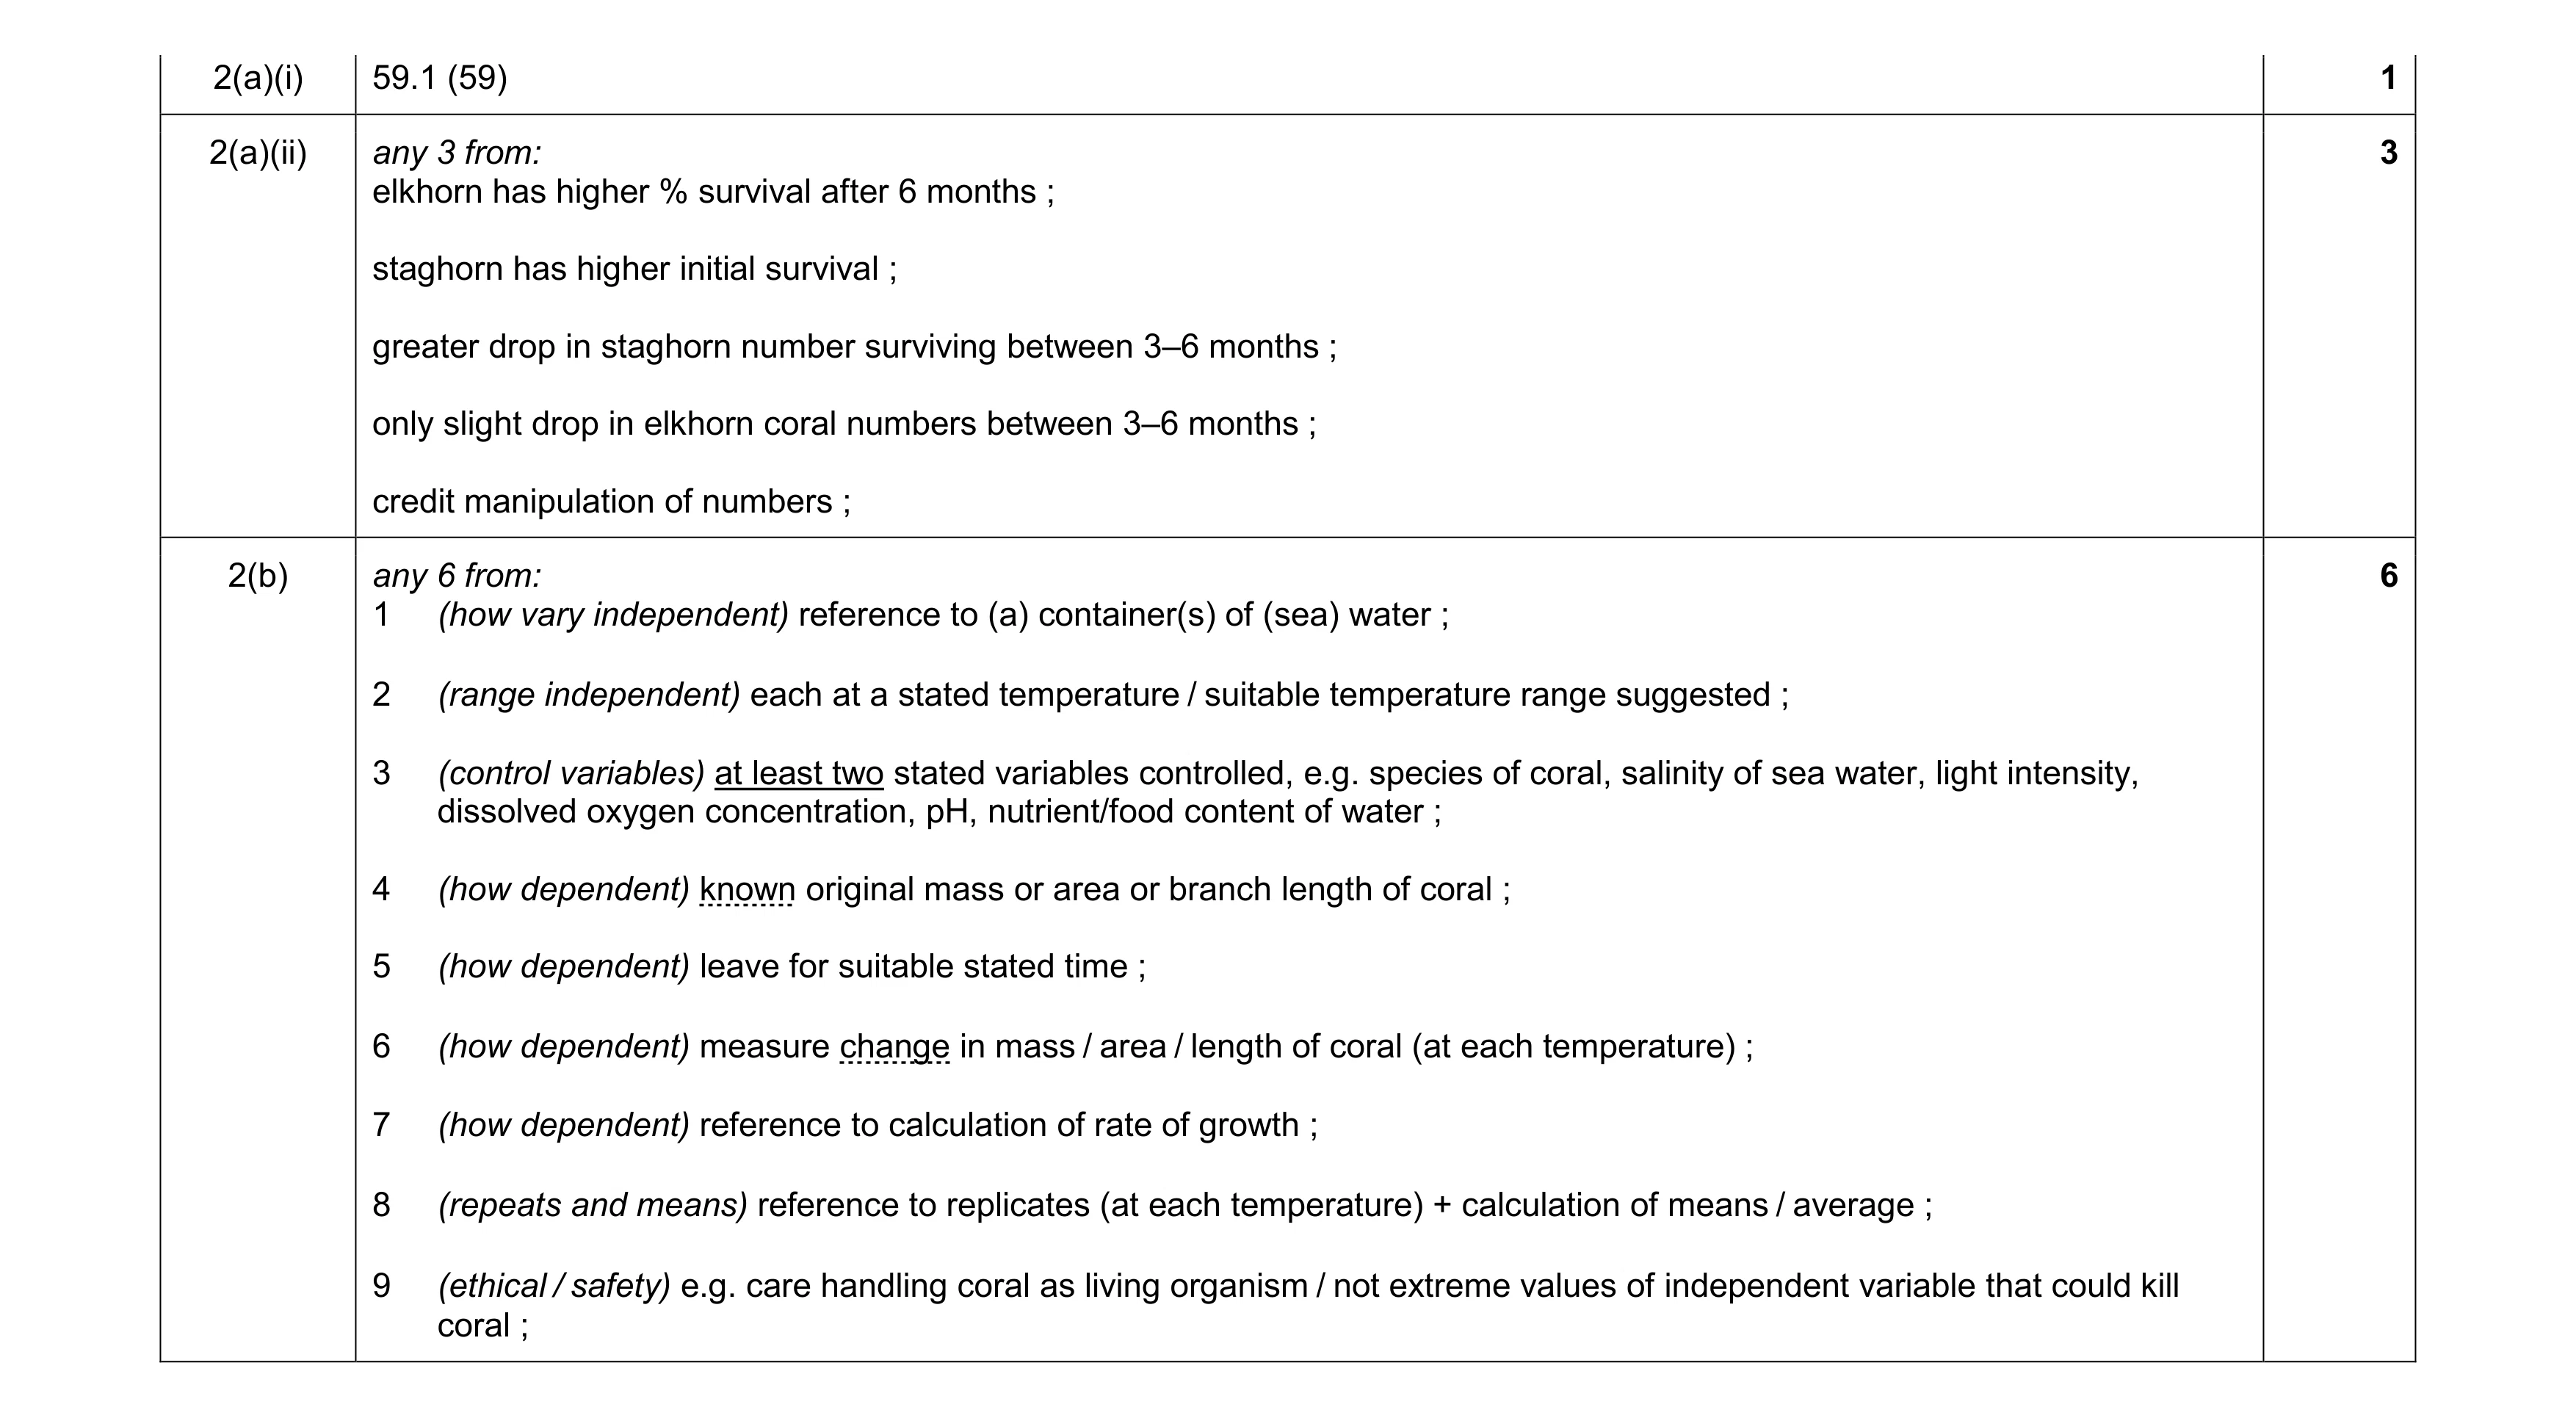 10
10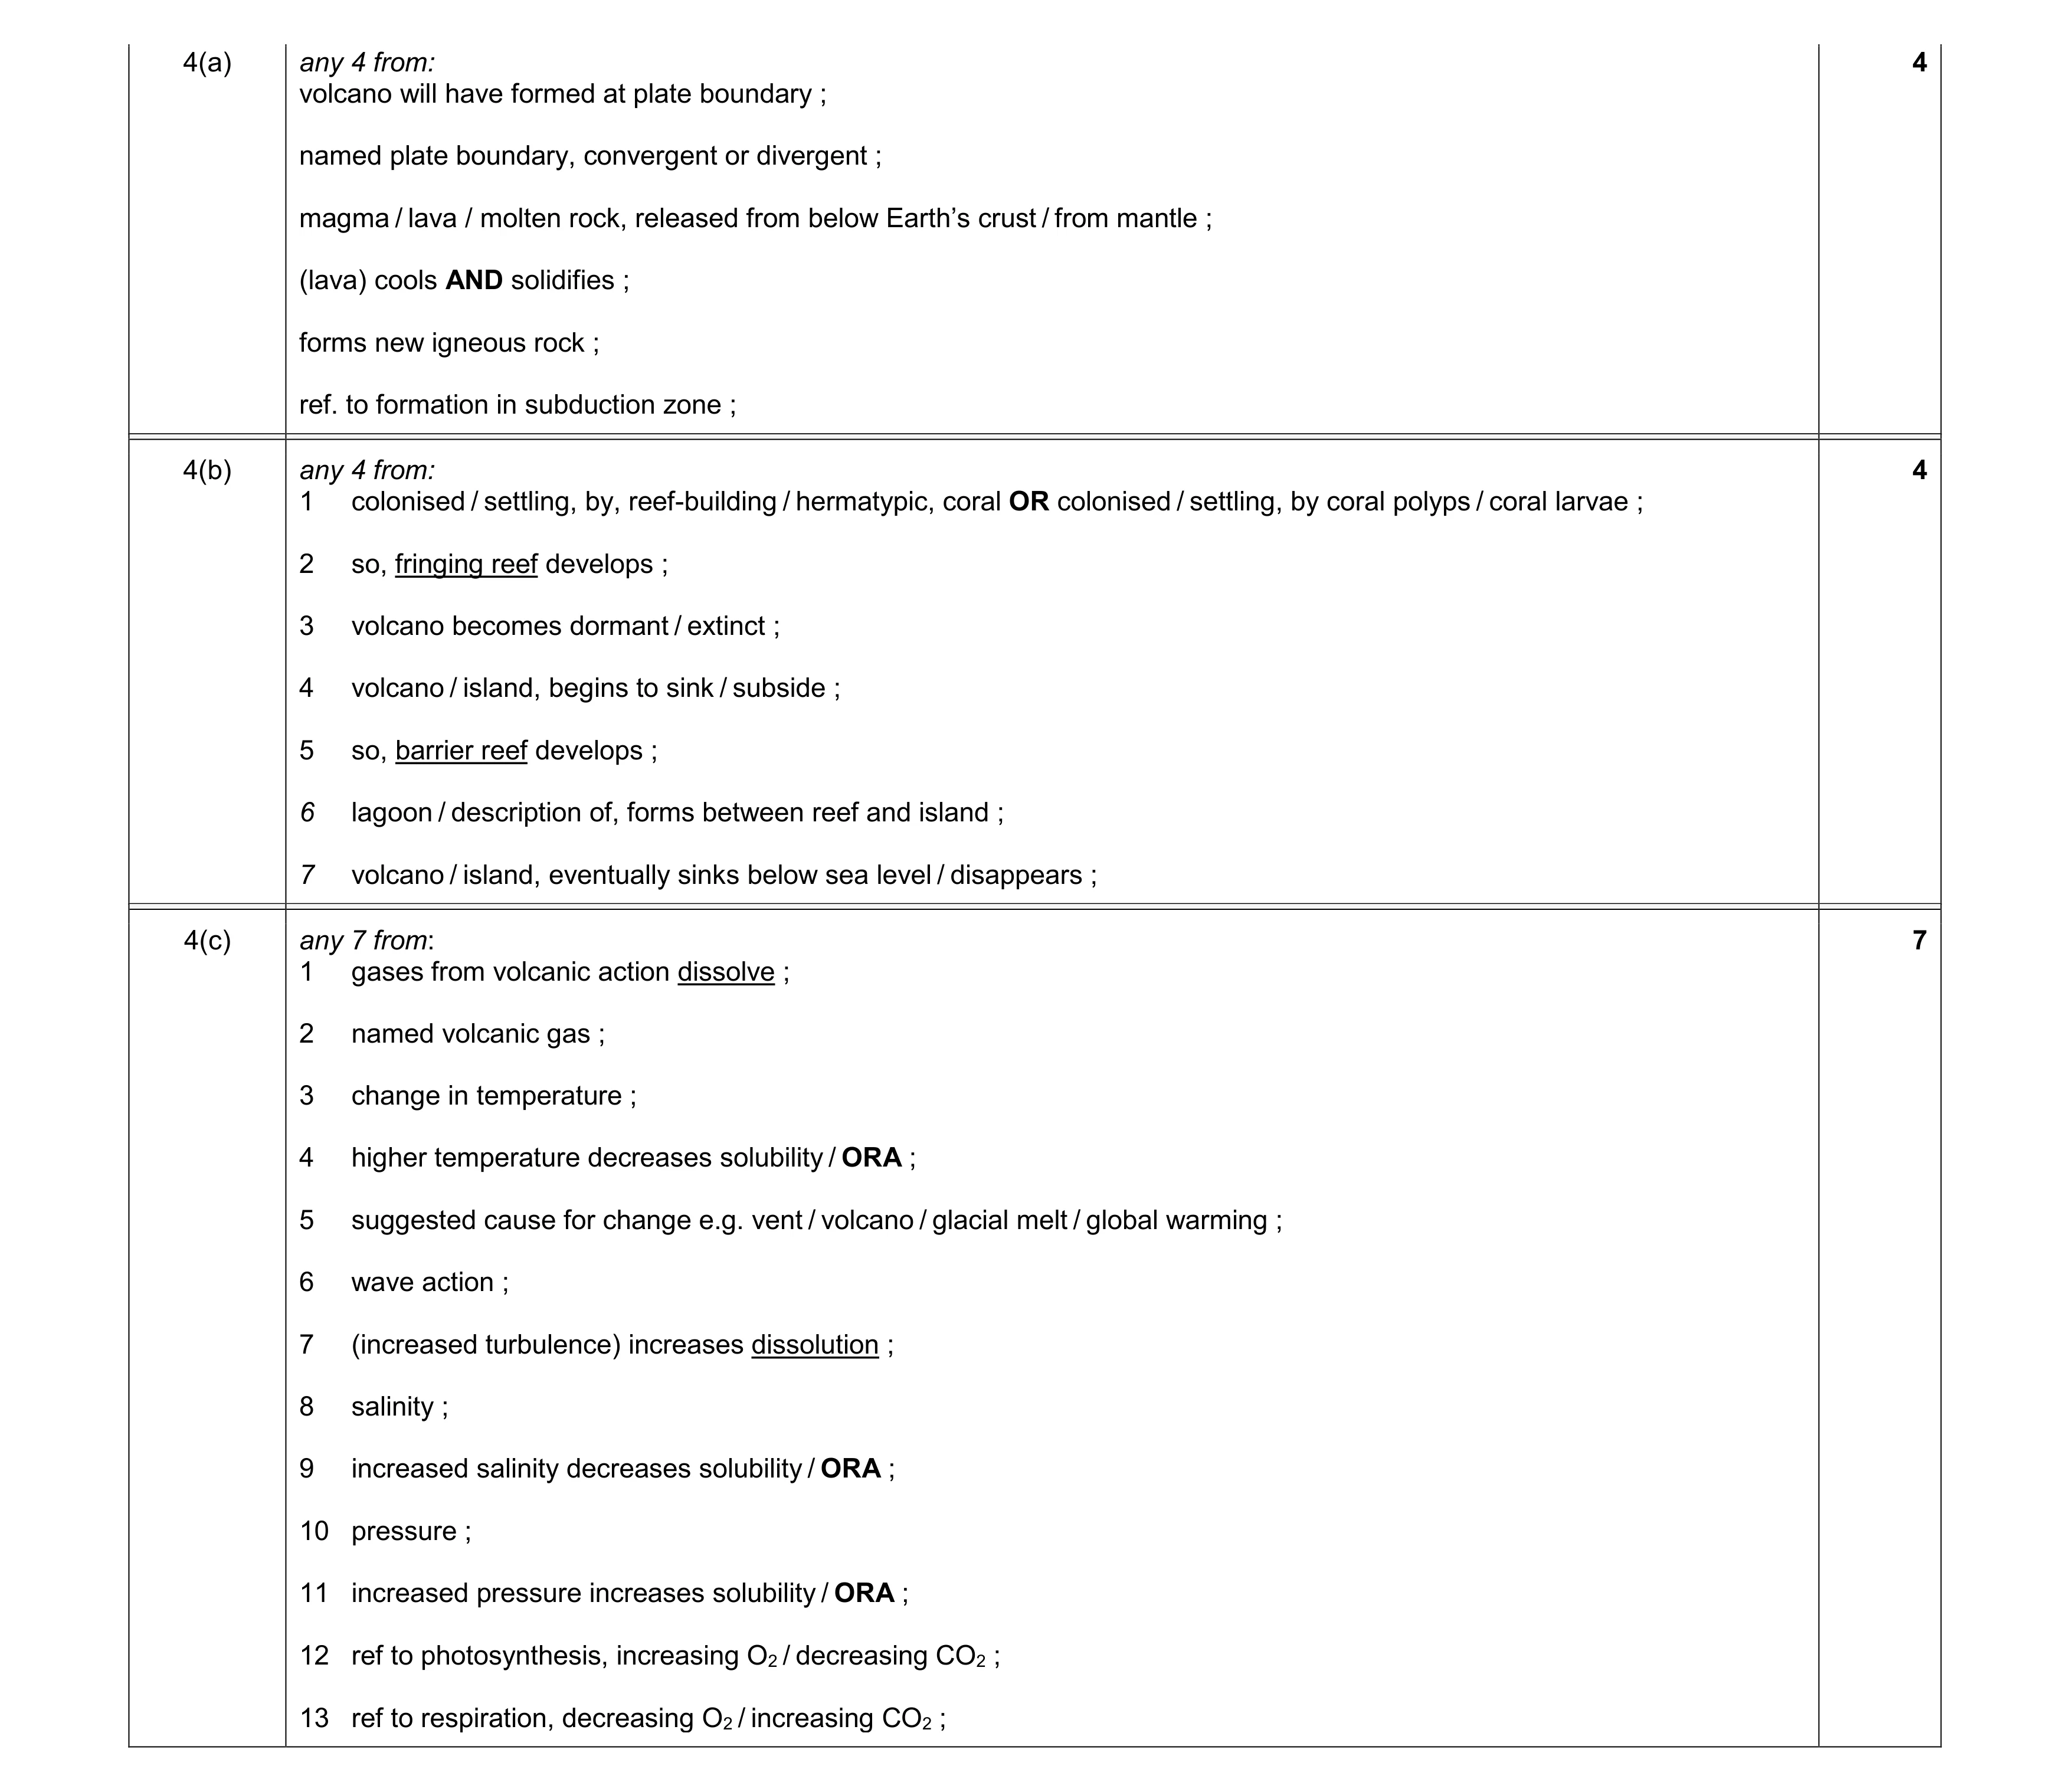 15
15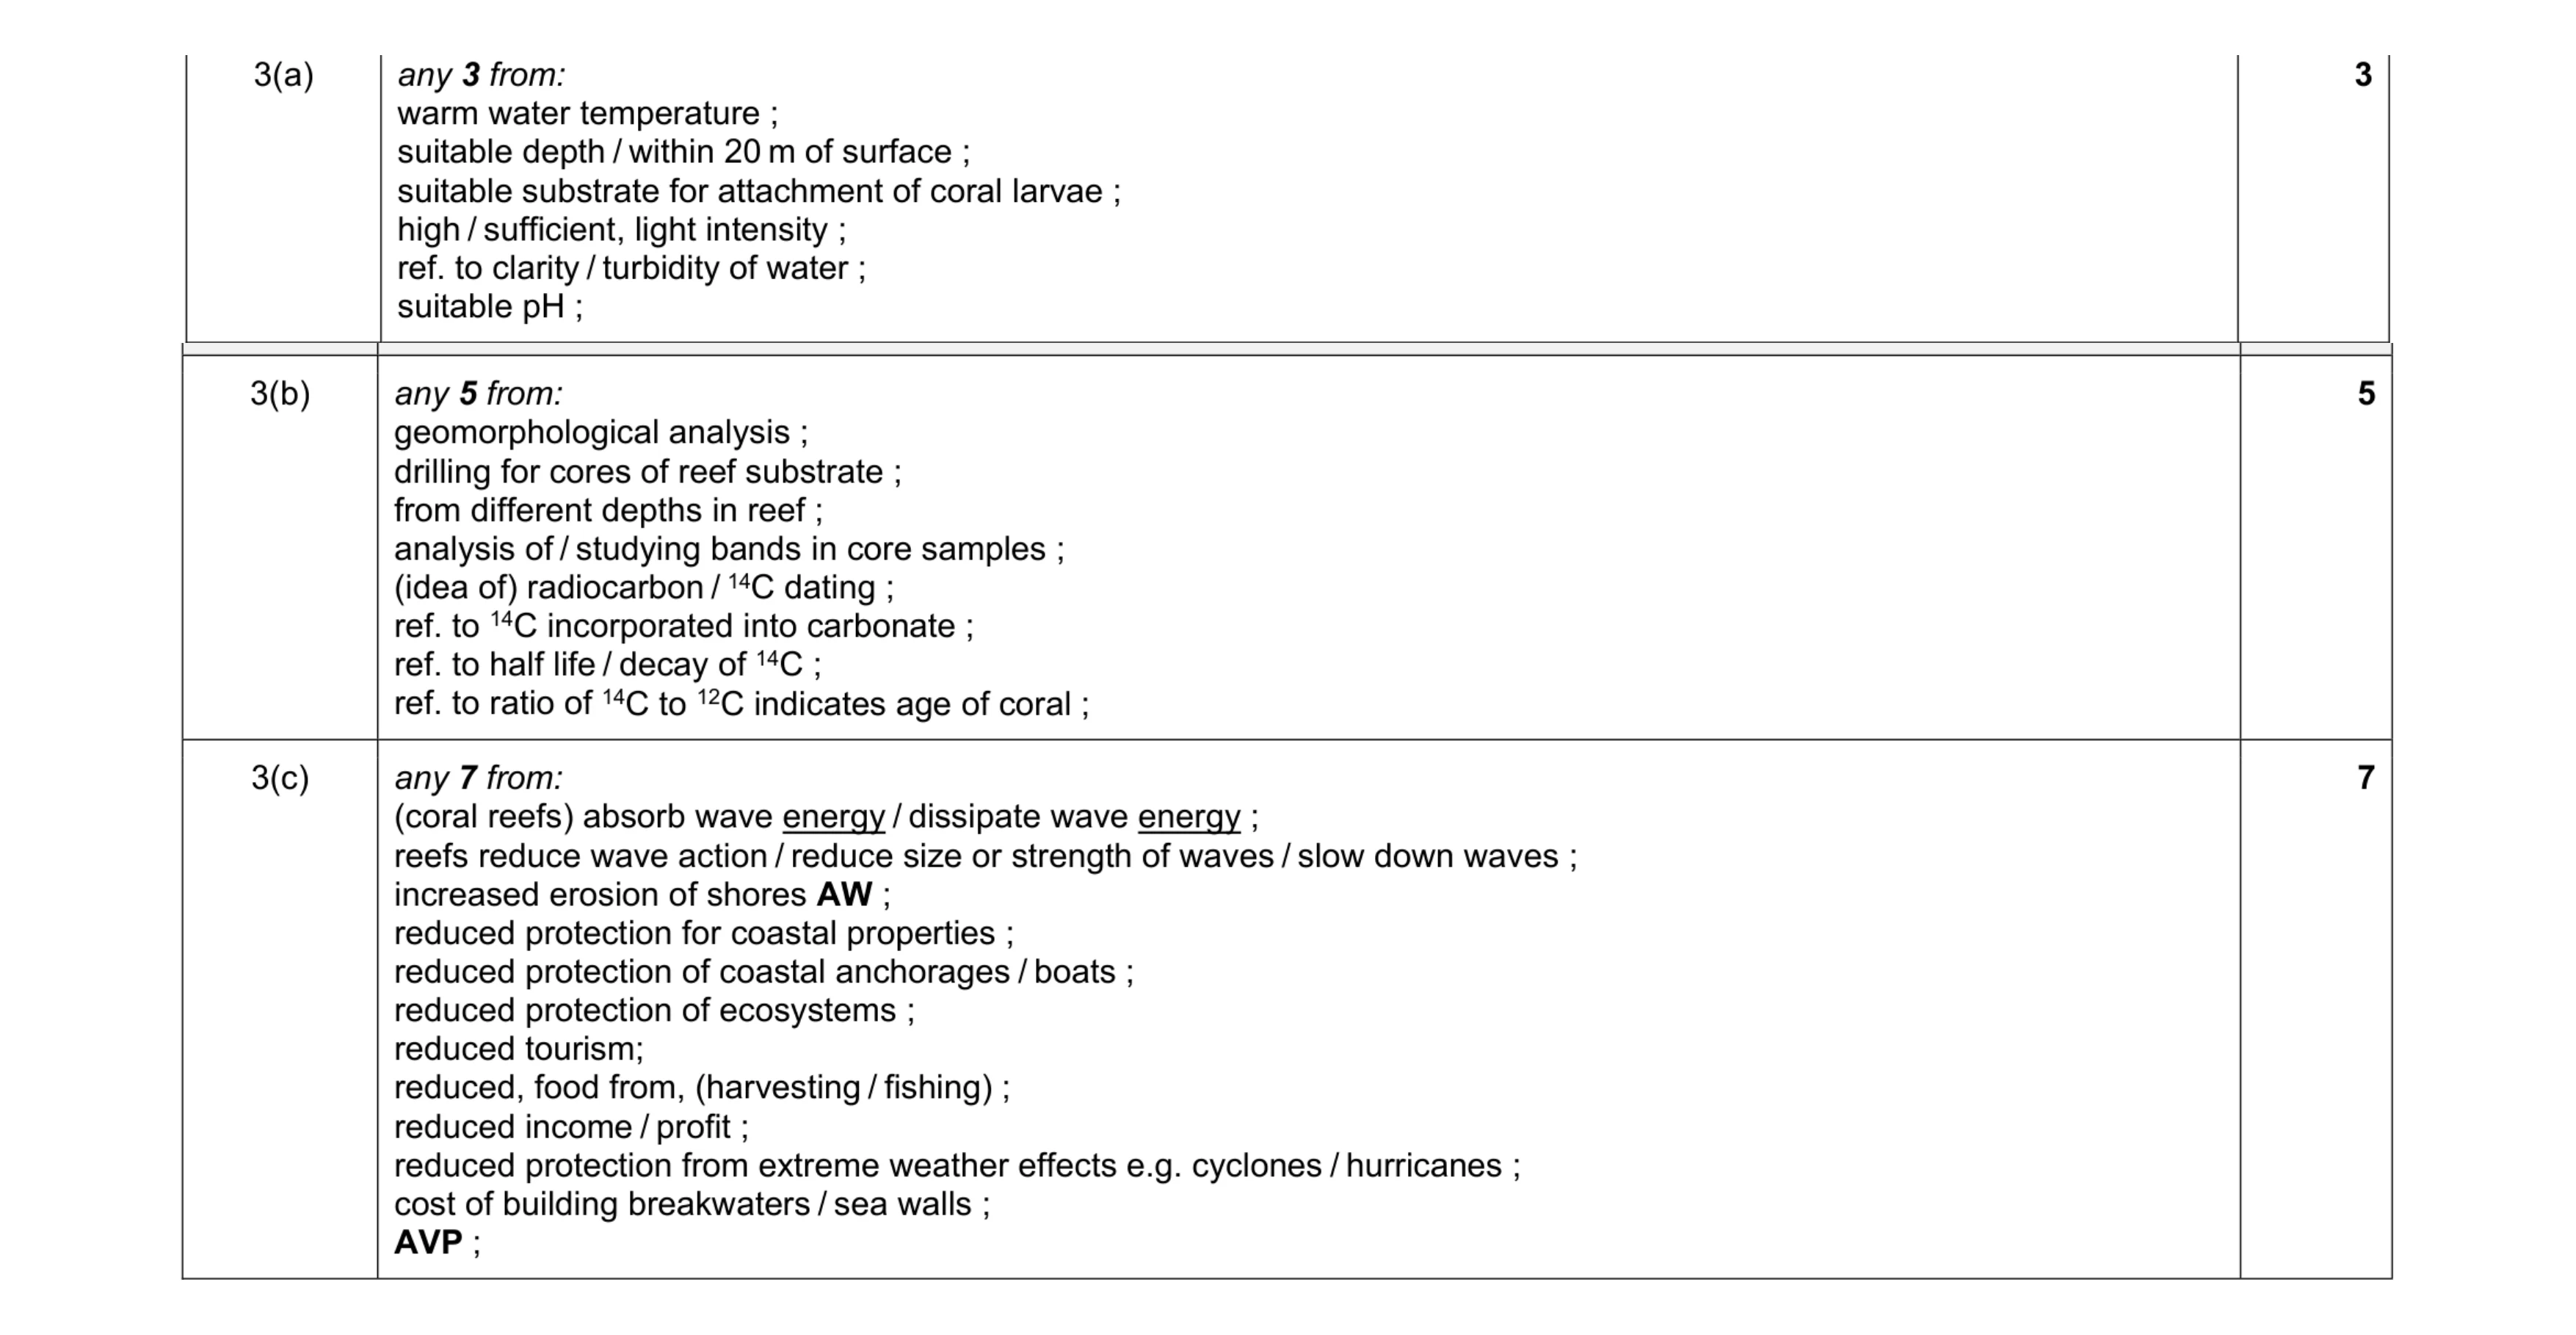 15
15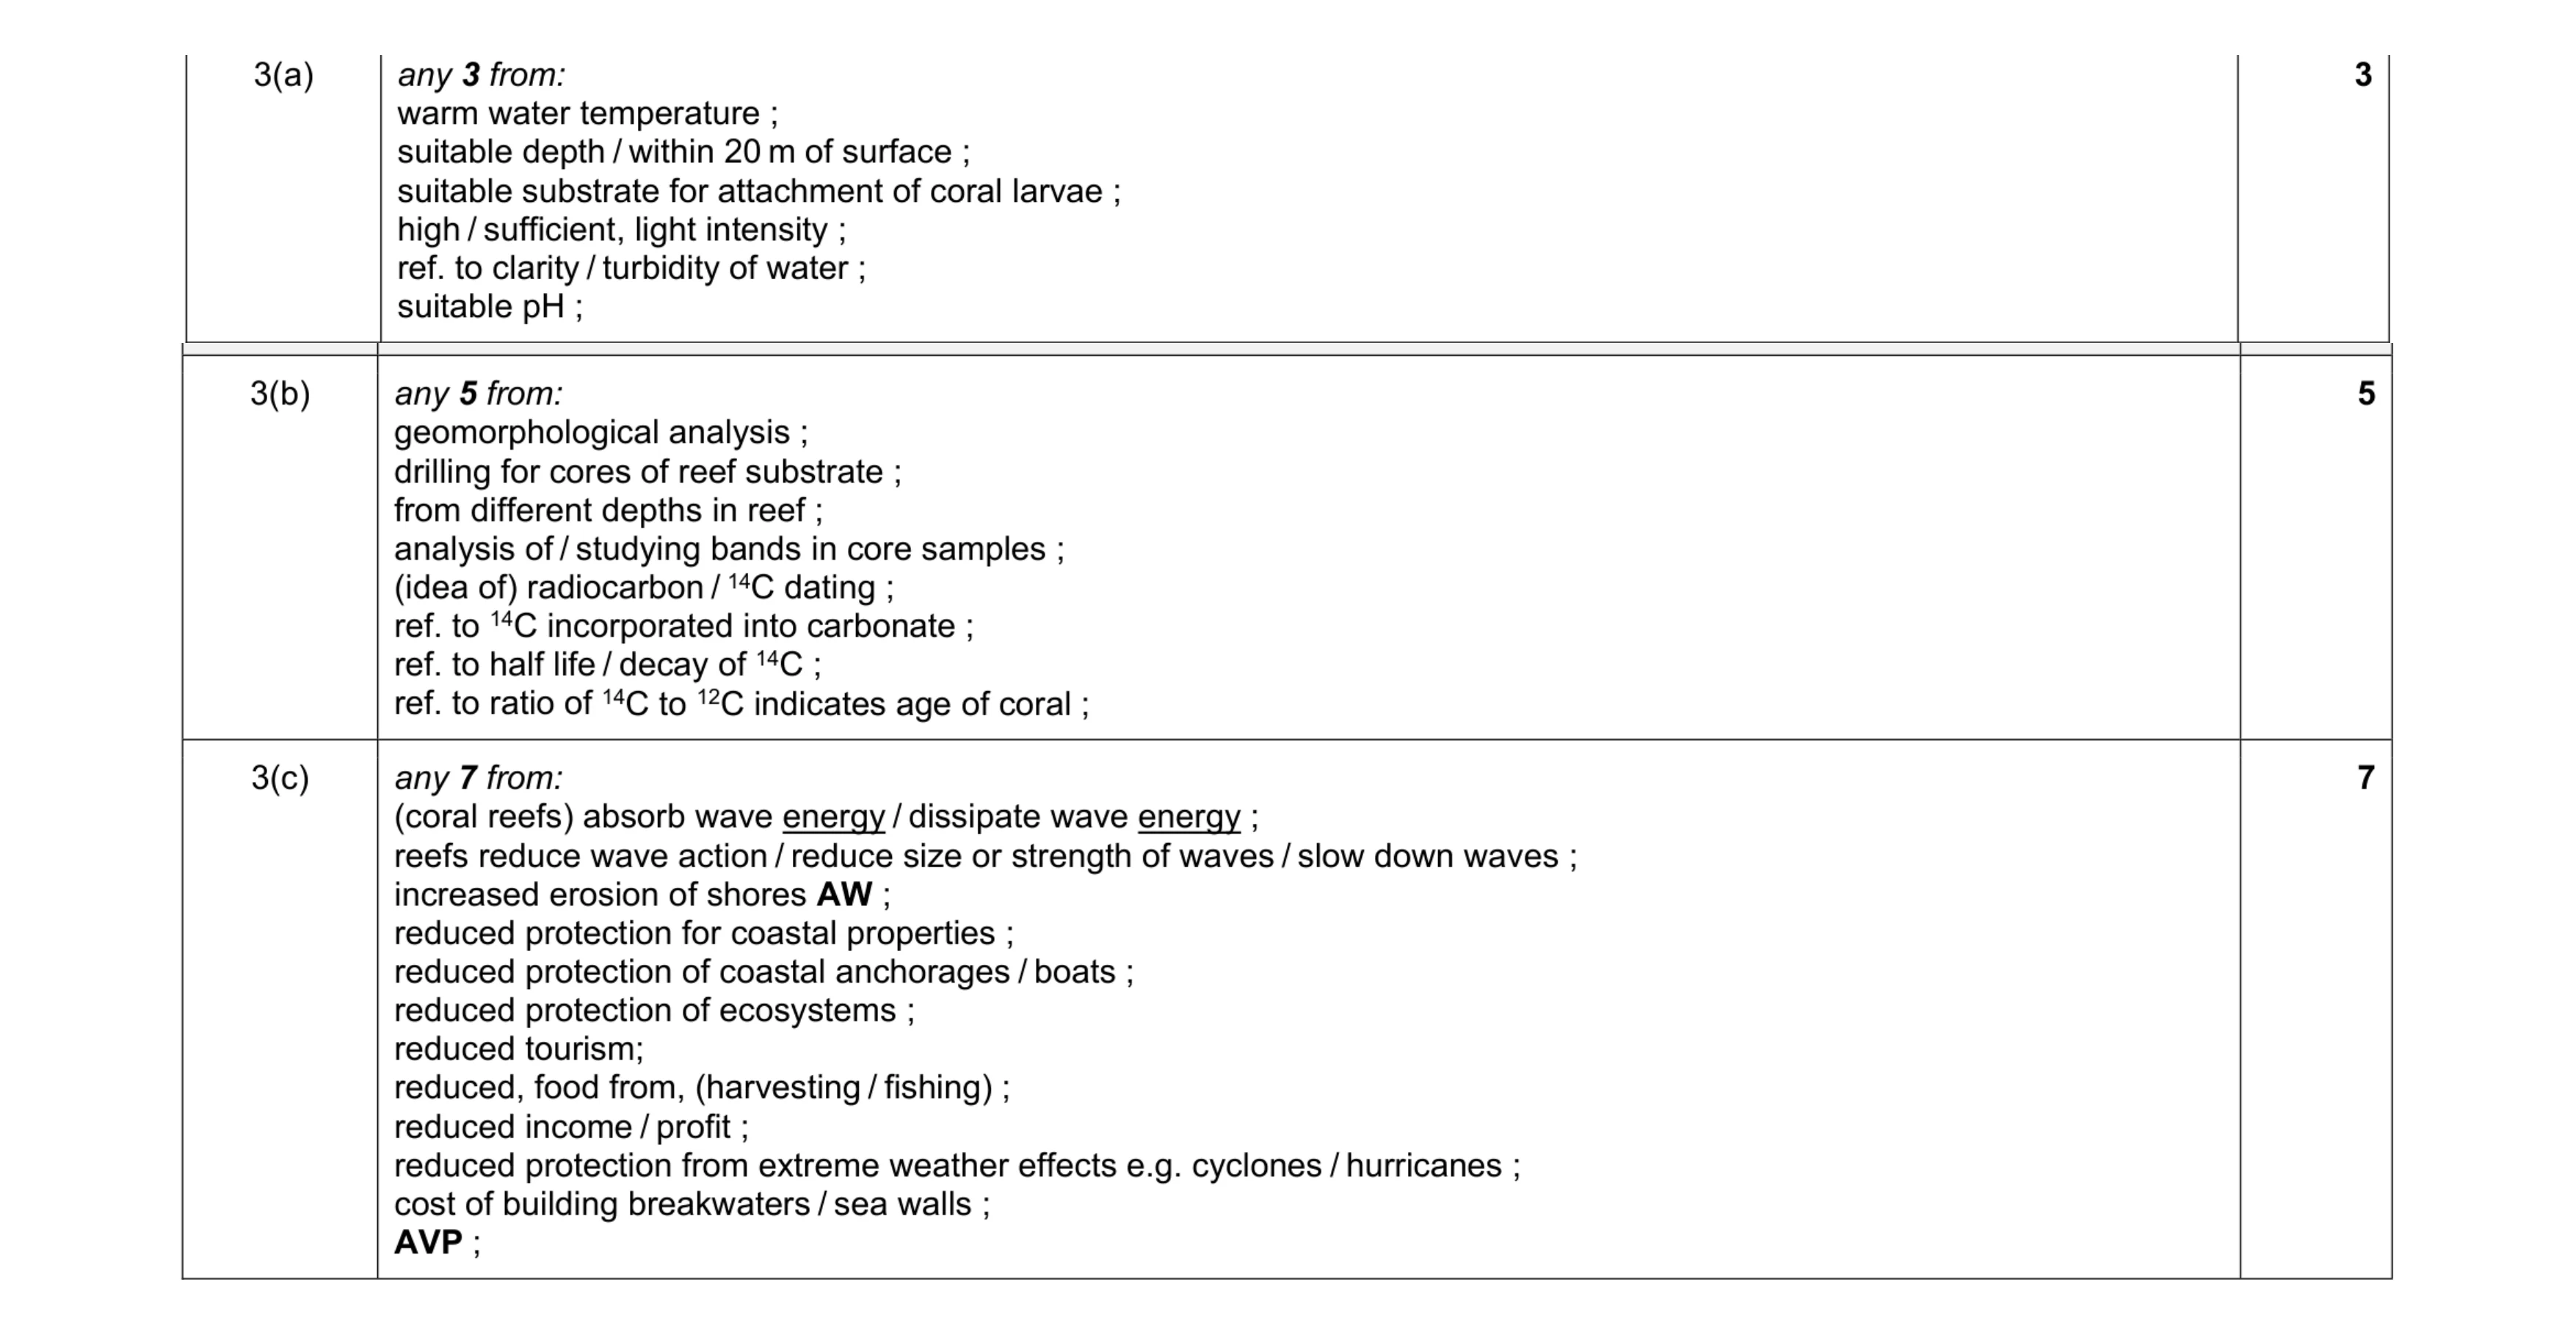 15
15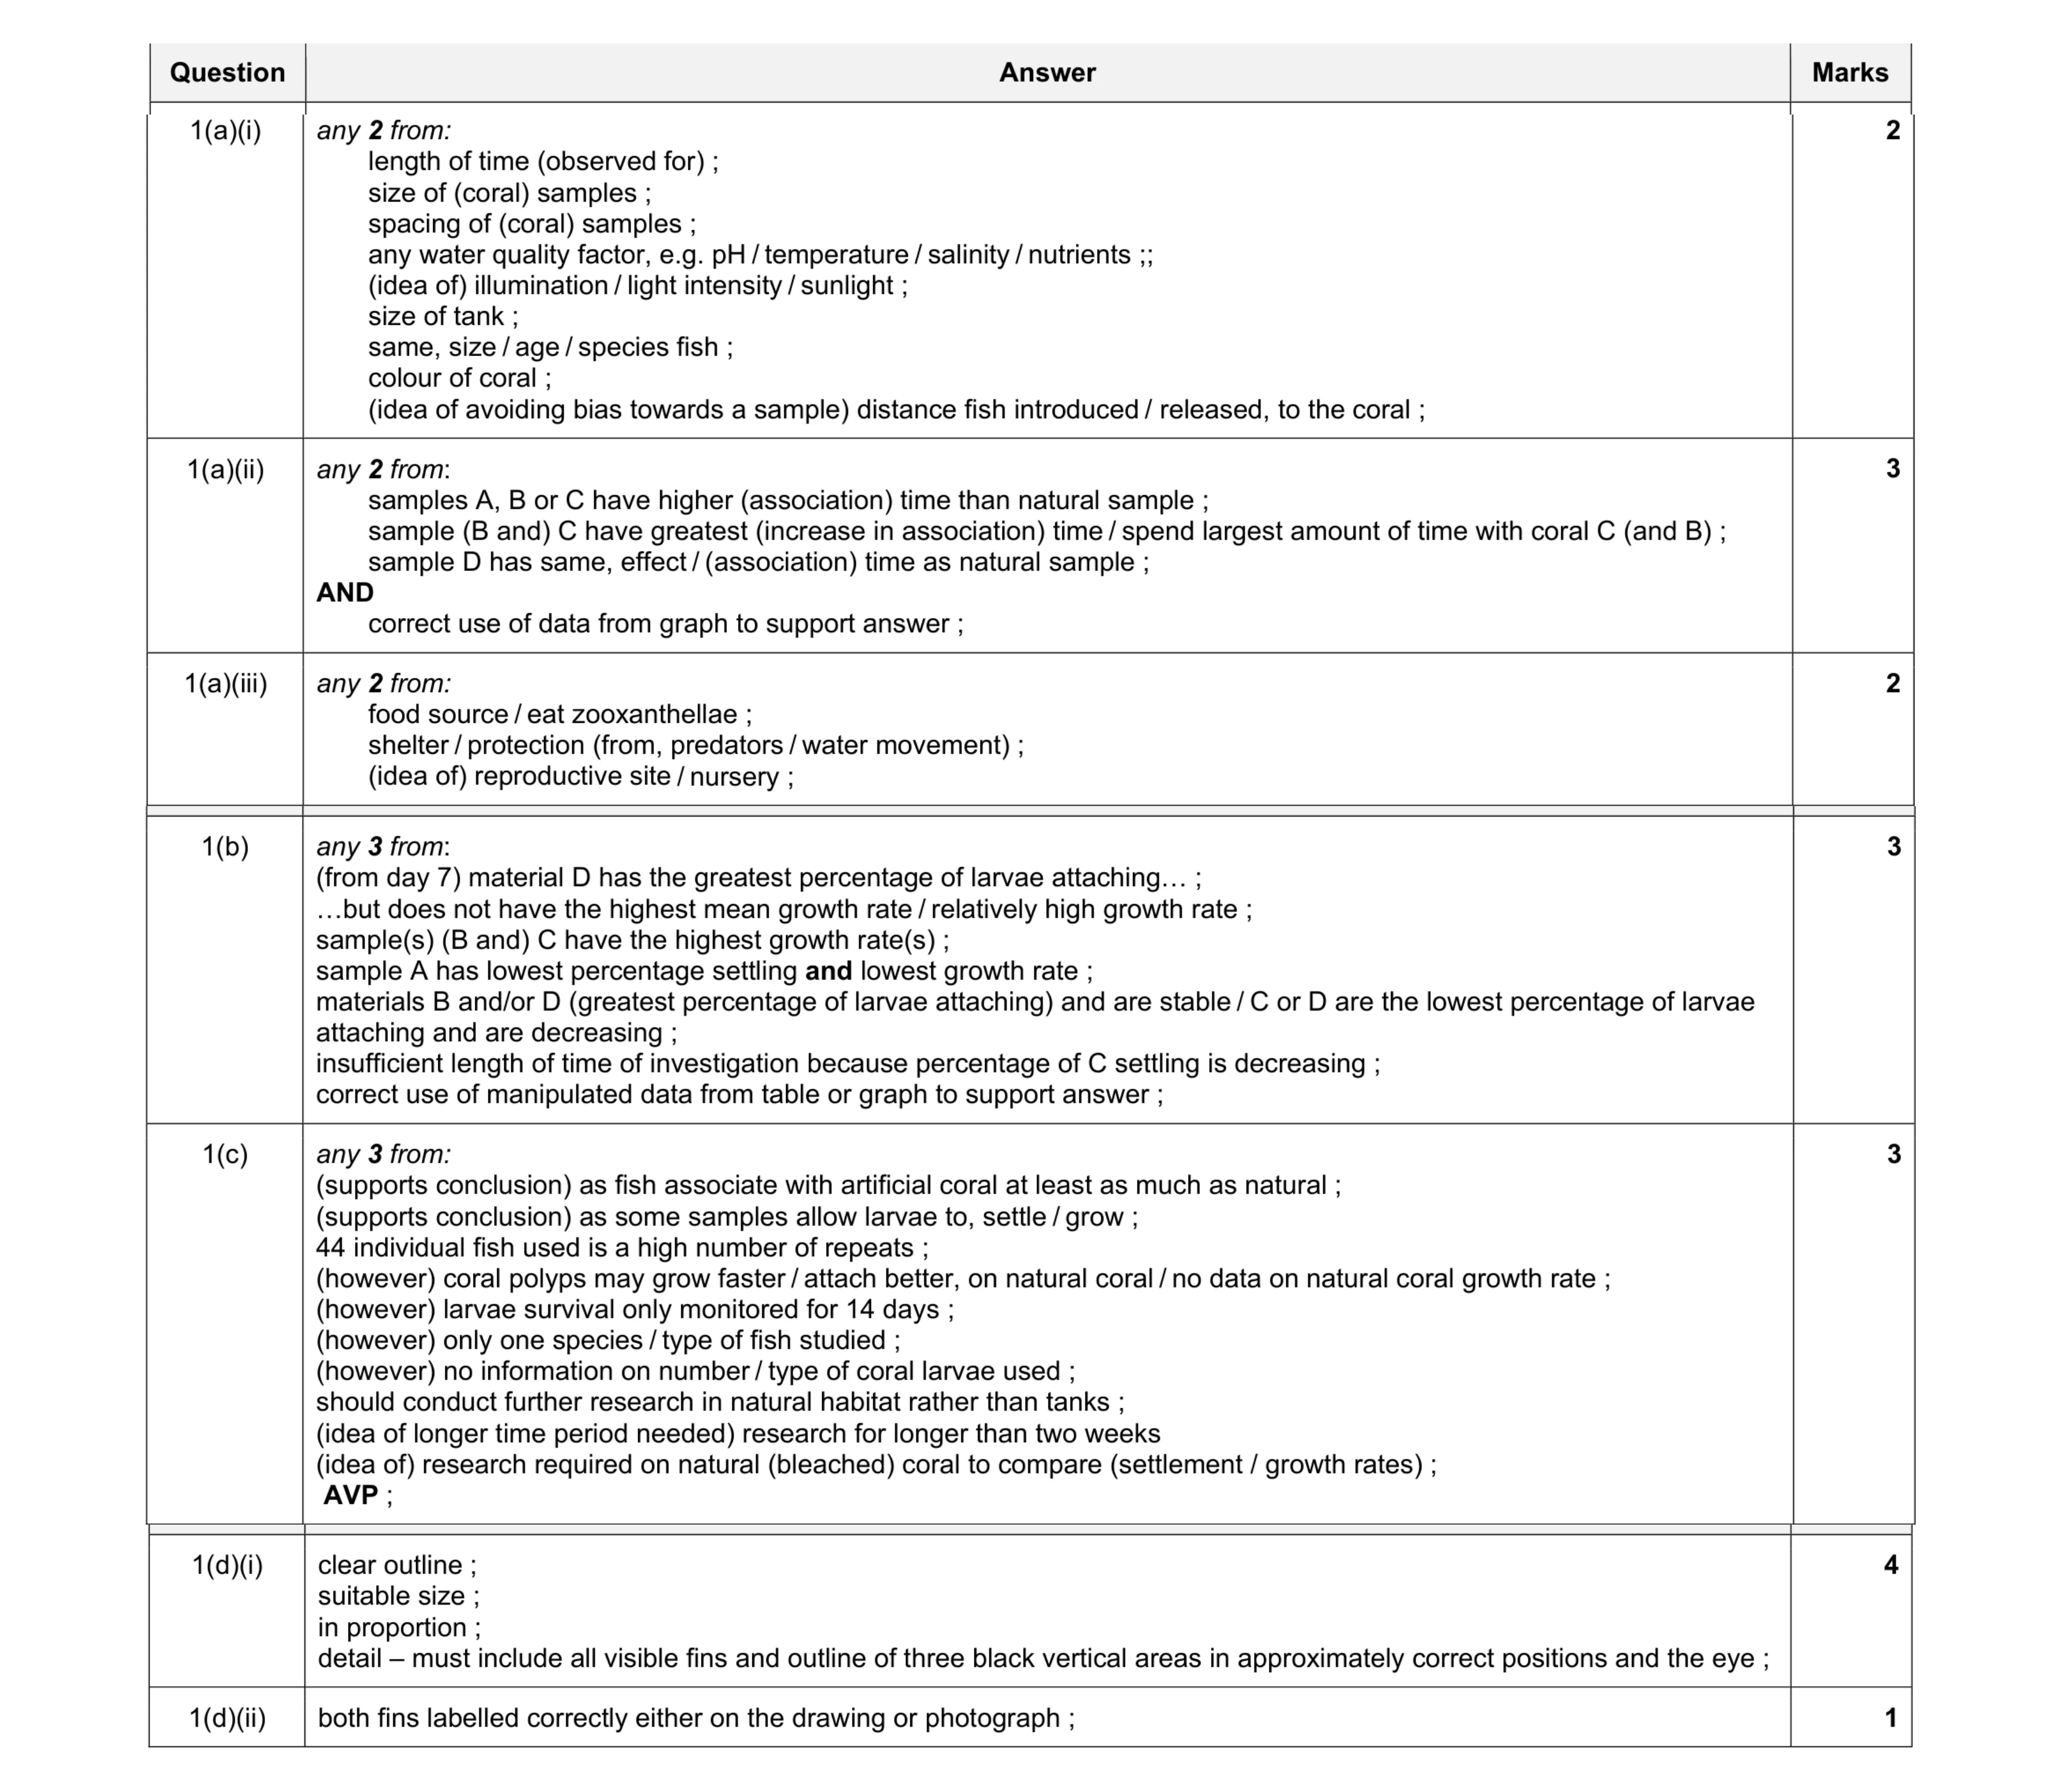 18
18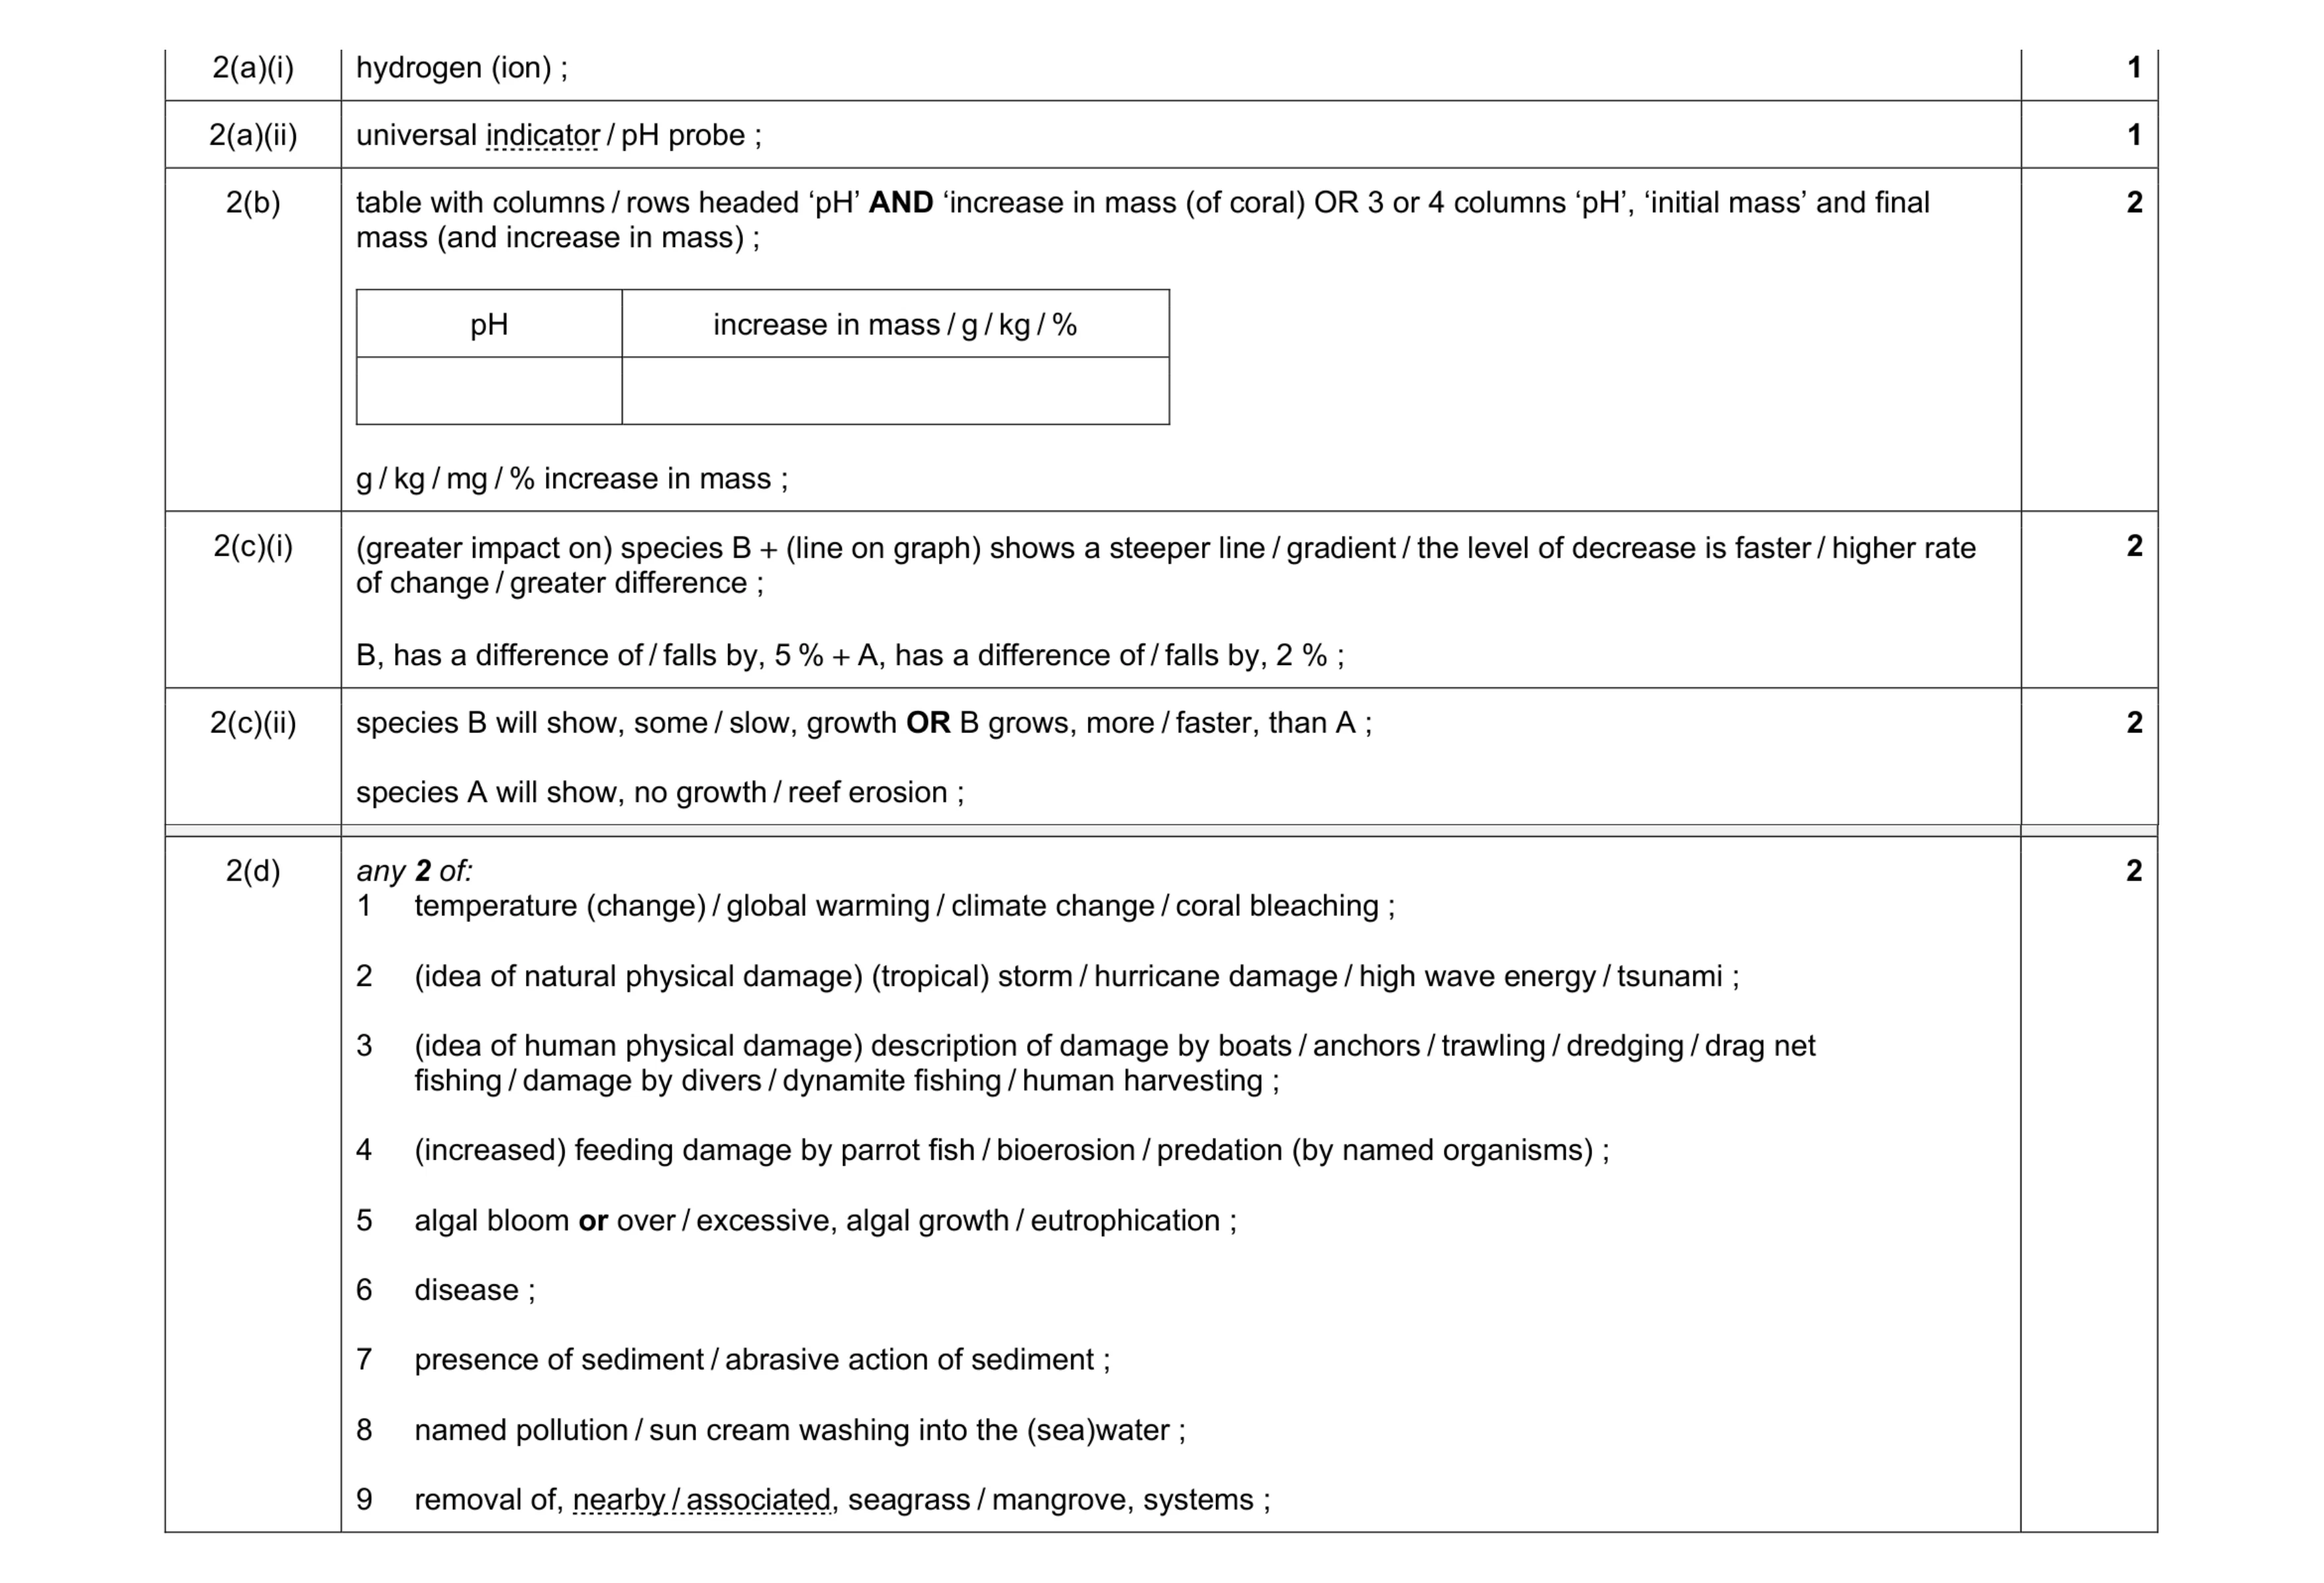 10
10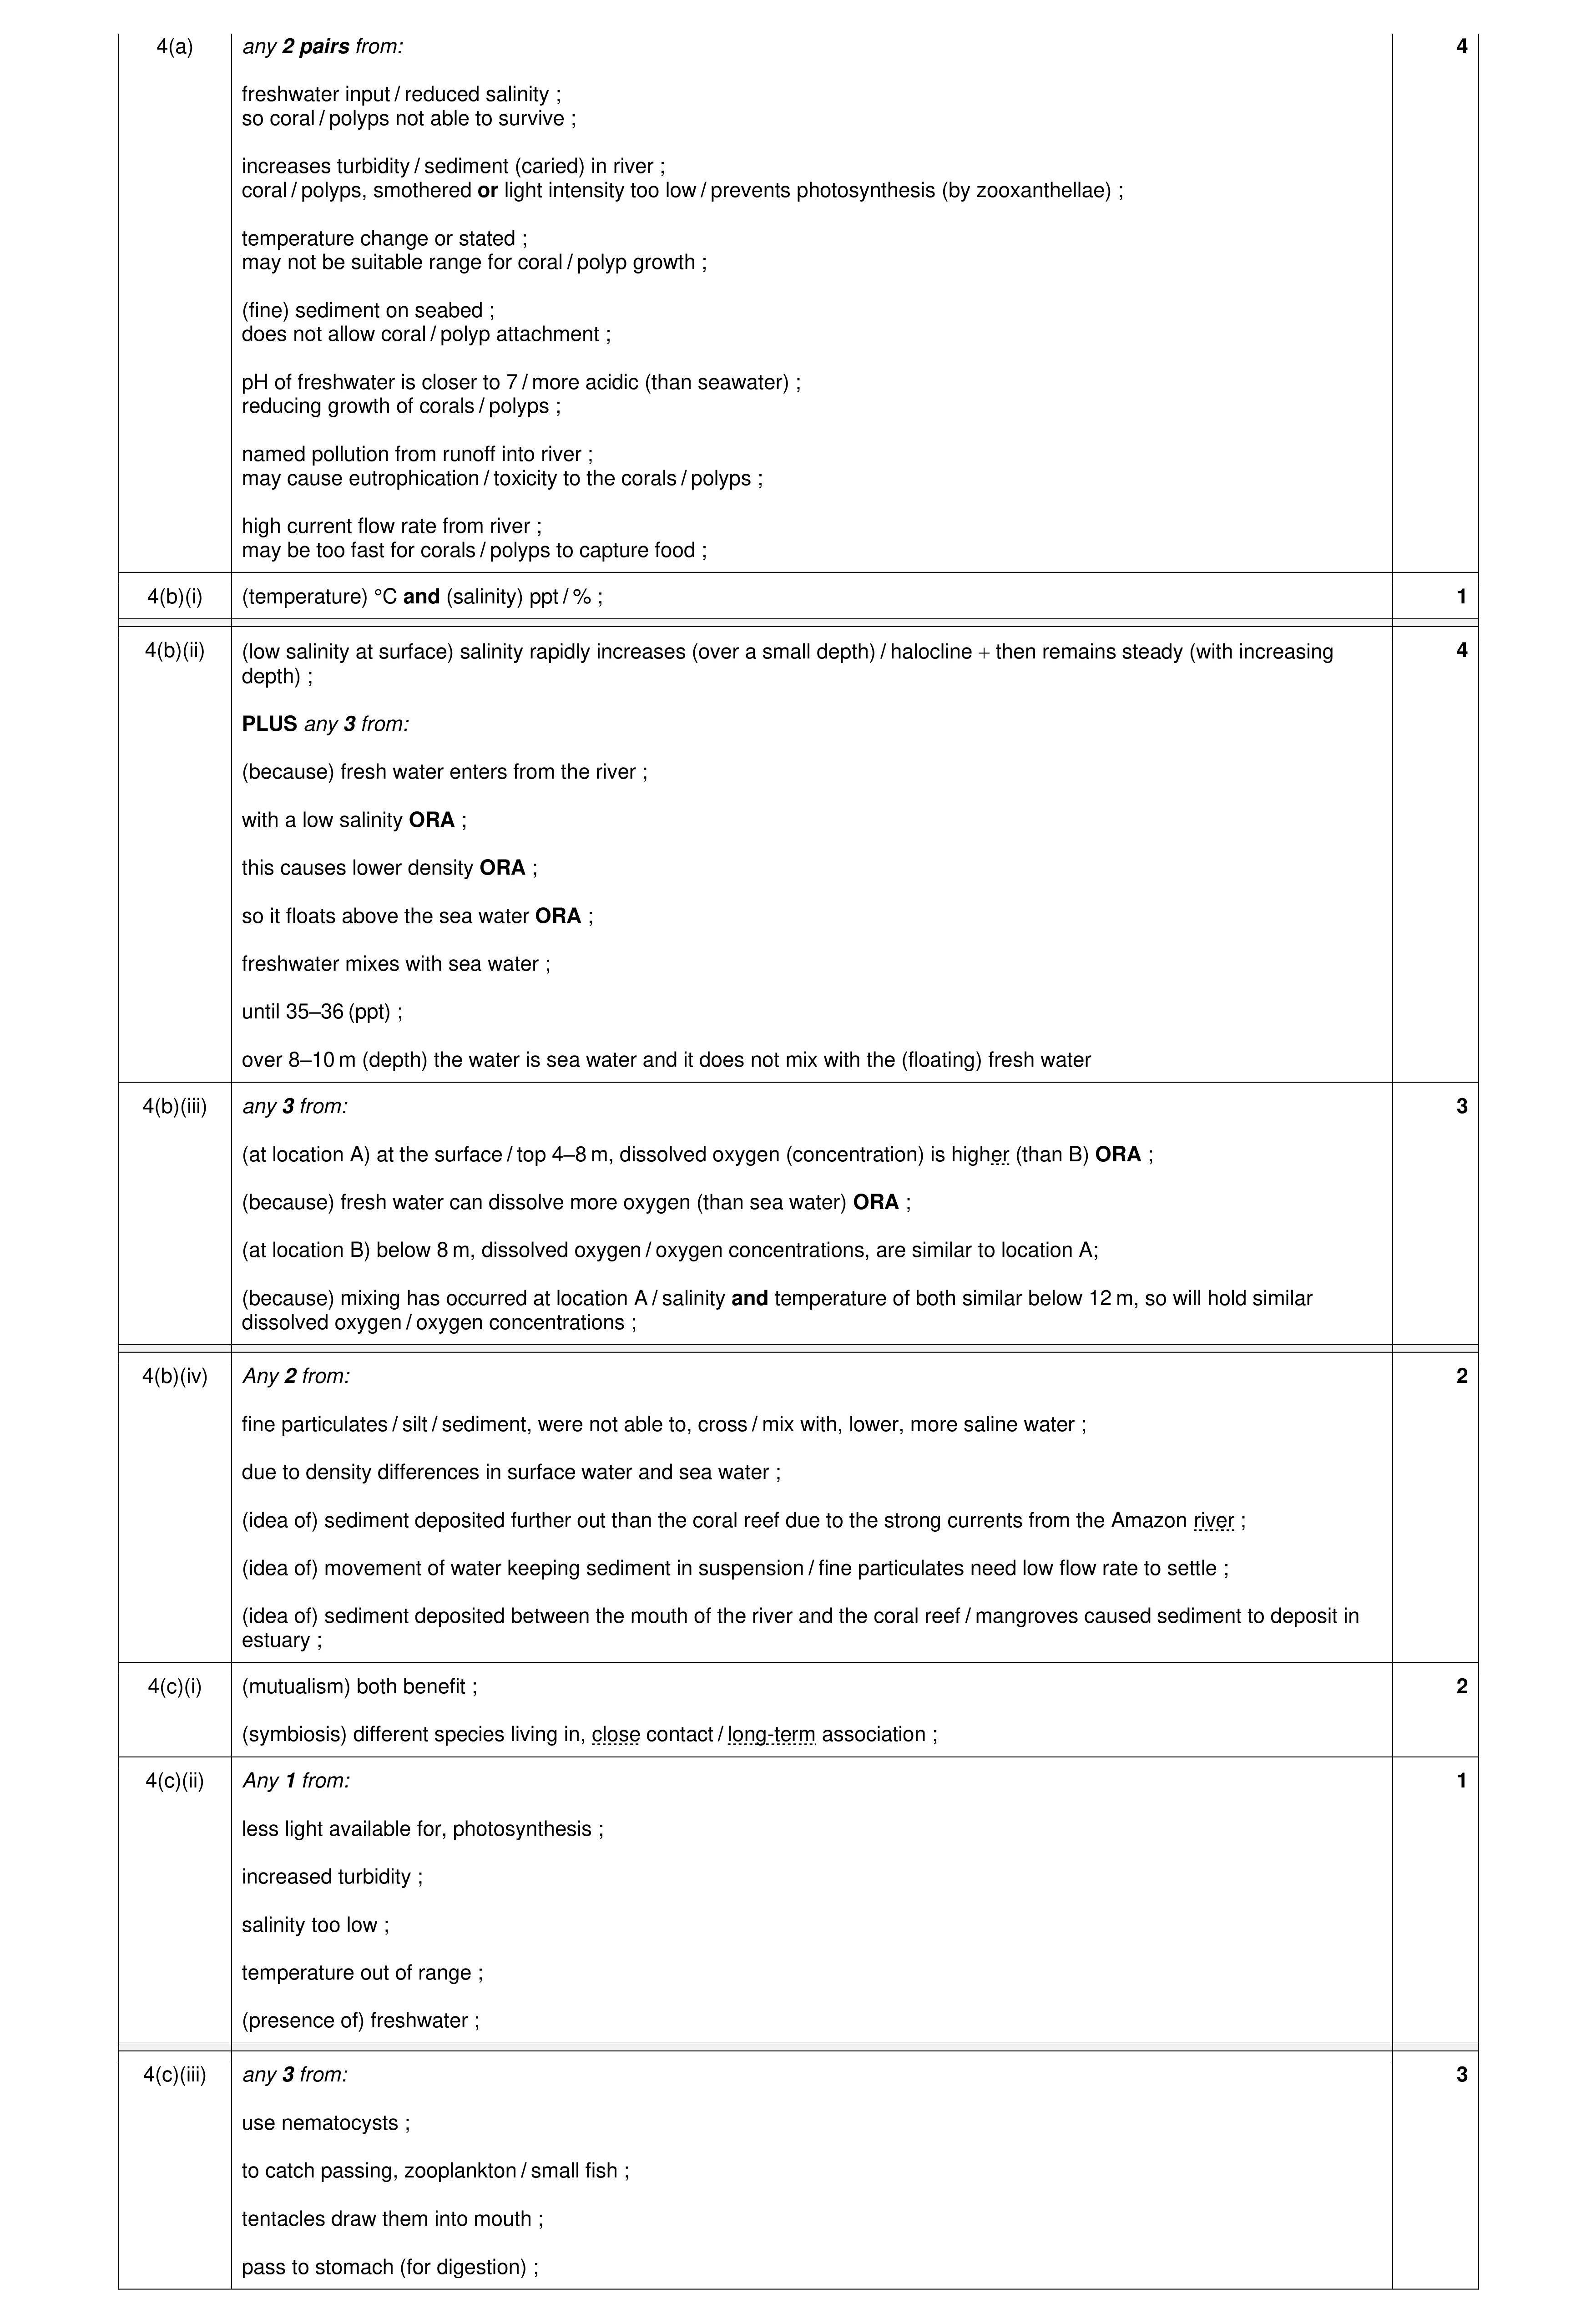 16
16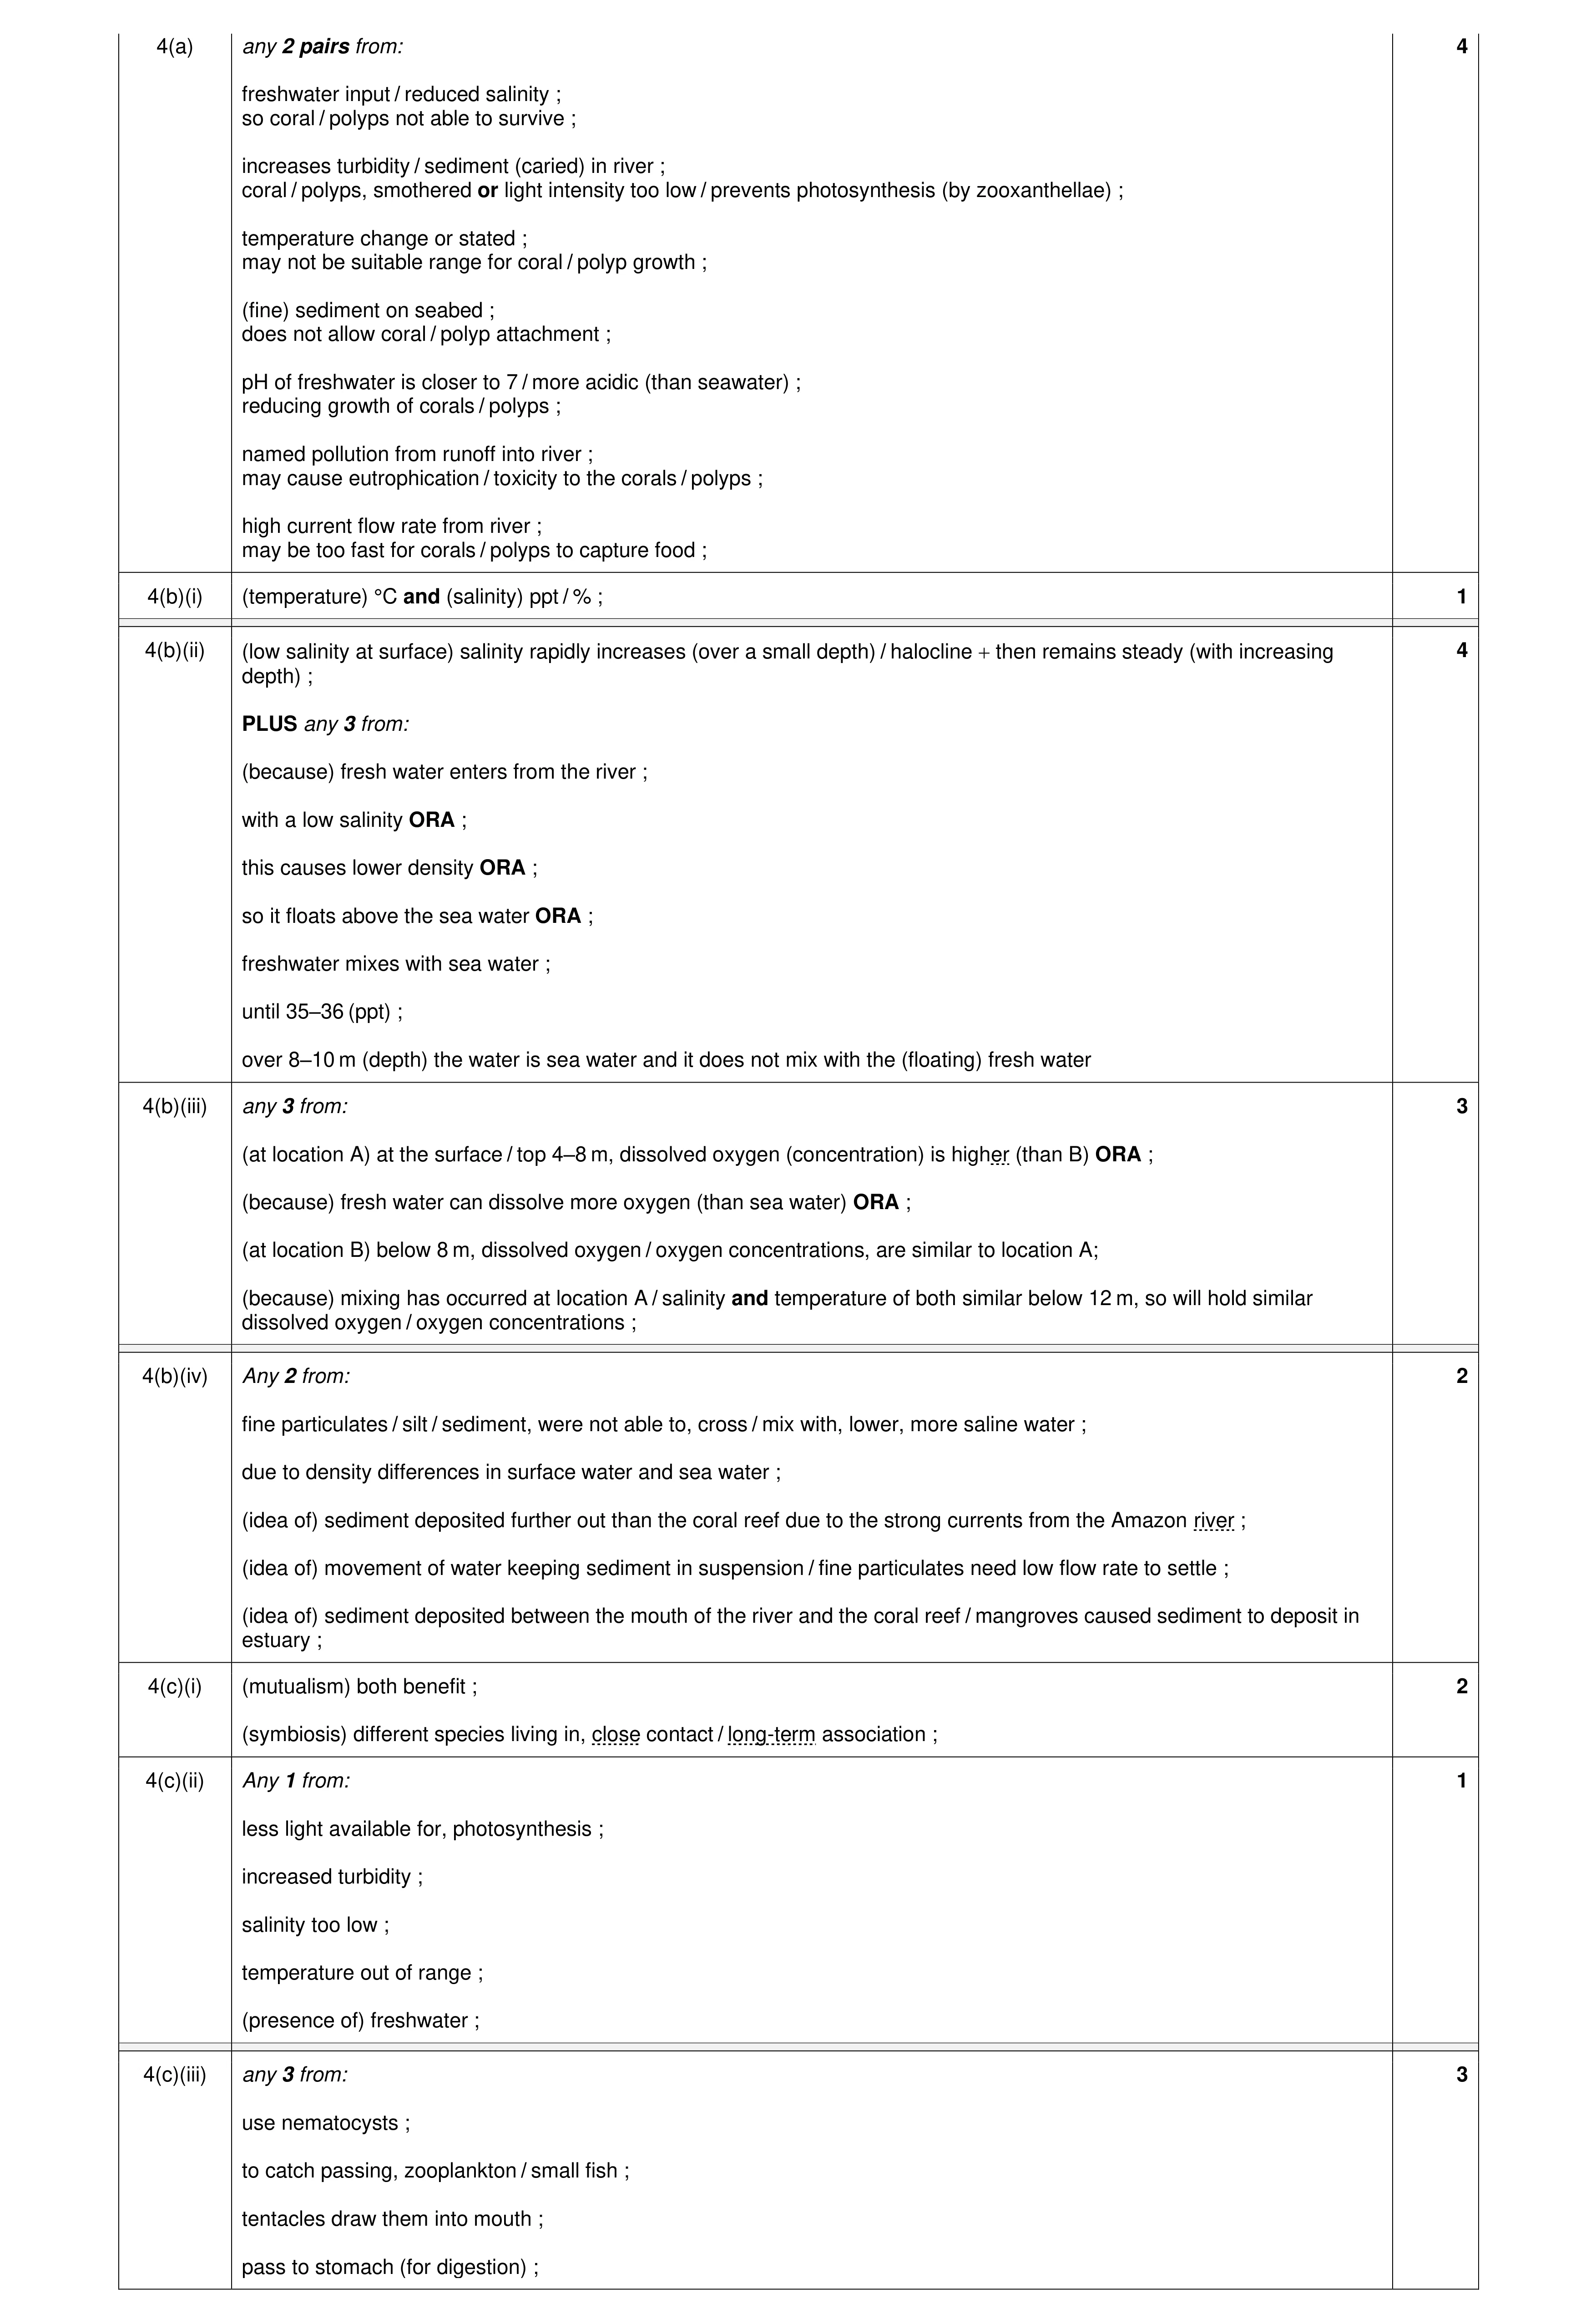 16
16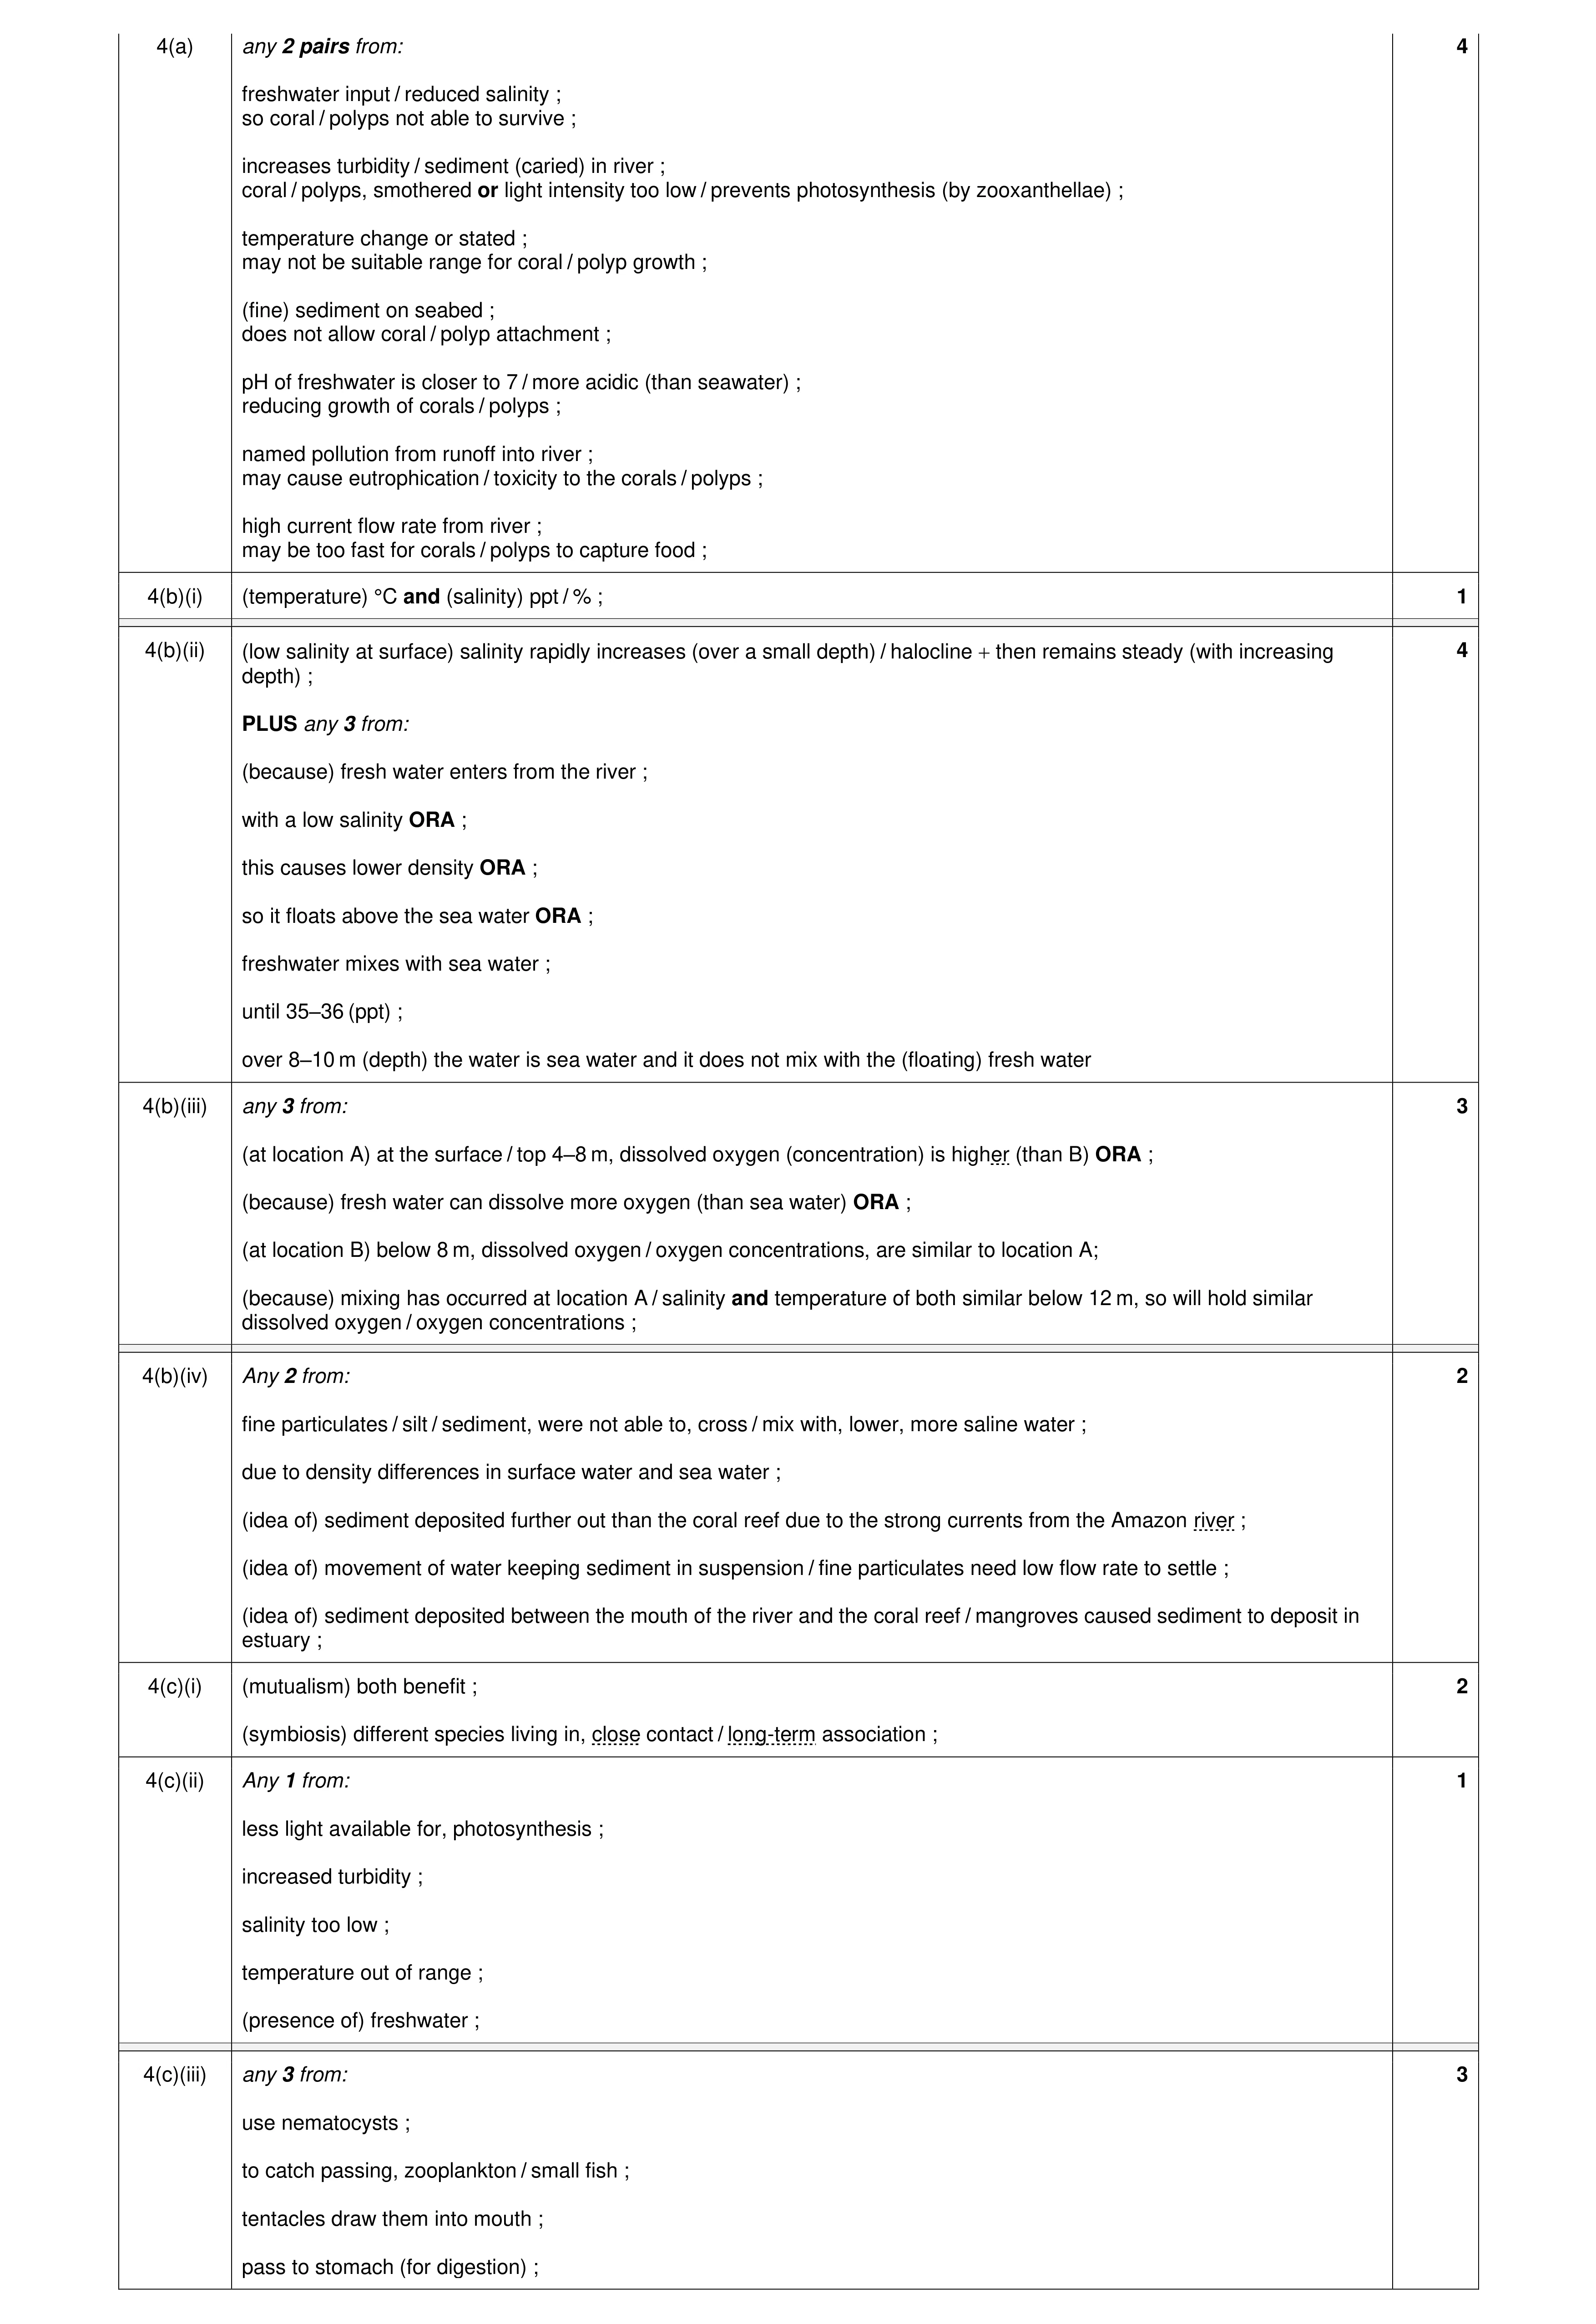 16
16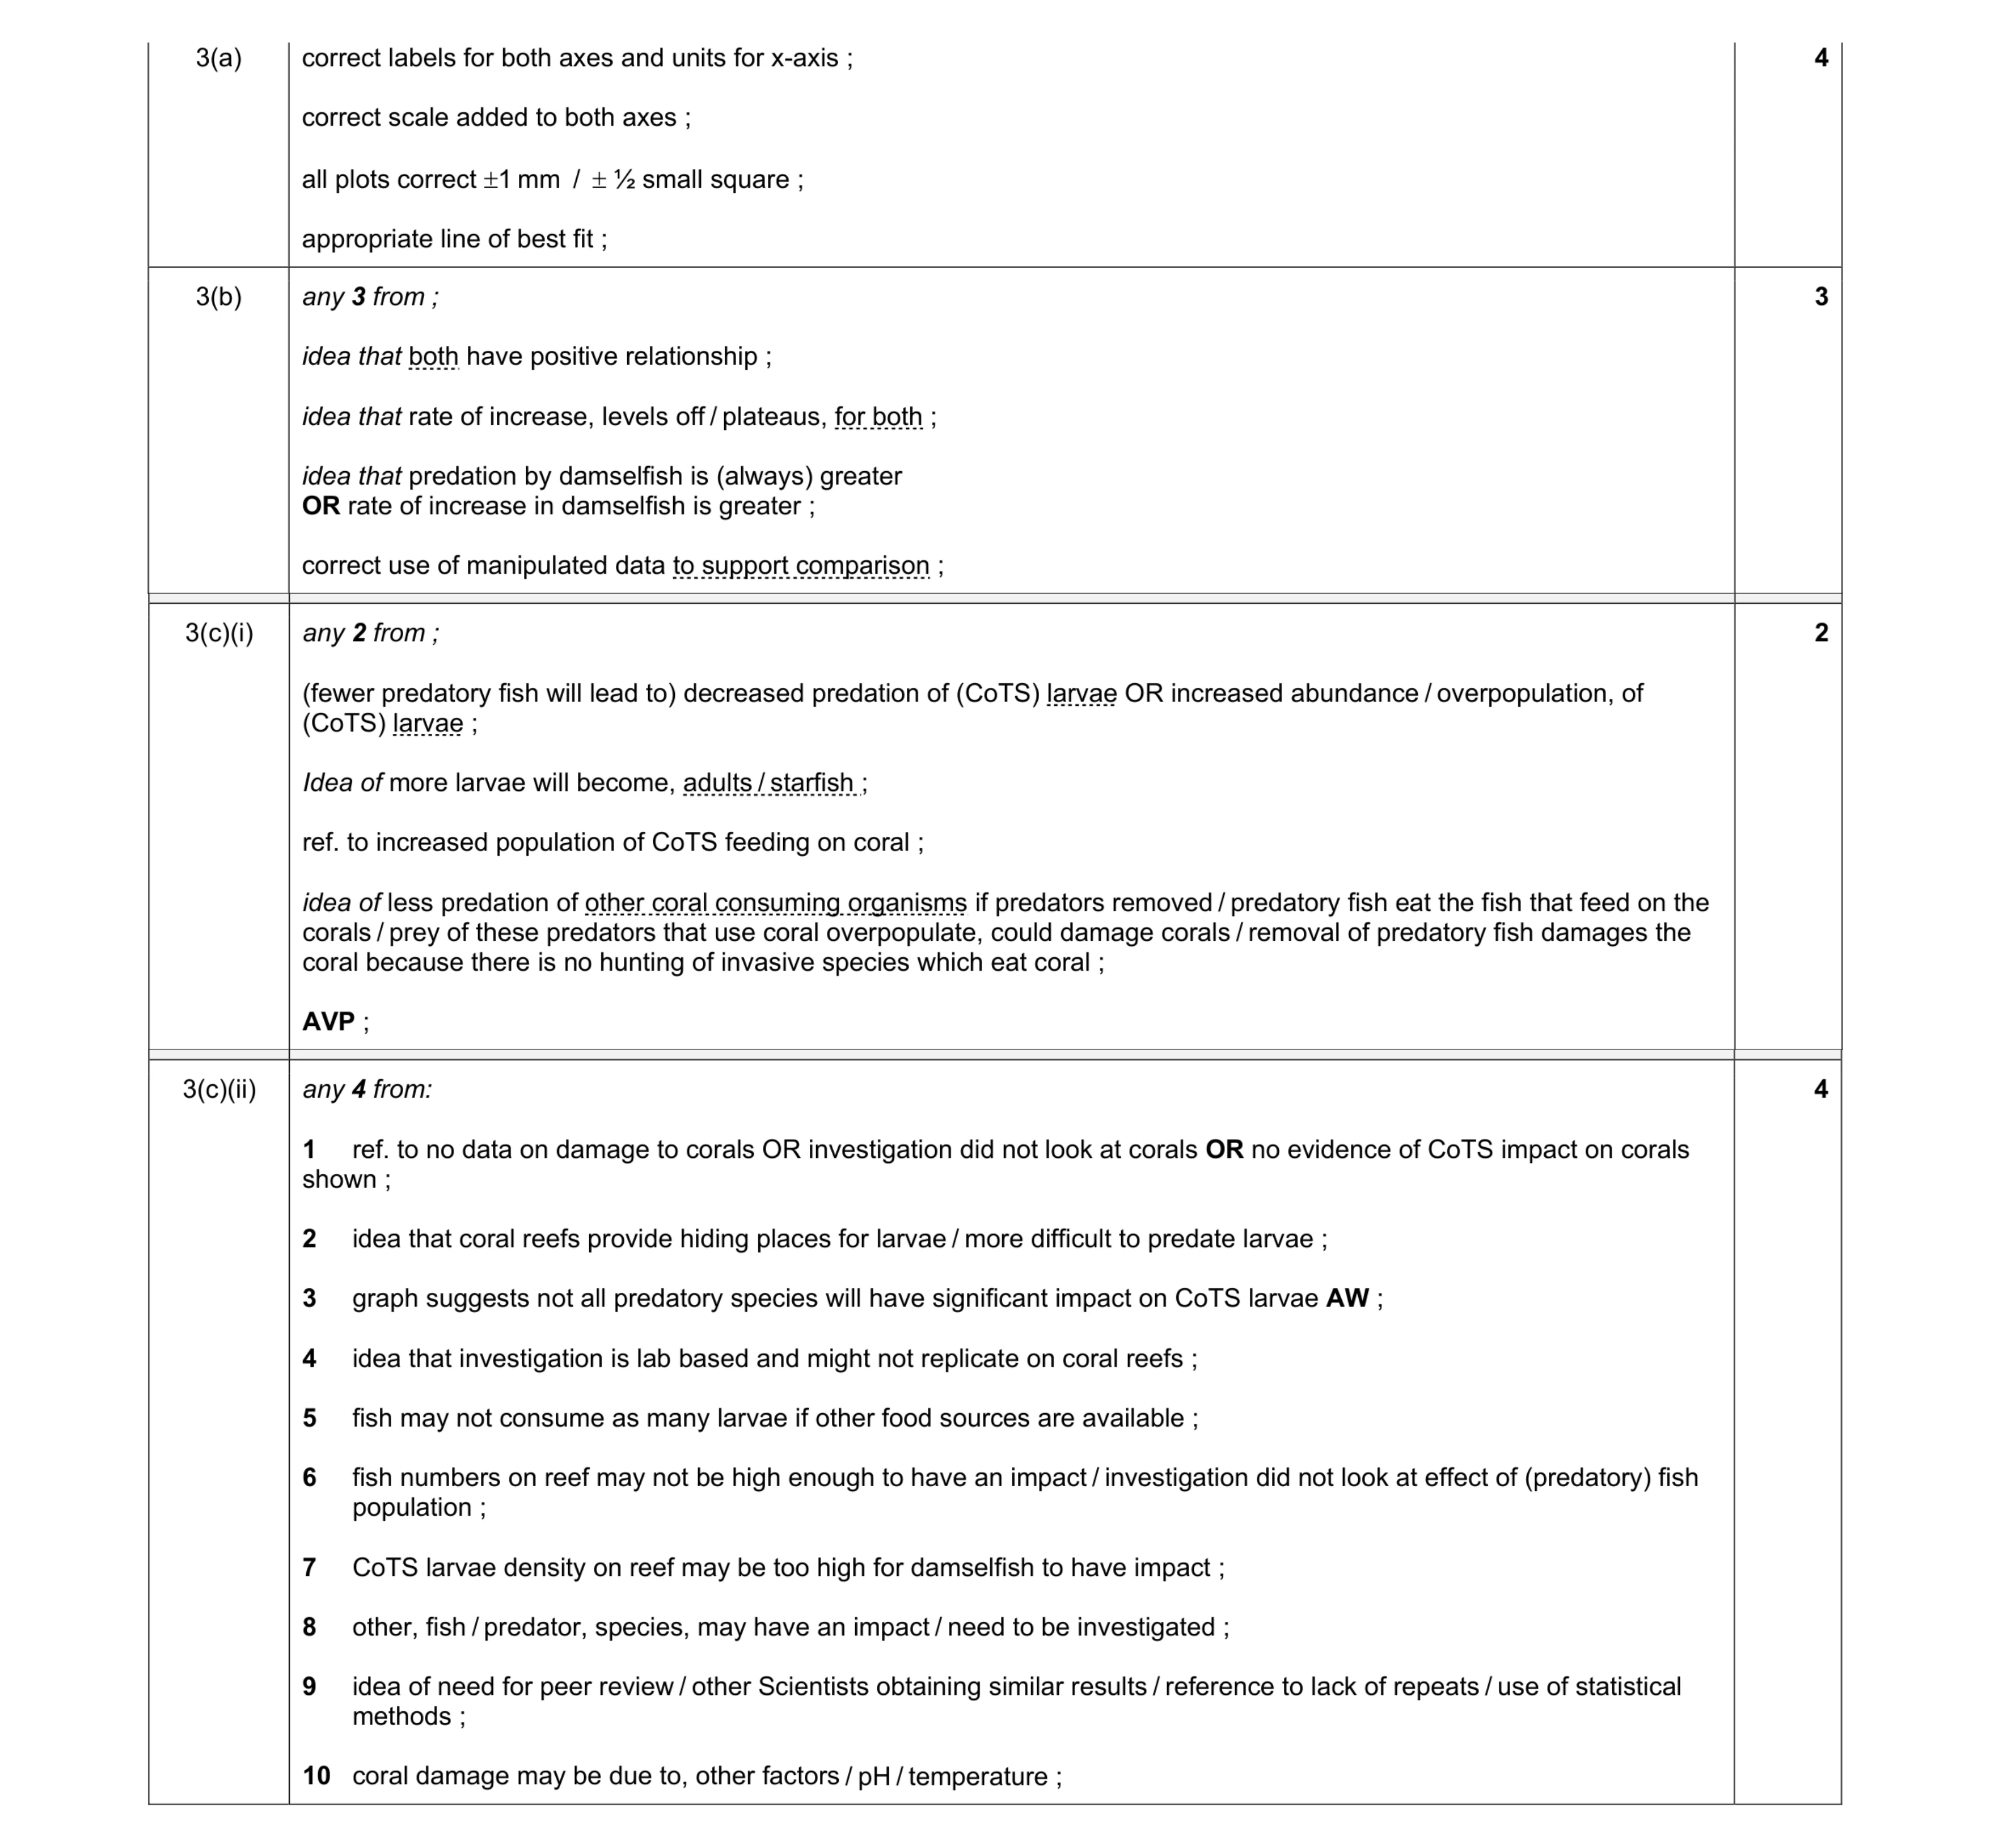 13
13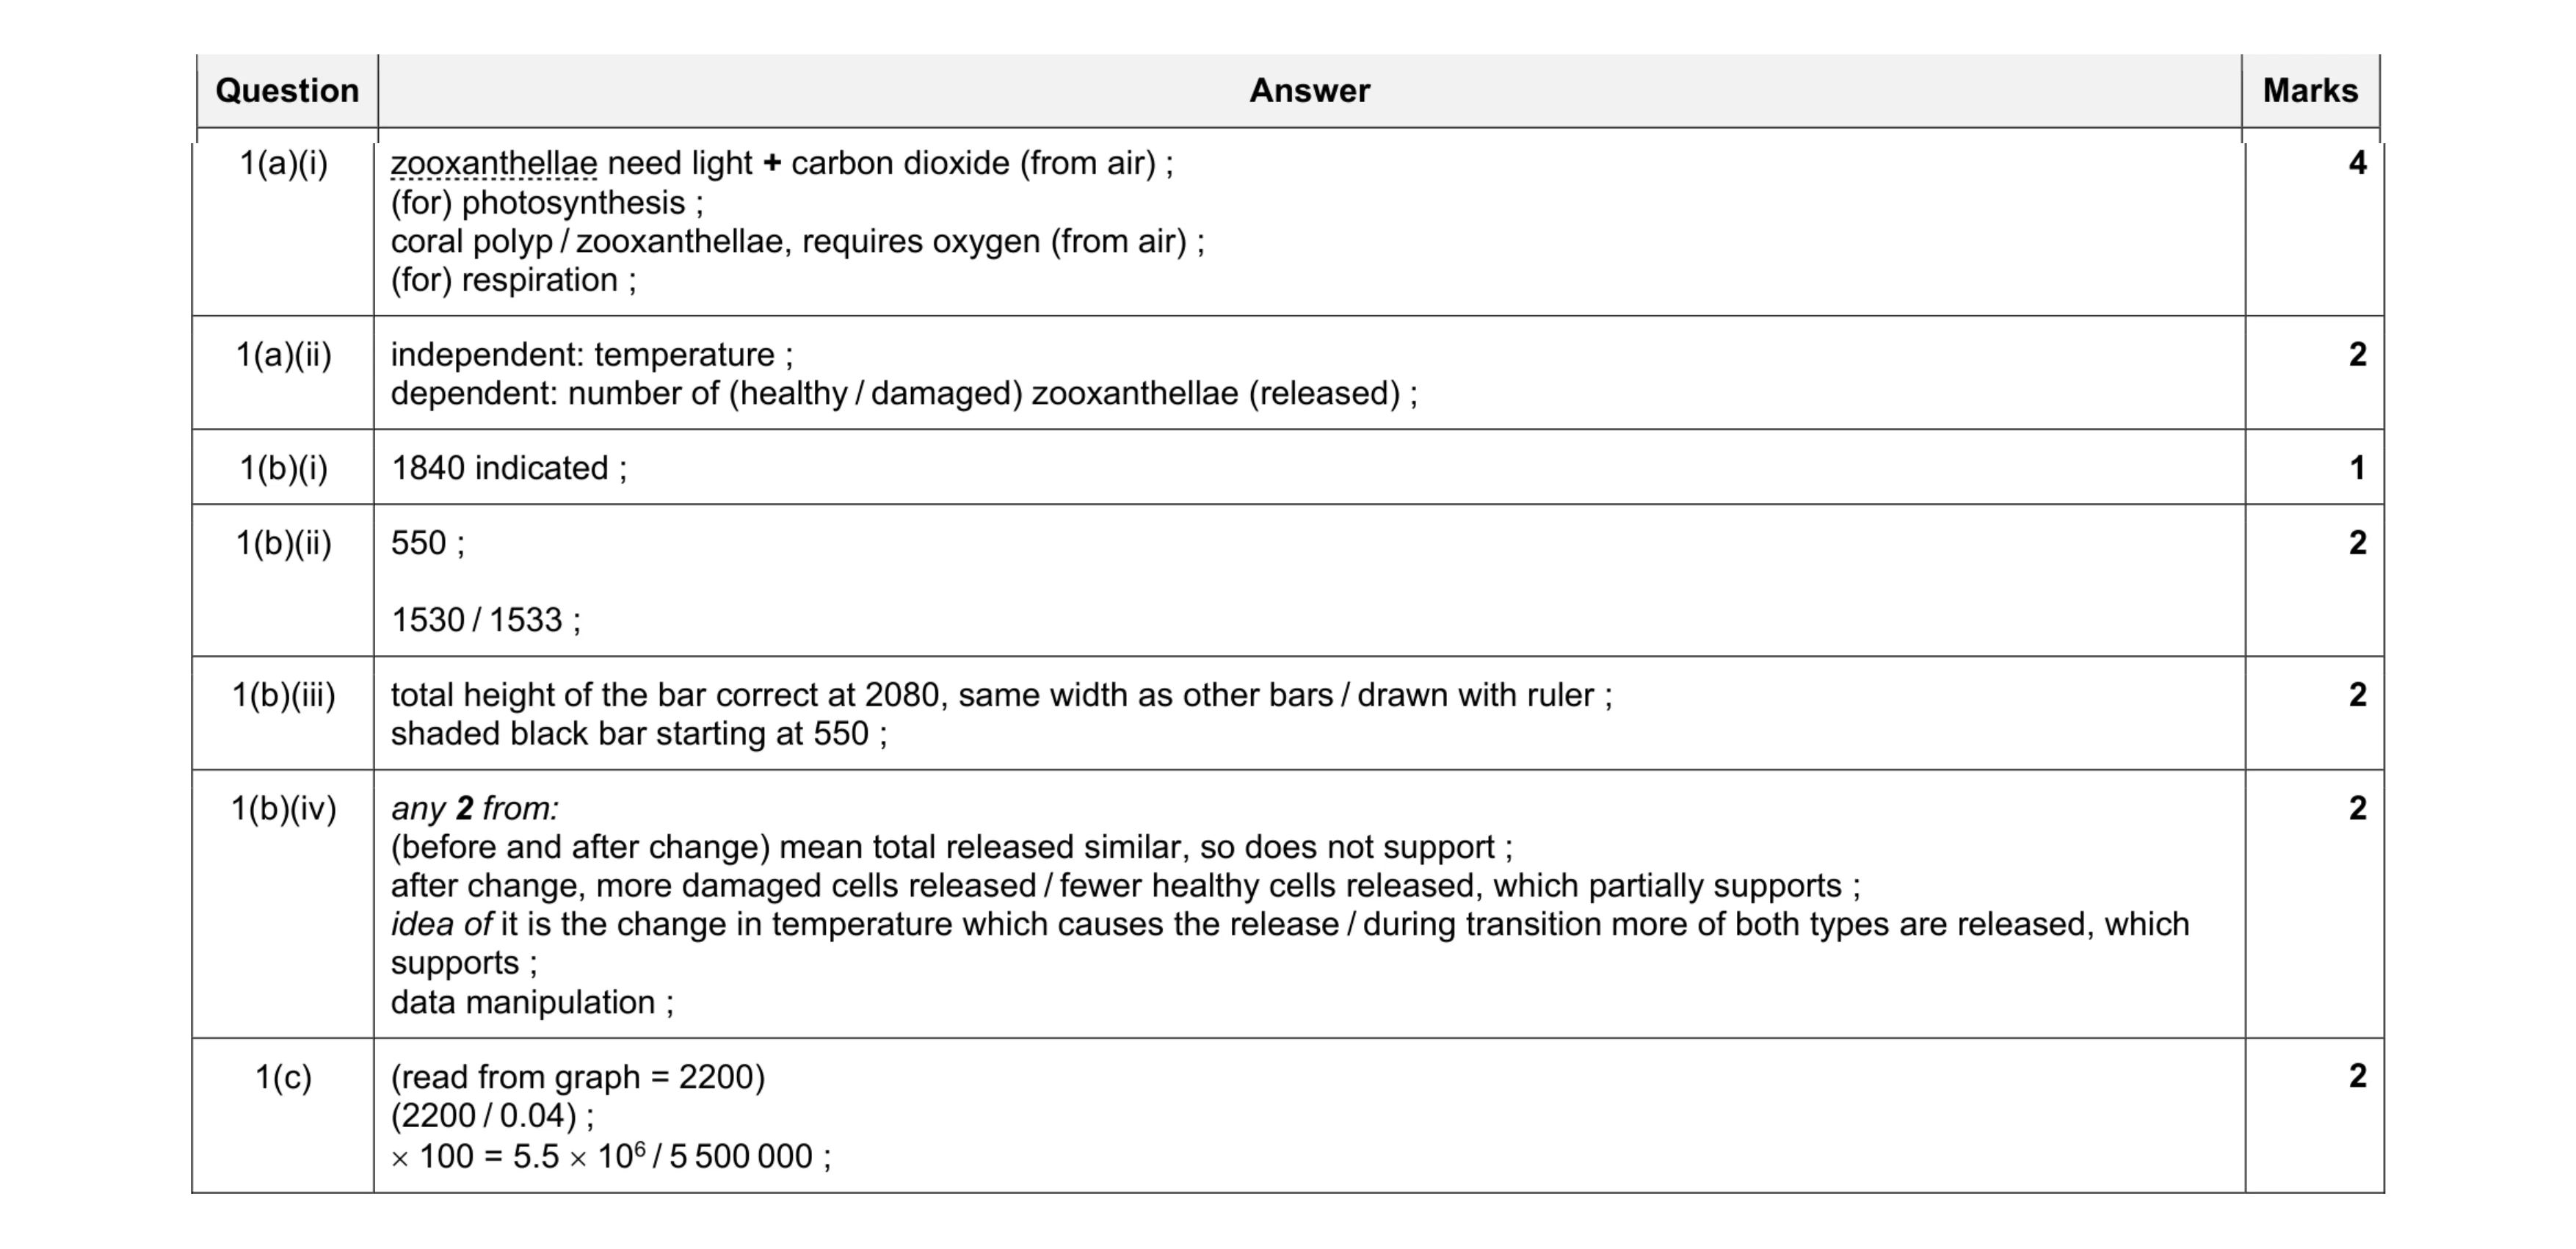 15
15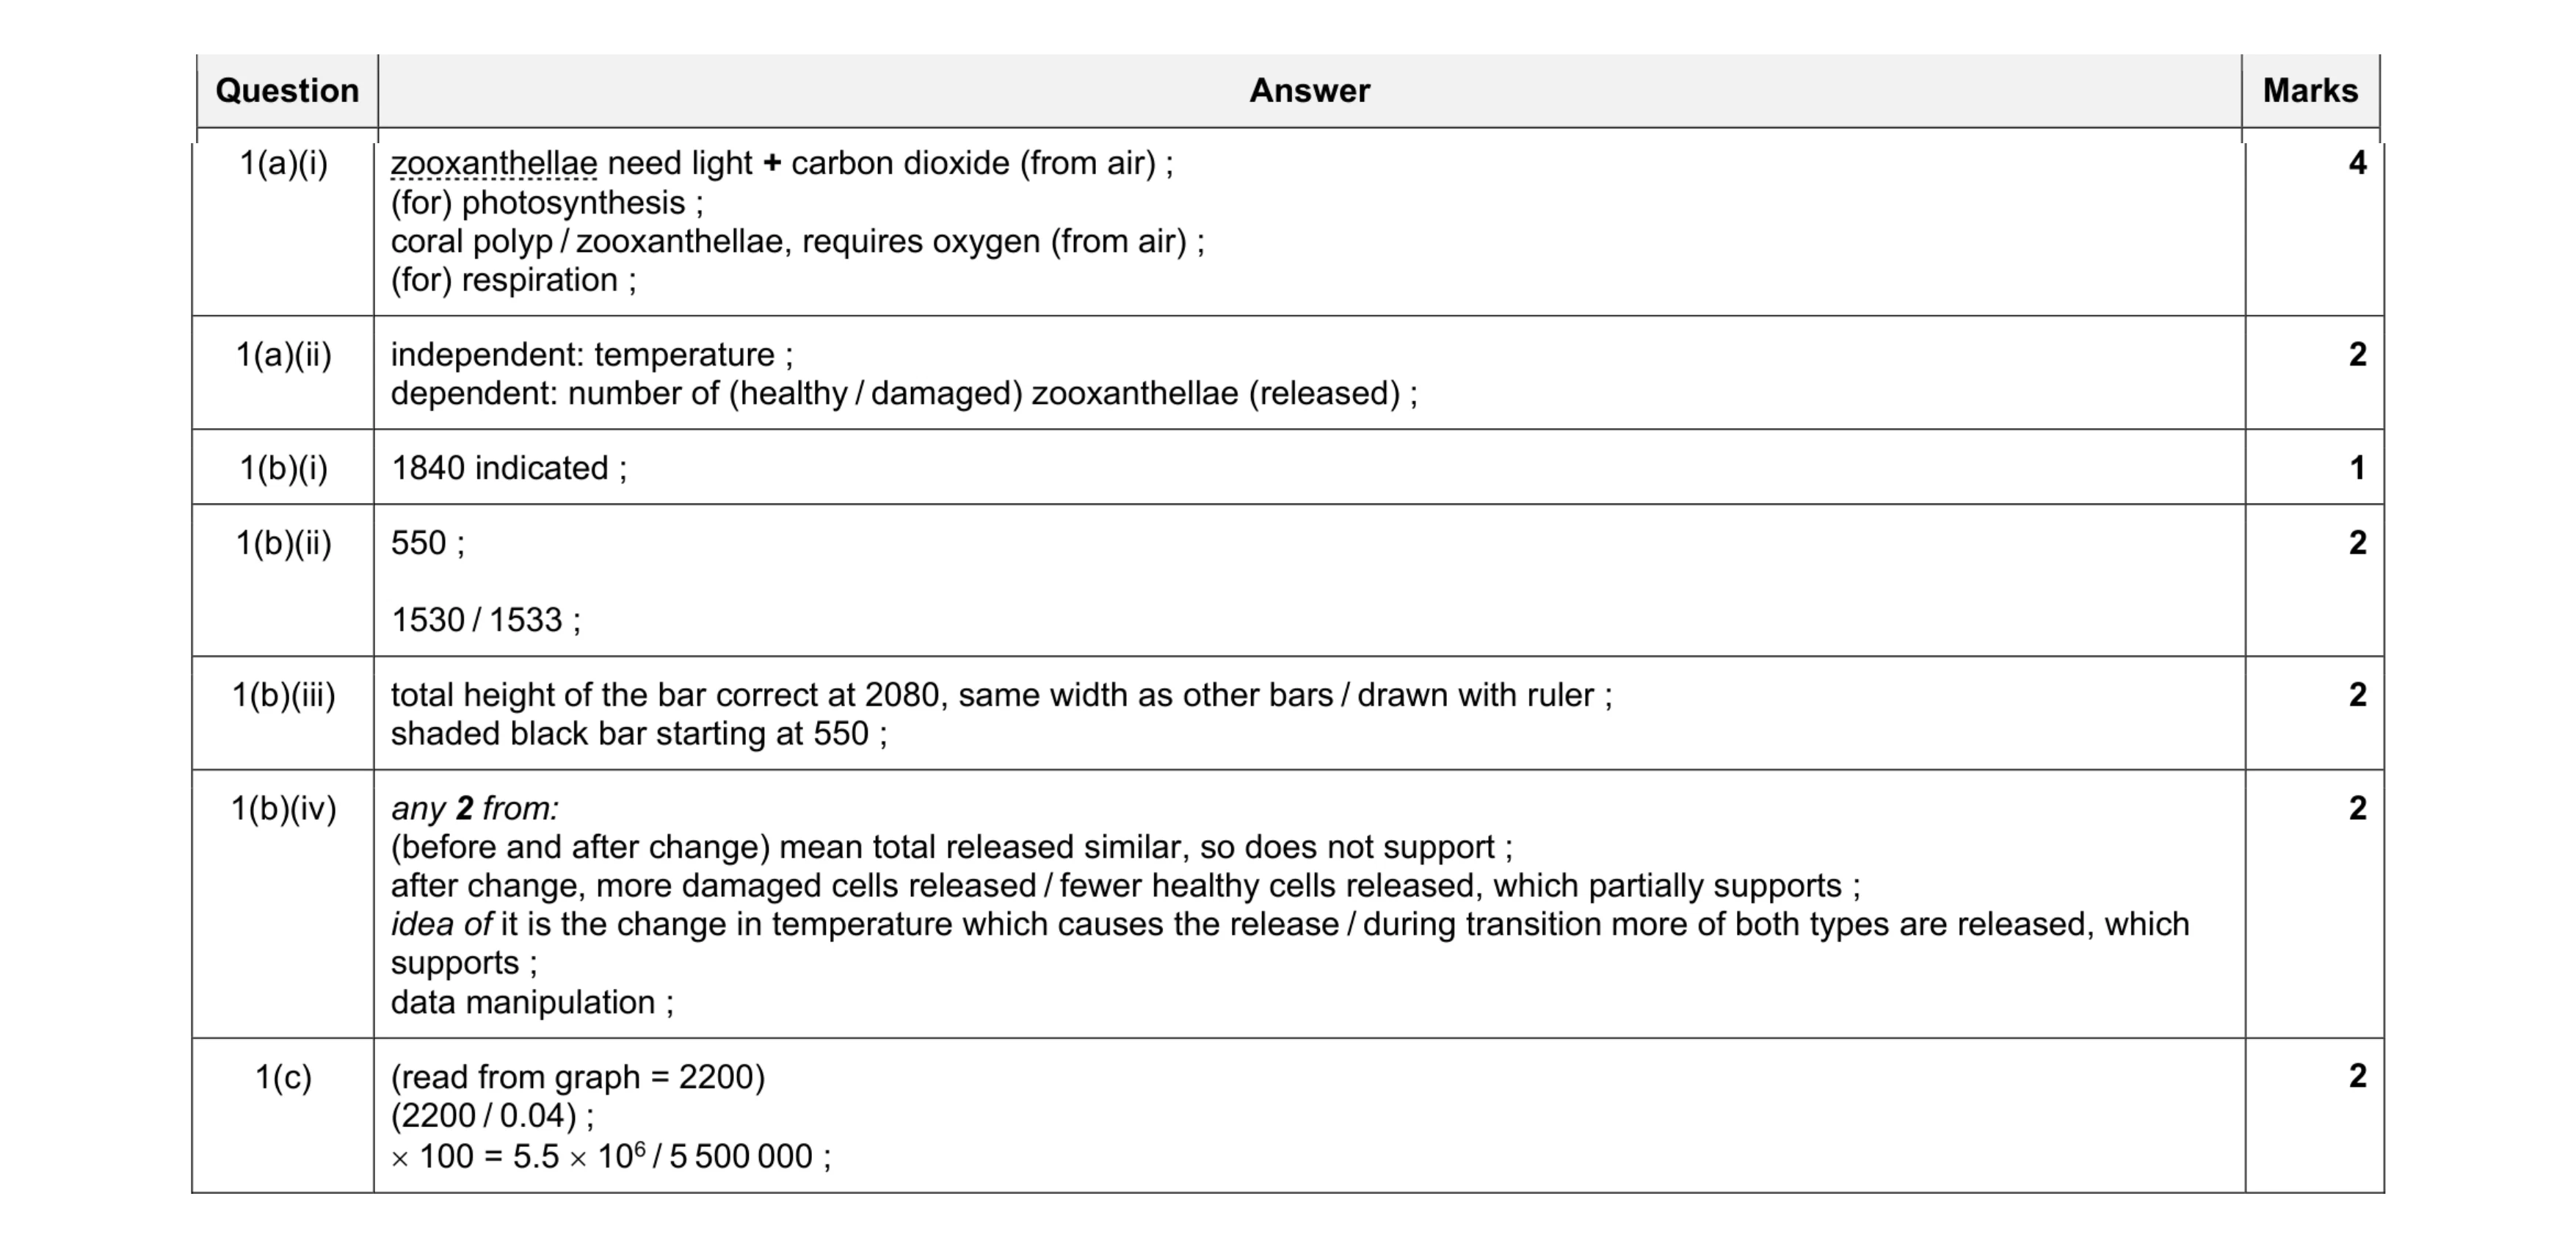 15
15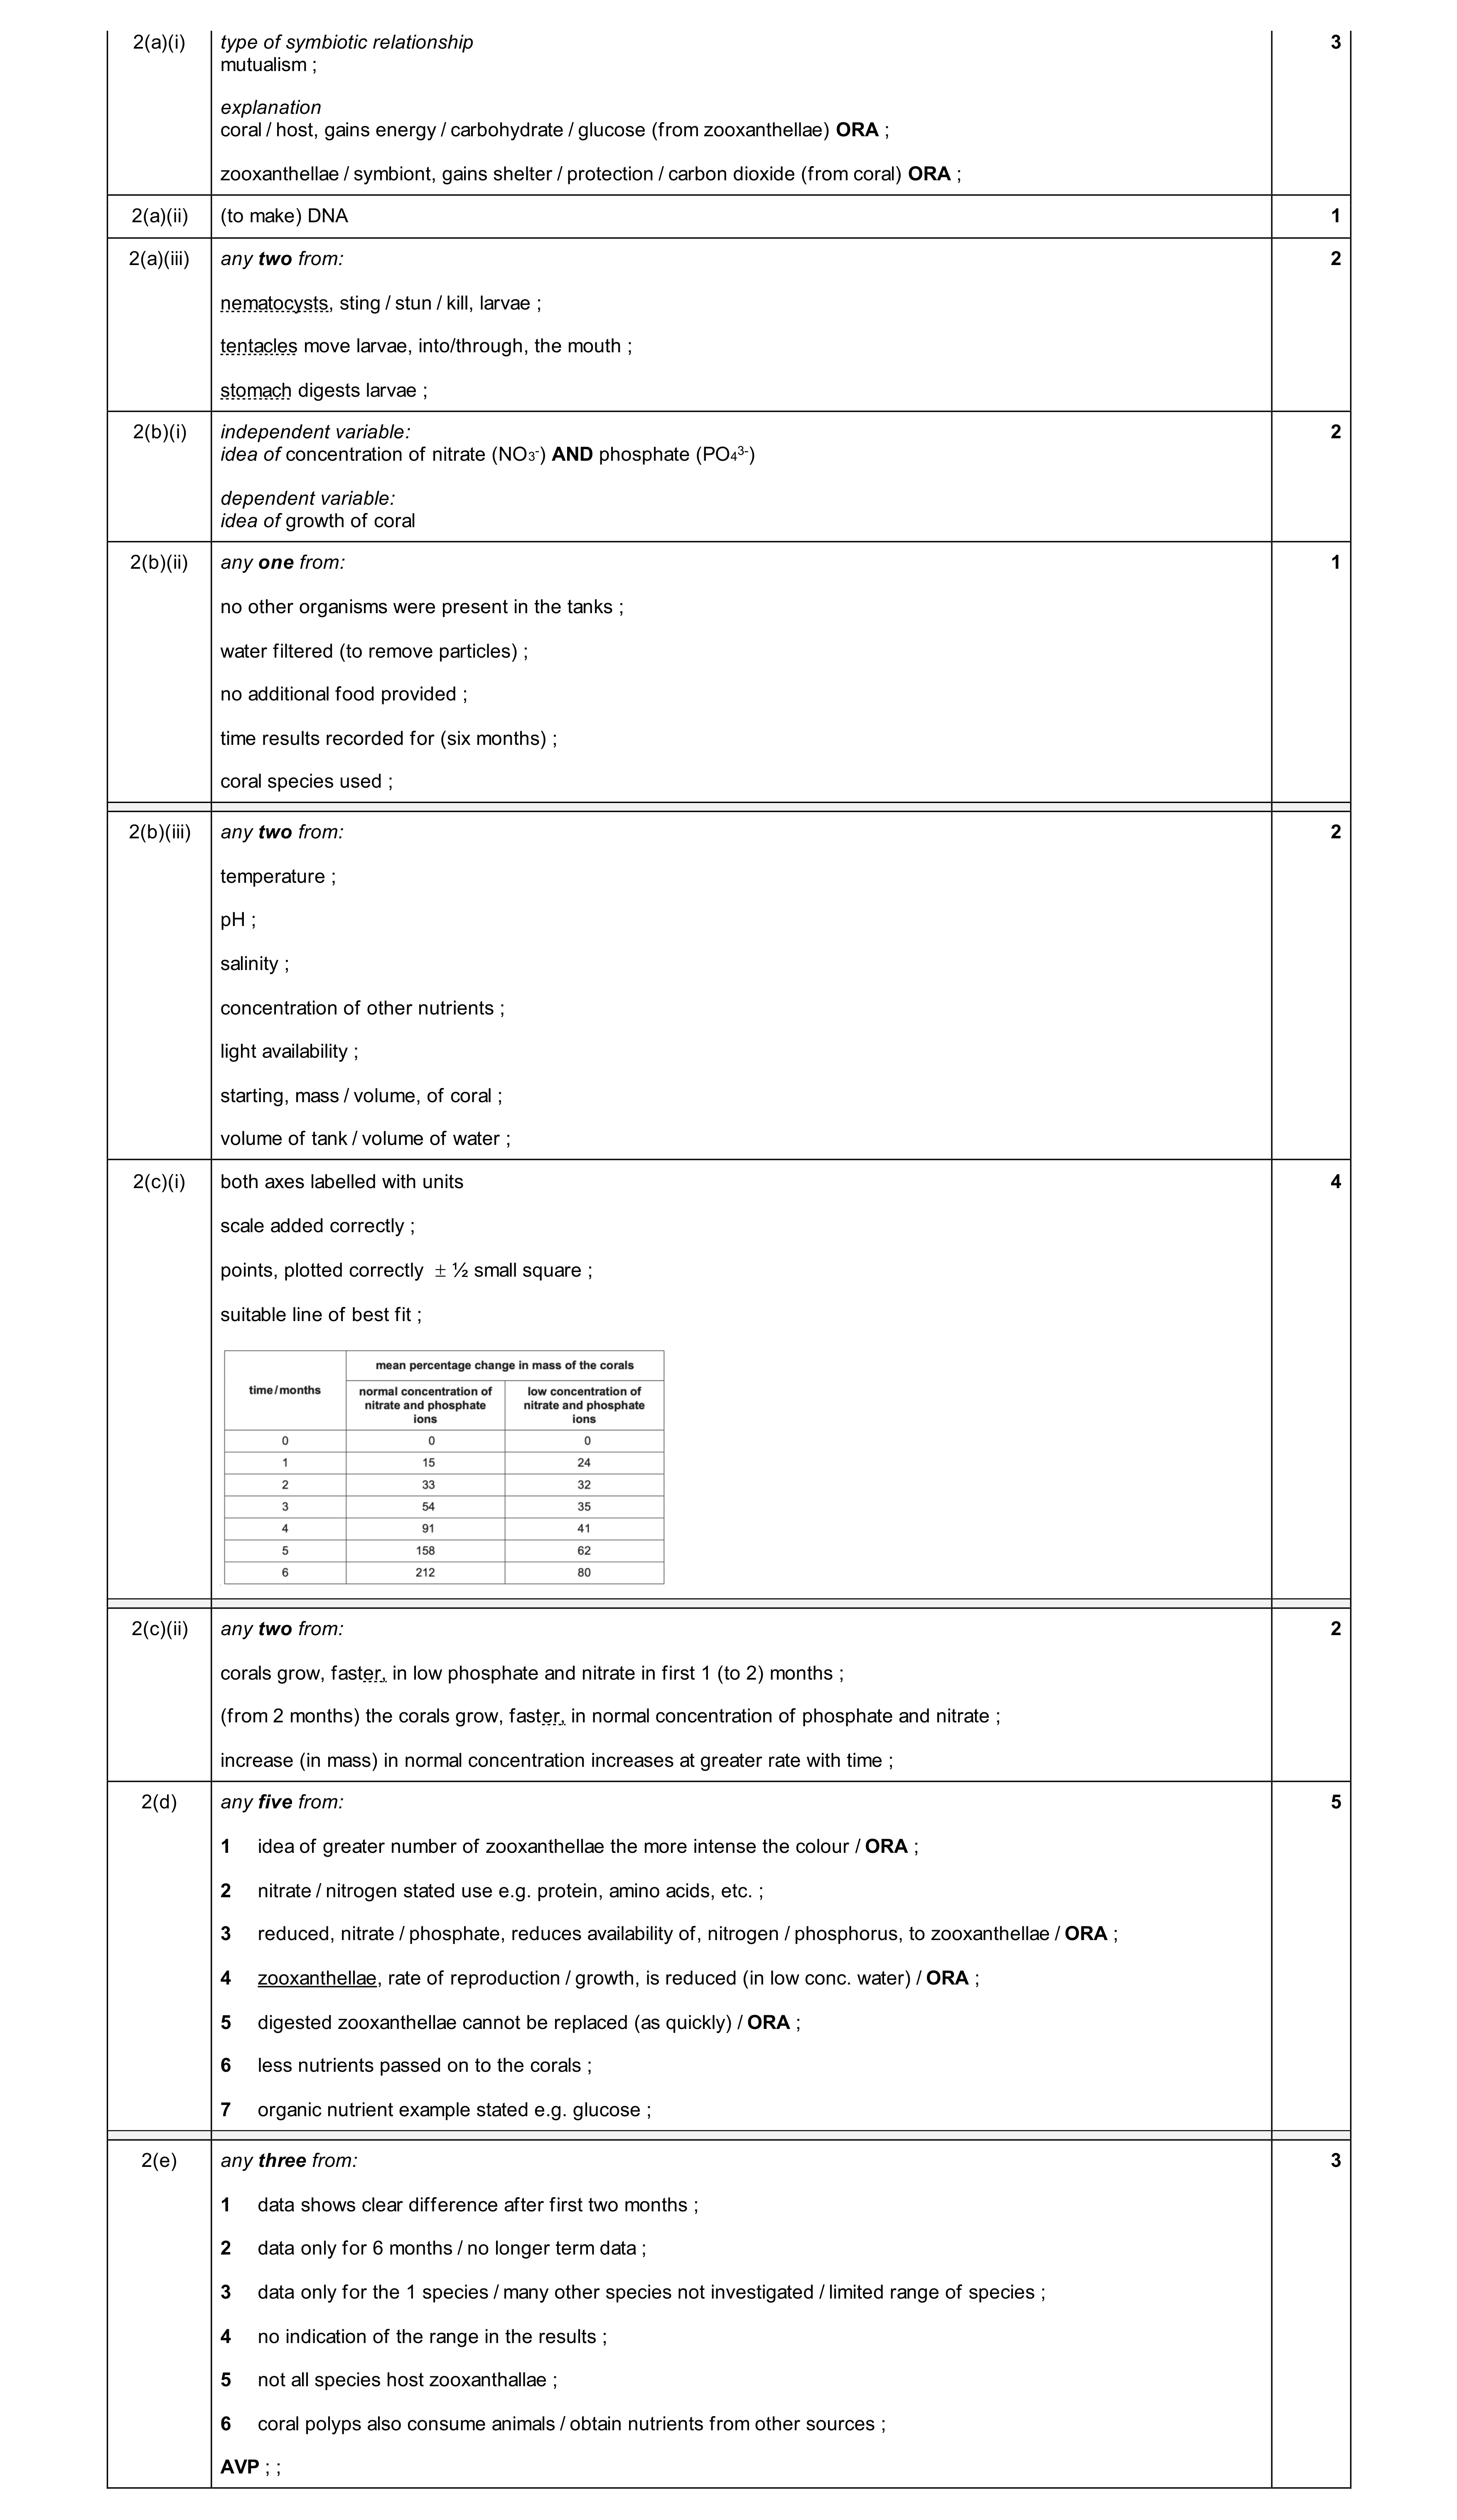 25
25