Cambridge A Level Marine Science 9693 — 2020 May/June Paper 2 · Variant 1
9693/21/M/J/20 · 4 questions · 50 marks · ≈56 min
The question paper and its mark scheme, free to read here and free to download. This is Cambridge’s own paper, exactly as it was sat.
Question paper12 pages


Mark scheme12 pages
Answers below. Sit the paper first if you are practising.
Questions as text
Q1 · A species of butterfly fish, Chaetodon austriacus, which inhabits coral reefs in the Red…
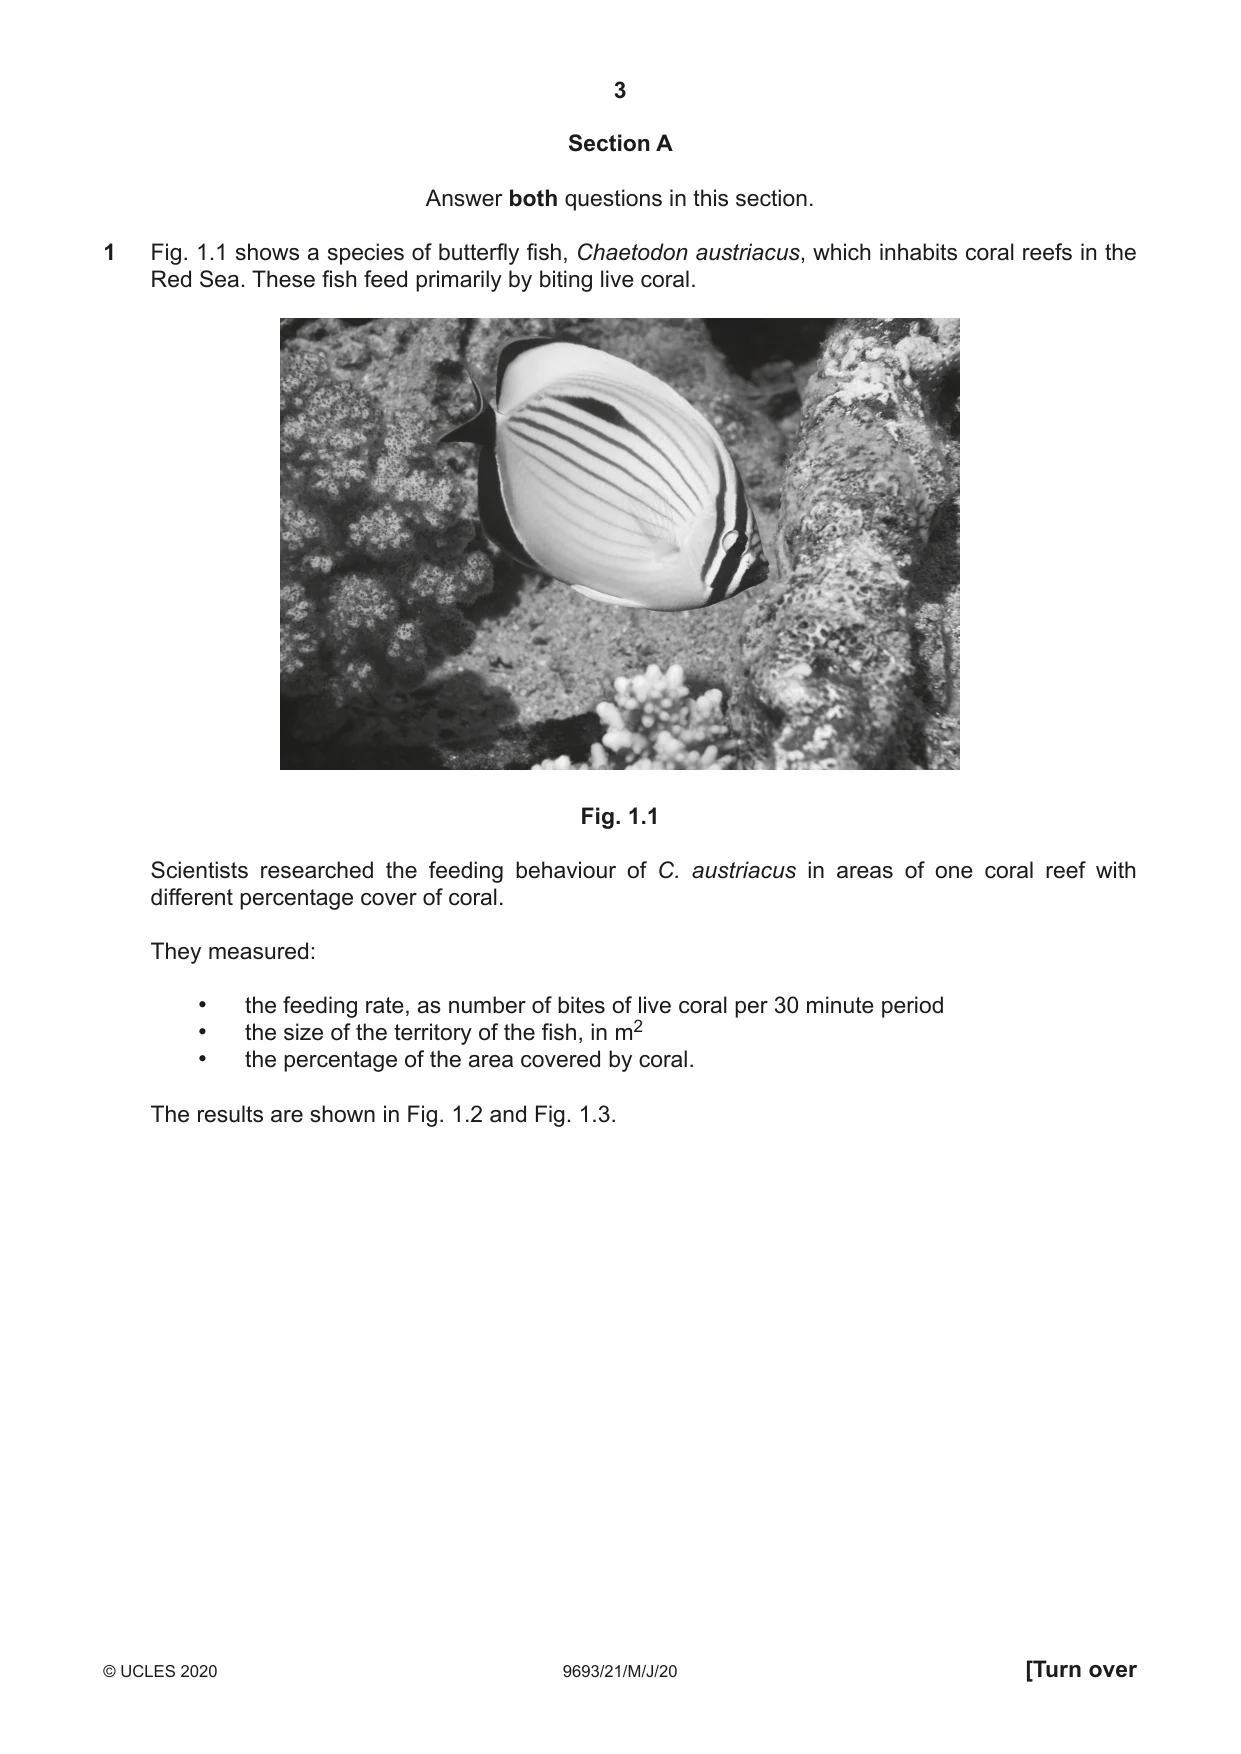
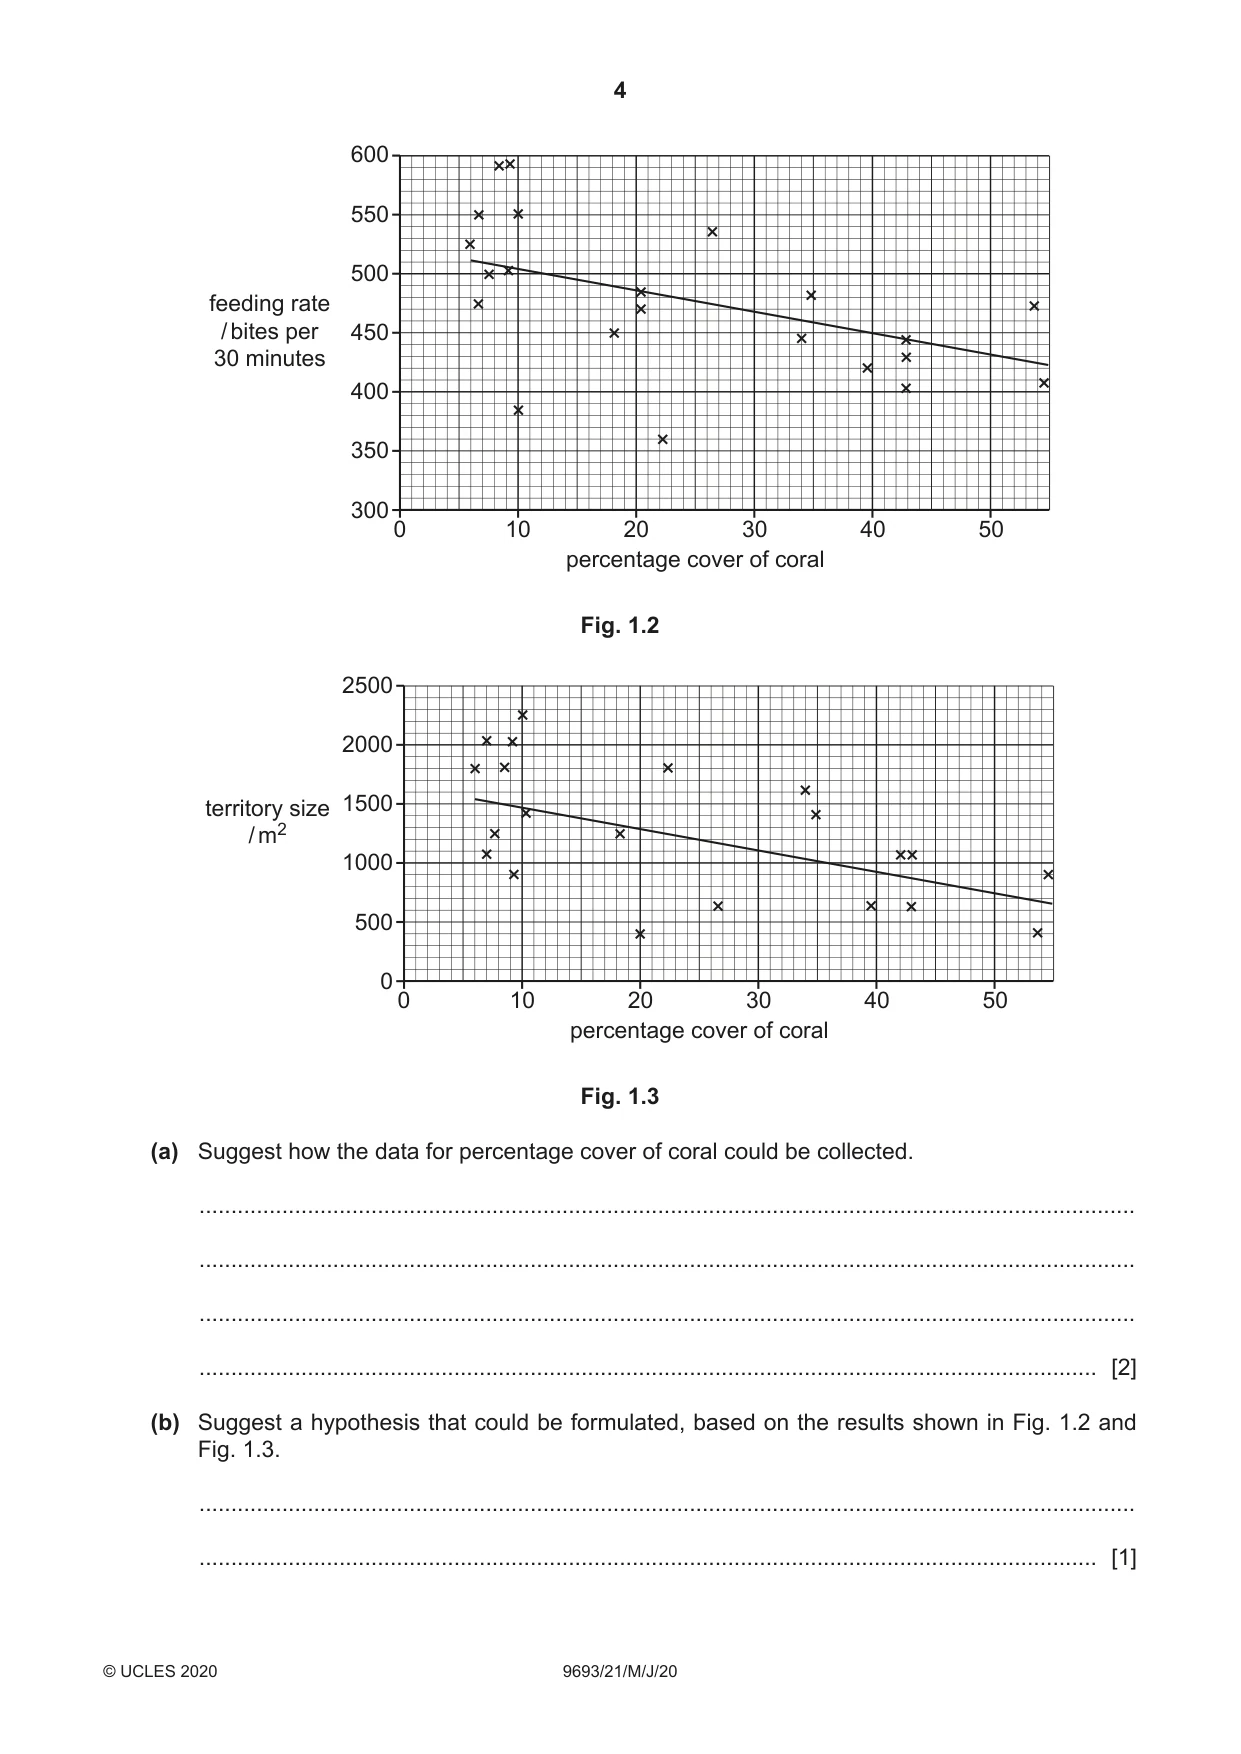
1 Fig. 1.1 shows a species of butterfly fish, Chaetodon austriacus, which inhabits coral reefs in the Red Sea. These fish feed primarily by biting live coral. Fig. 1.1 Scientists researched the feeding behaviour of C. austriacus in areas of one coral reef with different percentage cover of coral. They measured: • the feeding rate, as number of bites of live coral per 30 minute period • the size of the territory of the fish, in m2 • the percentage of the area covered by coral. The results are shown in Fig. 1.2 and Fig. 1.3. 600 550 500 feeding rate / bites per 450 30 minutes 400 350 300 0 10 20 30 40 50 percentage cover of coral Fig. 1.2 2500 2000 territory size 1500 / m2 1000 500 0 0 10 20 30 40 50 percentage cover of coral Fig. 1.3 (a) Suggest how the data for percentage cover of coral could be collected. ................................................................................................................................................... ................................................................................................................................................... ................................................................................................................................................... ............................................................................................................................................. [2] (b) Suggest a hypothesis that could be formulated, based on the results shown in Fig. 1.2 and Fig. 1.3. ................................................................................................................................................... ............................................................................................................................................. [1] (c) Suggest explanations for the patterns shown by the data in Fig. 1.2 and Fig. 1.3. ................................................................................................................................................... ................................................................................................................................................... ................................................................................................................................................... ................................................................................................................................................... ................................................................................................................................................... ............................................................................................................................................. [3] (d) The scientists suggested that measuring butterfly fish territory size or feeding rate could be used to assess the health of a coral reef. Discuss the extent to which the data support this suggestion. ................................................................................................................................................... ................................................................................................................................................... ................................................................................................................................................... ................................................................................................................................................... ................................................................................................................................................... ............................................................................................................................................. [3] [Total: 9]
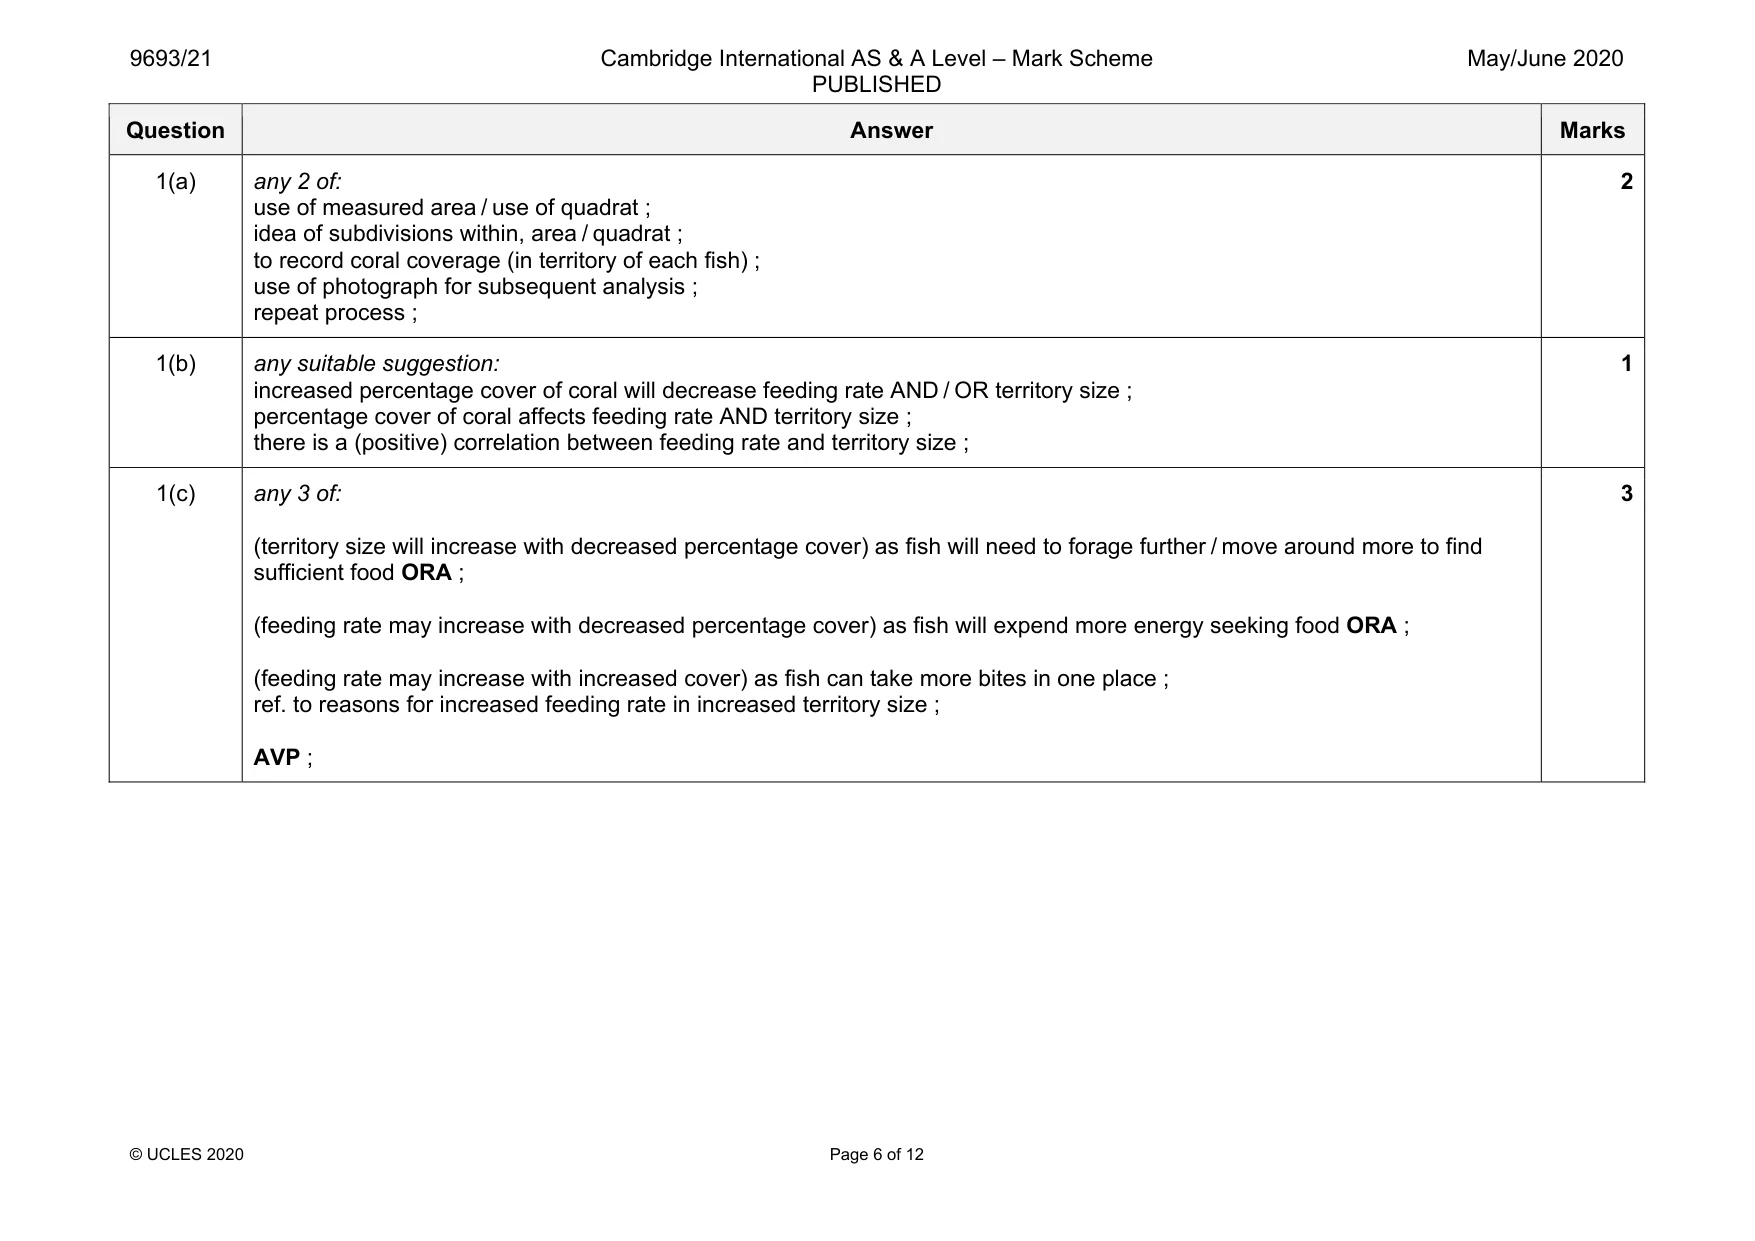
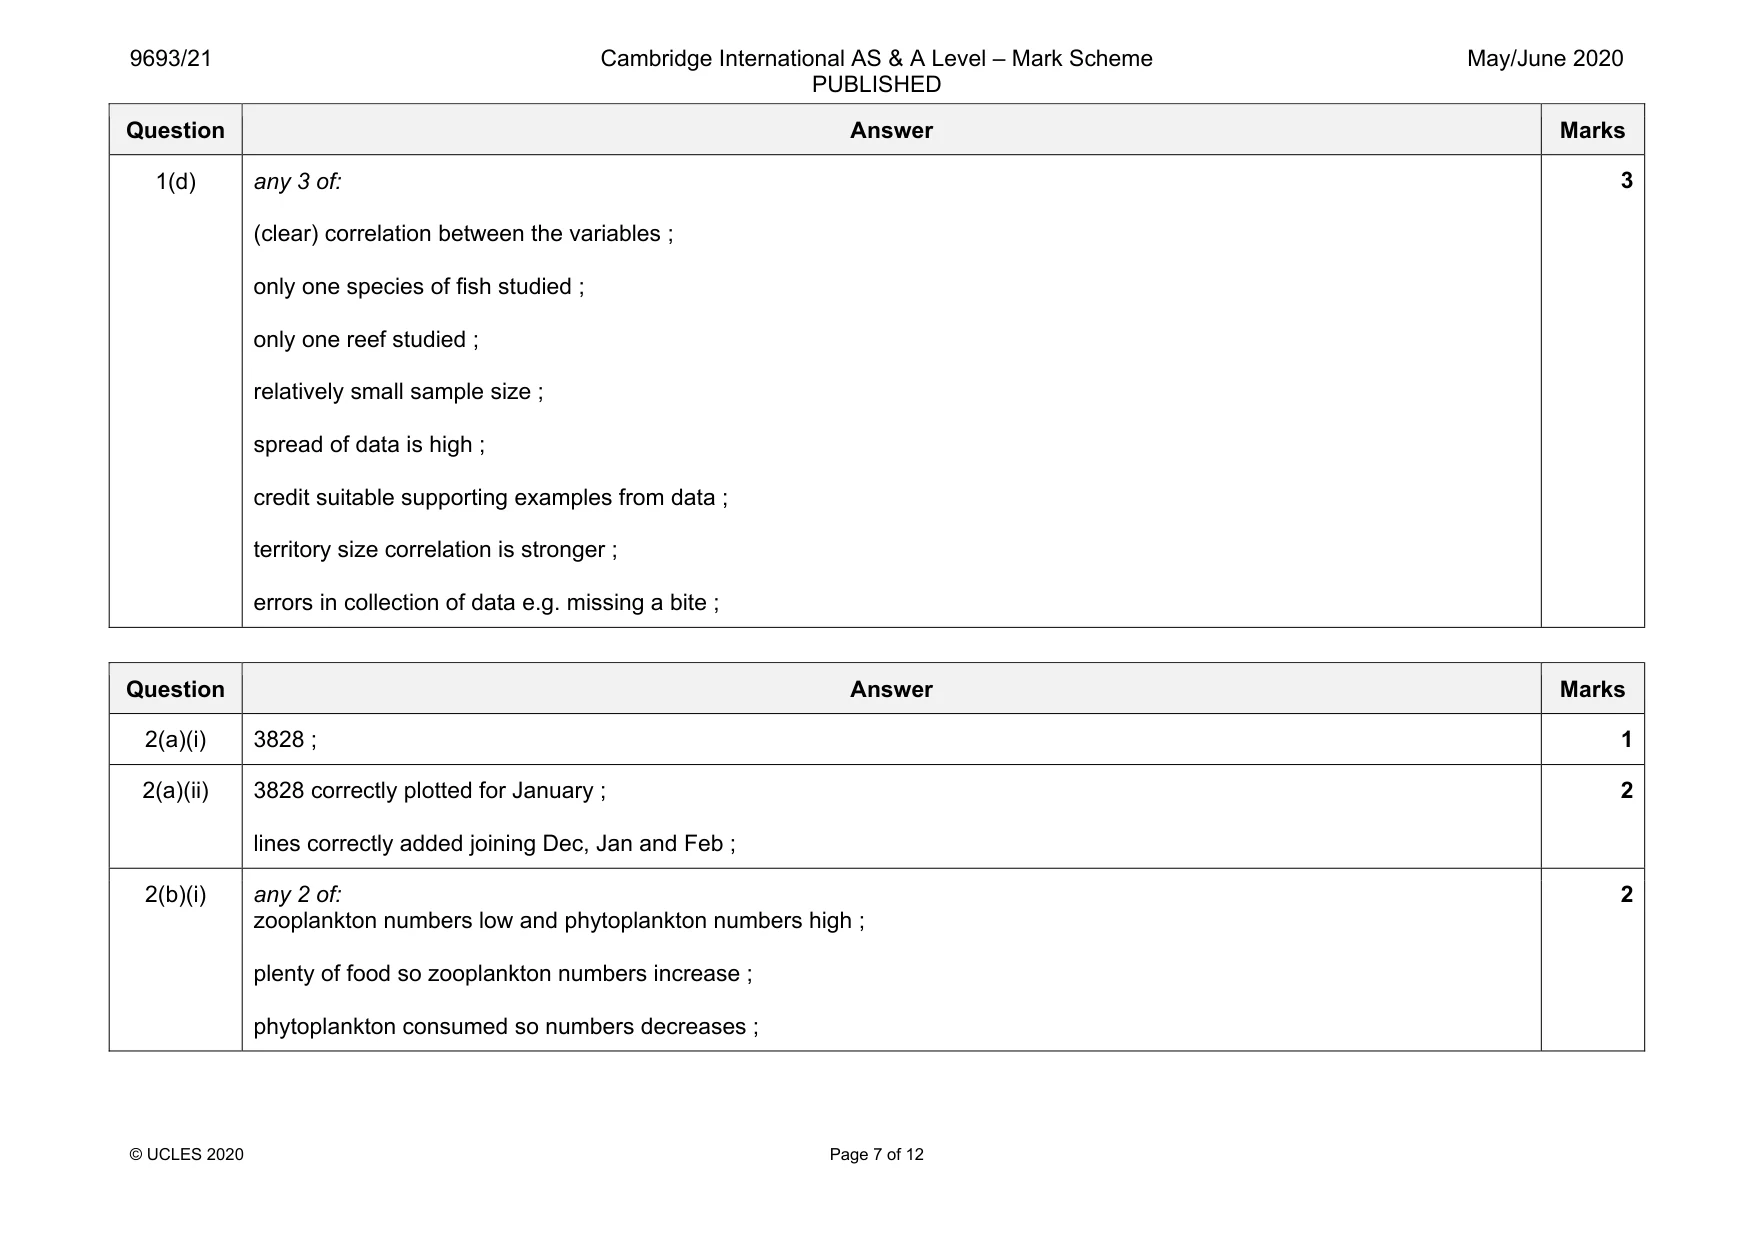
Mark scheme: 1(a) any 2 of: use of measured area / use of quadrat ; idea of subdivisions within, area / quadrat ; to record coral coverage (in territory of each fish) ; use of photograph for subsequent analysis ; repeat process ; 2 1(b) any suitable suggestion: increased percentage cover of coral will decrease feeding rate AND / OR territory size ; percentage cover of coral affects feeding rate AND territory size ; there is a (positive) correlation between feeding rate and territory size ; 1 1(c) any 3 of: (territory size will increase with decreased percentage cover) as fish will need to forage further / move around more to find sufficient food ORA ; (feeding rate may increase with decreased percentage cover) as fish will expend more energy seeking food ORA ; (feeding rate may increase with increased cover) as fish can take more bites in one place ; ref. to reasons for increased feeding rate in increased territory size ; AVP ; 3 Question Answer Marks 1(d) any 3 of: (clear) correlation between the variables ; only one species of fish studied ; only one reef studied ; relatively small sample size ; spread of data is high ; credit suitable supporting examples from data ; territory size correlation is stronger ; errors in collection of data e.g. missing a bite ; 3
Q2 · Phytoplankton are small photosynthetic organisms that float in the upper layers of the…
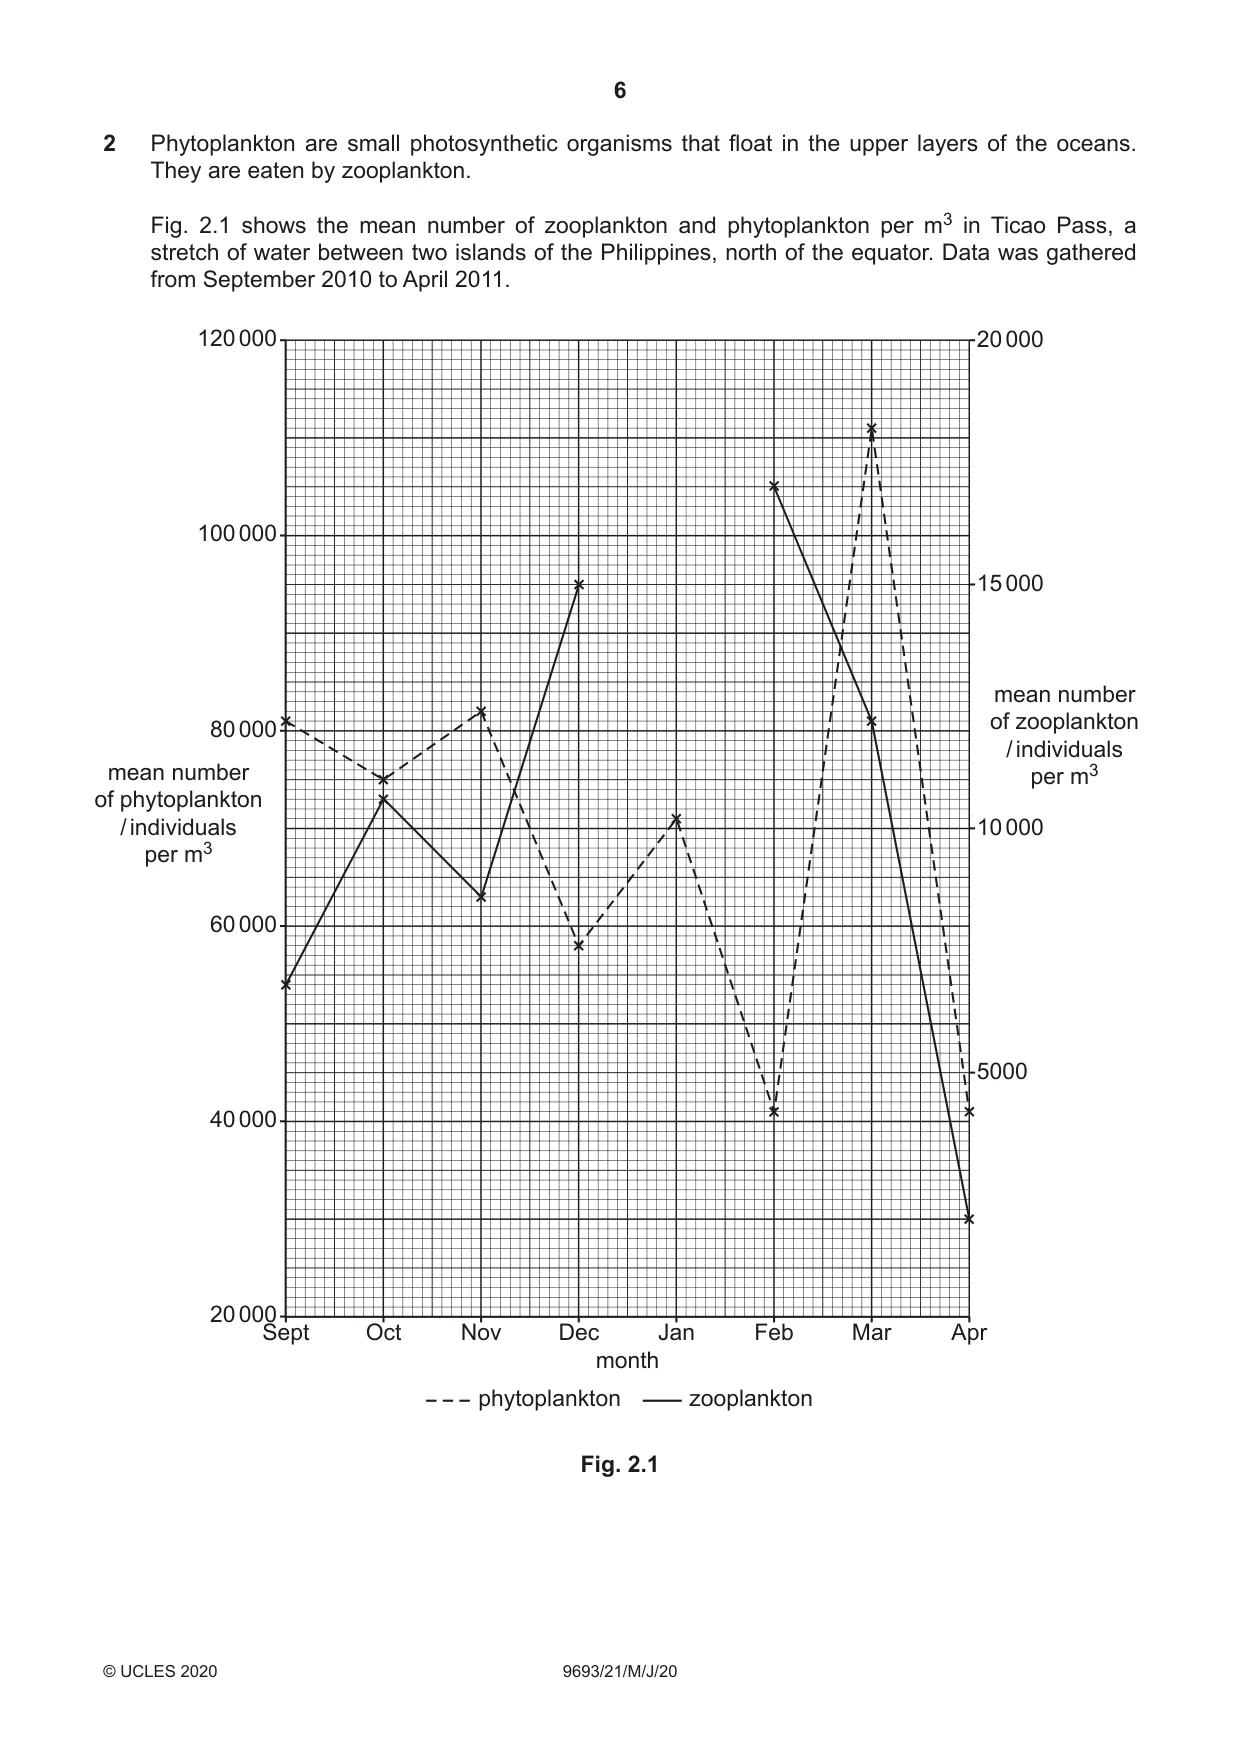
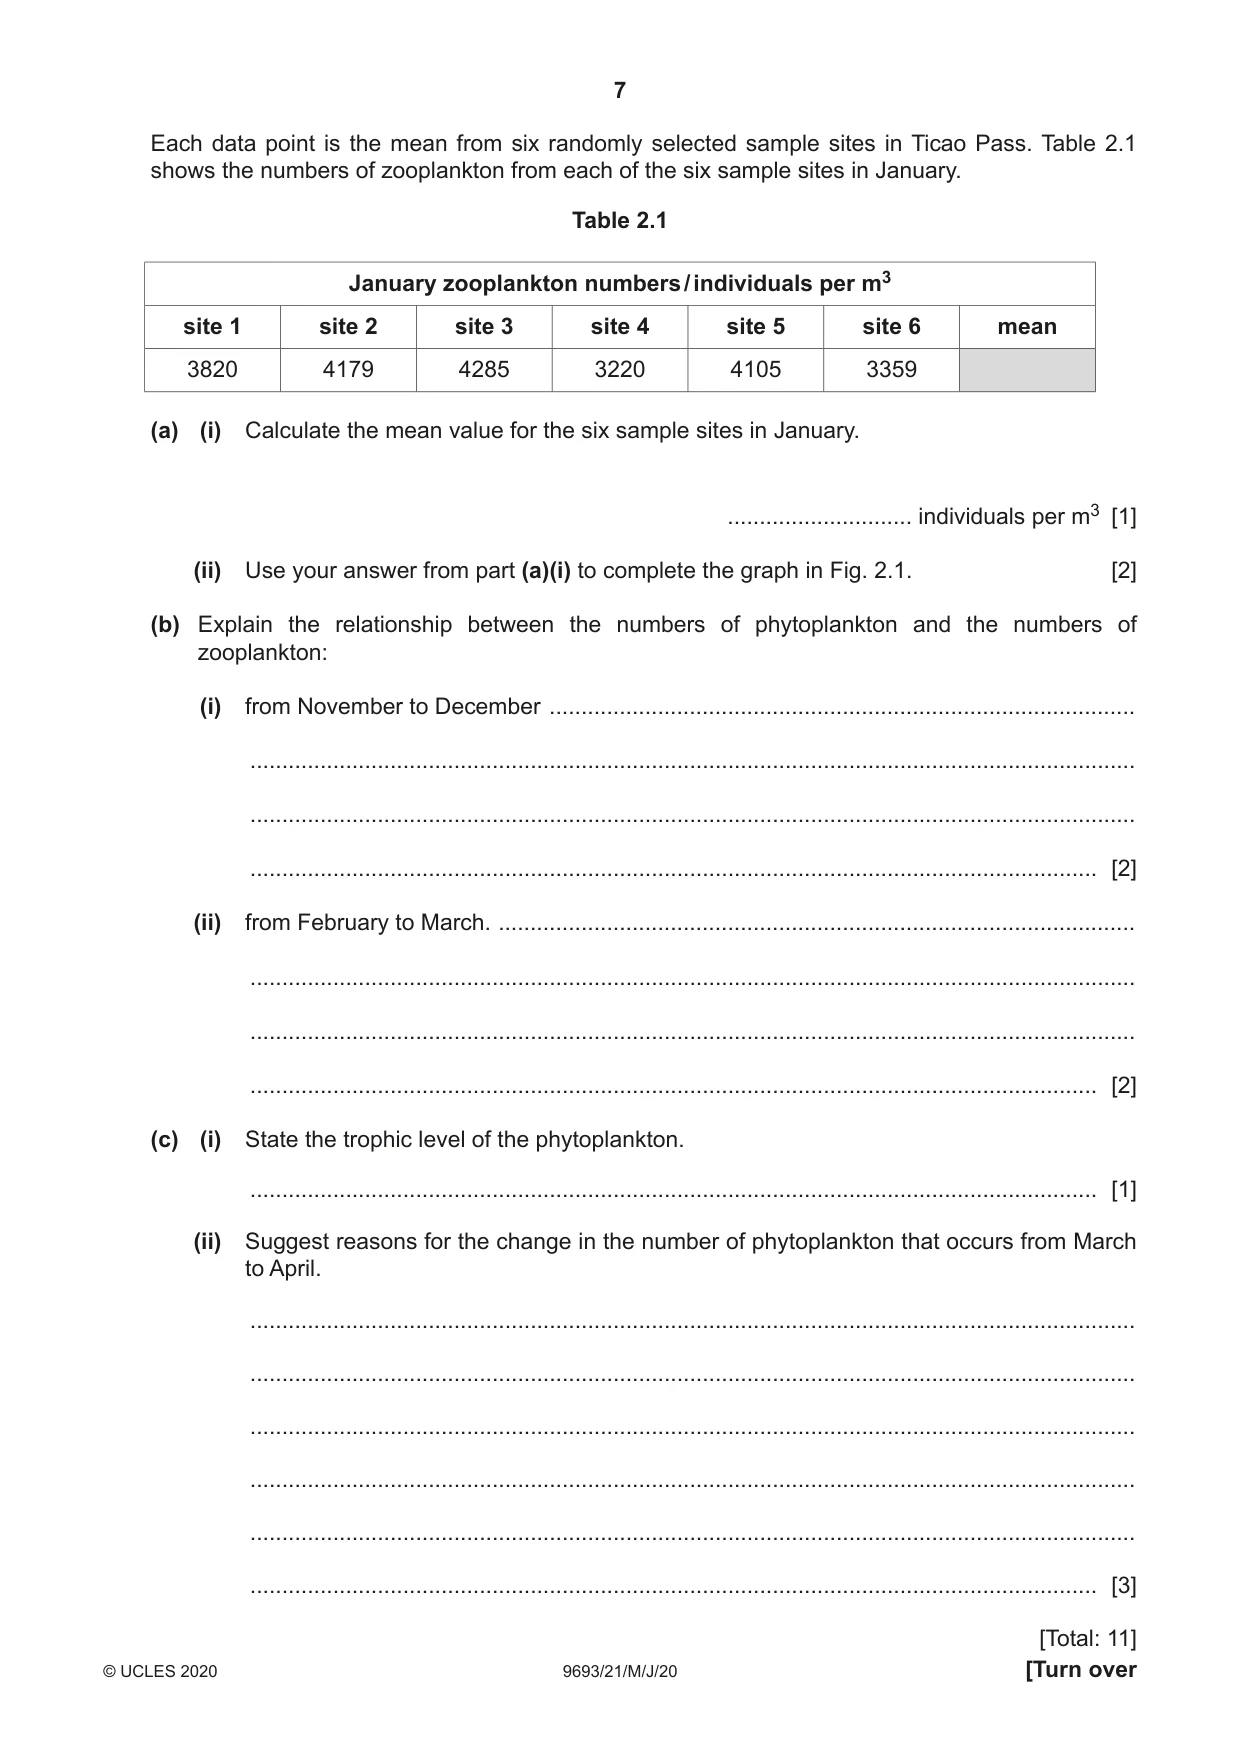
2 Phytoplankton are small photosynthetic organisms that float in the upper layers of the oceans. They are eaten by zooplankton. Fig. 2.1 shows the mean number of zooplankton and phytoplankton per m3 in Ticao Pass, a stretch of water between two islands of the Philippines, north of the equator. Data was gathered from September 2010 to April 2011. 120 000 20 000 100 000 15 000 mean number of zooplankton 80 000 / individuals mean number per m3 of phytoplankton / individuals 10 000 per m3 60 000 5000 40 000 20 000 Sept Oct Nov Dec Jan Feb Mar Apr month phytoplankton zooplankton Fig. 2.1 Each data point is the mean from six randomly selected sample sites in Ticao Pass. Table 2.1 shows the numbers of zooplankton from each of the six sample sites in January. Table 2.1 January zooplankton numbers / individuals per m3 site 1 site 2 site 3 site 4 site 5 site 6 mean 3820 4179 4285 3220 4105 3359 (a) (i) Calculate the mean value for the six sample sites in January. ............................. individuals per m3 [1] (ii) Use your answer from part (a)(i) to complete the graph in Fig. 2.1. [2] (b) Explain the relationship between the numbers of phytoplankton and the numbers of zooplankton: (i) from November to December ............................................................................................ ........................................................................................................................................... ........................................................................................................................................... ..................................................................................................................................... [2] (ii) from February to March. .................................................................................................... ........................................................................................................................................... ........................................................................................................................................... ..................................................................................................................................... [2] (c) (i) State the trophic level of the phytoplankton. ..................................................................................................................................... [1] (ii) Suggest reasons for the change in the number of phytoplankton that occurs from March to April. ........................................................................................................................................... ........................................................................................................................................... ........................................................................................................................................... ........................................................................................................................................... ........................................................................................................................................... ..................................................................................................................................... [3] [Total: 11]
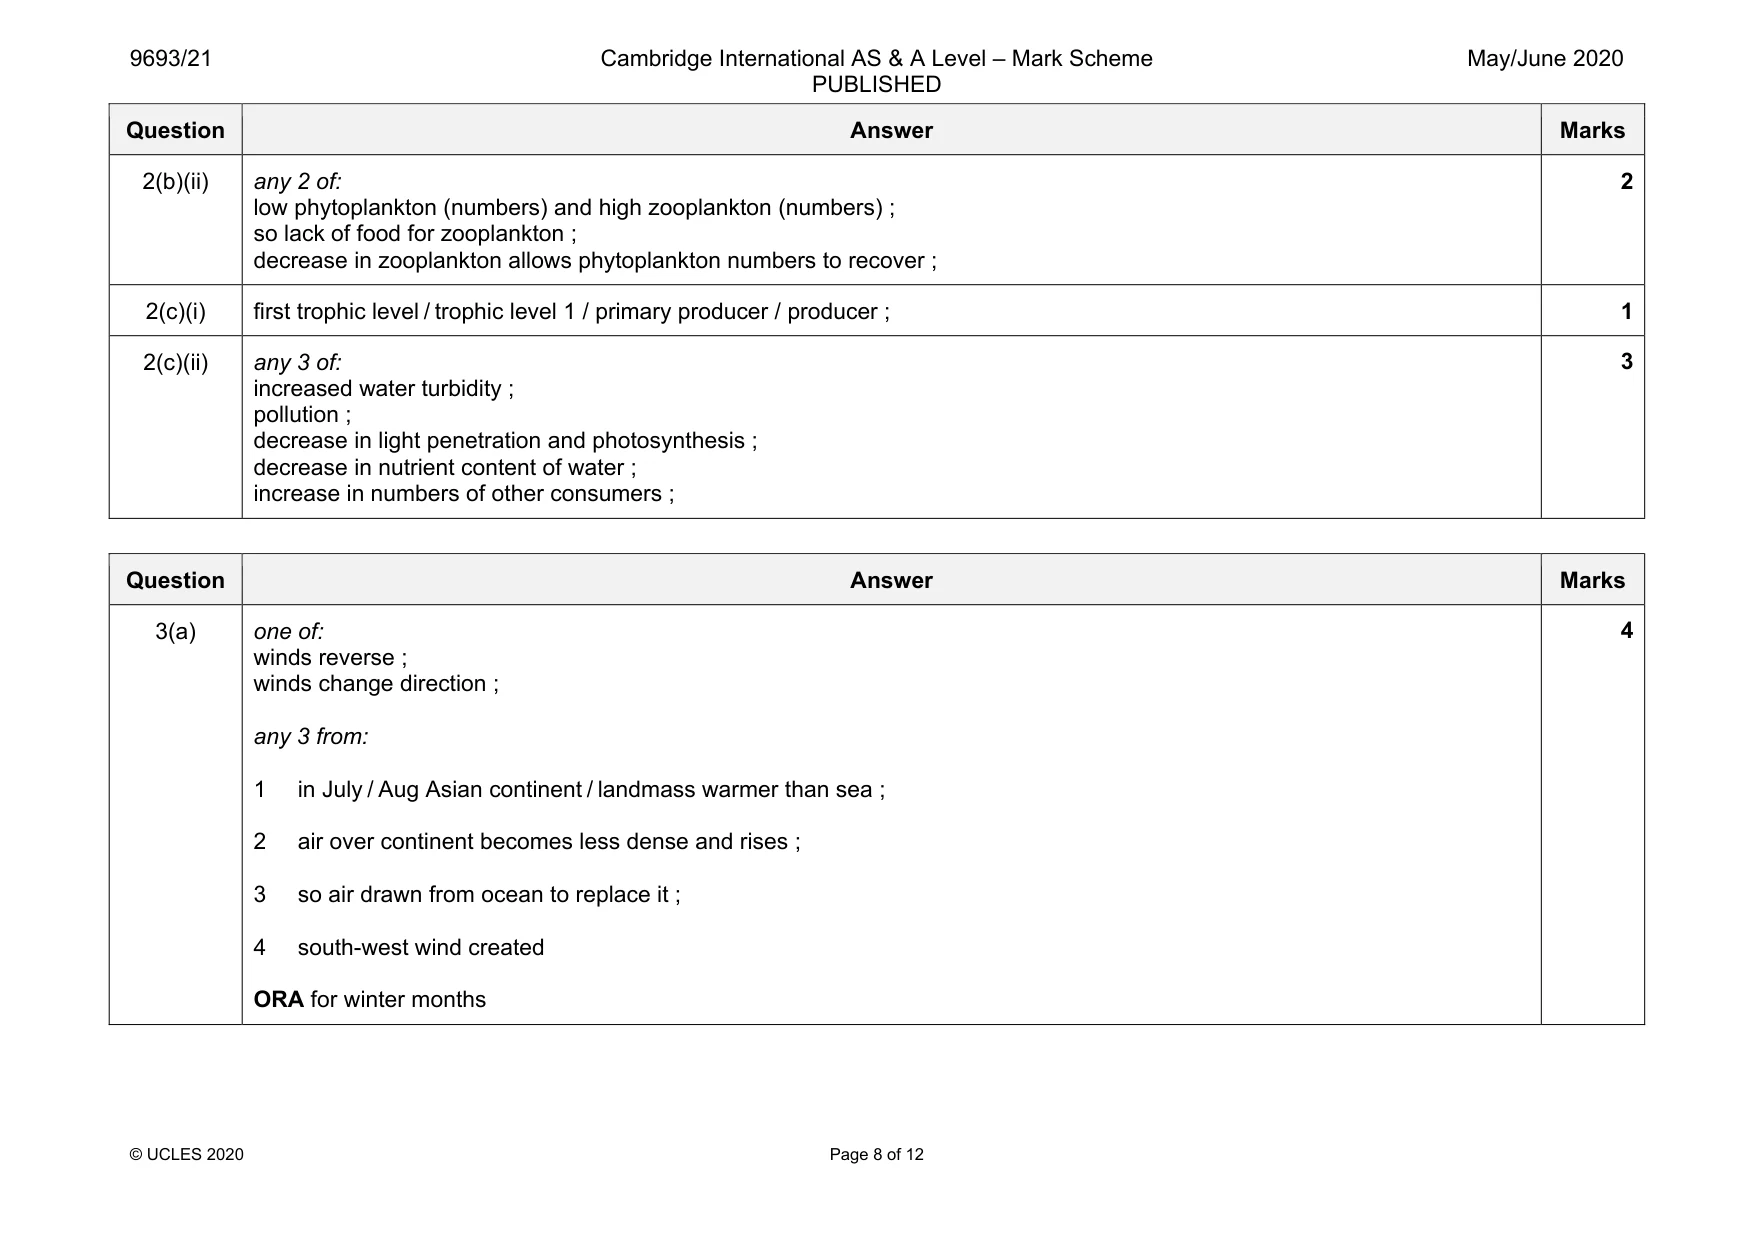
Mark scheme: 2(a)(i) 3828 ; 1 2(a)(ii) 3828 correctly plotted for January ; lines correctly added joining Dec, Jan and Feb ; 2 2(b)(i) any 2 of: zooplankton numbers low and phytoplankton numbers high ; plenty of food so zooplankton numbers increase ; phytoplankton consumed so numbers decreases ; 2 Question Answer Marks 2(b)(ii) any 2 of: low phytoplankton (numbers) and high zooplankton (numbers) ; so lack of food for zooplankton ; decrease in zooplankton allows phytoplankton numbers to recover ; 2 2(c)(i) first trophic level / trophic level 1 / primary producer / producer ; 1 2(c)(ii) any 3 of: increased water turbidity ; pollution ; decrease in light penetration and photosynthesis ; decrease in nutrient content of water ; increase in numbers of other consumers ; 3
Q3 · A research boat spent six months, from July to January, monitoring the currents and…
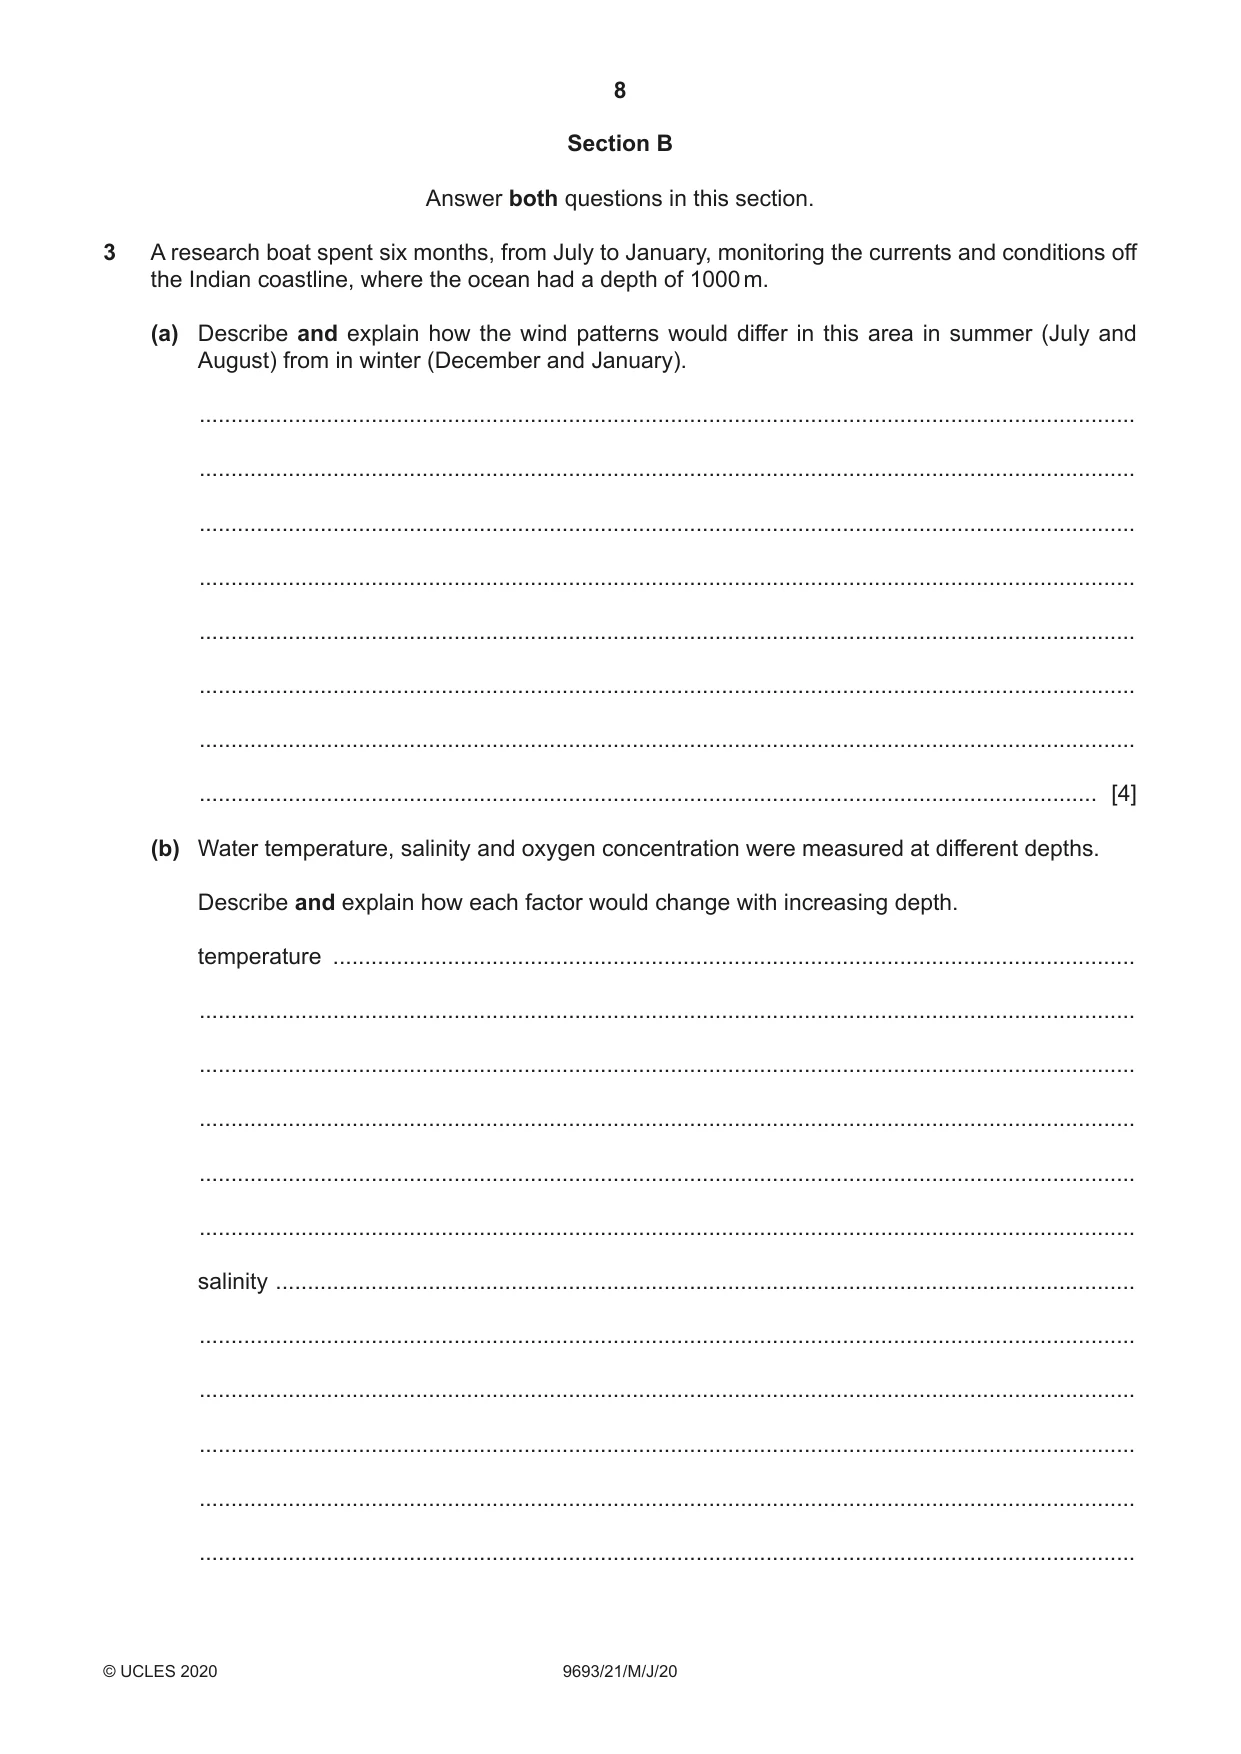
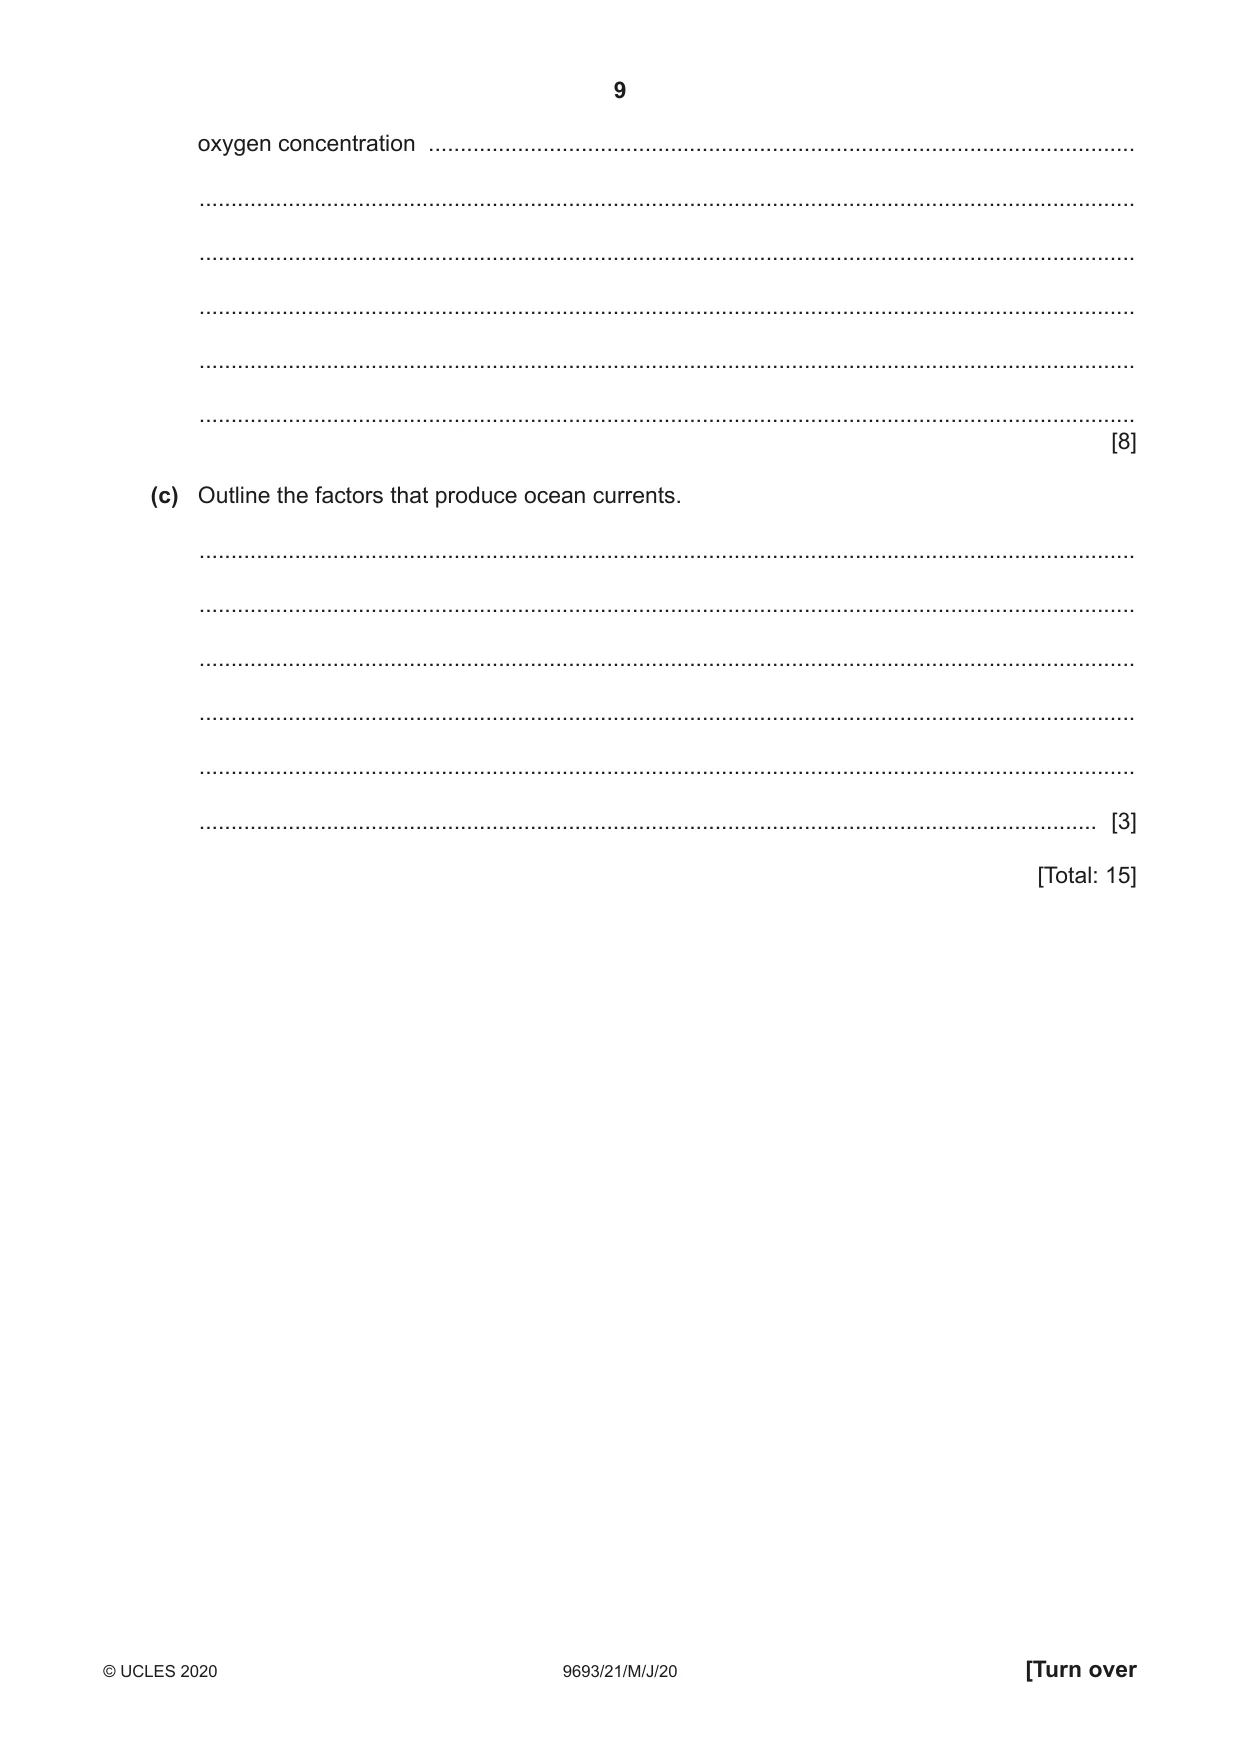
3 A research boat spent six months, from July to January, monitoring the currents and conditions off the Indian coastline, where the ocean had a depth of 1000 m. (a) Describe and explain how the wind patterns would differ in this area in summer (July and August) from in winter (December and January). ................................................................................................................................................... ................................................................................................................................................... ................................................................................................................................................... ................................................................................................................................................... ................................................................................................................................................... ................................................................................................................................................... ................................................................................................................................................... ............................................................................................................................................. [4] (b) Water temperature, salinity and oxygen concentration were measured at different depths. Describe and explain how each factor would change with increasing depth. temperature .............................................................................................................................. ................................................................................................................................................... ................................................................................................................................................... ................................................................................................................................................... ................................................................................................................................................... ................................................................................................................................................... salinity ....................................................................................................................................... ................................................................................................................................................... ................................................................................................................................................... ................................................................................................................................................... ................................................................................................................................................... ................................................................................................................................................... oxygen concentration ............................................................................................................... ................................................................................................................................................... ................................................................................................................................................... ................................................................................................................................................... ................................................................................................................................................... ................................................................................................................................................... [8] (c) Outline the factors that produce ocean currents. ................................................................................................................................................... ................................................................................................................................................... ................................................................................................................................................... ................................................................................................................................................... ................................................................................................................................................... ............................................................................................................................................. [3] [Total: 15]
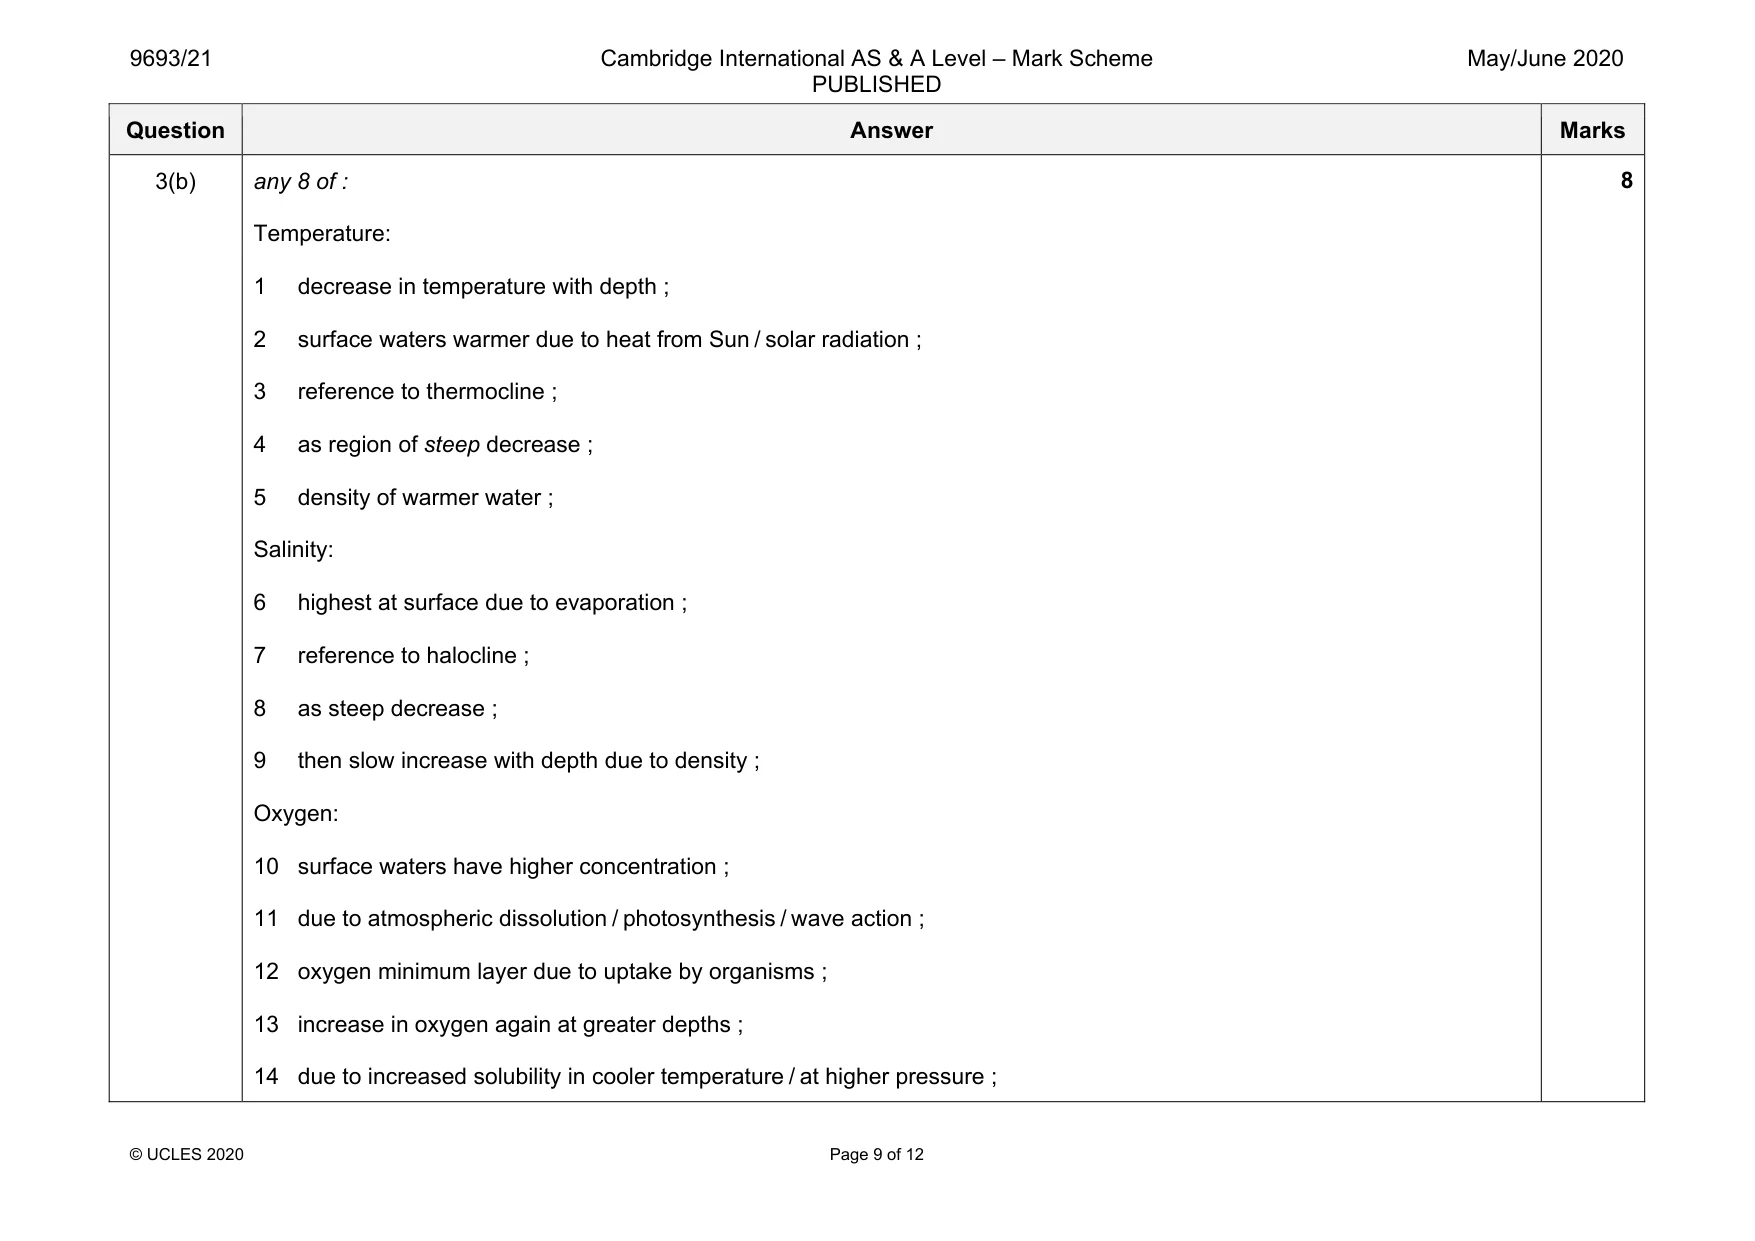
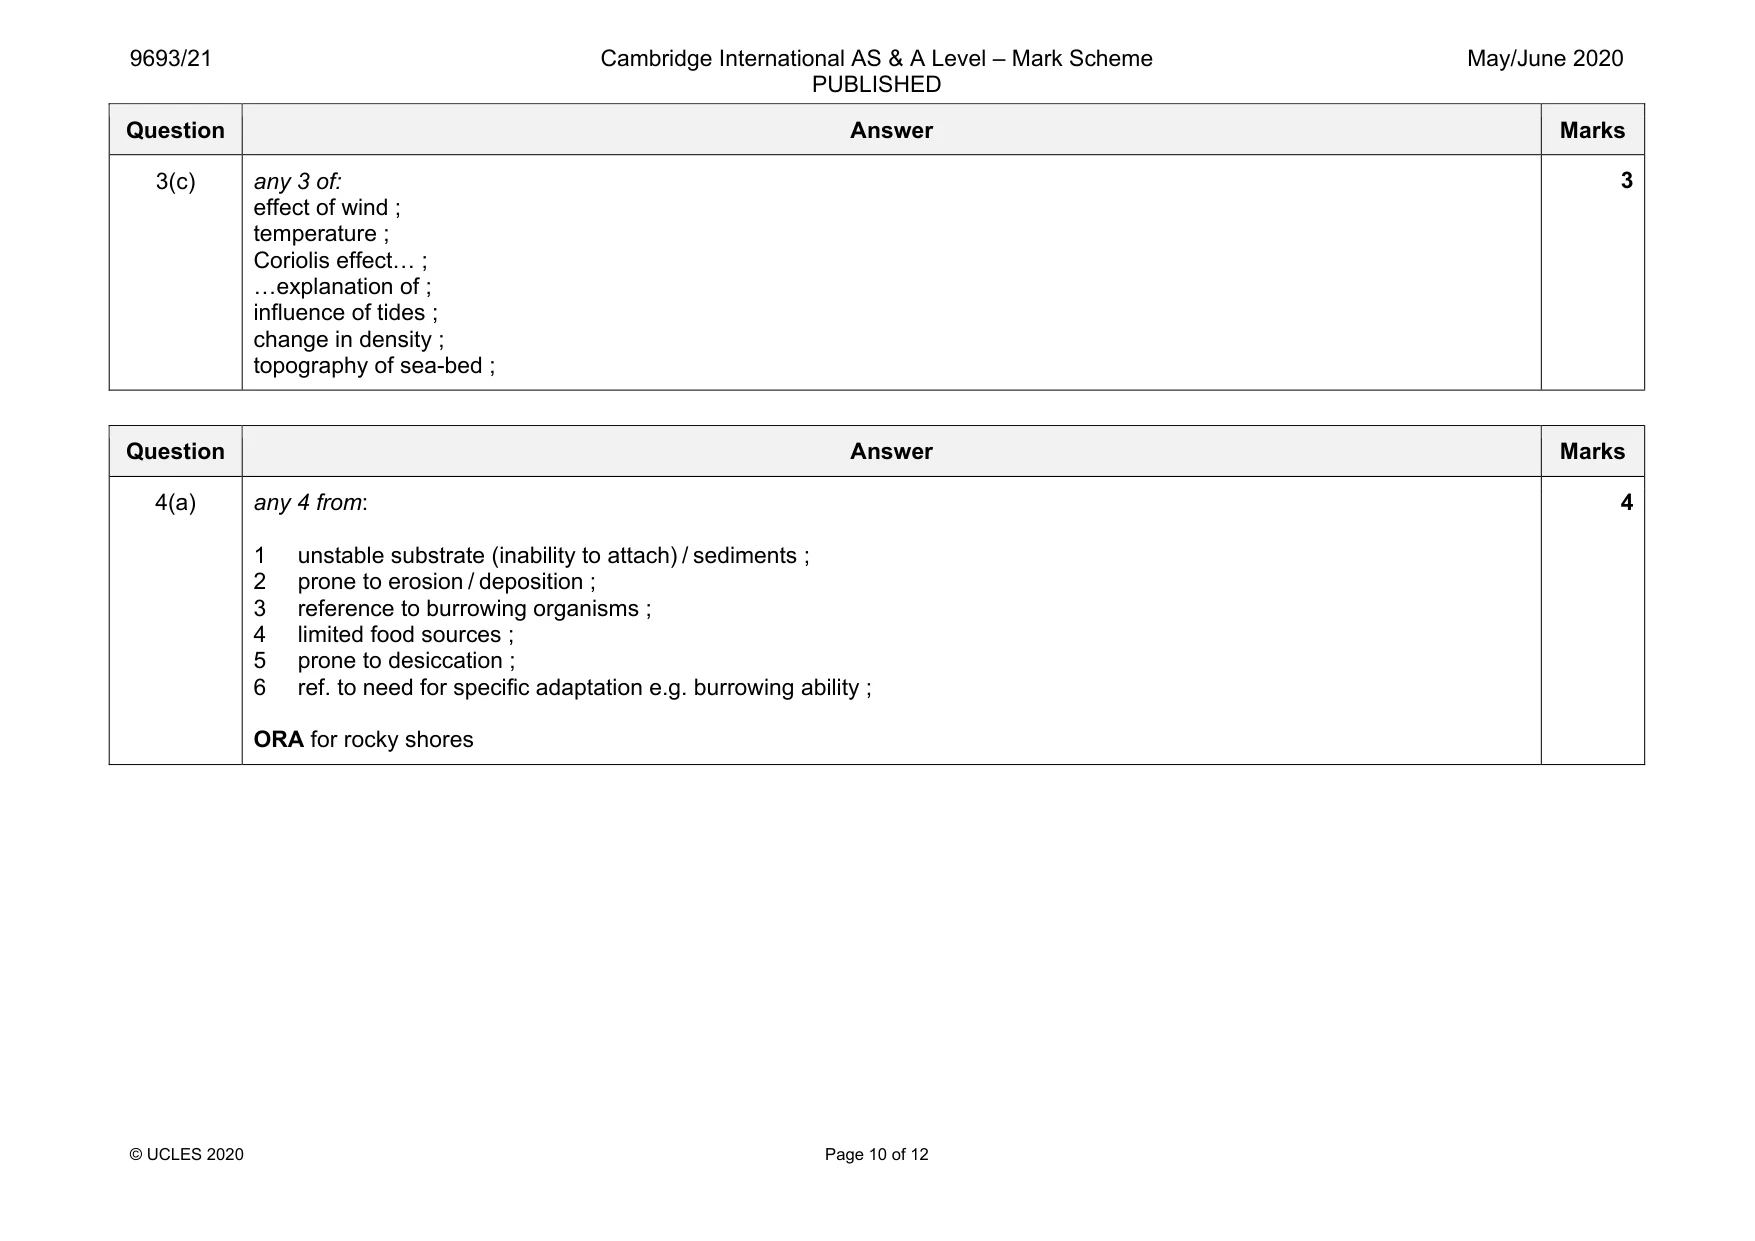
Mark scheme: 3(a) one of: winds reverse ; winds change direction ; any 3 from: 1 in July / Aug Asian continent / landmass warmer than sea ; 2 air over continent becomes less dense and rises ; 3 so air drawn from ocean to replace it ; 4 south-west wind created ORA for winter months Question Answer Marks 3(b) any 8 of : Temperature: 1 decrease in temperature with depth ; 2 surface waters warmer due to heat from Sun / solar radiation ; 3 reference to thermocline ; 4 as region of steep decrease ; 5 density of warmer water ; Salinity: 6 highest at surface due to evaporation ; 7 reference to halocline ; 8 as steep decrease ; 9 then slow increase with depth due to density ; Oxygen: 10 surface waters have higher concentration ; 11 due to atmospheric dissolution / photosynthesis / wave action ; 12 oxygen minimum layer due to uptake by organisms ; 13 increase in oxygen again at greater depths ; 14 due to increased solubility in cooler temperature / at higher pressure ; 8 Question Answer Marks 3(c) any 3 of: effect of wind ; temperature ; Coriolis effect… ; …explanation of ; influence of tides ; change in density ; topography of sea-bed ; 3
Q4 · Explain why the biodiversity on sandy shores is usually lower than that of rocky shores
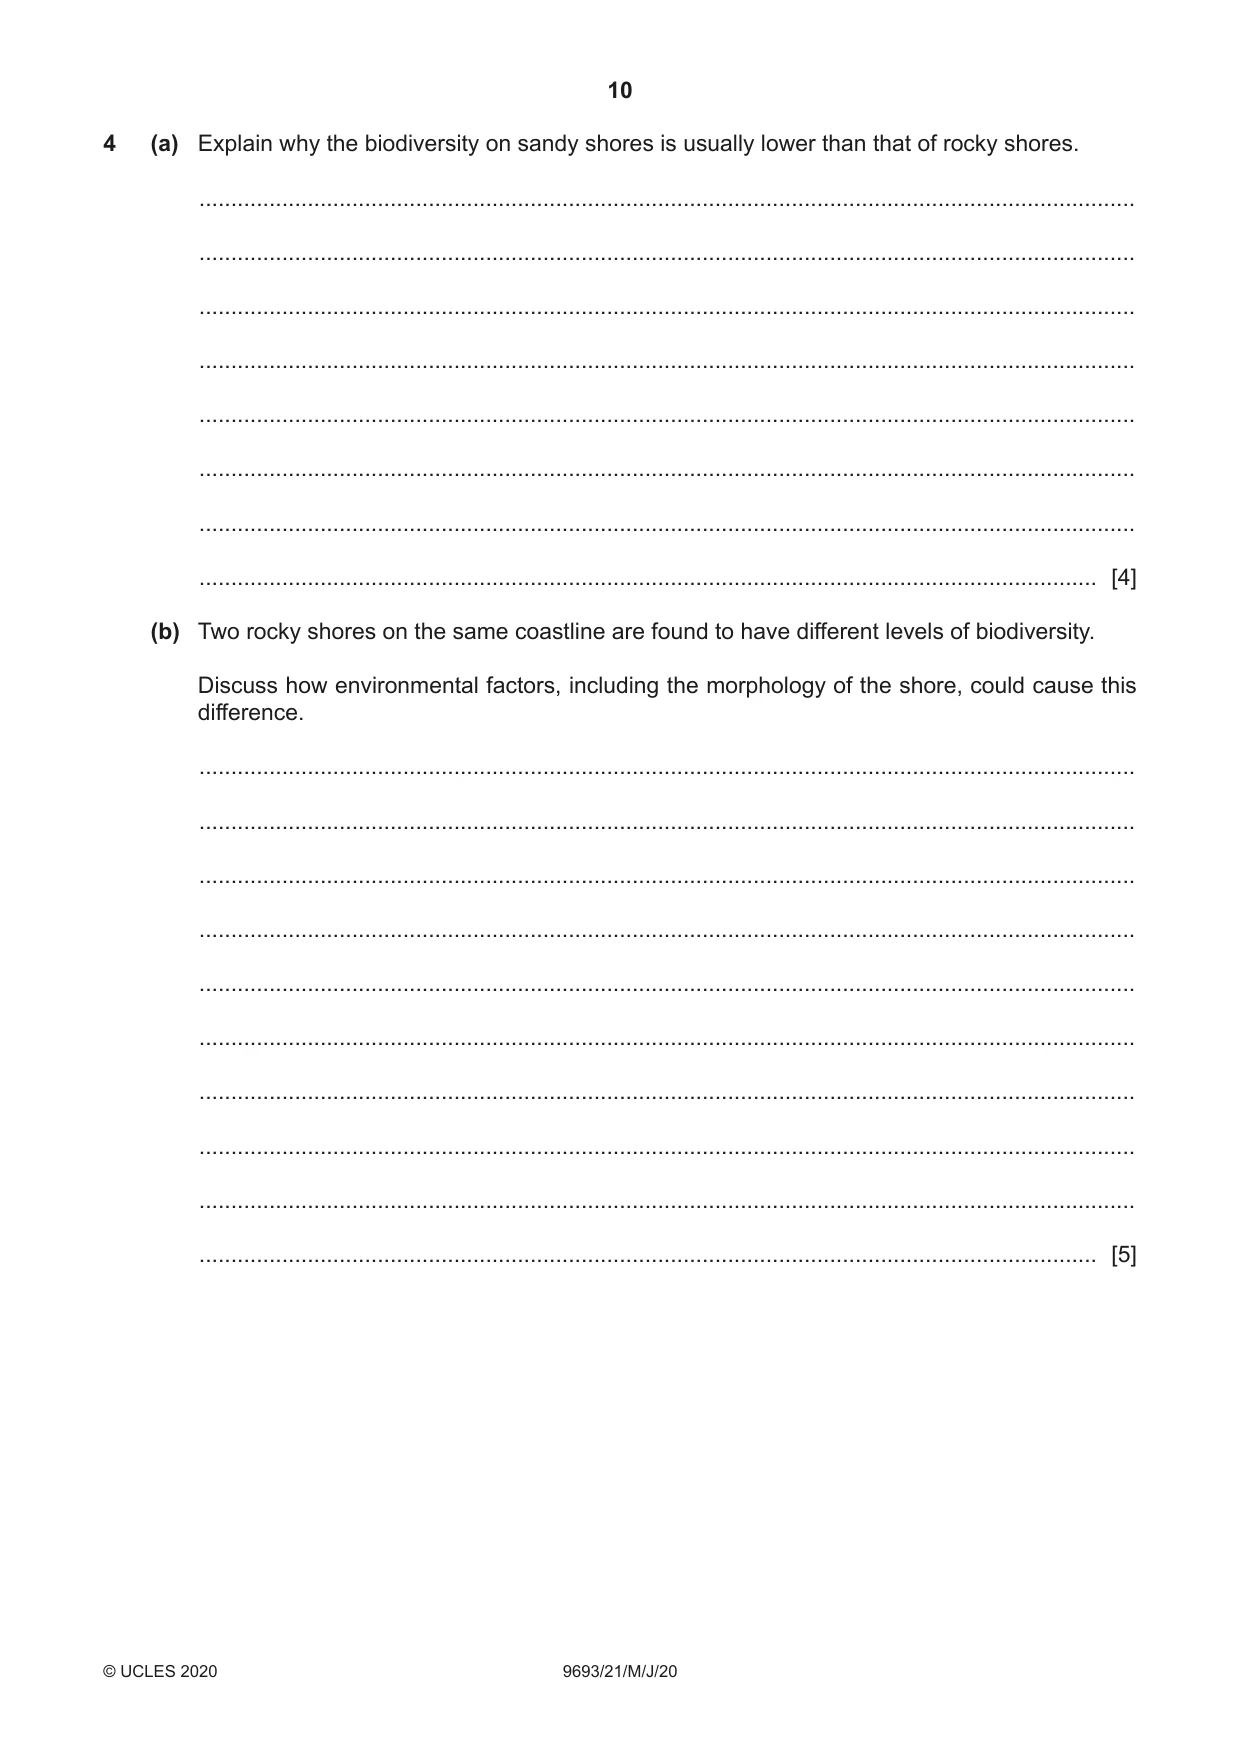
4 (a) Explain why the biodiversity on sandy shores is usually lower than that of rocky shores. ................................................................................................................................................... ................................................................................................................................................... ................................................................................................................................................... ................................................................................................................................................... ................................................................................................................................................... ................................................................................................................................................... ................................................................................................................................................... ............................................................................................................................................. [4] (b) Two rocky shores on the same coastline are found to have different levels of biodiversity. Discuss how environmental factors, including the morphology of the shore, could cause this difference. ................................................................................................................................................... ................................................................................................................................................... ................................................................................................................................................... ................................................................................................................................................... ................................................................................................................................................... ................................................................................................................................................... ................................................................................................................................................... ................................................................................................................................................... ................................................................................................................................................... ............................................................................................................................................. [5] (c) Explain why hydrothermal vents have very specific communities of organisms, which may change over time. ................................................................................................................................................... ................................................................................................................................................... ................................................................................................................................................... ................................................................................................................................................... ................................................................................................................................................... ................................................................................................................................................... ................................................................................................................................................... ................................................................................................................................................... ................................................................................................................................................... ................................................................................................................................................... ................................................................................................................................................... ............................................................................................................................................. [6] [Total: 15]
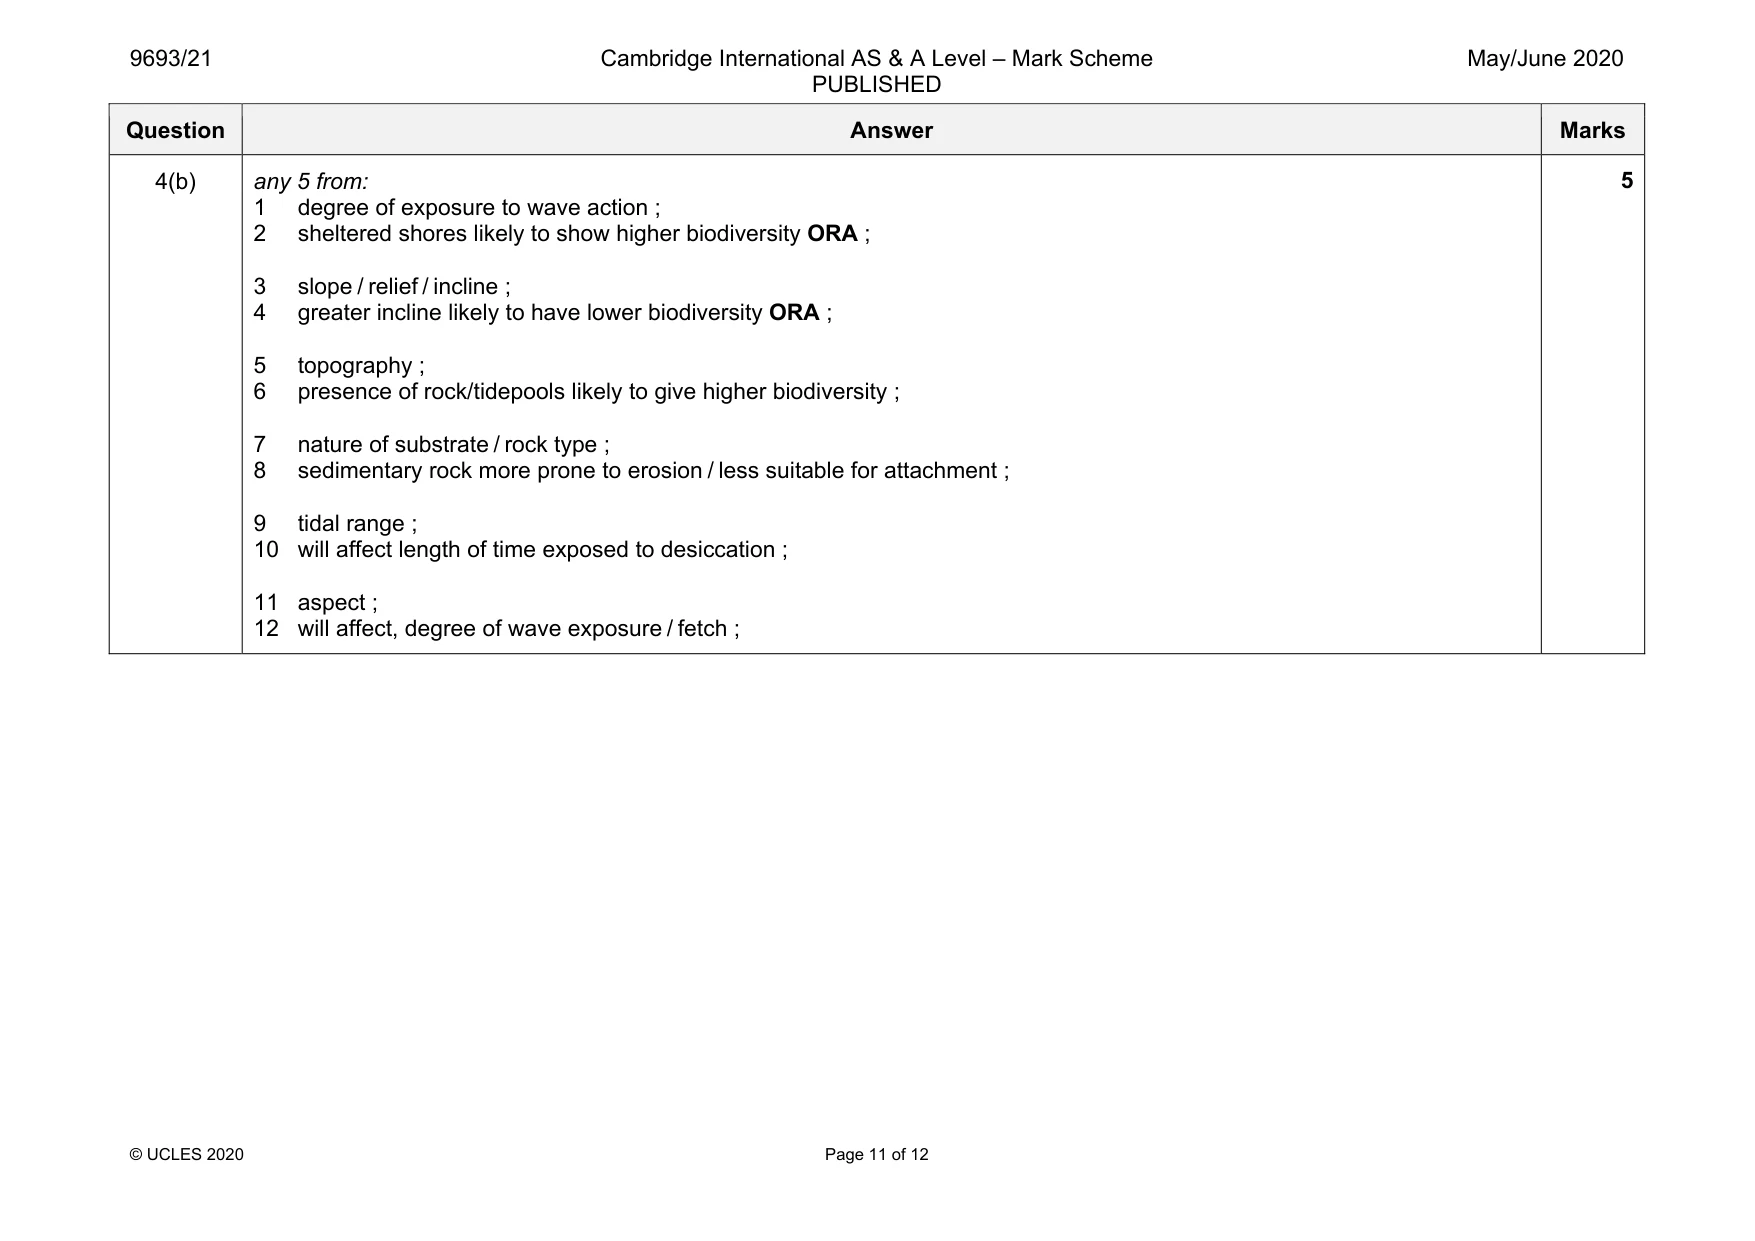
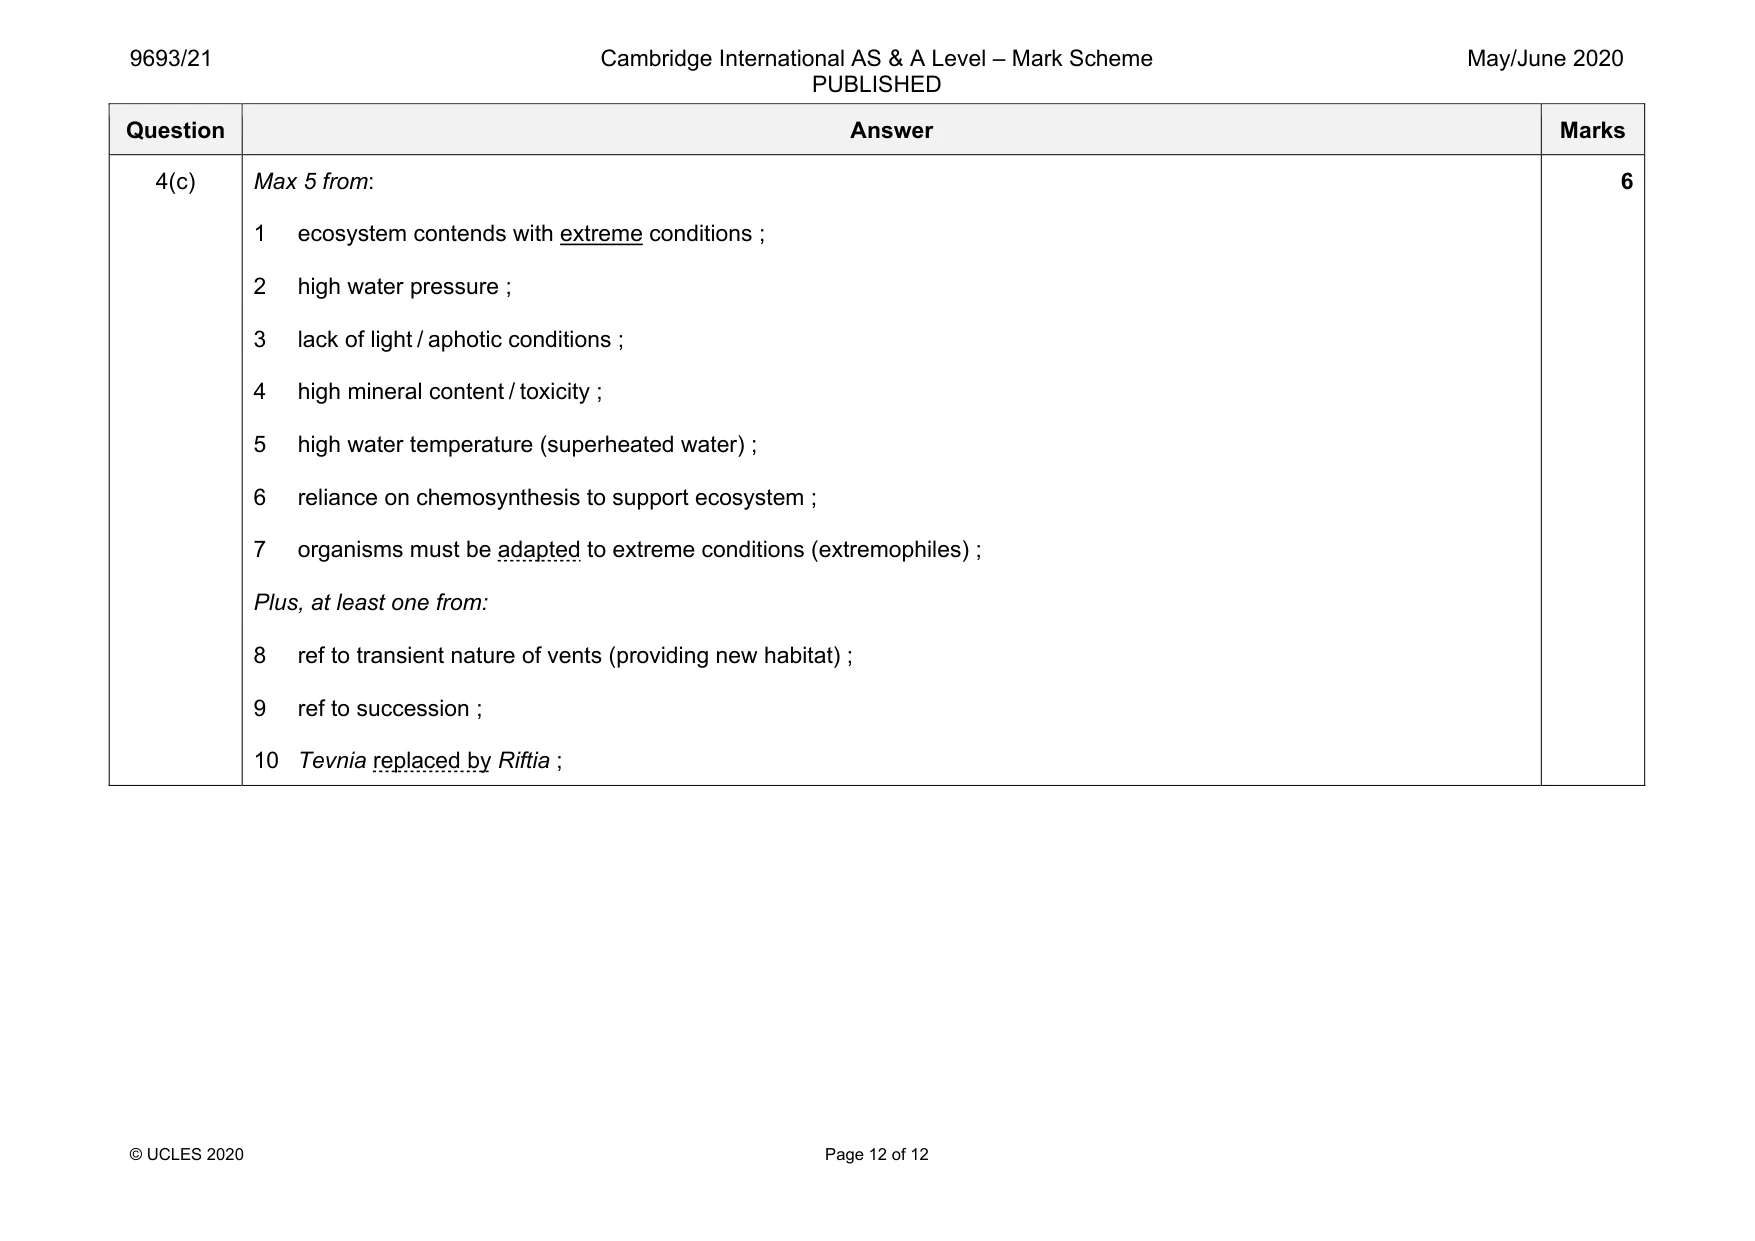
Mark scheme: 4(a) any 4 from: 1 unstable substrate (inability to attach) / sediments ; 2 prone to erosion / deposition ; 3 reference to burrowing organisms ; 4 limited food sources ; 5 prone to desiccation ; 6 ref. to need for specific adaptation e.g. burrowing ability ; ORA for rocky shores Question Answer Marks 4(b) any 5 from: 1 degree of exposure to wave action ; 2 sheltered shores likely to show higher biodiversity ORA ; 3 slope / relief / incline ; 4 greater incline likely to have lower biodiversity ORA ; 5 topography ; 6 presence of rock/tidepools likely to give higher biodiversity ; 7 nature of substrate / rock type ; 8 sedimentary rock more prone to erosion / less suitable for attachment ; 9 tidal range ; 10 will affect length of time exposed to desiccation ; 11 aspect ; 12 will affect, degree of wave exposure / fetch ; 5 Question Answer Marks 4(c) Max 5 from: 1 ecosystem contends with extreme conditions ; 2 high water pressure ; 3 lack of light / aphotic conditions ; 4 high mineral content / toxicity ; 5 high water temperature (superheated water) ; 6 reliance on chemosynthesis to support ecosystem ; 7 organisms must be adapted to extreme conditions (extremophiles) ; Plus, at least one from: 8 ref to transient nature of vents (providing new habitat) ; 9 ref to succession ; 10 Tevnia replaced by Riftia ; 6
What was in this paper
The subtopics covered by these 4 questions, and how many questions each got. Open one in a new tab to see every Cambridge question on it.