Cambridge A Level Marine Science 9693 — 2025 Oct/Nov Paper 2 · Variant 1
9693/21/O/N/25 · 5 questions · 75 marks · 105 min
The question paper and its mark scheme, free to read here and free to download. This is Cambridge’s own paper, exactly as it was sat.
Question paper24 pages




Mark scheme17 pages
Answers below. Sit the paper first if you are practising.
Questions as text
Q1 · A student investigates how salinity affects the freezing point of a solution
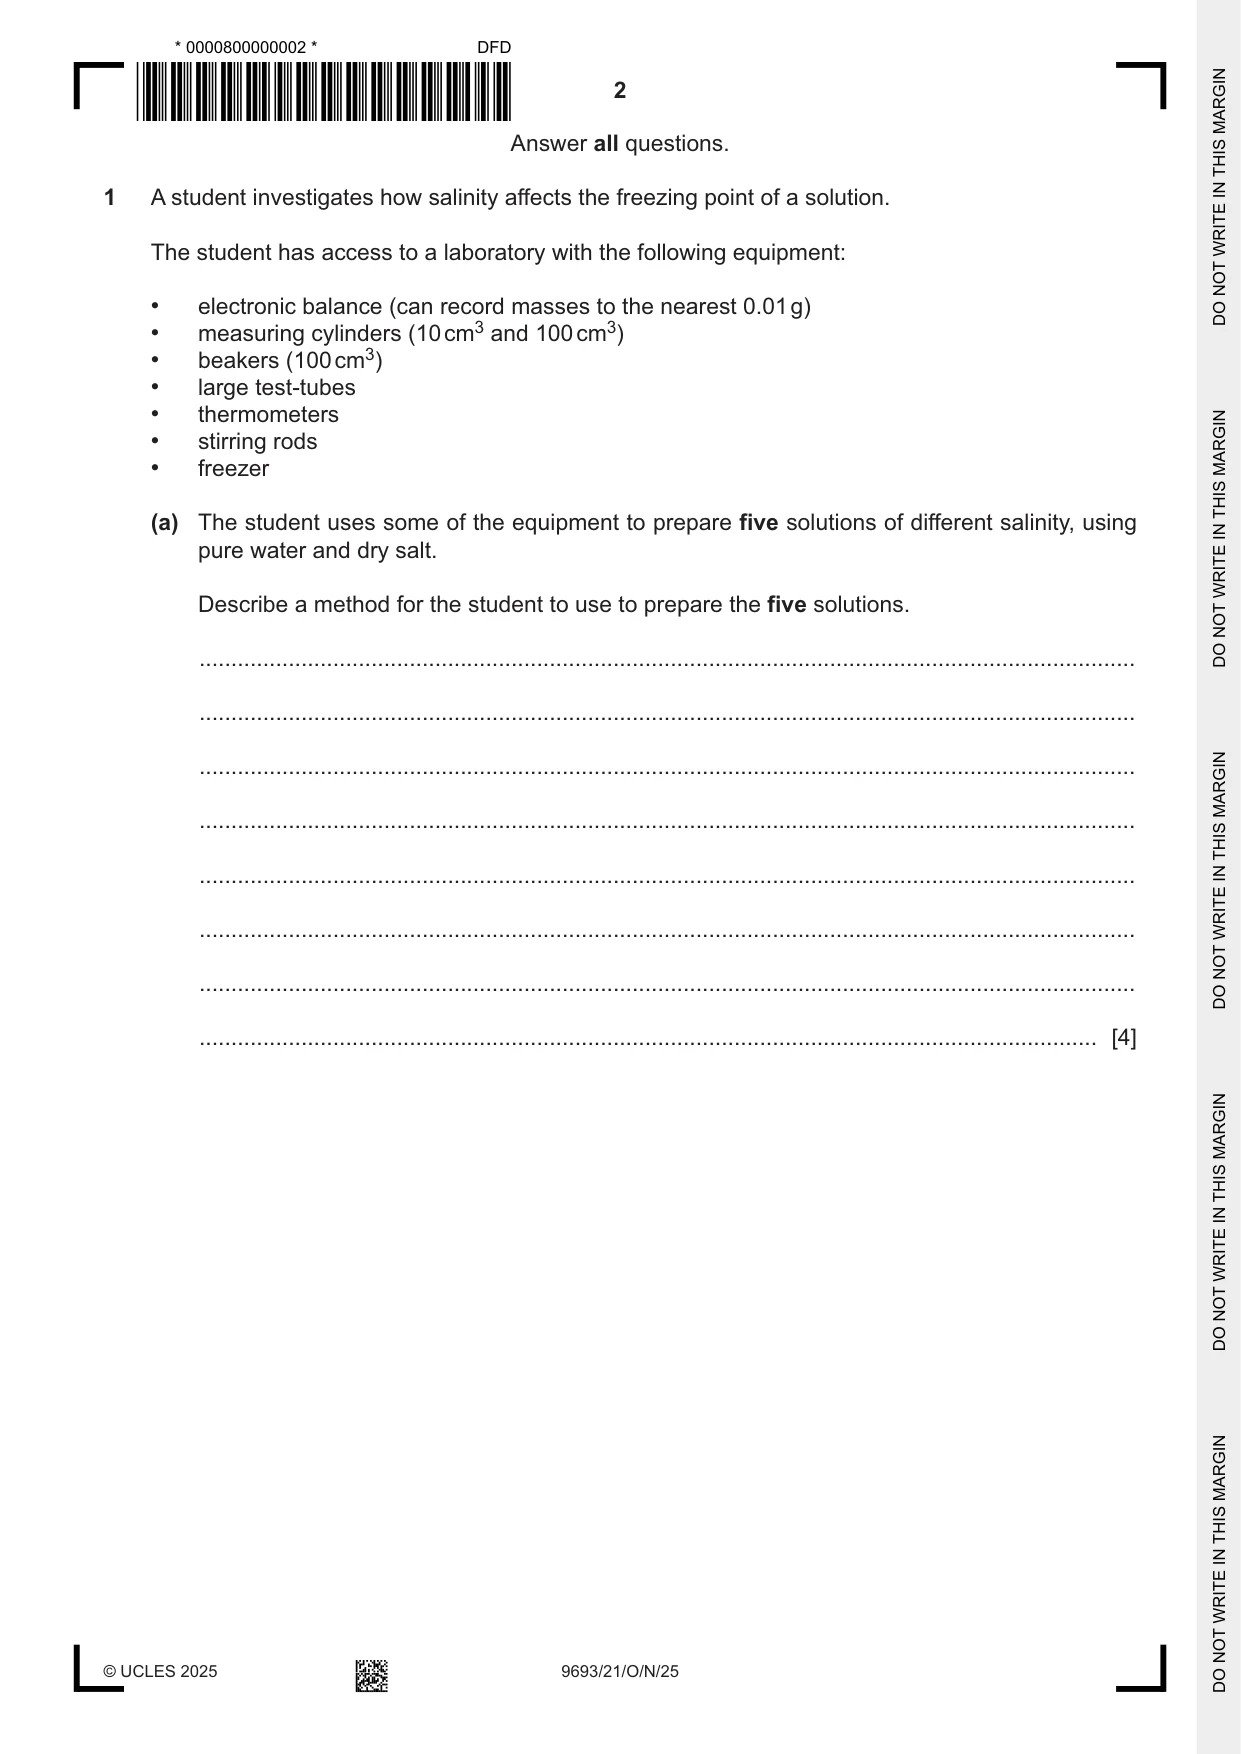
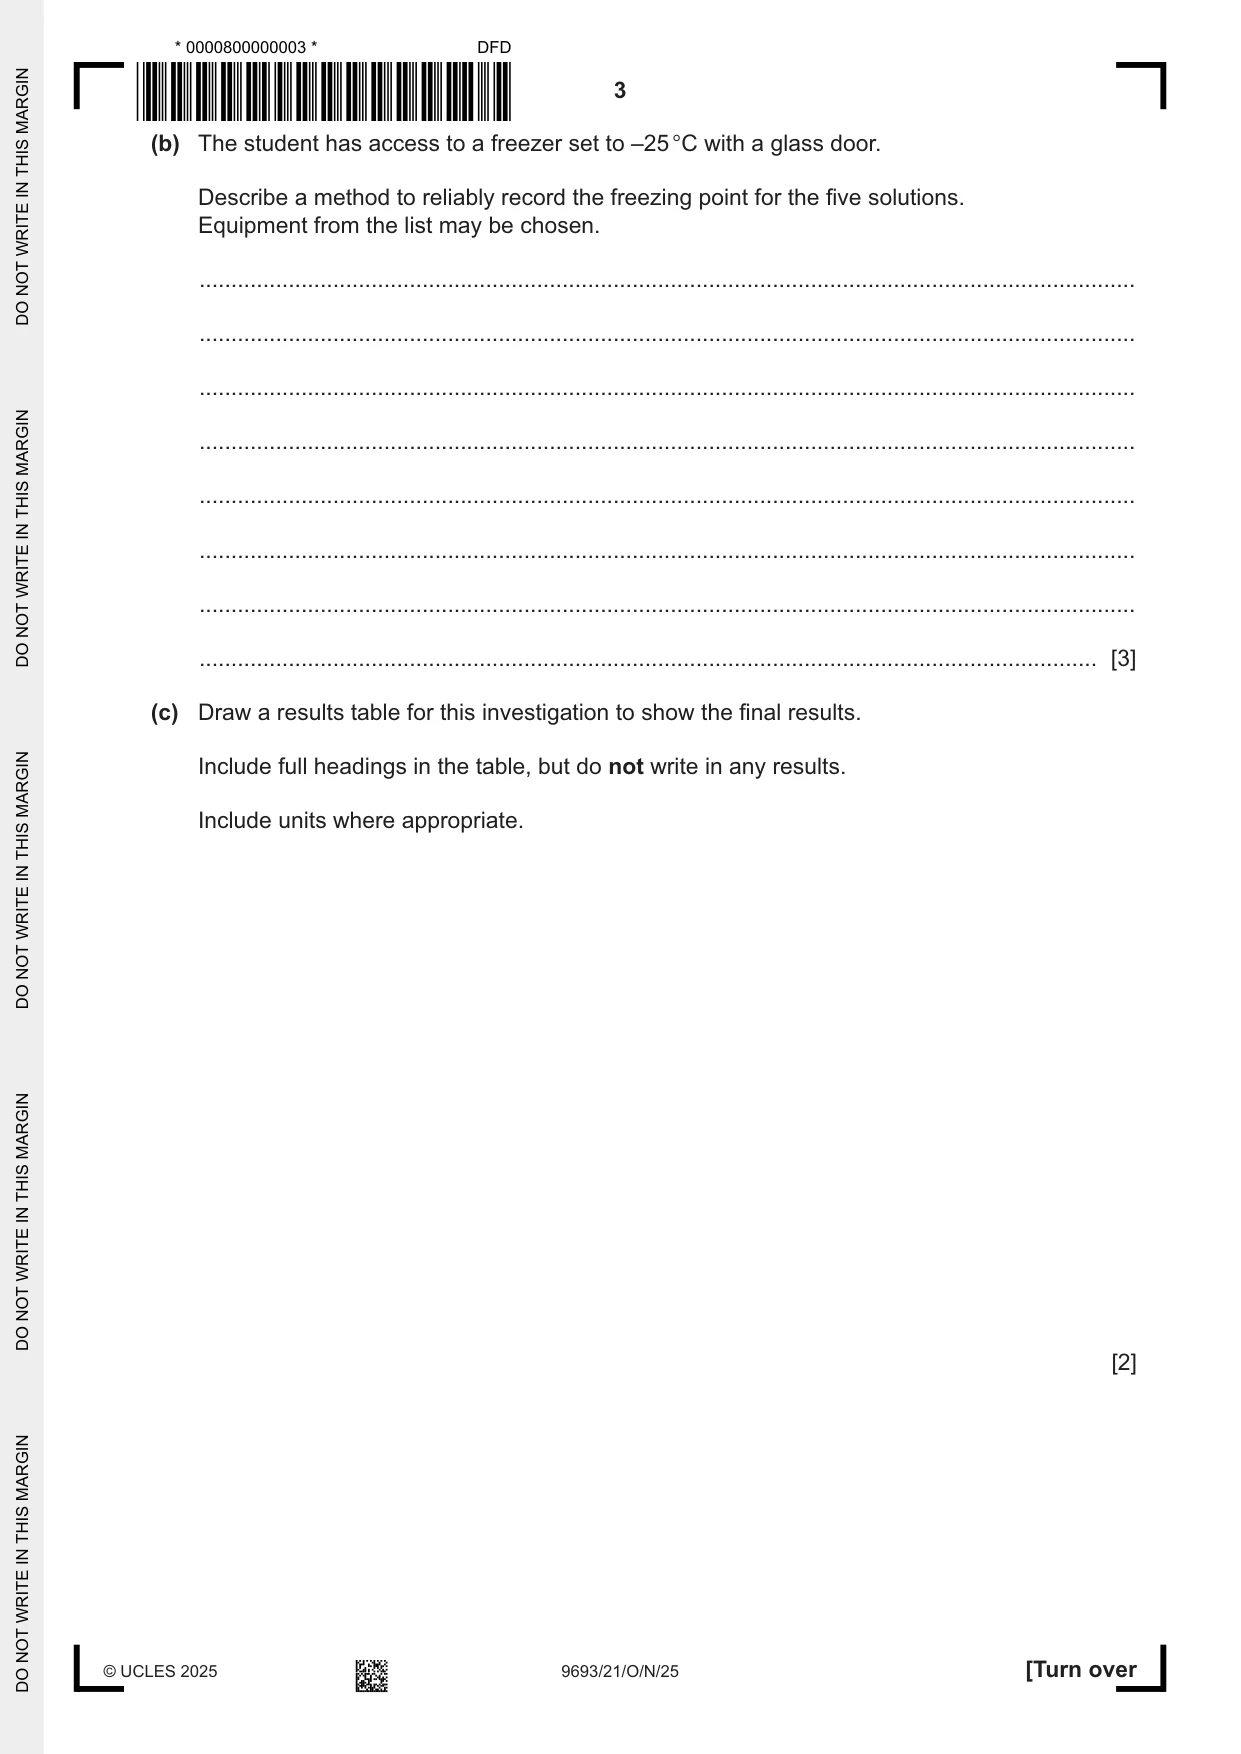
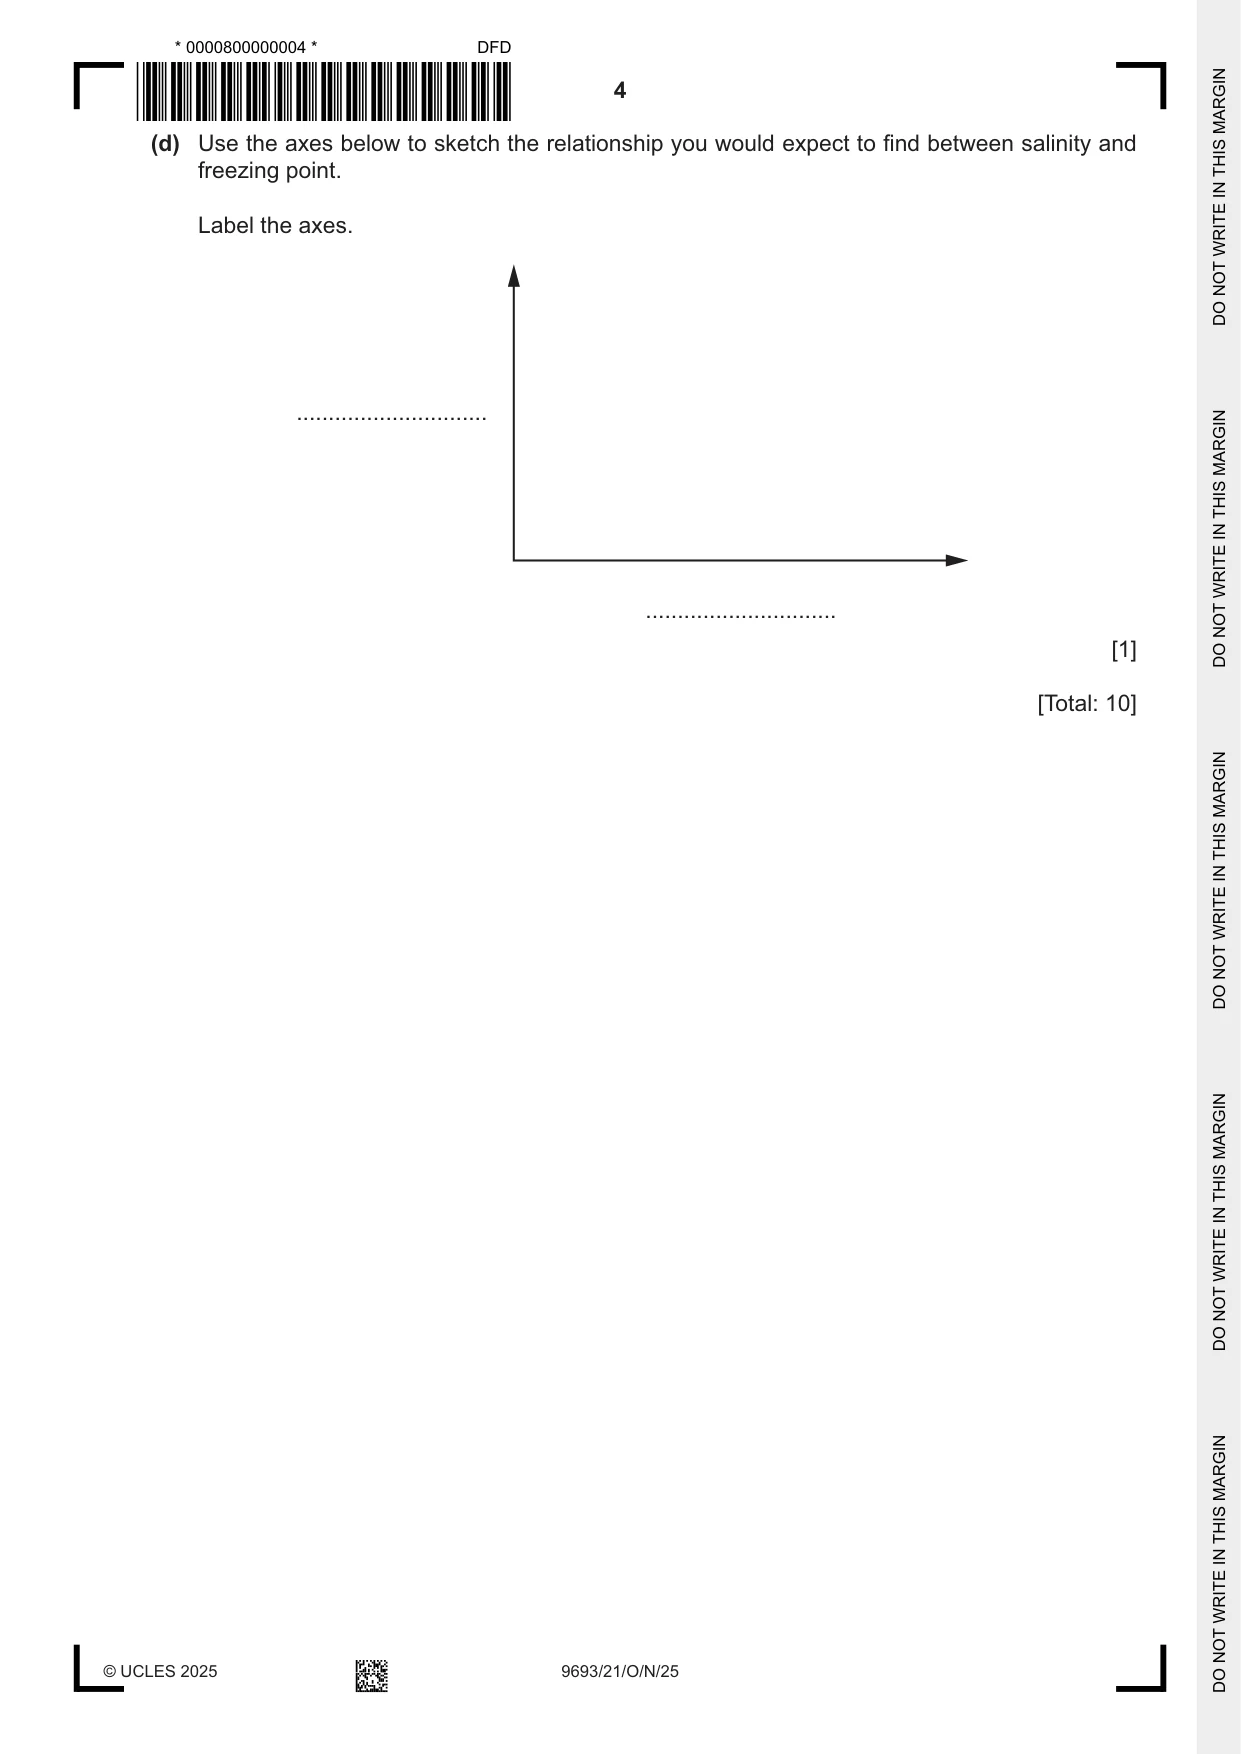
1 A student investigates how salinity affects the freezing point of a solution. The student has access to a laboratory with the following equipment: • electronic balance (can record masses to the nearest 0.01 g) • measuring cylinders (10 cm3 and 100 cm3) • beakers (100 cm3) • large test-tubes • thermometers • stirring rods • freezer (a) The student uses some of the equipment to prepare five solutions of different salinity, using pure water and dry salt. Describe a method for the student to use to prepare the five solutions. ................................................................................................................................................... ................................................................................................................................................... ................................................................................................................................................... ................................................................................................................................................... ................................................................................................................................................... ................................................................................................................................................... ................................................................................................................................................... ............................................................................................................................................. [4] (b) The student has access to a freezer set to –25 °C with a glass door. Describe a method to reliably record the freezing point for the five solutions. Equipment from the list may be chosen. ................................................................................................................................................... ................................................................................................................................................... ................................................................................................................................................... ................................................................................................................................................... ................................................................................................................................................... ................................................................................................................................................... ................................................................................................................................................... ............................................................................................................................................. [3] (c) Draw a results table for this investigation to show the final results. Include full headings in the table, but do not write in any results. Include units where appropriate. [2] (d) Use the axes below to sketch the relationship you would expect to find between salinity and freezing point. Label the axes. .............................. .............................. [1] [Total: 10]
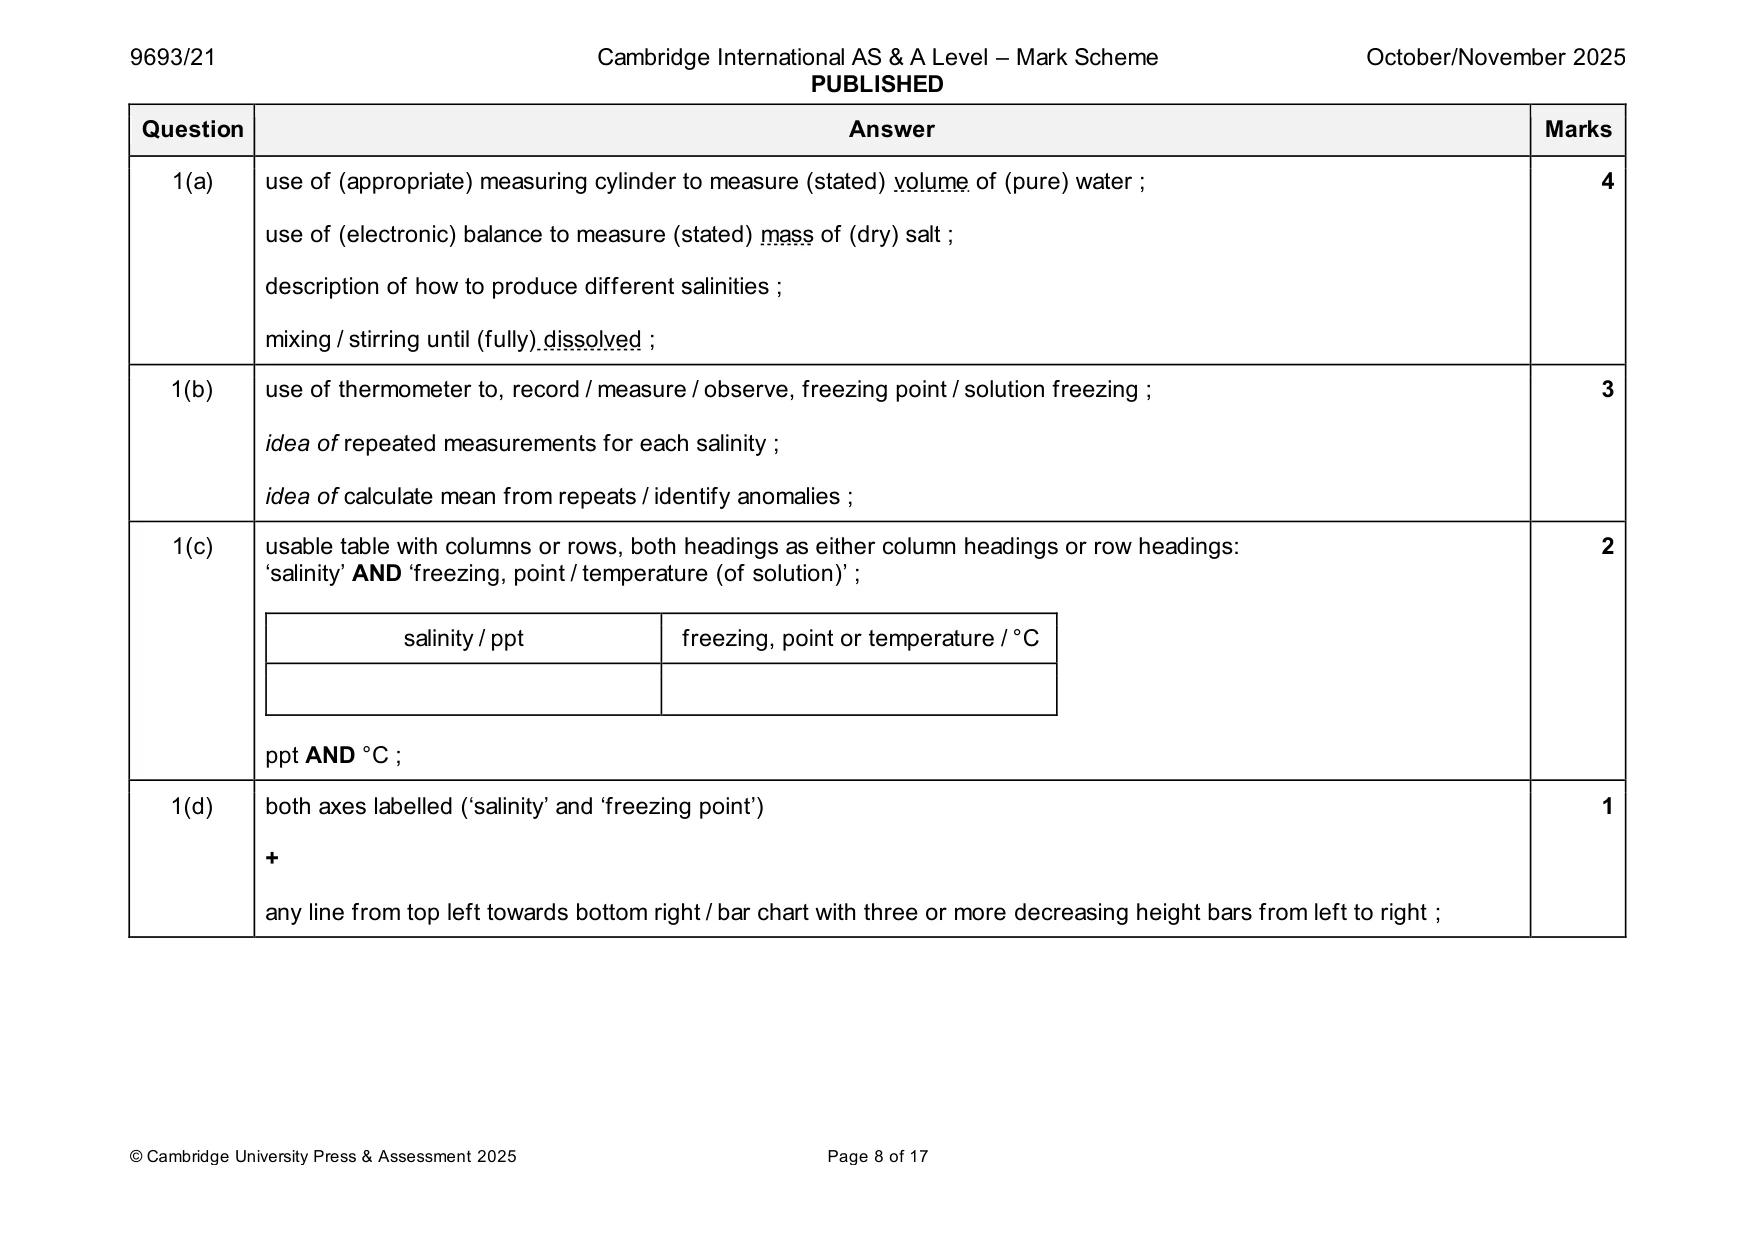
Mark scheme: Question Answer Marks 1(a) use of (appropriate) measuring cylinder to measure (stated) volume of (pure) water ; 4 use of (electronic) balance to measure (stated) mass of (dry) salt ; description of how to produce different salinities ; mixing / stirring until (fully) dissolved ; 1(b) use of thermometer to, record / measure / observe, freezing point / solution freezing ; 3 idea of repeated measurements for each salinity ; idea of calculate mean from repeats / identify anomalies ; 1(c) usable table with columns or rows, both headings as either column headings or row headings: 2 ‘salinity’ AND ‘freezing, point / temperature (of solution)’ ; salinity / ppt freezing, point or temperature / °C ppt AND °C ; 1(d) both axes labelled (‘salinity’ and ‘freezing point’) 1 + any line from top left towards bottom right / bar chart with three or more decreasing height bars from left to right ;
Q2 · Scientists investigated the relationship between corals and their symbionts
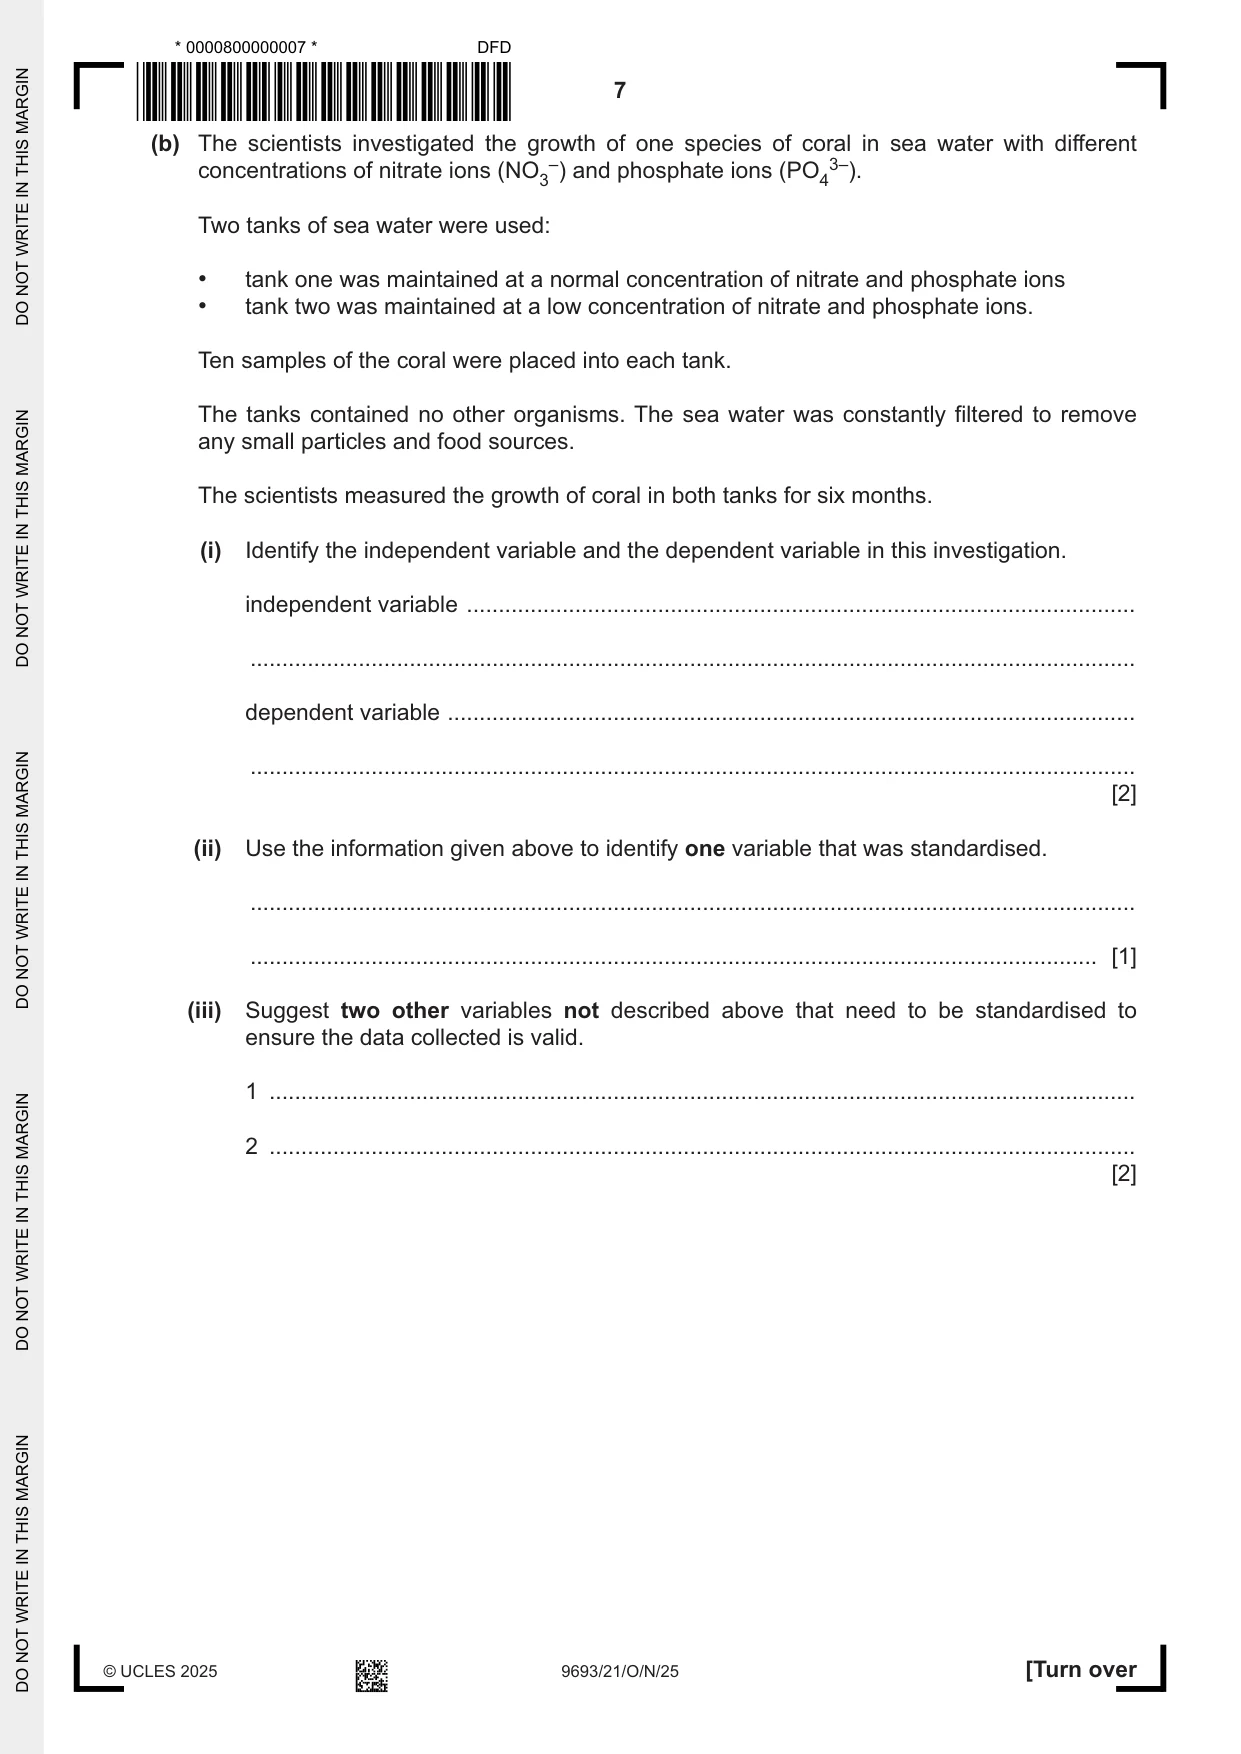
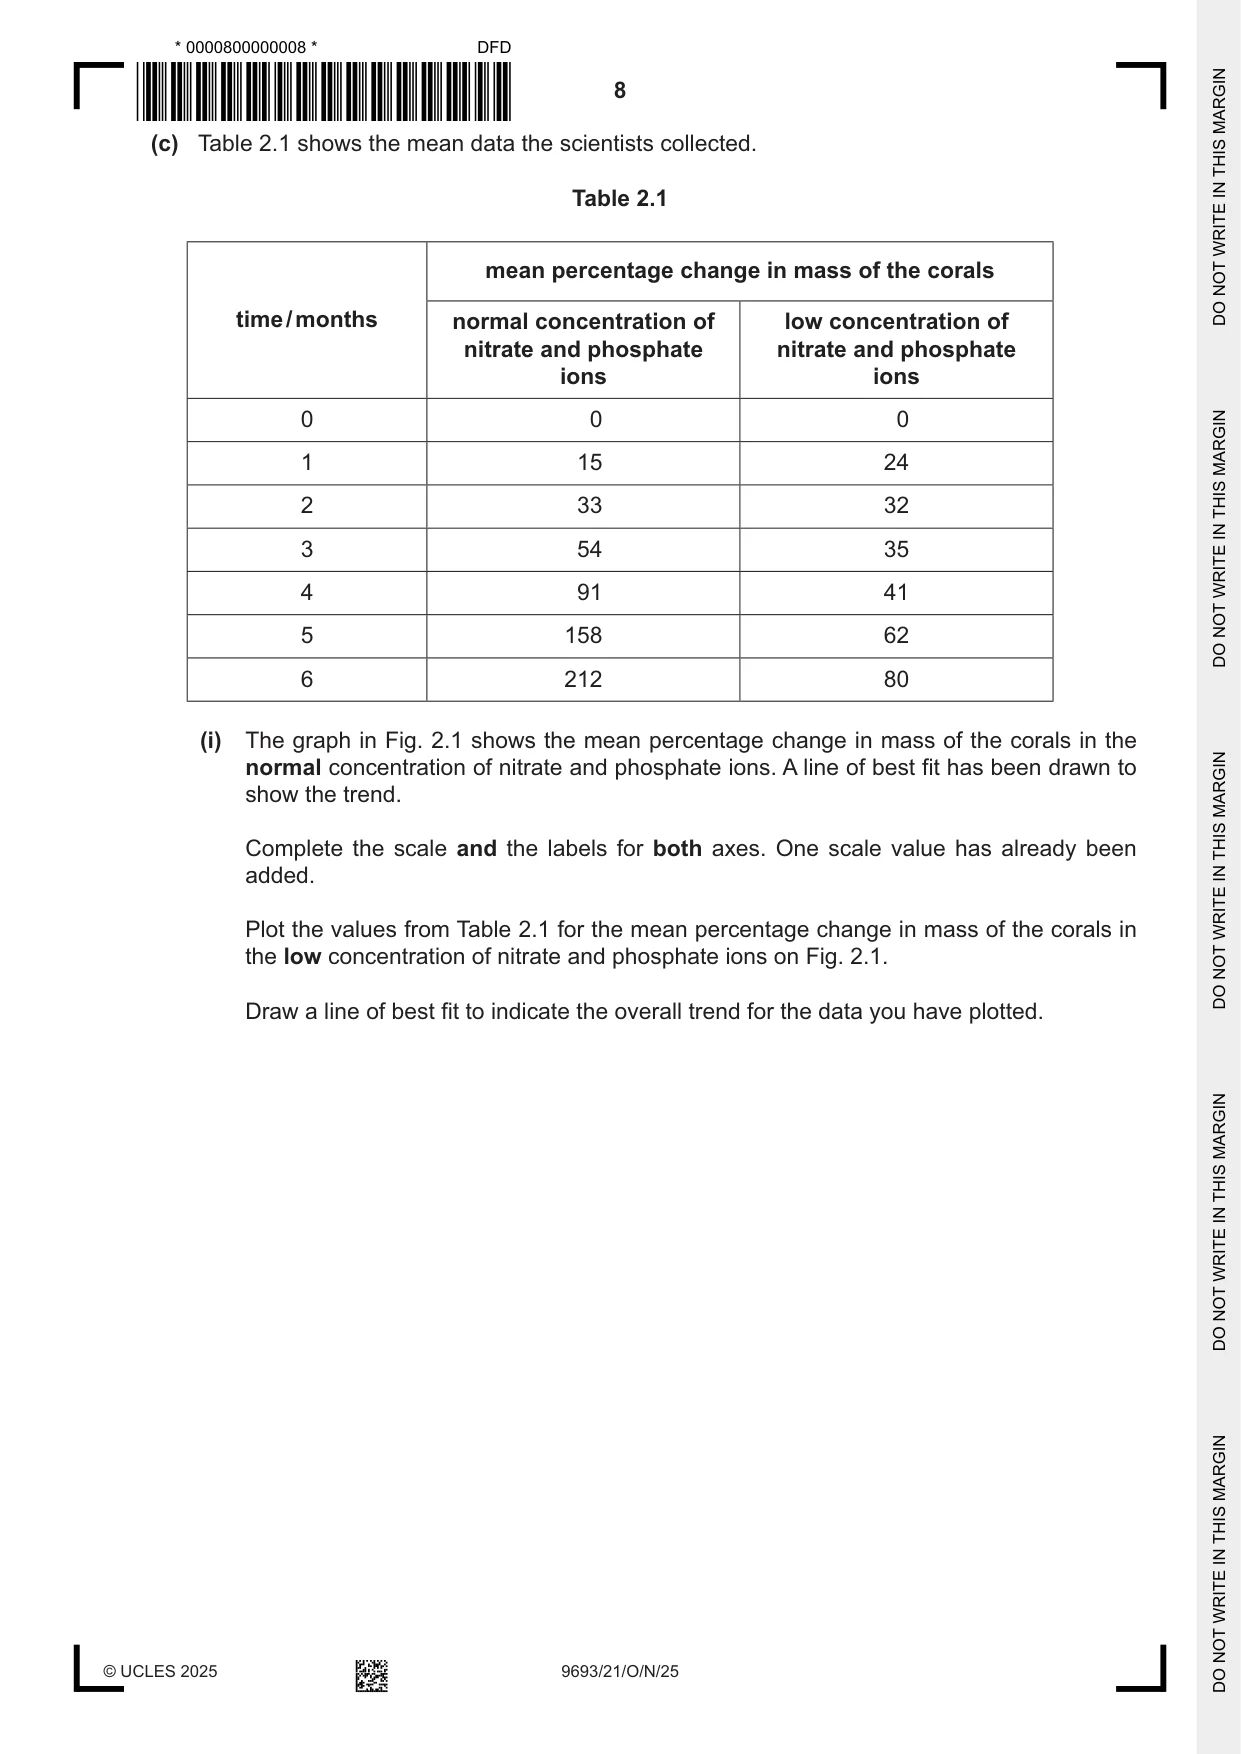
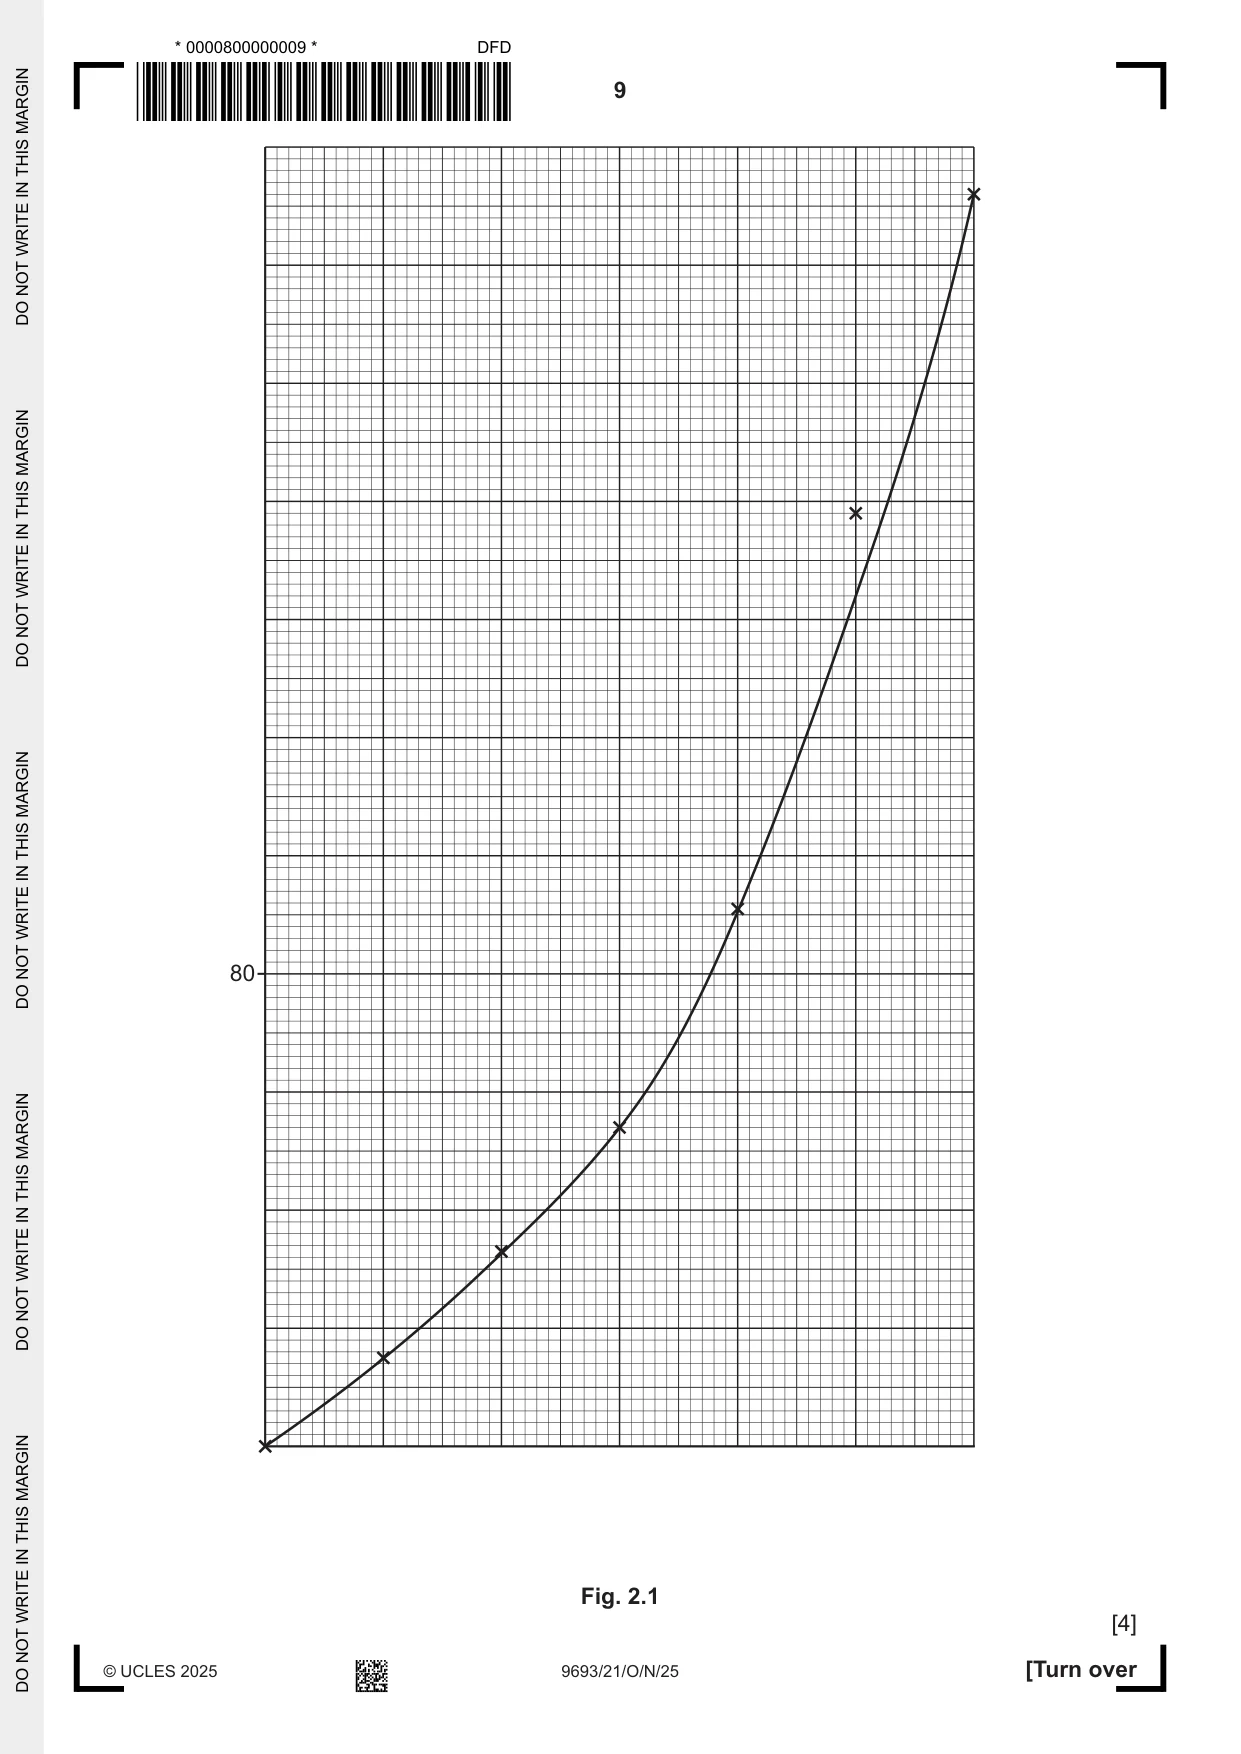
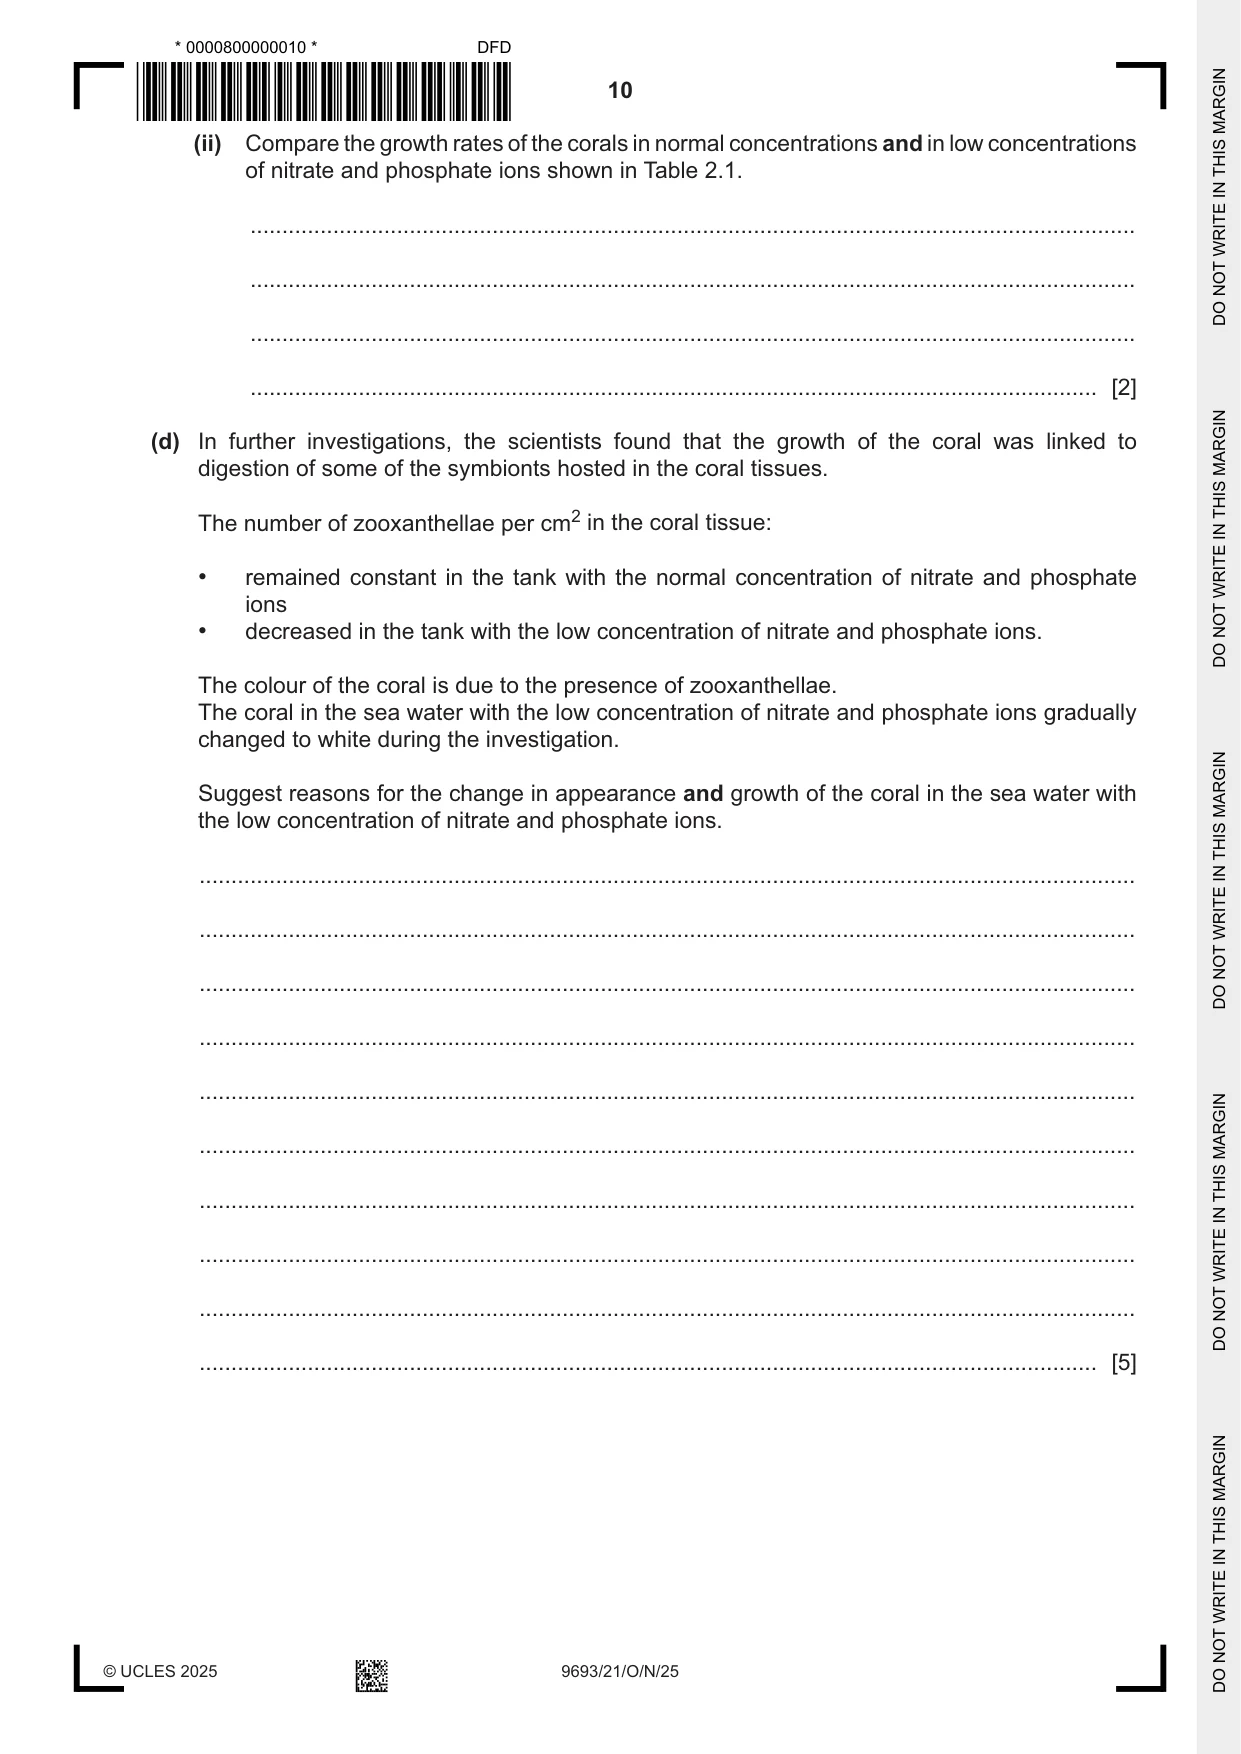
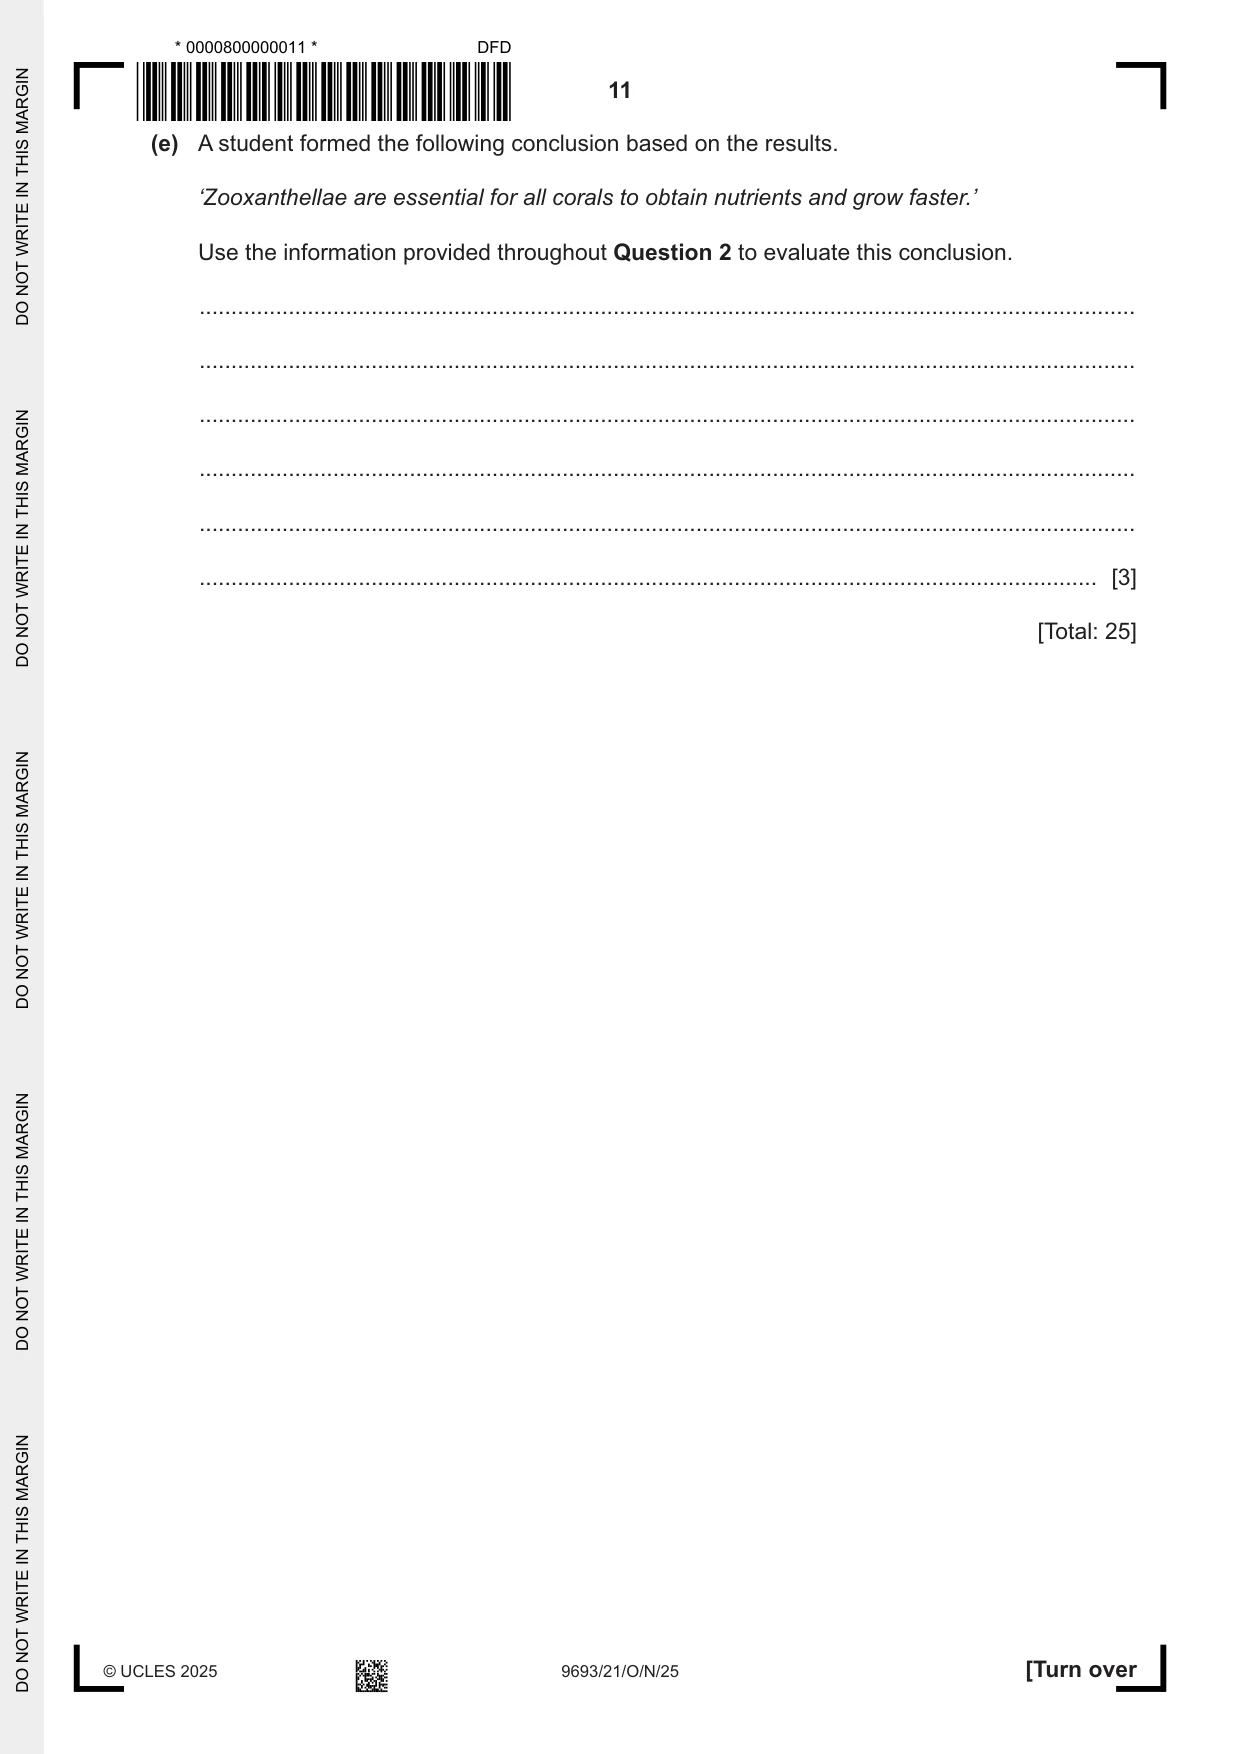
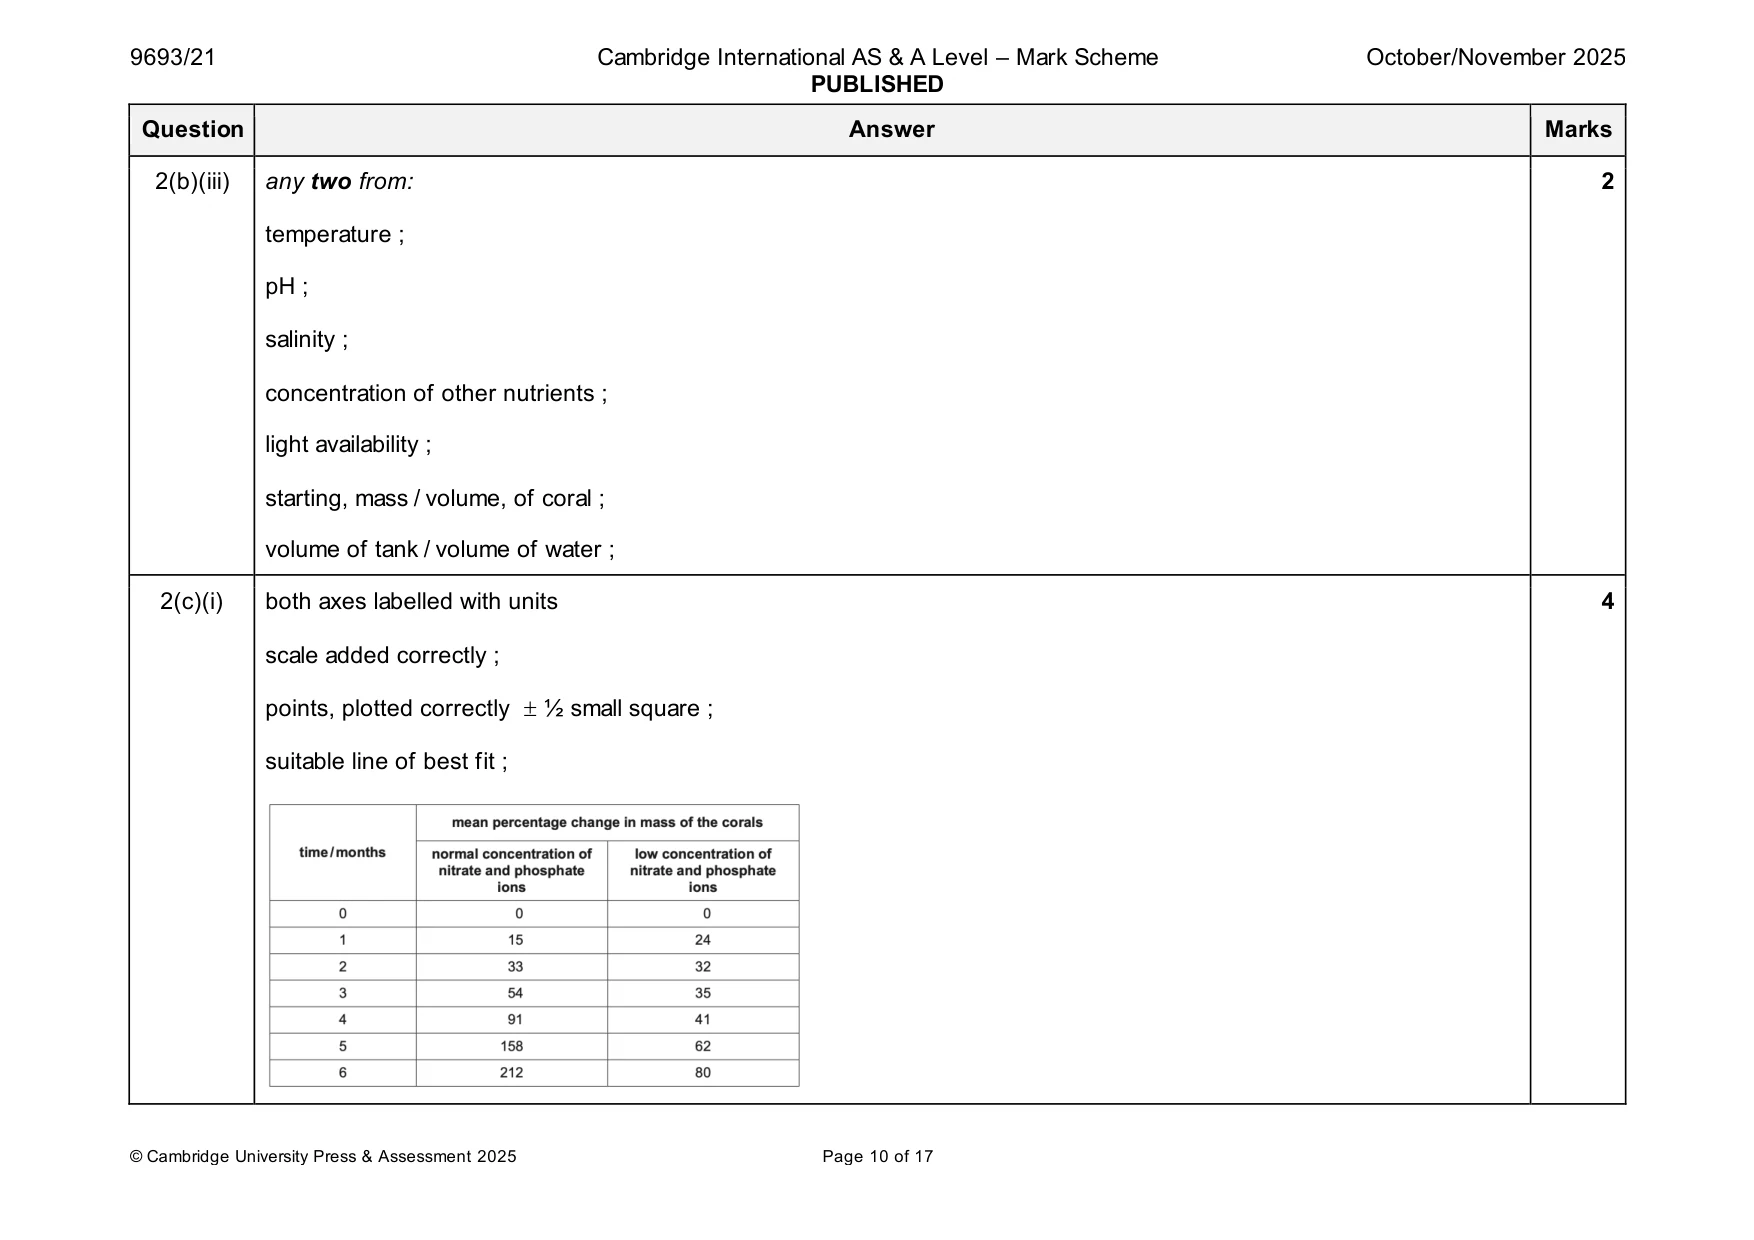
2 Scientists investigated the relationship between corals and their symbionts. They investigated if nitrogen and phosphorus are provided by the symbiont to the coral. (a) (i) State and explain the type of symbiotic relationship between coral polyps and zooxanthellae. type of symbiotic relationship ............................................................................................ explanation ........................................................................................................................ ........................................................................................................................................... ........................................................................................................................................... ........................................................................................................................................... [3] (ii) State one function of phosphorus in corals. ..................................................................................................................................... [1] (iii) Describe how the structure of coral polyps enables them to obtain nutrients from fish larvae. ........................................................................................................................................... ........................................................................................................................................... ........................................................................................................................................... ........................................................................................................................................... ..................................................................................................................................... [2] (b) The scientists investigated the growth of one species of coral in sea water with different concentrations of nitrate ions (NO3–) and phosphate ions (PO43–). Two tanks of sea water were used: • tank one was maintained at a normal concentration of nitrate and phosphate ions • tank two was maintained at a low concentration of nitrate and phosphate ions. Ten samples of the coral were placed into each tank. The tanks contained no other organisms. The sea water was constantly filtered to remove any small particles and food sources. The scientists measured the growth of coral in both tanks for six months. (i) Identify the independent variable and the dependent variable in this investigation. independent variable ......................................................................................................... ........................................................................................................................................... dependent variable ............................................................................................................ ........................................................................................................................................... [2] (ii) Use the information given above to identify one variable that was standardised. ........................................................................................................................................... ..................................................................................................................................... [1] (iii) Suggest two other variables not described above that need to be standardised to ensure the data collected is valid. 1 ........................................................................................................................................ 2 ........................................................................................................................................ [2] (c) Table 2.1 shows the mean data the scientists collected. Table 2.1 mean percentage change in mass of the corals time / months normal concentration of low concentration of nitrate and phosphate nitrate and phosphate ions ions 0 0 0 1 15 24 2 33 32 3 54 35 4 91 41 5 158 62 6 212 80 (i) The graph in Fig. 2.1 shows the mean percentage change in mass of the corals in the normal concentration of nitrate and phosphate ions. A line of best fit has been drawn to show the trend. Complete the scale and the labels for both axes. One scale value has already been added. Plot the values from Table 2.1 for the mean percentage change in mass of the corals in the low concentration of nitrate and phosphate ions on Fig. 2.1. Draw a line of best fit to indicate the overall trend for the data you have plotted. (ii) Compare the growth rates of the corals in normal concentrations and in low concentrations of nitrate and phosphate ions shown in Table 2.1. ........................................................................................................................................... ........................................................................................................................................... ........................................................................................................................................... ..................................................................................................................................... [2] (d) In further investigations, the scientists found that the growth of the coral was linked to digestion of some of the symbionts hosted in the coral tissues. The number of zooxanthellae per cm2 in the coral tissue: • remained constant in the tank with the normal concentration of nitrate and phosphate ions • decreased in the tank with the low concentration of nitrate and phosphate ions. The colour of the coral is due to the presence of zooxanthellae. The coral in the sea water with the low concentration of nitrate and phosphate ions gradually changed to white during the investigation. Suggest reasons for the change in appearance and growth of the coral in the sea water with the low concentration of nitrate and phosphate ions. ................................................................................................................................................... ................................................................................................................................................... ................................................................................................................................................... ................................................................................................................................................... ................................................................................................................................................... ................................................................................................................................................... ................................................................................................................................................... ................................................................................................................................................... ................................................................................................................................................... ............................................................................................................................................. [5] (e) A student formed the following conclusion based on the results. ‘Zooxanthellae are essential for all corals to obtain nutrients and grow faster.’ Use the information provided throughout Question 2 to evaluate this conclusion. ................................................................................................................................................... ................................................................................................................................................... ................................................................................................................................................... ................................................................................................................................................... ................................................................................................................................................... ............................................................................................................................................. [3] [Total: 25]
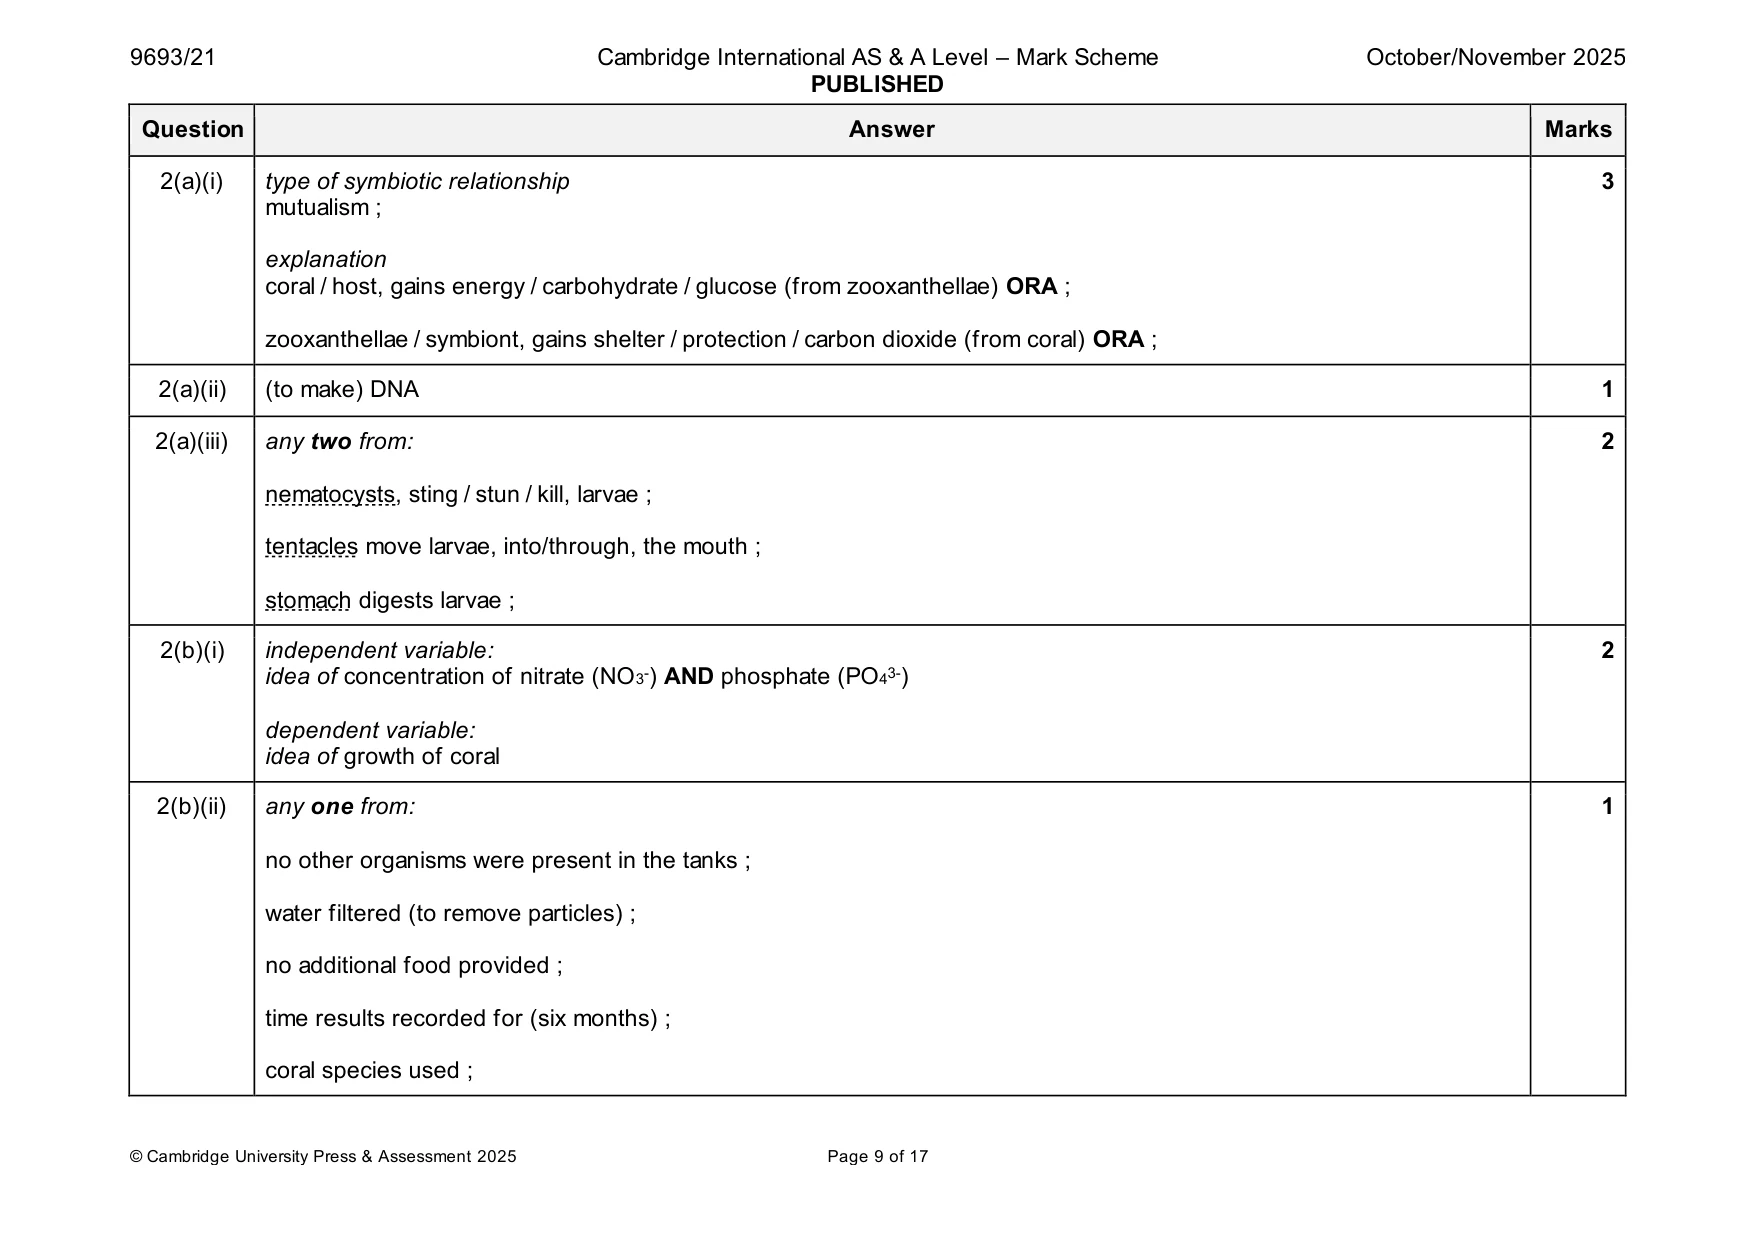
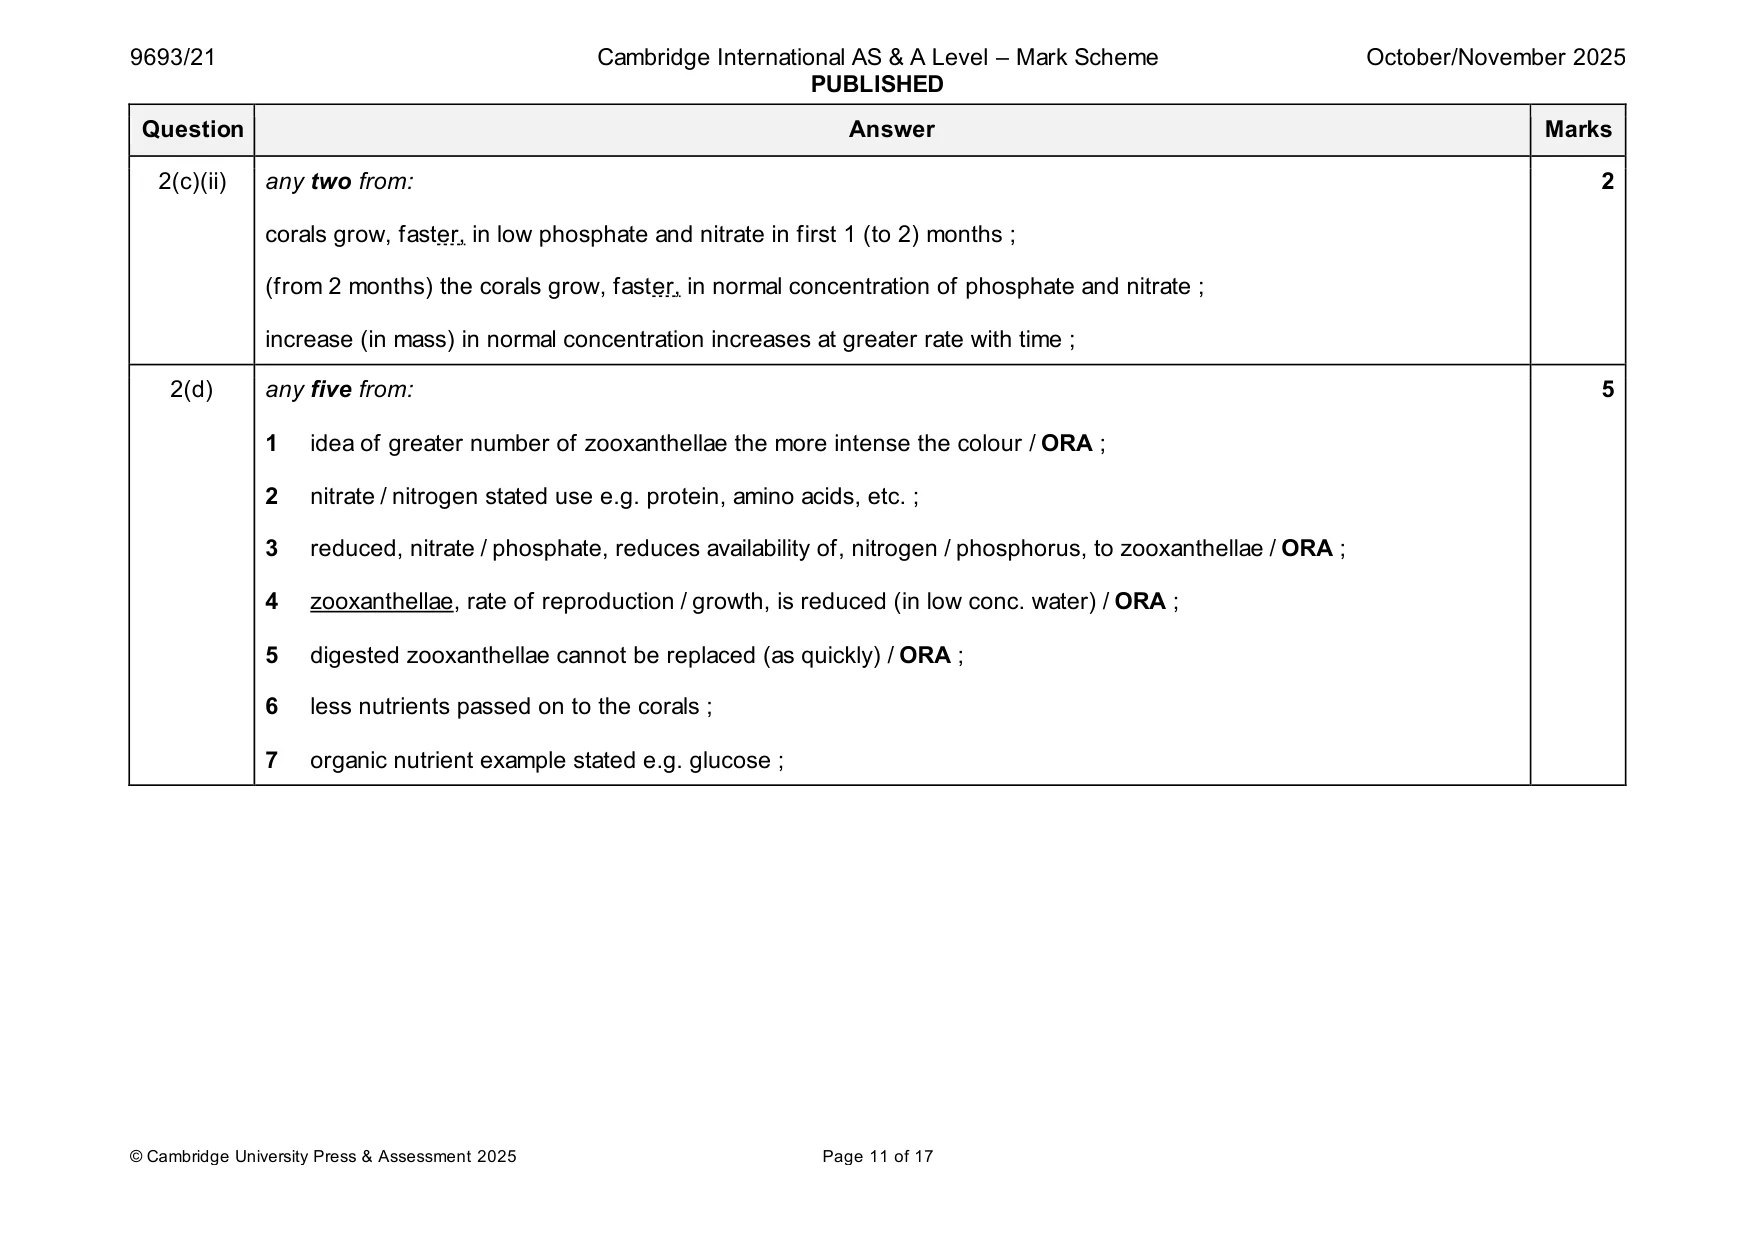
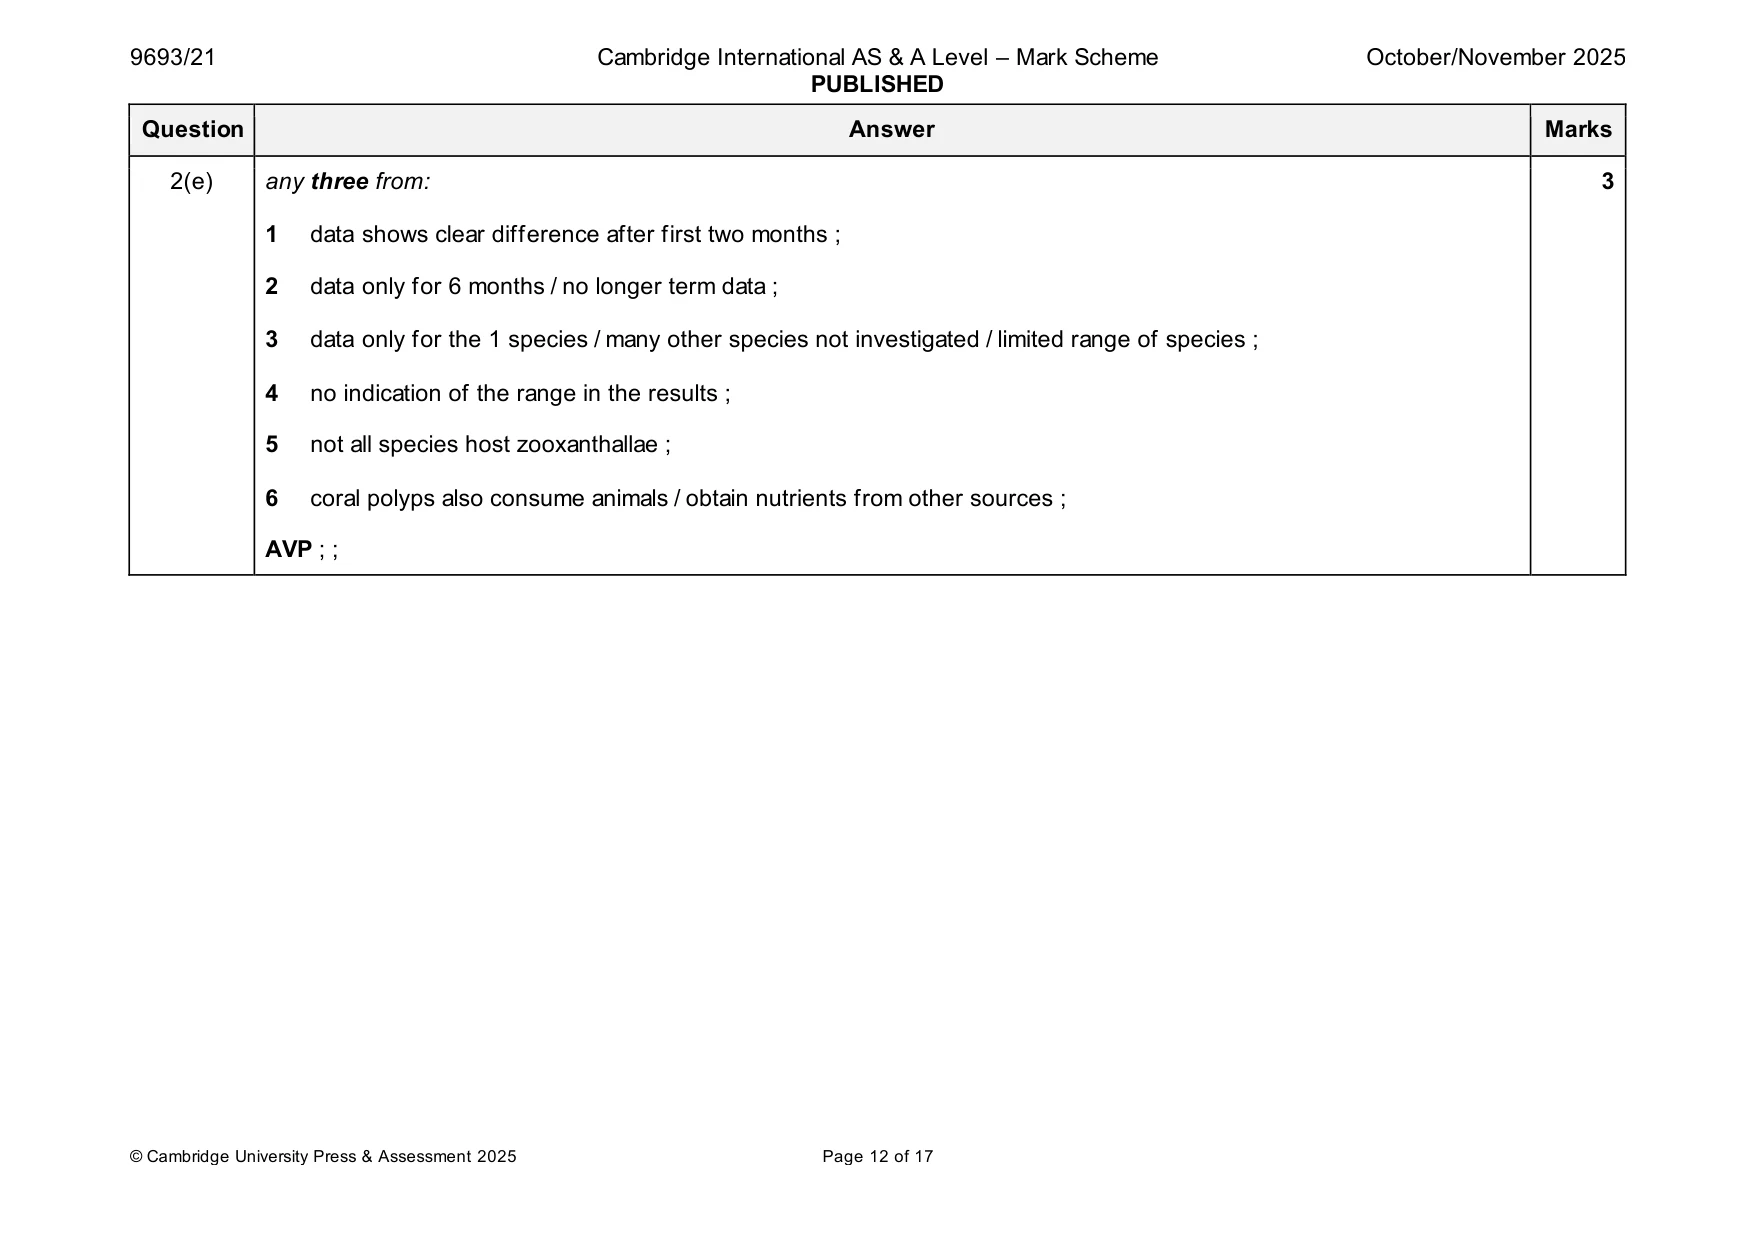
Mark scheme: 2(a)(i) type of symbiotic relationship 3 mutualism ; explanation coral / host, gains energy / carbohydrate / glucose (from zooxanthellae) ORA ; zooxanthellae / symbiont, gains shelter / protection / carbon dioxide (from coral) ORA ; 2(a)(ii) (to make) DNA 1 2(a)(iii) any two from: 2 nematocysts, sting / stun / kill, larvae ; tentacles move larvae, into/through, the mouth ; stomach digests larvae ; 2(b)(i) independent variable: 2 idea of concentration of nitrate (NO3-) AND phosphate (PO43-) dependent variable: idea of growth of coral 2(b)(ii) any one from: 1 no other organisms were present in the tanks ; water filtered (to remove particles) ; no additional food provided ; time results recorded for (six months) ; coral species used ; 2(b)(iii) any two from: 2 temperature ; pH ; salinity ; concentration of other nutrients ; light availability ; starting, mass / volume, of coral ; volume of tank / volume of water ; 2(c)(i) both axes labelled with units 4 scale added correctly ; points, plotted correctly ½ small square ; suitable line of best fit ; 2(c)(ii) any two from: 2 corals grow, faster, in low phosphate and nitrate in first 1 (to 2) months ; (from 2 months) the corals grow, faster, in normal concentration of phosphate and nitrate ; increase (in mass) in normal concentration increases at greater rate with time ; 2(d) any five from: 5 1 idea of greater number of zooxanthellae the more intense the colour / ORA ; 2 nitrate / nitrogen stated use e.g. protein, amino acids, etc. ; 3 reduced, nitrate / phosphate, reduces availability of, nitrogen / phosphorus, to zooxanthellae / ORA ; 4 zooxanthellae, rate of reproduction / growth, is reduced (in low conc. water) / ORA ; 5 digested zooxanthellae cannot be replaced (as quickly) / ORA ; 6 less nutrients passed on to the corals ; 7 organic nutrient example stated e.g. glucose ; 2(e) any three from: 3 1 data shows clear difference after first two months ; 2 data only for 6 months / no longer term data ; 3 data only for the 1 species / many other species not investigated / limited range of species ; 4 no indication of the range in the results ; 5 not all species host zooxanthallae ; 6 coral polyps also consume animals / obtain nutrients from other sources ; AVP ; ;
Q3 · Organisms are classified in a taxonomic hierarchy
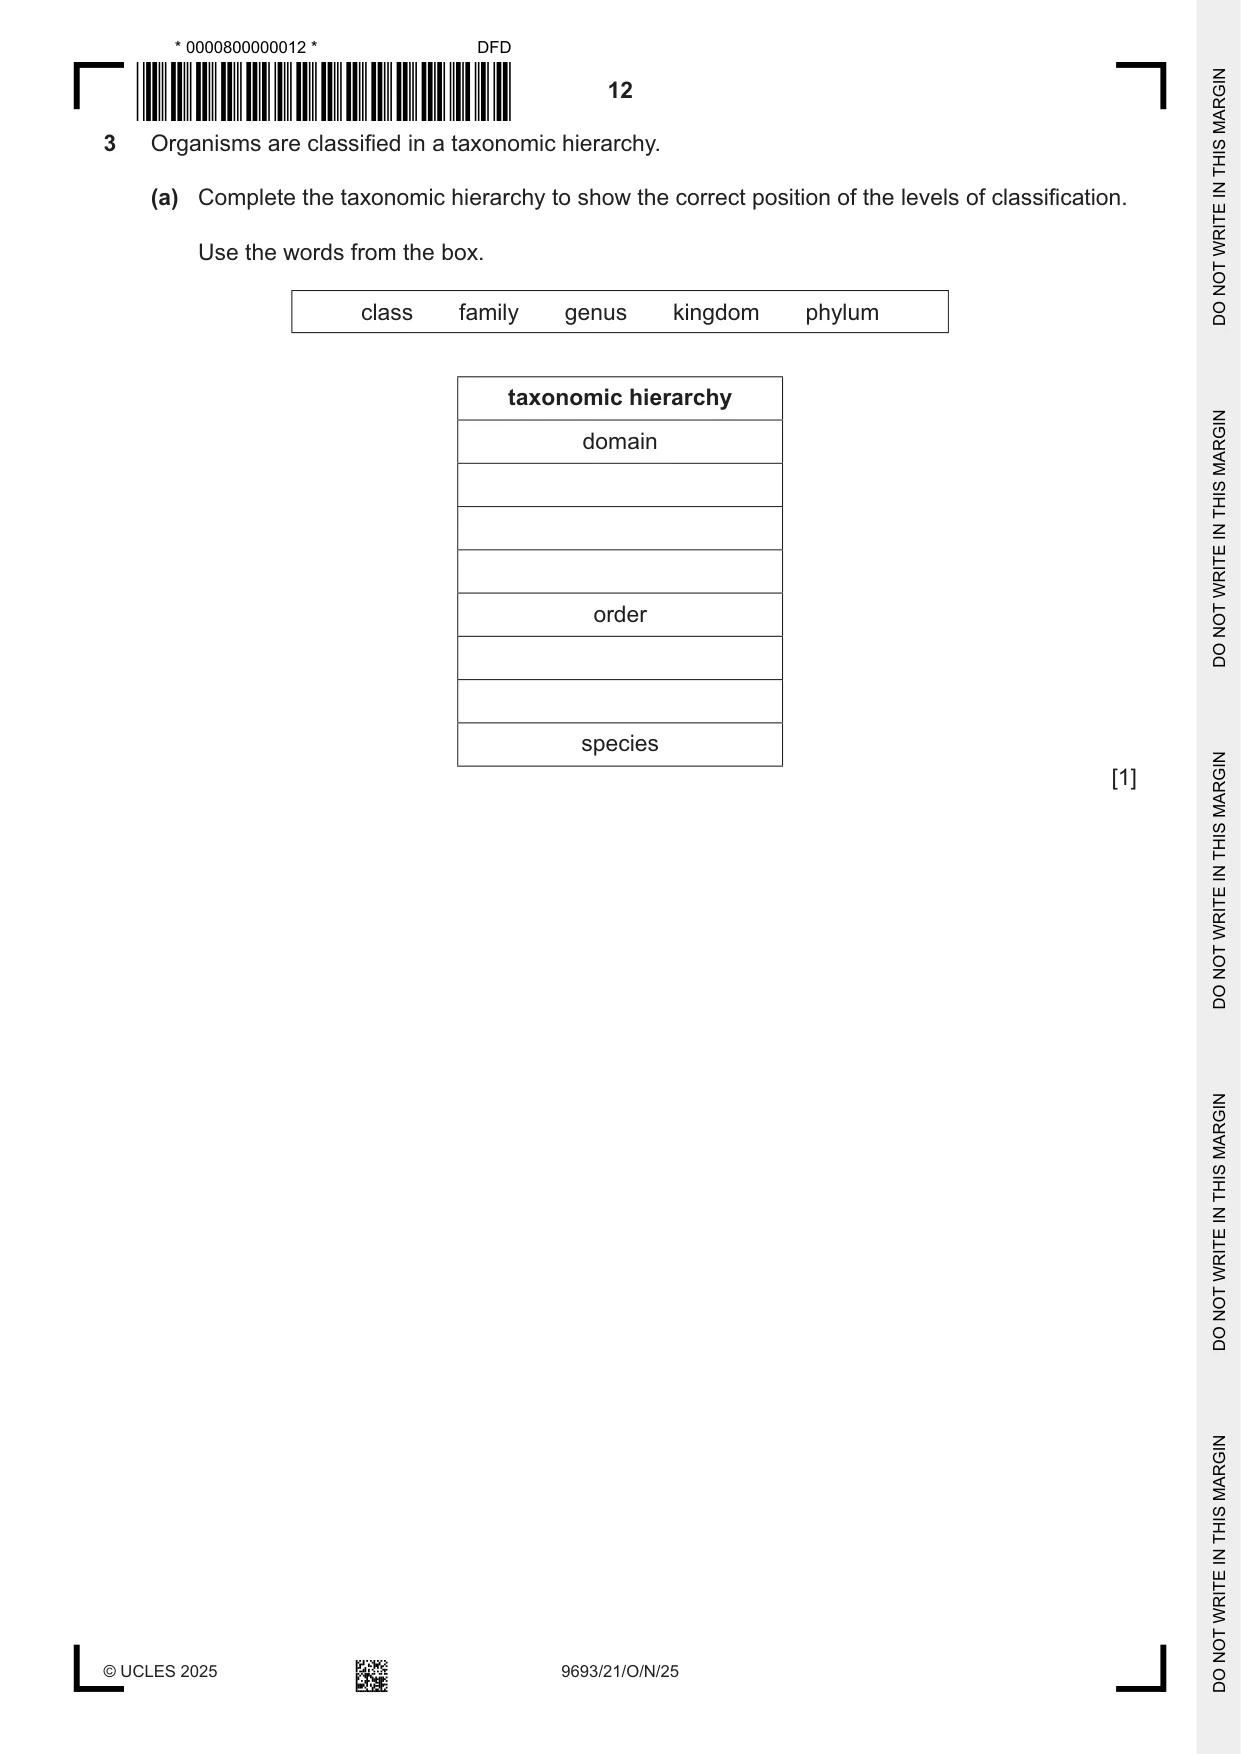
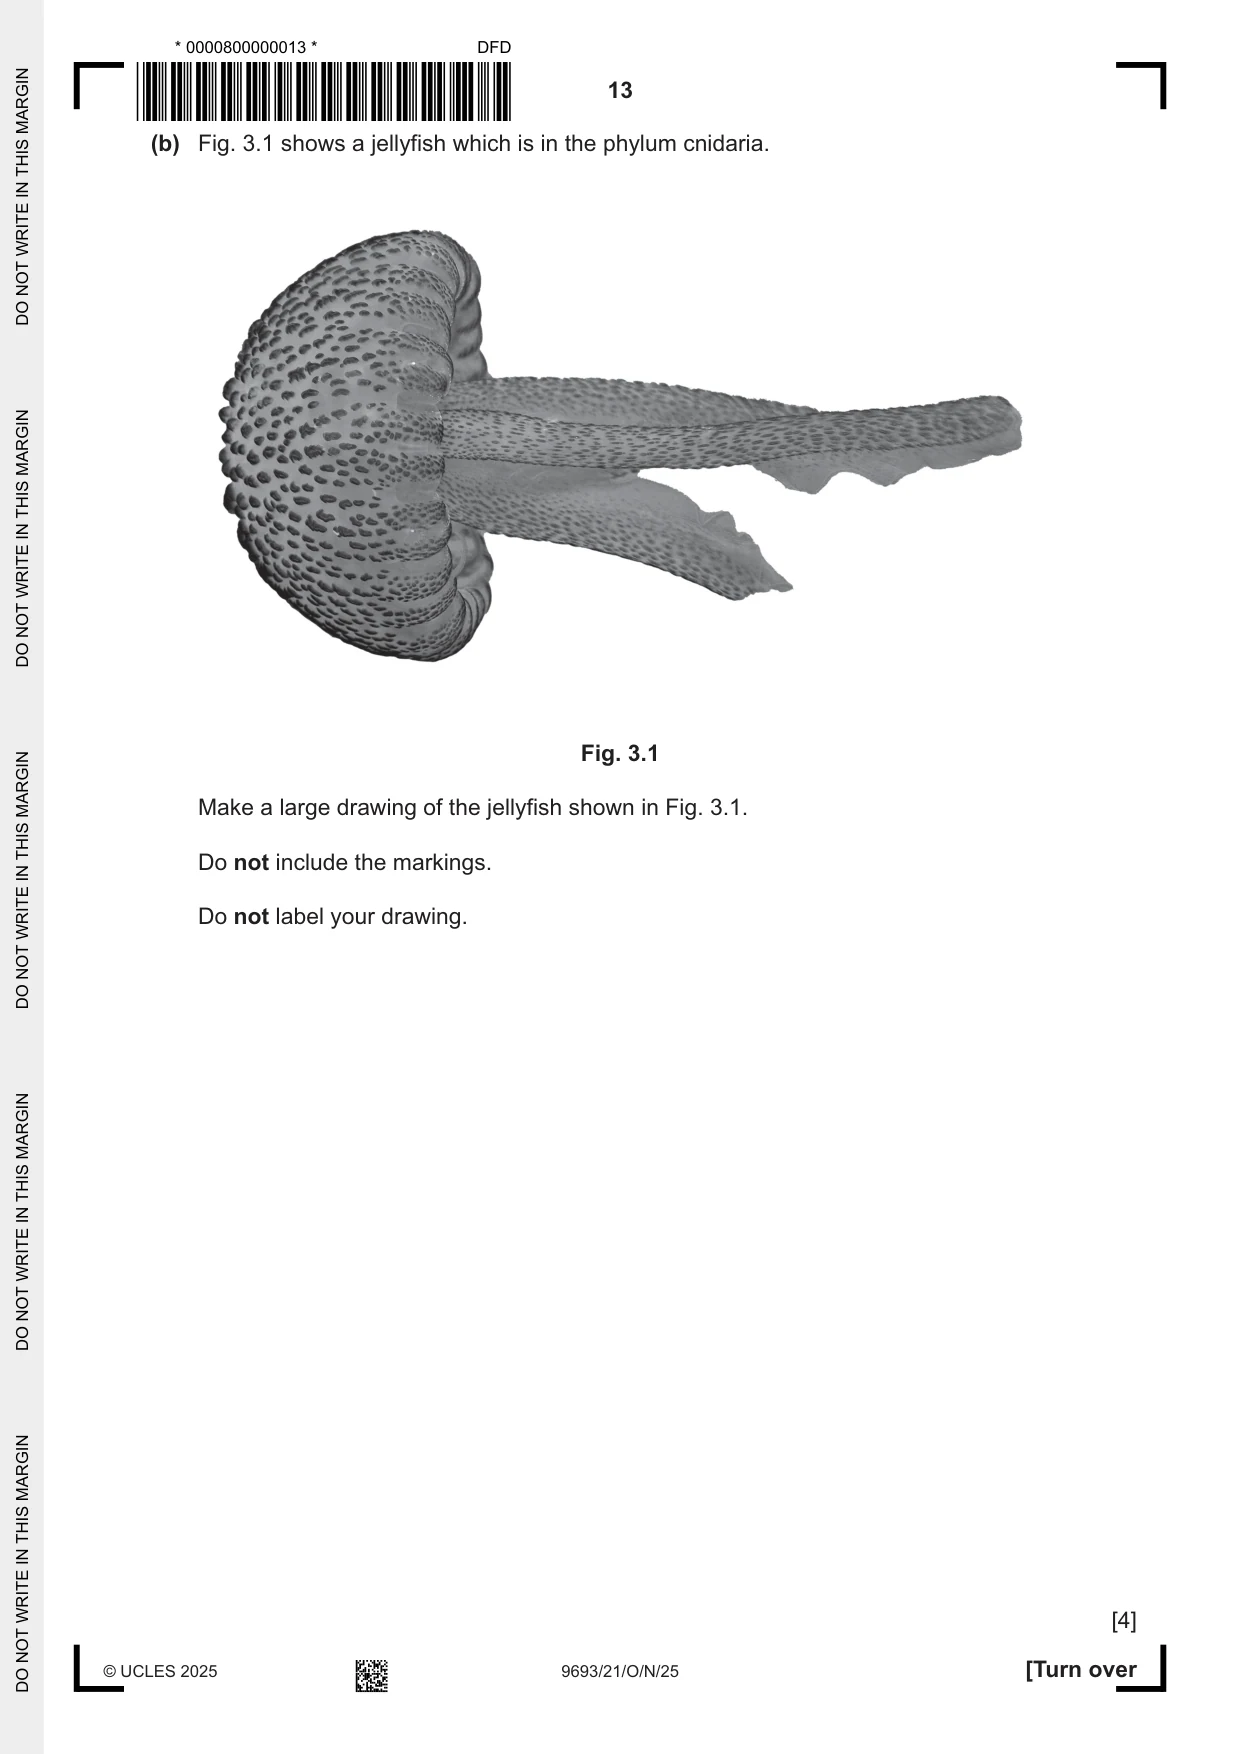
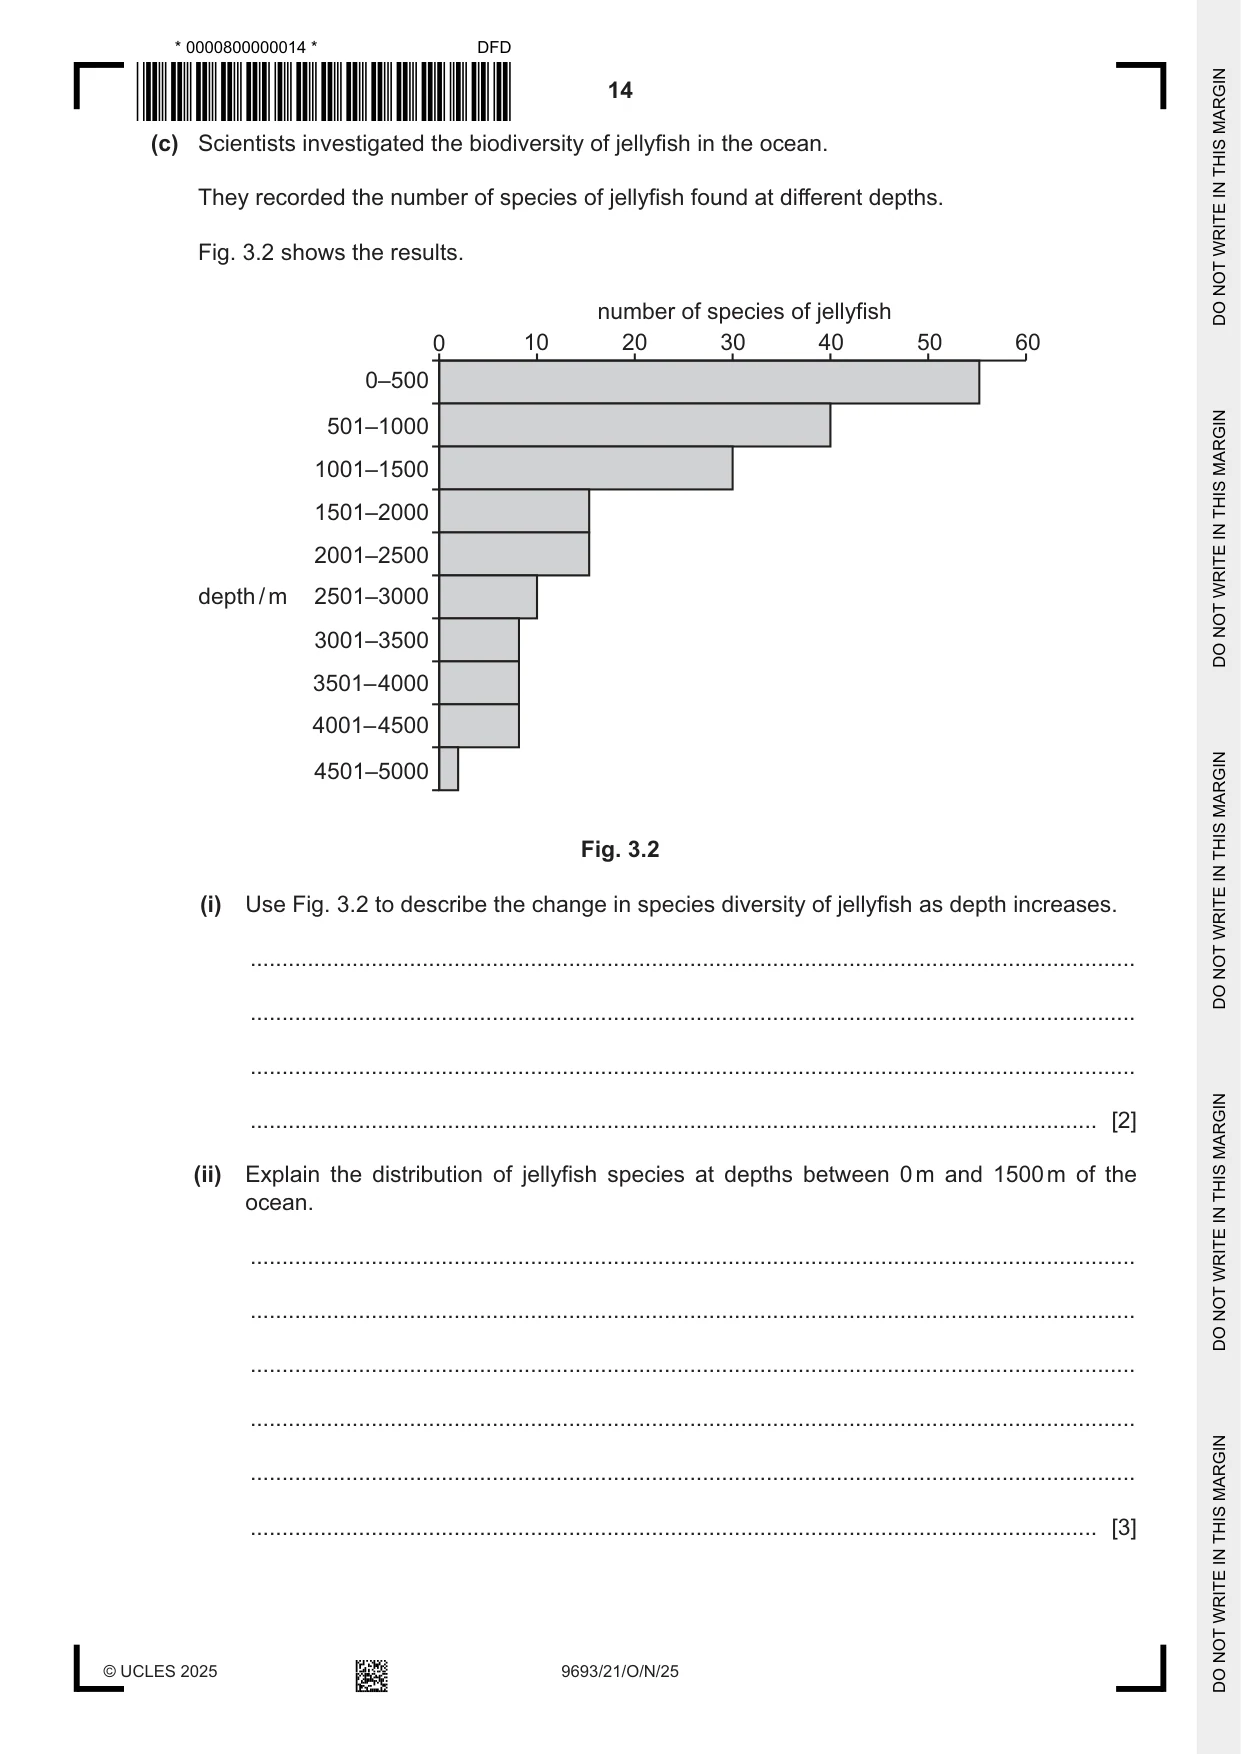
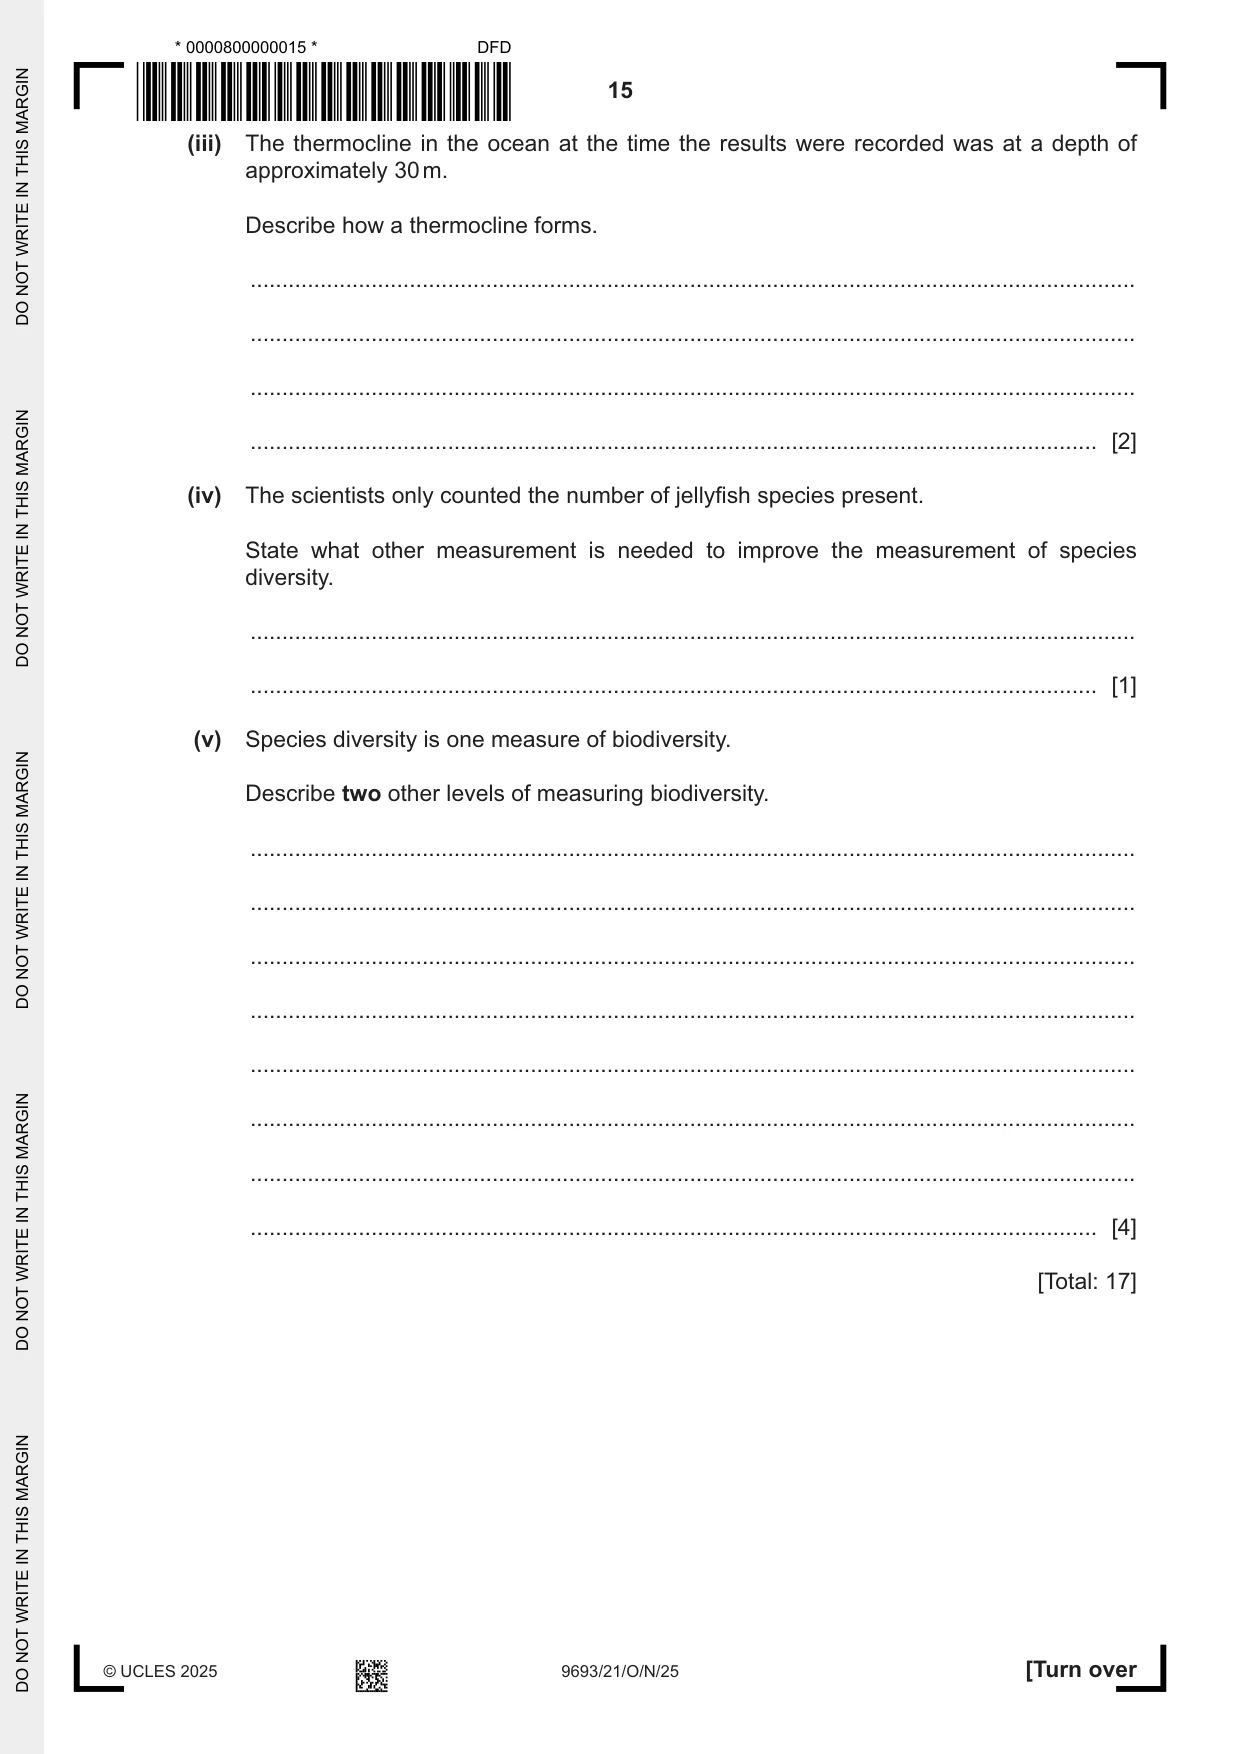
3 Organisms are classified in a taxonomic hierarchy. (a) Complete the taxonomic hierarchy to show the correct position of the levels of classification. Use the words from the box. class family genus kingdom phylum taxonomic hierarchy domain order species [1] (b) Fig. 3.1 shows a jellyfish which is in the phylum cnidaria. Fig. 3.1 Make a large drawing of the jellyfish shown in Fig. 3.1. Do not include the markings. Do not label your drawing. [4] (c) Scientists investigated the biodiversity of jellyfish in the ocean. They recorded the number of species of jellyfish found at different depths. Fig. 3.2 shows the results. number of species of jellyfish 0 10 20 30 40 50 60 0–500 501–1000 1001–1500 1501–2000 2001–2500 depth / m 2501–3000 3001–3500 3501– 4000 4001– 4500 4501–5000 Fig. 3.2 (i) Use Fig. 3.2 to describe the change in species diversity of jellyfish as depth increases. ........................................................................................................................................... ........................................................................................................................................... ........................................................................................................................................... ..................................................................................................................................... [2] (ii) Explain the distribution of jellyfish species at depths between 0 m and 1500 m of the ocean. ........................................................................................................................................... ........................................................................................................................................... ........................................................................................................................................... ........................................................................................................................................... ........................................................................................................................................... ..................................................................................................................................... [3] (iii) The thermocline in the ocean at the time the results were recorded was at a depth of approximately 30 m. Describe how a thermocline forms. ........................................................................................................................................... ........................................................................................................................................... ........................................................................................................................................... ..................................................................................................................................... [2] (iv) The scientists only counted the number of jellyfish species present. State what other measurement is needed to improve the measurement of species diversity. ........................................................................................................................................... ..................................................................................................................................... [1] (v) Species diversity is one measure of biodiversity. Describe two other levels of measuring biodiversity. ........................................................................................................................................... ........................................................................................................................................... ........................................................................................................................................... ........................................................................................................................................... ........................................................................................................................................... ........................................................................................................................................... ........................................................................................................................................... ..................................................................................................................................... [4] [Total: 17]
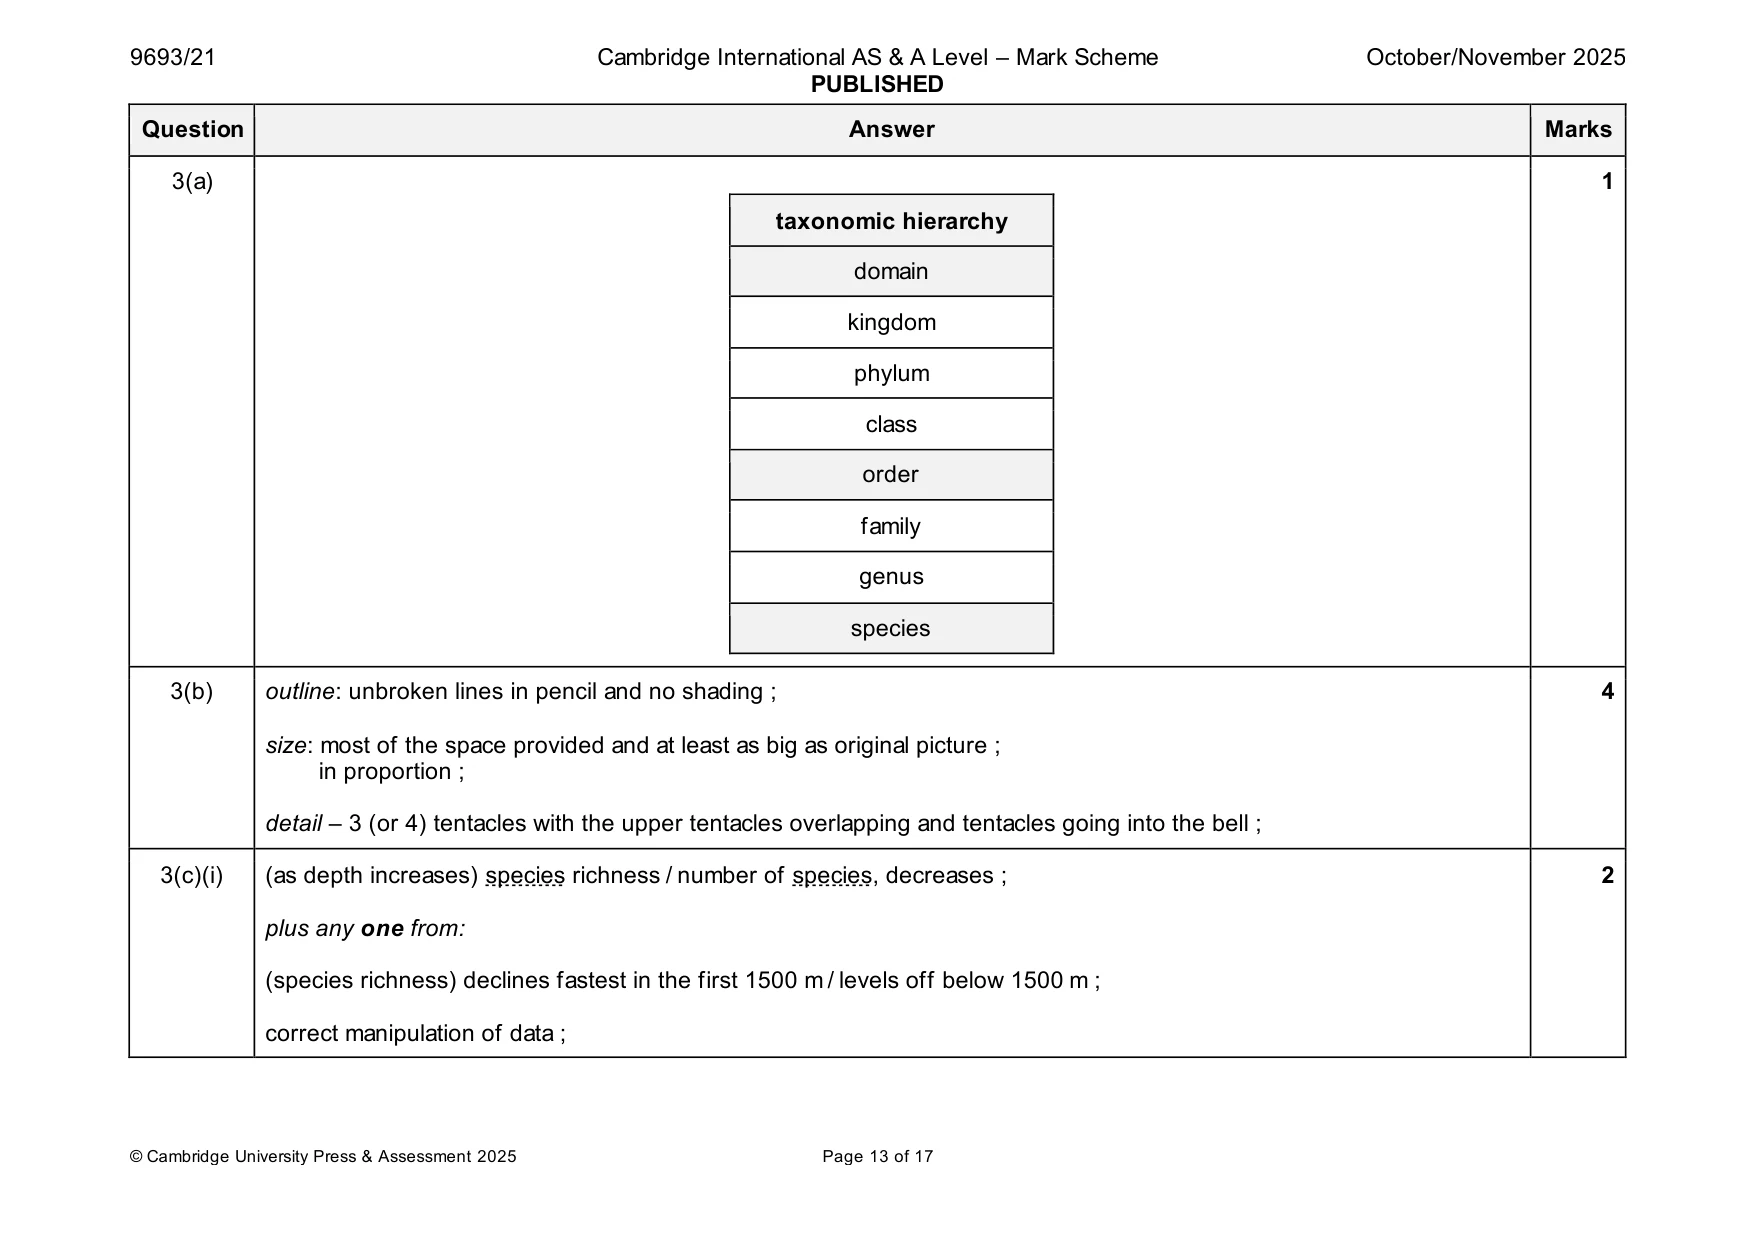
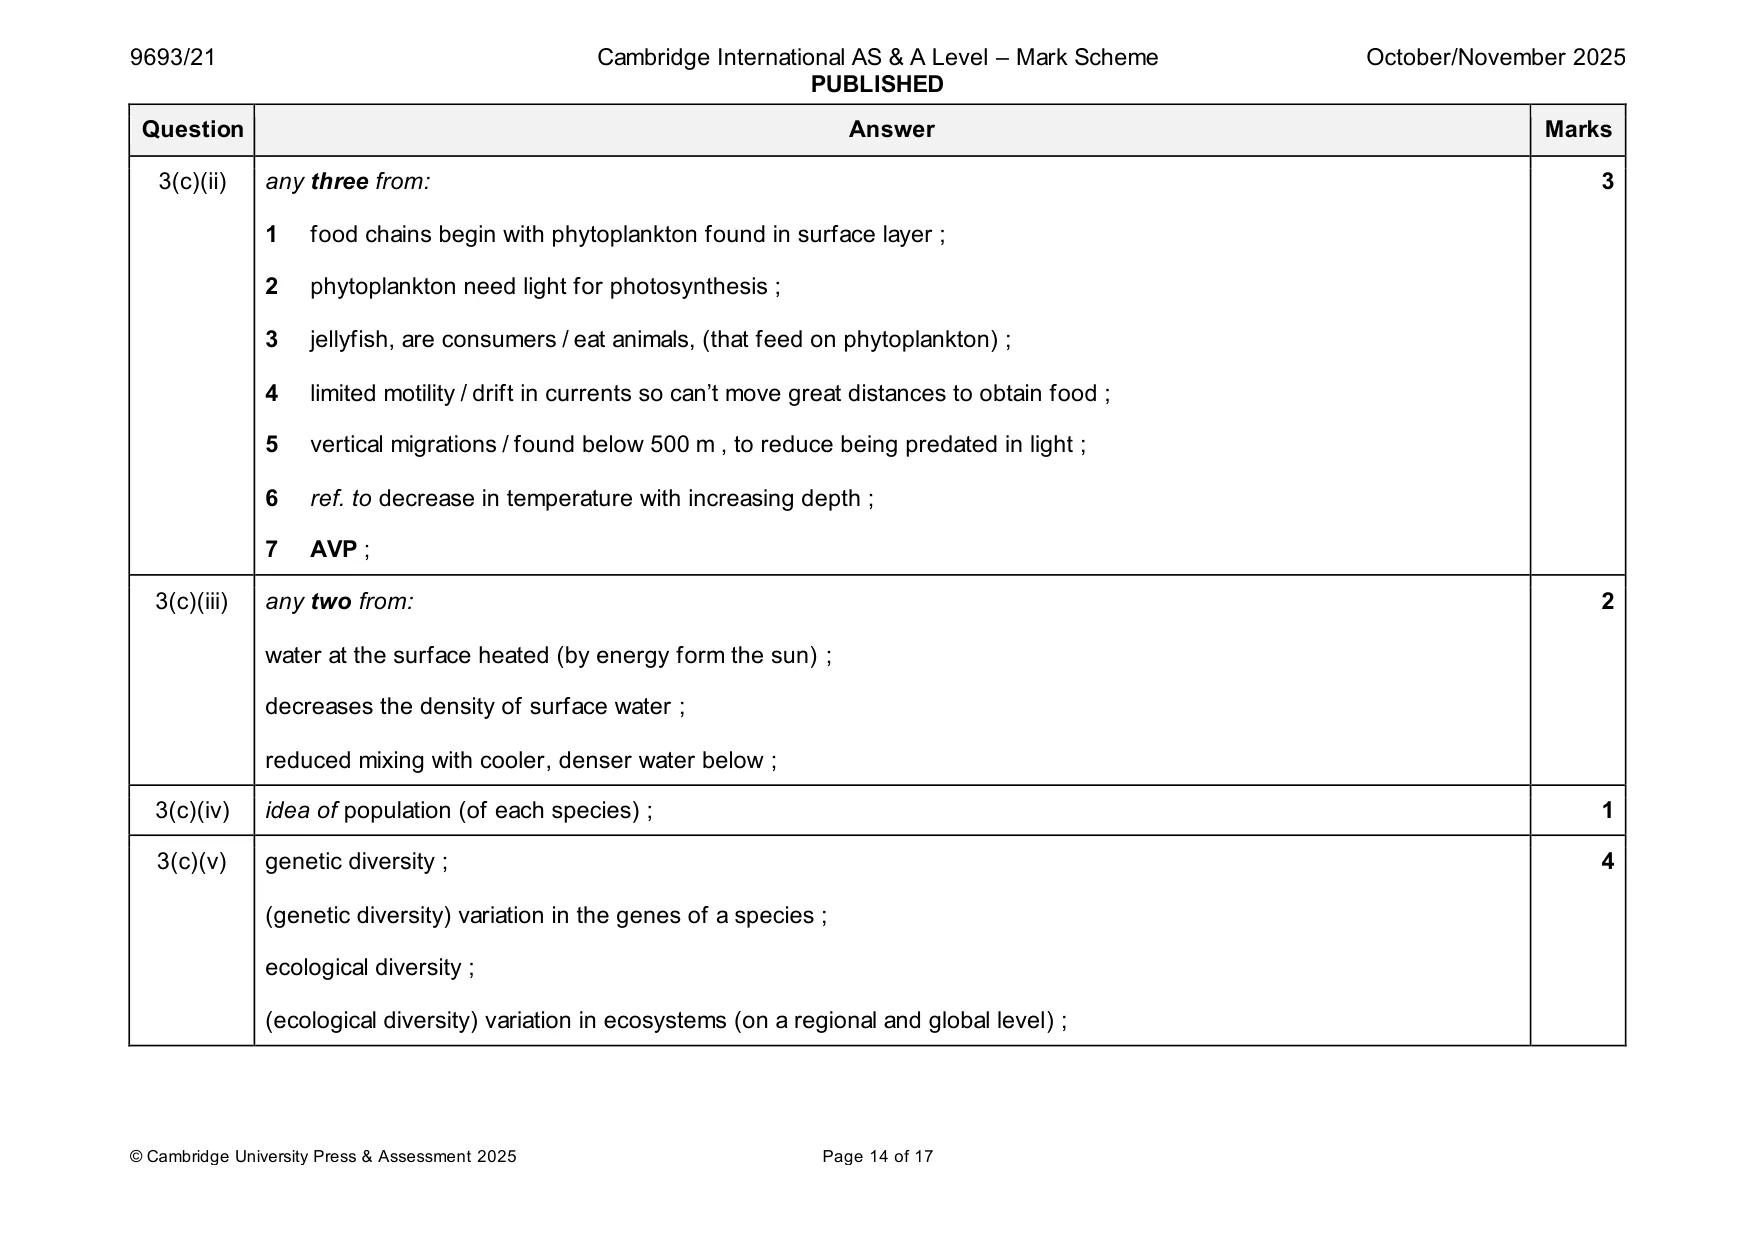
Mark scheme: 3(a) 1 taxonomic hierarchy domain kingdom phylum class order family genus species 3(b) outline: unbroken lines in pencil and no shading ; 4 size: most of the space provided and at least as big as original picture ; in proportion ; detail – 3 (or 4) tentacles with the upper tentacles overlapping and tentacles going into the bell ; 3(c)(i) (as depth increases) species richness / number of species, decreases ; 2 plus any one from: (species richness) declines fastest in the first 1500 m / levels off below 1500 m ; correct manipulation of data ; 3(c)(ii) any three from: 3 1 food chains begin with phytoplankton found in surface layer ; 2 phytoplankton need light for photosynthesis ; 3 jellyfish, are consumers / eat animals, (that feed on phytoplankton) ; 4 limited motility / drift in currents so can’t move great distances to obtain food ; 5 vertical migrations / found below 500 m , to reduce being predated in light ; 6 ref. to decrease in temperature with increasing depth ; 7 AVP ; 3(c)(iii) any two from: 2 water at the surface heated (by energy form the sun) ; decreases the density of surface water ; reduced mixing with cooler, denser water below ; 3(c)(iv) idea of population (of each species) ; 1 3(c)(v) genetic diversity ; 4 (genetic diversity) variation in the genes of a species ; ecological diversity ; (ecological diversity) variation in ecosystems (on a regional and global level) ;
Q4 · Scientists investigated the effect of marine protected areas (MPAs) on a species of fish…
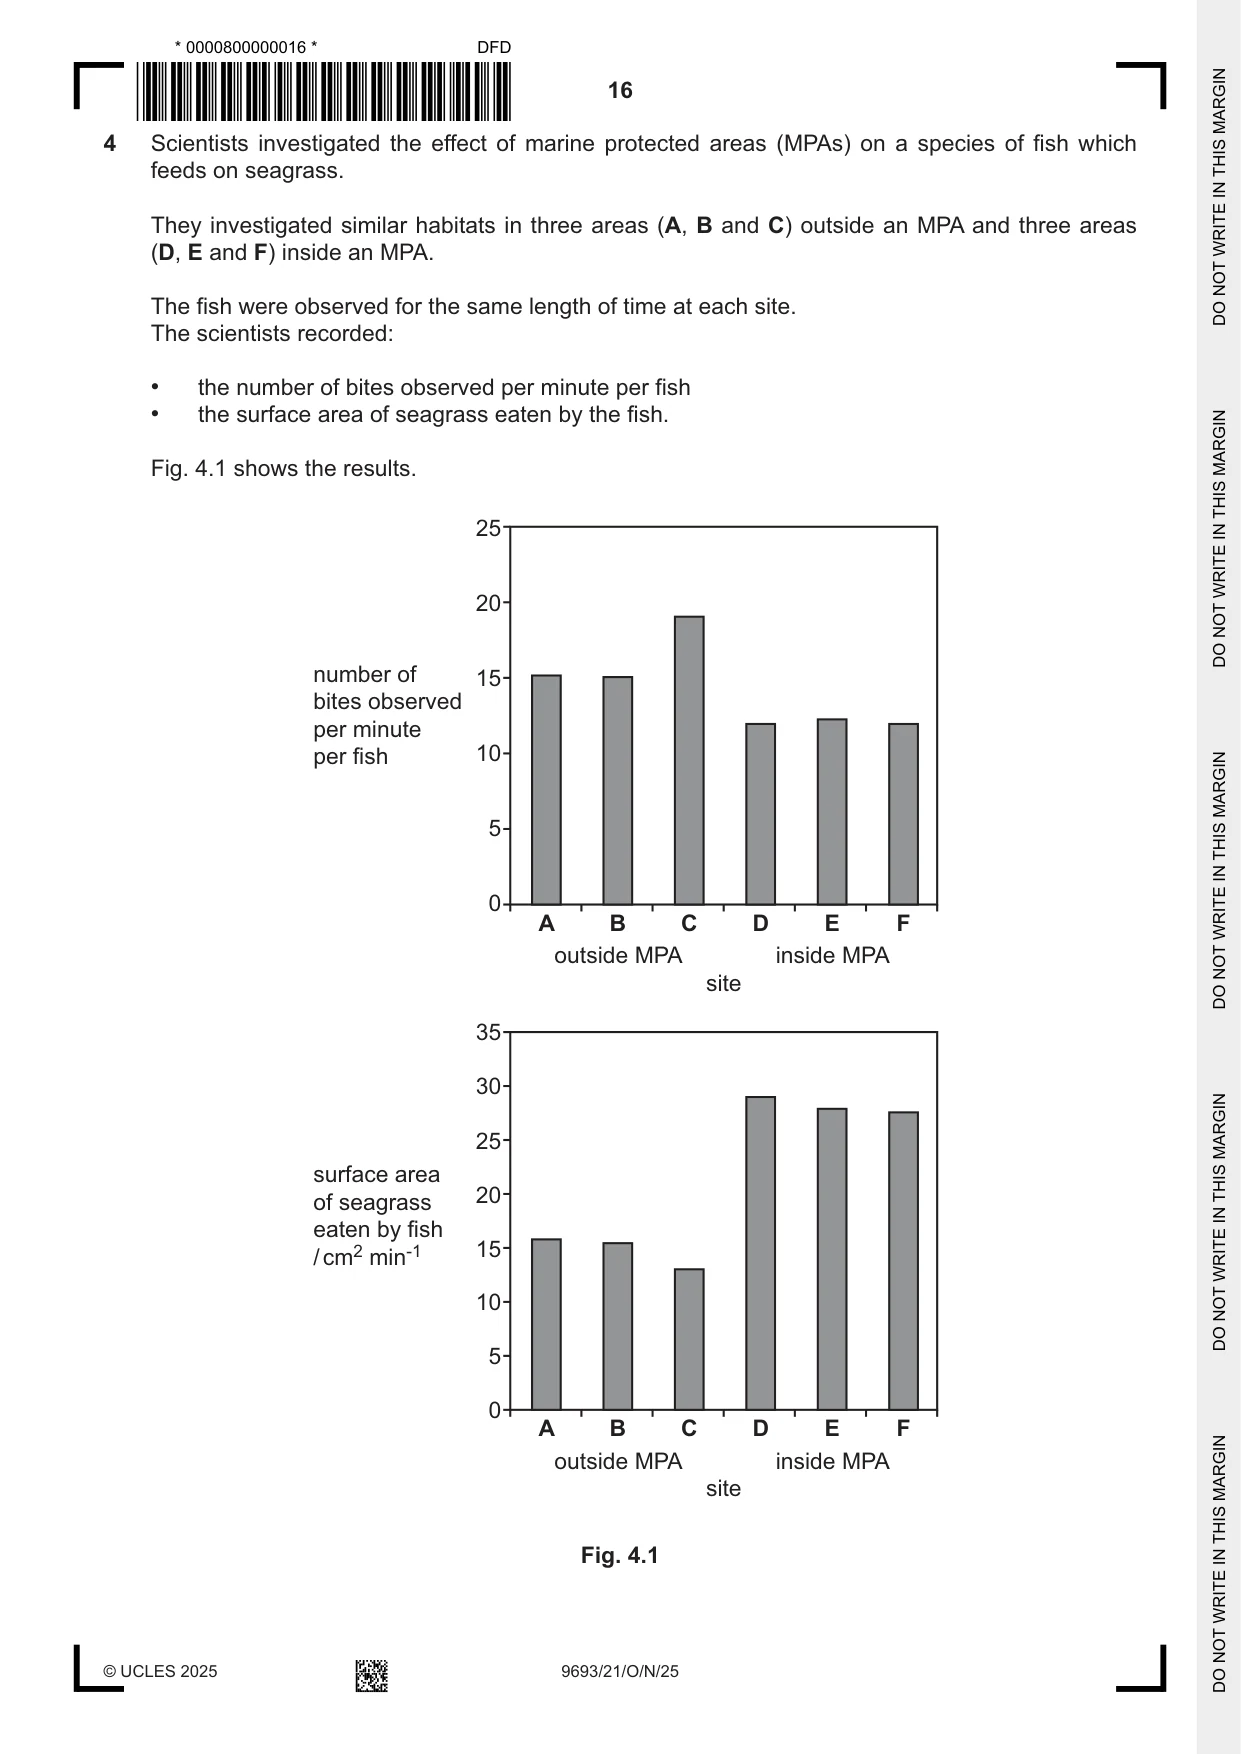
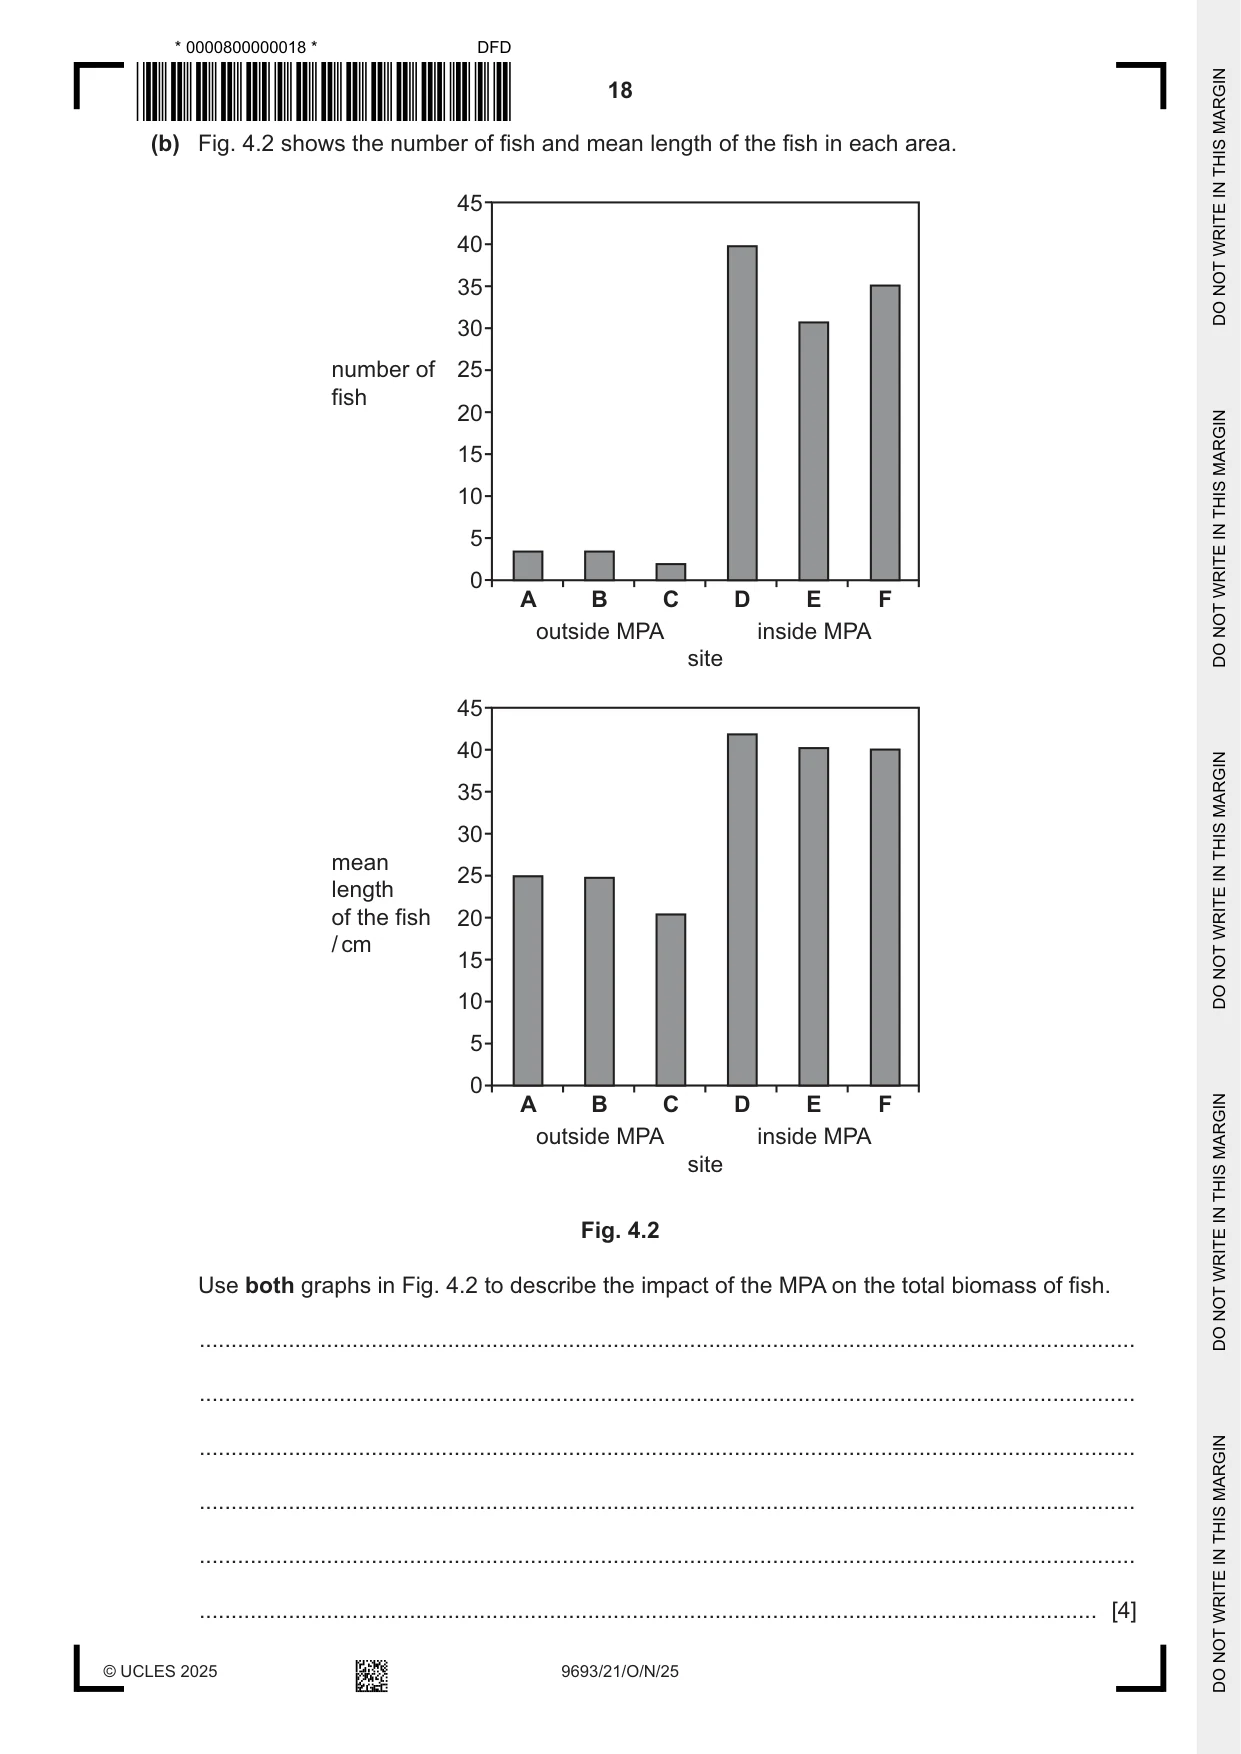
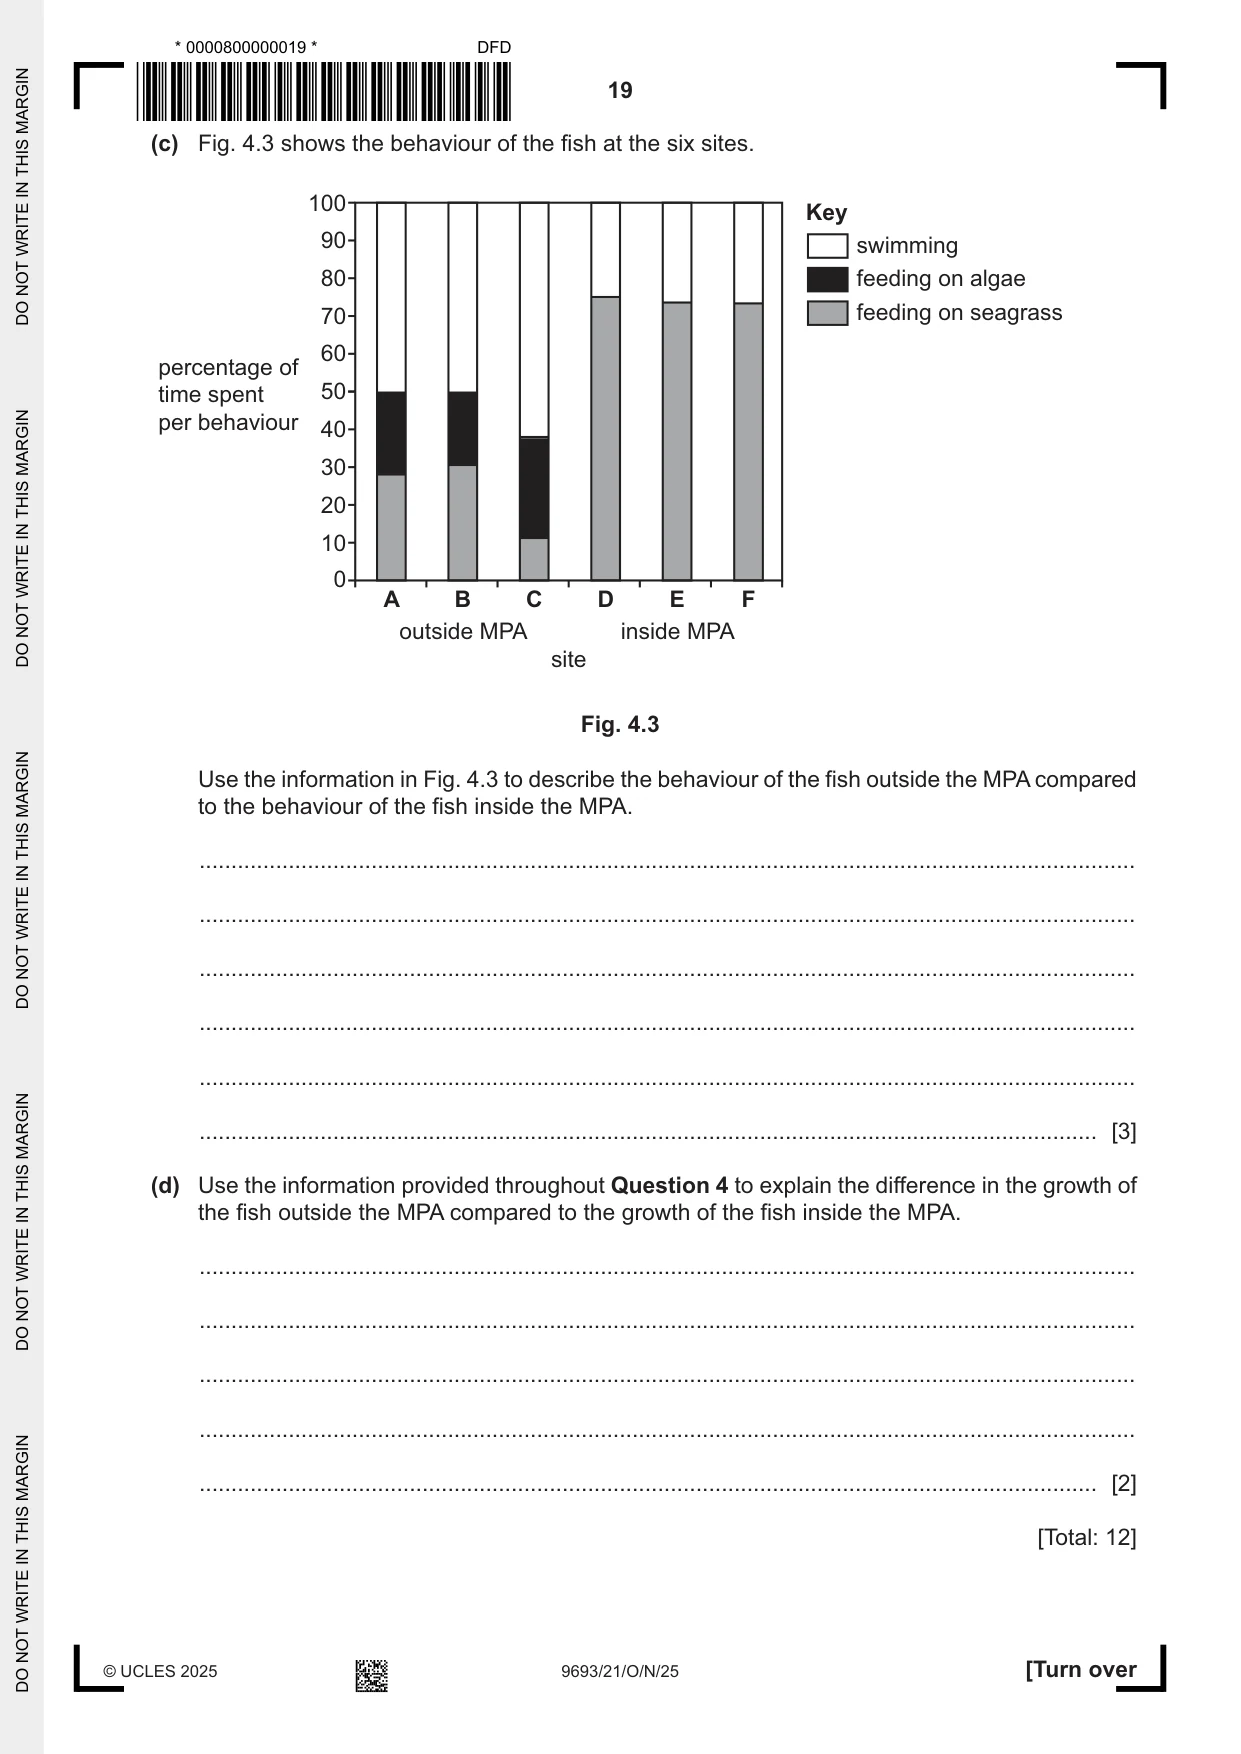
4 Scientists investigated the effect of marine protected areas (MPAs) on a species of fish which feeds on seagrass. They investigated similar habitats in three areas (A, B and C) outside an MPA and three areas (D, E and F) inside an MPA. The fish were observed for the same length of time at each site. The scientists recorded: • the number of bites observed per minute per fish • the surface area of seagrass eaten by the fish. Fig. 4.1 shows the results. 25 20 number of 15 bites observed per minute per fish 10 5 0 A B C D E F outside MPA inside MPA site 35 30 25 surface area 20 of seagrass eaten by fish 15 / cm2 min-1 10 5 0 A B C D E F outside MPA inside MPA site Fig. 4.1 (a) Use the data shown in Fig. 4.1 to describe the results in both graphs. ................................................................................................................................................... ................................................................................................................................................... ................................................................................................................................................... ................................................................................................................................................... ................................................................................................................................................... ............................................................................................................................................. [3] (b) Fig. 4.2 shows the number of fish and mean length of the fish in each area. 45 40 35 30 number of 25 fish 20 15 10 5 0 A B C D E F outside MPA inside MPA site 45 40 35 30 mean 25 length of the fish 20 / cm 15 10 5 0 A B C D E F outside MPA inside MPA site Fig. 4.2 Use both graphs in Fig. 4.2 to describe the impact of the MPA on the total biomass of fish. ................................................................................................................................................... ................................................................................................................................................... ................................................................................................................................................... ................................................................................................................................................... ................................................................................................................................................... ............................................................................................................................................. [4] (c) Fig. 4.3 shows the behaviour of the fish at the six sites. 100 Key 90 swimming 80 feeding on algae 70 feeding on seagrass 60 percentage of time spent 50 per behaviour 40 30 20 10 0 A B C D E F outside MPA inside MPA site Fig. 4.3 Use the information in Fig. 4.3 to describe the behaviour of the fish outside the MPA compared to the behaviour of the fish inside the MPA. ................................................................................................................................................... ................................................................................................................................................... ................................................................................................................................................... ................................................................................................................................................... ................................................................................................................................................... ............................................................................................................................................. [3] (d) Use the information provided throughout Question 4 to explain the difference in the growth of the fish outside the MPA compared to the growth of the fish inside the MPA. ................................................................................................................................................... ................................................................................................................................................... ................................................................................................................................................... ................................................................................................................................................... ............................................................................................................................................. [2] [Total: 12]
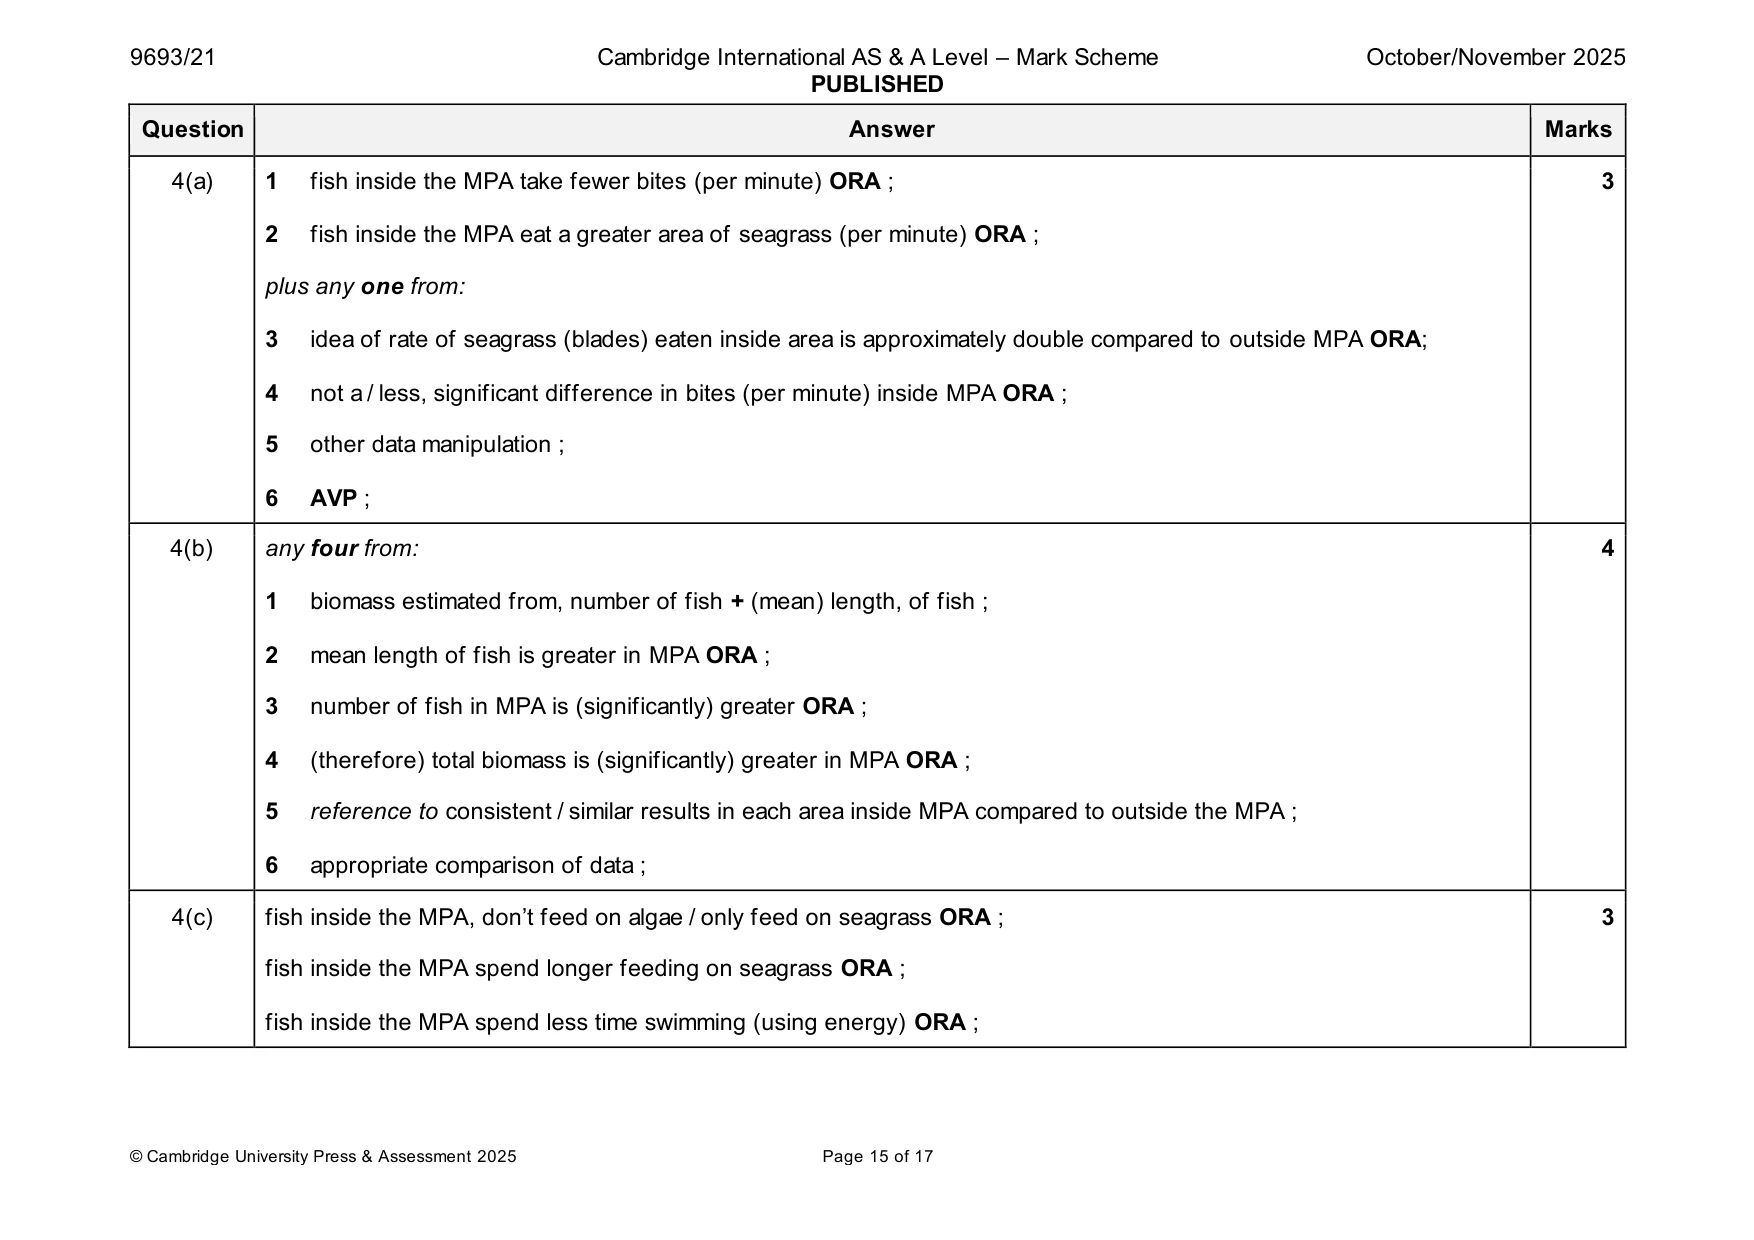
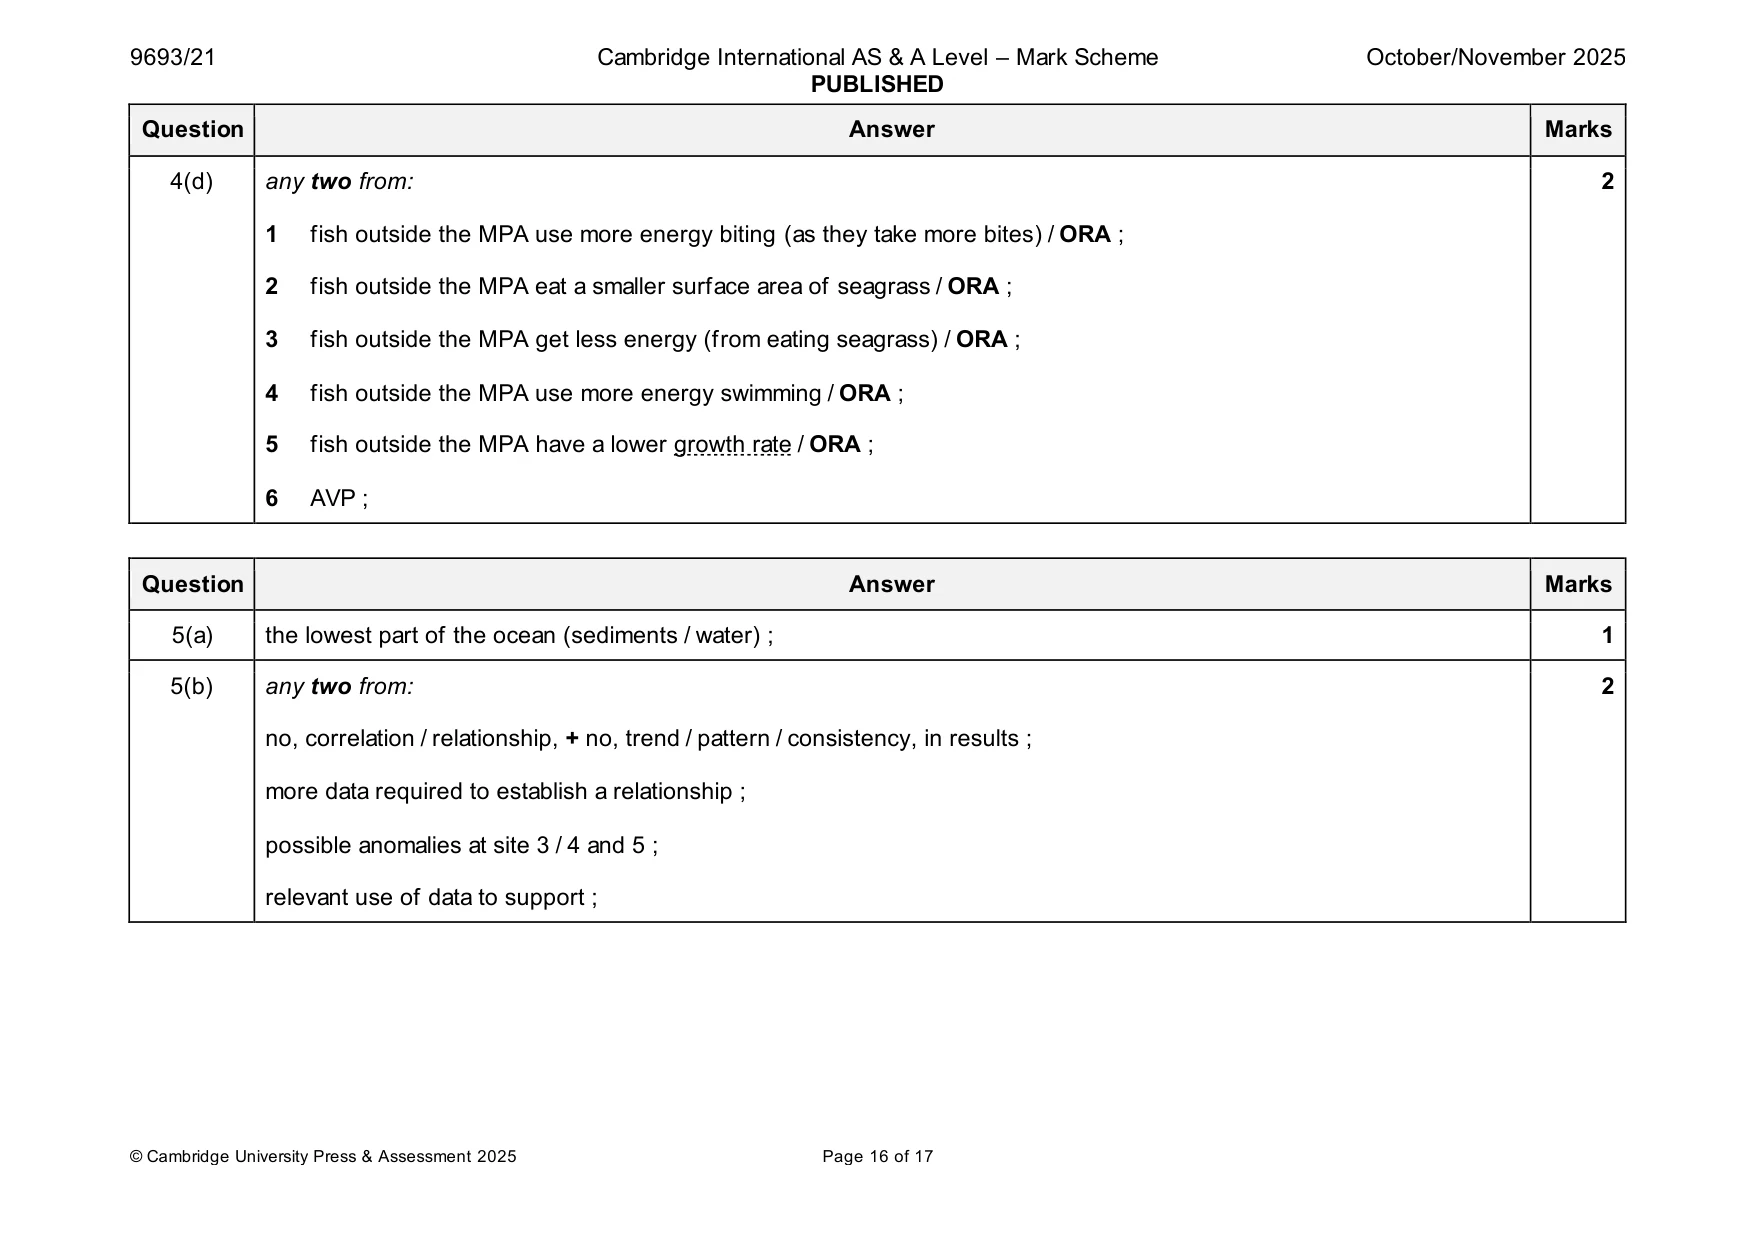
Mark scheme: 4(a) 1 fish inside the MPA take fewer bites (per minute) ORA ; 3 2 fish inside the MPA eat a greater area of seagrass (per minute) ORA ; plus any one from: 3 idea of rate of seagrass (blades) eaten inside area is approximately double compared to outside MPA ORA; 4 not a / less, significant difference in bites (per minute) inside MPA ORA ; 5 other data manipulation ; 6 AVP ; 4(b) any four from: 4 1 biomass estimated from, number of fish + (mean) length, of fish ; 2 mean length of fish is greater in MPA ORA ; 3 number of fish in MPA is (significantly) greater ORA ; 4 (therefore) total biomass is (significantly) greater in MPA ORA ; 5 reference to consistent / similar results in each area inside MPA compared to outside the MPA ; 6 appropriate comparison of data ; 4(c) fish inside the MPA, don’t feed on algae / only feed on seagrass ORA ; 3 fish inside the MPA spend longer feeding on seagrass ORA ; fish inside the MPA spend less time swimming (using energy) ORA ; 4(d) any two from: 2 1 fish outside the MPA use more energy biting (as they take more bites) / ORA ; 2 fish outside the MPA eat a smaller surface area of seagrass / ORA ; 3 fish outside the MPA get less energy (from eating seagrass) / ORA ; 4 fish outside the MPA use more energy swimming / ORA ; 5 fish outside the MPA have a lower growth rate / ORA ; 6 AVP ;
Q5 · Scientists studied the biodiversity at eight locations in the Arabian Sea
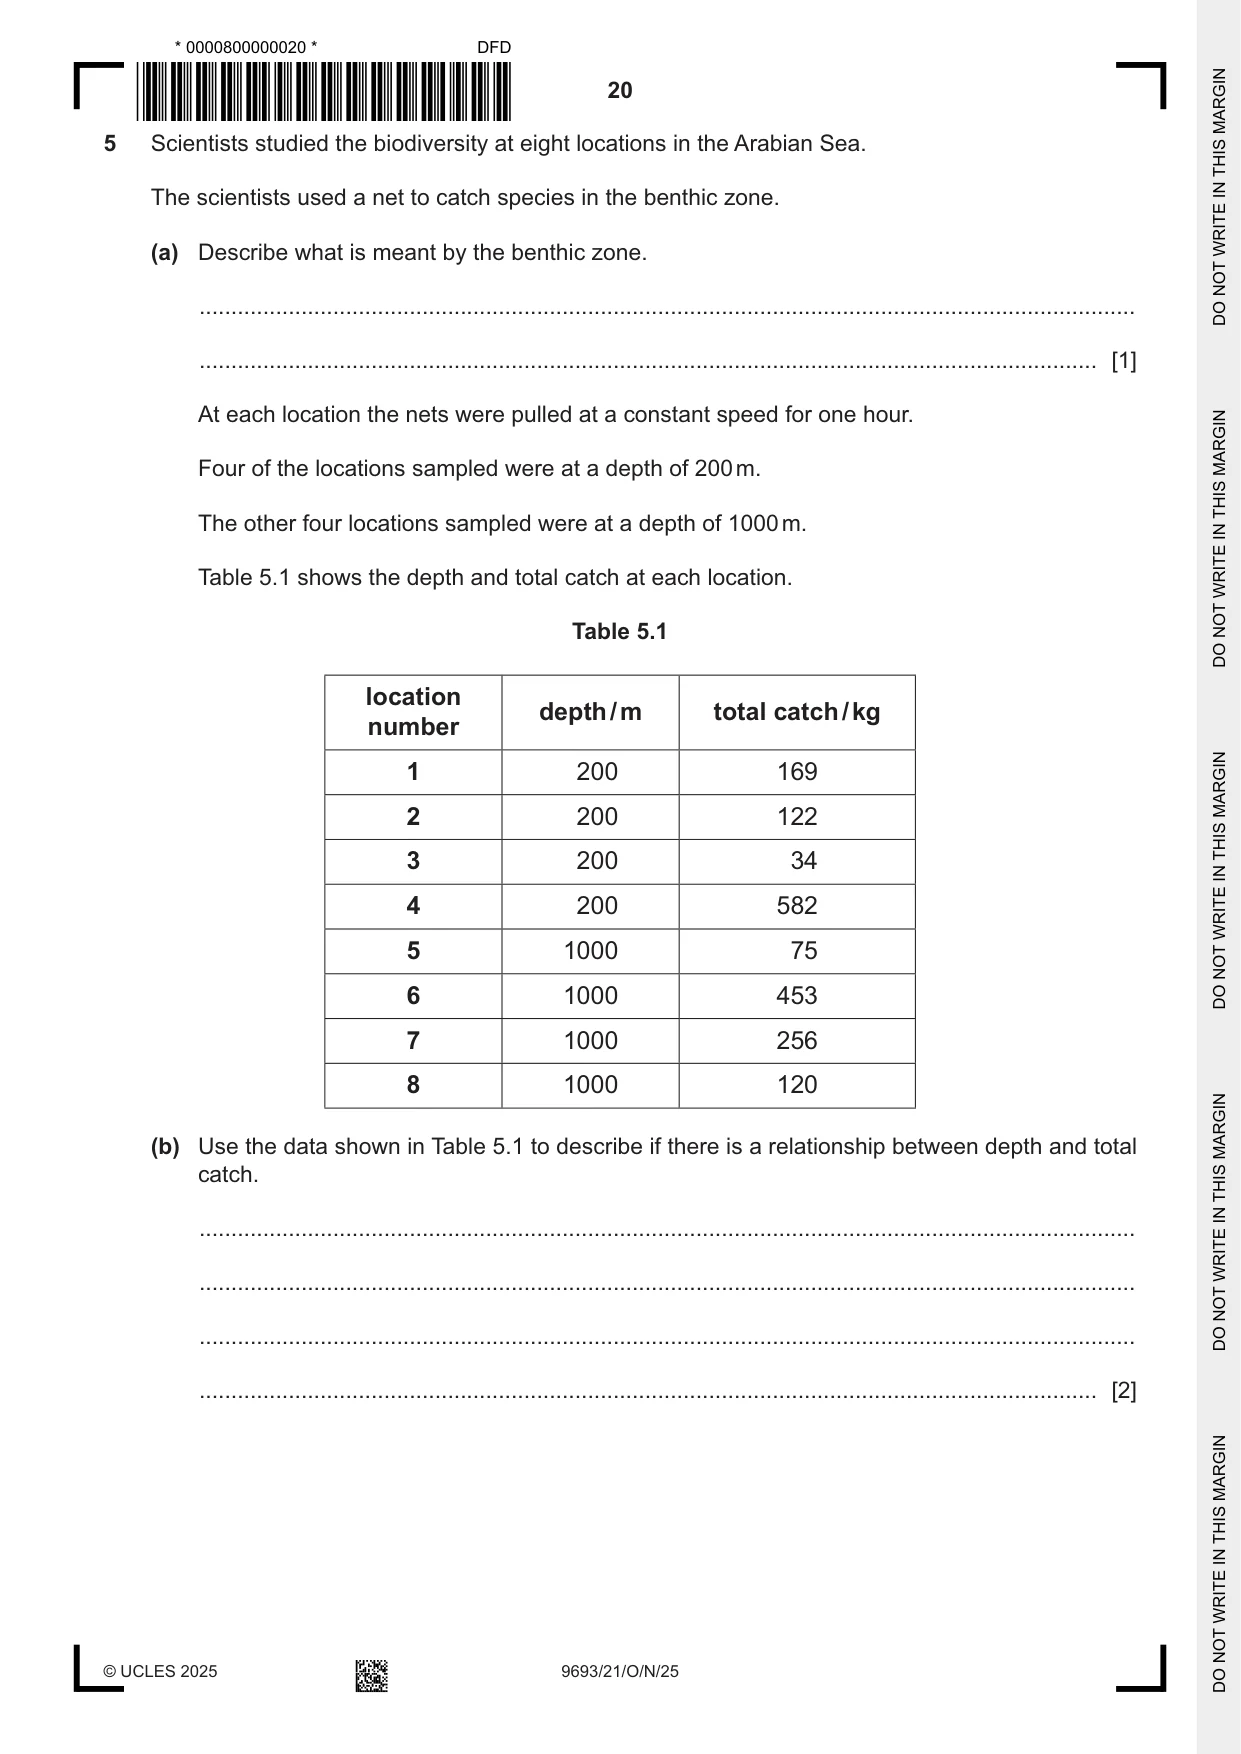
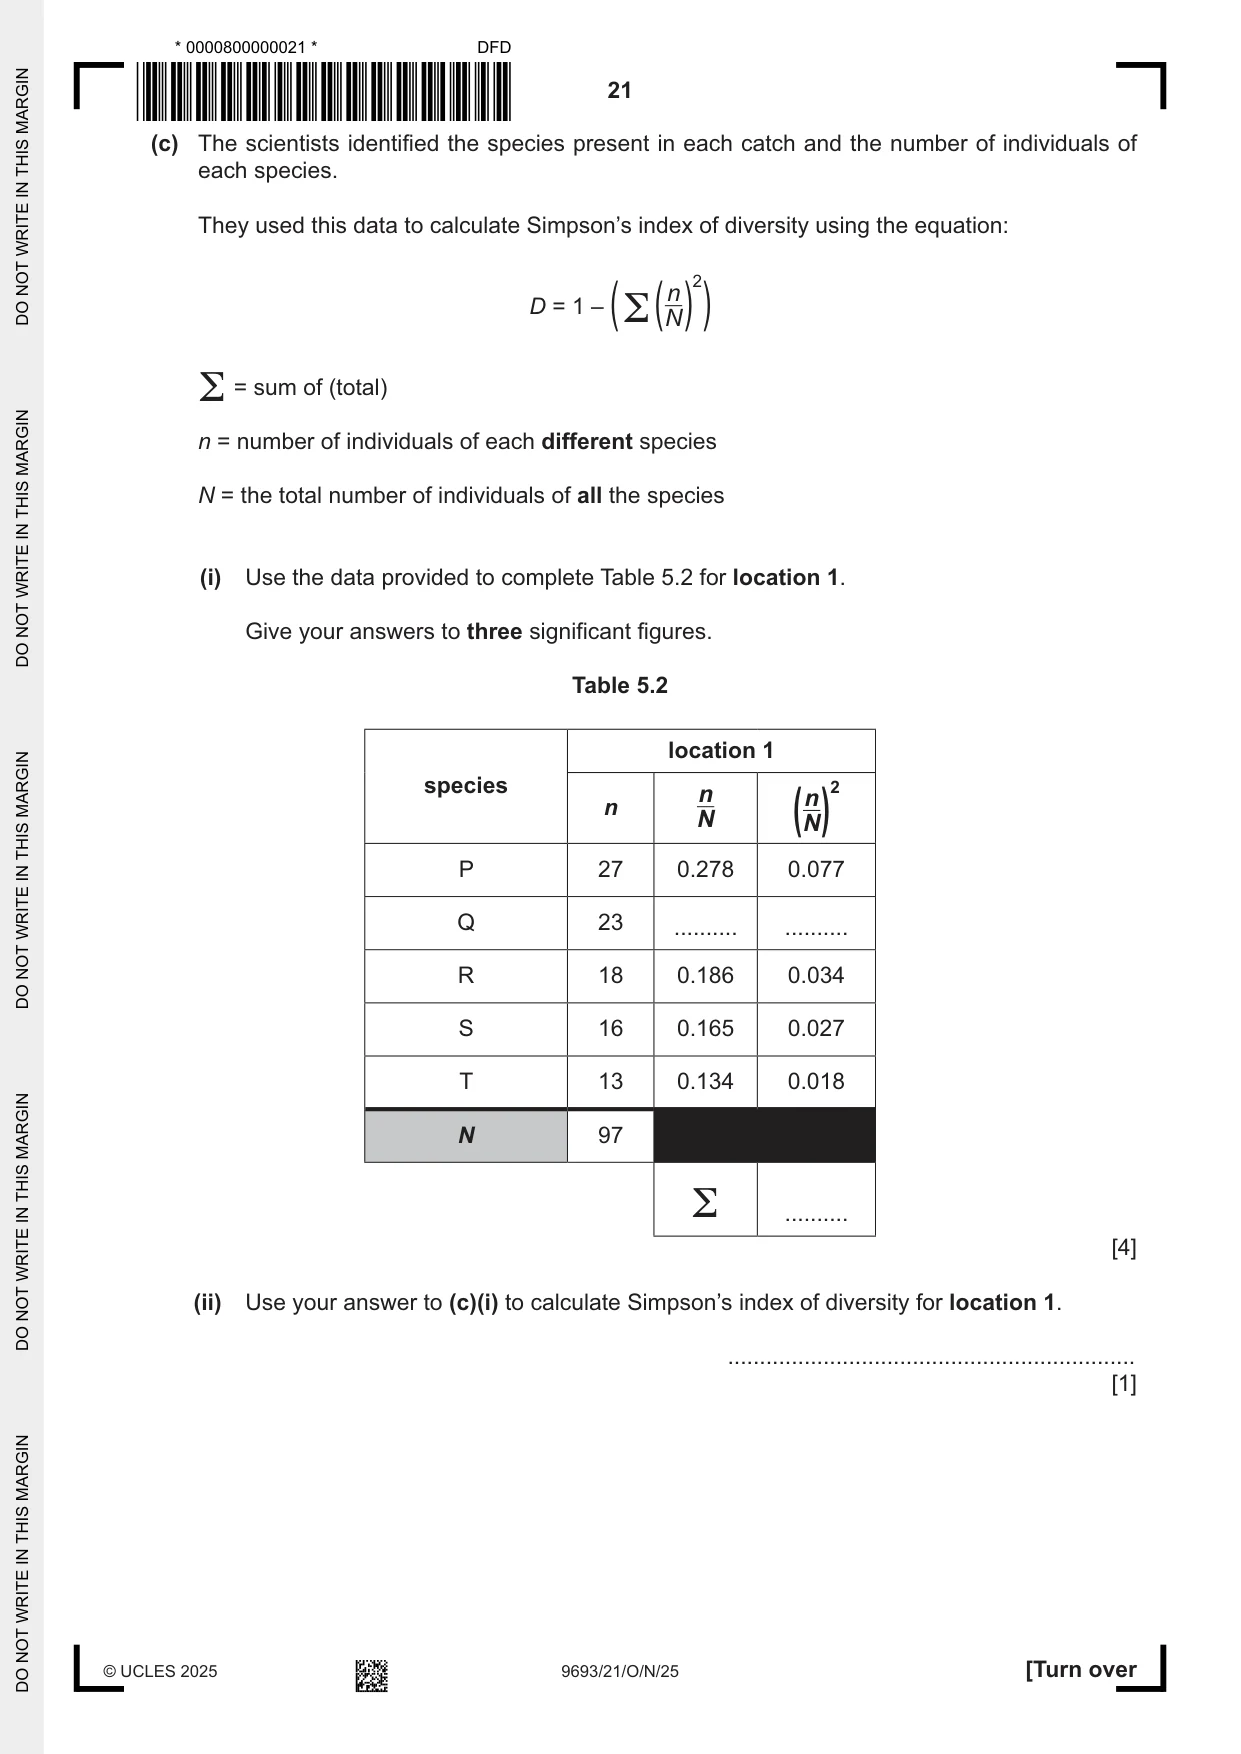
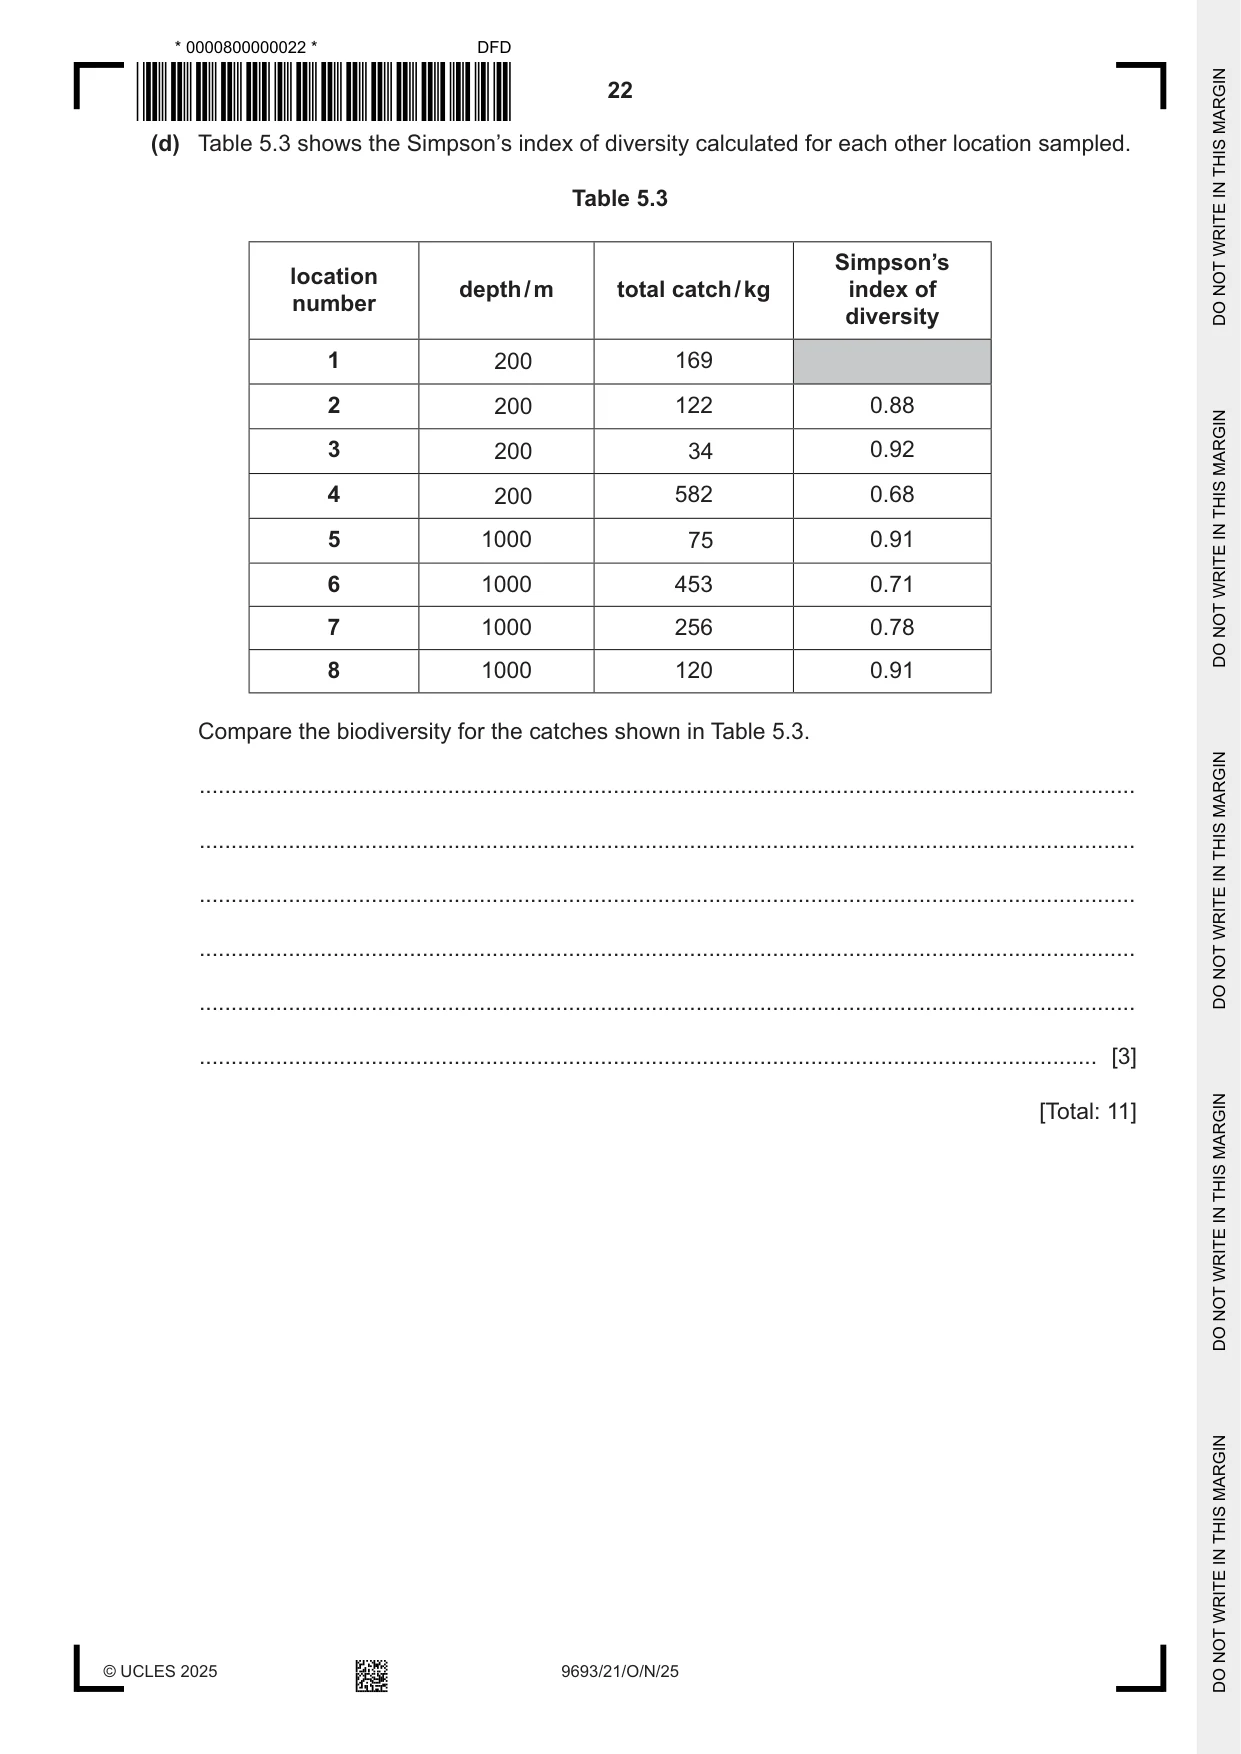
5 Scientists studied the biodiversity at eight locations in the Arabian Sea. The scientists used a net to catch species in the benthic zone. (a) Describe what is meant by the benthic zone. ................................................................................................................................................... ............................................................................................................................................. [1] At each location the nets were pulled at a constant speed for one hour. Four of the locations sampled were at a depth of 200 m. The other four locations sampled were at a depth of 1000 m. Table 5.1 shows the depth and total catch at each location. Table 5.1 location depth / m total catch / kg number 1 200 169 2 200 122 3 200 34 4 200 582 5 1000 75 6 1000 453 7 1000 256 8 1000 120 (b) Use the data shown in Table 5.1 to describe if there is a relationship between depth and total catch. ................................................................................................................................................... ................................................................................................................................................... ................................................................................................................................................... ............................................................................................................................................. [2] (c) The scientists identified the species present in each catch and the number of individuals of each species. They used this data to calculate Simpson’s index of diversity using the equation: 2 D = 1 – (Σ(nN) ) = sum of (total) Σ n = number of individuals of each different species N = the total number of individuals of all the species (i) Use the data provided to complete Table 5.2 for location 1. Give your answers to three significant figures. Table 5.2 location 1 species 2 n n n N ( N) P 27 0.278 0.077 Q 23 .......... .......... R 18 0.186 0.034 S 16 0.165 0.027 T 13 0.134 0.018 N 97 Σ .......... [4] (ii) Use your answer to (c)(i) to calculate Simpson’s index of diversity for location 1. ................................................................ [1] (d) Table 5.3 shows the Simpson’s index of diversity calculated for each other location sampled. Table 5.3 Simpson’s location depth / m total catch / kg index of number diversity 1 200 169 2 200 122 0.88 3 200 34 0.92 4 200 582 0.68 5 1000 75 0.91 6 1000 453 0.71 7 1000 256 0.78 8 1000 120 0.91 Compare the biodiversity for the catches shown in Table 5.3. ................................................................................................................................................... ................................................................................................................................................... ................................................................................................................................................... ................................................................................................................................................... ................................................................................................................................................... ............................................................................................................................................. [3] [Total: 11]
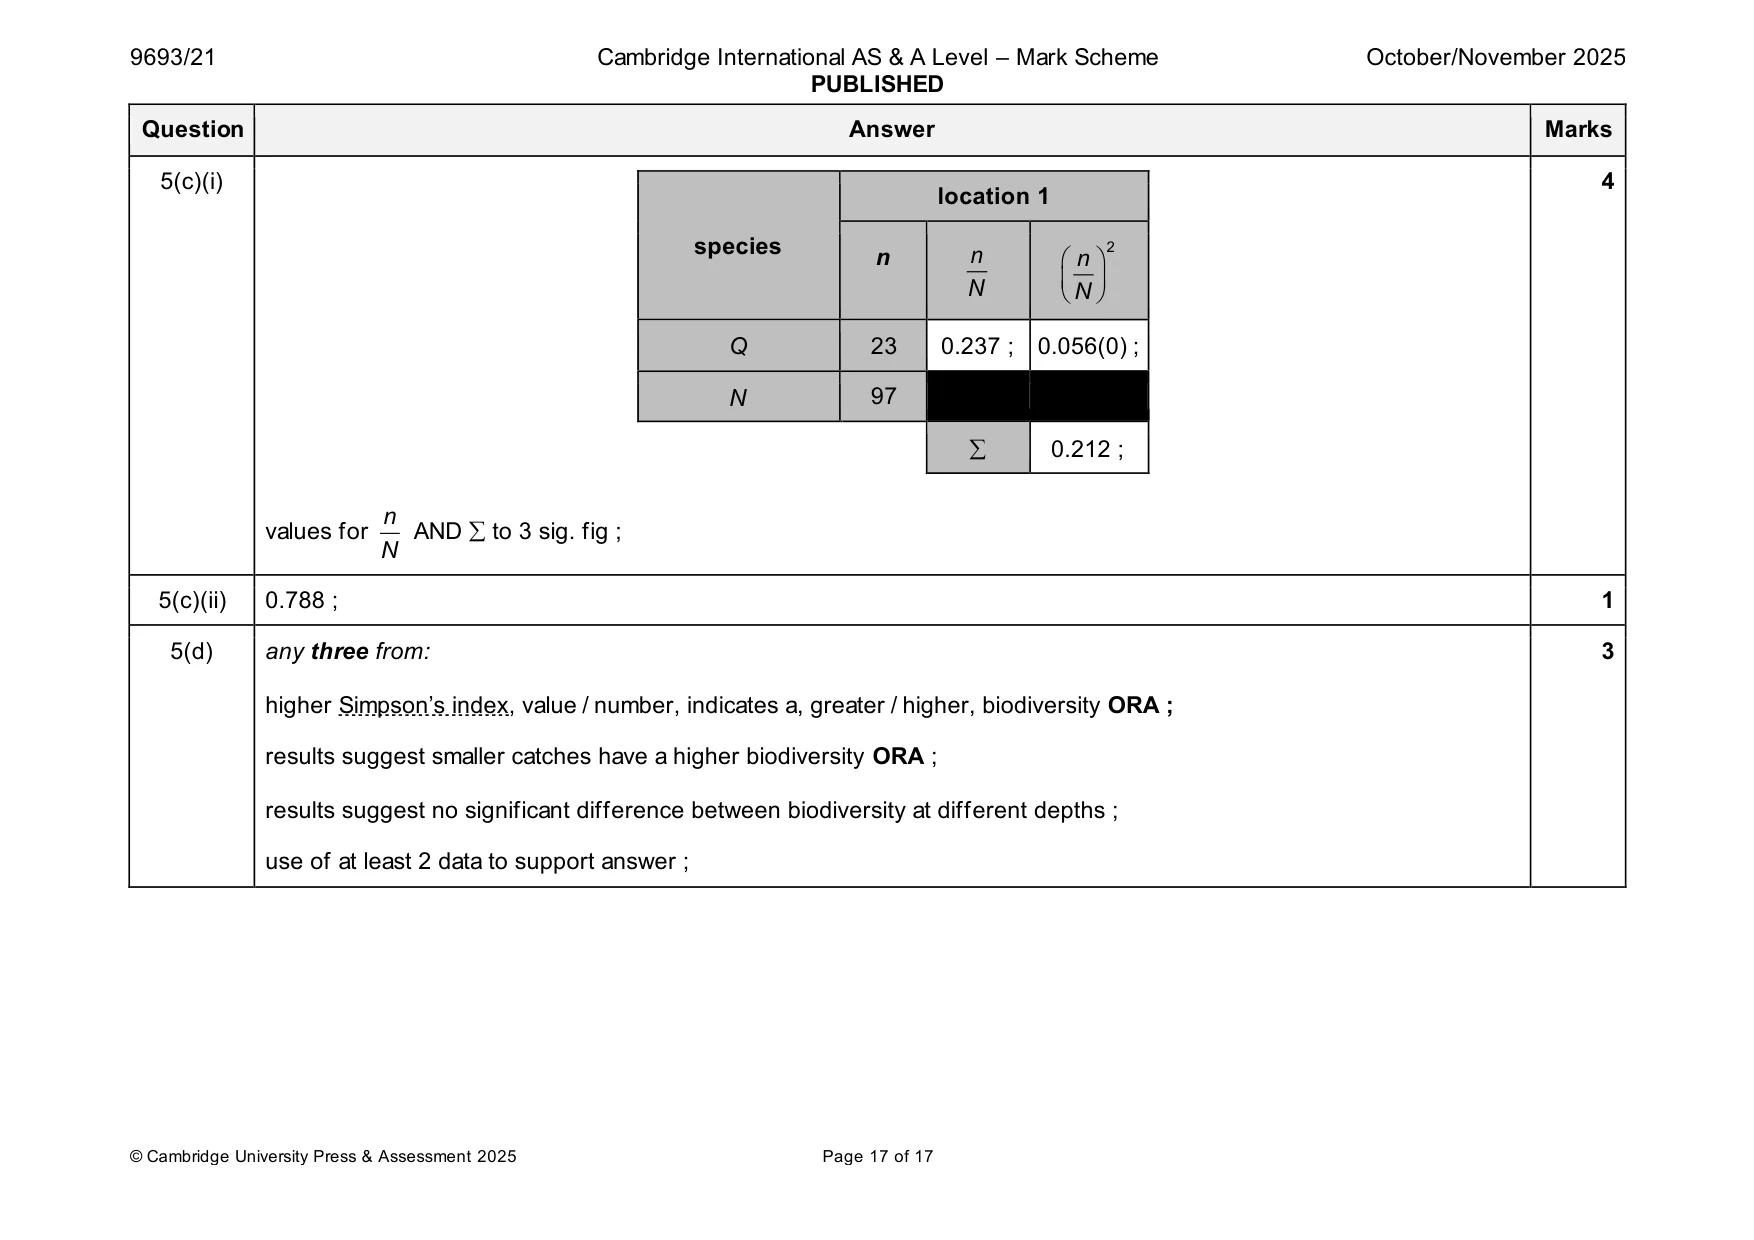
Mark scheme: 5(a) the lowest part of the ocean (sediments / water) ; 1 5(b) any two from: 2 no, correlation / relationship, + no, trend / pattern / consistency, in results ; more data required to establish a relationship ; possible anomalies at site 3 / 4 and 5 ; relevant use of data to support ; 5(c)(i) 4 location 1 species 2 n n n N N Q 23 0.237 ; 0.056(0) ; N 97 0.212 ; n values for AND to 3 sig. fig ; N 5(c)(ii) 0.788 ; 1 5(d) any three from: 3 higher Simpson’s index, value / number, indicates a, greater / higher, biodiversity ORA ; results suggest smaller catches have a higher biodiversity ORA ; results suggest no significant difference between biodiversity at different depths ; use of at least 2 data to support answer ;
What was in this paper
The subtopics covered by these 5 questions, and how many questions each got. Open one in a new tab to see every Cambridge question on it.
What you needed in this session
Cambridge’s own grade thresholds for 2025 Oct/Nov, Paper 2 · Variant 1. A higher threshold means an easier paper — the bar moves with how the cohort did.