Cambridge A Level Marine Science 9693 — 2019 May/June Paper 2 · Variant 1
9693/21/M/J/19 · 4 questions · 50 marks · ≈56 min
The question paper and its mark scheme, free to read here and free to download. This is Cambridge’s own paper, exactly as it was sat.
Question paper16 pages




Mark scheme8 pages
Answers below. Sit the paper first if you are practising.
Questions as text
Q1 · The common limpet, Patella vulgata, a mollusc that inhabits rocky shores across Northern…
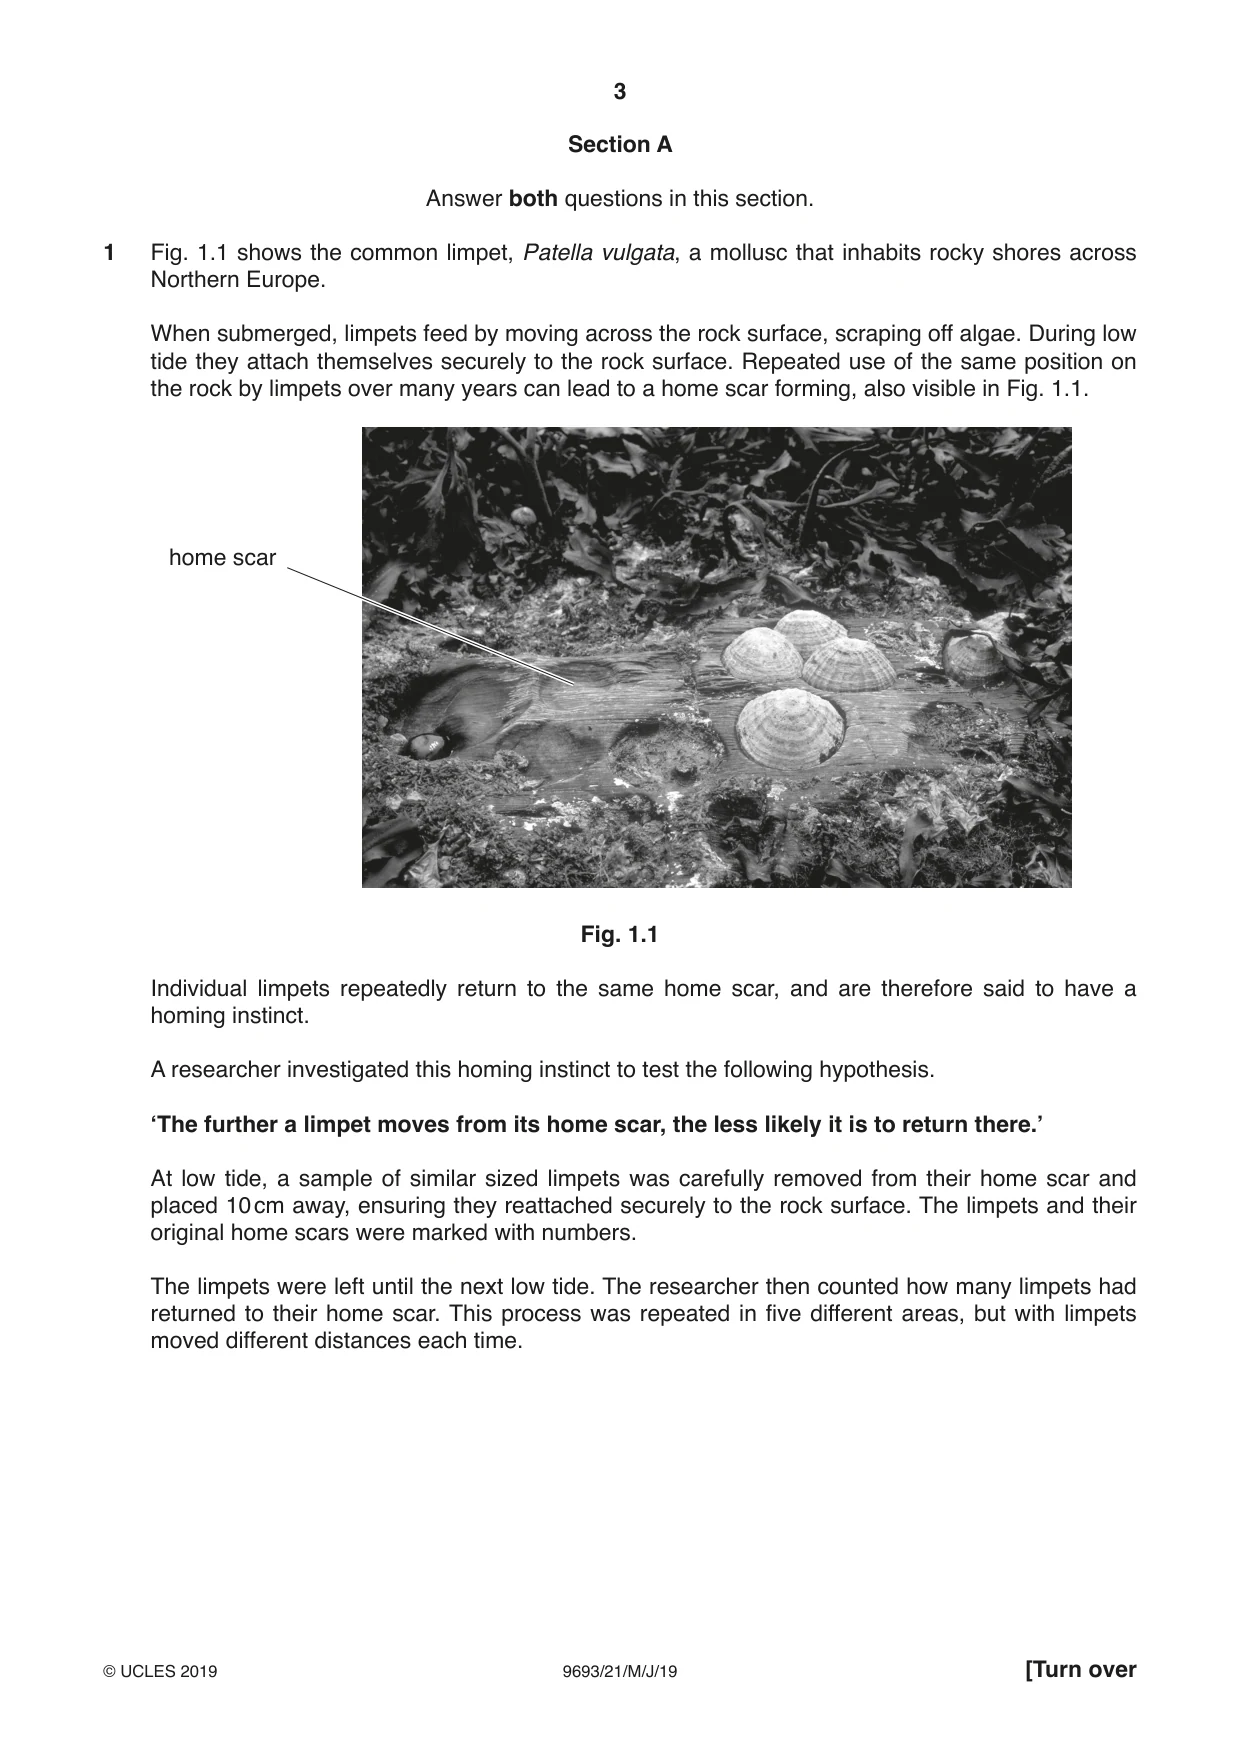
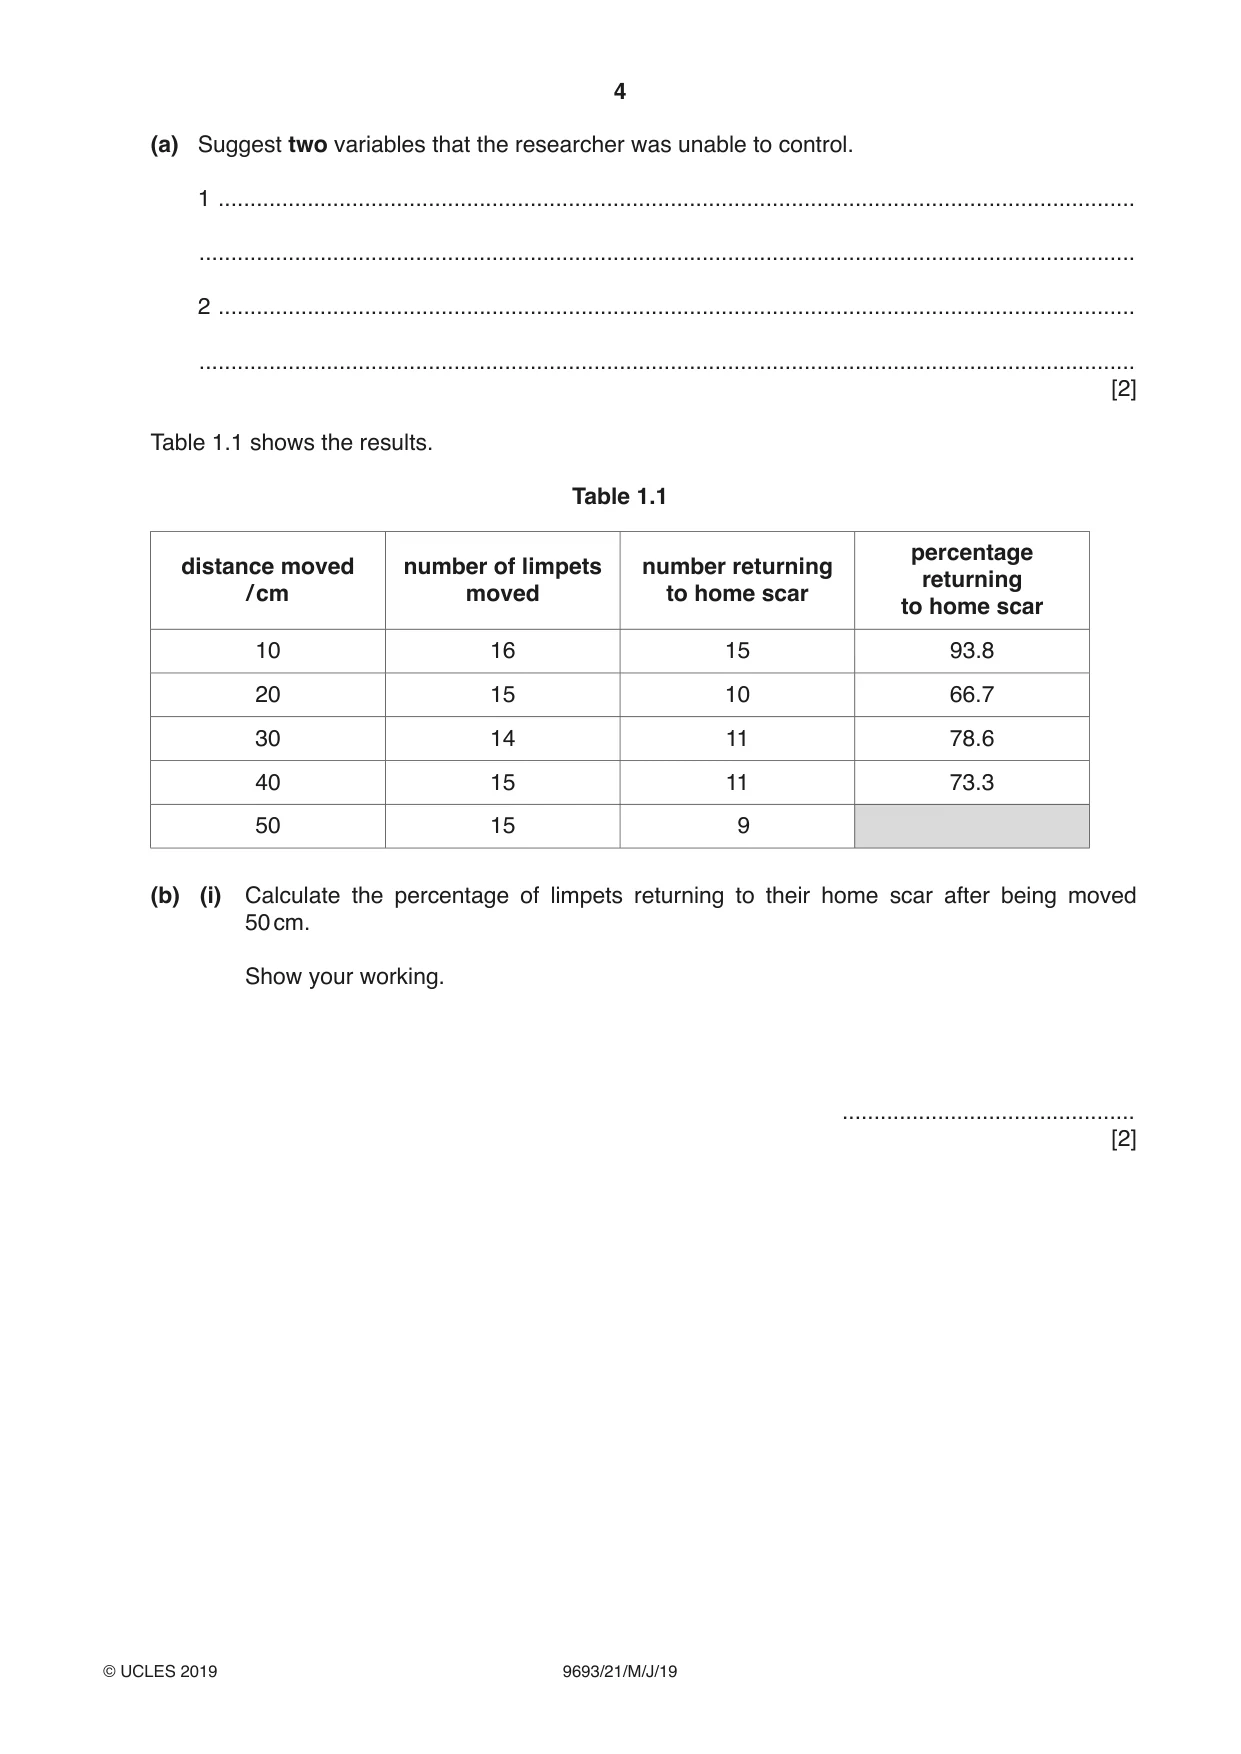
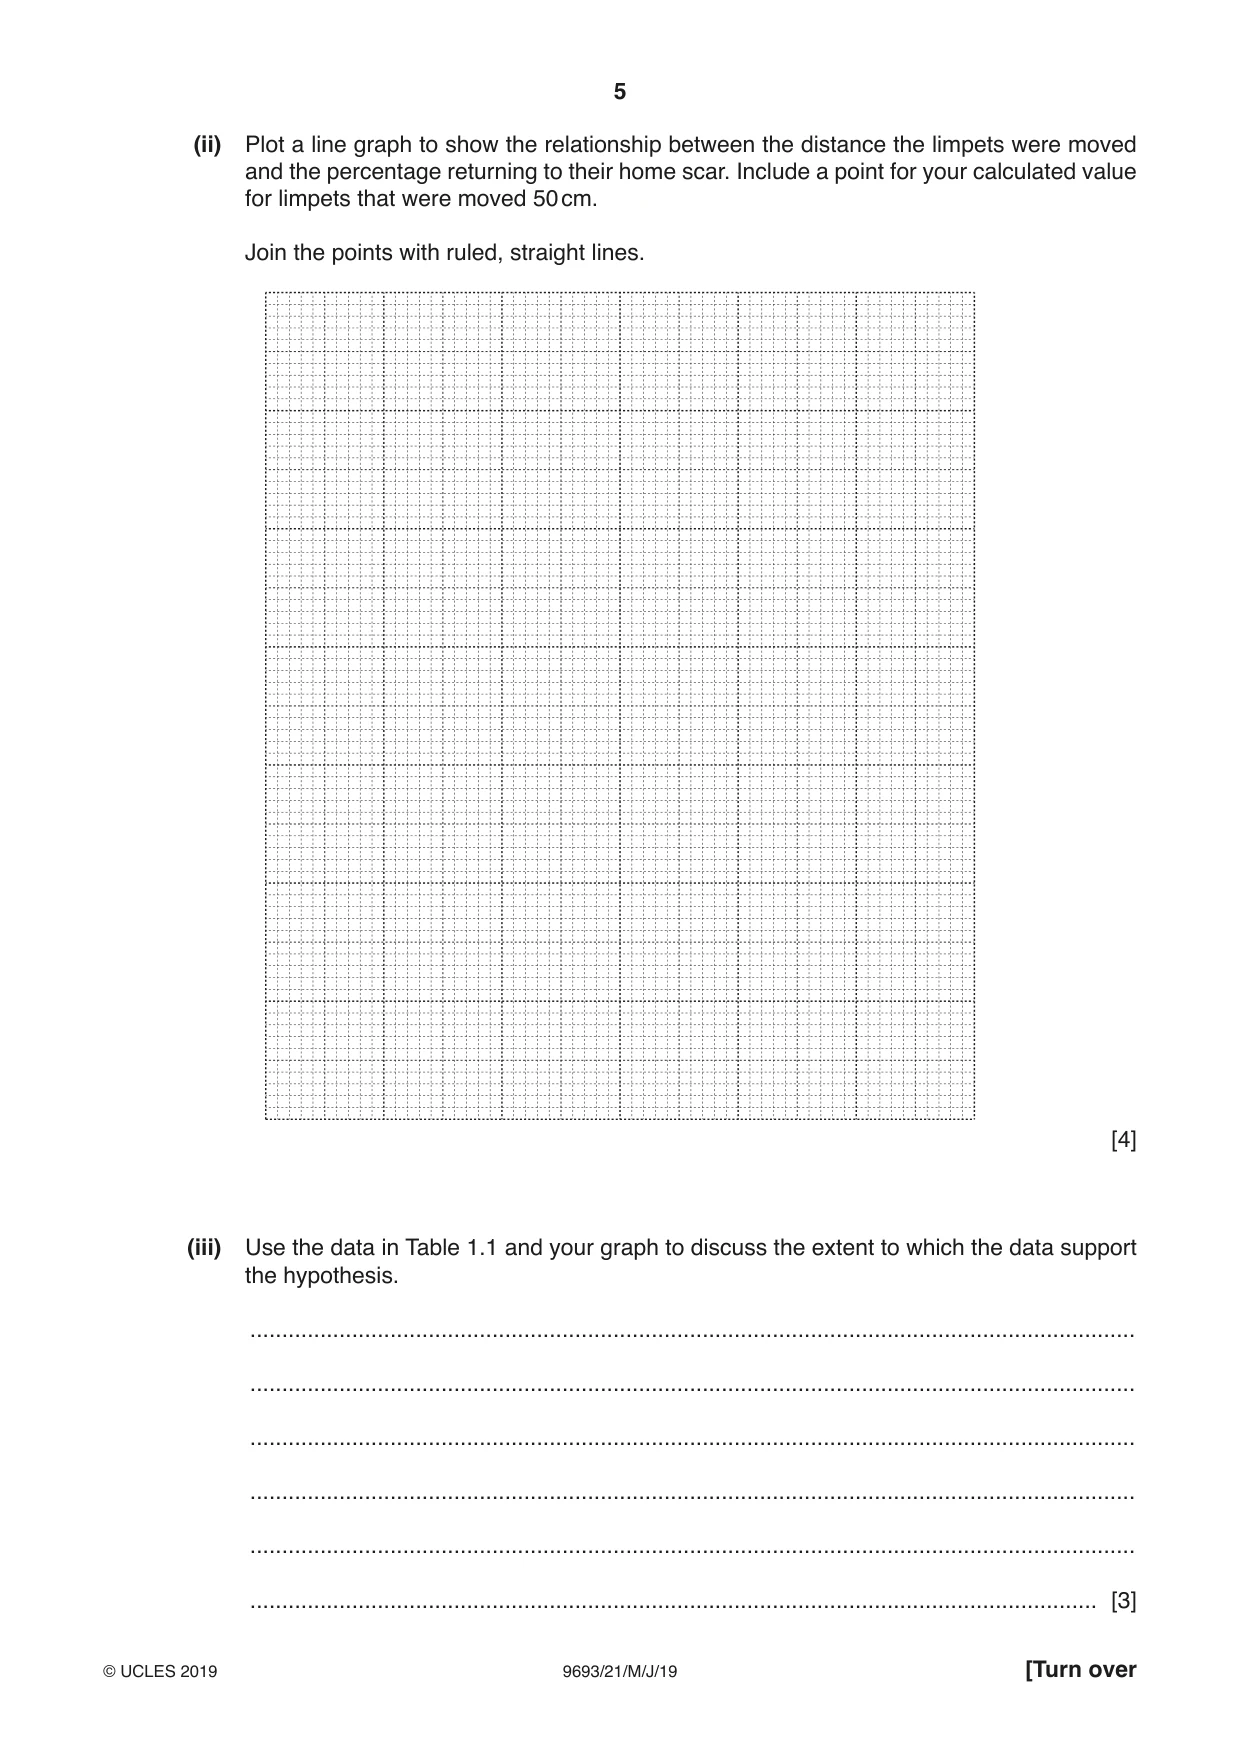
1 Fig. 1.1 shows the common limpet, Patella vulgata, a mollusc that inhabits rocky shores across Northern Europe. When submerged, limpets feed by moving across the rock surface, scraping off algae. During low tide they attach themselves securely to the rock surface. Repeated use of the same position on the rock by limpets over many years can lead to a home scar forming, also visible in Fig. 1.1. home scar Fig. 1.1 Individual limpets repeatedly return to the same home scar, and are therefore said to have a homing instinct. A researcher investigated this homing instinct to test the following hypothesis. ‘The further a limpet moves from its home scar, the less likely it is to return there.’ At low tide, a sample of similar sized limpets was carefully removed from their home scar and placed 10 cm away, ensuring they reattached securely to the rock surface. The limpets and their original home scars were marked with numbers. The limpets were left until the next low tide. The researcher then counted how many limpets had returned to their home scar. This process was repeated in five different areas, but with limpets moved different distances each time. (a) Suggest two variables that the researcher was unable to control. 1 ................................................................................................................................................ ................................................................................................................................................... 2 ................................................................................................................................................ ................................................................................................................................................... [2] Table 1.1 shows the results. Table 1.1 percentage distance moved number of limpets number returning returning / cm moved to home scar to home scar 10 16 15 93.8 20 15 10 66.7 30 14 11 78.6 40 15 11 73.3 50 15 9 (b) (i) Calculate the percentage of limpets returning to their home scar after being moved 50 cm. Show your working. .............................................. [2] (ii) Plot a line graph to show the relationship between the distance the limpets were moved and the percentage returning to their home scar. Include a point for your calculated value for limpets that were moved 50 cm. Join the points with ruled, straight lines. [4] (iii) Use the data in Table 1.1 and your graph to discuss the extent to which the data support the hypothesis. ........................................................................................................................................... ........................................................................................................................................... ........................................................................................................................................... ........................................................................................................................................... ........................................................................................................................................... ..................................................................................................................................... [3] (c) Suggest and explain how the homing instinct may increase the chance of survival of limpets. ................................................................................................................................................... ................................................................................................................................................... ................................................................................................................................................... ............................................................................................................................................. [2] [Total: 13]
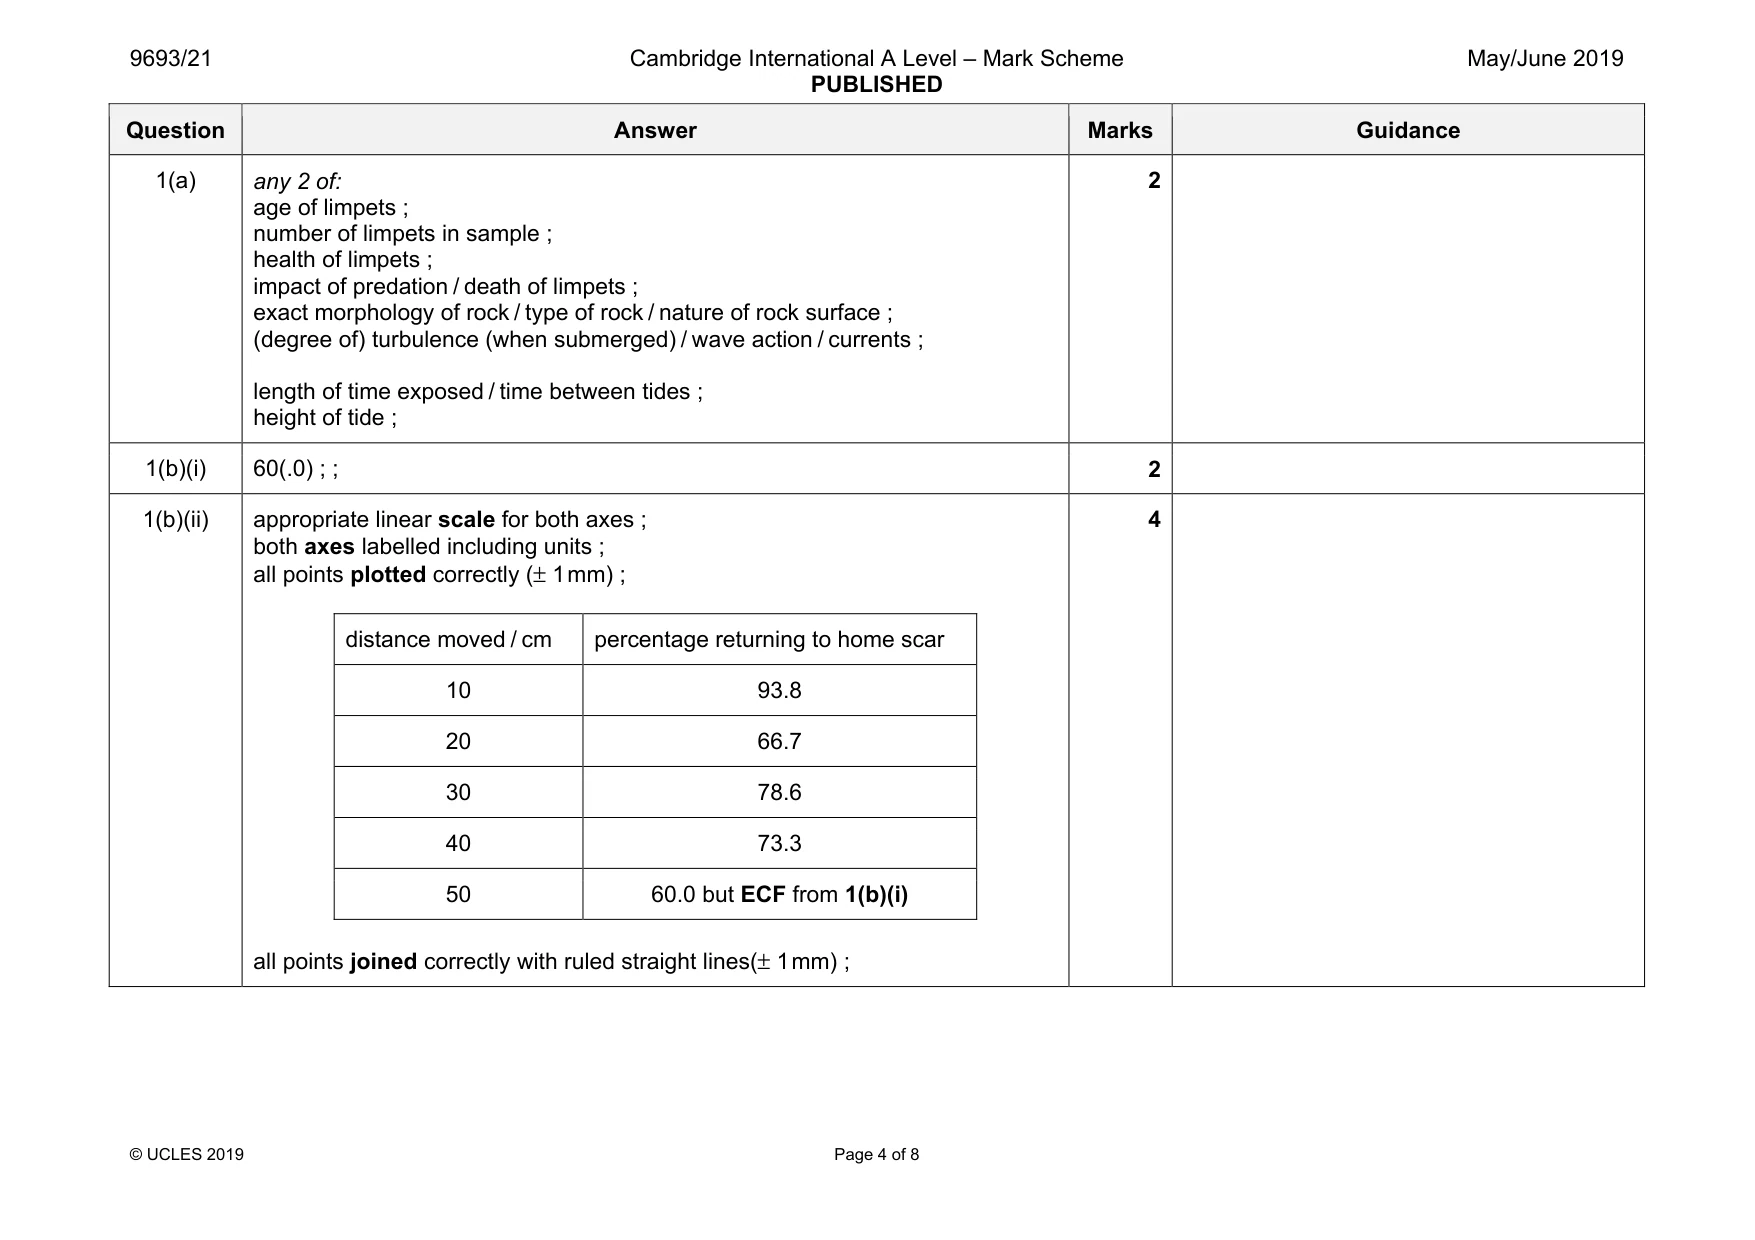
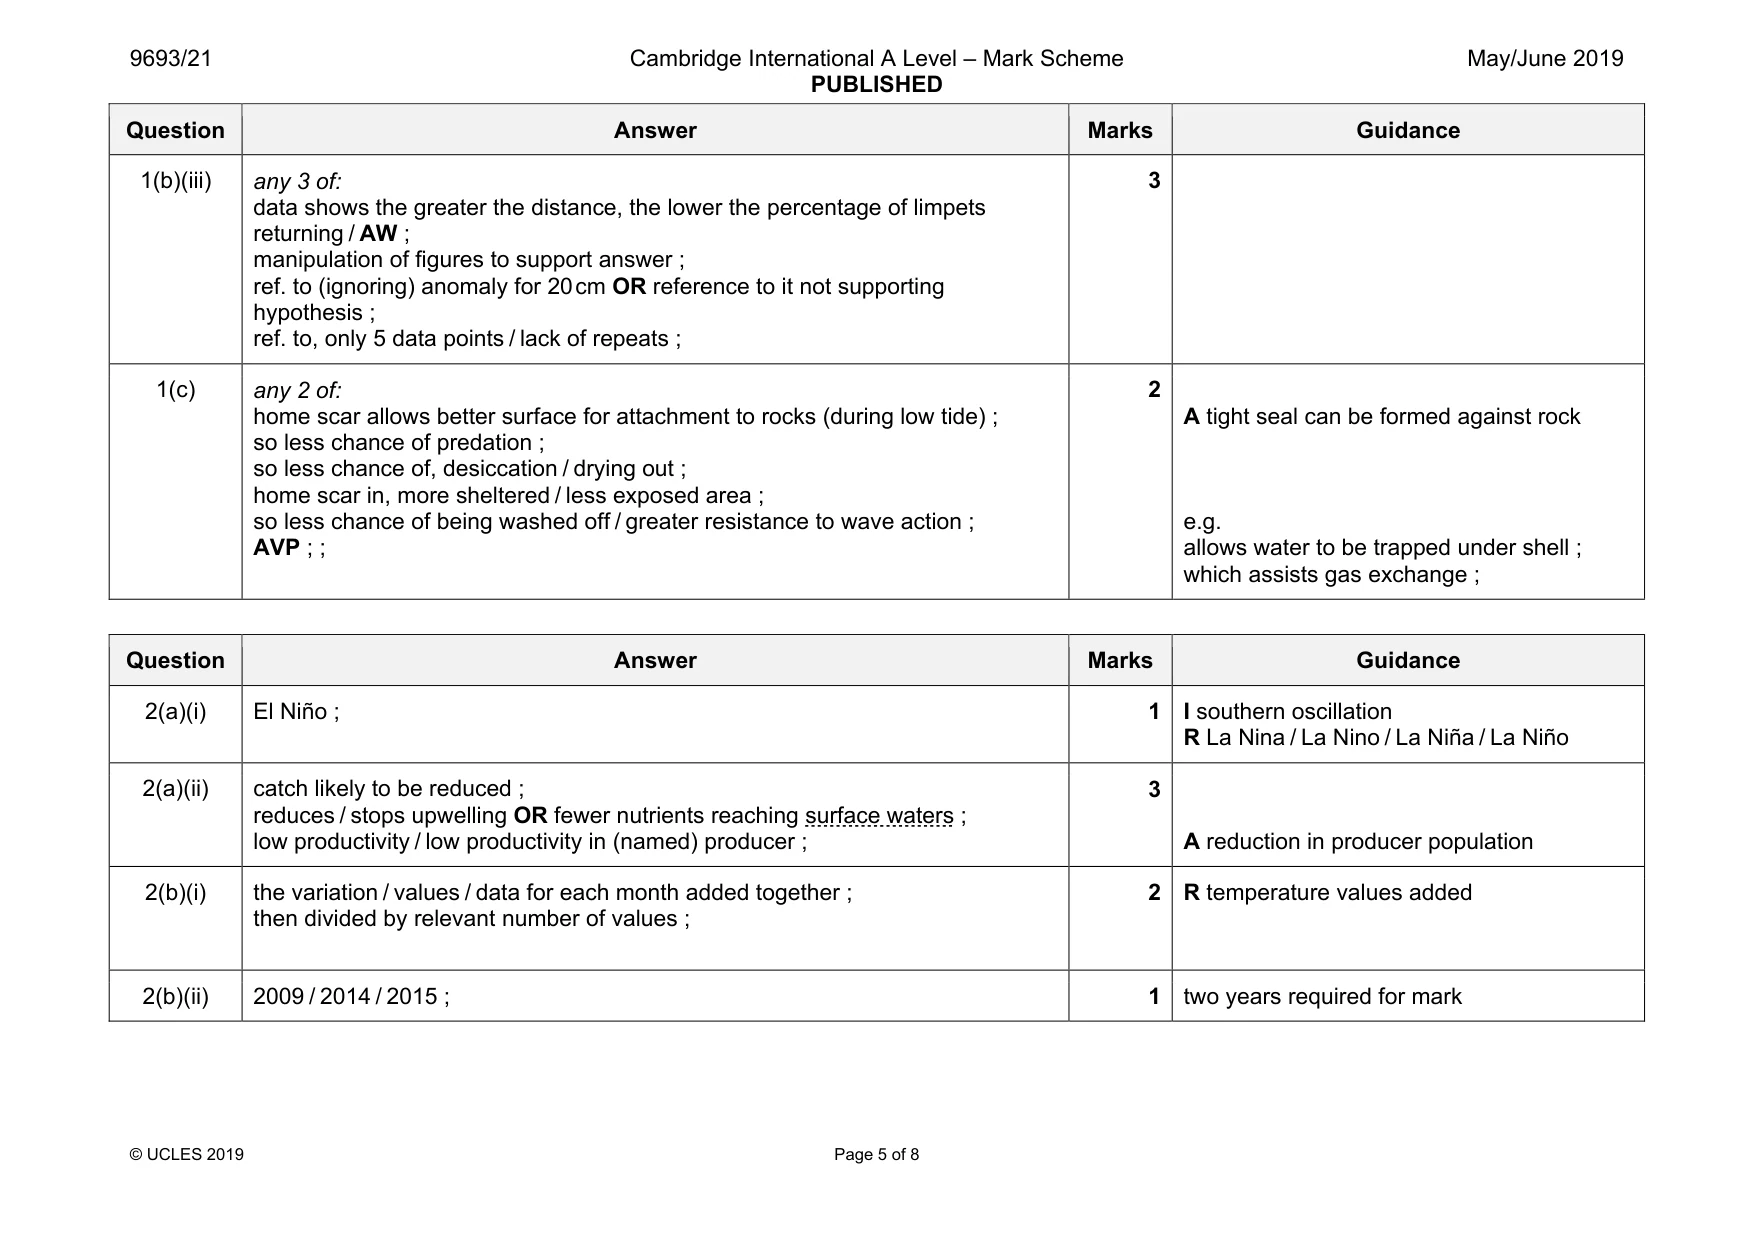
Mark scheme: 1(a) any 2 of: age of limpets ; number of limpets in sample ; health of limpets ; impact of predation / death of limpets ; exact morphology of rock / type of rock / nature of rock surface ; (degree of) turbulence (when submerged) / wave action / currents ; length of time exposed / time between tides ; height of tide ; 2 1(b)(i) 60(.0) ; ; 2 1(b)(ii) appropriate linear scale for both axes ; both axes labelled including units ; all points plotted correctly (± 1 mm) ; distance moved / cm percentage returning to home scar 10 93.8 20 66.7 30 78.6 40 73.3 50 60.0 but ECF from 1(b)(i) all points joined correctly with ruled straight lines(± 1 mm) ; 4 Question Answer Marks Guidance 1(b)(iii) any 3 of: data shows the greater the distance, the lower the percentage of limpets returning / AW ; manipulation of figures to support answer ; ref. to (ignoring) anomaly for 20 cm OR reference to it not supporting hypothesis ; ref. to, only 5 data points / lack of repeats ; 3 1(c) any 2 of: home scar allows better surface for attachment to rocks (during low tide) ; so less chance of predation ; so less chance of, desiccation / drying out ; home scar in, more sheltered / less exposed area ; so less chance of being washed off / greater resistance to wave action ; AVP ; ; 2 A tight seal can be formed against rock e.g. allows water to be trapped under shell ; which assists gas exchange ;
Q2 · How the sea surface temperature (SST) of the Pacific Ocean in December 1997 varied from…
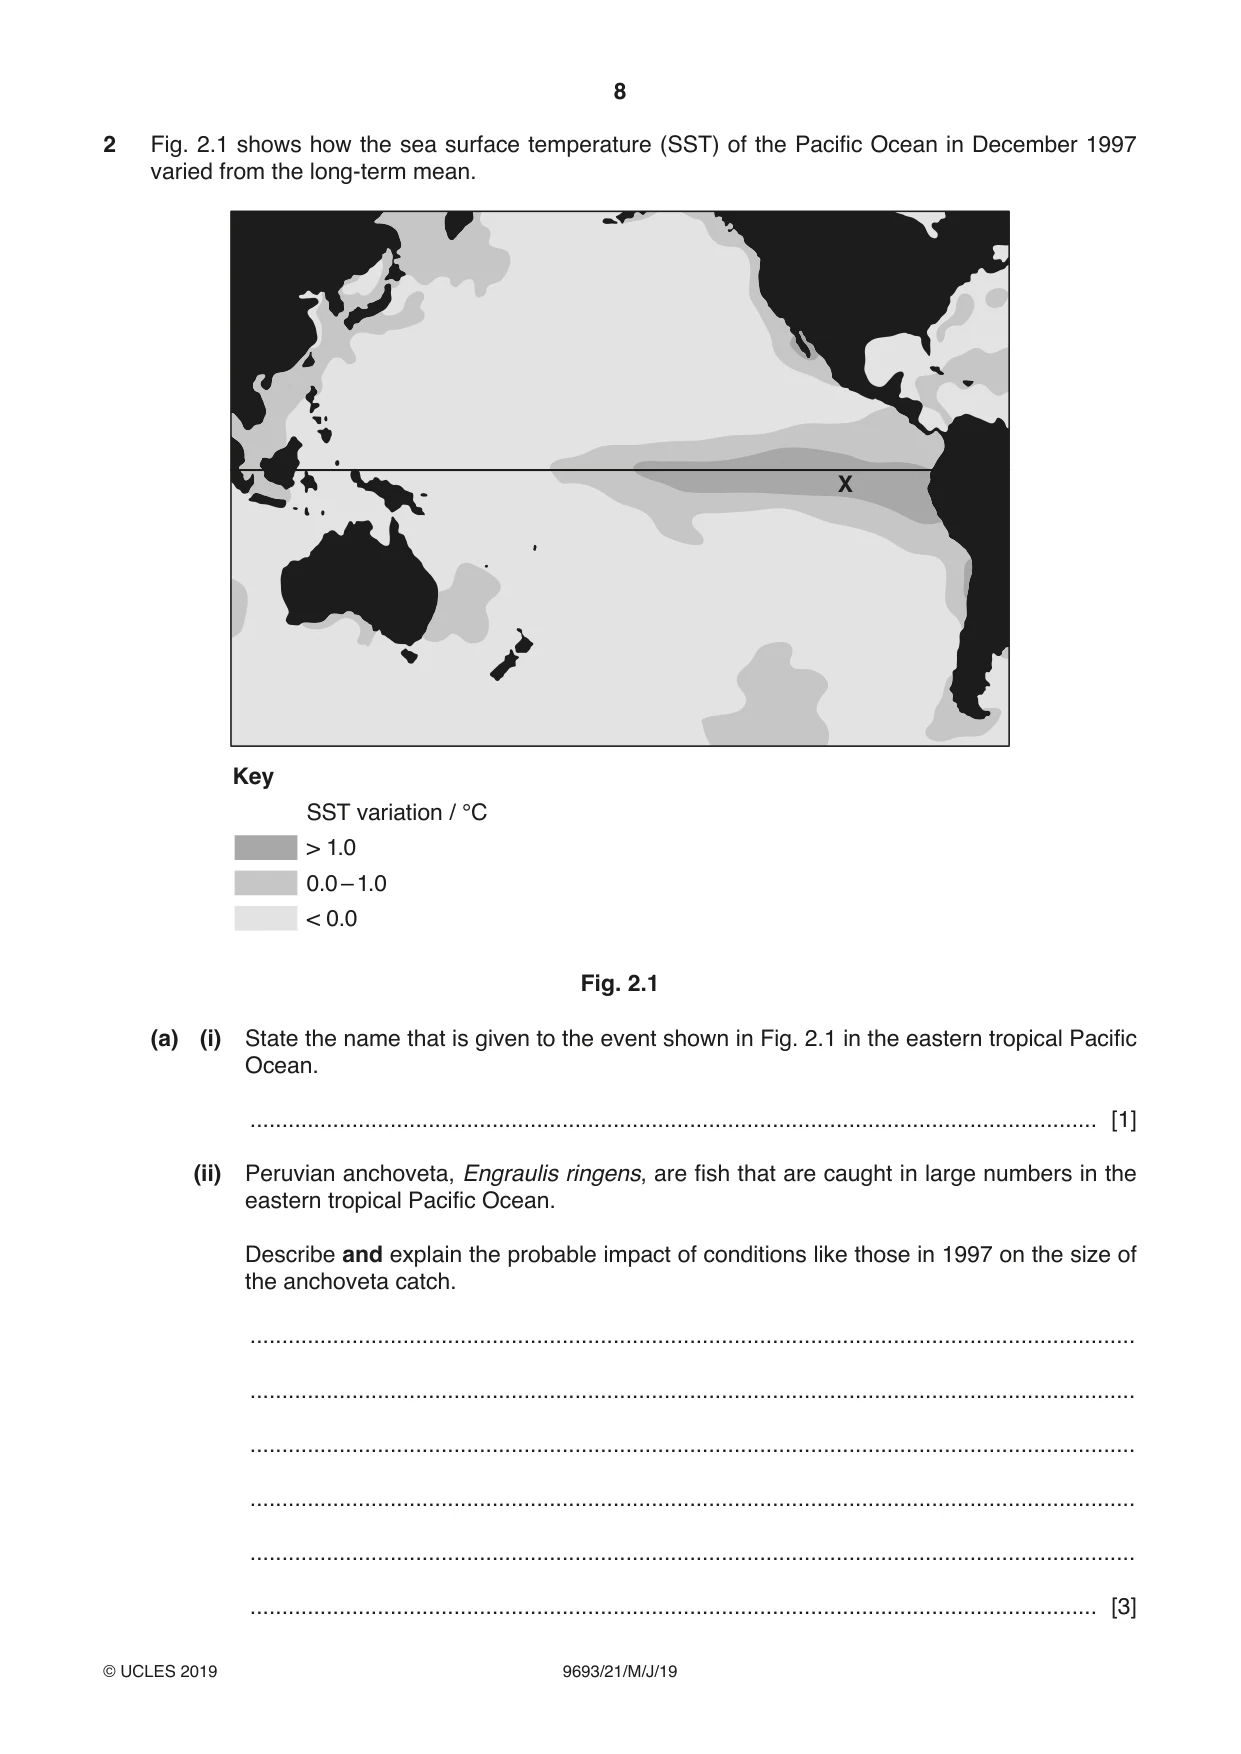
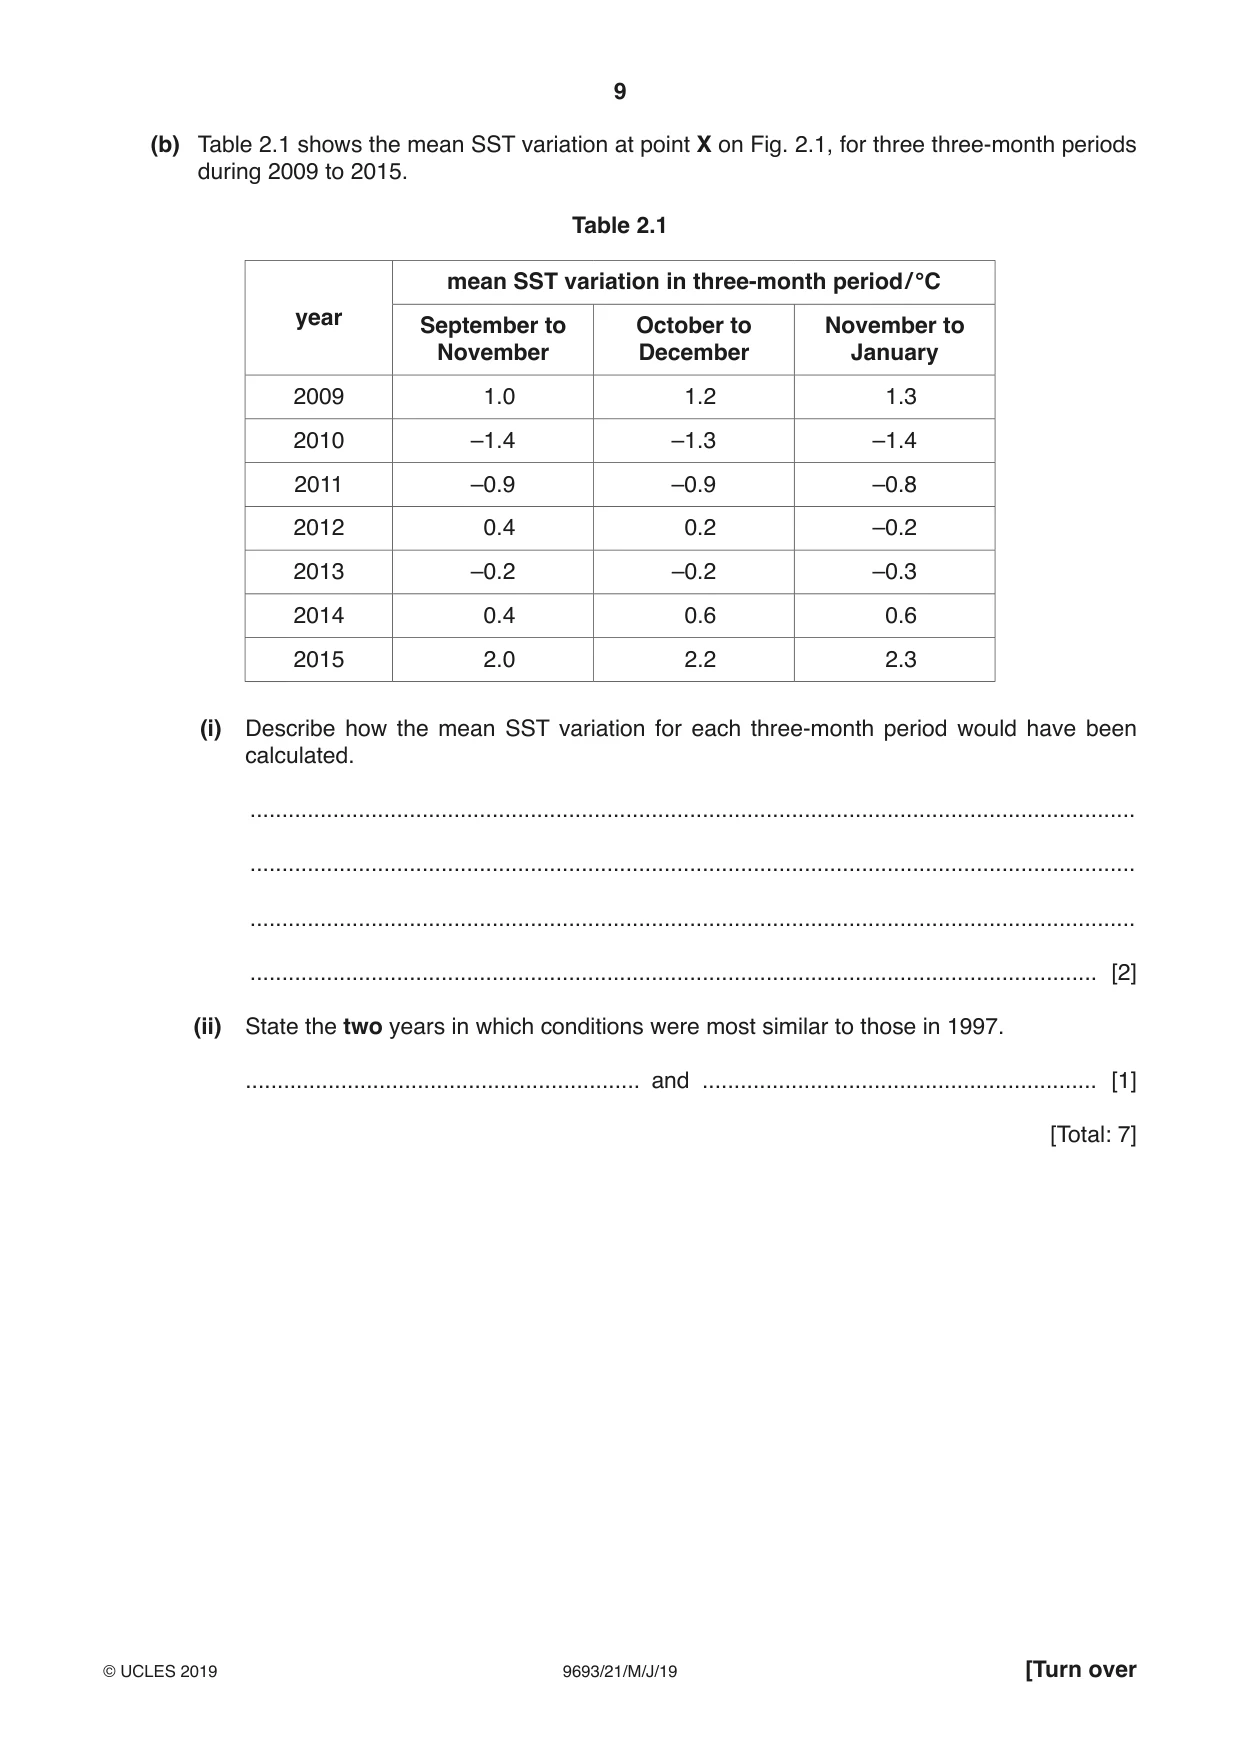
2 Fig. 2.1 shows how the sea surface temperature (SST) of the Pacific Ocean in December 1997 varied from the long-term mean. X Key SST variation / °C > 1.0 0.0 – 1.0 < 0.0 Fig. 2.1 (a) (i) State the name that is given to the event shown in Fig. 2.1 in the eastern tropical Pacific Ocean. ..................................................................................................................................... [1] (ii) Peruvian anchoveta, Engraulis ringens, are fish that are caught in large numbers in the eastern tropical Pacific Ocean. Describe and explain the probable impact of conditions like those in 1997 on the size of the anchoveta catch. ........................................................................................................................................... ........................................................................................................................................... ........................................................................................................................................... ........................................................................................................................................... ........................................................................................................................................... ..................................................................................................................................... [3] (b) Table 2.1 shows the mean SST variation at point X on Fig. 2.1, for three three-month periods during 2009 to 2015. Table 2.1 mean SST variation in three‑month period / °C year September to October to November to November December January 2009 1.0 1.2 1.3 2010 –1.4 –1.3 –1.4 2011 –0.9 –0.9 –0.8 2012 0.4 0.2 –0.2 2013 –0.2 –0.2 –0.3 2014 0.4 0.6 0.6 2015 2.0 2.2 2.3 (i) Describe how the mean SST variation for each three-month period would have been calculated. ........................................................................................................................................... ........................................................................................................................................... ........................................................................................................................................... ..................................................................................................................................... [2] (ii) State the two years in which conditions were most similar to those in 1997. .............................................................. and .............................................................. [1] [Total: 7]
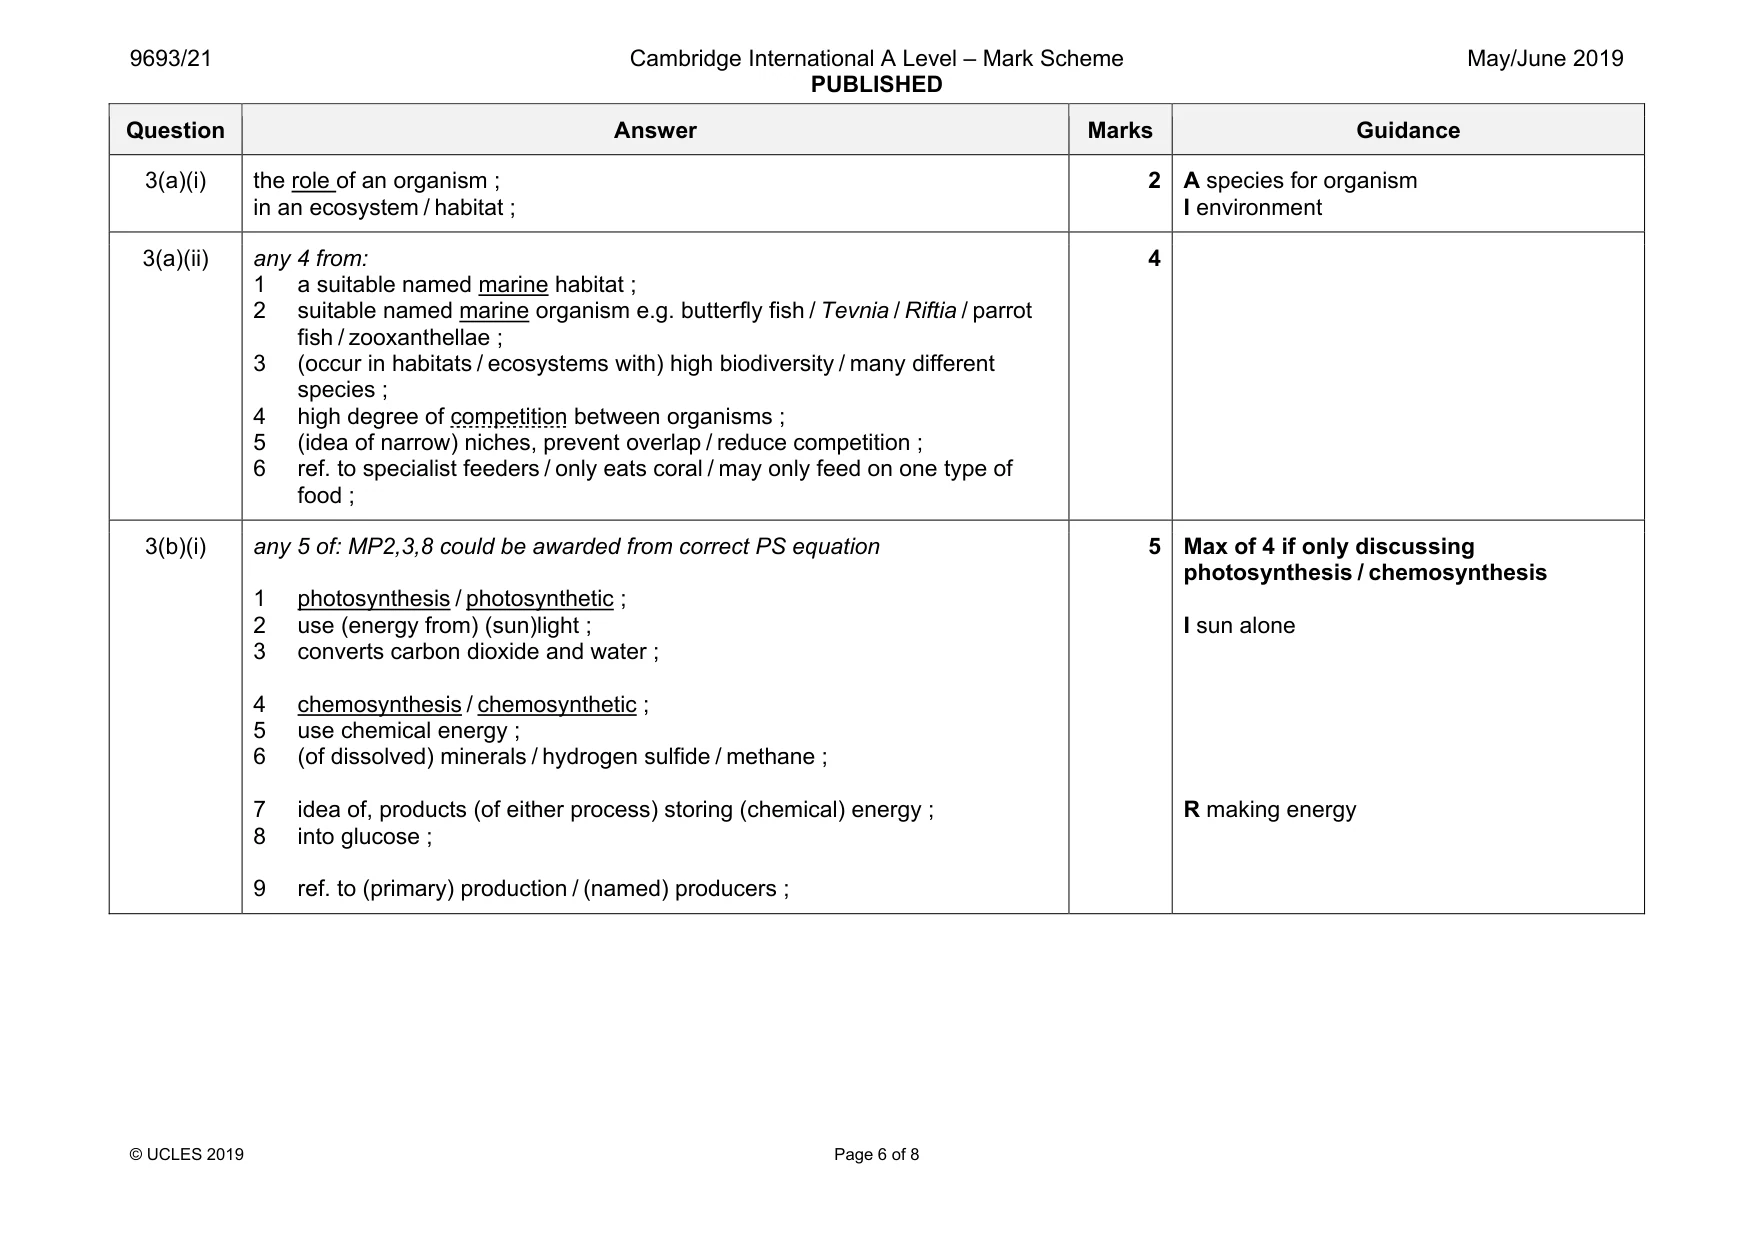
Mark scheme: 2(a)(i) El Niño ; 1 I southern oscillation R La Nina / La Nino / La Niña / La Niño 2(a)(ii) catch likely to be reduced ; reduces / stops upwelling OR fewer nutrients reaching surface waters ; low productivity / low productivity in (named) producer ; 3 A reduction in producer population 2(b)(i) the variation / values / data for each month added together ; then divided by relevant number of values ; 2 R temperature values added 2(b)(ii) 2009 / 2014 / 2015 ; 1 two years required for mark
Q3 · Define the term ecological niche
3 (a) (i) Define the term ecological niche. ........................................................................................................................................... ........................................................................................................................................... ........................................................................................................................................... ..................................................................................................................................... [2] (ii) With reference to one named example, explain why some marine habitats contain narrow ecological niches. ........................................................................................................................................... ........................................................................................................................................... ........................................................................................................................................... ........................................................................................................................................... ........................................................................................................................................... ........................................................................................................................................... ........................................................................................................................................... ..................................................................................................................................... [4] (b) (i) Describe two ways in which energy is made available to food chains. ........................................................................................................................................... ........................................................................................................................................... ........................................................................................................................................... ........................................................................................................................................... ........................................................................................................................................... ........................................................................................................................................... ........................................................................................................................................... ........................................................................................................................................... ........................................................................................................................................... ..................................................................................................................................... [5] (ii) As energy is passed along a food chain, only about 10% of the energy is transferred to the next trophic level. Explain why energy is lost as it is passed along a food chain. ........................................................................................................................................... ........................................................................................................................................... ........................................................................................................................................... ........................................................................................................................................... ........................................................................................................................................... ........................................................................................................................................... ........................................................................................................................................... ..................................................................................................................................... [4] [Total: 15]
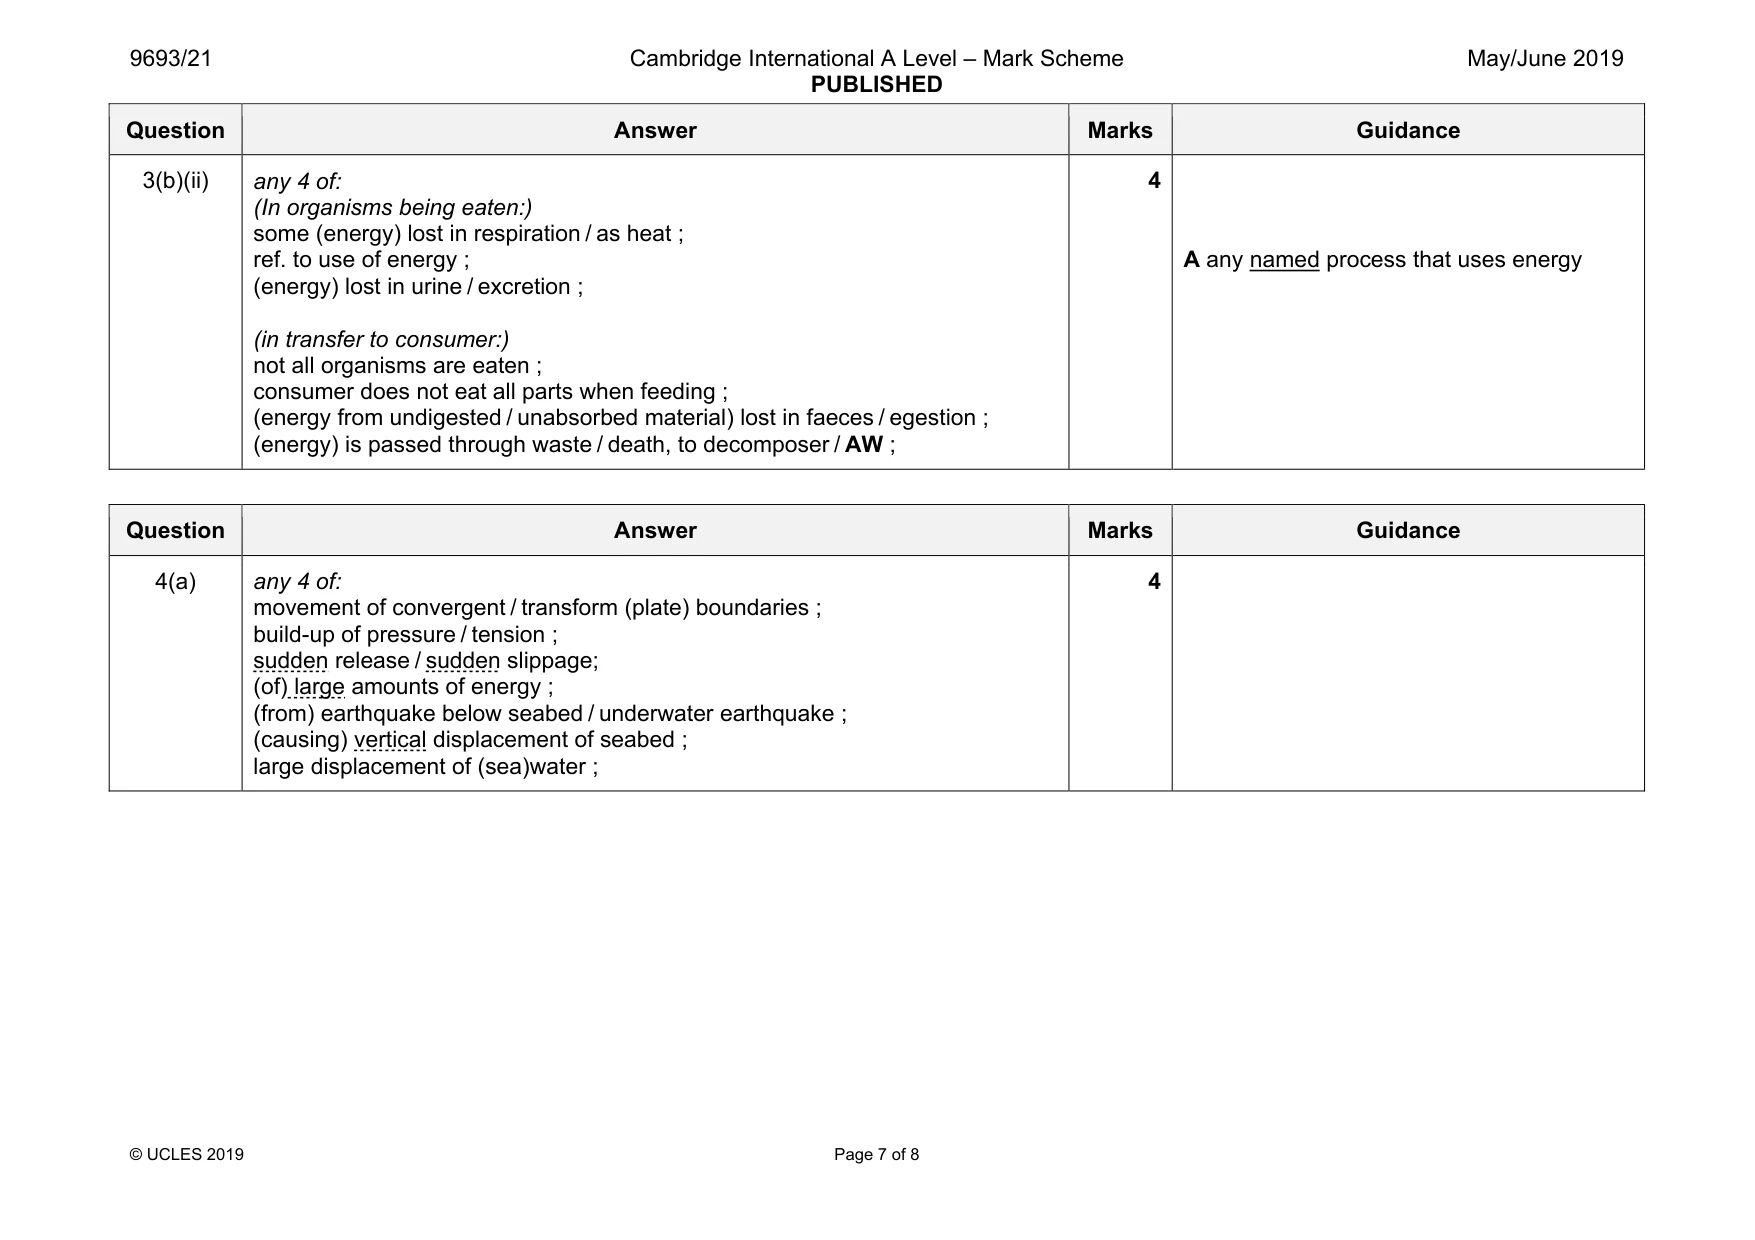
Mark scheme: 3(a)(i) the role of an organism ; in an ecosystem / habitat ; 2 I environment 3(a)(ii) any 4 from: 1 a suitable named marine habitat ; 2 suitable named marine organism e.g. butterfly fish / Tevnia / Riftia / parrot fish / zooxanthellae ; 3 (occur in habitats / ecosystems with) high biodiversity / many different species ; 4 high degree of competition between organisms ; 5 (idea of narrow) niches, prevent overlap / reduce competition ; 6 ref. to specialist feeders / only eats coral / may only feed on one type of food ; 4 3(b)(i) any 5 of: MP2,3,8 could be awarded from correct PS equation 1 photosynthesis / photosynthetic ; 2 use (energy from) (sun)light ; 3 converts carbon dioxide and water ; 4 chemosynthesis / chemosynthetic ; 5 use chemical energy ; 6 (of dissolved) minerals / hydrogen sulfide / methane ; 7 idea of, products (of either process) storing (chemical) energy ; 8 into glucose ; 9 ref. to (primary) production / (named) producers ; 5 Max of 4 if only discussing photosynthesis / chemosynthesis I sun alone R making energy Question Answer Marks Guidance 3(b)(ii) any 4 of: (In organisms being eaten:) some (energy) lost in respiration / as heat ; ref. to use of energy ; (energy) lost in urine / excretion ; (in transfer to consumer:) not all organisms are eaten ; consumer does not eat all parts when feeding ; (energy from undigested / unabsorbed material) lost in faeces / egestion ; (energy) is passed through waste / death, to decomposer / AW ; 4 A any named process that uses energy
Q4 · Explain how tectonic processes can lead to a tsunami
4 (a) Explain how tectonic processes can lead to a tsunami. ................................................................................................................................................... ................................................................................................................................................... ................................................................................................................................................... ................................................................................................................................................... ................................................................................................................................................... ................................................................................................................................................... ................................................................................................................................................... ............................................................................................................................................. [4] (b) Outline the Darwin-Dana-Daly theory of atoll formation. ................................................................................................................................................... ................................................................................................................................................... ................................................................................................................................................... ................................................................................................................................................... ................................................................................................................................................... ................................................................................................................................................... ................................................................................................................................................... ................................................................................................................................................... ................................................................................................................................................... ............................................................................................................................................. [5] (c) Tidal range is affected by the relative positions of the Earth, Moon and Sun. Describe how other factors can affect the tidal range. ................................................................................................................................................... ................................................................................................................................................... ................................................................................................................................................... ................................................................................................................................................... ................................................................................................................................................... ................................................................................................................................................... ................................................................................................................................................... ................................................................................................................................................... ................................................................................................................................................... ................................................................................................................................................... ................................................................................................................................................... ............................................................................................................................................. [6] [Total: 15]
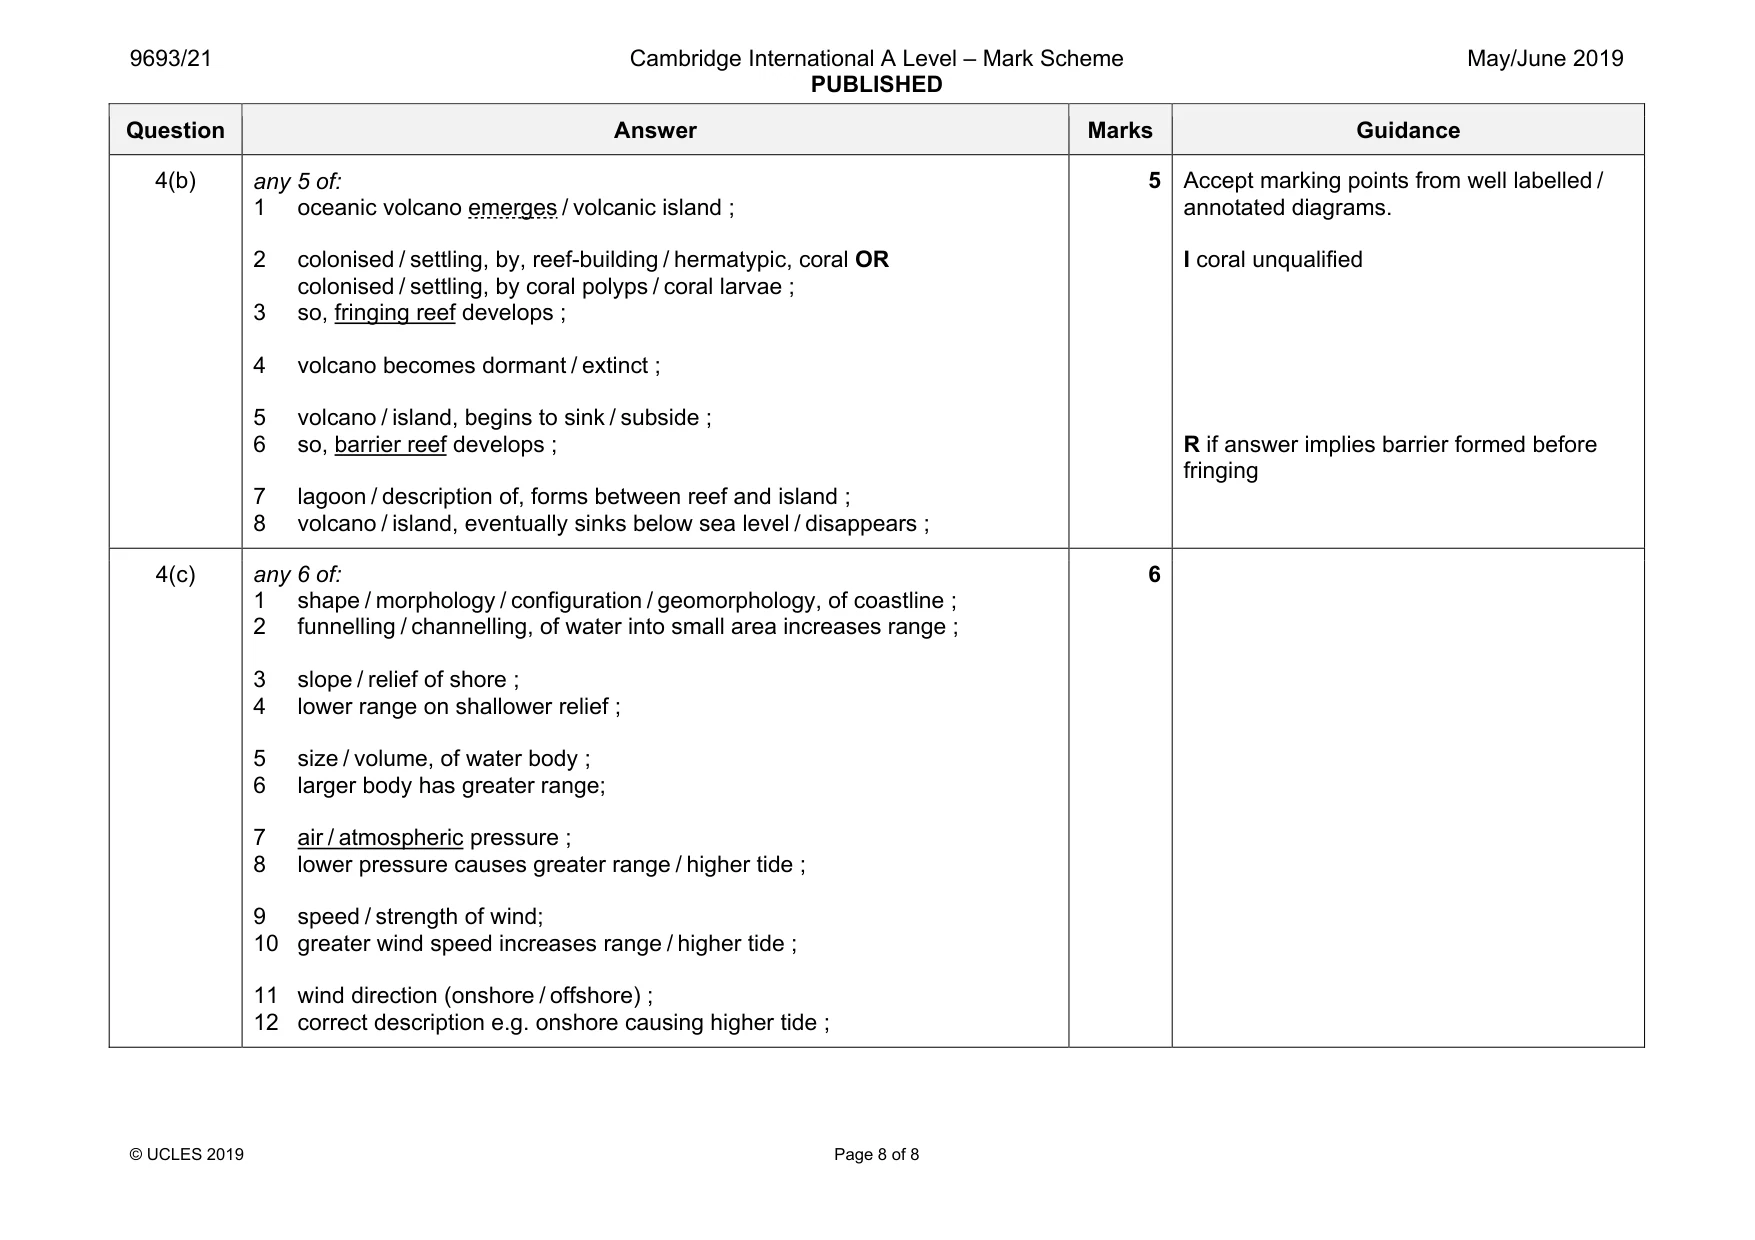
Mark scheme: 4(a) any 4 of: movement of convergent / transform (plate) boundaries ; build-up of pressure / tension ; sudden release / sudden slippage; (of) large amounts of energy ; (from) earthquake below seabed / underwater earthquake ; (causing) vertical displacement of seabed ; large displacement of (sea)water ; 4 Question Answer Marks Guidance 4(b) any 5 of: 1 oceanic volcano emerges / volcanic island ; 2 colonised / settling, by, reef-building / hermatypic, coral OR colonised / settling, by coral polyps / coral larvae ; 3 so, fringing reef develops ; 4 volcano becomes dormant / extinct ; 5 volcano / island, begins to sink / subside ; 6 so, barrier reef develops ; 7 lagoon / description of, forms between reef and island ; 8 volcano / island, eventually sinks below sea level / disappears ; 5 Accept marking points from well labelled / annotated diagrams. I coral unqualified R if answer implies barrier formed before fringing 4(c) any 6 of: 1 shape / morphology / configuration / geomorphology, of coastline ; 2 funnelling / channelling, of water into small area increases range ; 3 slope / relief of shore ; 4 lower range on shallower relief ; 5 size / volume, of water body ; 6 larger body has greater range; 7 air / atmospheric pressure ; 8 lower pressure causes greater range / higher tide ; 9 speed / strength of wind; 10 greater wind speed increases range / higher tide ; 11 wind direction (onshore / offshore) ; 12 correct description e.g. onshore causing higher tide ; 6
What was in this paper
The subtopics covered by these 4 questions, and how many questions each got. Open one in a new tab to see every Cambridge question on it.
What you needed in this session
Cambridge’s own grade thresholds for 2019 May/June, Paper 2 · Variant 1. A higher threshold means an easier paper — the bar moves with how the cohort did.