Cambridge A Level Marine Science 9693 — 2017 May/June Paper 2 · Variant 1
9693/21/M/J/17 · 4 questions · 50 marks · ≈56 min
The question paper and its mark scheme, free to read here and free to download. This is Cambridge’s own paper, exactly as it was sat.
Question paper12 pages

Mark scheme9 pages
Answers below. Sit the paper first if you are practising.
Questions as text
Q1 · A specimen of Laminaria longicruris
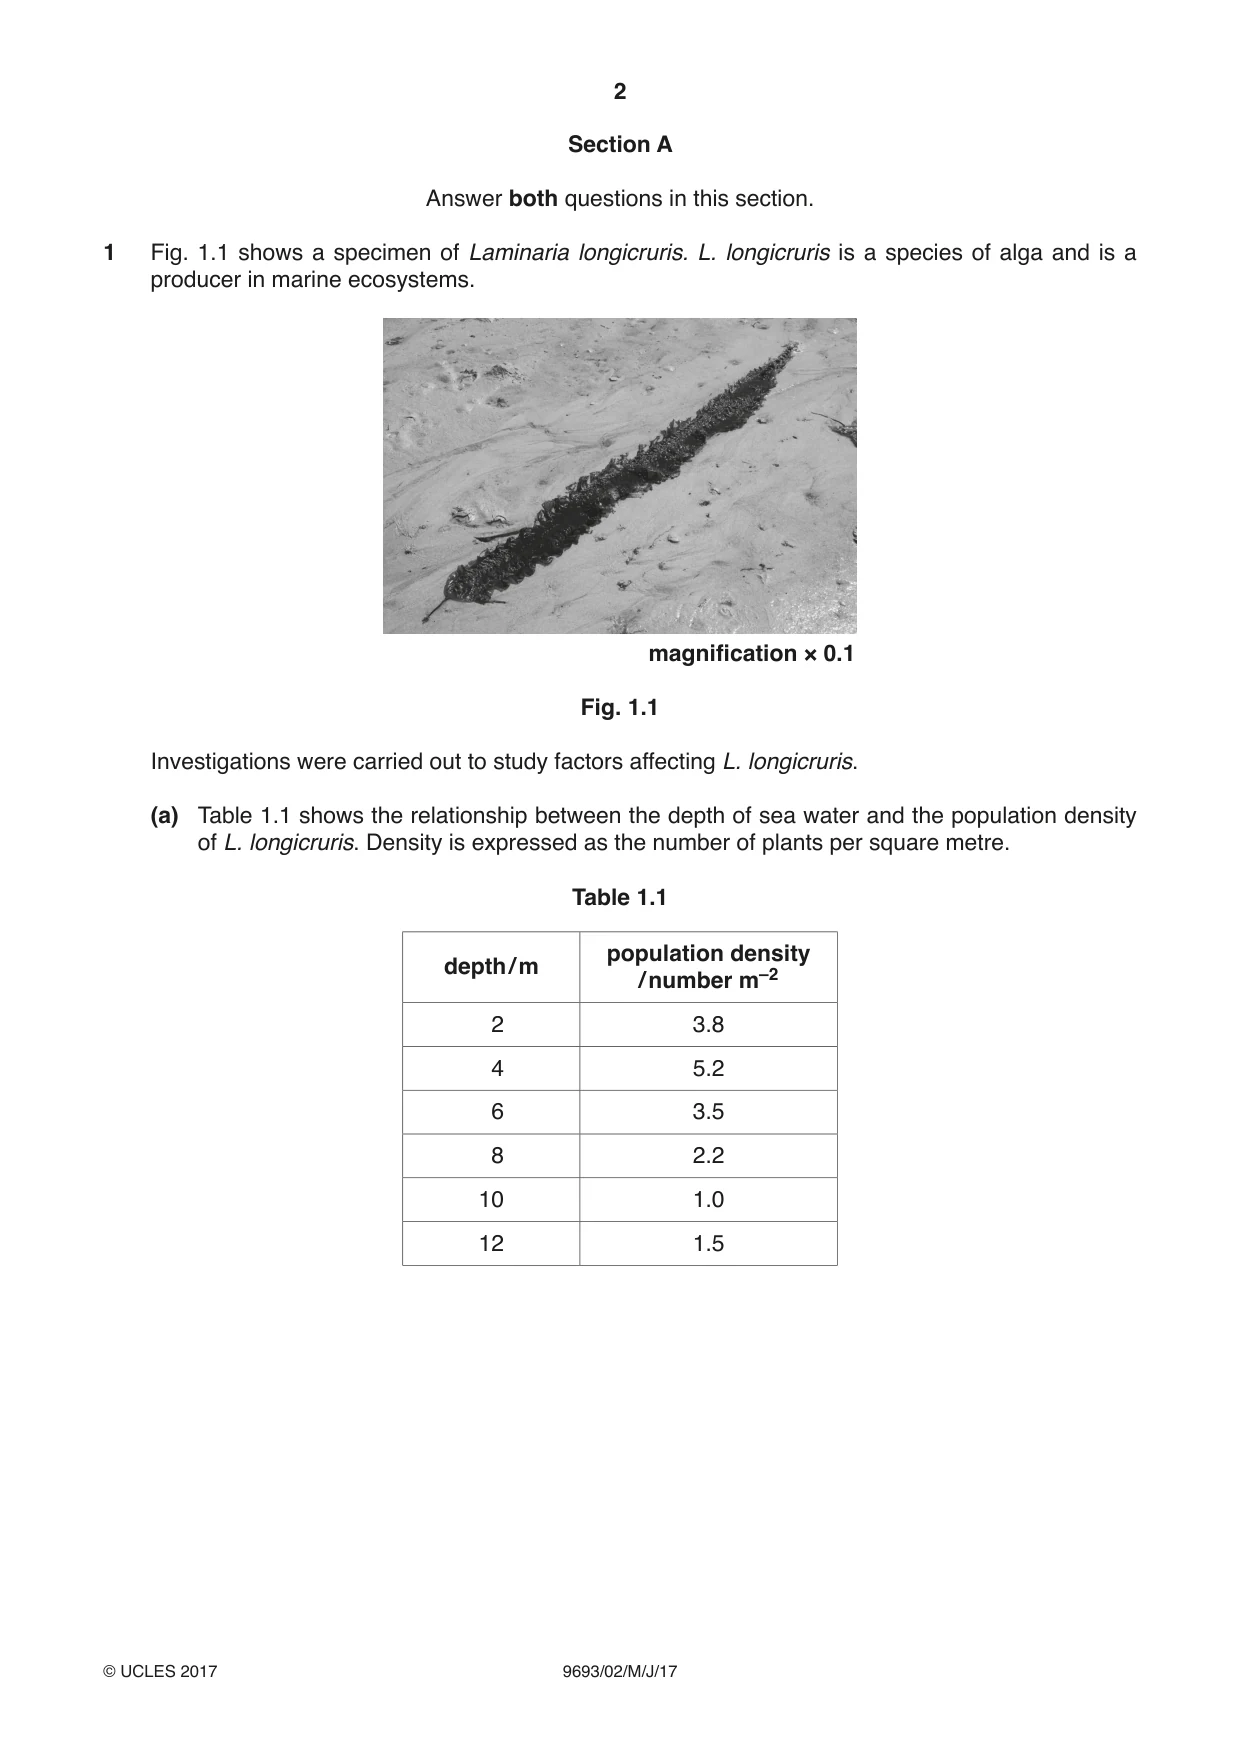
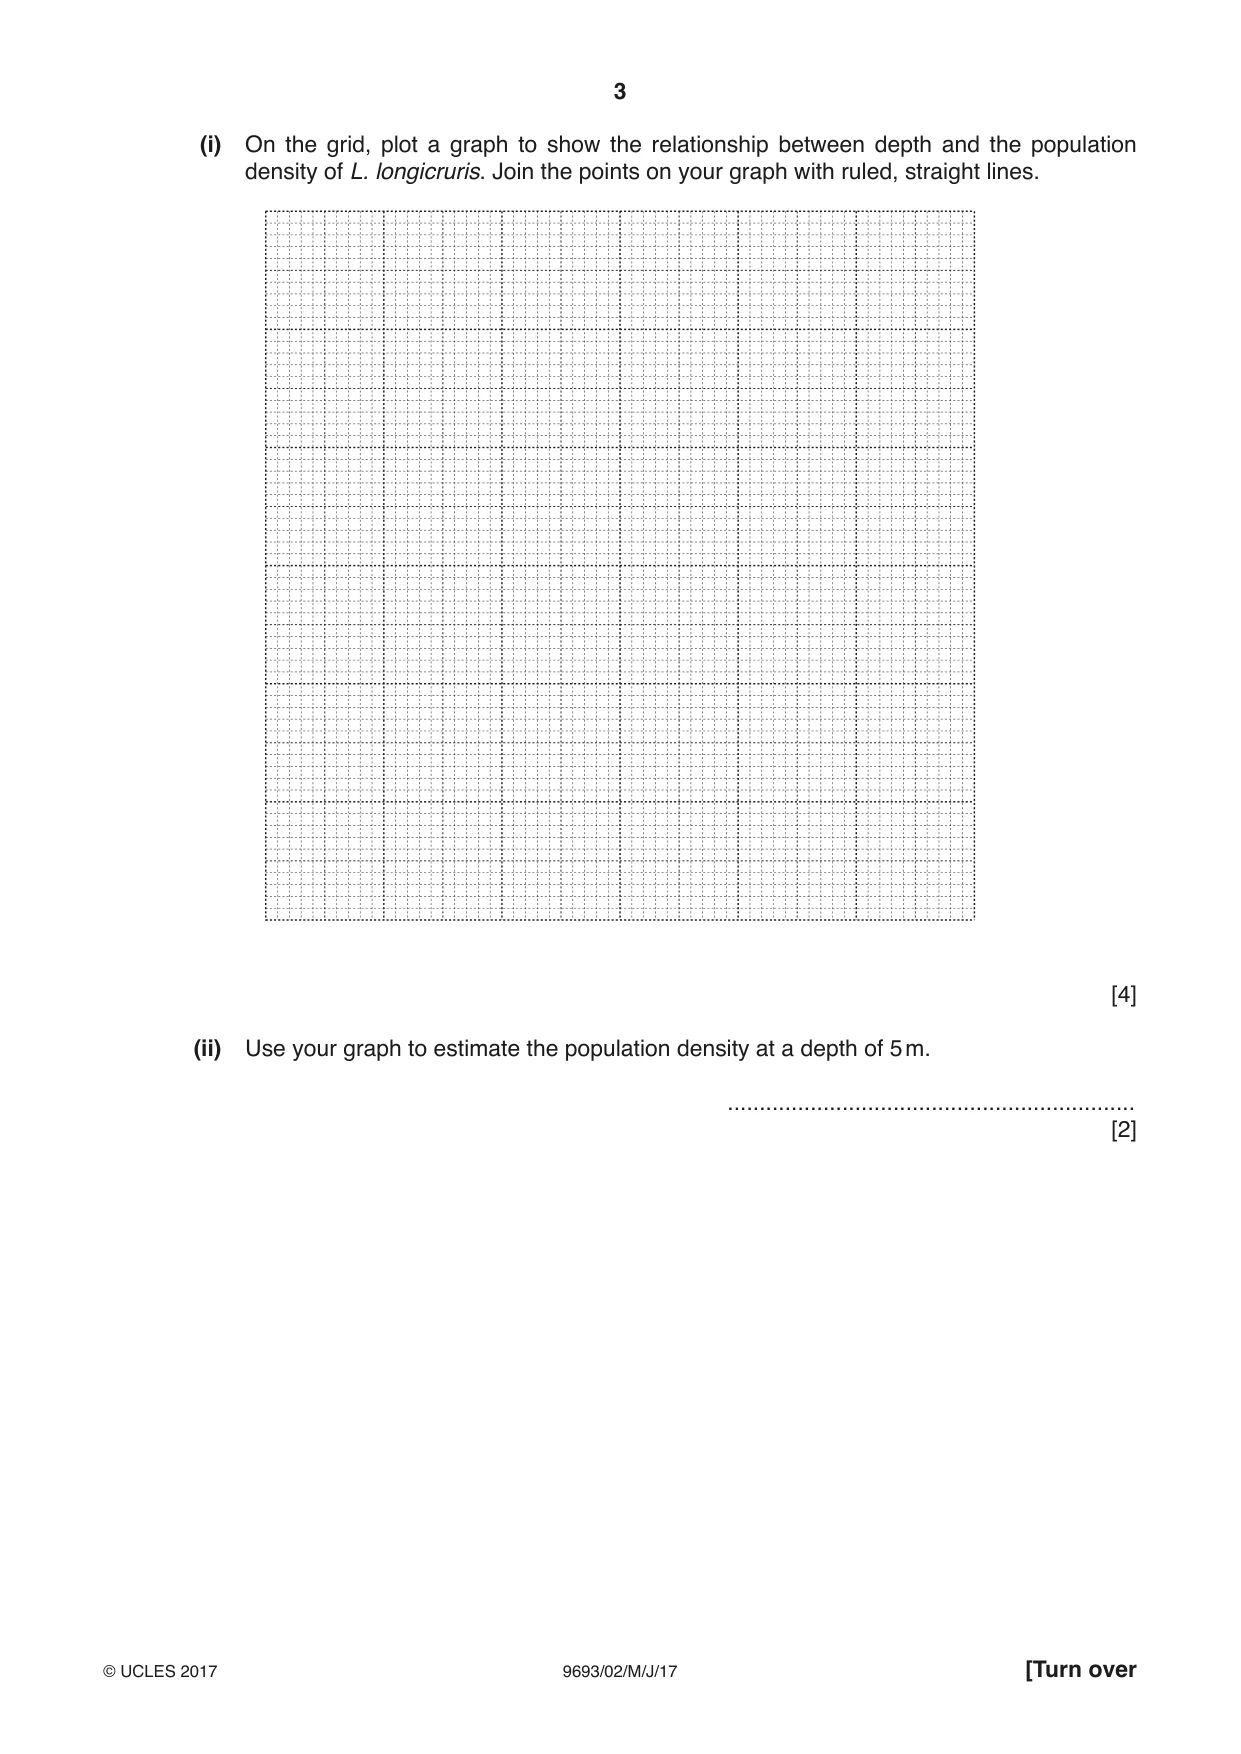
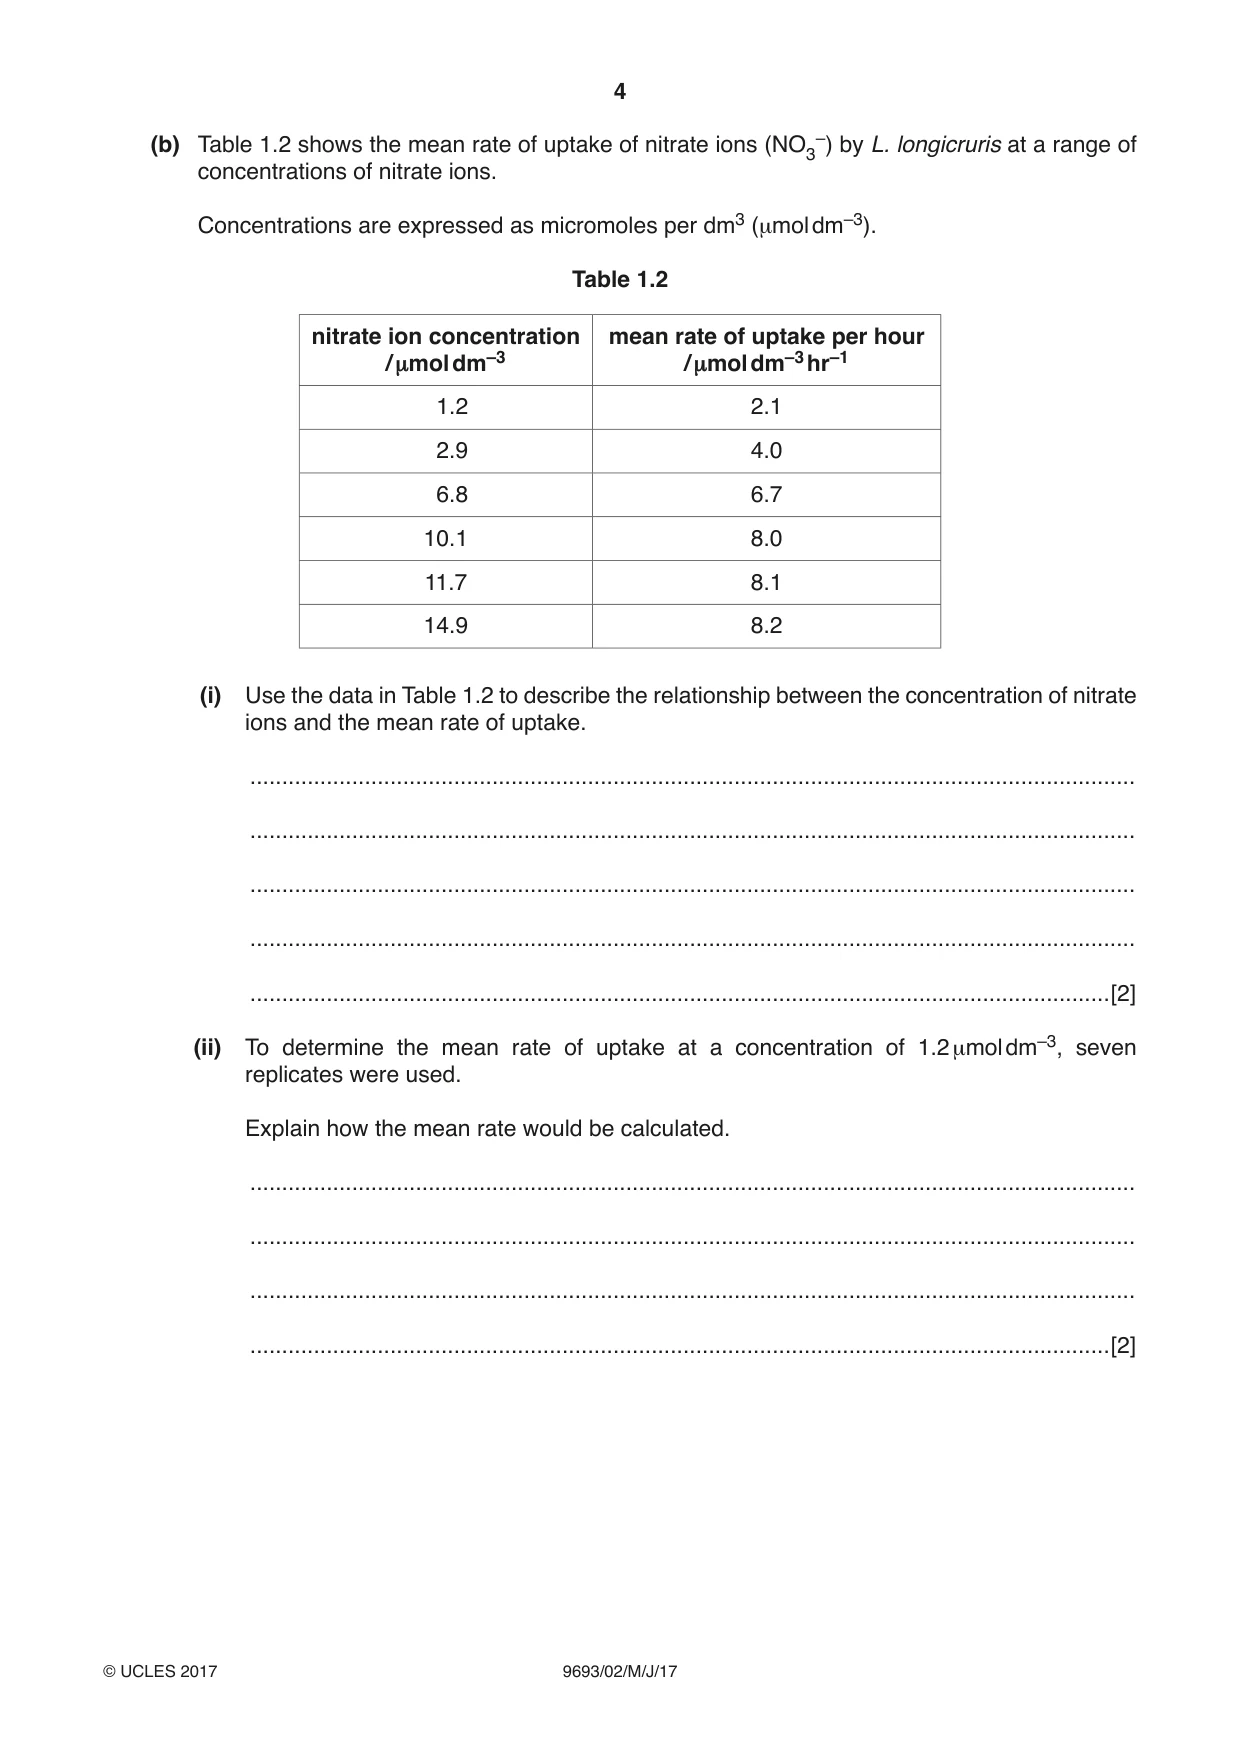
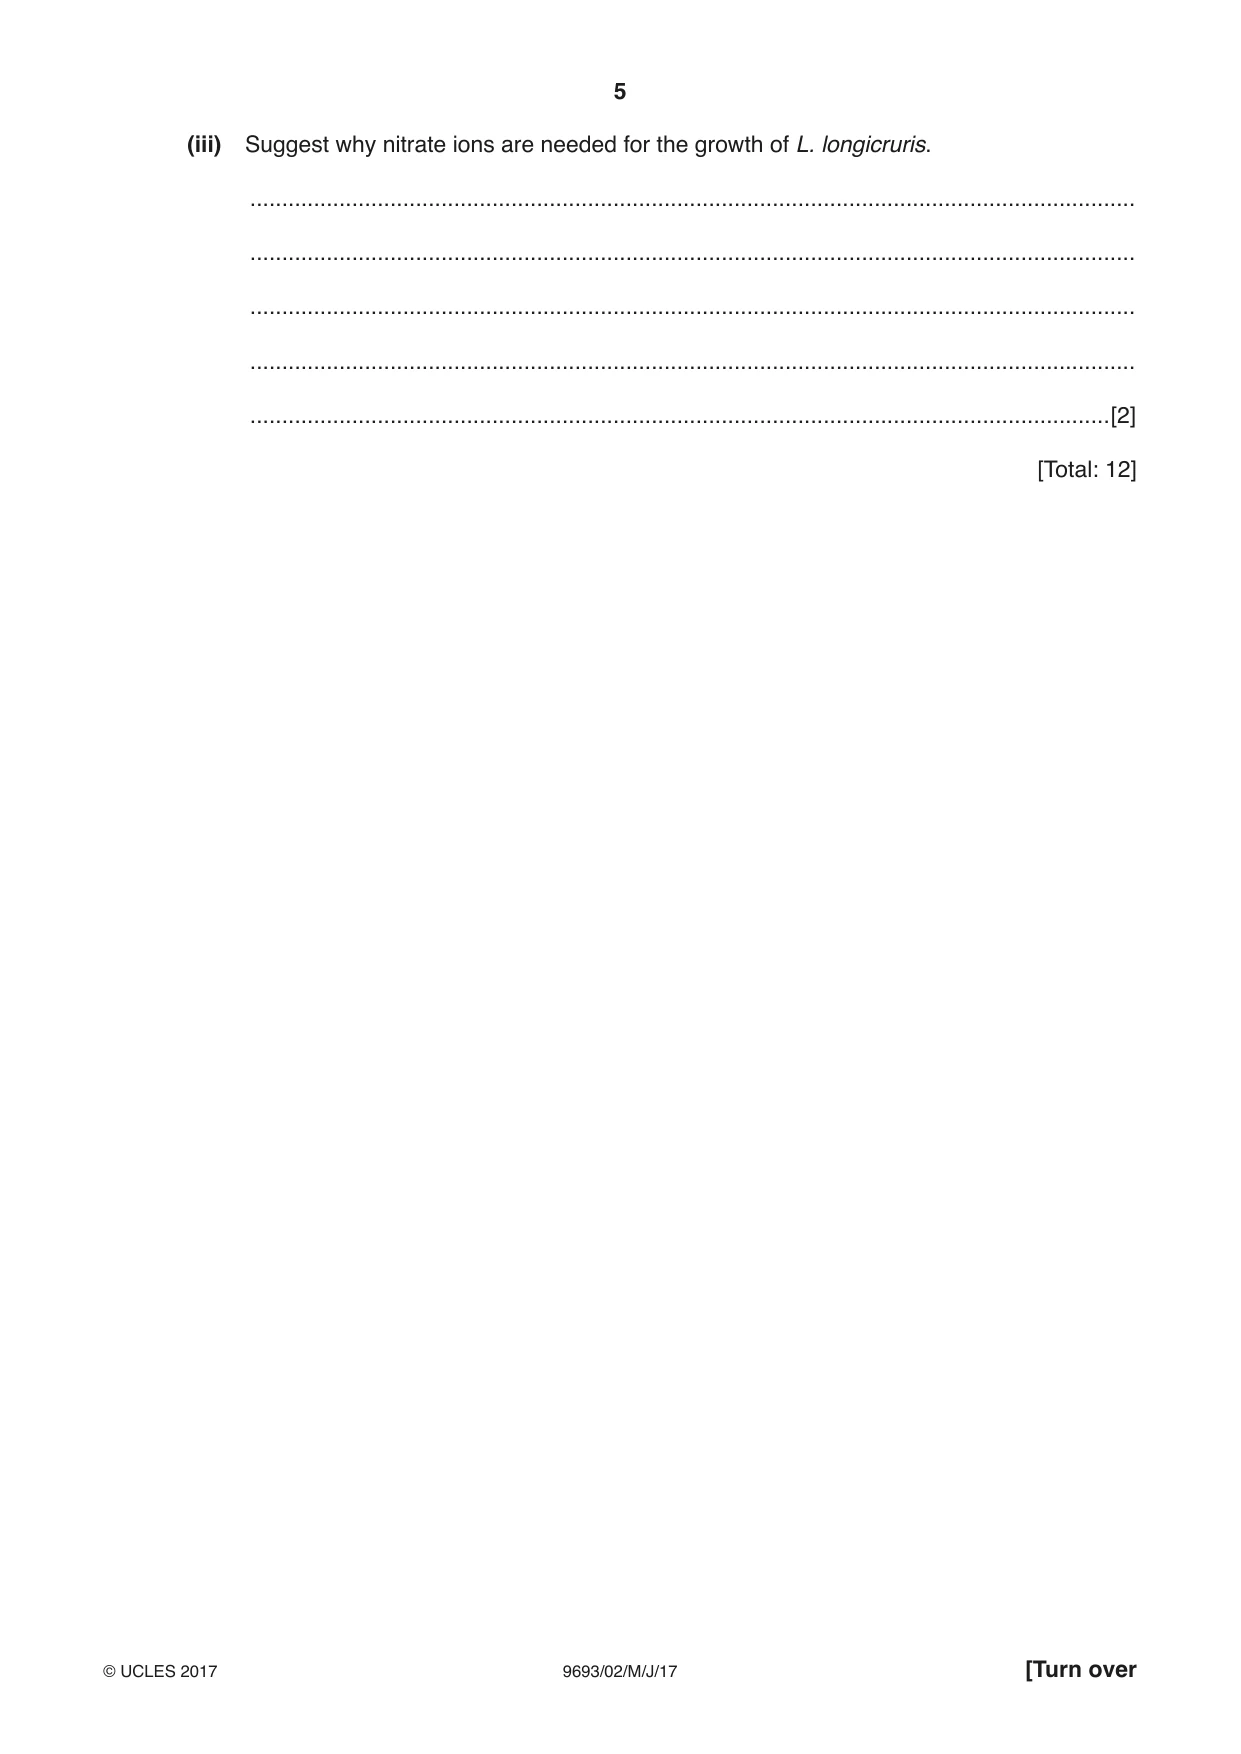
1 Fig. 1.1 shows a specimen of Laminaria longicruris. L. longicruris is a species of alga and is a producer in marine ecosystems. magnification × 0.1 Fig. 1.1 Investigations were carried out to study factors affecting L. longicruris. (a) Table 1.1 shows the relationship between the depth of sea water and the population density of L. longicruris. Density is expressed as the number of plants per square metre. Table 1.1 population density depth / m / number m–2 2 3.8 4 5.2 6 3.5 8 2.2 10 1.0 12 1.5 (i) On the grid, plot a graph to show the relationship between depth and the population density of L. longicruris. Join the points on your graph with ruled, straight lines. [4] (ii) Use your graph to estimate the population density at a depth of 5 m. ................................................................ [2] (b) Table 1.2 shows the mean rate of uptake of nitrate ions (NO3–) by L. longicruris at a range of concentrations of nitrate ions. Concentrations are expressed as micromoles per dm3 (µmol dm–3). Table 1.2 nitrate ion concentration mean rate of uptake per hour / µmol dm–3 / µmol dm–3 hr–1 1.2 2.1 2.9 4.0 6.8 6.7 10.1 8.0 11.7 8.1 14.9 8.2 (i) Use the data in Table 1.2 to describe the relationship between the concentration of nitrate ions and the mean rate of uptake. ........................................................................................................................................... ........................................................................................................................................... ........................................................................................................................................... ........................................................................................................................................... .......................................................................................................................................[2] (ii) To determine the mean rate of uptake at a concentration of 1.2 µmol dm–3, seven replicates were used. Explain how the mean rate would be calculated. ........................................................................................................................................... ........................................................................................................................................... ........................................................................................................................................... .......................................................................................................................................[2] (iii) Suggest why nitrate ions are needed for the growth of L. longicruris. ........................................................................................................................................... ........................................................................................................................................... ........................................................................................................................................... ........................................................................................................................................... .......................................................................................................................................[2] [Total: 12]
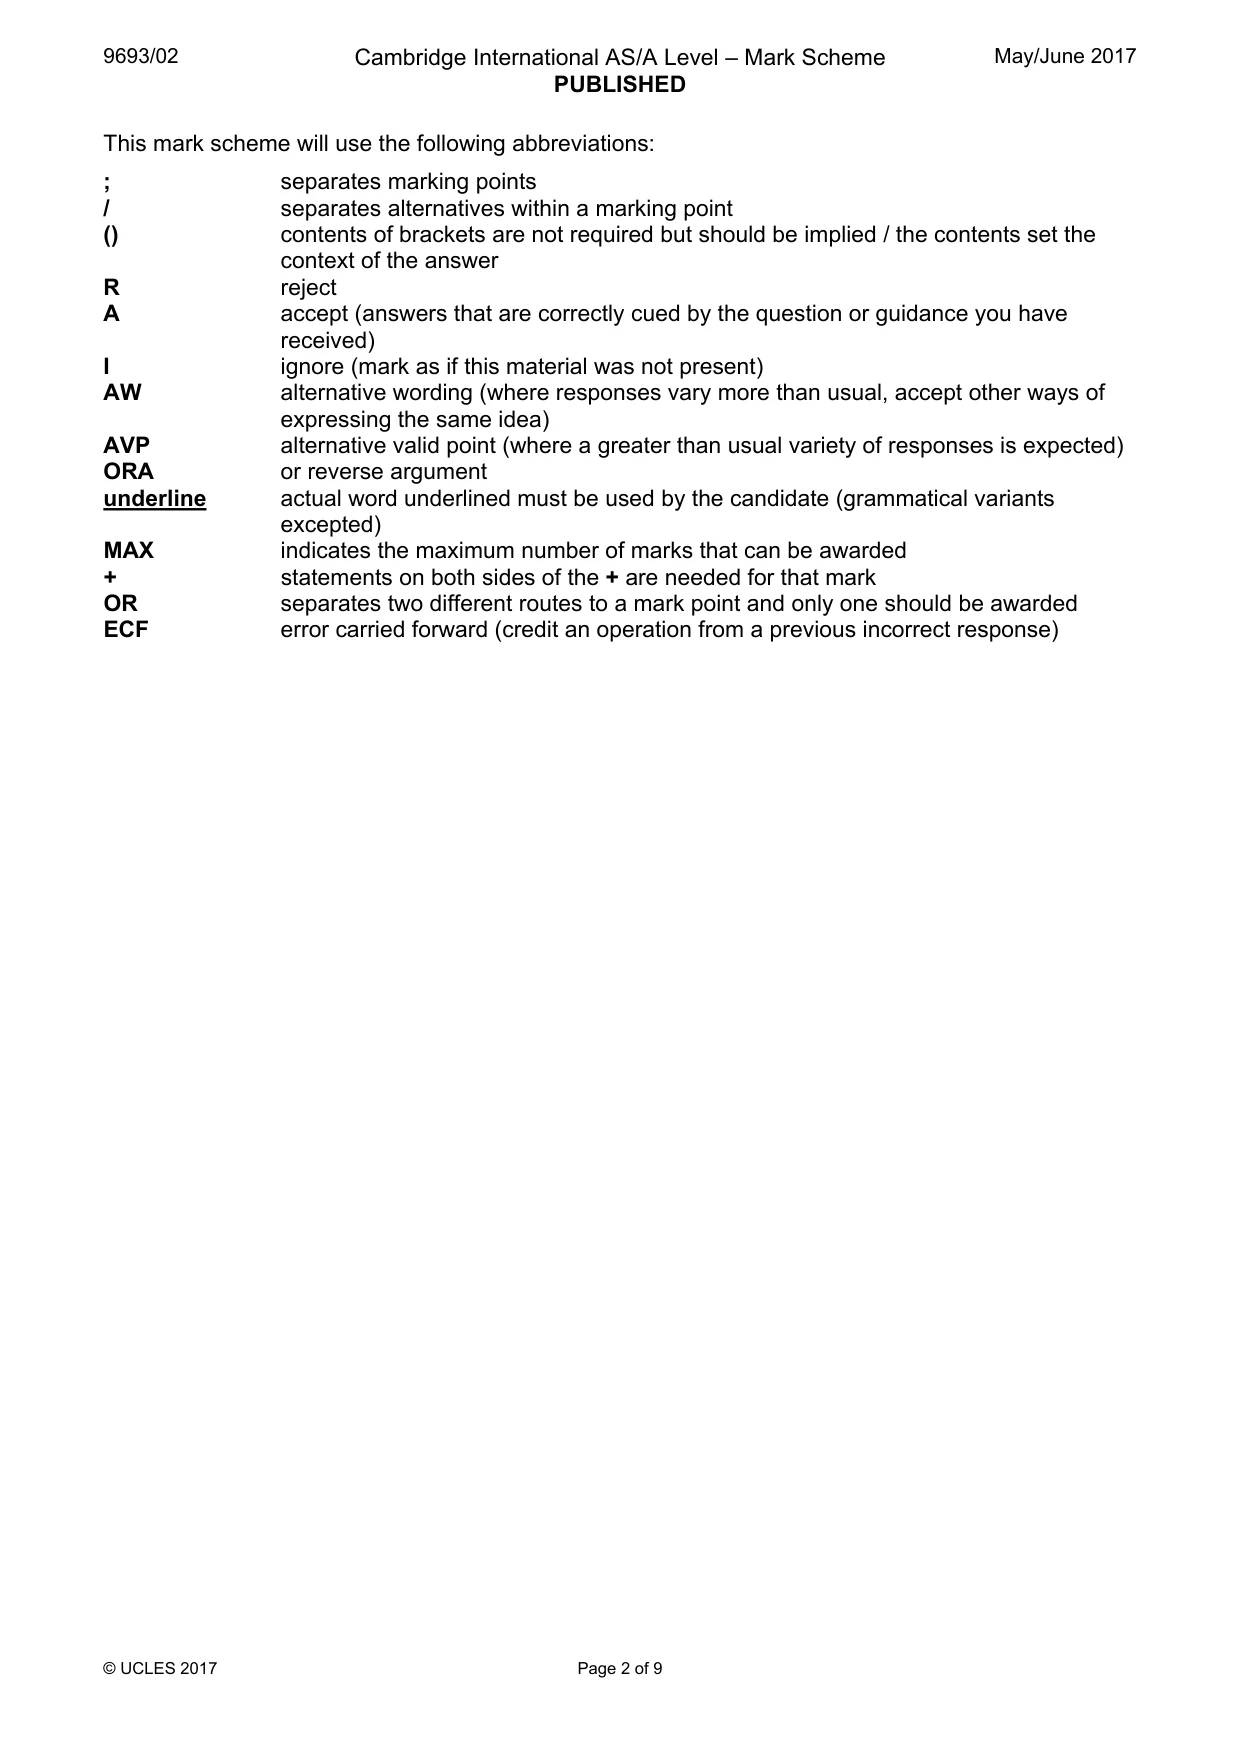
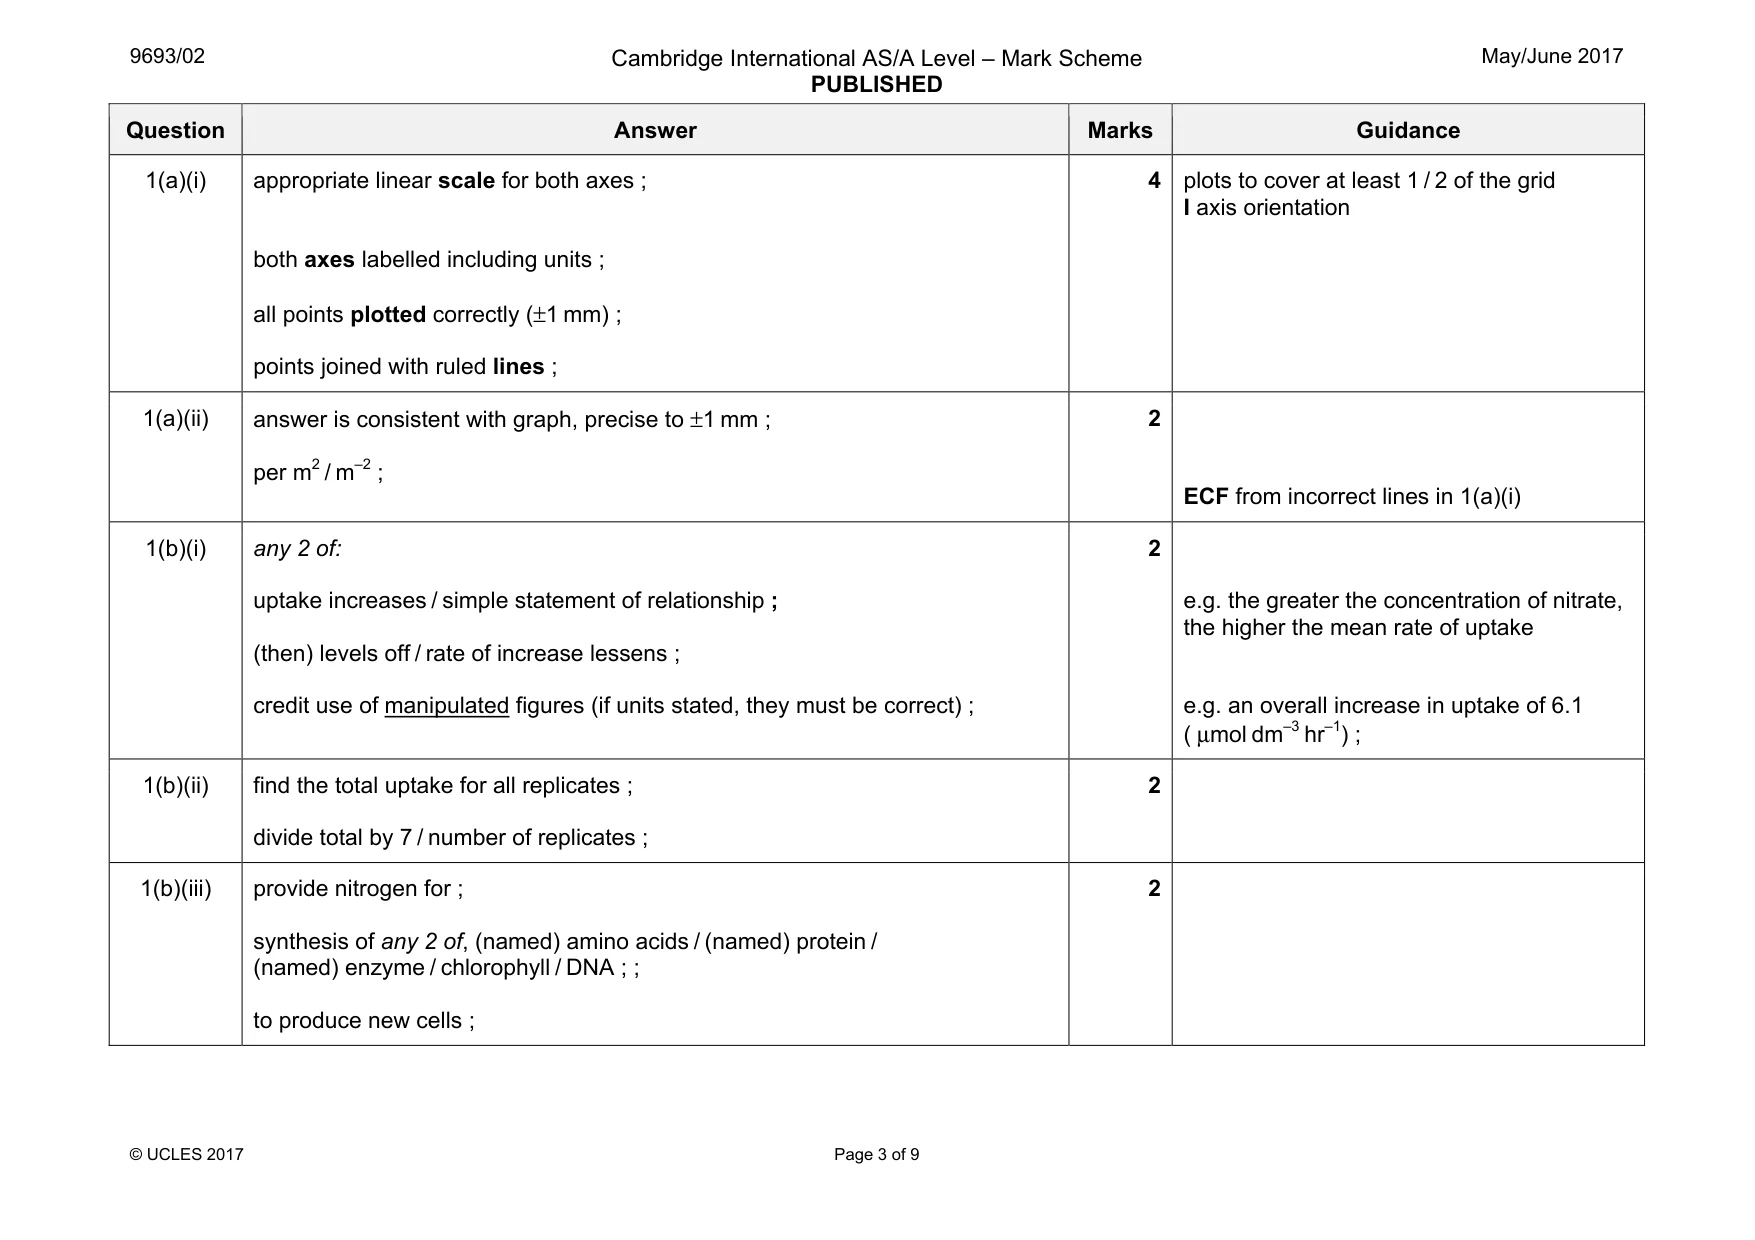
Mark scheme: 1(a)(i) appropriate linear scale for both axes ; both axes labelled including units ; all points plotted correctly (±1 mm) ; points joined with ruled lines ; 4 I axis orientation 1(a)(ii) answer is consistent with graph, precise to ±1 mm ; per m2 / m–2 ; 2 ECF from incorrect lines in 1(a)(i) 1(b)(i) any 2 of: uptake increases / simple statement of relationship ; (then) levels off / rate of increase lessens ; credit use of manipulated figures (if units stated, they must be correct) ; 2 e.g. the greater the concentration of nitrate, the higher the mean rate of uptake e.g. an overall increase in uptake of 6.1 ( µmol dm–3 hr–1) ; 1(b)(ii) find the total uptake for all replicates ; divide total by 7 / number of replicates ; 2 1(b)(iii) provide nitrogen for ; synthesis of any 2 of, (named) amino acids / (named) protein / (named) enzyme / chlorophyll / DNA ; ; to produce new cells ; 2
Q2 · A group of nine periwinkles, small molluscs found in the intertidal region of many rocky…
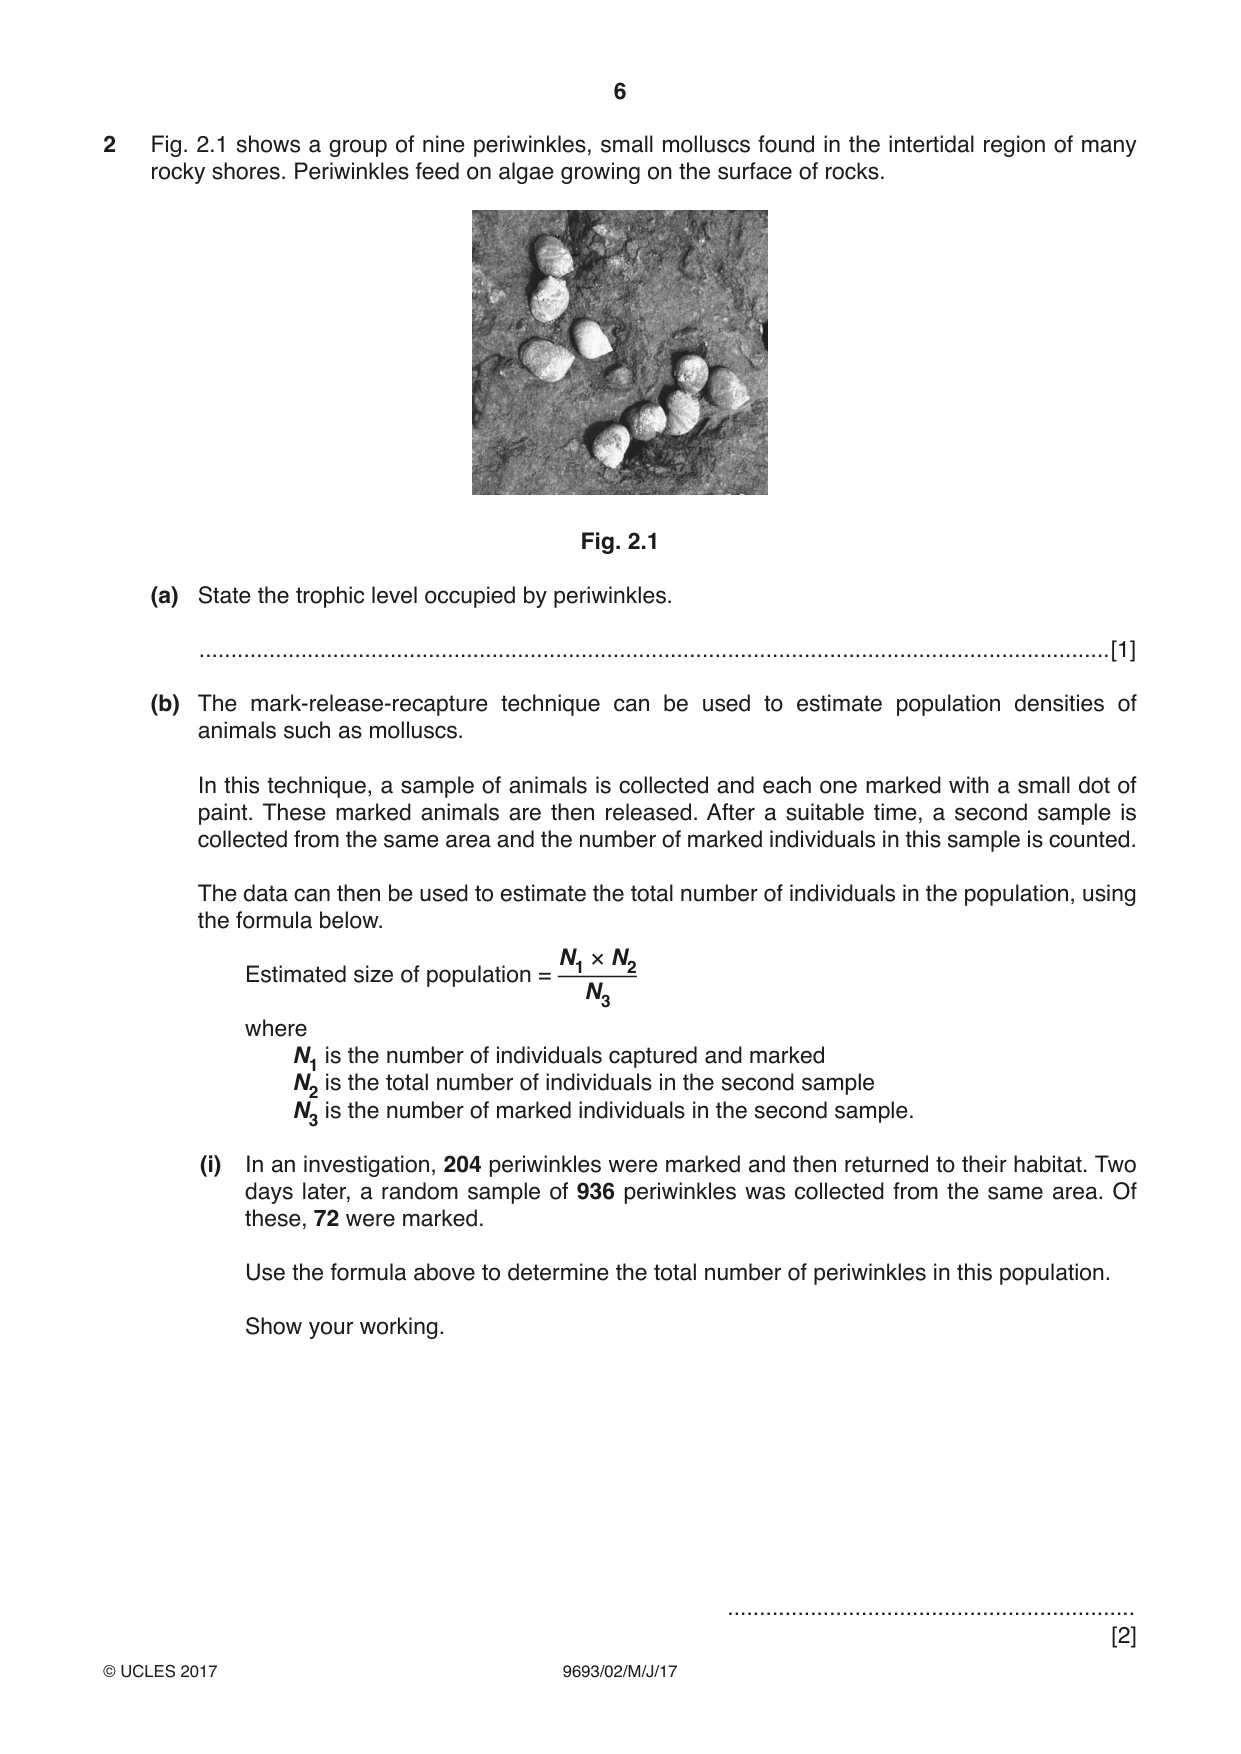
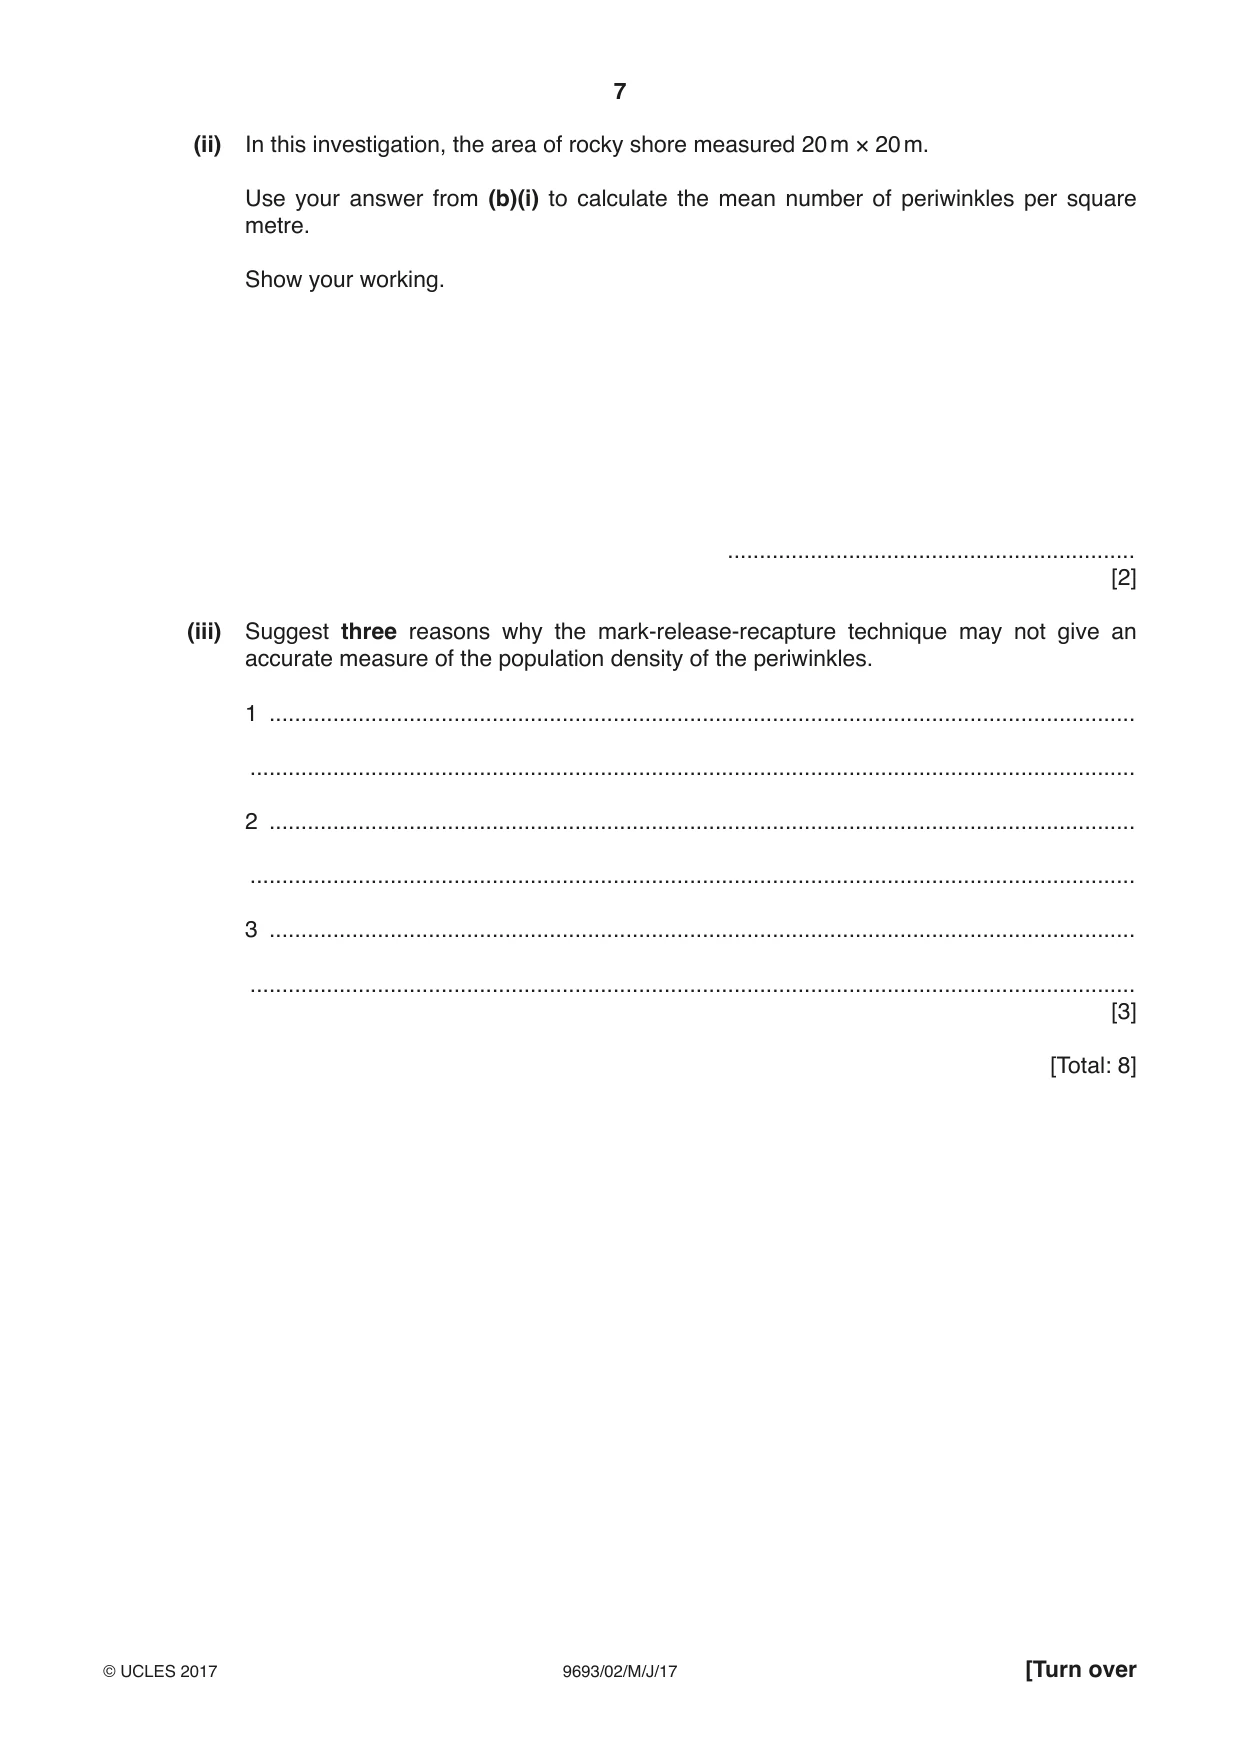
2 Fig. 2.1 shows a group of nine periwinkles, small molluscs found in the intertidal region of many rocky shores. Periwinkles feed on algae growing on the surface of rocks. Fig. 2.1 (a) State the trophic level occupied by periwinkles. ...............................................................................................................................................[1] (b) The mark-release-recapture technique can be used to estimate population densities of animals such as molluscs. In this technique, a sample of animals is collected and each one marked with a small dot of paint. These marked animals are then released. After a suitable time, a second sample is collected from the same area and the number of marked individuals in this sample is counted. The data can then be used to estimate the total number of individuals in the population, using the formula below. N1 × N2 Estimated size of population = N3 where N1 is the number of individuals captured and marked N2 is the total number of individuals in the second sample N3 is the number of marked individuals in the second sample. (i) In an investigation, 204 periwinkles were marked and then returned to their habitat. Two days later, a random sample of 936 periwinkles was collected from the same area. Of these, 72 were marked. Use the formula above to determine the total number of periwinkles in this population. Show your working. ................................................................ [2] (ii) In this investigation, the area of rocky shore measured 20 m × 20 m. Use your answer from (b)(i) to calculate the mean number of periwinkles per square metre. Show your working. ................................................................ [2] (iii) Suggest three reasons why the mark-release-recapture technique may not give an accurate measure of the population density of the periwinkles. 1 ........................................................................................................................................ ........................................................................................................................................... 2 ........................................................................................................................................ ........................................................................................................................................... 3 ........................................................................................................................................ ........................................................................................................................................... [3] [Total: 8]
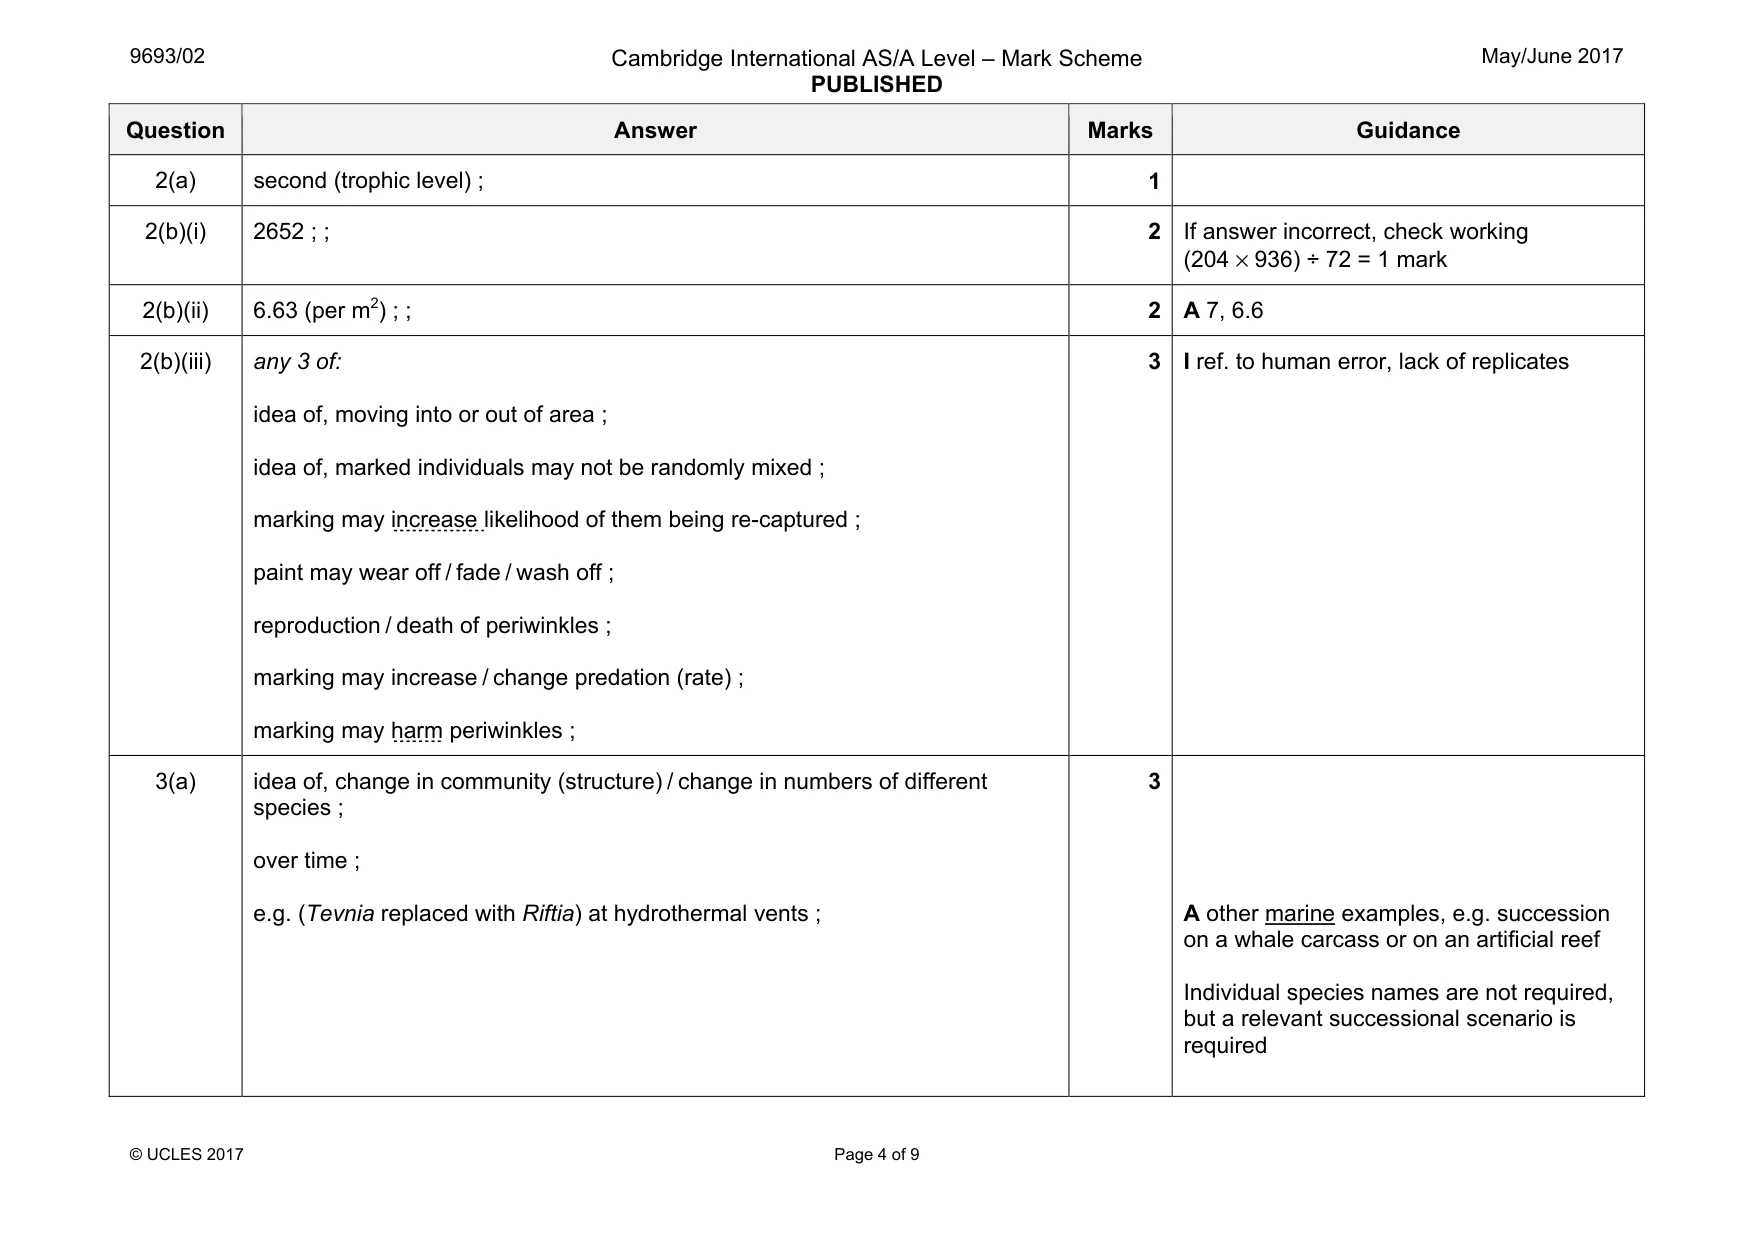
Mark scheme: 2(a) second (trophic level) ; 1 2(b)(i) 2652 ; ; 2 If answer incorrect, check working (204 × 936) ÷ 72 = 1 mark 2(b)(ii) 6.63 (per m2) ; ; 2 A 7, 6.6 2(b)(iii) any 3 of: idea of, moving into or out of area ; idea of, marked individuals may not be randomly mixed ; marking may increase likelihood of them being re-captured ; paint may wear off / fade / wash off ; reproduction / death of periwinkles ; marking may increase / change predation (rate) ; marking may harm periwinkles ; 3 I ref. to human error, lack of replicates
Q3 · Explain what is meant by the term succession and give one example from the marine…
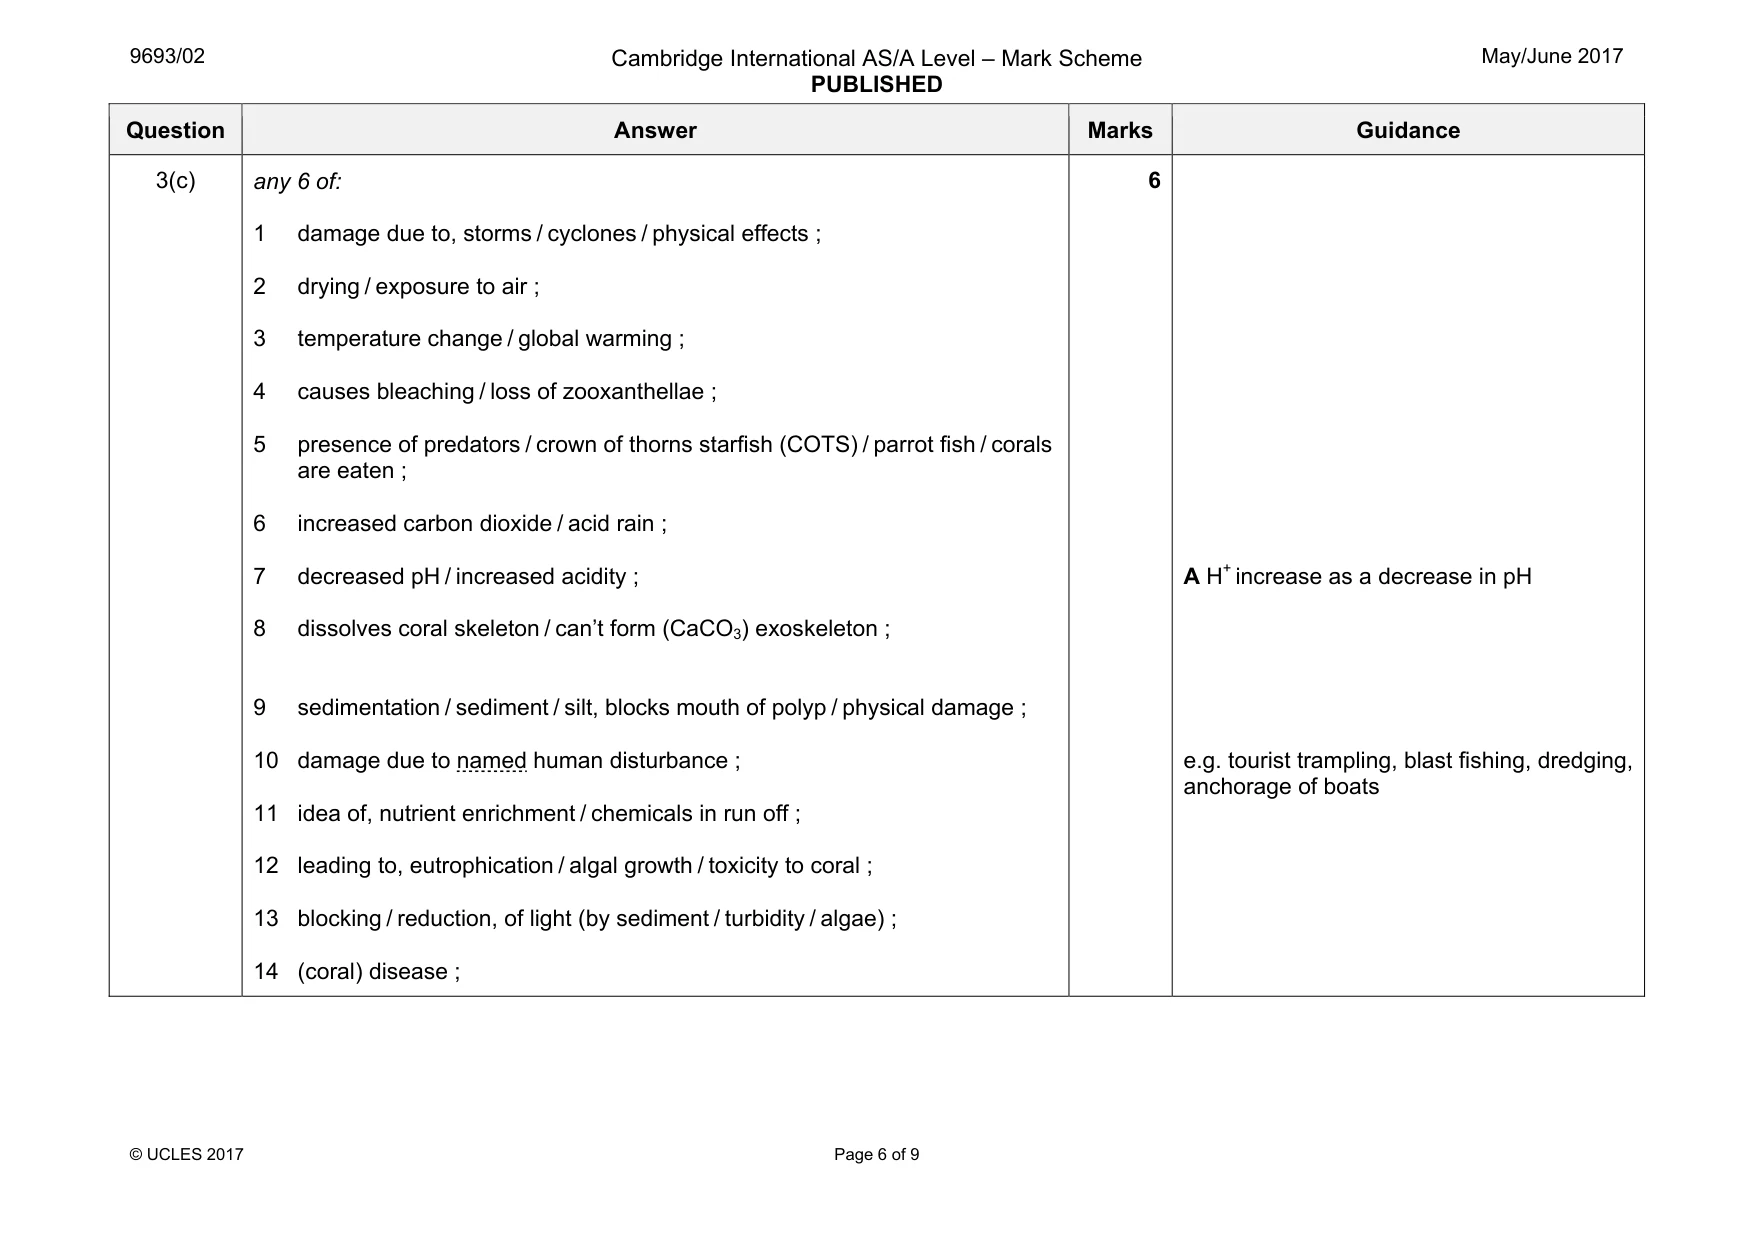
3 (a) Explain what is meant by the term succession and give one example from the marine environment. ................................................................................................................................................... ................................................................................................................................................... ................................................................................................................................................... ................................................................................................................................................... ................................................................................................................................................... ...............................................................................................................................................[3] (b) Explain how the processes of erosion and sedimentation give rise to the formation of muddy shores and rocky shores. ................................................................................................................................................... ................................................................................................................................................... ................................................................................................................................................... ................................................................................................................................................... ................................................................................................................................................... ................................................................................................................................................... ................................................................................................................................................... ................................................................................................................................................... ................................................................................................................................................... ................................................................................................................................................... ................................................................................................................................................... ...............................................................................................................................................[6] (c) Discuss the factors that can lead to a transition from the growth of a coral reef to reef erosion. ................................................................................................................................................... ................................................................................................................................................... ................................................................................................................................................... ................................................................................................................................................... ................................................................................................................................................... ................................................................................................................................................... ................................................................................................................................................... ................................................................................................................................................... ................................................................................................................................................... ................................................................................................................................................... ................................................................................................................................................... ................................................................................................................................................... ................................................................................................................................................... ...............................................................................................................................................[6] [Total: 15]
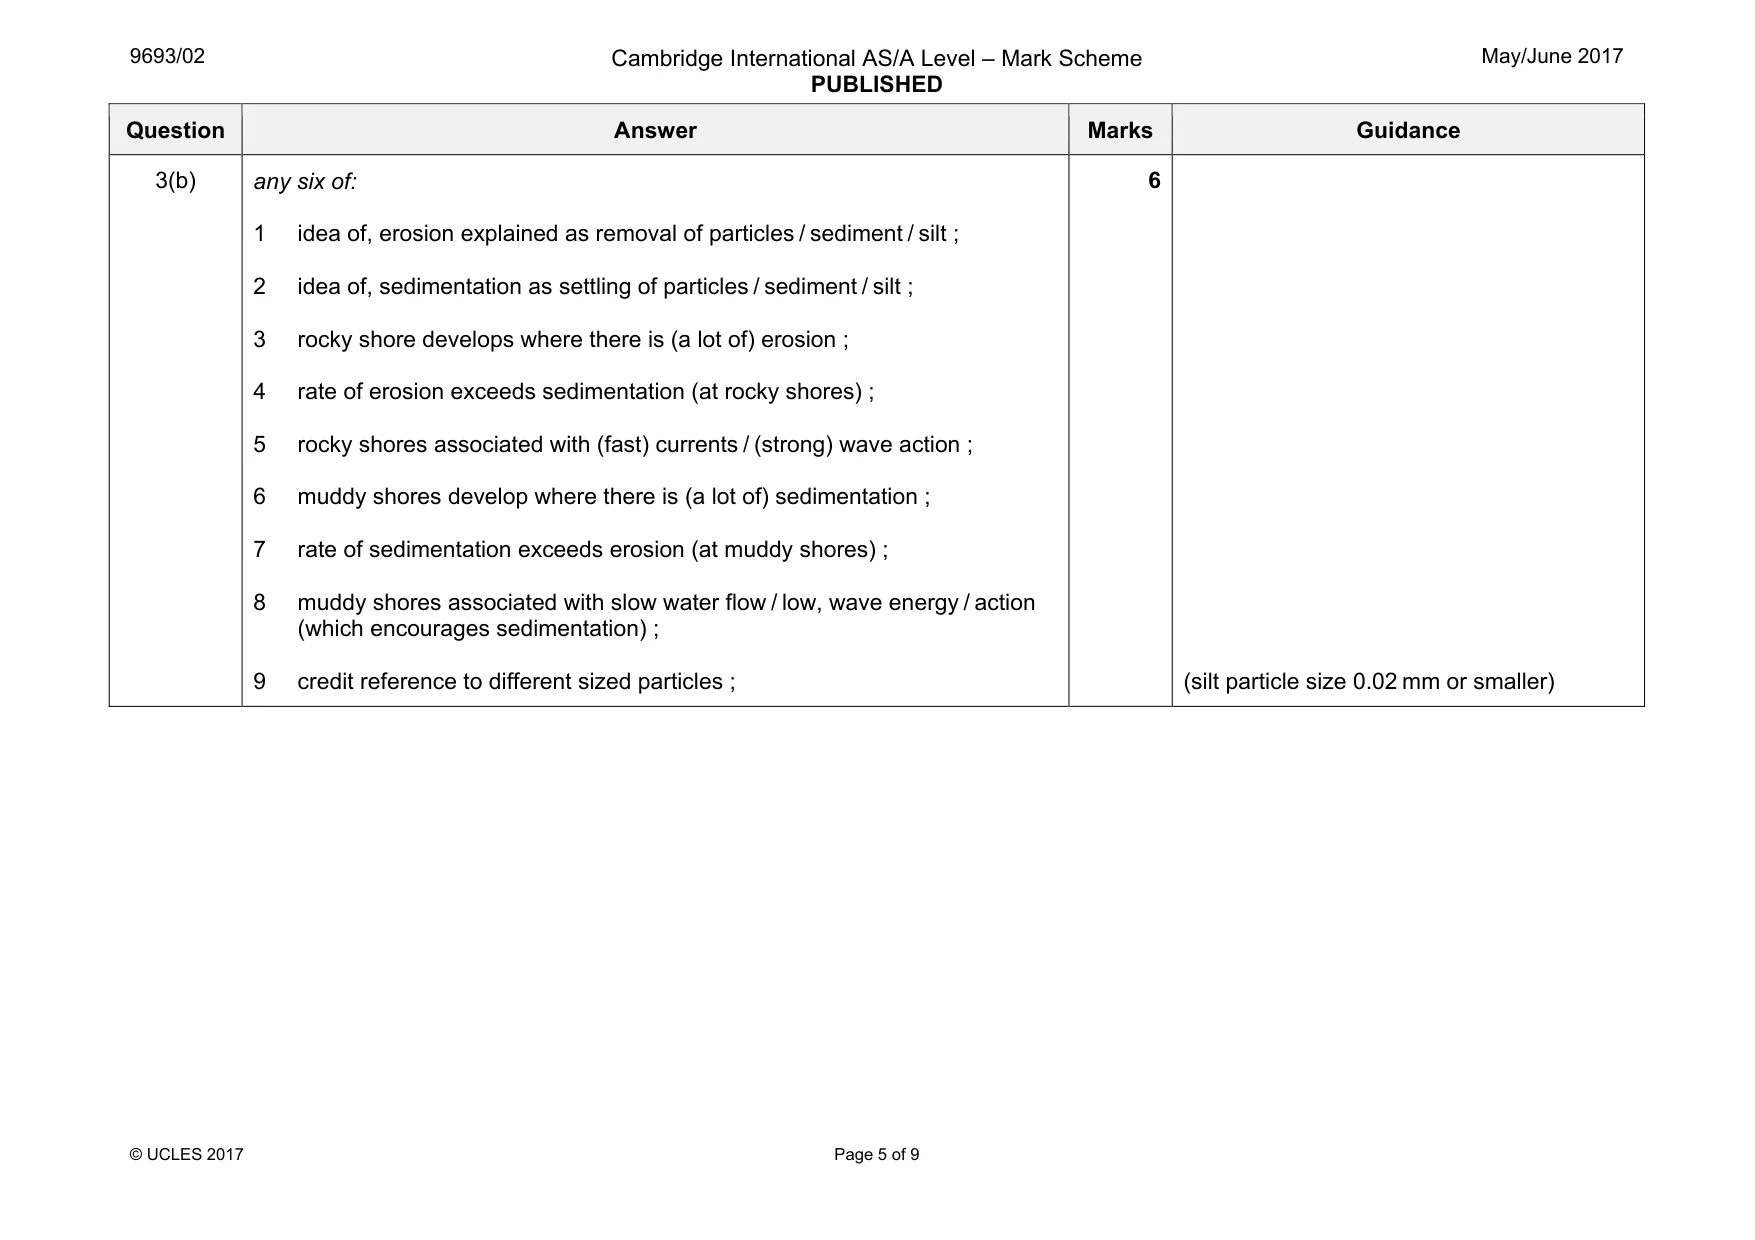
Mark scheme: 3(a) idea of, change in community (structure) / change in numbers of different species ; over time ; e.g. (Tevnia replaced with Riftia) at hydrothermal vents ; 3 A other marine examples, e.g. succession on a whale carcass or on an artificial reef Individual species names are not required, but a relevant successional scenario is required Question Answer Marks Guidance 3(b) any six of: 1 idea of, erosion explained as removal of particles / sediment / silt ; 2 idea of, sedimentation as settling of particles / sediment / silt ; 3 rocky shore develops where there is (a lot of) erosion ; 4 rate of erosion exceeds sedimentation (at rocky shores) ; 5 rocky shores associated with (fast) currents / (strong) wave action ; 6 muddy shores develop where there is (a lot of) sedimentation ; 7 rate of sedimentation exceeds erosion (at muddy shores) ; 8 muddy shores associated with slow water flow / low, wave energy / action (which encourages sedimentation) ; 9 credit reference to different sized particles ; 6 (silt particle size 0.02 mm or smaller) Question Answer Marks Guidance 3(c) any 6 of: 1 damage due to, storms / cyclones / physical effects ; 2 drying / exposure to air ; 3 temperature change / global warming ; 4 causes bleaching / loss of zooxanthellae ; 5 presence of predators / crown of thorns starfish (COTS) / parrot fish / corals are eaten ; 6 increased carbon dioxide / acid rain ; 7 decreased pH / increased acidity ; 8 dissolves coral skeleton / can’t form (CaCO3) exoskeleton ; 9 sedimentation / sediment / silt, blocks mouth of polyp / physical damage ; 10 damage due to named human disturbance ; 11 idea of, nutrient enrichment / chemicals in run off ; 12 leading to, eutrophication / algal growth / toxicity to coral ; 13 blocking / reduction, of light (by sediment / turbidity / algae) ; 14 (coral) disease ; 6 A H+ increase as a decrease in pH e.g. tourist trampling, blast fishing, dredging, anchorage of boats
Q4 · Explain how volcanic activity affects the chemical composition of sea water
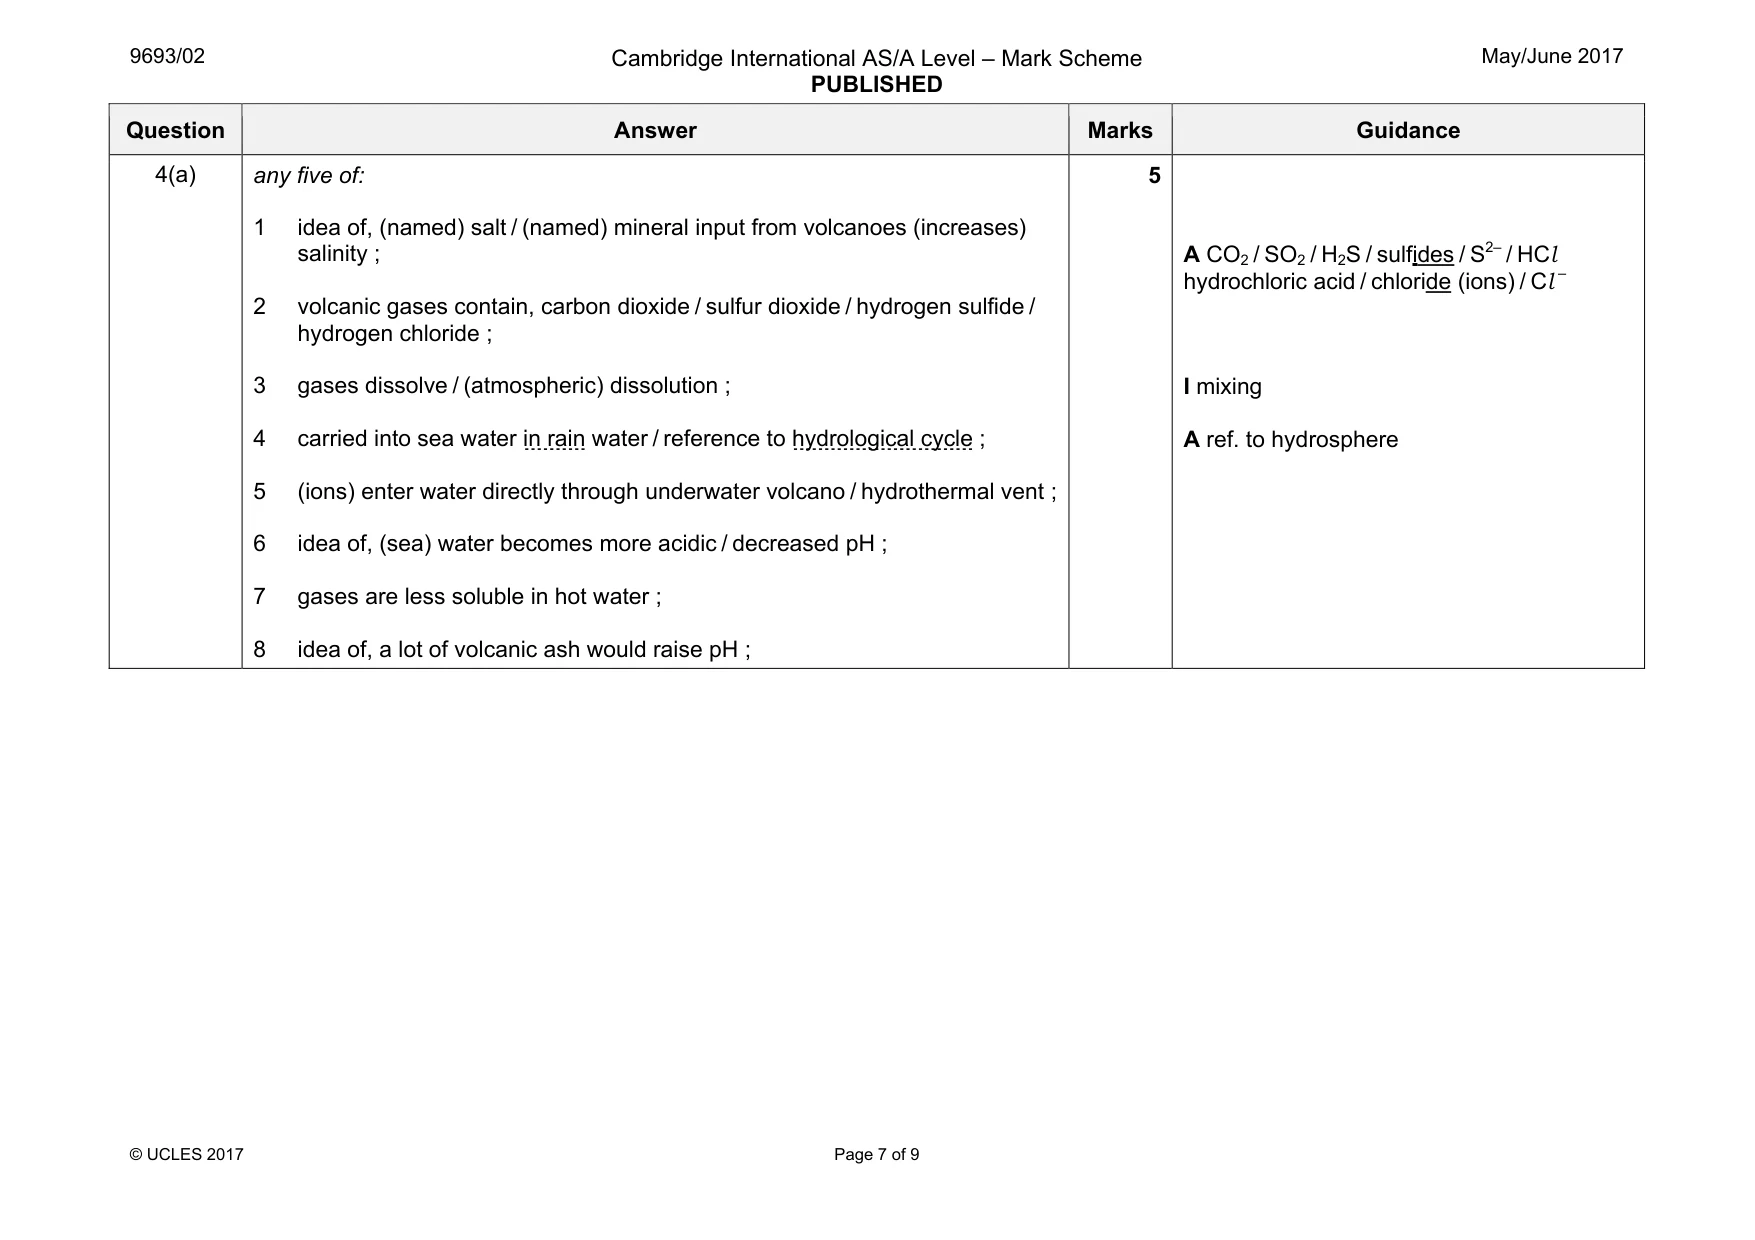
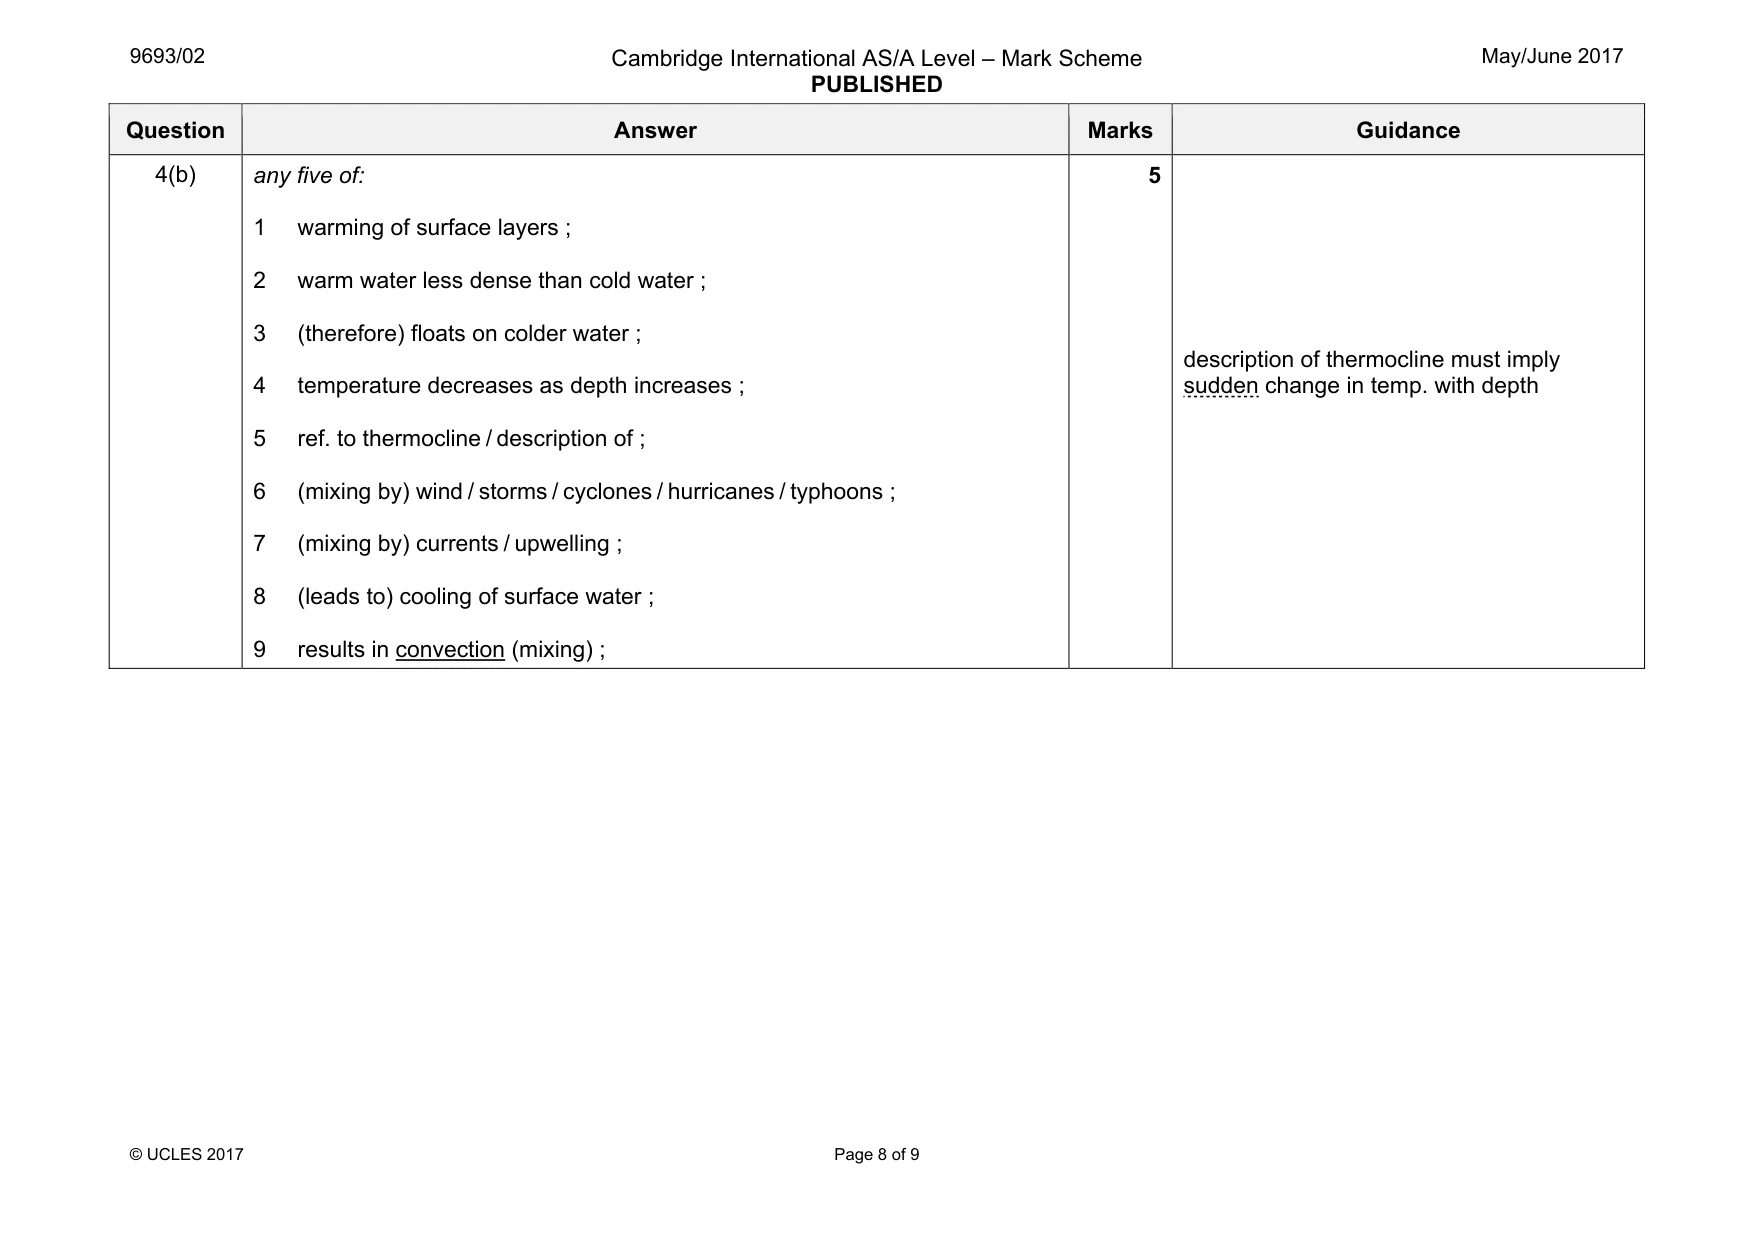
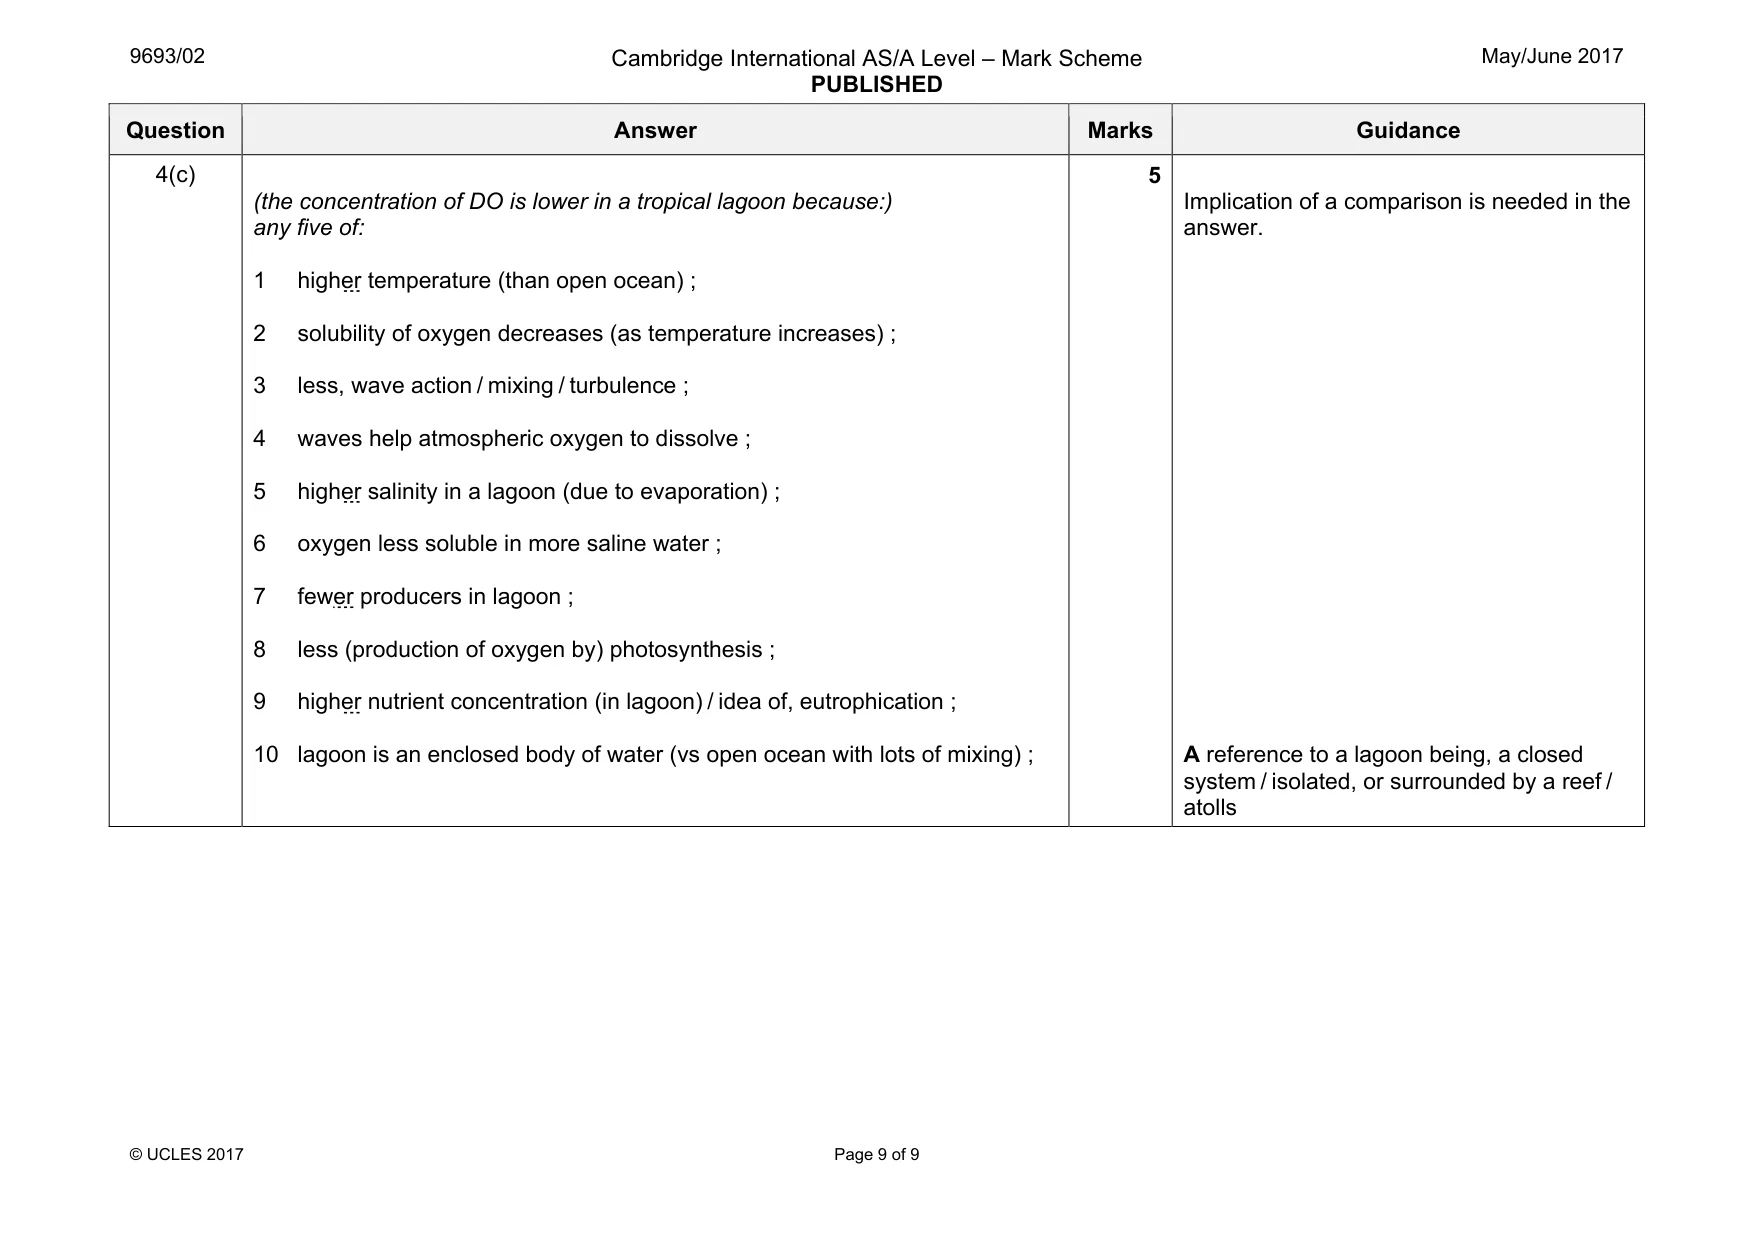
4 (a) Explain how volcanic activity affects the chemical composition of sea water. ................................................................................................................................................... ................................................................................................................................................... ................................................................................................................................................... ................................................................................................................................................... ................................................................................................................................................... ................................................................................................................................................... ................................................................................................................................................... ................................................................................................................................................... ................................................................................................................................................... ...............................................................................................................................................[5] (b) Describe how temperature gradients form in water columns to produce ocean layers and how mixing of these layers may occur. ................................................................................................................................................... ................................................................................................................................................... ................................................................................................................................................... ................................................................................................................................................... ................................................................................................................................................... ................................................................................................................................................... ................................................................................................................................................... ................................................................................................................................................... ................................................................................................................................................... ...............................................................................................................................................[5] (c) The concentration of dissolved oxygen in the surface water of open oceans ranges from 4 mg dm–3 to 9 mg dm–3. The concentration of dissolved oxygen in a tropical lagoon was measured and found to be 2.9 mg dm–3. Suggest explanations for this difference. ................................................................................................................................................... ................................................................................................................................................... ................................................................................................................................................... ................................................................................................................................................... ................................................................................................................................................... ................................................................................................................................................... ................................................................................................................................................... ................................................................................................................................................... ................................................................................................................................................... ................................................................................................................................................... ................................................................................................................................................... ...............................................................................................................................................[5] [Total: 15]
Mark scheme: 4(a) any five of: 1 idea of, (named) salt / (named) mineral input from volcanoes (increases) salinity ; 2 volcanic gases contain, carbon dioxide / sulfur dioxide / hydrogen sulfide / hydrogen chloride ; 3 gases dissolve / (atmospheric) dissolution ; 4 carried into sea water in rain water / reference to hydrological cycle ; 5 (ions) enter water directly through underwater volcano / hydrothermal vent ; 6 idea of, (sea) water becomes more acidic / decreased pH ; 7 gases are less soluble in hot water ; 8 idea of, a lot of volcanic ash would raise pH ; 5 A CO2 / SO2 / H2S / sulfides / S2– / HCl hydrochloric acid / chloride (ions) / Cl – I mixing A ref. to hydrosphere Question Answer Marks Guidance 4(b) any five of: 1 warming of surface layers ; 2 warm water less dense than cold water ; 3 (therefore) floats on colder water ; 4 temperature decreases as depth increases ; 5 ref. to thermocline / description of ; 6 (mixing by) wind / storms / cyclones / hurricanes / typhoons ; 7 (mixing by) currents / upwelling ; 8 (leads to) cooling of surface water ; 9 results in convection (mixing) ; 5 description of thermocline must imply sudden change in temp. with depth Question Answer Marks Guidance 4(c) (the concentration of DO is lower in a tropical lagoon because:) any five of: 1 higher temperature (than open ocean) ; 2 solubility of oxygen decreases (as temperature increases) ; 3 less, wave action / mixing / turbulence ; 4 waves help atmospheric oxygen to dissolve ; 5 higher salinity in a lagoon (due to evaporation) ; 6 oxygen less soluble in more saline water ; 7 fewer producers in lagoon ; 8 less (production of oxygen by) photosynthesis ; 9 higher nutrient concentration (in lagoon) / idea of, eutrophication ; 10 lagoon is an enclosed body of water (vs open ocean with lots of mixing) ; 5 Implication of a comparison is needed in the answer. A reference to a lagoon being, a closed system / isolated, or surrounded by a reef / atolls
What was in this paper
The subtopics covered by these 4 questions, and how many questions each got. Open one in a new tab to see every Cambridge question on it.
What you needed in this session
Cambridge’s own grade thresholds for 2017 May/June, Paper 2 · Variant 1. A higher threshold means an easier paper — the bar moves with how the cohort did.