Cambridge A Level Marine Science 9693 — 2023 May/June Paper 2 · Variant 1
9693/21/M/J/23 · 5 questions · 75 marks · ≈84 min
The question paper and its mark scheme, free to read here and free to download. This is Cambridge’s own paper, exactly as it was sat.
Question paper28 pages









Mark scheme16 pages
Answers below. Sit the paper first if you are practising.
Questions as text
Q1 · Apparatus used to investigate the rate of photosynthesis
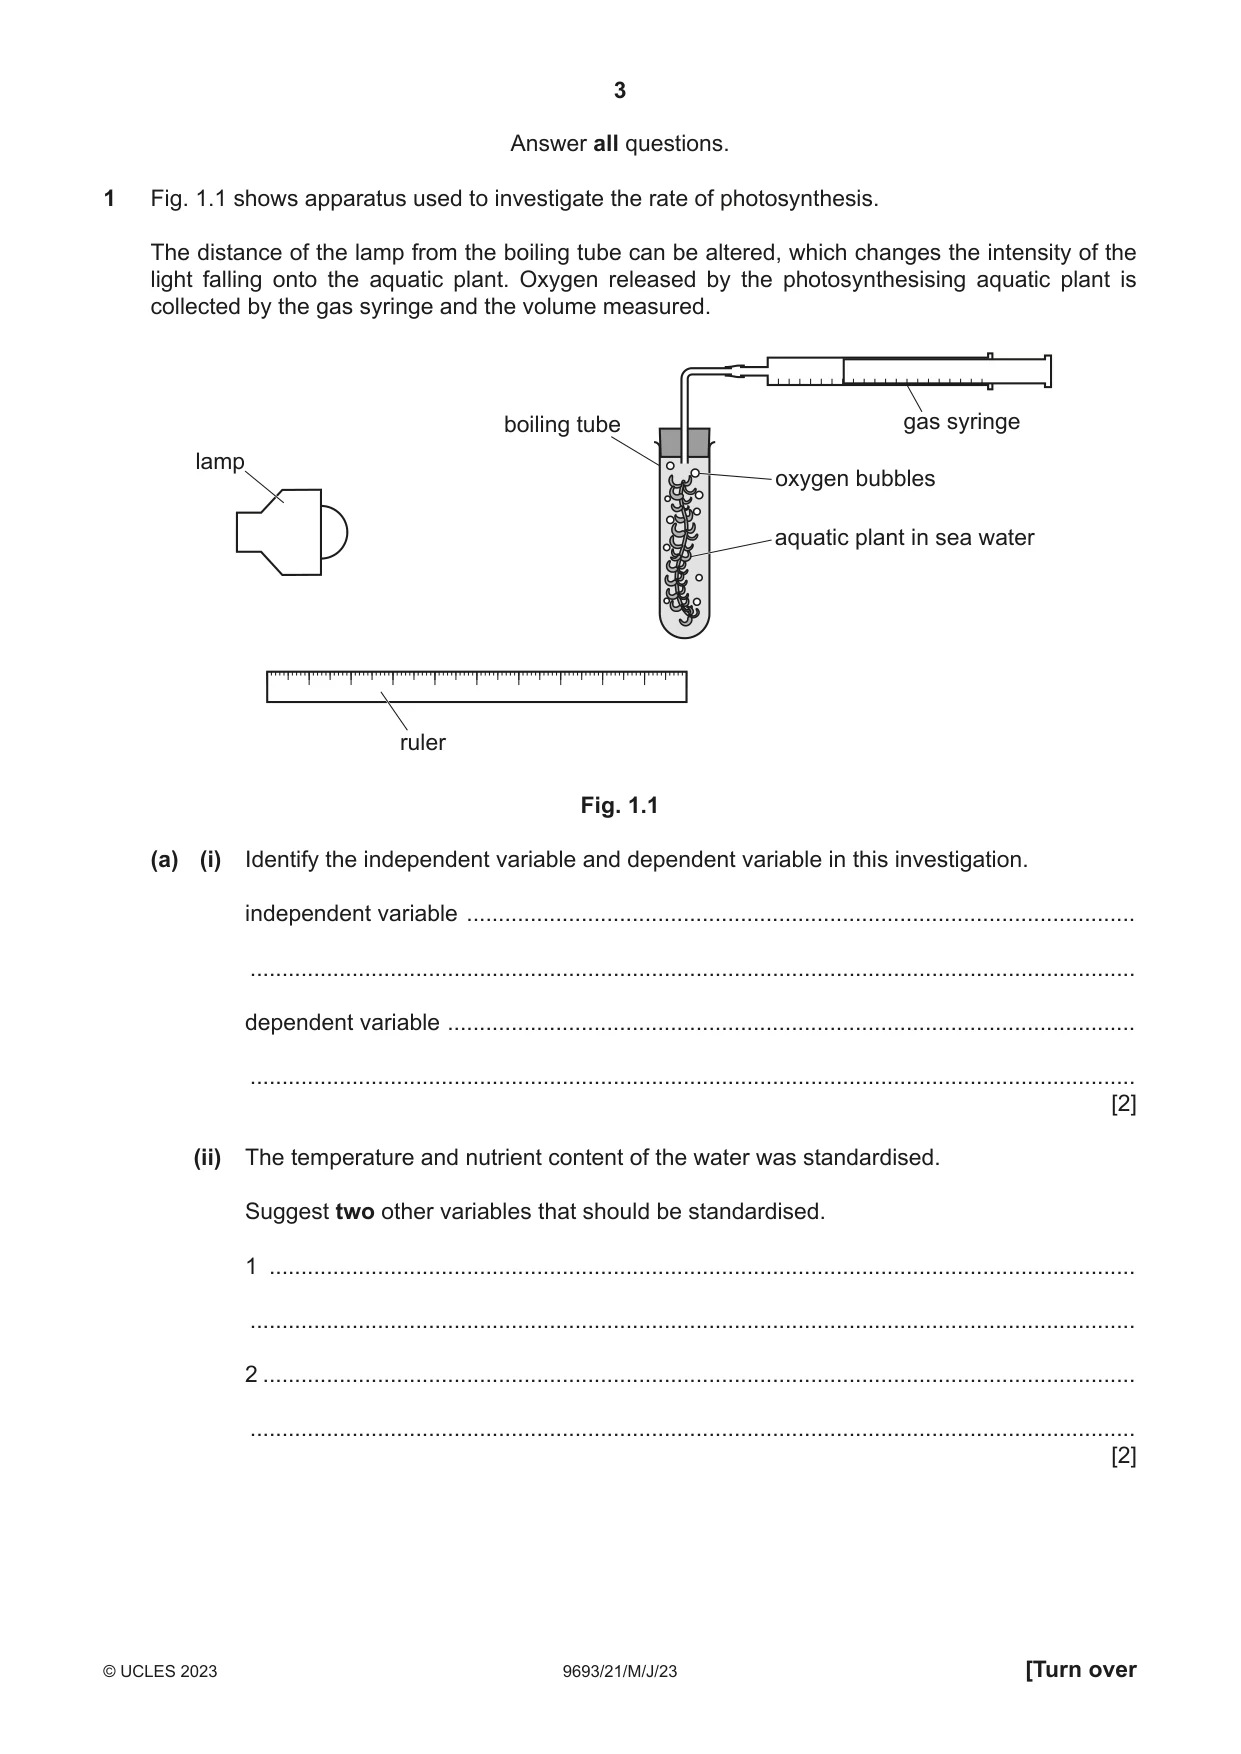
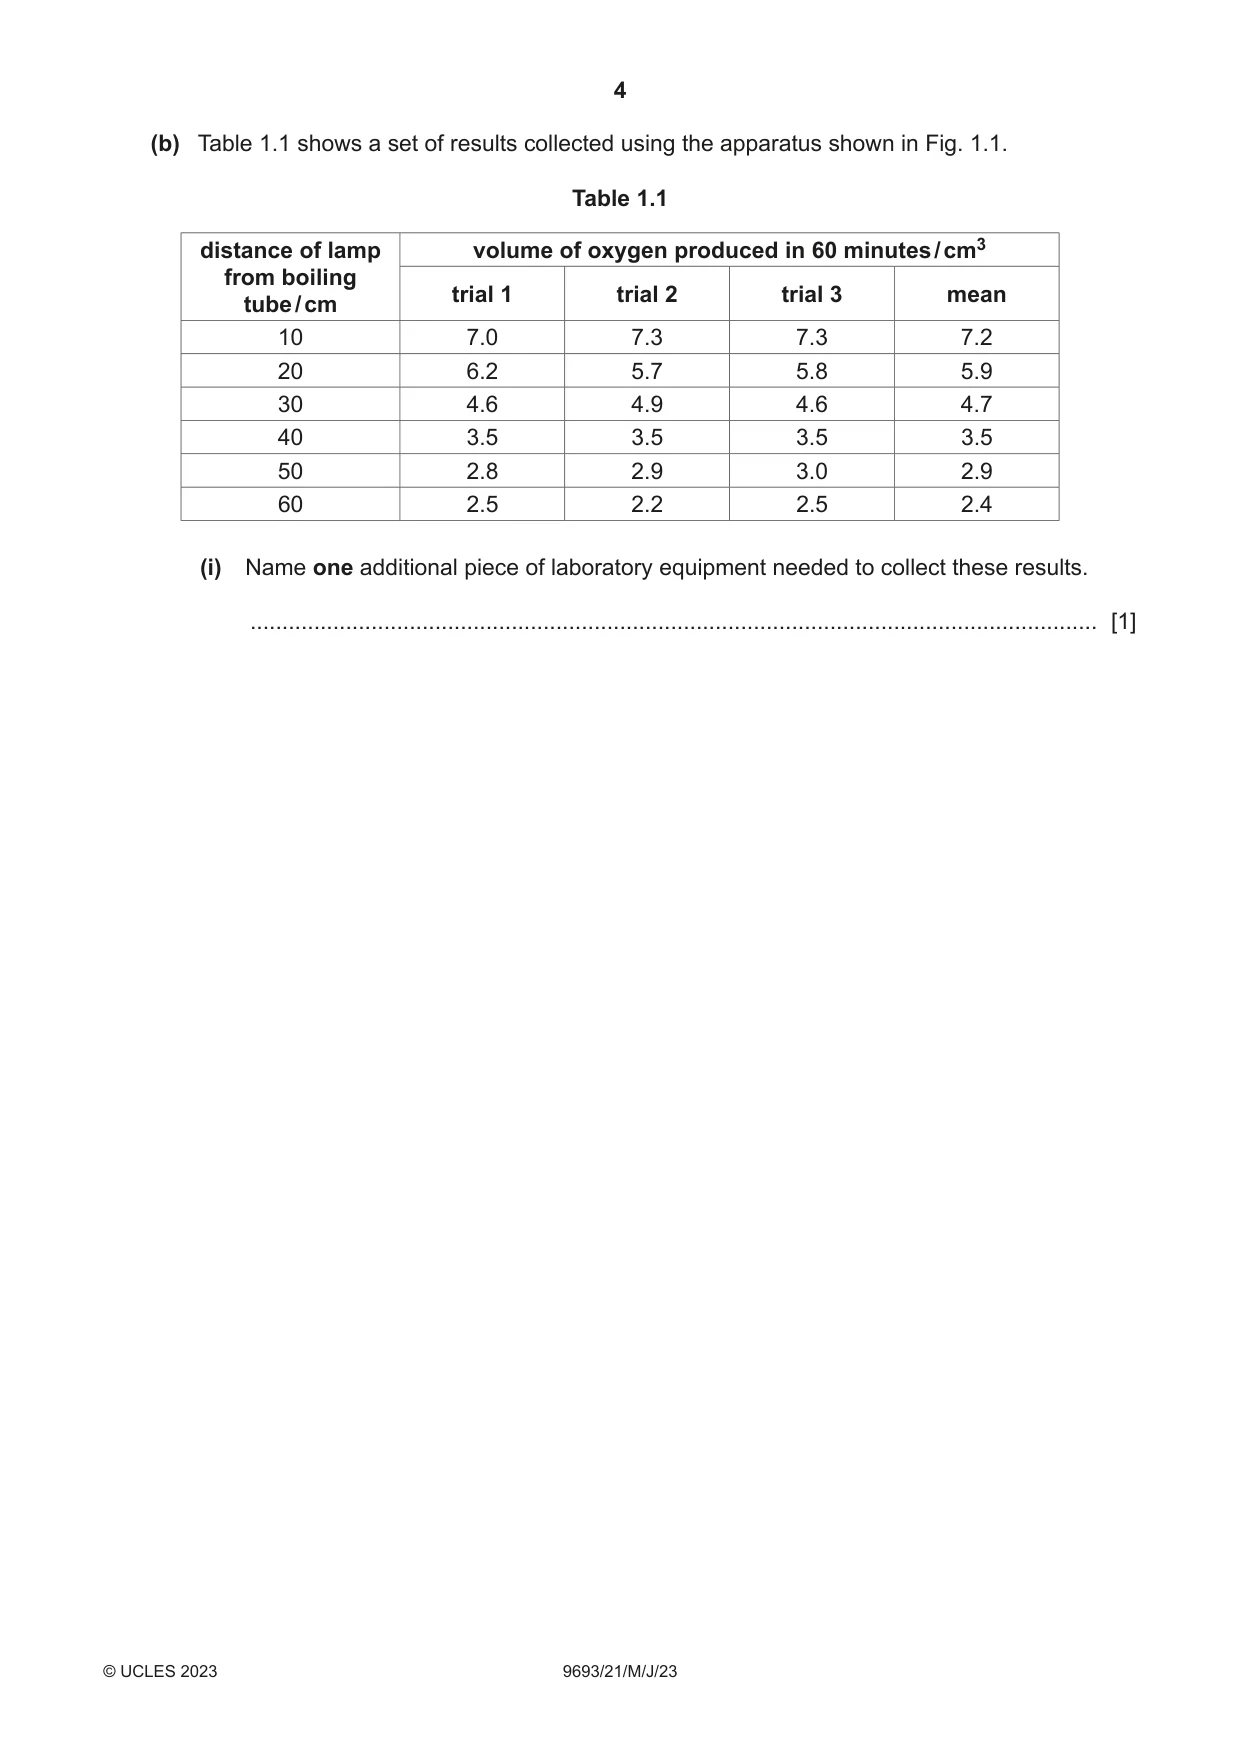
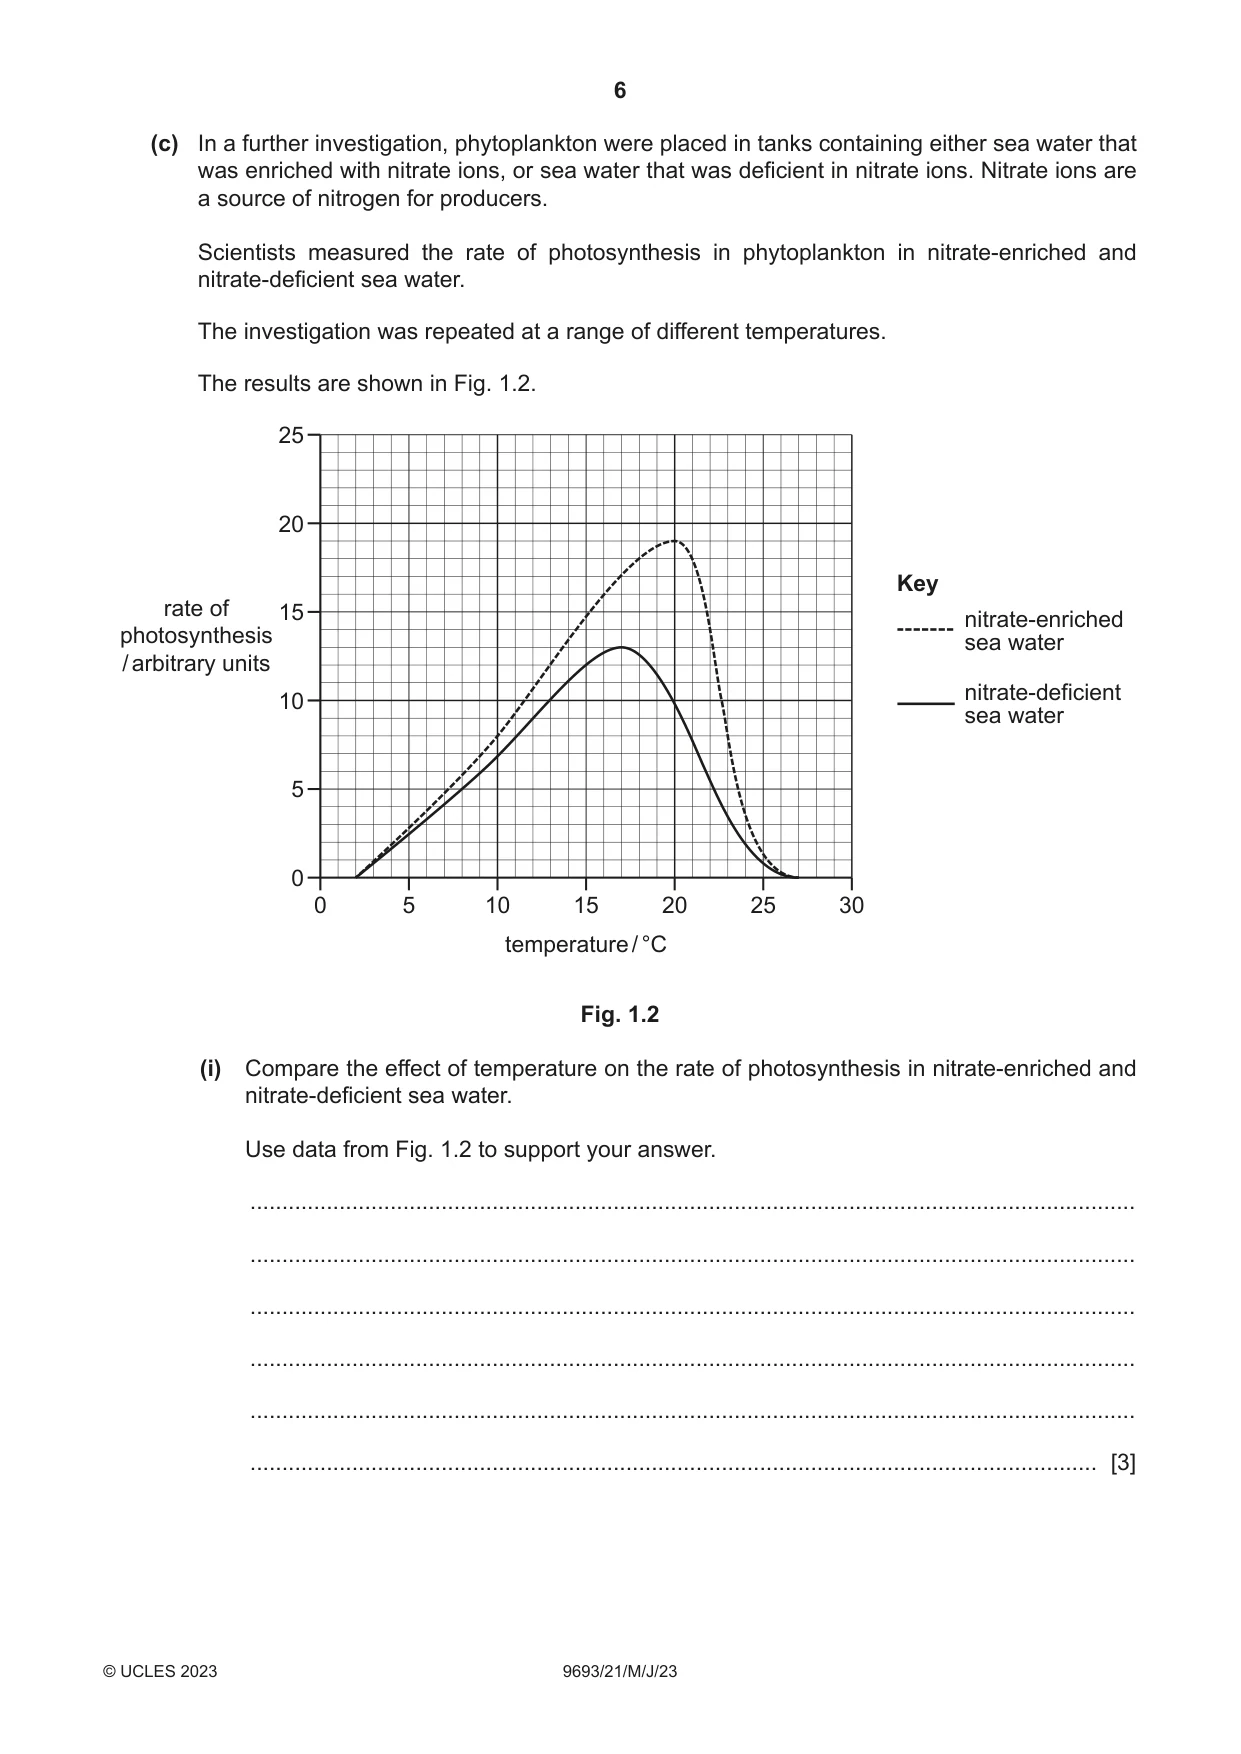
1 Fig. 1.1 shows apparatus used to investigate the rate of photosynthesis. The distance of the lamp from the boiling tube can be altered, which changes the intensity of the light falling onto the aquatic plant. Oxygen released by the photosynthesising aquatic plant is collected by the gas syringe and the volume measured. boiling tube gas syringe lamp oxygen bubbles aquatic plant in sea water ruler Fig. 1.1 (a) (i) Identify the independent variable and dependent variable in this investigation. independent variable ......................................................................................................... ........................................................................................................................................... dependent variable ............................................................................................................ ........................................................................................................................................... [2] (ii) The temperature and nutrient content of the water was standardised. Suggest two other variables that should be standardised. 1 ........................................................................................................................................ ........................................................................................................................................... 2 ......................................................................................................................................... ........................................................................................................................................... [2] (b) Table 1.1 shows a set of results collected using the apparatus shown in Fig. 1.1. Table 1.1 distance of lamp volume of oxygen produced in 60 minutes / cm3 from boiling trial 1 trial 2 trial 3 mean tube / cm 10 7.0 7.3 7.3 7.2 20 6.2 5.7 5.8 5.9 30 4.6 4.9 4.6 4.7 40 3.5 3.5 3.5 3.5 50 2.8 2.9 3.0 2.9 60 2.5 2.2 2.5 2.4 (i) Name one additional piece of laboratory equipment needed to collect these results. ..................................................................................................................................... [1] (ii) Plot a graph showing the relationship between the distance of the lamp from the boiling tube and the mean volume of oxygen produced in 60 minutes. [4] (iii) Explain the relationship shown between the distance of the lamp from the boiling tube and the volume of oxygen produced in 60 minutes. ........................................................................................................................................... ........................................................................................................................................... ........................................................................................................................................... ........................................................................................................................................... ........................................................................................................................................... ..................................................................................................................................... [3] (c) In a further investigation, phytoplankton were placed in tanks containing either sea water that was enriched with nitrate ions, or sea water that was deficient in nitrate ions. Nitrate ions are a source of nitrogen for producers. Scientists measured the rate of photosynthesis in phytoplankton in nitrate-enriched and nitrate-deficient sea water. The investigation was repeated at a range of different temperatures. The results are shown in Fig. 1.2. 25 20 Key rate of 15 nitrate-enriched photosynthesis sea water / arbitrary units nitrate-deficient 10 sea water 5 0 0 5 10 15 20 25 30 temperature / °C Fig. 1.2 (i) Compare the effect of temperature on the rate of photosynthesis in nitrate-enriched and nitrate-deficient sea water. Use data from Fig. 1.2 to support your answer. ........................................................................................................................................... ........................................................................................................................................... ........................................................................................................................................... ........................................................................................................................................... ........................................................................................................................................... ..................................................................................................................................... [3] (ii) Explain why the productivity of the phytoplankton would be higher in nitrate-enriched sea water. ........................................................................................................................................... ........................................................................................................................................... ........................................................................................................................................... ..................................................................................................................................... [2] [Total: 17]
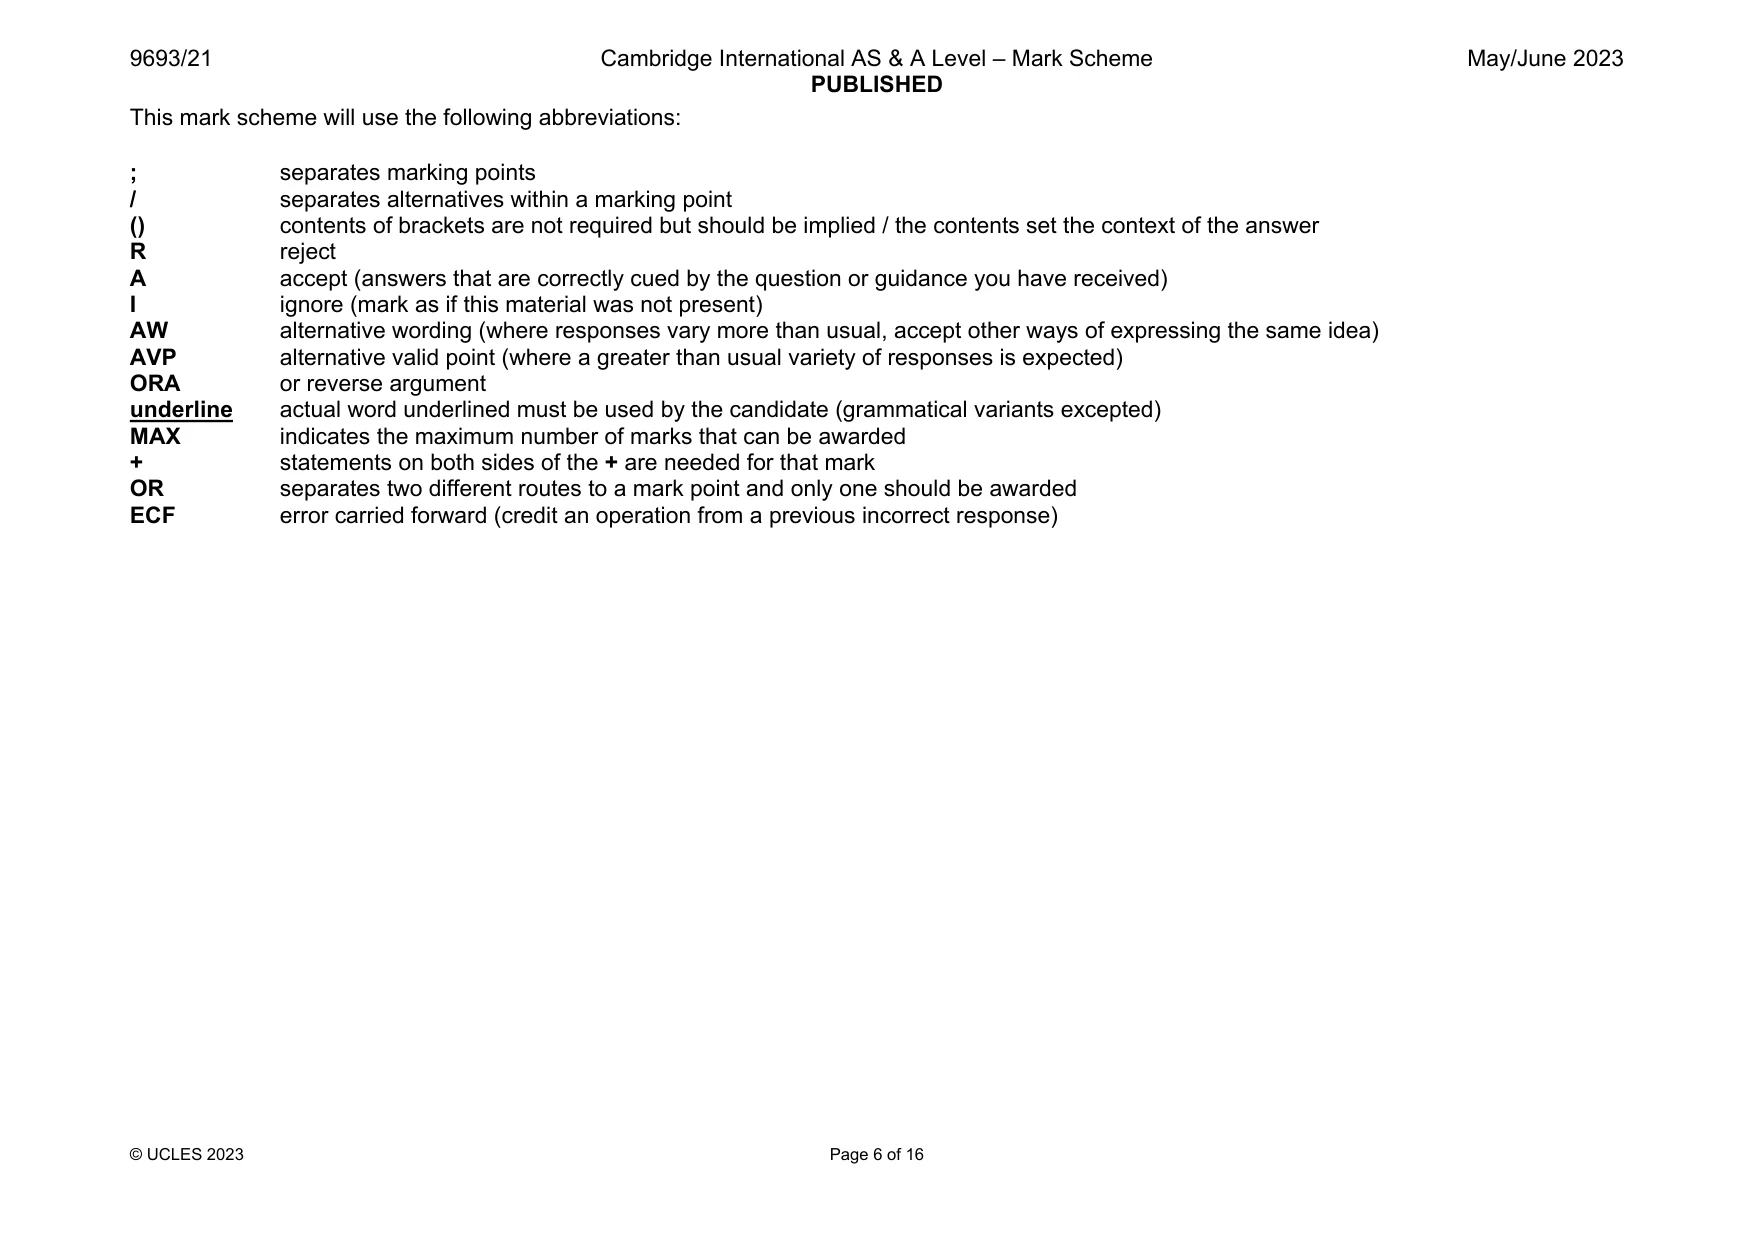
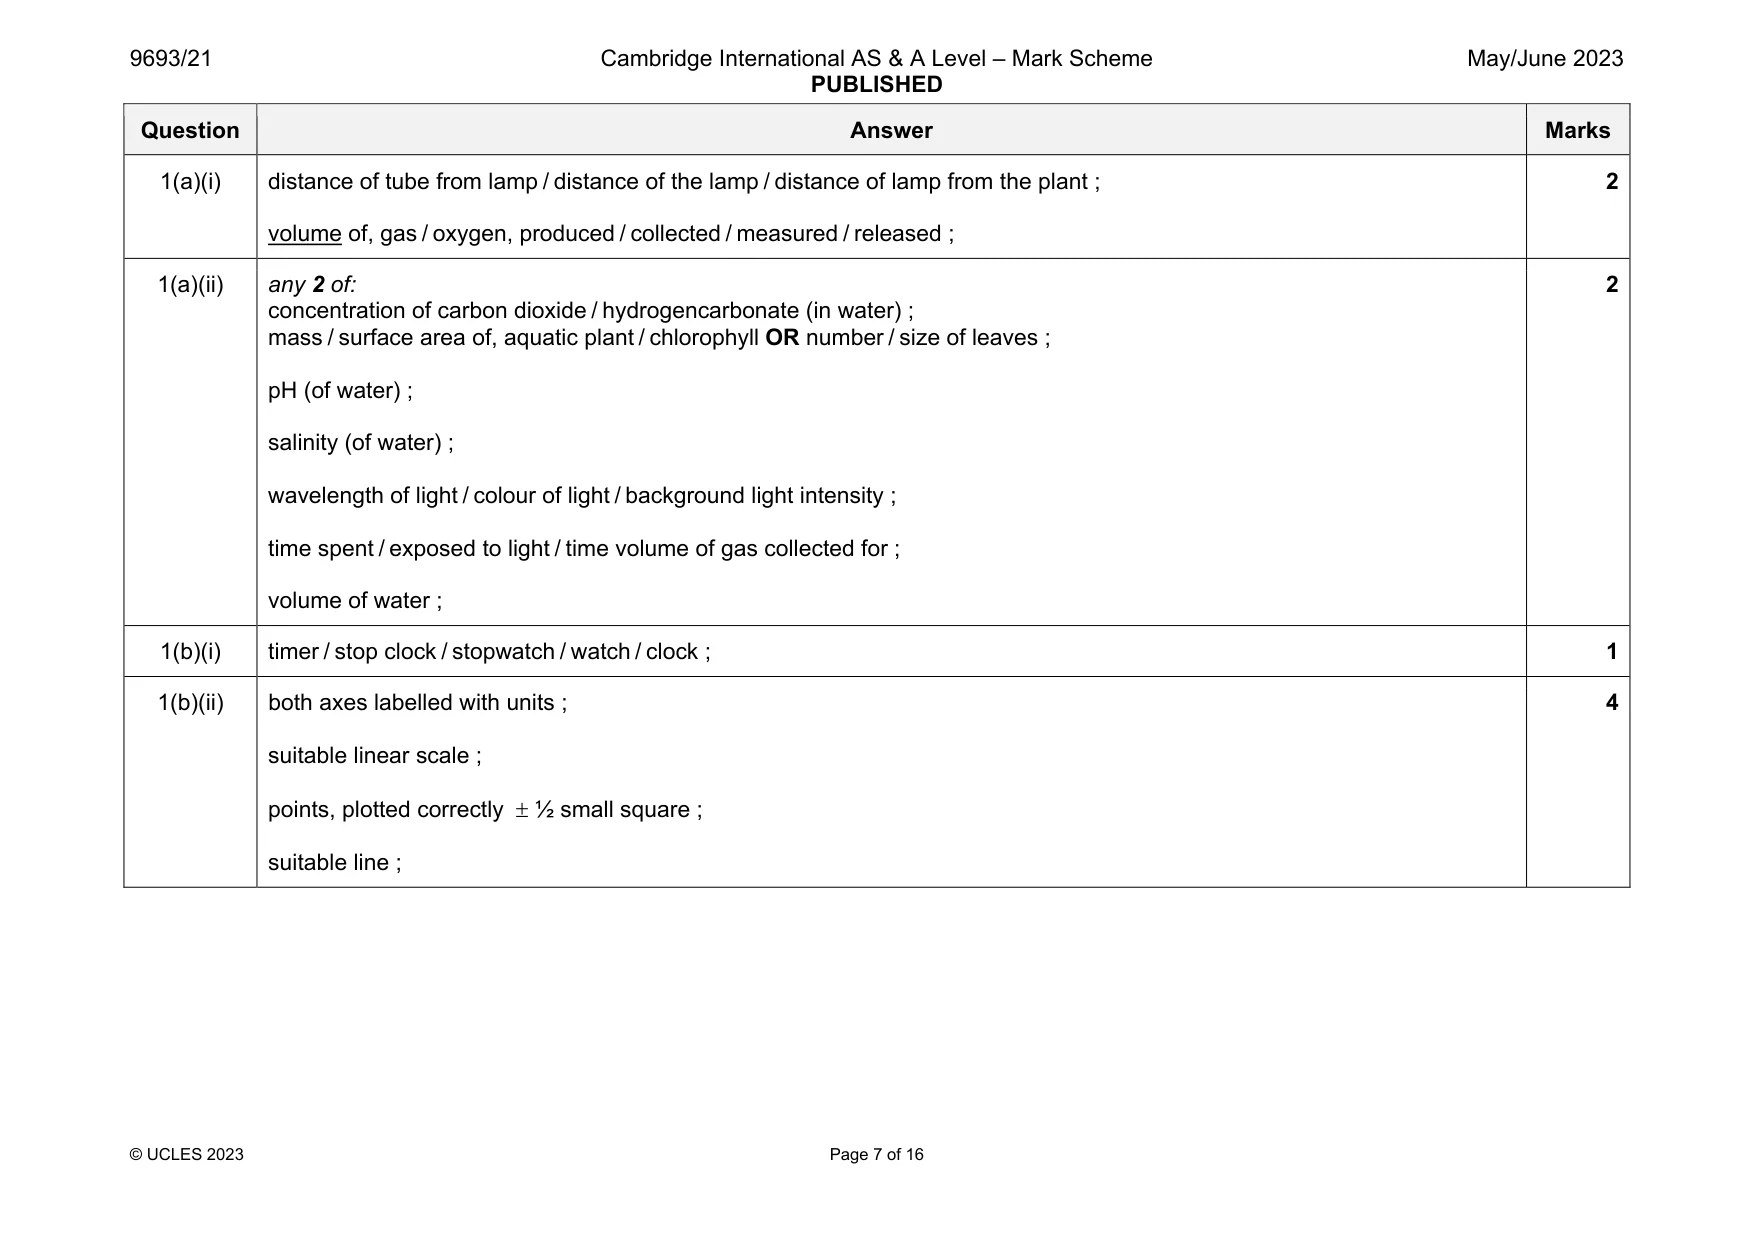
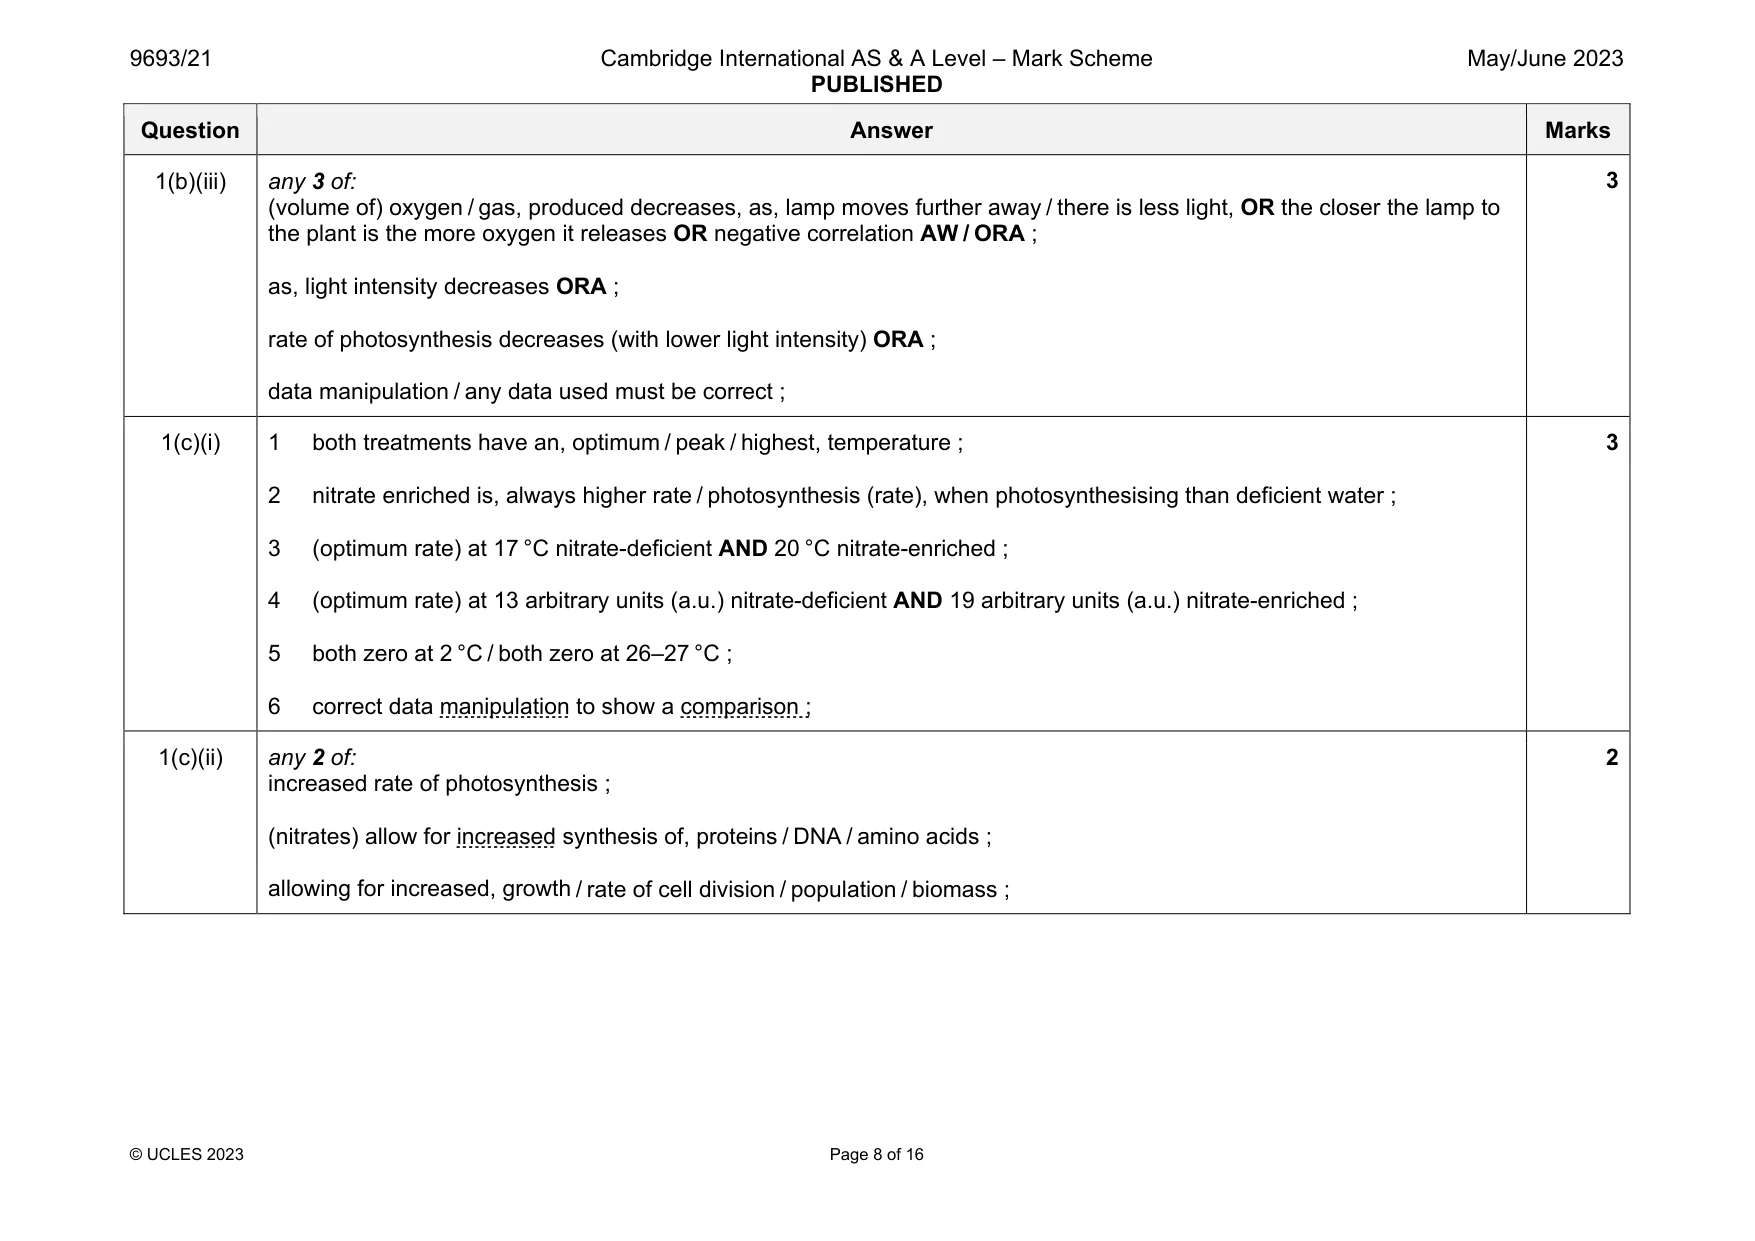
Mark scheme: 1(a)(i) distance of tube from lamp / distance of the lamp / distance of lamp from the plant ; volume of, gas / oxygen, produced / collected / measured / released ; 2 1(a)(ii) any 2 of: concentration of carbon dioxide / hydrogencarbonate (in water) ; mass / surface area of, aquatic plant / chlorophyll OR number / size of leaves ; pH (of water) ; salinity (of water) ; wavelength of light / colour of light / background light intensity ; time spent / exposed to light / time volume of gas collected for ; volume of water ; 2 1(b)(i) timer / stop clock / stopwatch / watch / clock ; 1 1(b)(ii) both axes labelled with units ; suitable linear scale ; points, plotted correctly ½ small square ; suitable line ; 4 Question Answer Marks 1(b)(iii) any 3 of: (volume of) oxygen / gas, produced decreases, as, lamp moves further away / there is less light, OR the closer the lamp to the plant is the more oxygen it releases OR negative correlation AW / ORA ; as, light intensity decreases ORA ; rate of photosynthesis decreases (with lower light intensity) ORA ; data manipulation / any data used must be correct ; 3 1(c)(i) 1 both treatments have an, optimum / peak / highest, temperature ; 2 nitrate enriched is, always higher rate / photosynthesis (rate), when photosynthesising than deficient water ; 3 (optimum rate) at 17 °C nitrate-deficient AND 20 °C nitrate-enriched ; 4 (optimum rate) at 13 arbitrary units (a.u.) nitrate-deficient AND 19 arbitrary units (a.u.) nitrate-enriched ; 5 both zero at 2 °C / both zero at 26–27 °C ; 6 correct data manipulation to show a comparison ; 3 1(c)(ii) any 2 of: increased rate of photosynthesis ; (nitrates) allow for increased synthesis of, proteins / DNA / amino acids ; allowing for increased, growth / rate of cell division / population / biomass ; 2
Q2 · Scientists investigated the effect of sea water pH on the change in mass of a species of…
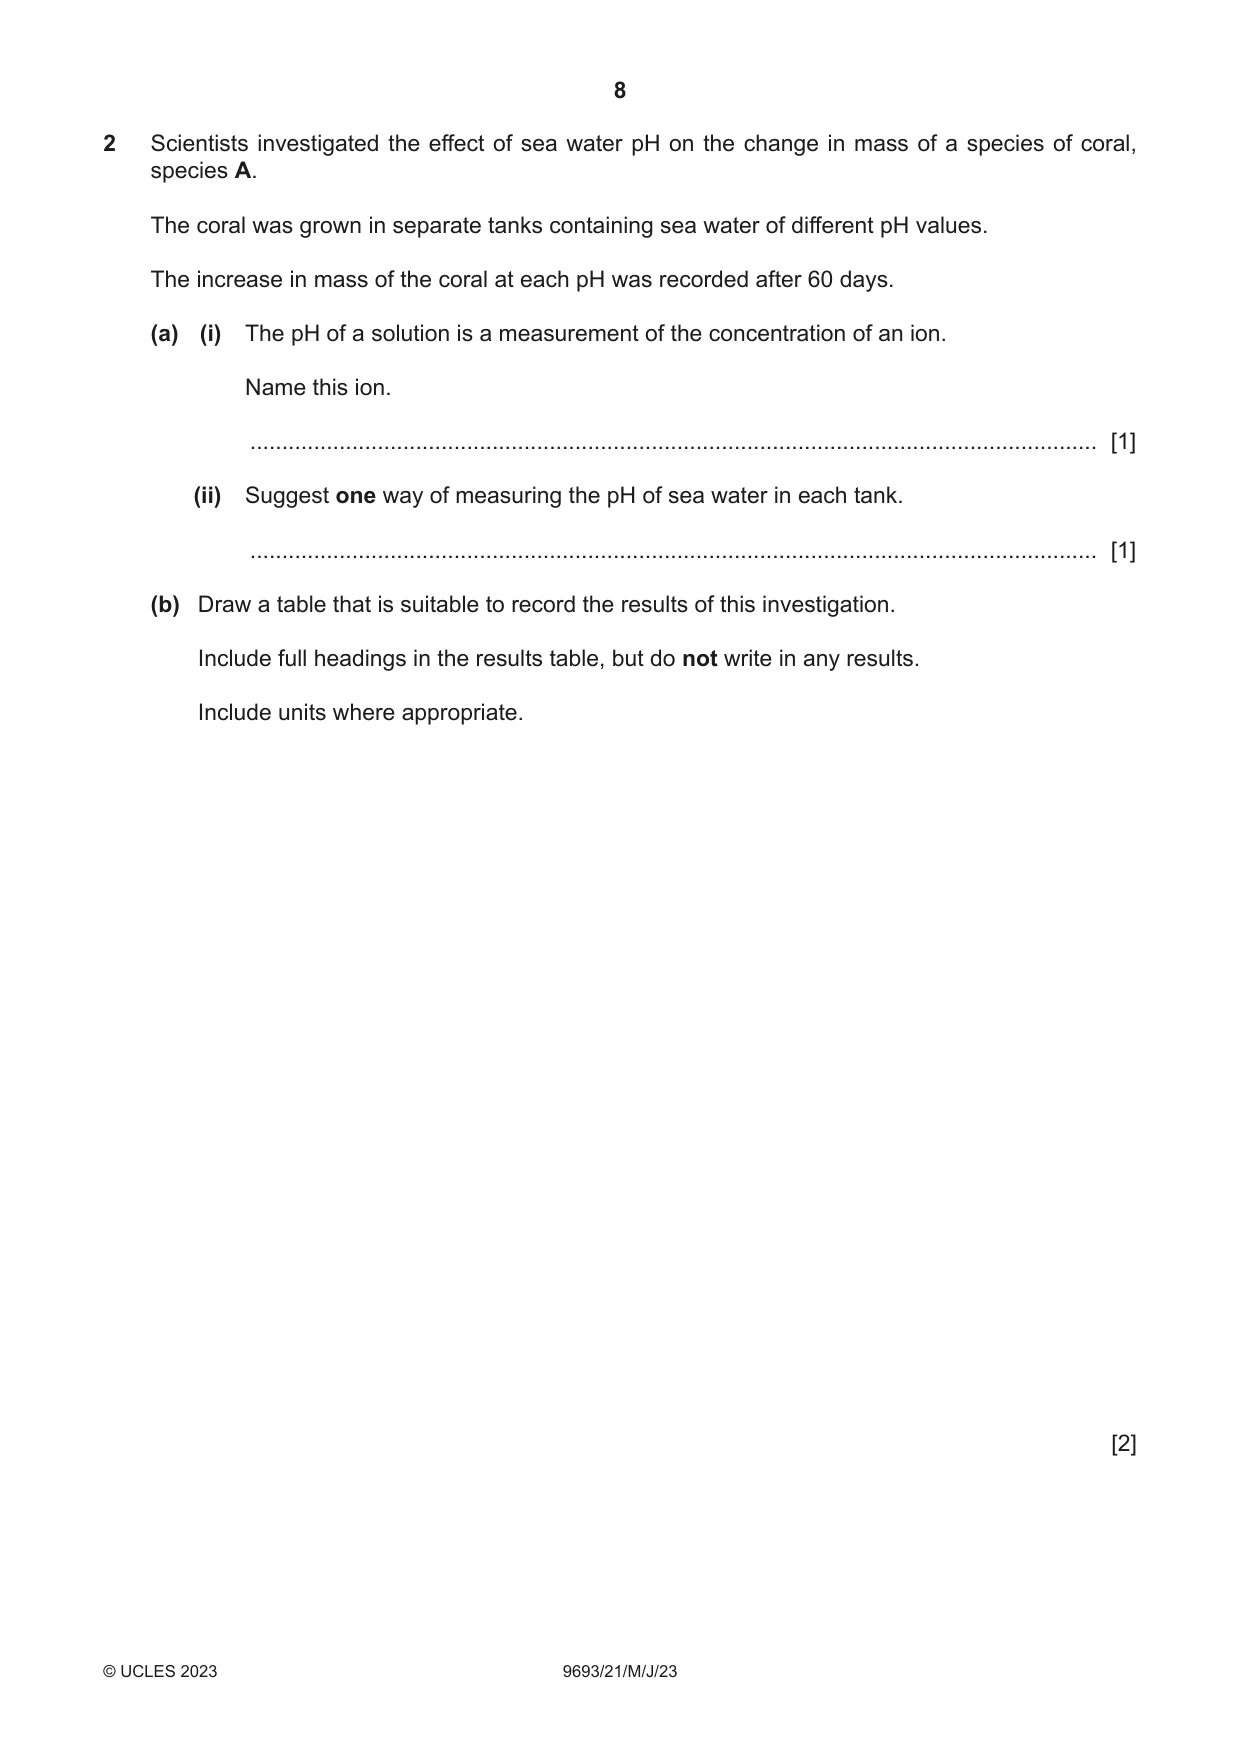
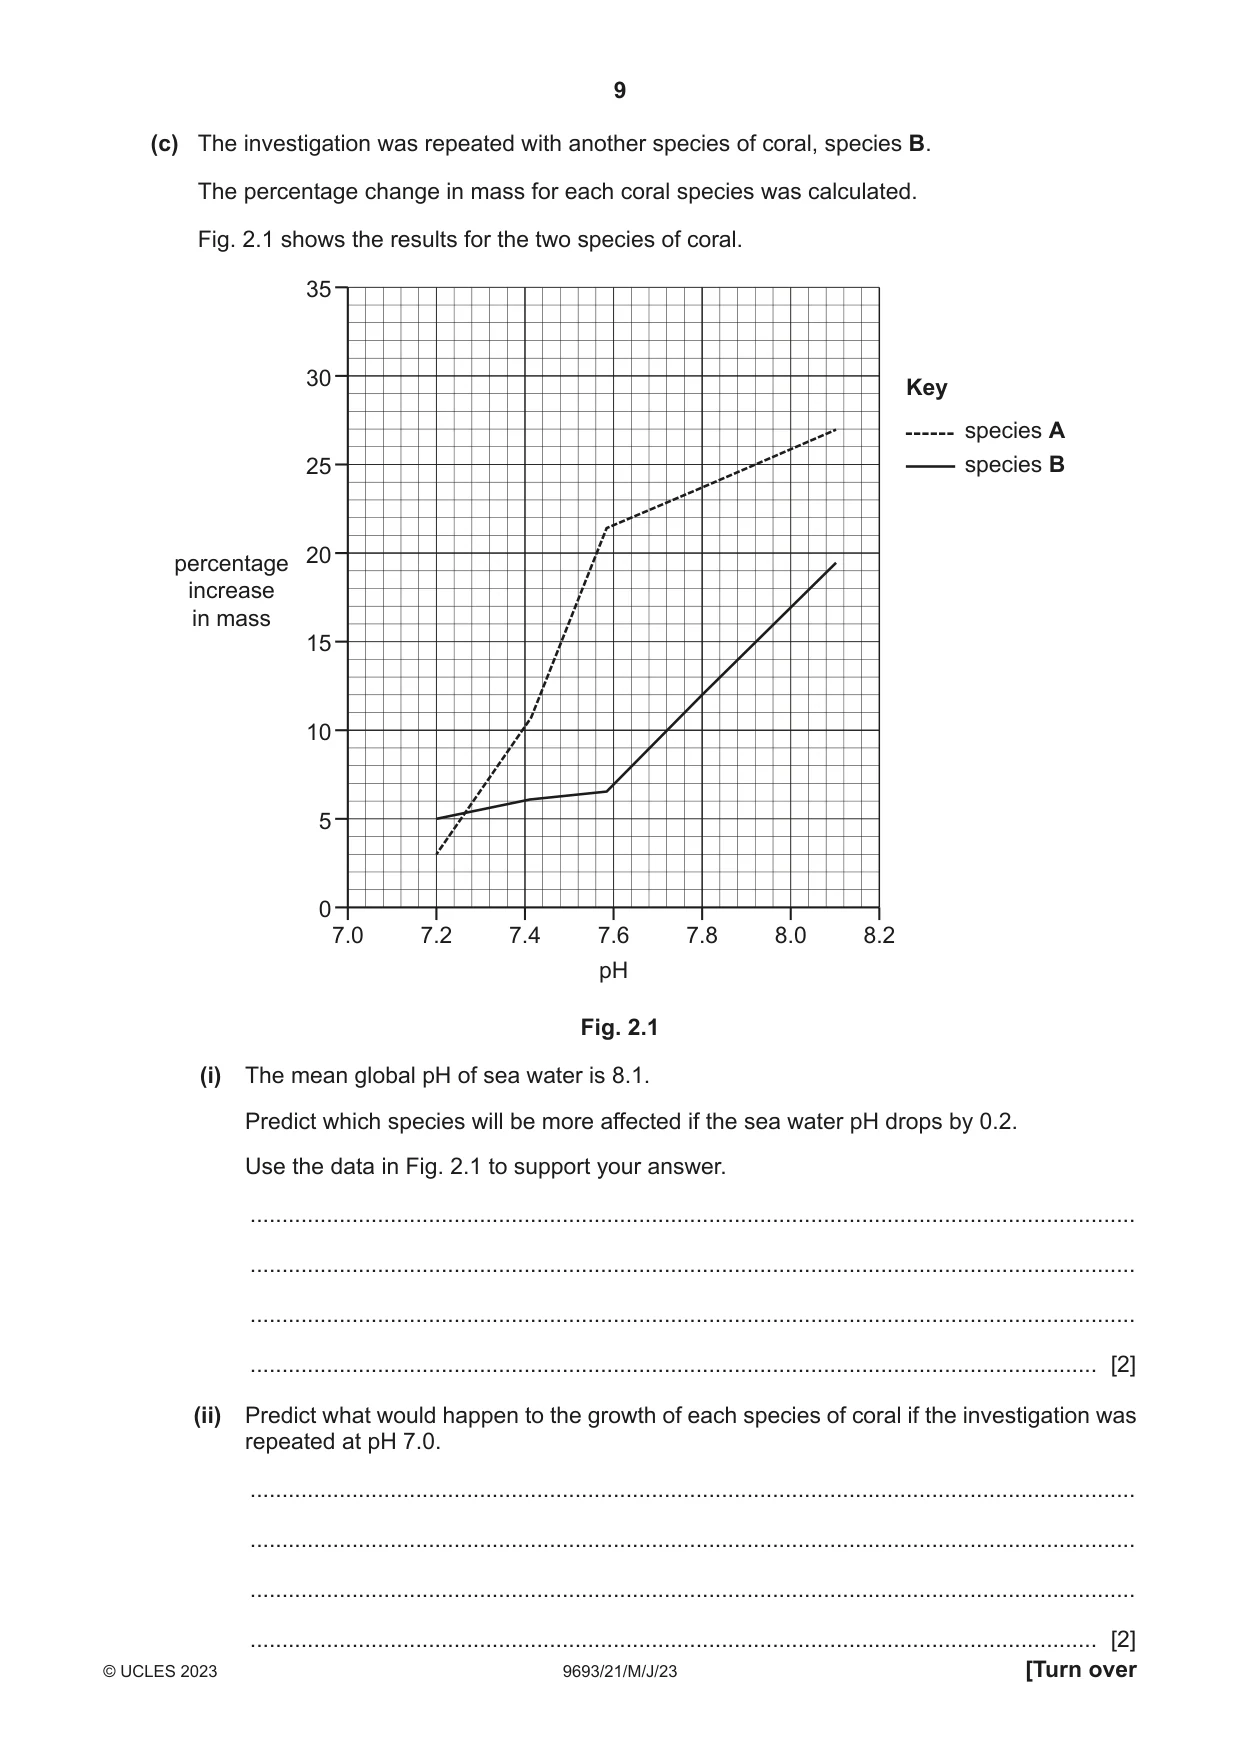
2 Scientists investigated the effect of sea water pH on the change in mass of a species of coral, species A. The coral was grown in separate tanks containing sea water of different pH values. The increase in mass of the coral at each pH was recorded after 60 days. (a) (i) The pH of a solution is a measurement of the concentration of an ion. Name this ion. ..................................................................................................................................... [1] (ii) Suggest one way of measuring the pH of sea water in each tank. ..................................................................................................................................... [1] (b) Draw a table that is suitable to record the results of this investigation. Include full headings in the results table, but do not write in any results. Include units where appropriate. [2] (c) The investigation was repeated with another species of coral, species B. The percentage change in mass for each coral species was calculated. Fig. 2.1 shows the results for the two species of coral. 35 30 Key species A 25 species B 20 percentage increase in mass 15 10 5 0 7.0 7.2 7.4 7.6 7.8 8.0 8.2 pH Fig. 2.1 (i) The mean global pH of sea water is 8.1. Predict which species will be more affected if the sea water pH drops by 0.2. Use the data in Fig. 2.1 to support your answer. ........................................................................................................................................... ........................................................................................................................................... ........................................................................................................................................... ..................................................................................................................................... [2] (ii) Predict what would happen to the growth of each species of coral if the investigation was repeated at pH 7.0. ........................................................................................................................................... ........................................................................................................................................... ........................................................................................................................................... ..................................................................................................................................... [2] (d) A decrease in sea water pH contributes to reef erosion. State two other factors that contribute to reef erosion. 1 ............................................................................................... 2 ............................................................................................... [2] [Total: 10]
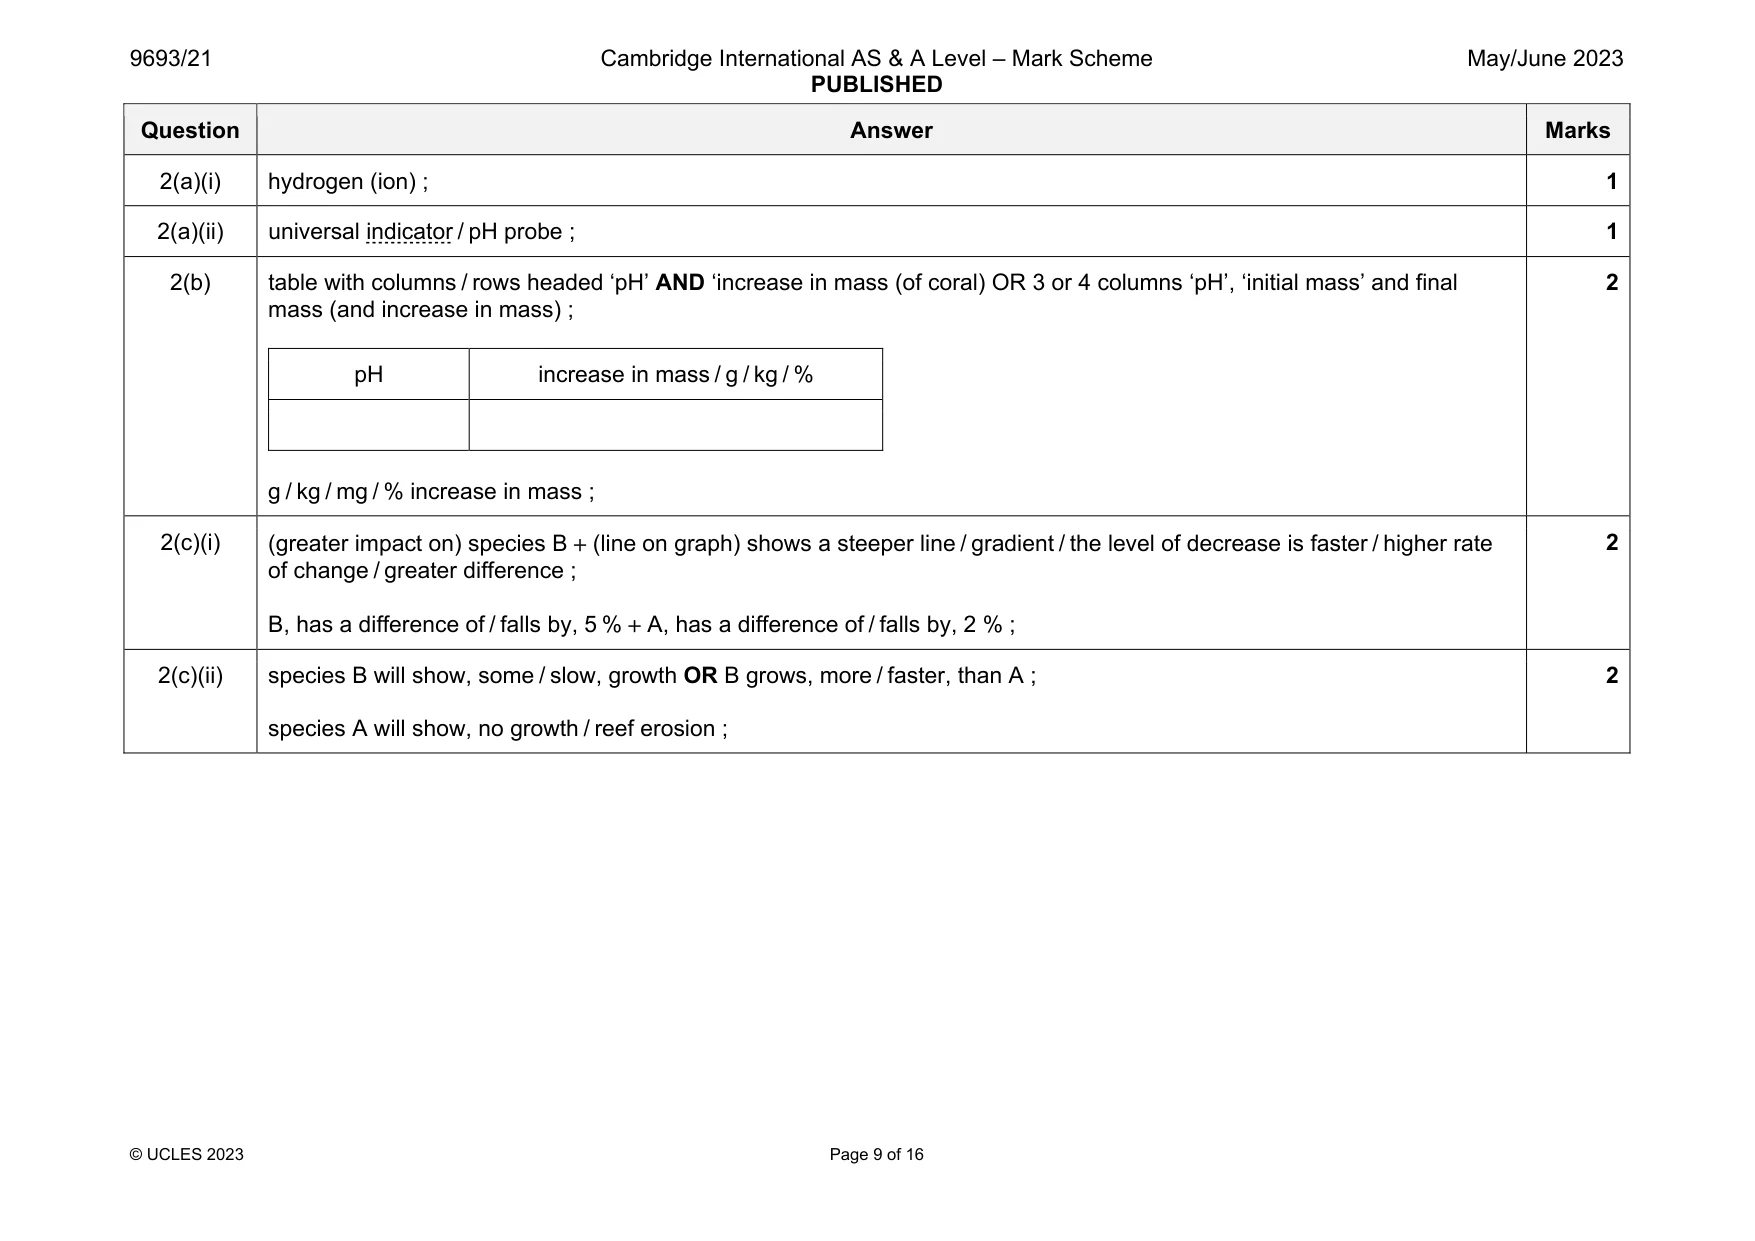
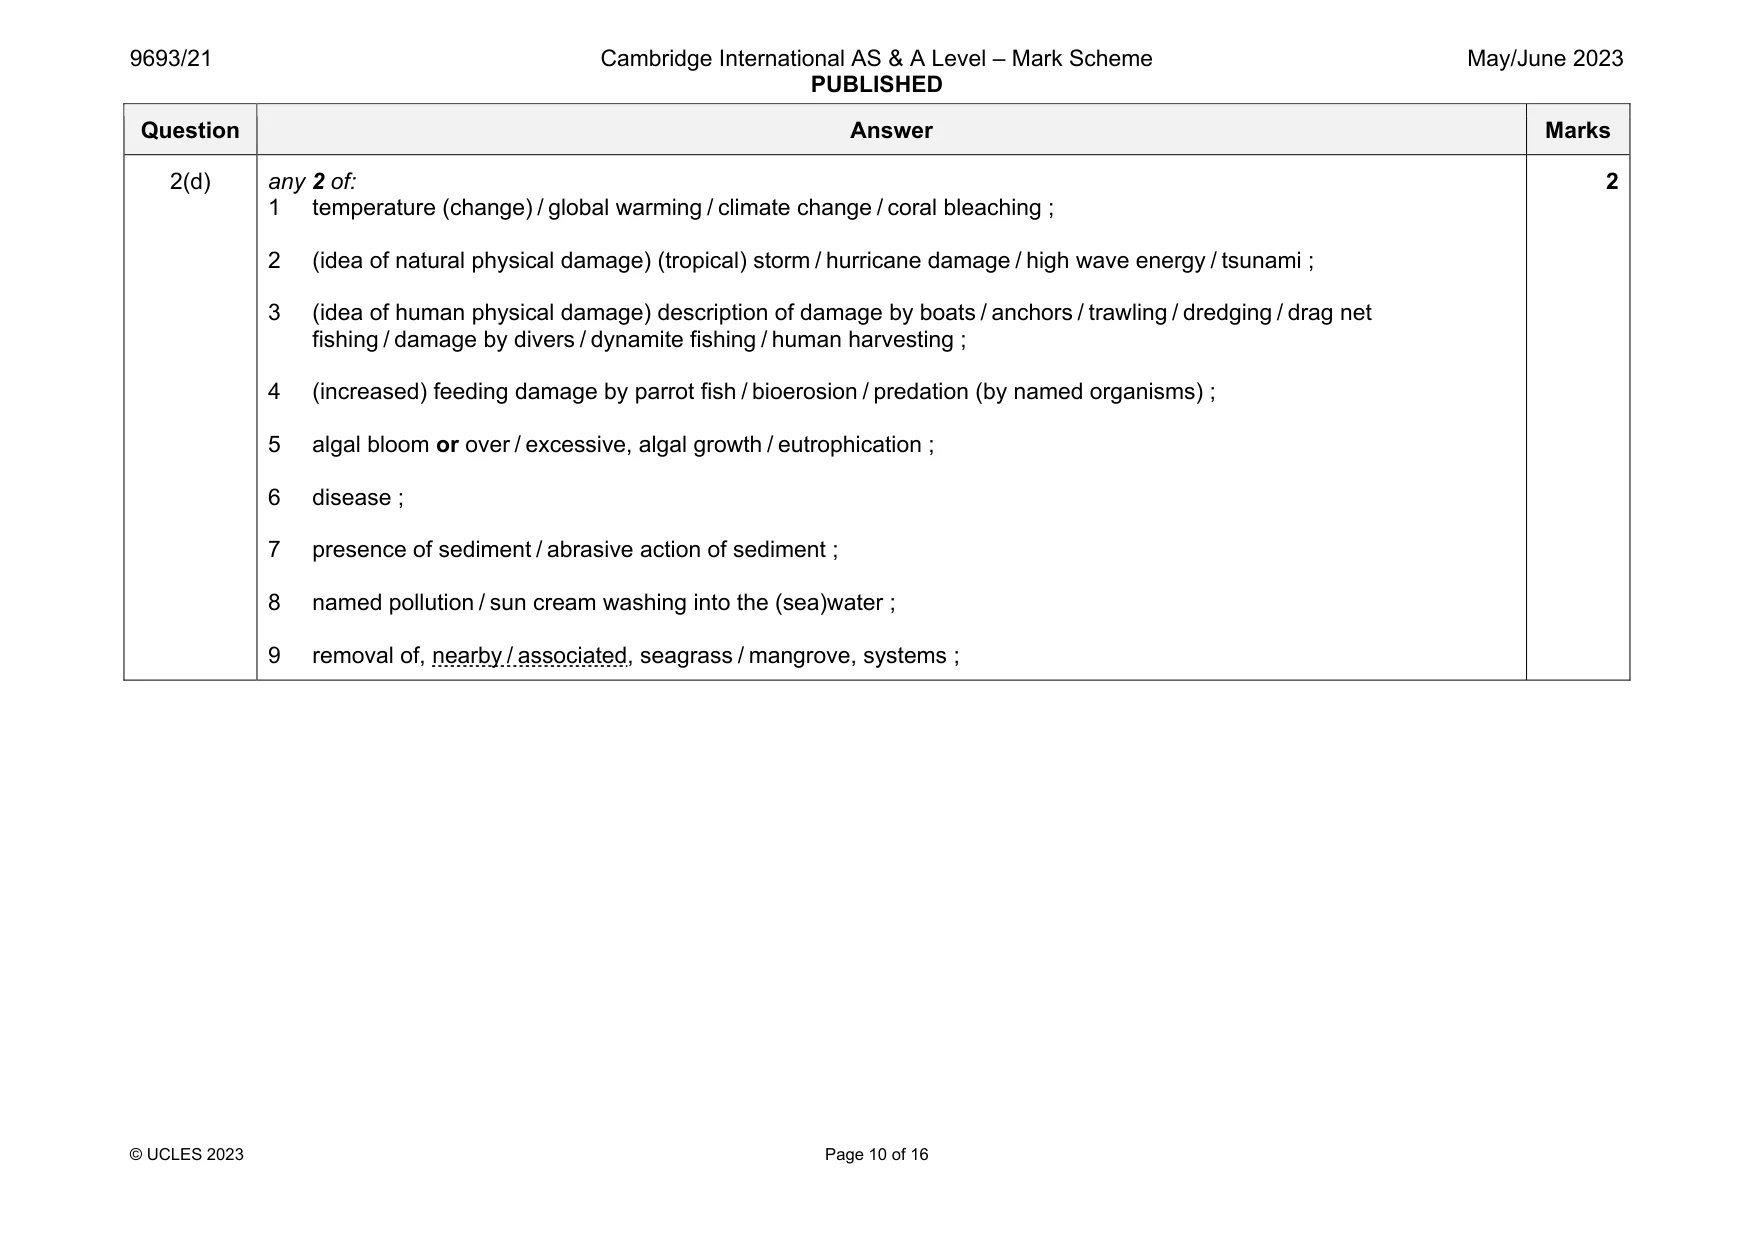
Mark scheme: 2(a)(i) hydrogen (ion) ; 1 2(a)(ii) universal indicator / pH probe ; 1 2(b) table with columns / rows headed ‘pH’ AND ‘increase in mass (of coral) OR 3 or 4 columns ‘pH’, ‘initial mass’ and final mass (and increase in mass) ; pH increase in mass / g / kg / % g / kg / mg / % increase in mass ; 2 2(c)(i) (greater impact on) species B (line on graph) shows a steeper line / gradient / the level of decrease is faster / higher rate of change / greater difference ; B, has a difference of / falls by, 5 % A, has a difference of / falls by, 2 % ; 2 2(c)(ii) species B will show, some / slow, growth OR B grows, more / faster, than A ; species A will show, no growth / reef erosion ; 2 Question Answer Marks 2(d) any 2 of: 1 temperature (change) / global warming / climate change / coral bleaching ; 2 (idea of natural physical damage) (tropical) storm / hurricane damage / high wave energy / tsunami ; 3 (idea of human physical damage) description of damage by boats / anchors / trawling / dredging / drag net fishing / damage by divers / dynamite fishing / human harvesting ; 4 (increased) feeding damage by parrot fish / bioerosion / predation (by named organisms) ; 5 algal bloom or over / excessive, algal growth / eutrophication ; 6 disease ; 7 presence of sediment / abrasive action of sediment ; 8 named pollution / sun cream washing into the (sea)water ; 9 removal of, nearby / associated, seagrass / mangrove, systems ; 2
Q3 · Mangrove forests are globally threatened ecosystems
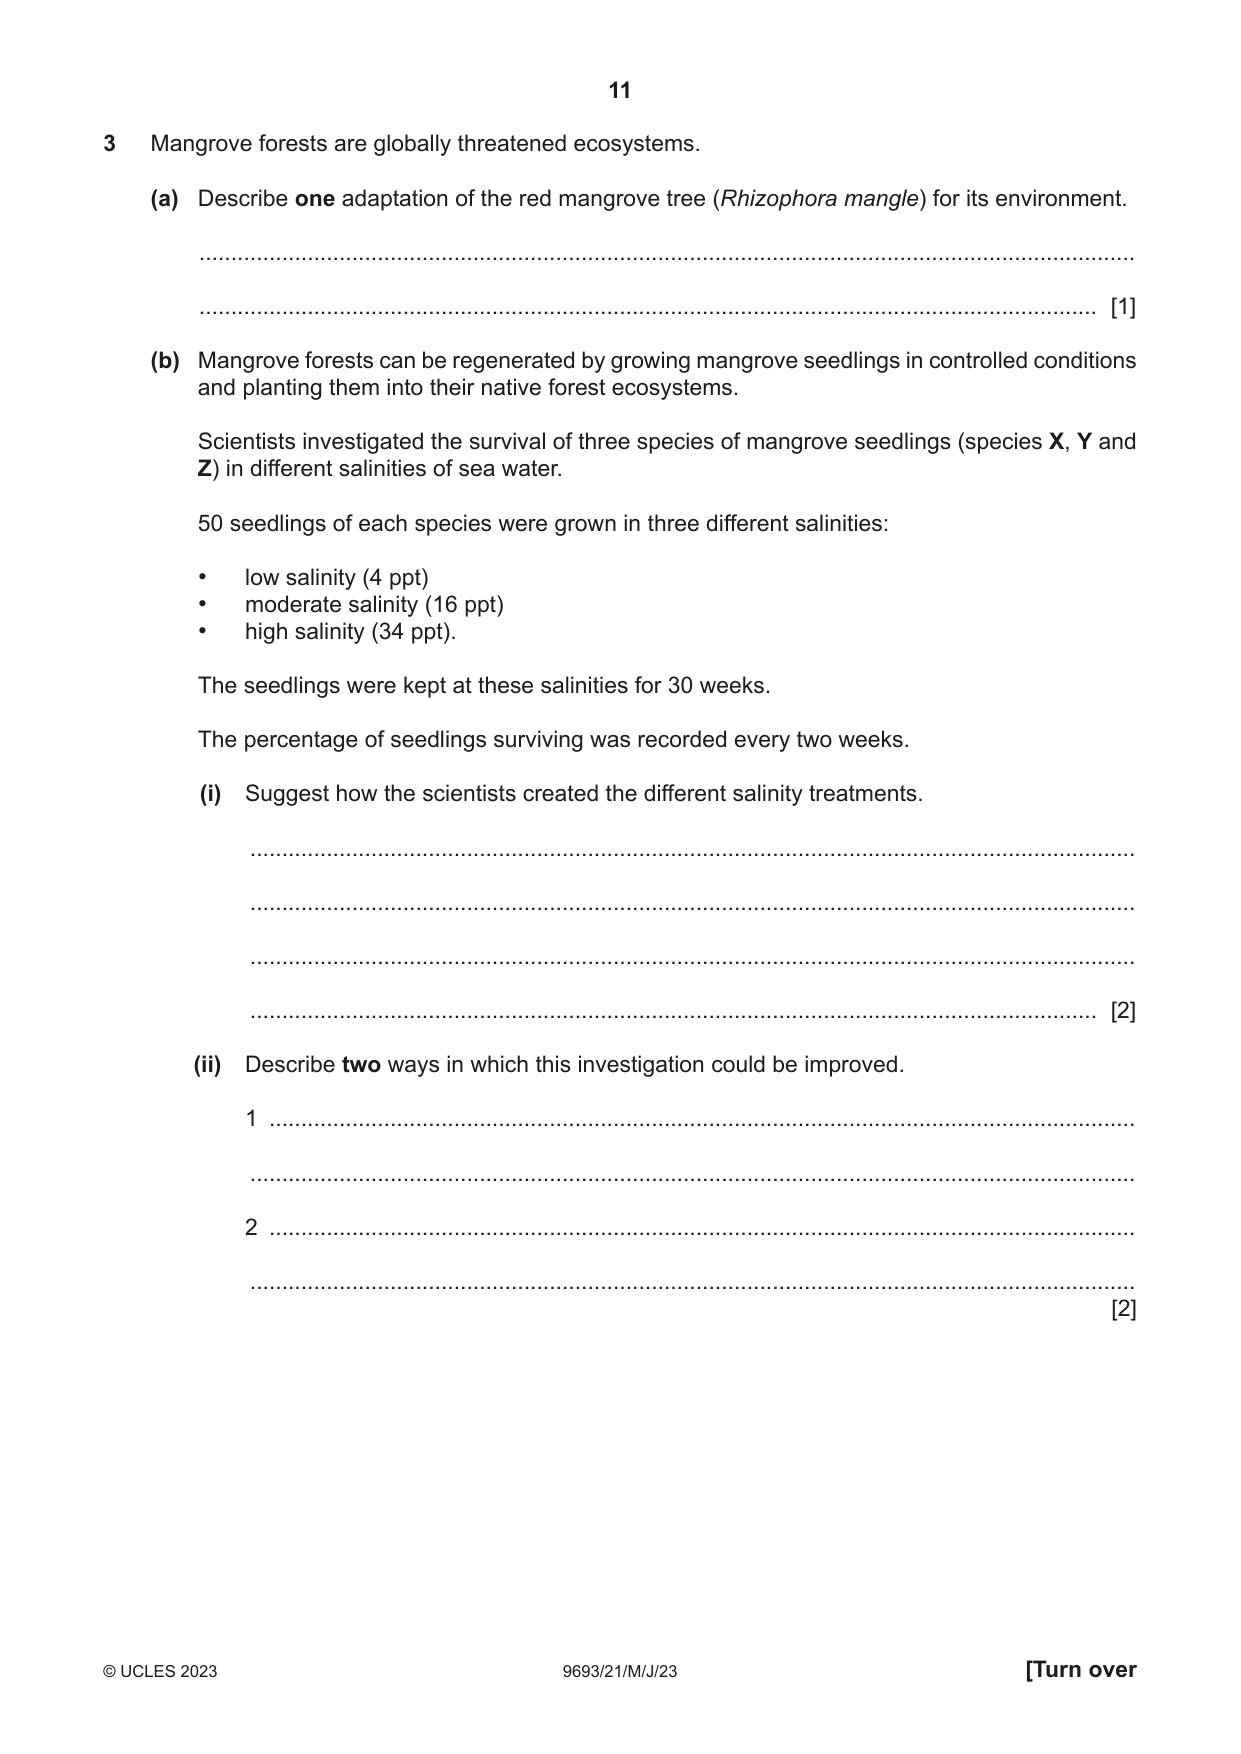
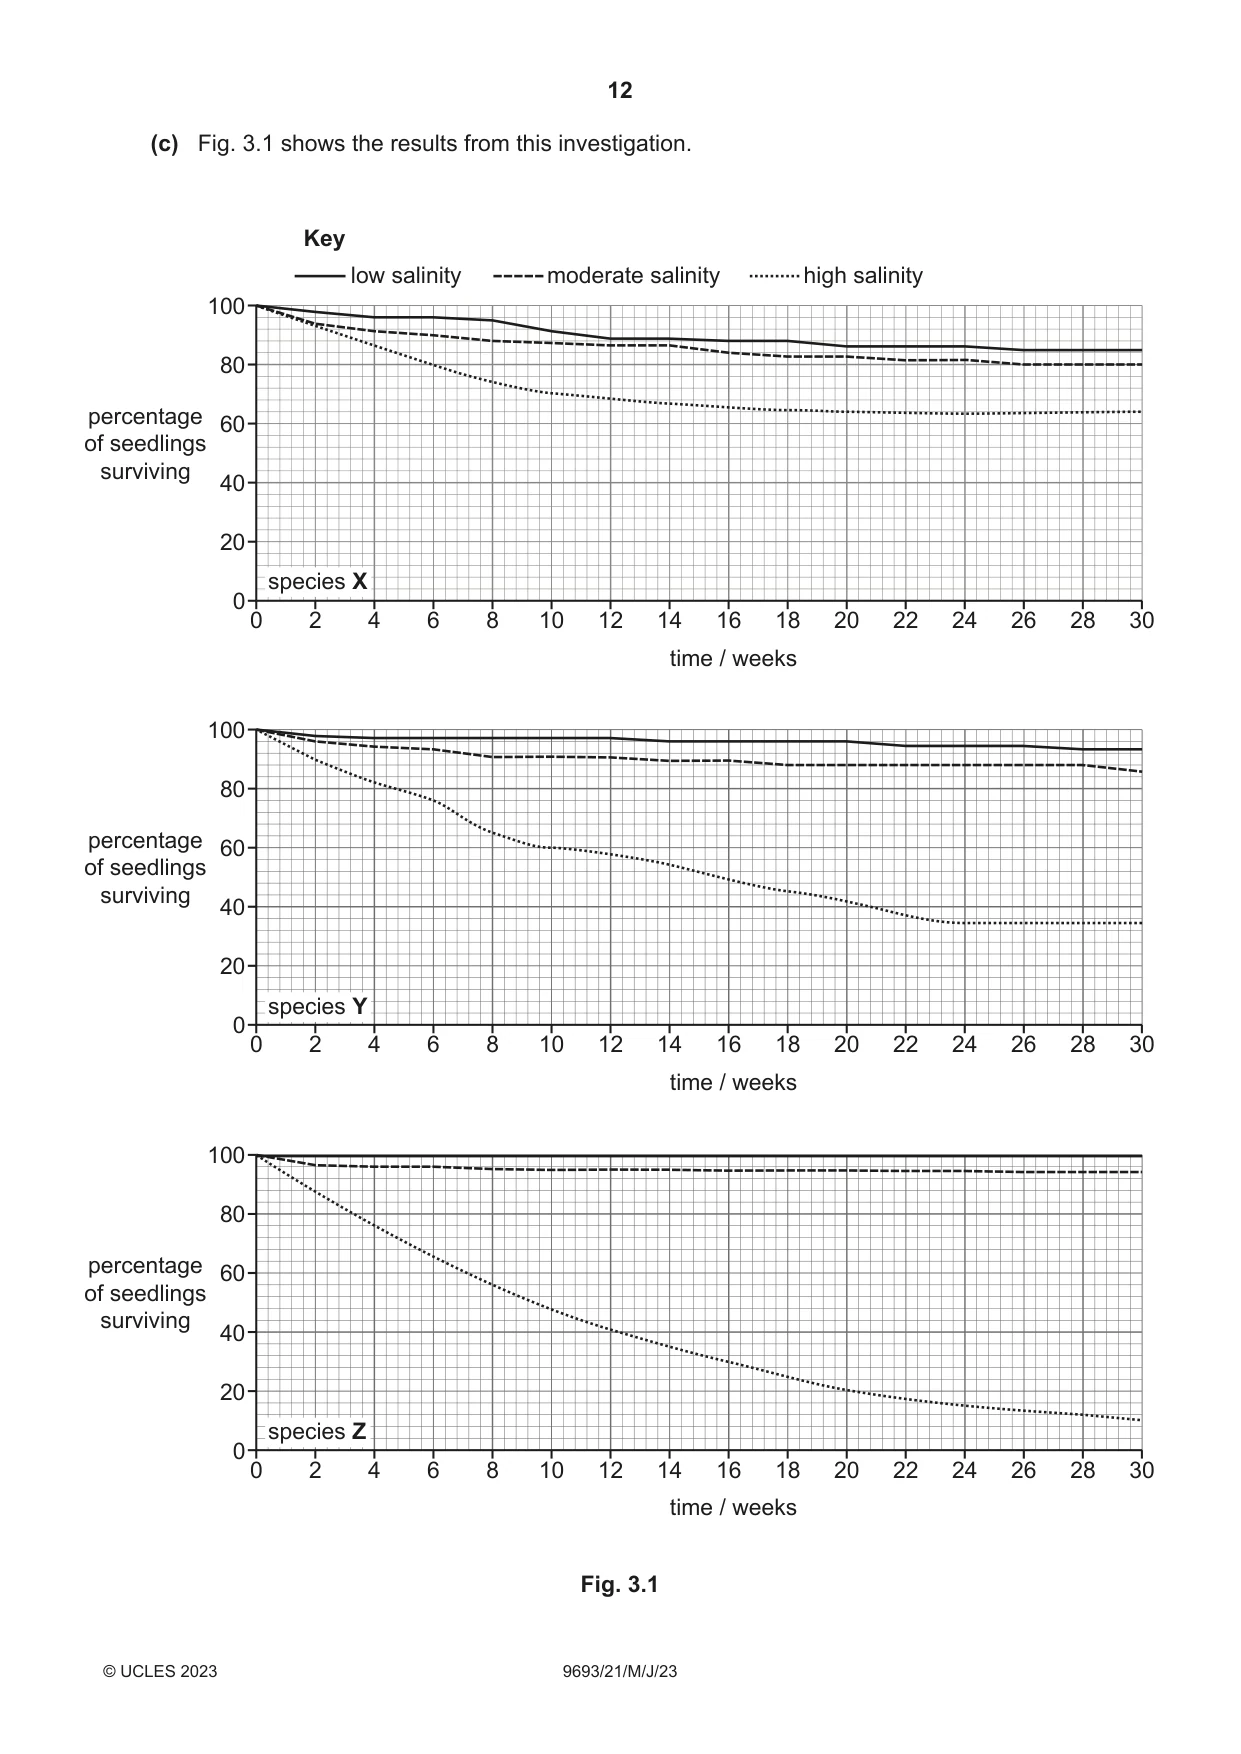
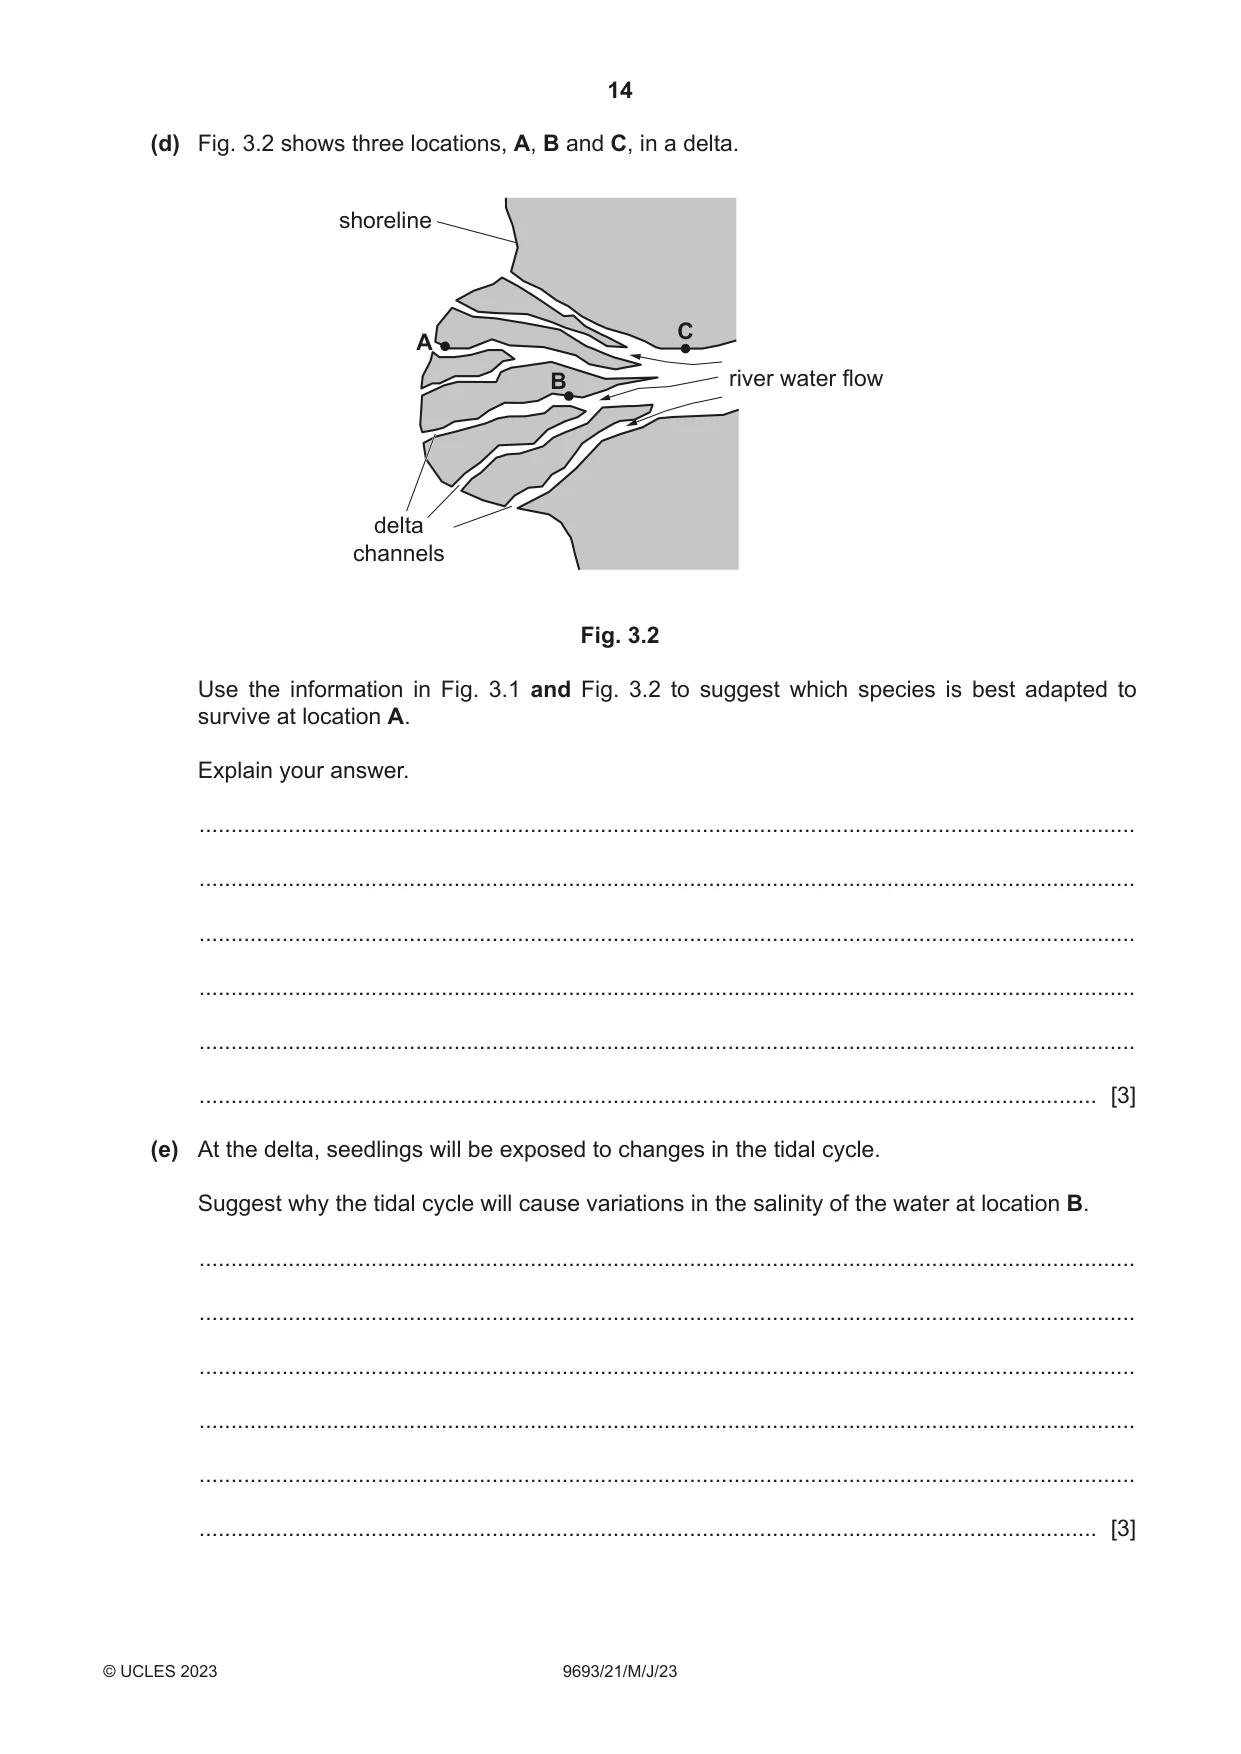
3 Mangrove forests are globally threatened ecosystems. (a) Describe one adaptation of the red mangrove tree (Rhizophora mangle) for its environment. ................................................................................................................................................... ............................................................................................................................................. [1] (b) Mangrove forests can be regenerated by growing mangrove seedlings in controlled conditions and planting them into their native forest ecosystems. Scientists investigated the survival of three species of mangrove seedlings (species X, Y and Z) in different salinities of sea water. 50 seedlings of each species were grown in three different salinities: • low salinity (4 ppt) • moderate salinity (16 ppt) • high salinity (34 ppt). The seedlings were kept at these salinities for 30 weeks. The percentage of seedlings surviving was recorded every two weeks. (i) Suggest how the scientists created the different salinity treatments. ........................................................................................................................................... ........................................................................................................................................... ........................................................................................................................................... ..................................................................................................................................... [2] (ii) Describe two ways in which this investigation could be improved. 1 ........................................................................................................................................ ........................................................................................................................................... 2 ........................................................................................................................................ ........................................................................................................................................... [2] (c) Fig. 3.1 shows the results from this investigation. Key low salinity moderate salinity high salinity 100 80 percentage 60 of seedlings surviving 40 20 species X 0 0 2 4 6 8 10 12 14 16 18 20 22 24 26 28 30 time / weeks 100 80 percentage 60 of seedlings surviving 40 20 species Y 0 0 2 4 6 8 10 12 14 16 18 20 22 24 26 28 30 time / weeks 100 80 percentage 60 of seedlings surviving 40 20 species Z 0 0 2 4 6 8 10 12 14 16 18 20 22 24 26 28 30 time / weeks Fig. 3.1 (i) Describe how the percentage of seedlings surviving in each salinity was calculated. ........................................................................................................................................... ..................................................................................................................................... [1] (ii) Calculate how many seedlings of species Z survived the first 10 weeks of the investigation in the highest salinity. Show your working. .......................................................... [2] (d) Fig. 3.2 shows three locations, A, B and C, in a delta. shoreline C A B river water flow delta channels Fig. 3.2 Use the information in Fig. 3.1 and Fig. 3.2 to suggest which species is best adapted to survive at location A. Explain your answer. ................................................................................................................................................... ................................................................................................................................................... ................................................................................................................................................... ................................................................................................................................................... ................................................................................................................................................... ............................................................................................................................................. [3] (e) At the delta, seedlings will be exposed to changes in the tidal cycle. Suggest why the tidal cycle will cause variations in the salinity of the water at location B. ................................................................................................................................................... ................................................................................................................................................... ................................................................................................................................................... ................................................................................................................................................... ................................................................................................................................................... ............................................................................................................................................. [3] (f) The conservation of mangrove ecosystems is important for human populations. State two benefits. 1 ................................................................................................................................................ ................................................................................................................................................... 2 ................................................................................................................................................ ............................................................................................................................................. [2] [Total: 16]
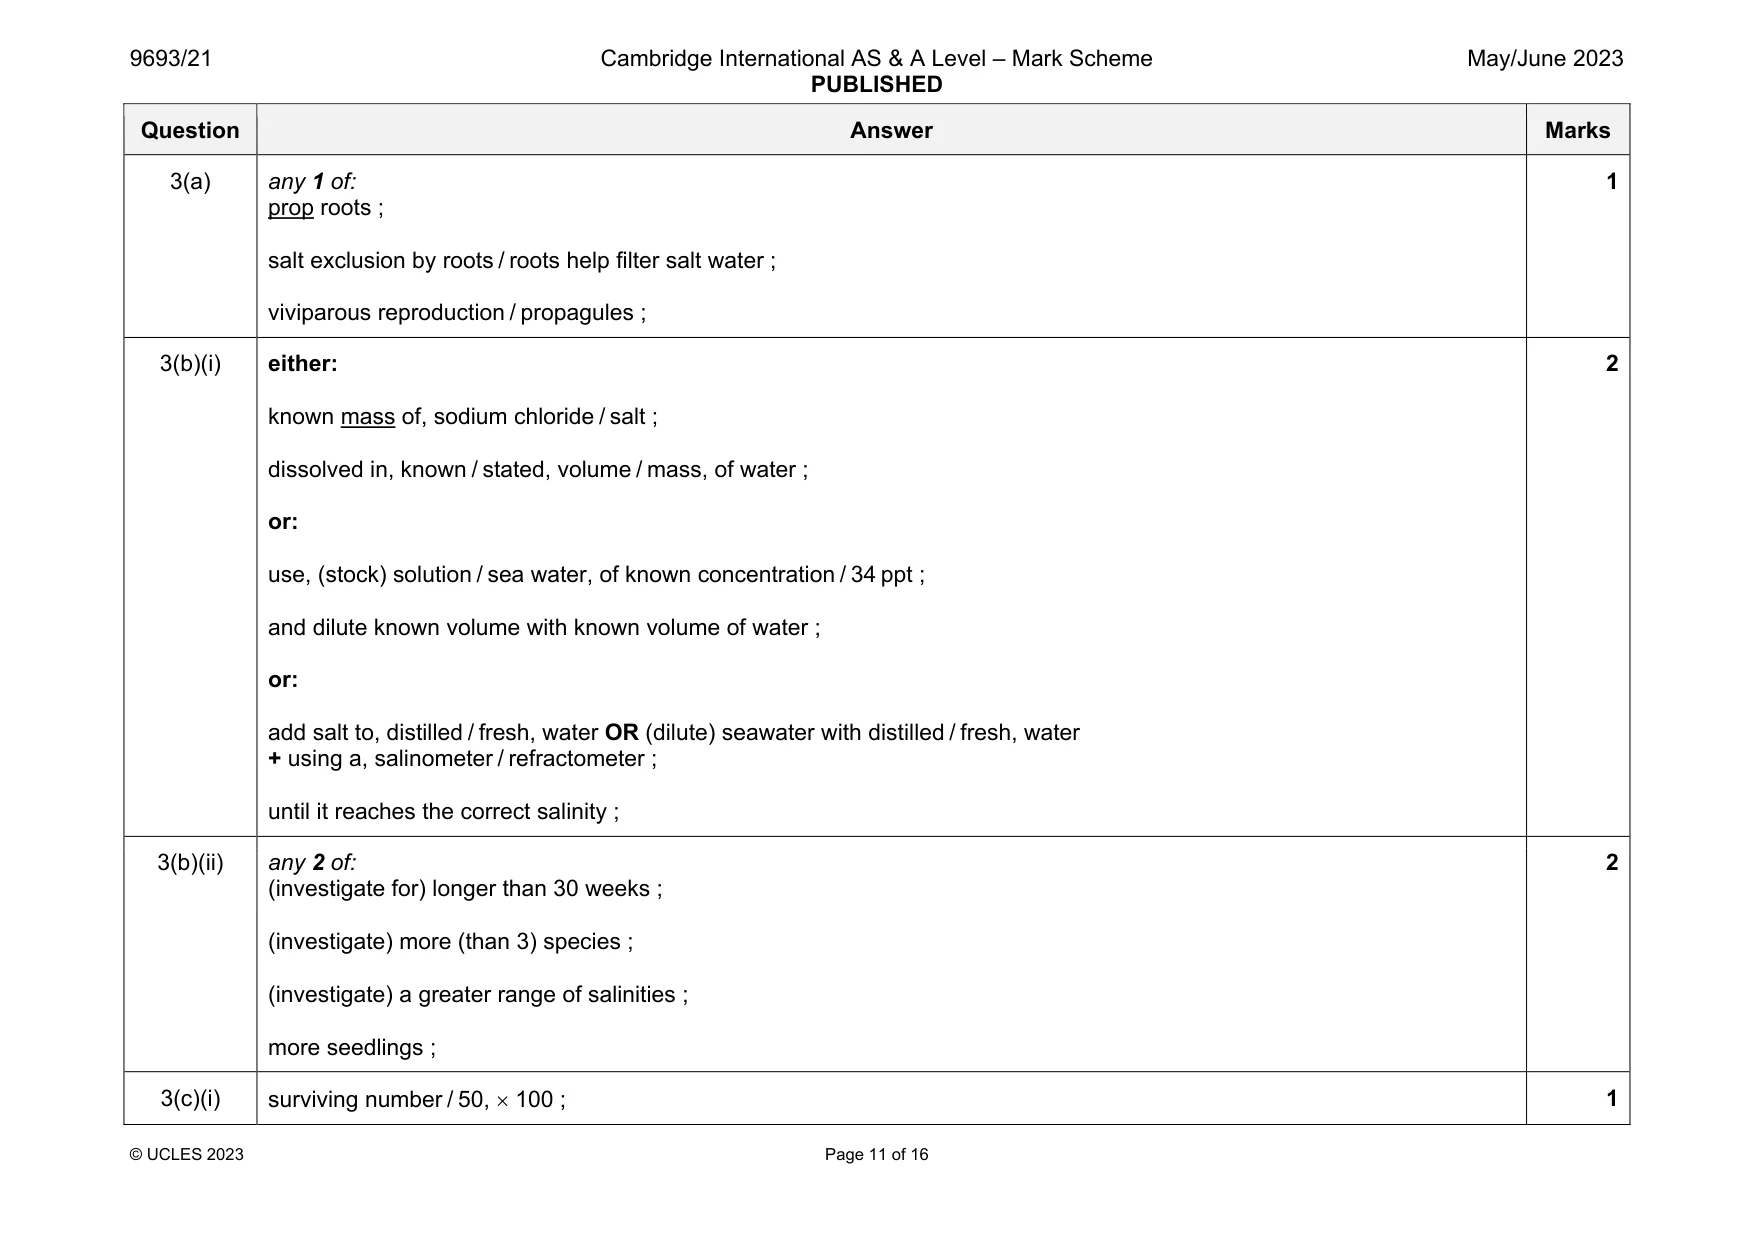
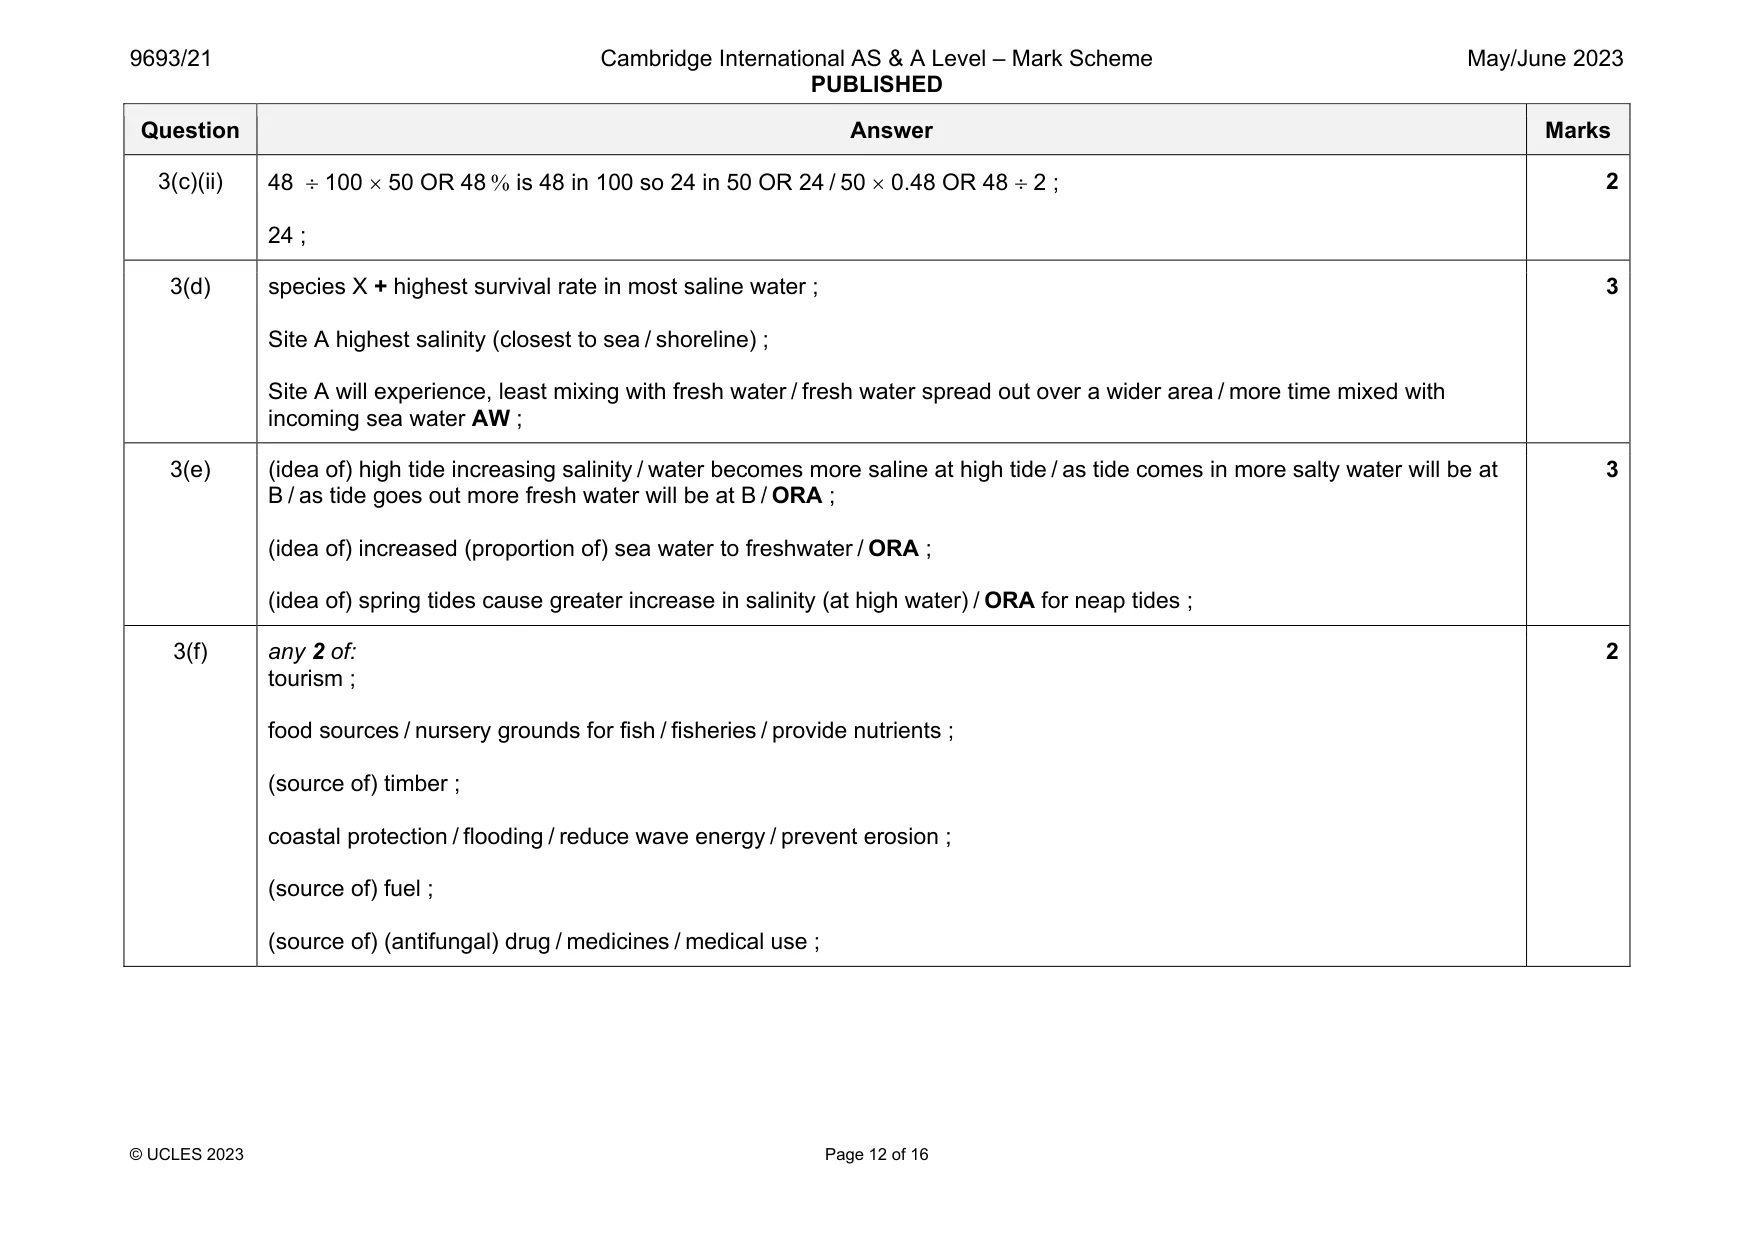
Mark scheme: 3(a) any 1 of: prop roots ; salt exclusion by roots / roots help filter salt water ; viviparous reproduction / propagules ; 1 3(b)(i) either: known mass of, sodium chloride / salt ; dissolved in, known / stated, volume / mass, of water ; or: use, (stock) solution / sea water, of known concentration / 34 ppt ; and dilute known volume with known volume of water ; or: add salt to, distilled / fresh, water OR (dilute) seawater with distilled / fresh, water + using a, salinometer / refractometer ; until it reaches the correct salinity ; 2 3(b)(ii) any 2 of: (investigate for) longer than 30 weeks ; (investigate) more (than 3) species ; (investigate) a greater range of salinities ; more seedlings ; 2 3(c)(i) surviving number / 50, 100 ; 1 Question Answer Marks 3(c)(ii) 48 100 50 OR 48 is 48 in 100 so 24 in 50 OR 24 / 50 0.48 OR 48 2 ; 24 ; 2 3(d) species X + highest survival rate in most saline water ; Site A highest salinity (closest to sea / shoreline) ; Site A will experience, least mixing with fresh water / fresh water spread out over a wider area / more time mixed with incoming sea water AW ; 3 3(e) (idea of) high tide increasing salinity / water becomes more saline at high tide / as tide comes in more salty water will be at B / as tide goes out more fresh water will be at B / ORA ; (idea of) increased (proportion of) sea water to freshwater / ORA ; (idea of) spring tides cause greater increase in salinity (at high water) / ORA for neap tides ; 3 3(f) any 2 of: tourism ; food sources / nursery grounds for fish / fisheries / provide nutrients ; (source of) timber ; coastal protection / flooding / reduce wave energy / prevent erosion ; (source of) fuel ; (source of) (antifungal) drug / medicines / medical use ; 2
Q4 · Sandy shore ecosystems often have low biodiversity
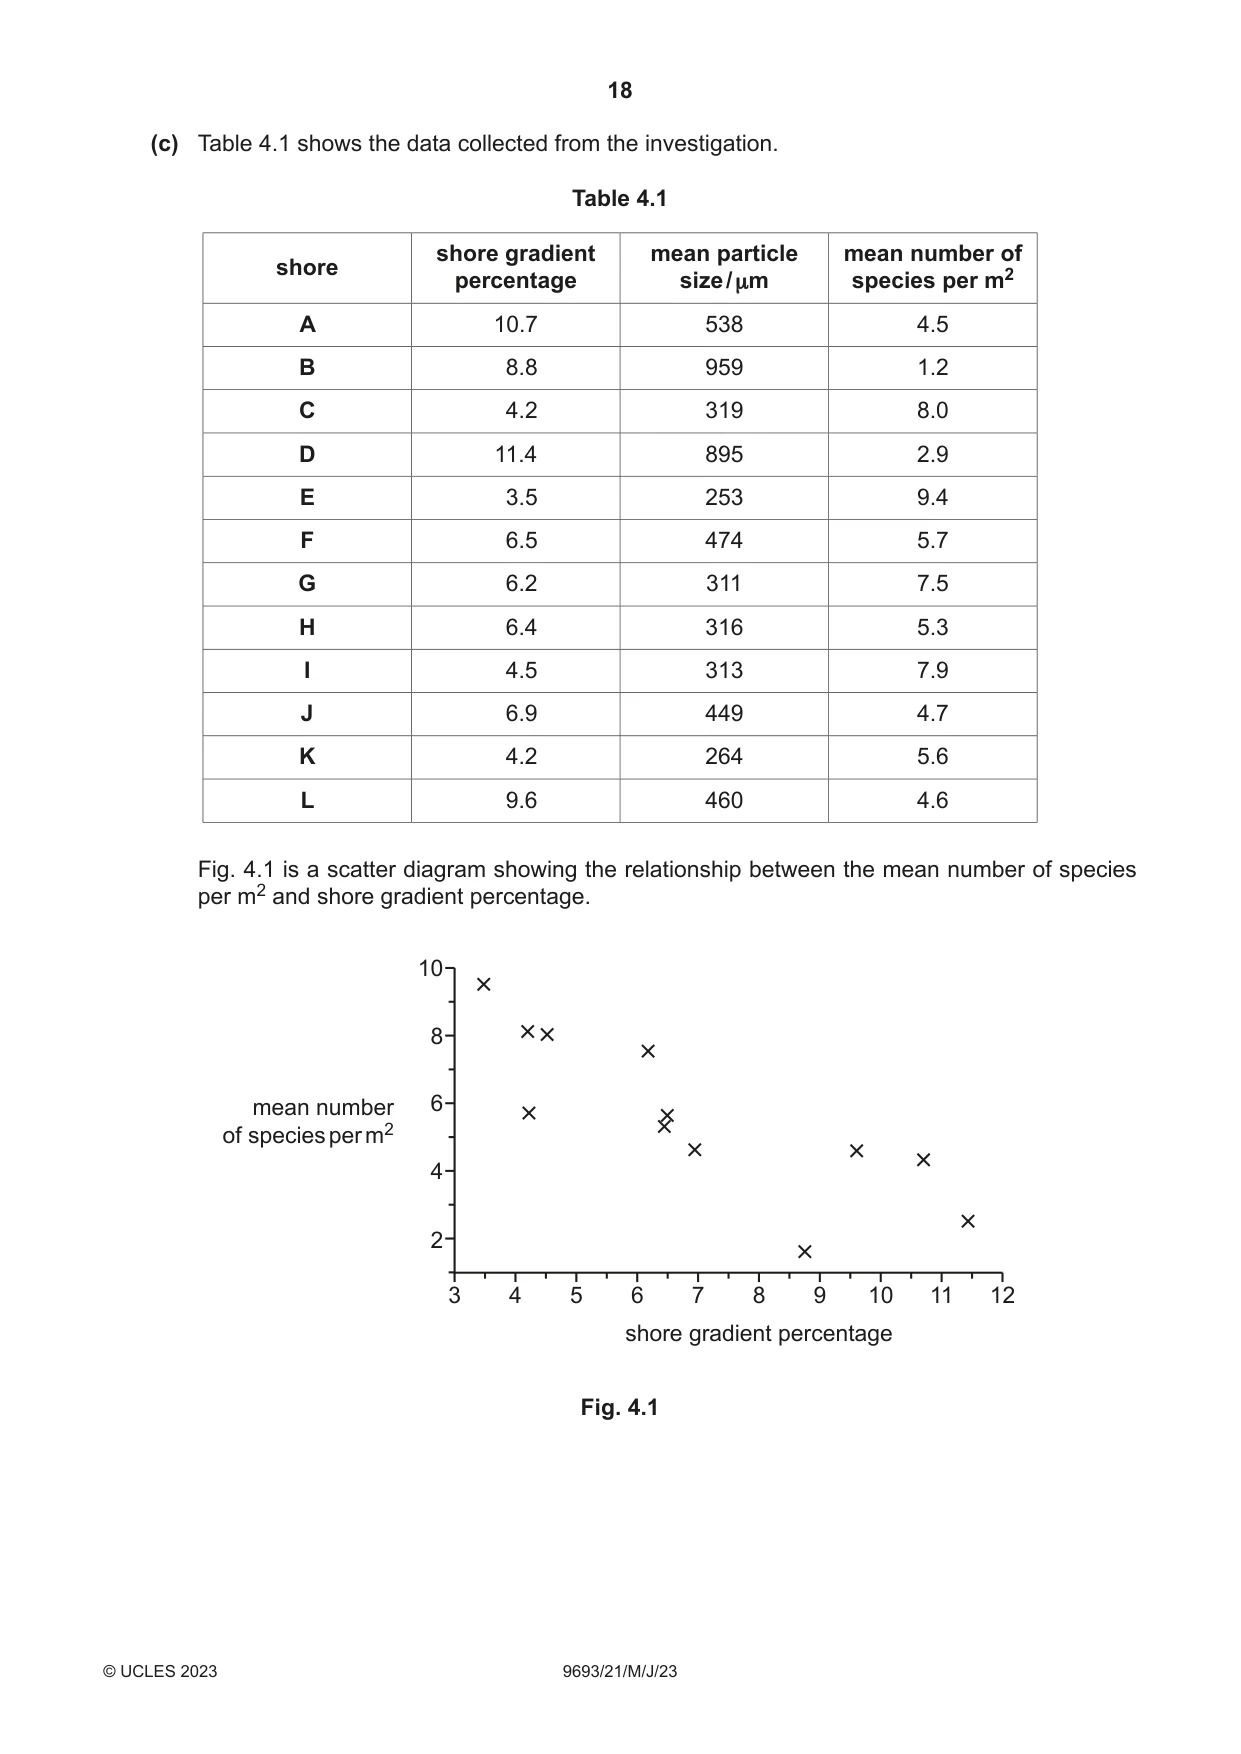
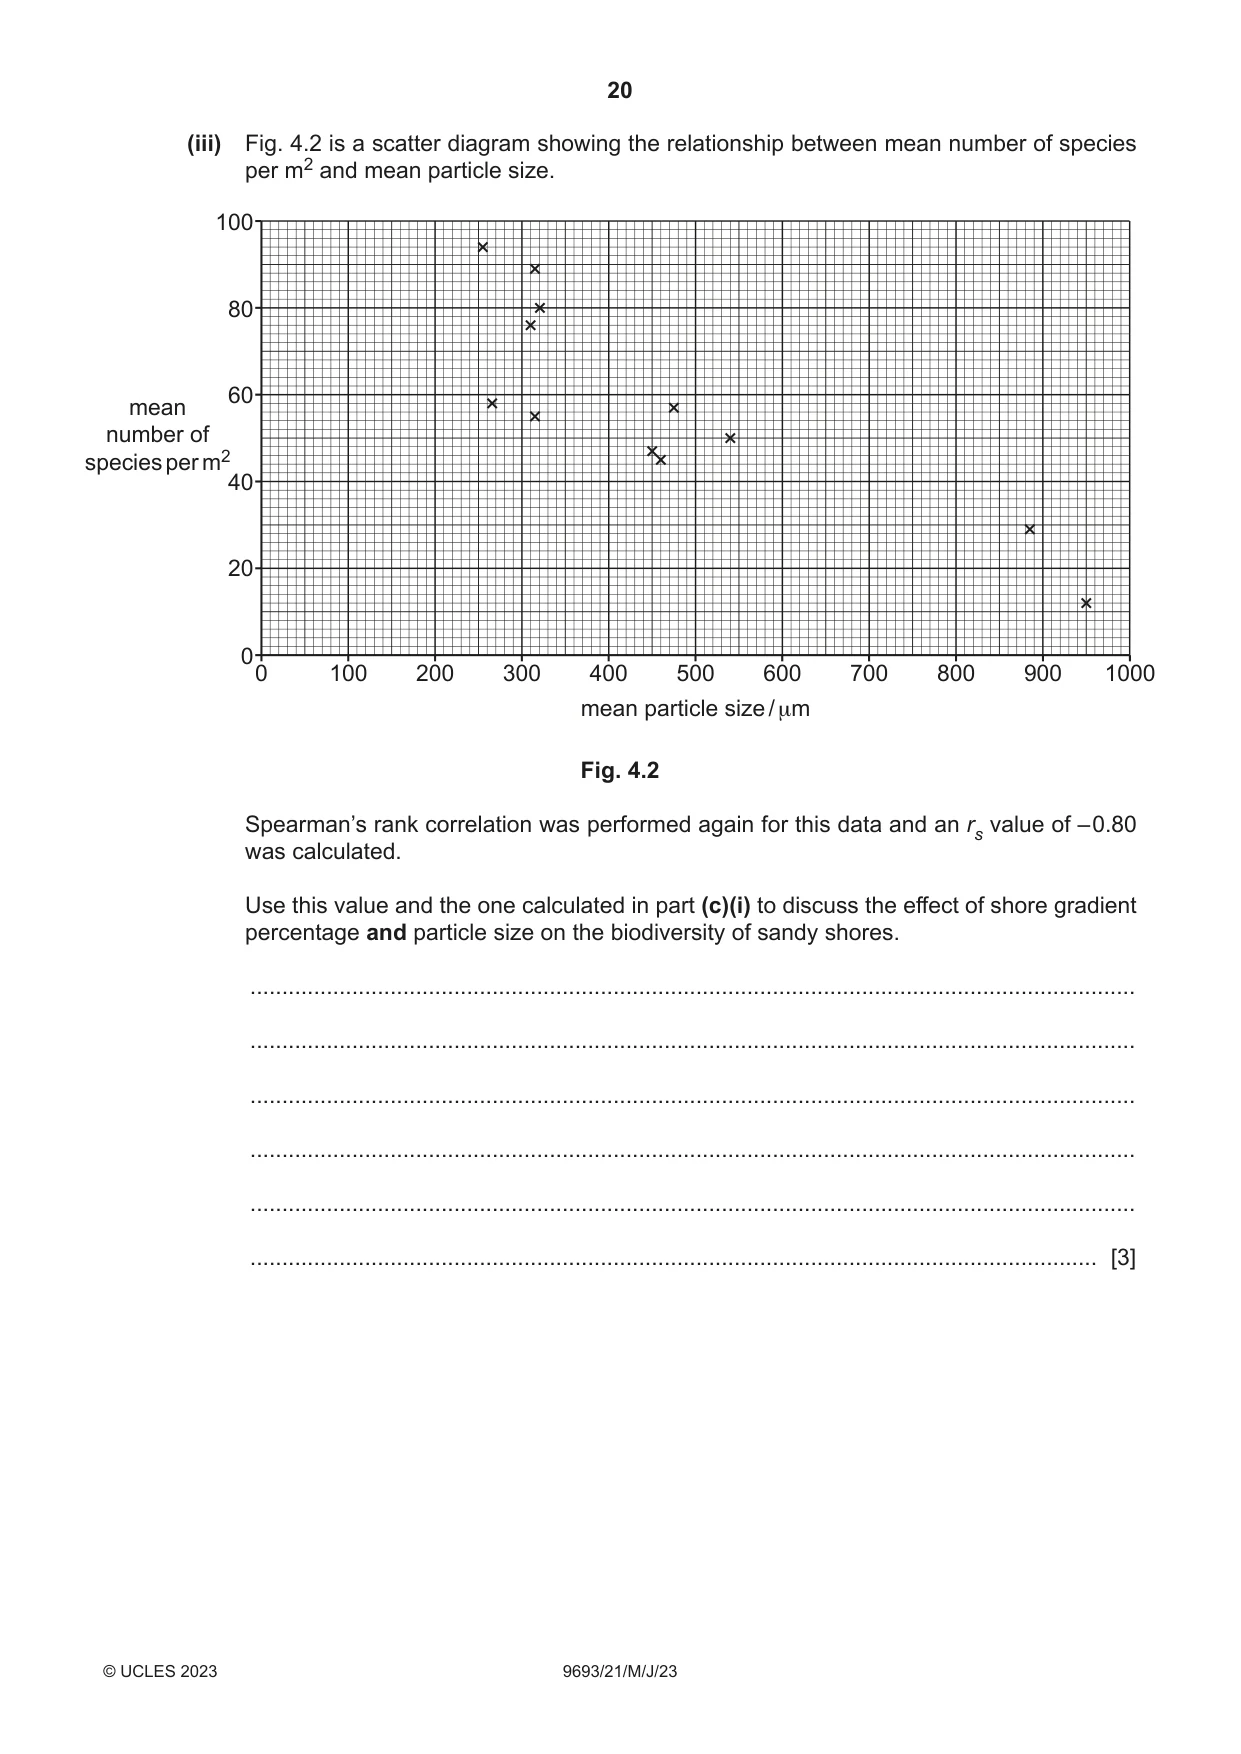
4 Sandy shore ecosystems often have low biodiversity. Scientists investigated abiotic factors that affect biodiversity on sandy shores. (a) State the meaning of the term abiotic factor. ................................................................................................................................................... ............................................................................................................................................. [1] (b) The scientists investigated the relationship between the gradient of the shore, particle size and biodiversity on 12 sandy shores, A–L, at low tide. The gradient of each shore was recorded as a percentage: the higher the percentage, the steeper the gradient. The mean number of species per m2 on each shore was estimated using sampling techniques. Describe a method that could be used to sample the mean number of species per m2 present on each shore. ................................................................................................................................................... ................................................................................................................................................... ................................................................................................................................................... ................................................................................................................................................... ................................................................................................................................................... ................................................................................................................................................... ................................................................................................................................................... ................................................................................................................................................... ................................................................................................................................................... ............................................................................................................................................. [5] (c) Table 4.1 shows the data collected from the investigation. Table 4.1 shore gradient mean particle mean number of shore percentage size / μm species per m2 A 10.7 538 4.5 B 8.8 959 1.2 C 4.2 319 8.0 D 11.4 895 2.9 E 3.5 253 9.4 F 6.5 474 5.7 G 6.2 311 7.5 H 6.4 316 5.3 I 4.5 313 7.9 J 6.9 449 4.7 K 4.2 264 5.6 L 9.6 460 4.6 Fig. 4.1 is a scatter diagram showing the relationship between the mean number of species per m2 and shore gradient percentage. 10 8 mean number 6 of species per m2 4 2 3 4 5 6 7 8 9 10 11 12 shore gradient percentage Fig. 4.1 (i) Scientists used Spearman’s rank correlation (rs) to decide if there was a correlation between the mean number of species per m2 and shore gradient percentage. The calculation for Spearman’s rank correlation (rs) uses the following equation: 6 × ΣD 2 rs = 1 – ( n3 – n ) where, Σ = sum of (total) n = number of pairs of items in the sample D = difference in rank between each pair of measurements A value of 539.5 was calculated for ΣD 2. Use this value and the information in Table 4.1 to calculate the value for rs. Give your answer to two significant figures. Show your working. rs = ......................................................... [3] (ii) Use your calculated value for rs in (c)(i) to describe the correlation between mean number of species per m2 and shore gradient percentage. Explain your answer. ........................................................................................................................................... ........................................................................................................................................... ........................................................................................................................................... ..................................................................................................................................... [2] (iii) Fig. 4.2 is a scatter diagram showing the relationship between mean number of species per m2 and mean particle size. 100 80 60 mean number of species per m2 40 20 0 0 100 200 300 400 500 600 700 800 900 1000 mean particle size / μm Fig. 4.2 Spearman’s rank correlation was performed again for this data and an rs value of – 0.80 was calculated. Use this value and the one calculated in part (c)(i) to discuss the effect of shore gradient percentage and particle size on the biodiversity of sandy shores. ........................................................................................................................................... ........................................................................................................................................... ........................................................................................................................................... ........................................................................................................................................... ........................................................................................................................................... ..................................................................................................................................... [3] (d) Suggest why particle size and shore gradient percentage may have an effect on the number of species per m2 found on each shore. ................................................................................................................................................... ................................................................................................................................................... ................................................................................................................................................... ................................................................................................................................................... ................................................................................................................................................... ................................................................................................................................................... ................................................................................................................................................... ............................................................................................................................................. [4] (e) Simpson’s index of diversity could be used to assess the biodiversity on each shore. Suggest why this would be a better measure of biodiversity than data used in this investigation. ................................................................................................................................................... ............................................................................................................................................. [1] [Total: 19]
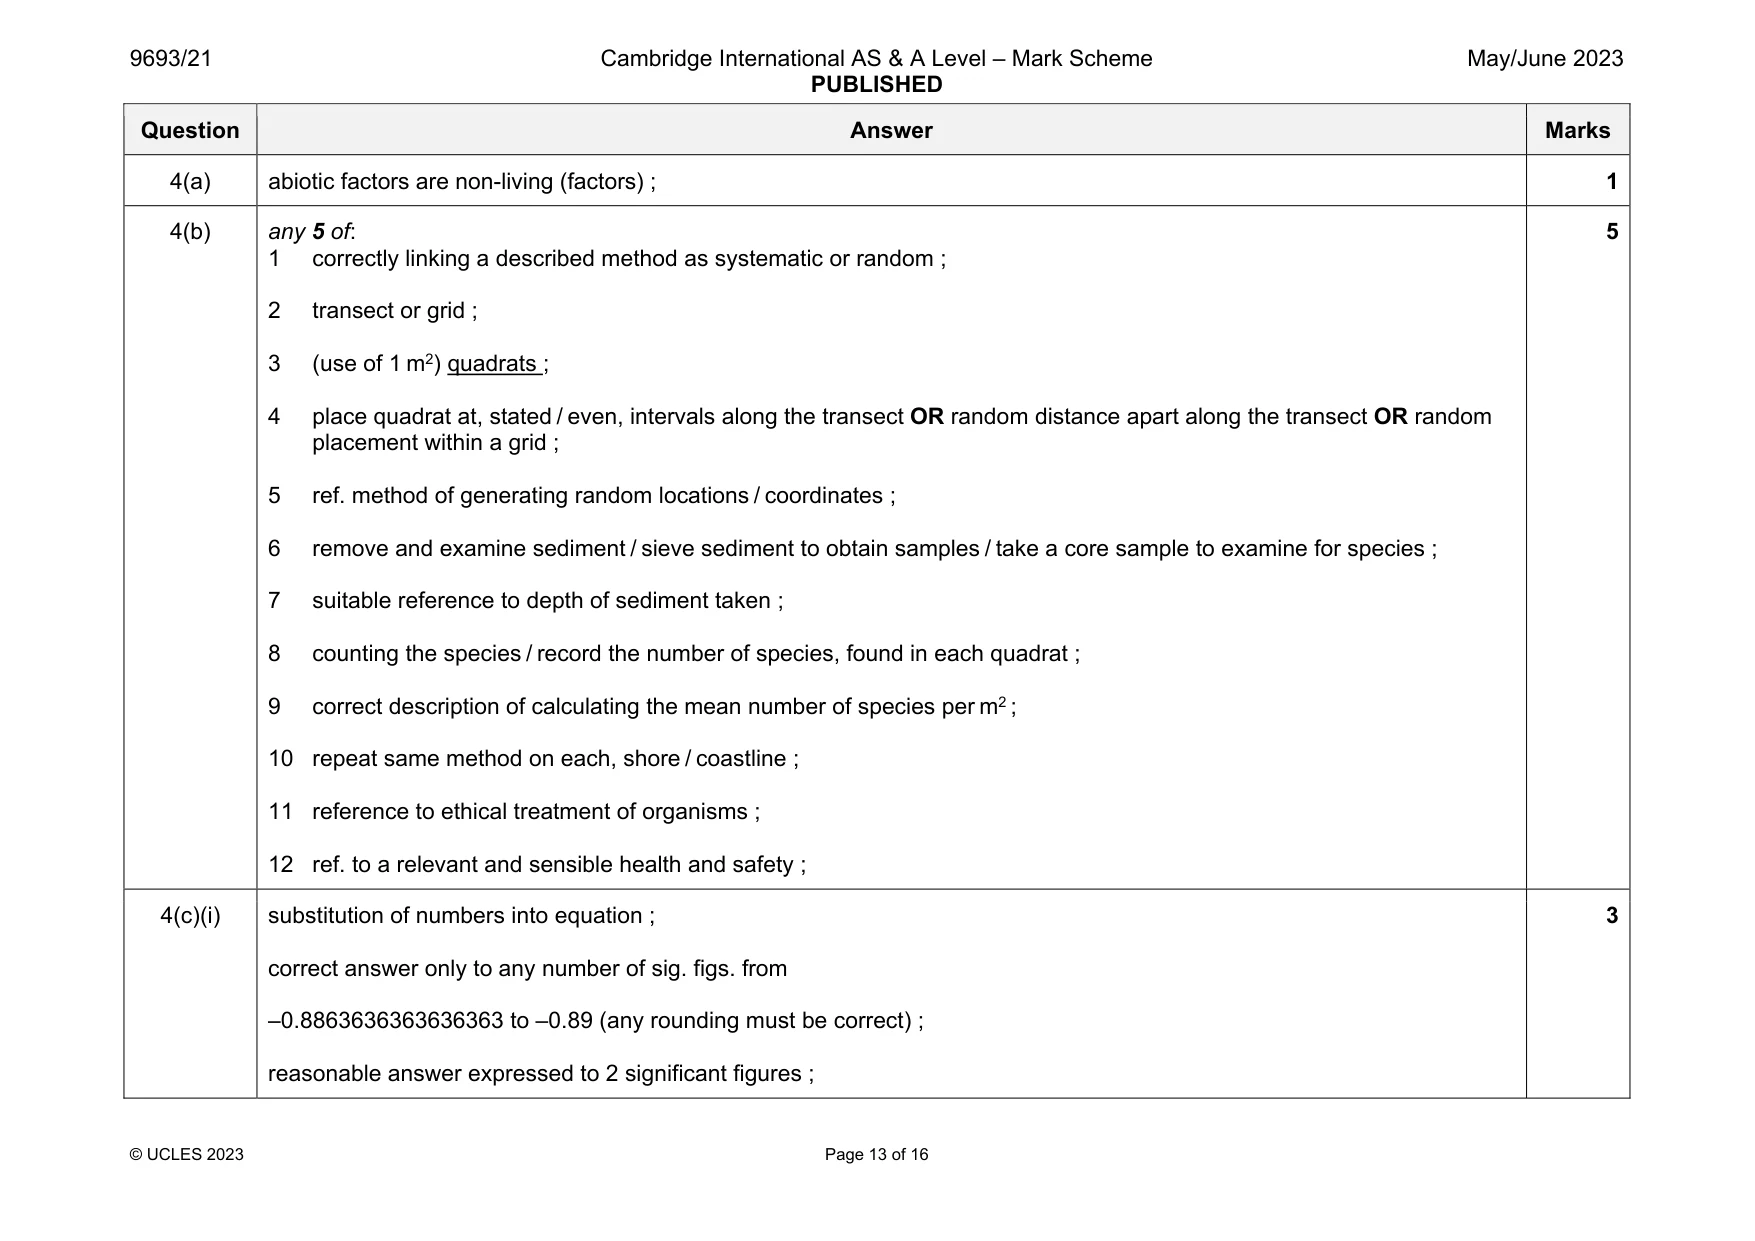
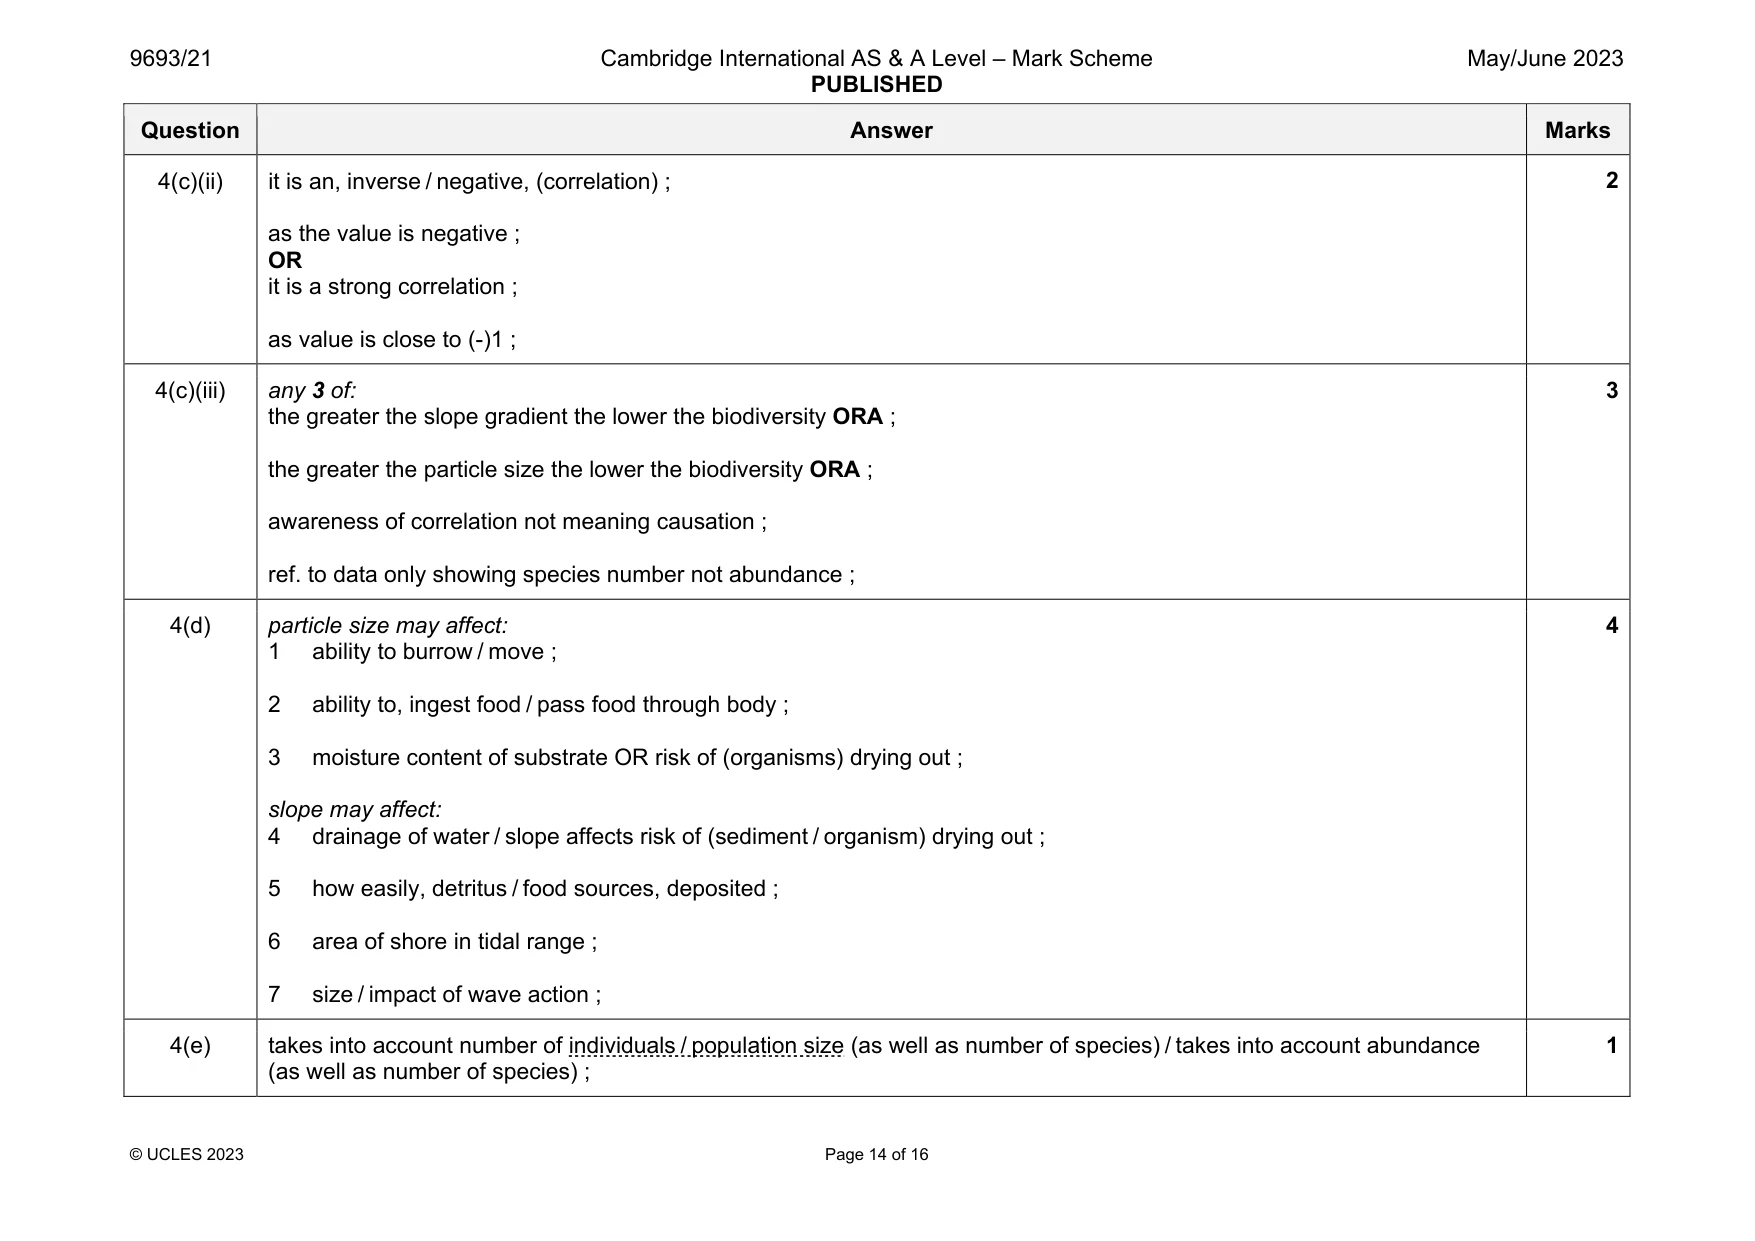
Mark scheme: 4(a) abiotic factors are non-living (factors) ; 1 4(b) any 5 of: 1 correctly linking a described method as systematic or random ; 2 transect or grid ; 3 (use of 1 m2) quadrats ; 4 place quadrat at, stated / even, intervals along the transect OR random distance apart along the transect OR random placement within a grid ; 5 ref. method of generating random locations / coordinates ; 6 remove and examine sediment / sieve sediment to obtain samples / take a core sample to examine for species ; 7 suitable reference to depth of sediment taken ; 8 counting the species / record the number of species, found in each quadrat ; 9 correct description of calculating the mean number of species per m2 ; 10 repeat same method on each, shore / coastline ; 11 reference to ethical treatment of organisms ; 12 ref. to a relevant and sensible health and safety ; 5 4(c)(i) substitution of numbers into equation ; correct answer only to any number of sig. figs. from –0.8863636363636363 to –0.89 (any rounding must be correct) ; reasonable answer expressed to 2 significant figures ; 3 Question Answer Marks 4(c)(ii) it is an, inverse / negative, (correlation) ; as the value is negative ; OR it is a strong correlation ; as value is close to (-)1 ; 2 4(c)(iii) any 3 of: the greater the slope gradient the lower the biodiversity ORA ; the greater the particle size the lower the biodiversity ORA ; awareness of correlation not meaning causation ; ref. to data only showing species number not abundance ; 3 4(d) particle size may affect: 1 ability to burrow / move ; 2 ability to, ingest food / pass food through body ; 3 moisture content of substrate OR risk of (organisms) drying out ; slope may affect: 4 drainage of water / slope affects risk of (sediment / organism) drying out ; 5 how easily, detritus / food sources, deposited ; 6 area of shore in tidal range ; 7 size / impact of wave action ; 4 4(e) takes into account number of individuals / population size (as well as number of species) / takes into account abundance (as well as number of species) ; 1
Question 5
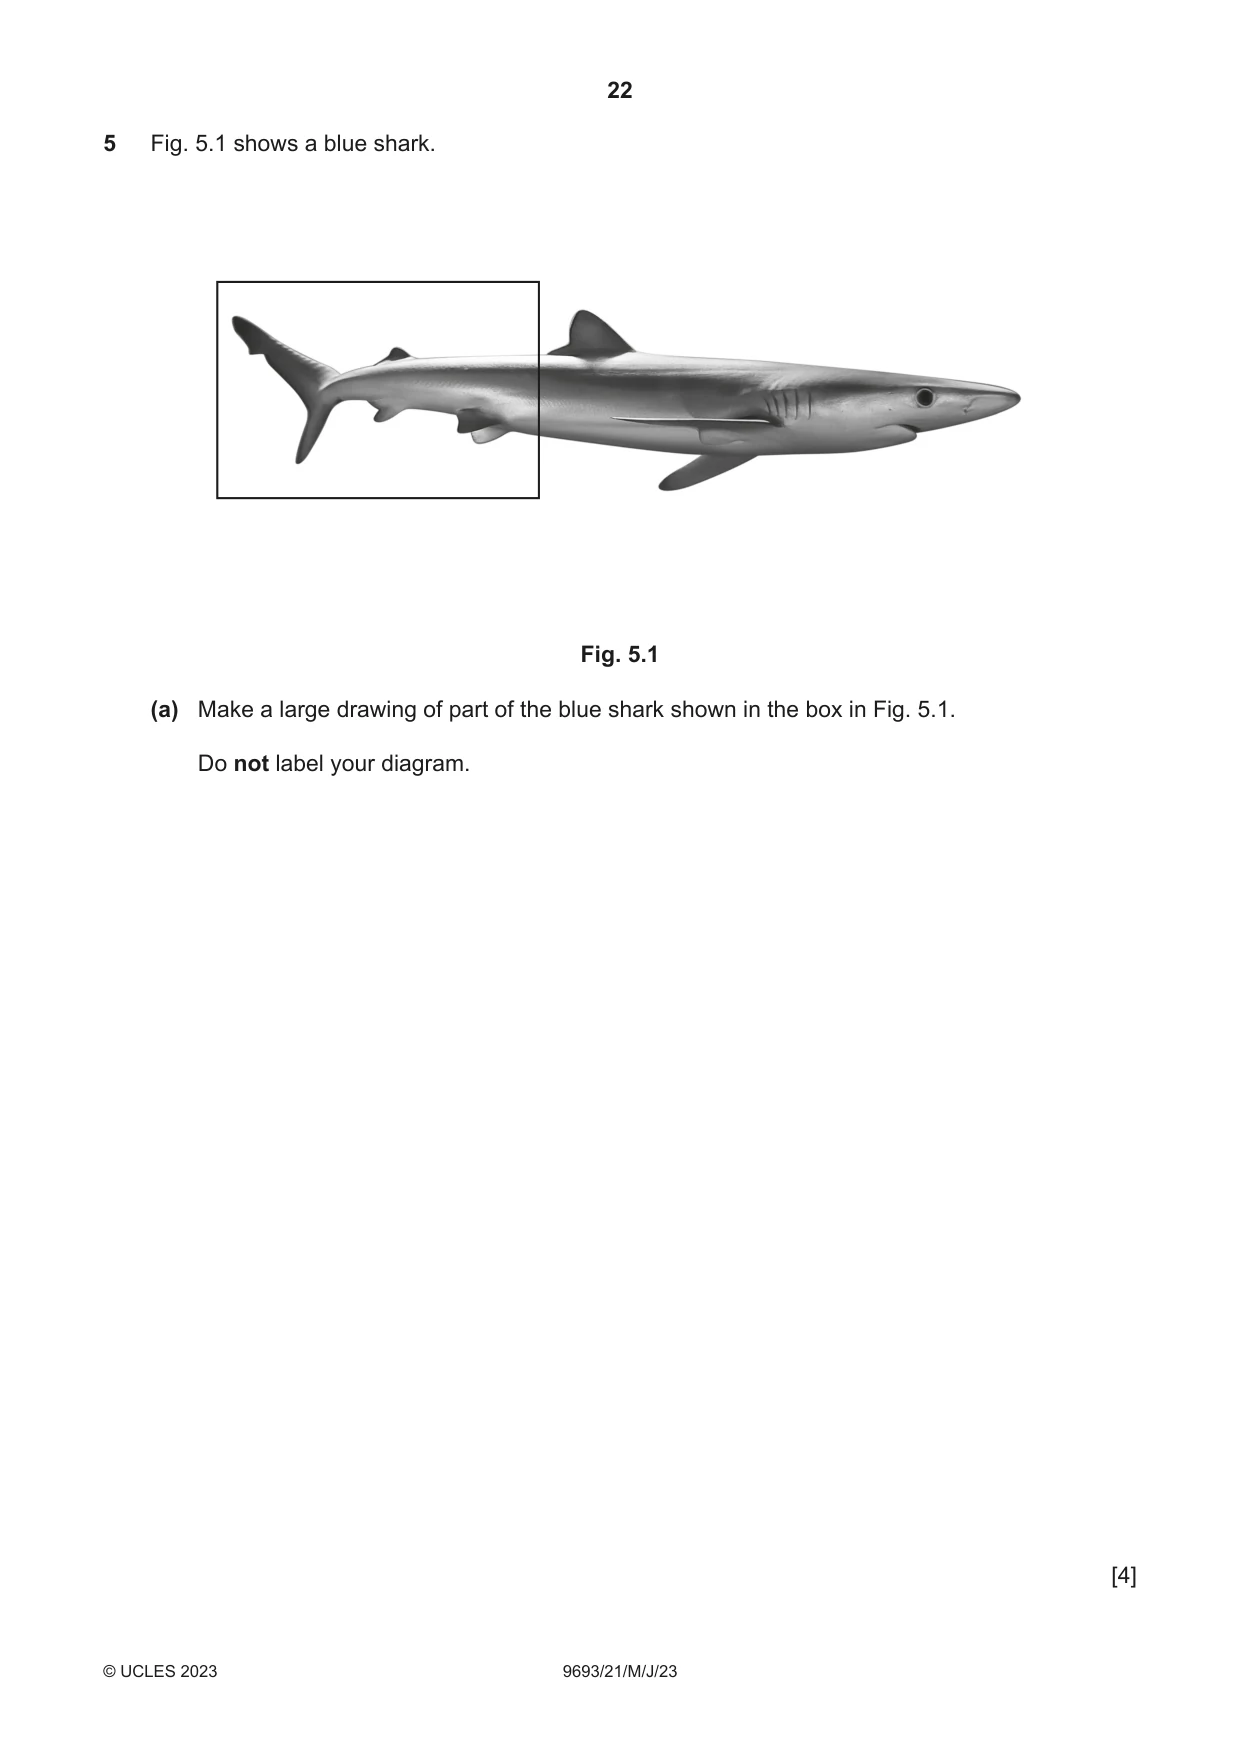
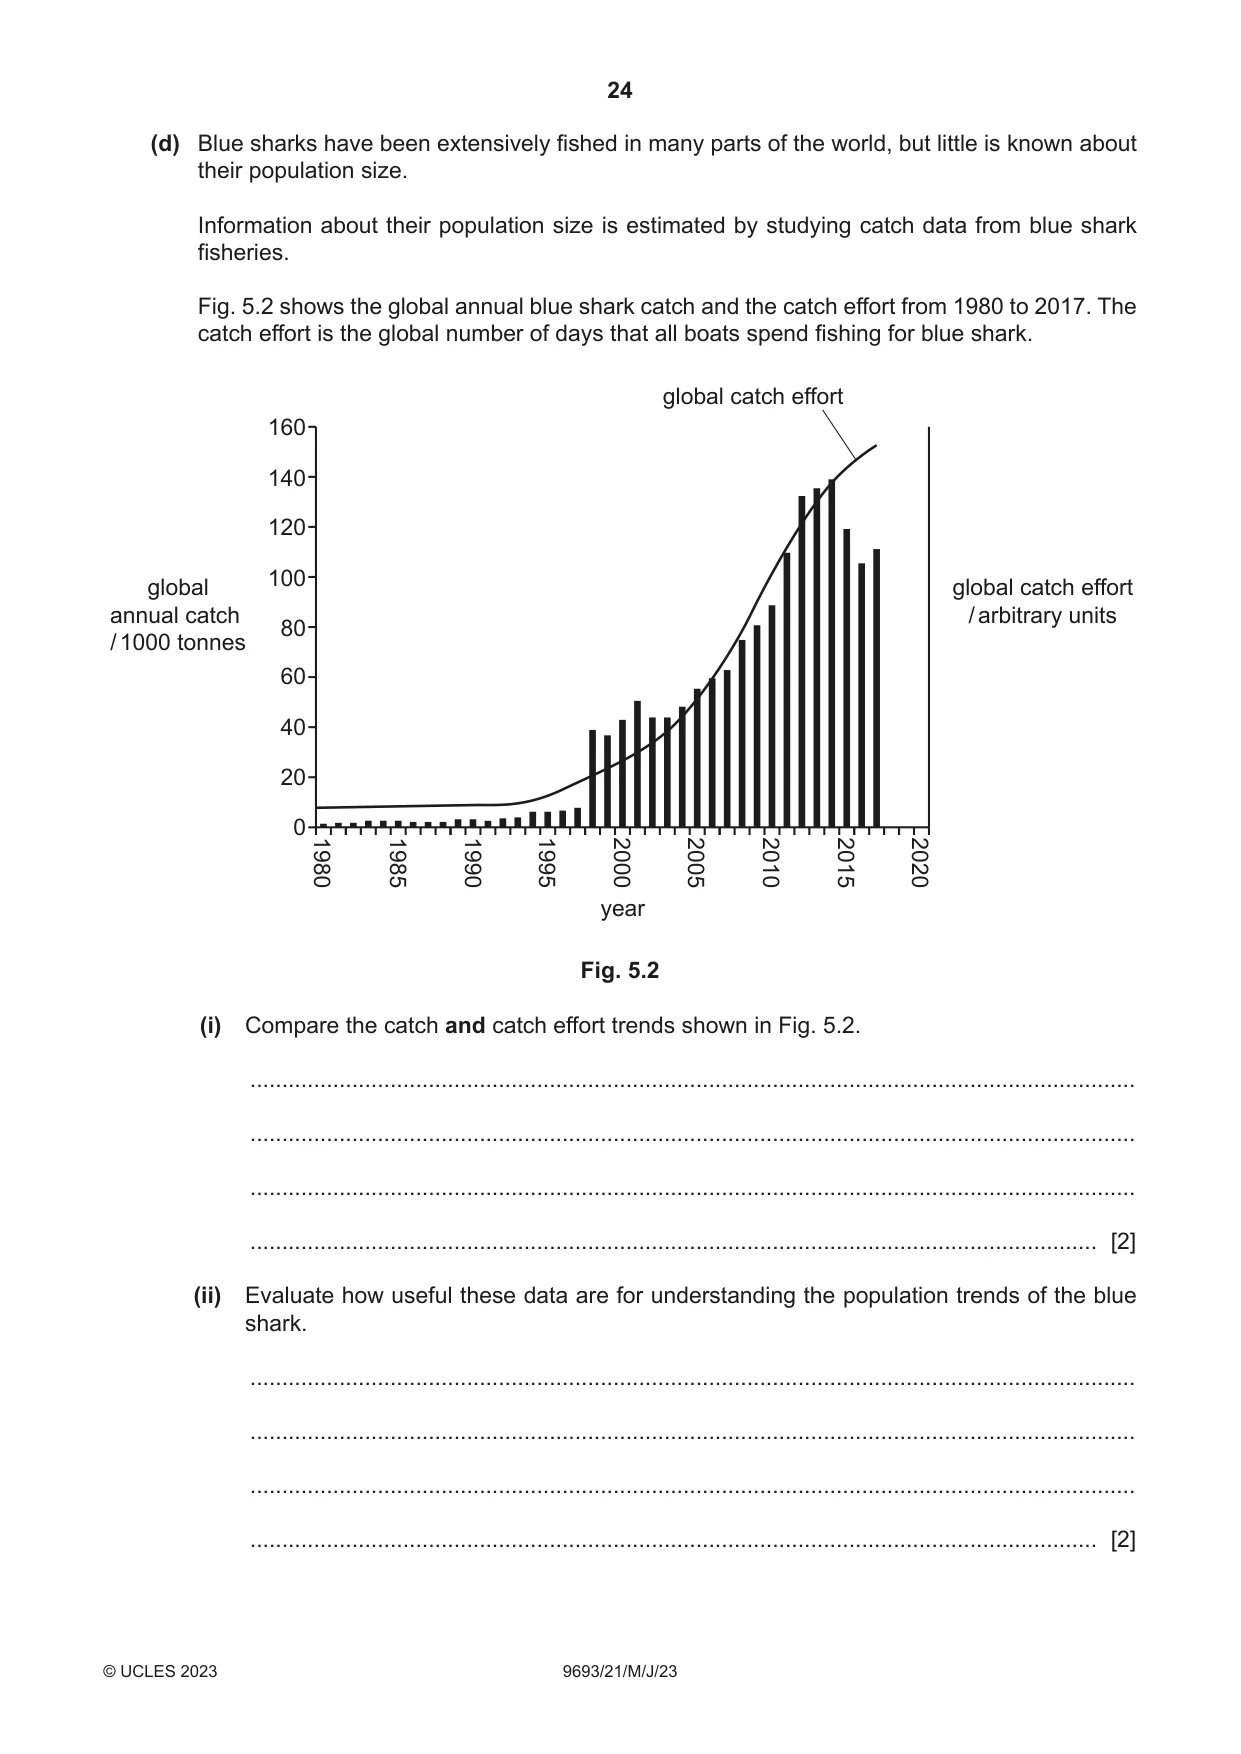
5 Fig. 5.1 shows a blue shark. Fig. 5.1 (a) Make a large drawing of part of the blue shark shown in the box in Fig. 5.1. Do not label your diagram. [4] (b) Blue sharks mainly inhabit the epipelagic zone. State what is meant by the epipelagic zone. ................................................................................................................................................... ............................................................................................................................................. [1] (c) Explain why blue sharks are described as carnivores and predators. ................................................................................................................................................... ................................................................................................................................................... ................................................................................................................................................... ............................................................................................................................................. [2] (d) Blue sharks have been extensively fished in many parts of the world, but little is known about their population size. Information about their population size is estimated by studying catch data from blue shark fisheries. Fig. 5.2 shows the global annual blue shark catch and the catch effort from 1980 to 2017. The catch effort is the global number of days that all boats spend fishing for blue shark. global catch effort 160 140 120 100 global global catch effort annual catch / arbitrary units 80/ 1000 tonnes 60 40 20 0 1980 1985 1990 1995 2000 2005 2010 2015 2020 year Fig. 5.2 (i) Compare the catch and catch effort trends shown in Fig. 5.2. ........................................................................................................................................... ........................................................................................................................................... ........................................................................................................................................... ..................................................................................................................................... [2] (ii) Evaluate how useful these data are for understanding the population trends of the blue shark. ........................................................................................................................................... ........................................................................................................................................... ........................................................................................................................................... ..................................................................................................................................... [2]
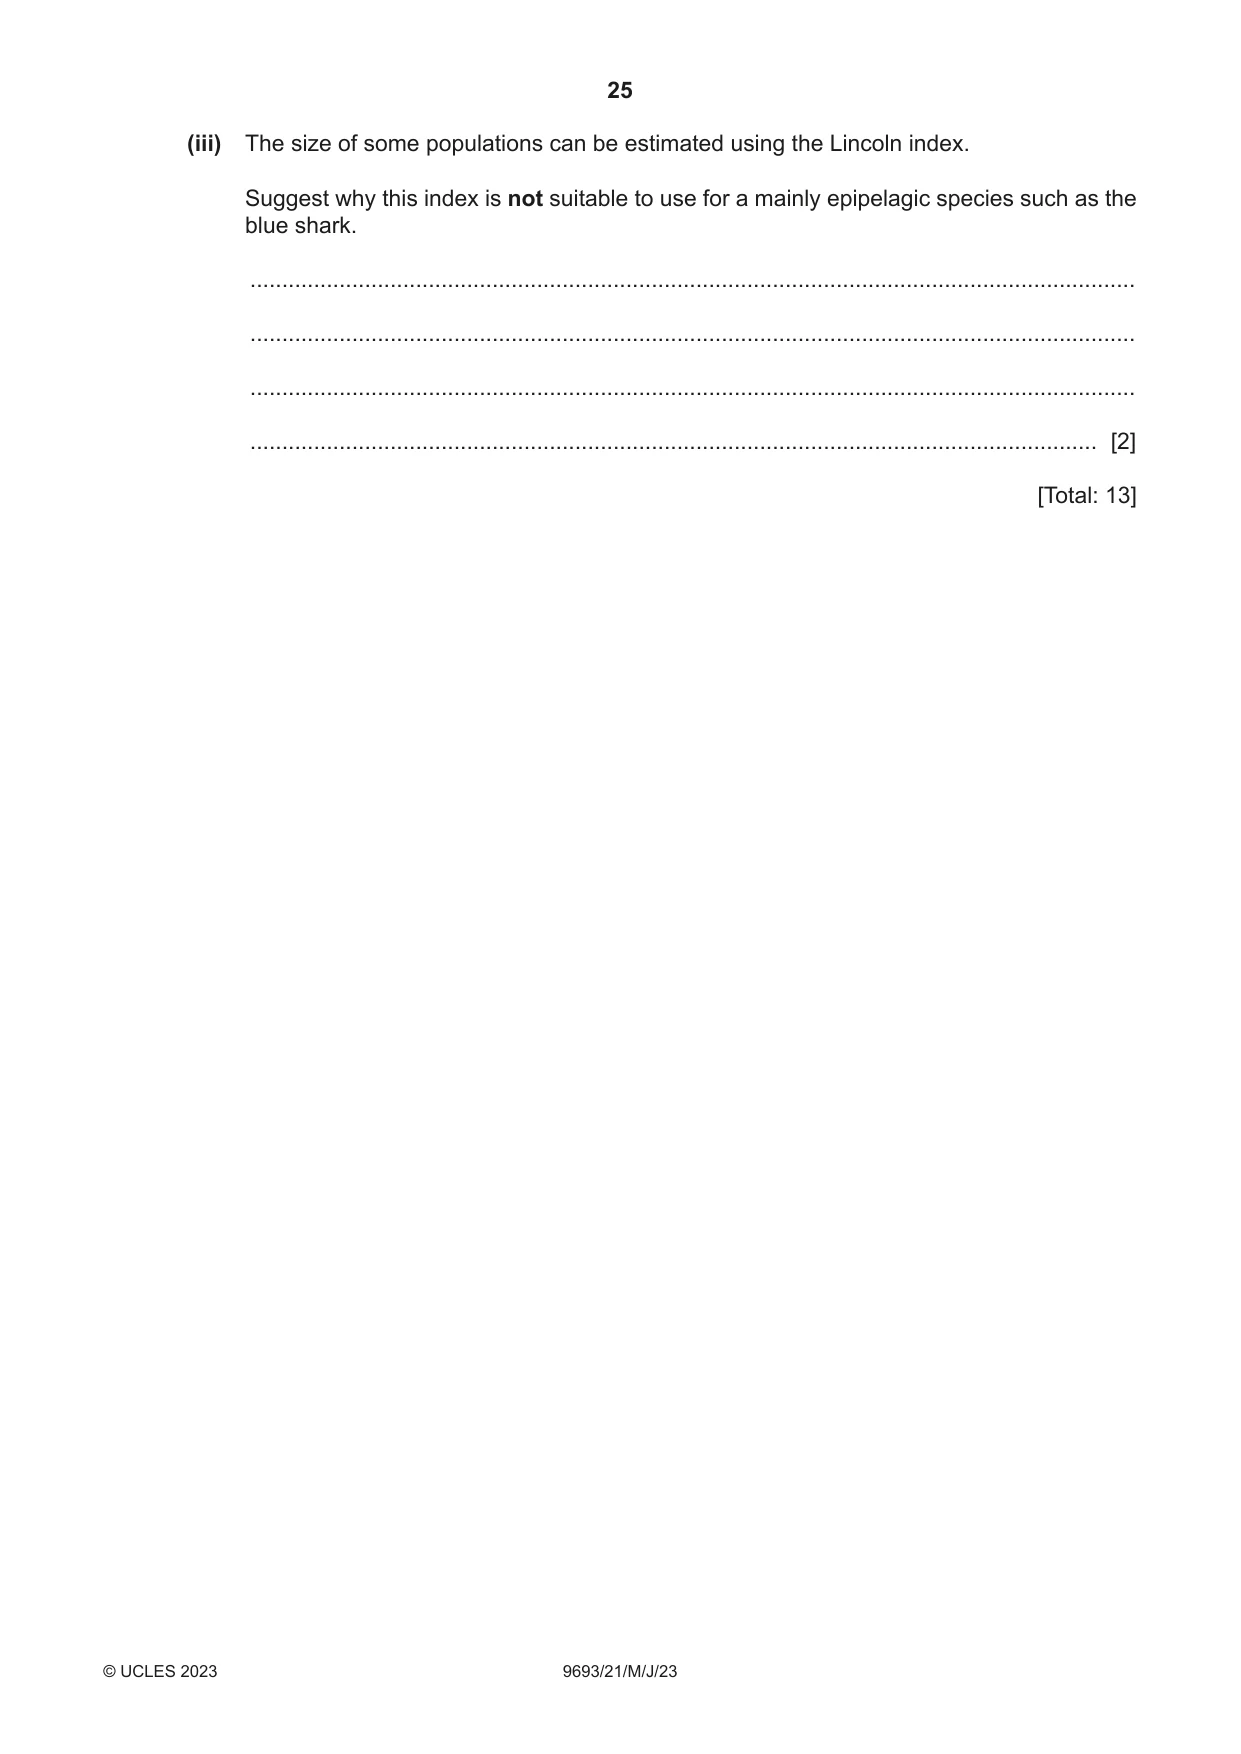
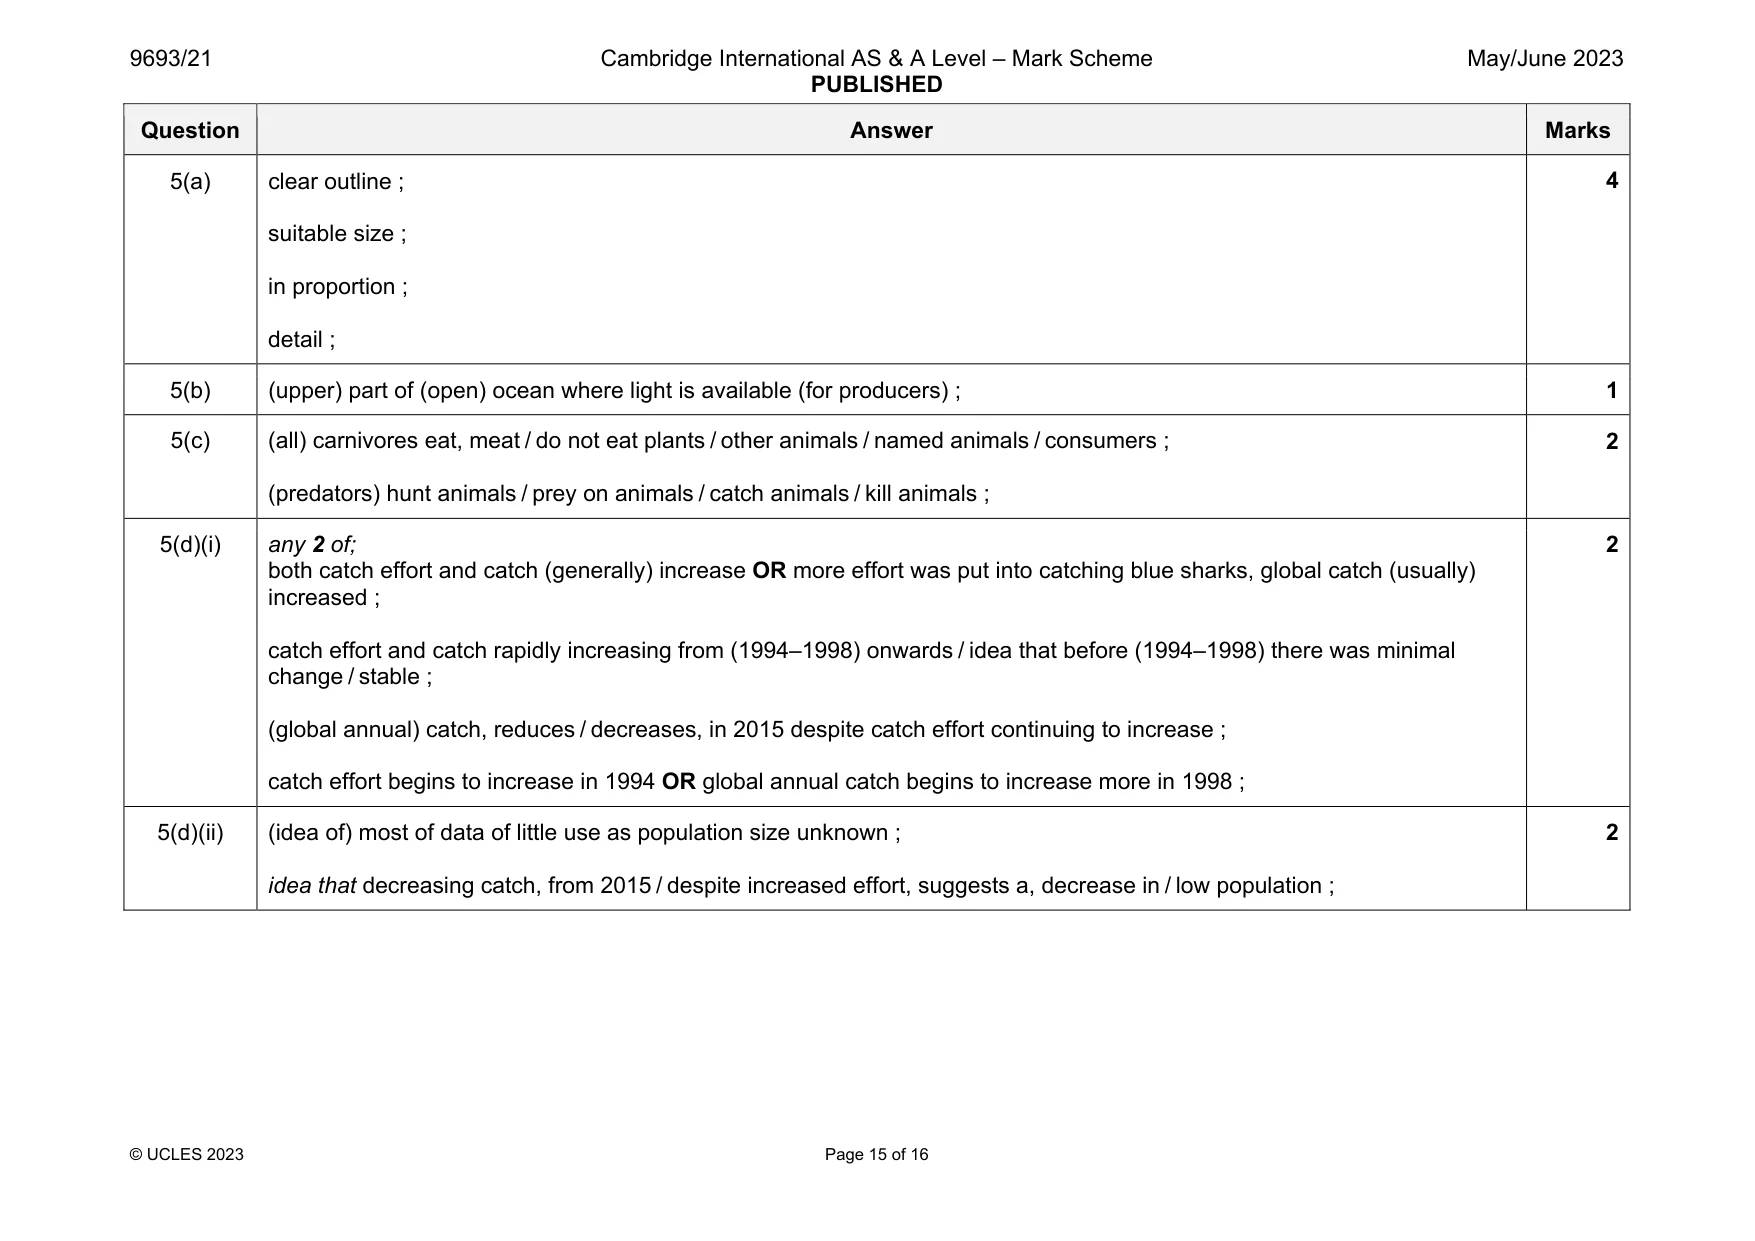
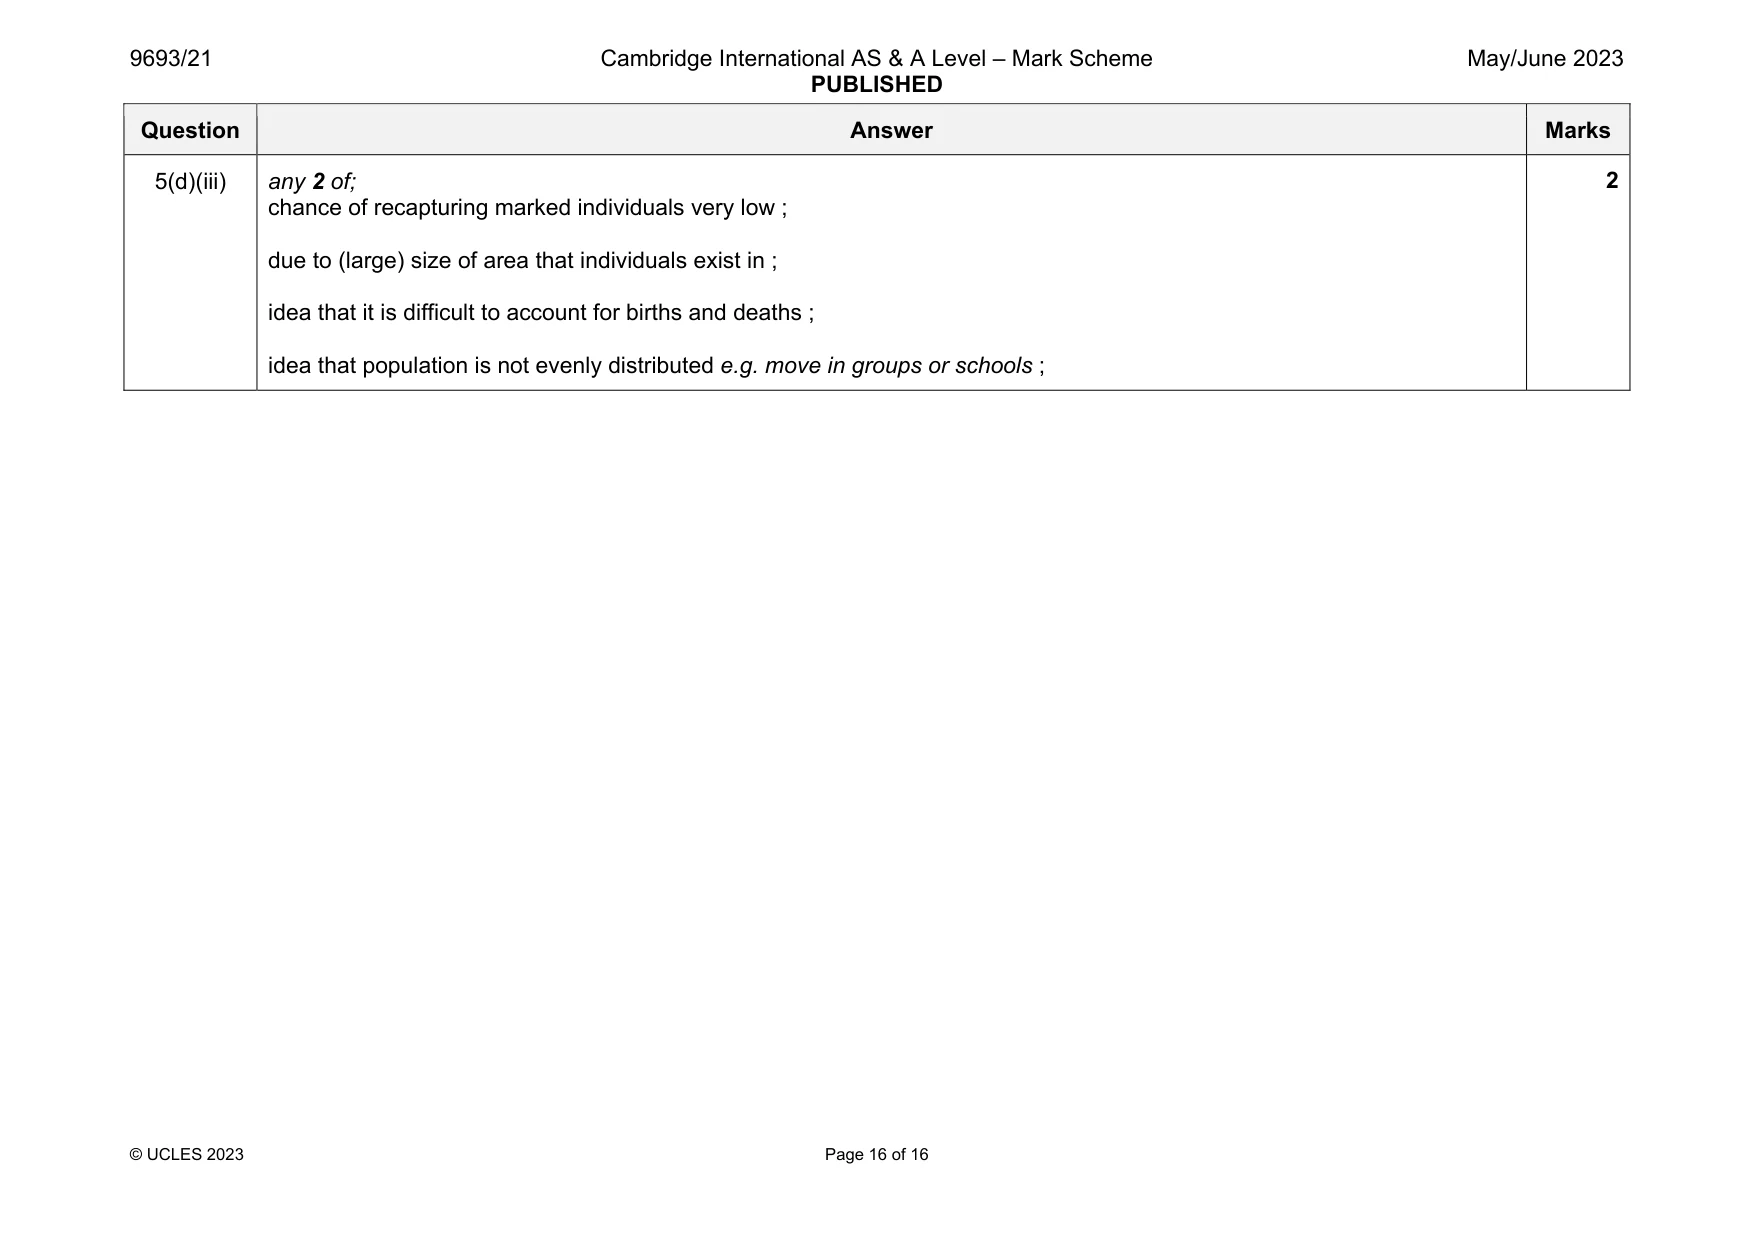
Mark scheme: 5(a) clear outline ; suitable size ; in proportion ; detail ; 5(b) (upper) part of (open) ocean where light is available (for producers) ; 1 5(c) (all) carnivores eat, meat / do not eat plants / other animals / named animals / consumers ; (predators) hunt animals / prey on animals / catch animals / kill animals ; 2 5(d)(i) any 2 of; both catch effort and catch (generally) increase OR more effort was put into catching blue sharks, global catch (usually) increased ; catch effort and catch rapidly increasing from (1994–1998) onwards / idea that before (1994–1998) there was minimal change / stable ; (global annual) catch, reduces / decreases, in 2015 despite catch effort continuing to increase ; catch effort begins to increase in 1994 OR global annual catch begins to increase more in 1998 ; 2 5(d)(ii) (idea of) most of data of little use as population size unknown ; idea that decreasing catch, from 2015 / despite increased effort, suggests a, decrease in / low population ; 2 Question Answer Marks 5(d)(iii) any 2 of; chance of recapturing marked individuals very low ; due to (large) size of area that individuals exist in ; idea that it is difficult to account for births and deaths ; idea that population is not evenly distributed e.g. move in groups or schools ; 2
What was in this paper
The subtopics covered by these 5 questions, and how many questions each got. Open one in a new tab to see every Cambridge question on it.
What you needed in this session
Cambridge’s own grade thresholds for 2023 May/June, Paper 2 · Variant 1. A higher threshold means an easier paper — the bar moves with how the cohort did.