Cambridge A Level Marine Science 9693 — 2022 May/June Paper 2 · Variant 1
9693/21/M/J/22 · 5 questions · 75 marks · ≈84 min
The question paper and its mark scheme, free to read here and free to download. This is Cambridge’s own paper, exactly as it was sat.
Question paper24 pages



Mark scheme14 pages
Answers below. Sit the paper first if you are practising.
Questions as text
Q1 · Artificial reefs are widely used to regenerate coral reef ecosystems
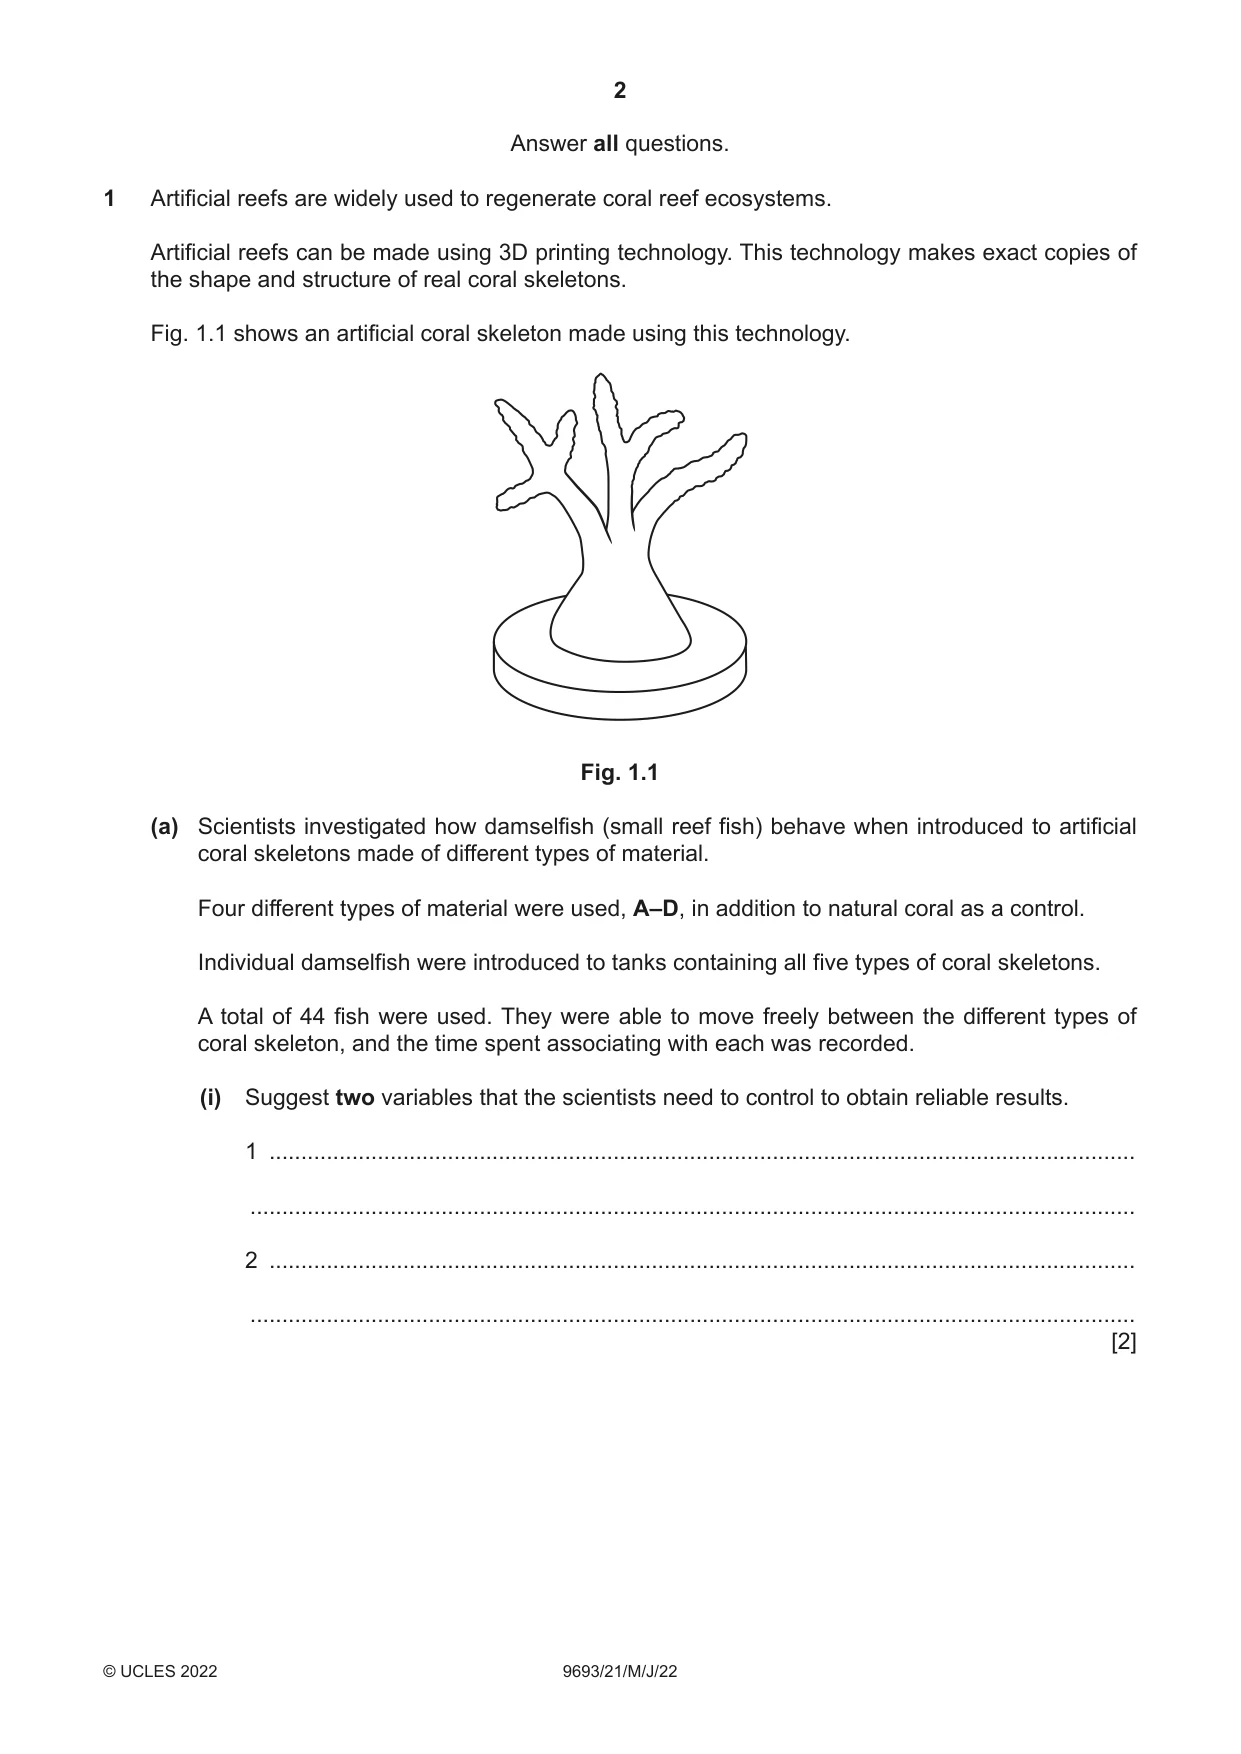
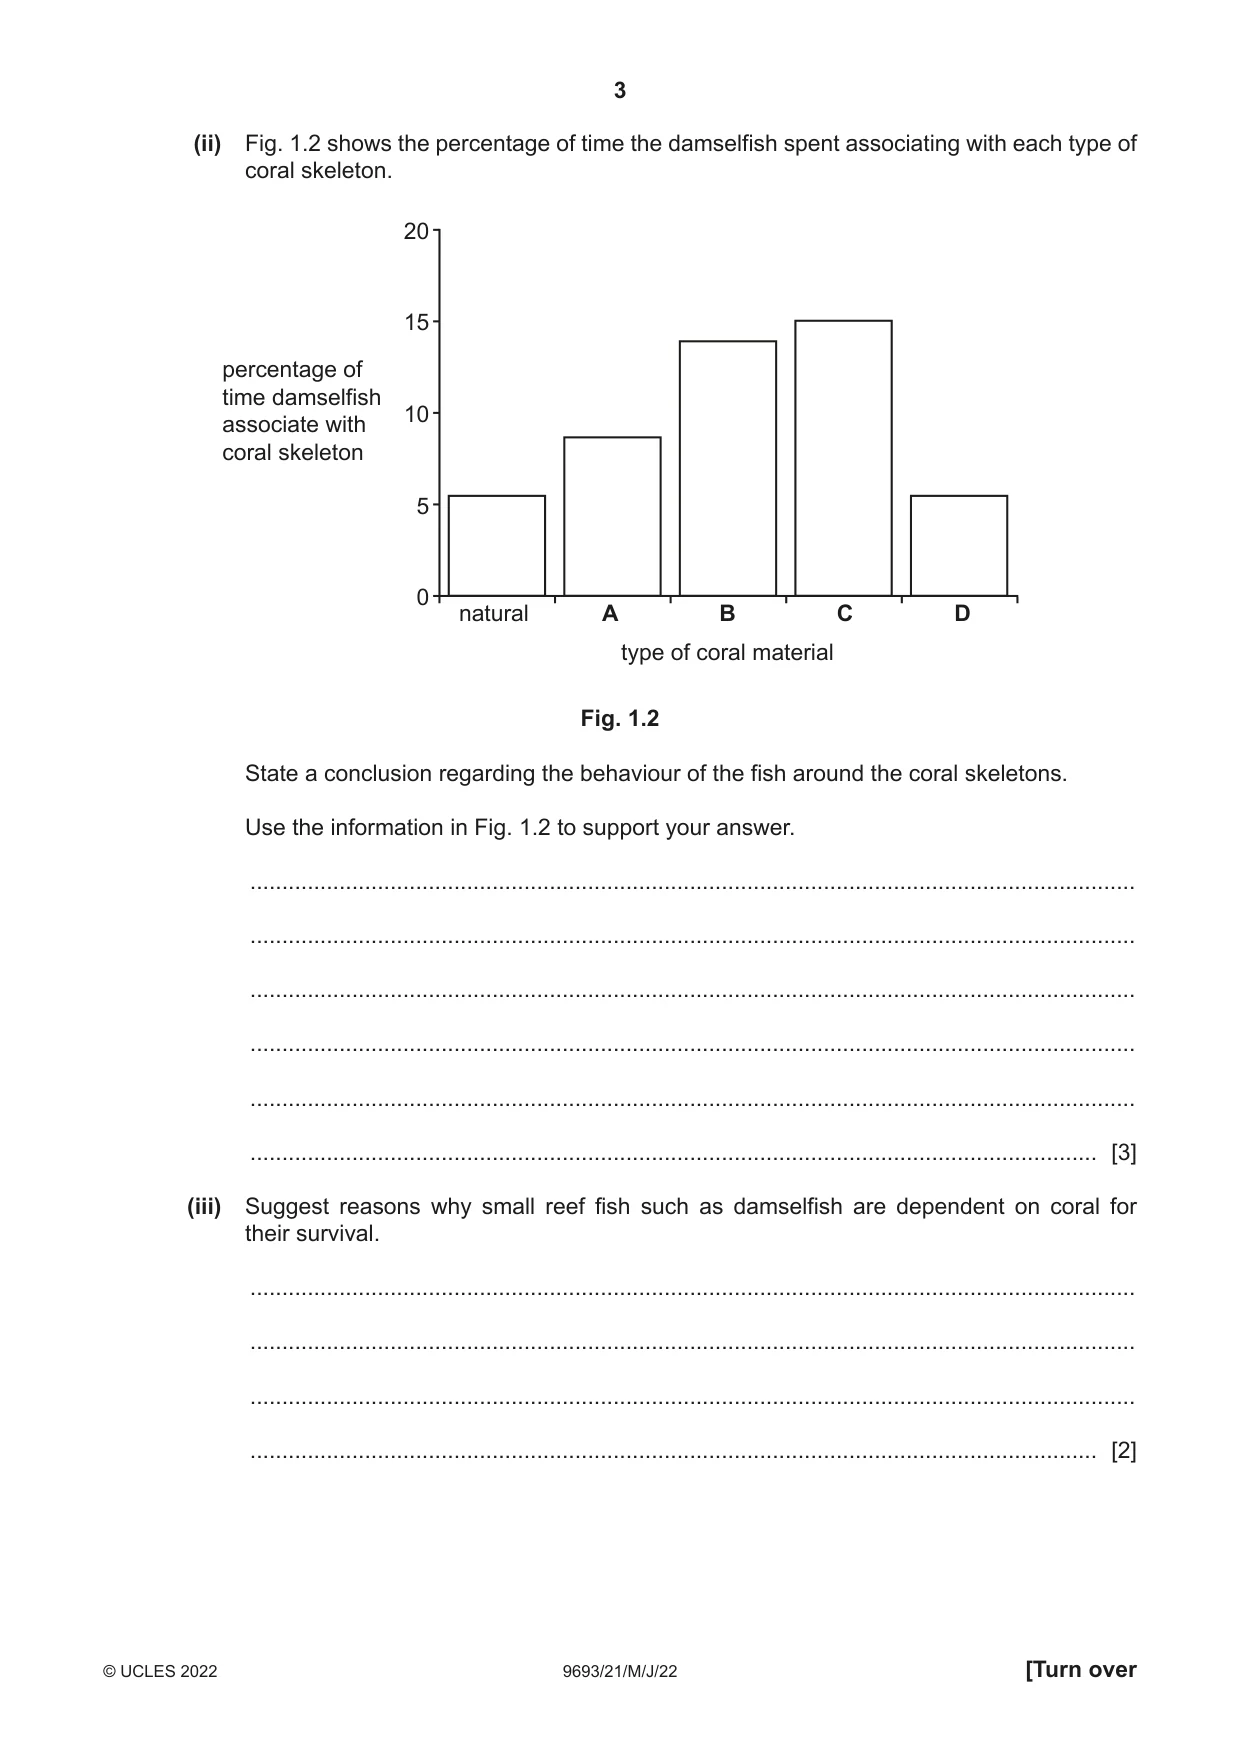
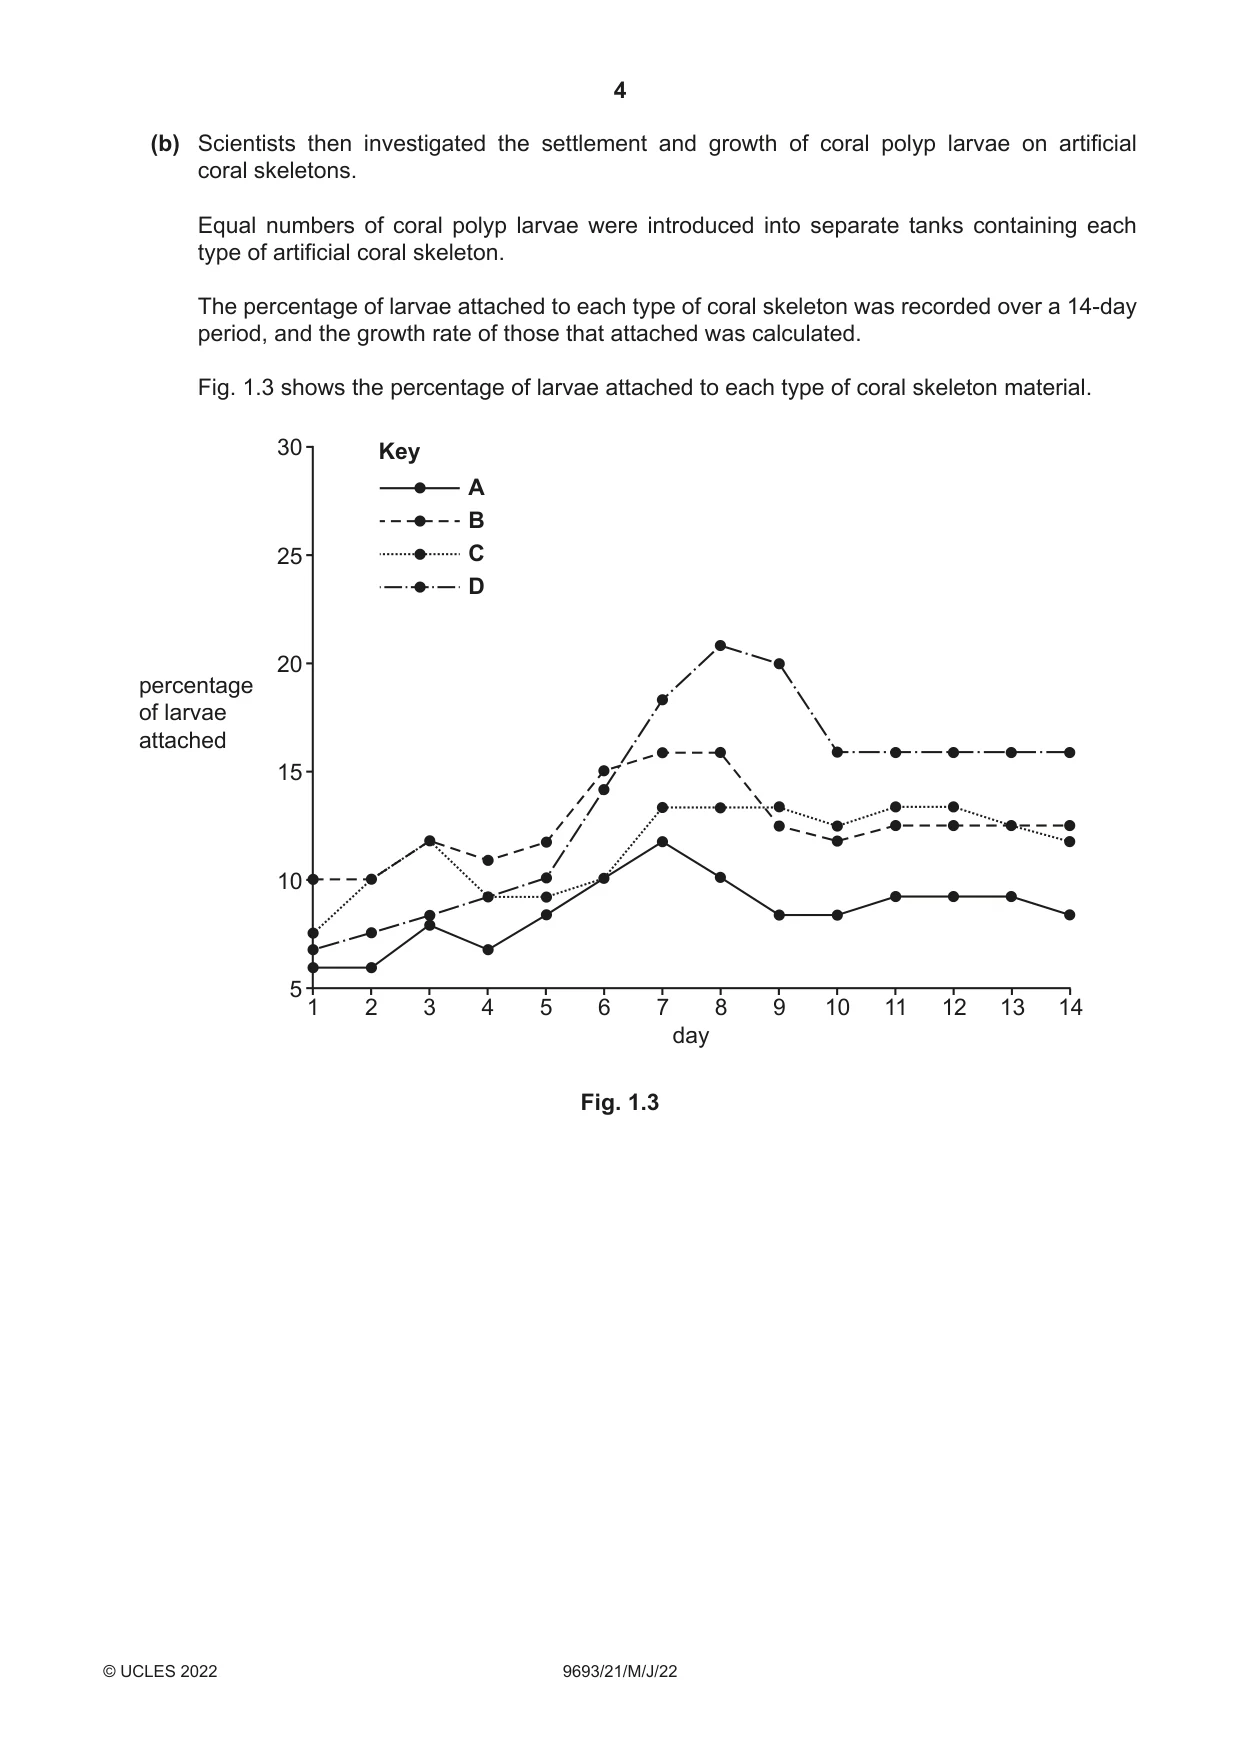
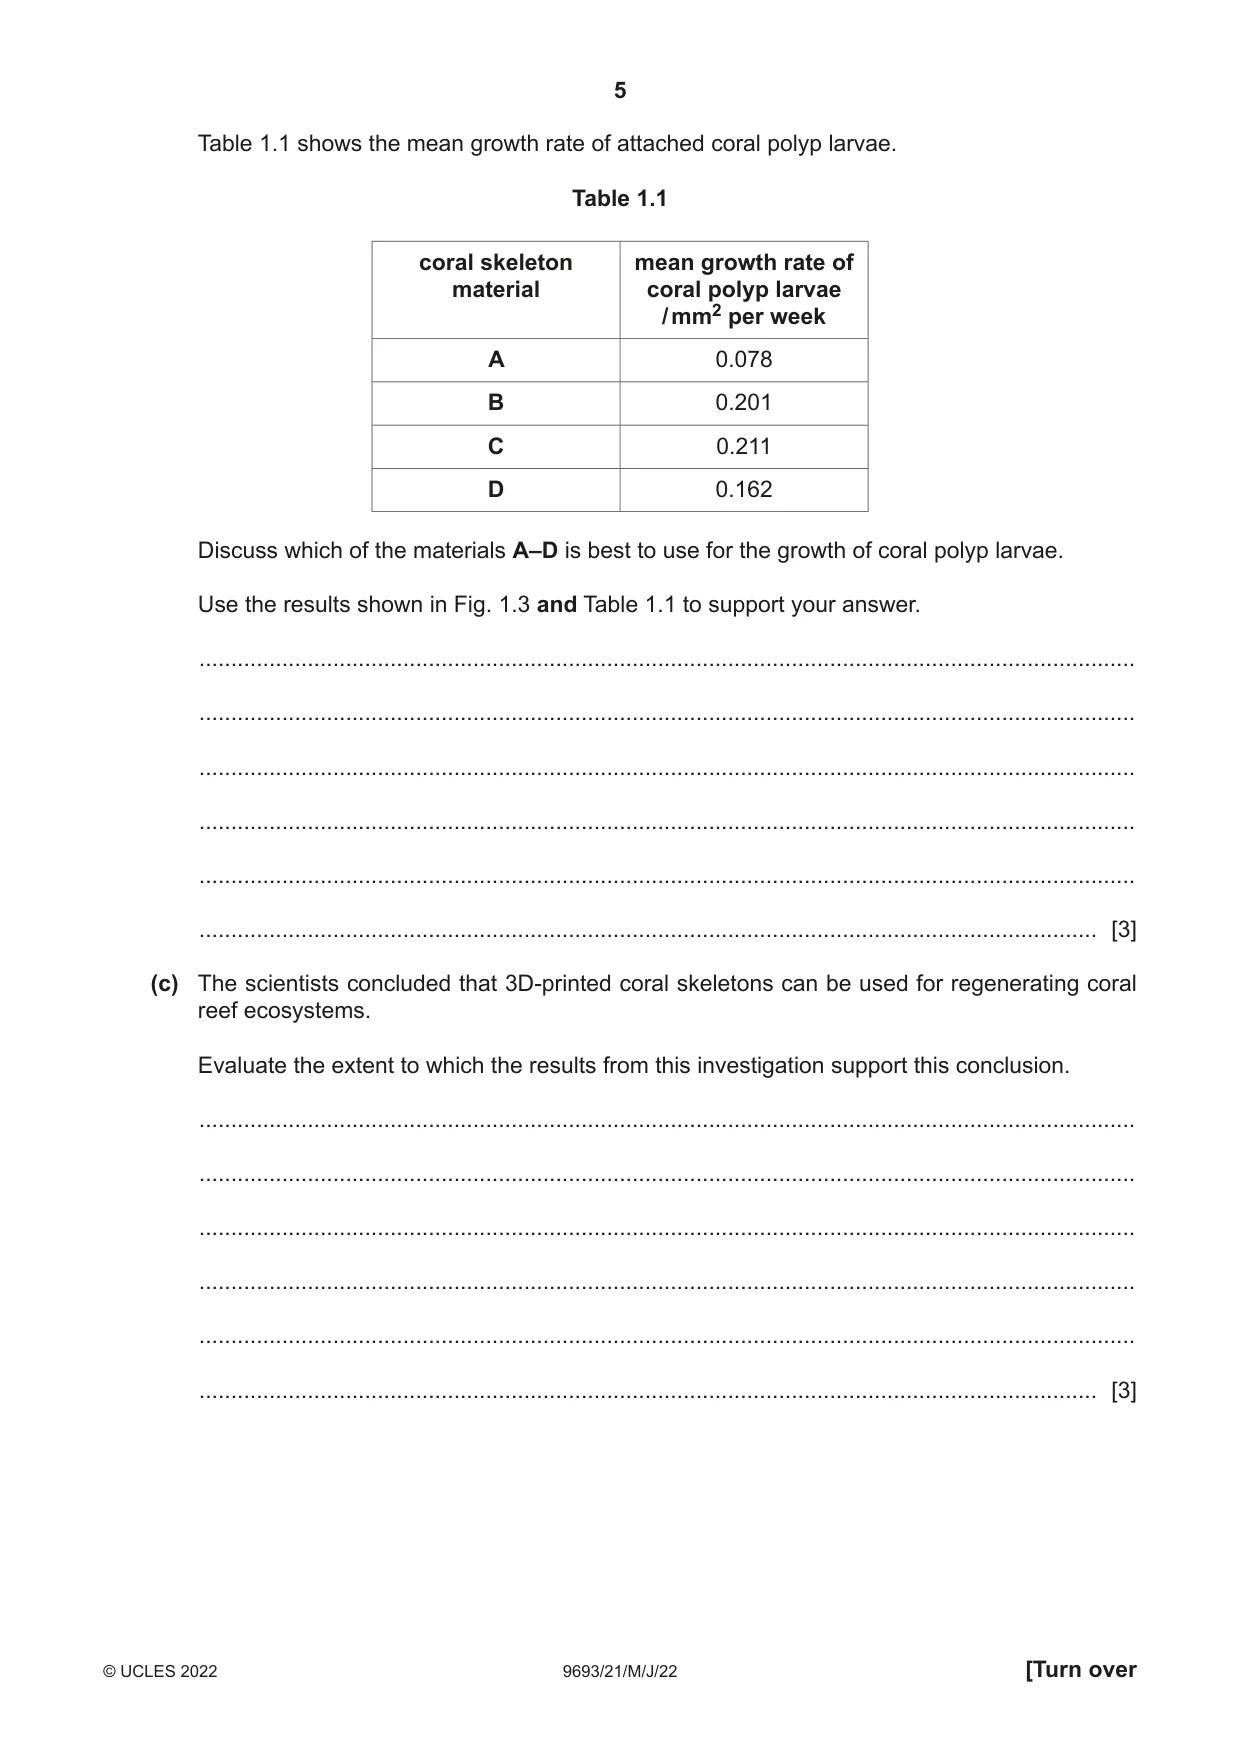
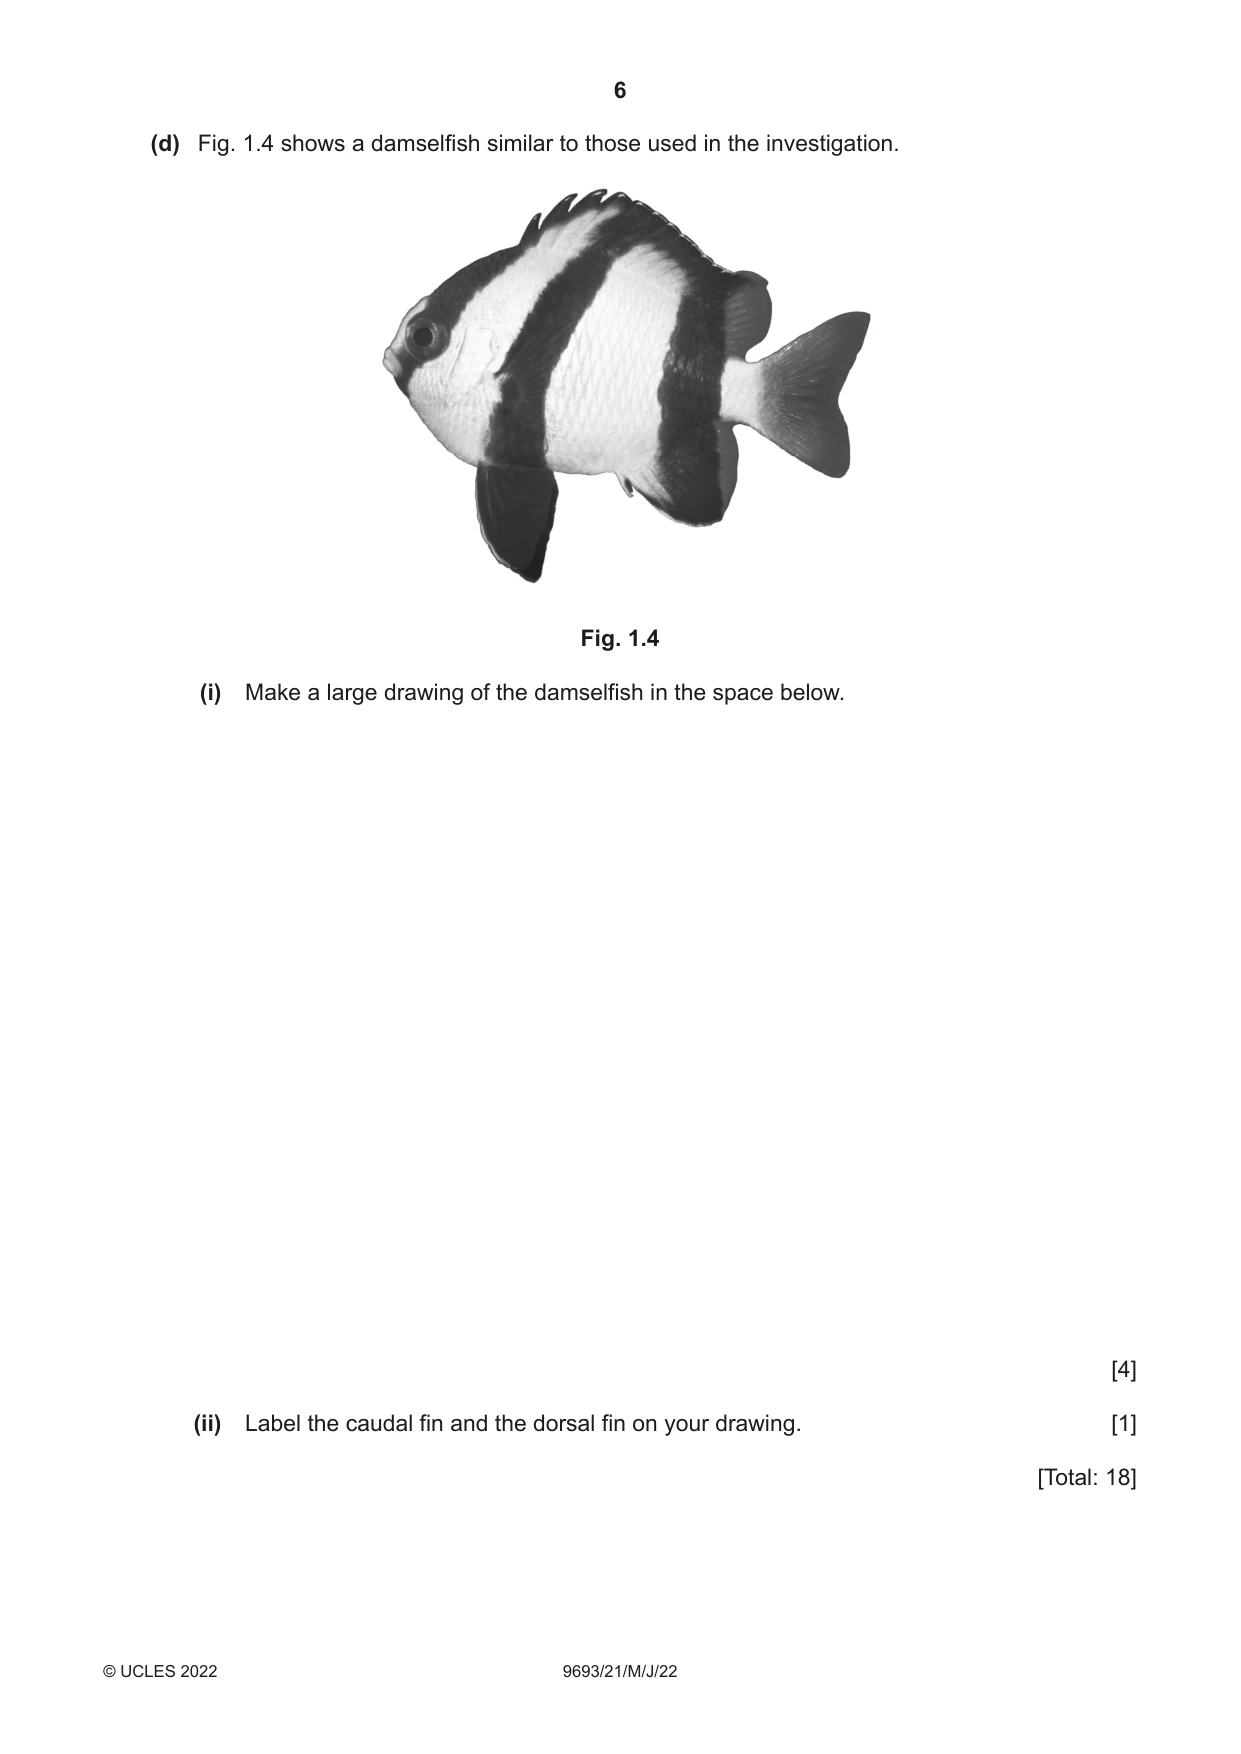
1 Artificial reefs are widely used to regenerate coral reef ecosystems. Artificial reefs can be made using 3D printing technology. This technology makes exact copies of the shape and structure of real coral skeletons. Fig. 1.1 shows an artificial coral skeleton made using this technology. Fig. 1.1 (a) Scientists investigated how damselfish (small reef fish) behave when introduced to artificial coral skeletons made of different types of material. Four different types of material were used, A–D, in addition to natural coral as a control. Individual damselfish were introduced to tanks containing all five types of coral skeletons. A total of 44 fish were used. They were able to move freely between the different types of coral skeleton, and the time spent associating with each was recorded. (i) Suggest two variables that the scientists need to control to obtain reliable results. 1 ........................................................................................................................................ ........................................................................................................................................... 2 ........................................................................................................................................ ........................................................................................................................................... [2] (ii) Fig. 1.2 shows the percentage of time the damselfish spent associating with each type of coral skeleton. 20 15 percentage of time damselfish 10 associate with coral skeleton 5 0 natural A B C D type of coral material Fig. 1.2 State a conclusion regarding the behaviour of the fish around the coral skeletons. Use the information in Fig. 1.2 to support your answer. ........................................................................................................................................... ........................................................................................................................................... ........................................................................................................................................... ........................................................................................................................................... ........................................................................................................................................... ..................................................................................................................................... [3] (iii) Suggest reasons why small reef fish such as damselfish are dependent on coral for their survival. ........................................................................................................................................... ........................................................................................................................................... ........................................................................................................................................... ..................................................................................................................................... [2] (b) Scientists then investigated the settlement and growth of coral polyp larvae on artificial coral skeletons. Equal numbers of coral polyp larvae were introduced into separate tanks containing each type of artificial coral skeleton. The percentage of larvae attached to each type of coral skeleton was recorded over a 14-day period, and the growth rate of those that attached was calculated. Fig. 1.3 shows the percentage of larvae attached to each type of coral skeleton material. 30 Key A B 25 C D 20 percentage of larvae attached 15 10 5 1 2 3 4 5 6 7 8 9 10 11 12 13 14 day Fig. 1.3 Table 1.1 shows the mean growth rate of attached coral polyp larvae. Table 1.1 coral skeleton mean growth rate of material coral polyp larvae / mm2 per week A 0.078 B 0.201 C 0.211 D 0.162 Discuss which of the materials A–D is best to use for the growth of coral polyp larvae. Use the results shown in Fig. 1.3 and Table 1.1 to support your answer. ................................................................................................................................................... ................................................................................................................................................... ................................................................................................................................................... ................................................................................................................................................... ................................................................................................................................................... ............................................................................................................................................. [3] (c) The scientists concluded that 3D-printed coral skeletons can be used for regenerating coral reef ecosystems. Evaluate the extent to which the results from this investigation support this conclusion. ................................................................................................................................................... ................................................................................................................................................... ................................................................................................................................................... ................................................................................................................................................... ................................................................................................................................................... ............................................................................................................................................. [3] (d) Fig. 1.4 shows a damselfish similar to those used in the investigation. Fig. 1.4 (i) Make a large drawing of the damselfish in the space below. [4] (ii) Label the caudal fin and the dorsal fin on your drawing. [1] [Total: 18]
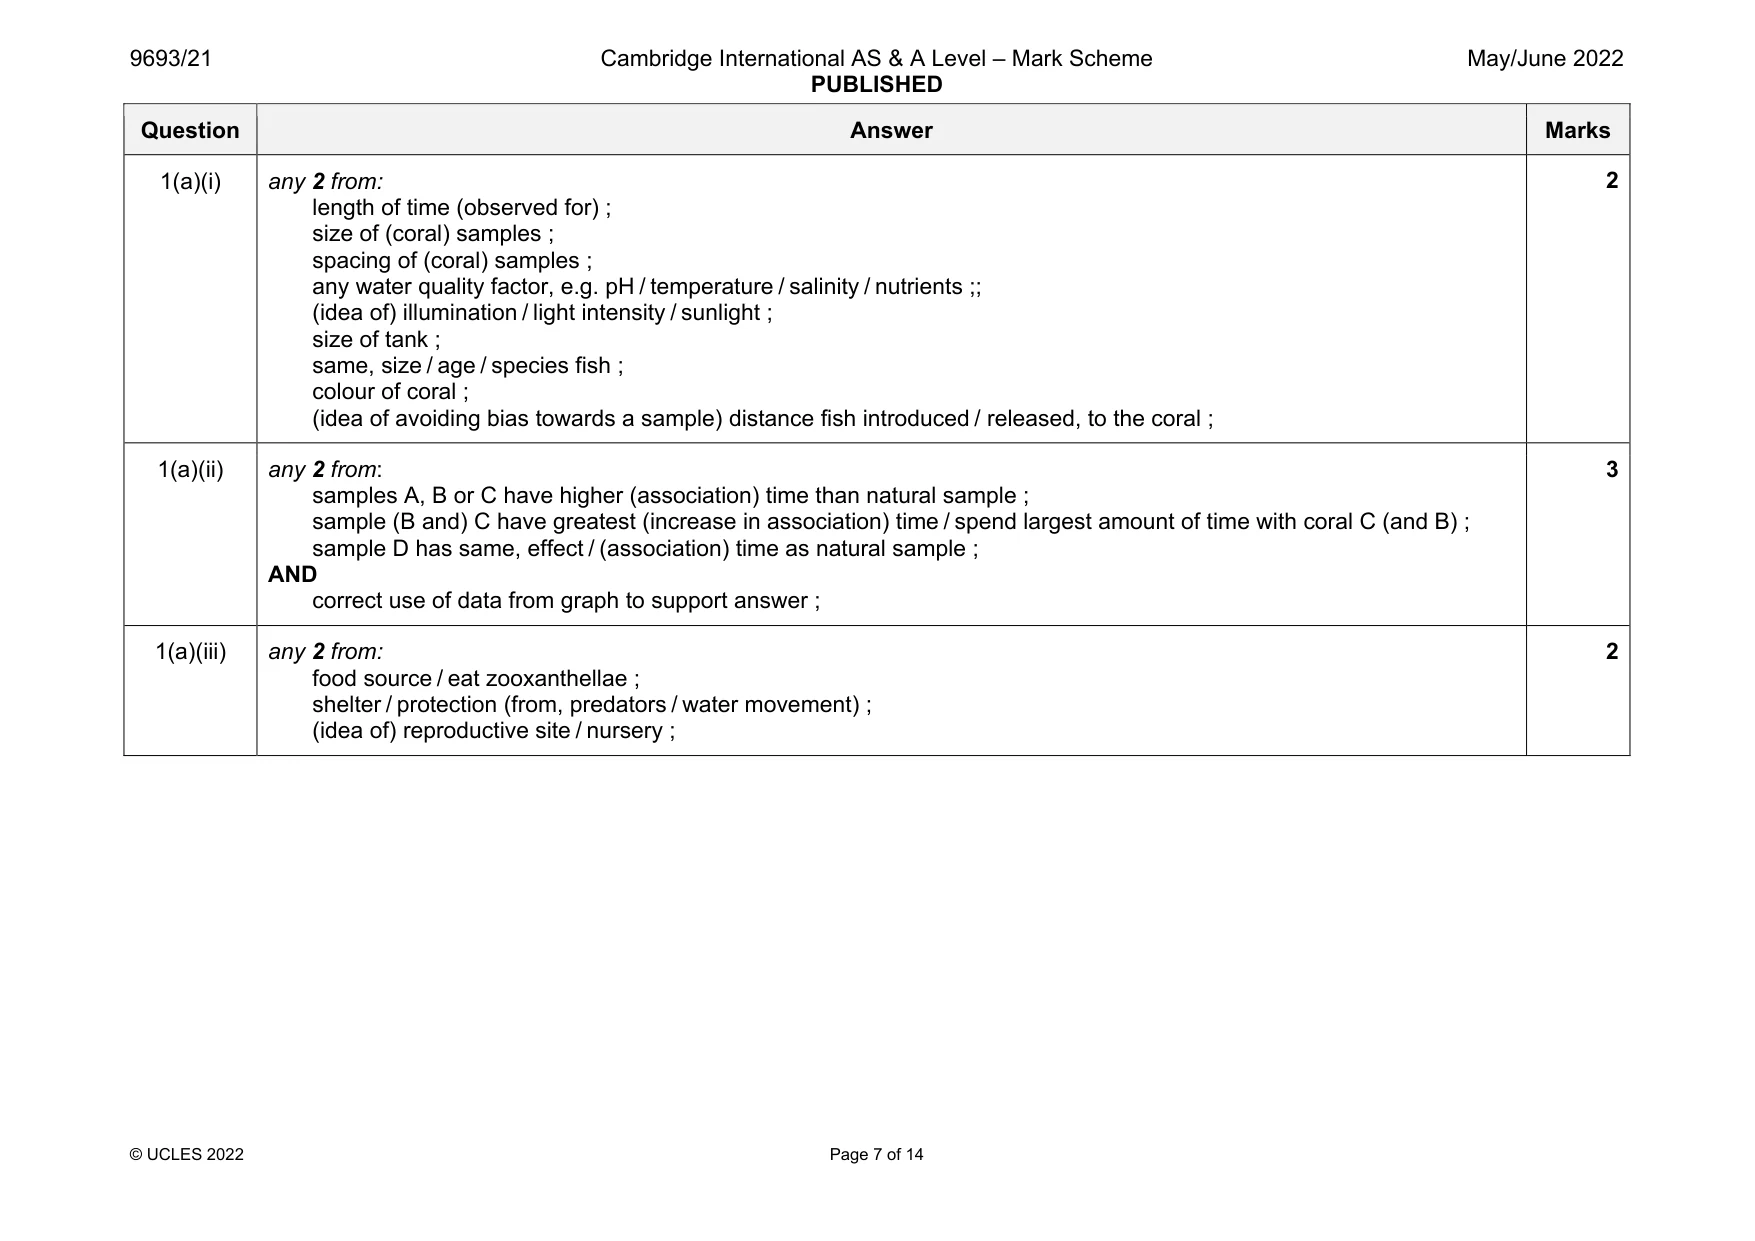
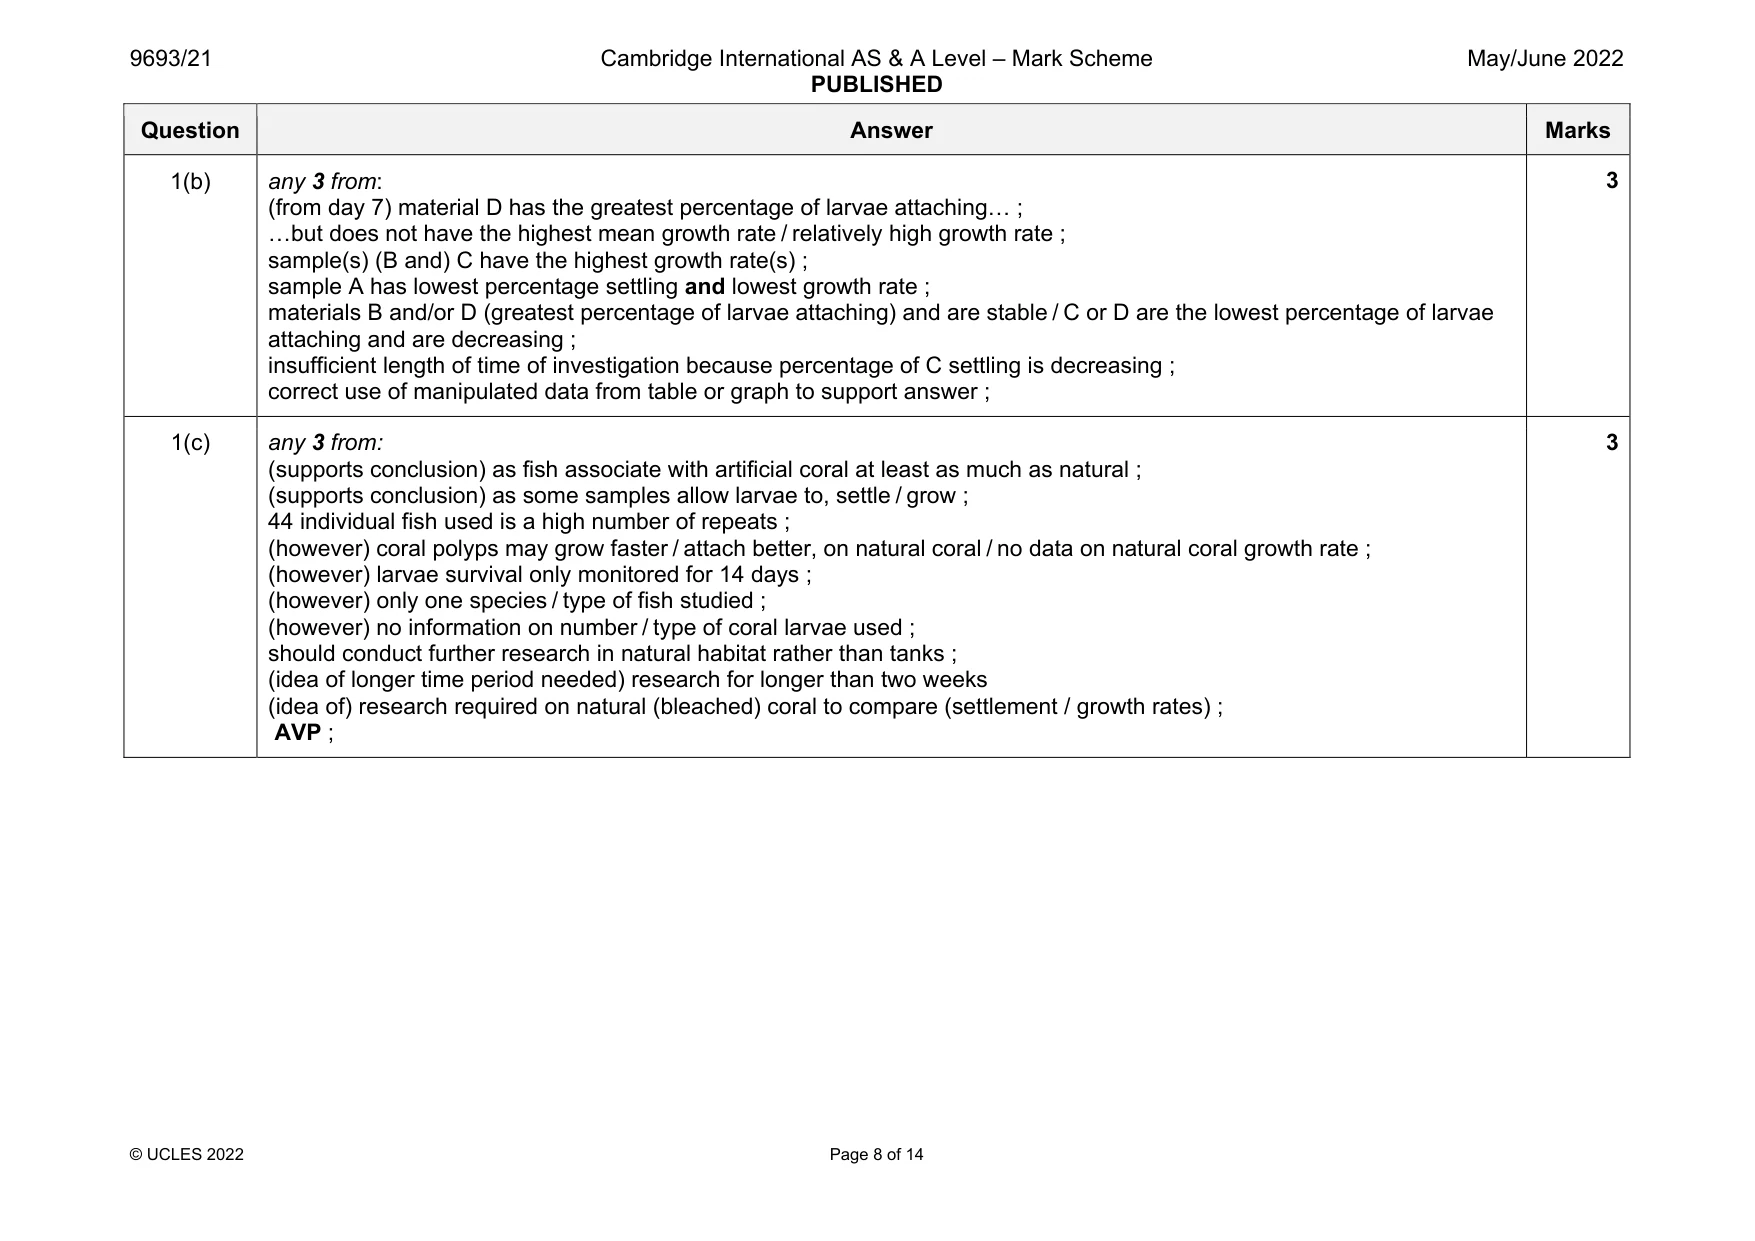
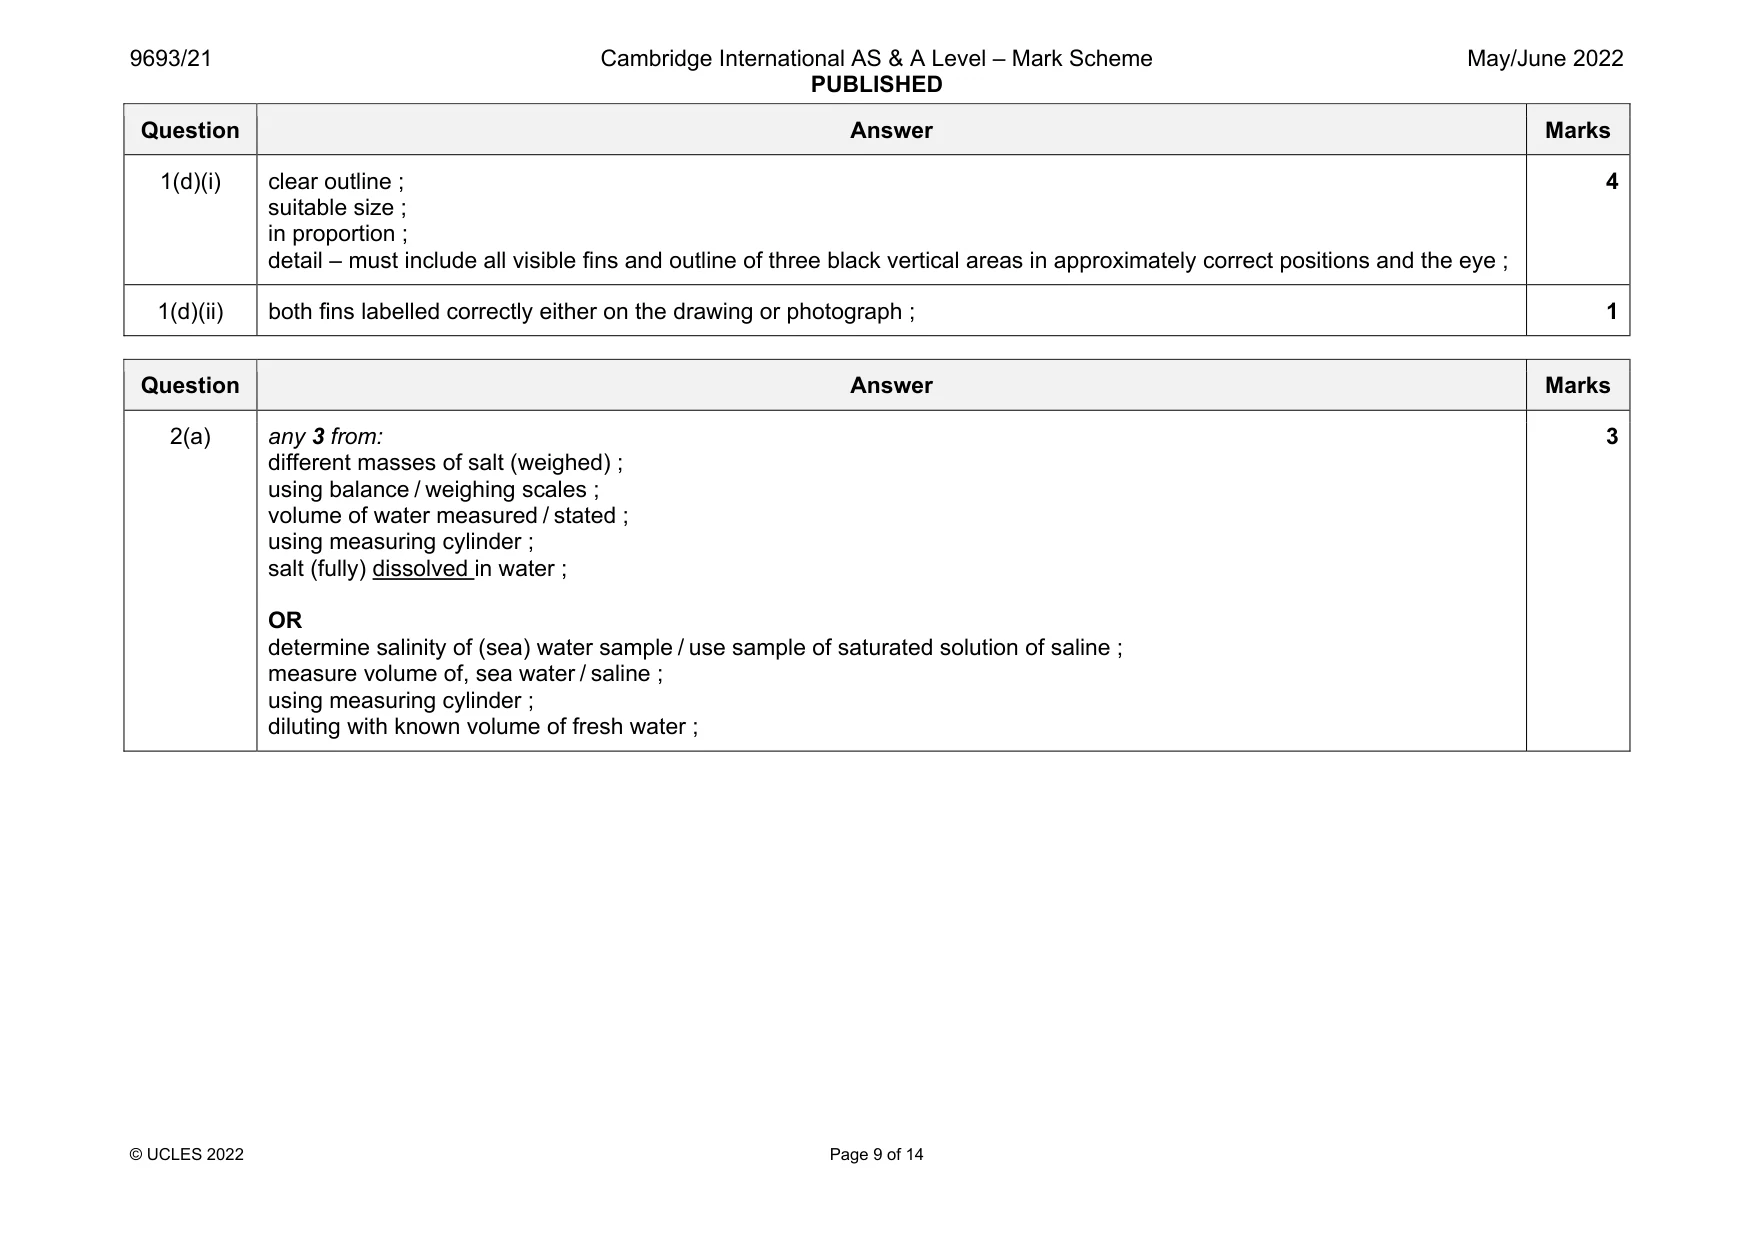
Mark scheme: 1(a)(i) any 2 from: length of time (observed for) ; size of (coral) samples ; spacing of (coral) samples ; any water quality factor, e.g. pH / temperature / salinity / nutrients ;; (idea of) illumination / light intensity / sunlight ; size of tank ; same, size / age / species fish ; colour of coral ; (idea of avoiding bias towards a sample) distance fish introduced / released, to the coral ; 1(a)(ii) any 2 from: samples A, B or C have higher (association) time than natural sample ; sample (B and) C have greatest (increase in association) time / spend largest amount of time with coral C (and B) ; sample D has same, effect / (association) time as natural sample ; AND correct use of data from graph to support answer ; 3 1(a)(iii) any 2 from: food source / eat zooxanthellae ; shelter / protection (from, predators / water movement) ; (idea of) reproductive site / nursery ; 2 Question Answer Marks 1(b) any 3 from: (from day 7) material D has the greatest percentage of larvae attaching… ; …but does not have the highest mean growth rate / relatively high growth rate ; sample(s) (B and) C have the highest growth rate(s) ; sample A has lowest percentage settling and lowest growth rate ; materials B and/or D (greatest percentage of larvae attaching) and are stable / C or D are the lowest percentage of larvae attaching and are decreasing ; insufficient length of time of investigation because percentage of C settling is decreasing ; correct use of manipulated data from table or graph to support answer ; 3 1(c) any 3 from: (supports conclusion) as fish associate with artificial coral at least as much as natural ; (supports conclusion) as some samples allow larvae to, settle / grow ; 44 individual fish used is a high number of repeats ; (however) coral polyps may grow faster / attach better, on natural coral / no data on natural coral growth rate ; (however) larvae survival only monitored for 14 days ; (however) only one species / type of fish studied ; (however) no information on number / type of coral larvae used ; should conduct further research in natural habitat rather than tanks ; (idea of longer time period needed) research for longer than two weeks (idea of) research required on natural (bleached) coral to compare (settlement / growth rates) ; AVP ; 3 Question Answer Marks 1(d)(i) clear outline ; suitable size ; in proportion ; detail – must include all visible fins and outline of three black vertical areas in approximately correct positions and the eye ; 4 1(d)(ii) both fins labelled correctly either on the drawing or photograph ; 1
Q2 · A student investigates the properties of water of different salinities
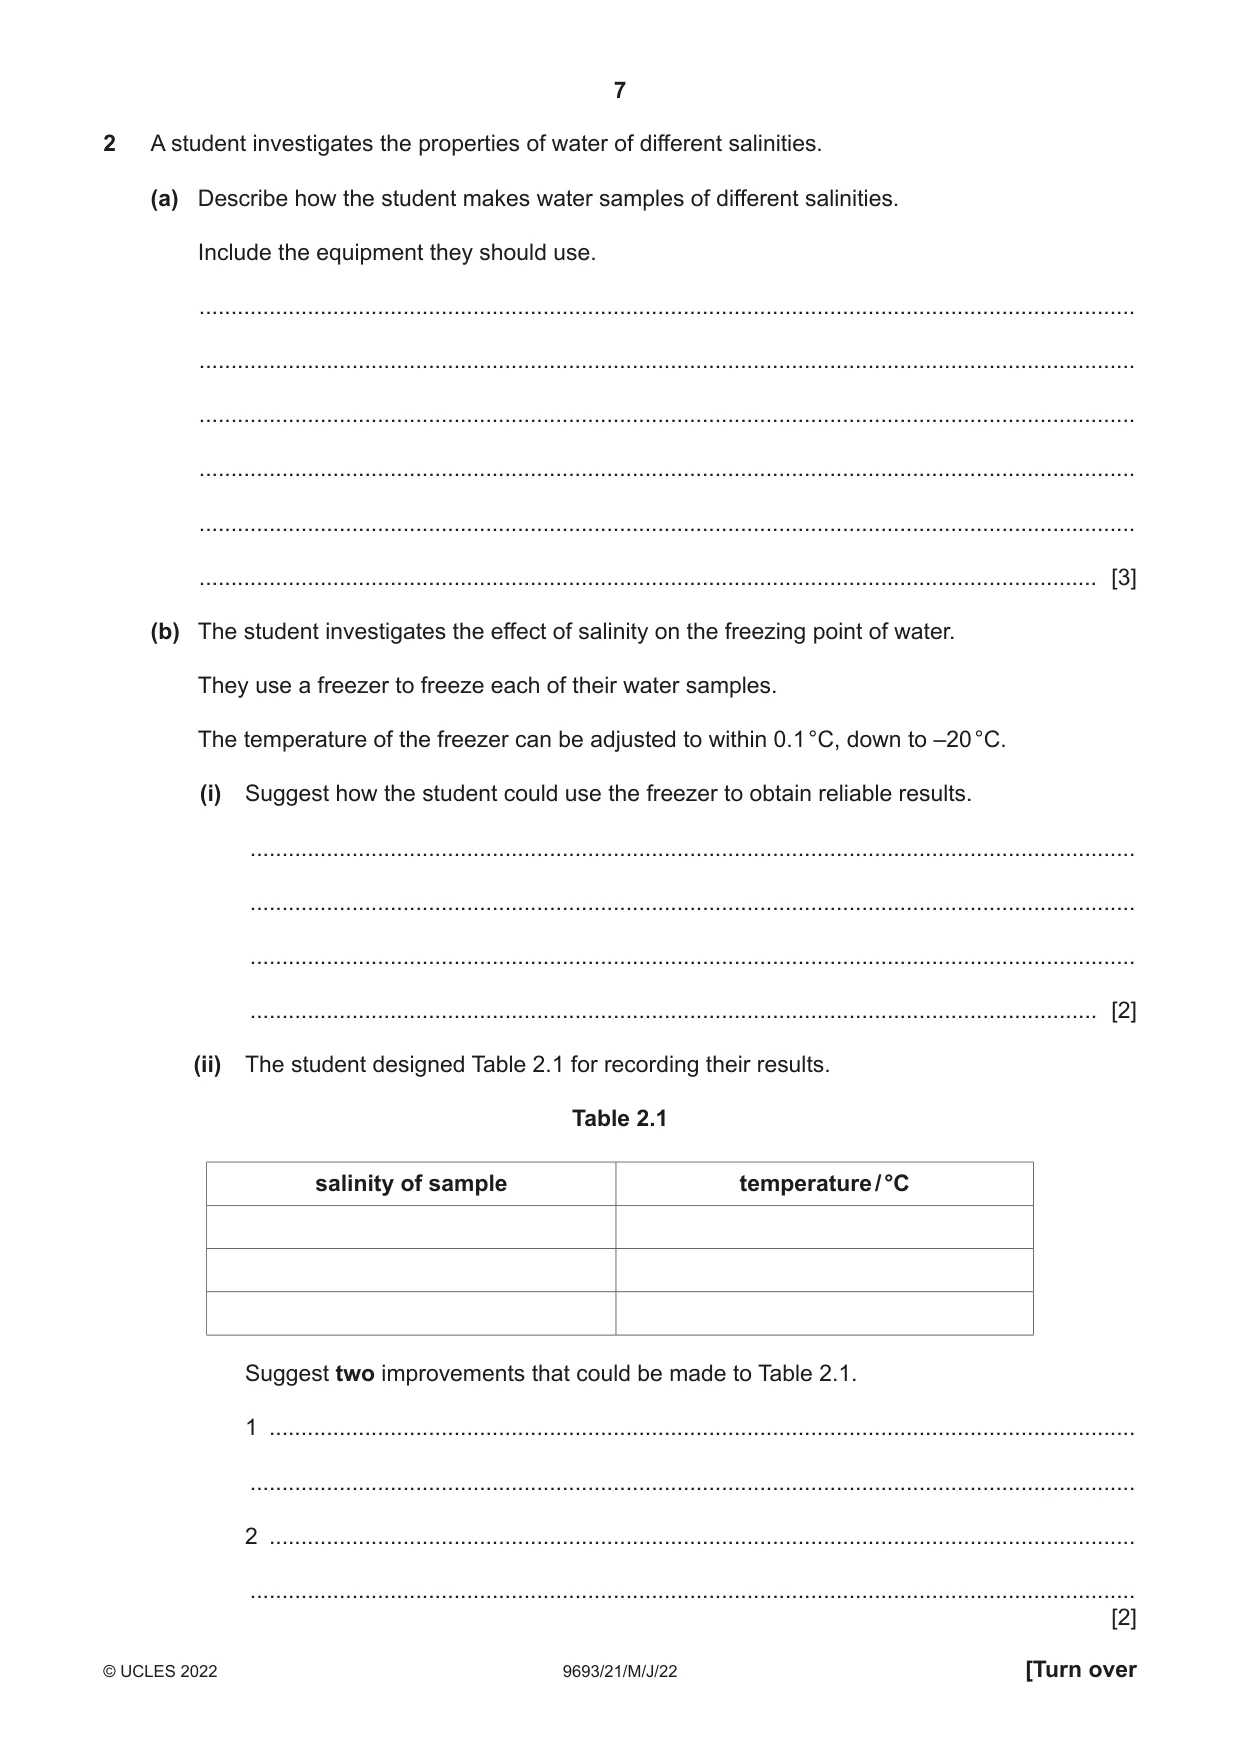
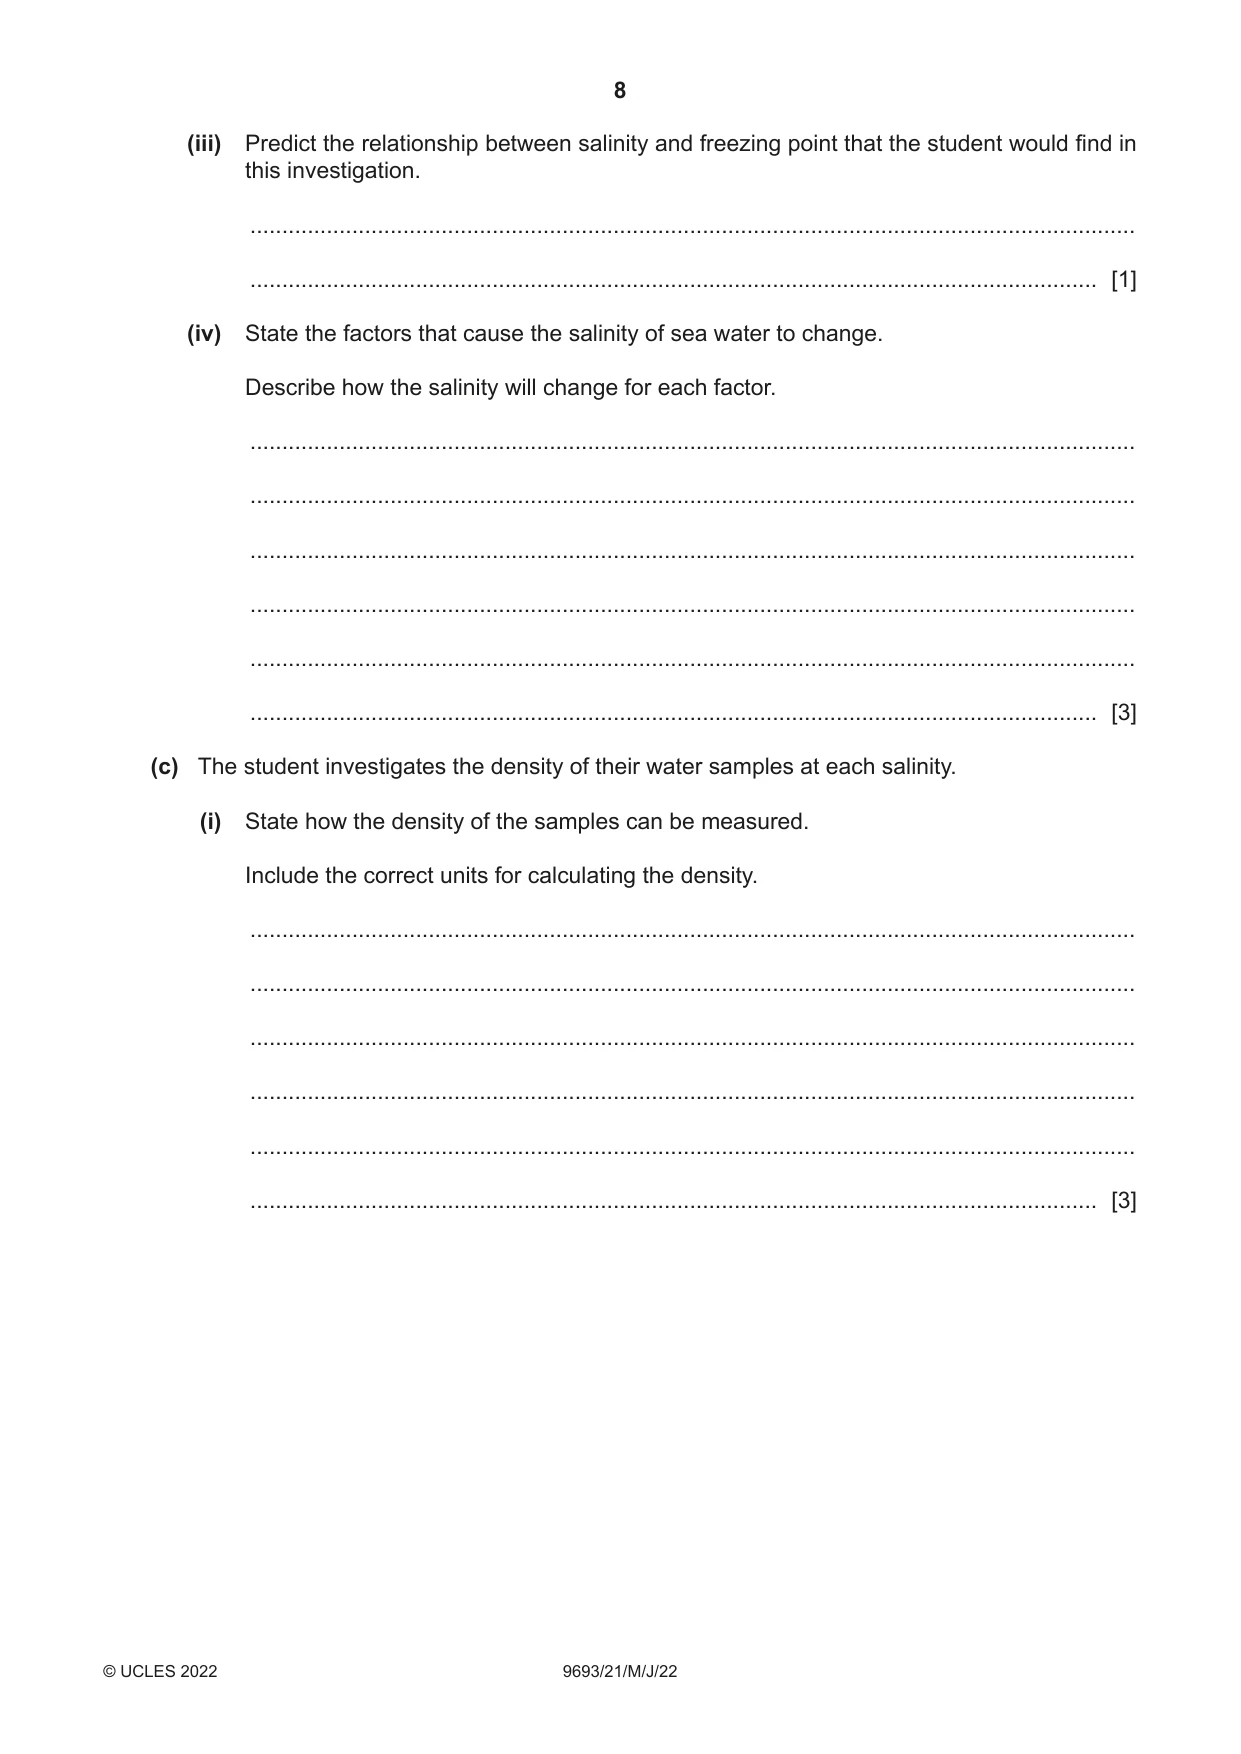
2 A student investigates the properties of water of different salinities. (a) Describe how the student makes water samples of different salinities. Include the equipment they should use. ................................................................................................................................................... ................................................................................................................................................... ................................................................................................................................................... ................................................................................................................................................... ................................................................................................................................................... ............................................................................................................................................. [3] (b) The student investigates the effect of salinity on the freezing point of water. They use a freezer to freeze each of their water samples. The temperature of the freezer can be adjusted to within 0.1 °C, down to –20 °C. (i) Suggest how the student could use the freezer to obtain reliable results. ........................................................................................................................................... ........................................................................................................................................... ........................................................................................................................................... ..................................................................................................................................... [2] (ii) The student designed Table 2.1 for recording their results. Table 2.1 salinity of sample temperature / °C Suggest two improvements that could be made to Table 2.1. 1 ........................................................................................................................................ ........................................................................................................................................... 2 ........................................................................................................................................ ........................................................................................................................................... [2] (iii) Predict the relationship between salinity and freezing point that the student would find in this investigation. ........................................................................................................................................... ..................................................................................................................................... [1] (iv) State the factors that cause the salinity of sea water to change. Describe how the salinity will change for each factor. ........................................................................................................................................... ........................................................................................................................................... ........................................................................................................................................... ........................................................................................................................................... ........................................................................................................................................... ..................................................................................................................................... [3] (c) The student investigates the density of their water samples at each salinity. (i) State how the density of the samples can be measured. Include the correct units for calculating the density. ........................................................................................................................................... ........................................................................................................................................... ........................................................................................................................................... ........................................................................................................................................... ........................................................................................................................................... ..................................................................................................................................... [3] (ii) Use the axes below to sketch the relationship you would expect to find between salinity and density. [2] (iii) Explain the significance of different salinities of sea water having different densities. ........................................................................................................................................... ........................................................................................................................................... ........................................................................................................................................... ..................................................................................................................................... [2] [Total: 18]
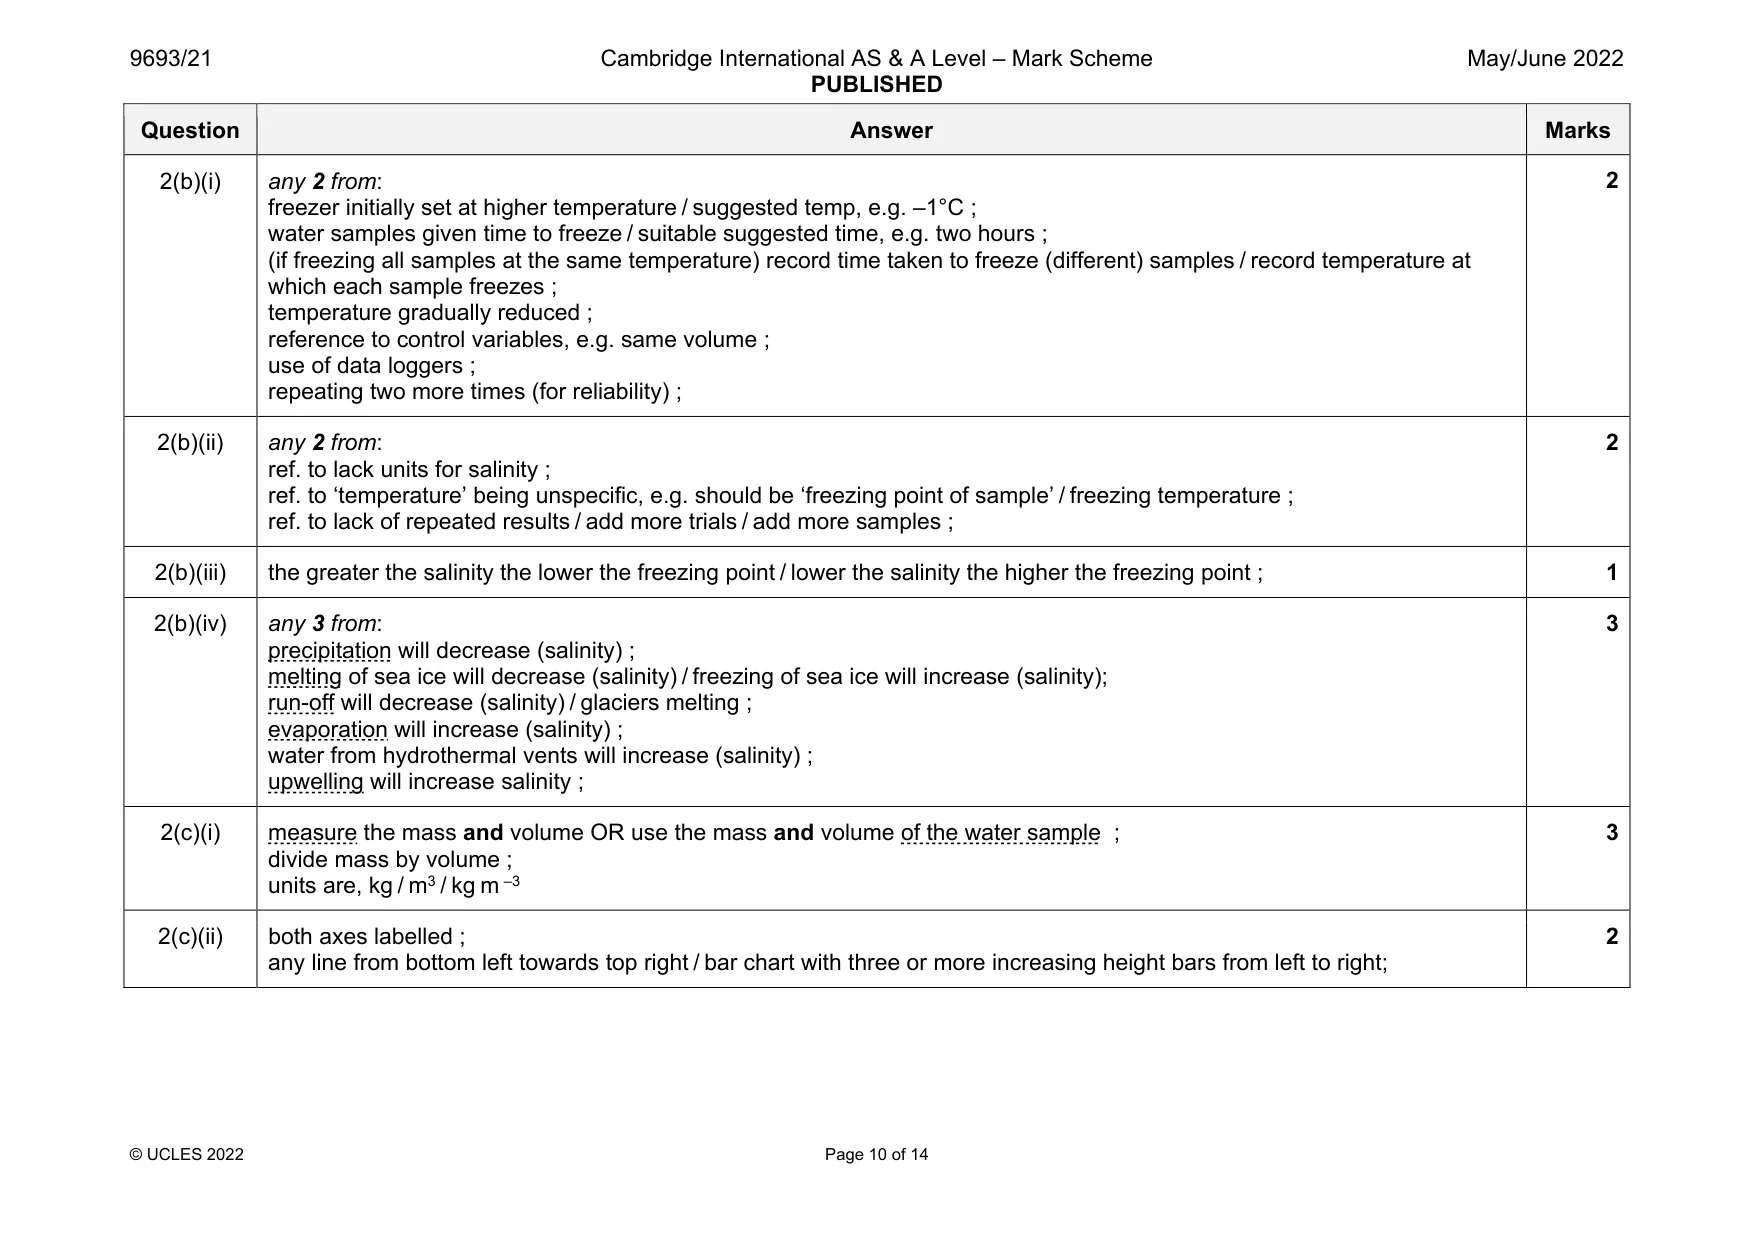
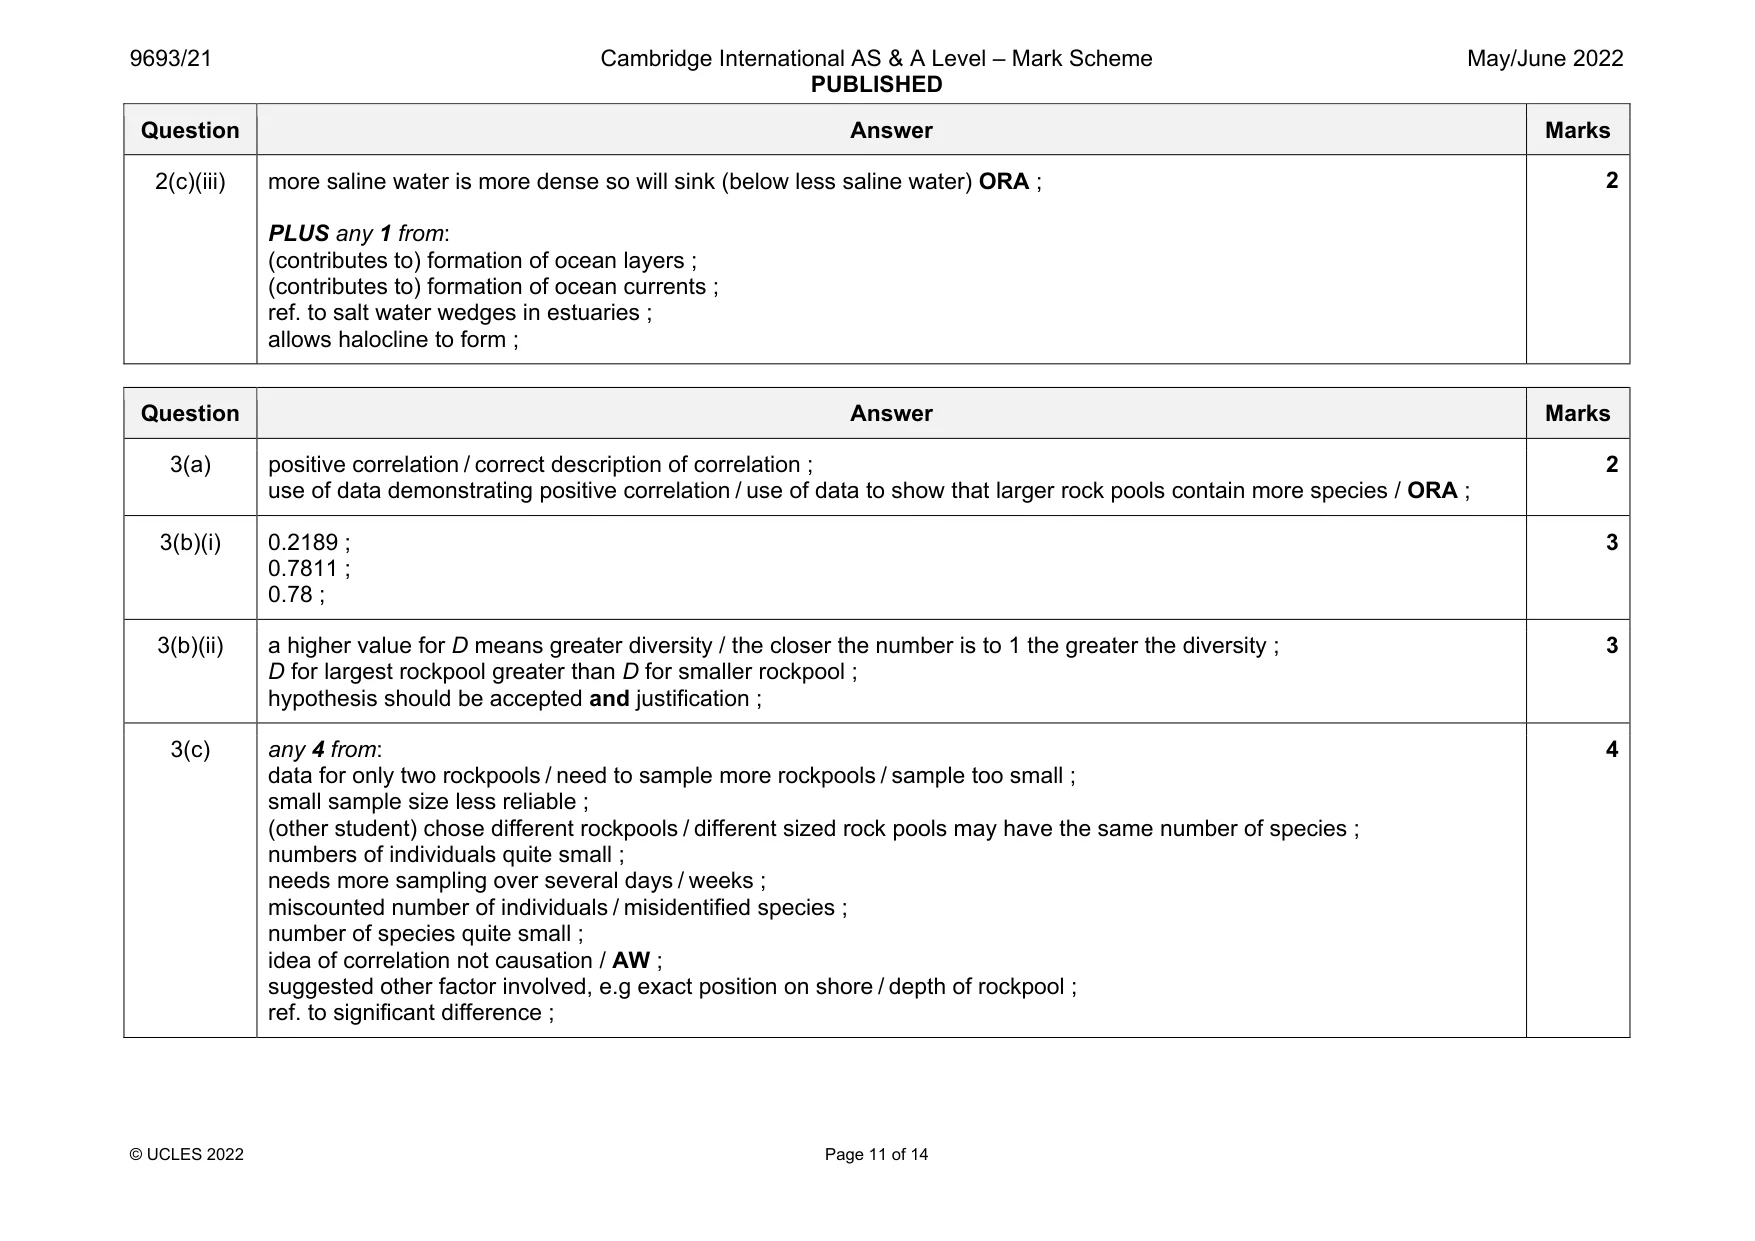
Mark scheme: 2(a) any 3 from: different masses of salt (weighed) ; using balance / weighing scales ; volume of water measured / stated ; using measuring cylinder ; salt (fully) dissolved in water ; OR determine salinity of (sea) water sample / use sample of saturated solution of saline ; measure volume of, sea water / saline ; using measuring cylinder ; diluting with known volume of fresh water ; Question Answer Marks 2(b)(i) any 2 from: freezer initially set at higher temperature / suggested temp, e.g. –1°C ; water samples given time to freeze / suitable suggested time, e.g. two hours ; (if freezing all samples at the same temperature) record time taken to freeze (different) samples / record temperature at which each sample freezes ; temperature gradually reduced ; reference to control variables, e.g. same volume ; use of data loggers ; repeating two more times (for reliability) ; 2 2(b)(ii) any 2 from: ref. to lack units for salinity ; ref. to ‘temperature’ being unspecific, e.g. should be ‘freezing point of sample’ / freezing temperature ; ref. to lack of repeated results / add more trials / add more samples ; 2 2(b)(iii) the greater the salinity the lower the freezing point / lower the salinity the higher the freezing point ; 1 2(b)(iv) any 3 from: precipitation will decrease (salinity) ; melting of sea ice will decrease (salinity) / freezing of sea ice will increase (salinity); run-off will decrease (salinity) / glaciers melting ; evaporation will increase (salinity) ; water from hydrothermal vents will increase (salinity) ; upwelling will increase salinity ; 3 2(c)(i) measure the mass and volume OR use the mass and volume of the water sample ; divide mass by volume ; units are, kg / m3 / kg m –3 3 2(c)(ii) both axes labelled ; any line from bottom left towards top right / bar chart with three or more increasing height bars from left to right; 2 Question Answer Marks 2(c)(iii) more saline water is more dense so will sink (below less saline water) ORA ; PLUS any 1 from: (contributes to) formation of ocean layers ; (contributes to) formation of ocean currents ; ref. to salt water wedges in estuaries ; allows halocline to form ; 2
Q3 · Rockpools are a common feature of rocky shores
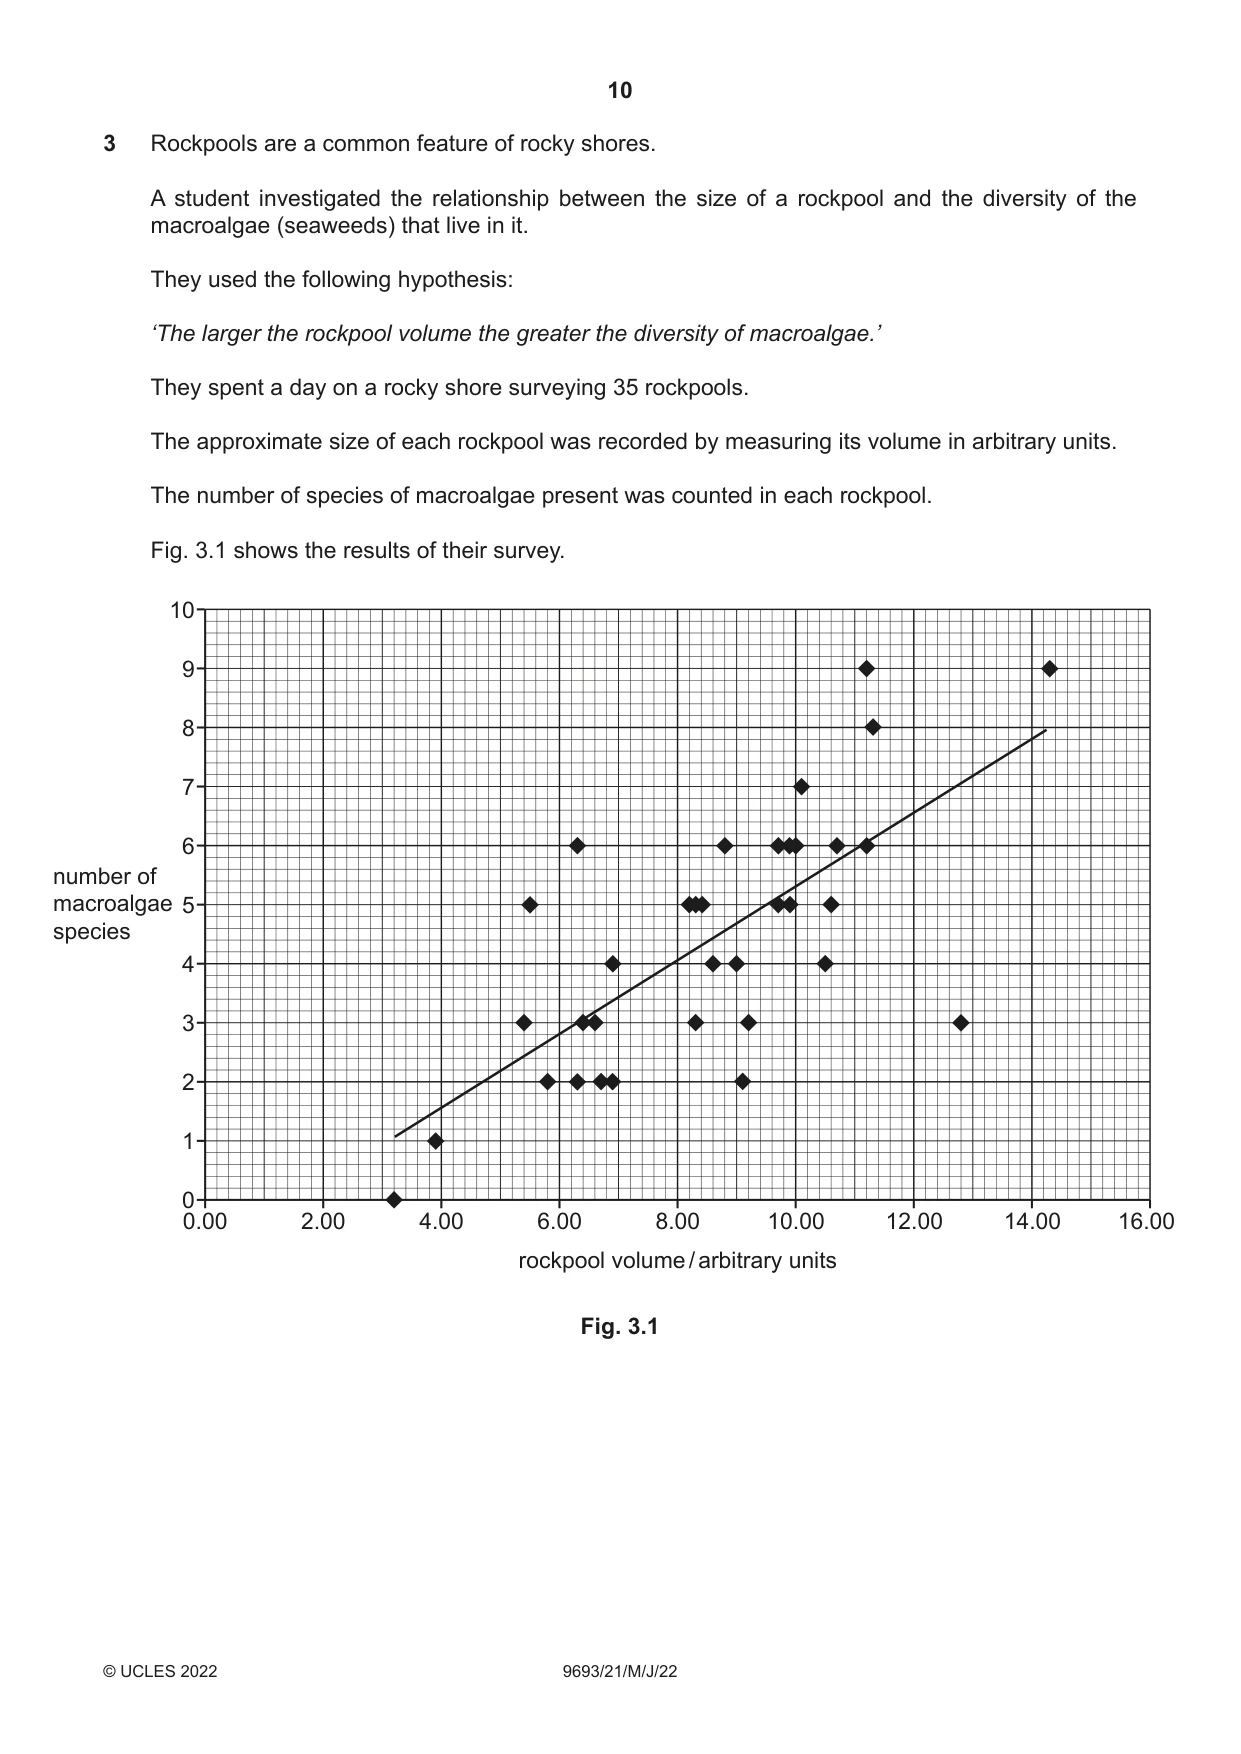
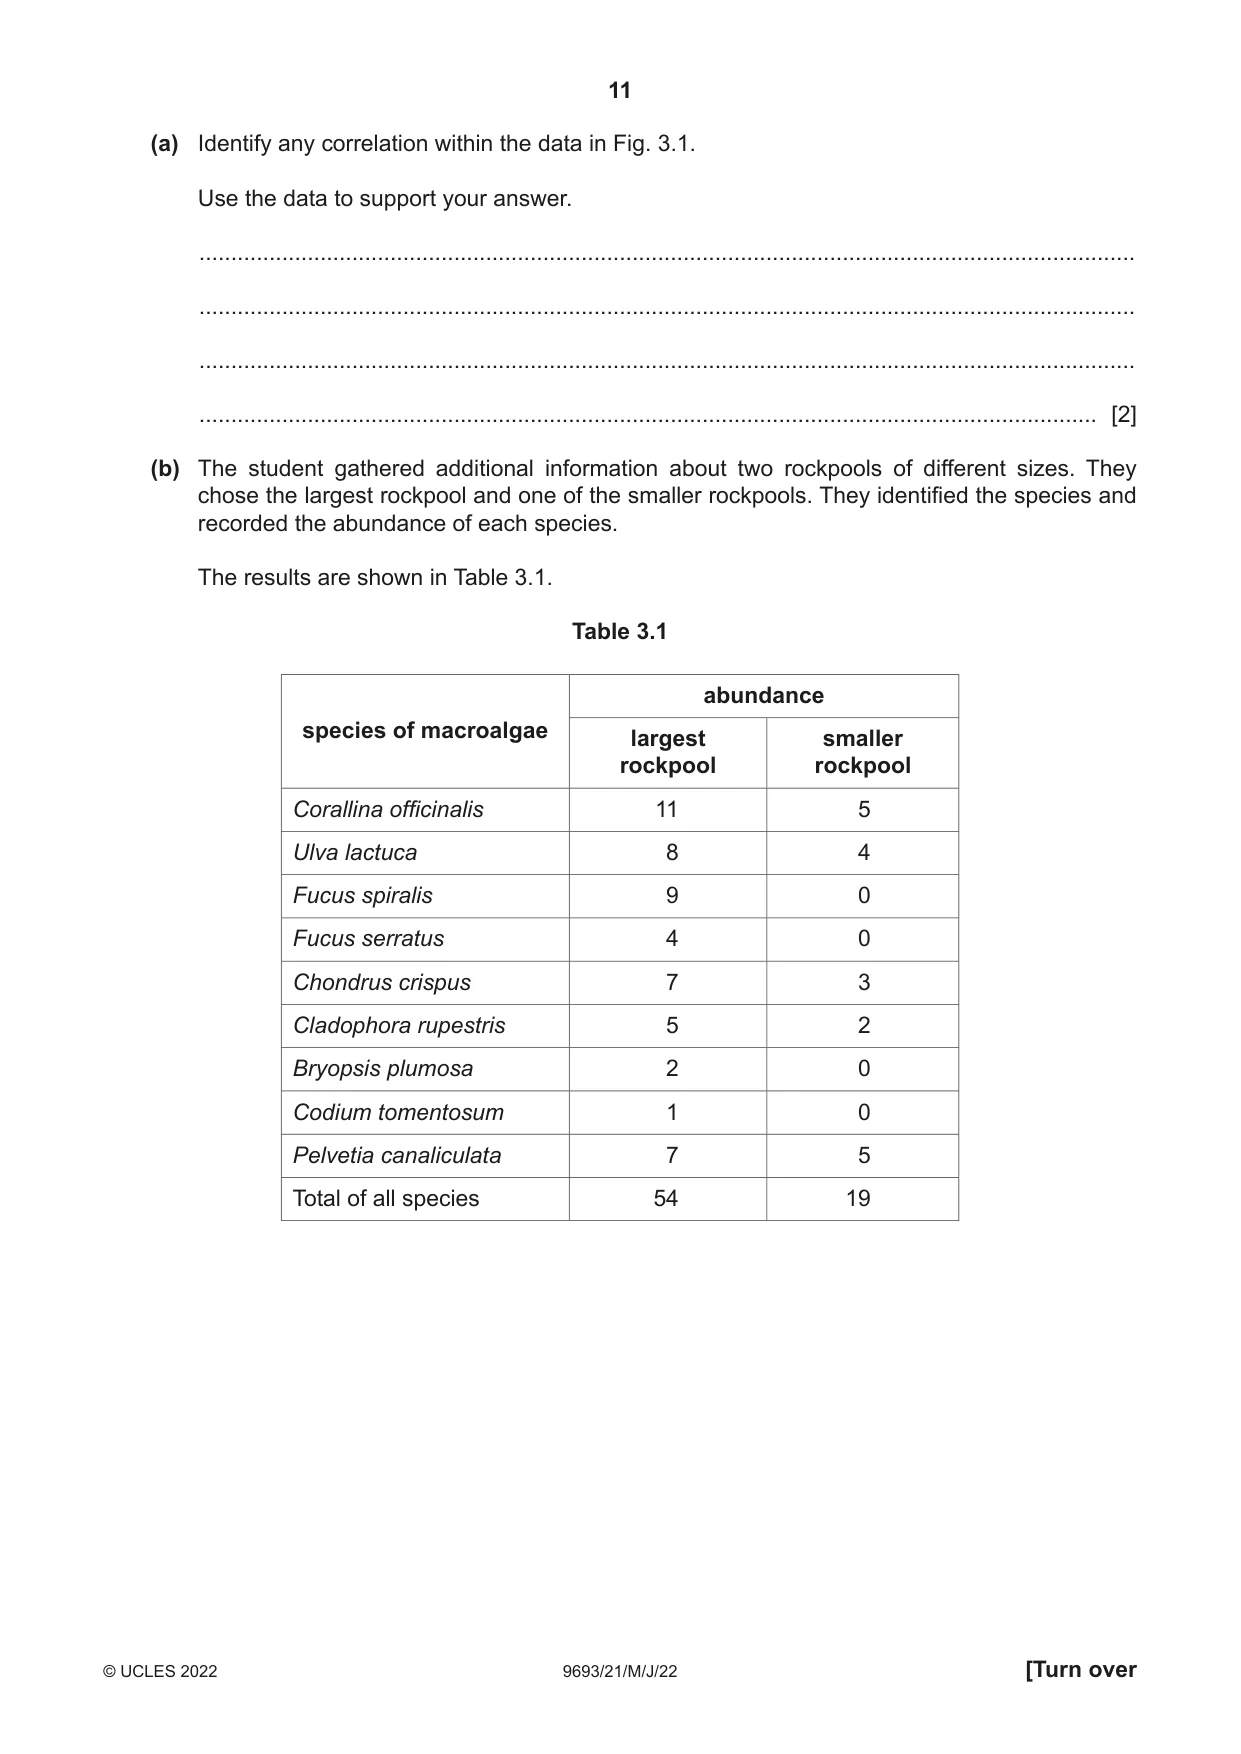
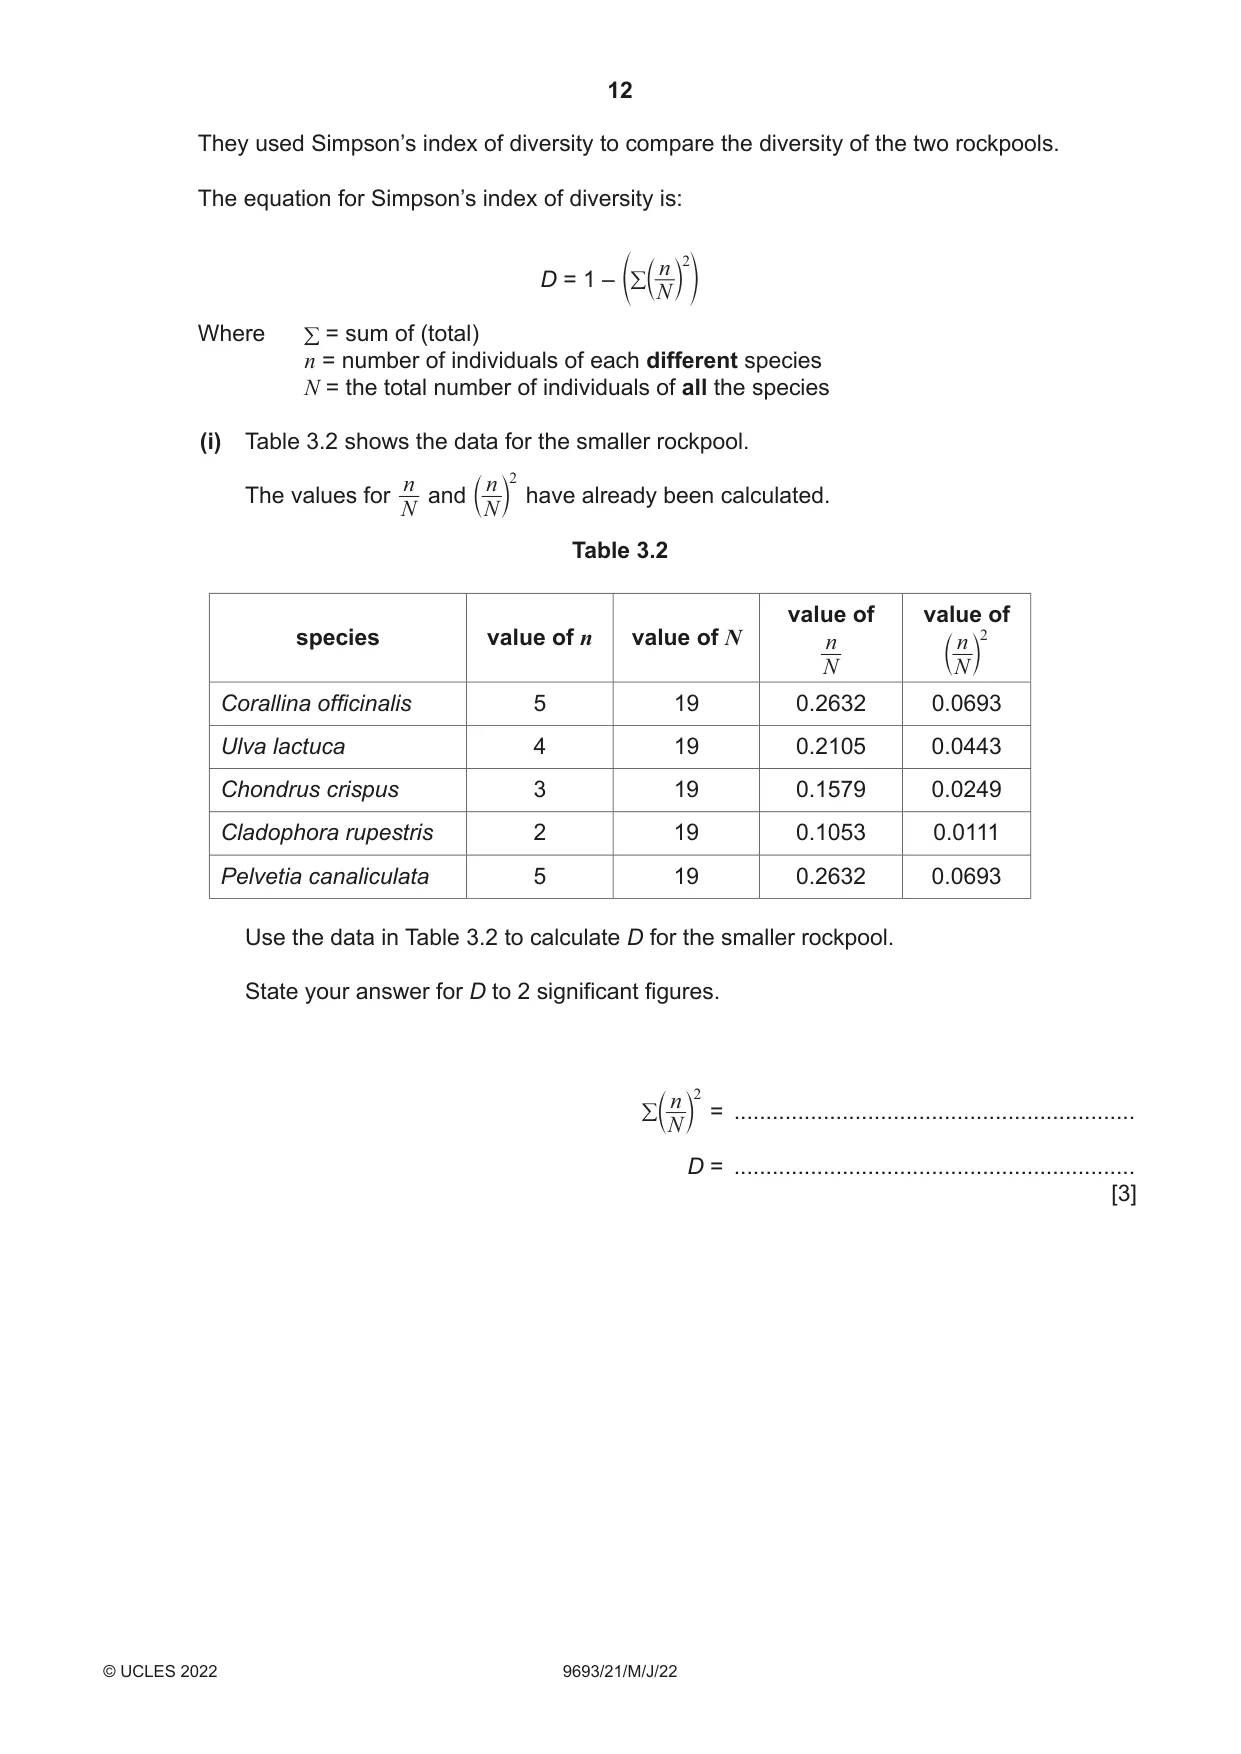
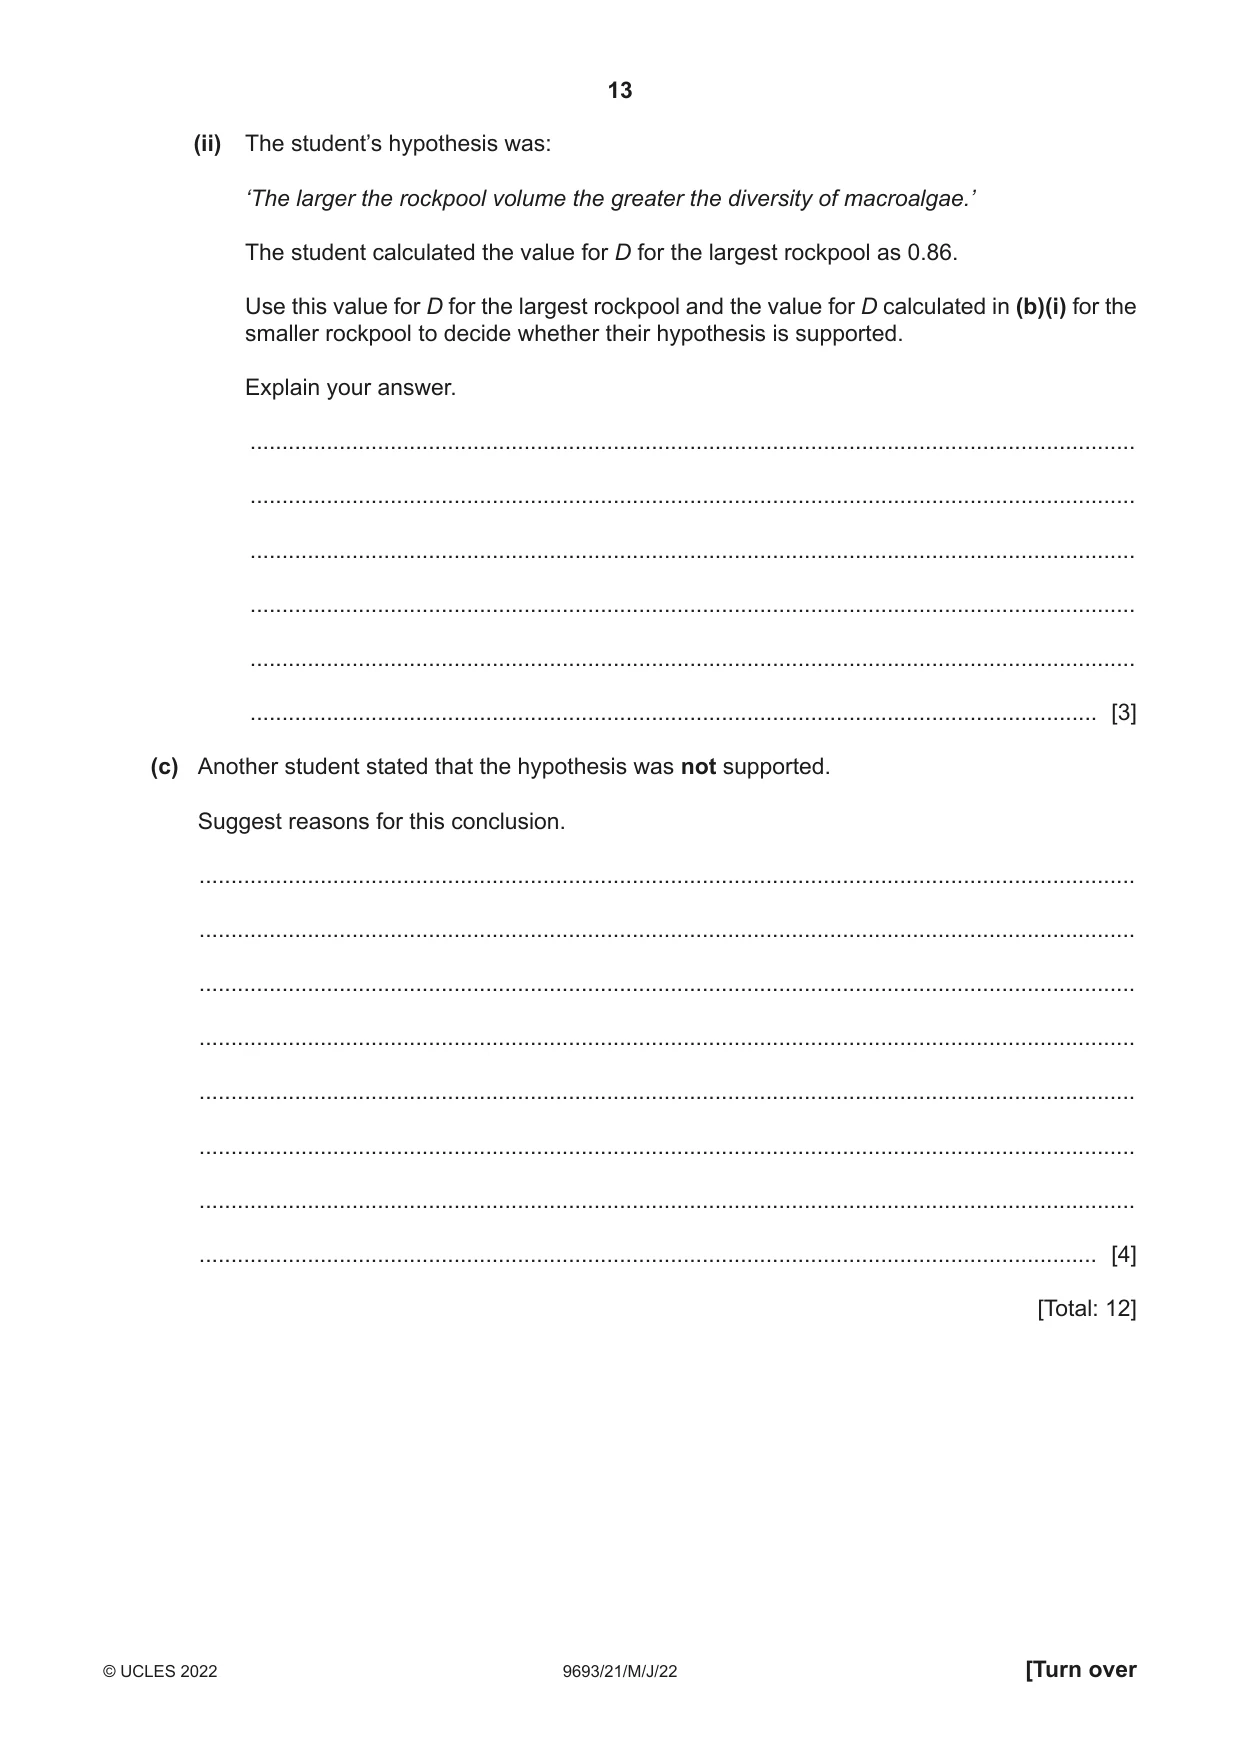
3 Rockpools are a common feature of rocky shores. A student investigated the relationship between the size of a rockpool and the diversity of the macroalgae (seaweeds) that live in it. They used the following hypothesis: ‘The larger the rockpool volume the greater the diversity of macroalgae.’ They spent a day on a rocky shore surveying 35 rockpools. The approximate size of each rockpool was recorded by measuring its volume in arbitrary units. The number of species of macroalgae present was counted in each rockpool. Fig. 3.1 shows the results of their survey. 10 9 8 7 6 number of macroalgae 5 species 4 3 2 1 0 0.00 2.00 4.00 6.00 8.00 10.00 12.00 14.00 16.00 rockpool volume / arbitrary units Fig. 3.1 (a) Identify any correlation within the data in Fig. 3.1. Use the data to support your answer. ................................................................................................................................................... ................................................................................................................................................... ................................................................................................................................................... ............................................................................................................................................. [2] (b) The student gathered additional information about two rockpools of different sizes. They chose the largest rockpool and one of the smaller rockpools. They identified the species and recorded the abundance of each species. The results are shown in Table 3.1. Table 3.1 abundance species of macroalgae largest smaller rockpool rockpool Corallina officinalis 11 5 Ulva lactuca 8 4 Fucus spiralis 9 0 Fucus serratus 4 0 Chondrus crispus 7 3 Cladophora rupestris 5 2 Bryopsis plumosa 2 0 Codium tomentosum 1 0 Pelvetia canaliculata 7 5 Total of all species 54 19 They used Simpson’s index of diversity to compare the diversity of the two rockpools. The equation for Simpson’s index of diversity is: n 2 D = 1 – / e b N l o Where / = sum of (total) n = number of individuals of each different species N = the total number of individuals of all the species (i) Table 3.2 shows the data for the smaller rockpool. n n 2 The values for and have already been calculated. N b N l Table 3.2 value of value of species value of n value of N n n 2 N b N l Corallina officinalis 5 19 0.2632 0.0693 Ulva lactuca 4 19 0.2105 0.0443 Chondrus crispus 3 19 0.1579 0.0249 Cladophora rupestris 2 19 0.1053 0.0111 Pelvetia canaliculata 5 19 0.2632 0.0693 Use the data in Table 3.2 to calculate D for the smaller rockpool. State your answer for D to 2 significant figures. n 2 / = ............................................................... b N l D = ............................................................... [3] (ii) The student’s hypothesis was: ‘The larger the rockpool volume the greater the diversity of macroalgae.’ The student calculated the value for D for the largest rockpool as 0.86. Use this value for D for the largest rockpool and the value for D calculated in (b)(i) for the smaller rockpool to decide whether their hypothesis is supported. Explain your answer. ........................................................................................................................................... ........................................................................................................................................... ........................................................................................................................................... ........................................................................................................................................... ........................................................................................................................................... ..................................................................................................................................... [3] (c) Another student stated that the hypothesis was not supported. Suggest reasons for this conclusion. ................................................................................................................................................... ................................................................................................................................................... ................................................................................................................................................... ................................................................................................................................................... ................................................................................................................................................... ................................................................................................................................................... ................................................................................................................................................... ............................................................................................................................................. [4] [Total: 12]
Mark scheme: 3(a) positive correlation / correct description of correlation ; use of data demonstrating positive correlation / use of data to show that larger rock pools contain more species / ORA ; 2 3(b)(i) 0.2189 ; 0.7811 ; 0.78 ; 3 3(b)(ii) a higher value for D means greater diversity / the closer the number is to 1 the greater the diversity ; D for largest rockpool greater than D for smaller rockpool ; hypothesis should be accepted and justification ; 3 3(c) any 4 from: data for only two rockpools / need to sample more rockpools / sample too small ; small sample size less reliable ; (other student) chose different rockpools / different sized rock pools may have the same number of species ; numbers of individuals quite small ; needs more sampling over several days / weeks ; miscounted number of individuals / misidentified species ; number of species quite small ; idea of correlation not causation / AW ; suggested other factor involved, e.g exact position on shore / depth of rockpool ; ref. to significant difference ; 4
Q4 · An atoll in the Indian Ocean
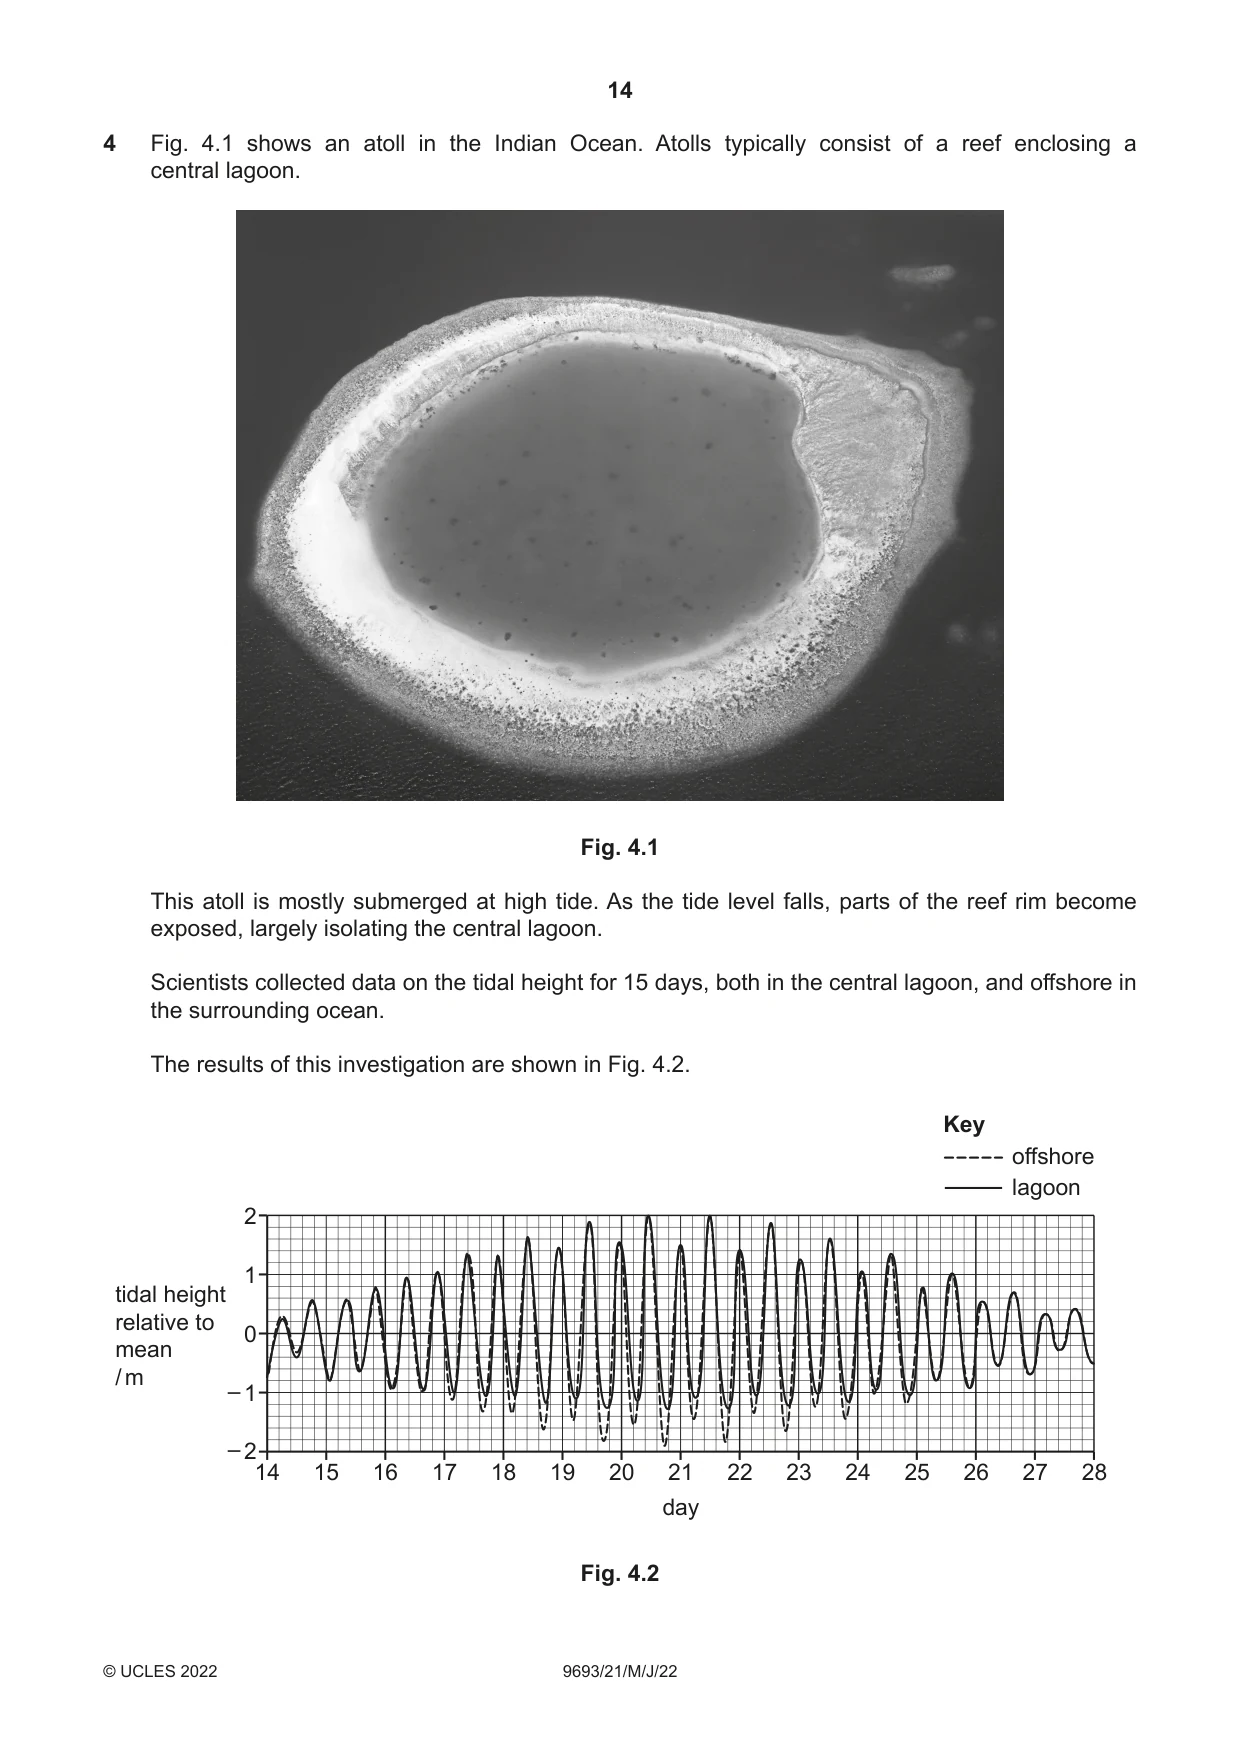
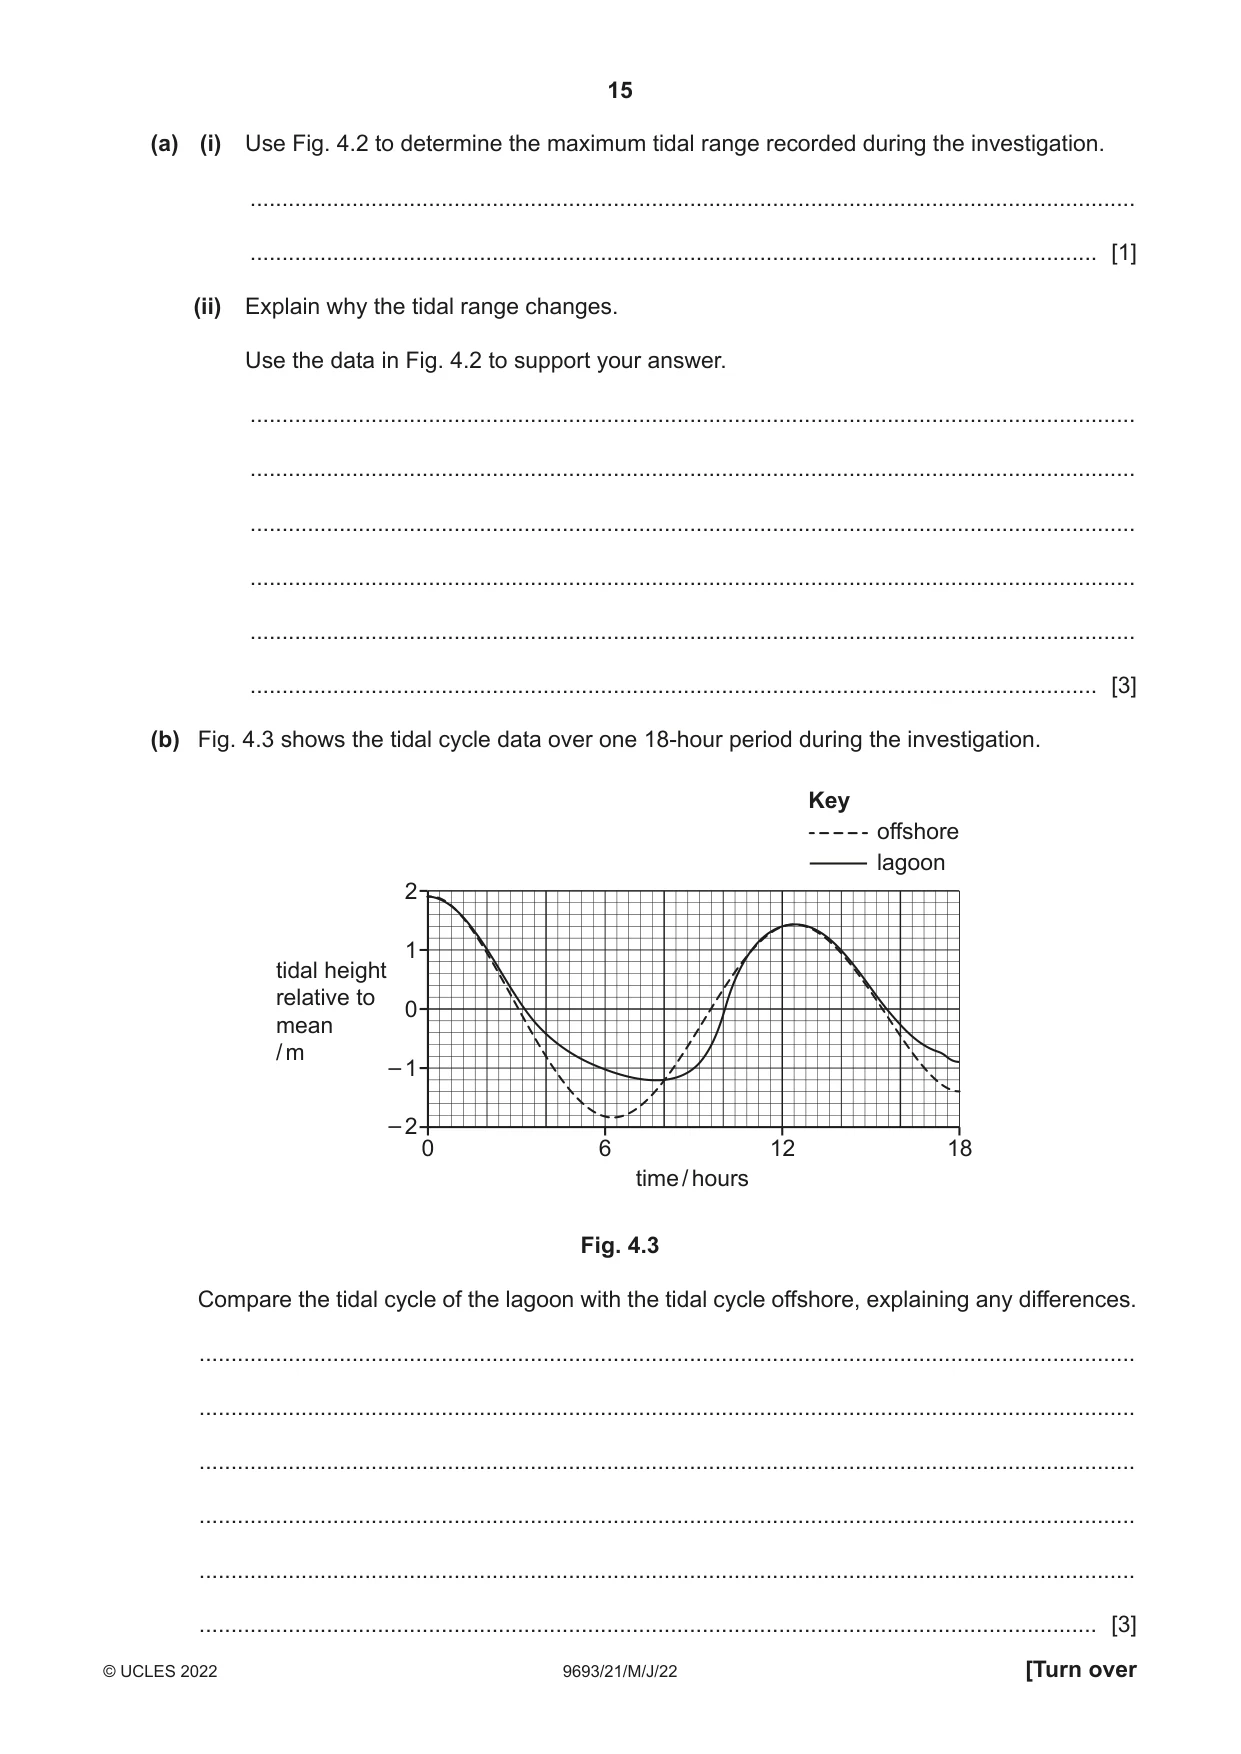
4 Fig. 4.1 shows an atoll in the Indian Ocean. Atolls typically consist of a reef enclosing a central lagoon. Fig. 4.1 This atoll is mostly submerged at high tide. As the tide level falls, parts of the reef rim become exposed, largely isolating the central lagoon. Scientists collected data on the tidal height for 15 days, both in the central lagoon, and offshore in the surrounding ocean. The results of this investigation are shown in Fig. 4.2. Key offshore lagoon 2 1 tidal height relative to 0 mean / m – 1 – 2 14 15 16 17 18 19 20 21 22 23 24 25 26 27 28 day Fig. 4.2 (a) (i) Use Fig. 4.2 to determine the maximum tidal range recorded during the investigation. ........................................................................................................................................... ..................................................................................................................................... [1] (ii) Explain why the tidal range changes. Use the data in Fig. 4.2 to support your answer. ........................................................................................................................................... ........................................................................................................................................... ........................................................................................................................................... ........................................................................................................................................... ........................................................................................................................................... ..................................................................................................................................... [3] (b) Fig. 4.3 shows the tidal cycle data over one 18-hour period during the investigation. Key offshore lagoon 2 1 tidal height relative to 0 mean / m – 1 – 2 0 6 12 18 time / hours Fig. 4.3 Compare the tidal cycle of the lagoon with the tidal cycle offshore, explaining any differences. ................................................................................................................................................... ................................................................................................................................................... ................................................................................................................................................... ................................................................................................................................................... ................................................................................................................................................... ............................................................................................................................................. [3] (c) Suggest how changes in the tidal cycle may affect biotic and abiotic factors in the lagoon. ................................................................................................................................................... ................................................................................................................................................... ................................................................................................................................................... ................................................................................................................................................... ................................................................................................................................................... ................................................................................................................................................... ................................................................................................................................................... ................................................................................................................................................... ................................................................................................................................................... ............................................................................................................................................. [5] [Total: 12]
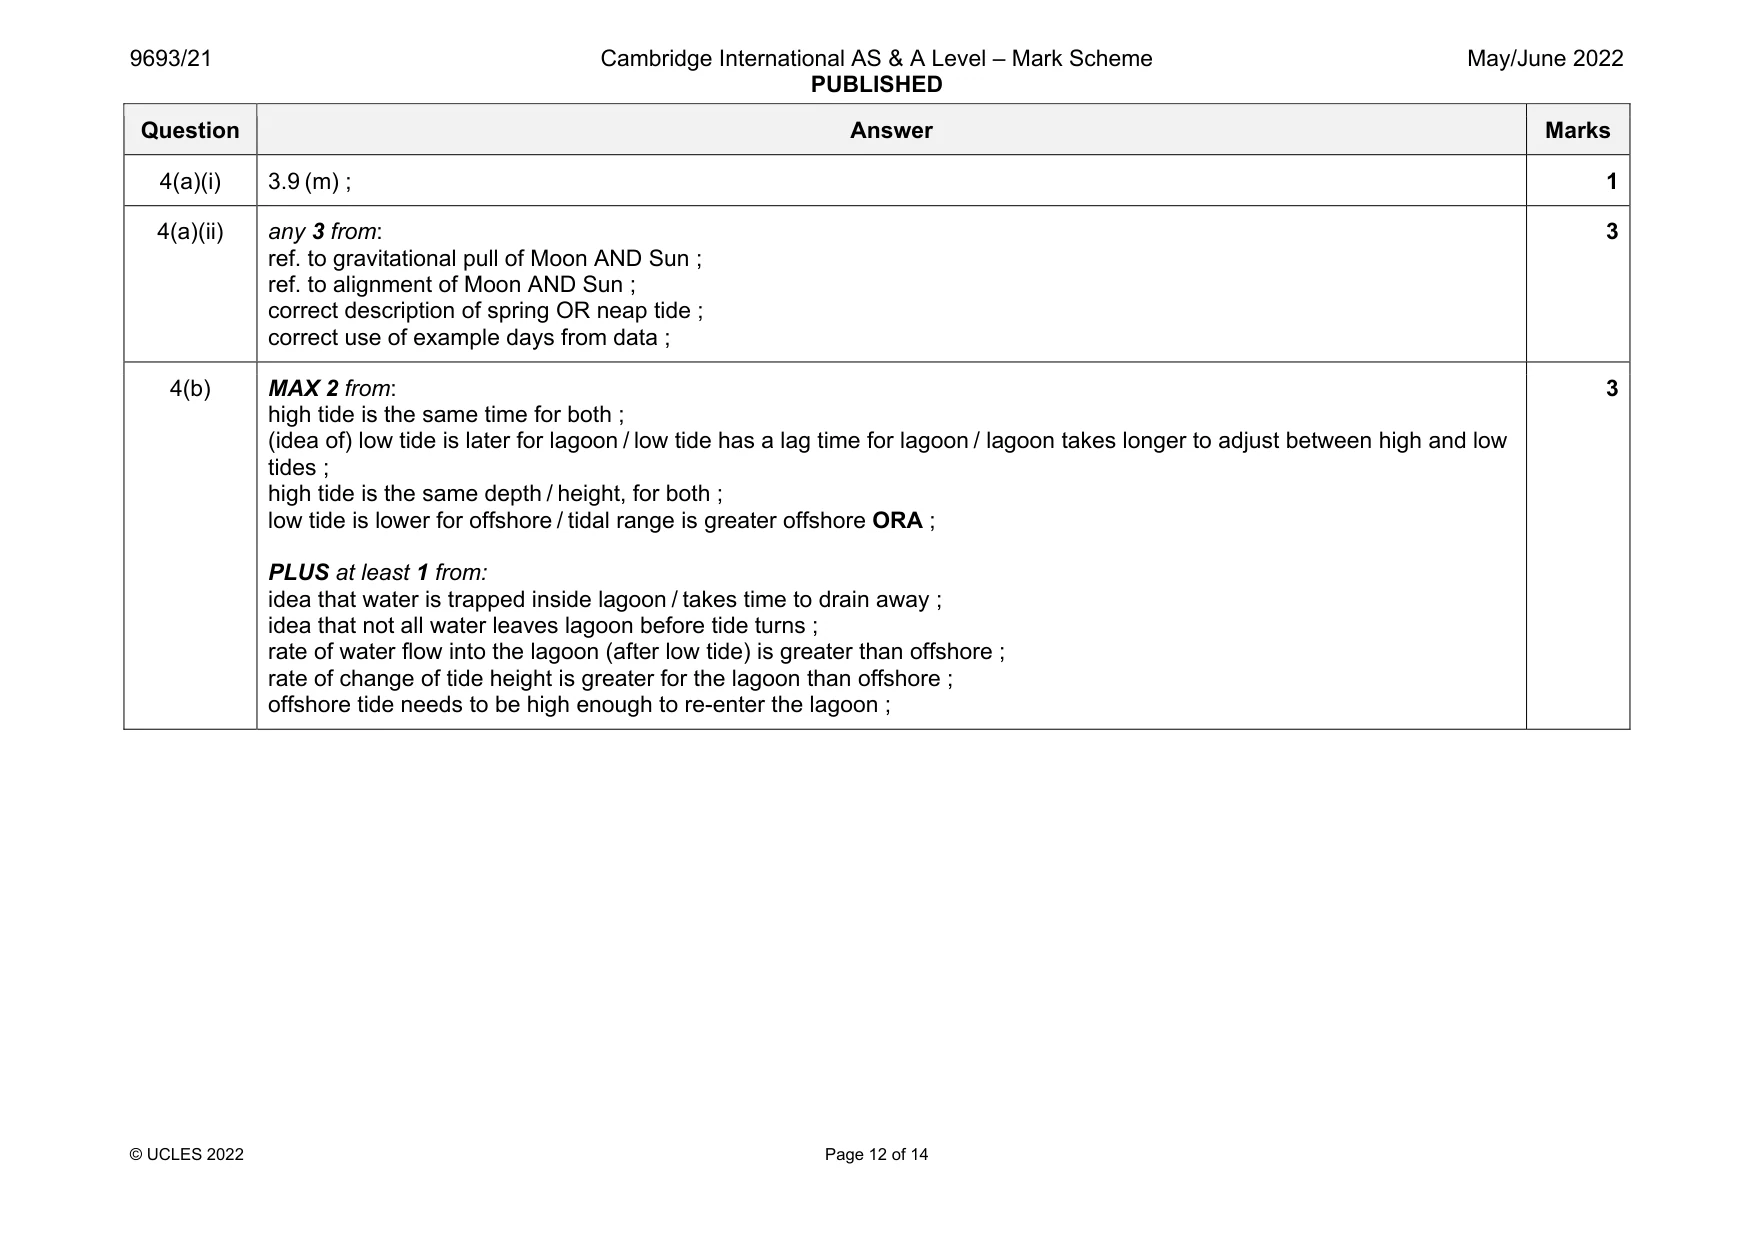
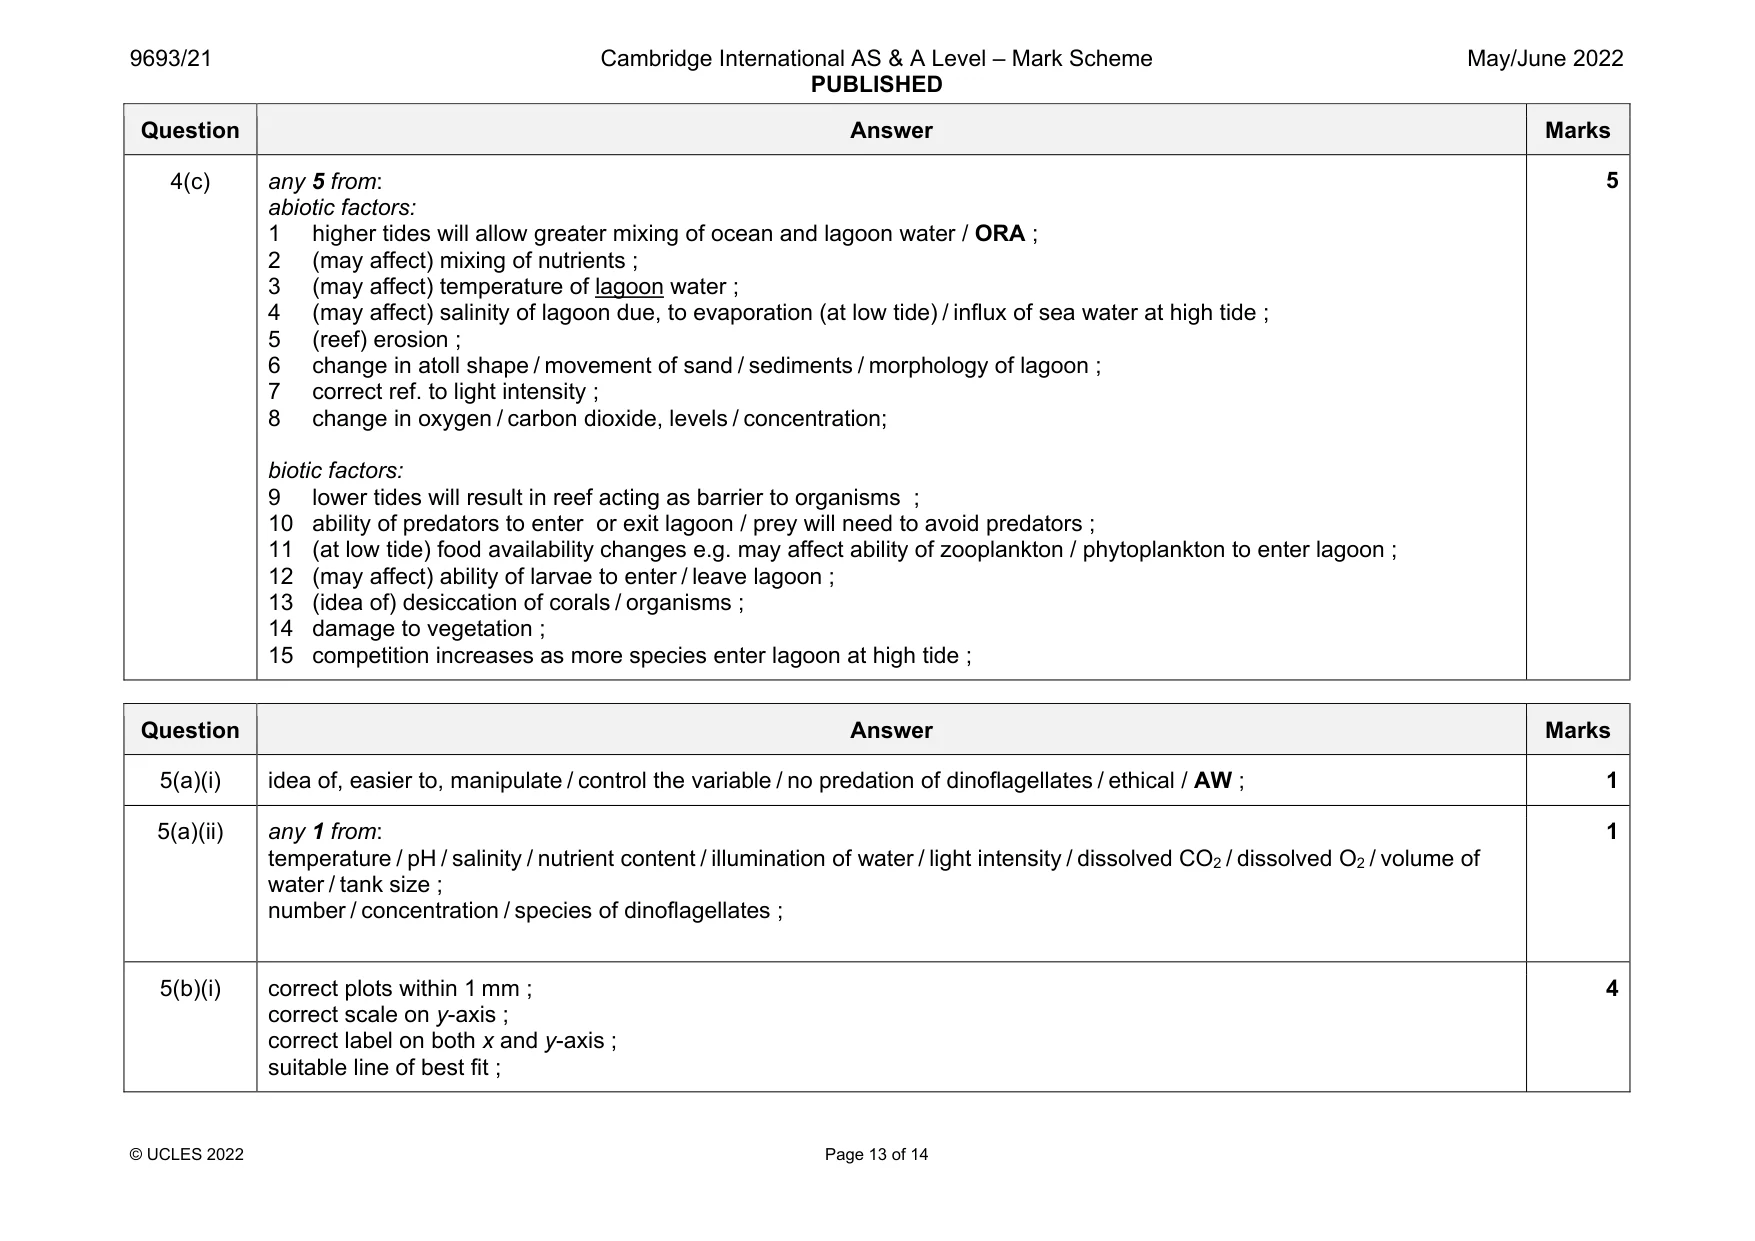
Mark scheme: 4(a)(i) 3.9 (m) ; 1 4(a)(ii) any 3 from: ref. to gravitational pull of Moon AND Sun ; ref. to alignment of Moon AND Sun ; correct description of spring OR neap tide ; correct use of example days from data ; 3 4(b) MAX 2 from: high tide is the same time for both ; (idea of) low tide is later for lagoon / low tide has a lag time for lagoon / lagoon takes longer to adjust between high and low tides ; high tide is the same depth / height, for both ; low tide is lower for offshore / tidal range is greater offshore ORA ; PLUS at least 1 from: idea that water is trapped inside lagoon / takes time to drain away ; idea that not all water leaves lagoon before tide turns ; rate of water flow into the lagoon (after low tide) is greater than offshore ; rate of change of tide height is greater for the lagoon than offshore ; offshore tide needs to be high enough to re-enter the lagoon ; 3 Question Answer Marks 4(c) any 5 from: abiotic factors: 1 higher tides will allow greater mixing of ocean and lagoon water / ORA ; 2 (may affect) mixing of nutrients ; 3 (may affect) temperature of lagoon water ; 4 (may affect) salinity of lagoon due, to evaporation (at low tide) / influx of sea water at high tide ; 5 (reef) erosion ; 6 change in atoll shape / movement of sand / sediments / morphology of lagoon ; 7 correct ref. to light intensity ; 8 change in oxygen / carbon dioxide, levels / concentration; biotic factors: 9 lower tides will result in reef acting as barrier to organisms ; 10 ability of predators to enter or exit lagoon / prey will need to avoid predators ; 11 (at low tide) food availability changes e.g. may affect ability of zooplankton / phytoplankton to enter lagoon ; 12 (may affect) ability of larvae to enter / leave lagoon ; 13 (idea of) desiccation of corals / organisms ; 14 damage to vegetation ; 15 competition increases as more species enter lagoon at high tide ; 5
Q5 · Bioluminescence occurs when organisms emit light from a chemical reaction in their tissues
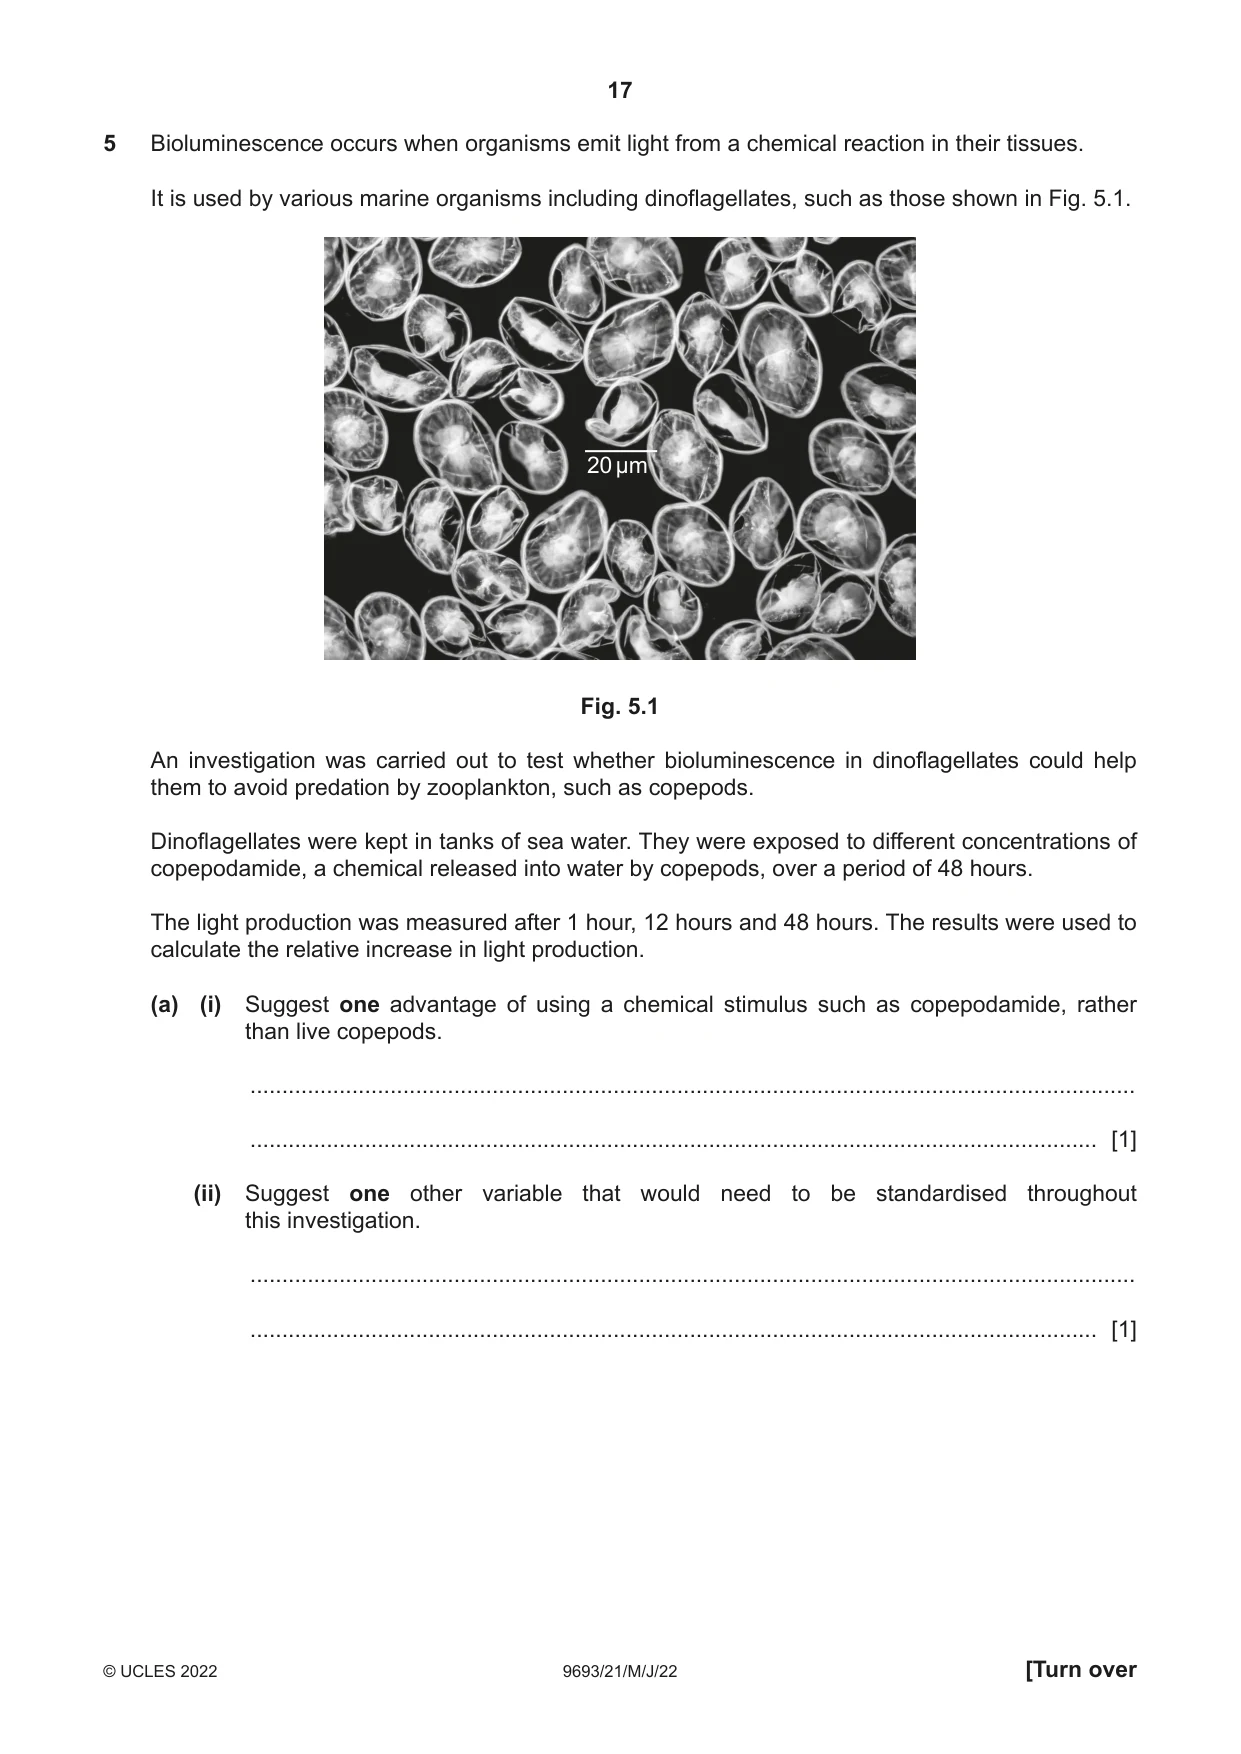
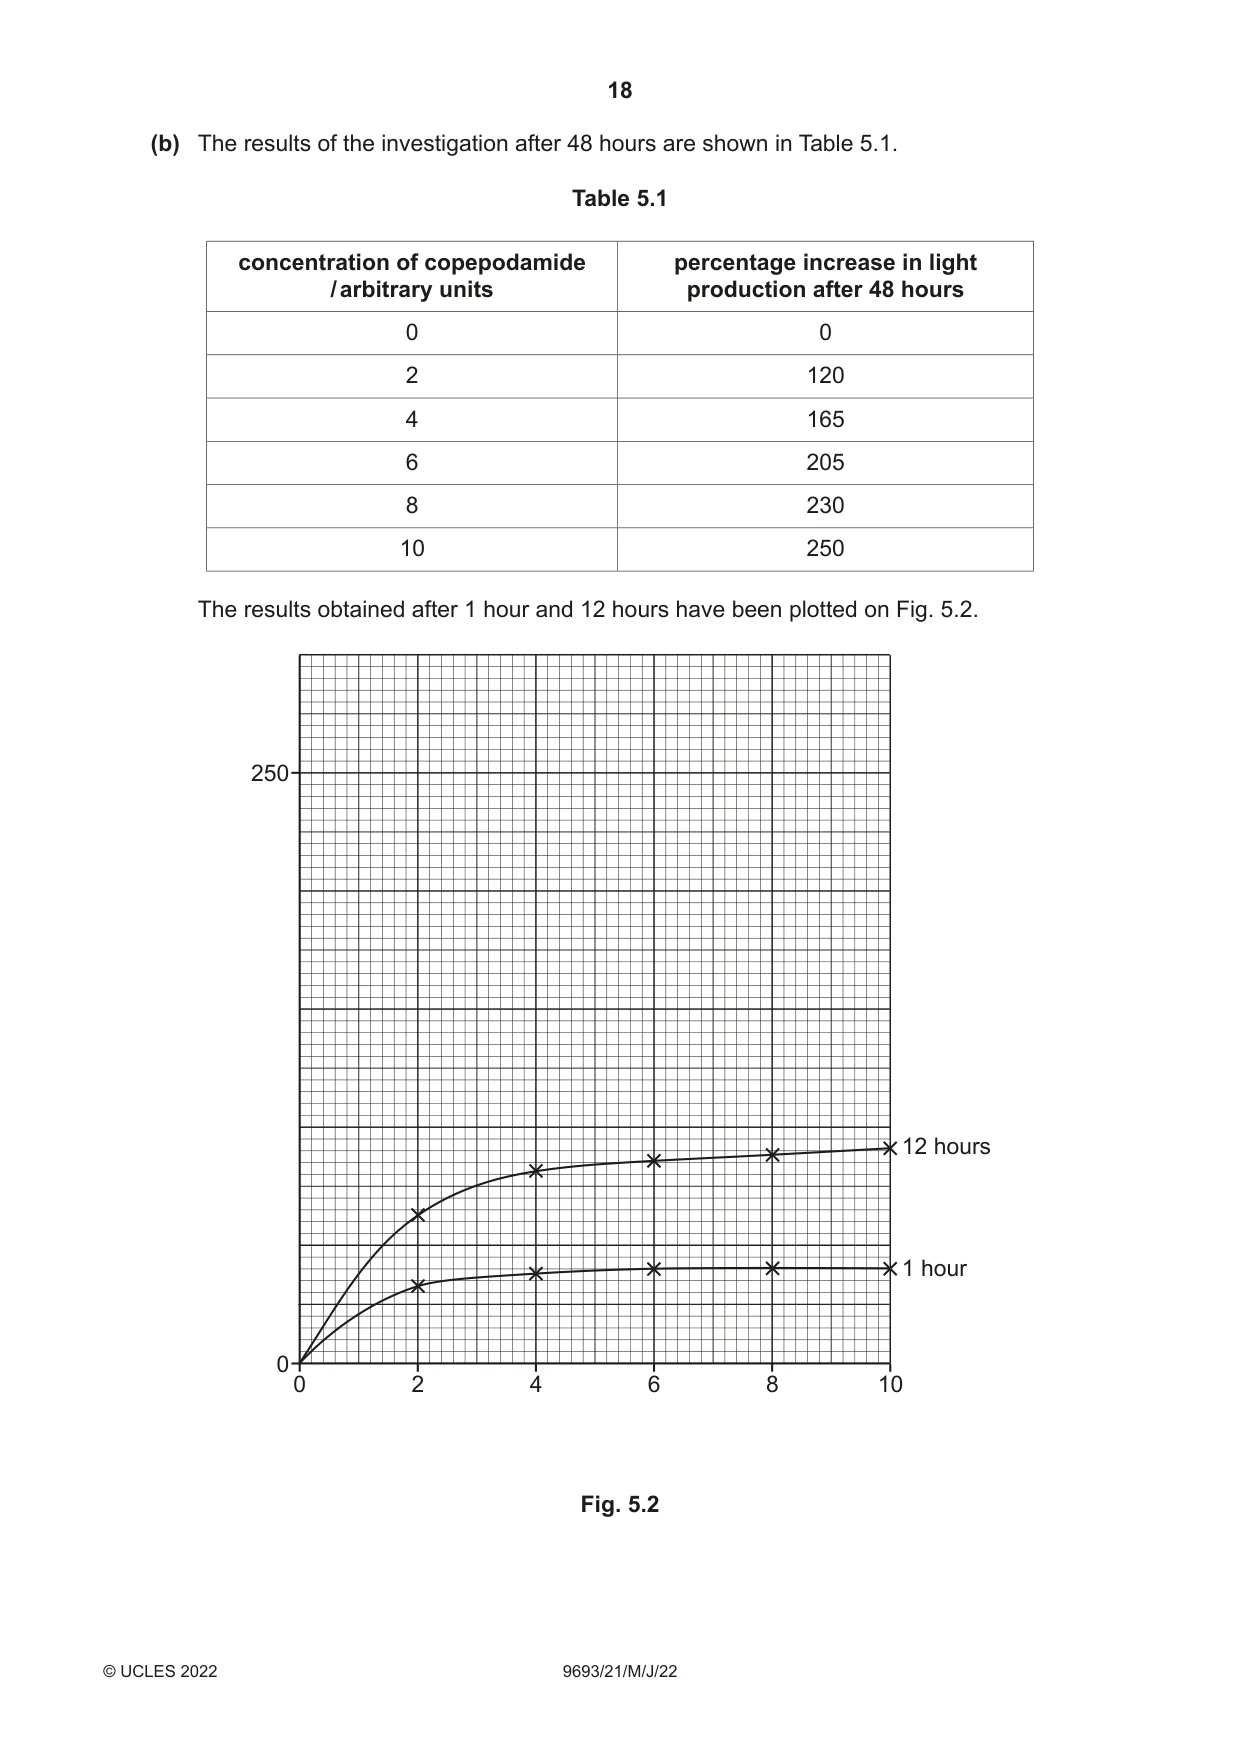
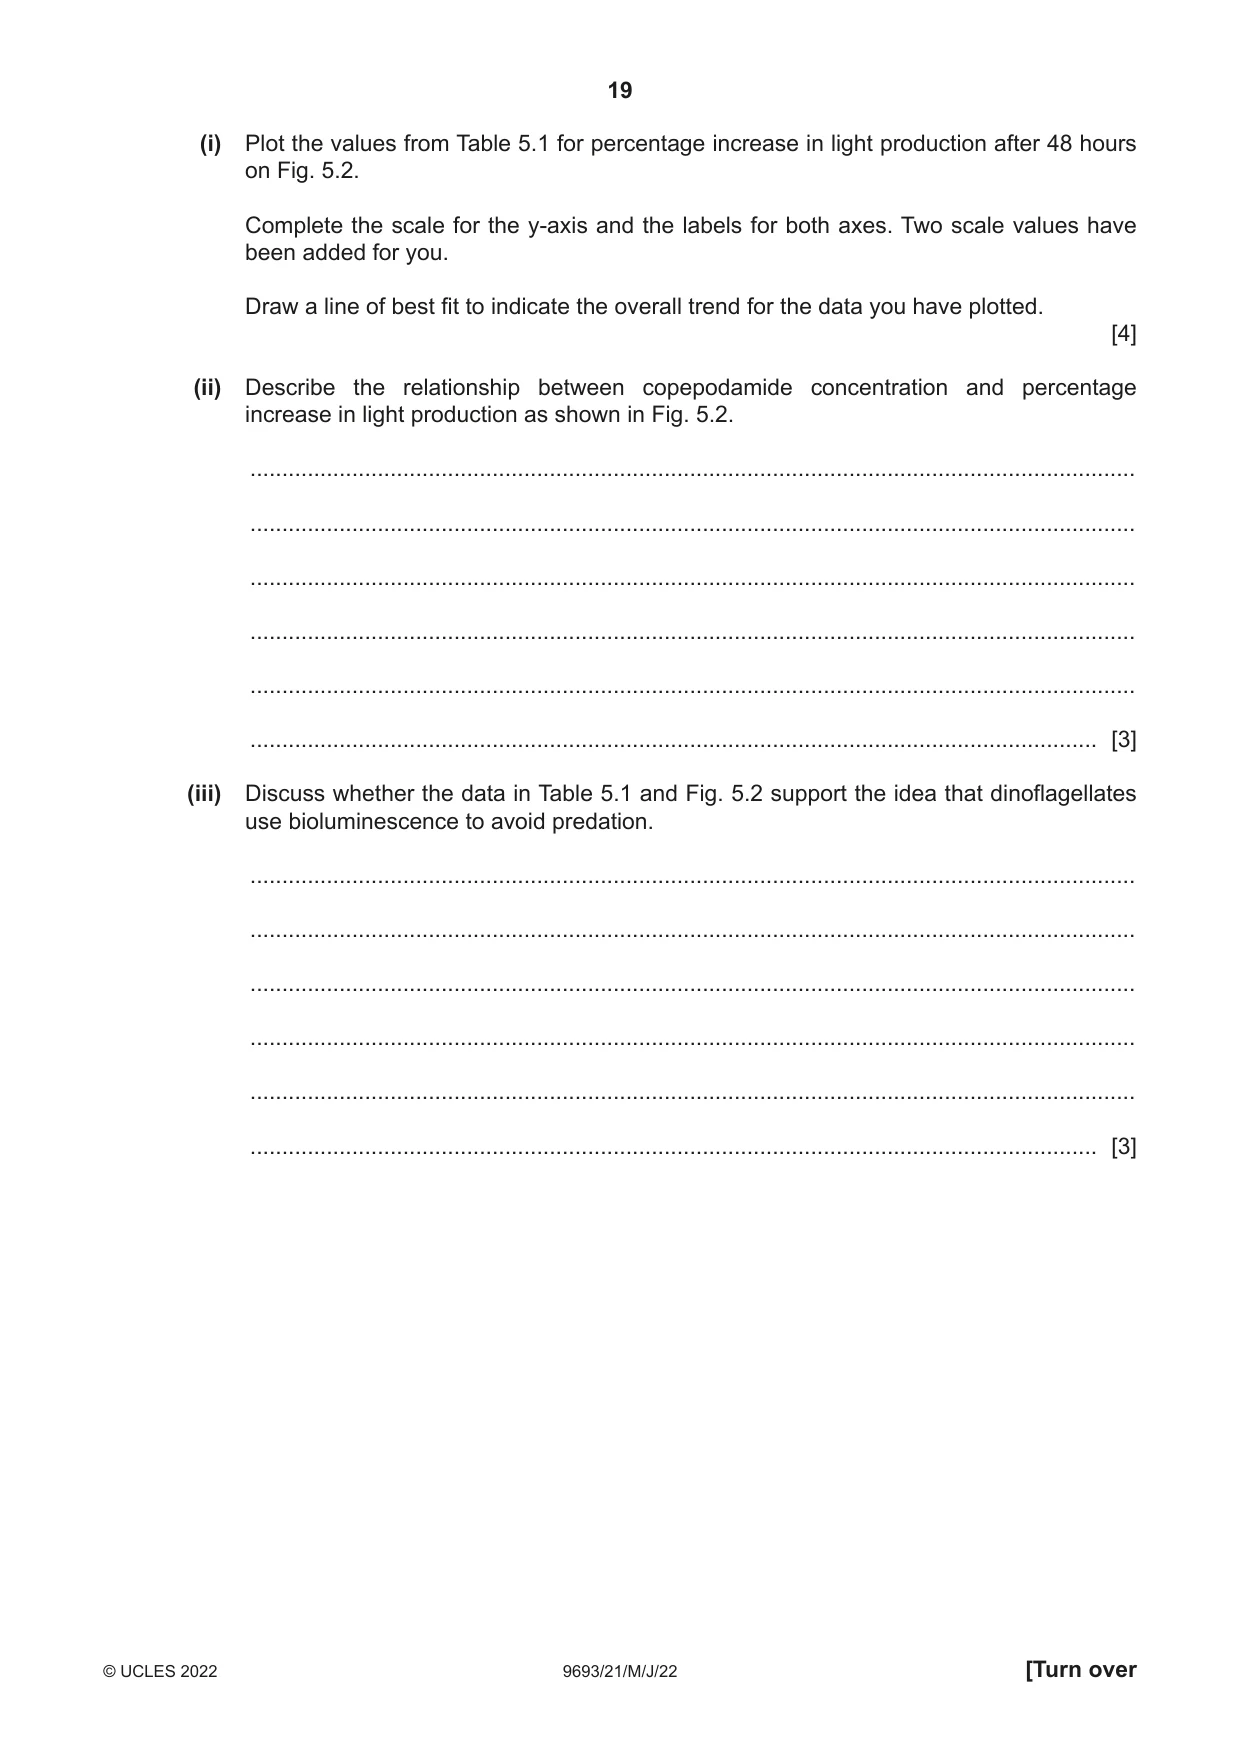
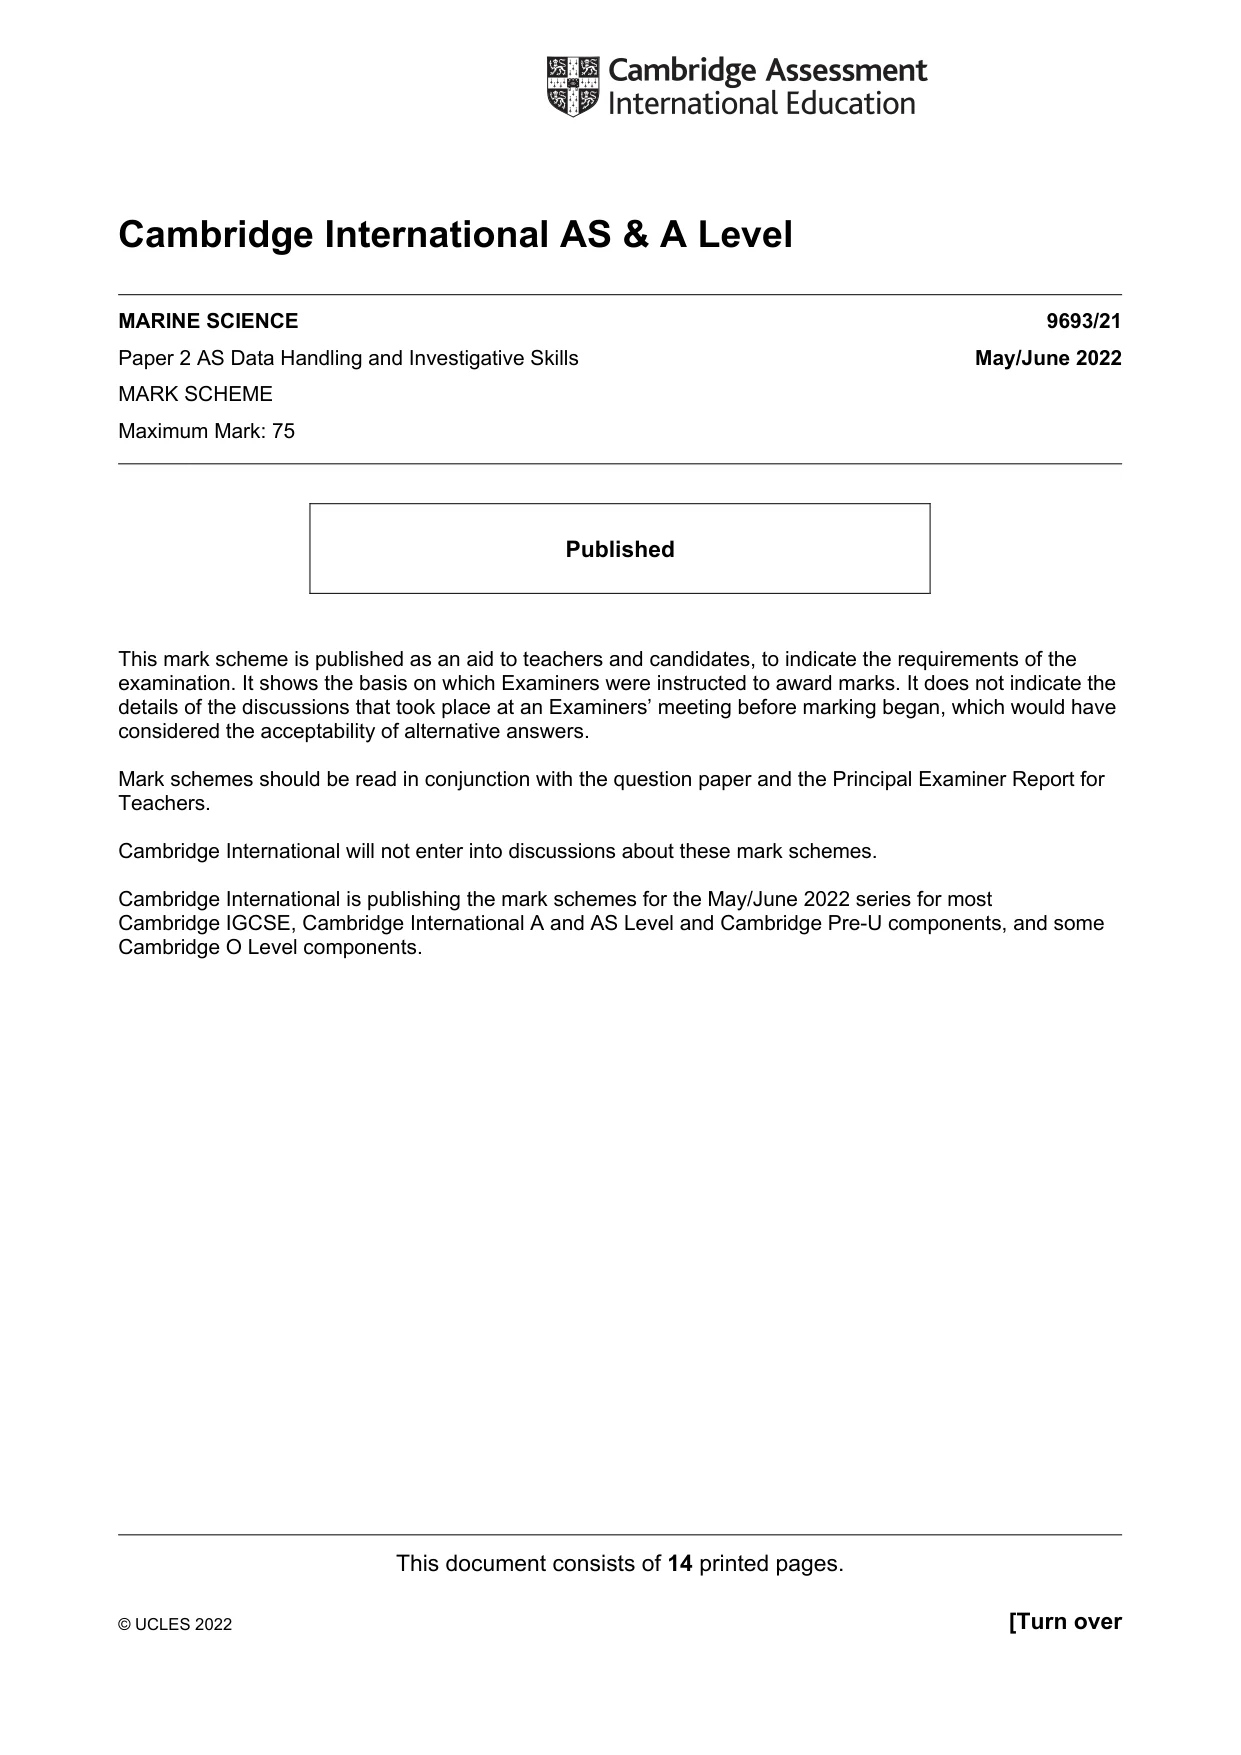
5 Bioluminescence occurs when organisms emit light from a chemical reaction in their tissues. It is used by various marine organisms including dinoflagellates, such as those shown in Fig. 5.1. 20 µm Fig. 5.1 An investigation was carried out to test whether bioluminescence in dinoflagellates could help them to avoid predation by zooplankton, such as copepods. Dinoflagellates were kept in tanks of sea water. They were exposed to different concentrations of copepodamide, a chemical released into water by copepods, over a period of 48 hours. The light production was measured after 1 hour, 12 hours and 48 hours. The results were used to calculate the relative increase in light production. (a) (i) Suggest one advantage of using a chemical stimulus such as copepodamide, rather than live copepods. ........................................................................................................................................... ..................................................................................................................................... [1] (ii) Suggest one other variable that would need to be standardised throughout this investigation. ........................................................................................................................................... ..................................................................................................................................... [1] (b) The results of the investigation after 48 hours are shown in Table 5.1. Table 5.1 concentration of copepodamide percentage increase in light / arbitrary units production after 48 hours 0 0 2 120 4 165 6 205 8 230 10 250 The results obtained after 1 hour and 12 hours have been plotted on Fig. 5.2. 250 12 hours 1 hour 0 0 2 4 6 8 10 Fig. 5.2 (i) Plot the values from Table 5.1 for percentage increase in light production after 48 hours on Fig. 5.2. Complete the scale for the y-axis and the labels for both axes. Two scale values have been added for you. Draw a line of best fit to indicate the overall trend for the data you have plotted. [4] (ii) Describe the relationship between copepodamide concentration and percentage increase in light production as shown in Fig. 5.2. ........................................................................................................................................... ........................................................................................................................................... ........................................................................................................................................... ........................................................................................................................................... ........................................................................................................................................... ..................................................................................................................................... [3] (iii) Discuss whether the data in Table 5.1 and Fig. 5.2 support the idea that dinoflagellates use bioluminescence to avoid predation. ........................................................................................................................................... ........................................................................................................................................... ........................................................................................................................................... ........................................................................................................................................... ........................................................................................................................................... ..................................................................................................................................... [3]
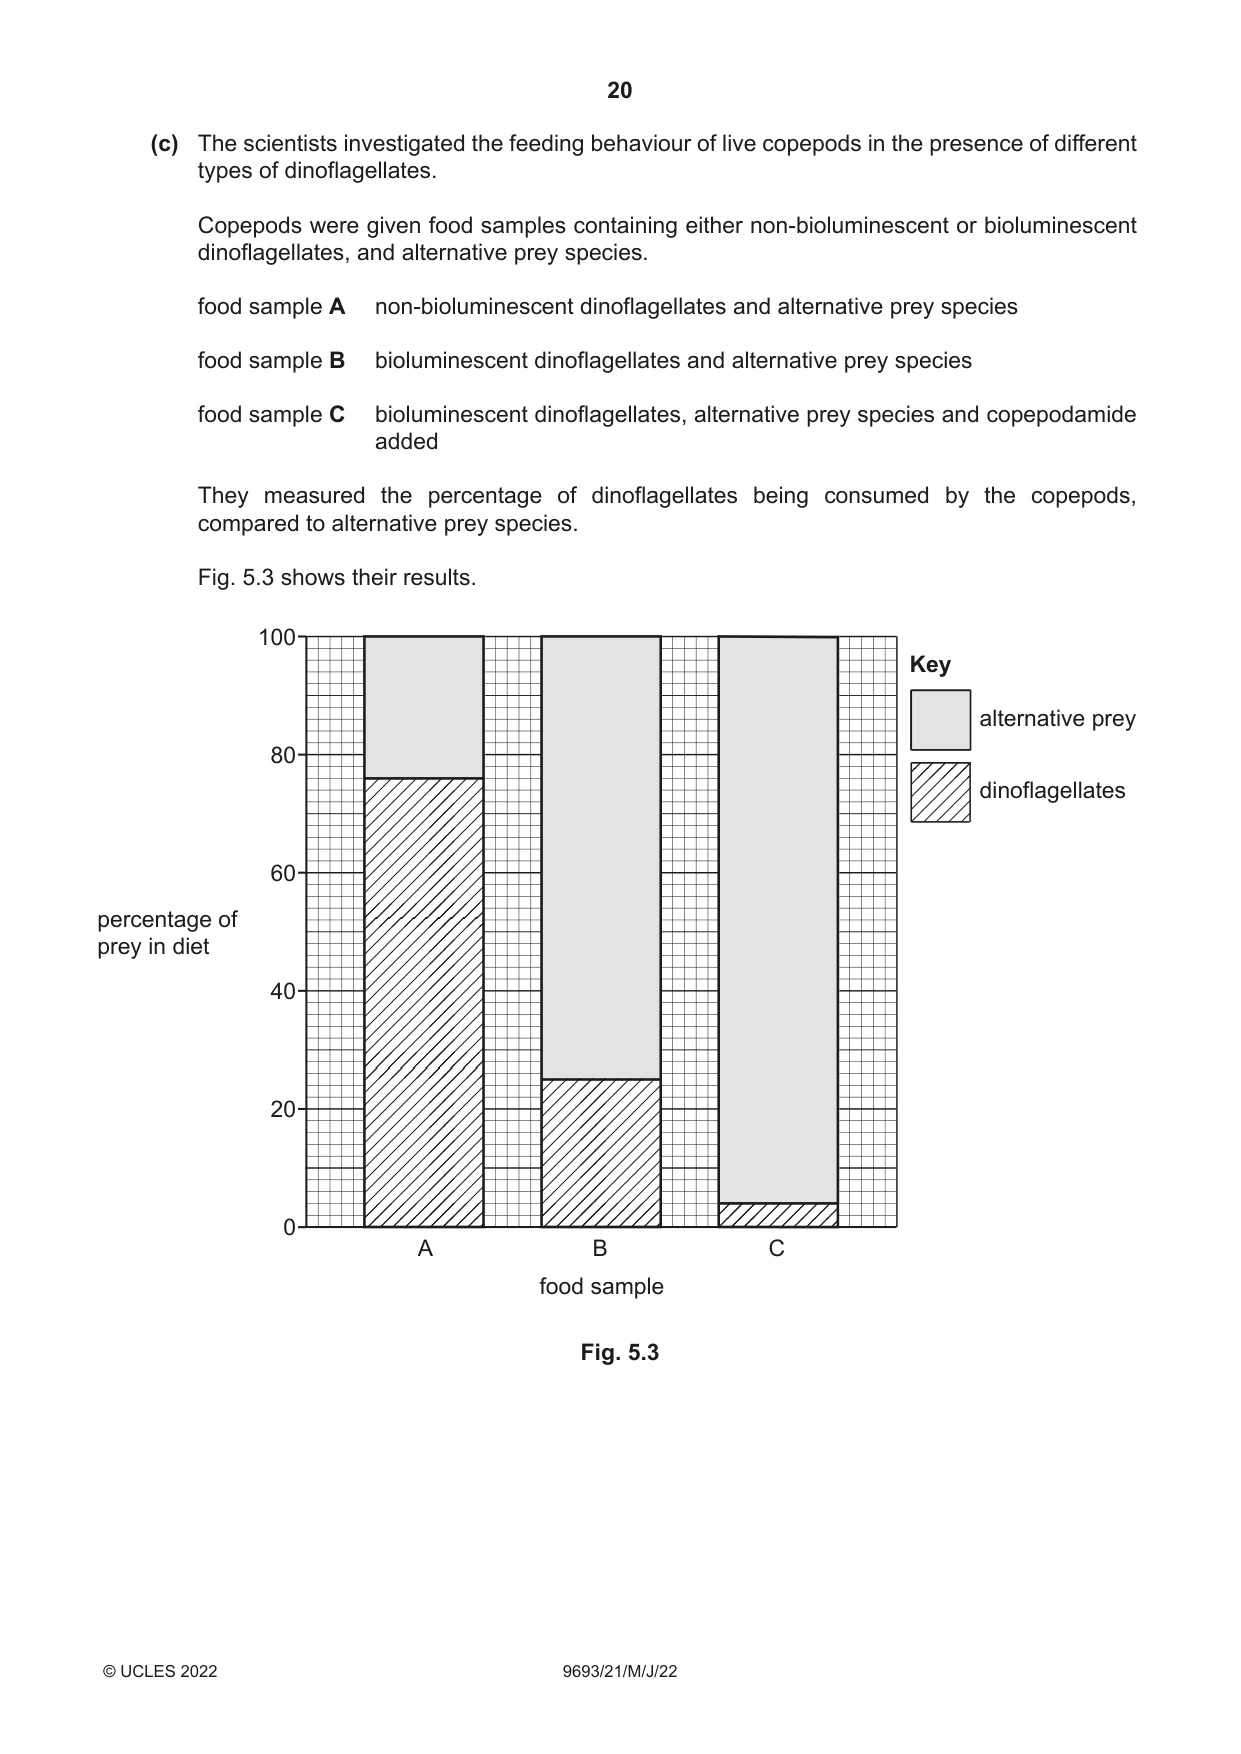
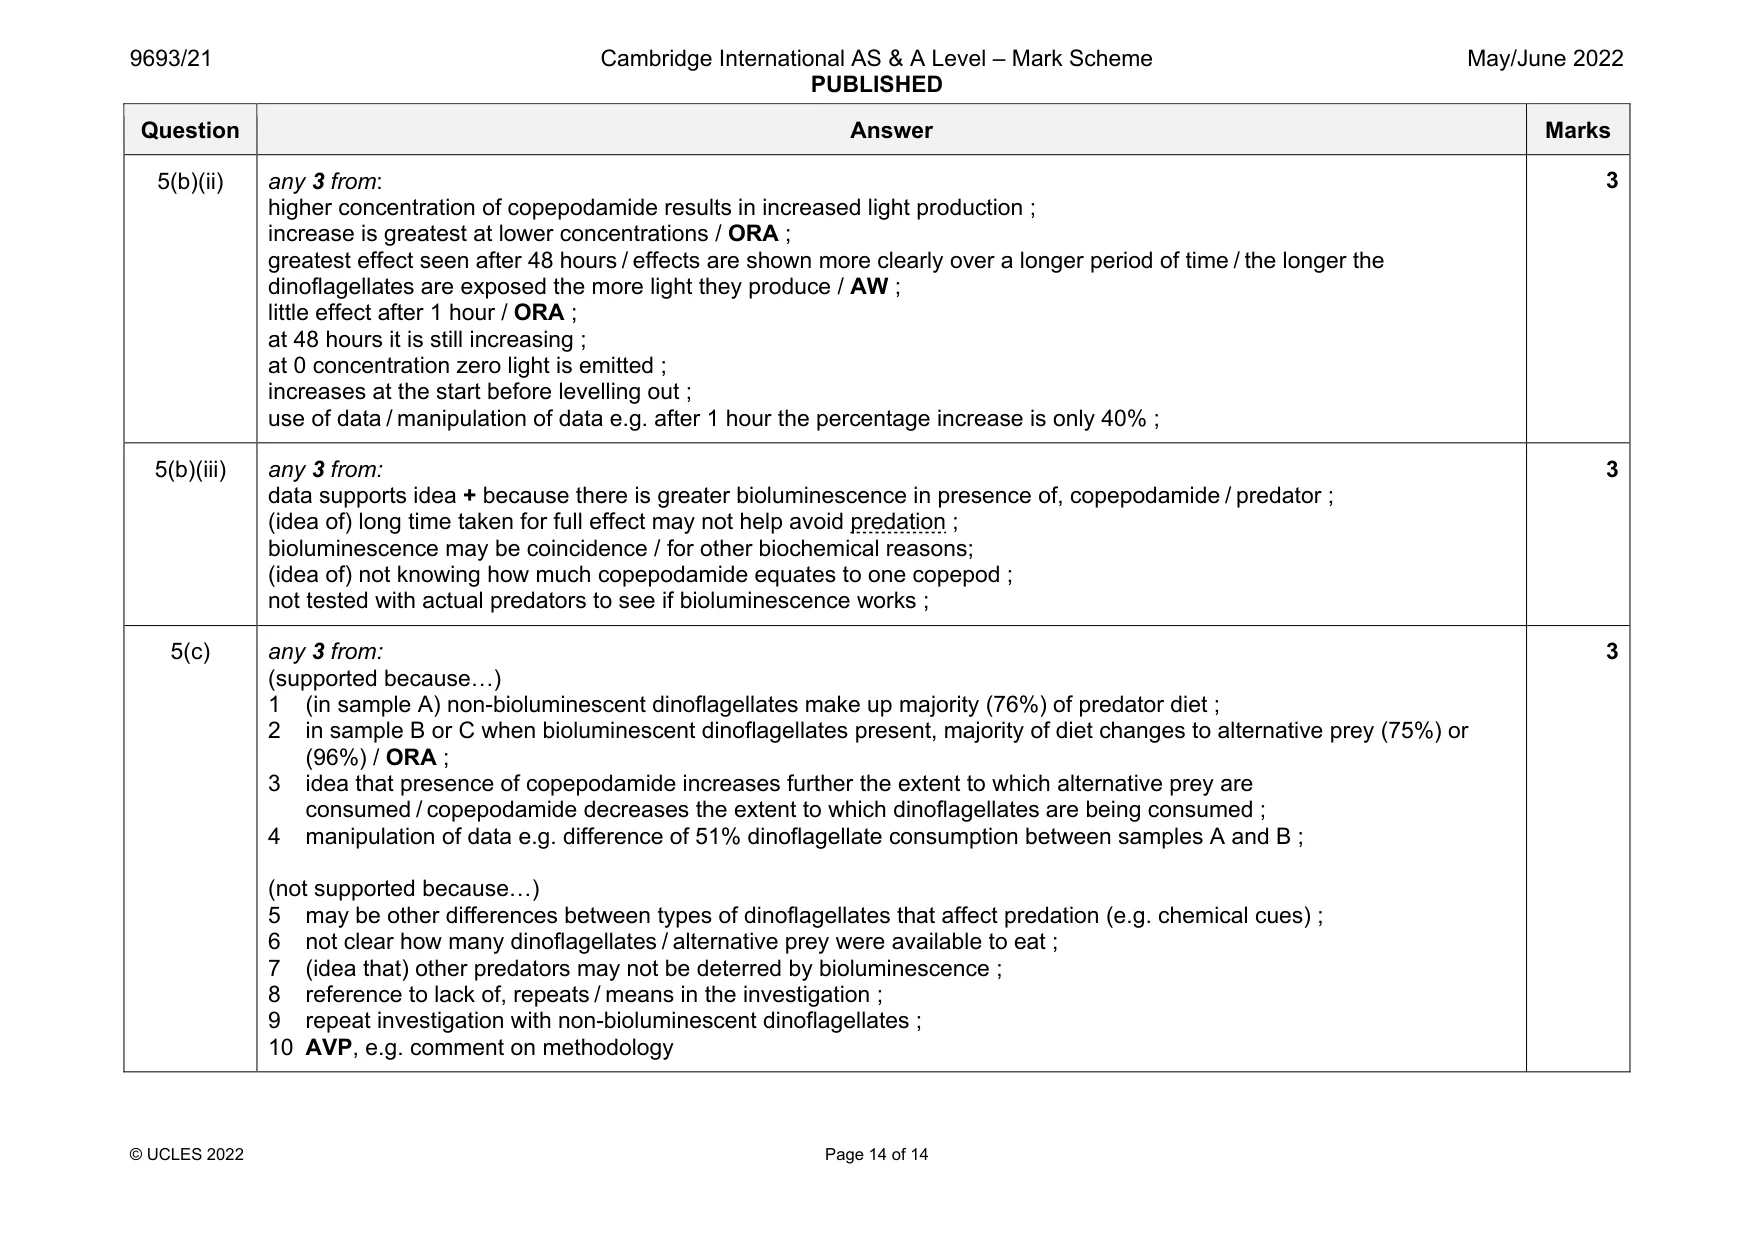
Mark scheme: 5(a)(i) idea of, easier to, manipulate / control the variable / no predation of dinoflagellates / ethical / AW ; 1 5(a)(ii) any 1 from: temperature / pH / salinity / nutrient content / illumination of water / light intensity / dissolved CO2 / dissolved O2 / volume of water / tank size ; number / concentration / species of dinoflagellates ; 1 5(b)(i) correct plots within 1 mm ; correct scale on y-axis ; correct label on both x and y-axis ; suitable line of best fit ; 4 Question Answer Marks 5(b)(ii) any 3 from: higher concentration of copepodamide results in increased light production ; increase is greatest at lower concentrations / ORA ; greatest effect seen after 48 hours / effects are shown more clearly over a longer period of time / the longer the dinoflagellates are exposed the more light they produce / AW ; little effect after 1 hour / ORA ; at 48 hours it is still increasing ; at 0 concentration zero light is emitted ; increases at the start before levelling out ; use of data / manipulation of data e.g. after 1 hour the percentage increase is only 40% ; 3 5(b)(iii) any 3 from: data supports idea + because there is greater bioluminescence in presence of, copepodamide / predator ; (idea of) long time taken for full effect may not help avoid predation ; bioluminescence may be coincidence / for other biochemical reasons; (idea of) not knowing how much copepodamide equates to one copepod ; not tested with actual predators to see if bioluminescence works ; 3 5(c) any 3 from: (supported because…) 1 (in sample A) non-bioluminescent dinoflagellates make up majority (76%) of predator diet ; 2 in sample B or C when bioluminescent dinoflagellates present, majority of diet changes to alternative prey (75%) or (96%) / ORA ; 3 idea that presence of copepodamide increases further the extent to which alternative prey are consumed / copepodamide decreases the extent to which dinoflagellates are being consumed ; 4 manipulation of data e.g. difference of 51% dinoflagellate consumption between samples A and B ; (not supported because…) 5 may be other differences between types of dinoflagellates that affect predation (e.g. chemical cues) ; 6 not clear how many dinoflagellates / alternative prey were available to eat ; 7 (idea that) other predators may not be deterred by bioluminescence ; 8 reference to lack of, repeats / means in the investigation ; 9 repeat investigation with non-bioluminescent dinoflagellates ; 10 AVP, e.g. comment on methodology 3
What was in this paper
The subtopics covered by these 5 questions, and how many questions each got. Open one in a new tab to see every Cambridge question on it.
What you needed in this session
Cambridge’s own grade thresholds for 2022 May/June, Paper 2 · Variant 1. A higher threshold means an easier paper — the bar moves with how the cohort did.