Cambridge A Level Marine Science 9693 — 2018 May/June Paper 2 · Variant 3
9693/23/M/J/18 · 4 questions · 50 marks · ≈56 min
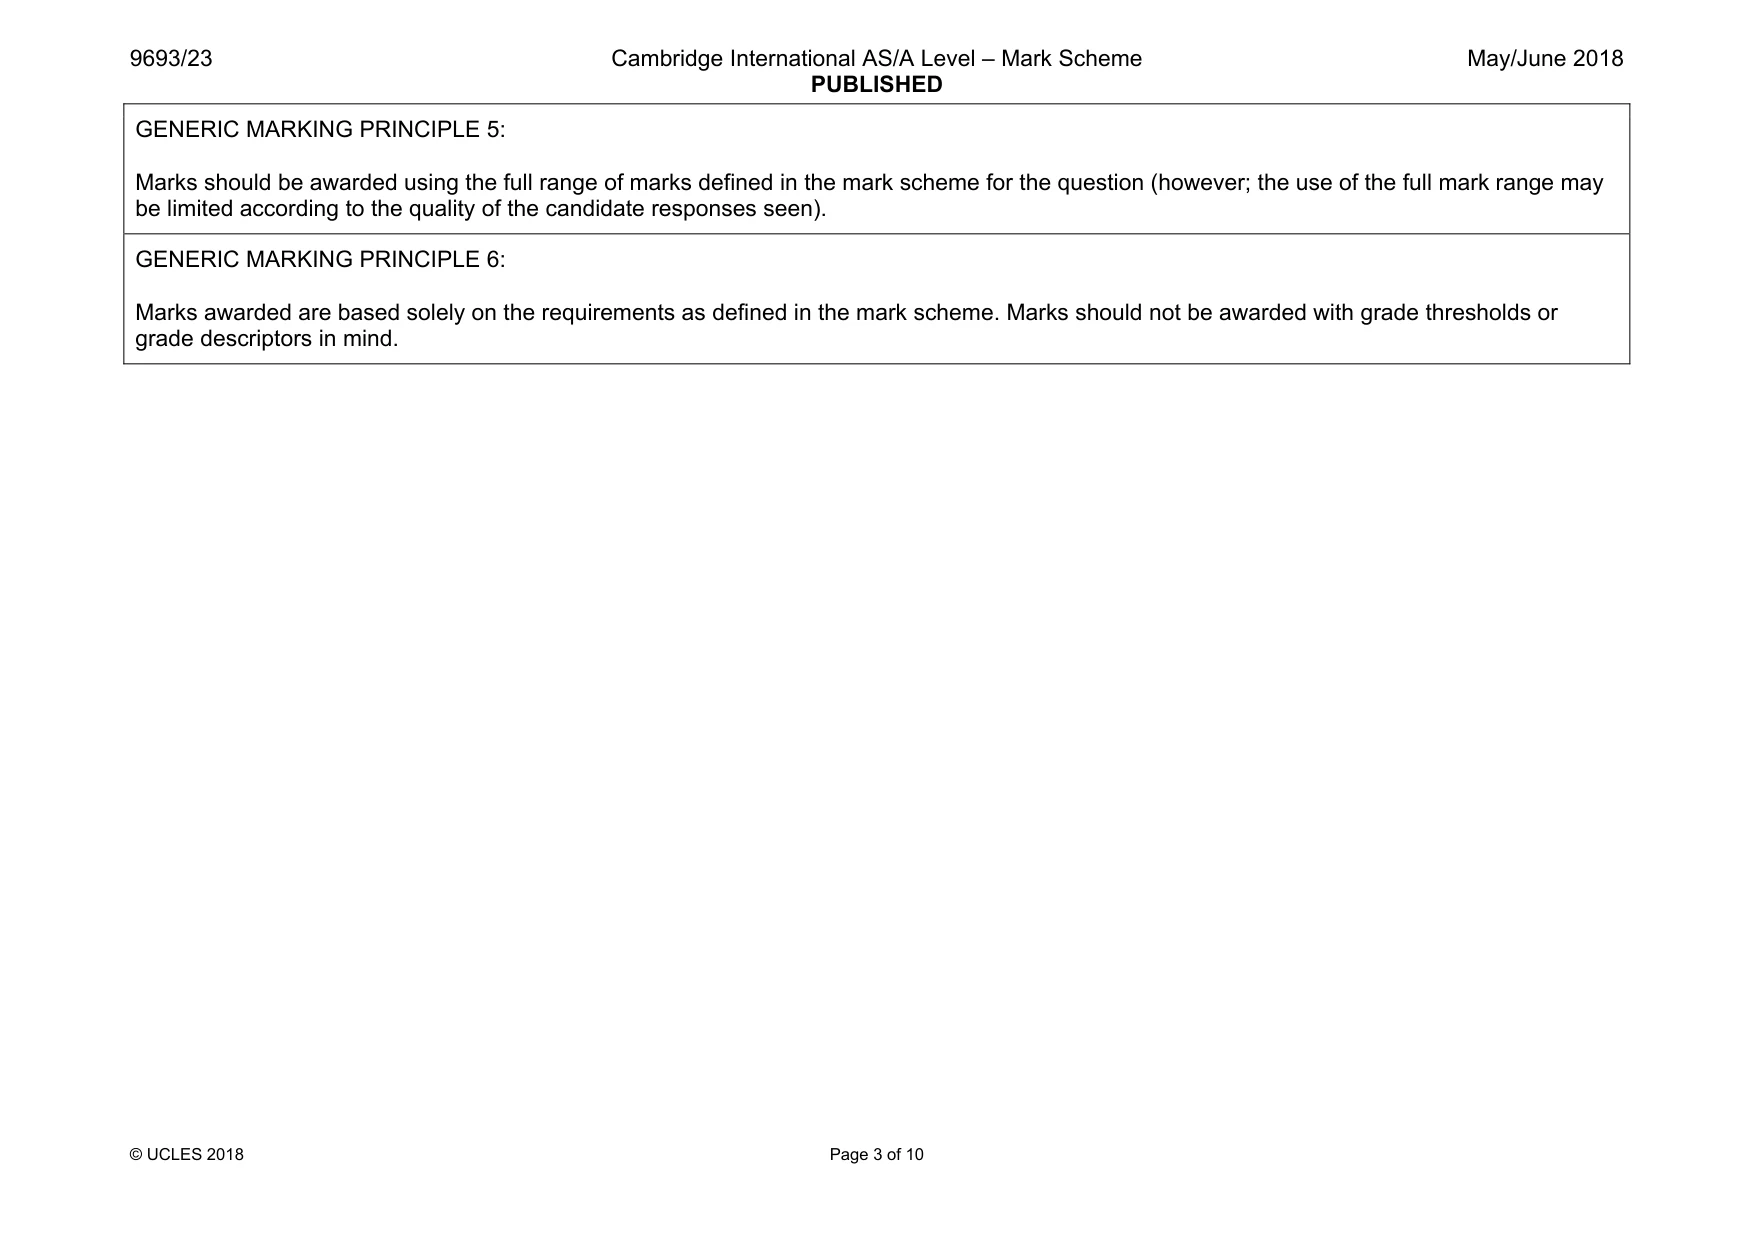
The question paper and its mark scheme, free to read here and free to download. This is Cambridge’s own paper, exactly as it was sat.
Question paper12 pages


Mark scheme10 pages
Answers below. Sit the paper first if you are practising.
Questions as text
Q1 · When a whale dies, its carcass (body) falls to the deep ocean floor
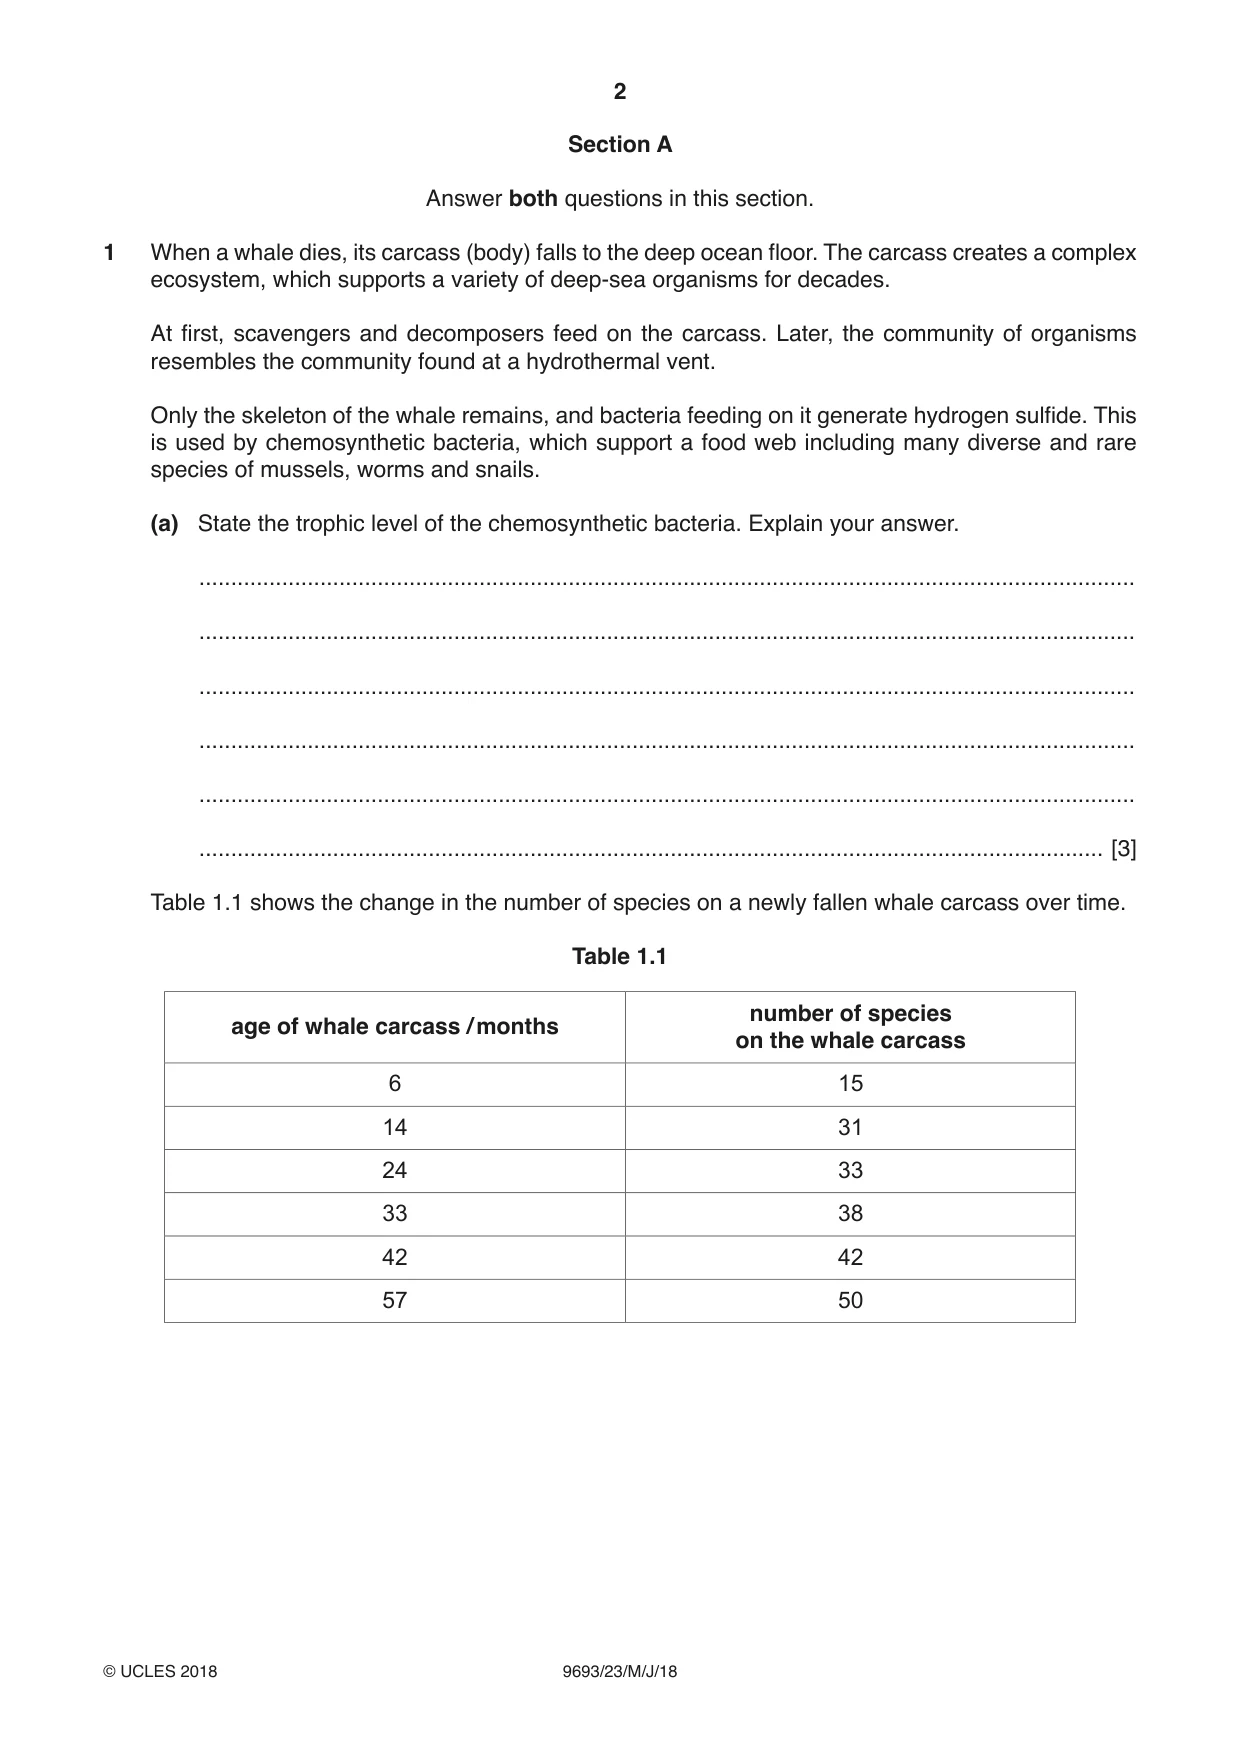
1 When a whale dies, its carcass (body) falls to the deep ocean floor. The carcass creates a complex ecosystem, which supports a variety of deep-sea organisms for decades. At first, scavengers and decomposers feed on the carcass. Later, the community of organisms resembles the community found at a hydrothermal vent. Only the skeleton of the whale remains, and bacteria feeding on it generate hydrogen sulfide. This is used by chemosynthetic bacteria, which support a food web including many diverse and rare species of mussels, worms and snails. (a) State the trophic level of the chemosynthetic bacteria. Explain your answer. ................................................................................................................................................... ................................................................................................................................................... ................................................................................................................................................... ................................................................................................................................................... ................................................................................................................................................... .............................................................................................................................................. [3] Table 1.1 shows the change in the number of species on a newly fallen whale carcass over time. Table 1.1 number of species age of whale carcass / months on the whale carcass 6 15 14 31 24 33 33 38 42 42 57 50 (b) On the grid, plot a graph of the data in Table 1.1. Join the points on your graph with ruled straight lines. [4] (c) Describe the relationship between the age of whale carcass and the number of species present. ................................................................................................................................................... ................................................................................................................................................... ................................................................................................................................................... .............................................................................................................................................. [2] [Total: 9]
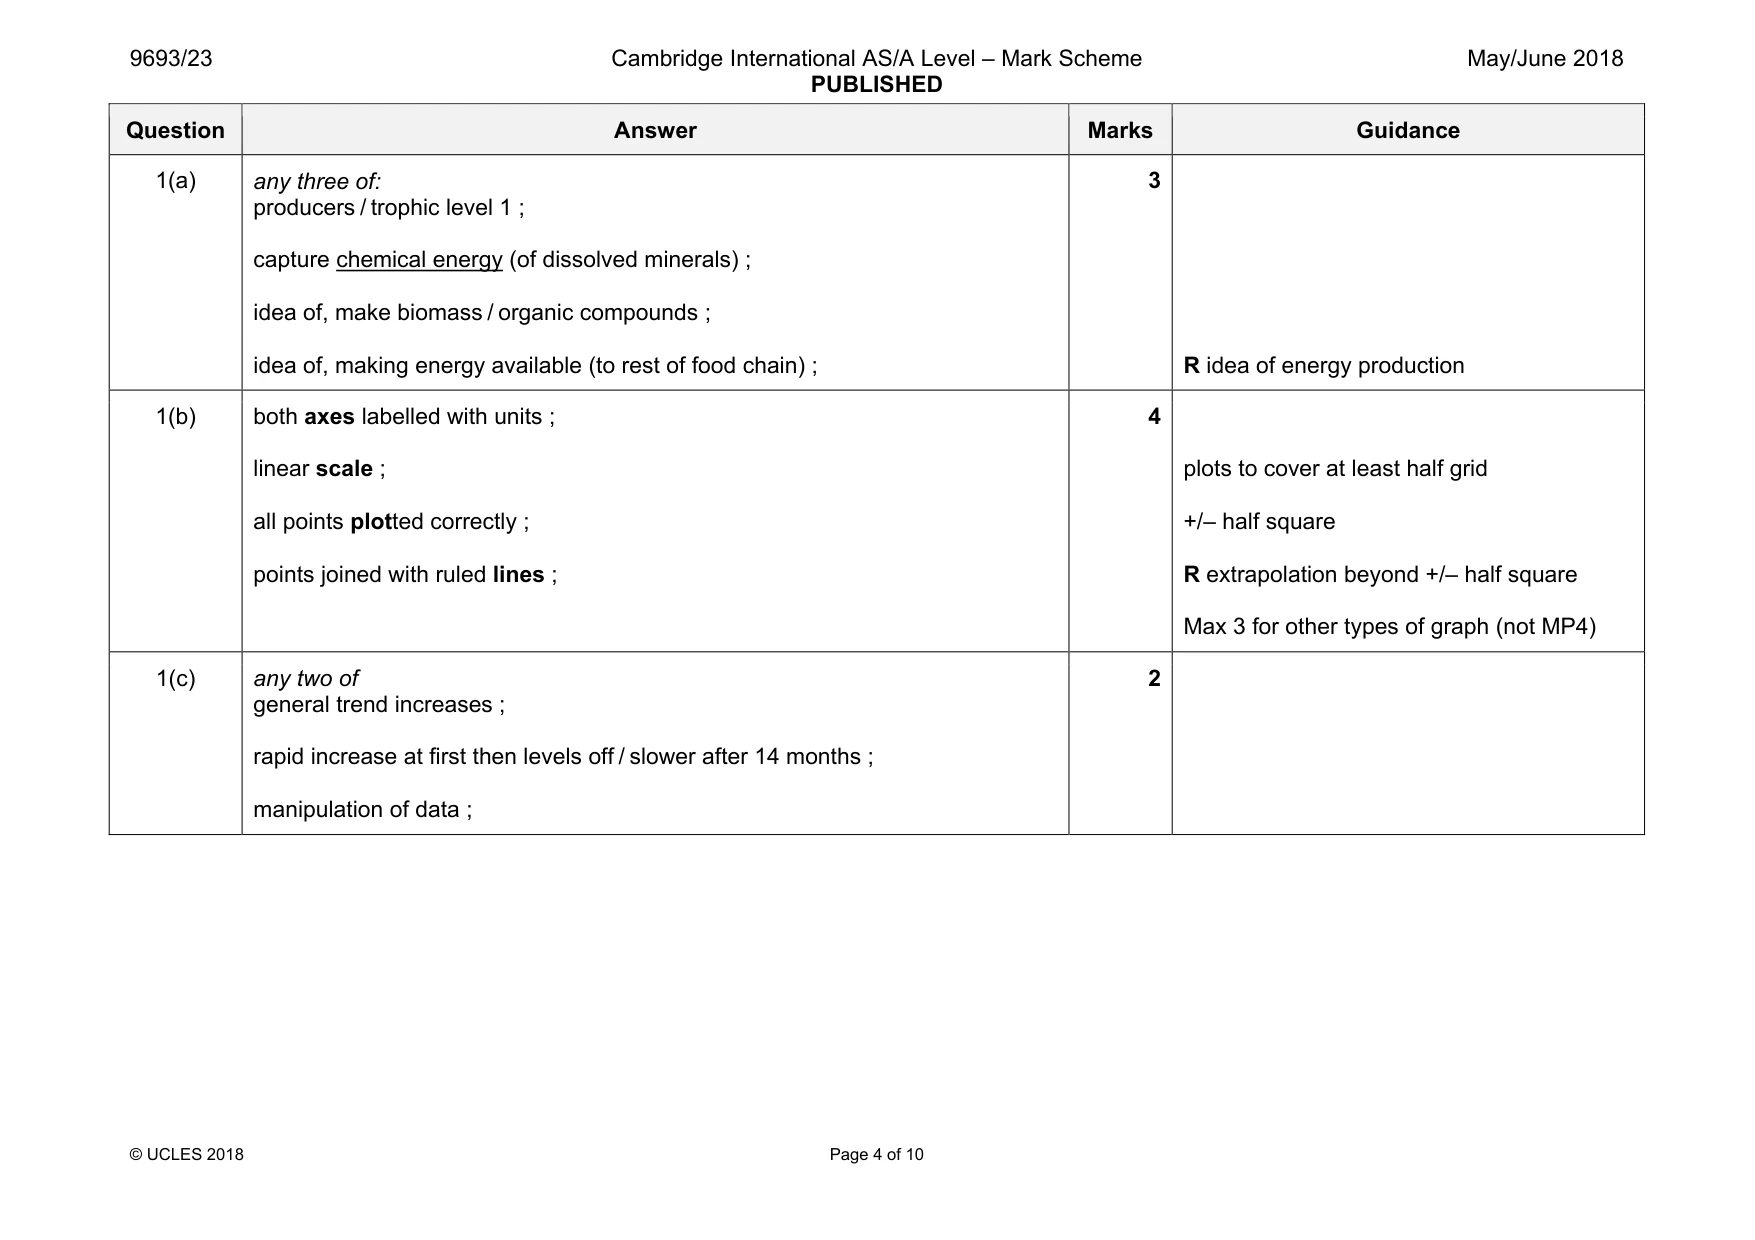
Mark scheme: 1(a) any three of: producers / trophic level 1 ; capture chemical energy (of dissolved minerals) ; idea of, make biomass / organic compounds ; idea of, making energy available (to rest of food chain) ; 3 R idea of energy production 1(b) both axes labelled with units ; linear scale ; all points plotted correctly ; points joined with ruled lines ; 4 plots to cover at least half grid +/– half square R extrapolation beyond +/– half square Max 3 for other types of graph (not MP4) 1(c) any two of general trend increases ; rapid increase at first then levels off / slower after 14 months ; manipulation of data ; 2
Q2 · Coral bleaching, in which coral polyps expel their zooxanthellae, can be caused by…
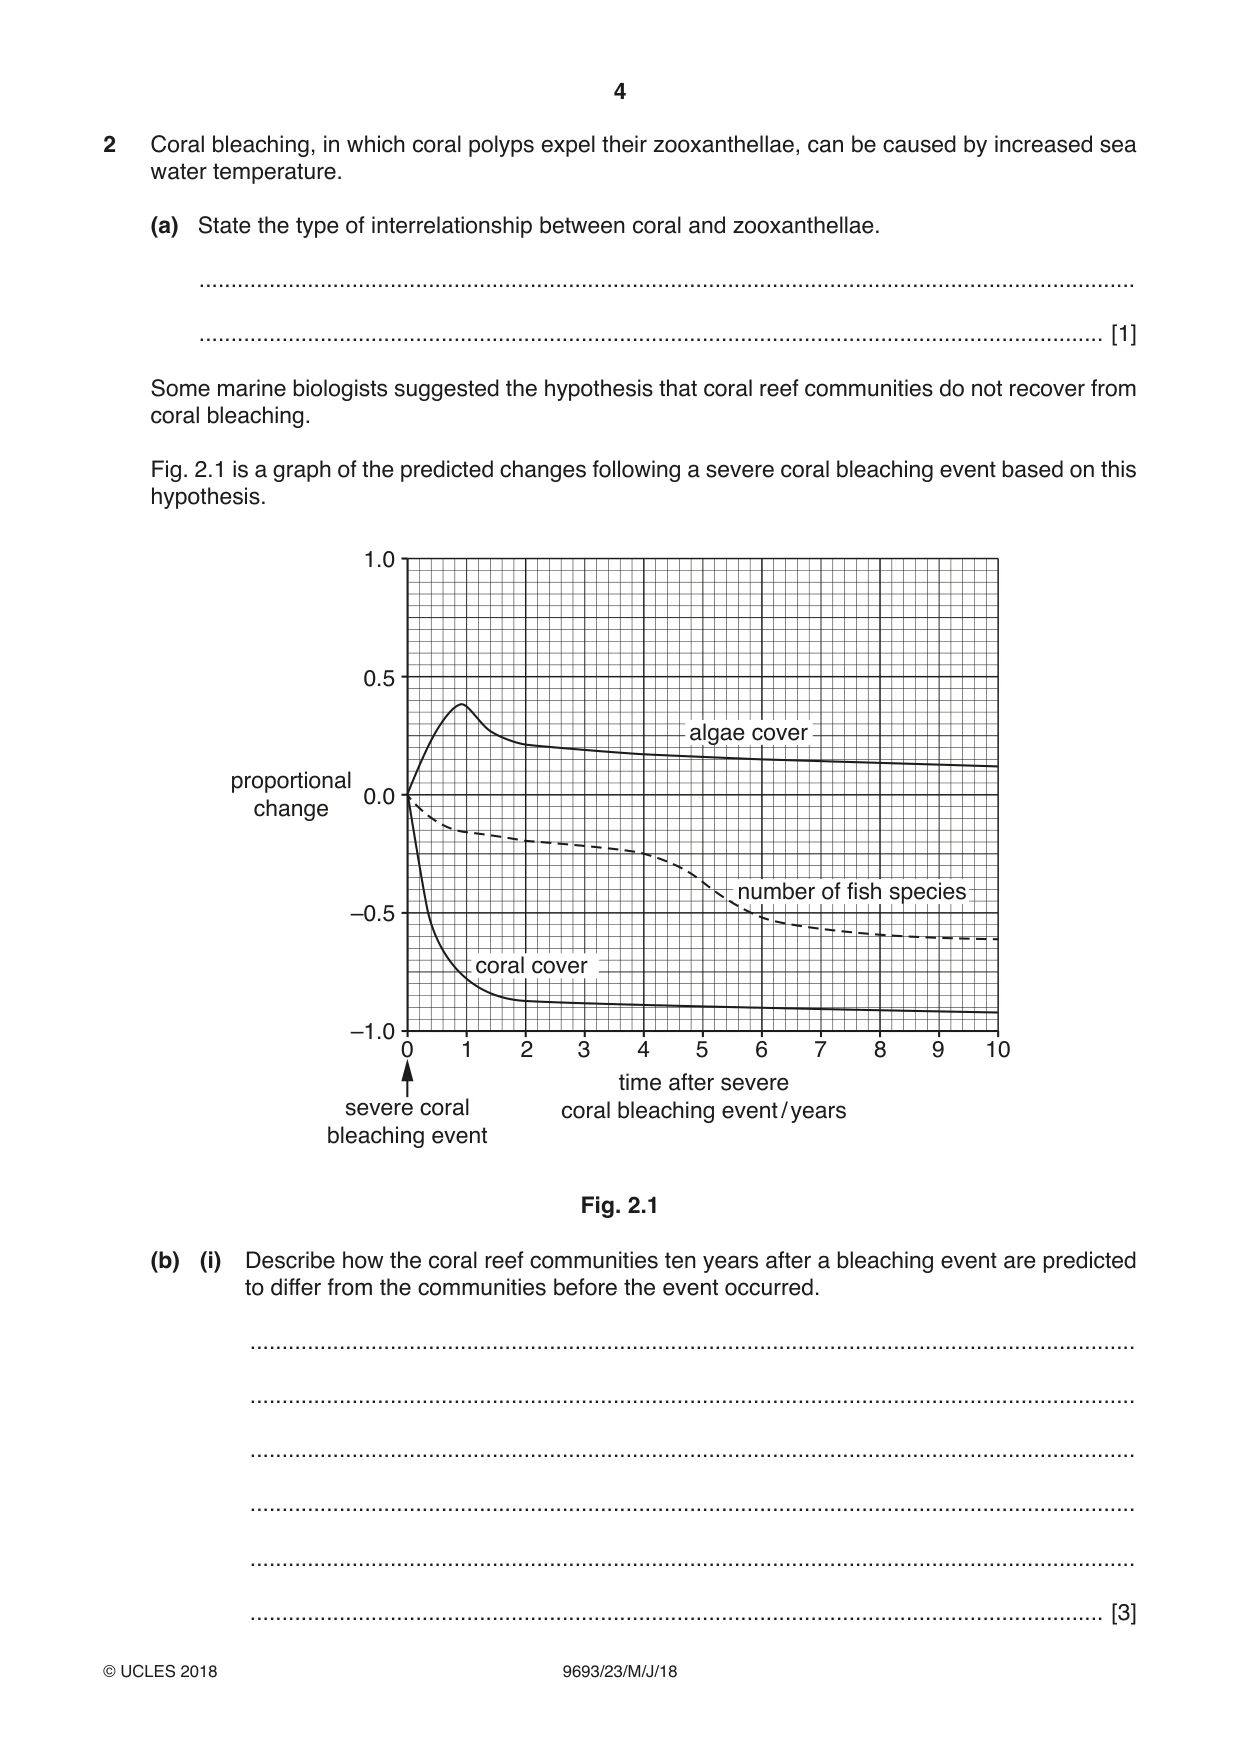
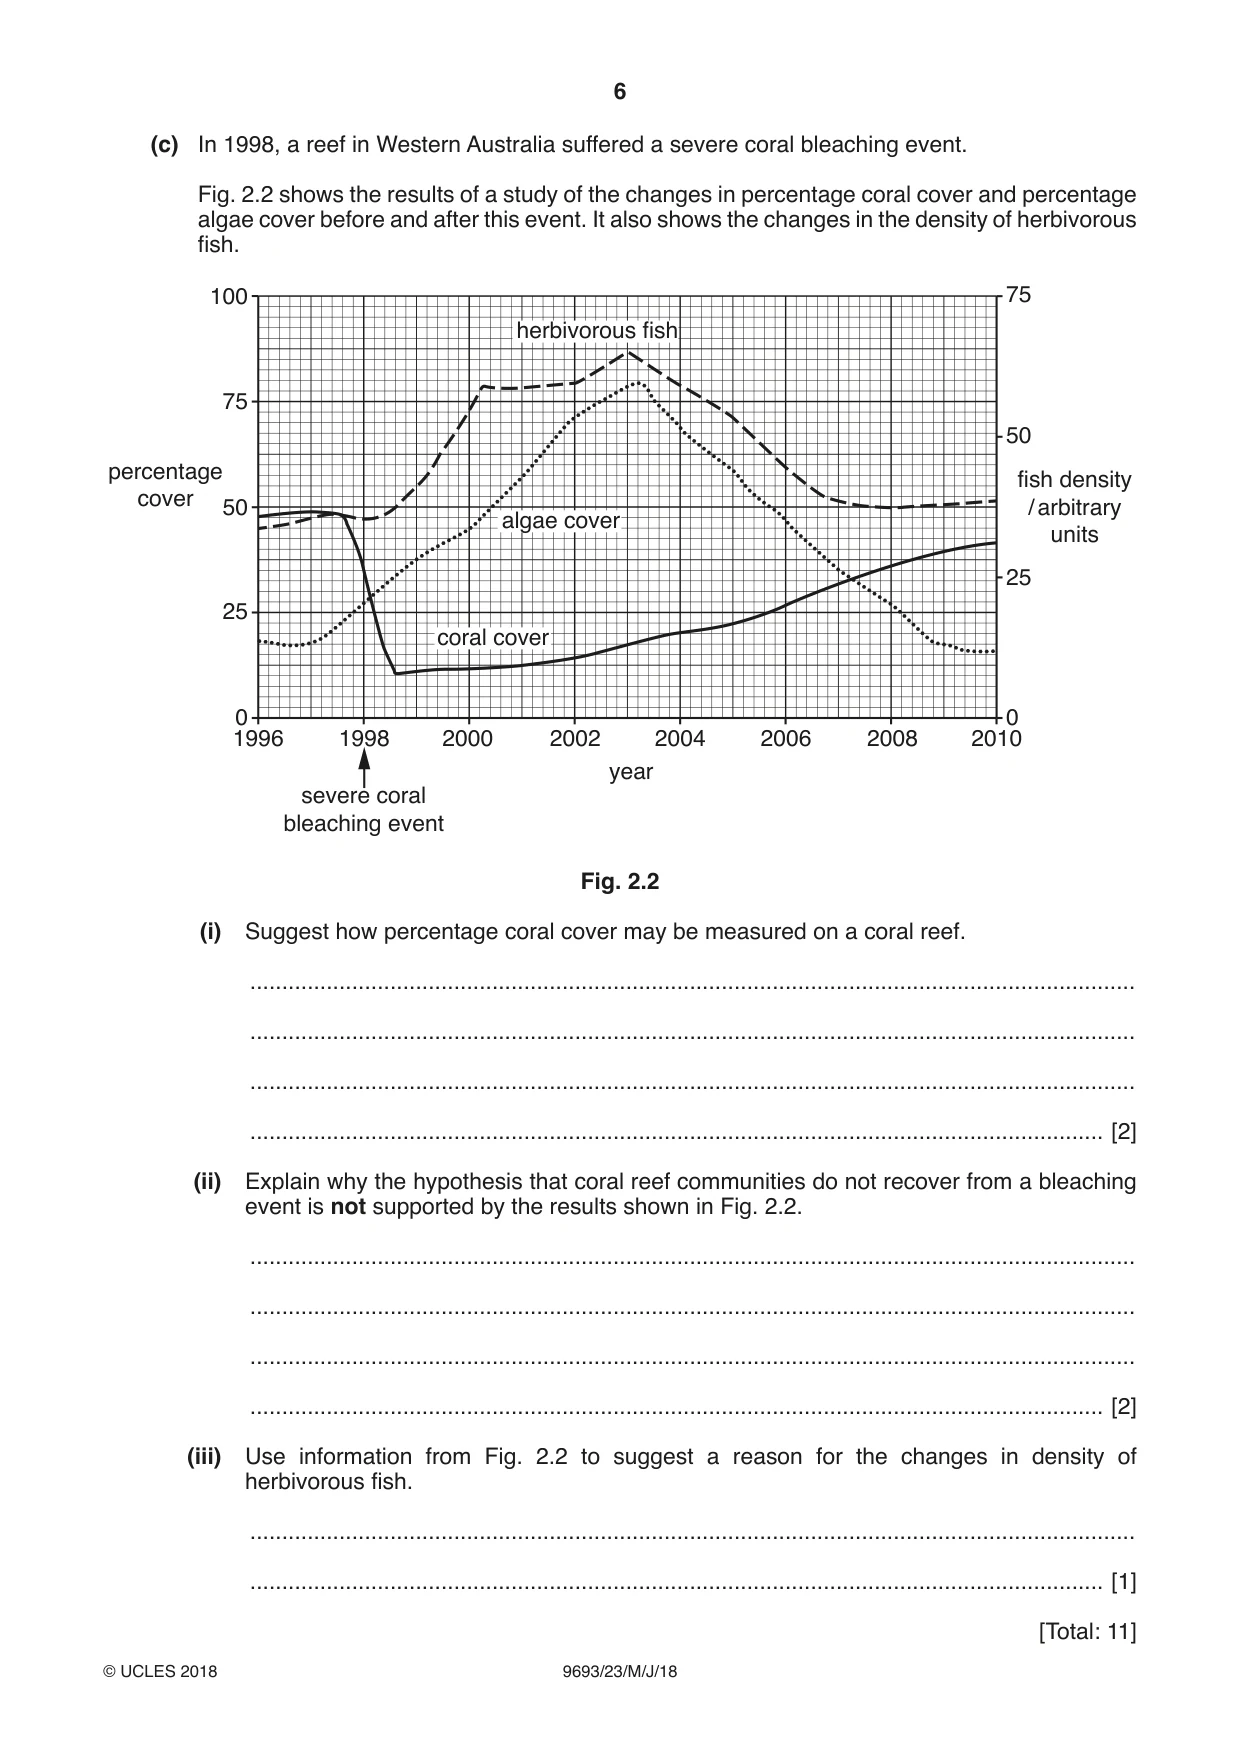
2 Coral bleaching, in which coral polyps expel their zooxanthellae, can be caused by increased sea water temperature. (a) State the type of interrelationship between coral and zooxanthellae. ................................................................................................................................................... .............................................................................................................................................. [1] Some marine biologists suggested the hypothesis that coral reef communities do not recover from coral bleaching. Fig. 2.1 is a graph of the predicted changes following a severe coral bleaching event based on this hypothesis. 1.0 0.5 algae cover proportional 0.0 change number of fish species –0.5 coral cover –1.0 0 1 2 3 4 5 6 7 8 9 10 time after severe severe coral coral bleaching event / years bleaching event Fig. 2.1 (b) (i) Describe how the coral reef communities ten years after a bleaching event are predicted to differ from the communities before the event occurred. ........................................................................................................................................... ........................................................................................................................................... ........................................................................................................................................... ........................................................................................................................................... ........................................................................................................................................... ...................................................................................................................................... [3] (ii) Suggest how the predicted changes in algae cover may result in a reduction in coral cover. ........................................................................................................................................... ........................................................................................................................................... ........................................................................................................................................... ...................................................................................................................................... [2] (c) In 1998, a reef in Western Australia suffered a severe coral bleaching event. Fig. 2.2 shows the results of a study of the changes in percentage coral cover and percentage algae cover before and after this event. It also shows the changes in the density of herbivorous fish. 100 75 herbivorous fish 75 50 percentage fish density cover 50 / arbitrary algae cover units 25 25 coral cover 0 0 1996 1998 2000 2002 2004 2006 2008 2010 year severe coral bleaching event Fig. 2.2 (i) Suggest how percentage coral cover may be measured on a coral reef. ........................................................................................................................................... ........................................................................................................................................... ........................................................................................................................................... ...................................................................................................................................... [2] (ii) Explain why the hypothesis that coral reef communities do not recover from a bleaching event is not supported by the results shown in Fig. 2.2. ........................................................................................................................................... ........................................................................................................................................... ........................................................................................................................................... ...................................................................................................................................... [2] (iii) Use information from Fig. 2.2 to suggest a reason for the changes in density of herbivorous fish. ........................................................................................................................................... ...................................................................................................................................... [1] [Total: 11]
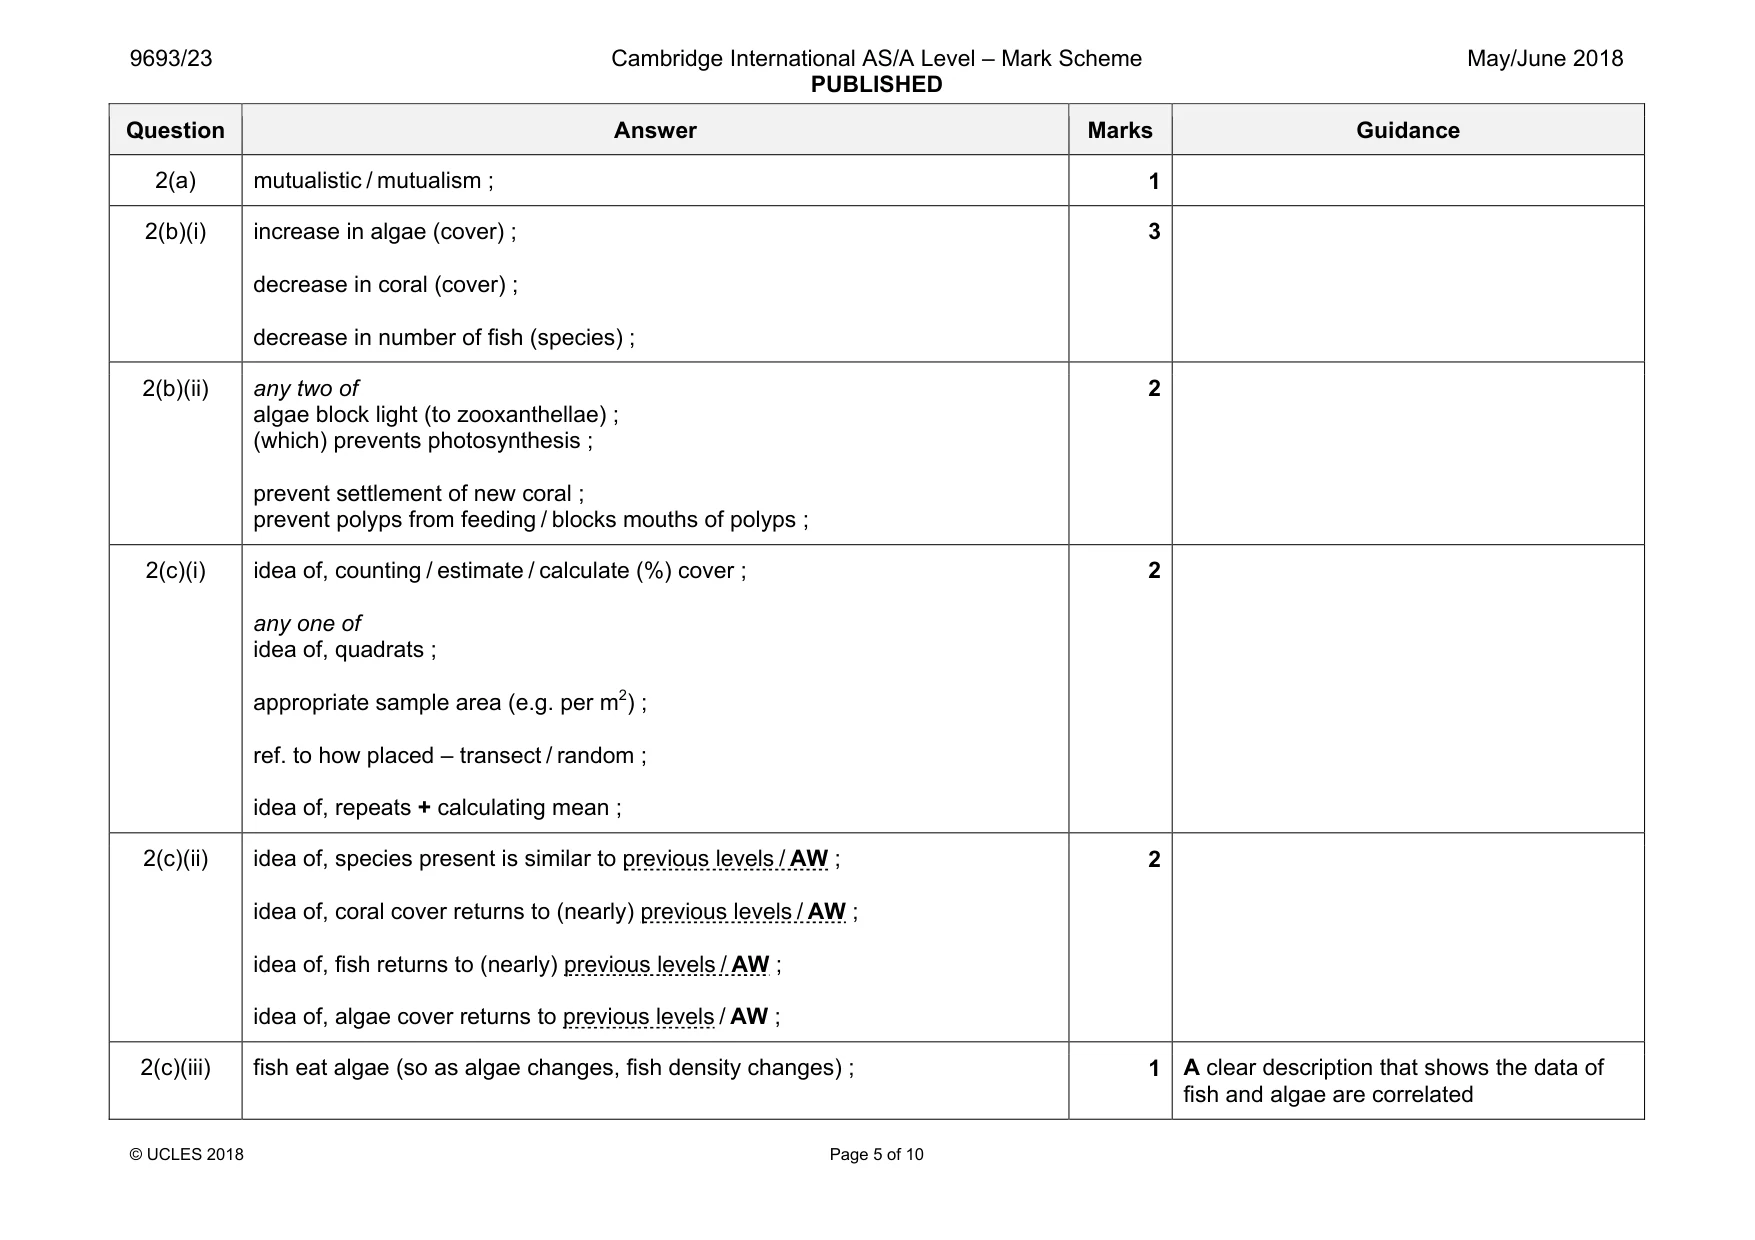
Mark scheme: 2(a) mutualistic / mutualism ; 1 2(b)(i) increase in algae (cover) ; decrease in coral (cover) ; decrease in number of fish (species) ; 3 2(b)(ii) any two of algae block light (to zooxanthellae) ; (which) prevents photosynthesis ; prevent settlement of new coral ; prevent polyps from feeding / blocks mouths of polyps ; 2 2(c)(i) idea of, counting / estimate / calculate (%) cover ; any one of idea of, quadrats ; appropriate sample area (e.g. per m2) ; ref. to how placed – transect / random ; idea of, repeats + calculating mean ; 2 2(c)(ii) idea of, species present is similar to previous levels / AW ; idea of, coral cover returns to (nearly) previous levels / AW ; idea of, fish returns to (nearly) previous levels / AW ; idea of, algae cover returns to previous levels / AW ; 2 2(c)(iii) fish eat algae (so as algae changes, fish density changes) ; 1 A clear description that shows the data of fish and algae are correlated
Q3 · Describe how a tropical cyclone develops
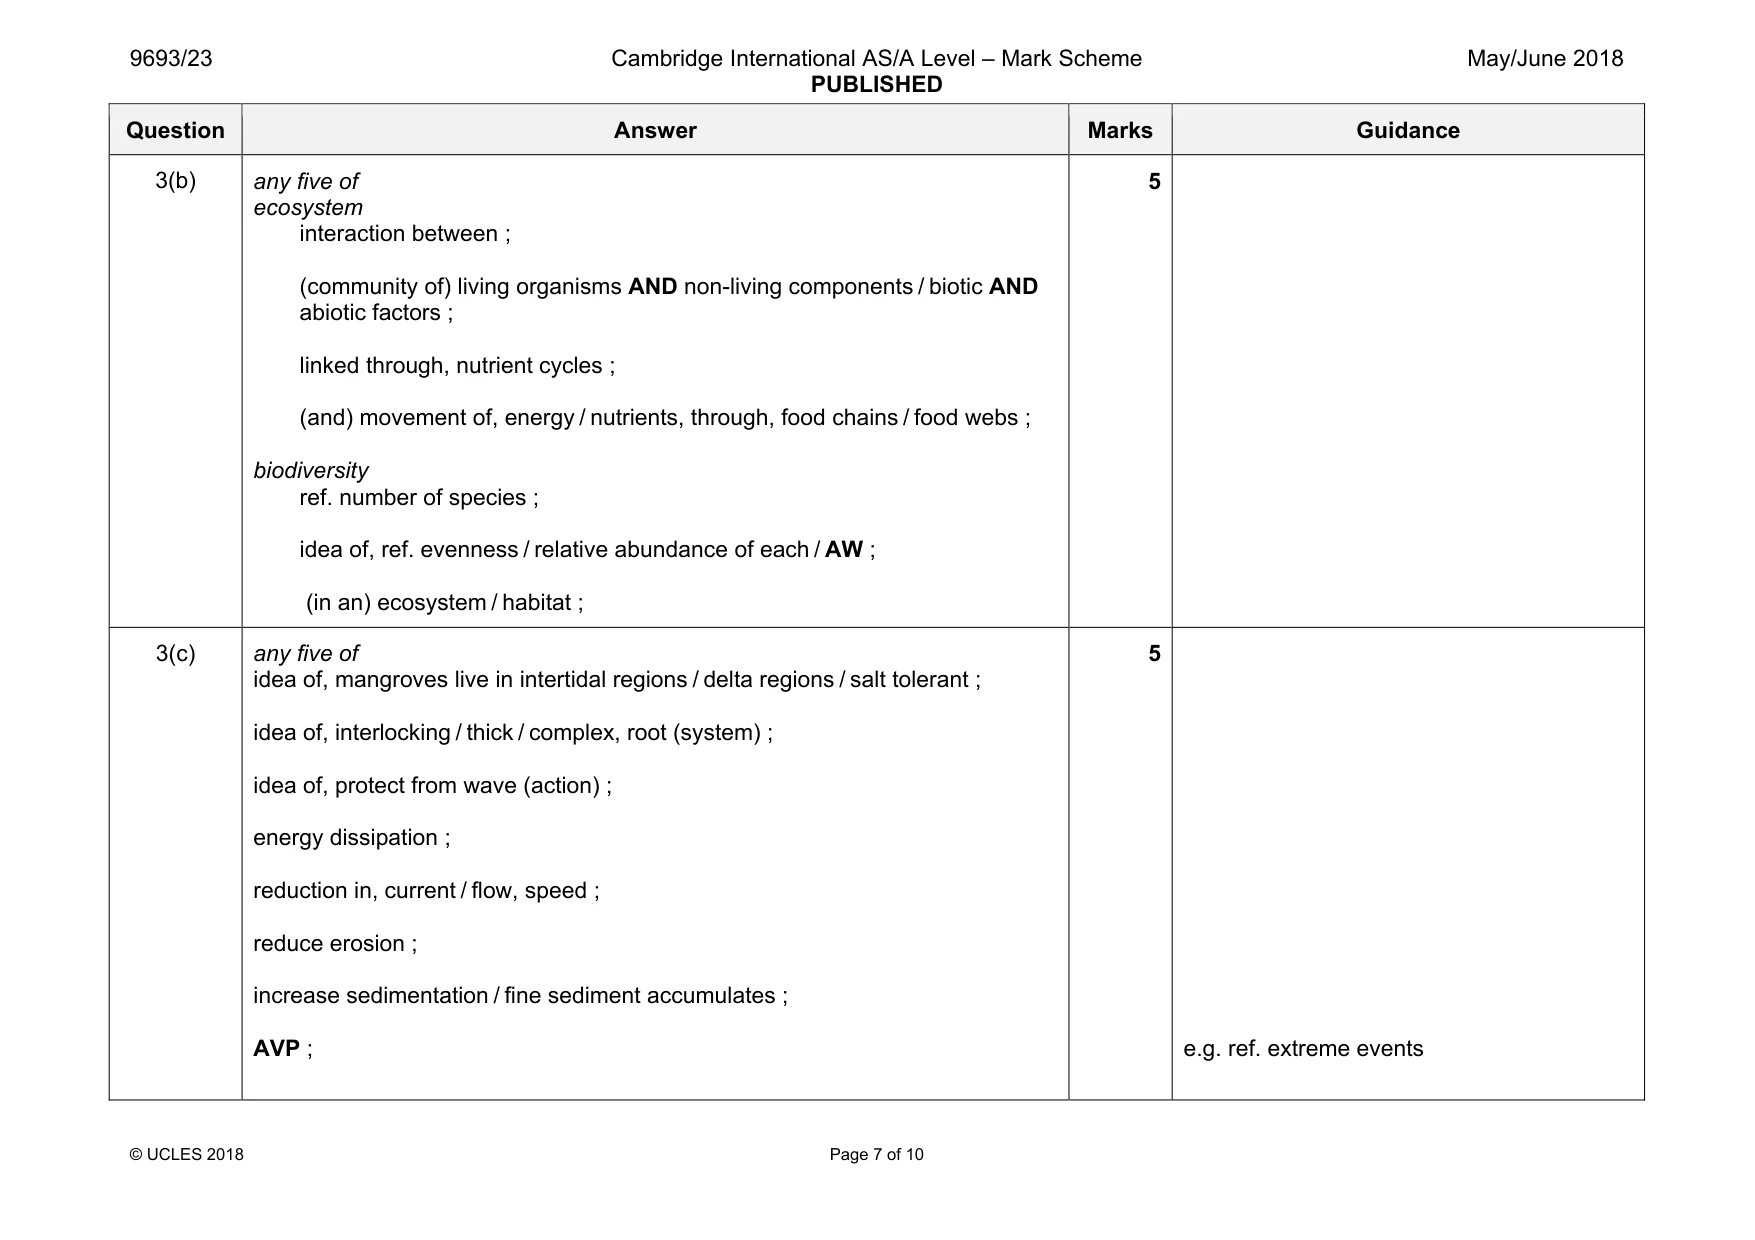
3 (a) Describe how a tropical cyclone develops. ................................................................................................................................................... ................................................................................................................................................... ................................................................................................................................................... ................................................................................................................................................... ................................................................................................................................................... ................................................................................................................................................... ................................................................................................................................................... ................................................................................................................................................... ................................................................................................................................................... .............................................................................................................................................. [5] (b) Explain the meaning of the terms ecosystem and biodiversity. ................................................................................................................................................... ................................................................................................................................................... ................................................................................................................................................... ................................................................................................................................................... ................................................................................................................................................... ................................................................................................................................................... ................................................................................................................................................... ................................................................................................................................................... ................................................................................................................................................... .............................................................................................................................................. [5] (c) Outline how mangroves protect tropical coastlines. ................................................................................................................................................... ................................................................................................................................................... ................................................................................................................................................... ................................................................................................................................................... ................................................................................................................................................... ................................................................................................................................................... ................................................................................................................................................... ................................................................................................................................................... ................................................................................................................................................... .............................................................................................................................................. [5] [Total: 15]
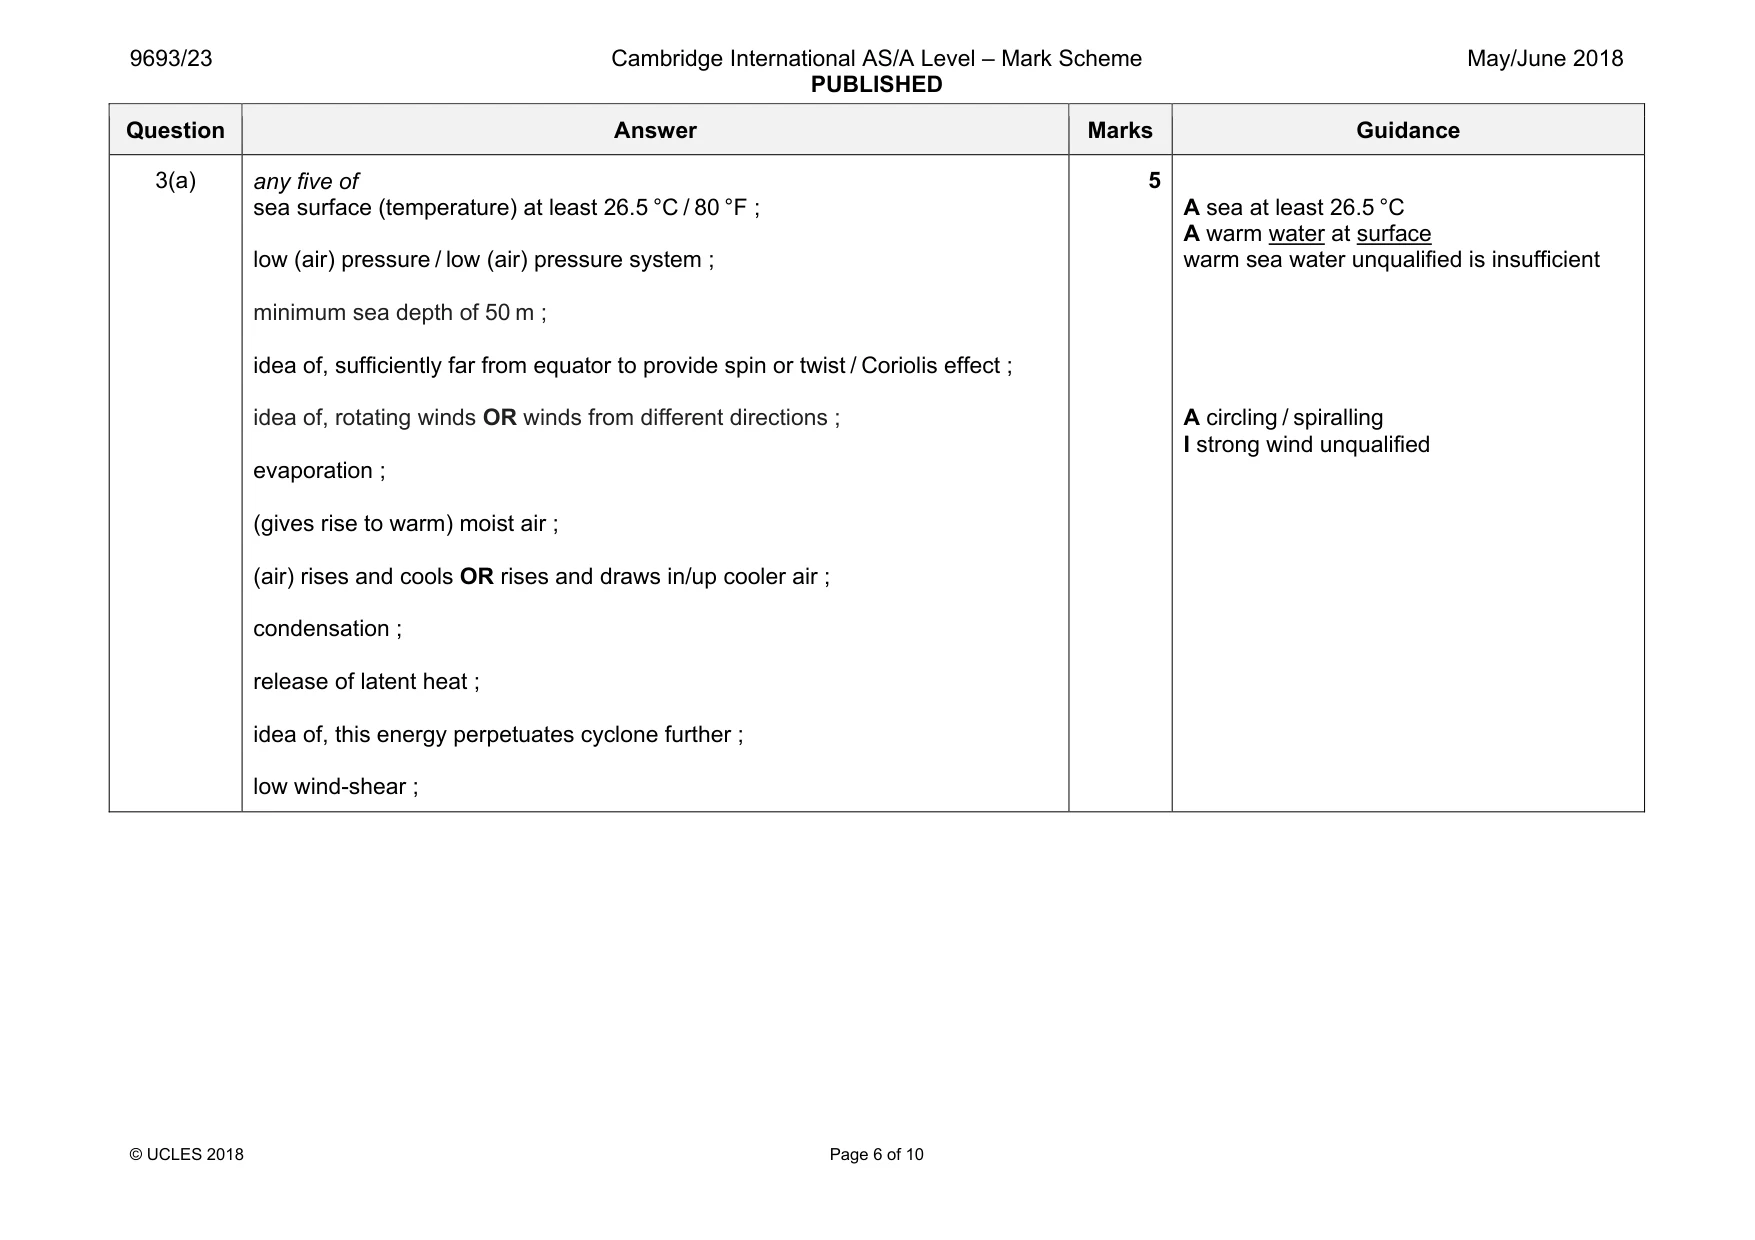
Mark scheme: 3(a) any five of sea surface (temperature) at least 26.5 °C / 80 °F ; low (air) pressure / low (air) pressure system ; minimum sea depth of 50 m ; idea of, sufficiently far from equator to provide spin or twist / Coriolis effect ; idea of, rotating winds OR winds from different directions ; evaporation ; (gives rise to warm) moist air ; (air) rises and cools OR rises and draws in/up cooler air ; condensation ; release of latent heat ; idea of, this energy perpetuates cyclone further ; low wind-shear ; 5 A sea at least 26.5 °C A warm water at surface warm sea water unqualified is insufficient A circling / spiralling I strong wind unqualified Question Answer Marks Guidance 3(b) any five of ecosystem interaction between ; (community of) living organisms AND non-living components / biotic AND abiotic factors ; linked through, nutrient cycles ; (and) movement of, energy / nutrients, through, food chains / food webs ; biodiversity ref. number of species ; idea of, ref. evenness / relative abundance of each / AW ; (in an) ecosystem / habitat ; 5 3(c) any five of idea of, mangroves live in intertidal regions / delta regions / salt tolerant ; idea of, interlocking / thick / complex, root (system) ; idea of, protect from wave (action) ; energy dissipation ; reduction in, current / flow, speed ; reduce erosion ; increase sedimentation / fine sediment accumulates ; AVP ; 5 e.g. ref. extreme events
Q4 · The Humboldt Current off the coasts of Chile and Peru causes upwelling
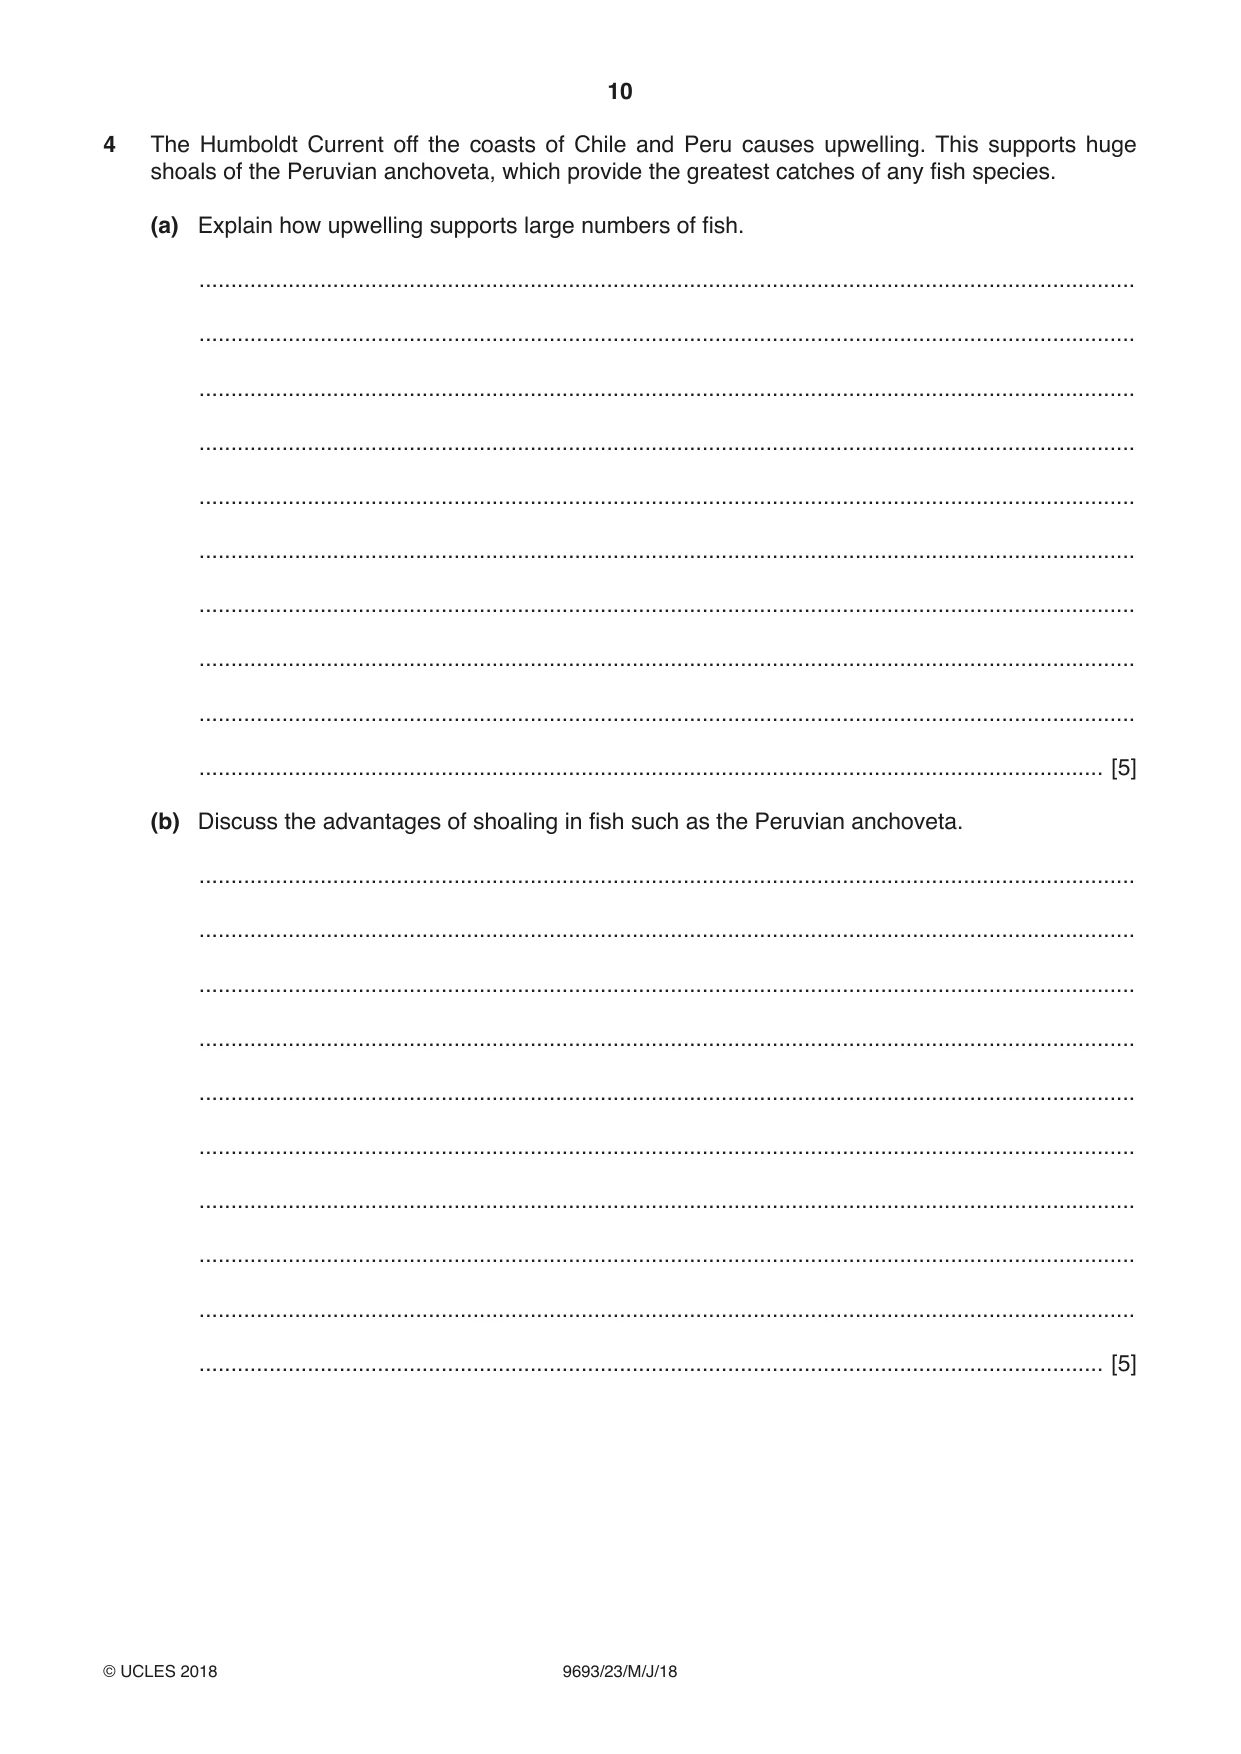
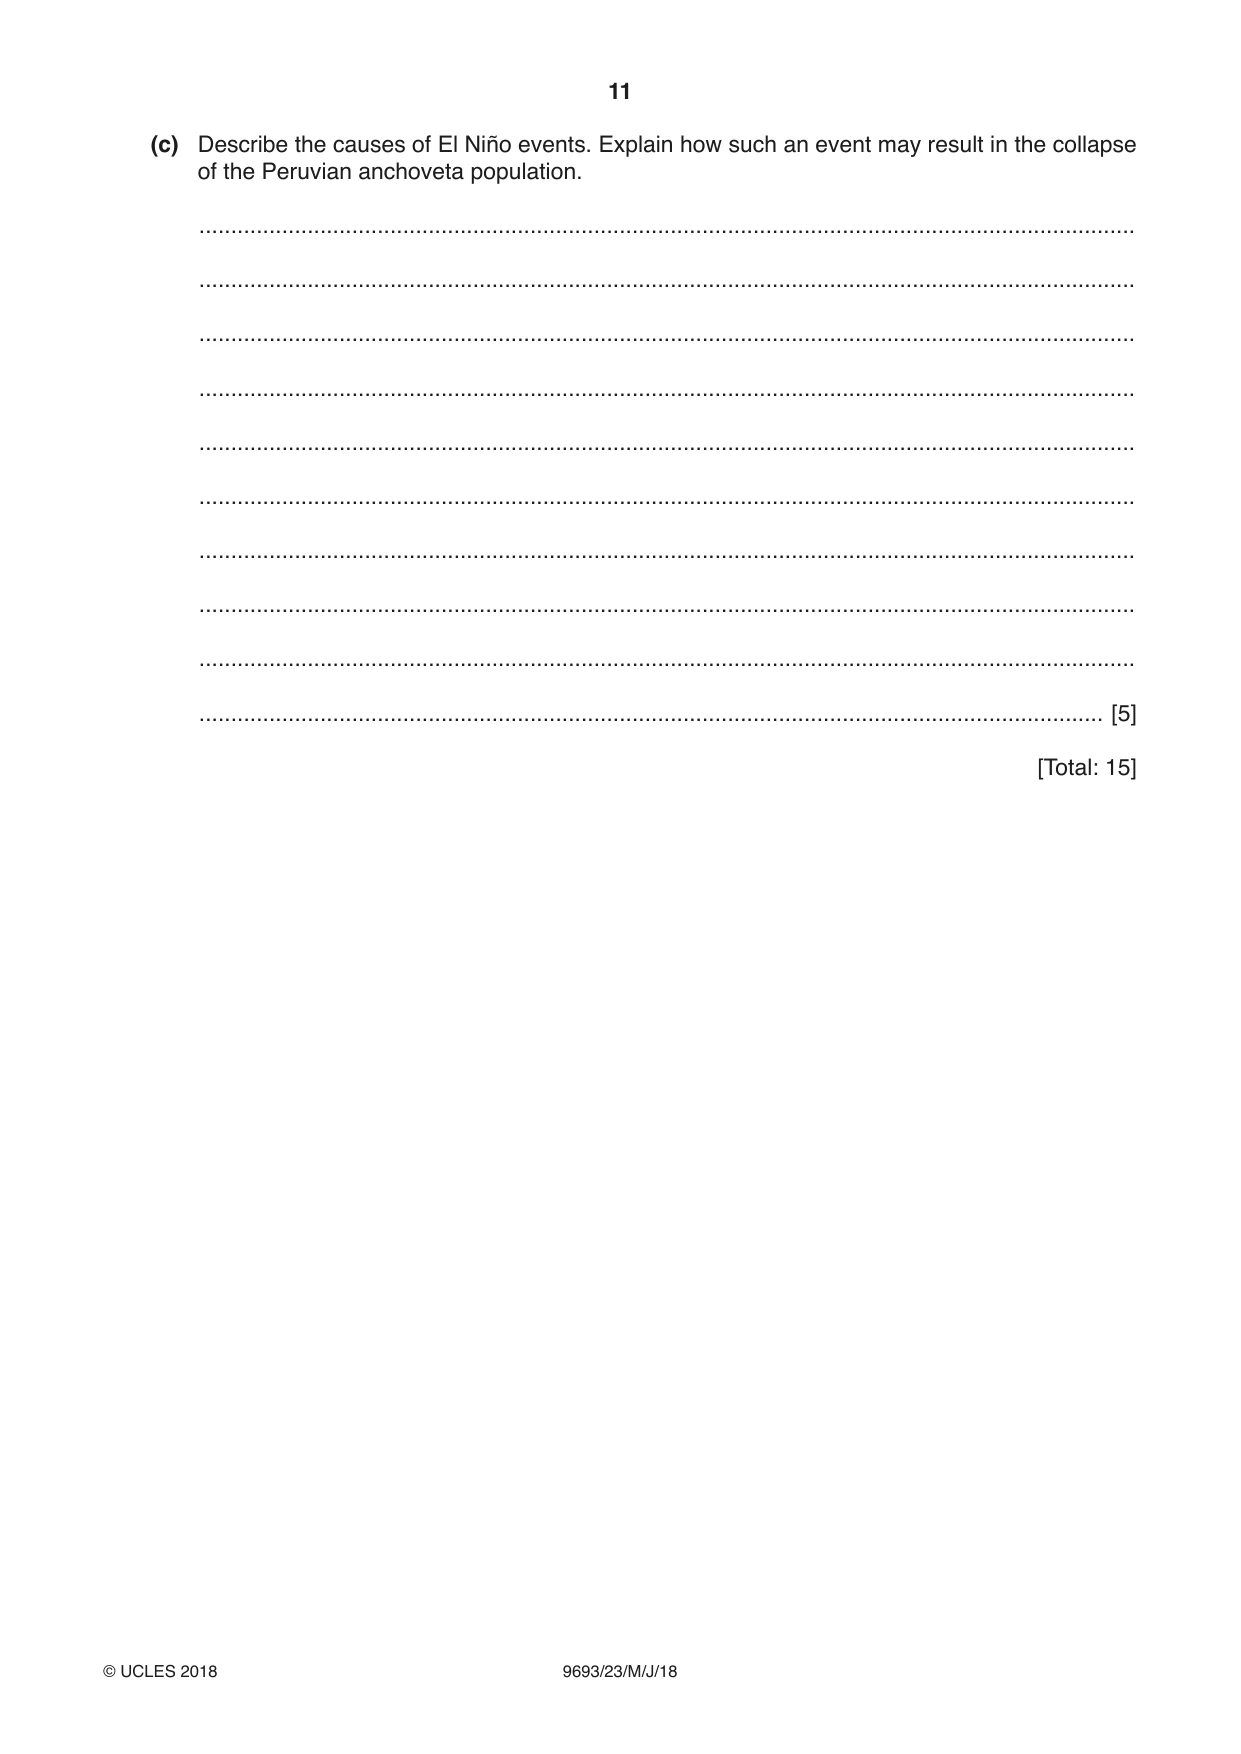
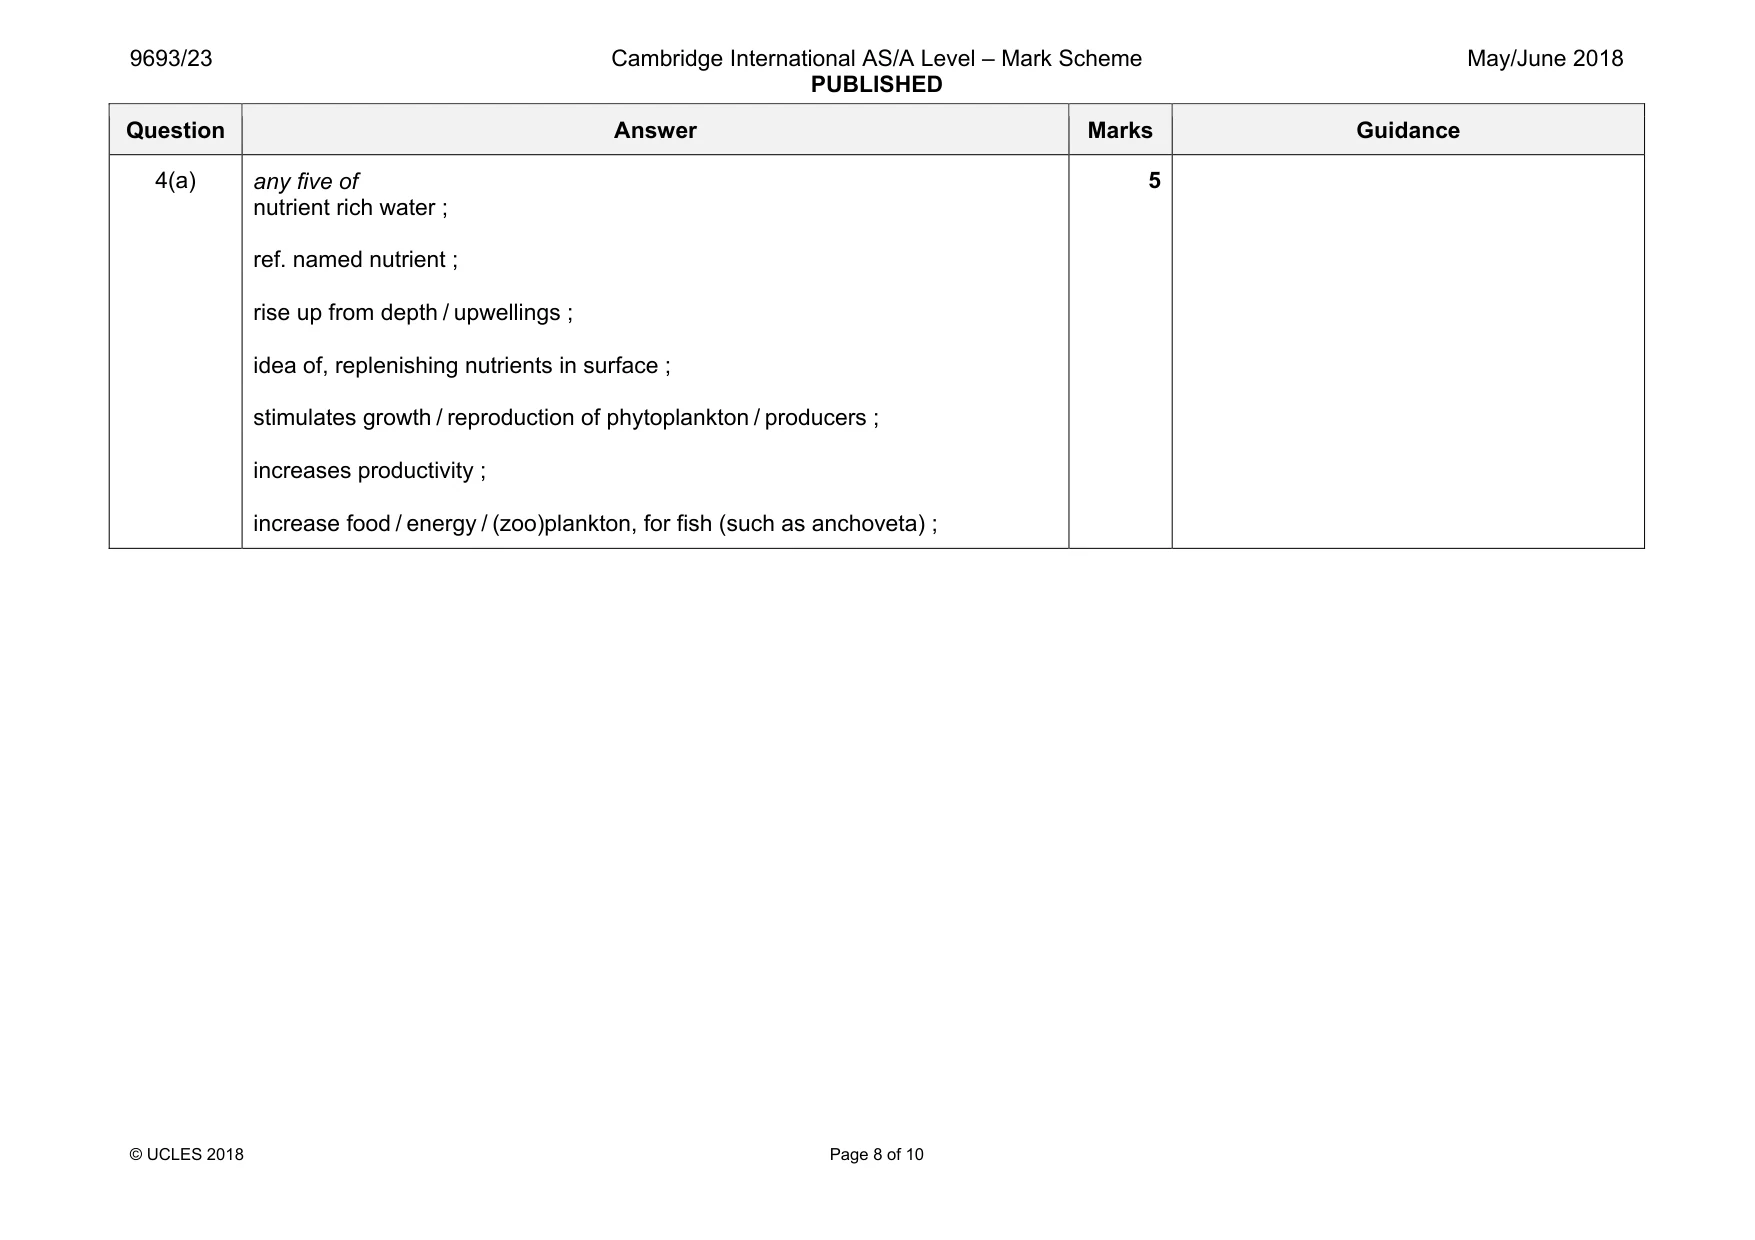
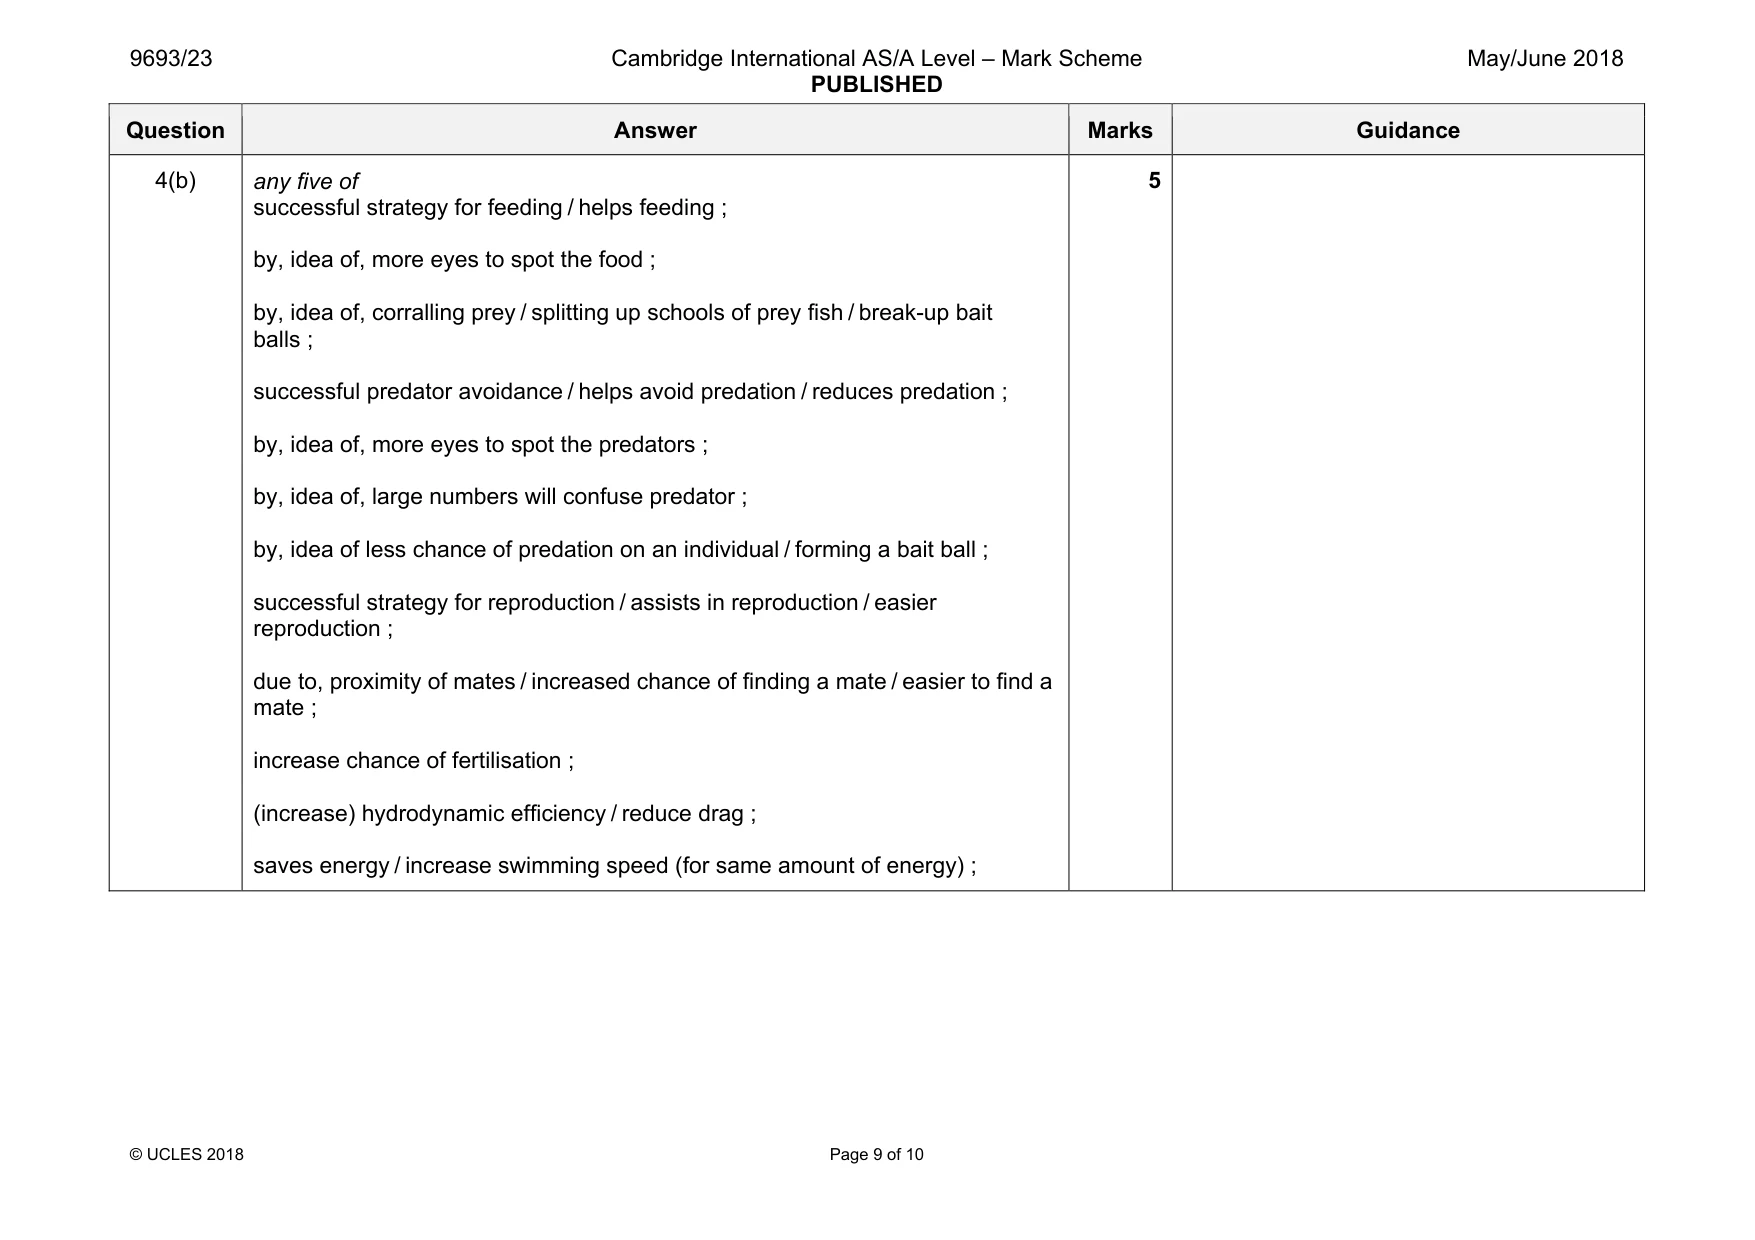
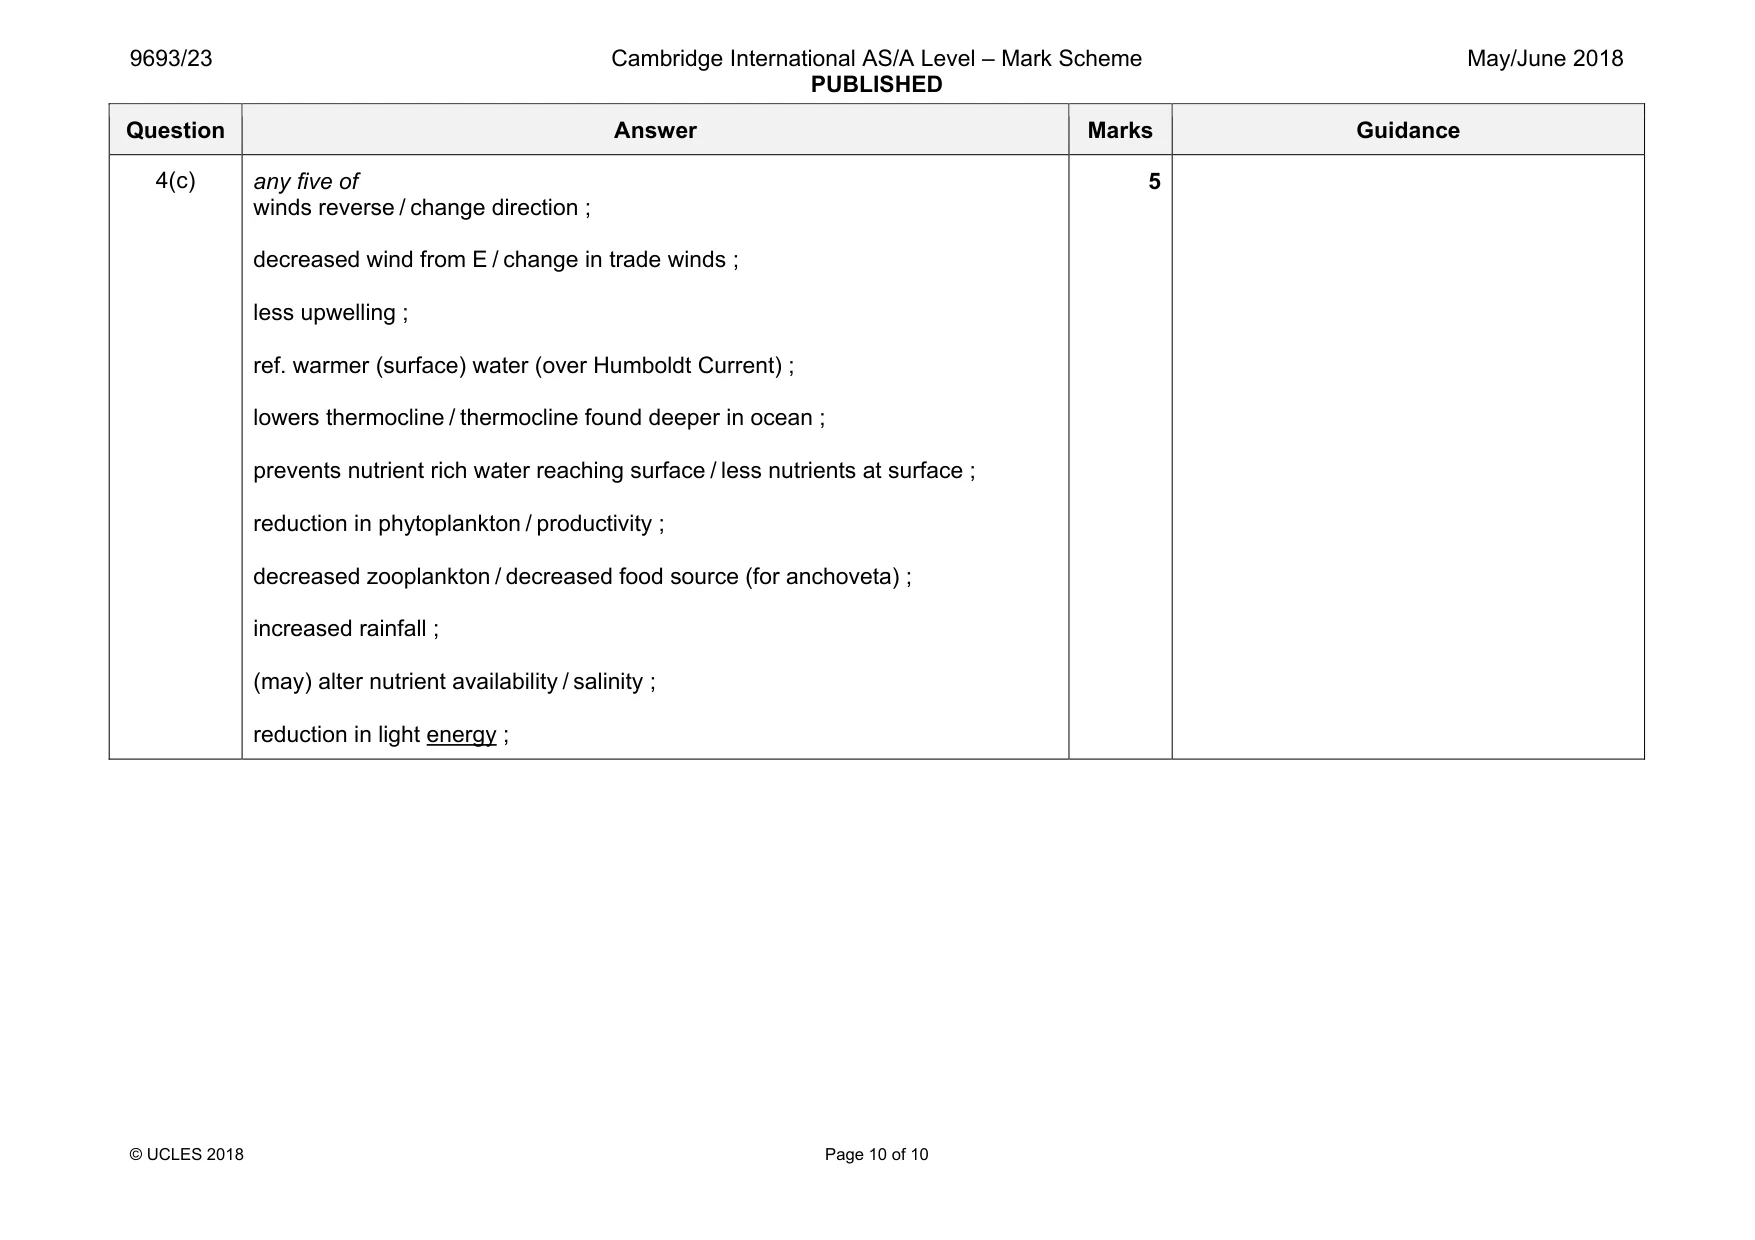
4 The Humboldt Current off the coasts of Chile and Peru causes upwelling. This supports huge shoals of the Peruvian anchoveta, which provide the greatest catches of any fish species. (a) Explain how upwelling supports large numbers of fish. ................................................................................................................................................... ................................................................................................................................................... ................................................................................................................................................... ................................................................................................................................................... ................................................................................................................................................... ................................................................................................................................................... ................................................................................................................................................... ................................................................................................................................................... ................................................................................................................................................... .............................................................................................................................................. [5] (b) Discuss the advantages of shoaling in fish such as the Peruvian anchoveta. ................................................................................................................................................... ................................................................................................................................................... ................................................................................................................................................... ................................................................................................................................................... ................................................................................................................................................... ................................................................................................................................................... ................................................................................................................................................... ................................................................................................................................................... ................................................................................................................................................... .............................................................................................................................................. [5] (c) Describe the causes of El Niño events. Explain how such an event may result in the collapse of the Peruvian anchoveta population. ................................................................................................................................................... ................................................................................................................................................... ................................................................................................................................................... ................................................................................................................................................... ................................................................................................................................................... ................................................................................................................................................... ................................................................................................................................................... ................................................................................................................................................... ................................................................................................................................................... .............................................................................................................................................. [5] [Total: 15]
Mark scheme: 4(a) any five of nutrient rich water ; ref. named nutrient ; rise up from depth / upwellings ; idea of, replenishing nutrients in surface ; stimulates growth / reproduction of phytoplankton / producers ; increases productivity ; increase food / energy / (zoo)plankton, for fish (such as anchoveta) ; 5 Question Answer Marks Guidance 4(b) any five of successful strategy for feeding / helps feeding ; by, idea of, more eyes to spot the food ; by, idea of, corralling prey / splitting up schools of prey fish / break-up bait balls ; successful predator avoidance / helps avoid predation / reduces predation ; by, idea of, more eyes to spot the predators ; by, idea of, large numbers will confuse predator ; by, idea of less chance of predation on an individual / forming a bait ball ; successful strategy for reproduction / assists in reproduction / easier reproduction ; due to, proximity of mates / increased chance of finding a mate / easier to find a mate ; increase chance of fertilisation ; (increase) hydrodynamic efficiency / reduce drag ; saves energy / increase swimming speed (for same amount of energy) ; 5 Question Answer Marks Guidance 4(c) any five of winds reverse / change direction ; decreased wind from E / change in trade winds ; less upwelling ; ref. warmer (surface) water (over Humboldt Current) ; lowers thermocline / thermocline found deeper in ocean ; prevents nutrient rich water reaching surface / less nutrients at surface ; reduction in phytoplankton / productivity ; decreased zooplankton / decreased food source (for anchoveta) ; increased rainfall ; (may) alter nutrient availability / salinity ; reduction in light energy ; 5
What was in this paper
The subtopics covered by these 4 questions, and how many questions each got. Open one in a new tab to see every Cambridge question on it.
What you needed in this session
Cambridge’s own grade thresholds for 2018 May/June, Paper 2 · Variant 3. A higher threshold means an easier paper — the bar moves with how the cohort did.