Cambridge A Level Marine Science 9693 — 2024 May/June Paper 2 · Variant 3
9693/23/M/J/24 · 5 questions · 75 marks · ≈84 min
The question paper and its mark scheme, free to read here and free to download. This is Cambridge’s own paper, exactly as it was sat.
Question paper20 pages






Mark scheme10 pages
Answers below. Sit the paper first if you are practising.
Questions as text
Q1 · When sea water temperature increases, coral polyps release zooxanthellae
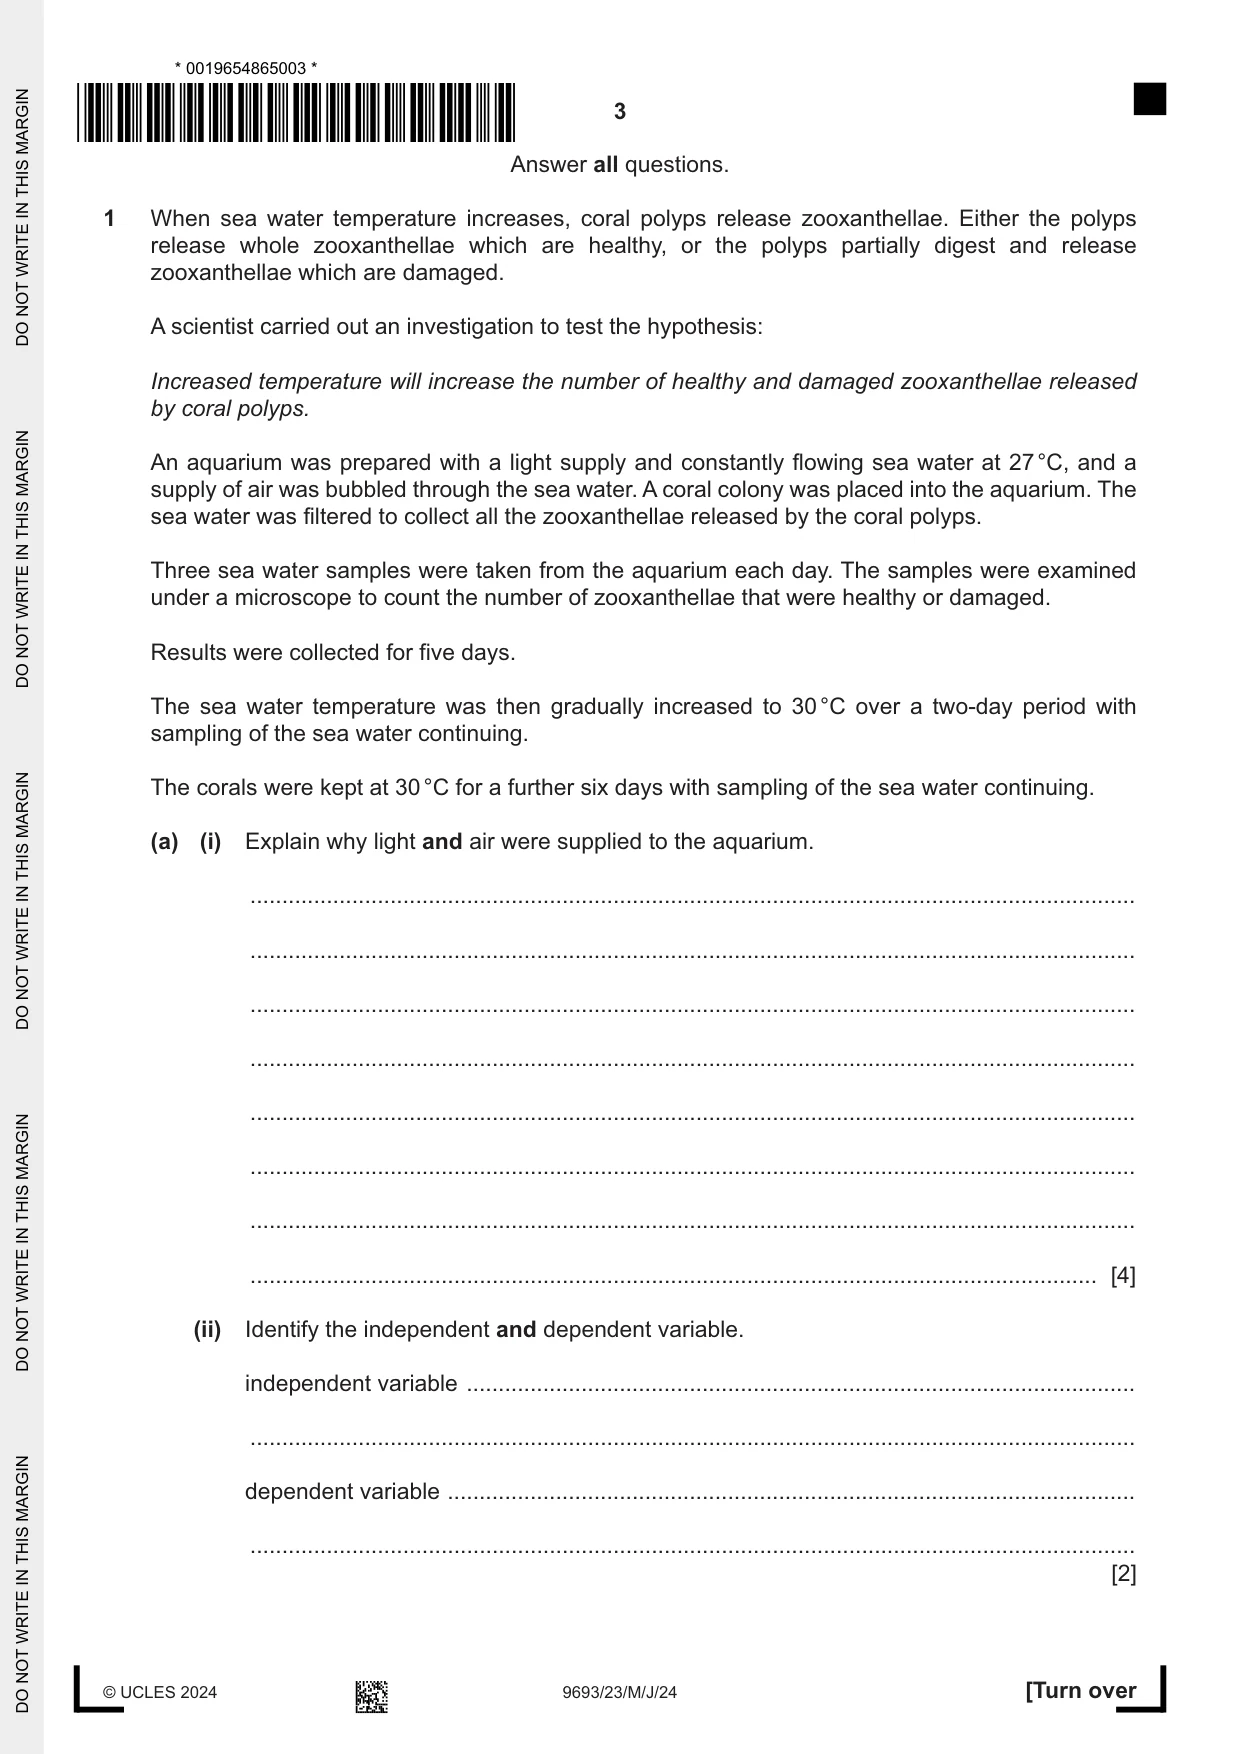
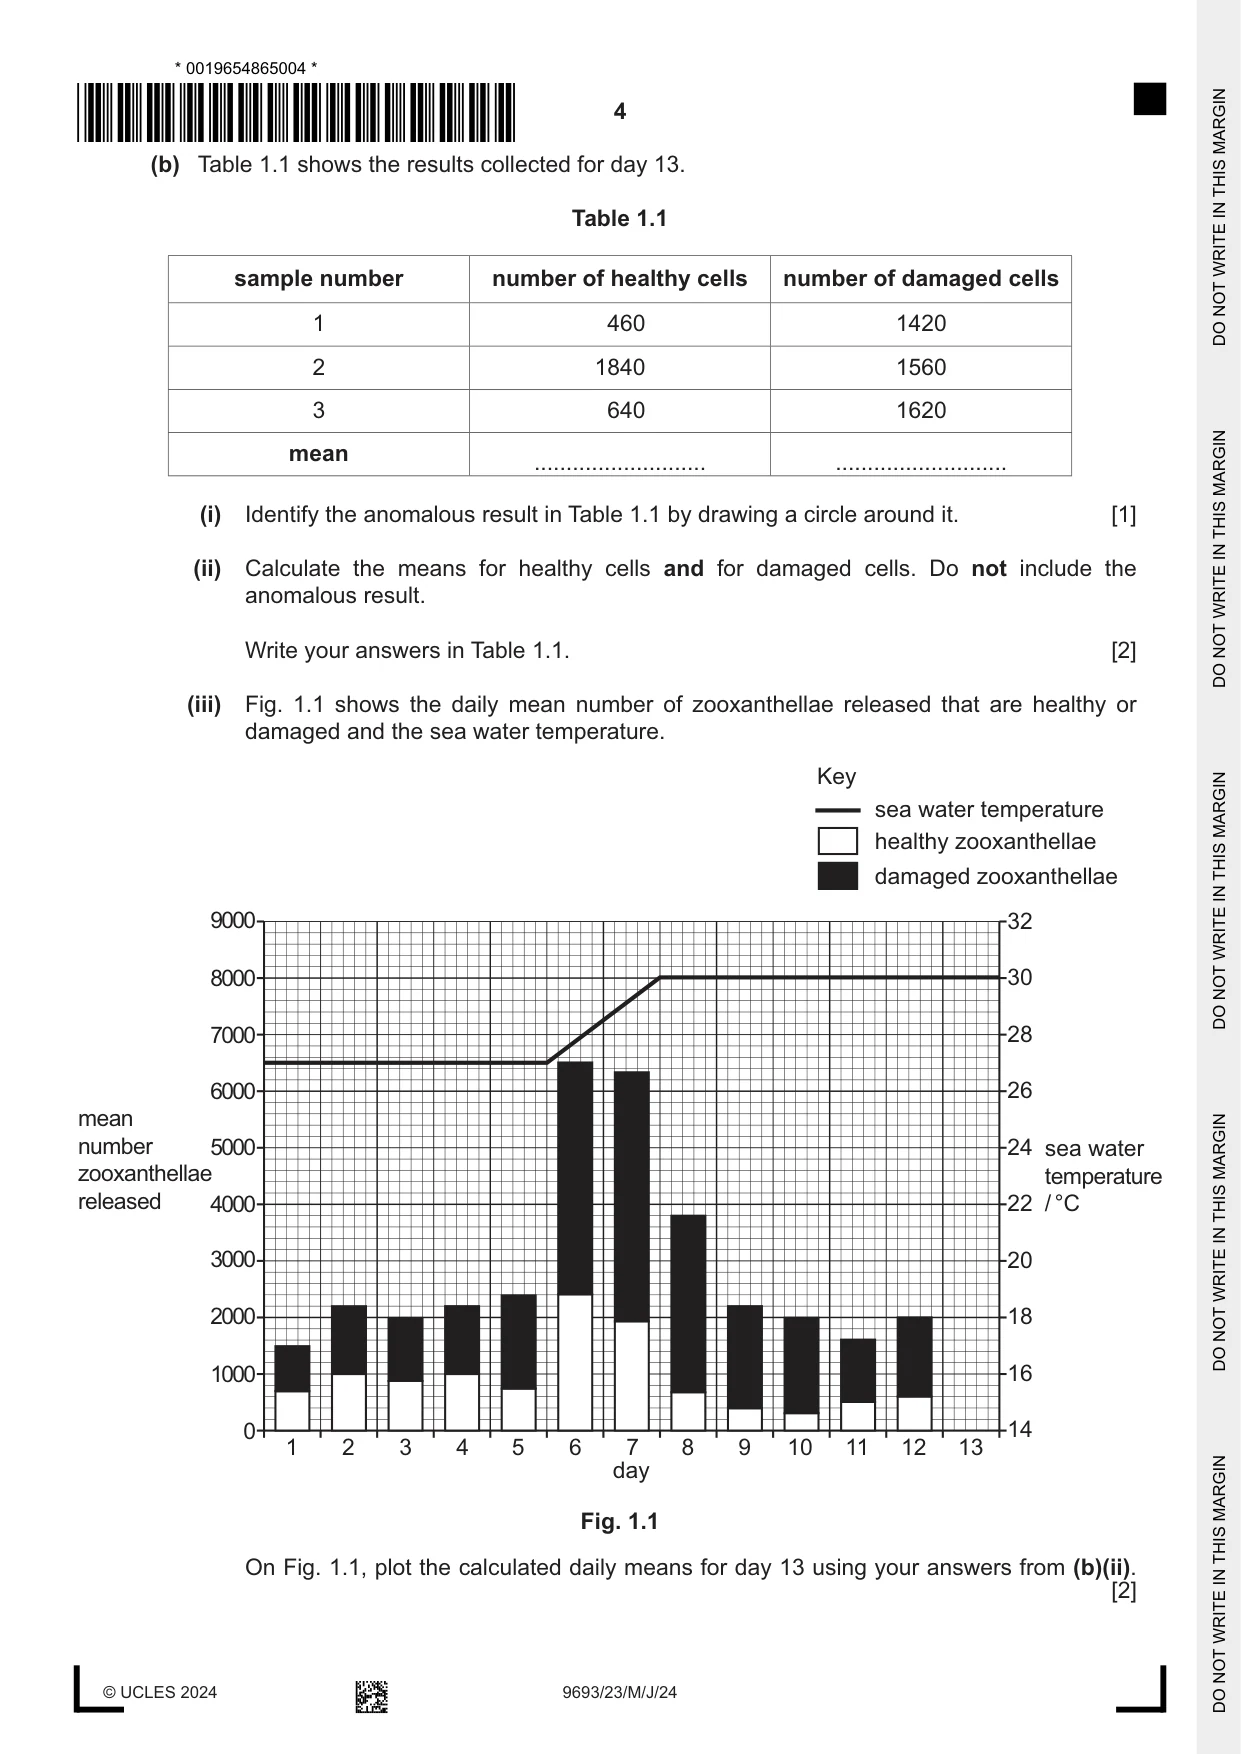
1 When sea water temperature increases, coral polyps release zooxanthellae. Either the polyps release whole zooxanthellae which are healthy, or the polyps partially digest and release zooxanthellae which are damaged. A scientist carried out an investigation to test the hypothesis: Increased temperature will increase the number of healthy and damaged zooxanthellae released by coral polyps. An aquarium was prepared with a light supply and constantly flowing sea water at 27 °C, and a supply of air was bubbled through the sea water. A coral colony was placed into the aquarium. The sea water was filtered to collect all the zooxanthellae released by the coral polyps. Three sea water samples were taken from the aquarium each day. The samples were examined under a microscope to count the number of zooxanthellae that were healthy or damaged. Results were collected for five days. The sea water temperature was then gradually increased to 30 °C over a two-day period with sampling of the sea water continuing. The corals were kept at 30 °C for a further six days with sampling of the sea water continuing. (a) (i) Explain why light and air were supplied to the aquarium. ........................................................................................................................................... ........................................................................................................................................... ........................................................................................................................................... ........................................................................................................................................... ........................................................................................................................................... ........................................................................................................................................... ........................................................................................................................................... ..................................................................................................................................... [4] (ii) Identify the independent and dependent variable. independent variable ......................................................................................................... ........................................................................................................................................... dependent variable ............................................................................................................ ........................................................................................................................................... [2] (b) Table 1.1 shows the results collected for day 13. Table 1.1 sample number number of healthy cells number of damaged cells 1 460 1420 2 1840 1560 3 640 1620 mean ........................... ........................... (i) Identify the anomalous result in Table 1.1 by drawing a circle around it. [1] (ii) Calculate the means for healthy cells and for damaged cells. Do not include the anomalous result. Write your answers in Table 1.1. [2] (iii) Fig. 1.1 shows the daily mean number of zooxanthellae released that are healthy or damaged and the sea water temperature. Key sea water temperature healthy zooxanthellae damaged zooxanthellae 9000 32 8000 30 7000 28 6000 26 mean number 5000 24 sea water zooxanthellae temperature released 4000 22 / °C 3000 20 2000 18 1000 16 0 14 1 2 3 4 5 6 7 8 9 10 11 12 13 day Fig. 1.1 On Fig. 1.1, plot the calculated daily means for day 13 using your answers from (b)(ii). [2] (iv) Discuss the extent to which the results of the investigation support the hypothesis the scientist was testing. ........................................................................................................................................... ........................................................................................................................................... ........................................................................................................................................... ..................................................................................................................................... [2] (c) On day 4, the number of zooxanthellae released was 0.04% of the total zooxanthellae held in one coral polyp. Calculate the number of zooxanthellae living in one coral polyp. Show your working. .......................................................... [2] [Total: 15]
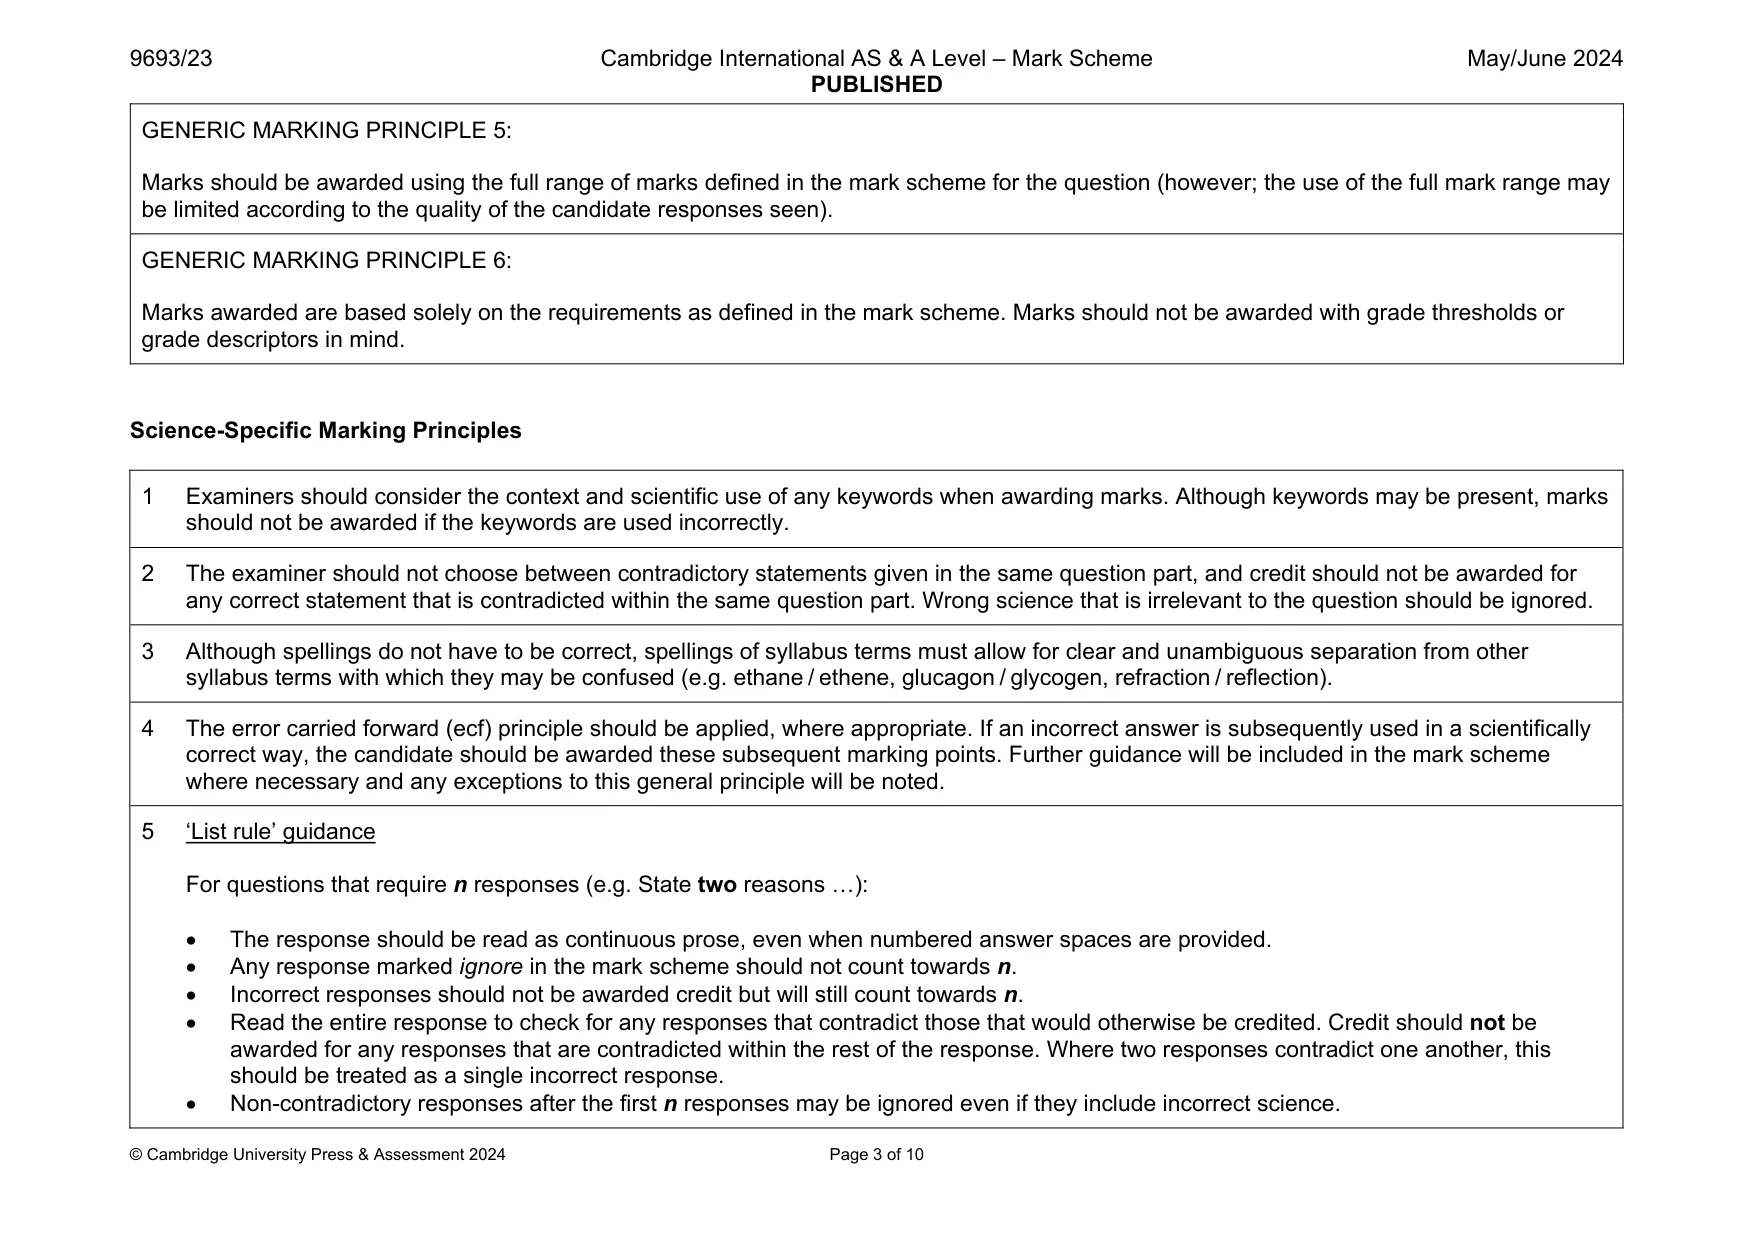
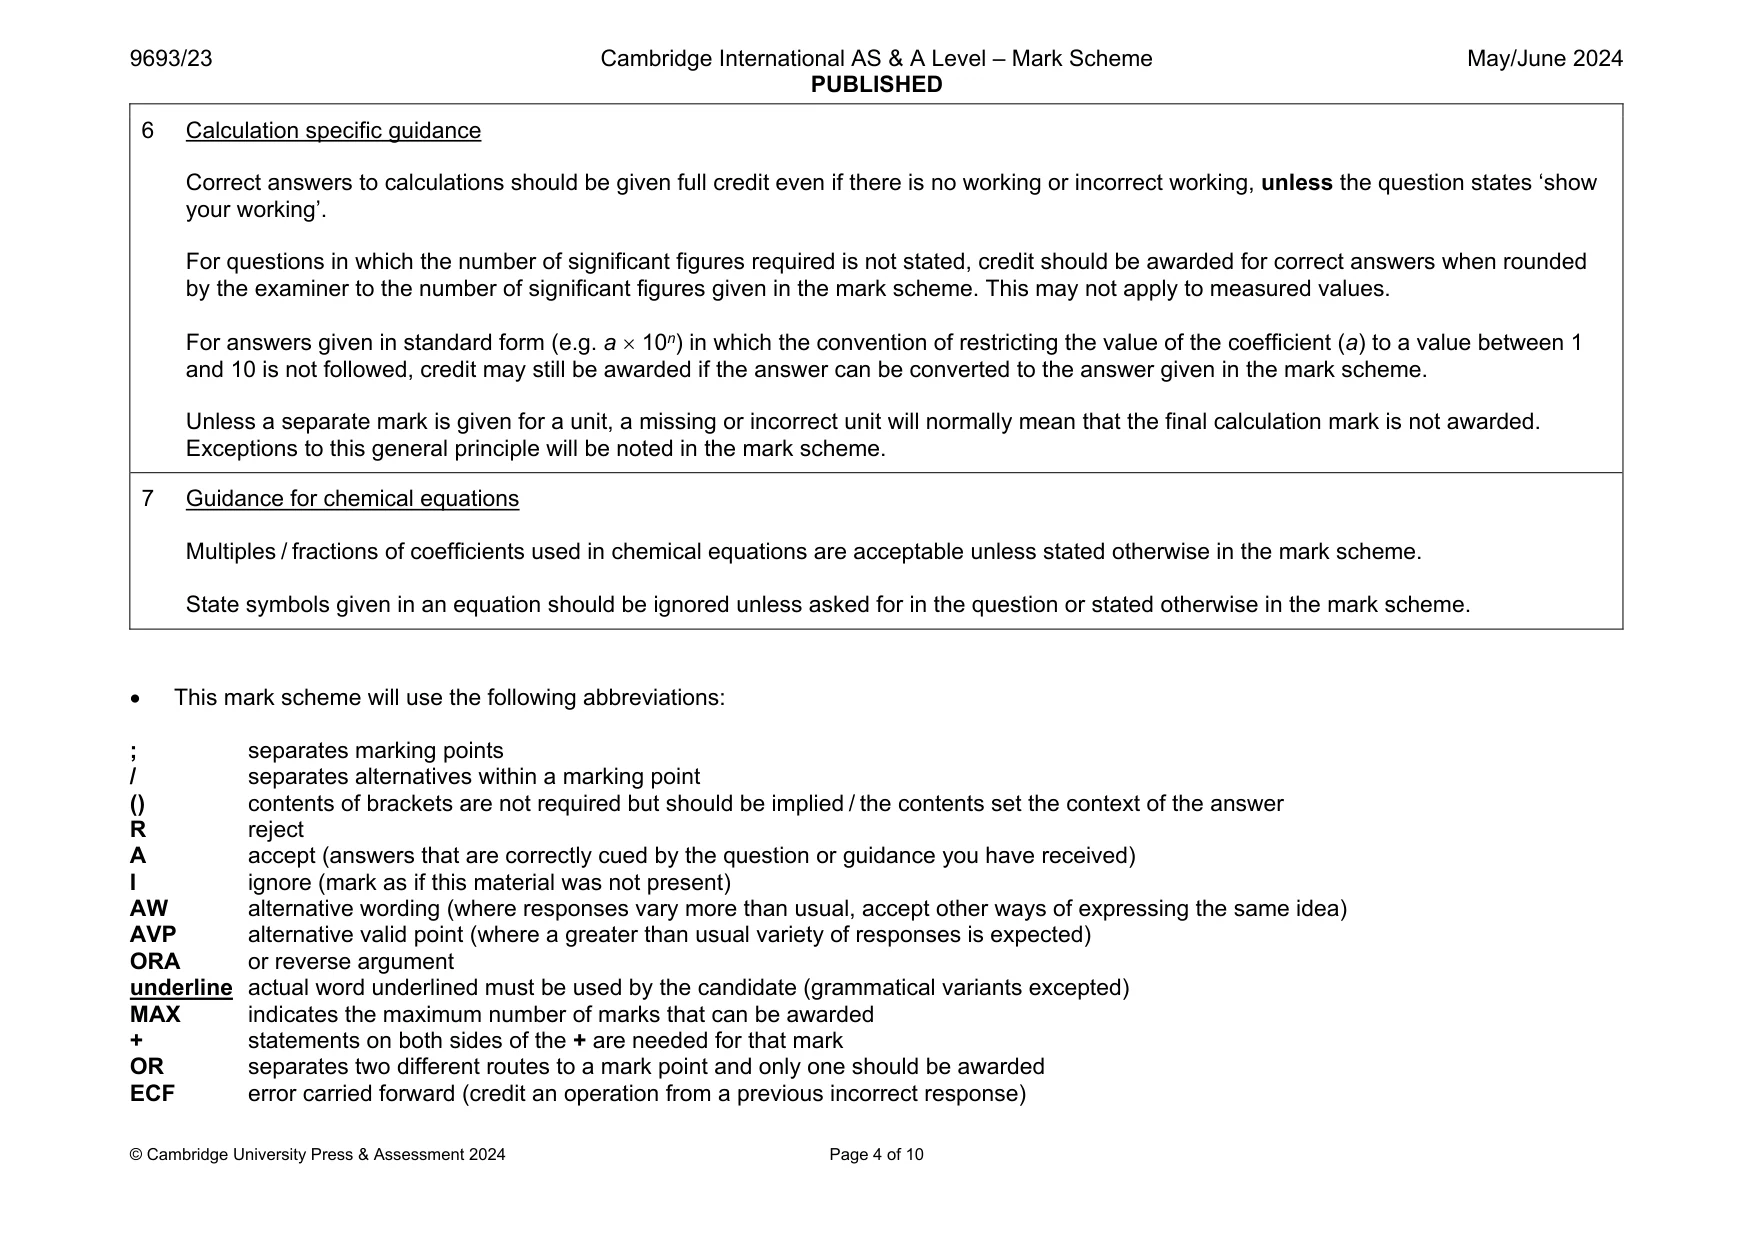
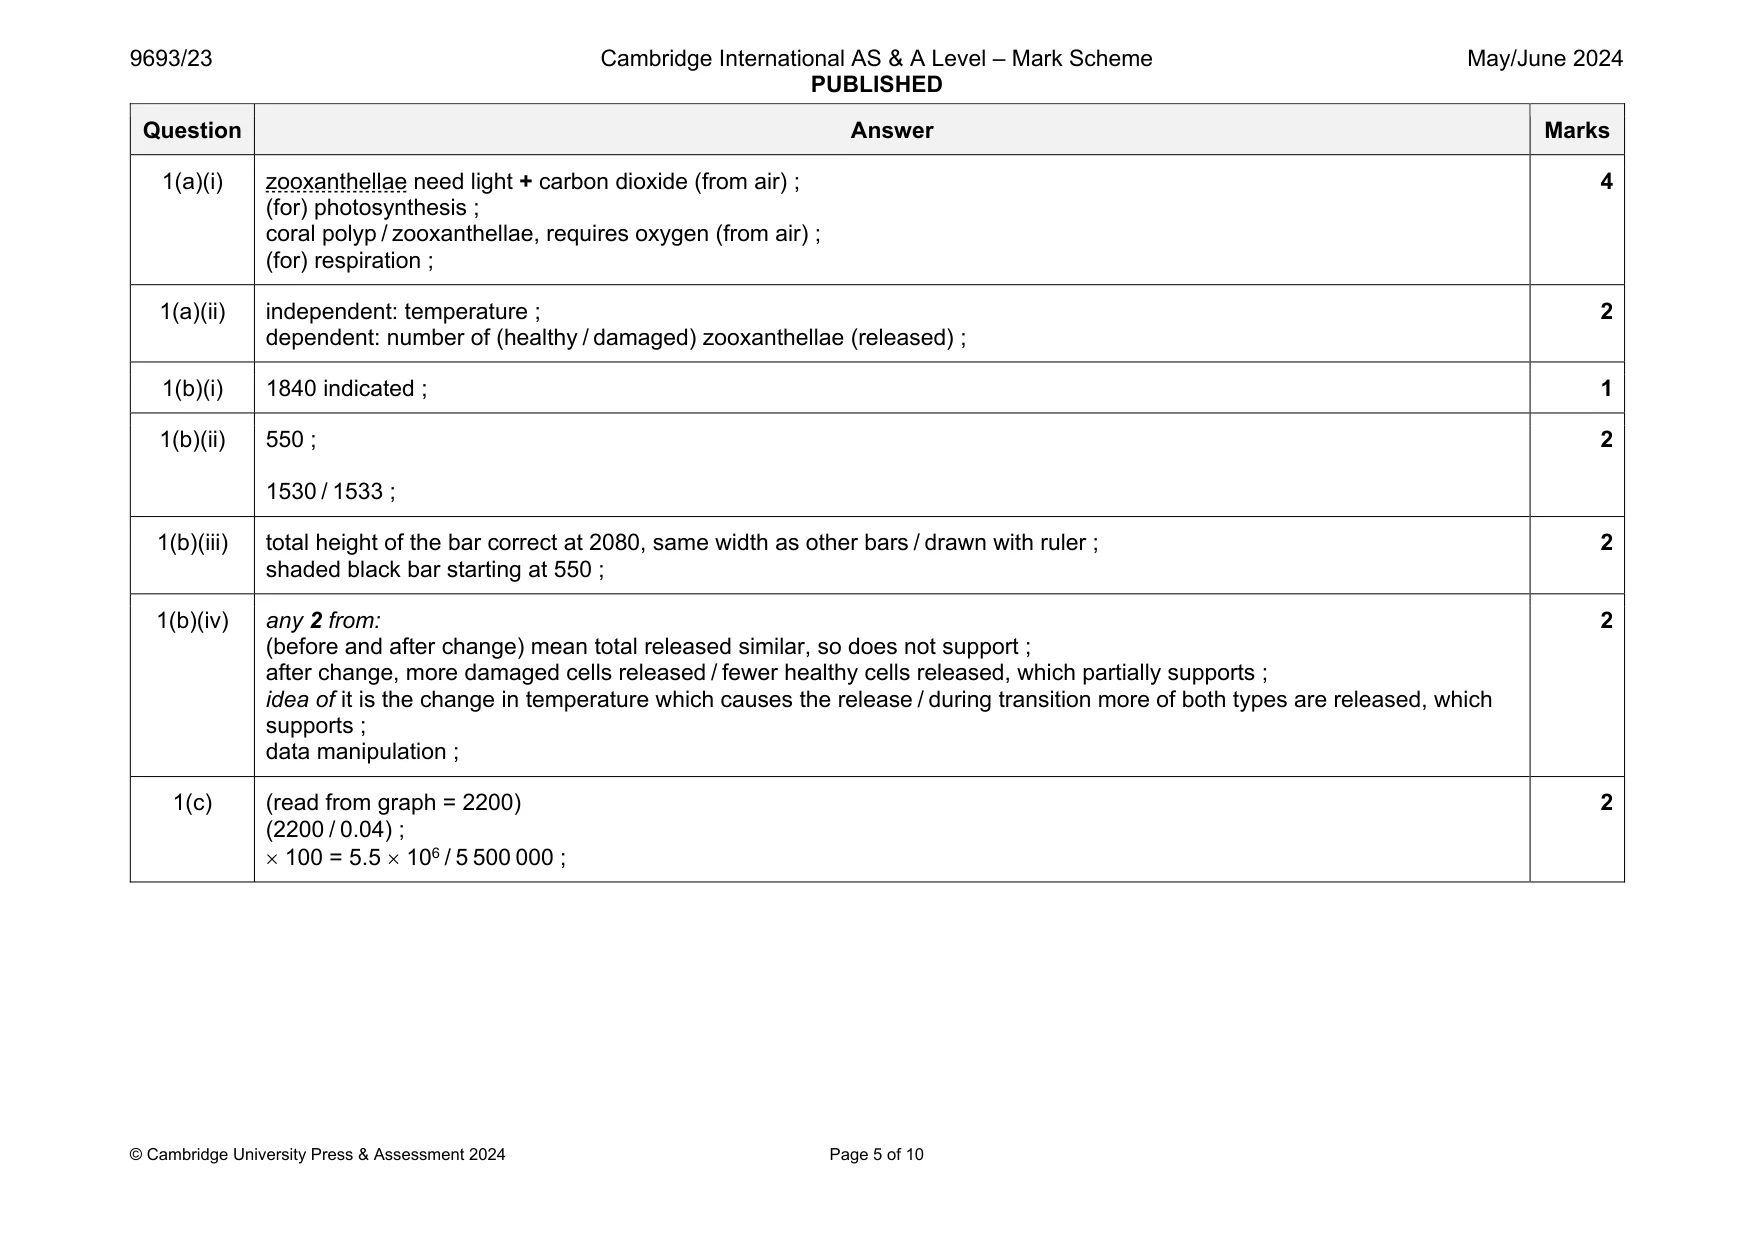
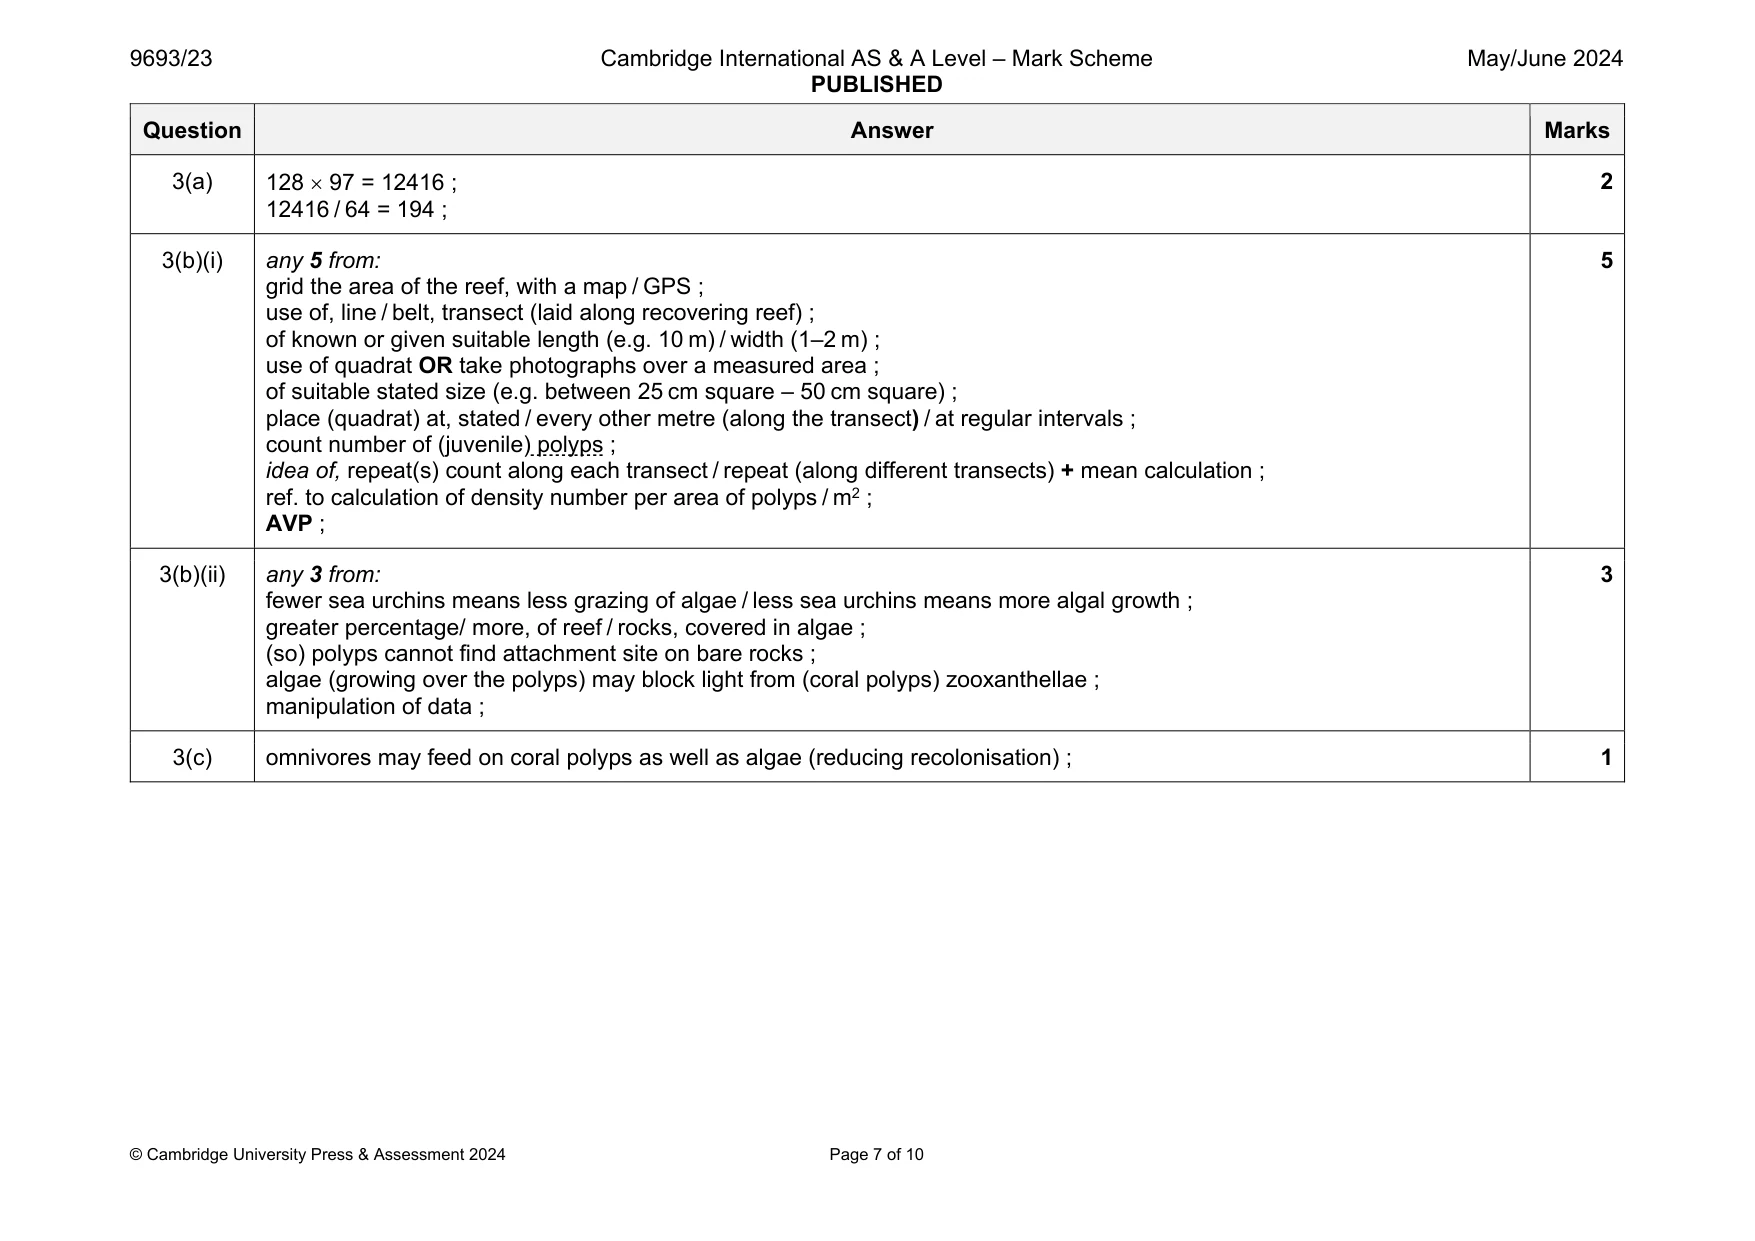
Mark scheme: 1(a)(i) zooxanthellae need light + carbon dioxide (from air) ; (for) photosynthesis ; coral polyp / zooxanthellae, requires oxygen (from air) ; (for) respiration ; 4 1(a)(ii) independent: temperature ; dependent: number of (healthy / damaged) zooxanthellae (released) ; 2 1(b)(i) 1840 indicated ; 1 1(b)(ii) 550 ; 1530 / 1533 ; 2 1(b)(iii) total height of the bar correct at 2080, same width as other bars / drawn with ruler ; shaded black bar starting at 550 ; 2 1(b)(iv) any 2 from: (before and after change) mean total released similar, so does not support ; after change, more damaged cells released / fewer healthy cells released, which partially supports ; idea of it is the change in temperature which causes the release / during transition more of both types are released, which supports ; data manipulation ; 2 1(c) (read from graph = 2200) (2200 / 0.04) ; 100 = 5.5 106 / 5 500 000 ; 2
Q2 · A plaice, Pleuronectes platessa
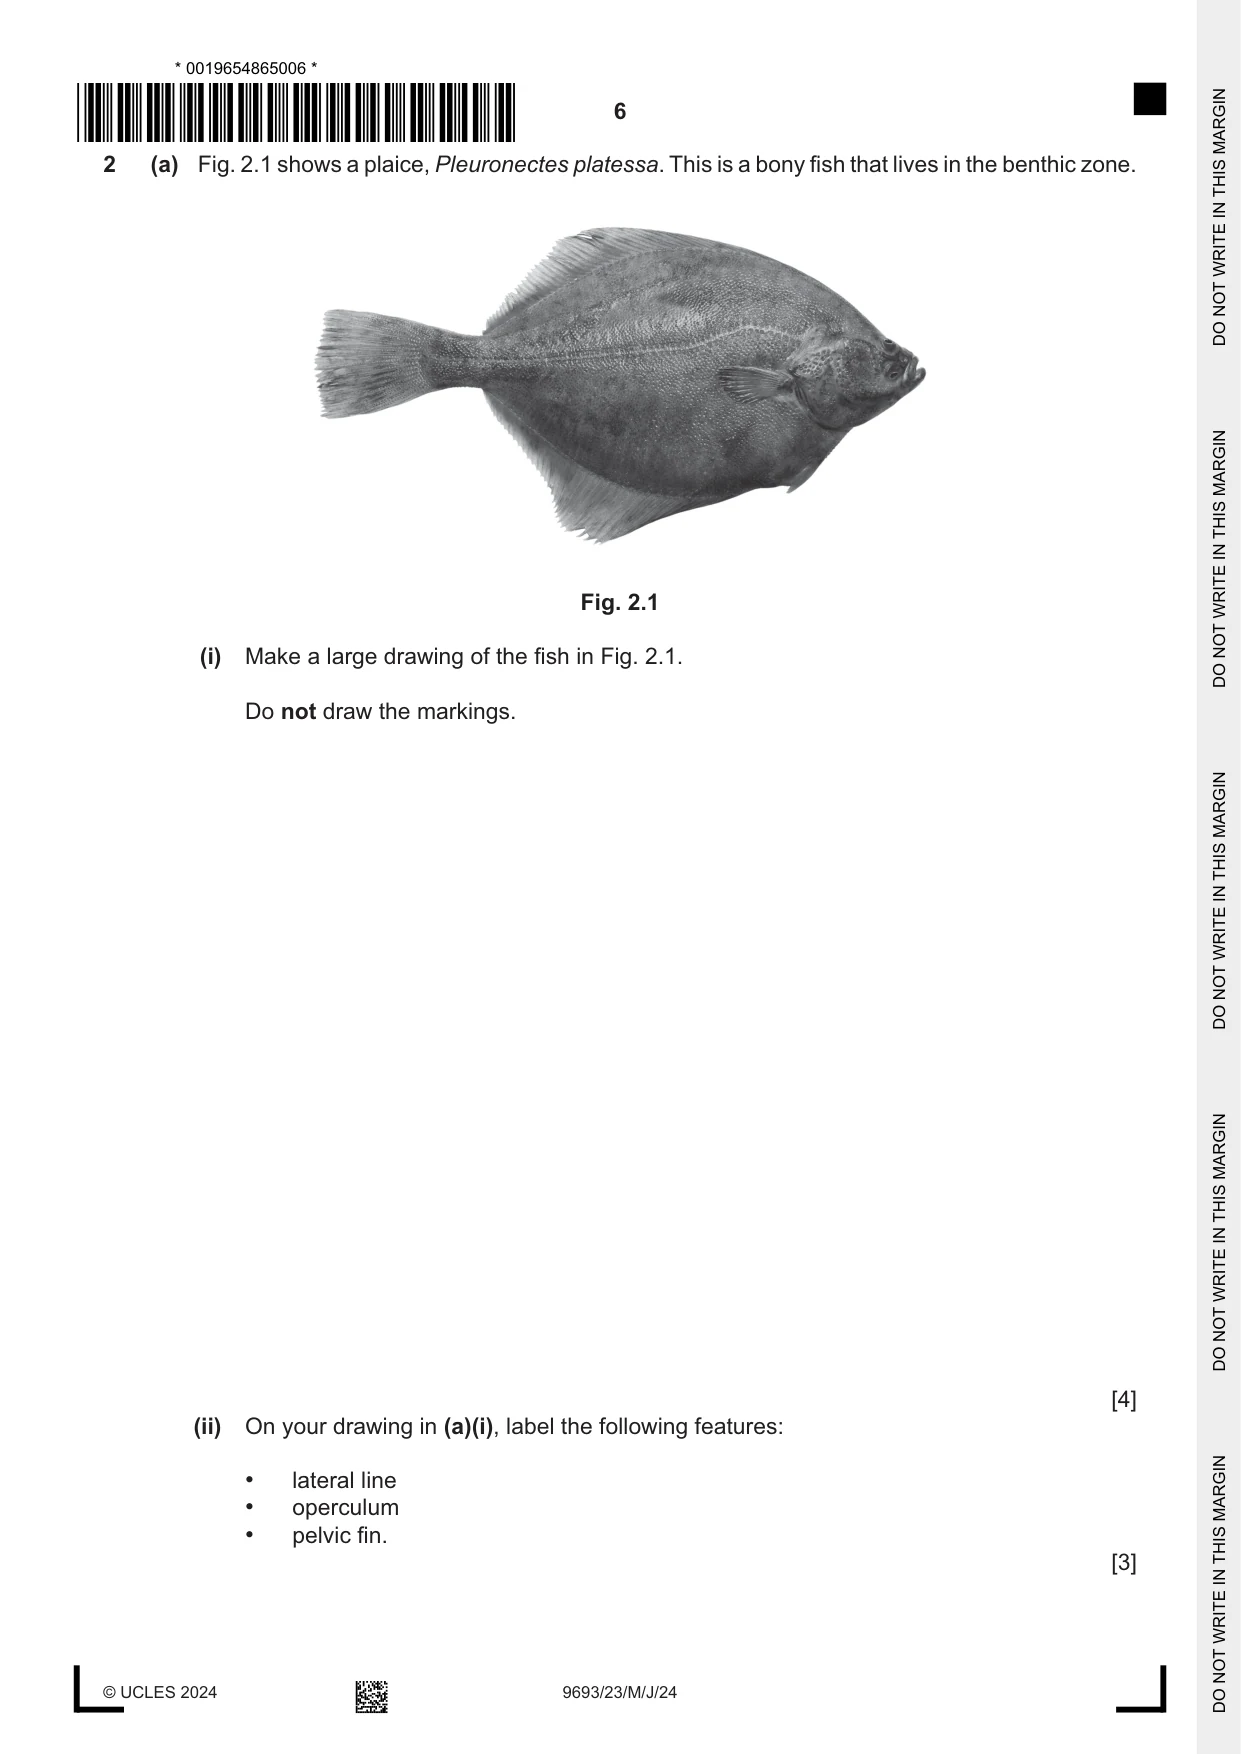
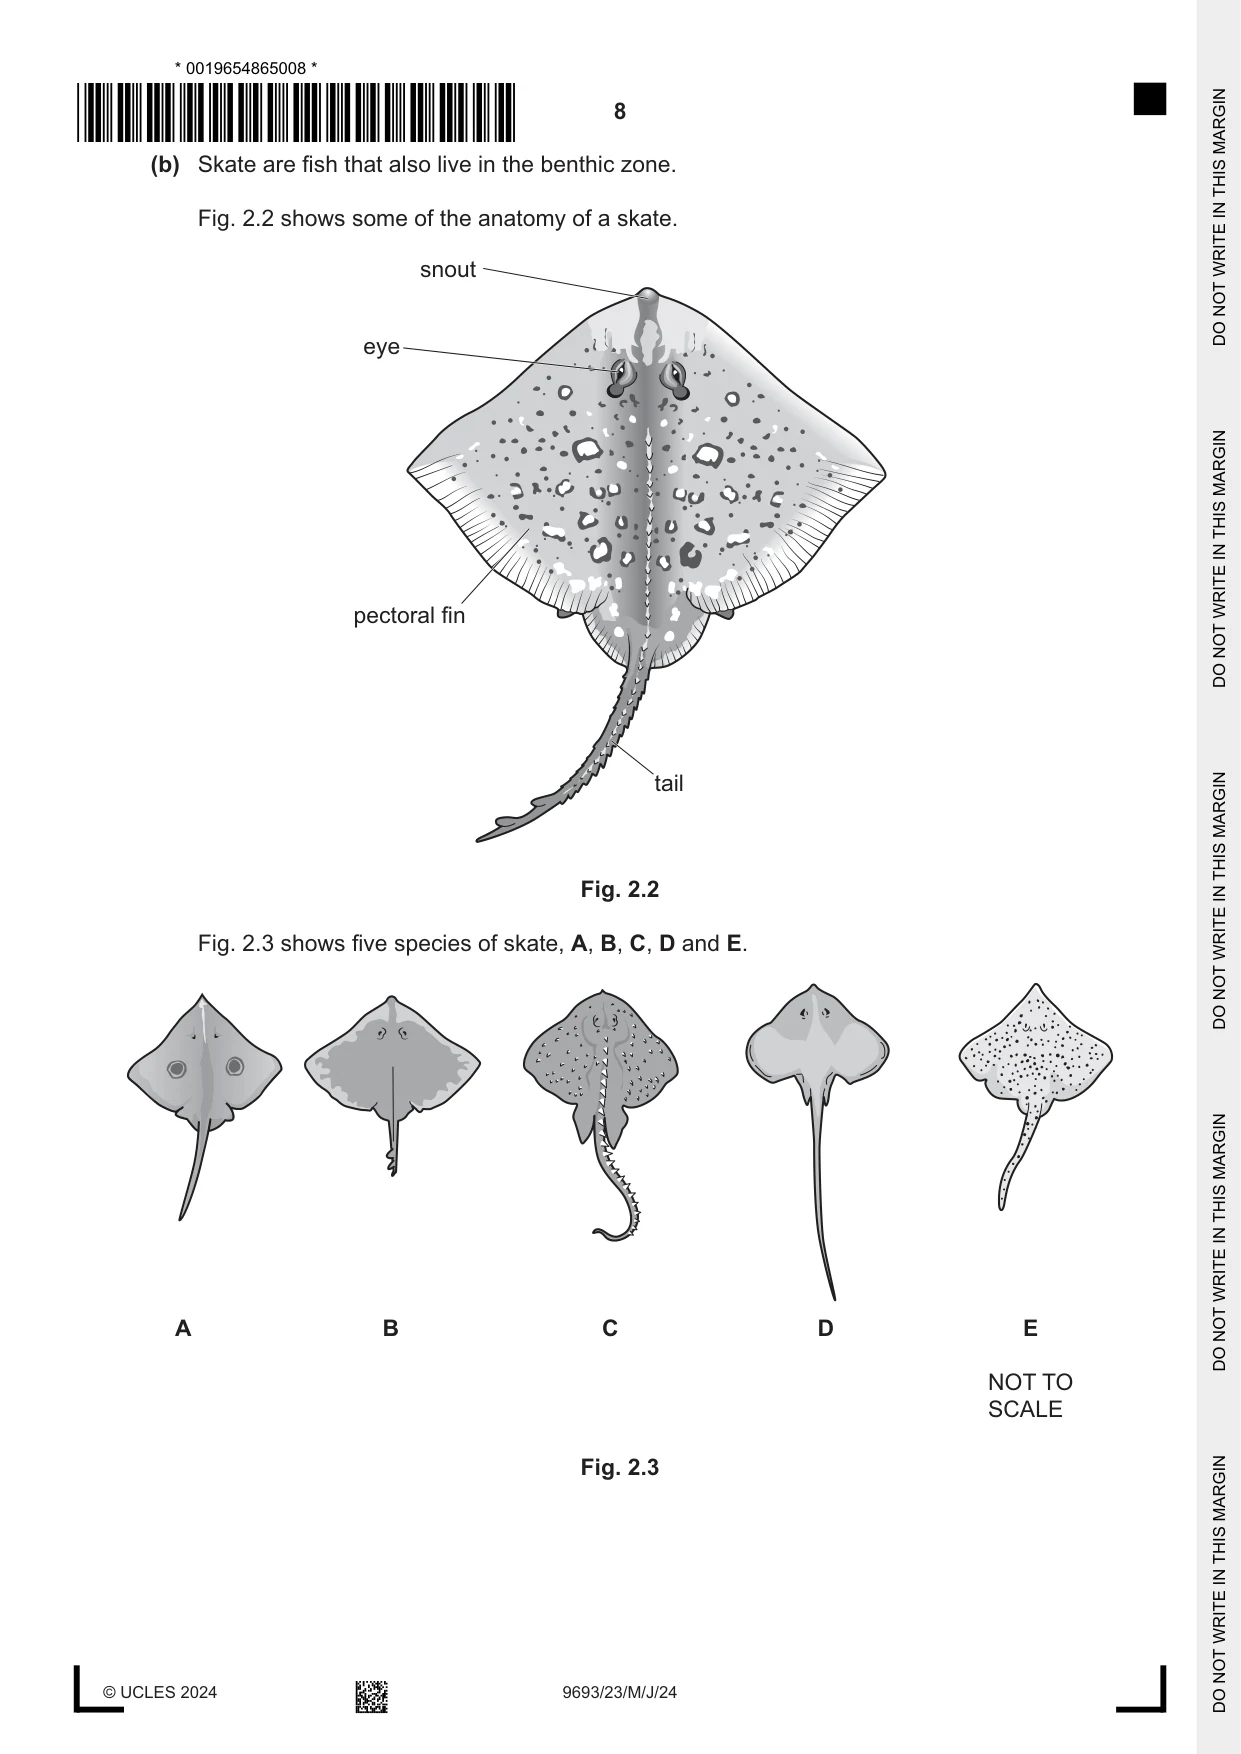
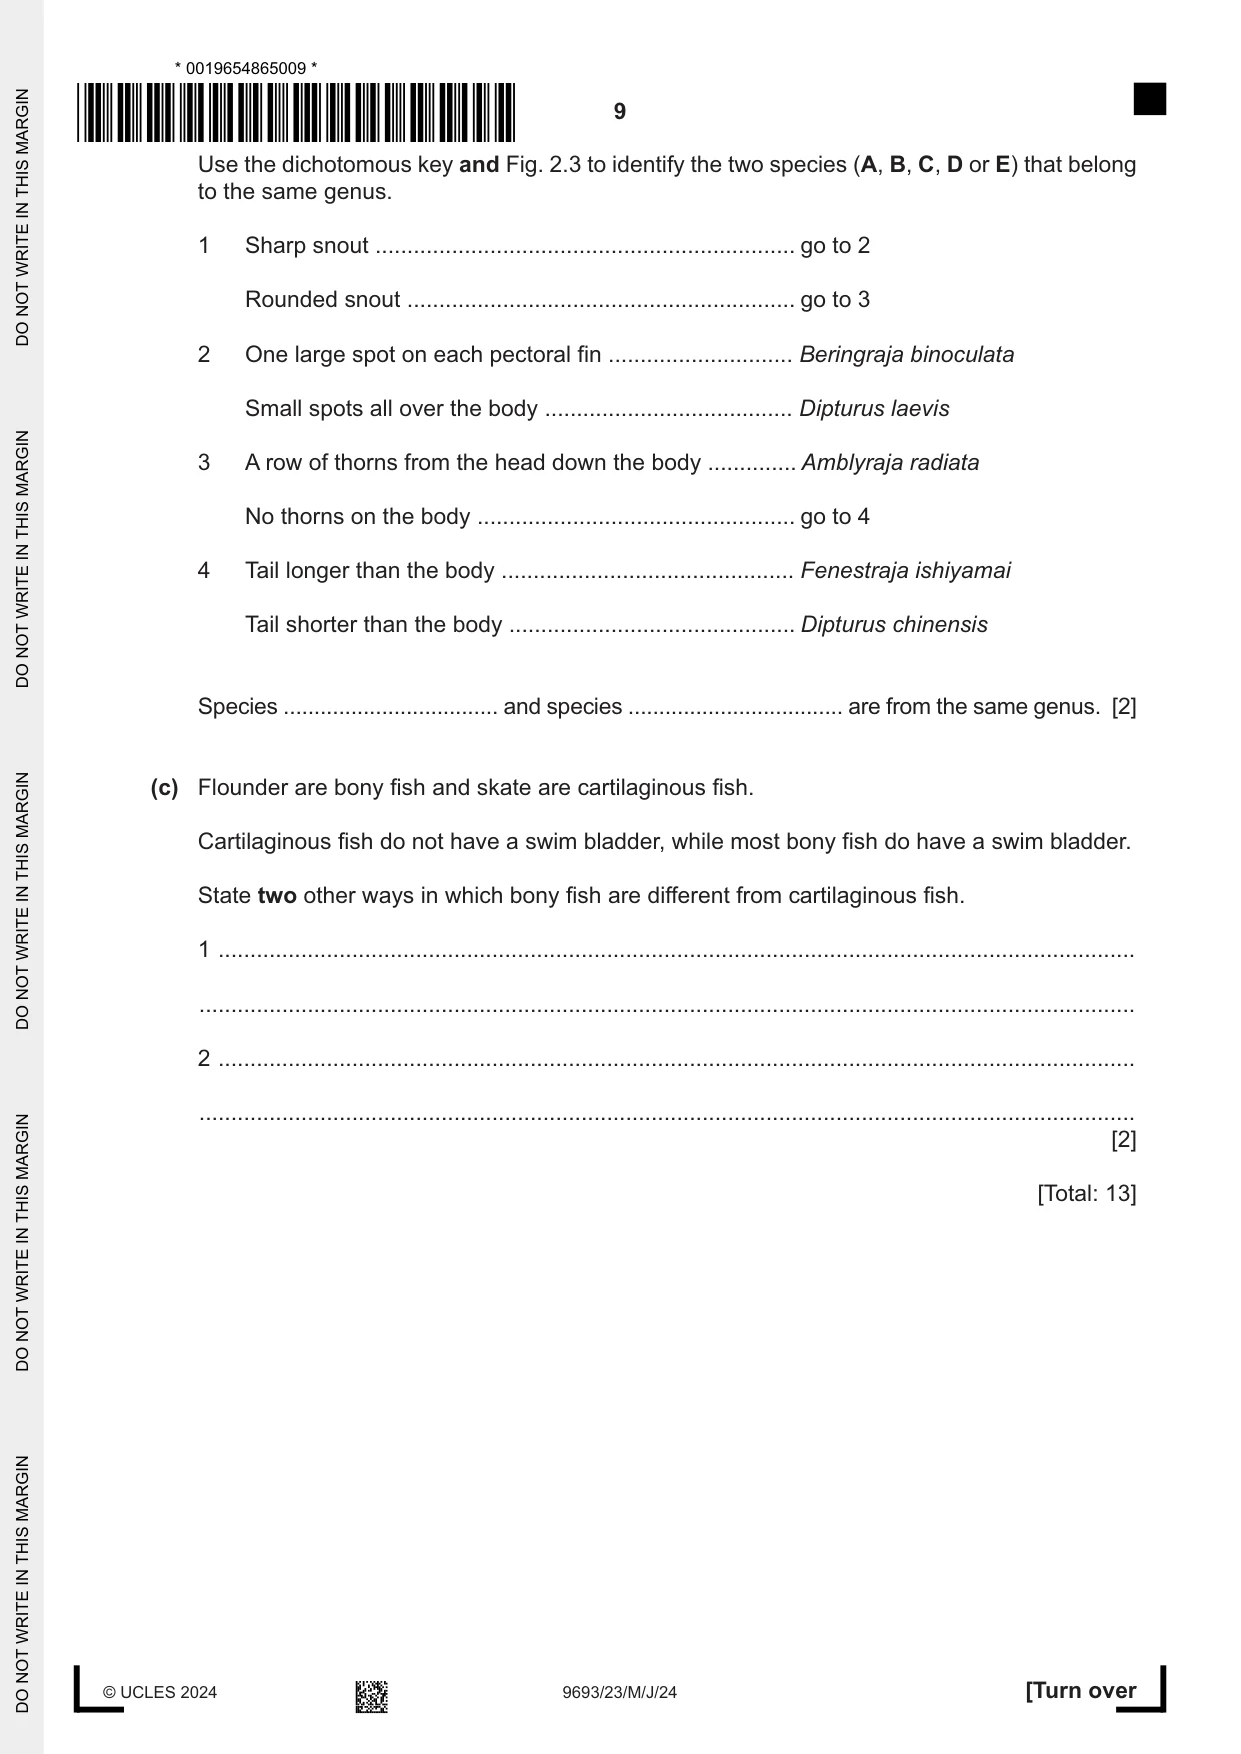
2 (a) Fig. 2.1 shows a plaice, Pleuronectes platessa. This is a bony fish that lives in the benthic zone. Fig. 2.1 (i) Make a large drawing of the fish in Fig. 2.1. Do not draw the markings. [4] (ii) On your drawing in (a)(i), label the following features: • lateral line • operculum • pelvic fin. [3] (iii) The larvae of plaice live in the zooplankton community. When they reach a length of 2.5 cm, they settle on the sea bed and during their development their organs migrate to one side of their body. Suggest why adult plaice do not have a swim bladder but the larvae do have a swim bladder. ........................................................................................................................................... ........................................................................................................................................... ........................................................................................................................................... ..................................................................................................................................... [2] (b) Skate are fish that also live in the benthic zone. Fig. 2.2 shows some of the anatomy of a skate. snout eye pectoral fin tail Fig. 2.2 Fig. 2.3 shows five species of skate, A, B, C, D and E. A B C D E NOT TO SCALE Fig. 2.3 Use the dichotomous key and Fig. 2.3 to identify the two species (A, B, C, D or E) that belong to the same genus. 1 Sharp snout .................................................................. go to 2 Rounded snout ............................................................. go to 3 2 One large spot on each pectoral fin ............................. Beringraja binoculata Small spots all over the body ....................................... Dipturus laevis 3 A row of thorns from the head down the body .............. Amblyraja radiata No thorns on the body .................................................. go to 4 4 Tail longer than the body .............................................. Fenestraja ishiyamai Tail shorter than the body ............................................. Dipturus chinensis Species ................................... and species ................................... are from the same genus. [2] (c) Flounder are bony fish and skate are cartilaginous fish. Cartilaginous fish do not have a swim bladder, while most bony fish do have a swim bladder. State two other ways in which bony fish are different from cartilaginous fish. 1 ................................................................................................................................................ ................................................................................................................................................... 2 ................................................................................................................................................ ................................................................................................................................................... [2] [Total: 13]
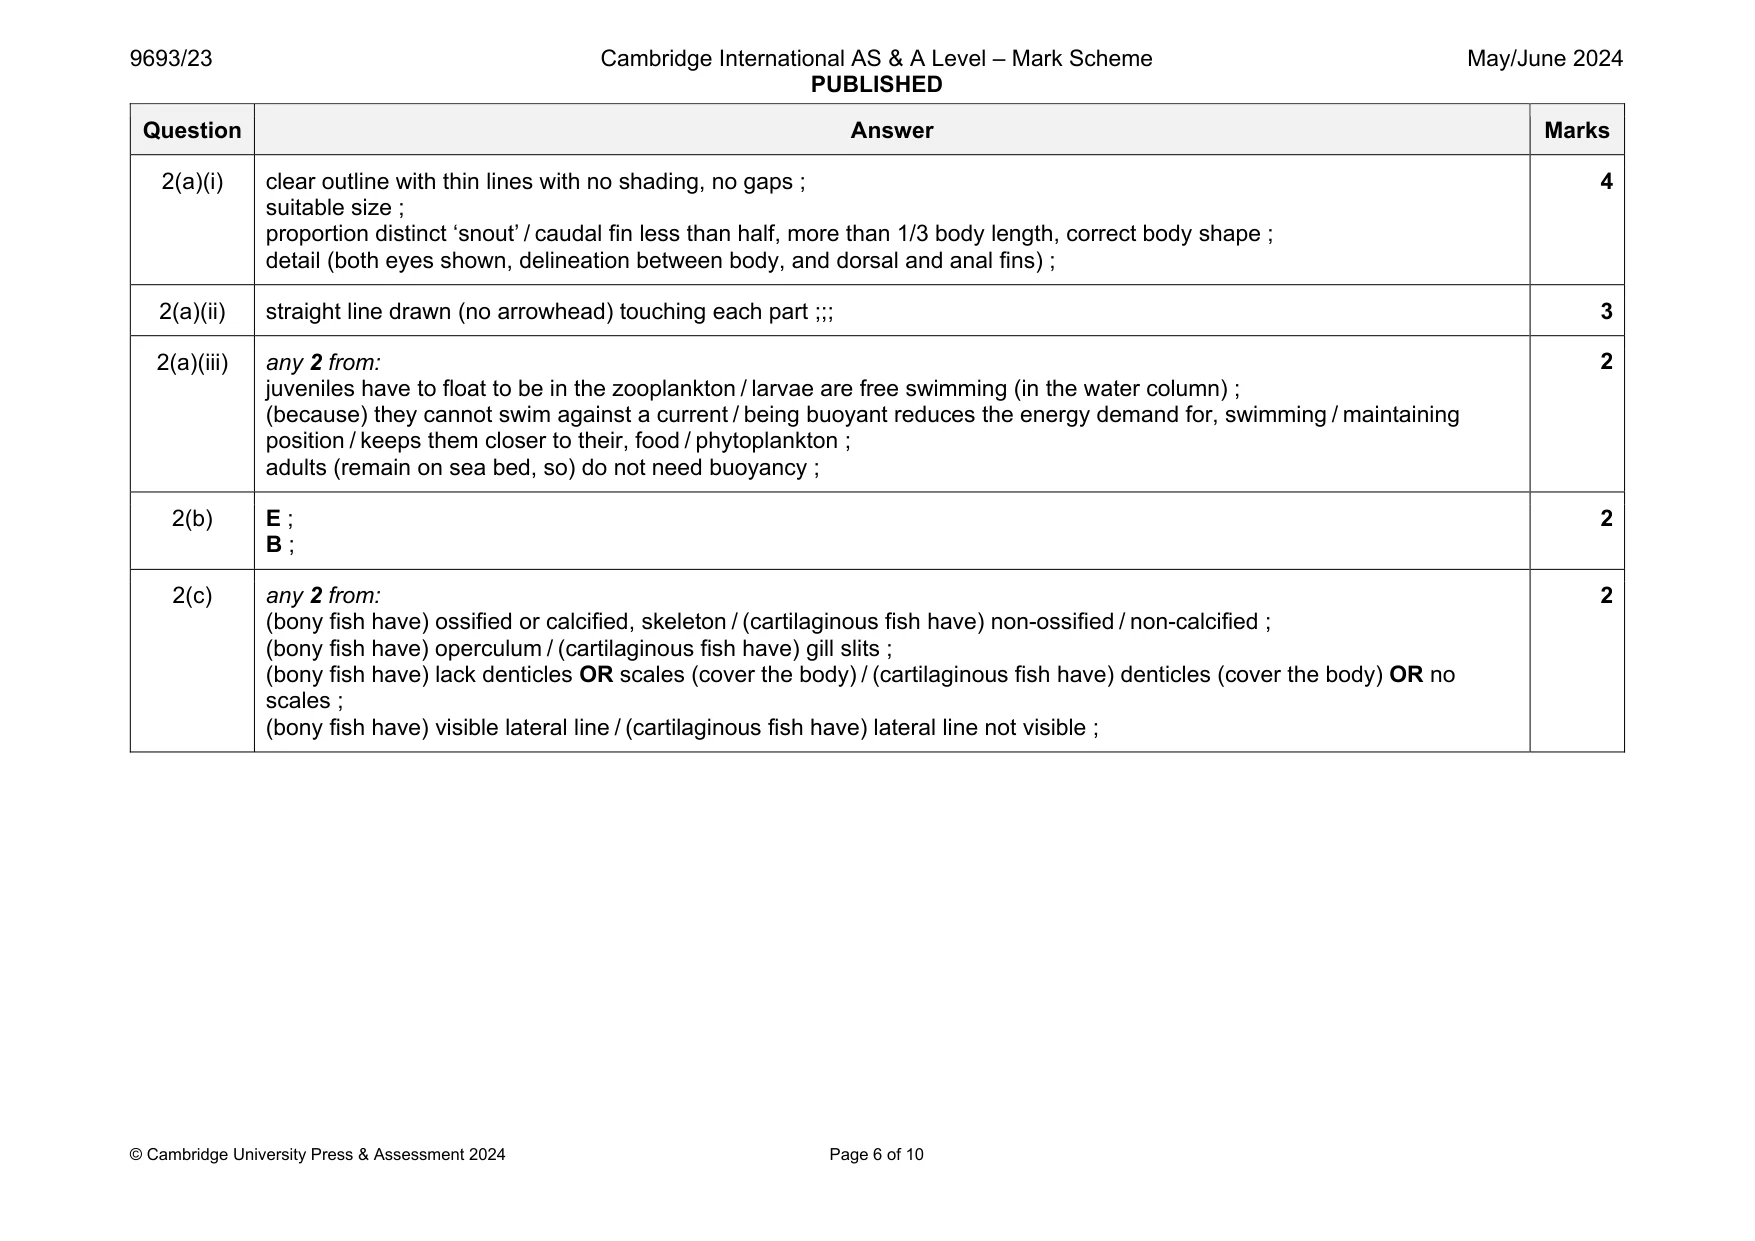
Mark scheme: 2(a)(i) clear outline with thin lines with no shading, no gaps ; suitable size ; proportion distinct ‘snout’ / caudal fin less than half, more than 1/3 body length, correct body shape ; detail (both eyes shown, delineation between body, and dorsal and anal fins) ; 4 2(a)(ii) straight line drawn (no arrowhead) touching each part ;;; 3 2(a)(iii) any 2 from: juveniles have to float to be in the zooplankton / larvae are free swimming (in the water column) ; (because) they cannot swim against a current / being buoyant reduces the energy demand for, swimming / maintaining position / keeps them closer to their, food / phytoplankton ; adults (remain on sea bed, so) do not need buoyancy ; 2 2(b) E ; B ; 2 2(c) any 2 from: (bony fish have) ossified or calcified, skeleton / (cartilaginous fish have) non-ossified / non-calcified ; (bony fish have) operculum / (cartilaginous fish have) gill slits ; (bony fish have) lack denticles OR scales (cover the body) / (cartilaginous fish have) denticles (cover the body) OR no scales ; (bony fish have) visible lateral line / (cartilaginous fish have) lateral line not visible ; 2
Q3 · A scientist used the mark-release-recapture technique to estimate the population size, N…
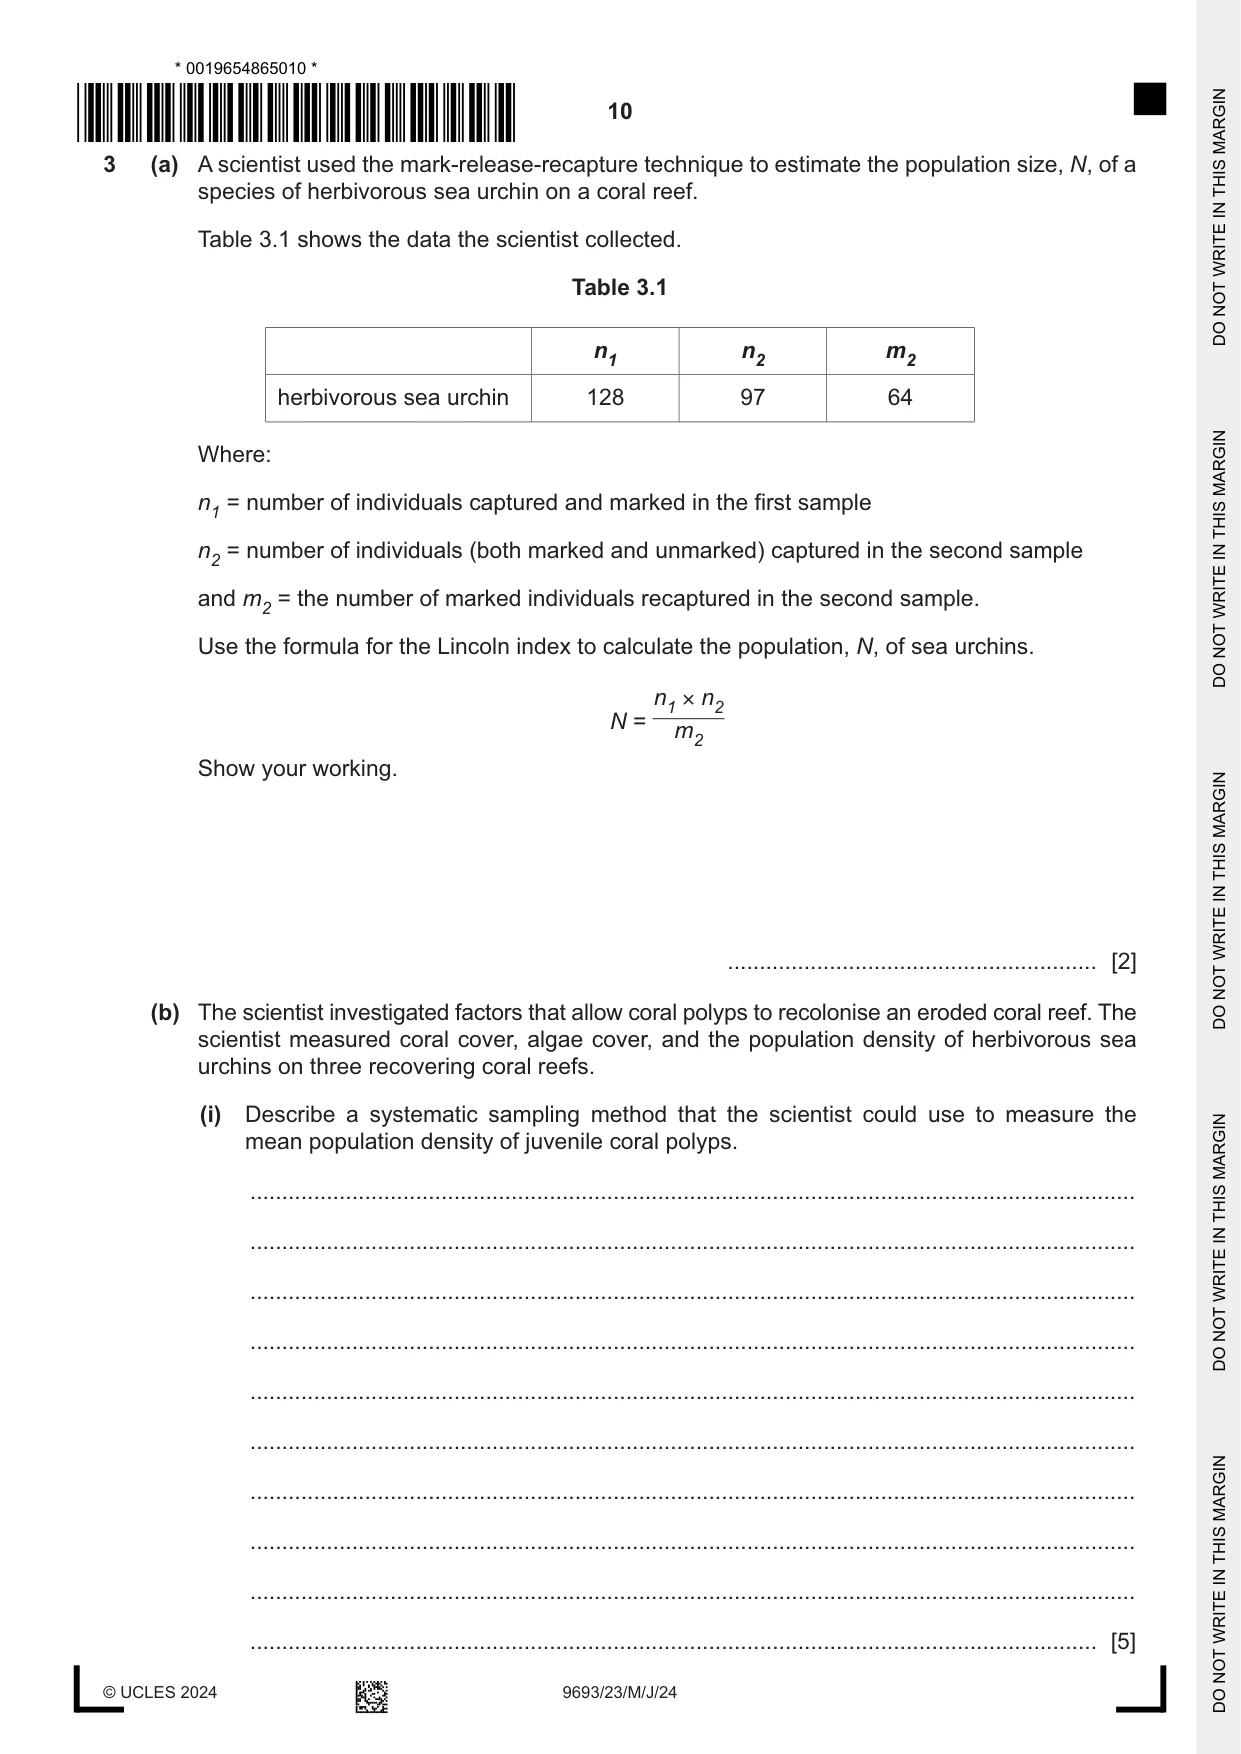
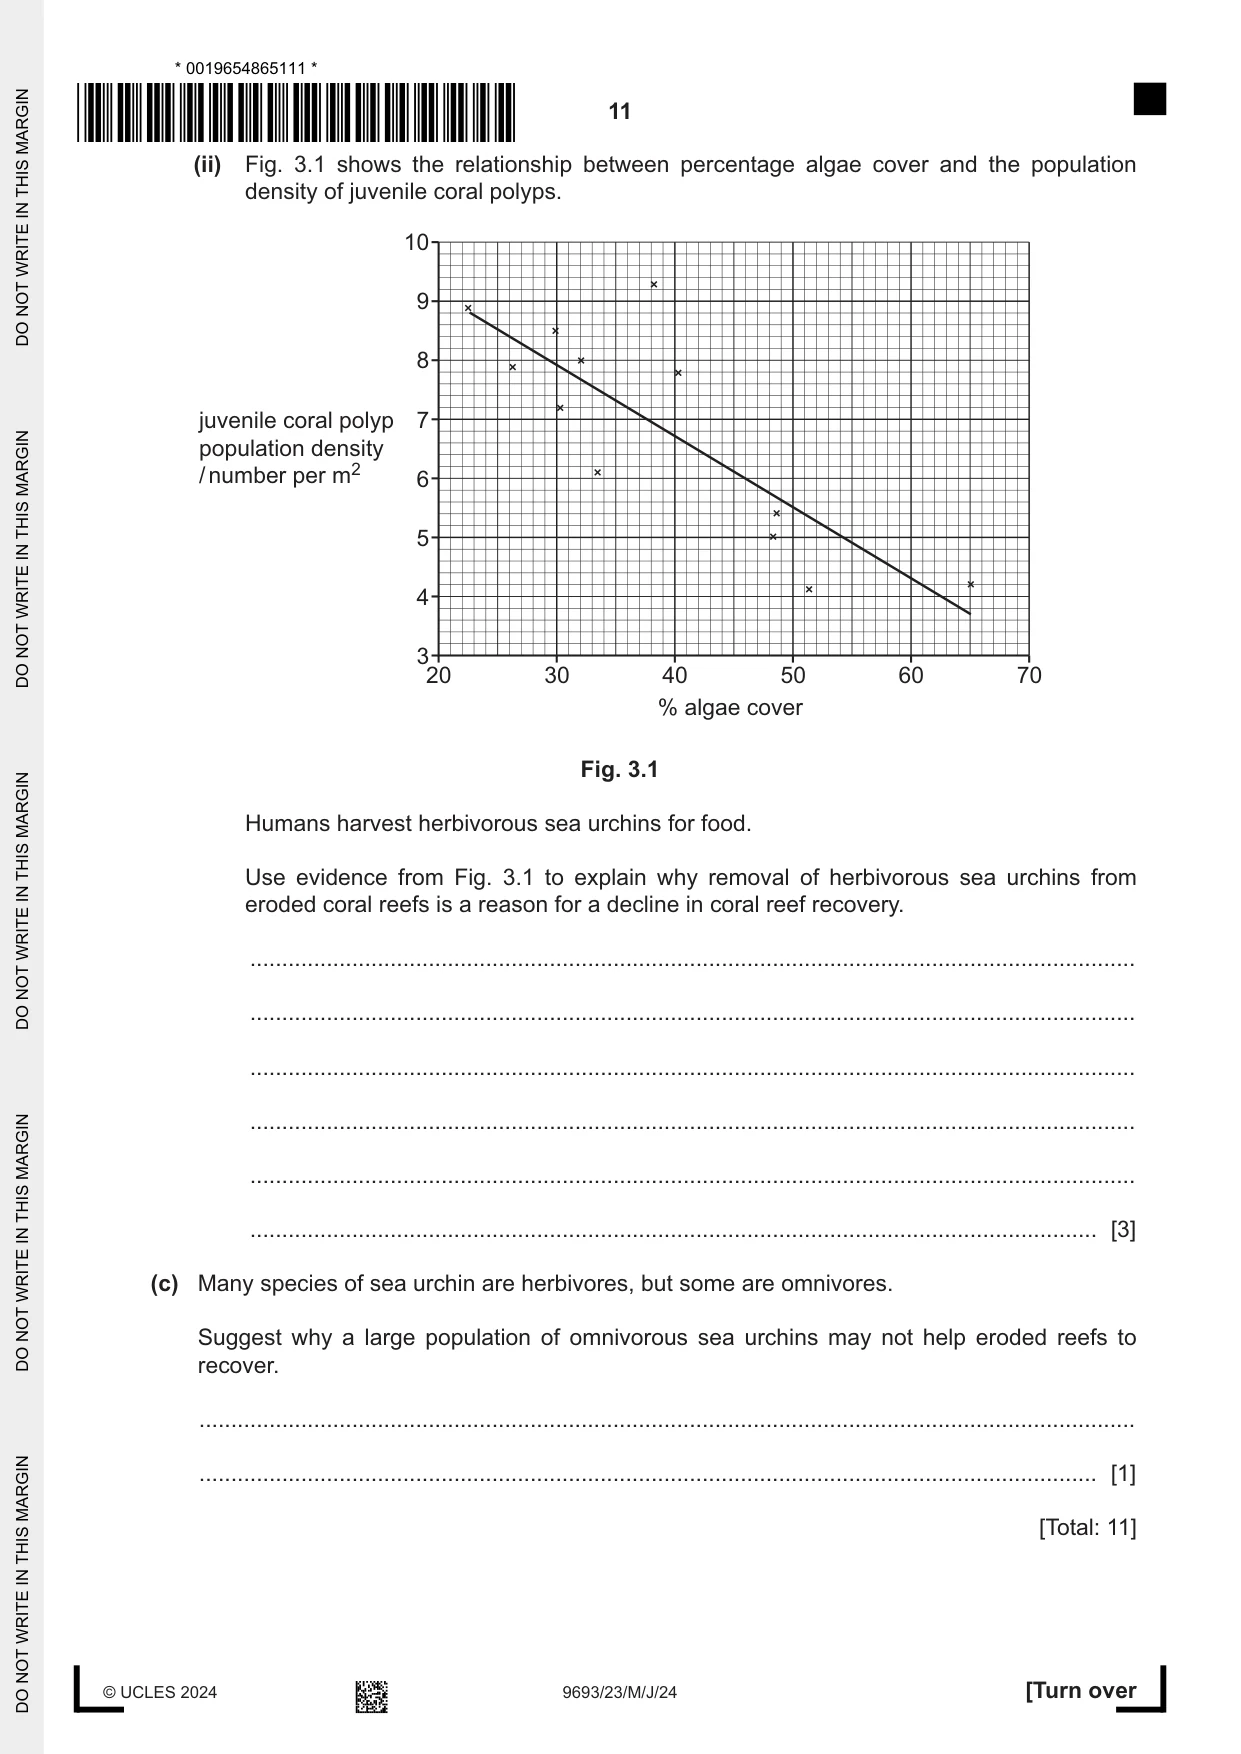
3 (a) A scientist used the mark-release-recapture technique to estimate the population size, N, of a species of herbivorous sea urchin on a coral reef. Table 3.1 shows the data the scientist collected. Table 3.1 n1 n2 m2 herbivorous sea urchin 128 97 64 Where: n1 = number of individuals captured and marked in the first sample n2 = number of individuals (both marked and unmarked) captured in the second sample and m2 = the number of marked individuals recaptured in the second sample. Use the formula for the Lincoln index to calculate the population, N, of sea urchins. n1 × n2 N = m2 Show your working. .......................................................... [2] (b) The scientist investigated factors that allow coral polyps to recolonise an eroded coral reef. The scientist measured coral cover, algae cover, and the population density of herbivorous sea urchins on three recovering coral reefs. (i) Describe a systematic sampling method that the scientist could use to measure the mean population density of juvenile coral polyps. ........................................................................................................................................... ........................................................................................................................................... ........................................................................................................................................... ........................................................................................................................................... ........................................................................................................................................... ........................................................................................................................................... ........................................................................................................................................... ........................................................................................................................................... ........................................................................................................................................... ..................................................................................................................................... [5] (ii) Fig. 3.1 shows the relationship between percentage algae cover and the population density of juvenile coral polyps. 10 9 8 juvenile coral polyp 7 population density / number per m2 6 5 4 3 20 30 40 50 60 70 % algae cover Fig. 3.1 Humans harvest herbivorous sea urchins for food. Use evidence from Fig. 3.1 to explain why removal of herbivorous sea urchins from eroded coral reefs is a reason for a decline in coral reef recovery. ........................................................................................................................................... ........................................................................................................................................... ........................................................................................................................................... ........................................................................................................................................... ........................................................................................................................................... ..................................................................................................................................... [3] (c) Many species of sea urchin are herbivores, but some are omnivores. Suggest why a large population of omnivorous sea urchins may not help eroded reefs to recover. ................................................................................................................................................... ............................................................................................................................................. [1] [Total: 11]
Mark scheme: 3(a) 12416 / 64 = 194 ; 2 3(b)(i) any 5 from: grid the area of the reef, with a map / GPS ; use of, line / belt, transect (laid along recovering reef) ; of known or given suitable length (e.g. 10 m) / width (1–2 m) ; use of quadrat OR take photographs over a measured area ; of suitable stated size (e.g. between 25 cm square – 50 cm square) ; place (quadrat) at, stated / every other metre (along the transect) / at regular intervals ; count number of (juvenile) polyps ; idea of, repeat(s) count along each transect / repeat (along different transects) + mean calculation ; ref. to calculation of density number per area of polyps / m2 ; AVP ; 5 3(b)(ii) any 3 from: fewer sea urchins means less grazing of algae / less sea urchins means more algal growth ; greater percentage/ more, of reef / rocks, covered in algae ; (so) polyps cannot find attachment site on bare rocks ; algae (growing over the polyps) may block light from (coral polyps) zooxanthellae ; manipulation of data ; 3 3(c) omnivores may feed on coral polyps as well as algae (reducing recolonisation) ; 1
Q4 · The mean rate of photosynthesis each month and the water temperature throughout the year…
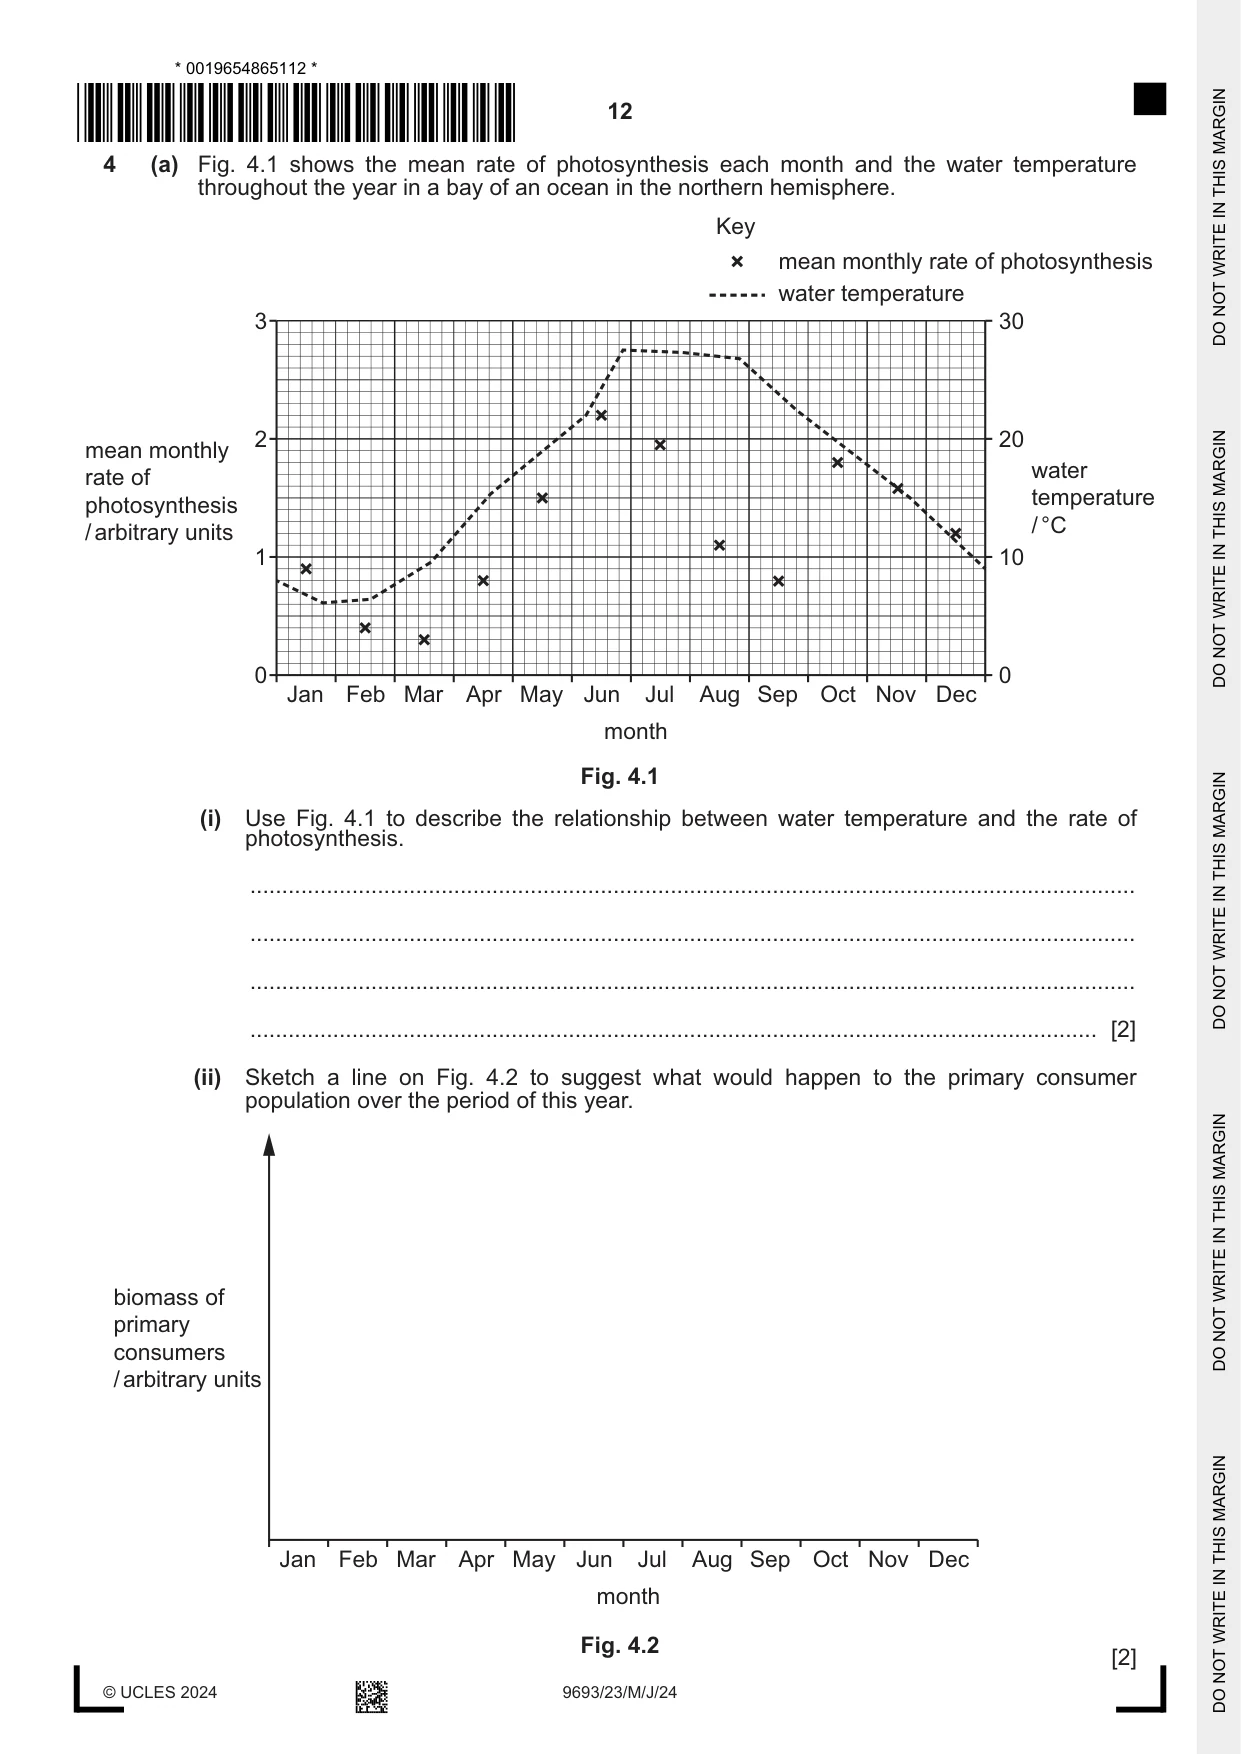
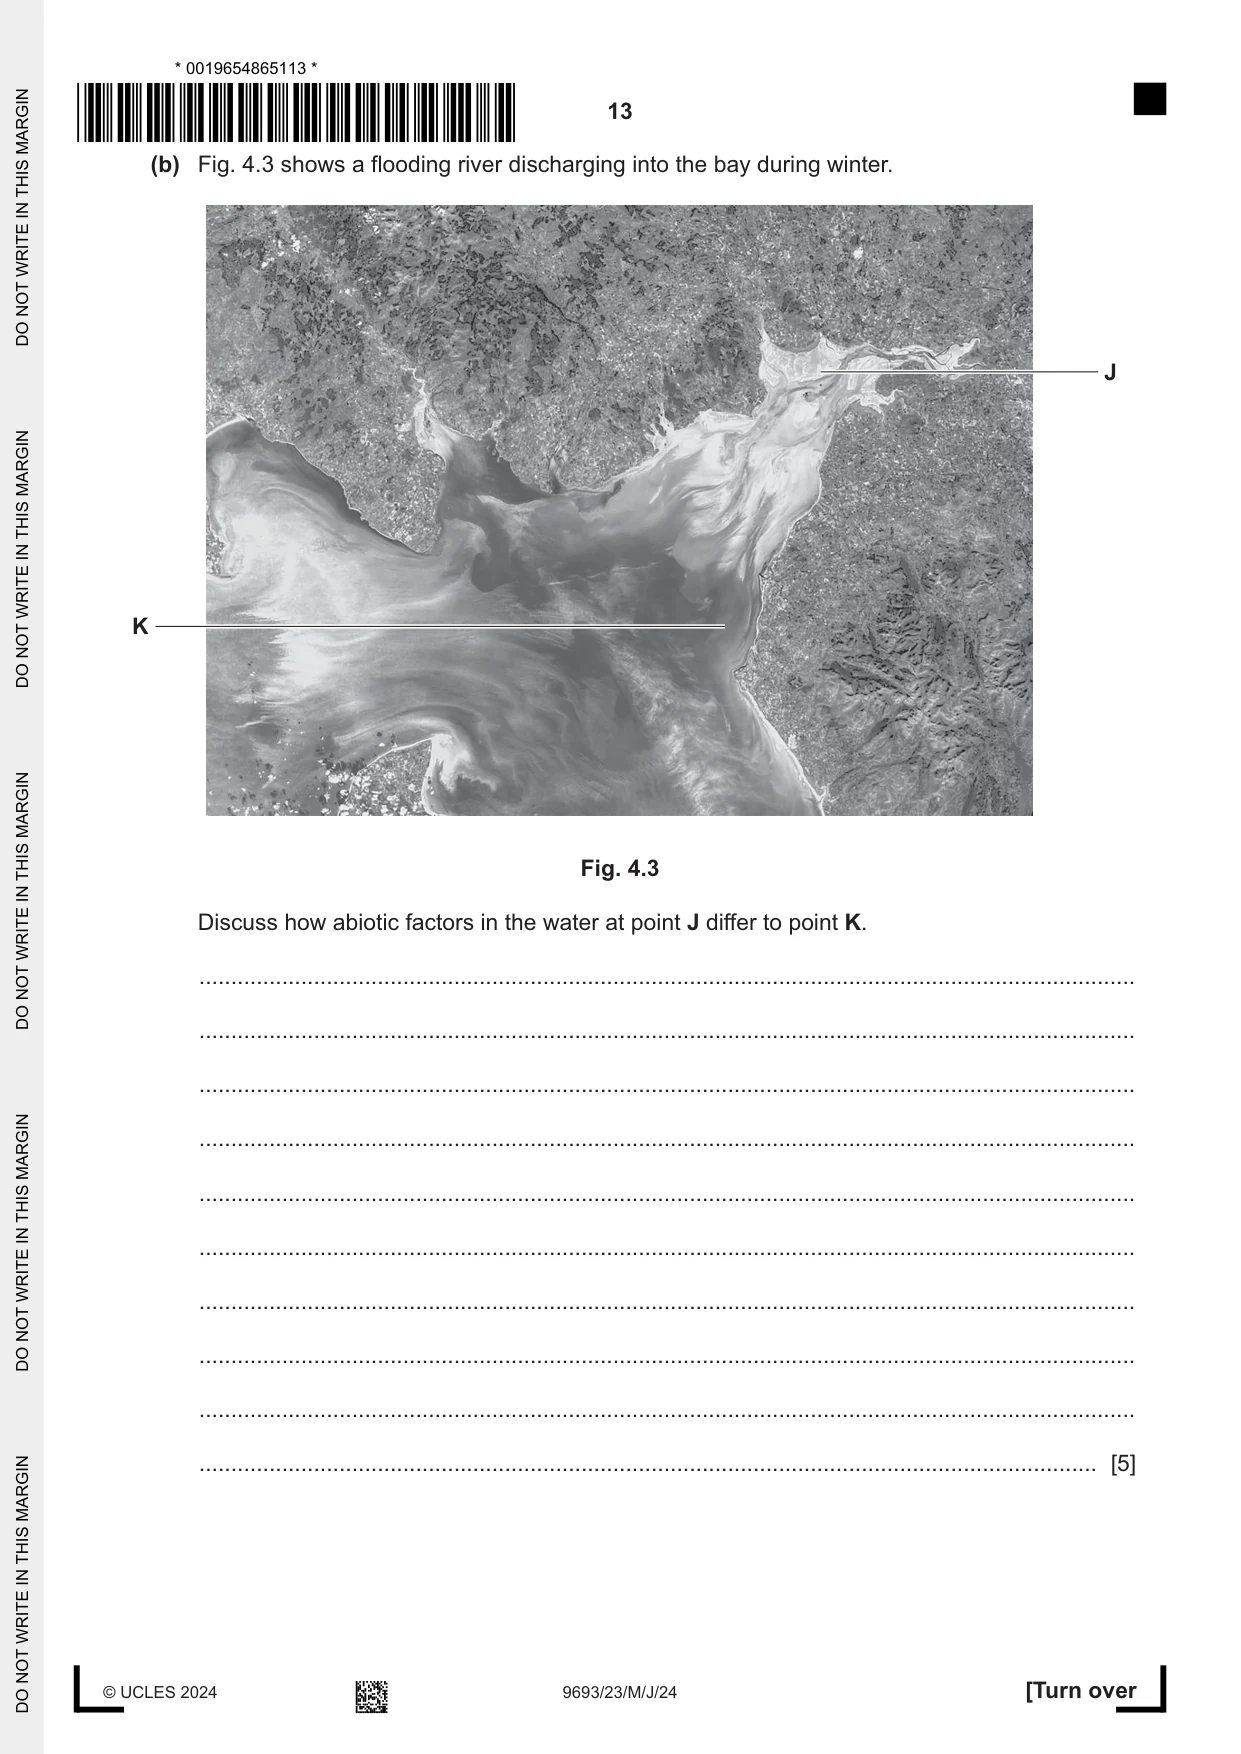
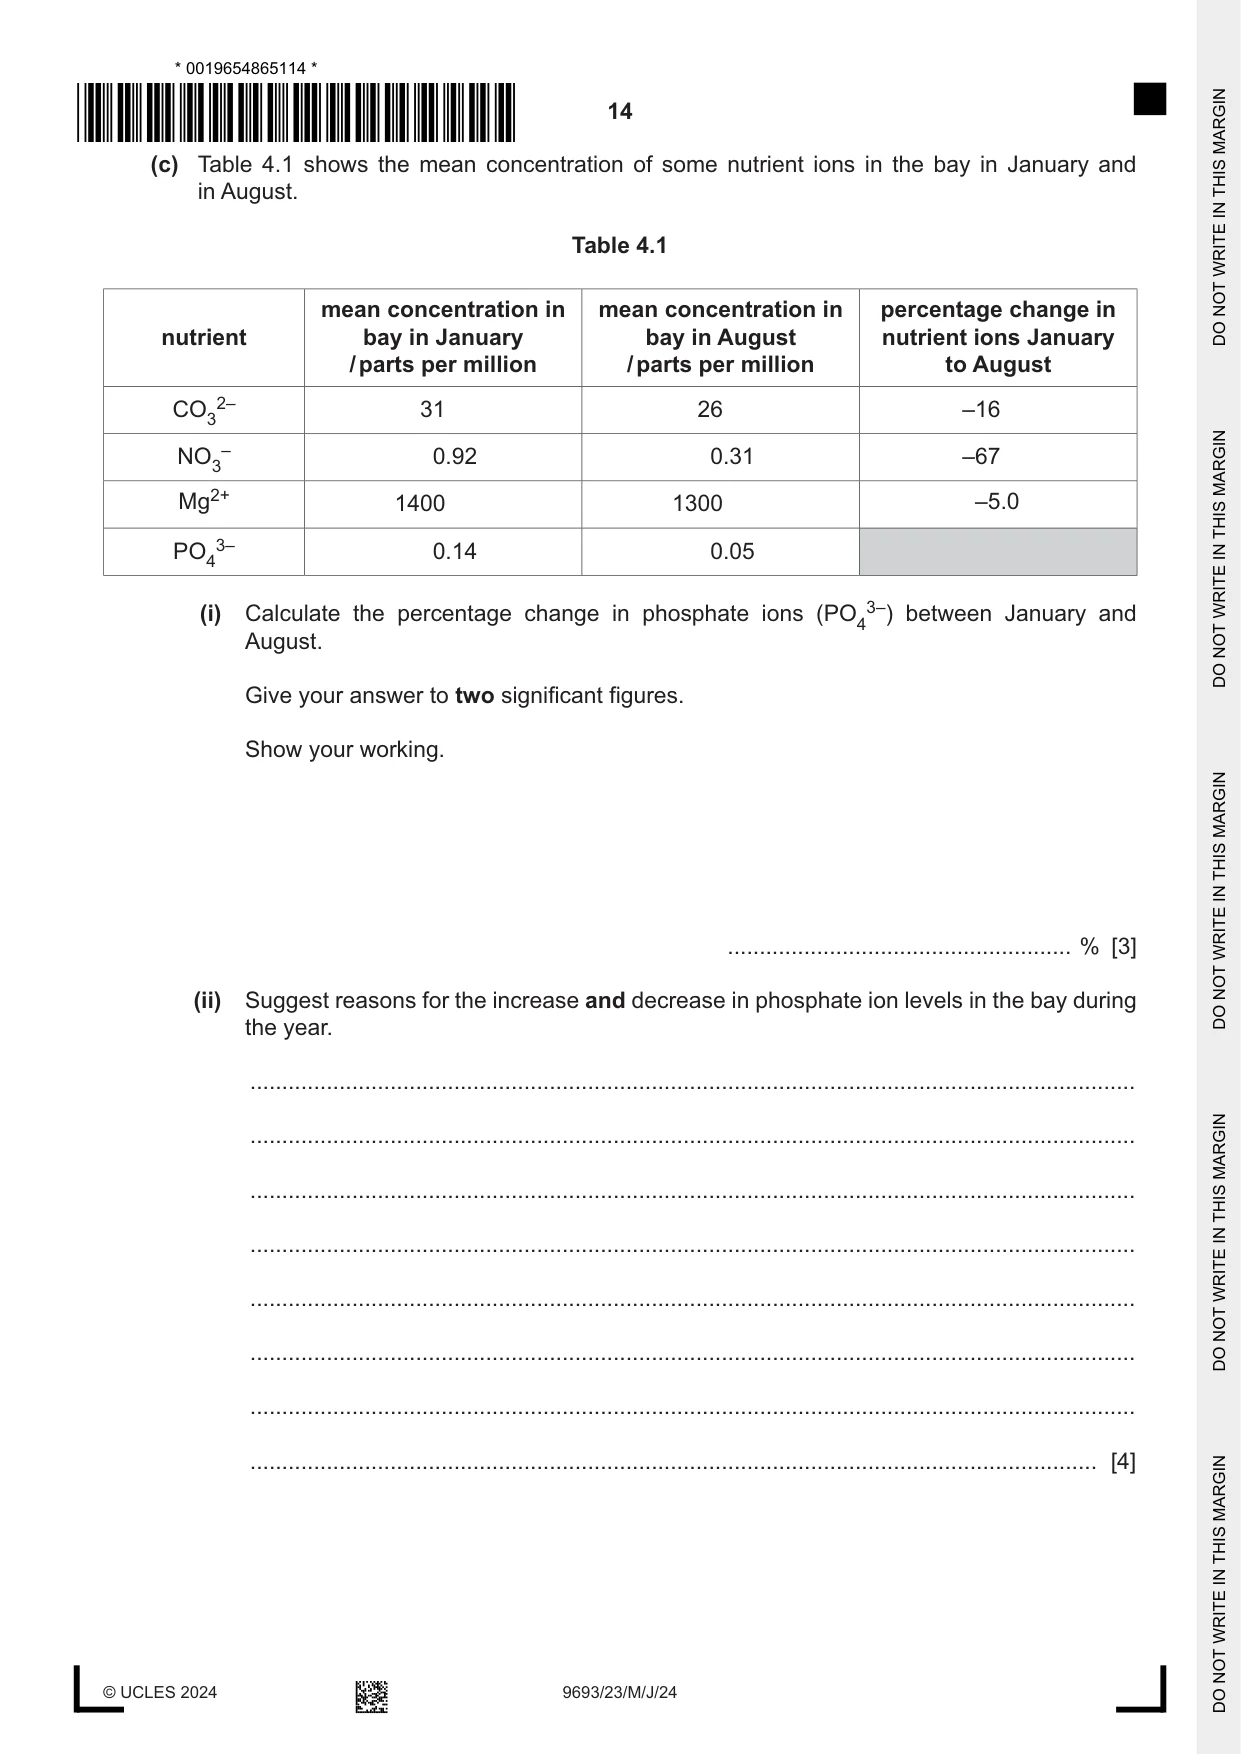
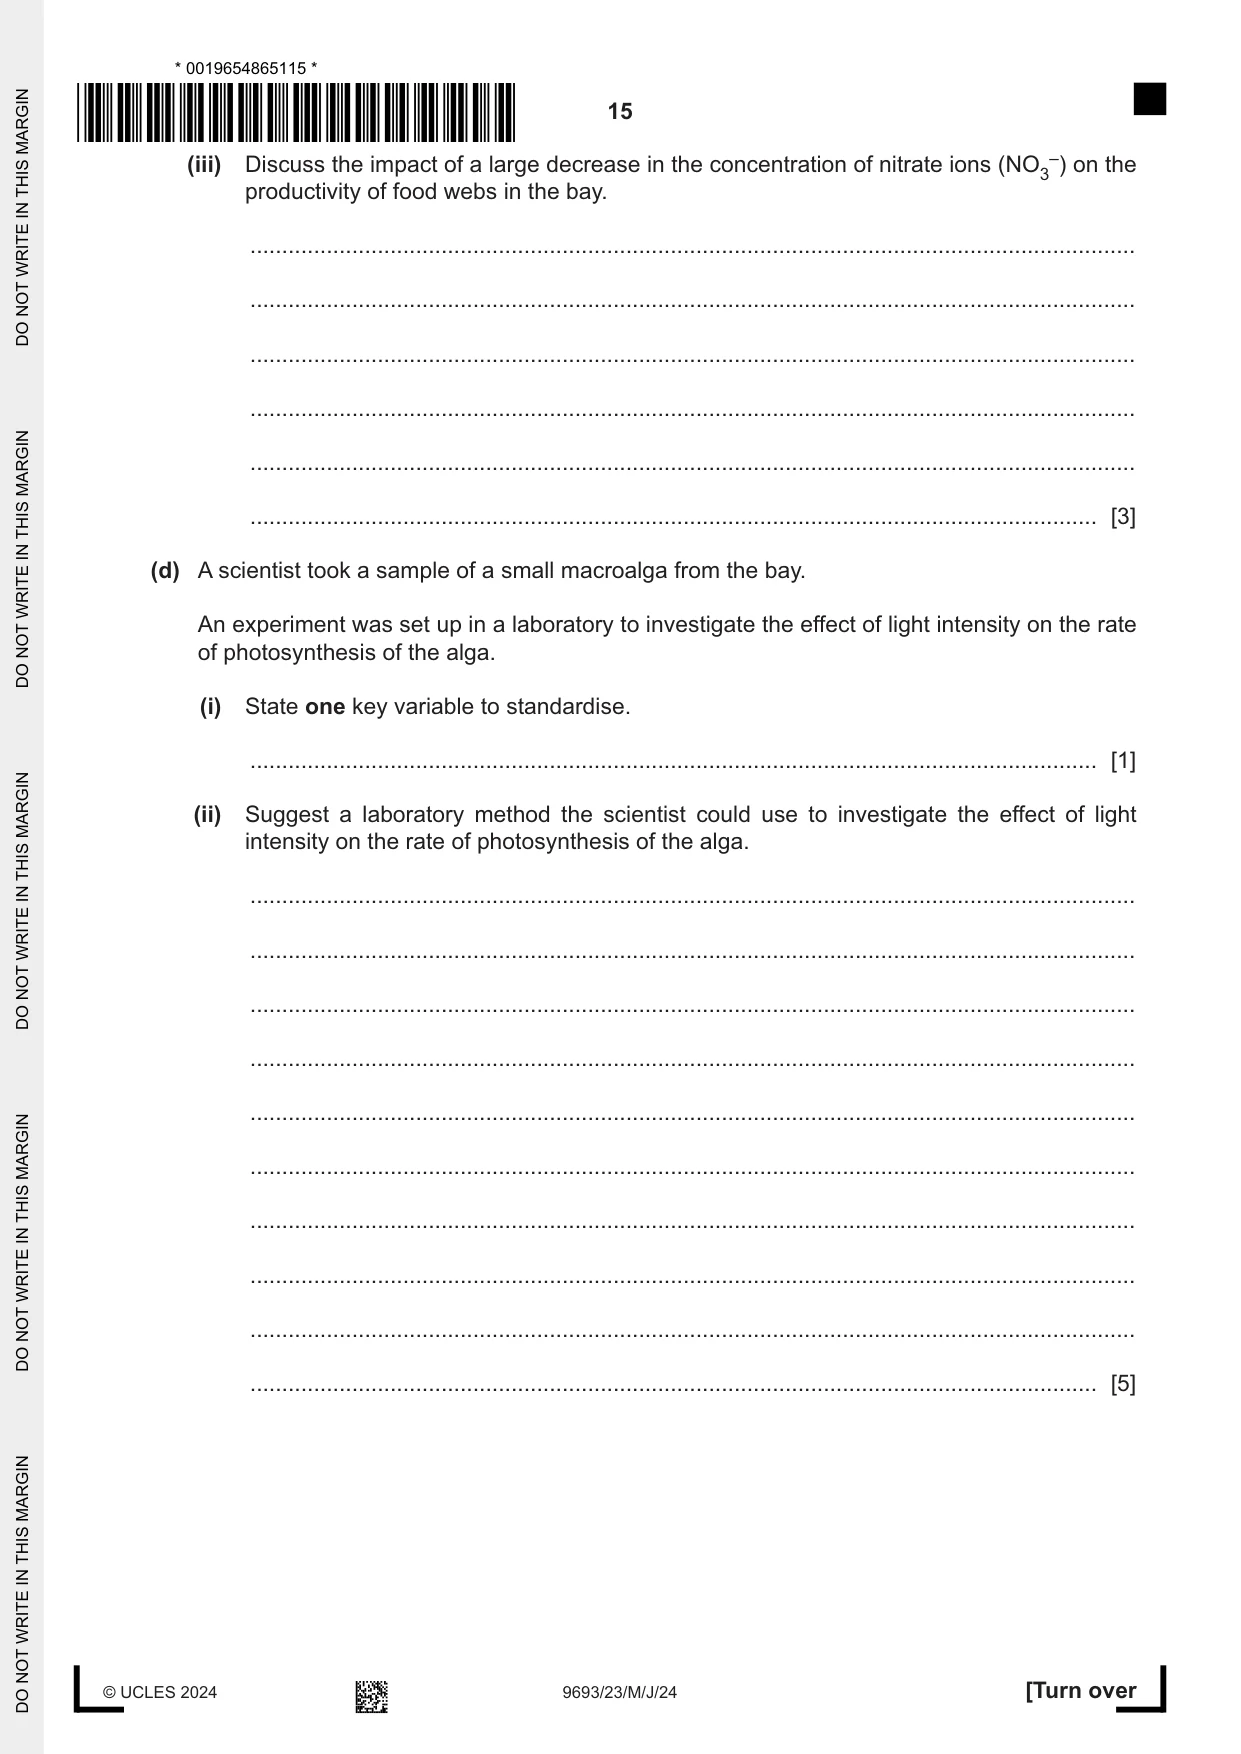
4 (a) Fig. 4.1 shows the mean rate of photosynthesis each month and the water temperature throughout the year in a bay of an ocean in the northern hemisphere. Key mean monthly rate of photosynthesis water temperature 3 30 2 20mean monthly waterrate of temperaturephotosynthesis / °C/ arbitrary units 1 10 0 0 Jan Feb Mar Apr May Jun Jul Aug Sep Oct Nov Dec month Fig. 4.1 (i) Use Fig. 4.1 to describe the relationship between water temperature and the rate of photosynthesis. ........................................................................................................................................... ........................................................................................................................................... ........................................................................................................................................... ..................................................................................................................................... [2] (ii) Sketch a line on Fig. 4.2 to suggest what would happen to the primary consumer population over the period of this year. biomass of primary consumers / arbitrary units Jan Feb Mar Apr May Jun Jul Aug Sep Oct Nov Dec month Fig. 4.2 [2] (b) Fig. 4.3 shows a flooding river discharging into the bay during winter. J K Fig. 4.3 Discuss how abiotic factors in the water at point J differ to point K. ................................................................................................................................................... ................................................................................................................................................... ................................................................................................................................................... ................................................................................................................................................... ................................................................................................................................................... ................................................................................................................................................... ................................................................................................................................................... ................................................................................................................................................... ................................................................................................................................................... ............................................................................................................................................. [5] (c) Table 4.1 shows the mean concentration of some nutrient ions in the bay in January and in August. Table 4.1 mean concentration in mean concentration in percentage change in nutrient bay in January bay in August nutrient ions January / parts per million / parts per million to August CO32– 31 26 –16 NO3– 0.92 0.31 –67 Mg2+ 1400 1300 –5.0 PO43– 0.14 0.05 (i) Calculate the percentage change in phosphate ions (PO43–) between January and August. Give your answer to two significant figures. Show your working. ...................................................... % [3] (ii) Suggest reasons for the increase and decrease in phosphate ion levels in the bay during the year. ........................................................................................................................................... ........................................................................................................................................... ........................................................................................................................................... ........................................................................................................................................... ........................................................................................................................................... ........................................................................................................................................... ........................................................................................................................................... ..................................................................................................................................... [4] (iii) Discuss the impact of a large decrease in the concentration of nitrate ions (NO3–) on the productivity of food webs in the bay. ........................................................................................................................................... ........................................................................................................................................... ........................................................................................................................................... ........................................................................................................................................... ........................................................................................................................................... ..................................................................................................................................... [3] (d) A scientist took a sample of a small macroalga from the bay. An experiment was set up in a laboratory to investigate the effect of light intensity on the rate of photosynthesis of the alga. (i) State one key variable to standardise. ..................................................................................................................................... [1] (ii) Suggest a laboratory method the scientist could use to investigate the effect of light intensity on the rate of photosynthesis of the alga. ........................................................................................................................................... ........................................................................................................................................... ........................................................................................................................................... ........................................................................................................................................... ........................................................................................................................................... ........................................................................................................................................... ........................................................................................................................................... ........................................................................................................................................... ........................................................................................................................................... ..................................................................................................................................... [5] (iii) Draw a table to record the results. Include units. Do not write in any results. [3] [Total: 28]
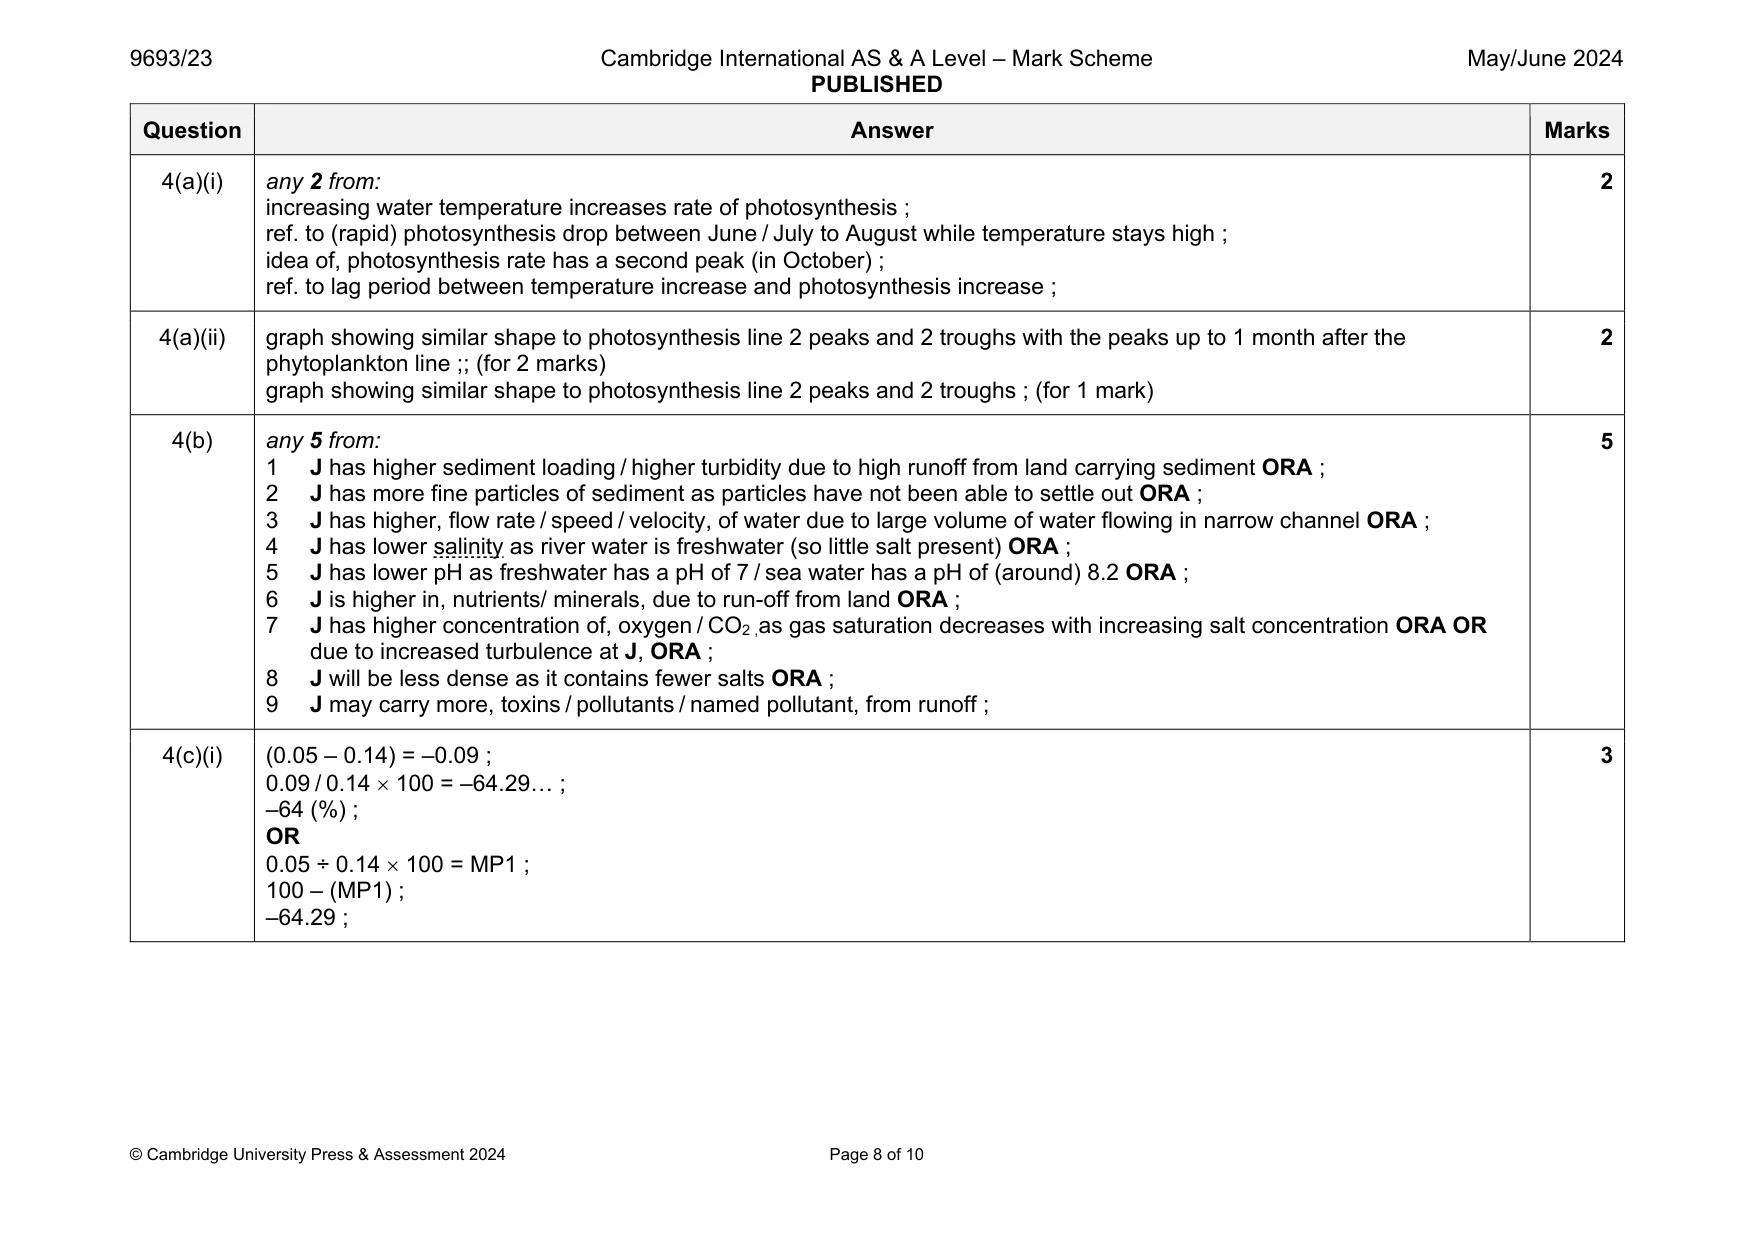
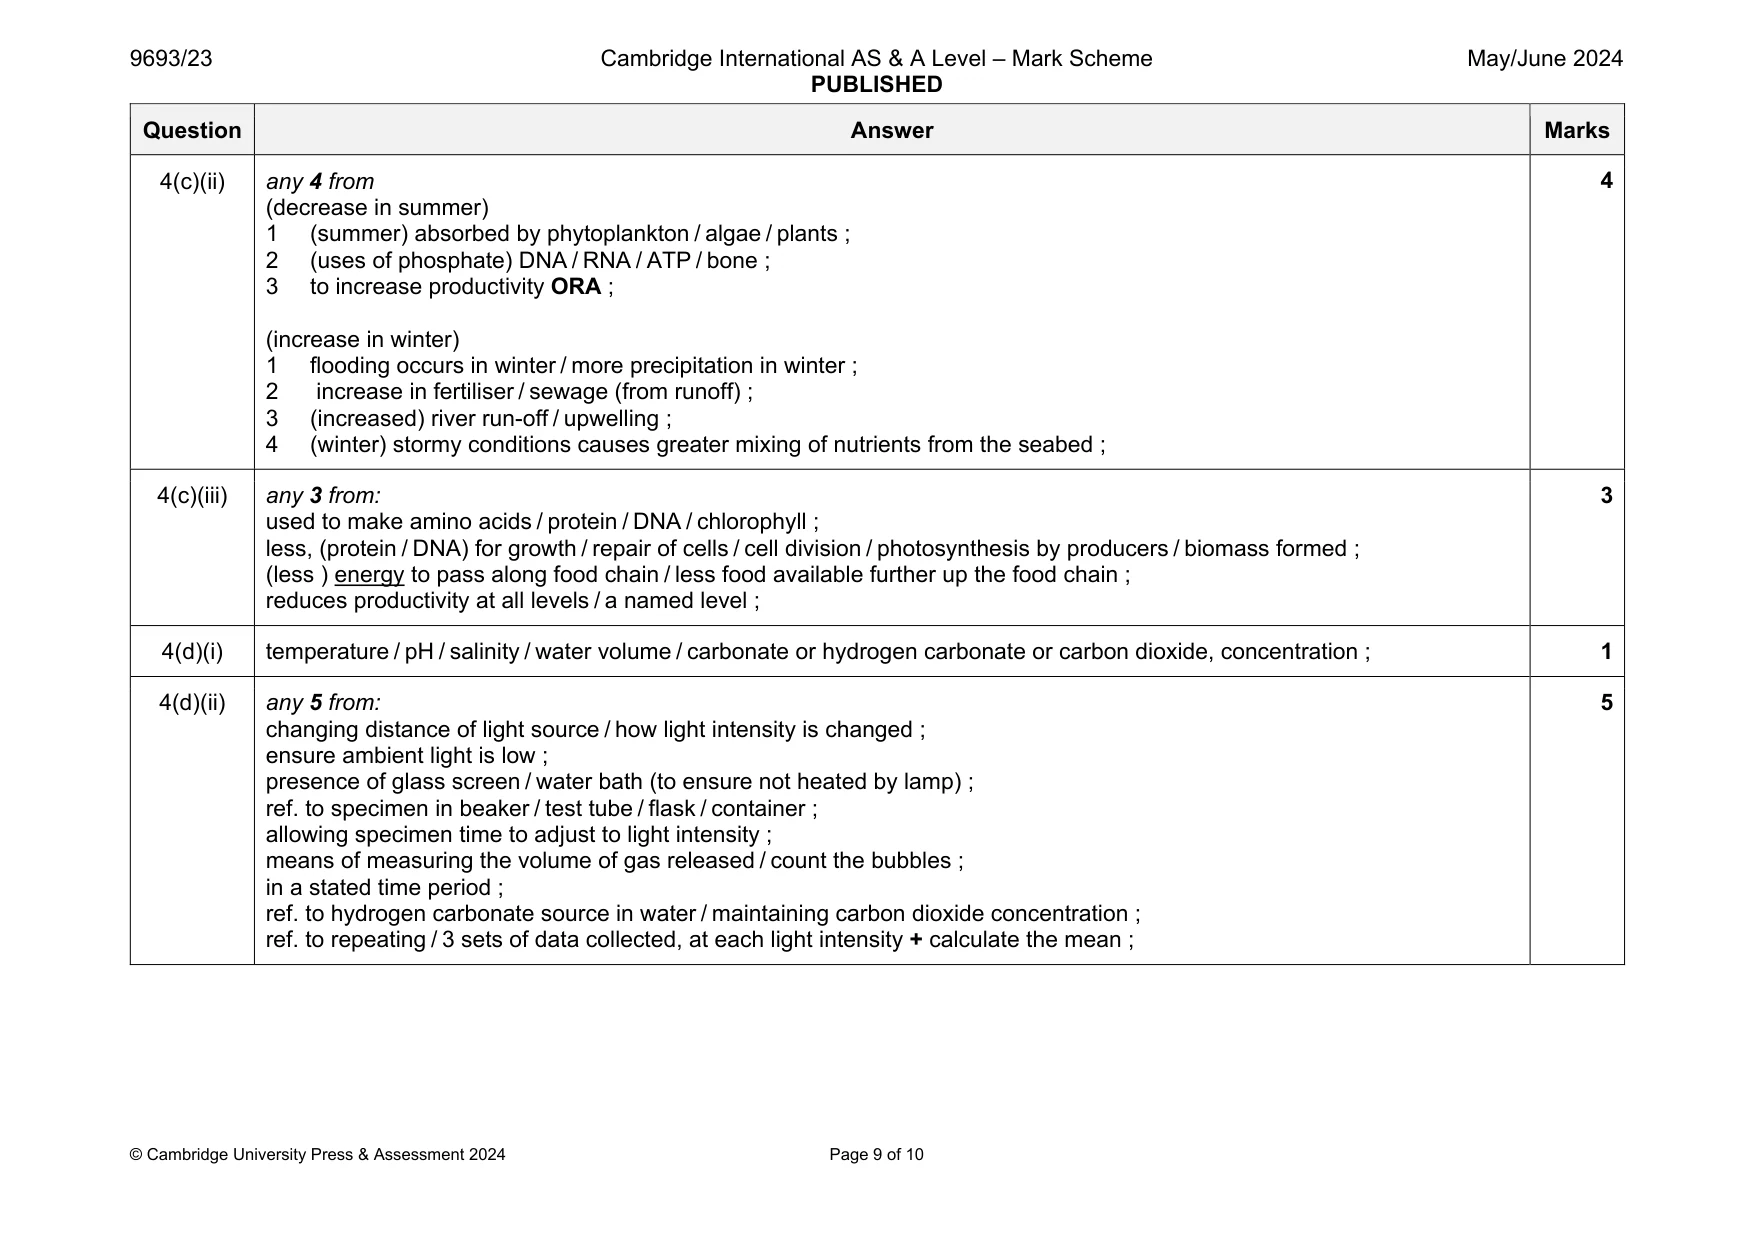
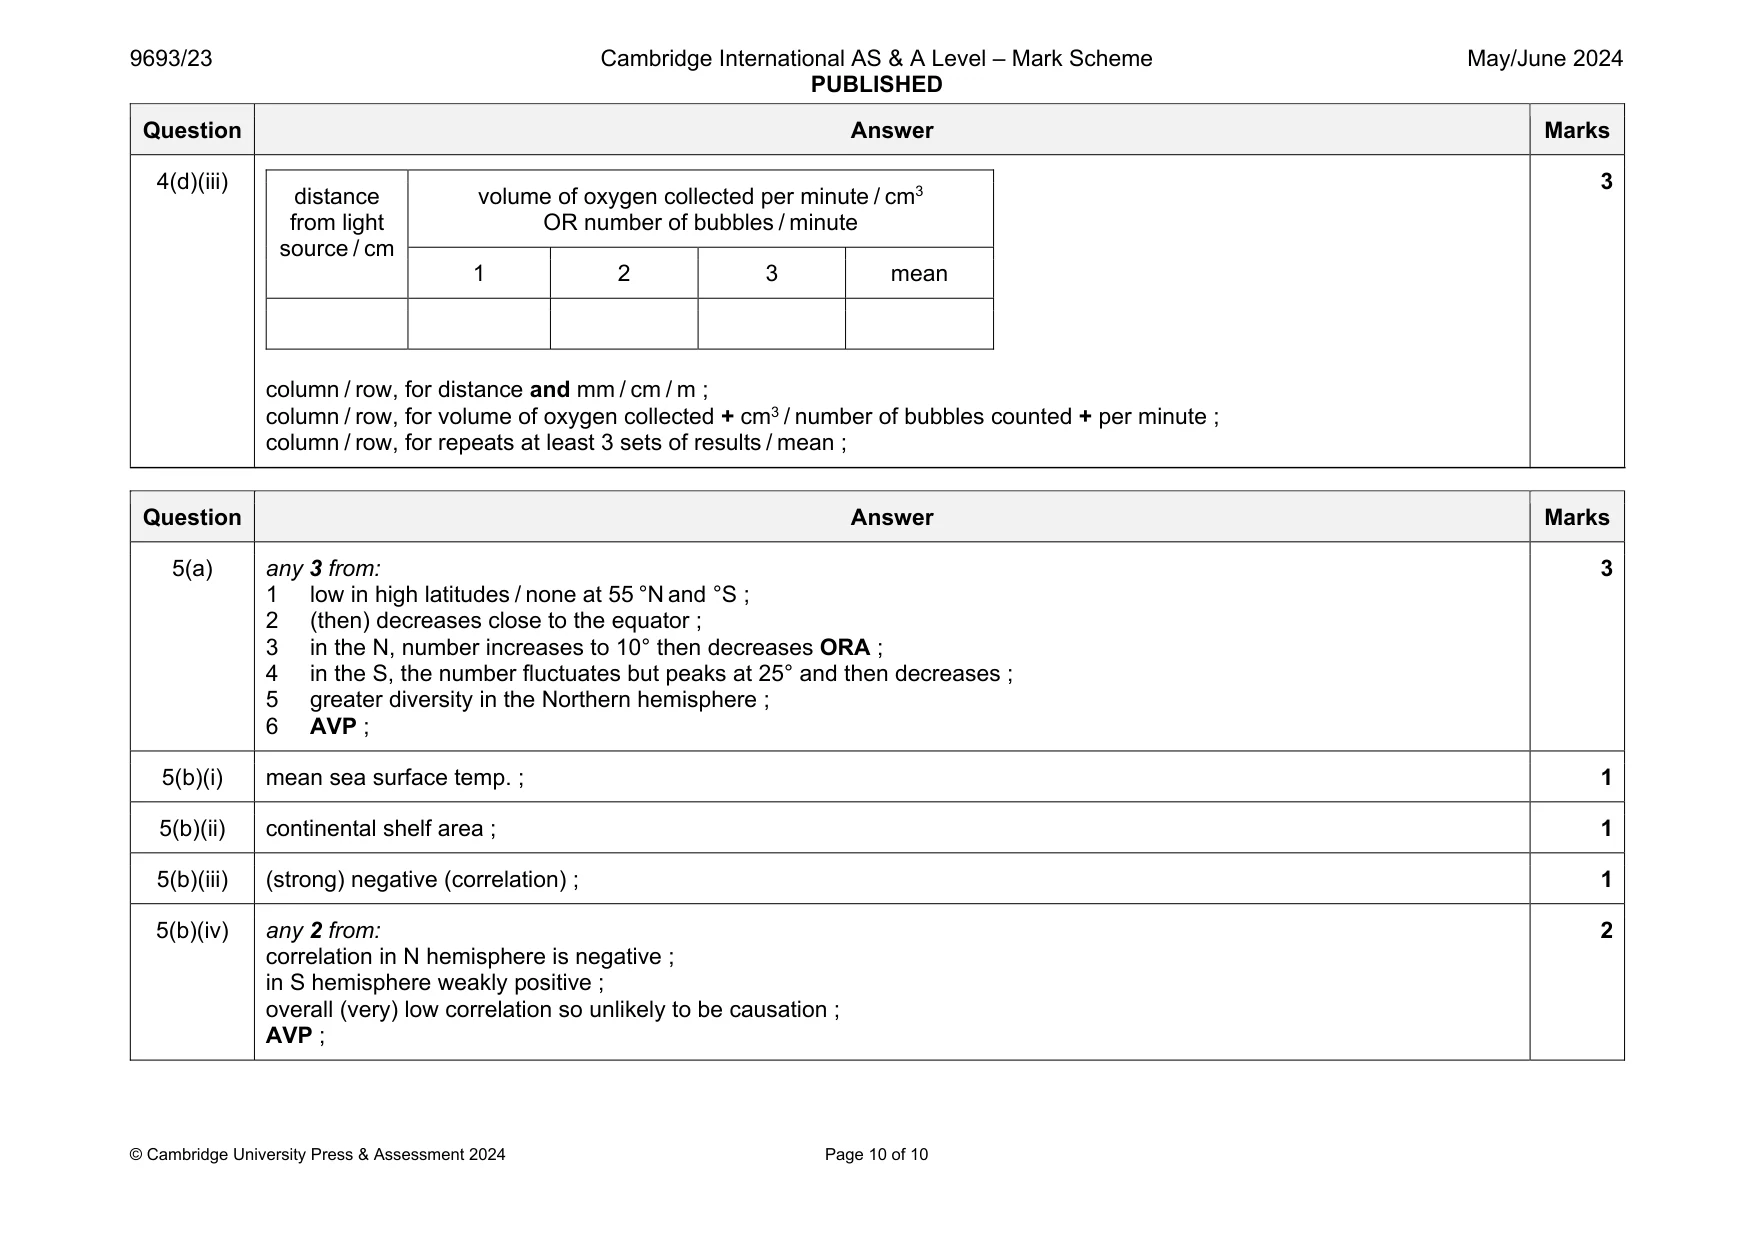
Mark scheme: 4(a)(i) any 2 from: increasing water temperature increases rate of photosynthesis ; ref. to (rapid) photosynthesis drop between June / July to August while temperature stays high ; idea of, photosynthesis rate has a second peak (in October) ; ref. to lag period between temperature increase and photosynthesis increase ; 2 4(a)(ii) graph showing similar shape to photosynthesis line 2 peaks and 2 troughs with the peaks up to 1 month after the phytoplankton line ;; (for 2 marks) graph showing similar shape to photosynthesis line 2 peaks and 2 troughs ; (for 1 mark) 2 4(b) any 5 from: 1 J has higher sediment loading / higher turbidity due to high runoff from land carrying sediment ORA ; 2 J has more fine particles of sediment as particles have not been able to settle out ORA ; 3 J has higher, flow rate / speed / velocity, of water due to large volume of water flowing in narrow channel ORA ; 4 J has lower salinity as river water is freshwater (so little salt present) ORA ; 5 J has lower pH as freshwater has a pH of 7 / sea water has a pH of (around) 8.2 ORA ; 6 J is higher in, nutrients/ minerals, due to run-off from land ORA ; 7 J has higher concentration of, oxygen / CO2 ,as gas saturation decreases with increasing salt concentration ORA OR due to increased turbulence at J, ORA ; 8 J will be less dense as it contains fewer salts ORA ; 9 J may carry more, toxins / pollutants / named pollutant, from runoff ; 5 4(c)(i) (0.05 – 0.14) = –0.09 ; 0.09 / 0.14 100 = –64.29… ; –64 (%) ; OR 0.05 ÷ 0.14 100 = MP1 ; 100 – (MP1) ; –64.29 ; 3 Question Answer Marks 4(c)(ii) any 4 from (decrease in summer) 1 (summer) absorbed by phytoplankton / algae / plants ; 2 (uses of phosphate) DNA / RNA / ATP / bone ; 3 to increase productivity ORA ; (increase in winter) 1 flooding occurs in winter / more precipitation in winter ; 2 increase in fertiliser / sewage (from runoff) ; 3 (increased) river run-off / upwelling ; 4 (winter) stormy conditions causes greater mixing of nutrients from the seabed ; 4 4(c)(iii) any 3 from: used to make amino acids / protein / DNA / chlorophyll ; less, (protein / DNA) for growth / repair of cells / cell division / photosynthesis by producers / biomass formed ; (less ) energy to pass along food chain / less food available further up the food chain ; reduces productivity at all levels / a named level ; 3 4(d)(i) temperature / pH / salinity / water volume / carbonate or hydrogen carbonate or carbon dioxide, concentration ; 1 4(d)(ii) any 5 from: changing distance of light source / how light intensity is changed ; ensure ambient light is low ; presence of glass screen / water bath (to ensure not heated by lamp) ; ref. to specimen in beaker / test tube / flask / container ; allowing specimen time to adjust to light intensity ; means of measuring the volume of gas released / count the bubbles ; in a stated time period ; ref. to hydrogen carbonate source in water / maintaining carbon dioxide concentration ; ref. to repeating / 3 sets of data collected, at each light intensity + calculate the mean ; 5 Question Answer Marks 4(d)(iii) distance from light source / cm volume of oxygen collected per minute / cm3 OR number of bubbles / minute 1 2 3 mean column / row, for distance and mm / cm / m ; column / row, for volume of oxygen collected + cm3 / number of bubbles counted + per minute ; column / row, for repeats at least 3 sets of results / mean ; 3
Q5 · Latitude describes a north or south position of a point on the Earth’s surface
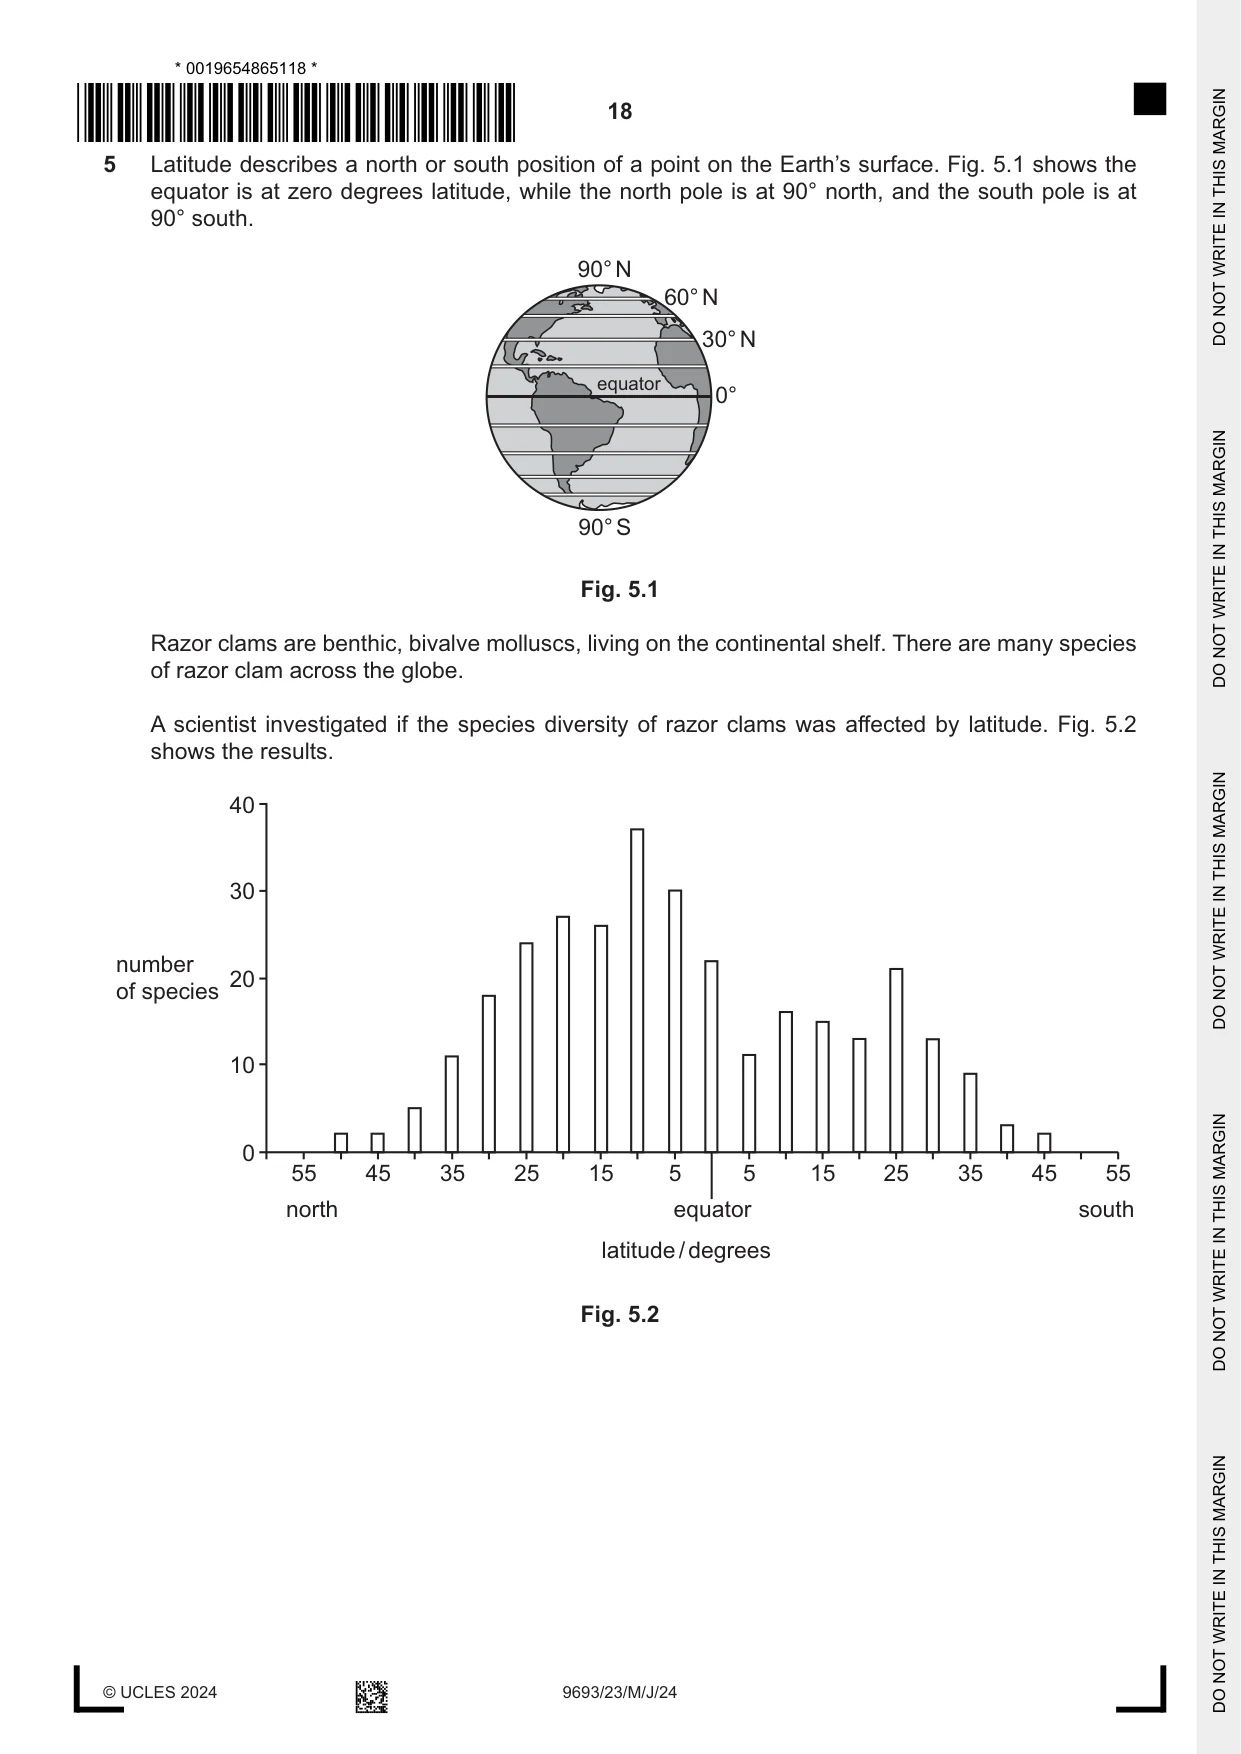
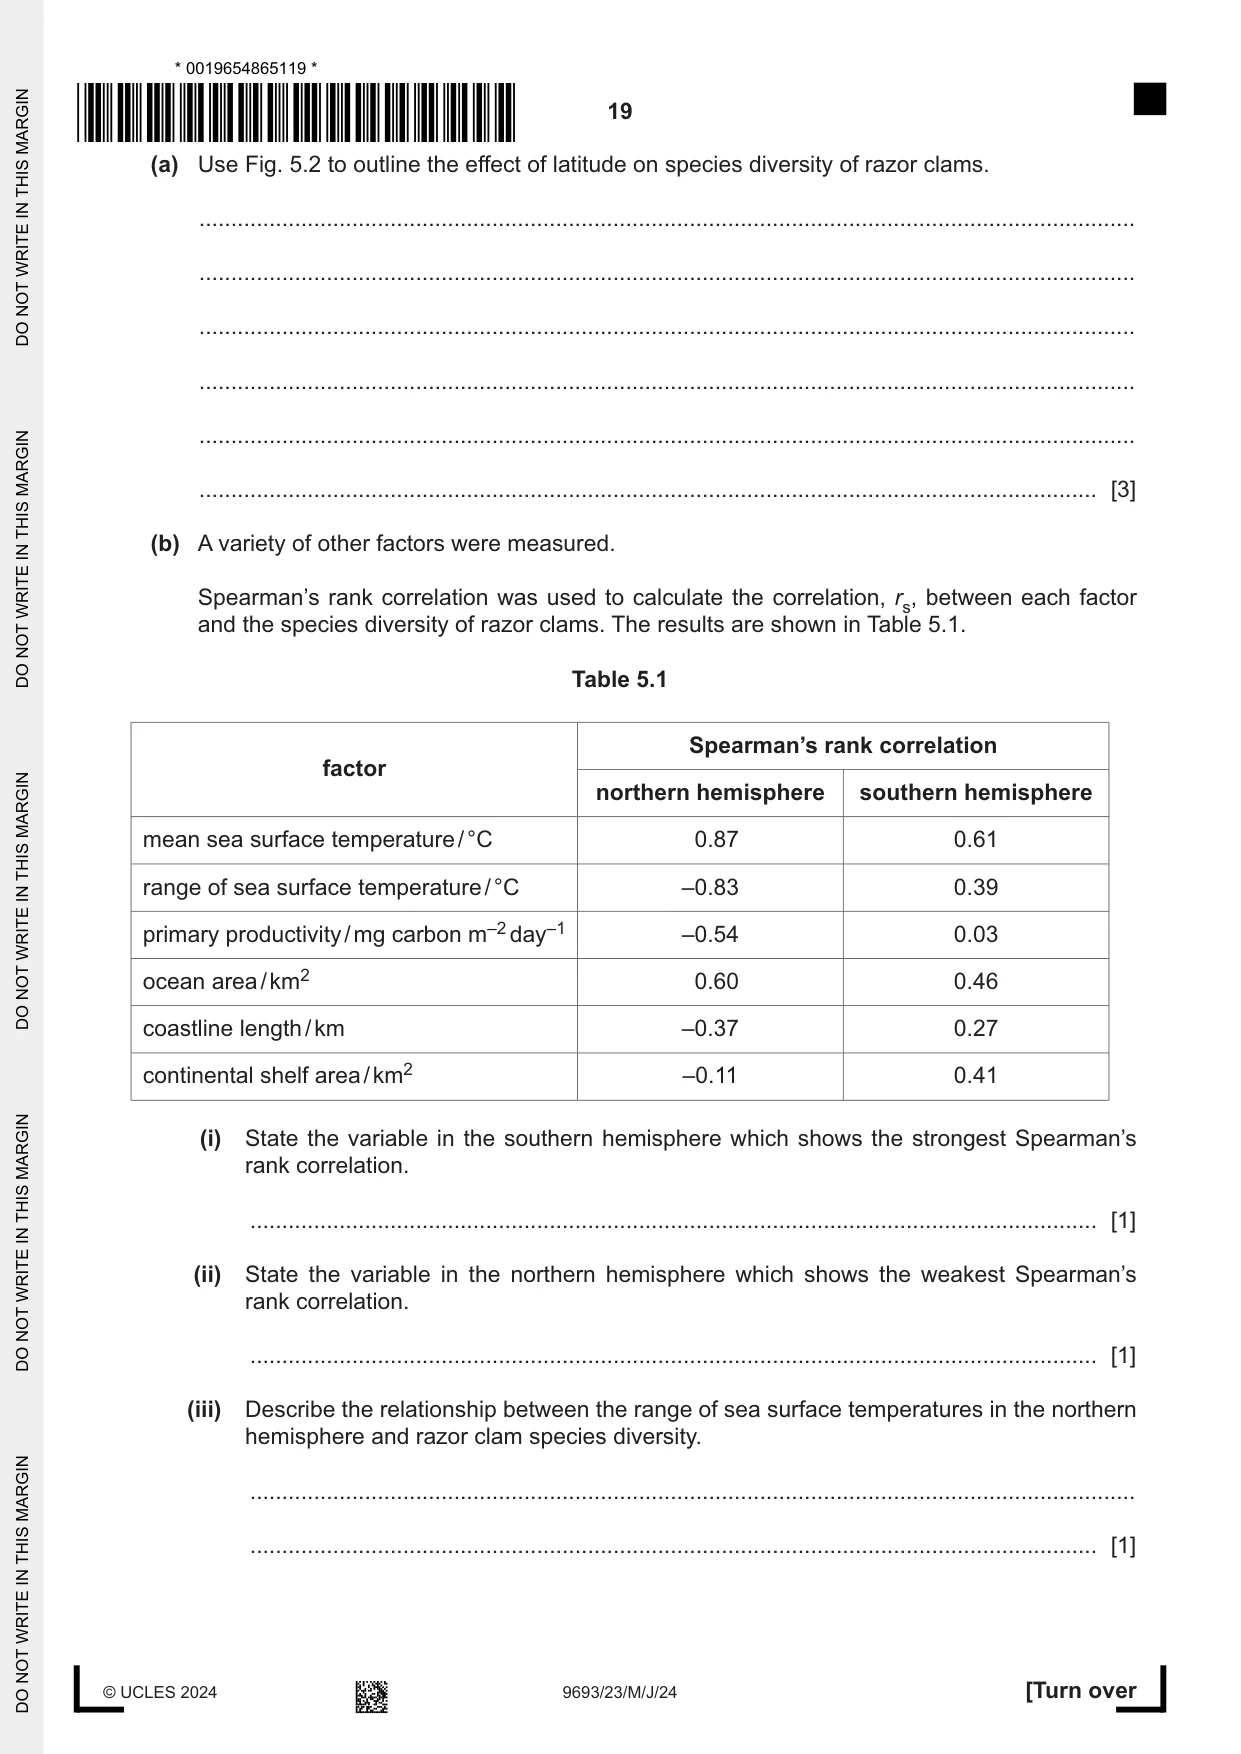
5 Latitude describes a north or south position of a point on the Earth’s surface. Fig. 5.1 shows the equator is at zero degrees latitude, while the north pole is at 90° north, and the south pole is at 90° south. 90° N 60° N 30° N equator 0° 90° S Fig. 5.1 Razor clams are benthic, bivalve molluscs, living on the continental shelf. There are many species of razor clam across the globe. A scientist investigated if the species diversity of razor clams was affected by latitude. Fig. 5.2 shows the results. 40 30 number 20 of species 10 0 55 45 35 25 15 5 5 15 25 35 45 55 north equator south latitude / degrees Fig. 5.2 (a) Use Fig. 5.2 to outline the effect of latitude on species diversity of razor clams. ................................................................................................................................................... ................................................................................................................................................... ................................................................................................................................................... ................................................................................................................................................... ................................................................................................................................................... ............................................................................................................................................. [3] (b) A variety of other factors were measured. Spearman’s rank correlation was used to calculate the correlation, rs, between each factor and the species diversity of razor clams. The results are shown in Table 5.1. Table 5.1 Spearman’s rank correlation factor northern hemisphere southern hemisphere mean sea surface temperature / °C 0.87 0.61 range of sea surface temperature / °C –0.83 0.39 primary productivity / mg carbon m–2 day–1 –0.54 0.03 ocean area / km2 0.60 0.46 coastline length / km –0.37 0.27 continental shelf area / km2 –0.11 0.41 (i) State the variable in the southern hemisphere which shows the strongest Spearman’s rank correlation. ..................................................................................................................................... [1] (ii) State the variable in the northern hemisphere which shows the weakest Spearman’s rank correlation. ..................................................................................................................................... [1] (iii) Describe the relationship between the range of sea surface temperatures in the northern hemisphere and razor clam species diversity. ........................................................................................................................................... ..................................................................................................................................... [1] (iv) Evaluate if the correlation data for razor clam species diversity and primary productivity show a causal relationship. ........................................................................................................................................... ........................................................................................................................................... ........................................................................................................................................... ..................................................................................................................................... [2] [Total: 8] The boundaries and names shown, the designations used and the presentation of material on any maps contained in this question paper/insert do not imply official endorsement or acceptance by Cambridge Assessment International Education concerning the legal status of any country, territory, or area or any of its authorities, or of the delimitation of its frontiers or boundaries.
Mark scheme: 5(a) any 3 from: 1 low in high latitudes / none at 55 °N and °S ; 2 (then) decreases close to the equator ; 3 in the N, number increases to 10° then decreases ORA ; 4 in the S, the number fluctuates but peaks at 25° and then decreases ; 5 greater diversity in the Northern hemisphere ; 6 AVP ; 5(b)(i) mean sea surface temp. ; 1 5(b)(ii) continental shelf area ; 1 5(b)(iii) (strong) negative (correlation) ; 1 5(b)(iv) any 2 from: correlation in N hemisphere is negative ; in S hemisphere weakly positive ; overall (very) low correlation so unlikely to be causation ; AVP ; 2
What was in this paper
The subtopics covered by these 5 questions, and how many questions each got. Open one in a new tab to see every Cambridge question on it.
What you needed in this session
Cambridge’s own grade thresholds for 2024 May/June, Paper 2 · Variant 3. A higher threshold means an easier paper — the bar moves with how the cohort did.