Cambridge A Level Marine Science 9693 — 2018 May/June Paper 2 · Variant 1
9693/21/M/J/18 · 4 questions · 50 marks · ≈56 min
The question paper and its mark scheme, free to read here and free to download. This is Cambridge’s own paper, exactly as it was sat.
Question paper12 pages



Mark scheme9 pages
Answers below. Sit the paper first if you are practising.
Questions as text
Q1 · The global fishing catch for southern bluefin tuna, a large carnivorous fish, from 1951…
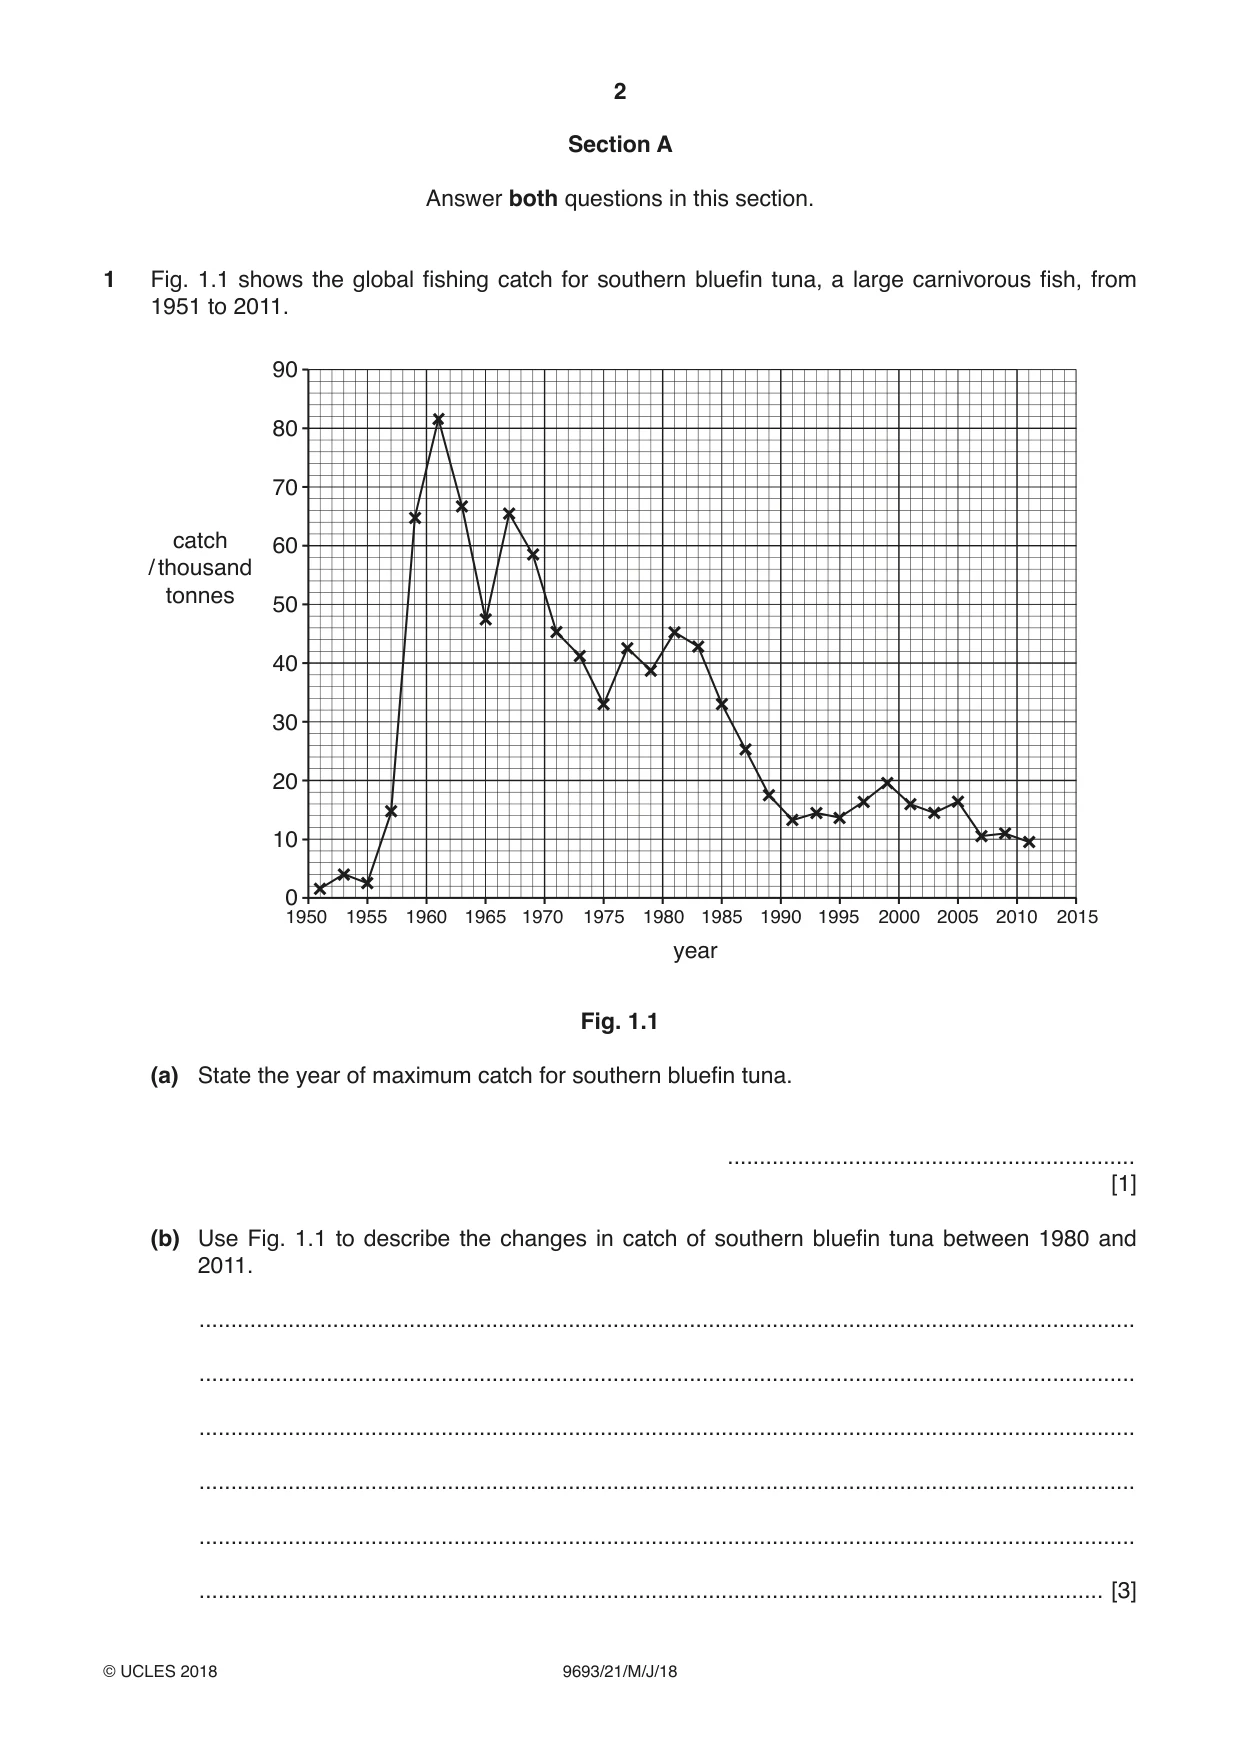
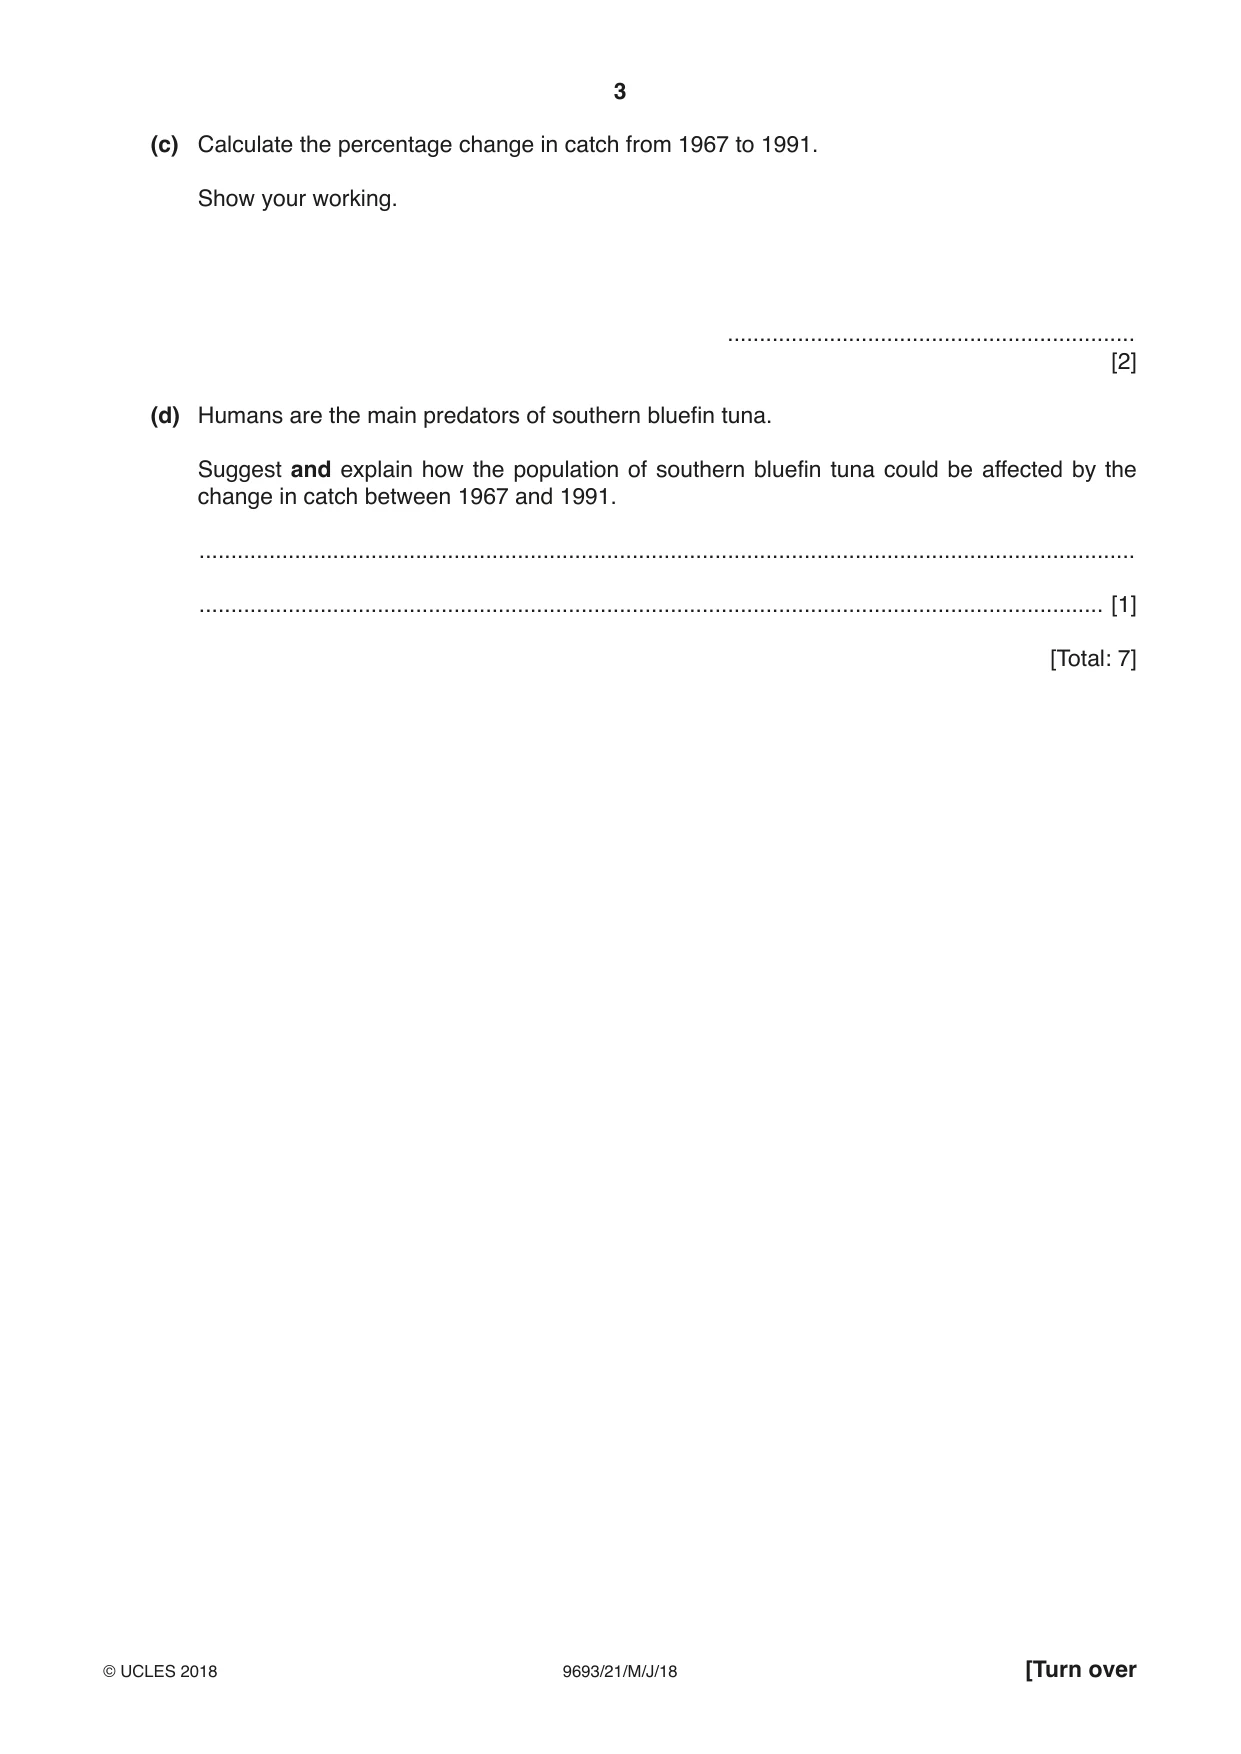
1 Fig. 1.1 shows the global fishing catch for southern bluefin tuna, a large carnivorous fish, from 1951 to 2011. 90 80 70 catch 60 / thousand tonnes 50 40 30 20 10 0 1950 1955 1960 1965 1970 1975 1980 1985 1990 1995 2000 2005 2010 2015 year Fig. 1.1 (a) State the year of maximum catch for southern bluefin tuna. ................................................................ [1] (b) Use Fig. 1.1 to describe the changes in catch of southern bluefin tuna between 1980 and 2011. ................................................................................................................................................... ................................................................................................................................................... ................................................................................................................................................... ................................................................................................................................................... ................................................................................................................................................... .............................................................................................................................................. [3] (c) Calculate the percentage change in catch from 1967 to 1991. Show your working. ................................................................ [2] (d) Humans are the main predators of southern bluefin tuna. Suggest and explain how the population of southern bluefin tuna could be affected by the change in catch between 1967 and 1991. ................................................................................................................................................... .............................................................................................................................................. [1] [Total: 7]
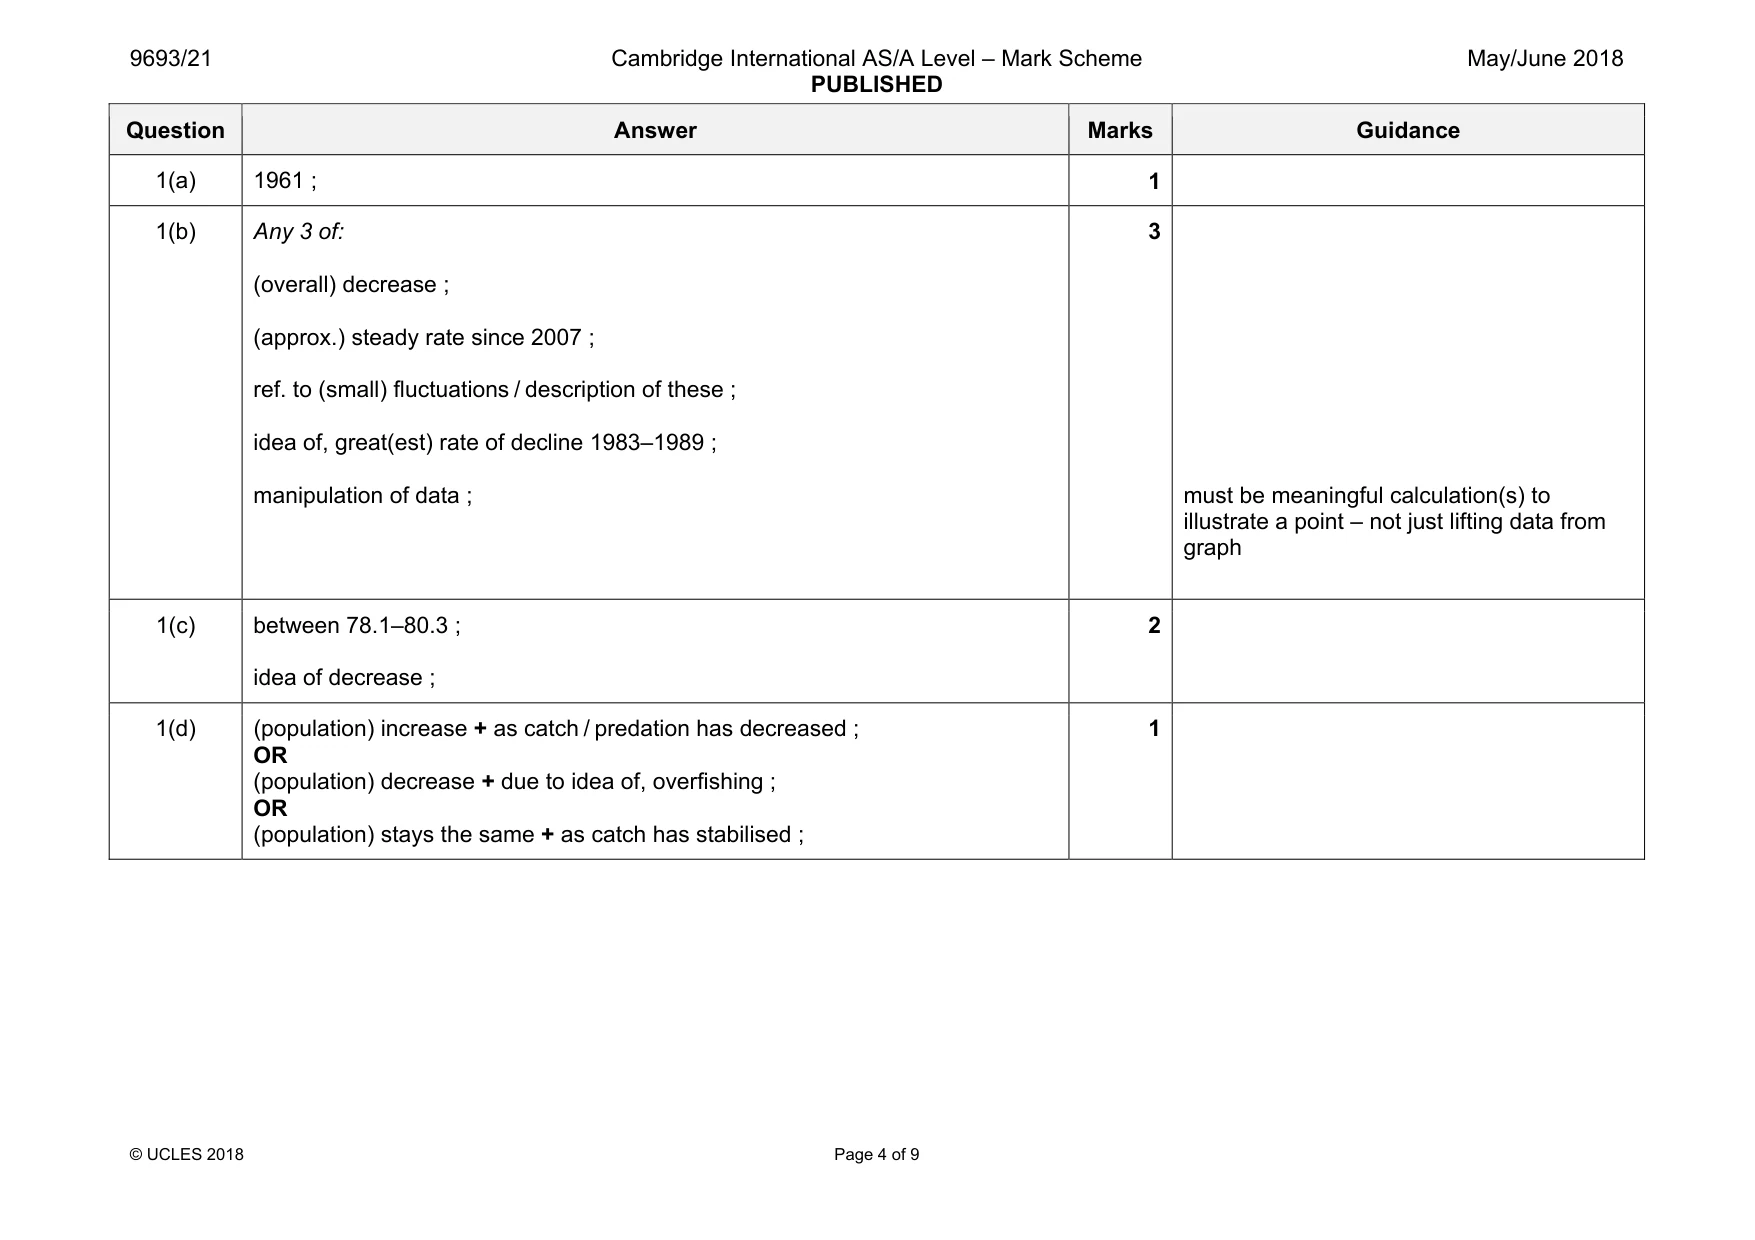
Mark scheme: 1(a) 1961 ; 1 1(b) Any 3 of: (overall) decrease ; (approx.) steady rate since 2007 ; ref. to (small) fluctuations / description of these ; idea of, great(est) rate of decline 1983–1989 ; manipulation of data ; 3 must be meaningful calculation(s) to illustrate a point – not just lifting data from graph 1(c) between 78.1–80.3 ; idea of decrease ; 2 1(d) (population) increase + as catch / predation has decreased ; OR (population) decrease + due to idea of, overfishing ; OR (population) stays the same + as catch has stabilised ; 1
Q2 · Divers carried out a survey to test the following hypothesis: Each species of coral has…
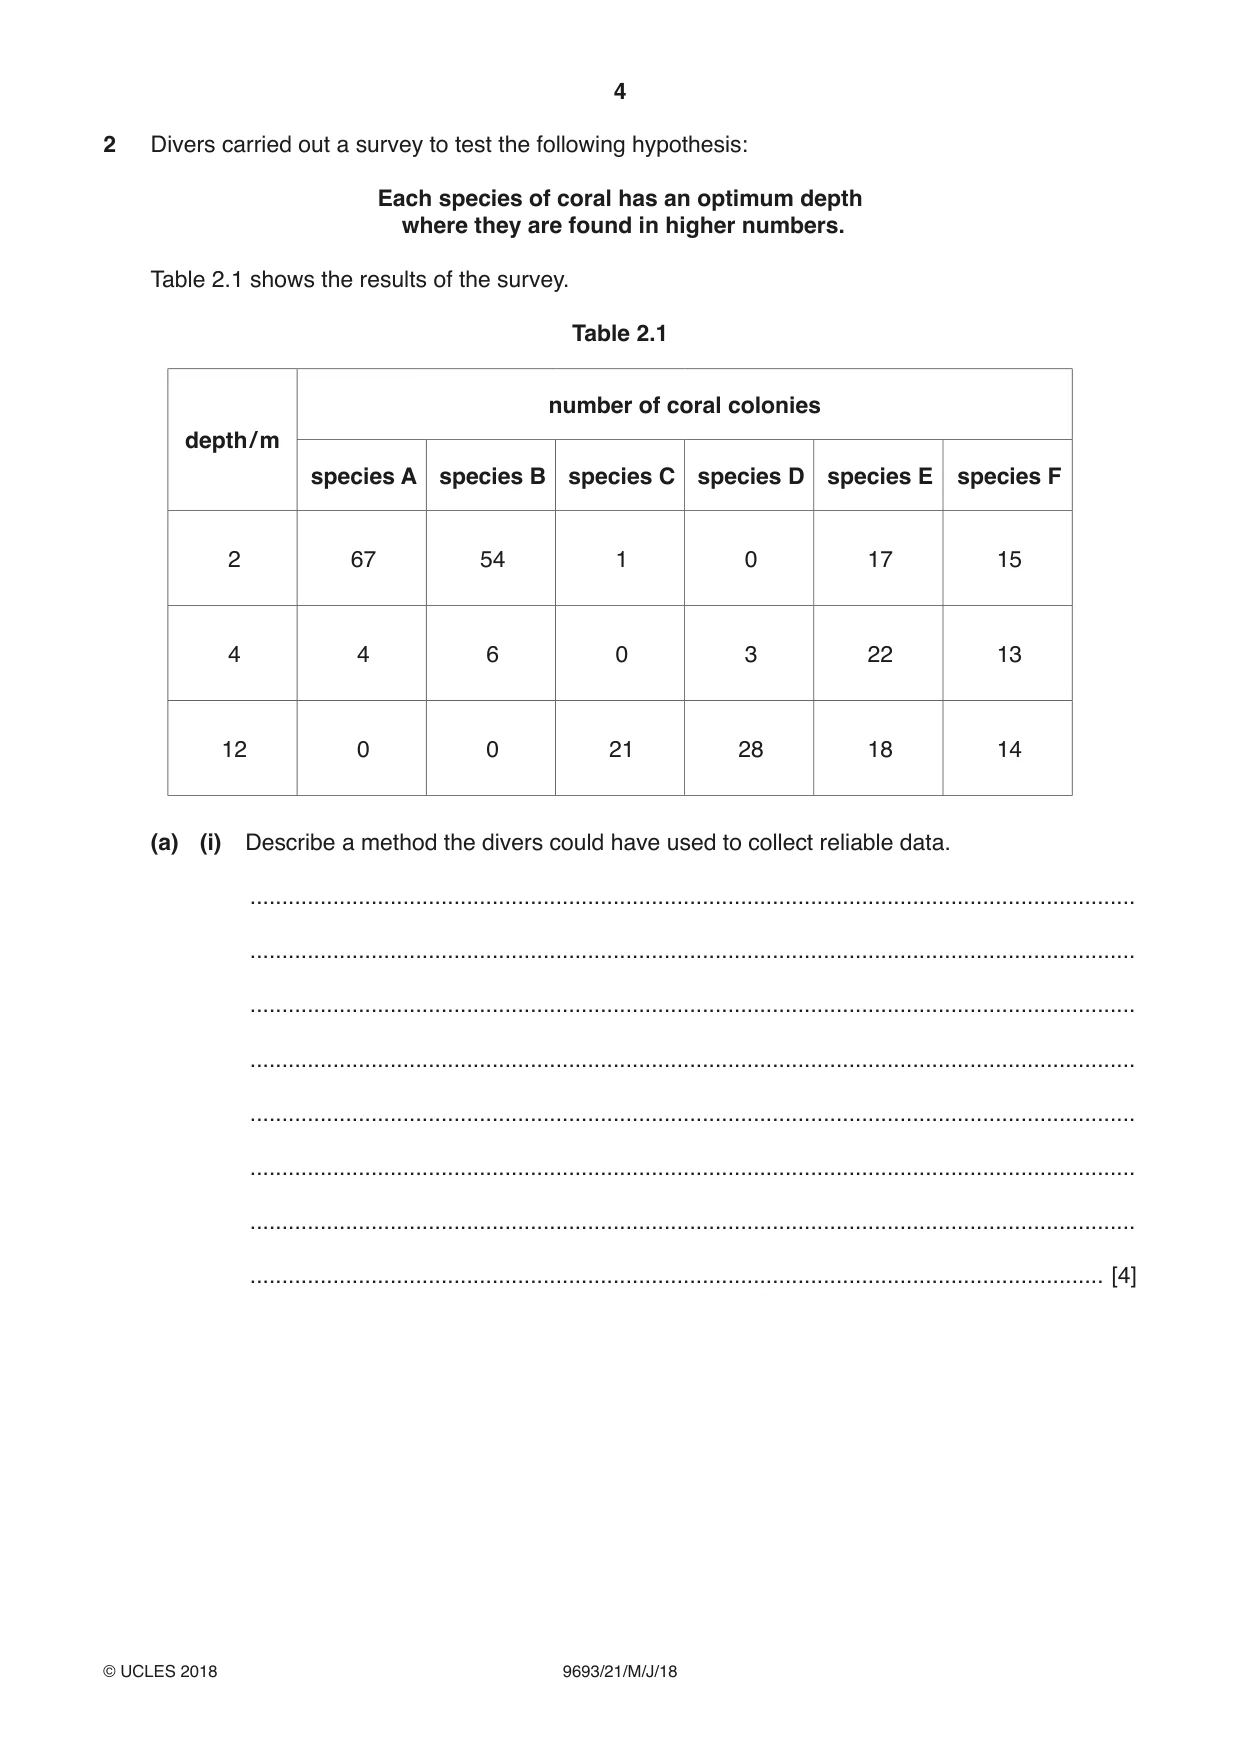
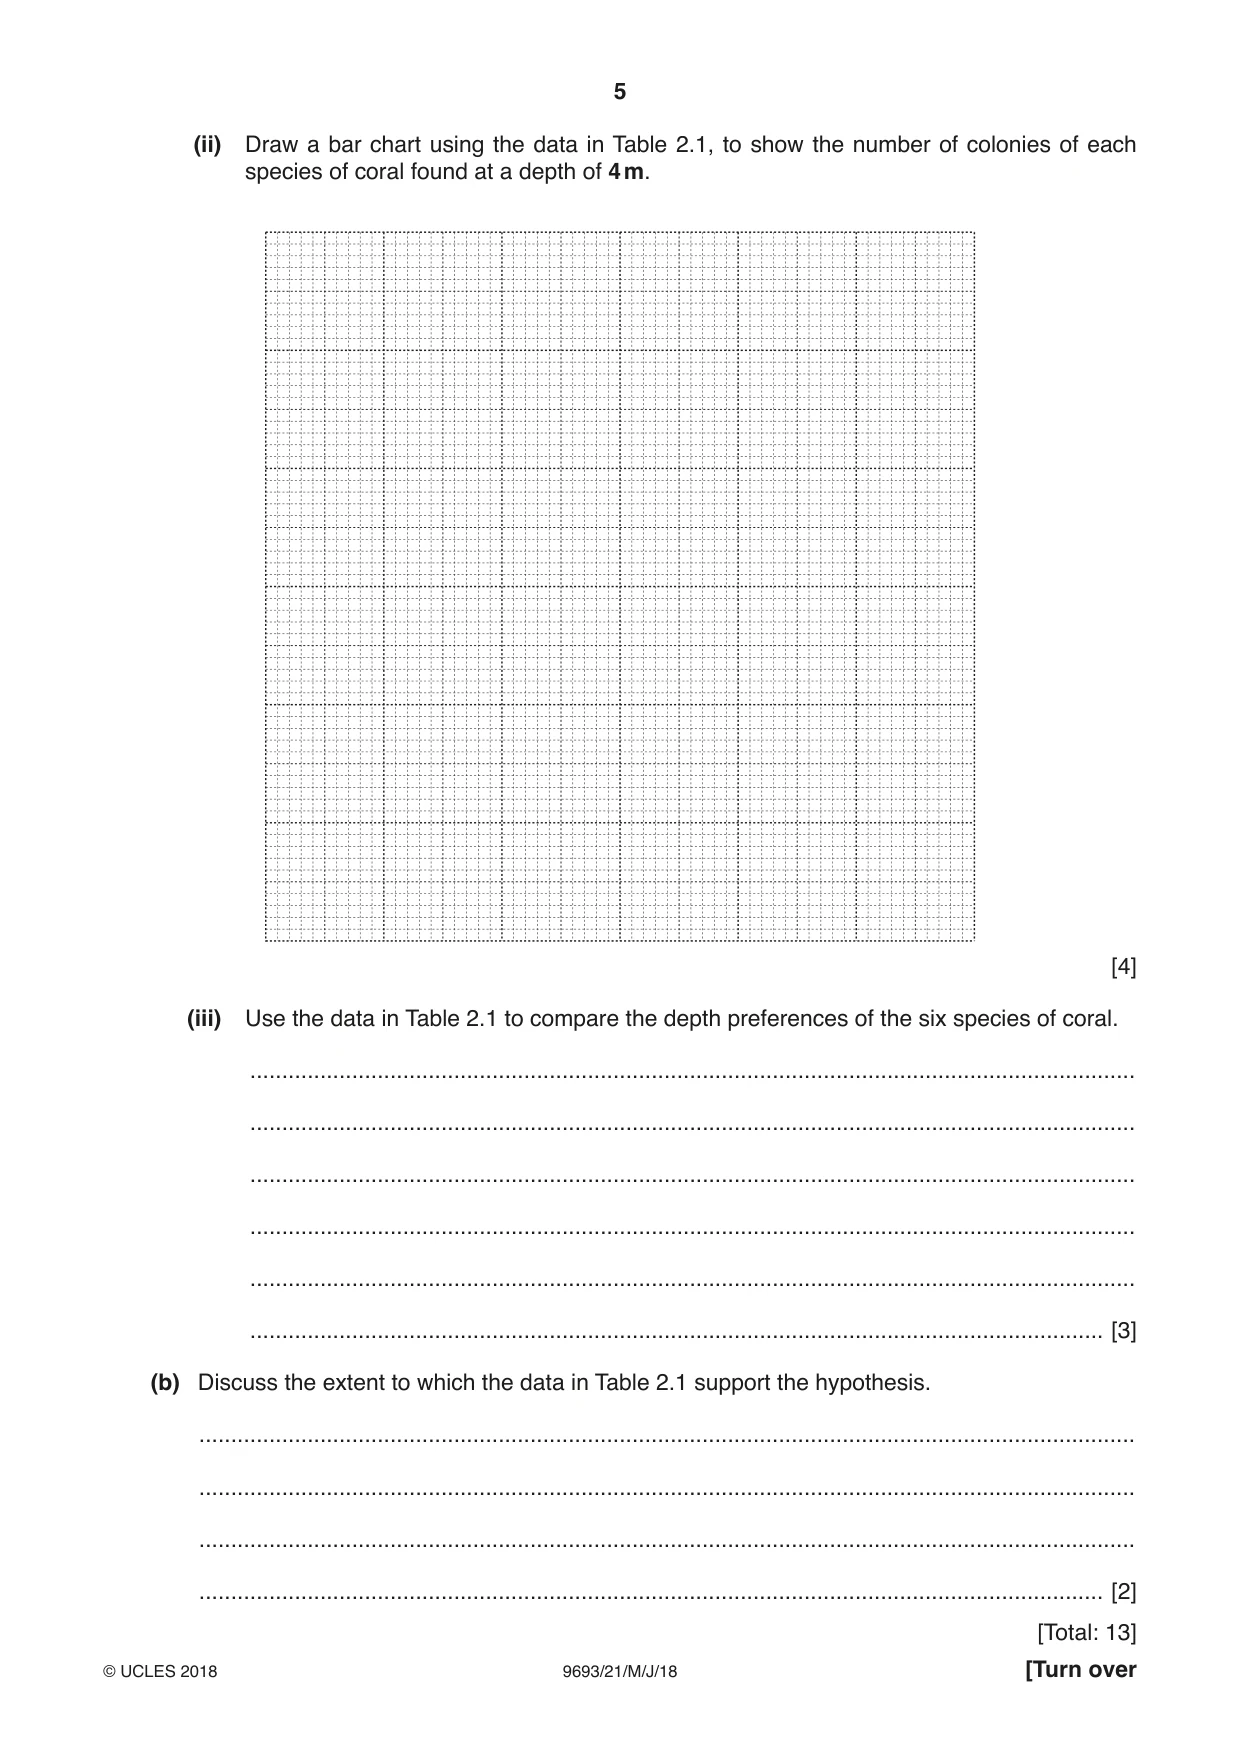
2 Divers carried out a survey to test the following hypothesis: Each species of coral has an optimum depth where they are found in higher numbers. Table 2.1 shows the results of the survey. Table 2.1 number of coral colonies depth / m species A species B species C species D species E species F 2 67 54 1 0 17 15 4 4 6 0 3 22 13 12 0 0 21 28 18 14 (a) (i) Describe a method the divers could have used to collect reliable data. ........................................................................................................................................... ........................................................................................................................................... ........................................................................................................................................... ........................................................................................................................................... ........................................................................................................................................... ........................................................................................................................................... ........................................................................................................................................... ...................................................................................................................................... [4] (ii) Draw a bar chart using the data in Table 2.1, to show the number of colonies of each species of coral found at a depth of 4 m. [4] (iii) Use the data in Table 2.1 to compare the depth preferences of the six species of coral. ........................................................................................................................................... ........................................................................................................................................... ........................................................................................................................................... ........................................................................................................................................... ........................................................................................................................................... ...................................................................................................................................... [3] (b) Discuss the extent to which the data in Table 2.1 support the hypothesis. ................................................................................................................................................... ................................................................................................................................................... ................................................................................................................................................... .............................................................................................................................................. [2] [Total: 13]
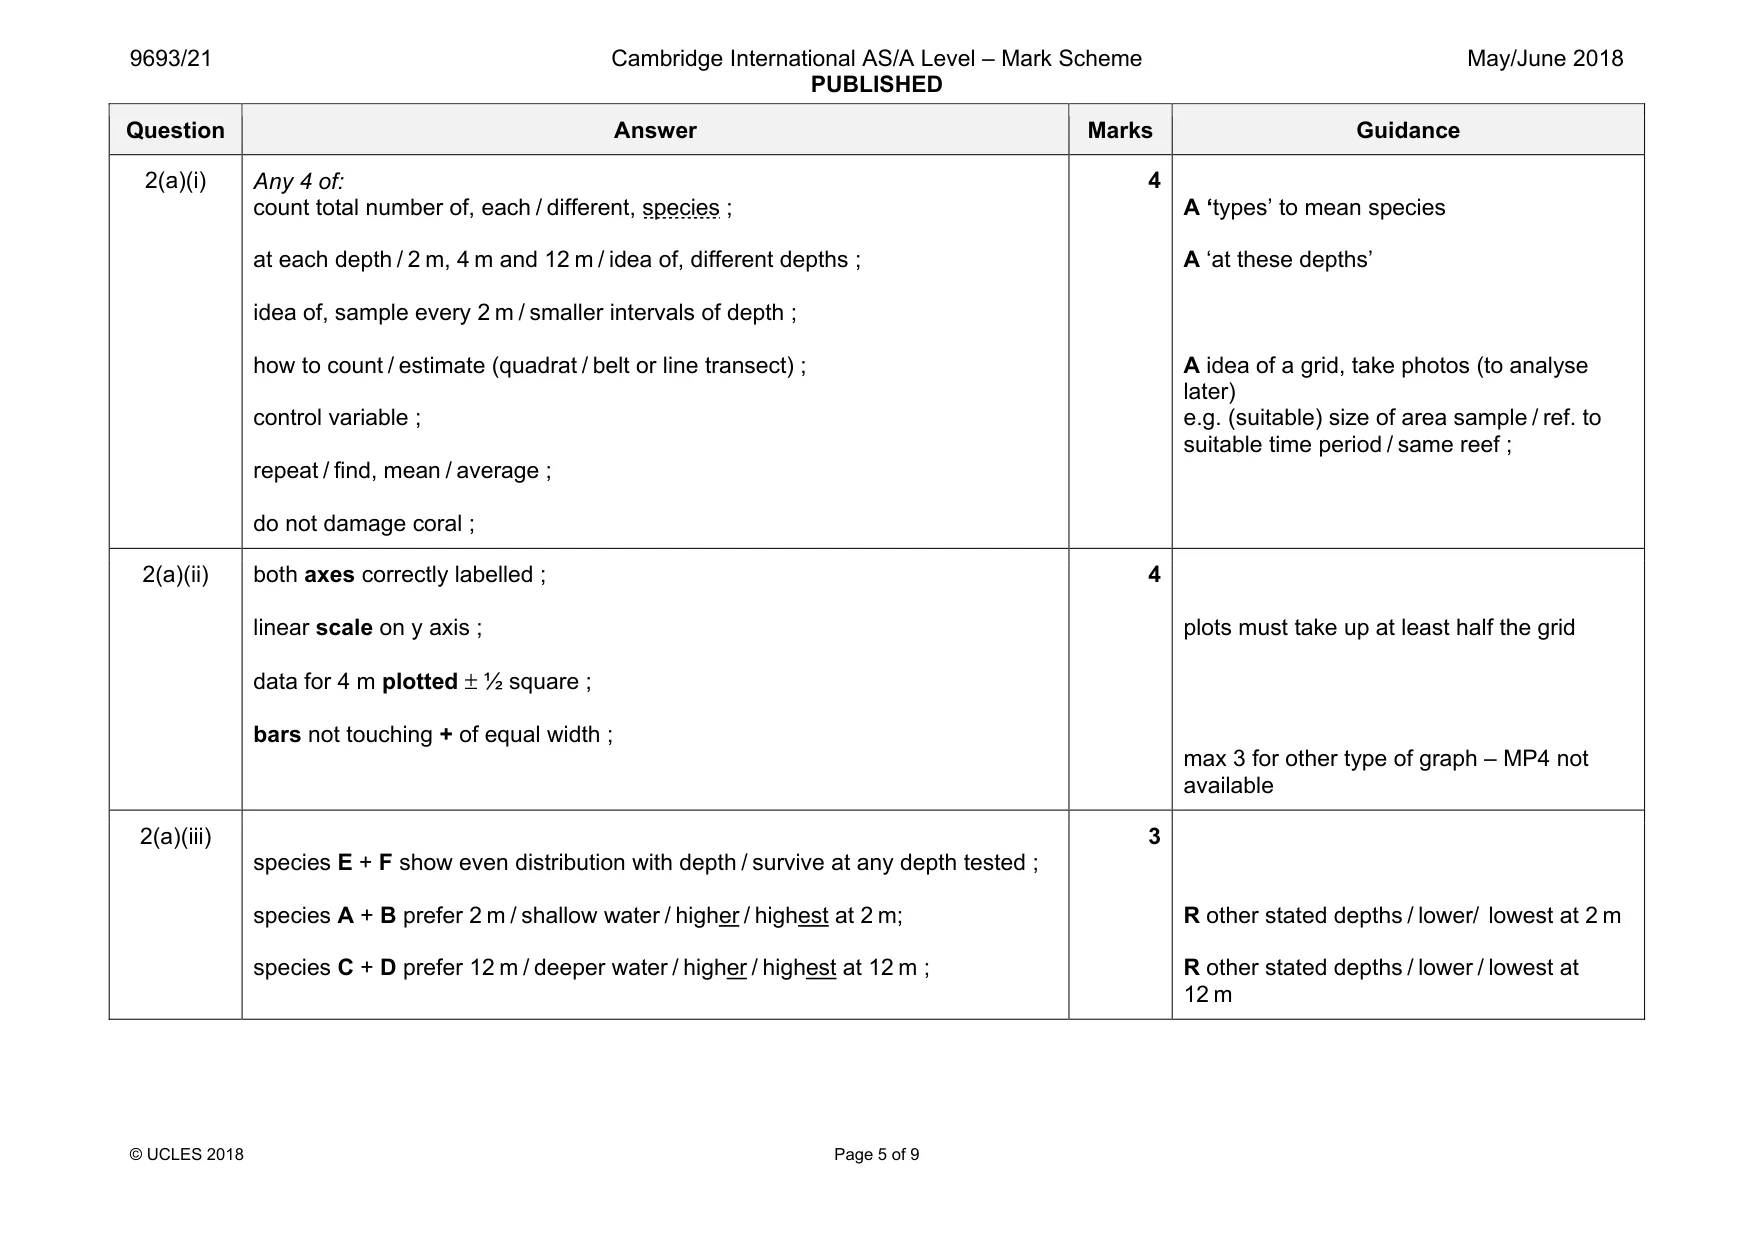
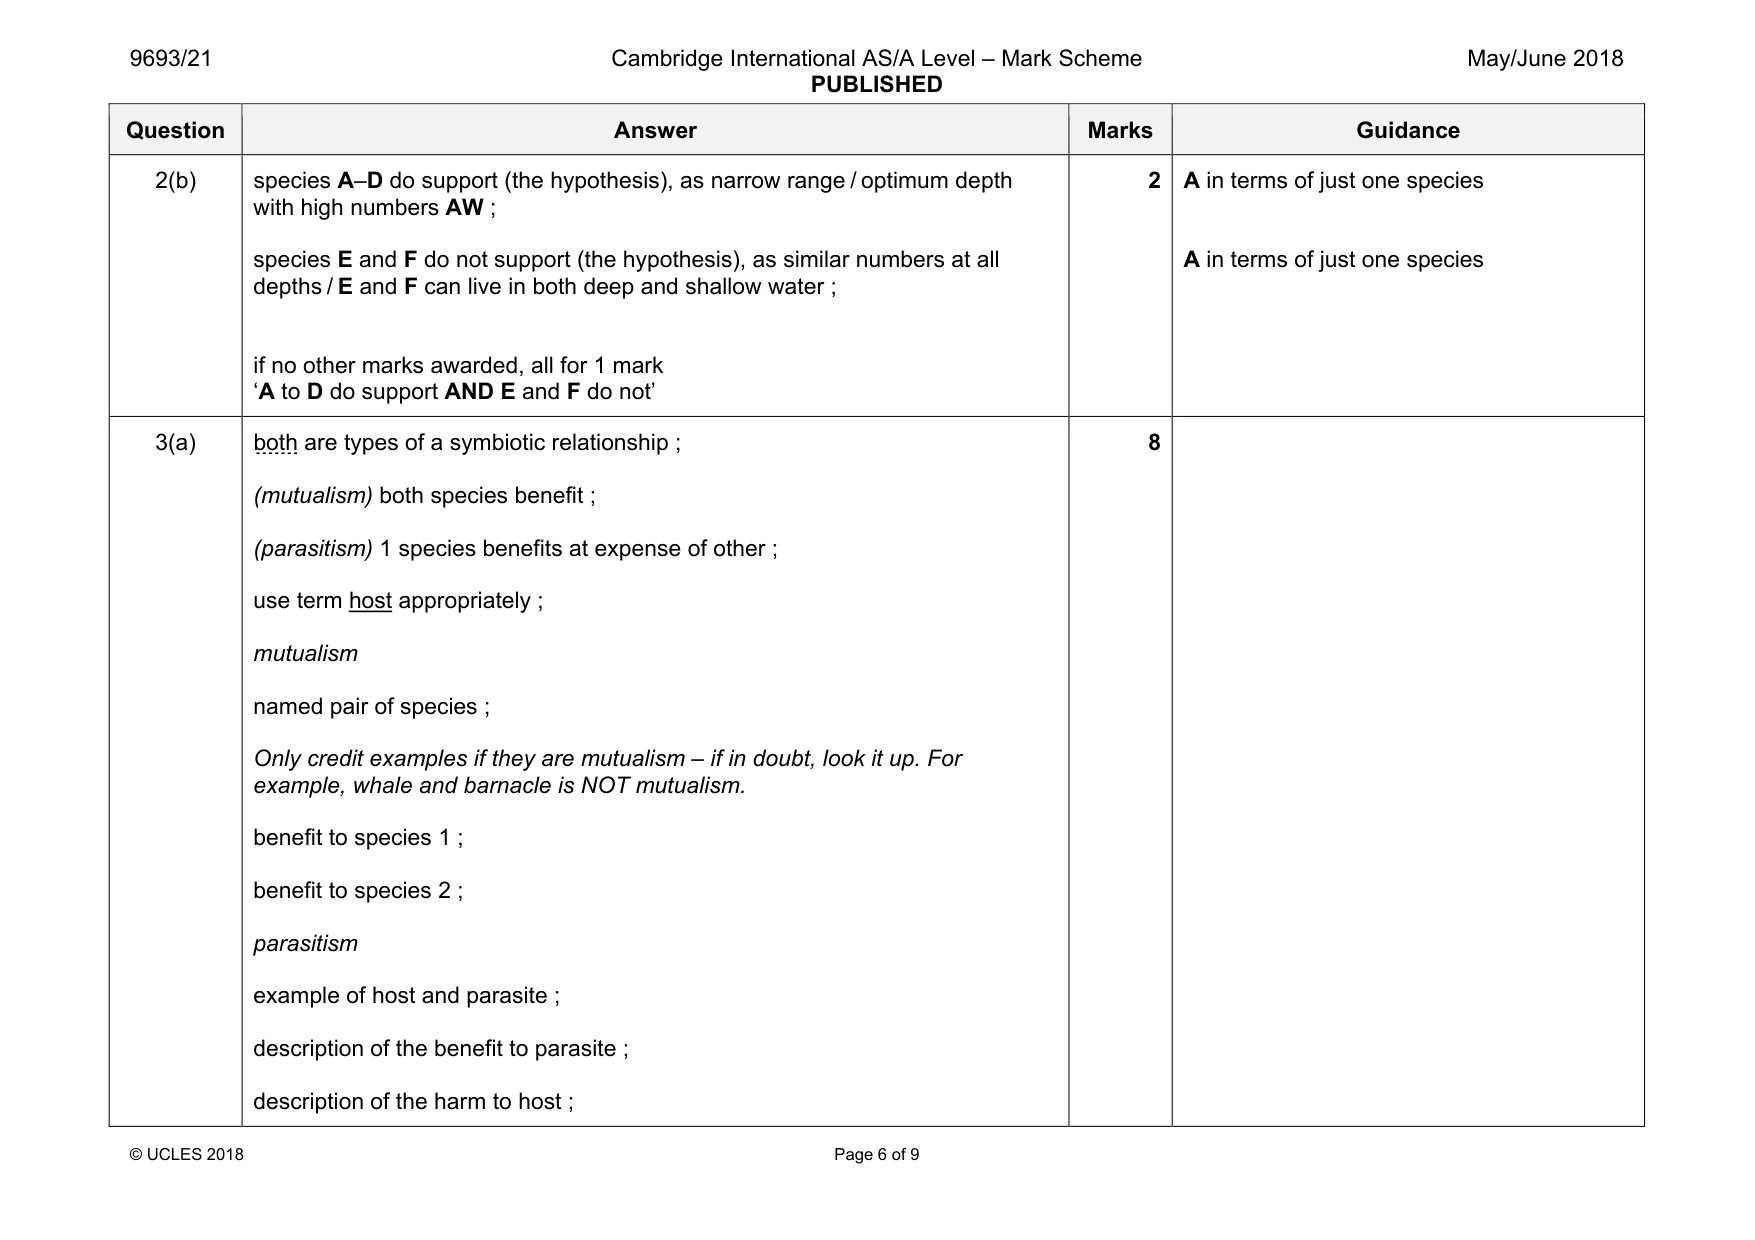
Mark scheme: 2(a)(i) Any 4 of: count total number of, each / different, species ; at each depth / 2 m, 4 m and 12 m / idea of, different depths ; idea of, sample every 2 m / smaller intervals of depth ; how to count / estimate (quadrat / belt or line transect) ; control variable ; repeat / find, mean / average ; do not damage coral ; 4 A ‘types’ to mean species A ‘at these depths’ A idea of a grid, take photos (to analyse later) e.g. (suitable) size of area sample / ref. to suitable time period / same reef ; 2(a)(ii) both axes correctly labelled ; linear scale on y axis ; data for 4 m plotted ± ½ square ; bars not touching + of equal width ; 4 plots must take up at least half the grid max 3 for other type of graph – MP4 not available 2(a)(iii) species E + F show even distribution with depth / survive at any depth tested ; species A + B prefer 2 m / shallow water / higher / highest at 2 m; species C + D prefer 12 m / deeper water / higher / highest at 12 m ; 3 R other stated depths / lower/ lowest at 2 m R other stated depths / lower / lowest at 12 m Question Answer Marks Guidance 2(b) species A–D do support (the hypothesis), as narrow range / optimum depth with high numbers AW ; species E and F do not support (the hypothesis), as similar numbers at all depths / E and F can live in both deep and shallow water ; if no other marks awarded, all for 1 mark ‘A to D do support AND E and F do not’ 2 A in terms of just one species A in terms of just one species
Q3 · Mutualism and parasitism are two examples of interrelationships between species
3 (a) Mutualism and parasitism are two examples of interrelationships between species. Describe each of these types of interrelationships, with reference to specific marine examples. ................................................................................................................................................... ................................................................................................................................................... ................................................................................................................................................... ................................................................................................................................................... ................................................................................................................................................... ................................................................................................................................................... ................................................................................................................................................... ................................................................................................................................................... ................................................................................................................................................... ................................................................................................................................................... ................................................................................................................................................... ................................................................................................................................................... ................................................................................................................................................... ................................................................................................................................................... ................................................................................................................................................... .............................................................................................................................................. [8] (b) (i) Coral reefs are areas with high productivity. Explain the meaning of the term productivity. ........................................................................................................................................... ........................................................................................................................................... ........................................................................................................................................... ...................................................................................................................................... [2] (ii) Suggest reasons why coral reefs have a high productivity. ........................................................................................................................................... ........................................................................................................................................... ........................................................................................................................................... ........................................................................................................................................... ........................................................................................................................................... ........................................................................................................................................... ........................................................................................................................................... ........................................................................................................................................... ........................................................................................................................................... ...................................................................................................................................... [5] [Total: 15]
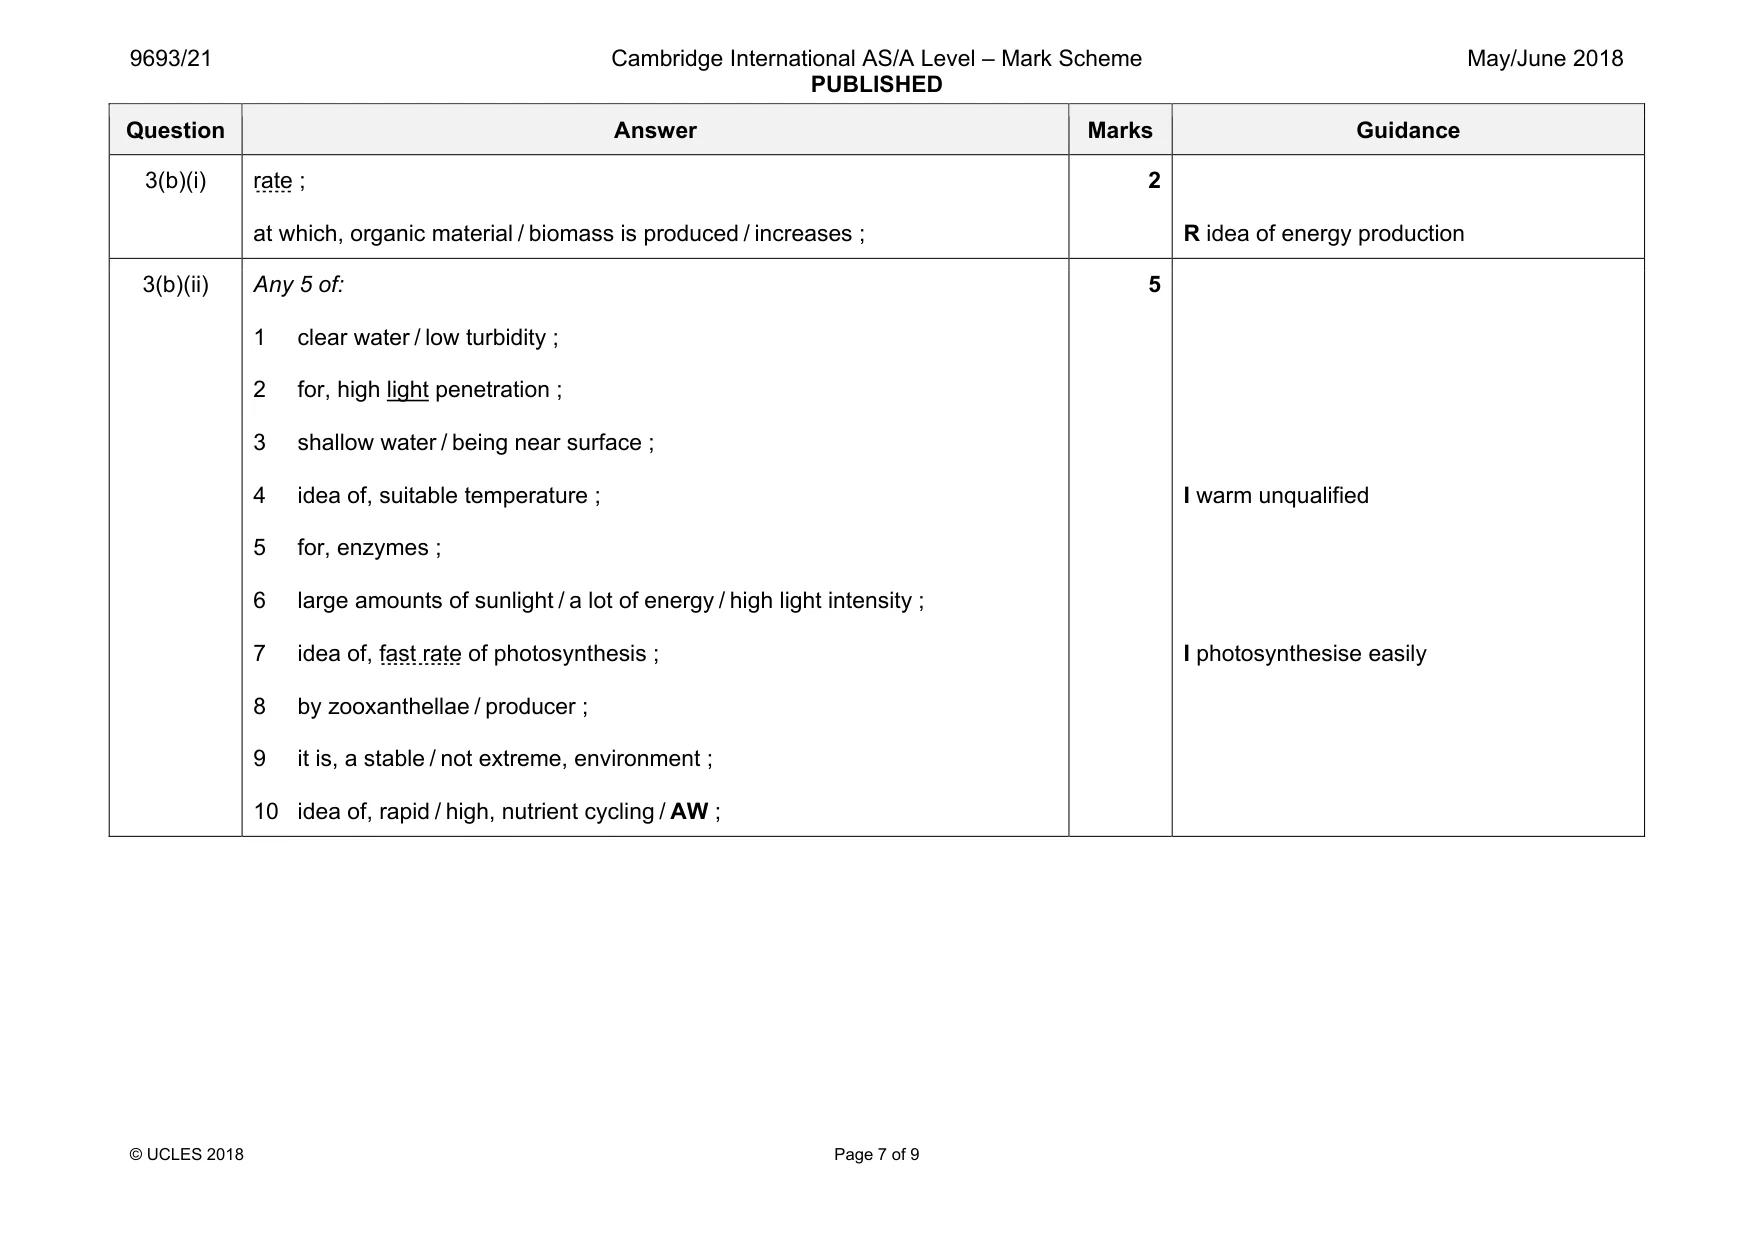
Mark scheme: 3(a) both are types of a symbiotic relationship ; (mutualism) both species benefit ; (parasitism) 1 species benefits at expense of other ; use term host appropriately ; mutualism named pair of species ; Only credit examples if they are mutualism – if in doubt, look it up. For example, whale and barnacle is NOT mutualism. benefit to species 1 ; benefit to species 2 ; parasitism example of host and parasite ; description of the benefit to parasite ; description of the harm to host ; 8 Question Answer Marks Guidance 3(b)(i) rate ; at which, organic material / biomass is produced / increases ; 2 R idea of energy production 3(b)(ii) Any 5 of: 1 clear water / low turbidity ; 2 for, high light penetration ; 3 shallow water / being near surface ; 4 idea of, suitable temperature ; 5 for, enzymes ; 6 large amounts of sunlight / a lot of energy / high light intensity ; 7 idea of, fast rate of photosynthesis ; 8 by zooxanthellae / producer ; 9 it is, a stable / not extreme, environment ; 10 idea of, rapid / high, nutrient cycling / AW ; 5 I warm unqualified I photosynthesise easily
Q4 · Explain how the alignment of the Sun and the Moon affects the tidal range
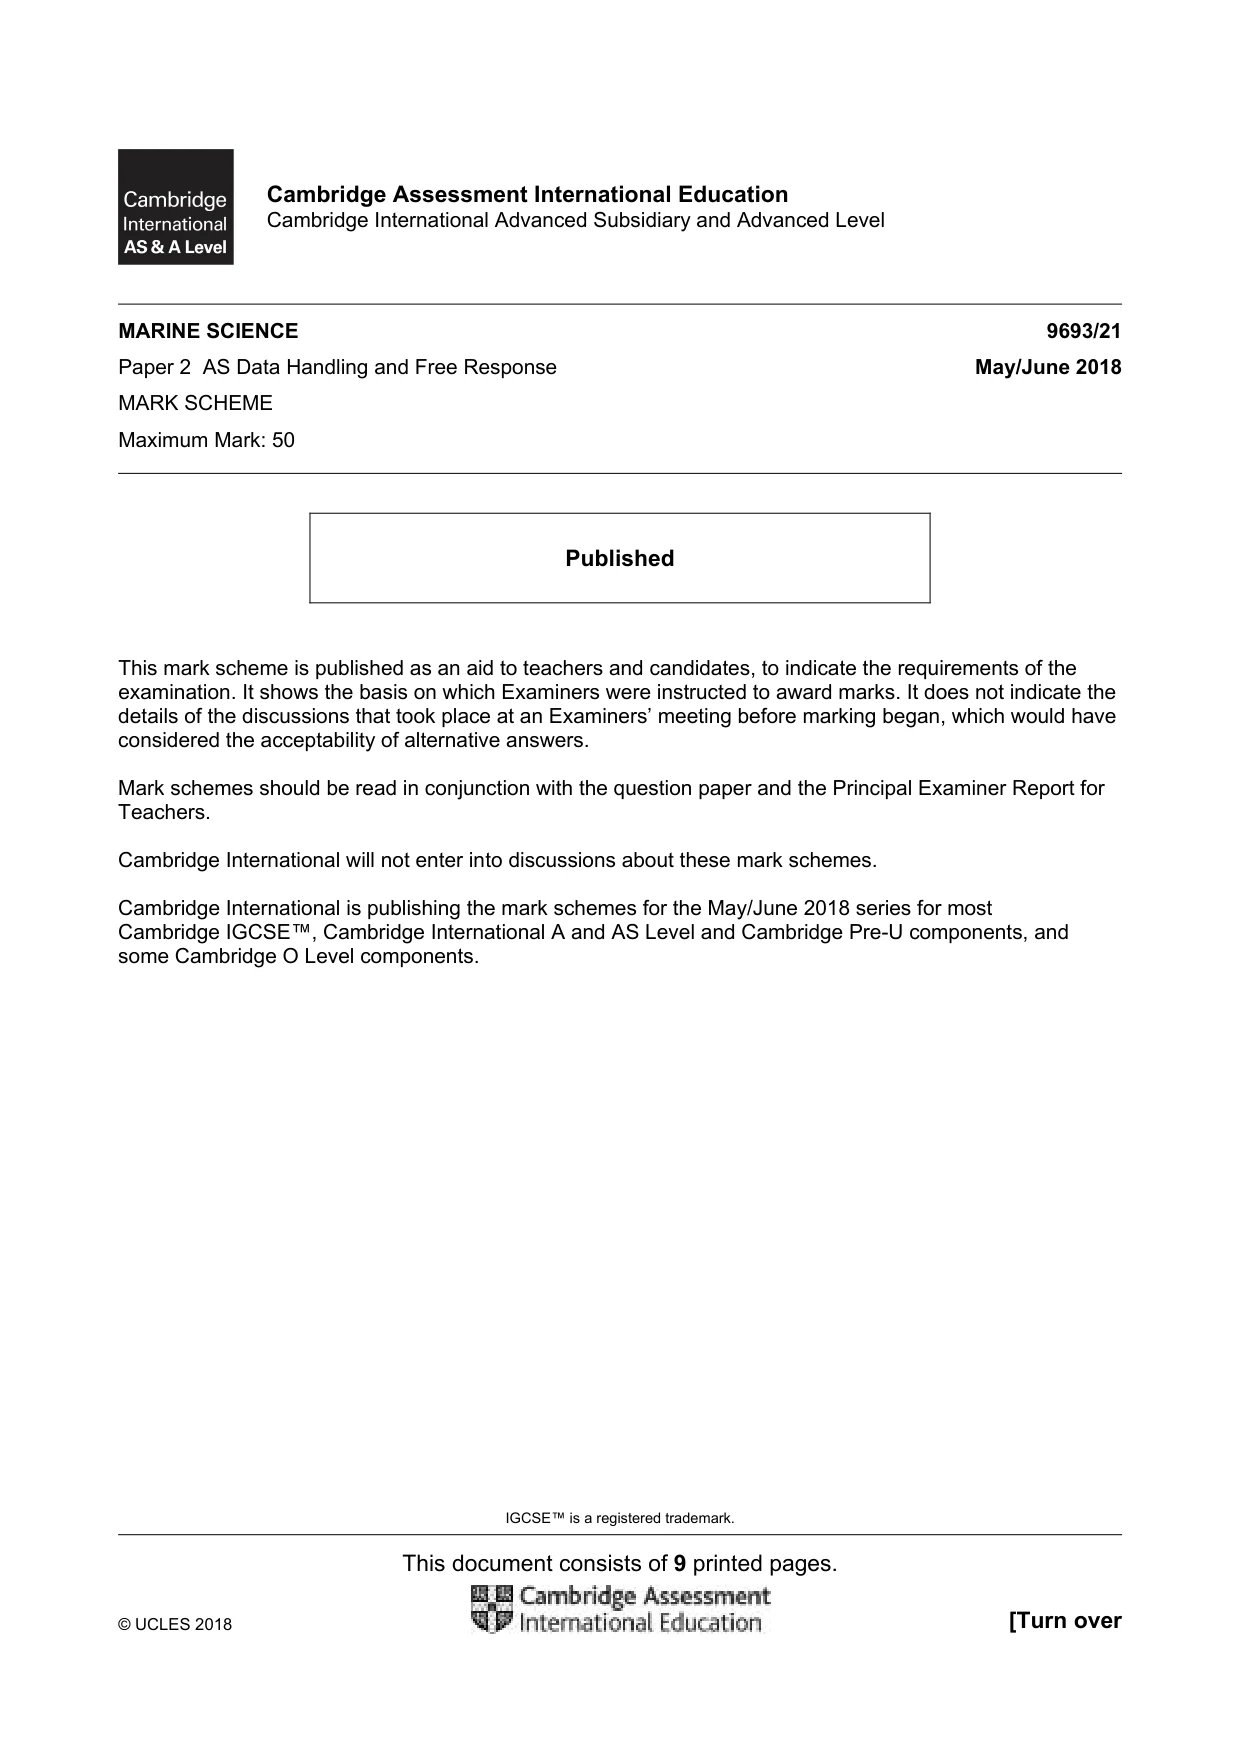
4 (a) (i) Explain how the alignment of the Sun and the Moon affects the tidal range. You may use diagrams in your answer. ........................................................................................................................................... ........................................................................................................................................... ........................................................................................................................................... ........................................................................................................................................... ........................................................................................................................................... ........................................................................................................................................... ........................................................................................................................................... ........................................................................................................................................... ........................................................................................................................................... ........................................................................................................................................... ........................................................................................................................................... ........................................................................................................................................... ........................................................................................................................................... ........................................................................................................................................... ........................................................................................................................................... ...................................................................................................................................... [6] (ii) Describe other factors that can affect tidal range. ........................................................................................................................................... ........................................................................................................................................... ........................................................................................................................................... ........................................................................................................................................... ........................................................................................................................................... ...................................................................................................................................... [3] (b) Outline how environmental factors affect the formation of communities on a rocky shore. ................................................................................................................................................... ................................................................................................................................................... ................................................................................................................................................... ................................................................................................................................................... ................................................................................................................................................... ................................................................................................................................................... ................................................................................................................................................... ................................................................................................................................................... ................................................................................................................................................... ................................................................................................................................................... ................................................................................................................................................... .............................................................................................................................................. [6] [Total: 15]
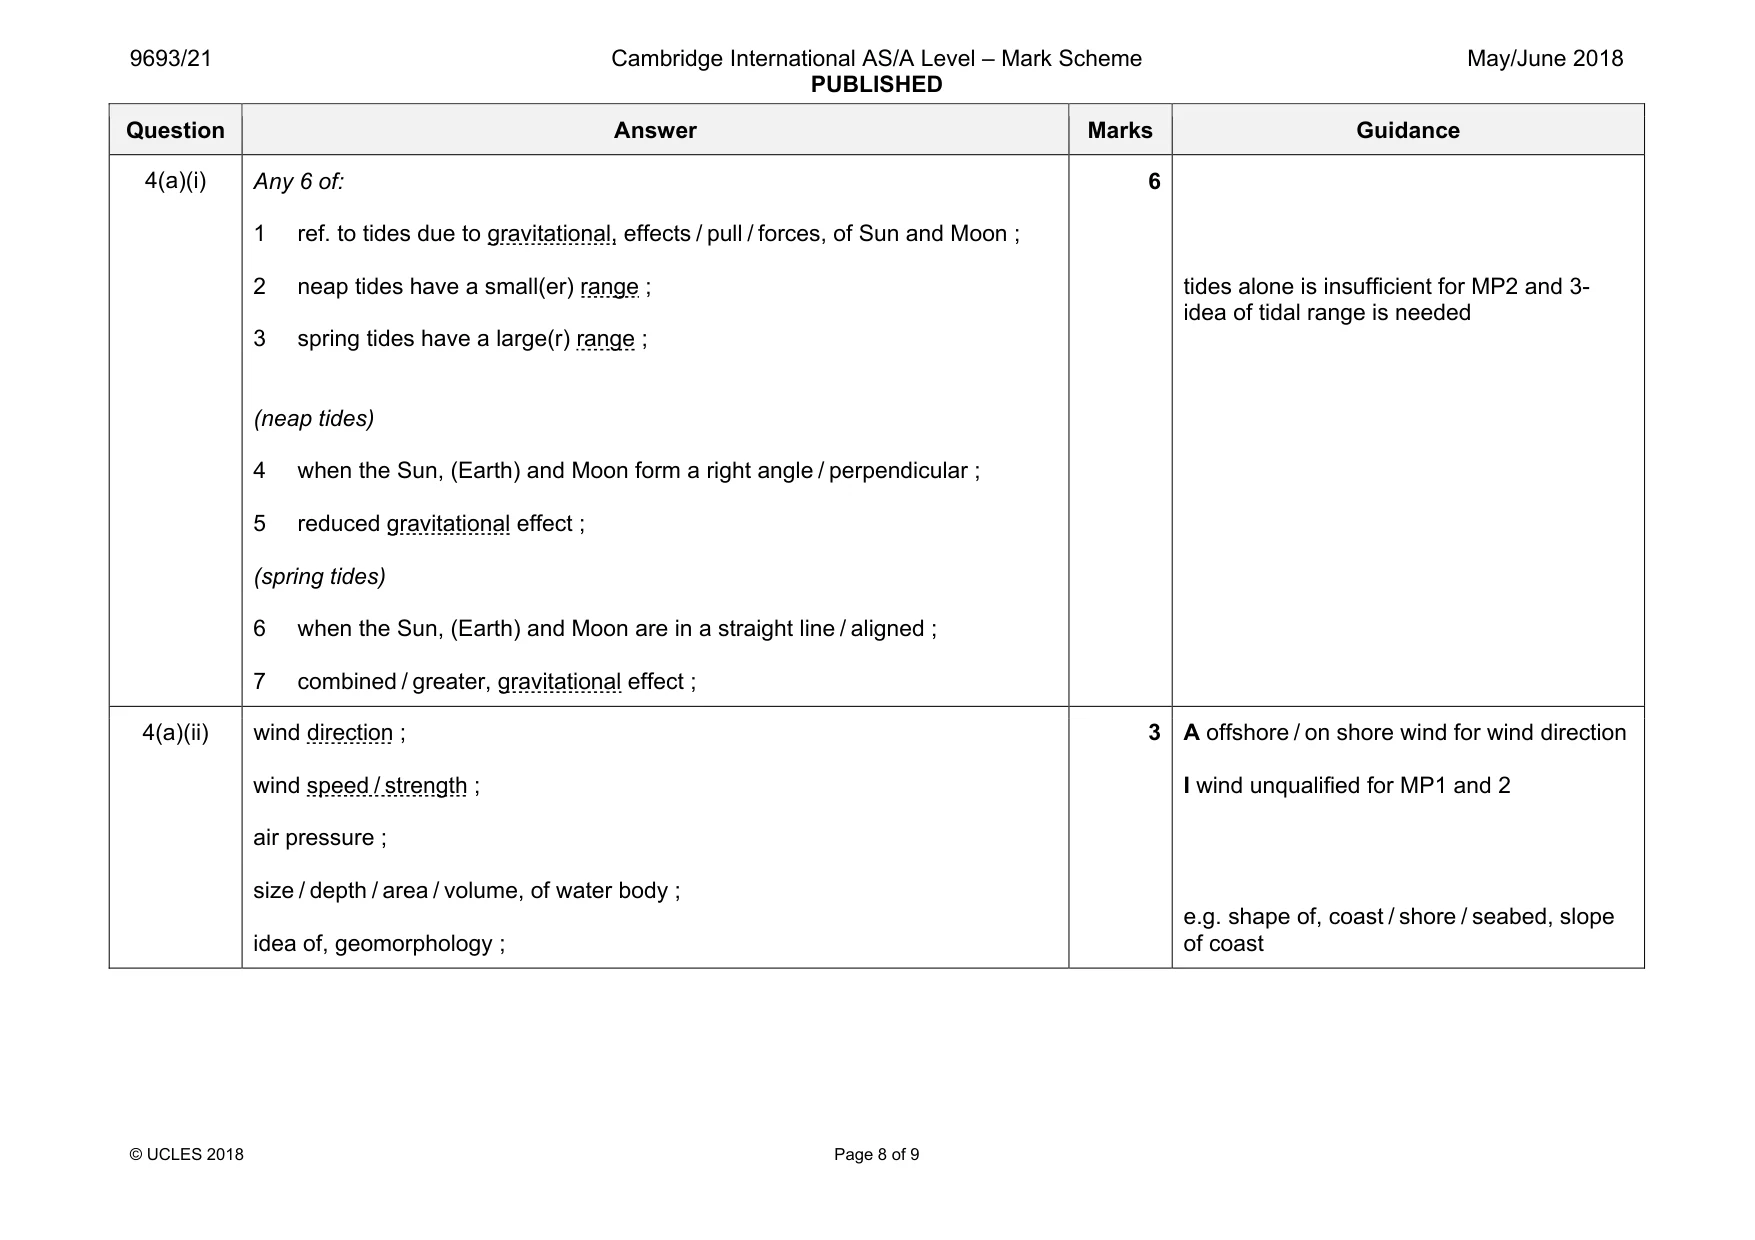
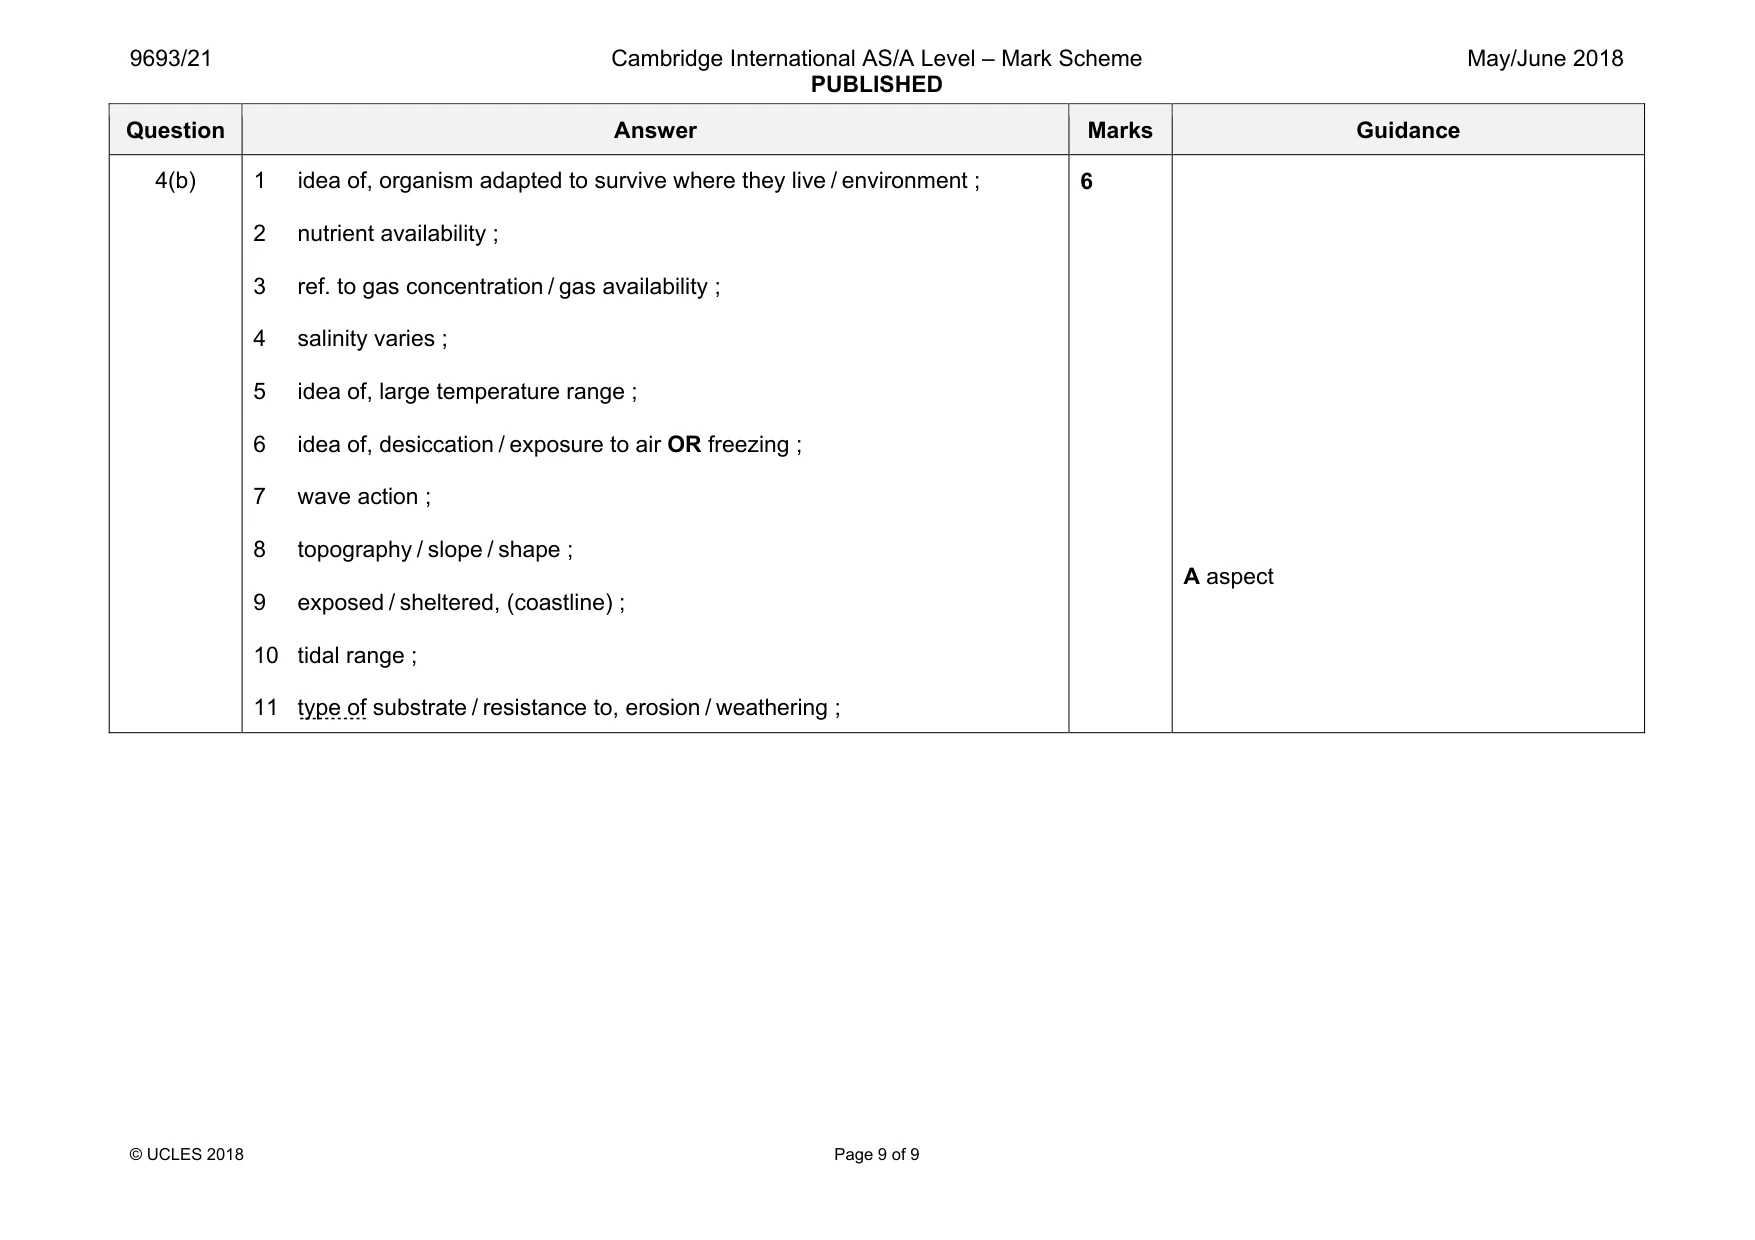
Mark scheme: 4(a)(i) Any 6 of: 1 ref. to tides due to gravitational, effects / pull / forces, of Sun and Moon ; 2 neap tides have a small(er) range ; 3 spring tides have a large(r) range ; (neap tides) 4 when the Sun, (Earth) and Moon form a right angle / perpendicular ; 5 reduced gravitational effect ; (spring tides) 6 when the Sun, (Earth) and Moon are in a straight line / aligned ; 7 combined / greater, gravitational effect ; 6 tides alone is insufficient for MP2 and 3- idea of tidal range is needed 4(a)(ii) wind direction ; wind speed / strength ; air pressure ; size / depth / area / volume, of water body ; idea of, geomorphology ; 3 A offshore / on shore wind for wind direction I wind unqualified for MP1 and 2 e.g. shape of, coast / shore / seabed, slope of coast Question Answer Marks Guidance 4(b) 1 idea of, organism adapted to survive where they live / environment ; 2 nutrient availability ; 3 ref. to gas concentration / gas availability ; 4 salinity varies ; 5 idea of, large temperature range ; 6 idea of, desiccation / exposure to air OR freezing ; 7 wave action ; 8 topography / slope / shape ; 9 exposed / sheltered, (coastline) ; 10 tidal range ; 11 type of substrate / resistance to, erosion / weathering ; 6 A aspect
What was in this paper
The subtopics covered by these 4 questions, and how many questions each got. Open one in a new tab to see every Cambridge question on it.
What you needed in this session
Cambridge’s own grade thresholds for 2018 May/June, Paper 2 · Variant 1. A higher threshold means an easier paper — the bar moves with how the cohort did.