Cambridge A Level Marine Science 9693 — 2023 Oct/Nov Paper 2 · Variant 1
9693/21/O/N/23 · 4 questions · 75 marks · ≈84 min
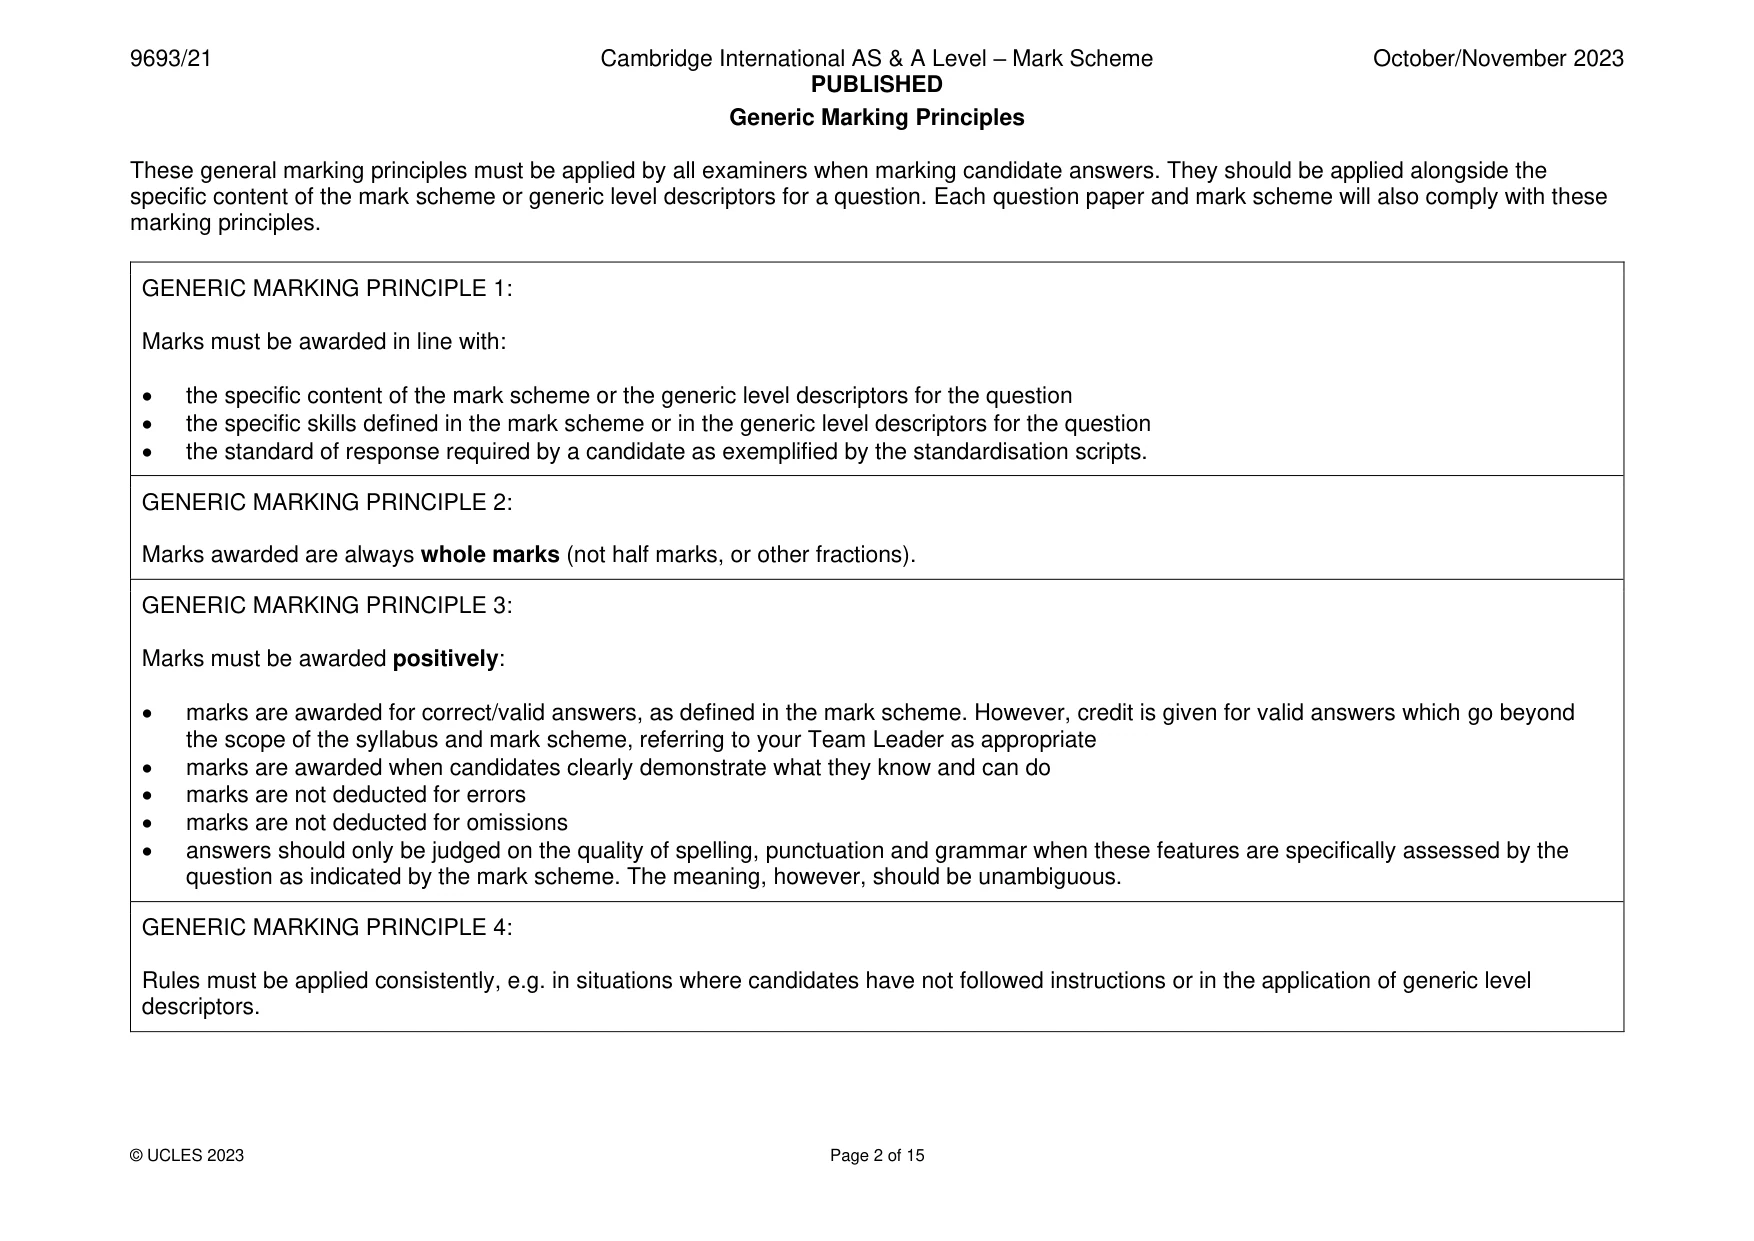
The question paper and its mark scheme, free to read here and free to download. This is Cambridge’s own paper, exactly as it was sat.
Question paper16 pages

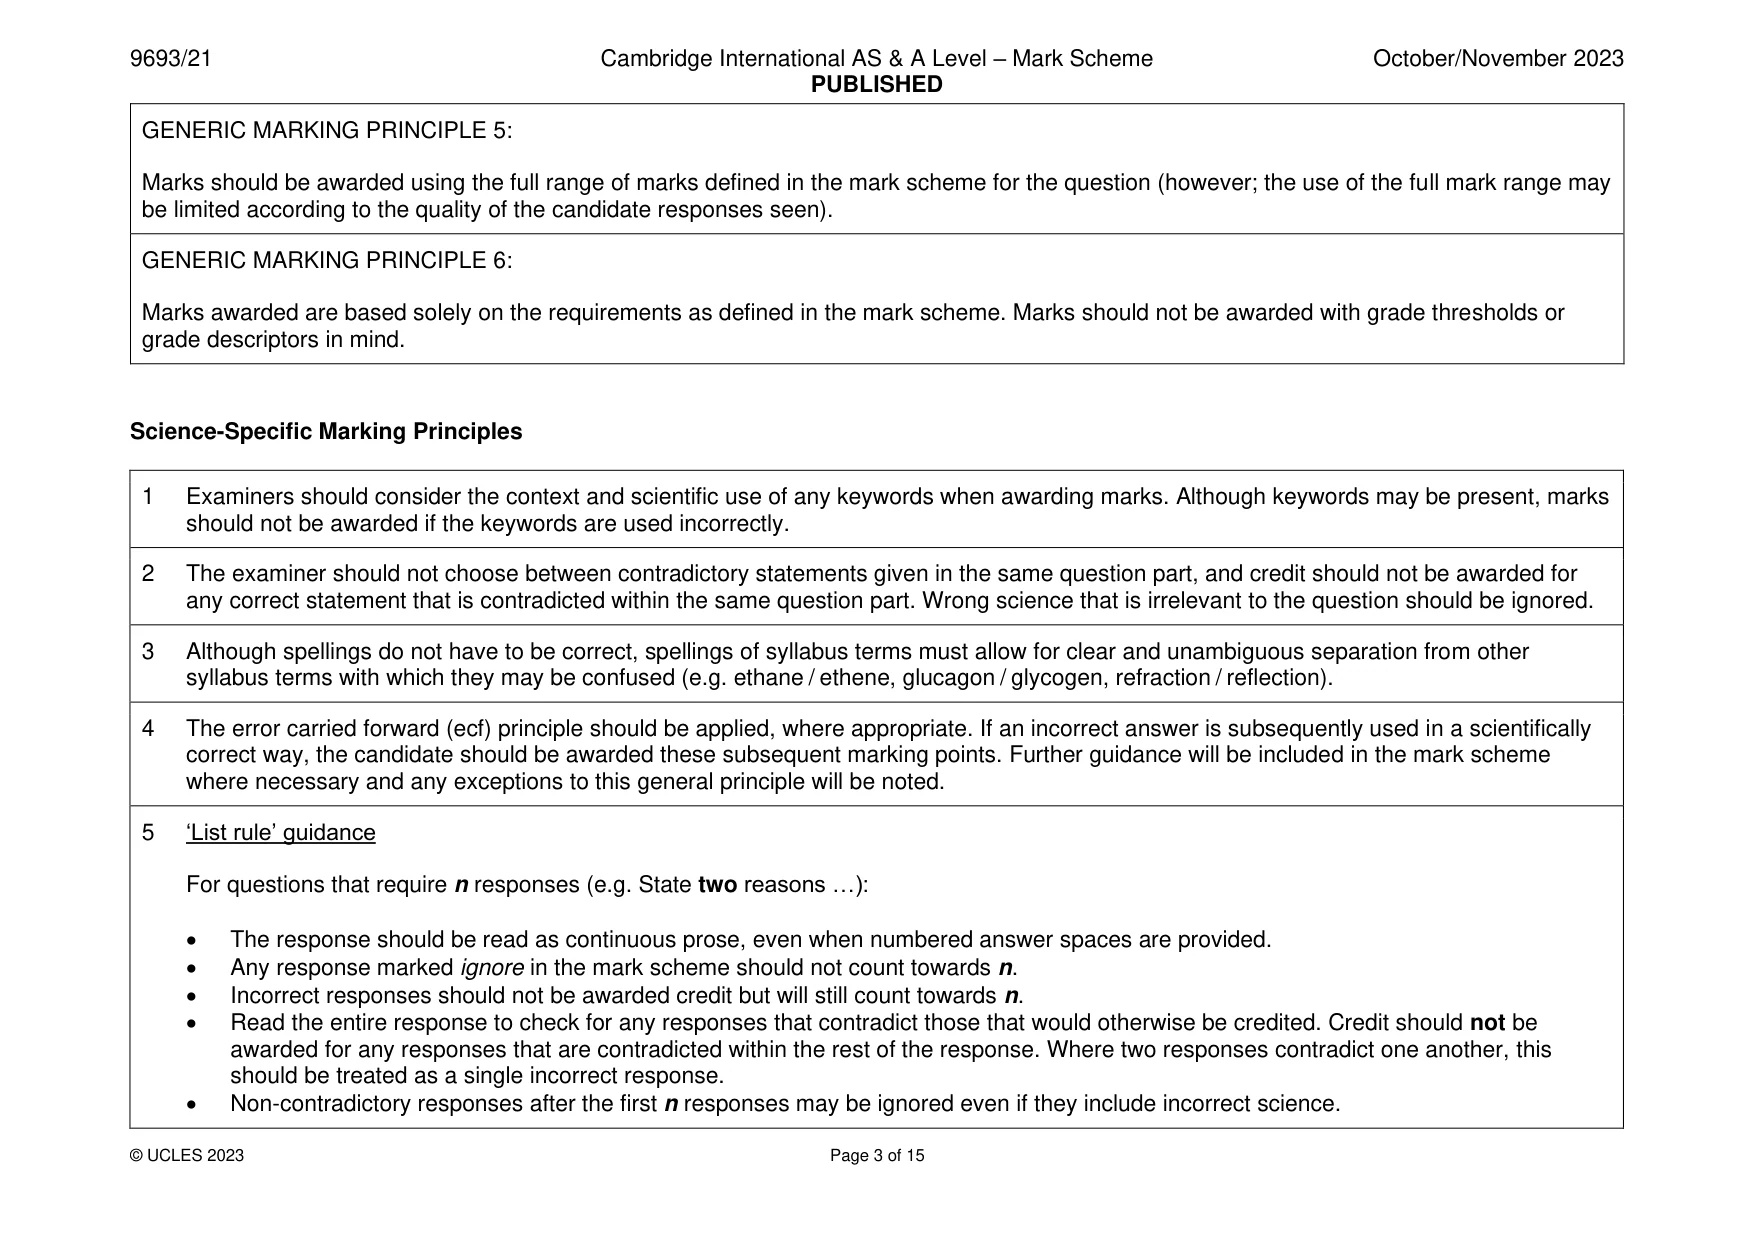
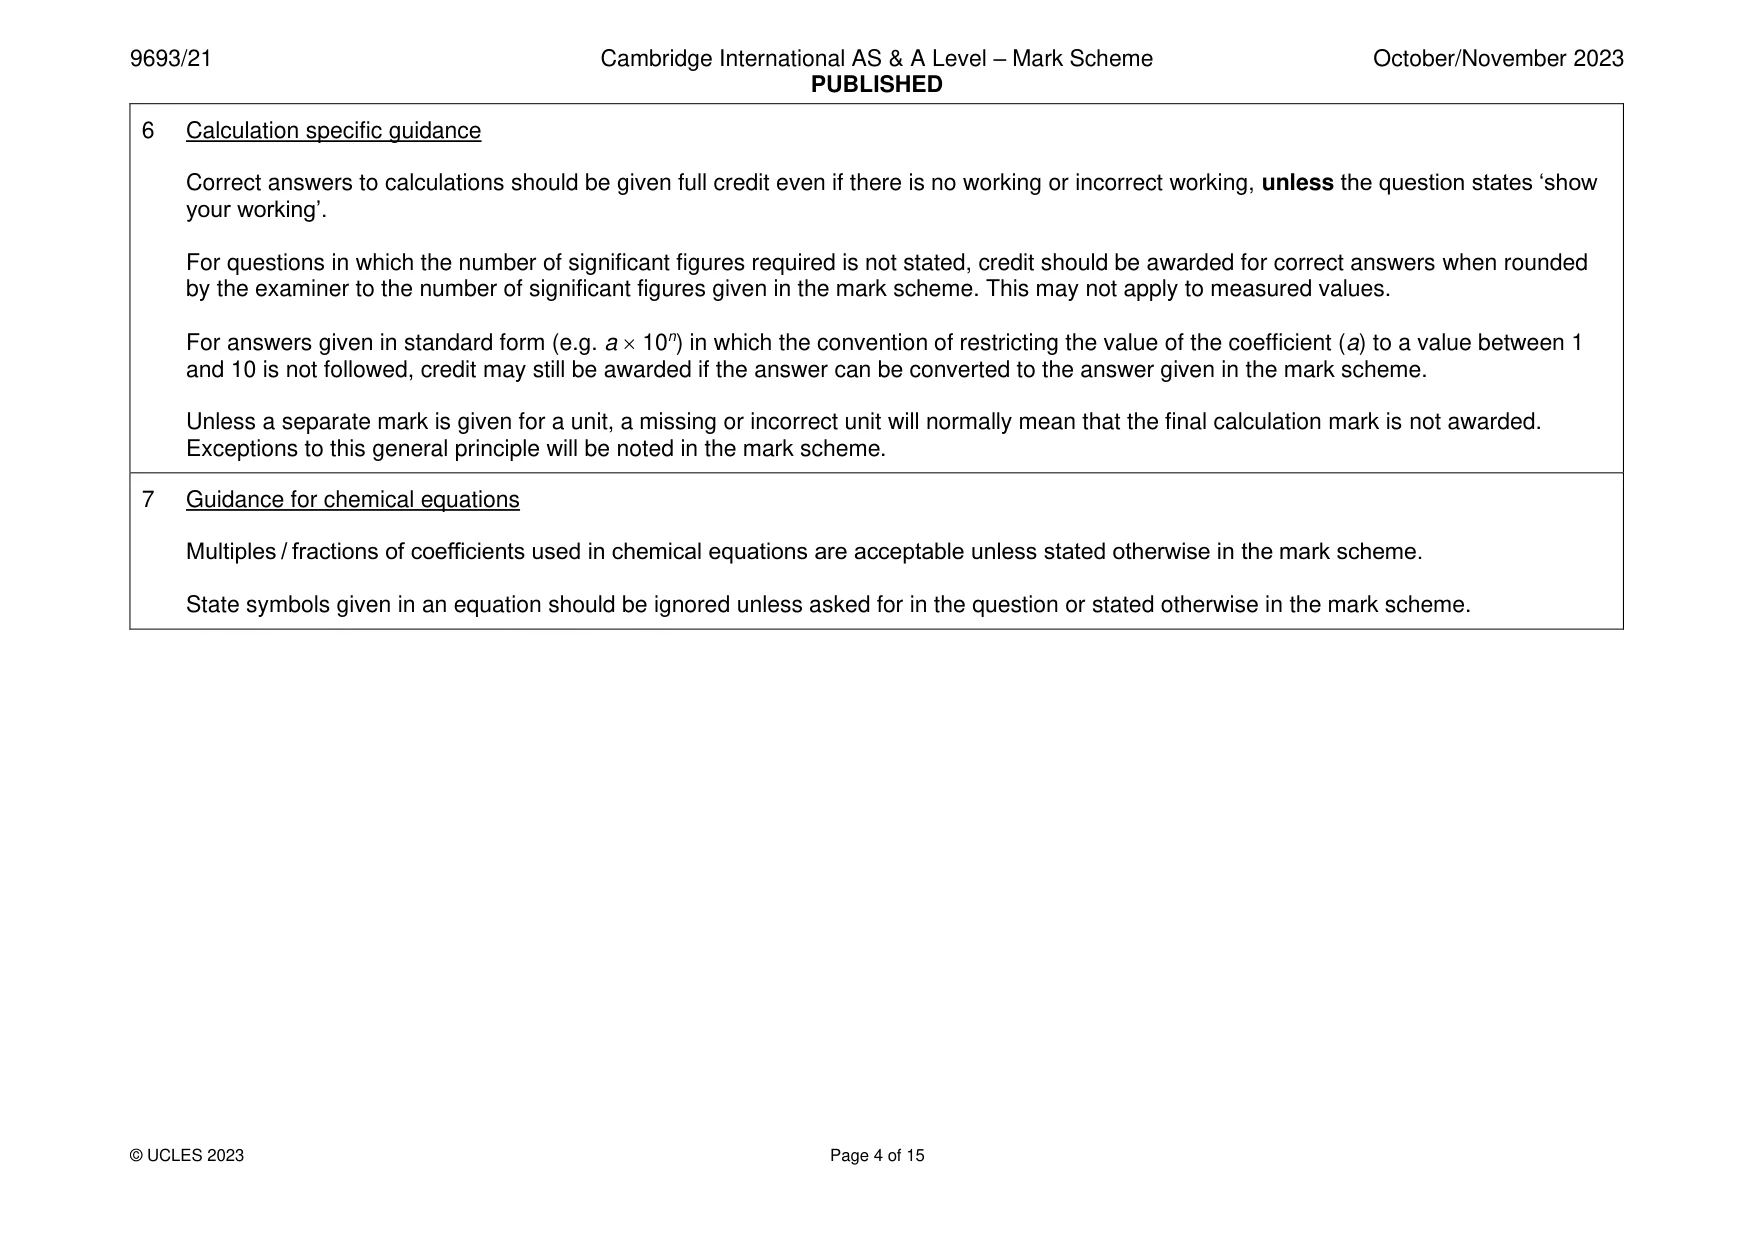
Mark scheme15 pages
Answers below. Sit the paper first if you are practising.
Questions as text
Q1 · Mangrove forests are important ecosystems
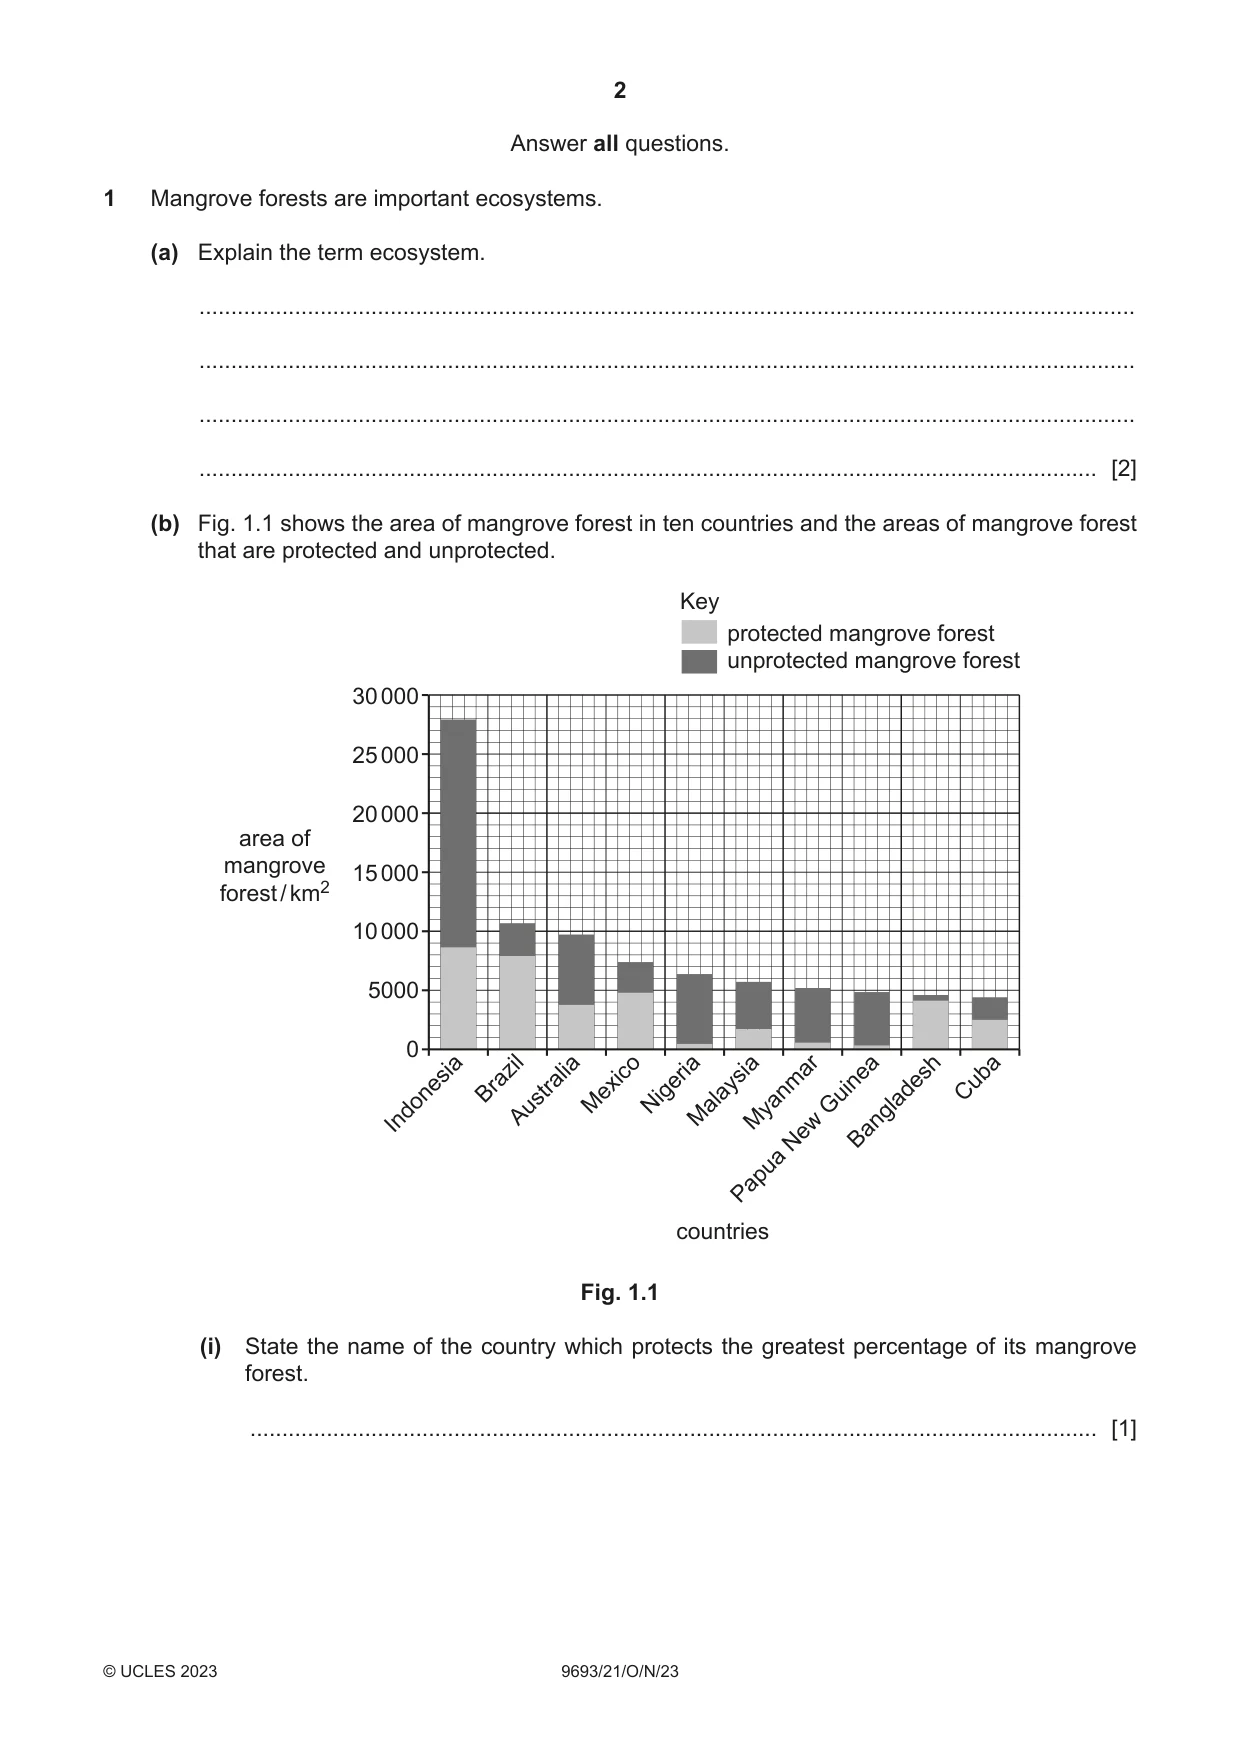
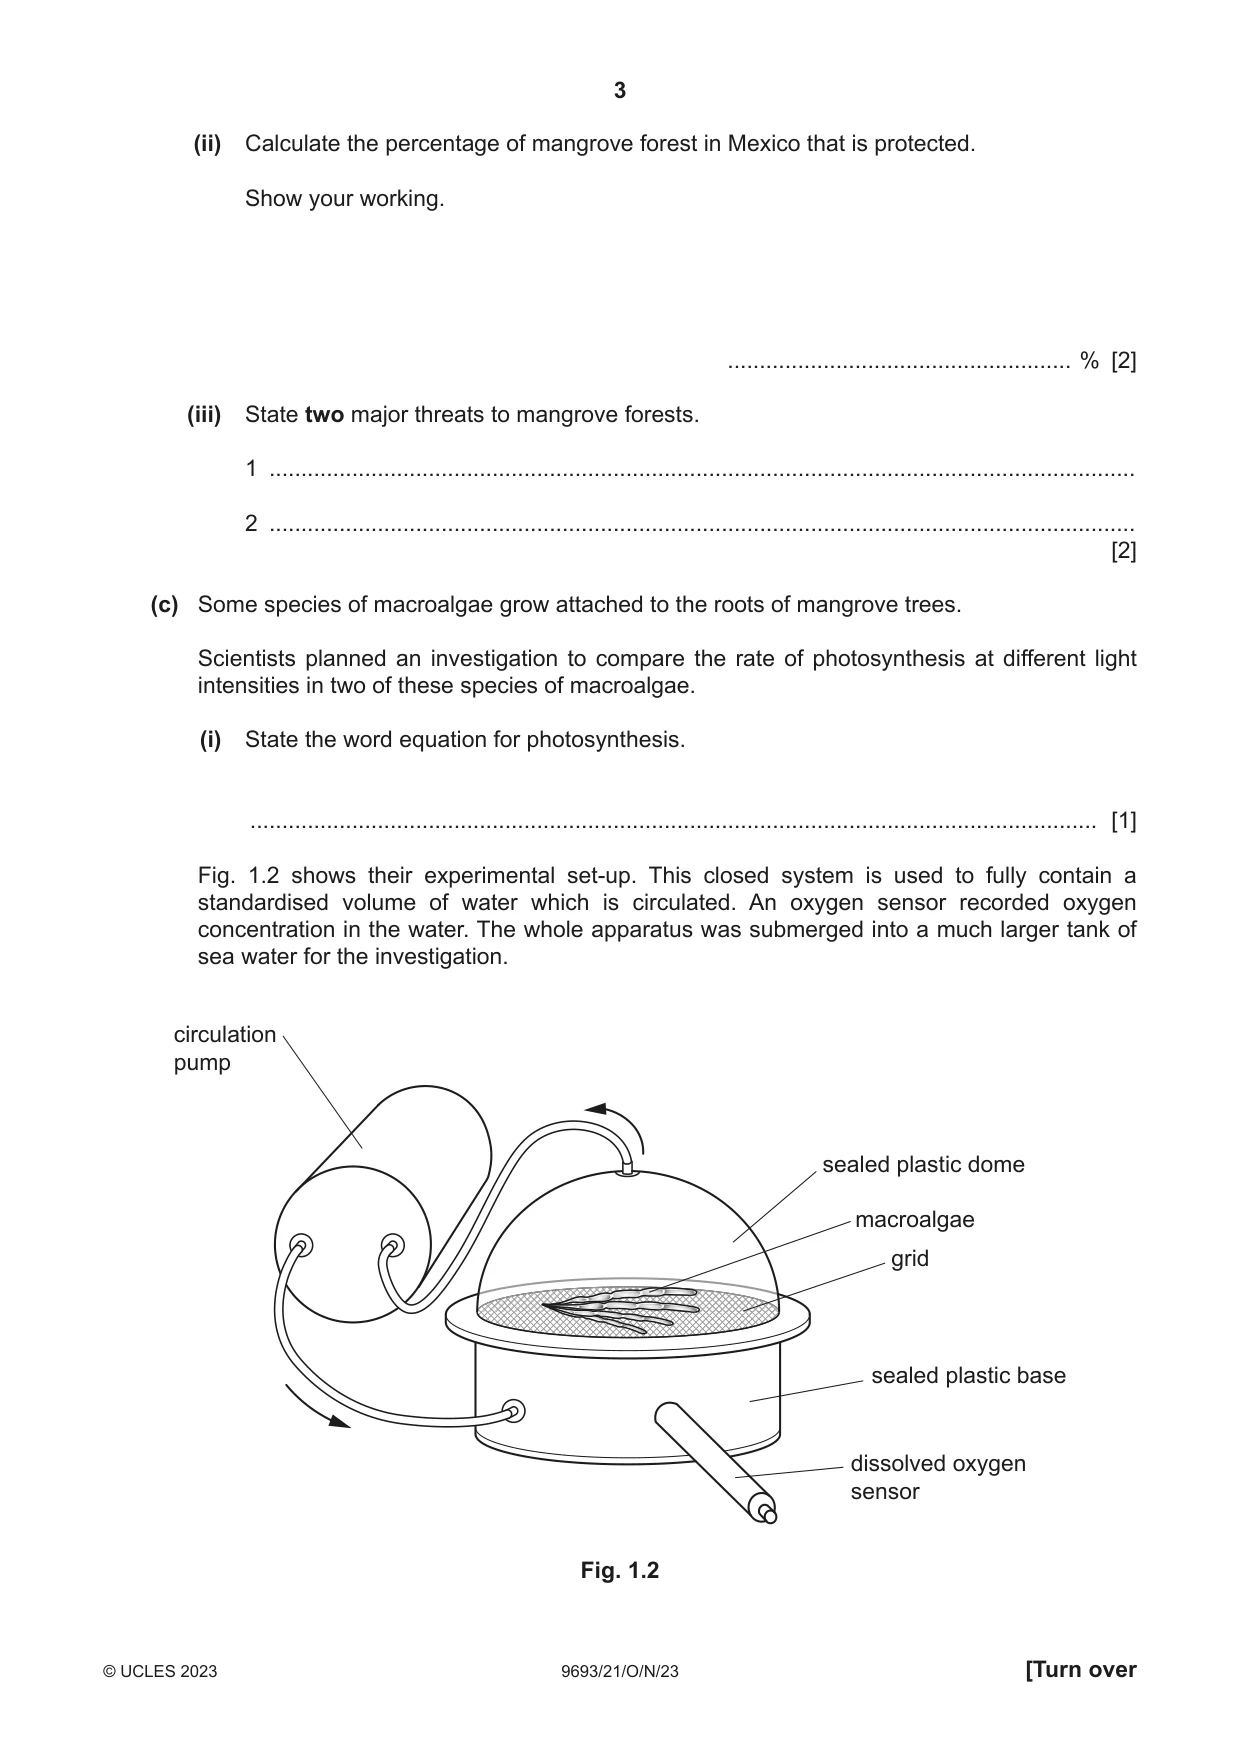
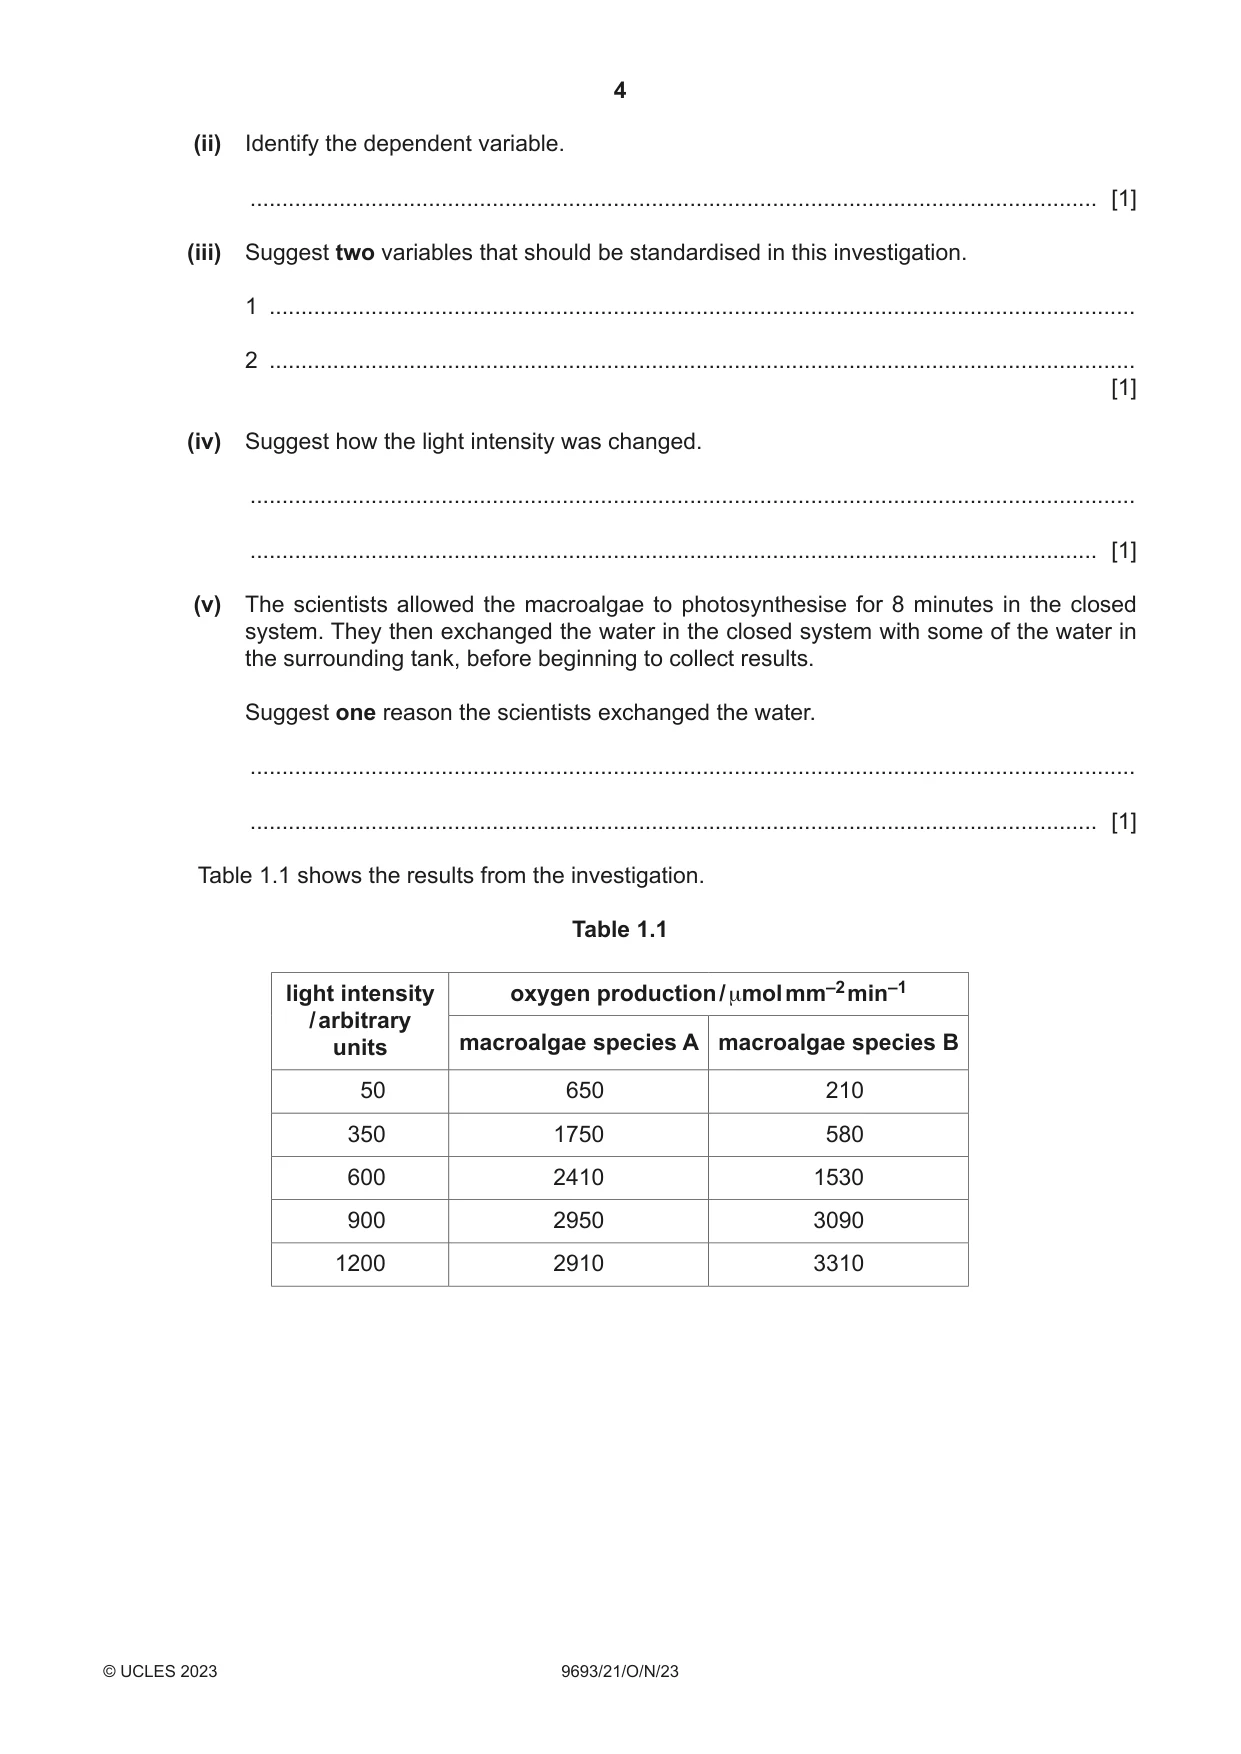
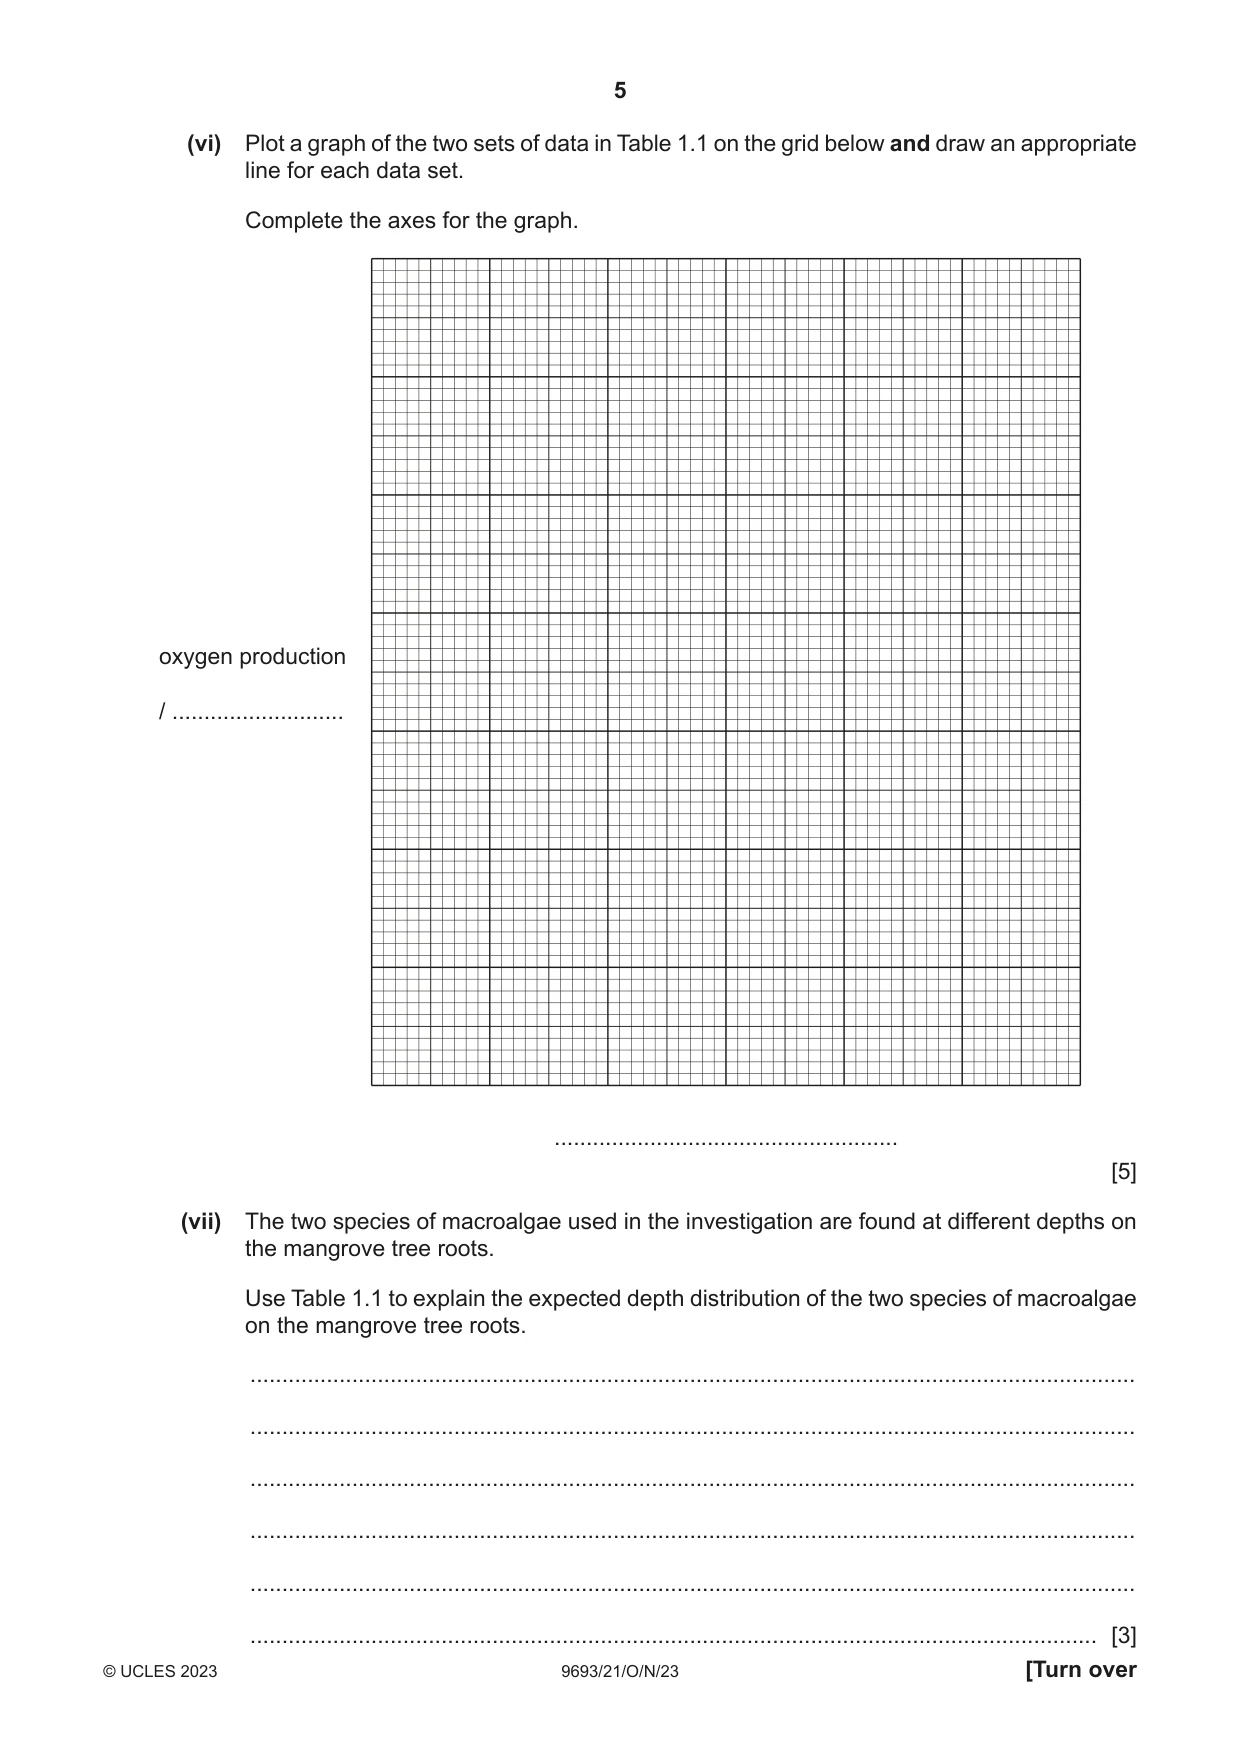
1 Mangrove forests are important ecosystems. (a) Explain the term ecosystem. ................................................................................................................................................... ................................................................................................................................................... ................................................................................................................................................... ............................................................................................................................................. [2] (b) Fig. 1.1 shows the area of mangrove forest in ten countries and the areas of mangrove forest that are protected and unprotected. Key protected mangrove forest unprotected mangrove forest 30 000 25 000 20 000 area of mangrove 15 000 forest / km2 10 000 5000 0 IndonesiaBrazilAustraliaMexicoNigeriaMalaysiaMyanmar GuineaBangladeshCuba New Papua countries Fig. 1.1 (i) State the name of the country which protects the greatest percentage of its mangrove forest. ..................................................................................................................................... [1] (ii) Calculate the percentage of mangrove forest in Mexico that is protected. Show your working. ...................................................... % [2] (iii) State two major threats to mangrove forests. 1 ........................................................................................................................................ 2 ........................................................................................................................................ [2] (c) Some species of macroalgae grow attached to the roots of mangrove trees. Scientists planned an investigation to compare the rate of photosynthesis at different light intensities in two of these species of macroalgae. (i) State the word equation for photosynthesis. ..................................................................................................................................... [1] Fig. 1.2 shows their experimental set-up. This closed system is used to fully contain a standardised volume of water which is circulated. An oxygen sensor recorded oxygen concentration in the water. The whole apparatus was submerged into a much larger tank of sea water for the investigation. circulation pump sealed plastic dome macroalgae grid sealed plastic base dissolved oxygen sensor Fig. 1.2 (ii) Identify the dependent variable. ..................................................................................................................................... [1] (iii) Suggest two variables that should be standardised in this investigation. 1 ........................................................................................................................................ 2 ........................................................................................................................................ [1] (iv) Suggest how the light intensity was changed. ........................................................................................................................................... ..................................................................................................................................... [1] (v) The scientists allowed the macroalgae to photosynthesise for 8 minutes in the closed system. They then exchanged the water in the closed system with some of the water in the surrounding tank, before beginning to collect results. Suggest one reason the scientists exchanged the water. ........................................................................................................................................... ..................................................................................................................................... [1] Table 1.1 shows the results from the investigation. Table 1.1 light intensity oxygen production / μmol mm–2 min–1 / arbitrary units macroalgae species A macroalgae species B 50 650 210 350 1750 580 600 2410 1530 900 2950 3090 1200 2910 3310 (vi) Plot a graph of the two sets of data in Table 1.1 on the grid below and draw an appropriate line for each data set. Complete the axes for the graph. oxygen production / ........................... ...................................................... [5] (vii) The two species of macroalgae used in the investigation are found at different depths on the mangrove tree roots. Use Table 1.1 to explain the expected depth distribution of the two species of macroalgae on the mangrove tree roots. ........................................................................................................................................... ........................................................................................................................................... ........................................................................................................................................... ........................................................................................................................................... ........................................................................................................................................... ..................................................................................................................................... [3] (viii) At a light intensity of zero the oxygen level decreased during the investigation. Explain this observation. ........................................................................................................................................... ........................................................................................................................................... ........................................................................................................................................... ..................................................................................................................................... [2] [Total: 22]
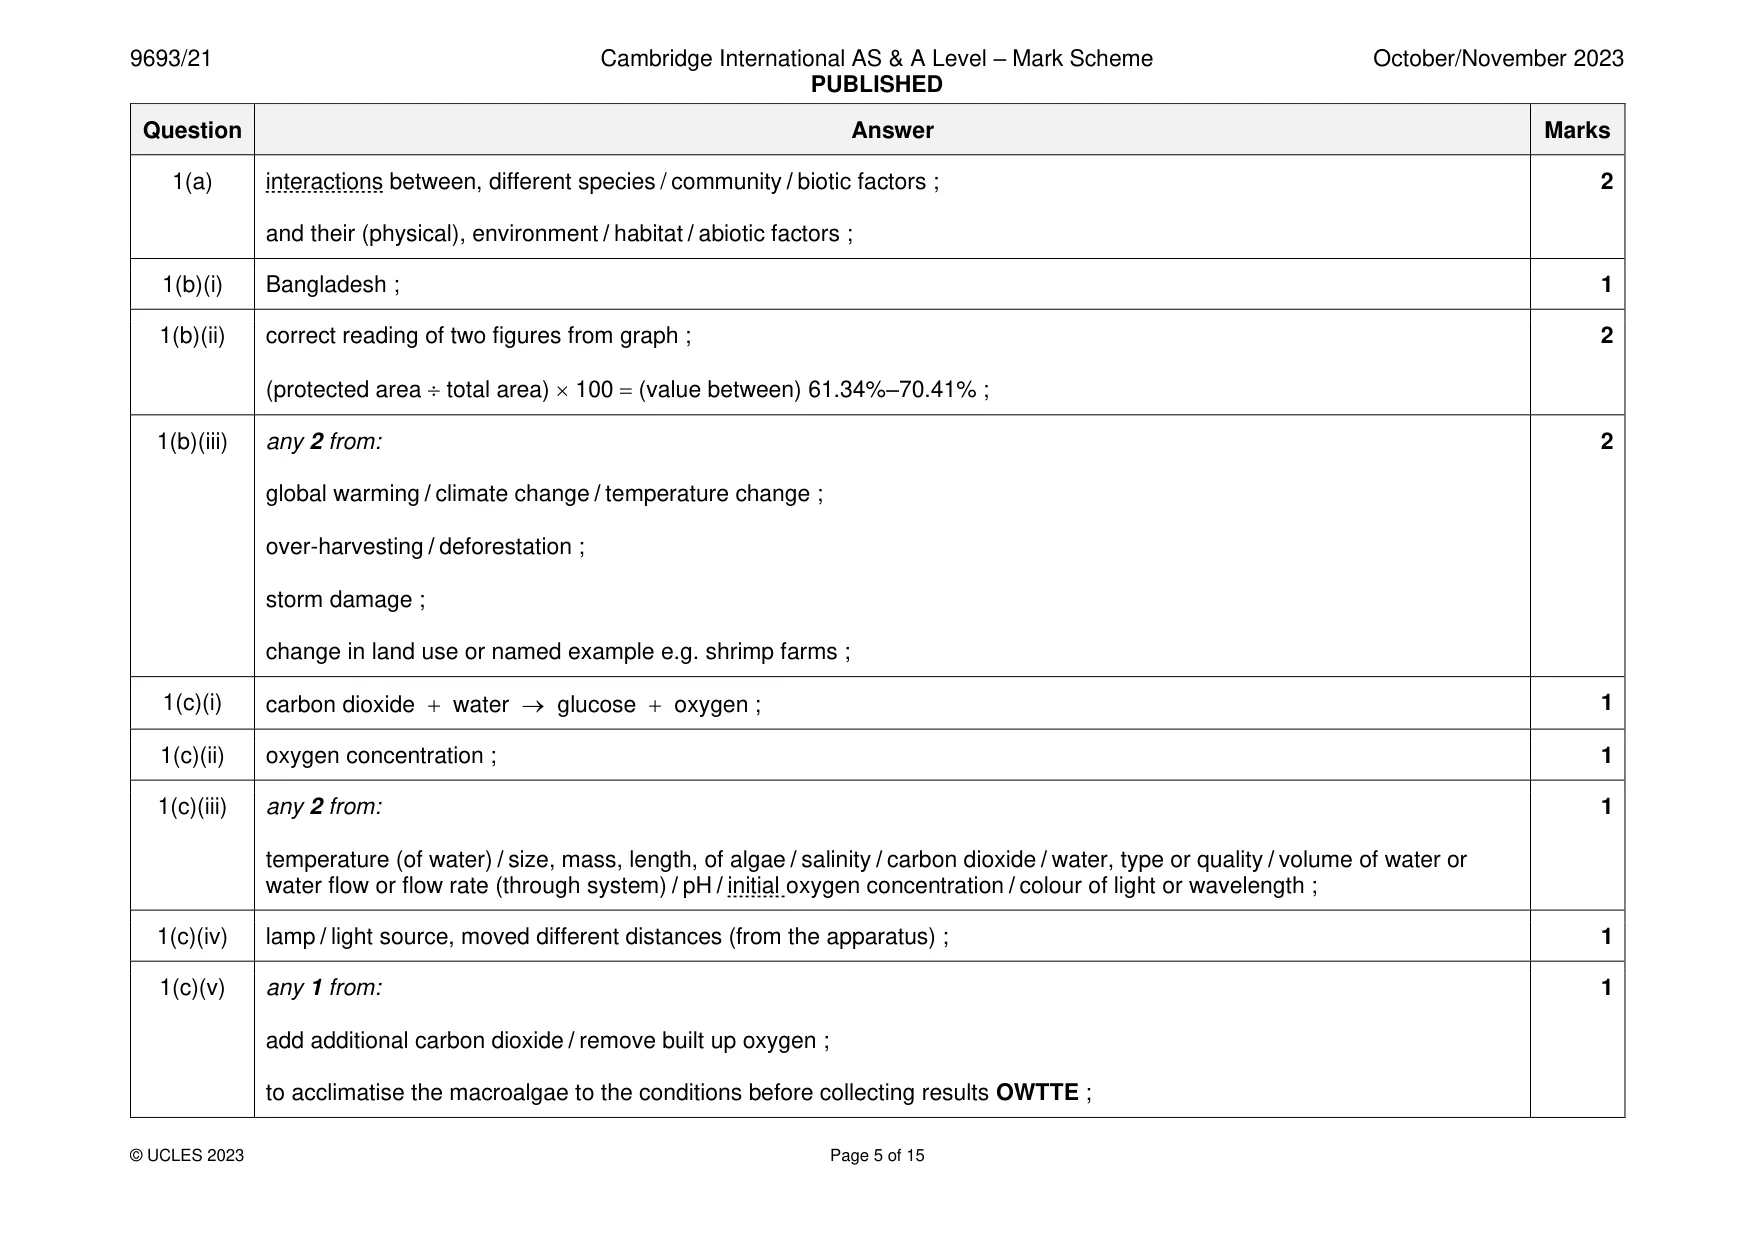
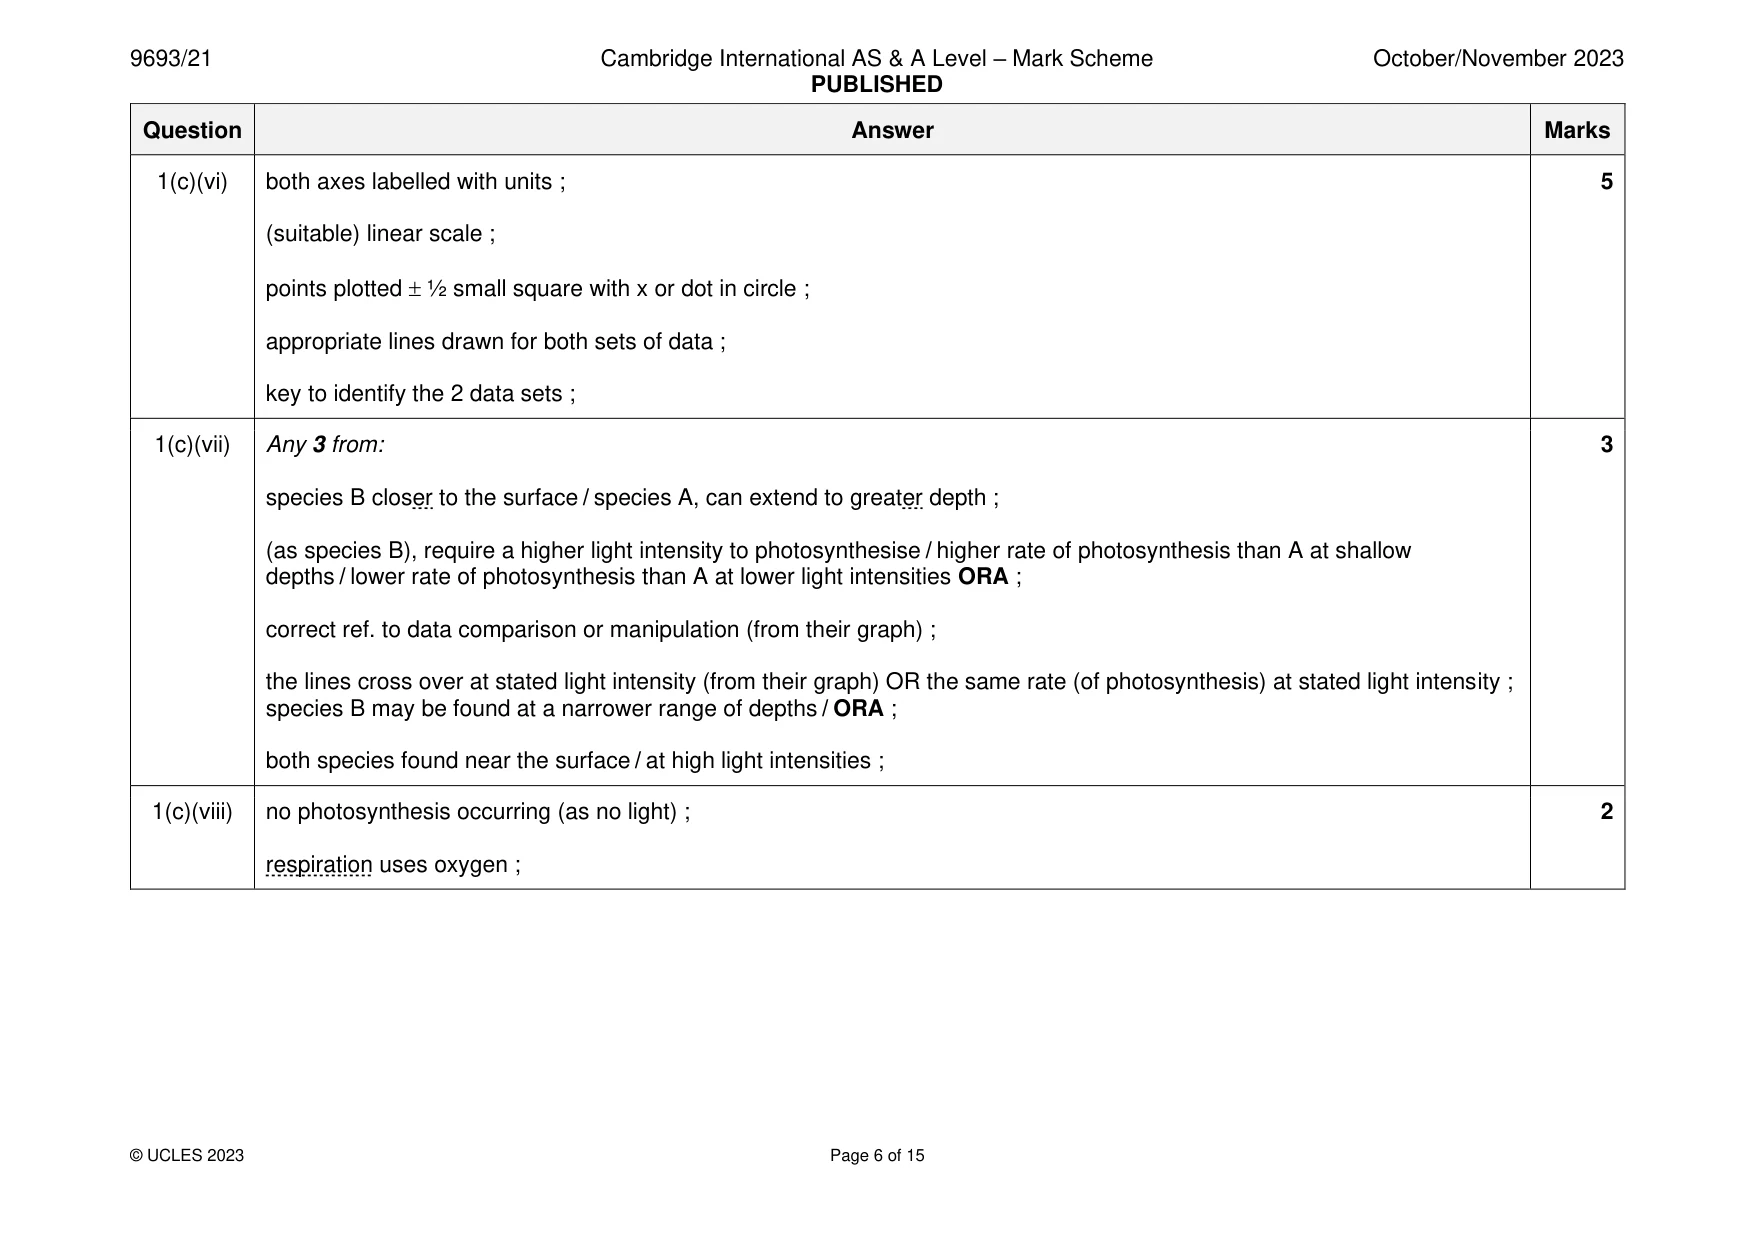
Mark scheme: Question Answer Marks 1(a) interactions between, different species / community / biotic factors ; 2 and their (physical), environment / habitat / abiotic factors ; 1(b)(i) Bangladesh ; 1 1(b)(ii) correct reading of two figures from graph ; 2 (protected area total area) 100 = (value between) 61.34%–70.41% ; 1(b)(iii) any 2 from: 2 global warming / climate change / temperature change ; over-harvesting / deforestation ; storm damage ; change in land use or named example e.g. shrimp farms ; 1(c)(i) carbon dioxide + water → glucose + oxygen ; 1 1(c)(ii) oxygen concentration ; 1 1(c)(iii) any 2 from: 1 temperature (of water) / size, mass, length, of algae / salinity / carbon dioxide / water, type or quality / volume of water or water flow or flow rate (through system) / pH / initial oxygen concentration / colour of light or wavelength ; 1(c)(iv) lamp / light source, moved different distances (from the apparatus) ; 1 1(c)(v) any 1 from: 1 add additional carbon dioxide / remove built up oxygen ; to acclimatise the macroalgae to the conditions before collecting results OWTTE ; 1(c)(vi) both axes labelled with units ; 5 (suitable) linear scale ; points plotted ½ small square with x or dot in circle ; appropriate lines drawn for both sets of data ; key to identify the 2 data sets ; 1(c)(vii) Any 3 from: 3 species B closer to the surface / species A, can extend to greater depth ; (as species B), require a higher light intensity to photosynthesise / higher rate of photosynthesis than A at shallow depths / lower rate of photosynthesis than A at lower light intensities ORA ; correct ref. to data comparison or manipulation (from their graph) ; the lines cross over at stated light intensity (from their graph) OR the same rate (of photosynthesis) at stated light intensity ; species B may be found at a narrower range of depths / ORA ; both species found near the surface / at high light intensities ; 1(c)(viii) no photosynthesis occurring (as no light) ; 2 respiration uses oxygen ;
Q2 · A group of students investigated how the distribution of crabs on a rocky shore varied…
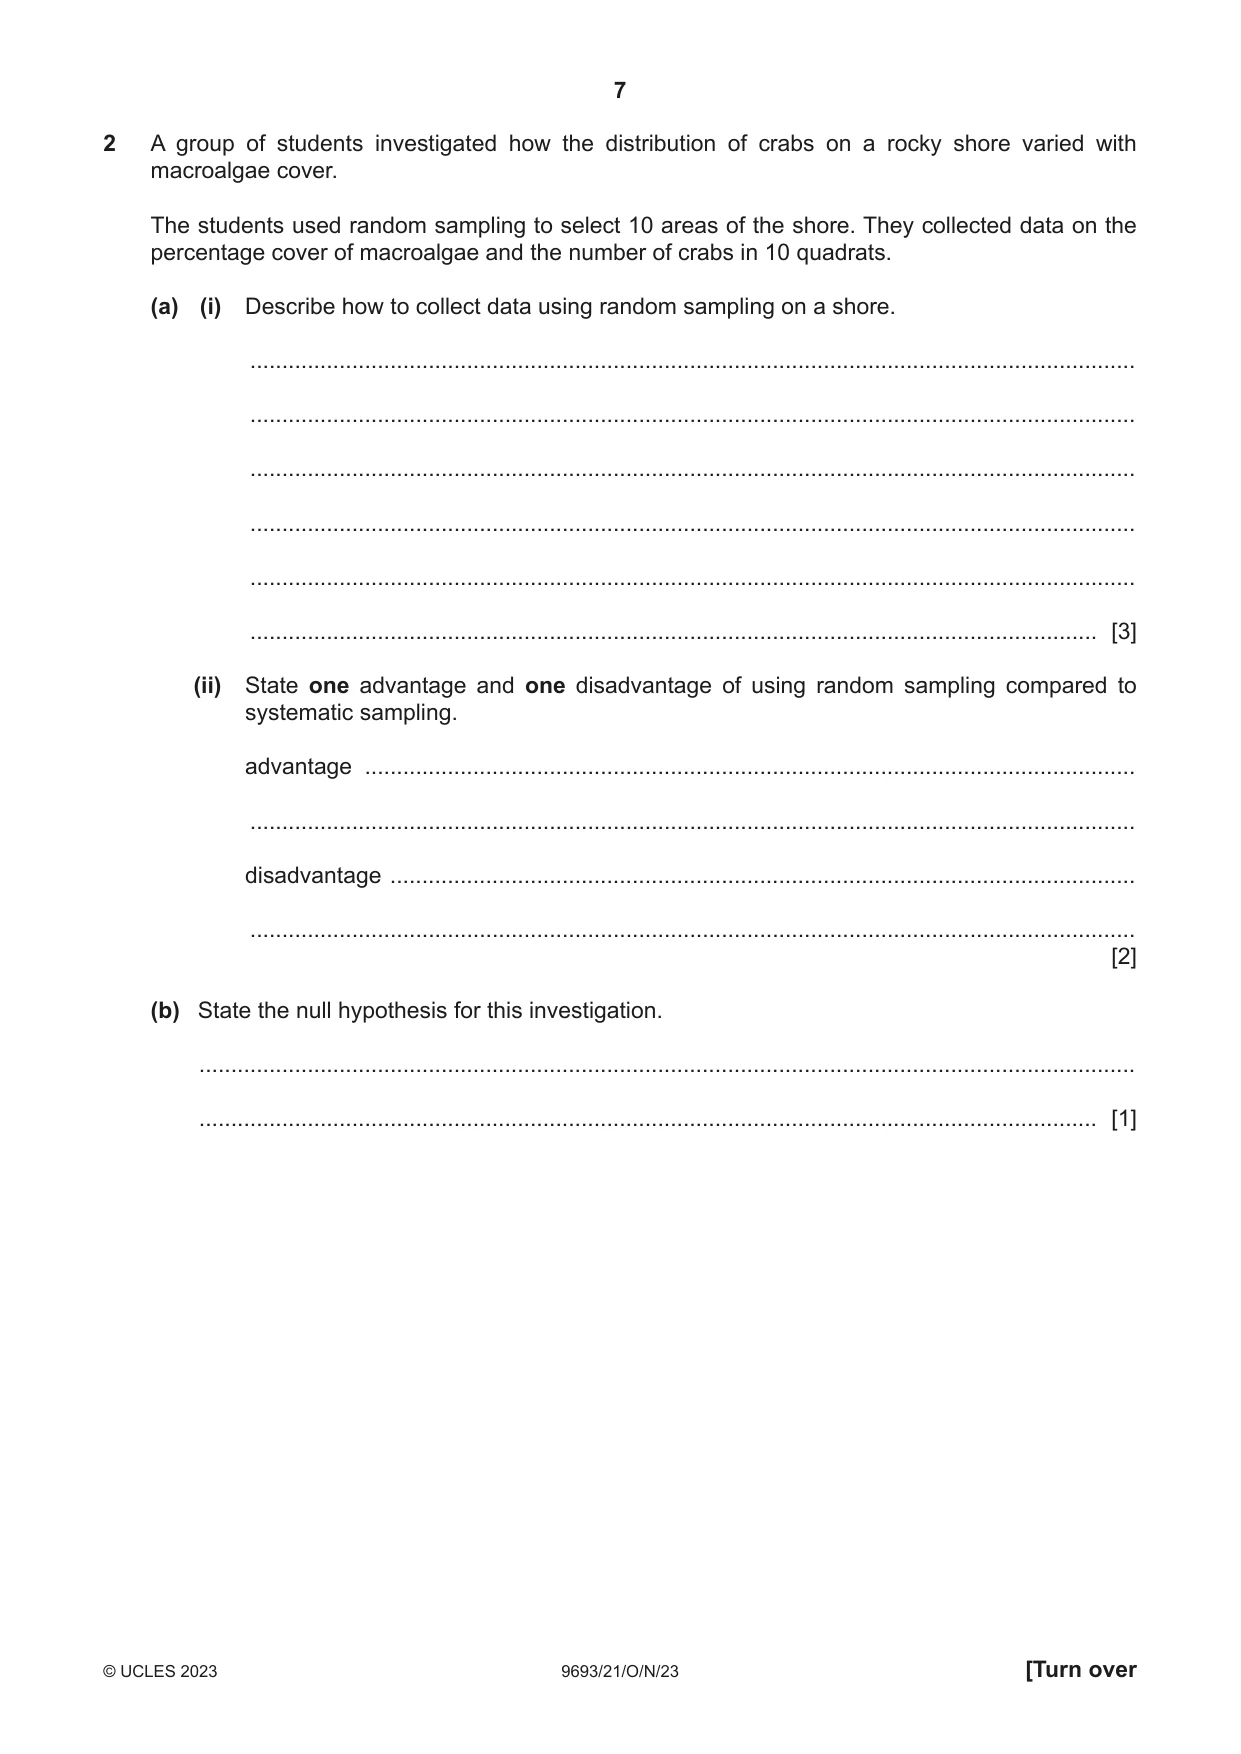
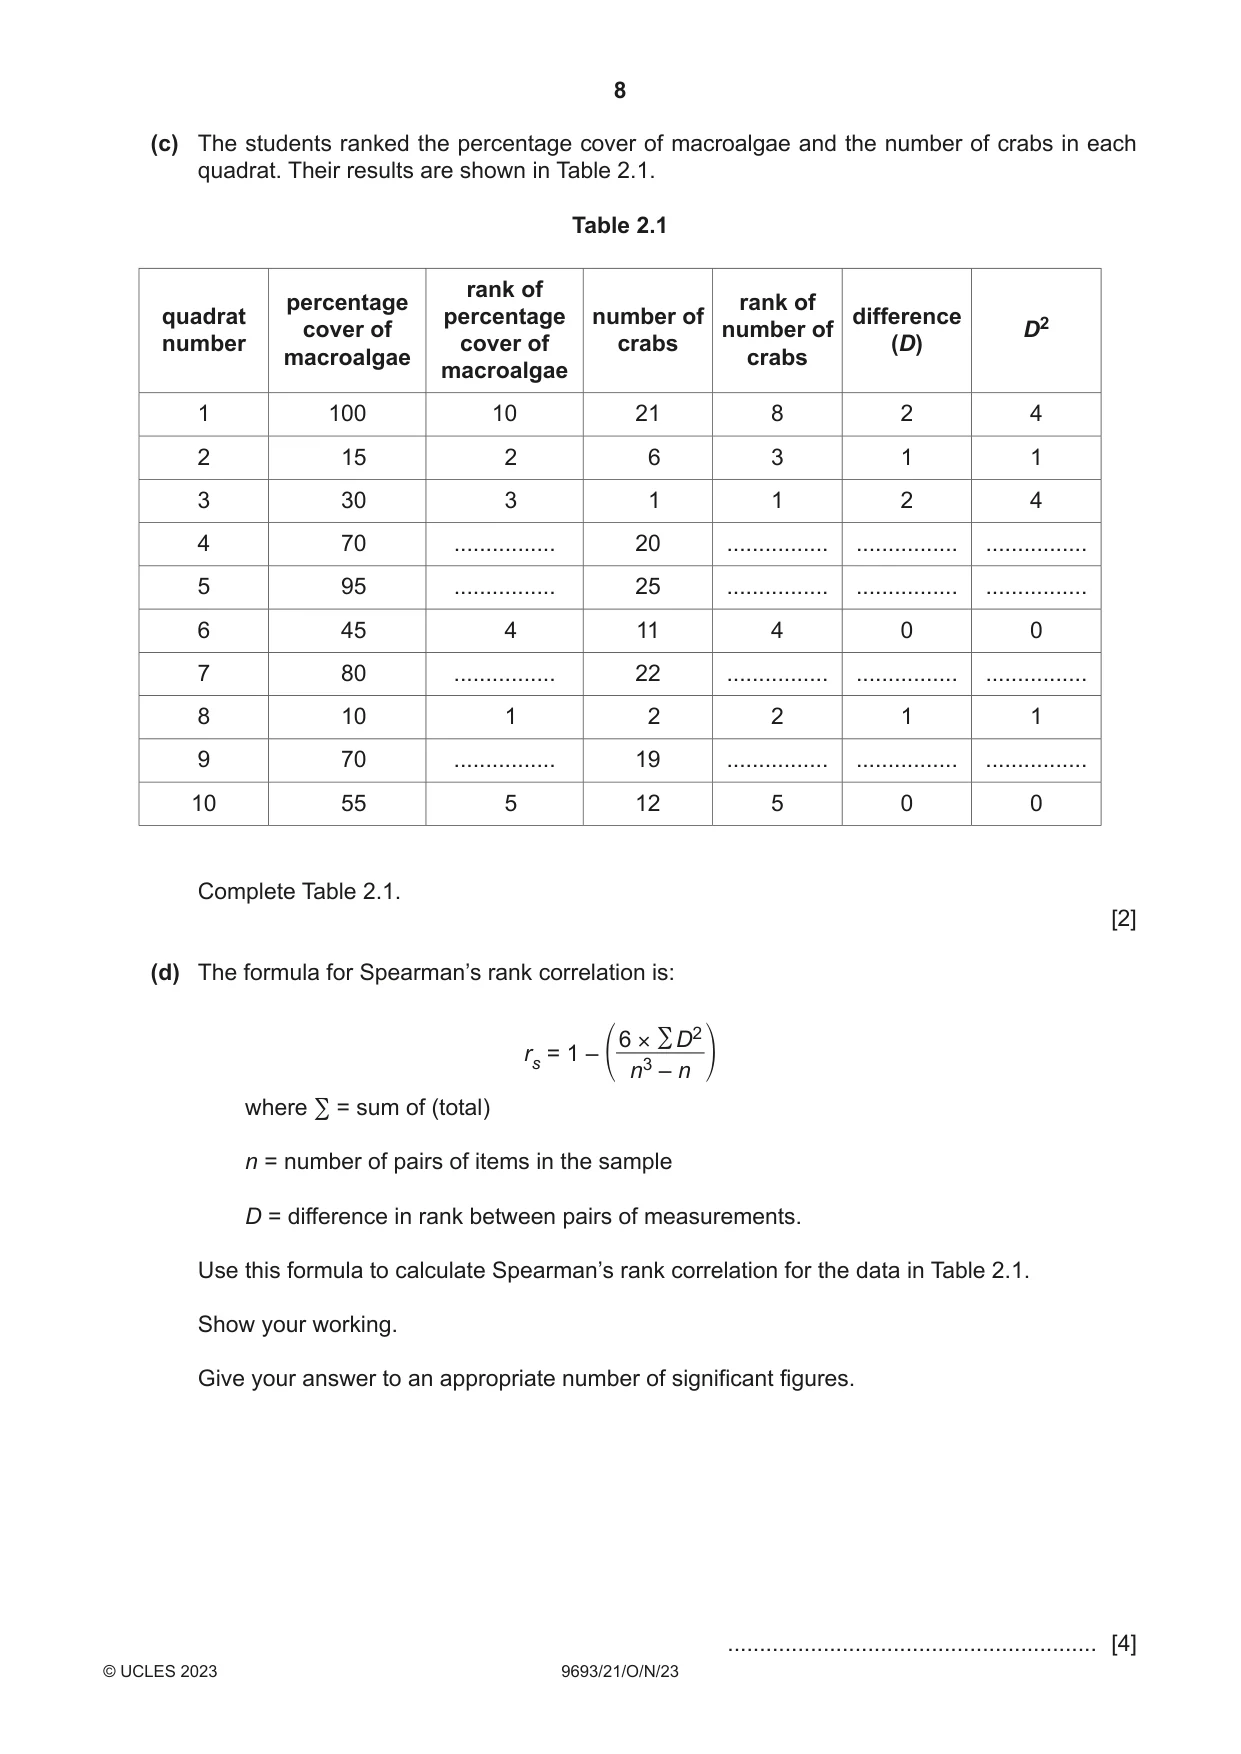
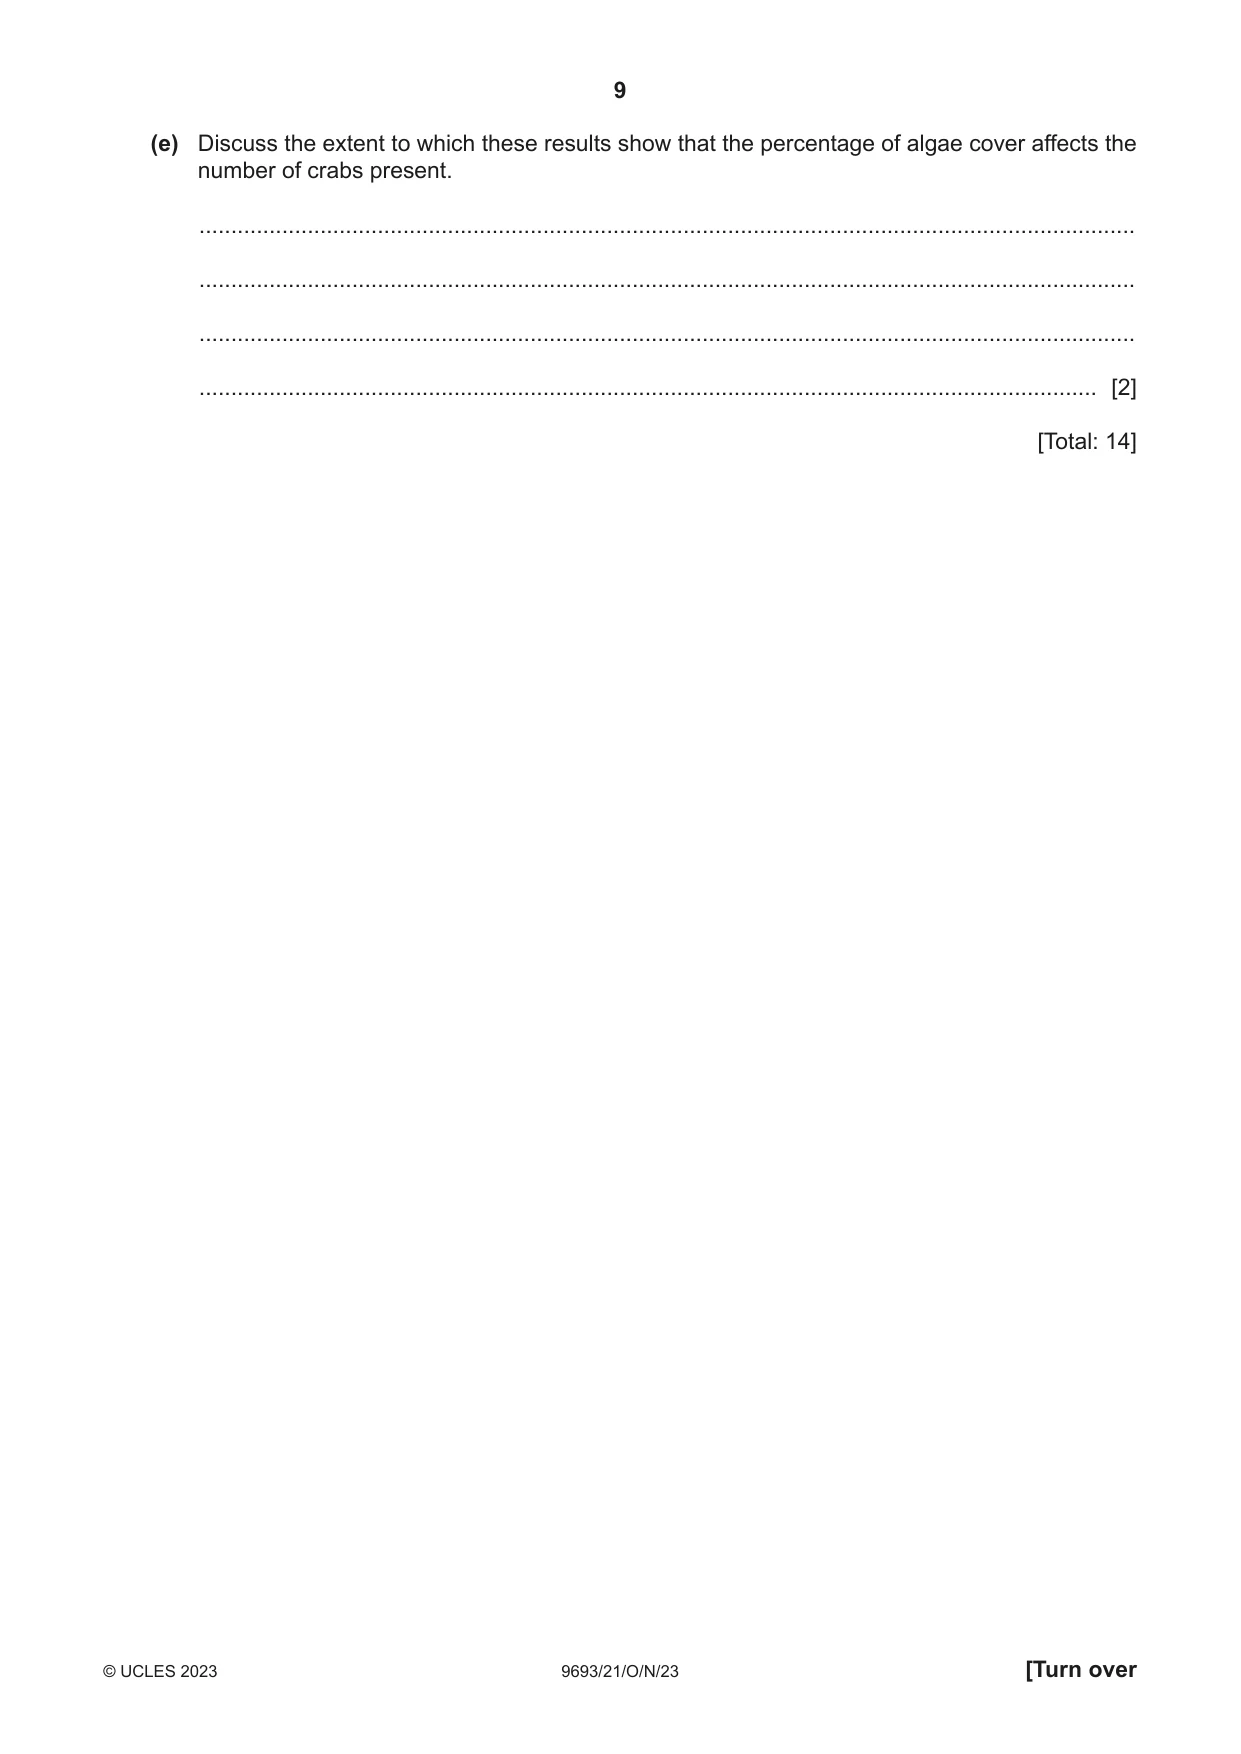
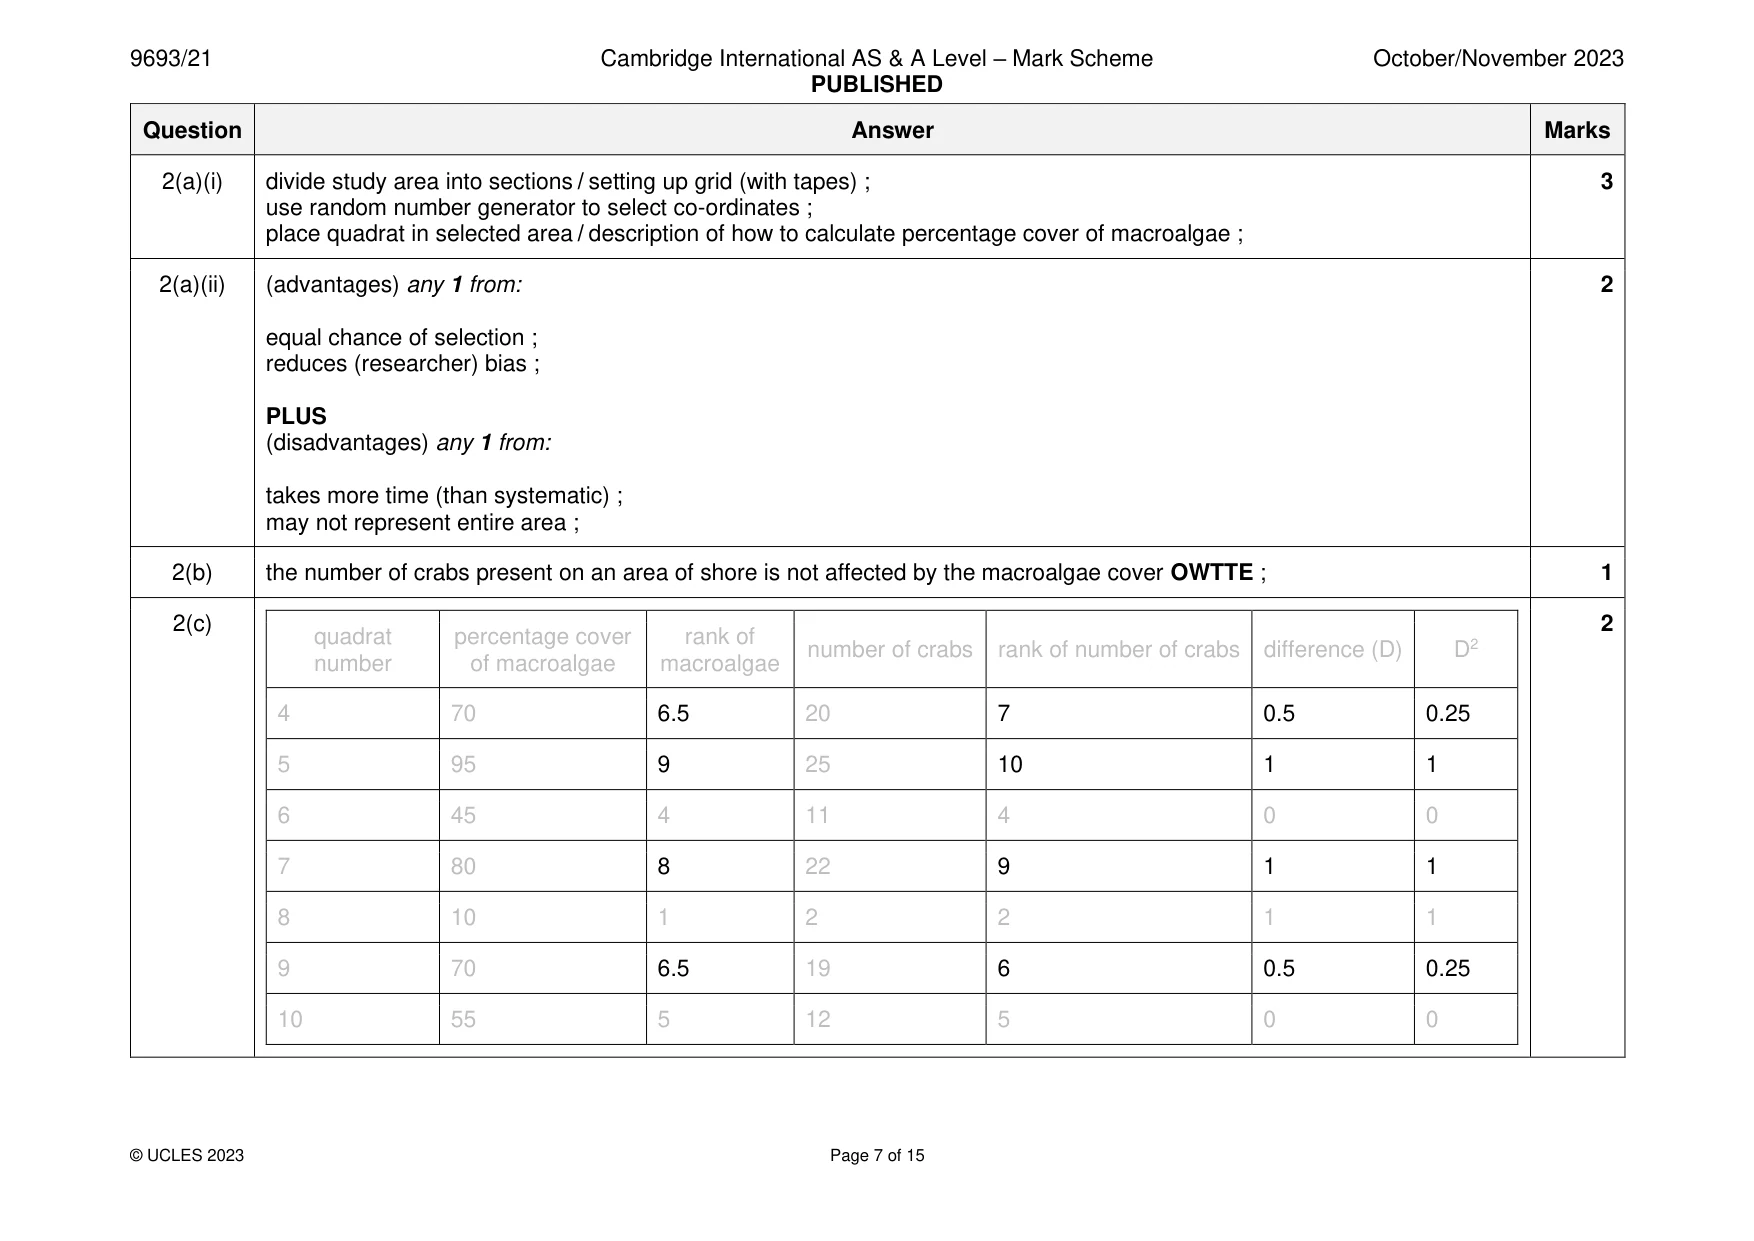
2 A group of students investigated how the distribution of crabs on a rocky shore varied with macroalgae cover. The students used random sampling to select 10 areas of the shore. They collected data on the percentage cover of macroalgae and the number of crabs in 10 quadrats. (a) (i) Describe how to collect data using random sampling on a shore. ........................................................................................................................................... ........................................................................................................................................... ........................................................................................................................................... ........................................................................................................................................... ........................................................................................................................................... ..................................................................................................................................... [3] (ii) State one advantage and one disadvantage of using random sampling compared to systematic sampling. advantage ......................................................................................................................... ........................................................................................................................................... disadvantage ..................................................................................................................... ........................................................................................................................................... [2] (b) State the null hypothesis for this investigation. ................................................................................................................................................... ............................................................................................................................................. [1] (c) The students ranked the percentage cover of macroalgae and the number of crabs in each quadrat. Their results are shown in Table 2.1. Table 2.1 rank of percentage rank of quadrat percentage number of difference cover of number of D2 number cover of crabs (D) macroalgae crabs macroalgae 1 100 10 21 8 2 4 2 15 2 6 3 1 1 3 30 3 1 1 2 4 4 70 ................ 20 ................ ................ ................ 5 95 ................ 25 ................ ................ ................ 6 45 4 11 4 0 0 7 80 ................ 22 ................ ................ ................ 8 10 1 2 2 1 1 9 70 ................ 19 ................ ................ ................ 10 55 5 12 5 0 0 Complete Table 2.1. [2] (d) The formula for Spearman’s rank correlation is: 6 × ∑ D2 rs = 1 – n3 – n where ∑ = sum of (total) n = number of pairs of items in the sample D = difference in rank between pairs of measurements. Use this formula to calculate Spearman’s rank correlation for the data in Table 2.1. Show your working. Give your answer to an appropriate number of significant figures. .......................................................... [4] (e) Discuss the extent to which these results show that the percentage of algae cover affects the number of crabs present. ................................................................................................................................................... ................................................................................................................................................... ................................................................................................................................................... ............................................................................................................................................. [2] [Total: 14]
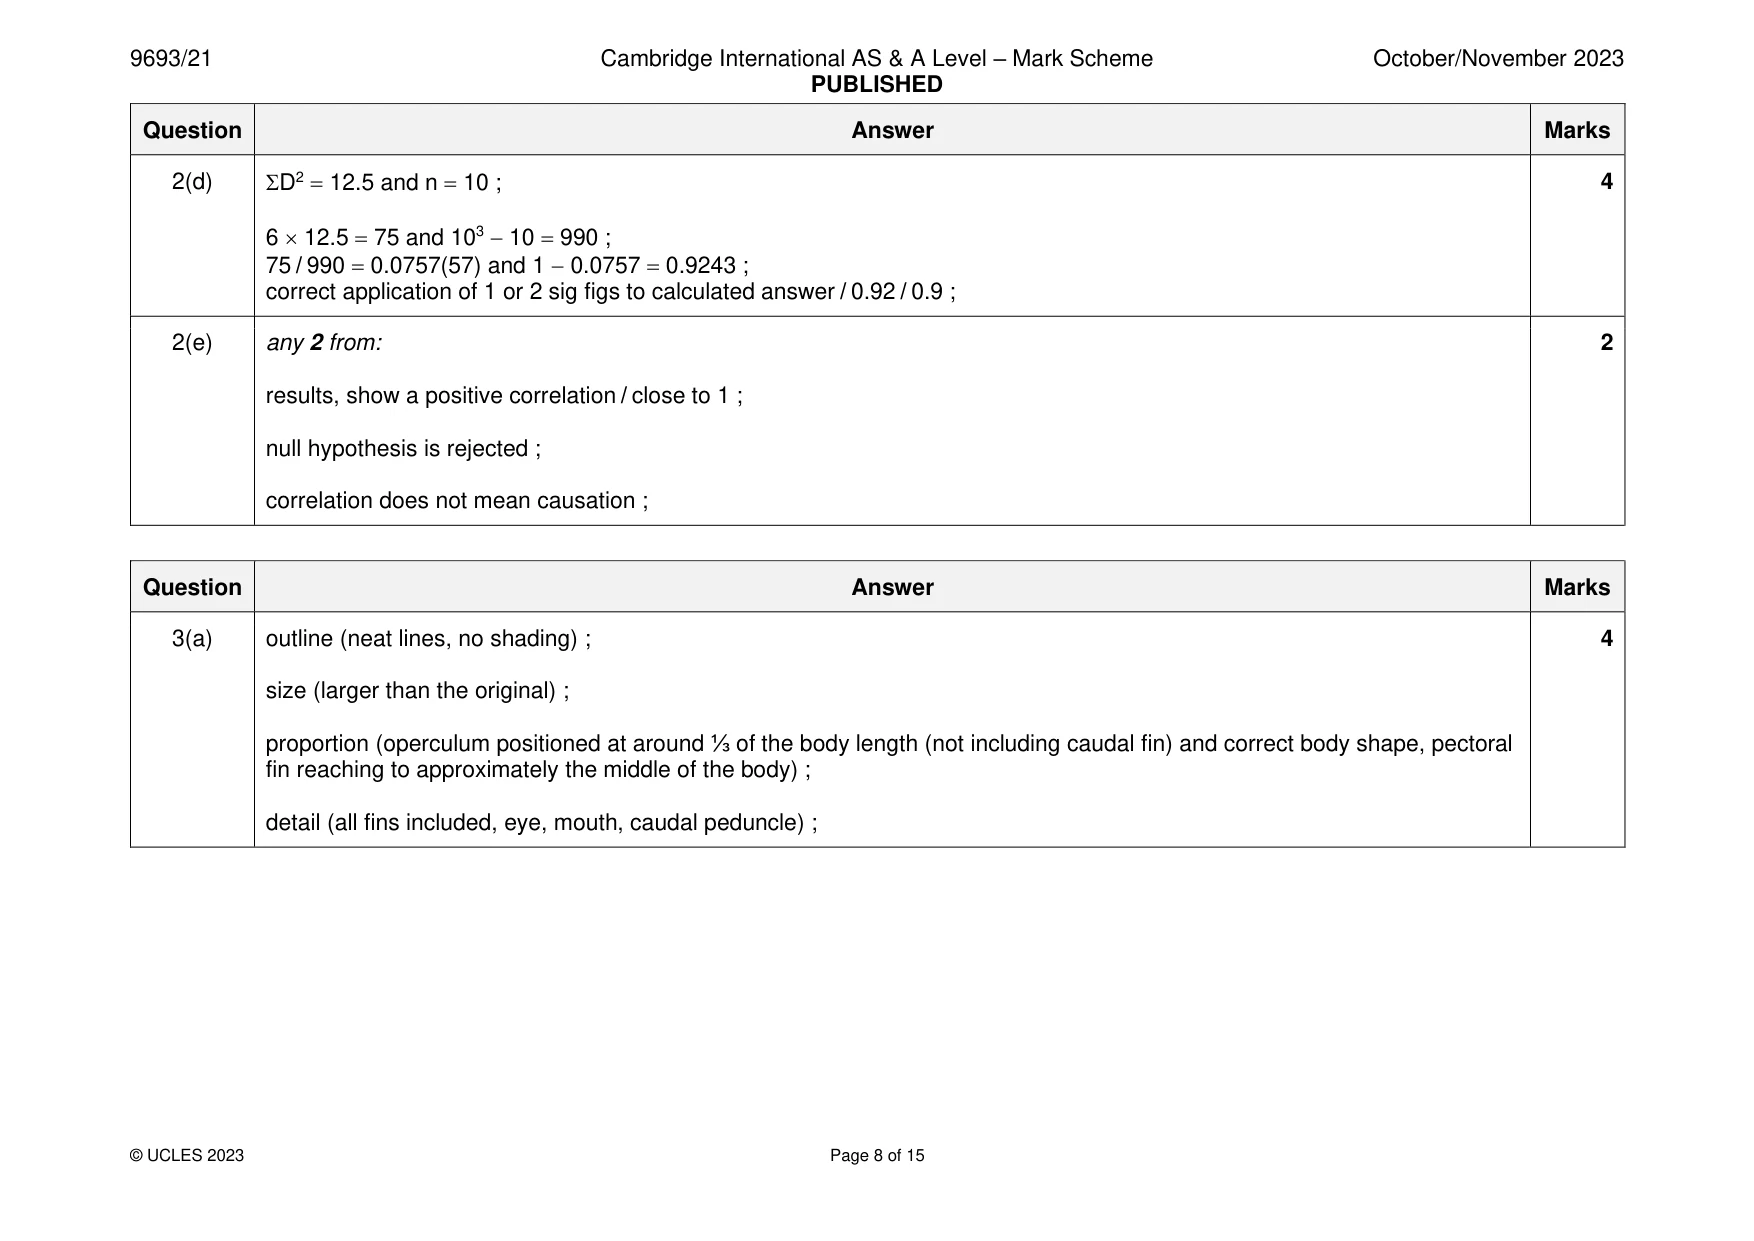
Mark scheme: 2(a)(i) divide study area into sections / setting up grid (with tapes) ; 3 use random number generator to select co-ordinates ; place quadrat in selected area / description of how to calculate percentage cover of macroalgae ; 2(a)(ii) (advantages) any 1 from: 2 equal chance of selection ; reduces (researcher) bias ; PLUS (disadvantages) any 1 from: takes more time (than systematic) ; may not represent entire area ; 2(b) the number of crabs present on an area of shore is not affected by the macroalgae cover OWTTE ; 1 2(c) 2 quadrat percentage cover rank of number of crabs rank of number of crabs difference (D) D2 number of macroalgae macroalgae 4 70 6.5 20 7 0.5 0.25 5 95 9 25 10 1 1 6 45 4 11 4 0 0 7 80 8 22 9 1 1 8 10 1 2 2 1 1 9 70 6.5 19 6 0.5 0.25 10 55 5 12 5 0 0 2(d) D2 = 12.5 and n = 10 ; 4 6 12.5 = 75 and 103 − 10 = 990 ; 75 / 990 = 0.0757(57) and 1 − 0.0757 = 0.9243 ; correct application of 1 or 2 sig figs to calculated answer / 0.92 / 0.9 ; 2(e) any 2 from: 2 results, show a positive correlation / close to 1 ; null hypothesis is rejected ; correlation does not mean causation ;
Q3 · A red snapper, a fish commonly harvested for human food from coral reefs
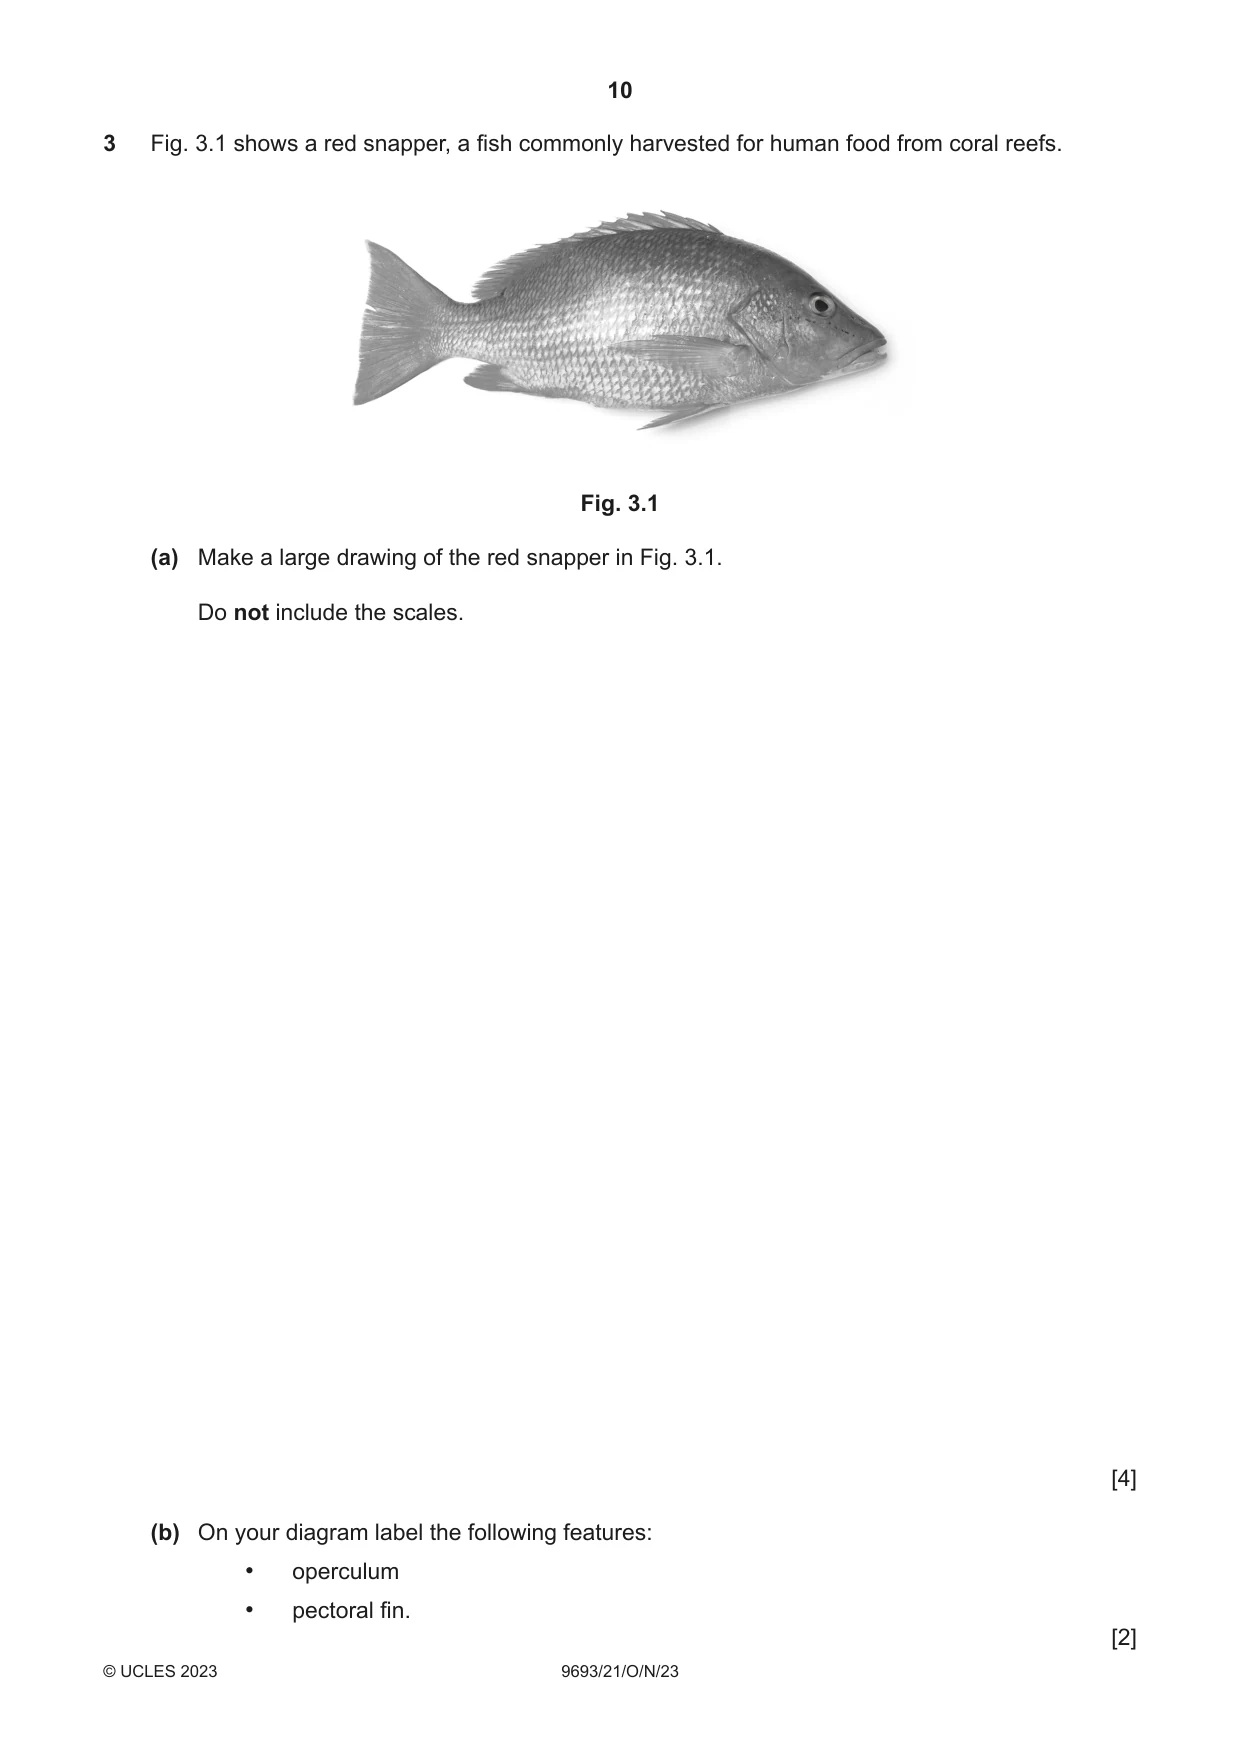
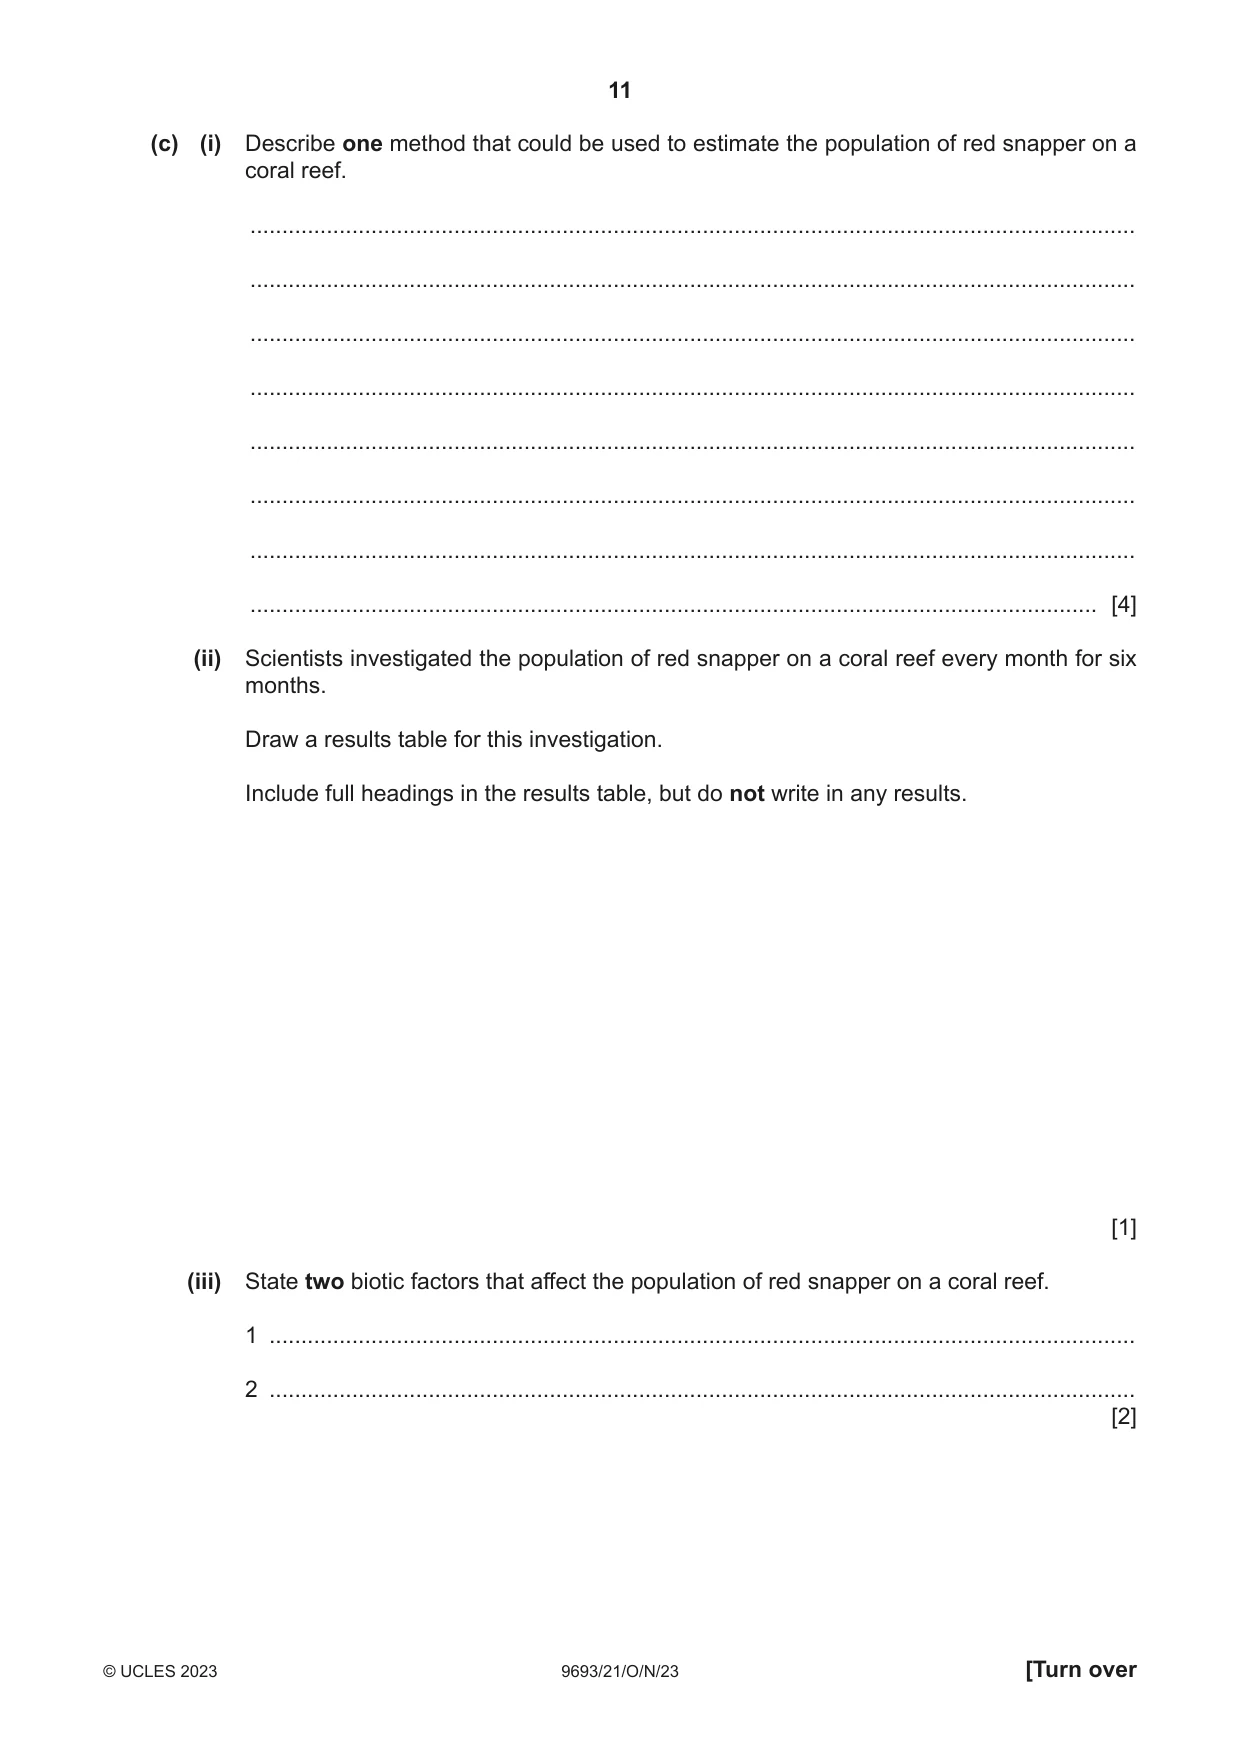
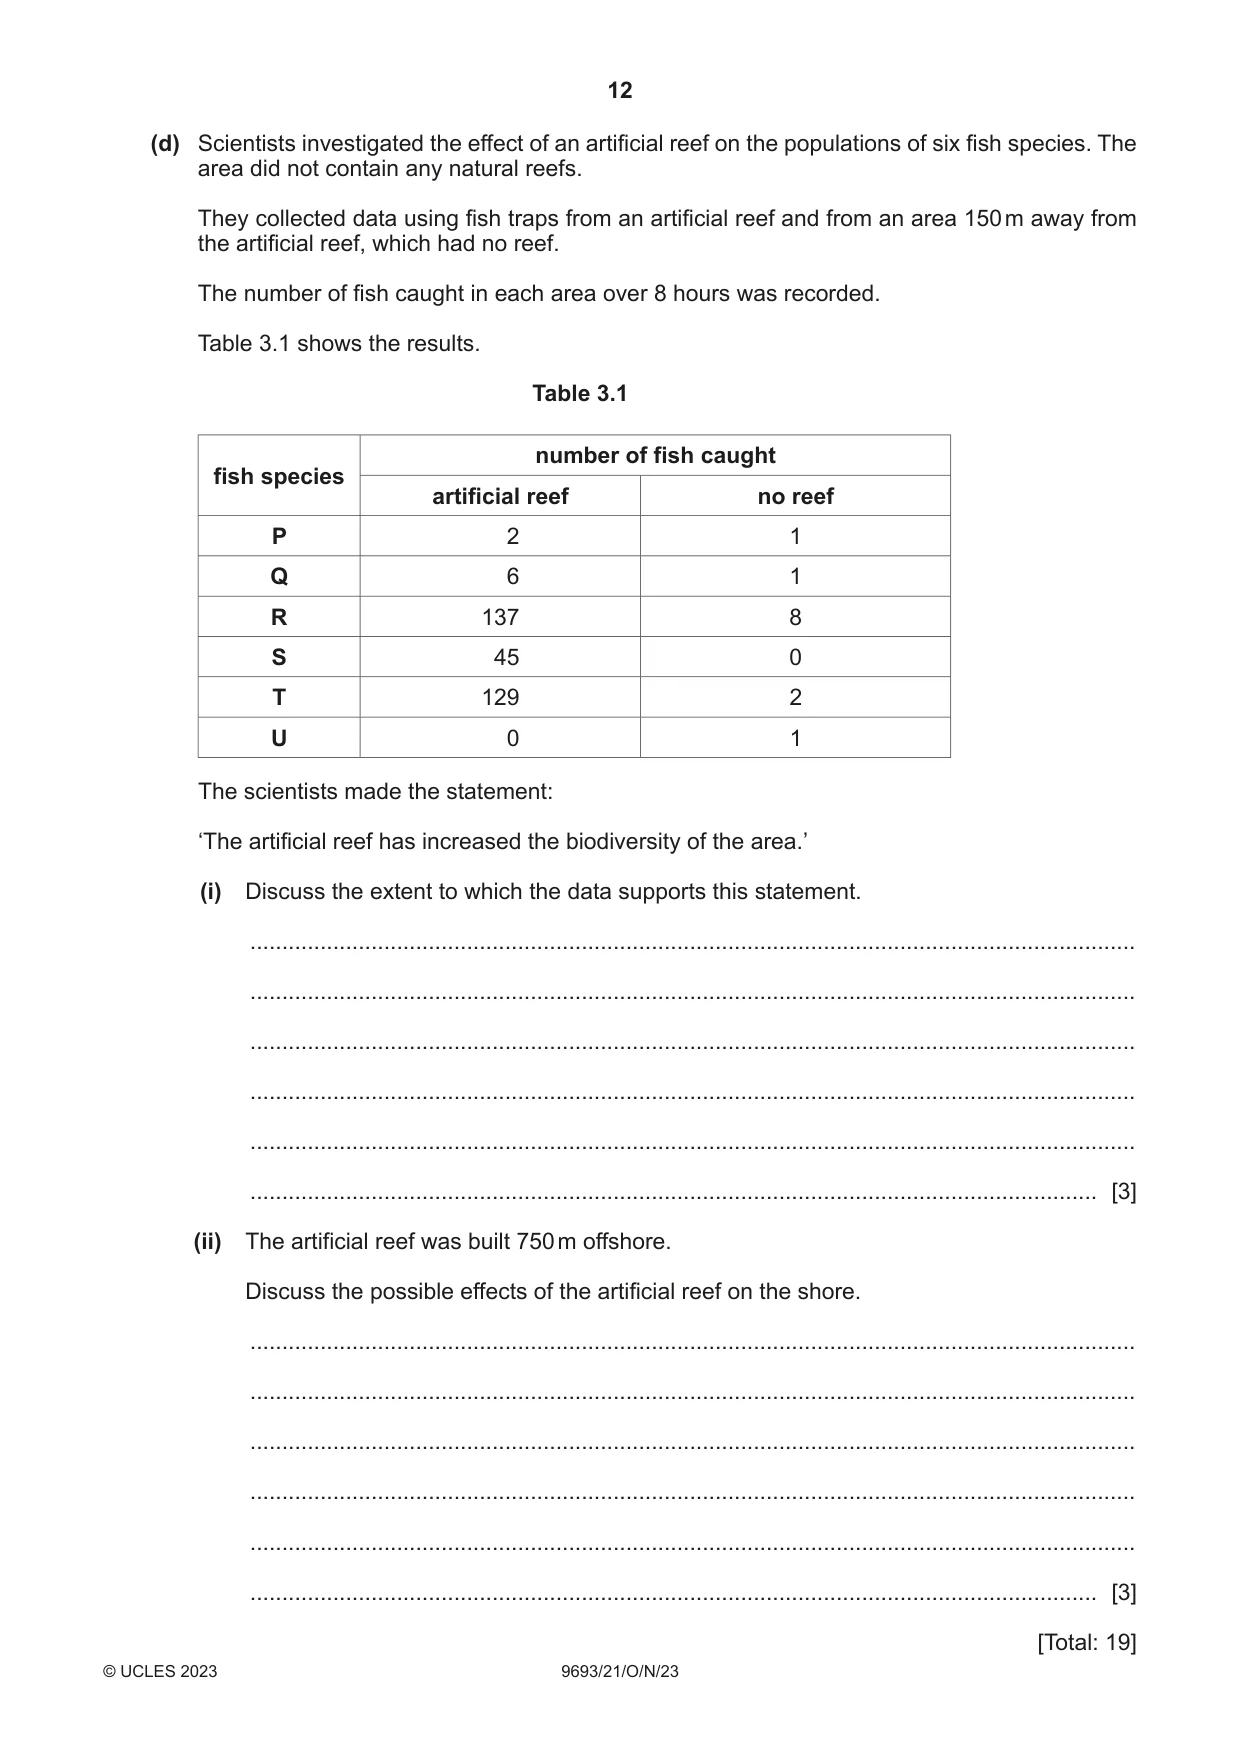
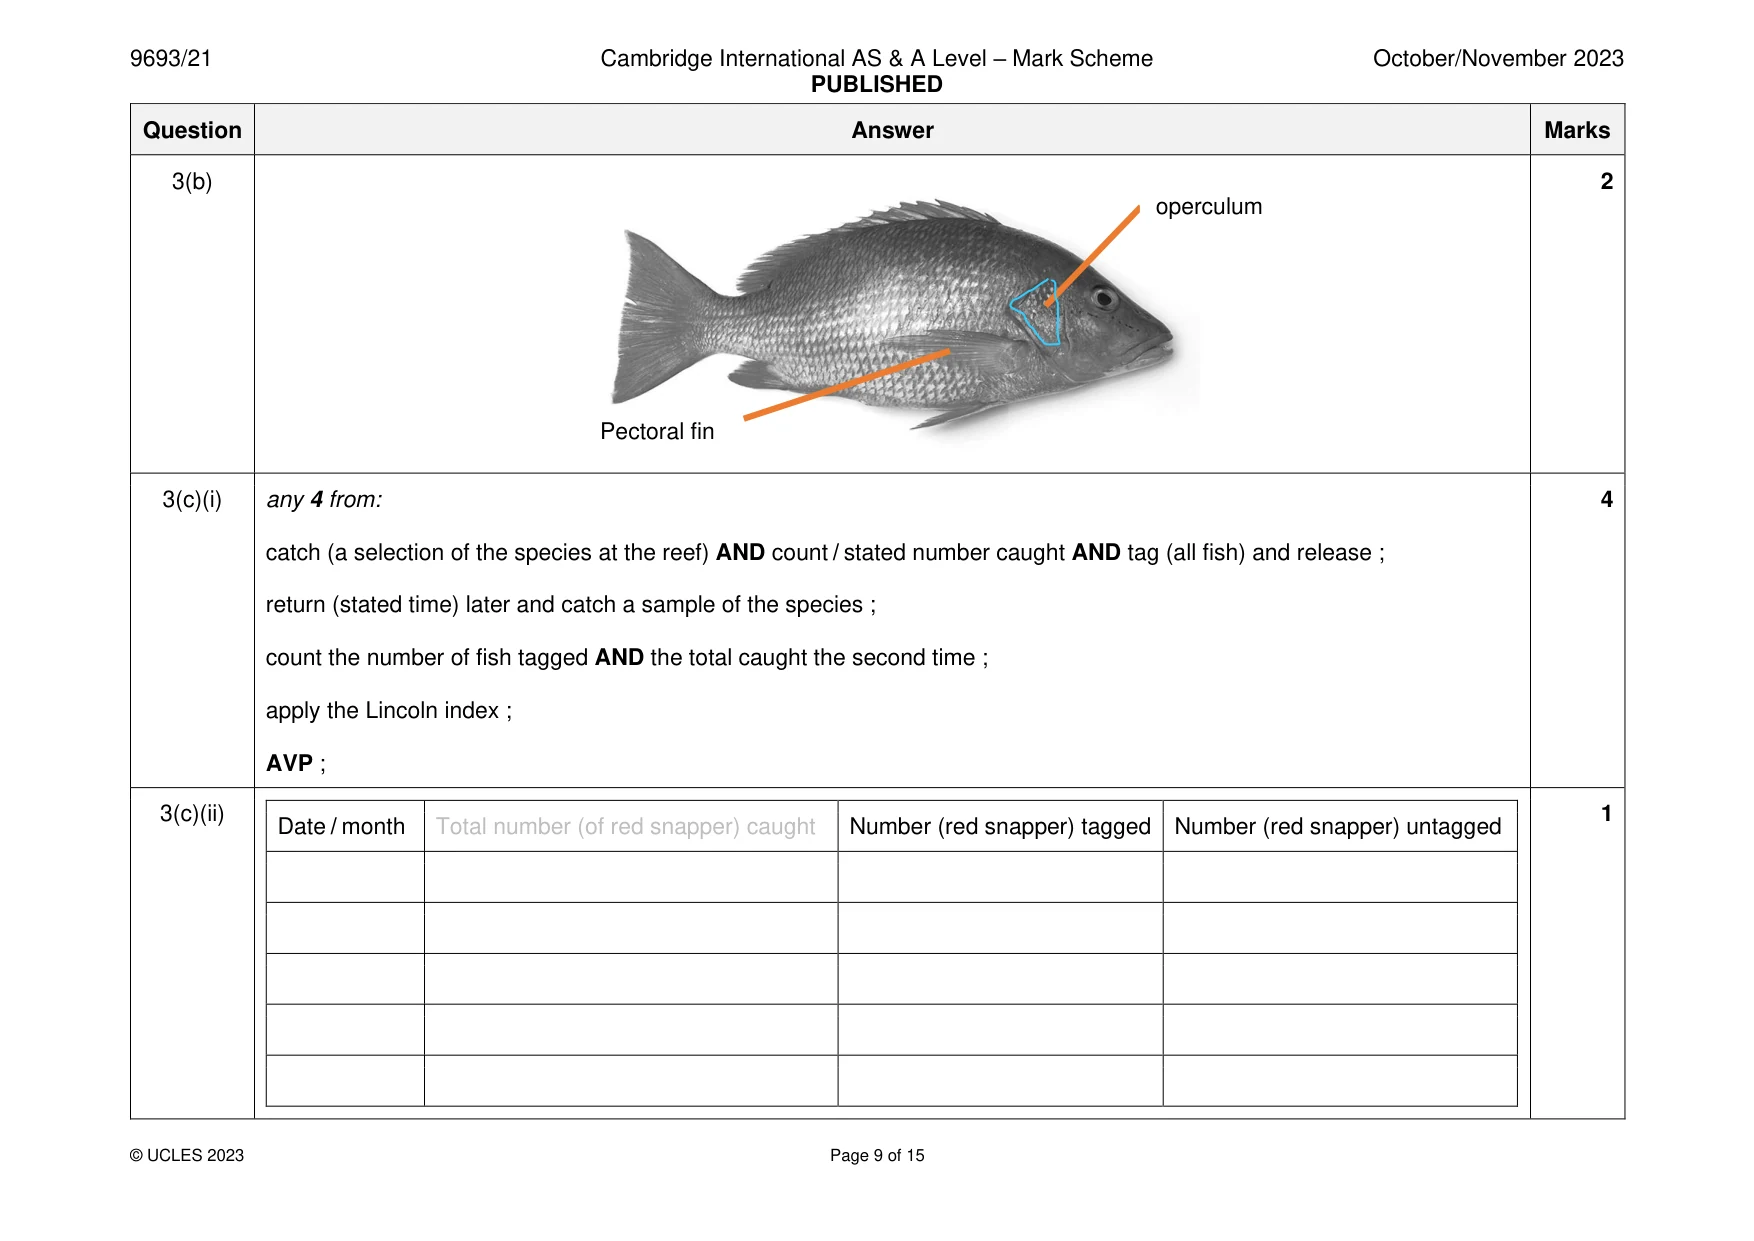
3 Fig. 3.1 shows a red snapper, a fish commonly harvested for human food from coral reefs. Fig. 3.1 (a) Make a large drawing of the red snapper in Fig. 3.1. Do not include the scales. [4] (b) On your diagram label the following features: • operculum • pectoral fin. [2] (c) (i) Describe one method that could be used to estimate the population of red snapper on a coral reef. ........................................................................................................................................... ........................................................................................................................................... ........................................................................................................................................... ........................................................................................................................................... ........................................................................................................................................... ........................................................................................................................................... ........................................................................................................................................... ..................................................................................................................................... [4] (ii) Scientists investigated the population of red snapper on a coral reef every month for six months. Draw a results table for this investigation. Include full headings in the results table, but do not write in any results. [1] (iii) State two biotic factors that affect the population of red snapper on a coral reef. 1 ........................................................................................................................................ 2 ........................................................................................................................................ [2] (d) Scientists investigated the effect of an artificial reef on the populations of six fish species. The area did not contain any natural reefs. They collected data using fish traps from an artificial reef and from an area 150 m away from the artificial reef, which had no reef. The number of fish caught in each area over 8 hours was recorded. Table 3.1 shows the results. Table 3.1 number of fish caught fish species artificial reef no reef P 2 1 Q 6 1 R 137 8 S 45 0 T 129 2 U 0 1 The scientists made the statement: ‘The artificial reef has increased the biodiversity of the area.’ (i) Discuss the extent to which the data supports this statement. ........................................................................................................................................... ........................................................................................................................................... ........................................................................................................................................... ........................................................................................................................................... ........................................................................................................................................... ..................................................................................................................................... [3] (ii) The artificial reef was built 750 m offshore. Discuss the possible effects of the artificial reef on the shore. ........................................................................................................................................... ........................................................................................................................................... ........................................................................................................................................... ........................................................................................................................................... ........................................................................................................................................... ..................................................................................................................................... [3] [Total: 19]
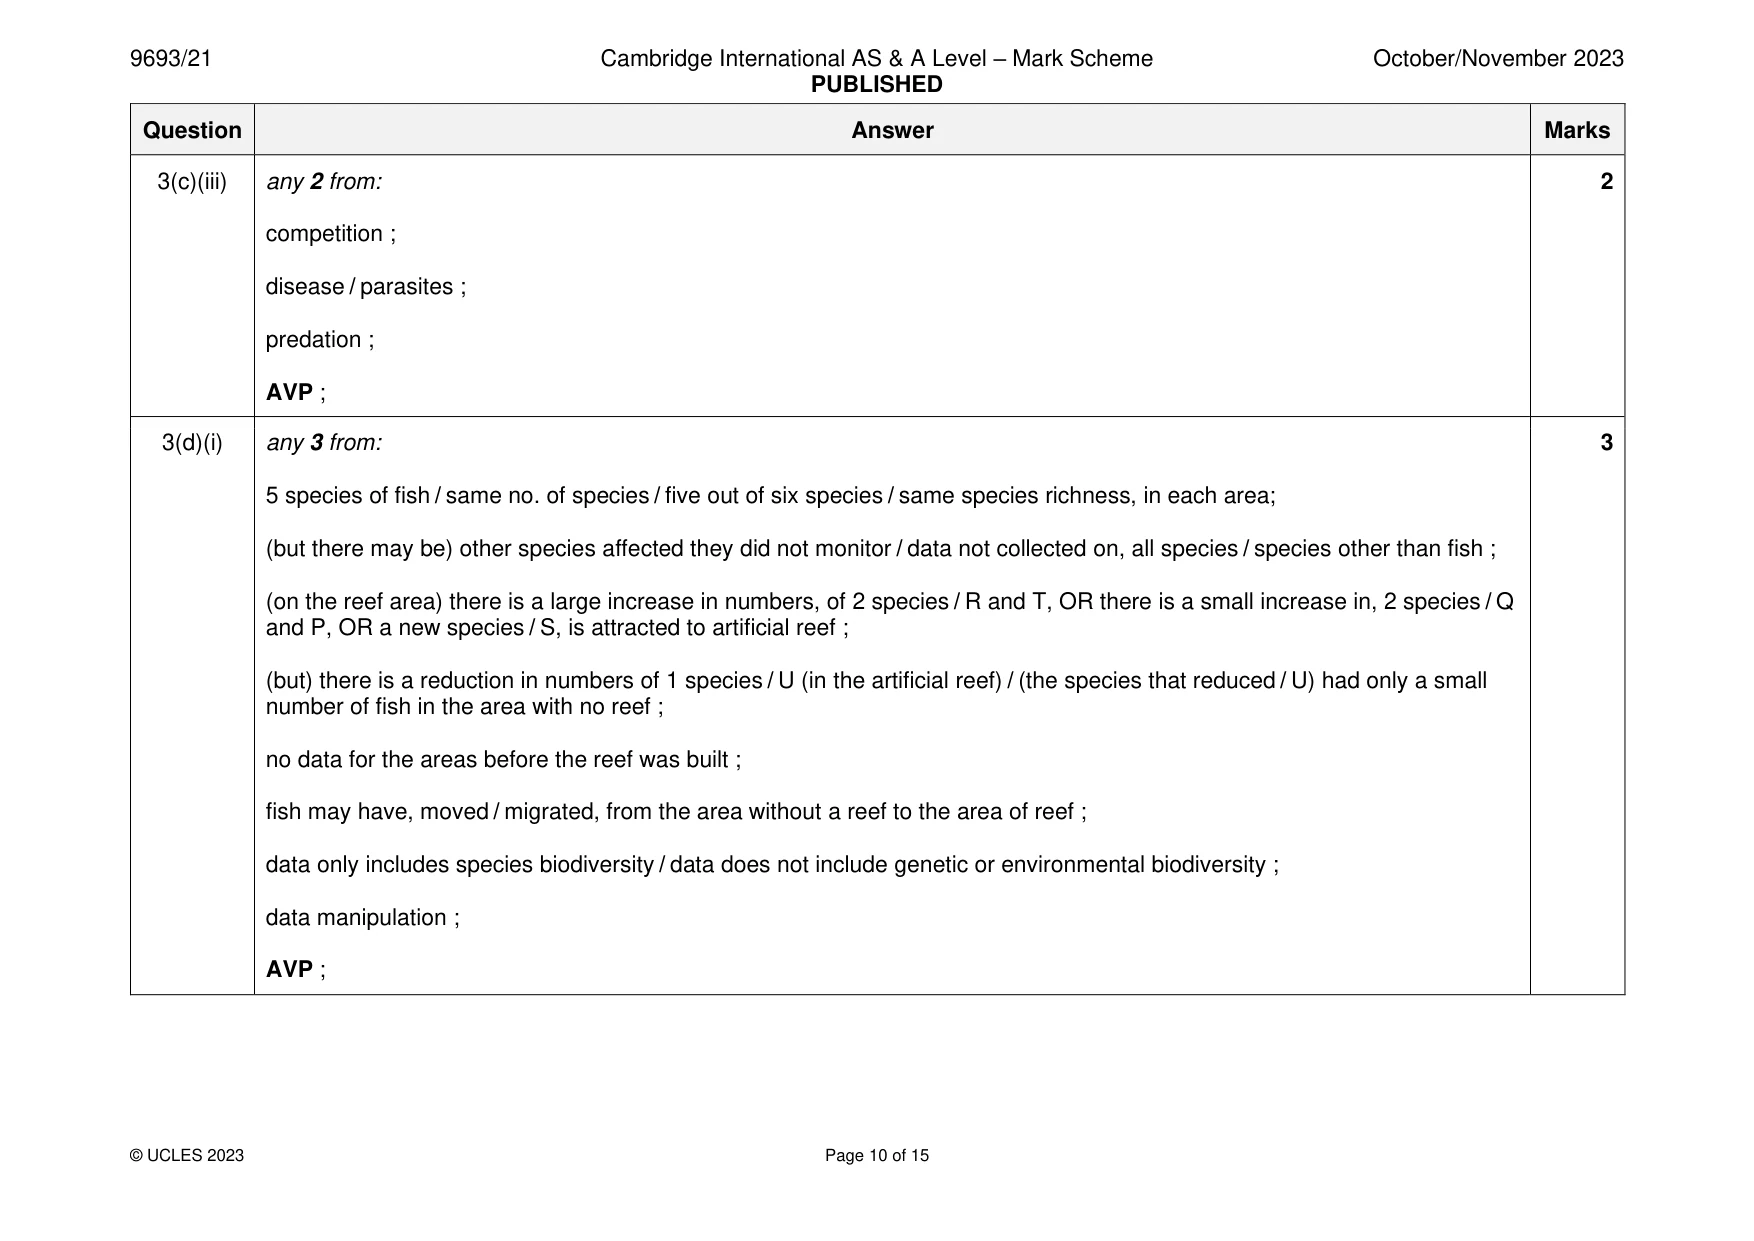
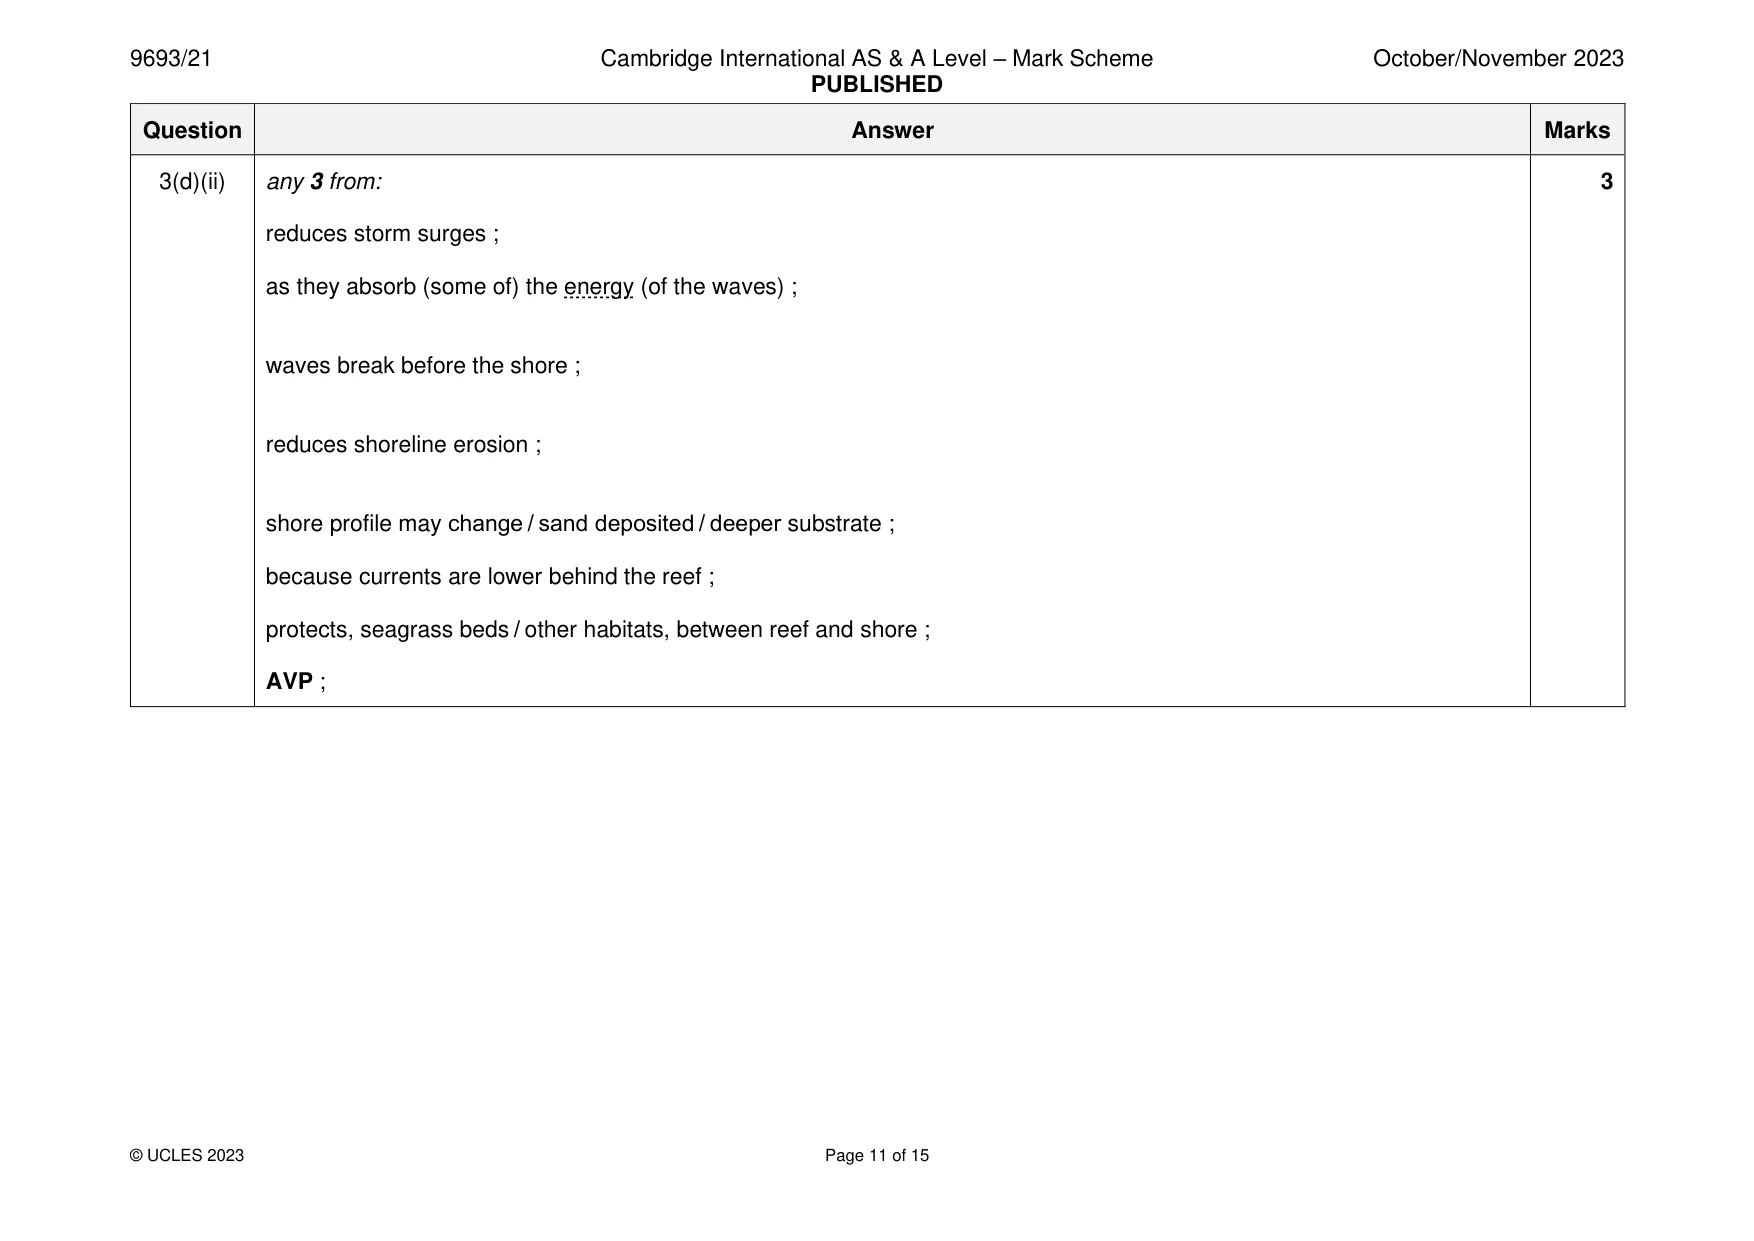
Mark scheme: 3(a) outline (neat lines, no shading) ; 4 size (larger than the original) ; proportion (operculum positioned at around ⅓ of the body length (not including caudal fin) and correct body shape, pectoral fin reaching to approximately the middle of the body) ; detail (all fins included, eye, mouth, caudal peduncle) ; 3(b) 2 operculum Pectoral fin 3(c)(i) any 4 from: 4 catch (a selection of the species at the reef) AND count / stated number caught AND tag (all fish) and release ; return (stated time) later and catch a sample of the species ; count the number of fish tagged AND the total caught the second time ; apply the Lincoln index ; AVP ; 3(c)(ii) 1 Date / month Total number (of red snapper) caught Number (red snapper) tagged Number (red snapper) untagged 3(c)(iii) any 2 from: 2 competition ; disease / parasites ; predation ; AVP ; 3(d)(i) any 3 from: 3 5 species of fish / same no. of species / five out of six species / same species richness, in each area; (but there may be) other species affected they did not monitor / data not collected on, all species / species other than fish ; (on the reef area) there is a large increase in numbers, of 2 species / R and T, OR there is a small increase in, 2 species / Q and P, OR a new species / S, is attracted to artificial reef ; (but) there is a reduction in numbers of 1 species / U (in the artificial reef) / (the species that reduced / U) had only a small number of fish in the area with no reef ; no data for the areas before the reef was built ; fish may have, moved / migrated, from the area without a reef to the area of reef ; data only includes species biodiversity / data does not include genetic or environmental biodiversity ; data manipulation ; AVP ; 3(d)(ii) any 3 from: 3 reduces storm surges ; as they absorb (some of) the energy (of the waves) ; waves break before the shore ; reduces shoreline erosion ; shore profile may change / sand deposited / deeper substrate ; because currents are lower behind the reef ; protects, seagrass beds / other habitats, between reef and shore ; AVP ;
Q4 · In 2016 scientists located a previously unknown coral reef near the mouth of the Amazon…
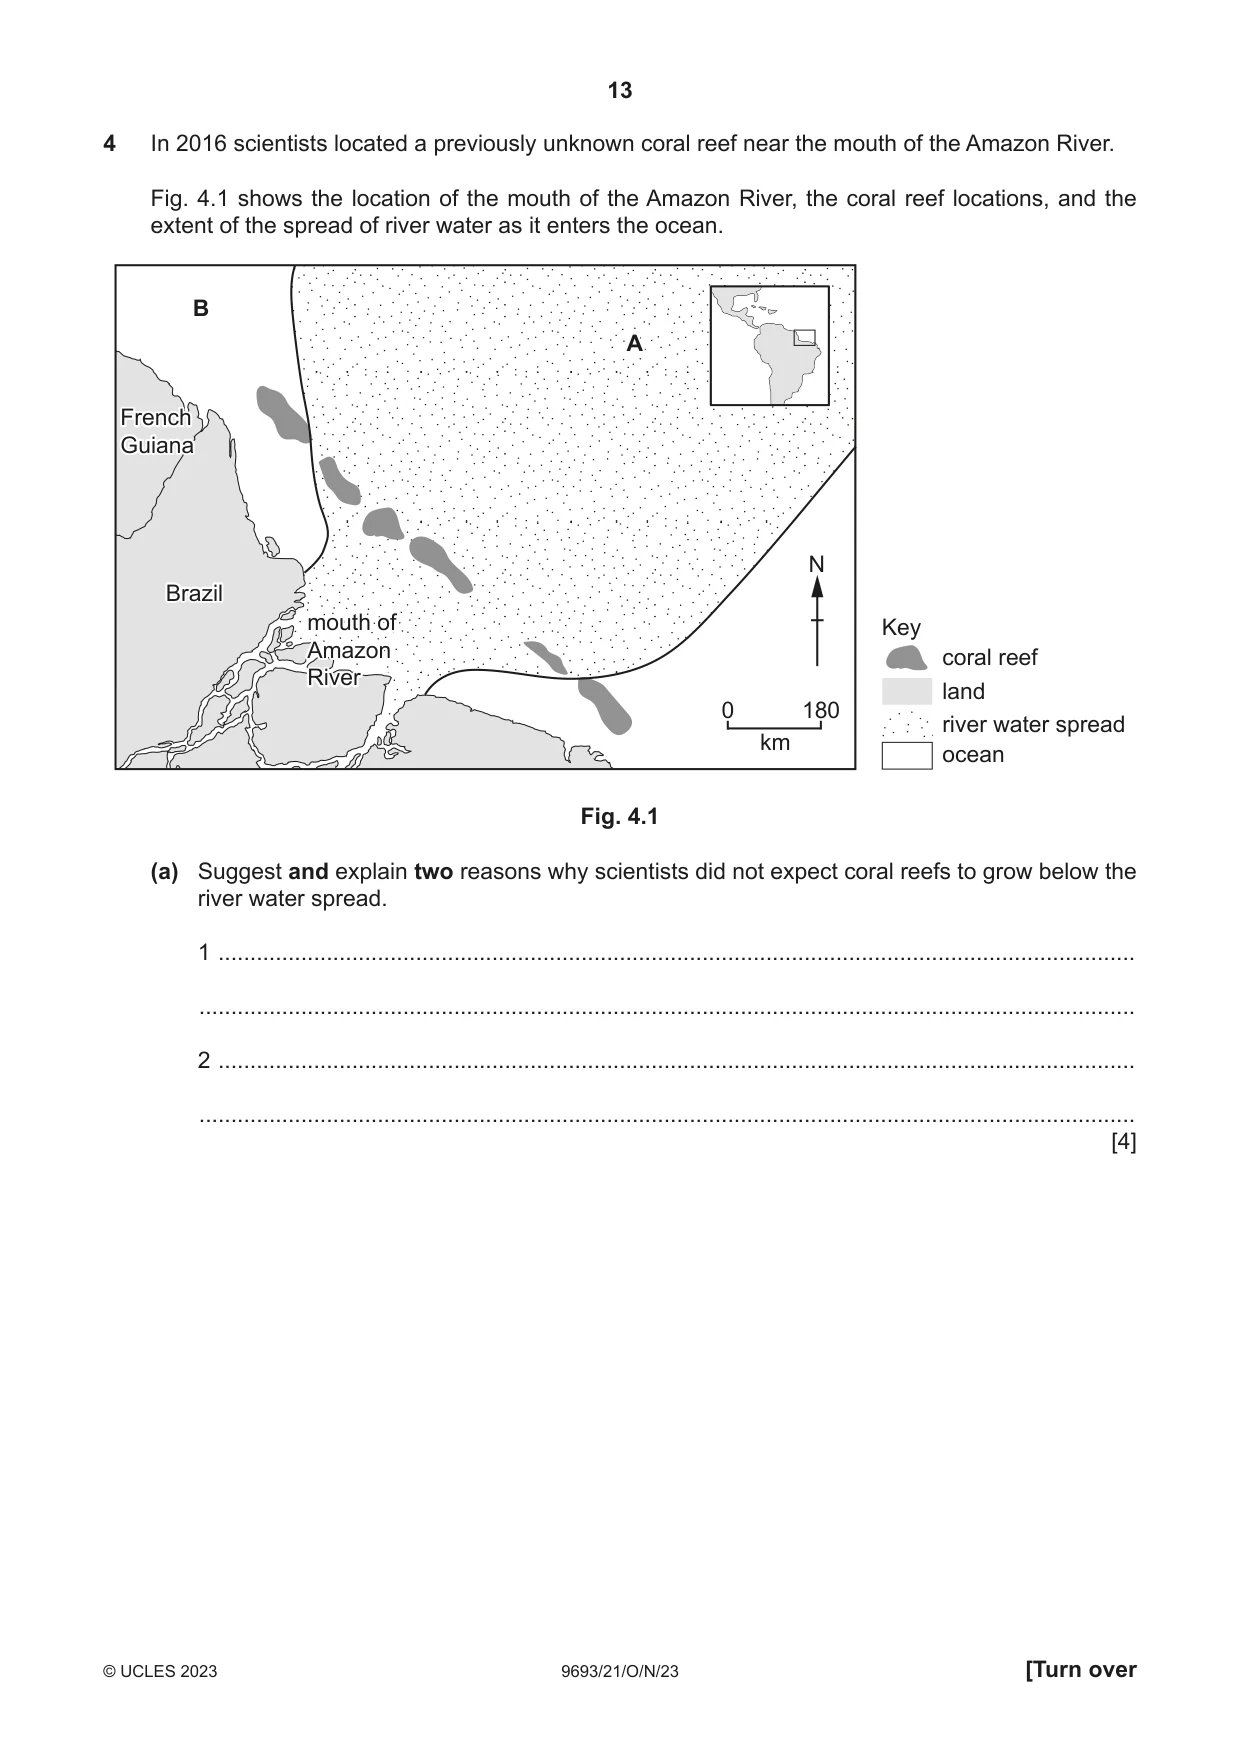
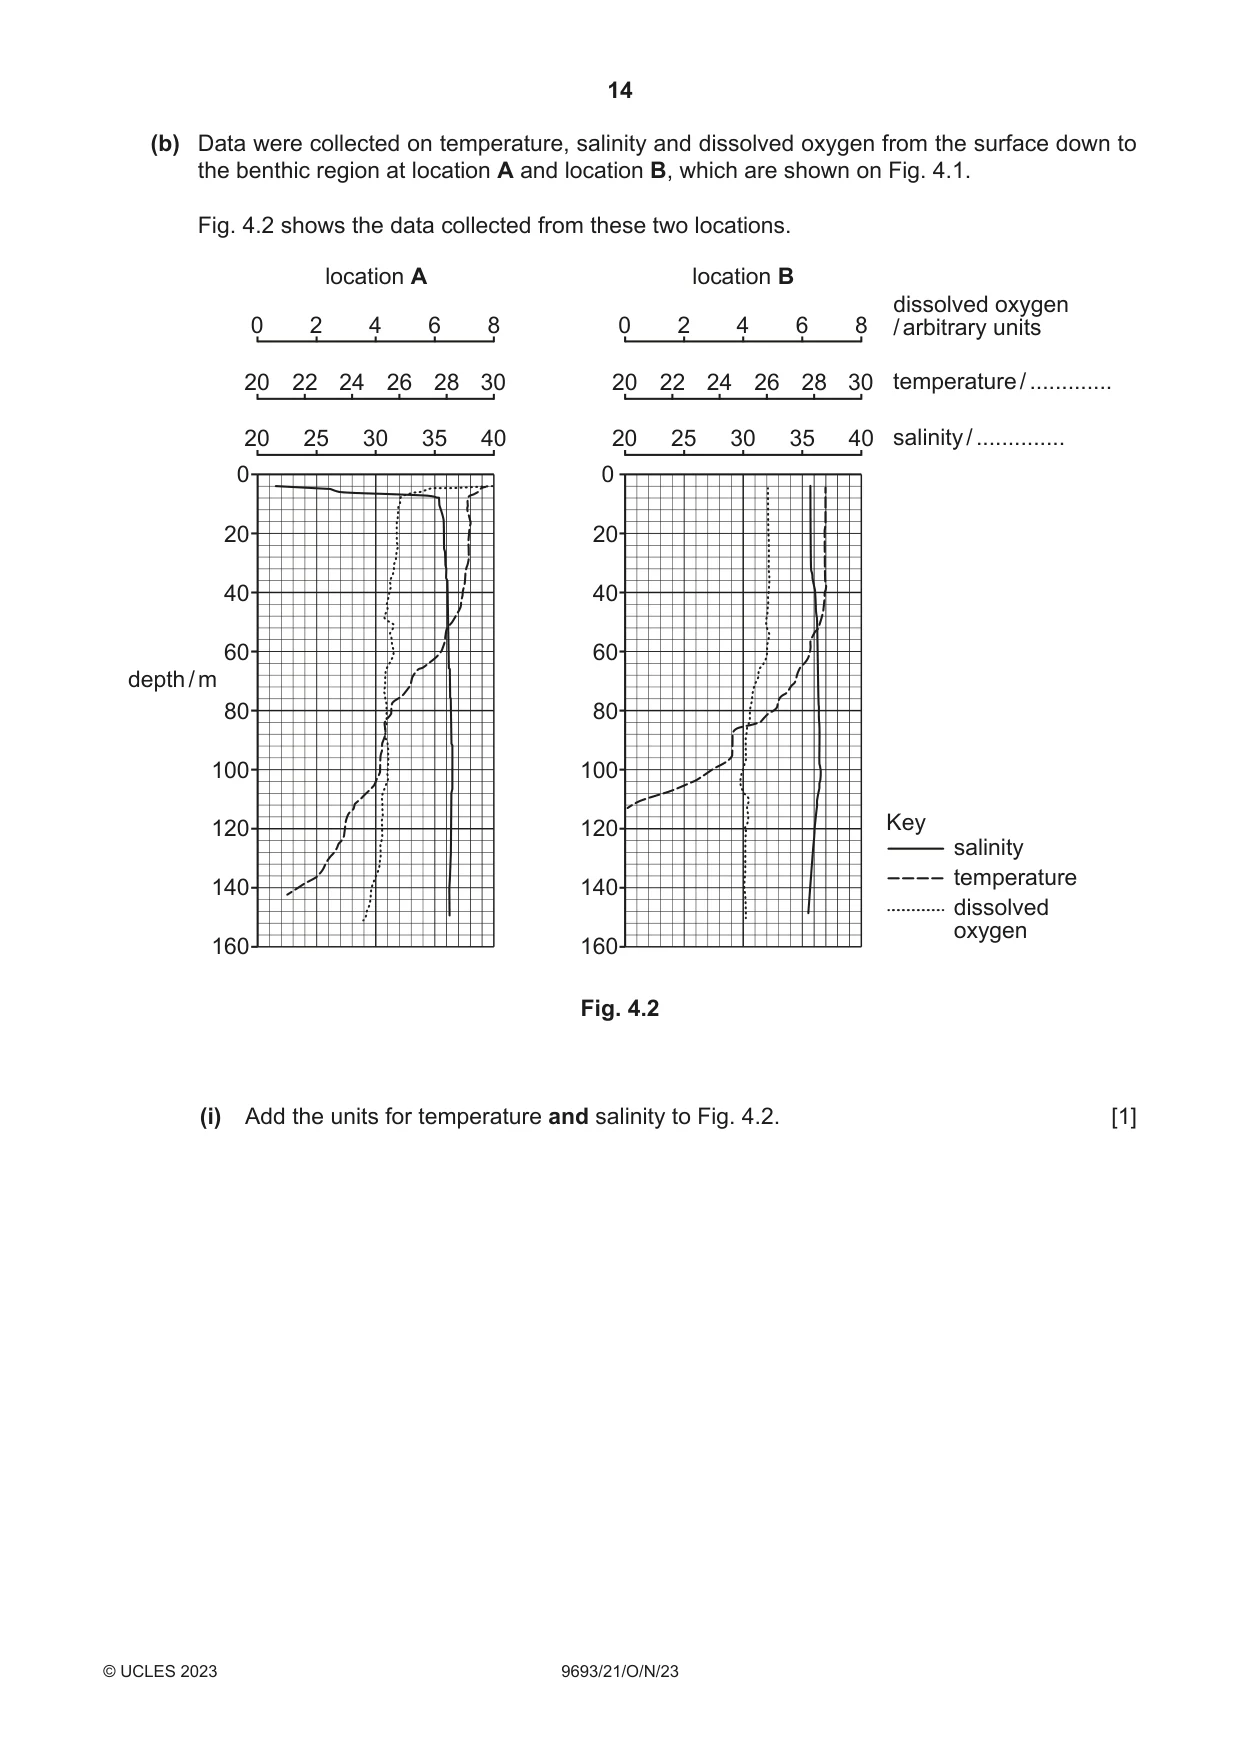
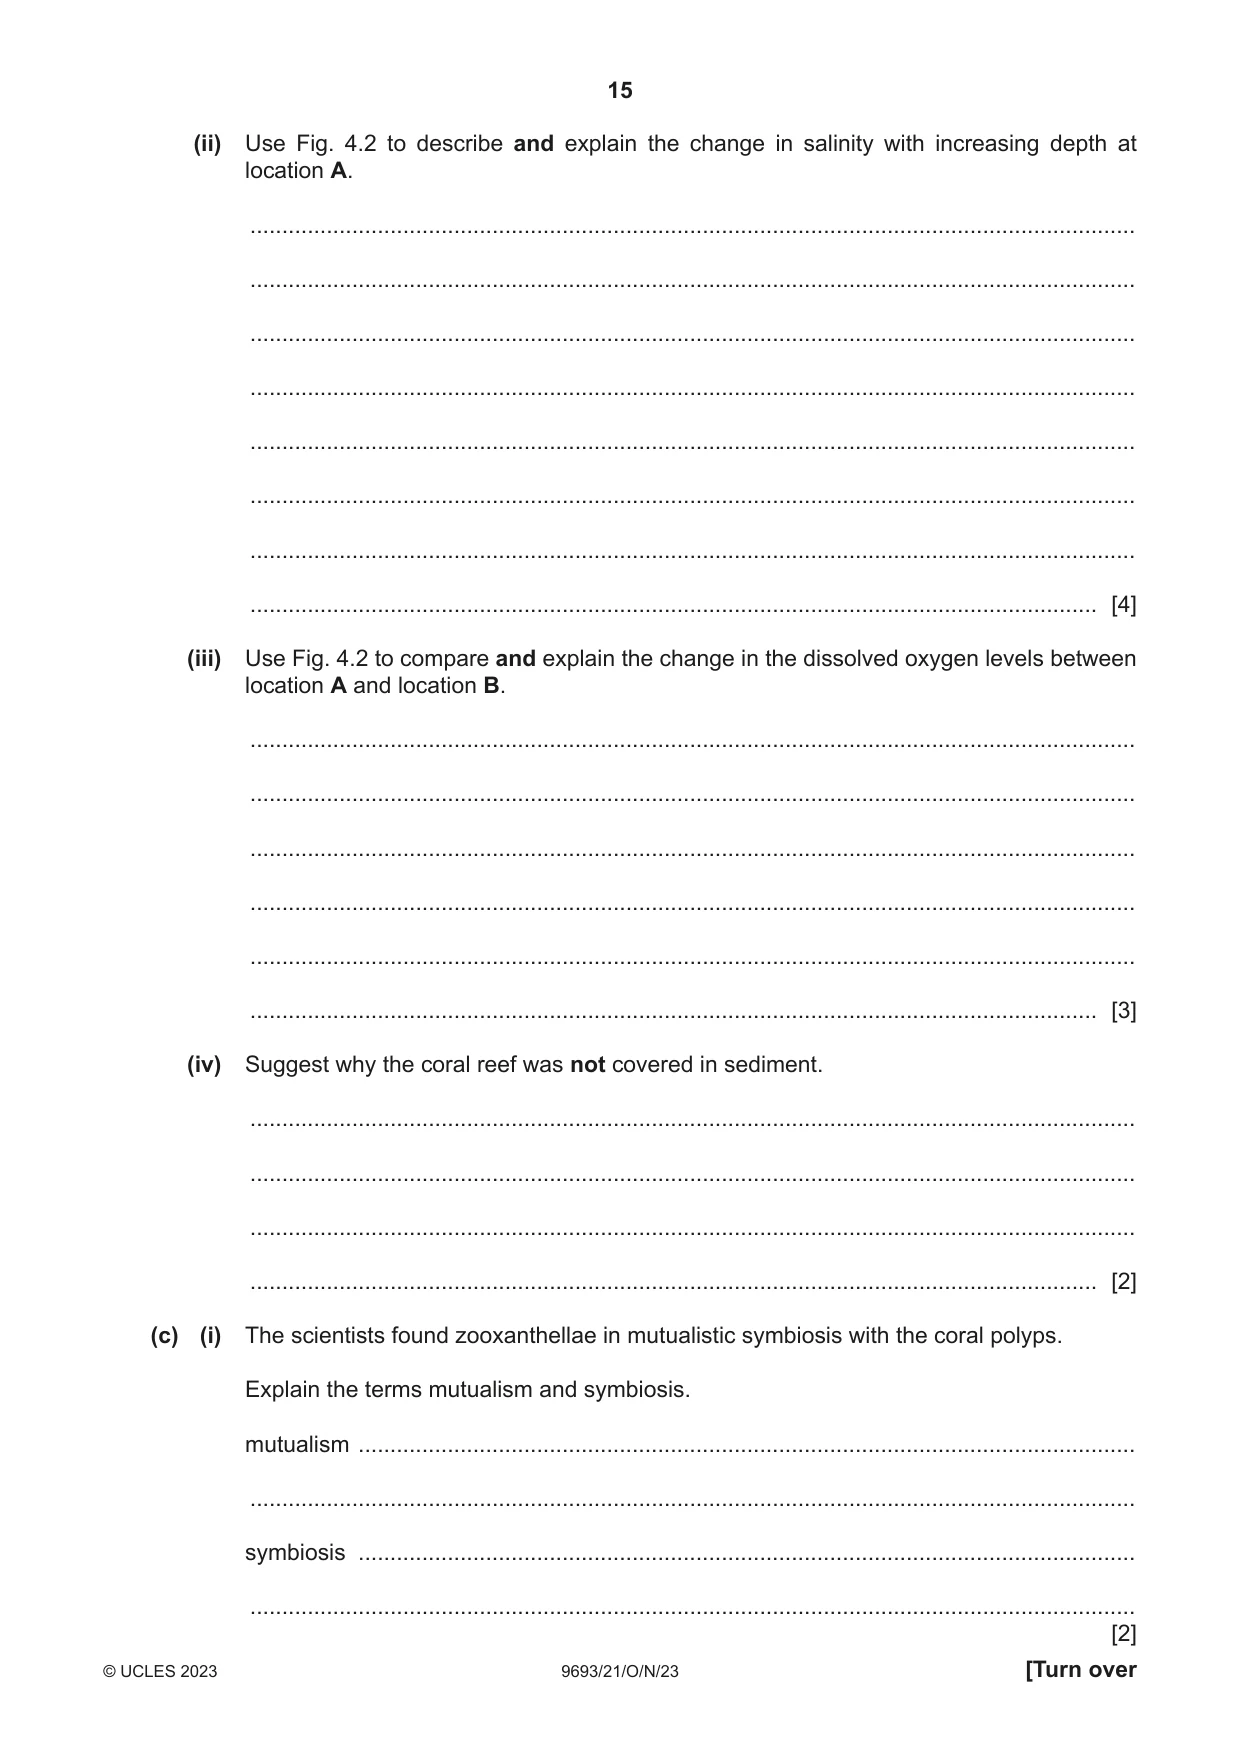
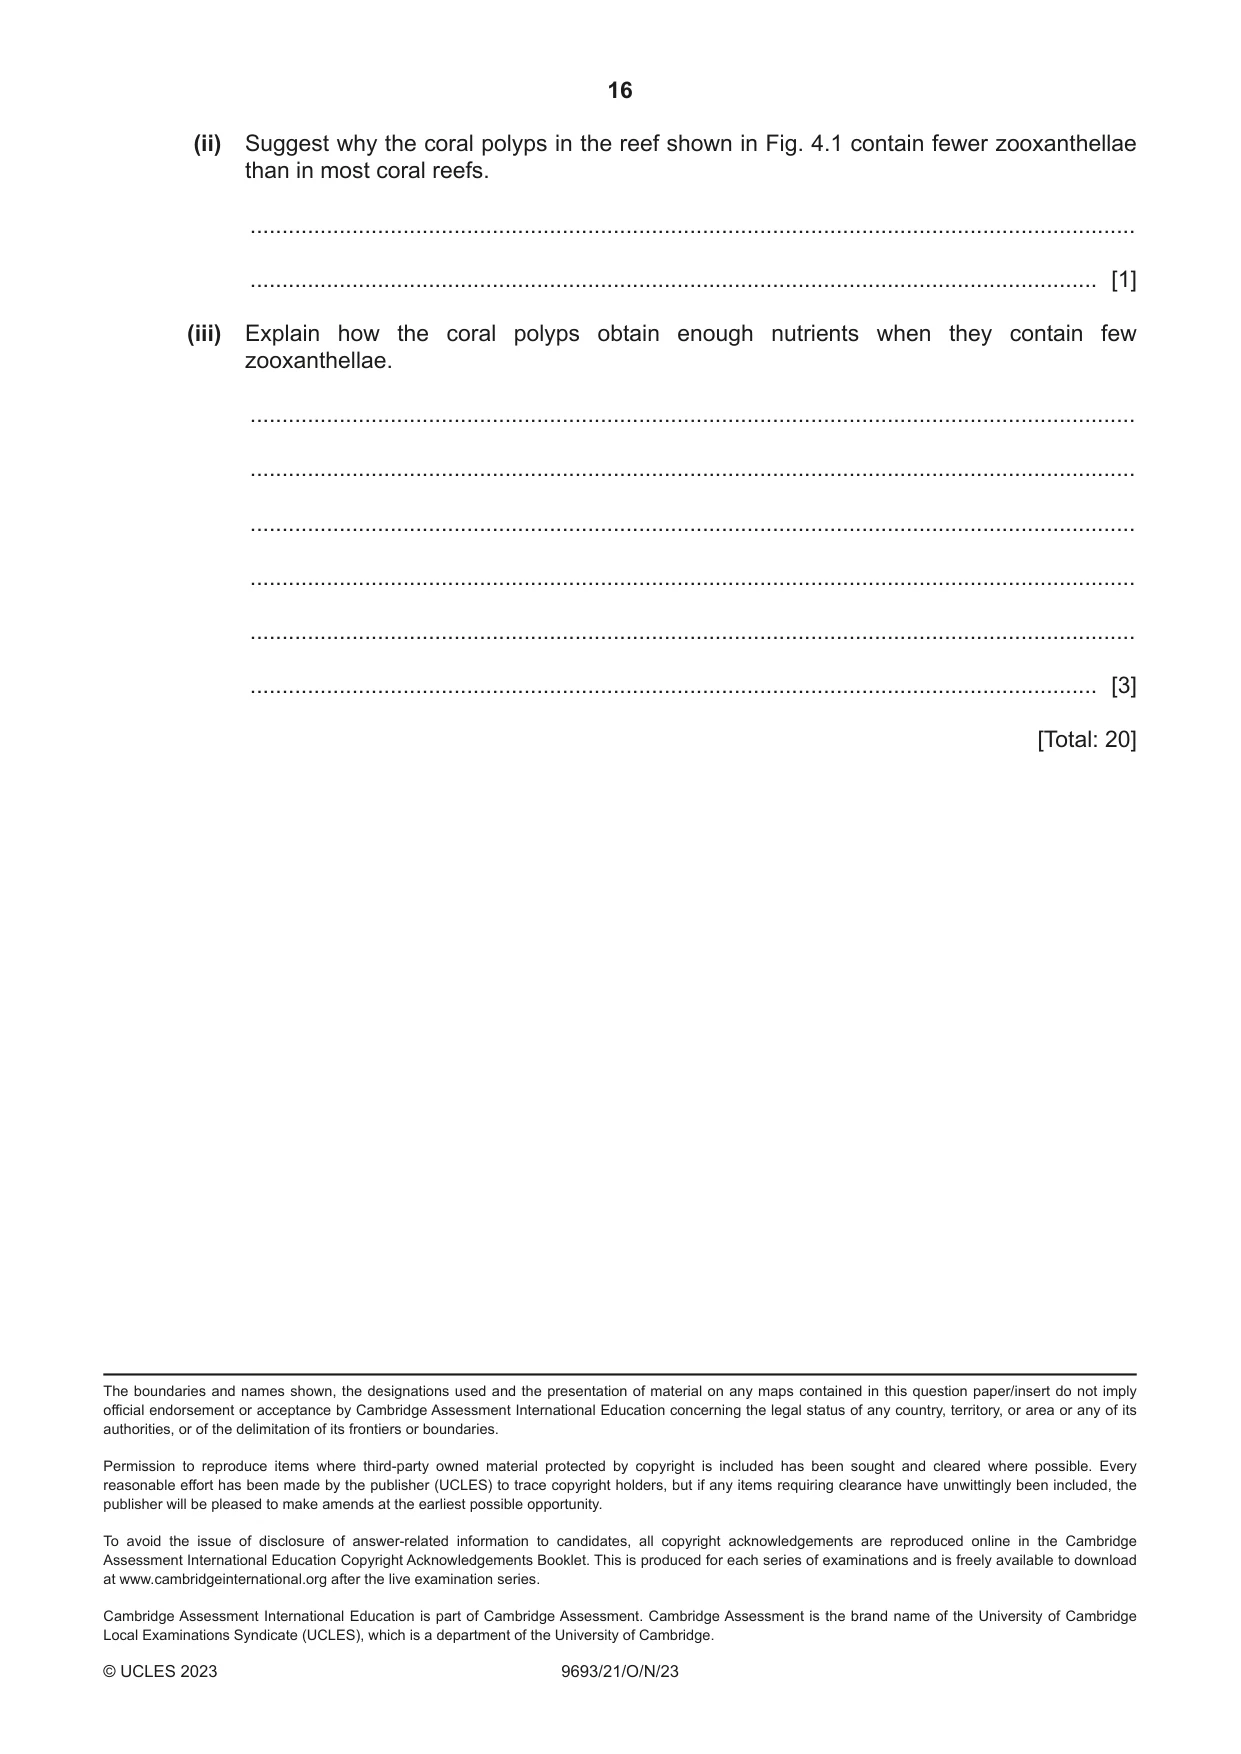
4 In 2016 scientists located a previously unknown coral reef near the mouth of the Amazon River. Fig. 4.1 shows the location of the mouth of the Amazon River, the coral reef locations, and the extent of the spread of river water as it enters the ocean. B A FrenchFrench GuianaGuiana N BrazilBrazil mouthmouth ofof Key AmazonAmazon coral reef RiverRiver land 0 180 river water spread km ocean Fig. 4.1 (a) Suggest and explain two reasons why scientists did not expect coral reefs to grow below the river water spread. 1 ................................................................................................................................................ ................................................................................................................................................... 2 ................................................................................................................................................ ................................................................................................................................................... [4] (b) Data were collected on temperature, salinity and dissolved oxygen from the surface down to the benthic region at location A and location B, which are shown on Fig. 4.1. Fig. 4.2 shows the data collected from these two locations. location A location B dissolved oxygen 0 2 4 6 8 0 2 4 6 8 / arbitrary units 20 22 24 26 28 30 20 22 24 26 28 30 temperature / ............. 20 25 30 35 40 20 25 30 35 40 salinity / .............. 0 0 20 20 40 40 60 60 depth / m 80 80 100 100 120 120 Key salinity temperature 140 140 dissolved oxygen 160 160 Fig. 4.2 (i) Add the units for temperature and salinity to Fig. 4.2. [1] (ii) Use Fig. 4.2 to describe and explain the change in salinity with increasing depth at location A. ........................................................................................................................................... ........................................................................................................................................... ........................................................................................................................................... ........................................................................................................................................... ........................................................................................................................................... ........................................................................................................................................... ........................................................................................................................................... ..................................................................................................................................... [4] (iii) Use Fig. 4.2 to compare and explain the change in the dissolved oxygen levels between location A and location B. ........................................................................................................................................... ........................................................................................................................................... ........................................................................................................................................... ........................................................................................................................................... ........................................................................................................................................... ..................................................................................................................................... [3] (iv) Suggest why the coral reef was not covered in sediment. ........................................................................................................................................... ........................................................................................................................................... ........................................................................................................................................... ..................................................................................................................................... [2] (c) (i) The scientists found zooxanthellae in mutualistic symbiosis with the coral polyps. Explain the terms mutualism and symbiosis. mutualism .......................................................................................................................... ........................................................................................................................................... symbiosis .......................................................................................................................... ...........................................................................................................................................
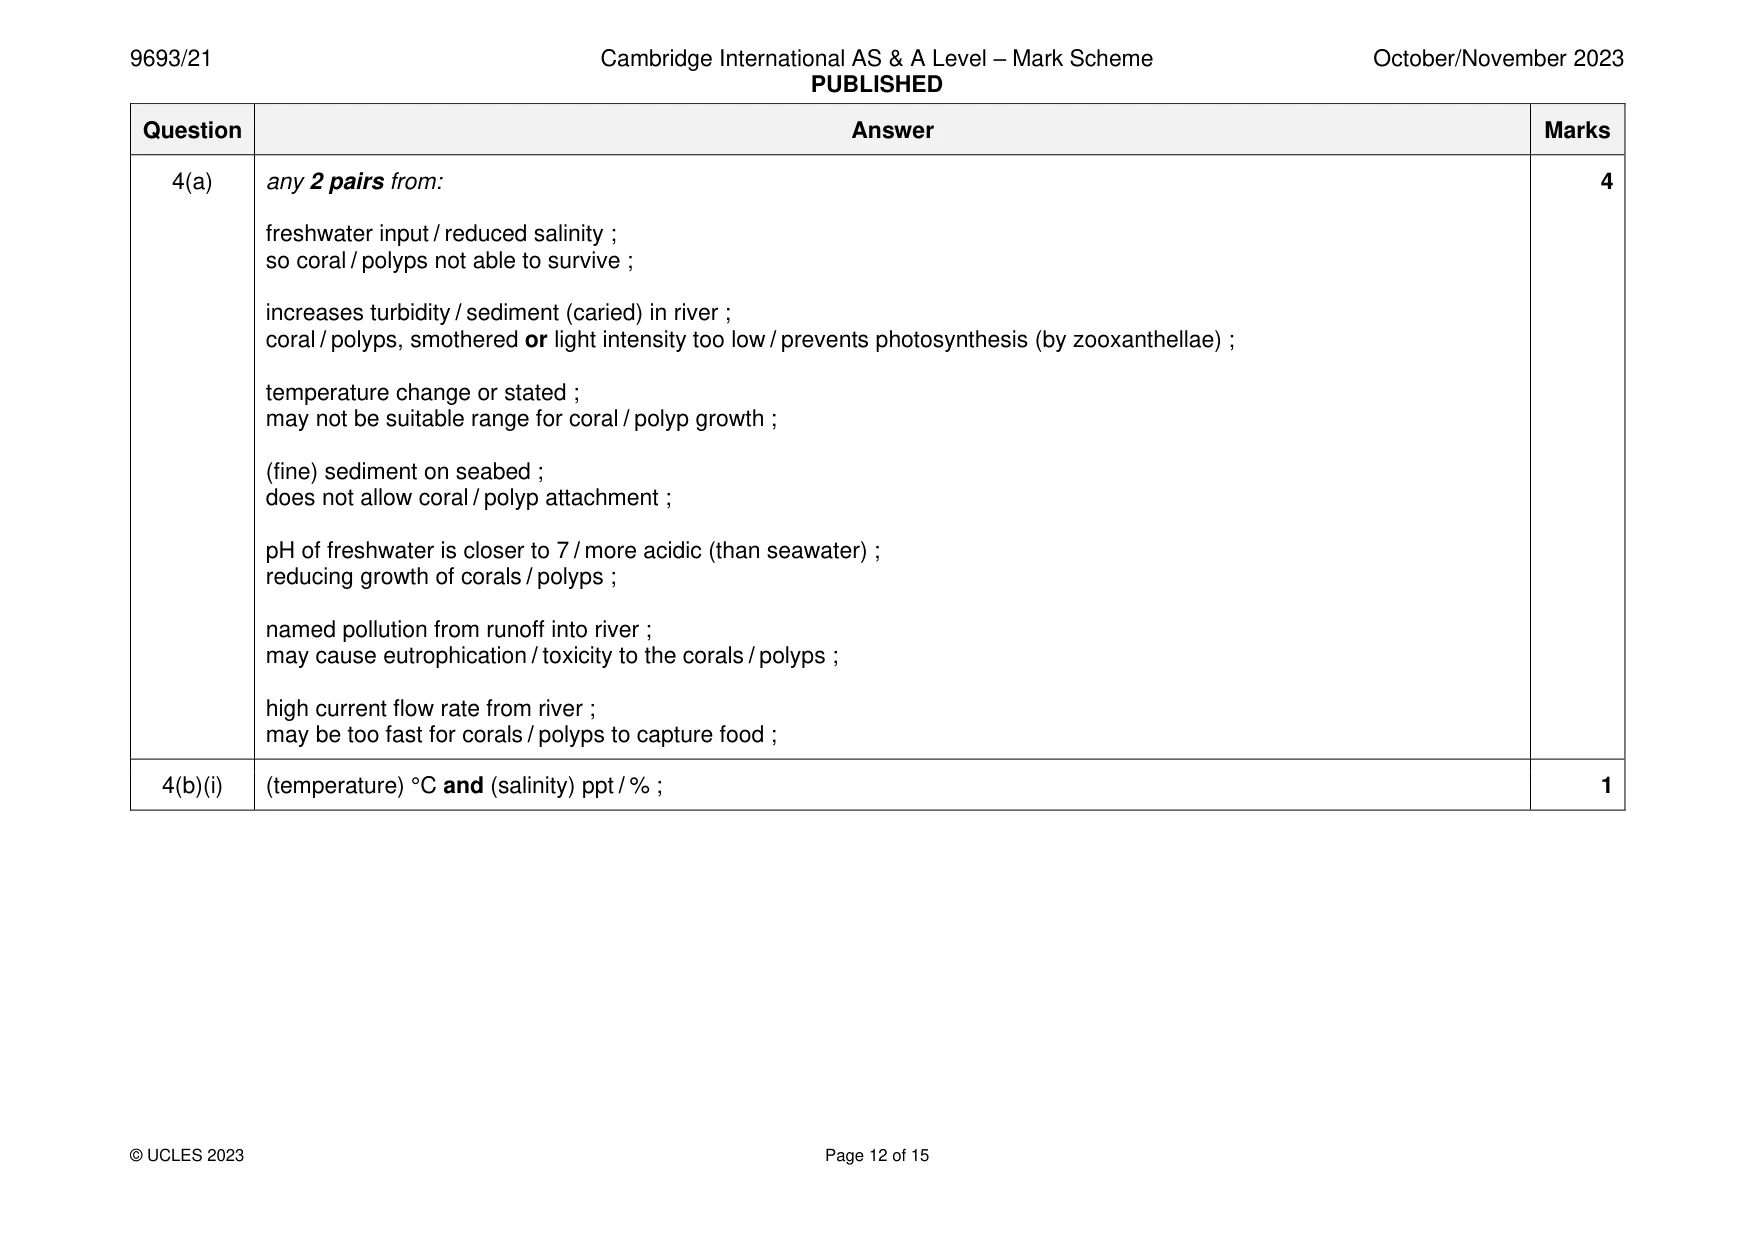
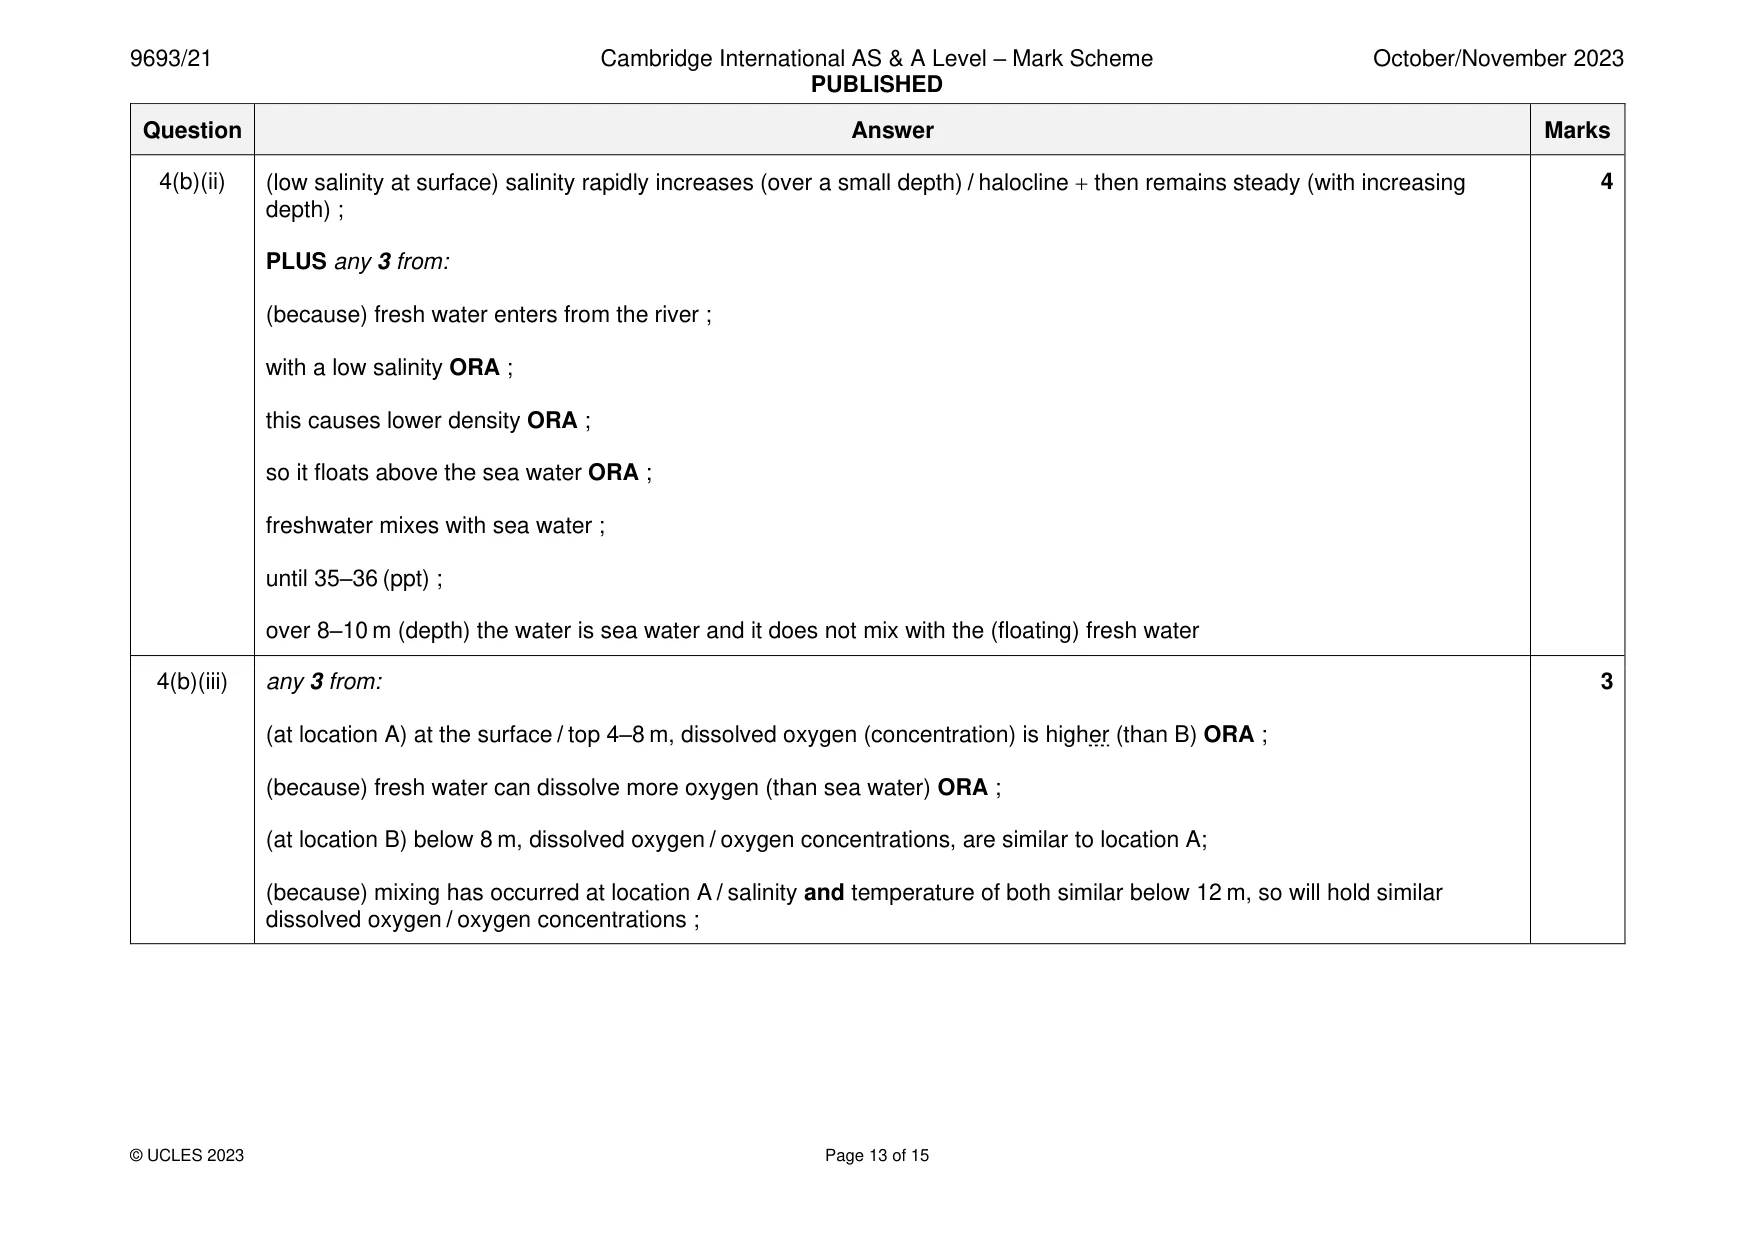
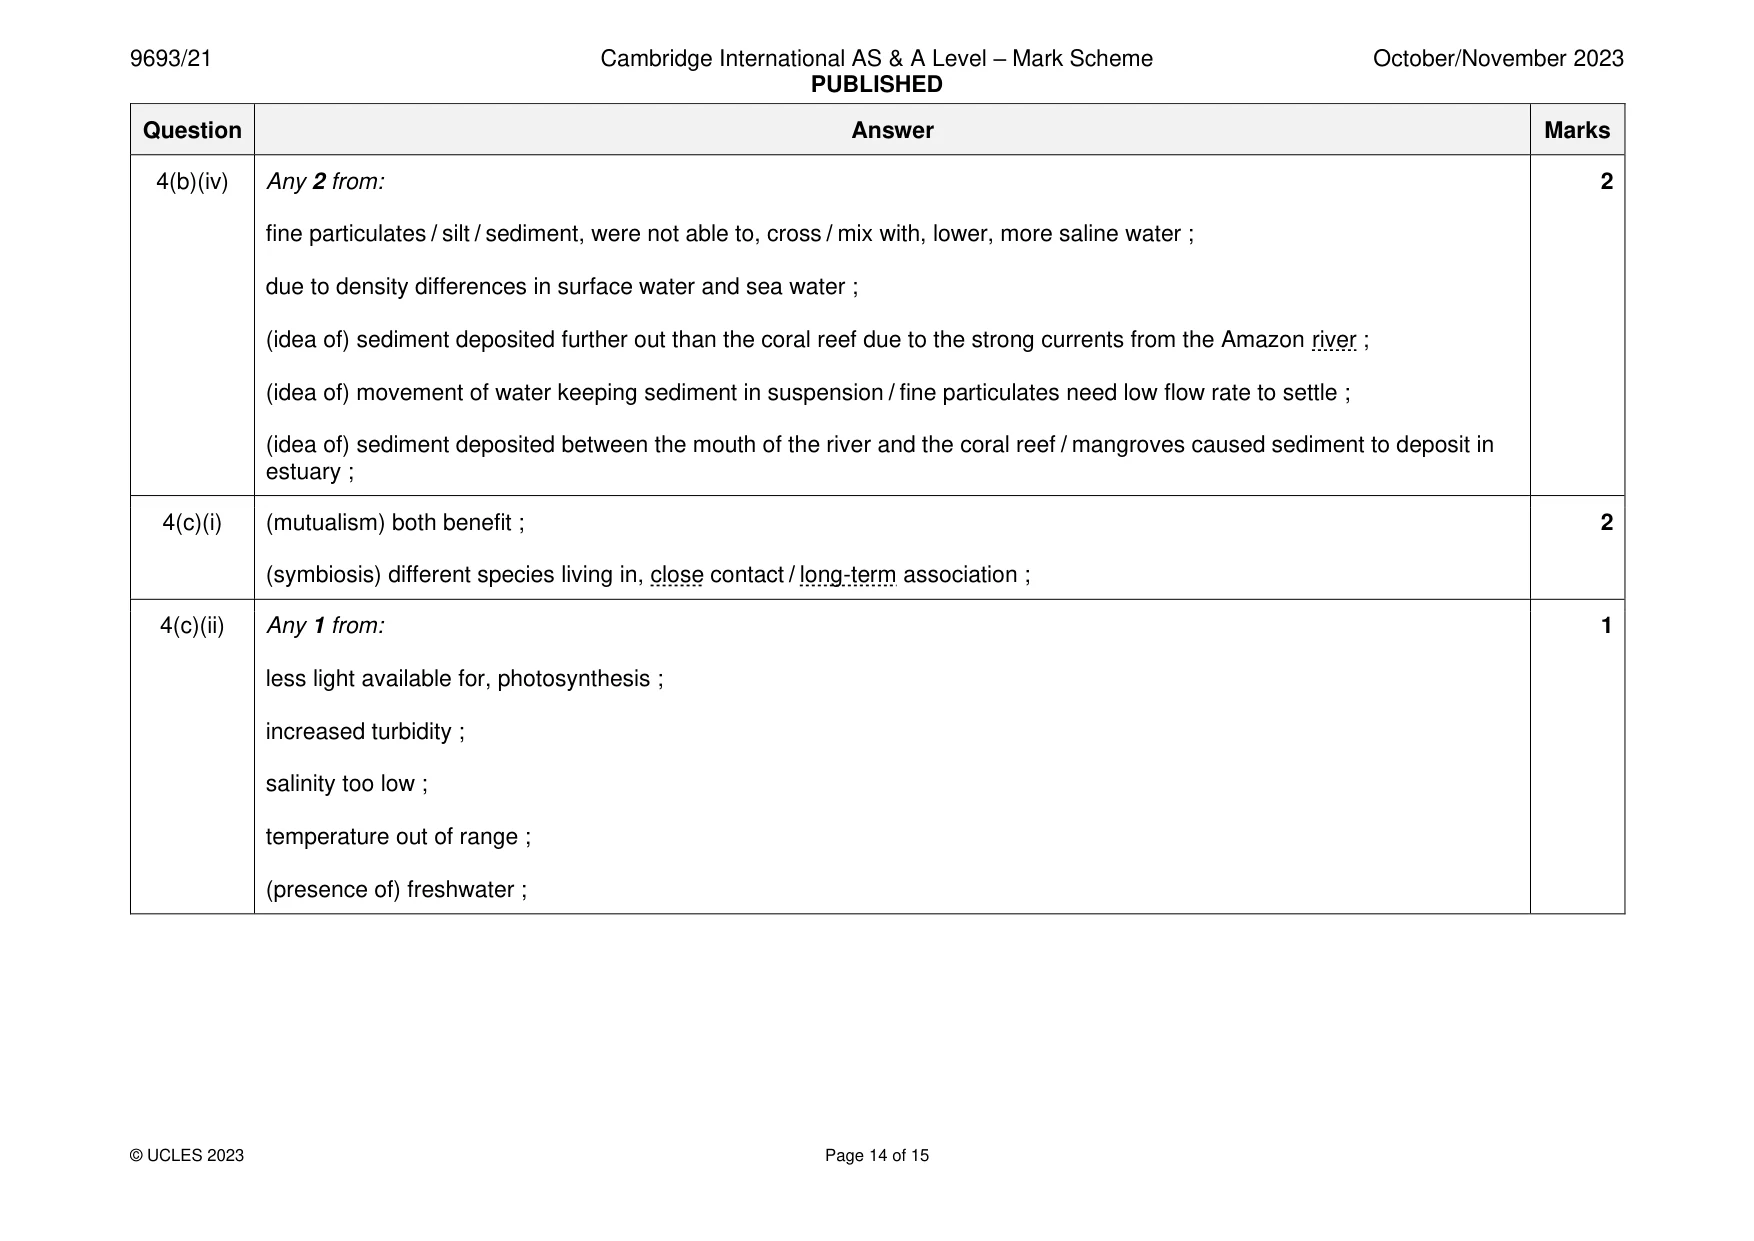
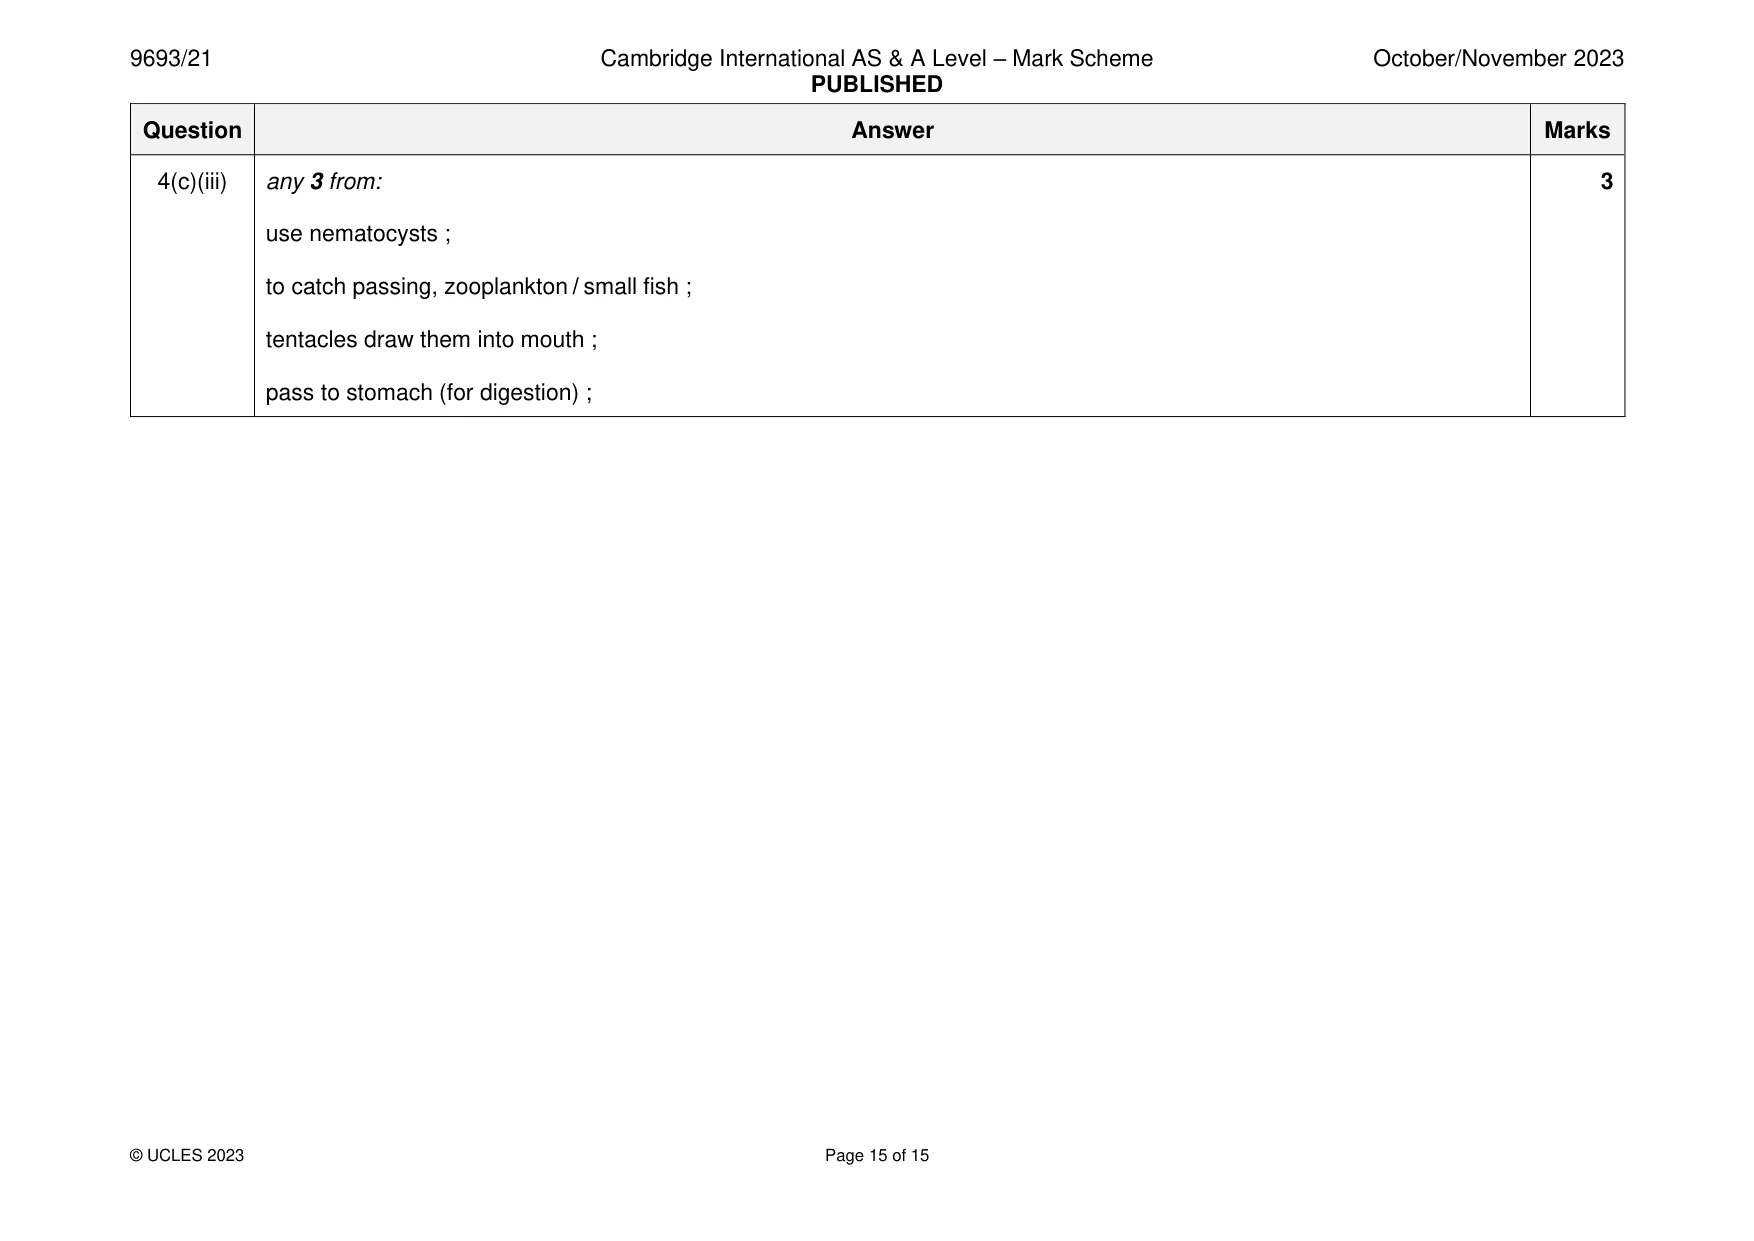
Mark scheme: 4(a) any 2 pairs from: 4 freshwater input / reduced salinity ; so coral / polyps not able to survive ; increases turbidity / sediment (caried) in river ; coral / polyps, smothered or light intensity too low / prevents photosynthesis (by zooxanthellae) ; temperature change or stated ; may not be suitable range for coral / polyp growth ; (fine) sediment on seabed ; does not allow coral / polyp attachment ; pH of freshwater is closer to 7 / more acidic (than seawater) ; reducing growth of corals / polyps ; named pollution from runoff into river ; may cause eutrophication / toxicity to the corals / polyps ; high current flow rate from river ; may be too fast for corals / polyps to capture food ; 4(b)(i) (temperature) °C and (salinity) ppt / % ; 1 4(b)(ii) (low salinity at surface) salinity rapidly increases (over a small depth) / halocline + then remains steady (with increasing 4 depth) ; PLUS any 3 from: (because) fresh water enters from the river ; with a low salinity ORA ; this causes lower density ORA ; so it floats above the sea water ORA ; freshwater mixes with sea water ; until 35–36 (ppt) ; over 8–10 m (depth) the water is sea water and it does not mix with the (floating) fresh water 4(b)(iii) any 3 from: 3 (at location A) at the surface / top 4–8 m, dissolved oxygen (concentration) is higher (than B) ORA ; (because) fresh water can dissolve more oxygen (than sea water) ORA ; (at location B) below 8 m, dissolved oxygen / oxygen concentrations, are similar to location A; (because) mixing has occurred at location A / salinity and temperature of both similar below 12 m, so will hold similar dissolved oxygen / oxygen concentrations ; 4(b)(iv) Any 2 from: 2 fine particulates / silt / sediment, were not able to, cross / mix with, lower, more saline water ; due to density differences in surface water and sea water ; (idea of) sediment deposited further out than the coral reef due to the strong currents from the Amazon river ; (idea of) movement of water keeping sediment in suspension / fine particulates need low flow rate to settle ; (idea of) sediment deposited between the mouth of the river and the coral reef / mangroves caused sediment to deposit in estuary ; 4(c)(i) (mutualism) both benefit ; 2 (symbiosis) different species living in, close contact / long-term association ; 4(c)(ii) Any 1 from: 1 less light available for, photosynthesis ; increased turbidity ; salinity too low ; temperature out of range ; (presence of) freshwater ; 4(c)(iii) any 3 from: 3 use nematocysts ; to catch passing, zooplankton / small fish ; tentacles draw them into mouth ; pass to stomach (for digestion) ;
What was in this paper
The subtopics covered by these 4 questions, and how many questions each got. Open one in a new tab to see every Cambridge question on it.
What you needed in this session
Cambridge’s own grade thresholds for 2023 Oct/Nov, Paper 2 · Variant 1. A higher threshold means an easier paper — the bar moves with how the cohort did.