Questions as text
Q1 · A tax is said to be regressive when A low income earners pay a higher proportion of their… 9708/31 Oct/Nov 2010
13 A tax is said to be regressive when A low income earners pay a higher proportion of their income in tax than high income earners. B marginal tax rates exceed average tax rates. C the cost of collecting the tax exceeds the revenue raised. D the marginal rate of tax is higher for high income earners than low income earners.
1 marks
Answer: A
This question in 9708/31 Oct/Nov 2010
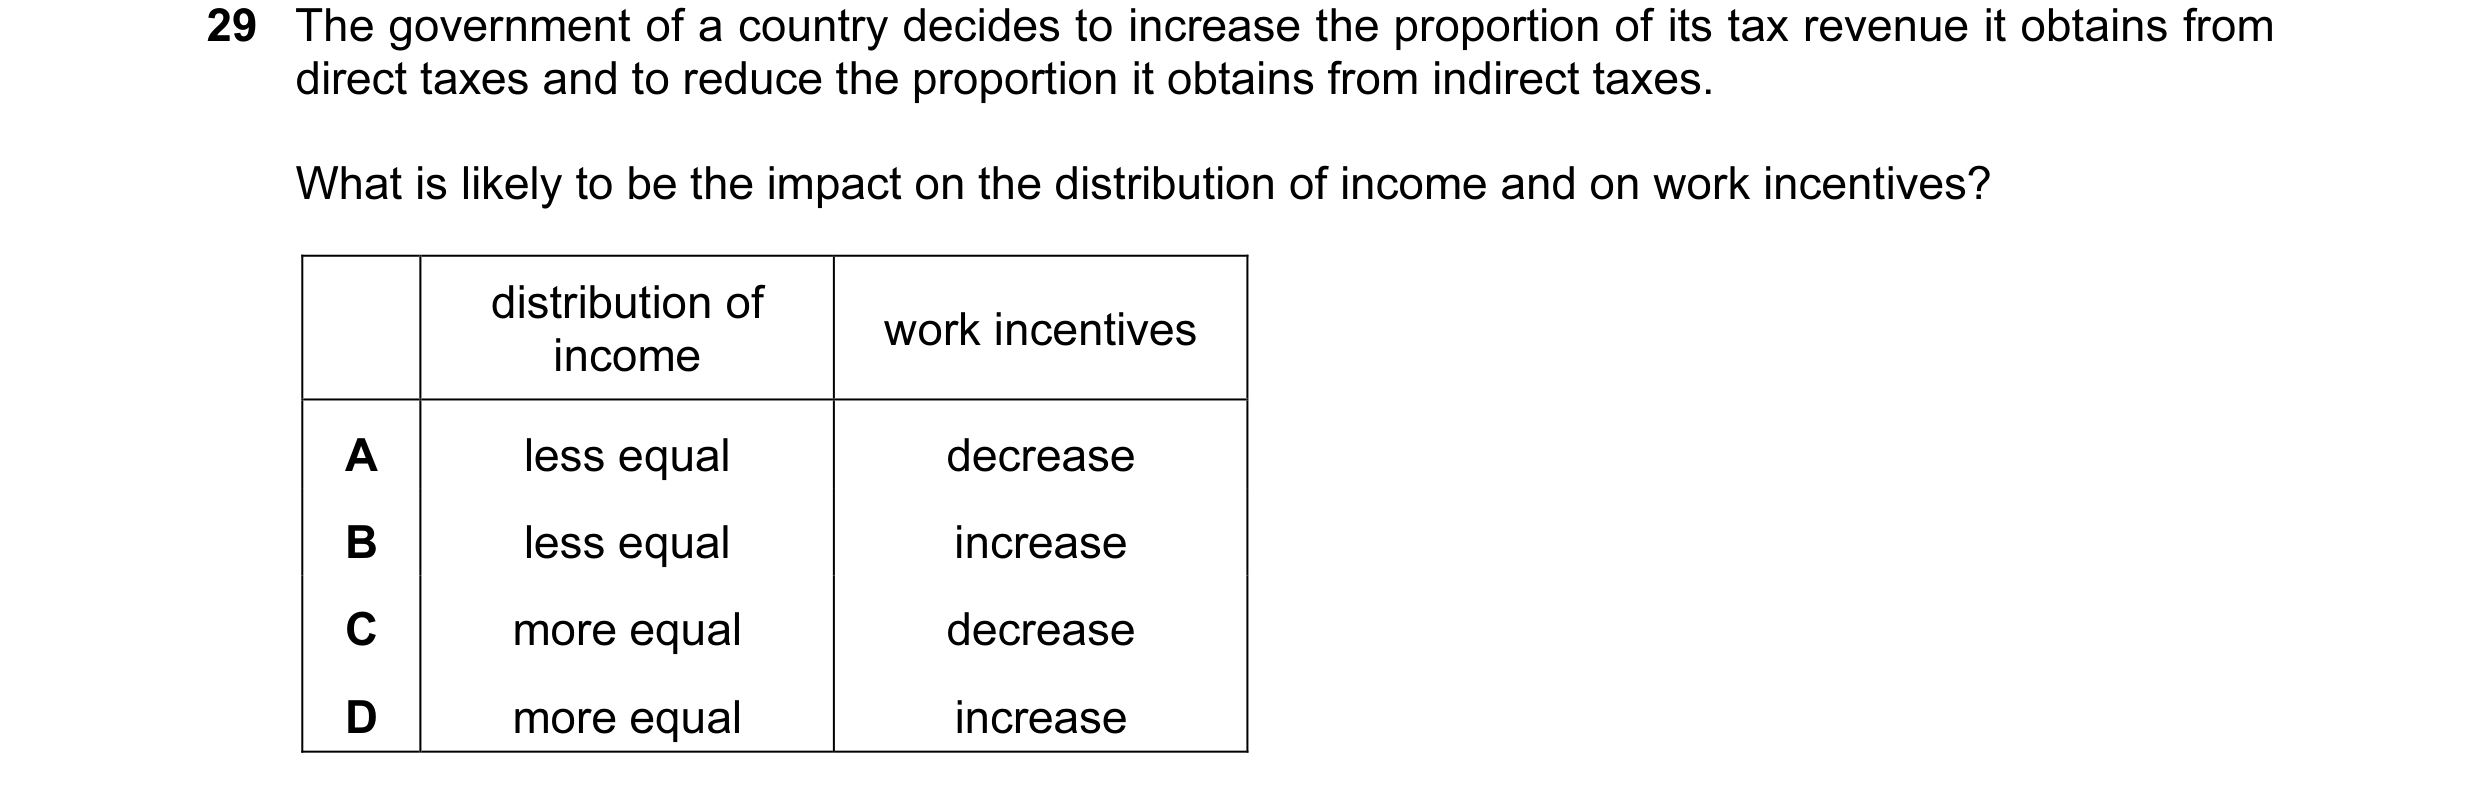
Q2 · The government of a country decides to increase the proportion of its tax revenue it… 9708/31 Oct/Nov 2010
29 The government of a country decides to increase the proportion of its tax revenue it obtains from direct taxes and to reduce the proportion it obtains from indirect taxes. What is likely to be the impact on the distribution of income and on work incentives? distribution of work incentives income A less equal decrease B less equal increase C more equal decrease D more equal increase
1 marks
Answer: C
This question in 9708/31 Oct/Nov 2010
Q3 · A tax is said to be regressive when A low income earners pay a higher proportion of their… 9708/32 Oct/Nov 2010
13 A tax is said to be regressive when A low income earners pay a higher proportion of their income in tax than high income earners. B marginal tax rates exceed average tax rates. C the cost of collecting the tax exceeds the revenue raised. D the marginal rate of tax is higher for high income earners than low income earners.
1 marks
Answer: A
This question in 9708/32 Oct/Nov 2010
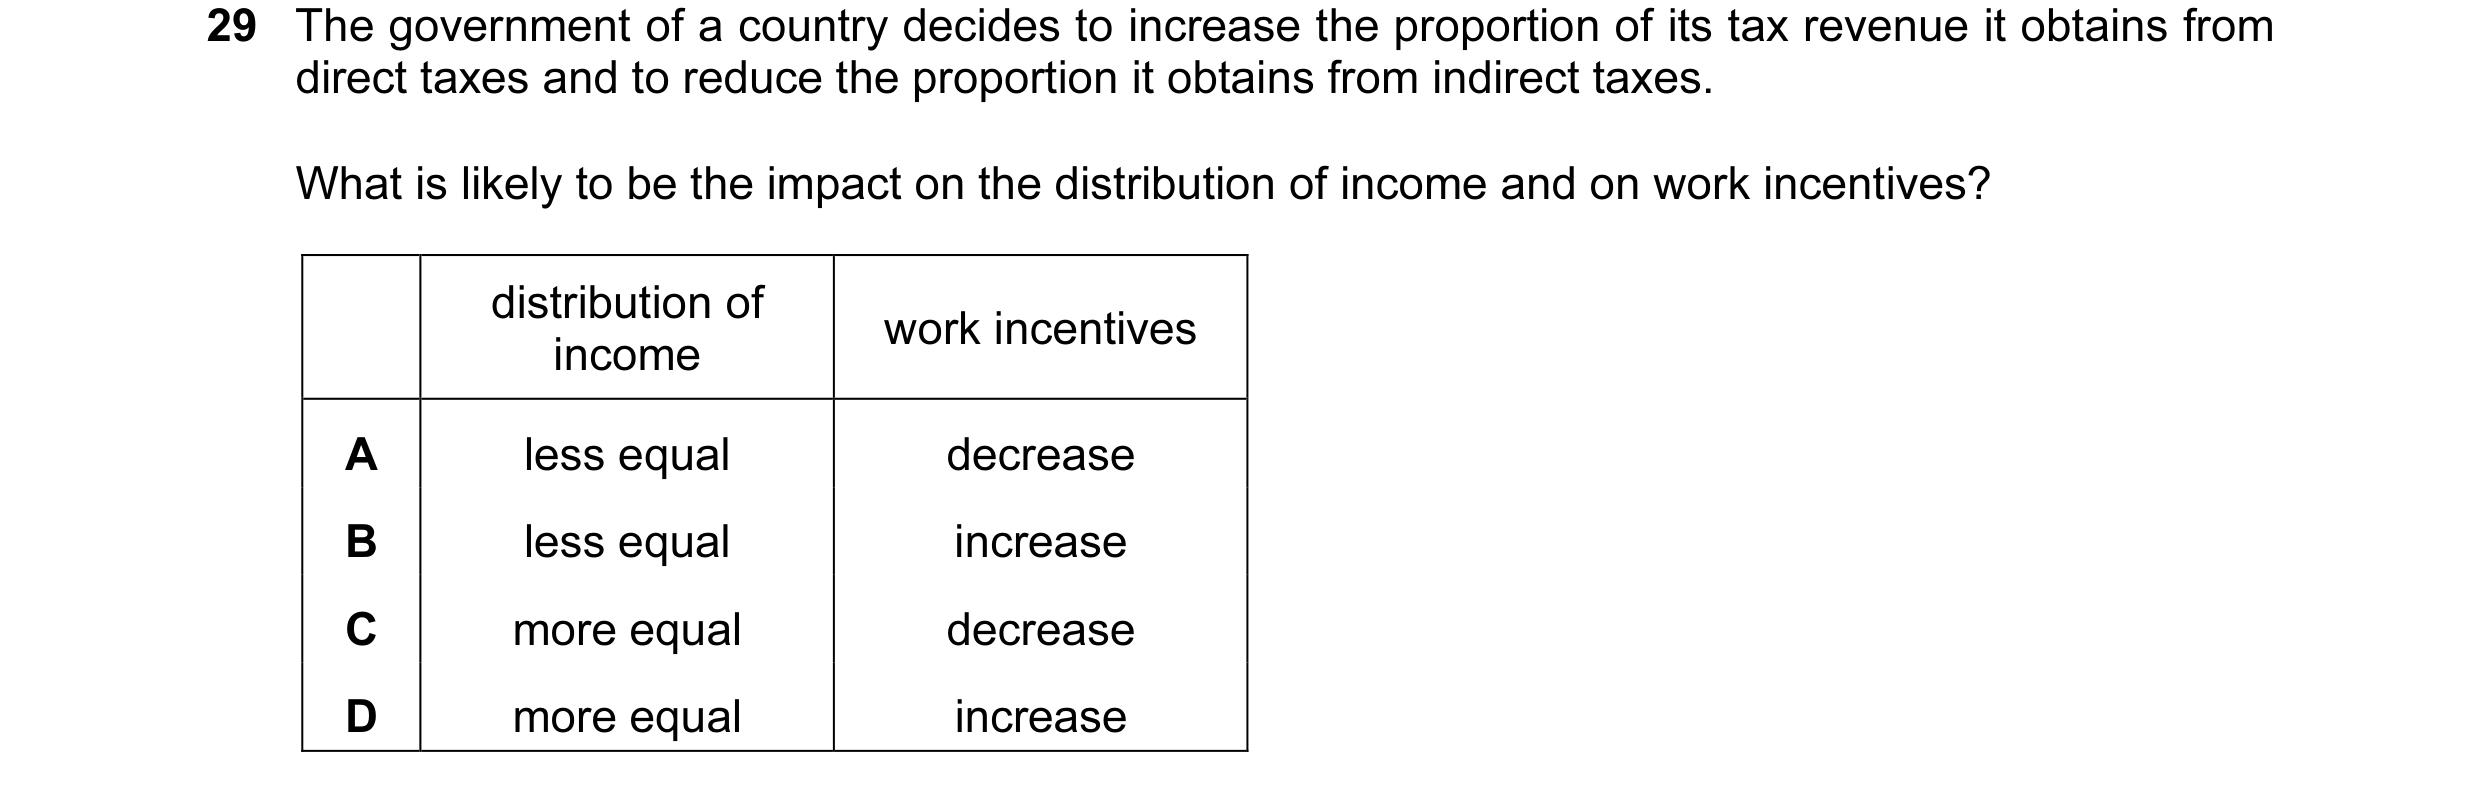
Q4 · The government of a country decides to increase the proportion of its tax revenue it… 9708/32 Oct/Nov 2010
29 The government of a country decides to increase the proportion of its tax revenue it obtains from direct taxes and to reduce the proportion it obtains from indirect taxes. What is likely to be the impact on the distribution of income and on work incentives? distribution of work incentives income A less equal decrease B less equal increase C more equal decrease D more equal increase
1 marks
Answer: C
This question in 9708/32 Oct/Nov 2010
Q5 · A tax is said to be regressive when A low income earners pay a higher proportion of their… 9708/33 Oct/Nov 2010
12 A tax is said to be regressive when A low income earners pay a higher proportion of their income in tax than high income earners. B marginal tax rates exceed average tax rates. C the cost of collecting the tax exceeds the revenue raised. D the marginal rate of tax is higher for high income earners than low income earners.
1 marks
Answer: A
This question in 9708/33 Oct/Nov 2010
Q6 · The government of a country decides to increase the proportion of its tax revenue it… 9708/33 Oct/Nov 2010
28 The government of a country decides to increase the proportion of its tax revenue it obtains from direct taxes and to reduce the proportion it obtains from indirect taxes. What is likely to be the impact on the distribution of income and on work incentives? distribution of work incentives income A less equal decrease B less equal increase C more equal decrease D more equal increase
1 marks
Answer: C
This question in 9708/33 Oct/Nov 2010
Q7 · Which tax is most likely to be regressive? 9708/31 May/June 2011
26 Which tax is most likely to be regressive? A an inheritance tax B a property tax C a sales tax D income tax
1 marks
Answer: C
This question in 9708/31 May/June 2011
Q8 · Which tax is most likely to be regressive? 9708/32 May/June 2011
25 Which tax is most likely to be regressive? A an inheritance tax B a property tax C a sales tax D income tax
1 marks
Answer: C
This question in 9708/32 May/June 2011
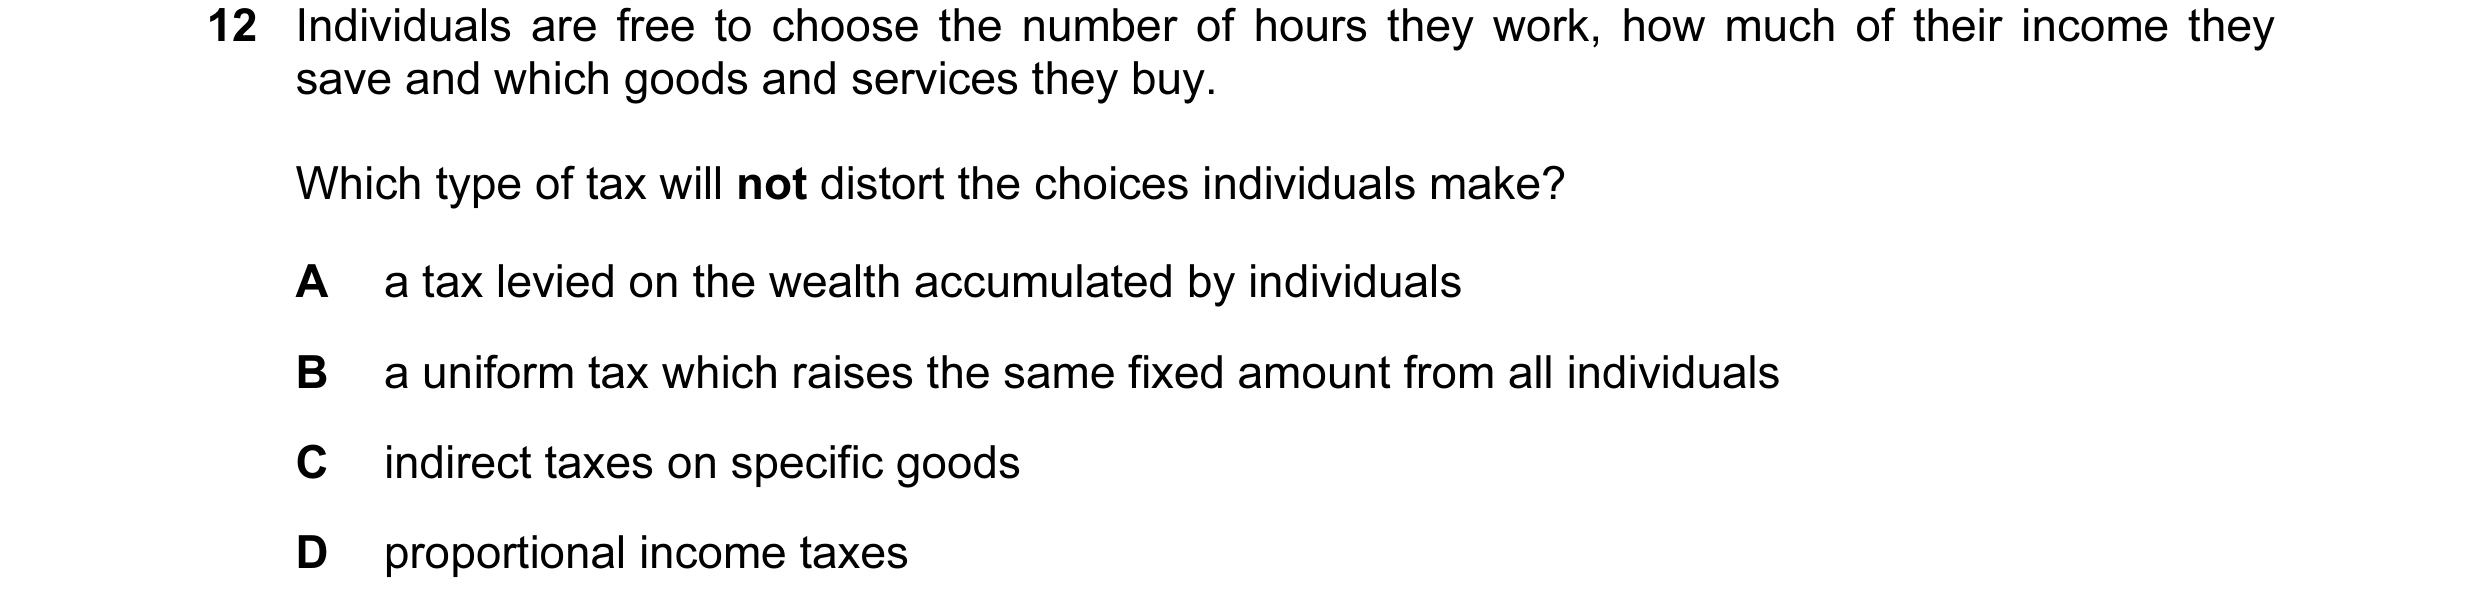
Q9 · Individuals are free to choose the number of hours they work, how much of their income… 9708/33 May/June 2011
12 Individuals are free to choose the number of hours they work, how much of their income they save and which goods and services they buy. Which type of tax will not distort the choices individuals make? A a tax levied on the wealth accumulated by individuals B a uniform tax which raises the same fixed amount from all individuals C indirect taxes on specific goods D proportional income taxes
1 marks
Answer: B
This question in 9708/33 May/June 2011
Q10 · Which tax is most likely to be regressive? 9708/33 May/June 2011
25 Which tax is most likely to be regressive? A an inheritance tax B a property tax C a sales tax D income tax
1 marks
Answer: C
This question in 9708/33 May/June 2011
Q11 · The diagram illustrates the working of a negative income tax system (NIT), where… 9708/31 Oct/Nov 2011
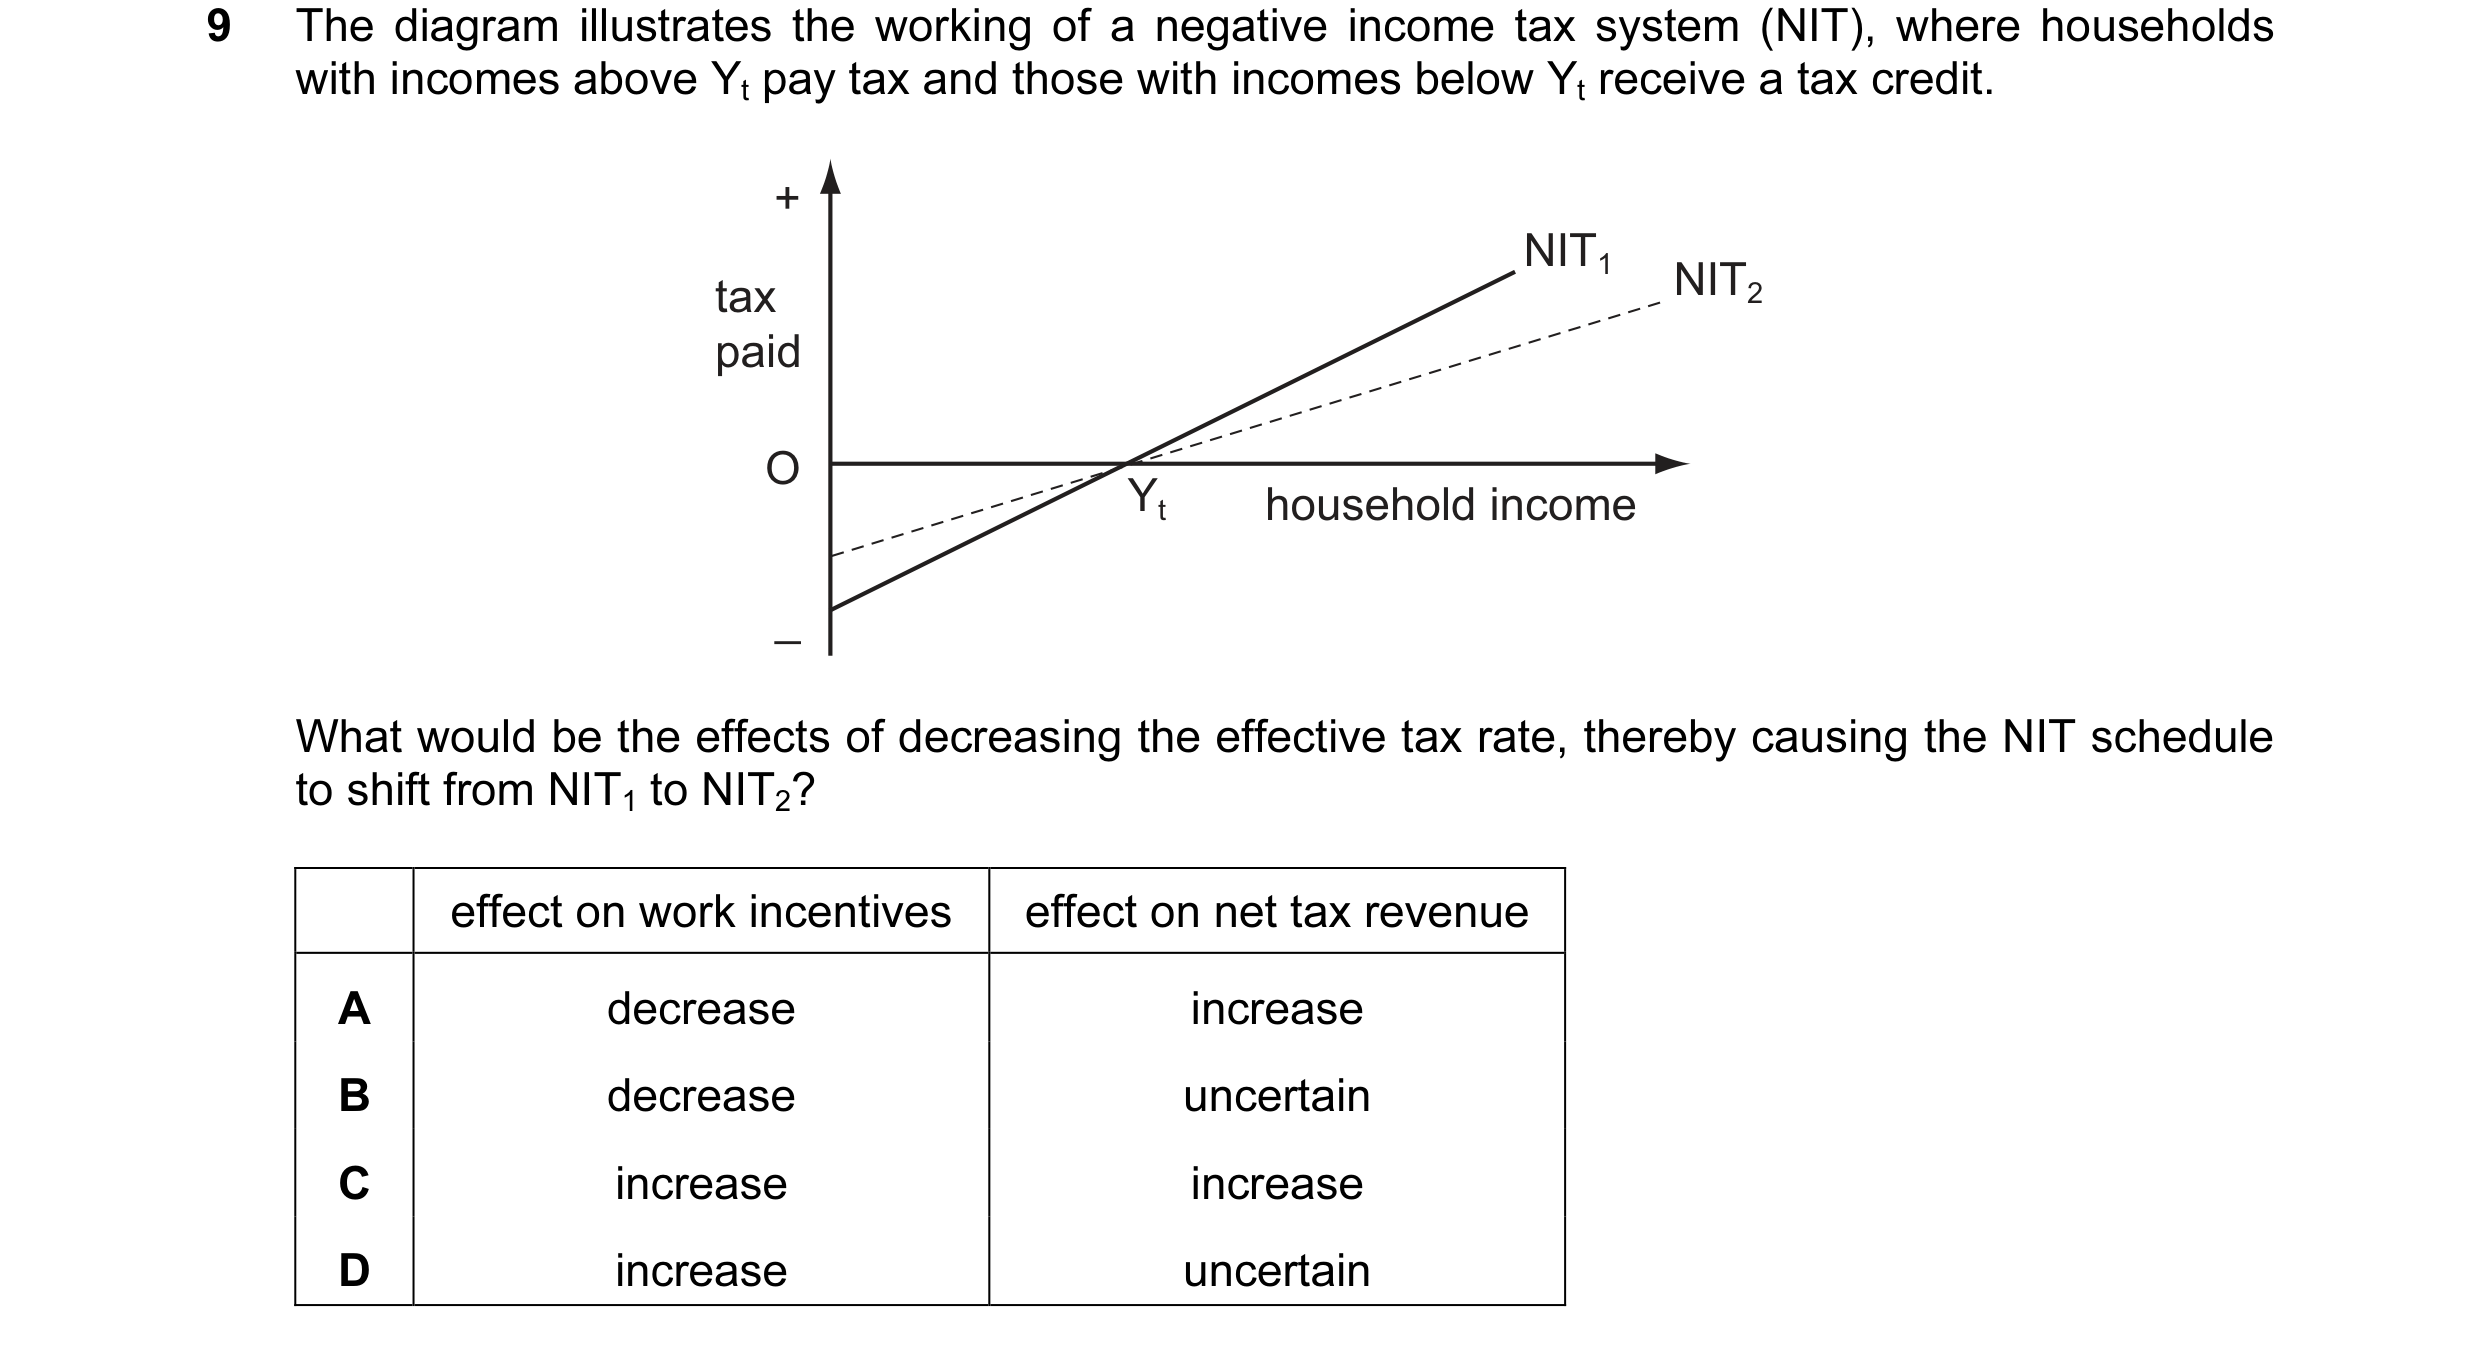
10 The diagram illustrates the working of a negative income tax system (NIT), where households with incomes above Yt pay tax and those with incomes below Yt receive a tax credit. + NIT1 tax NIT2 paid O Yt household income _ What would be the effects of decreasing the effective tax rate, thereby causing the NIT schedule to shift from NIT1 to NIT2? effect on work incentives effect on net tax revenue A decrease increase B decrease uncertain C increase increase D increase uncertain
1 marks
Answer: D
This question in 9708/31 Oct/Nov 2011
Q12 · Which commodities should a government tax if it wishes to make the tax system more… 9708/31 Oct/Nov 2011
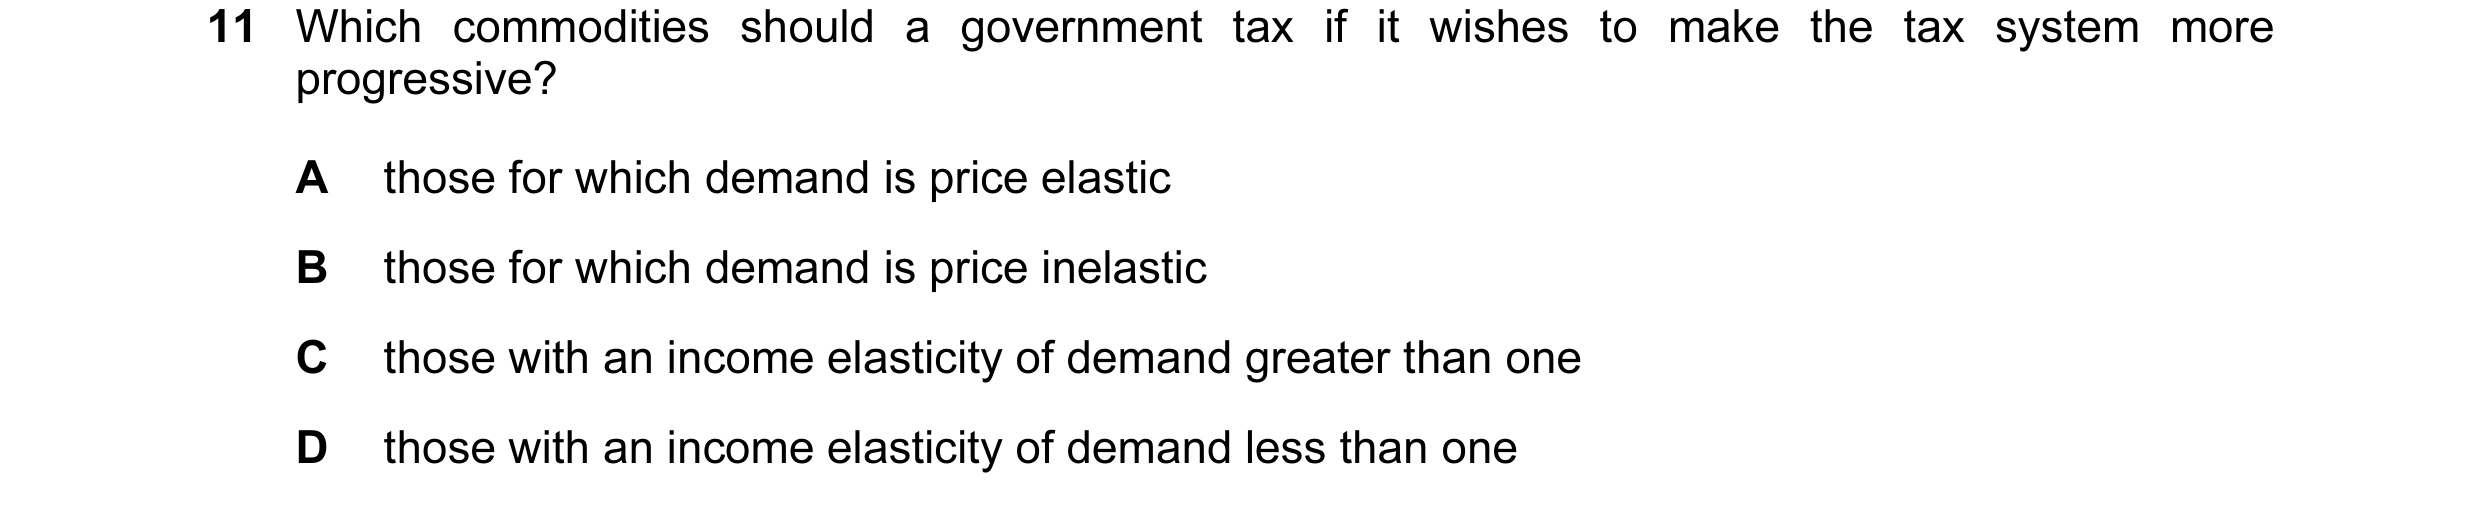
11 Which commodities should a government tax if it wishes to make the tax system more progressive? A those for which demand is price elastic B those for which demand is price inelastic C those with an income elasticity of demand greater than one D those with an income elasticity of demand less than one
1 marks
Answer: C
This question in 9708/31 Oct/Nov 2011
Q13 · A regressive tax is defined as one where A all taxpayers pay the same absolute amount of… 9708/31 Oct/Nov 2011
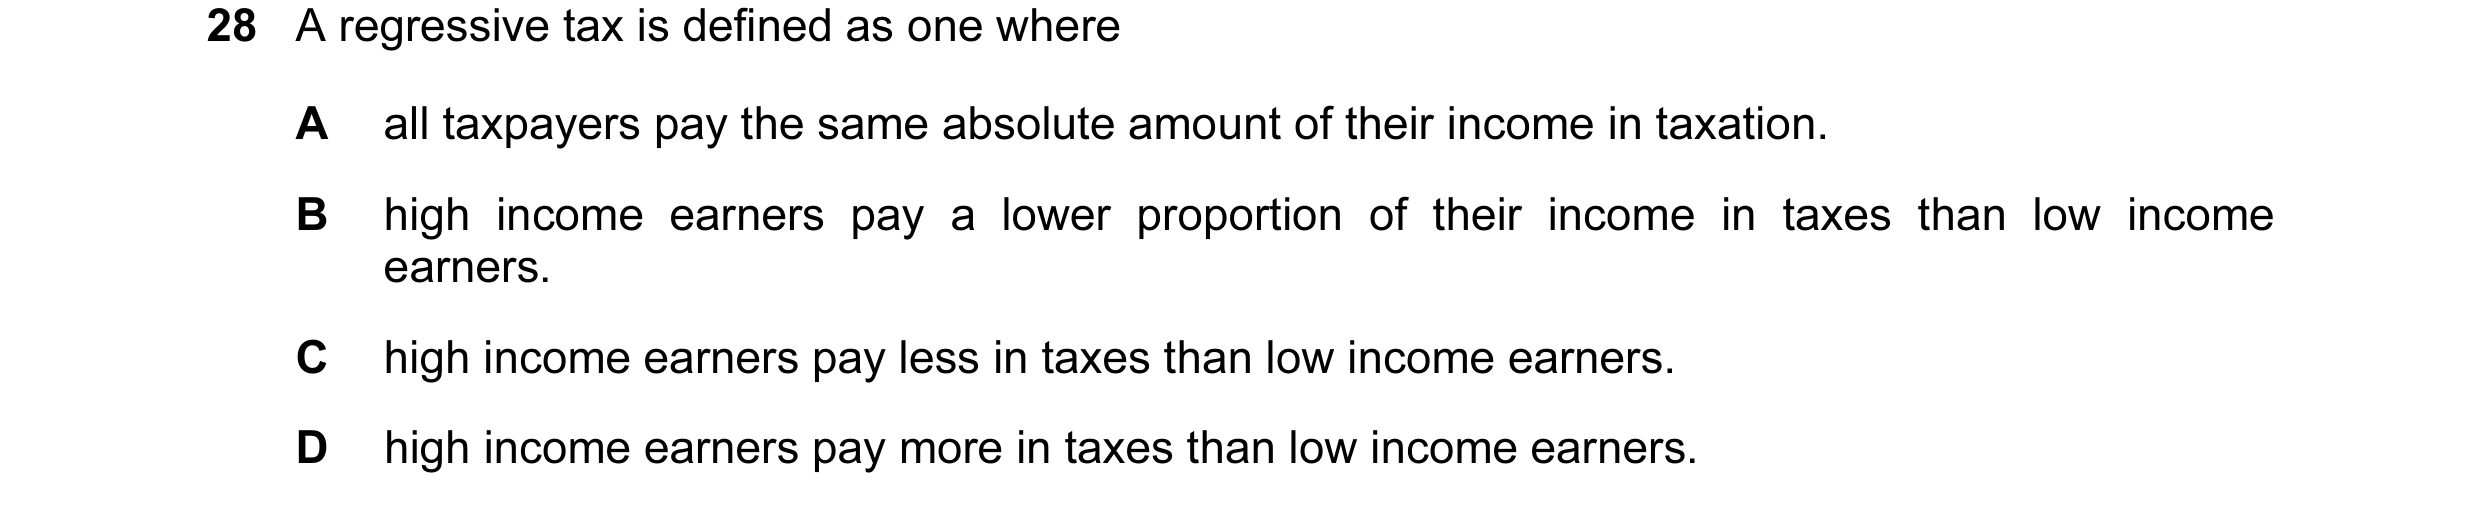
28 A regressive tax is defined as one where A all taxpayers pay the same absolute amount of their income in taxation. B high income earners pay a lower proportion of their income in taxes than low income earners. C high income earners pay less in taxes than low income earners. D high income earners pay more in taxes than low income earners.
1 marks
Answer: B
This question in 9708/31 Oct/Nov 2011
Q14 · The government of a country decides to increase the proportion of its tax revenue that it… 9708/32 Oct/Nov 2011
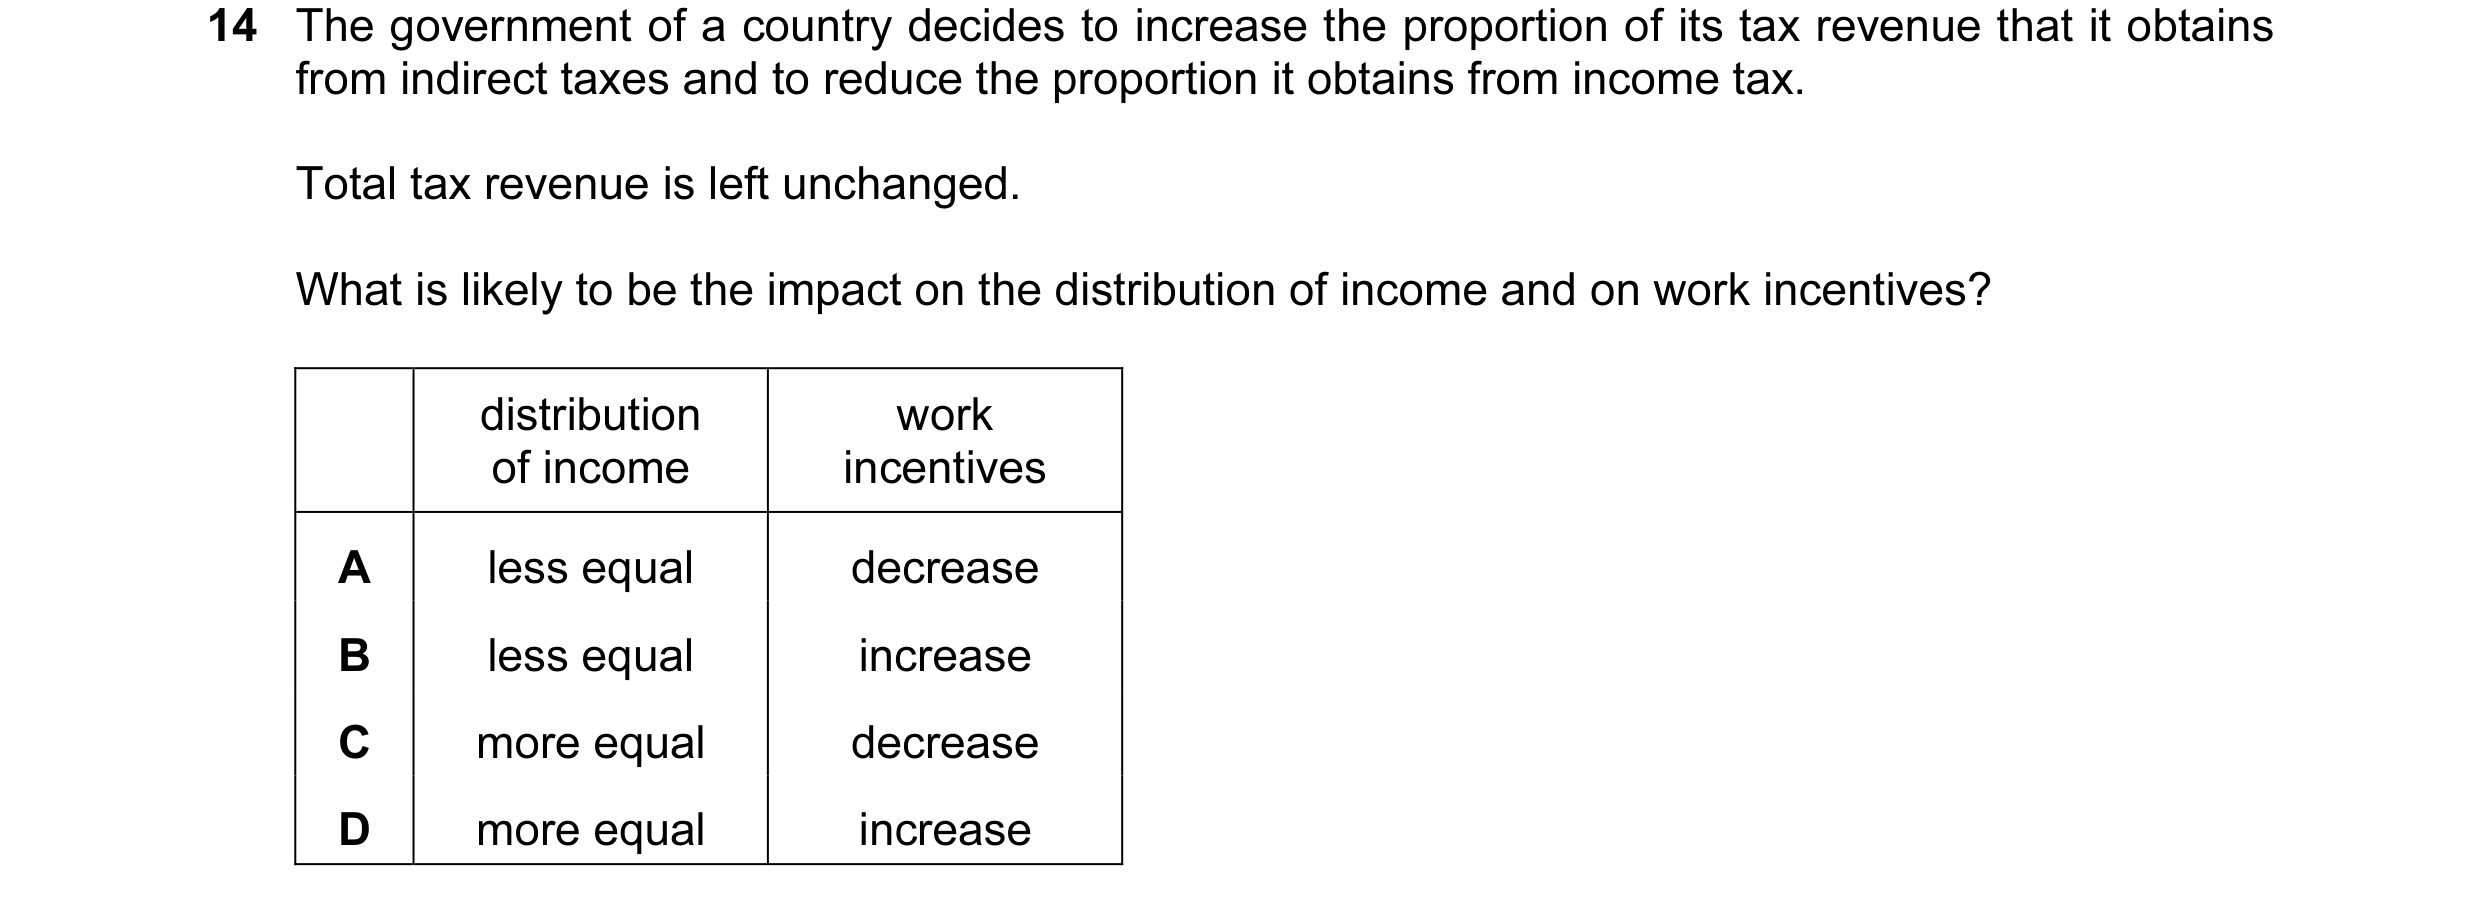
14 The government of a country decides to increase the proportion of its tax revenue that it obtains from indirect taxes and to reduce the proportion it obtains from income tax. Total tax revenue is left unchanged. What is likely to be the impact on the distribution of income and on work incentives? distribution work of income incentives A less equal decrease B less equal increase C more equal decrease D more equal increase
1 marks
Answer: B
This question in 9708/32 Oct/Nov 2011
Q15 · Assuming no change in tax rates or tax-free allowances, for which tax would the amount… 9708/32 Oct/Nov 2011
29 Assuming no change in tax rates or tax-free allowances, for which tax would the amount paid in tax become a smaller proportion of taxpayers’ income during a period of wage and price inflation? A a progressive income tax B a specific tax on tobacco C capital gains tax D value added tax
1 marks
Answer: B
This question in 9708/32 Oct/Nov 2011
Q16 · The diagram illustrates the working of a negative income tax system (NIT), where… 9708/33 Oct/Nov 2011
9 The diagram illustrates the working of a negative income tax system (NIT), where households with incomes above Yt pay tax and those with incomes below Yt receive a tax credit. + NIT1 tax NIT2 paid O Yt household income _ What would be the effects of decreasing the effective tax rate, thereby causing the NIT schedule to shift from NIT1 to NIT2? effect on work incentives effect on net tax revenue A decrease increase B decrease uncertain C increase increase D increase uncertain
1 marks
Answer: D
This question in 9708/33 Oct/Nov 2011
Q17 · What is most likely to be regressive? 9708/32 Oct/Nov 2012
15 What is most likely to be regressive? A corporate profit taxes B state pension benefits C specific tax on cigarettes D unemployment benefits
1 marks
Answer: C
This question in 9708/32 Oct/Nov 2012
Q18 · Why is it more effective to increase regressive taxes rather than progressive taxes when… 9708/32 Oct/Nov 2012
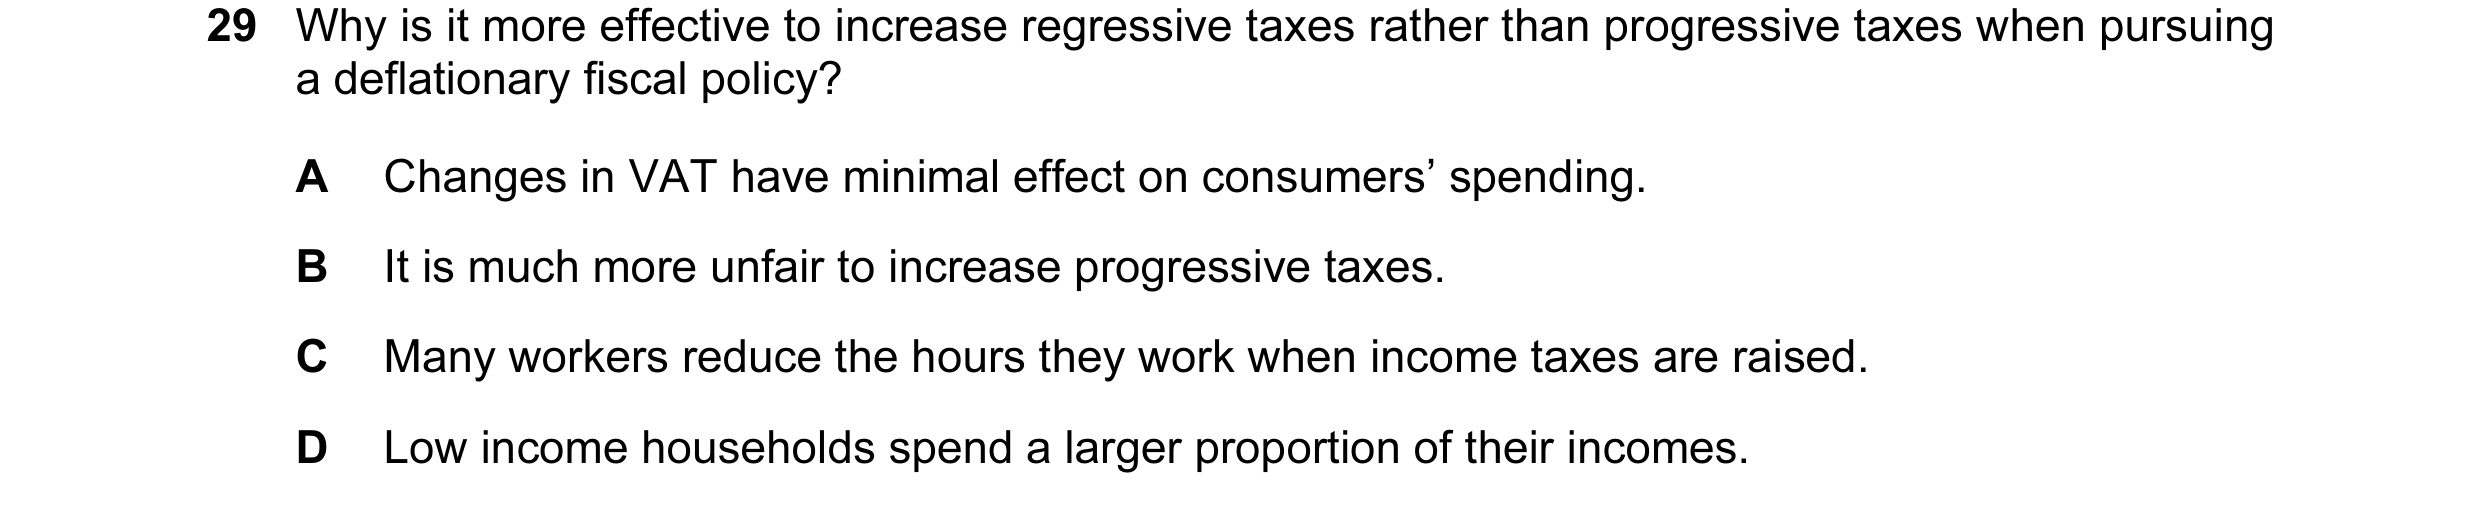
29 Why is it more effective to increase regressive taxes rather than progressive taxes when pursuing a deflationary fiscal policy? A Changes in VAT have minimal effect on consumers’ spending. B It is much more unfair to increase progressive taxes. C Many workers reduce the hours they work when income taxes are raised. D Low income households spend a larger proportion of their incomes.
1 marks
Answer: D
This question in 9708/32 Oct/Nov 2012
Q19 · A country has a negative income tax 9708/31 May/June 2013
13 A country has a negative income tax. The curve NT in the diagram shows the country’s initial tax schedule. + NT1 tax NT O income – A change in the tax rate causes the schedule to shift to NT1. What is most likely to be the impact on incentives and on equity? incentives equity A improvement improvement B improvement worsening C worsening improvement D worsening worsening
1 marks
Answer: C
This question in 9708/31 May/June 2013
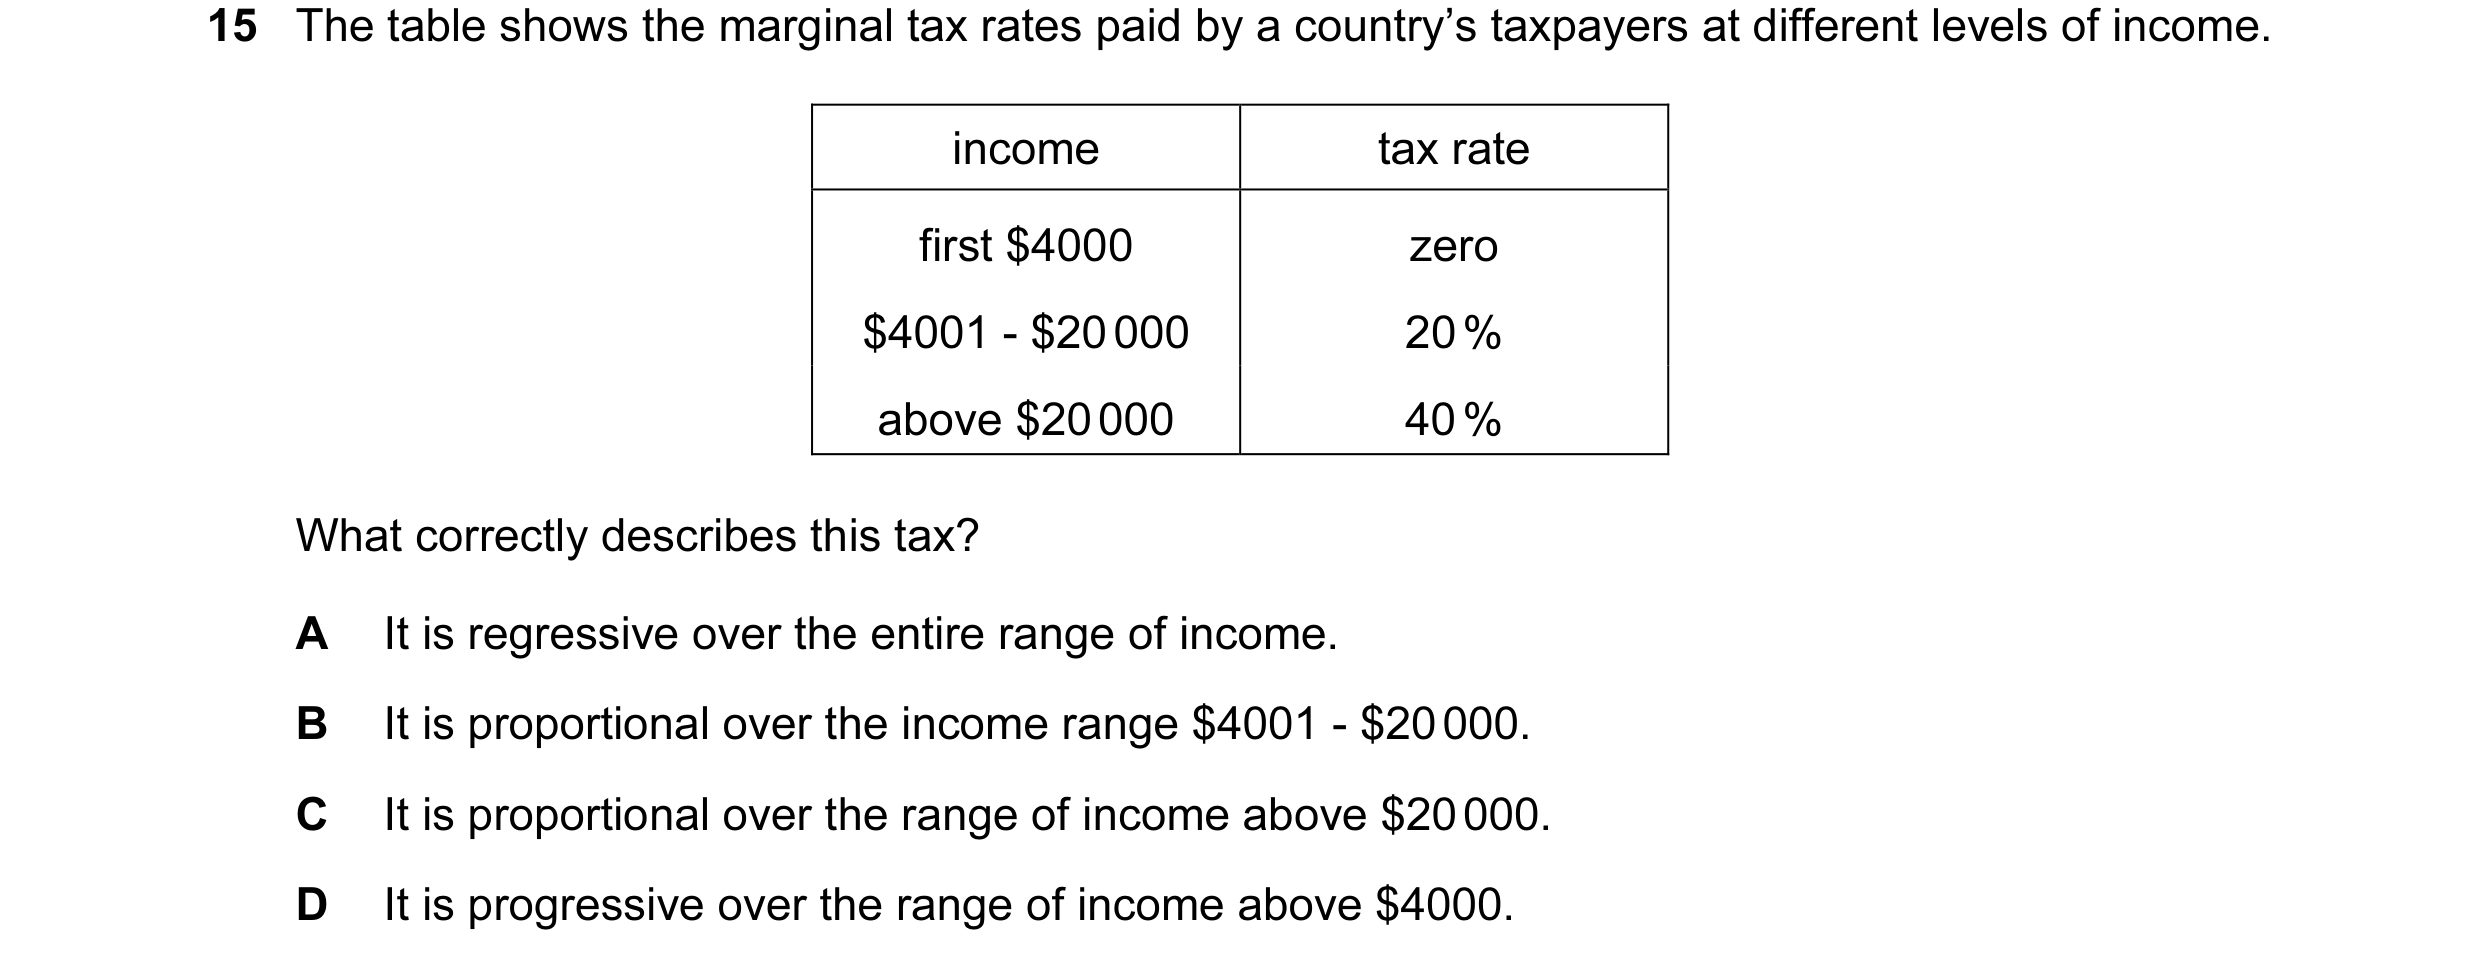
Q20 · The table shows the marginal tax rates paid by a country’s taxpayers at different levels… 9708/32 May/June 2013
15 The table shows the marginal tax rates paid by a country’s taxpayers at different levels of income. income tax rate first $4000 zero $4001 - $20 000 20 % above $20 000 40 % What correctly describes this tax? A It is regressive over the entire range of income. B It is proportional over the income range $4001 - $20 000. C It is proportional over the range of income above $20 000. D It is progressive over the range of income above $4000.
1 marks
Answer: D
This question in 9708/32 May/June 2013
Q21 · A country has a negative income tax 9708/33 May/June 2013
13 A country has a negative income tax. The curve NT in the diagram shows the country’s initial tax schedule. + NT1 tax NT O income – A change in the tax rate causes the schedule to shift to NT1. What is most likely to be the impact on incentives and on equity? incentives equity A improvement improvement B improvement worsening C worsening improvement D worsening worsening
1 marks
Answer: C
This question in 9708/33 May/June 2013
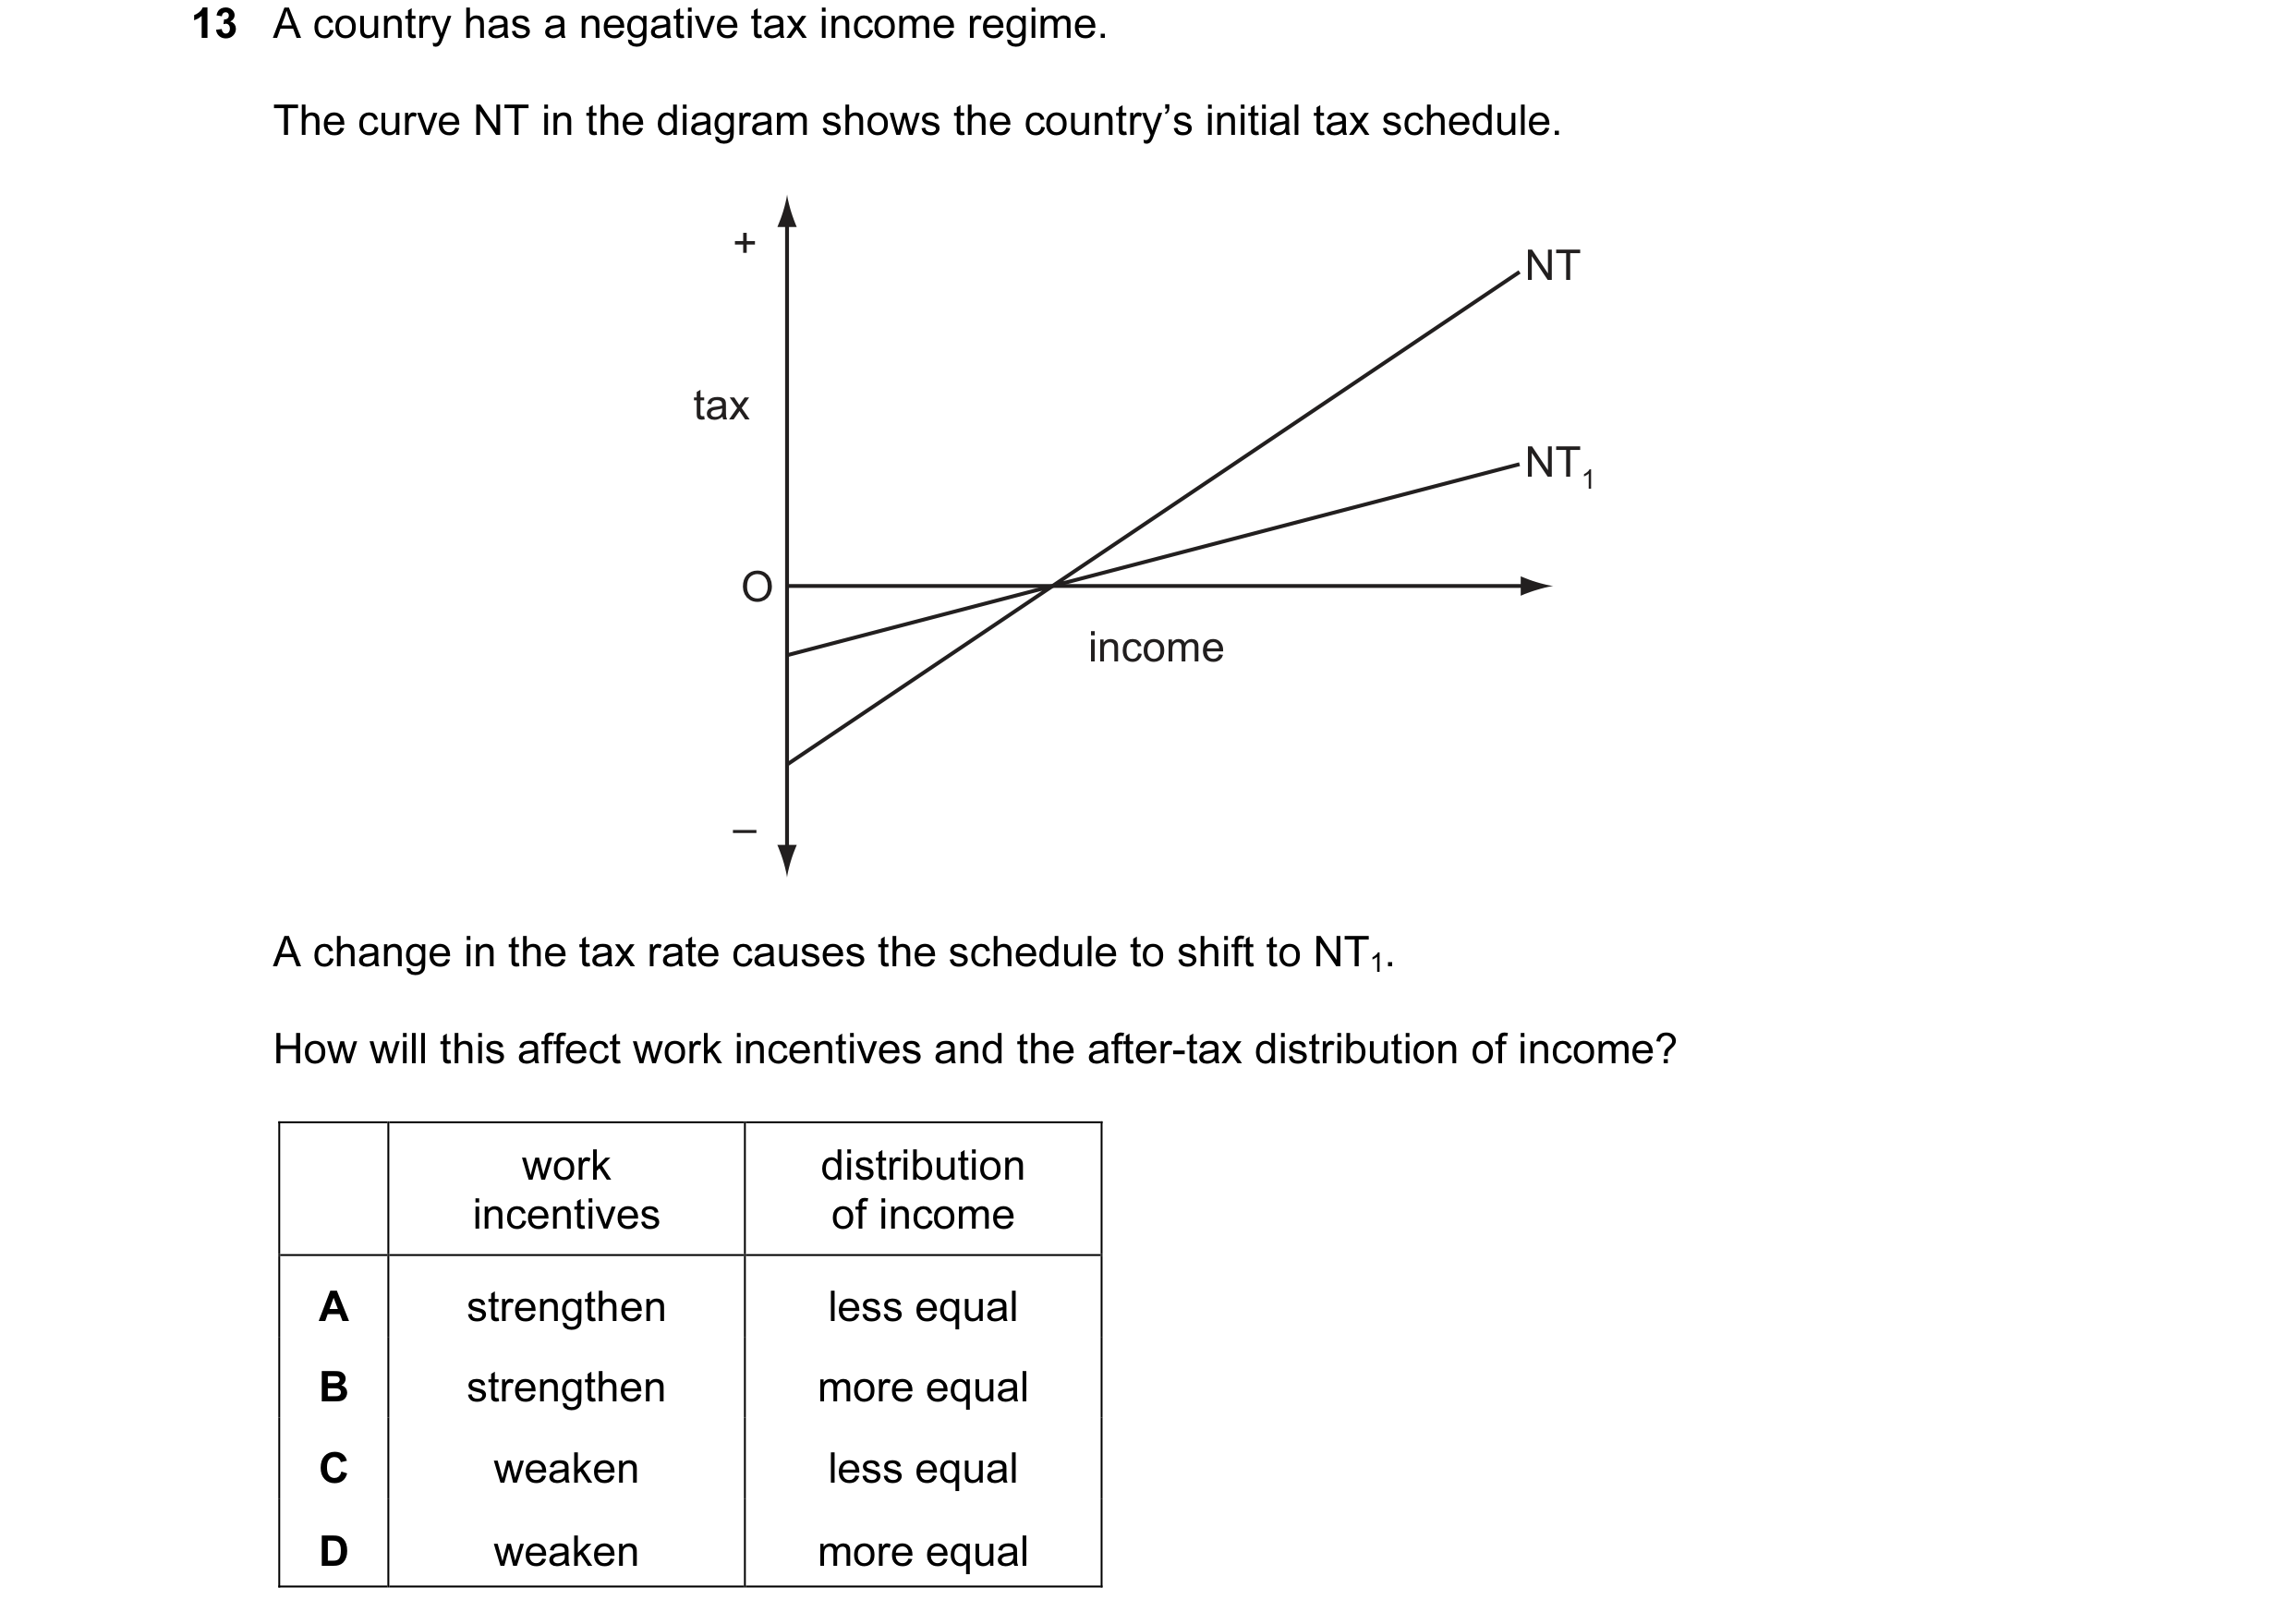
Q22 · A country has a negative tax income regime 9708/31 Oct/Nov 2013
13 A country has a negative tax income regime. The curve NT in the diagram shows the country’s initial tax schedule. + NT tax NT1 O income – A change in the tax rate causes the schedule to shift to NT1. How will this affect work incentives and the after-tax distribution of income? work distribution incentives of income A strengthen less equal B strengthen more equal C weaken less equal D weaken more equal
1 marks
Answer: A
This question in 9708/31 Oct/Nov 2013
Q23 · What are the losses in economic efficiency that are likely to result from a policy of… 9708/31 Oct/Nov 2013
15 What are the losses in economic efficiency that are likely to result from a policy of income redistribution from the rich to the poor? distortion of individual administrative costs disincentive choices between work of the redistribution effects and leisure policy A yes yes no B yes yes yes C no no no D no no yes
1 marks
Answer: B
This question in 9708/31 Oct/Nov 2013
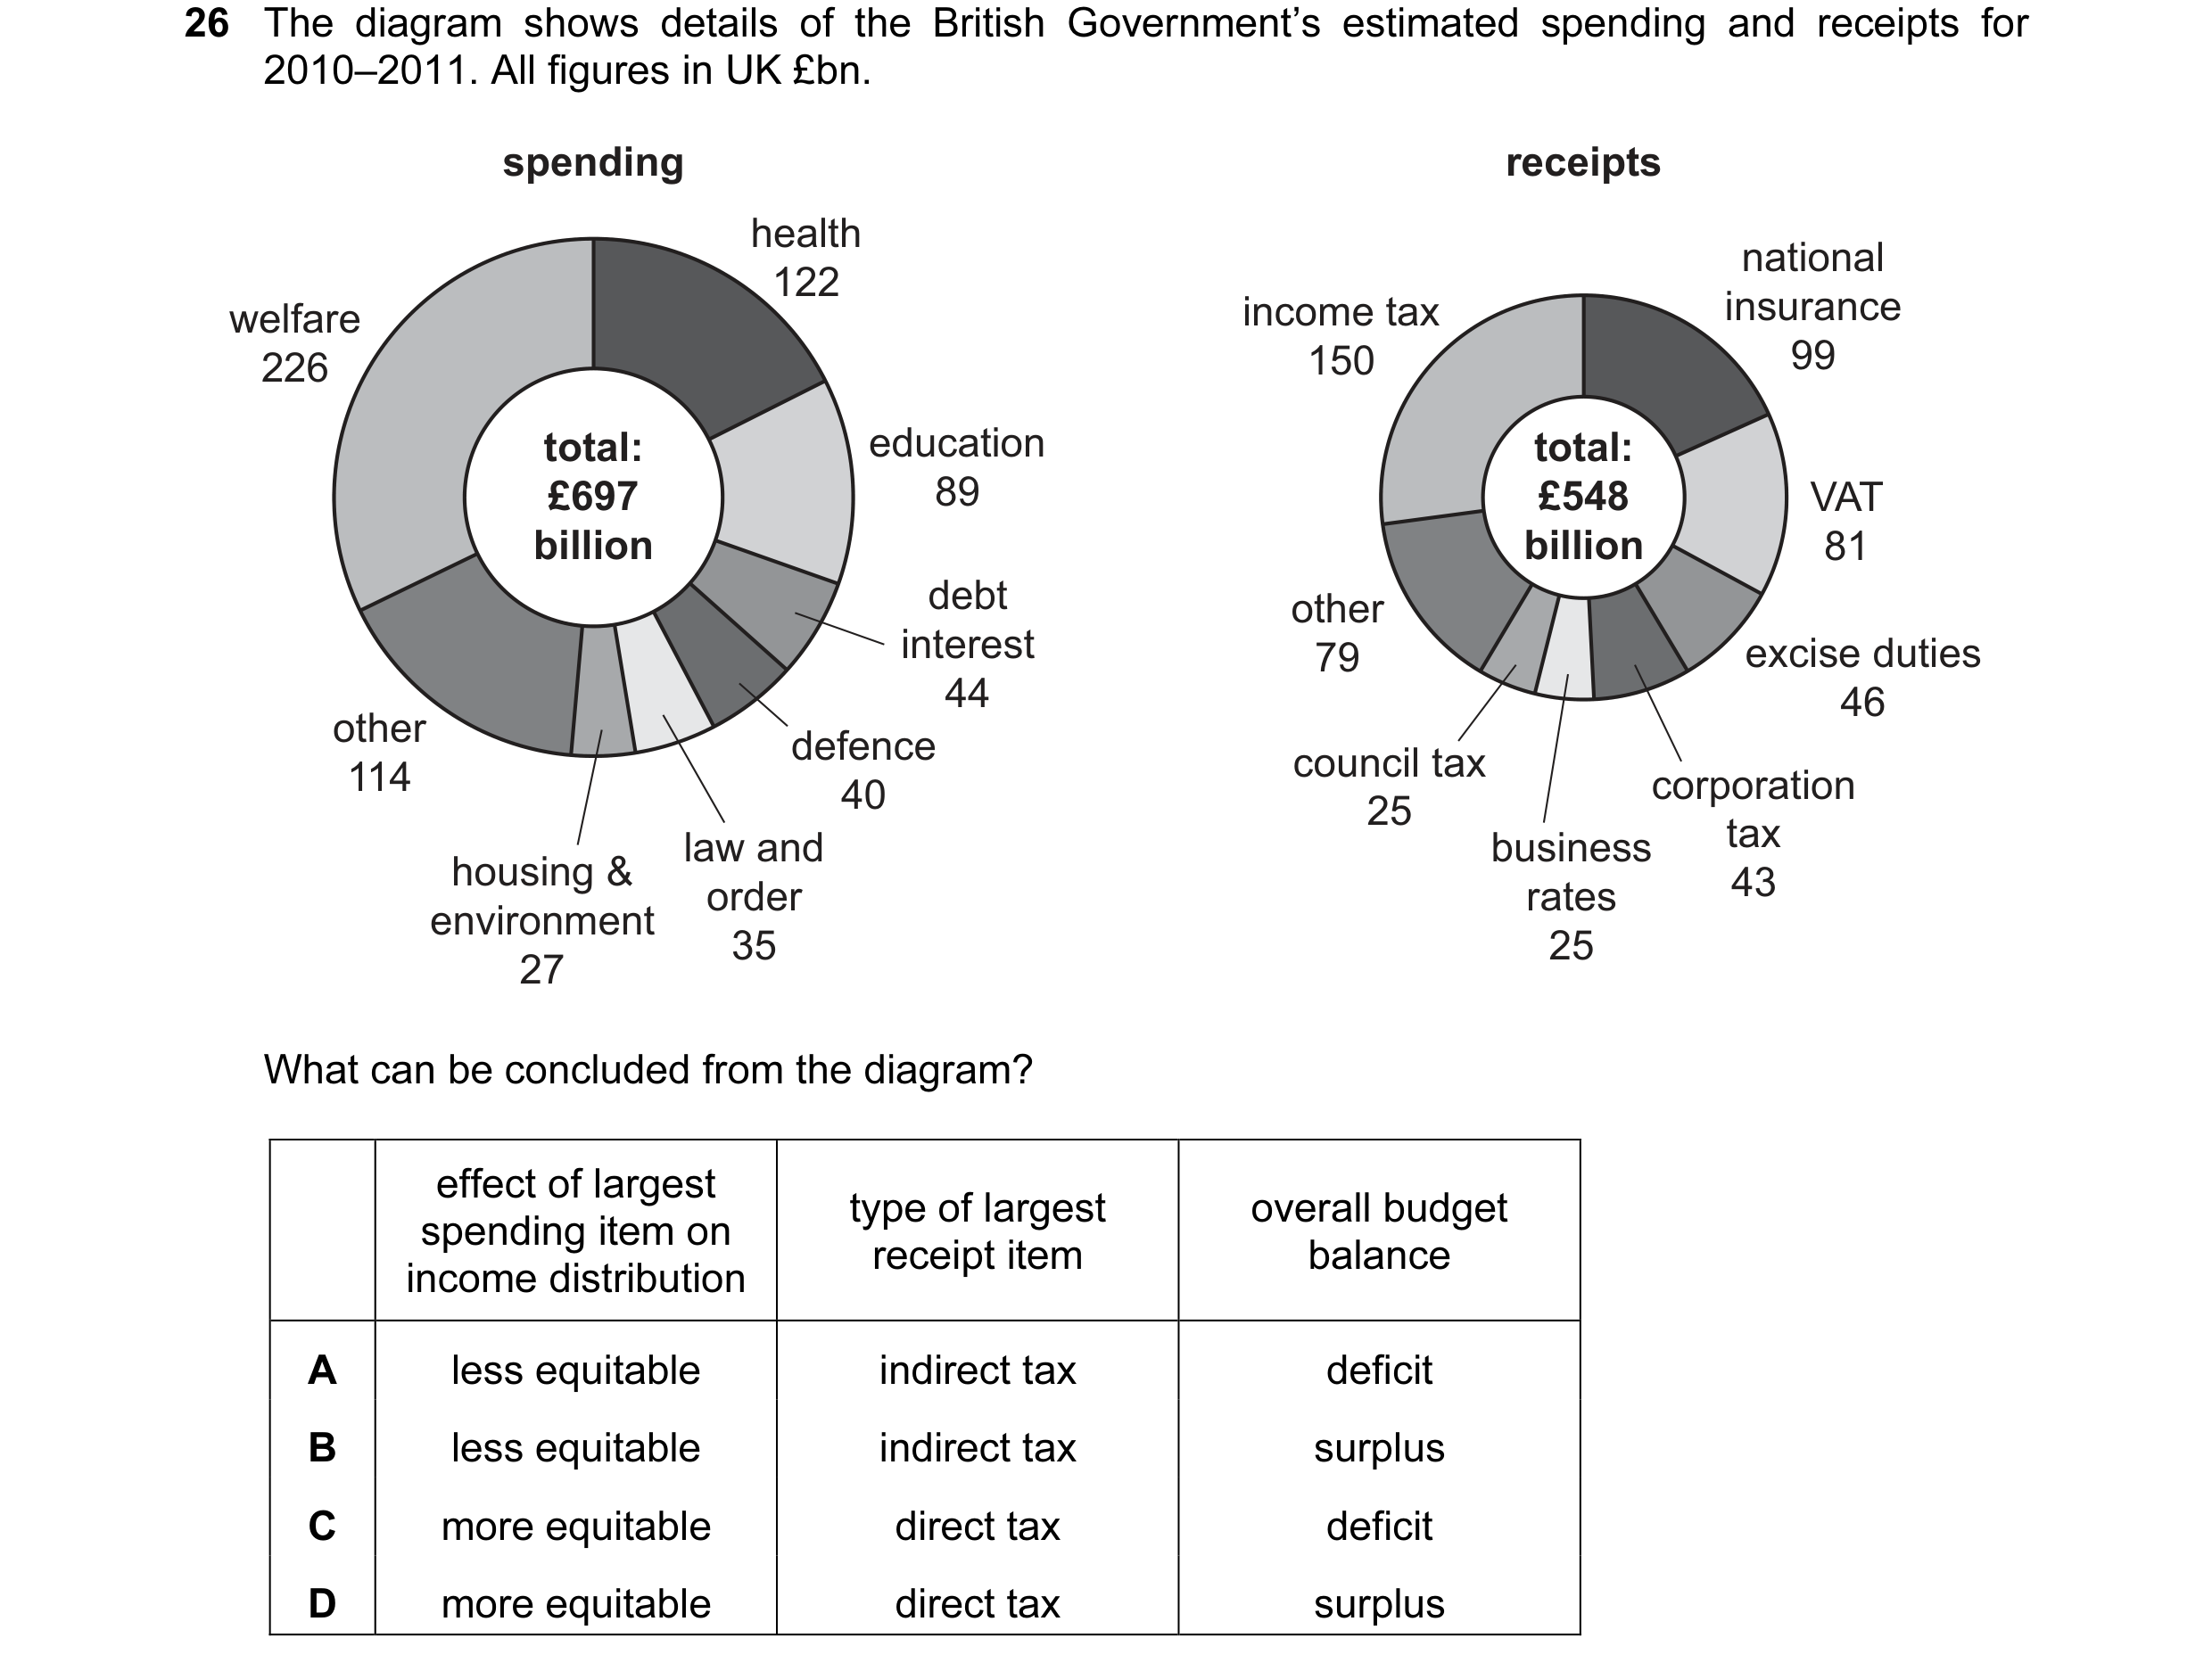
Q24 · The diagram shows details of the British Government’s estimated spending and receipts for… 9708/31 Oct/Nov 2013
26 The diagram shows details of the British Government’s estimated spending and receipts for 2010–2011. All figures in UK £bn. spending receipts health national 122 welfare income tax insurance 226 150 99 total: education total: £697 89 £548 VAT billion billion 81 debt other interest 79 excise duties 44 46 other defence 114 council tax 40 corporation 25 law and business tax housing & 43 order rates environment 35 25 27 What can be concluded from the diagram? effect of largest type of largest overall budget spending item on receipt item balance income distribution A less equitable indirect tax deficit B less equitable indirect tax surplus C more equitable direct tax deficit D more equitable direct tax surplus
1 marks
Answer: C
This question in 9708/31 Oct/Nov 2013
Q25 · A country has a negative income tax 9708/32 Oct/Nov 2013
14 A country has a negative income tax. The curve NT in the diagram shows the country’s initial tax schedule. + NT1 tax NT O income – A change in the tax rate causes the schedule to shift to NT1. How will this affect work incentives and the after-tax distribution of income? work distribution incentives of income A strengthen more equal B strengthen less equal C weaken less equal D weaken more equal
1 marks
Answer: D
This question in 9708/32 Oct/Nov 2013
Q26 · What is most likely to contribute to households finding themselves in a poverty trap? 9708/32 Oct/Nov 2013
15 What is most likely to contribute to households finding themselves in a poverty trap? A means-tested benefits B progressive taxation C regressive taxation D universal benefits
1 marks
Answer: A
This question in 9708/32 Oct/Nov 2013
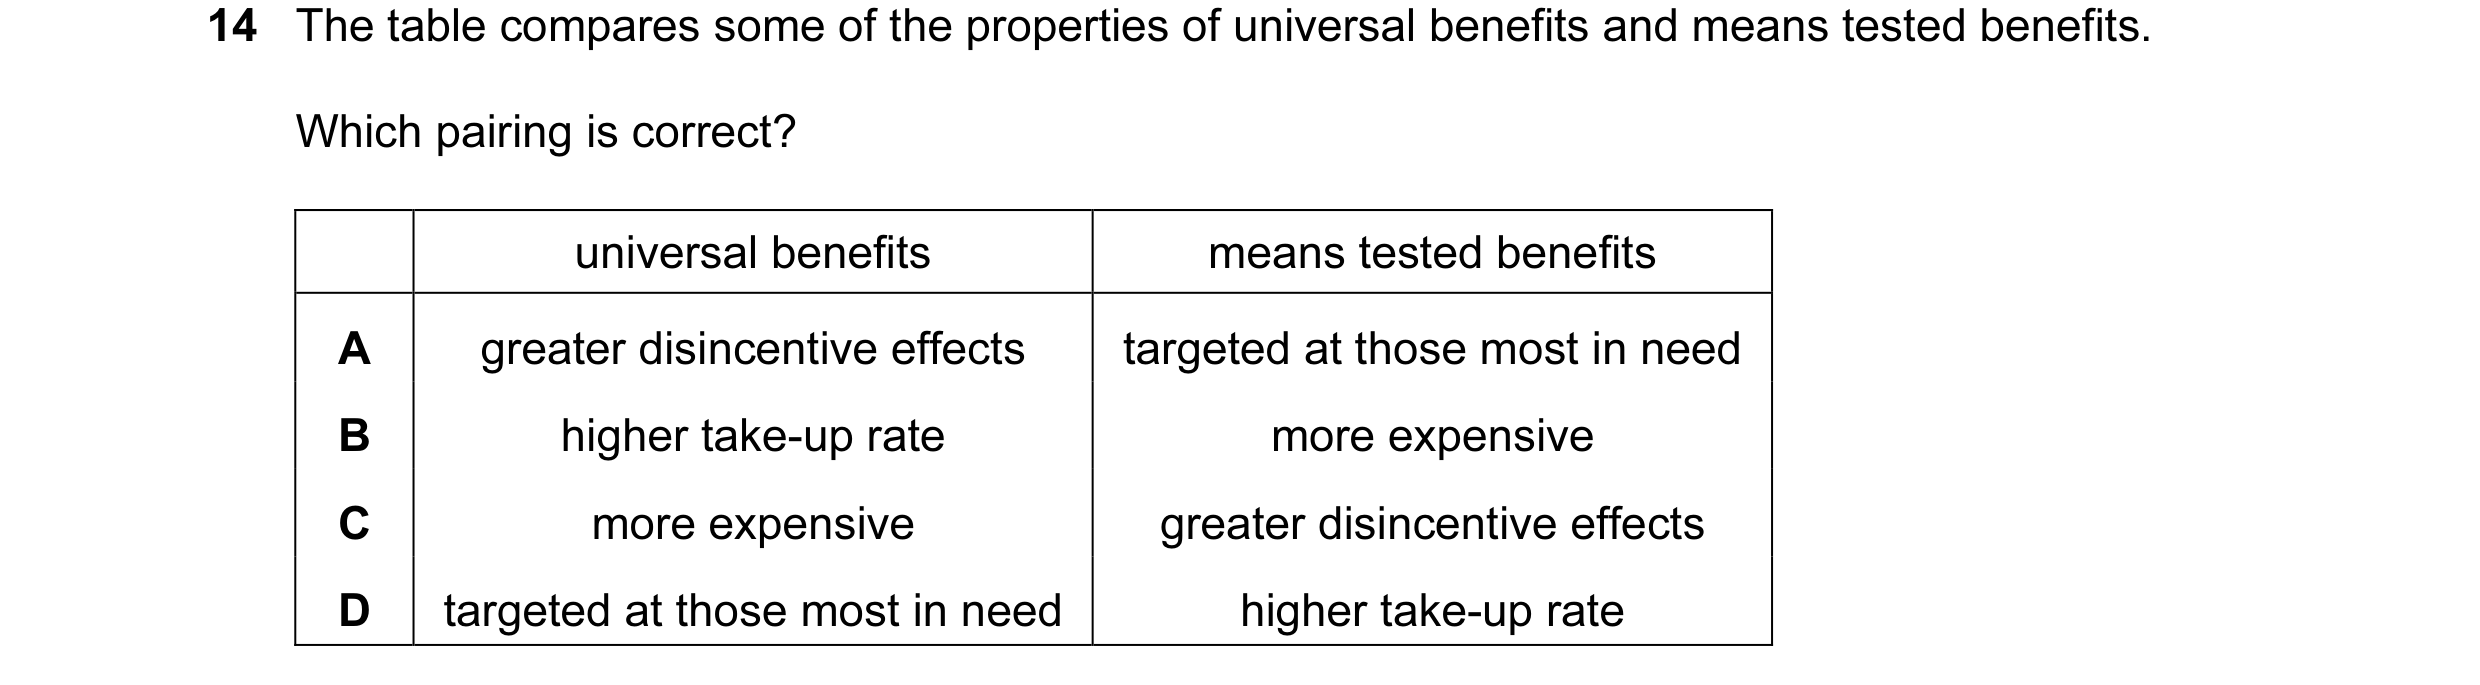
Q27 · The table compares some of the properties of universal benefits and means tested benefits 9708/33 Oct/Nov 2013
14 The table compares some of the properties of universal benefits and means tested benefits. Which pairing is correct? universal benefits means tested benefits A greater disincentive effects targeted at those most in need B higher take-up rate more expensive C more expensive greater disincentive effects D targeted at those most in need higher take-up rate
1 marks
Answer: C
This question in 9708/33 Oct/Nov 2013
Q28 · Which combination of government interventions would be intended to support the lower… 9708/31 Oct/Nov 2014
27 Which combination of government interventions would be intended to support the lower income group in an economy? welfare payment tax system type of subsidy system A means tested progressive food B means tested proportional private transport C universal proportional food D universal progressive private transport
1 marks
Answer: A
This question in 9708/31 Oct/Nov 2014
Q29 · A country has a negative income tax system 9708/33 Oct/Nov 2014
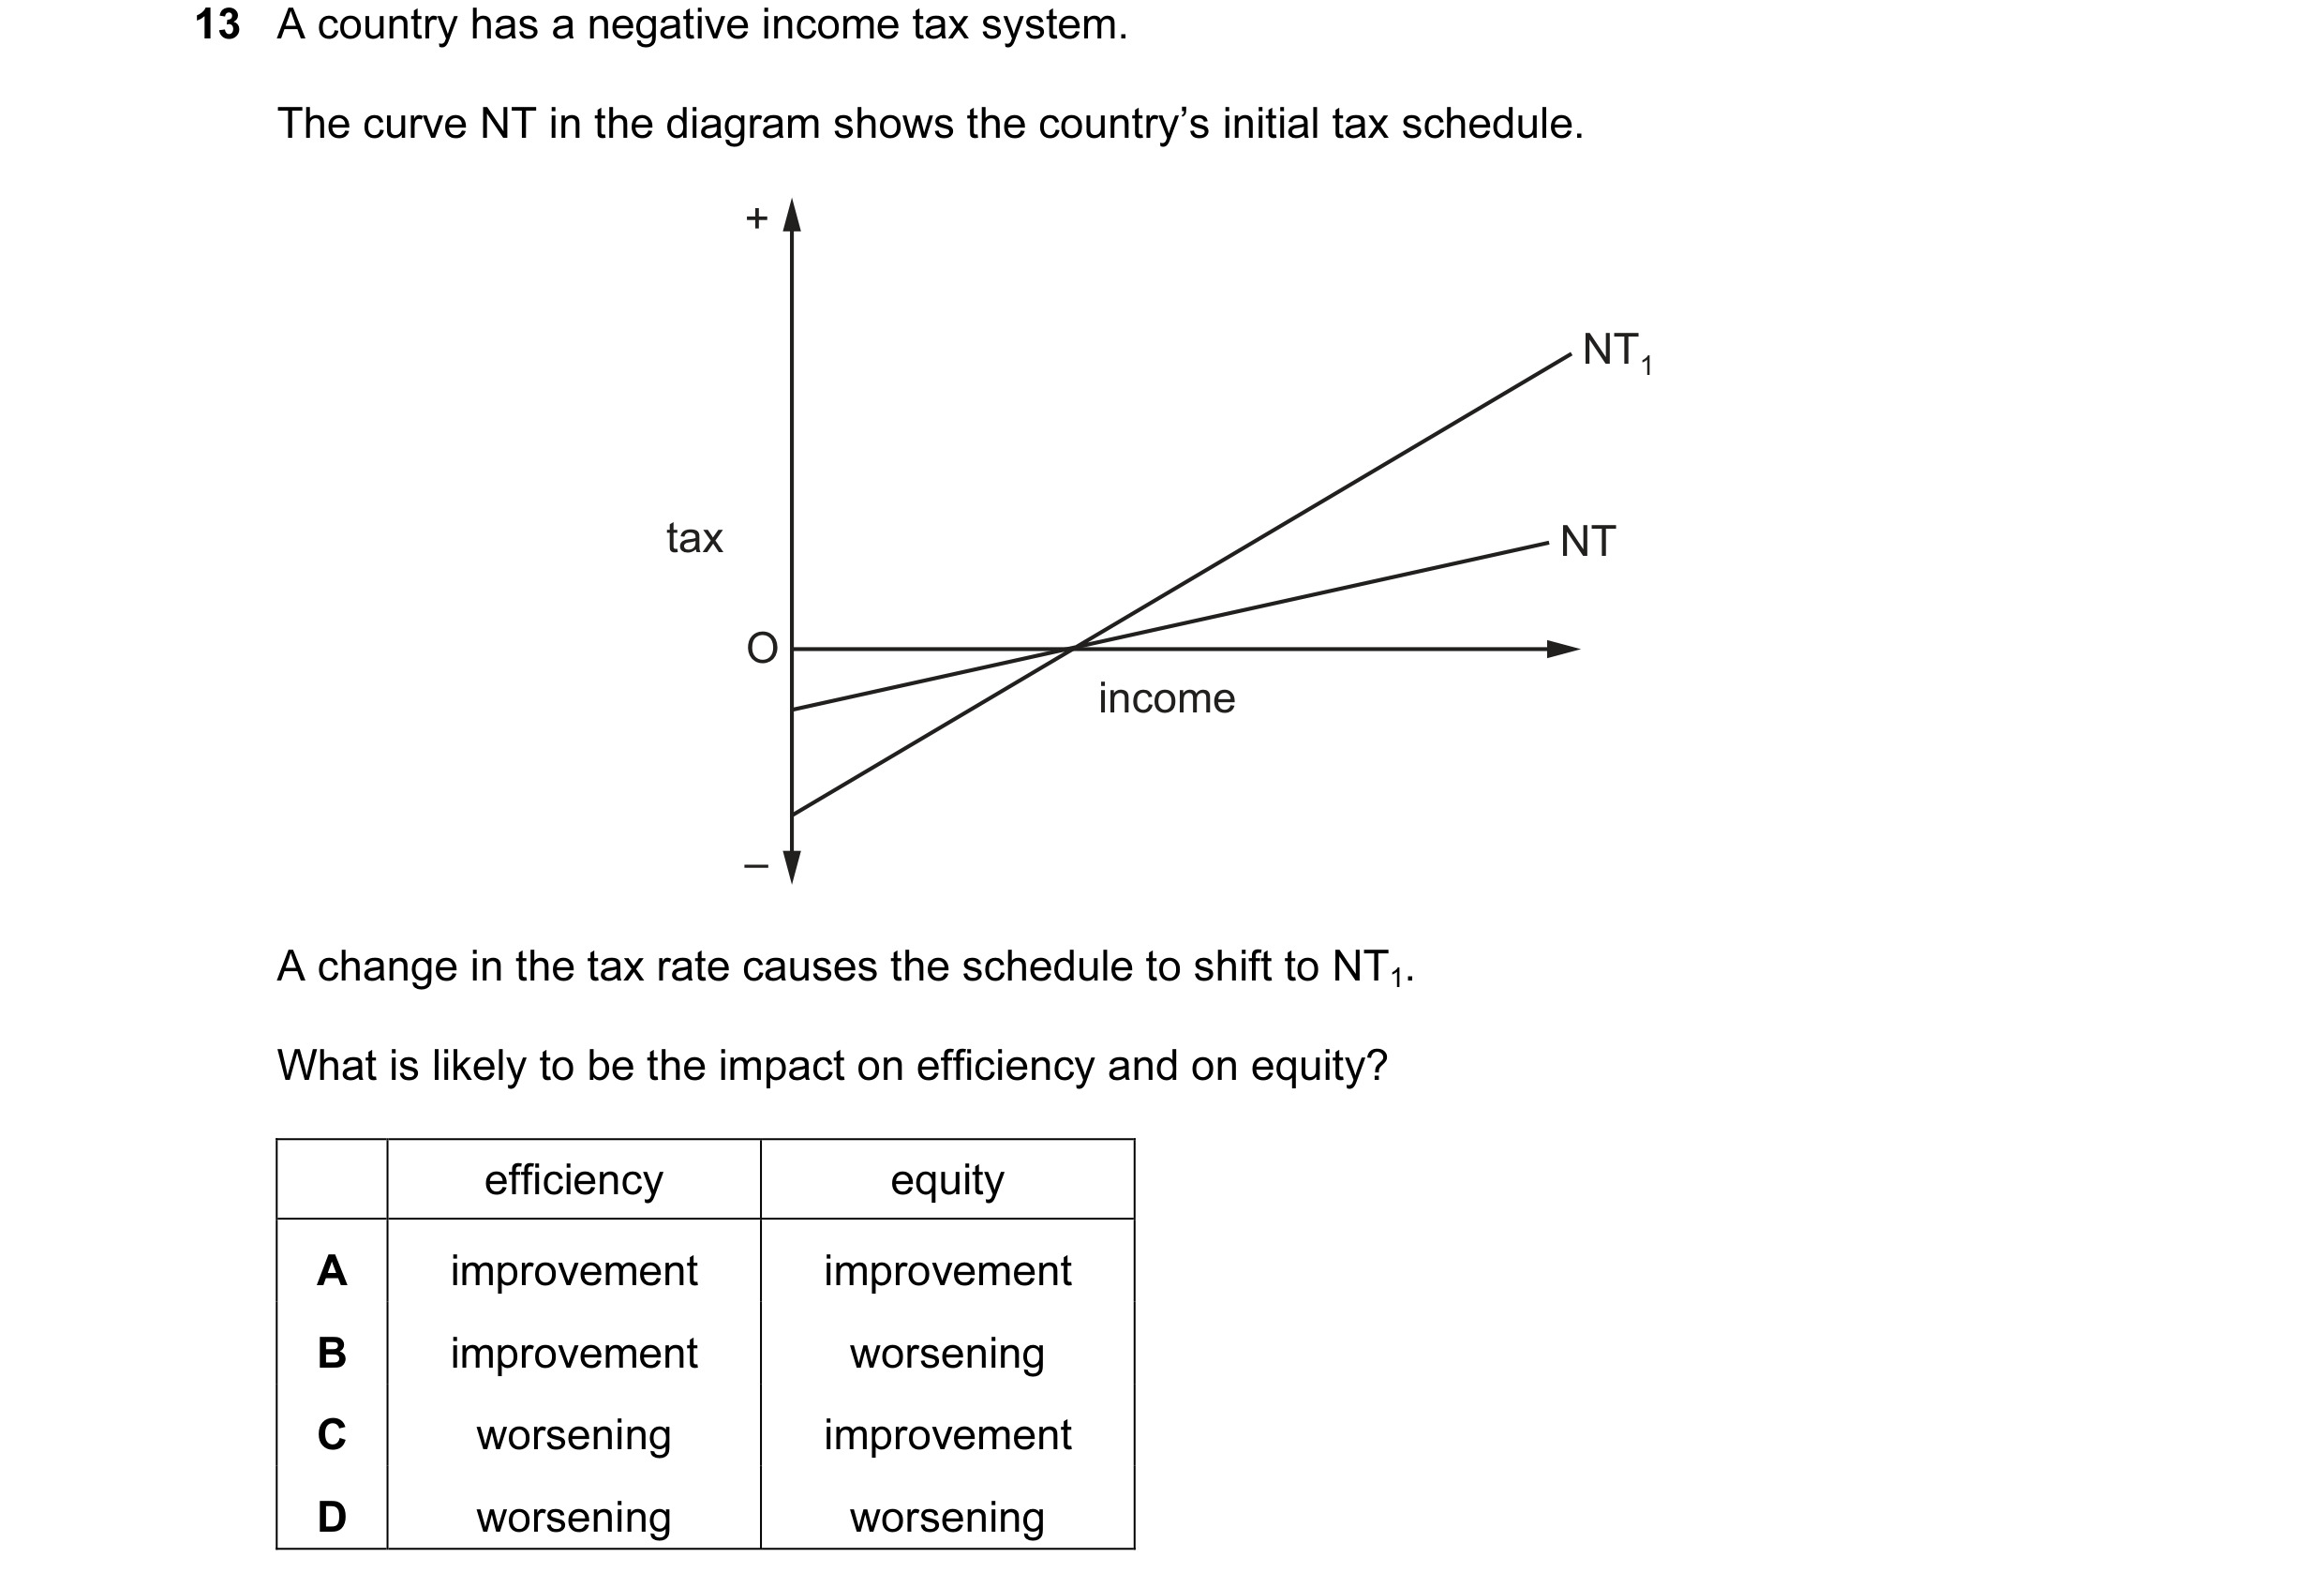
13 A country has a negative income tax system. The curve NT in the diagram shows the country’s initial tax schedule. + NT1 tax NT O income – A change in the tax rate causes the schedule to shift to NT1. What is likely to be the impact on efficiency and on equity? efficiency equity A improvement improvement B improvement worsening C worsening improvement D worsening worsening
1 marks
Answer: C
This question in 9708/33 Oct/Nov 2014
Q30 · What acts as a constraint on the use of income taxes to redistribute income to poorer… 9708/33 Oct/Nov 2014
16 What acts as a constraint on the use of income taxes to redistribute income to poorer groups in society? A the costs to employers of tax collection B the fact that poorer groups have a higher marginal propensity to save C the fact that richer and poorer groups have the same marginal propensity to consume D the likelihood that, at some point, higher marginal taxes will reduce tax revenue
1 marks
Answer: D
This question in 9708/33 Oct/Nov 2014
Q31 · Which combination of policy changes is most likely to redistribute income from the… 9708/31 May/June 2015
15 Which combination of policy changes is most likely to redistribute income from the richest households to the poorest households in an economy? means-tested universal excise duties benefits benefits A decrease increase decrease B decrease increase increase C increase decrease increase D increase decrease decrease
1 marks
Answer: A
This question in 9708/31 May/June 2015
Q32 · When will a society have achieved an equitable distribution of income? 9708/32 May/June 2015
14 When will a society have achieved an equitable distribution of income? A when all individuals have equal job opportunities B when all workers are paid wages equal to their marginal value product C when the incomes within the society are equally distributed D when the society believes that the distribution of income is fair
1 marks
Answer: D
This question in 9708/32 May/June 2015
Q33 · Which tax is most likely to be regressive? 9708/31 Oct/Nov 2015
27 Which tax is most likely to be regressive? A an inheritance tax B a property tax C a sales tax D income tax
1 marks
This question in 9708/31 Oct/Nov 2015
Q34 · A country has a negative income tax 9708/32 Oct/Nov 2015
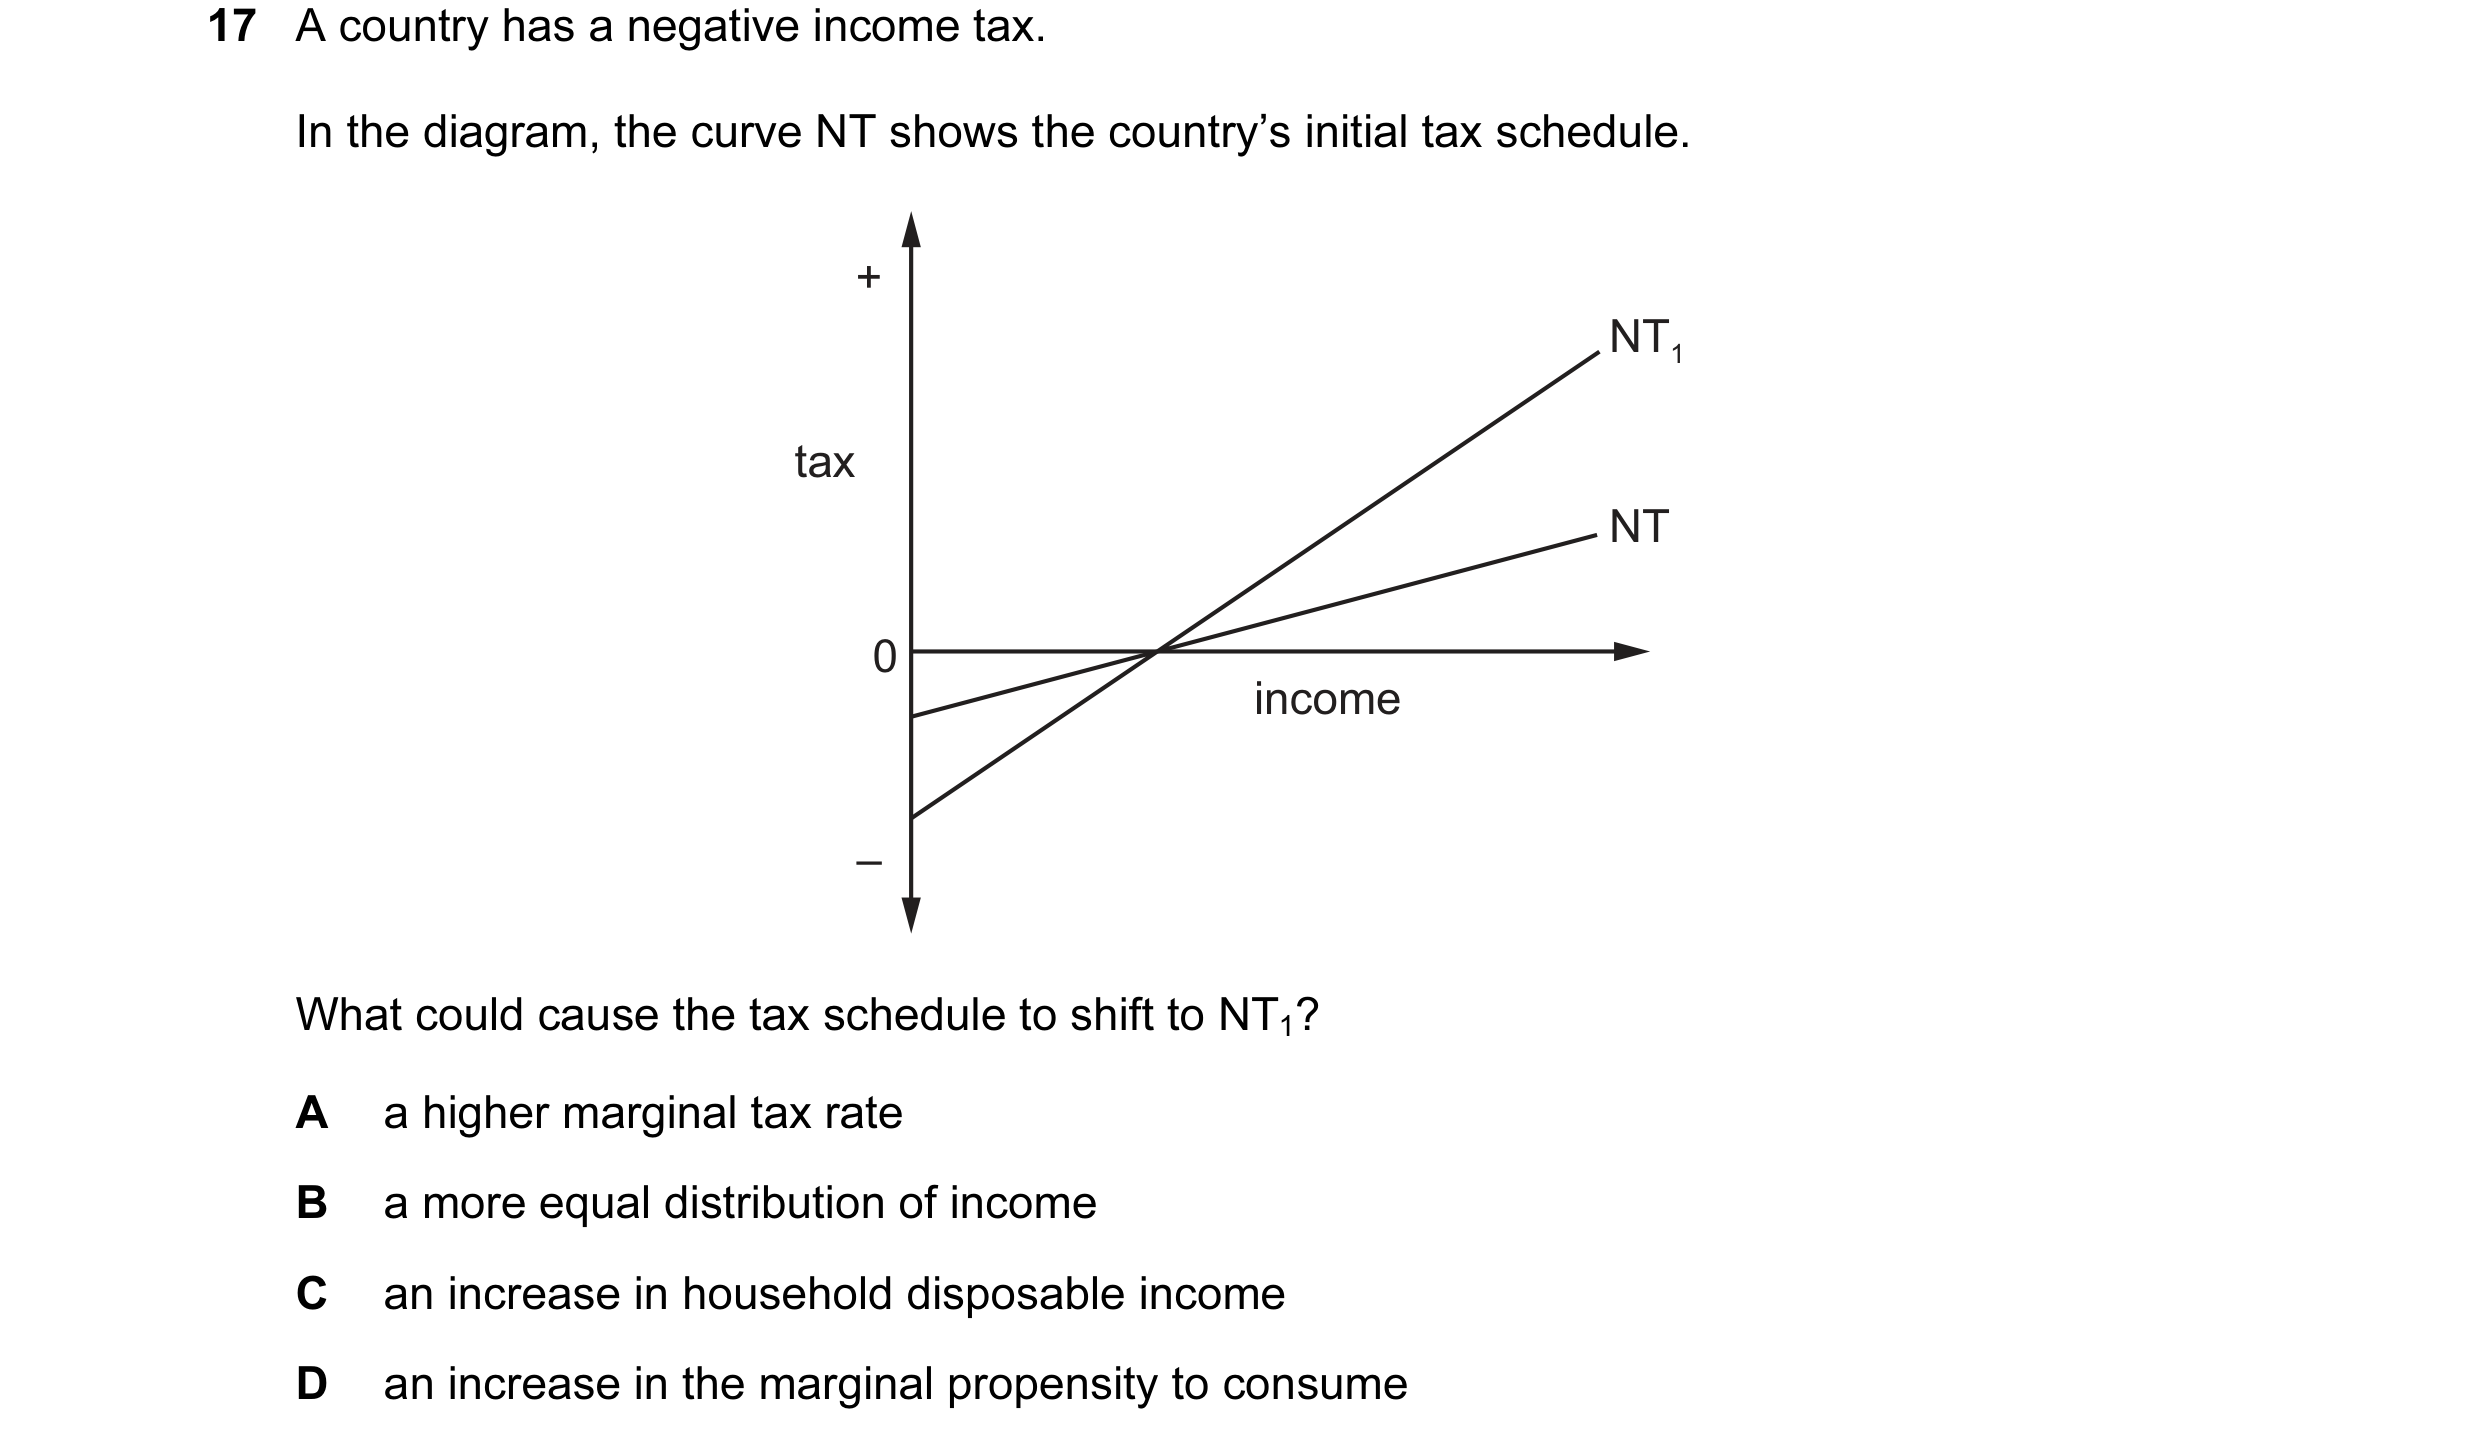
17 A country has a negative income tax. In the diagram, the curve NT shows the country’s initial tax schedule. + NT1 tax NT 0 income – What could cause the tax schedule to shift to NT1? A a higher marginal tax rate B a more equal distribution of income C an increase in household disposable income D an increase in the marginal propensity to consume
1 marks
Answer: A
This question in 9708/32 Oct/Nov 2015
Q35 · What would be most likely to give rise to a conflict between efficiency and equity? 9708/33 Oct/Nov 2015
15 What would be most likely to give rise to a conflict between efficiency and equity? A an increase in government expenditure on health care B an increase in interest rates C an increase in subsidies to public transport in congested urban areas D an increase in the highest rate of income tax
1 marks
Answer: D
This question in 9708/33 Oct/Nov 2015
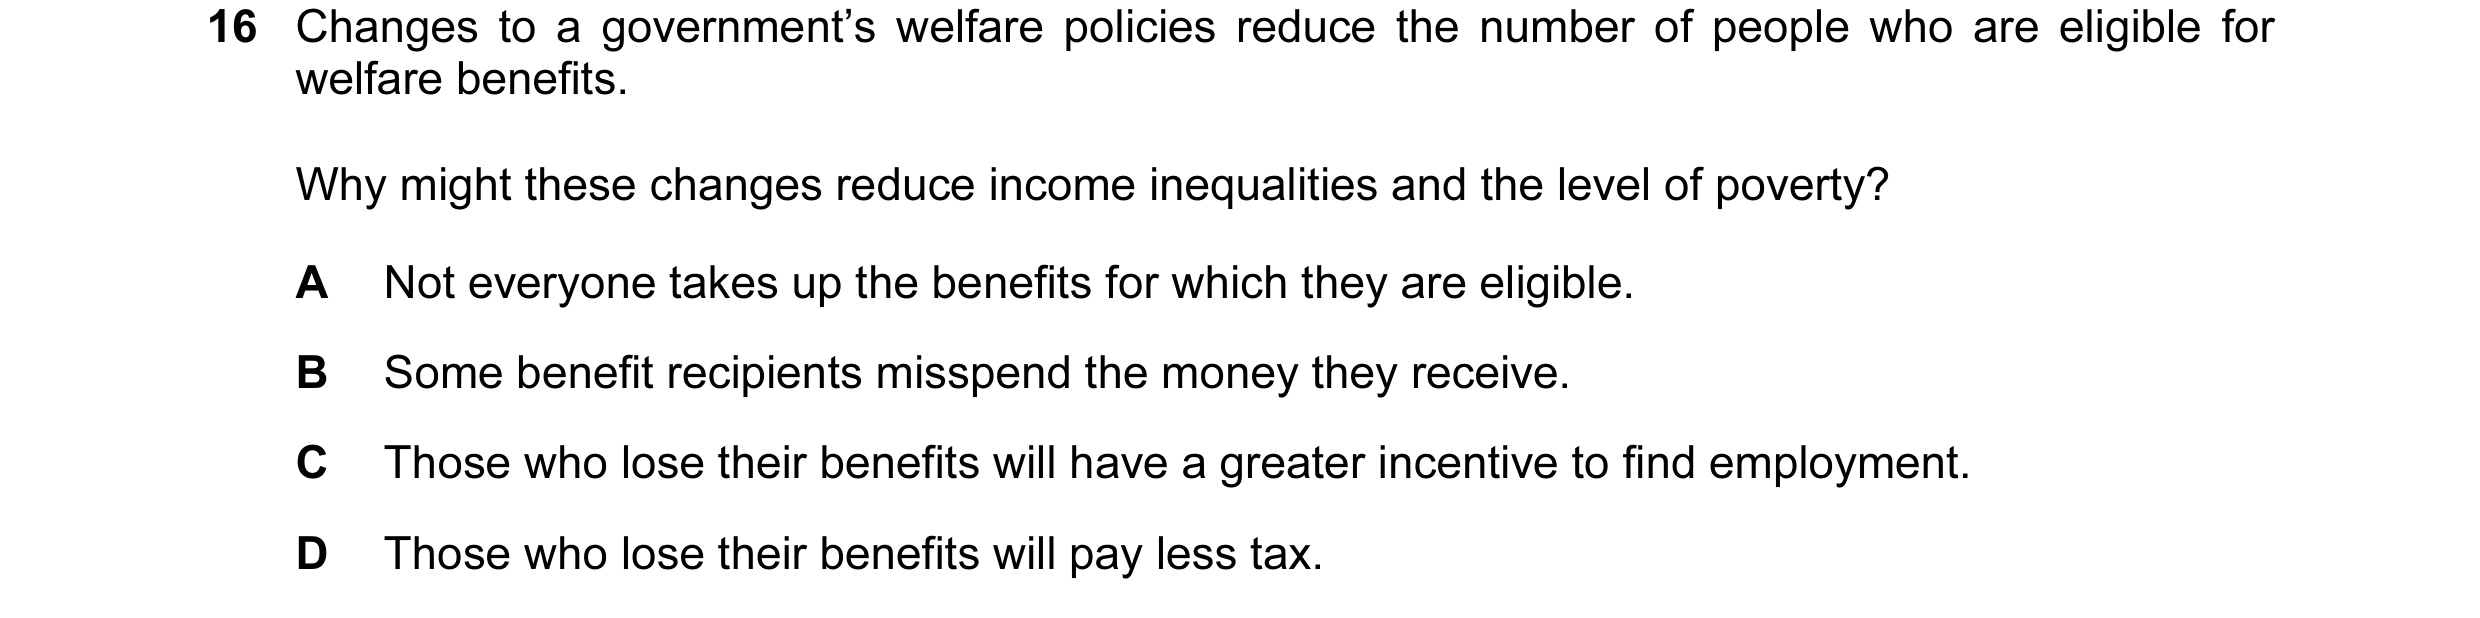
Q36 · Changes to a government’s welfare policies reduce the number of people who are eligible… 9708/33 Oct/Nov 2015
16 Changes to a government’s welfare policies reduce the number of people who are eligible for welfare benefits. Why might these changes reduce income inequalities and the level of poverty? A Not everyone takes up the benefits for which they are eligible. B Some benefit recipients misspend the money they receive. C Those who lose their benefits will have a greater incentive to find employment. D Those who lose their benefits will pay less tax.
1 marks
Answer: C
This question in 9708/33 Oct/Nov 2015
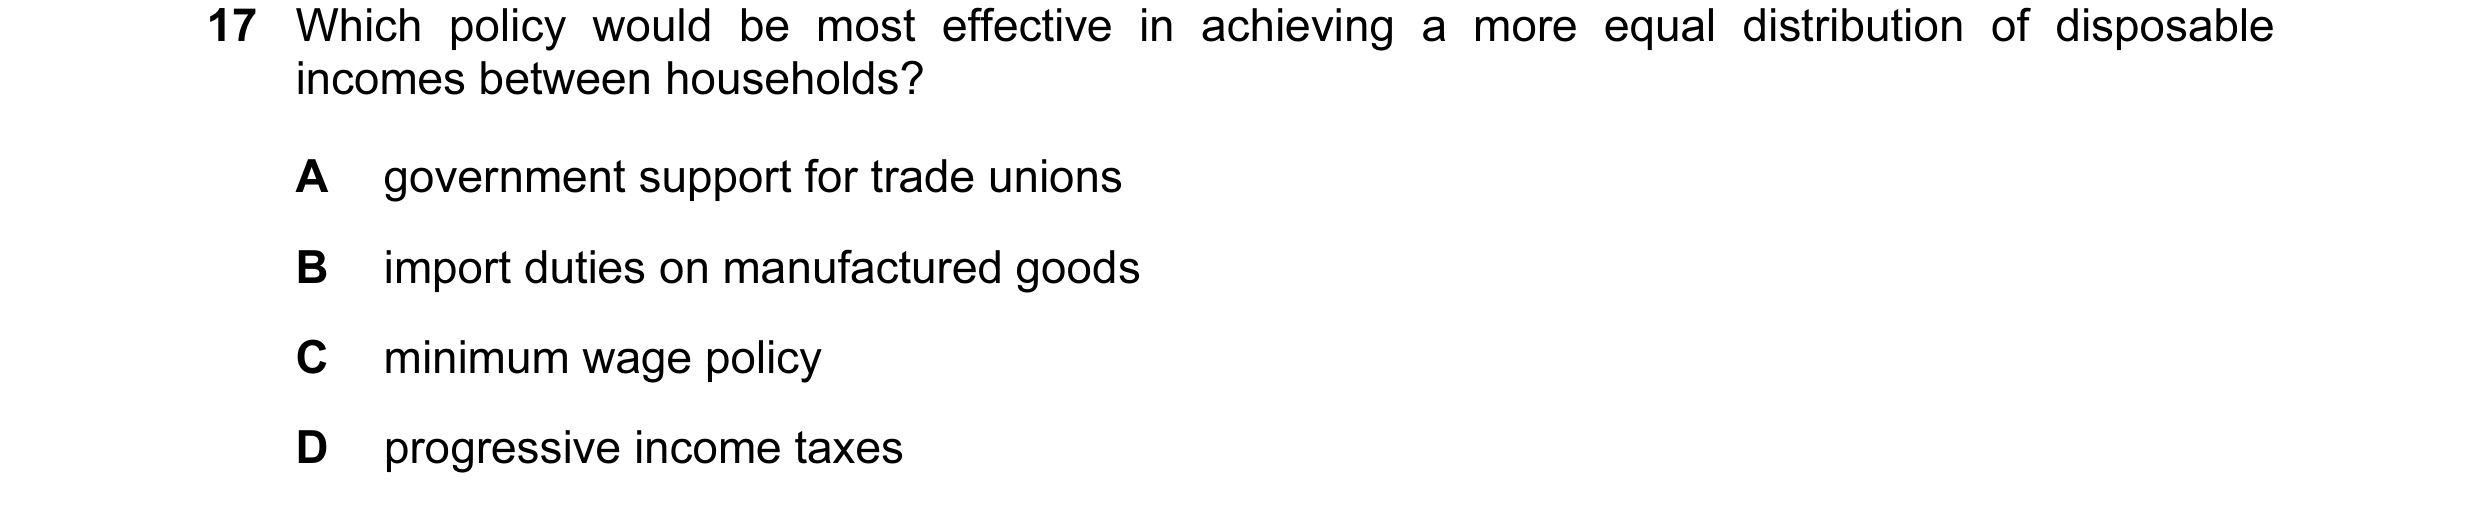
Q37 · Which policy would be most effective in achieving a more equal distribution of disposable… 9708/32 May/June 2016
17 Which policy would be most effective in achieving a more equal distribution of disposable incomes between households? A government support for trade unions B import duties on manufactured goods C minimum wage policy D progressive income taxes
1 marks
Answer: D
This question in 9708/32 May/June 2016
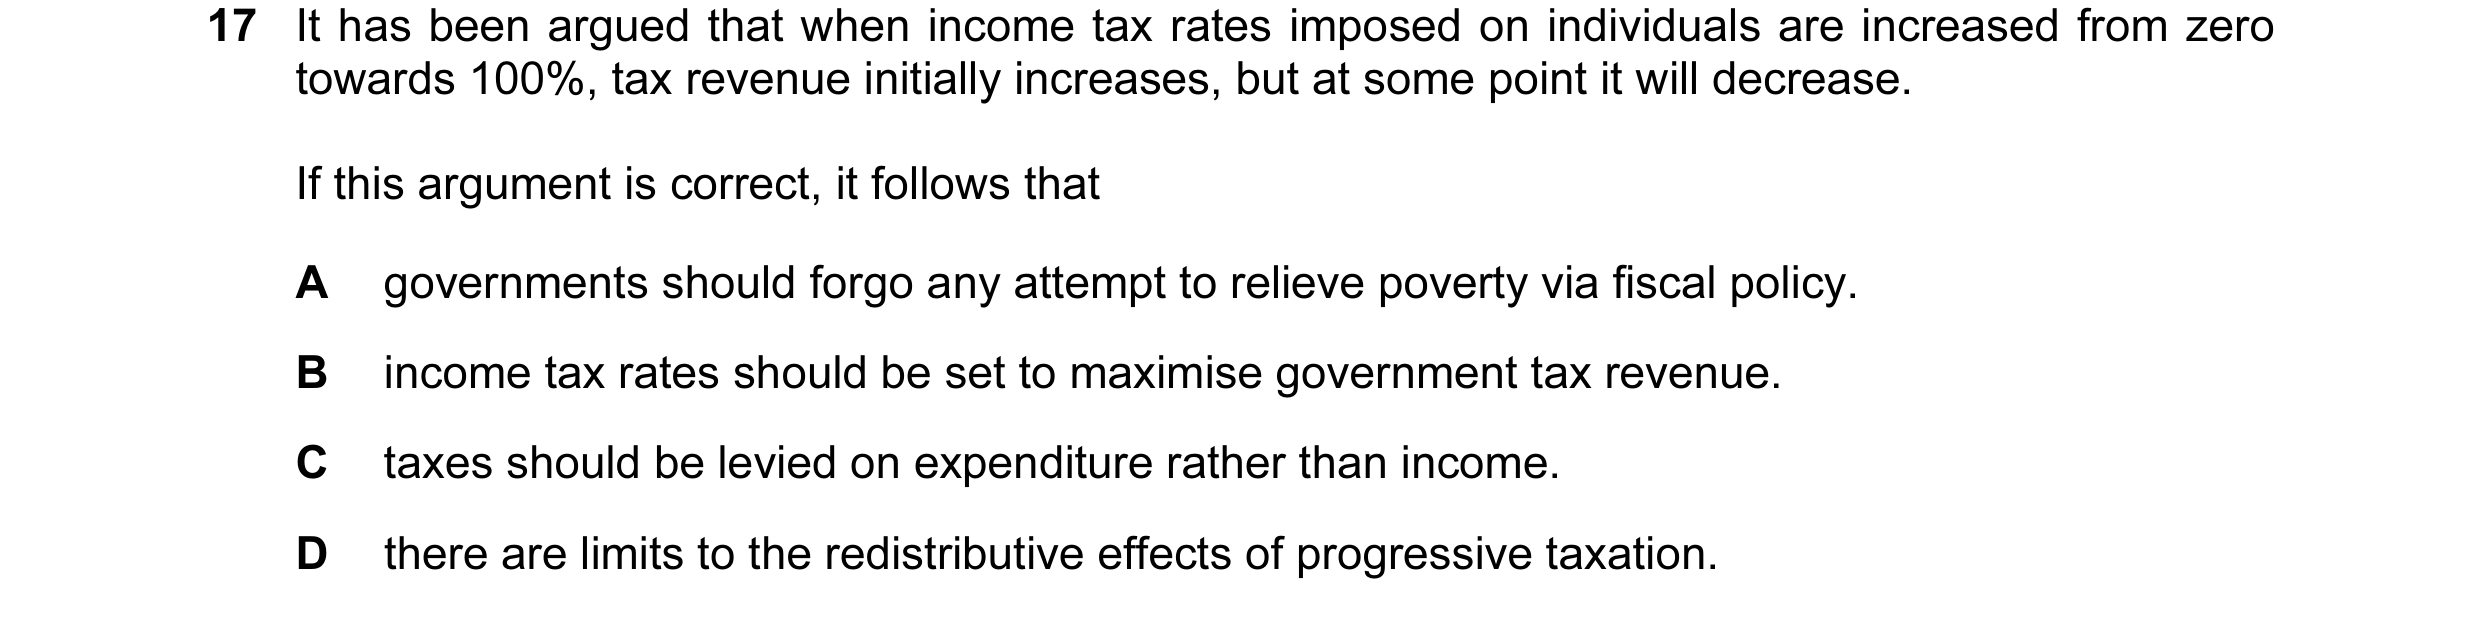
Q38 · It has been argued that when income tax rates imposed on individuals are increased from… 9708/33 May/June 2016
17 It has been argued that when income tax rates imposed on individuals are increased from zero towards 100%, tax revenue initially increases, but at some point it will decrease. If this argument is correct, it follows that A governments should forgo any attempt to relieve poverty via fiscal policy. B income tax rates should be set to maximise government tax revenue. C taxes should be levied on expenditure rather than income. D there are limits to the redistributive effects of progressive taxation.
1 marks
Answer: D
This question in 9708/33 May/June 2016
Q39 · Which measure is least likely to help a household out of the poverty trap? 9708/32 Oct/Nov 2016
16 Which measure is least likely to help a household out of the poverty trap? A changing a universal benefit to a means-tested benefit B increasing the threshold at which income tax is paid C introducing a national minimum wage D reducing the basic rate of income tax
1 marks
Answer: A
This question in 9708/32 Oct/Nov 2016
Q40 · Governments consider both efficiency and equity in deciding microeconomic policy 9708/33 Oct/Nov 2016
15 Governments consider both efficiency and equity in deciding microeconomic policy. What statement about the resulting decisions is correct? A An economically inefficient outcome is certain to be inequitable. B Both efficiency and equity decisions are based on positive economic judgements. C Equity can only be achieved when incomes are redistributed equally. D The creation of an equitable situation may increase economic efficiency.
1 marks
Answer: D
This question in 9708/33 Oct/Nov 2016
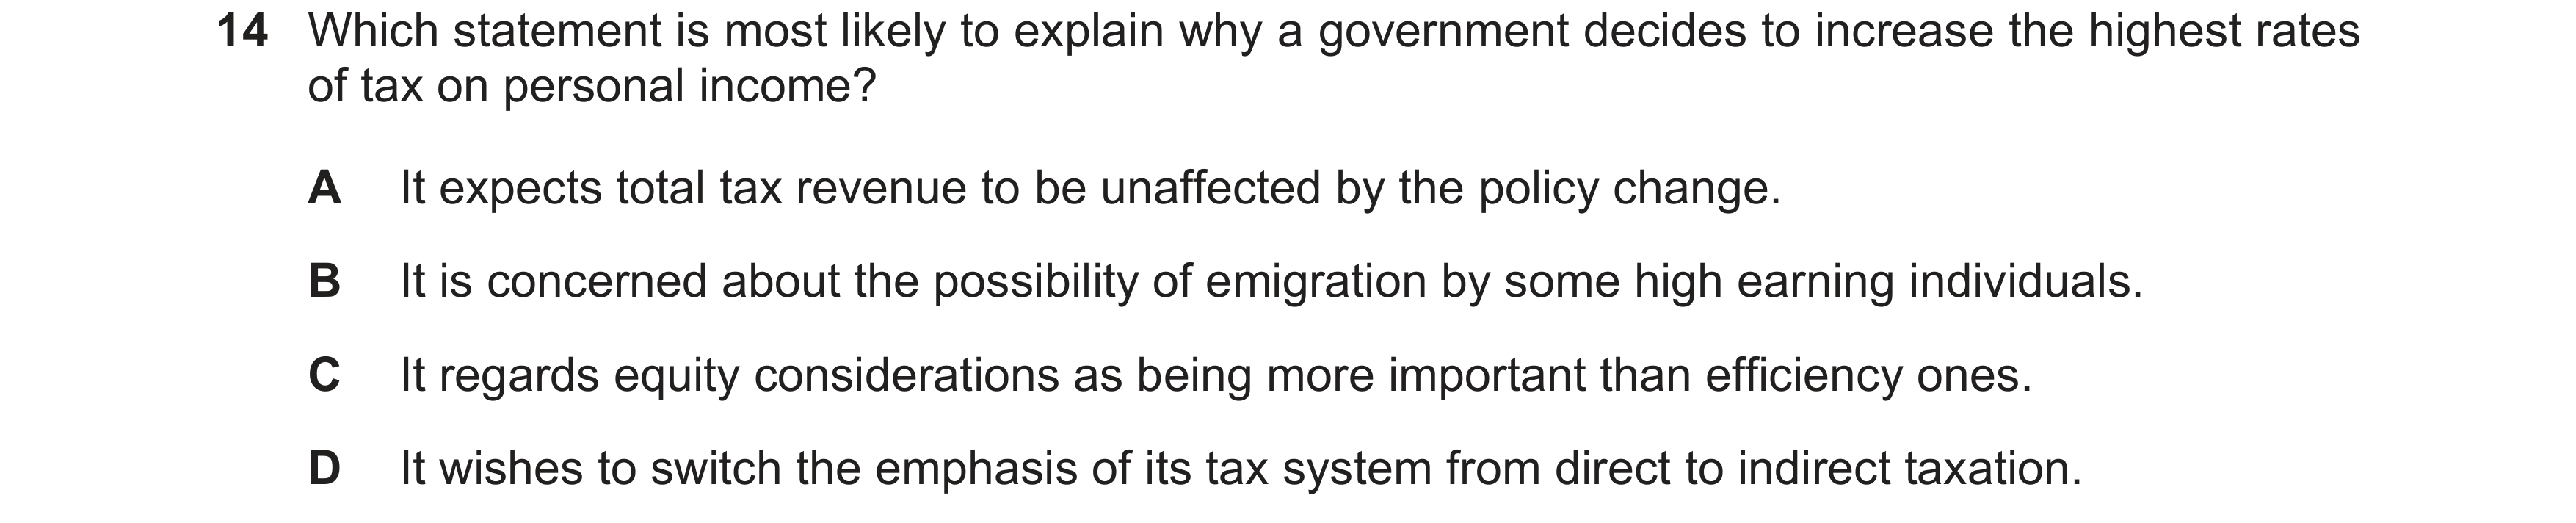
Q41 · Which statement is most likely to explain why a government decides to increase the… 9708/32 May/June 2017
14 Which statement is most likely to explain why a government decides to increase the highest rates of tax on personal income? A It expects total tax revenue to be unaffected by the policy change. B It is concerned about the possibility of emigration by some high earning individuals. C It regards equity considerations as being more important than efficiency ones. D It wishes to switch the emphasis of its tax system from direct to indirect taxation.
1 marks
Answer: C
This question in 9708/32 May/June 2017
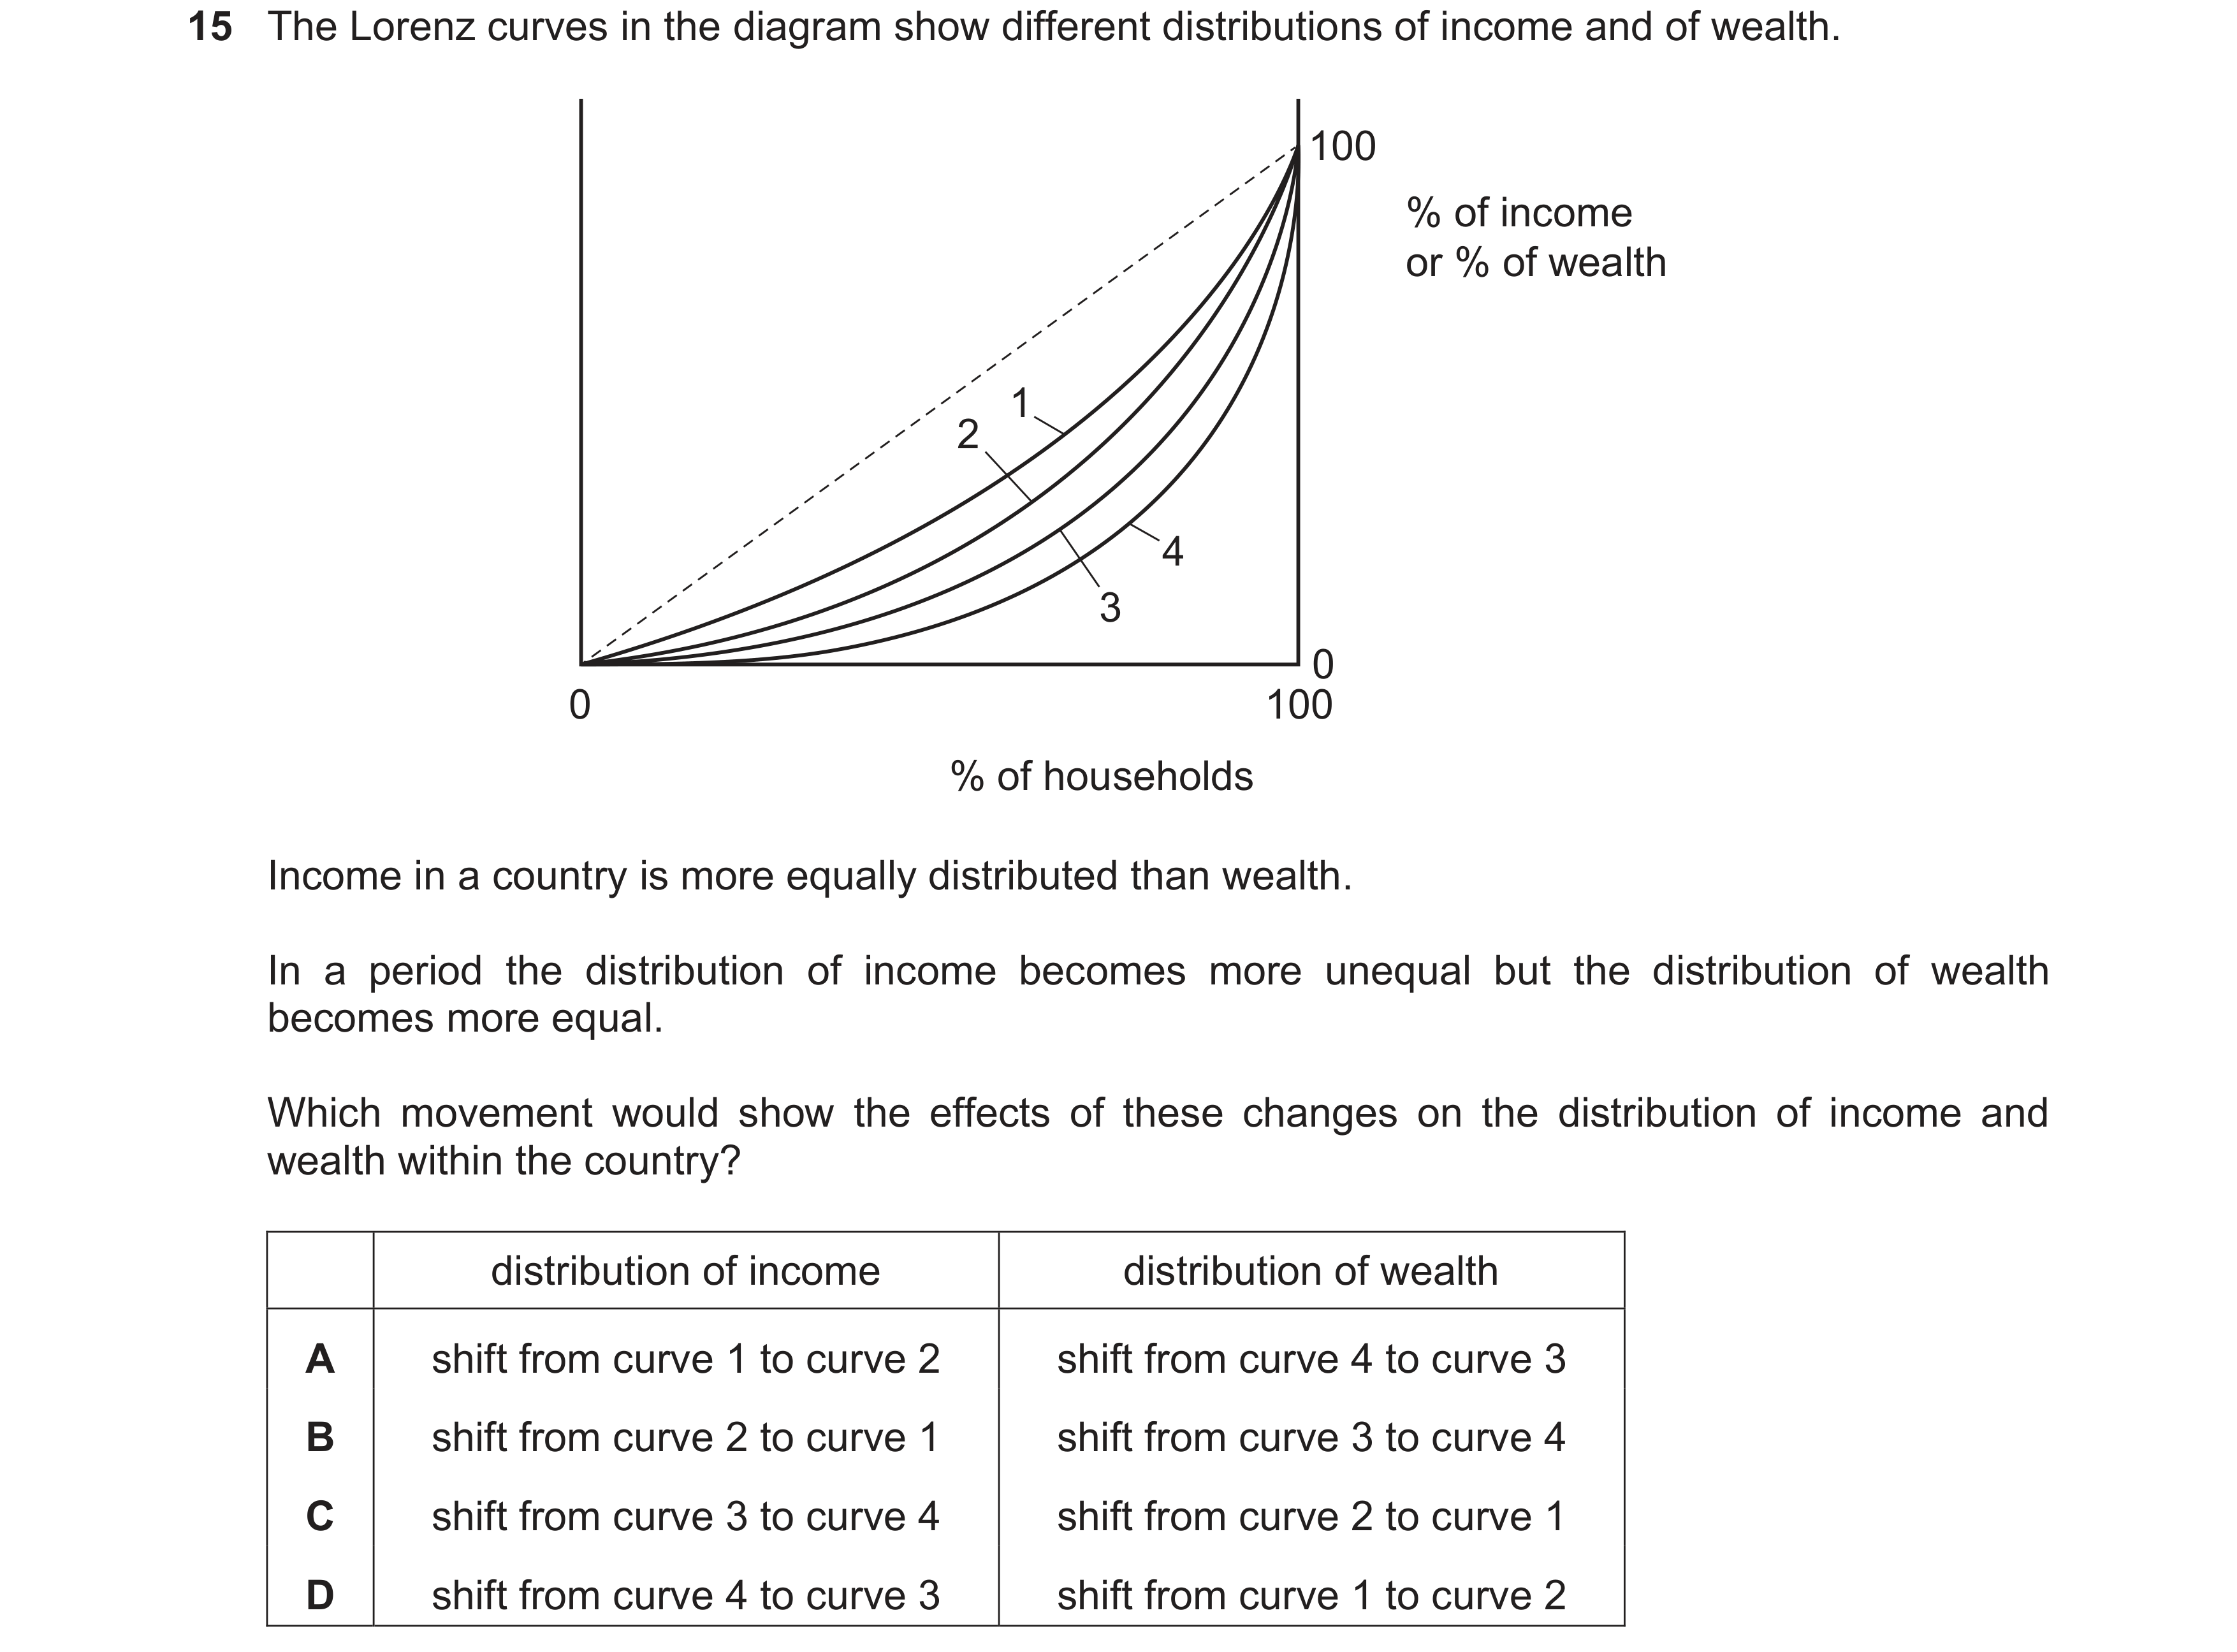
Q42 · The Lorenz curves in the diagram show different distributions of income and of wealth 9708/32 May/June 2017
15 The Lorenz curves in the diagram show different distributions of income and of wealth. 100 % of income or % of wealth 1 2 4 3 0 0 100 % of households Income in a country is more equally distributed than wealth. In a period the distribution of income becomes more unequal but the distribution of wealth becomes more equal. Which movement would show the effects of these changes on the distribution of income and wealth within the country? distribution of income distribution of wealth A shift from curve 1 to curve 2 shift from curve 4 to curve 3 B shift from curve 2 to curve 1 shift from curve 3 to curve 4 C shift from curve 3 to curve 4 shift from curve 2 to curve 1 D shift from curve 4 to curve 3 shift from curve 1 to curve 2
1 marks
Answer: A
This question in 9708/32 May/June 2017
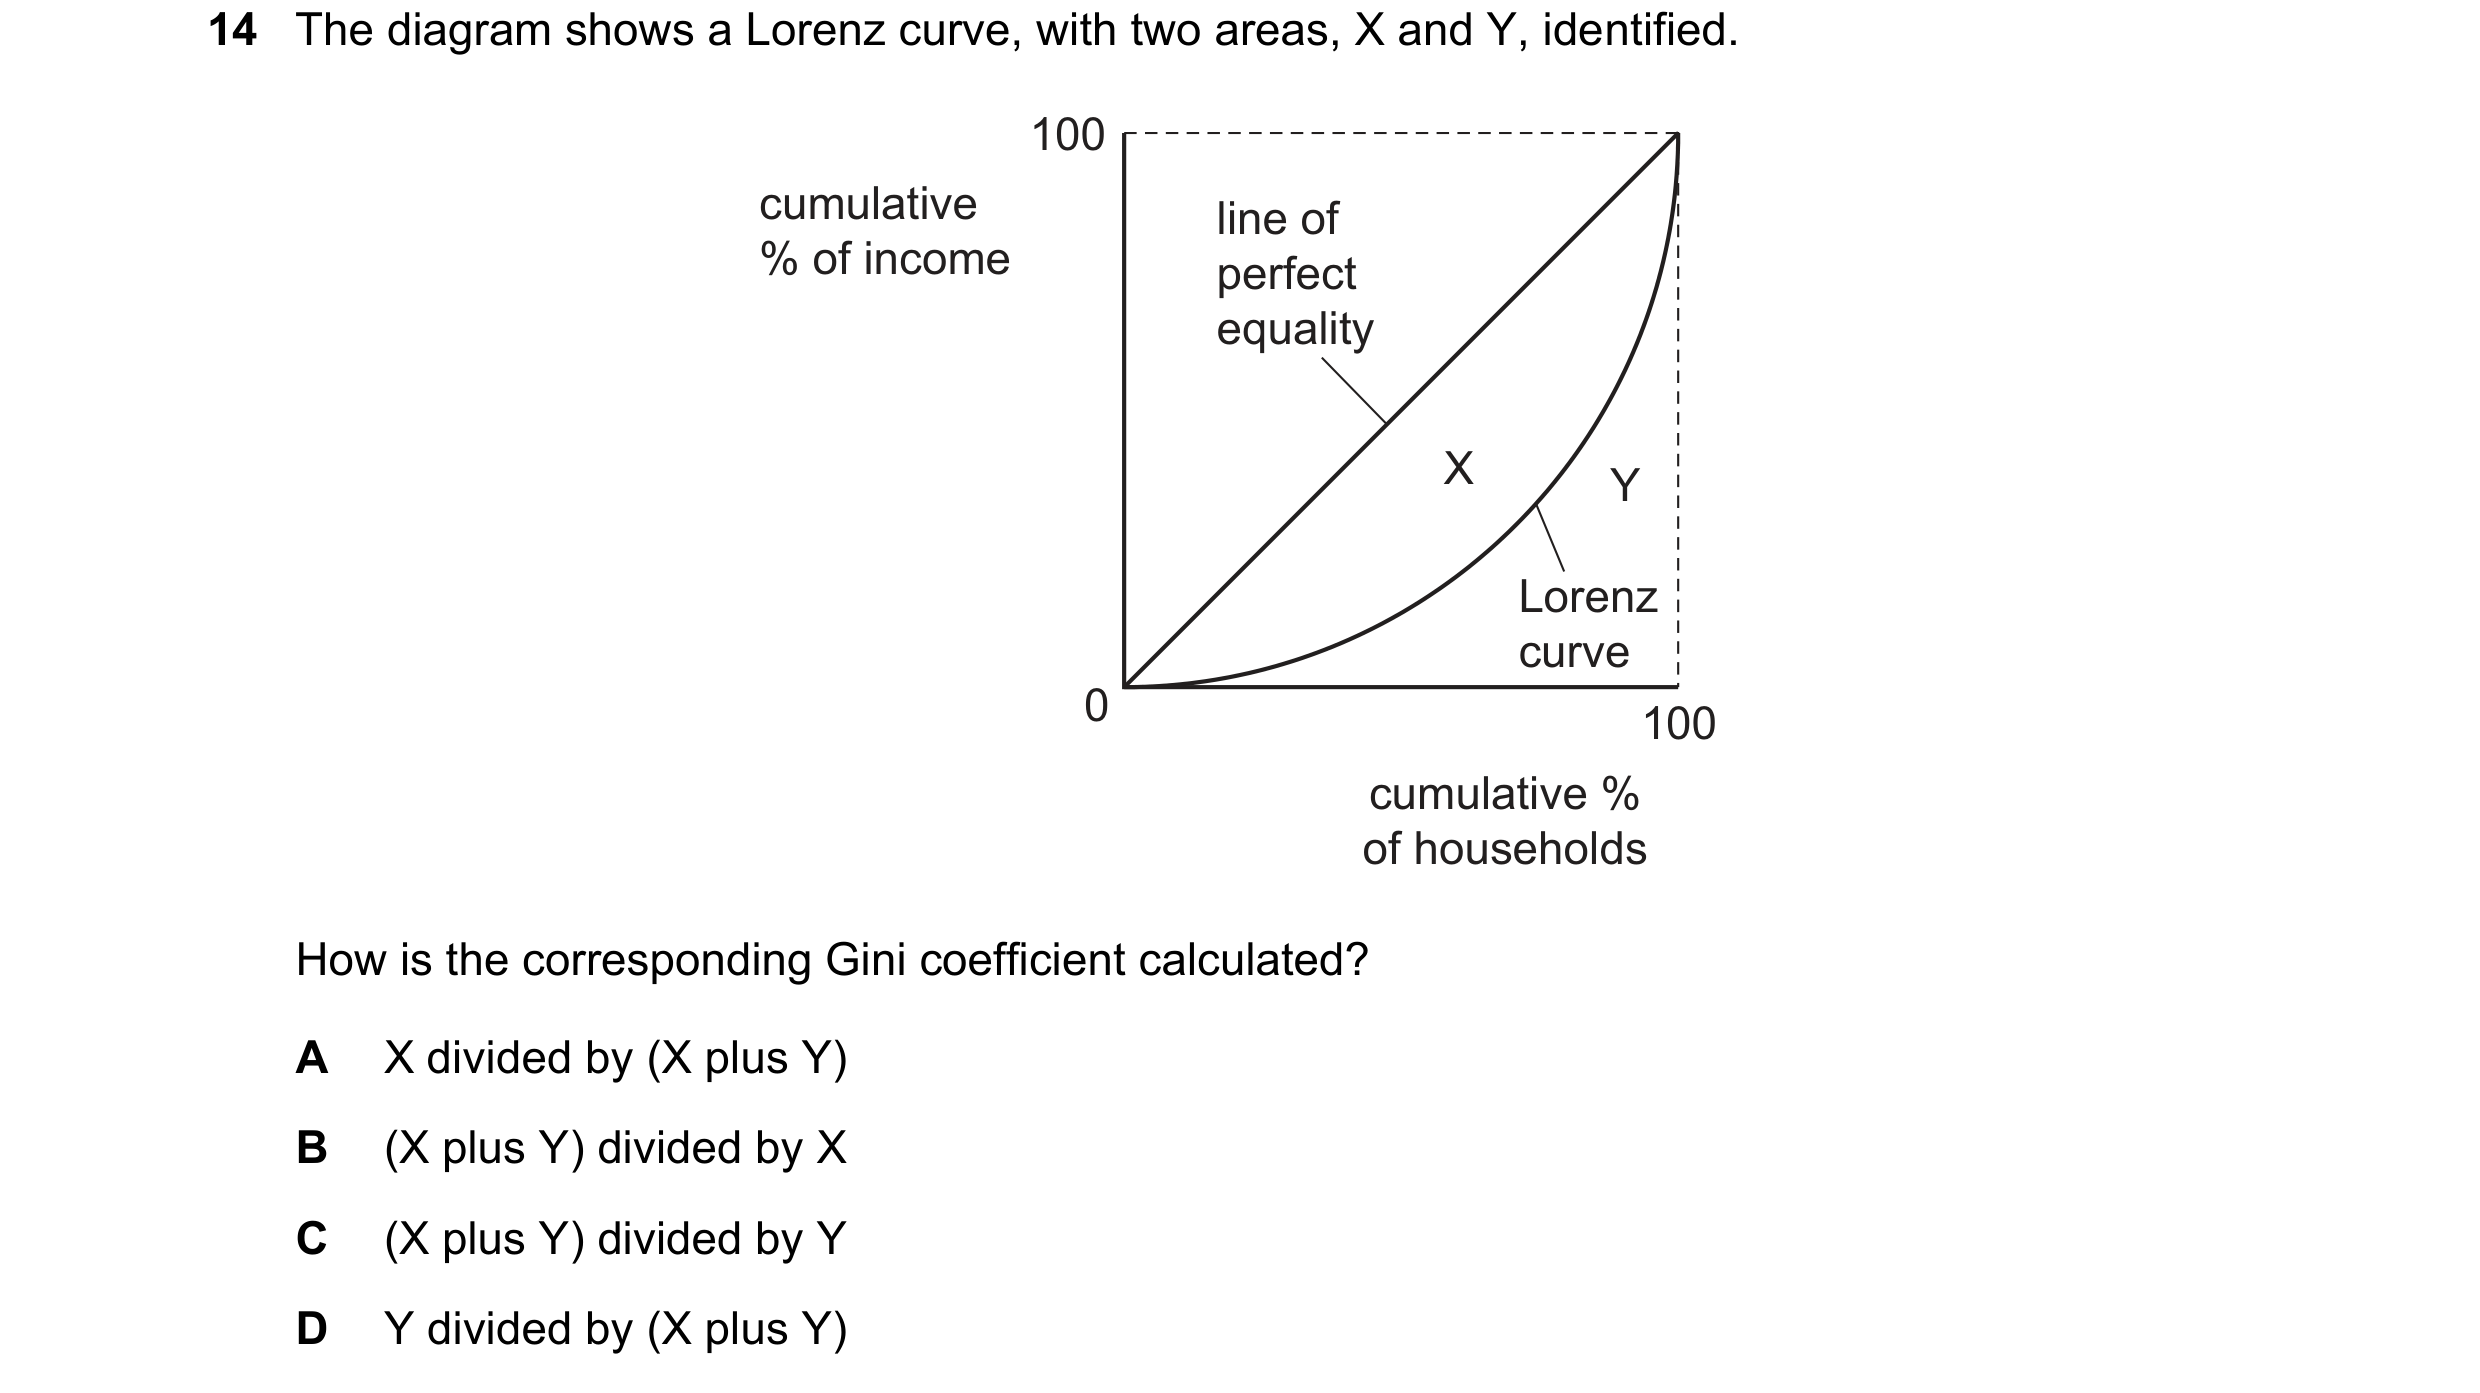
Q43 · The diagram shows a Lorenz curve, with two areas, X and Y, identified 9708/33 May/June 2017
14 The diagram shows a Lorenz curve, with two areas, X and Y, identified. 100 cumulative line of % of income perfect equality X Y Lorenz curve 0 100 cumulative % of households How is the corresponding Gini coefficient calculated? A X divided by (X plus Y) B X plus Y divided by X C X plus Y divided by Y D Y divided by (X plus Y)
1 marks
Answer: A
This question in 9708/33 May/June 2017
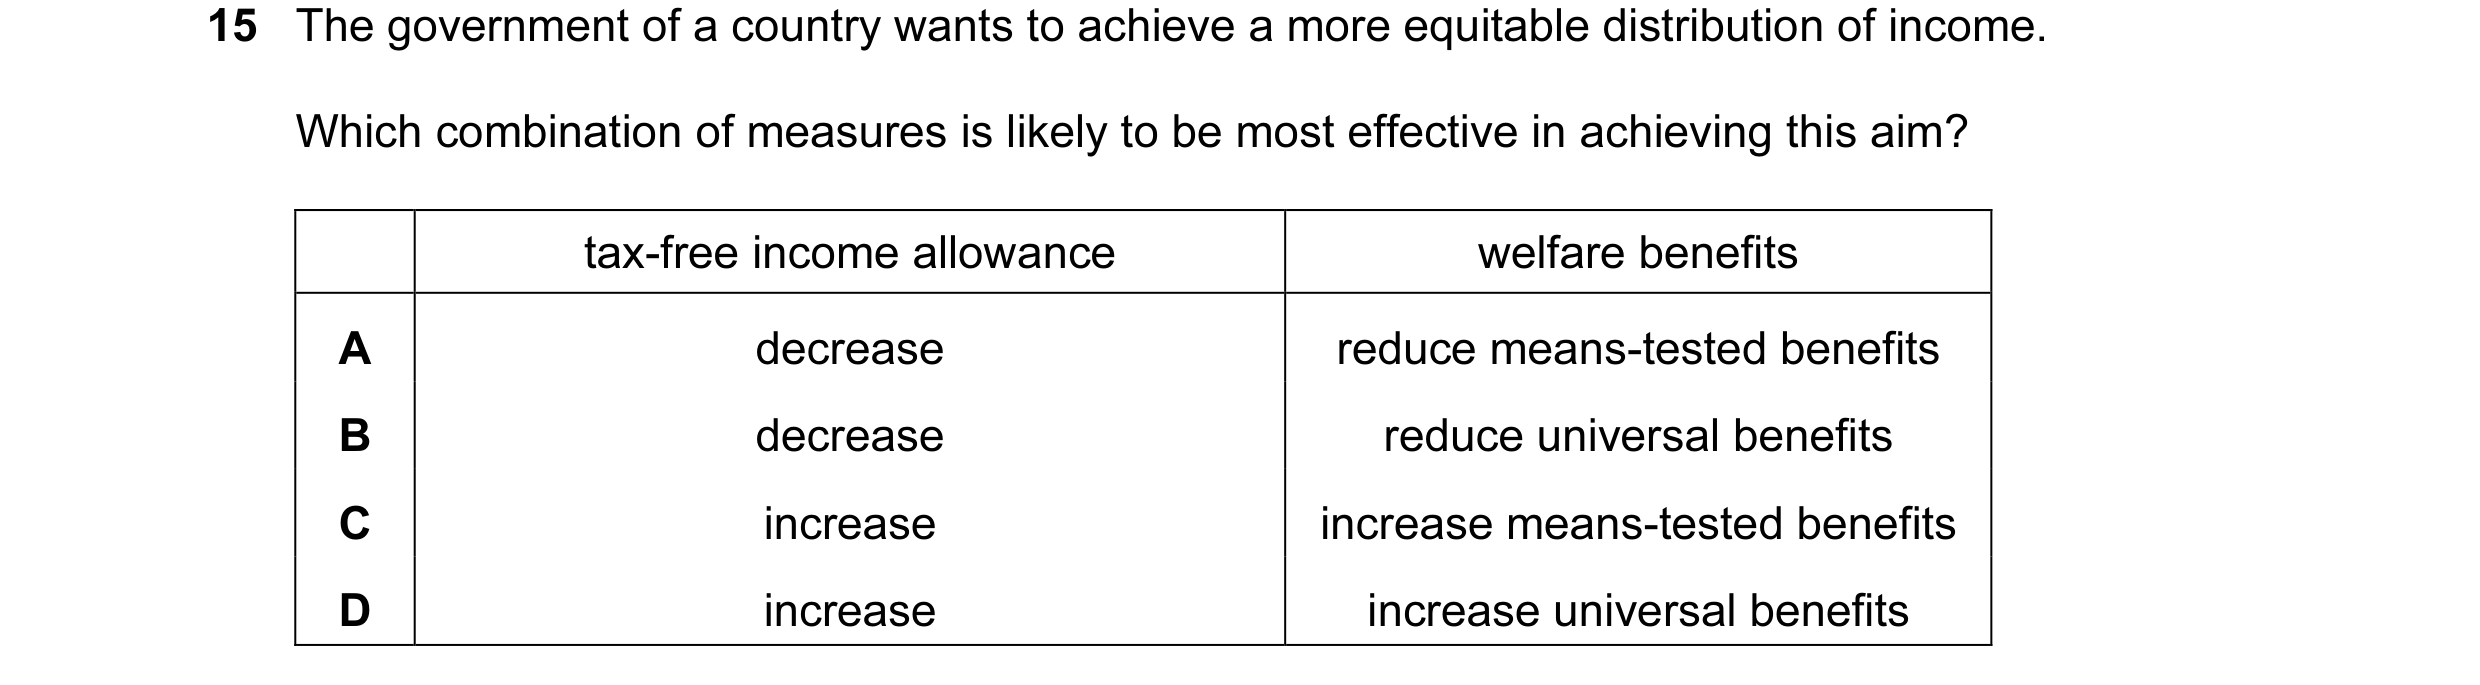
Q44 · The government of a country wants to achieve a more equitable distribution of income 9708/33 May/June 2017
15 The government of a country wants to achieve a more equitable distribution of income. Which combination of measures is likely to be most effective in achieving this aim? tax-free income allowance welfare benefits A decrease reduce means-tested benefits B decrease reduce universal benefits C increase increase means-tested benefits D increase increase universal benefits
1 marks
Answer: C
This question in 9708/33 May/June 2017
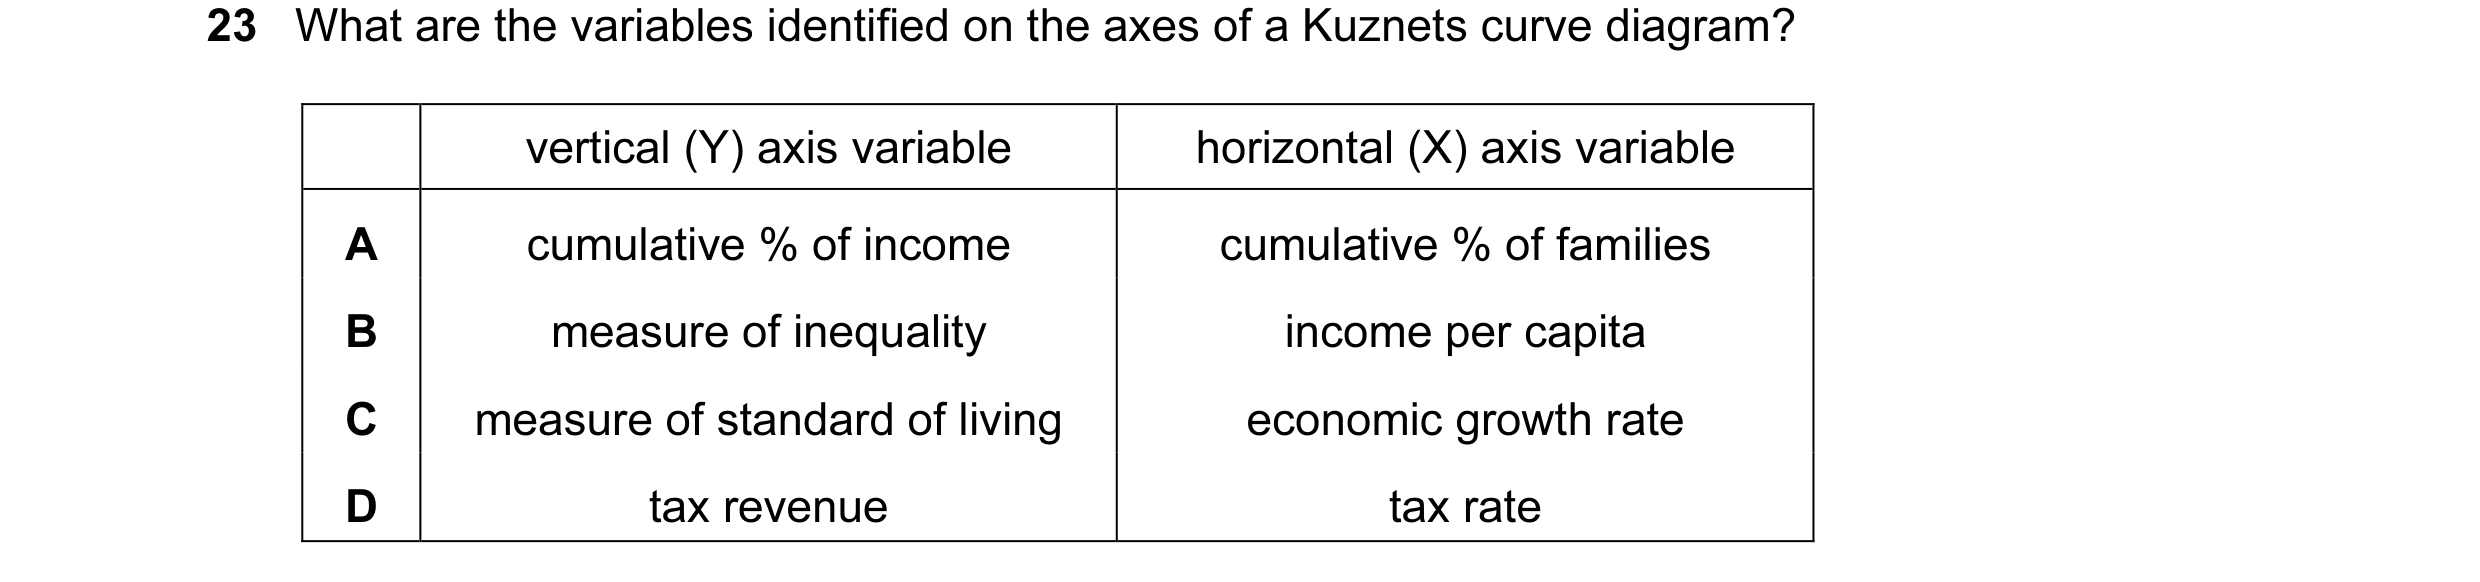
Q45 · What are the variables identified on the axes of a Kuznets curve diagram? 9708/33 May/June 2017
23 What are the variables identified on the axes of a Kuznets curve diagram? vertical (Y) axis variable horizontal (X) axis variable A cumulative % of income cumulative % of families B measure of inequality income per capita C measure of standard of living economic growth rate D tax revenue tax rate
1 marks
Answer: B
This question in 9708/33 May/June 2017
Q46 · A country has a negative income tax 9708/32 Feb/March 2019
13 A country has a negative income tax. The curve NT in the diagram shows the country’s initial tax schedule. + NT1 tax NT O income – A change in the tax rate causes the schedule to shift to NT1. How will this affect work incentives and the after-tax distribution of income? work distribution incentives of income A strengthen more equal B strengthen less equal C weaken less equal D weaken more equal
1 marks
Answer: D
This question in 9708/32 Feb/March 2019
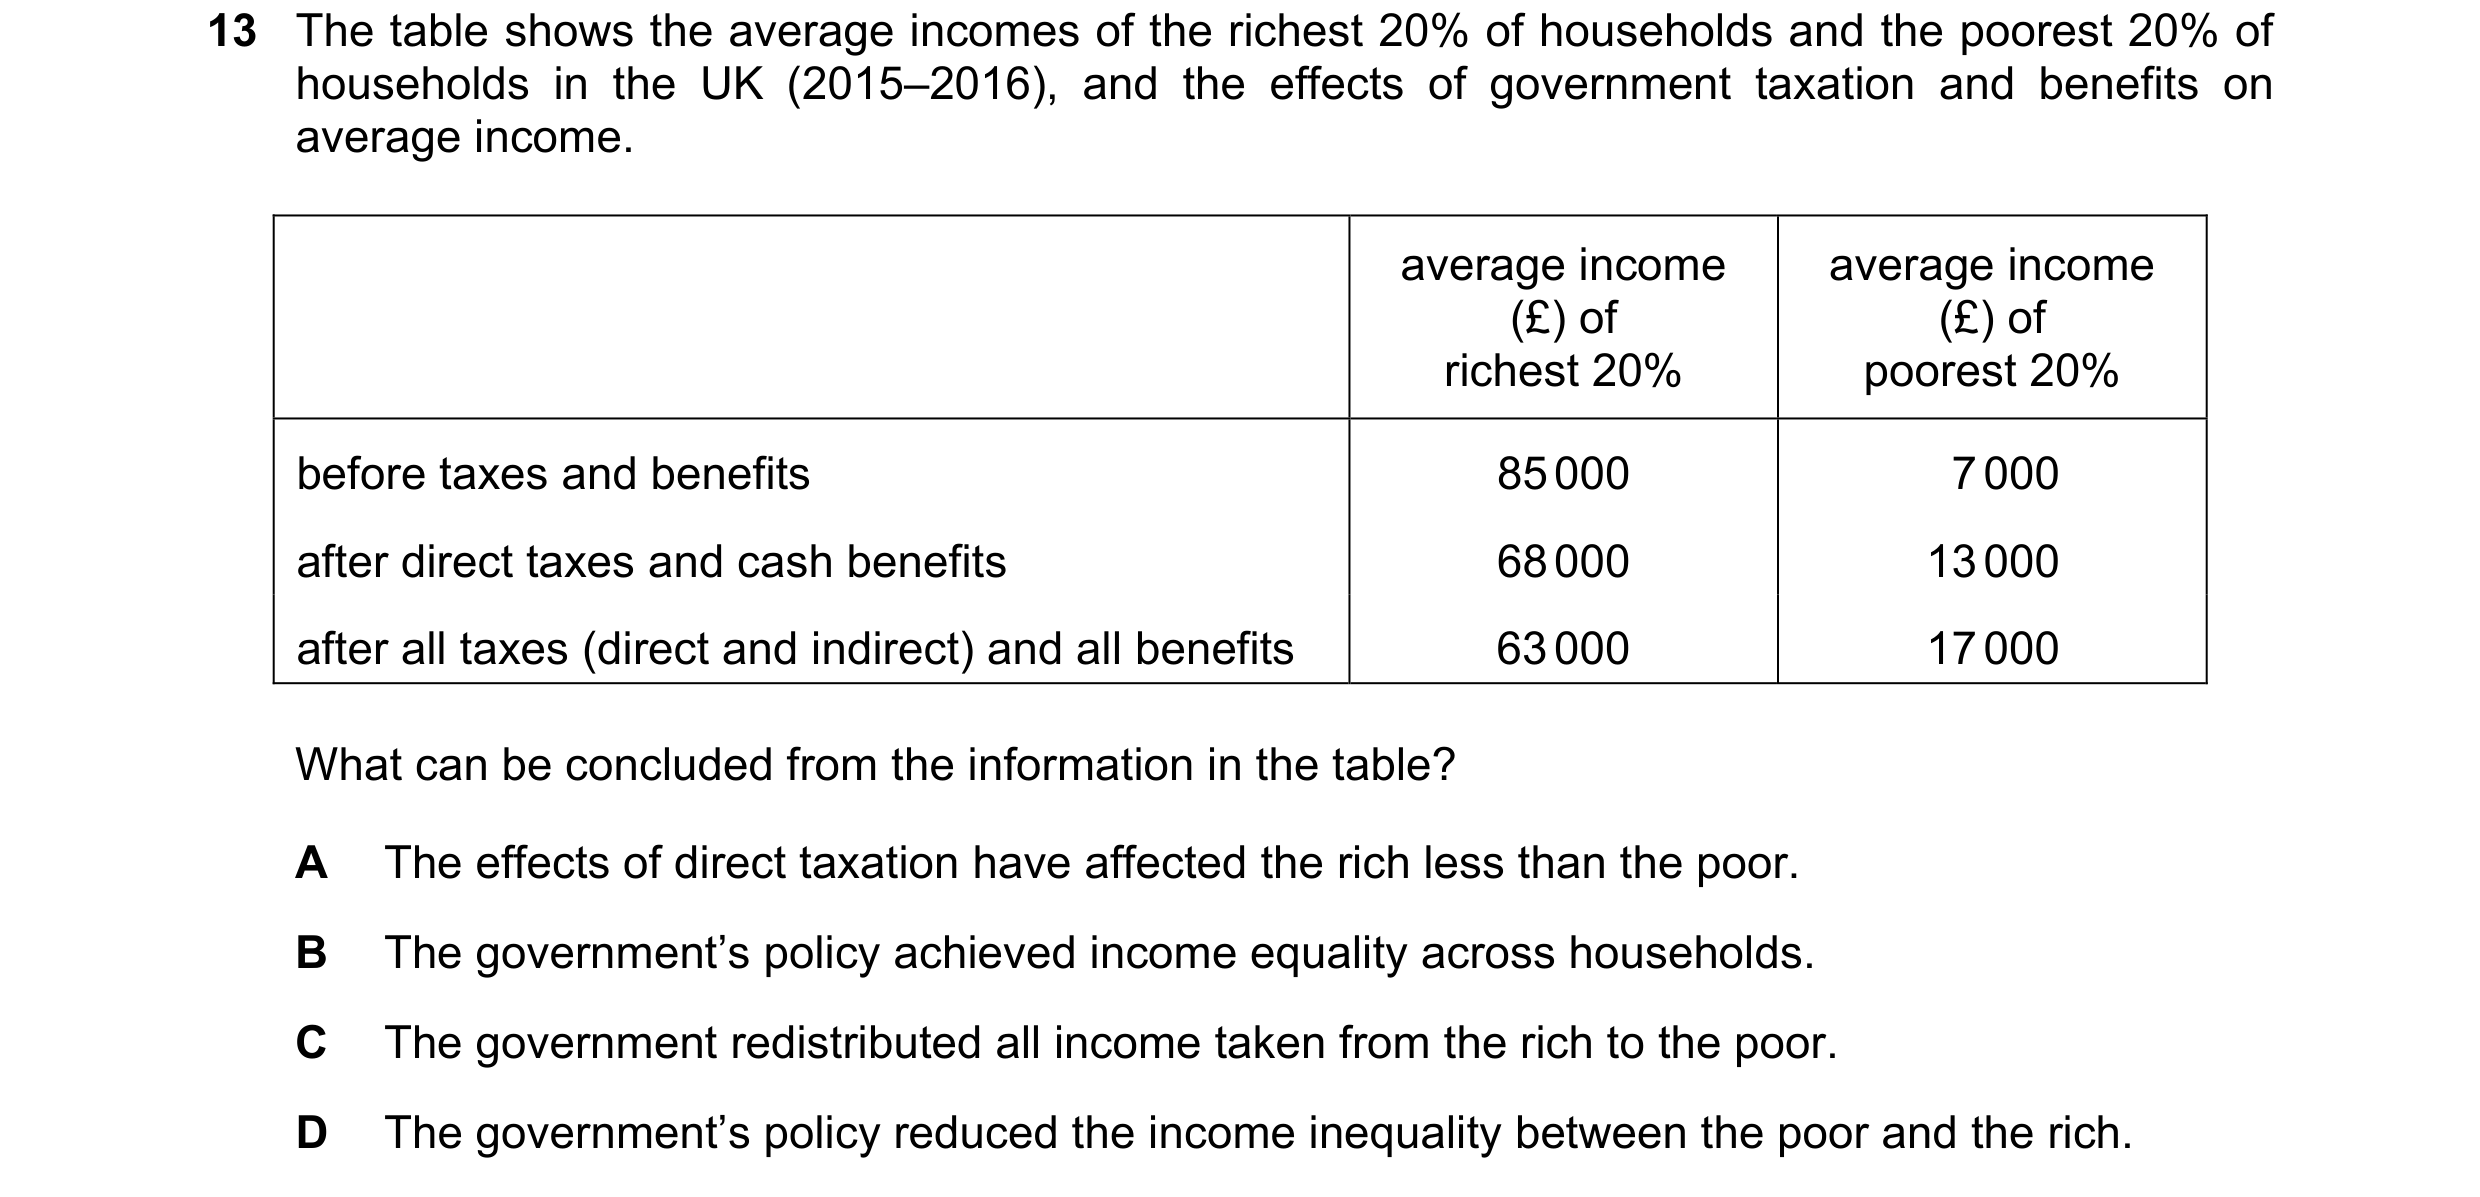
Q47 · The table shows the average incomes of the richest 20% of households and the poorest 20%… 9708/32 May/June 2019
13 The table shows the average incomes of the richest 20% of households and the poorest 20% of households in the UK (2015–2016), and the effects of government taxation and benefits on average income. average income average income (£) of (£) of richest 20% poorest 20% before taxes and benefits 85 000 7 000 after direct taxes and cash benefits 68 000 13 000 after all taxes (direct and indirect) and all benefits 63 000 17 000 What can be concluded from the information in the table? A The effects of direct taxation have affected the rich less than the poor. B The government’s policy achieved income equality across households. C The government redistributed all income taken from the rich to the poor. D The government’s policy reduced the income inequality between the poor and the rich.
1 marks
Answer: D
This question in 9708/32 May/June 2019
Q48 · A country has a negative income tax regime 9708/32 Oct/Nov 2019
15 A country has a negative income tax regime. The curve NT in the diagram shows the country’s initial tax schedule. + NT tax NT1 O income – A change in the tax rate causes the schedule to shift to NT1. How will this affect work incentives and the after-tax distribution of income? work distribution incentives of income A strengthen less equal B strengthen more equal C weaken less equal D weaken more equal
1 marks
Answer: A
This question in 9708/32 Oct/Nov 2019
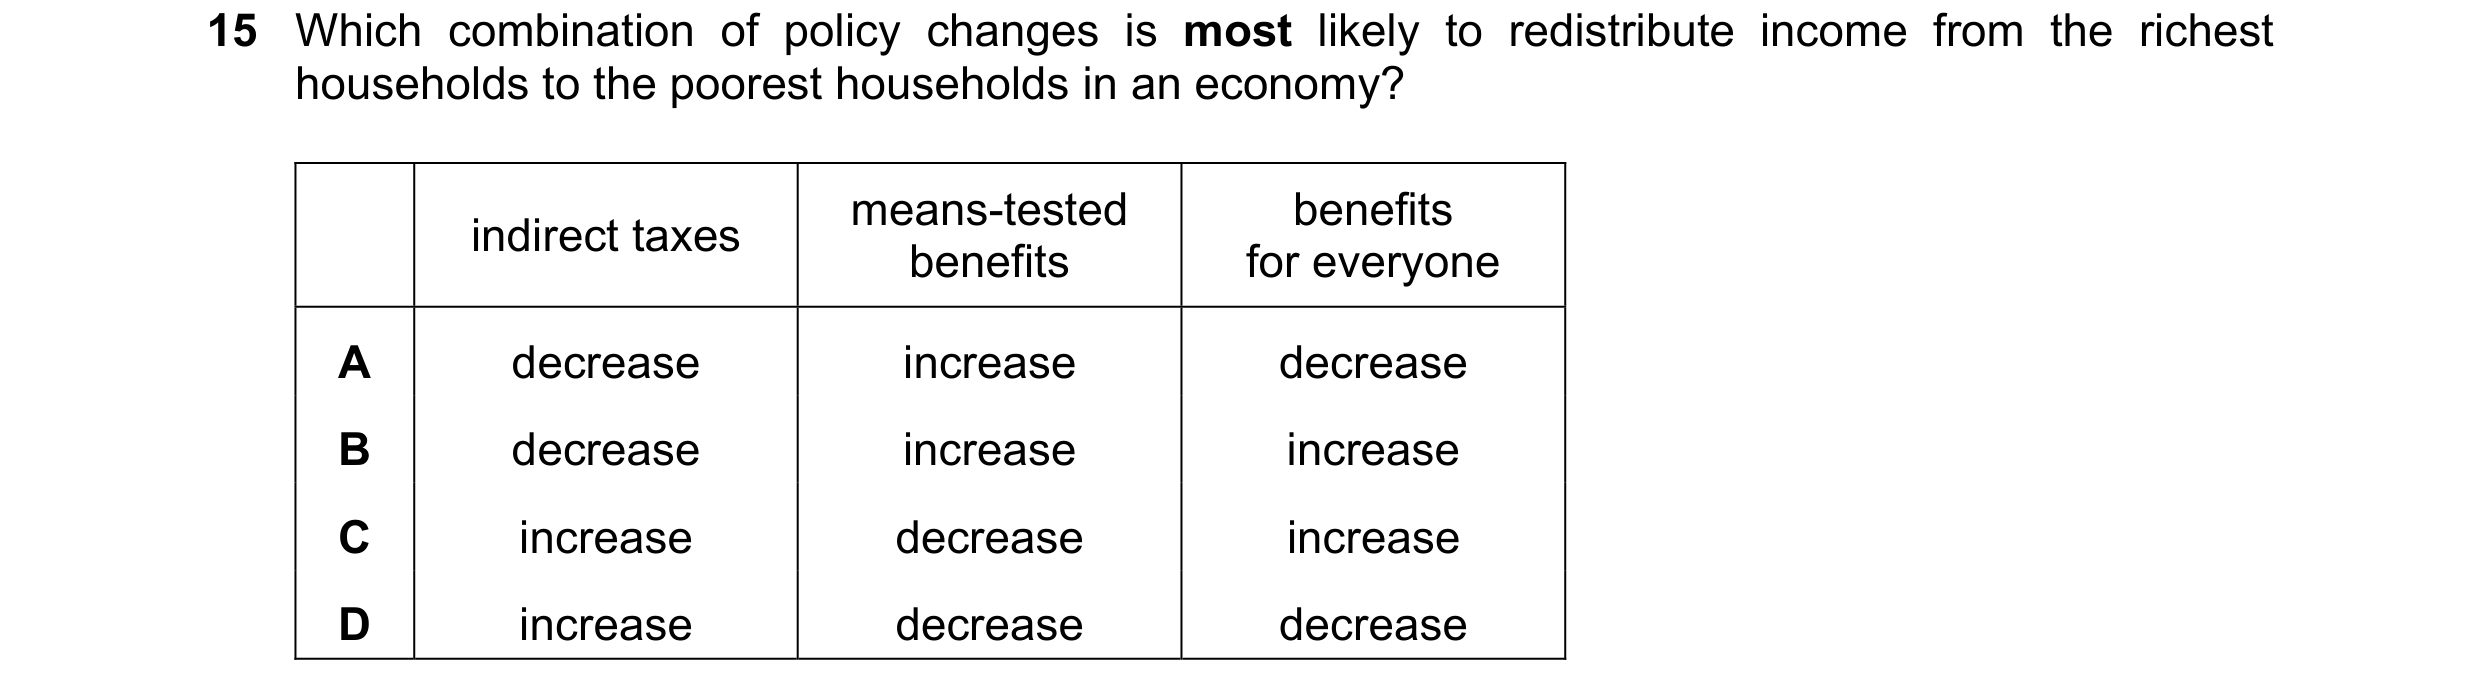
Q49 · Which combination of policy changes is most likely to redistribute income from the… 9708/32 Feb/March 2020
15 Which combination of policy changes is most likely to redistribute income from the richest households to the poorest households in an economy? means-tested benefits indirect taxes benefits for everyone A decrease increase decrease B decrease increase increase C increase decrease increase D increase decrease decrease
1 marks
Answer: A
This question in 9708/32 Feb/March 2020
Q50 · When does a more equal distribution of income occur? 9708/31 Oct/Nov 2020
15 When does a more equal distribution of income occur? A when a country’s income tax system is made more progressive B when someone is made better off without making someone else worse off C when the best use is made of scarce resources D when there is an increase in the Gini coefficient
1 marks
Answer: A
This question in 9708/31 Oct/Nov 2020
Q51 · What indicates that a more equal distribution of income has been achieved? 9708/32 Oct/Nov 2020
14 What indicates that a more equal distribution of income has been achieved? A a faster rate of economic growth B a higher Human Development Index C a lower Gini coefficient D a lower tax / GDP ratio
1 marks
Answer: C
This question in 9708/32 Oct/Nov 2020
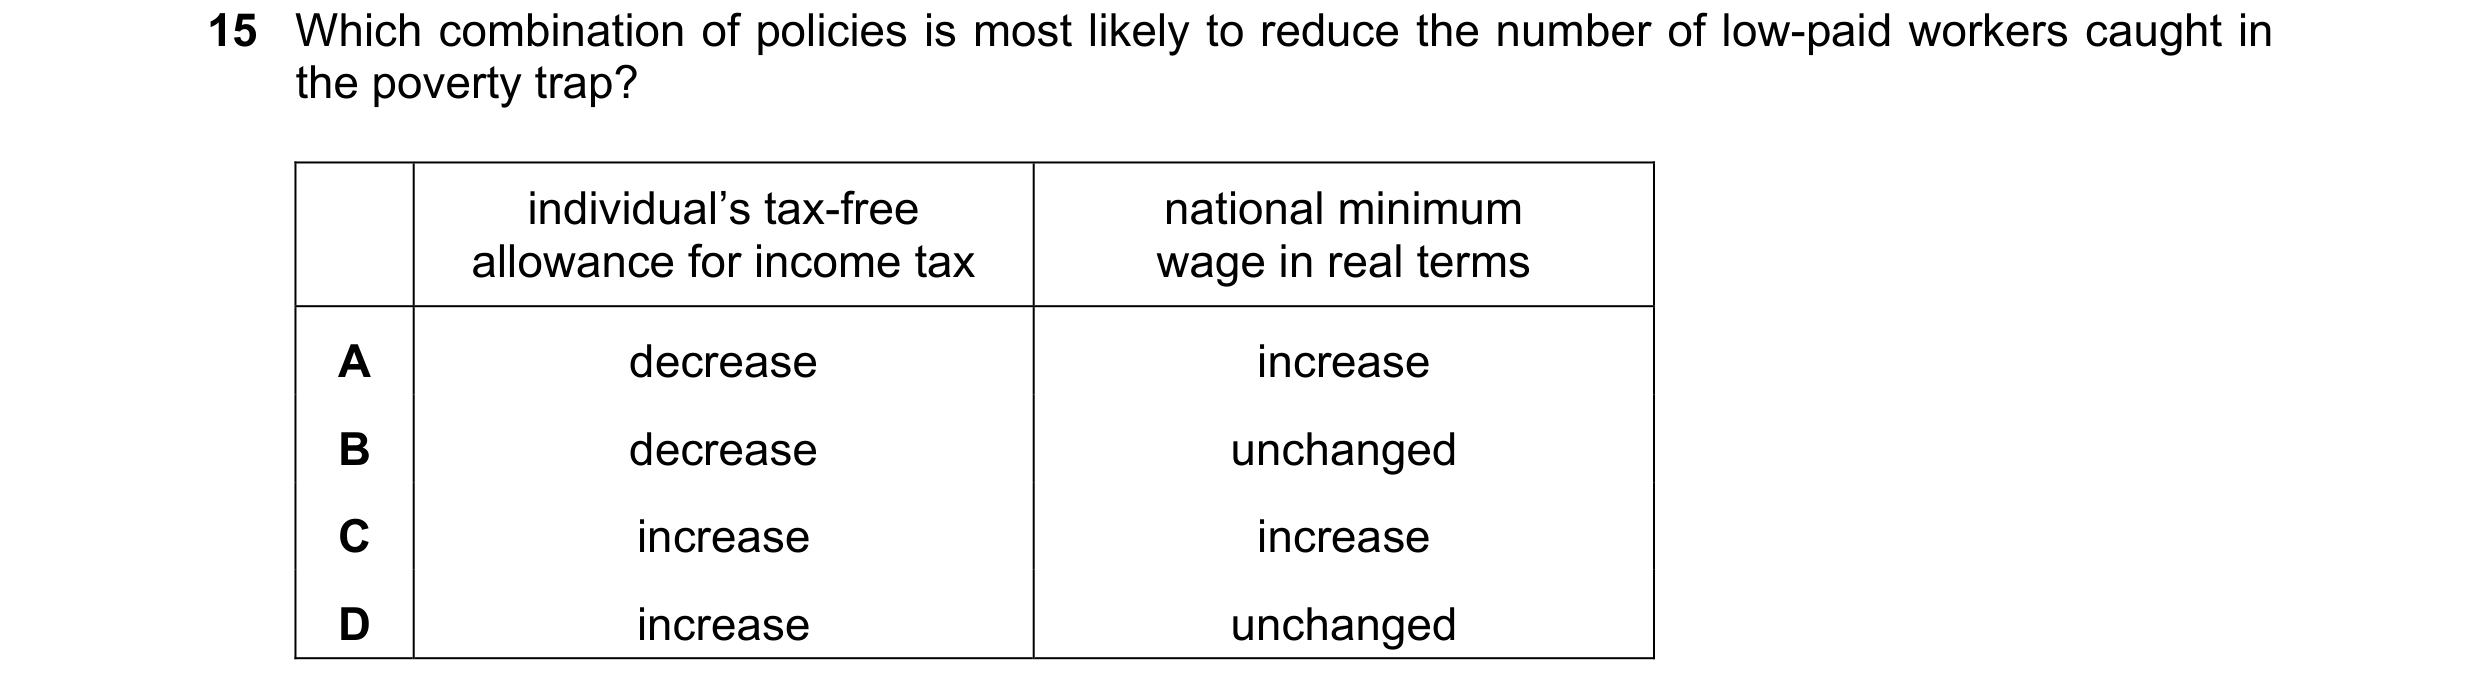
Q52 · Which combination of policies is most likely to reduce the number of low-paid workers… 9708/32 Oct/Nov 2020
15 Which combination of policies is most likely to reduce the number of low-paid workers caught in the poverty trap? individual’s tax-free national minimum allowance for income tax wage in real terms A decrease increase B decrease unchanged C increase increase D increase unchanged
1 marks
Answer: C
This question in 9708/32 Oct/Nov 2020
Q53 · The diagram shows a Lorenz curve, with two areas, X and Y, identified 9708/33 Oct/Nov 2020
14 The diagram shows a Lorenz curve, with two areas, X and Y, identified. 100 cumulative line of % of income perfect equality X Y Lorenz curve 0 100 cumulative % of households How is the corresponding Gini coefficient calculated? A X divided by (X plus Y) B (X plus Y) divided by X C (X plus Y) divided by Y D Y divided by (X plus Y)
1 marks
Answer: A
This question in 9708/33 Oct/Nov 2020
Q54 · Which combination of government policies will be most likely to affect inter-generational… 9708/33 Oct/Nov 2020
15 Which combination of government policies will be most likely to affect inter-generational equity? A a fall in overseas aid expenditure and a rise in domestic military spending B a fall in the top rate of income tax and a rise in the sales tax (VAT) on luxury goods C a rise in educational maintenance allowances and a fall in state pensions D a rise in unemployment benefits and a rise in national insurance contributions
1 marks
Answer: C
This question in 9708/33 Oct/Nov 2020
Q55 · Recent research has shown that consumption of some foods might be harmful 9708/32 Feb/March 2021
15 Recent research has shown that consumption of some foods might be harmful. A government committee considers how to intervene in the markets. Which intervention is most likely to reduce consumption of these foods without reducing income equality? A a minimum price for the harmful foods B a subsidy for substitute foods C an ad valorem tax on the harmful foods D an indirect tax on the harmful foods
1 marks
Answer: B
This question in 9708/32 Feb/March 2021
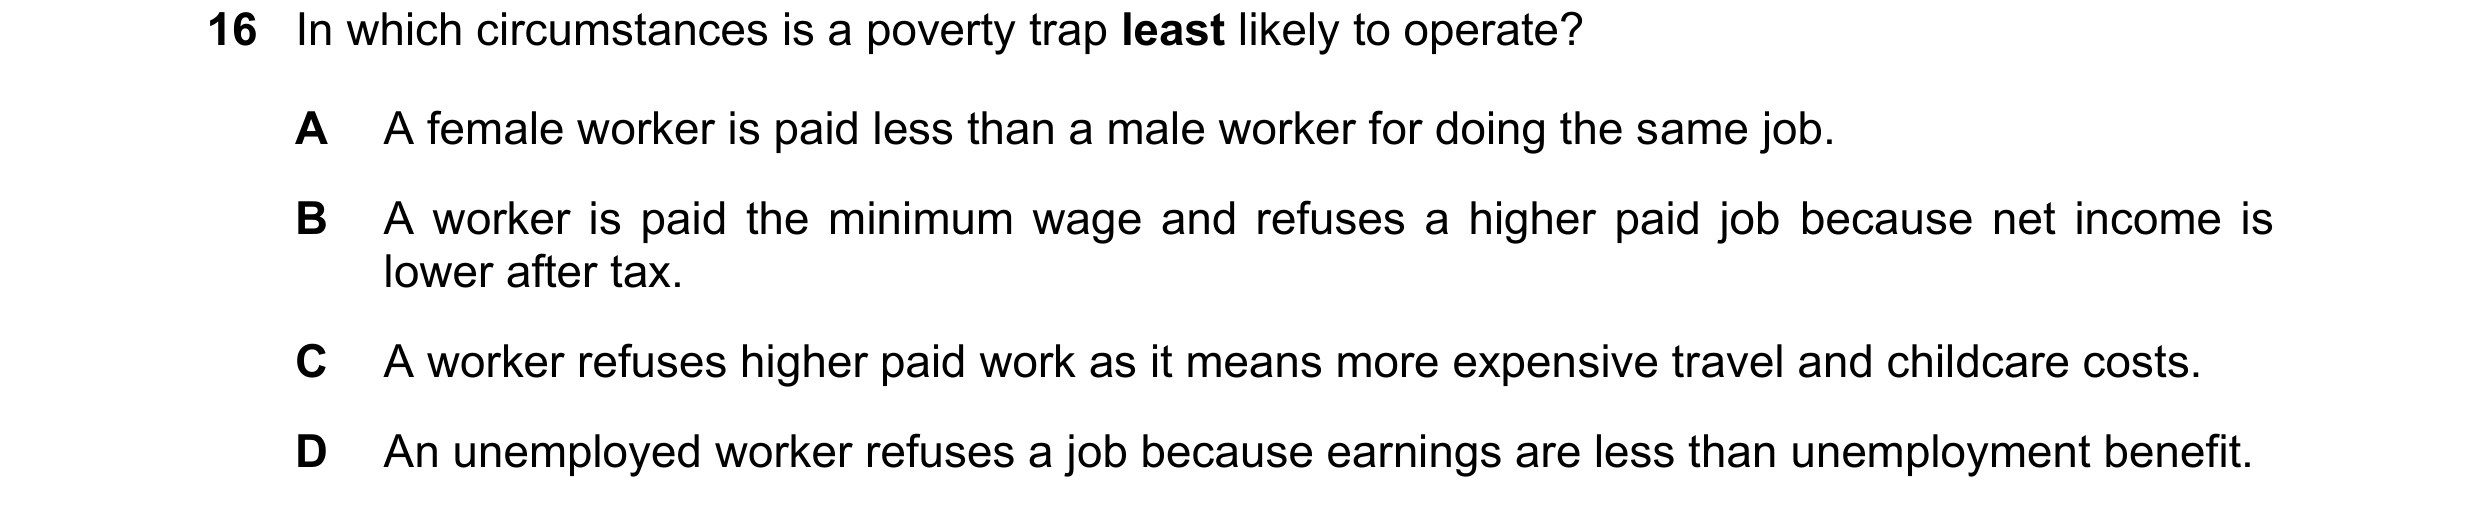
Q56 · In which circumstances is a poverty trap least likely to operate? 9708/32 Feb/March 2021
16 In which circumstances is a poverty trap least likely to operate? A A female worker is paid less than a male worker for doing the same job. B A worker is paid the minimum wage and refuses a higher paid job because net income is lower after tax. C A worker refuses higher paid work as it means more expensive travel and childcare costs. D An unemployed worker refuses a job because earnings are less than unemployment benefit.
1 marks
Answer: A
This question in 9708/32 Feb/March 2021
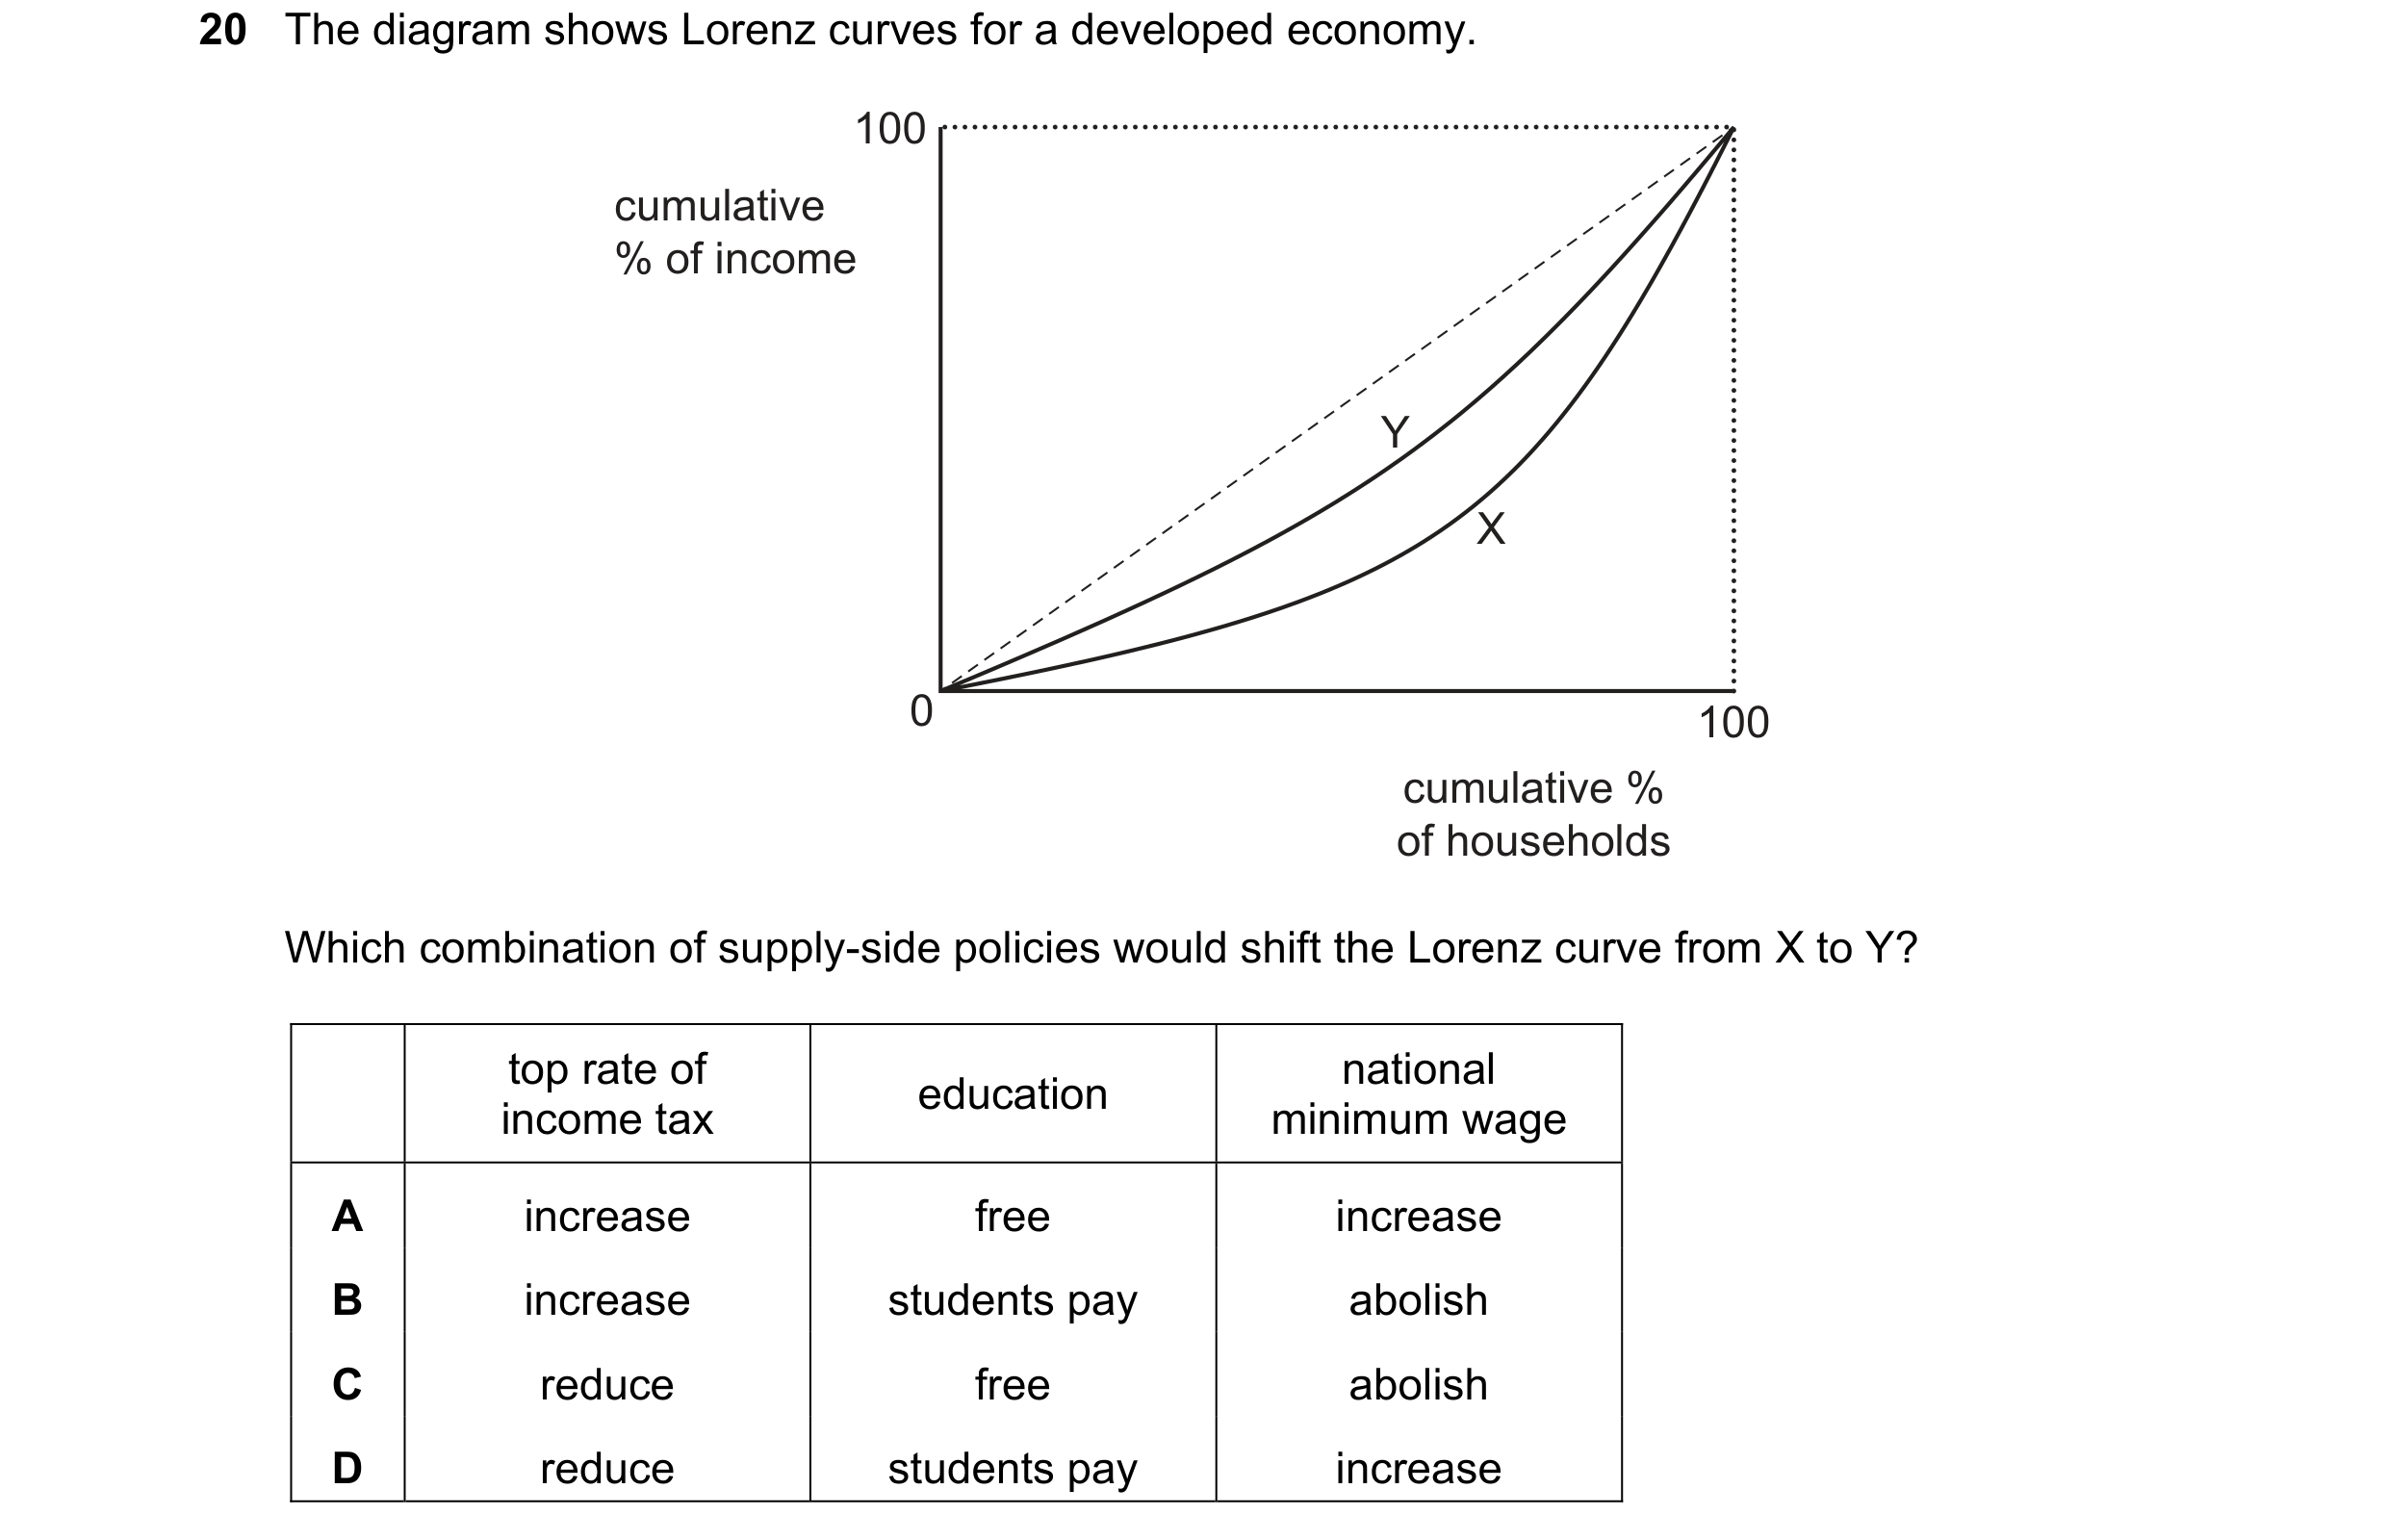
Q57 · The diagram shows Lorenz curves for a developed economy 9708/32 Feb/March 2021
20 The diagram shows Lorenz curves for a developed economy. 100 cumulative % of income Y X 0 100 cumulative % of households Which combination of supply-side policies would shift the Lorenz curve from X to Y? top rate of national education income tax minimum wage A increase free increase B increase students pay abolish C reduce free abolish D reduce students pay increase
1 marks
Answer: A
This question in 9708/32 Feb/March 2021
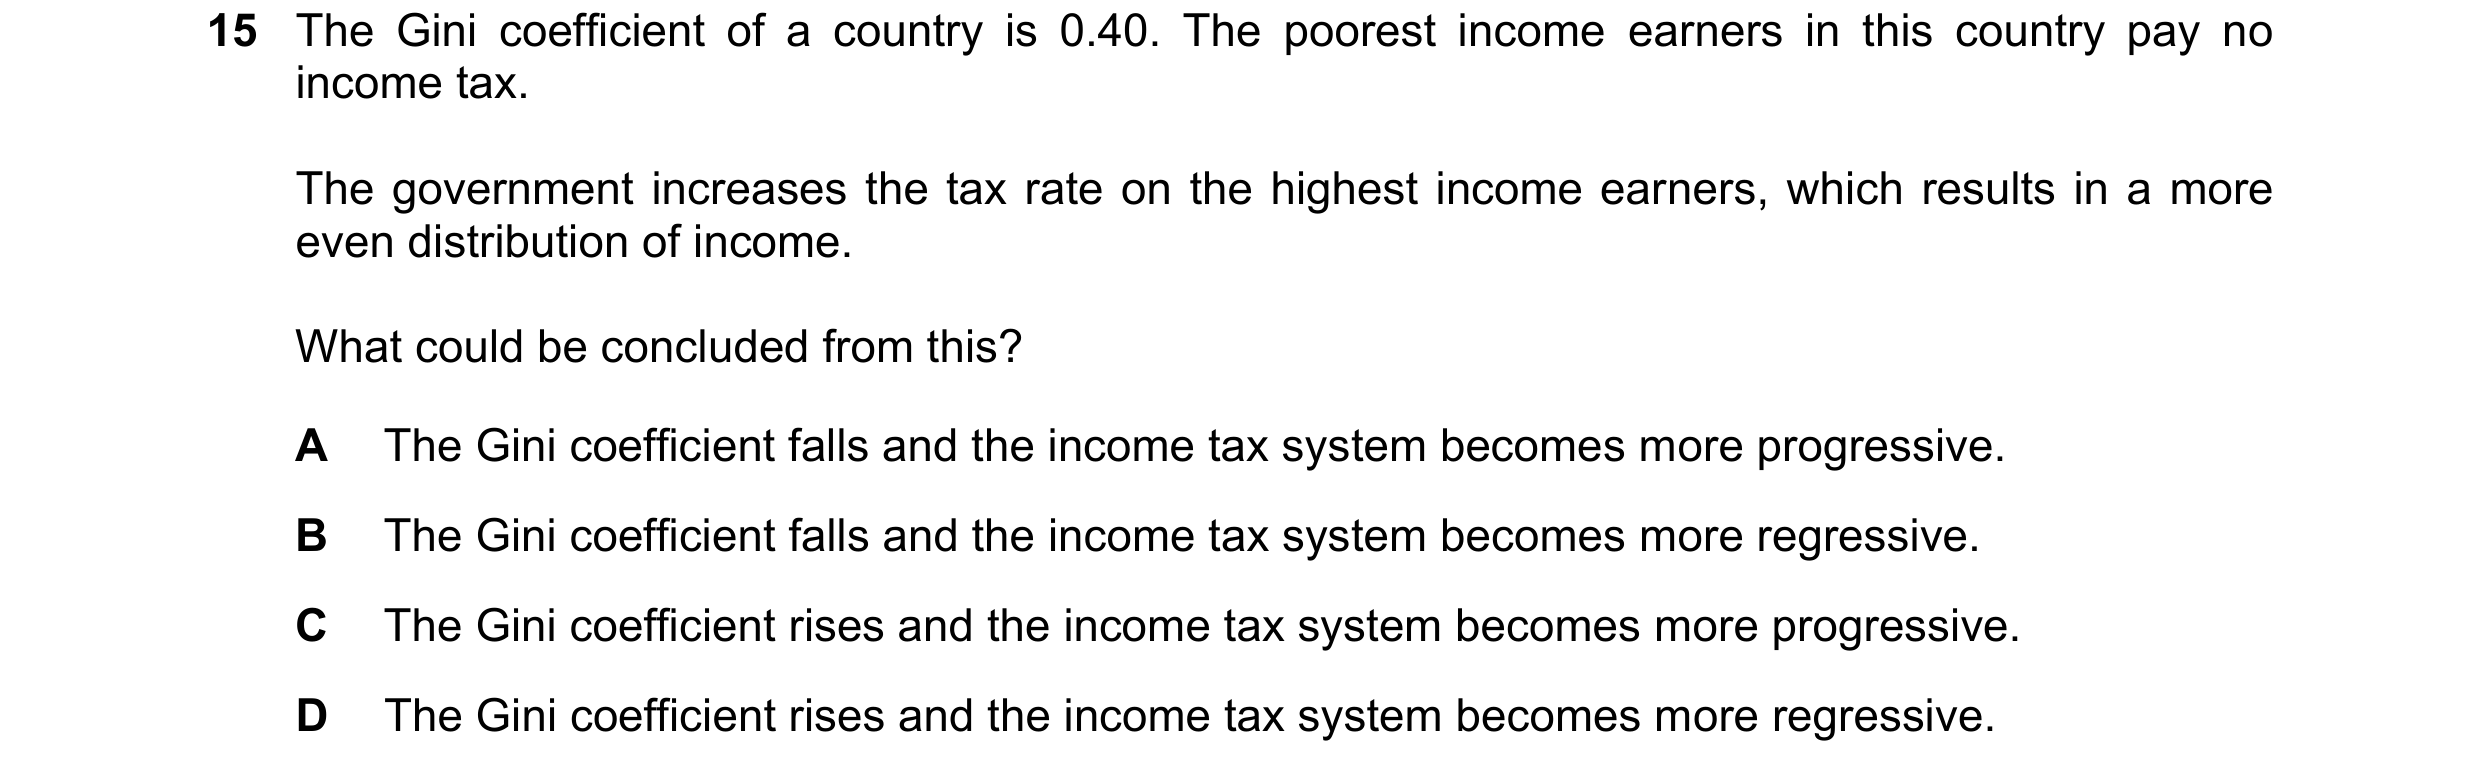
Q58 · The Gini coefficient of a country is 0.40 9708/31 May/June 2021
15 The Gini coefficient of a country is 0.40. The poorest income earners in this country pay no income tax. The government increases the tax rate on the highest income earners, which results in a more even distribution of income. What could be concluded from this? A The Gini coefficient falls and the income tax system becomes more progressive. B The Gini coefficient falls and the income tax system becomes more regressive. C The Gini coefficient rises and the income tax system becomes more progressive. D The Gini coefficient rises and the income tax system becomes more regressive.
1 marks
Answer: A
This question in 9708/31 May/June 2021
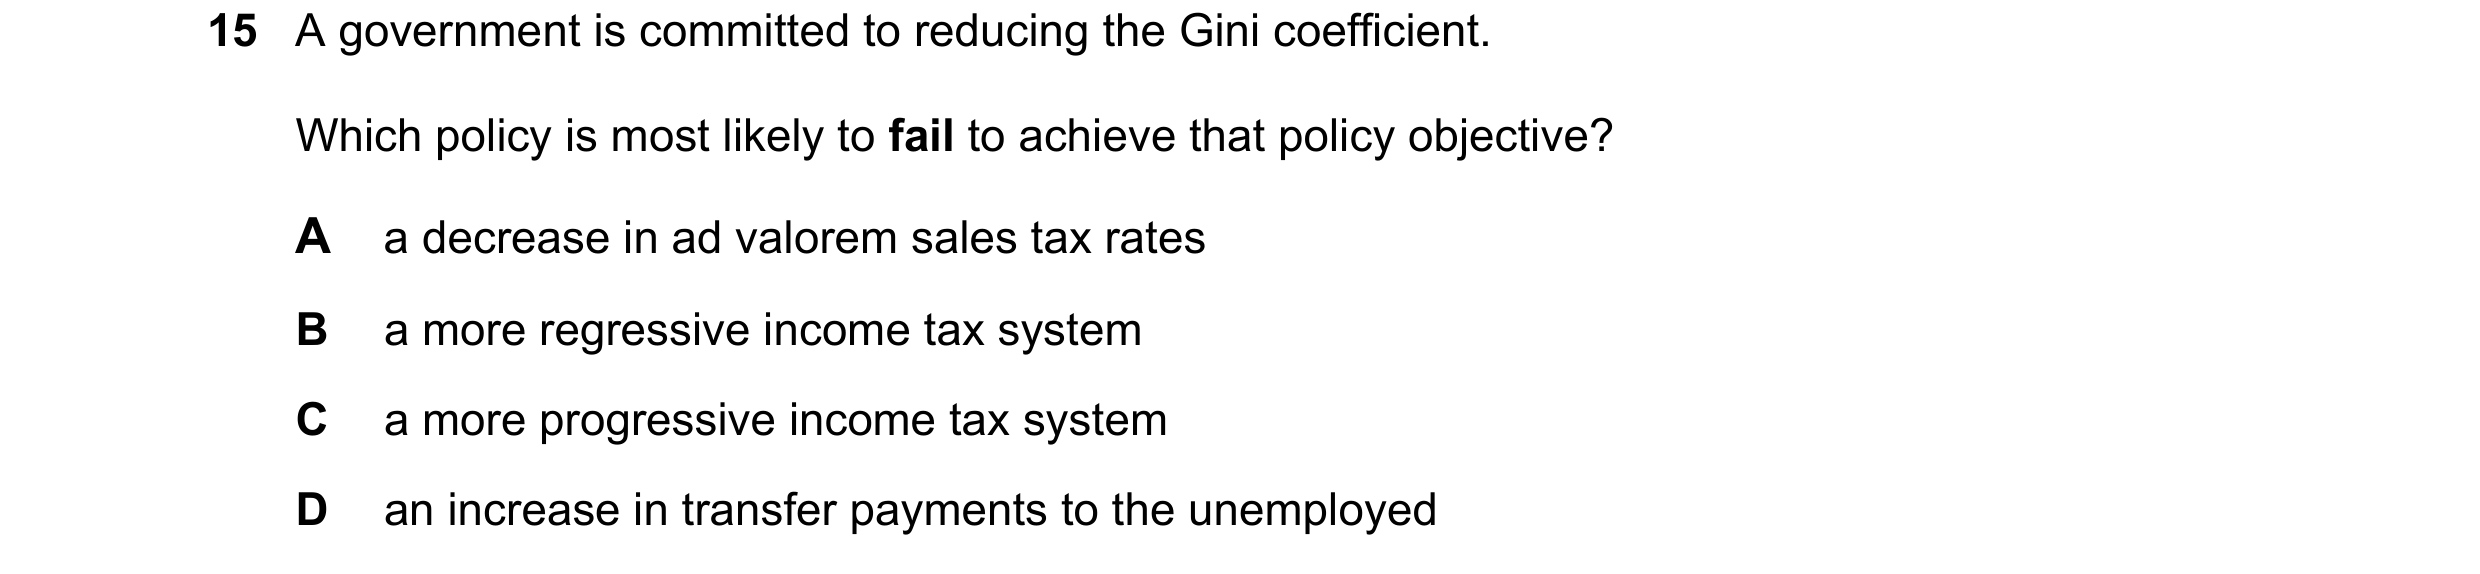
Q59 · A government is committed to reducing the Gini coefficient 9708/32 May/June 2021
15 A government is committed to reducing the Gini coefficient. Which policy is most likely to fail to achieve that policy objective? A a decrease in ad valorem sales tax rates B a more regressive income tax system C a more progressive income tax system D an increase in transfer payments to the unemployed
1 marks
Answer: B
This question in 9708/32 May/June 2021
Q60 · The Gini coefficient of a country is 0.40 9708/33 May/June 2021
15 The Gini coefficient of a country is 0.40. The poorest income earners in this country pay no income tax. The government increases the tax rate on the highest income earners, which results in a more even distribution of income. What could be concluded from this? A The Gini coefficient falls and the income tax system becomes more progressive. B The Gini coefficient falls and the income tax system becomes more regressive. C The Gini coefficient rises and the income tax system becomes more progressive. D The Gini coefficient rises and the income tax system becomes more regressive.
1 marks
Answer: A
This question in 9708/33 May/June 2021
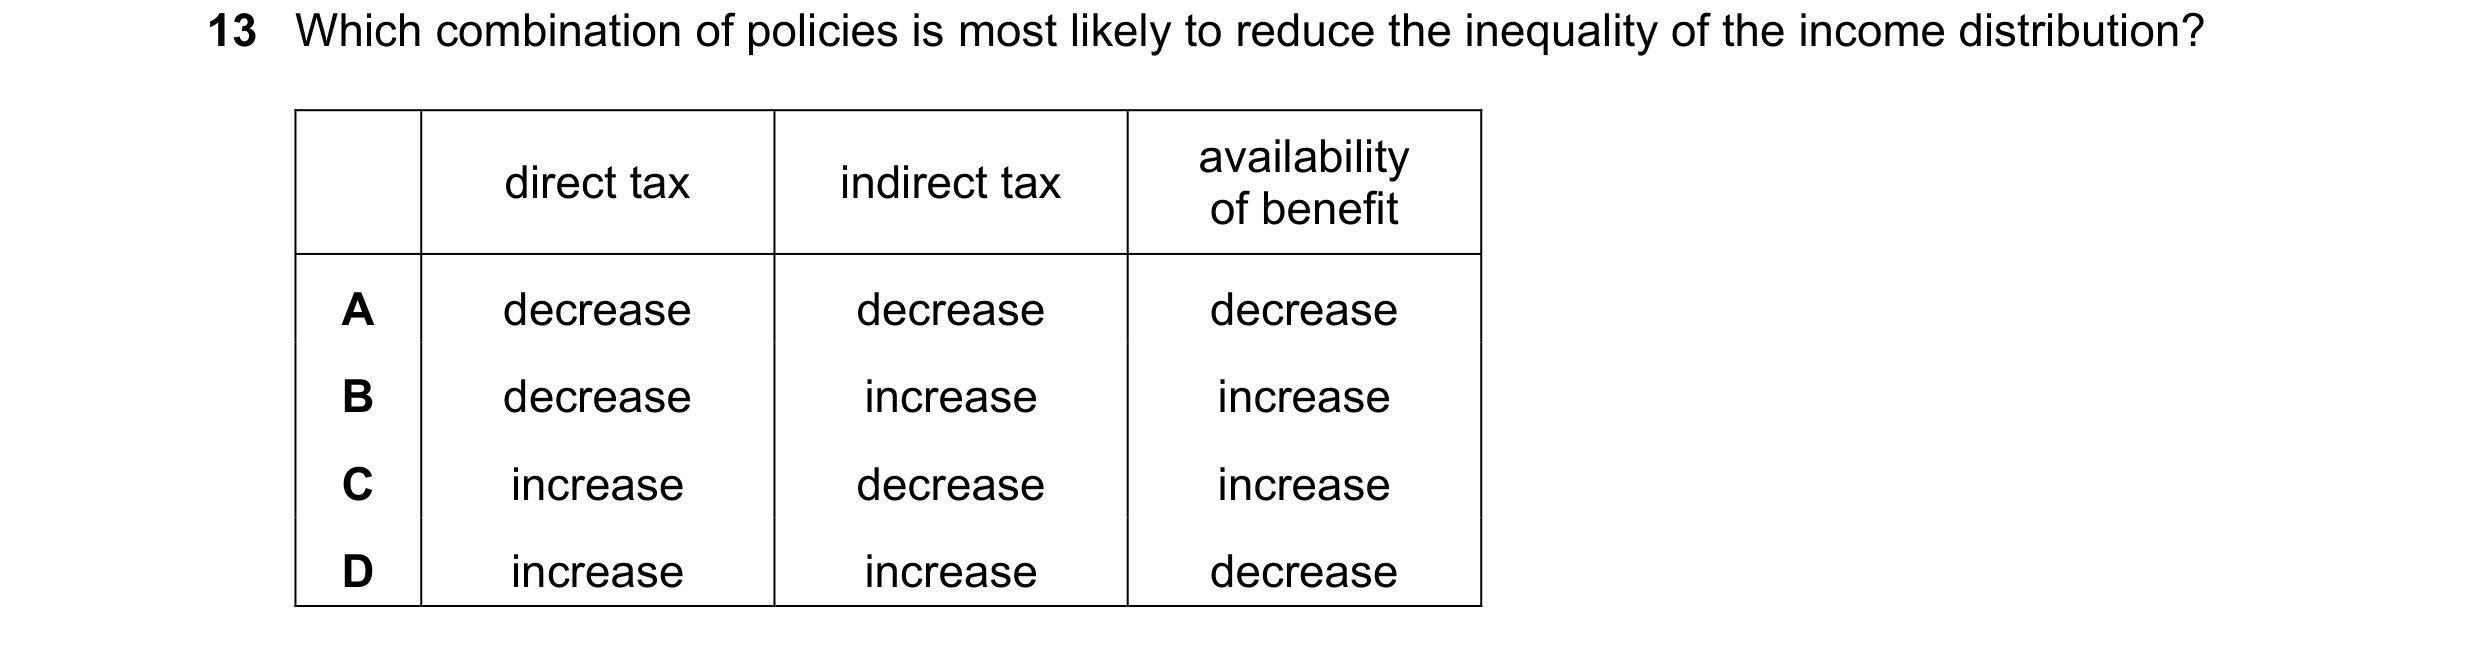
Q61 · Which combination of policies is most likely to reduce the inequality of the income… 9708/31 Oct/Nov 2021
13 Which combination of policies is most likely to reduce the inequality of the income distribution? availability direct tax indirect tax of benefit A decrease decrease decrease B decrease increase increase C increase decrease increase D increase increase decrease
1 marks
Answer: C
This question in 9708/31 Oct/Nov 2021
Q62 · The diagram shows an economy’s Lorenz curve (VW) 9708/31 Oct/Nov 2021
15 The diagram shows an economy’s Lorenz curve (VW). W 100 cumulative 45° % of income X Y V 00 100 cumulative % of population The area of Y is three times bigger than the area of X. What is the value of the economy’s Gini coefficient? A 3 1 B 4 1 C 3 4 D 3 4
1 marks
Answer: B
This question in 9708/31 Oct/Nov 2021
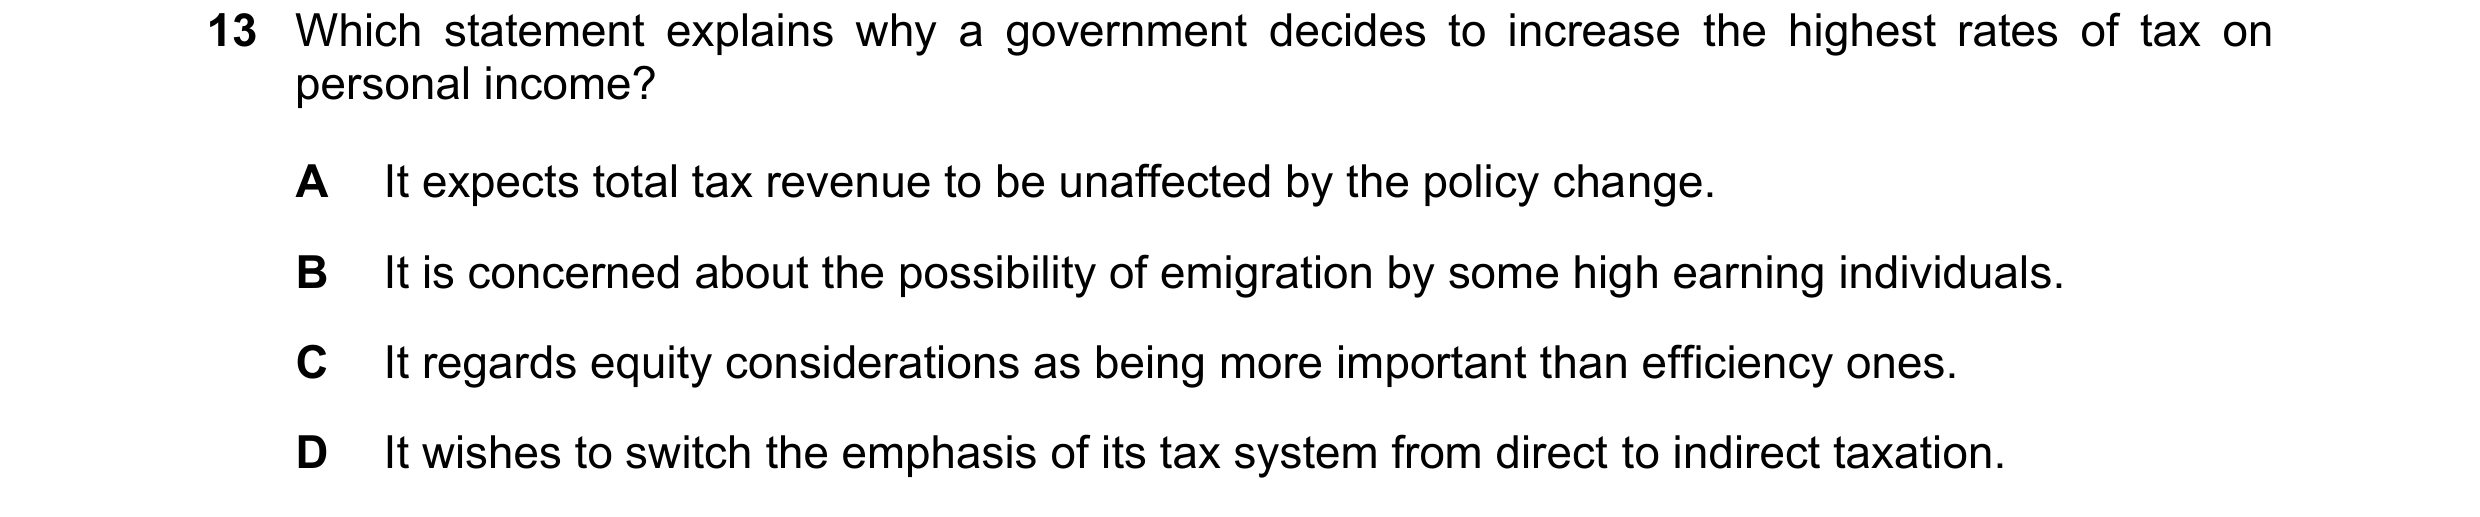
Q63 · Which statement explains why a government decides to increase the highest rates of tax on… 9708/32 Oct/Nov 2021
13 Which statement explains why a government decides to increase the highest rates of tax on personal income? A It expects total tax revenue to be unaffected by the policy change. B It is concerned about the possibility of emigration by some high earning individuals. C It regards equity considerations as being more important than efficiency ones. D It wishes to switch the emphasis of its tax system from direct to indirect taxation.
1 marks
Answer: C
This question in 9708/32 Oct/Nov 2021
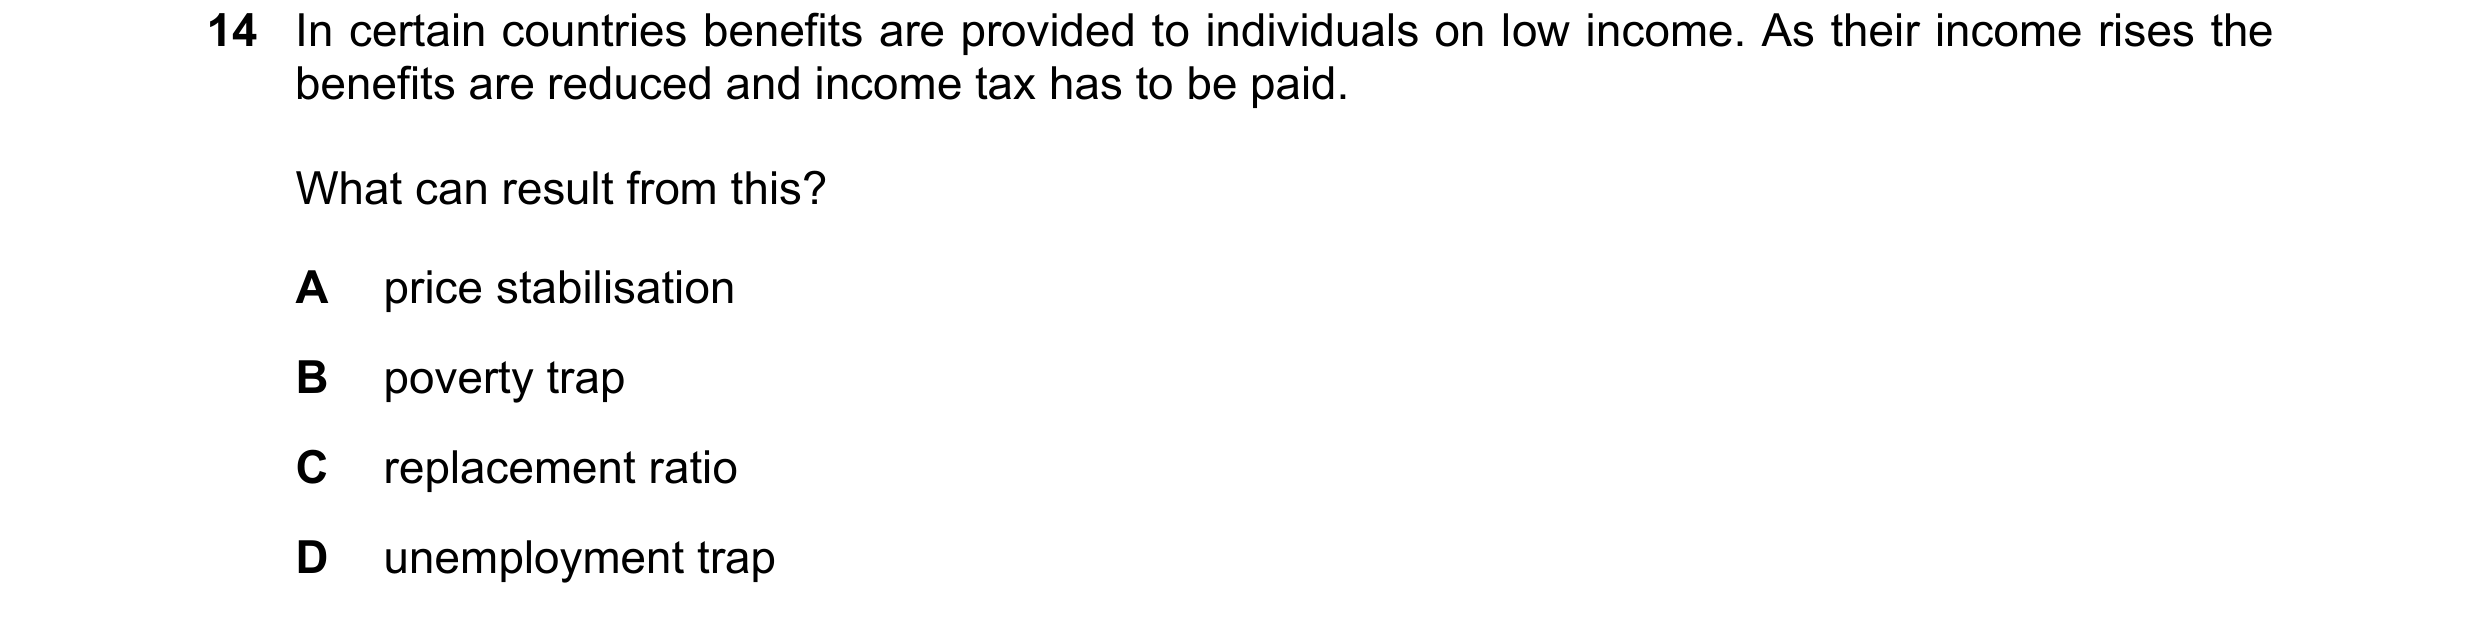
Q64 · In certain countries benefits are provided to individuals on low income 9708/32 Oct/Nov 2021
14 In certain countries benefits are provided to individuals on low income. As their income rises the benefits are reduced and income tax has to be paid. What can result from this? A price stabilisation B poverty trap C replacement ratio D unemployment trap
1 marks
Answer: B
This question in 9708/32 Oct/Nov 2021
Q65 · What changes are most likely to reduce the level of income inequality in an economy? 9708/32 Oct/Nov 2021
20 What changes are most likely to reduce the level of income inequality in an economy? A additional government regulation of product and factor markets B increased progressive direct taxation and decreased indirect taxation C increased trade union power and reduced labour market flexibility D reduced welfare benefits and increased rate of interest
1 marks
Answer: B
This question in 9708/32 Oct/Nov 2021
Q66 · What is shown by the Kuznets curve? 9708/31 May/June 2022
20 What is shown by the Kuznets curve? A the rise and then fall in the balance of trade deficit following a devaluation B the rise and then fall in the economic growth rate as the GDP increases C the rise and then fall in inequality as the level of income per head rises D the rise and then fall in tax revenue as the tax rate is increased
1 marks
Answer: C
This question in 9708/31 May/June 2022
Q67 · What is shown by the Kuznets curve? 9708/33 May/June 2022
20 What is shown by the Kuznets curve? A the rise and then fall in the balance of trade deficit following a devaluation B the rise and then fall in the economic growth rate as the GDP increases C the rise and then fall in inequality as the level of income per head rises D the rise and then fall in tax revenue as the tax rate is increased
1 marks
Answer: C
This question in 9708/33 May/June 2022
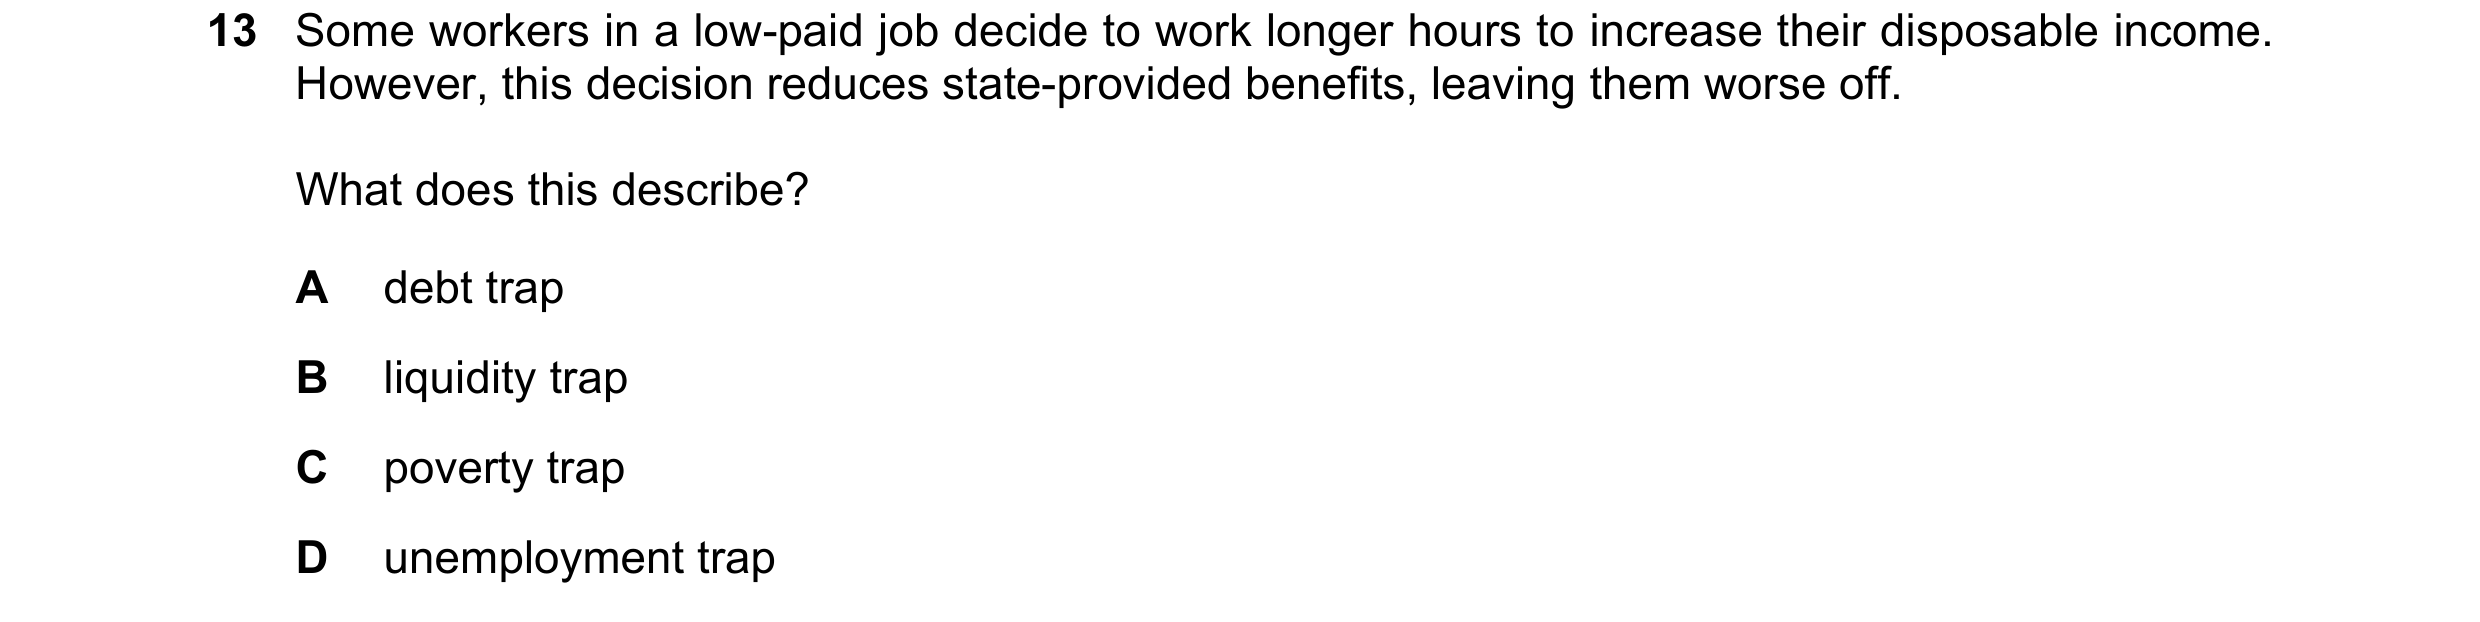
Q68 · Some workers in a low-paid job decide to work longer hours to increase their disposable… 9708/31 Oct/Nov 2022
13 Some workers in a low-paid job decide to work longer hours to increase their disposable income. However, this decision reduces state-provided benefits, leaving them worse off. What does this describe? A debt trap B liquidity trap C poverty trap D unemployment trap
1 marks
Answer: C
This question in 9708/31 Oct/Nov 2022
Q69 · Governments often aim to reduce income inequalities 9708/32 Oct/Nov 2022
14 Governments often aim to reduce income inequalities. The diagram shows the effects of using taxation and benefits to try to achieve this aim. 100 000 average income per household 80 000 key ($ per year) original income 60 000 disposable income final income 40 000 20 000 0 bottom 2nd 3rd 4th top 20% 20% 20% 20% 20% household income What can be concluded from the diagram about the effects of taxes and benefits? A All income groups are better off except those originally earning more than $40 000 per year. B Benefits paid to the lower income groups are not a burden because they are not paid out of tax revenues. C The average final income of the top 20% exceeds the combined final incomes of the other groups. D The progressive taxation system still favours the top 20% over the bottom 20% of households.
1 marks
Answer: A
This question in 9708/32 Oct/Nov 2022
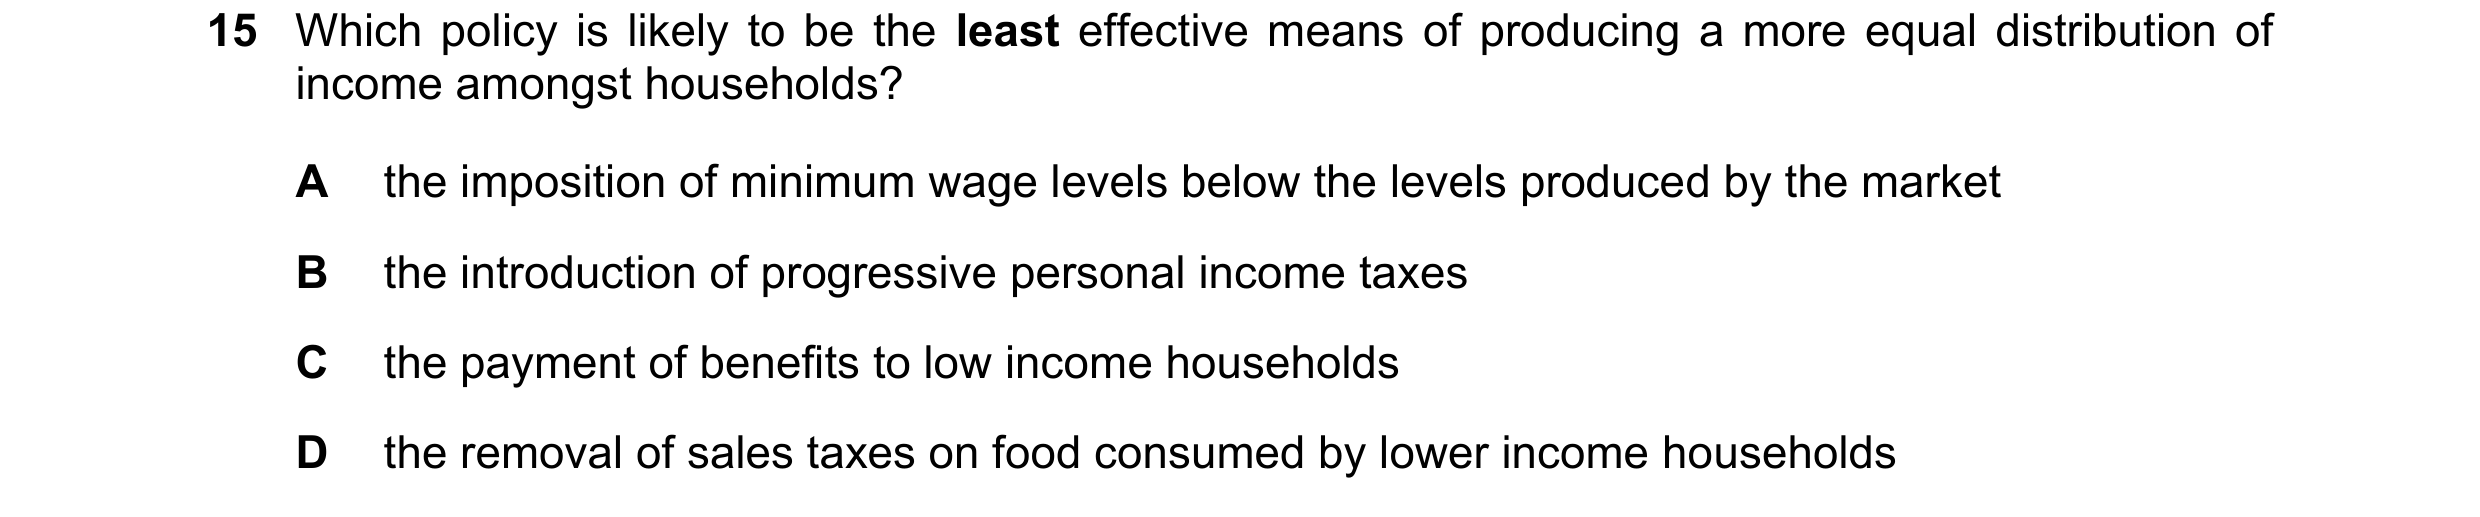
Q70 · Which policy is likely to be the least effective means of producing a more equal… 9708/32 Oct/Nov 2022
15 Which policy is likely to be the least effective means of producing a more equal distribution of income amongst households? A the imposition of minimum wage levels below the levels produced by the market B the introduction of progressive personal income taxes C the payment of benefits to low income households D the removal of sales taxes on food consumed by lower income households
1 marks
Answer: A
This question in 9708/32 Oct/Nov 2022
Q71 · The table shows the average incomes of the richest 20% of households and the poorest 20%… 9708/33 Oct/Nov 2022
15 The table shows the average incomes of the richest 20% of households and the poorest 20% of households in the UK (2015–2016), and the effects of government taxation and benefits on average income. average income average income (£) of (£) of richest 20% poorest 20% before taxes and benefits 85 000 7 000 after direct taxes and cash benefits 68 000 13 000 after all taxes (direct and indirect) and all benefits 63 000 17 000 What can be concluded from the information in the table? A The effects of direct taxation have affected the rich less than the poor. B The government’s policy achieved income equality across households. C The government redistributed all income taken from the rich to the poor. D The government’s policy reduced the income inequality between the poor and the rich.
1 marks
Answer: D
This question in 9708/33 Oct/Nov 2022
Q72 · Which changes in direct and indirect tax are likely to increase the inequality in the… 9708/32 Feb/March 2023
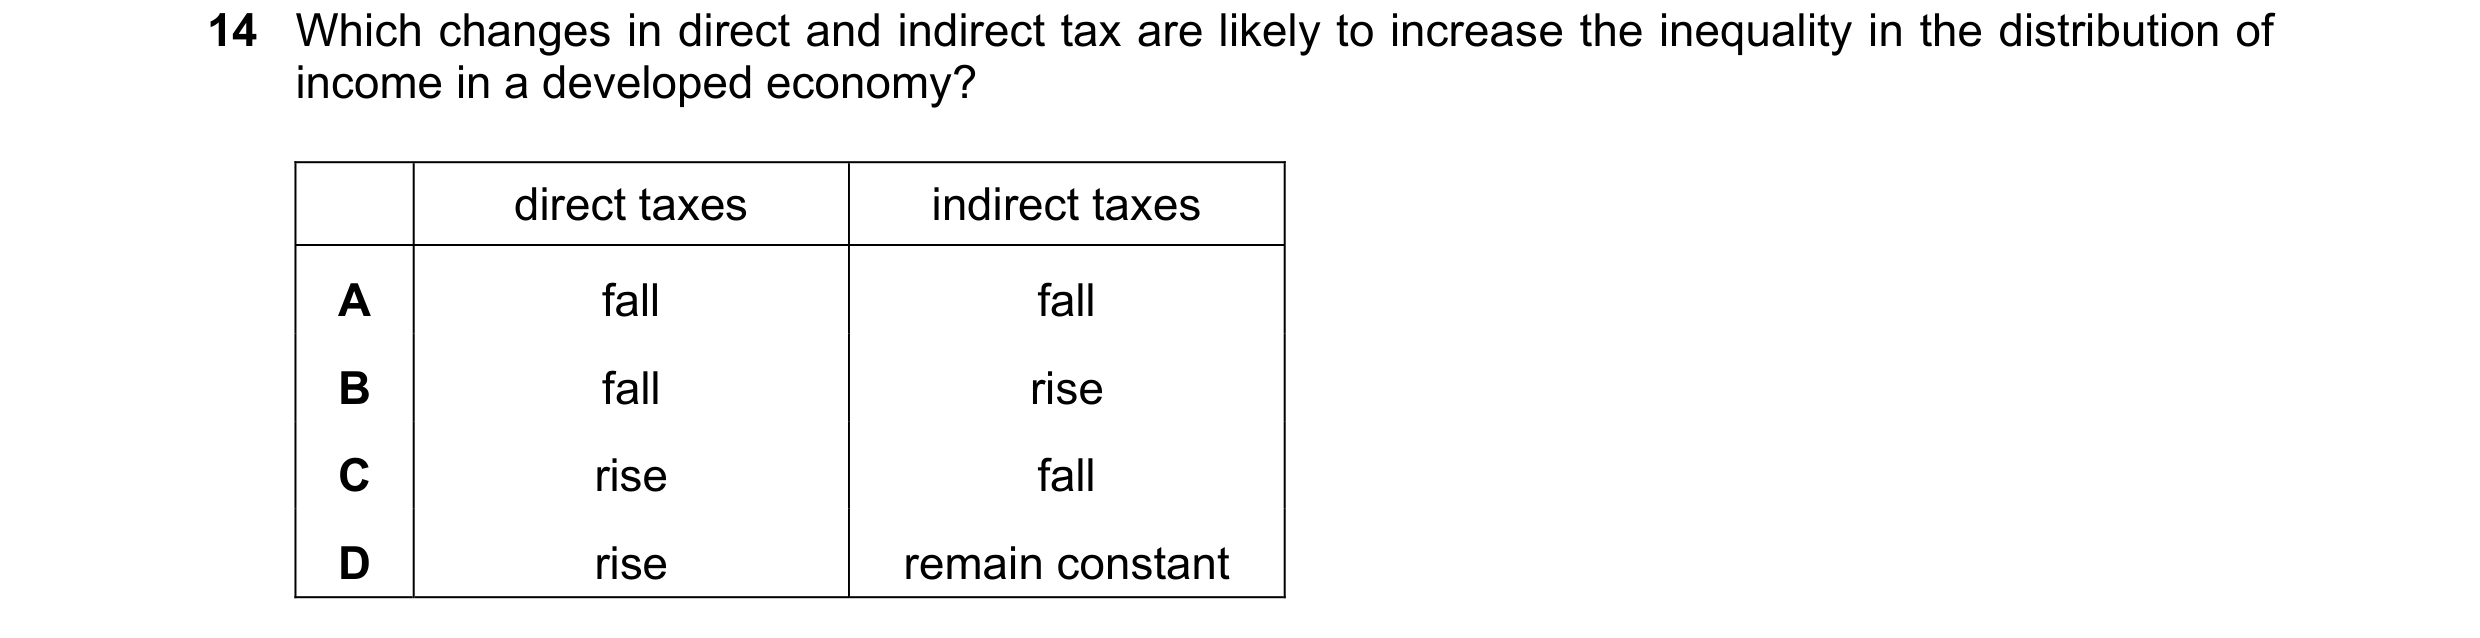
14 Which changes in direct and indirect tax are likely to increase the inequality in the distribution of income in a developed economy? direct taxes indirect taxes A fall fall B fall rise C rise fall D rise remain constant
1 marks
Answer: B
This question in 9708/32 Feb/March 2023
Q73 · In a country, the top 20% of earners pay 45% in income tax and 25% on sales taxes, and… 9708/32 Feb/March 2023
16 In a country, the top 20% of earners pay 45% in income tax and 25% on sales taxes, and receive 5% in cash benefits. What is the percentage of disposable income for this group? A 30% B 55% C 60% D 80%
1 marks
Answer: C
This question in 9708/32 Feb/March 2023
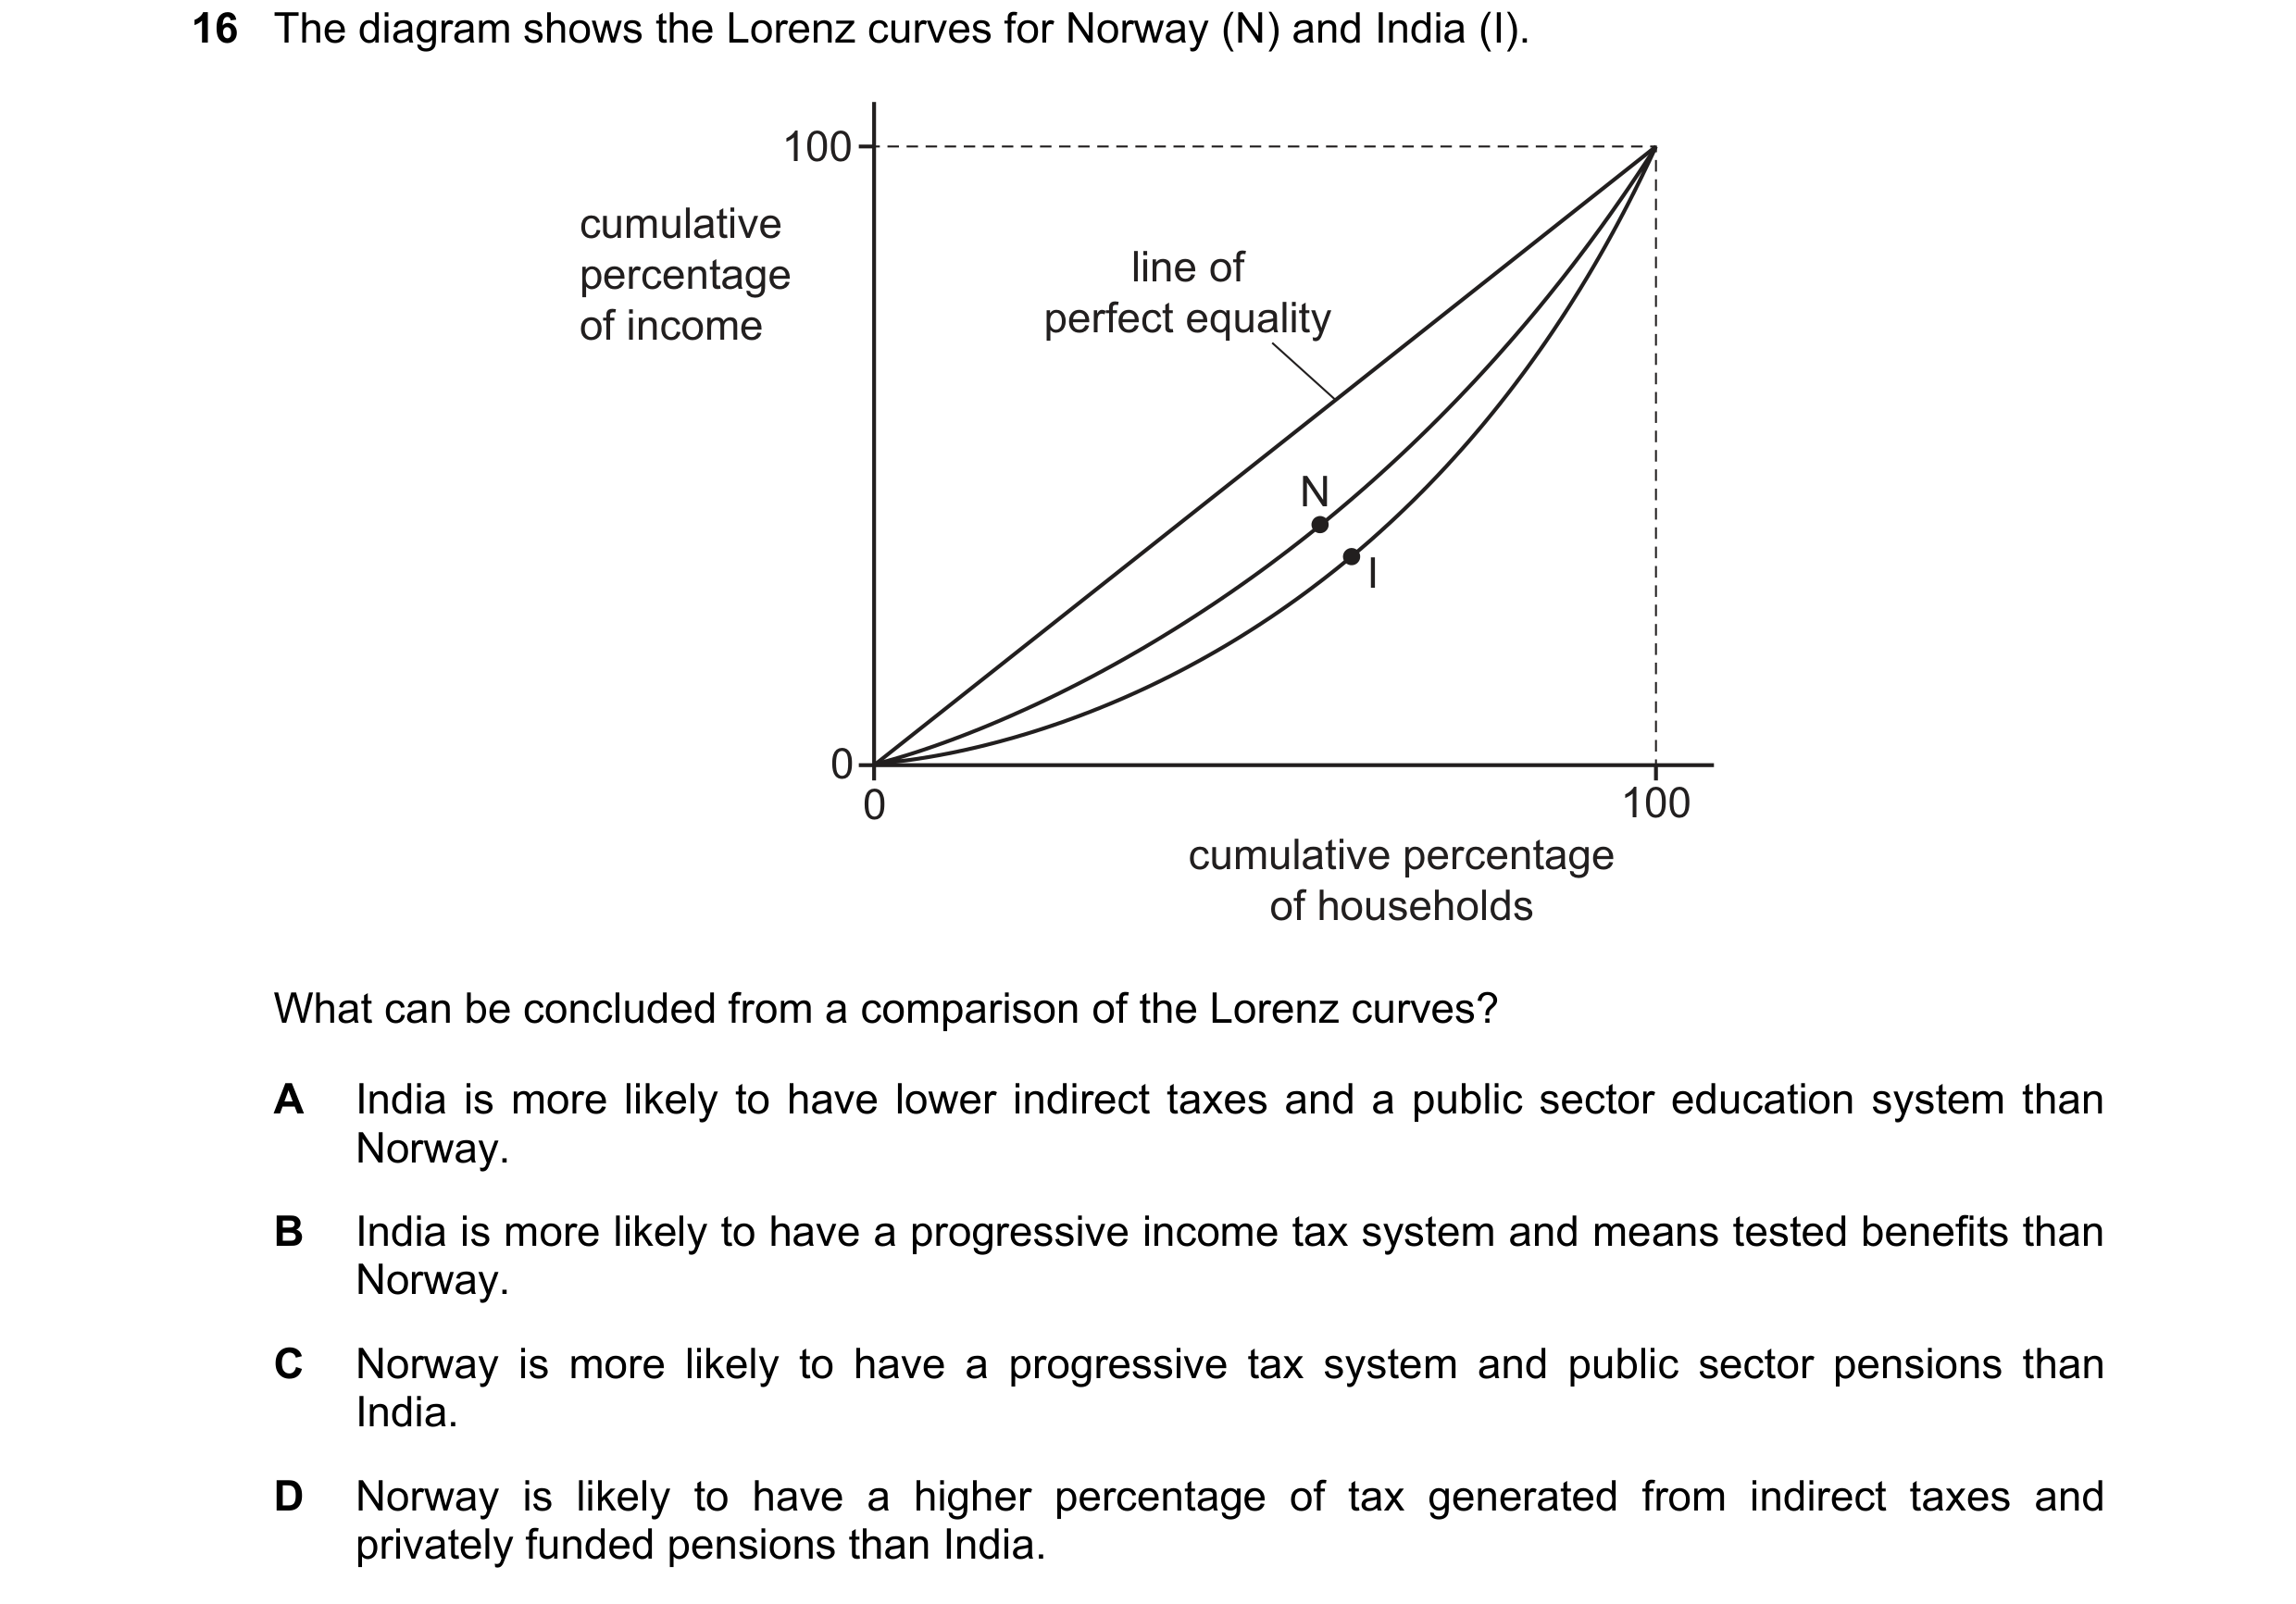
Q74 · The diagram shows the Lorenz curves for Norway (N) and India (I) 9708/31 May/June 2023
16 The diagram shows the Lorenz curves for Norway (N) and India (I). 100 cumulative percentage line of of income perfect equality N I 0 0 100 cumulative percentage of households What can be concluded from a comparison of the Lorenz curves? A India is more likely to have lower indirect taxes and a public sector education system than Norway. B India is more likely to have a progressive income tax system and means tested benefits than Norway. C Norway is more likely to have a progressive tax system and public sector pensions than India. D Norway is likely to have a higher percentage of tax generated from indirect taxes and privately funded pensions than India.
1 marks
Answer: C
This question in 9708/31 May/June 2023
Q75 · The diagram shows a Lorenz curve with two areas, X and Y, identified 9708/31 May/June 2023
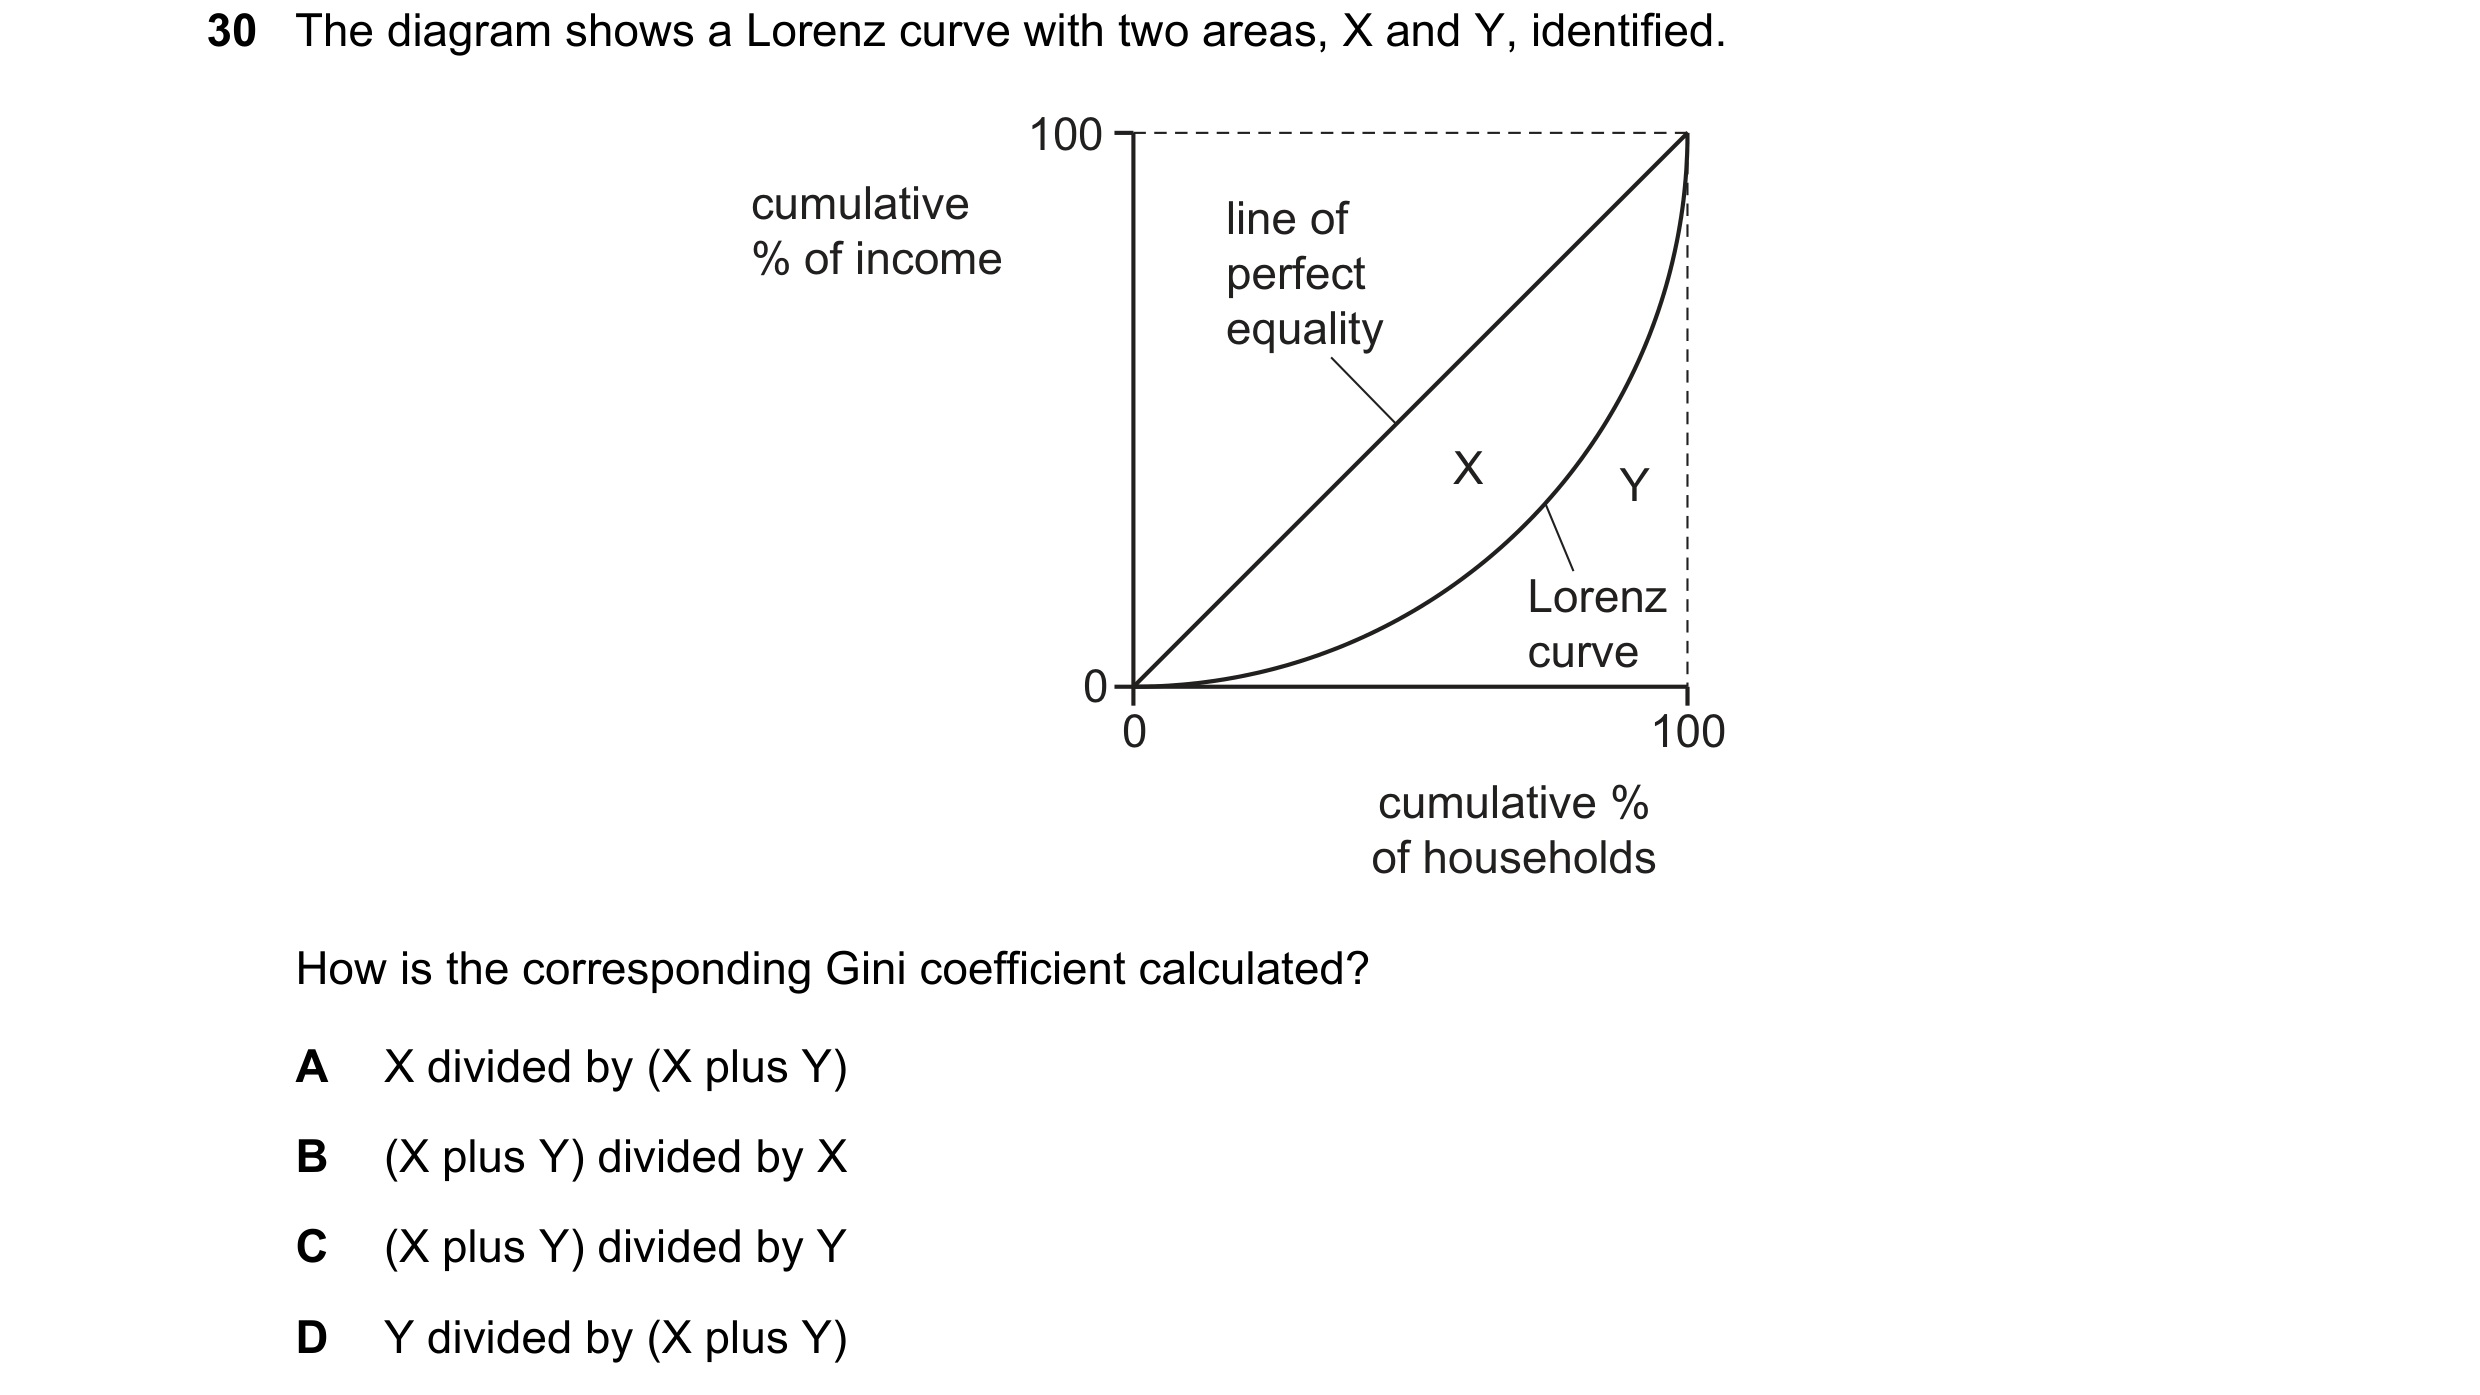
30 The diagram shows a Lorenz curve with two areas, X and Y, identified. 100 cumulative line of % of income perfect equality X Y Lorenz curve 0 0 100 cumulative % of households How is the corresponding Gini coefficient calculated? A X divided by (X plus Y) B (X plus Y) divided by X C (X plus Y) divided by Y D Y divided by (X plus Y)
1 marks
Answer: A
This question in 9708/31 May/June 2023
Q76 · What is likely to cause a more equal distribution of income in the long run? 9708/32 May/June 2023
15 What is likely to cause a more equal distribution of income in the long run? A a reduction in the top rate of taxation B an increase in government spending on education and training C an increase in unemployment D privatisation of the education sector
1 marks
Answer: B
This question in 9708/32 May/June 2023
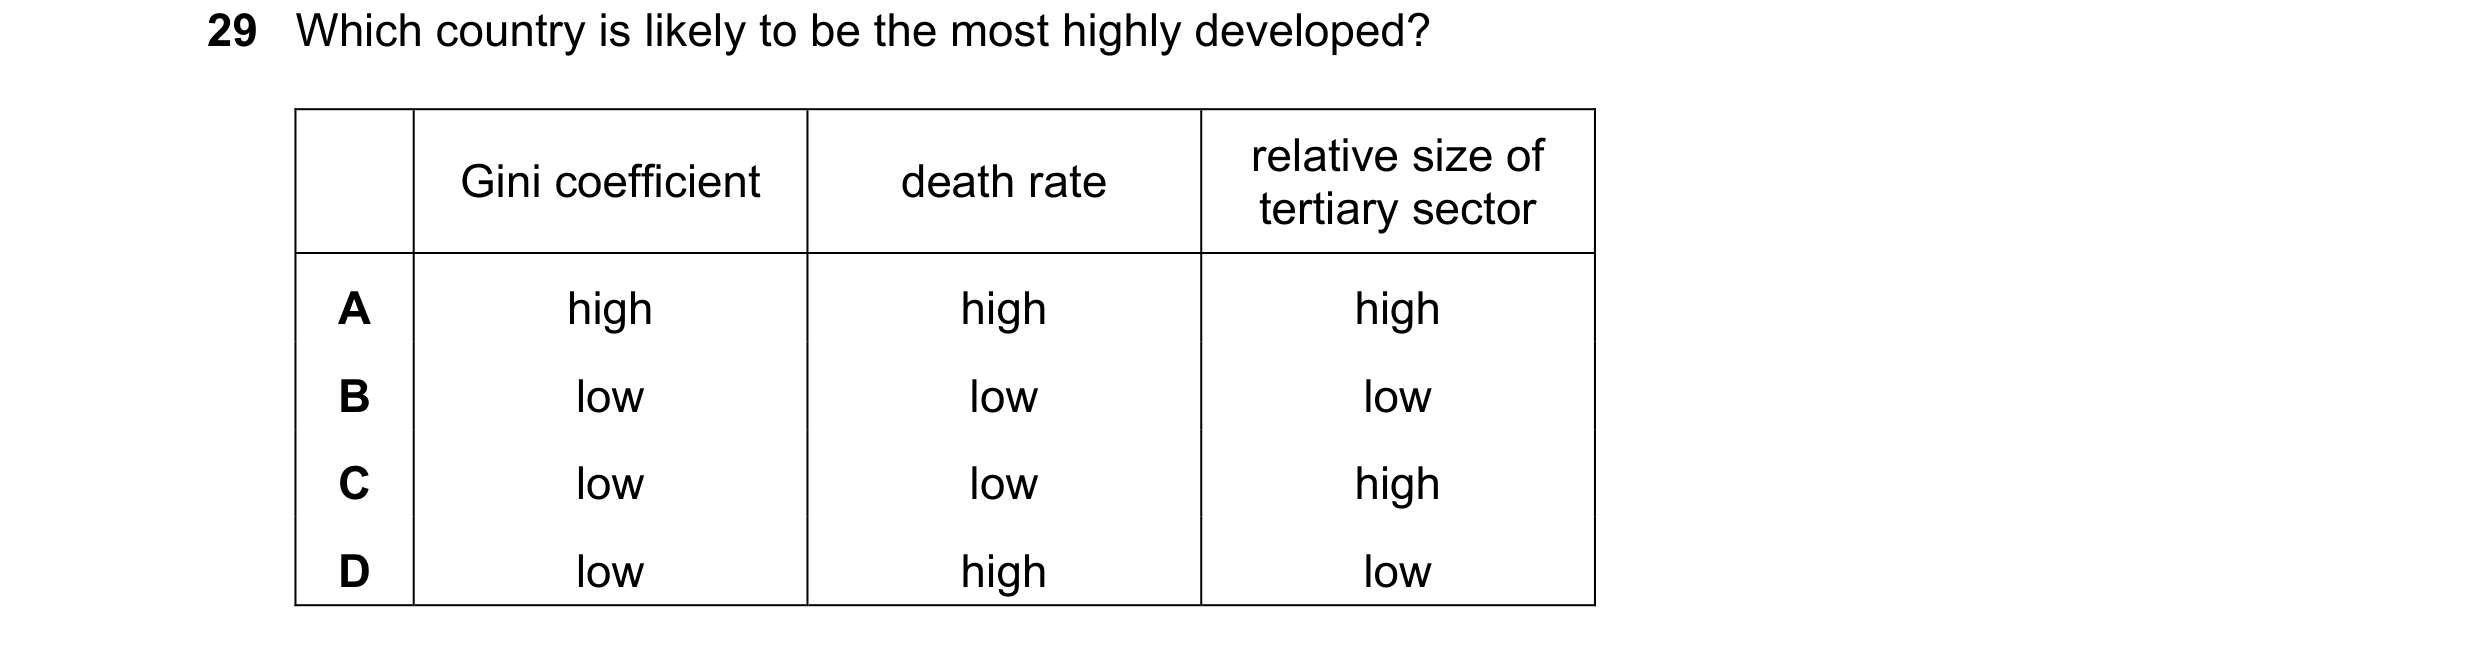
Q77 · Which country is likely to be the most highly developed? 9708/32 May/June 2023
29 Which country is likely to be the most highly developed? relative size of Gini coefficient death rate tertiary sector A high high high B low low low C low low high D low high low
1 marks
Answer: C
This question in 9708/32 May/June 2023
Q78 · The diagram shows the Lorenz curves for Norway (N) and India (I) 9708/33 May/June 2023
16 The diagram shows the Lorenz curves for Norway (N) and India (I). 100 cumulative percentage line of of income perfect equality N I 0 0 100 cumulative percentage of households What can be concluded from a comparison of the Lorenz curves? A India is more likely to have lower indirect taxes and a public sector education system than Norway. B India is more likely to have a progressive income tax system and means tested benefits than Norway. C Norway is more likely to have a progressive tax system and public sector pensions than India. D Norway is likely to have a higher percentage of tax generated from indirect taxes and privately funded pensions than India.
1 marks
Answer: C
This question in 9708/33 May/June 2023
Q79 · The diagram shows a Lorenz curve with two areas, X and Y, identified 9708/33 May/June 2023
30 The diagram shows a Lorenz curve with two areas, X and Y, identified. 100 cumulative line of % of income perfect equality X Y Lorenz curve 0 0 100 cumulative % of households How is the corresponding Gini coefficient calculated? A X divided by (X plus Y) B (X plus Y) divided by X C (X plus Y) divided by Y D Y divided by (X plus Y)
1 marks
Answer: A
This question in 9708/33 May/June 2023
Q80 · What is likely to result if a government introduces a new regressive tax? 9708/31 Oct/Nov 2023
14 What is likely to result if a government introduces a new regressive tax? A Aggregate demand will increase. B Employment opportunities will increase. C Income equality will improve. D Tax revenues will increase.
1 marks
Answer: D
This question in 9708/31 Oct/Nov 2023
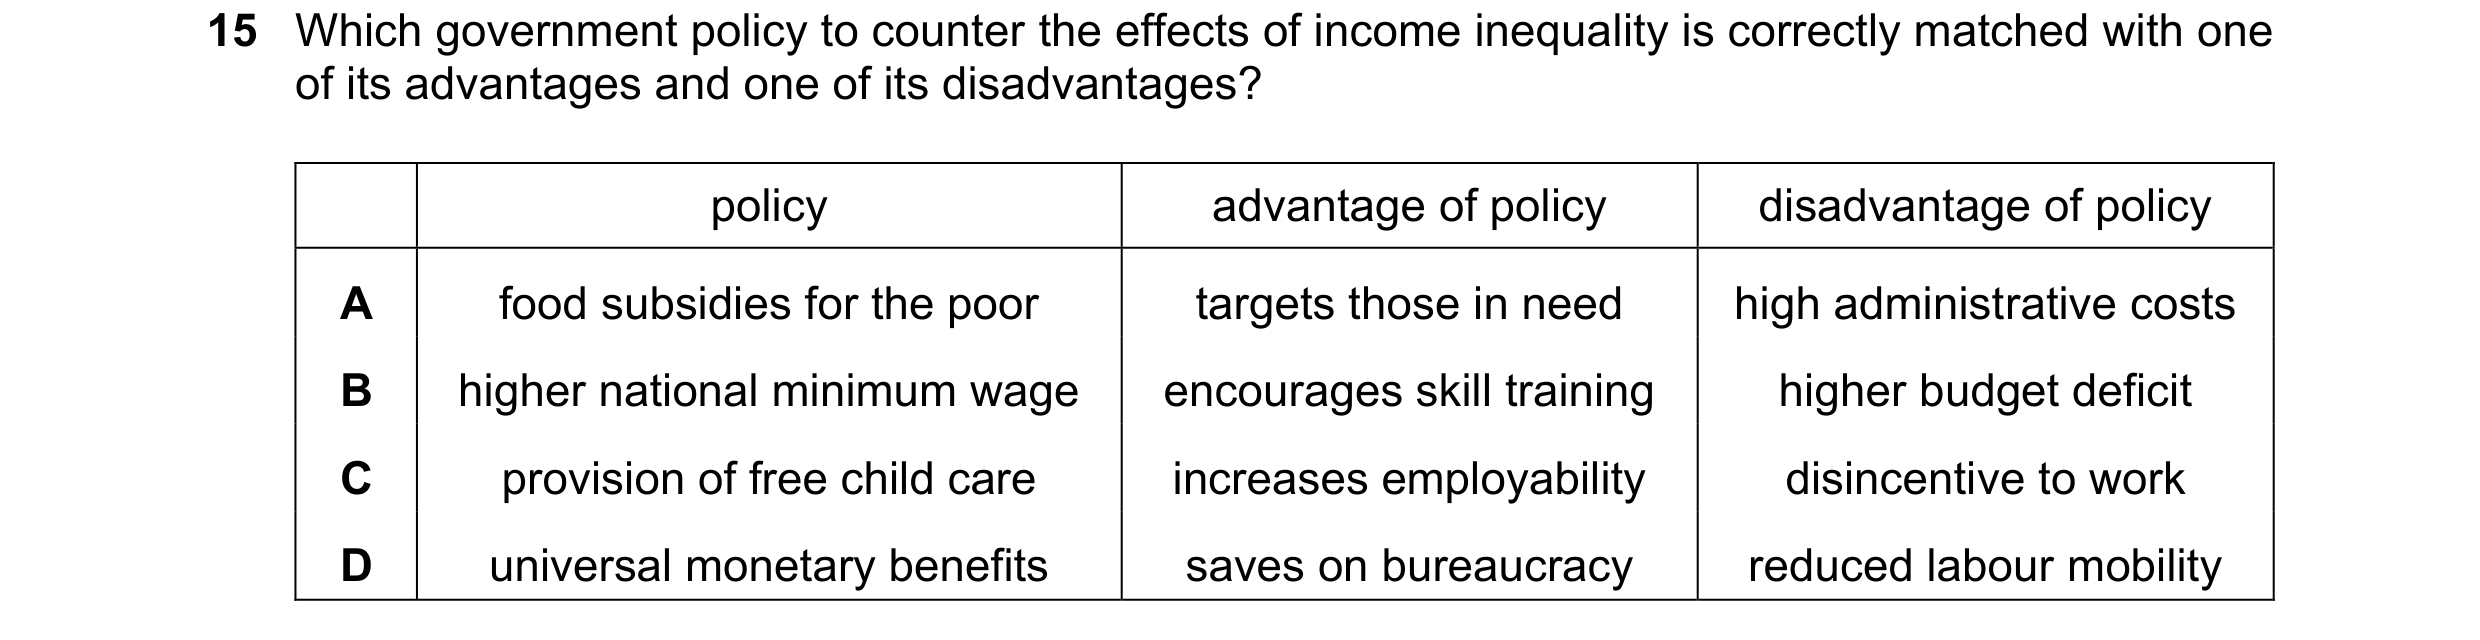
Q81 · Which government policy to counter the effects of income inequality is correctly matched… 9708/31 Oct/Nov 2023
15 Which government policy to counter the effects of income inequality is correctly matched with one of its advantages and one of its disadvantages? policy advantage of policy disadvantage of policy A food subsidies for the poor targets those in need high administrative costs B higher national minimum wage encourages skill training higher budget deficit C provision of free child care increases employability disincentive to work D universal monetary benefits saves on bureaucracy reduced labour mobility
1 marks
Answer: A
This question in 9708/31 Oct/Nov 2023
Q82 · A government wishes to improve the income distribution between the richest and poorest in… 9708/31 Oct/Nov 2023
25 A government wishes to improve the income distribution between the richest and poorest in society. It introduces means tested benefits for workers on low incomes. To pay for this, income tax rates for the highest paid will increase. What is the most significant strength and weakness of this policy approach? strength weakness A benefits are only given poor non-workers to those in need will be no better off B intergenerational tax avoidance equity is improved is more likely C workers will be encouraged to taxation has become work more hours more regressive D the policy approach will be wealth distribution will be affected efficient to operate more than income distribution
1 marks
Answer: A
This question in 9708/31 Oct/Nov 2023
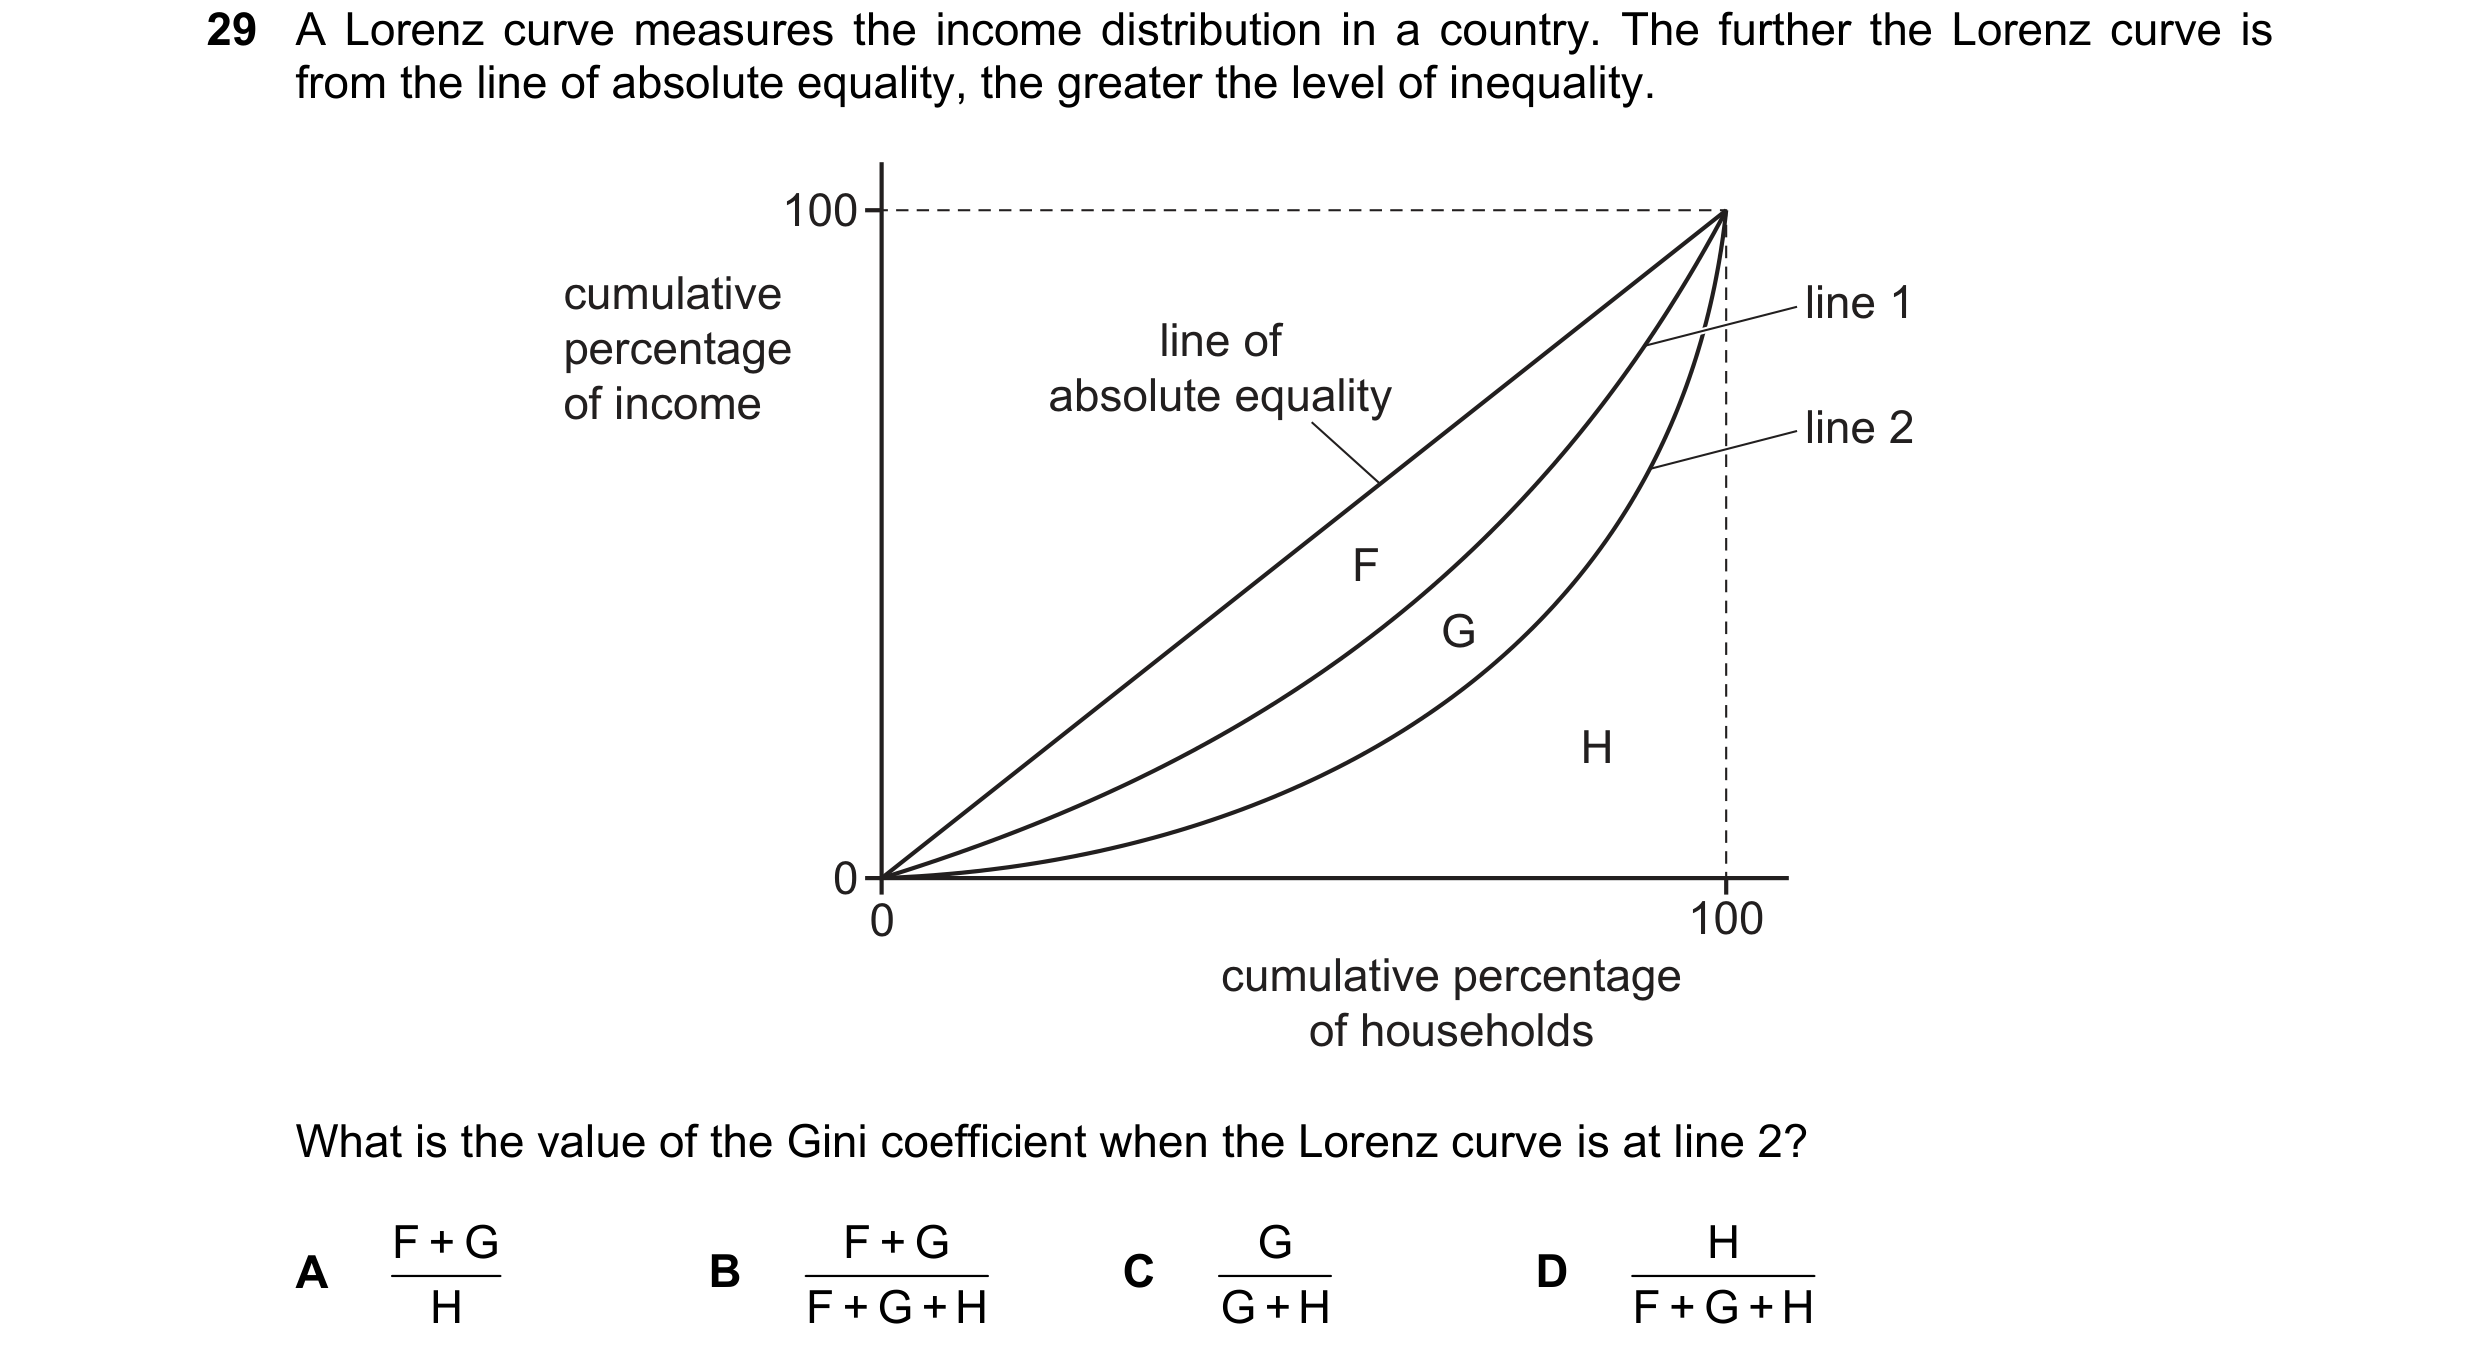
Q83 · A Lorenz curve measures the income distribution in a country 9708/31 Oct/Nov 2023
29 A Lorenz curve measures the income distribution in a country. The further the Lorenz curve is from the line of absolute equality, the greater the level of inequality. 100 cumulative line 1 percentage line of of income absolute equality line 2 F G H 0 0 100 cumulative percentage of households What is the value of the Gini coefficient when the Lorenz curve is at line 2? F + G F + G G H A B F + G + H C G + H D F + G + H H
1 marks
Answer: B
This question in 9708/31 Oct/Nov 2023
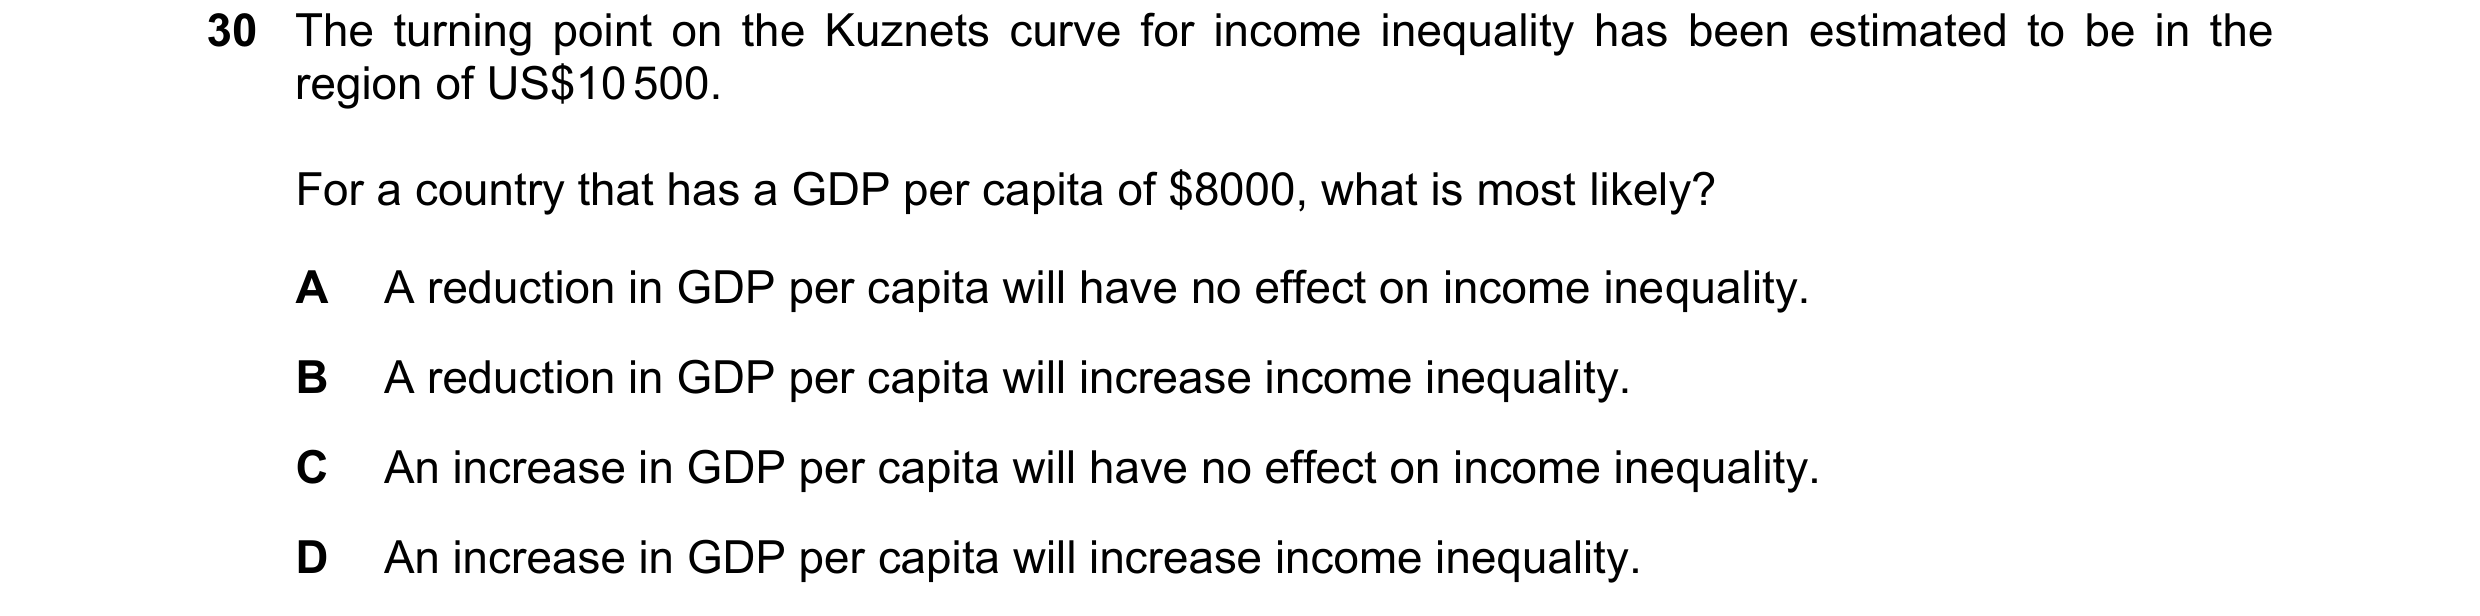
Q84 · The turning point on the Kuznets curve for income inequality has been estimated to be in… 9708/31 Oct/Nov 2023
30 The turning point on the Kuznets curve for income inequality has been estimated to be in the region of US$10 500. For a country that has a GDP per capita of $8000, what is most likely? A A reduction in GDP per capita will have no effect on income inequality. B A reduction in GDP per capita will increase income inequality. C An increase in GDP per capita will have no effect on income inequality. D An increase in GDP per capita will increase income inequality.
1 marks
Answer: D
This question in 9708/31 Oct/Nov 2023
Q85 · What is most likely to increase relative poverty in a country? 9708/33 Oct/Nov 2023
13 What is most likely to increase relative poverty in a country? A increasing means-tested benefit levels B increasing the power of trade unions C making the tax system more progressive D removing the national minimum wage
1 marks
Answer: D
This question in 9708/33 Oct/Nov 2023
Q86 · What will cause a household to be caught in the poverty trap? 9708/31 May/June 2024
13 What will cause a household to be caught in the poverty trap? A A household earns less than the international poverty line of $2.15 per person per day. B A household spends more than it earns in a month. C A household’s earnings rise at a lower rate than the rise in inflation. D An extra dollar earnt by a household causes a greater loss in government benefit payments.
1 marks
Answer: D
This question in 9708/31 May/June 2024
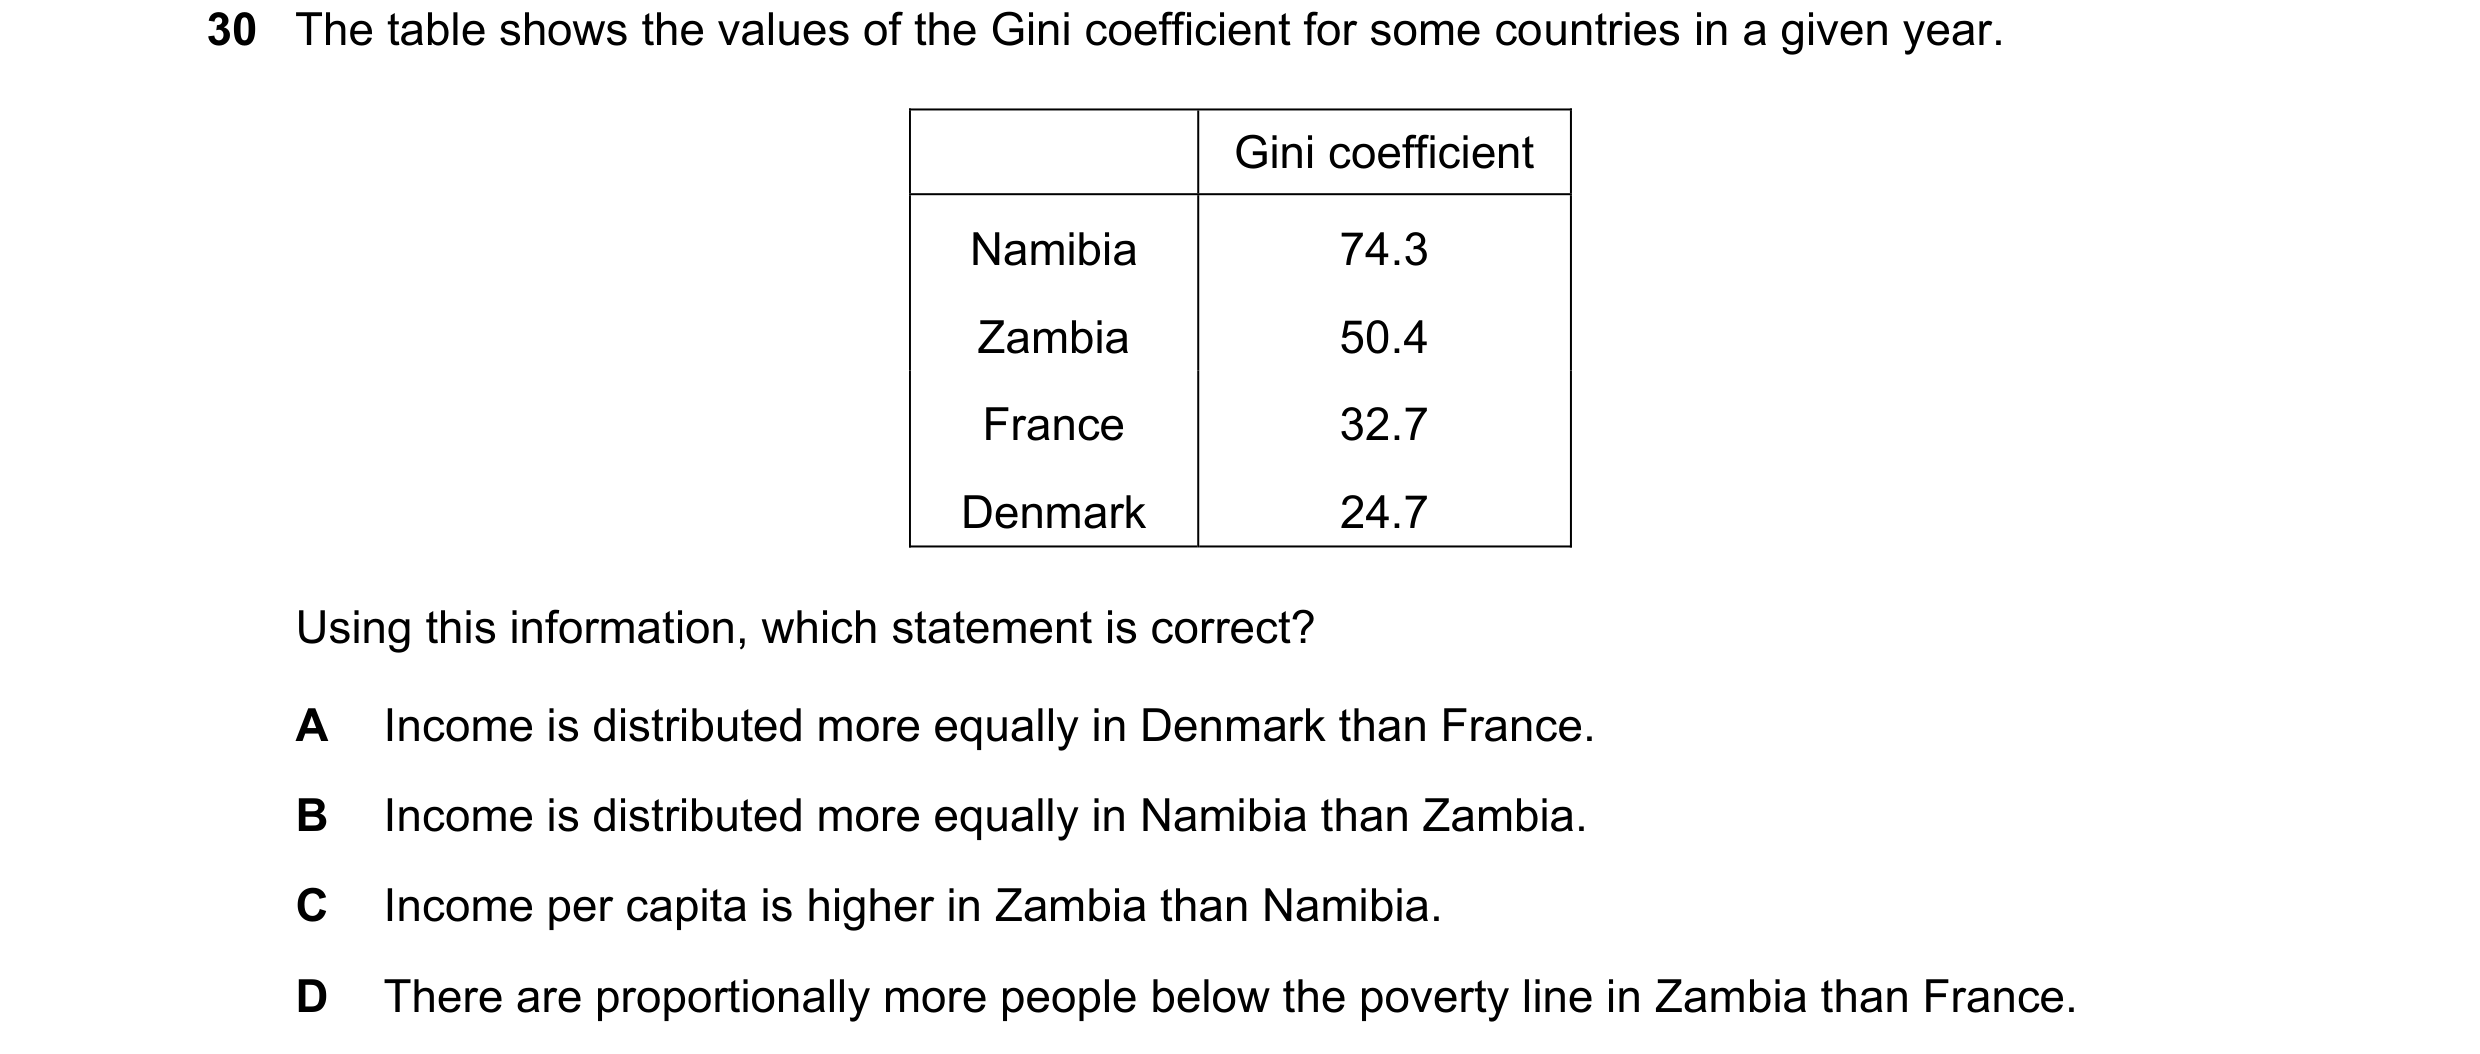
Q87 · The table shows the values of the Gini coefficient for some countries in a given year 9708/31 May/June 2024
30 The table shows the values of the Gini coefficient for some countries in a given year. Gini coefficient Namibia 74.3 Zambia 50.4 France 32.7 Denmark 24.7 Using this information, which statement is correct? A Income is distributed more equally in Denmark than France. B Income is distributed more equally in Namibia than Zambia. C Income per capita is higher in Zambia than Namibia. D There are proportionally more people below the poverty line in Zambia than France.
1 marks
Answer: A
This question in 9708/31 May/June 2024
Q88 · What will cause a household to be caught in the poverty trap? 9708/33 May/June 2024
13 What will cause a household to be caught in the poverty trap? A A household earns less than the international poverty line of $2.15 per person per day. B A household spends more than it earns in a month. C A household’s earnings rise at a lower rate than the rise in inflation. D An extra dollar earnt by a household causes a greater loss in government benefit payments.
1 marks
Answer: D
This question in 9708/33 May/June 2024
Q89 · The table shows the values of the Gini coefficient for some countries in a given year 9708/33 May/June 2024
30 The table shows the values of the Gini coefficient for some countries in a given year. Gini coefficient Namibia 74.3 Zambia 50.4 France 32.7 Denmark 24.7 Using this information, which statement is correct? A Income is distributed more equally in Denmark than France. B Income is distributed more equally in Namibia than Zambia. C Income per capita is higher in Zambia than Namibia. D There are proportionally more people below the poverty line in Zambia than France.
1 marks
Answer: A
This question in 9708/33 May/June 2024
Q90 · When does a more equal distribution of income occur? 9708/32 Feb/March 2025
9 When does a more equal distribution of income occur? A when a country’s income tax system is made more progressive B when someone is made better off without making someone else worse off C when the best use is made of scarce resources D when there is an increase in the Gini coefficient
1 marks
Answer: A
This question in 9708/32 Feb/March 2025


 1 / 28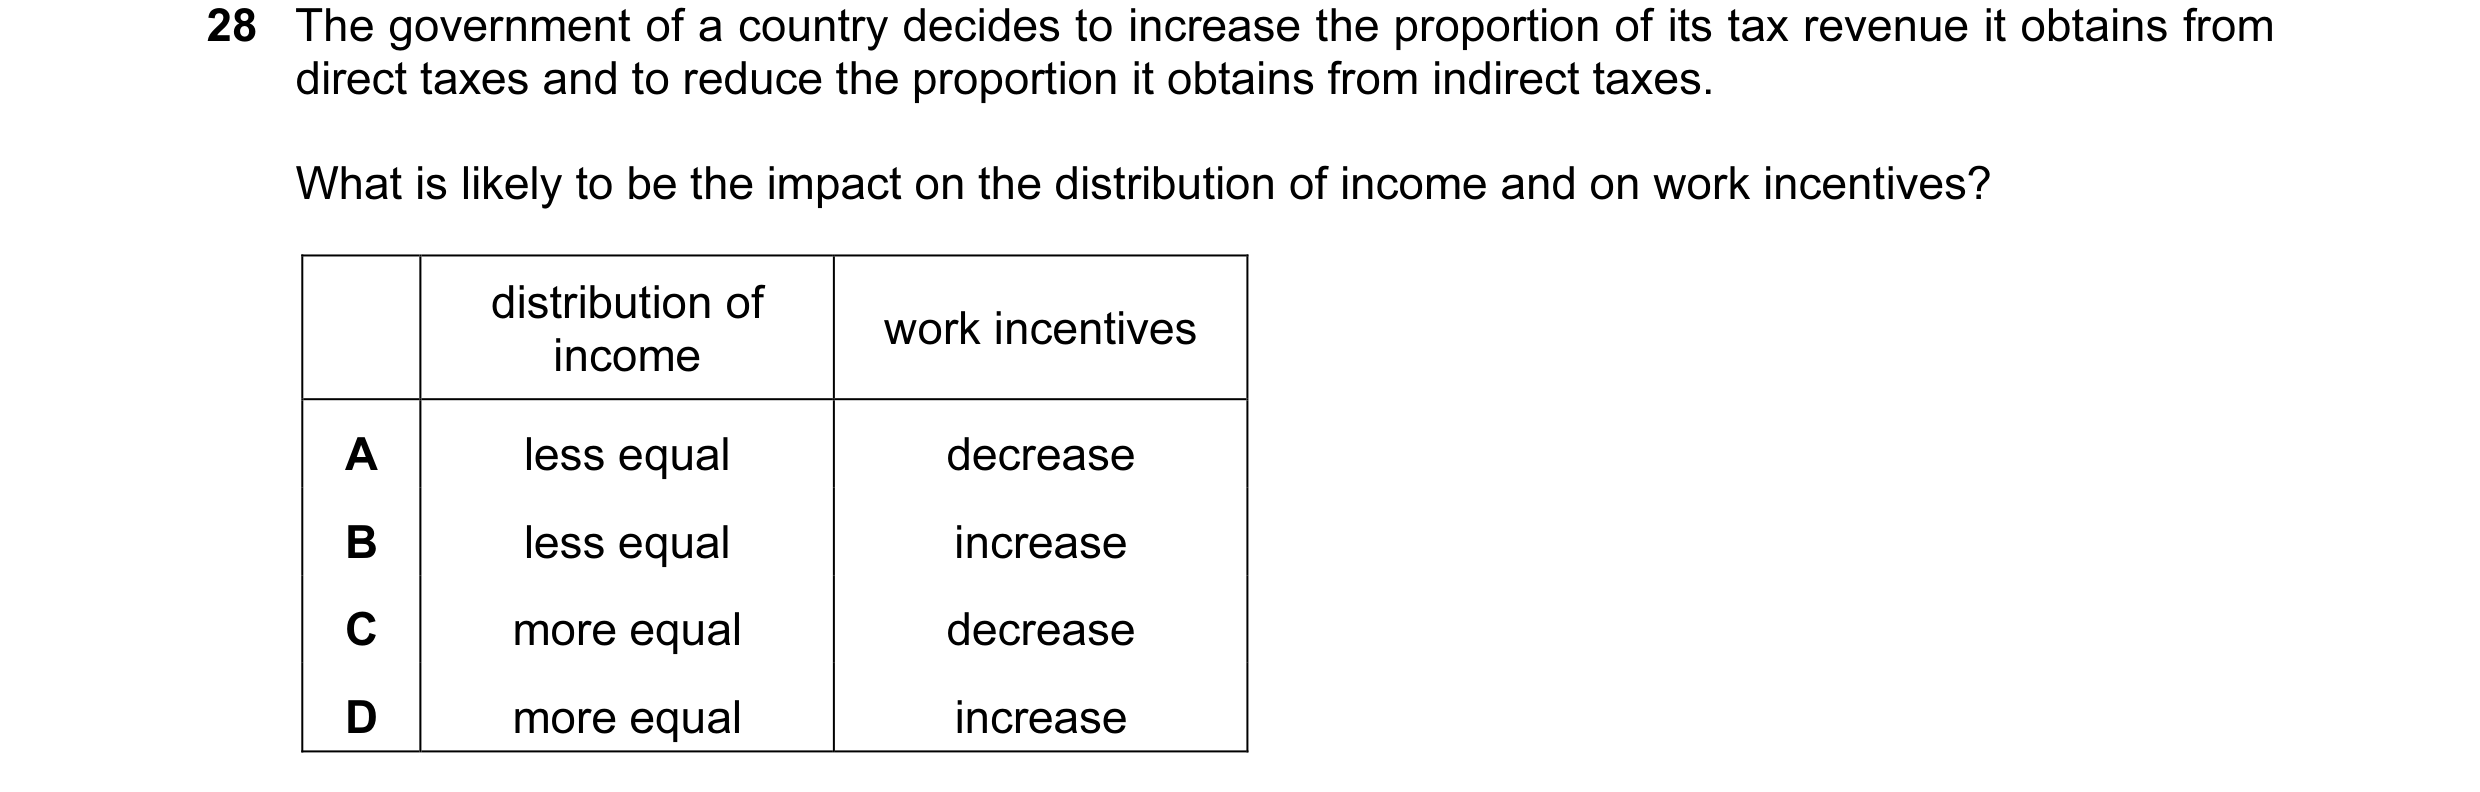


 2 / 28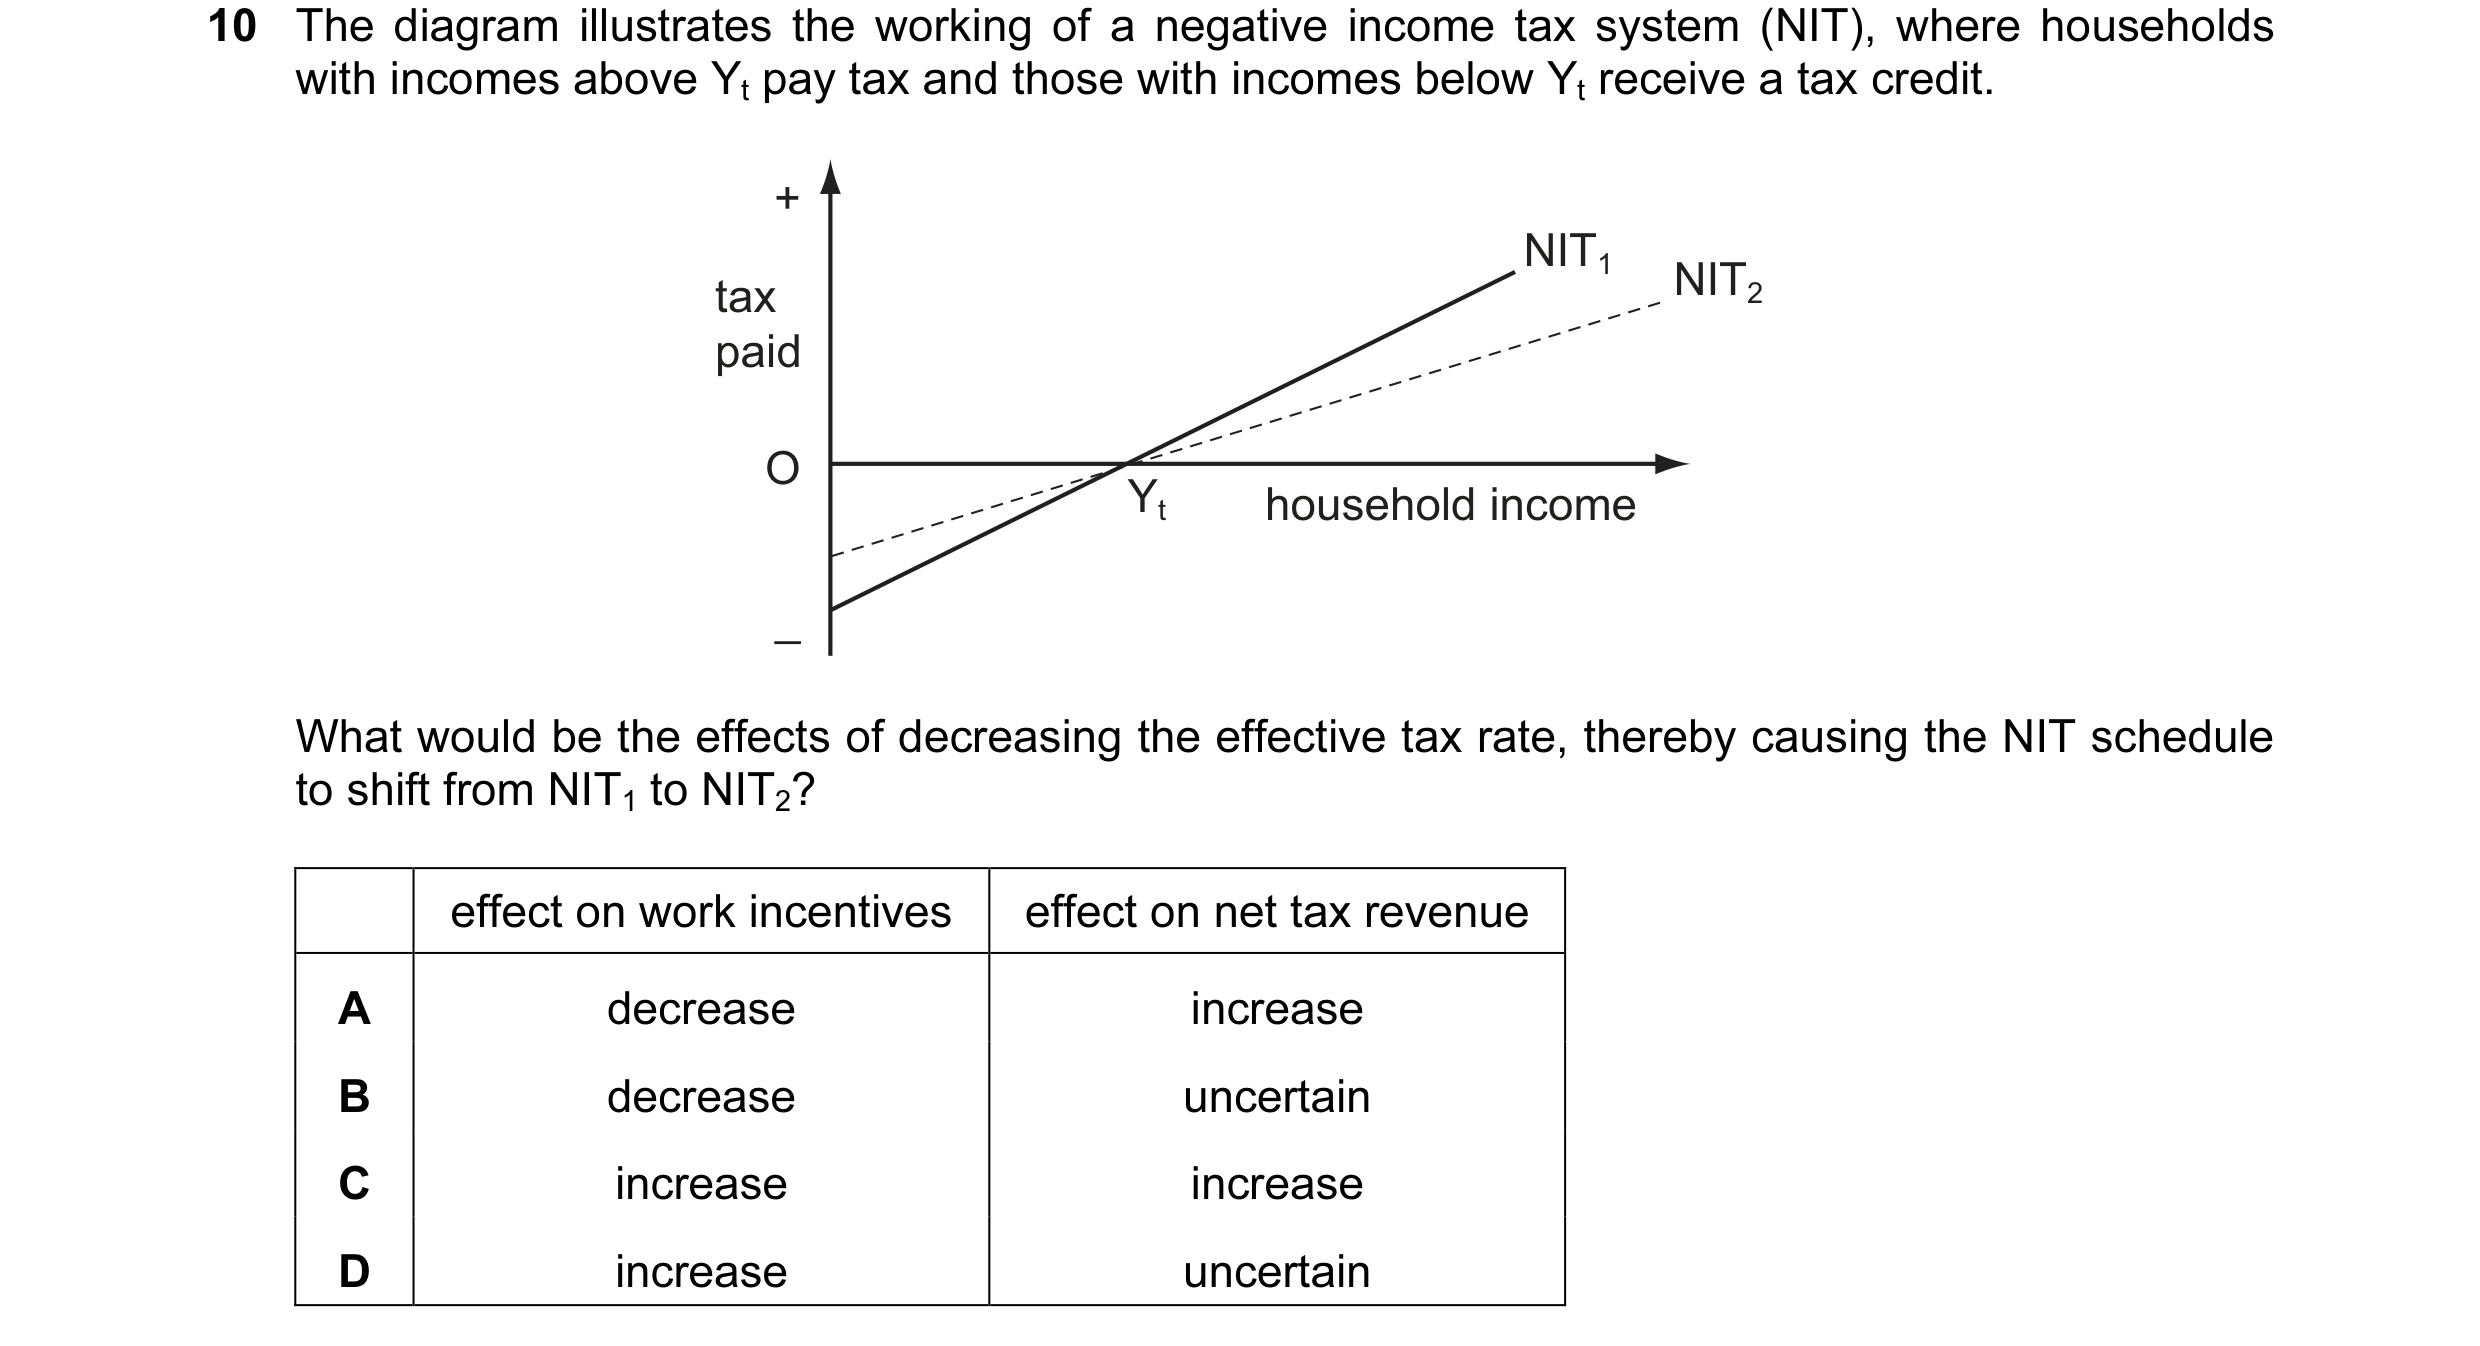
 3 / 28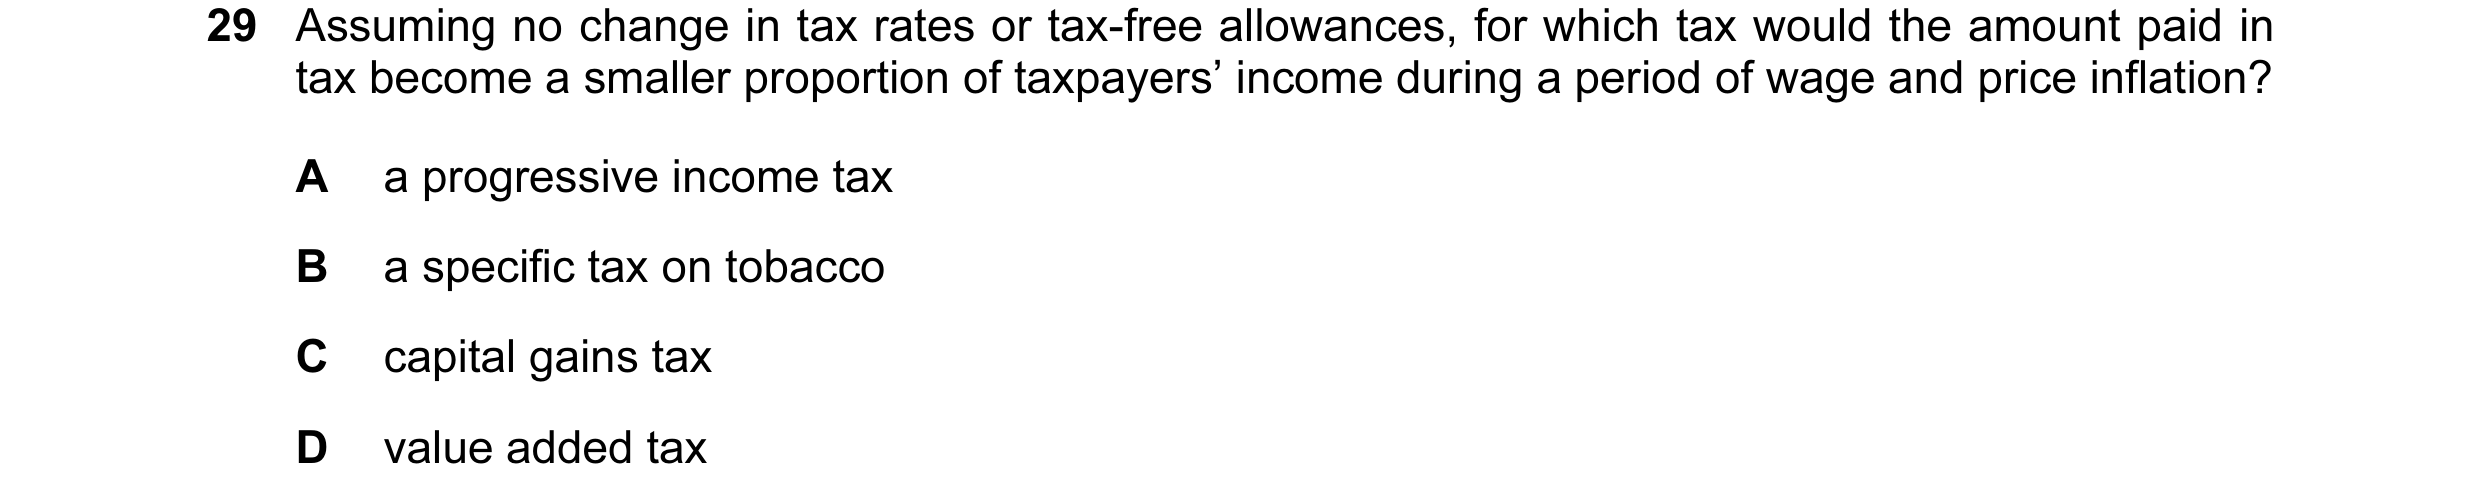

 4 / 28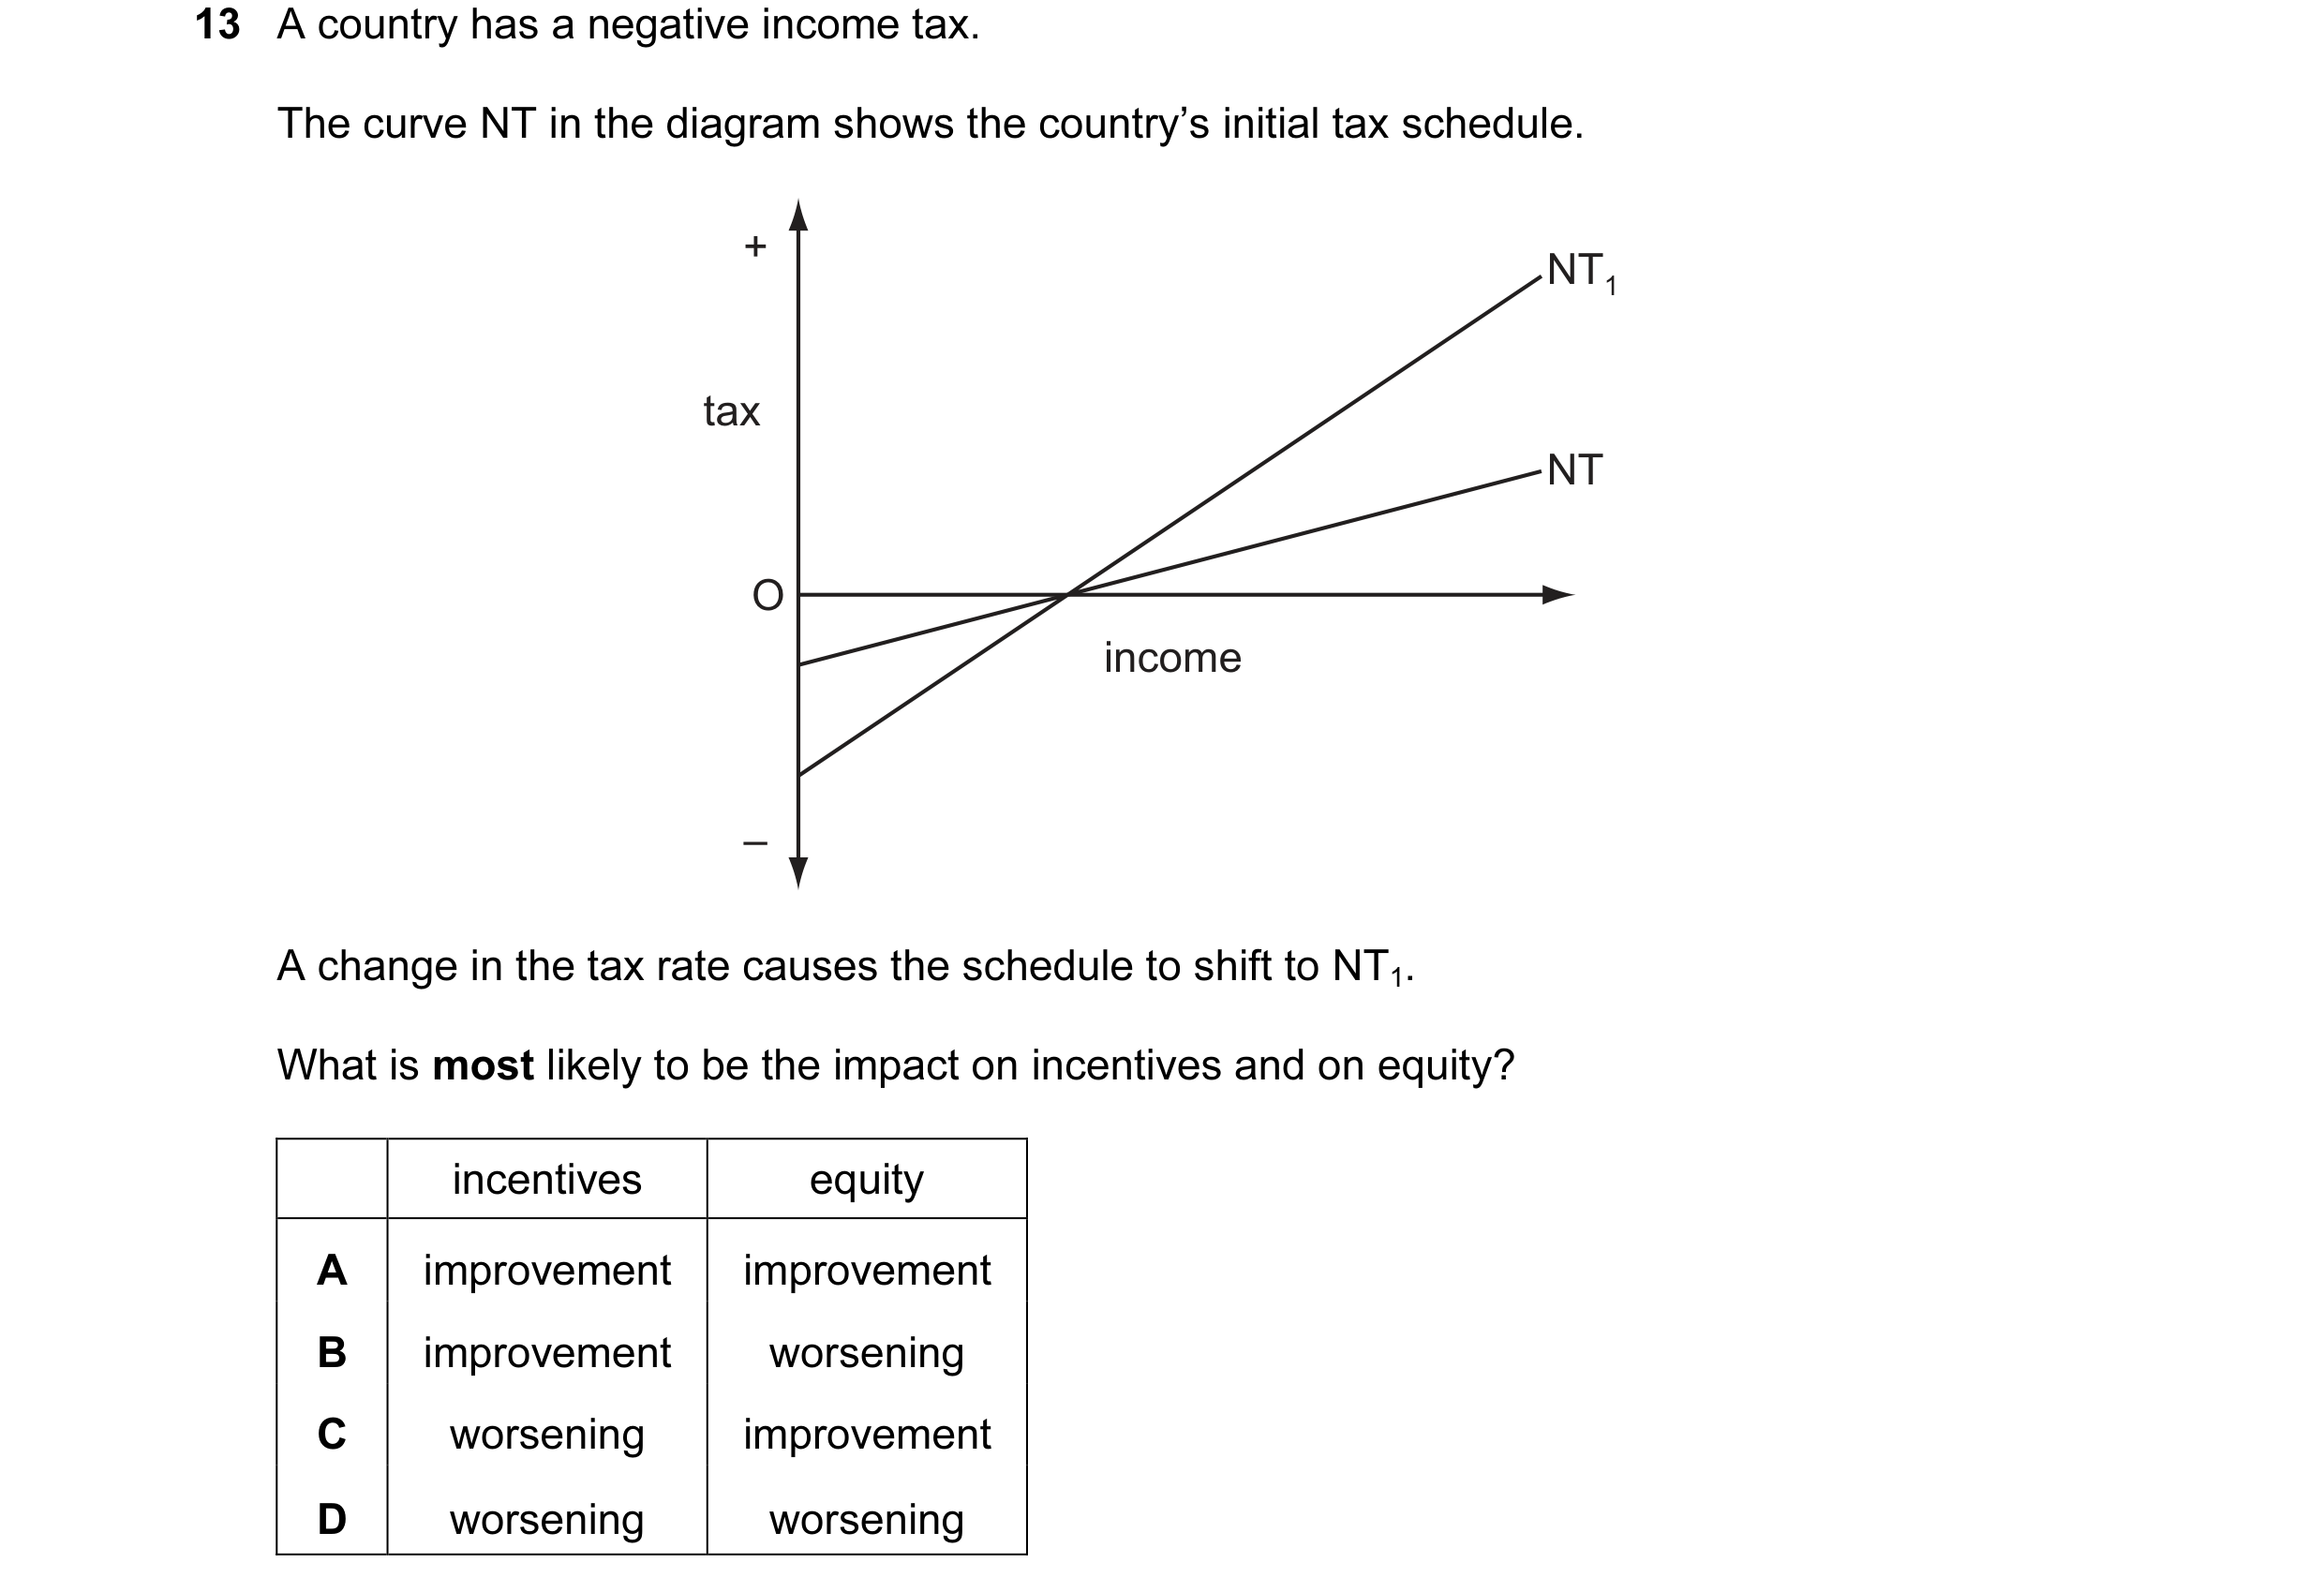
 5 / 28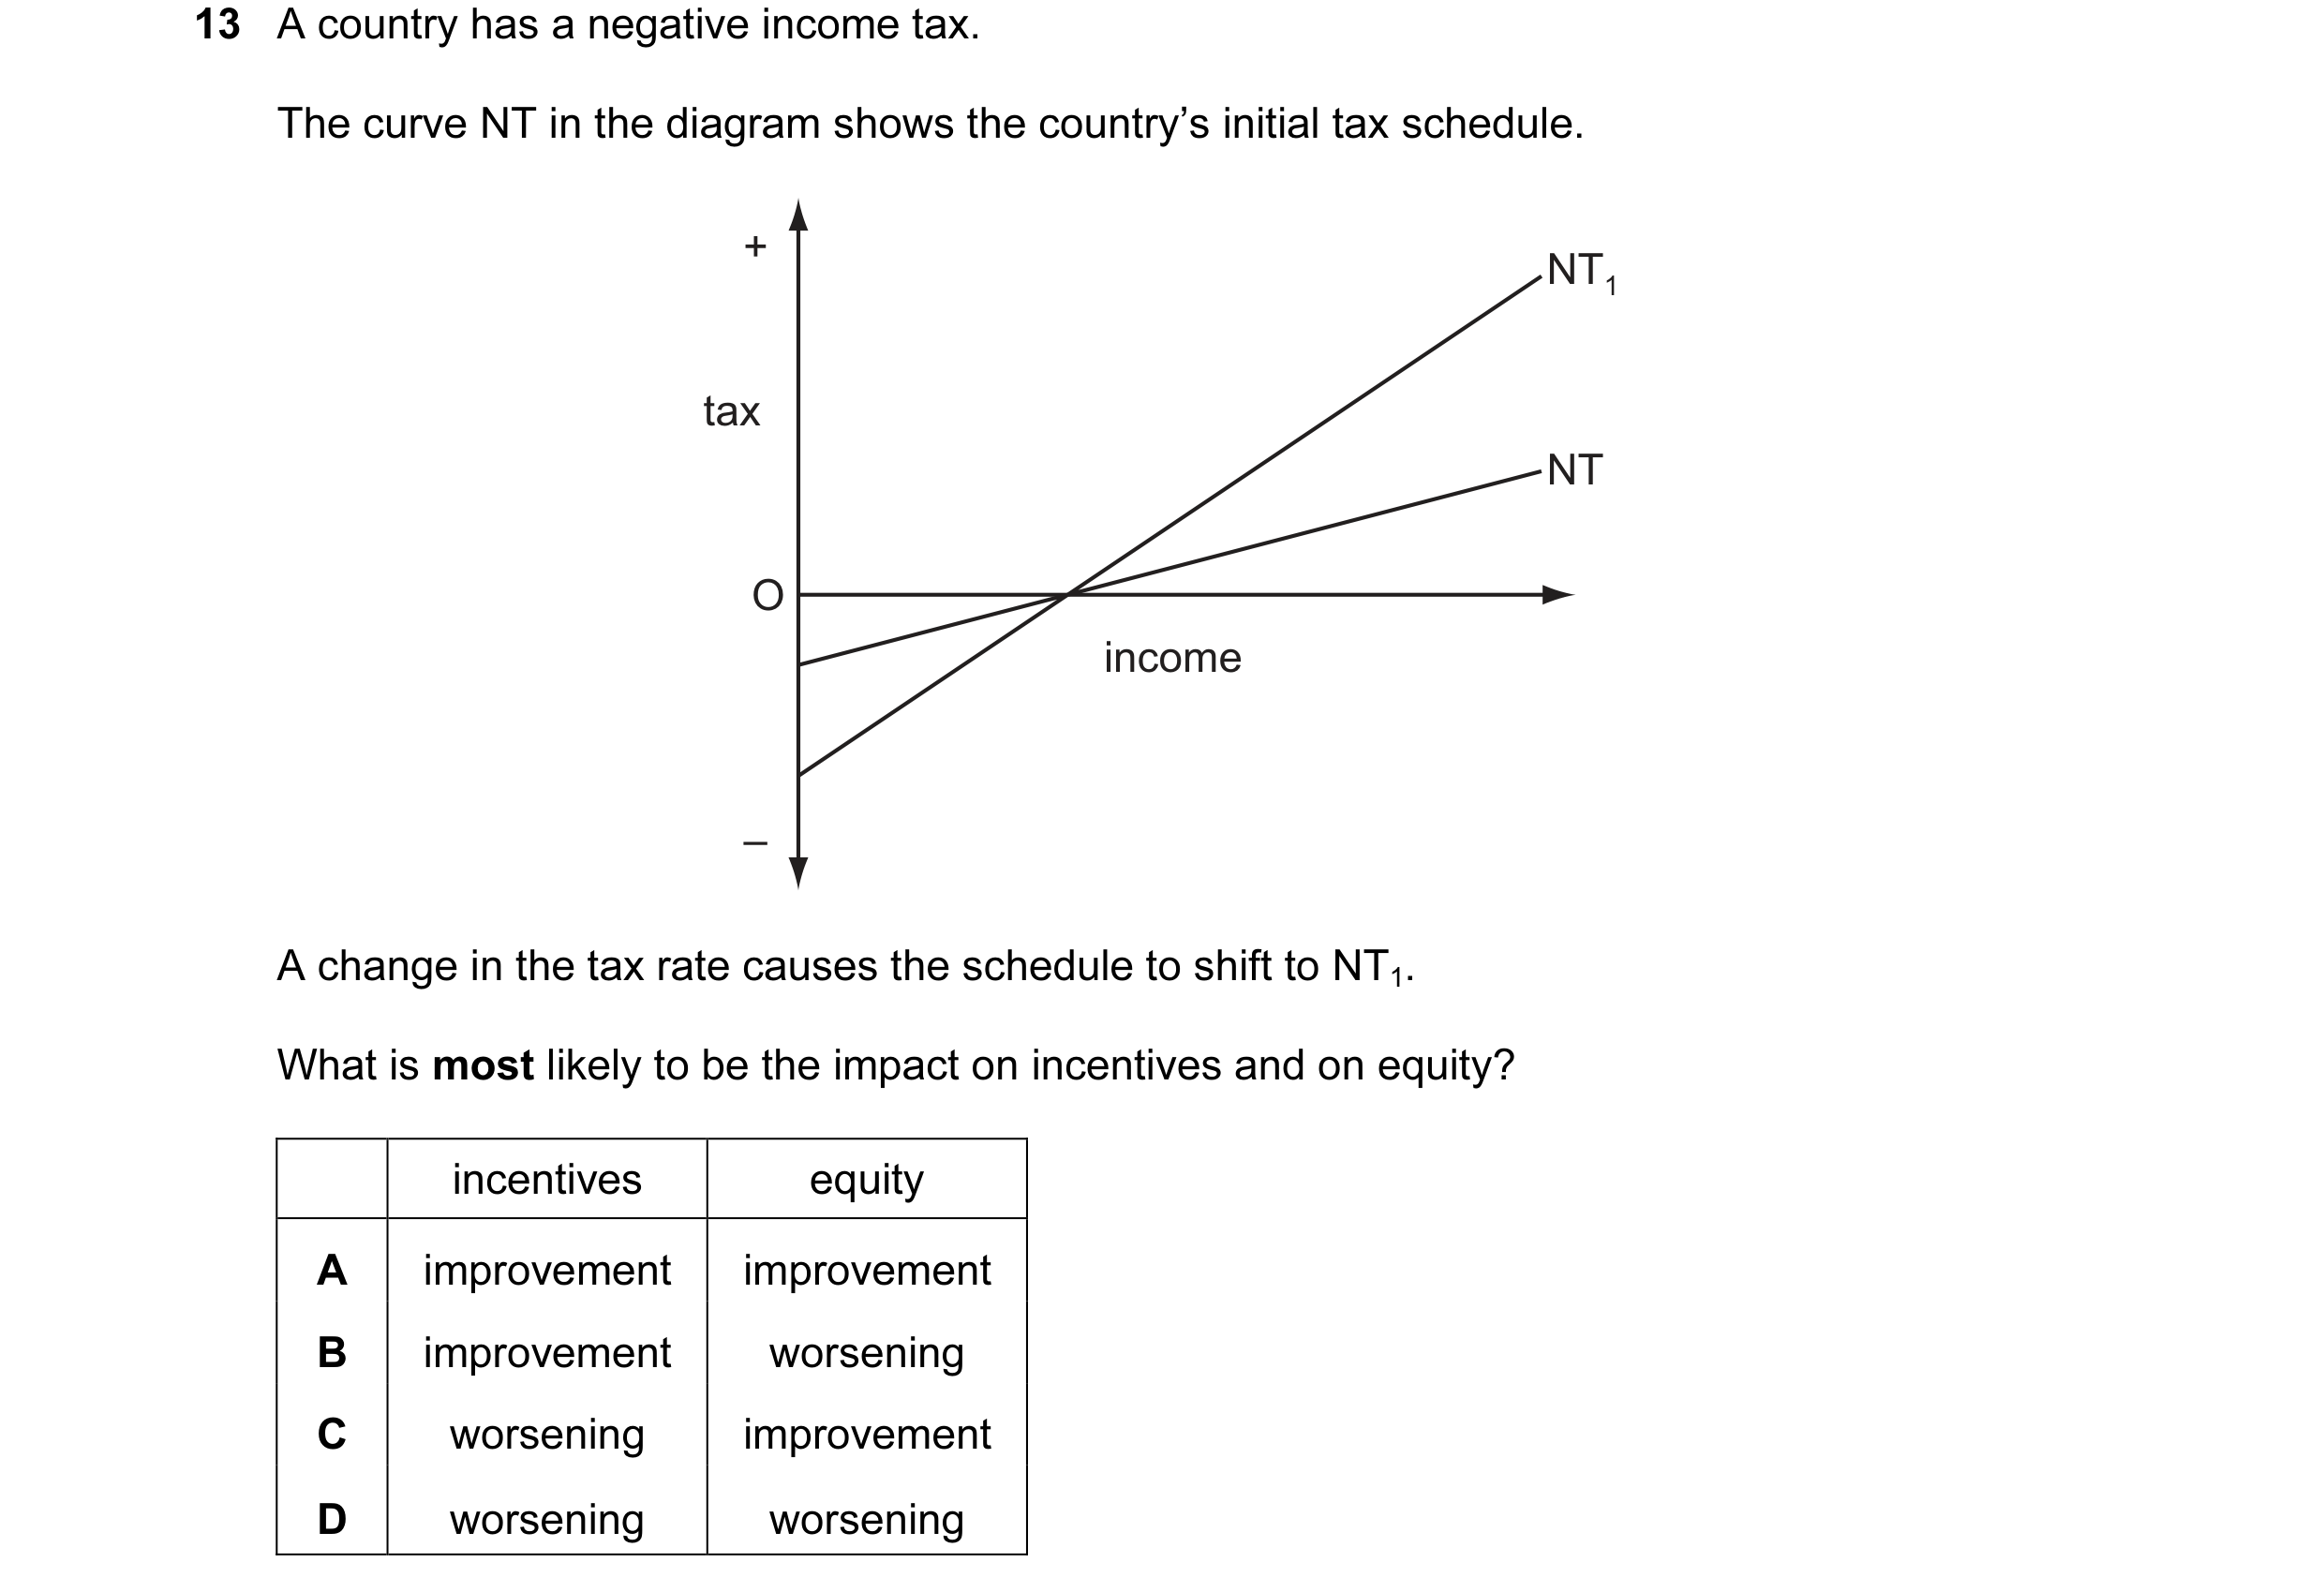
 6 / 28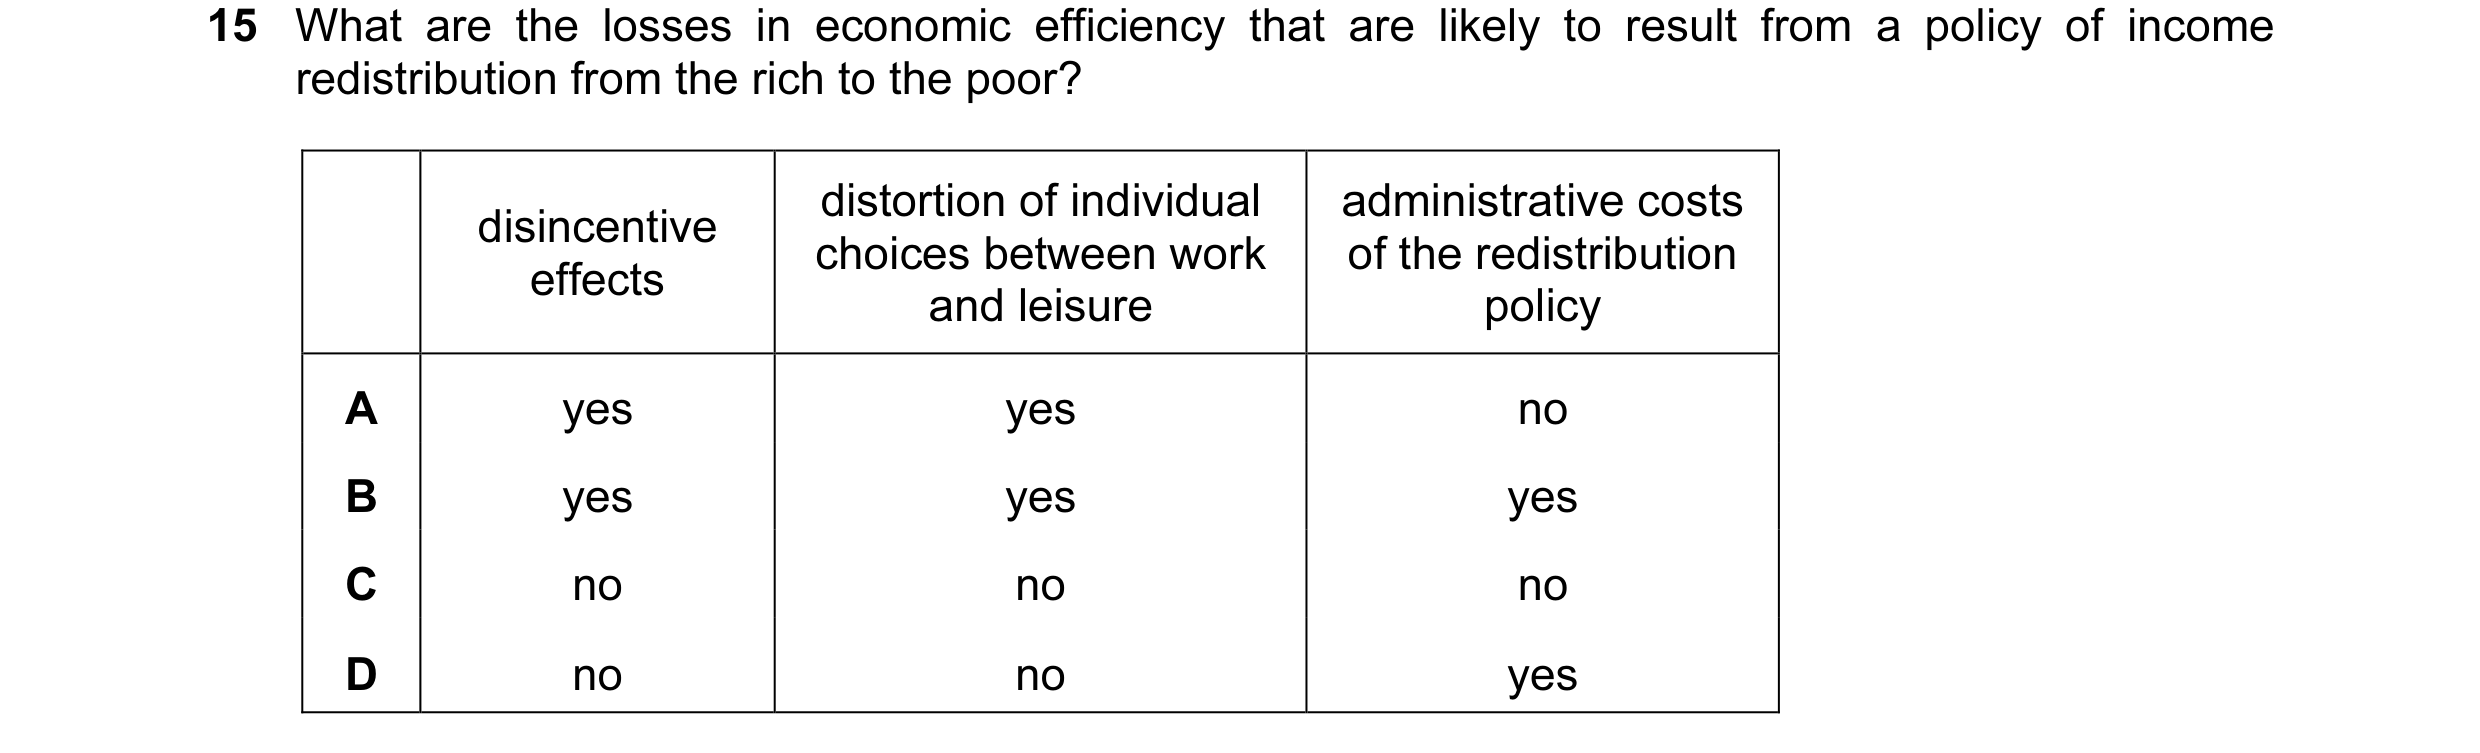
 7 / 28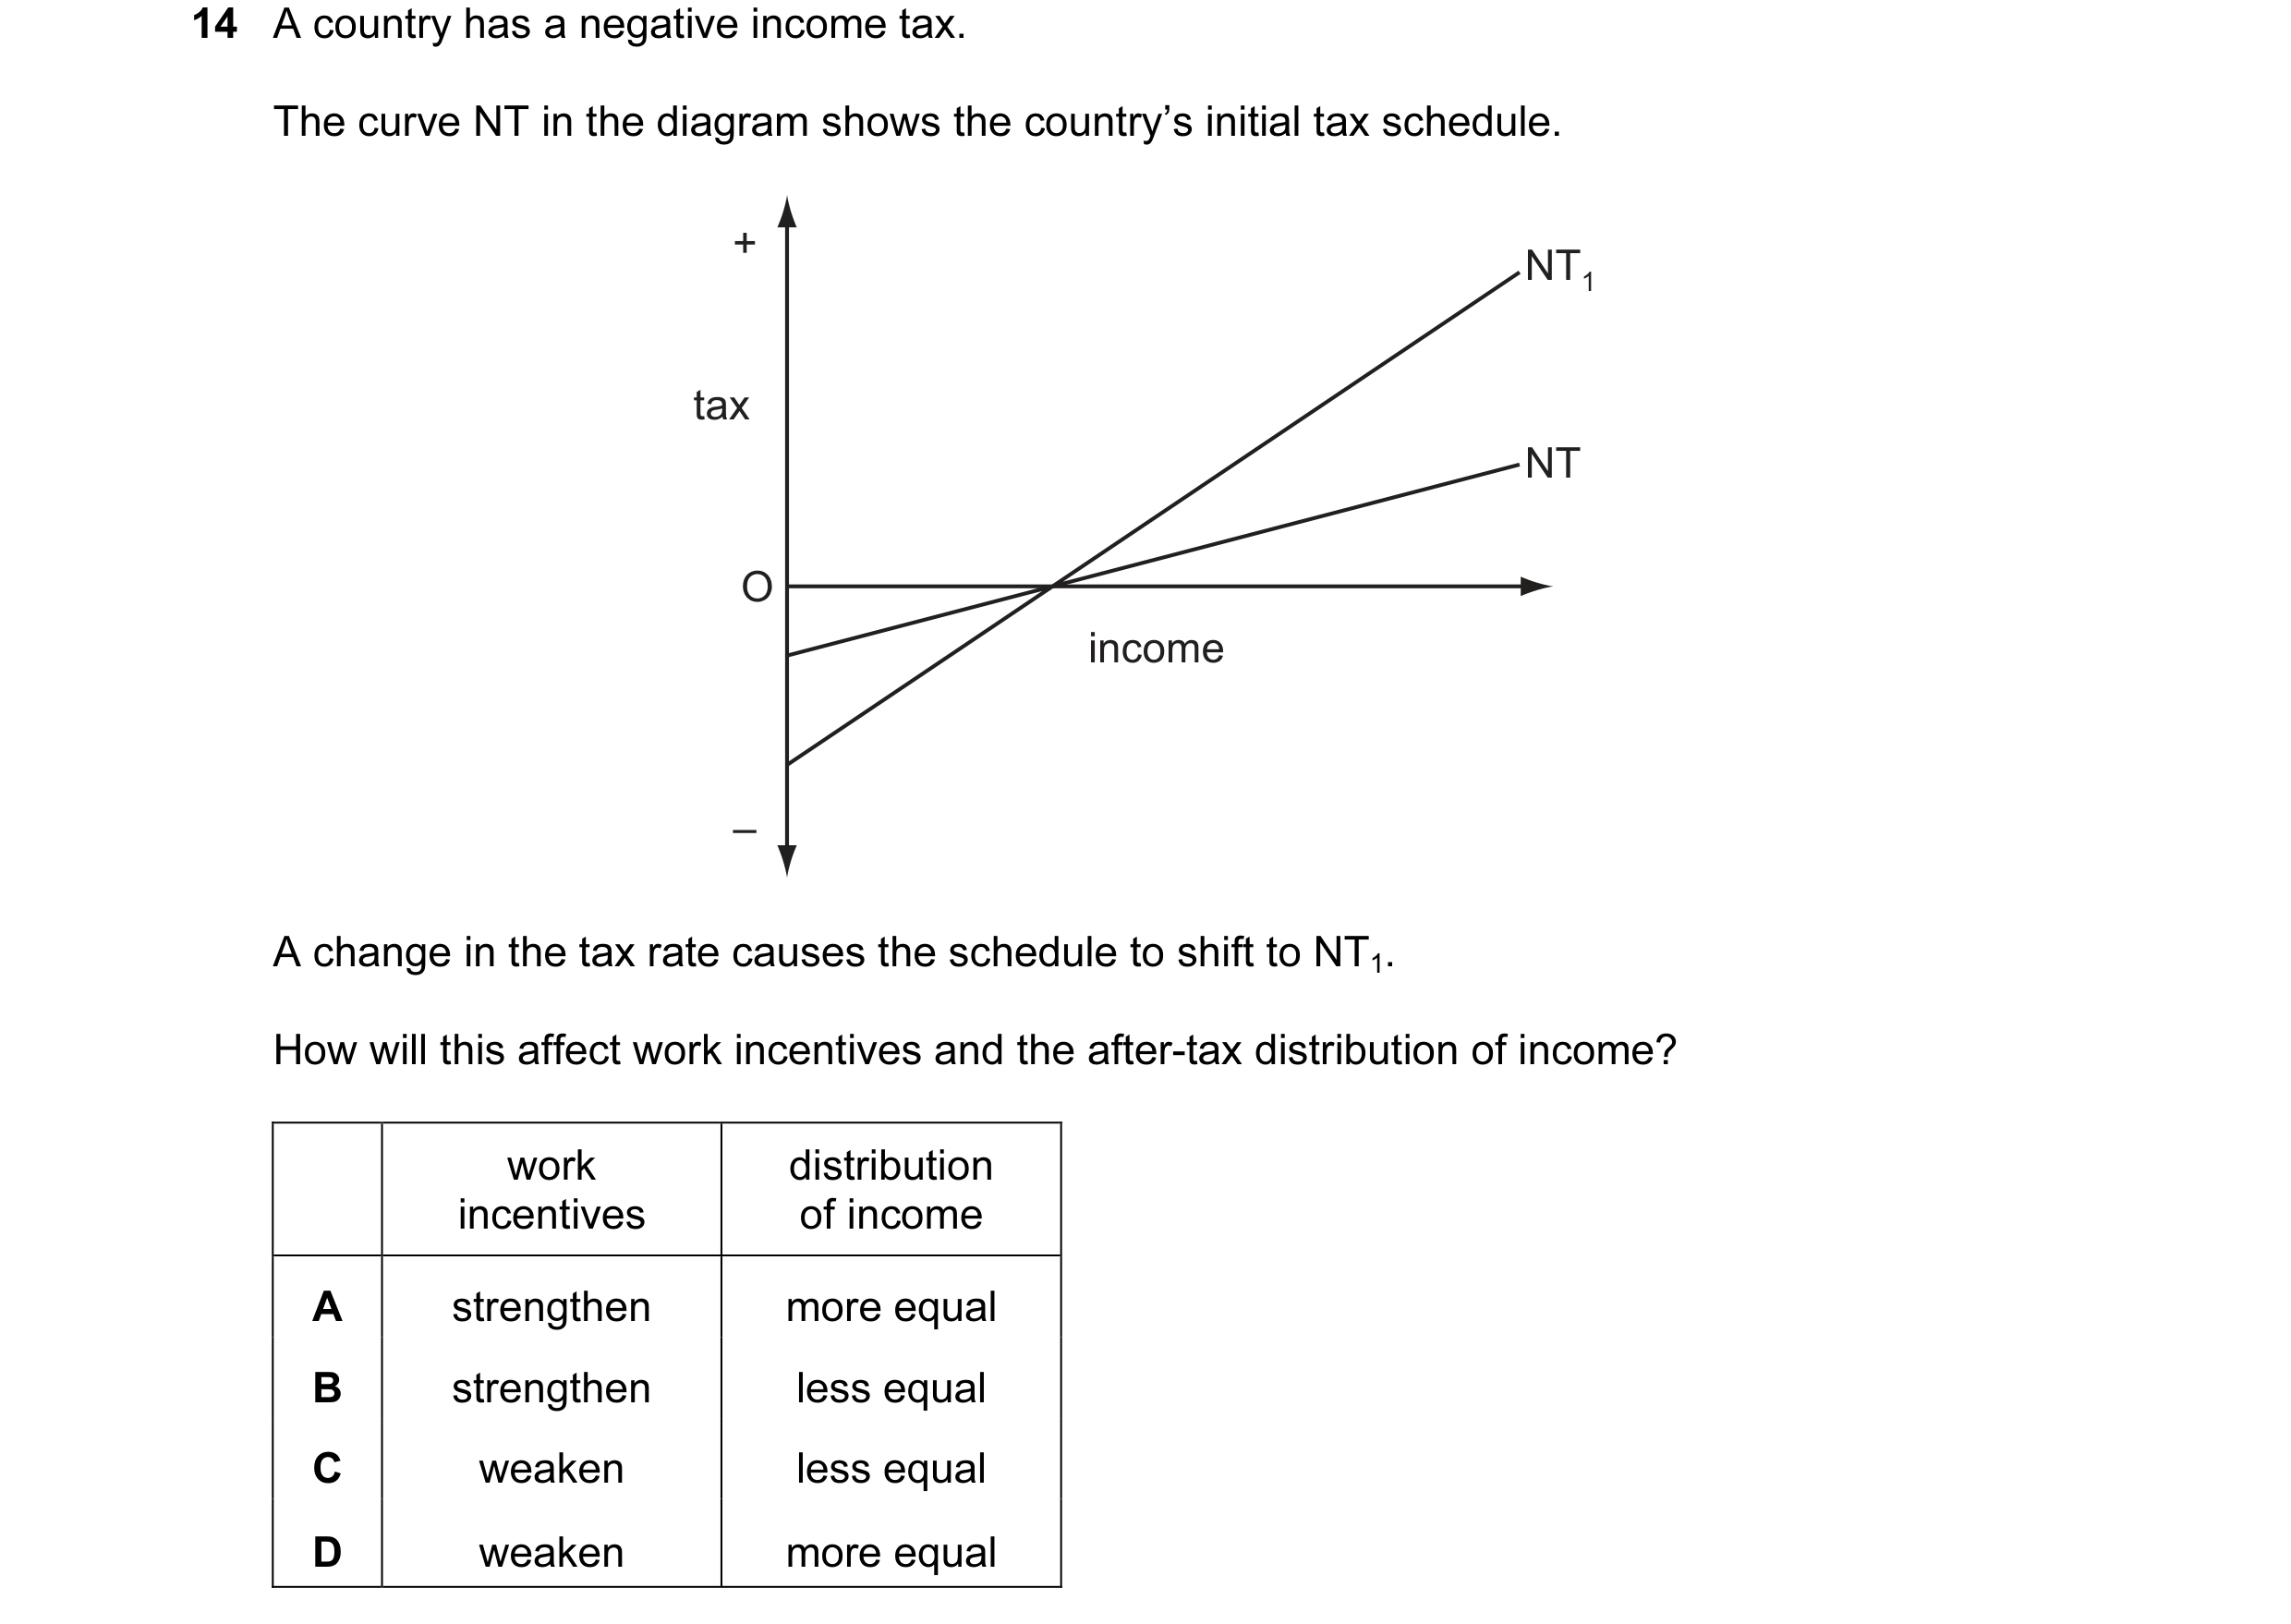

 8 / 28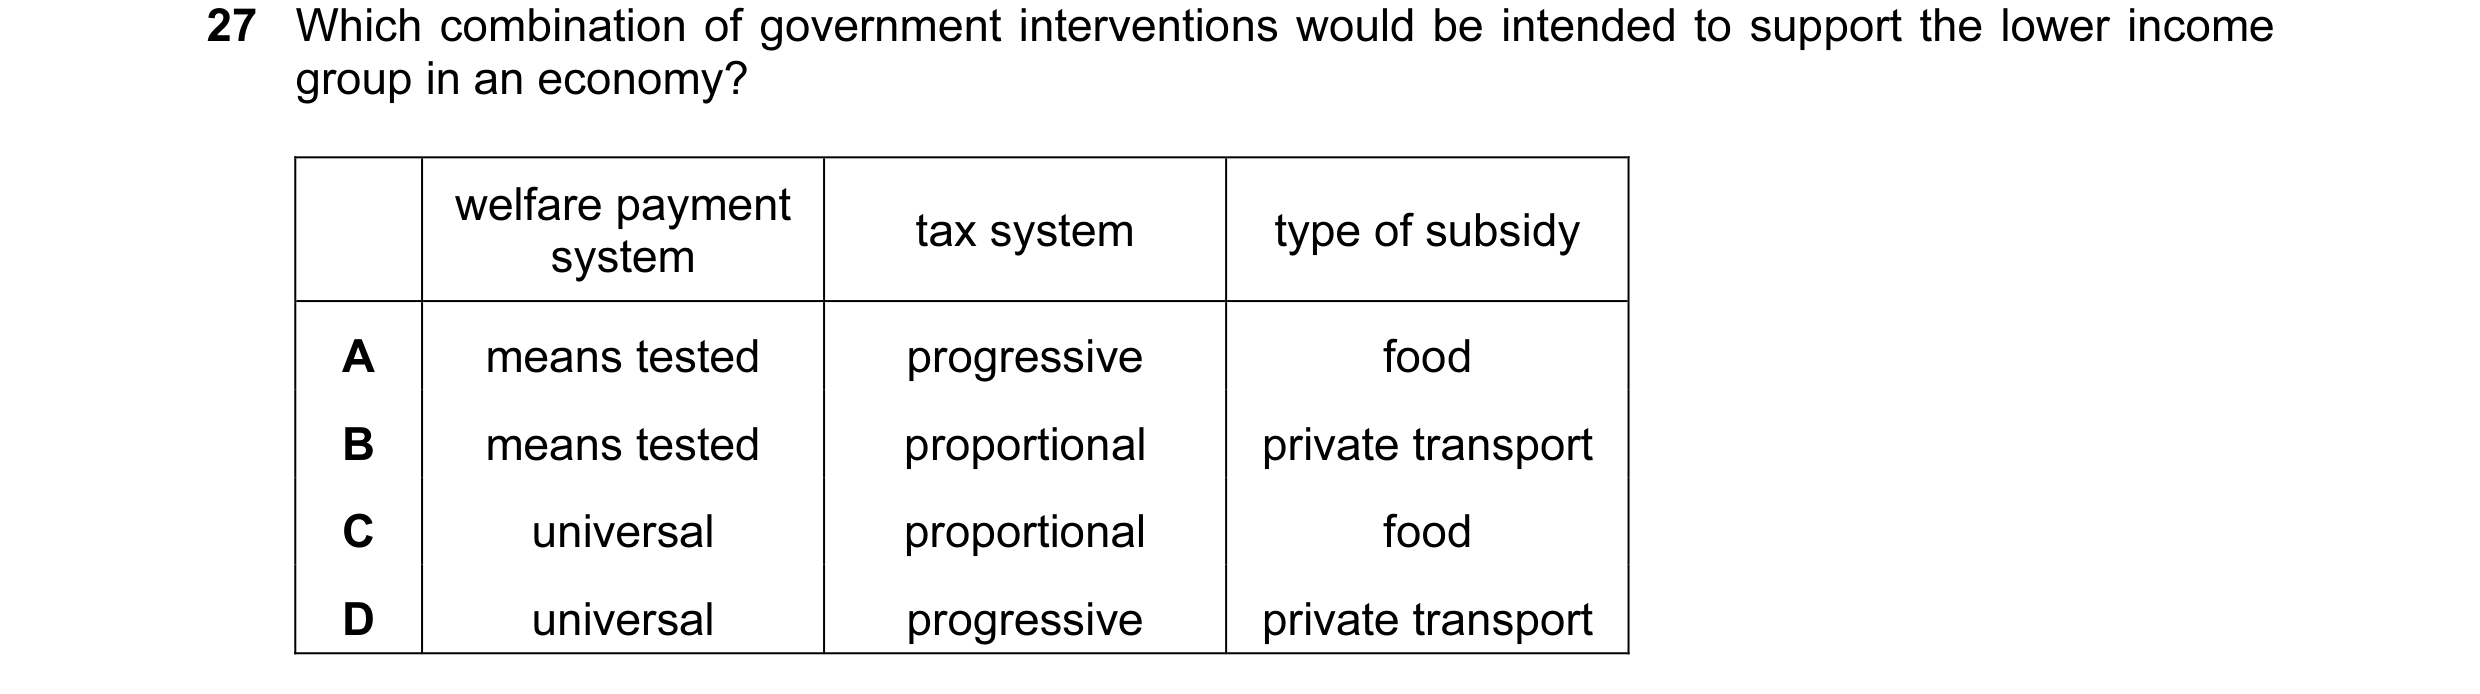
 9 / 28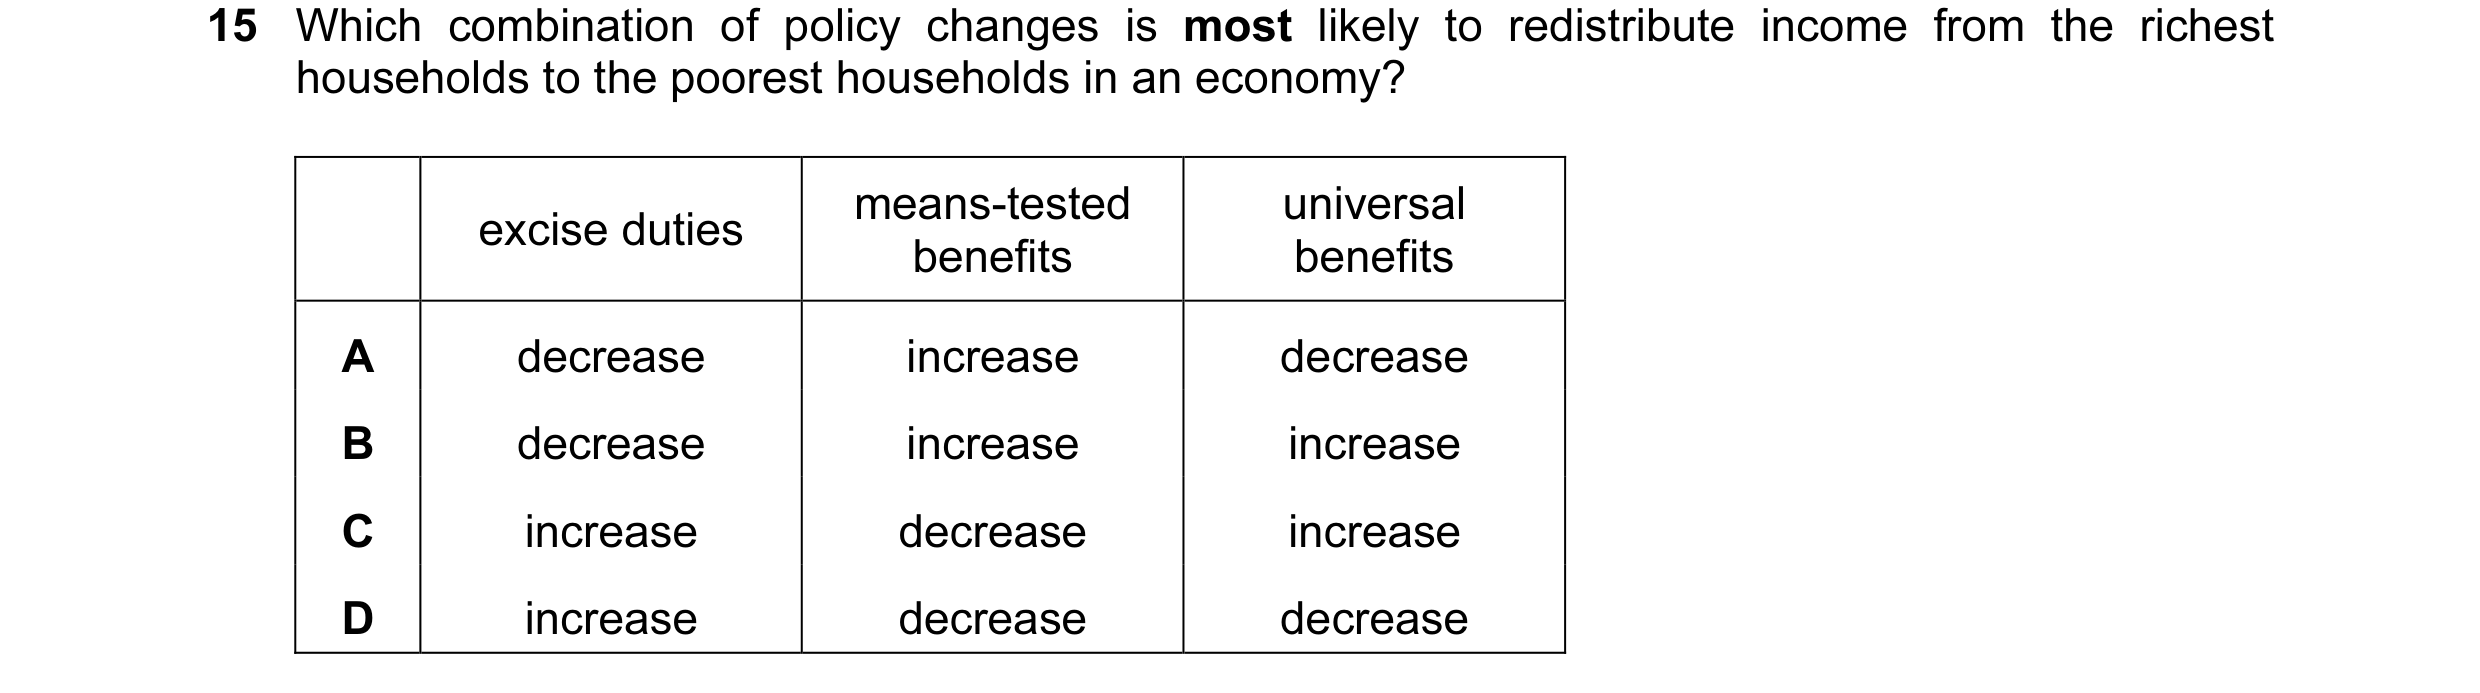


 10 / 28
 11 / 28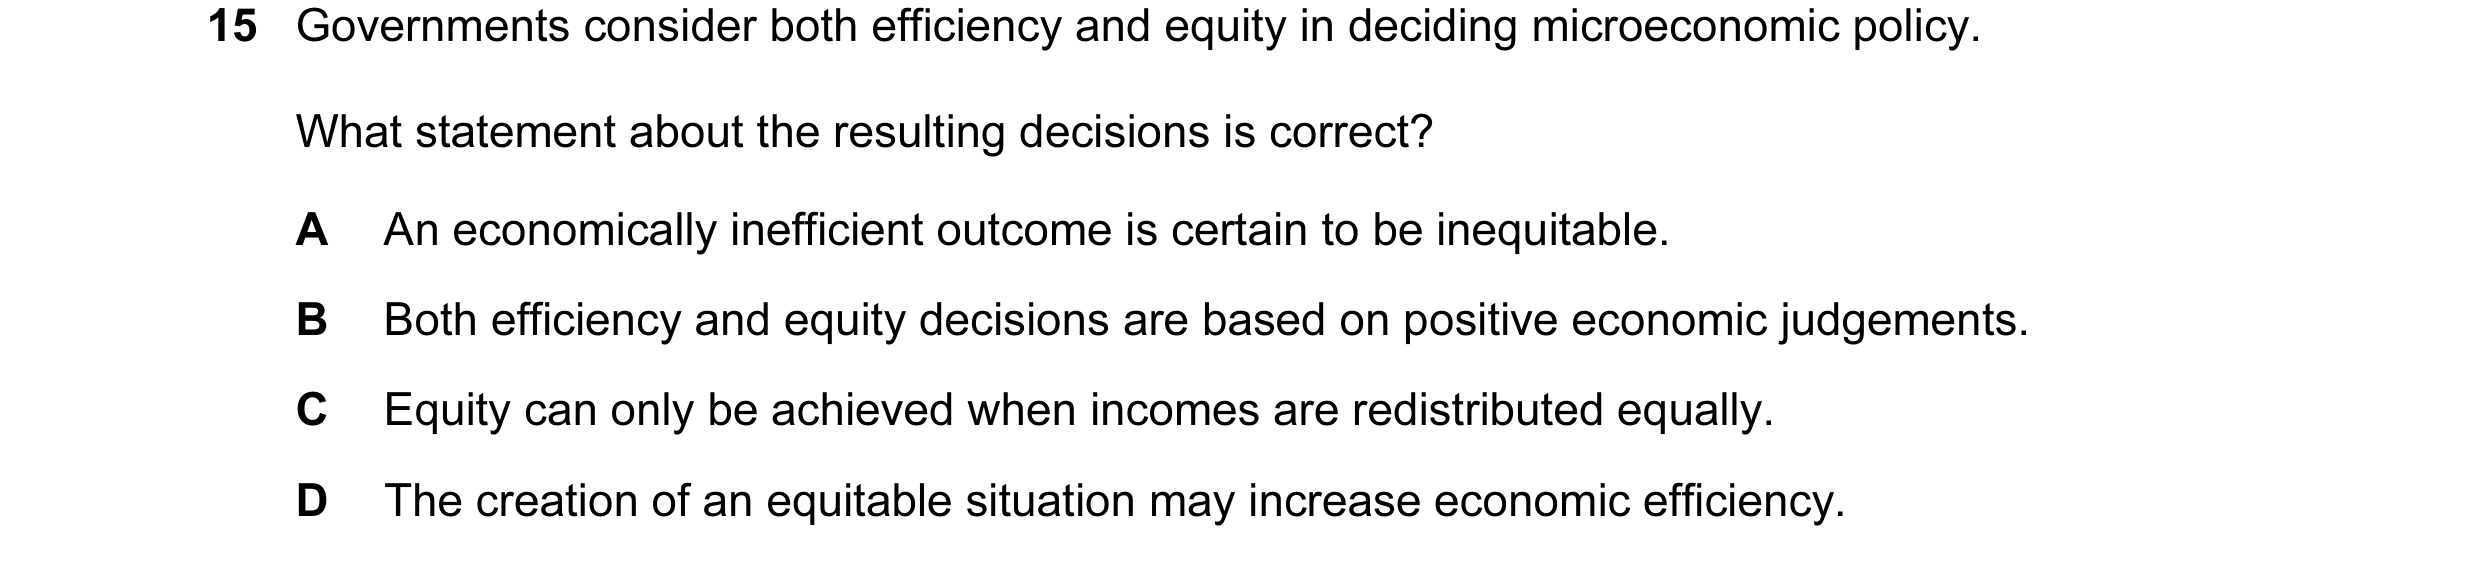
 12 / 28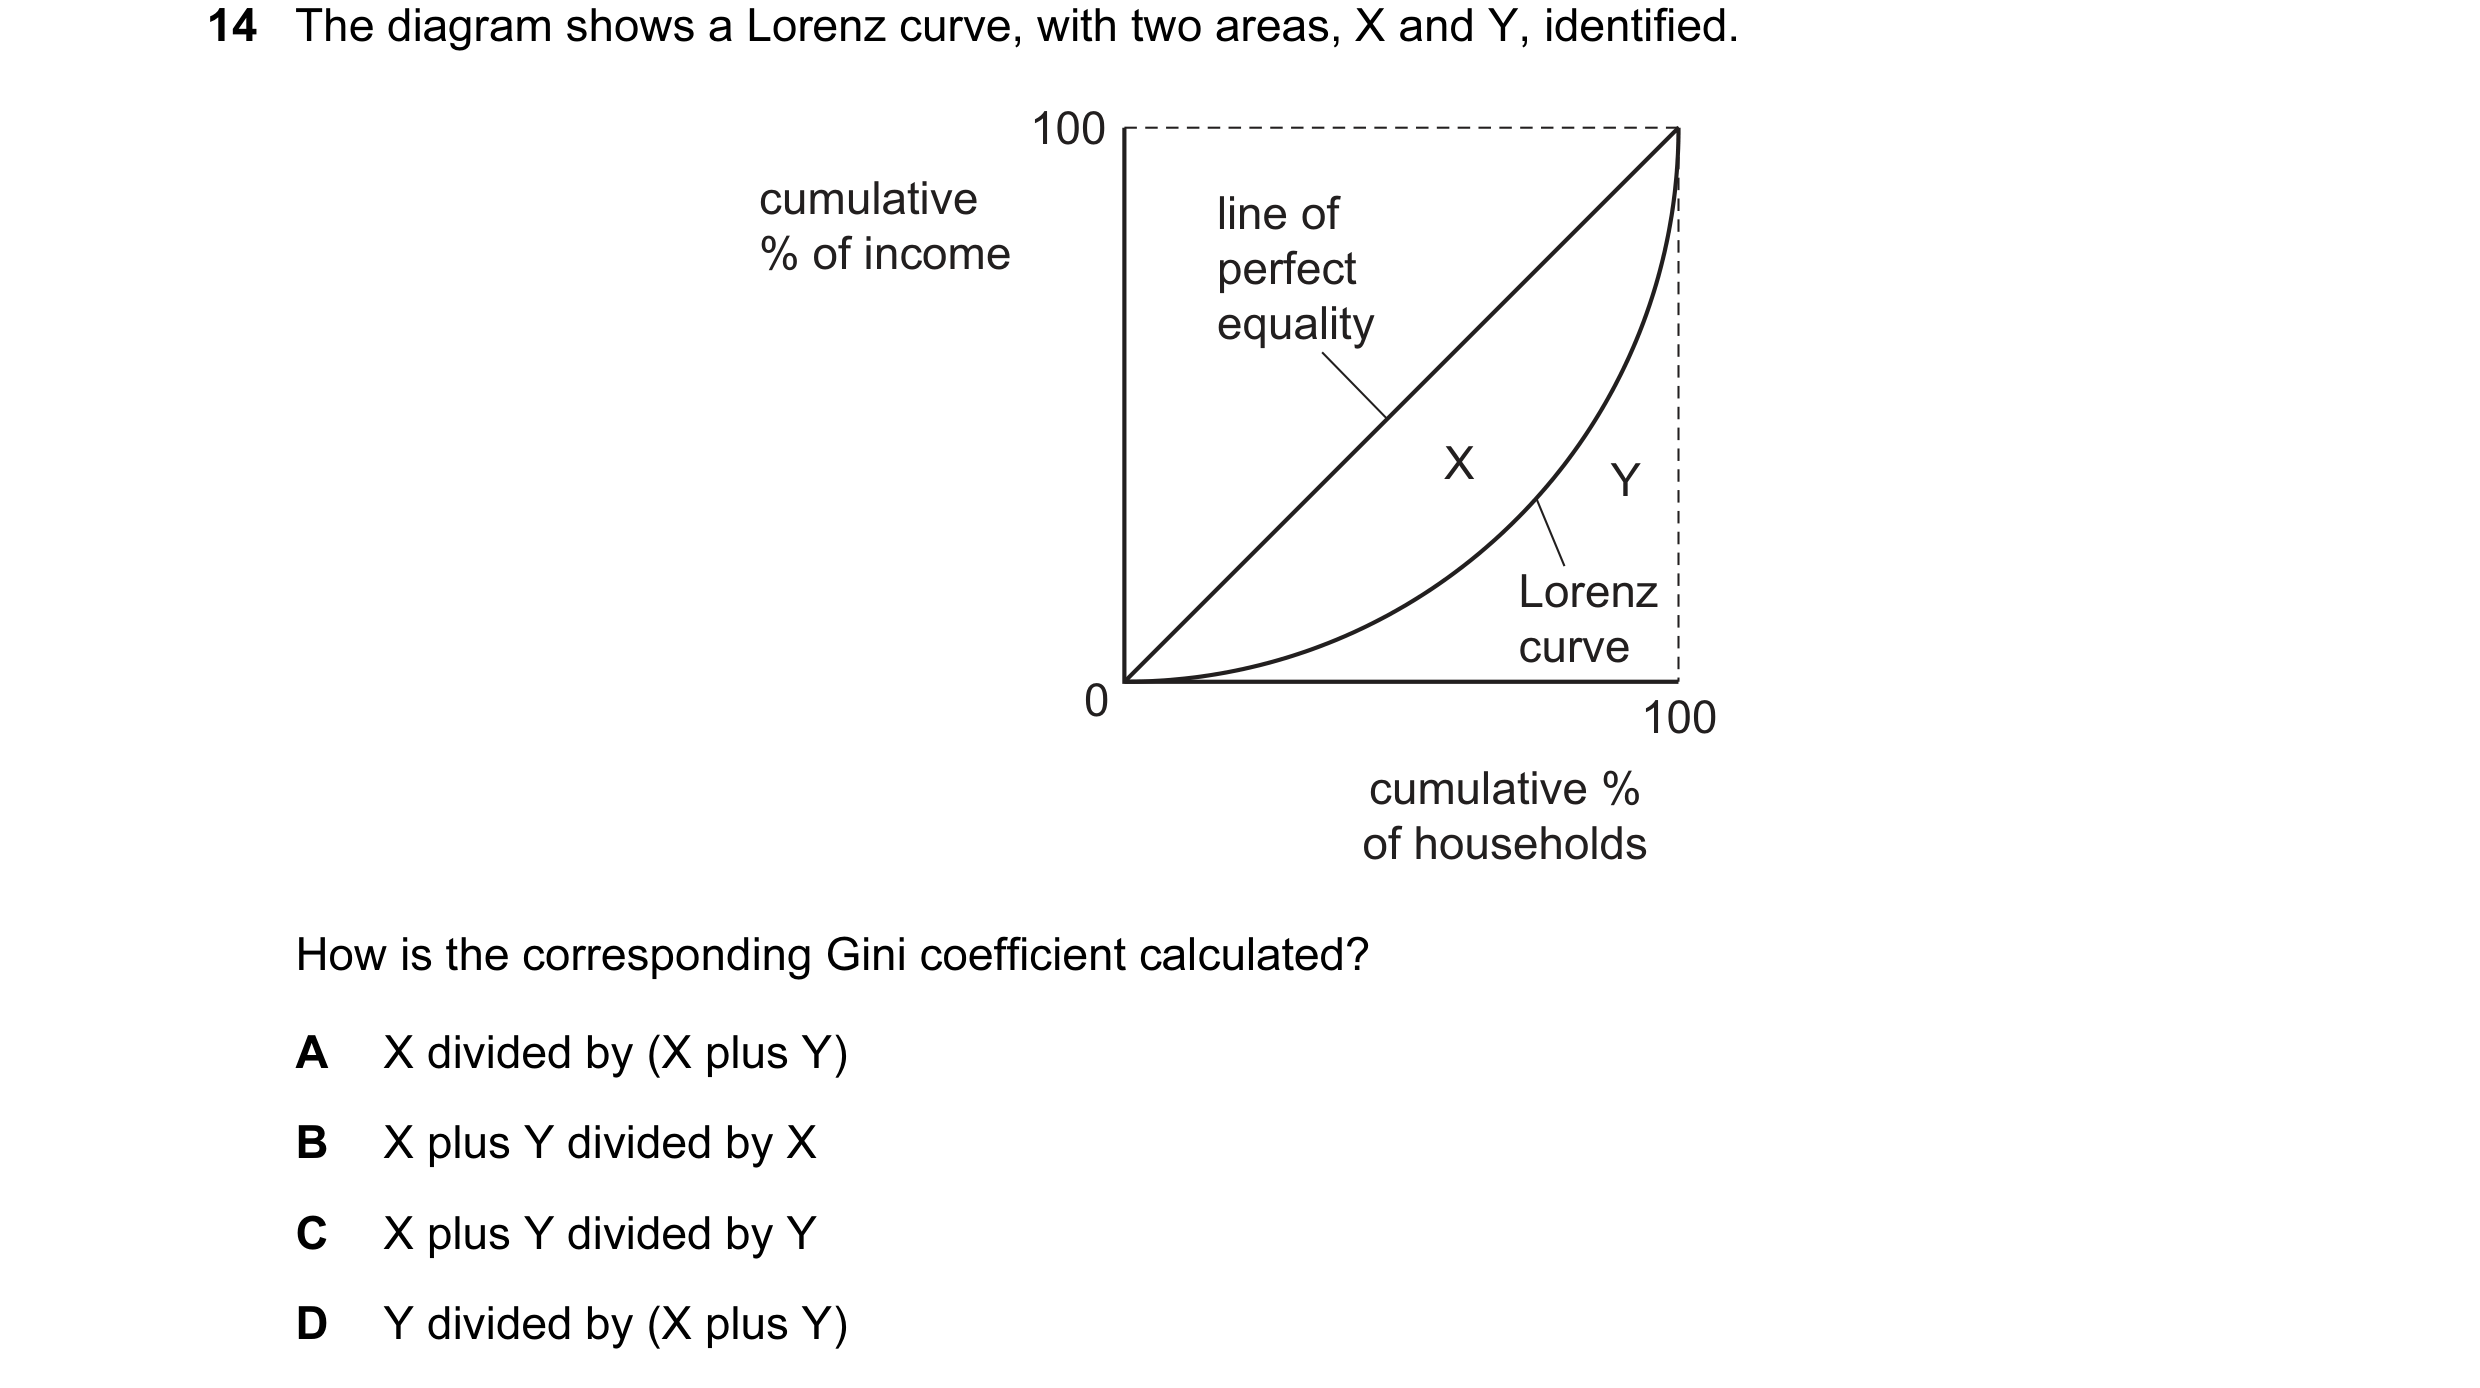
 13 / 28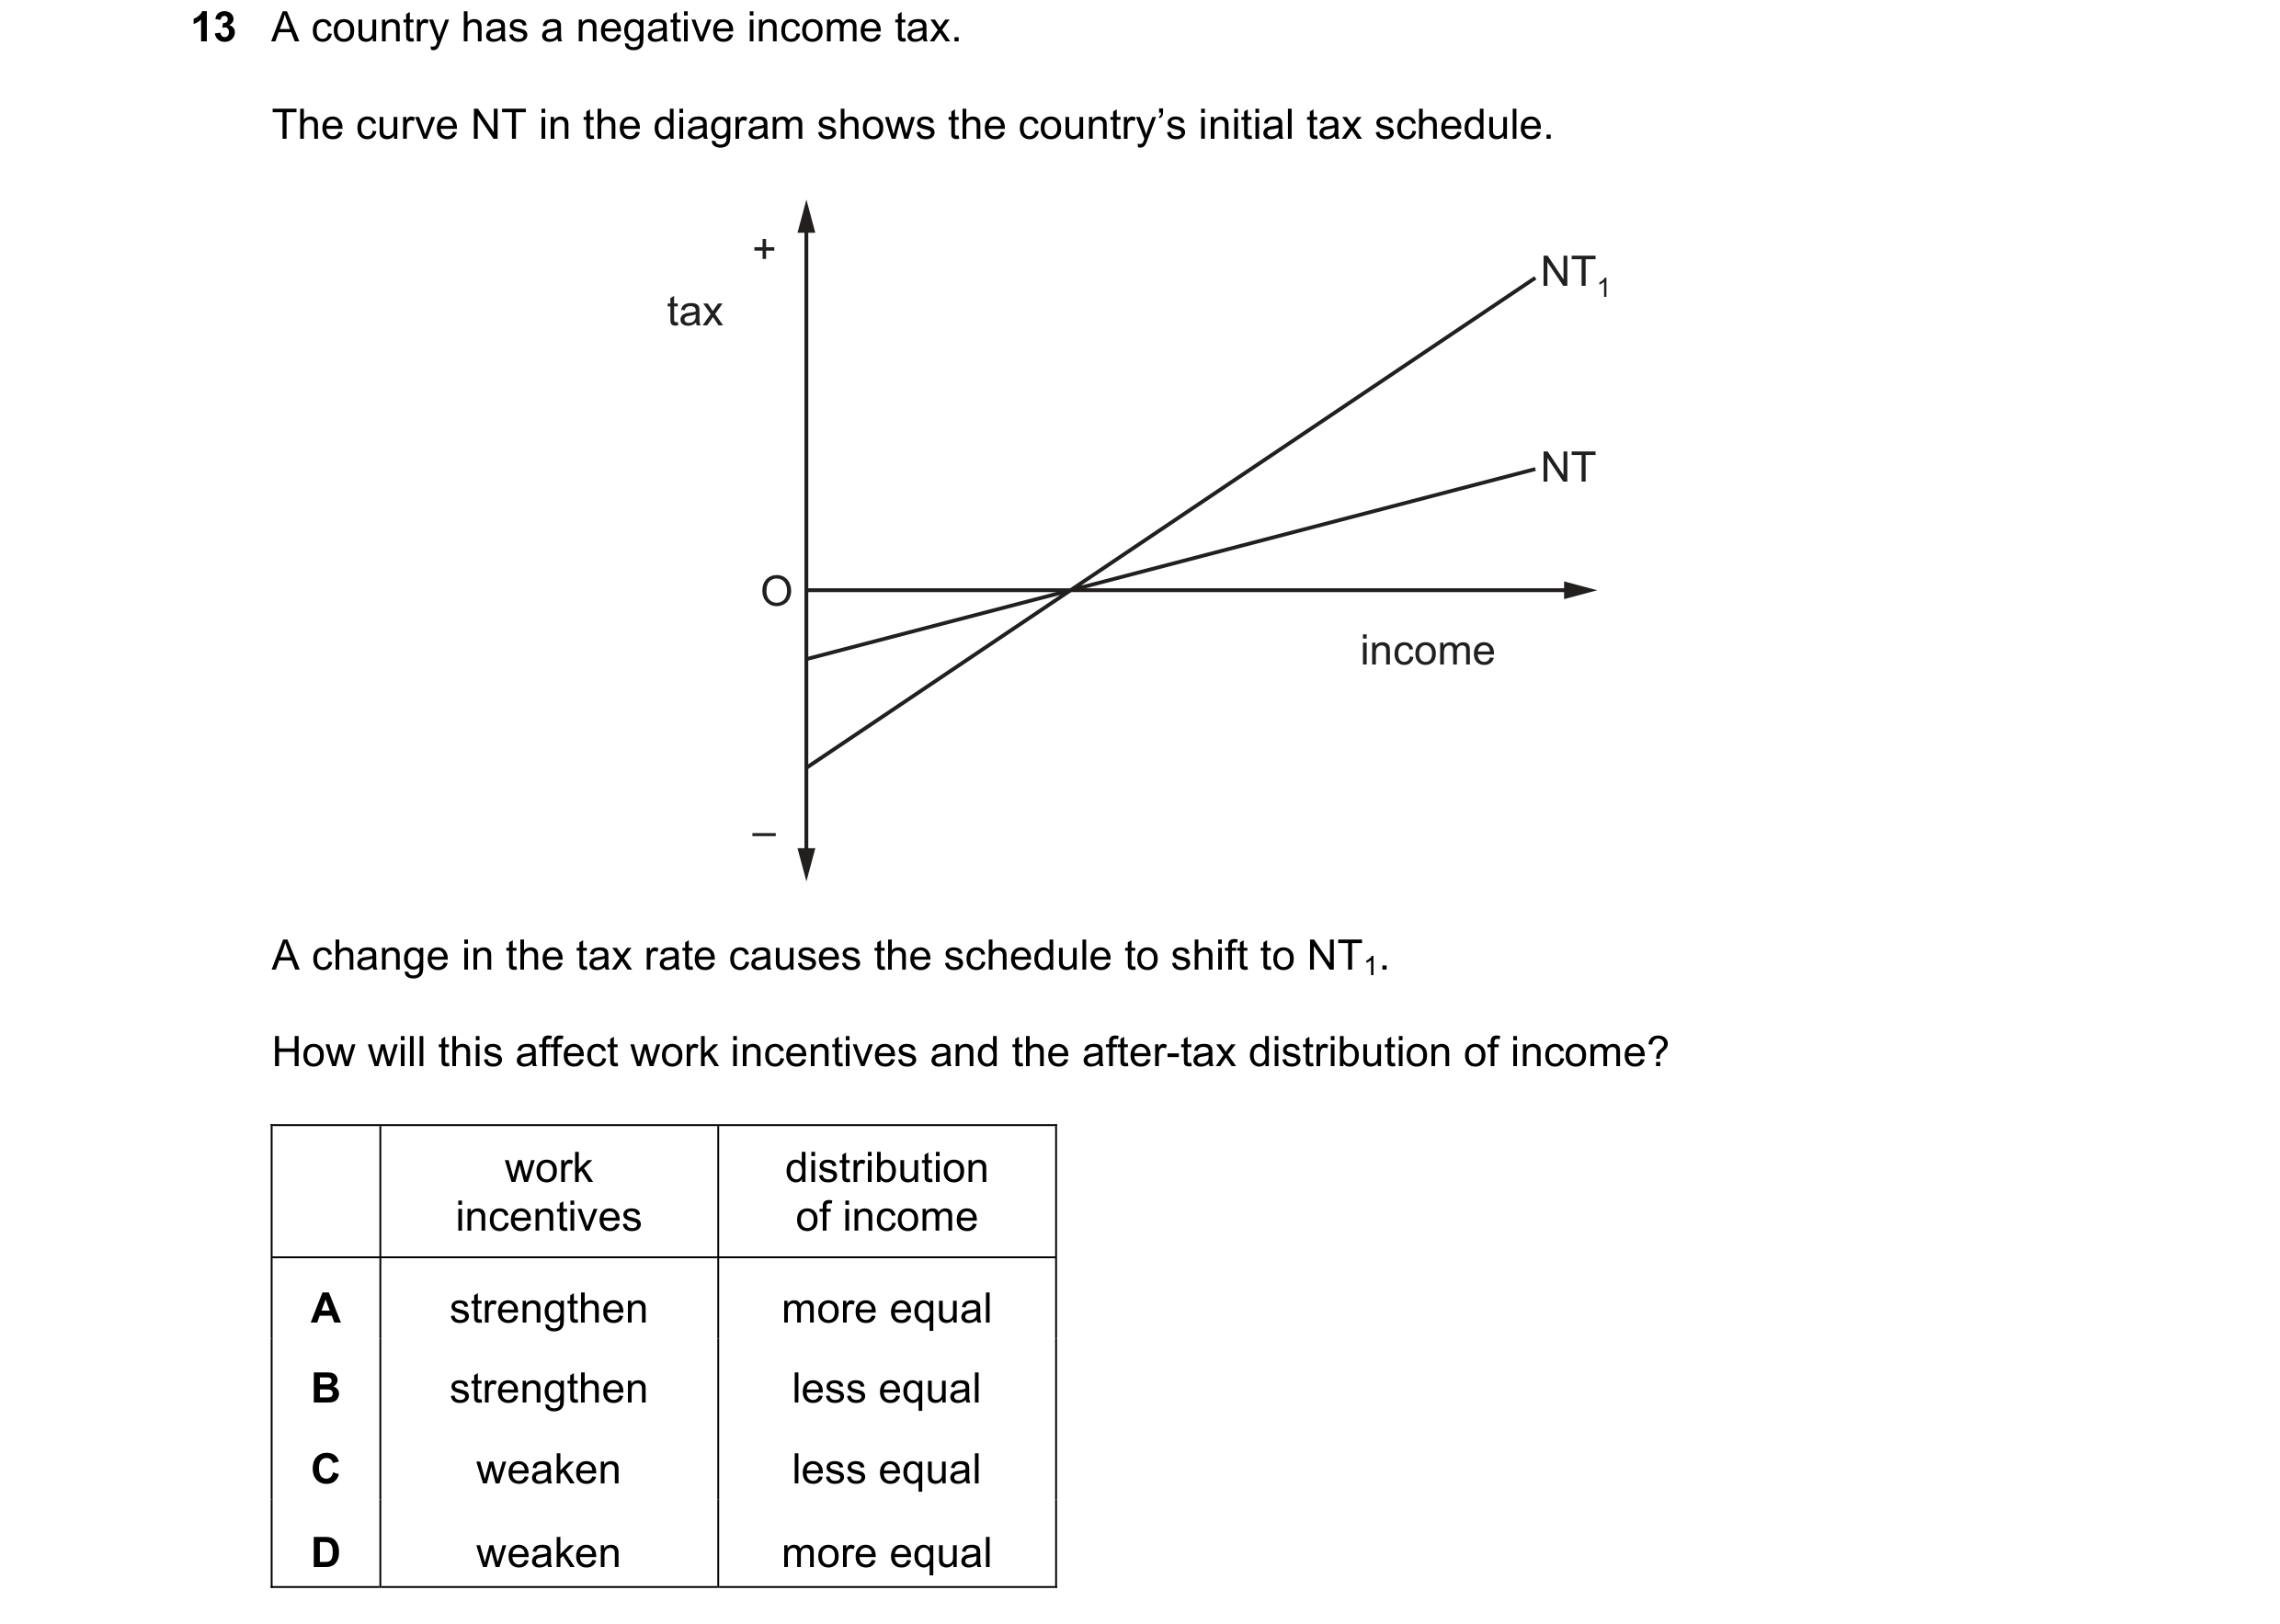
 14 / 28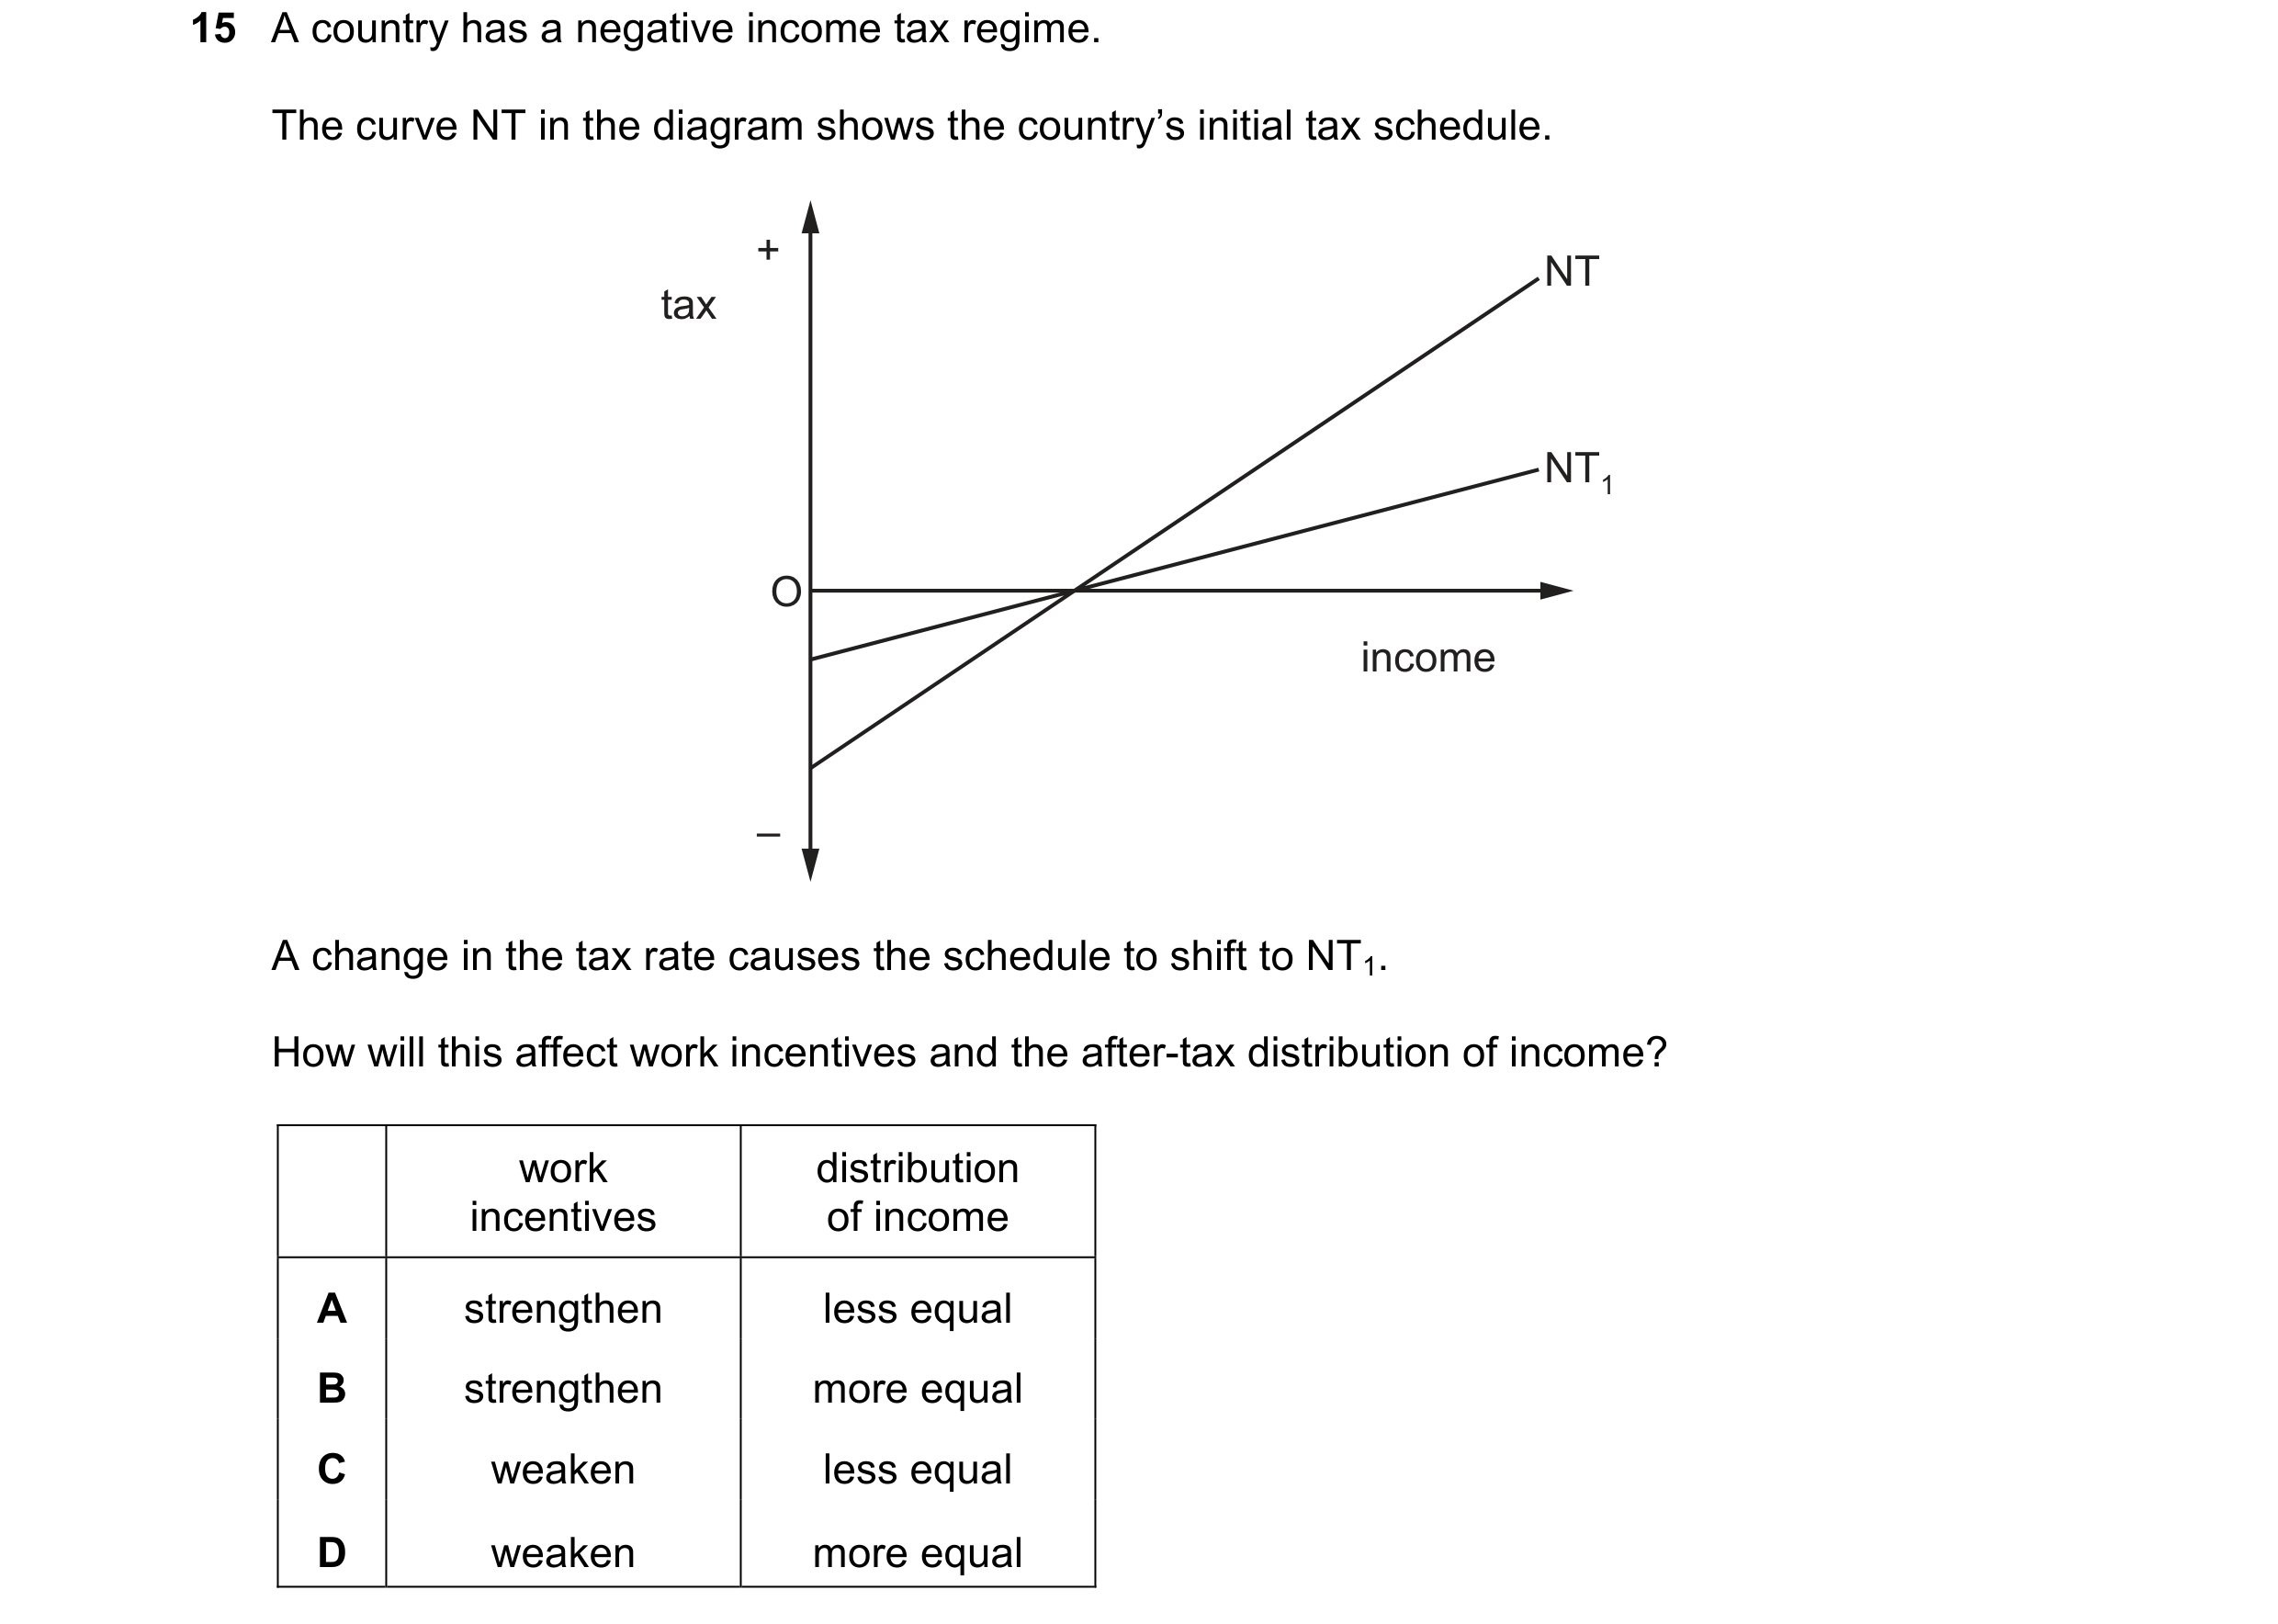
 15 / 28
 16 / 28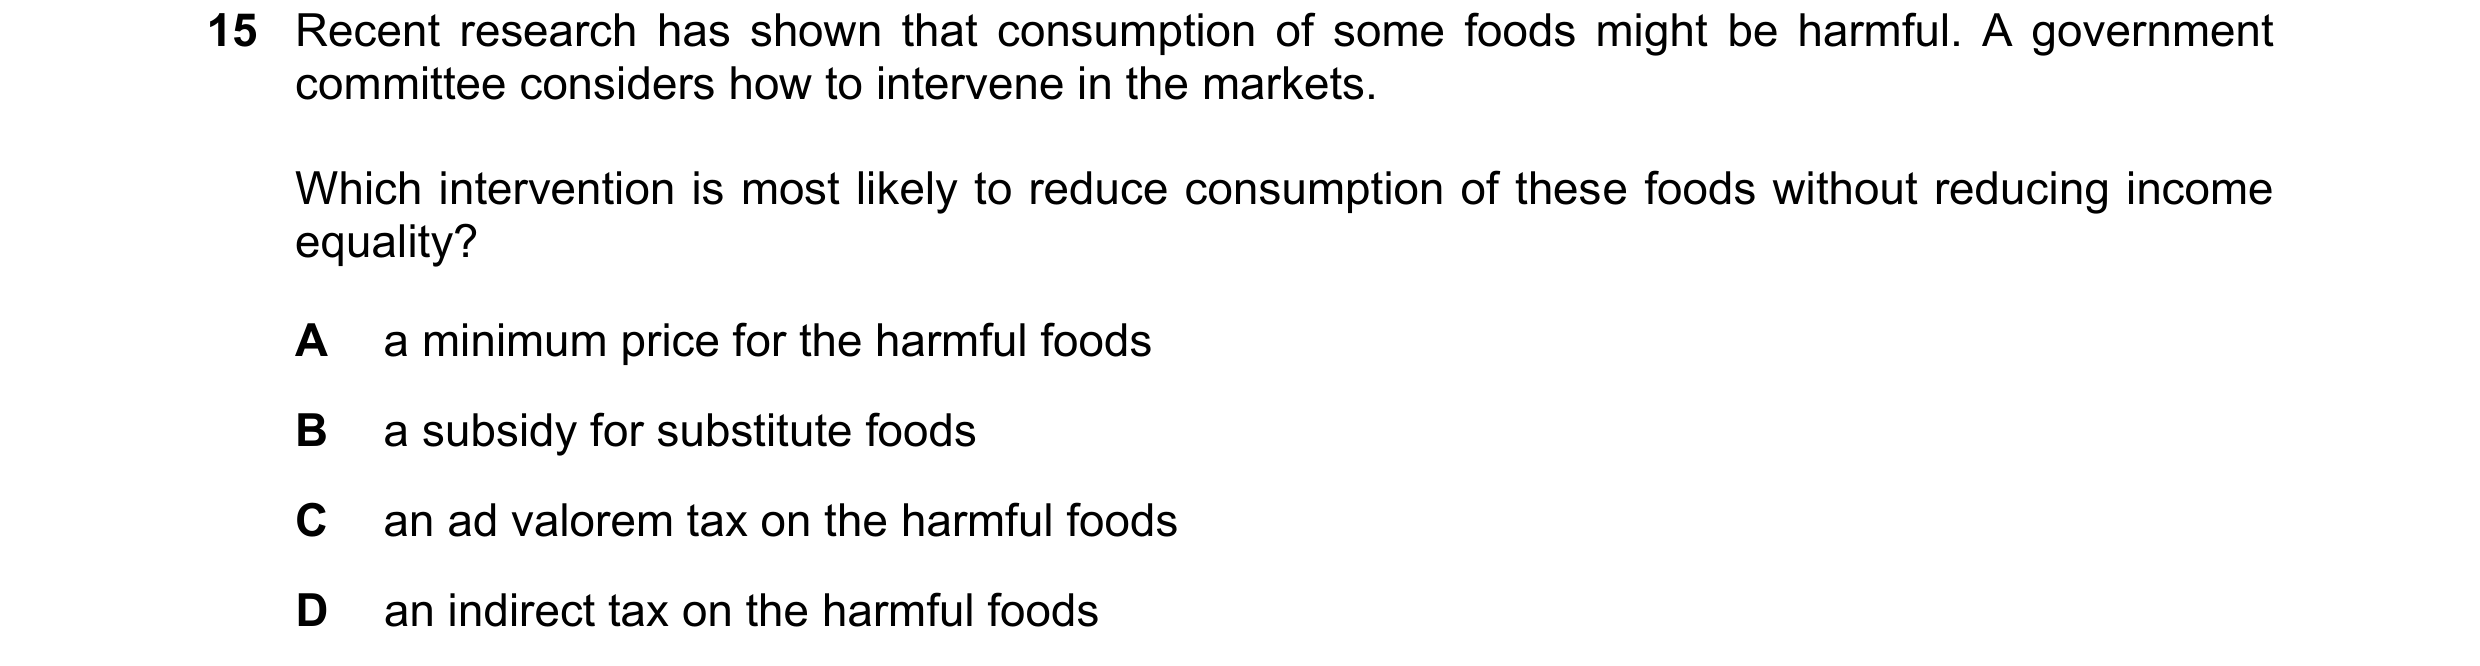
 17 / 28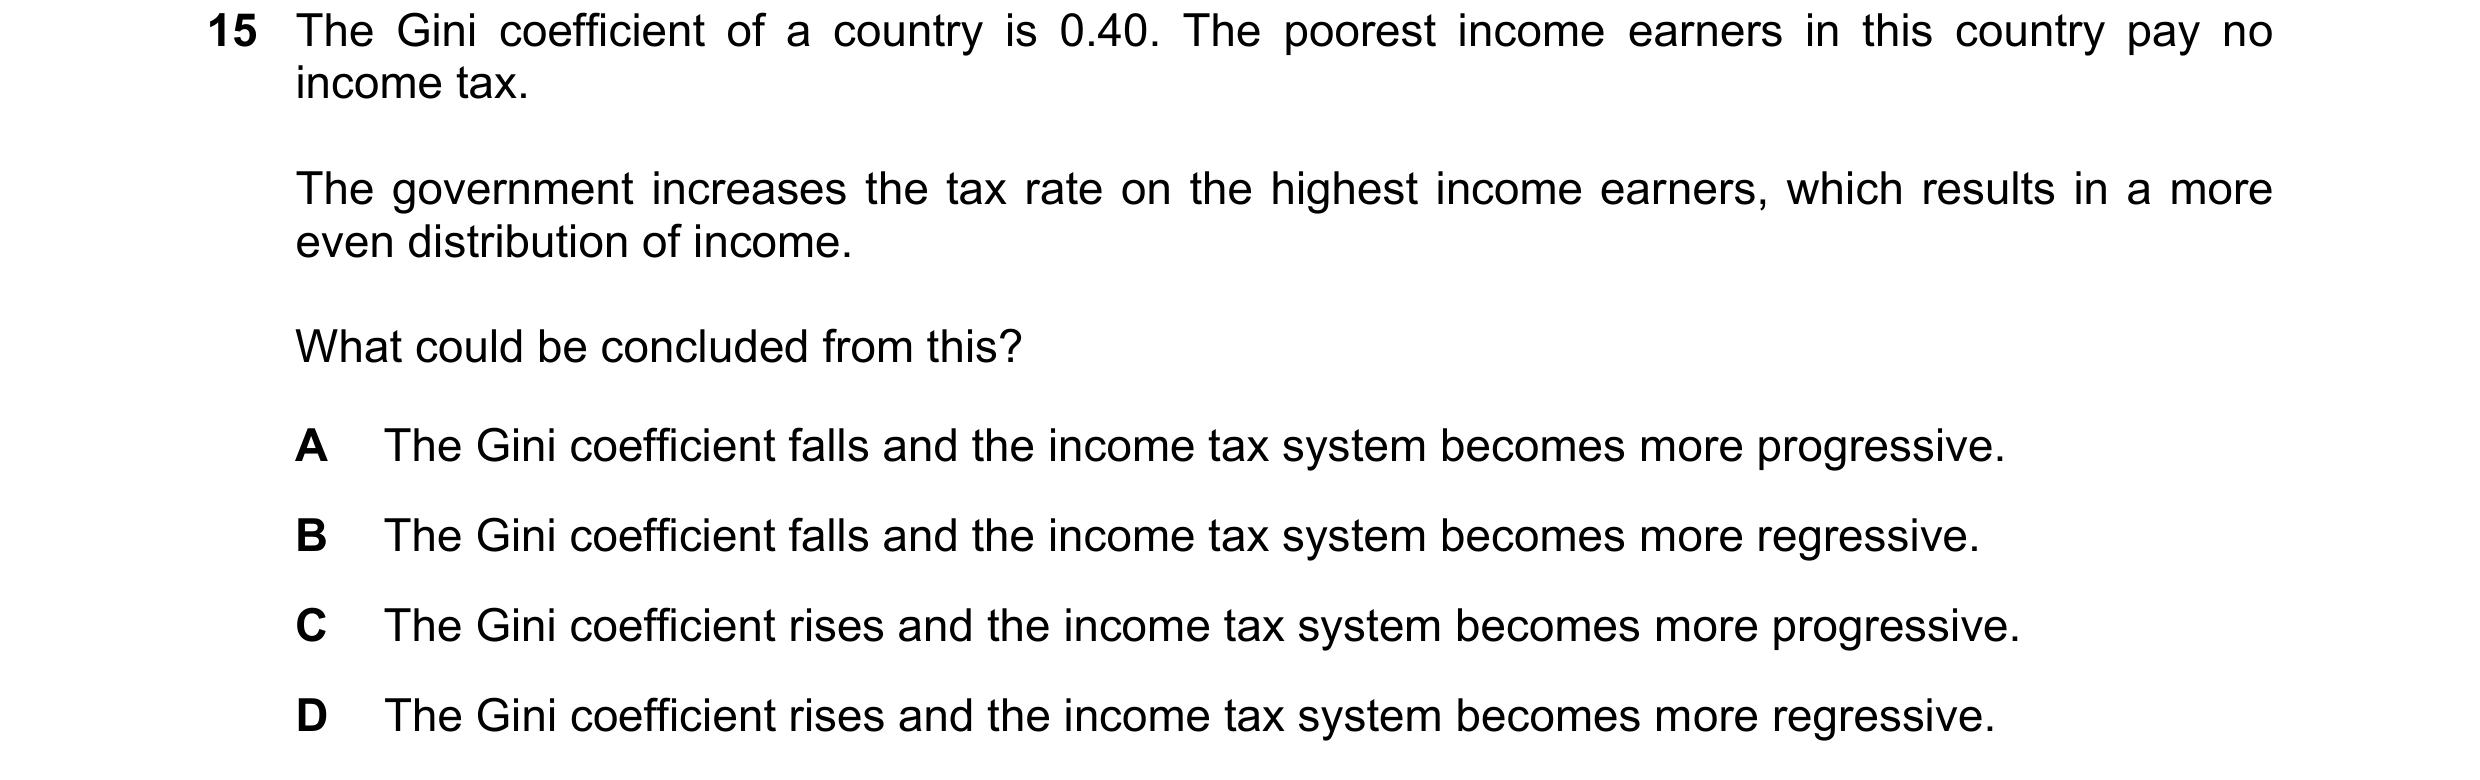
 18 / 28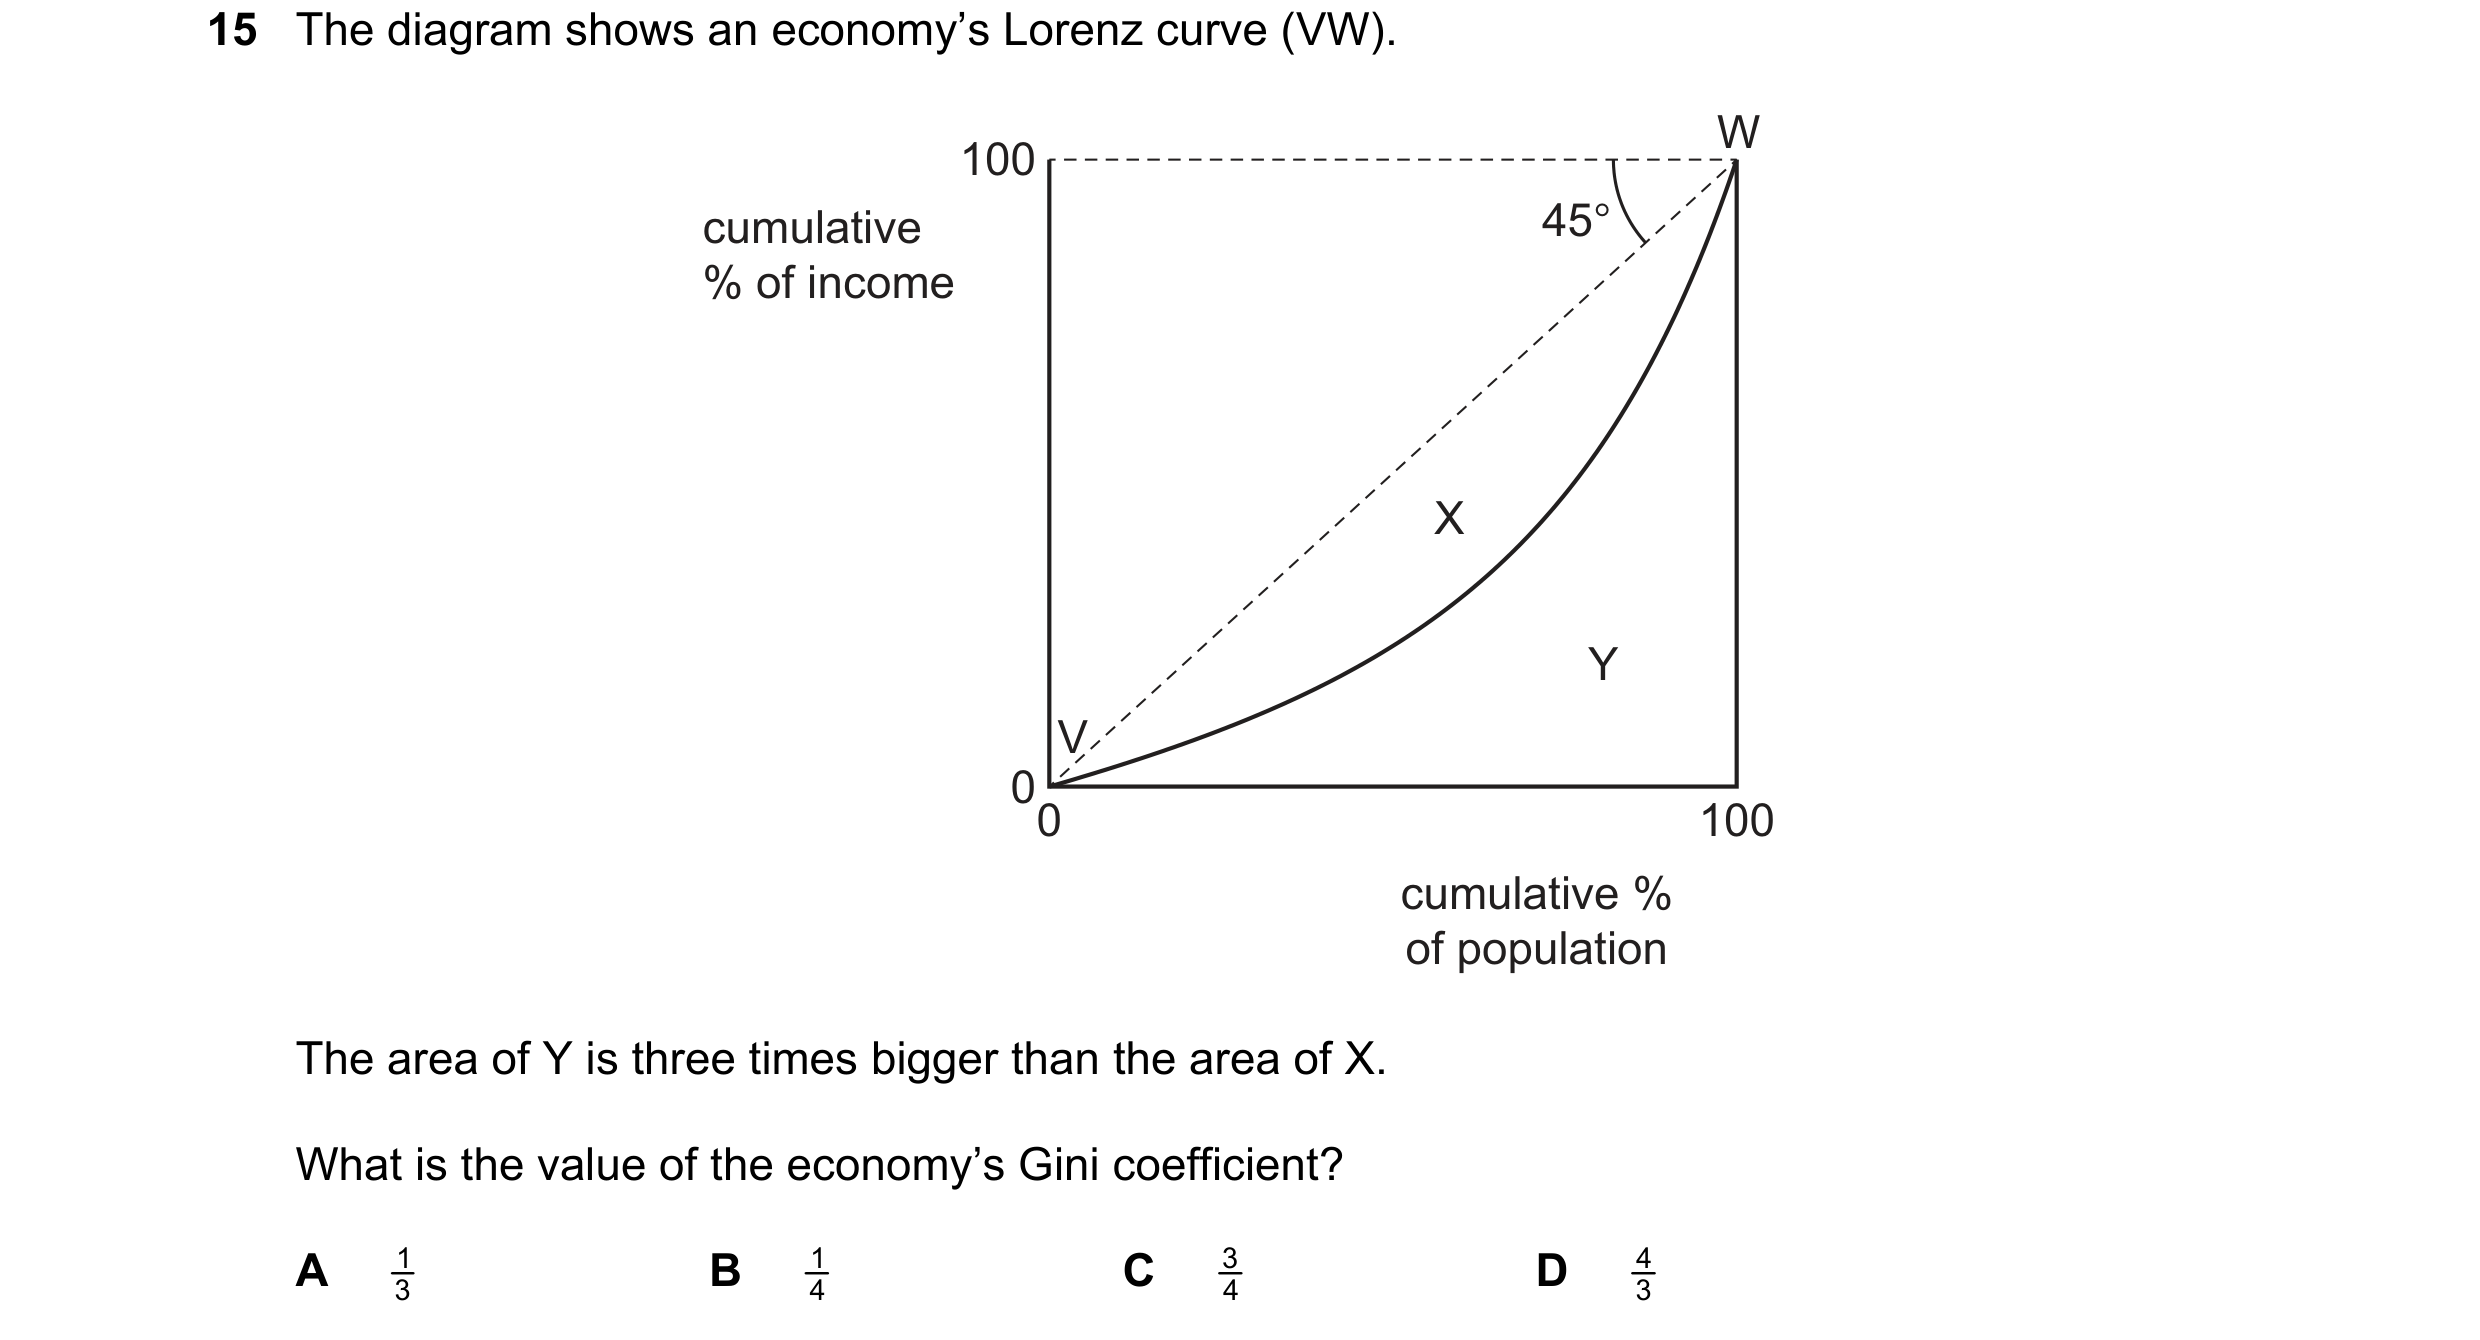
 19 / 28

 20 / 28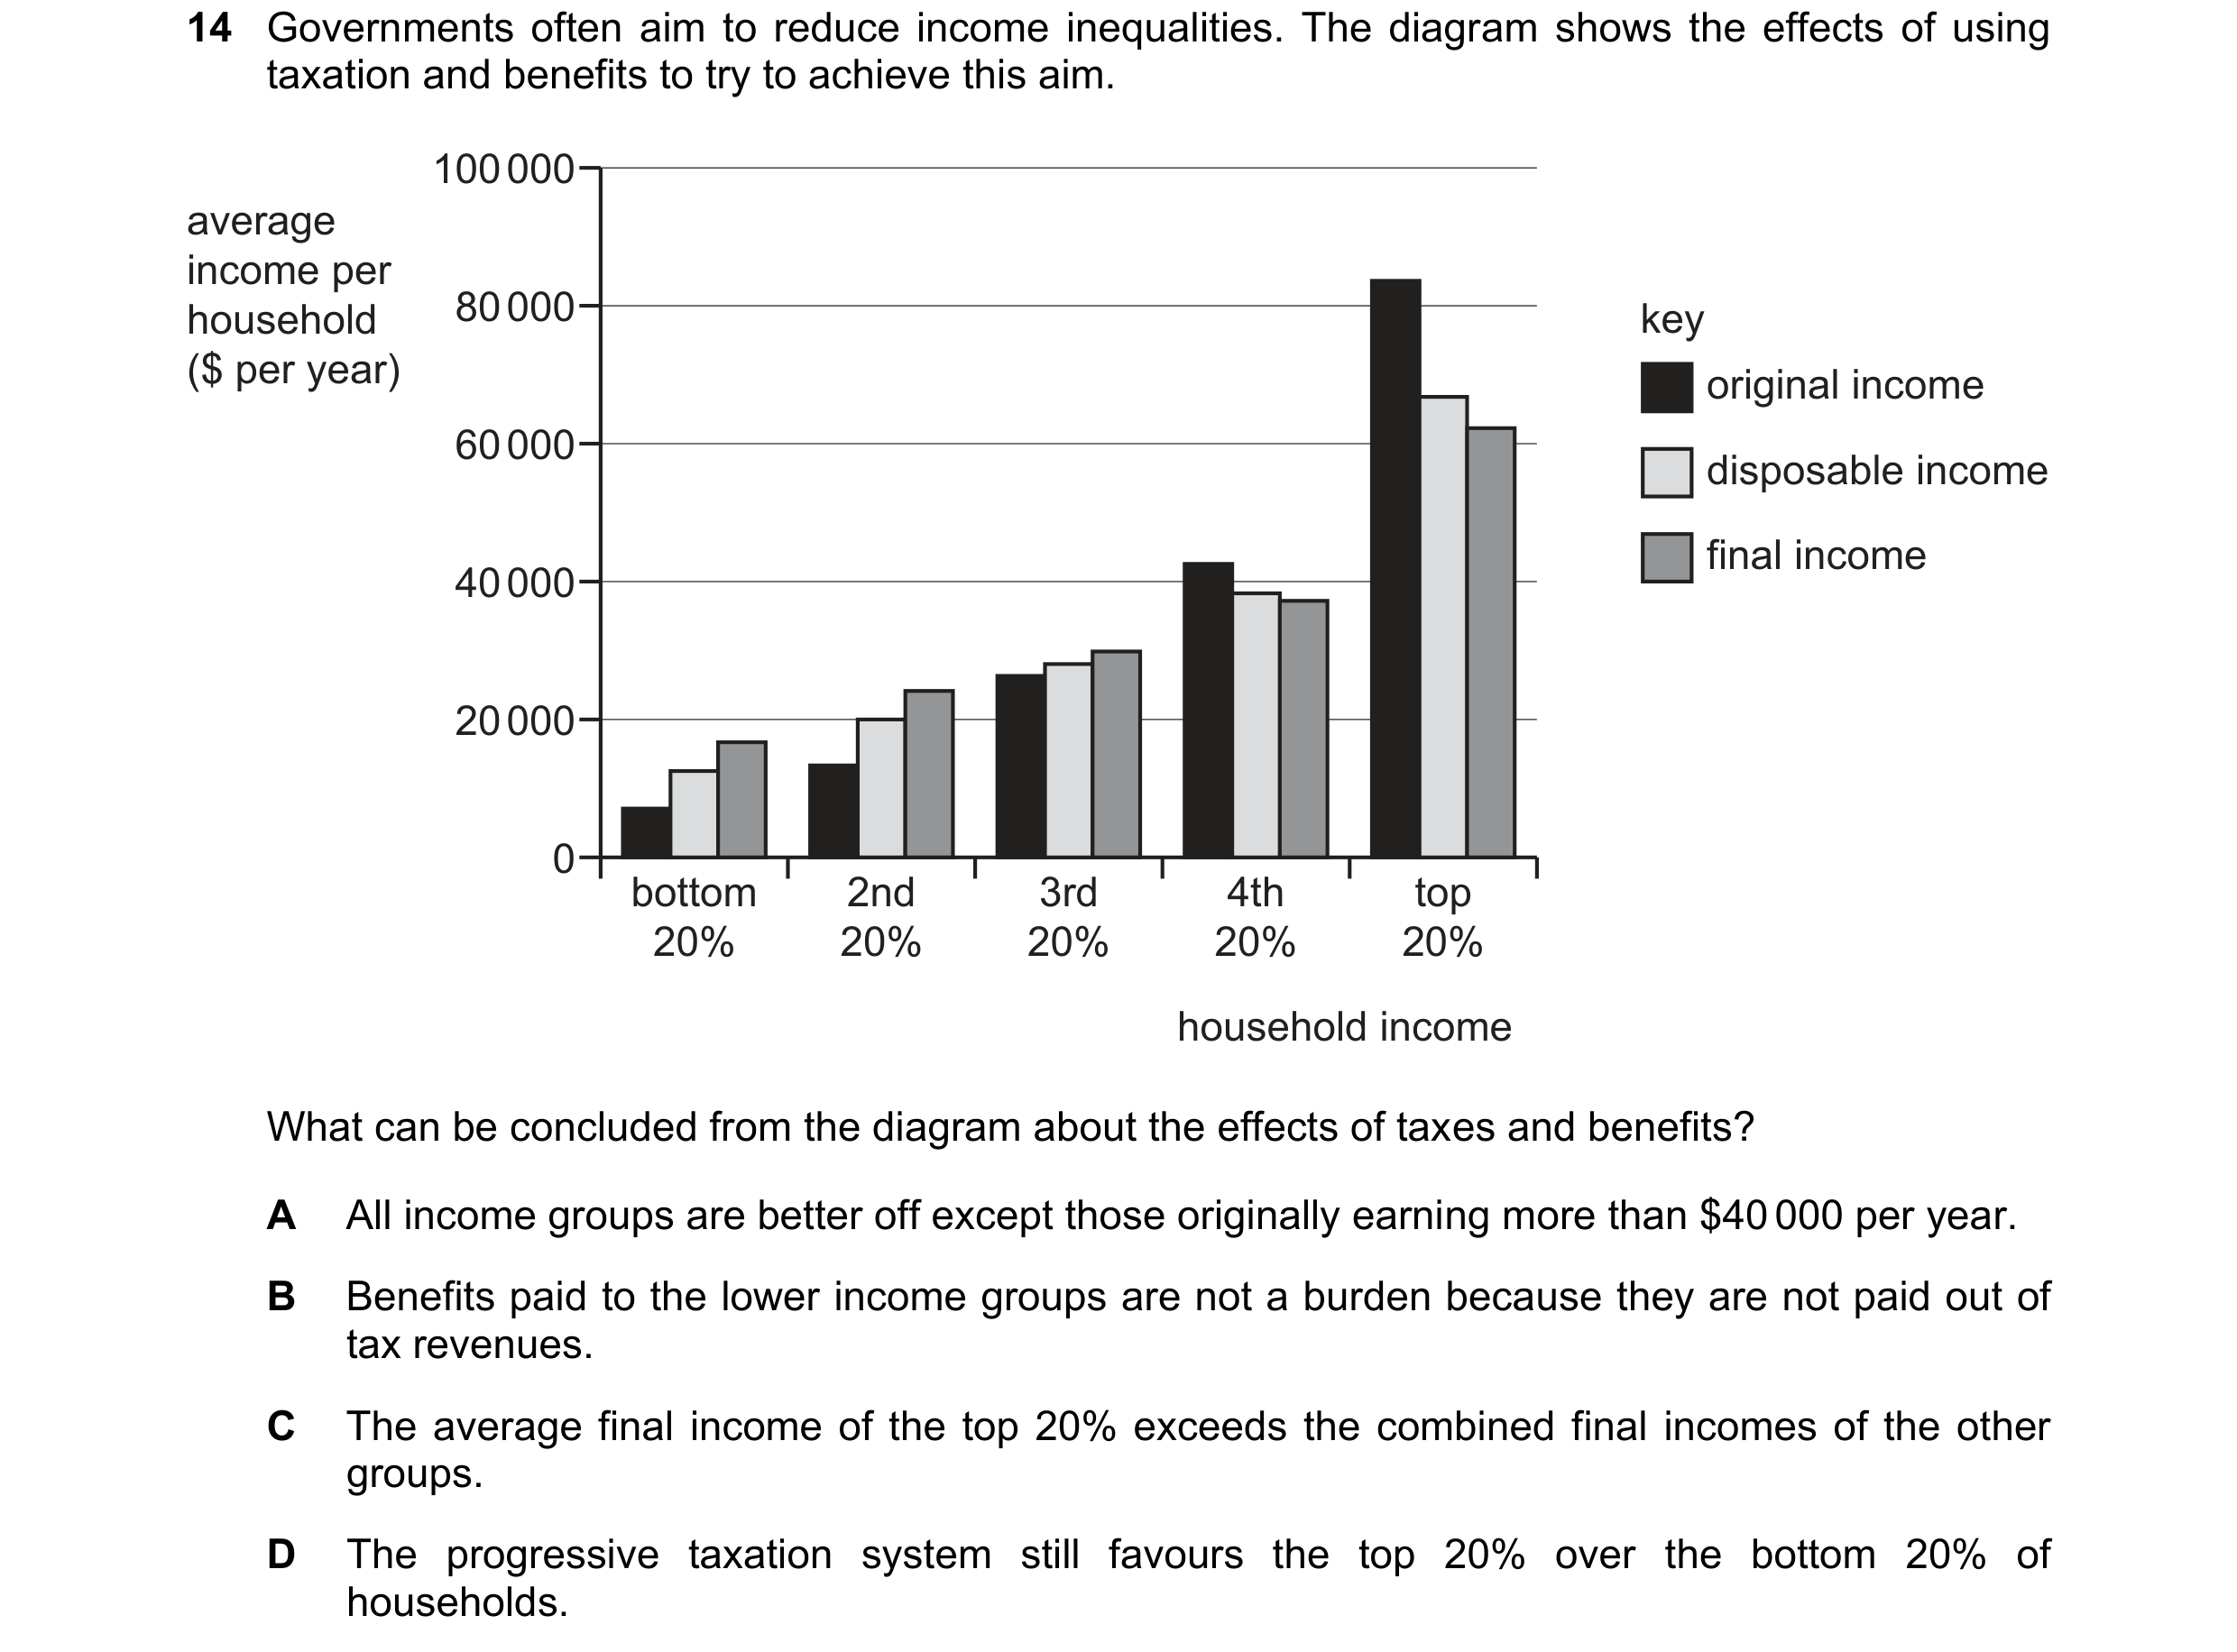
 21 / 28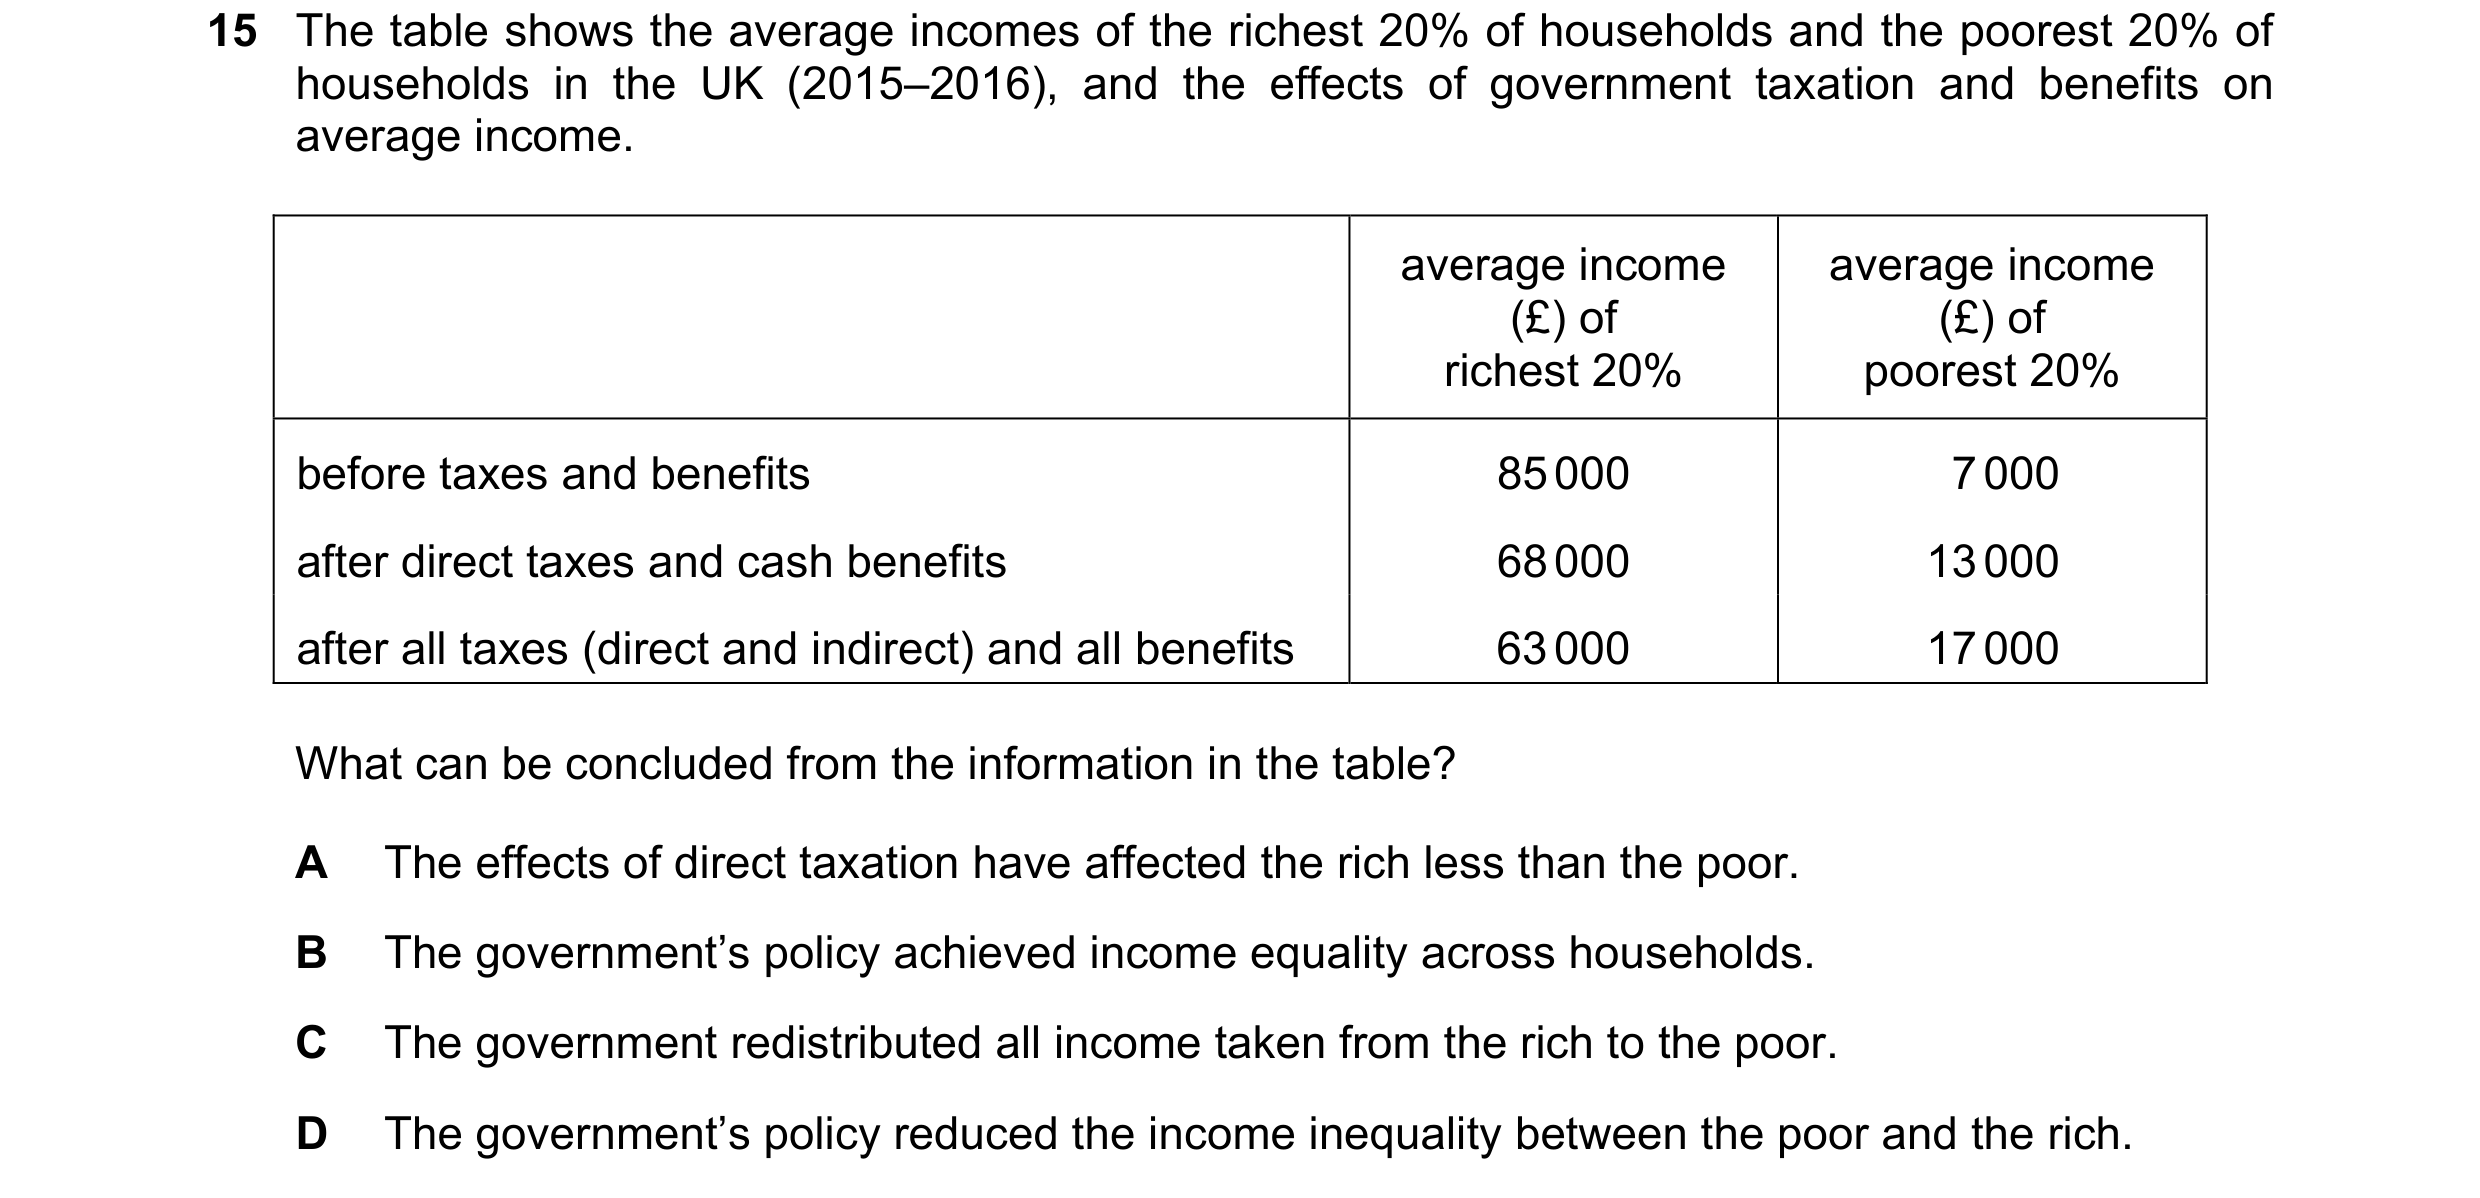
 22 / 28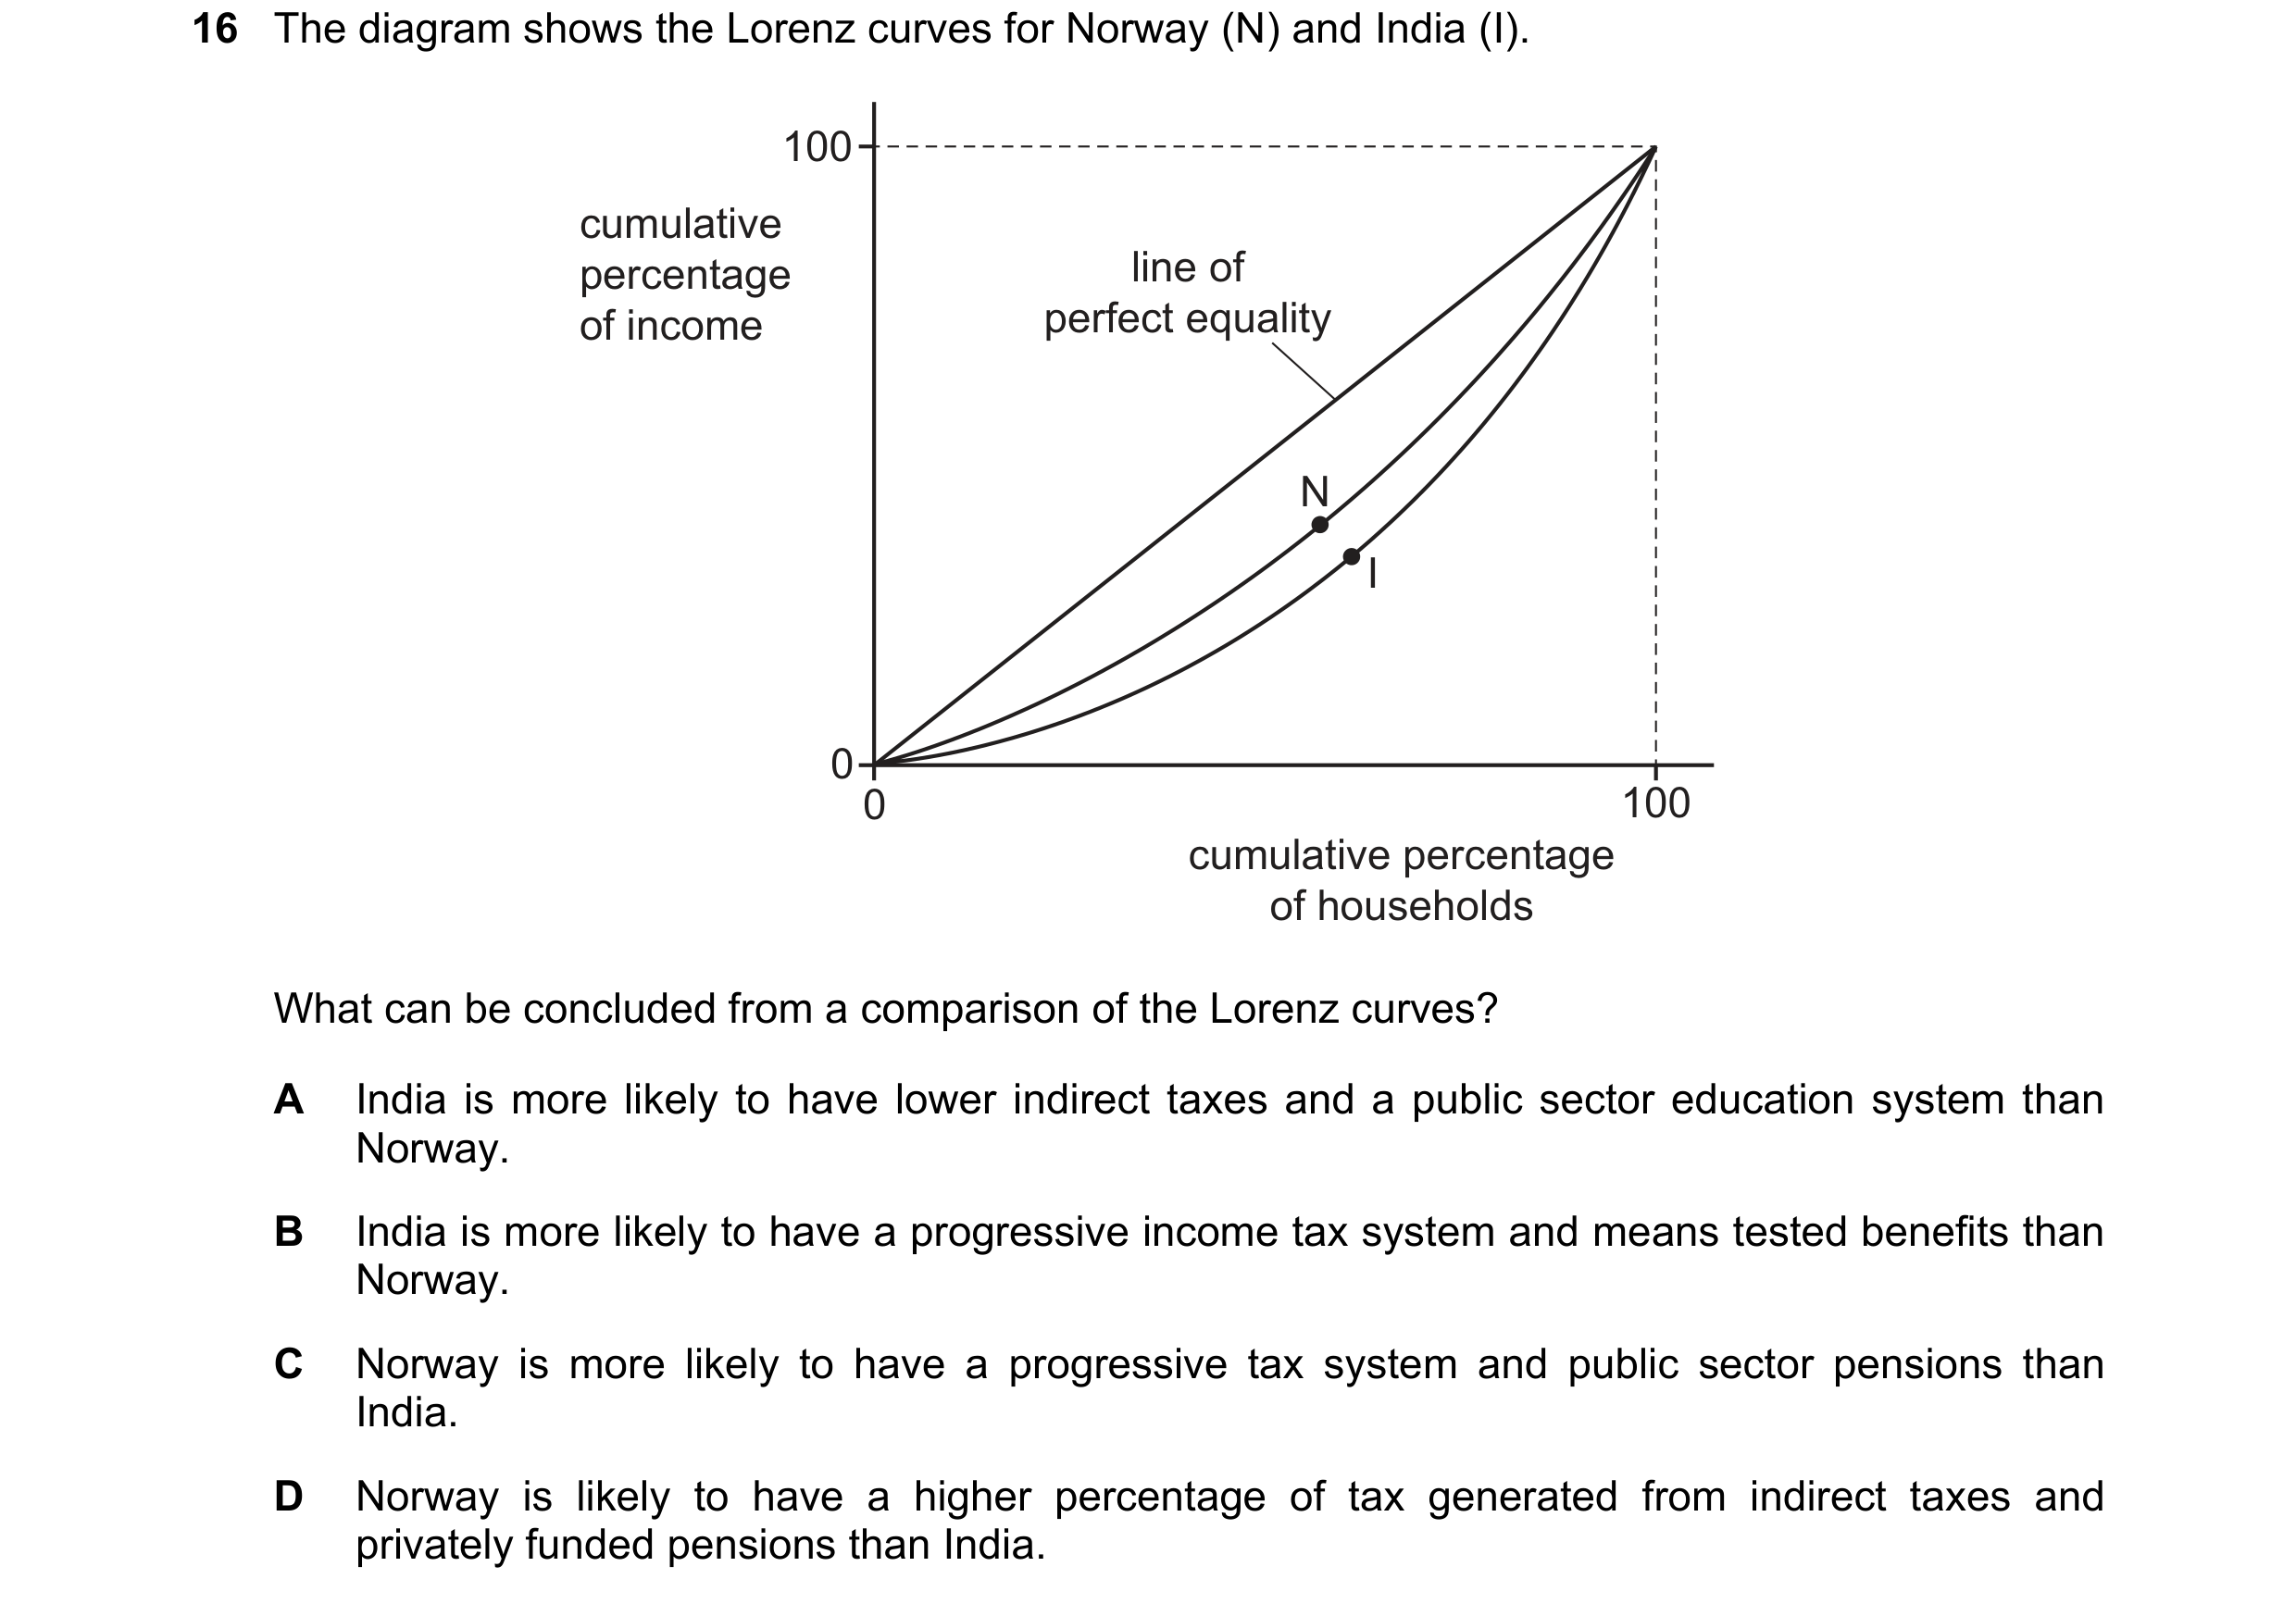
 23 / 28
 24 / 28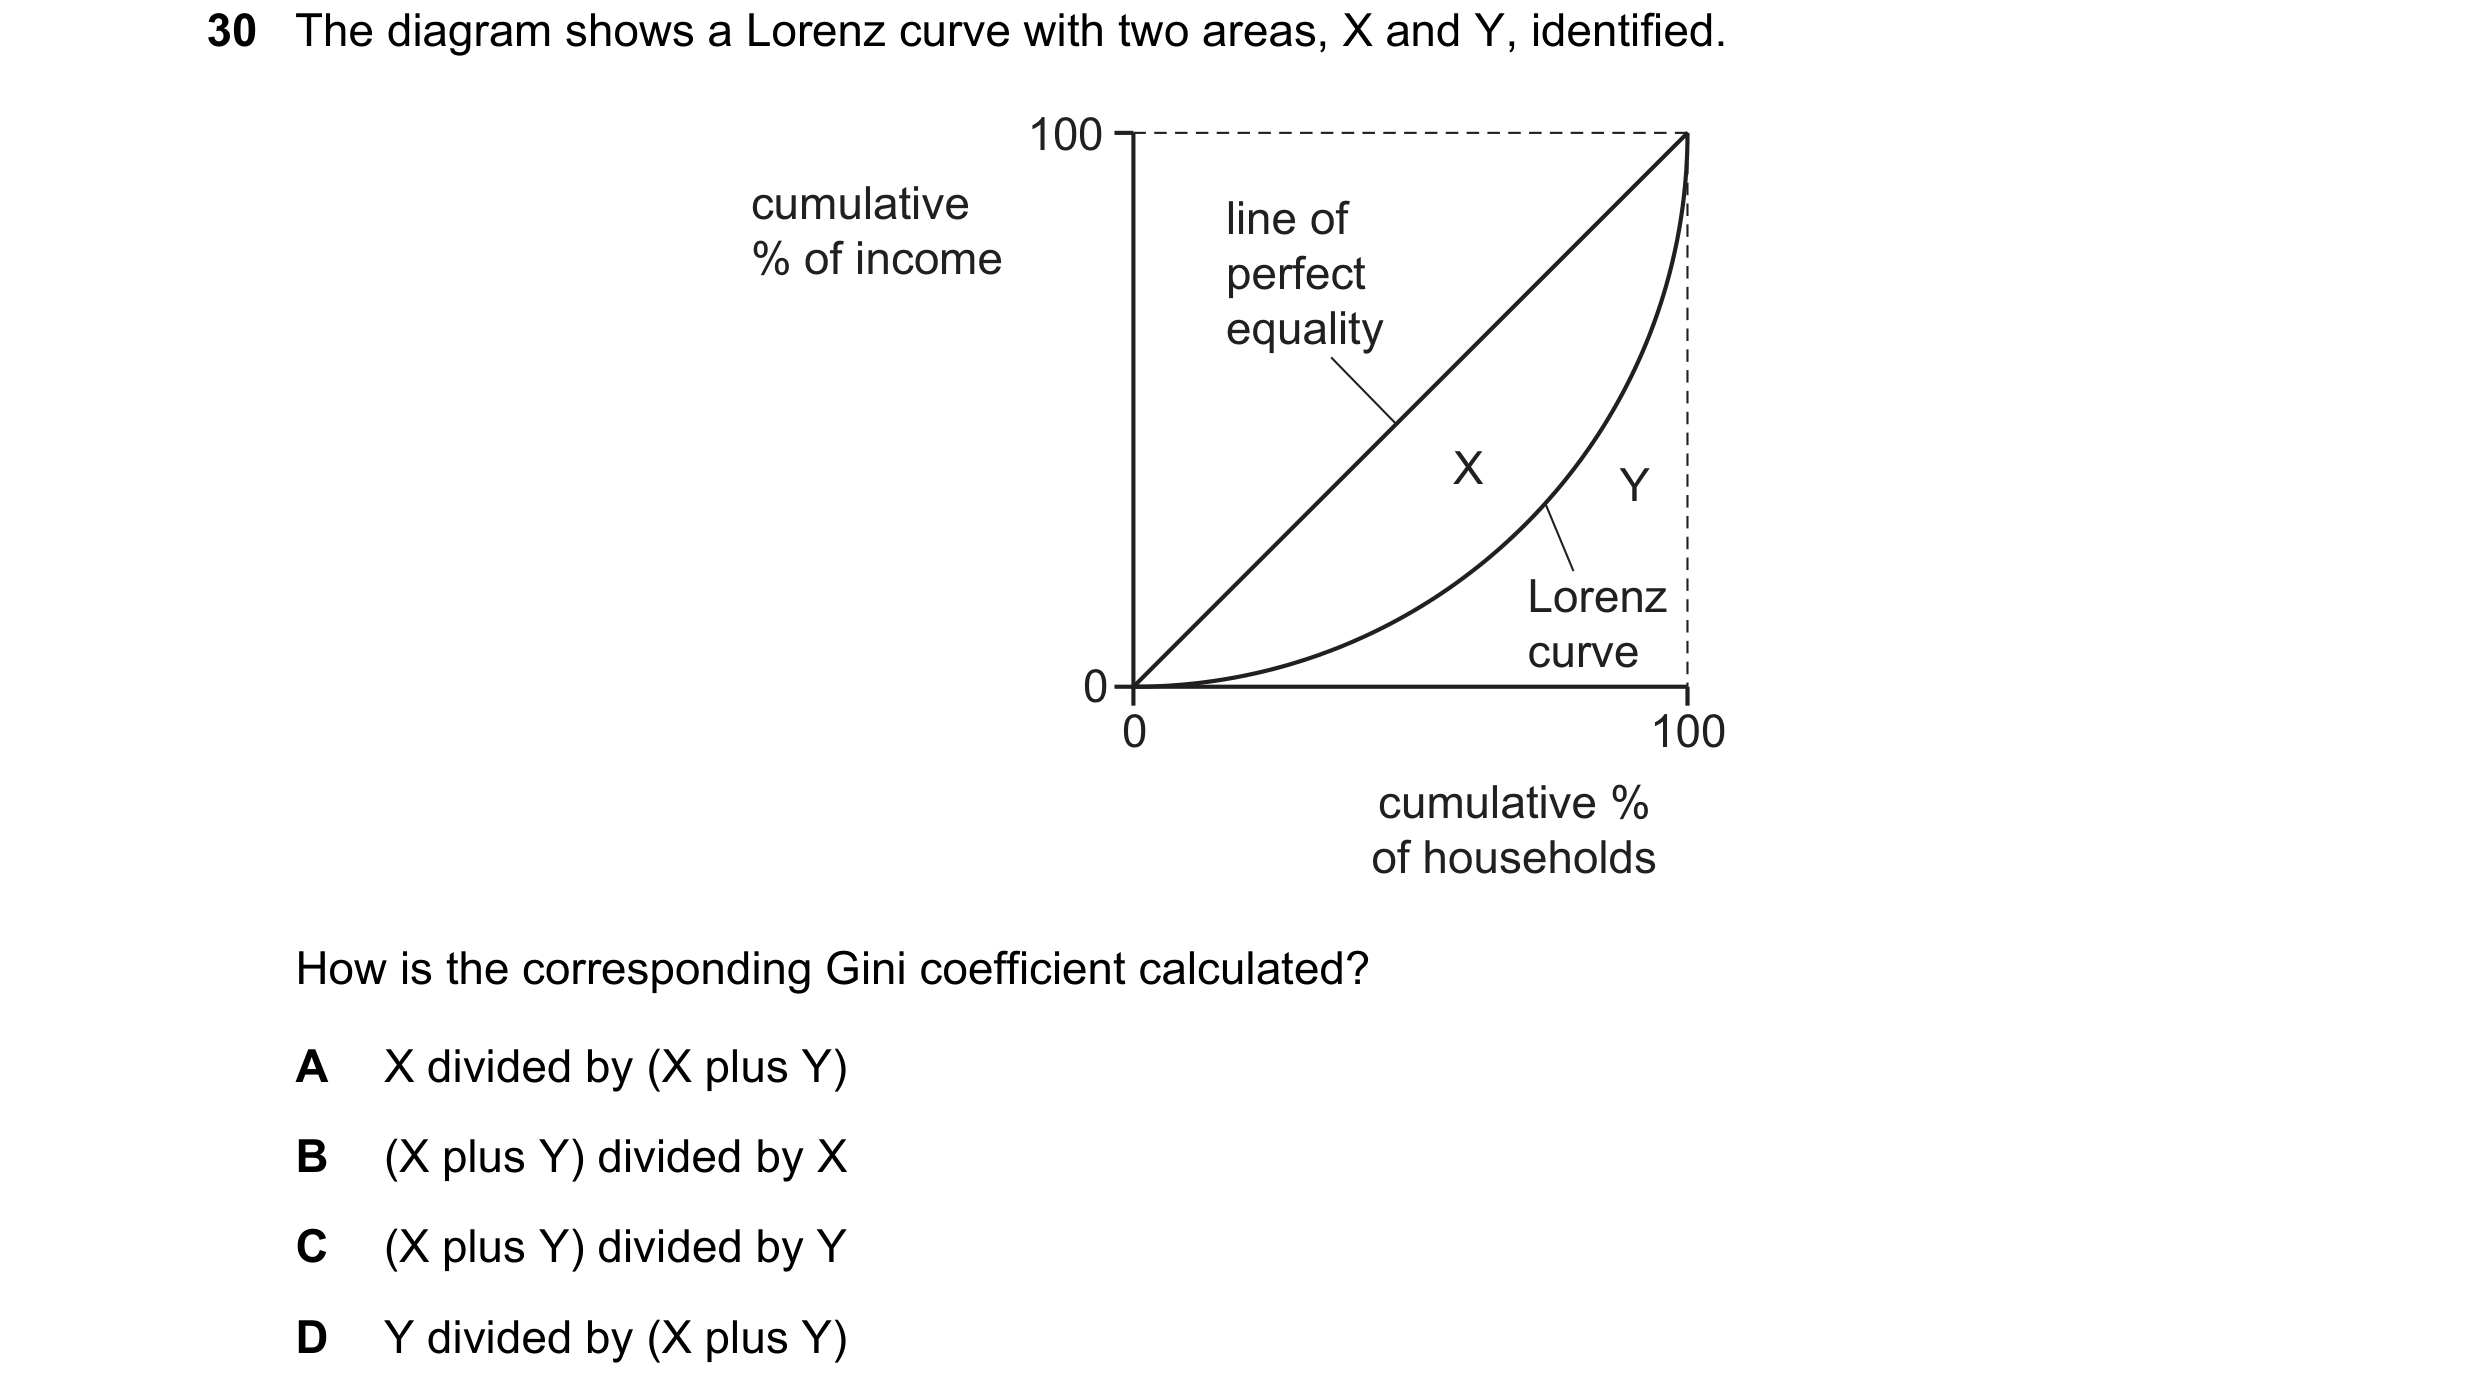

 25 / 28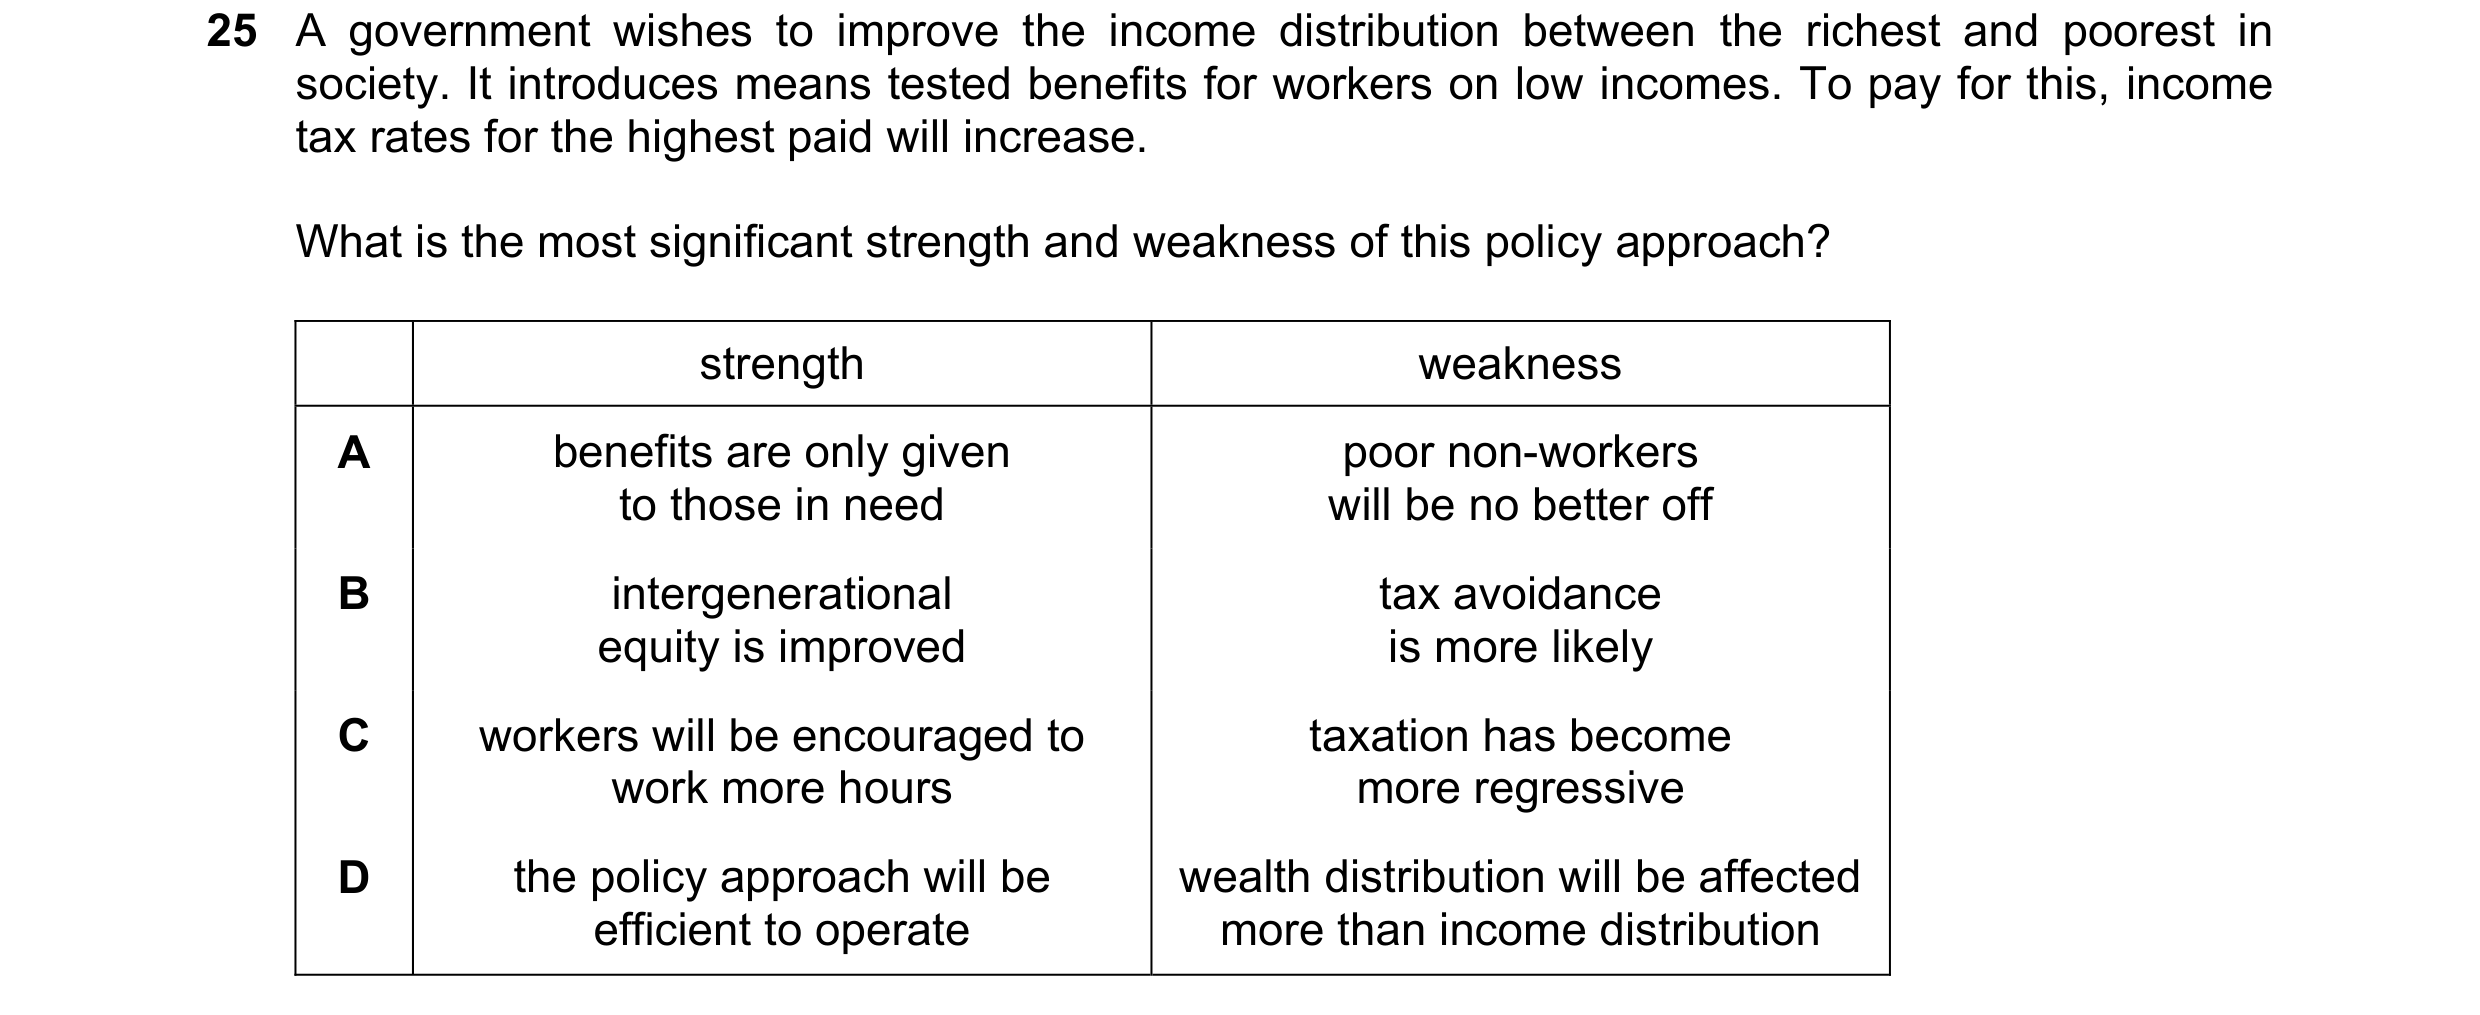
 26 / 28

 27 / 28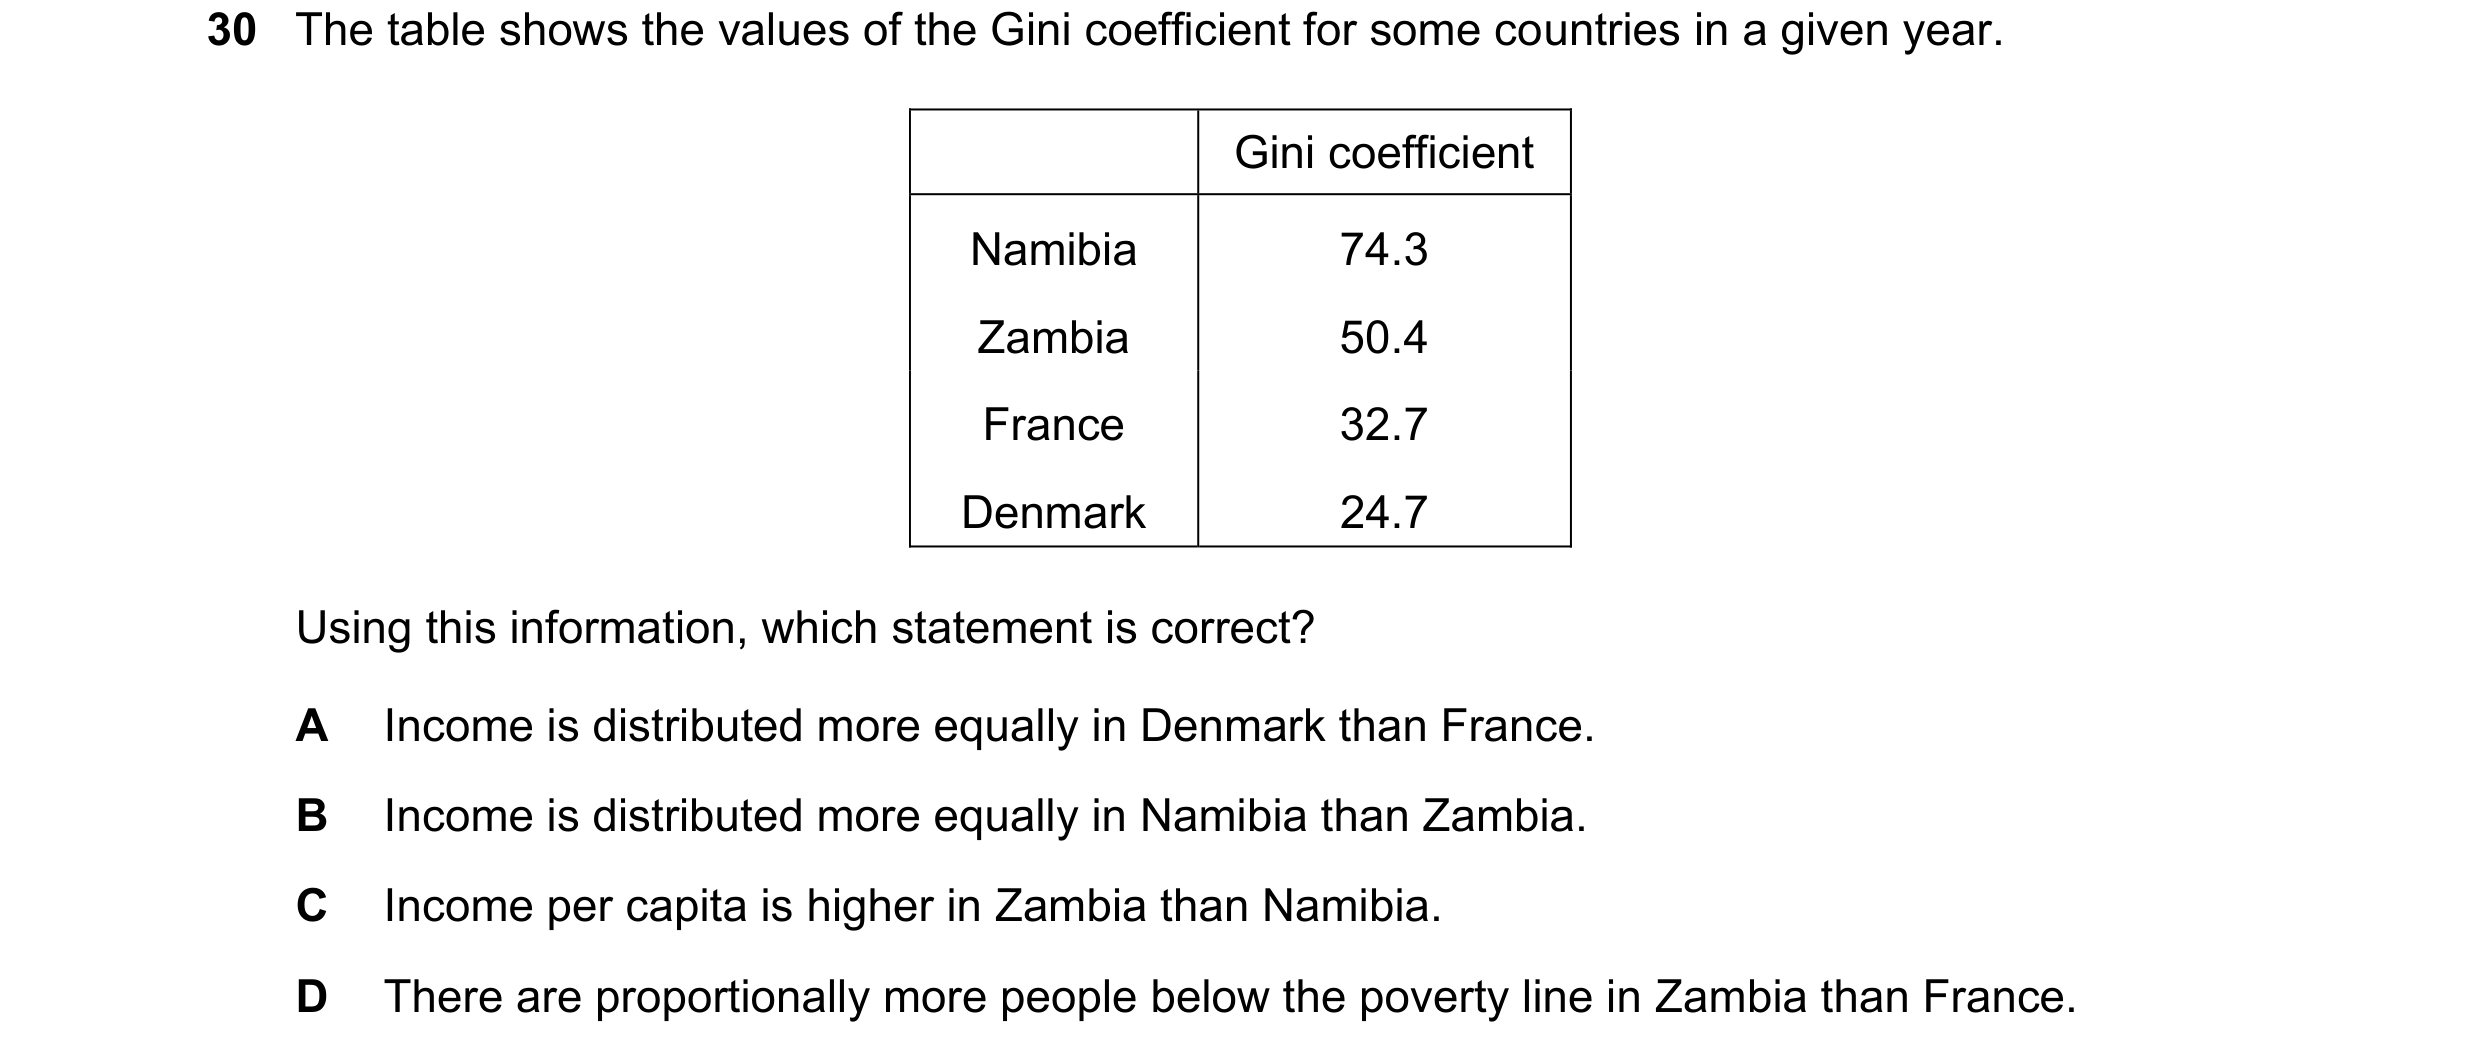
 28 / 28