Questions as text
Q1 · An economy is operating at a point on its production possibility curve 9708/31 Oct/Nov 2009
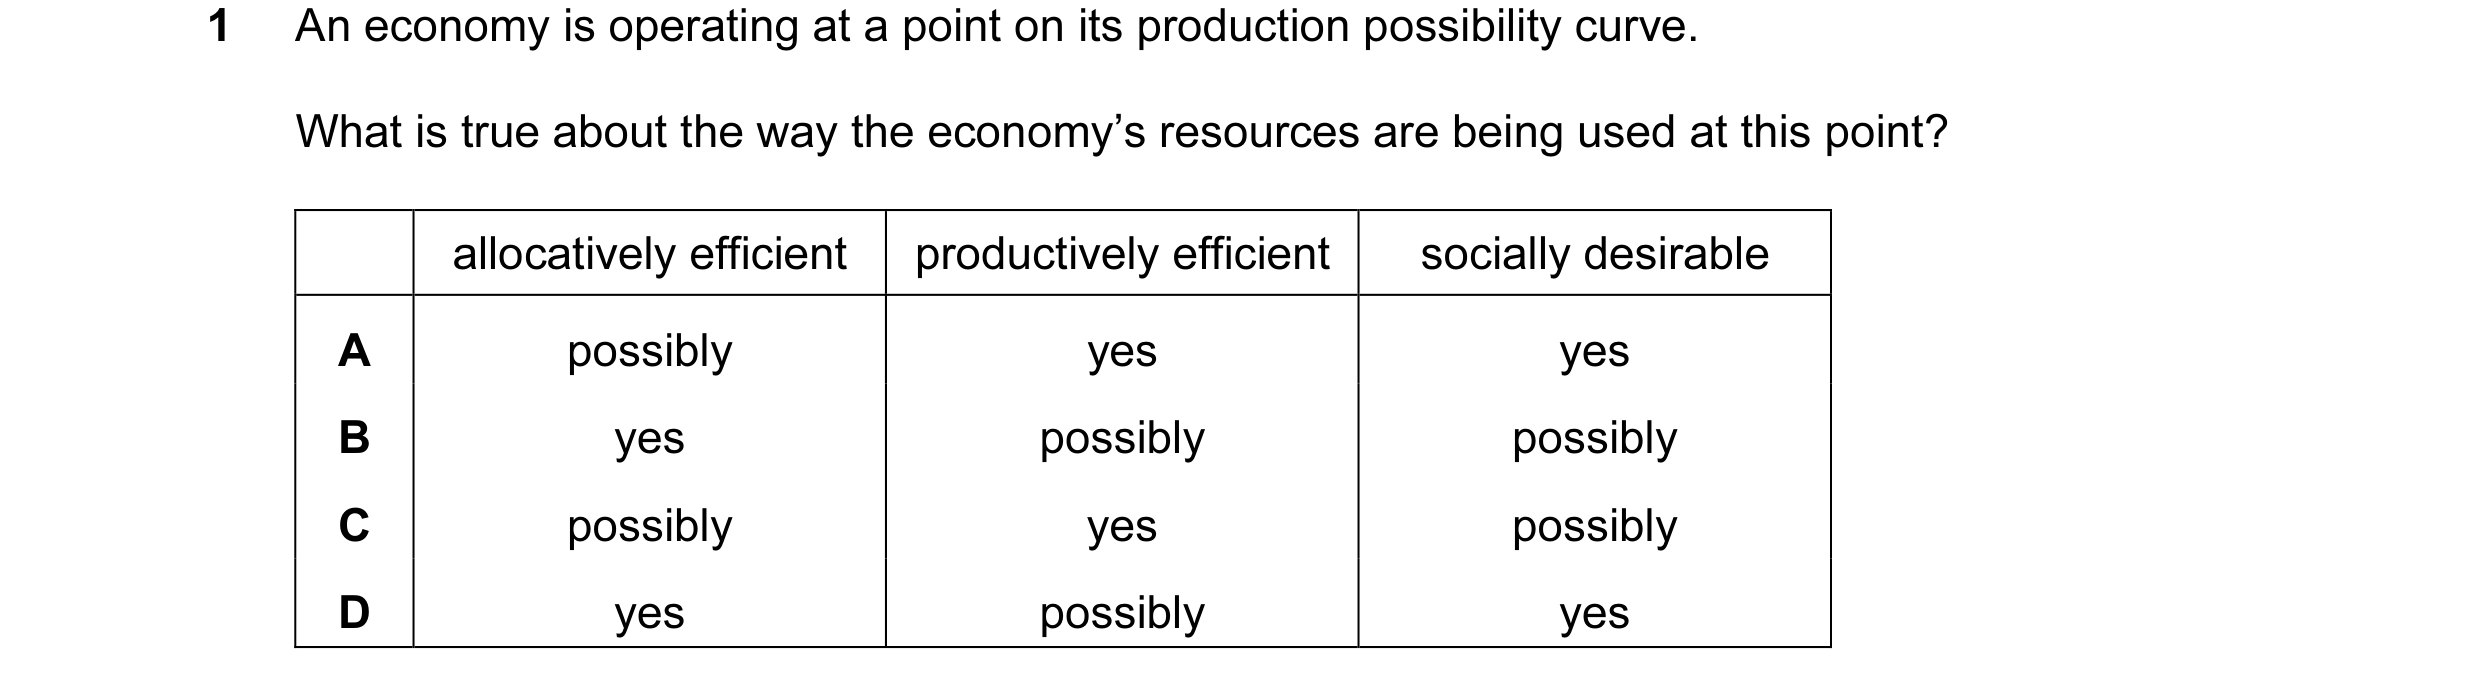
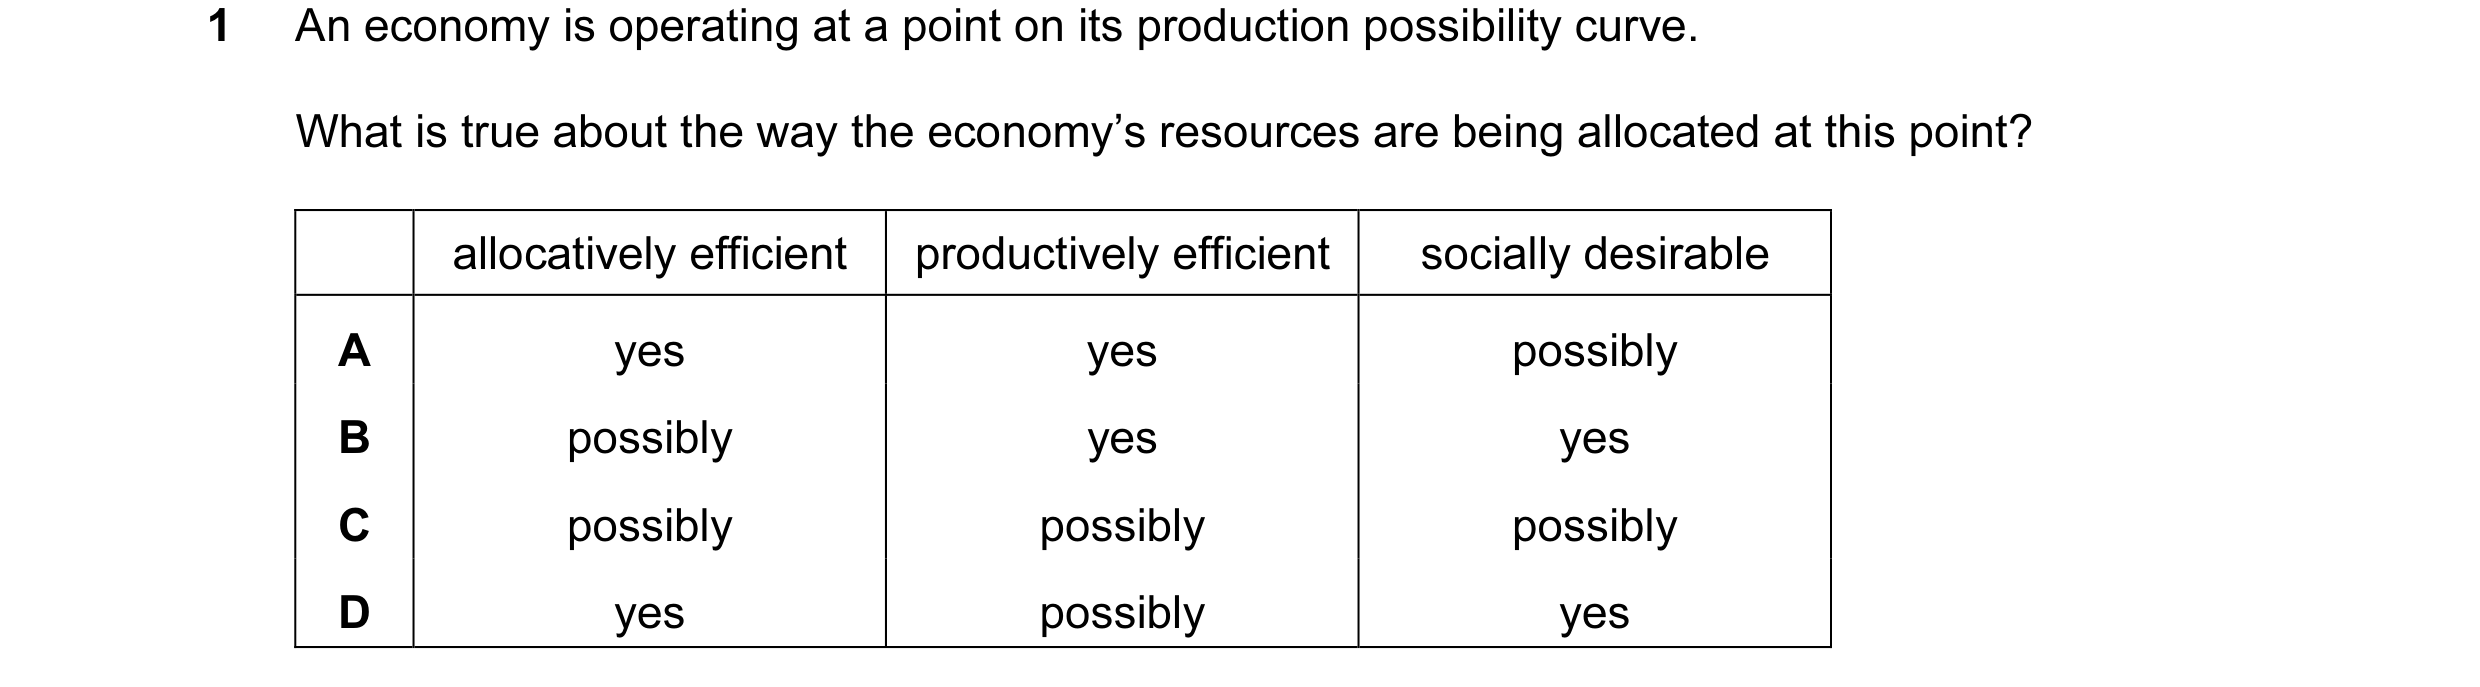
1 An economy is operating at a point on its production possibility curve. What is true about the way the economy’s resources are being used at this point? allocatively efficient productively efficient socially desirable A possibly yes yes B yes possibly possibly C possibly yes possibly D yes possibly yes
1 marks
Answer: C
This question in 9708/31 Oct/Nov 2009
Q2 · The diagram shows an industry producing under conditions of constant average costs 9708/31 Oct/Nov 2009
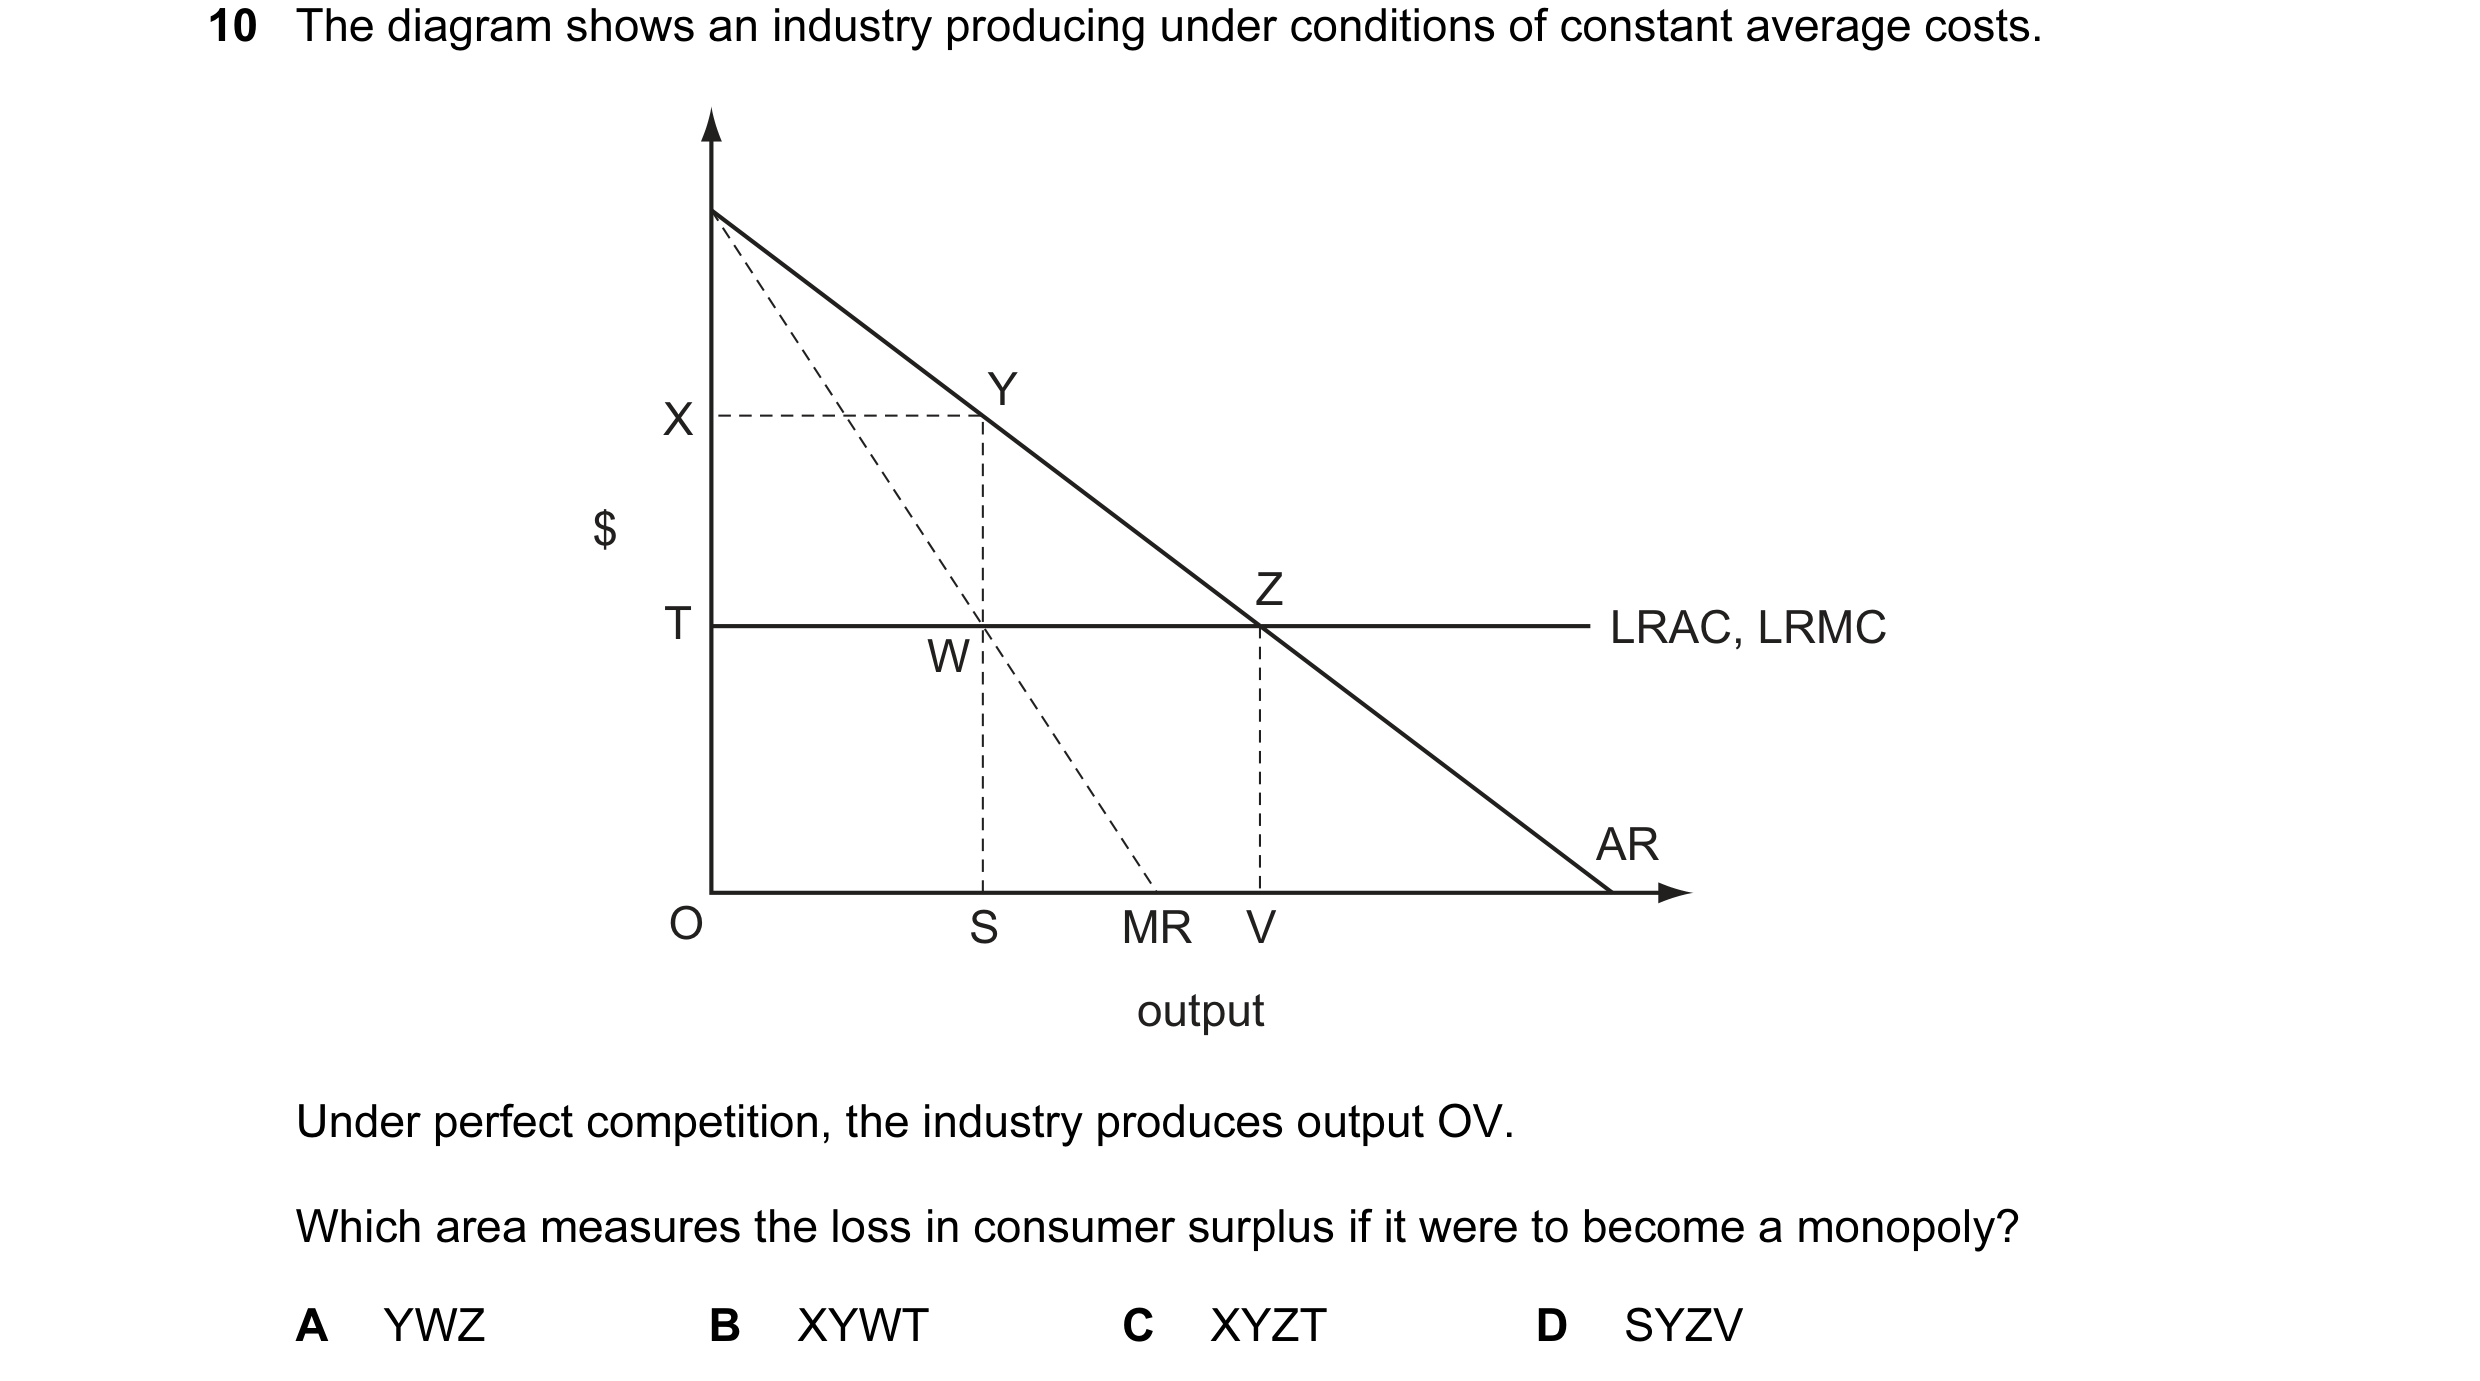
10 The diagram shows an industry producing under conditions of constant average costs. Y X $ Z T LRAC, LRMC W AR O S MR V output Under perfect competition, the industry produces output OV. Which area measures the loss in consumer surplus if it were to become a monopoly? A YWZ B XYWT C XYZT D SYZV
1 marks
Answer: C
This question in 9708/31 Oct/Nov 2009
Q3 · What could prevent a market economy achieving allocative efficiency? 9708/31 Oct/Nov 2009
15 What could prevent a market economy achieving allocative efficiency? A disagreement among consumers over resource allocation B inequalities in the distribution of income and wealth C an inability to produce free goods D an inability to produce public goods
1 marks
Answer: D
This question in 9708/31 Oct/Nov 2009
Q4 · The diagram shows an industry producing under conditions of constant average costs 9708/32 Oct/Nov 2009
9 The diagram shows an industry producing under conditions of constant average costs. Y X $ Z T LRAC, LRMC W AR O S MR V output Under perfect competition, the industry produces output OV. Which area measures the loss in consumer surplus if it were to become a monopoly? A YWZ B XYWT C XYZT D SYZV
1 marks
Answer: C
This question in 9708/32 Oct/Nov 2009
Q5 · What could prevent a market economy achieving allocative efficiency? 9708/32 Oct/Nov 2009
14 What could prevent a market economy achieving allocative efficiency? A disagreement among consumers over resource allocation B inequalities in the distribution of income and wealth C an inability to produce free goods D an inability to produce public goods
1 marks
Answer: D
This question in 9708/32 Oct/Nov 2009
Q6 · An economy is operating at a point on its production possibility curve 9708/32 Oct/Nov 2009
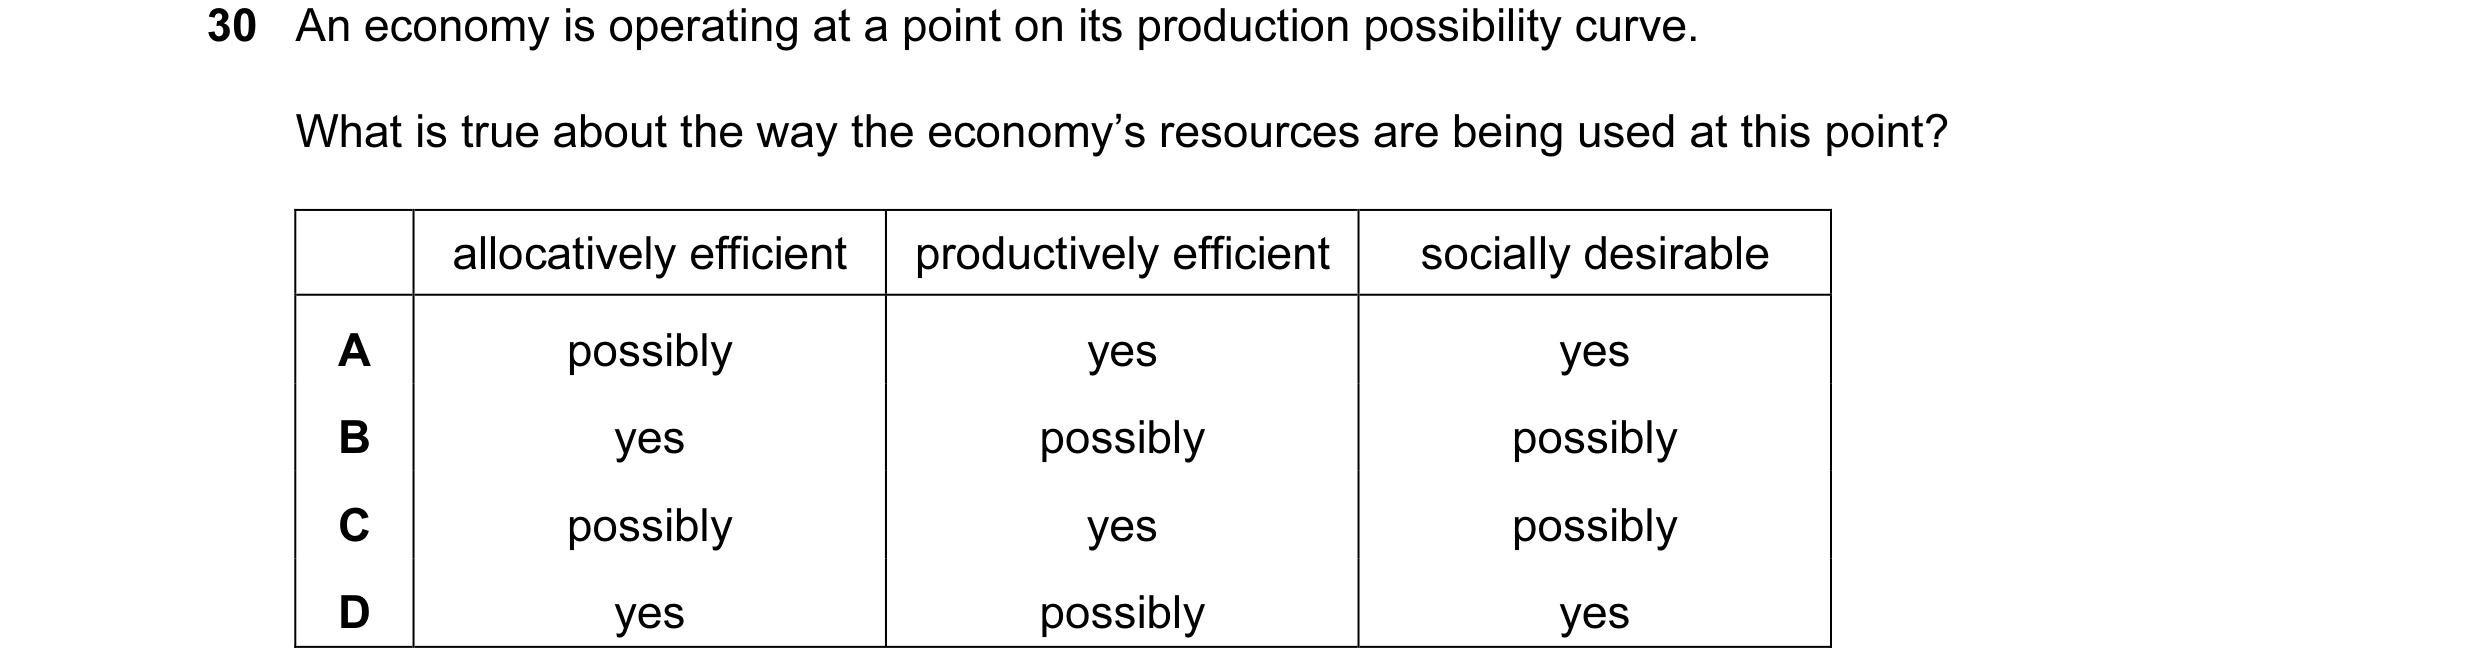
30 An economy is operating at a point on its production possibility curve. What is true about the way the economy’s resources are being used at this point? allocatively efficient productively efficient socially desirable A possibly yes yes B yes possibly possibly C possibly yes possibly D yes possibly yes
1 marks
Answer: C
This question in 9708/32 Oct/Nov 2009
Q7 · Which is a correct statement about efficiency? 9708/31 May/June 2010
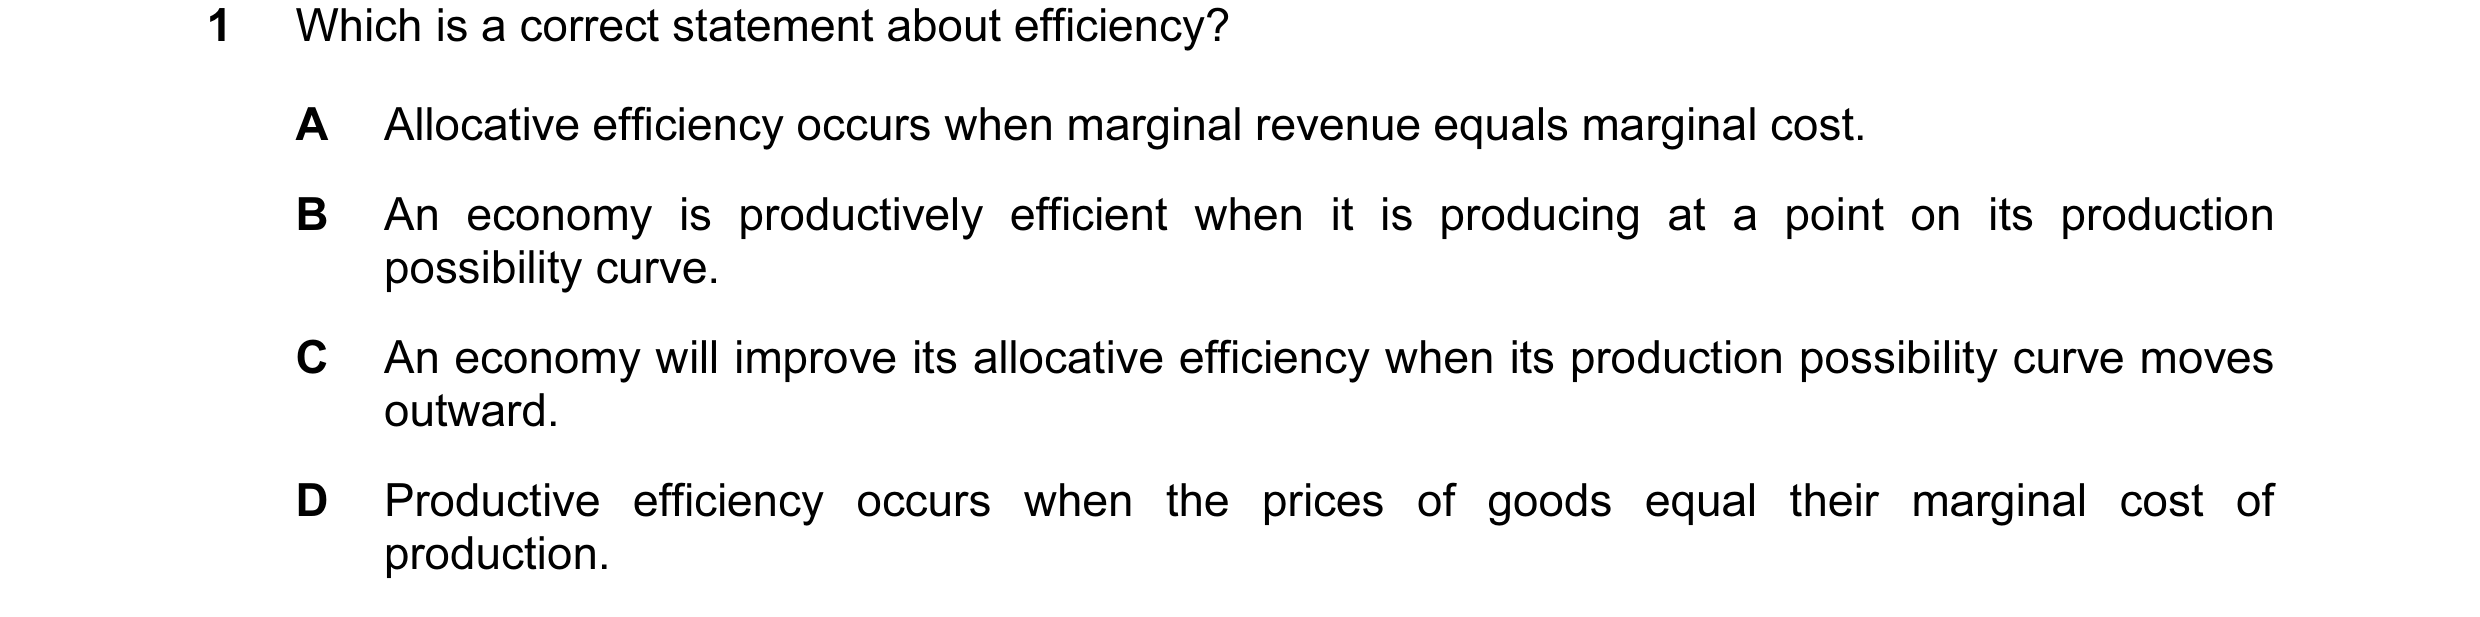
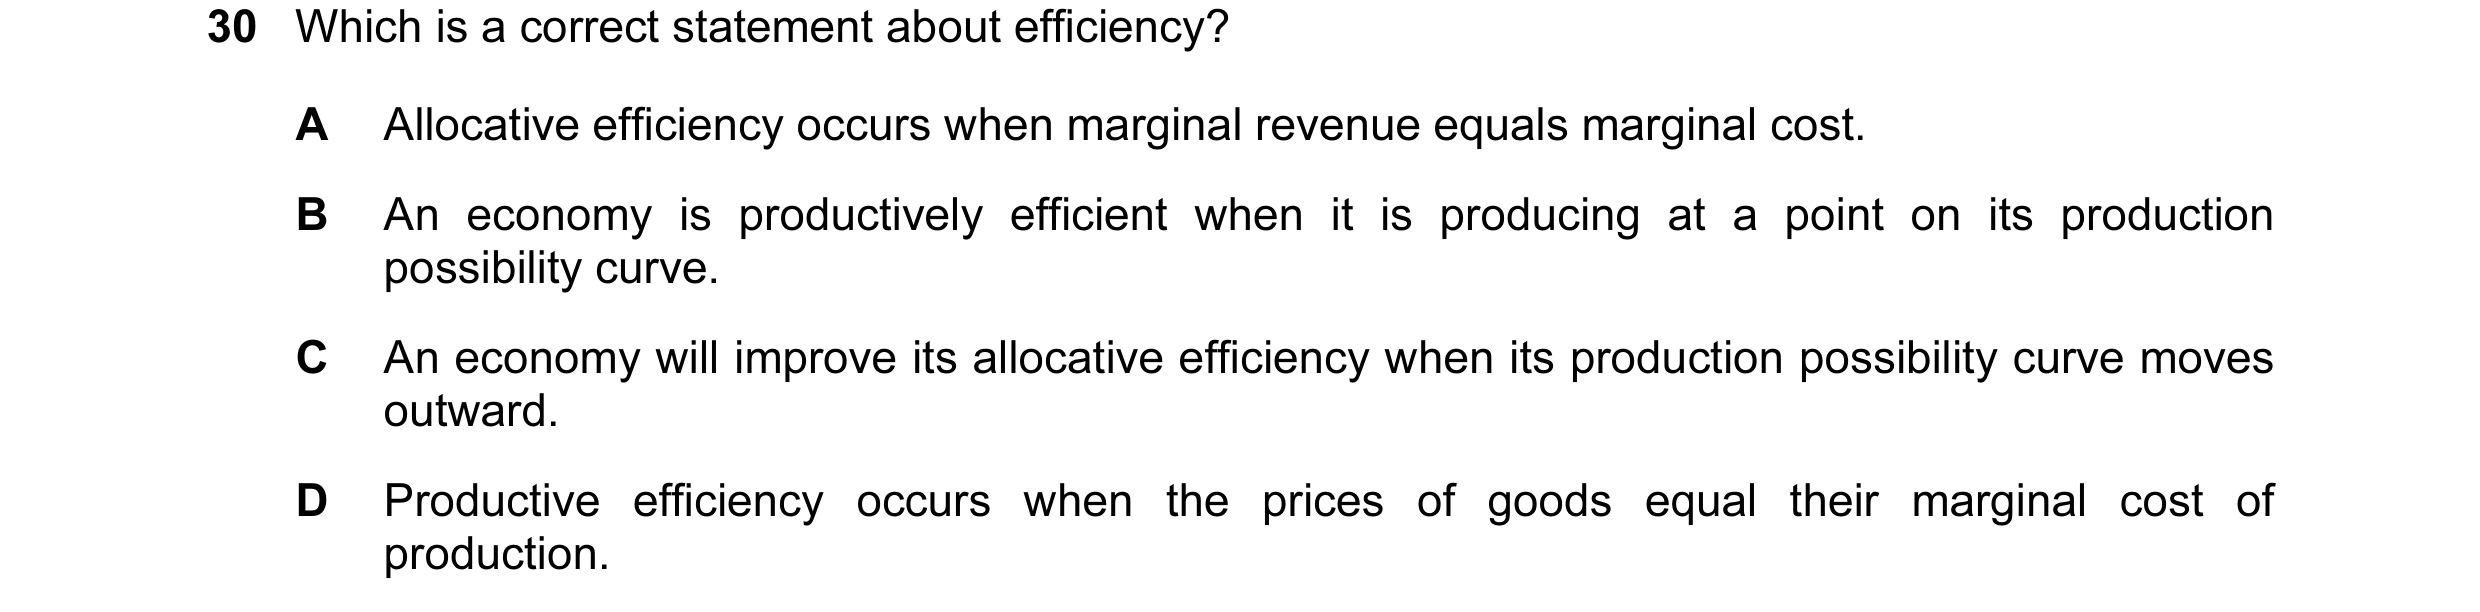
1 Which is a correct statement about efficiency? A Allocative efficiency occurs when marginal revenue equals marginal cost. B An economy is productively efficient when it is producing at a point on its production possibility curve. C An economy will improve its allocative efficiency when its production possibility curve moves outward. D Productive efficiency occurs when the prices of goods equal their marginal cost of production.
1 marks
Answer: B
This question in 9708/31 May/June 2010
Q8 · A competitive market becomes a monopoly 9708/31 May/June 2010
13 A competitive market becomes a monopoly. What is likely to happen? A Consumer surplus will be reduced by the amount of the deadweight loss. B Producer surplus will be reduced by the amount of the deadweight loss. C The loss in consumer surplus will be balanced by the increase in producer surplus. D There will be a transfer of surplus from consumer to producer.
1 marks
Answer: D
This question in 9708/31 May/June 2010
Q9 · Which is a correct statement about efficiency? 9708/32 May/June 2010
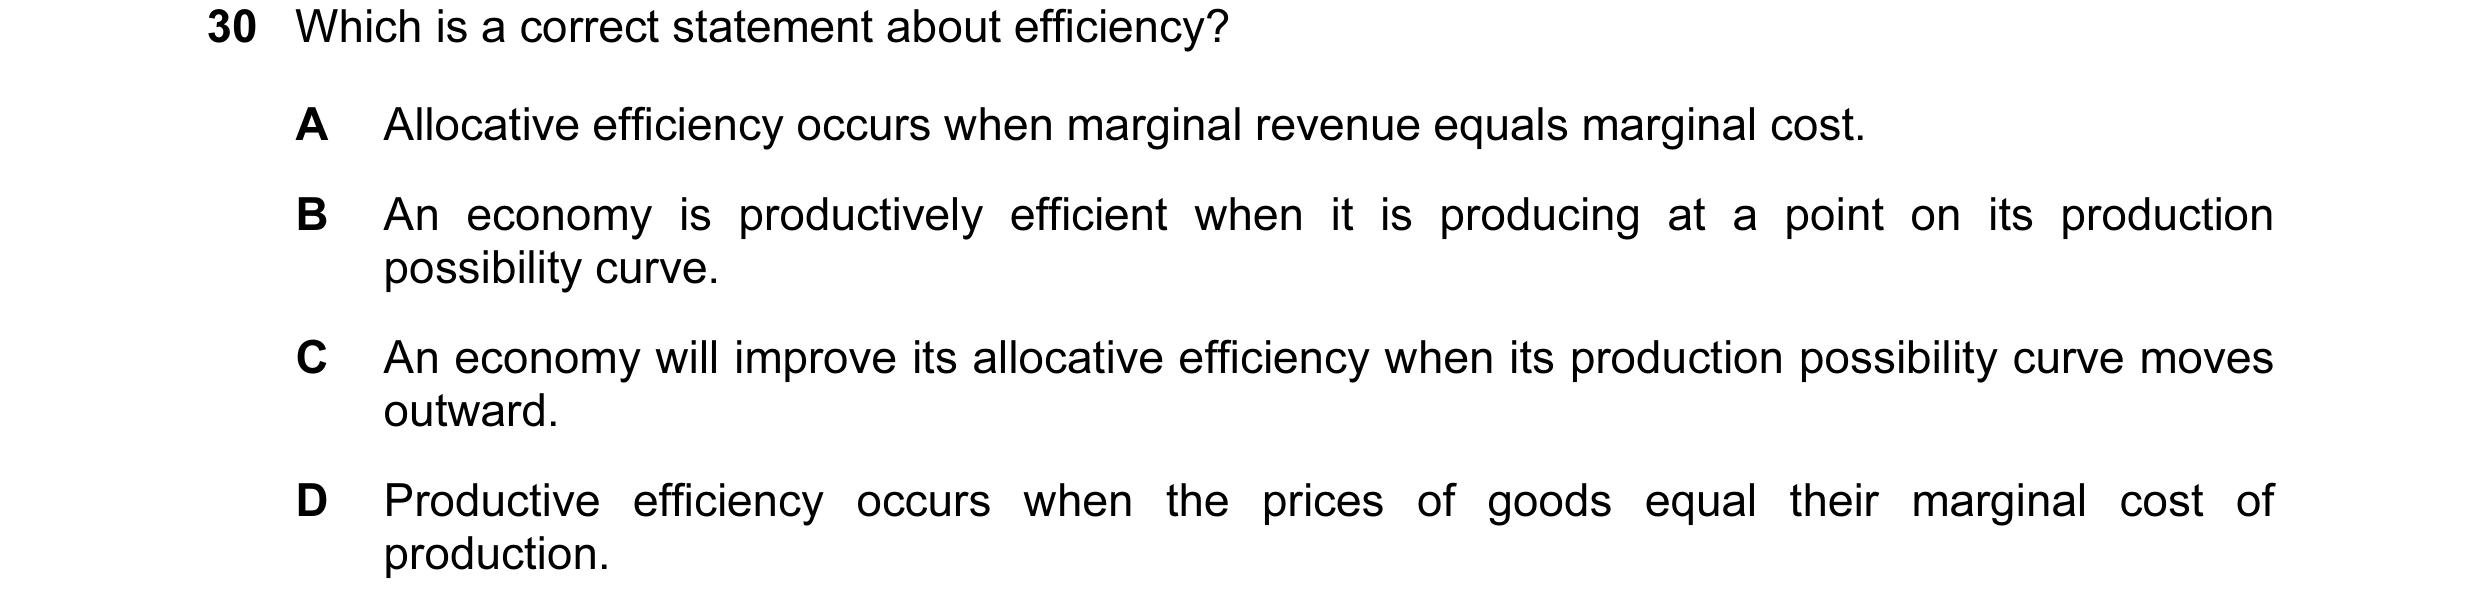
30 Which is a correct statement about efficiency? A Allocative efficiency occurs when marginal revenue equals marginal cost. B An economy is productively efficient when it is producing at a point on its production possibility curve. C An economy will improve its allocative efficiency when its production possibility curve moves outward. D Productive efficiency occurs when the prices of goods equal their marginal cost of production.
1 marks
Answer: B
This question in 9708/32 May/June 2010
Q10 · A competitive market becomes a monopoly 9708/33 May/June 2010
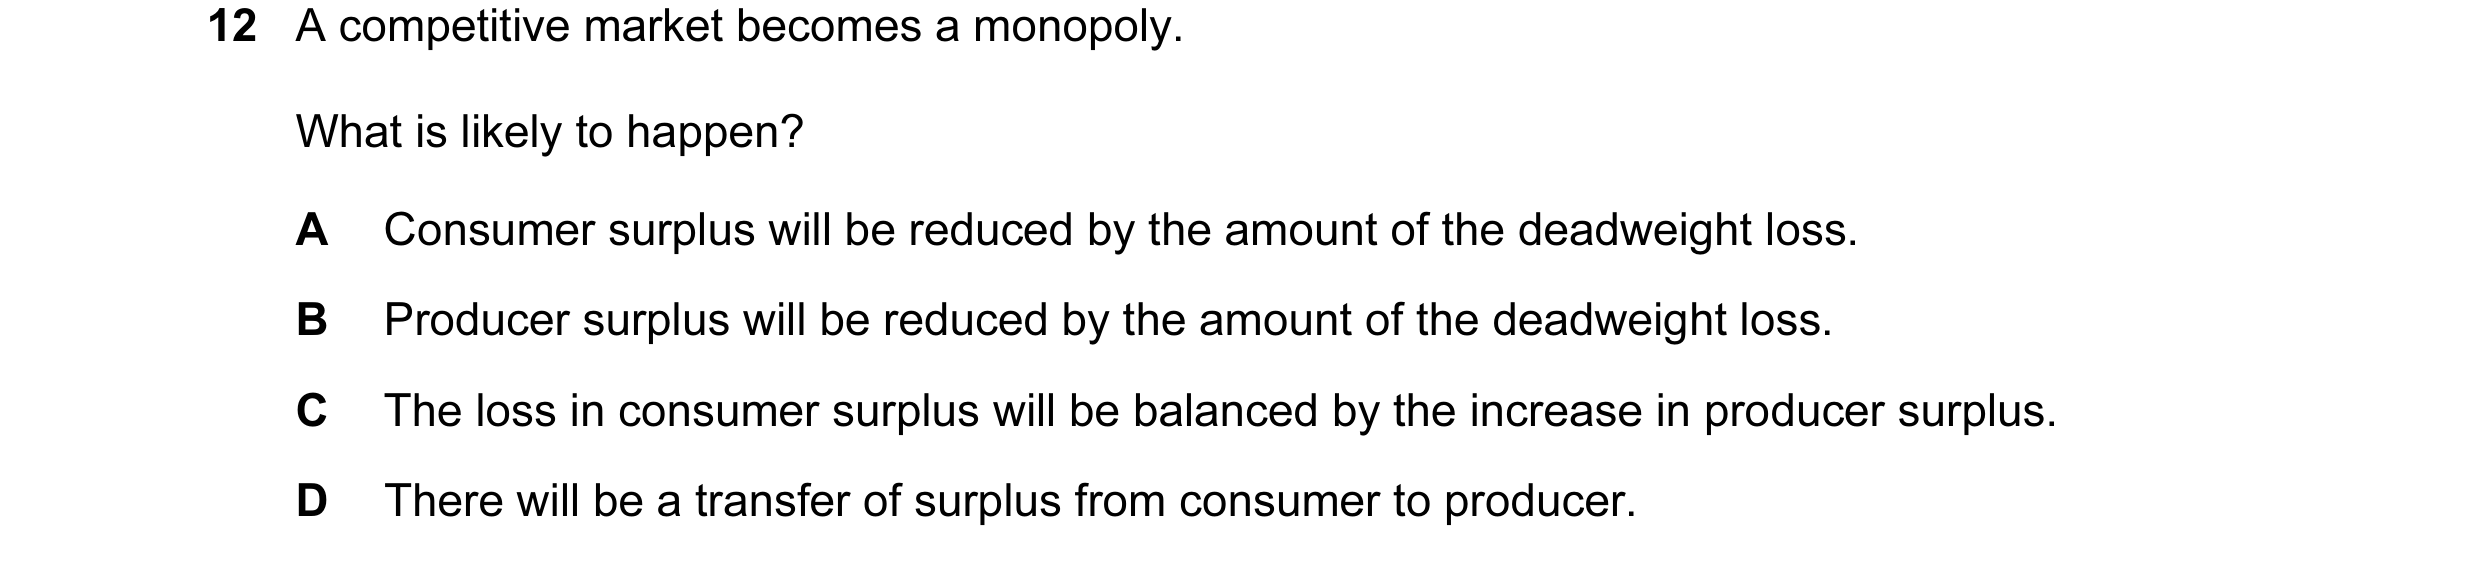
12 A competitive market becomes a monopoly. What is likely to happen? A Consumer surplus will be reduced by the amount of the deadweight loss. B Producer surplus will be reduced by the amount of the deadweight loss. C The loss in consumer surplus will be balanced by the increase in producer surplus. D There will be a transfer of surplus from consumer to producer.
1 marks
Answer: D
This question in 9708/33 May/June 2010
Q11 · Which is a correct statement about efficiency? 9708/33 May/June 2010
30 Which is a correct statement about efficiency? A Allocative efficiency occurs when marginal revenue equals marginal cost. B An economy is productively efficient when it is producing at a point on its production possibility curve. C An economy will improve its allocative efficiency when its production possibility curve moves outward. D Productive efficiency occurs when the prices of goods equal their marginal cost of production.
1 marks
Answer: B
This question in 9708/33 May/June 2010
Q12 · In an economy no one can be made better off without making others worse off 9708/31 Oct/Nov 2010
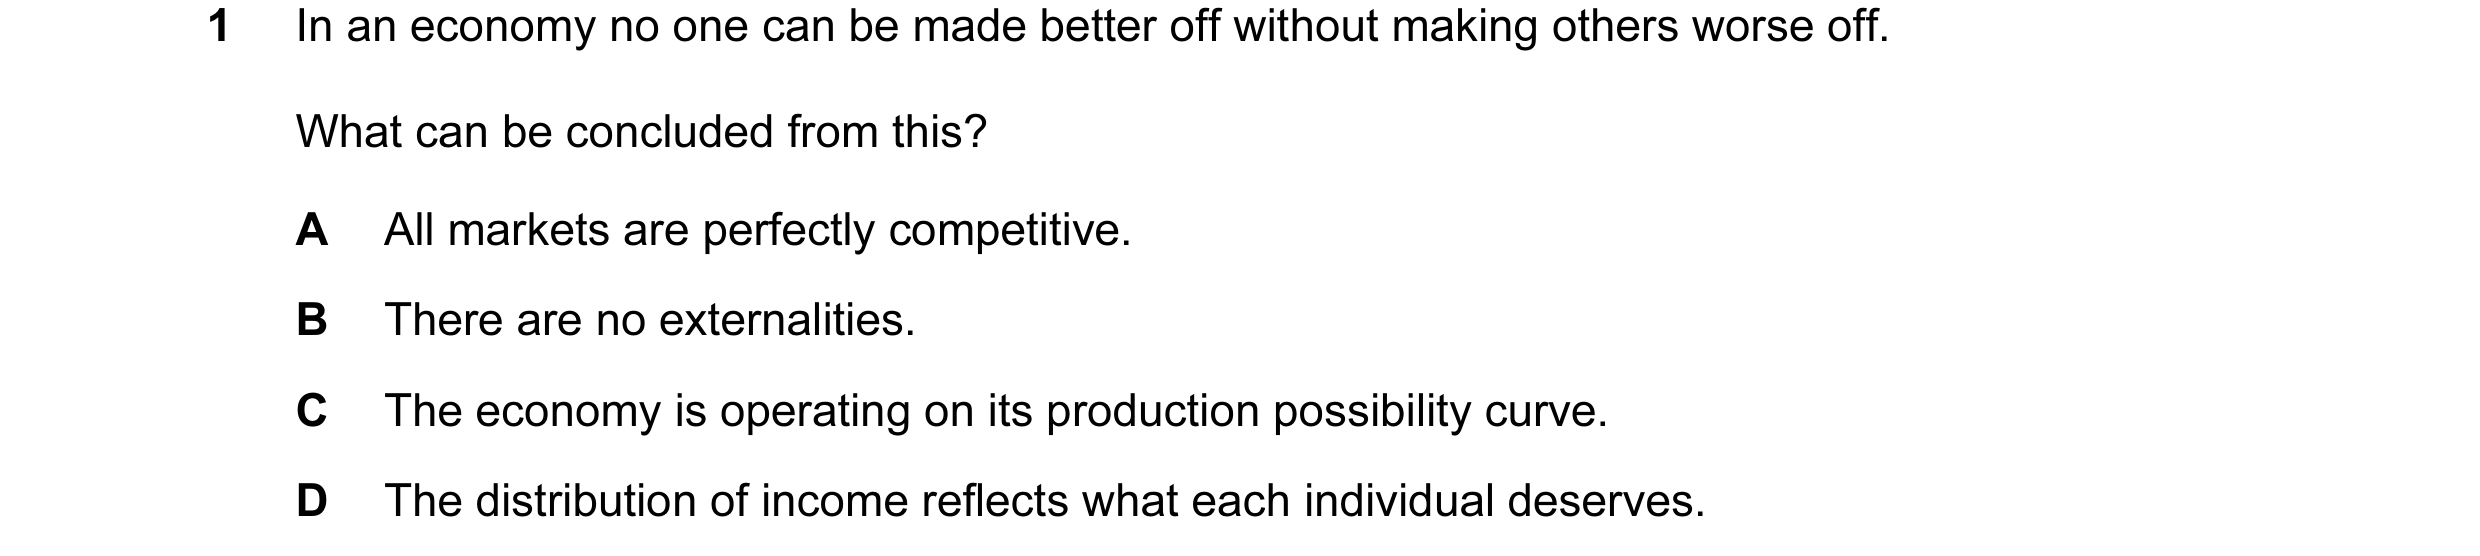
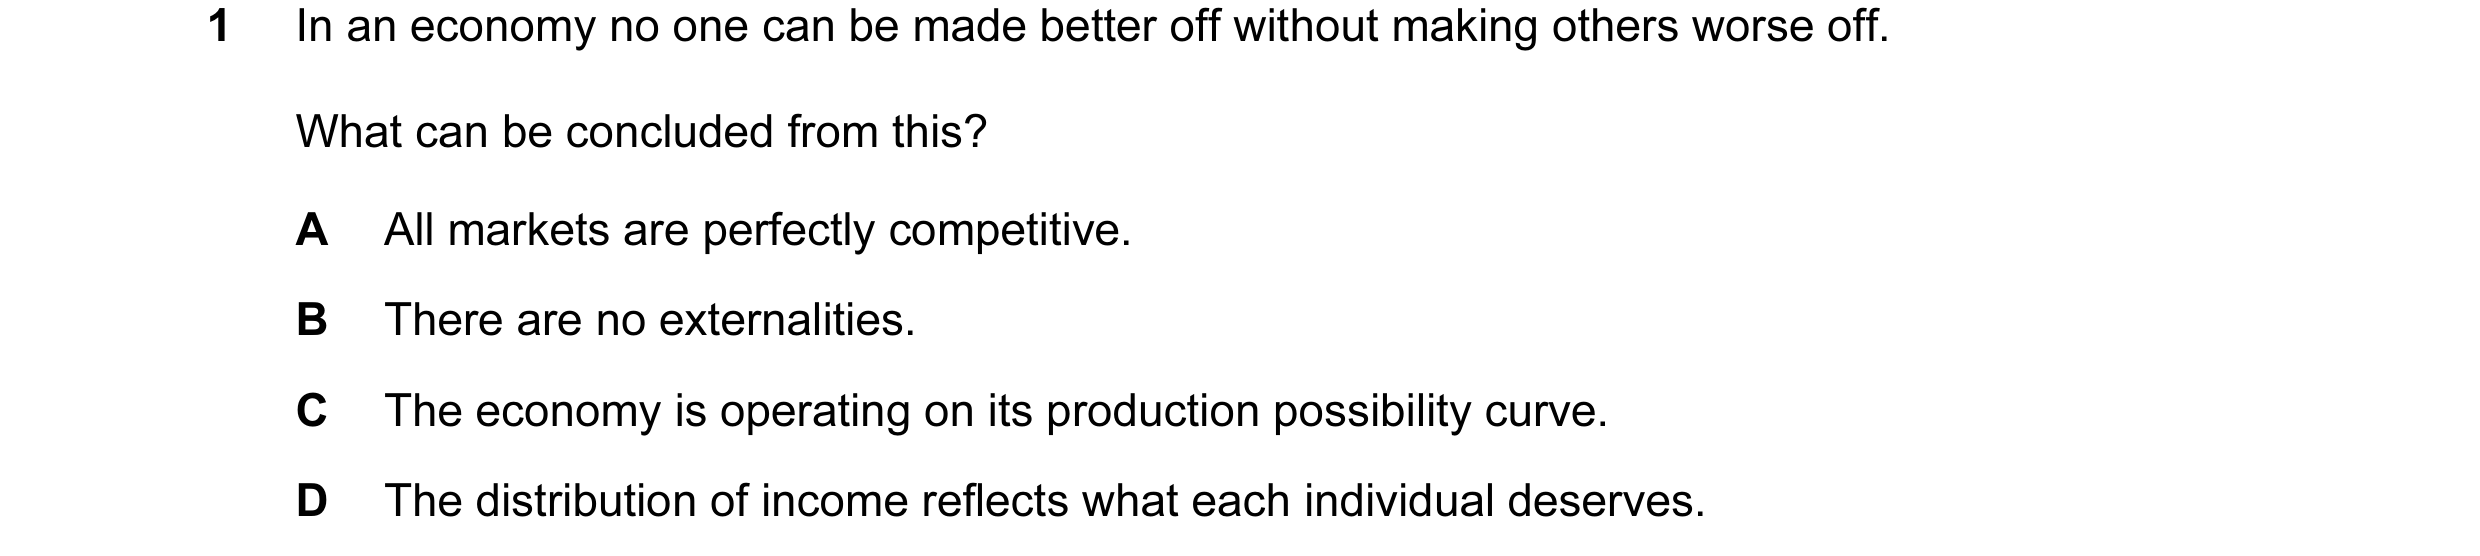
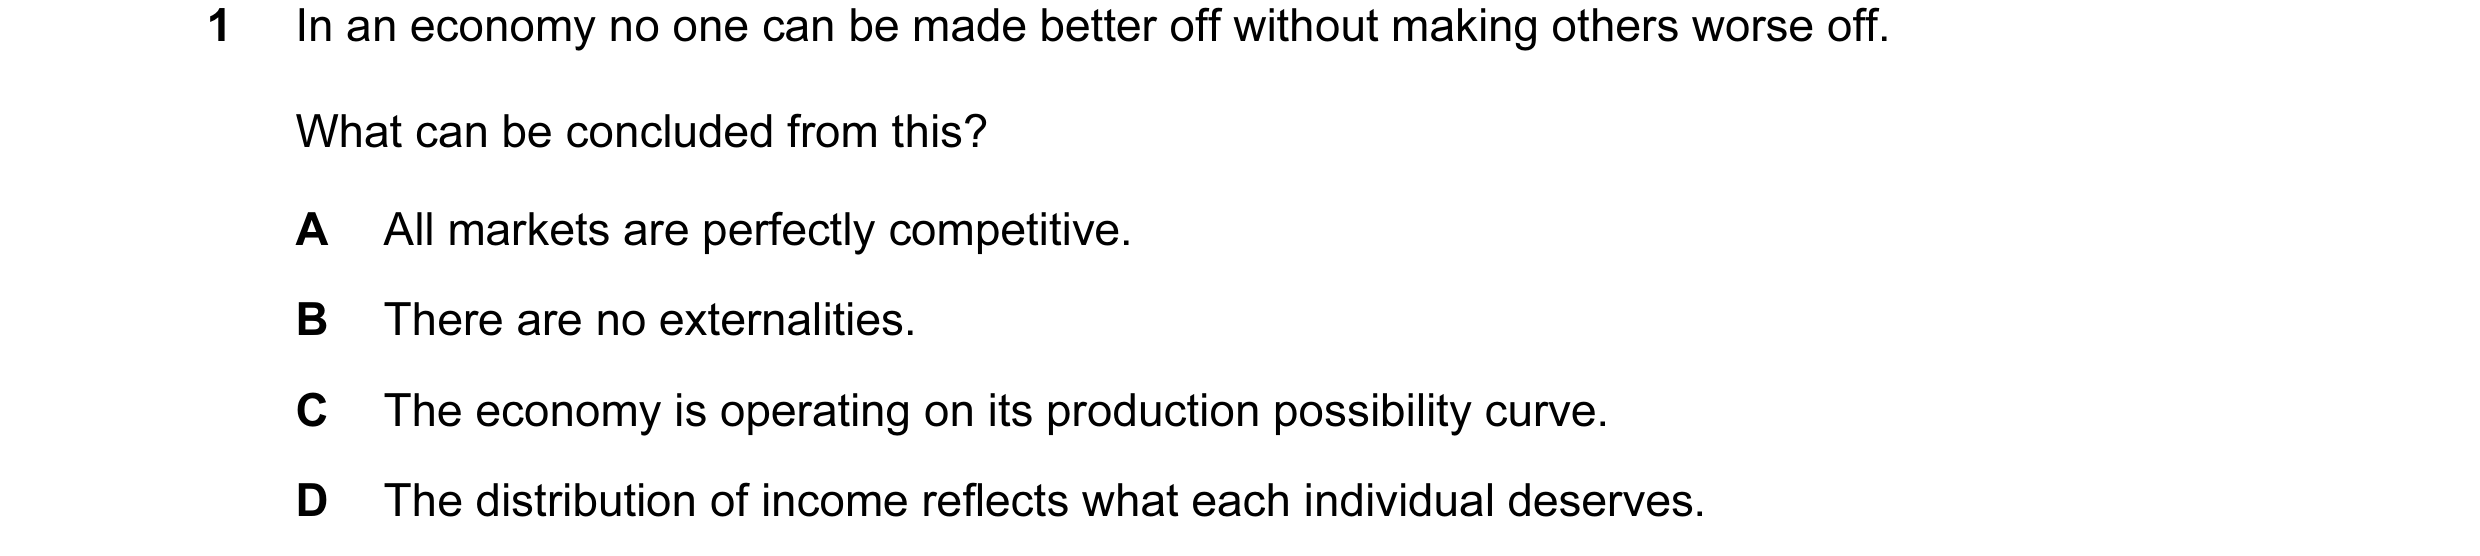
1 In an economy no one can be made better off without making others worse off. What can be concluded from this? A All markets are perfectly competitive. B There are no externalities. C The economy is operating on its production possibility curve. D The distribution of income reflects what each individual deserves.
1 marks
Answer: C
This question in 9708/31 Oct/Nov 2010
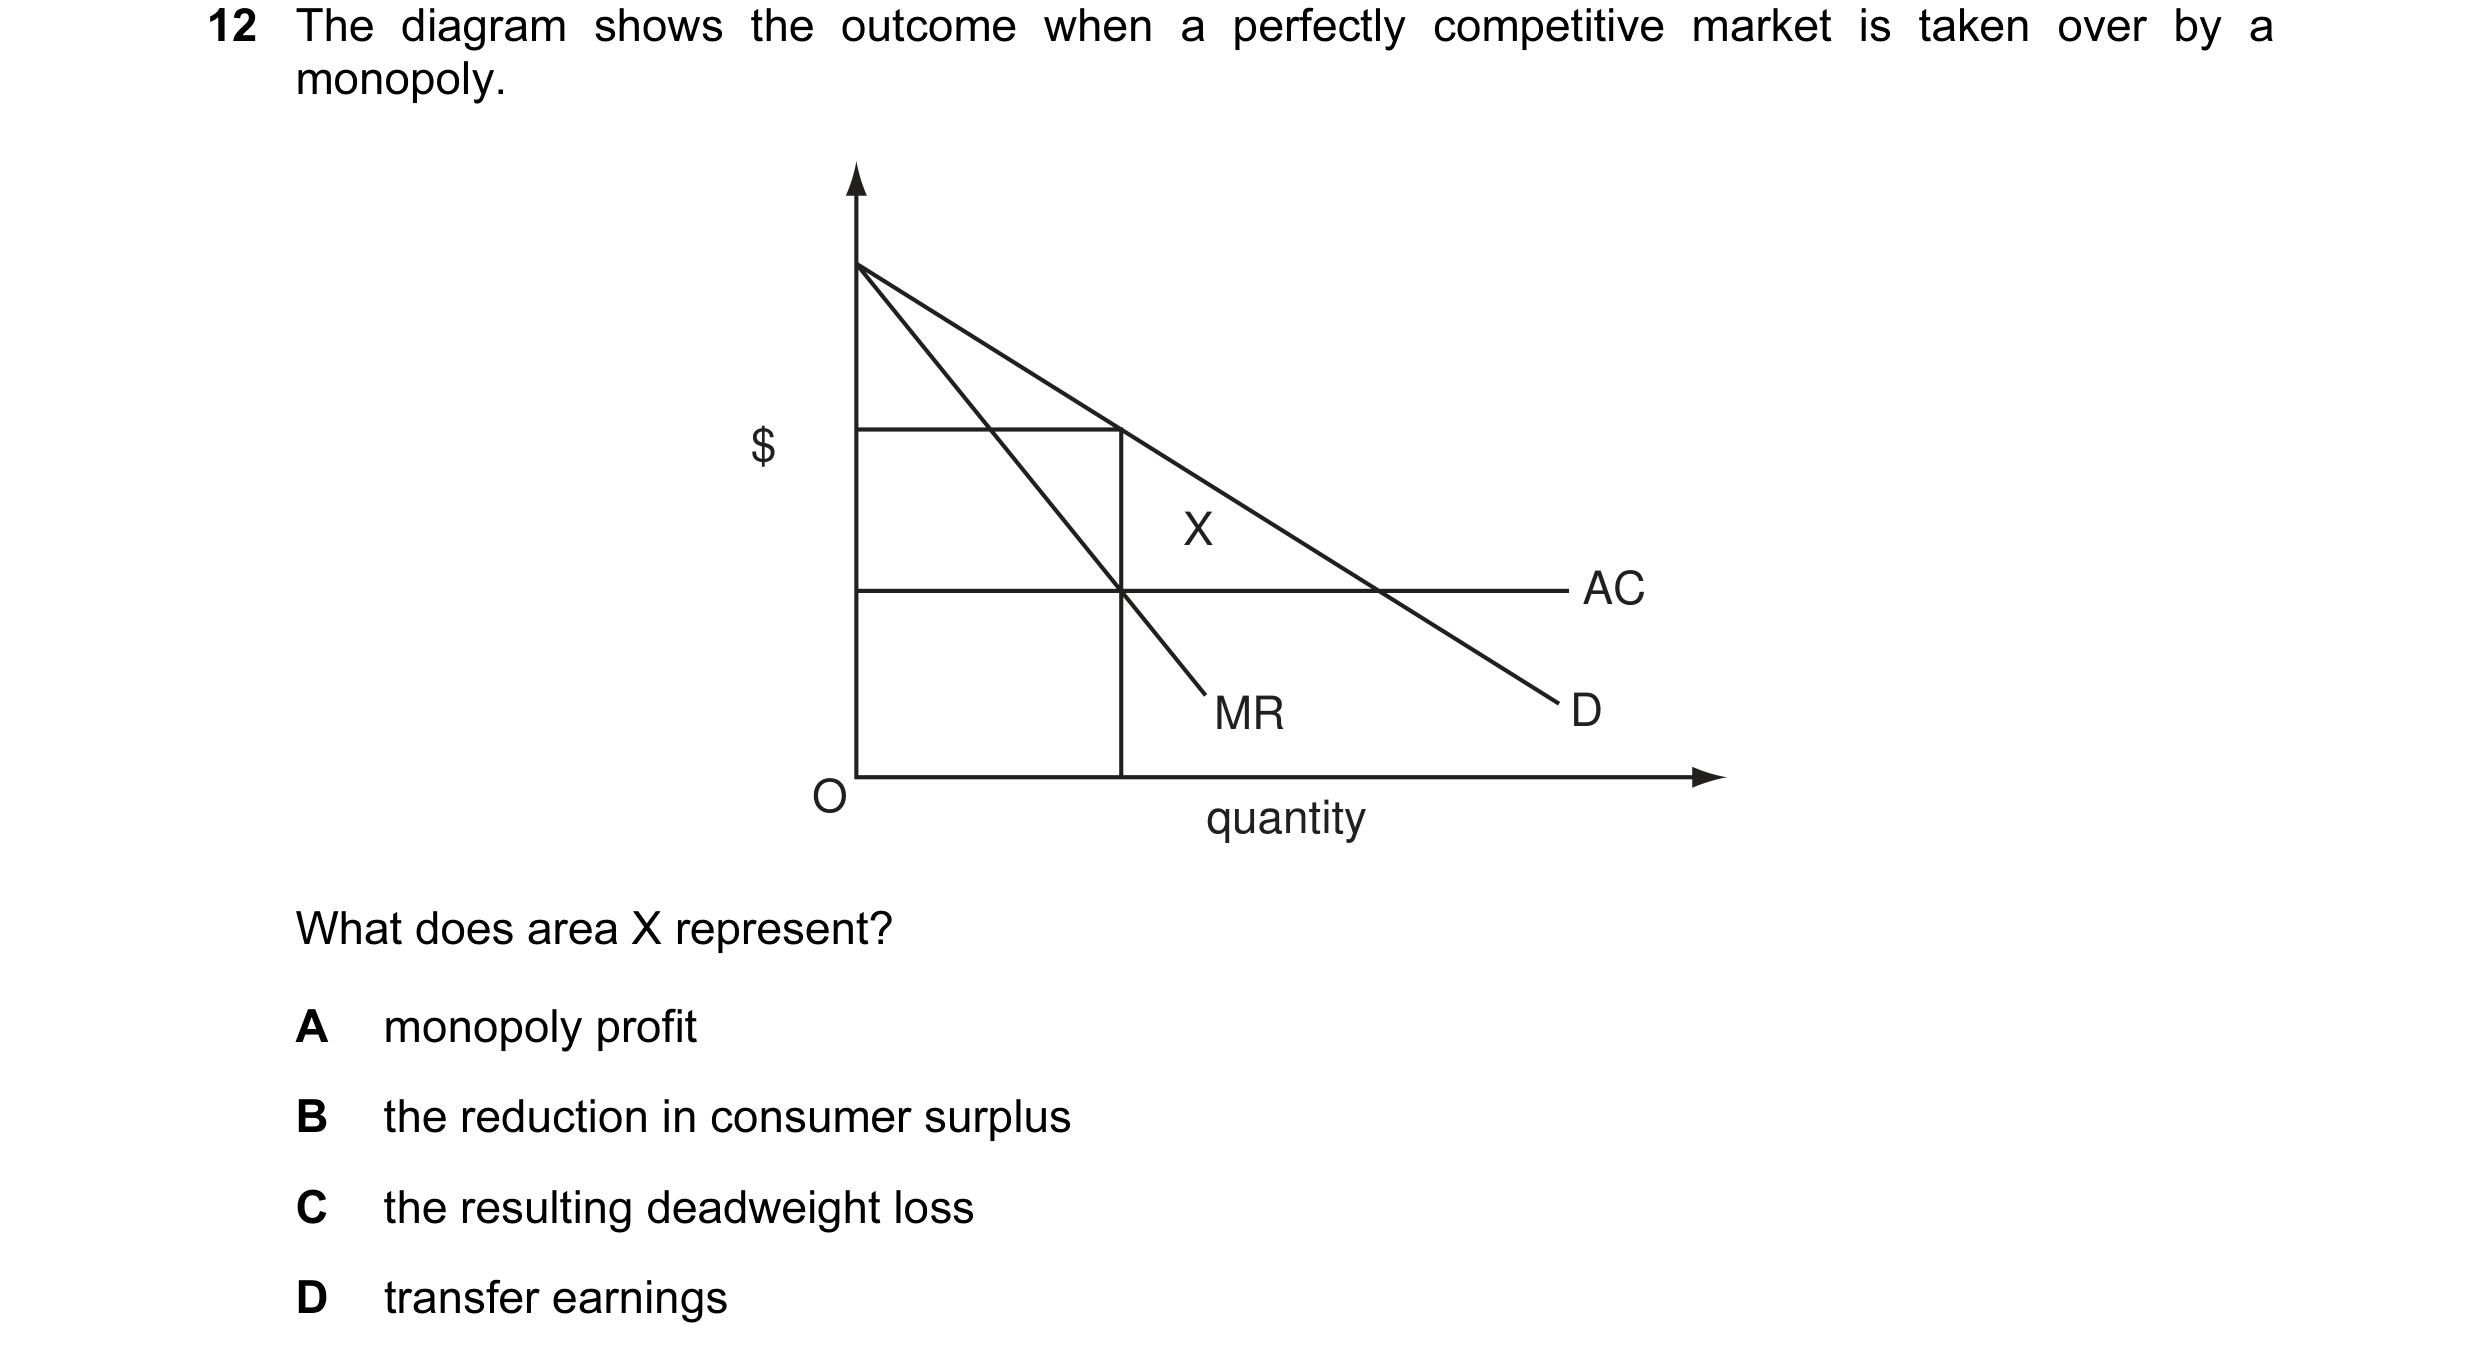
Q13 · The diagram shows the outcome when a perfectly competitive market is taken over by a… 9708/31 Oct/Nov 2010
12 The diagram shows the outcome when a perfectly competitive market is taken over by a monopoly. $ X AC MR D O quantity What does area X represent? A monopoly profit B the reduction in consumer surplus C the resulting deadweight loss D transfer earnings
1 marks
Answer: C
This question in 9708/31 Oct/Nov 2010
Q14 · In an economy no one can be made better off without making others worse off 9708/32 Oct/Nov 2010
1 In an economy no one can be made better off without making others worse off. What can be concluded from this? A All markets are perfectly competitive. B There are no externalities. C The economy is operating on its production possibility curve. D The distribution of income reflects what each individual deserves.
1 marks
Answer: C
This question in 9708/32 Oct/Nov 2010
Q15 · The diagram shows the outcome when a perfectly competitive market is taken over by a… 9708/32 Oct/Nov 2010
12 The diagram shows the outcome when a perfectly competitive market is taken over by a monopoly. $ X AC MR D O quantity What does area X represent? A monopoly profit B the reduction in consumer surplus C the resulting deadweight loss D transfer earnings
1 marks
Answer: C
This question in 9708/32 Oct/Nov 2010
Q16 · The diagram shows the outcome when a perfectly competitive market is taken over by a… 9708/33 Oct/Nov 2010
11 The diagram shows the outcome when a perfectly competitive market is taken over by a monopoly. $ X AC MR D O quantity What does area X represent? A monopoly profit B the reduction in consumer surplus C the resulting deadweight loss D transfer earnings
1 marks
Answer: C
This question in 9708/33 Oct/Nov 2010
Q17 · In an economy no one can be made better off without making others worse off 9708/33 Oct/Nov 2010
30 In an economy no one can be made better off without making others worse off. What can be concluded from this? A All markets are perfectly competitive. B There are no externalities. C The economy is operating on its production possibility curve. D The distribution of income reflects what each individual deserves.
1 marks
Answer: C
This question in 9708/33 Oct/Nov 2010
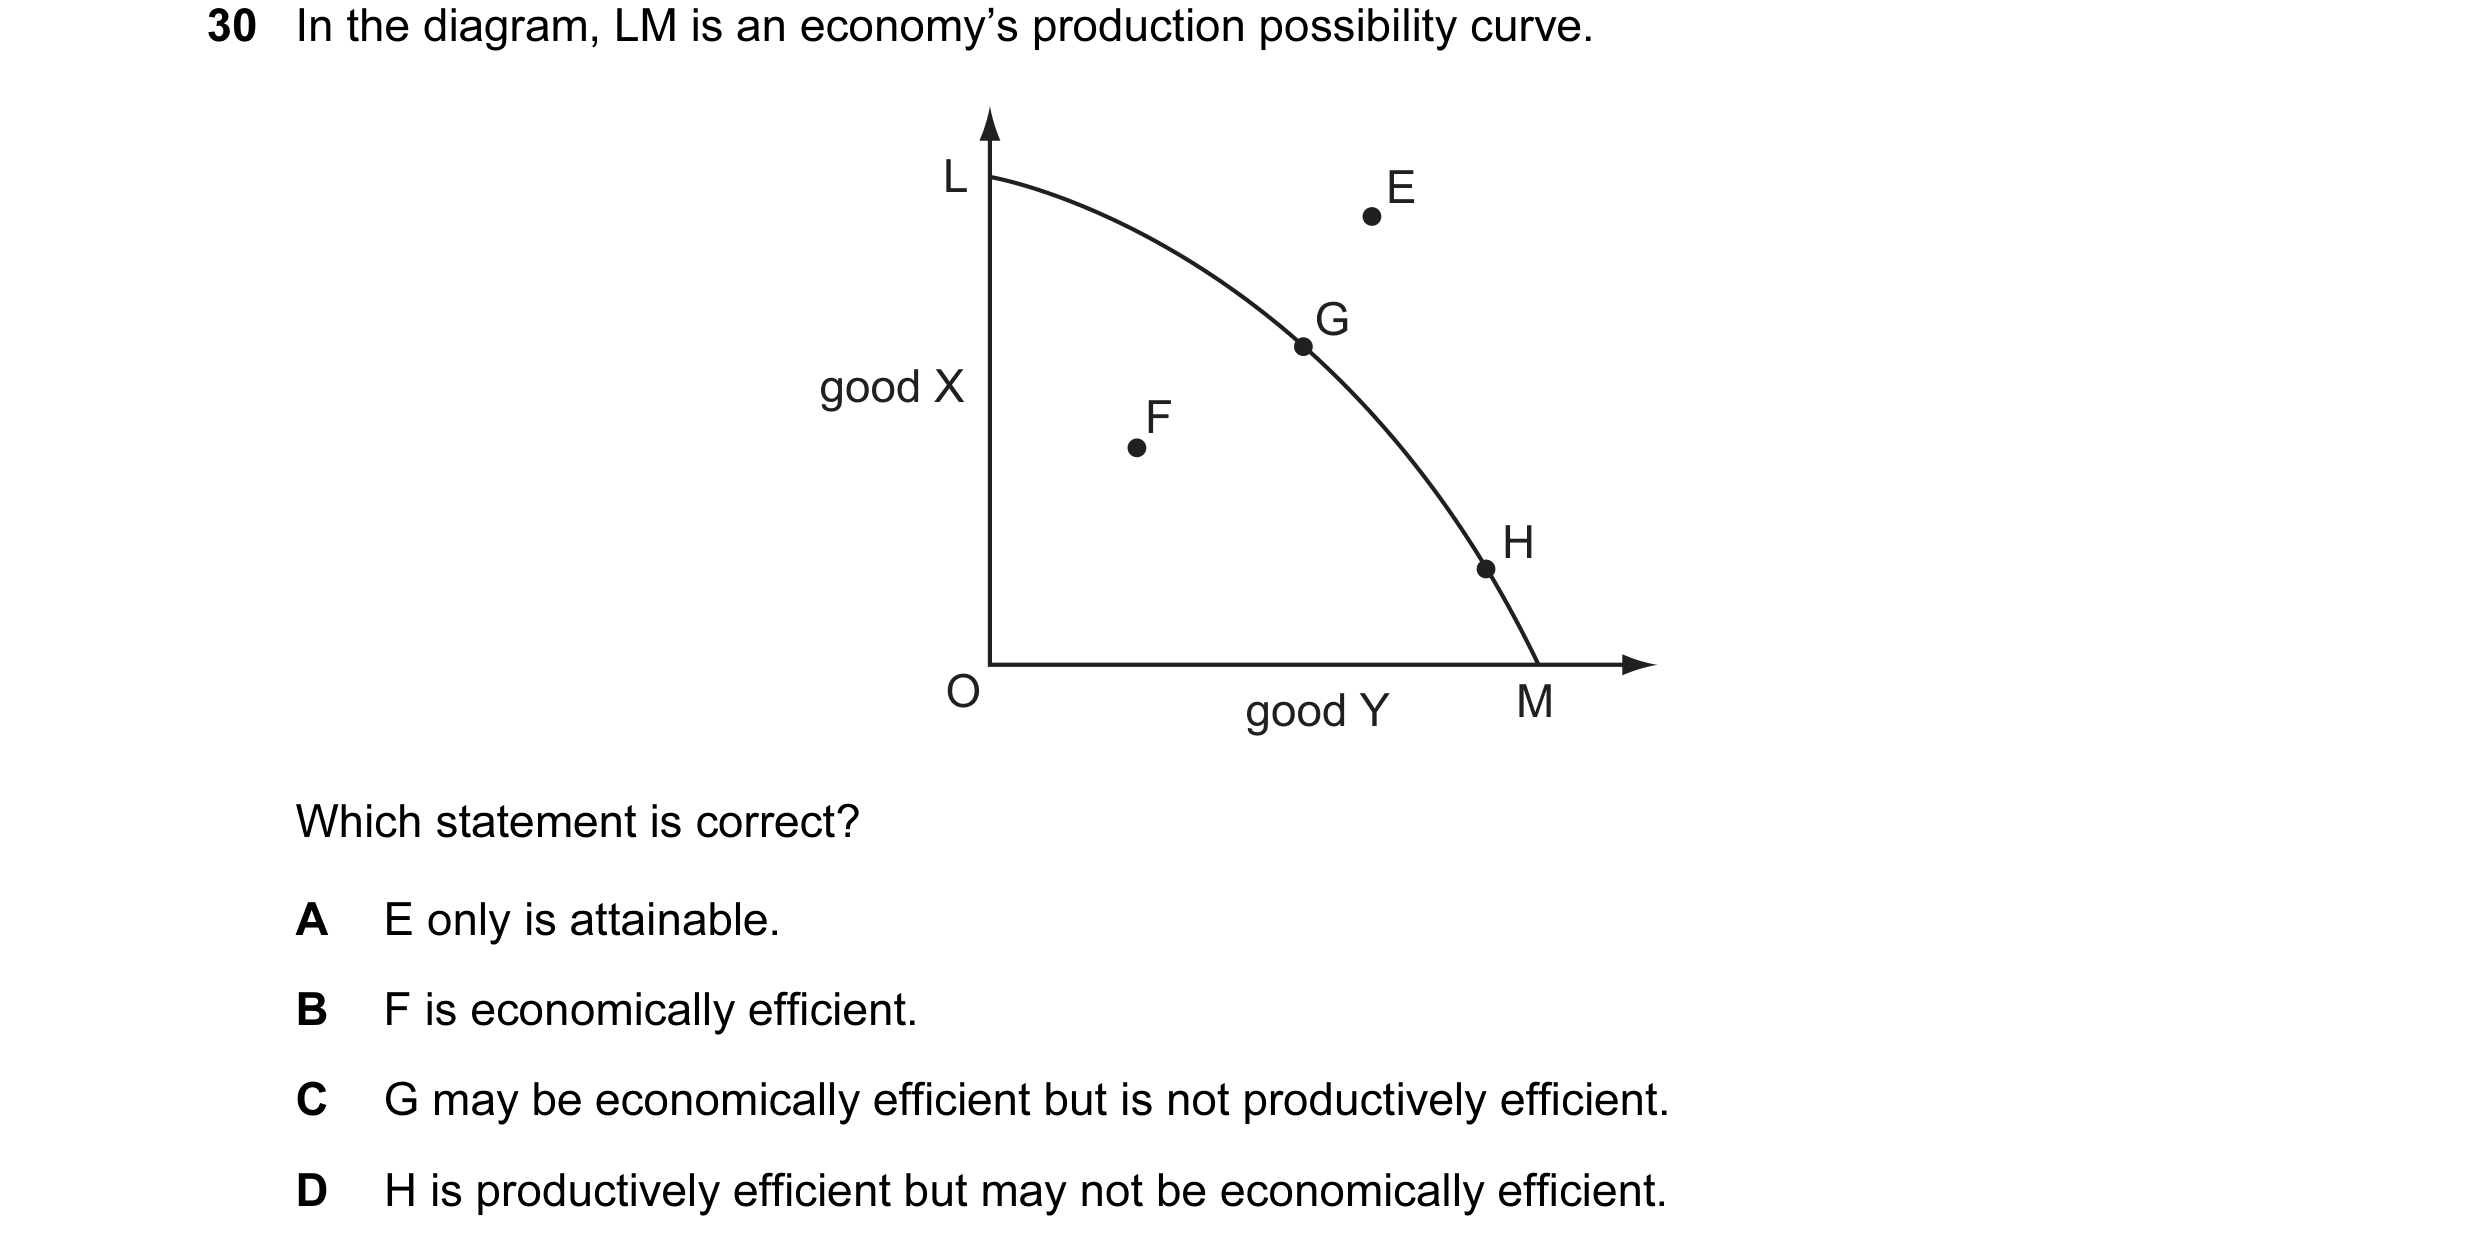
Q18 · In the diagram, LM is an economy’s production possibility curve 9708/32 May/June 2011
30 In the diagram, LM is an economy’s production possibility curve. L E G good X F H O good Y M Which statement is correct? A E only is attainable. B F is economically efficient. C G may be economically efficient but is not productively efficient. D H is productively efficient but may not be economically efficient.
1 marks
Answer: D
This question in 9708/32 May/June 2011
Q19 · In the diagram, LM is an economy’s production possibility curve 9708/33 May/June 2011
30 In the diagram, LM is an economy’s production possibility curve. L E G good X F H O good Y M Which statement is correct? A E only is attainable. B F is economically efficient. C G may be economically efficient but is not productively efficient. D H is productively efficient but may not be economically efficient.
1 marks
Answer: D
This question in 9708/33 May/June 2011
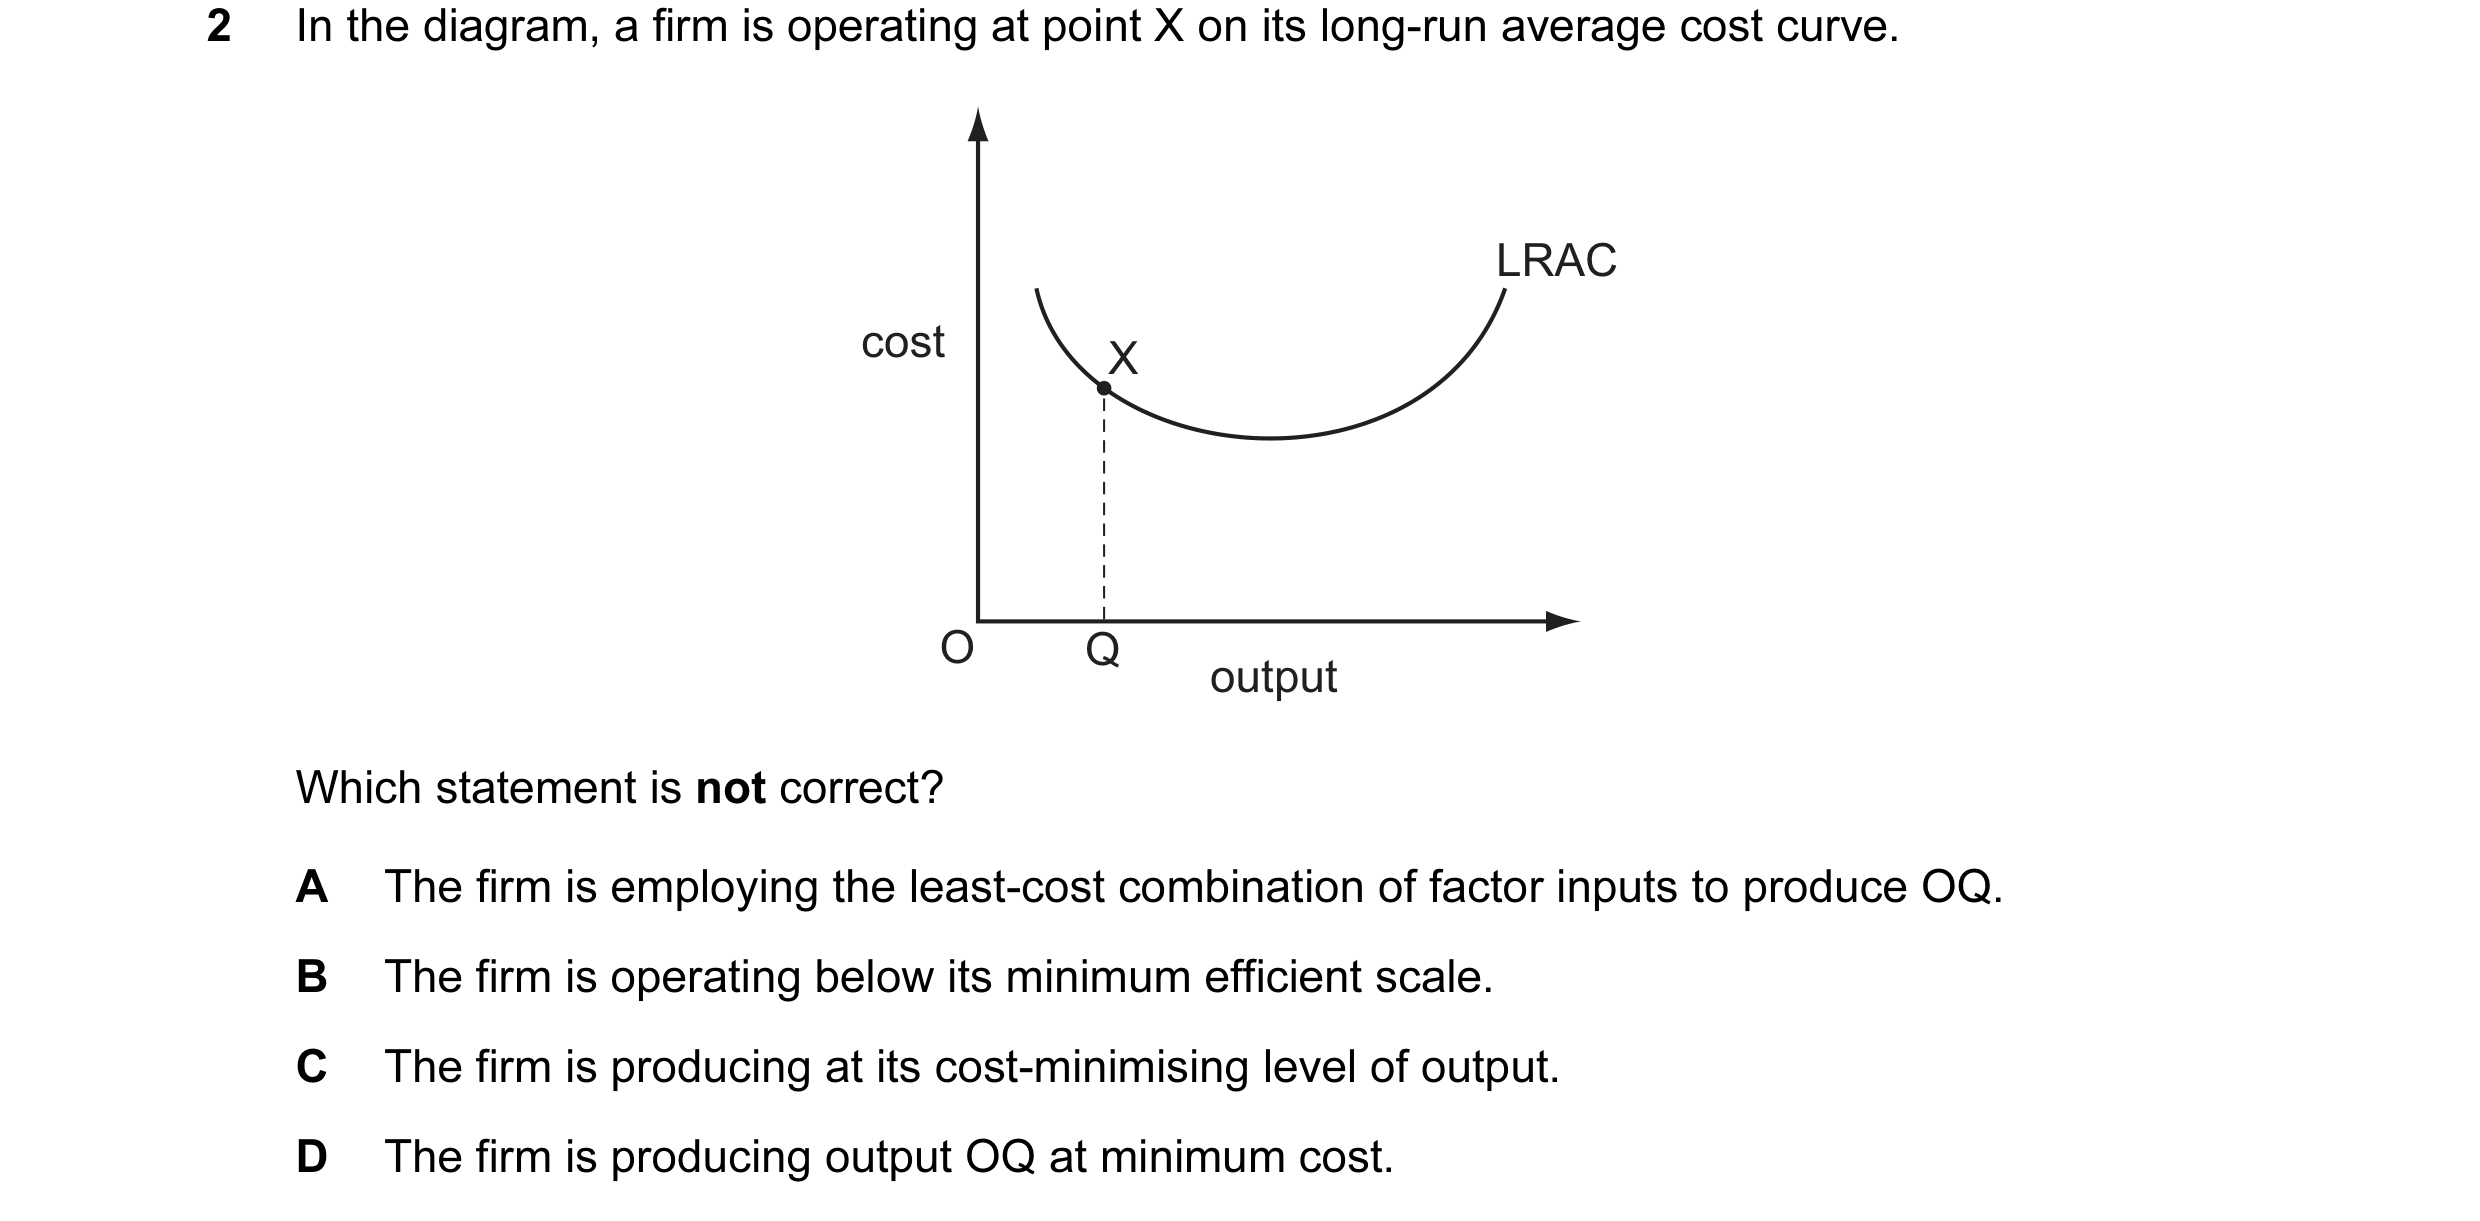
Q20 · In the diagram, a firm is operating at point X on its long-run average cost curve 9708/31 Oct/Nov 2011
2 In the diagram, a firm is operating at point X on its long-run average cost curve. LRAC cost X O Q output Which statement is not correct? A The firm is employing the least-cost combination of factor inputs to produce OQ. B The firm is operating below its minimum efficient scale. C The firm is producing at its cost-minimising level of output. D The firm is producing output OQ at minimum cost.
1 marks
Answer: C
This question in 9708/31 Oct/Nov 2011
Q21 · The Chinese government is increasing the role of market forces in its economy 9708/31 Oct/Nov 2011
12 The Chinese government is increasing the role of market forces in its economy. However, in 2008 it imposed temporary maximum price controls on energy and transport. Why might a government, committed to reducing central planning, introduce price controls? A to increase allocative efficiency B to increase the incentive for producers to raise supply C to reduce consumer demand D to reduce expectations of inflation
1 marks
Answer: D
This question in 9708/31 Oct/Nov 2011
Q22 · The diagram shows a firm’s long-run cost and revenue curves 9708/32 Oct/Nov 2011
2 The diagram shows a firm’s long-run cost and revenue curves. LRMC LRAC costs, revenue AR MR O A B C D output At which level of output is the firm both allocatively and productively efficient? A OA B OB C OC D OD
1 marks
Answer: C
This question in 9708/32 Oct/Nov 2011
Q23 · Which condition must be met for economic efficiency to be achieved? 9708/31 May/June 2012
1 Which condition must be met for economic efficiency to be achieved? A Marginal social costs are zero in the production of all goods. B Marginal social costs are at a minimum in the production of all goods. C Marginal social benefits are at a maximum in the production of all goods. D Marginal social costs equal marginal social benefits in the production of all goods.
1 marks
Answer: D
This question in 9708/31 May/June 2012
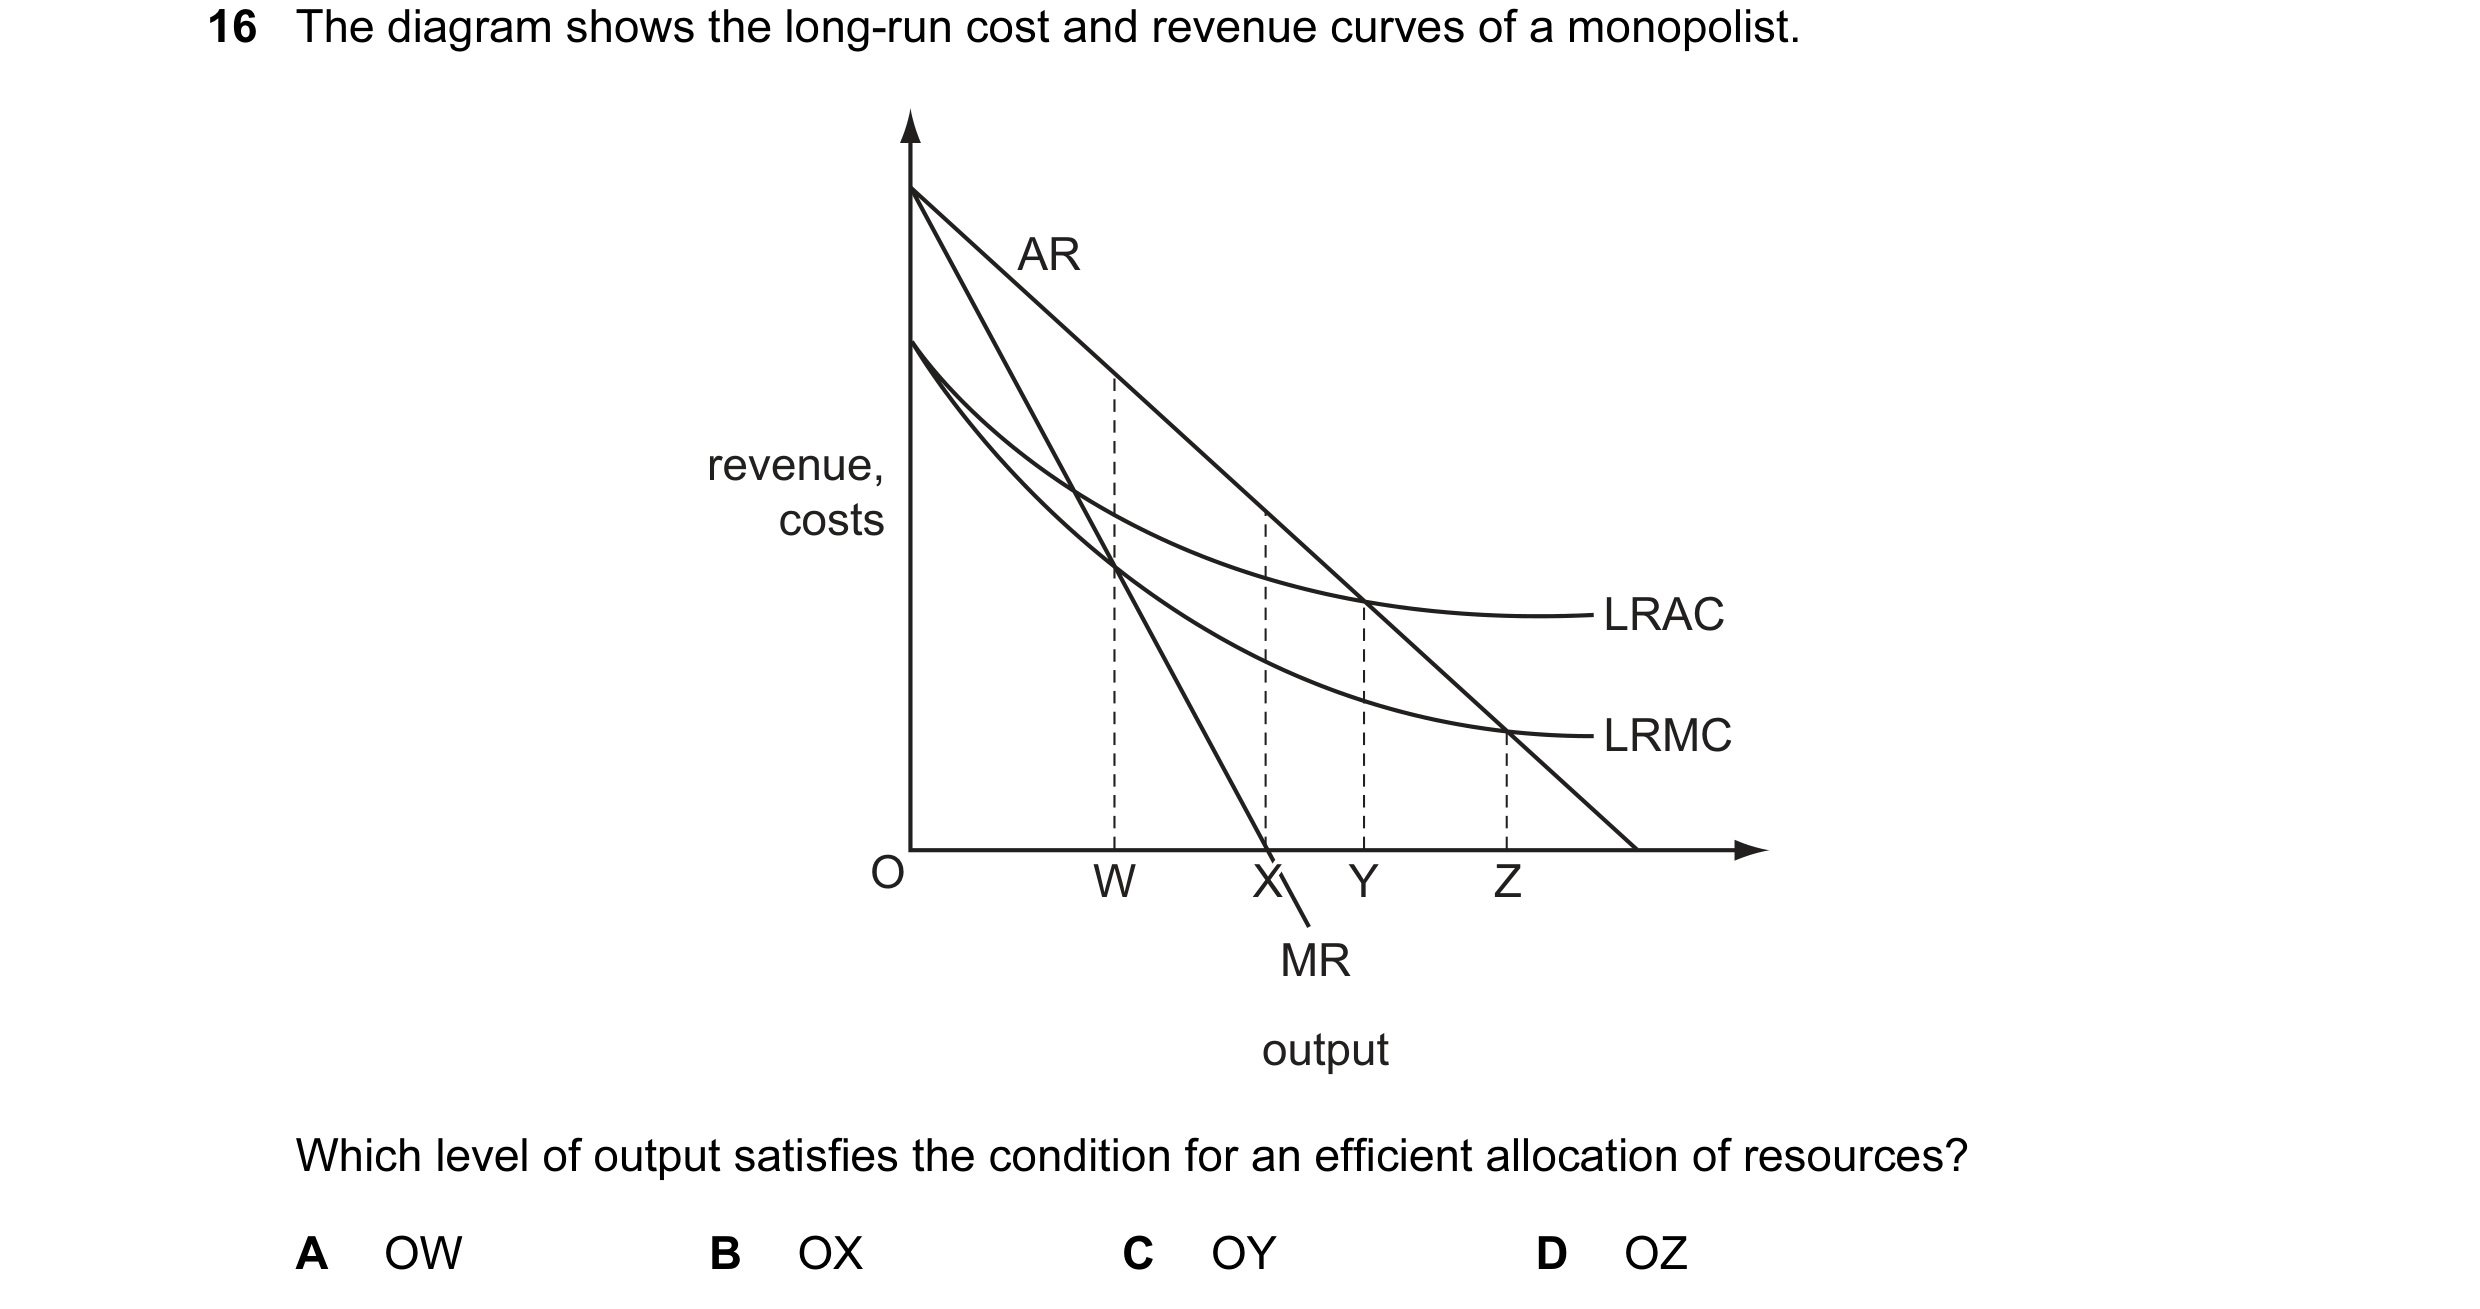
Q24 · The diagram shows the long-run cost and revenue curves of a monopolist 9708/31 May/June 2012
16 The diagram shows the long-run cost and revenue curves of a monopolist. AR revenue, costs LRAC LRMC O W X Y Z MR output Which level of output satisfies the condition for an efficient allocation of resources? A OW B OX C OY D OZ
1 marks
Answer: D
This question in 9708/31 May/June 2012
Q25 · When is economic efficiency achieved in an economy? 9708/32 May/June 2012
1 When is economic efficiency achieved in an economy? A when nobody can become better off without somebody else becoming worse off B when the economy is operating at its natural rate of unemployment C when the level of social costs is minimised D when the rate of economic growth is maximised
1 marks
Answer: A
This question in 9708/32 May/June 2012
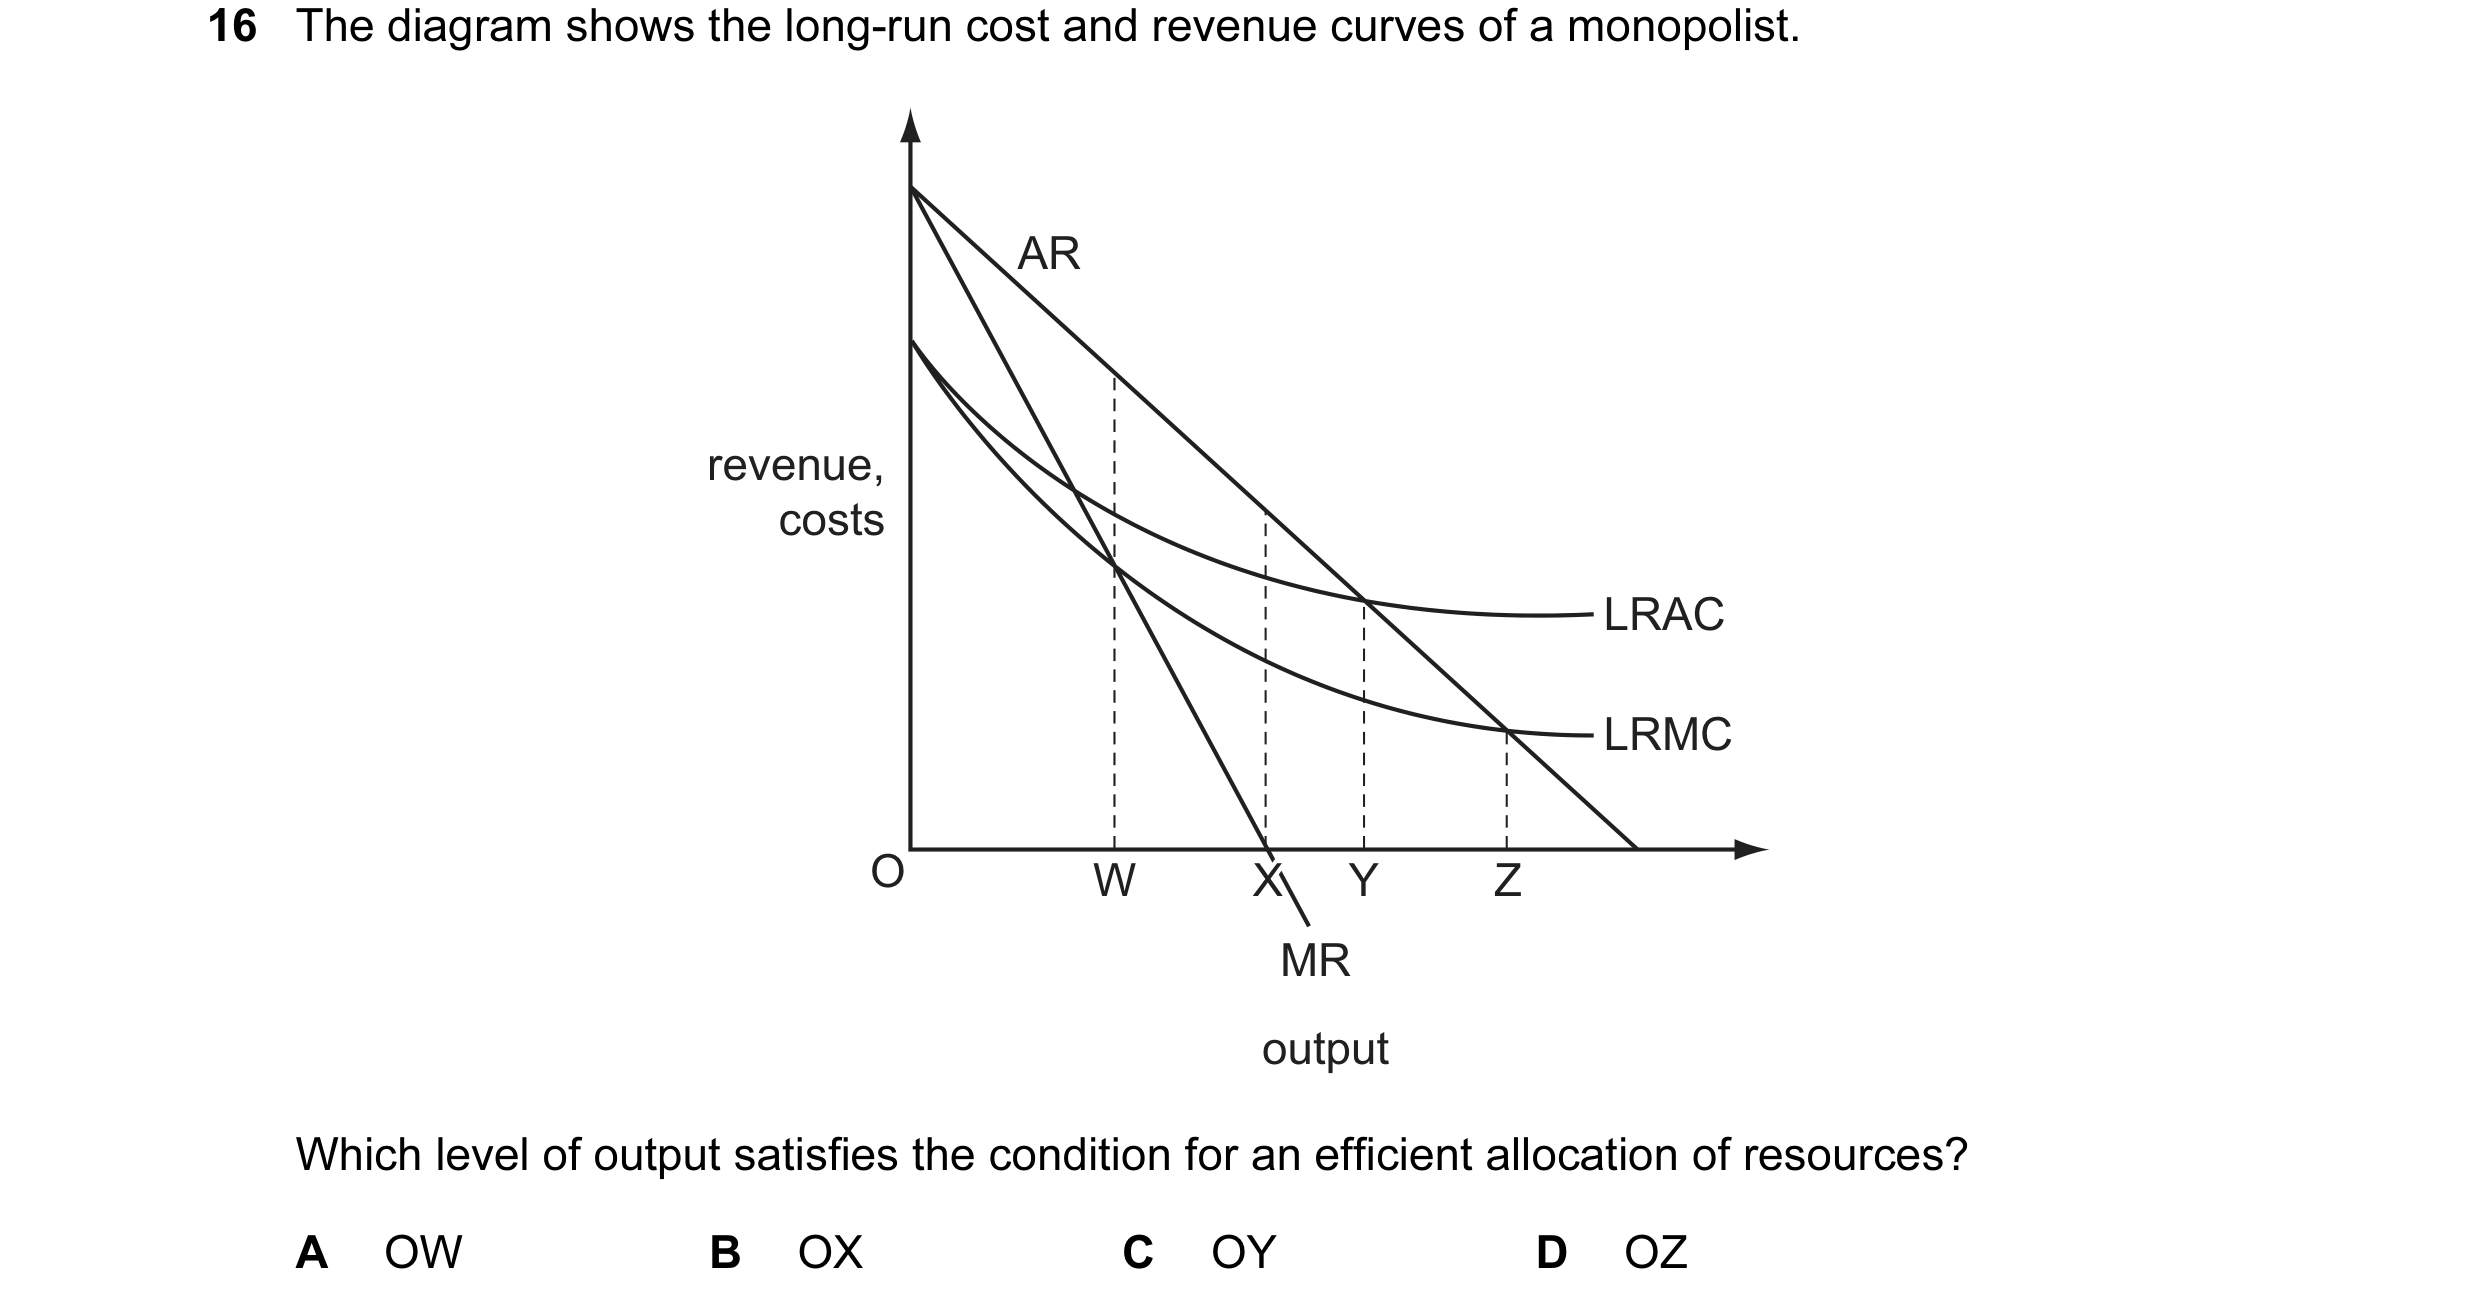
Q26 · The diagram shows the long-run cost and revenue curves of a monopolist 9708/32 May/June 2012
16 The diagram shows the long-run cost and revenue curves of a monopolist. AR revenue, costs LRAC LRMC O W X Y Z MR output Which level of output satisfies the condition for an efficient allocation of resources? A OW B OX C OY D OZ
1 marks
Answer: D
This question in 9708/32 May/June 2012
Q27 · Which condition must be met for economic efficiency to be achieved? 9708/33 May/June 2012
1 Which condition must be met for economic efficiency to be achieved? A Marginal social costs are zero in the production of all goods. B Marginal social costs are at a minimum in the production of all goods. C Marginal social benefits are at a maximum in the production of all goods. D Marginal social costs equal marginal social benefits in the production of all goods.
1 marks
Answer: D
This question in 9708/33 May/June 2012
Q28 · The diagram shows a profit-maximising firm’s cost and revenue curves 9708/32 Oct/Nov 2012
13 The diagram shows a profit-maximising firm’s cost and revenue curves. MC MR AC cost , revenue AR O W X Y Z output What would be the increase in the firm’s output if it was required to charge a price equal to marginal cost? A WX B XY C WY D XZ
1 marks
Answer: C
This question in 9708/32 Oct/Nov 2012
Q29 · All firms in an economy produce at levels of output where price and marginal private cost… 9708/32 Oct/Nov 2012
14 All firms in an economy produce at levels of output where price and marginal private cost are equal. Why might this not be sufficient to ensure that allocative efficiency is achieved? A a small number of buyers and sellers B differences in consumers’ preferences C product differentiation D the presence of externalities
1 marks
Answer: D
This question in 9708/32 Oct/Nov 2012
Q30 · An economy is operating at a point on its production possibility curve 9708/33 Oct/Nov 2012
1 An economy is operating at a point on its production possibility curve. What is true about the way the economy’s resources are being allocated at this point? allocatively efficient productively efficient socially desirable A yes yes possibly B possibly yes yes C possibly possibly possibly D yes possibly yes
1 marks
This question in 9708/33 Oct/Nov 2012
Q31 · What does not pose a threat to the achievement of allocative efficiency? 9708/33 Oct/Nov 2012
13 What does not pose a threat to the achievement of allocative efficiency? A imperfect information on the part of consumers B income inequalities C the existence of externalities D the presence of monopolistic elements
1 marks
This question in 9708/33 Oct/Nov 2012
Q32 · At present, a monopolist is required by the industry regulator to charge a price equal to… 9708/33 Oct/Nov 2012
14 At present, a monopolist is required by the industry regulator to charge a price equal to marginal cost. The table summarises the consequences if the firm were allowed instead to maximise its profits. $million increase in monopoly profits 5 loss of consumer surplus 8 What would be the resulting deadweight loss? A $3 million B $5 million C $8 million D $13 million
1 marks
This question in 9708/33 Oct/Nov 2012
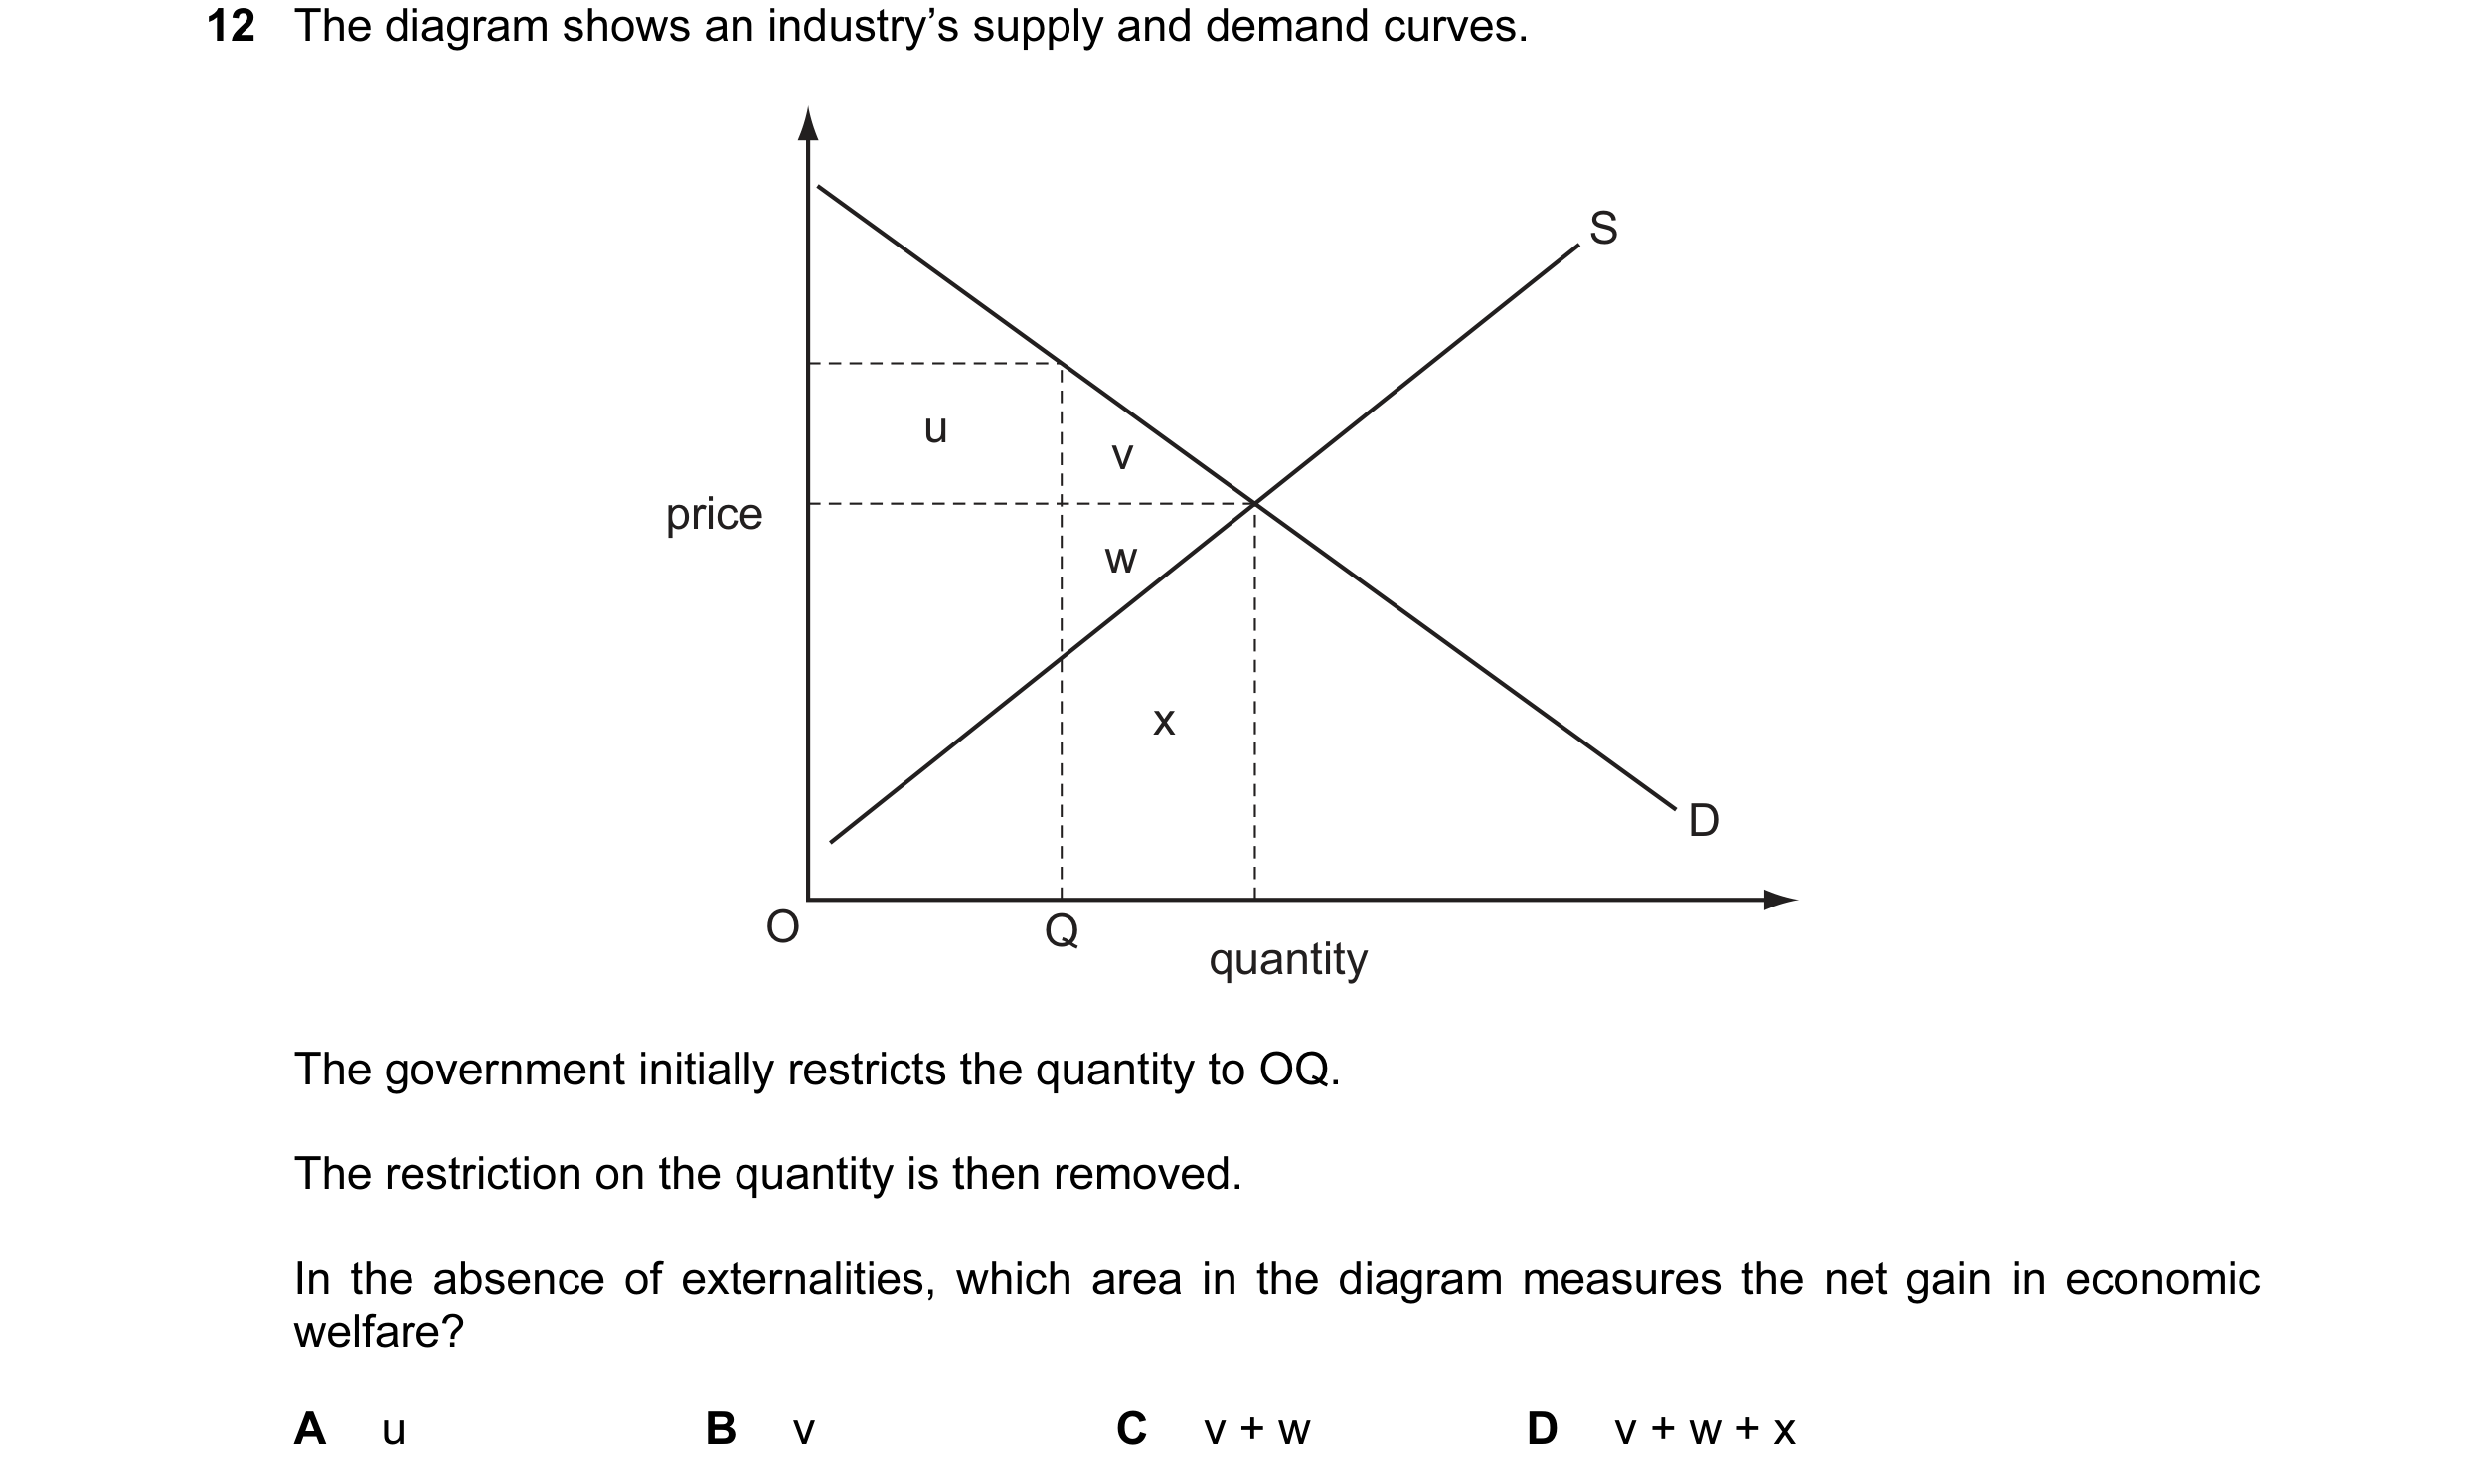
Q33 · The diagram shows an industry’s supply and demand curves 9708/31 May/June 2013
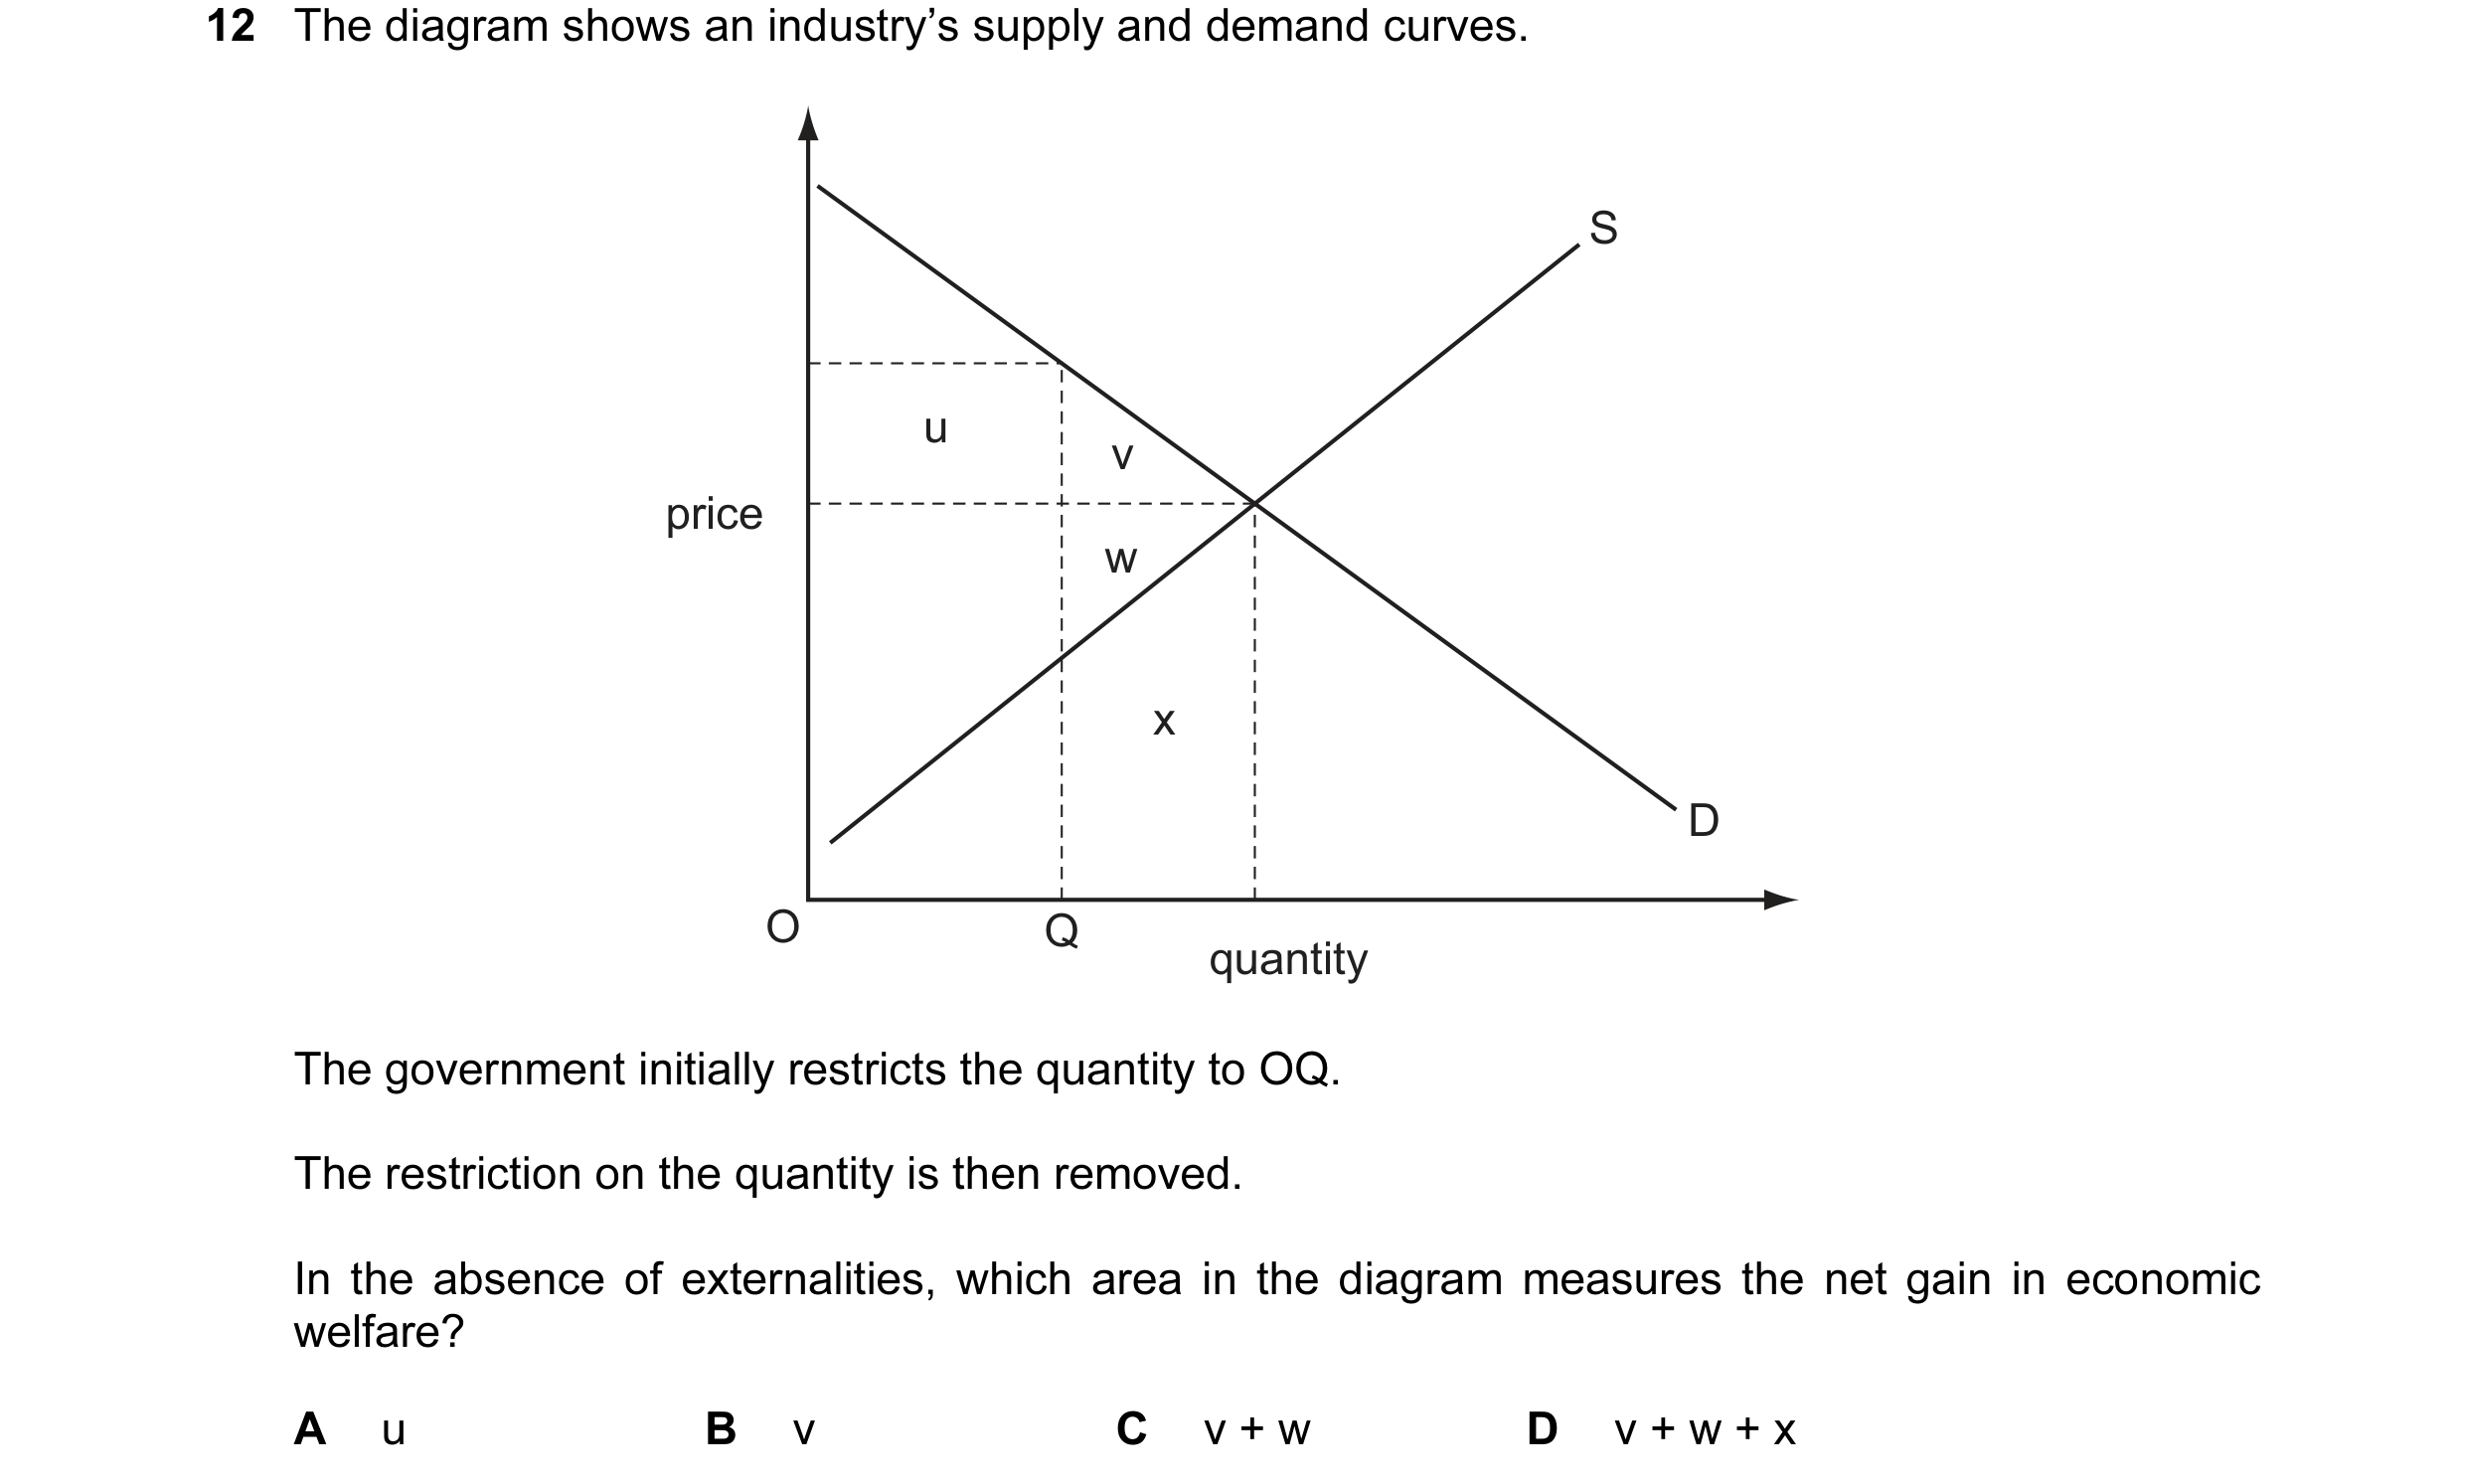
12 The diagram shows an industry’s supply and demand curves. S u v price w x D O Q quantity The government initially restricts the quantity to OQ. The restriction on the quantity is then removed. In the absence of externalities, which area in the diagram measures the net gain in economic welfare? A u B v C v + w D v + w + x
1 marks
Answer: C
This question in 9708/31 May/June 2013
Q34 · A firm operates in a perfectly competitive market 9708/32 May/June 2013
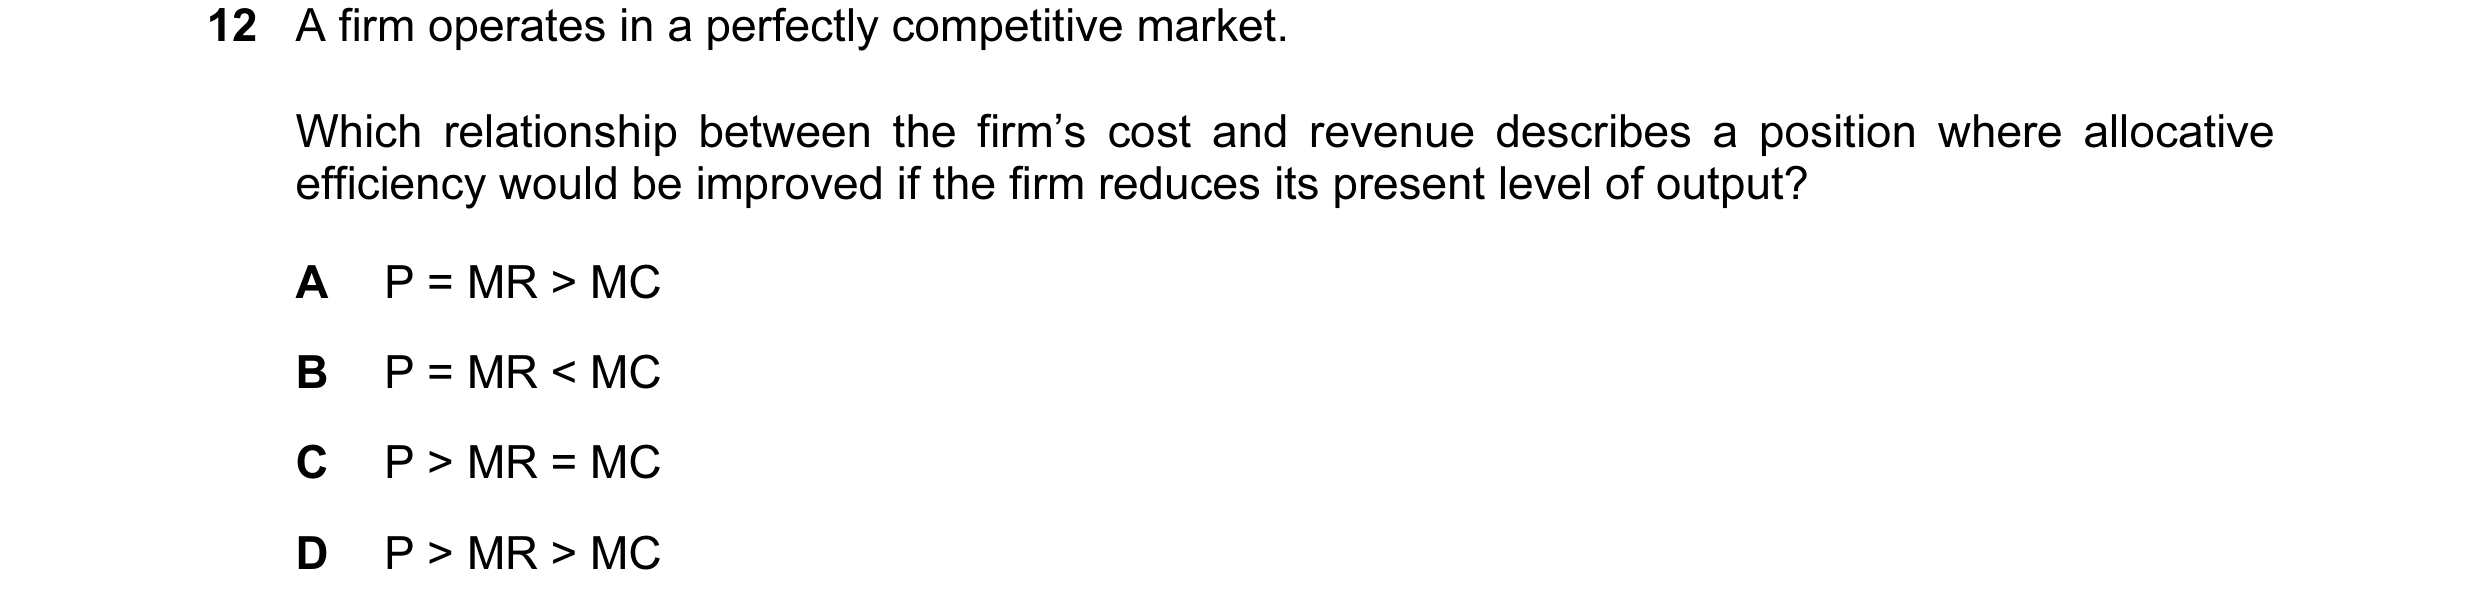
12 A firm operates in a perfectly competitive market. Which relationship between the firm’s cost and revenue describes a position where allocative efficiency would be improved if the firm reduces its present level of output? A P = MR > MC B P = MR < MC C P > MR = MC D P > MR > MC
1 marks
Answer: B
This question in 9708/32 May/June 2013
Q35 · The curve in the diagram shows the minimum combinations of capital and labour that are… 9708/32 May/June 2013
14 The curve in the diagram shows the minimum combinations of capital and labour that are needed to produce 100 units of output. G capital Q = 100 O labour A firm’s management hires the combination of capital and labour indicated by point G in the diagram to produce 100 units of output. Which term best describes this situation? A lack of specialisation B managerial diseconomy C market failure D X-inefficiency
1 marks
Answer: D
This question in 9708/32 May/June 2013
Q36 · The diagram shows an industry’s supply and demand curves 9708/33 May/June 2013
12 The diagram shows an industry’s supply and demand curves. S u v price w x D O Q quantity The government initially restricts the quantity to OQ. The restriction on the quantity is then removed. In the absence of externalities, which area in the diagram measures the net gain in economic welfare? A u B v C v + w D v + w + x
1 marks
Answer: C
This question in 9708/33 May/June 2013
Q37 · The diagram shows a firm’s cost and revenue curves 9708/31 Oct/Nov 2013
10 The diagram shows a firm’s cost and revenue curves. MC cost / revenue AC MR AR O output The firm changes its objective from sales revenue maximisation to profit maximisation. How will this affect the net economic welfare of the following groups in the short run? customers workers A fall rise B fall fall C rise rise D rise fall
1 marks
Answer: B
This question in 9708/31 Oct/Nov 2013
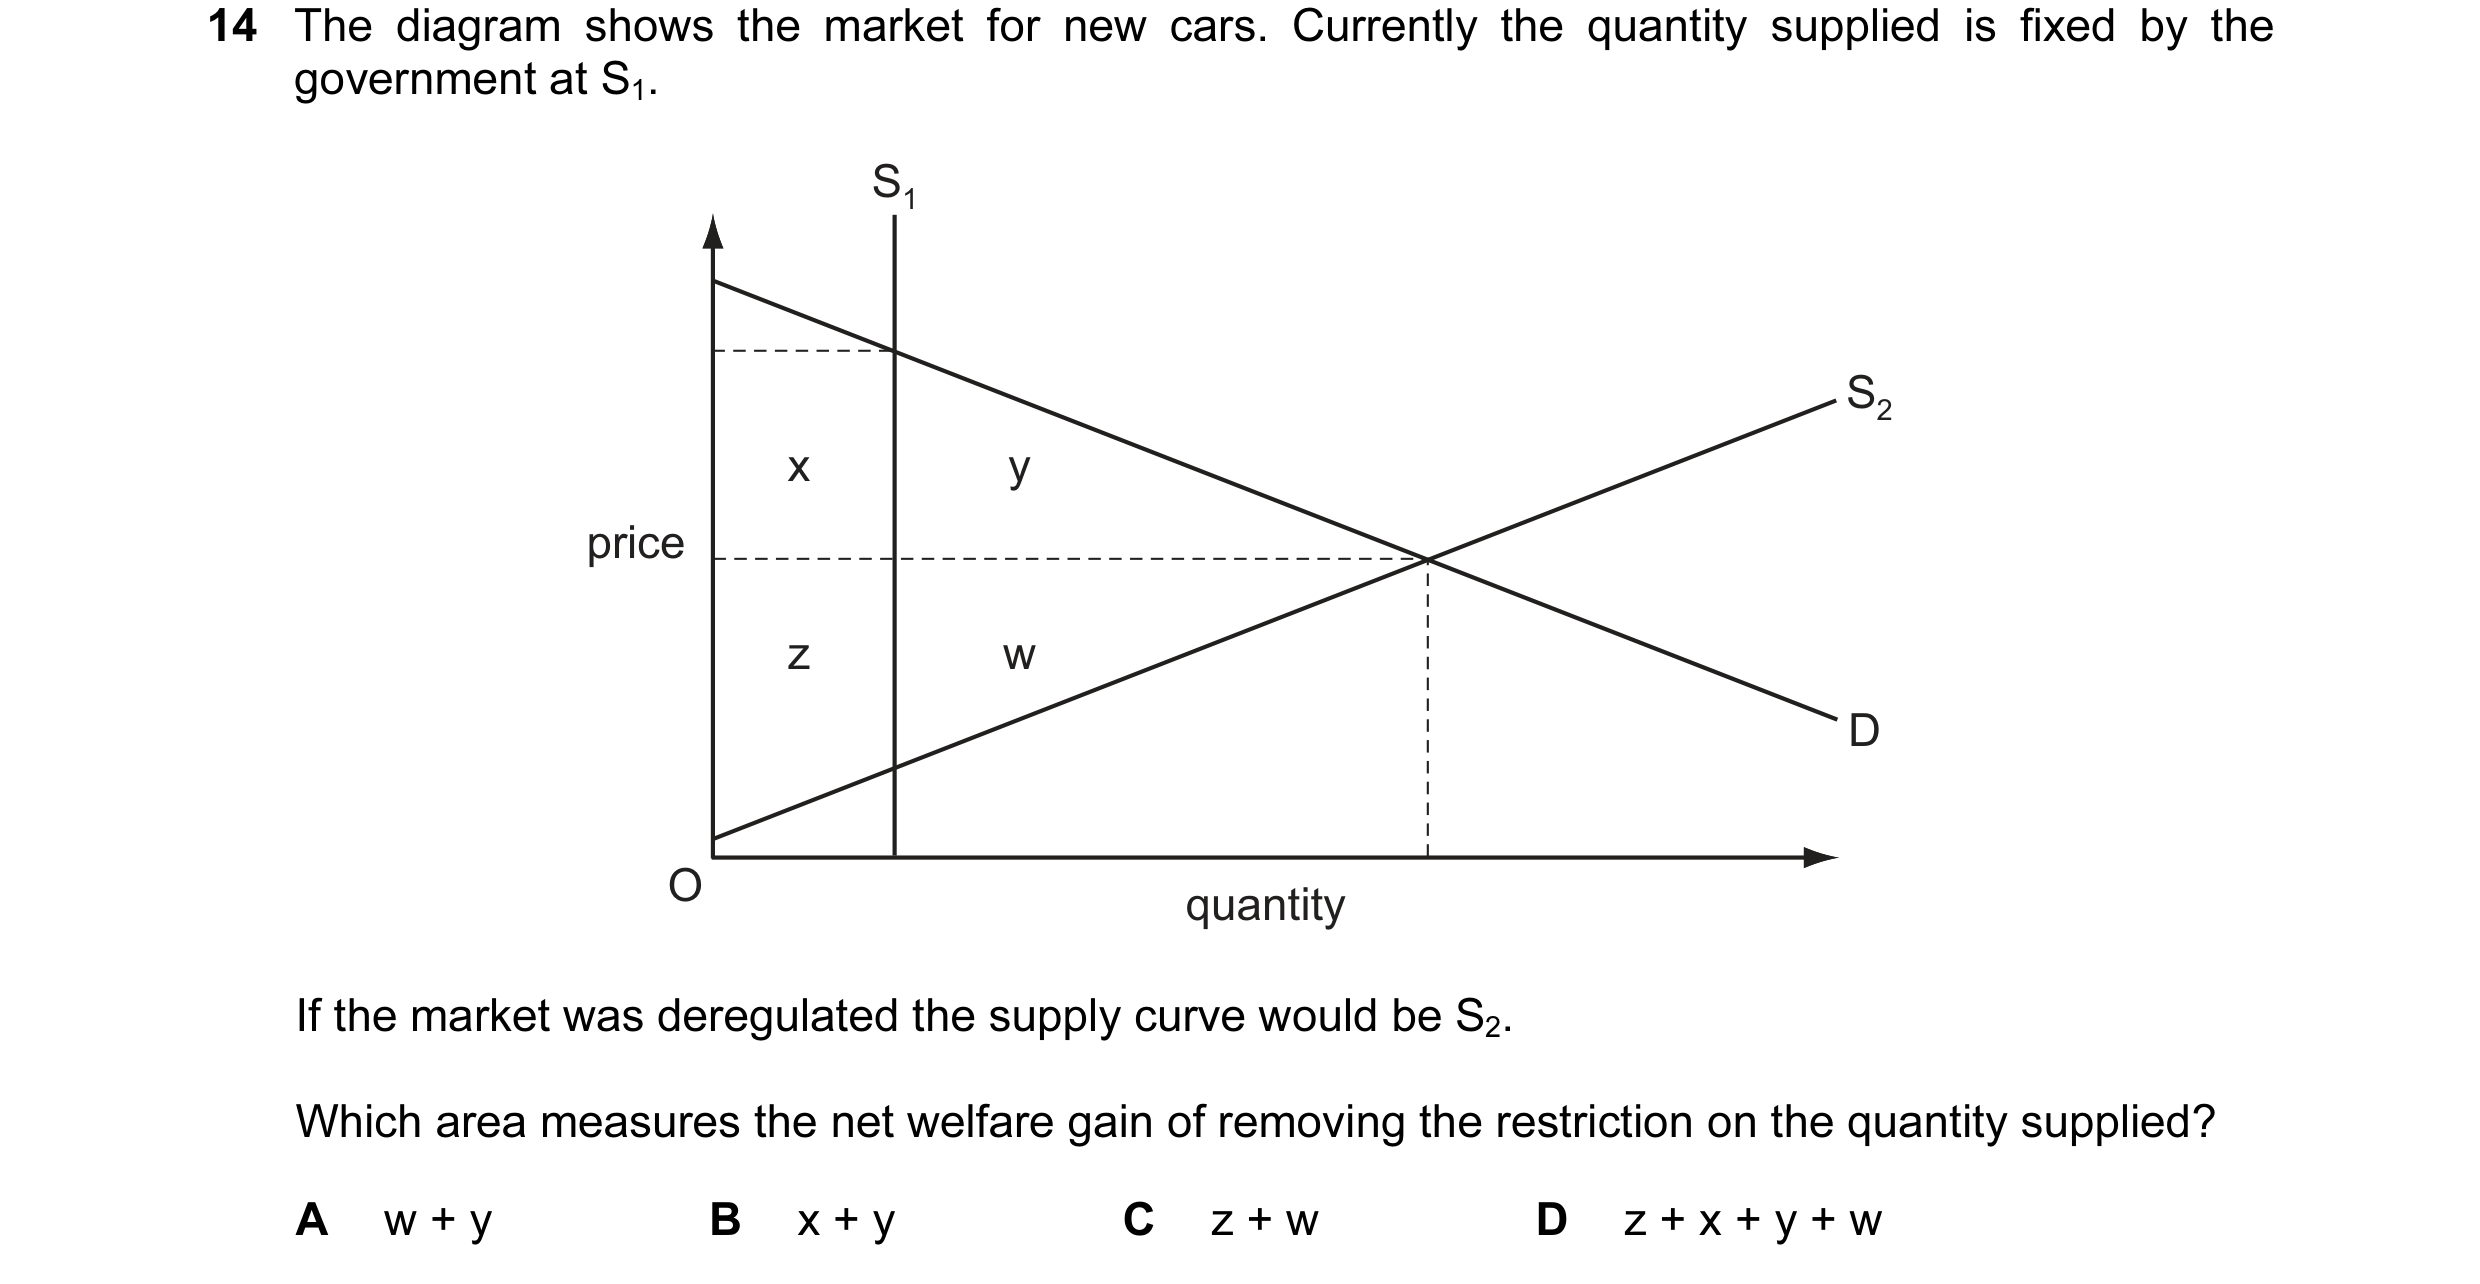
Q38 · The diagram shows the market for new cars 9708/31 Oct/Nov 2013
14 The diagram shows the market for new cars. Currently the quantity supplied is fixed by the government at S1. S1 S2 x y price z w D O quantity If the market was deregulated the supply curve would be S2. Which area measures the net welfare gain of removing the restriction on the quantity supplied? A w + y B x + y C z + w D z + x + y + w
1 marks
Answer: A
This question in 9708/31 Oct/Nov 2013
Q39 · What is the purpose of trying to achieve economic efficiency? 9708/32 Oct/Nov 2013
1 What is the purpose of trying to achieve economic efficiency? A to ensure that economic decisions are made equitably B to ensure that firms are internationally competitive C to ensure that firms maximise their profit levels D to ensure that the economy does not waste scarce resources
1 marks
Answer: D
This question in 9708/32 Oct/Nov 2013
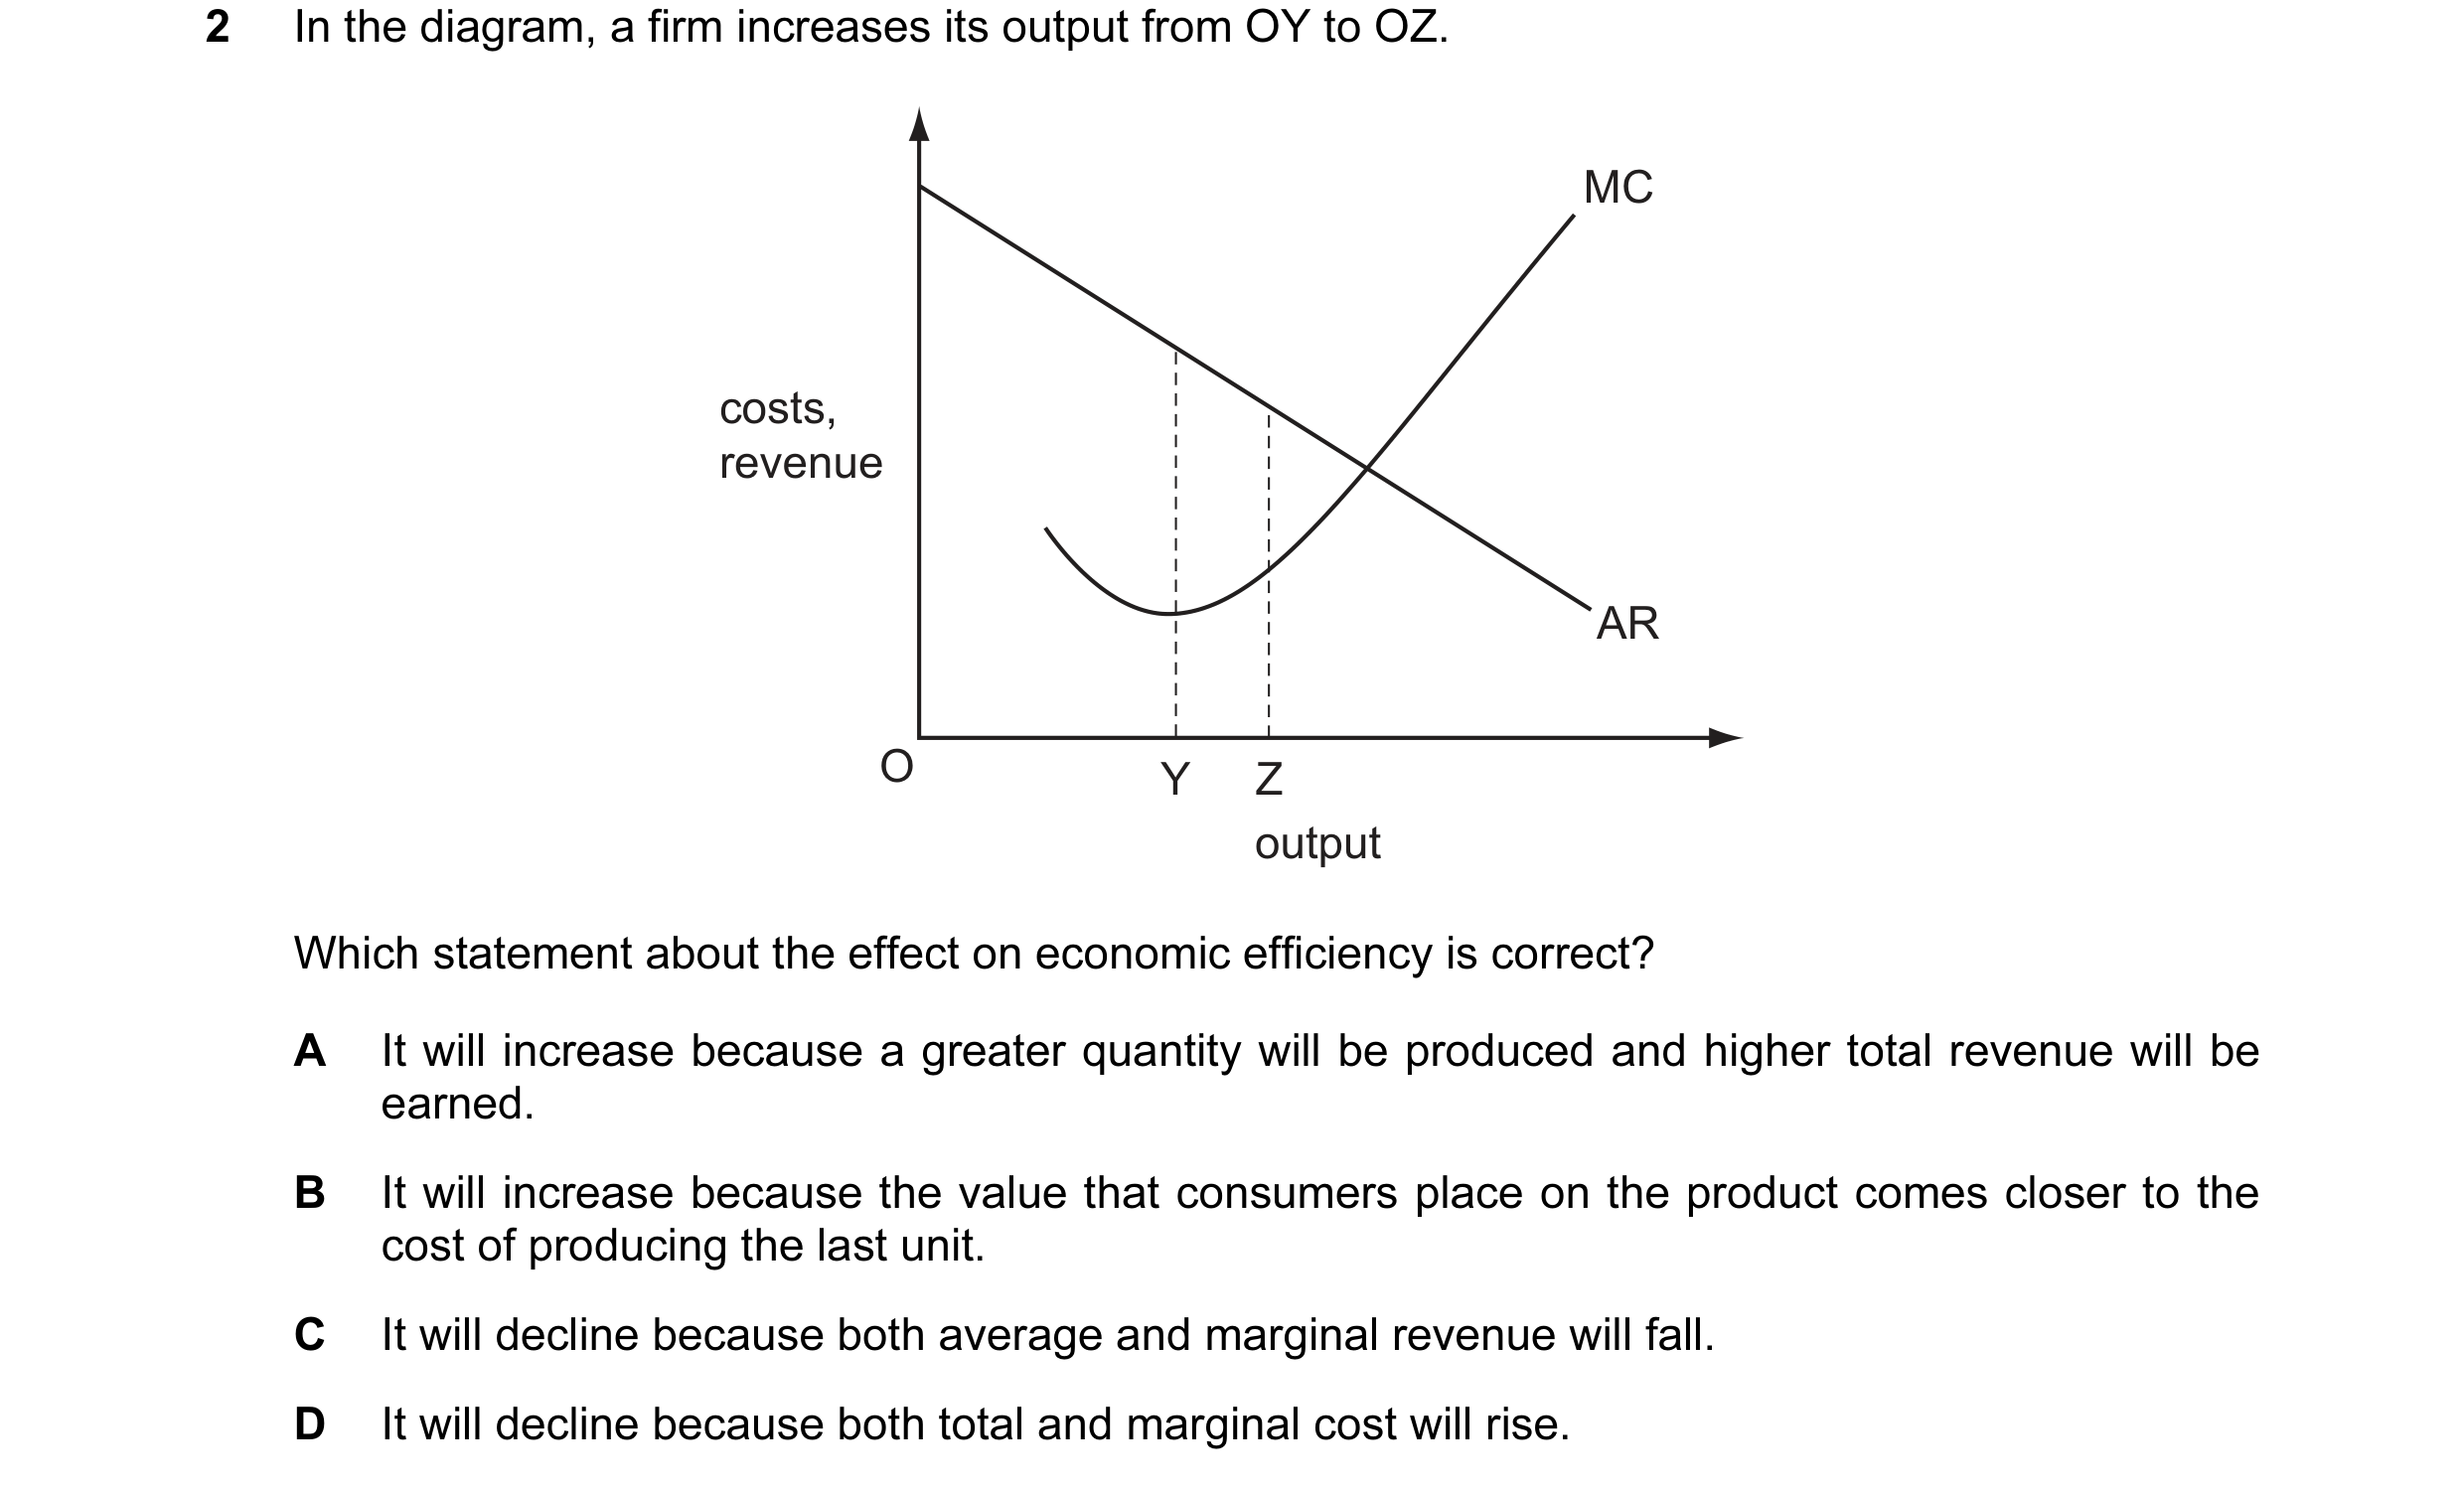
Q40 · In the diagram, a firm increases its output from OY to OZ 9708/33 Oct/Nov 2013
1 In the diagram, a firm increases its output from OY to OZ. MC costs, revenue AR O Y Z output Which statement about the effect on economic efficiency is correct? A It will increase because a greater quantity will be produced and higher total revenue will be earned. B It will increase because the value that consumers place on the product comes closer to the cost of producing the last unit. C It will decline because both average and marginal revenue will fall. D It will decline because both total and marginal cost will rise.
1 marks
Answer: B
This question in 9708/33 Oct/Nov 2013
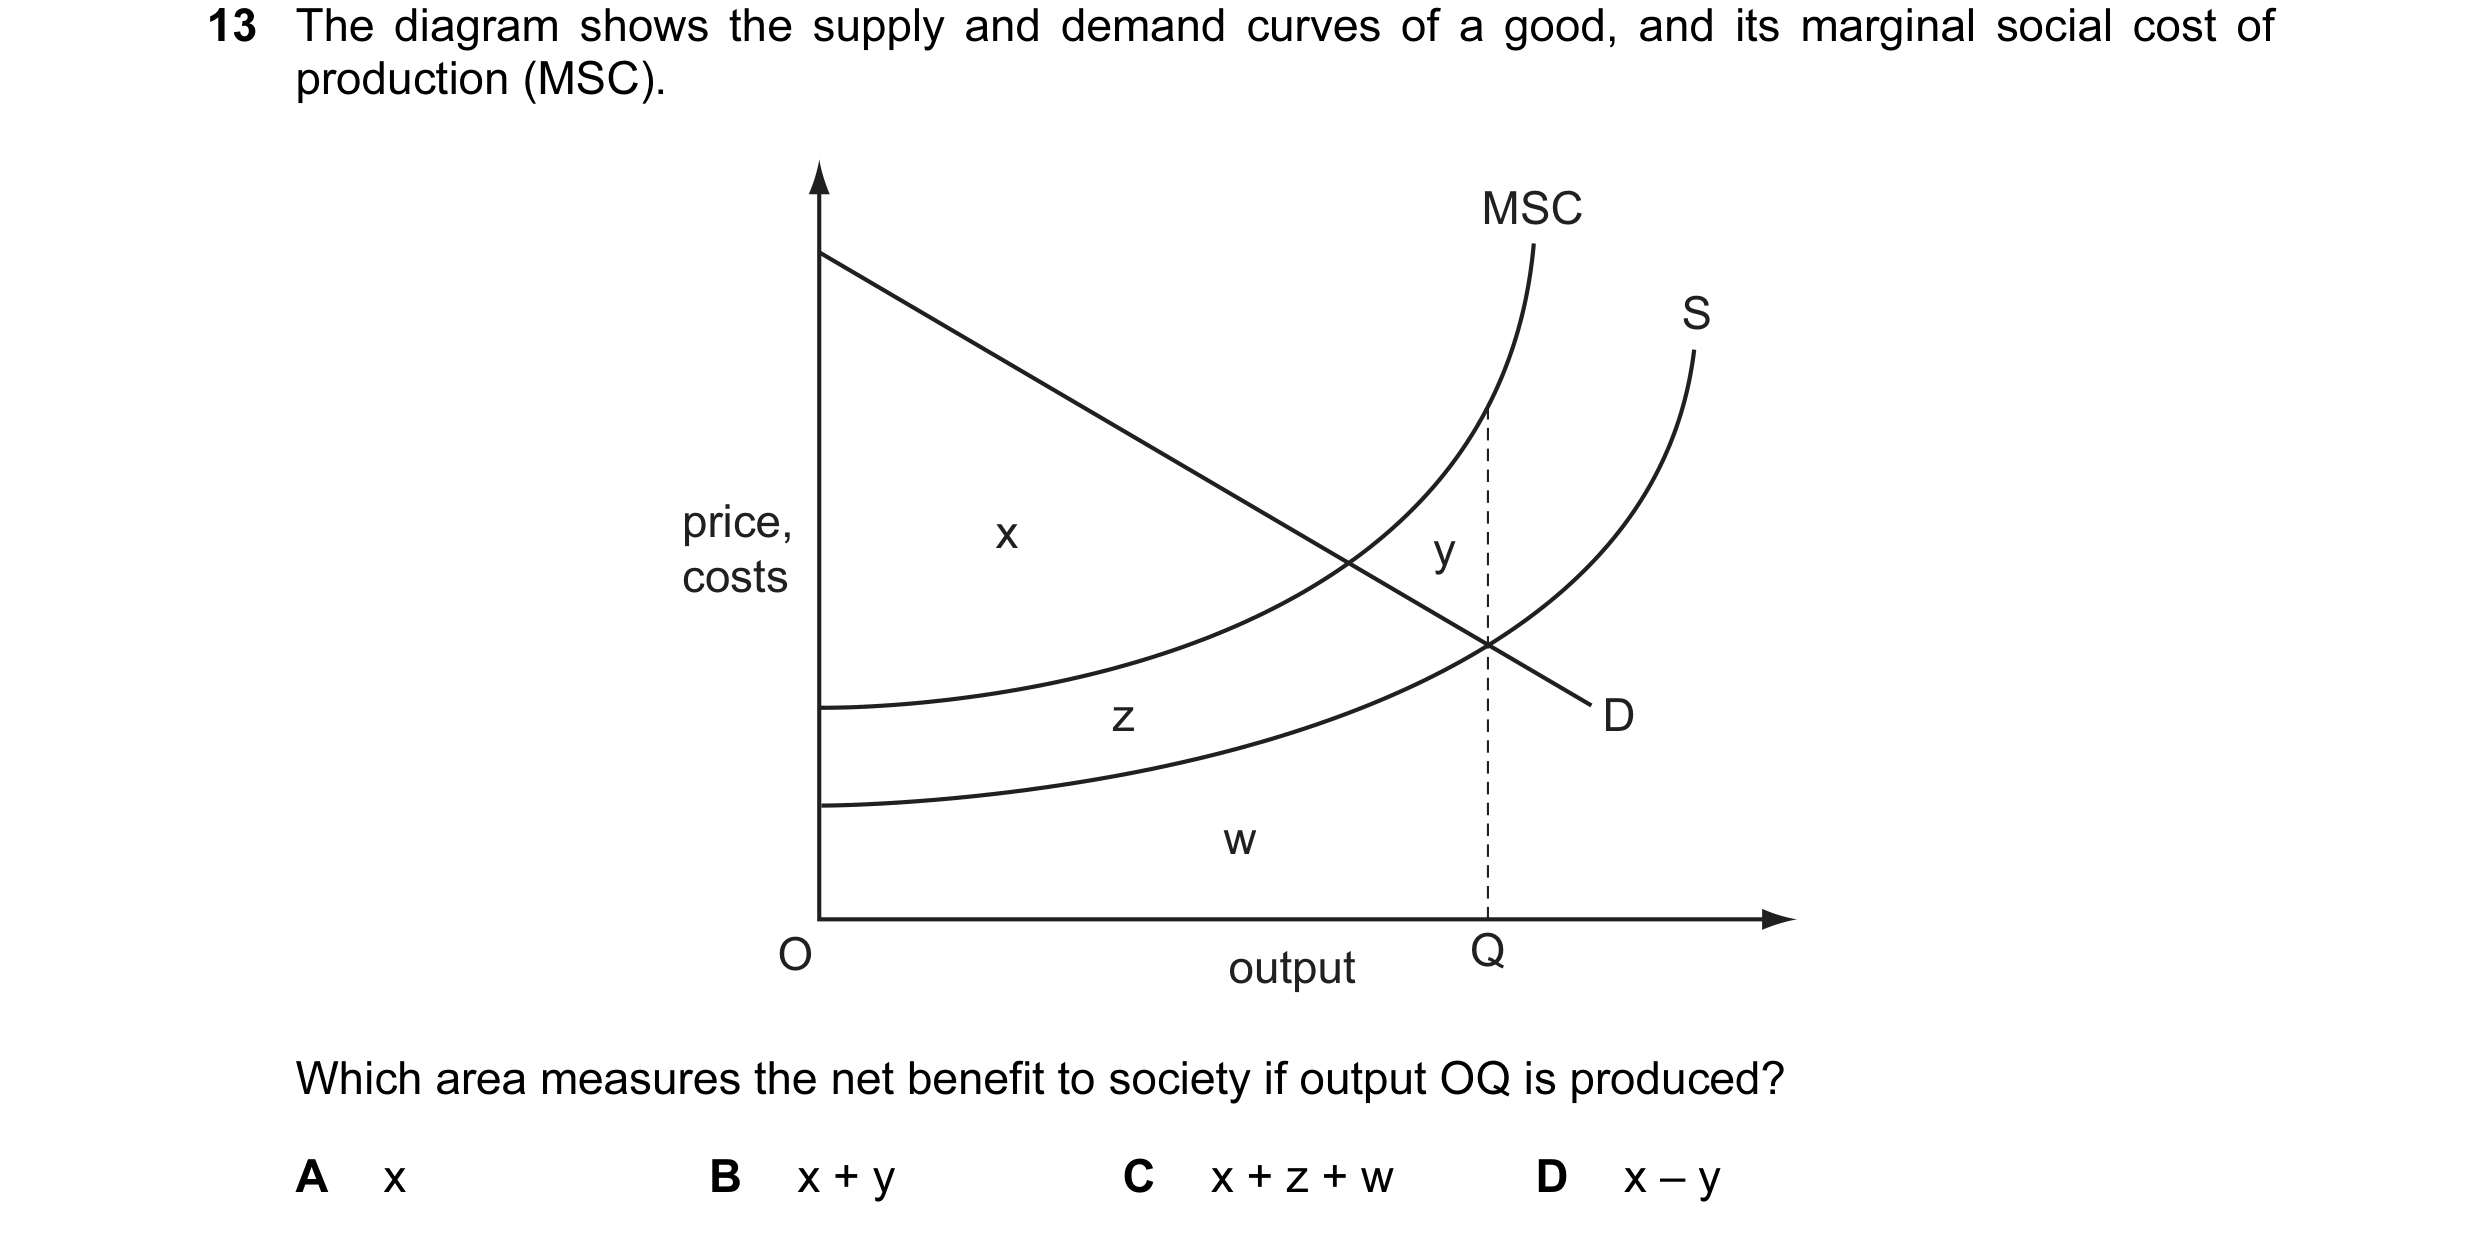
Q41 · The diagram shows the supply and demand curves of a good, and its marginal social cost of… 9708/33 Oct/Nov 2013
13 The diagram shows the supply and demand curves of a good, and its marginal social cost of production (MSC). MSC S price, x y costs z D w O output Q Which area measures the net benefit to society if output OQ is produced? A x B x + y C x + z + w D x – y
1 marks
Answer: D
This question in 9708/33 Oct/Nov 2013
Q42 · Which statement about efficiency is correct? 9708/31 Oct/Nov 2014
1 Which statement about efficiency is correct? A Allocative efficiency occurs when marginal revenue equals marginal cost. B An economy is productively efficient when it is producing at a point on its production possibility curve. C An economy will improve its allocative efficiency when its production possibility curve moves outward. D Productive efficiency occurs when the prices of goods equal their marginal cost of production.
1 marks
Answer: B
This question in 9708/31 Oct/Nov 2014
Q43 · In many countries, laws exist which prohibit firms from copying innovations introduced by… 9708/31 Oct/Nov 2014
14 In many countries, laws exist which prohibit firms from copying innovations introduced by other firms. What is the economic reason behind these laws? A A degree of monopoly power can help to achieve allocative efficiency. B A degree of monopoly power may be helpful in achieving technical progress. C Research and development is best conducted by government organisations. D The prices of goods produced by monopolies need to be regulated.
1 marks
Answer: B
This question in 9708/31 Oct/Nov 2014
Q44 · Which policy change will make some individuals better off without making anyone worse off? 9708/31 Oct/Nov 2014
15 Which policy change will make some individuals better off without making anyone worse off? A allowing farmers to buy and sell milk quotas B introducing a national minimum wage C introducing free bus travel for those over 60 D removing restrictions on the opening hours of supermarkets
1 marks
Answer: A
This question in 9708/31 Oct/Nov 2014
Q45 · In an economy no one can be made better off without making others worse off 9708/33 Oct/Nov 2014
1 In an economy no one can be made better off without making others worse off. What can be concluded from this? A All markets are perfectly competitive. B There are no externalities. C The economy is operating on its production possibility curve. D The distribution of income reflects what each individual deserves.
1 marks
Answer: C
This question in 9708/33 Oct/Nov 2014
Q46 · A country has a negative income tax system 9708/33 Oct/Nov 2014
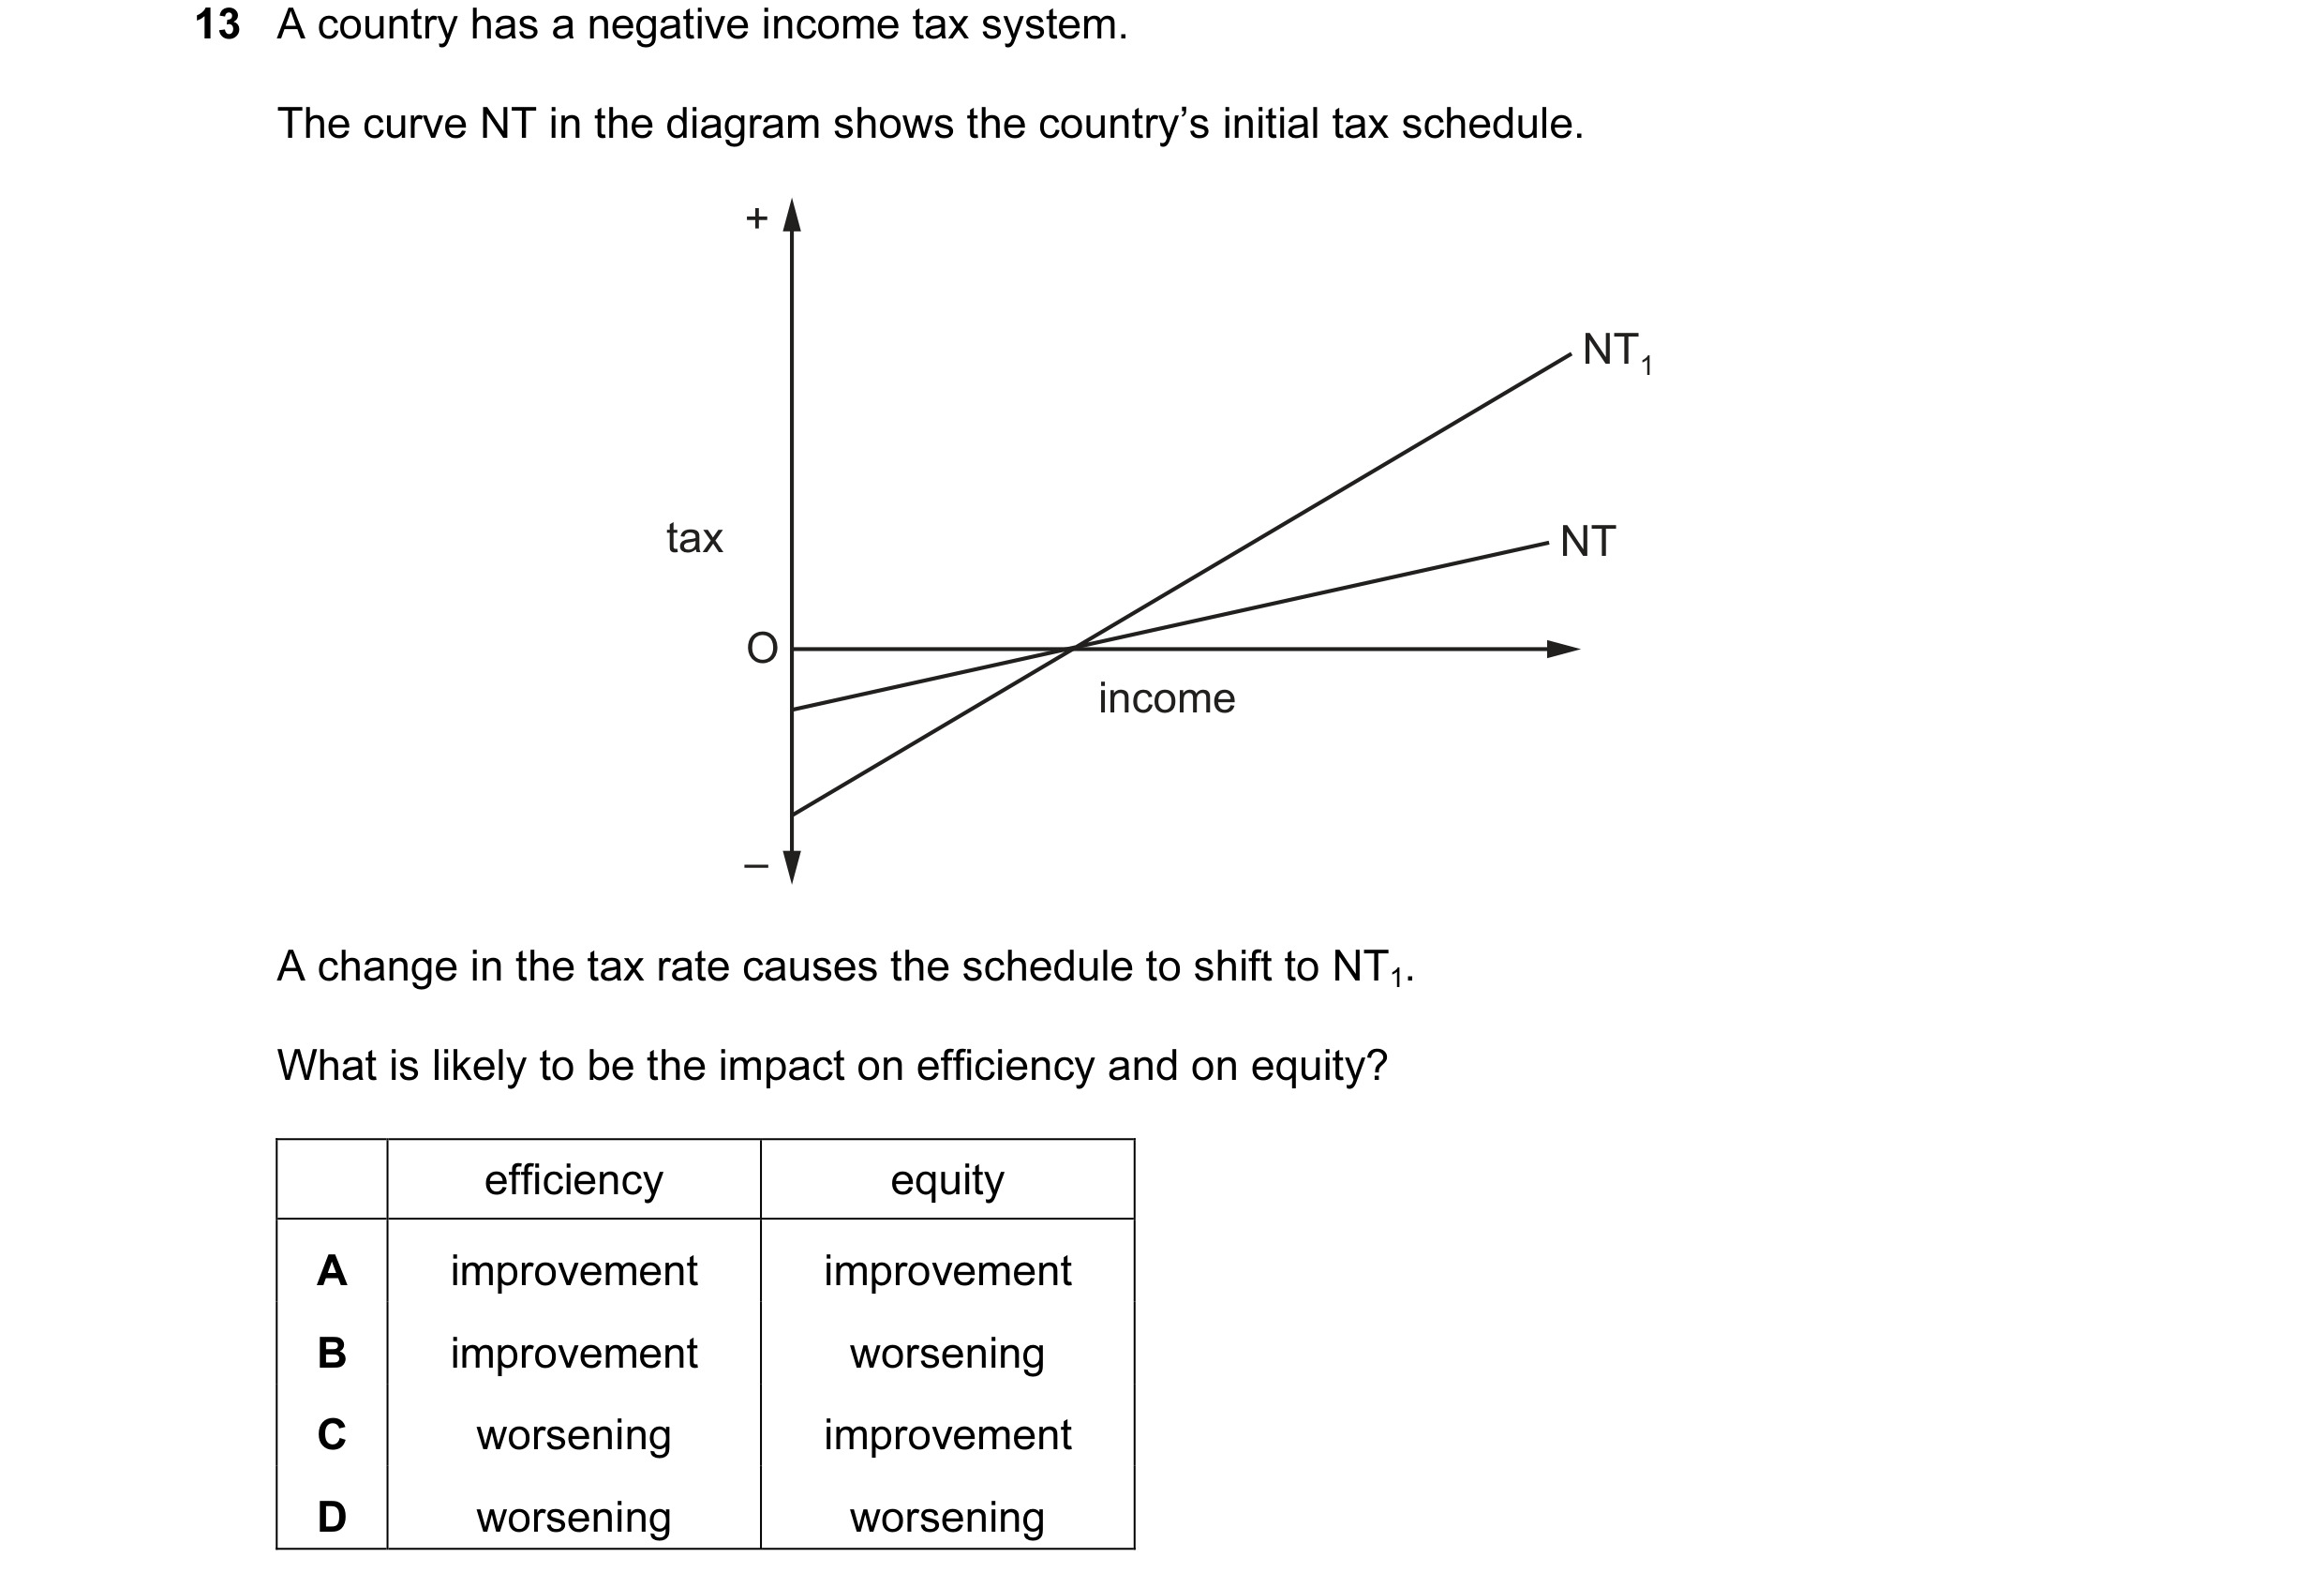
13 A country has a negative income tax system. The curve NT in the diagram shows the country’s initial tax schedule. + NT1 tax NT O income – A change in the tax rate causes the schedule to shift to NT1. What is likely to be the impact on efficiency and on equity? efficiency equity A improvement improvement B improvement worsening C worsening improvement D worsening worsening
1 marks
Answer: C
This question in 9708/33 Oct/Nov 2014
Q47 · The table shows the costs of two milk producers 9708/33 Oct/Nov 2014
14 The table shows the costs of two milk producers. cost per litre ($) firm X 10 firm Y 7 The price received by producers is $12 per litre. Both firms have been given quotas allowing them to produce 200 litres per day. Firm Y asks firm X if it can buy firm X’s quota. Assuming constant costs of production and zero costs of entry and exit, what is the minimum amount (per day) firm X would be willing to accept to sell its quota to firm Y? A $400 B $600 C $1000 D $2400
1 marks
Answer: A
This question in 9708/33 Oct/Nov 2014
Q48 · An economy reallocates resources and moves along its production possibility frontier 9708/31 May/June 2015
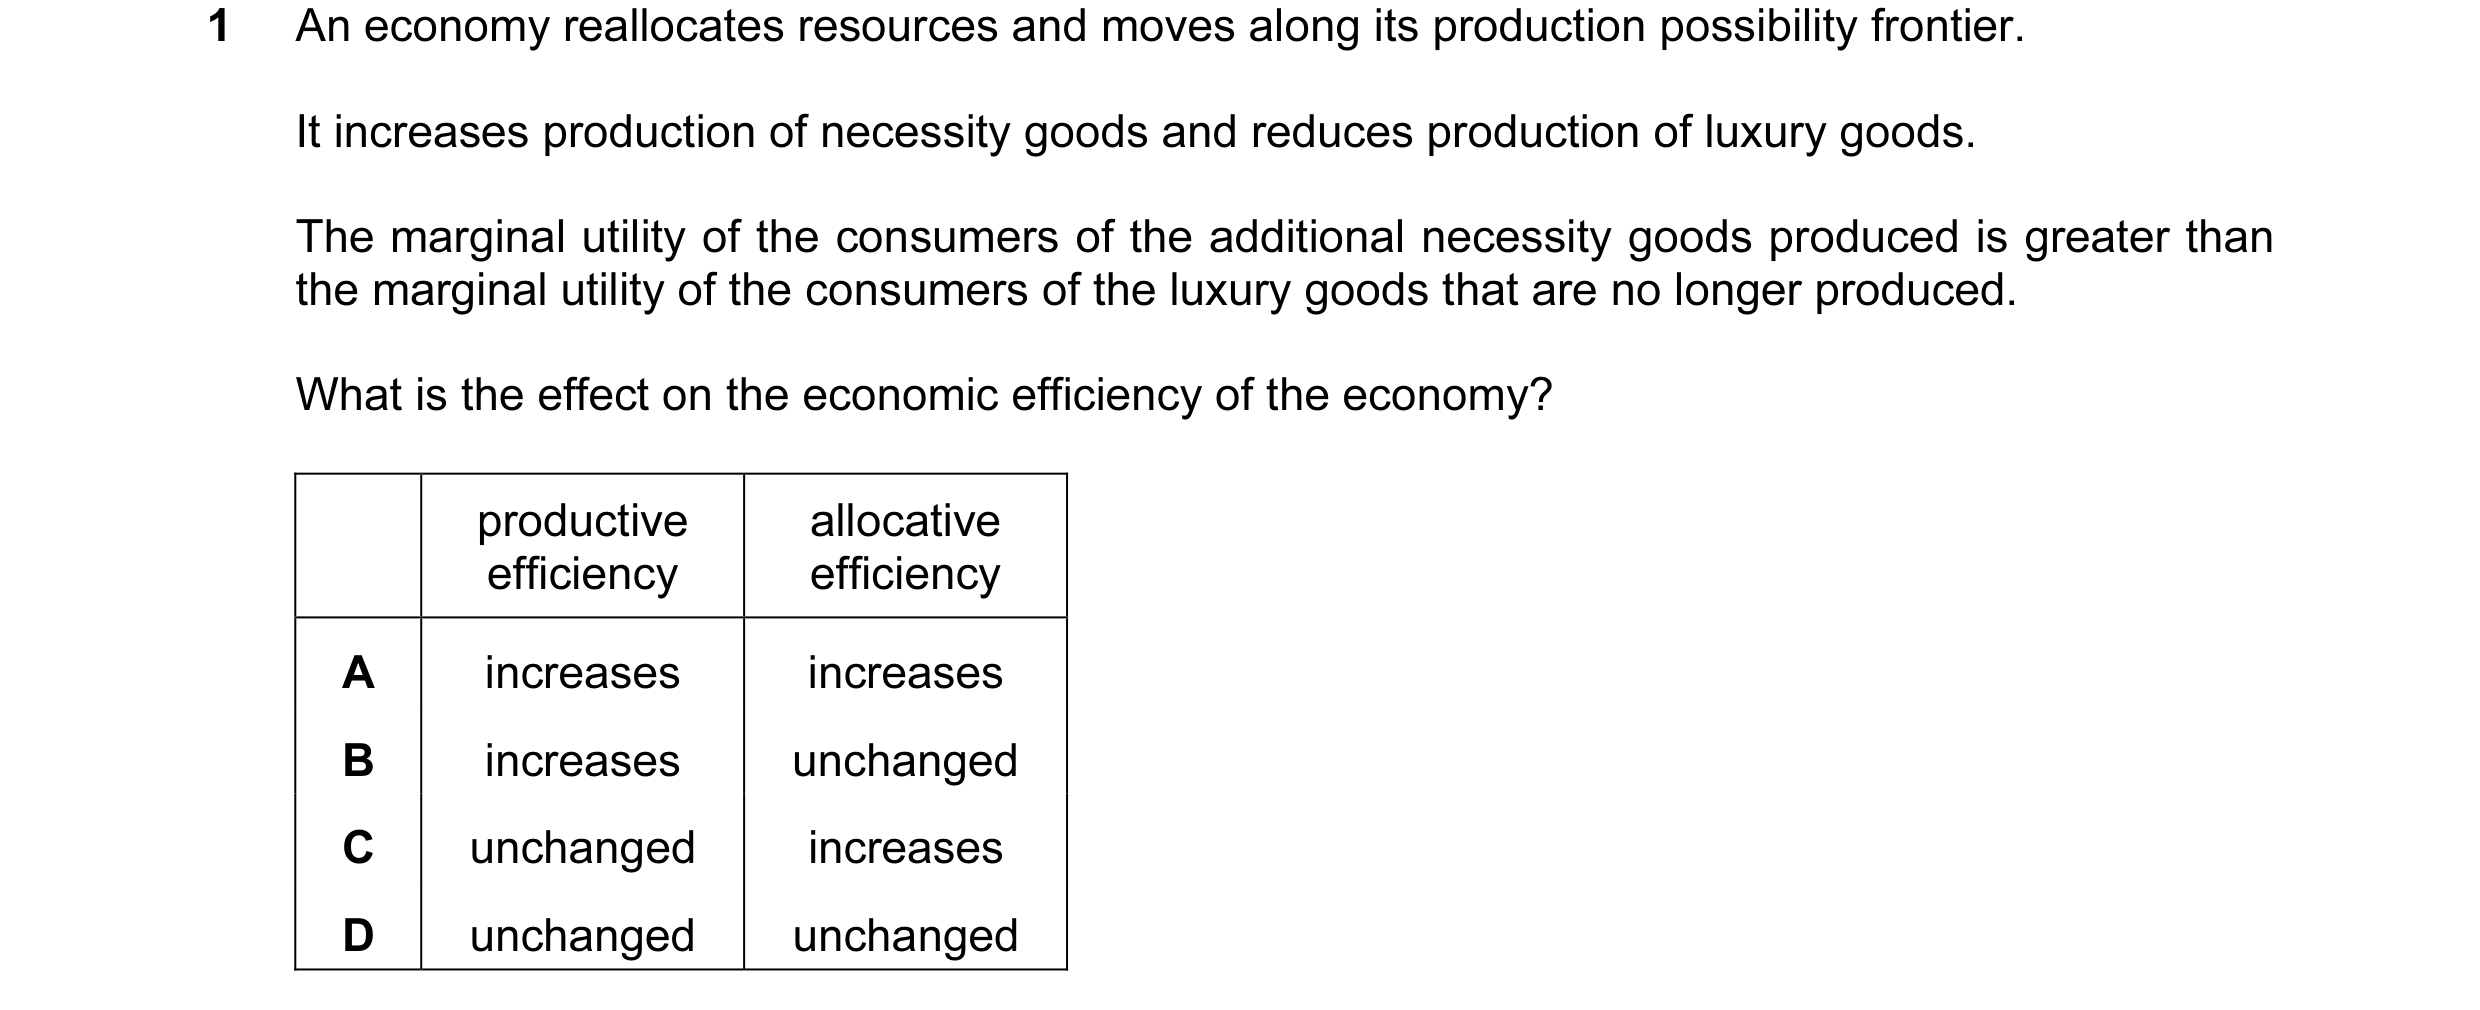
1 An economy reallocates resources and moves along its production possibility frontier. It increases production of necessity goods and reduces production of luxury goods. The marginal utility of the consumers of the additional necessity goods produced is greater than the marginal utility of the consumers of the luxury goods that are no longer produced. What is the effect on the economic efficiency of the economy? productive allocative efficiency efficiency A increases increases B increases unchanged C unchanged increases D unchanged unchanged
1 marks
Answer: C
This question in 9708/31 May/June 2015
Q49 · What need not pose a potential threat to allocative efficiency in a market economy? 9708/32 May/June 2015
1 What need not pose a potential threat to allocative efficiency in a market economy? A externalities B differentiated products C monopolistic elements D perfect knowledge
1 marks
Answer: D
This question in 9708/32 May/June 2015
Q50 · A country’s steel producers are members of a cartel 9708/32 May/June 2015
16 A country’s steel producers are members of a cartel. Each member is allocated a production quota and initially produces the maximum allowed under its quota. What will be the effect on productive efficiency and on the industry’s profits if the producers are allowed to trade the quotas amongst themselves? effect on effect productive on profits efficiency A improvement increase B improvement no change C no change increase D no change no change
1 marks
Answer: A
This question in 9708/32 May/June 2015
Q51 · An economy is said to be economically inefficient if A it is possible to make some people… 9708/31 Oct/Nov 2015
1 An economy is said to be economically inefficient if A it is possible to make some people better off without making other people worse off. B the distribution of income is socially unacceptable. C the government sector is growing at the expense of the private sector. D wage rates rise faster than production.
1 marks
This question in 9708/31 Oct/Nov 2015
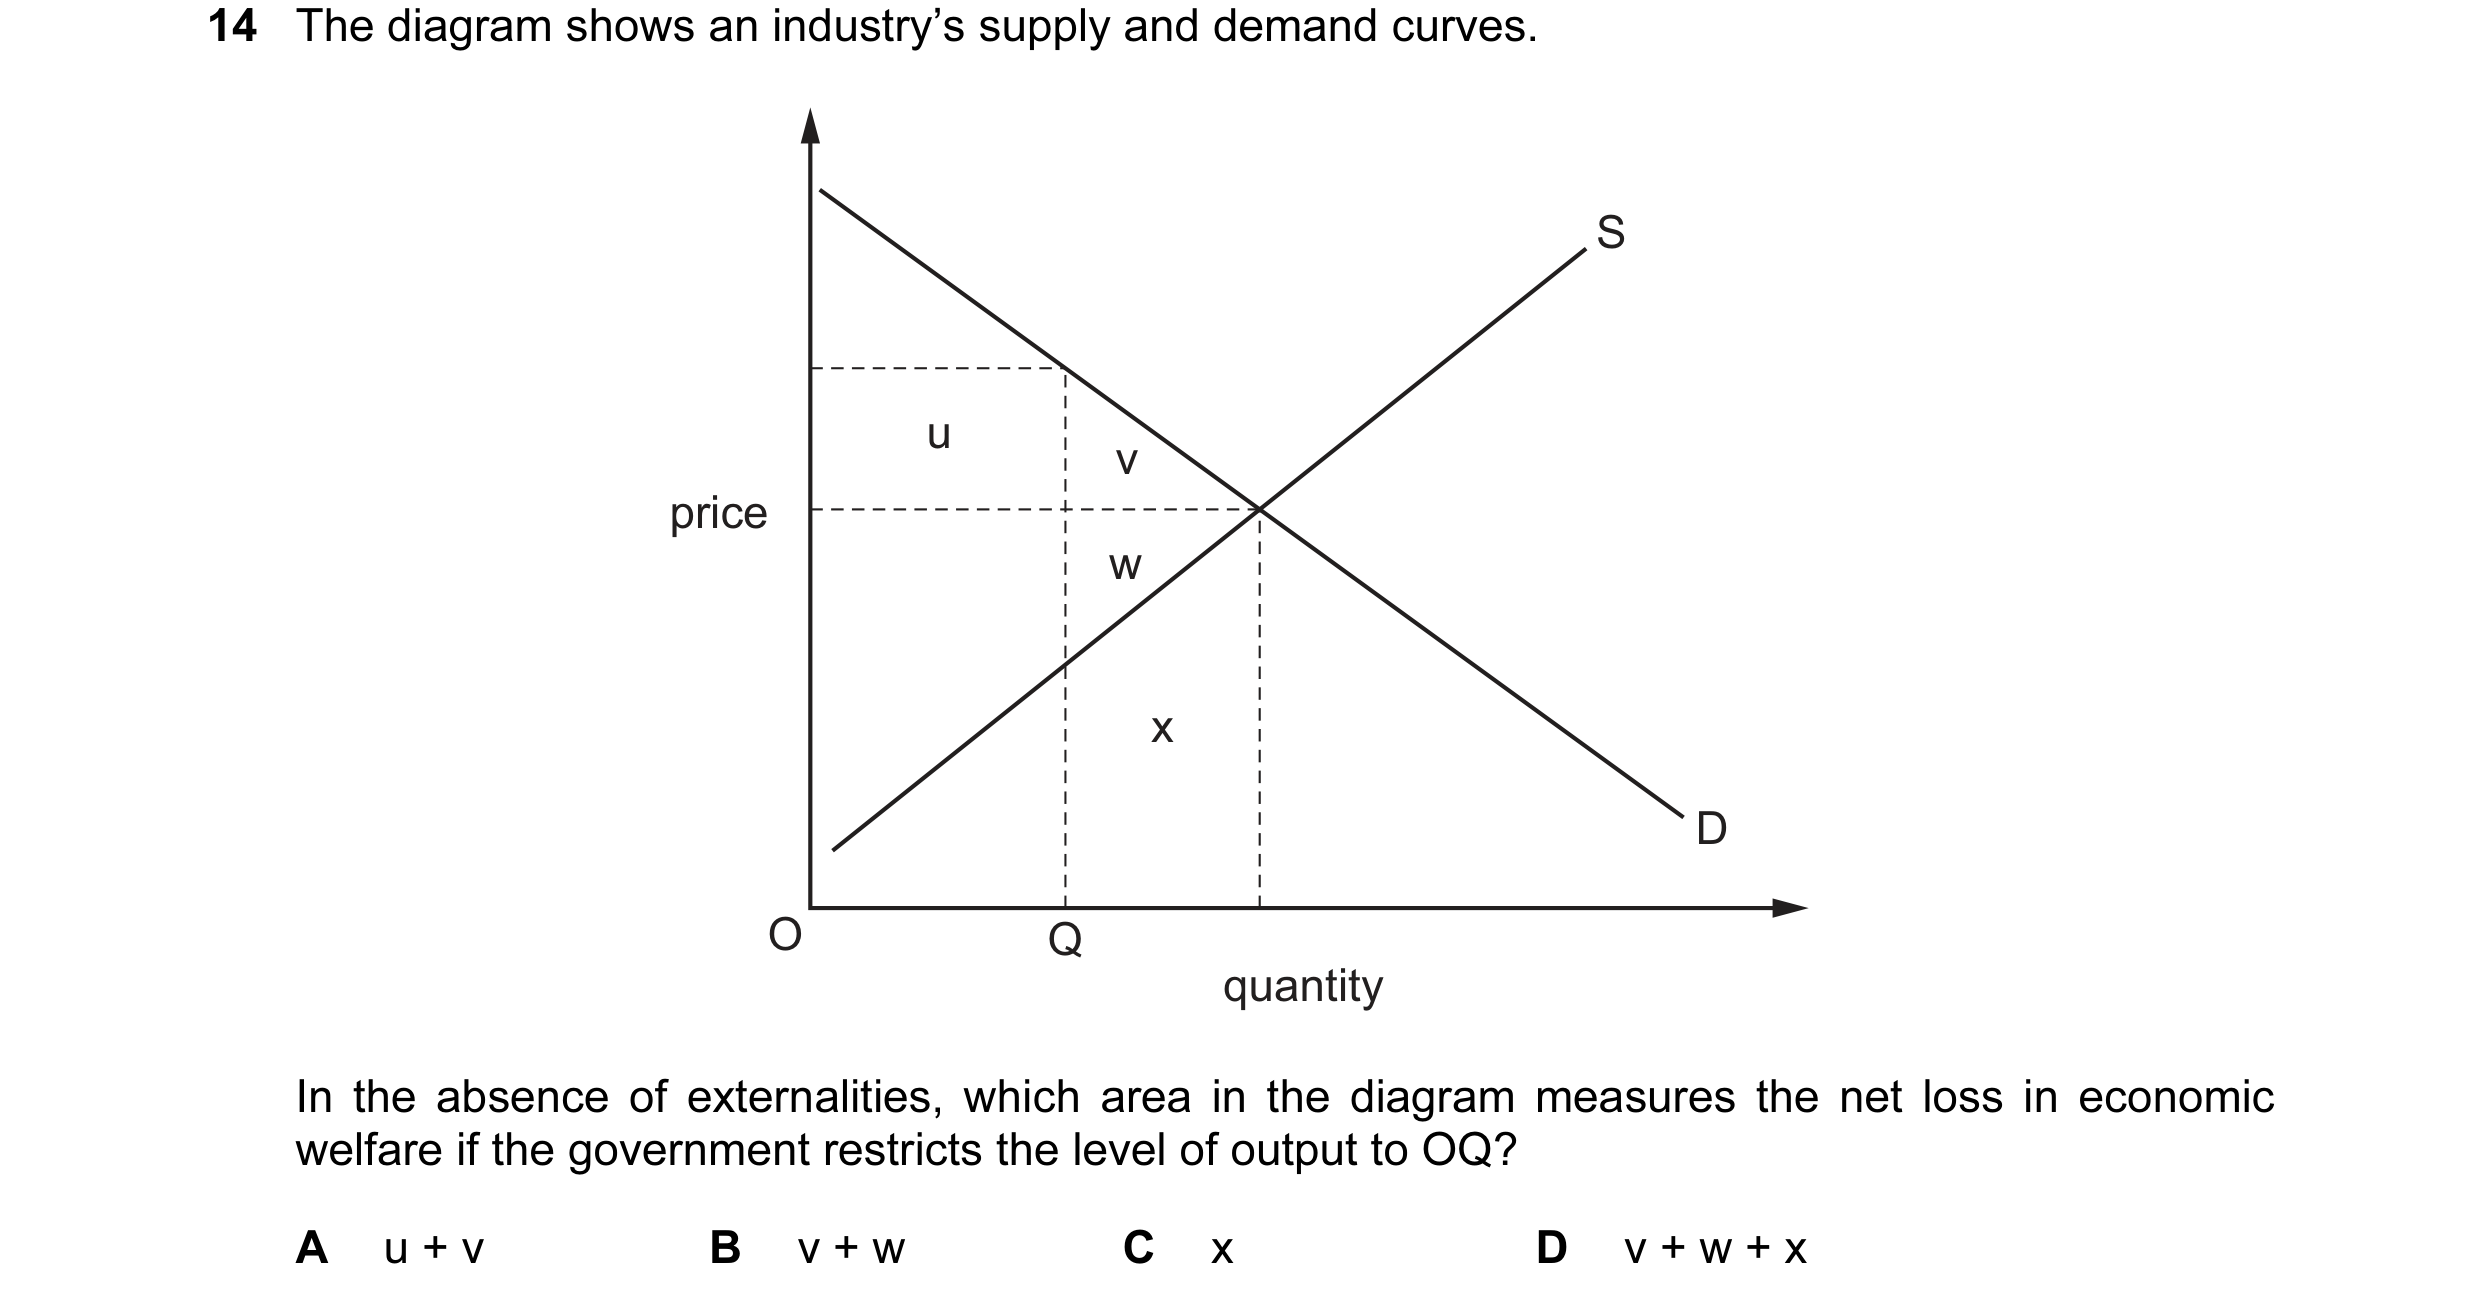
Q52 · The diagram shows an industry’s supply and demand curves 9708/31 Oct/Nov 2015
14 The diagram shows an industry’s supply and demand curves. S u v price w x D O Q quantity In the absence of externalities, which area in the diagram measures the net loss in economic welfare if the government restricts the level of output to OQ? A u + v B v + w C x D v + w + x
1 marks
This question in 9708/31 Oct/Nov 2015
Q53 · The diagram shows the production possibility curve for a successful transition economy… 9708/32 Oct/Nov 2015
1 The diagram shows the production possibility curve for a successful transition economy that moves from point X to point Y over time. X public sector output Y O private sector output During the transition process the population of the country expressed a strong preference for increased privatisation. What happens to economic efficiency as a result of the transition from point X to point Y? productive allocative efficiency efficiency A increases decreases B increases increases C unchanged decreases D unchanged unchanged
1 marks
Answer: B
This question in 9708/32 Oct/Nov 2015
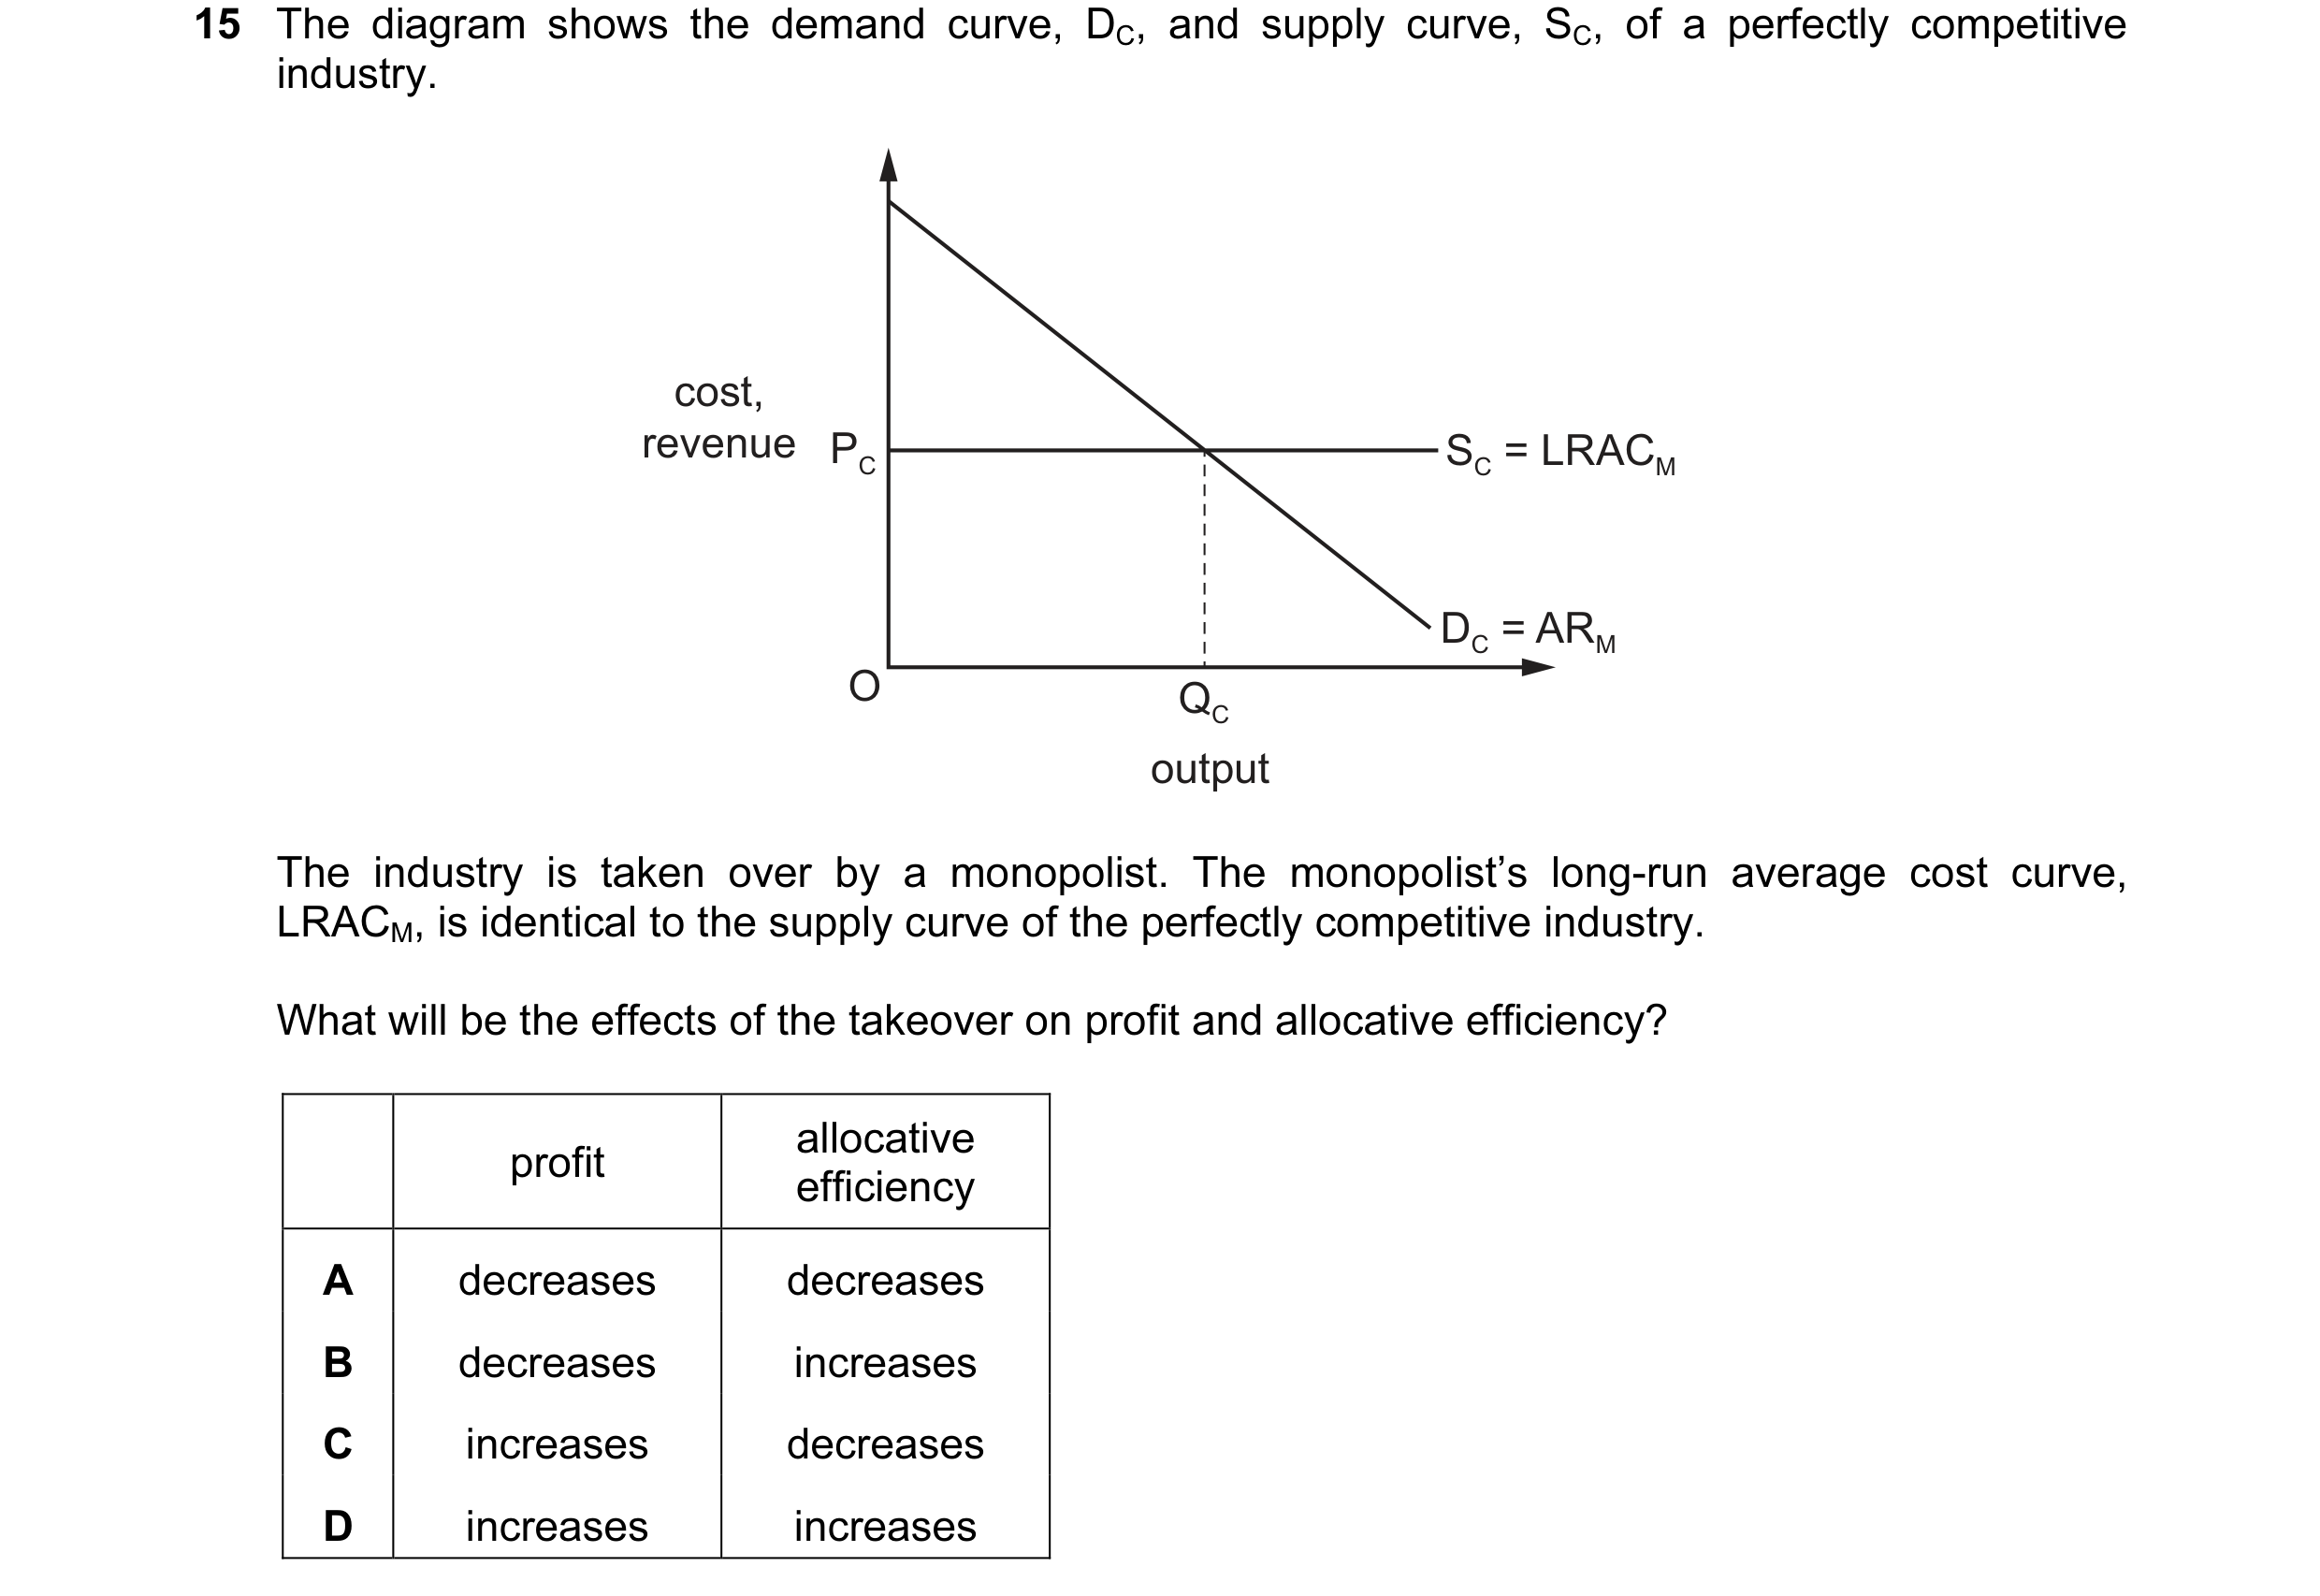
Q54 · The diagram shows the demand curve, DC, and supply curve, SC, of a perfectly competitive… 9708/32 Oct/Nov 2015
15 The diagram shows the demand curve, DC, and supply curve, SC, of a perfectly competitive industry. cost, revenue PC SC = LRACM DC = ARM O QC output The industry is taken over by a monopolist. The monopolist’s long-run average cost curve, LRACM, is identical to the supply curve of the perfectly competitive industry. What will be the effects of the takeover on profit and allocative efficiency? allocative profit efficiency A decreases decreases B decreases increases C increases decreases D increases increases
1 marks
Answer: C
This question in 9708/32 Oct/Nov 2015
Q55 · In an economy, no one can be made better off without making someone else worse off 9708/33 Oct/Nov 2015
1 In an economy, no one can be made better off without making someone else worse off. What does not necessarily follow from this? A The conditions for allocative efficiency have been met. B The conditions for productive efficiency have been met. C The distribution of income is socially acceptable. D The economy is operating at a point on its production possibility frontier.
1 marks
Answer: C
This question in 9708/33 Oct/Nov 2015
Q56 · What would be most likely to give rise to a conflict between efficiency and equity? 9708/33 Oct/Nov 2015
15 What would be most likely to give rise to a conflict between efficiency and equity? A an increase in government expenditure on health care B an increase in interest rates C an increase in subsidies to public transport in congested urban areas D an increase in the highest rate of income tax
1 marks
Answer: D
This question in 9708/33 Oct/Nov 2015
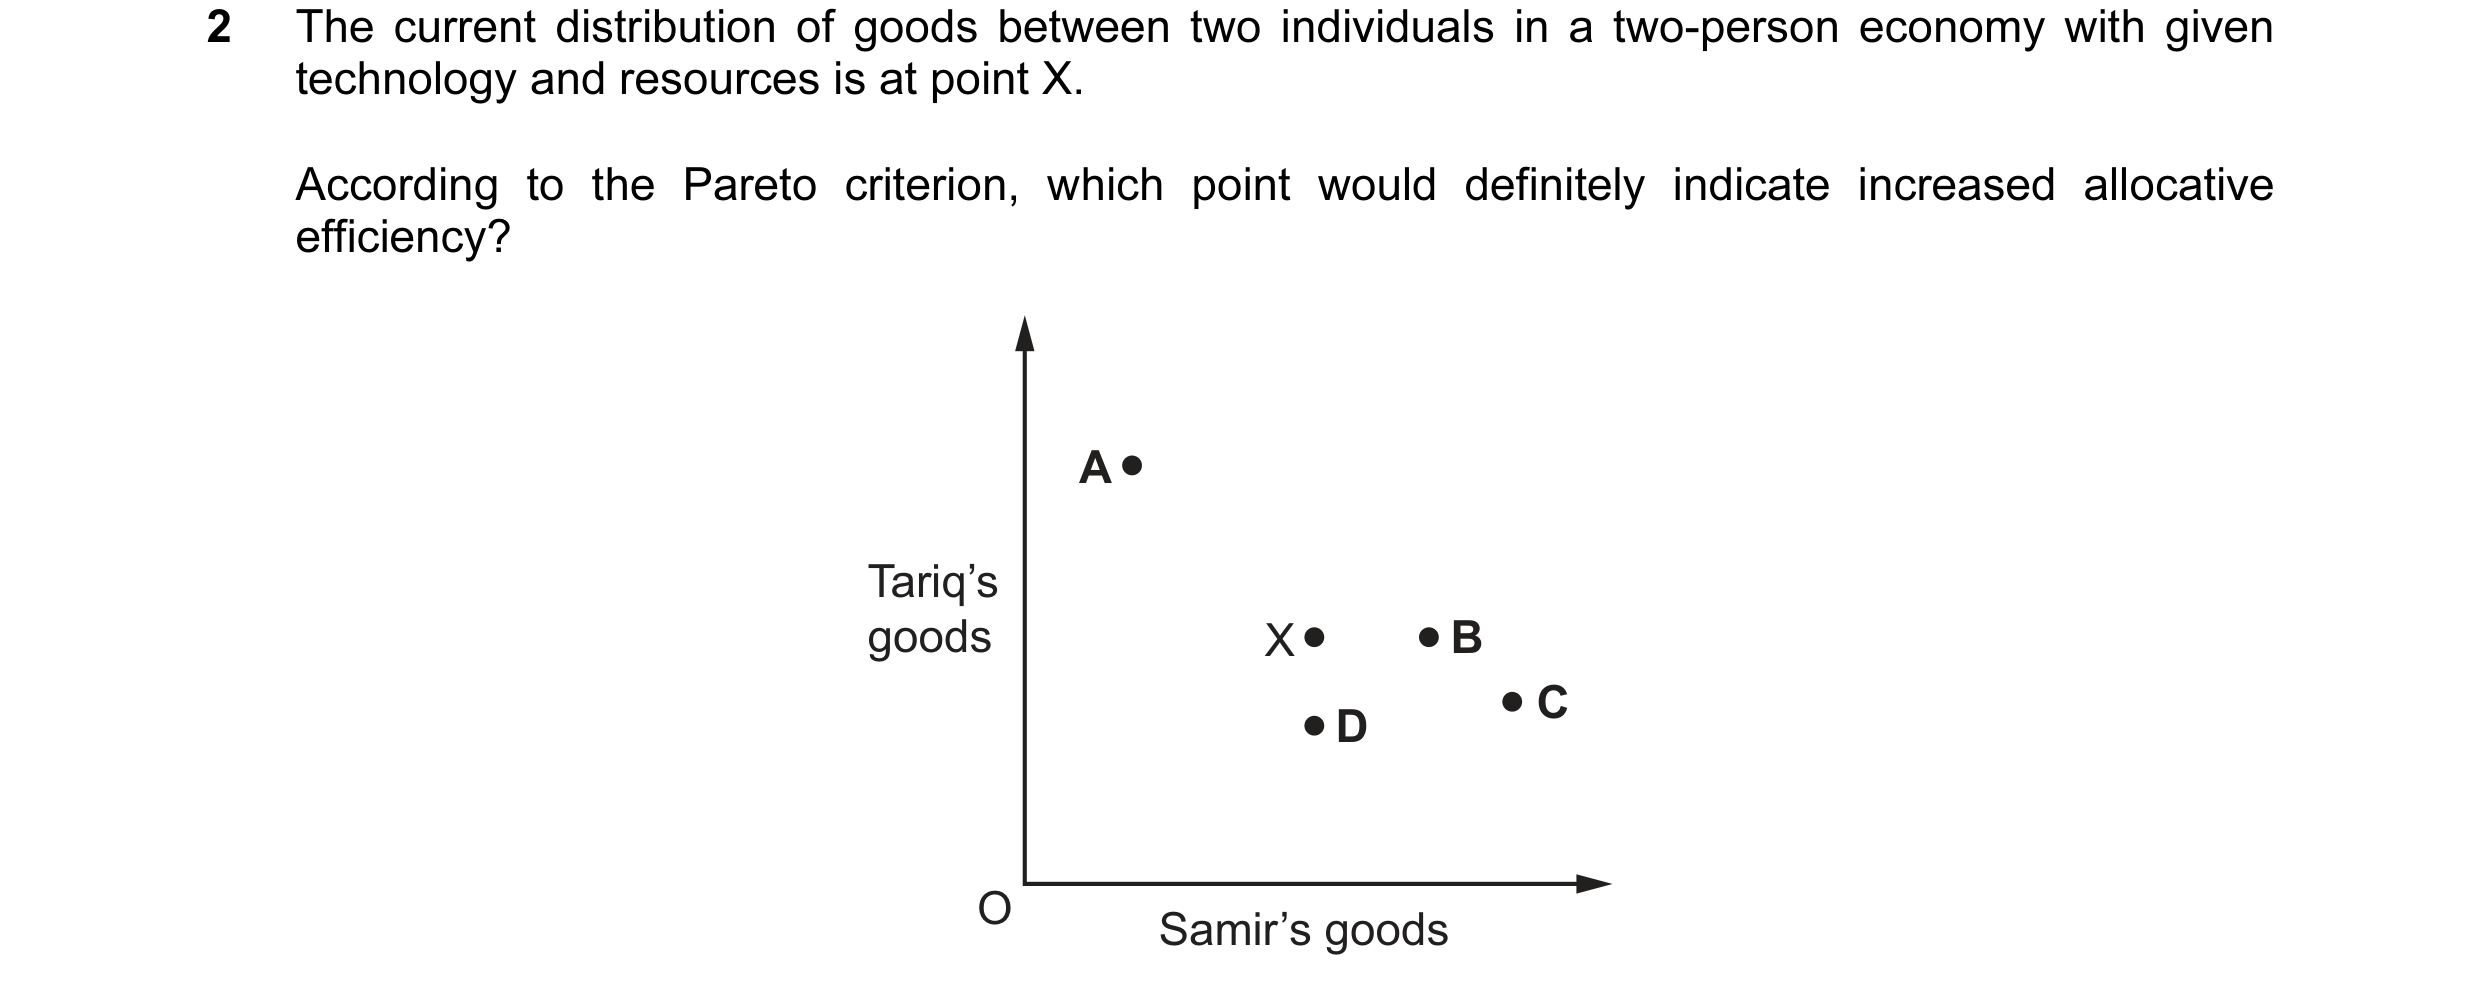
Q57 · The current distribution of goods between two individuals in a two-person economy with… 9708/32 May/June 2016
2 The current distribution of goods between two individuals in a two-person economy with given technology and resources is at point X. According to the Pareto criterion, which point would definitely indicate increased allocative efficiency? A Tariq’s goods X B C D O Samir’s goods
1 marks
Answer: B
This question in 9708/32 May/June 2016
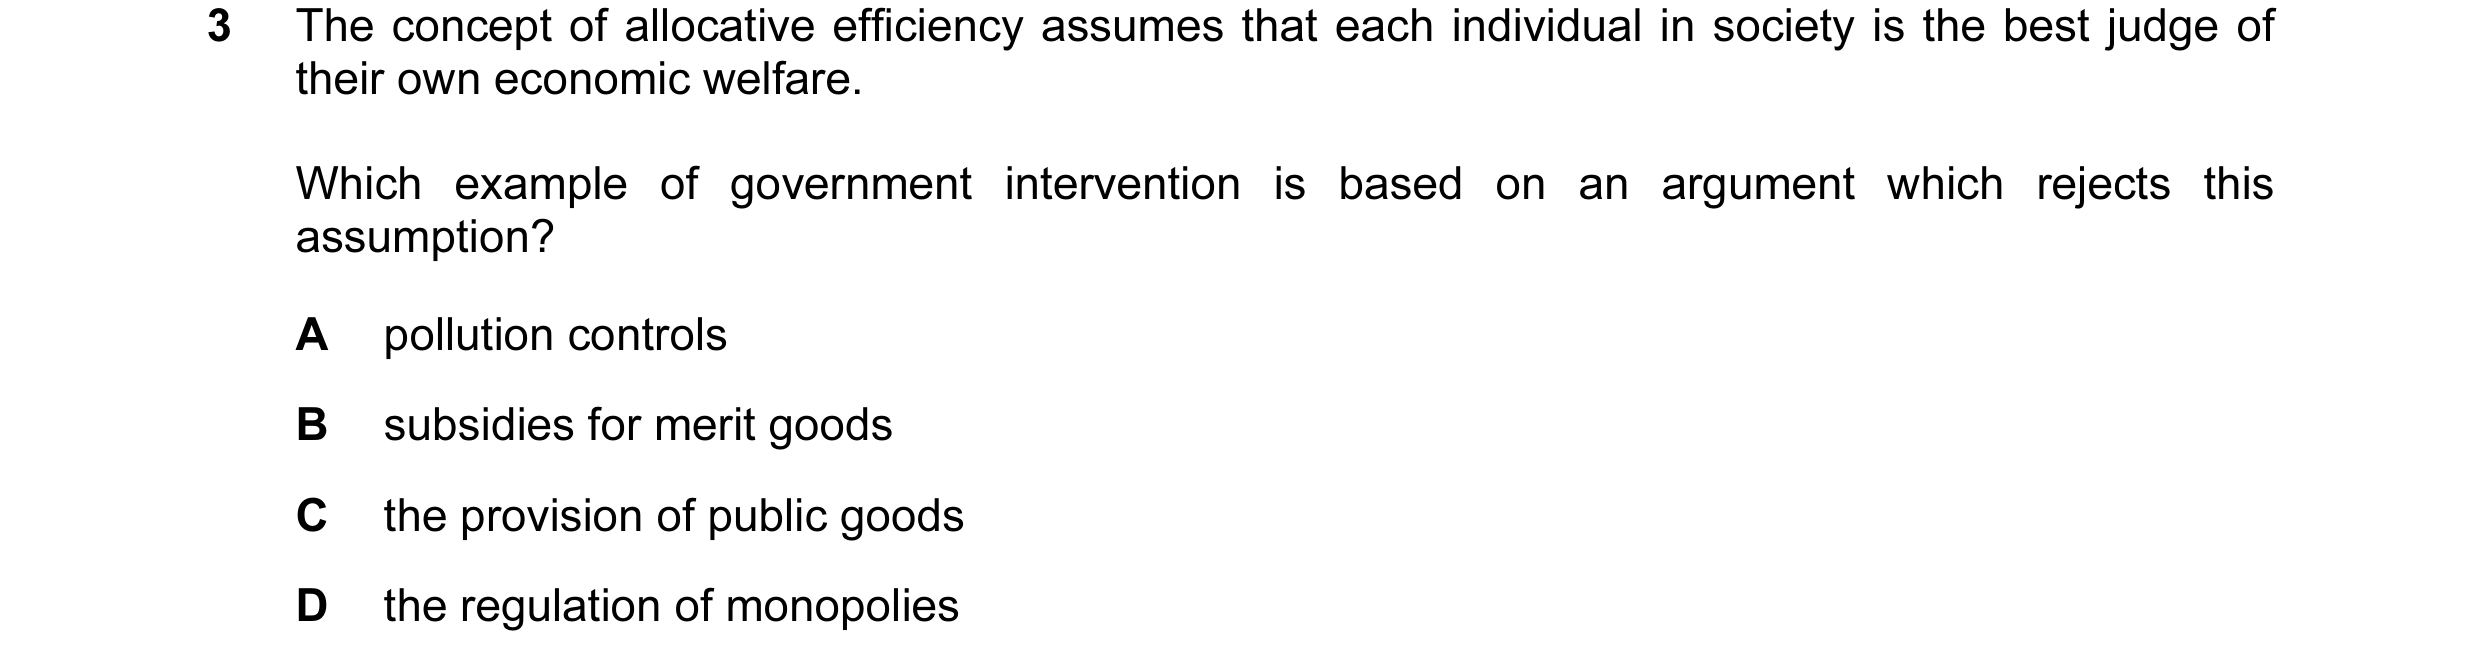
Q58 · The concept of allocative efficiency assumes that each individual in society is the best… 9708/32 May/June 2016
3 The concept of allocative efficiency assumes that each individual in society is the best judge of their own economic welfare. Which example of government intervention is based on an argument which rejects this assumption? A pollution controls B subsidies for merit goods C the provision of public goods D the regulation of monopolies
1 marks
Answer: B
This question in 9708/32 May/June 2016
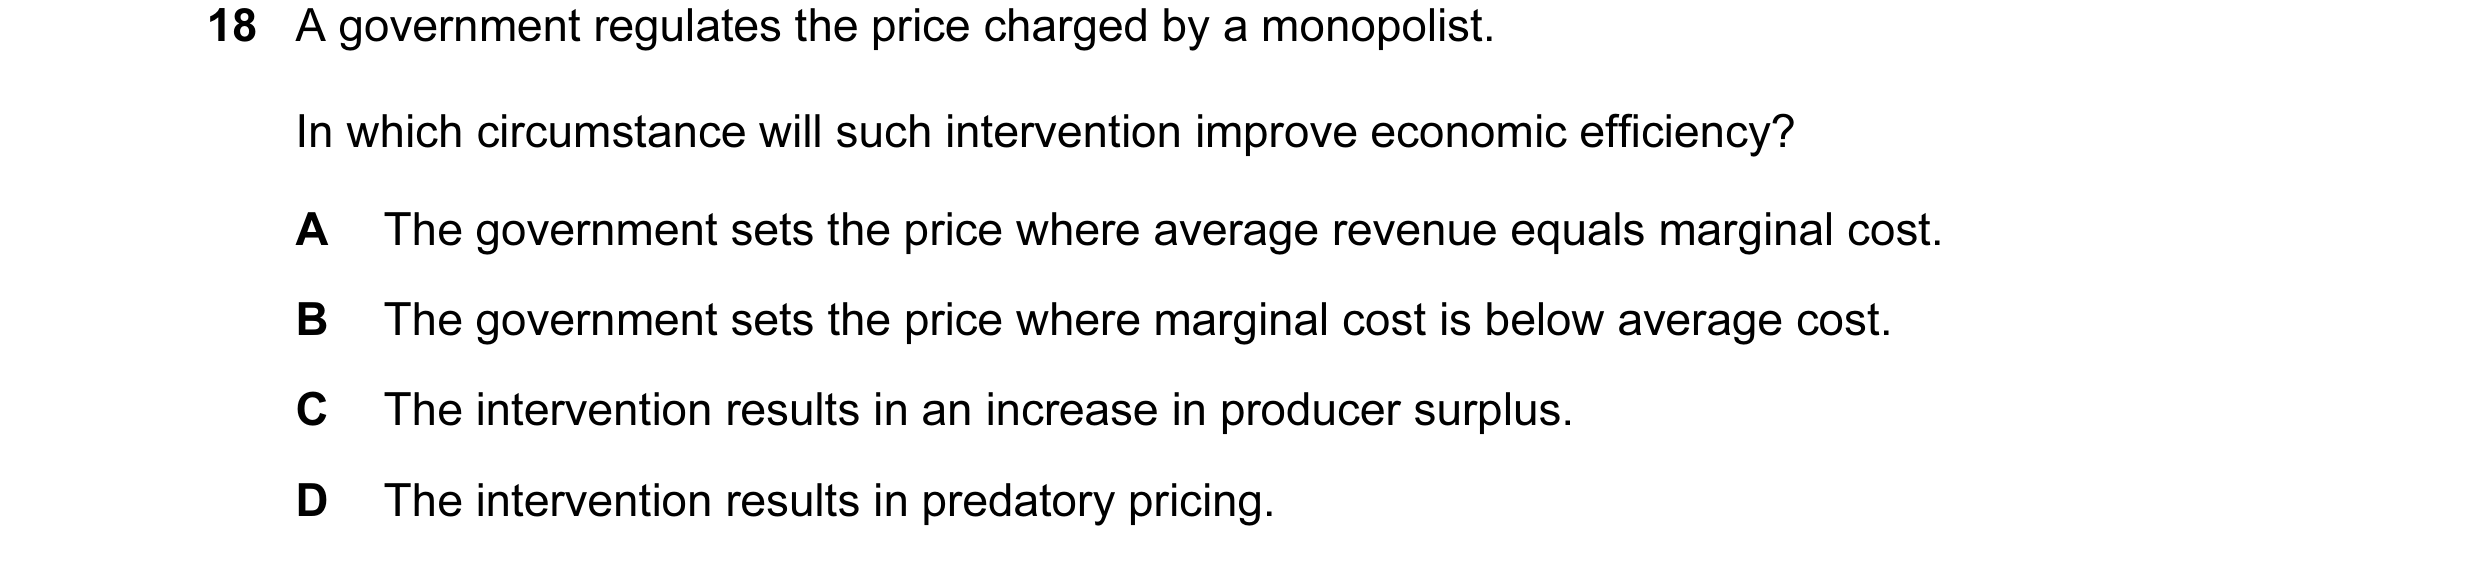
Q59 · A government regulates the price charged by a monopolist 9708/32 May/June 2016
18 A government regulates the price charged by a monopolist. In which circumstance will such intervention improve economic efficiency? A The government sets the price where average revenue equals marginal cost. B The government sets the price where marginal cost is below average cost. C The intervention results in an increase in producer surplus. D The intervention results in predatory pricing.
1 marks
Answer: A
This question in 9708/32 May/June 2016
Q60 · Which statement is not usually associated with the achievement of economic efficiency? 9708/33 May/June 2016
1 Which statement is not usually associated with the achievement of economic efficiency? A There is efficiency in consumption if there is no way to redistribute goods among consumers that makes some consumers better off without making others worse off. B There is efficiency in output levels if there is no different mix of output that would make some people better off without making others worse off. C There is efficiency in pricing if there is no other pattern of prices that would make some producers better off without making others worse off. D There is efficiency in production if there is no way to produce more of some goods without producing less of other goods.
1 marks
Answer: C
This question in 9708/33 May/June 2016
Q61 · What is the purpose of trying to achieve economic efficiency? 9708/32 Oct/Nov 2016
1 What is the purpose of trying to achieve economic efficiency? A to achieve full employment B to achieve the cheapest possible price for products C to ensure resources are not wasted D to use as many resources as possible
1 marks
Answer: C
This question in 9708/32 Oct/Nov 2016
Q62 · In the diagram, a firm increases its output from OY to OZ 9708/32 Oct/Nov 2016
2 In the diagram, a firm increases its output from OY to OZ. MC costs, revenue AR O Y Z output Which statement about the effect on economic efficiency is correct? A It will increase because a greater quantity will be produced and higher total revenue will be earned. B It will increase because the value that consumers place on the product comes closer to the cost of producing the last unit. C It will decline because both average and marginal revenue will fall. D It will decline because both total and marginal cost will rise.
1 marks
Answer: B
This question in 9708/32 Oct/Nov 2016
Q63 · Which is not a source of market failure? 9708/32 Oct/Nov 2016
14 Which is not a source of market failure? A imperfect information B income inequality C monopoly D non-excludability
1 marks
Answer: B
This question in 9708/32 Oct/Nov 2016
Q64 · What could not justify state intervention in an economy on grounds of ‘market failure’? 9708/33 Oct/Nov 2016
14 What could not justify state intervention in an economy on grounds of ‘market failure’? A monopoly supply of certain goods B pollution of rivers C the existence of large-scale poverty D the existence of public goods
1 marks
Answer: C
This question in 9708/33 Oct/Nov 2016
Q65 · Governments consider both efficiency and equity in deciding microeconomic policy 9708/33 Oct/Nov 2016
15 Governments consider both efficiency and equity in deciding microeconomic policy. What statement about the resulting decisions is correct? A An economically inefficient outcome is certain to be inequitable. B Both efficiency and equity decisions are based on positive economic judgements. C Equity can only be achieved when incomes are redistributed equally. D The creation of an equitable situation may increase economic efficiency.
1 marks
Answer: D
This question in 9708/33 Oct/Nov 2016
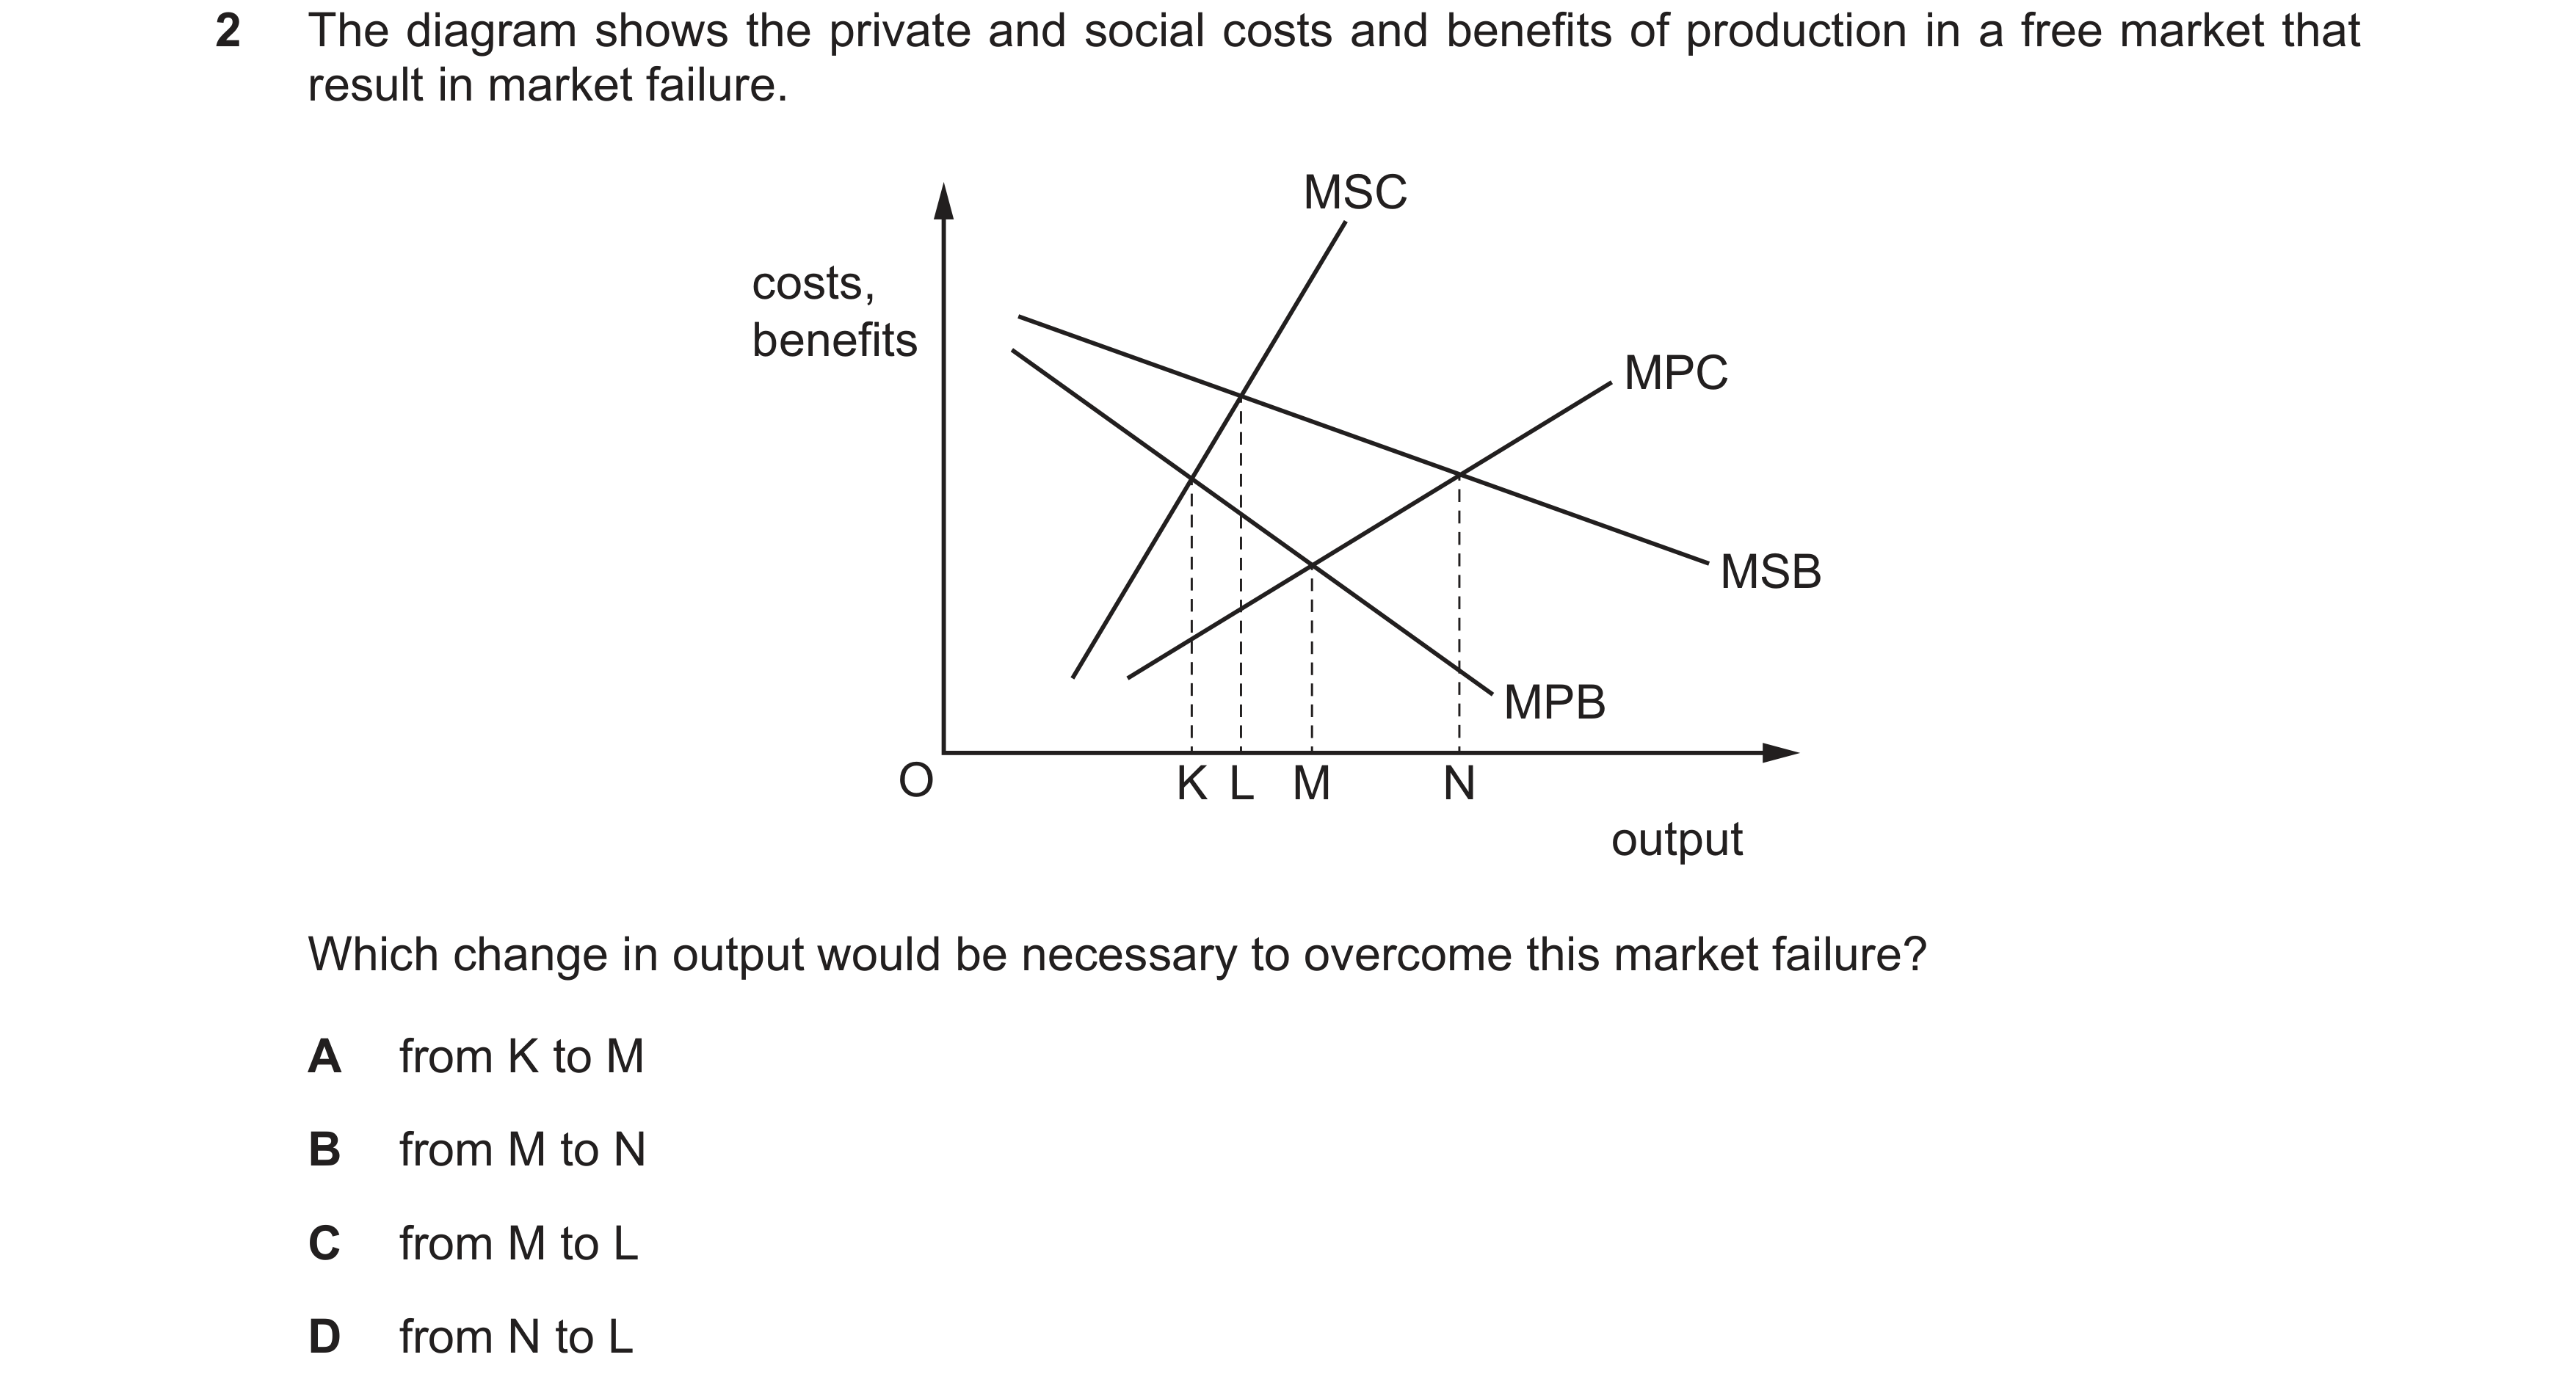
Q66 · The diagram shows the private and social costs and benefits of production in a free… 9708/32 May/June 2017
2 The diagram shows the private and social costs and benefits of production in a free market that result in market failure. MSC costs, benefits MPC MSB MPB O K L M N output Which change in output would be necessary to overcome this market failure? A from K to M B from M to N C from M to L D from N to L
1 marks
Answer: C
This question in 9708/32 May/June 2017
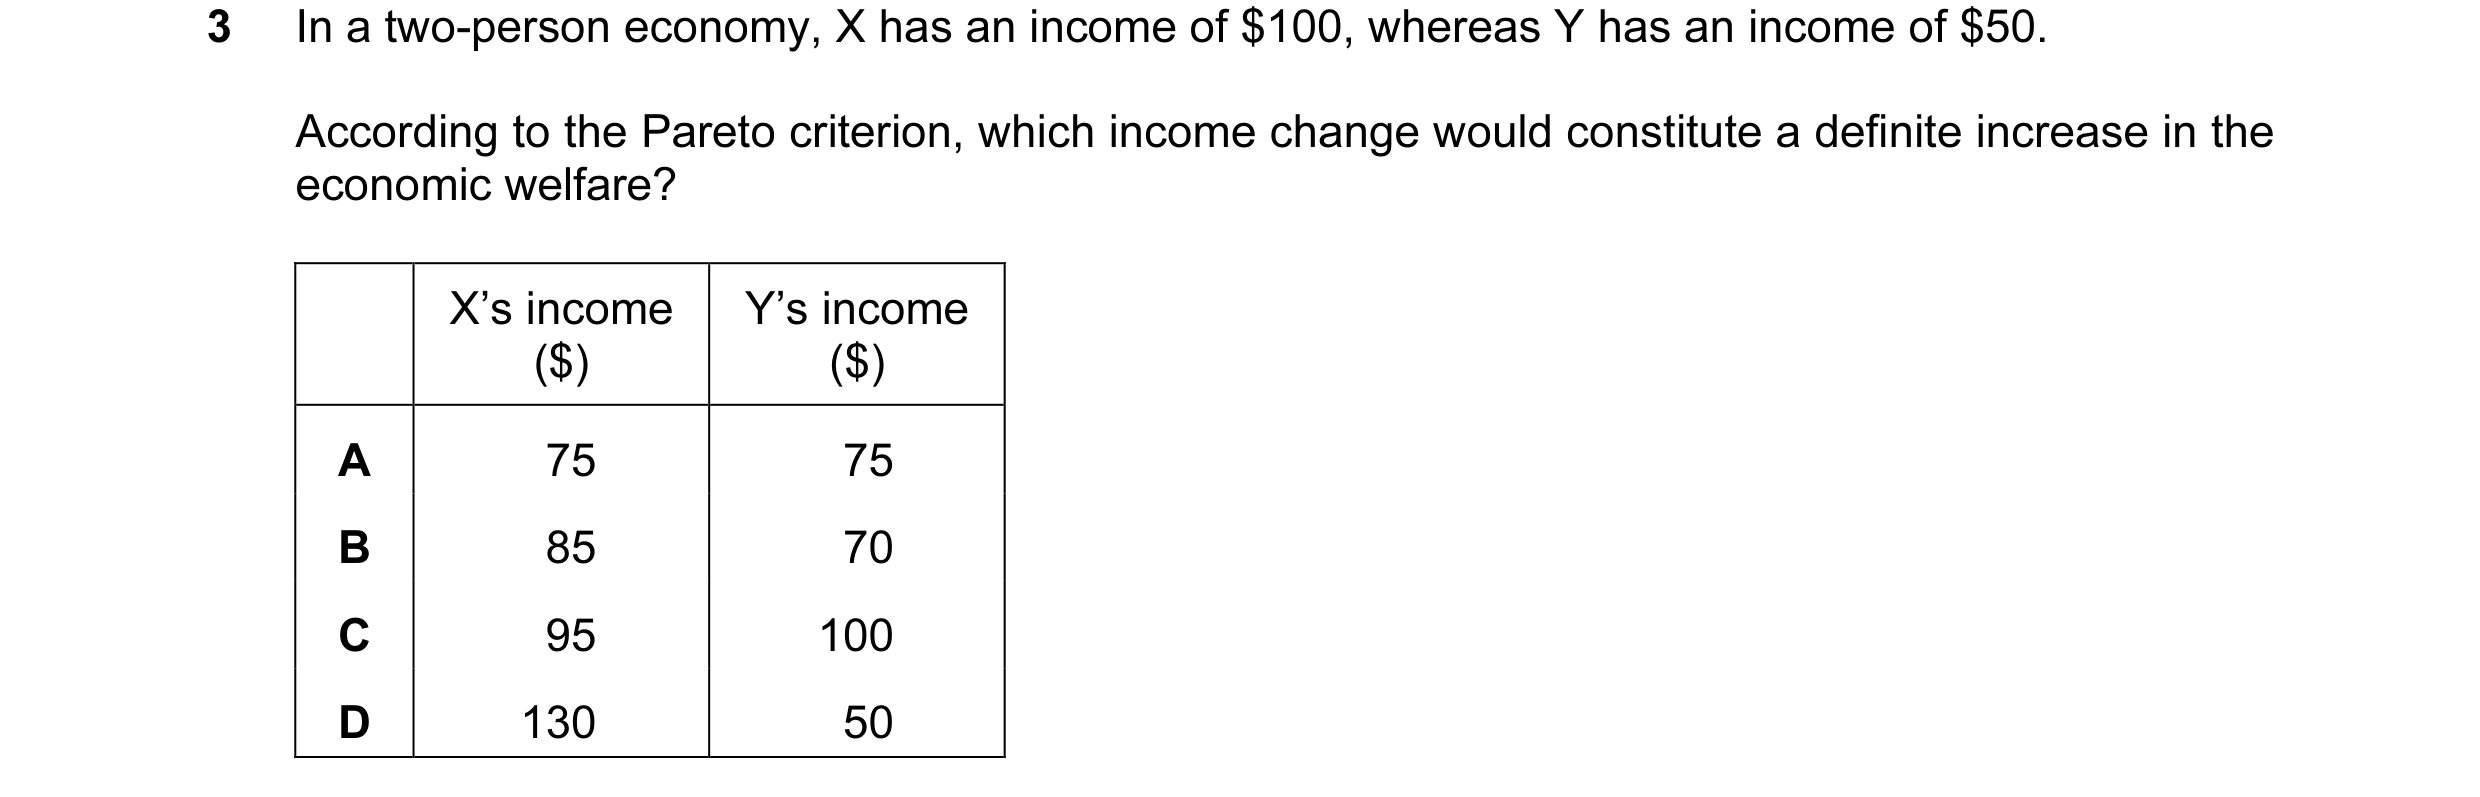
Q67 · In a two-person economy, X has an income of $100, whereas Y has an income of $50 9708/33 May/June 2017
3 In a two-person economy, X has an income of $100, whereas Y has an income of $50. According to the Pareto criterion, which income change would constitute a definite increase in the economic welfare? X’s income Y’s income ($) ($) A 75 75 B 85 70 C 95 100 D 130 50
1 marks
Answer: D
This question in 9708/33 May/June 2017
Q68 · What does not pose a threat to the achievement of allocative efficiency? 9708/32 Oct/Nov 2018
3 What does not pose a threat to the achievement of allocative efficiency? A imperfect information on the part of consumers B income inequalities C the existence of externalities D the presence of monopolistic elements
1 marks
Answer: B
This question in 9708/32 Oct/Nov 2018
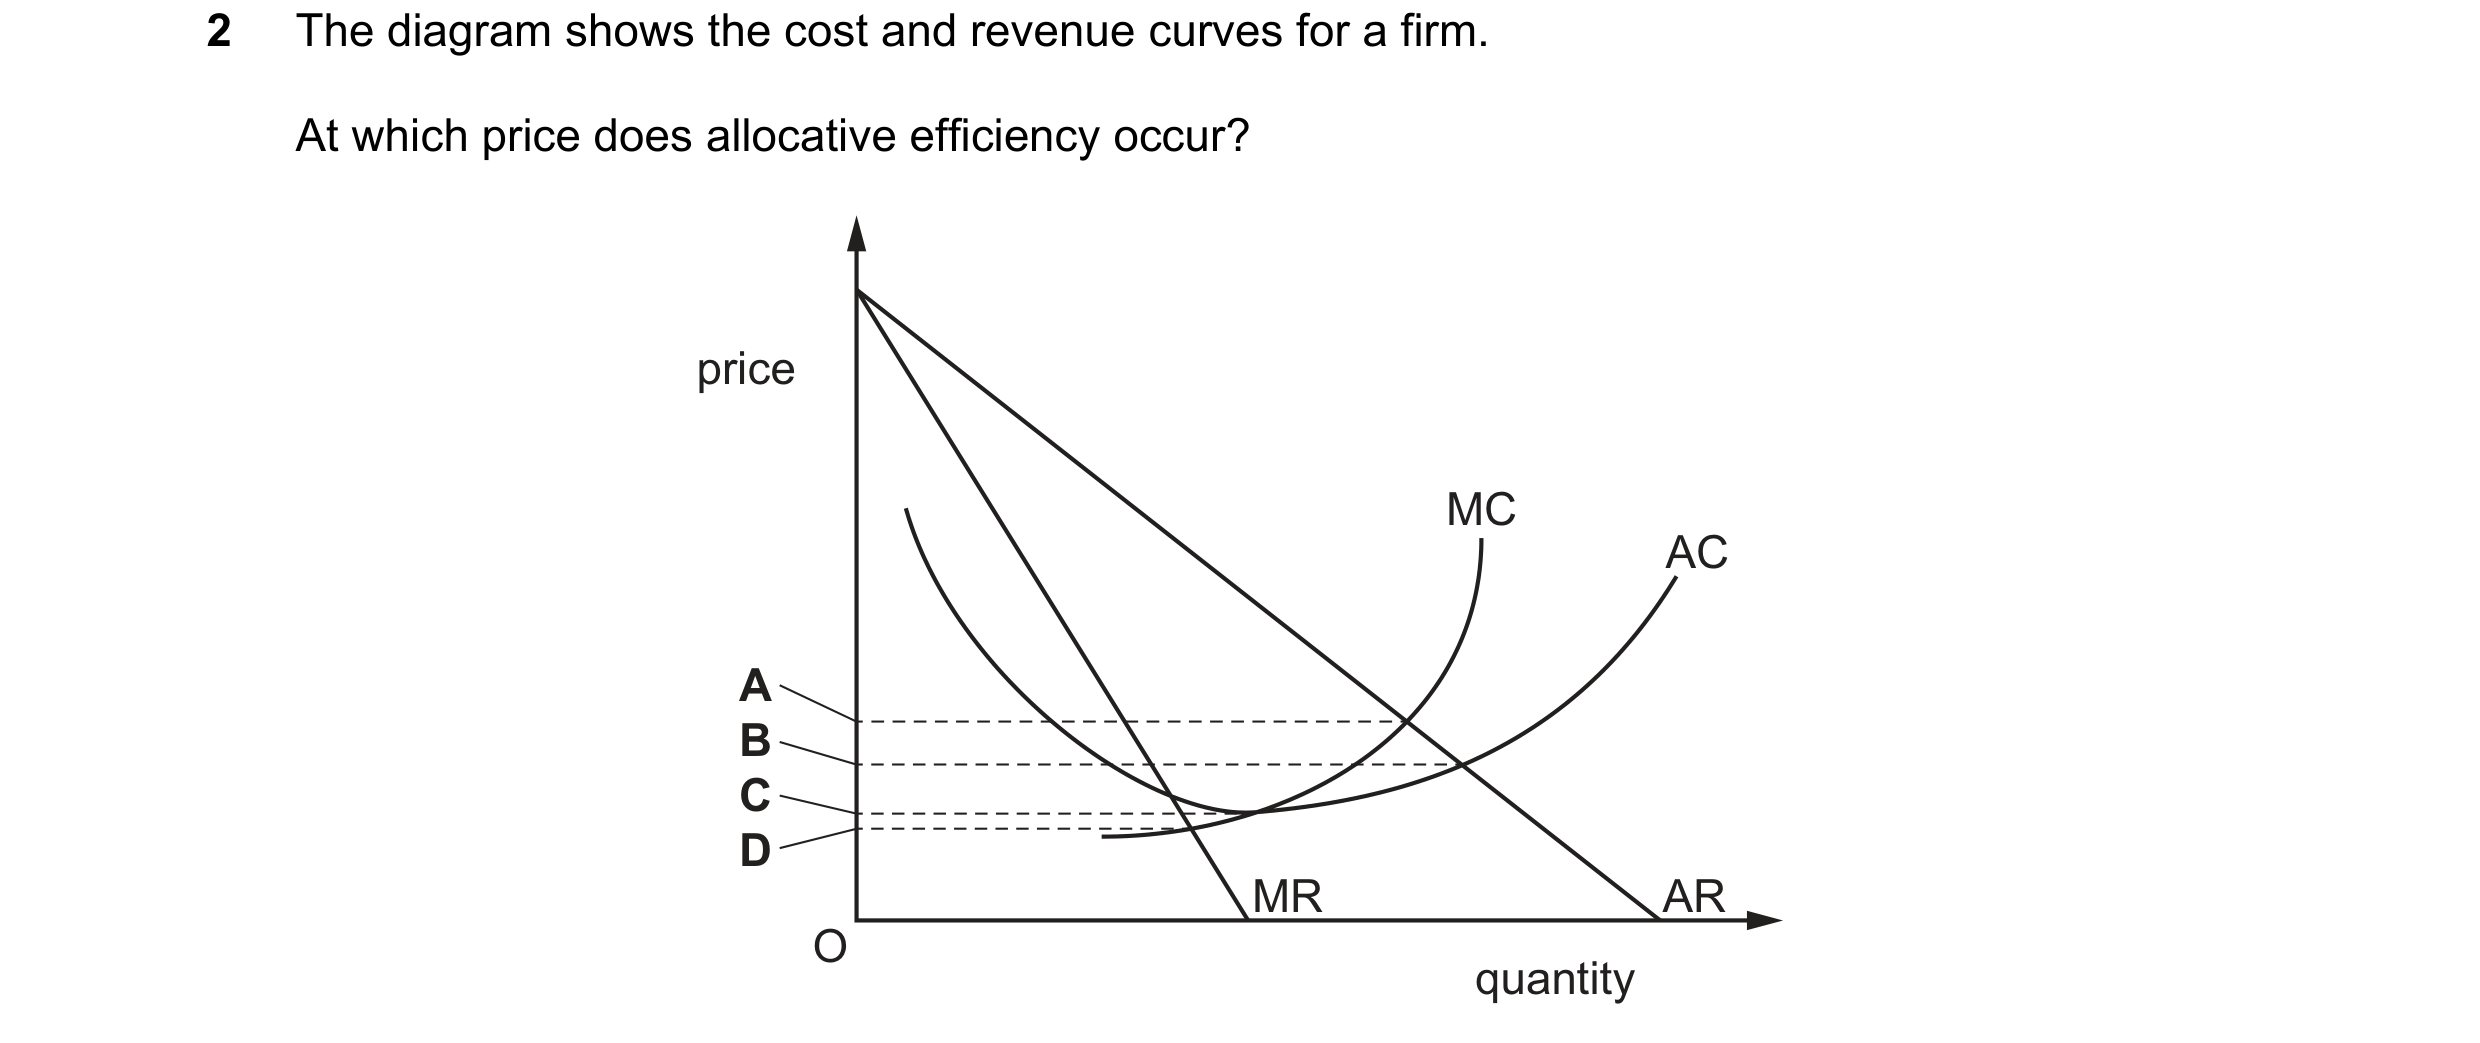
Q69 · The diagram shows the cost and revenue curves for a firm 9708/32 Feb/March 2019
2 The diagram shows the cost and revenue curves for a firm. At which price does allocative efficiency occur? price MC AC A B C D MR AR O quantity
1 marks
Answer: A
This question in 9708/32 Feb/March 2019
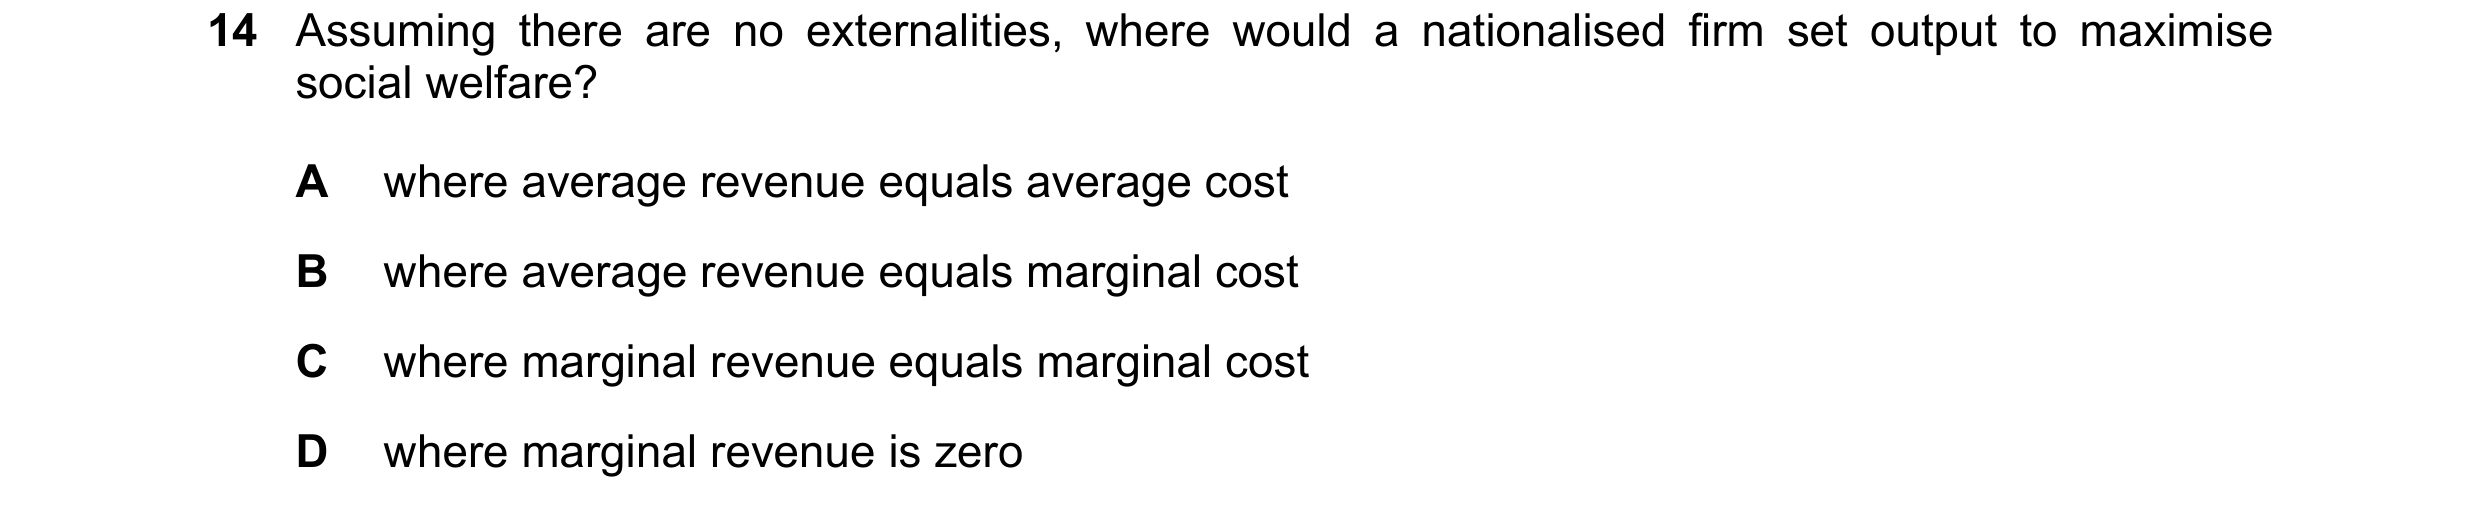
Q70 · Assuming there are no externalities, where would a nationalised firm set output to… 9708/32 May/June 2019
14 Assuming there are no externalities, where would a nationalised firm set output to maximise social welfare? A where average revenue equals average cost B where average revenue equals marginal cost C where marginal revenue equals marginal cost D where marginal revenue is zero
1 marks
Answer: B
This question in 9708/32 May/June 2019
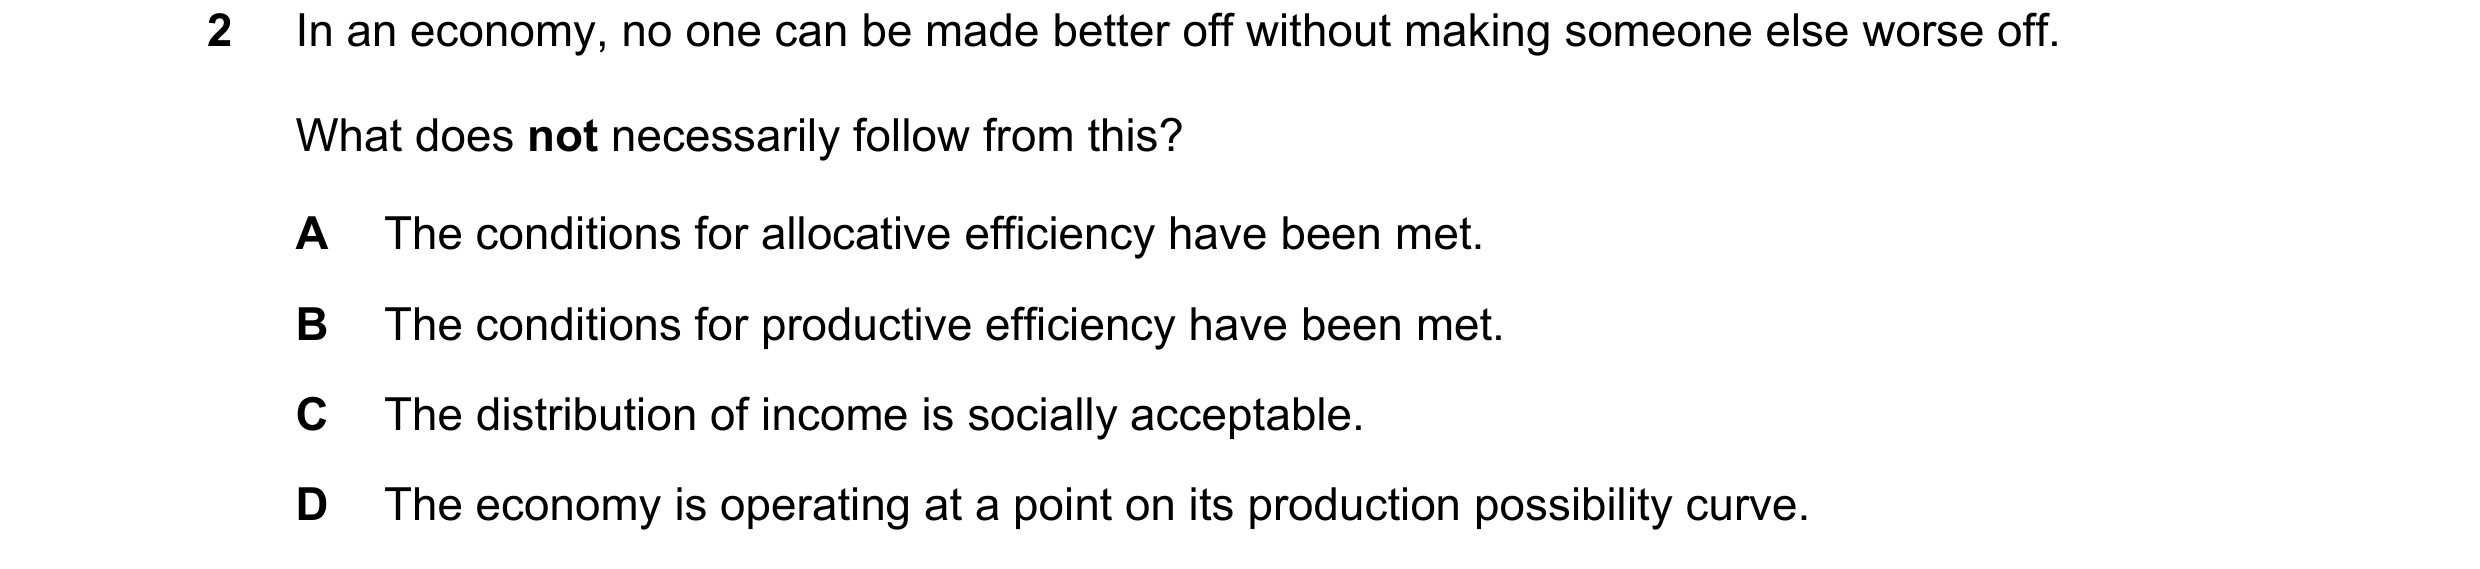
Q71 · In an economy, no one can be made better off without making someone else worse off 9708/32 Oct/Nov 2019
2 In an economy, no one can be made better off without making someone else worse off. What does not necessarily follow from this? A The conditions for allocative efficiency have been met. B The conditions for productive efficiency have been met. C The distribution of income is socially acceptable. D The economy is operating at a point on its production possibility curve.
1 marks
Answer: C
This question in 9708/32 Oct/Nov 2019
Q72 · What is not a source of market failure? 9708/32 Oct/Nov 2019
18 What is not a source of market failure? A imperfect information B income inequality C monopoly D non-excludability
1 marks
Answer: B
This question in 9708/32 Oct/Nov 2019
Q73 · What is correct if a firm in a perfectly competitive market is maximising its long-run… 9708/32 Feb/March 2020
2 What is correct if a firm in a perfectly competitive market is maximising its long-run profits? it is allocatively it is productively efficient efficient A no no B no yes C yes no D yes yes
1 marks
Answer: D
This question in 9708/32 Feb/March 2020
Q74 · What is necessary to achieve Pareto efficiency? 9708/32 Oct/Nov 2020
1 What is necessary to achieve Pareto efficiency? A Both consumers and producers must be made better off. B Everybody must be made equally better off. C One person must benefit without anyone else being worse off. D The welfare gains must exceed the welfare losses.
1 marks
Answer: C
This question in 9708/32 Oct/Nov 2020
Q75 · Which situation should not lead to market failure? 9708/33 Oct/Nov 2020
3 Which situation should not lead to market failure? A Managers in a firm have information unavailable to shareholders. B Resources such as solar energy can be continuously renewed. C Resource allocation is not always Pareto efficient. D Undesirable goods are overproduced.
1 marks
Answer: B
This question in 9708/33 Oct/Nov 2020
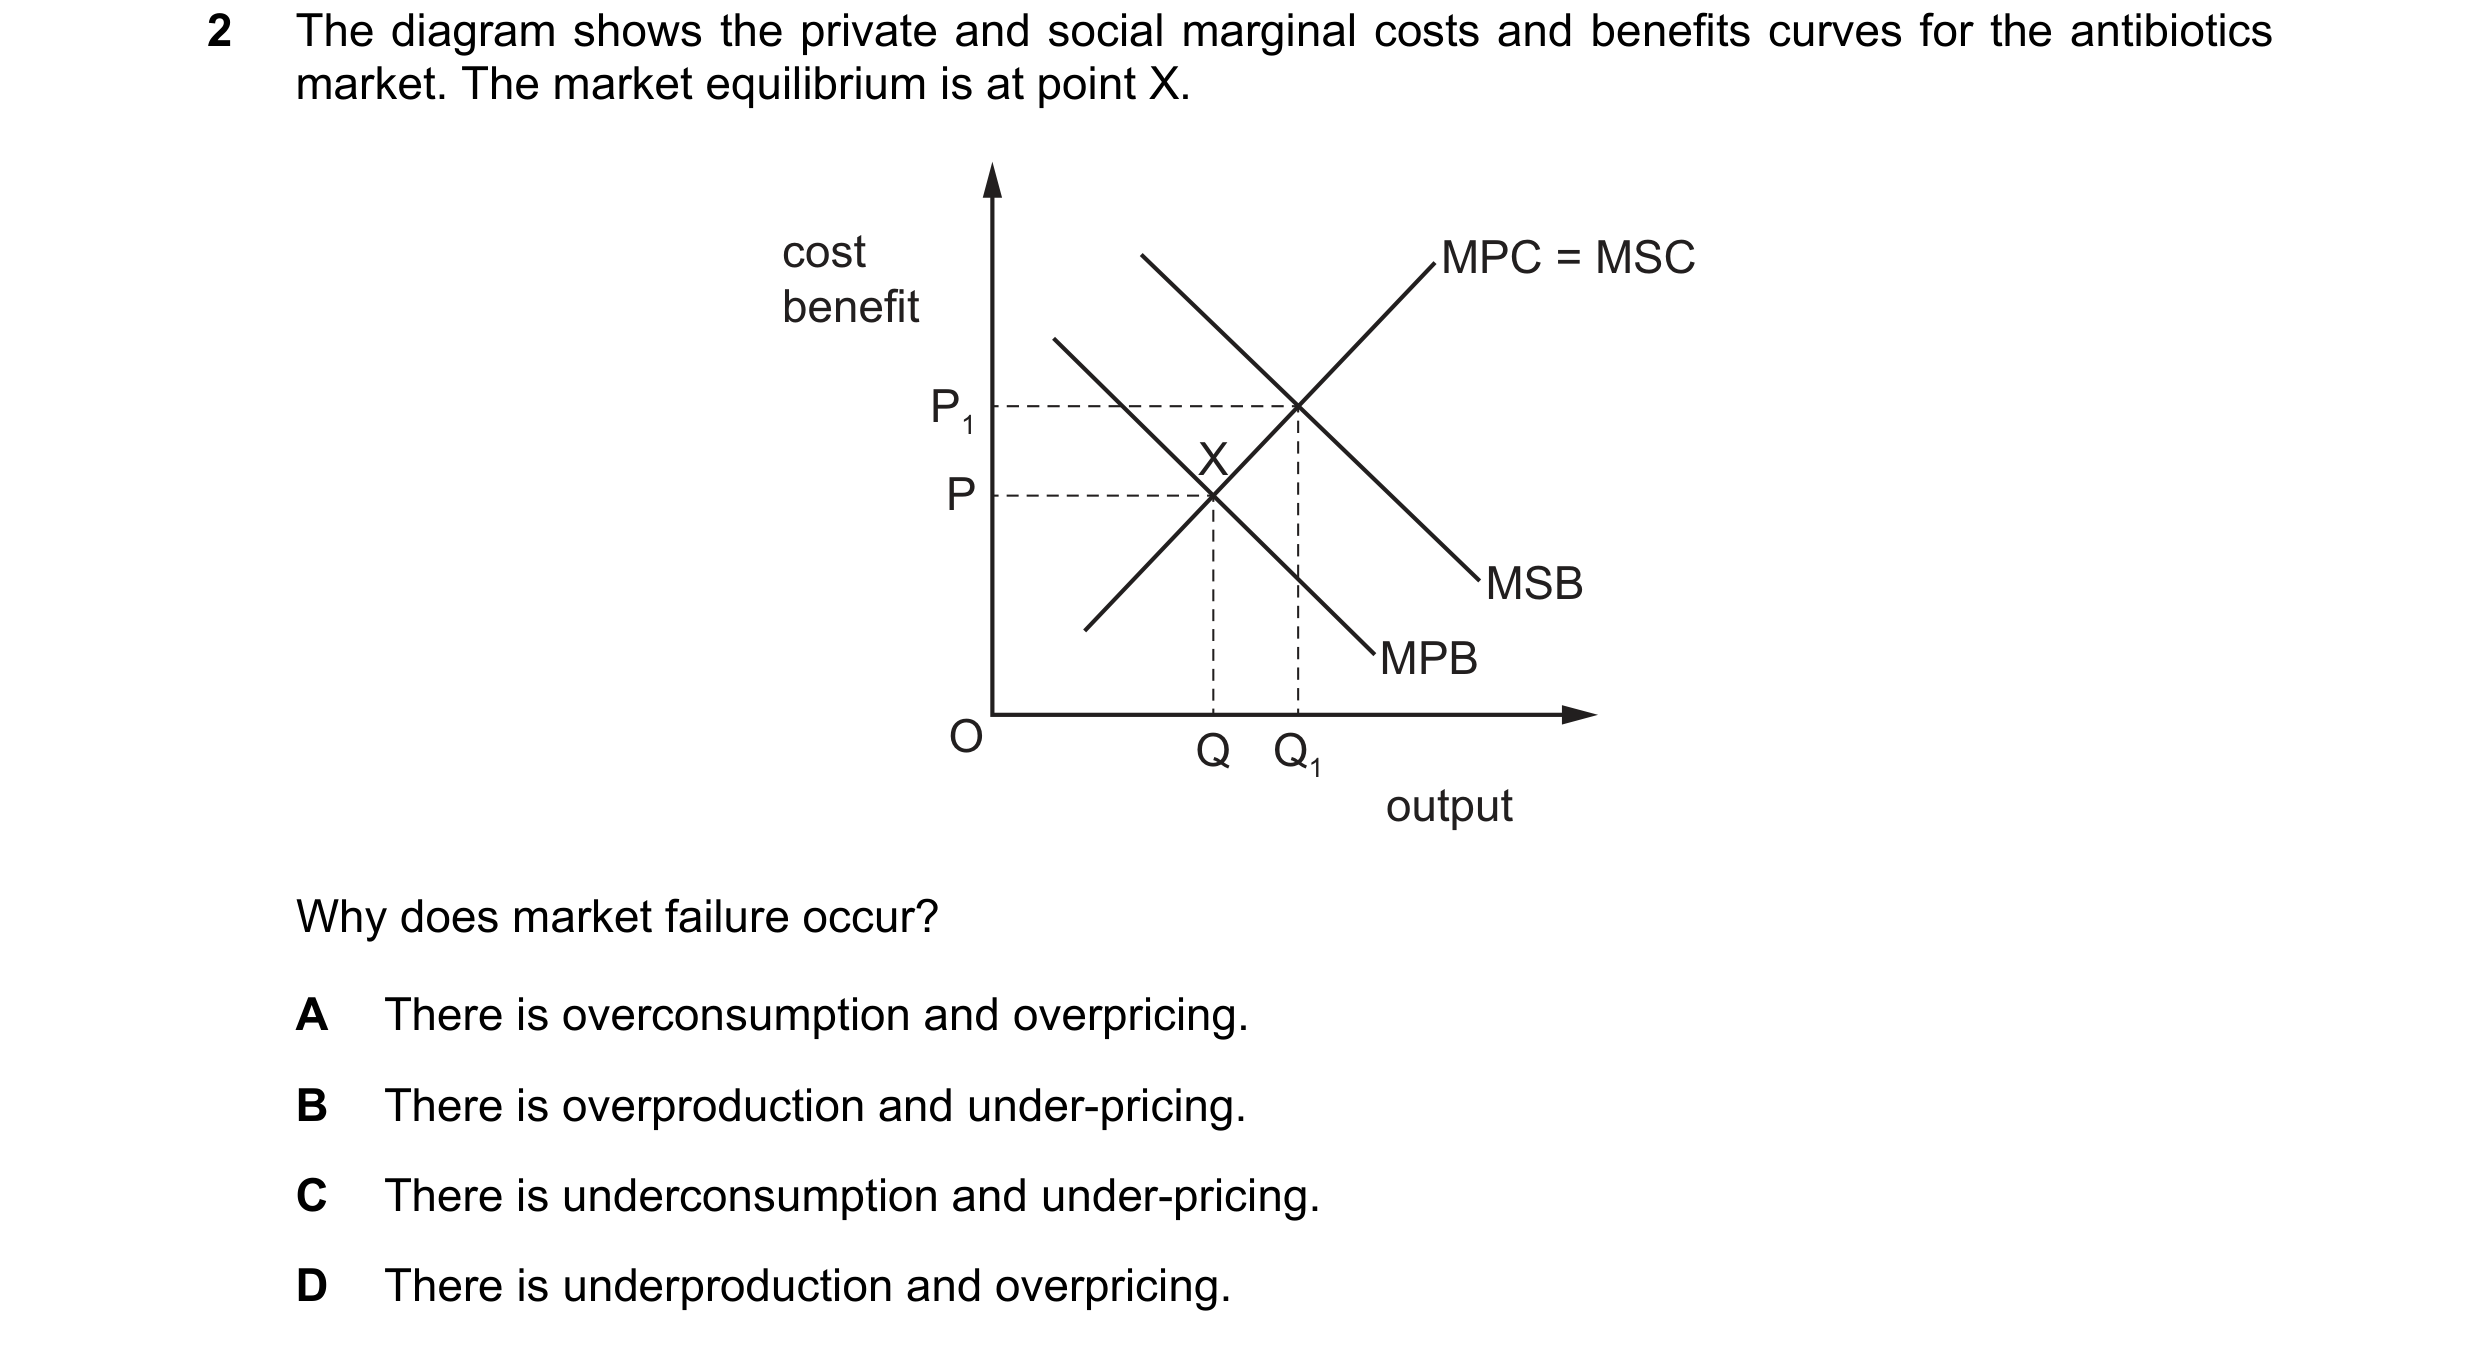
Q76 · The diagram shows the private and social marginal costs and benefits curves for the… 9708/32 Feb/March 2021
2 The diagram shows the private and social marginal costs and benefits curves for the antibiotics market. The market equilibrium is at point X. cost MPC = MSC benefit P1 X P MSB MPB O Q Q1 output Why does market failure occur? A There is overconsumption and overpricing. B There is overproduction and under-pricing. C There is underconsumption and under-pricing. D There is underproduction and overpricing.
1 marks
Answer: C
This question in 9708/32 Feb/March 2021
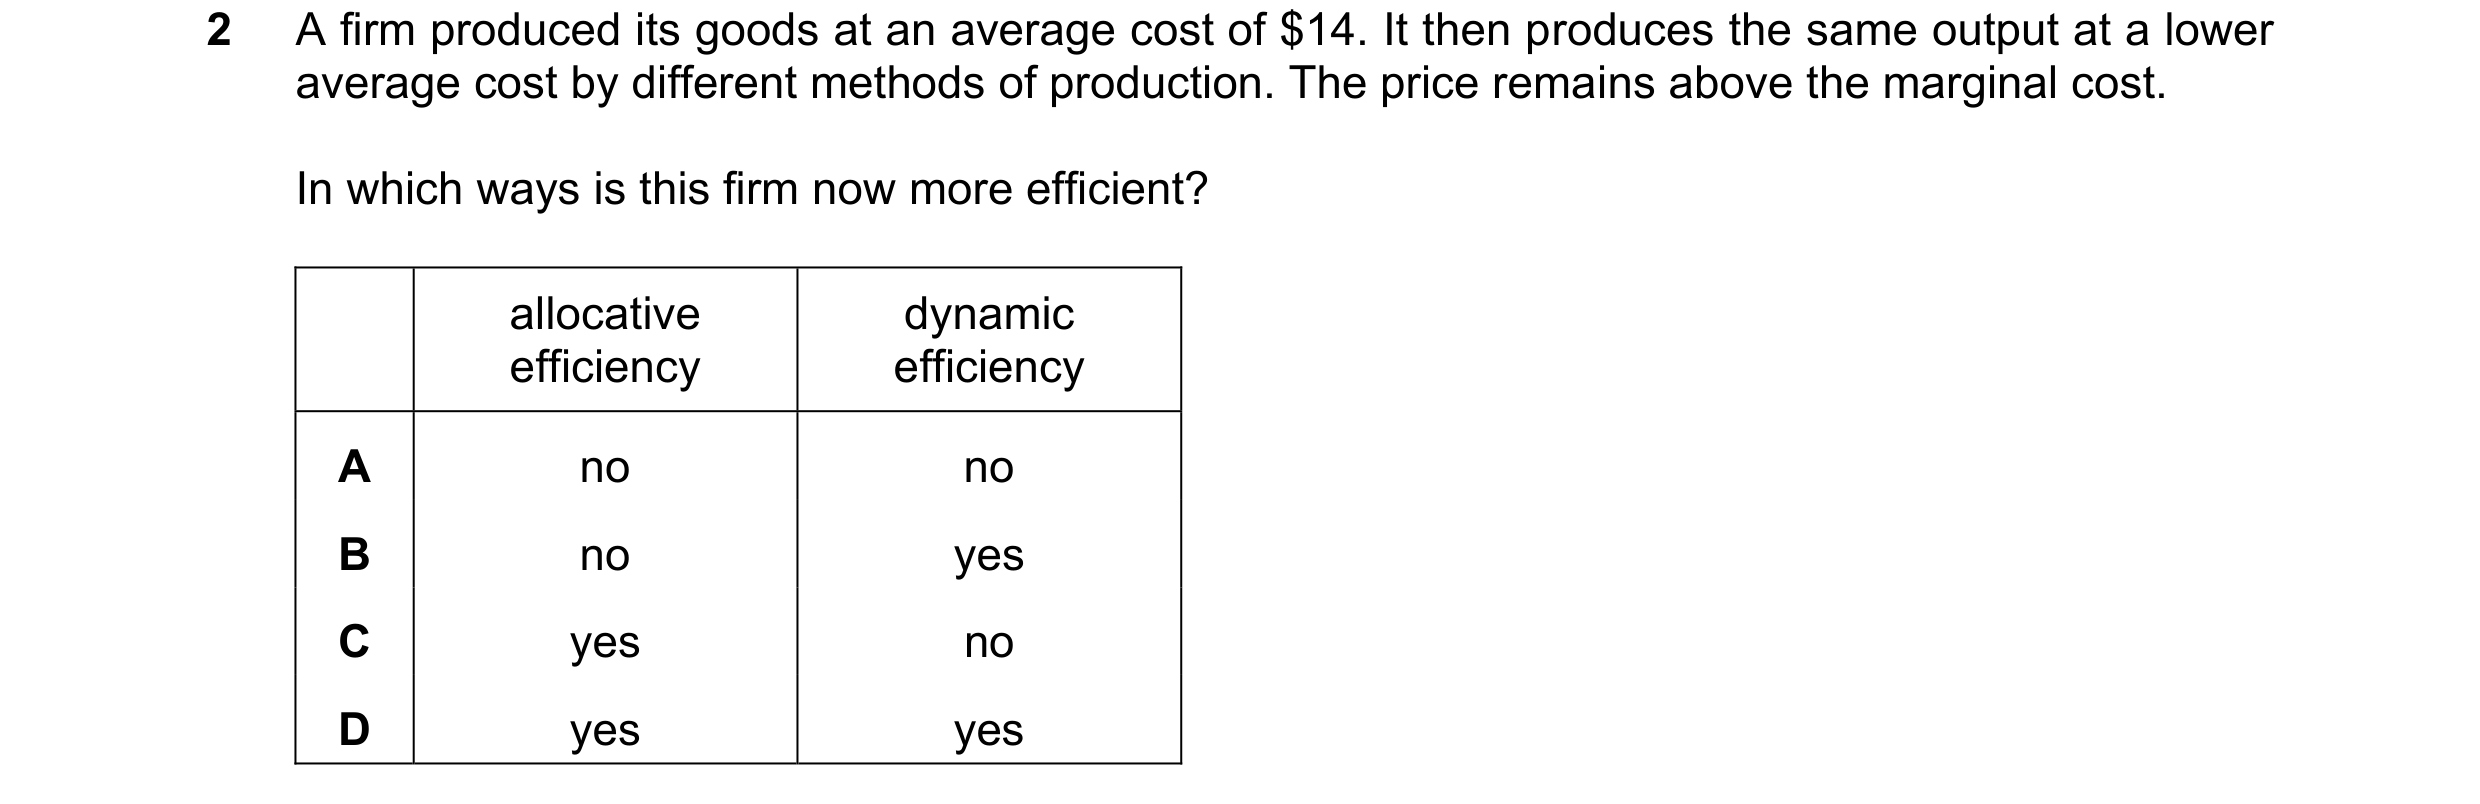
Q77 · A firm produced its goods at an average cost of $14 9708/31 May/June 2021
2 A firm produced its goods at an average cost of $14. It then produces the same output at a lower average cost by different methods of production. The price remains above the marginal cost. In which ways is this firm now more efficient? allocative dynamic efficiency efficiency A no no B no yes C yes no D yes yes
1 marks
Answer: B
This question in 9708/31 May/June 2021
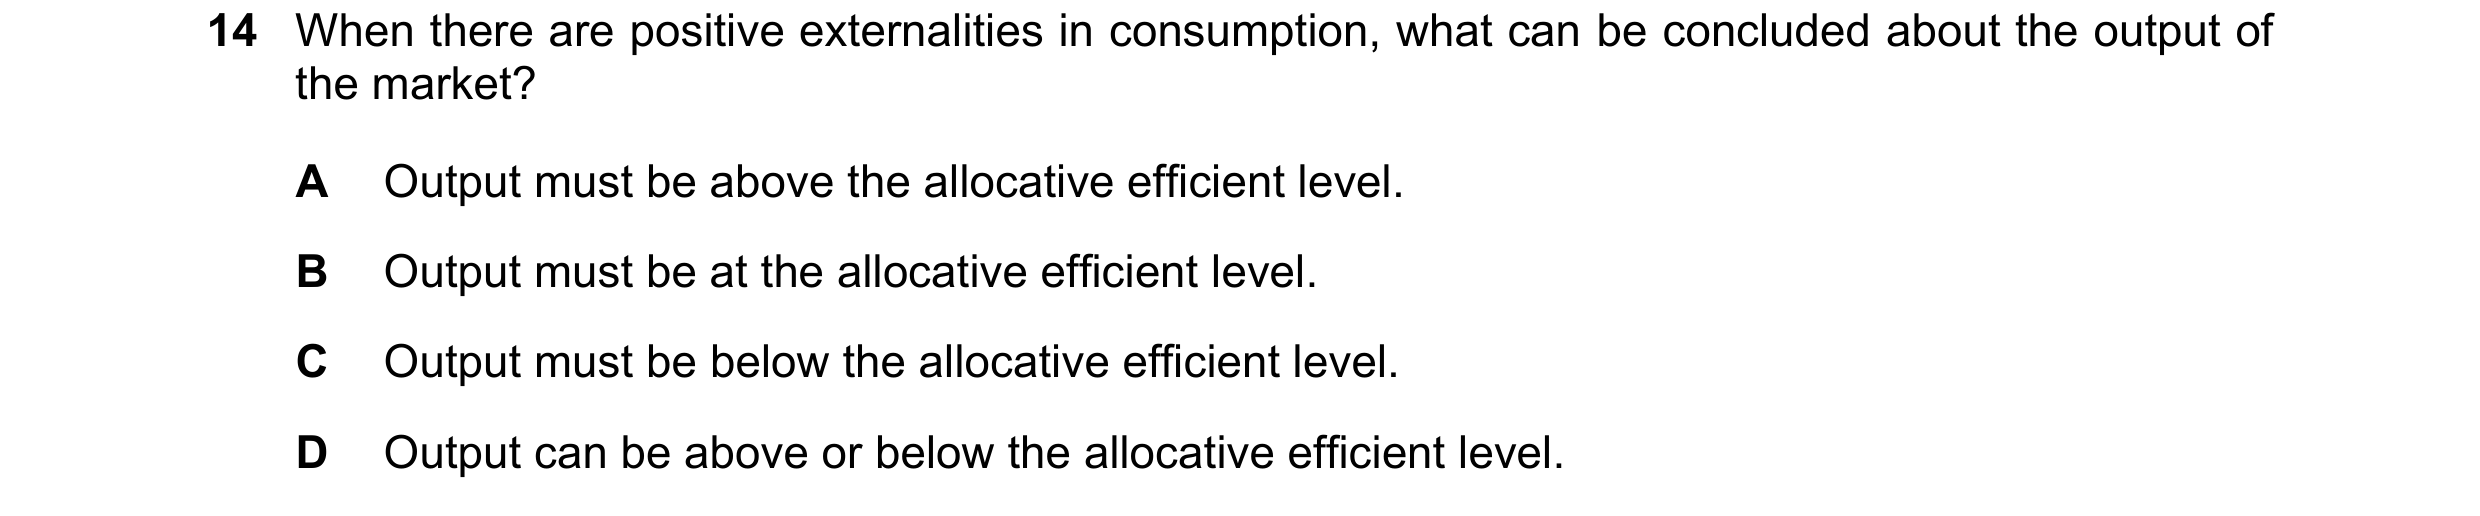
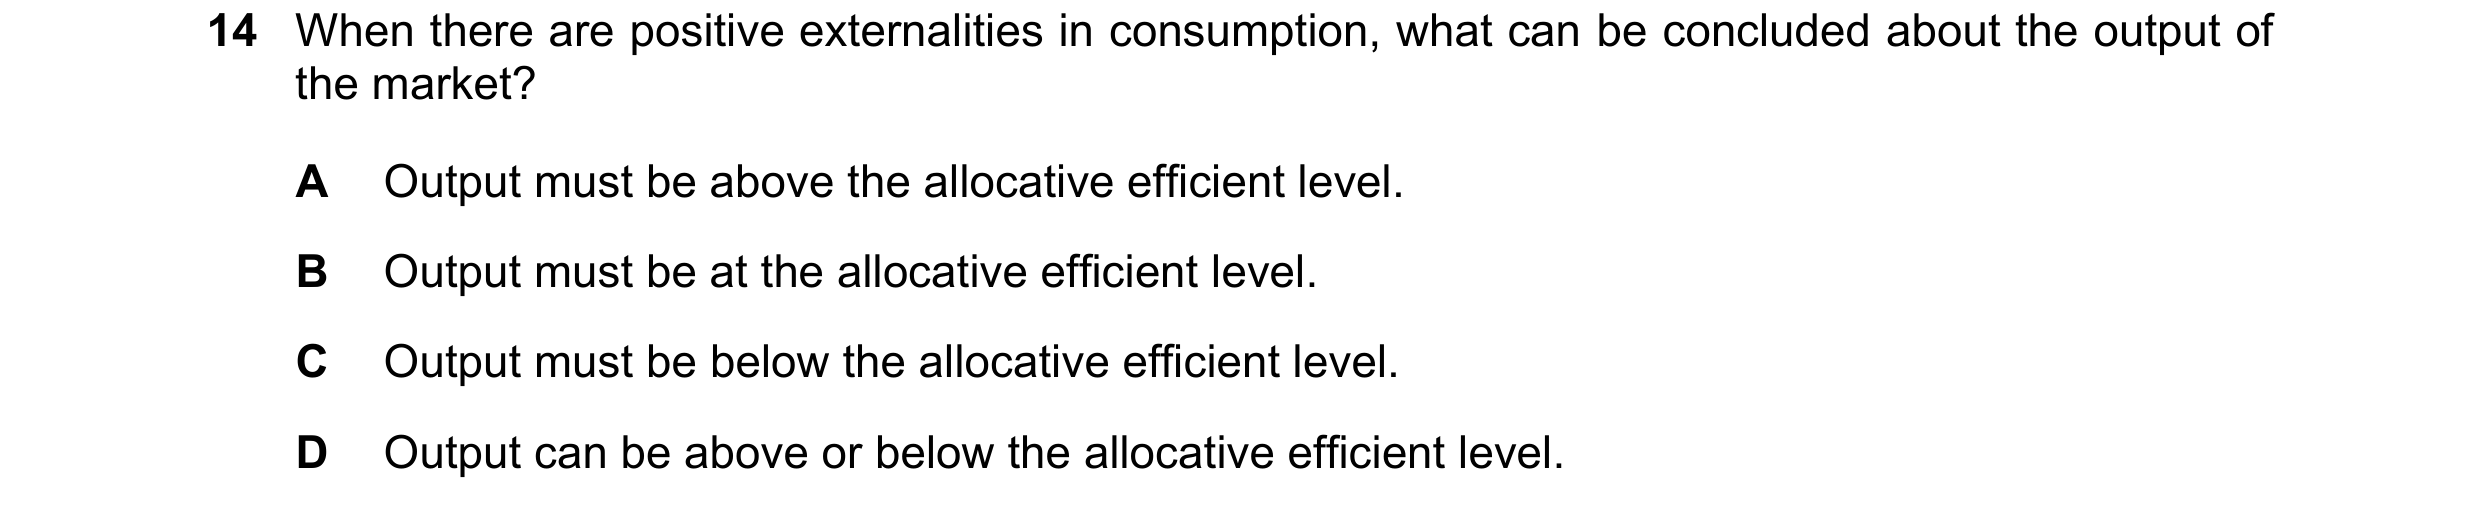
Q78 · When there are positive externalities in consumption, what can be concluded about the… 9708/31 May/June 2021
14 When there are positive externalities in consumption, what can be concluded about the output of the market? A Output must be above the allocative efficient level. B Output must be at the allocative efficient level. C Output must be below the allocative efficient level. D Output can be above or below the allocative efficient level.
1 marks
Answer: C
This question in 9708/31 May/June 2021
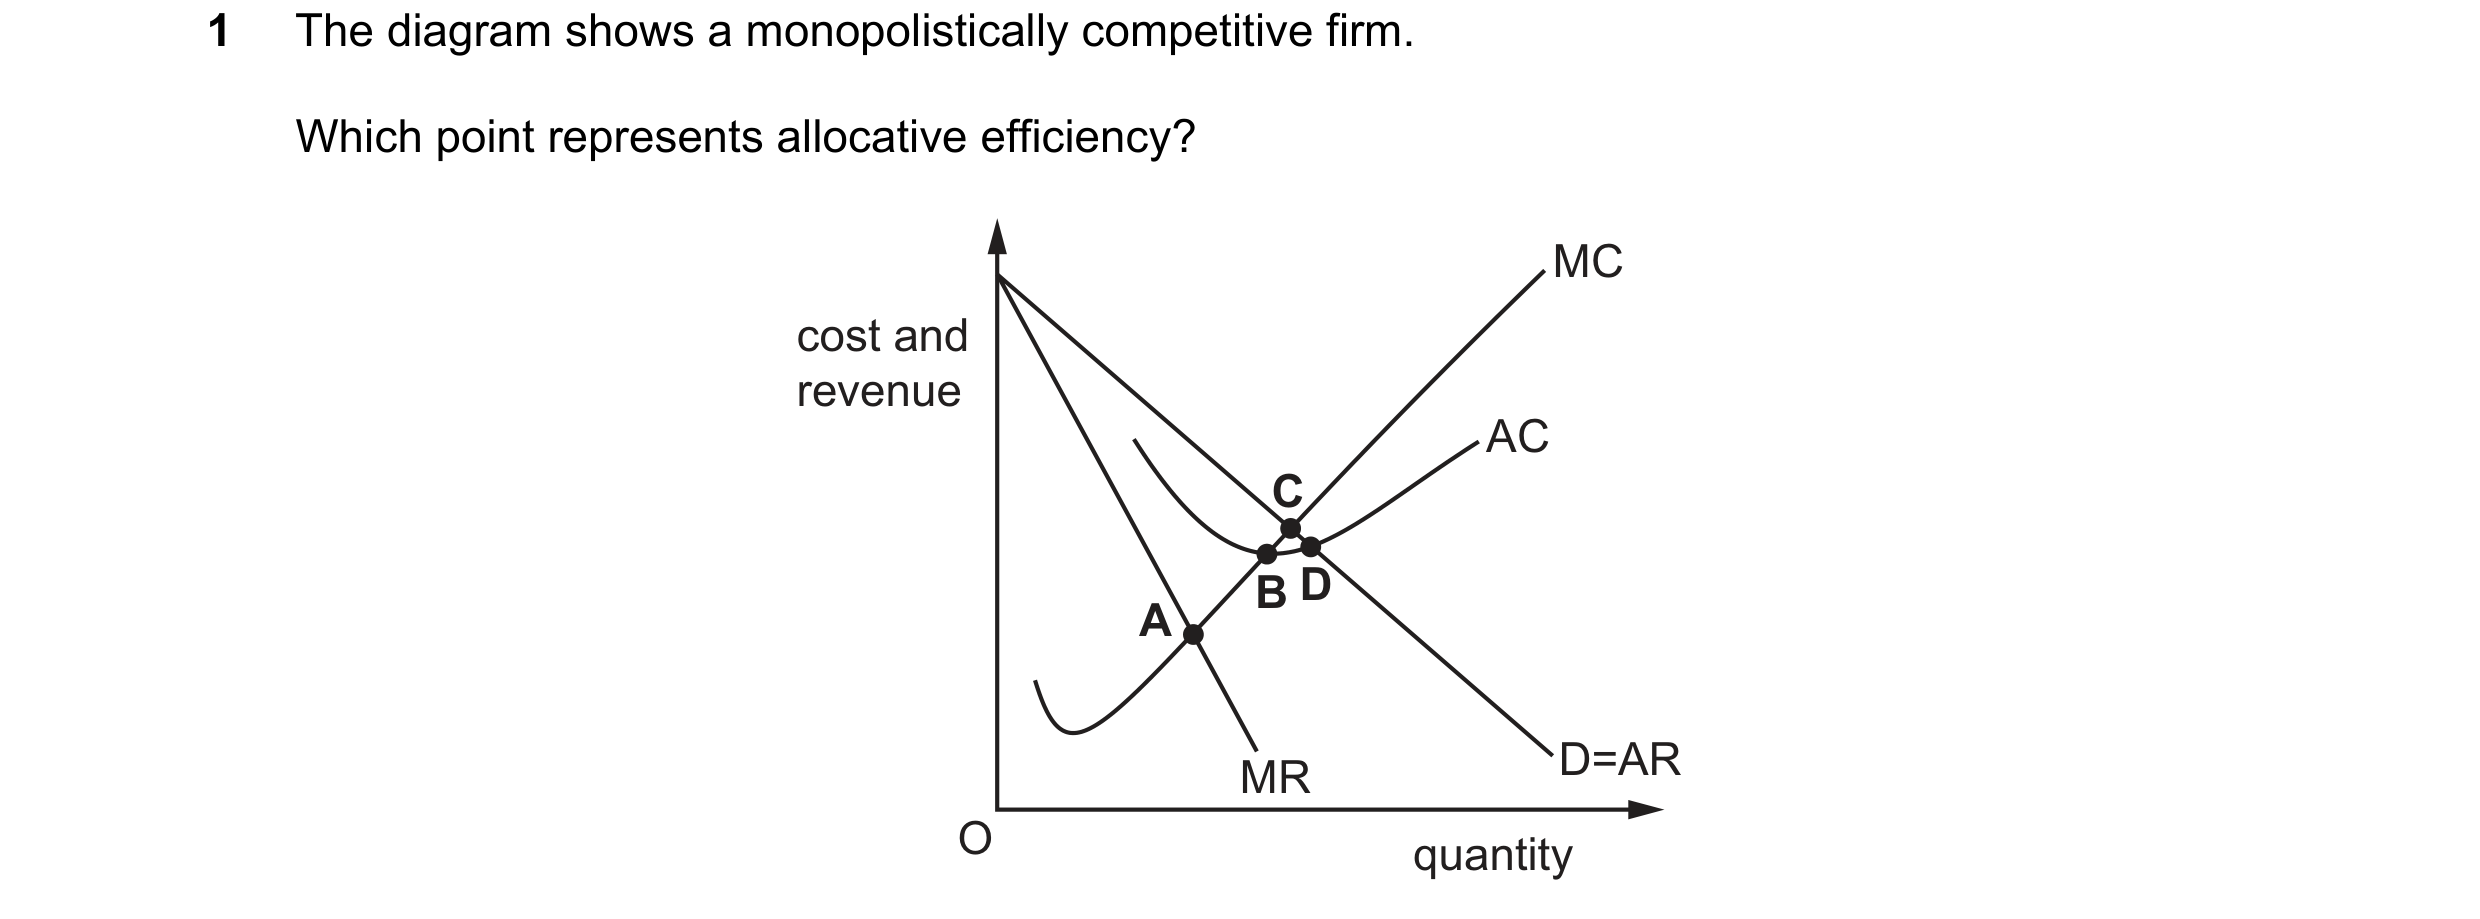
Q79 · The diagram shows a monopolistically competitive firm 9708/32 May/June 2021
1 The diagram shows a monopolistically competitive firm. Which point represents allocative efficiency? MC cost and revenue AC C B D A MR D=AR O quantity
1 marks
Answer: C
This question in 9708/32 May/June 2021
Q80 · What is an argument against government intervention when there is market failure? 9708/32 May/June 2021
2 What is an argument against government intervention when there is market failure? A Government intervention could increase positive externalities. B Government intervention could increase the availability of merit goods. C Government intervention could lead to a less efficient outcome. D Government intervention could reduce information failure.
1 marks
Answer: C
This question in 9708/32 May/June 2021
Q81 · The diagram shows the long-run cost and revenue curves for a public sector monopoly 9708/32 May/June 2021
10 The diagram shows the long-run cost and revenue curves for a public sector monopoly. revenue and costs AR LRAC MR LRMC O output The government decides to set a price that maximises social welfare. What will be the consequence of this decision? A The firm will experience diseconomies of scale. B The firm will make a loss. C The firm will maximise profits. D The firm will maximise total revenue.
1 marks
Answer: B
This question in 9708/32 May/June 2021
Q82 · A firm produced its goods at an average cost of $14 9708/33 May/June 2021
2 A firm produced its goods at an average cost of $14. It then produces the same output at a lower average cost by different methods of production. The price remains above the marginal cost. In which ways is this firm now more efficient? allocative dynamic efficiency efficiency A no no B no yes C yes no D yes yes
1 marks
Answer: B
This question in 9708/33 May/June 2021
Q83 · When there are positive externalities in consumption, what can be concluded about the… 9708/33 May/June 2021
14 When there are positive externalities in consumption, what can be concluded about the output of the market? A Output must be above the allocative efficient level. B Output must be at the allocative efficient level. C Output must be below the allocative efficient level. D Output can be above or below the allocative efficient level.
1 marks
Answer: C
This question in 9708/33 May/June 2021
Q84 · What is a necessary condition required to achieve Pareto efficiency? 9708/31 Oct/Nov 2021
1 What is a necessary condition required to achieve Pareto efficiency? A when it is not possible for some people to become better off without others becoming worse off B when it is possible to produce greater output with the same quantity of inputs C when resources have spare capacity D when resources can be re-allocated and total consumer satisfaction can be increased
1 marks
Answer: A
This question in 9708/31 Oct/Nov 2021
Q85 · A government deregulates several industries with the aim to increase allocative and… 9708/31 Oct/Nov 2021
3 A government deregulates several industries with the aim to increase allocative and productive efficiency. Which change makes it less likely that the government will meet its aim? A an increase in the availability of cheap loans to start new businesses B an increase in merger and takeover activity in the industries C an increase in information about prices for consumers available on the internet D a reduction in fixed costs in the deregulated industries
1 marks
Answer: B
This question in 9708/31 Oct/Nov 2021
Q86 · Which statement best defines productive efficiency? 9708/32 Oct/Nov 2021
1 Which statement best defines productive efficiency? A It is not possible to increase profits by changing the level of production. B It is not possible to make anyone better off without others becoming worse off. C It is not possible to produce the level of output at a lower unit cost. D It is not possible to produce outside the production possibility curve.
1 marks
Answer: C
This question in 9708/32 Oct/Nov 2021
Q87 · An economy requires large inputs of steel for its building programmes 9708/32 Oct/Nov 2021
15 An economy requires large inputs of steel for its building programmes. After political pressure, the government imposes a minimum price on imported foreign steel. When would this intervention lead to economic inefficiency? A when it encourages domestic steel producers to achieve economies of scale B when it prevents dumping of low-grade steel C when it protects jobs of highly productive steel workers D when it reduces competition for steel workers
1 marks
Answer: D
This question in 9708/32 Oct/Nov 2021
Q88 · Which statement identifies the condition necessary to achieve Pareto optimality? 9708/31 May/June 2022
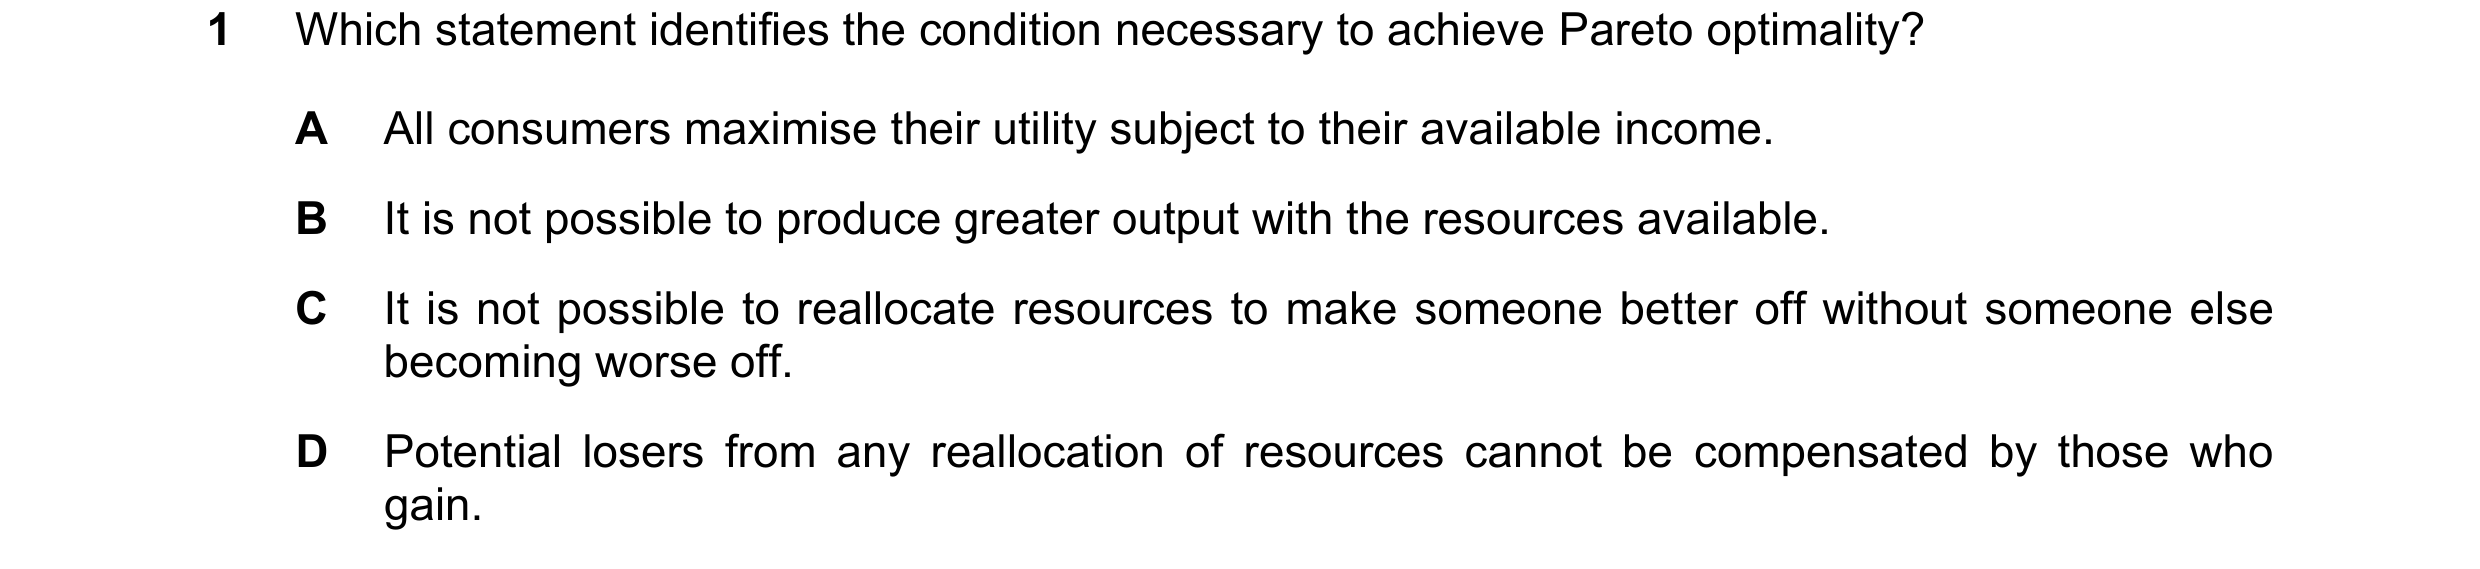
1 Which statement identifies the condition necessary to achieve Pareto optimality? A All consumers maximise their utility subject to their available income. B It is not possible to produce greater output with the resources available. C It is not possible to reallocate resources to make someone better off without someone else becoming worse off. D Potential losers from any reallocation of resources cannot be compensated by those who gain.
1 marks
Answer: C
This question in 9708/31 May/June 2022
Q89 · The diagram shows a production possibility curve (LM) for an economy producing… 9708/31 May/June 2022
2 The diagram shows a production possibility curve (LM) for an economy producing agricultural goods and manufacturing goods. L agricultural goods R T S M O manufacturing goods What can be concluded from the diagram? A The economy must be allocatively efficient at point R. B The economy is Pareto efficient at point T. C The economy is productively efficient at point S. D The opportunity cost is constant as we move from L to M.
1 marks
Answer: C
This question in 9708/31 May/June 2022
Q90 · What is not a source of market failure? 9708/31 May/June 2022
13 What is not a source of market failure? A imperfect information B income inequality C monopoly D non-excludability
1 marks
Answer: B
This question in 9708/31 May/June 2022
Q91 · Which statement identifies the condition necessary to achieve Pareto optimality? 9708/33 May/June 2022
1 Which statement identifies the condition necessary to achieve Pareto optimality? A All consumers maximise their utility subject to their available income. B It is not possible to produce greater output with the resources available. C It is not possible to reallocate resources to make someone better off without someone else becoming worse off. D Potential losers from any reallocation of resources cannot be compensated by those who gain.
1 marks
Answer: C
This question in 9708/33 May/June 2022
Q92 · The diagram shows a production possibility curve (LM) for an economy producing… 9708/33 May/June 2022
2 The diagram shows a production possibility curve (LM) for an economy producing agricultural goods and manufacturing goods. L agricultural goods R T S M O manufacturing goods What can be concluded from the diagram? A The economy must be allocatively efficient at point R. B The economy is Pareto efficient at point T. C The economy is productively efficient at point S. D The opportunity cost is constant as we move from L to M.
1 marks
Answer: C
This question in 9708/33 May/June 2022
Q93 · What is not a source of market failure? 9708/33 May/June 2022
13 What is not a source of market failure? A imperfect information B income inequality C monopoly D non-excludability
1 marks
Answer: B
This question in 9708/33 May/June 2022
Q94 · In an economy, no-one can be made better off without making someone else worse off 9708/31 Oct/Nov 2022
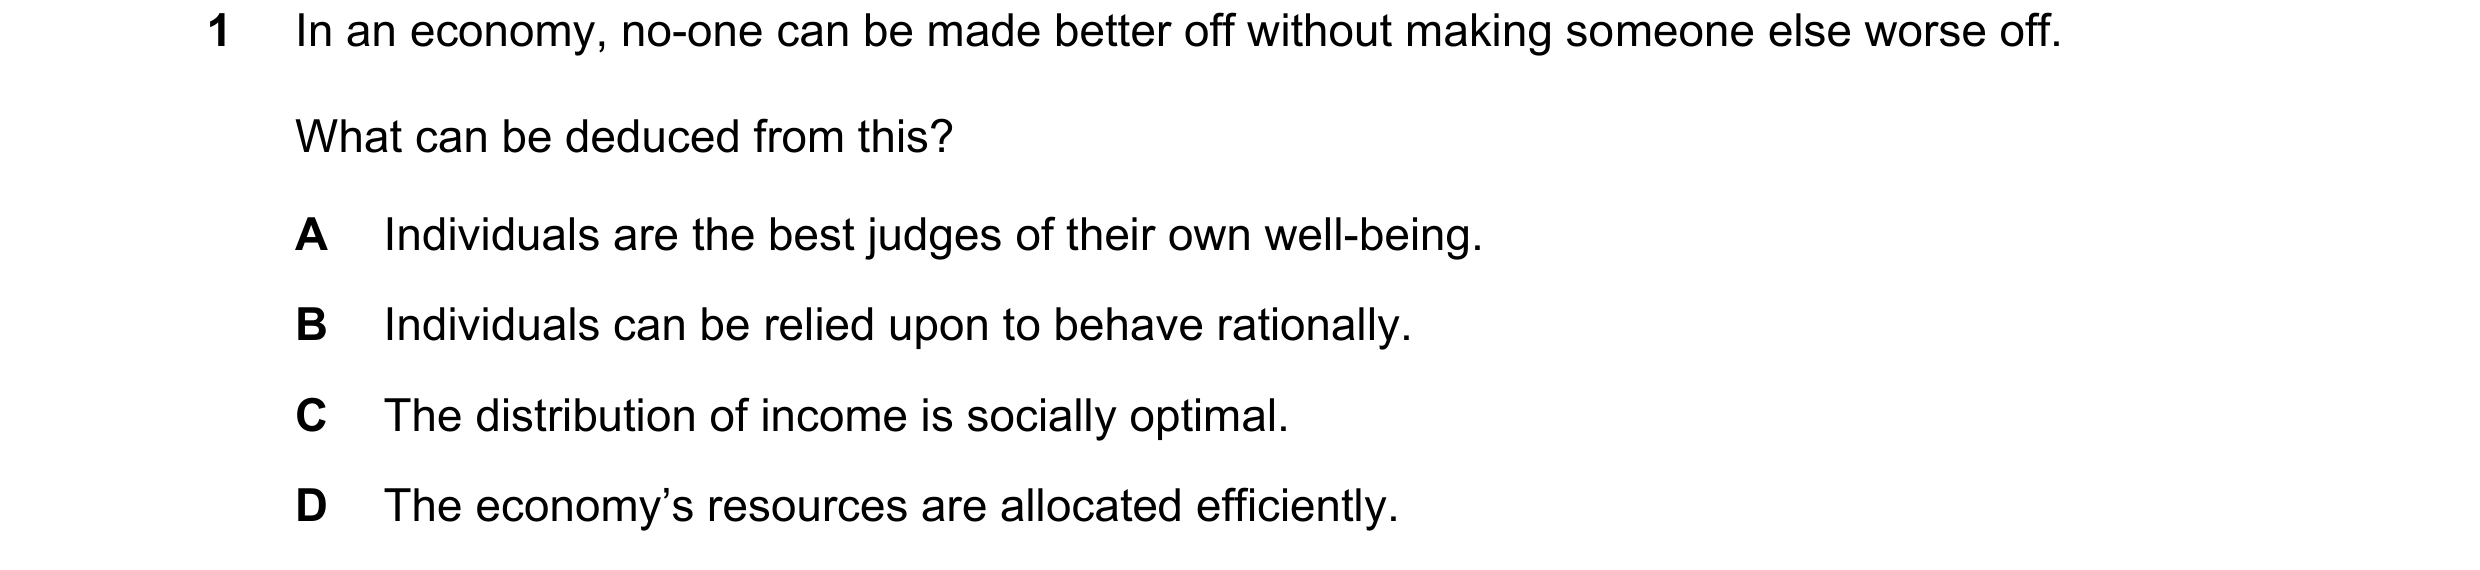
1 In an economy, no-one can be made better off without making someone else worse off. What can be deduced from this? A Individuals are the best judges of their own well-being. B Individuals can be relied upon to behave rationally. C The distribution of income is socially optimal. D The economy’s resources are allocated efficiently.
1 marks
Answer: D
This question in 9708/31 Oct/Nov 2022
Q95 · What is most likely to improve the allocative efficiency of a market? 9708/32 Oct/Nov 2022
1 What is most likely to improve the allocative efficiency of a market? A a higher market concentration ratio B collusion between firms in the market C entry of new firms into the market D mergers of firms in the market
1 marks
Answer: C
This question in 9708/32 Oct/Nov 2022
Q96 · When is Pareto efficiency achieved? 9708/33 Oct/Nov 2022
1 When is Pareto efficiency achieved? A at a level of output that is productively and allocatively efficient B when everyone has equal amounts of goods and services C when social benefits are greater than private benefits D when social marginal benefit is greater than social marginal cost
1 marks
Answer: A
This question in 9708/33 Oct/Nov 2022
Q97 · What is likely to help create dynamic efficiency? 9708/32 Feb/March 2023
4 What is likely to help create dynamic efficiency? A Entry barriers are reduced to increase competition in the market. B Firms are legally bound to produce where price equals marginal cost. C Taxes on profits are raised to encourage firms to produce where price equals average cost. D Taxes on retained profits are reduced to encourage investment in new technology.
1 marks
Answer: D
This question in 9708/32 Feb/March 2023
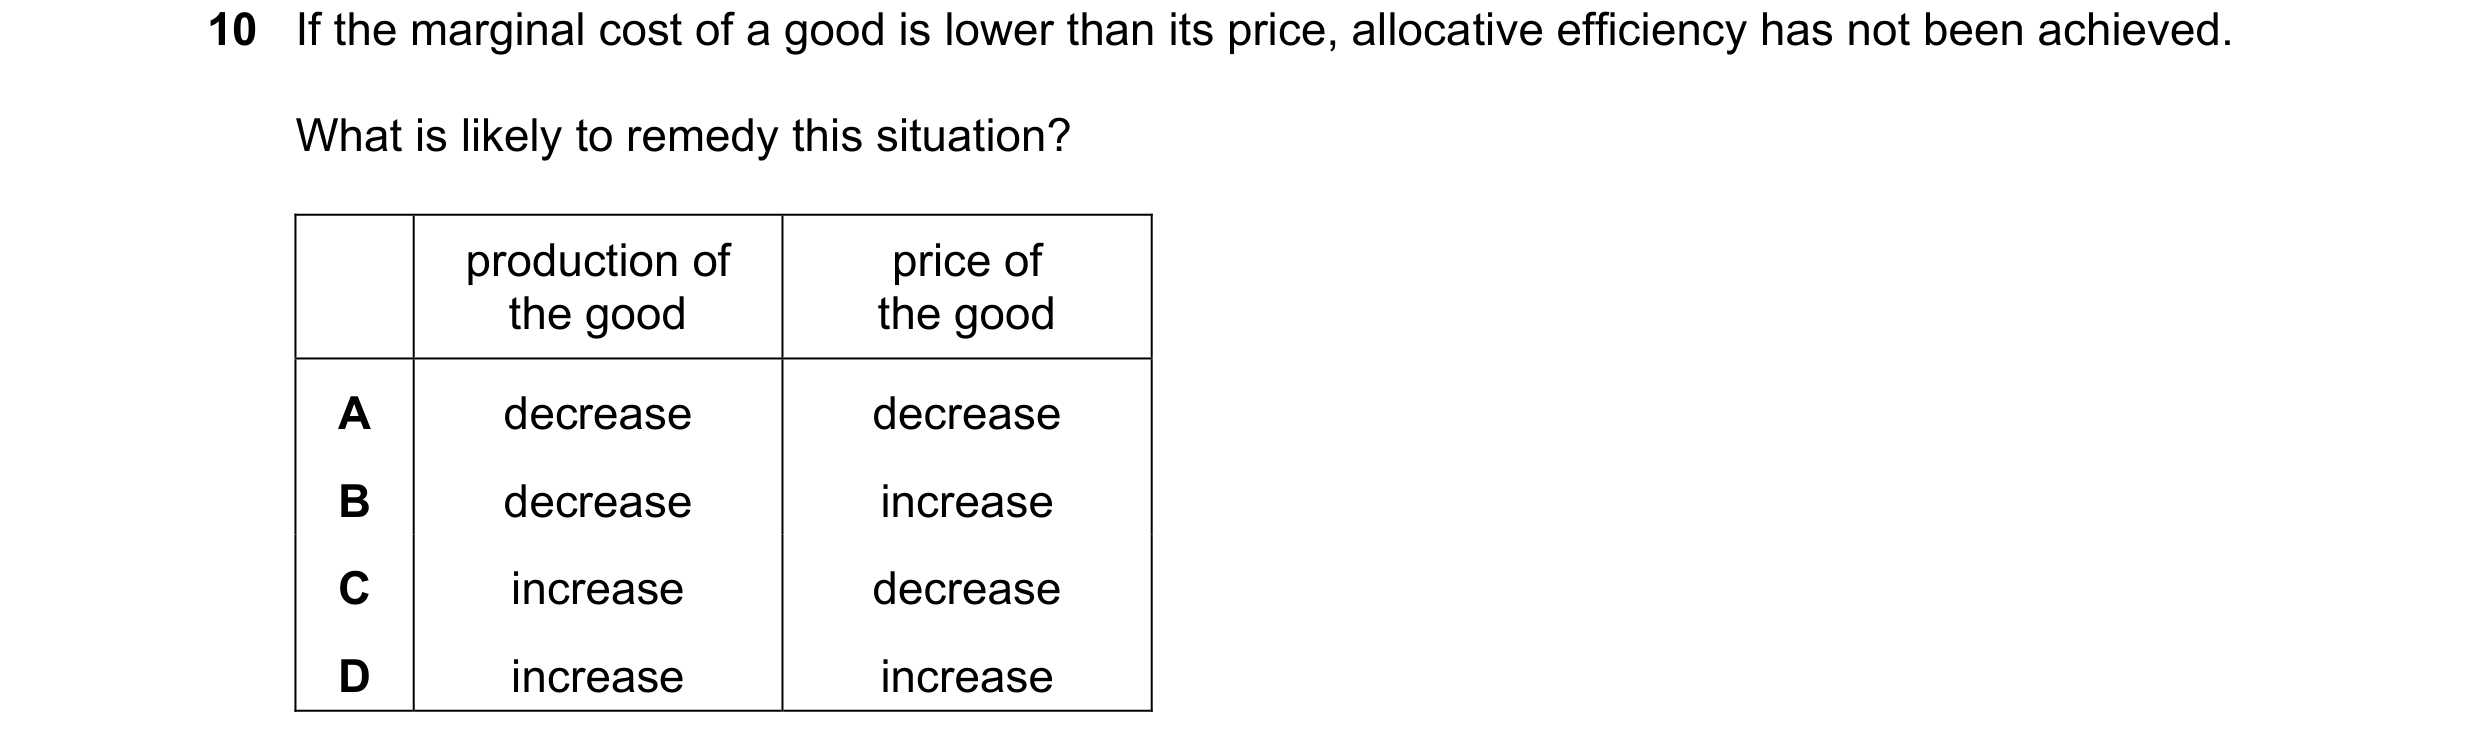
Q98 · If the marginal cost of a good is lower than its price, allocative efficiency has not… 9708/32 Feb/March 2023
10 If the marginal cost of a good is lower than its price, allocative efficiency has not been achieved. What is likely to remedy this situation? production of price of the good the good A decrease decrease B decrease increase C increase decrease D increase increase
1 marks
Answer: C
This question in 9708/32 Feb/March 2023
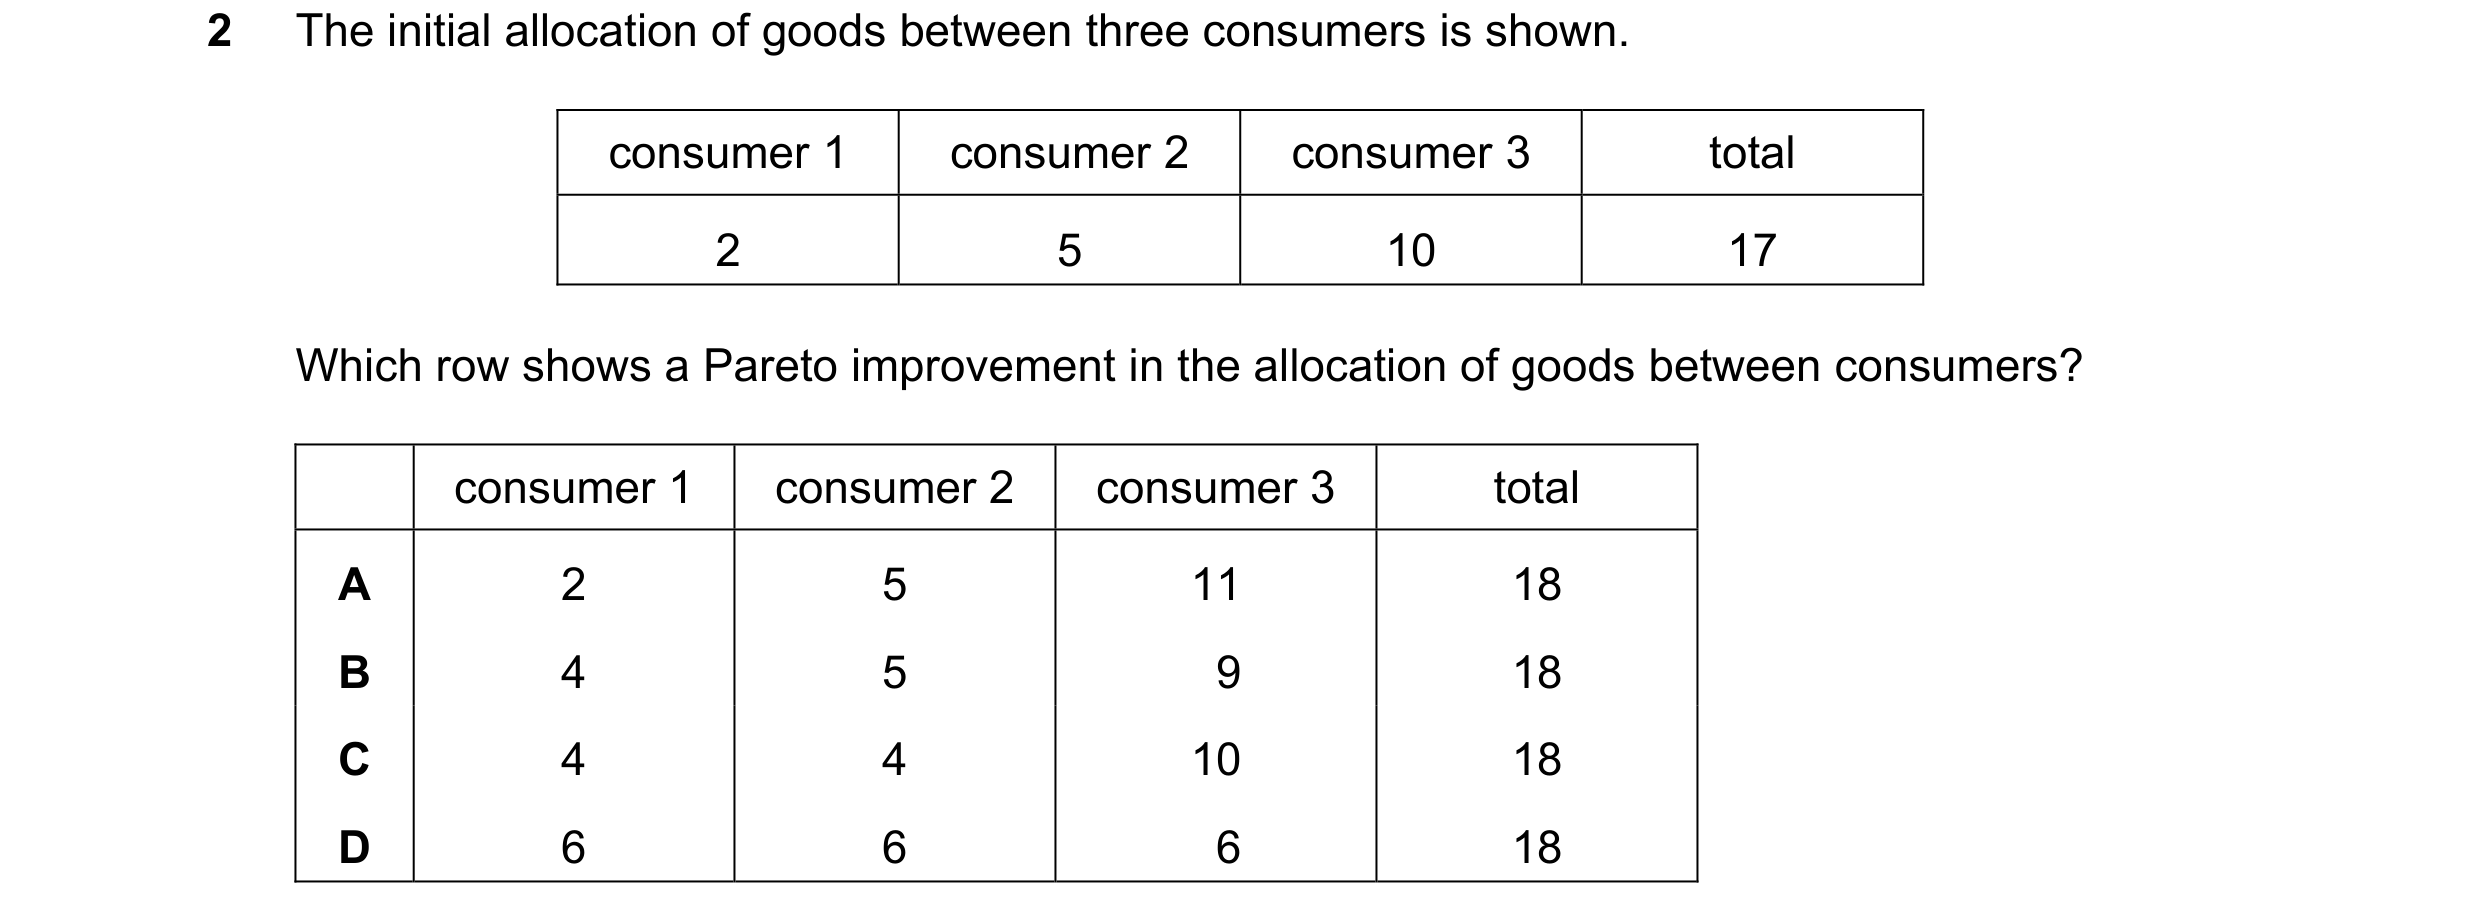
Q99 · The initial allocation of goods between three consumers is shown 9708/31 May/June 2023
2 The initial allocation of goods between three consumers is shown. consumer 1 consumer 2 consumer 3 total 2 5 10 17 Which row shows a Pareto improvement in the allocation of goods between consumers? consumer 1 consumer 2 consumer 3 total A 2 5 11 18 B 4 5 9 18 C 4 4 10 18 D 6 6 6 18
1 marks
Answer: A
This question in 9708/31 May/June 2023
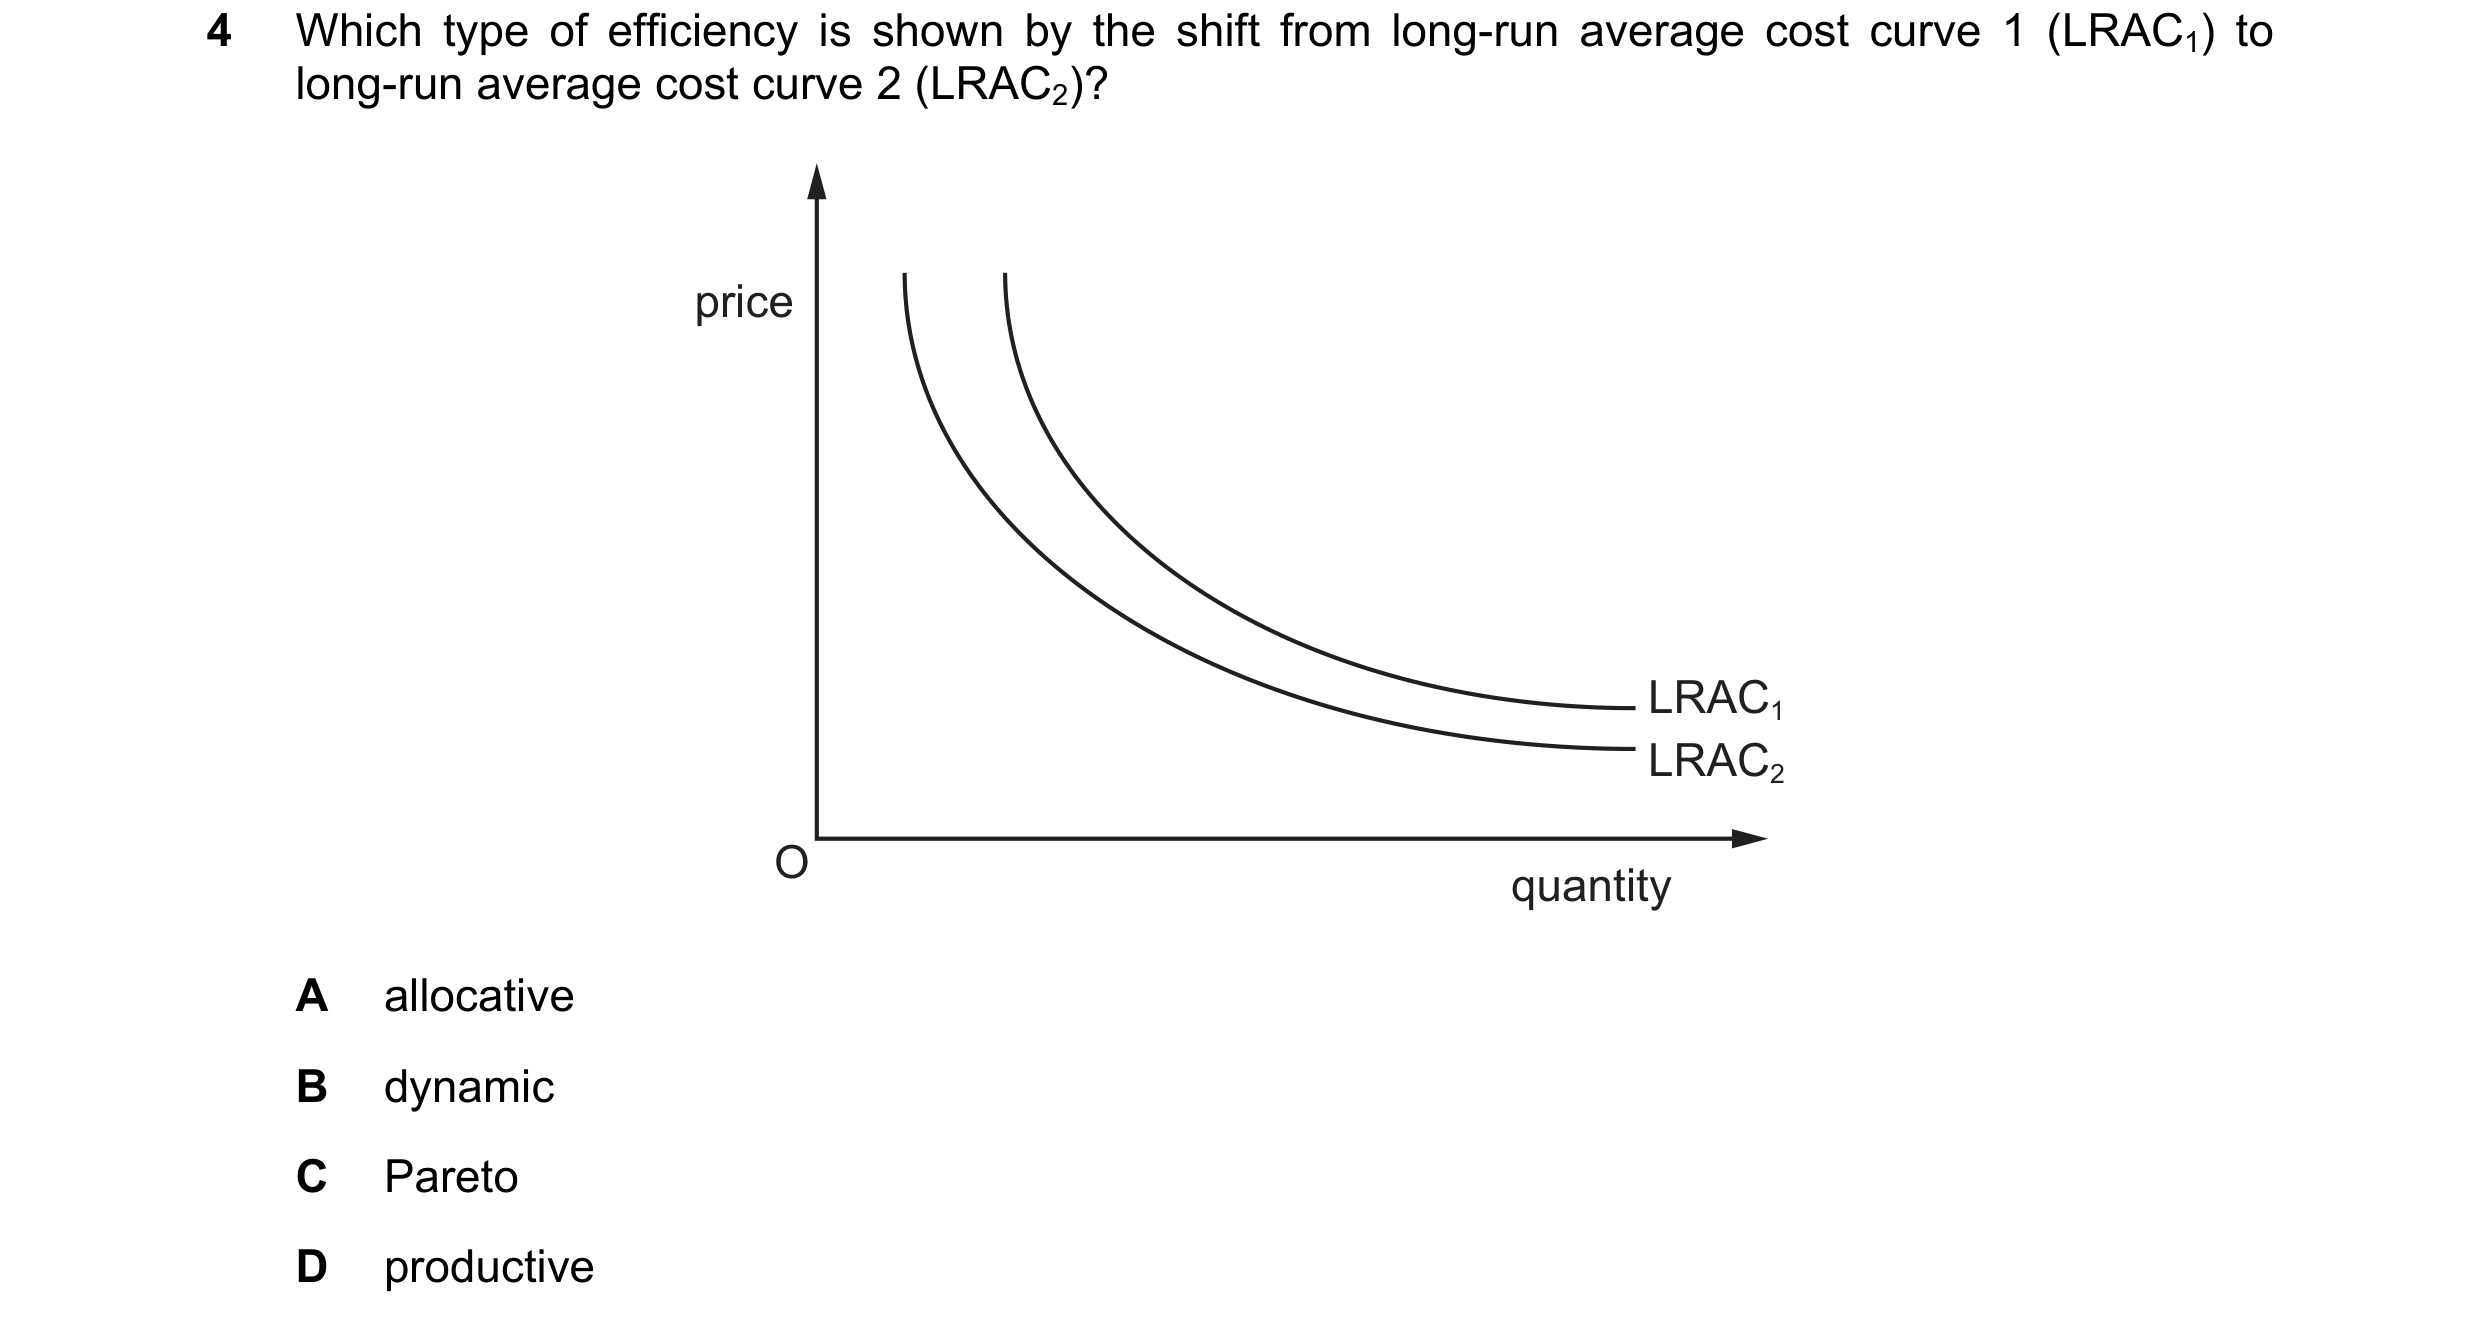
Q100 · Which type of efficiency is shown by the shift from long-run average cost curve 1 (LRAC1)… 9708/31 May/June 2023
4 Which type of efficiency is shown by the shift from long-run average cost curve 1 (LRAC1) to long-run average cost curve 2 (LRAC2)? price LRAC1 LRAC2 O quantity A allocative B dynamic C Pareto D productive
1 marks
Answer: B
This question in 9708/31 May/June 2023
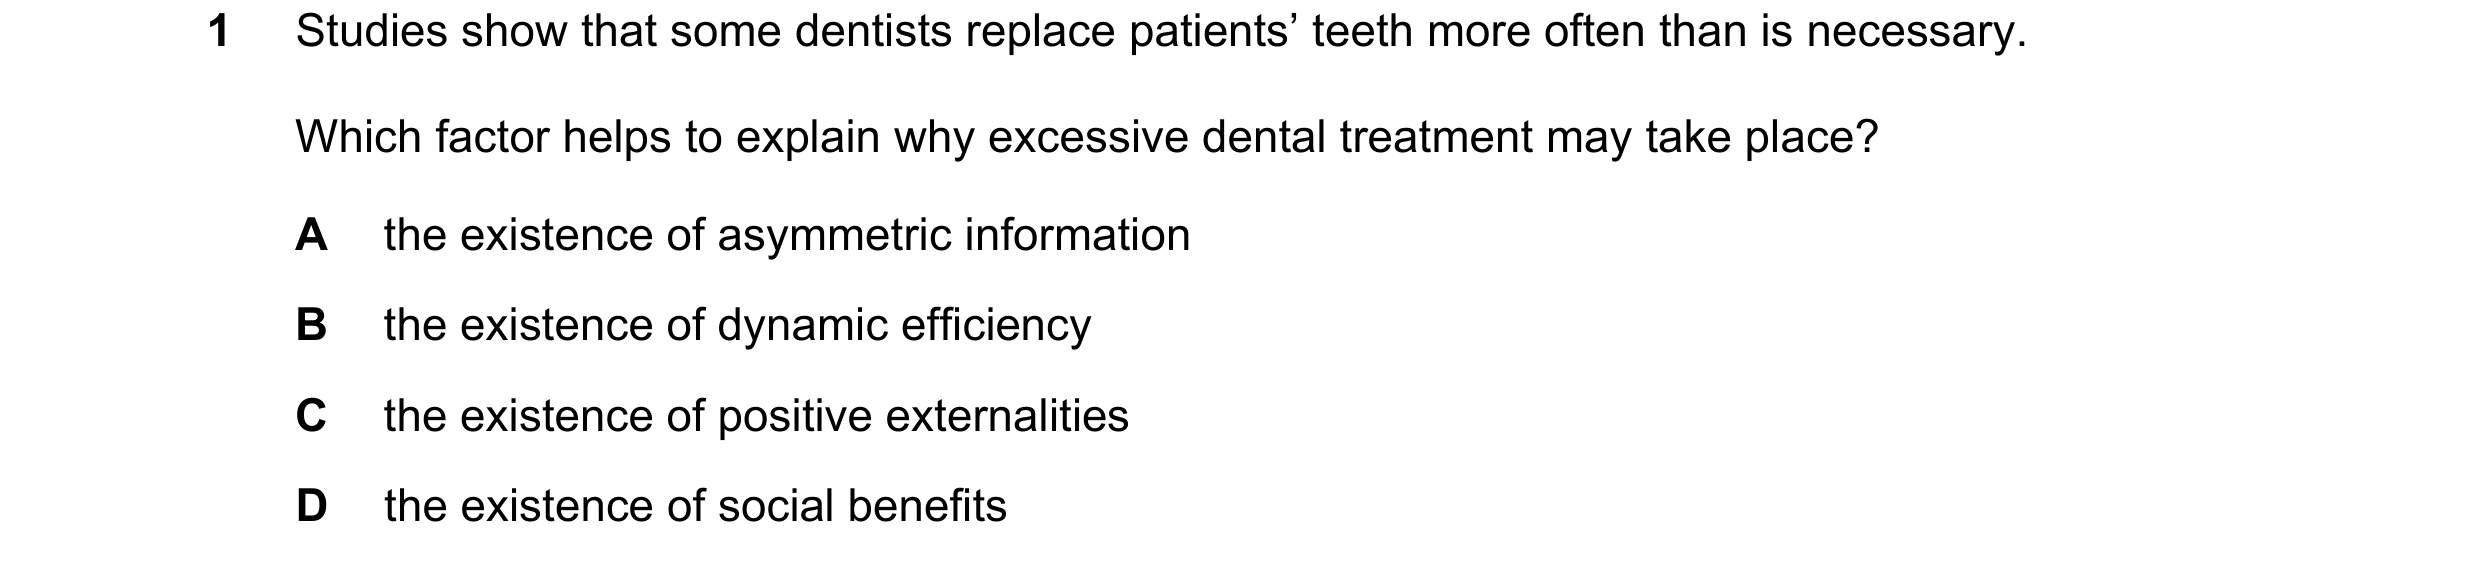
Q101 · Studies show that some dentists replace patients’ teeth more often than is necessary 9708/32 May/June 2023
1 Studies show that some dentists replace patients’ teeth more often than is necessary. Which factor helps to explain why excessive dental treatment may take place? A the existence of asymmetric information B the existence of dynamic efficiency C the existence of positive externalities D the existence of social benefits
1 marks
Answer: A
This question in 9708/32 May/June 2023
Q102 · What can be done to help to overcome moral hazard? 9708/32 May/June 2023
7 What can be done to help to overcome moral hazard? A charging the same insurance premium to all people in the same age group B designing insurance contracts so that the insurance company and client share any loss C giving unconditional financial support to banks to protect jobs D guaranteeing jobs for bank managers to provide a sense of security
1 marks
Answer: B
This question in 9708/32 May/June 2023
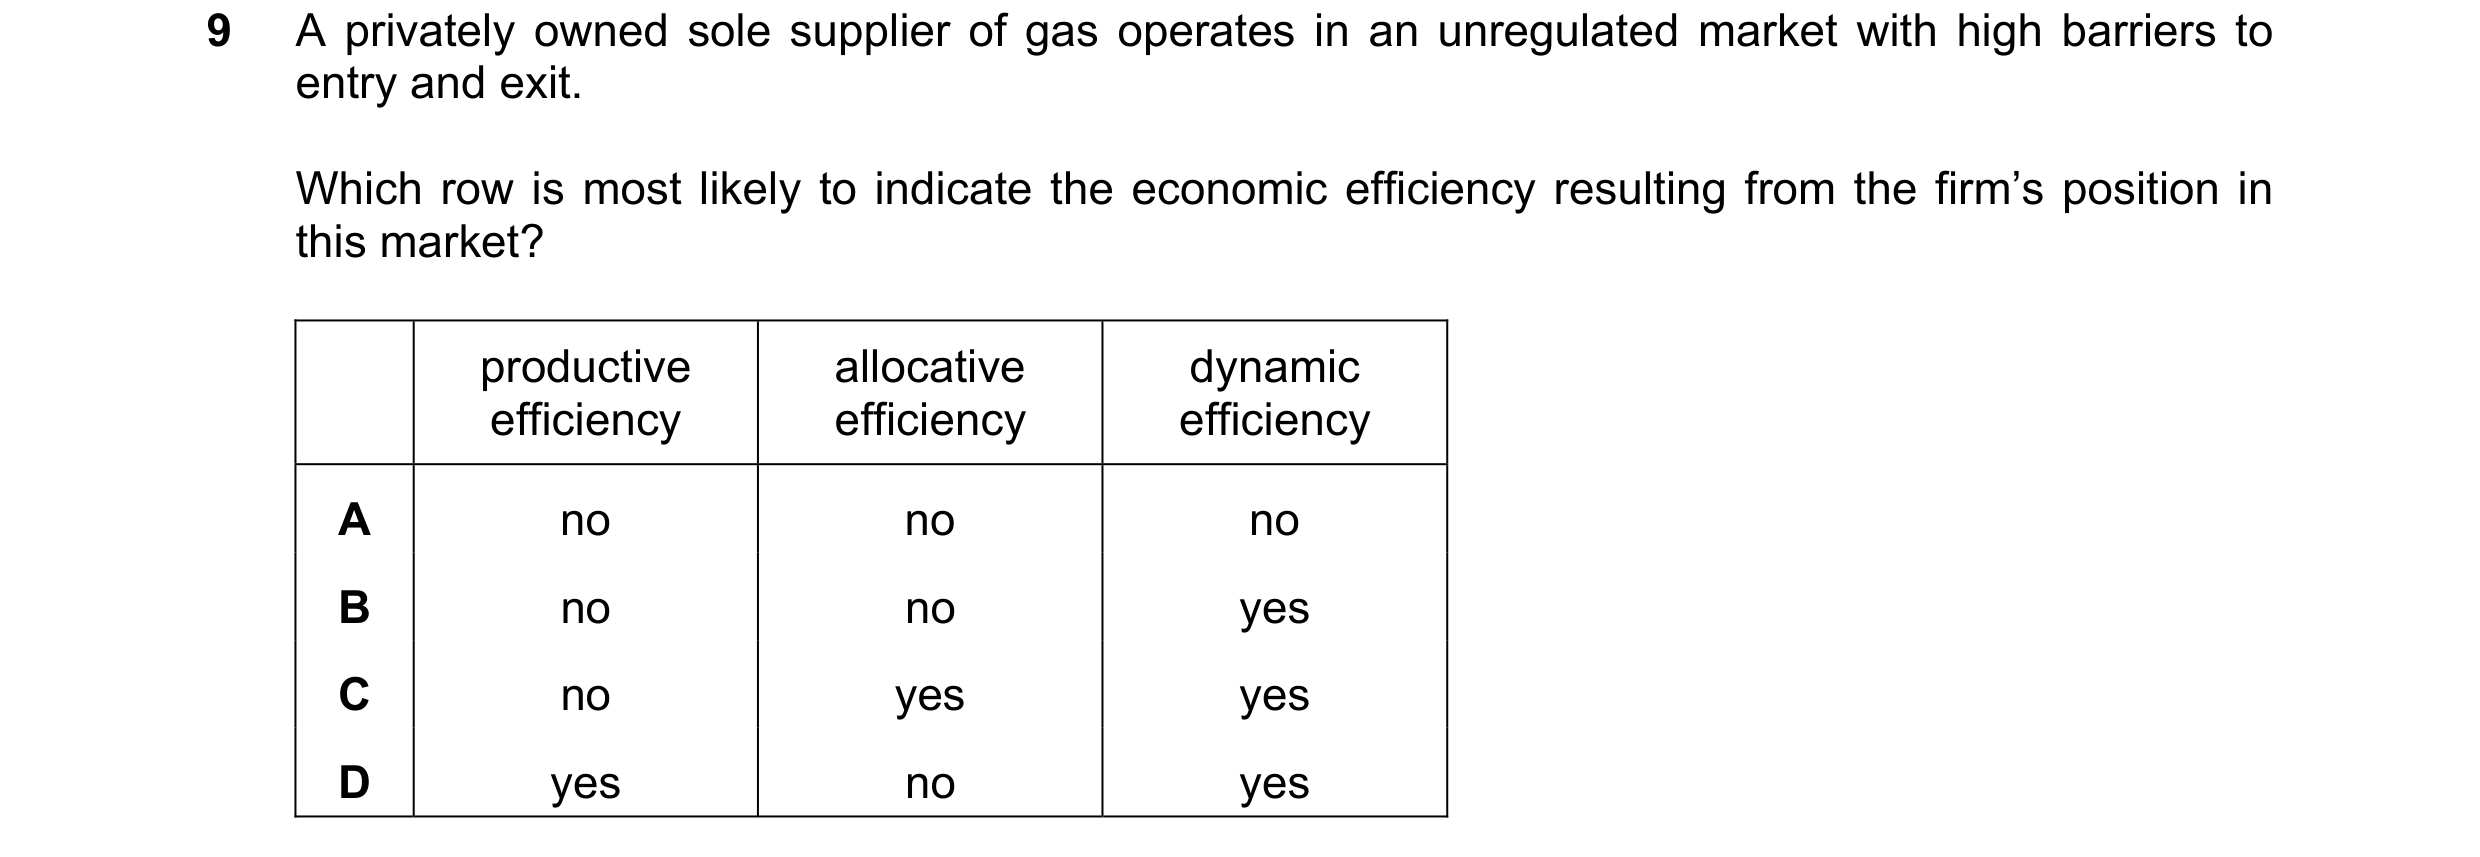
Q103 · A privately owned sole supplier of gas operates in an unregulated market with high… 9708/32 May/June 2023
9 A privately owned sole supplier of gas operates in an unregulated market with high barriers to entry and exit. Which row is most likely to indicate the economic efficiency resulting from the firm’s position in this market? productive allocative dynamic efficiency efficiency efficiency A no no no B no no yes C no yes yes D yes no yes
1 marks
Answer: B
This question in 9708/32 May/June 2023
Q104 · The initial allocation of goods between three consumers is shown 9708/33 May/June 2023
2 The initial allocation of goods between three consumers is shown. consumer 1 consumer 2 consumer 3 total 2 5 10 17 Which row shows a Pareto improvement in the allocation of goods between consumers? consumer 1 consumer 2 consumer 3 total A 2 5 11 18 B 4 5 9 18 C 4 4 10 18 D 6 6 6 18
1 marks
Answer: A
This question in 9708/33 May/June 2023
Q105 · Which type of efficiency is shown by the shift from long-run average cost curve 1 (LRAC1)… 9708/33 May/June 2023
4 Which type of efficiency is shown by the shift from long-run average cost curve 1 (LRAC1) to long-run average cost curve 2 (LRAC2)? price LRAC1 LRAC2 O quantity A allocative B dynamic C Pareto D productive
1 marks
Answer: B
This question in 9708/33 May/June 2023
Q106 · The diagram shows the demand for and supply of a good and the marginal social costs (MSC)… 9708/33 May/June 2023
10 The diagram shows the demand for and supply of a good and the marginal social costs (MSC) for that good. MSC costs, revenue S y x z w D O Q output Assuming there are no external benefits, which area measures the net social benefit at output OQ? A x B x – y C x + y D x – y – z
1 marks
Answer: B
This question in 9708/33 May/June 2023
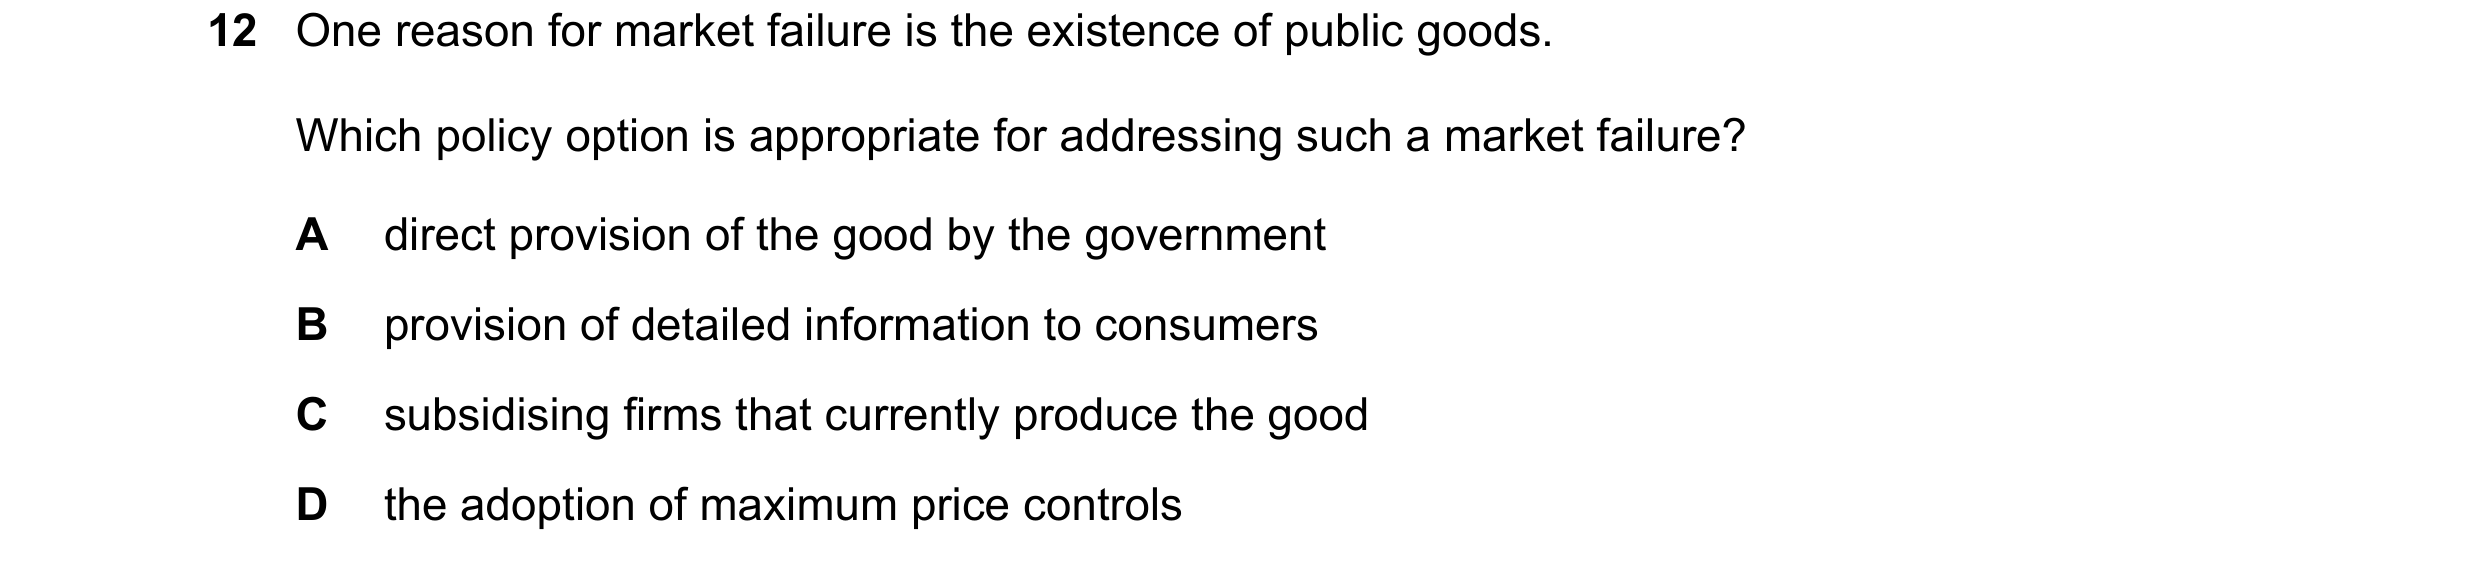
Q107 · One reason for market failure is the existence of public goods 9708/33 May/June 2023
12 One reason for market failure is the existence of public goods. Which policy option is appropriate for addressing such a market failure? A direct provision of the good by the government B provision of detailed information to consumers C subsidising firms that currently produce the good D the adoption of maximum price controls
1 marks
Answer: A
This question in 9708/33 May/June 2023
Q108 · How is dynamic efficiency represented on a diagram? 9708/31 Oct/Nov 2023
8 How is dynamic efficiency represented on a diagram? A a downward move to the minimum point of a long-run average cost curve B a downward shift in the long-run average cost curve C a move from a point inside a production possibility curve to a point on it D a reduction in marginal revenue so that it equals long-run marginal cost
1 marks
Answer: B
This question in 9708/31 Oct/Nov 2023
Q109 · What is consistent with a movement towards Pareto optimality? 9708/33 Oct/Nov 2023
10 What is consistent with a movement towards Pareto optimality? A when negative externality lowers the utility of an individual B when consumption of a good is non-rival C when reallocation of resources can make someone better off without making any other person worse off D when trade takes place to make one nation better off at the expense of its trading partner
1 marks
Answer: C
This question in 9708/33 Oct/Nov 2023
Q110 · What is an example of market failure? 9708/32 Feb/March 2025
2 What is an example of market failure? A a firm incurring a loss by selling goods at prices below the average cost B a guaranteed price that results in the accumulation of unsold stocks C low income earners being unable to buy high-priced goods D under-provision of a socially desirable good
1 marks
Answer: D
This question in 9708/32 Feb/March 2025
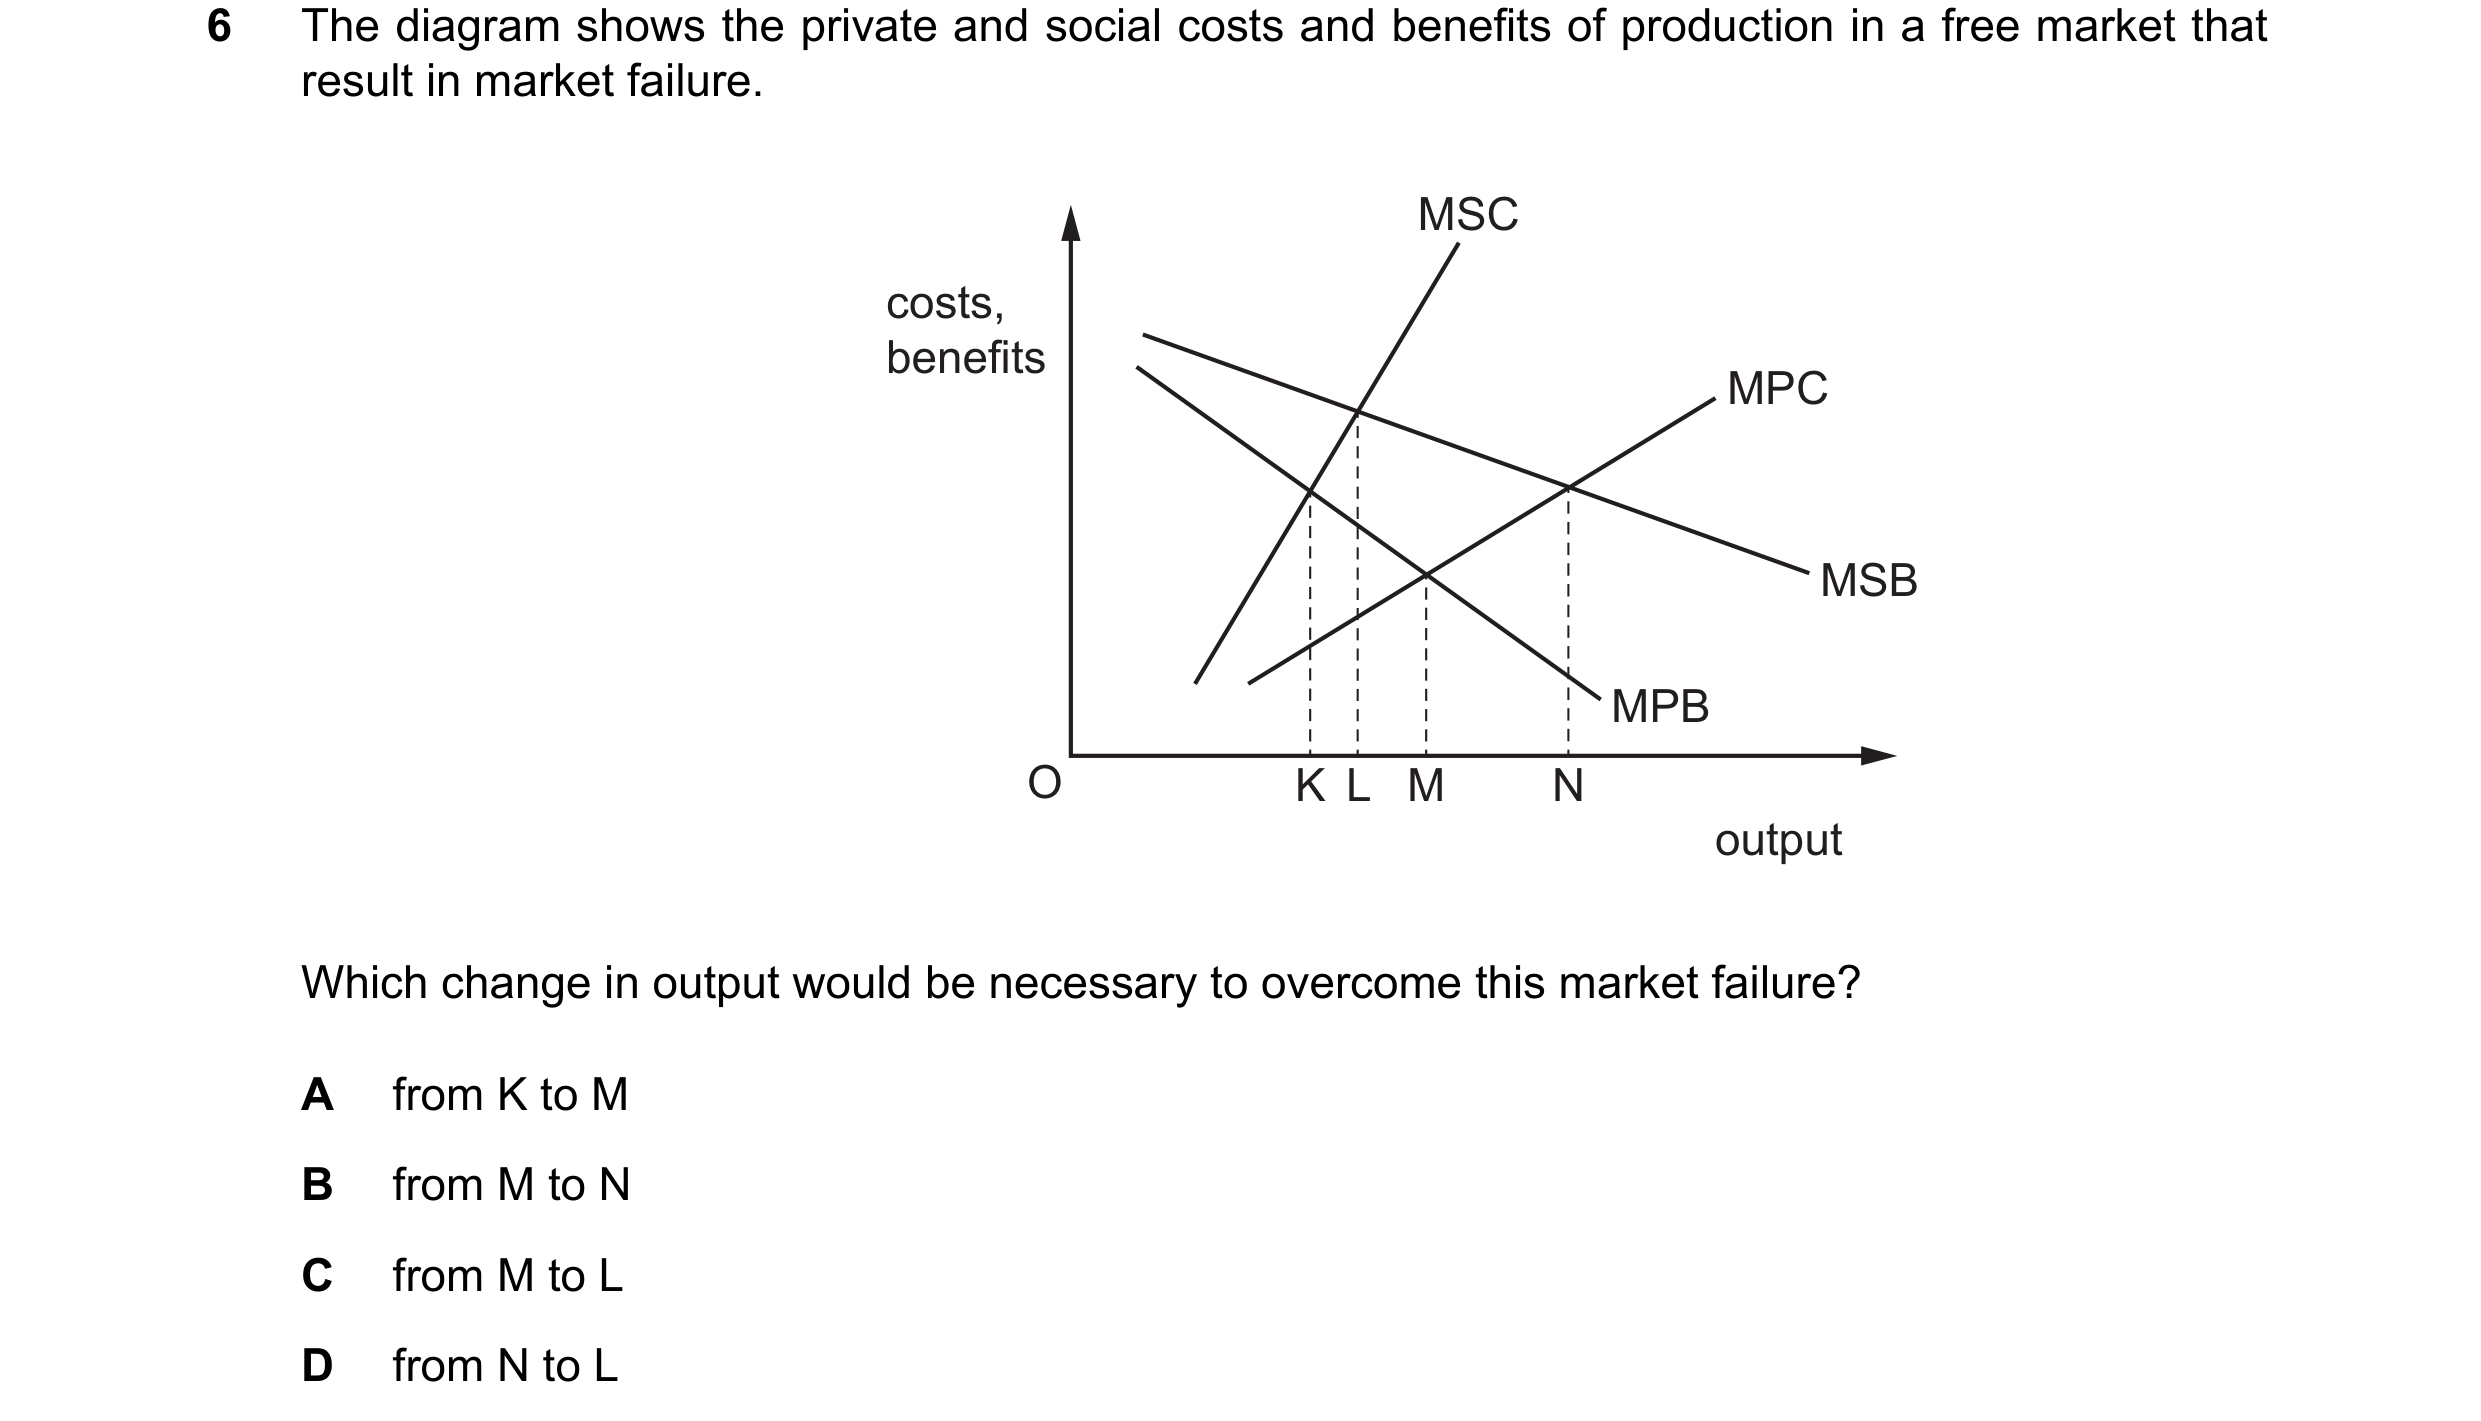
Q111 · The diagram shows the private and social costs and benefits of production in a free… 9708/32 Feb/March 2025
6 The diagram shows the private and social costs and benefits of production in a free market that result in market failure. MSC costs, benefits MPC MSB MPB O K L M N output Which change in output would be necessary to overcome this market failure? A from K to M B from M to N C from M to L D from N to L
1 marks
Answer: C
This question in 9708/32 Feb/March 2025
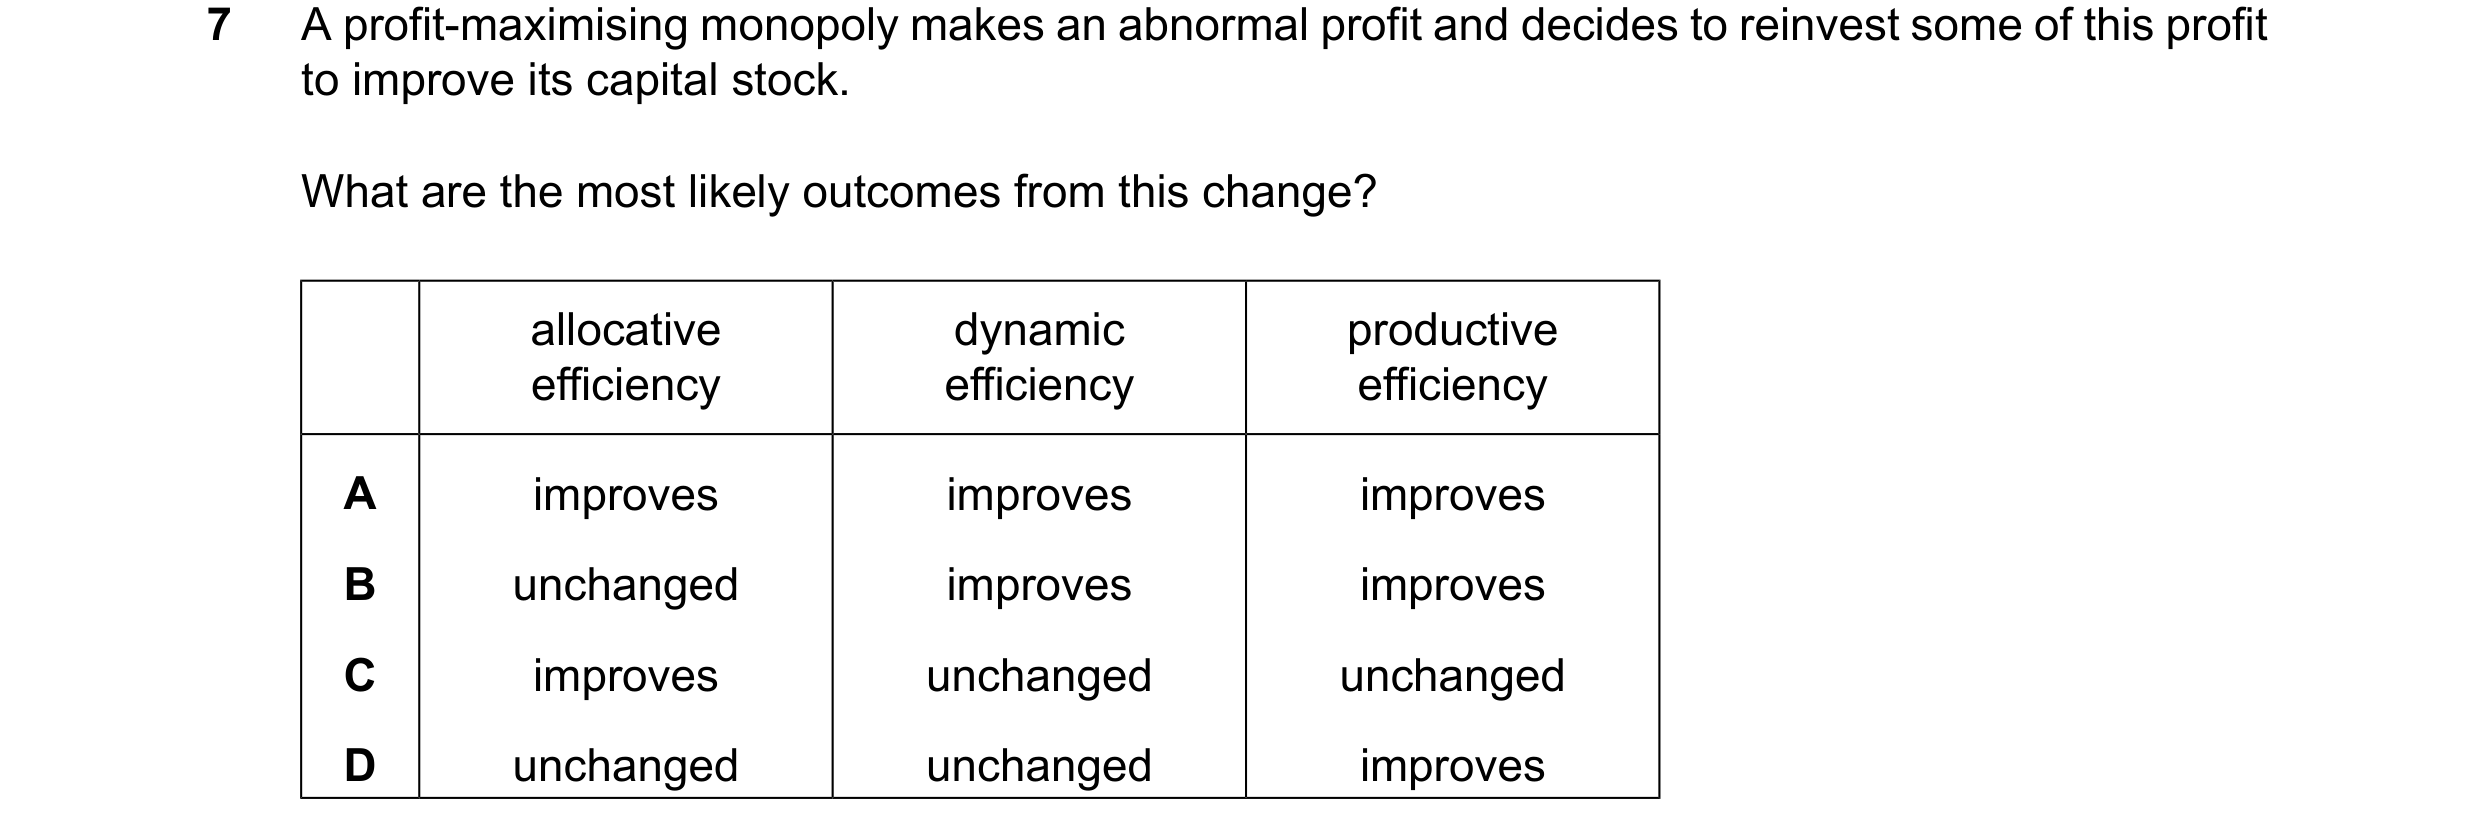
Q112 · A profit-maximising monopoly makes an abnormal profit and decides to reinvest some of… 9708/32 Feb/March 2025
7 A profit-maximising monopoly makes an abnormal profit and decides to reinvest some of this profit to improve its capital stock. What are the most likely outcomes from this change? allocative dynamic productive efficiency efficiency efficiency A improves improves improves B unchanged improves improves C improves unchanged unchanged D unchanged unchanged improves
1 marks
Answer: B
This question in 9708/32 Feb/March 2025
 1 / 32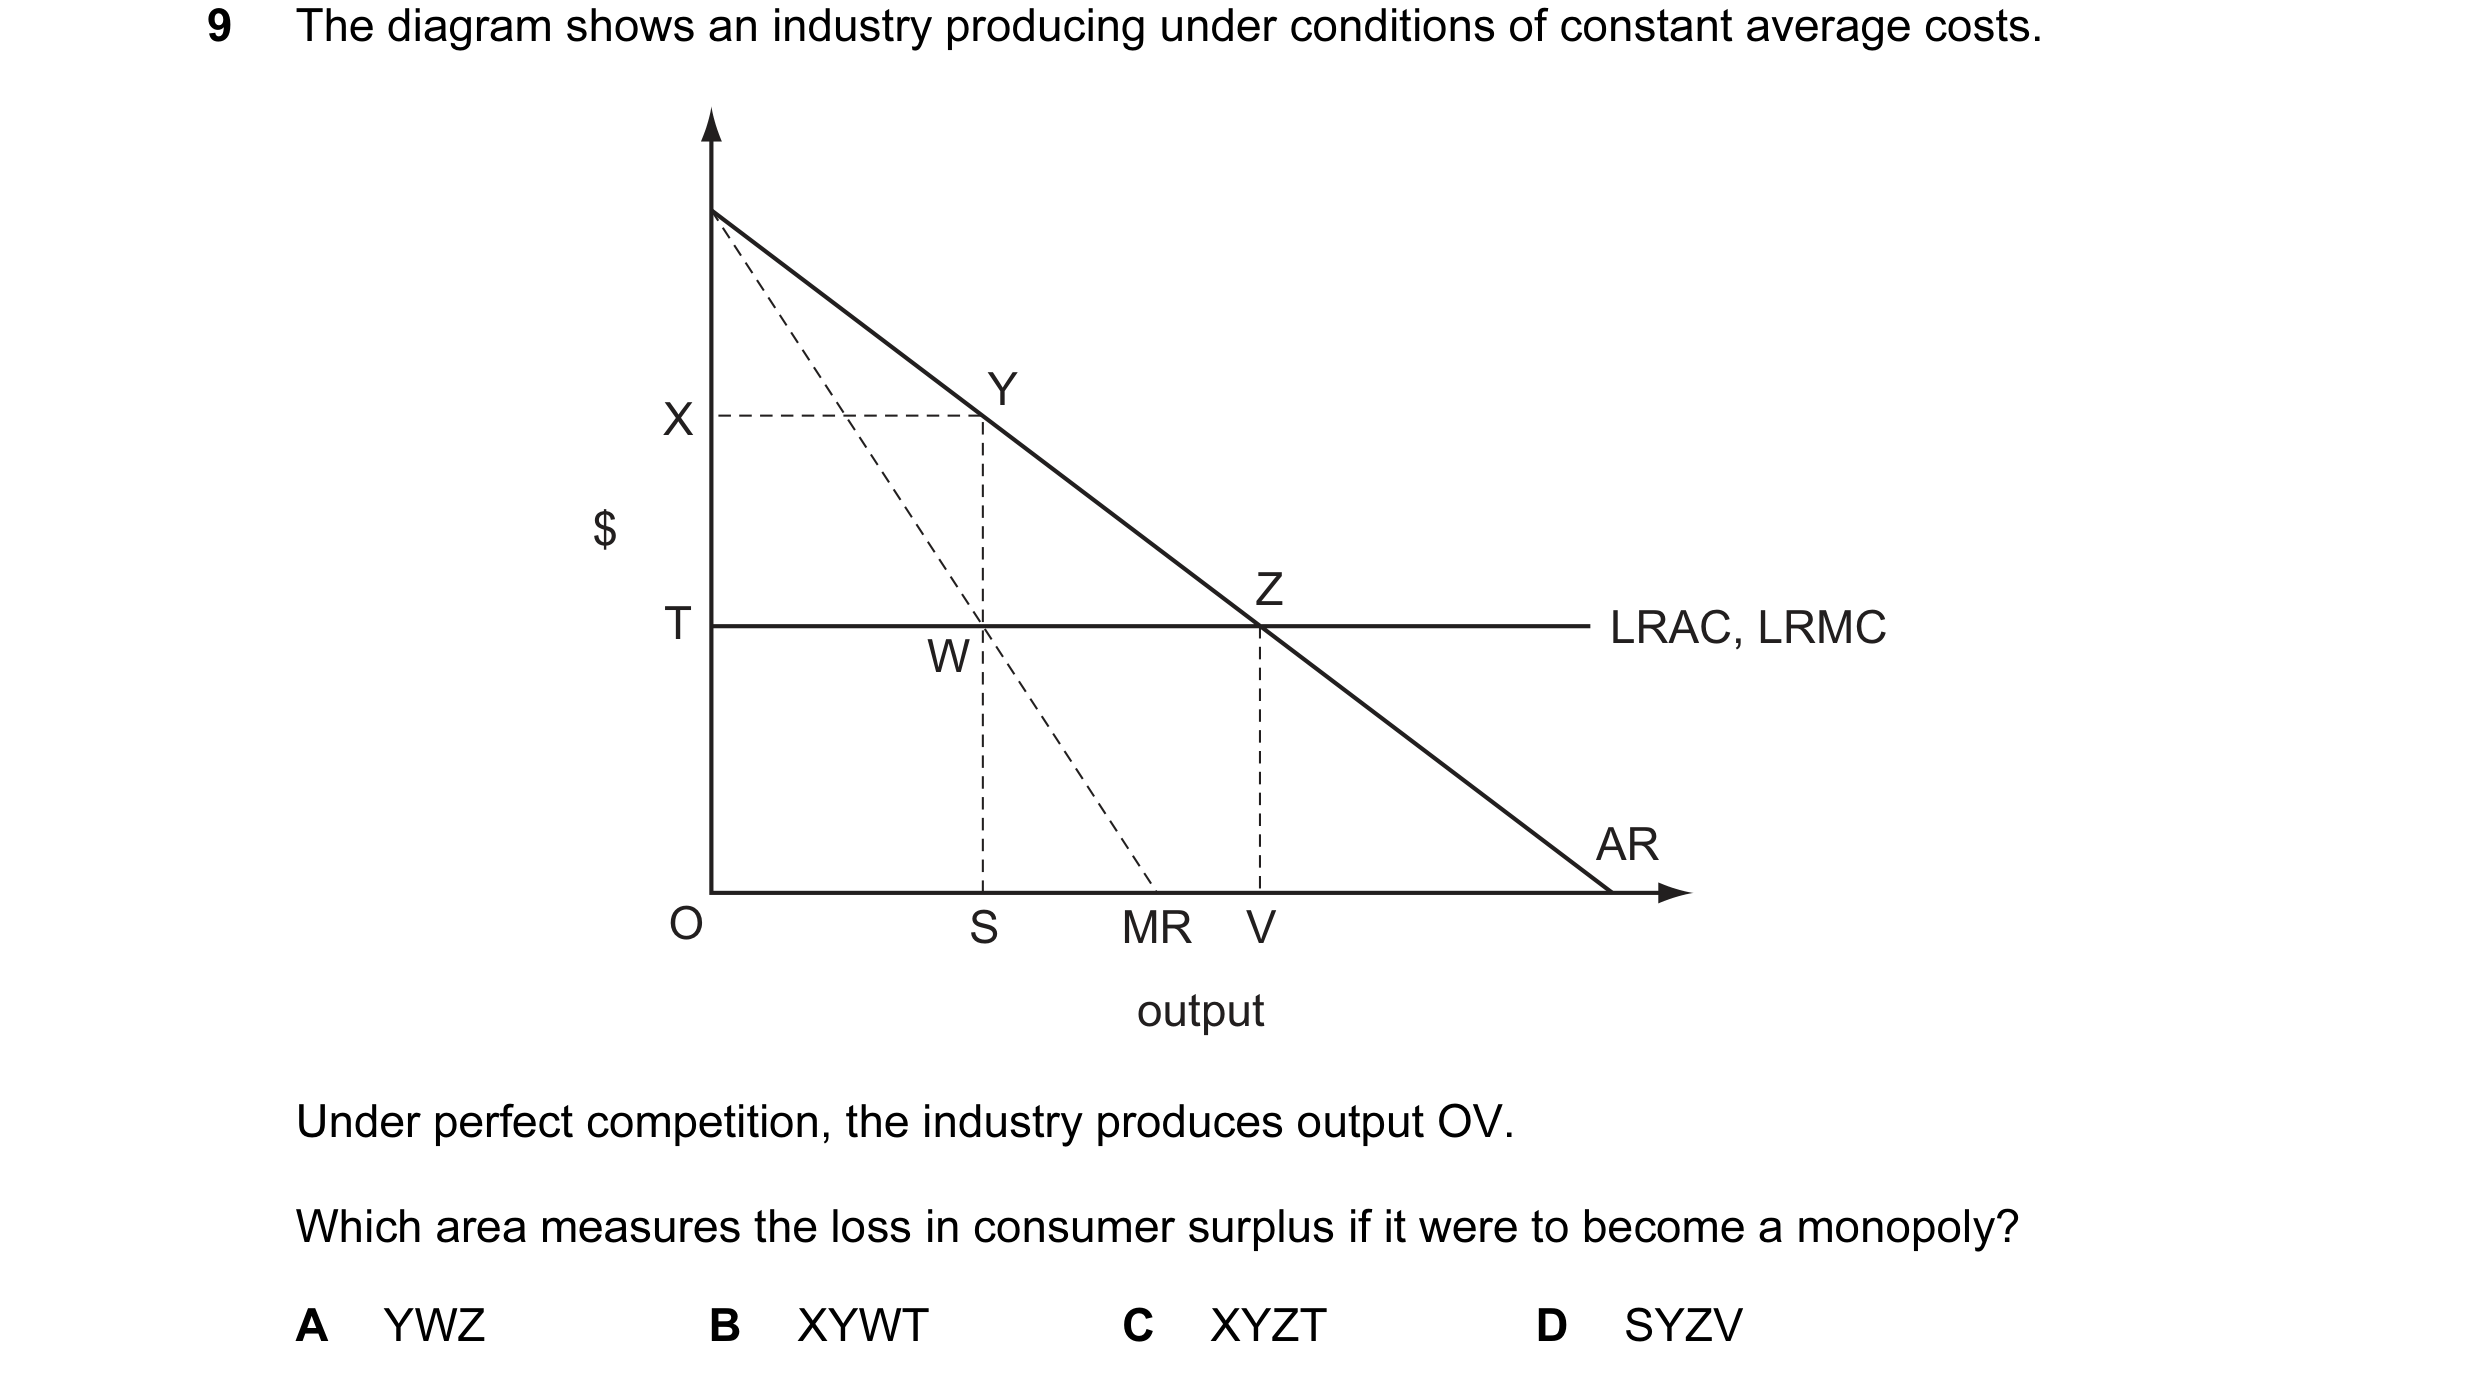

 2 / 32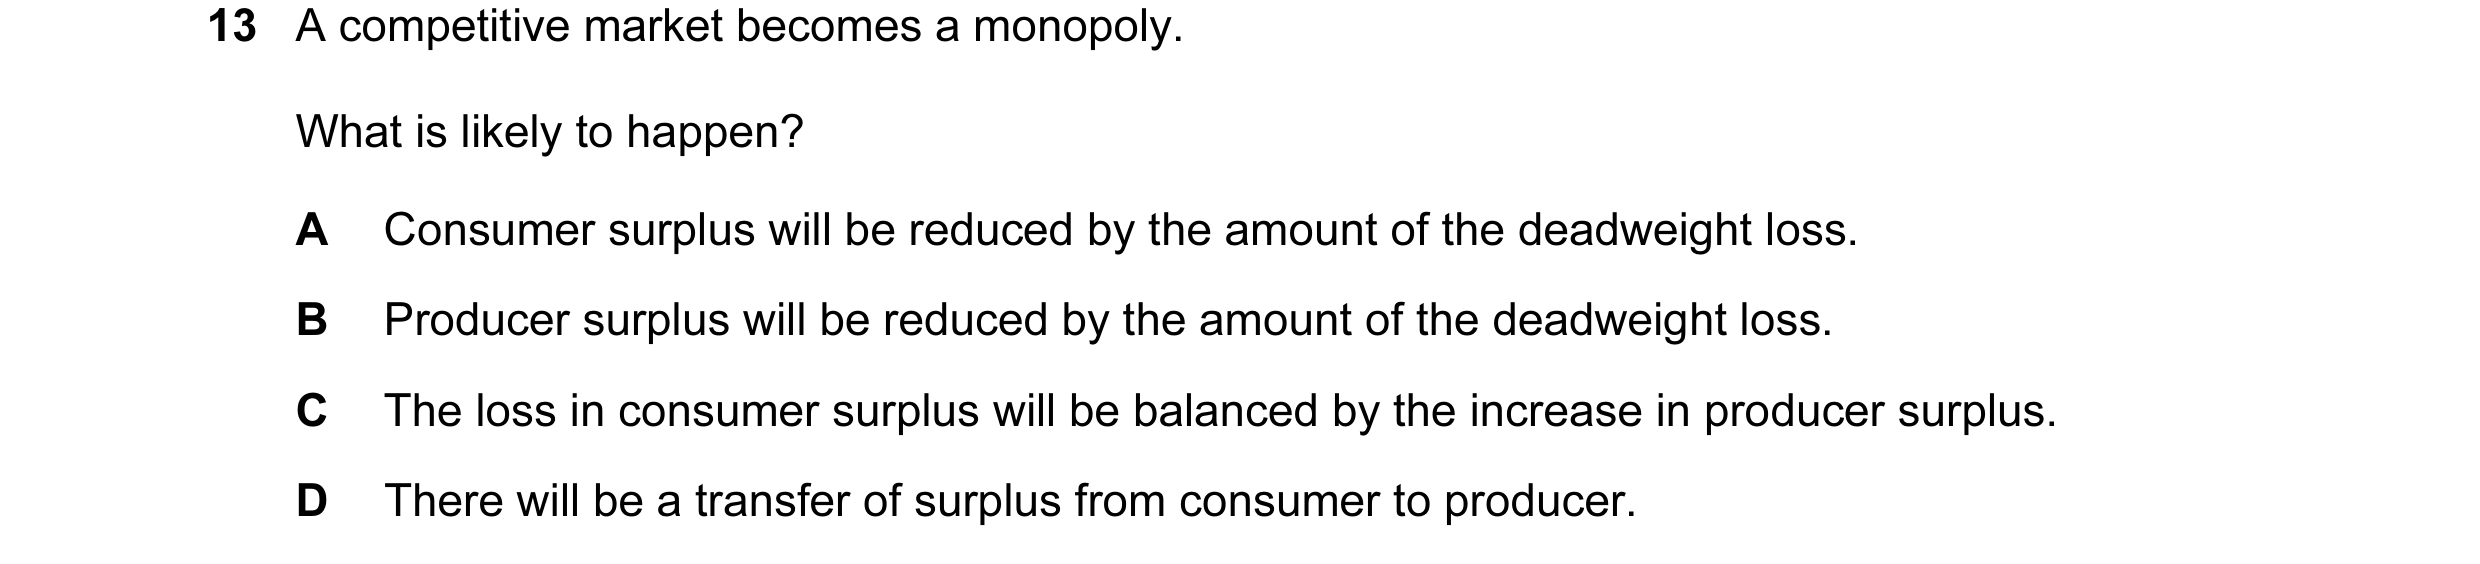
 3 / 32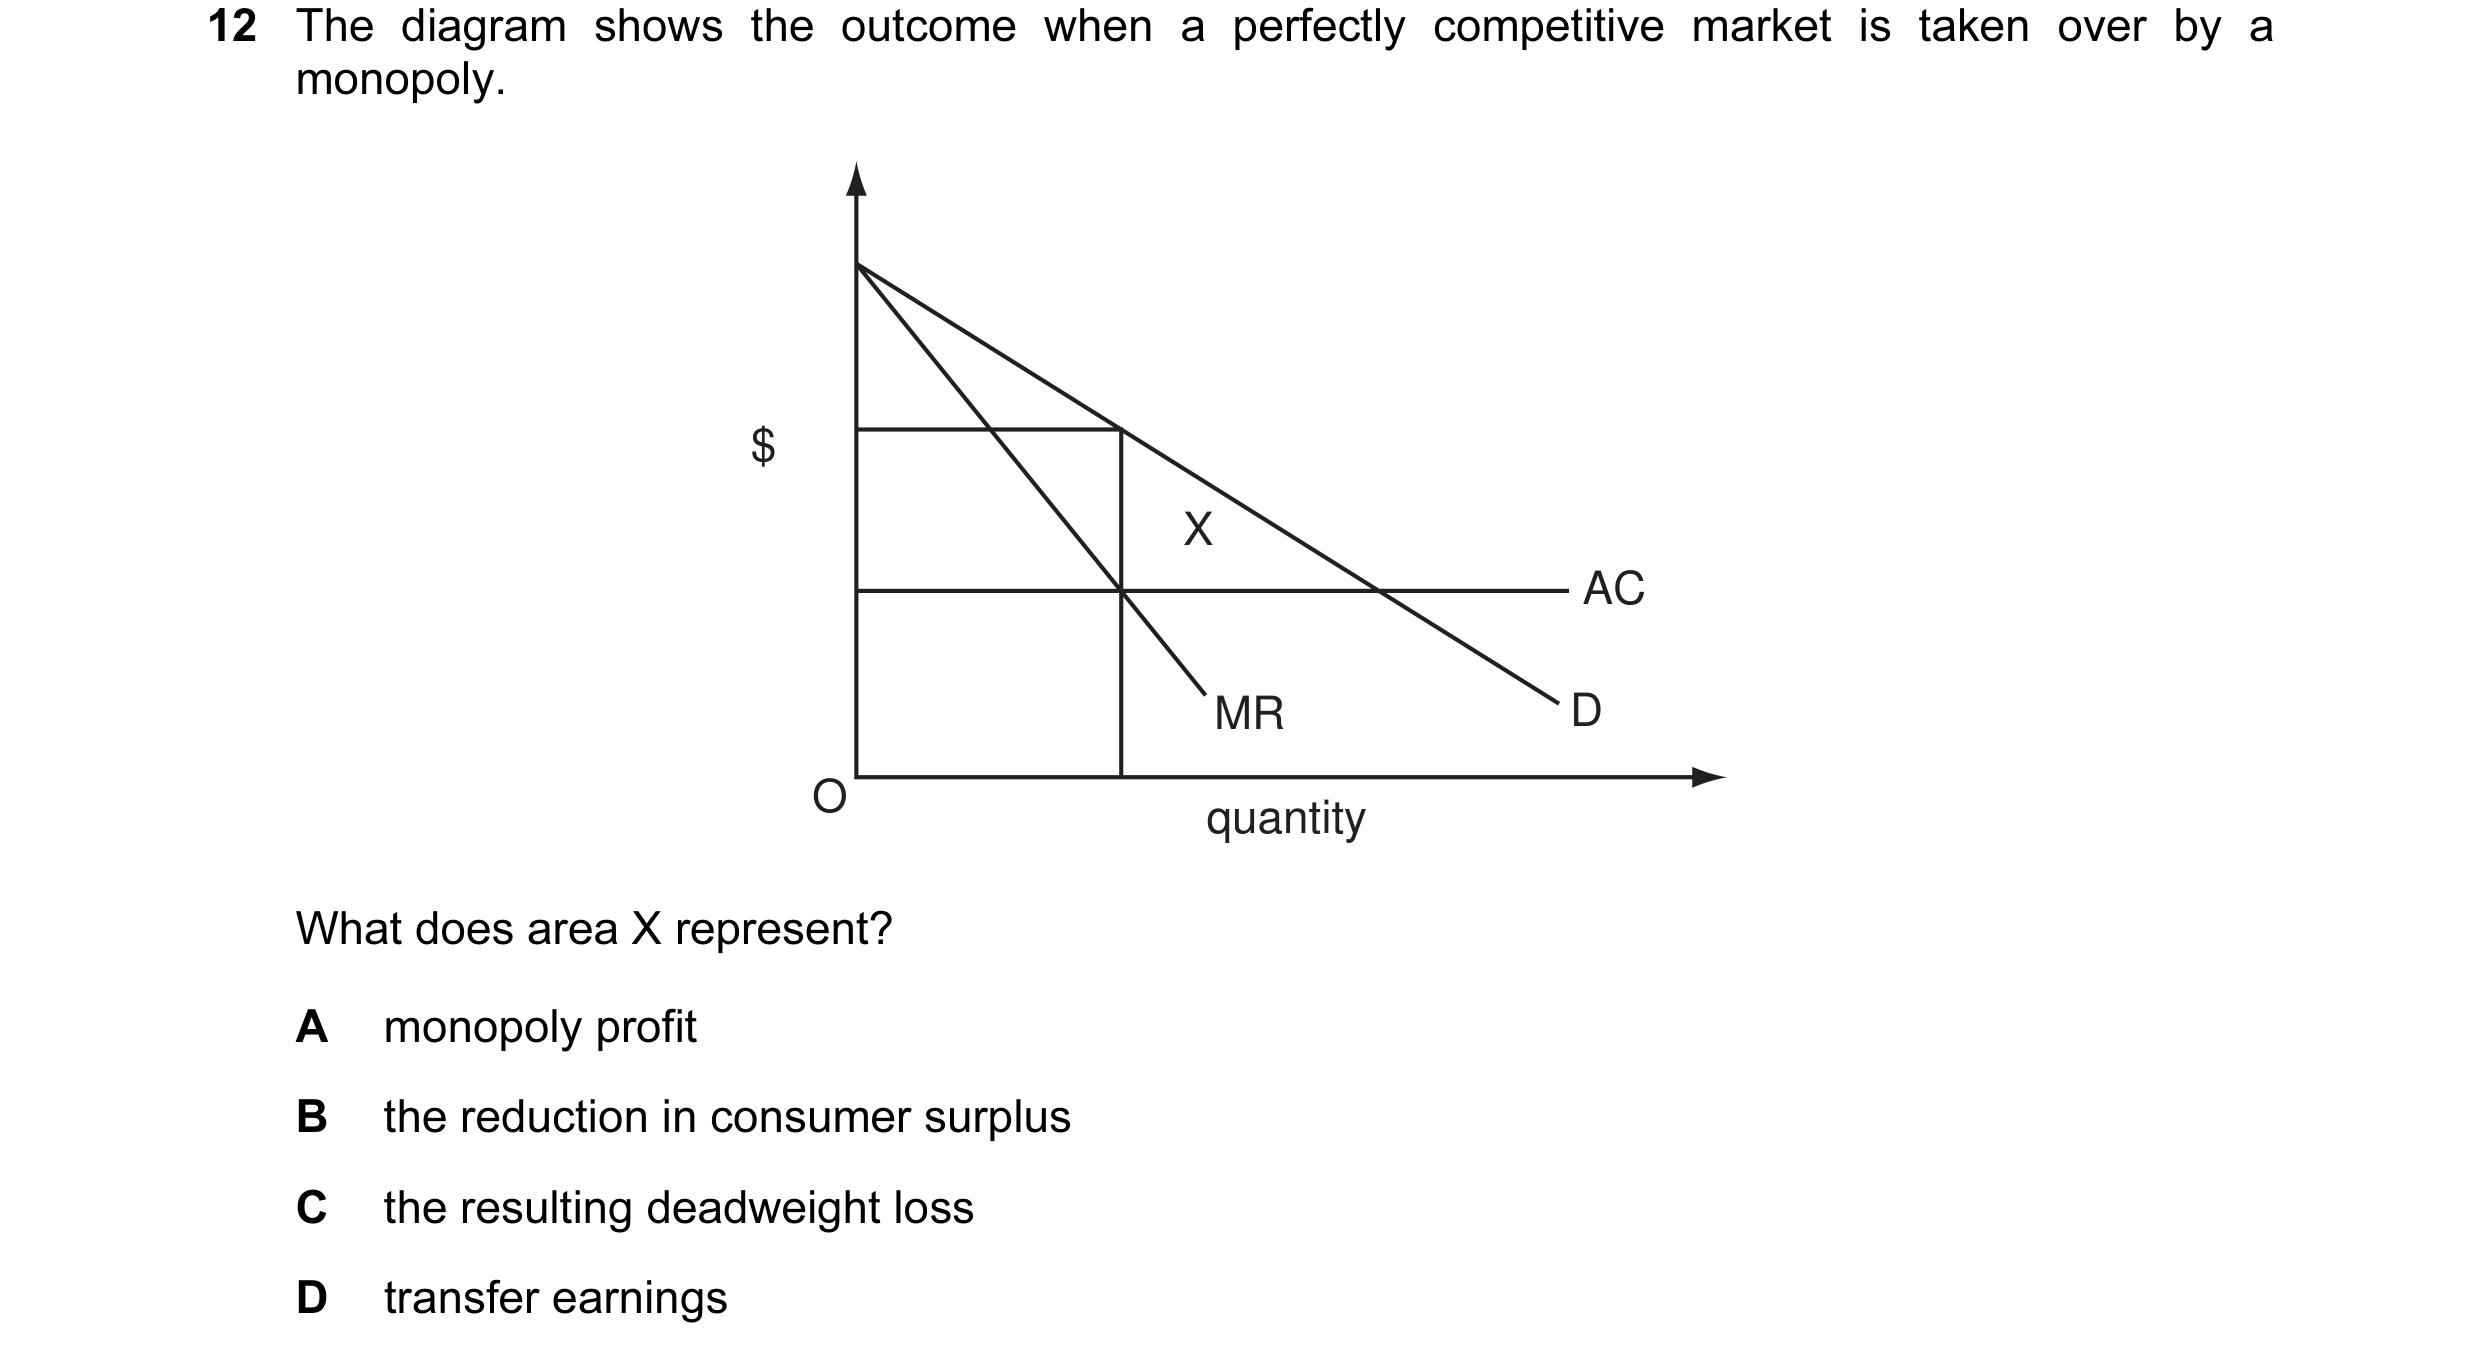
 4 / 32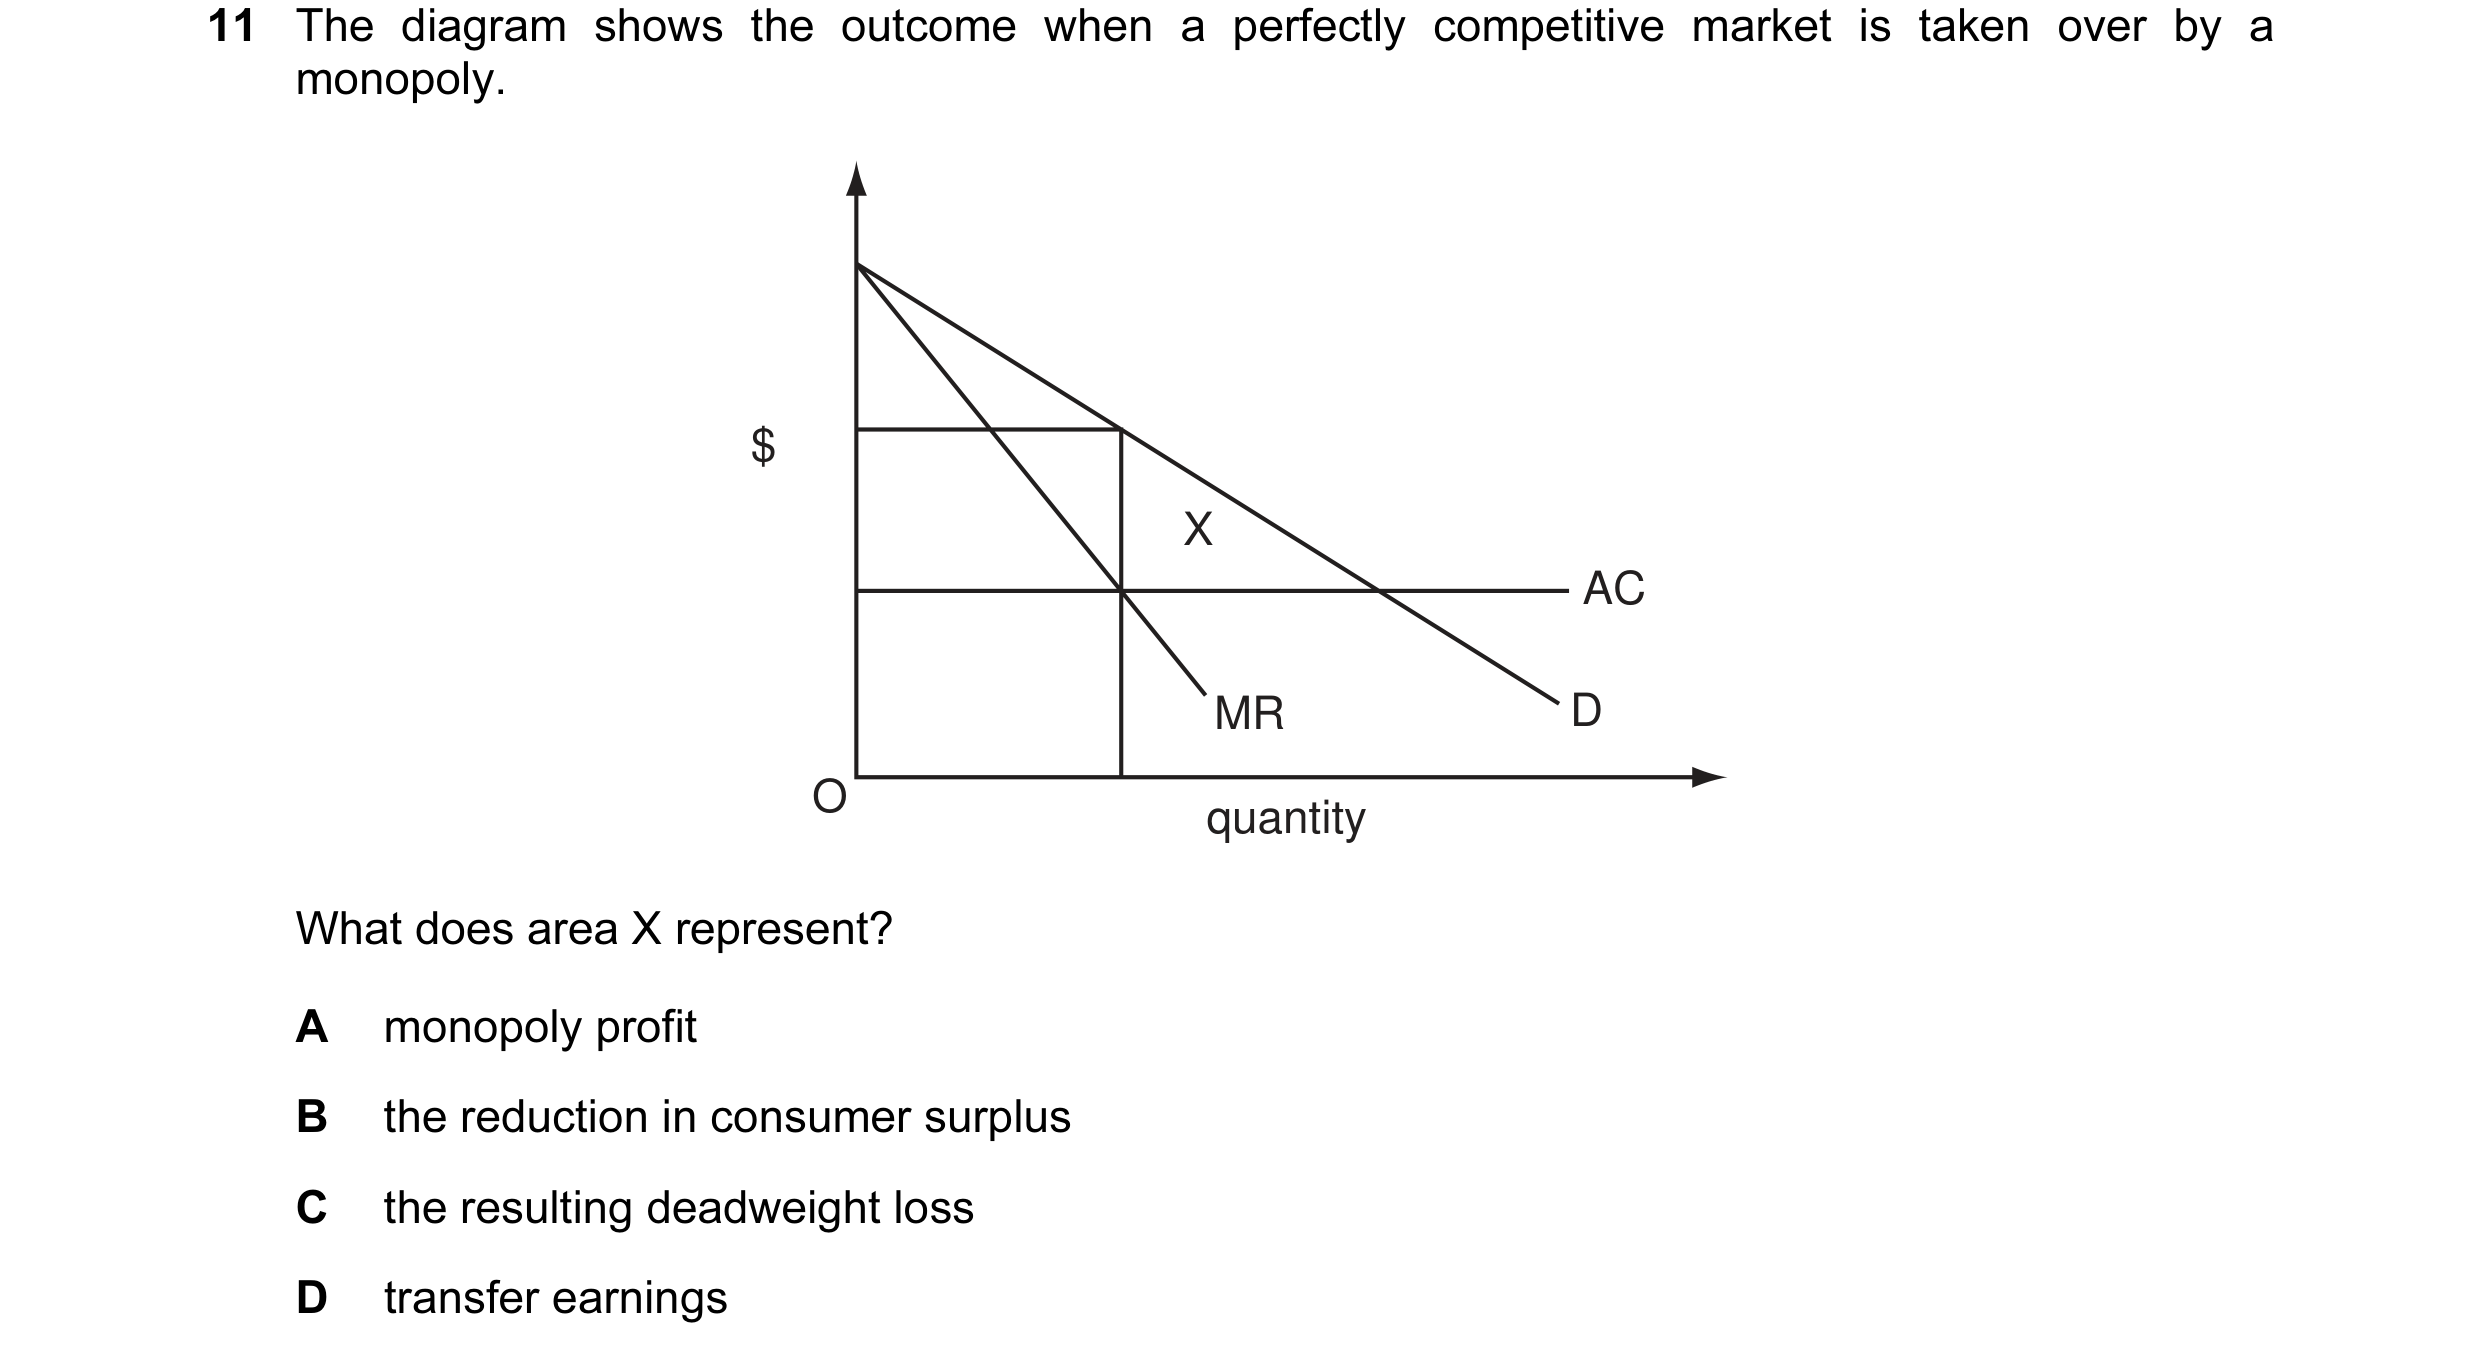
 5 / 32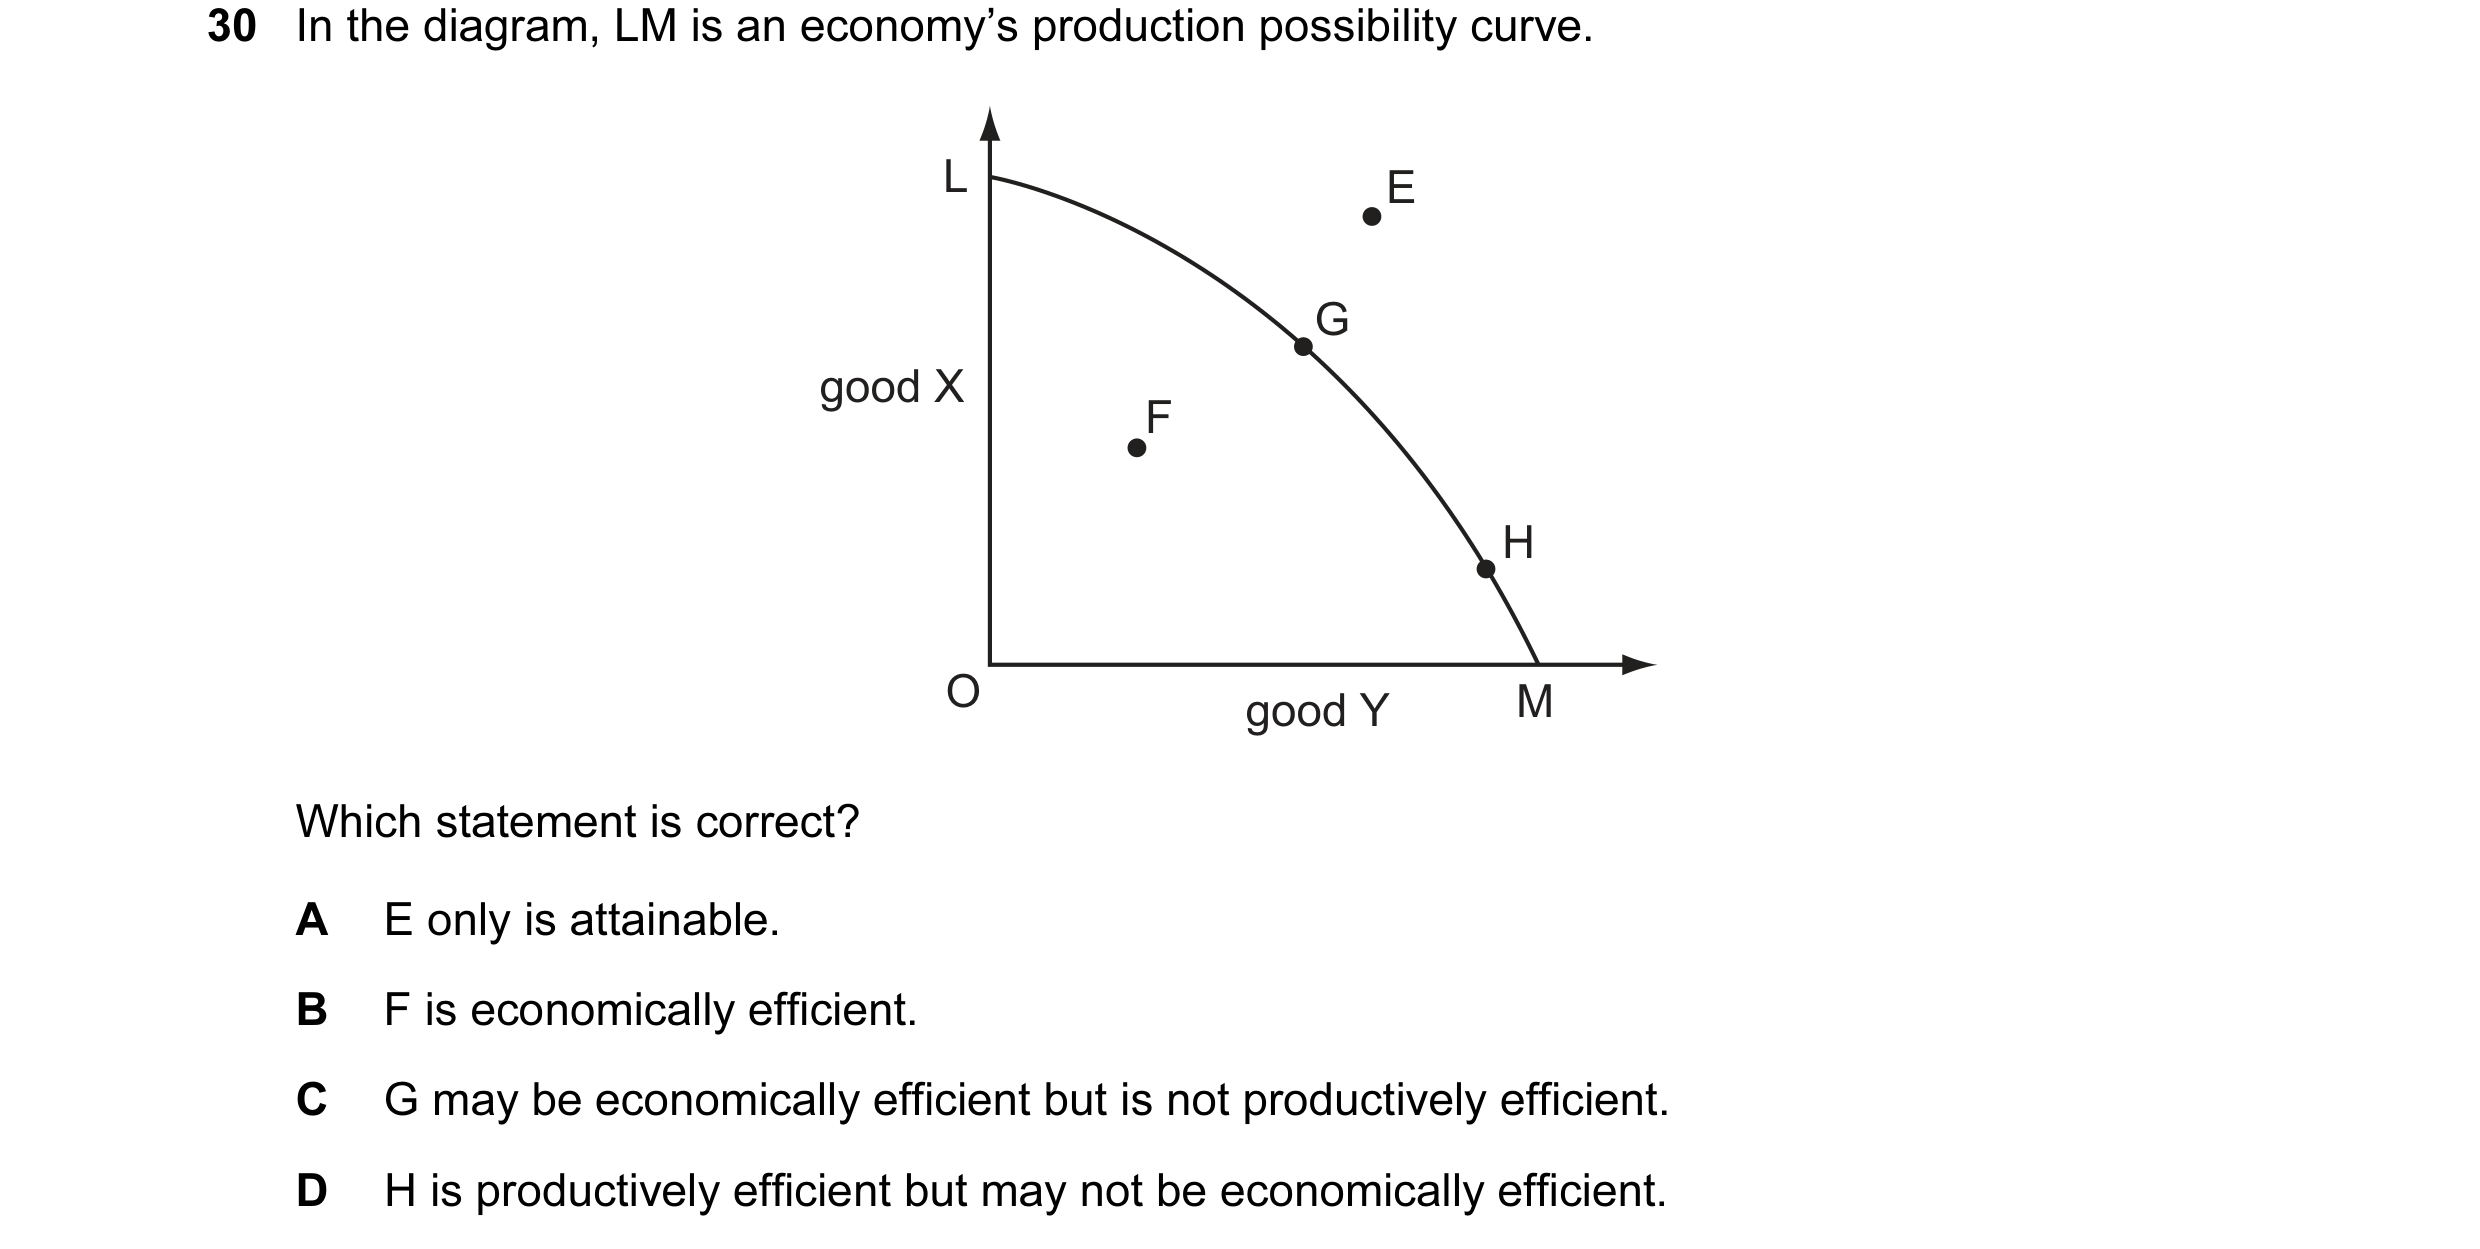
 6 / 32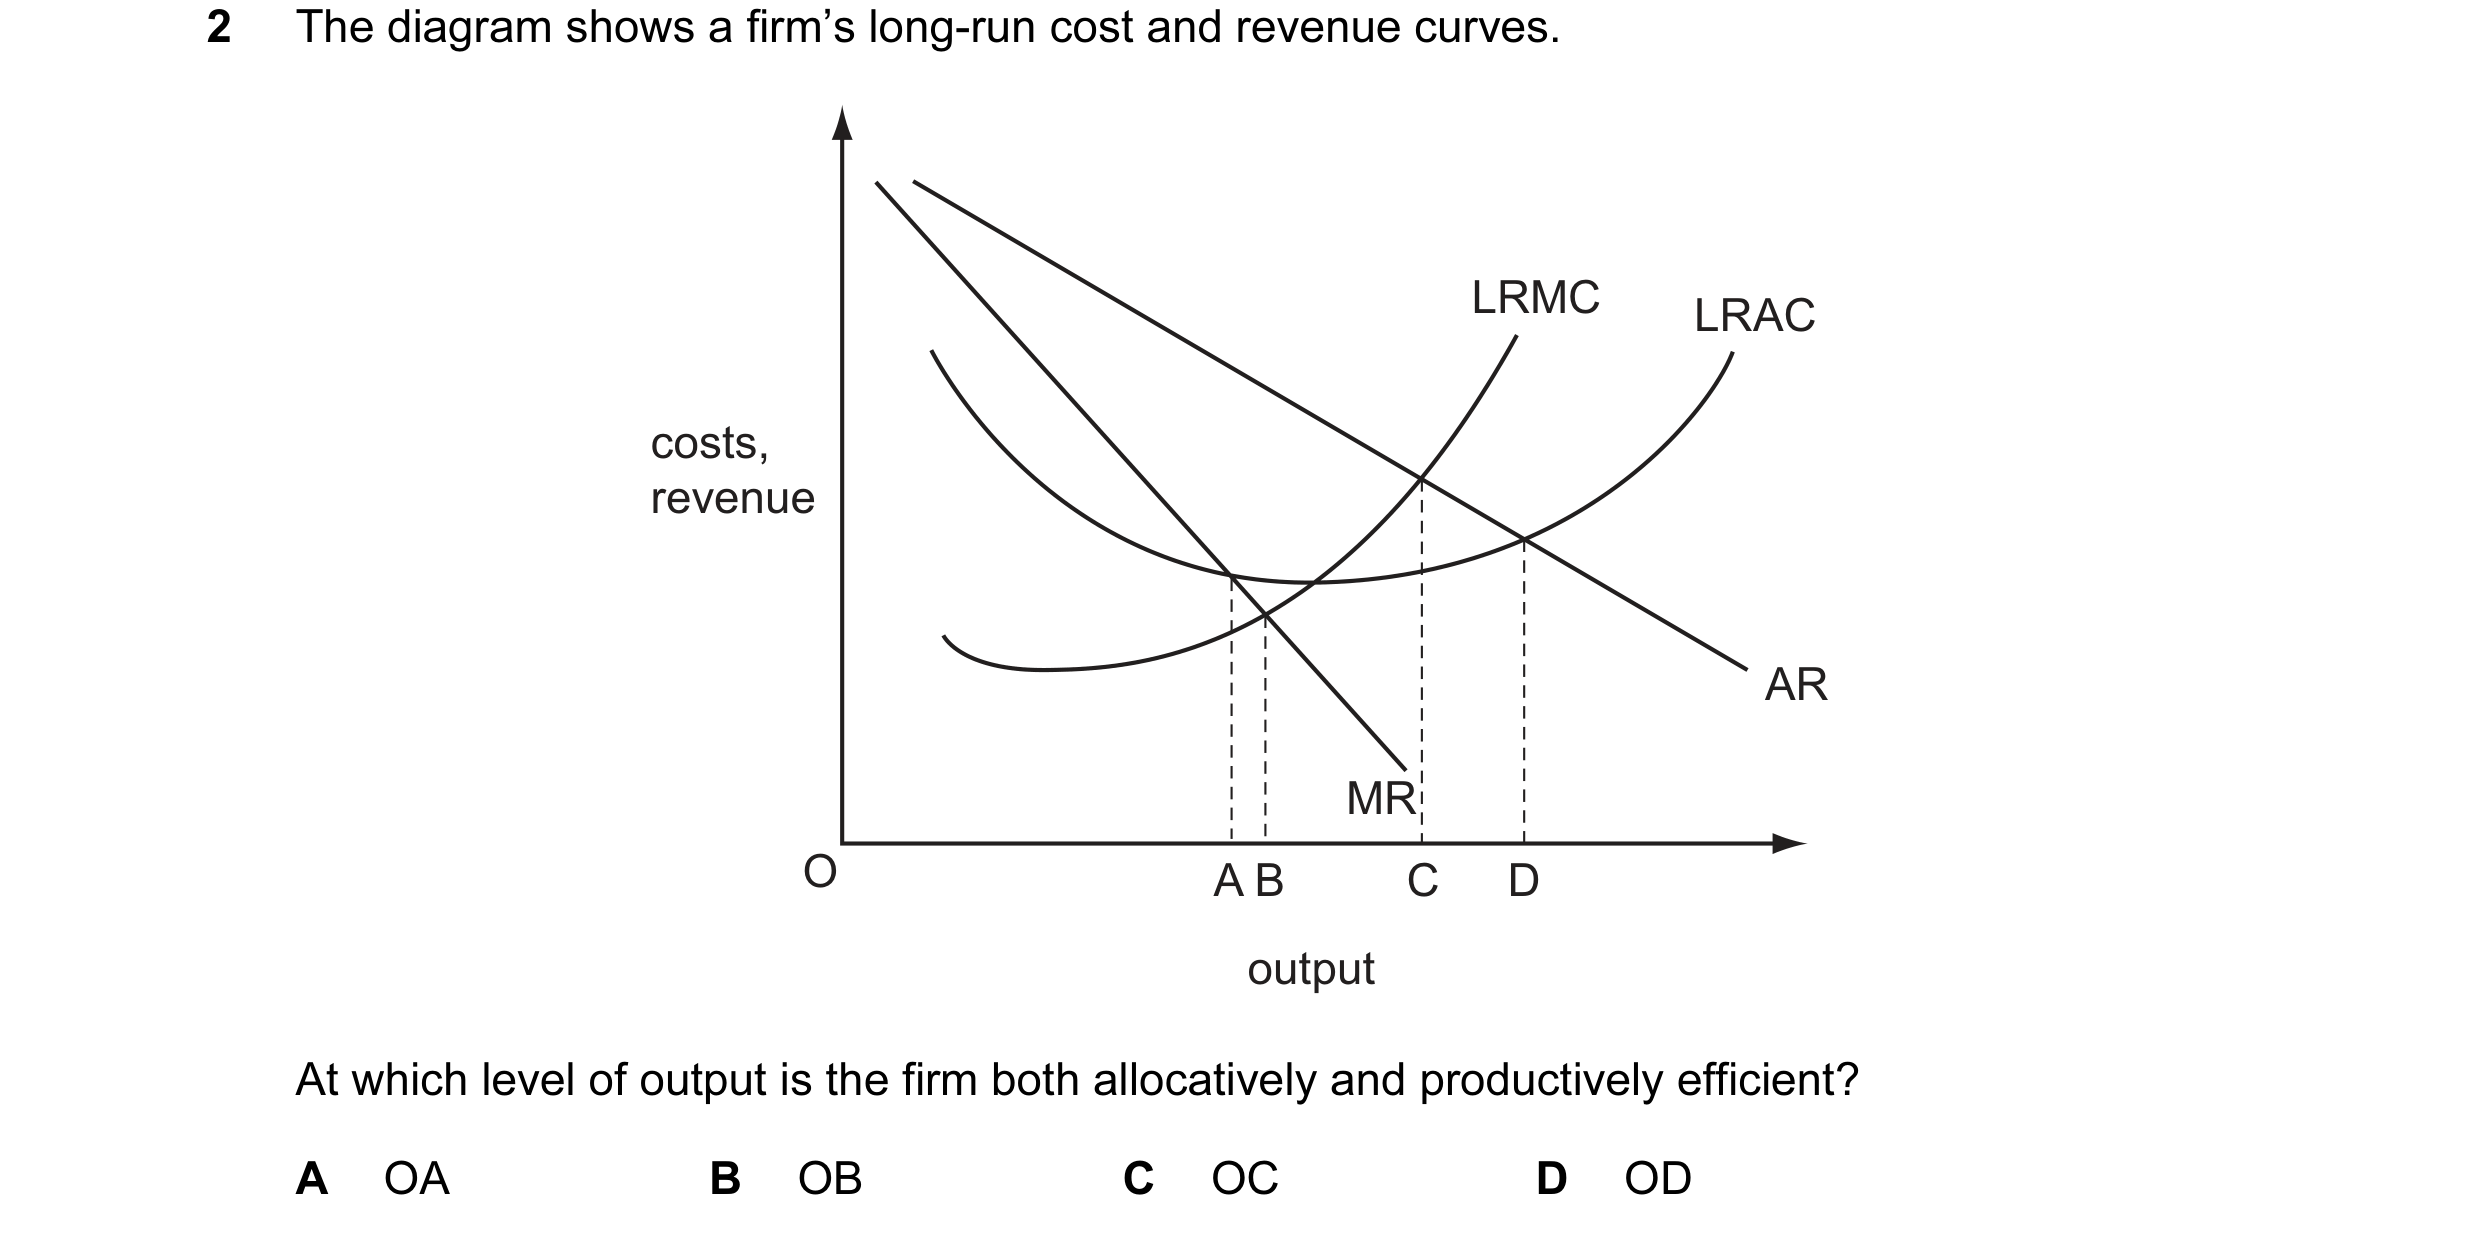

 7 / 32
 8 / 32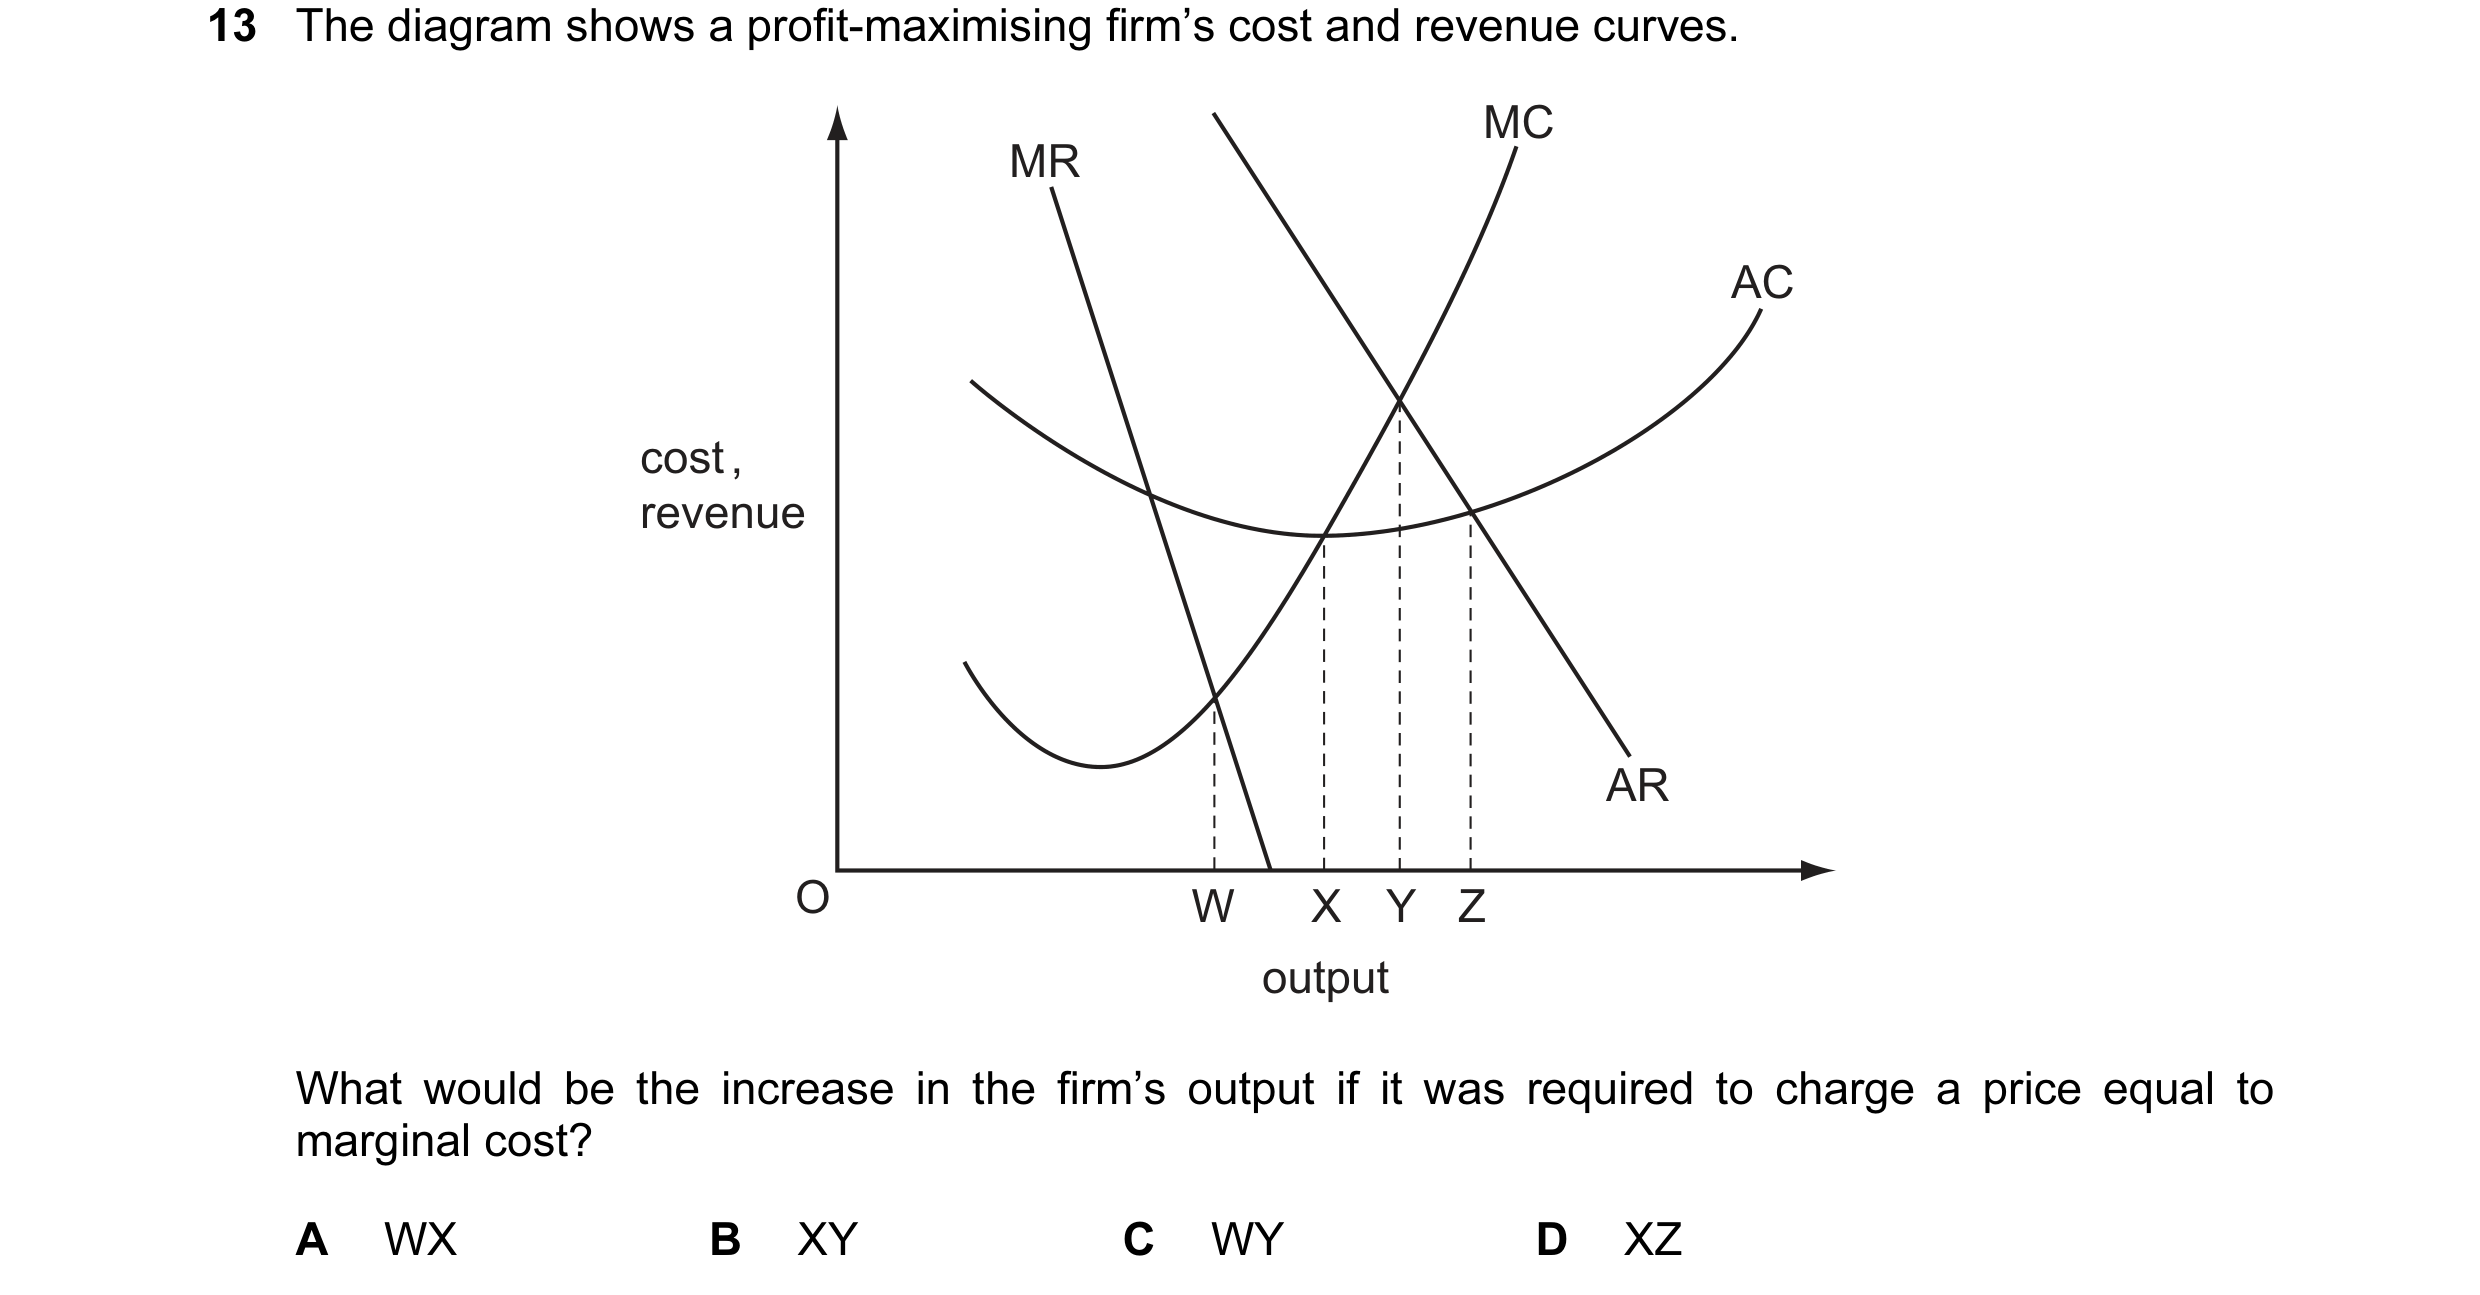
 9 / 32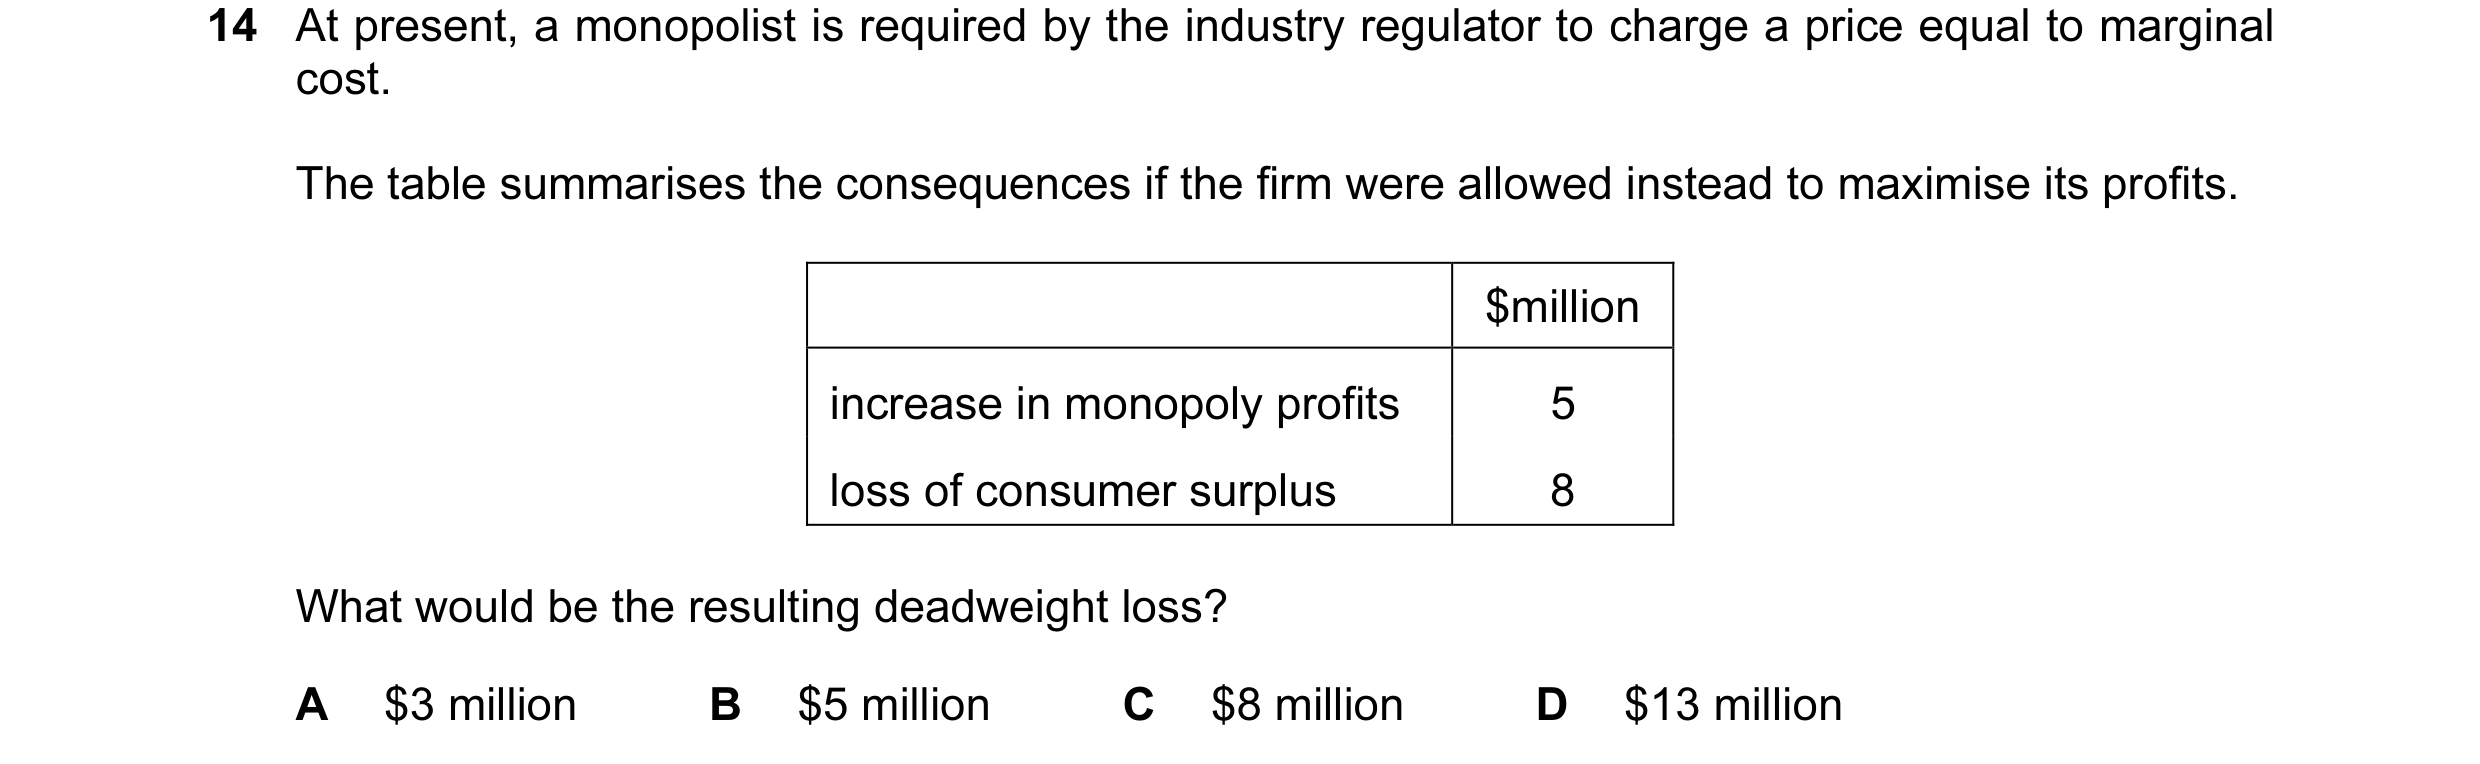
 10 / 32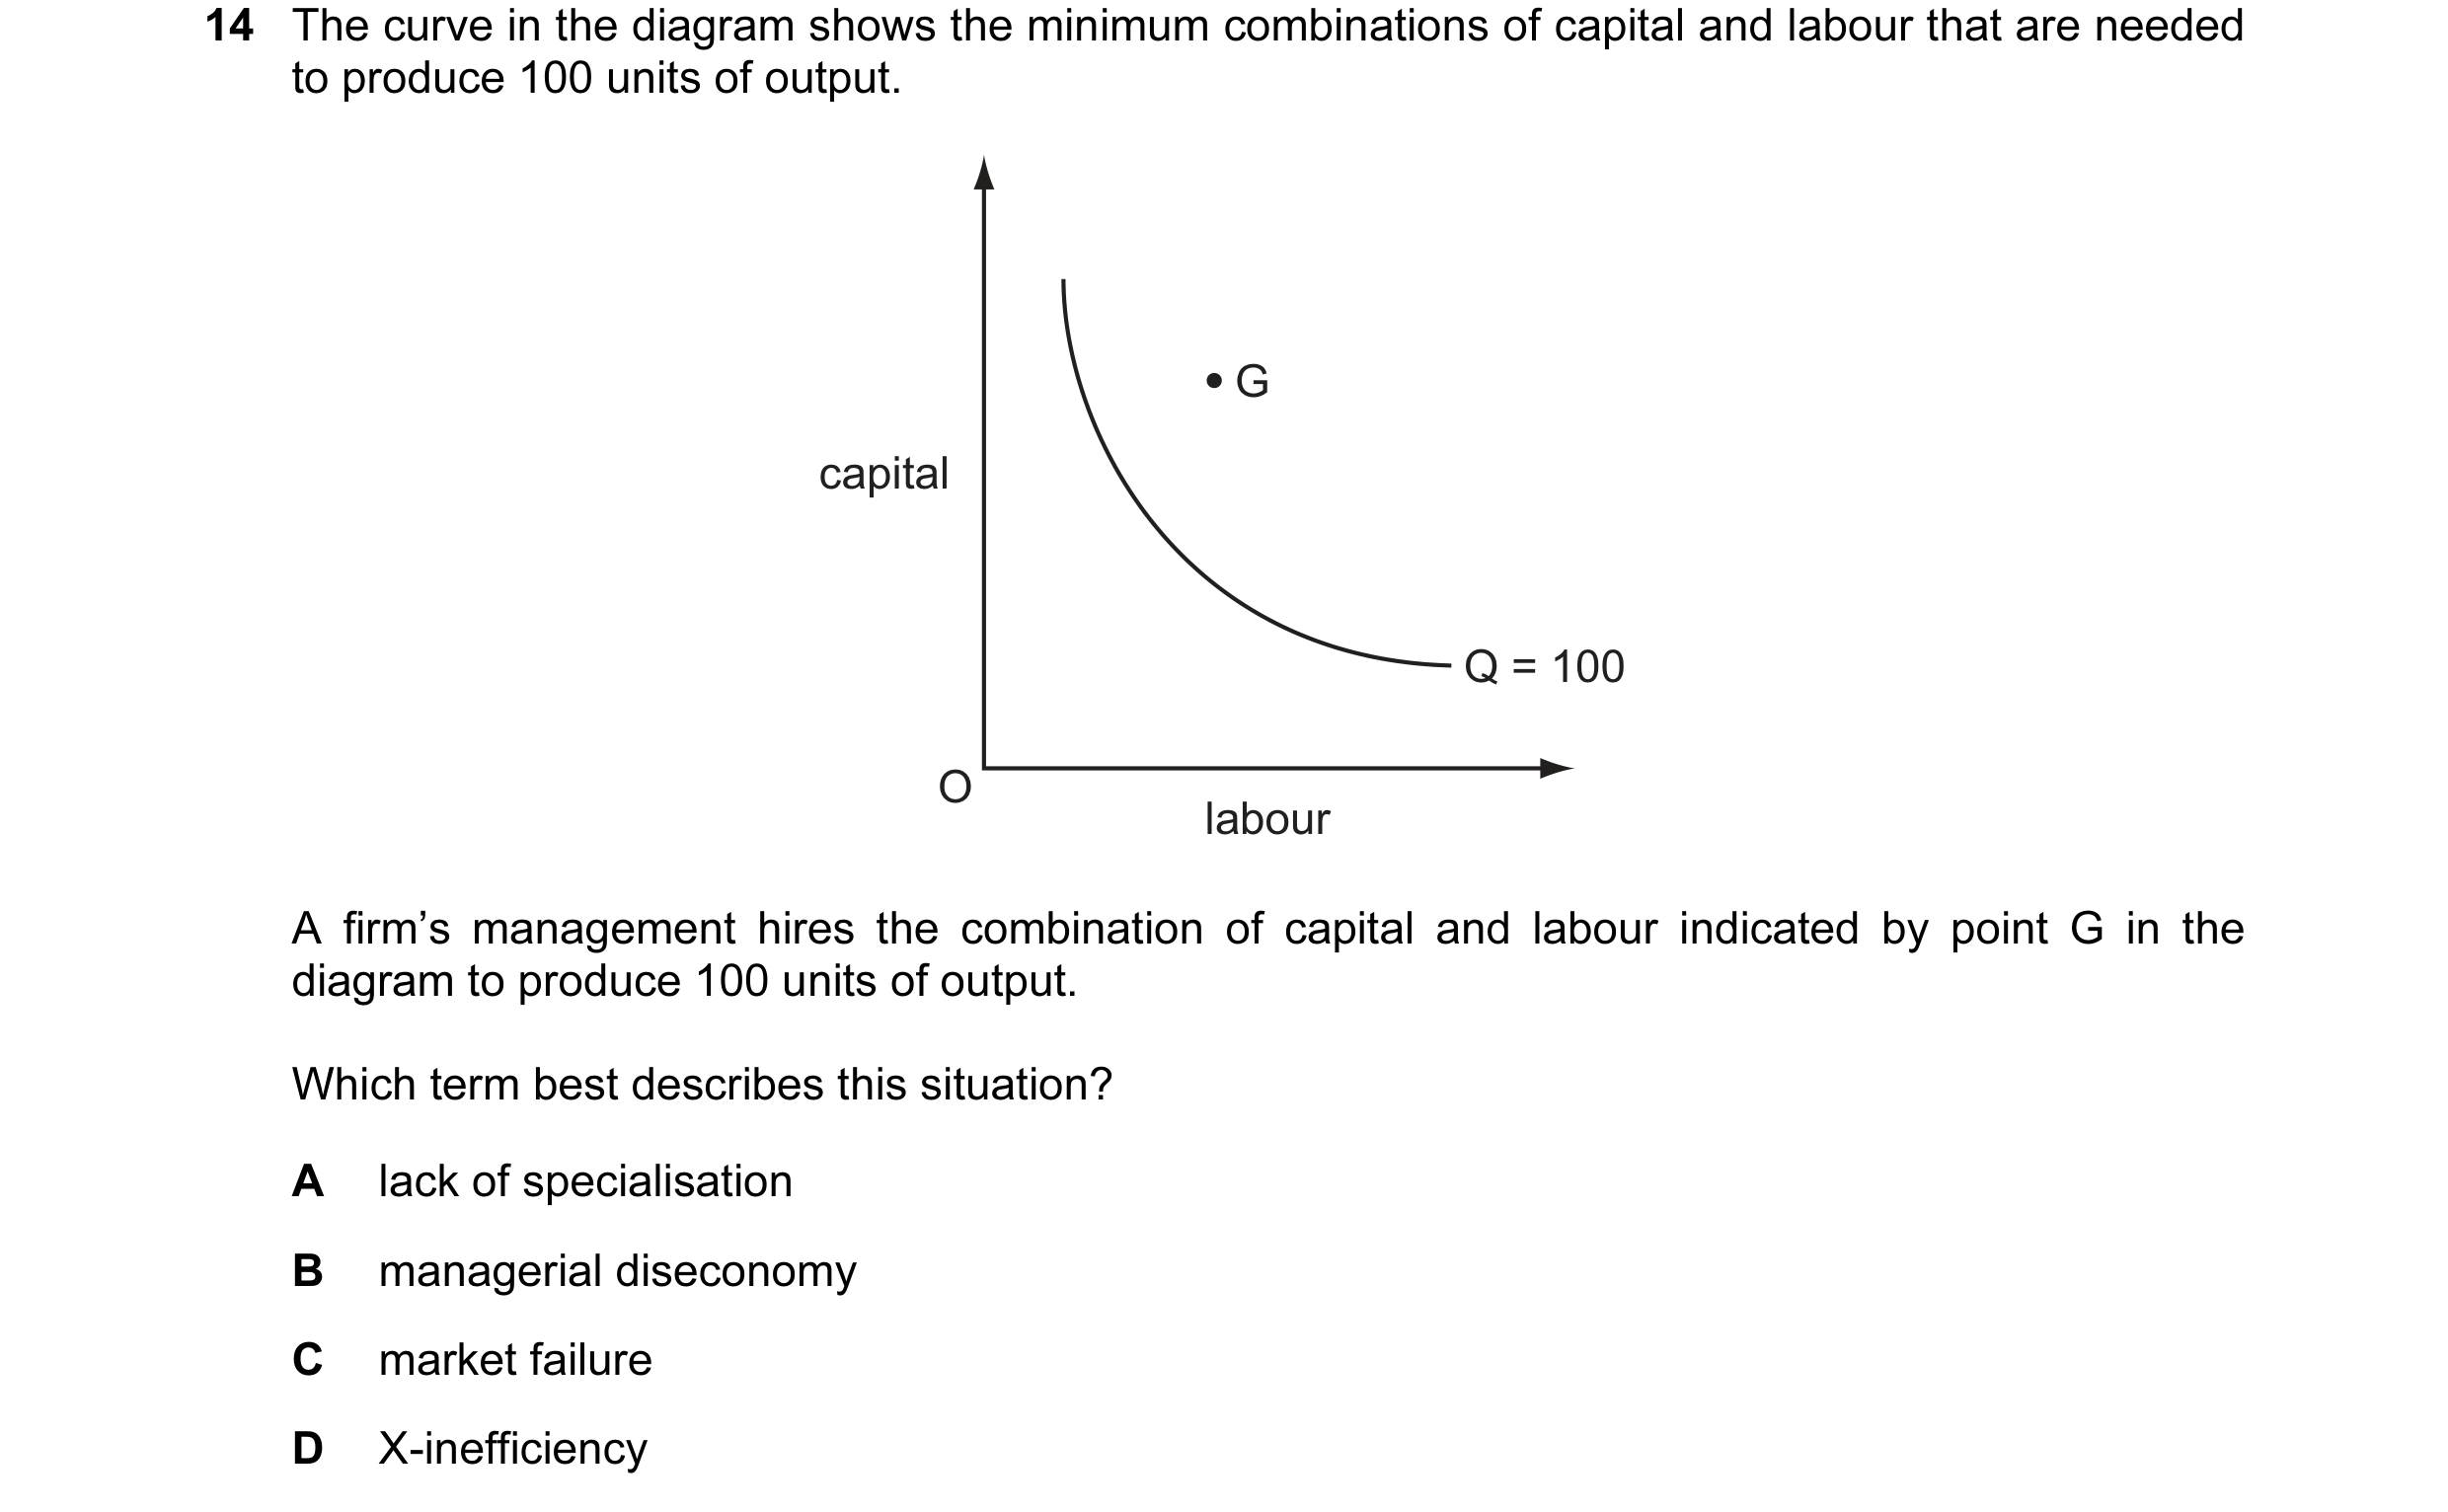
 11 / 32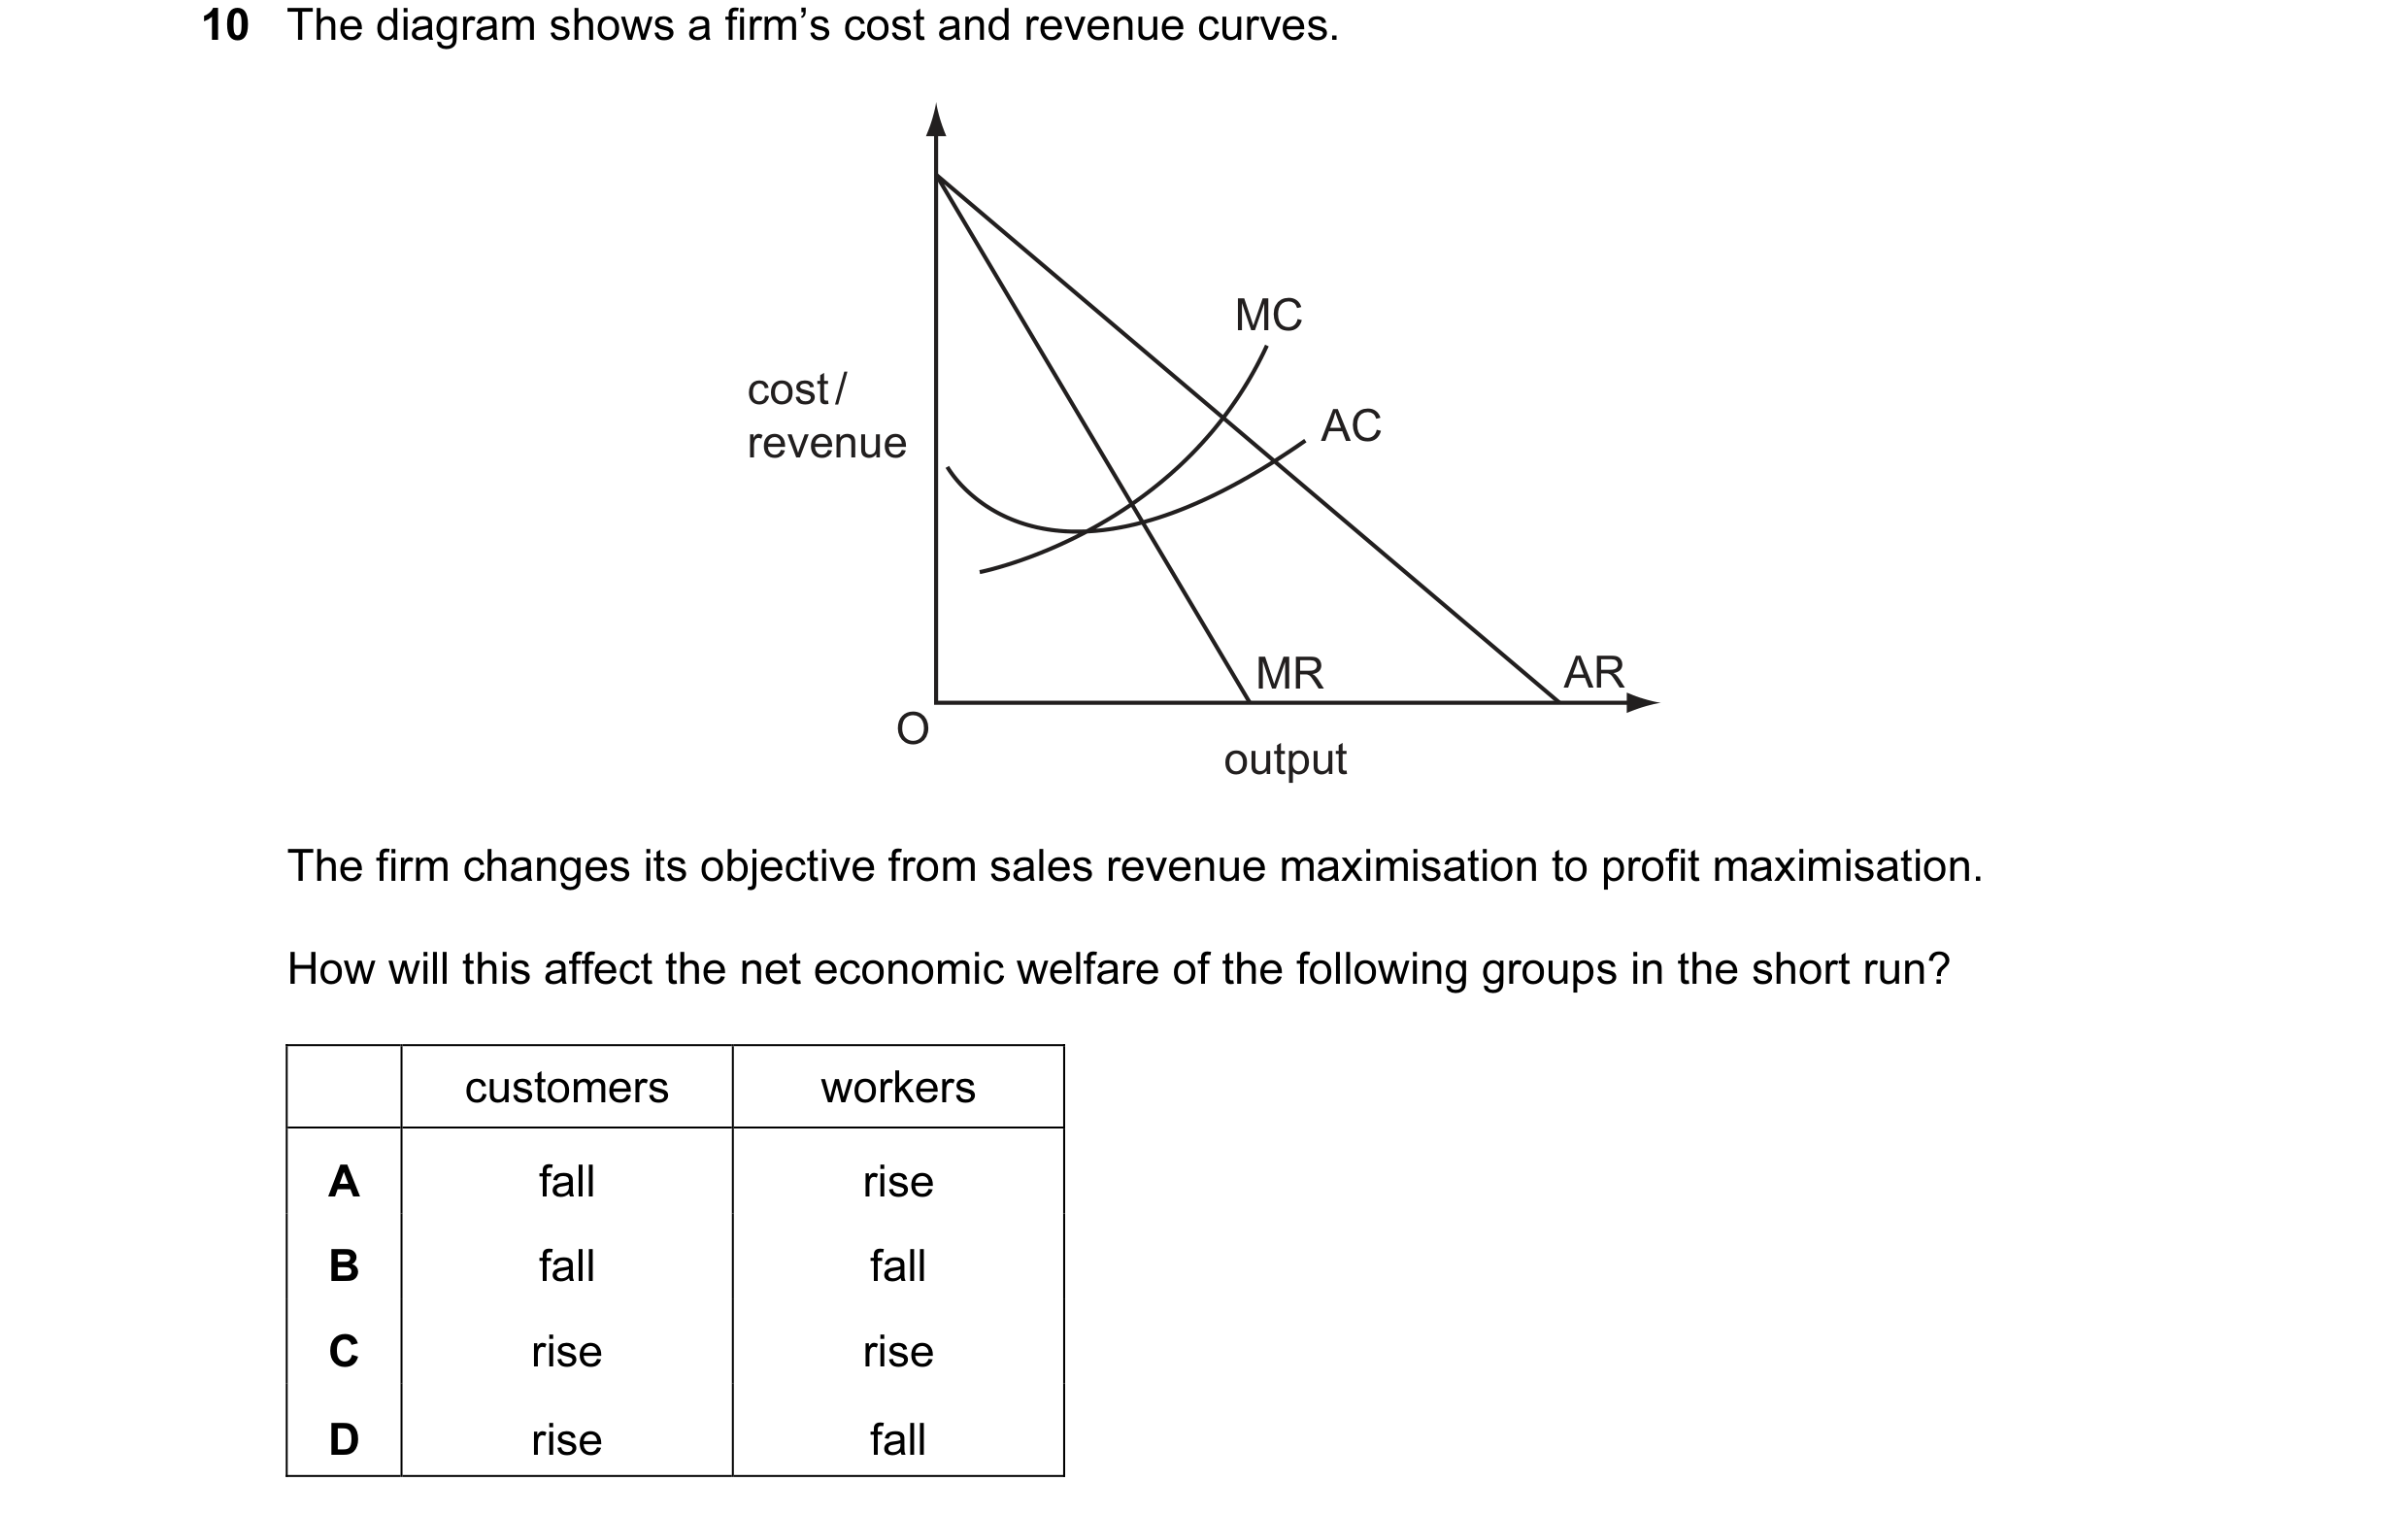
 12 / 32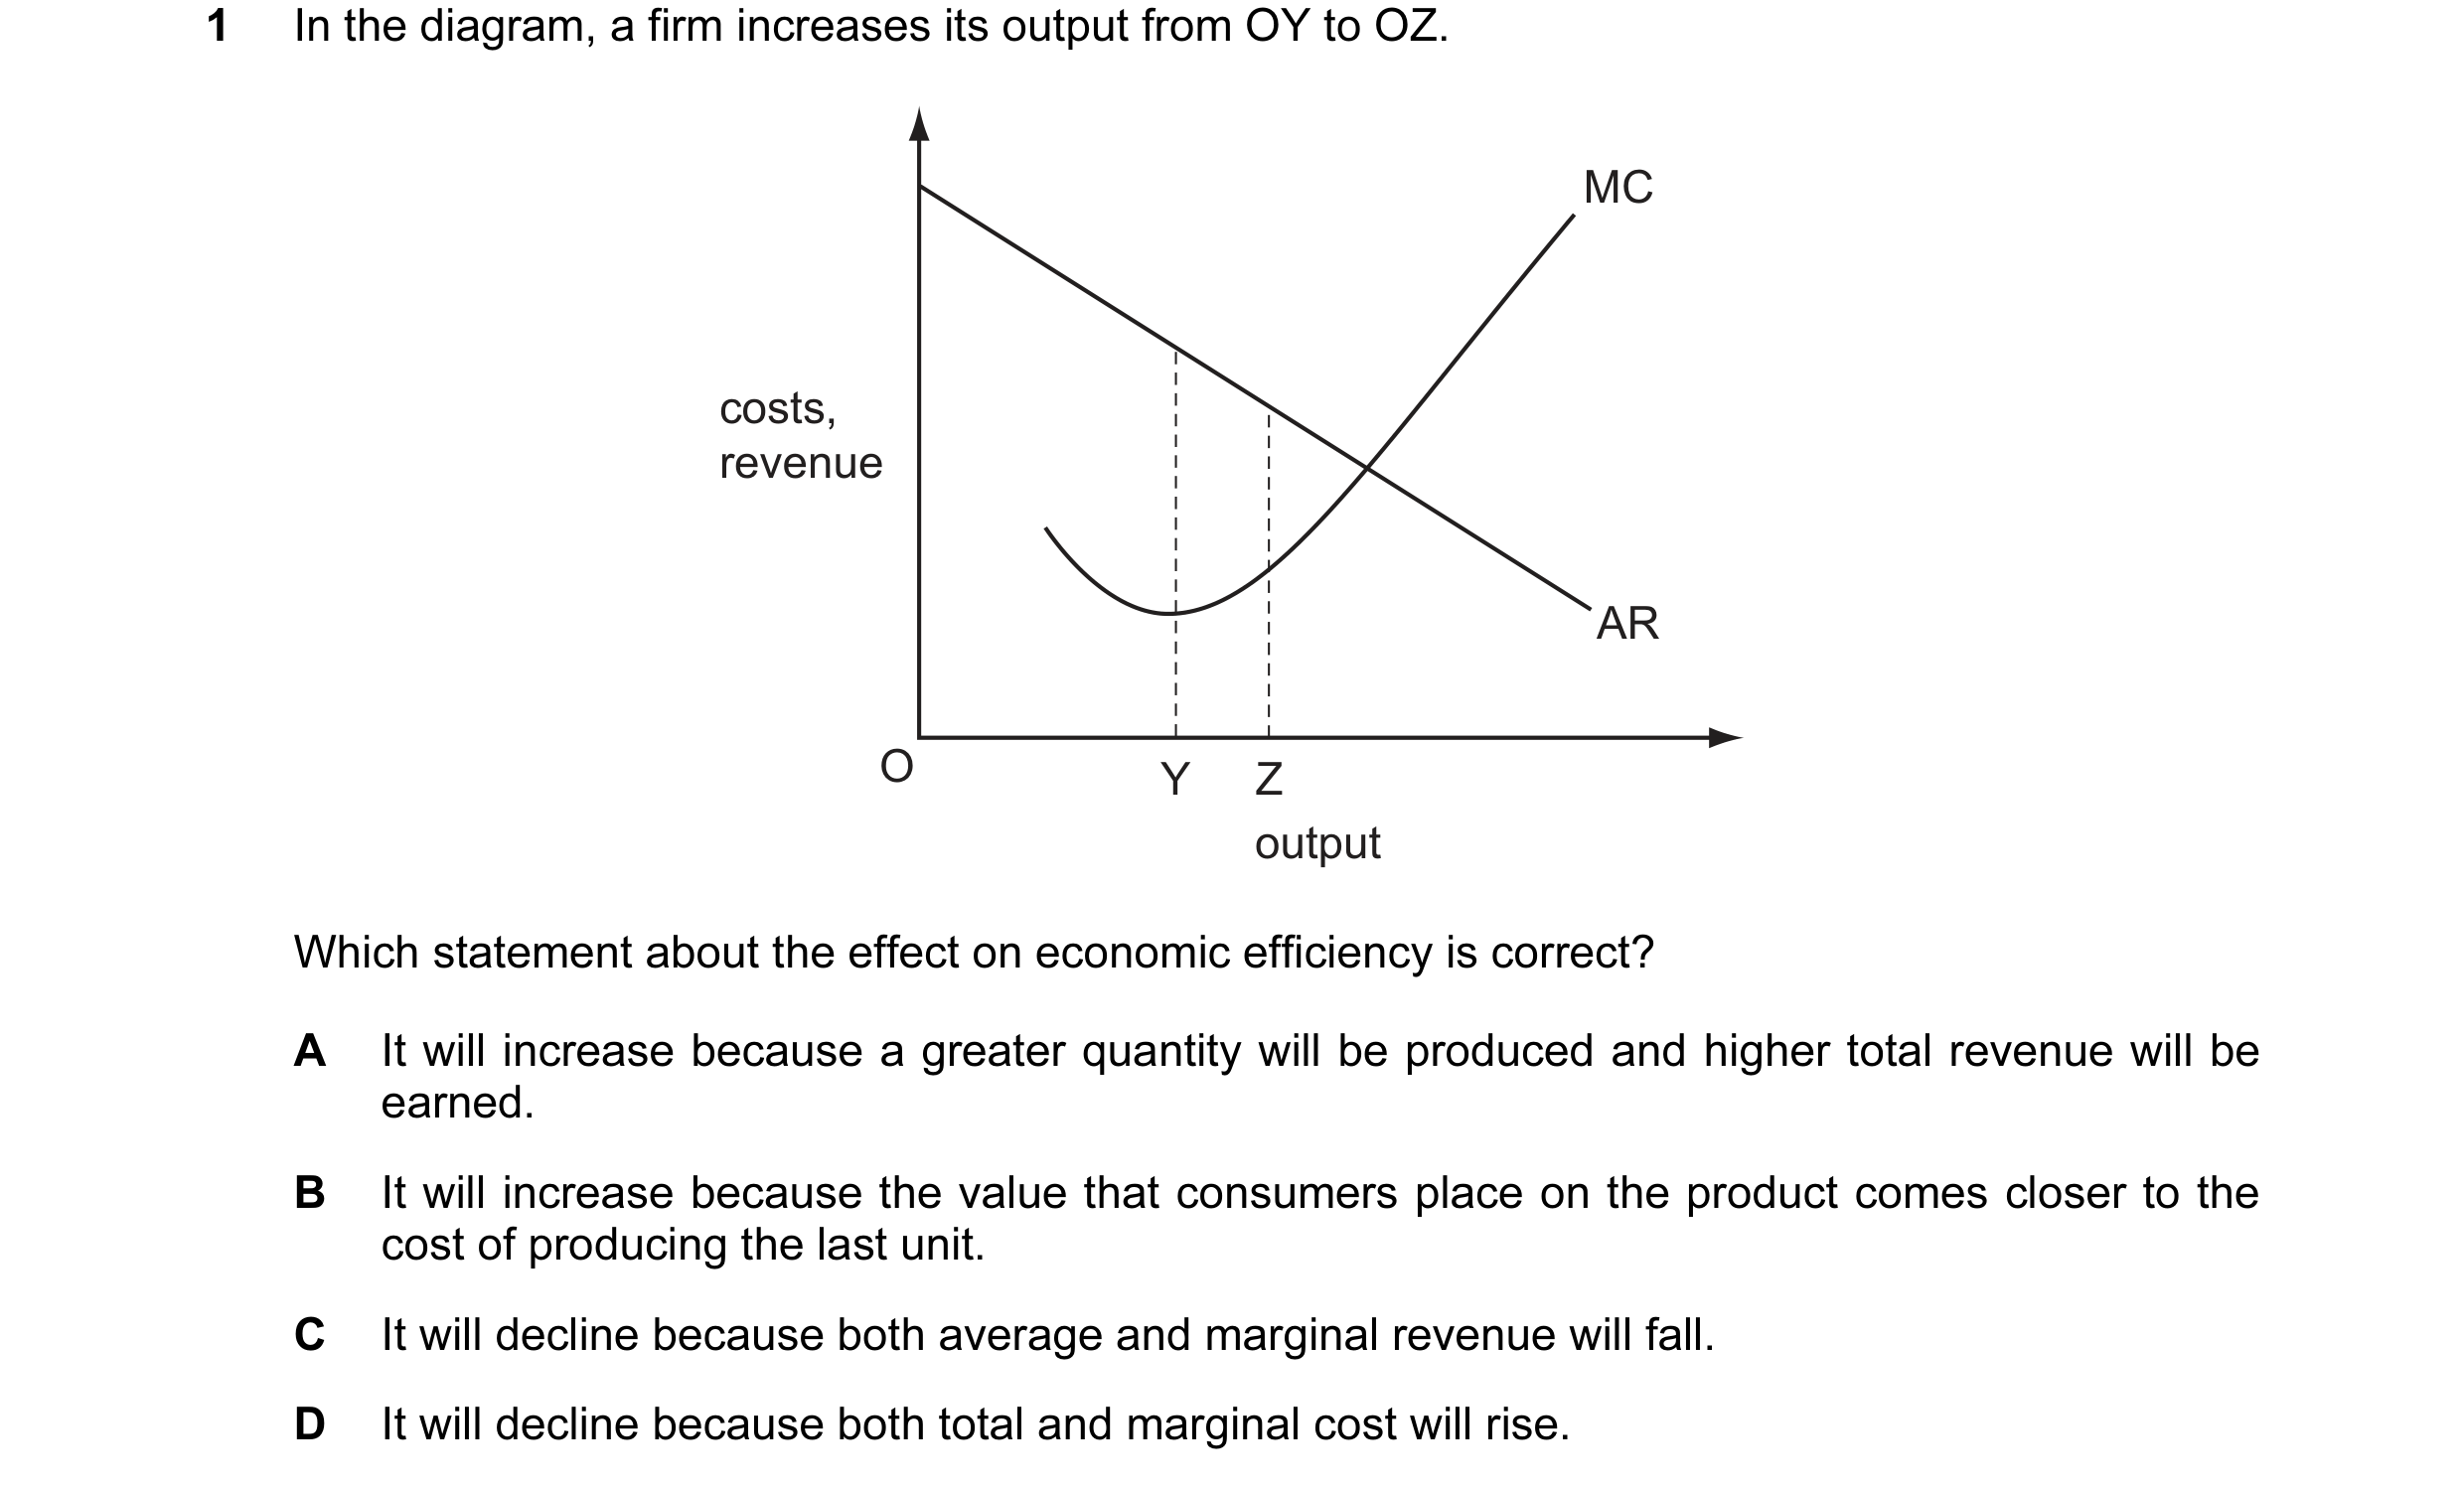
 13 / 32

 14 / 32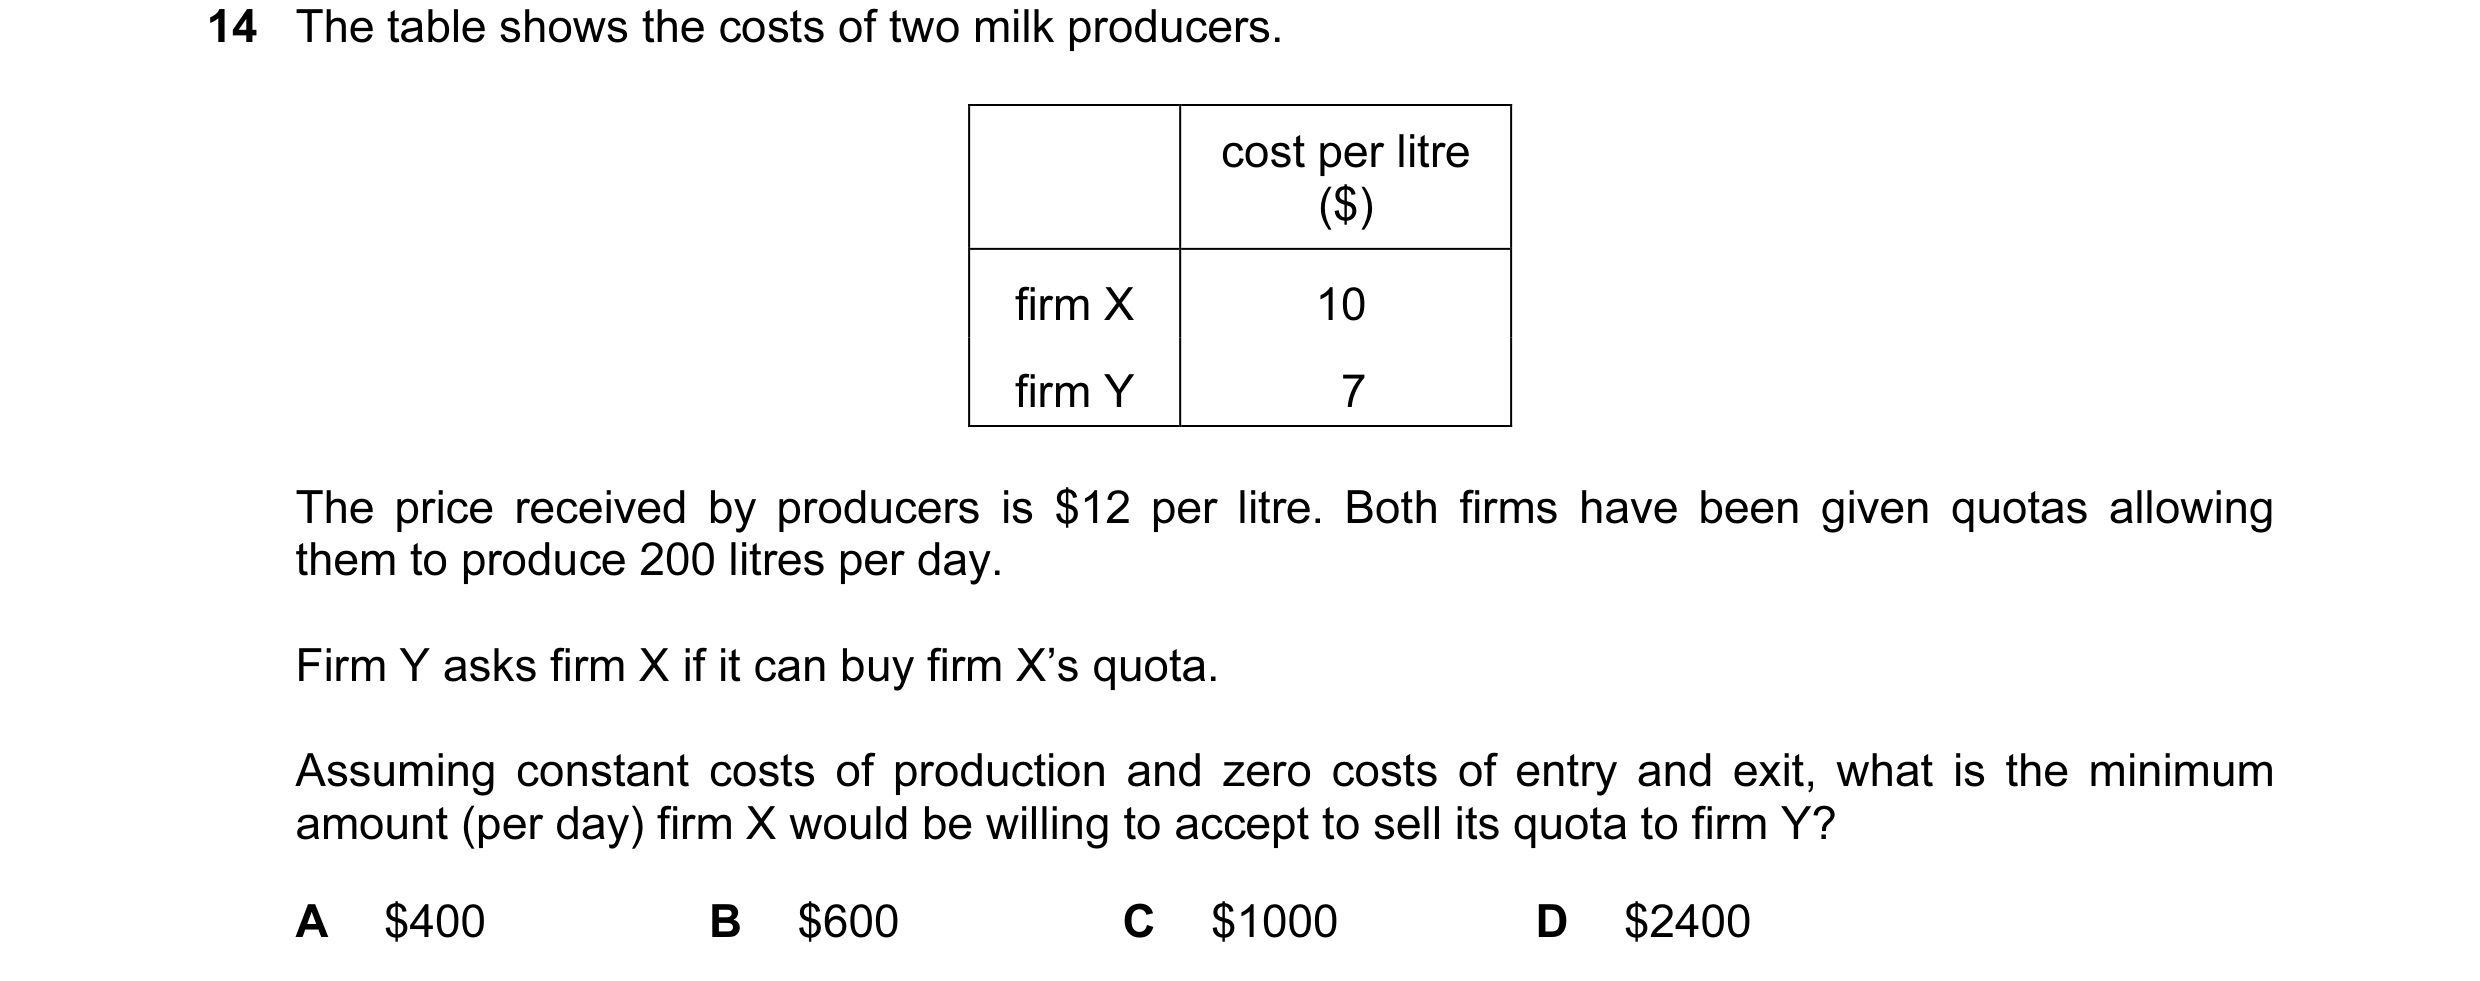
 15 / 32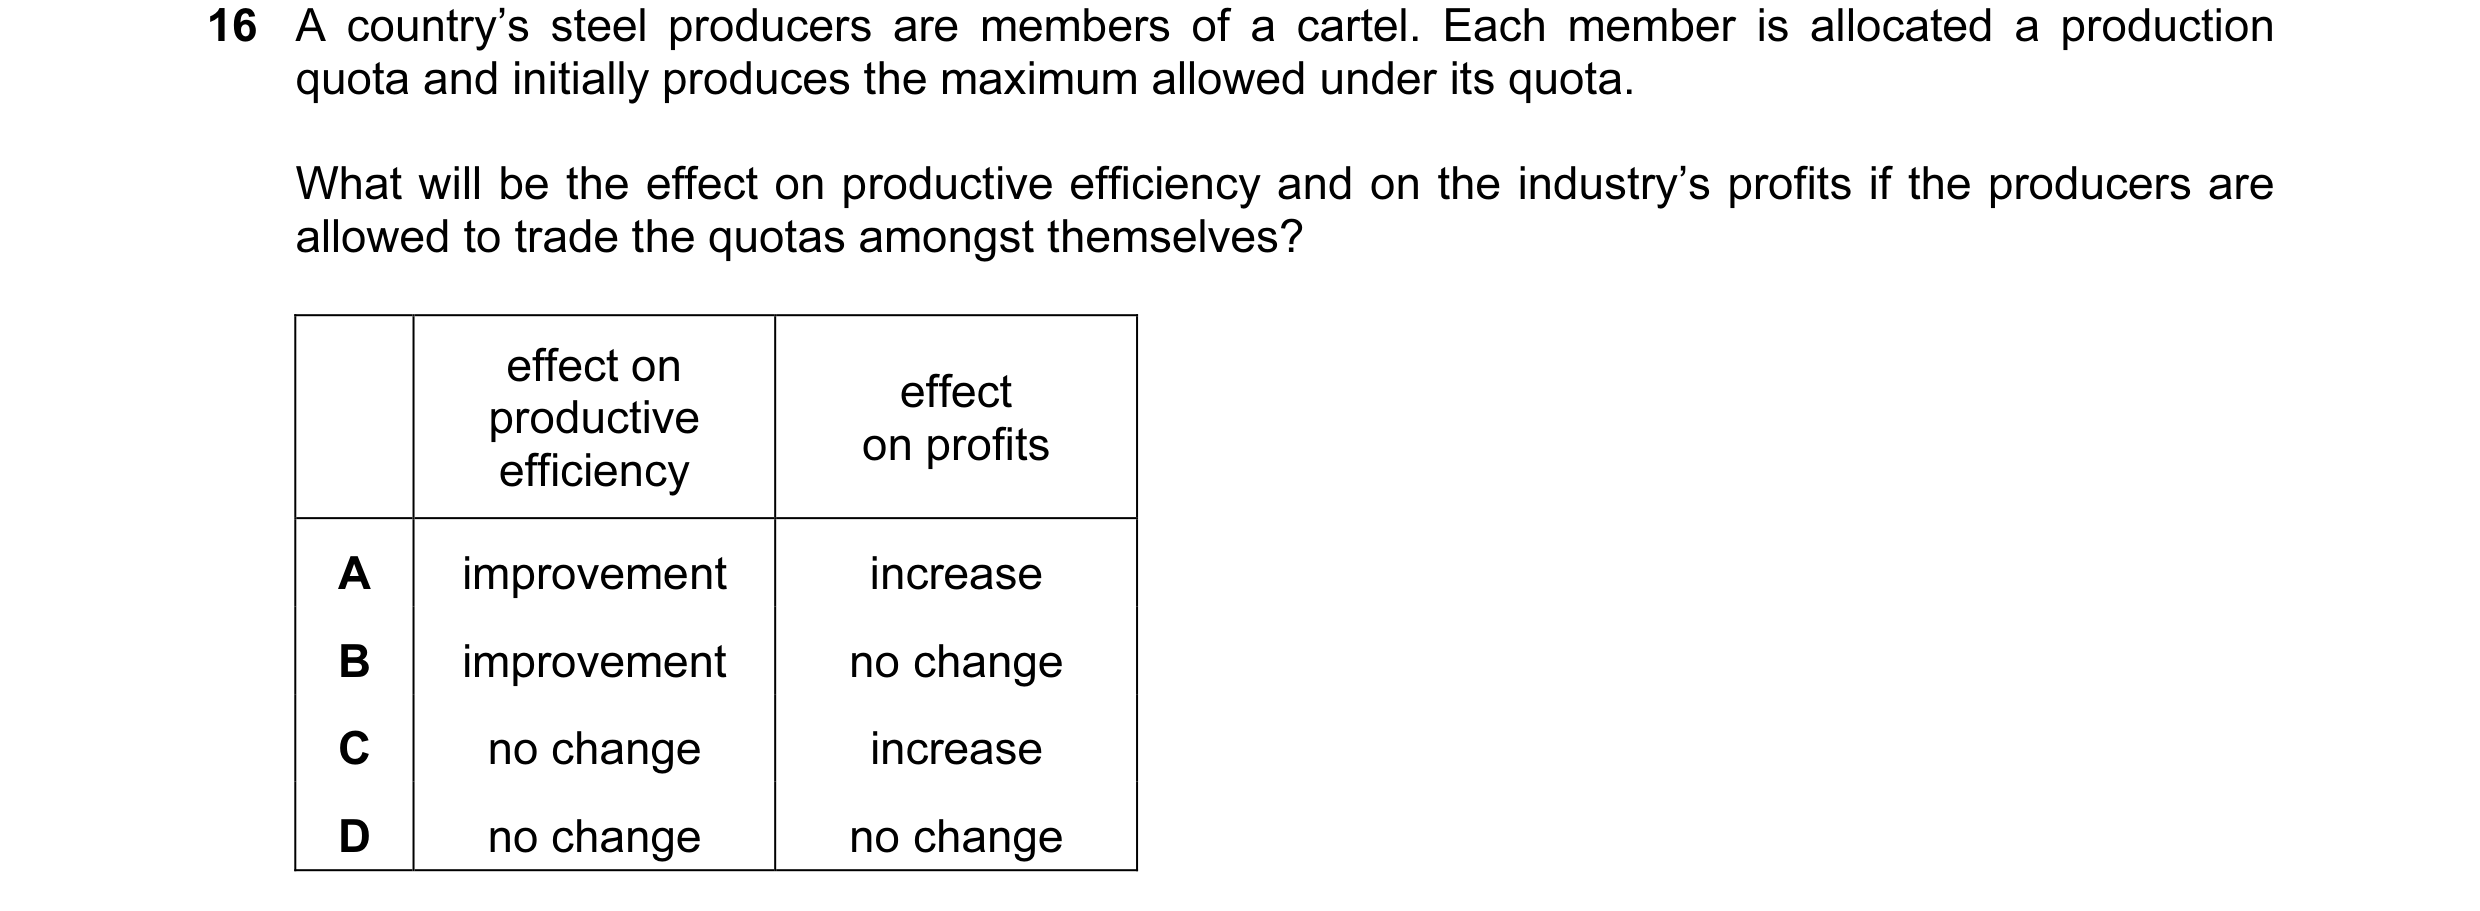

 16 / 32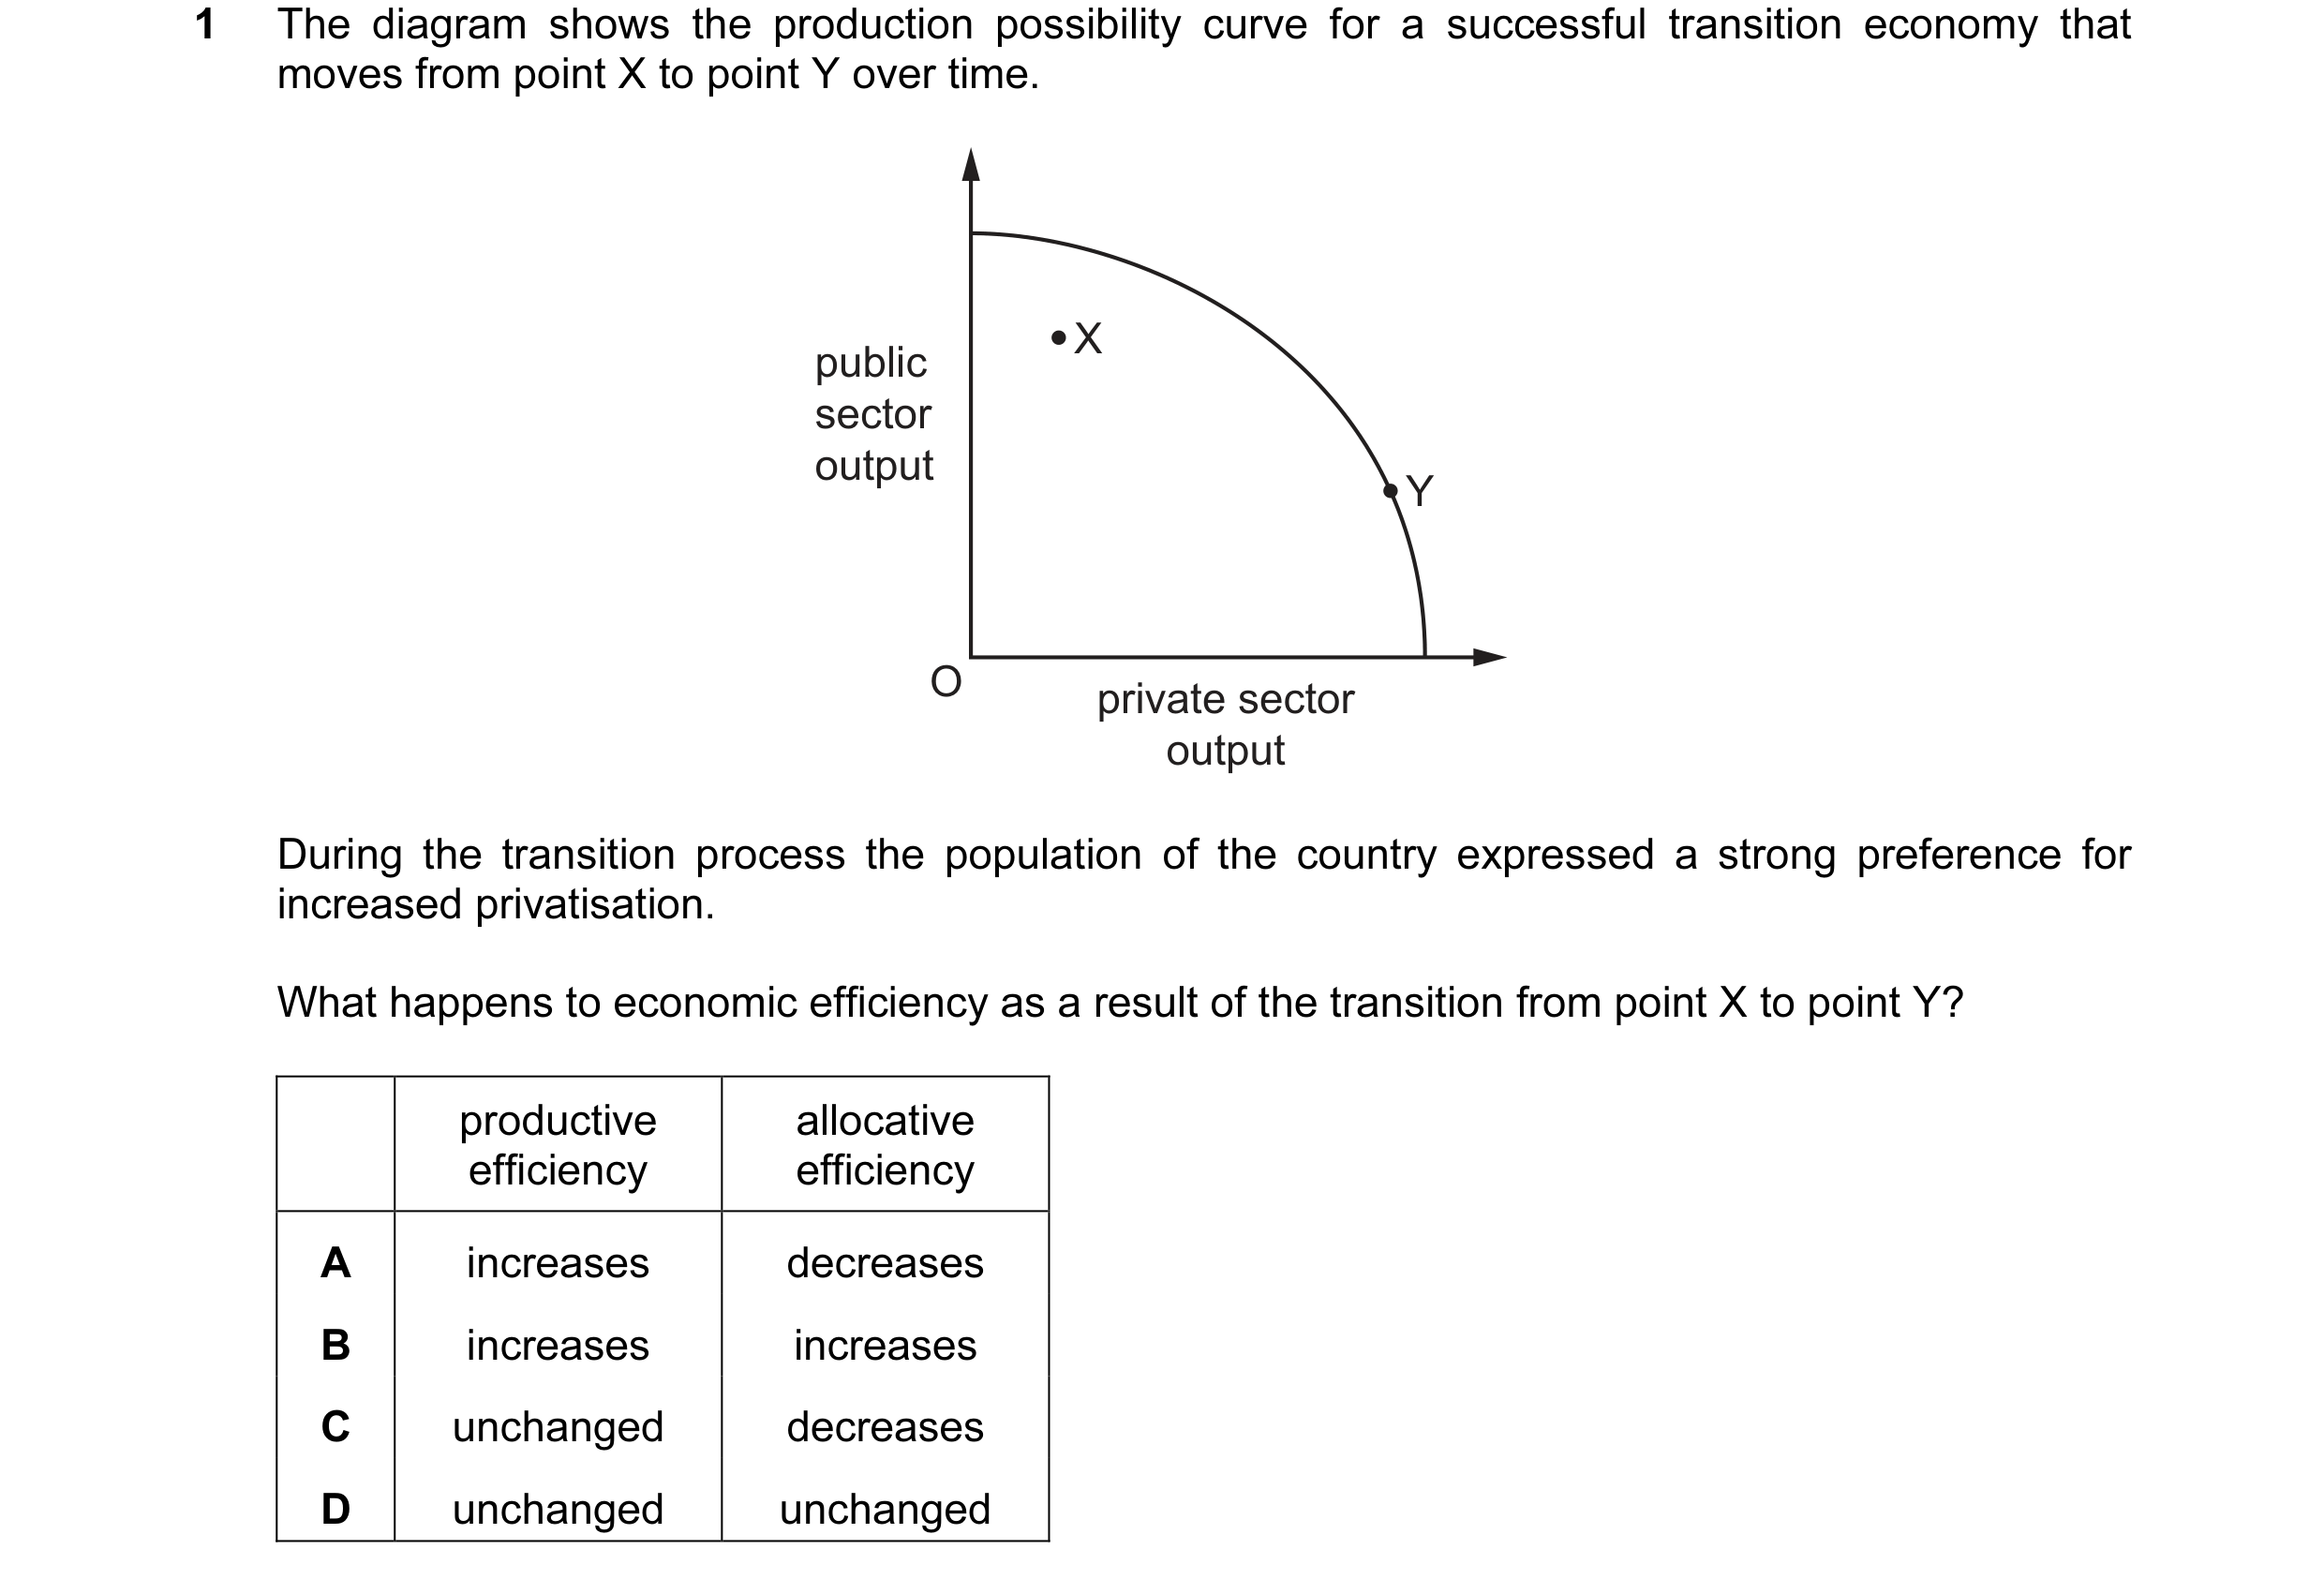
 17 / 32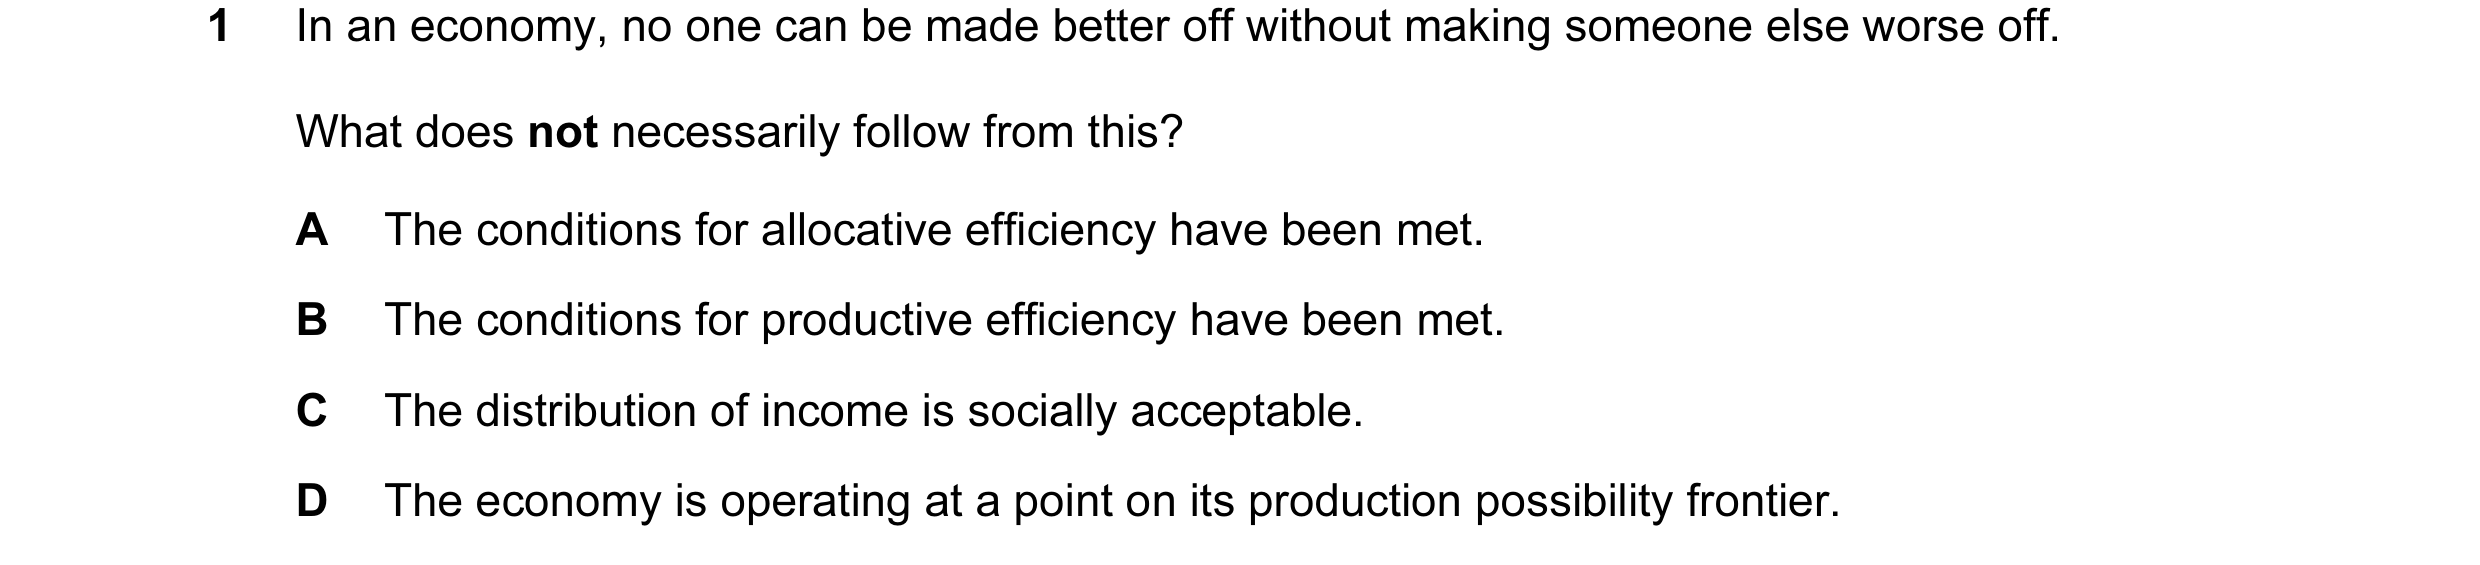

 18 / 32

 19 / 32
 20 / 32
 21 / 32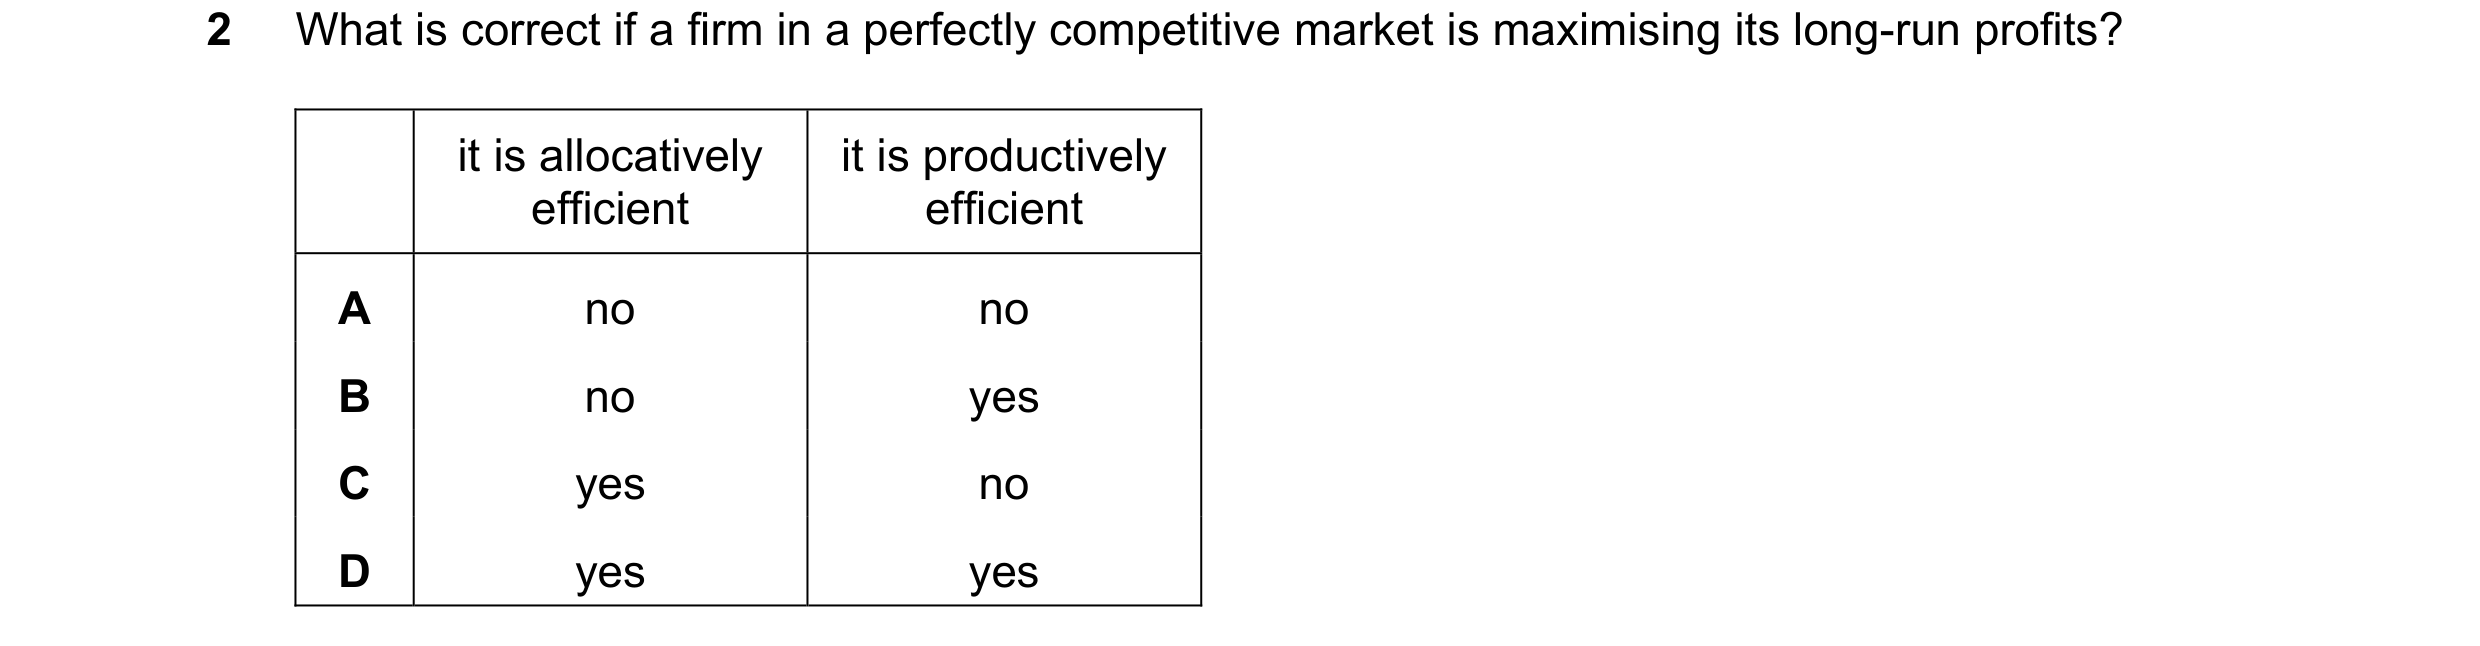


 22 / 32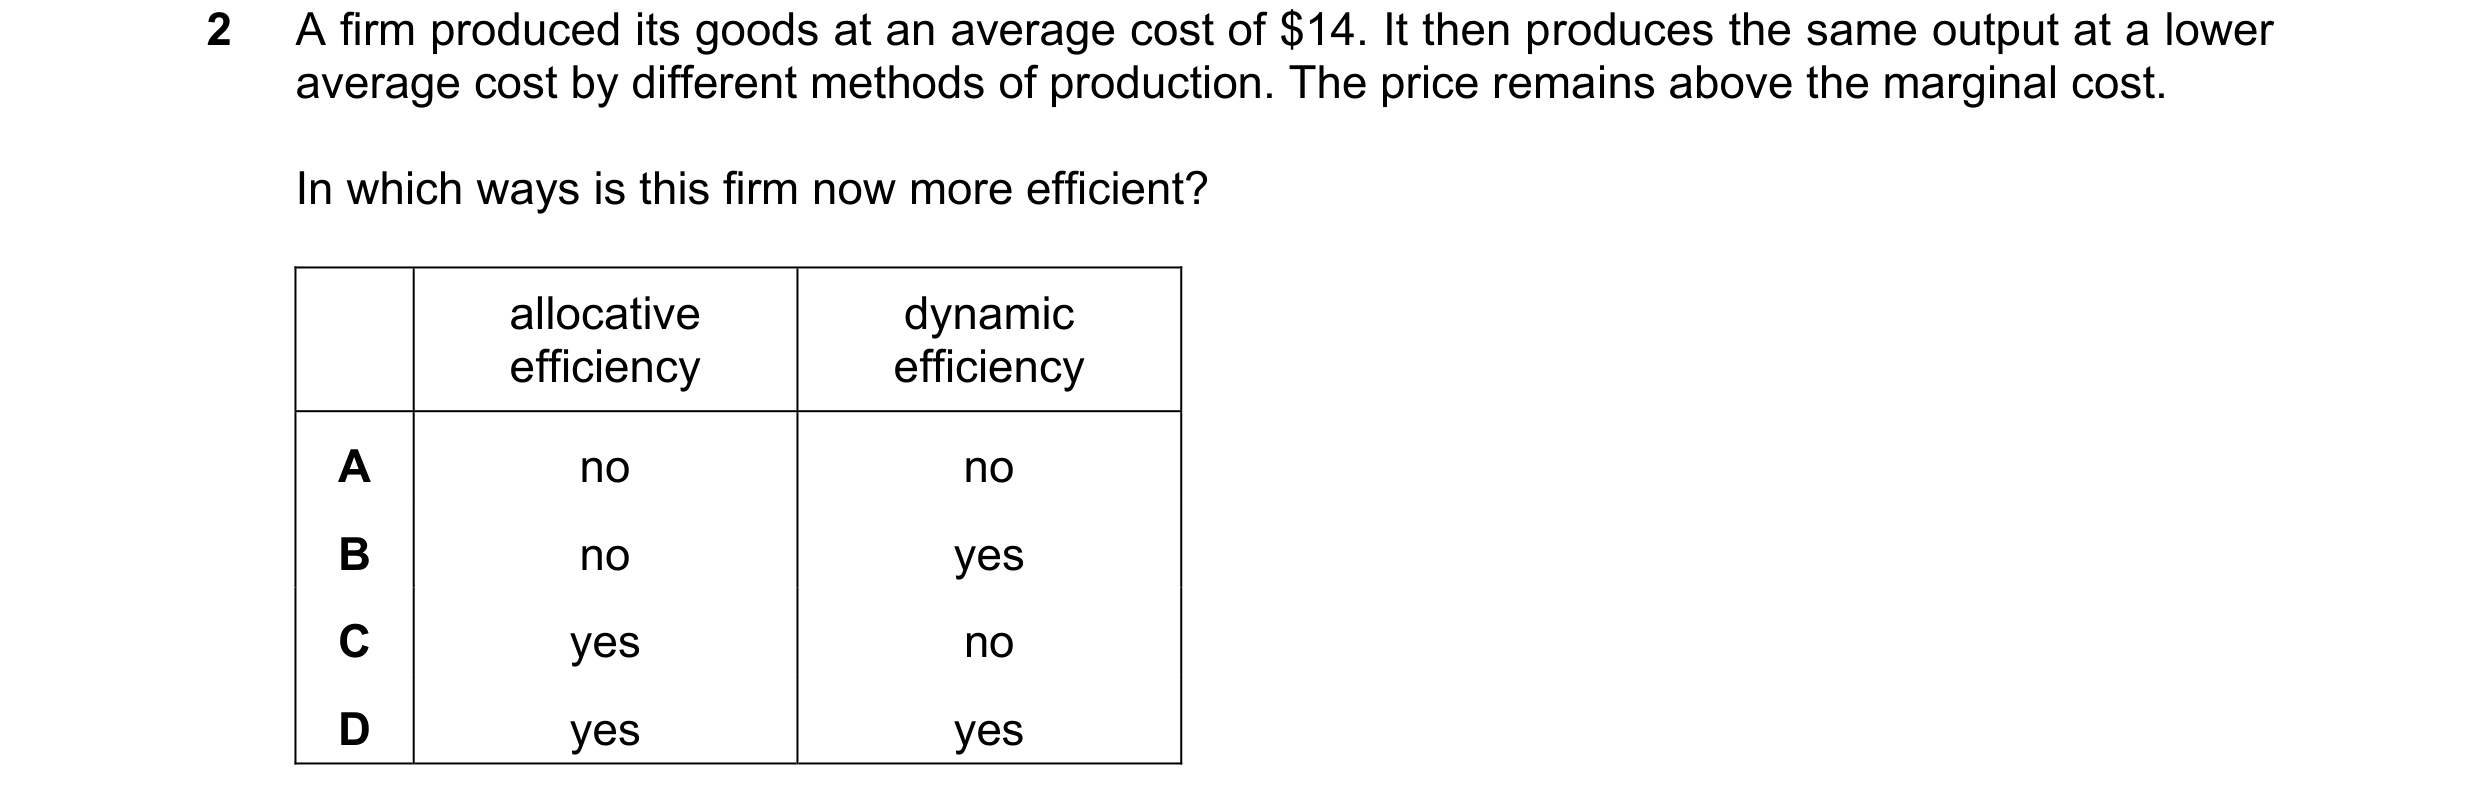
 23 / 32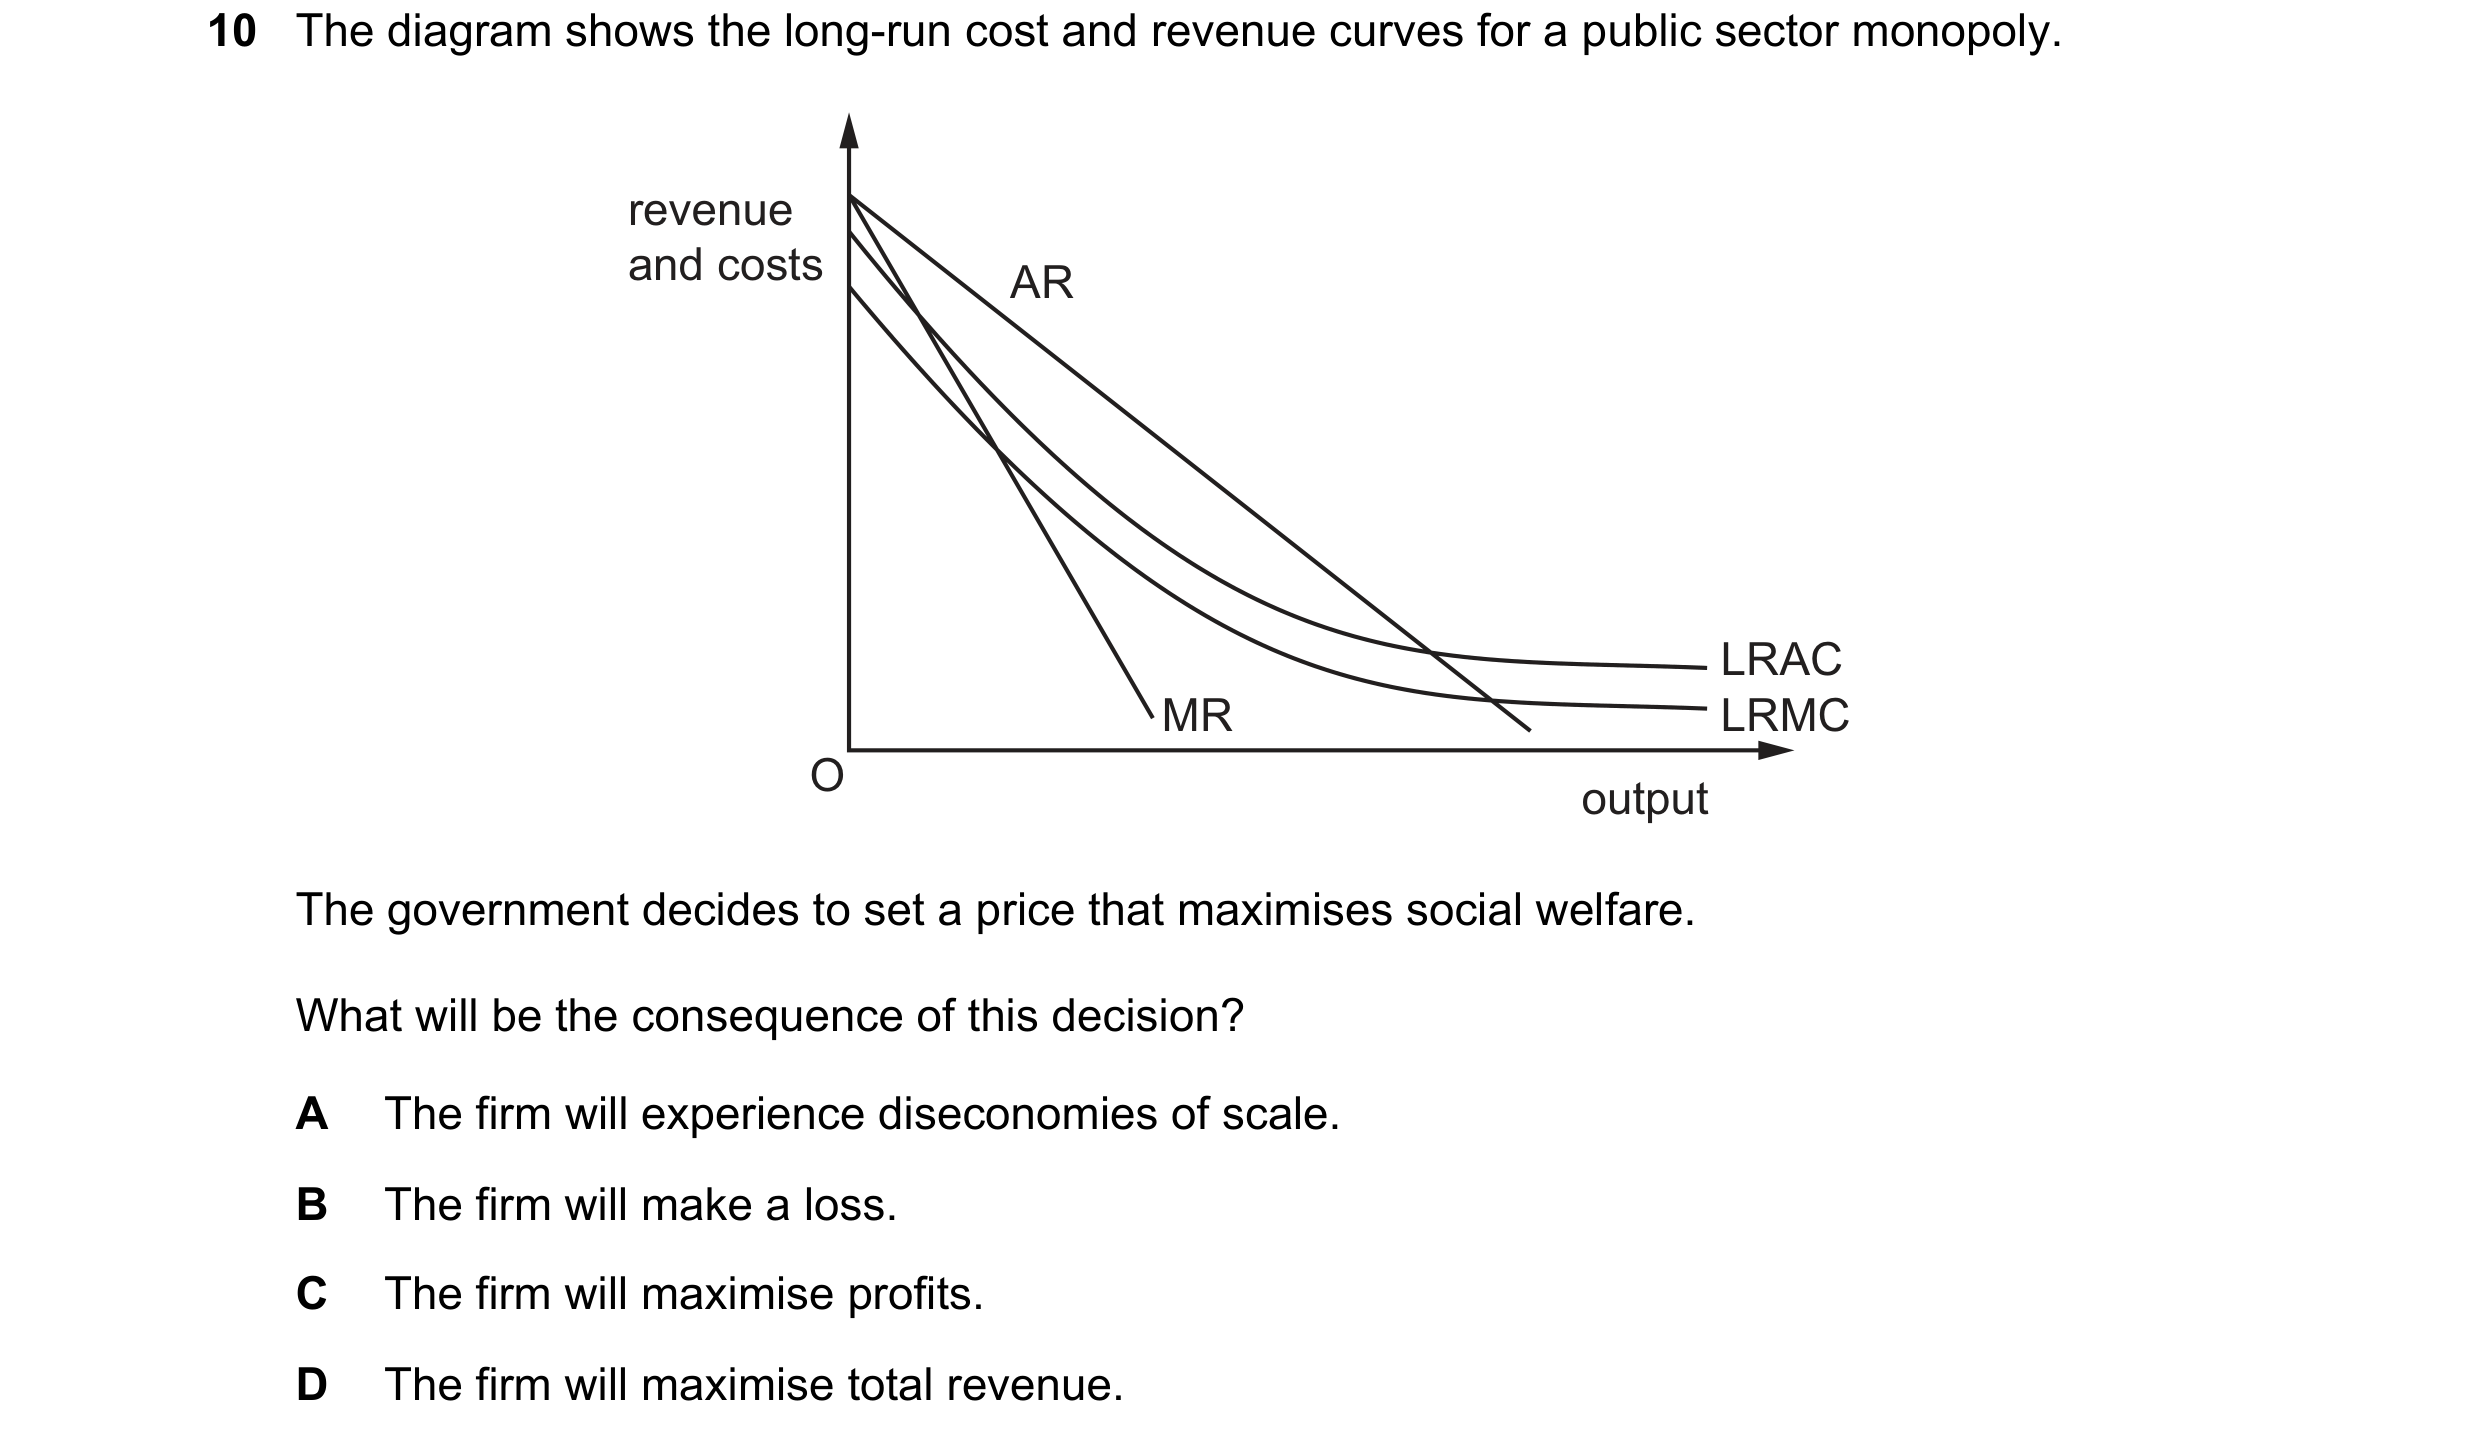
 24 / 32

 25 / 32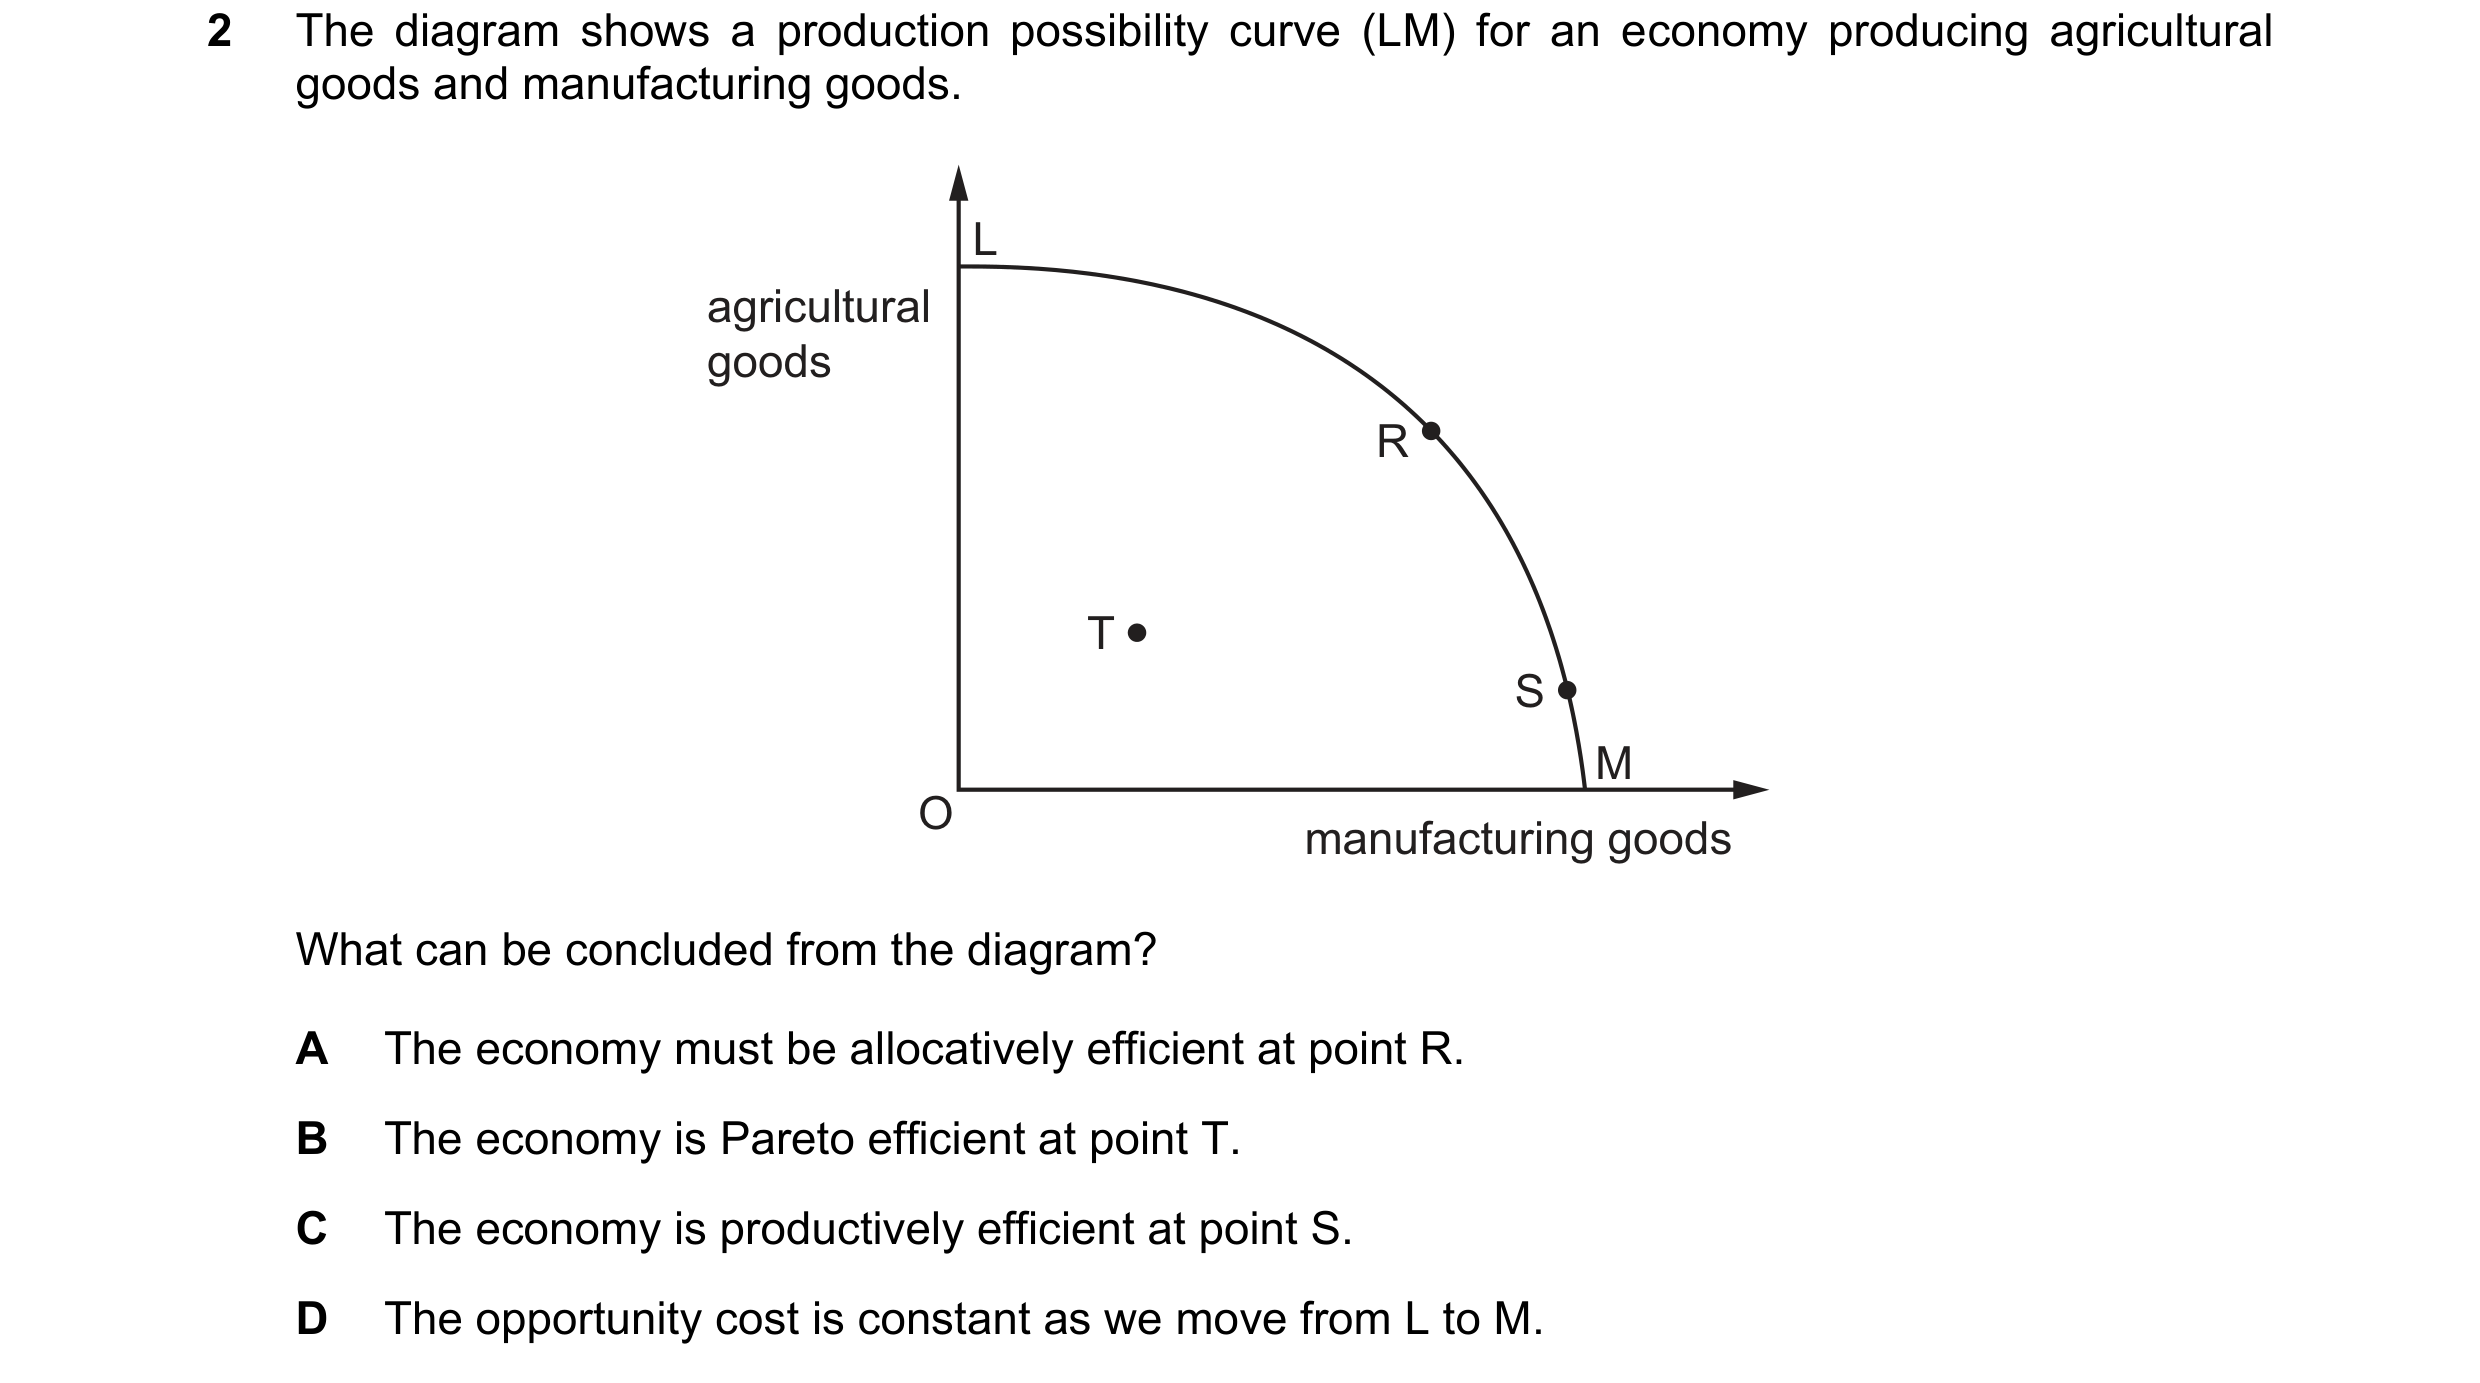

 26 / 32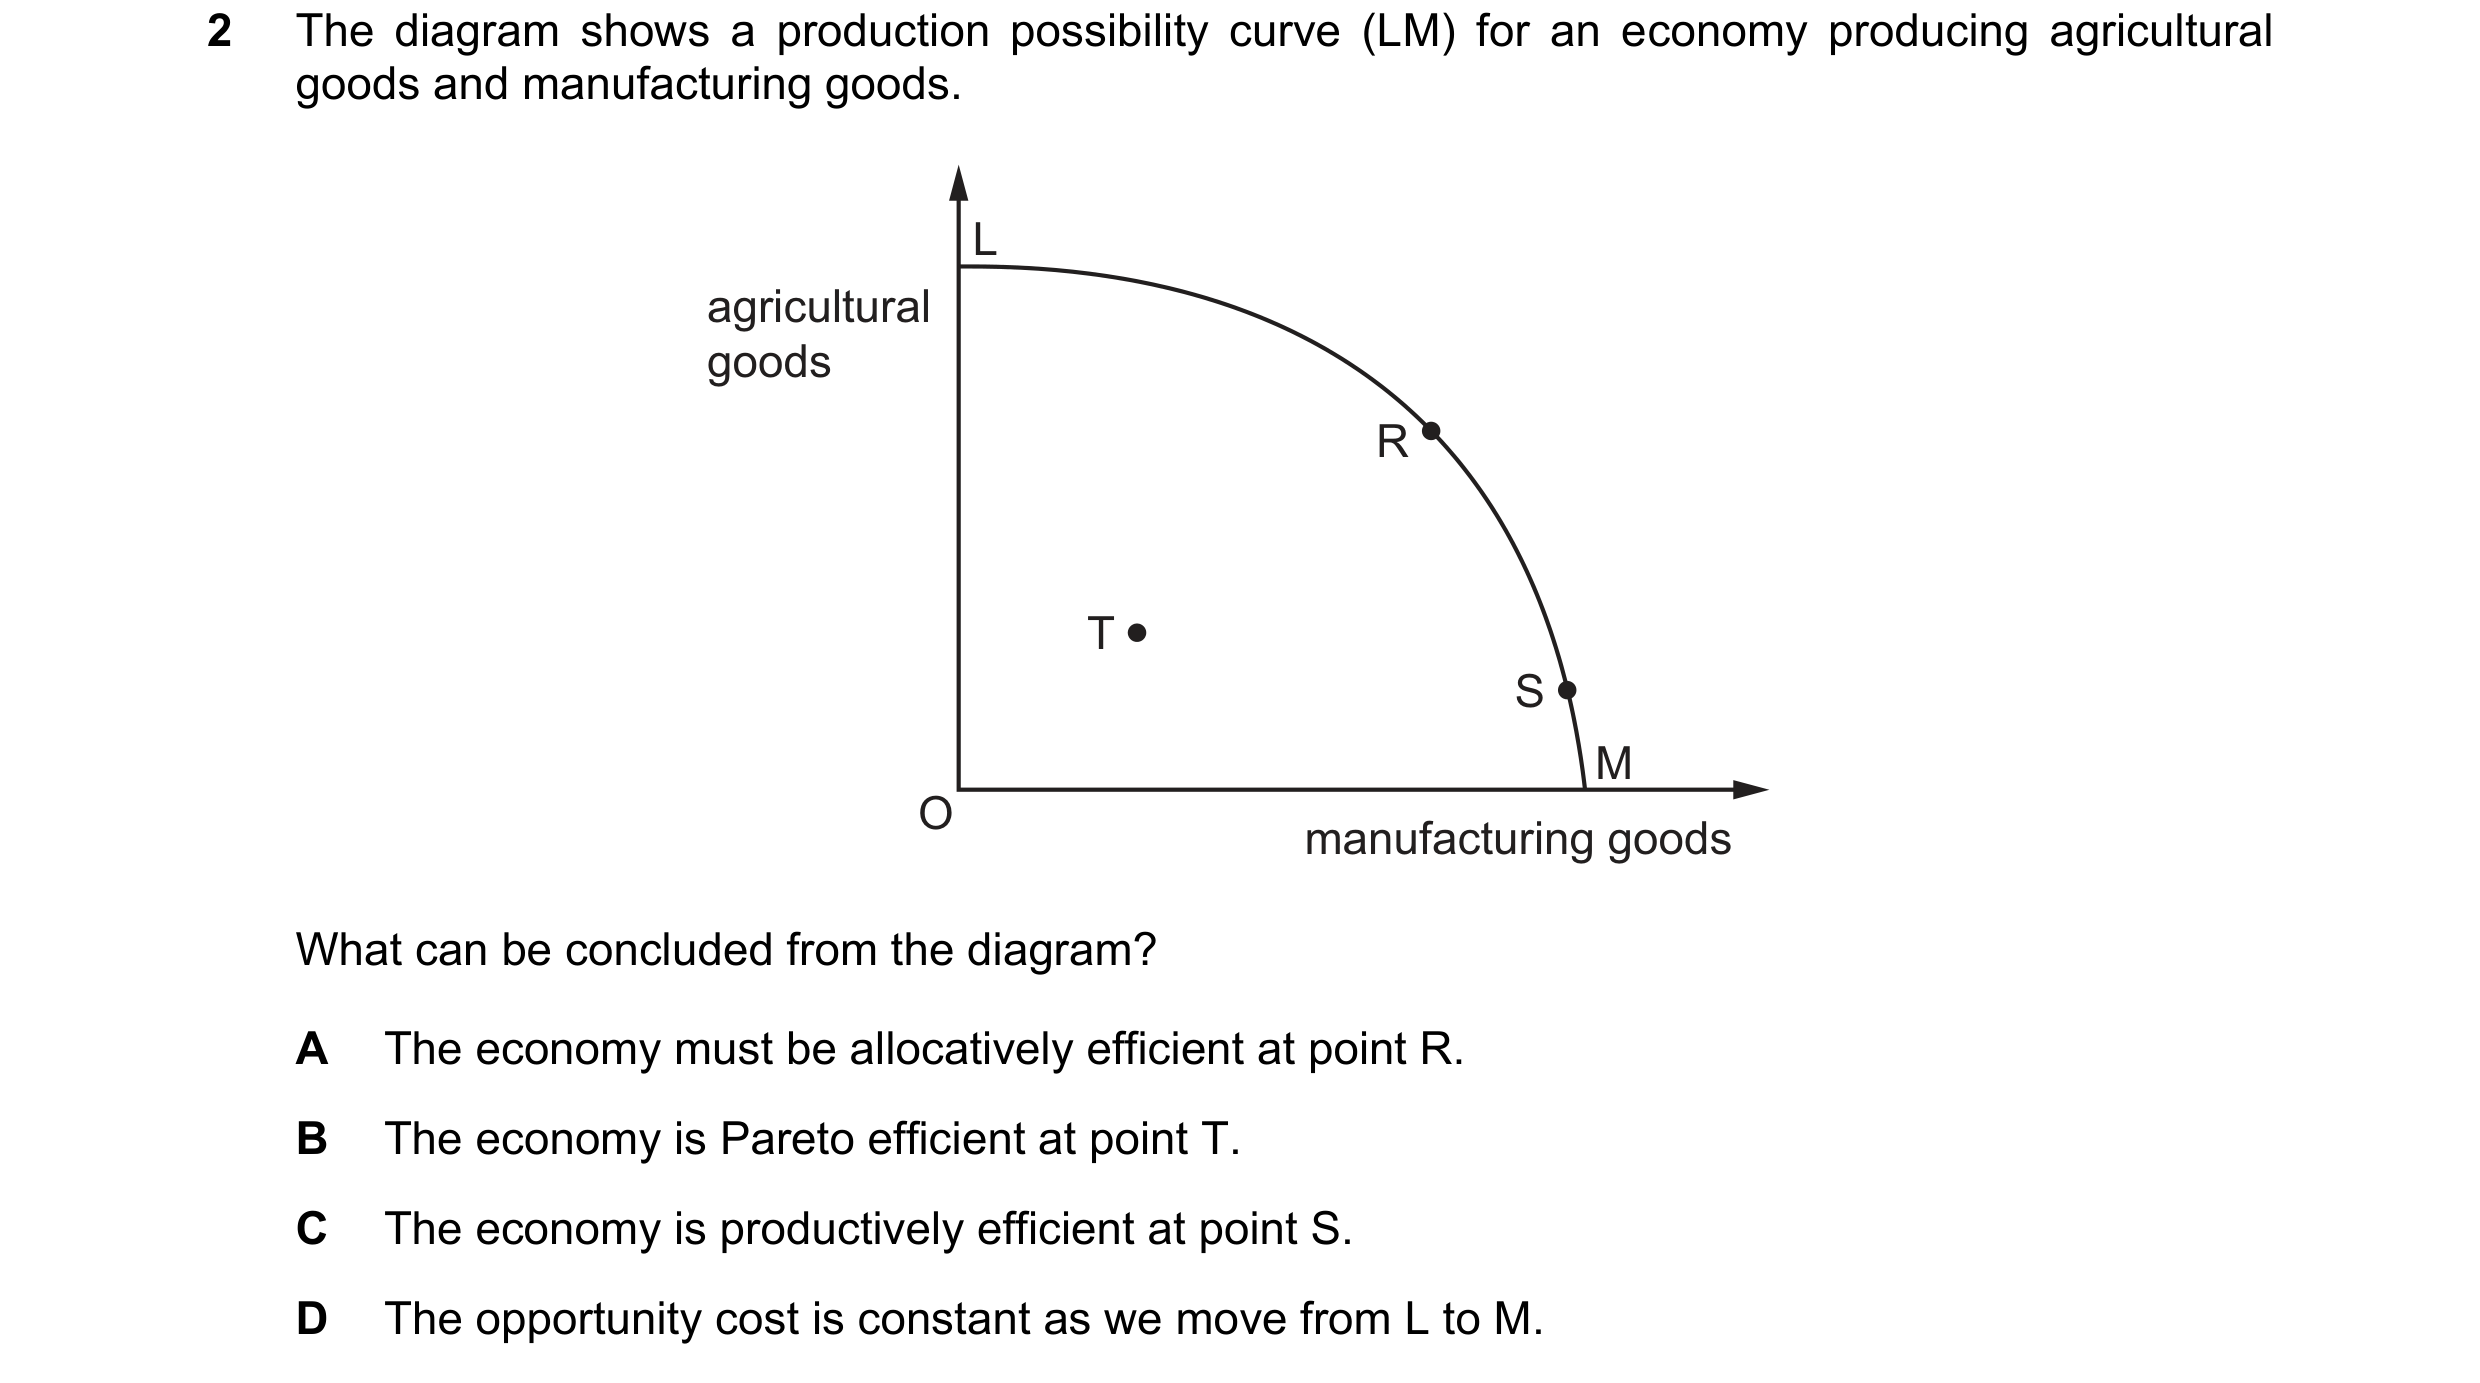

 27 / 32

 28 / 32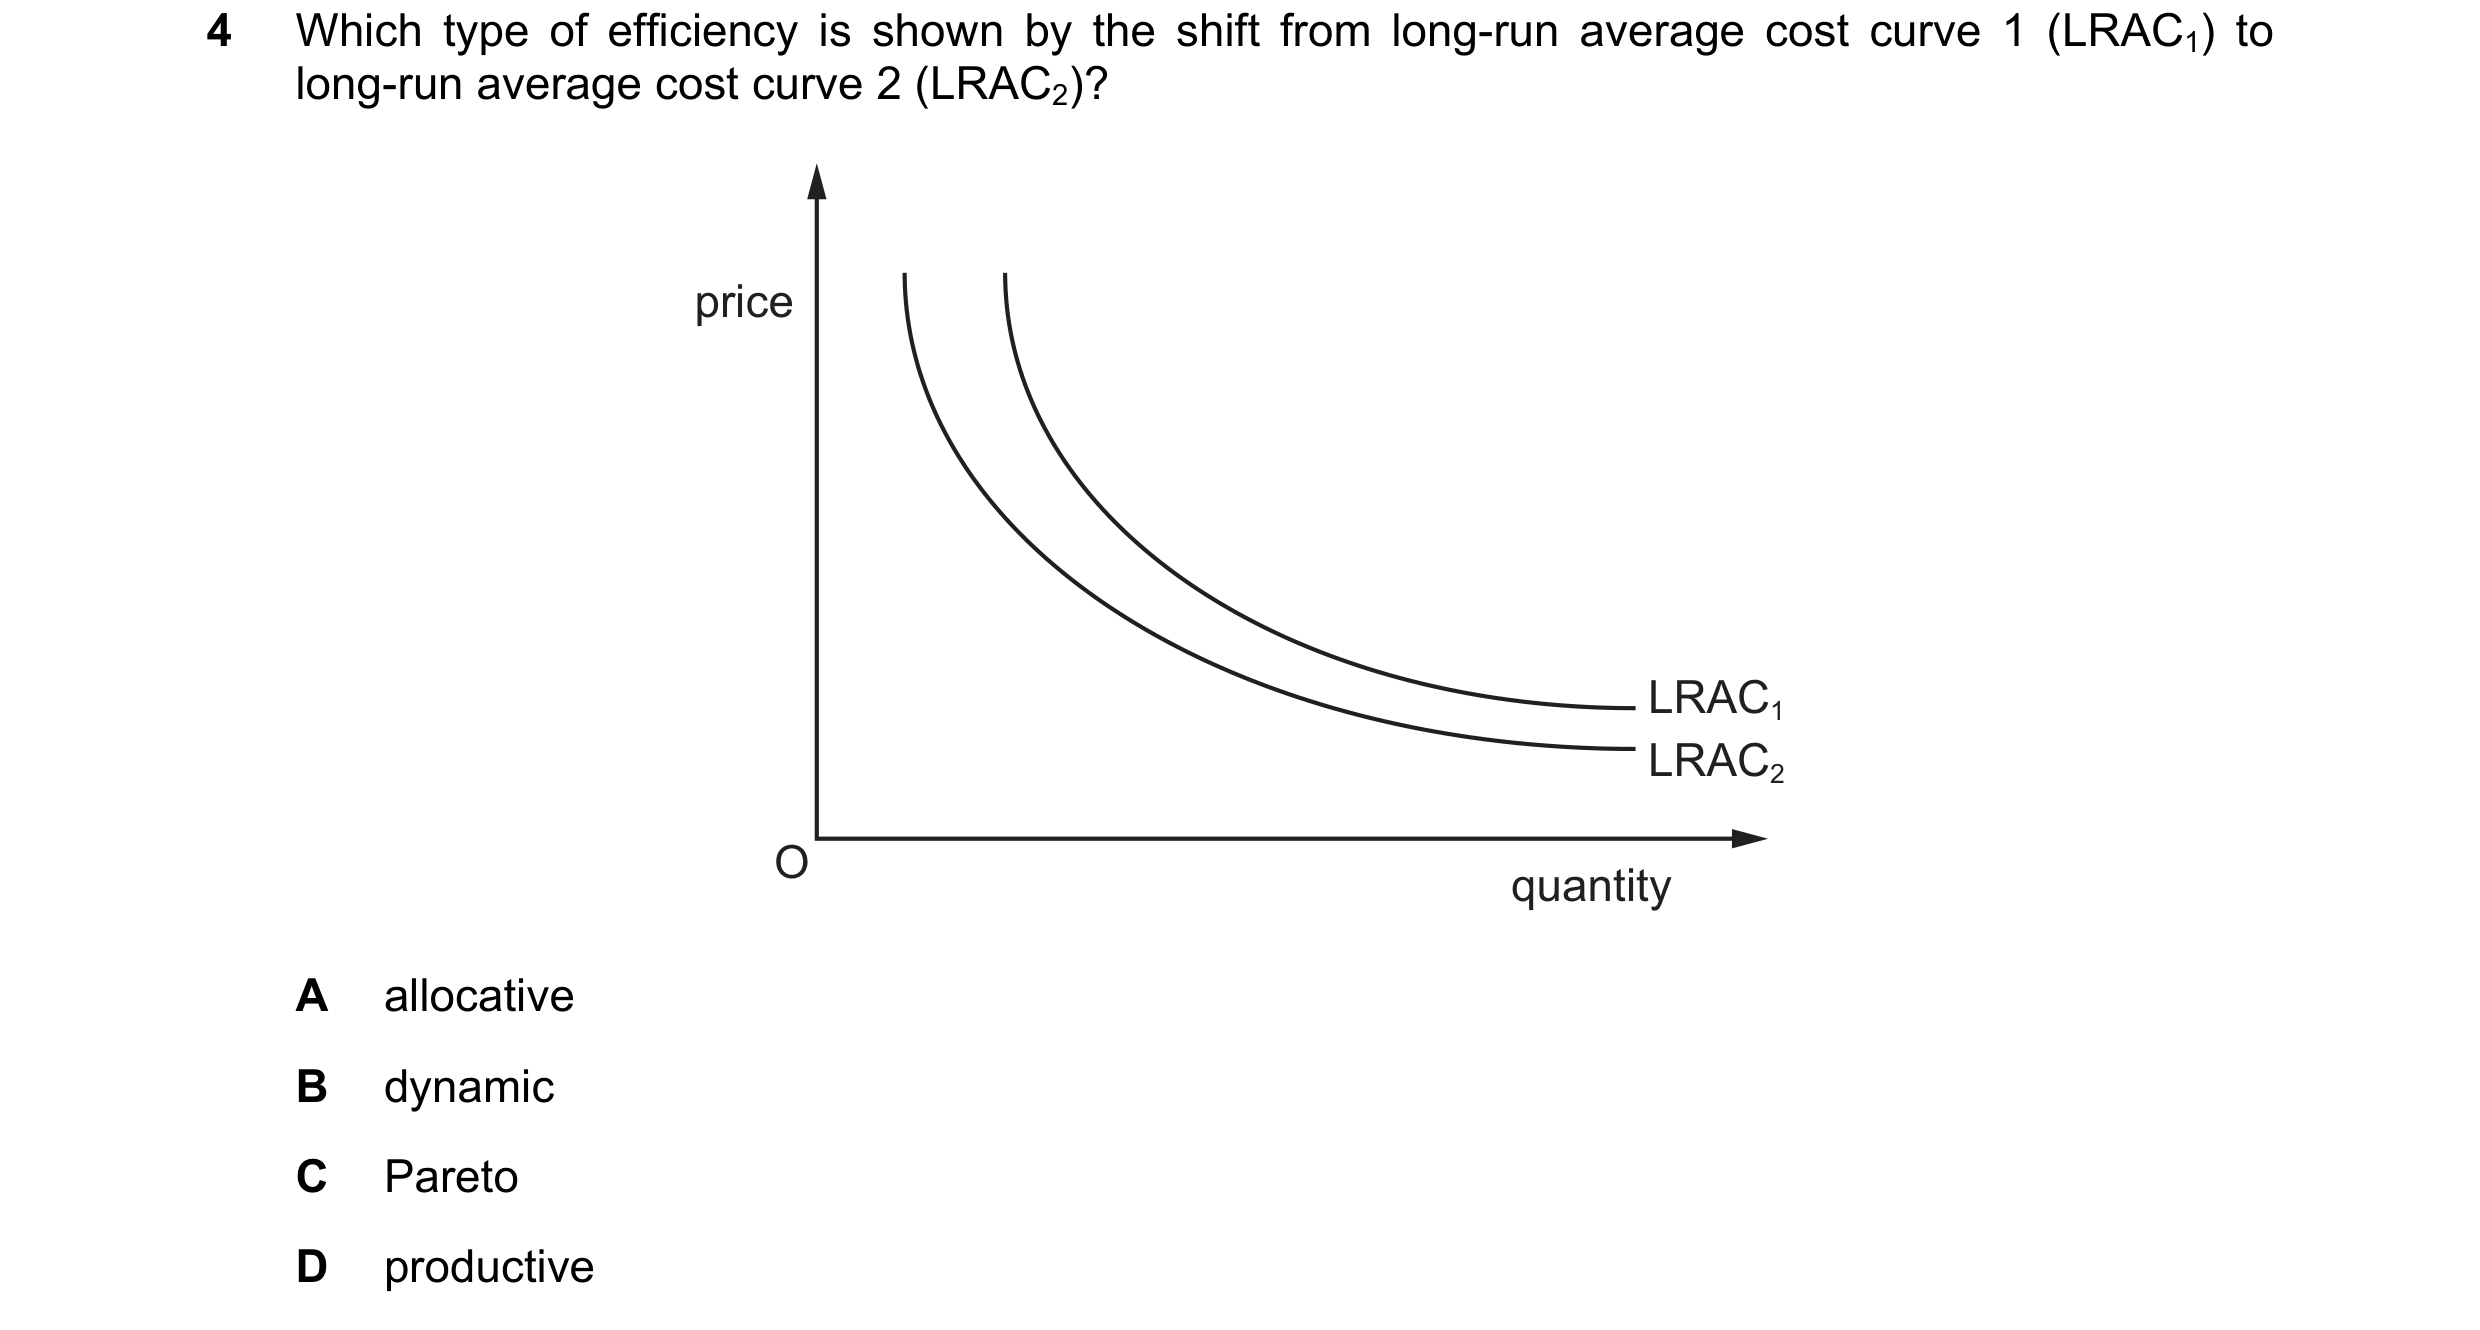

 29 / 32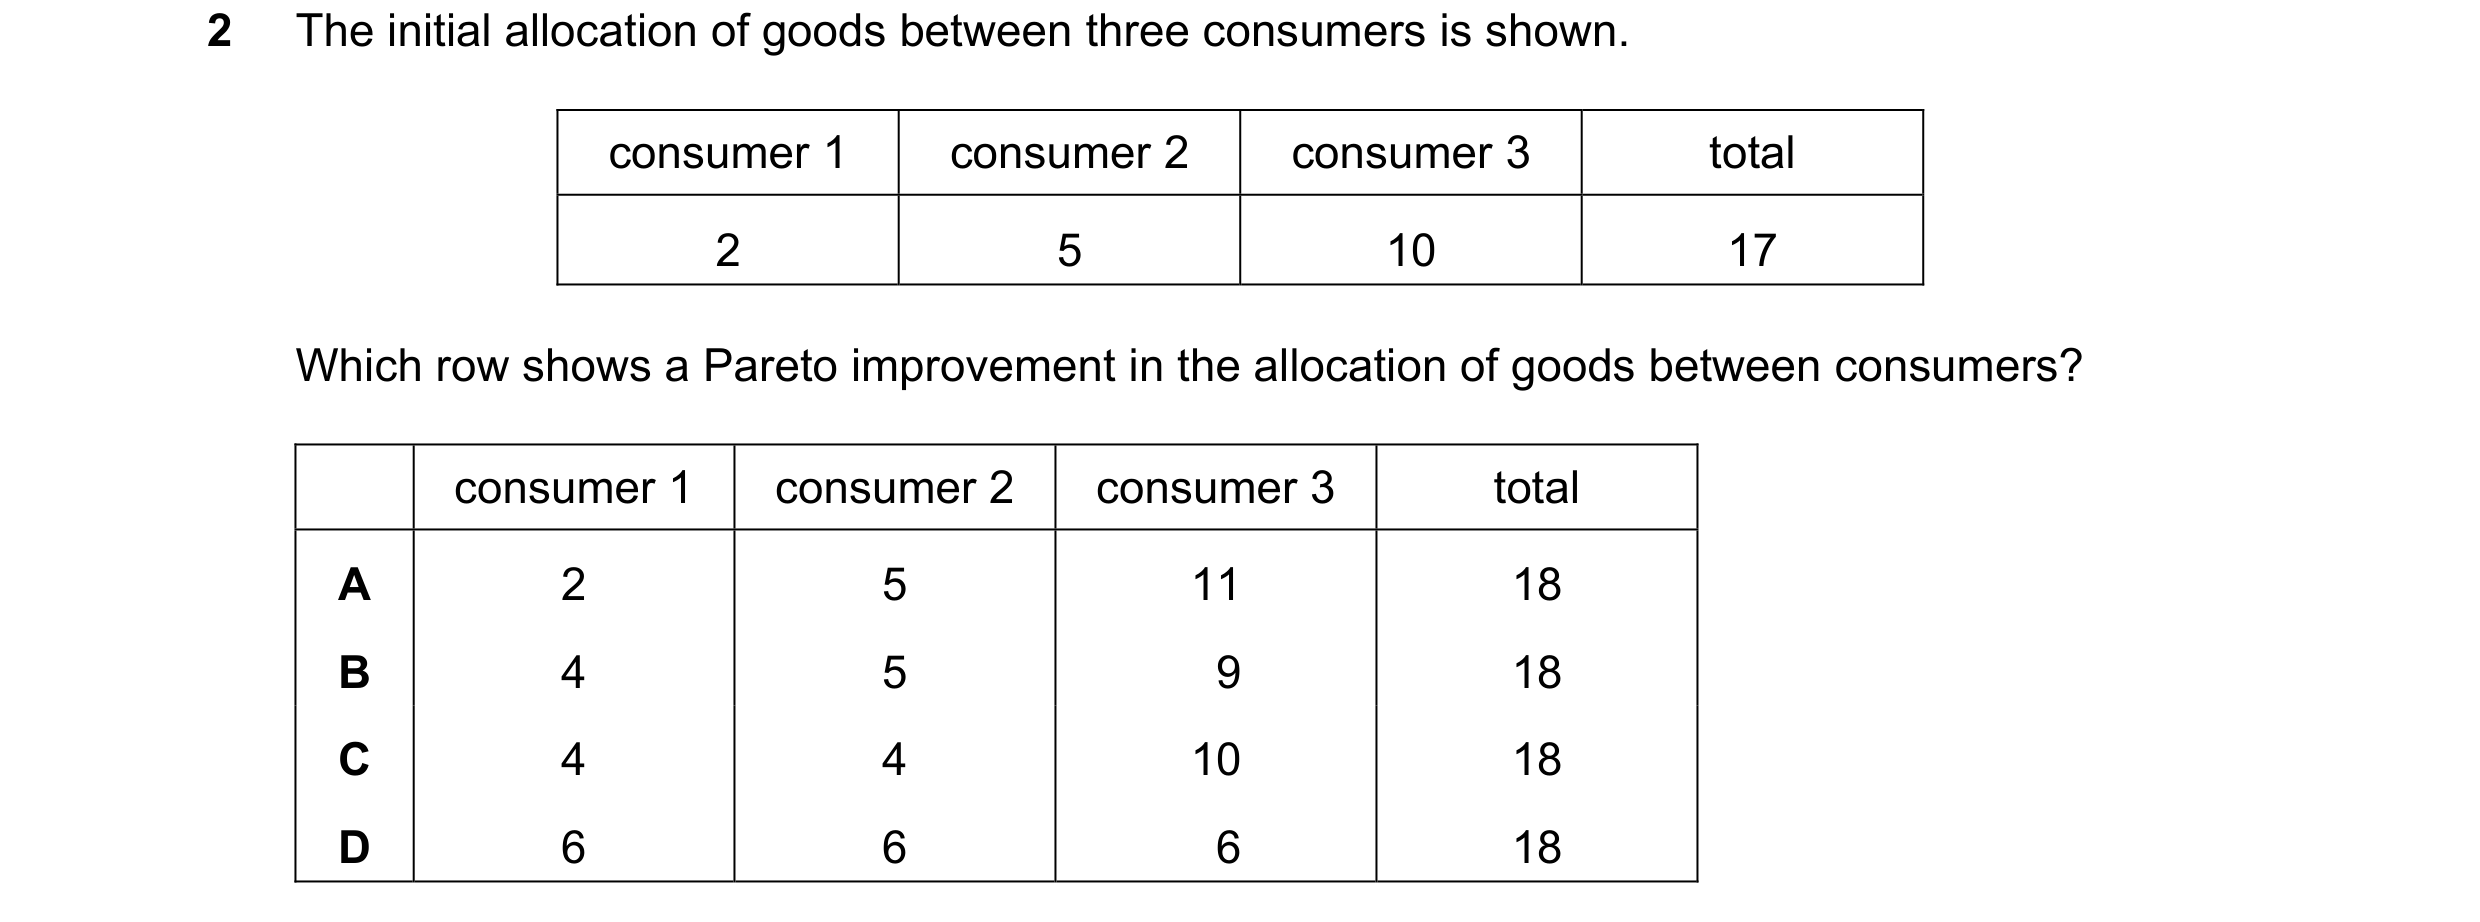
 30 / 32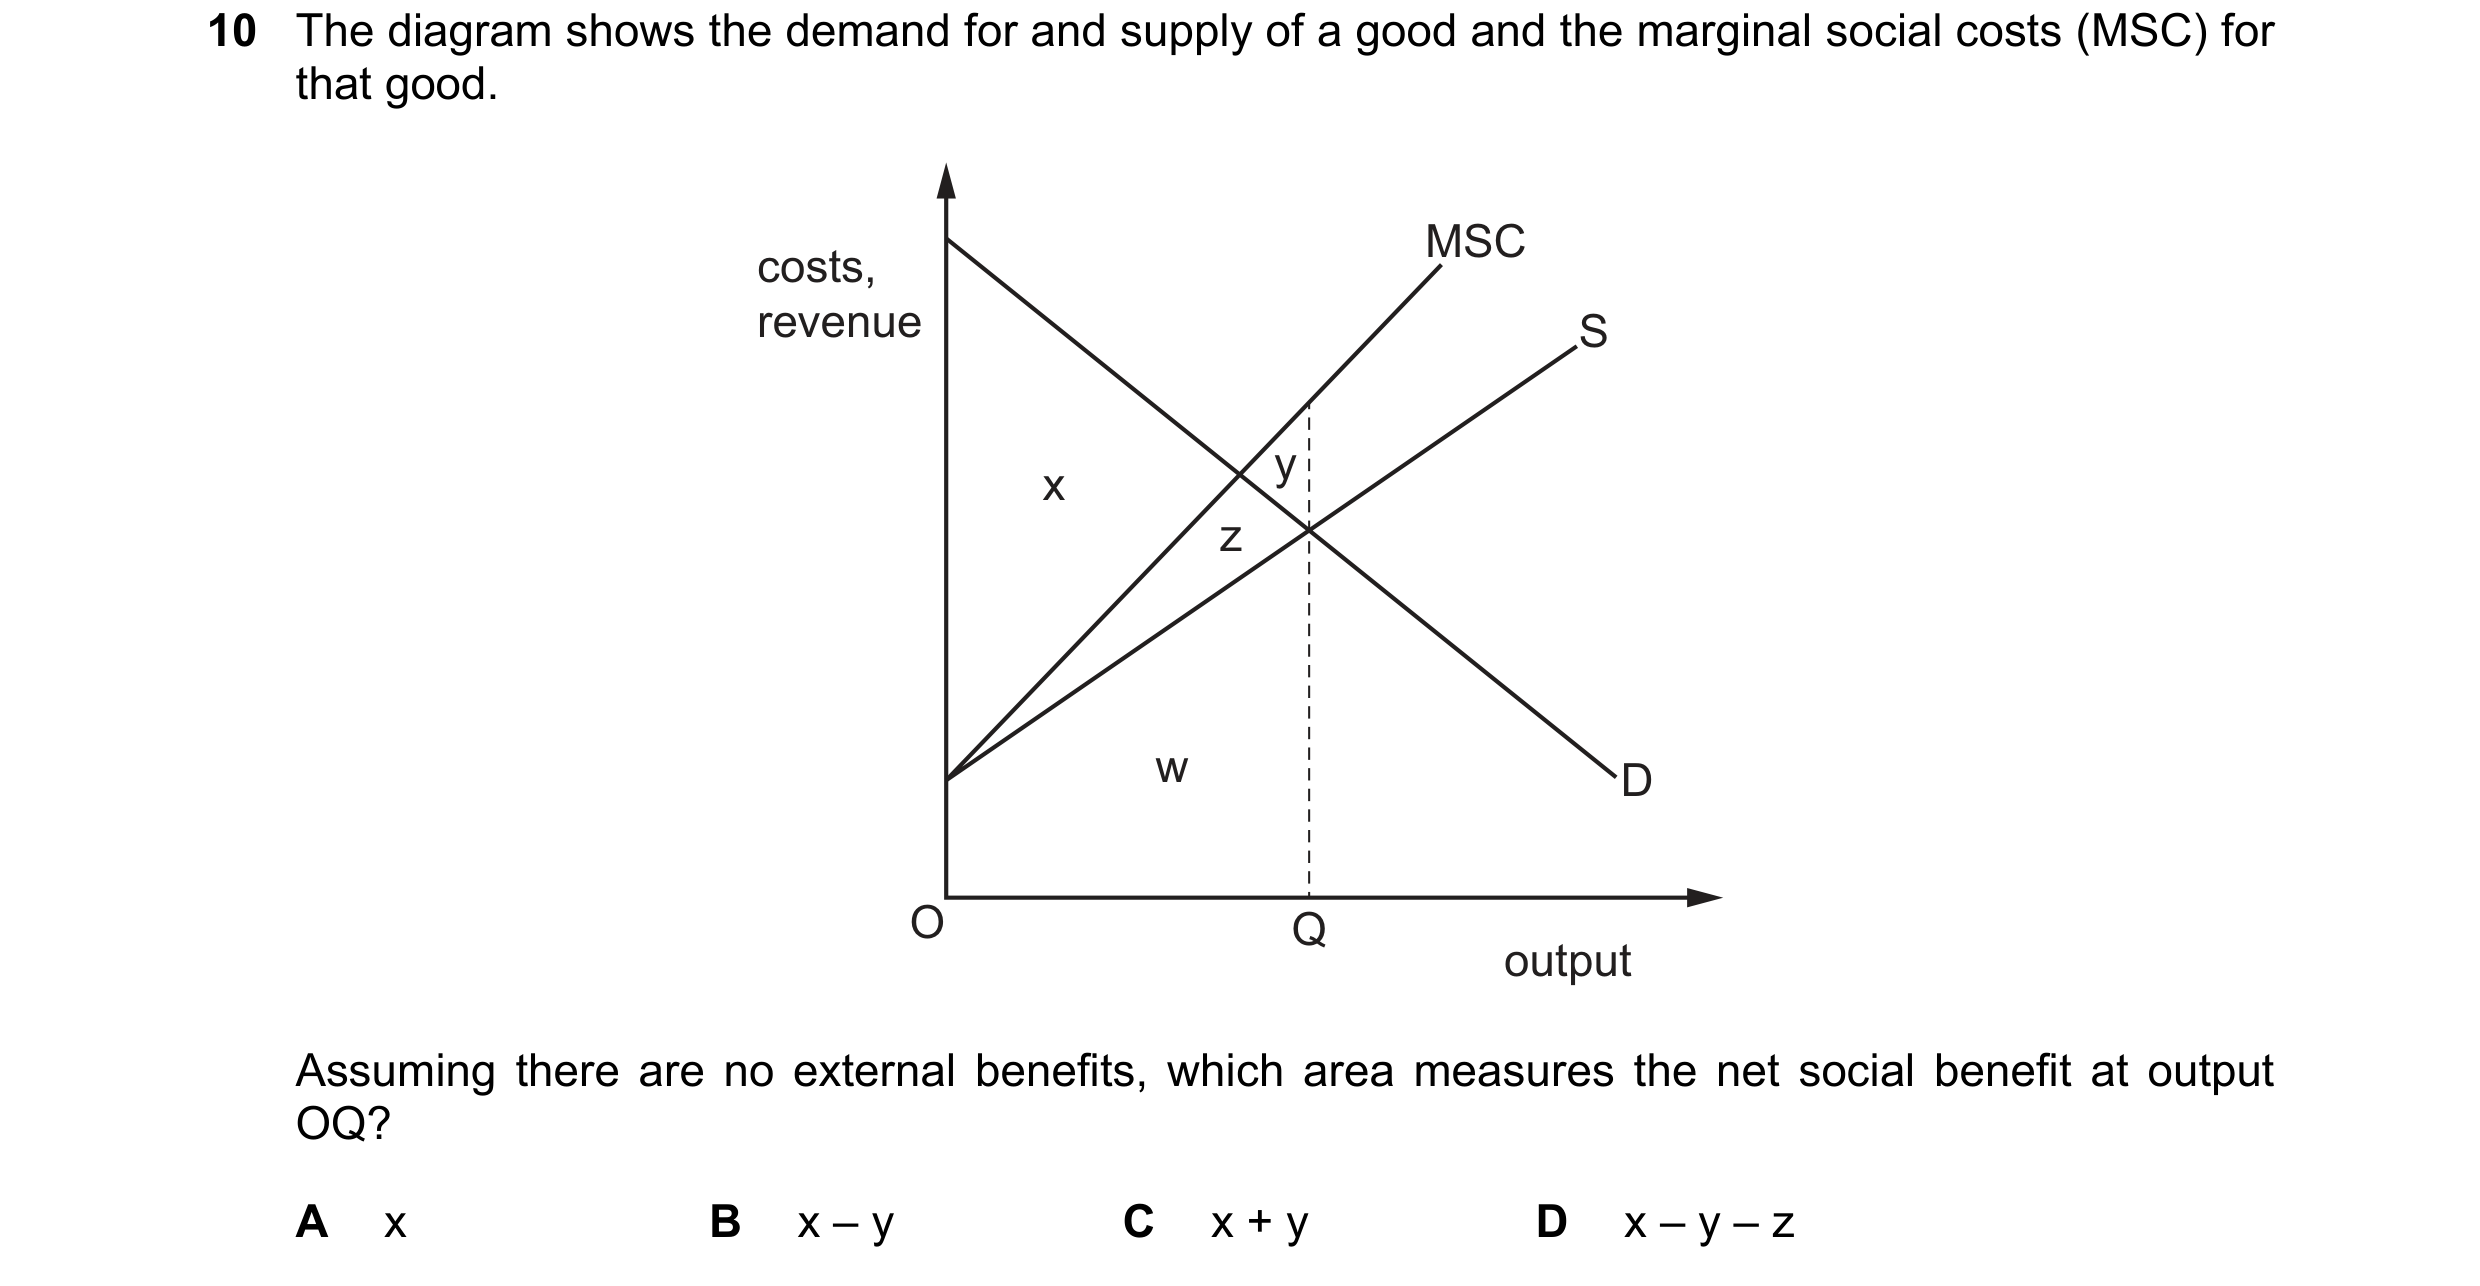

 31 / 32
 32 / 32