Questions as text
Q1 · Two plants, A and B, of the same species 0654/41 Oct/Nov 2018
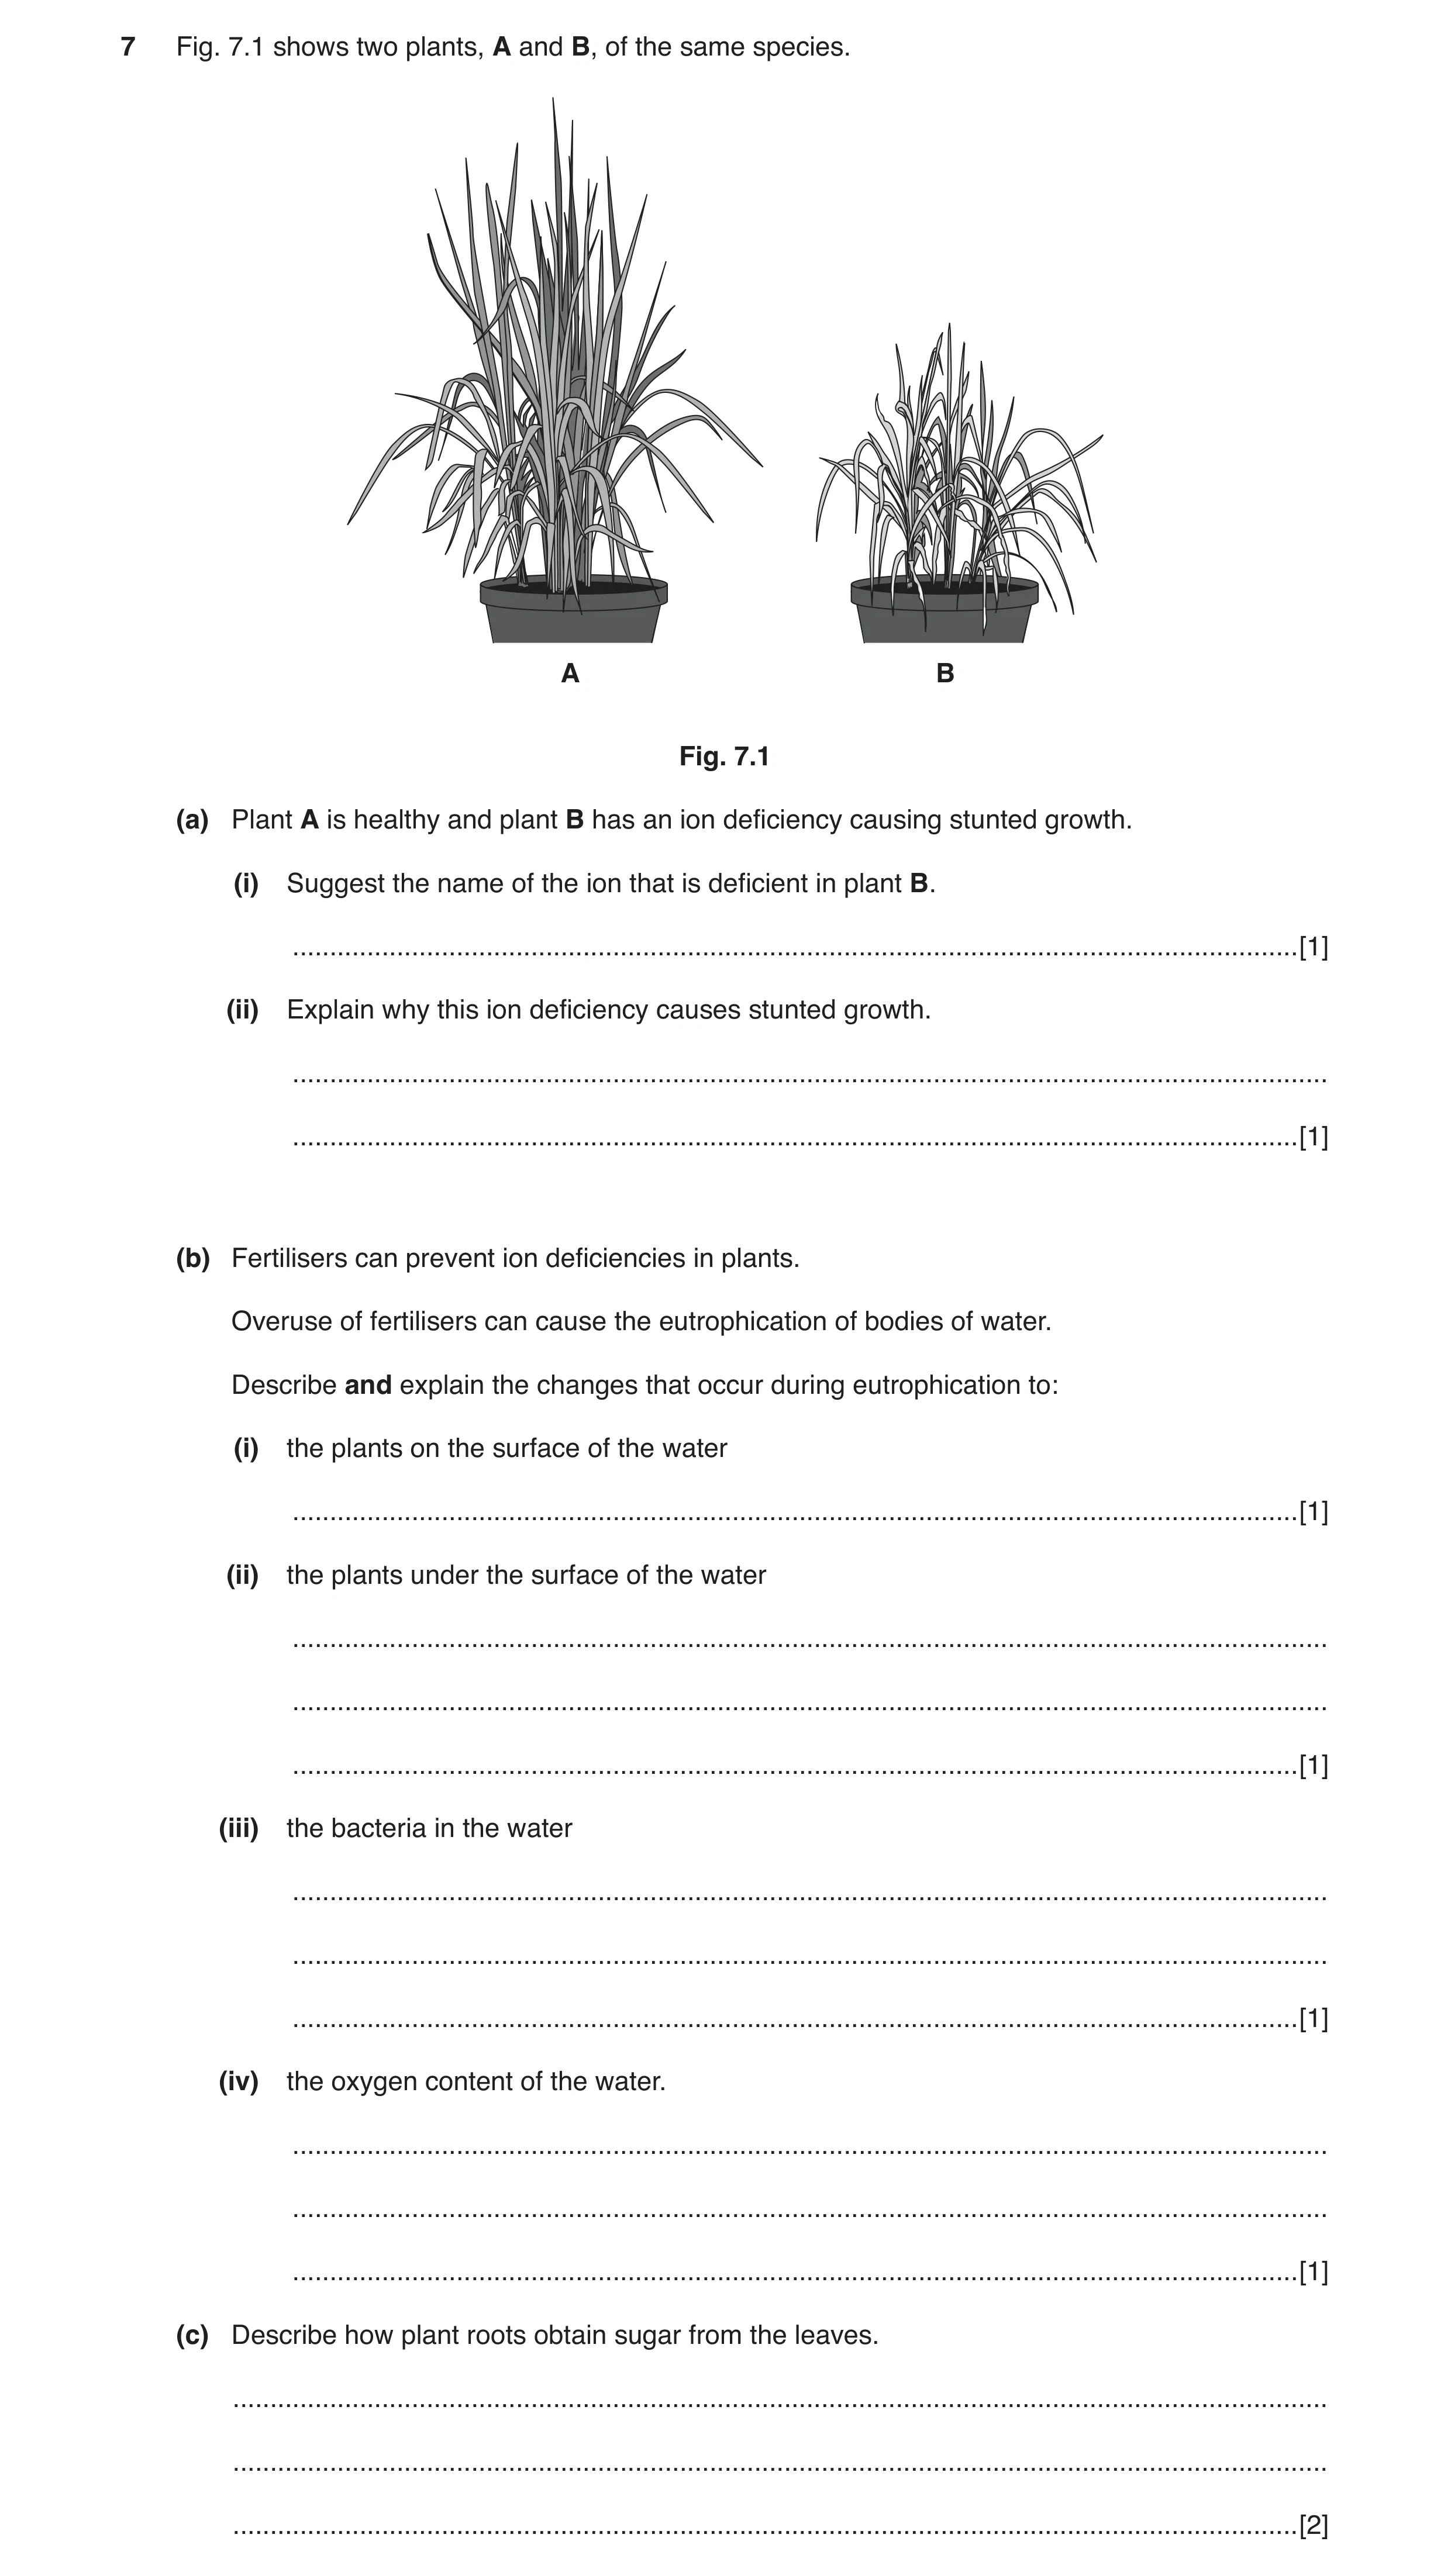
7 Fig. 7.1 shows two plants, A and B, of the same species. A B Fig. 7.1 (a) Plant A is healthy and plant B has an ion deficiency causing stunted growth. (i) Suggest the name of the ion that is deficient in plant B. … [1] (ii) Explain why this ion deficiency causes stunted growth. … … [1] (b) Fertilisers can prevent ion deficiencies in plants. Overuse of fertilisers can cause the eutrophication of bodies of water. Describe and explain the changes that occur during eutrophication to: (i) the plants on the surface of the water … [1] (ii) the plants under the surface of the water … … … [1] (iii) the bacteria in the water … … … [1] (iv) the oxygen content of the water. … … … [1] (c) Describe how plant roots obtain sugar from the leaves. … … … [2]
8 marks
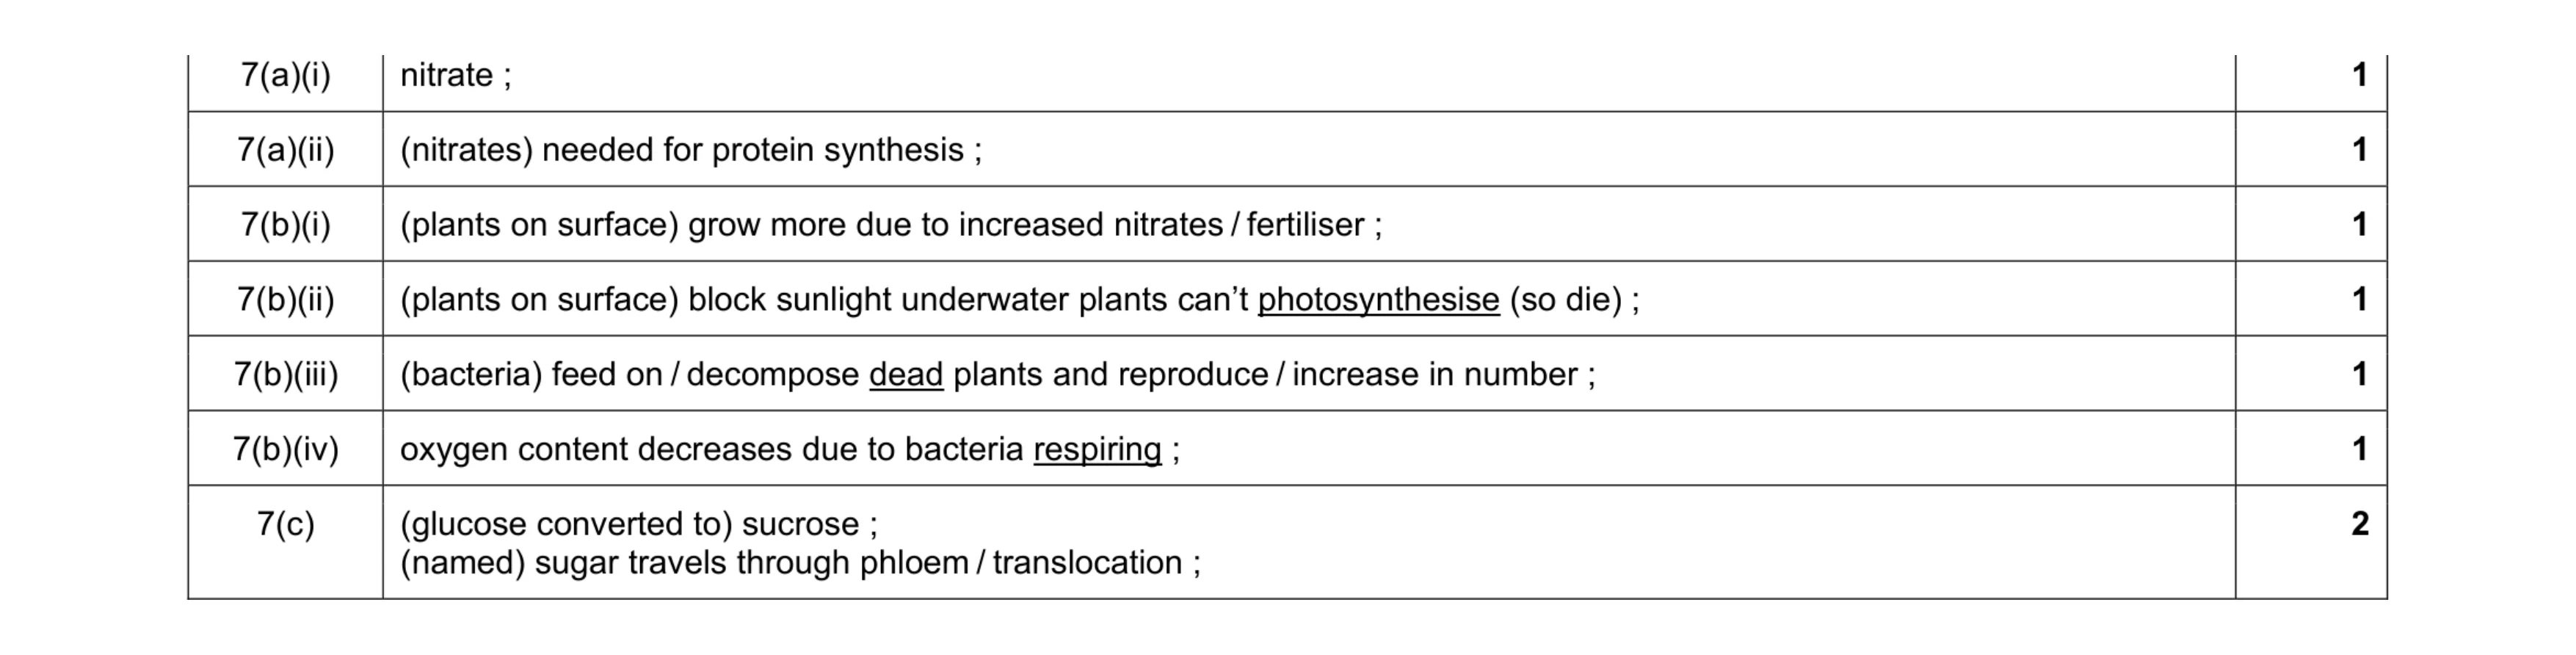
Mark scheme: 7(a)(i) nitrate ; 1 7(a)(ii) (nitrates) needed for protein synthesis ; 1 7(b)(i) (plants on surface) grow more due to increased nitrates / fertiliser ; 1 7(b)(ii) (plants on surface) block sunlight underwater plants can’t photosynthesise (so die) ; 1 7(b)(iii) (bacteria) feed on / decompose dead plants and reproduce / increase in number ; 1 7(b)(iv) oxygen content decreases due to bacteria respiring ; 1 7(c) (glucose converted to) sucrose ; (named) sugar travels through phloem / translocation ; 2
This question in 0654/41 Oct/Nov 2018
Q2 · A student investigates the need for chlorophyll in photosynthesis 0654/43 May/June 2019
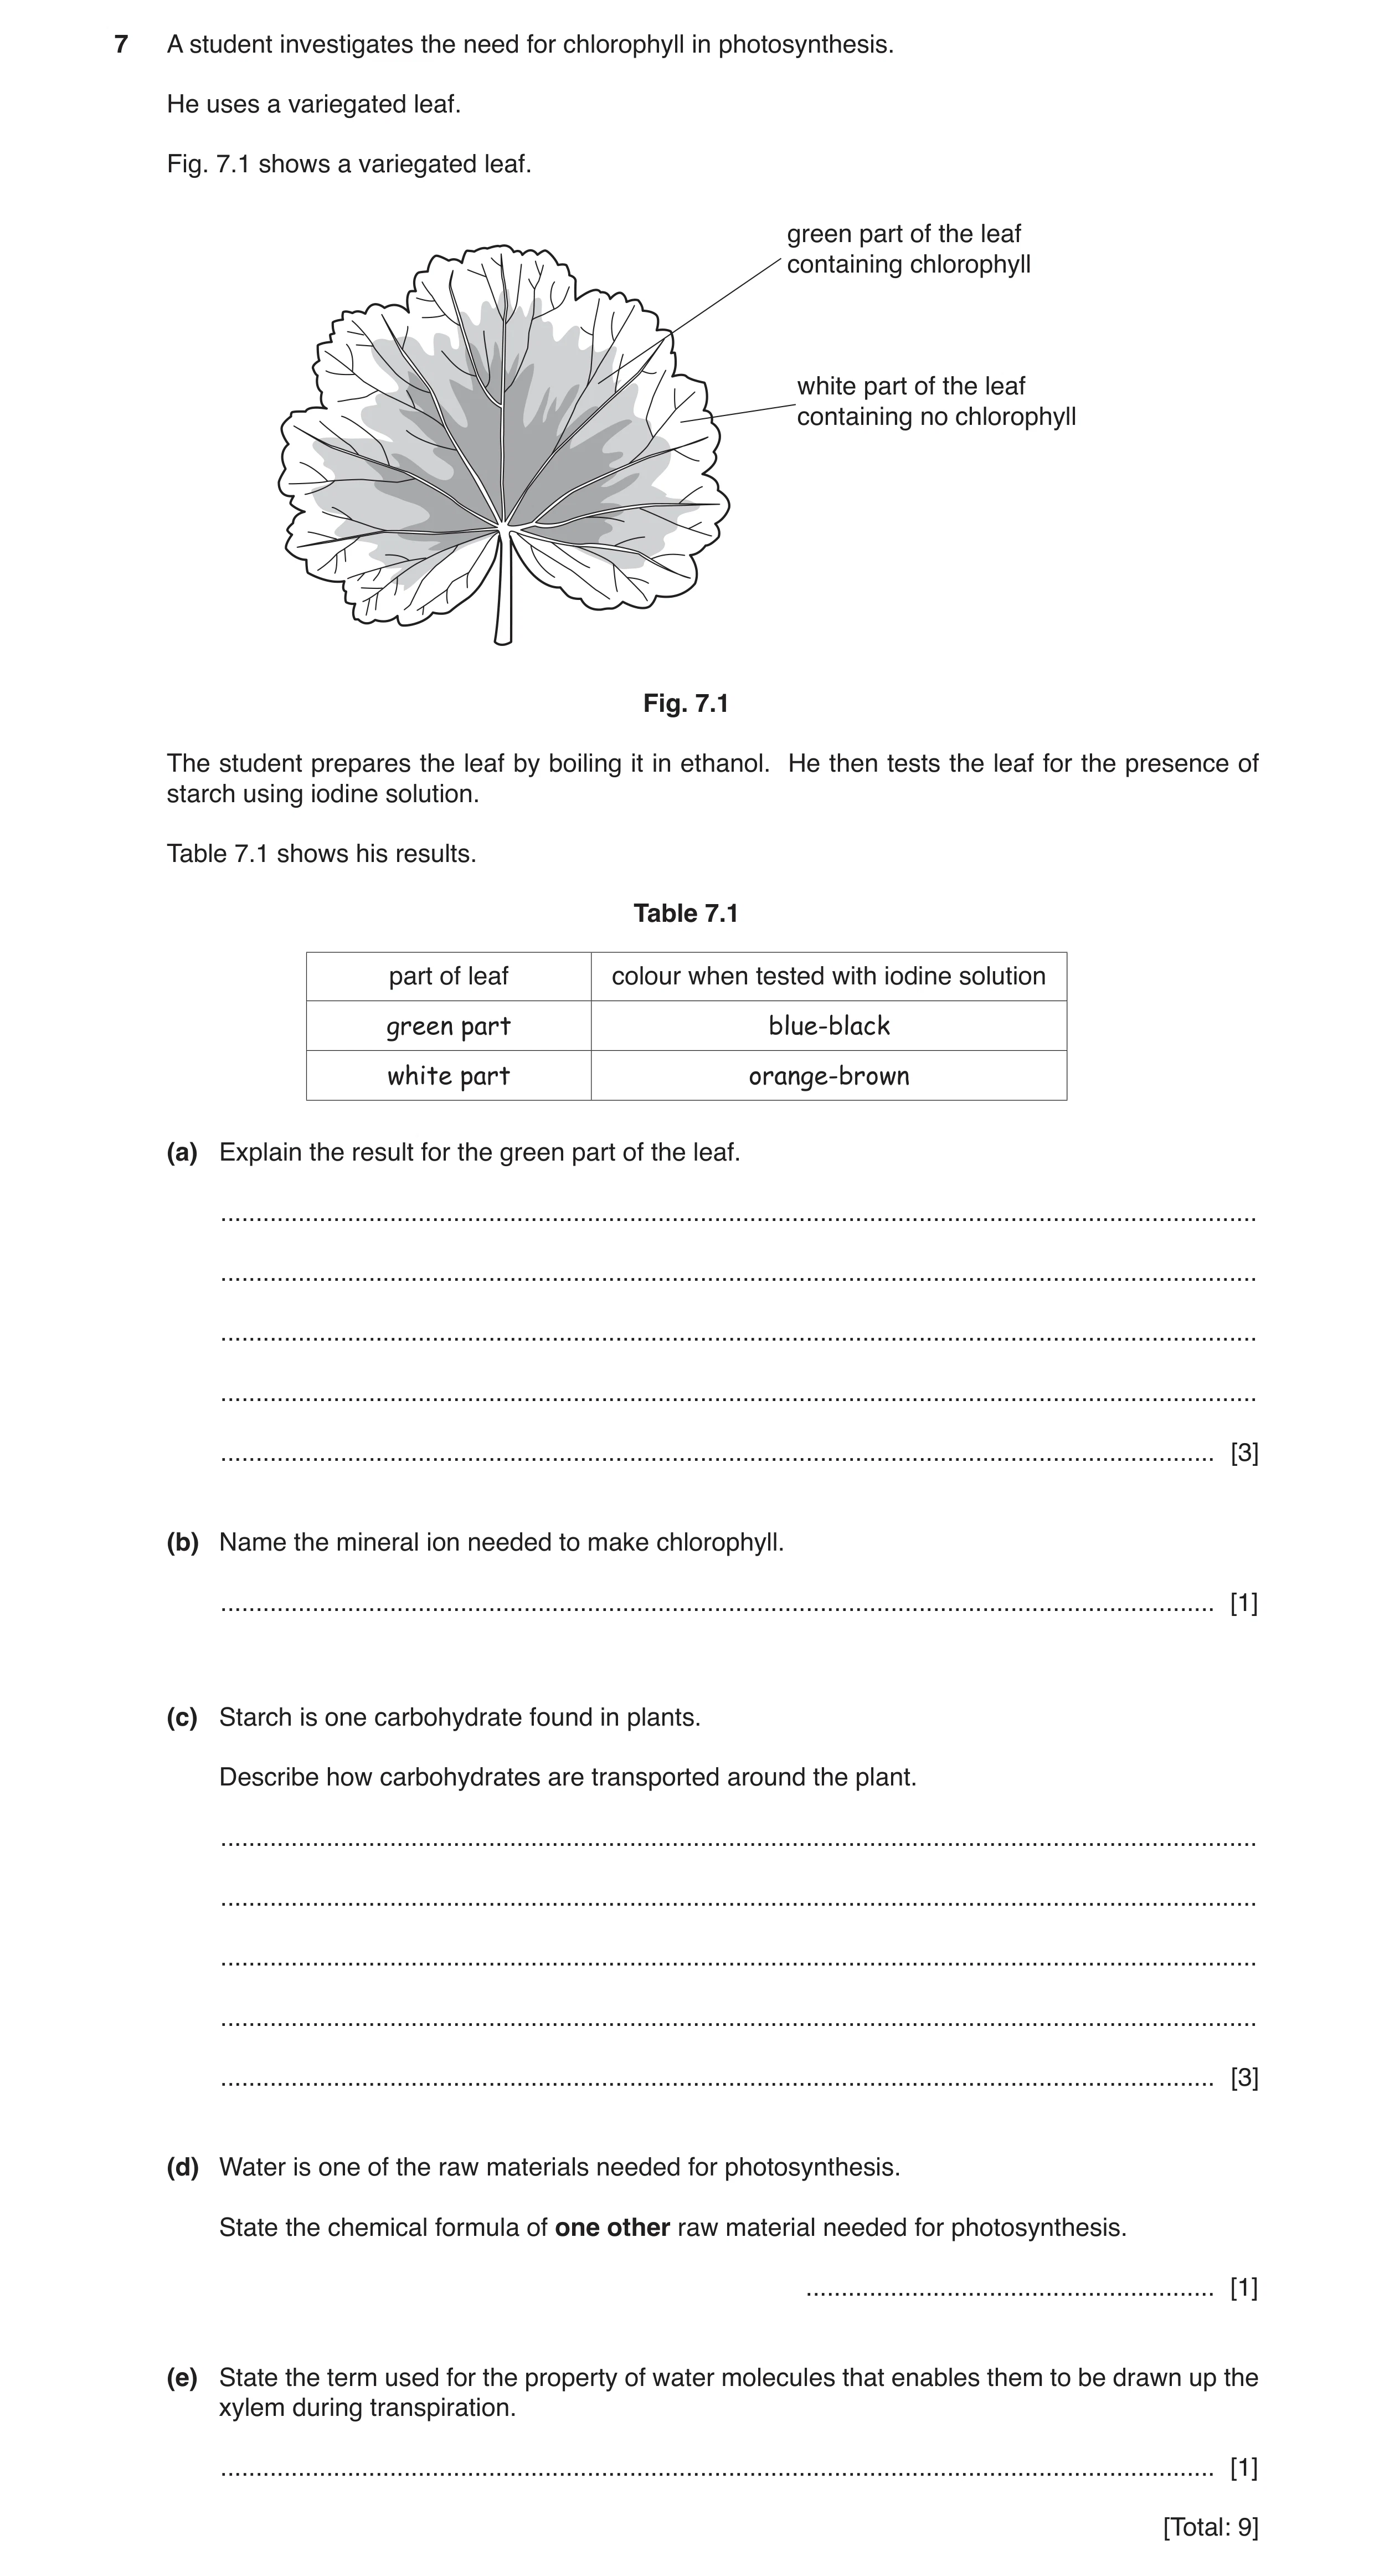
7 A student investigates the need for chlorophyll in photosynthesis. He uses a variegated leaf. Fig. 7.1 shows a variegated leaf. green part of the leaf containing chlorophyll white part of the leaf containing no chlorophyll Fig. 7.1 The student prepares the leaf by boiling it in ethanol. He then tests the leaf for the presence of starch using iodine solution. Table 7.1 shows his results. Table 7.1 part of leaf colour when tested with iodine solution green part blue-black white part orange-brown (a) Explain the result for the green part of the leaf. … … … … … [3] (b) Name the mineral ion needed to make chlorophyll. … [1] (c) Starch is one carbohydrate found in plants. Describe how carbohydrates are transported around the plant. … … … … … [3] (d) Water is one of the raw materials needed for photosynthesis. State the chemical formula of one other raw material needed for photosynthesis. … [1] (e) State the term used for the property of water molecules that enables them to be drawn up the xylem during transpiration. … [1] [Total: 9]
9 marks
Mark scheme: 7(a) green parts photosynthesise ; (photosynthesis) produces glucose ; glucose turned to starch ; starch turns iodine blue-black / reacts with iodine ; max 3 7(b) magnesium ; 1 7(c) ref to translocation ; as sucrose ; in the phloem ; from, source / regions of production / leaf, to, sink / regions or storage / where they are used in respiration / examples, / growth ; max 3 7(d) CO2 ; 1 7(e) cohesion ; 1
This question in 0654/43 May/June 2019
Q3 · Scientists investigate where translocation and transpiration occur in a plant stem 0654/43 Oct/Nov 2019
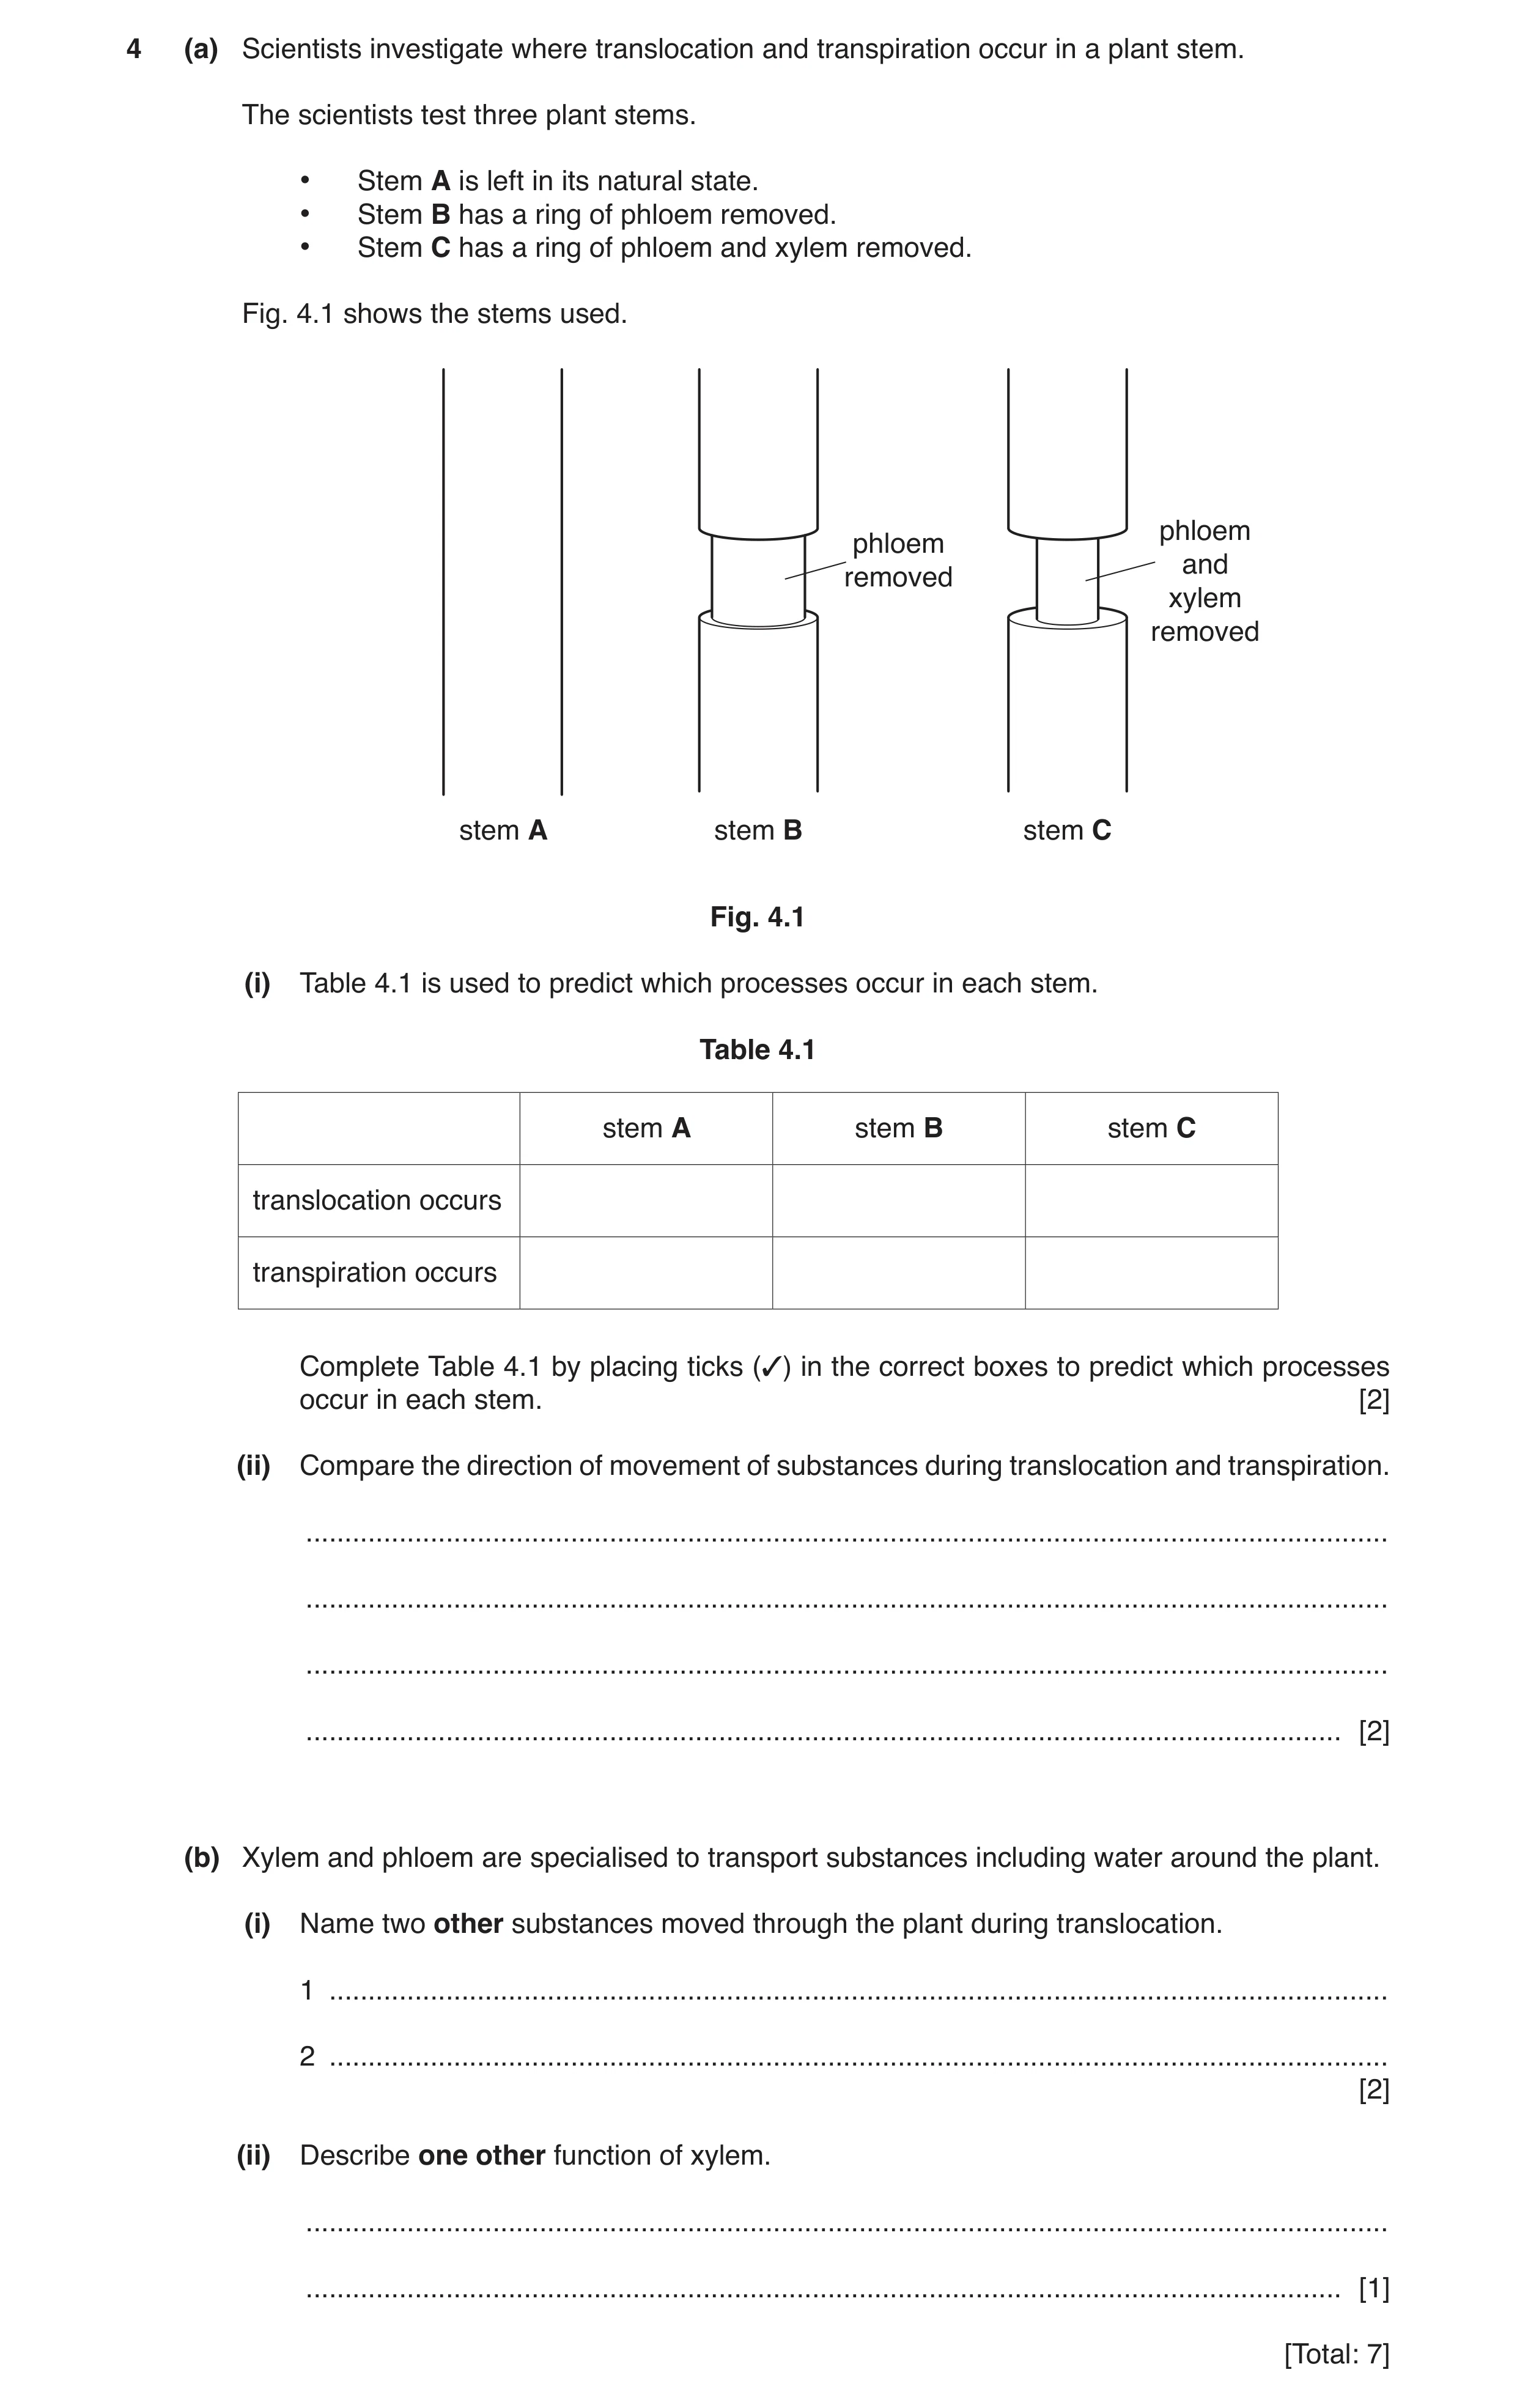
4 (a) Scientists investigate where translocation and transpiration occur in a plant stem. The scientists test three plant stems. • Stem A is left in its natural state. • Stem B has a ring of phloem removed. • Stem C has a ring of phloem and xylem removed. Fig. 4.1 shows the stems used. phloem phloem and removed xylem removed stem A stem B stem C Fig. 4.1 (i) Table 4.1 is used to predict which processes occur in each stem. Table 4.1 stem A stem B stem C translocation occurs transpiration occurs Complete Table 4.1 by placing ticks (✓) in the correct boxes to predict which processes occur in each stem. [2] (ii) Compare the direction of movement of substances during translocation and transpiration. … … … … [2] (b) Xylem and phloem are specialised to transport substances including water around the plant. (i) Name two other substances moved through the plant during translocation. 1 … 2 … [2] (ii) Describe one other function of xylem. … … [1] [Total: 7]
7 marks
Mark scheme: 4(a)(i) stem A stem B stem C translocation occurs 3 transpiration occurs 3 3 2 4(a)(ii) transpiration (only) occurs, upwards / up the plant / from root to leaf ; translocation occurs up and down the plant / AW ; 2 4(b)(i) sucrose ; amino acids ; 2 4(b)(ii) support (the stem / the plant) ; 1
This question in 0654/43 Oct/Nov 2019
Q4 · A student investigates the effect of temperature on the rate of photosynthesis in elodea… 0654/41 May/June 2020
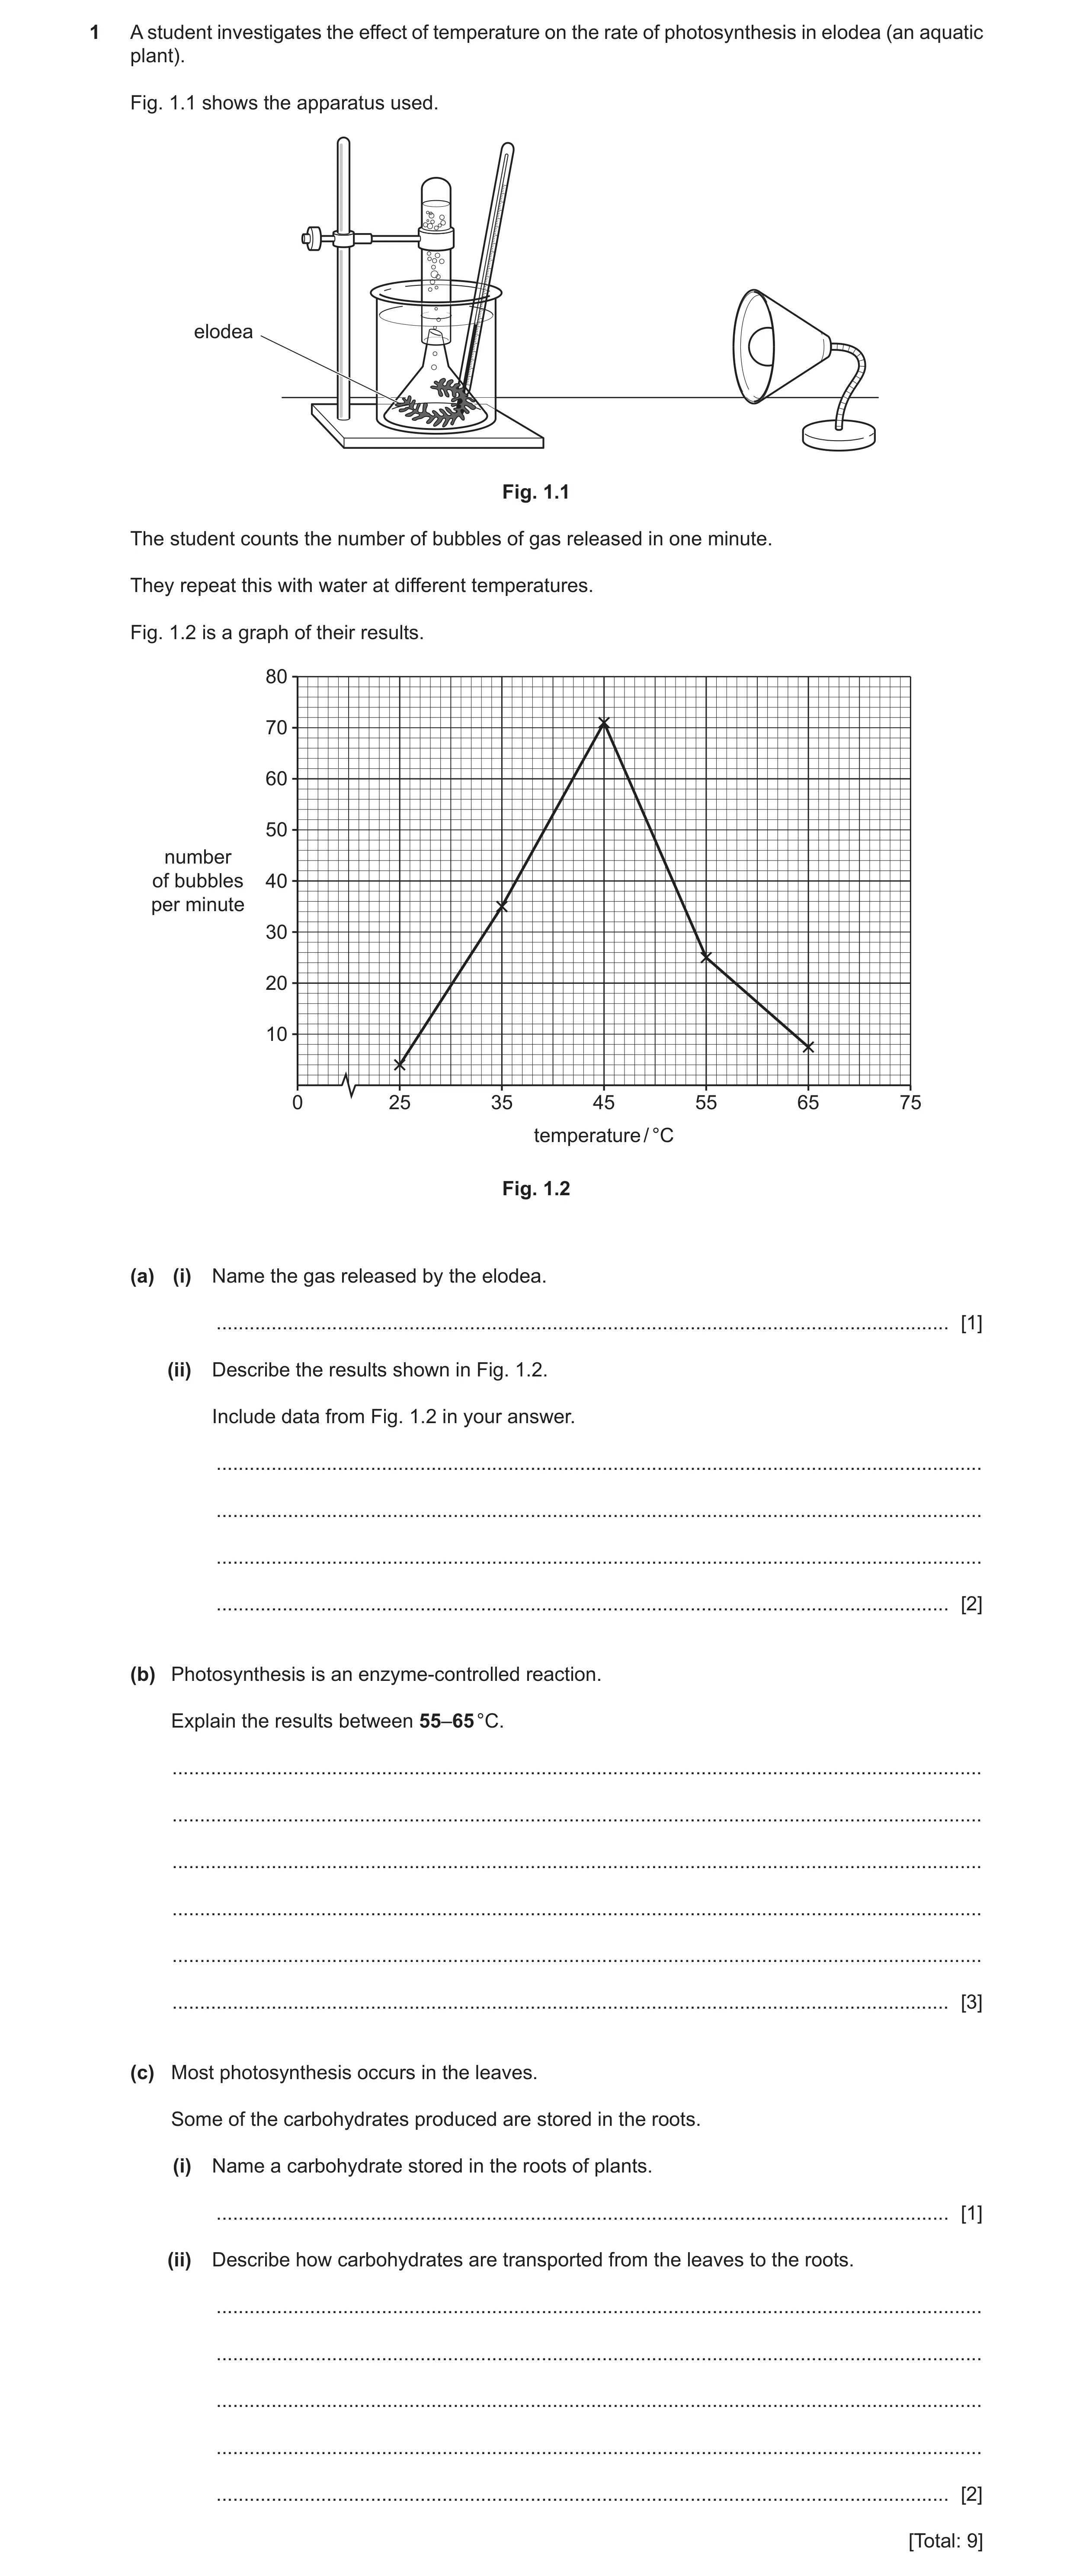
1 A student investigates the effect of temperature on the rate of photosynthesis in elodea (an aquatic plant). Fig. 1.1 shows the apparatus used. elodea Fig. 1.1 The student counts the number of bubbles of gas released in one minute. They repeat this with water at different temperatures. Fig. 1.2 is a graph of their results. 80 70 60 50 number of bubbles 40 per minute 30 20 10 0 25 35 45 55 65 75 temperature / °C Fig. 1.2 (a) (i) Name the gas released by the elodea. … [1] (ii) Describe the results shown in Fig. 1.2. Include data from Fig. 1.2 in your answer. … … … … [2] (b) Photosynthesis is an enzyme-controlled reaction. Explain the results between 55–65 °C. … … … … … … [3] (c) Most photosynthesis occurs in the leaves. Some of the carbohydrates produced are stored in the roots. (i) Name a carbohydrate stored in the roots of plants. … [1] (ii) Describe how carbohydrates are transported from the leaves to the roots. … … … … … [2] [Total: 9]
9 marks
Mark scheme: 1(a)(i) oxygen ; 1 1(a)(ii) the number of bubbles released / rate of photosynthesis increases and decreases (with temperature) ; peak at 45°C / 71 bubbles per minute ; 2 1(b) enzymes denature at high temperature ; active site shape is changed ; substrate can no longer fit ; so rate of, reaction / photosynthesis decreases ; max 3 1(c)(i) starch ; 1 1(c)(ii) ref to translocation ; transported as sucrose ; through the phloem ; max 2
This question in 0654/41 May/June 2020
Q5 · A sketch graph showing the effect of temperature on the rate of transpiration (loss of… 0654/42 May/June 2020
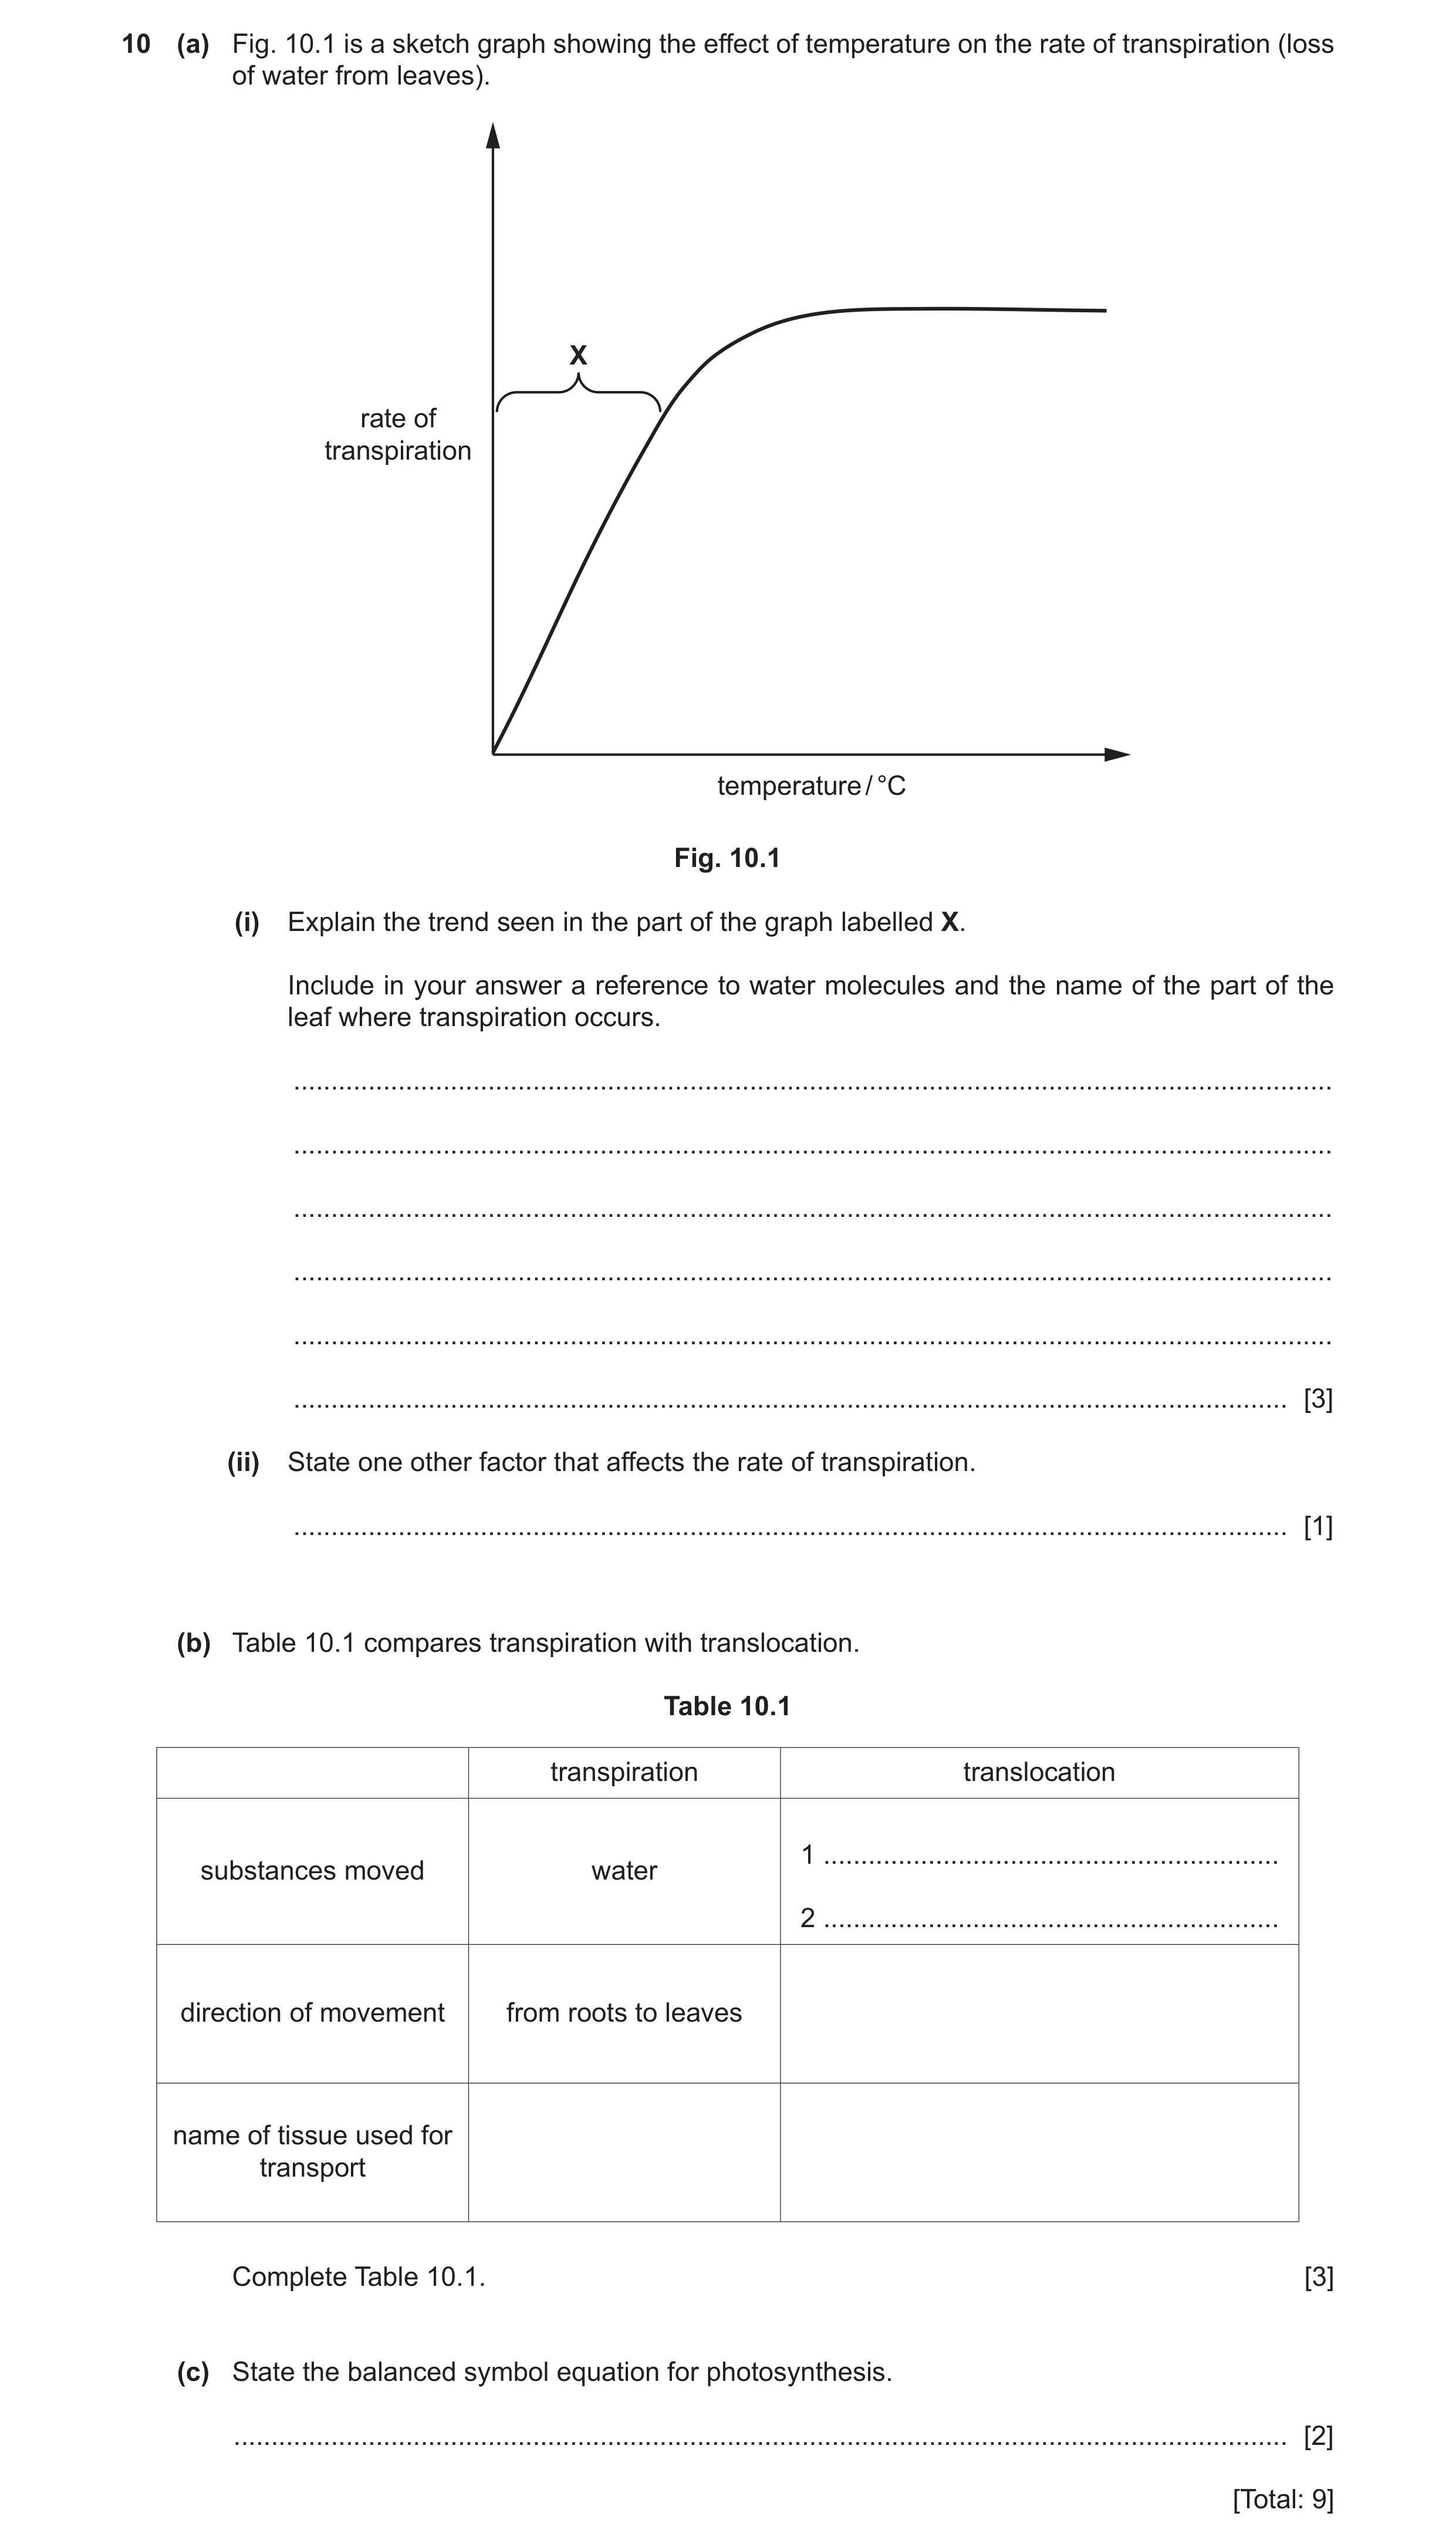
10 (a) Fig. 10.1 is a sketch graph showing the effect of temperature on the rate of transpiration (loss of water from leaves). X rate of transpiration temperature / °C Fig. 10.1 (i) Explain the trend seen in the part of the graph labelled X. Include in your answer a reference to water molecules and the name of the part of the leaf where transpiration occurs. … … … … … … [3] (ii) State one other factor that affects the rate of transpiration. … [1] (b) Table 10.1 compares transpiration with translocation. Table 10.1 transpiration translocation 1 … substances moved water 2 … direction of movement from roots to leaves name of tissue used for transport Complete Table 10.1. [3] (c) State the balanced symbol equation for photosynthesis. … [2] [Total: 9]
9 marks
Mark scheme: 10(a)(i) increase in temperature (no mark) increase in kinetic energy of water molecules ; increased rate of evaporation ; increased loss of water (vapour) through stomata ; 3 10(a)(ii) humidity ; 1 Question Answer Marks 10(b) transpiration translocation substances moved water 1 sucrose 2 amino acids direction of movement from roots to leaves from source to storage / sink name of tissue used for transport xylem phloem ;;; 1 mark for each correct row 3 10(c) 6CO2 + 6H2O → C6H12O6 + 6O2 left hand side ; right hand side ; 2
This question in 0654/42 May/June 2020
Q6 · A diagram of a cross-section of a leaf 0654/42 Feb/March 2021
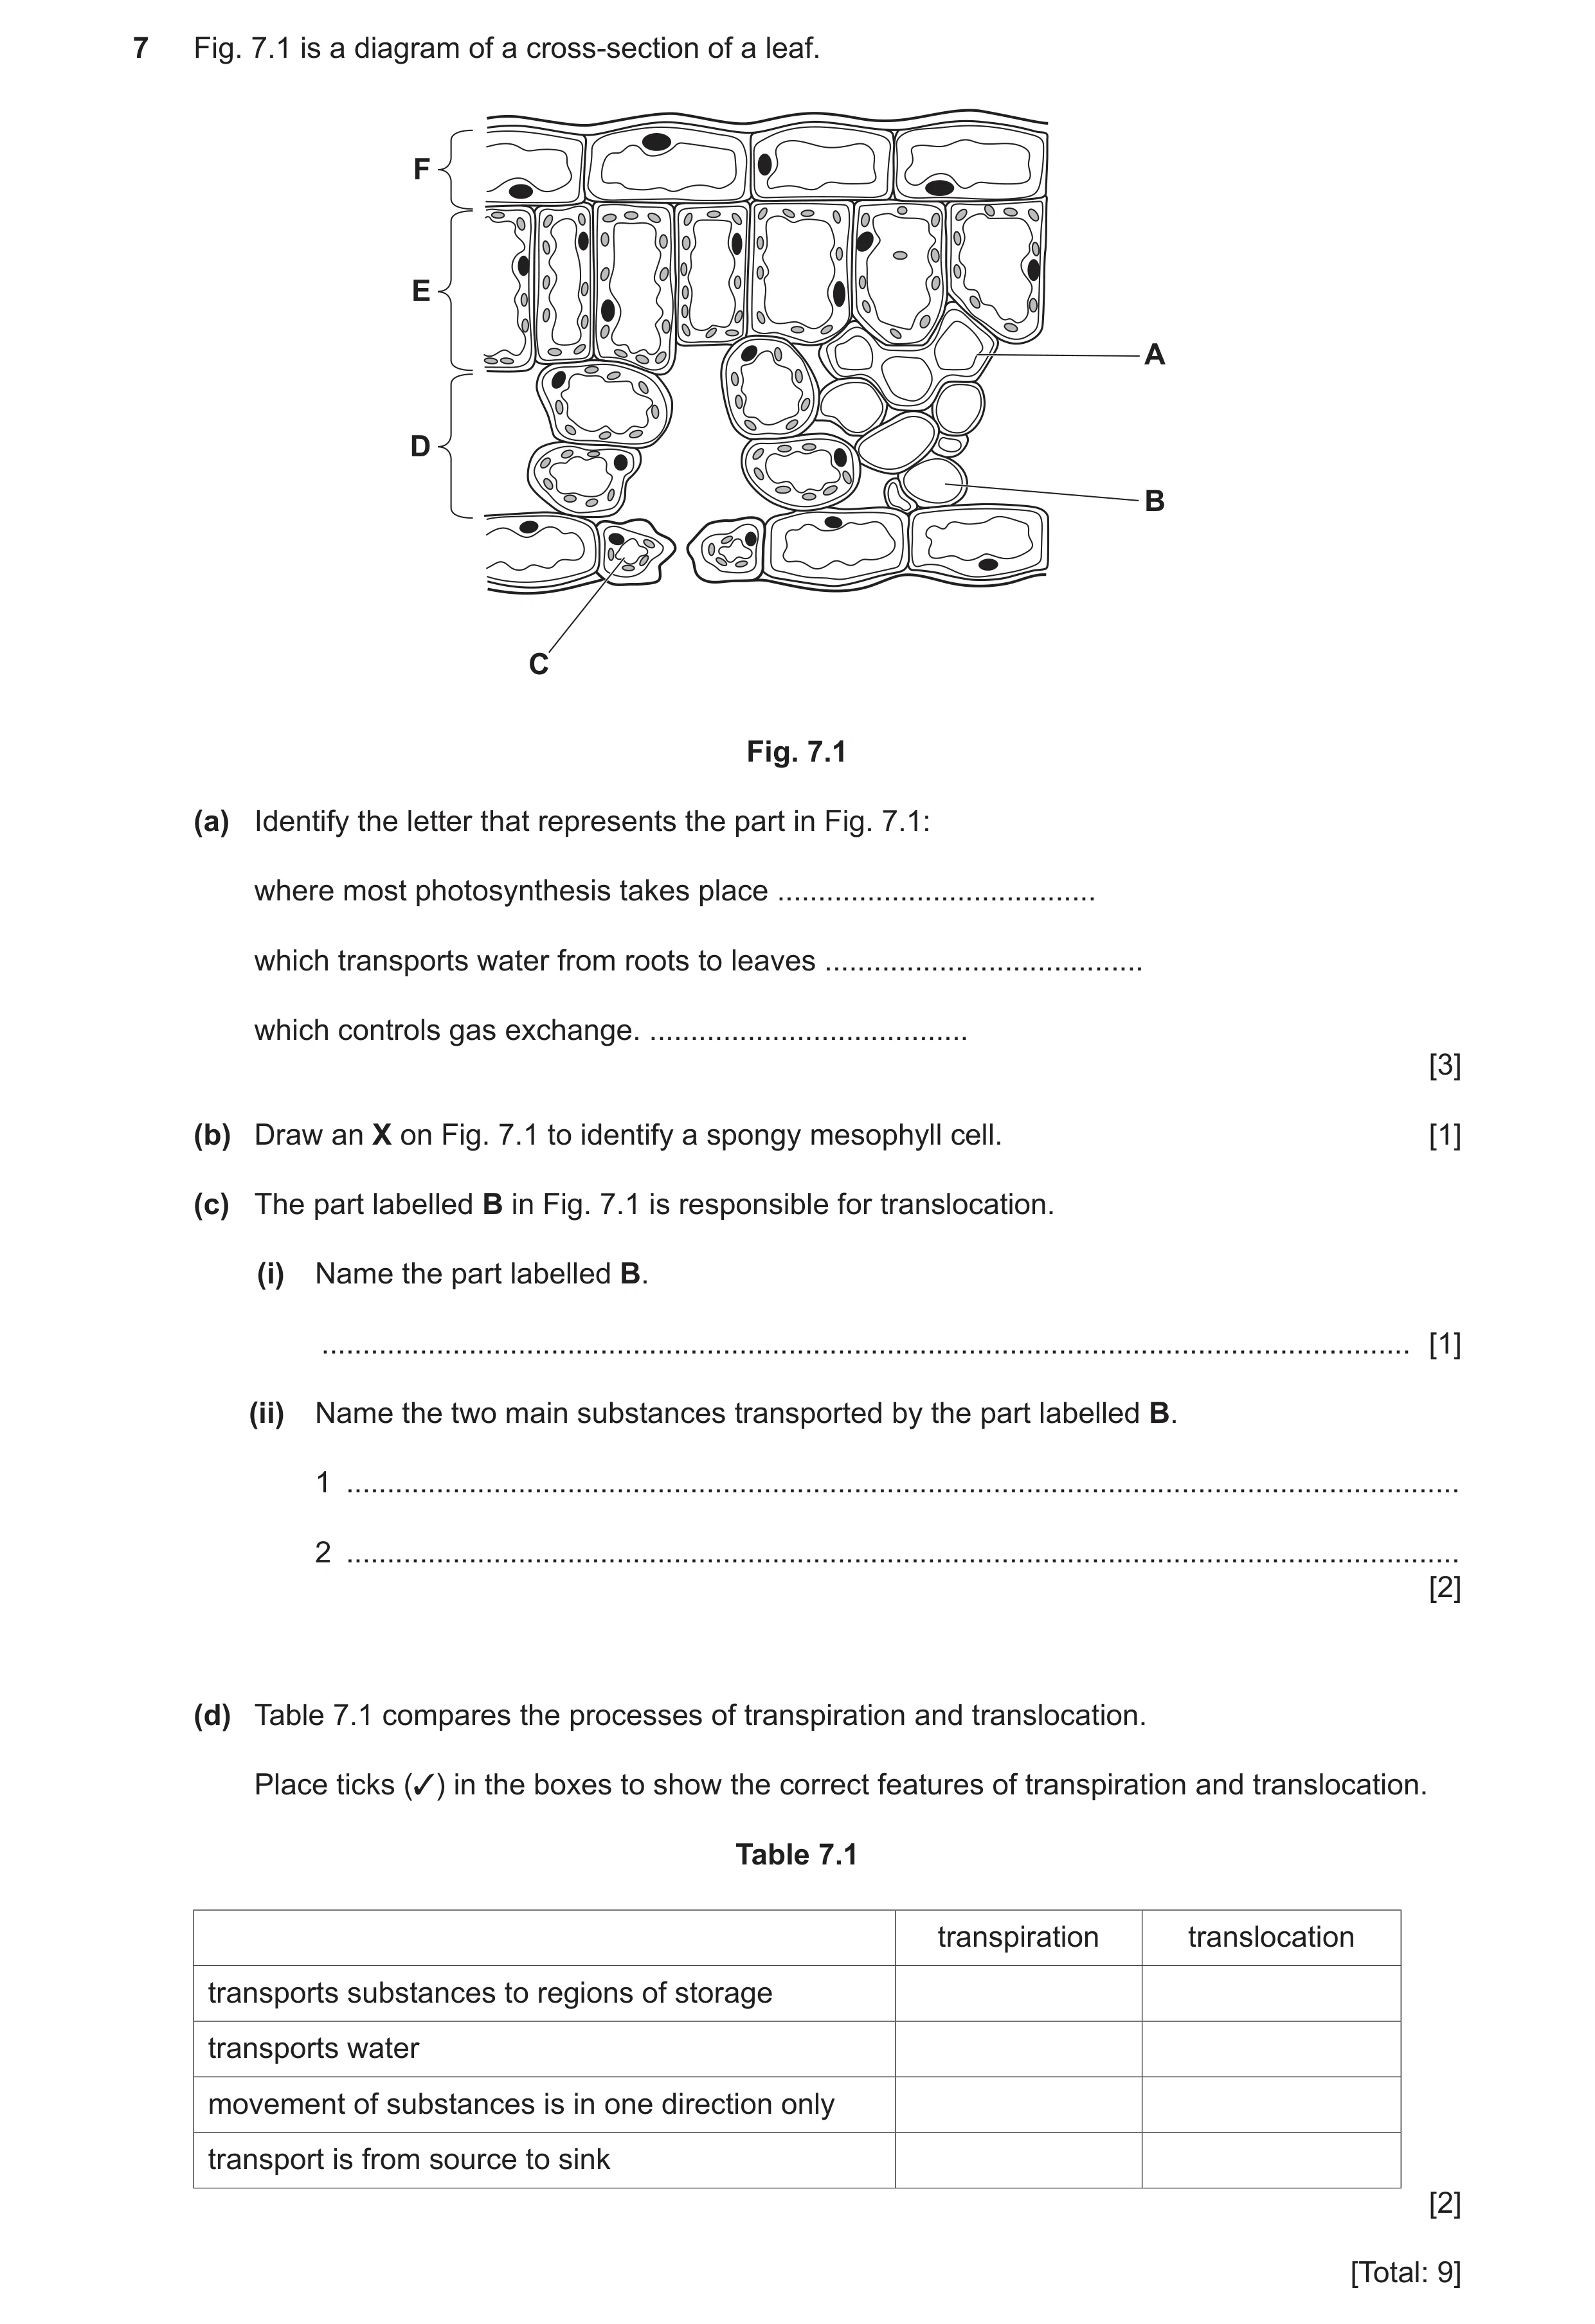
7 Fig. 7.1 is a diagram of a cross-section of a leaf. F E A D B C Fig. 7.1 (a) Identify the letter that represents the part in Fig. 7.1: where most photosynthesis takes place … which transports water from roots to leaves … which controls gas exchange. … [3] (b) Draw an X on Fig. 7.1 to identify a spongy mesophyll cell. [1] (c) The part labelled B in Fig. 7.1 is responsible for translocation. (i) Name the part labelled B. … [1] (ii) Name the two main substances transported by the part labelled B. 1 … 2 … [2] (d) Table 7.1 compares the processes of transpiration and translocation. Place ticks (3) in the boxes to show the correct features of transpiration and translocation. Table 7.1 transpiration translocation transports substances to regions of storage transports water movement of substances is in one direction only transport is from source to sink [2] [Total: 9]
9 marks
Mark scheme: 7(a) E ; A ; C ; 3 7(b) X on one of the spongy mesophyll cells ; 1 7(c)(i) phloem ; 1 7(c)(ii) sucrose ; amino acids ; 2 7(d) transpiration translocation transports substances to regions of storage transports water movement of substances is in one direction only transport is from source to sink ;; 2
This question in 0654/42 Feb/March 2021
Q7 · A photomicrograph of some plant cells 0654/42 Feb/March 2022
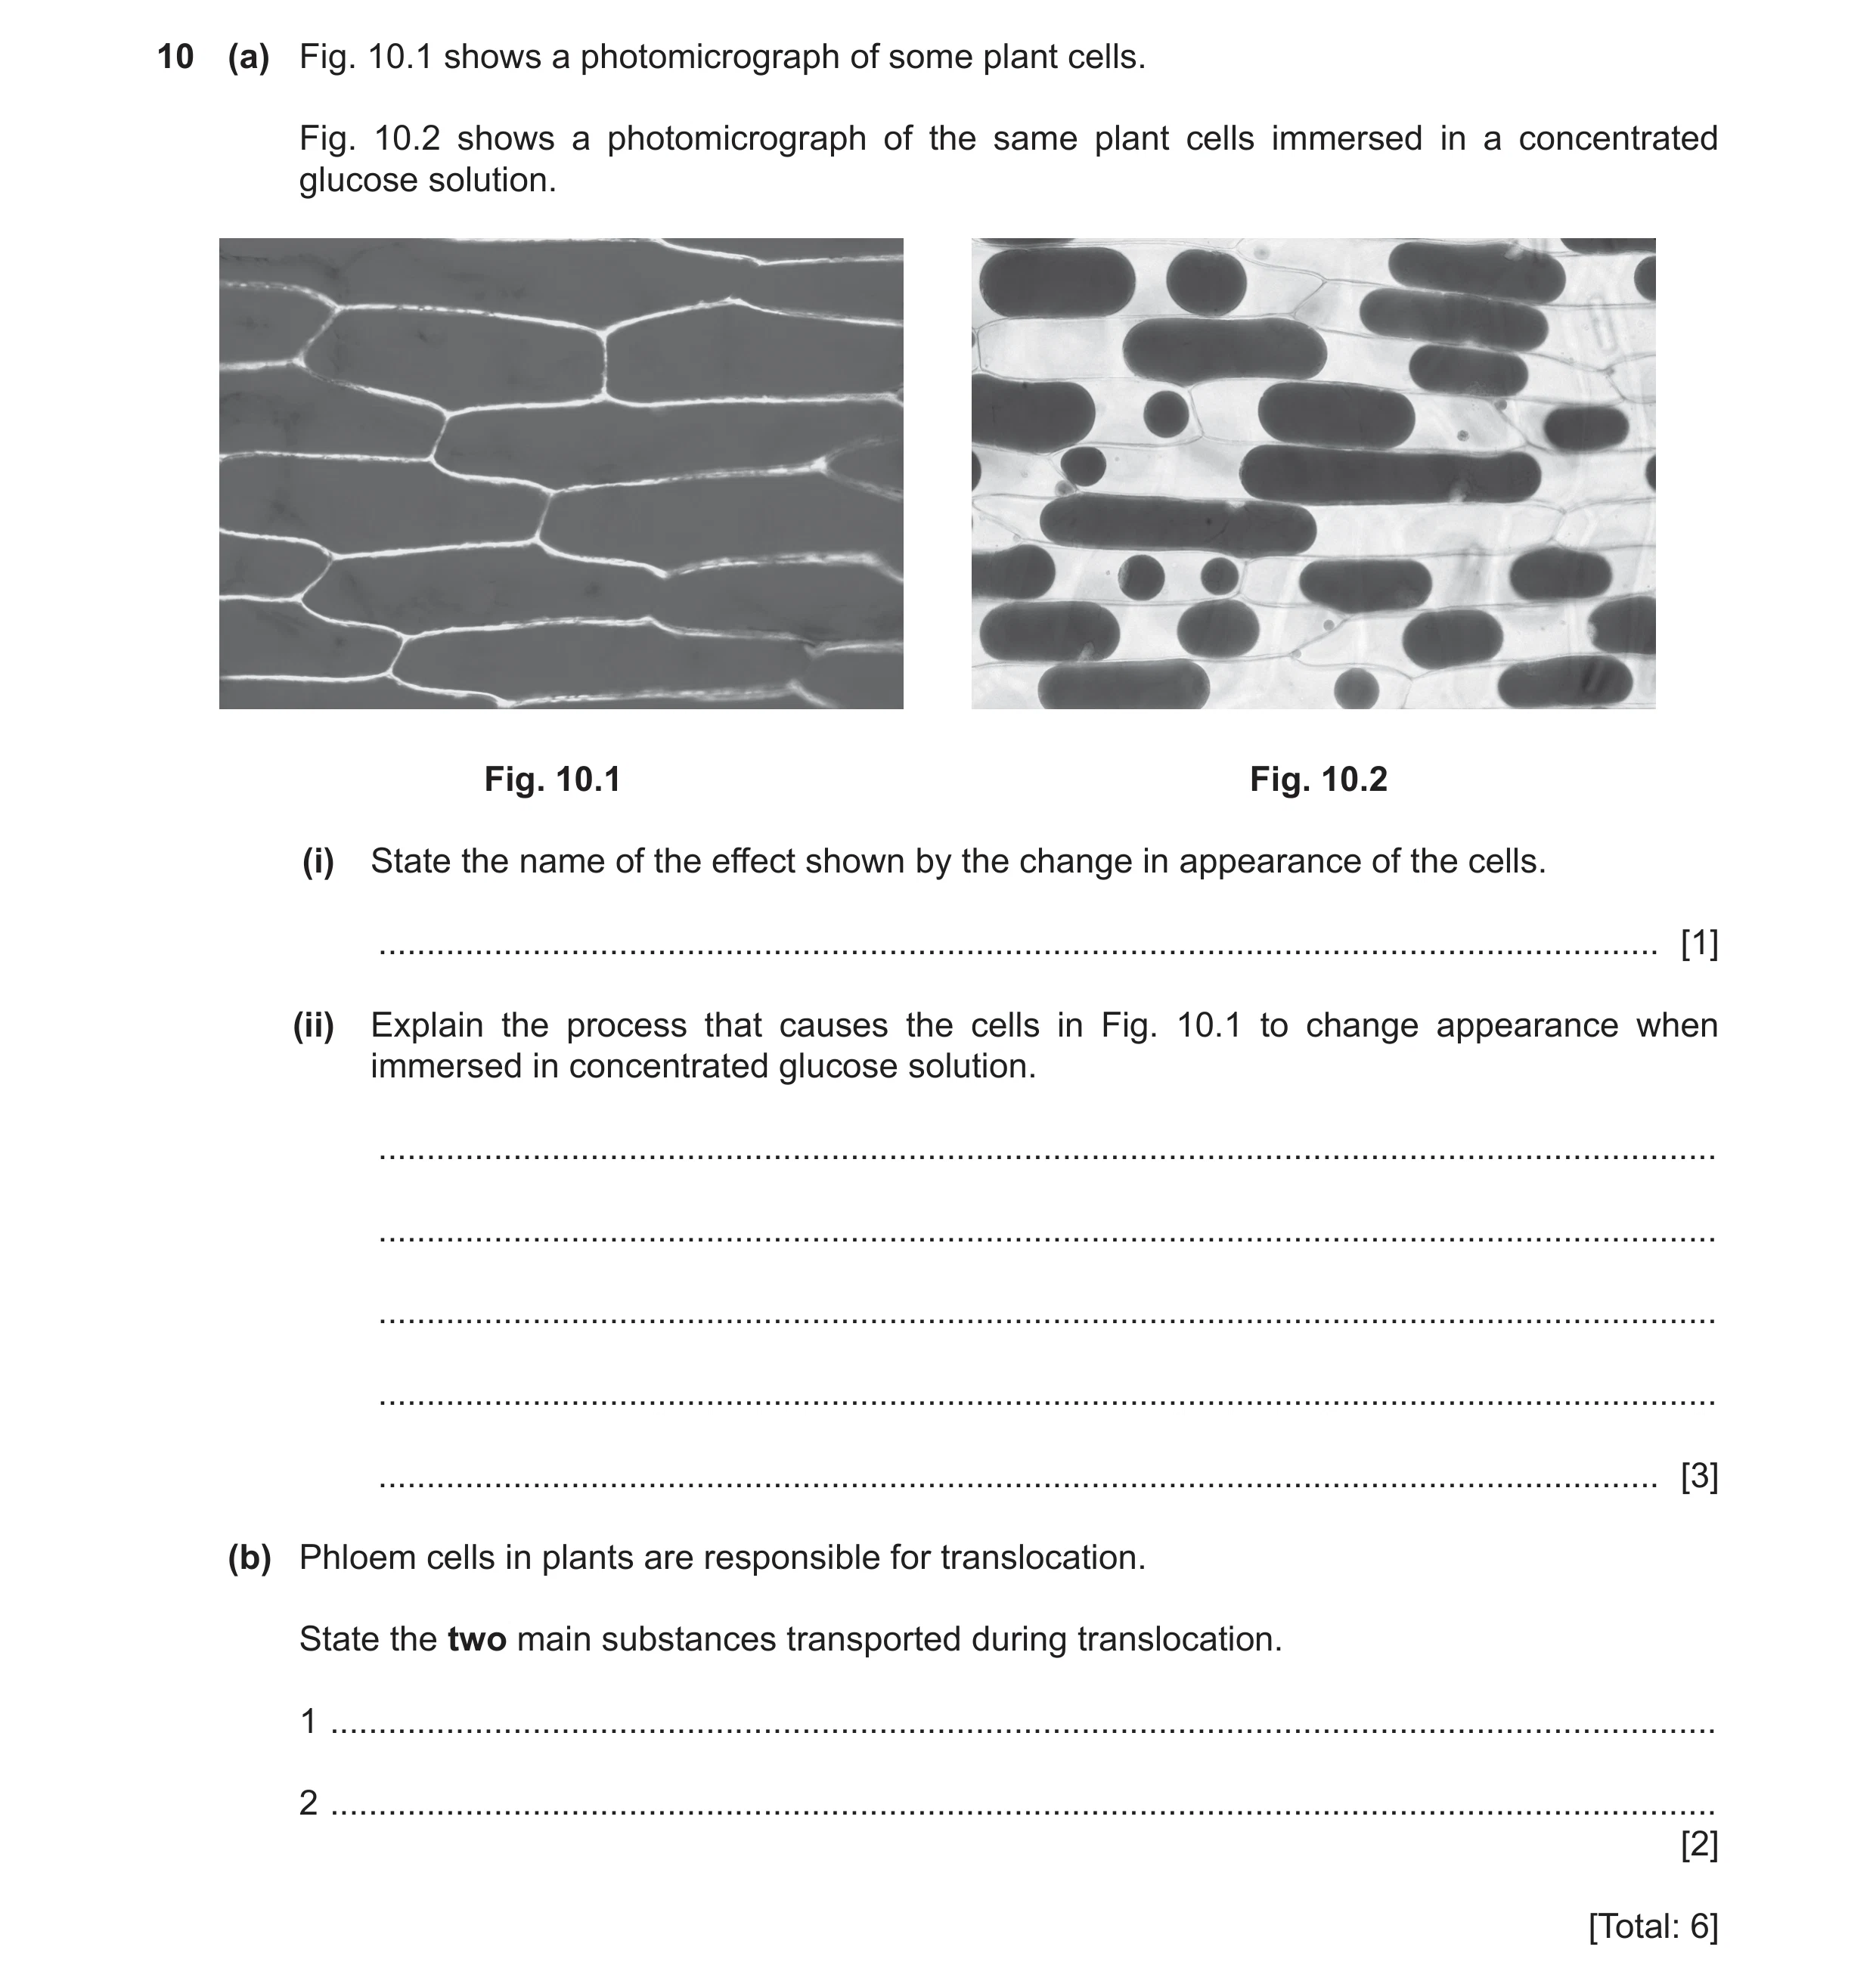
10 (a) Fig. 10.1 shows a photomicrograph of some plant cells. Fig. 10.2 shows a photomicrograph of the same plant cells immersed in a concentrated glucose solution. Fig. 10.1 Fig. 10.2 (i) State the name of the effect shown by the change in appearance of the cells. … [1] (ii) Explain the process that causes the cells in Fig. 10.1 to change appearance when immersed in concentrated glucose solution. … … … … … [3] (b) Phloem cells in plants are responsible for translocation. State the two main substances transported during translocation. 1 … 2 … [2] [Total: 6]
6 marks
Mark scheme: 10(a)(i) plasmolysis ; 1 10(a)(ii) any three from: higher water potential inside the cells than outside the cells ; water moves from high water potential to low water potential / water moves down a water potential gradient ; across a partially permeable membrane / water moves out of the cells ; ref to osmosis ; 3 10(b) sucrose ; amino acids ; 2
This question in 0654/42 Feb/March 2022
Q8 · A student investigates the effect of temperature on the rate of transpiration 0654/42 May/June 2022
7 (a) A student investigates the effect of temperature on the rate of transpiration. (i) Complete Fig. 7.1 by: • labelling the x‑axis • drawing a line to predict the expected results. rate of transpiration Fig. 7.1 [2] (ii) The investigation is repeated at a greater humidity. Explain the effect of increasing humidity on the rate of transpiration. … … … … … [3] (b) Transpiration is the loss of water vapour from the leaves. (i) Explain why transpiration causes a column of water to move upwards in the xylem. … … … … [2] (ii) State the term that describes how water molecules are held together. … [1] (c) Name two cells in leaves that are adapted for gas exchange. 1 … 2 … [2] (d) The process of translocation is also used in plants. Draw three lines from the word translocation to the boxes on the right to make three correct sentences. occurs in the phloem. involves the movement of amino acids. only involves movement of substances from root to shoot. Translocation transports substances to the source in a plant. transports glucose. transports substances to regions of storage in a plant. [3] [Total: 13]
13 marks
Mark scheme: 7(a)(i) temperature on x-axis ; line showing an increase (and levelling off) ; 2 7(a)(ii) any three from: transpiration rate decreases ; increase in water (vapour) in the, atmosphere / air ; idea of decreases the, water potential / concentration, gradient ; (so) less, evaporation / diffusion ; 3 7(b)(i) transpiration pull ; causes, a water potential gradient / a difference in water potential ; 2 7(b)(ii) cohesion ; 1 7(c) spongy mesophyll (cells) ; guard (cells) ; 2 7(d) translocation linked to: occurs in the phloem ; involves the movement of amino acids ; transport substances to regions of storage in a plant ; 3
This question in 0654/42 May/June 2022
Q9 · A student investigates the effect of temperature on the rate of photosynthesis 0654/43 May/June 2022
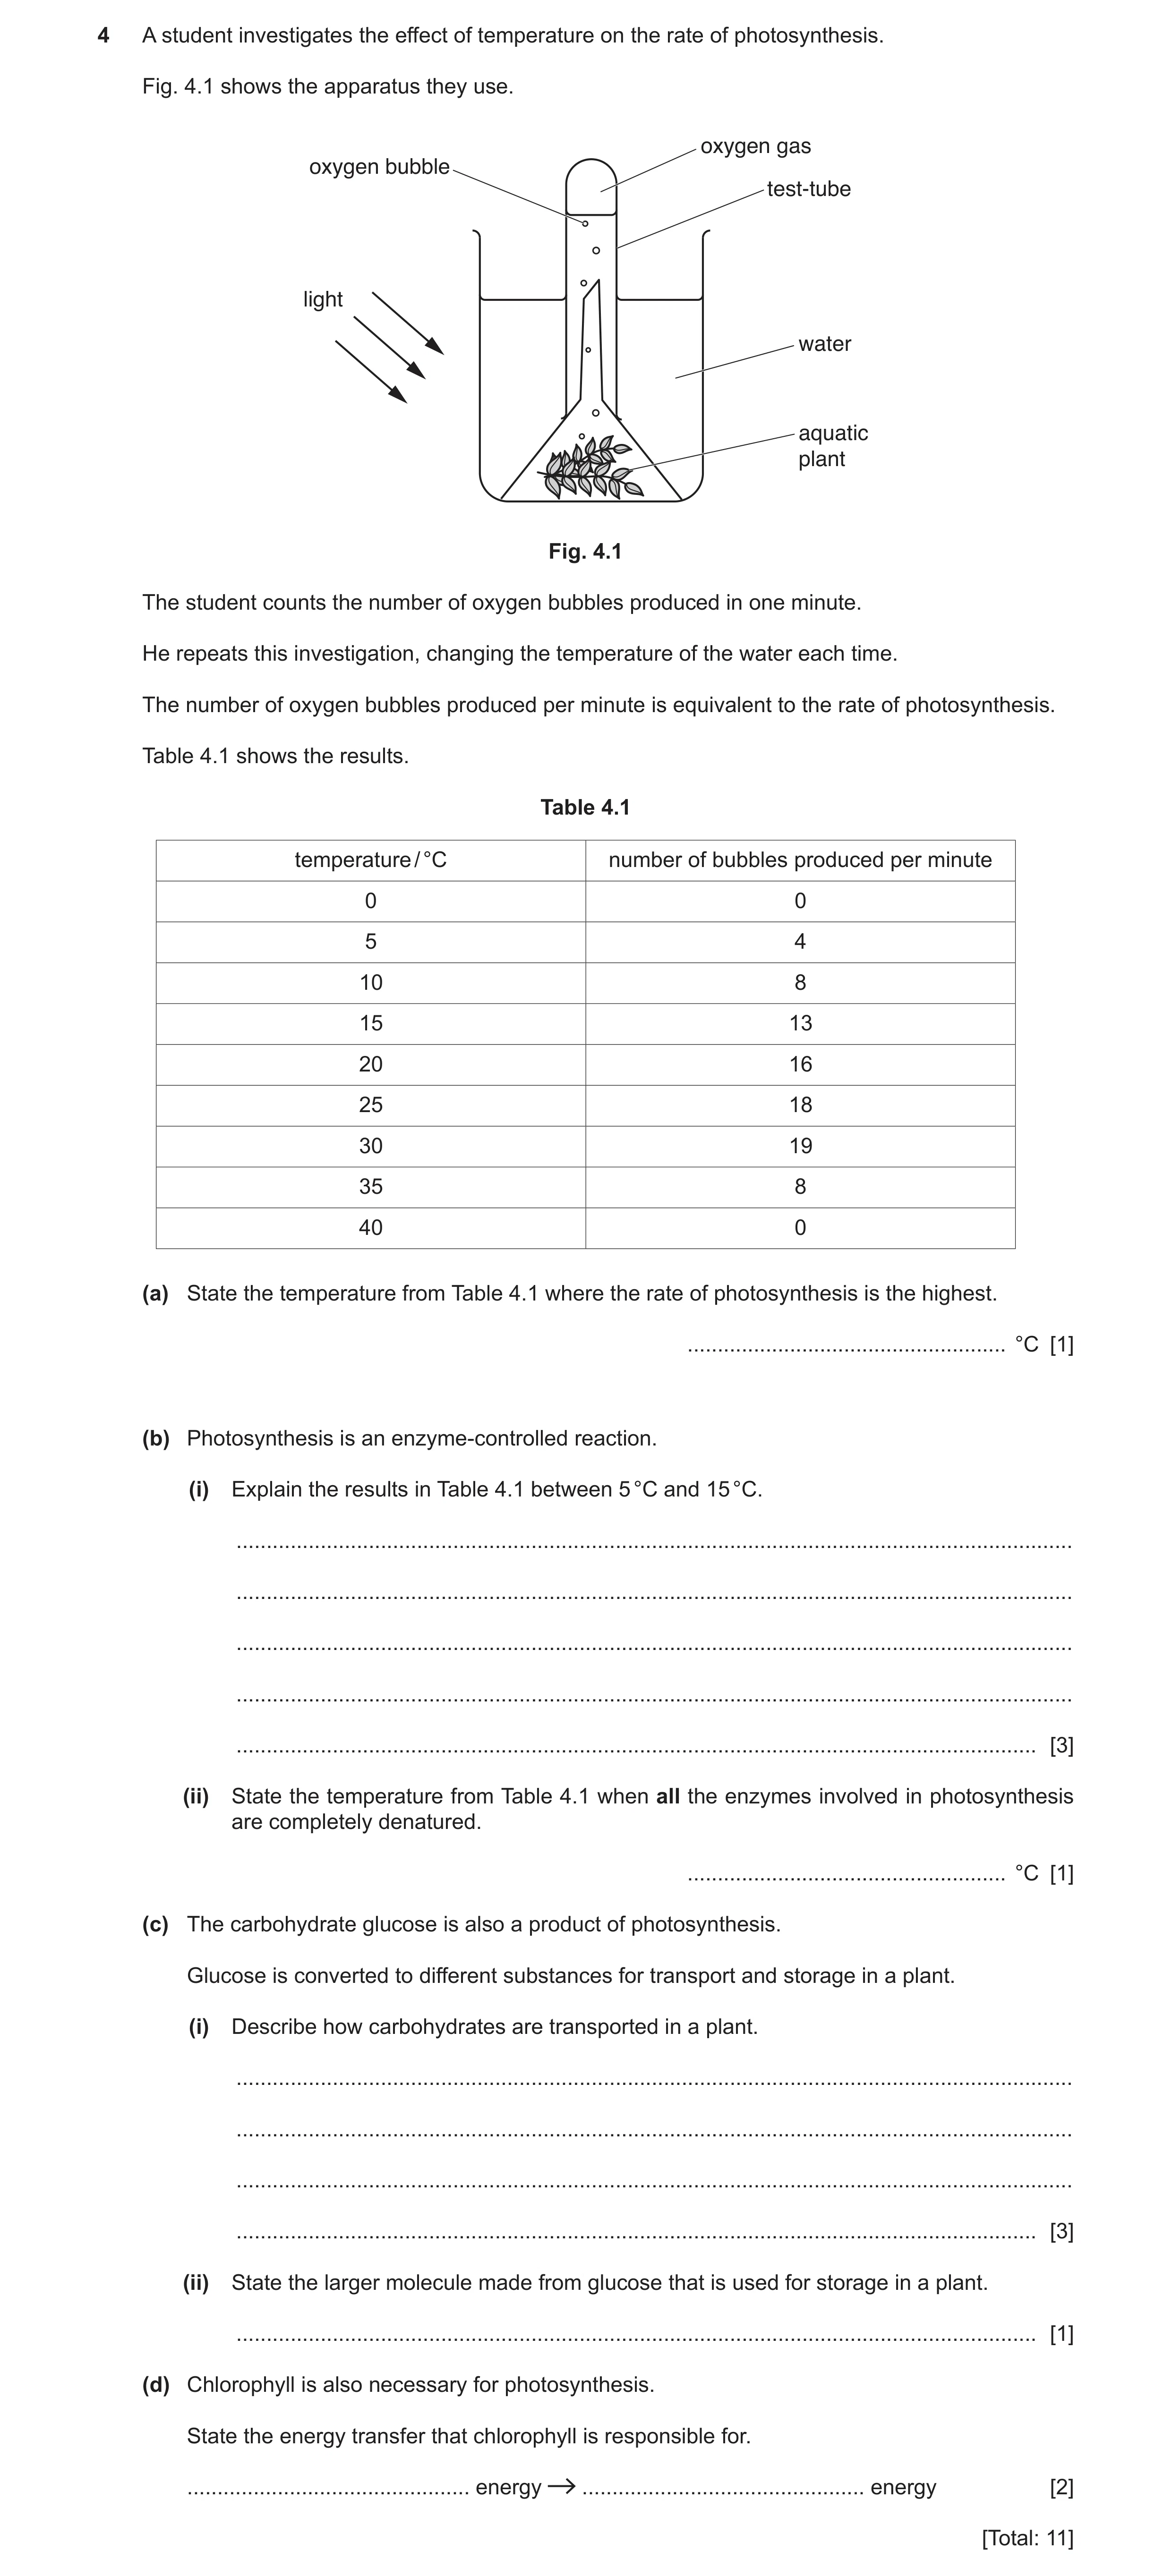
4 A student investigates the effect of temperature on the rate of photosynthesis. Fig. 4.1 shows the apparatus they use. oxygen gas oxygen bubble test-tube light water aquatic plant Fig. 4.1 The student counts the number of oxygen bubbles produced in one minute. He repeats this investigation, changing the temperature of the water each time. The number of oxygen bubbles produced per minute is equivalent to the rate of photosynthesis. Table 4.1 shows the results. Table 4.1 temperature / °C number of bubbles produced per minute 0 0 5 4 10 8 15 13 20 16 25 18 30 19 35 8 40 0 (a) State the temperature from Table 4.1 where the rate of photosynthesis is the highest. … °C [1] (b) Photosynthesis is an enzyme-controlled reaction. (i) Explain the results in Table 4.1 between 5 °C and 15 °C. … … … … … [3] (ii) State the temperature from Table 4.1 when all the enzymes involved in photosynthesis are completely denatured. … °C [1] (c) The carbohydrate glucose is also a product of photosynthesis. Glucose is converted to different substances for transport and storage in a plant. (i) Describe how carbohydrates are transported in a plant. … … … … [3] (ii) State the larger molecule made from glucose that is used for storage in a plant. … [1] (d) Chlorophyll is also necessary for photosynthesis. State the energy transfer that chlorophyll is responsible for. … energy … energy [2] [Total: 11]
11 marks
Mark scheme: 4(a) 30 (°C) ; 1 4(b)(i) (increasing temperature) increases the energy / speed of molecules ; increases number of molecules reaching activation energy ; increases frequency of (effective) collisions ; faster rate of photosynthesis ; max 3 3 4(b)(ii) 40 (°C) ; 1 4(c)(i) as sucrose ; in the phloem ; by translocation ; 3 4(c)(ii) starch ; 1 4(d) light ; chemical ; 2
This question in 0654/43 May/June 2022
Q10 · A diagram of a cross-section through a leaf 0654/42 Oct/Nov 2022
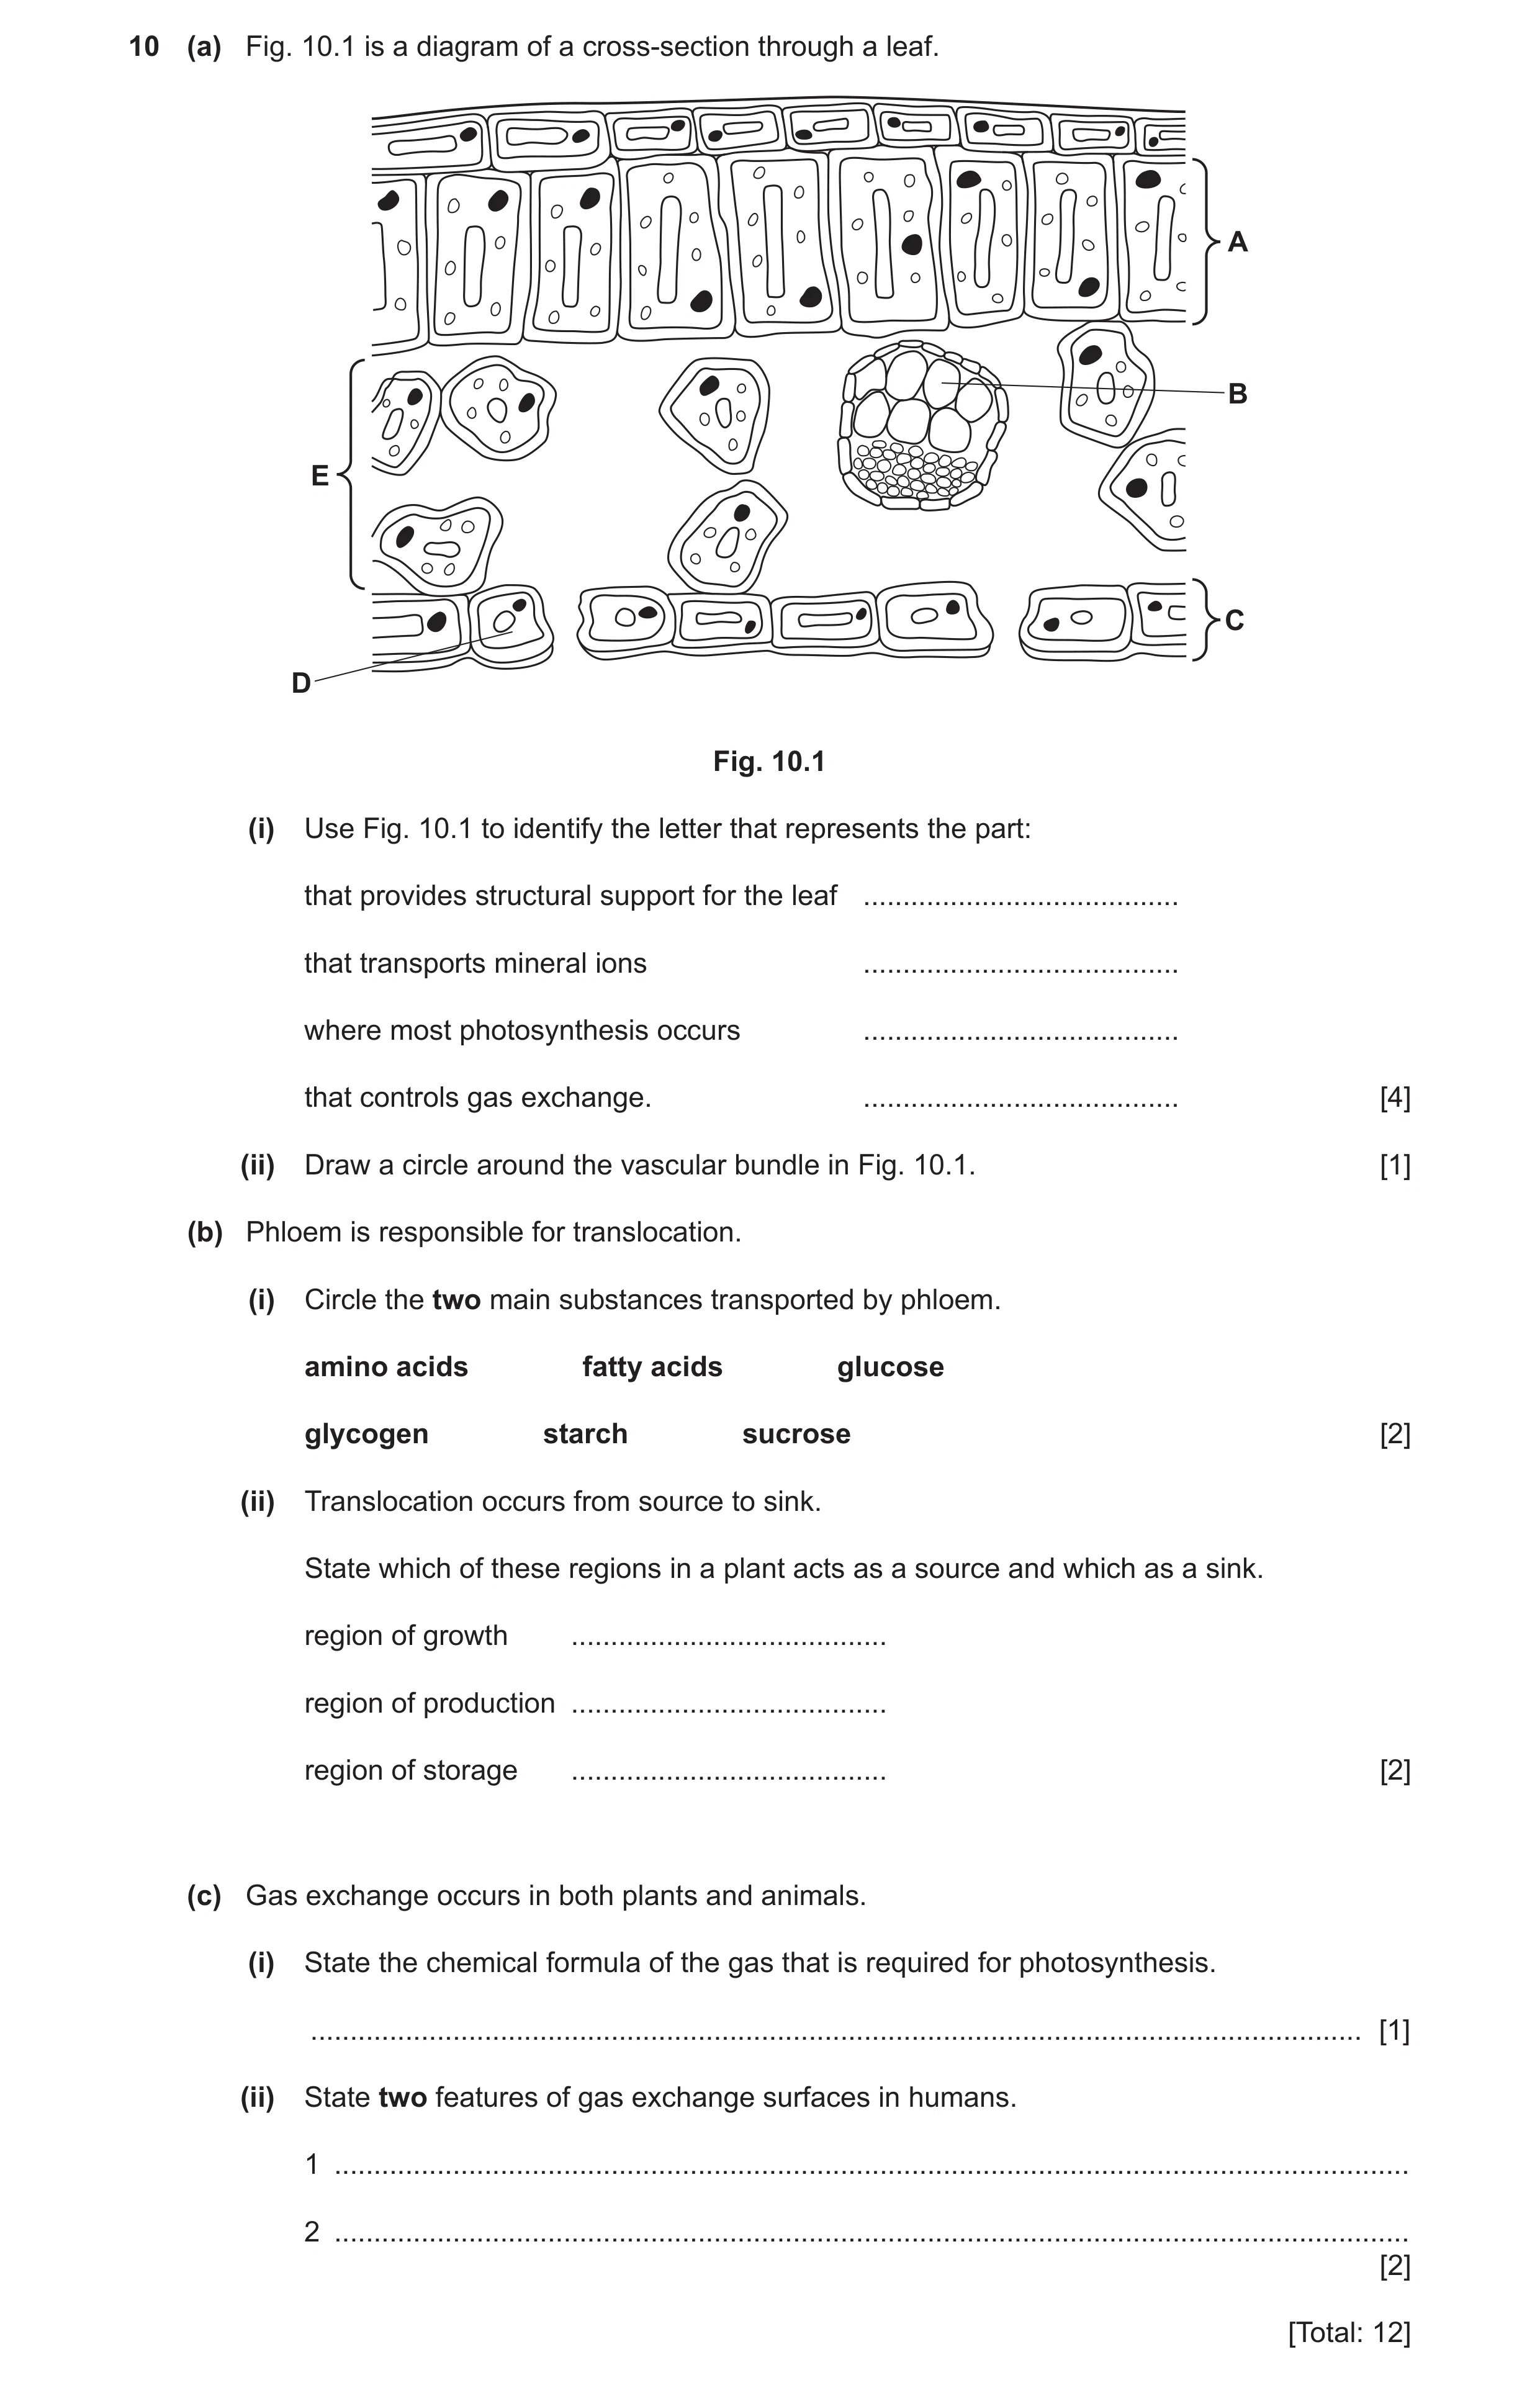
10 (a) Fig. 10.1 is a diagram of a cross-section through a leaf. A B E C D Fig. 10.1 (i) Use Fig. 10.1 to identify the letter that represents the part: that provides structural support for the leaf … that transports mineral ions … where most photosynthesis occurs … that controls gas exchange. … [4] (ii) Draw a circle around the vascular bundle in Fig. 10.1. [1] (b) Phloem is responsible for translocation. (i) Circle the two main substances transported by phloem. amino acids fatty acids glucose glycogen starch sucrose [2] (ii) Translocation occurs from source to sink. State which of these regions in a plant acts as a source and which as a sink. region of growth … region of production … region of storage … [2] (c) Gas exchange occurs in both plants and animals. (i) State the chemical formula of the gas that is required for photosynthesis. … [1] (ii) State two features of gas exchange surfaces in humans. 1 … 2 … [2] [Total: 12]
12 marks
Mark scheme: 10(a)(i) B ; 4 B ; A ; D ; 10(a)(ii) circle drawn round the vascular bundle ; 1 10(b)(i) amino acids ; 2 sucrose ; 10(b)(ii) sink 2 source sink ;; 1 correct = 0 2 correct = 1 3 correct = 2 10(c)(i) CO2 ; 1 10(c)(ii) any two from: 2 large surface area ; thin (surface) ; good blood supply ; good ventilation with air ;
This question in 0654/42 Oct/Nov 2022
Q11 · A graph showing the effect of temperature on the rate of transpiration in one leaf 0654/43 May/June 2023
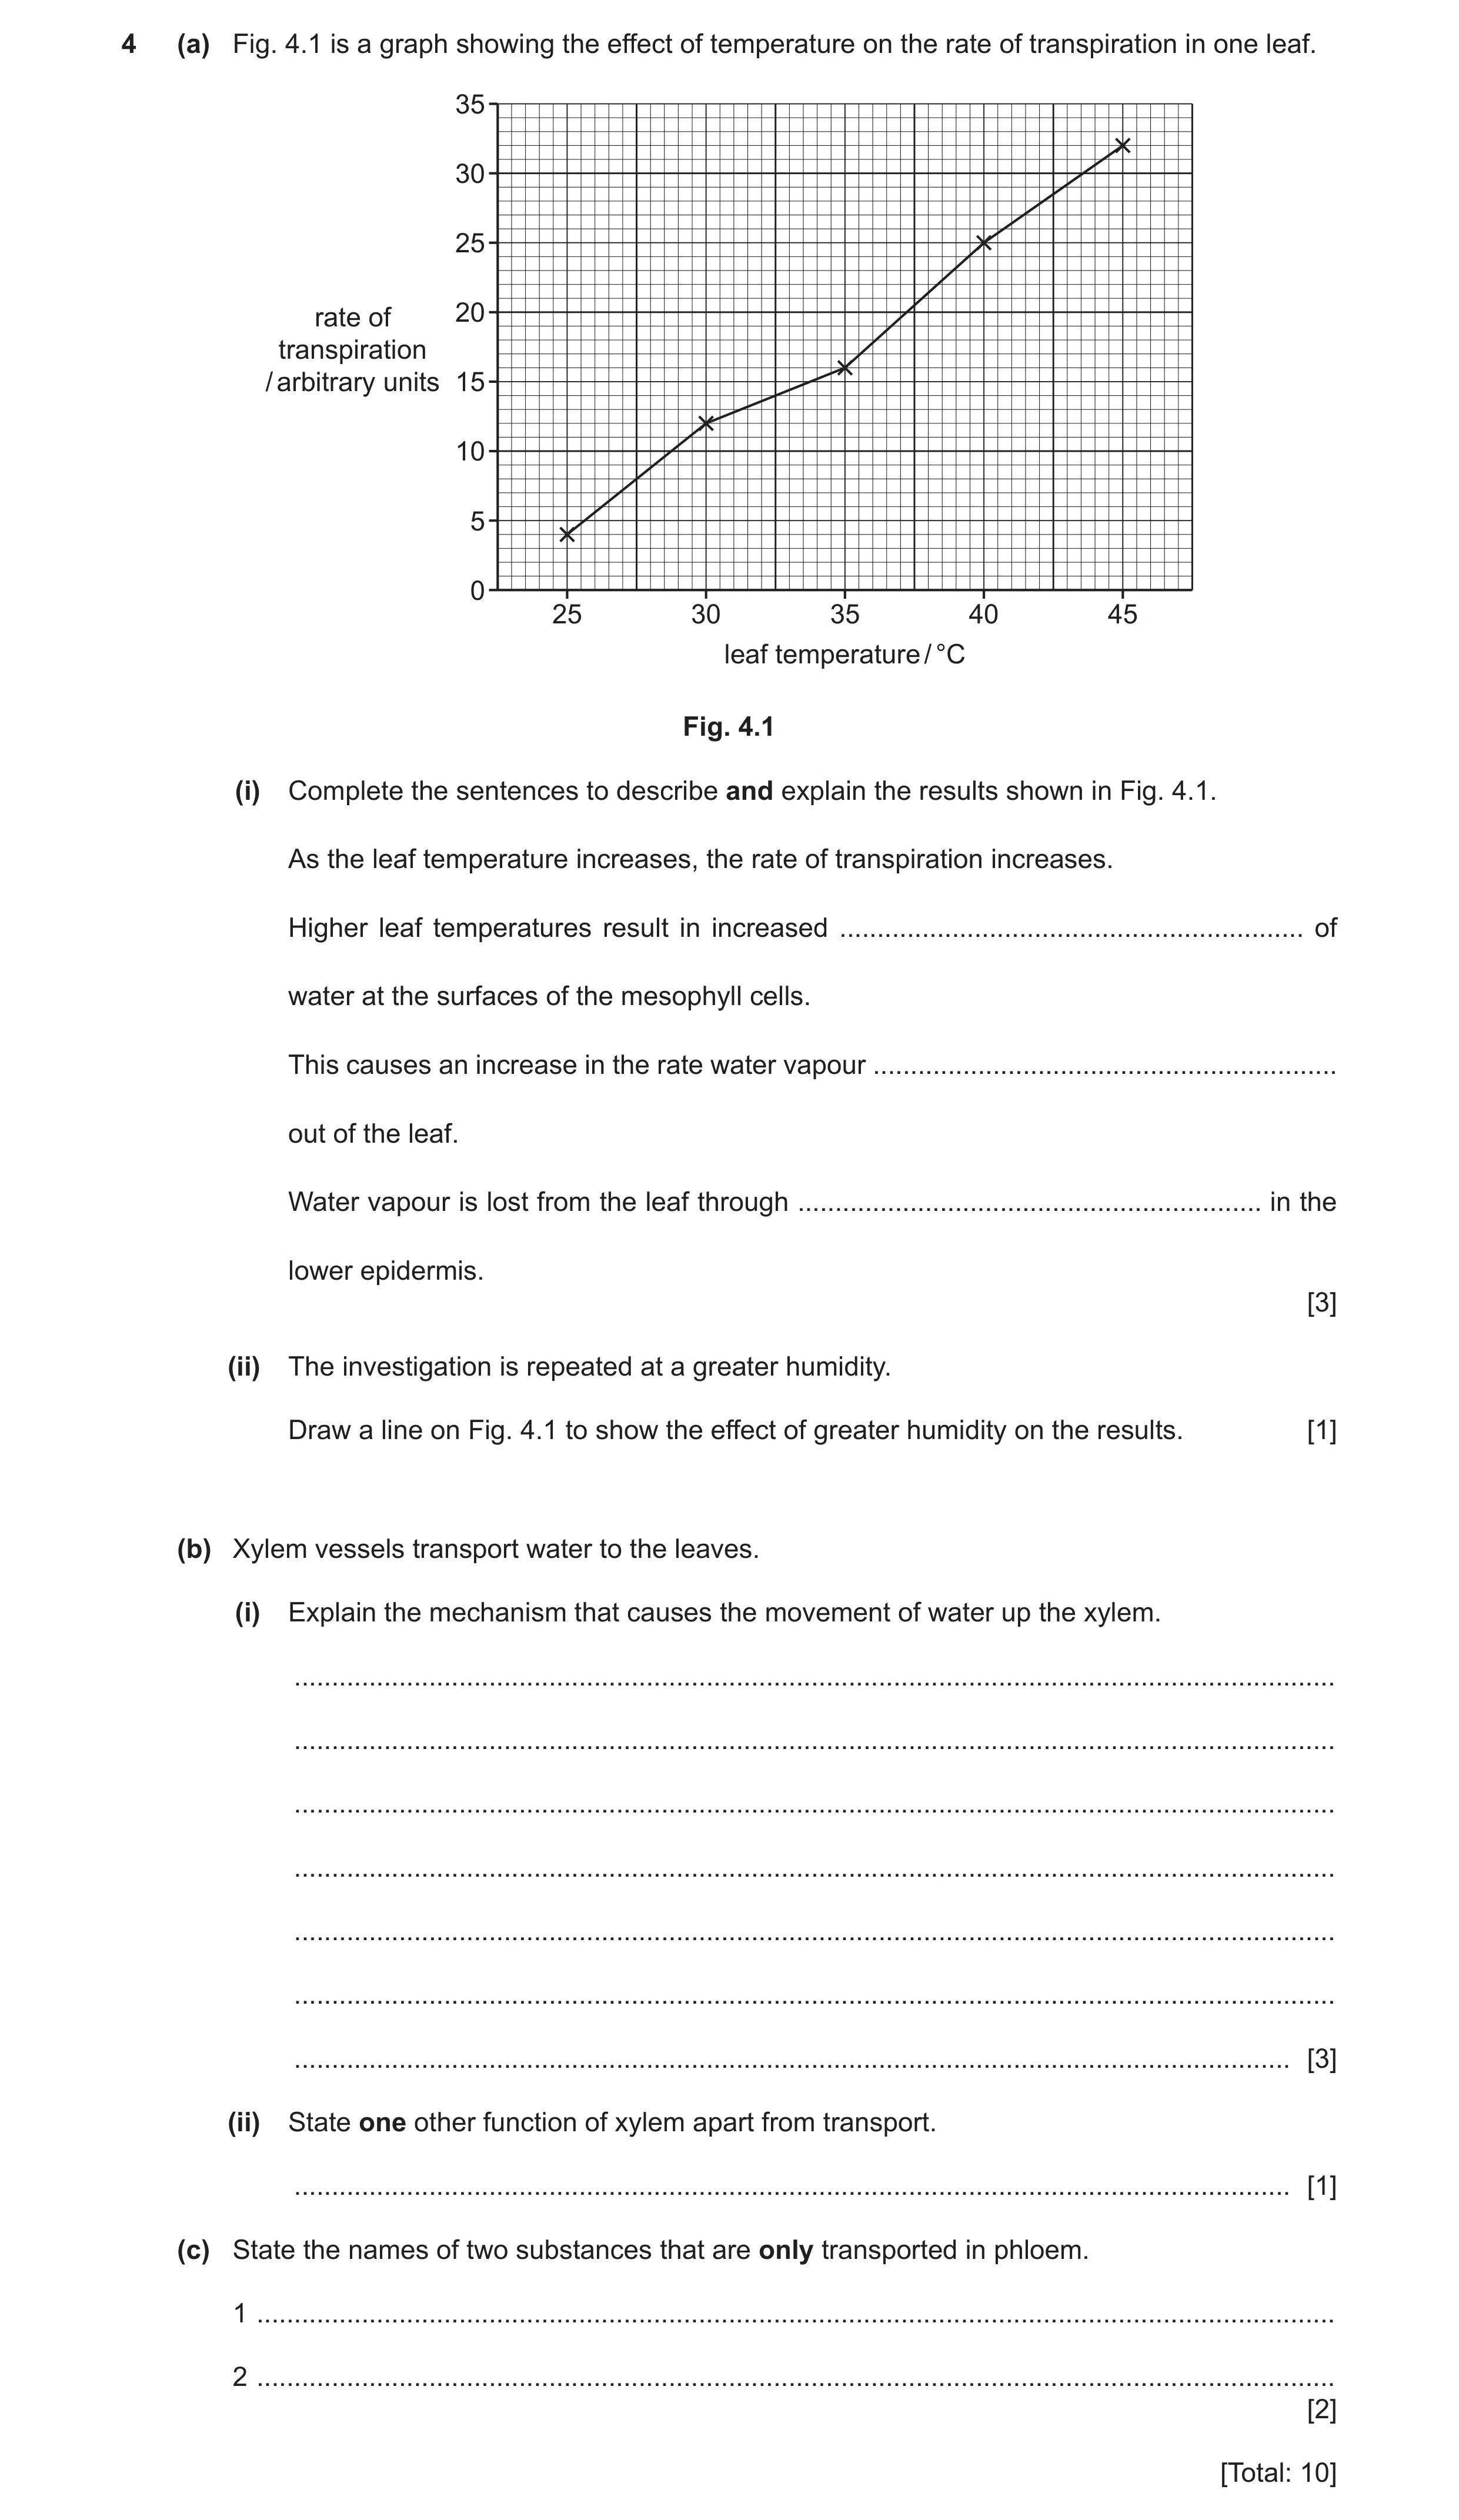
4 (a) Fig. 4.1 is a graph showing the effect of temperature on the rate of transpiration in one leaf. 35 30 25 rate of 20 transpiration / arbitrary units 15 10 5 0 25 30 35 40 45 leaf temperature / °C Fig. 4.1 (i) Complete the sentences to describe and explain the results shown in Fig. 4.1. As the leaf temperature increases, the rate of transpiration increases. Higher leaf temperatures result in increased … of water at the surfaces of the mesophyll cells. This causes an increase in the rate water vapour … out of the leaf. Water vapour is lost from the leaf through … in the lower epidermis. [3] (ii) The investigation is repeated at a greater humidity. Draw a line on Fig. 4.1 to show the effect of greater humidity on the results. [1] (b) Xylem vessels transport water to the leaves. (i) Explain the mechanism that causes the movement of water up the xylem. … … … … … … … [3] (ii) State one other function of xylem apart from transport. … [1] (c) State the names of two substances that are only transported in phloem. 1 … 2 … [2] [Total: 10]
10 marks
Mark scheme: 4(a)(i) evaporation ; diffuses ; stomata ; 3 4(a)(ii) line drawn showing a decreased rate of transpiration ; 1 4(b)(i) any three from: ref to transpiration pull ; creation of a water potential gradient / reduction of water potential at top of the xylem ; that draws up a column of water molecules / AW ; water molecules held together by cohesion ; 3 4(b)(ii) support / AW ; 1 4(c) sucrose ; amino acids ; 2
This question in 0654/43 May/June 2023
Q12 · State the balanced symbol equation for photosynthesis 0654/42 Oct/Nov 2024
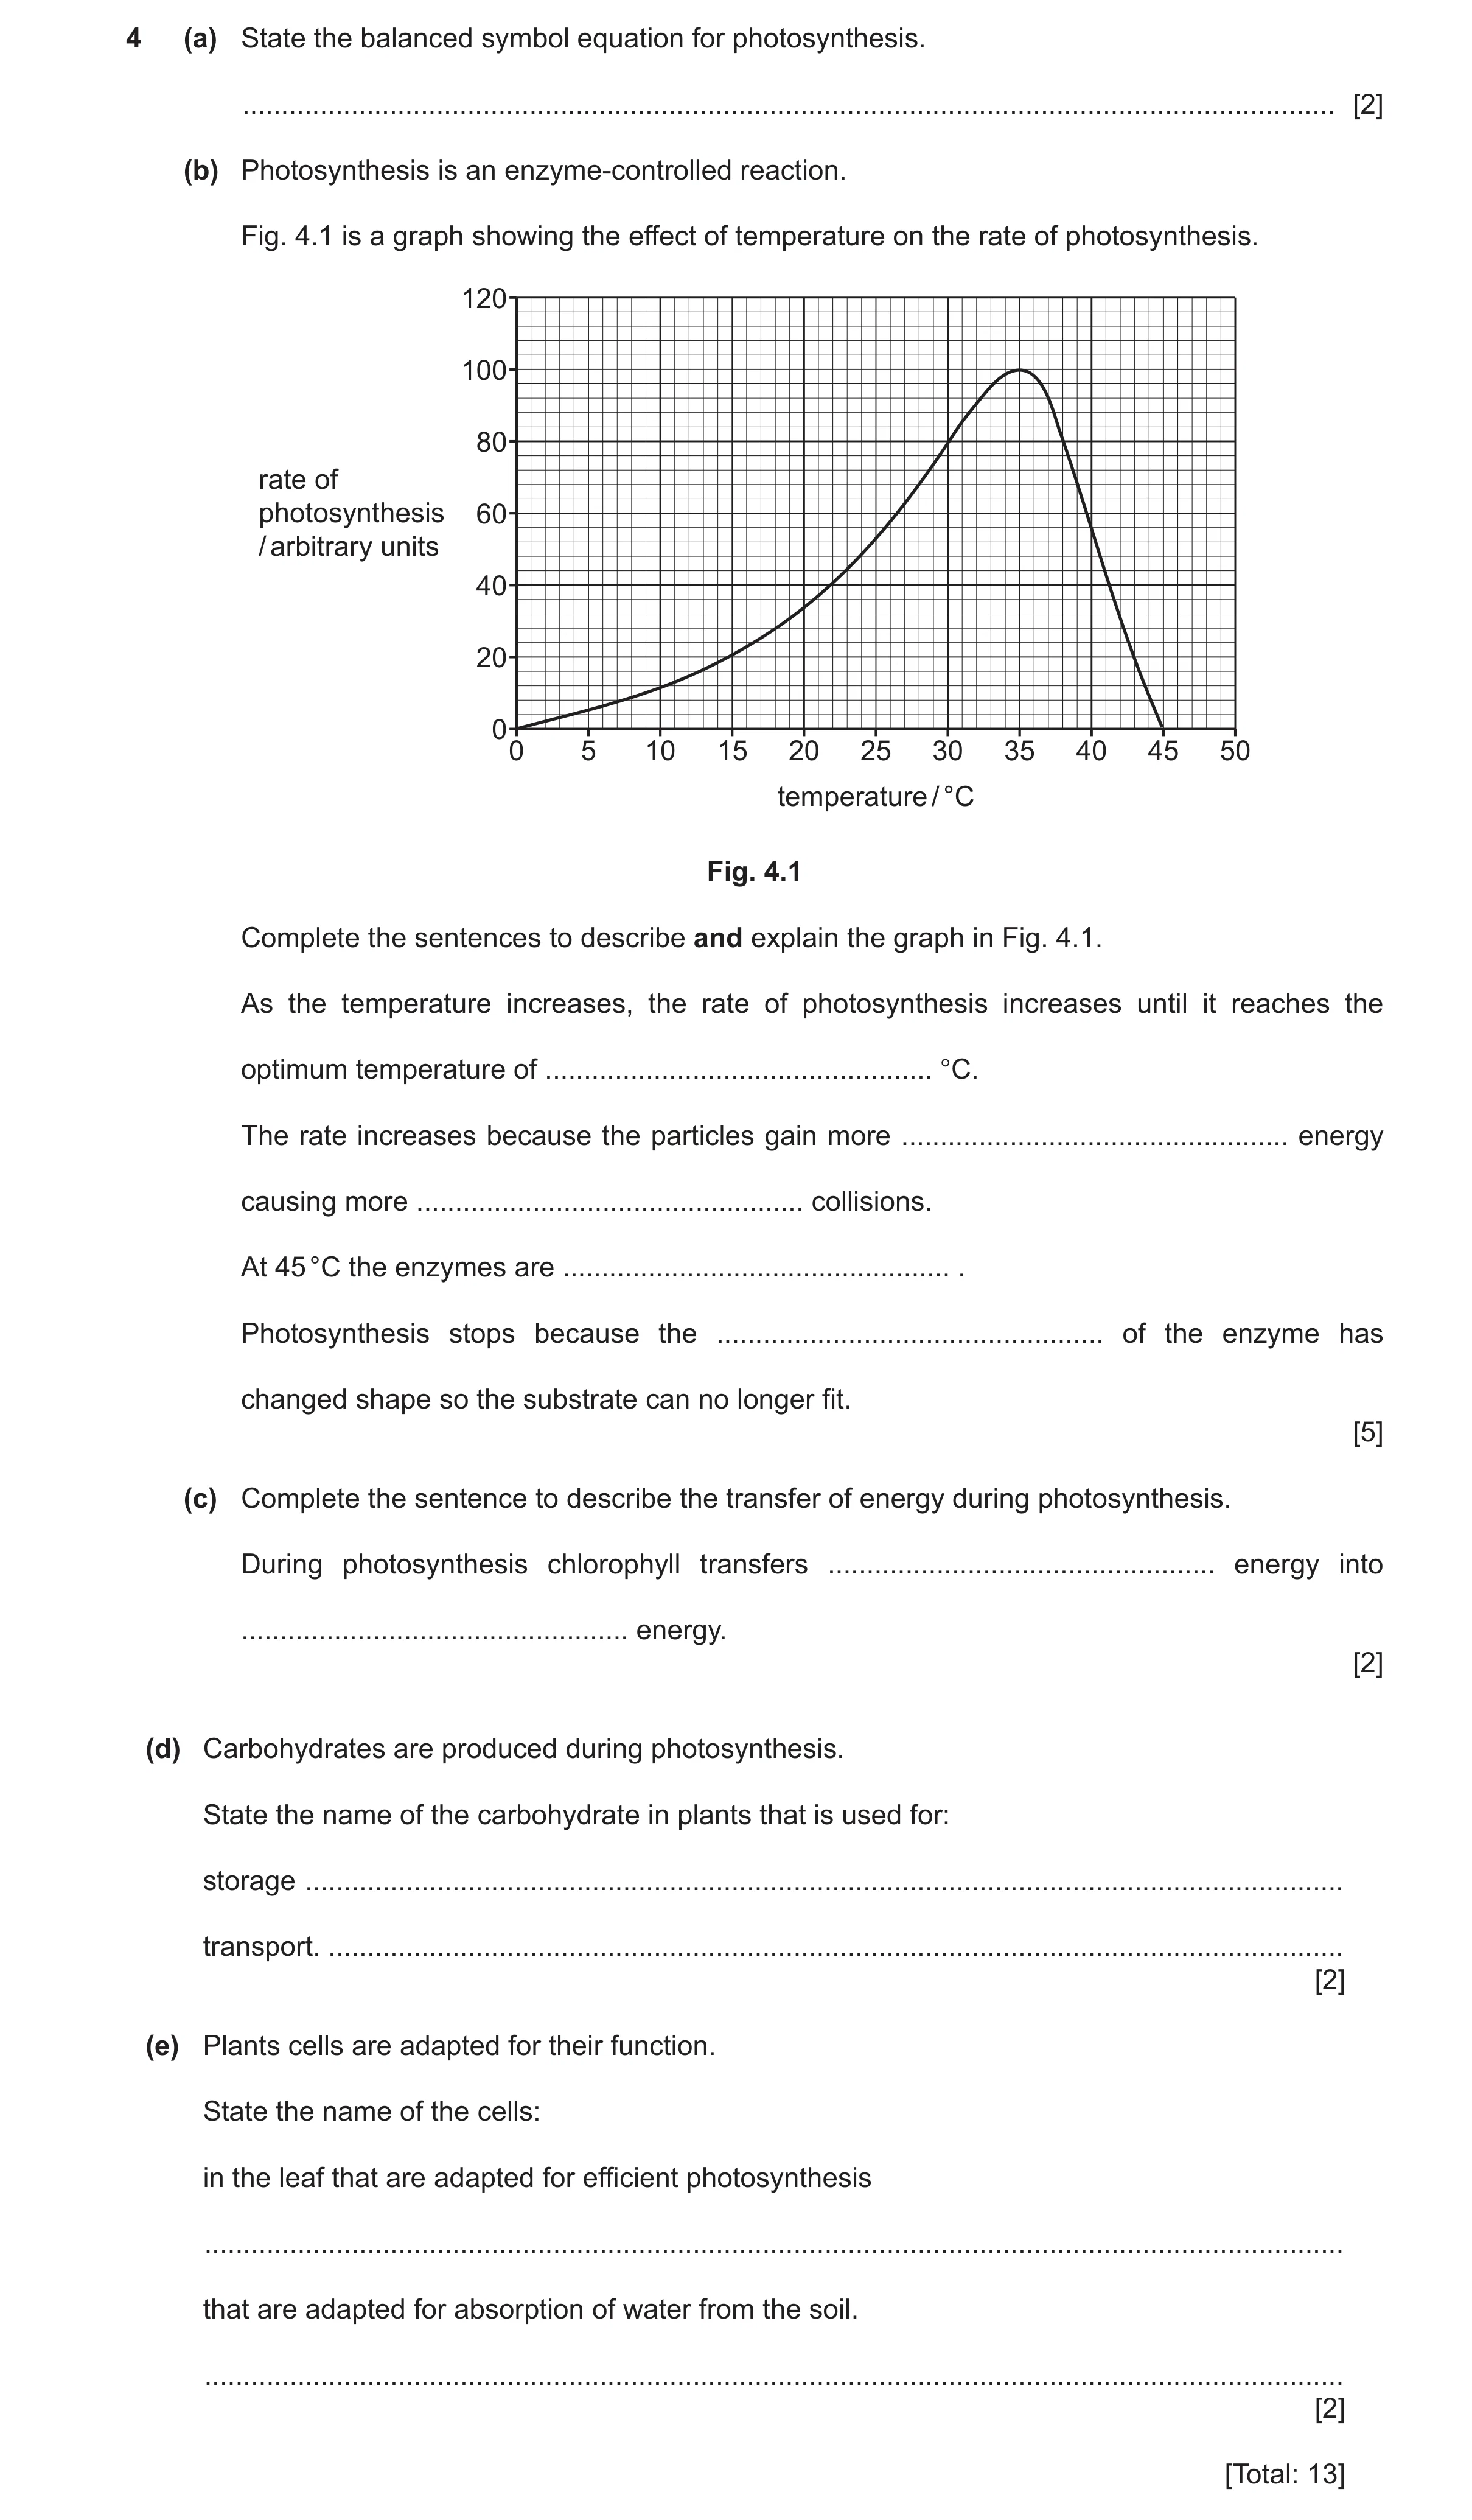
4 (a) State the balanced symbol equation for photosynthesis. … [2] (b) Photosynthesis is an enzyme-controlled reaction. Fig. 4.1 is a graph showing the effect of temperature on the rate of photosynthesis. 120 100 80 rate of photosynthesis 60 / arbitrary units 40 20 00 5 10 15 20 25 30 35 40 45 50 temperature / °C Fig. 4.1 Complete the sentences to describe and explain the graph in Fig. 4.1. As the temperature increases, the rate of photosynthesis increases until it reaches the optimum temperature of … °C. The rate increases because the particles gain more … energy causing more … collisions. At 45 °C the enzymes are … . Photosynthesis stops because the … of the enzyme has changed shape so the substrate can no longer fit. [5] (c) Complete the sentence to describe the transfer of energy during photosynthesis. During photosynthesis chlorophyll transfers … energy into … energy. [2] (d) Carbohydrates are produced during photosynthesis. State the name of the carbohydrate in plants that is used for: storage … transport. … [2] (e) Plants cells are adapted for their function. State the name of the cells: in the leaf that are adapted for efficient photosynthesis … that are adapted for absorption of water from the soil. … [2] [Total: 13]
13 marks
Mark scheme: 4(a) 2 6CO2 + 6H2O → C6H12O6 + 6O2 one mark for correctly balanced reactants (either order) ; one mark for correctly balanced products (either order) ; 4(b) 35 ; 5 kinetic ; successful / effective / frequent ; denatured ; active site ; 4(c) light ; 2 chemical ; 4(d) starch ; 2 sucrose ; 4(e) palisade mesophyll (cell) ; 2 root hair (cell) ;
This question in 0654/42 Oct/Nov 2024
Q13 · A cross-section through a leaf 0654/42 Feb/March 2025
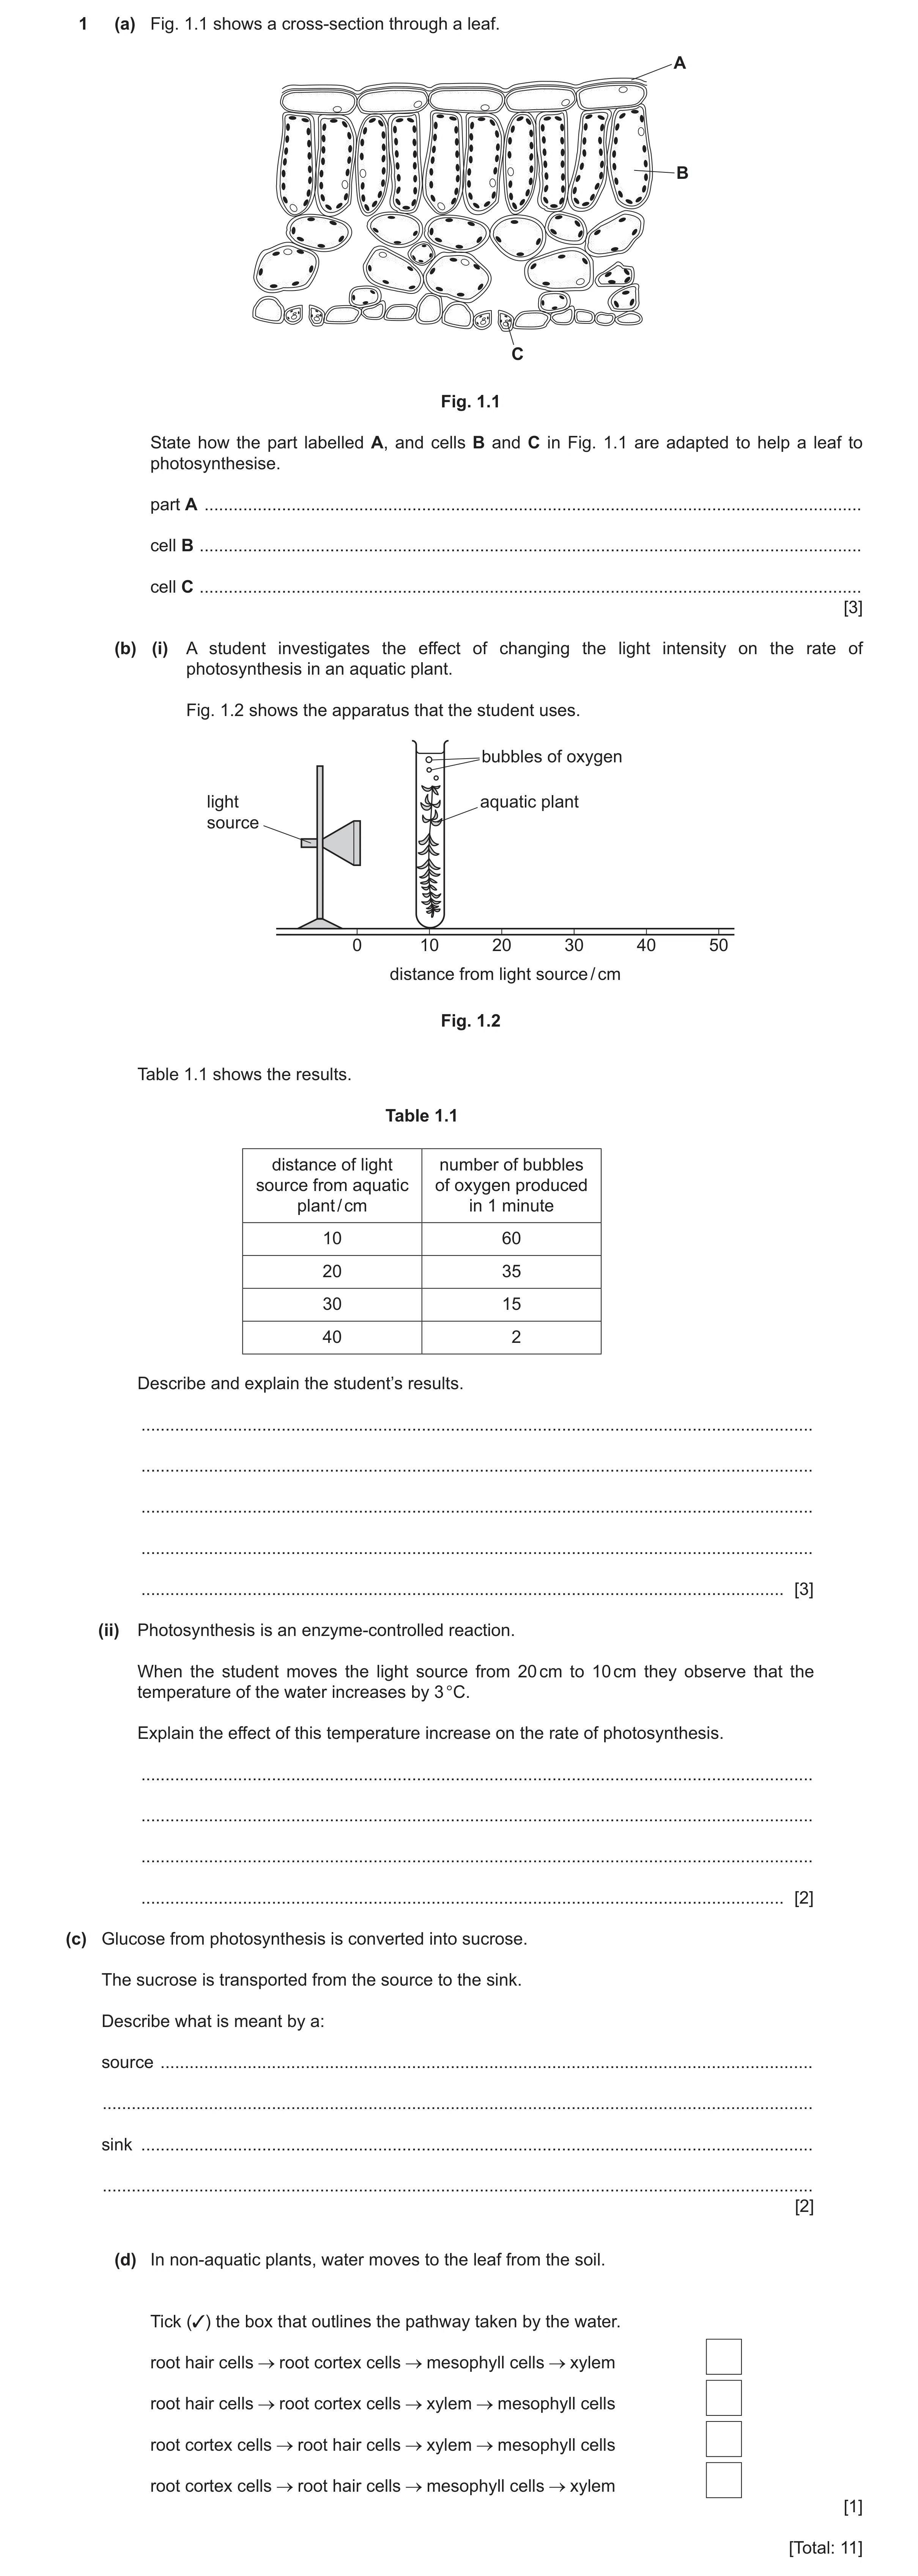
1 (a) Fig. 1.1 shows a cross-section through a leaf. A B C Fig. 1.1 State how the part labelled A, and cells B and C in Fig. 1.1 are adapted to help a leaf to photosynthesise. part A … cell B … cell C … [3] (b) (i) A student investigates the effect of changing the light intensity on the rate of photosynthesis in an aquatic plant. Fig. 1.2 shows the apparatus that the student uses. bubbles of oxygen light aquatic plant source 0 10 20 30 40 50 distance from light source / cm Fig. 1.2 Table 1.1 shows the results. Table 1.1 distance of light number of bubbles source from aquatic of oxygen produced plant / cm in 1 minute 10 60 20 35 30 15 40 2 Describe and explain the student’s results. … … … … … [3] (ii) Photosynthesis is an enzyme-controlled reaction. When the student moves the light source from 20 cm to 10 cm they observe that the temperature of the water increases by 3 °C. Explain the effect of this temperature increase on the rate of photosynthesis. … … … … [2] (c) Glucose from photosynthesis is converted into sucrose. The sucrose is transported from the source to the sink. Describe what is meant by a: source … … sink … … [2] (d) In non-aquatic plants, water moves to the leaf from the soil. Tick (✓) the box that outlines the pathway taken by the water. root hair cells root cortex cells mesophyll cells xylem root hair cells root cortex cells xylem mesophyll cells root cortex cells root hair cells xylem mesophyll cells root cortex cells root hair cells mesophyll cells xylem [1] [Total: 11]
11 marks
Mark scheme: Question Answer Marks 1(a) part A - waterproof / transparent ; 3 cell B - contain lots of chloroplasts / located near the upper surface of leaf / elongated or column-shaped, to pack together more tightly ; cell C - open and close stomata ; 1(b)(i) as distance of light source increases, the number of bubbles / the volume of oxygen, decreases or rate of photosynthesis 3 decreases ; and any two from: light intensity decreases with distance from light source light provides energy for photosynthesis oxygen is a product of photosynthesis ; ; 1(b)(ii) any two from: 2 increase in the rate of photosynthesis – no mark: increase in kinetic energy more effective collisions / more frequent collisions more enzyme-substrate complexes form ; ; 1(c) source – part of the plants that release, sucrose / amino acids ; 2 sink – part of plants that, use / store, sucrose / amino acids ; 1(d) 1 ;
This question in 0654/42 Feb/March 2025
Q14 · A diagram of a germinating bean seed 0654/43 May/June 2025
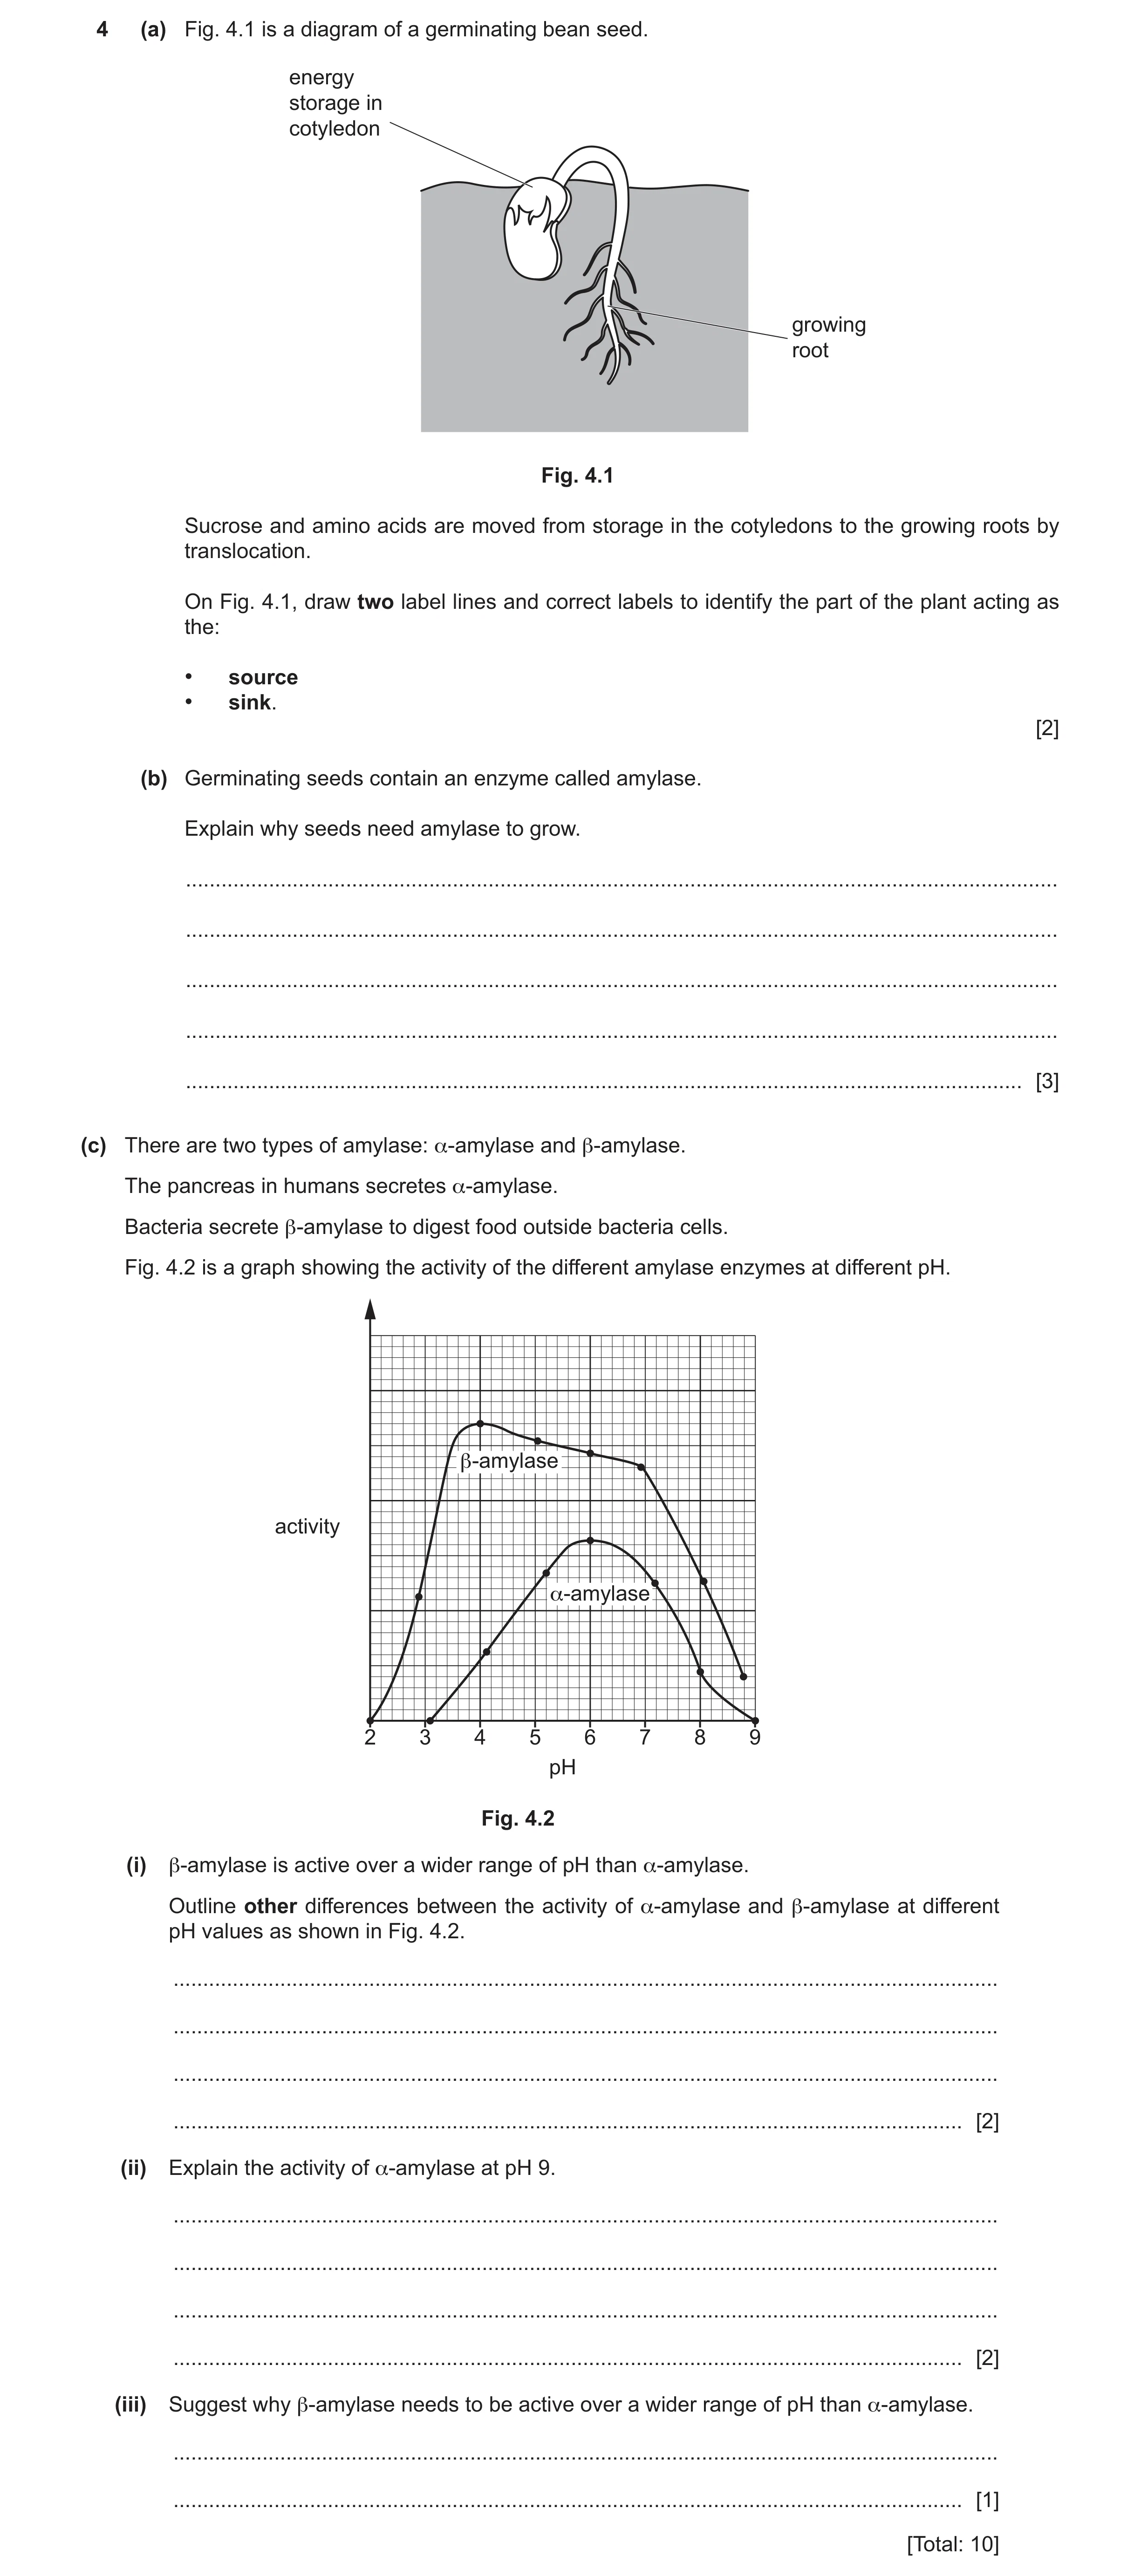
4 (a) Fig. 4.1 is a diagram of a germinating bean seed. energy storage in cotyledon growing root Fig. 4.1 Sucrose and amino acids are moved from storage in the cotyledons to the growing roots by translocation. On Fig. 4.1, draw two label lines and correct labels to identify the part of the plant acting as the: • source • sink. [2] (b) Germinating seeds contain an enzyme called amylase. Explain why seeds need amylase to grow. … … … … … [3] (c) There are two types of amylase: α-amylase and β-amylase. The pancreas in humans secretes α-amylase. Bacteria secrete β-amylase to digest food outside bacteria cells. Fig. 4.2 is a graph showing the activity of the different amylase enzymes at different pH. β-amylase activity α-amylase 2 3 4 5 6 7 8 9 pH Fig. 4.2 (i) β-amylase is active over a wider range of pH than α-amylase. Outline other differences between the activity of α-amylase and β-amylase at different pH values as shown in Fig. 4.2. … … … … [2] (ii) Explain the activity of α-amylase at pH 9. … … … … [2] (iii) Suggest why β-amylase needs to be active over a wider range of pH than α-amylase. … … [1] [Total: 10]
10 marks
Mark scheme: 4(a) 2 source sink source label to the cotyledons; sink label to the roots; 4(b) any three from 3 starch (in seeds) is energy store; starch is a large molecule (so cannot be transported); amylase breaks down starch to (simple reducing) sugars; (sugars) used in respiration; energy needed (for growth of plant); 4(c)(i) two comparative differences;; 2 4(c)(ii) enzyme is denatured; 2 active site no longer complementary to substrate / starch; 4(c)(iii) idea that in cells / small intestine, pH value stays the same but outside cells it, varies / changes; 1
This question in 0654/43 May/June 2025
 10 / 21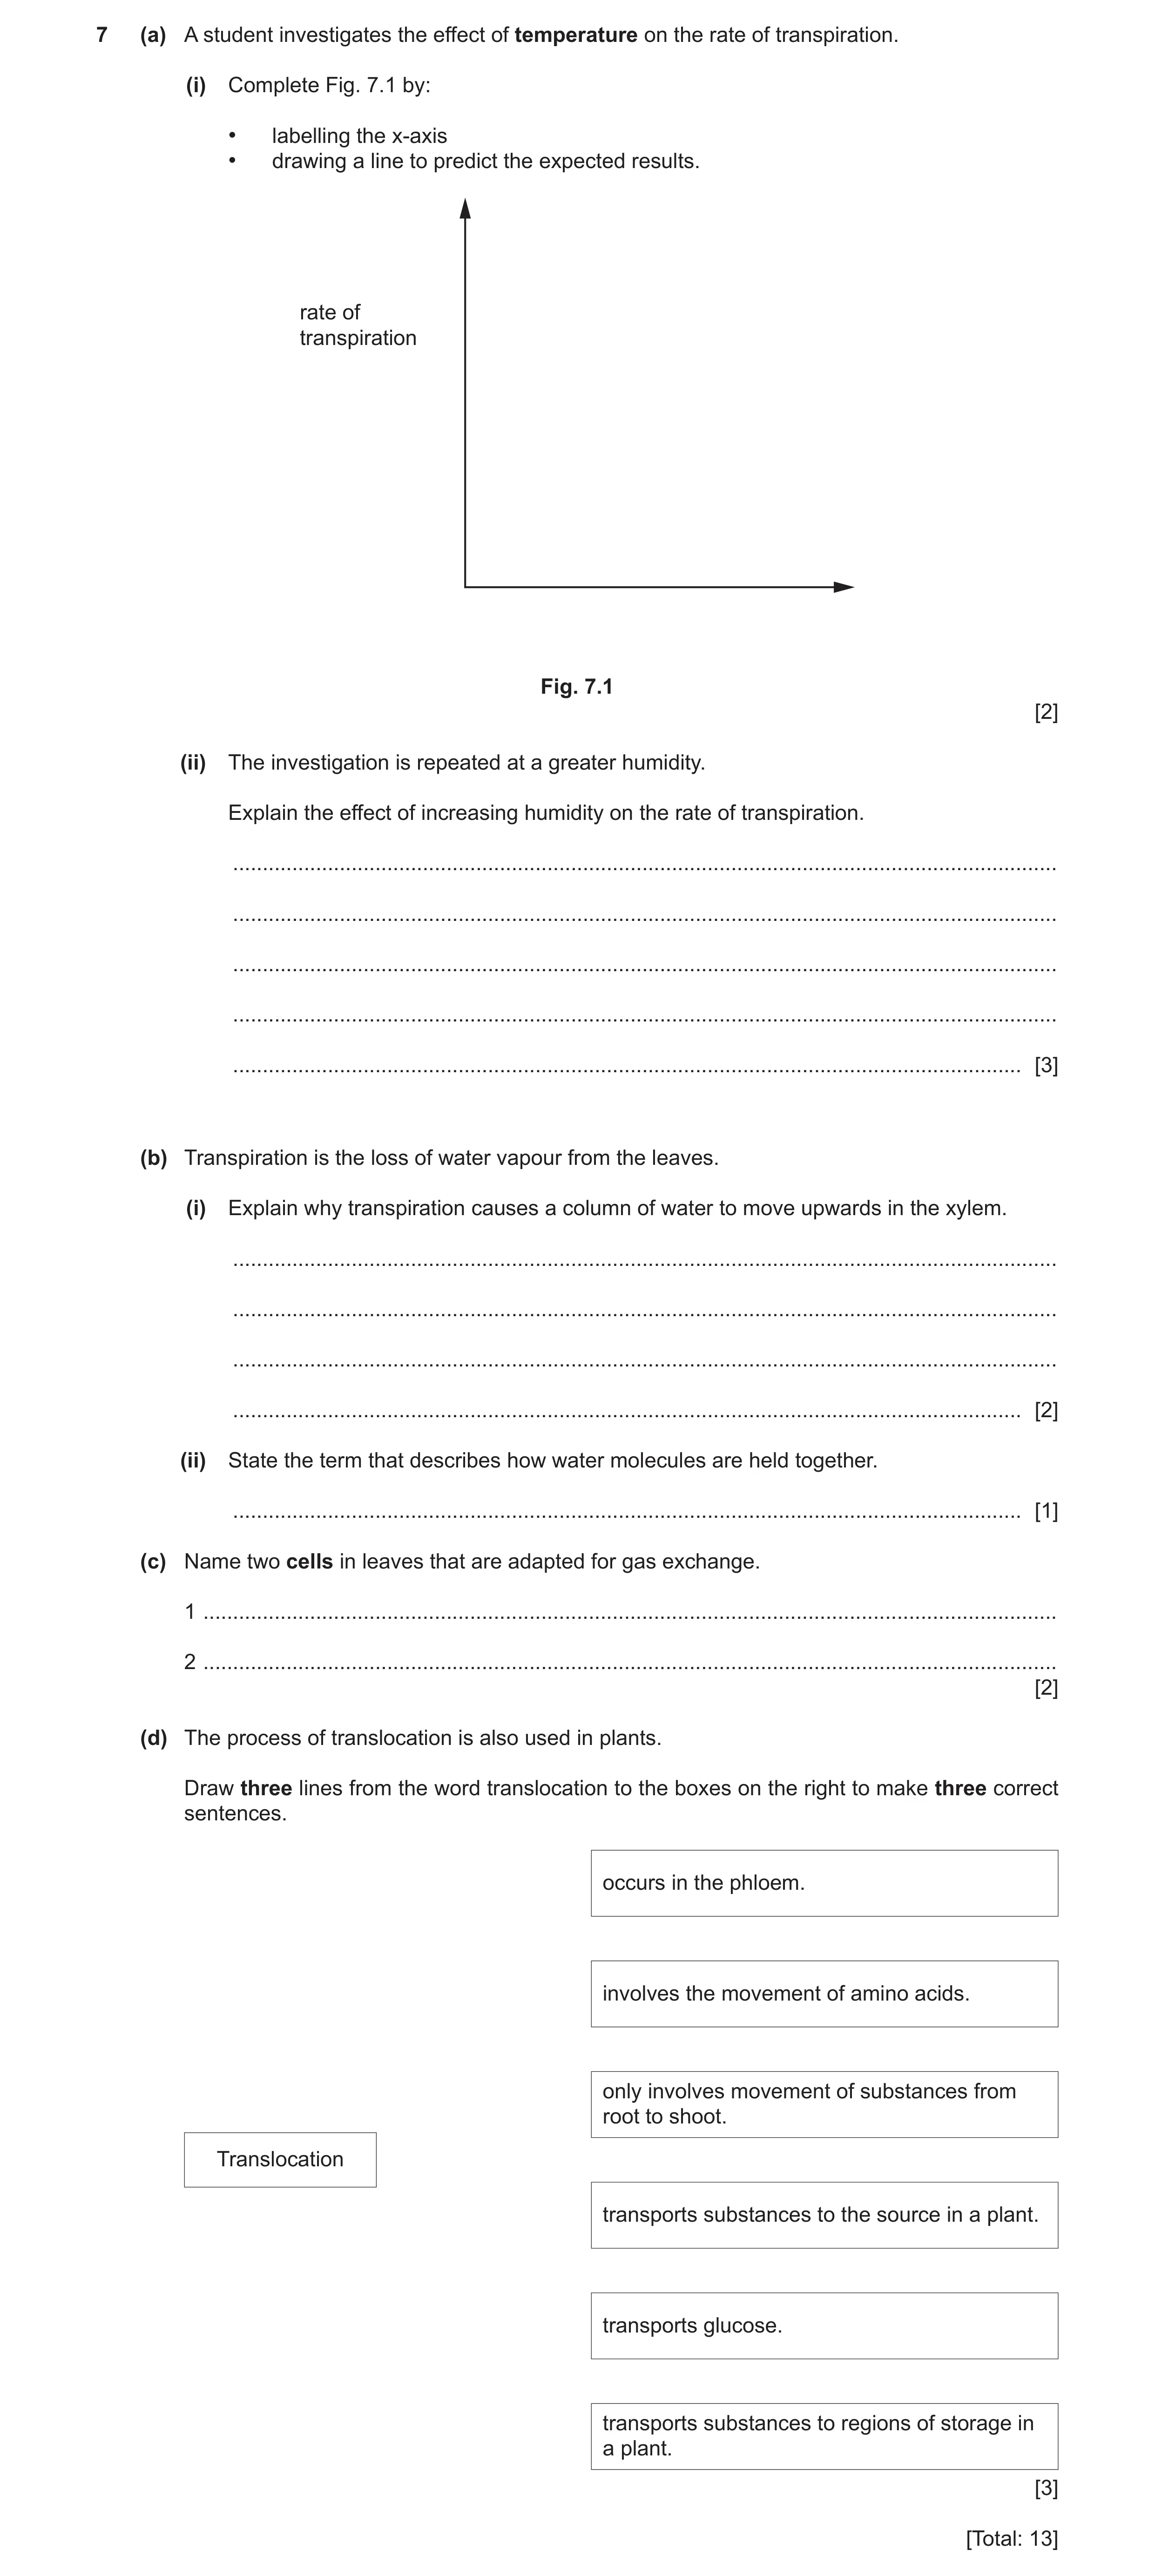
 8
8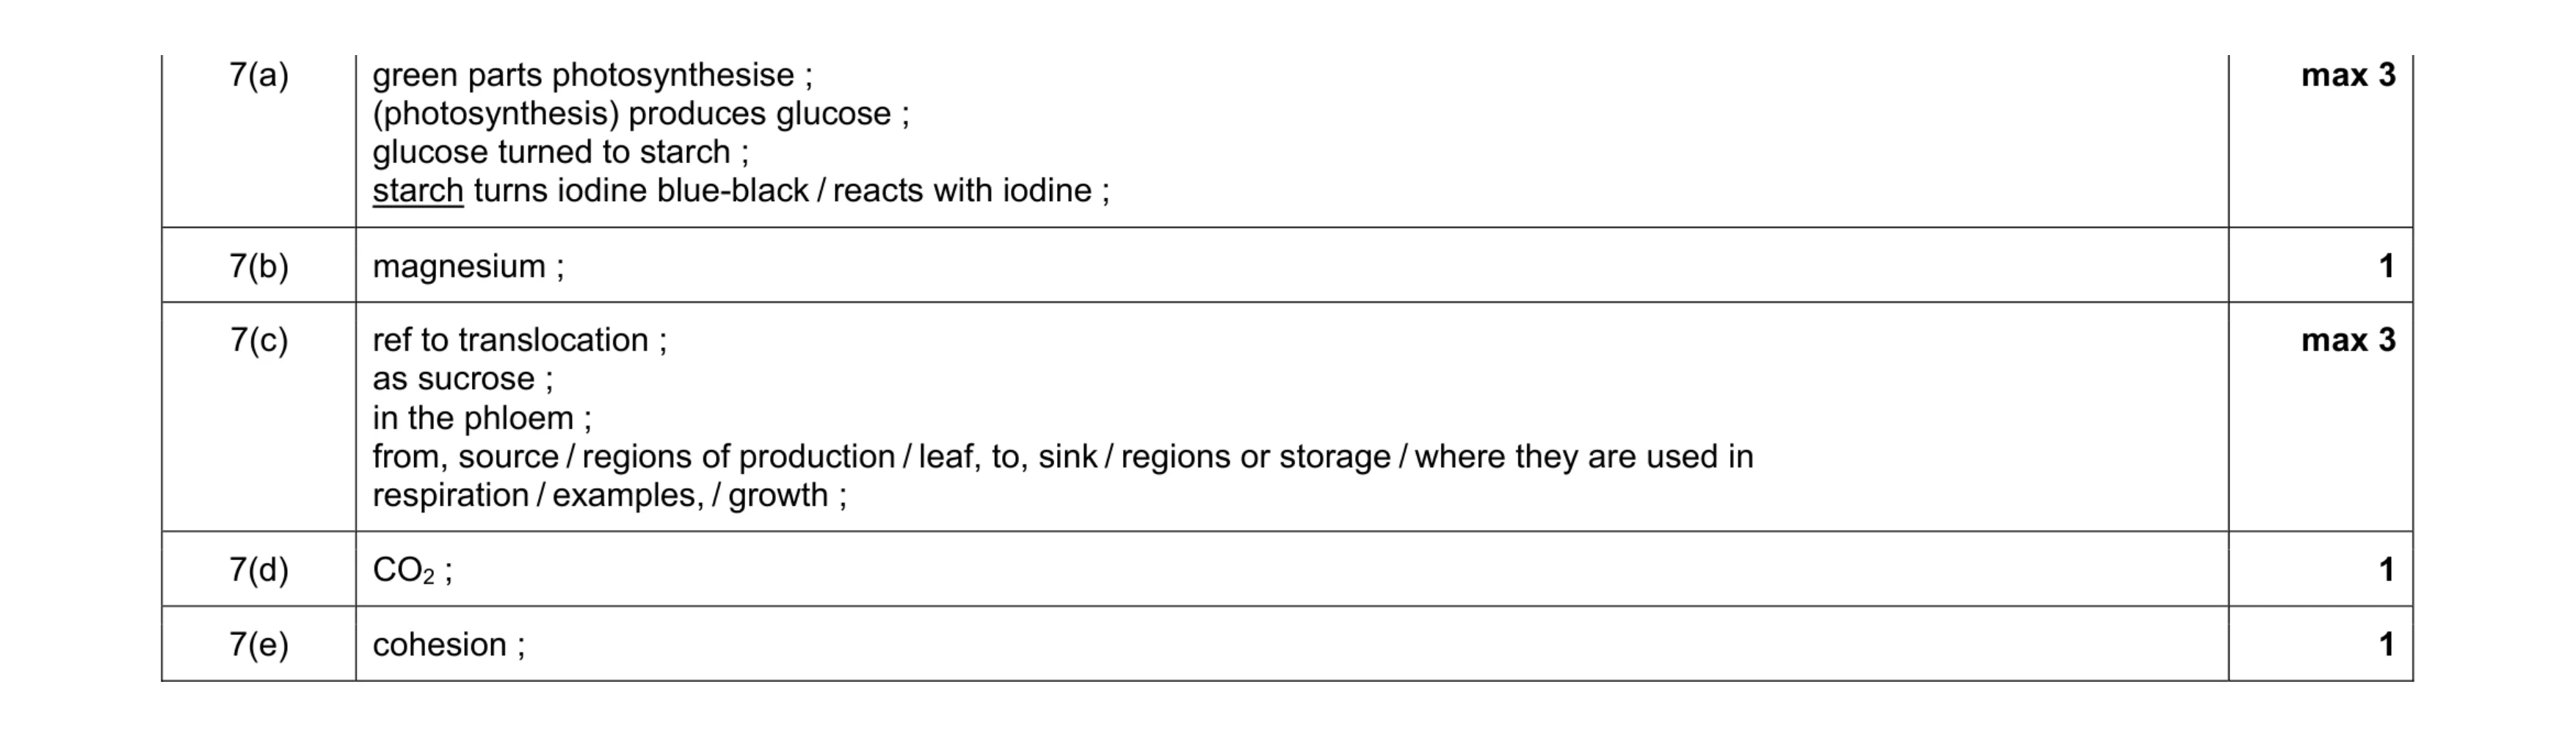 9
9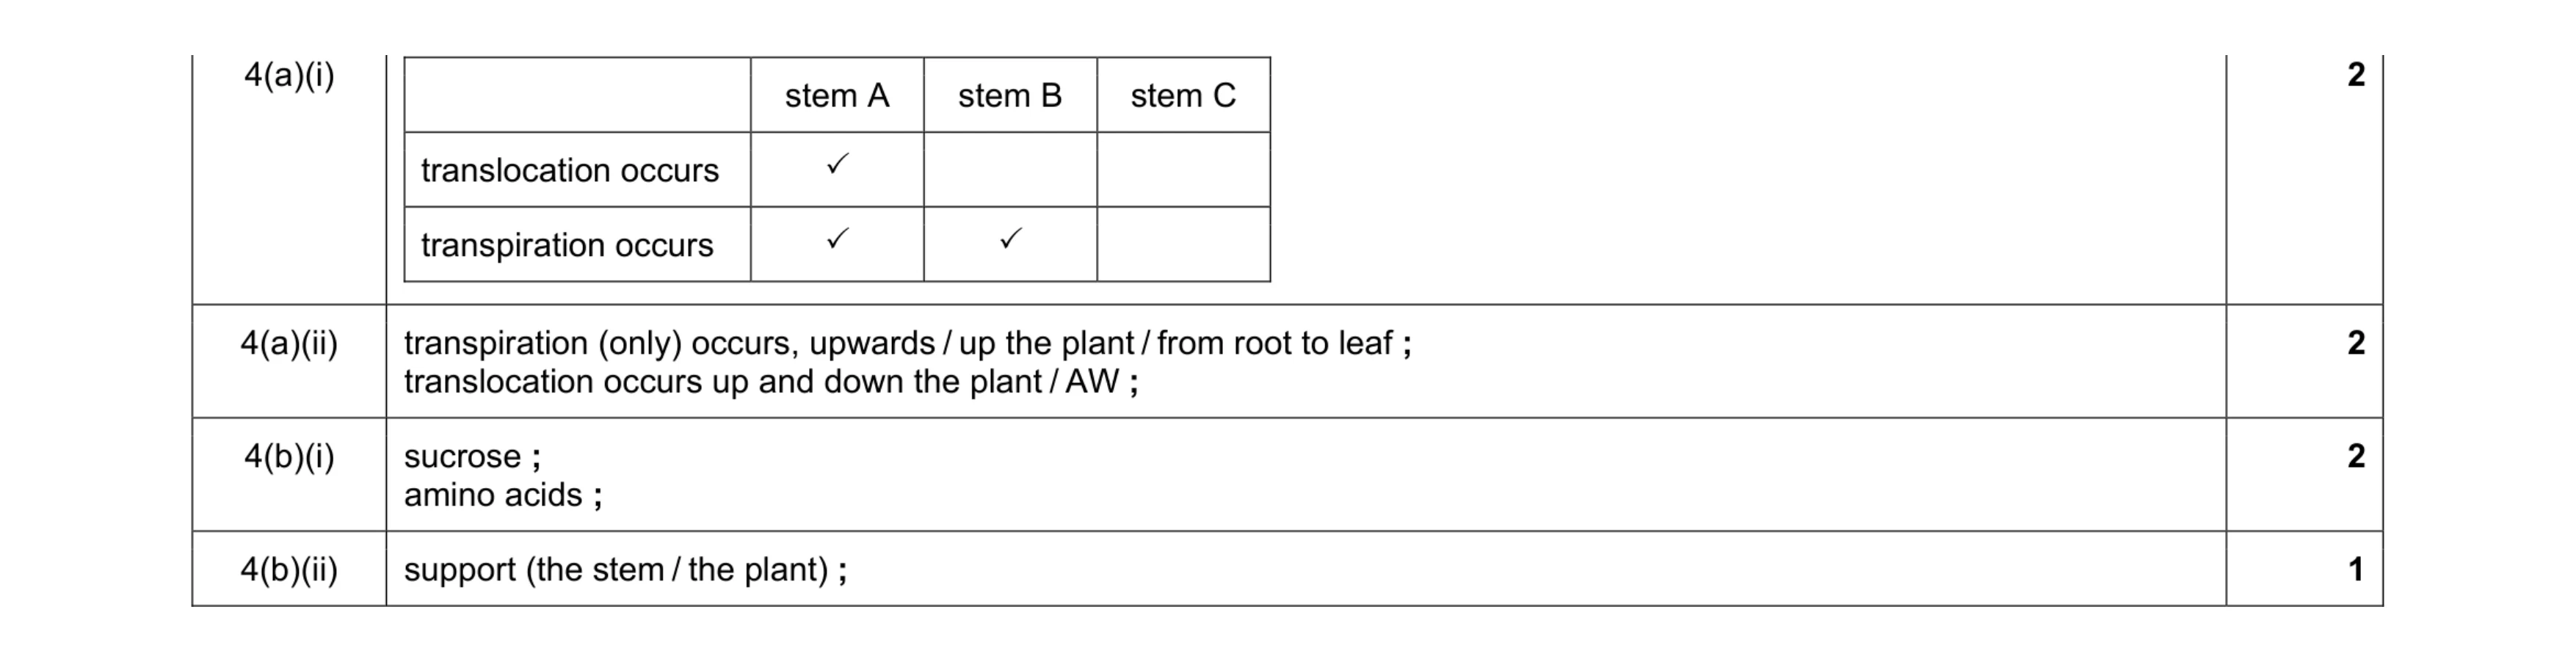 7
7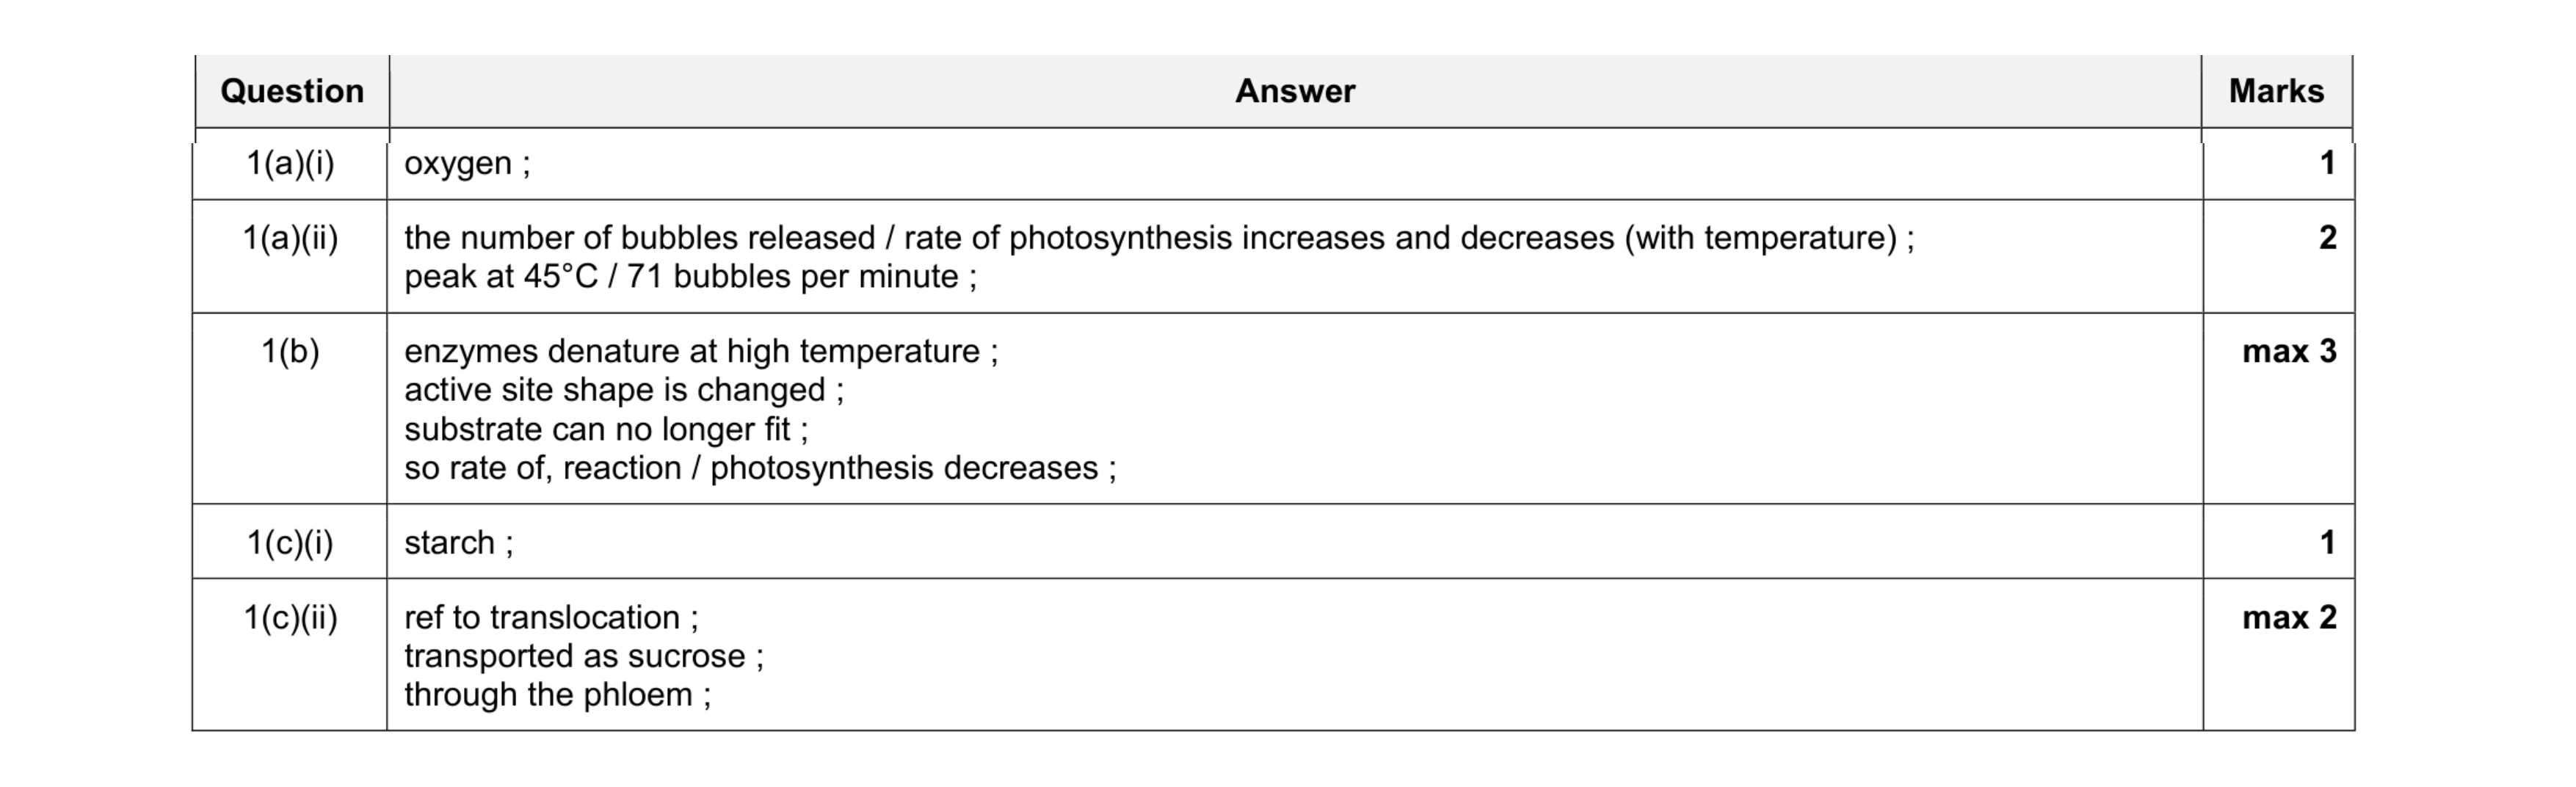 9
9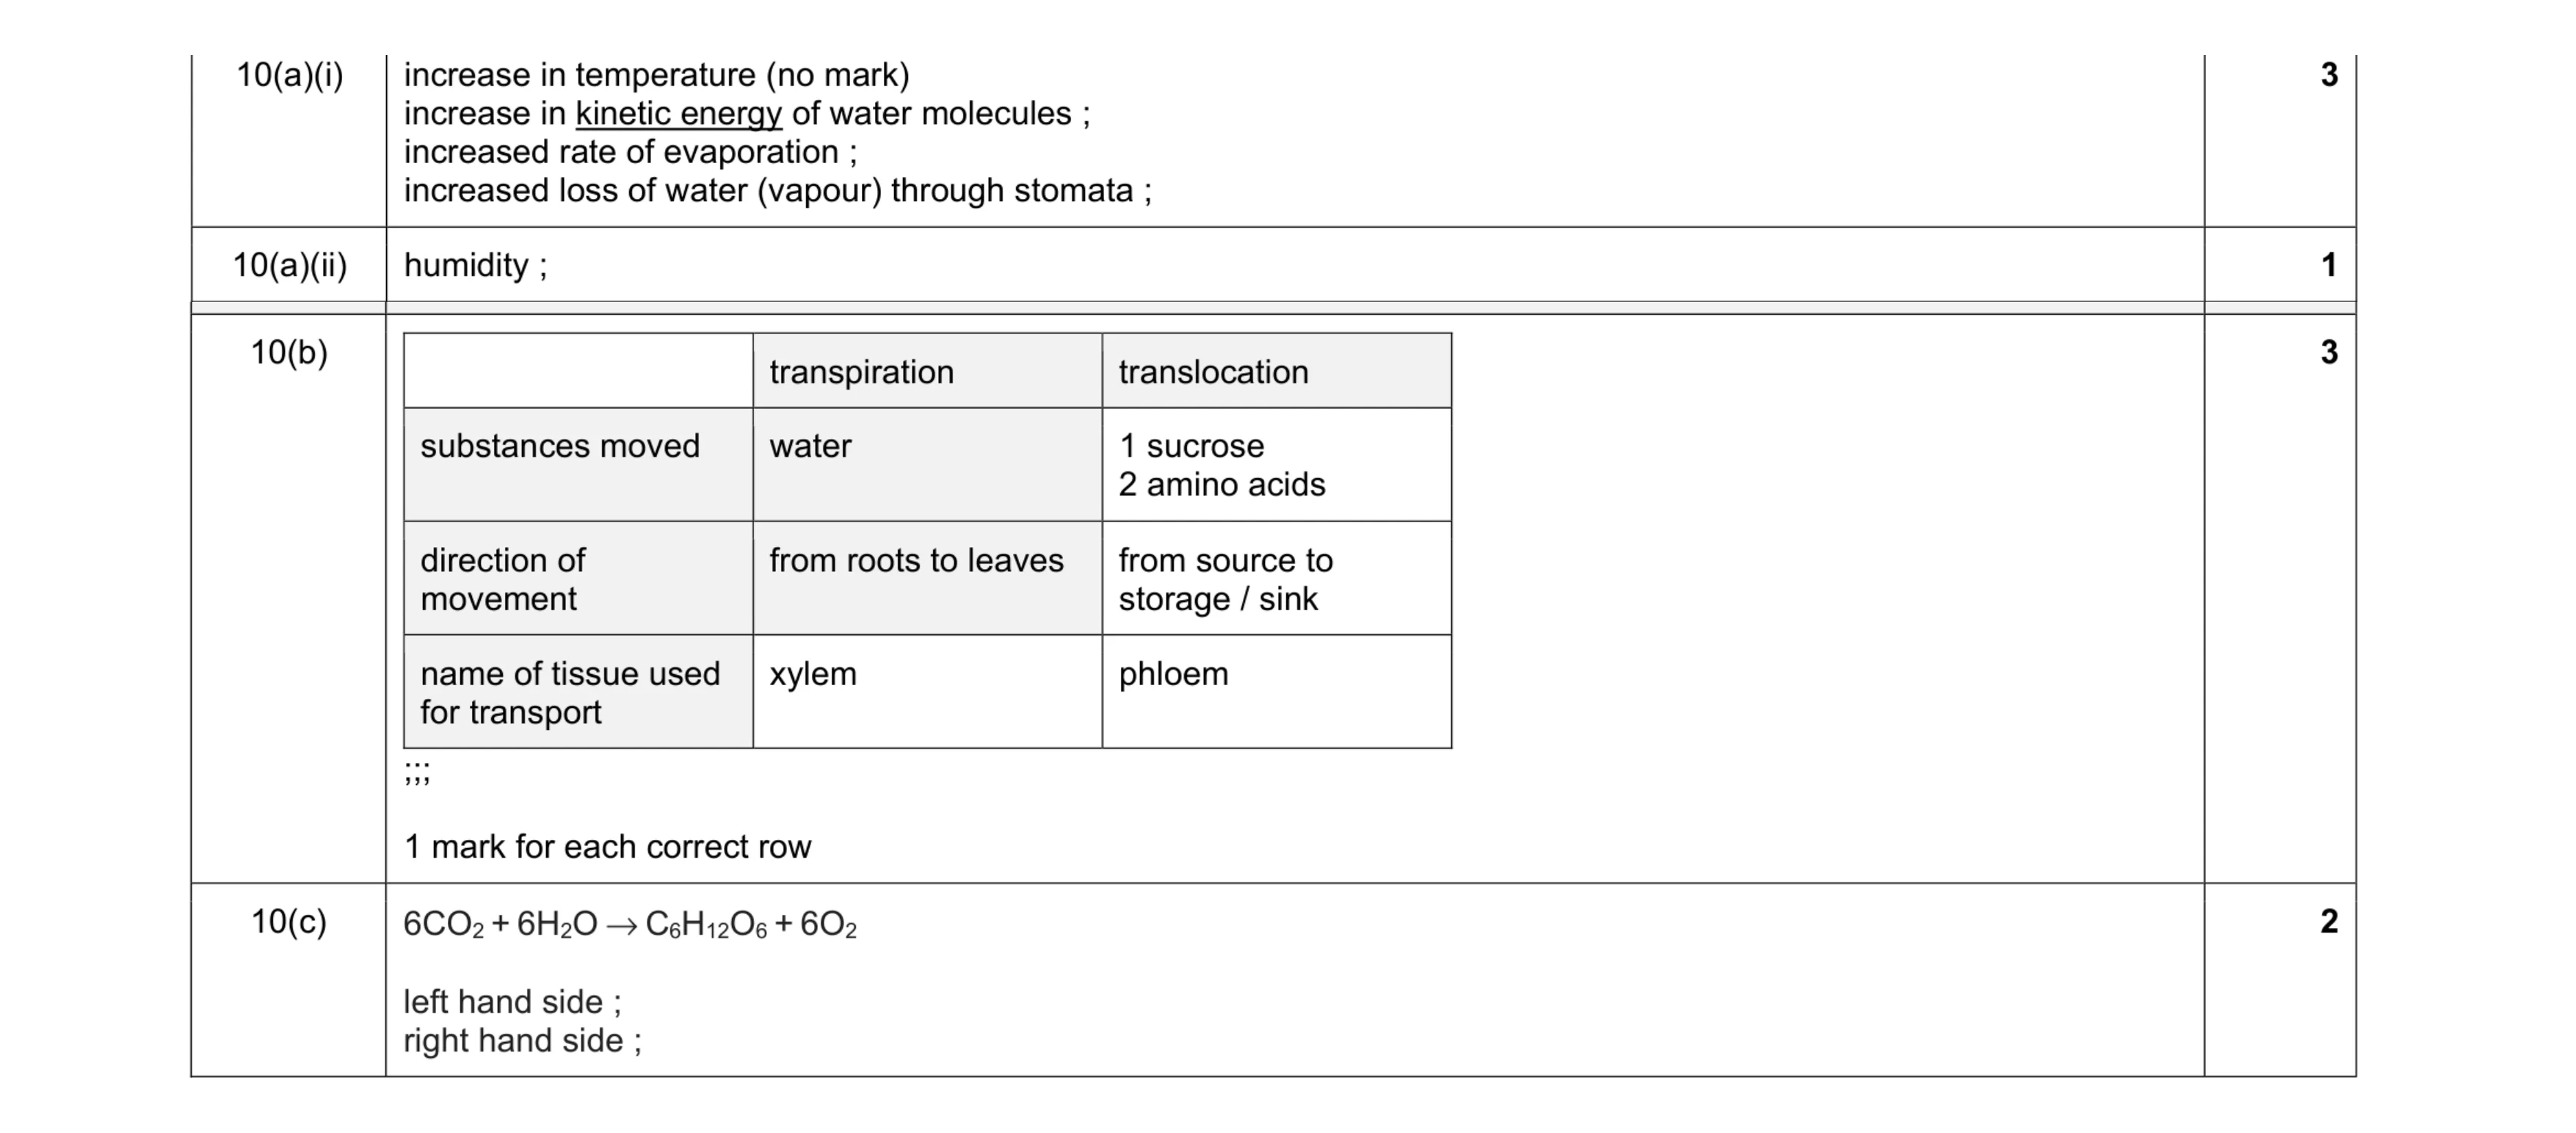 9
9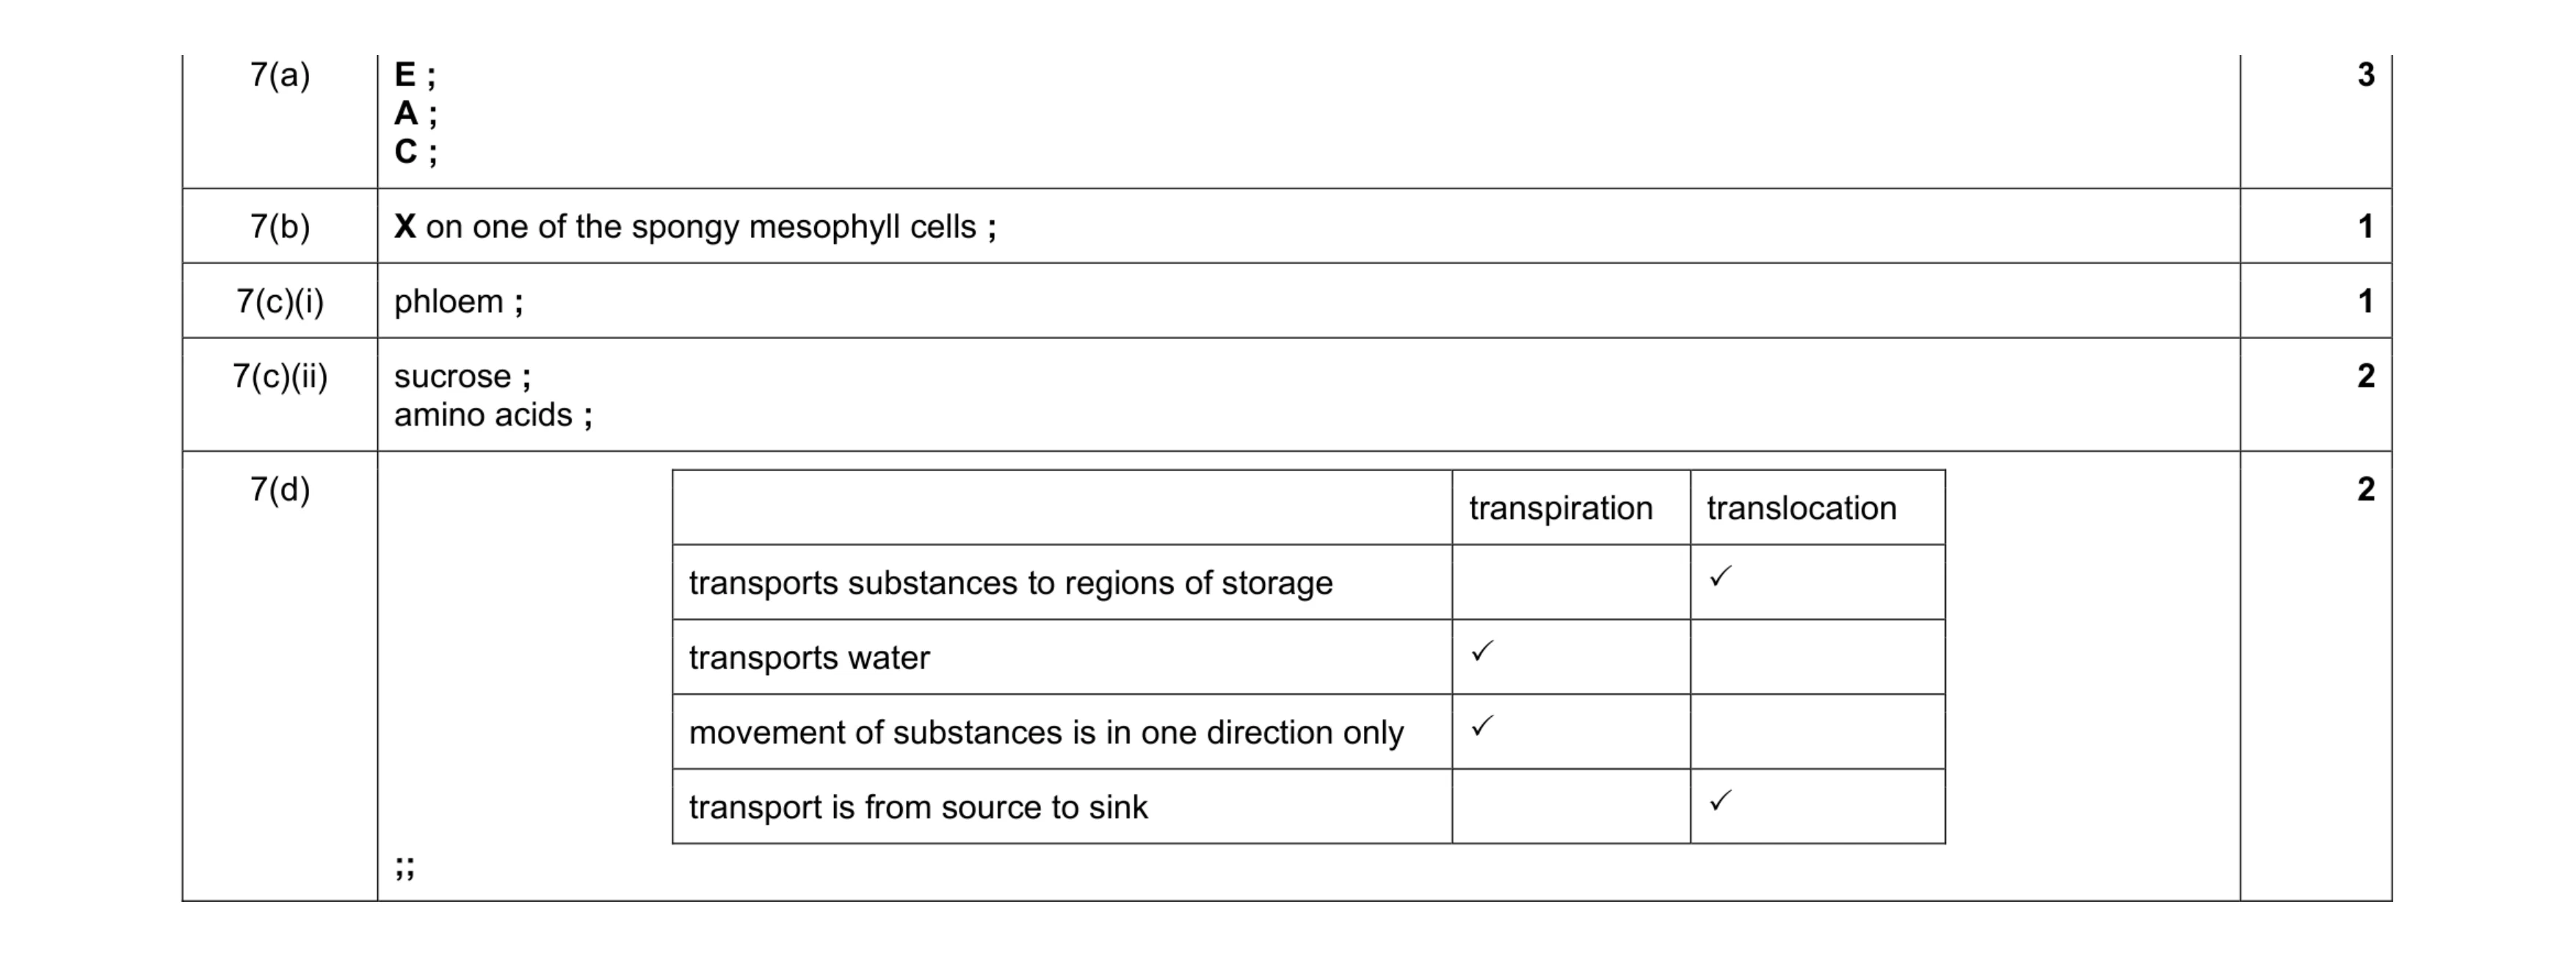 9
9 6
6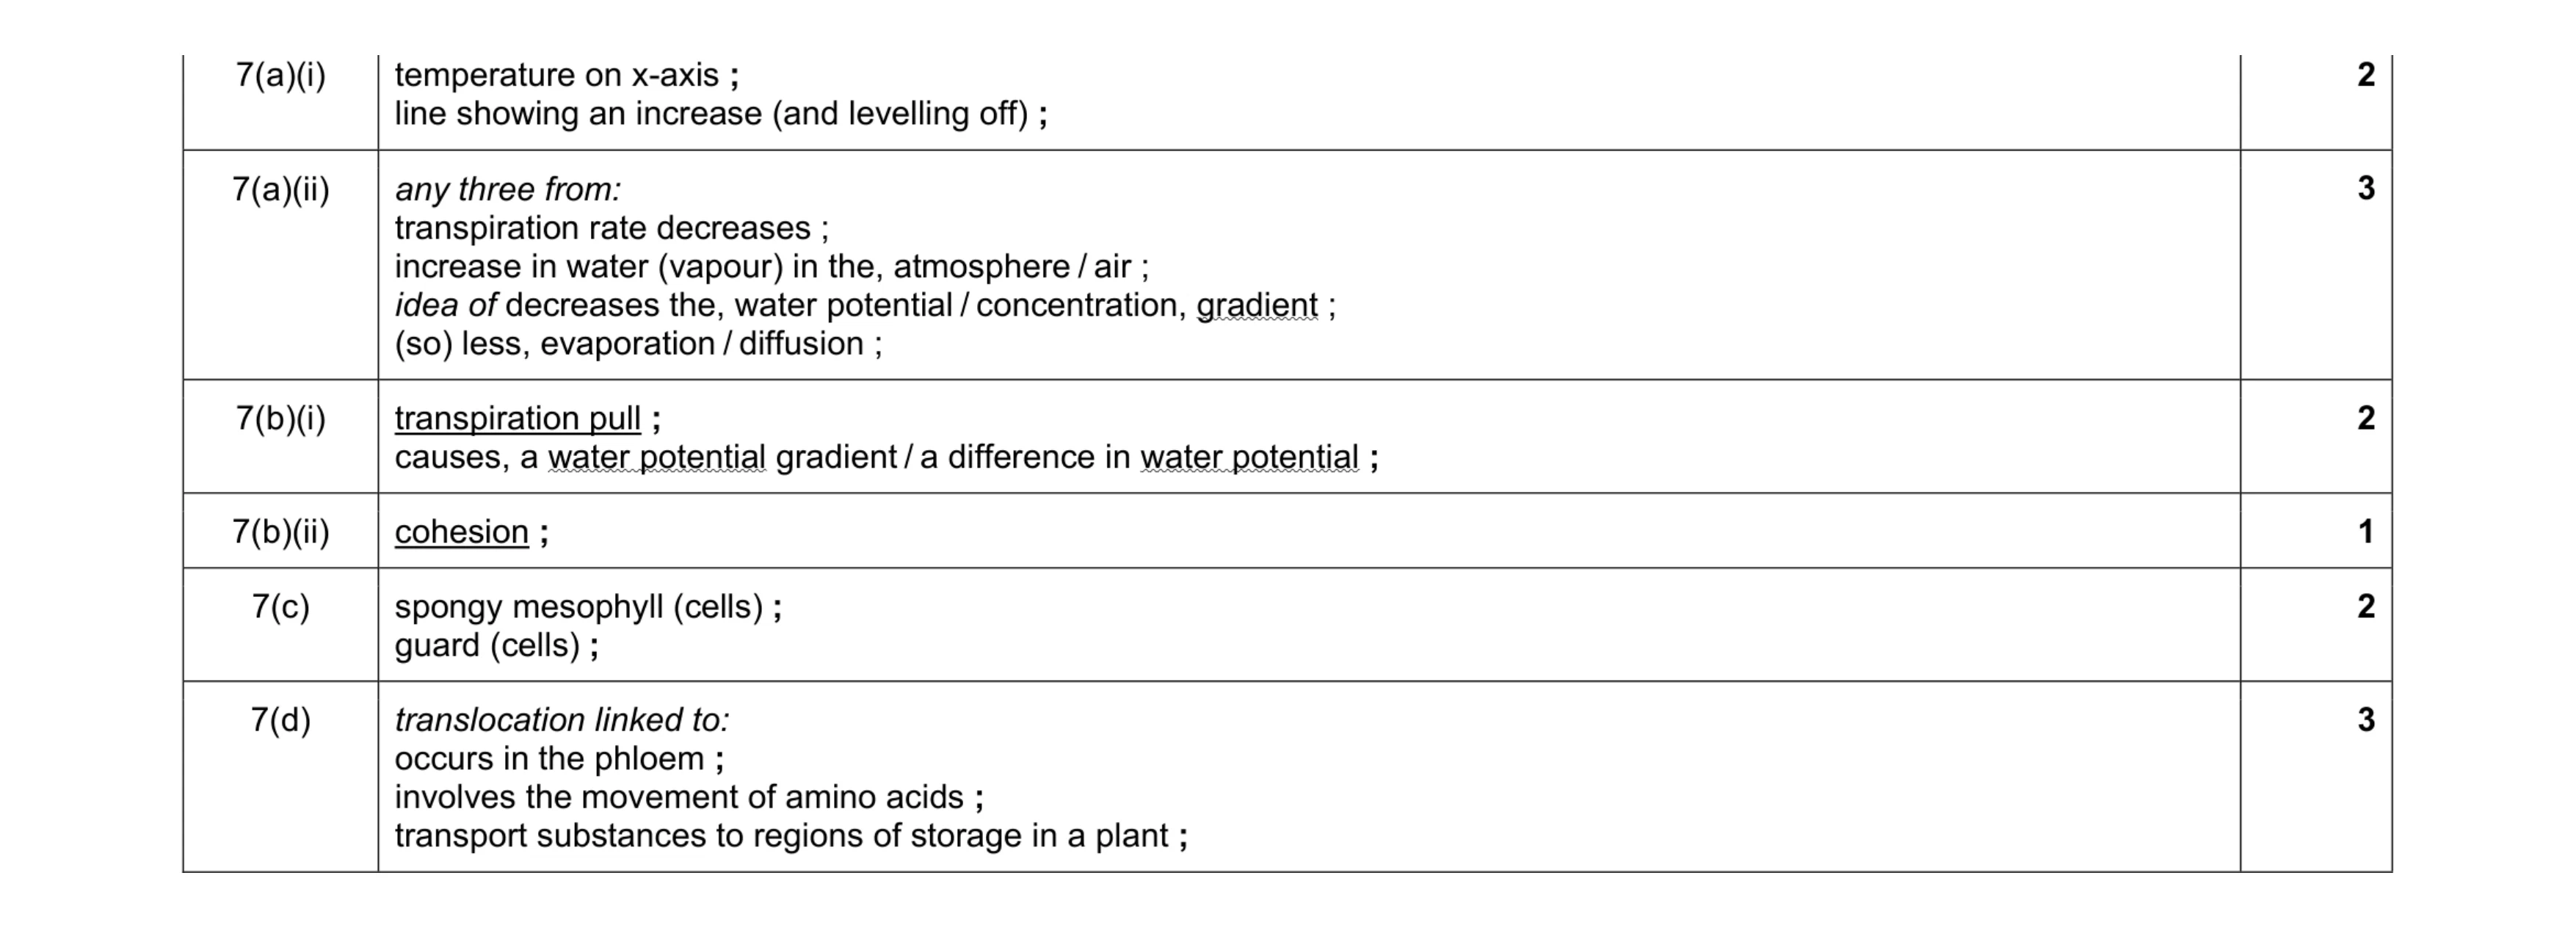 13
13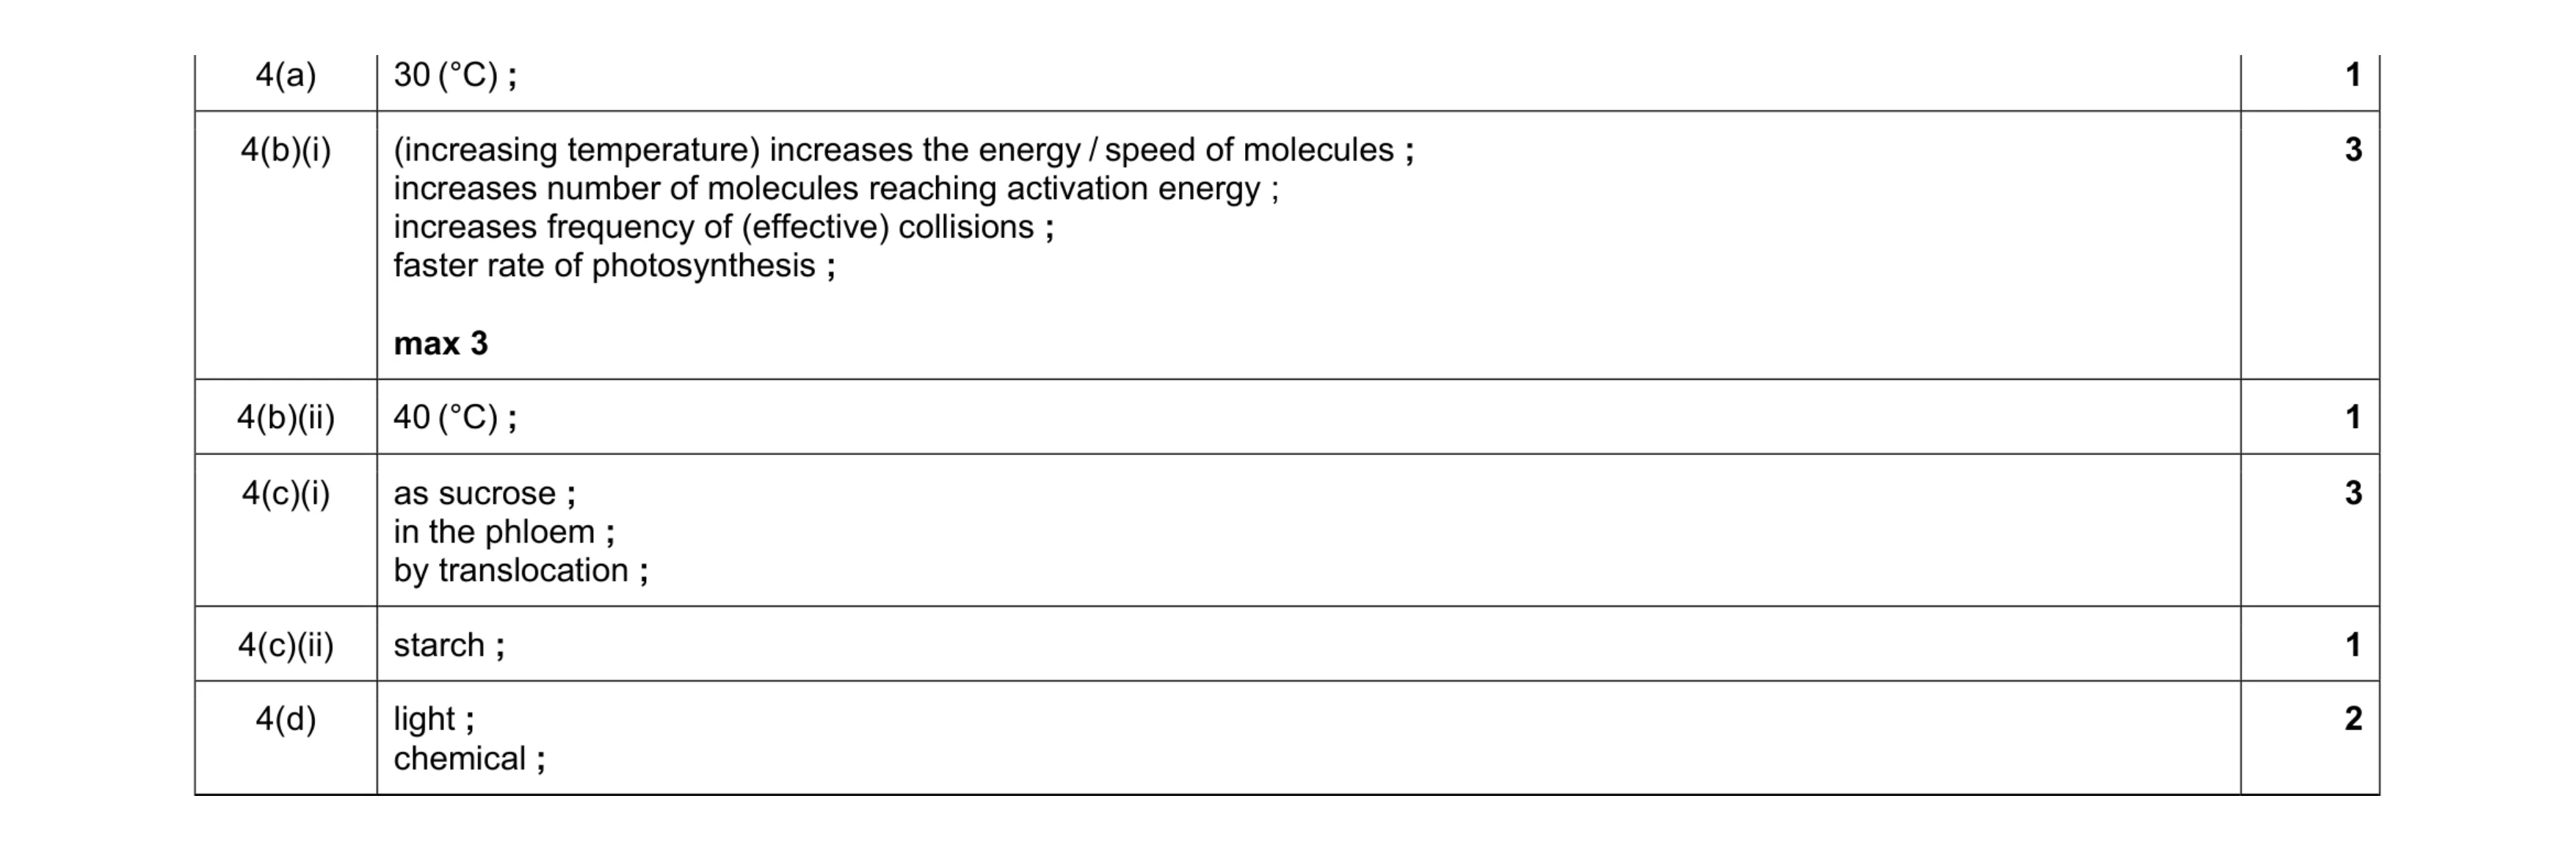 11
11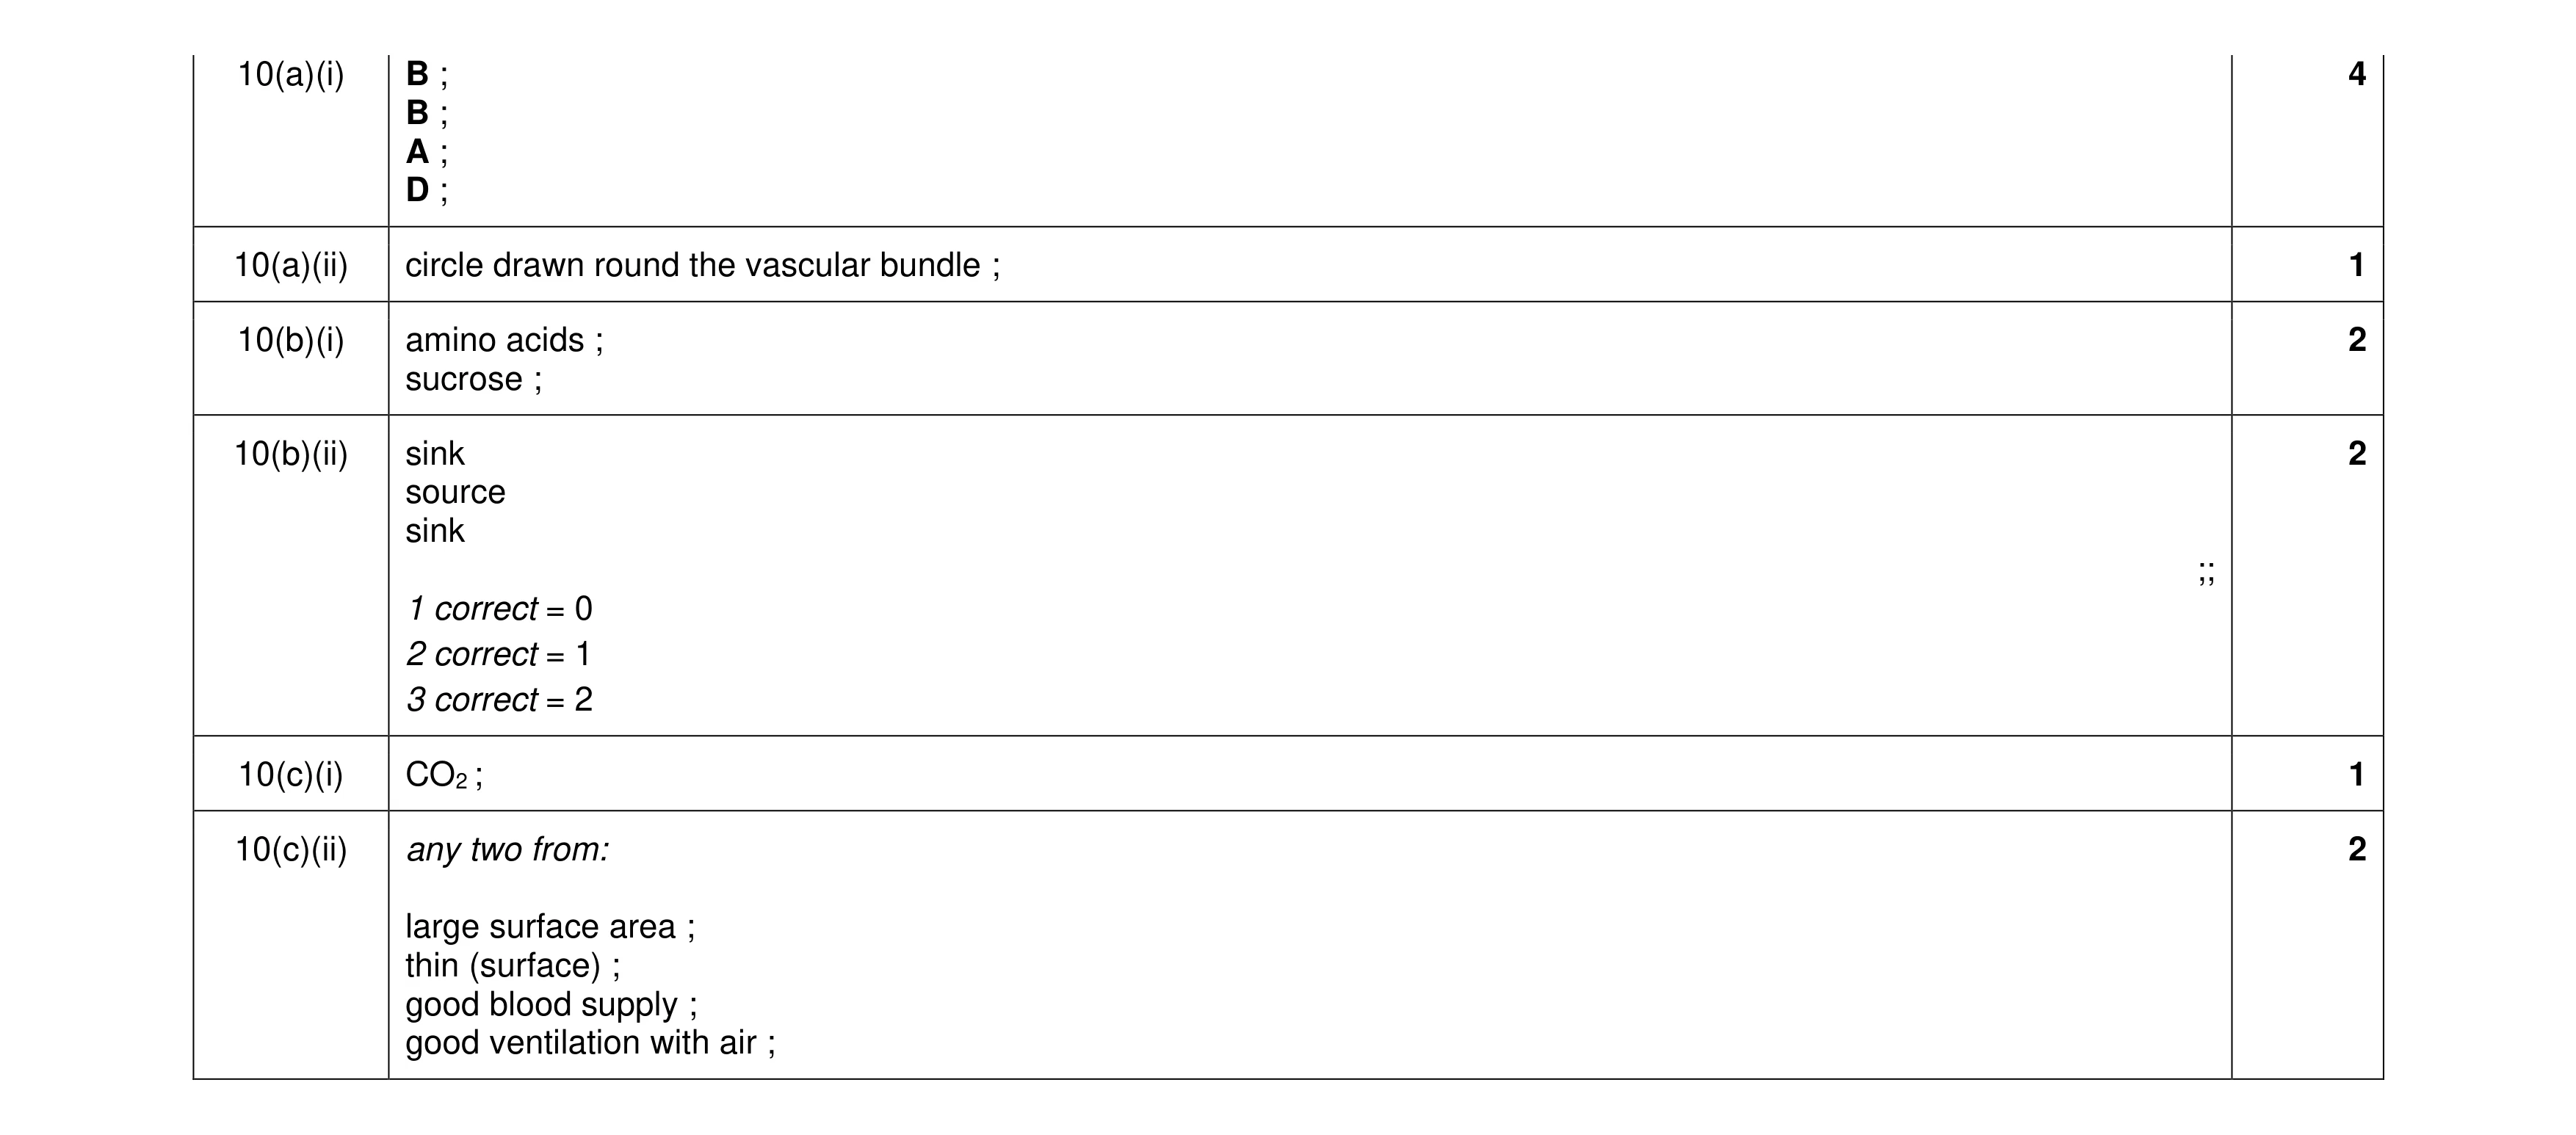 12
12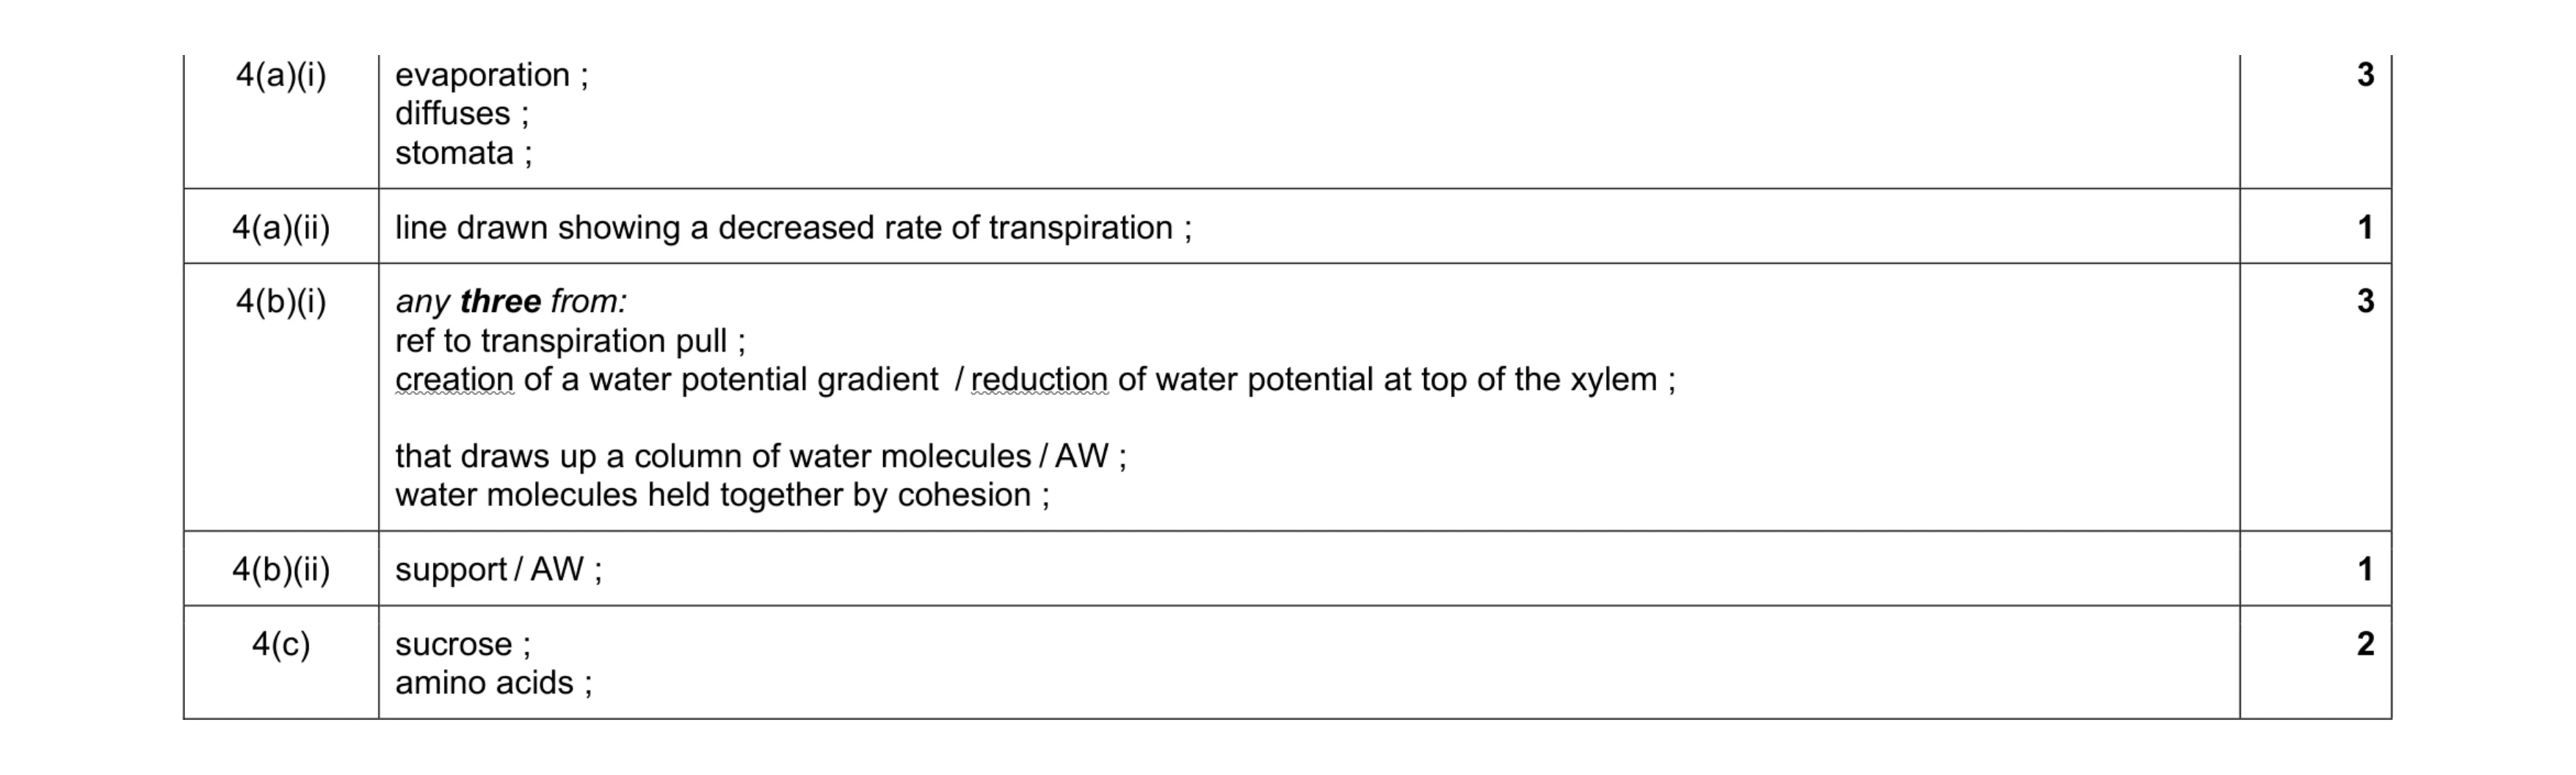 10
10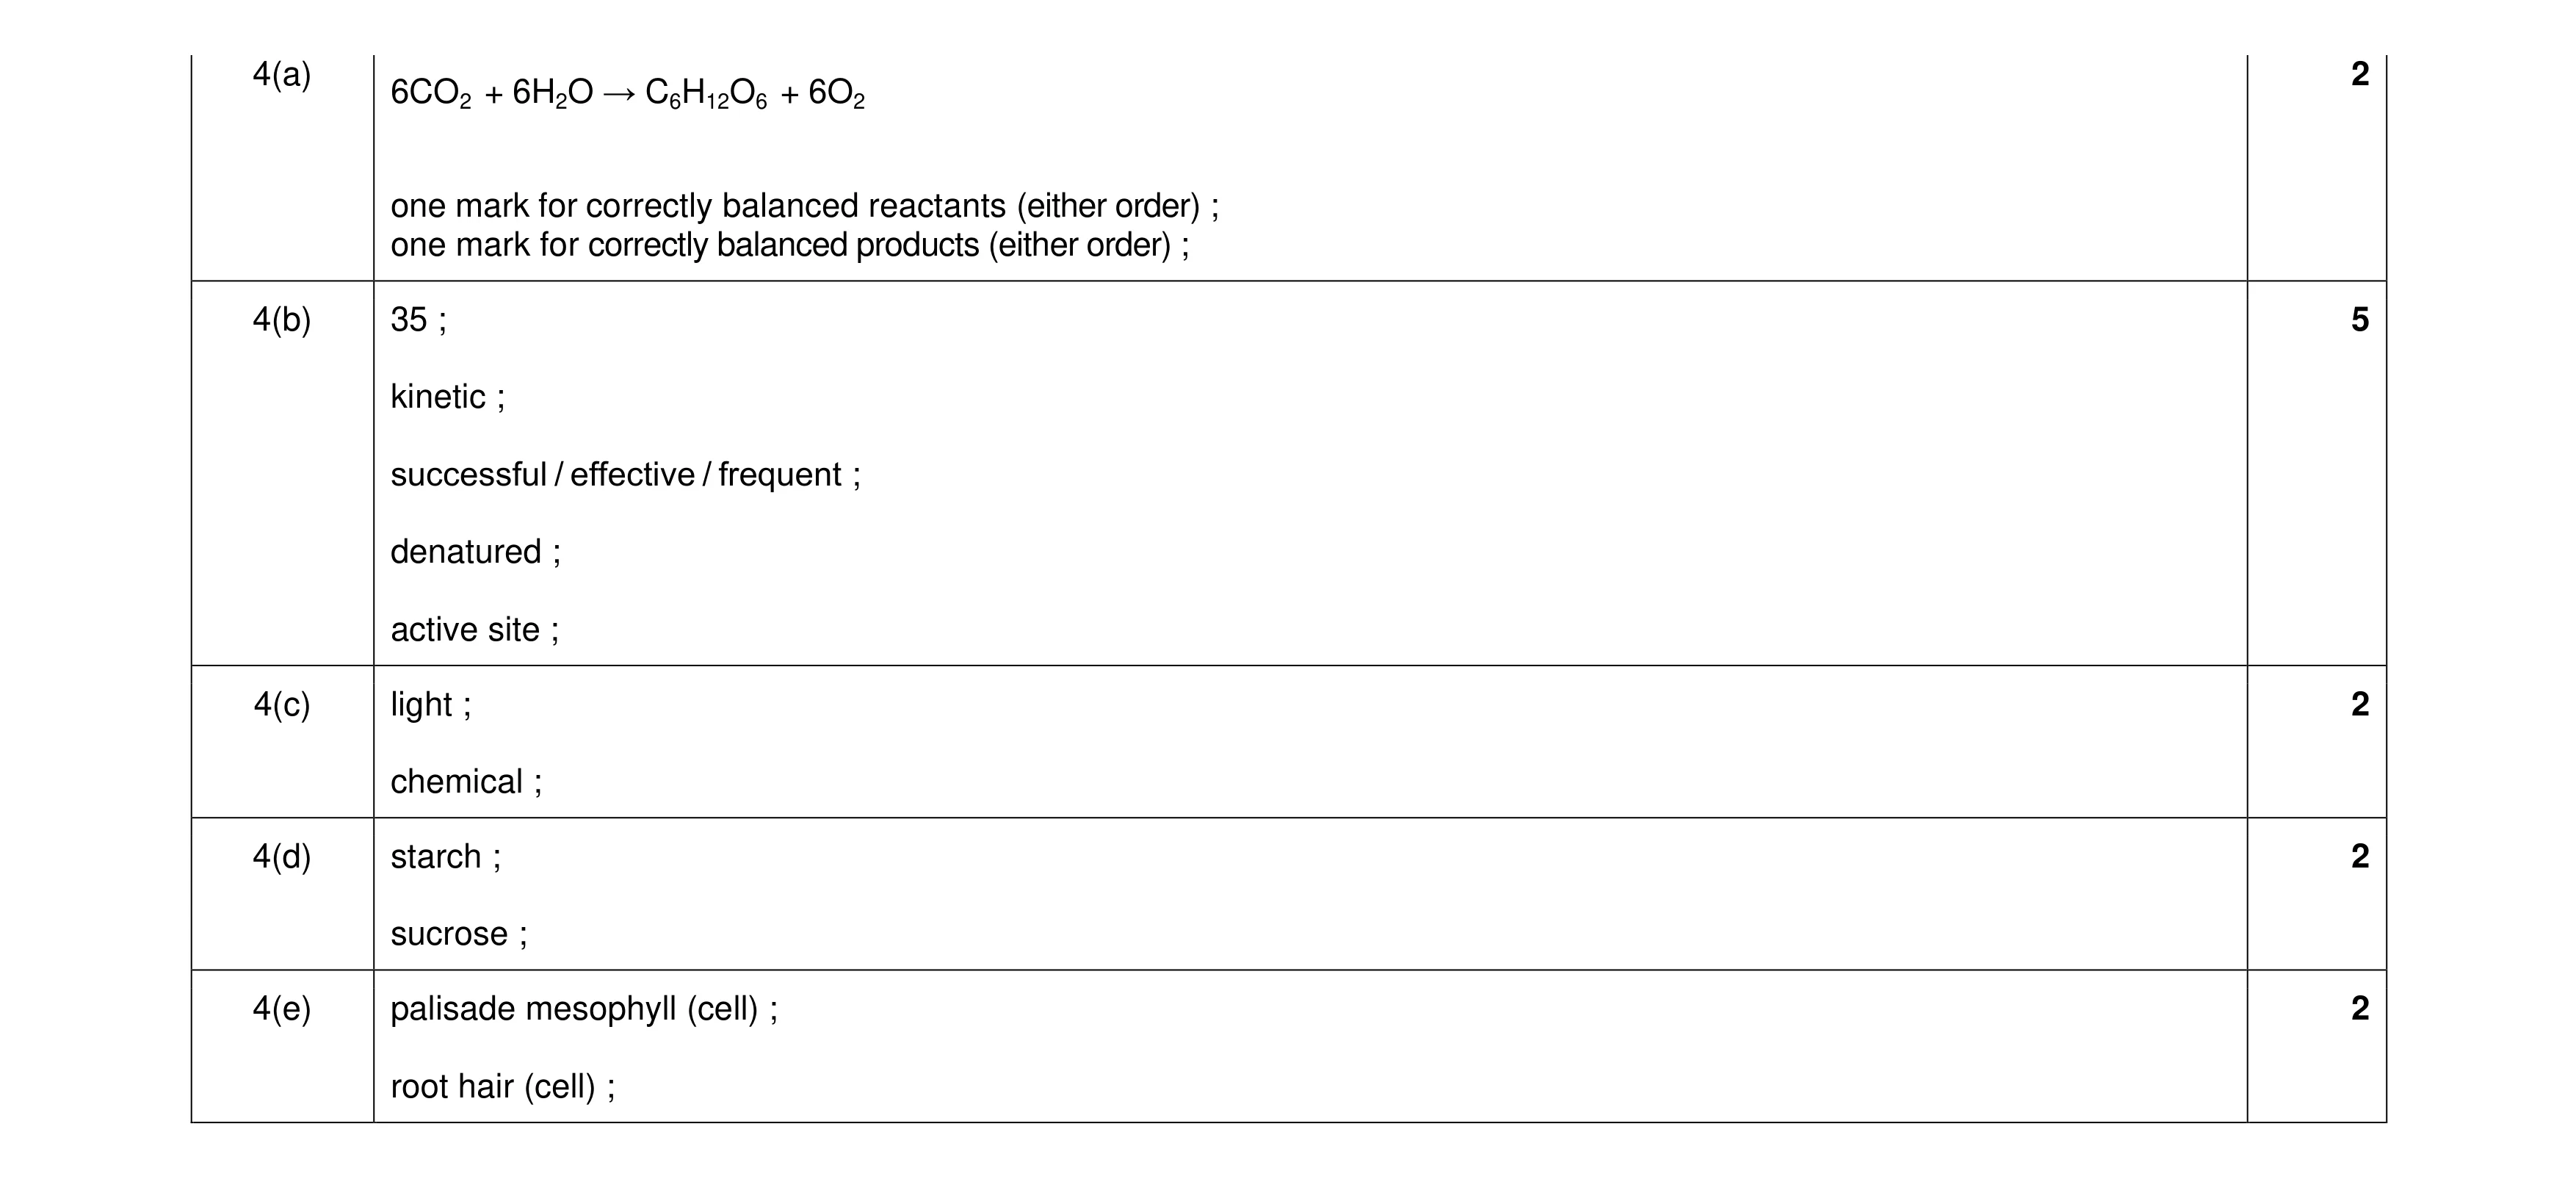 13
13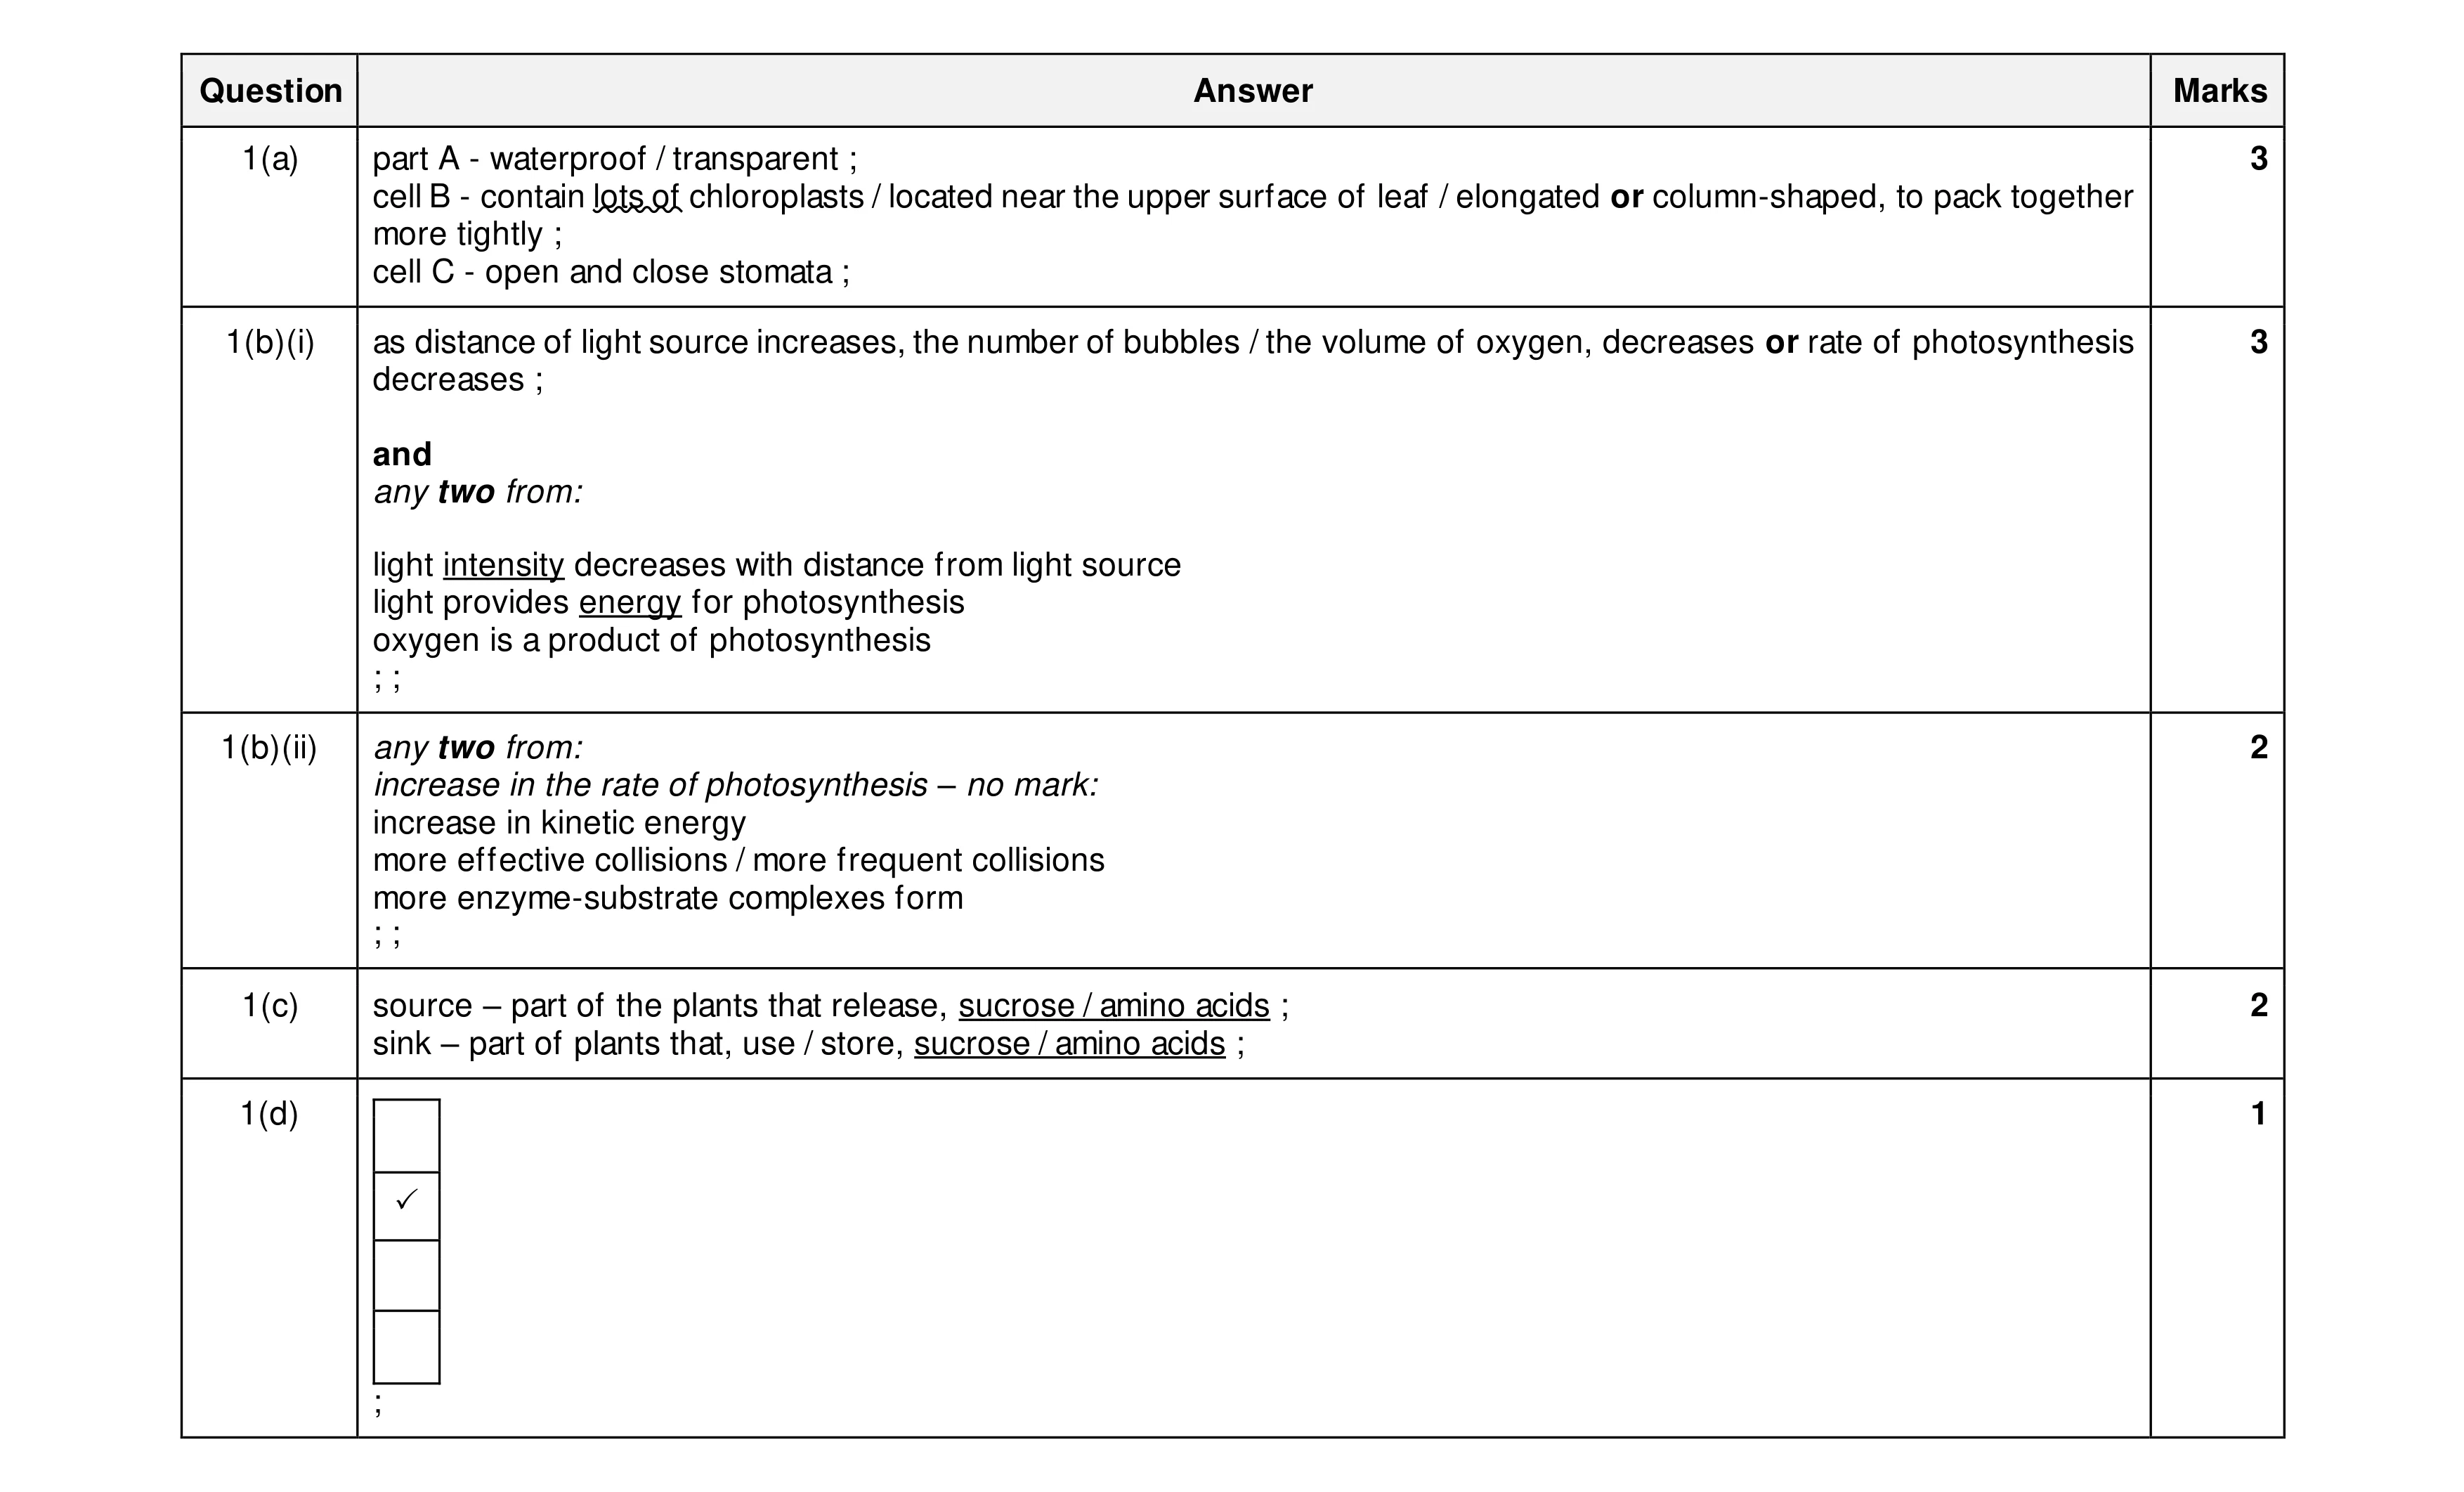 11
11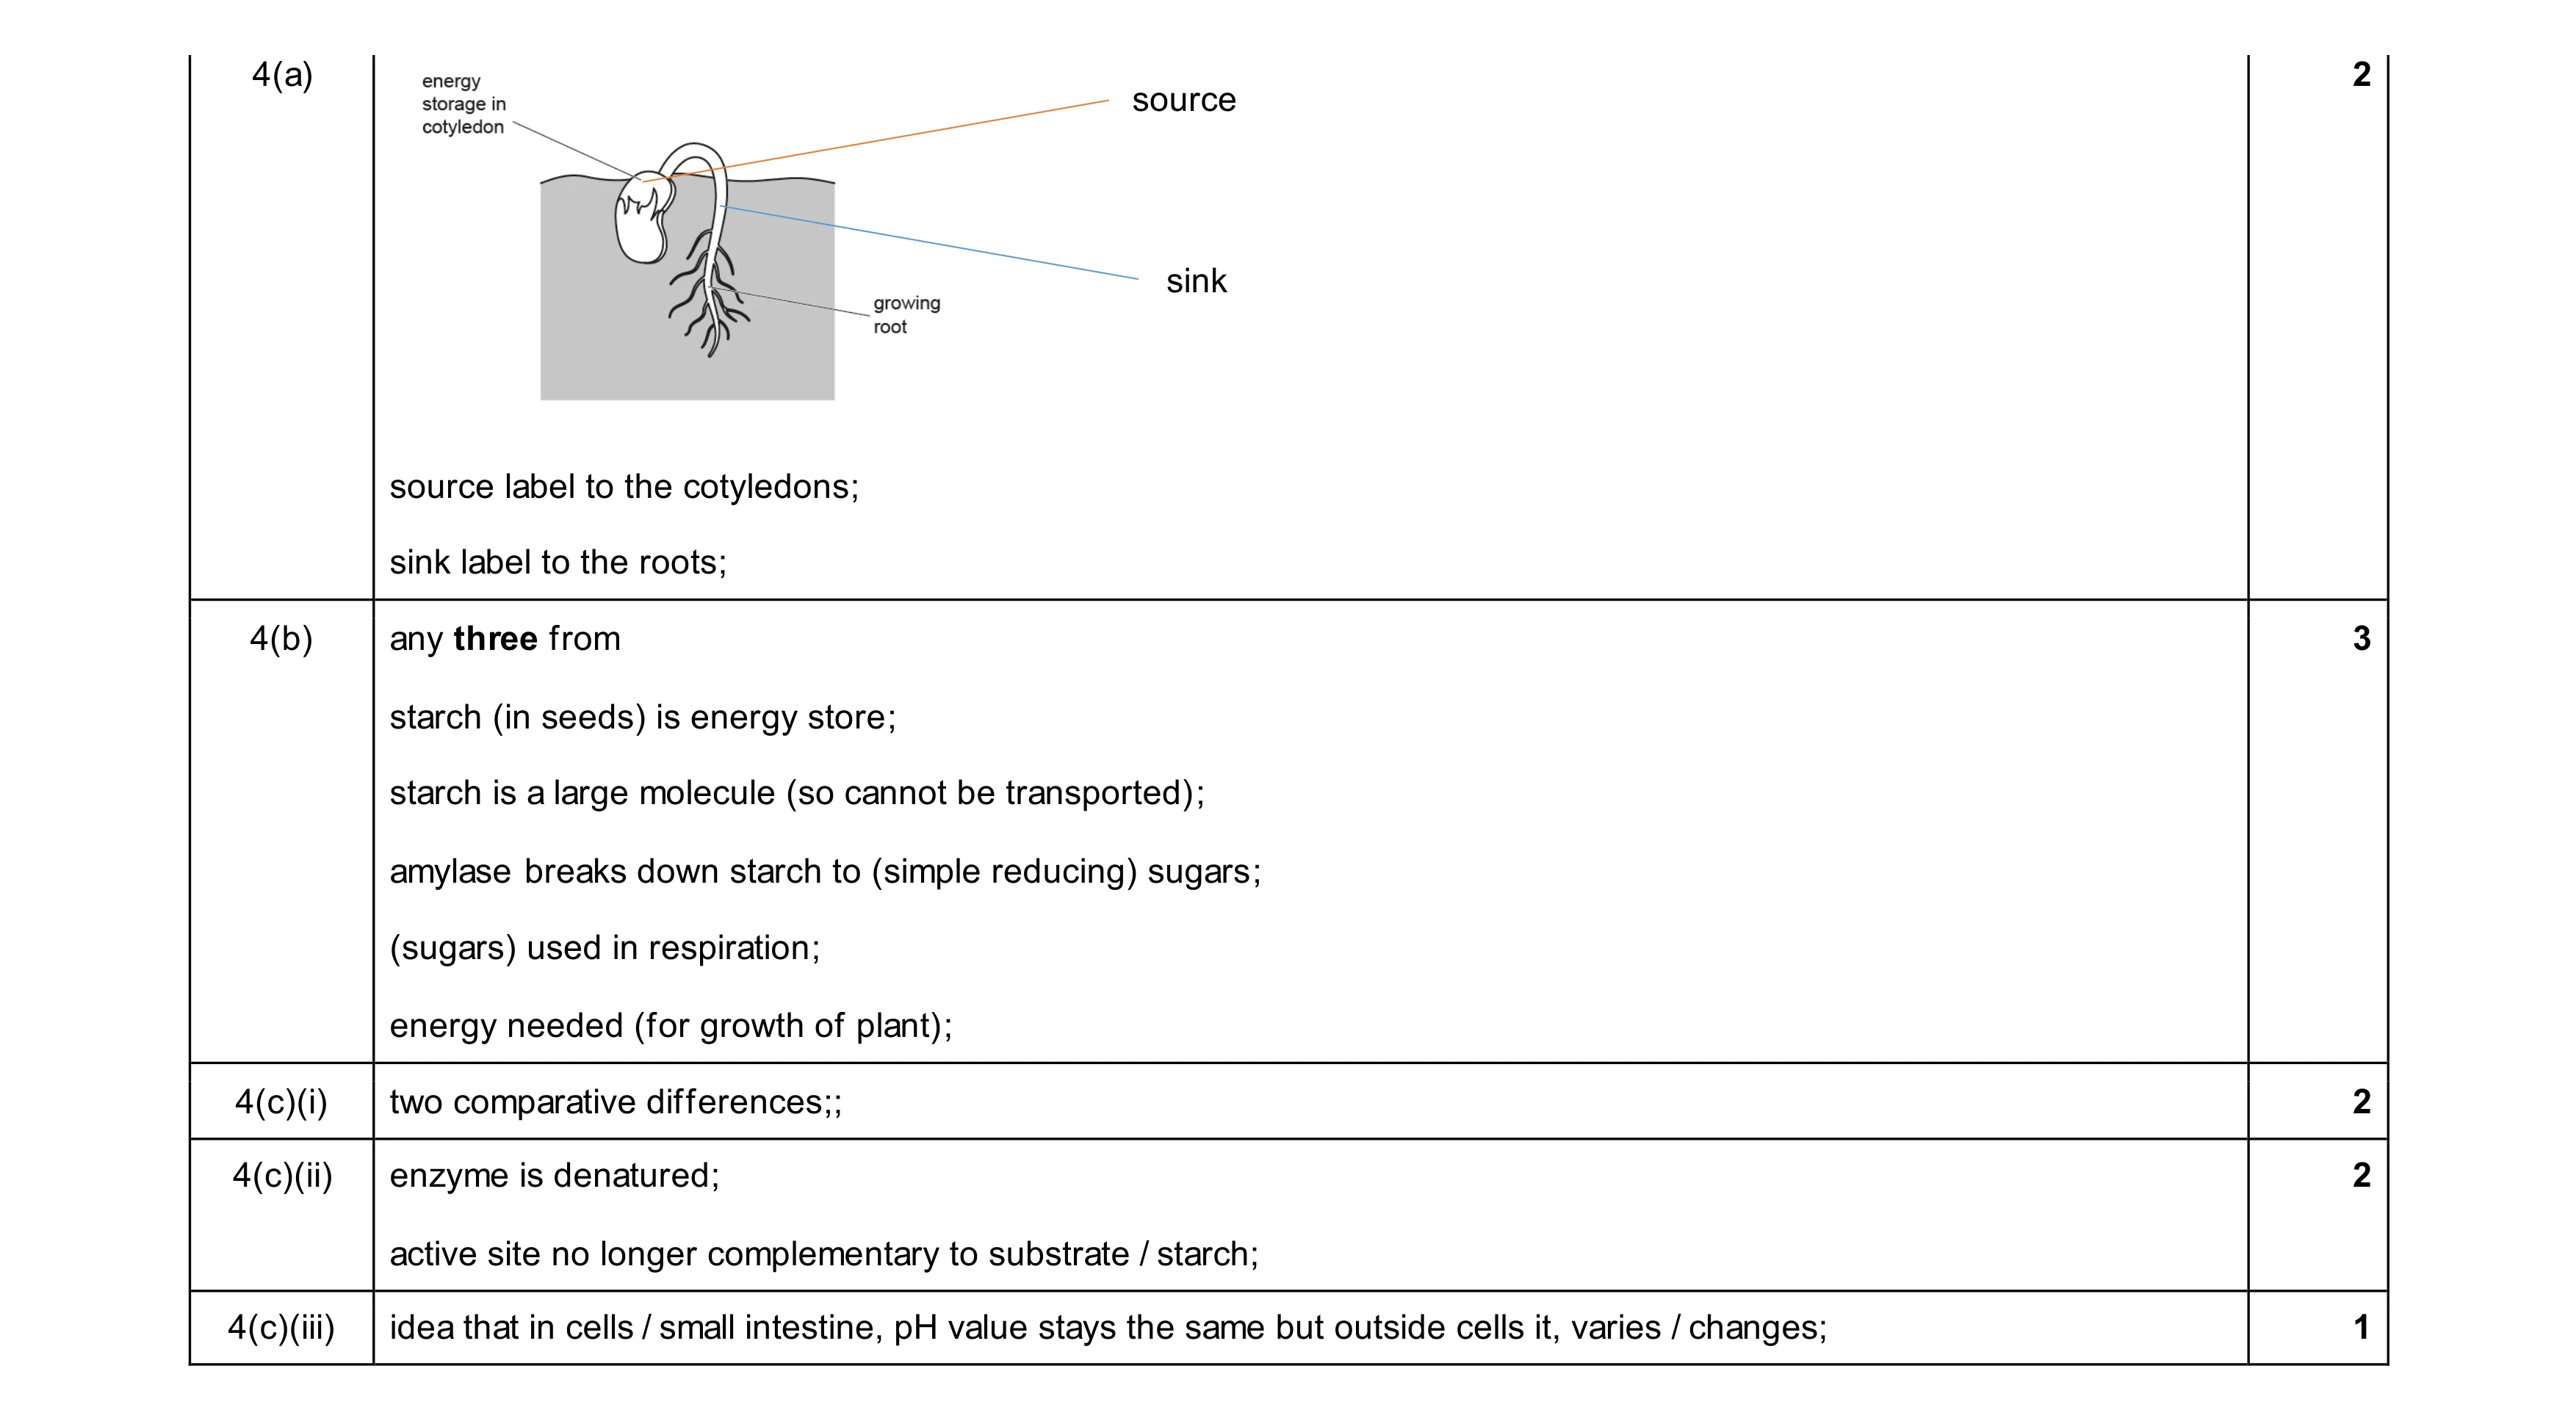 10
10