Questions as text
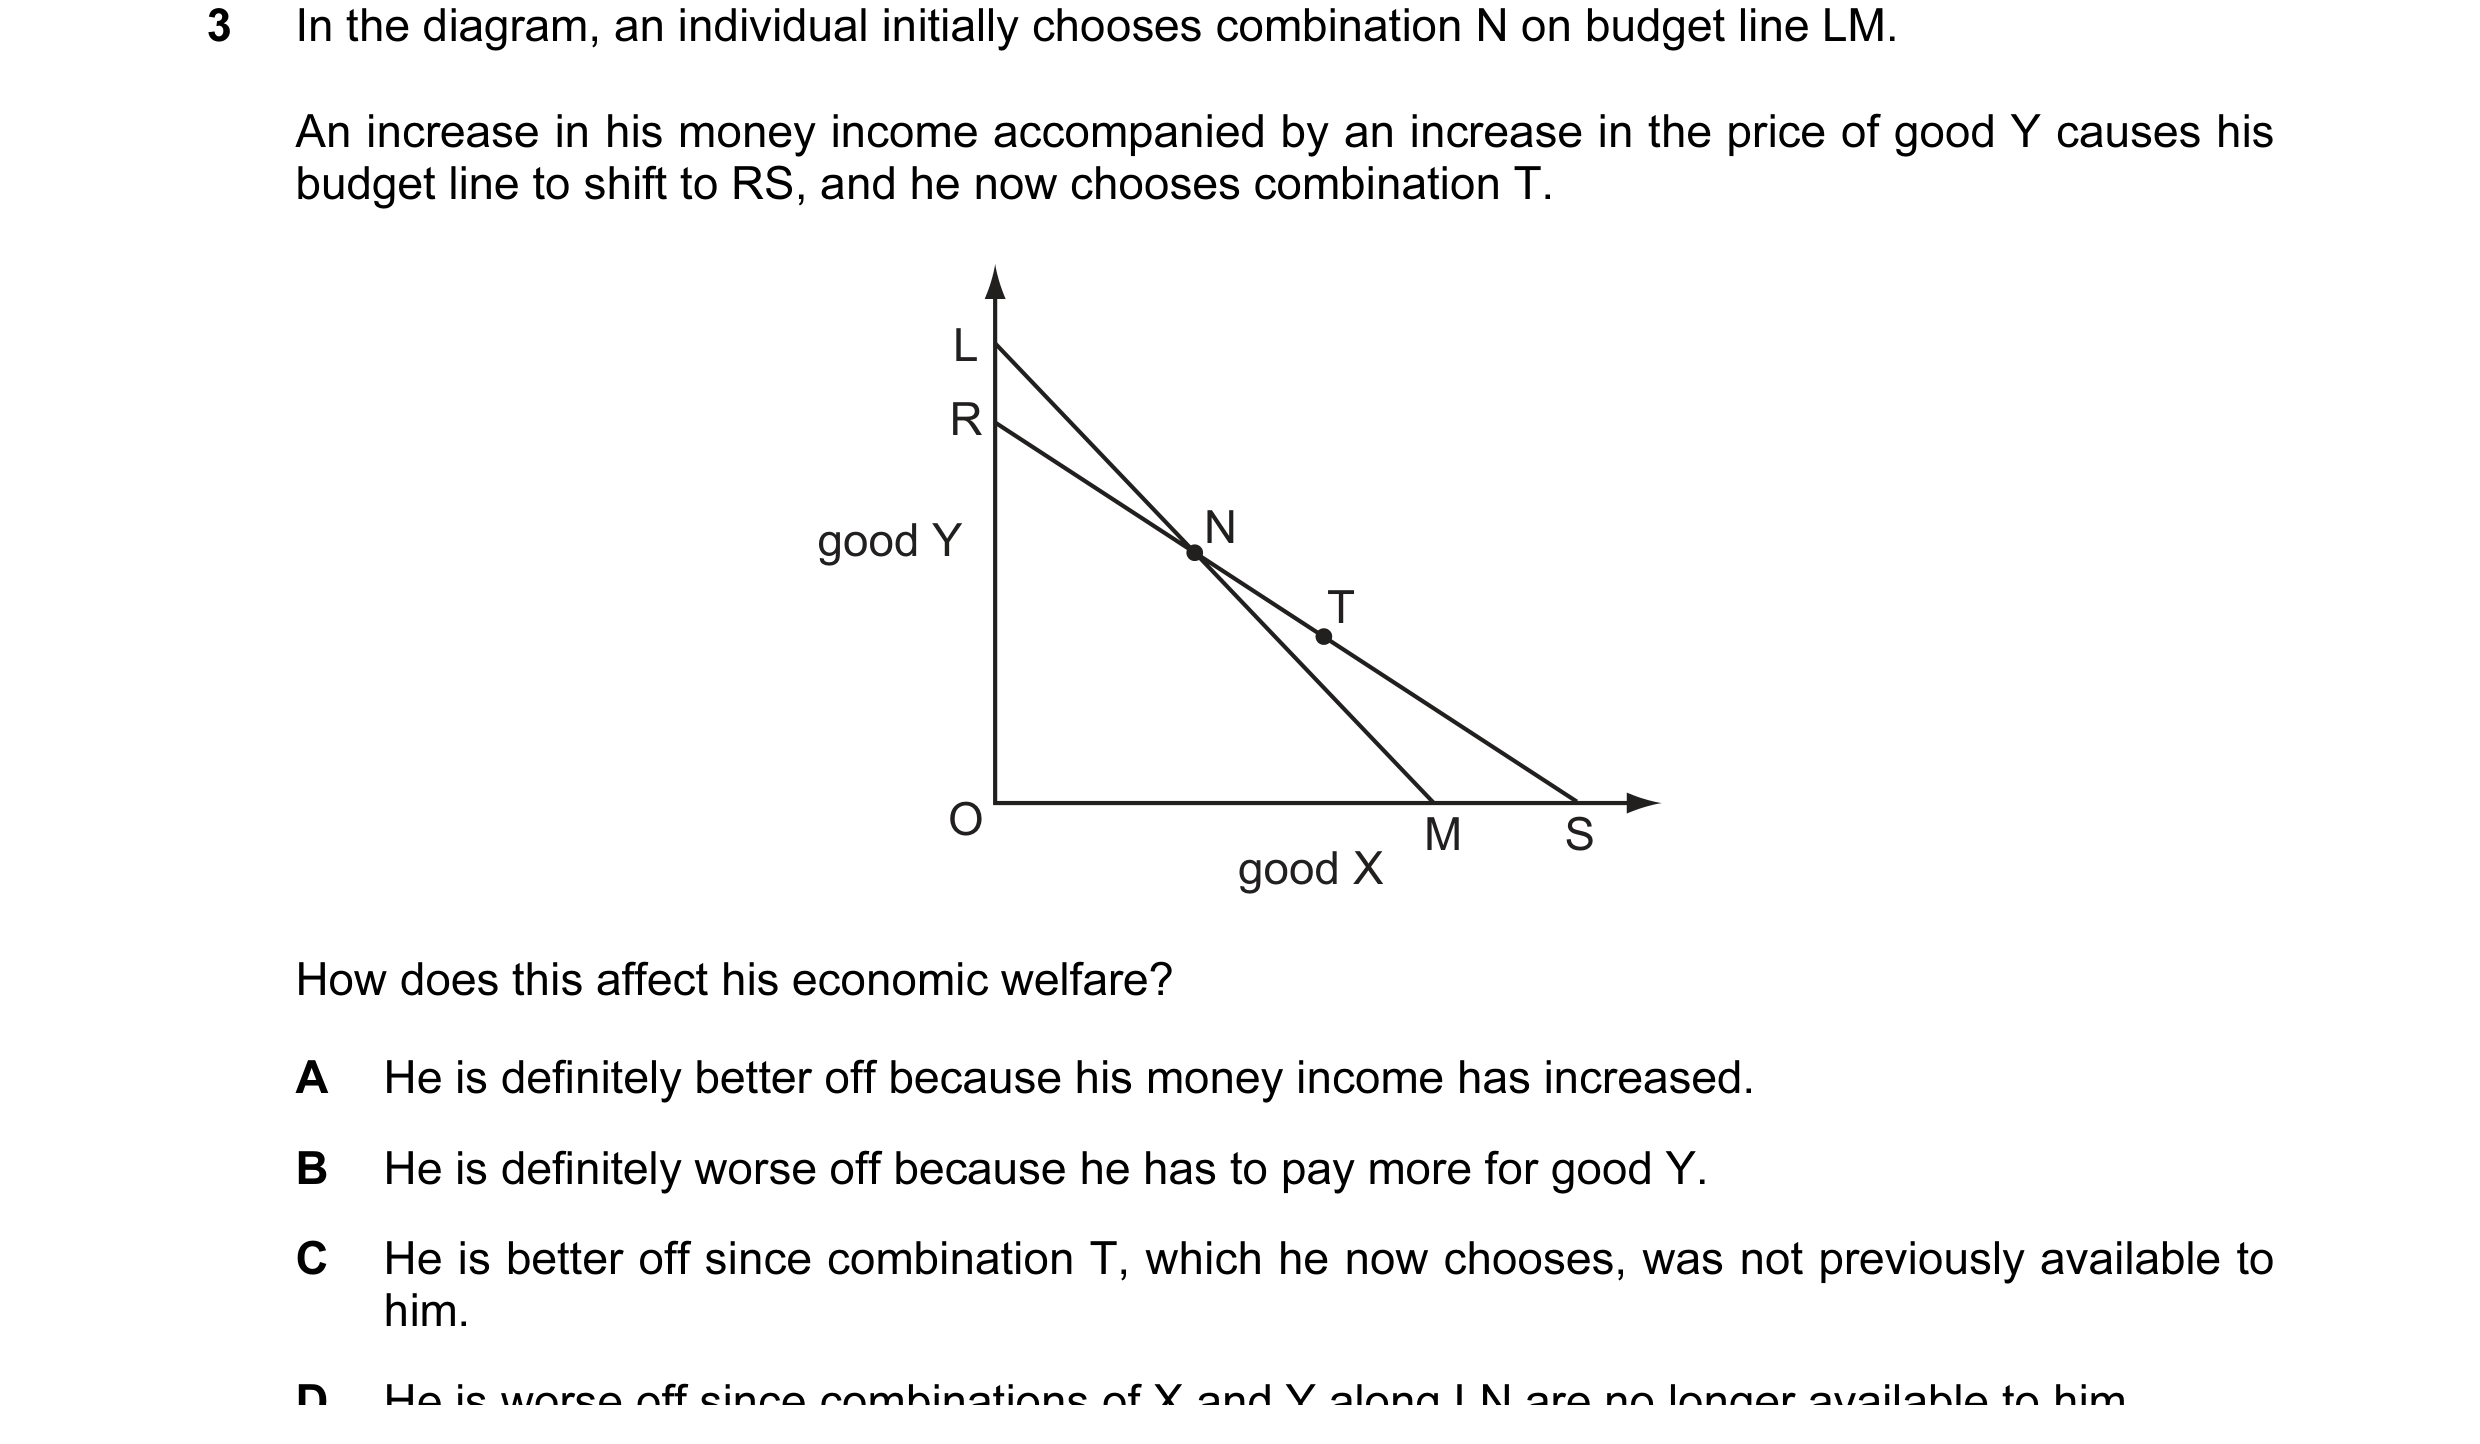
Q1 · In the diagram, an individual initially chooses combination N on budget line LM 9708/31 Oct/Nov 2009
3 In the diagram, an individual initially chooses combination N on budget line LM. An increase in his money income accompanied by an increase in the price of good Y causes his budget line to shift to RS, and he now chooses combination T. L R good Y N T O M S good X How does this affect his economic welfare? A He is definitely better off because his money income has increased. B He is definitely worse off because he has to pay more for good Y. C He is better off since combination T, which he now chooses, was not previously available to him. D He is worse off since combinations of X and Y along LN are no longer available to him.
1 marks
Answer: C
This question in 9708/31 Oct/Nov 2009
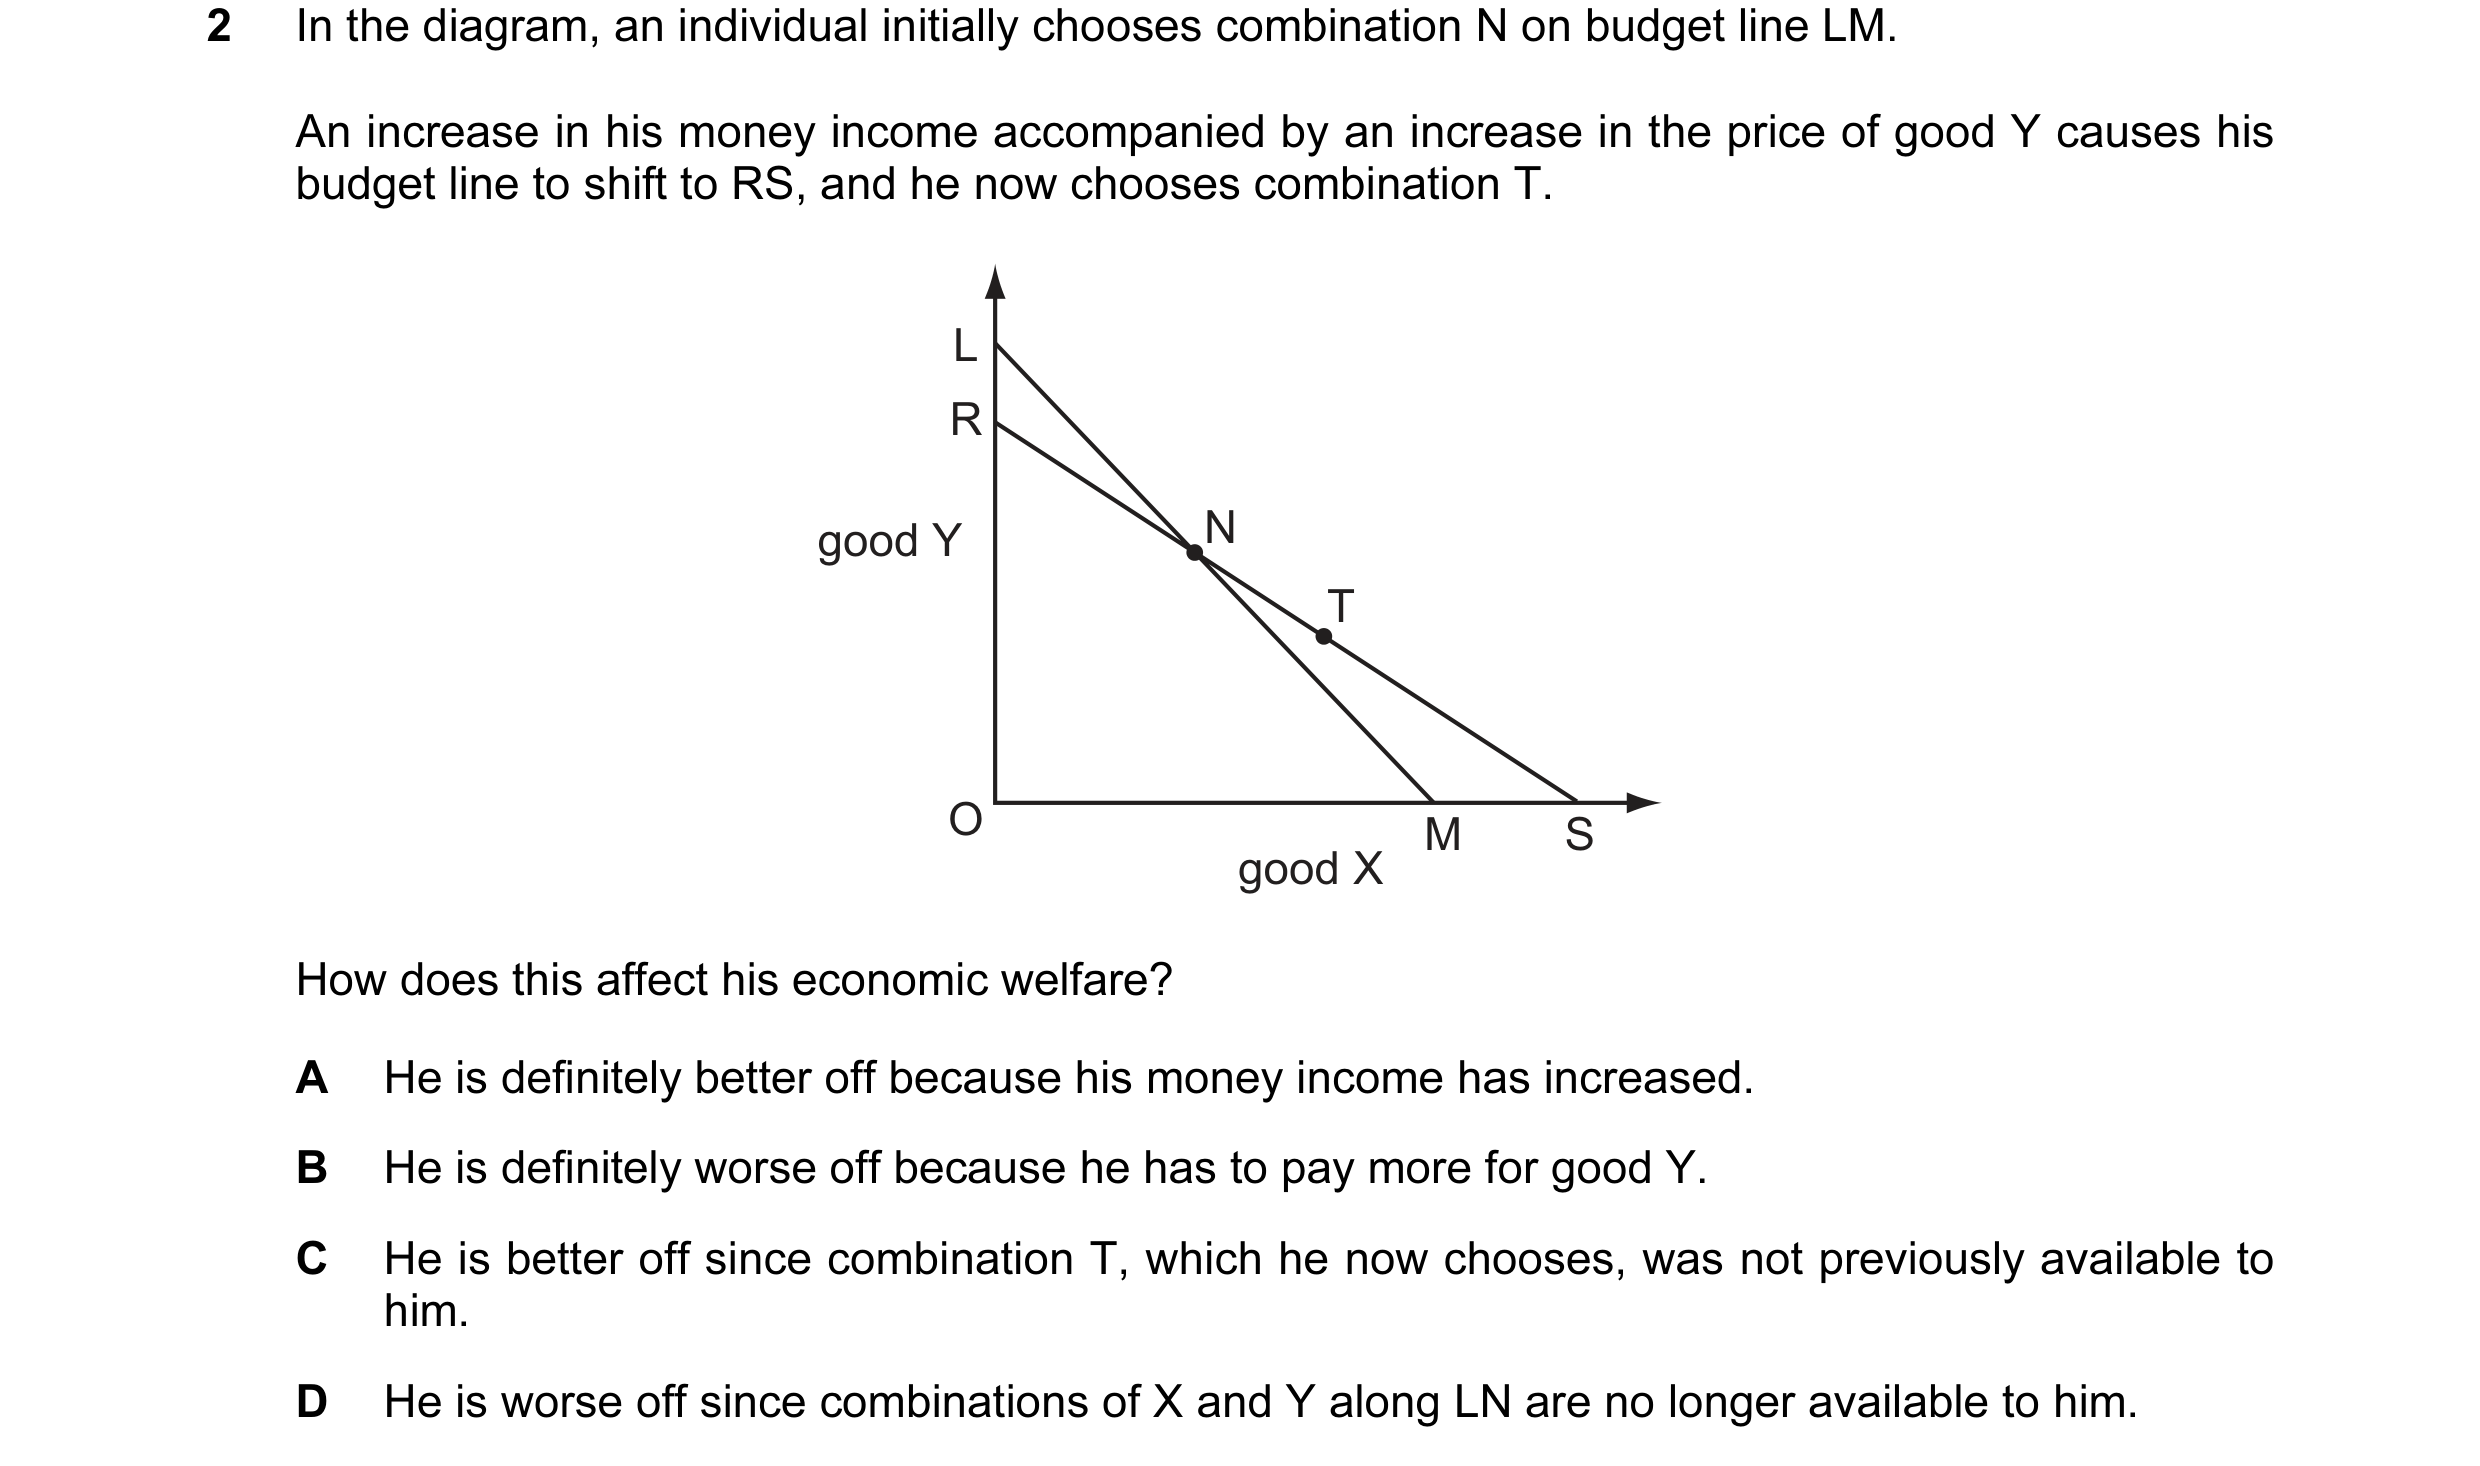
Q2 · In the diagram, an individual initially chooses combination N on budget line LM 9708/32 Oct/Nov 2009
2 In the diagram, an individual initially chooses combination N on budget line LM. An increase in his money income accompanied by an increase in the price of good Y causes his budget line to shift to RS, and he now chooses combination T. L R good Y N T O M S good X How does this affect his economic welfare? A He is definitely better off because his money income has increased. B He is definitely worse off because he has to pay more for good Y. C He is better off since combination T, which he now chooses, was not previously available to him. D He is worse off since combinations of X and Y along LN are no longer available to him.
1 marks
Answer: C
This question in 9708/32 Oct/Nov 2009
Q3 · In the diagram a consumer’s budget line shifts from GH to JK 9708/31 May/June 2010
3 In the diagram a consumer’s budget line shifts from GH to JK. J G good Y O K H good X Which statement must be correct? A The price of good X has increased relative to the price of good Y. B The prices of both goods have fallen. C There has been an increase in the consumer’s real income. D There has been an increase in the consumer’s money income.
1 marks
Answer: A
This question in 9708/31 May/June 2010
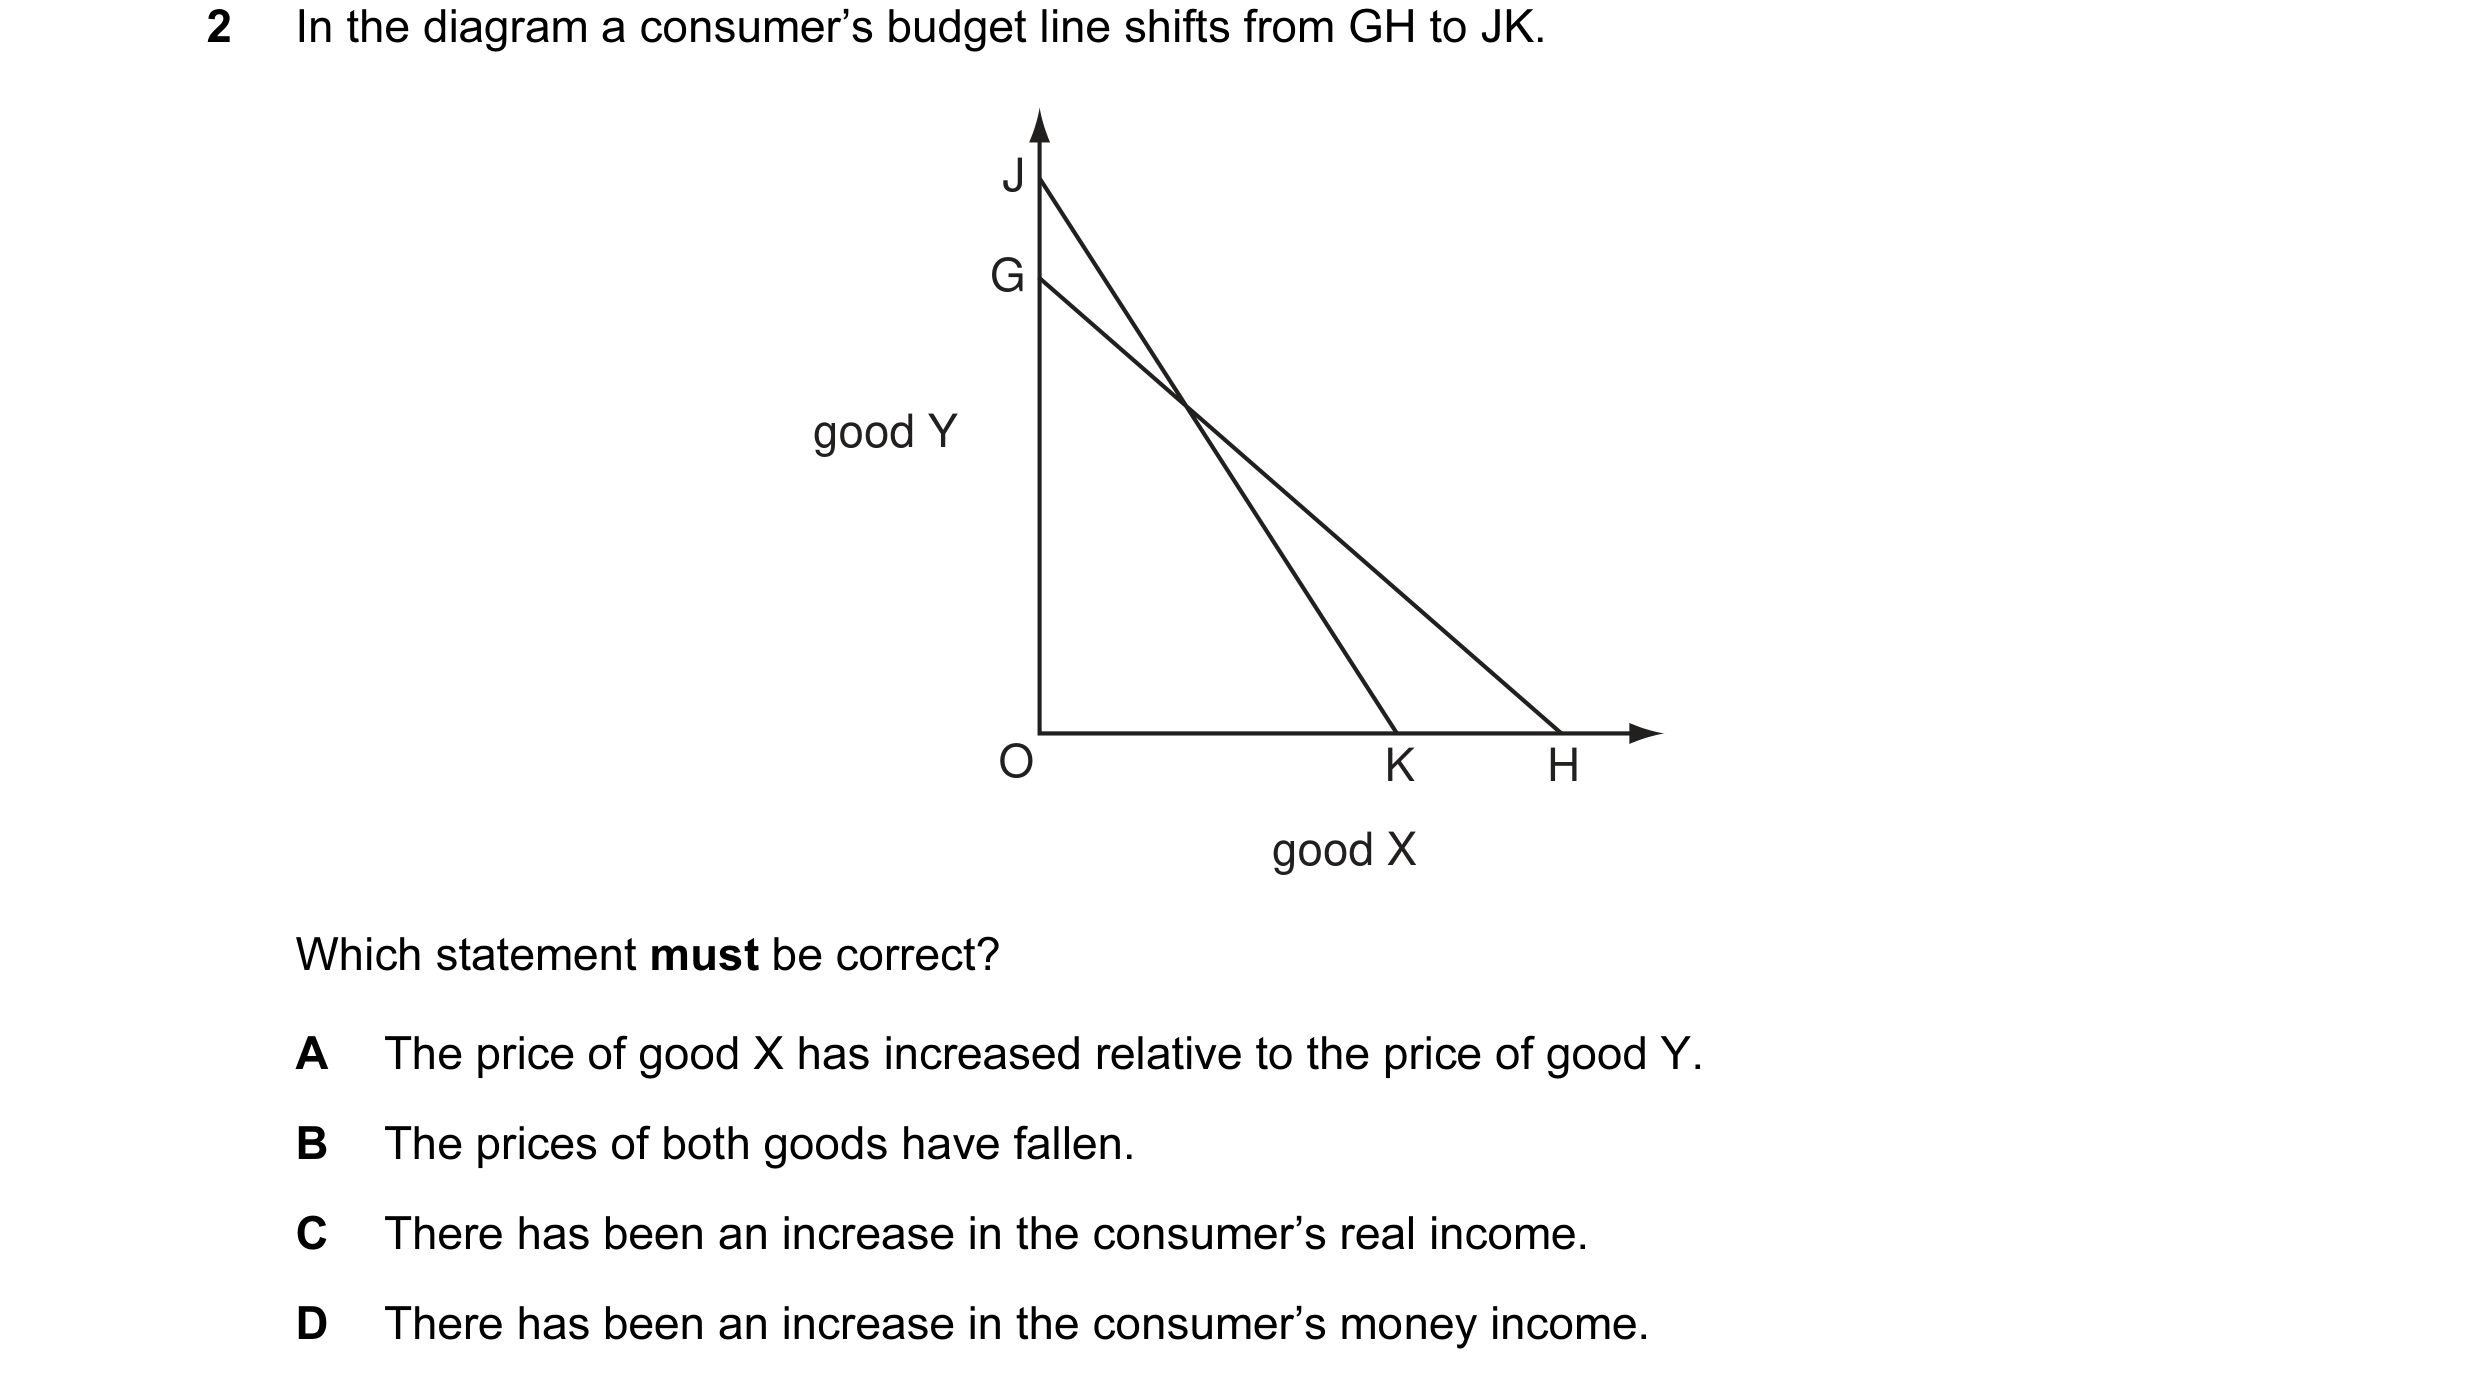
Q4 · In the diagram a consumer’s budget line shifts from GH to JK 9708/32 May/June 2010
2 In the diagram a consumer’s budget line shifts from GH to JK. J G good Y O K H good X Which statement must be correct? A The price of good X has increased relative to the price of good Y. B The prices of both goods have fallen. C There has been an increase in the consumer’s real income. D There has been an increase in the consumer’s money income.
1 marks
Answer: A
This question in 9708/32 May/June 2010
Q5 · In the diagram a consumer’s budget line shifts from GH to JK 9708/33 May/June 2010
2 In the diagram a consumer’s budget line shifts from GH to JK. J G good Y O K H good X Which statement must be correct? A The price of good X has increased relative to the price of good Y. B The prices of both goods have fallen. C There has been an increase in the consumer’s real income. D There has been an increase in the consumer’s money income.
1 marks
Answer: A
This question in 9708/33 May/June 2010
Q6 · The line RS in the diagram shows the different combinations of goods X and Y that a… 9708/31 Oct/Nov 2010
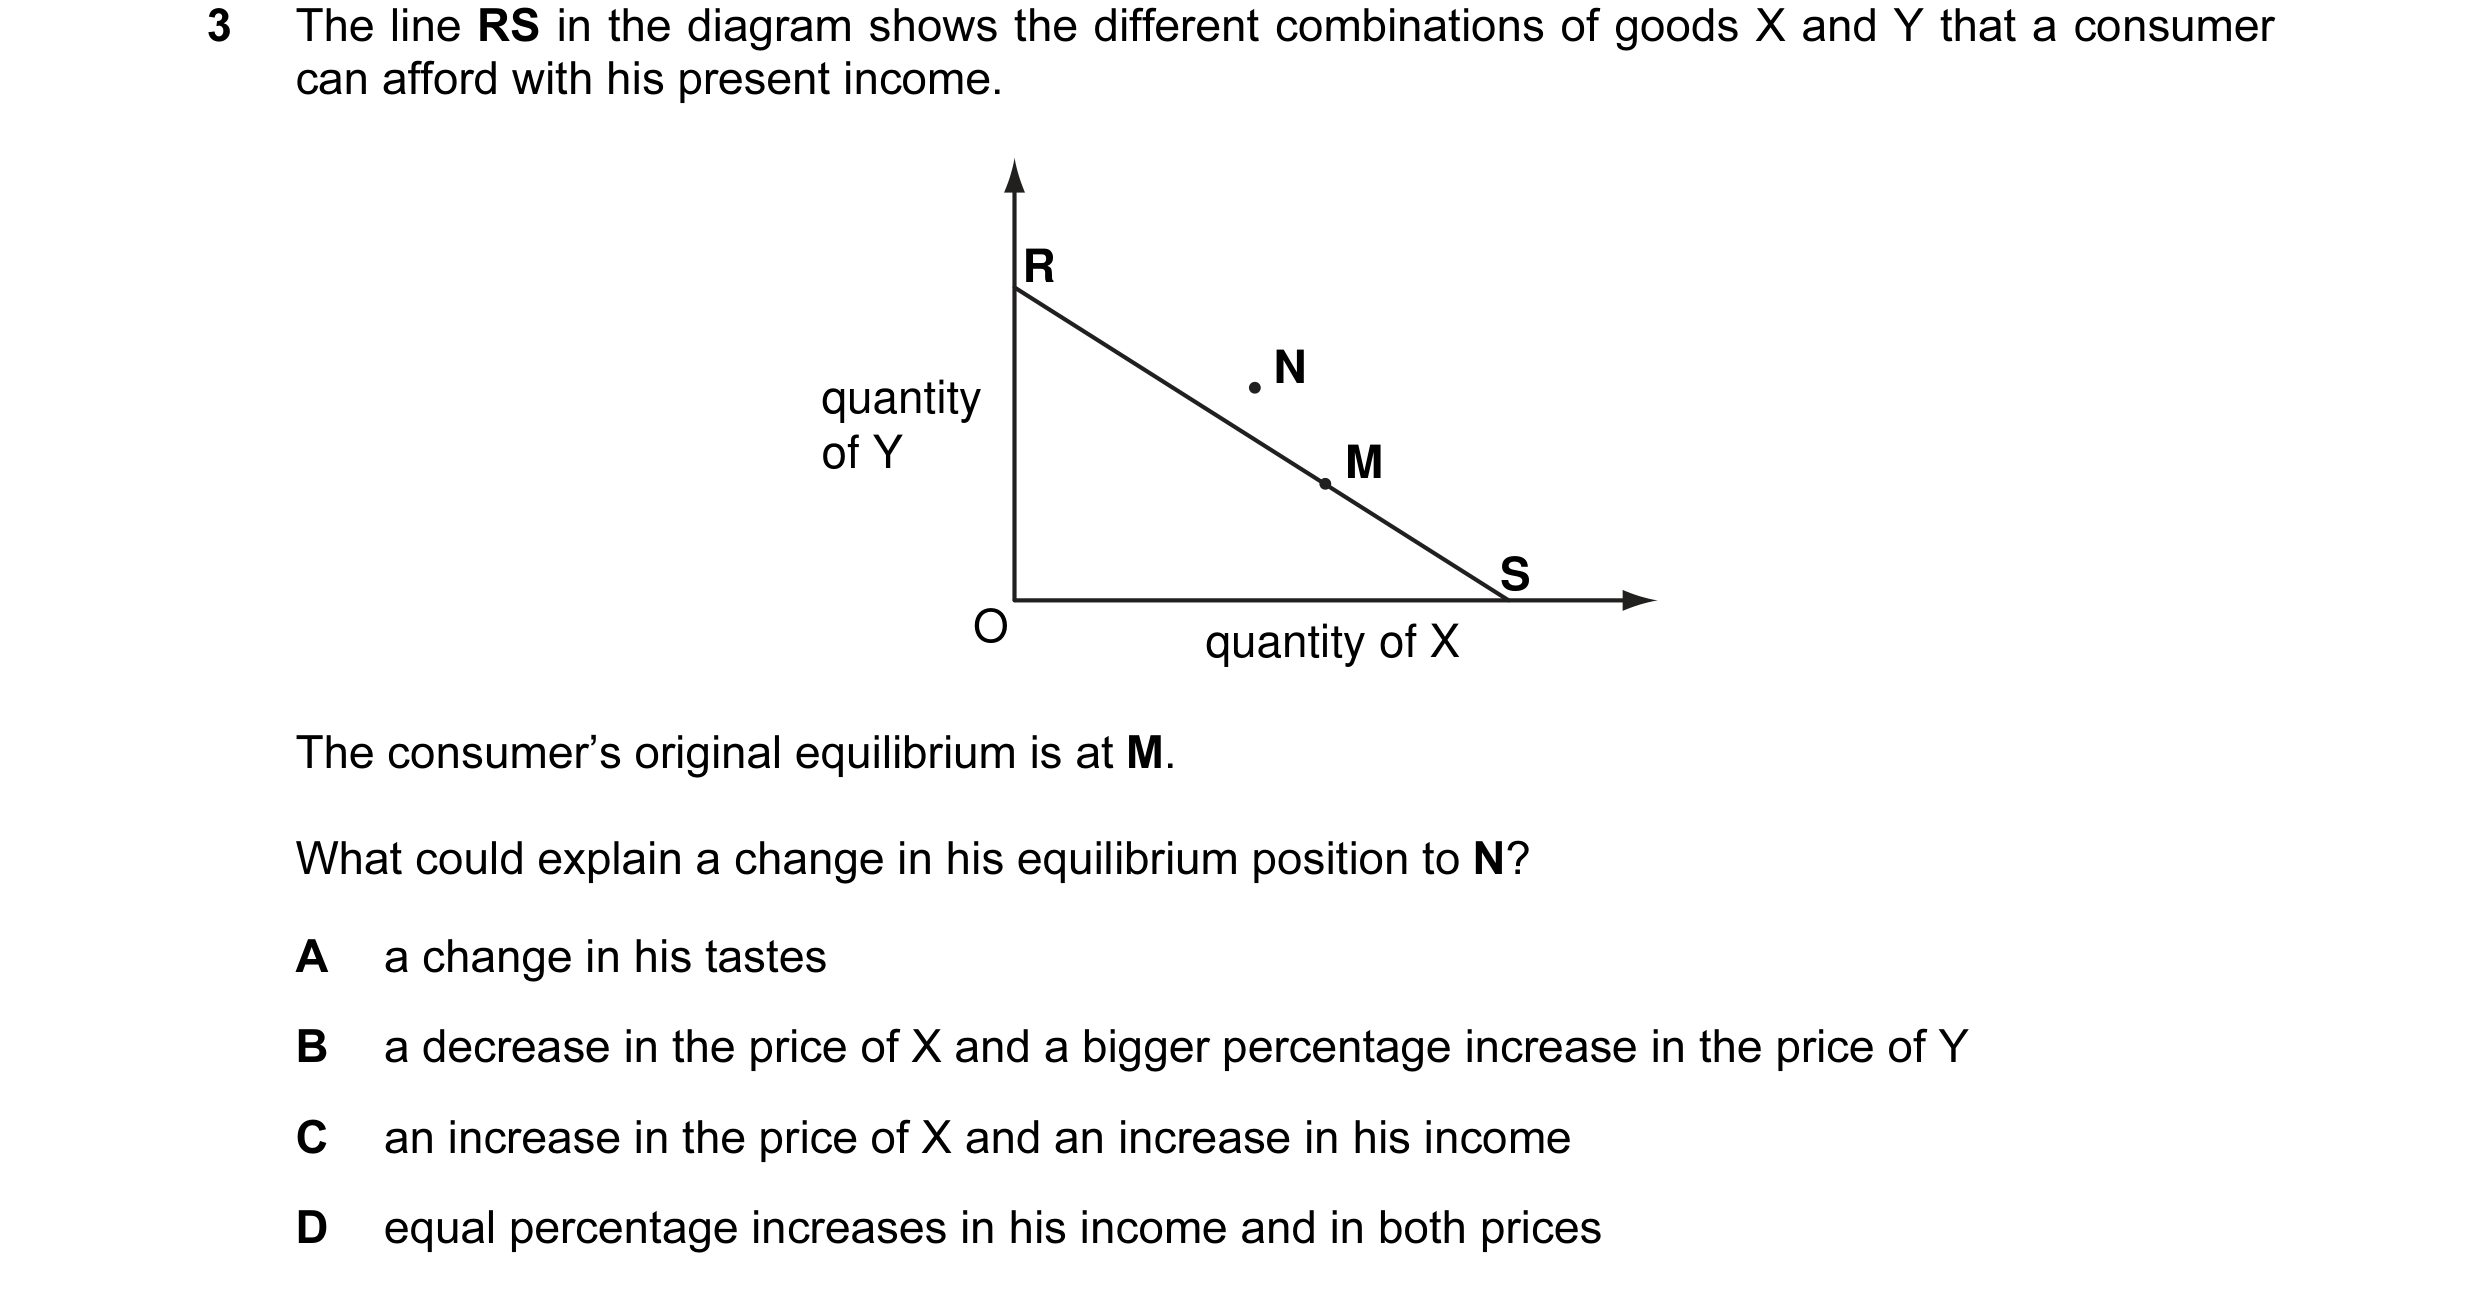
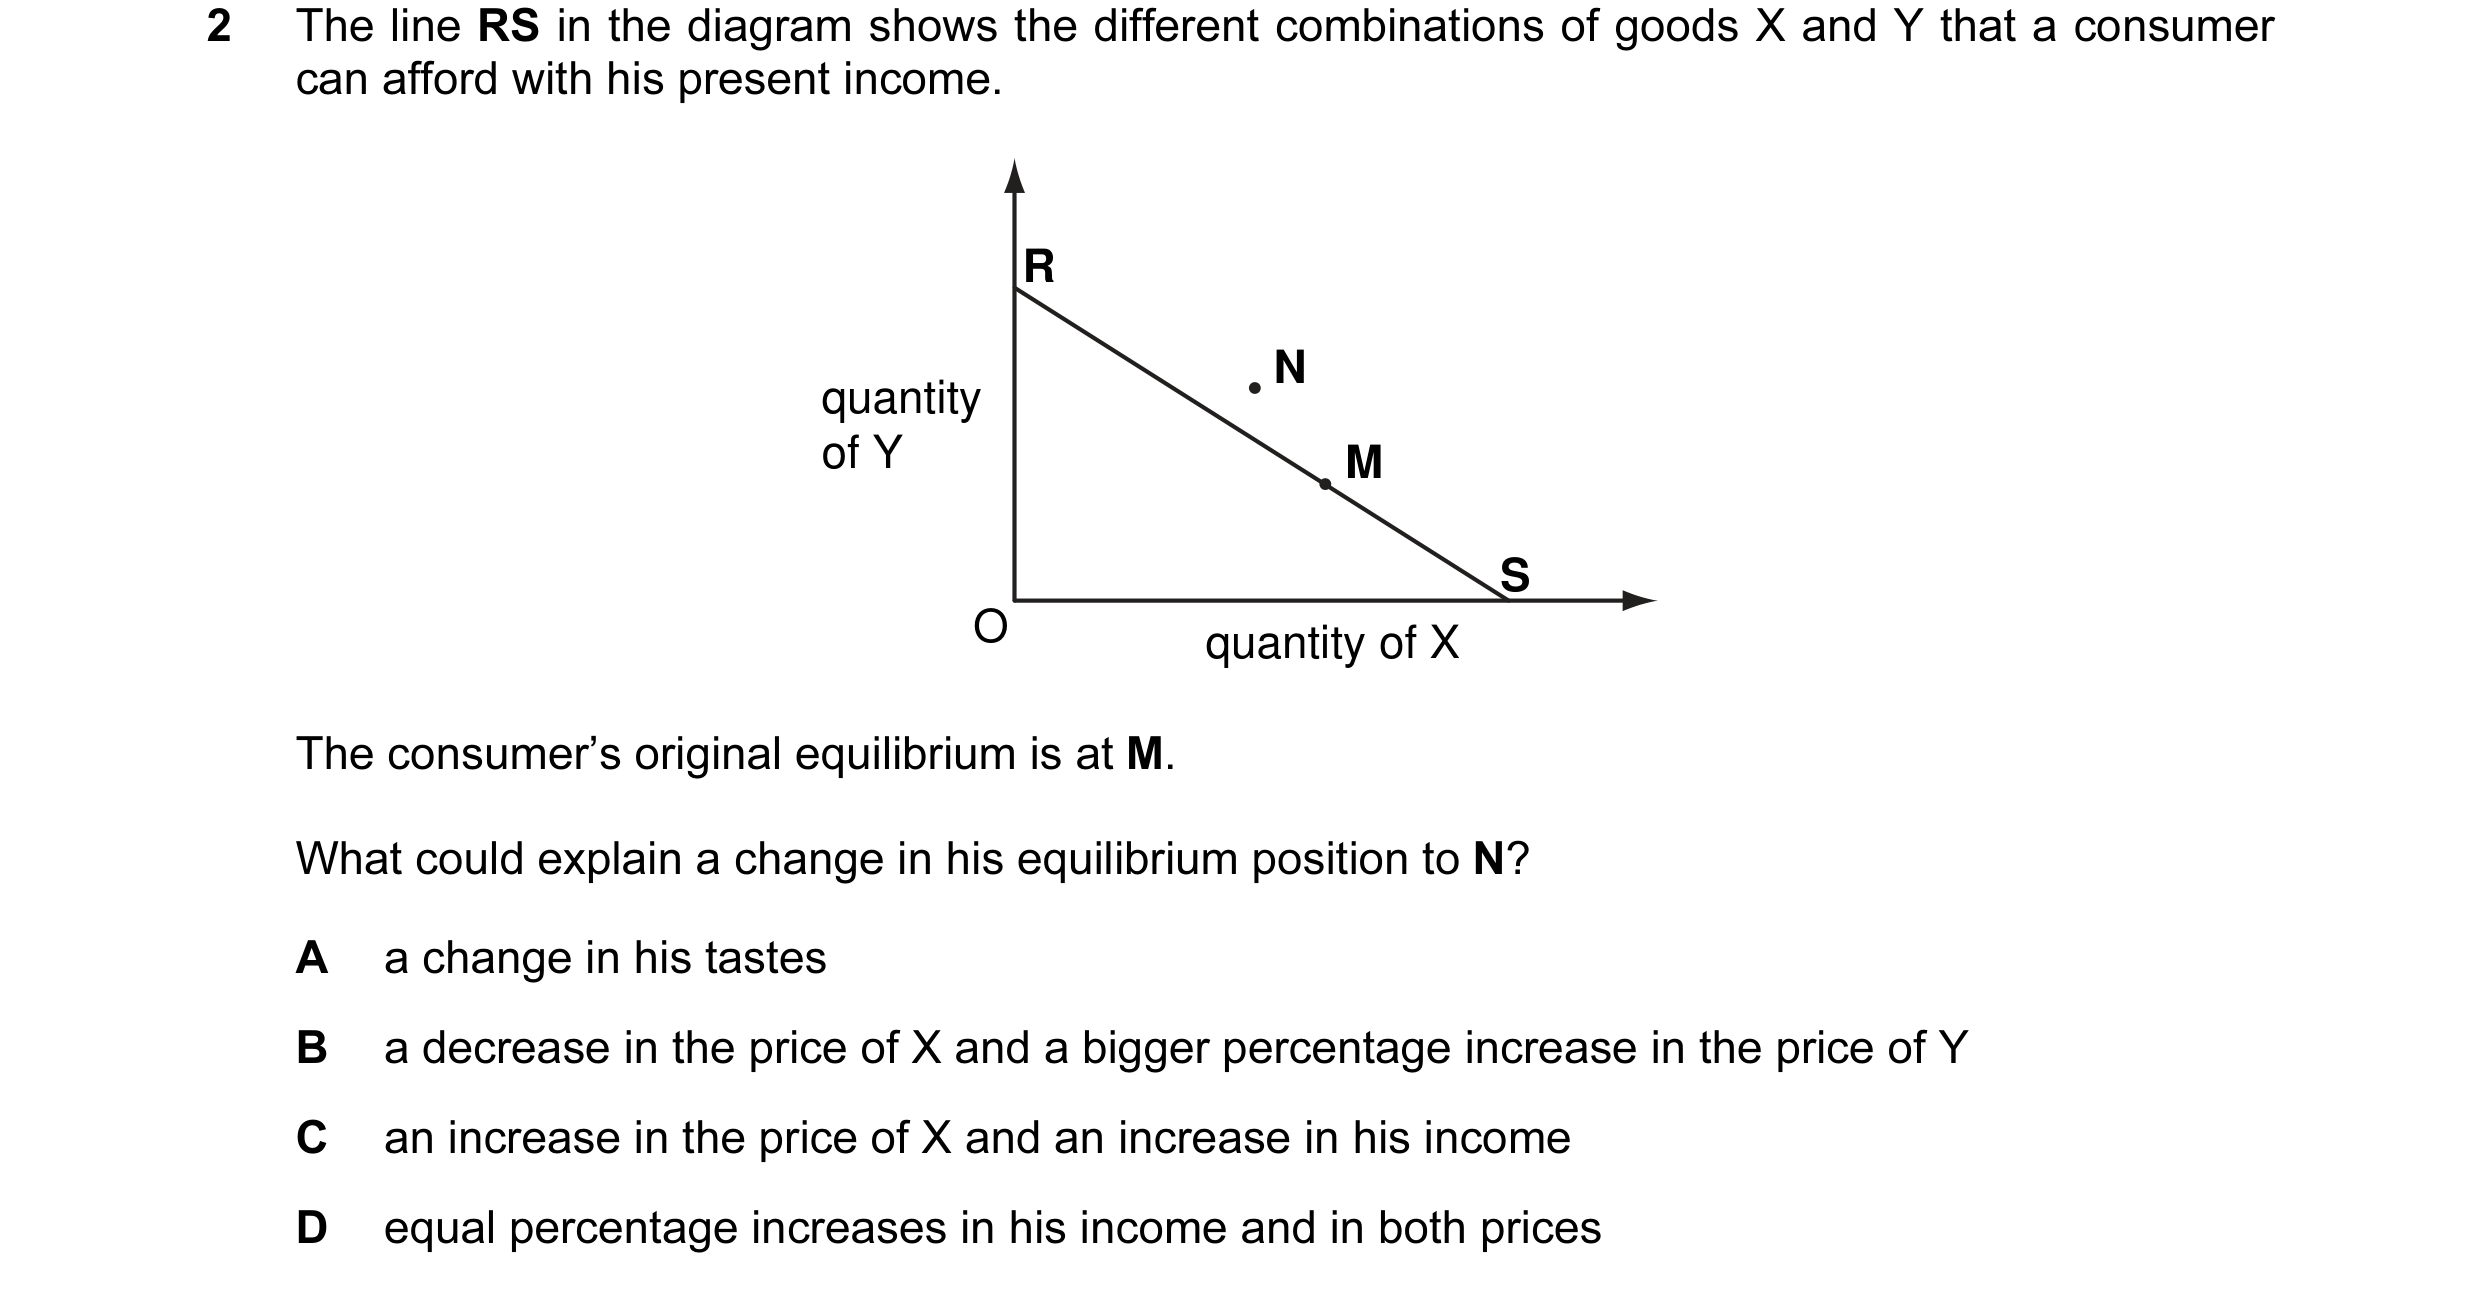
3 The line RS in the diagram shows the different combinations of goods X and Y that a consumer can afford with his present income. R N quantity of Y M S O quantity of X The consumer’s original equilibrium is at M. What could explain a change in his equilibrium position to N? A a change in his tastes B a decrease in the price of X and a bigger percentage increase in the price of Y C an increase in the price of X and an increase in his income D equal percentage increases in his income and in both prices
1 marks
Answer: C
This question in 9708/31 Oct/Nov 2010
Q7 · The line RS in the diagram shows the different combinations of goods X and Y that a… 9708/32 Oct/Nov 2010
3 The line RS in the diagram shows the different combinations of goods X and Y that a consumer can afford with his present income. R N quantity of Y M S O quantity of X The consumer’s original equilibrium is at M. What could explain a change in his equilibrium position to N? A a change in his tastes B a decrease in the price of X and a bigger percentage increase in the price of Y C an increase in the price of X and an increase in his income D equal percentage increases in his income and in both prices
1 marks
Answer: C
This question in 9708/32 Oct/Nov 2010
Q8 · The line RS in the diagram shows the different combinations of goods X and Y that a… 9708/33 Oct/Nov 2010
2 The line RS in the diagram shows the different combinations of goods X and Y that a consumer can afford with his present income. R N quantity of Y M S O quantity of X The consumer’s original equilibrium is at M. What could explain a change in his equilibrium position to N? A a change in his tastes B a decrease in the price of X and a bigger percentage increase in the price of Y C an increase in the price of X and an increase in his income D equal percentage increases in his income and in both prices
1 marks
Answer: C
This question in 9708/33 Oct/Nov 2010
Q9 · In the diagram, a consumer’s initial budget line is JK 9708/31 May/June 2011
3 In the diagram, a consumer’s initial budget line is JK. G J good Y O H K good X Assuming no change in the price of X, what could explain a shift in the consumer’s budget line to GH? consumer’s money price of good Y income A decrease decrease B decrease increase C increase decrease D increase increase
1 marks
Answer: A
This question in 9708/31 May/June 2011
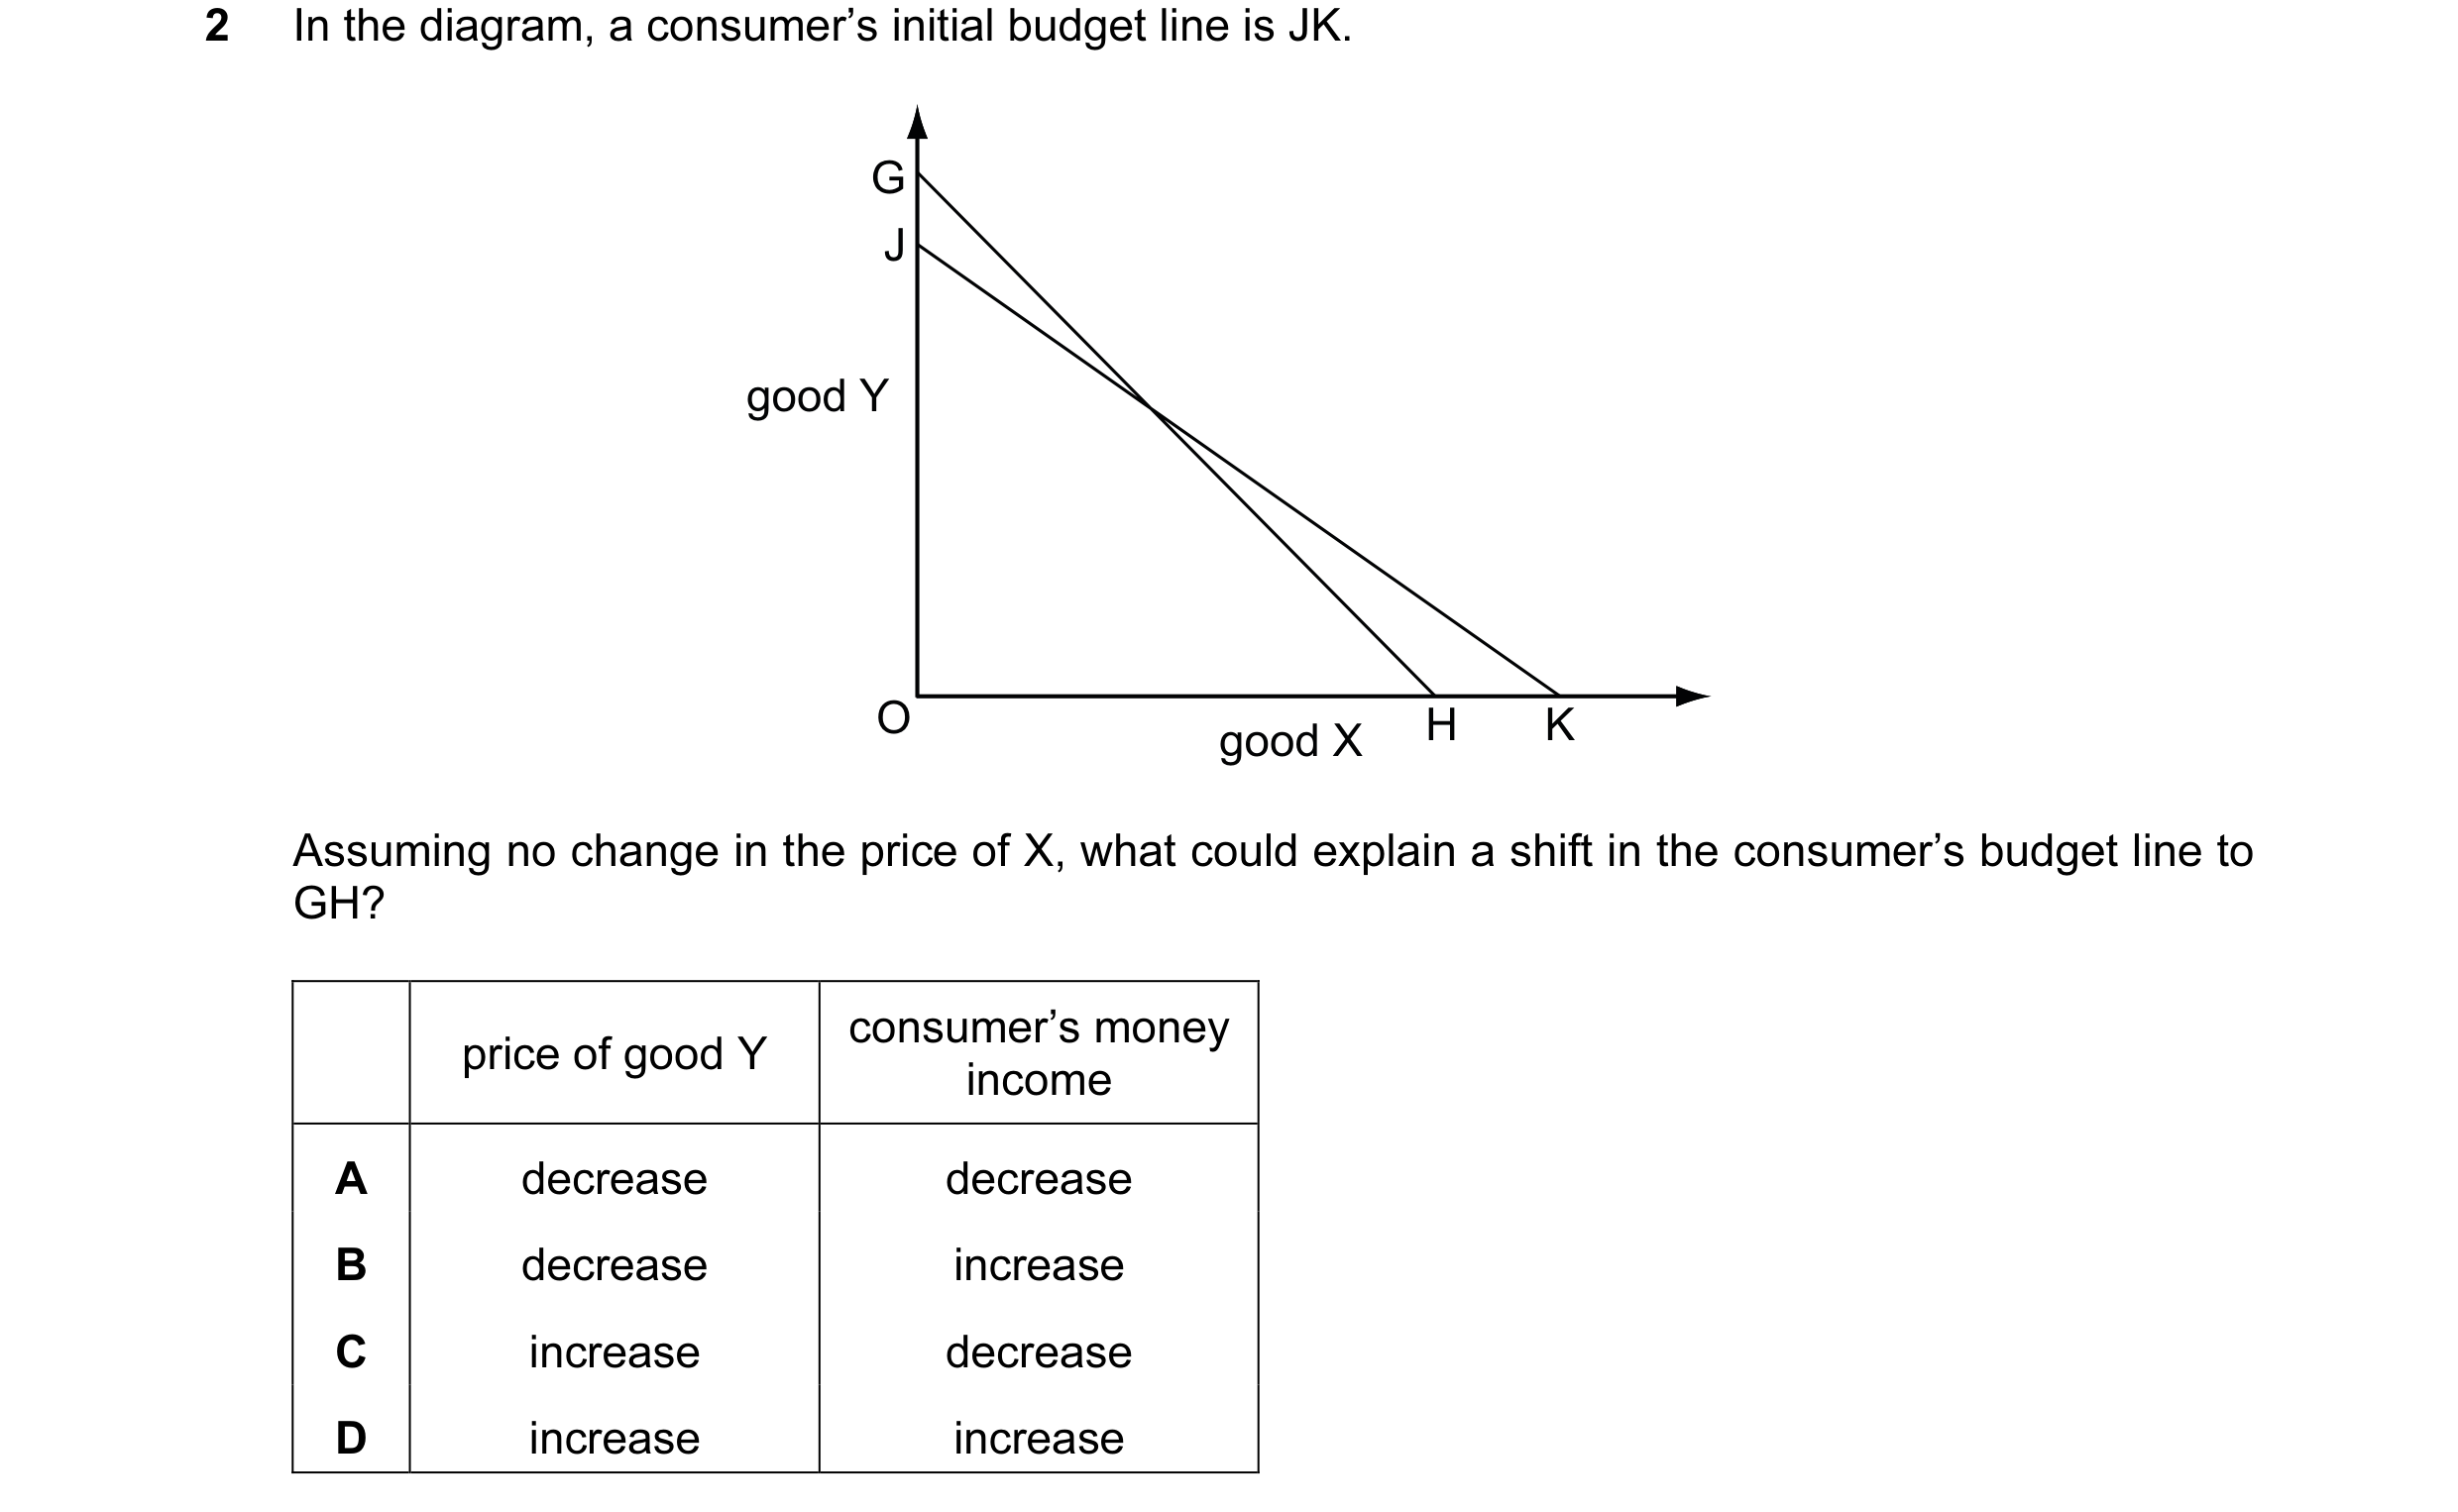
Q10 · In the diagram, a consumer’s initial budget line is JK 9708/32 May/June 2011
2 In the diagram, a consumer’s initial budget line is JK. G J good Y O H K good X Assuming no change in the price of X, what could explain a shift in the consumer’s budget line to GH? consumer’s money price of good Y income A decrease decrease B decrease increase C increase decrease D increase increase
1 marks
Answer: A
This question in 9708/32 May/June 2011
Q11 · In the diagram, a consumer’s initial budget line is JK 9708/33 May/June 2011
2 In the diagram, a consumer’s initial budget line is JK. G J good Y O H K good X Assuming no change in the price of X, what could explain a shift in the consumer’s budget line to GH? consumer’s money price of good Y income A decrease decrease B decrease increase C increase decrease D increase increase
1 marks
Answer: A
This question in 9708/33 May/June 2011
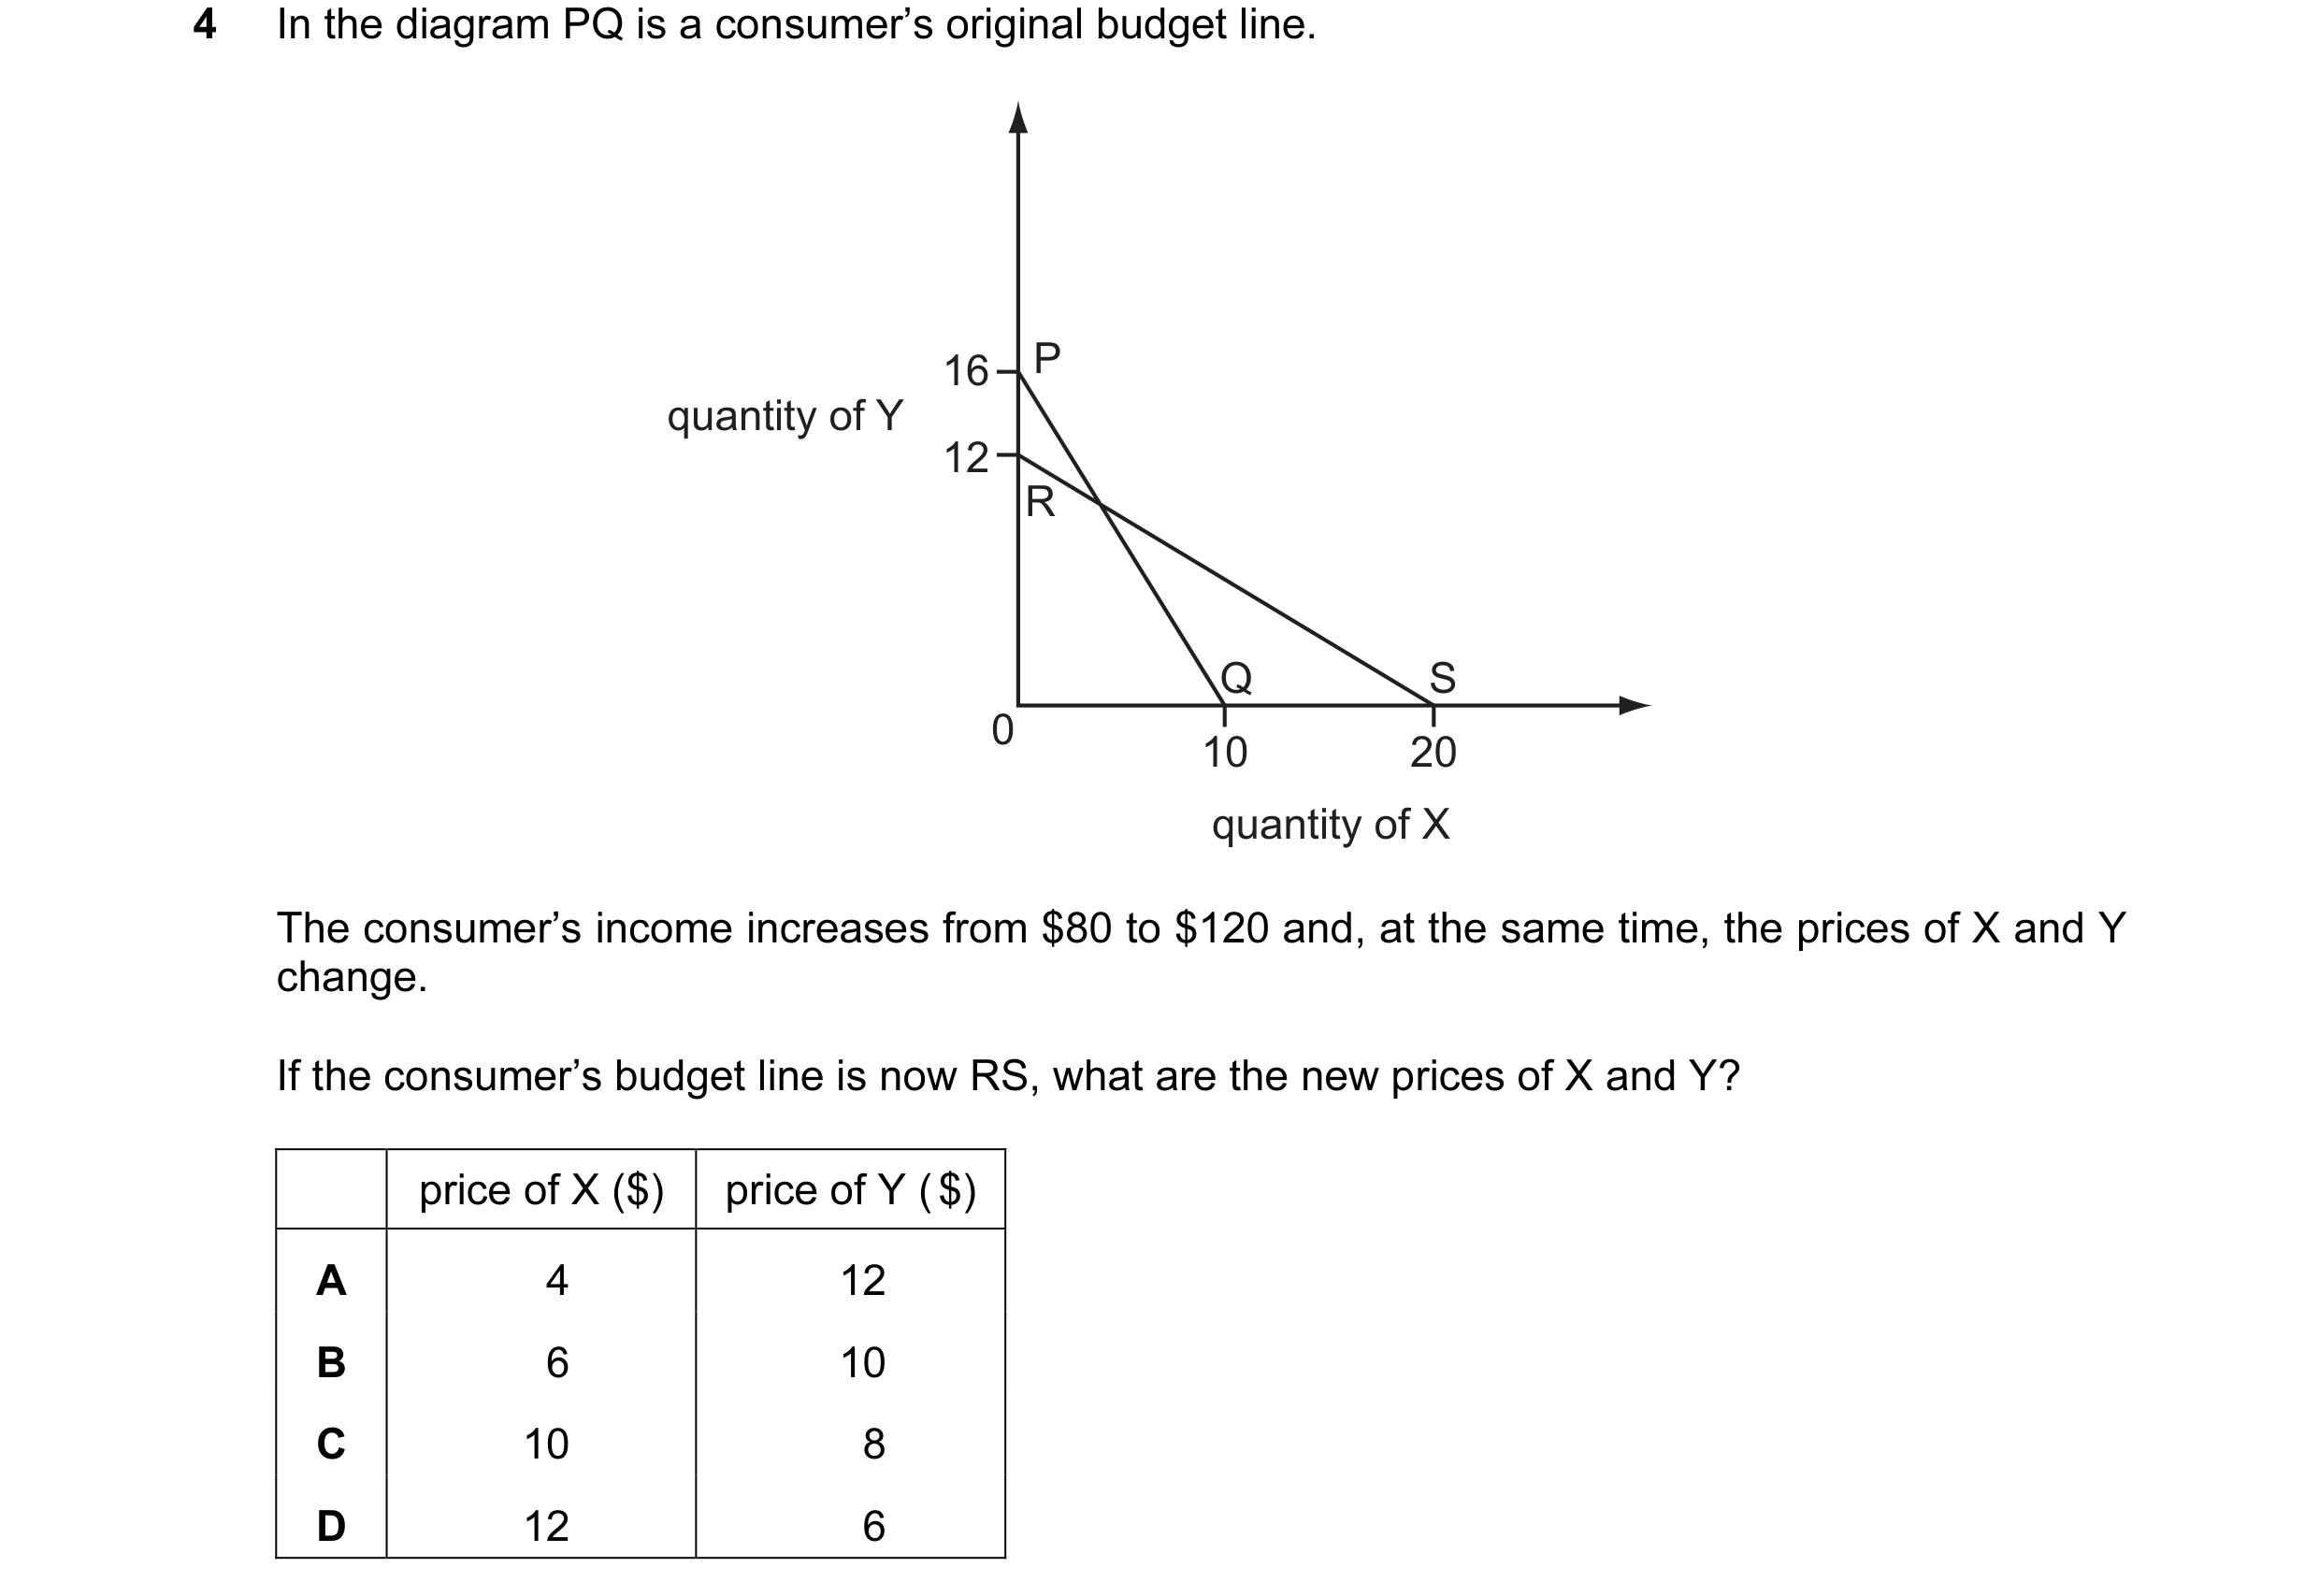
Q12 · In the diagram PQ is a consumer’s original budget line 9708/31 Oct/Nov 2011
4 In the diagram PQ is a consumer’s original budget line. 16 P quantity of Y 12 R Q S 0 10 20 quantity of X The consumer’s income increases from $80 to $120 and, at the same time, the prices of X and Y change. If the consumer’s budget line is now RS, what are the new prices of X and Y? price of X ($) price of Y ( $) A 4 12 B 6 10 C 10 8 D 12 6
1 marks
Answer: B
This question in 9708/31 Oct/Nov 2011
Q13 · In the diagram PQ is a consumer’s original budget line 9708/33 Oct/Nov 2011
3 In the diagram PQ is a consumer’s original budget line. 16 P quantity of Y 12 R Q S 0 10 20 quantity of X The consumer’s income increases from $80 to $120 and, at the same time, the prices of X and Y change. If the consumer’s budget line is now RS, what are the new prices of X and Y? price of X ($) price of Y ( $) A 4 12 B 6 10 C 10 8 D 12 6
1 marks
Answer: B
This question in 9708/33 Oct/Nov 2011
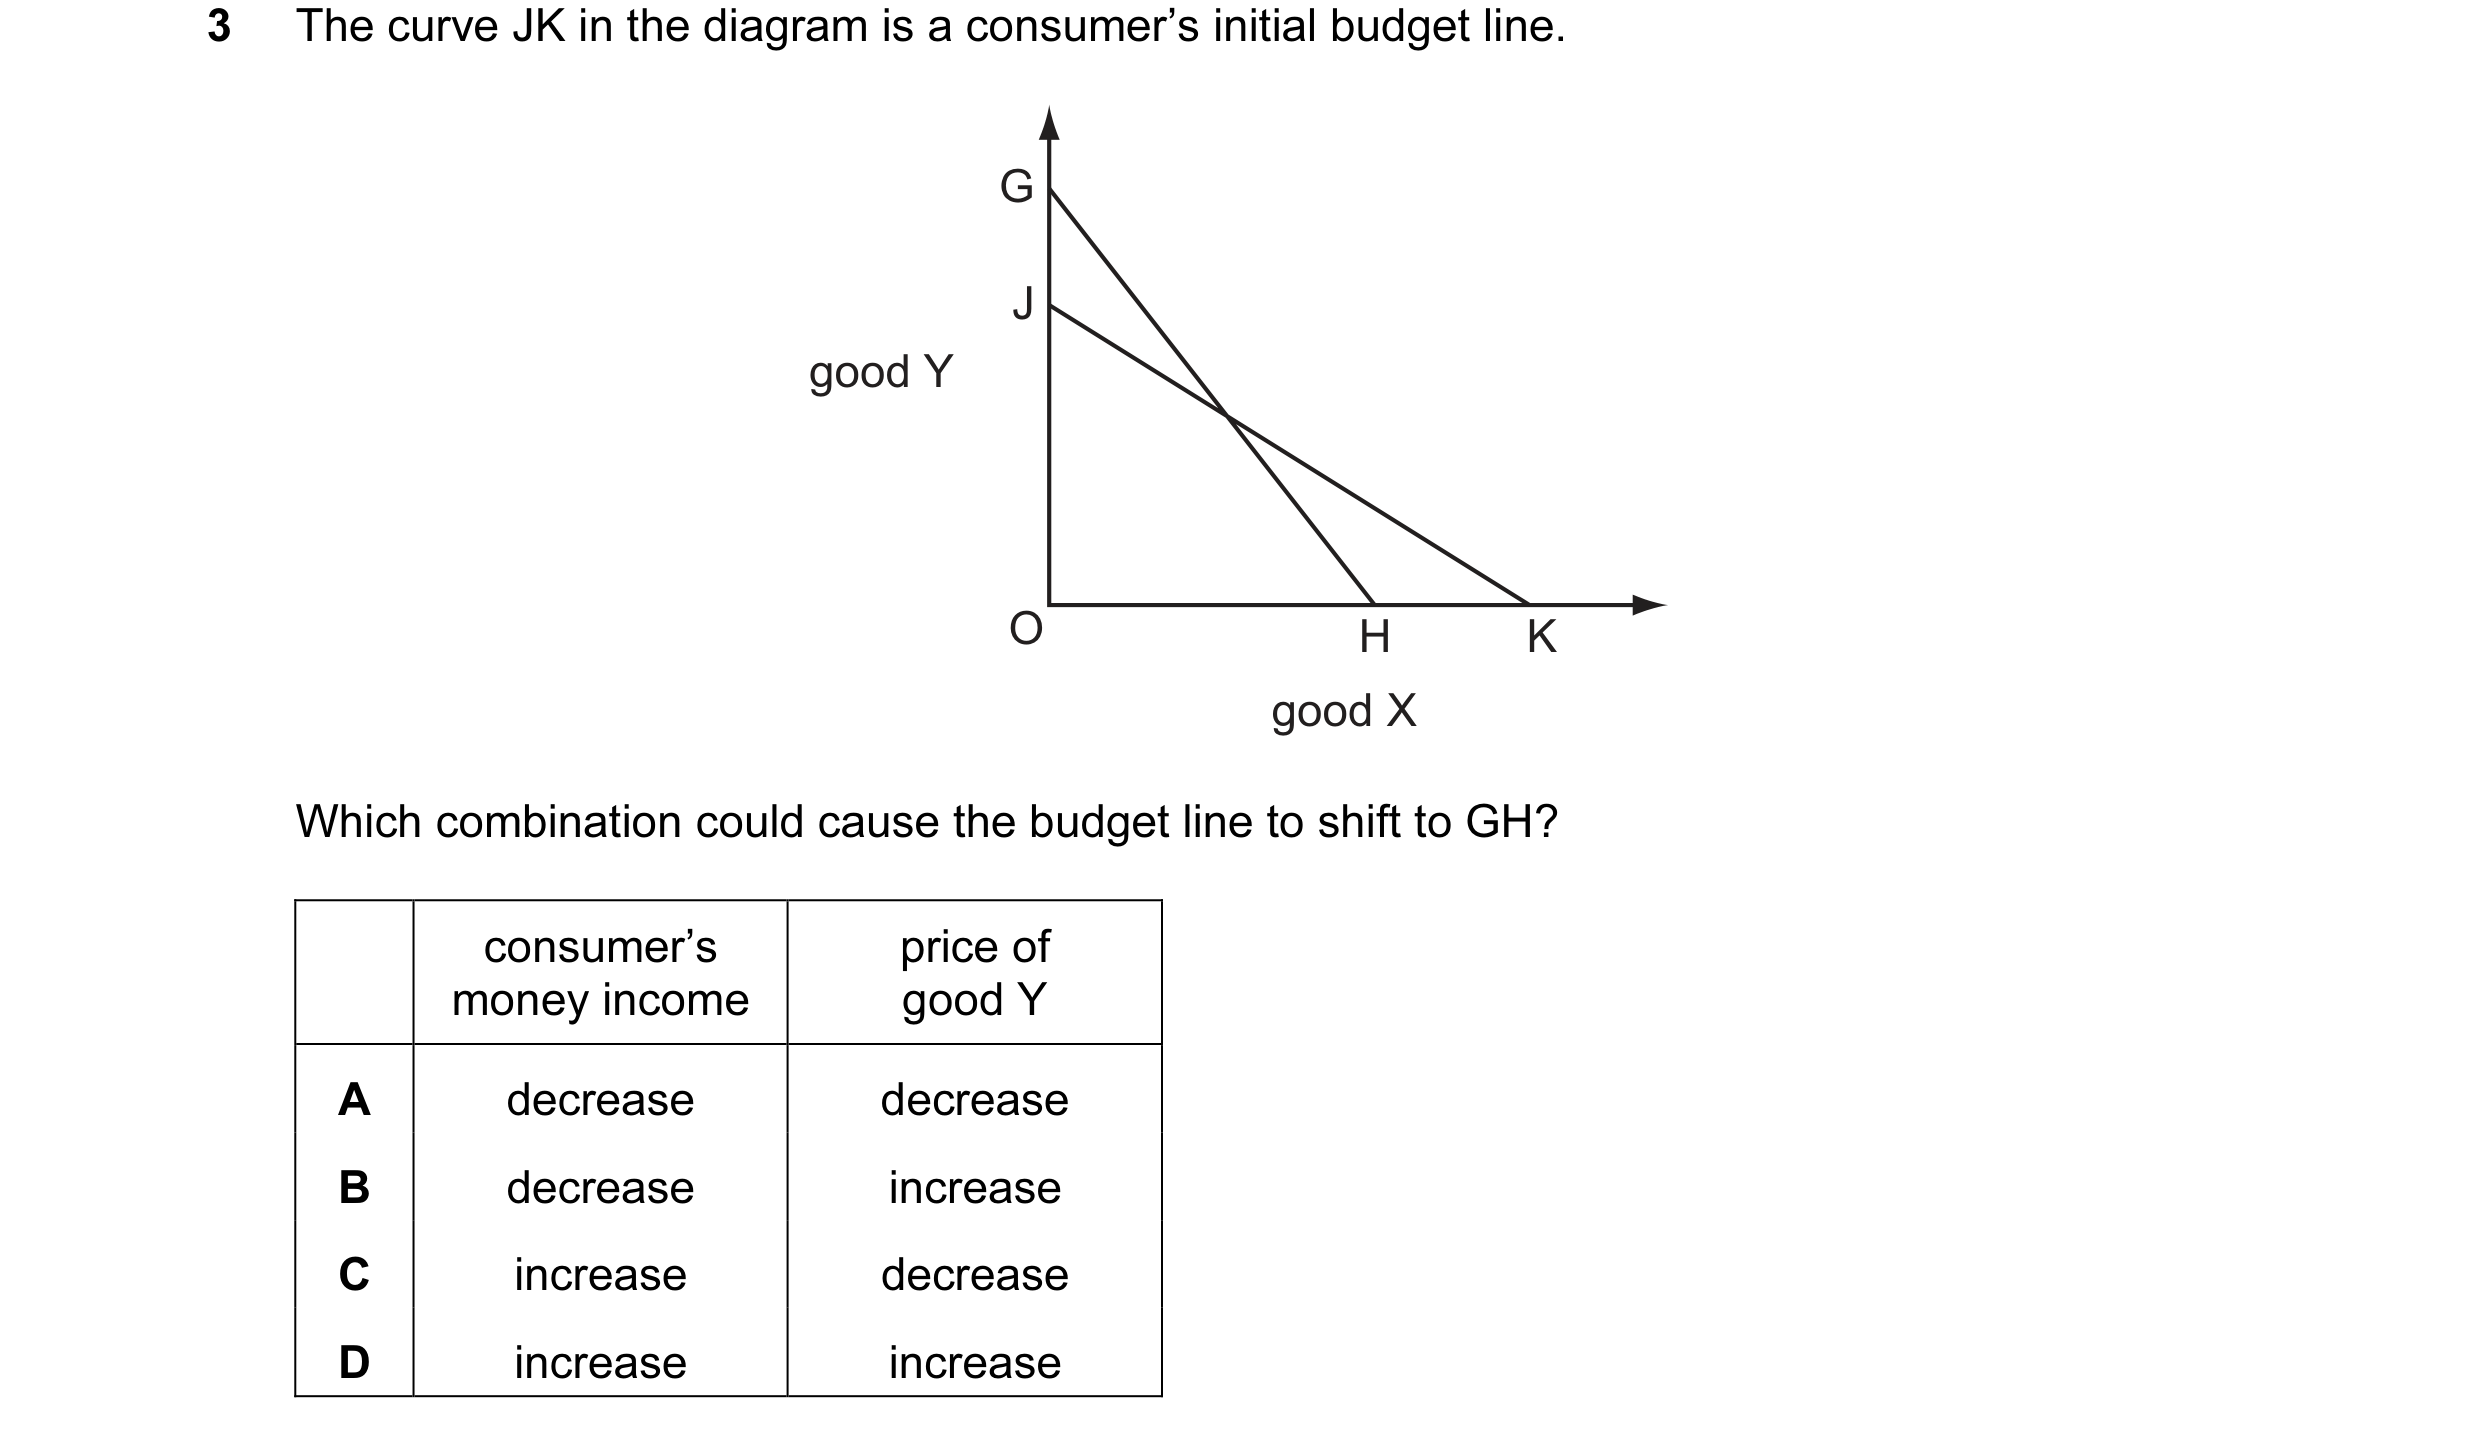
Q14 · The curve JK in the diagram is a consumer’s initial budget line 9708/31 May/June 2012
3 The curve JK in the diagram is a consumer’s initial budget line. G J good Y O H K good X Which combination could cause the budget line to shift to GH? consumer’s price of money income good Y A decrease decrease B decrease increase C increase decrease D increase increase
1 marks
Answer: A
This question in 9708/31 May/June 2012
Q15 · The curve GH in the diagram is a consumer’s initial budget line 9708/32 May/June 2012
3 The curve GH in the diagram is a consumer’s initial budget line. G J good Y O H K good X Which combination could cause the budget line to shift to JK? price of consumers’ good X money income A decrease decrease B decrease increase C increase decrease D increase increase
1 marks
Answer: A
This question in 9708/32 May/June 2012
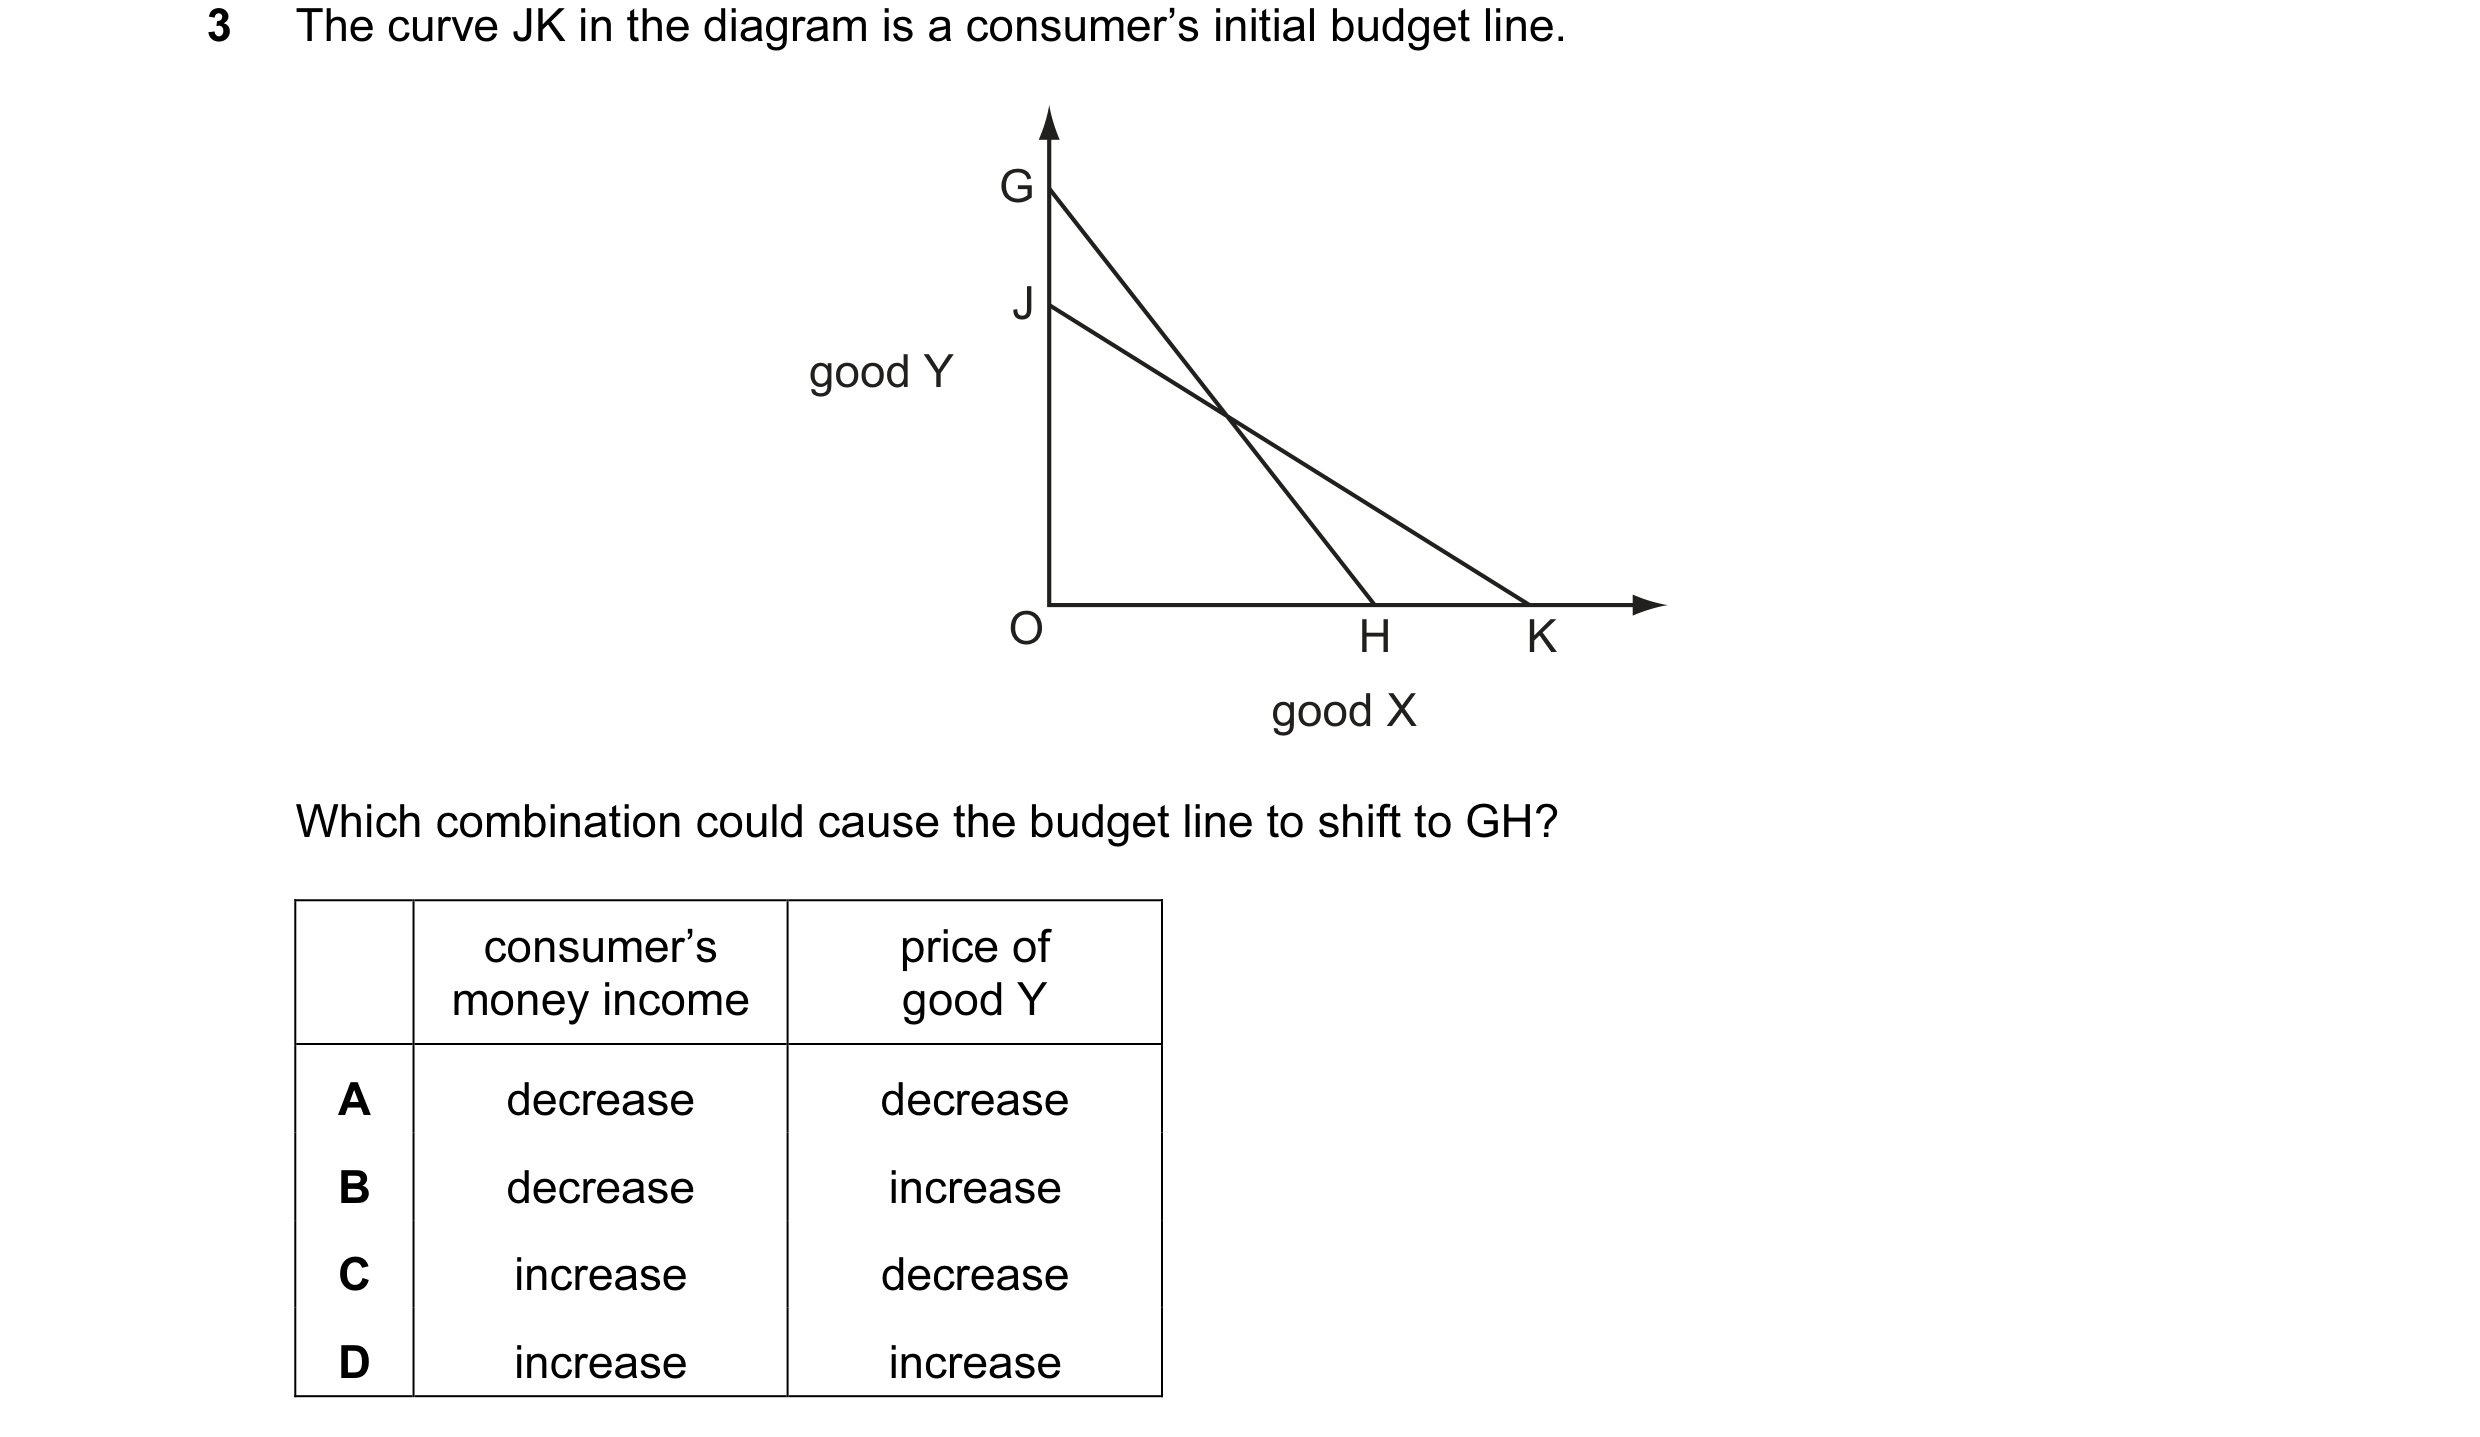
Q16 · The curve JK in the diagram is a consumer’s initial budget line 9708/33 May/June 2012
3 The curve JK in the diagram is a consumer’s initial budget line. G J good Y O H K good X Which combination could cause the budget line to shift to GH? consumer’s price of money income good Y A decrease decrease B decrease increase C increase decrease D increase increase
1 marks
Answer: A
This question in 9708/33 May/June 2012
Q17 · In the diagram a consumer's budget line shifts from JK to JH 9708/32 Oct/Nov 2012
3 In the diagram a consumer's budget line shifts from JK to JH. J good Y O K H good X What can definitely be concluded from the diagram? A There has been a decrease in the price of good Y. B There has been a decrease in the consumer's money income. C There has been an increase in the consumer’s real income. D There has been no change in the price of good X.
1 marks
Answer: C
This question in 9708/32 Oct/Nov 2012
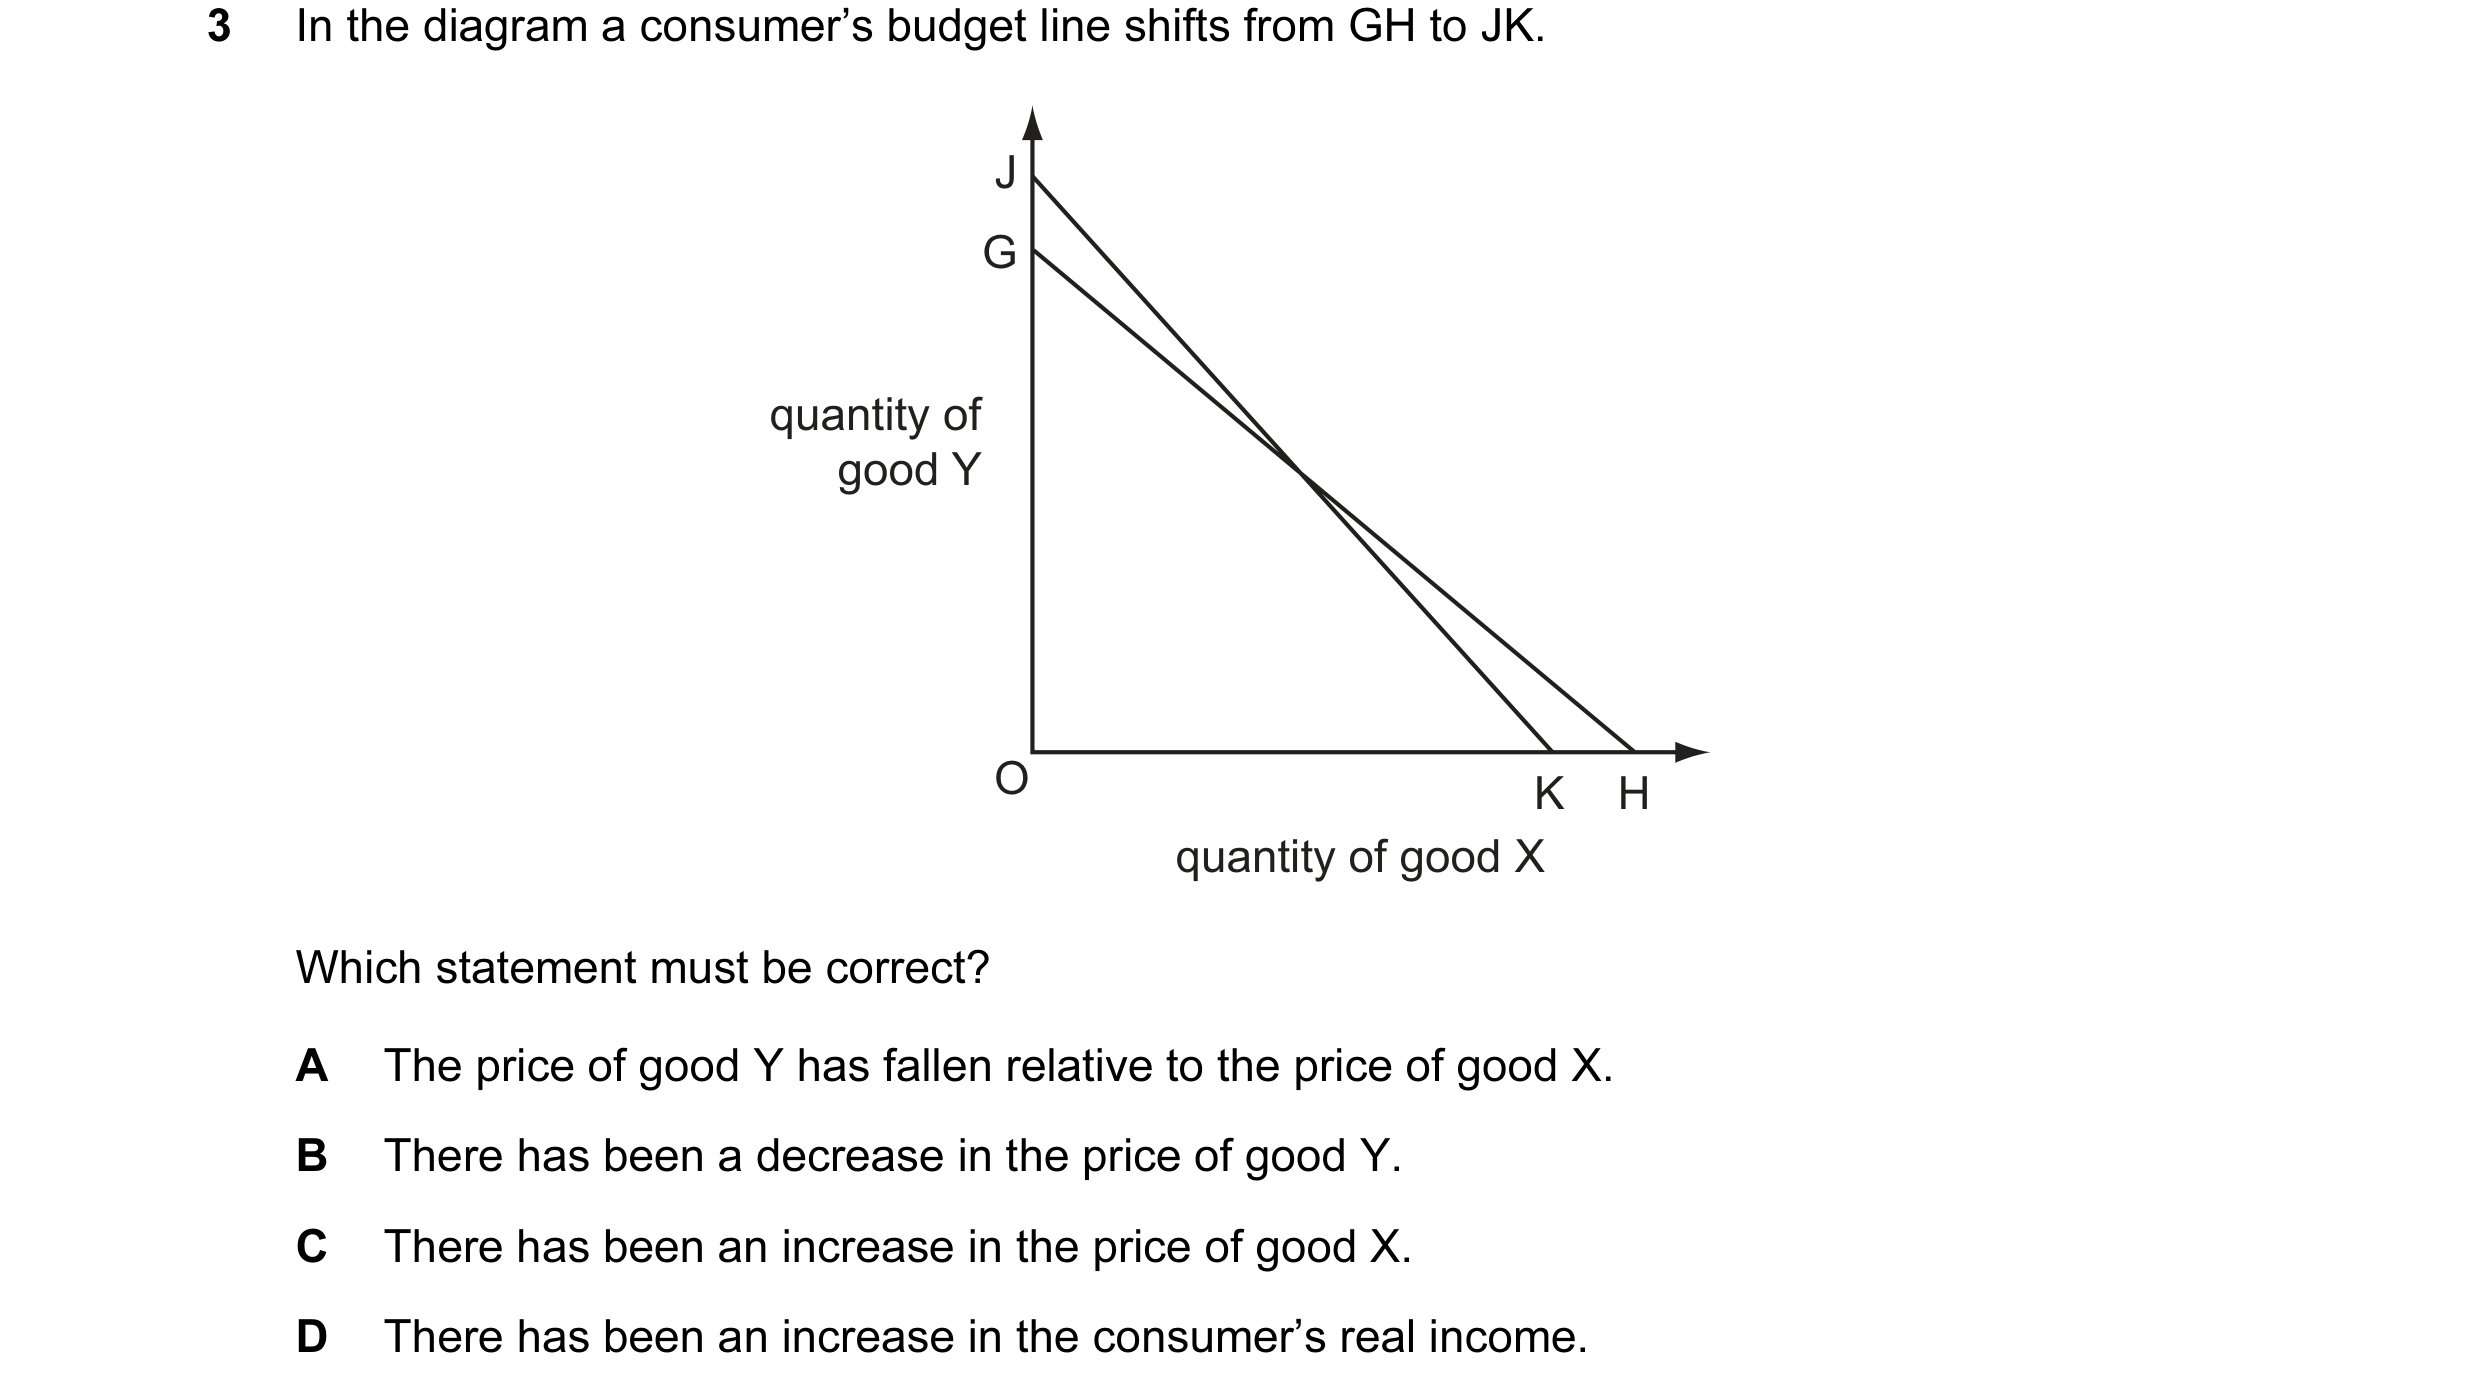
Q18 · In the diagram a consumer’s budget line shifts from GH to JK 9708/32 May/June 2013
3 In the diagram a consumer’s budget line shifts from GH to JK. J G quantity of good Y O K H quantity of good X Which statement must be correct? A The price of good Y has fallen relative to the price of good X. B There has been a decrease in the price of good Y. C There has been an increase in the price of good X. D There has been an increase in the consumer’s real income.
1 marks
Answer: A
This question in 9708/32 May/June 2013
Q19 · In the diagram a consumer’s budget line shifts from JK to GH 9708/31 Oct/Nov 2013
3 In the diagram a consumer’s budget line shifts from JK to GH. J G quantity of good Y O K H quantity of good X Which statement must be correct? A There has been an increase in the consumer’s money income. B There has been a decrease in the consumer’s real income. C Good Y has become relatively more expensive. D The price of good X has increased.
1 marks
Answer: C
This question in 9708/31 Oct/Nov 2013
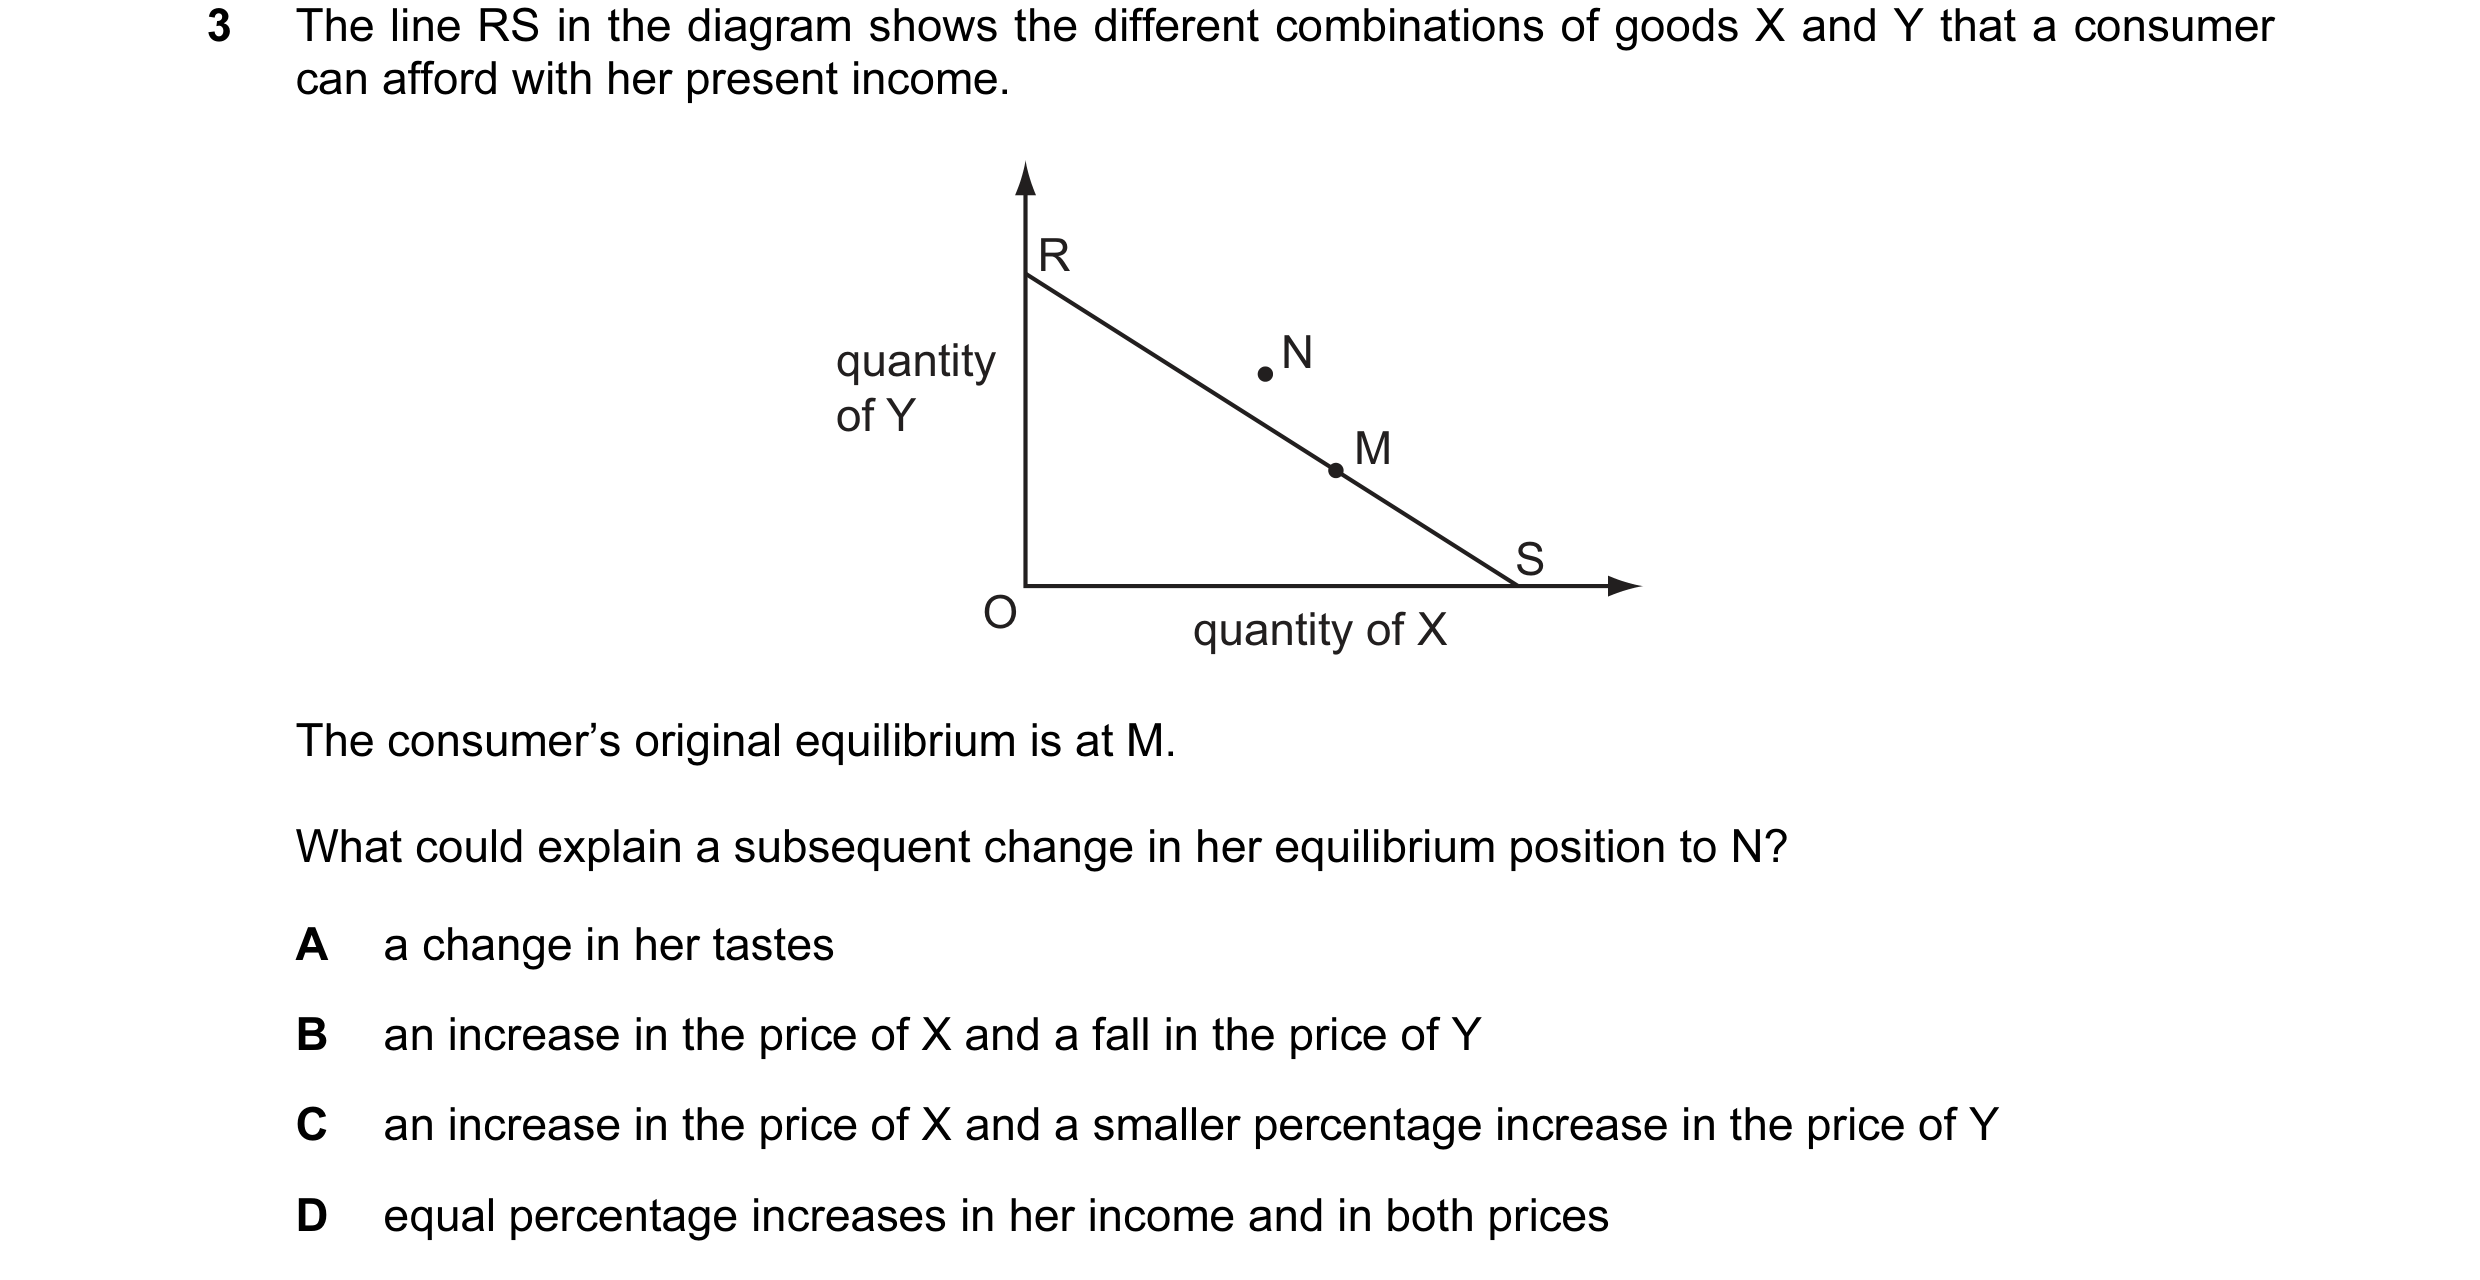
Q20 · The line RS in the diagram shows the different combinations of goods X and Y that a… 9708/32 Oct/Nov 2013
3 The line RS in the diagram shows the different combinations of goods X and Y that a consumer can afford with her present income. R quantity N of Y M S O quantity of X The consumer’s original equilibrium is at M. What could explain a subsequent change in her equilibrium position to N? A a change in her tastes B an increase in the price of X and a fall in the price of Y C an increase in the price of X and a smaller percentage increase in the price of Y D equal percentage increases in her income and in both prices
1 marks
Answer: B
This question in 9708/32 Oct/Nov 2013
Q21 · What is not held constant when calculating the income effect of a change in the price of… 9708/33 Oct/Nov 2013
3 What is not held constant when calculating the income effect of a change in the price of a good? A the consumer’s money income B the consumer’s preferences C the consumer’s real income D the prices of other goods
1 marks
Answer: C
This question in 9708/33 Oct/Nov 2013
Q22 · In the diagram a consumer’s budget line shifts from GH to JK 9708/31 Oct/Nov 2014
3 In the diagram a consumer’s budget line shifts from GH to JK. J G good Y O K H good X Which statement must be correct? A The price of good X has increased relative to the price of good Y. B The prices of both goods have fallen. C There has been an increase in the consumer’s real income. D There has been an increase in the consumer’s money income.
1 marks
Answer: A
This question in 9708/31 Oct/Nov 2014
Q23 · In the diagram a consumer's budget line shifts from GH to JK 9708/33 Oct/Nov 2014
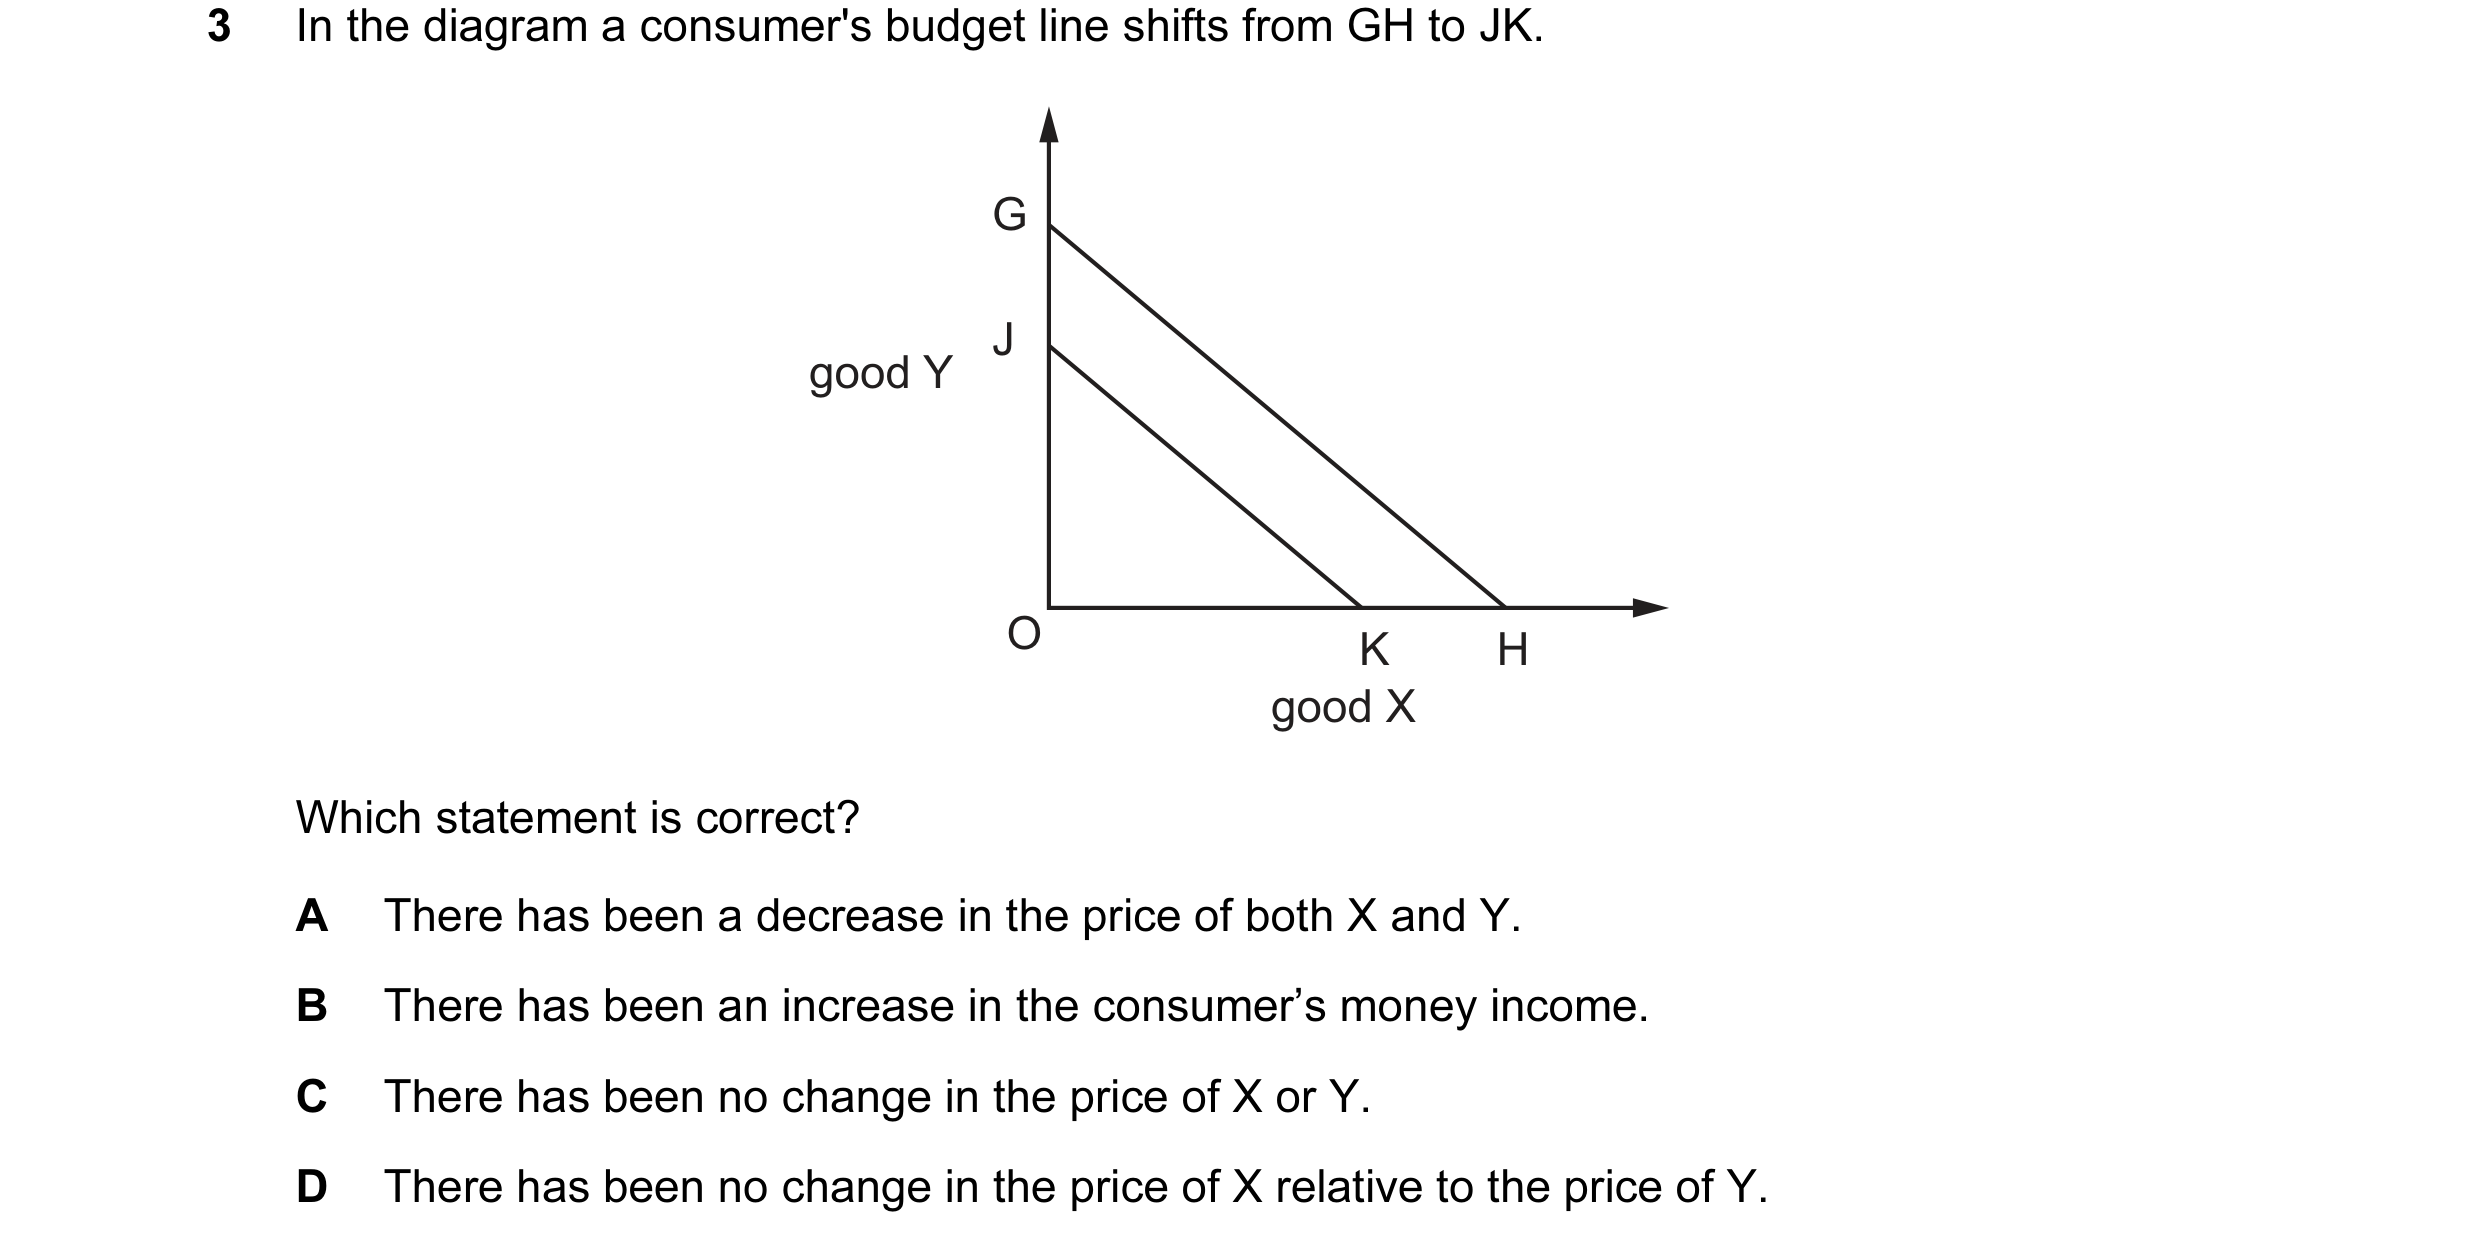
3 In the diagram a consumer's budget line shifts from GH to JK. G J good Y O K H good X Which statement is correct? A There has been a decrease in the price of both X and Y. B There has been an increase in the consumer’s money income. C There has been no change in the price of X or Y. D There has been no change in the price of X relative to the price of Y.
1 marks
Answer: D
This question in 9708/33 Oct/Nov 2014
Q24 · The curve JK in the diagram is a consumer’s initial budget line 9708/31 May/June 2015
3 The curve JK in the diagram is a consumer’s initial budget line. G J good Y O H K good X Which combination could cause the budget line to shift to GH? price of consumer’s good X money income A increase increase B decrease decrease C increase decrease D decrease increase
1 marks
Answer: A
This question in 9708/31 May/June 2015
Q25 · For the purposes of measuring the income effect of a change in the price of a good, what… 9708/32 May/June 2015
3 For the purposes of measuring the income effect of a change in the price of a good, what is not held constant? A consumer preferences B relative prices C the consumer’s money income D the consumer’s real income
1 marks
Answer: D
This question in 9708/32 May/June 2015
Q26 · In the diagram, PQ is a consumer’s original budget line 9708/32 Oct/Nov 2015
3 In the diagram, PQ is a consumer’s original budget line. 16 P quantity of Y 12 R Q S 0 10 20 quantity of X The consumer’s income increases from $80 to $120 and, at the same time, the prices of X and Y change. If the consumer’s budget line is now RS, what are the new prices of X and Y? price of X ($) price of Y ( $) A 4 12 B 6 10 C 10 8 D 12 6
1 marks
Answer: B
This question in 9708/32 Oct/Nov 2015
Q27 · The line RS in the diagram is a consumer’s budget line 9708/33 Oct/Nov 2015
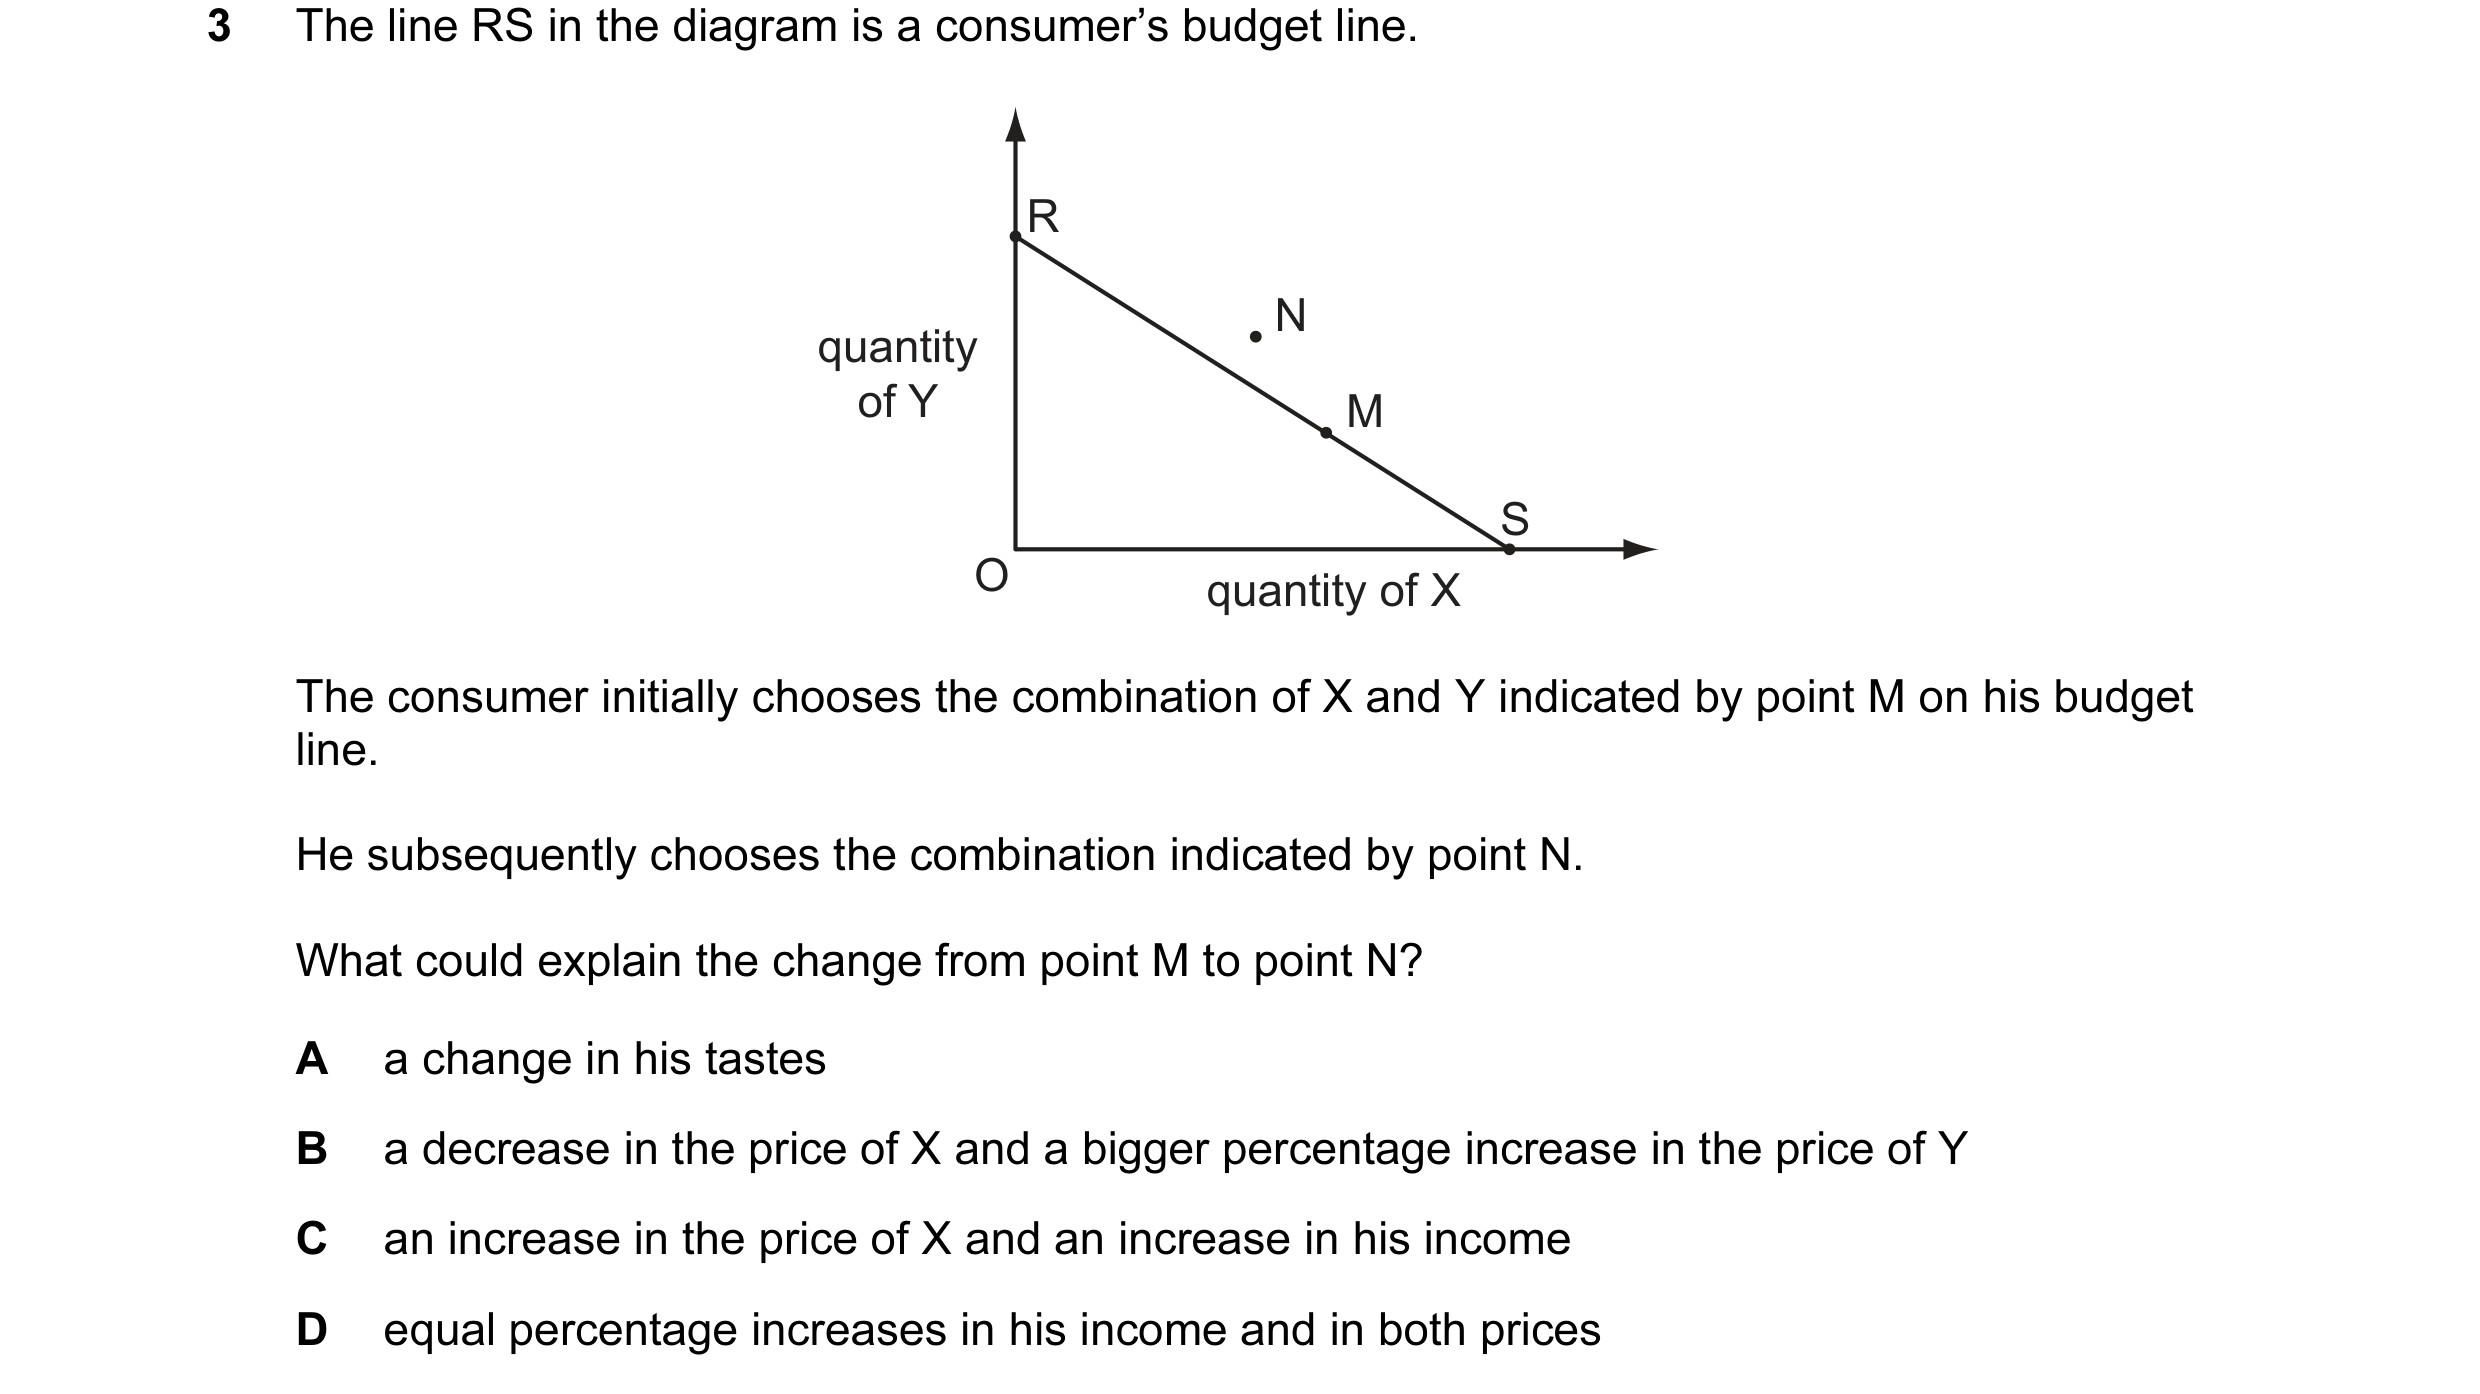
3 The line RS in the diagram is a consumer’s budget line. R N quantity of Y M S O quantity of X The consumer initially chooses the combination of X and Y indicated by point M on his budget line. He subsequently chooses the combination indicated by point N. What could explain the change from point M to point N? A a change in his tastes B a decrease in the price of X and a bigger percentage increase in the price of Y C an increase in the price of X and an increase in his income D equal percentage increases in his income and in both prices
1 marks
Answer: C
This question in 9708/33 Oct/Nov 2015
Q28 · In the indifference curve diagram point M is the consumer’s initial equilibrium and MN is… 9708/32 May/June 2016
4 In the indifference curve diagram point M is the consumer’s initial equilibrium and MN is the substitution effect of a fall in the price of good X. If good X is a Giffen good which point will be the consumer’s new equilibrium point after the fall in the price of good X? J A B C good Y D M N I O K L good X
1 marks
Answer: A
This question in 9708/32 May/June 2016
Q29 · The diagram shows two indifference curves and two budget lines for two goods X and Y 9708/33 May/June 2016
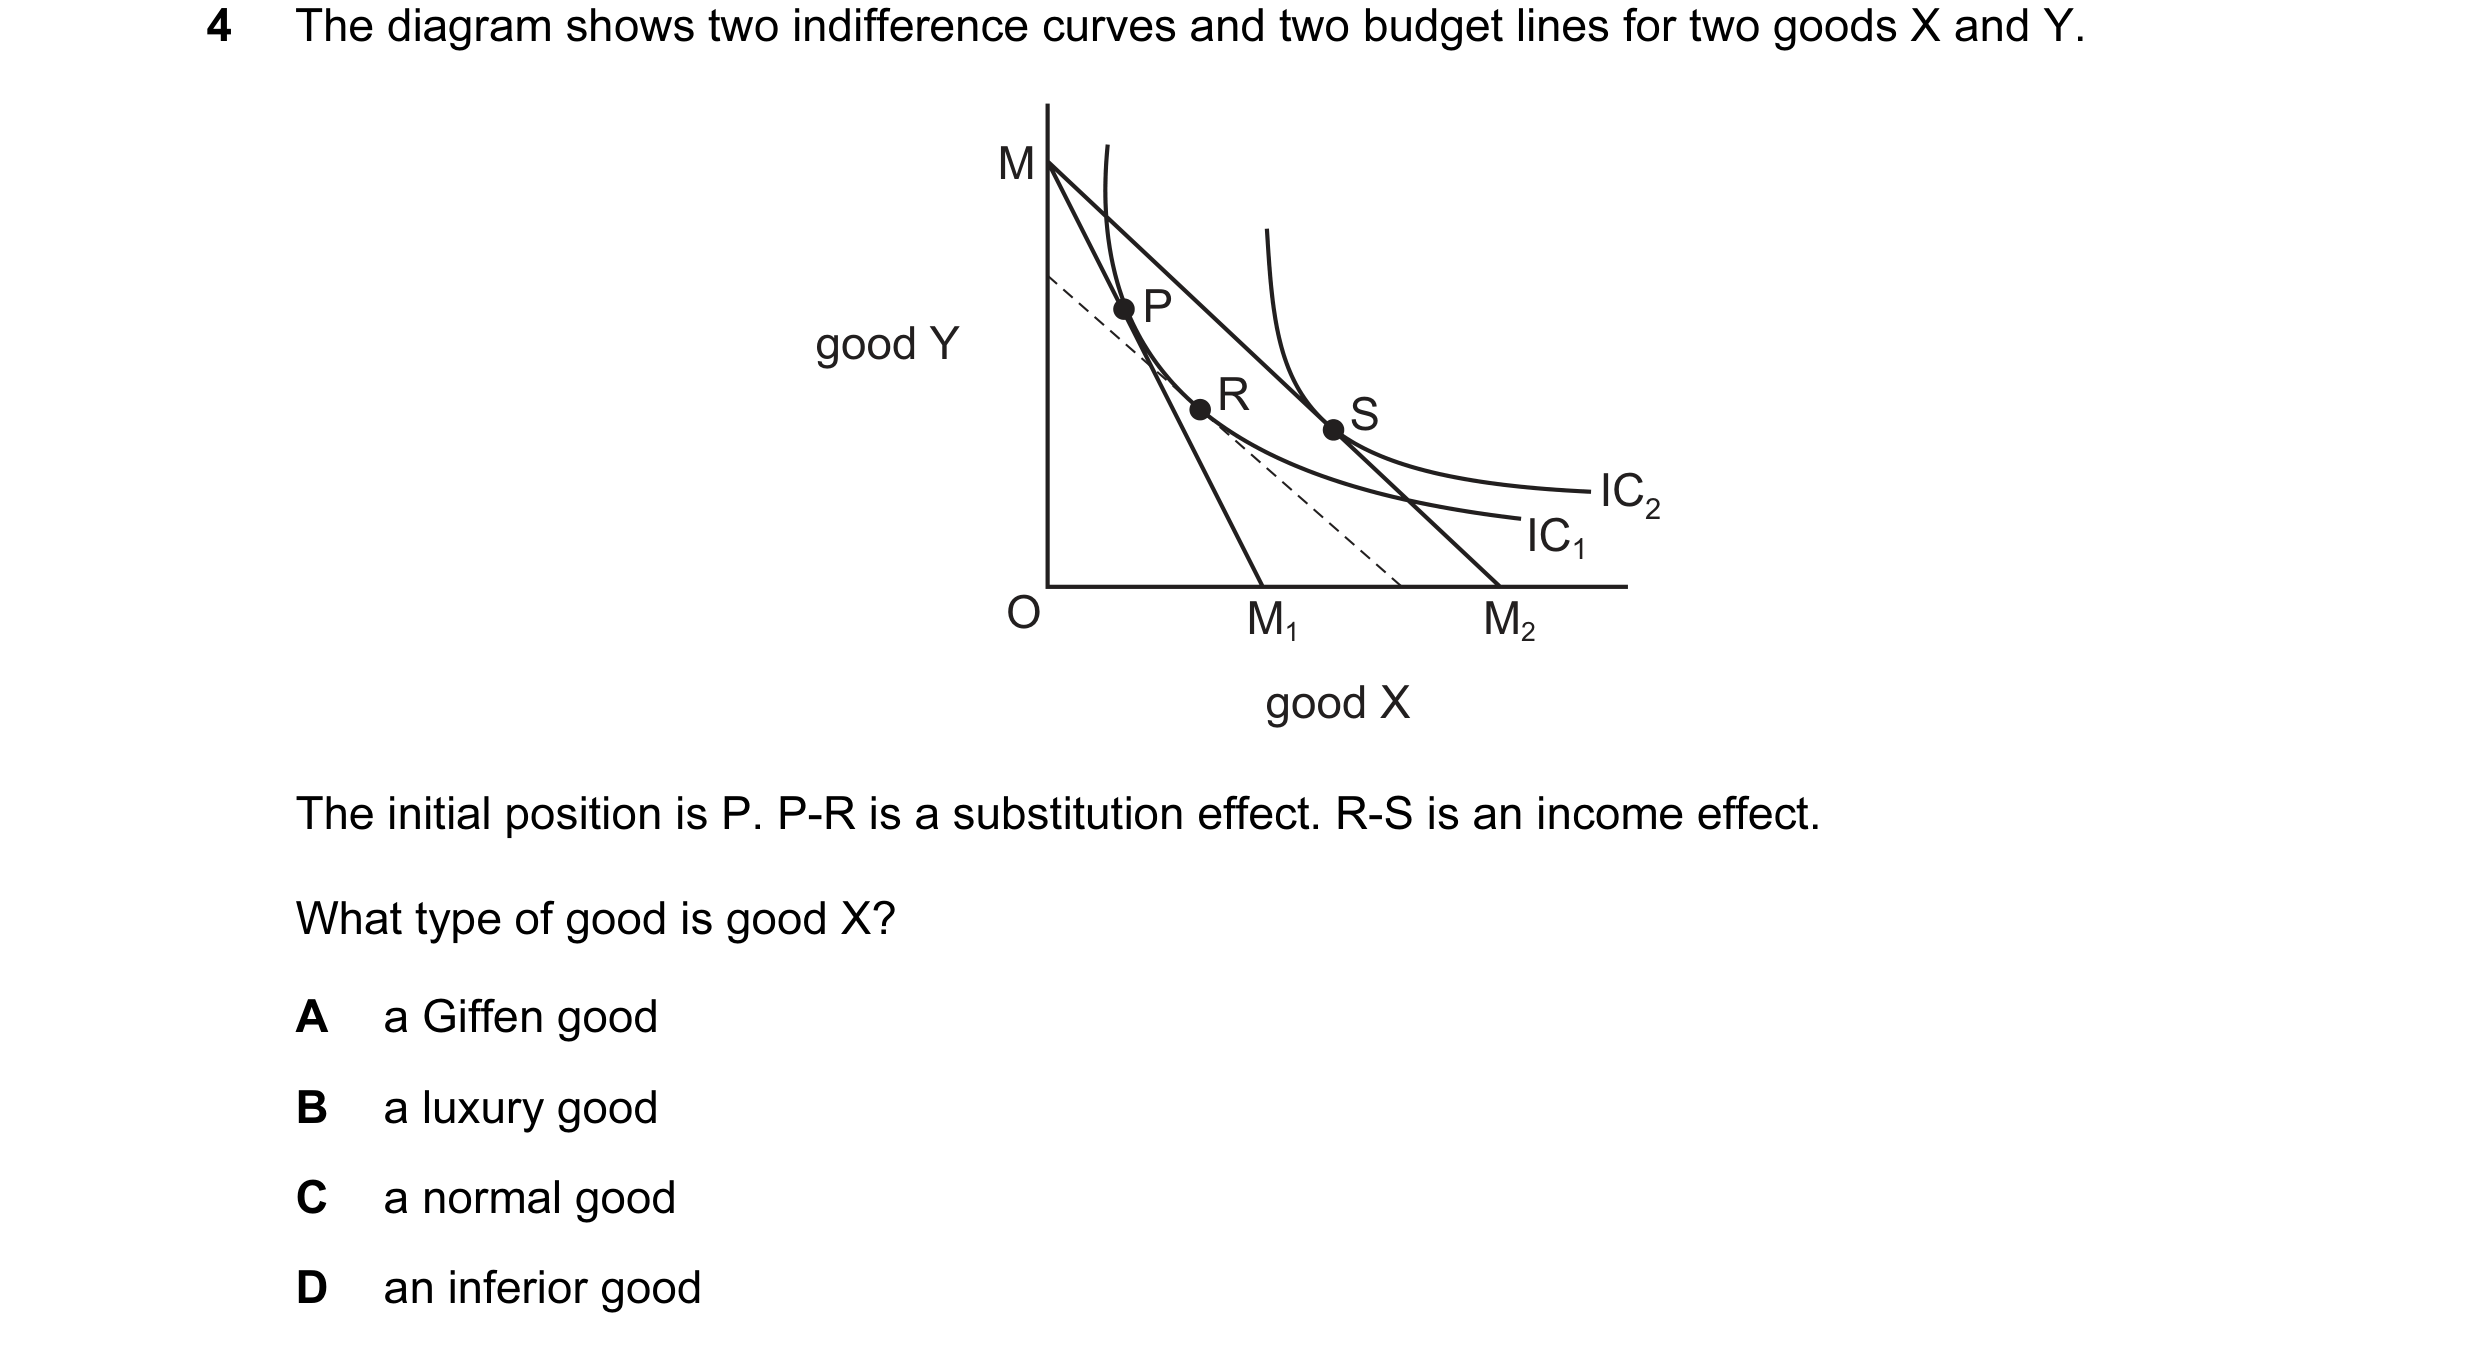
4 The diagram shows two indifference curves and two budget lines for two goods X and Y. M P good Y R S IC2 IC1 O M1 M2 good X The initial position is P. P-R is a substitution effect. R-S is an income effect. What type of good is good X? A a Giffen good B a luxury good C a normal good D an inferior good
1 marks
Answer: C
This question in 9708/33 May/June 2016
Q30 · The diagram shows two indifference curves and two budget lines for goods X and Y 9708/32 Oct/Nov 2016
5 The diagram shows two indifference curves and two budget lines for goods X and Y. Y good Y H F G IC2 IC1 O X1 X2 good X The consumer’s initial position is at point F. The consumer’s preferred final position becomes point H. What does the movement from F to G represent? A the income effect of a price fall for X B the price effect of a price change for X C the substitution effect of a price fall for X D the substitution effect of a price rise for X
1 marks
Answer: C
This question in 9708/32 Oct/Nov 2016
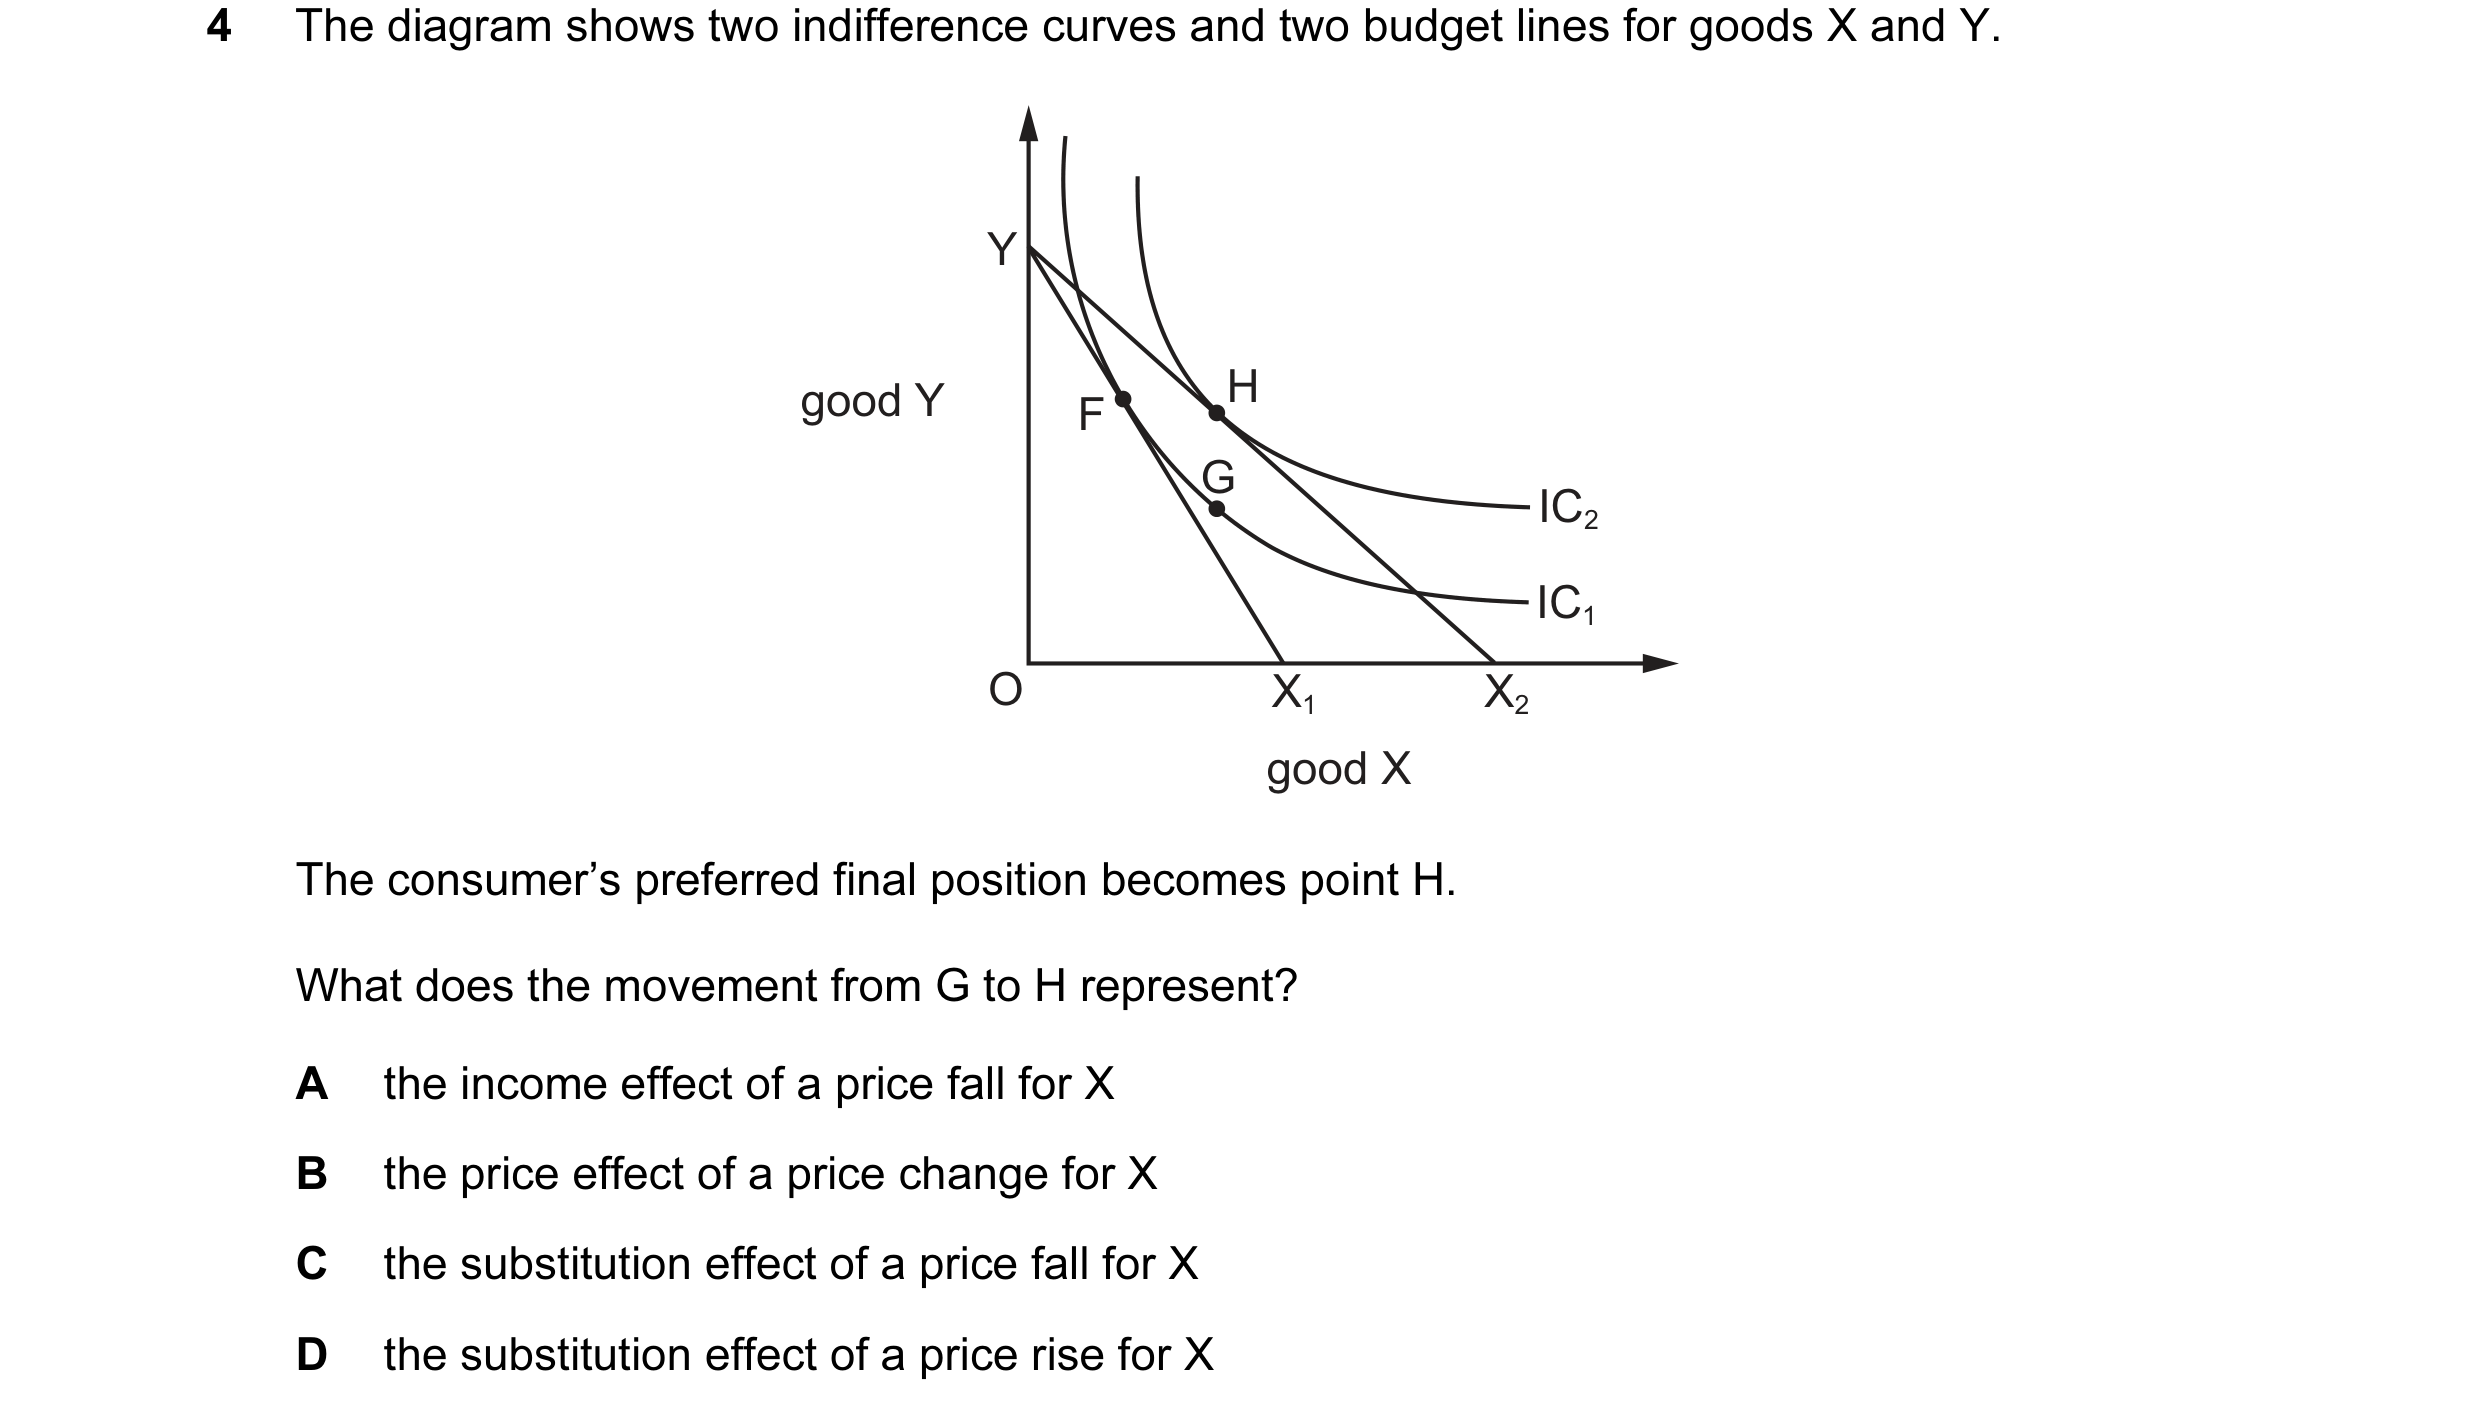
Q31 · The diagram shows two indifference curves and two budget lines for goods X and Y 9708/33 Oct/Nov 2016
4 The diagram shows two indifference curves and two budget lines for goods X and Y. Y good Y H F G IC2 IC1 O X1 X2 good X The consumer’s preferred final position becomes point H. What does the movement from G to H represent? A the income effect of a price fall for X B the price effect of a price change for X C the substitution effect of a price fall for X D the substitution effect of a price rise for X
1 marks
Answer: A
This question in 9708/33 Oct/Nov 2016
Q32 · The diagram shows two indifference curves for a consumer 9708/32 May/June 2017
4 The diagram shows two indifference curves for a consumer. good Y R Q IC2 IC1 O good X What can be concluded if the consumer’s equilibrium moves from Q to R? A The consumer is acting rationally. B The consumer’s money income is unchanged. C The opportunity cost of good Y is constant. D The price of good X has risen.
1 marks
Answer: A
This question in 9708/32 May/June 2017
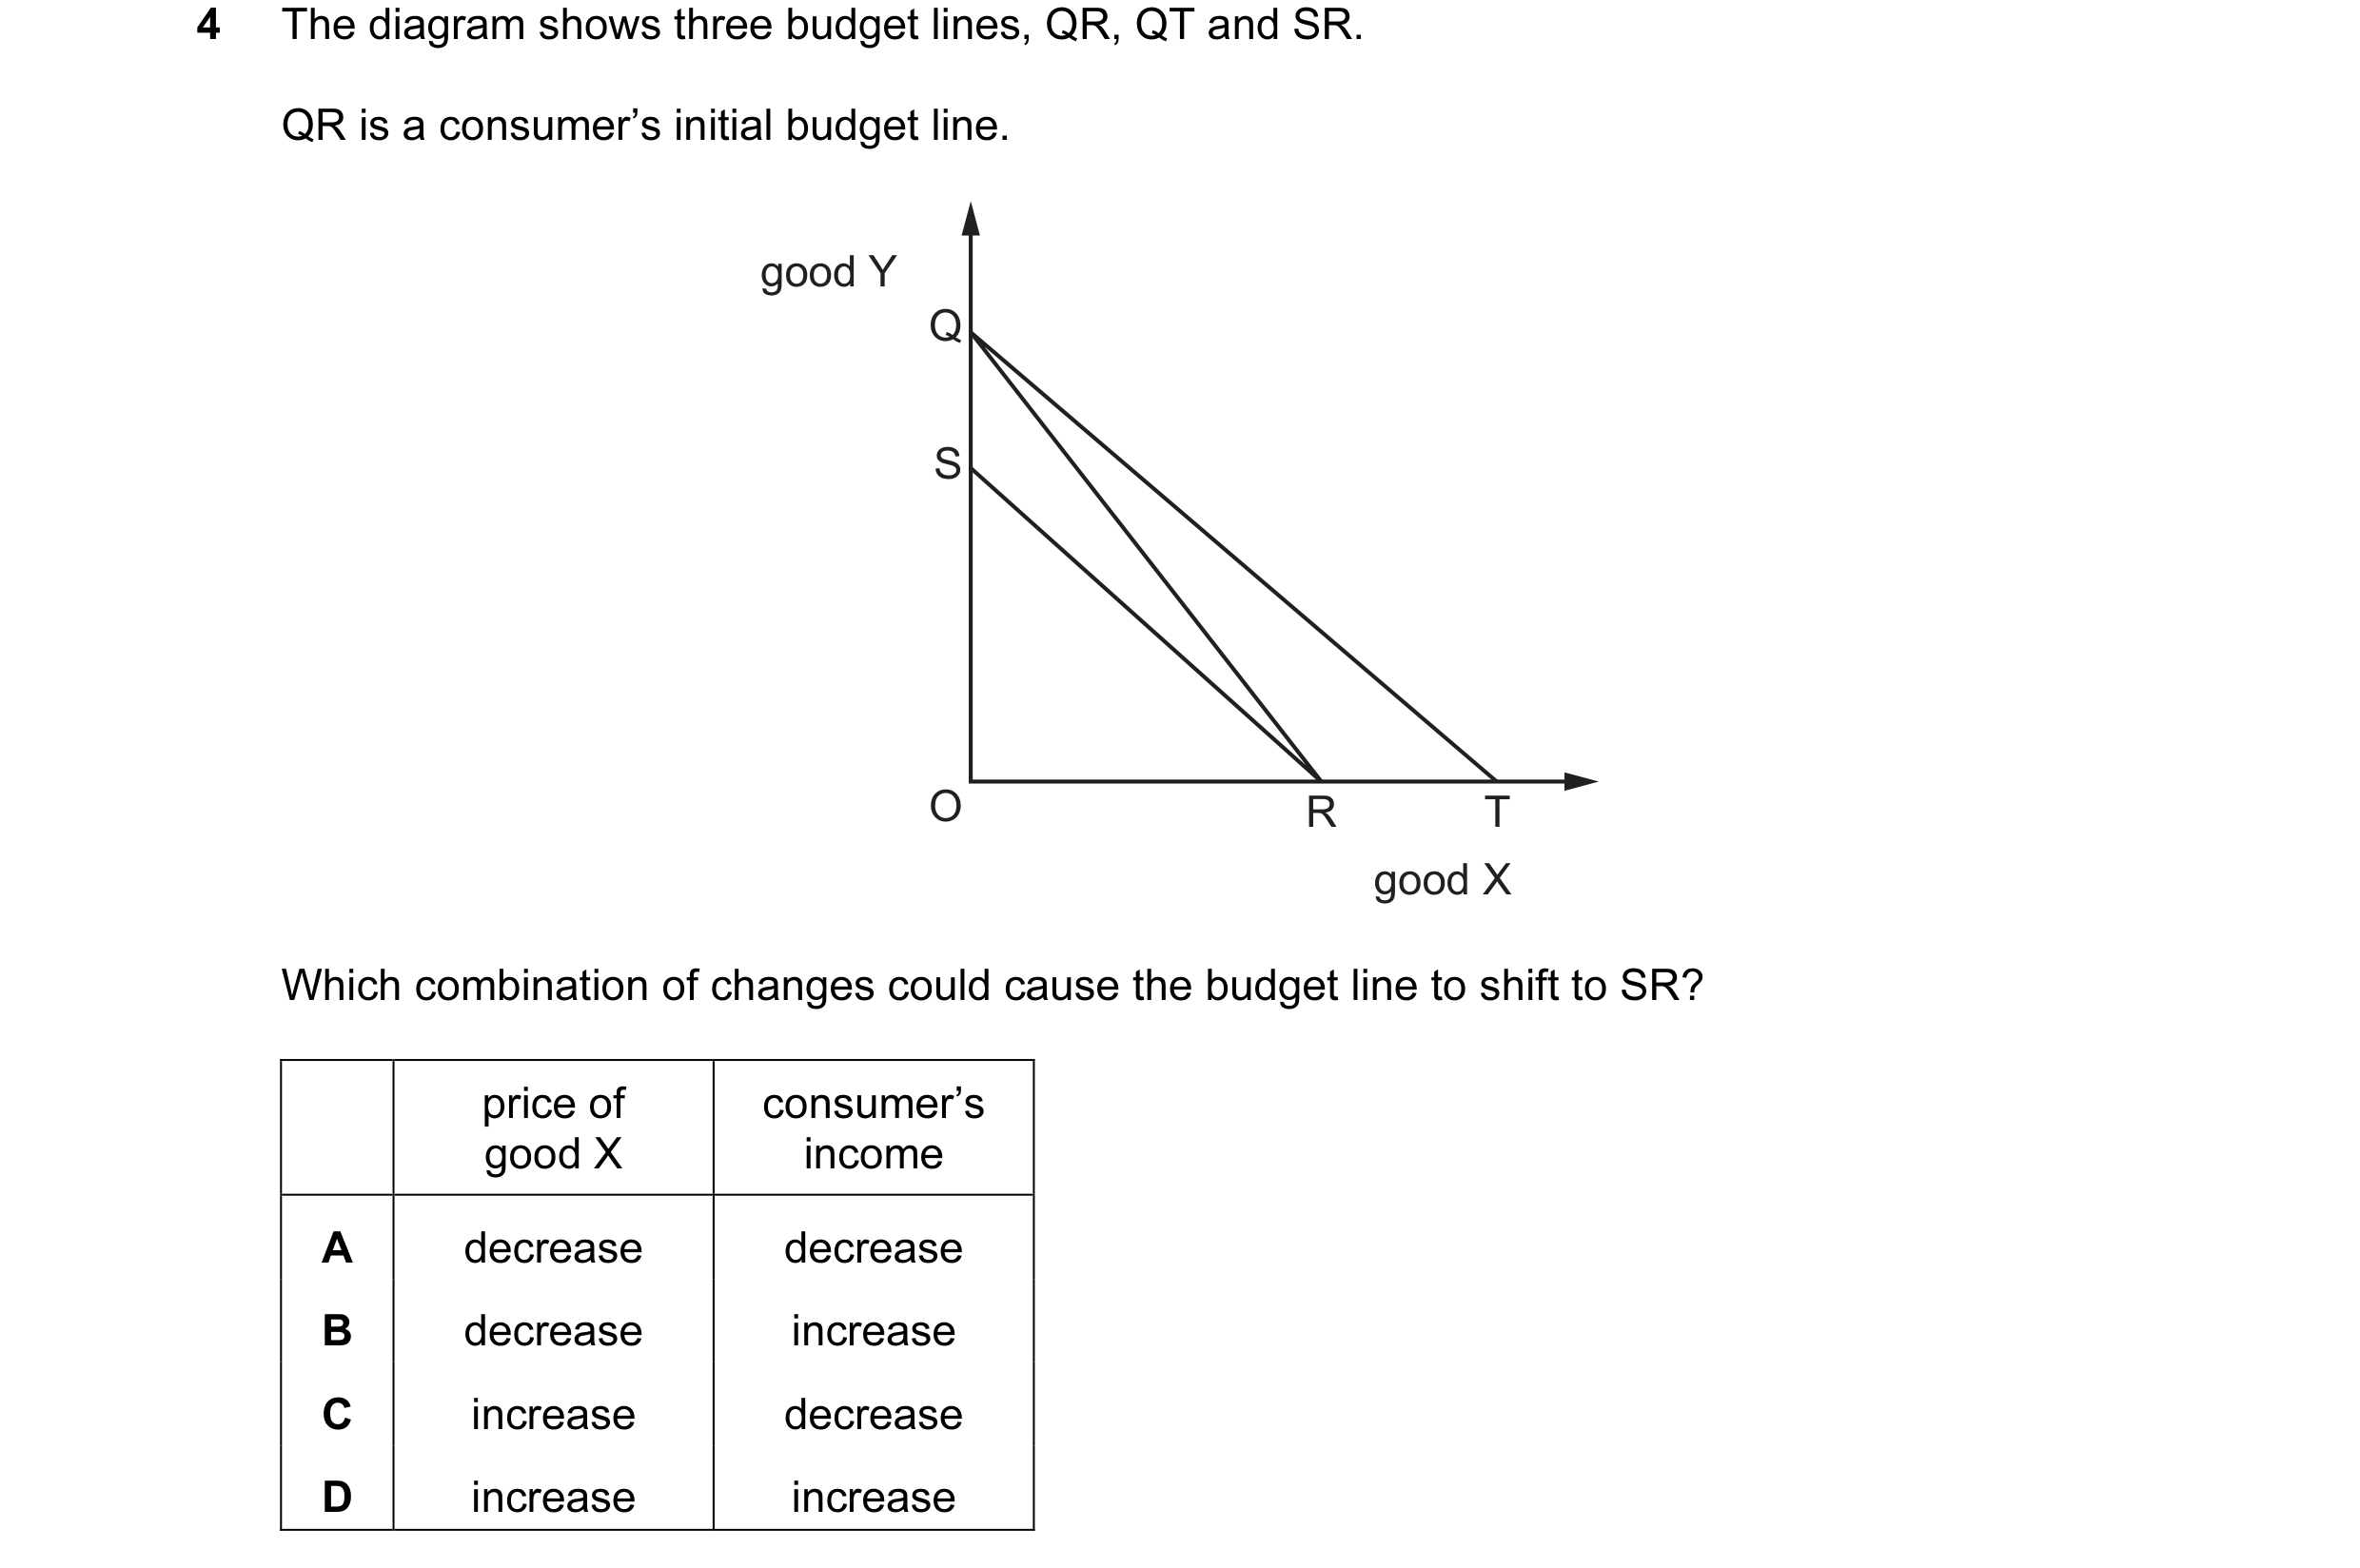
Q33 · The diagram shows three budget lines, QR, QT and SR 9708/33 May/June 2017
4 The diagram shows three budget lines, QR, QT and SR. QR is a consumer’s initial budget line. good Y Q S O R T good X Which combination of changes could cause the budget line to shift to SR? price of consumer’s good X income A decrease decrease B decrease increase C increase decrease D increase increase
1 marks
Answer: A
This question in 9708/33 May/June 2017
Q34 · The diagram shows two indifference curves for a consumer 9708/33 May/June 2017
10 The diagram shows two indifference curves for a consumer. good Y IC2 IC1 O good X What necessarily differs between IC1 and IC2? A level of income B level of satisfaction C price of good X D price of good Y
1 marks
Answer: B
This question in 9708/33 May/June 2017
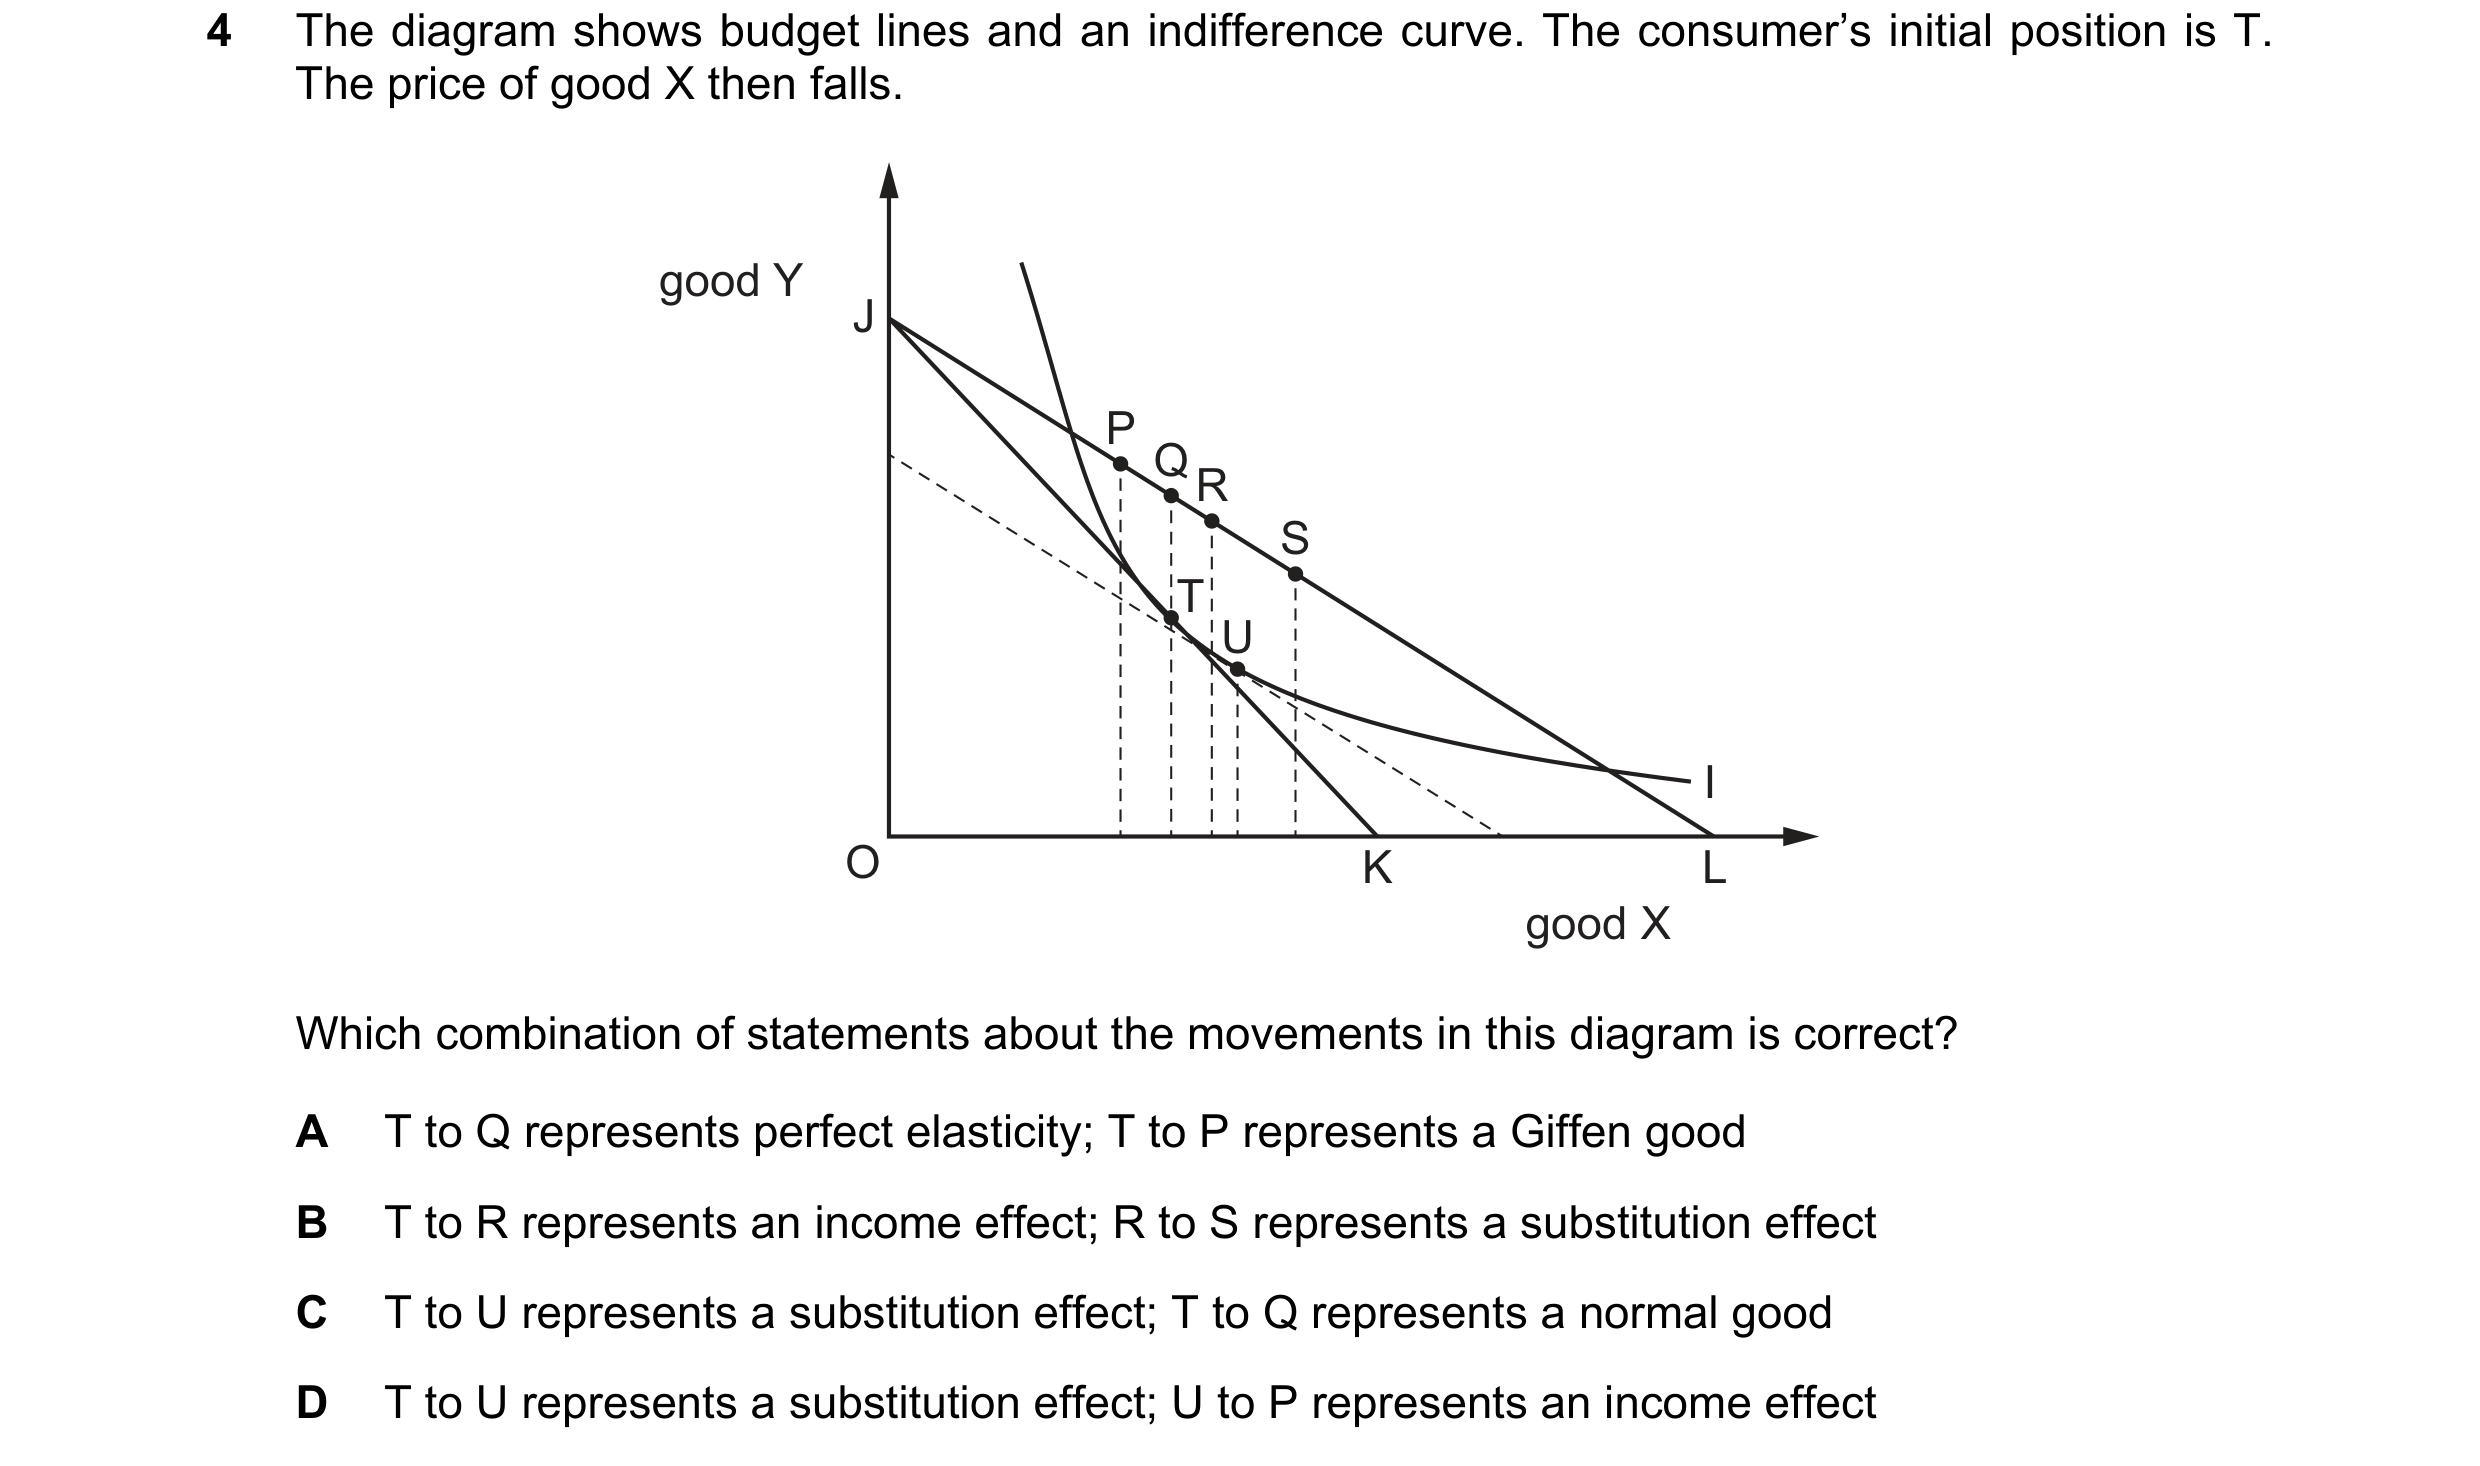
Q35 · The diagram shows budget lines and an indifference curve 9708/32 Oct/Nov 2018
4 The diagram shows budget lines and an indifference curve. The consumer’s initial position is T. The price of good X then falls. good Y J P Q R S T U I O K L good X Which combination of statements about the movements in this diagram is correct? A T to Q represents perfect elasticity; T to P represents a Giffen good B T to R represents an income effect; R to S represents a substitution effect C T to U represents a substitution effect; T to Q represents a normal good D T to U represents a substitution effect; U to P represents an income effect
1 marks
Answer: D
This question in 9708/32 Oct/Nov 2018
Q36 · The diagram shows various combinations of apples and rice which are potentially available… 9708/32 Oct/Nov 2018
5 The diagram shows various combinations of apples and rice which are potentially available to a consumer. apples X Z W Y O rice If standard indifference curves were added to the diagram they would show that the consumer is indifferent between combination X and combination W. What can be concluded? A The consumer is indifferent between combination Y and combination Z. B The consumer is indifferent between combination Z and combination W. C The consumer prefers combination Y to combination X. D The consumer prefers combination Z to combination W.
1 marks
Answer: D
This question in 9708/32 Oct/Nov 2018
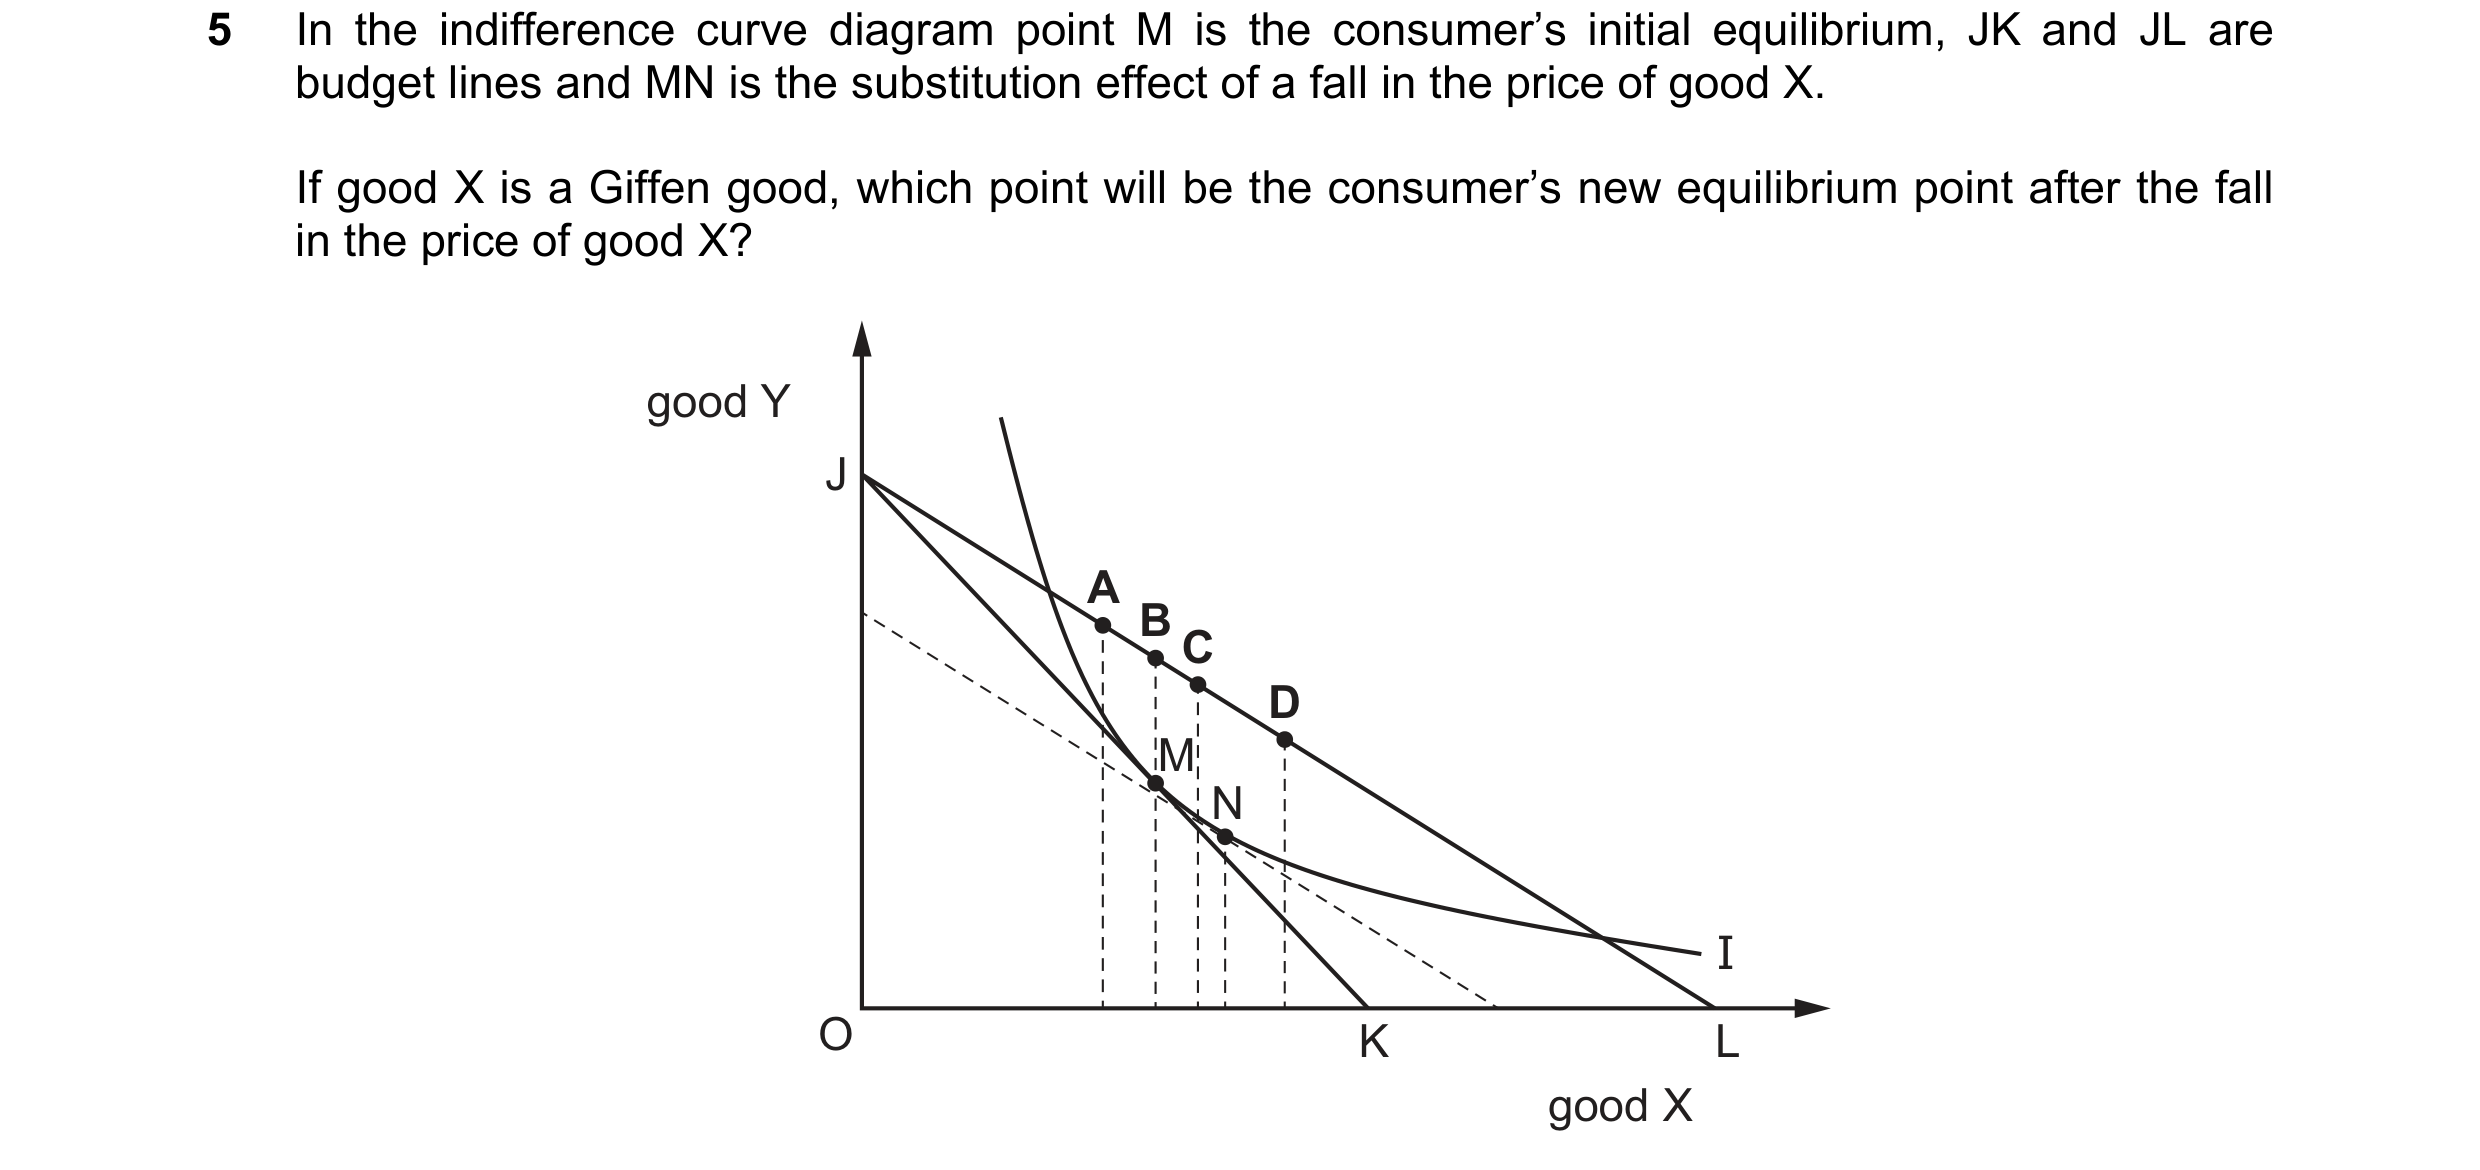
Q37 · In the indifference curve diagram point M is the consumer’s initial equilibrium, JK and… 9708/32 Feb/March 2019
5 In the indifference curve diagram point M is the consumer’s initial equilibrium, JK and JL are budget lines and MN is the substitution effect of a fall in the price of good X. If good X is a Giffen good, which point will be the consumer’s new equilibrium point after the fall in the price of good X? good Y J A B C D M N I O K L good X
1 marks
Answer: A
This question in 9708/32 Feb/March 2019
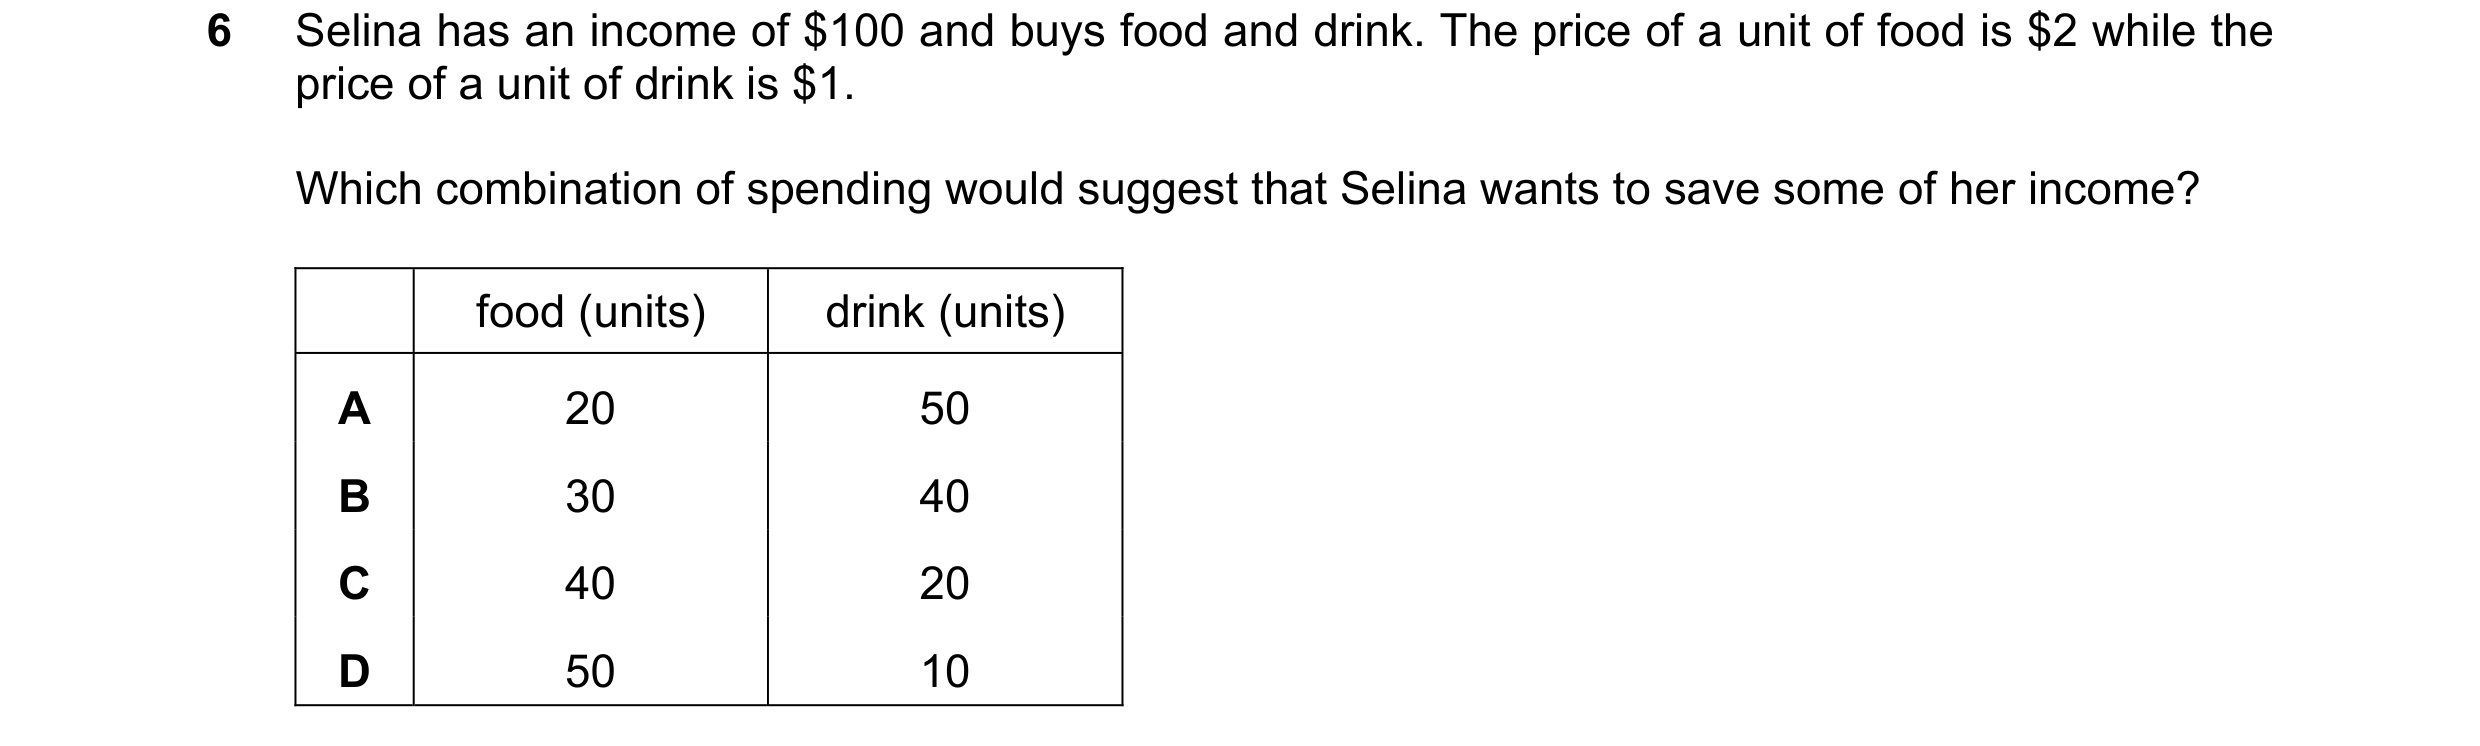
Q38 · Selina has an income of $100 and buys food and drink 9708/32 Feb/March 2019
6 Selina has an income of $100 and buys food and drink. The price of a unit of food is $2 while the price of a unit of drink is $1. Which combination of spending would suggest that Selina wants to save some of her income? food (units) drink (units) A 20 50 B 30 40 C 40 20 D 50 10
1 marks
Answer: A
This question in 9708/32 Feb/March 2019
Q39 · The diagram shows budget lines for normal goods X and Y 9708/32 May/June 2019
5 The diagram shows budget lines for normal goods X and Y. P good Y O R Q good X What could cause a budget line to shift from PQ to PR? level of price of X price of Y consumer incomes A fall rise fall B no change rise no change C rise no change no change D rise no change rise
1 marks
Answer: C
This question in 9708/32 May/June 2019
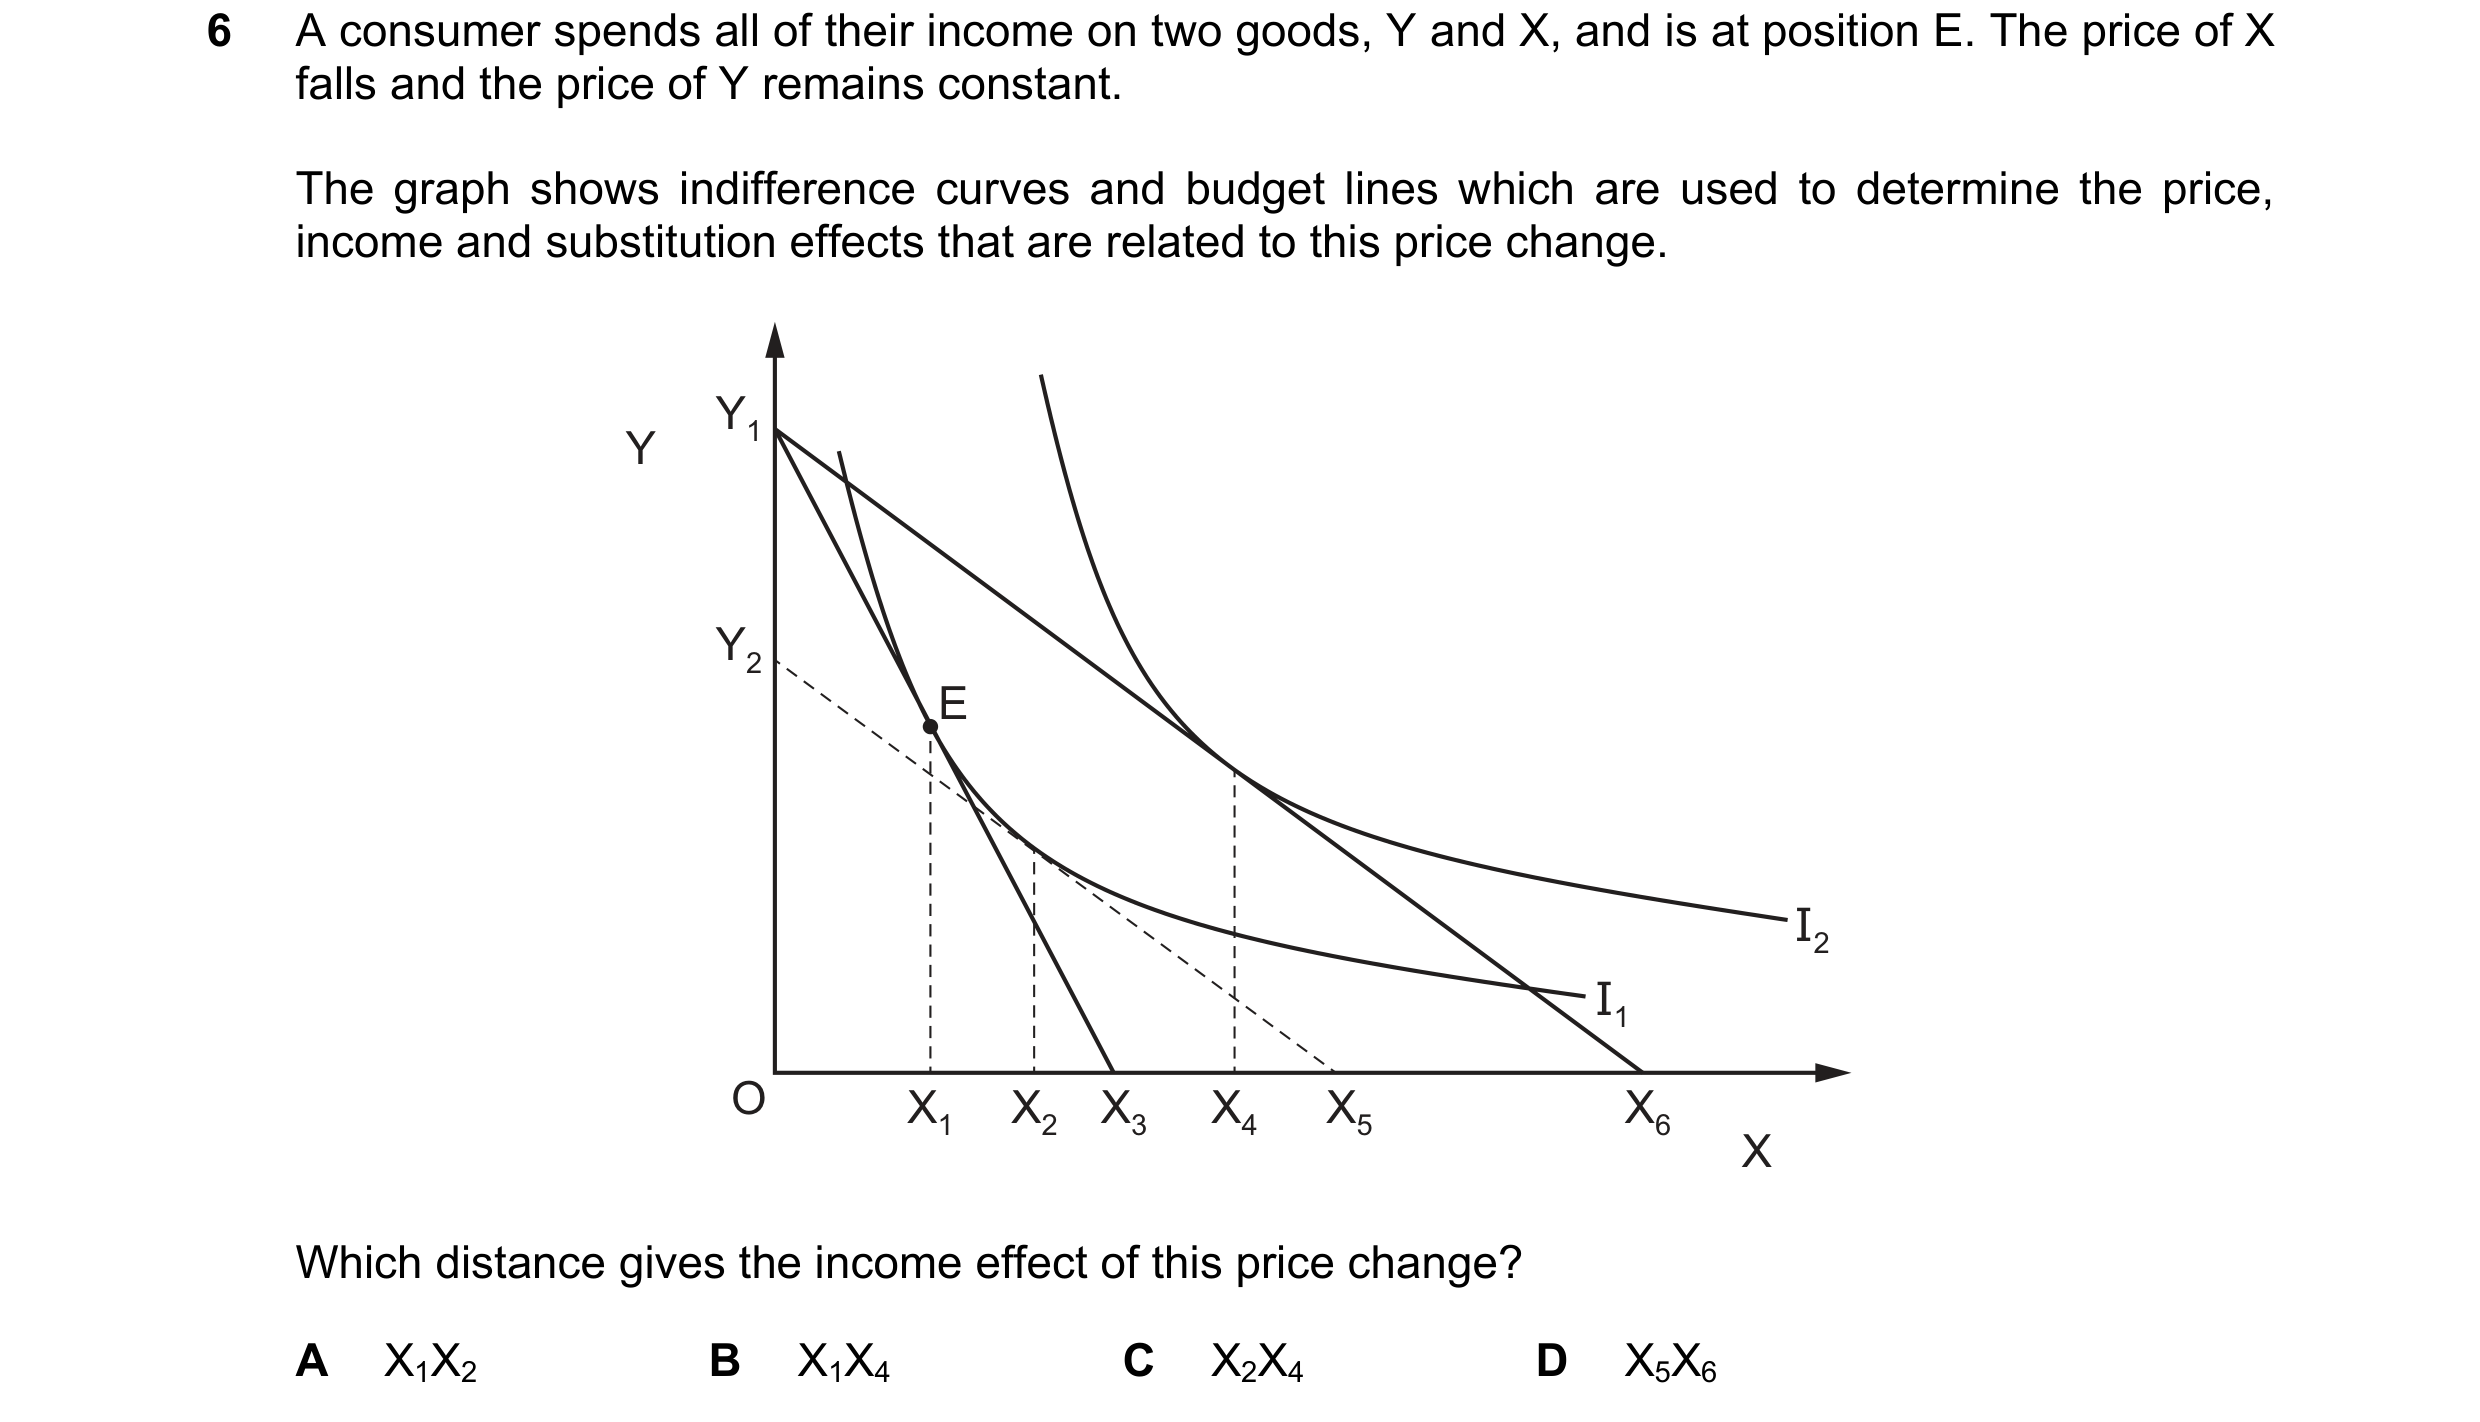
Q40 · A consumer spends all of their income on two goods, Y and X, and is at position E 9708/32 May/June 2019
6 A consumer spends all of their income on two goods, Y and X, and is at position E. The price of X falls and the price of Y remains constant. The graph shows indifference curves and budget lines which are used to determine the price, income and substitution effects that are related to this price change. Y1 Y Y2 E I2 I1 O X1 X2 X3 X4 X5 X6 X Which distance gives the income effect of this price change? A X1X2 B X1X4 C X2X4 D X5X6
1 marks
Answer: C
This question in 9708/32 May/June 2019
Q41 · The curve JK in the diagram is a consumer’s initial budget line 9708/32 Oct/Nov 2019
6 The curve JK in the diagram is a consumer’s initial budget line. G good Y J O H K good X Which combination could cause the budget line to shift to GH? consumer’s price of good X money income A increase increase B decrease decrease C increase decrease D decrease increase
1 marks
Answer: A
This question in 9708/32 Oct/Nov 2019
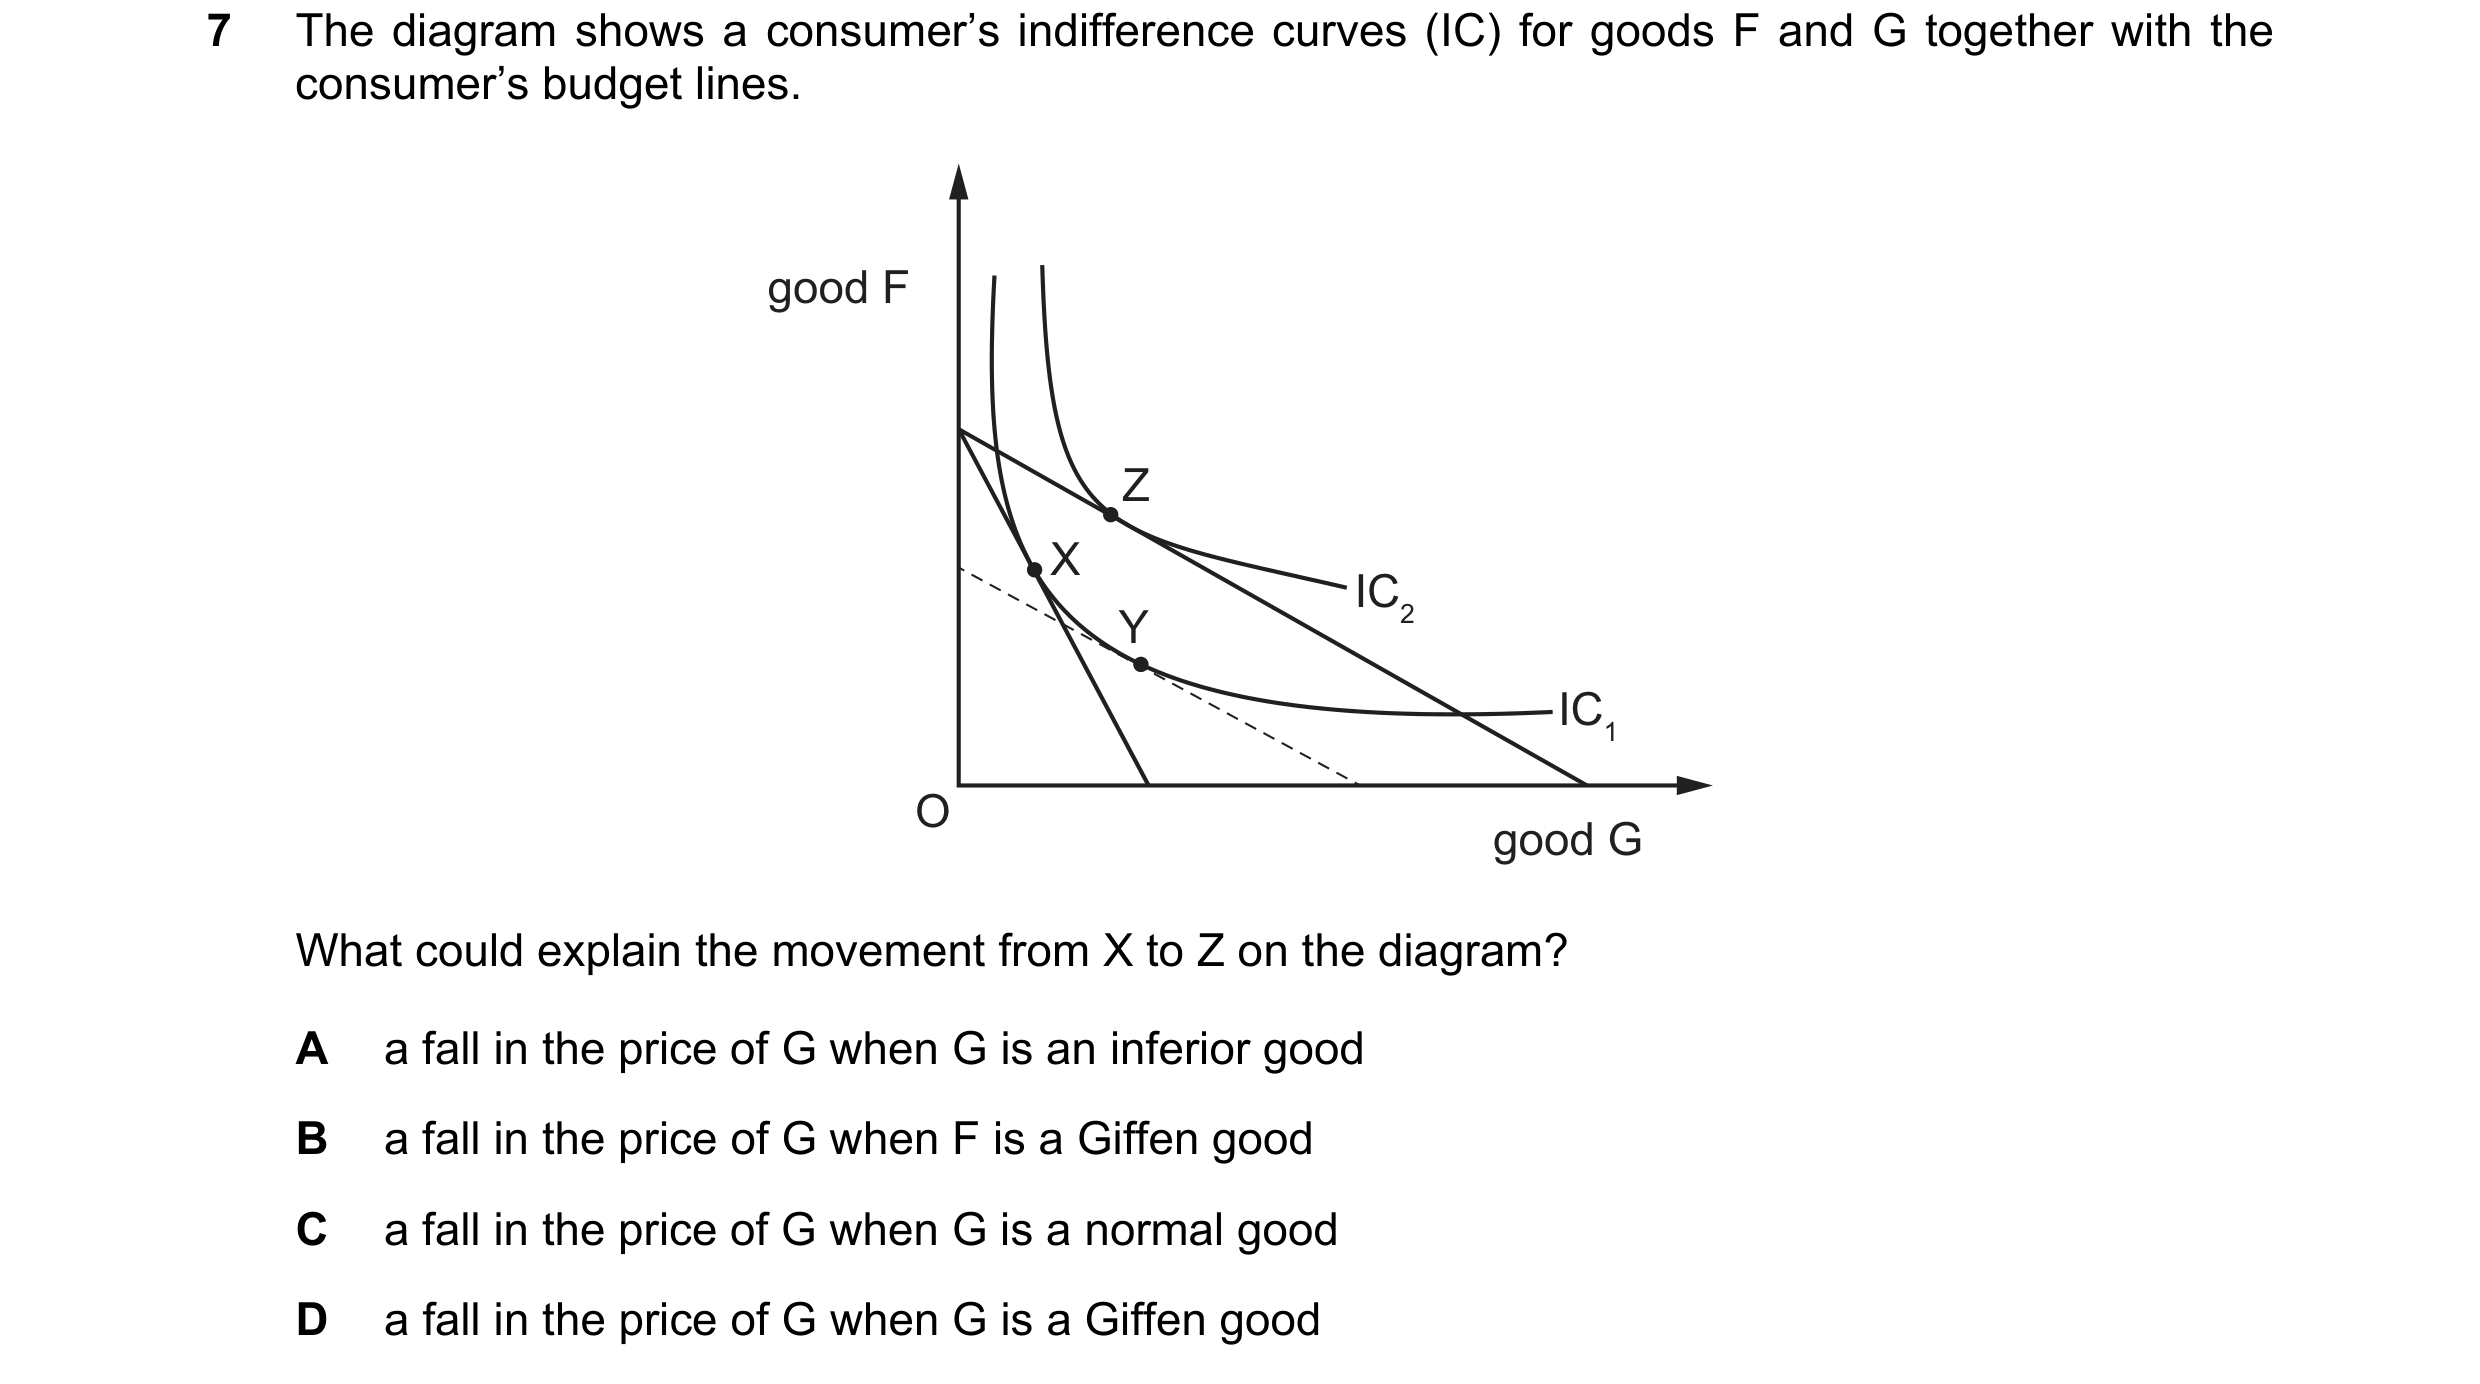
Q42 · The diagram shows a consumer’s indifference curves (IC) for goods F and G together with… 9708/32 Oct/Nov 2019
7 The diagram shows a consumer’s indifference curves (IC) for goods F and G together with the consumer’s budget lines. good F Z X IC2 Y IC1 O good G What could explain the movement from X to Z on the diagram? A a fall in the price of G when G is an inferior good B a fall in the price of G when F is a Giffen good C a fall in the price of G when G is a normal good D a fall in the price of G when G is a Giffen good
1 marks
Answer: A
This question in 9708/32 Oct/Nov 2019
Q43 · The diagram shows a consumer’s indifference curves and a budget line for electronic goods… 9708/32 Feb/March 2020
5 The diagram shows a consumer’s indifference curves and a budget line for electronic goods and food. If income and prices remain the same, at which point on the diagram will the consumer maximise satisfaction? electronic goods A C B I3 I2 D I1 O food
1 marks
Answer: B
This question in 9708/32 Feb/March 2020
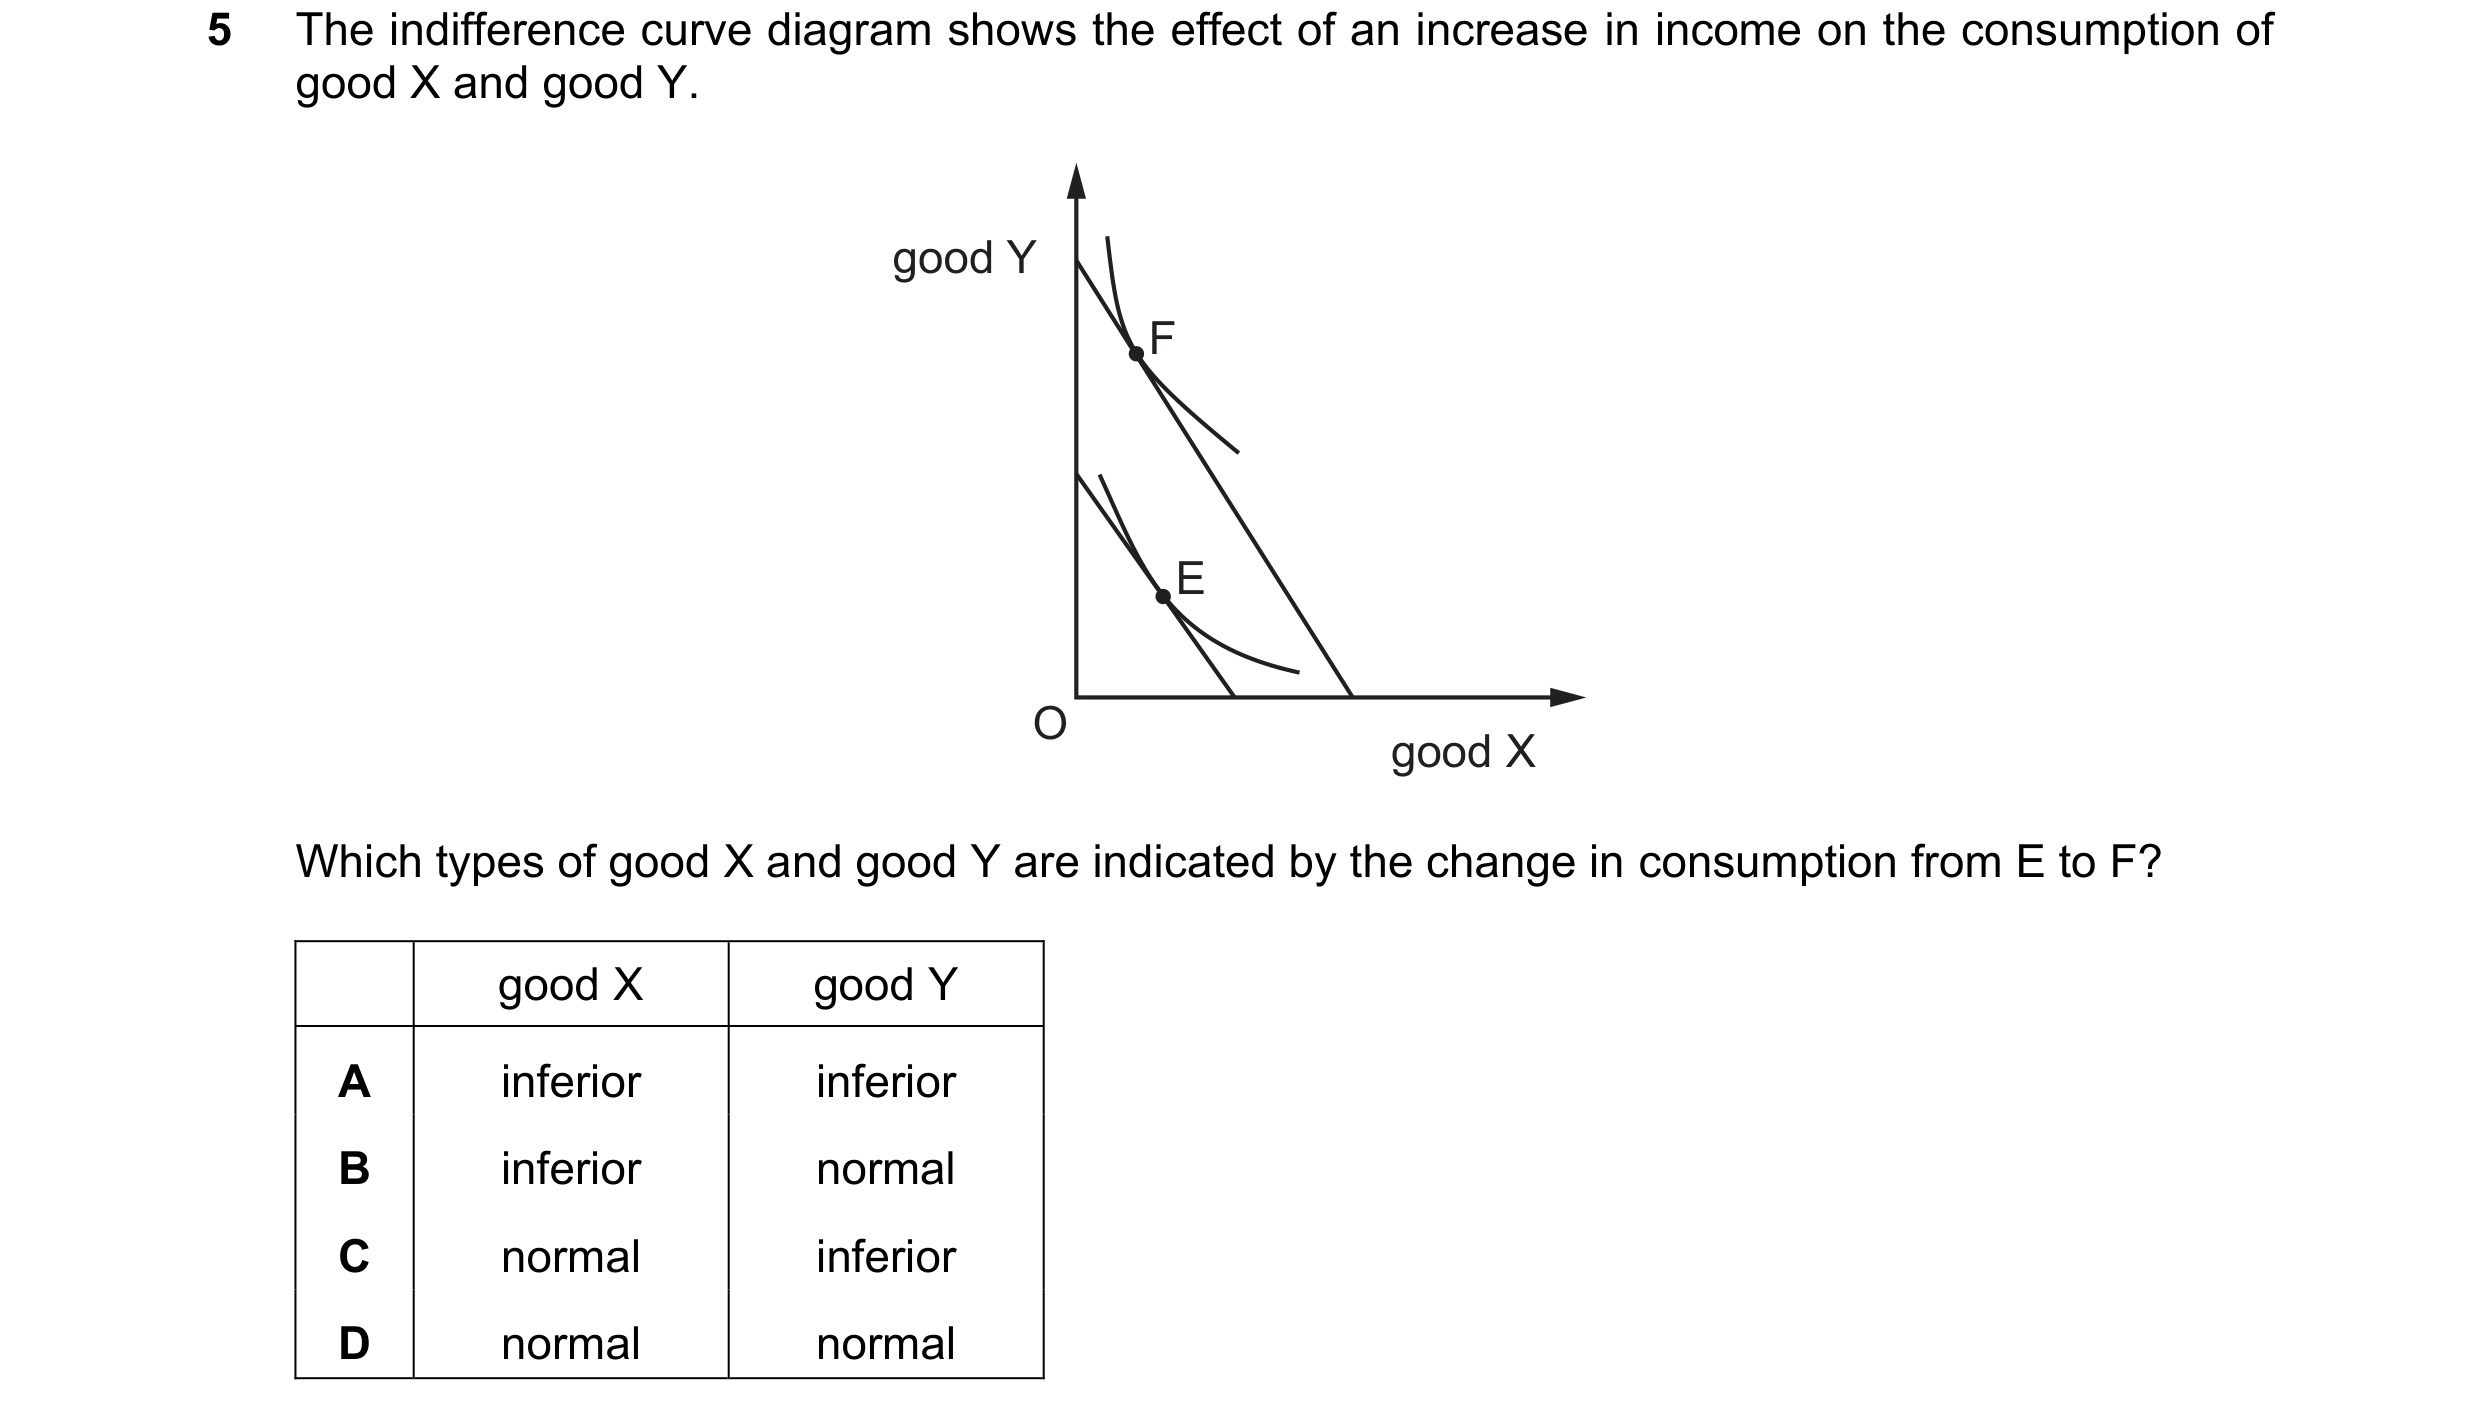
Q44 · The indifference curve diagram shows the effect of an increase in income on the… 9708/31 Oct/Nov 2020
5 The indifference curve diagram shows the effect of an increase in income on the consumption of good X and good Y. good Y F E O good X Which types of good X and good Y are indicated by the change in consumption from E to F? good X good Y A inferior inferior B inferior normal C normal inferior D normal normal
1 marks
Answer: B
This question in 9708/31 Oct/Nov 2020
Q45 · The diagrams show a consumer’s indifference curves (IC) and budget lines (BL) for an… 9708/32 Oct/Nov 2020
5 The diagrams show a consumer’s indifference curves (IC) and budget lines (BL) for an inferior good and a normal good. Which diagram shows the effect of a cut in income tax on the consumer’s choice? A B normal BL2 normal BL2 good good BL1 BL1 IC2 IC2 IC1 IC1 O O inferior good inferior good C D normal BL2 normal BL2 good good BL1 IC2 BL1 IC2 IC1 IC1 O O inferior good inferior good
1 marks
Answer: A
This question in 9708/32 Oct/Nov 2020
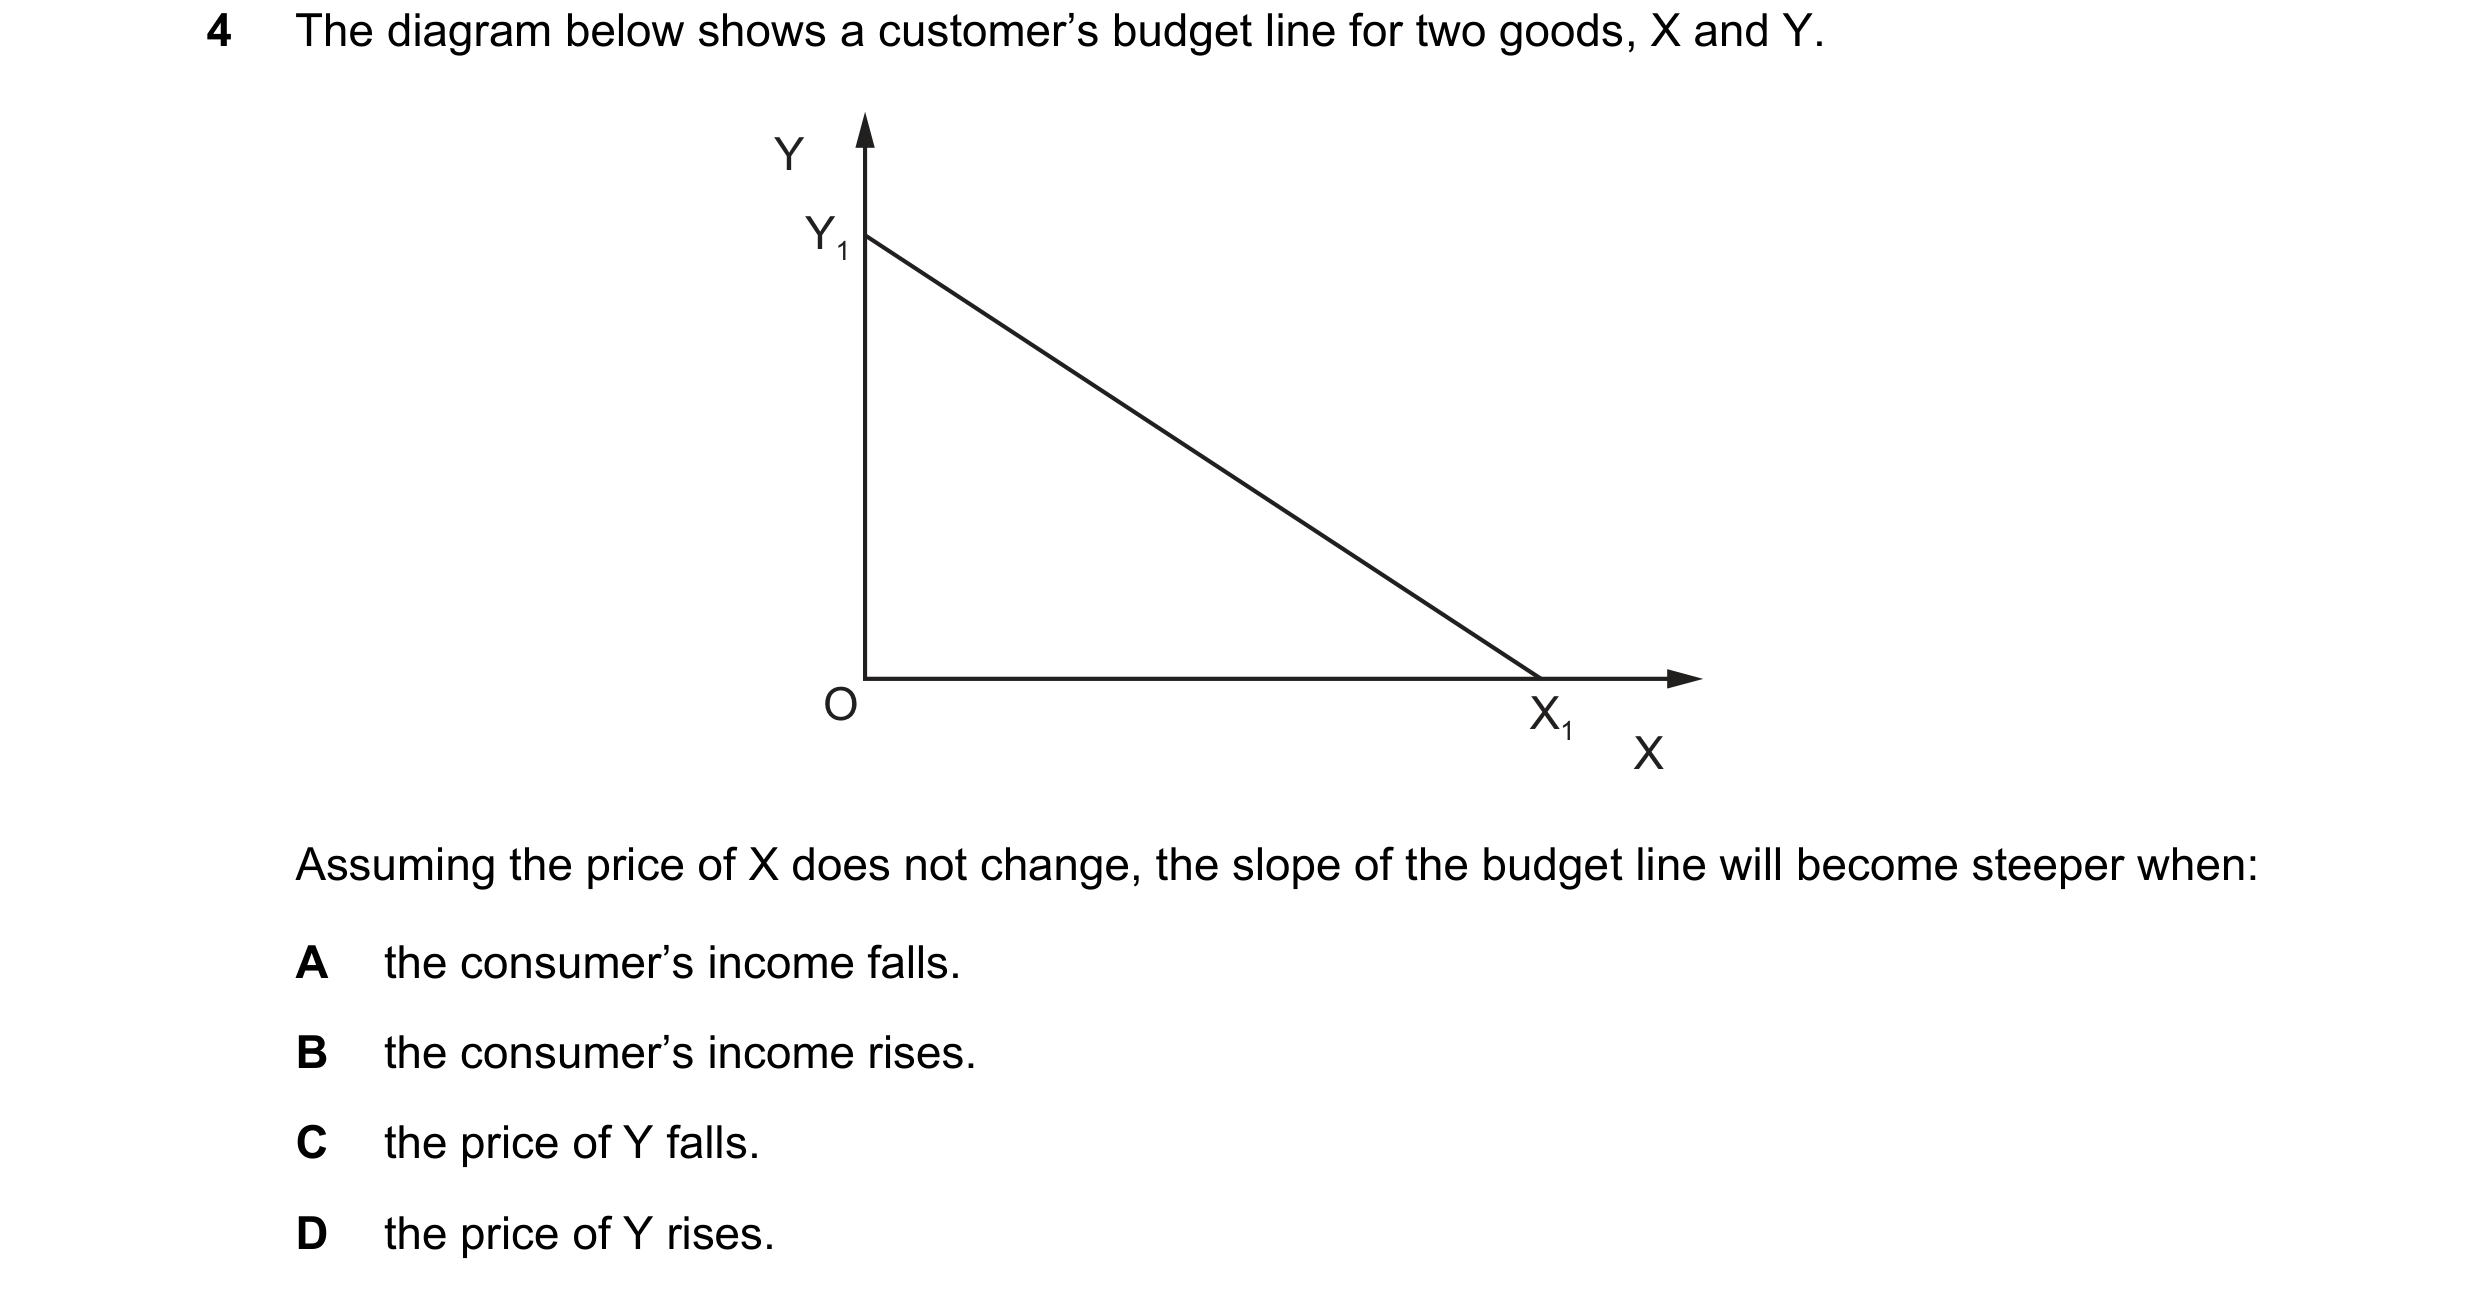
Q46 · The diagram below shows a customer’s budget line for two goods, X and Y 9708/33 Oct/Nov 2020
4 The diagram below shows a customer’s budget line for two goods, X and Y. Y Y1 O X1 X Assuming the price of X does not change, the slope of the budget line will become steeper when: A the consumer’s income falls. B the consumer’s income rises. C the price of Y falls. D the price of Y rises.
1 marks
Answer: C
This question in 9708/33 Oct/Nov 2020
Q47 · A utility-maximising consumer has a fixed income and can choose between good X and good Y 9708/32 Feb/March 2021
4 A utility-maximising consumer has a fixed income and can choose between good X and good Y. The diagram shows her budget line and different consumption combinations (F, G, H, J, K and L) of products X and Y. F good G Y J H K L O good X Which consumption combinations are currently available to her? A F, G, H and L B F, G, J, and L C G, J and L only D G, H, J and L
1 marks
Answer: D
This question in 9708/32 Feb/March 2021
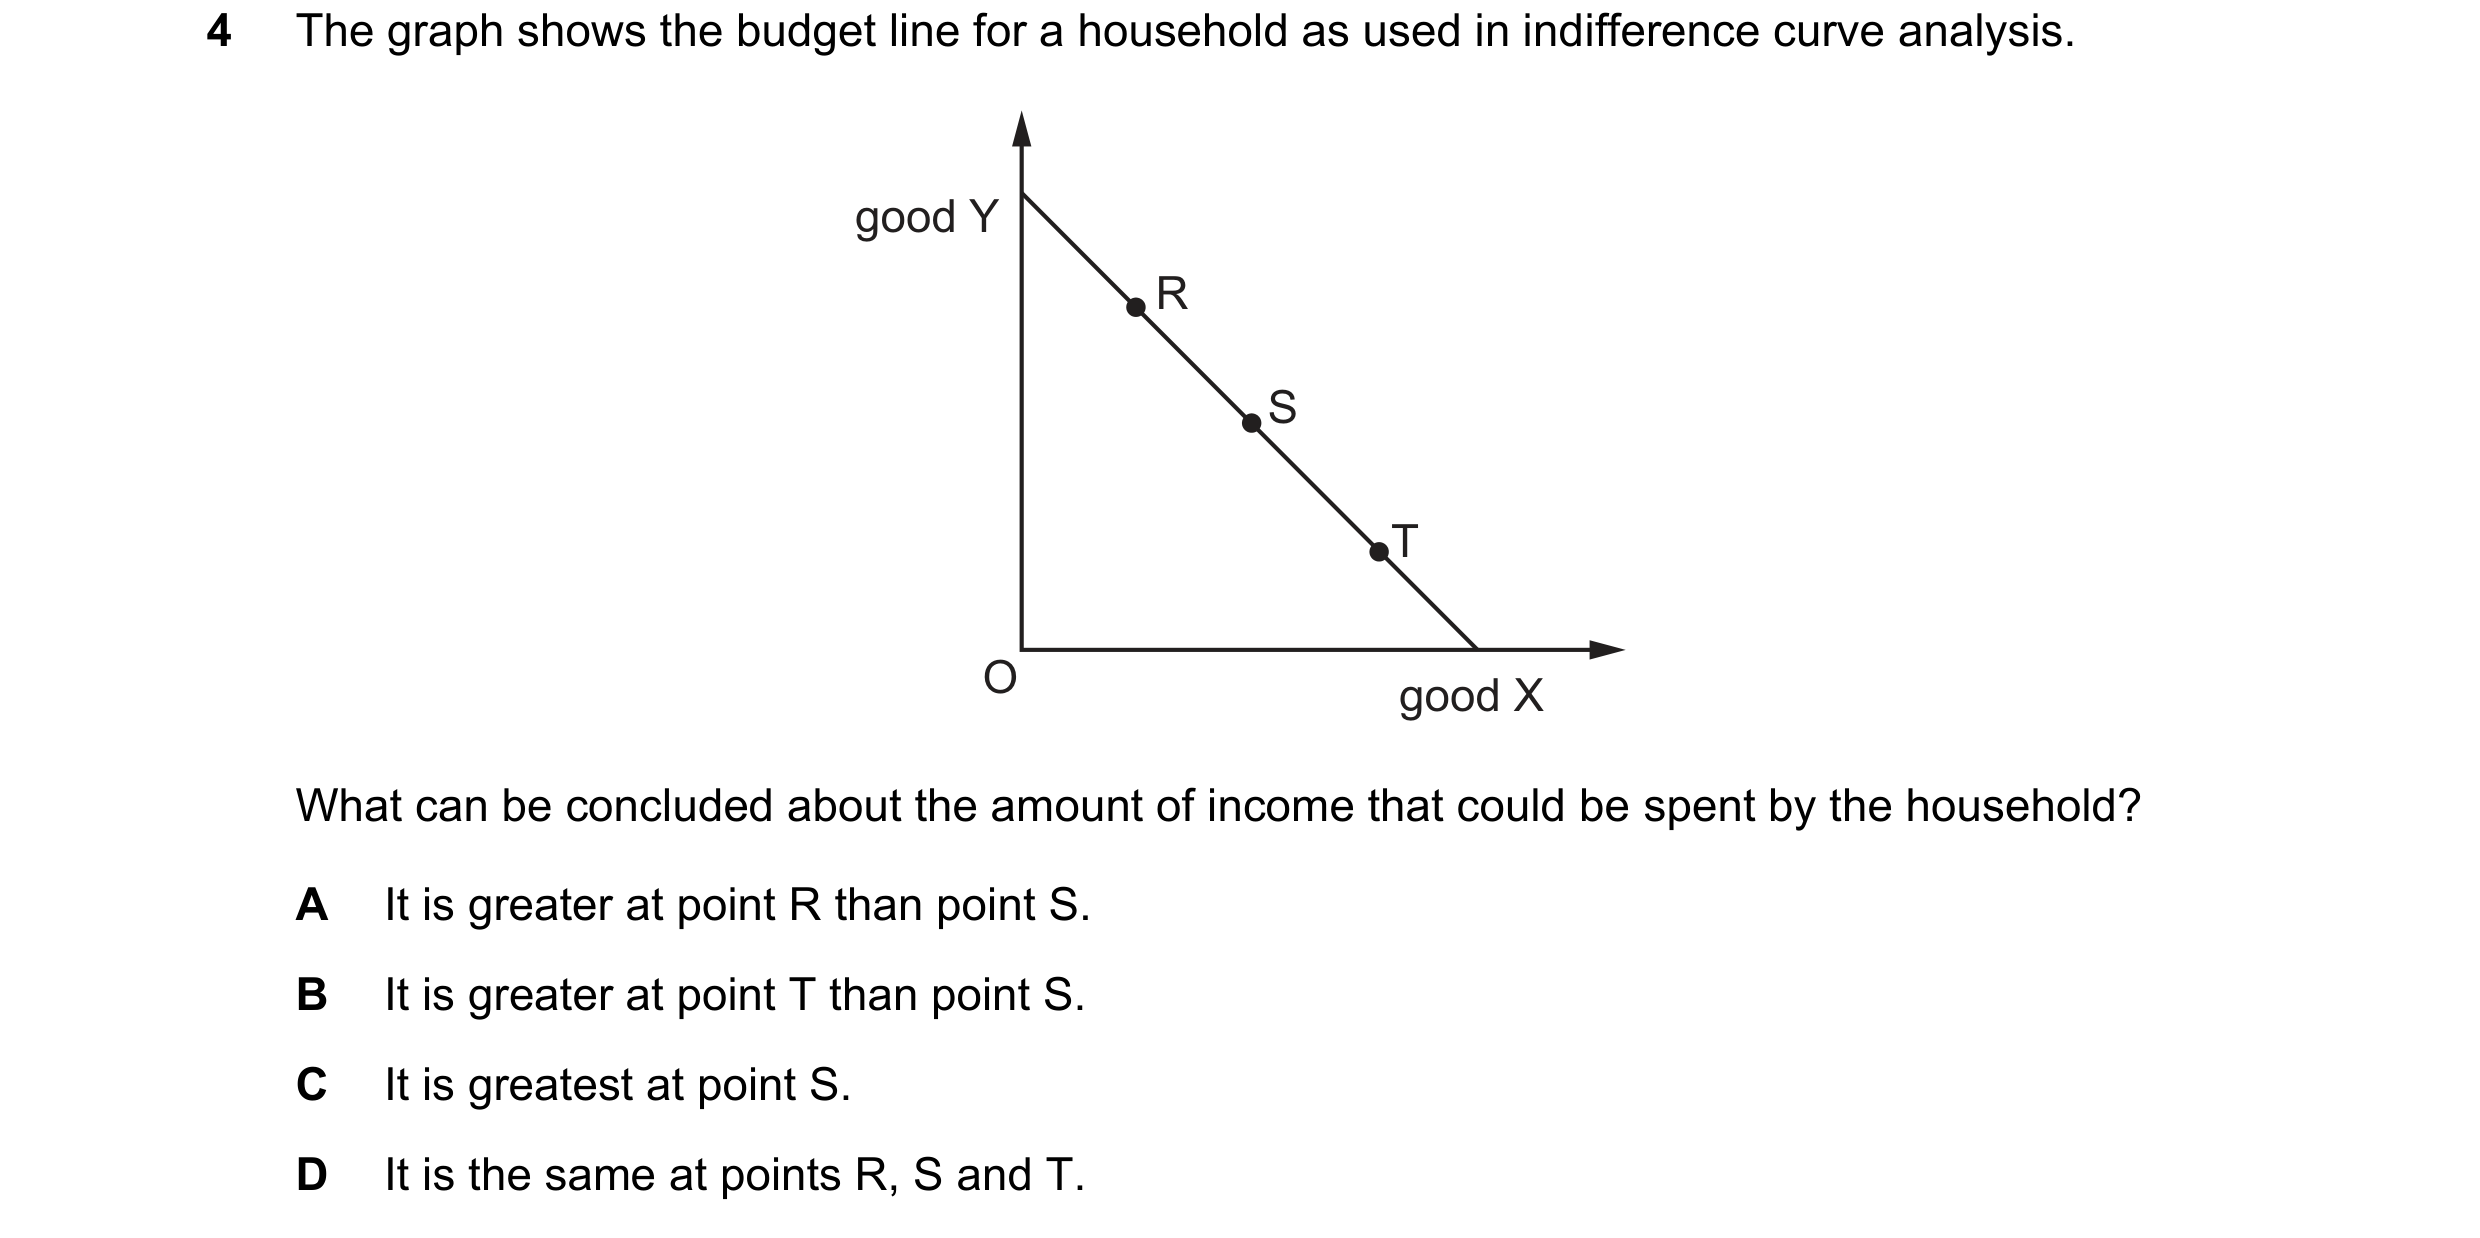
Q48 · The graph shows the budget line for a household as used in indifference curve analysis 9708/31 May/June 2021
4 The graph shows the budget line for a household as used in indifference curve analysis. good Y R S T O good X What can be concluded about the amount of income that could be spent by the household? A It is greater at point R than point S. B It is greater at point T than point S. C It is greatest at point S. D It is the same at points R, S and T.
1 marks
Answer: D
This question in 9708/31 May/June 2021
Q49 · The graph shows the budget line for a household as used in indifference curve analysis 9708/33 May/June 2021
4 The graph shows the budget line for a household as used in indifference curve analysis. good Y R S T O good X What can be concluded about the amount of income that could be spent by the household? A It is greater at point R than point S. B It is greater at point T than point S. C It is greatest at point S. D It is the same at points R, S and T.
1 marks
Answer: D
This question in 9708/33 May/June 2021
Q50 · What does a budget line on an indifference curve diagram show? 9708/31 Oct/Nov 2021
5 What does a budget line on an indifference curve diagram show? A the amount that a household has available to spend plotted against time B the combinations of two goods that can be purchased when all income is spent C the difference between a government’s income and expenditure plotted against time D the relationship between the price of a good and the amount demanded
1 marks
Answer: B
This question in 9708/31 Oct/Nov 2021
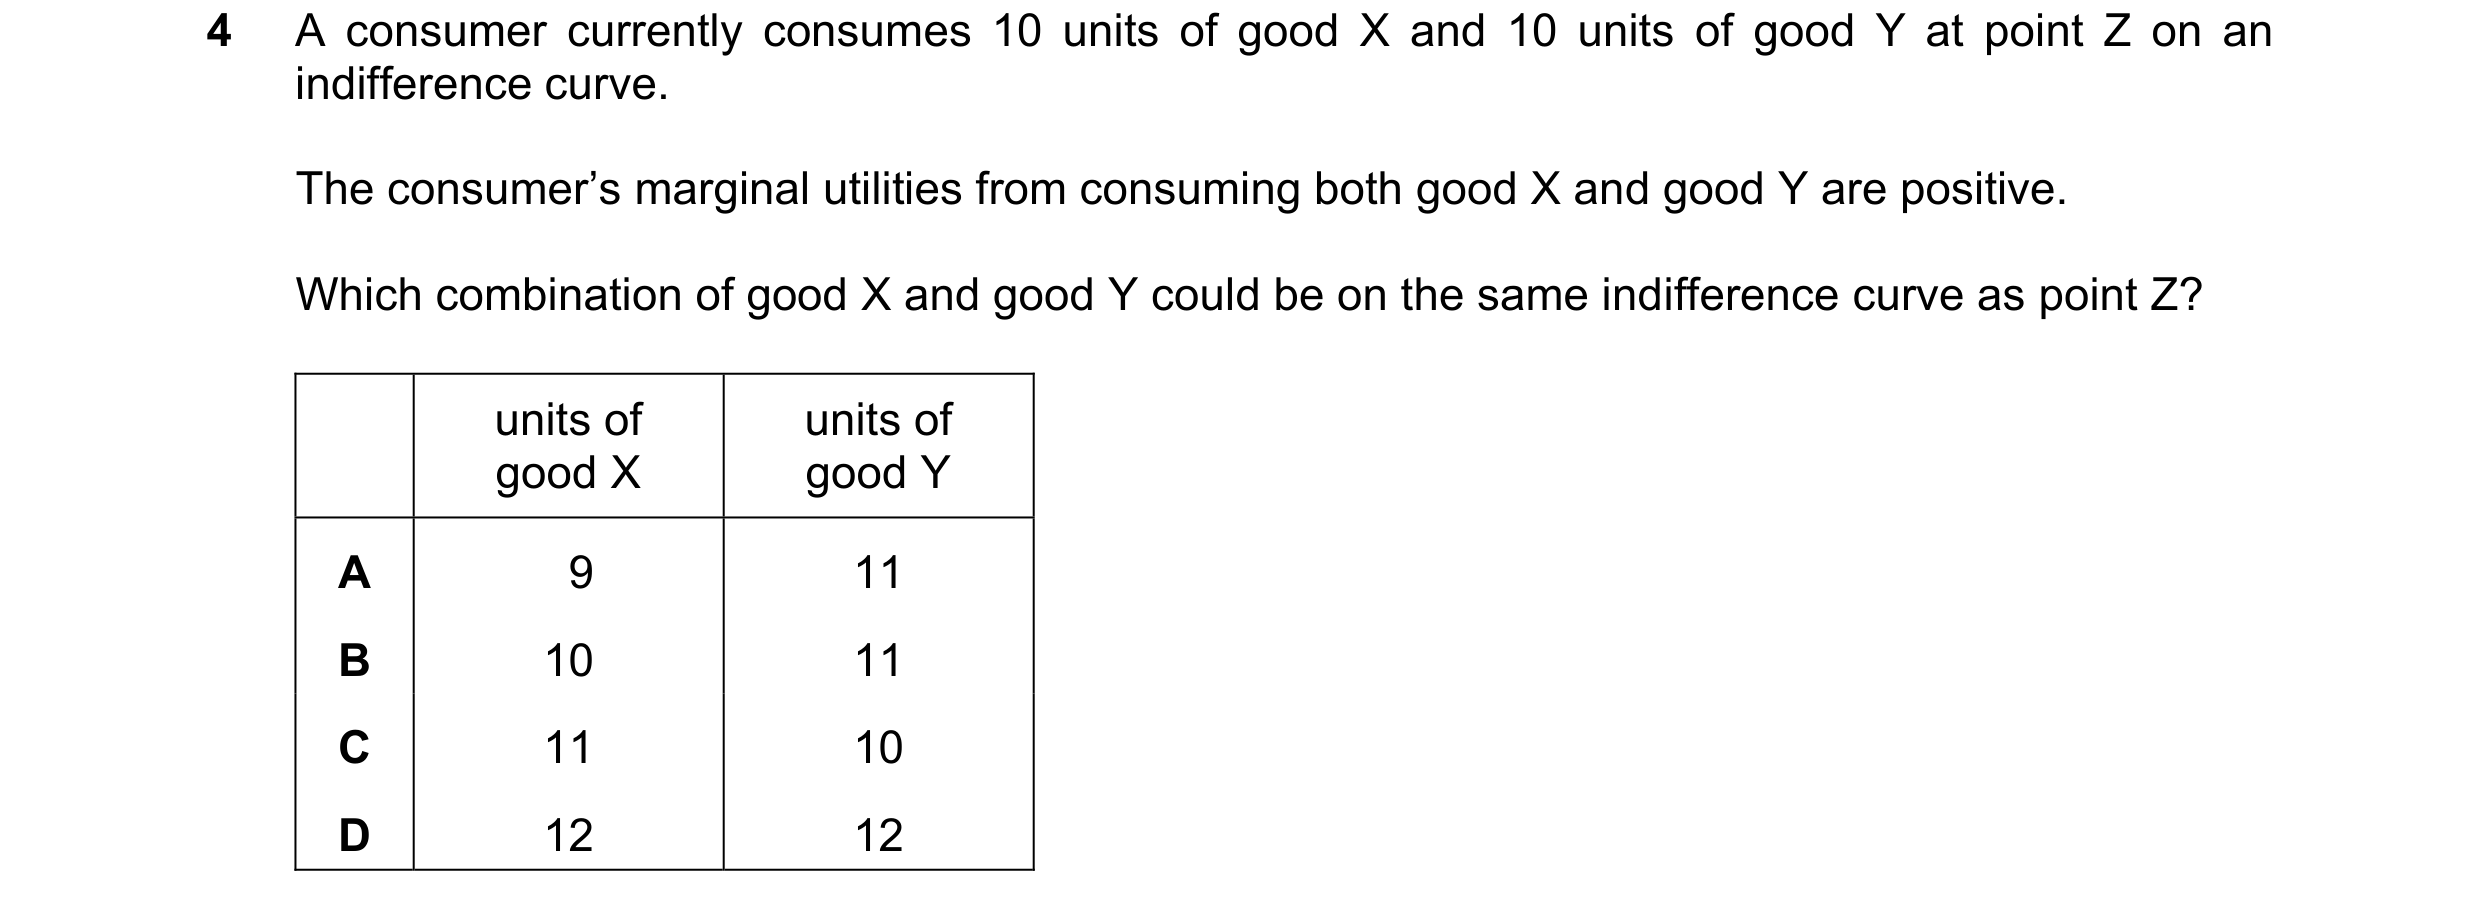
Q51 · A consumer currently consumes 10 units of good X and 10 units of good Y at point Z on an… 9708/32 Oct/Nov 2021
4 A consumer currently consumes 10 units of good X and 10 units of good Y at point Z on an indifference curve. The consumer’s marginal utilities from consuming both good X and good Y are positive. Which combination of good X and good Y could be on the same indifference curve as point Z? units of units of good X good Y A 9 11 B 10 11 C 11 10 D 12 12
1 marks
Answer: A
This question in 9708/32 Oct/Nov 2021
Q52 · The diagram shows two indifference curves and two budget lines for goods X and Y 9708/32 Oct/Nov 2021
5 The diagram shows two indifference curves and two budget lines for goods X and Y. The consumer’s initial equilibrium is point R. good Y Y2 Y1 S IC2 R IC1 O X1 X2 good X There is a shift in the budget line from Y1X1 to Y2X2 and the new equilibrium for the consumer is point S. What can definitely be concluded about good X? A It is a Giffen good. B It is an inferior good. C It is a normal good. D It is a public good.
1 marks
Answer: B
This question in 9708/32 Oct/Nov 2021
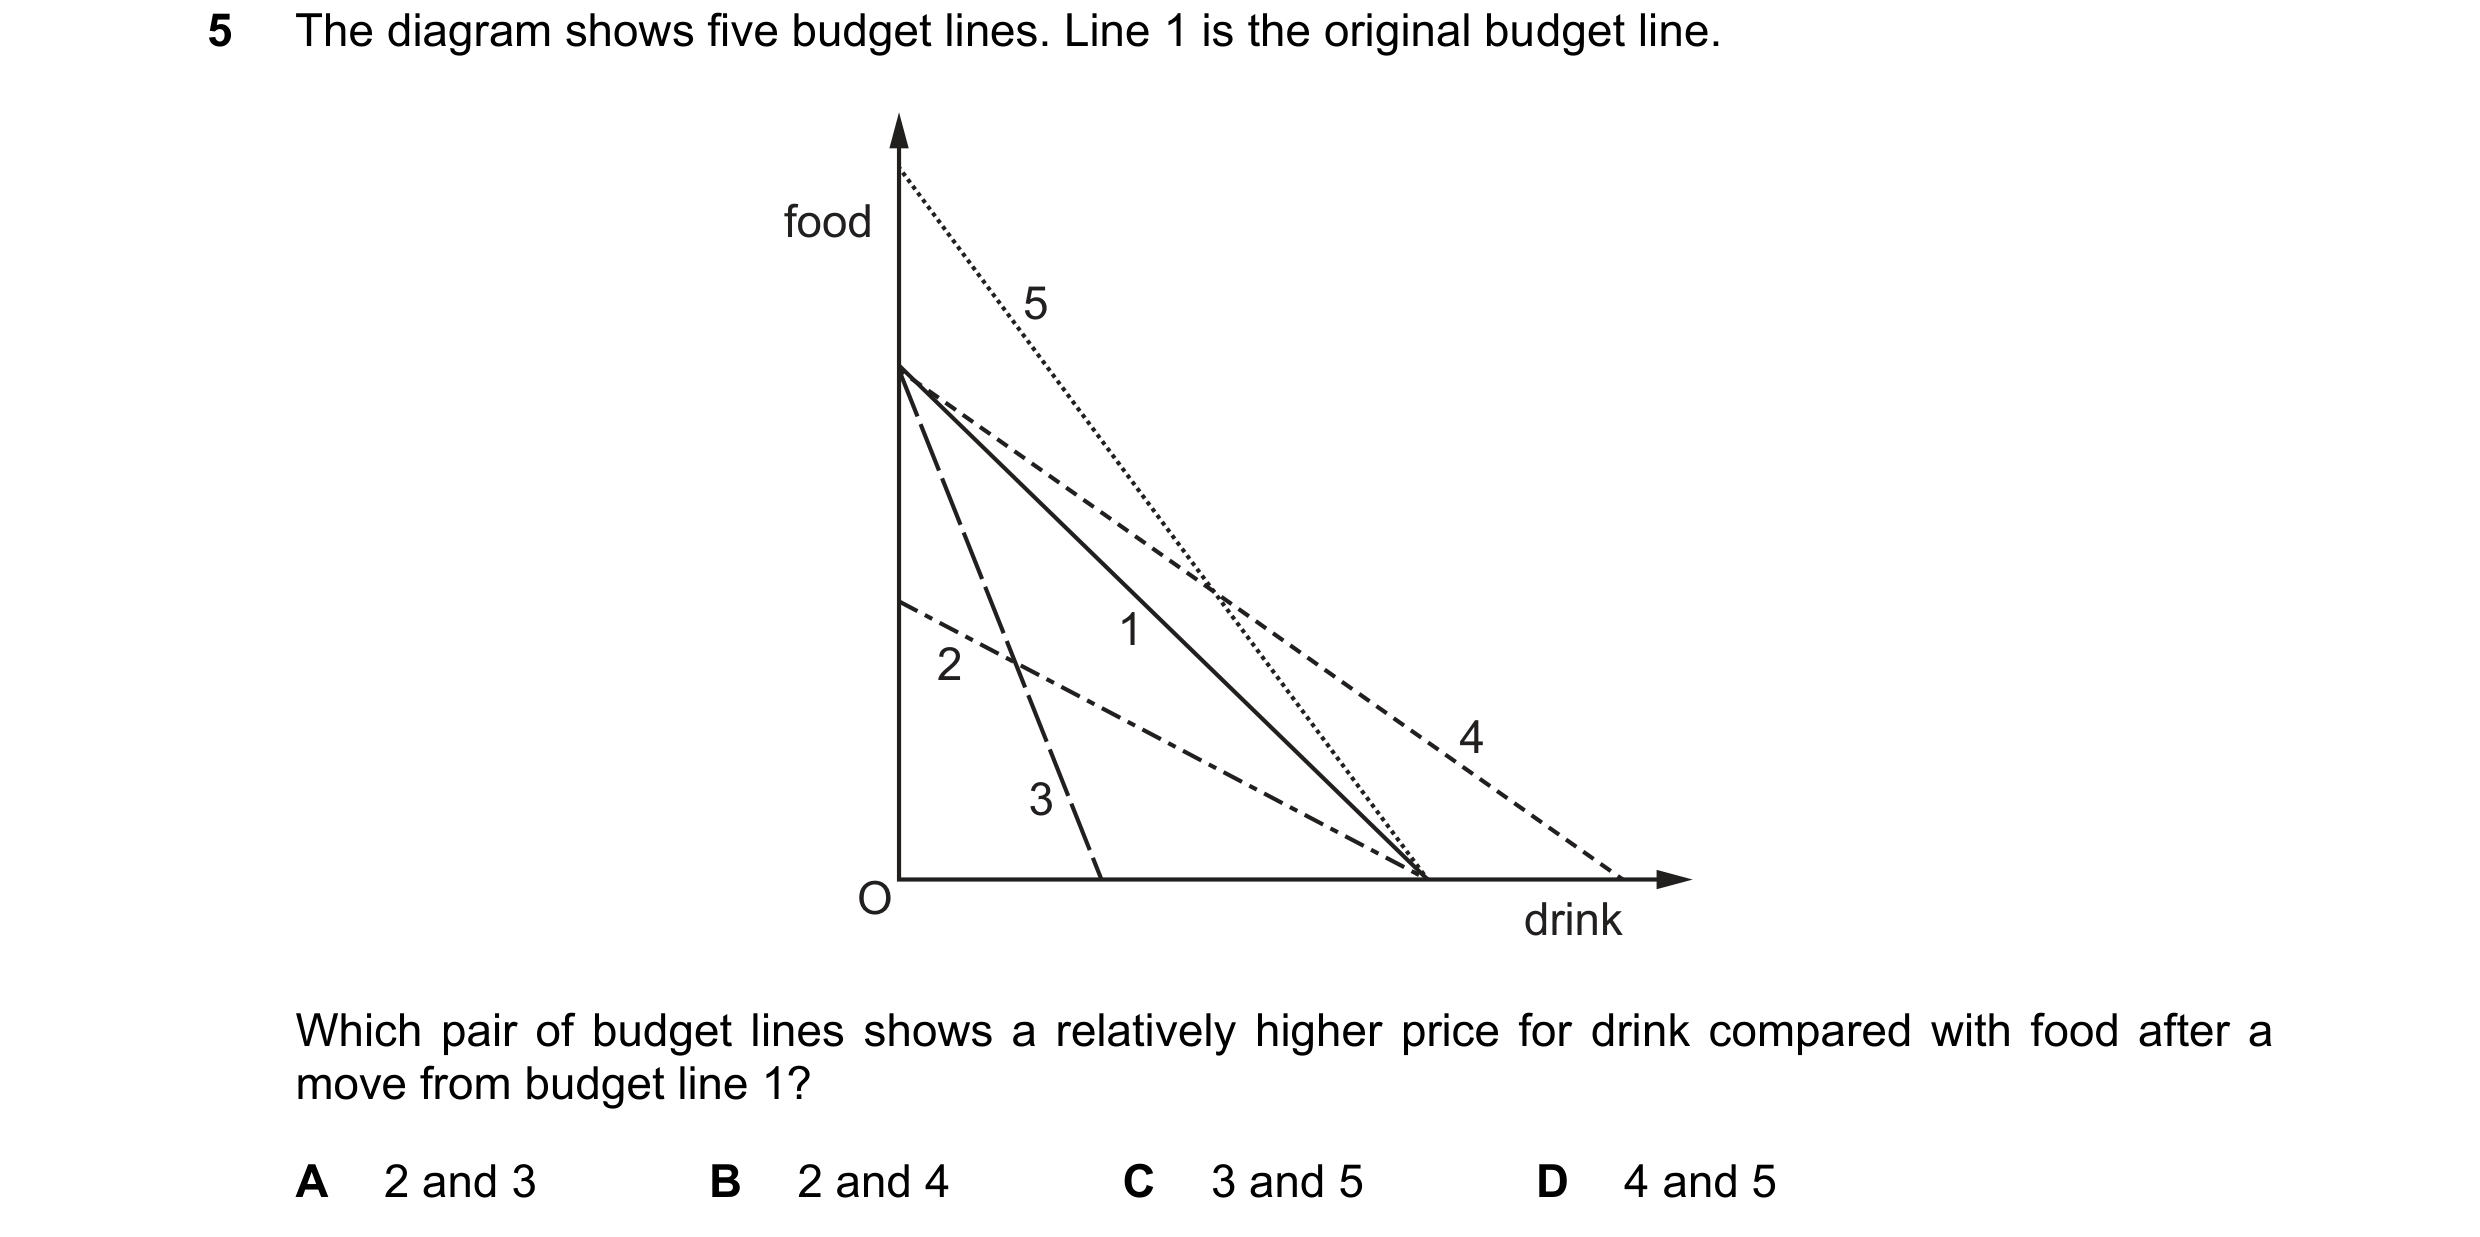
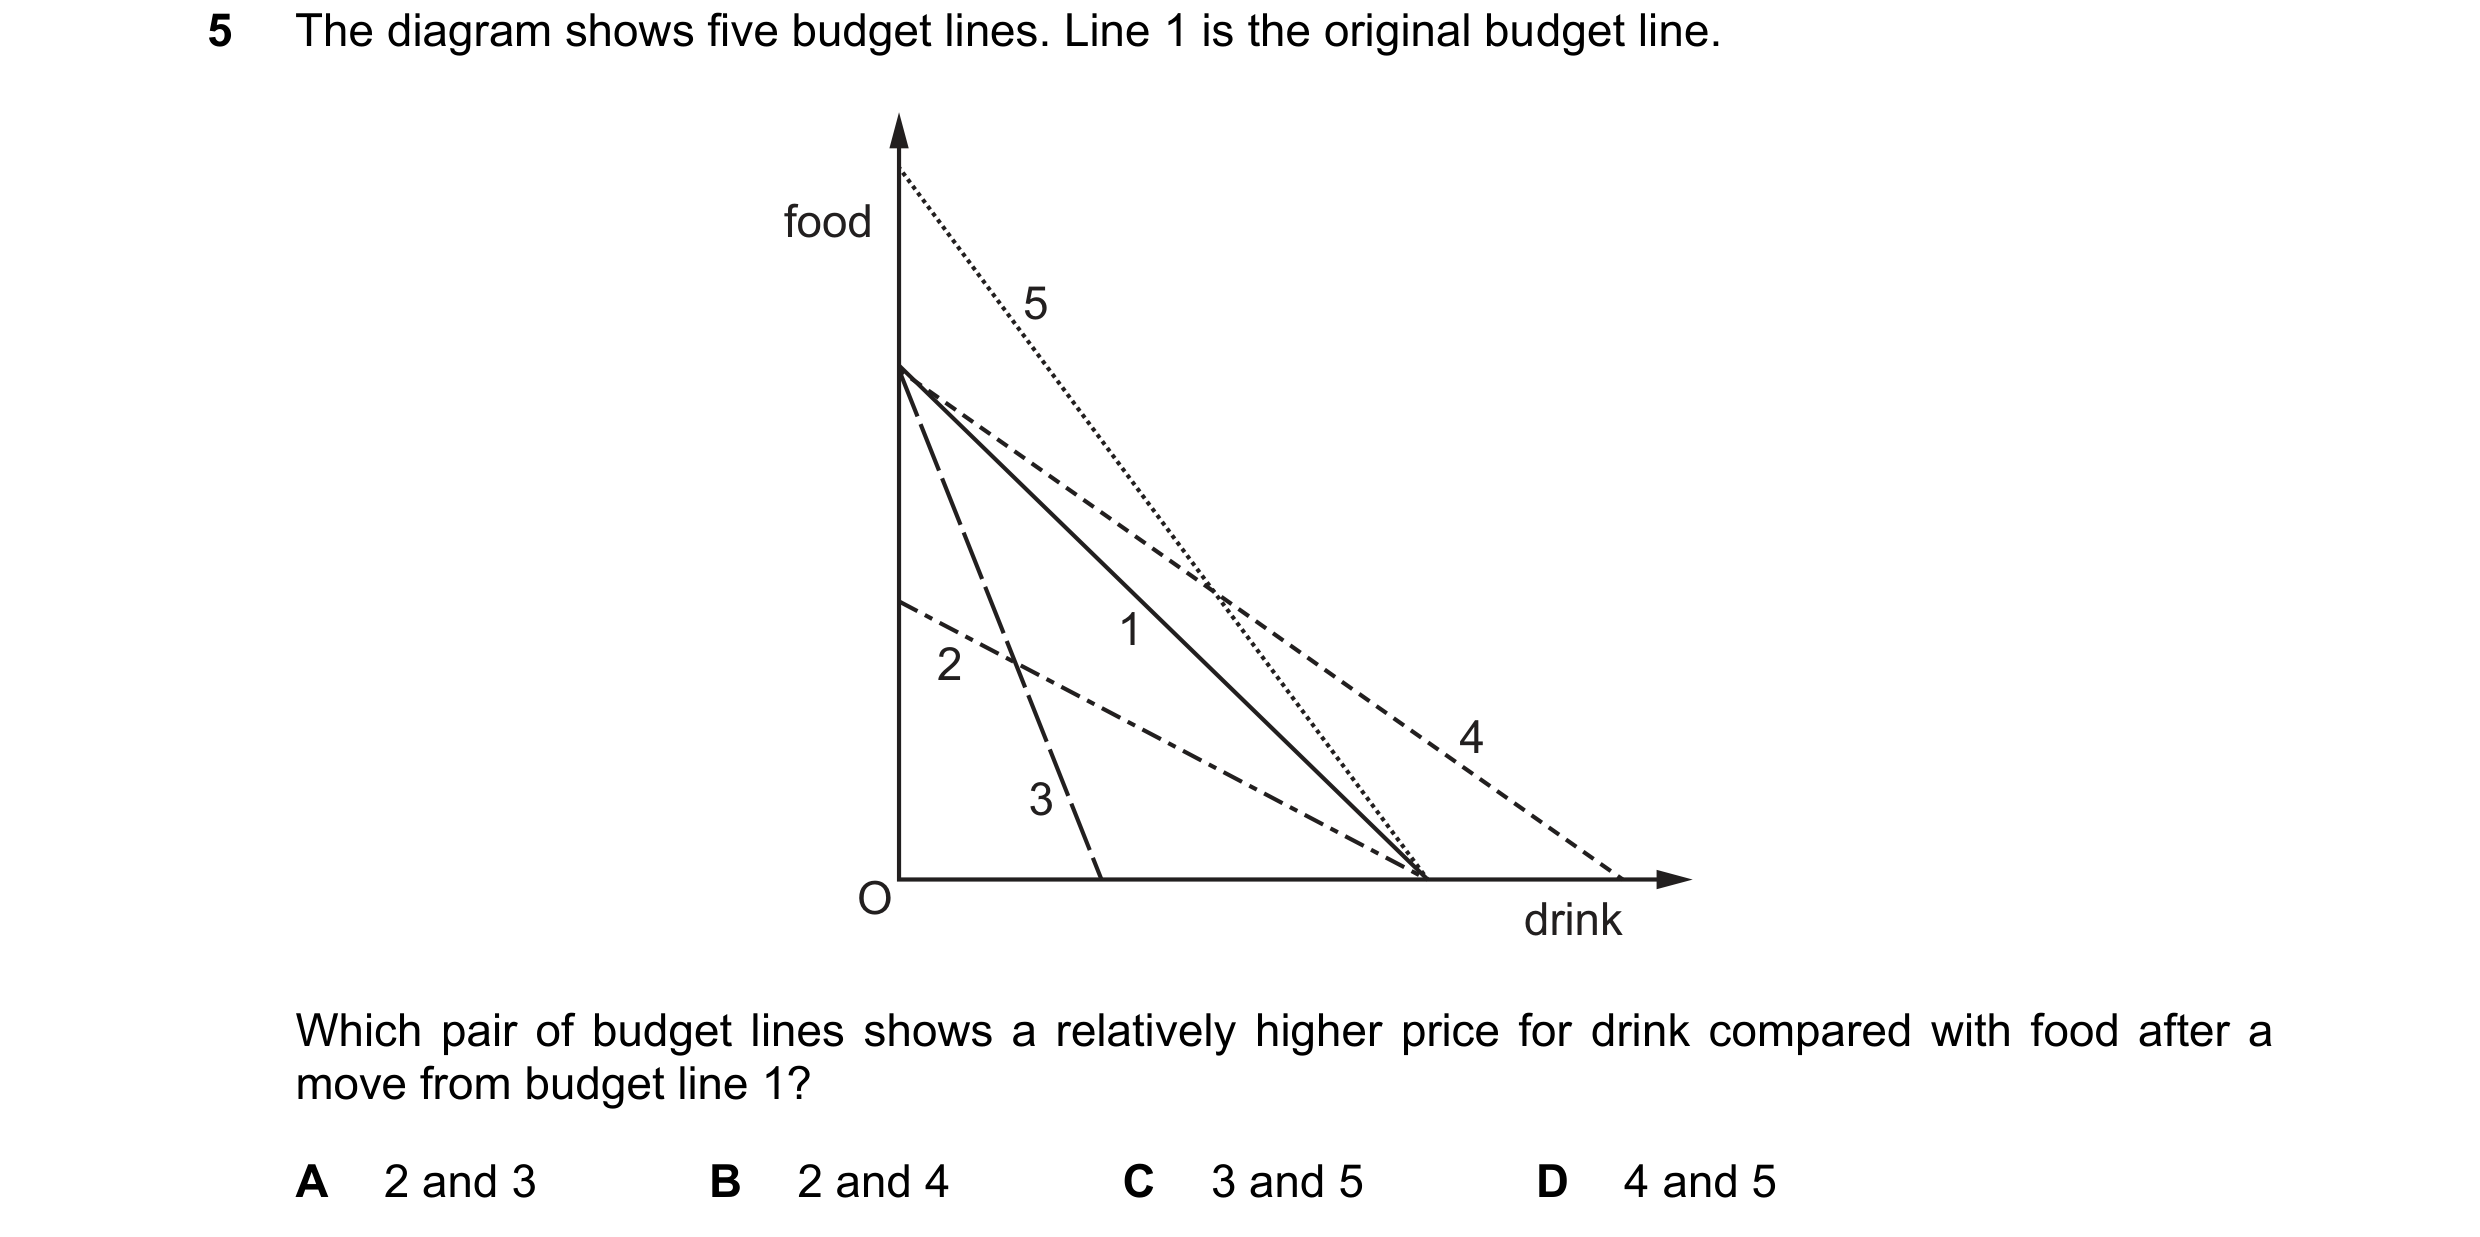
Q53 · The diagram shows five budget lines 9708/31 May/June 2022
5 The diagram shows five budget lines. Line 1 is the original budget line. food 5 1 2 4 3 O drink Which pair of budget lines shows a relatively higher price for drink compared with food after a move from budget line 1? A 2 and 3 B 2 and 4 C 3 and 5 D 4 and 5
1 marks
Answer: C
This question in 9708/31 May/June 2022
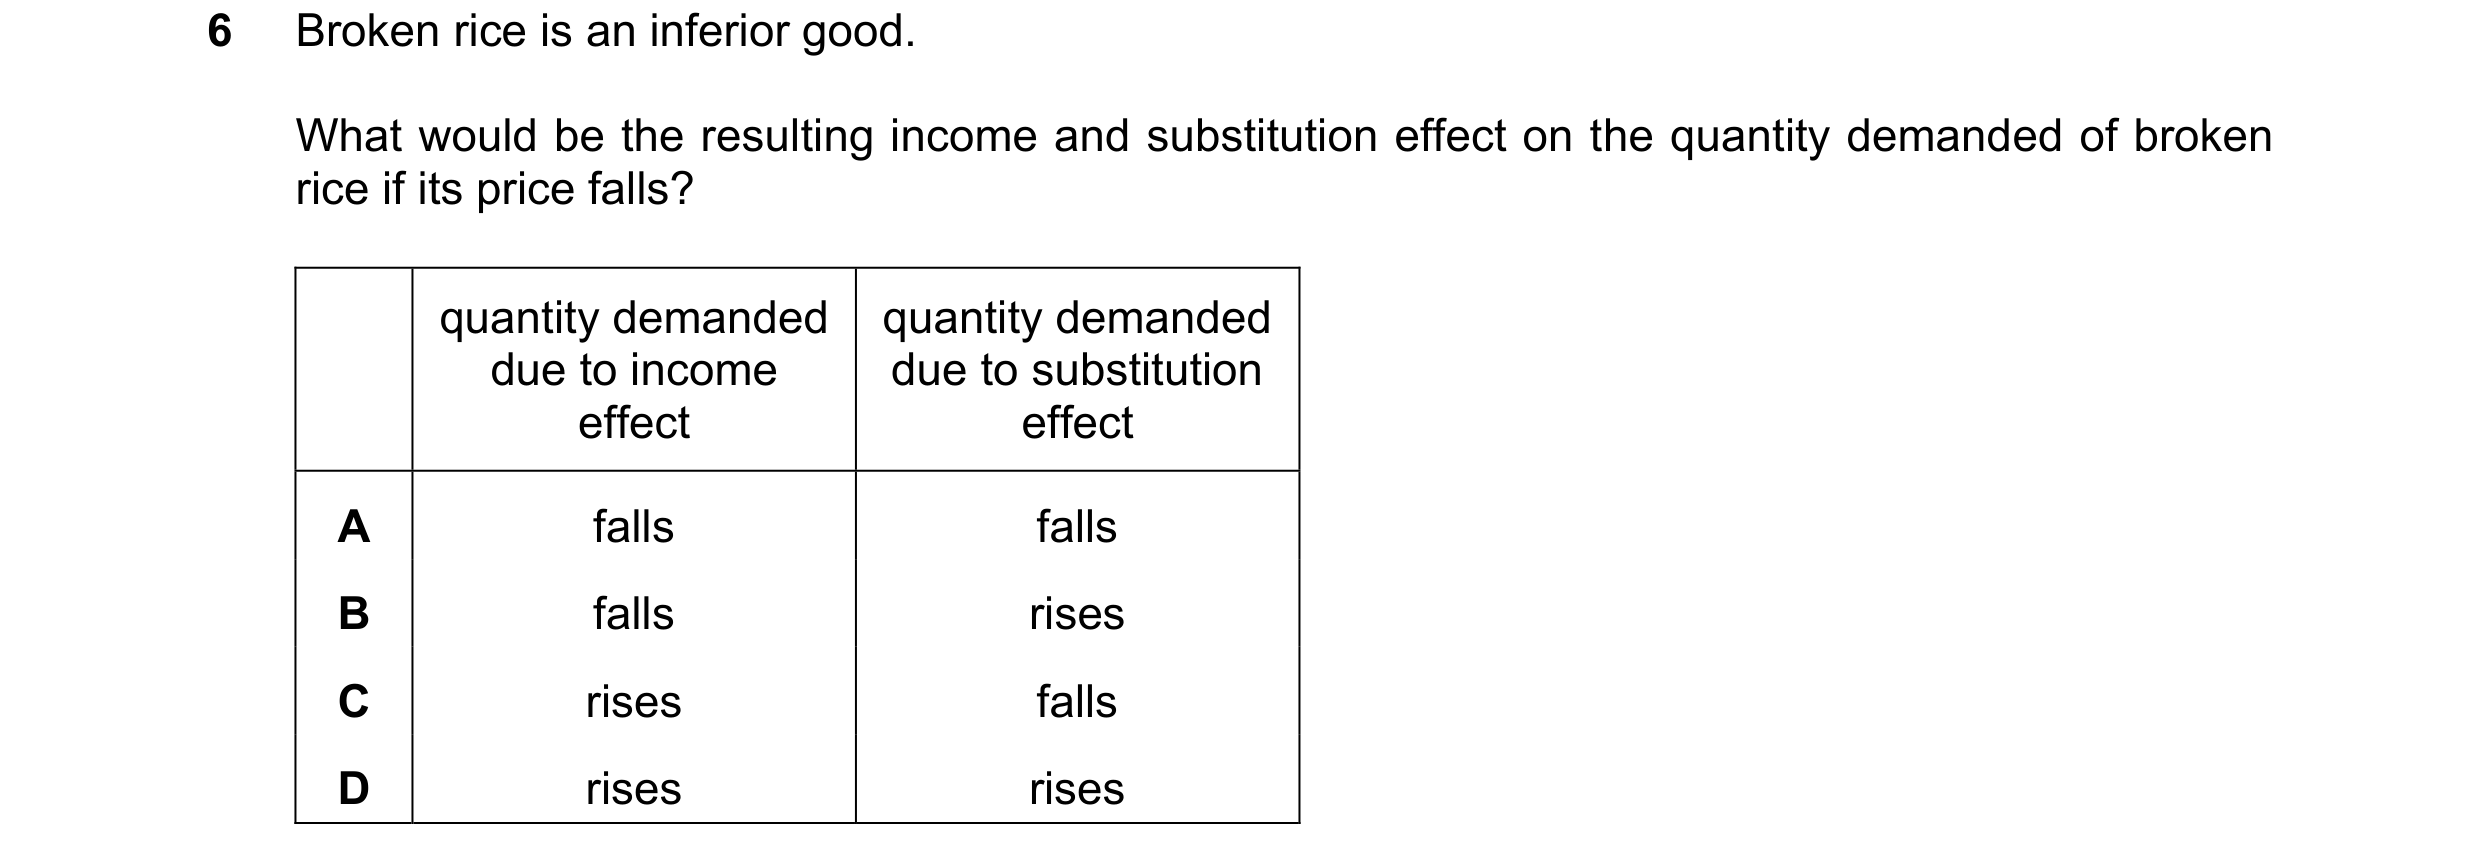
Q54 · Broken rice is an inferior good 9708/31 May/June 2022
6 Broken rice is an inferior good. What would be the resulting income and substitution effect on the quantity demanded of broken rice if its price falls? quantity demanded quantity demanded due to income due to substitution effect effect A falls falls B falls rises C rises falls D rises rises
1 marks
Answer: B
This question in 9708/31 May/June 2022
Q55 · The diagram shows five budget lines 9708/33 May/June 2022
5 The diagram shows five budget lines. Line 1 is the original budget line. food 5 1 2 4 3 O drink Which pair of budget lines shows a relatively higher price for drink compared with food after a move from budget line 1? A 2 and 3 B 2 and 4 C 3 and 5 D 4 and 5
1 marks
Answer: C
This question in 9708/33 May/June 2022
Q56 · Broken rice is an inferior good 9708/33 May/June 2022
6 Broken rice is an inferior good. What would be the resulting income and substitution effect on the quantity demanded of broken rice if its price falls? quantity demanded quantity demanded due to income due to substitution effect effect A falls falls B falls rises C rises falls D rises rises
1 marks
Answer: B
This question in 9708/33 May/June 2022
Q57 · Which statement is correct? 9708/31 Oct/Nov 2022
5 Which statement is correct? A A budget line shows the combinations of two goods which can be bought with a given income. B A budget line shows the combinations of two goods which a consumer wants to buy. C A budget line shows the difference between income and expenditure. D A budget line shows the maximum potential output of two goods with given resources.
1 marks
Answer: A
This question in 9708/31 Oct/Nov 2022
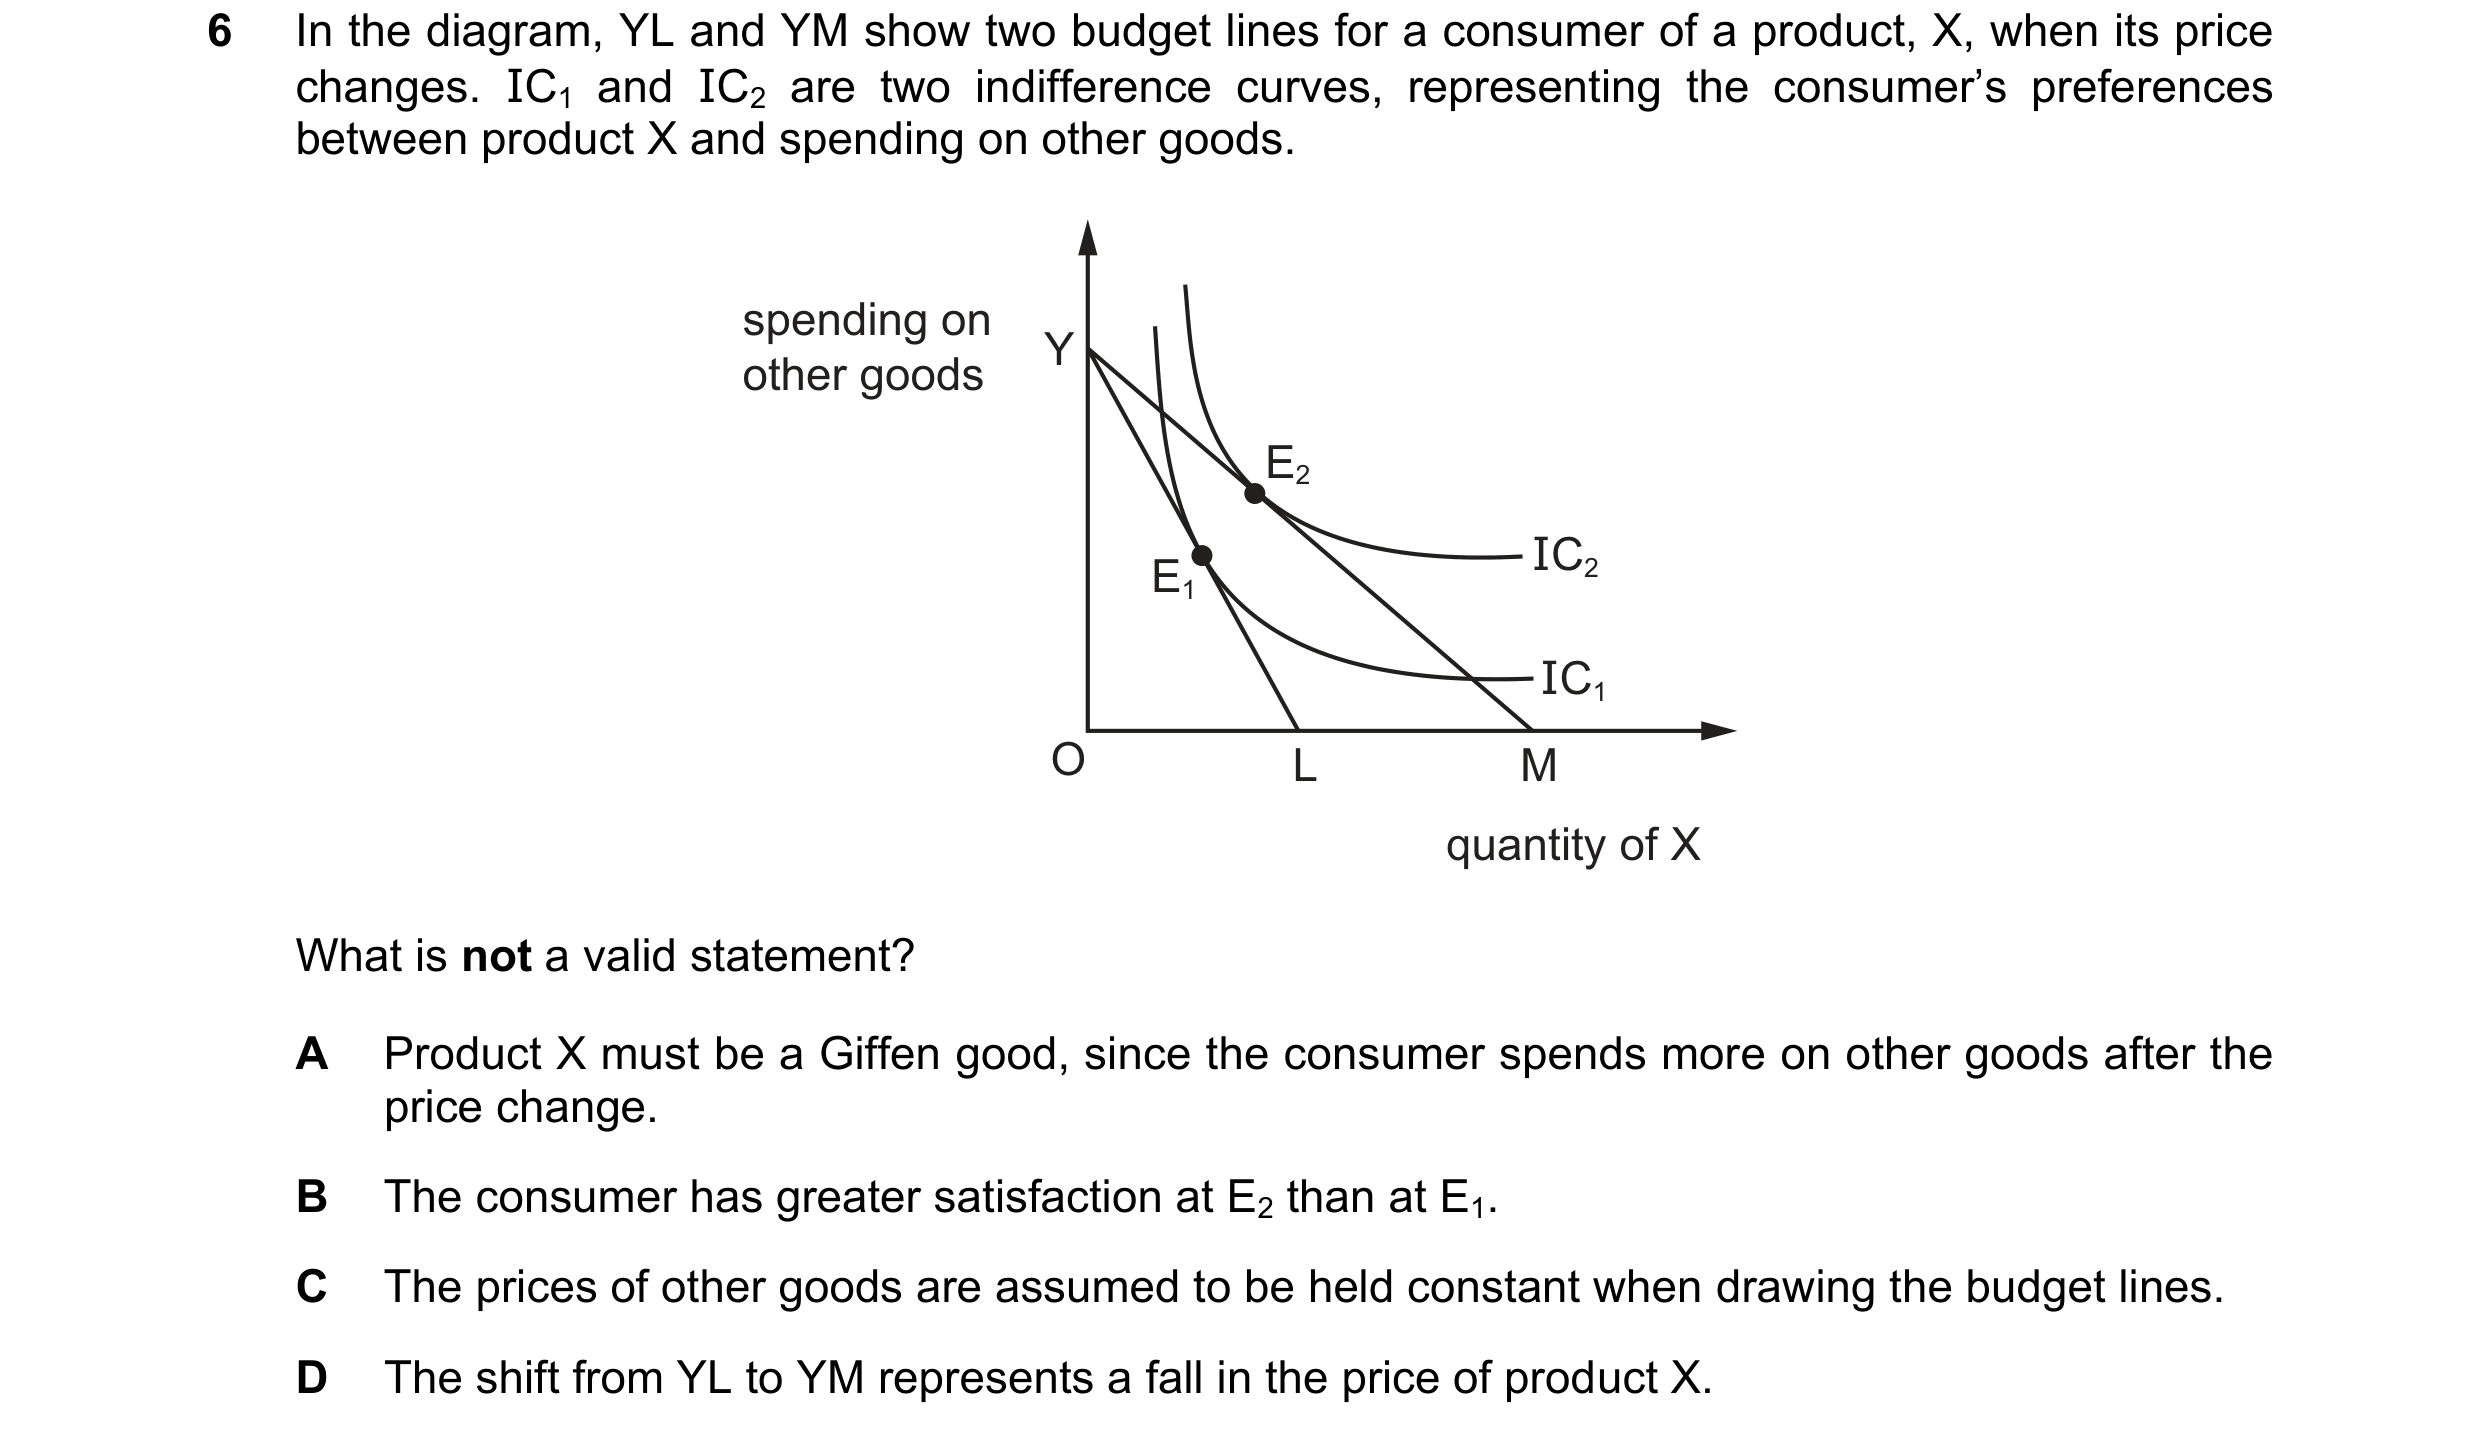
Q58 · In the diagram, YL and YM show two budget lines for a consumer of a product, X, when its… 9708/31 Oct/Nov 2022
6 In the diagram, YL and YM show two budget lines for a consumer of a product, X, when its price changes. IC1 and IC2 are two indifference curves, representing the consumer’s preferences between product X and spending on other goods. spending on Y other goods E2 IC2 E1 IC1 O L M quantity of X What is not a valid statement? A Product X must be a Giffen good, since the consumer spends more on other goods after the price change. B The consumer has greater satisfaction at E2 than at E1. C The prices of other goods are assumed to be held constant when drawing the budget lines. D The shift from YL to YM represents a fall in the price of product X.
1 marks
Answer: A
This question in 9708/31 Oct/Nov 2022
Q59 · Which statement about a budget line in consumer behaviour theory is correct? 9708/32 Oct/Nov 2022
5 Which statement about a budget line in consumer behaviour theory is correct? A It illustrates consumer preference between two goods. B It illustrates combinations of two goods that consumers are able to purchase with a given income. C It illustrates the least cost combination of goods that yield the same level of utility. D It illustrates the income effect of a price change.
1 marks
Answer: B
This question in 9708/32 Oct/Nov 2022
Q60 · When the price of a good increases, which statement is correct according to the analysis… 9708/32 Oct/Nov 2022
6 When the price of a good increases, which statement is correct according to the analysis that uses budget lines and indifference curves? A The income and substitution effects of the price increase will work in opposite directions in the case of a Giffen good. B The income effect of the price increase will result in reduced consumption for all goods. C The new equilibrium position will be where the new budget line meets the original indifference curve. D The price rise will be represented by a parallel shift inwards of the original budget line.
1 marks
Answer: A
This question in 9708/32 Oct/Nov 2022
Q61 · The diagram shows a consumer’s initial budget line is GH and a set of indifference curves… 9708/33 Oct/Nov 2022
5 The diagram shows a consumer’s initial budget line is GH and a set of indifference curves IC1, IC2 and IC3 for goods R and S. The original equilibrium for the consumer is point X. The inflation rate is rising faster than money incomes. What will be the most likely new equilibrium for the consumer if all real income is spent? good R G B A X D IC2 IC1 C IC3 O H good S
1 marks
Answer: D
This question in 9708/33 Oct/Nov 2022
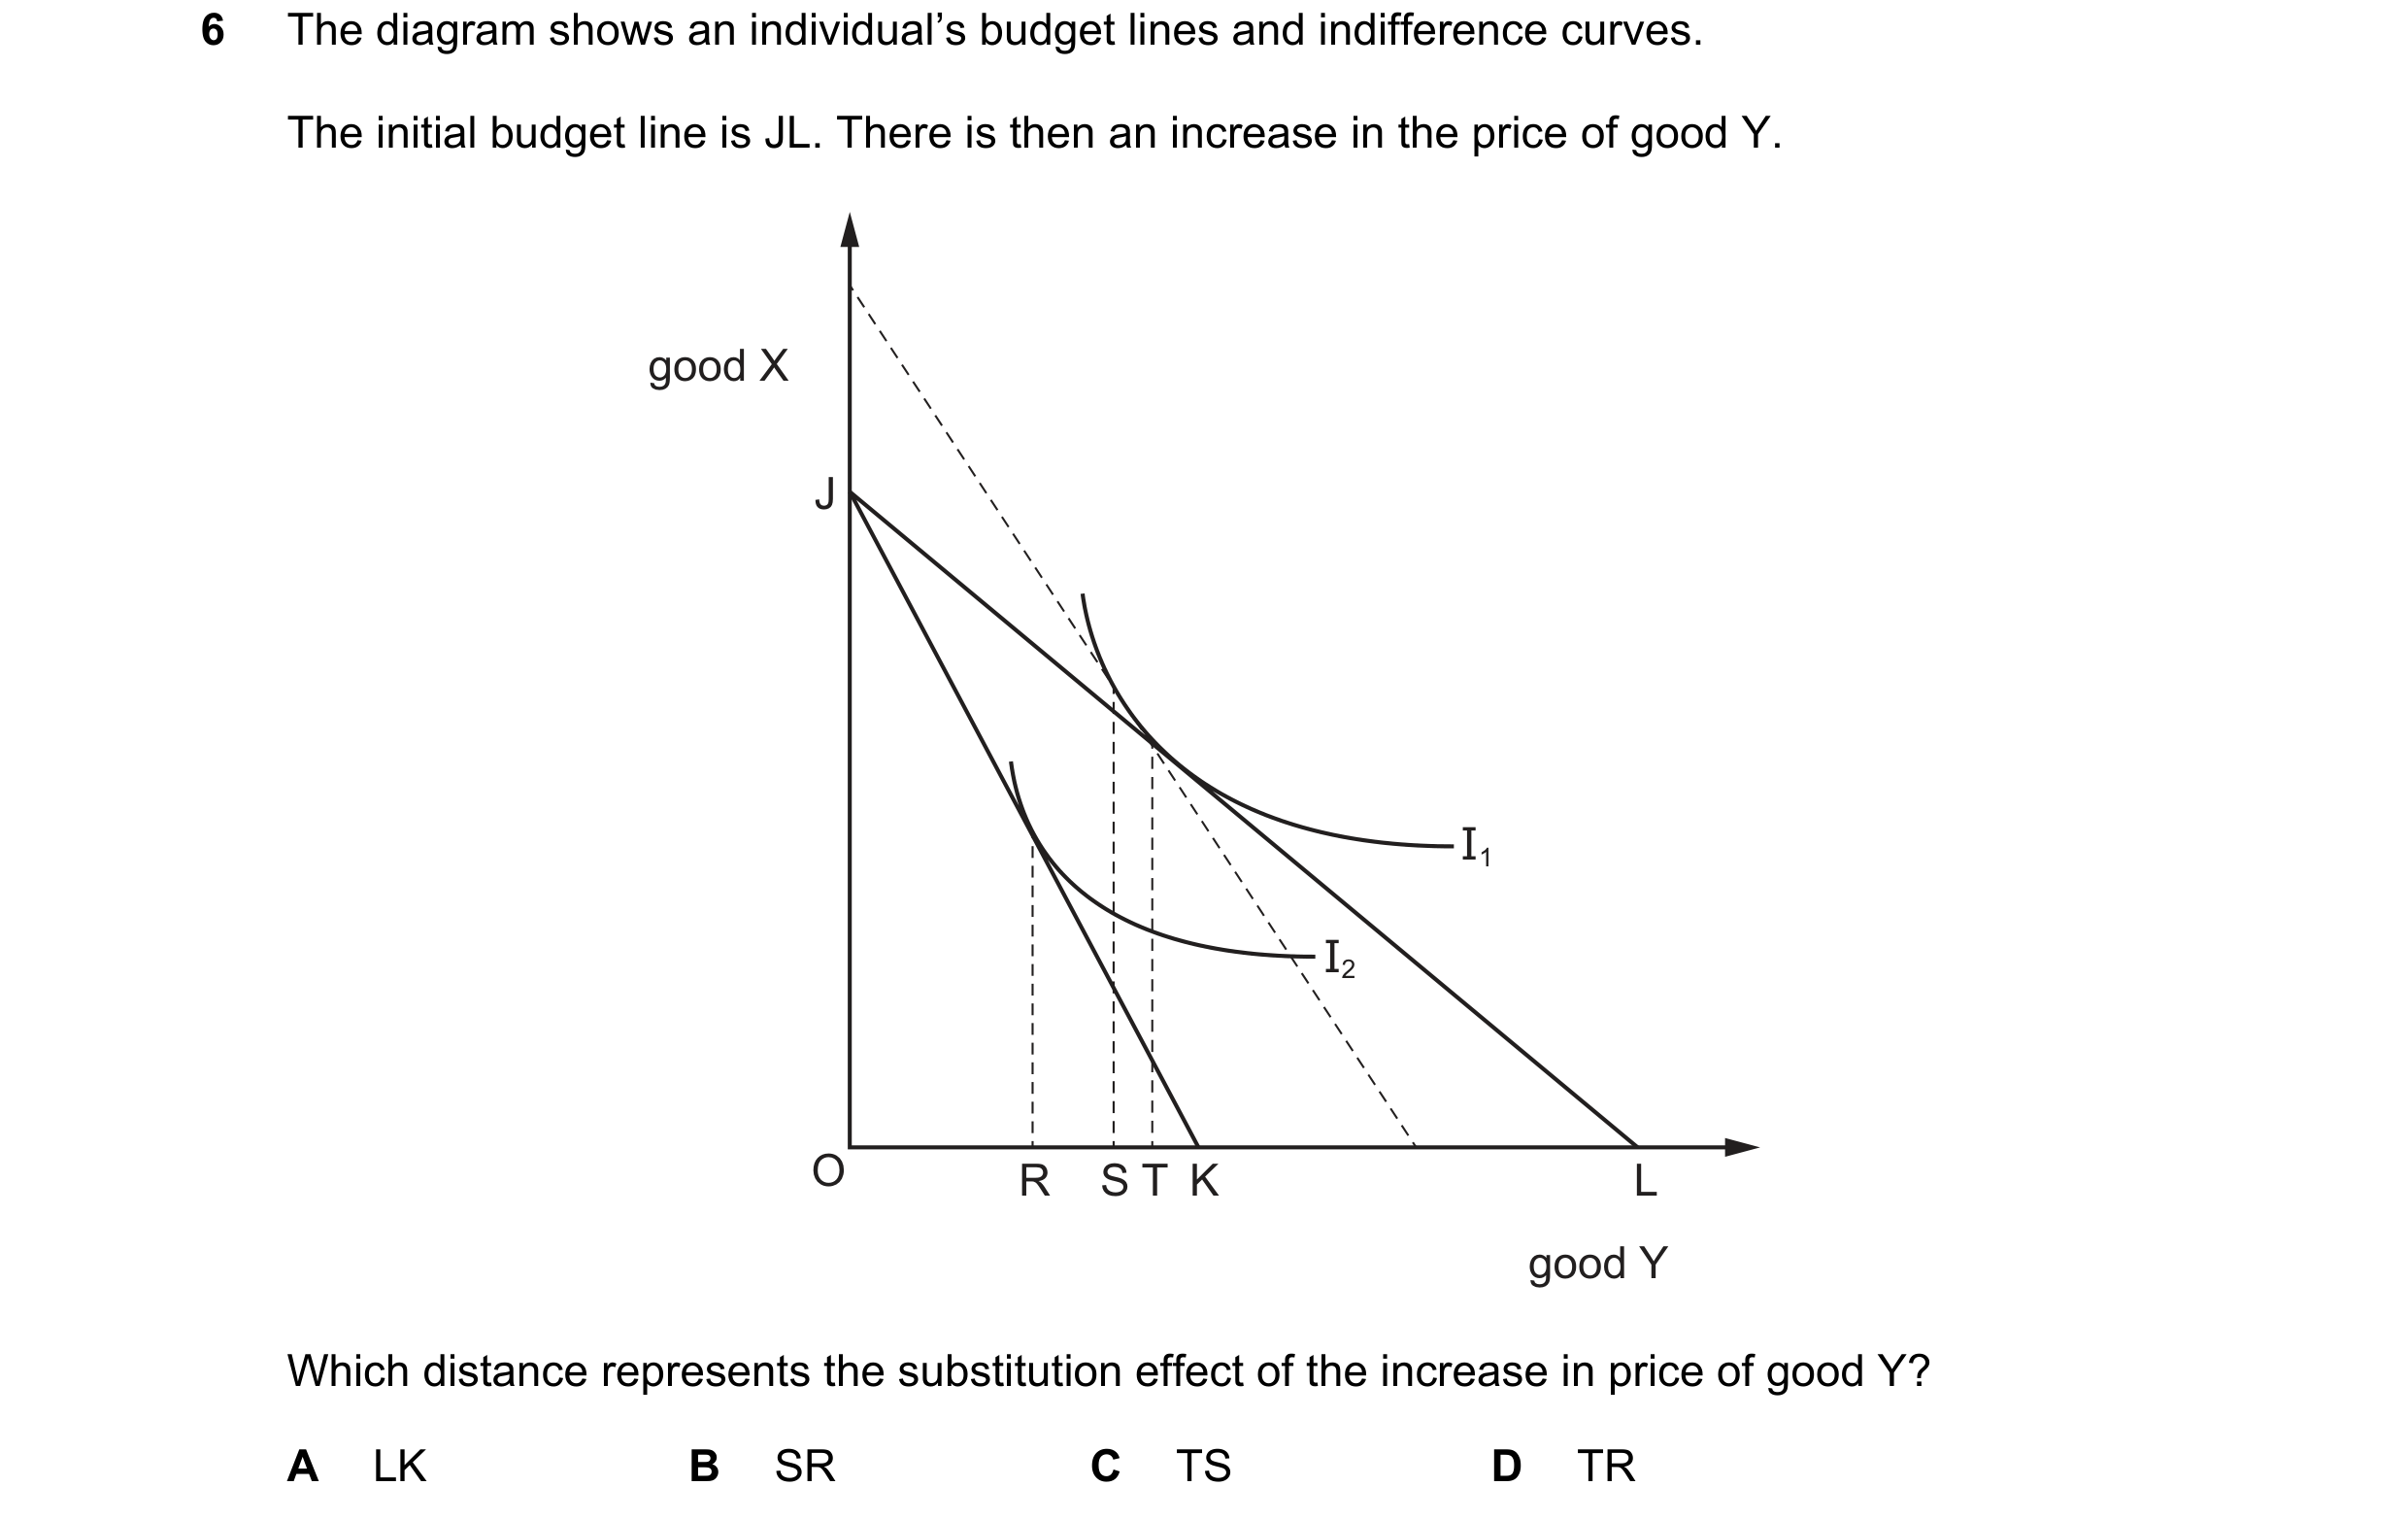
Q62 · The diagram shows an individual’s budget lines and indifference curves 9708/33 Oct/Nov 2022
6 The diagram shows an individual’s budget lines and indifference curves. The initial budget line is JL. There is then an increase in the price of good Y. good X J I1 I2 O R S T K L good Y Which distance represents the substitution effect of the increase in price of good Y? A LK B SR C TS D TR
1 marks
Answer: C
This question in 9708/33 Oct/Nov 2022
Q63 · The diagram shows the effect of a price change on an individual consumer’s equilibrium… 9708/32 Feb/March 2023
3 The diagram shows the effect of a price change on an individual consumer’s equilibrium, moving from E1 to E2. good Y F E2 E1 I2 I1 O G H good X What can be deduced from the diagram about the price change, the substitution effect and the income effect? substitution price change income effect effect A price of X falls positive positive B price of X falls positive negative C price of Y rises negative positive D price of Y rises negative negative
1 marks
Answer: B
This question in 9708/32 Feb/March 2023
Q64 · Which assumption in relation to an indifference theory diagram is not correct? 9708/31 May/June 2023
3 Which assumption in relation to an indifference theory diagram is not correct? A The consumer’s income may change. B The consumer may change their satisfaction-maximising objective. C The consumers may change their tastes and preferences. D The relative prices of products may change.
1 marks
Answer: B
This question in 9708/31 May/June 2023
Q65 · The diagram shows an individual’s indifference curve, I1, for apples and pears 9708/32 May/June 2023
2 The diagram shows an individual’s indifference curve, I1, for apples and pears. apples 19 Y X 12 I1 0 0 2 4 pears What can be concluded from the movement from point X to point Y on this curve? A The individual can afford more apples than pears. B The individual has not changed their total utility. C The individual prefers apples to pears. D The individual has gained more utility by moving from point X to point Y.
1 marks
Answer: B
This question in 9708/32 May/June 2023
Q66 · Which assumption in relation to an indifference theory diagram is not correct? 9708/33 May/June 2023
3 Which assumption in relation to an indifference theory diagram is not correct? A The consumer’s income may change. B The consumer may change their satisfaction-maximising objective. C The consumers may change their tastes and preferences. D The relative prices of products may change.
1 marks
Answer: B
This question in 9708/33 May/June 2023
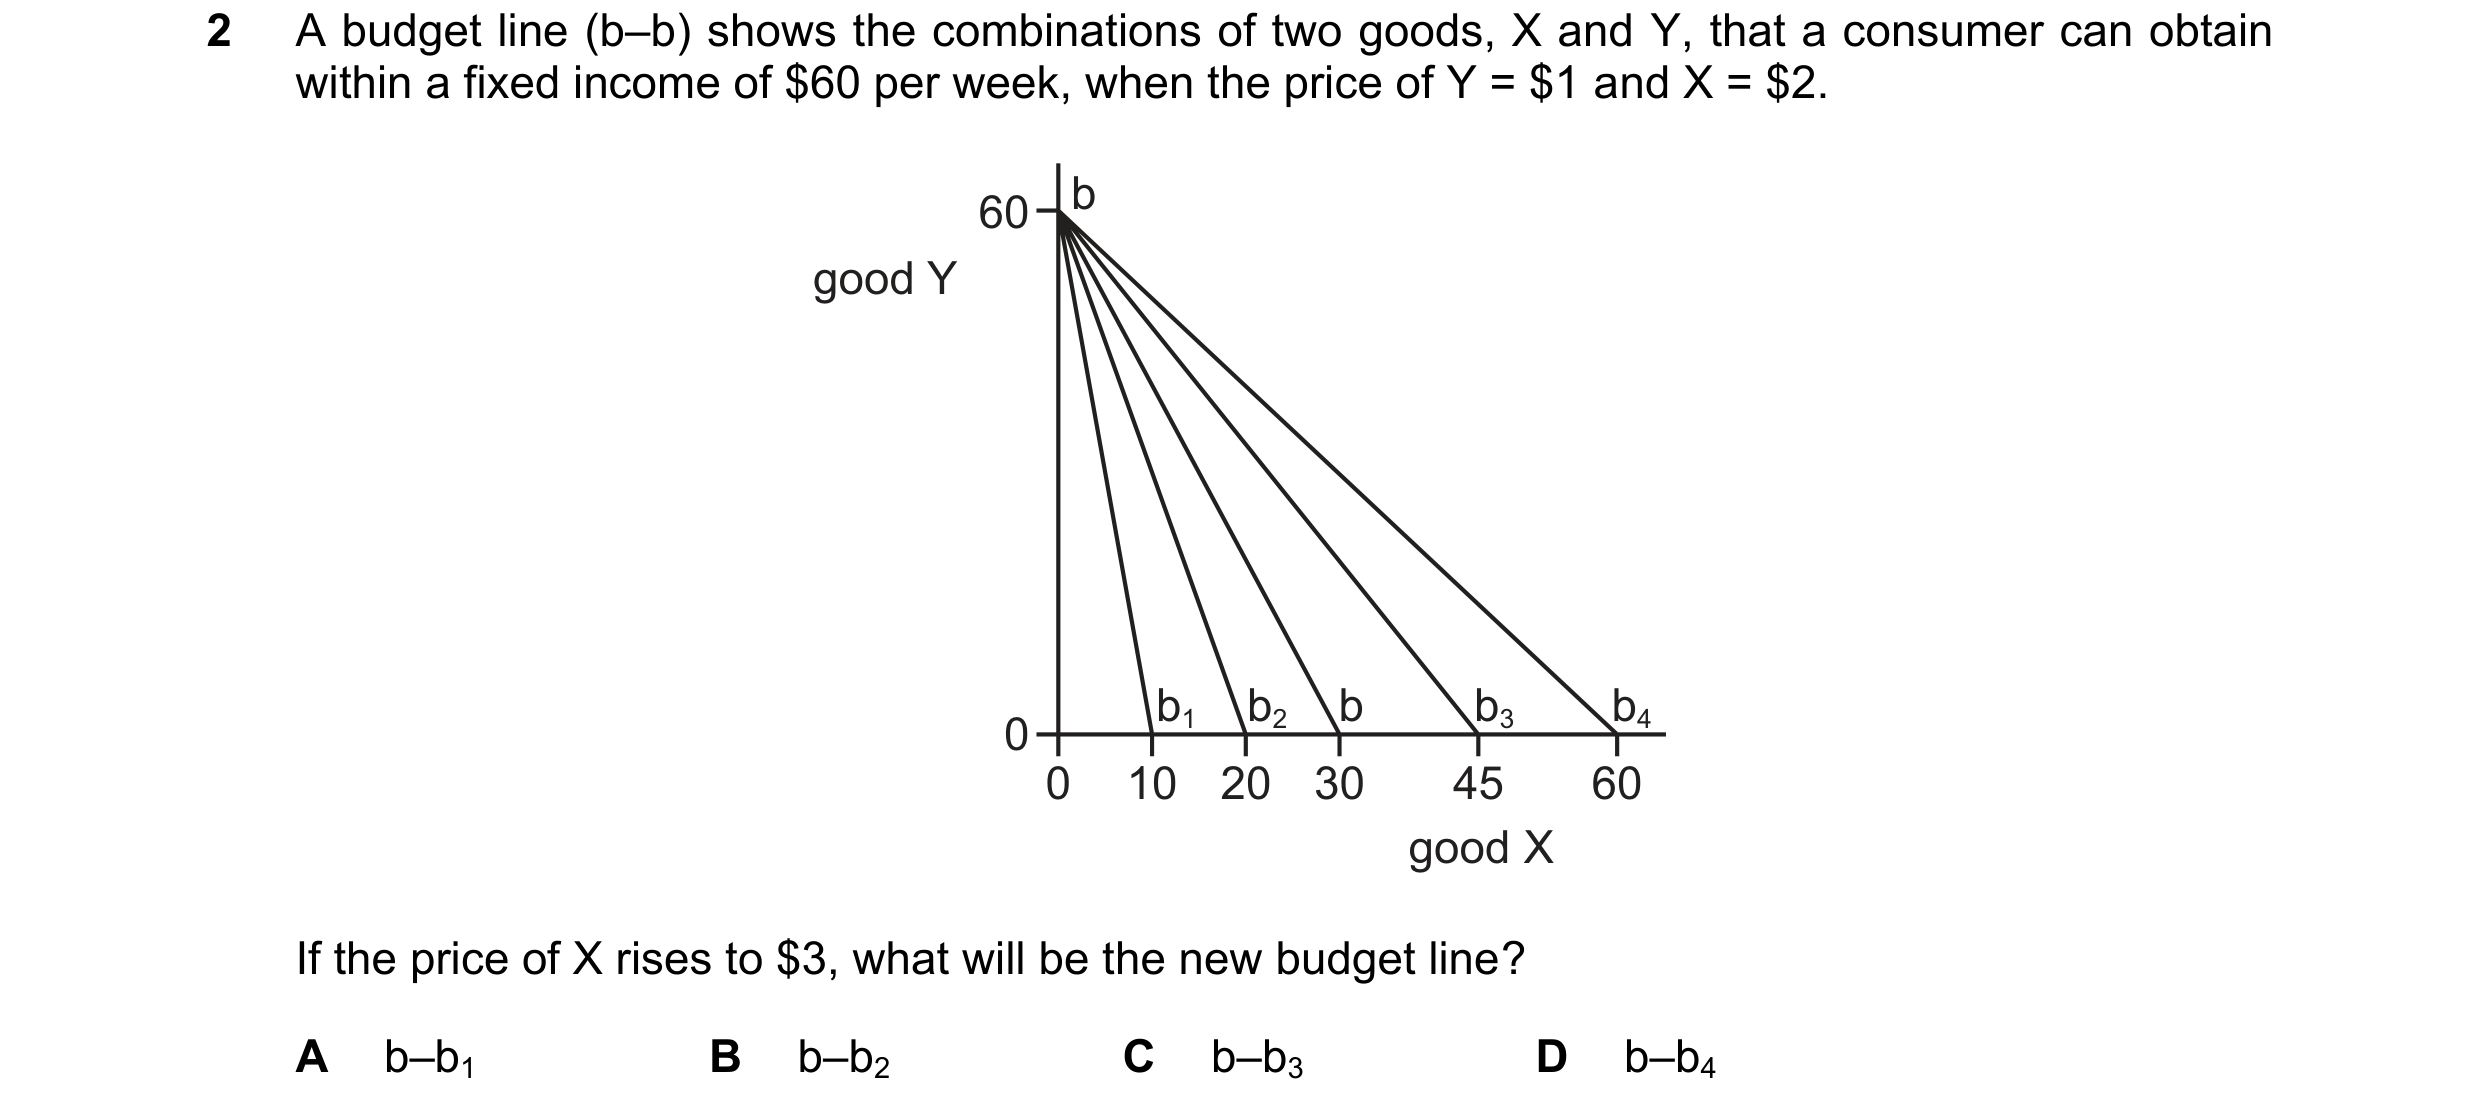
Q67 · A budget line (b–b) shows the combinations of two goods, X and Y, that a consumer can… 9708/31 Oct/Nov 2023
2 A budget line (b–b) shows the combinations of two goods, X and Y, that a consumer can obtain within a fixed income of $60 per week, when the price of Y = $1 and X = $2. 60 b good Y b1 b2 b b3 b4 0 0 10 20 30 45 60 good X If the price of X rises to $3, what will be the new budget line? A b–b1 B b–b2 C b–b3 D b–b4
1 marks
Answer: B
This question in 9708/31 Oct/Nov 2023
Q68 · An indifference curve is typically drawn with a convex shape 9708/33 Oct/Nov 2023
2 An indifference curve is typically drawn with a convex shape. Which economic concept explains the reason for this convex shape? A allocative efficiency B diminishing marginal rate of substitution C Pareto optimality D the equi-marginal principle
1 marks
Answer: B
This question in 9708/33 Oct/Nov 2023
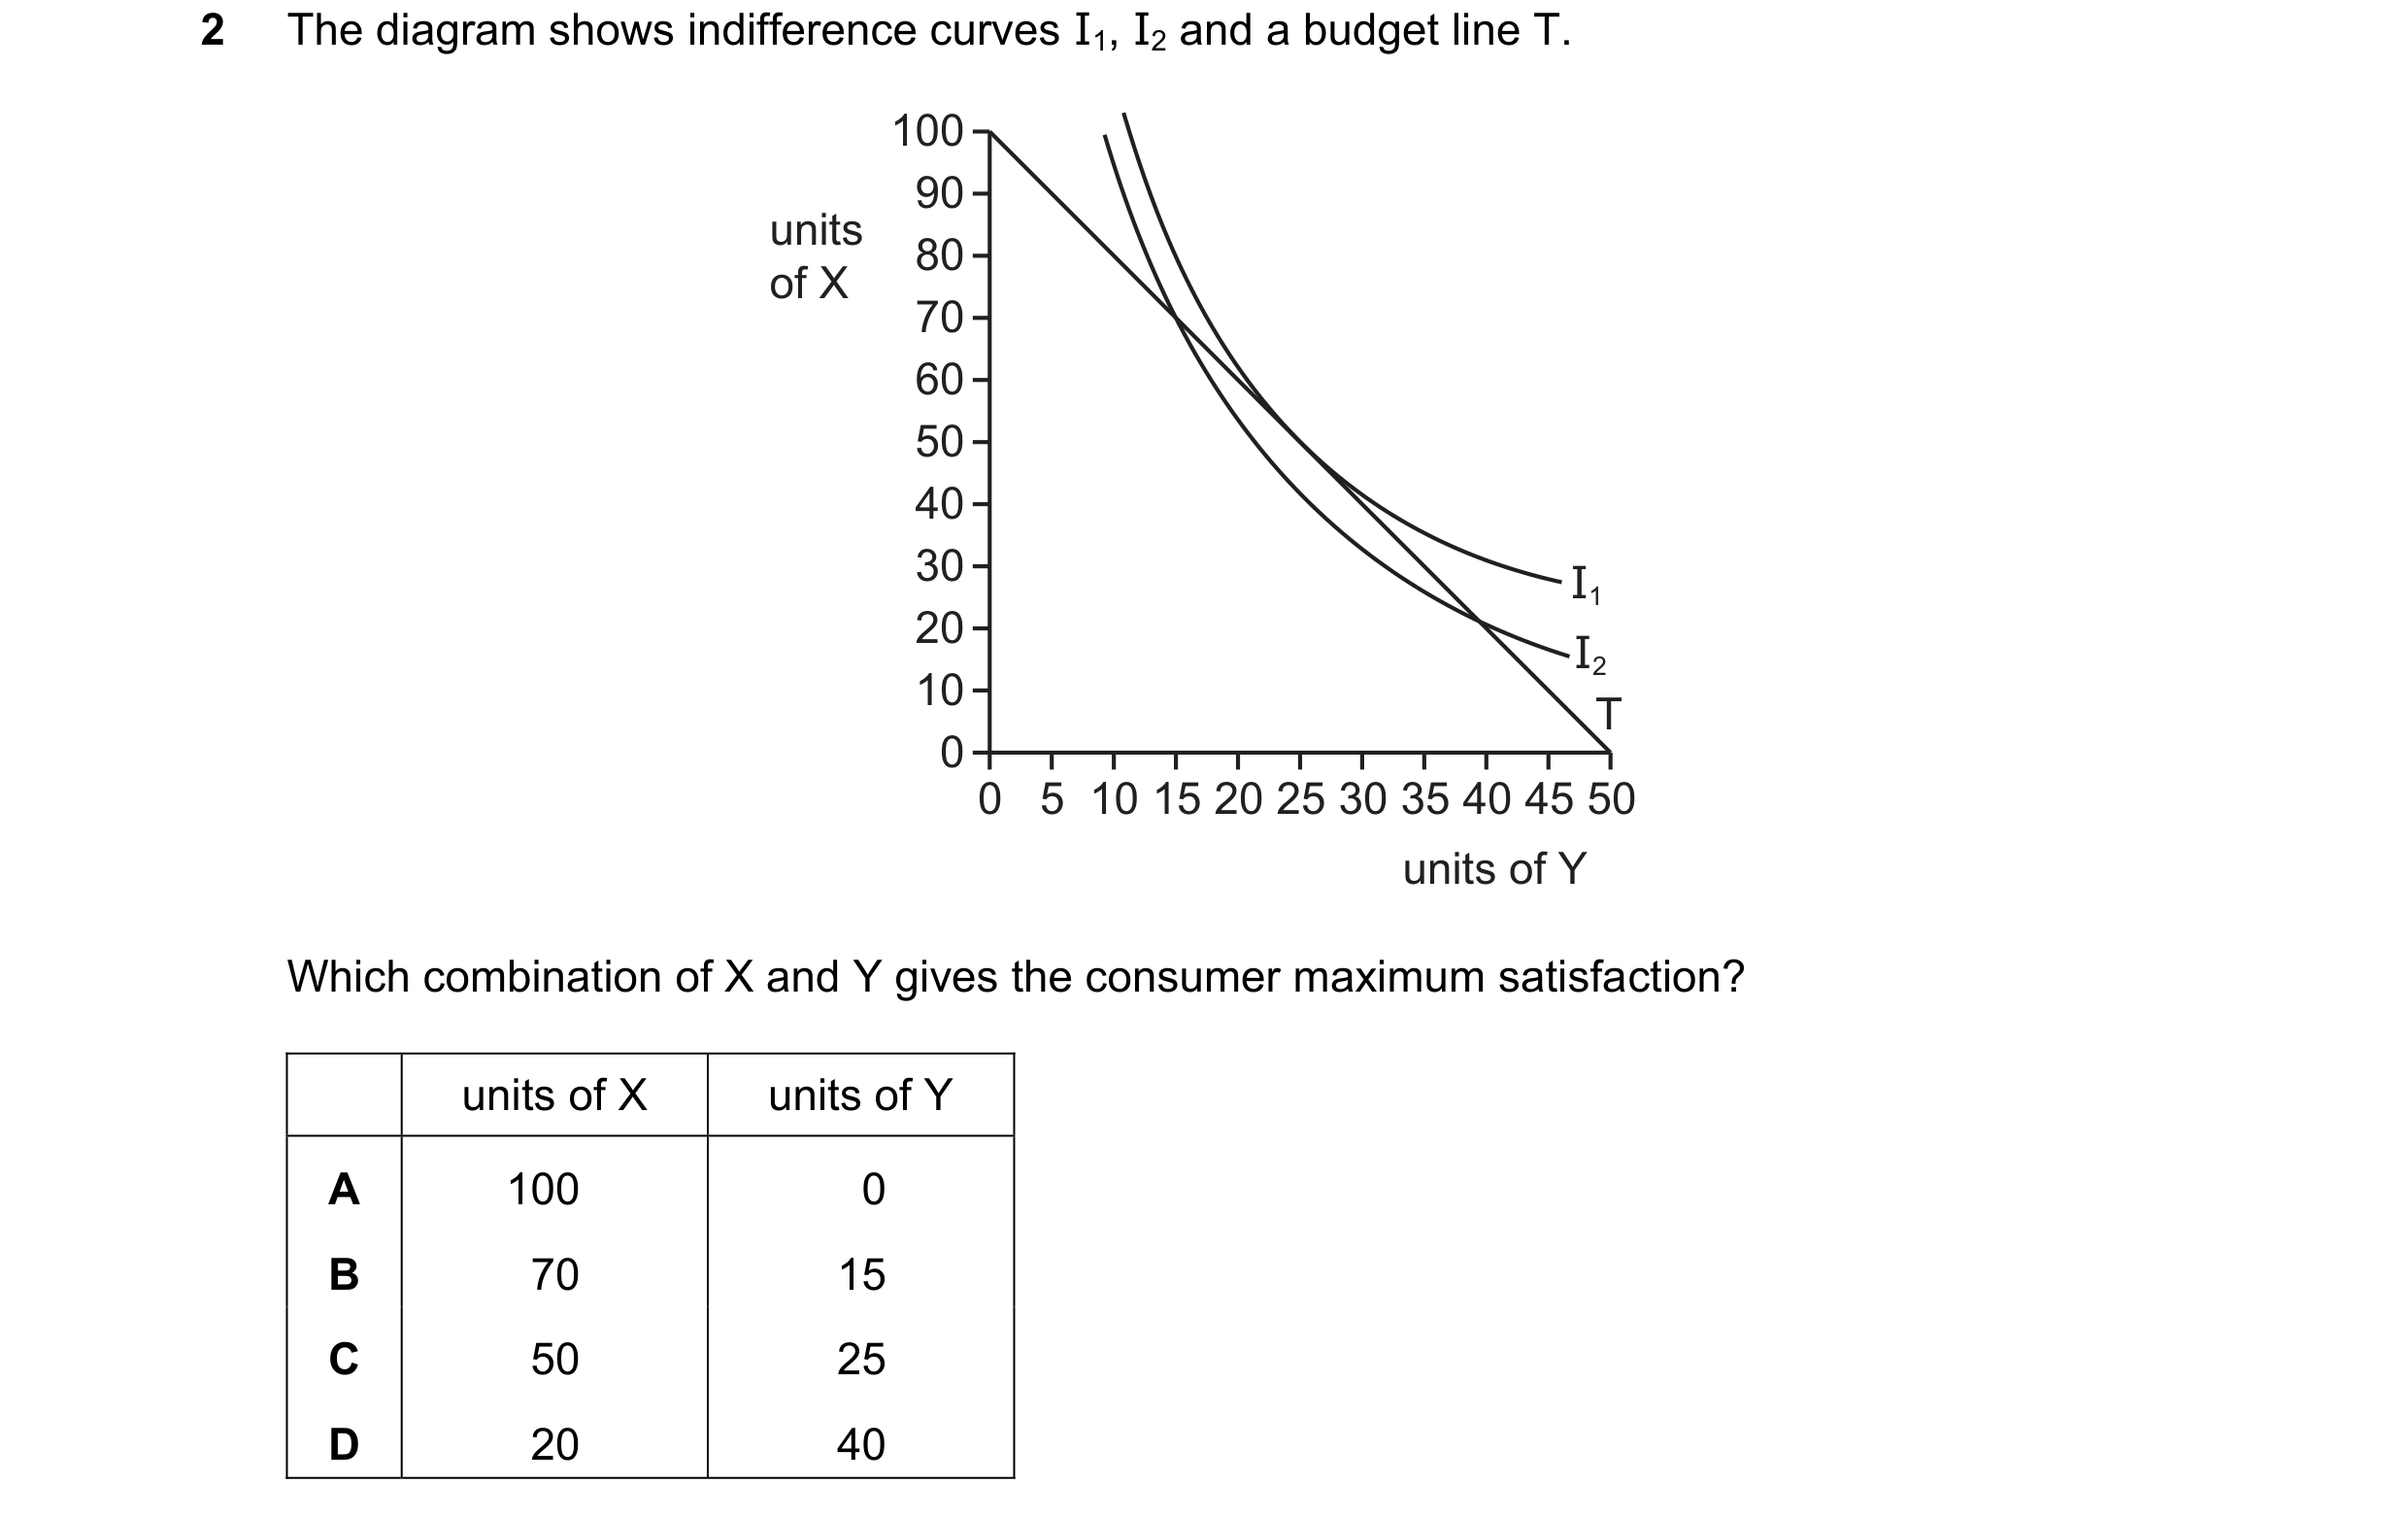
Q69 · The diagram shows indifference curves I1, I2 and a budget line T 9708/31 May/June 2024
2 The diagram shows indifference curves I1, I2 and a budget line T. 100 90 units 80 of X 70 60 50 40 30 I1 20 I2 10 T 0 0 5 10 15 20 25 30 35 40 45 50 units of Y Which combination of X and Y gives the consumer maximum satisfaction? units of X units of Y A 100 0 B 70 15 C 50 25 D 20 40
1 marks
Answer: C
This question in 9708/31 May/June 2024
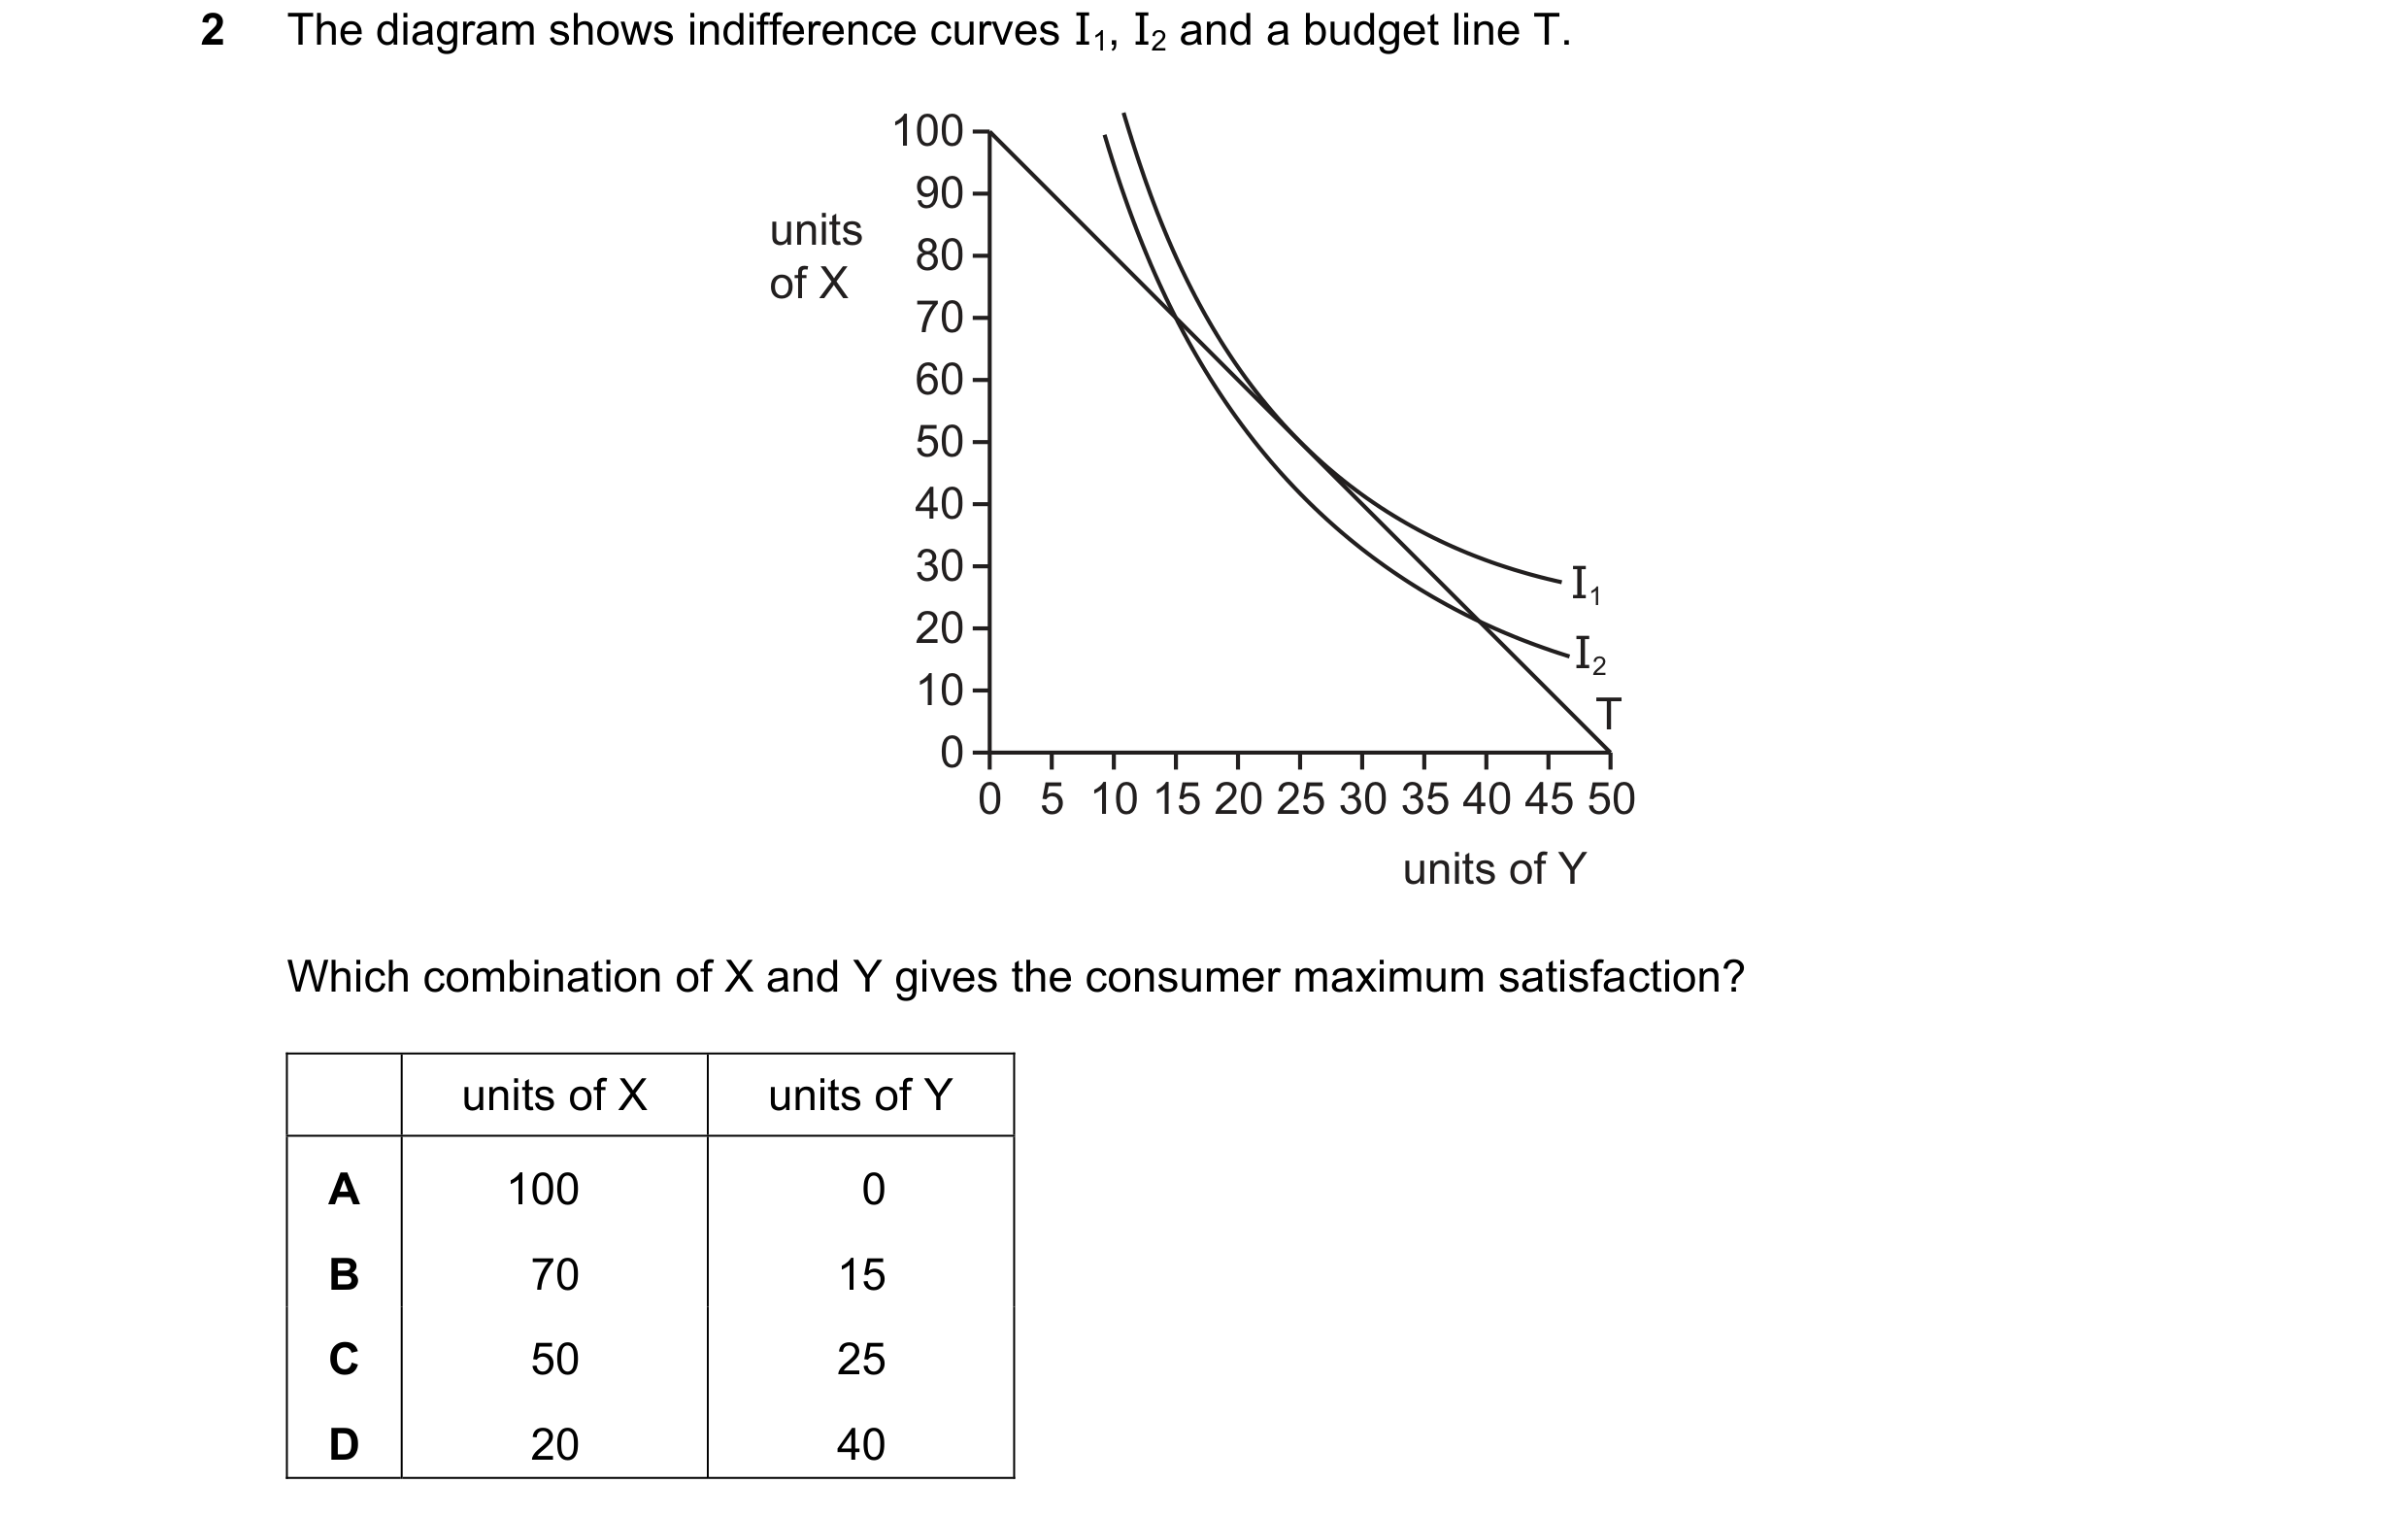
Q70 · The diagram shows indifference curves I1, I2 and a budget line T 9708/33 May/June 2024
2 The diagram shows indifference curves I1, I2 and a budget line T. 100 90 units 80 of X 70 60 50 40 30 I1 20 I2 10 T 0 0 5 10 15 20 25 30 35 40 45 50 units of Y Which combination of X and Y gives the consumer maximum satisfaction? units of X units of Y A 100 0 B 70 15 C 50 25 D 20 40
1 marks
Answer: C
This question in 9708/33 May/June 2024
 1 / 32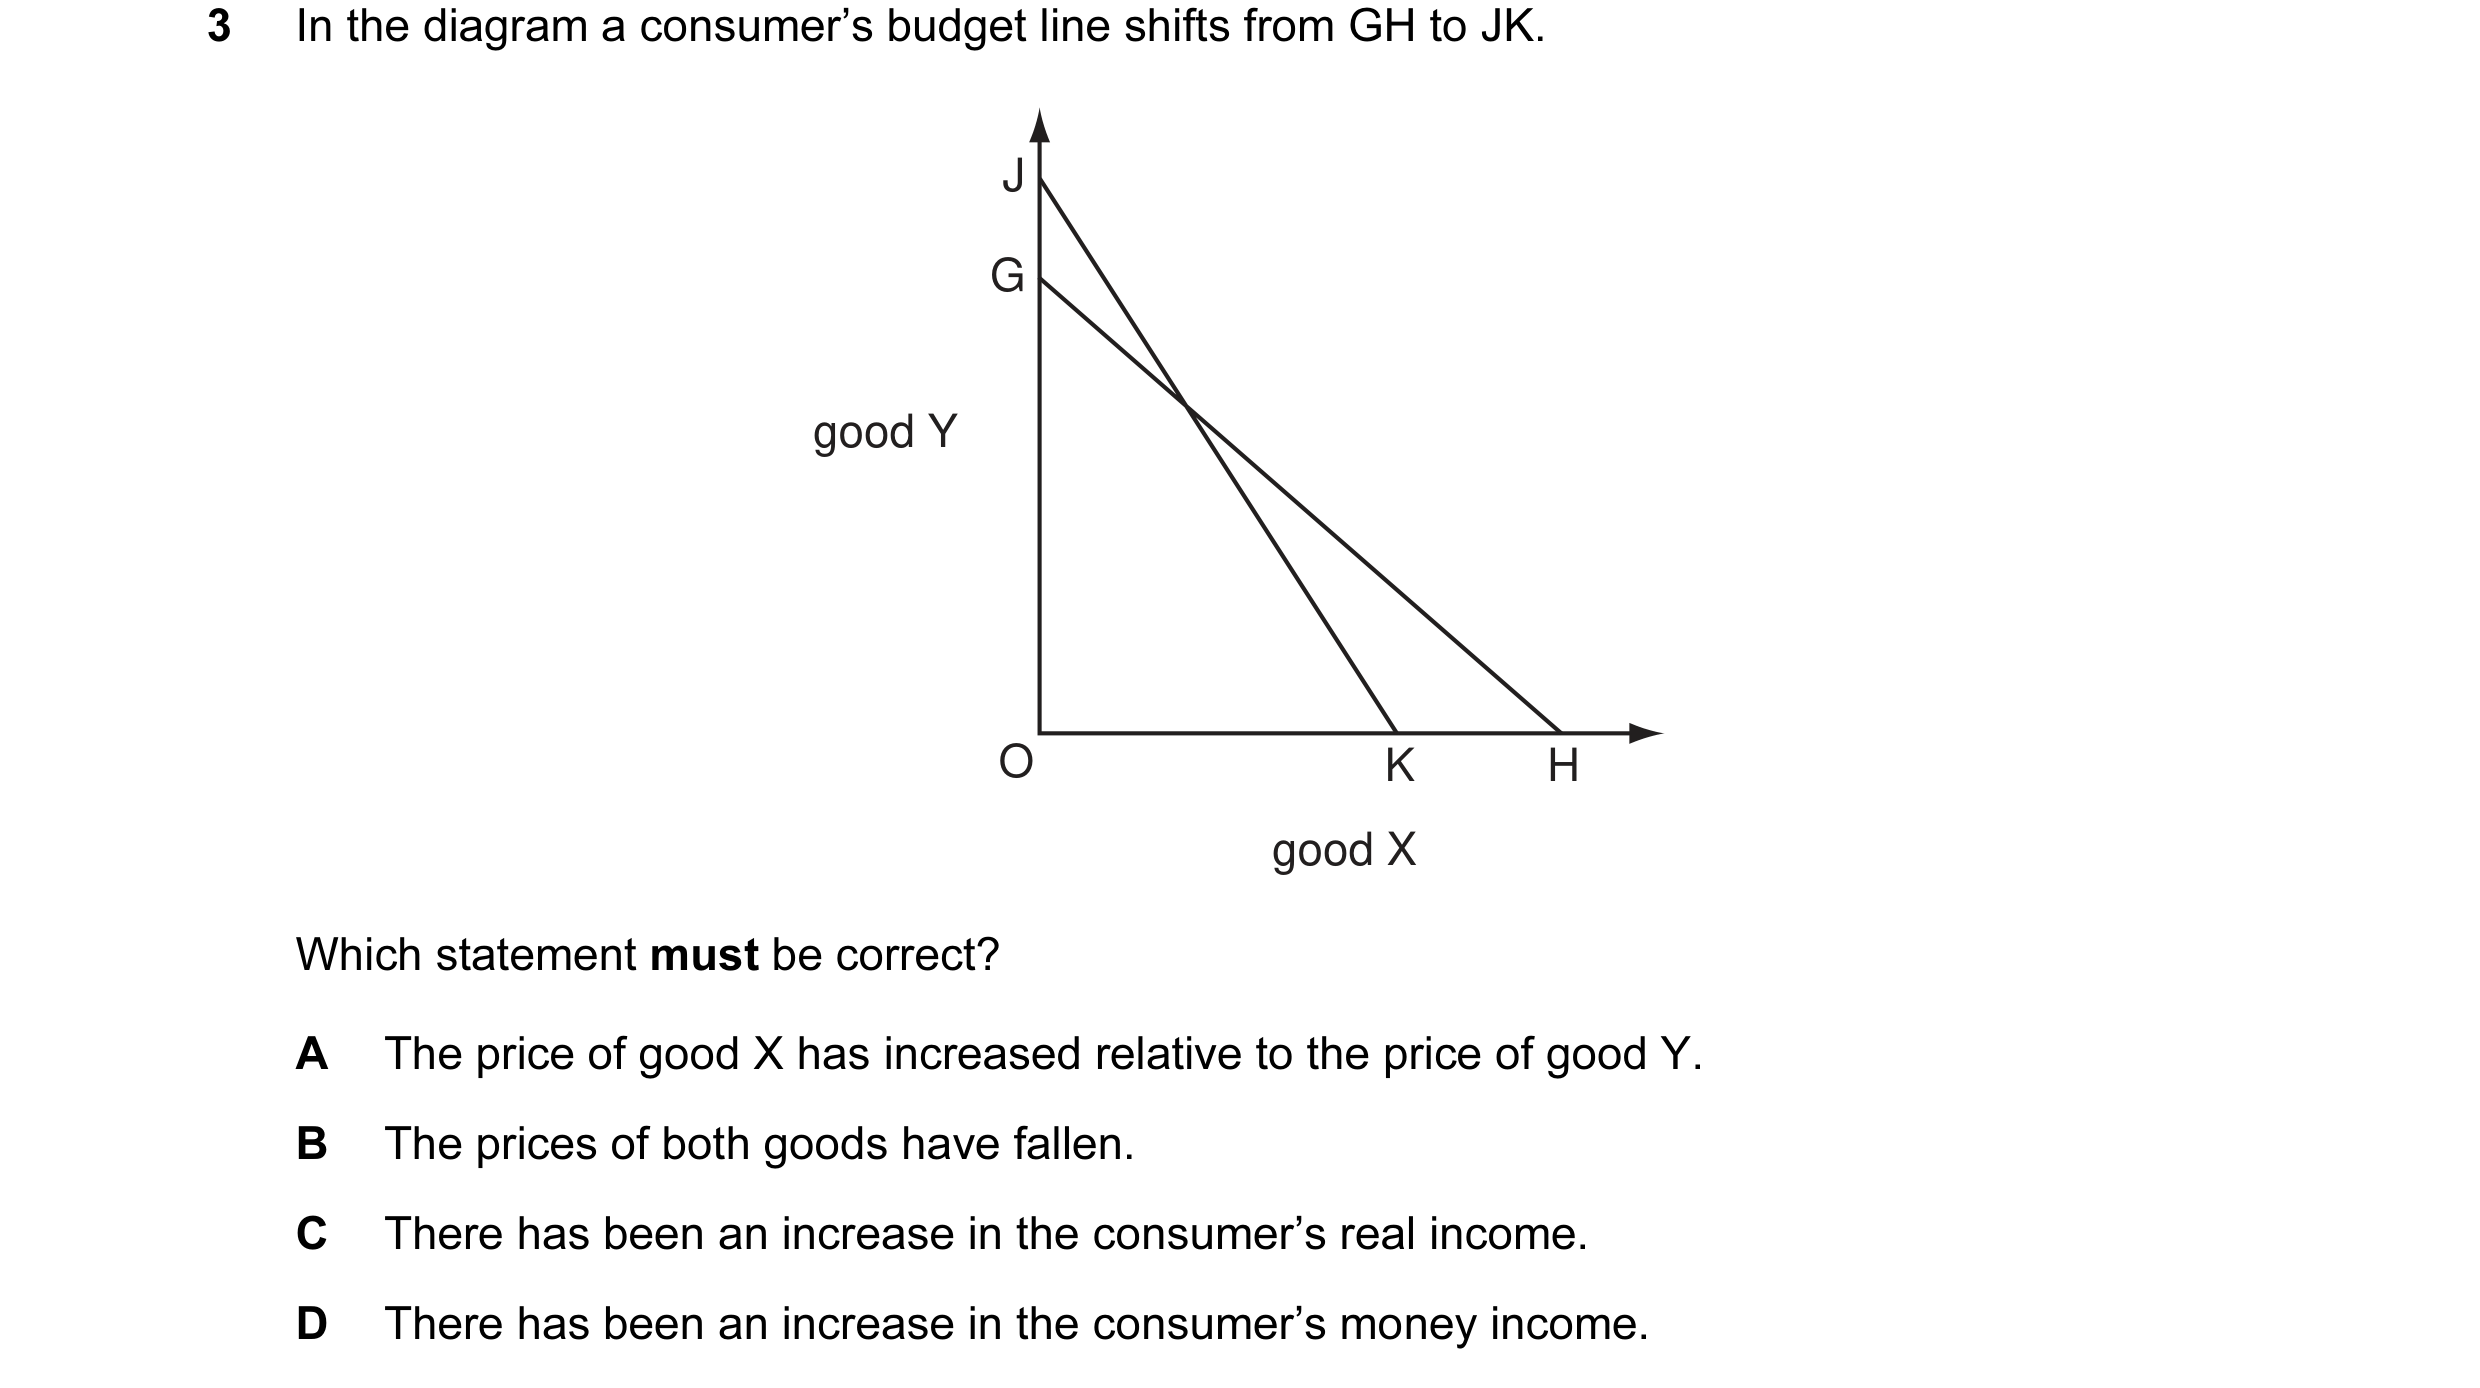
 2 / 32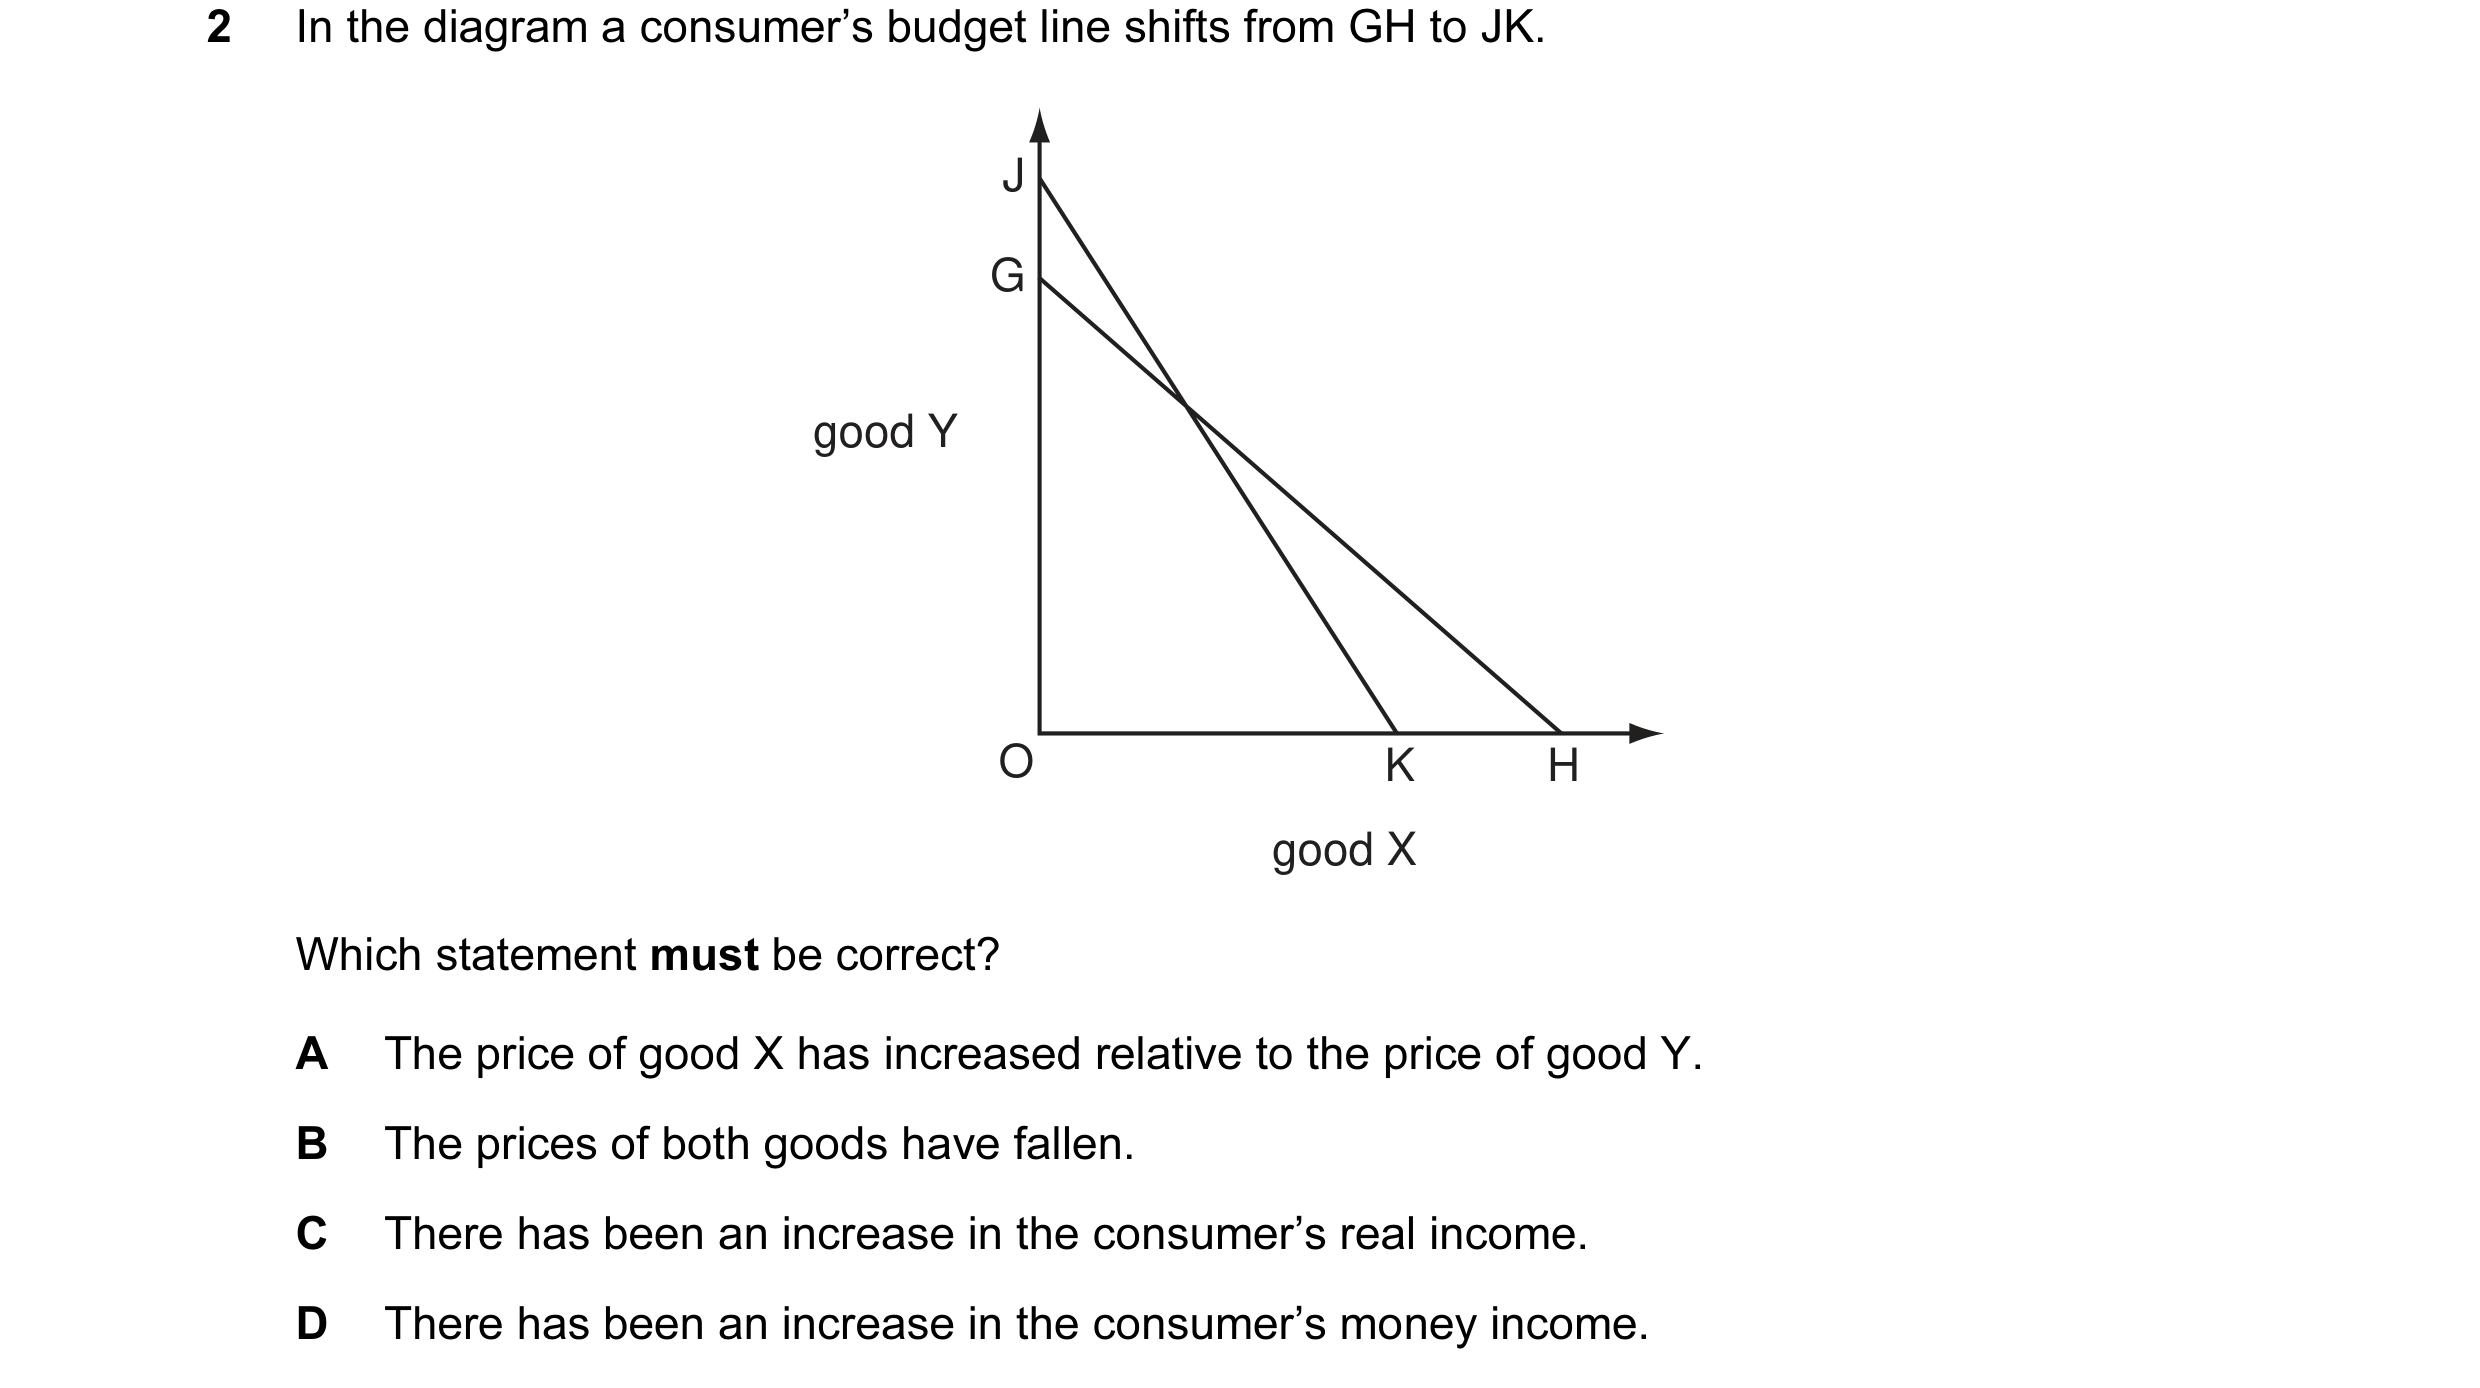
 3 / 32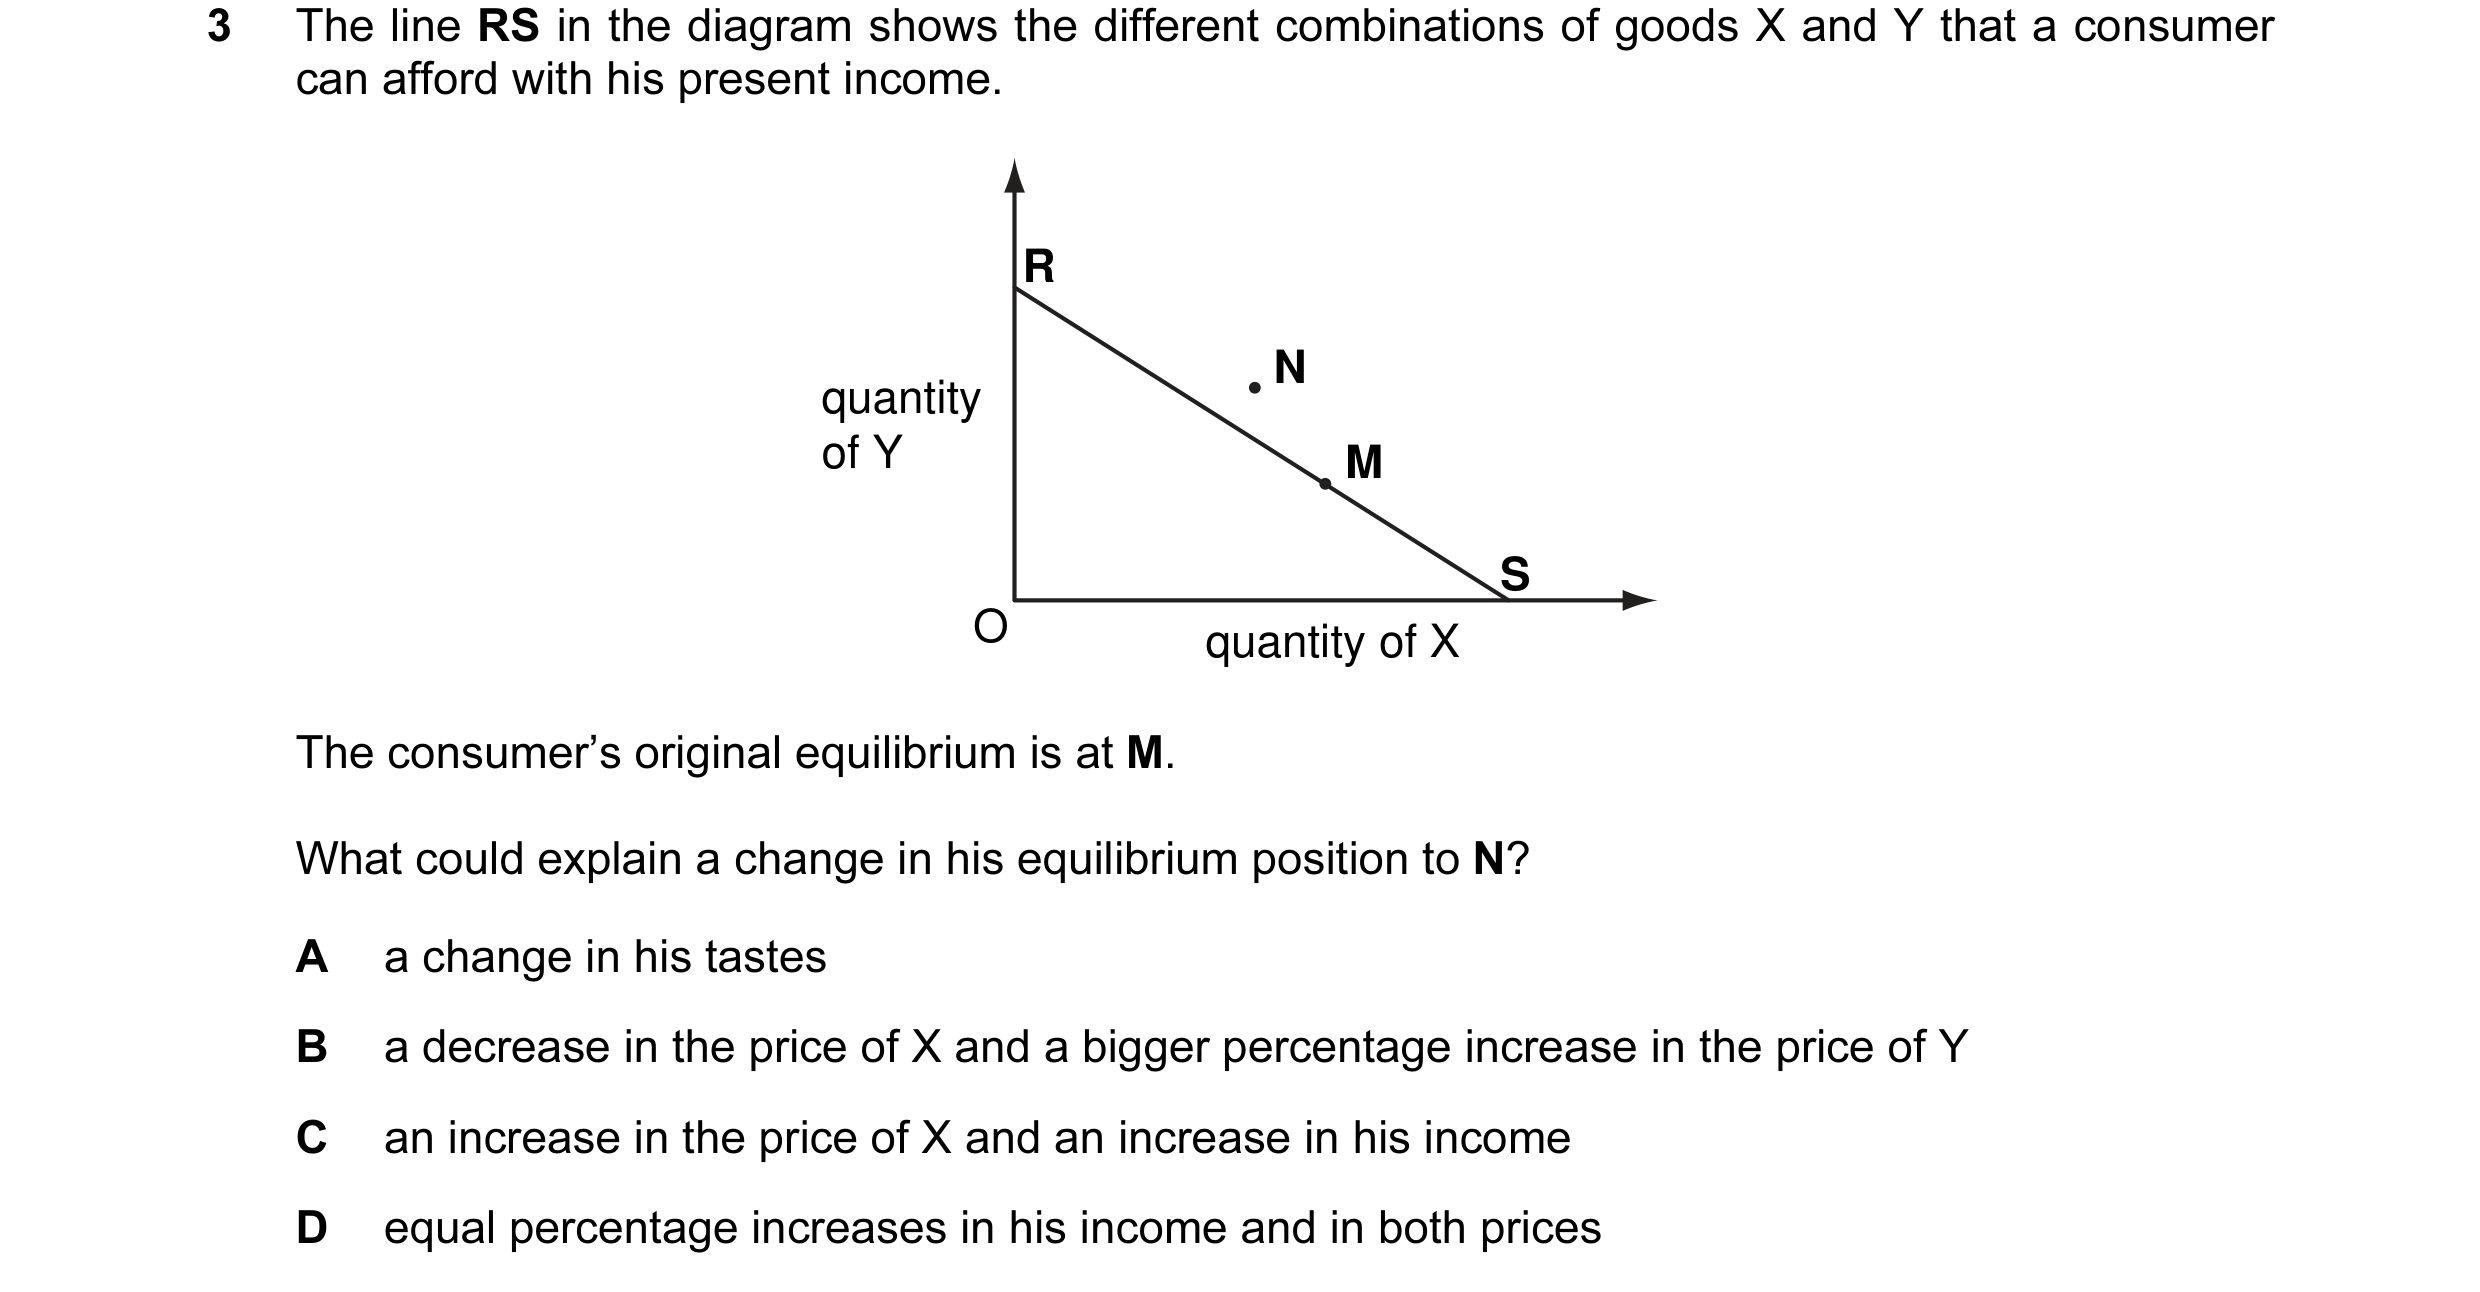
 4 / 32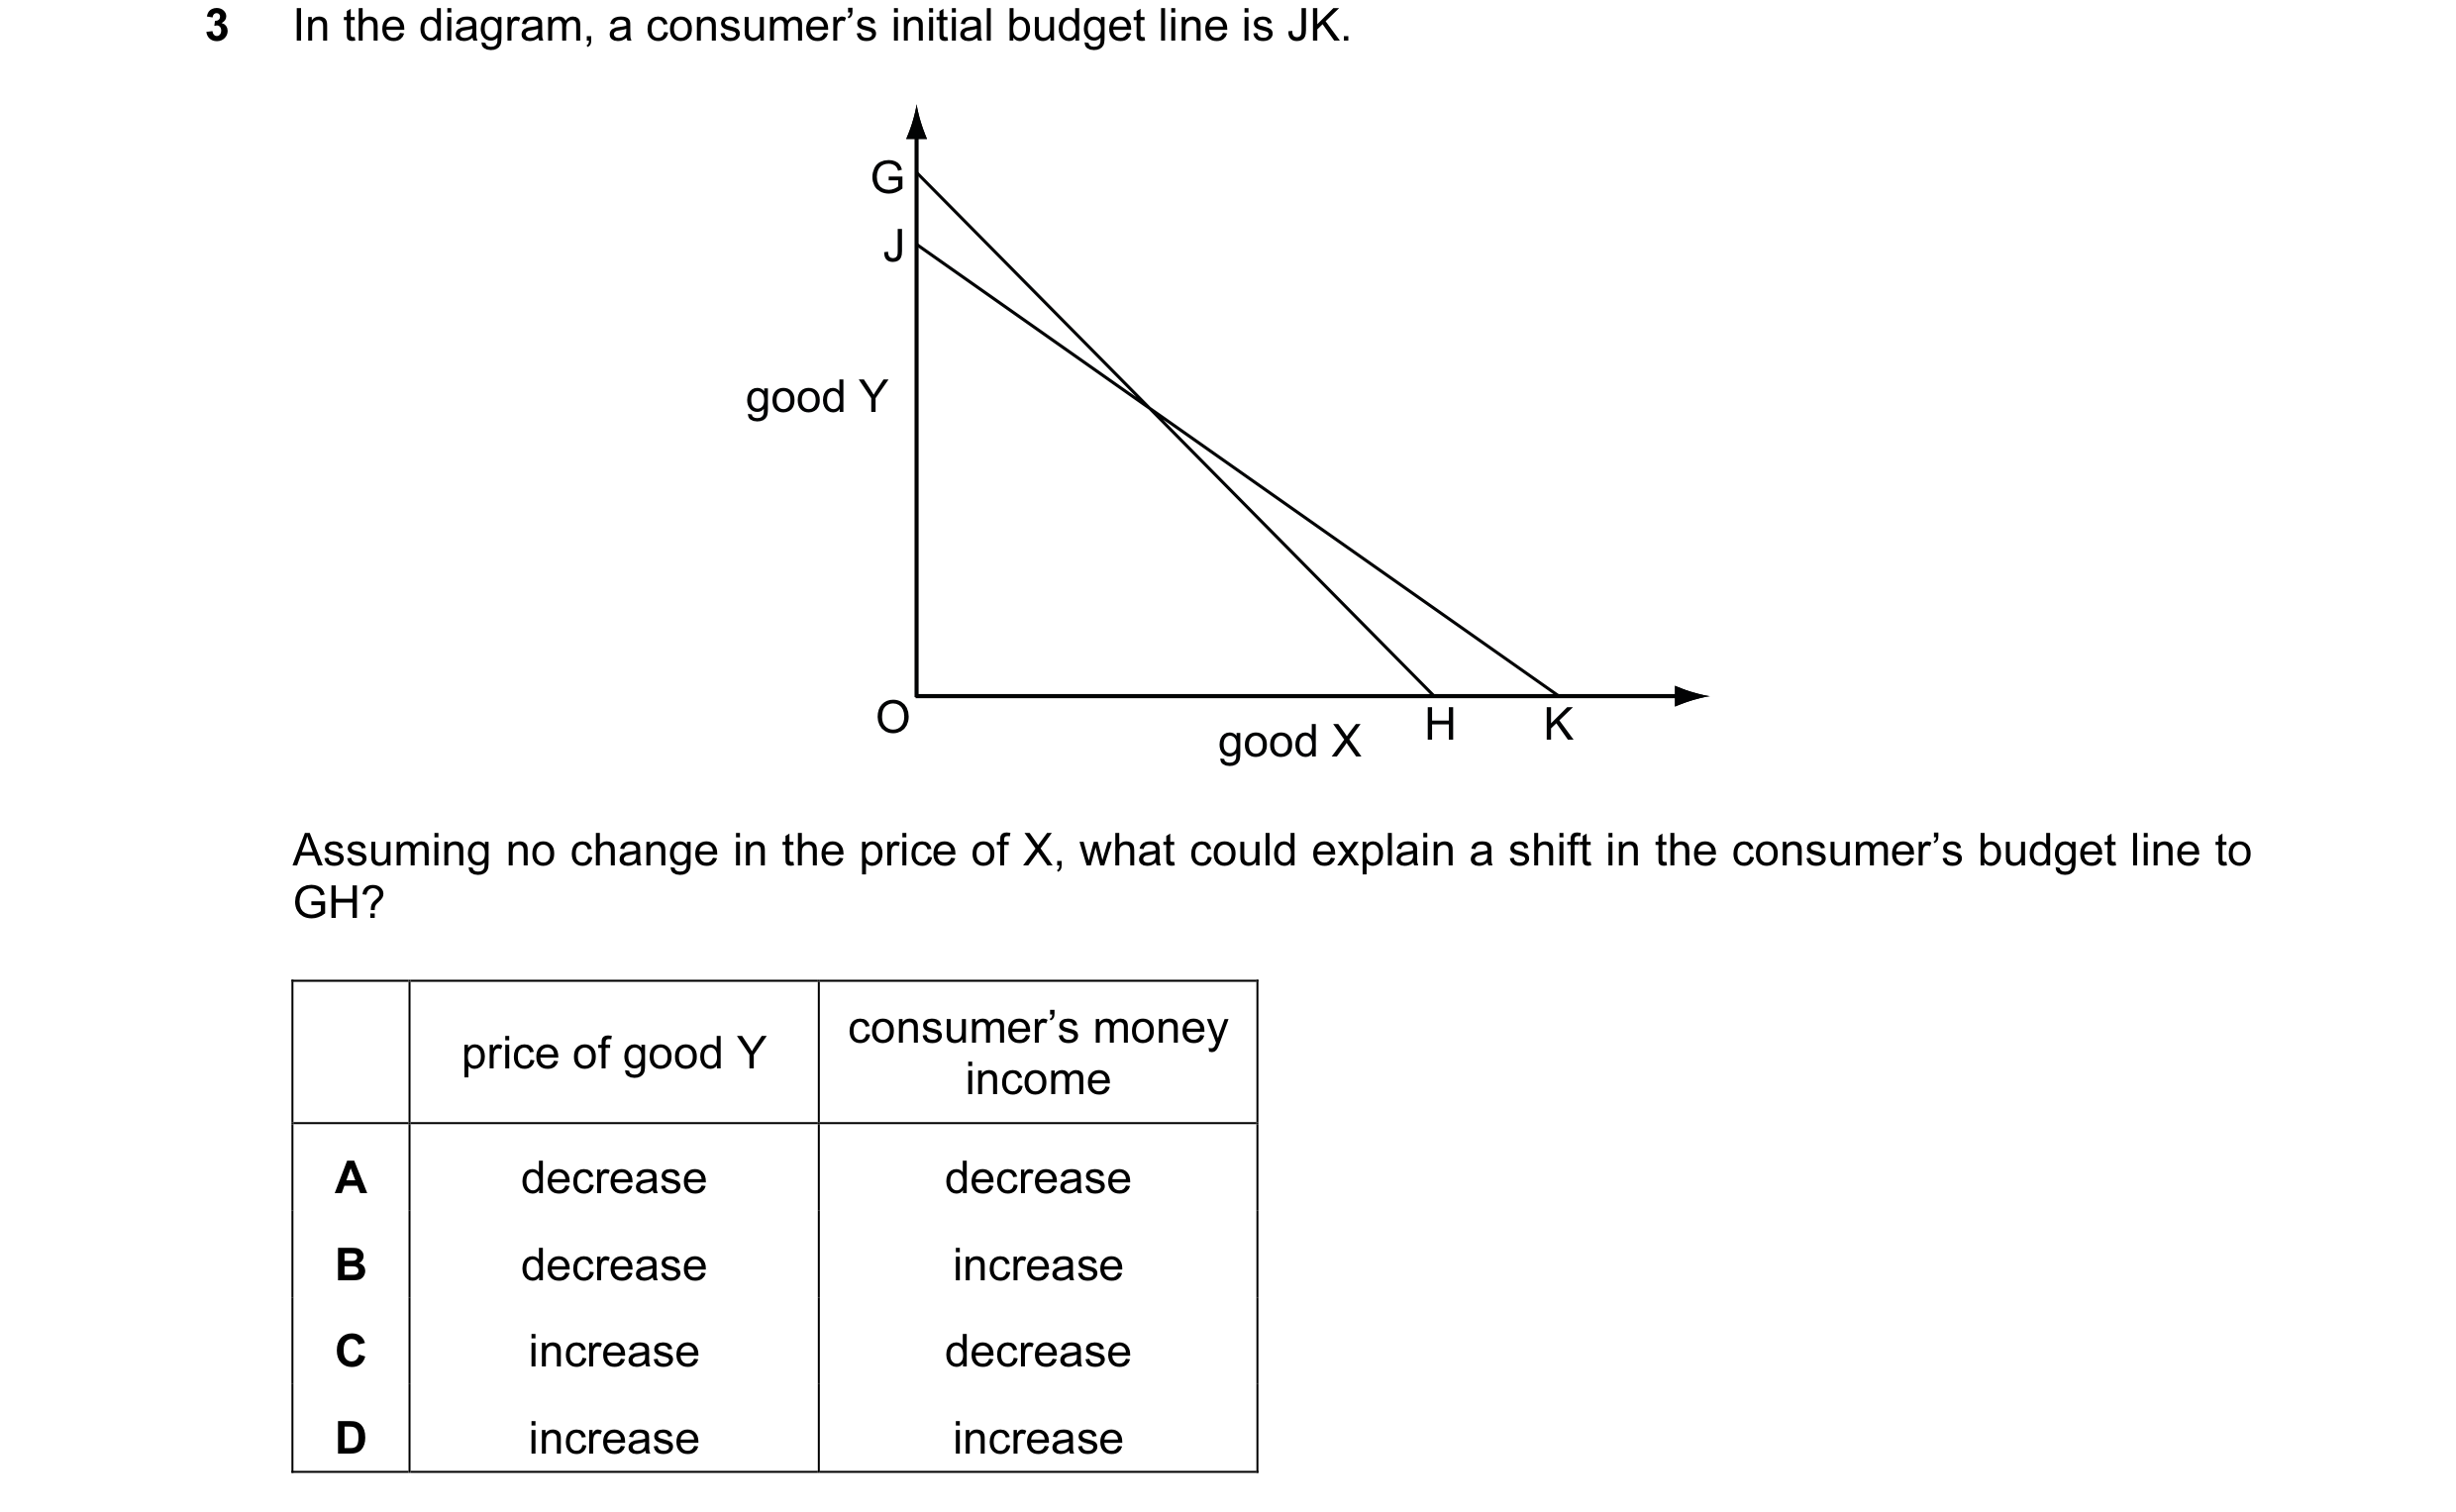
 5 / 32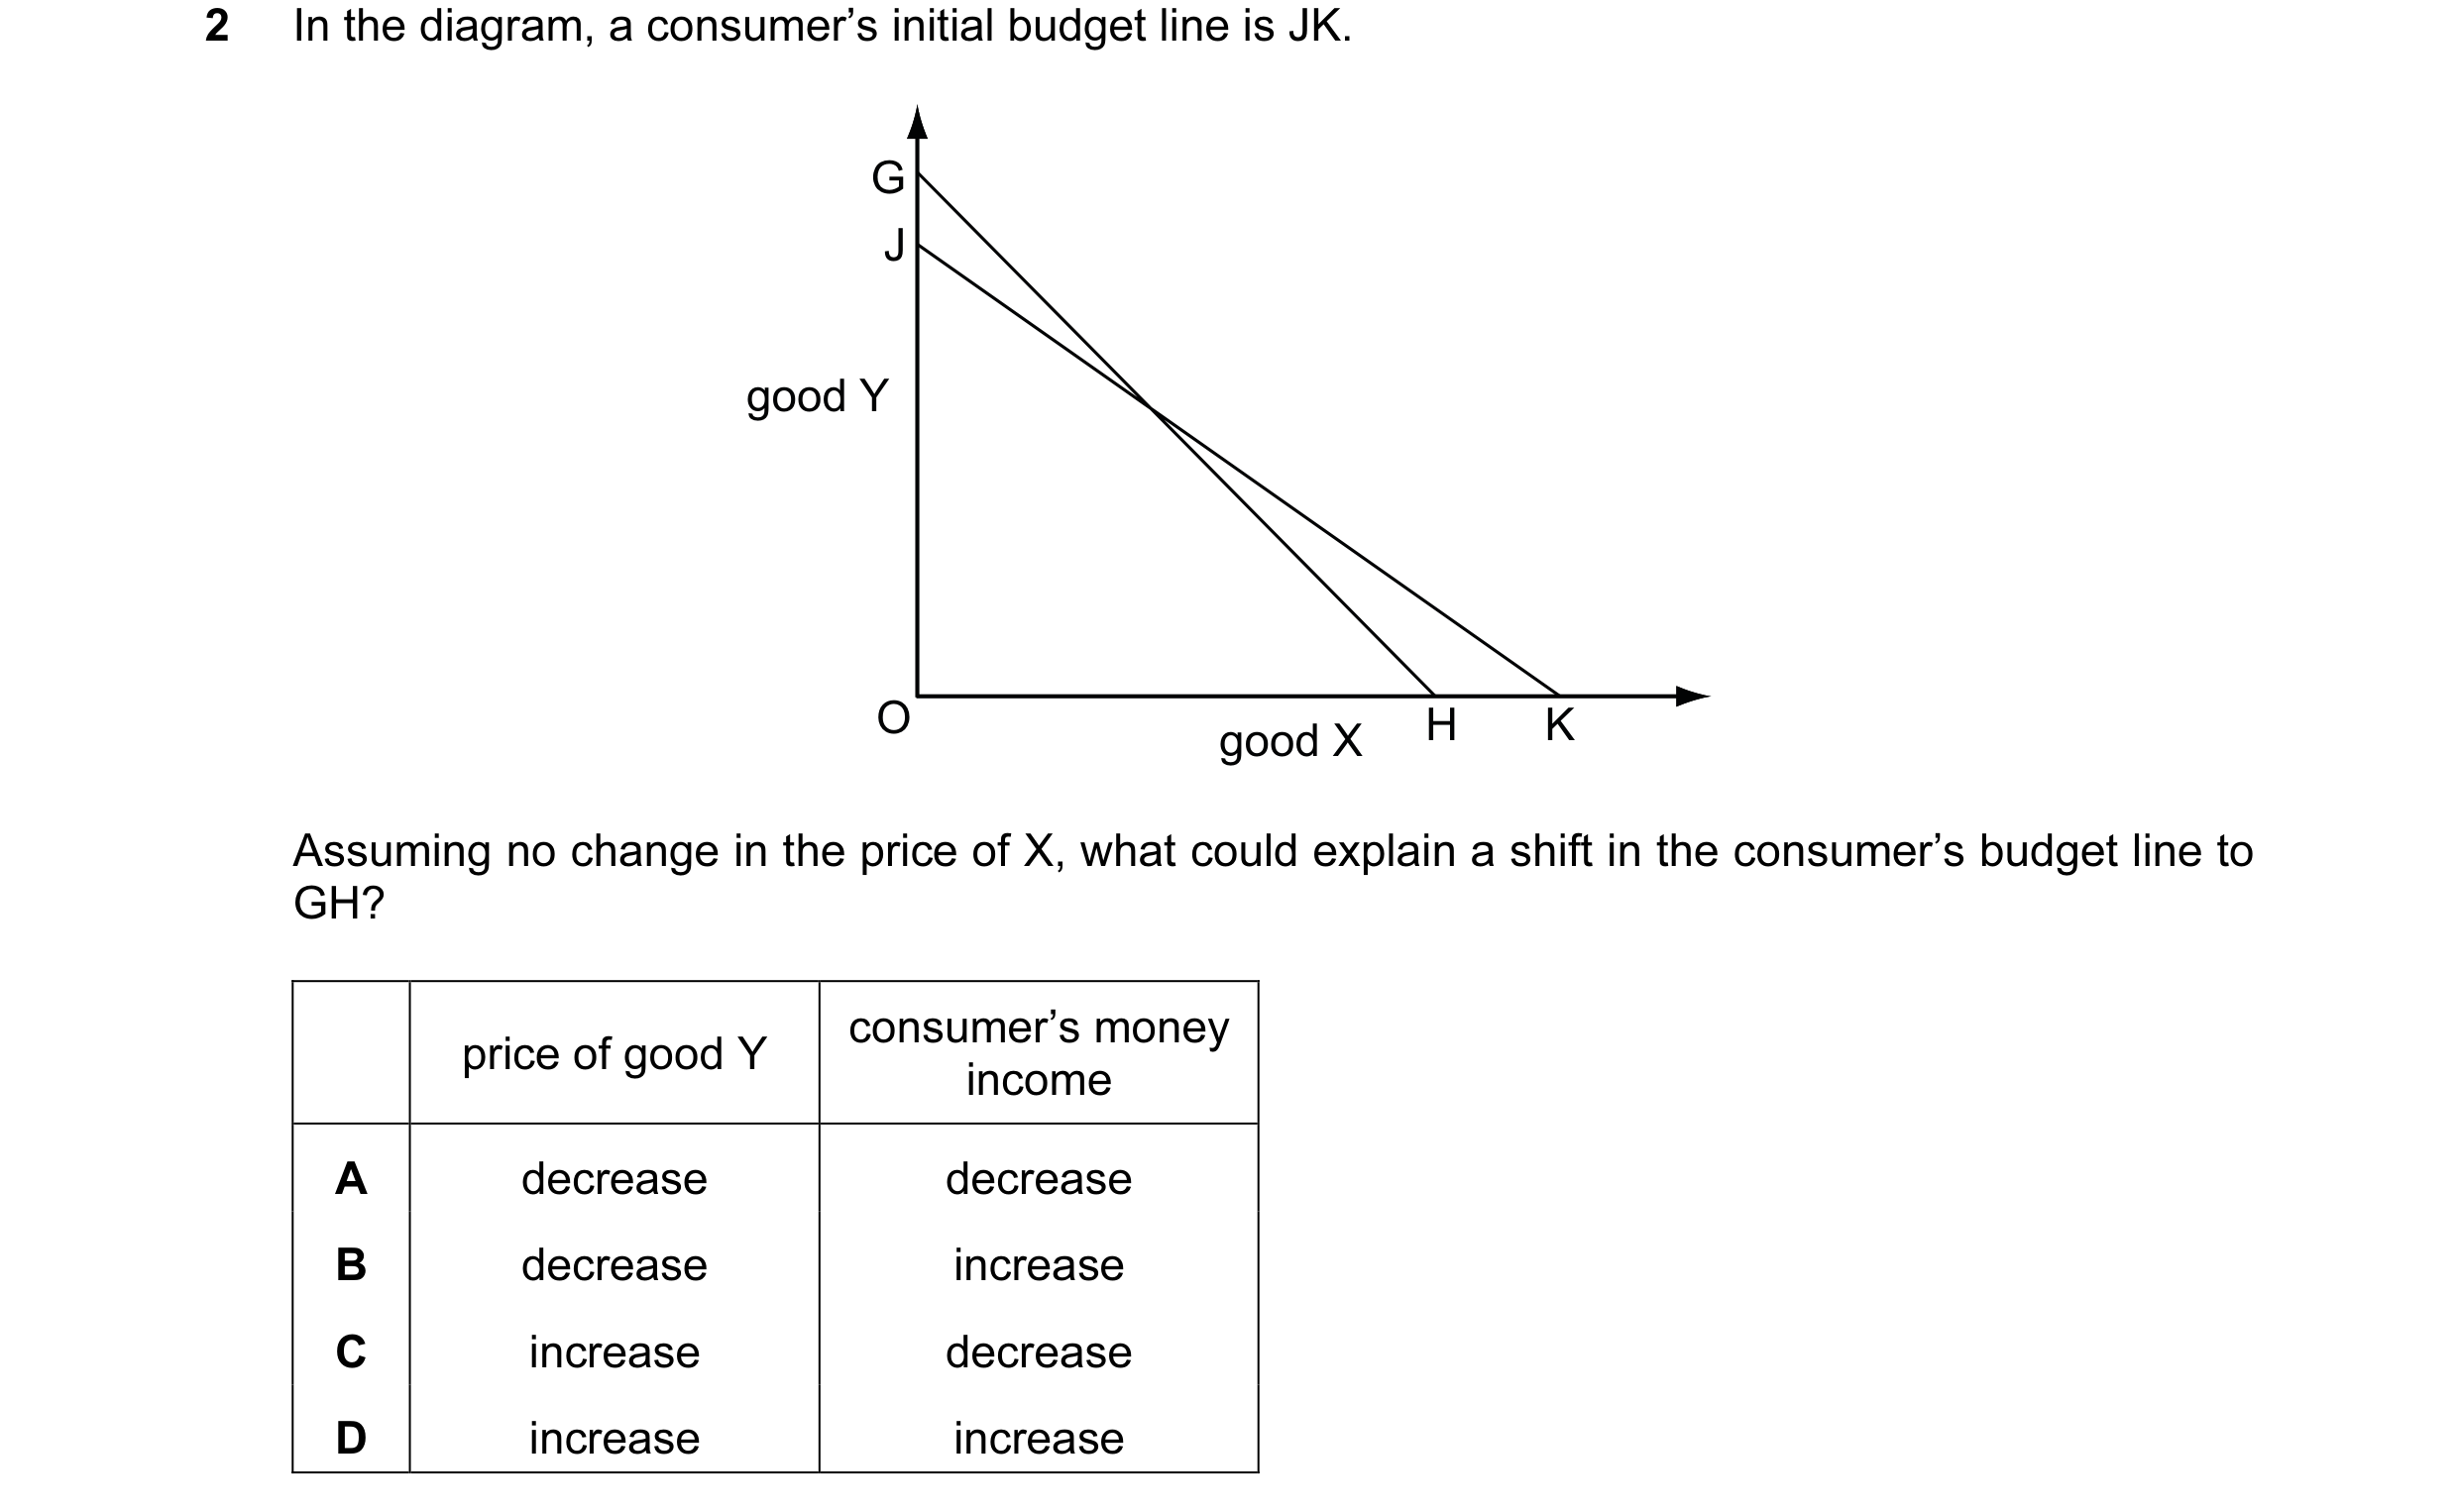
 6 / 32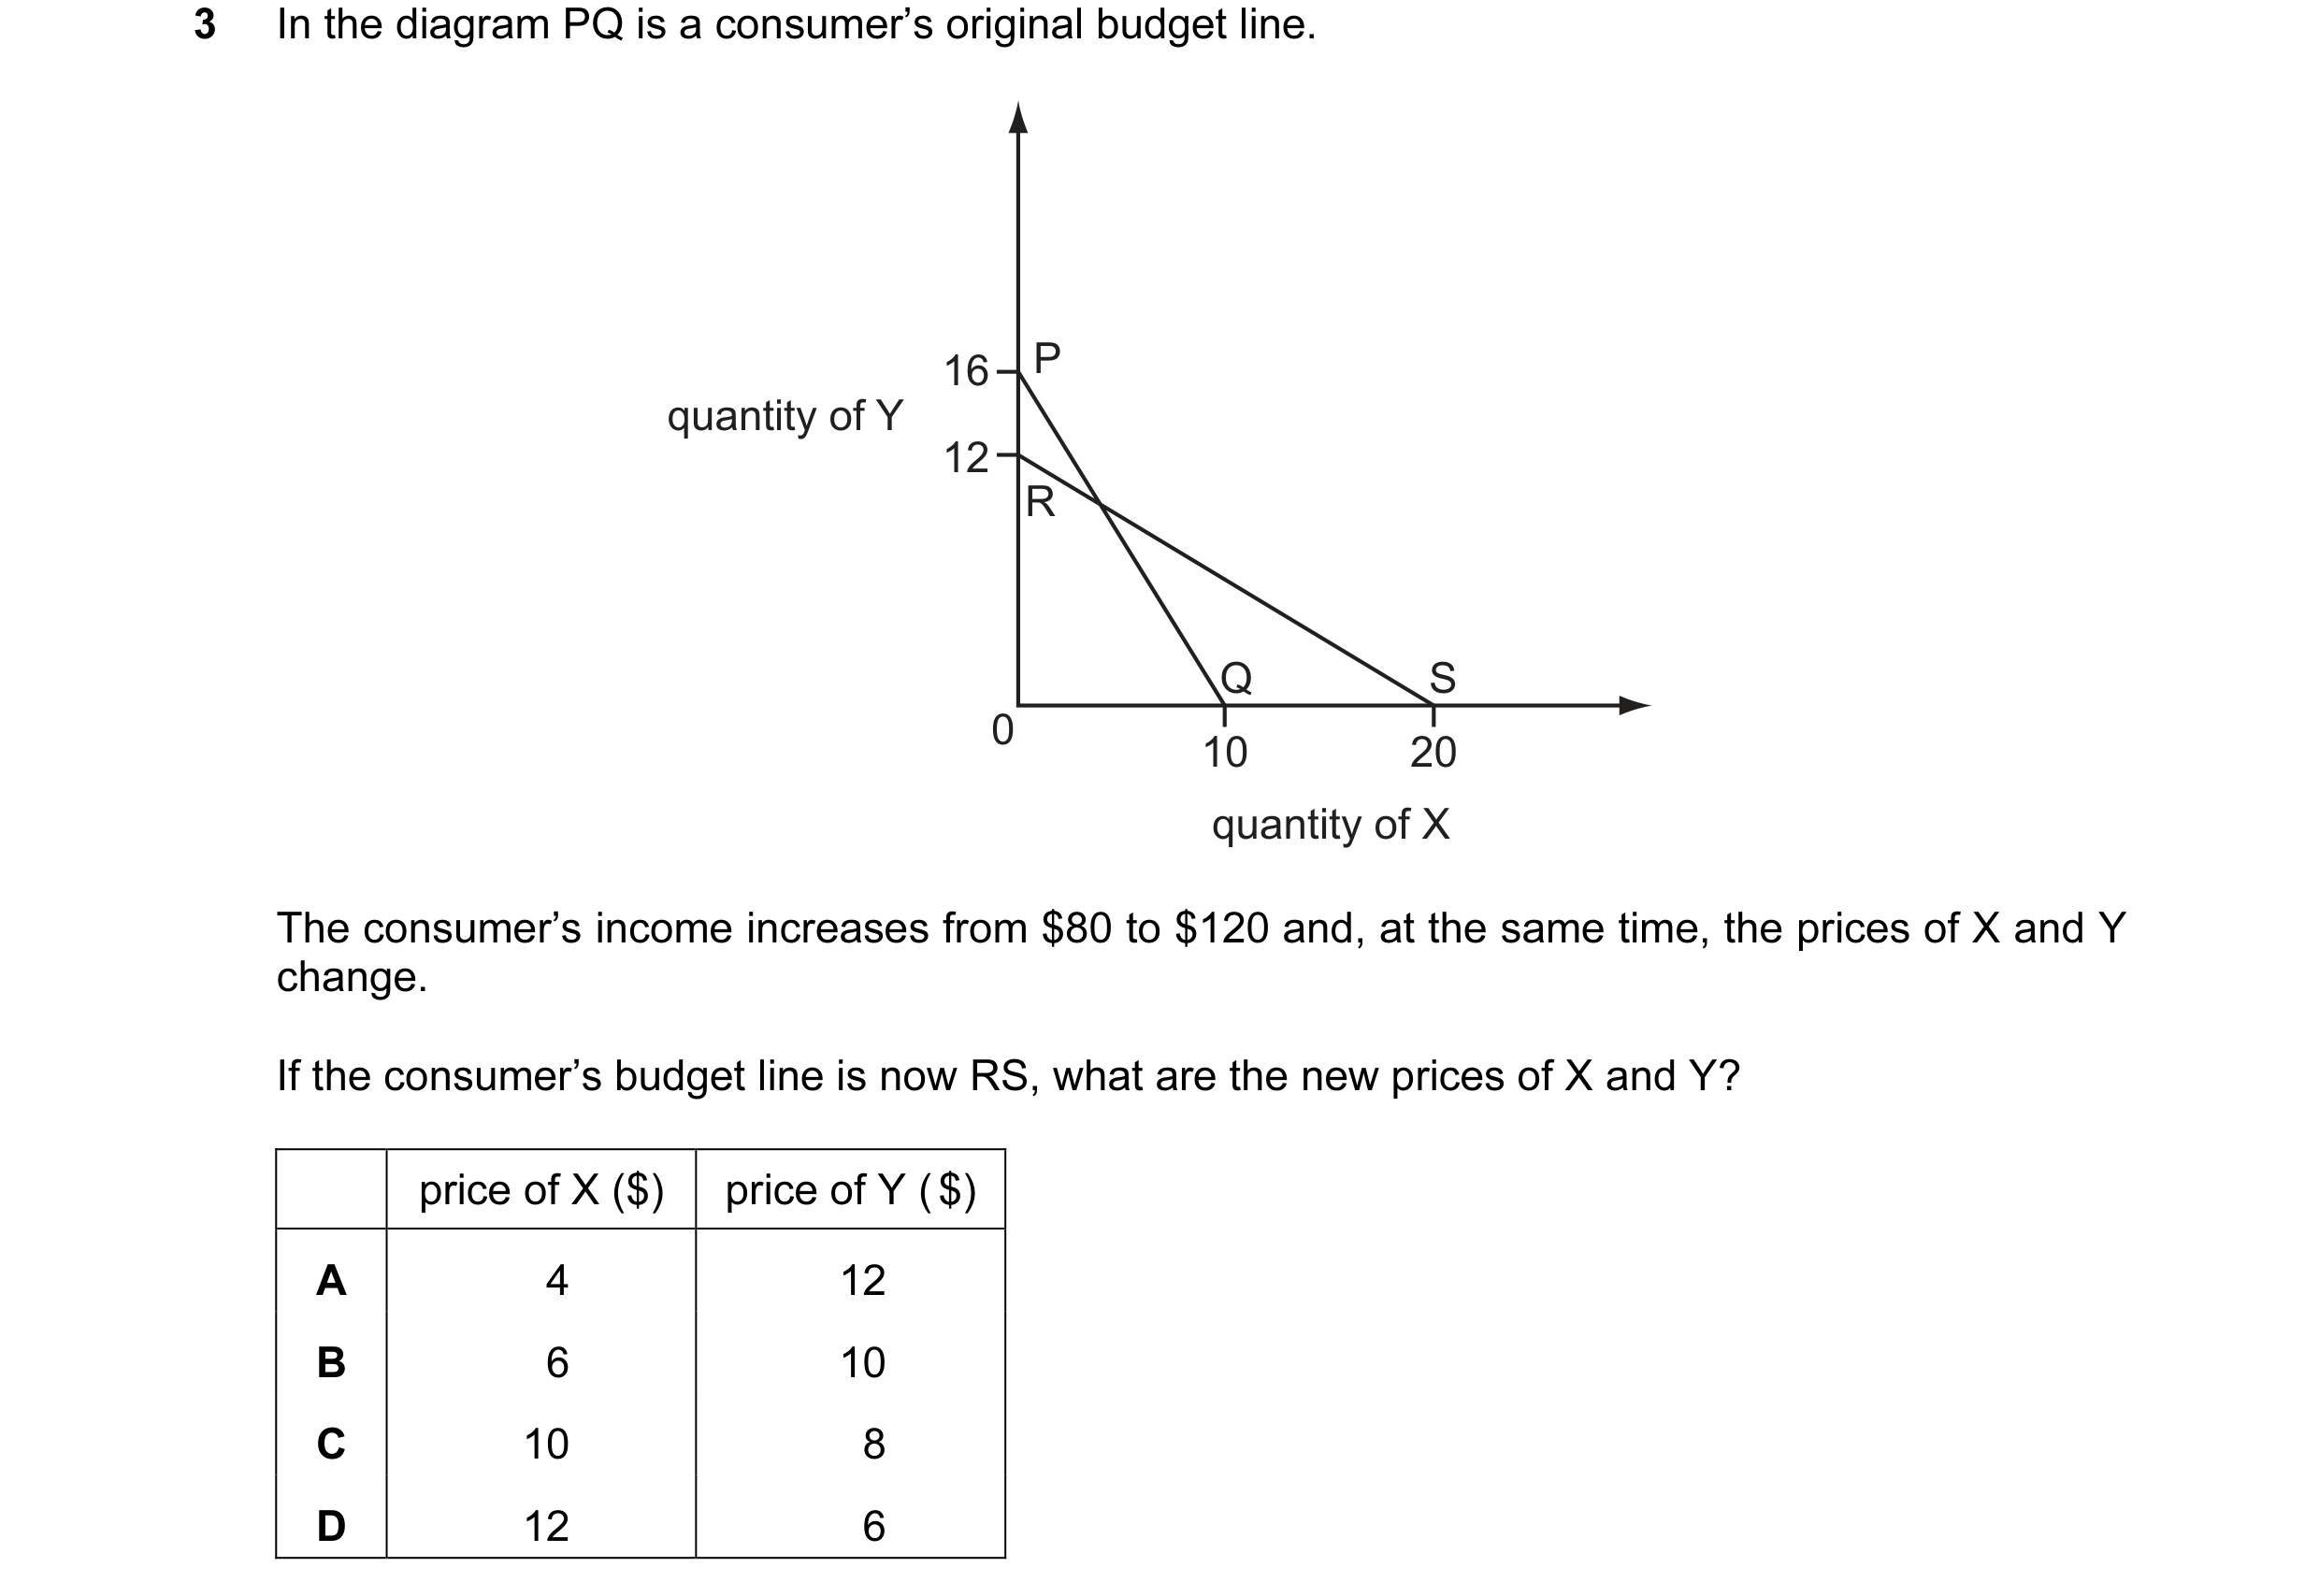
 7 / 32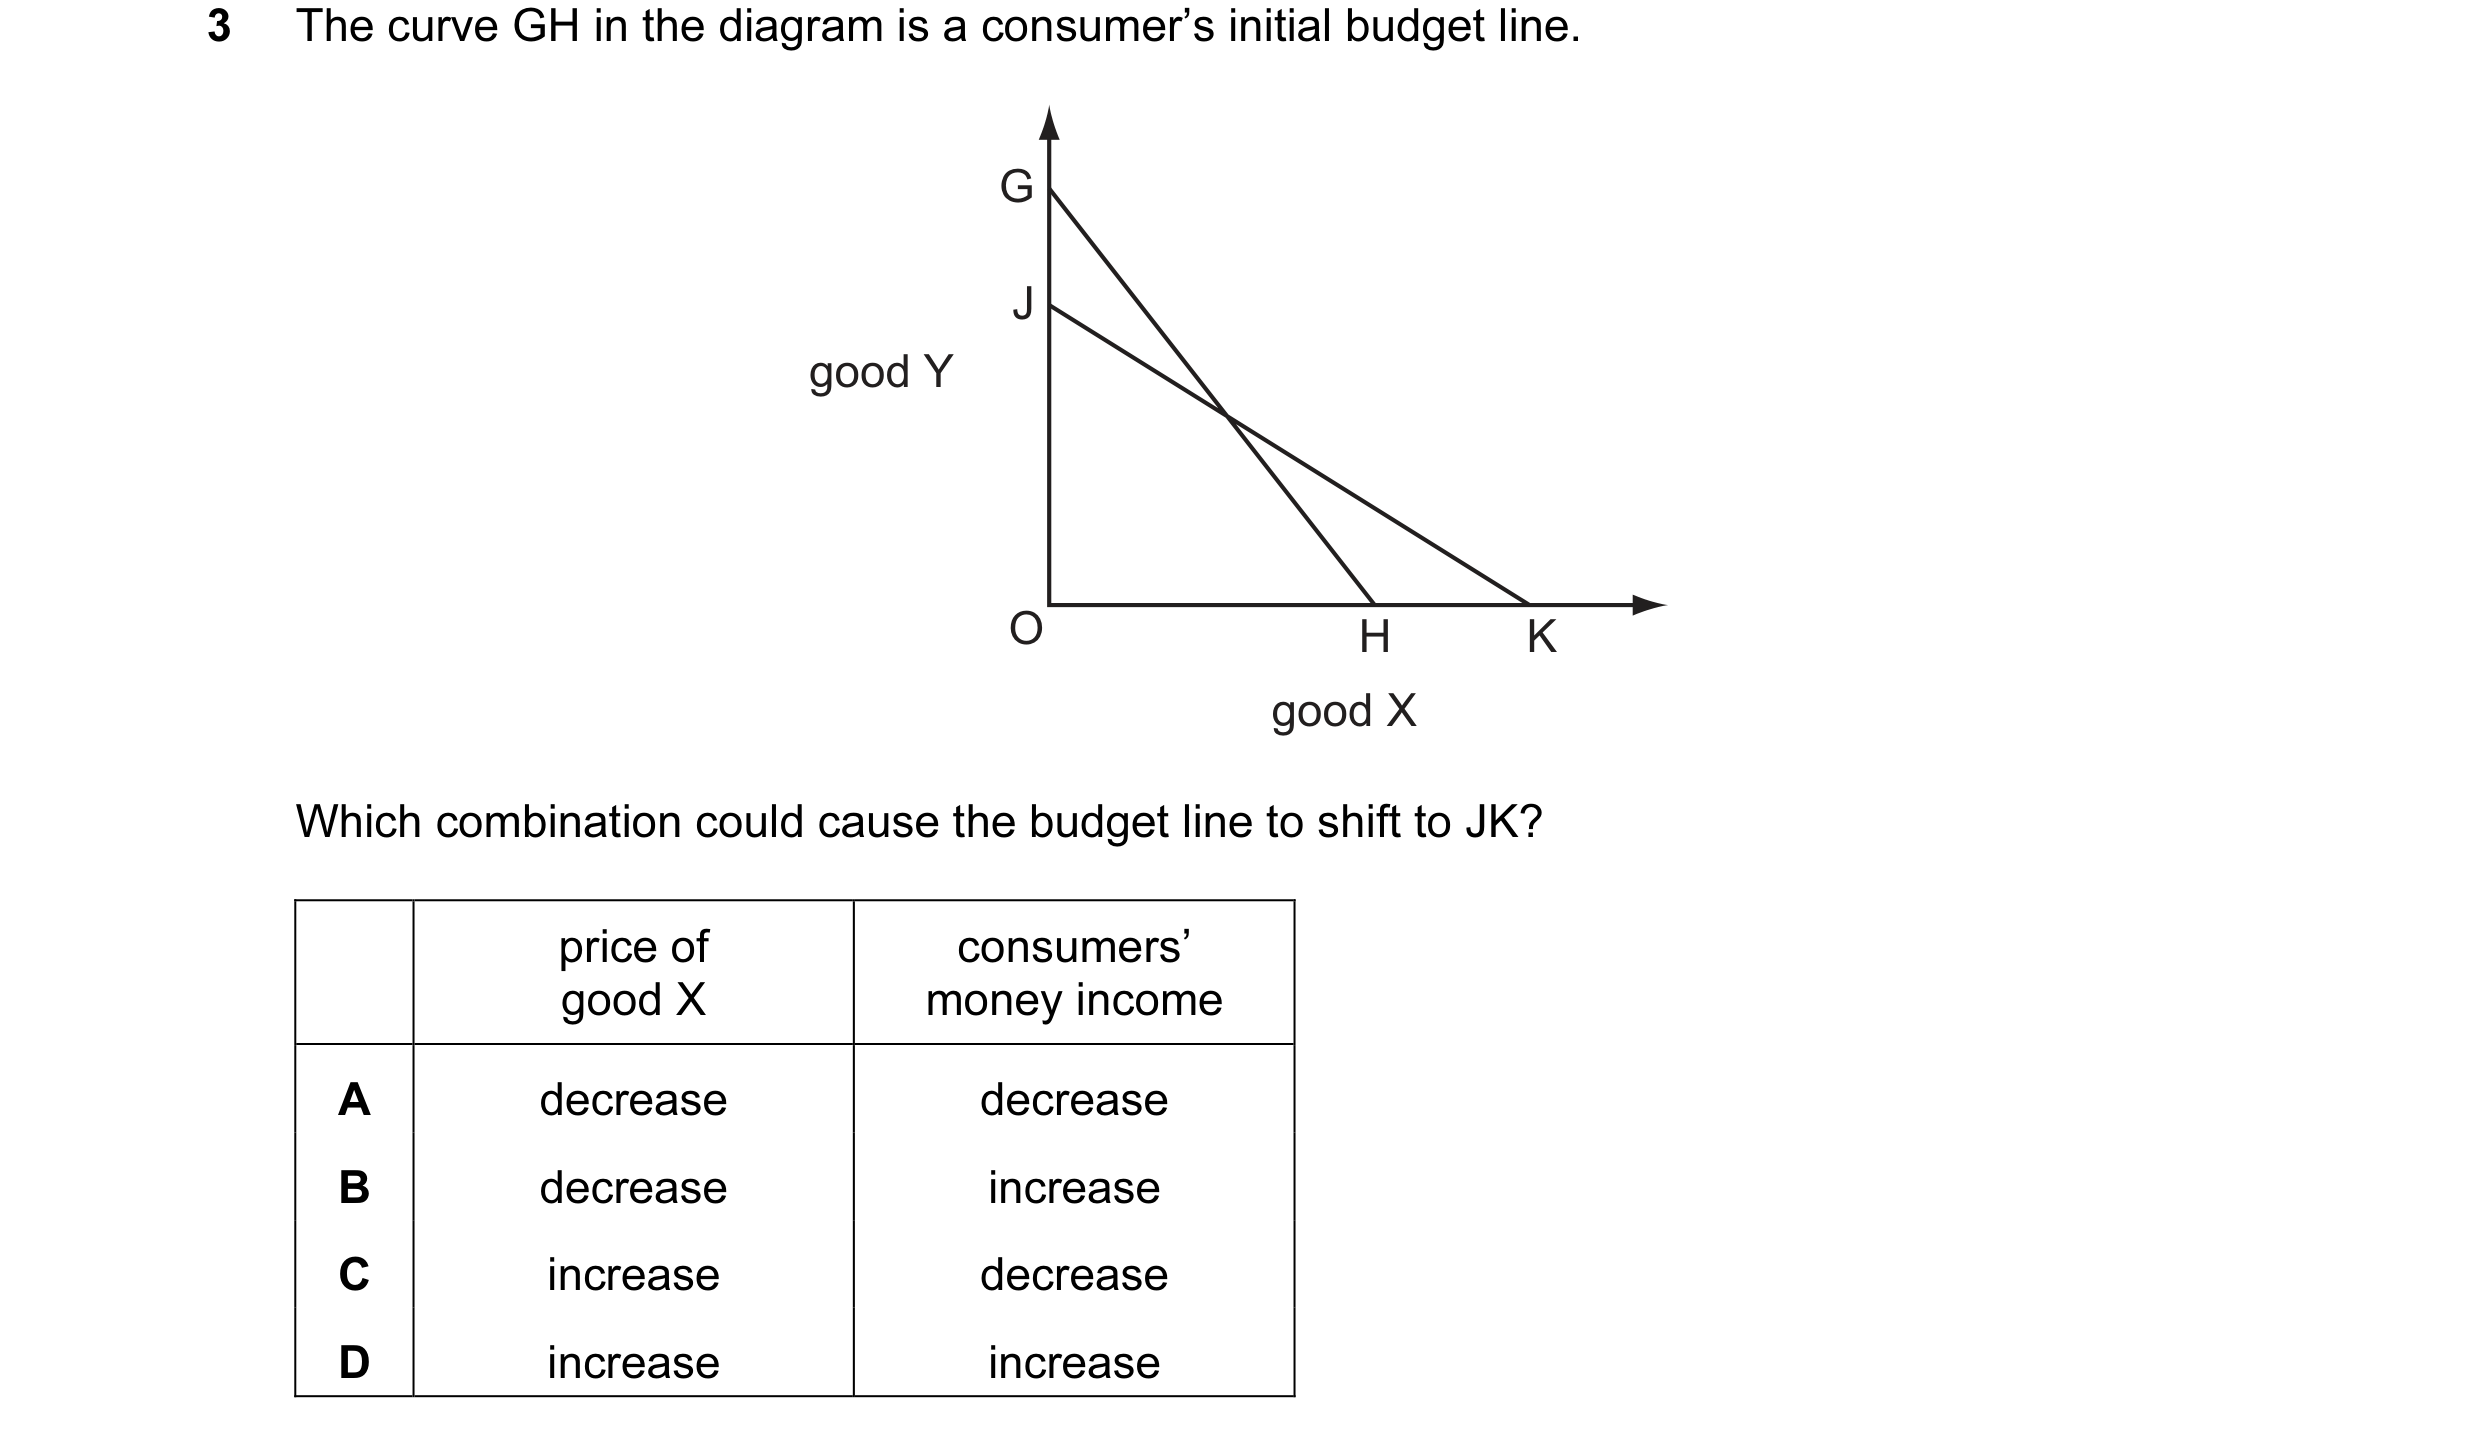
 8 / 32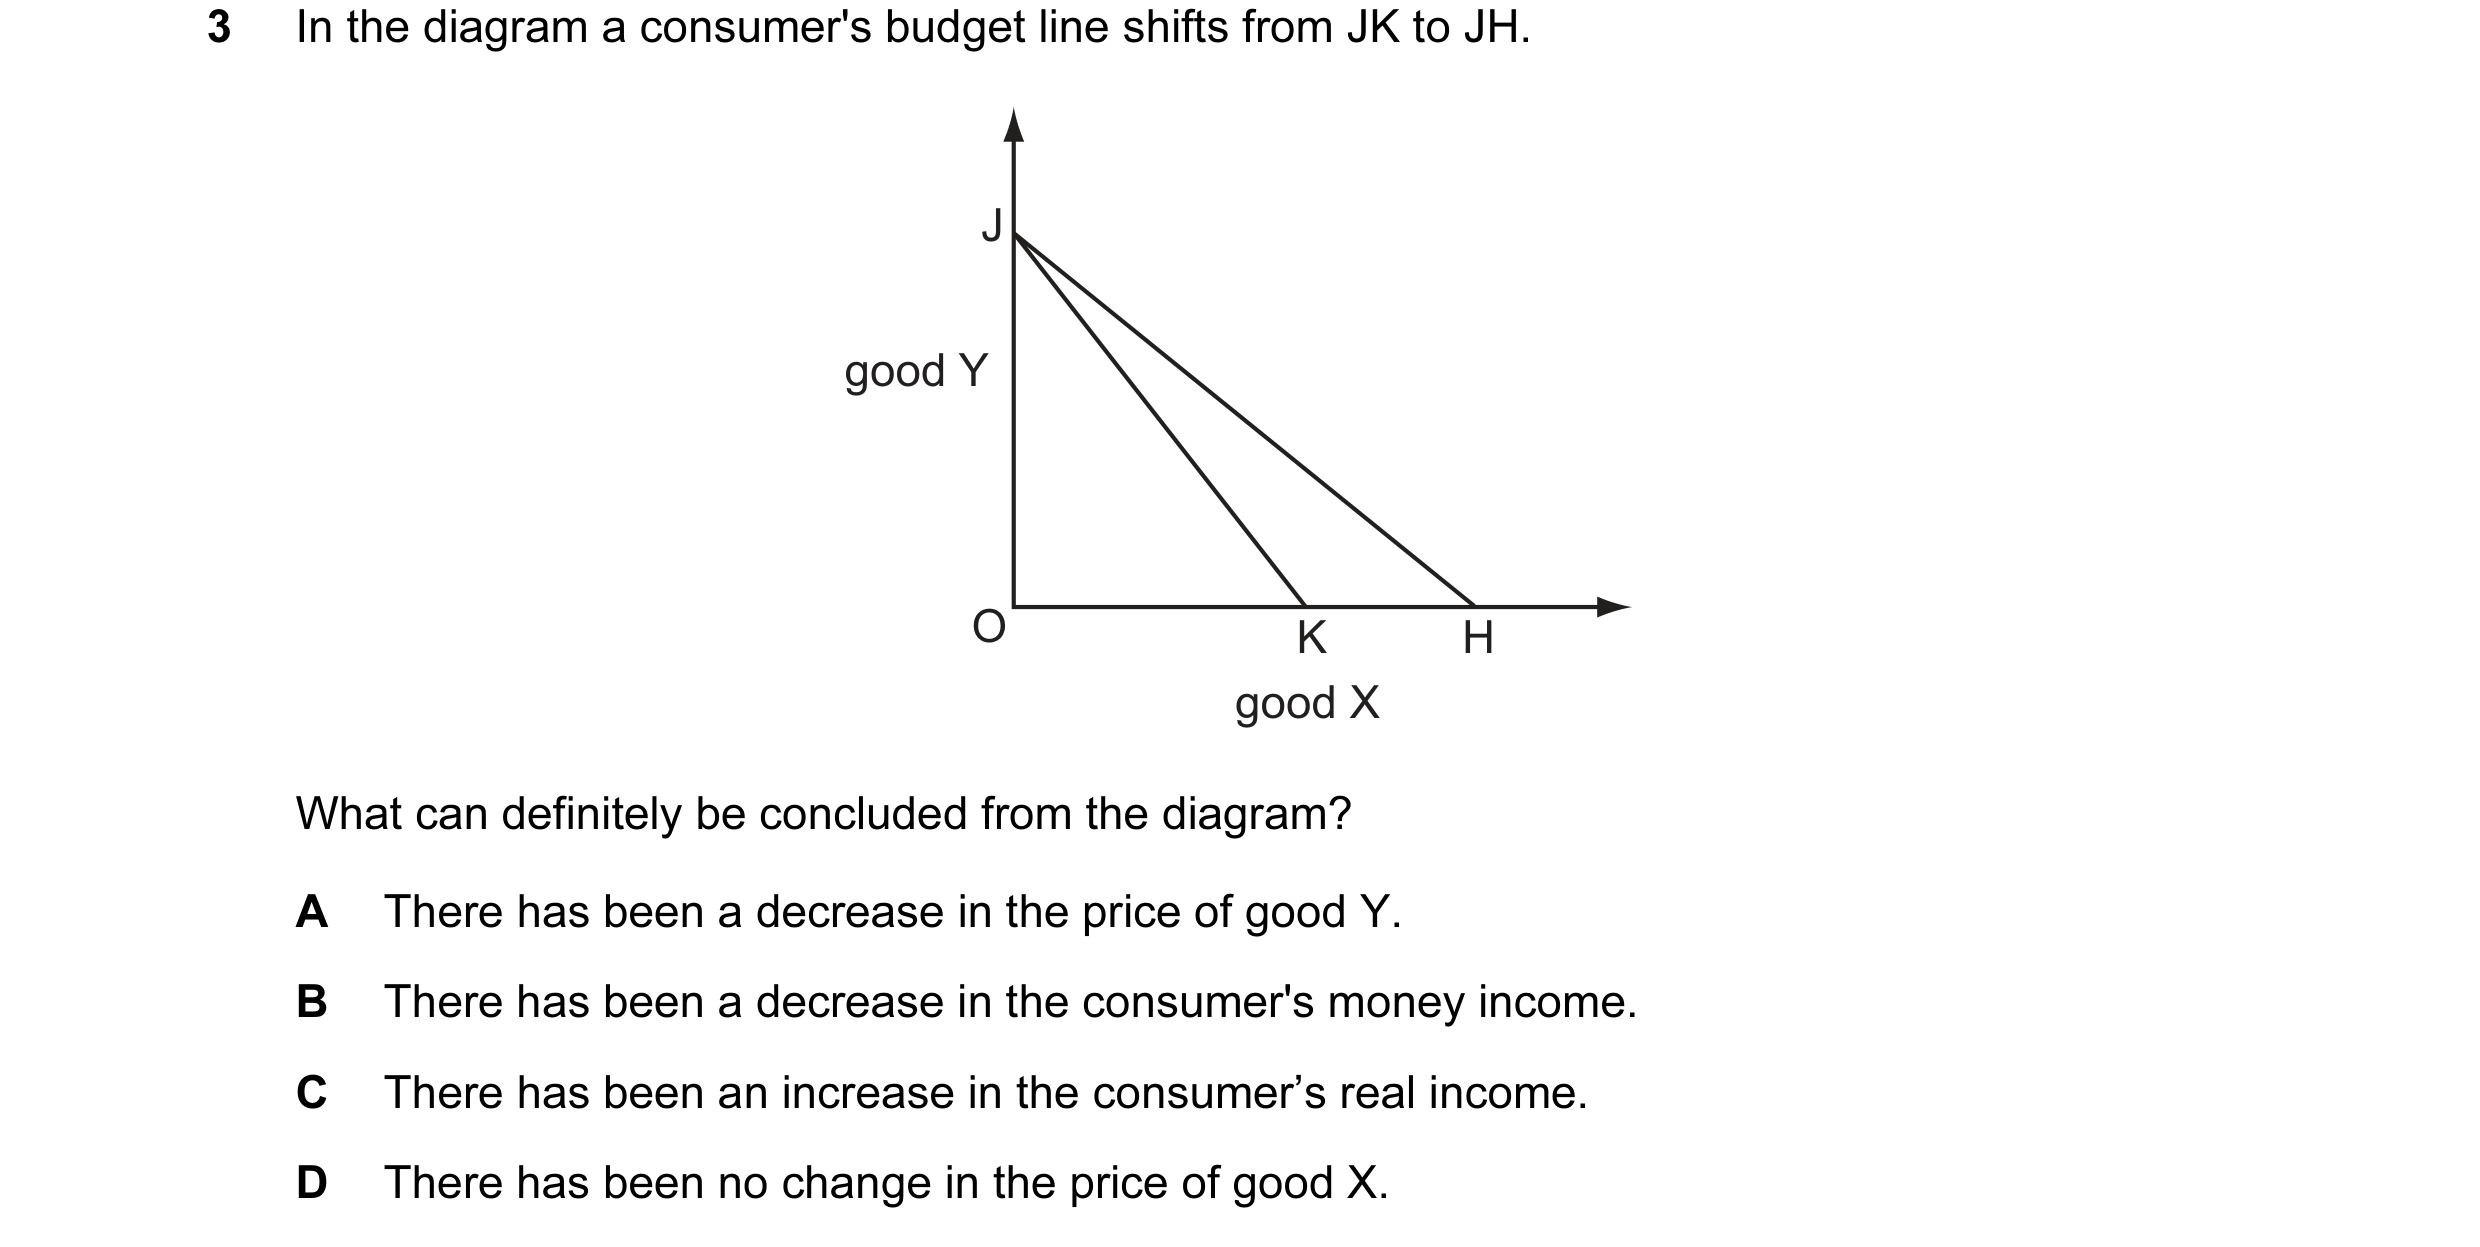
 9 / 32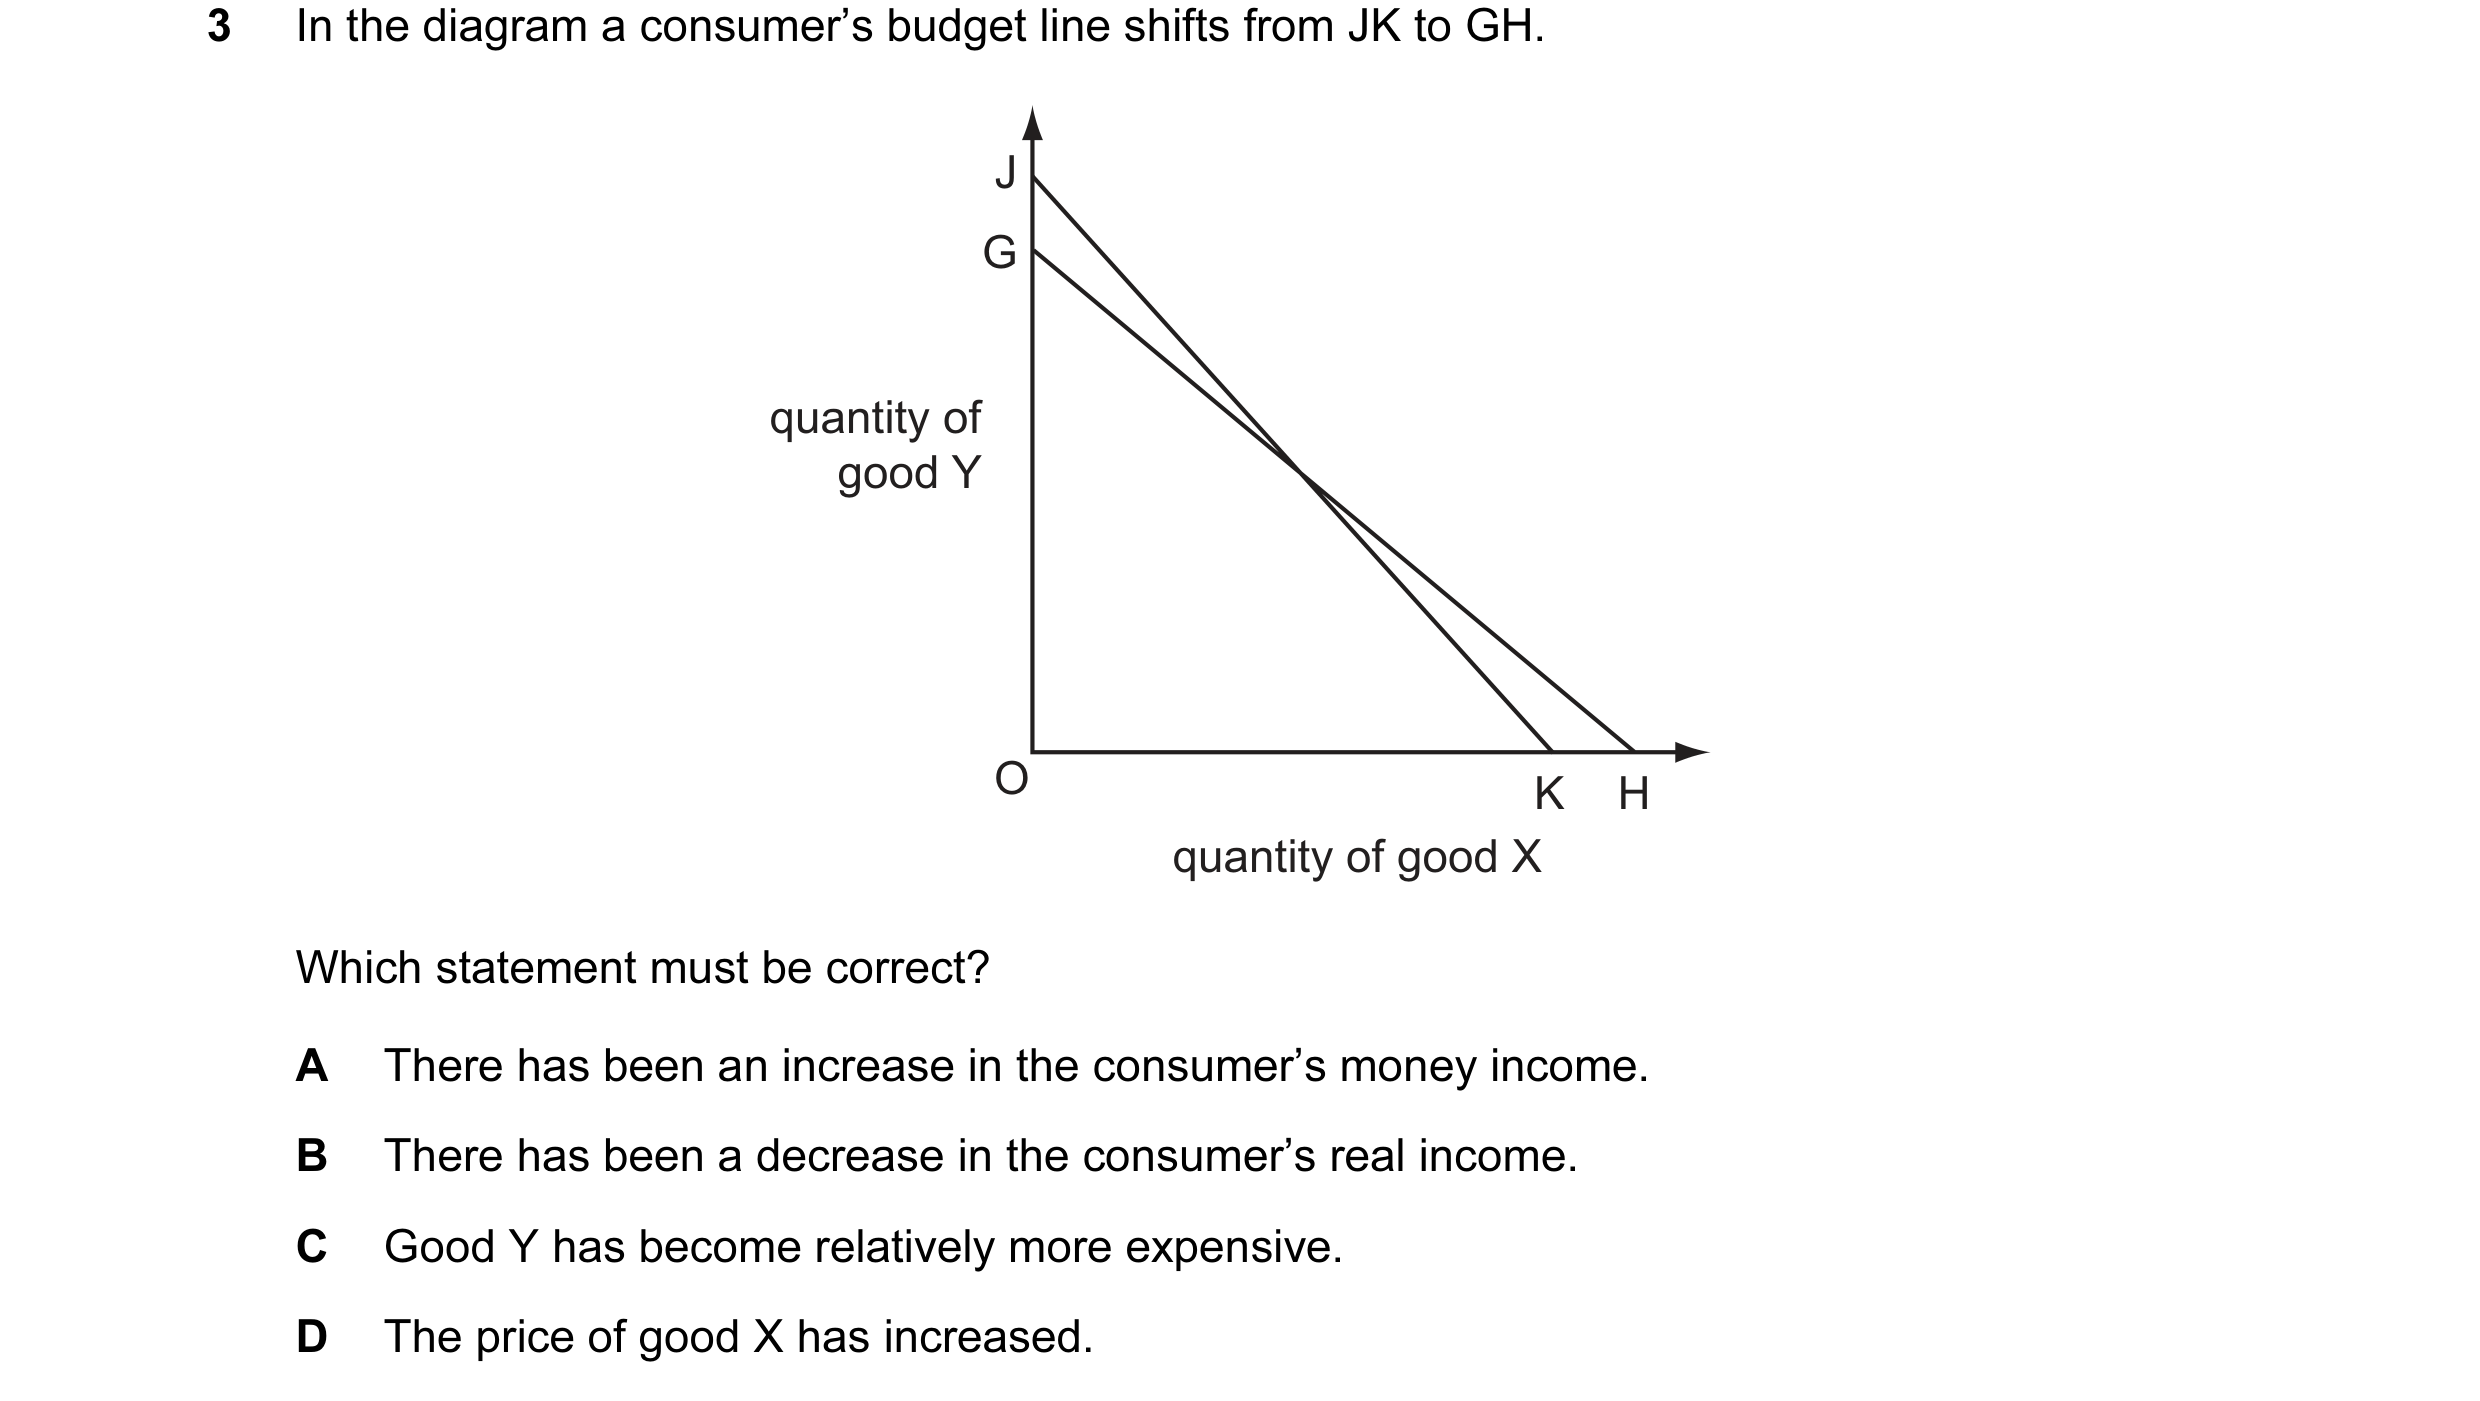
 10 / 32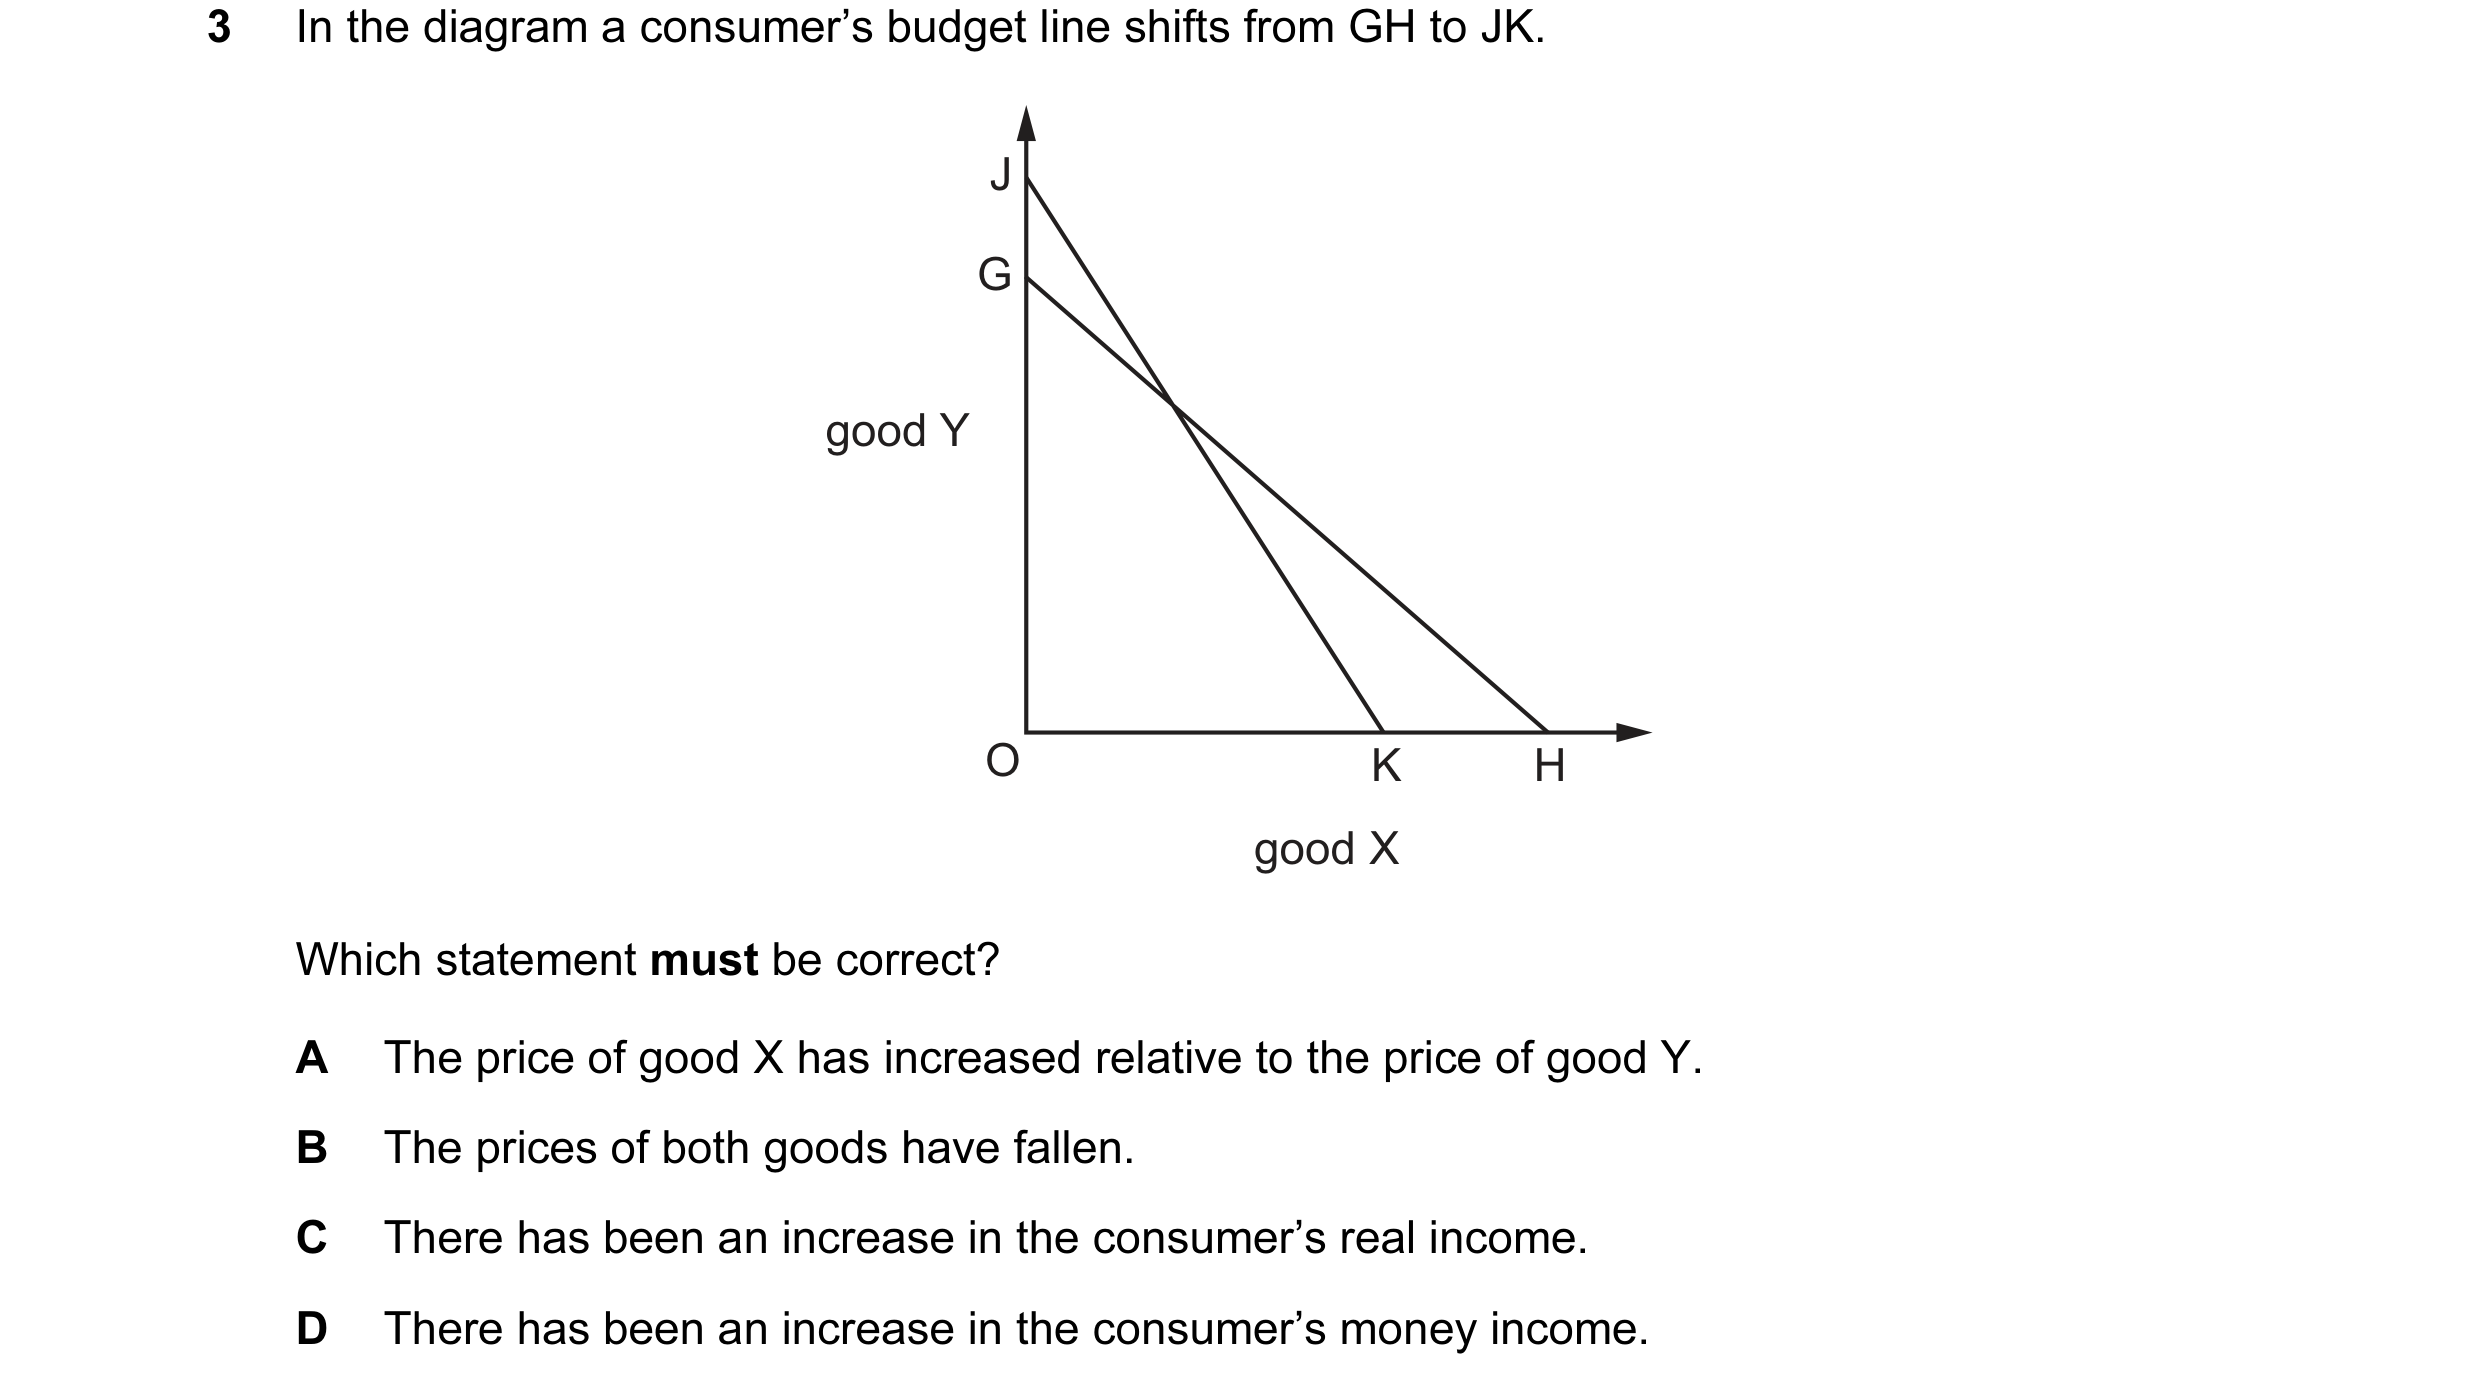
 11 / 32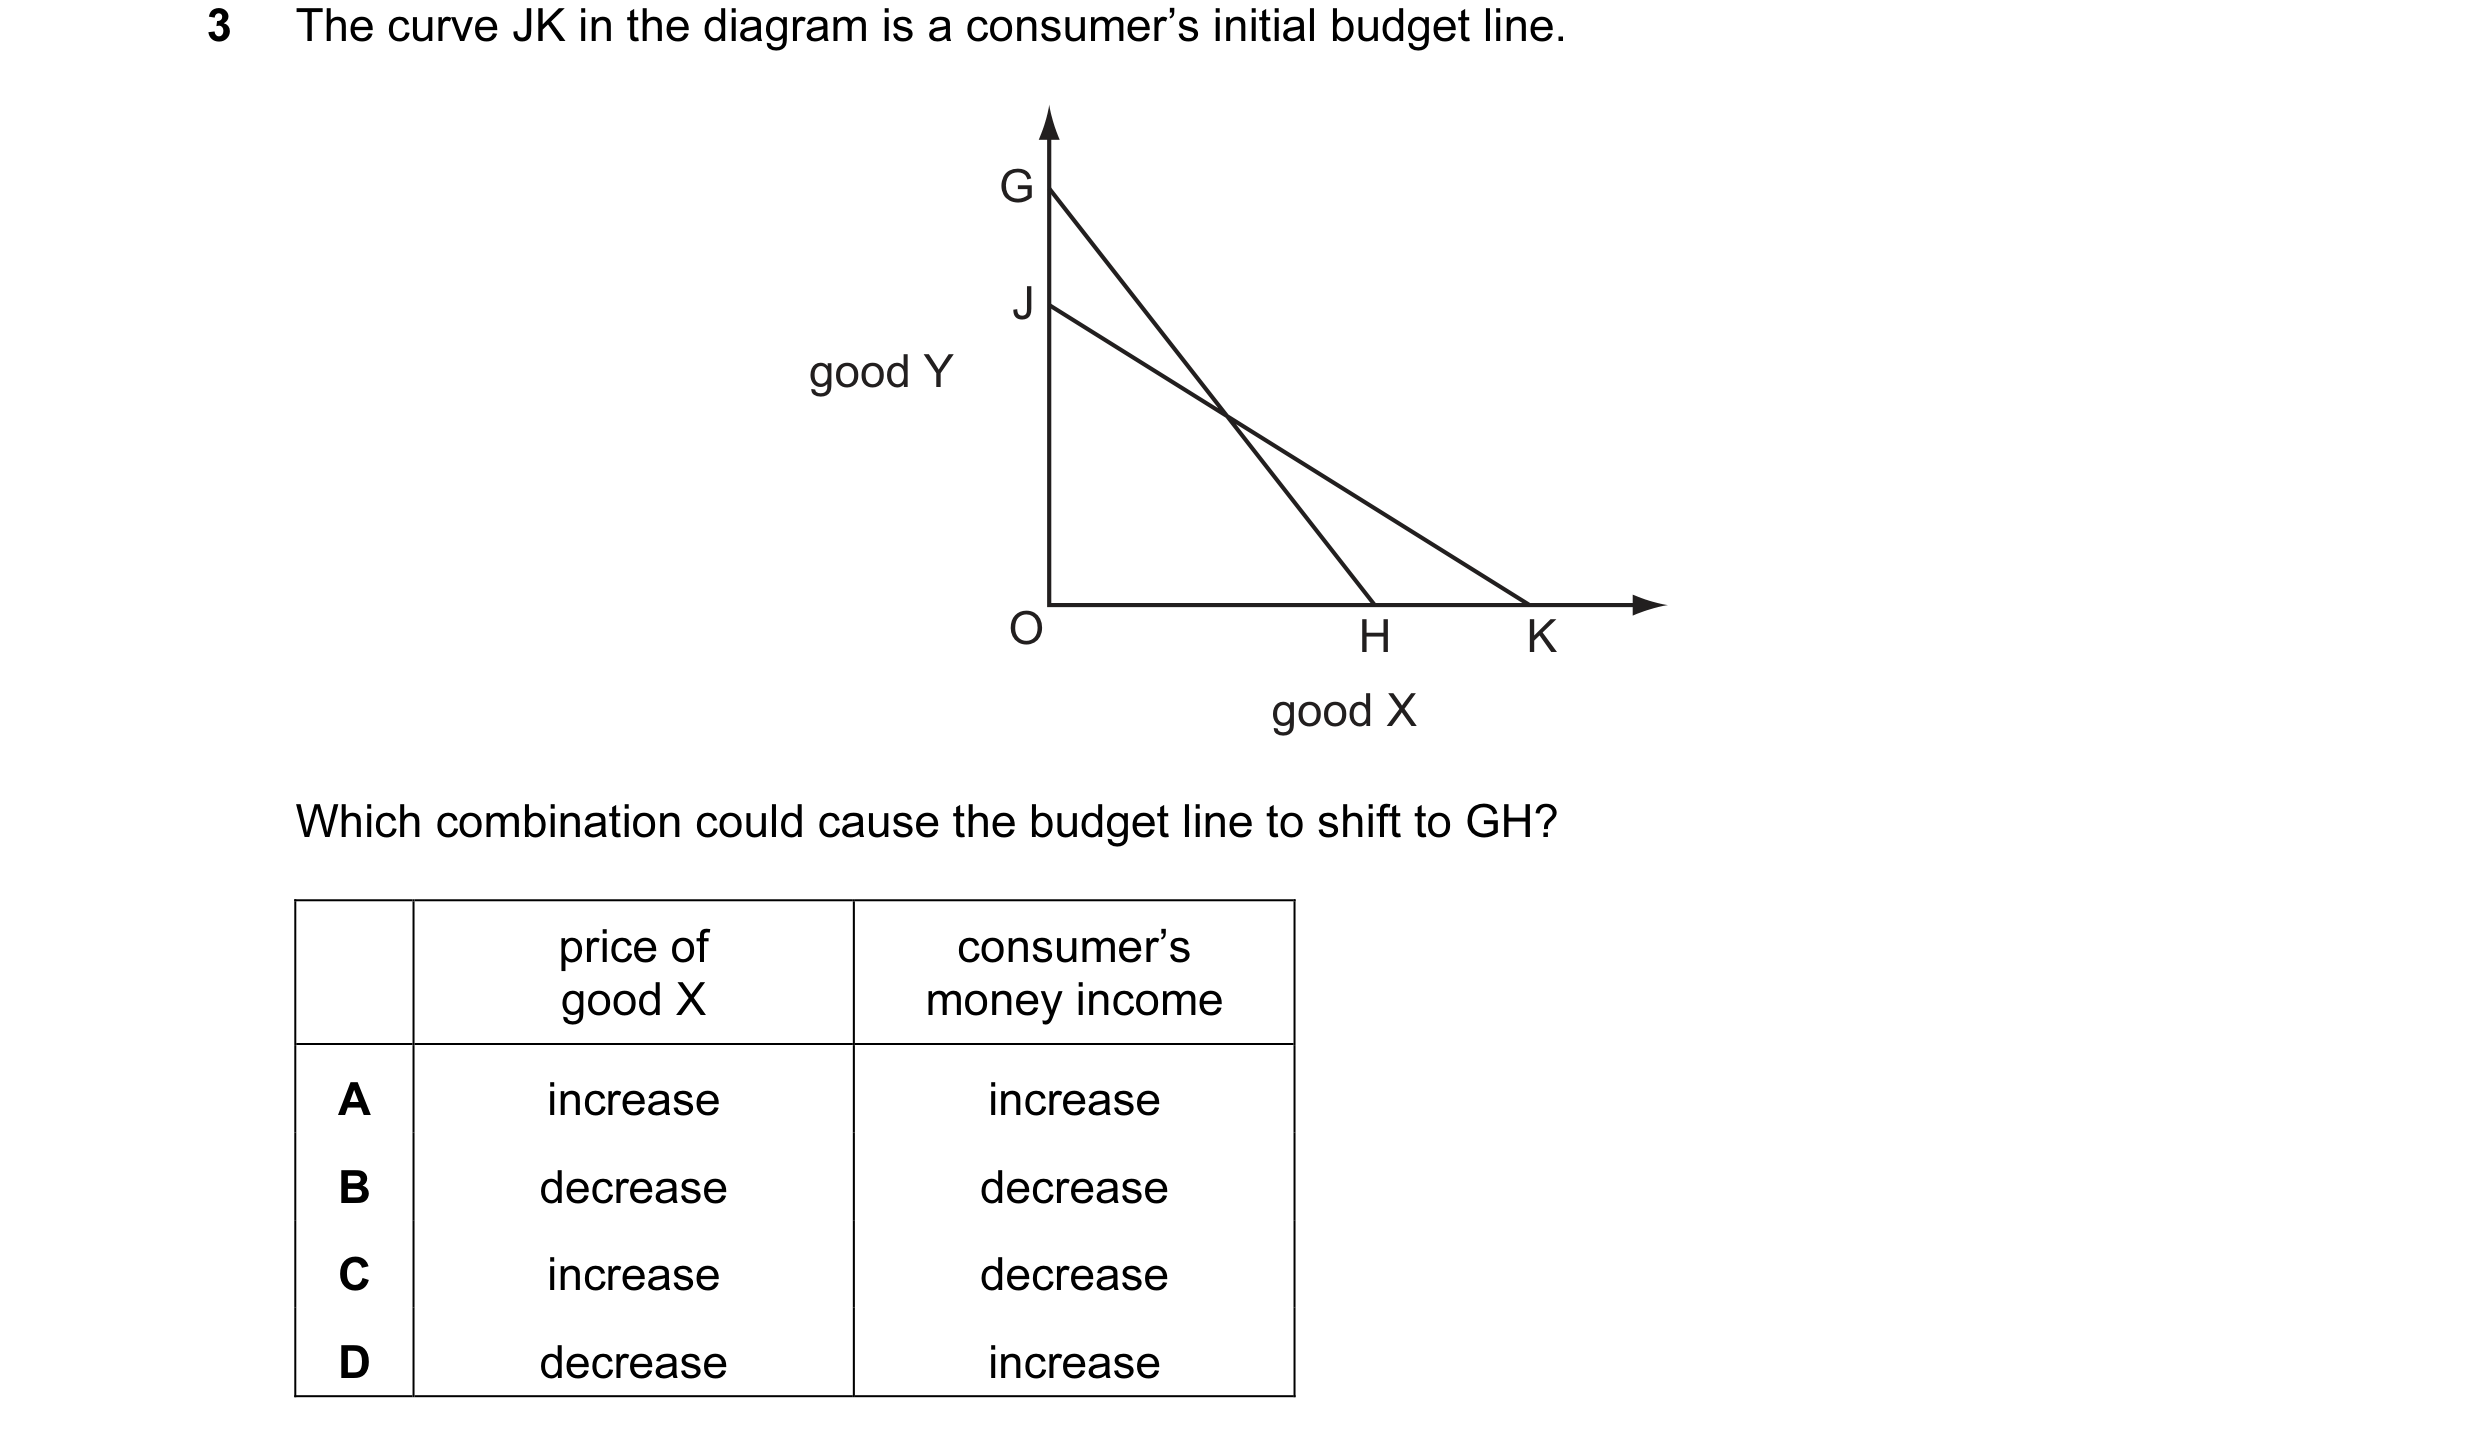
 12 / 32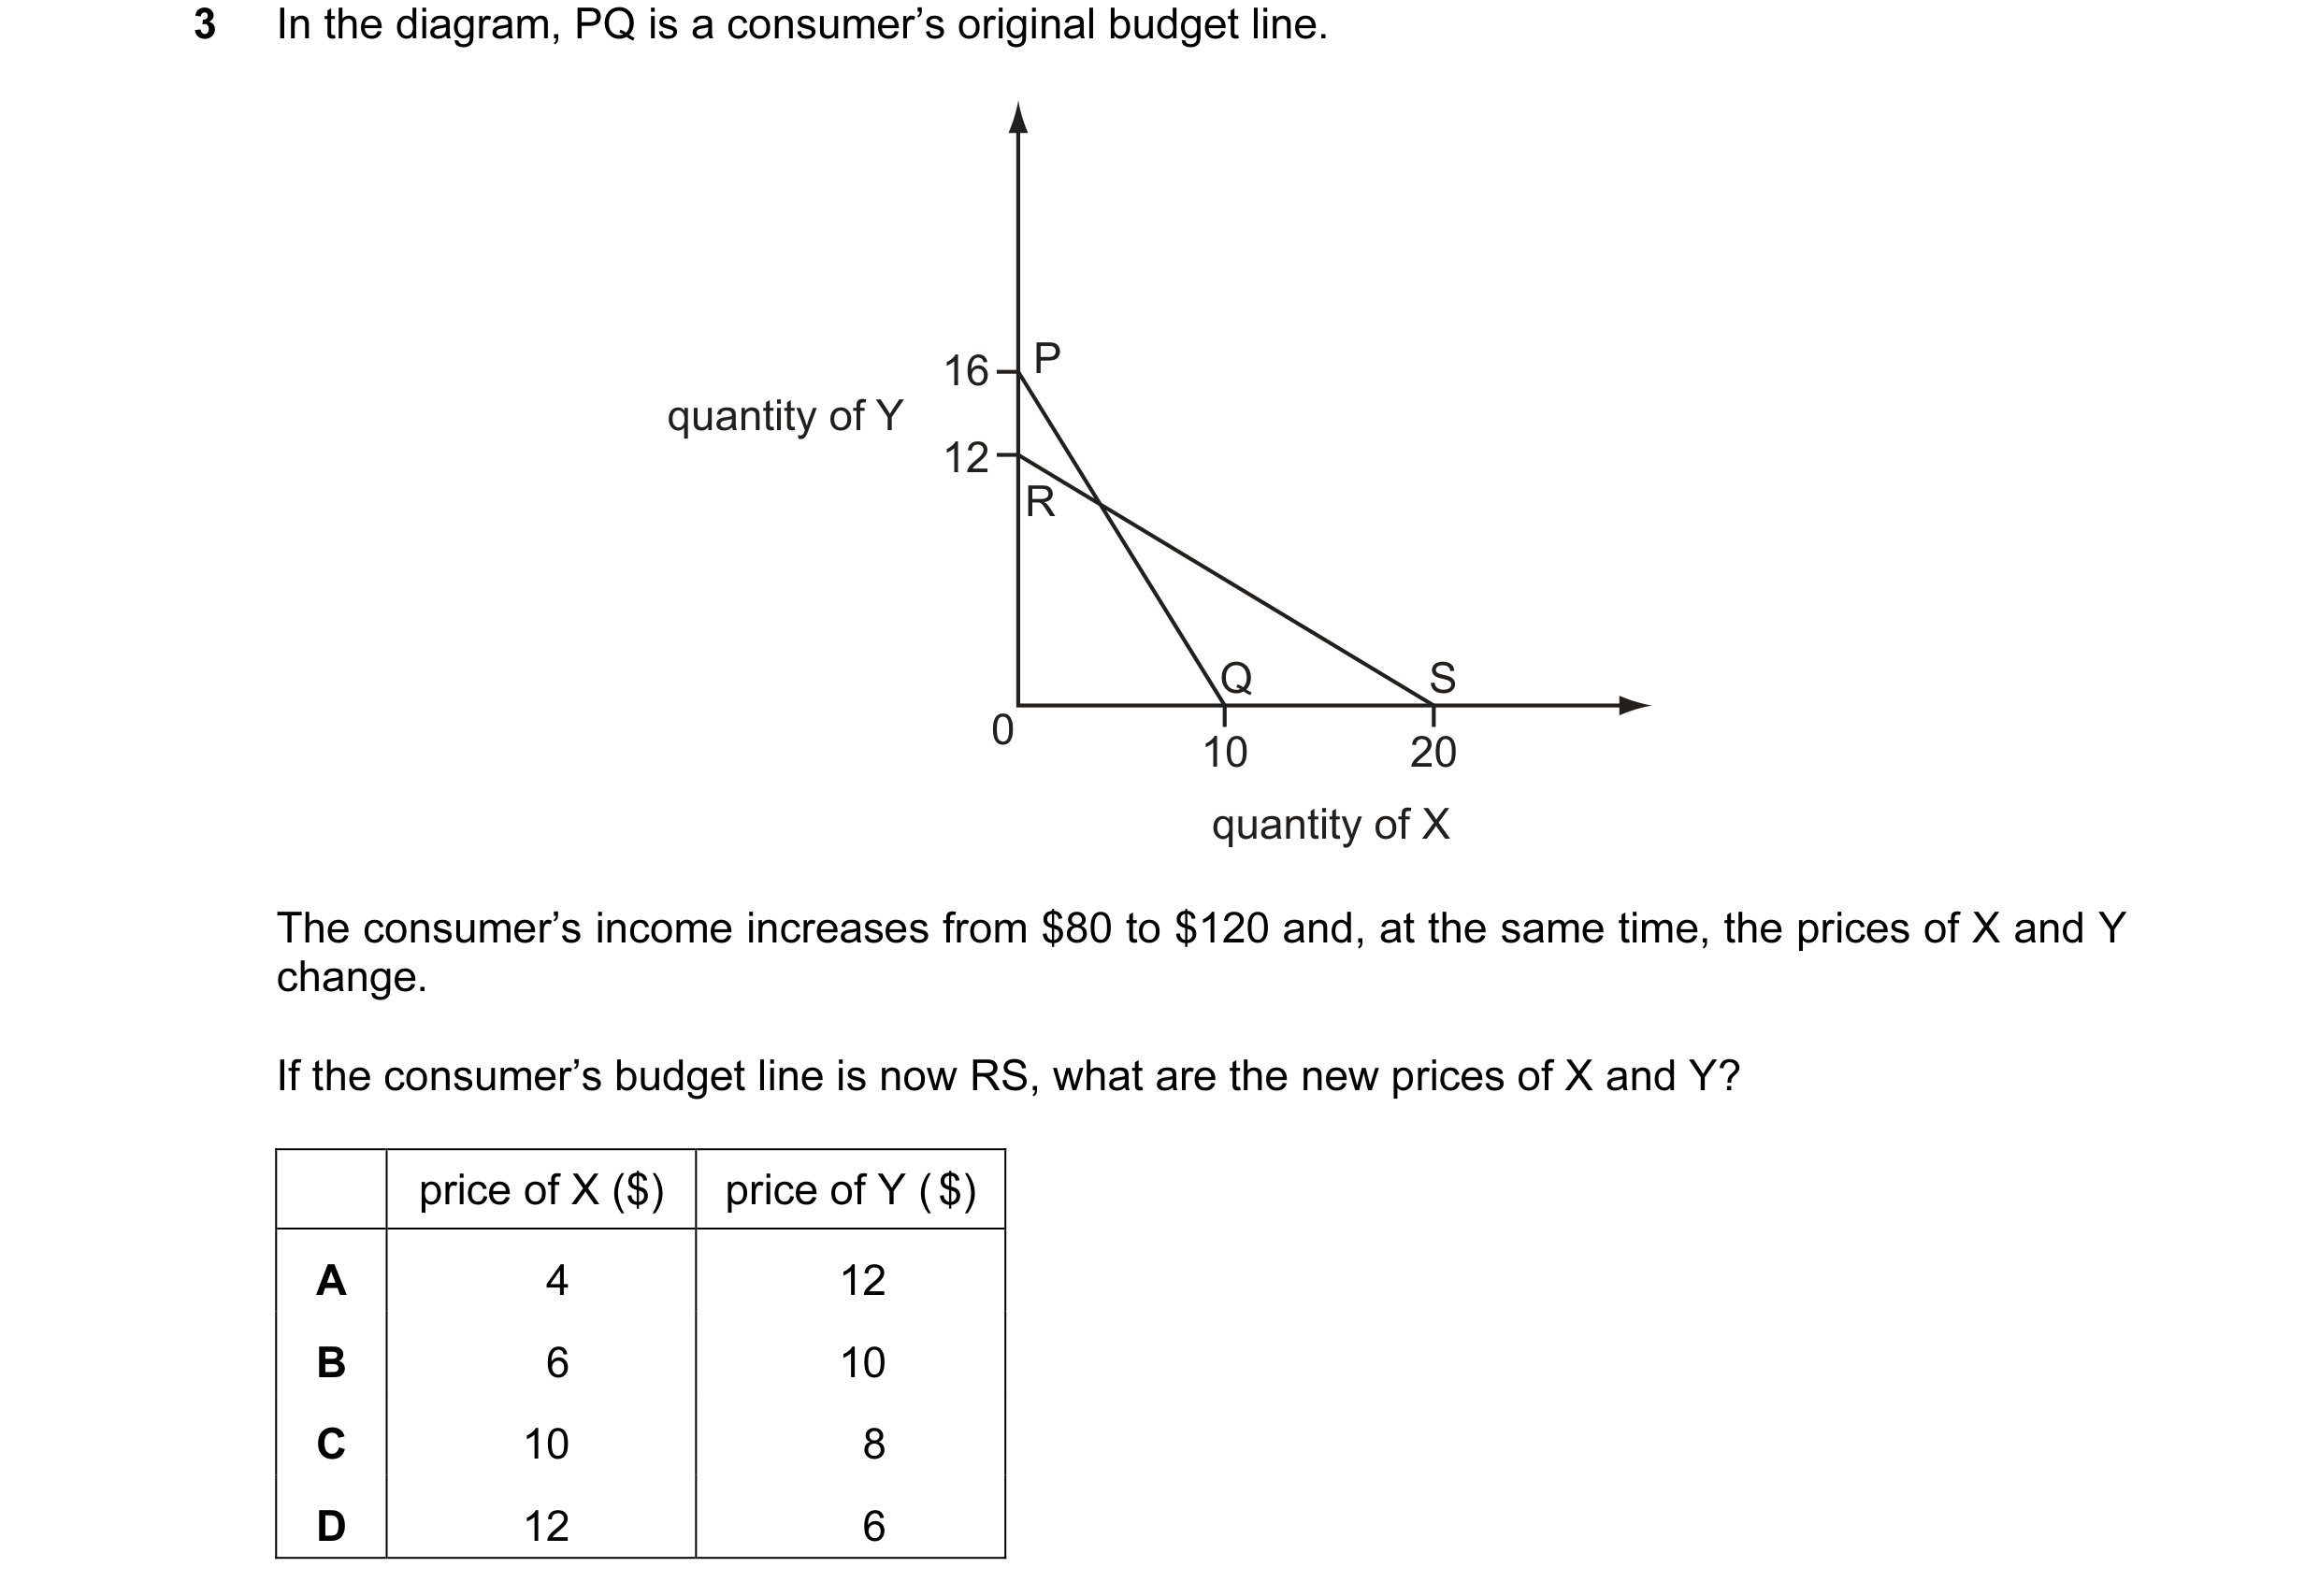
 13 / 32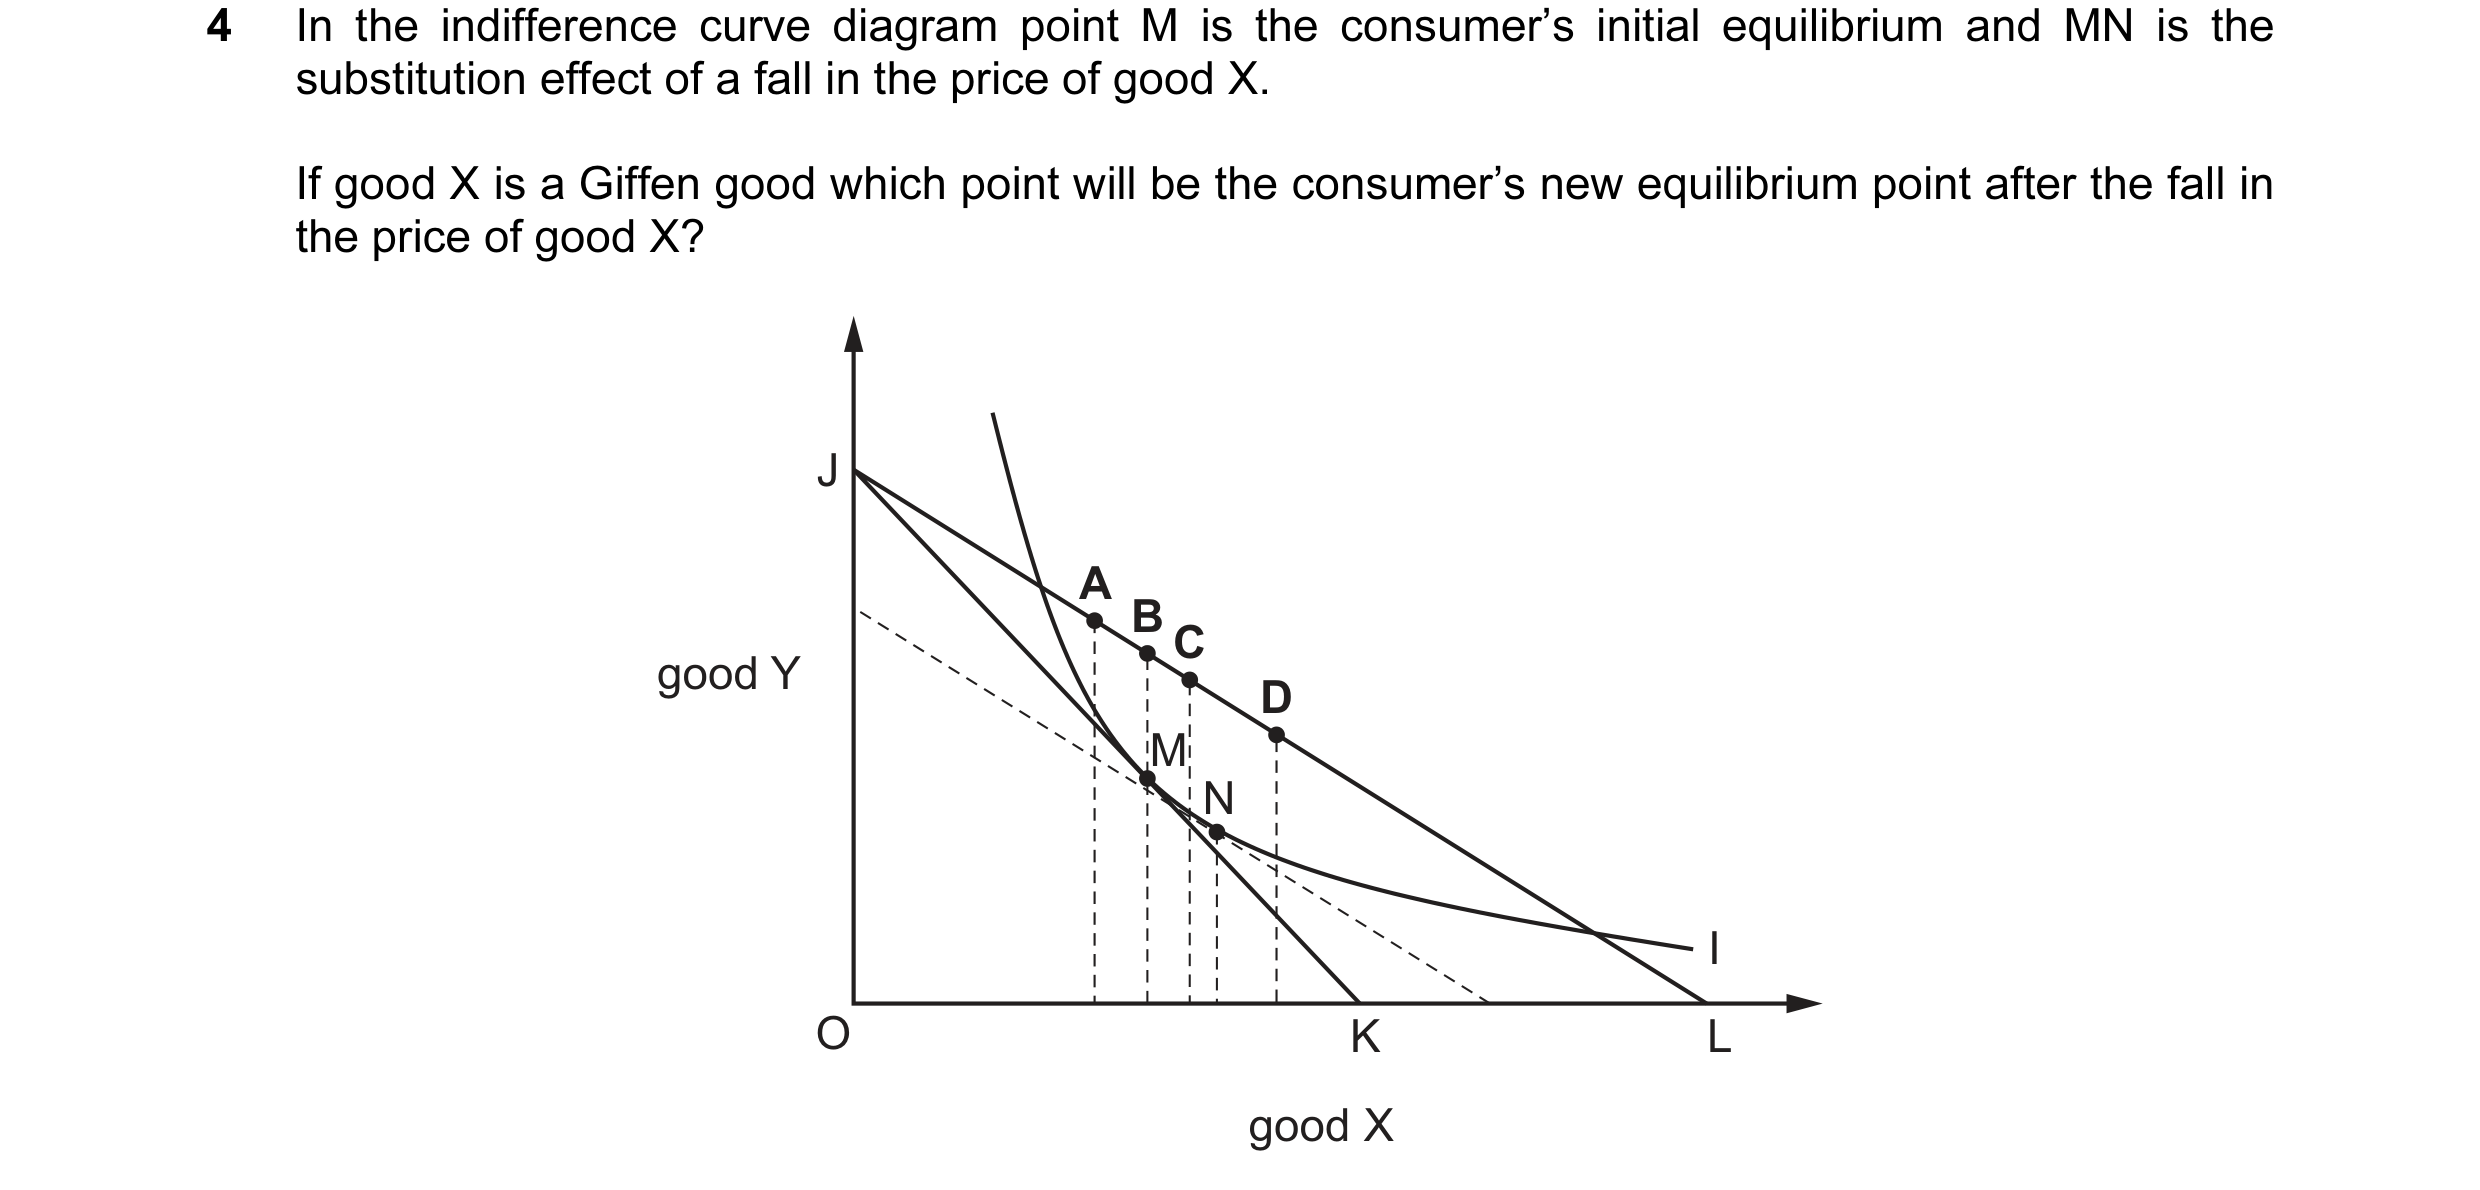
 14 / 32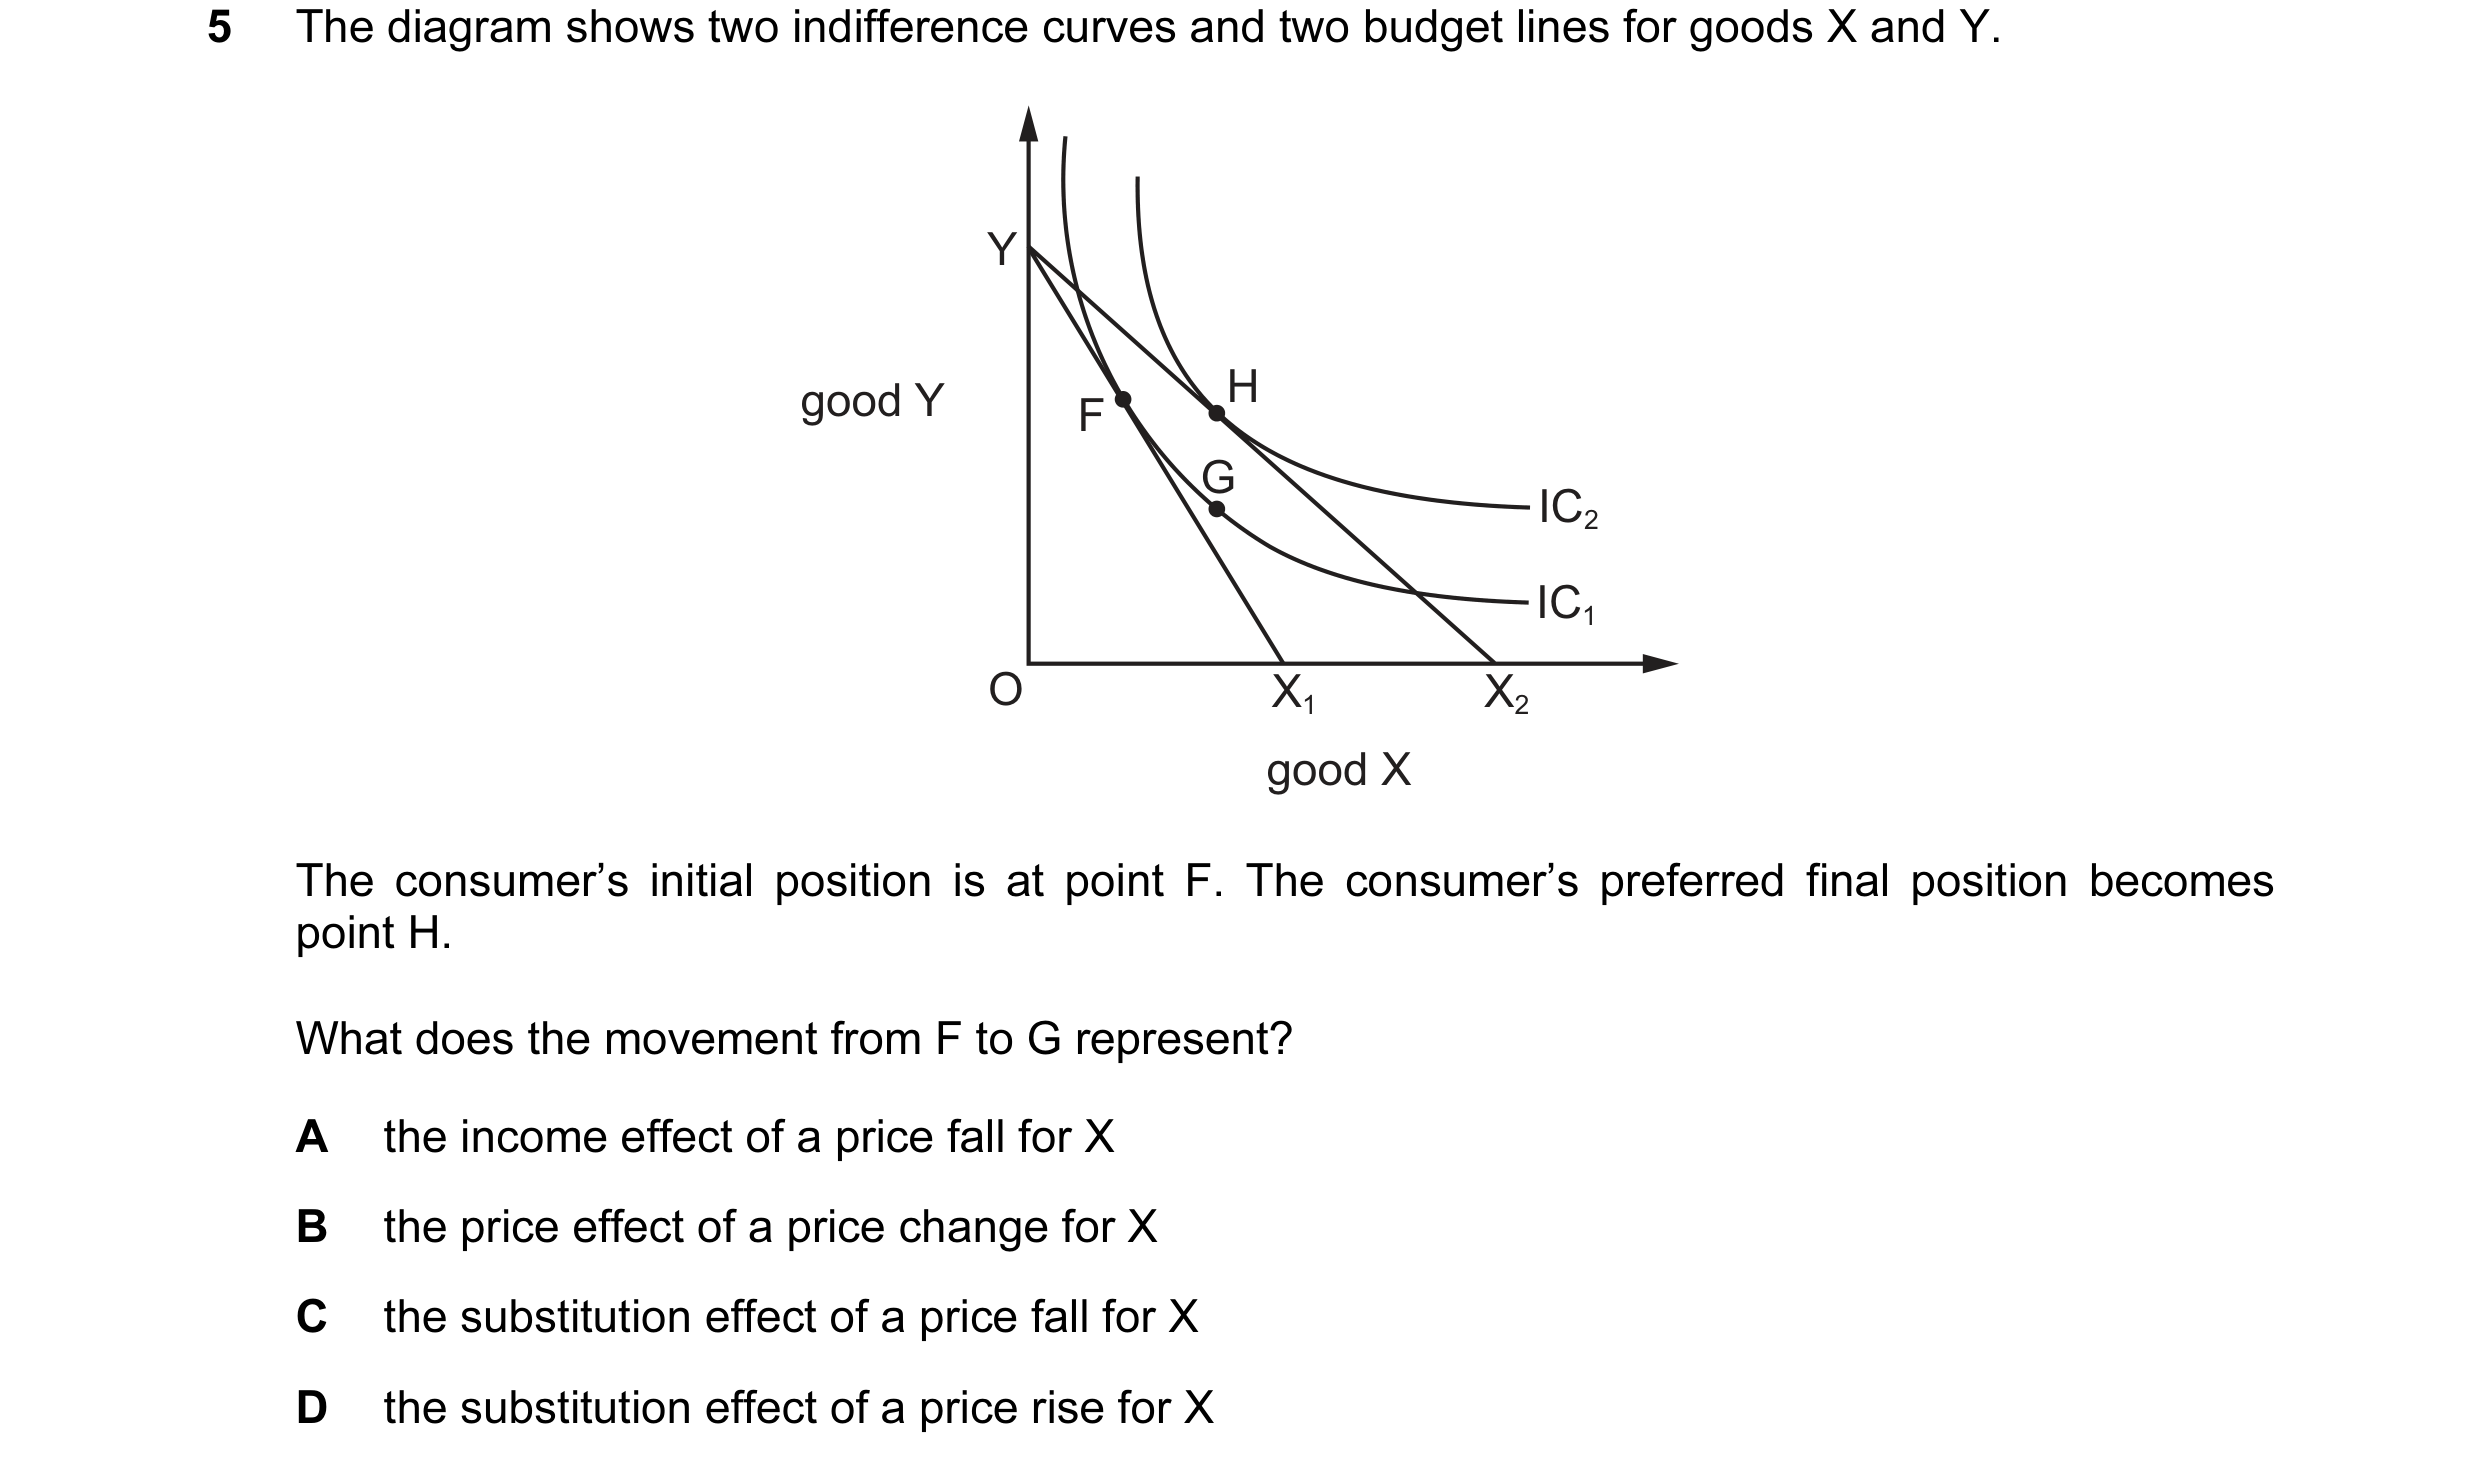
 15 / 32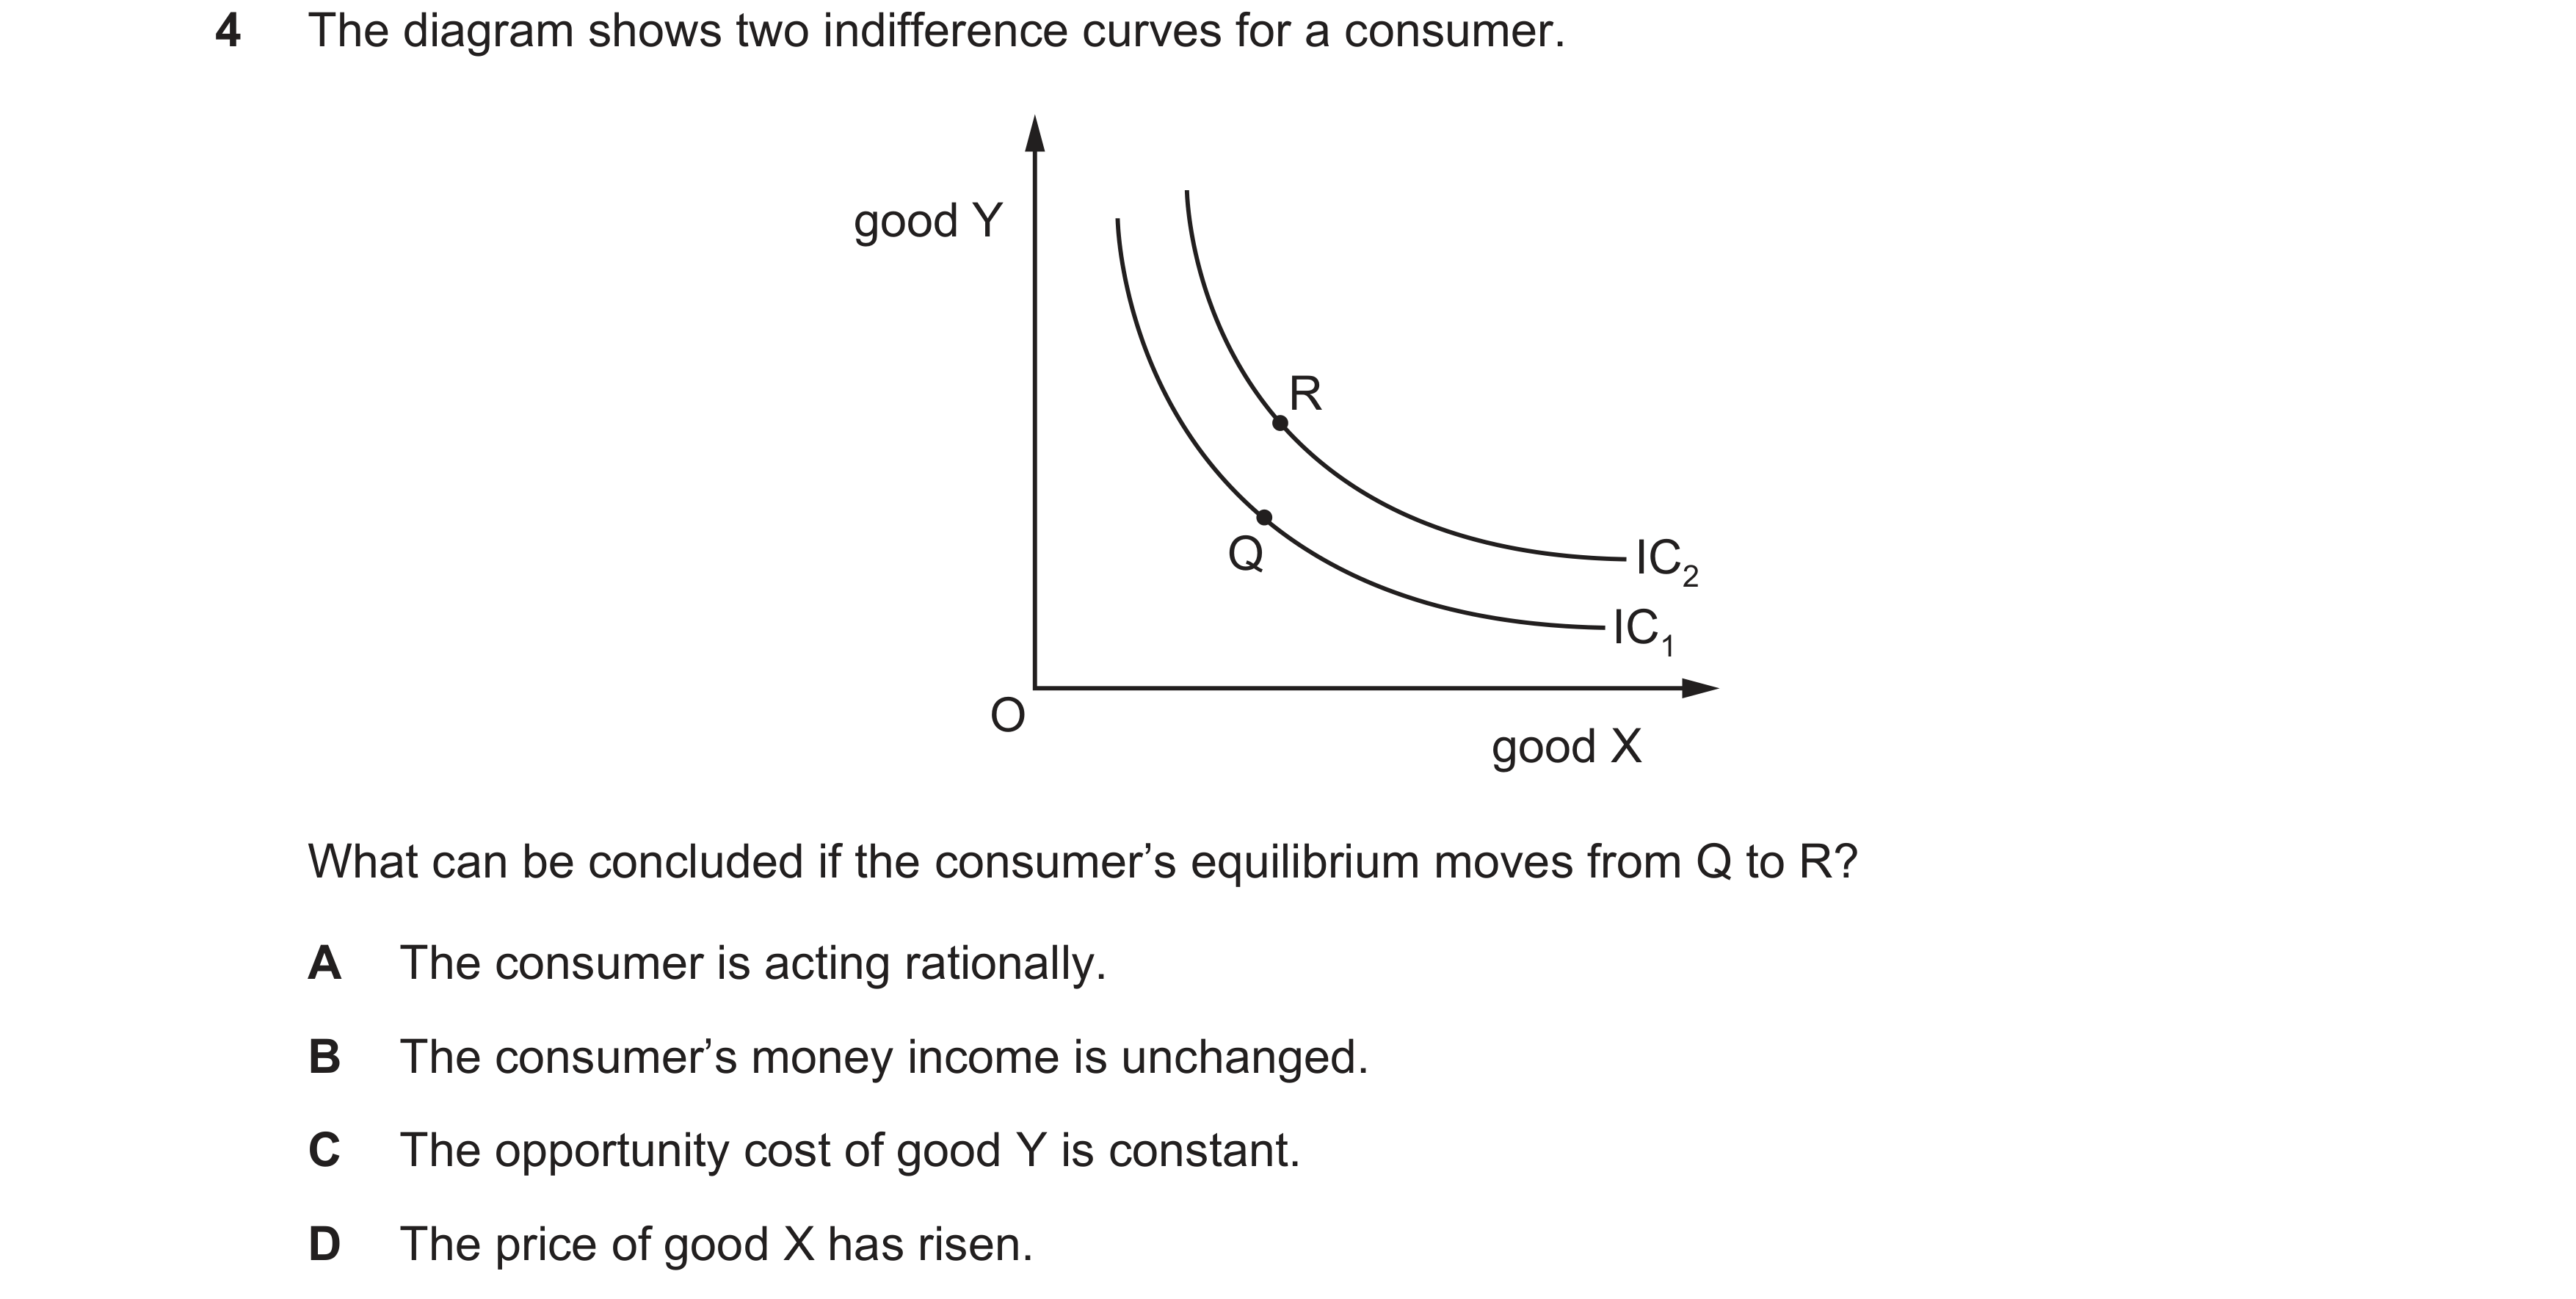
 16 / 32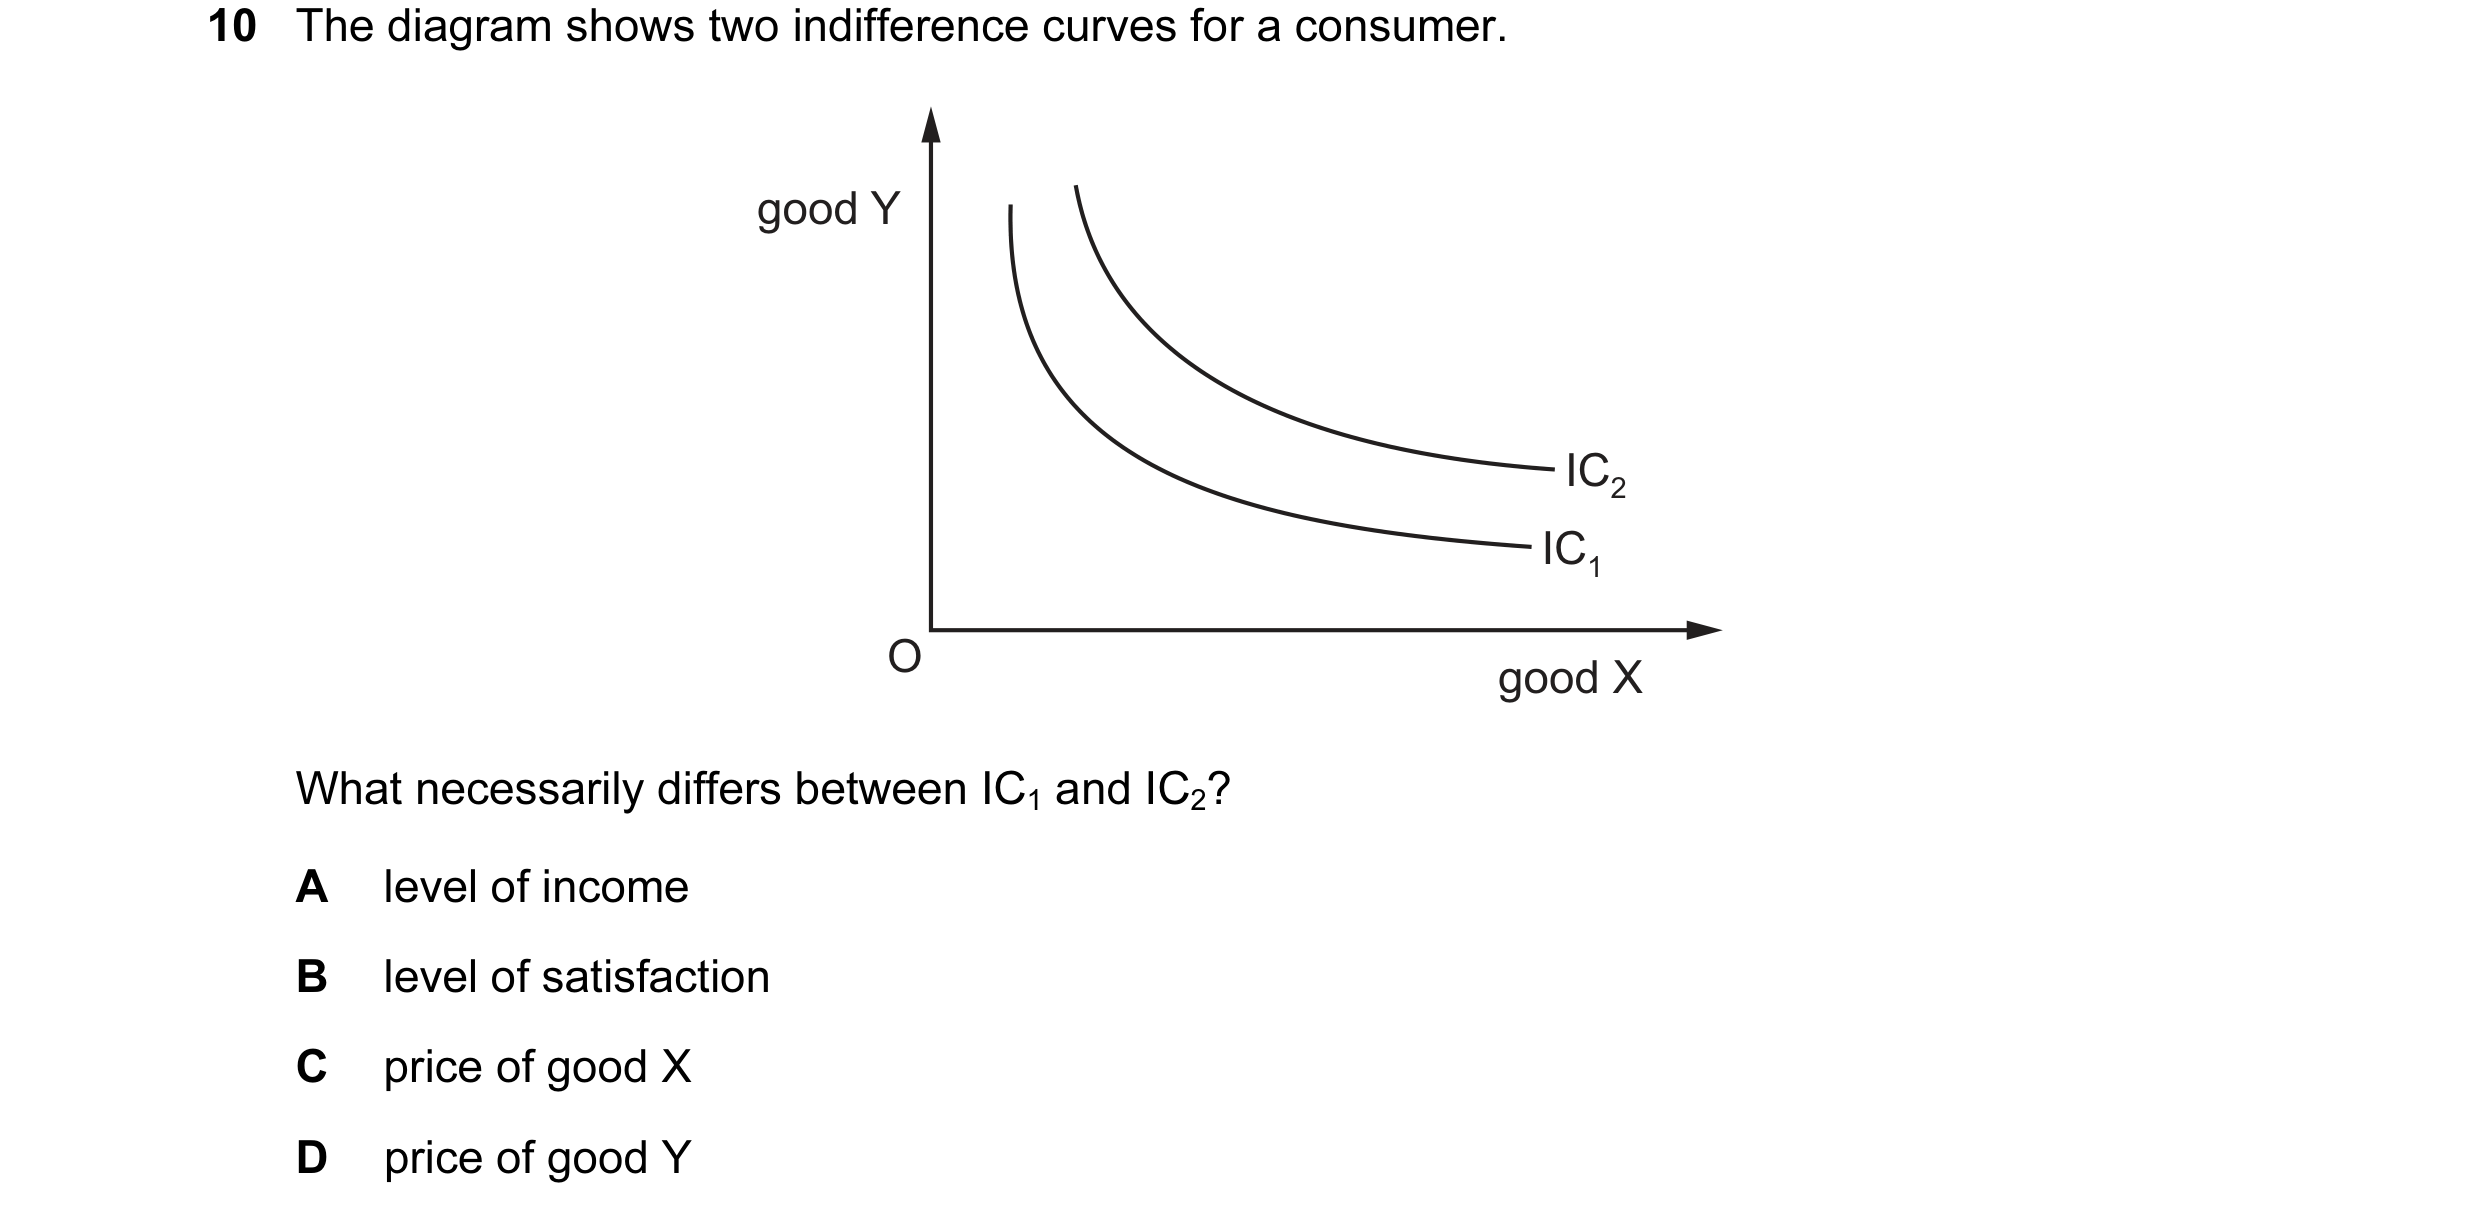
 17 / 32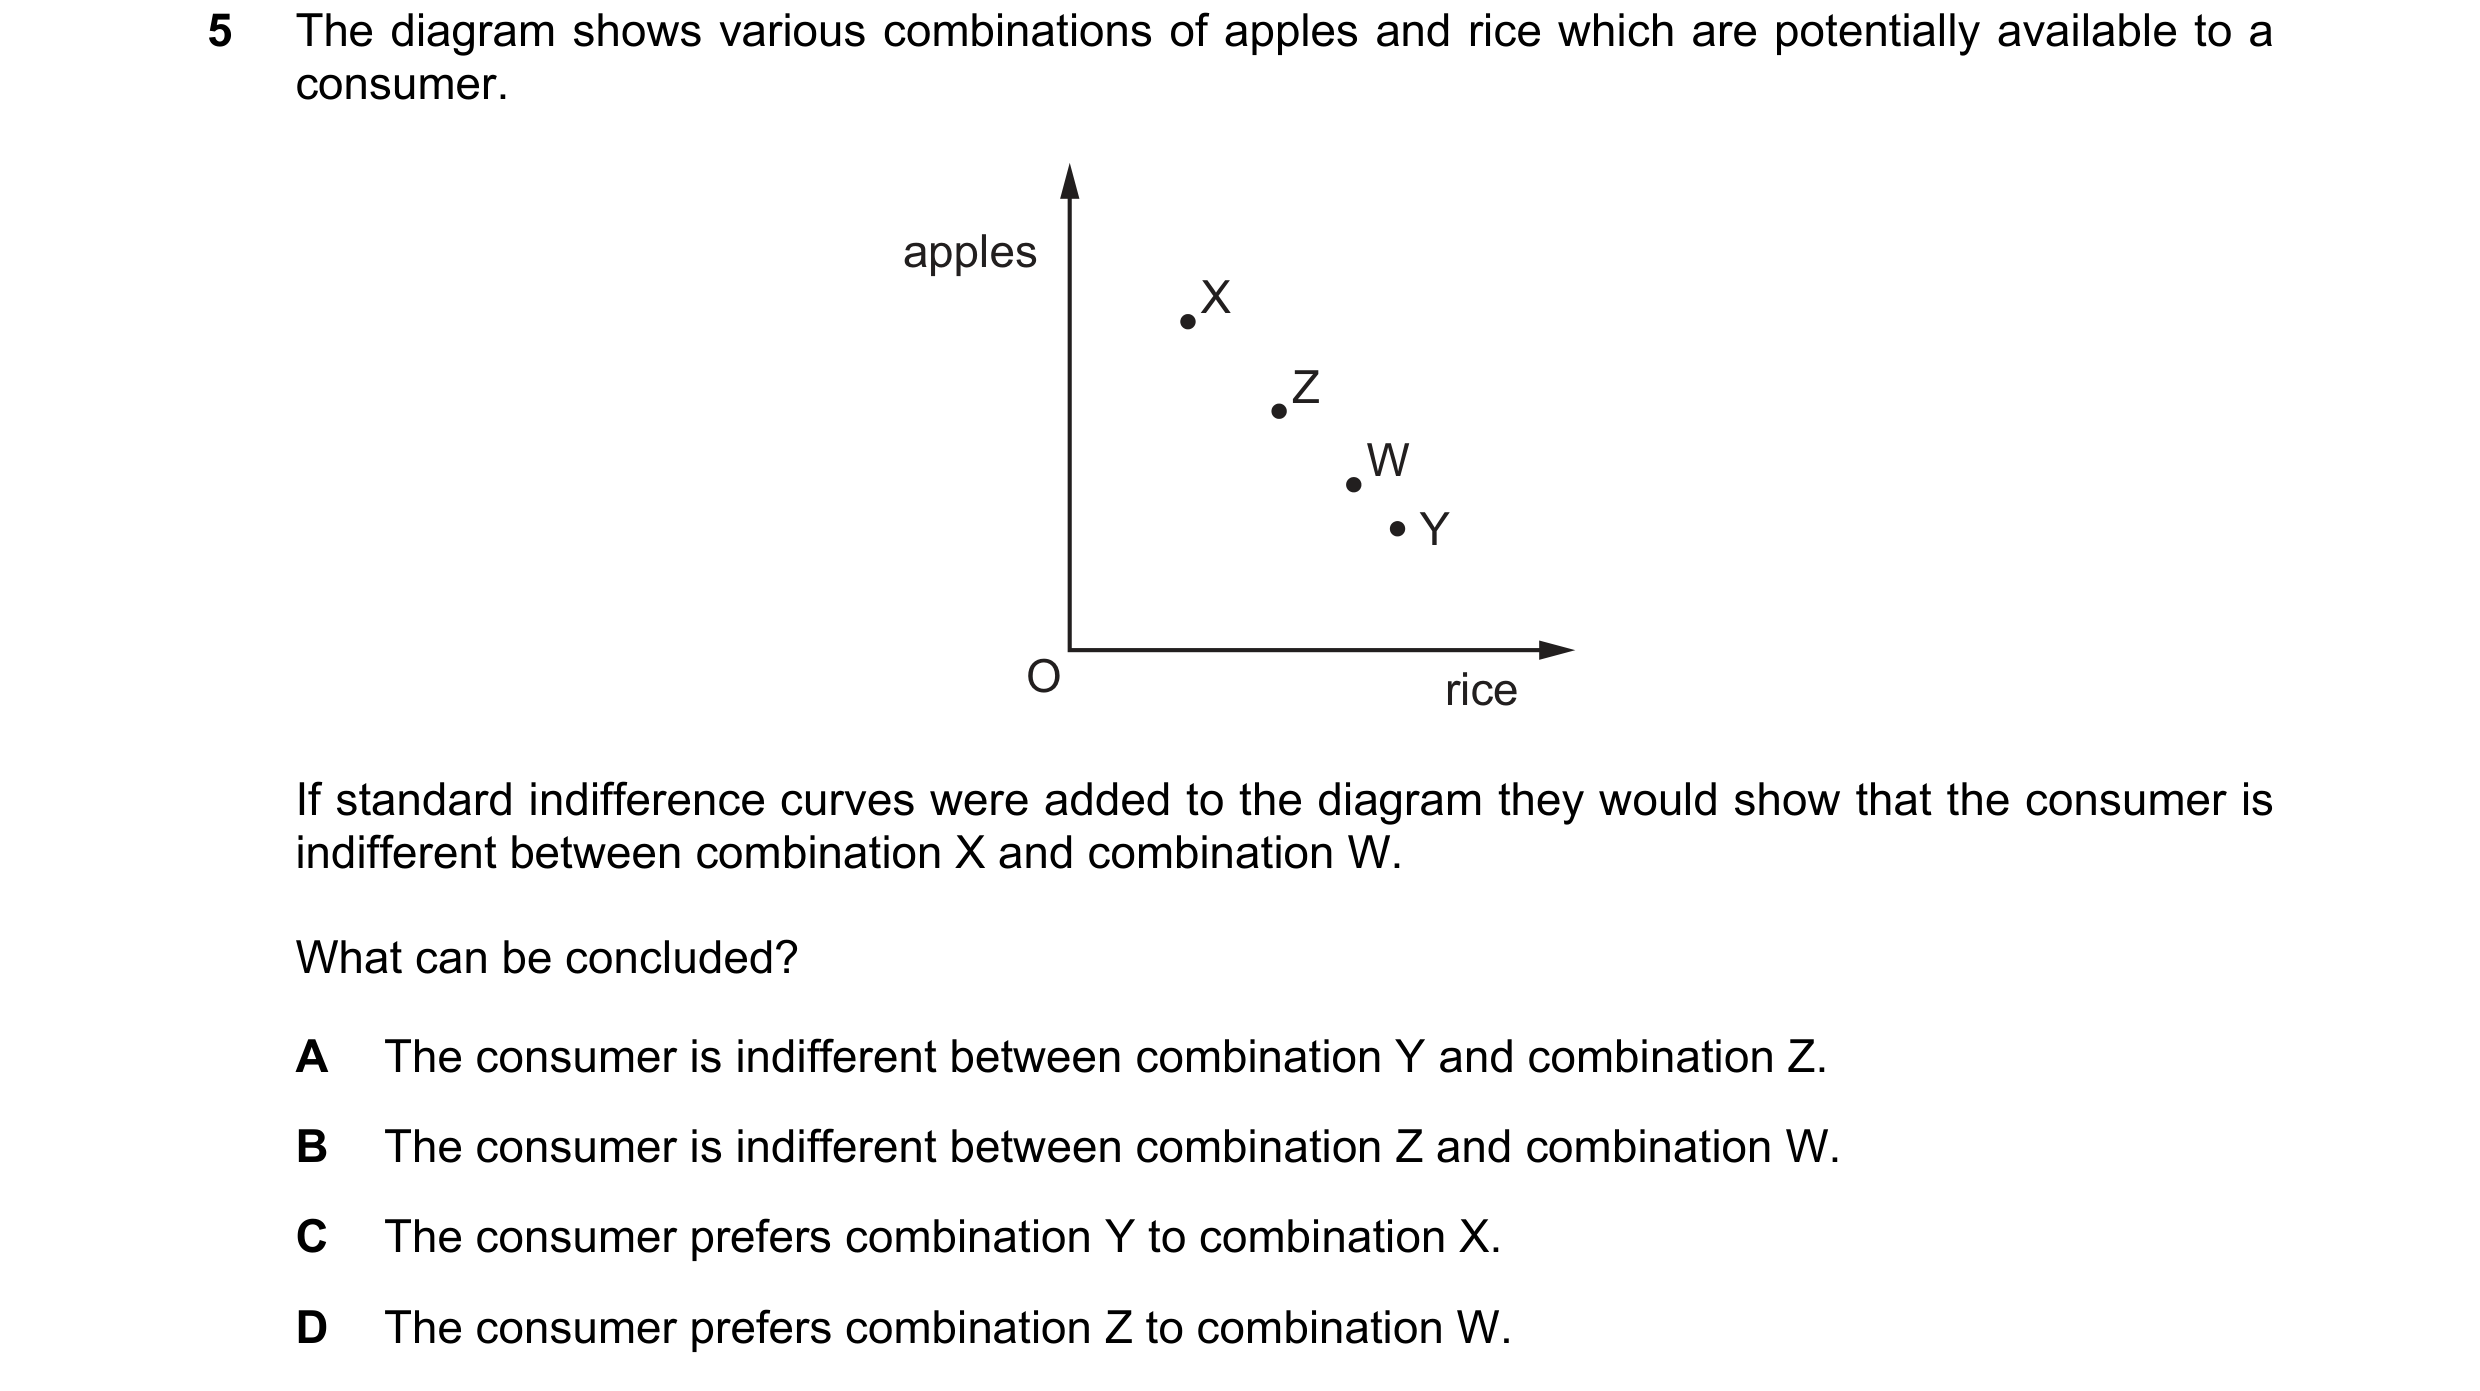
 18 / 32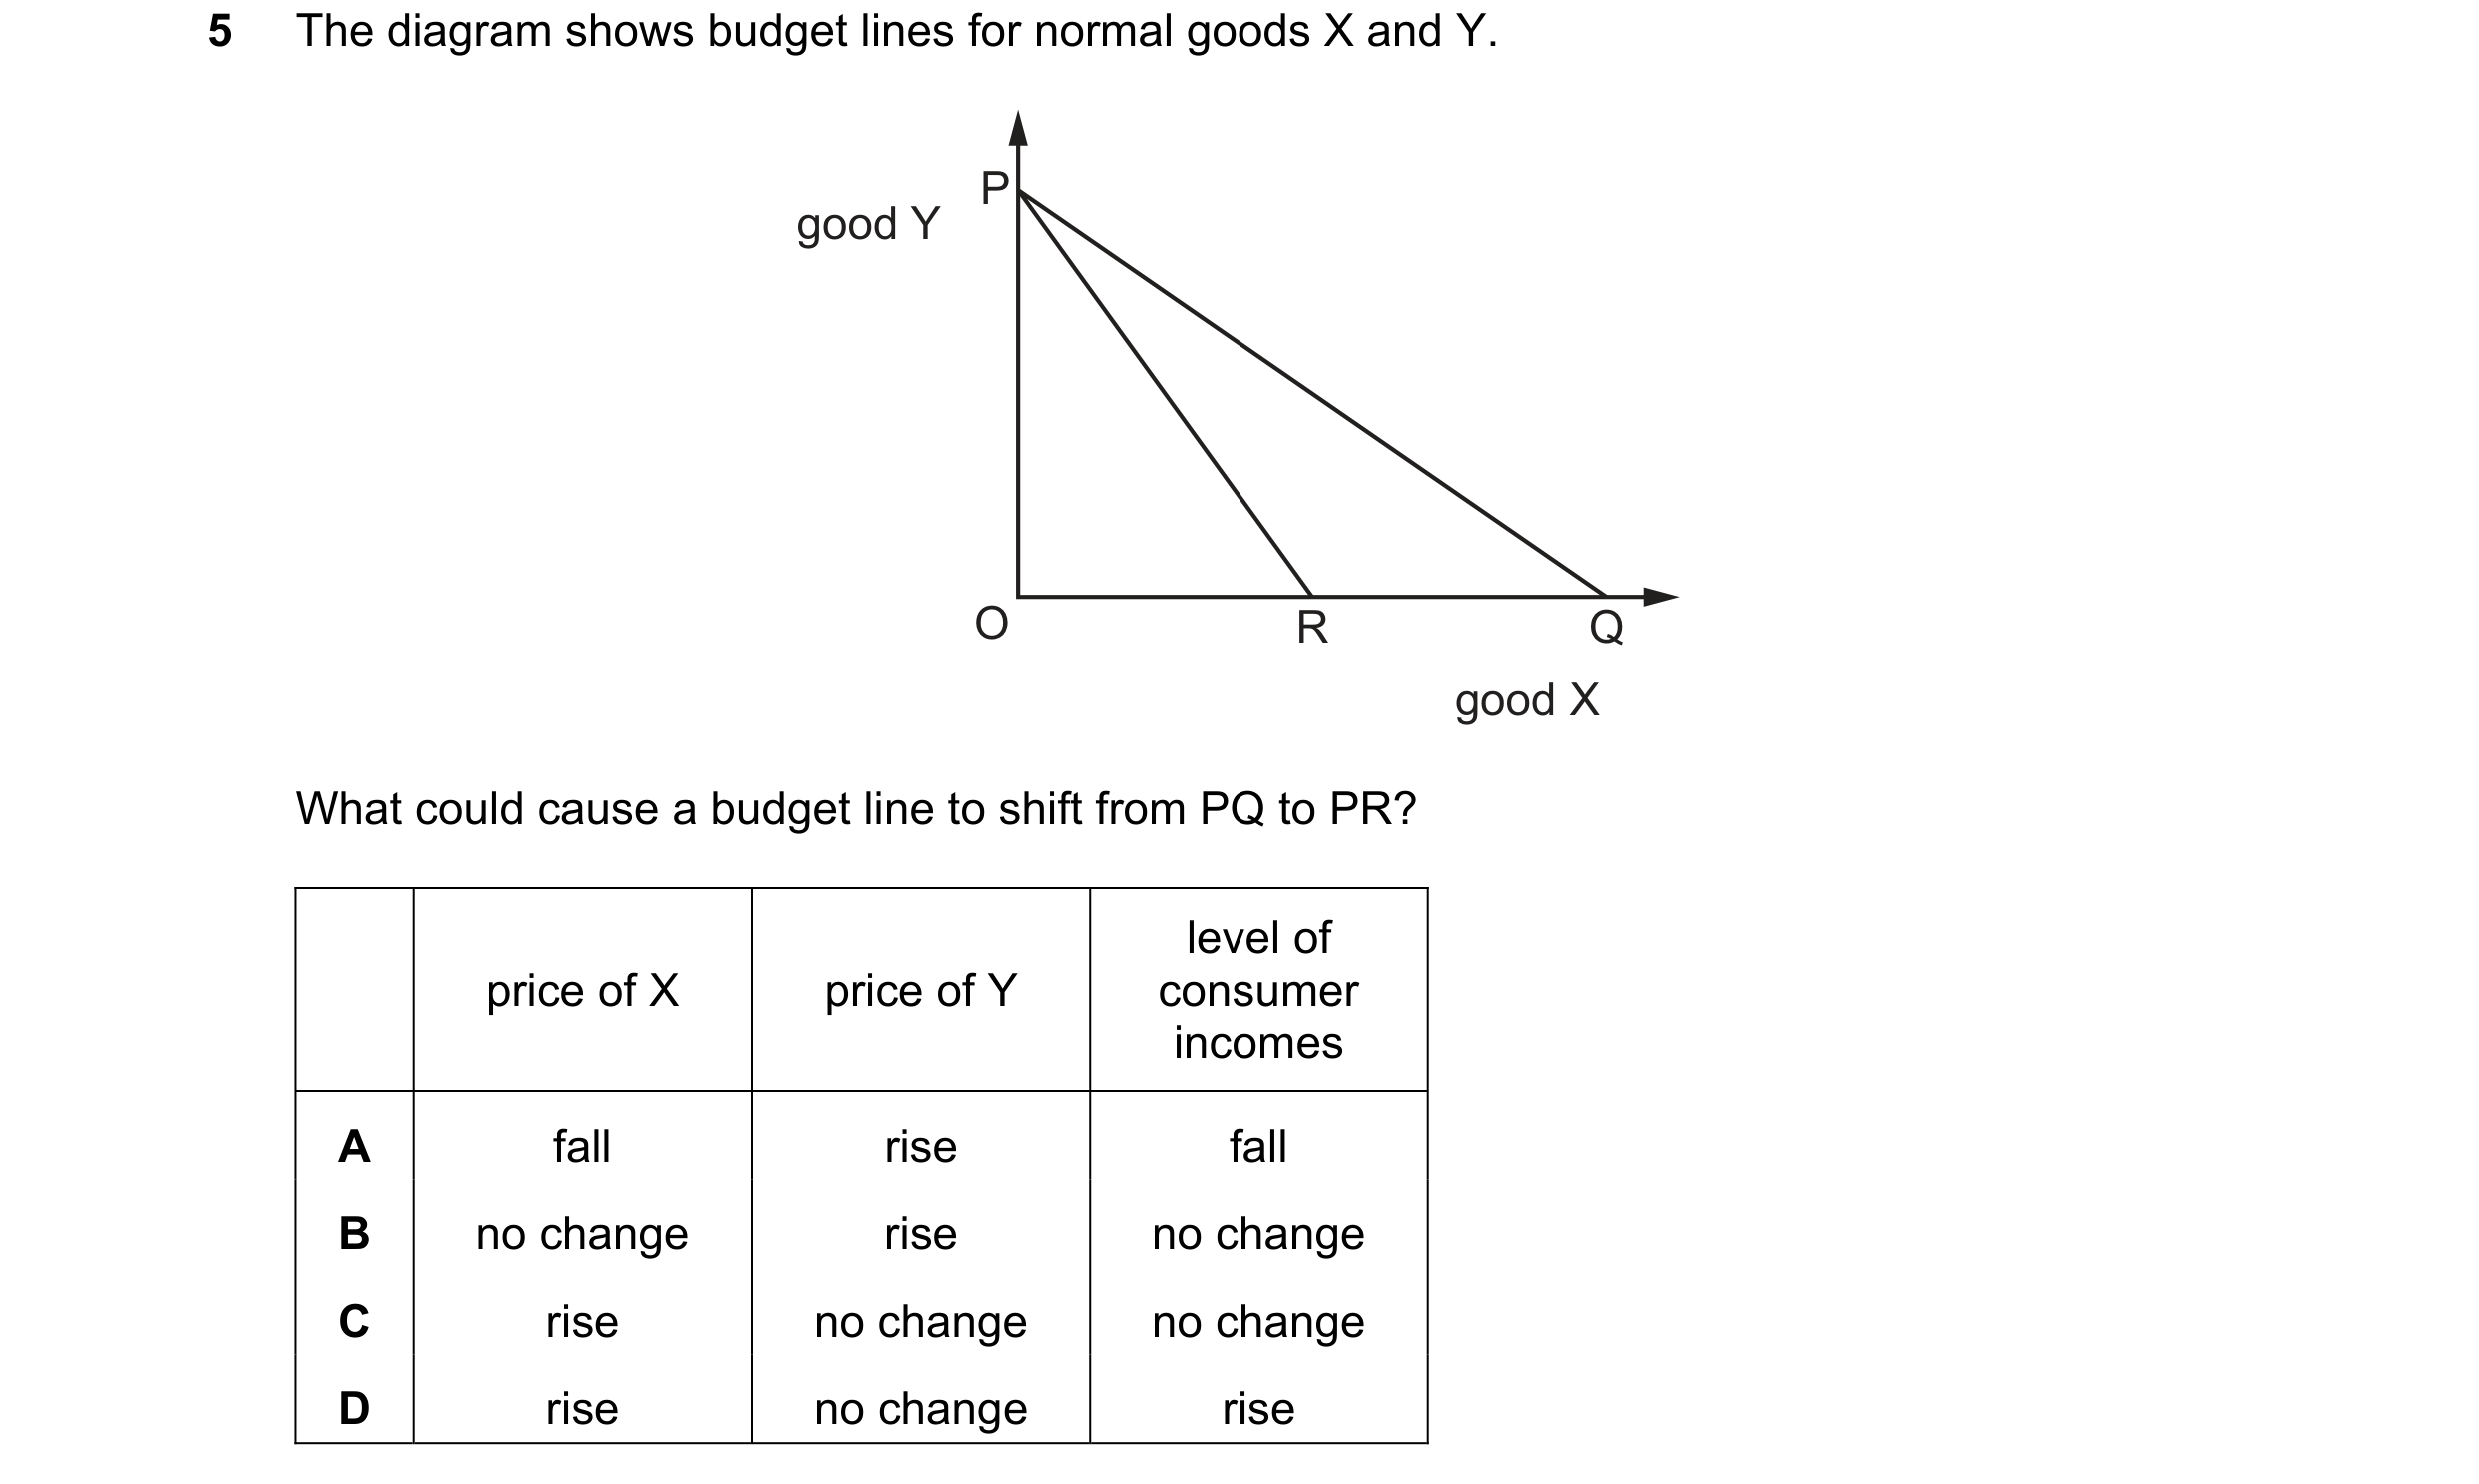
 19 / 32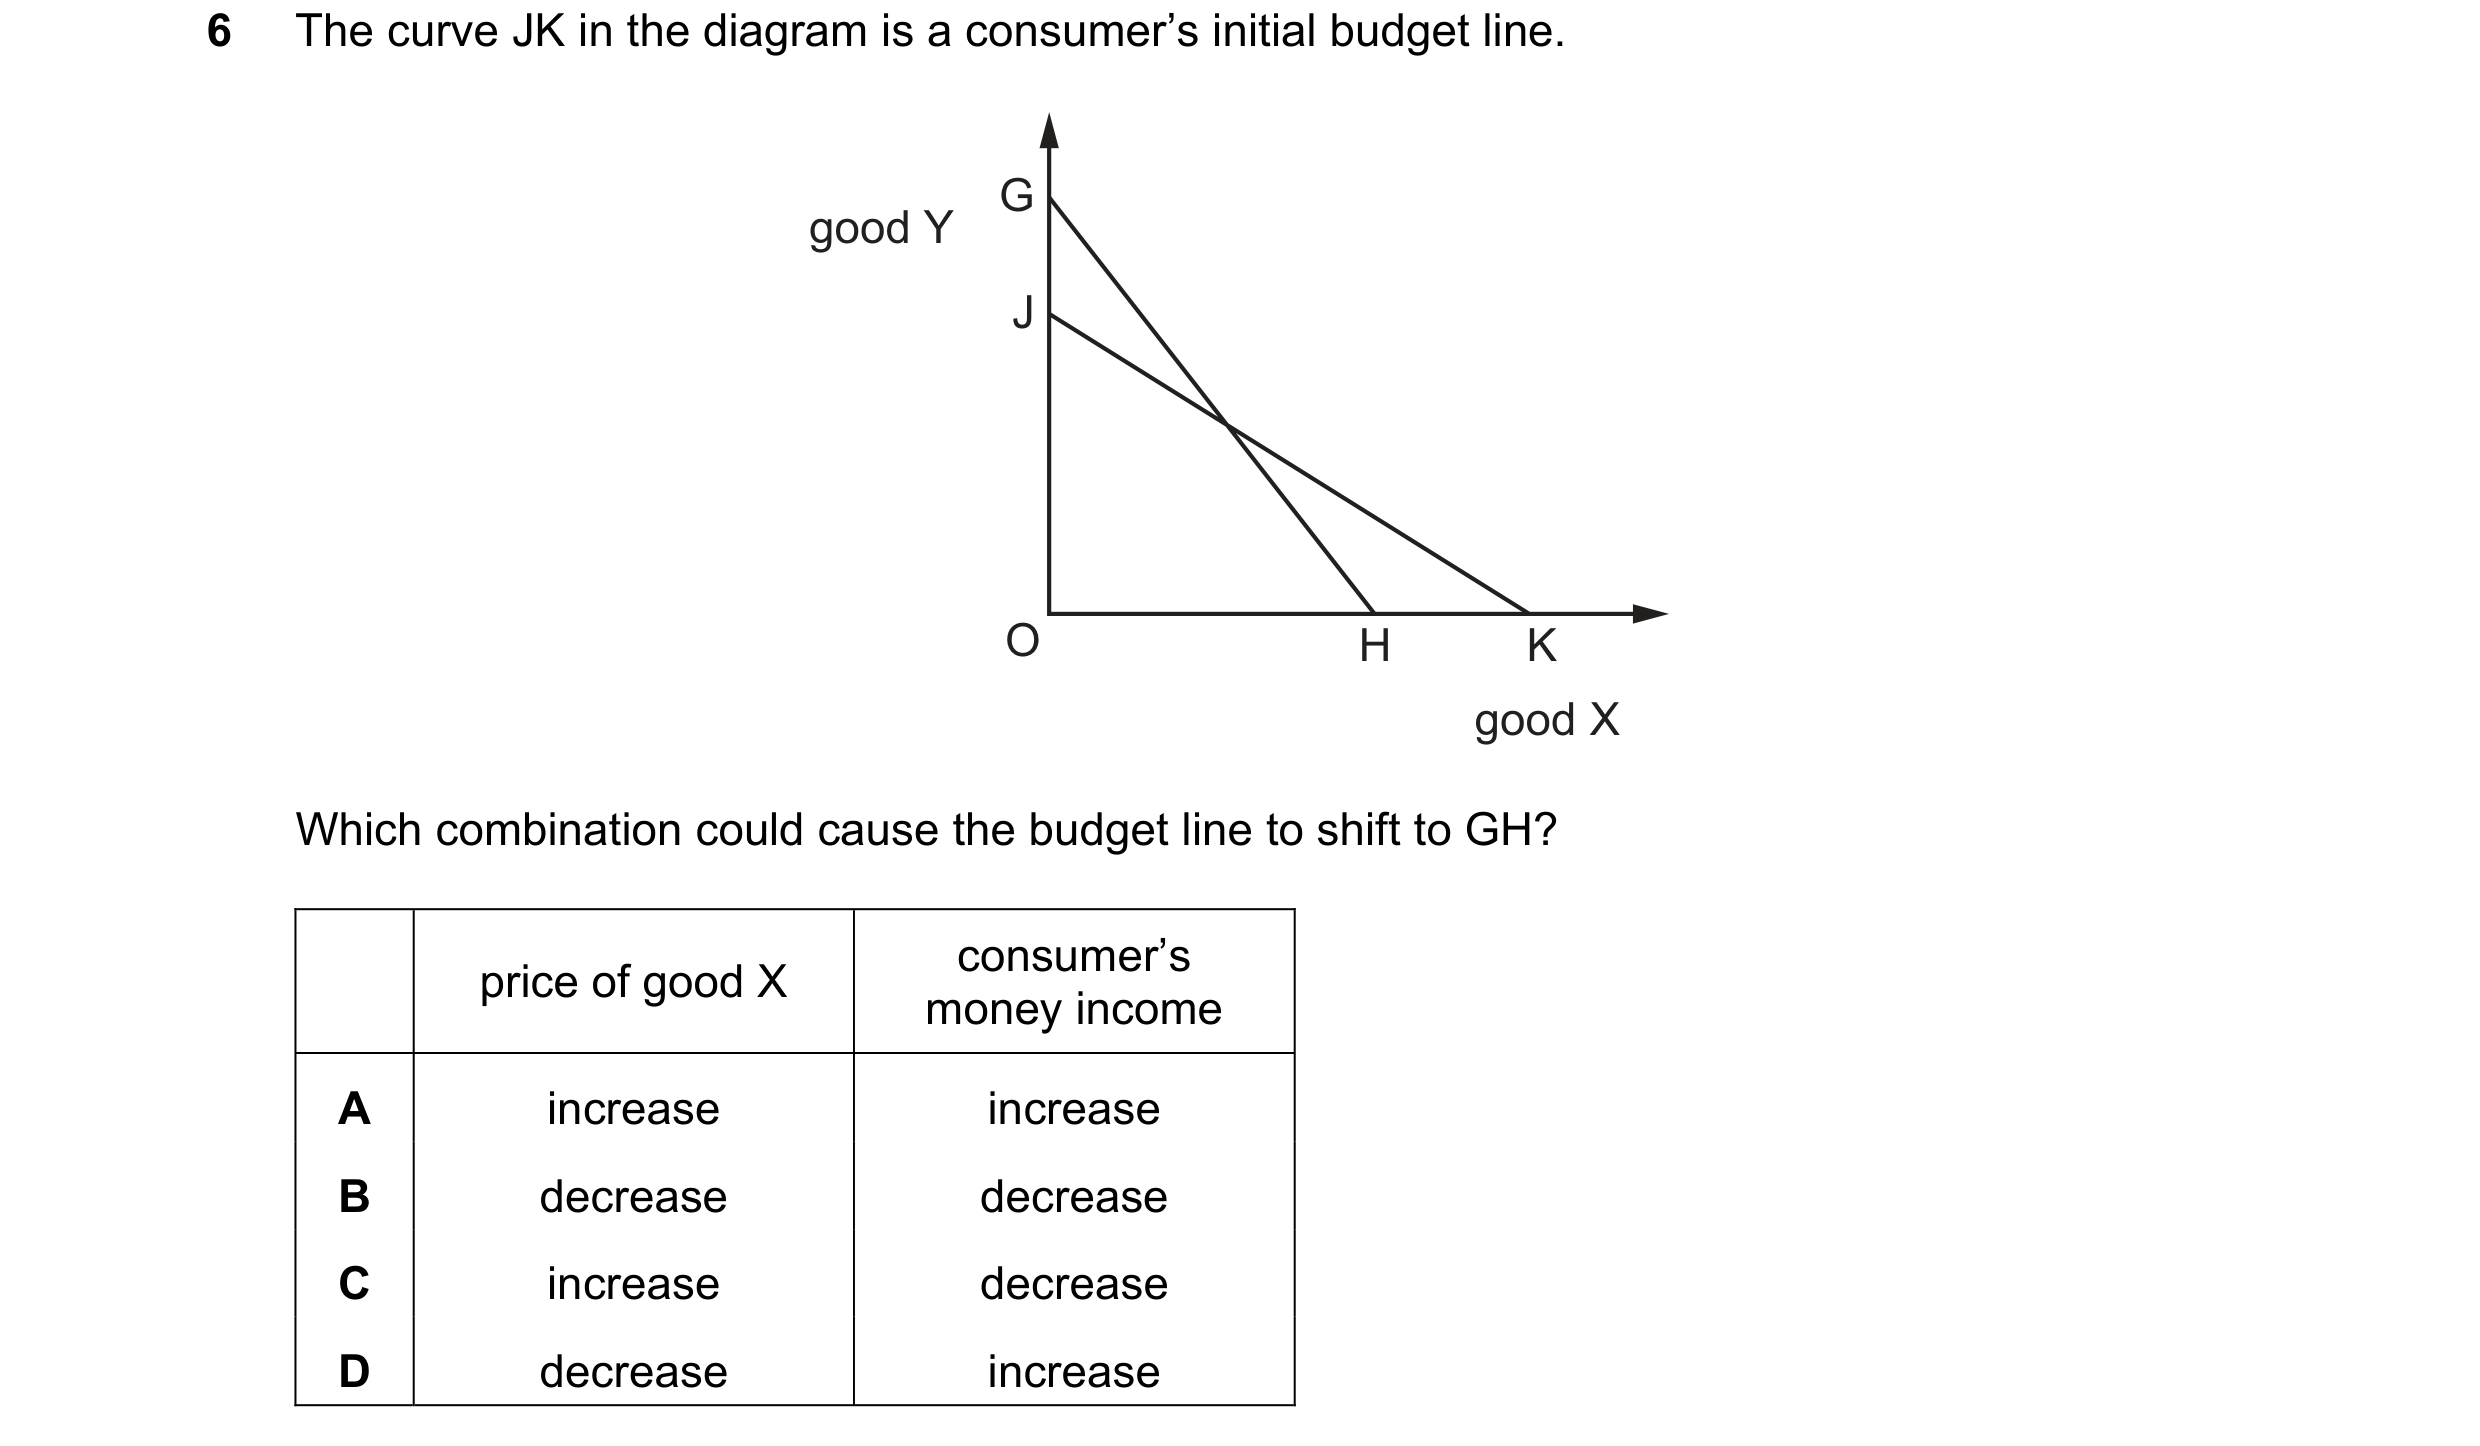
 20 / 32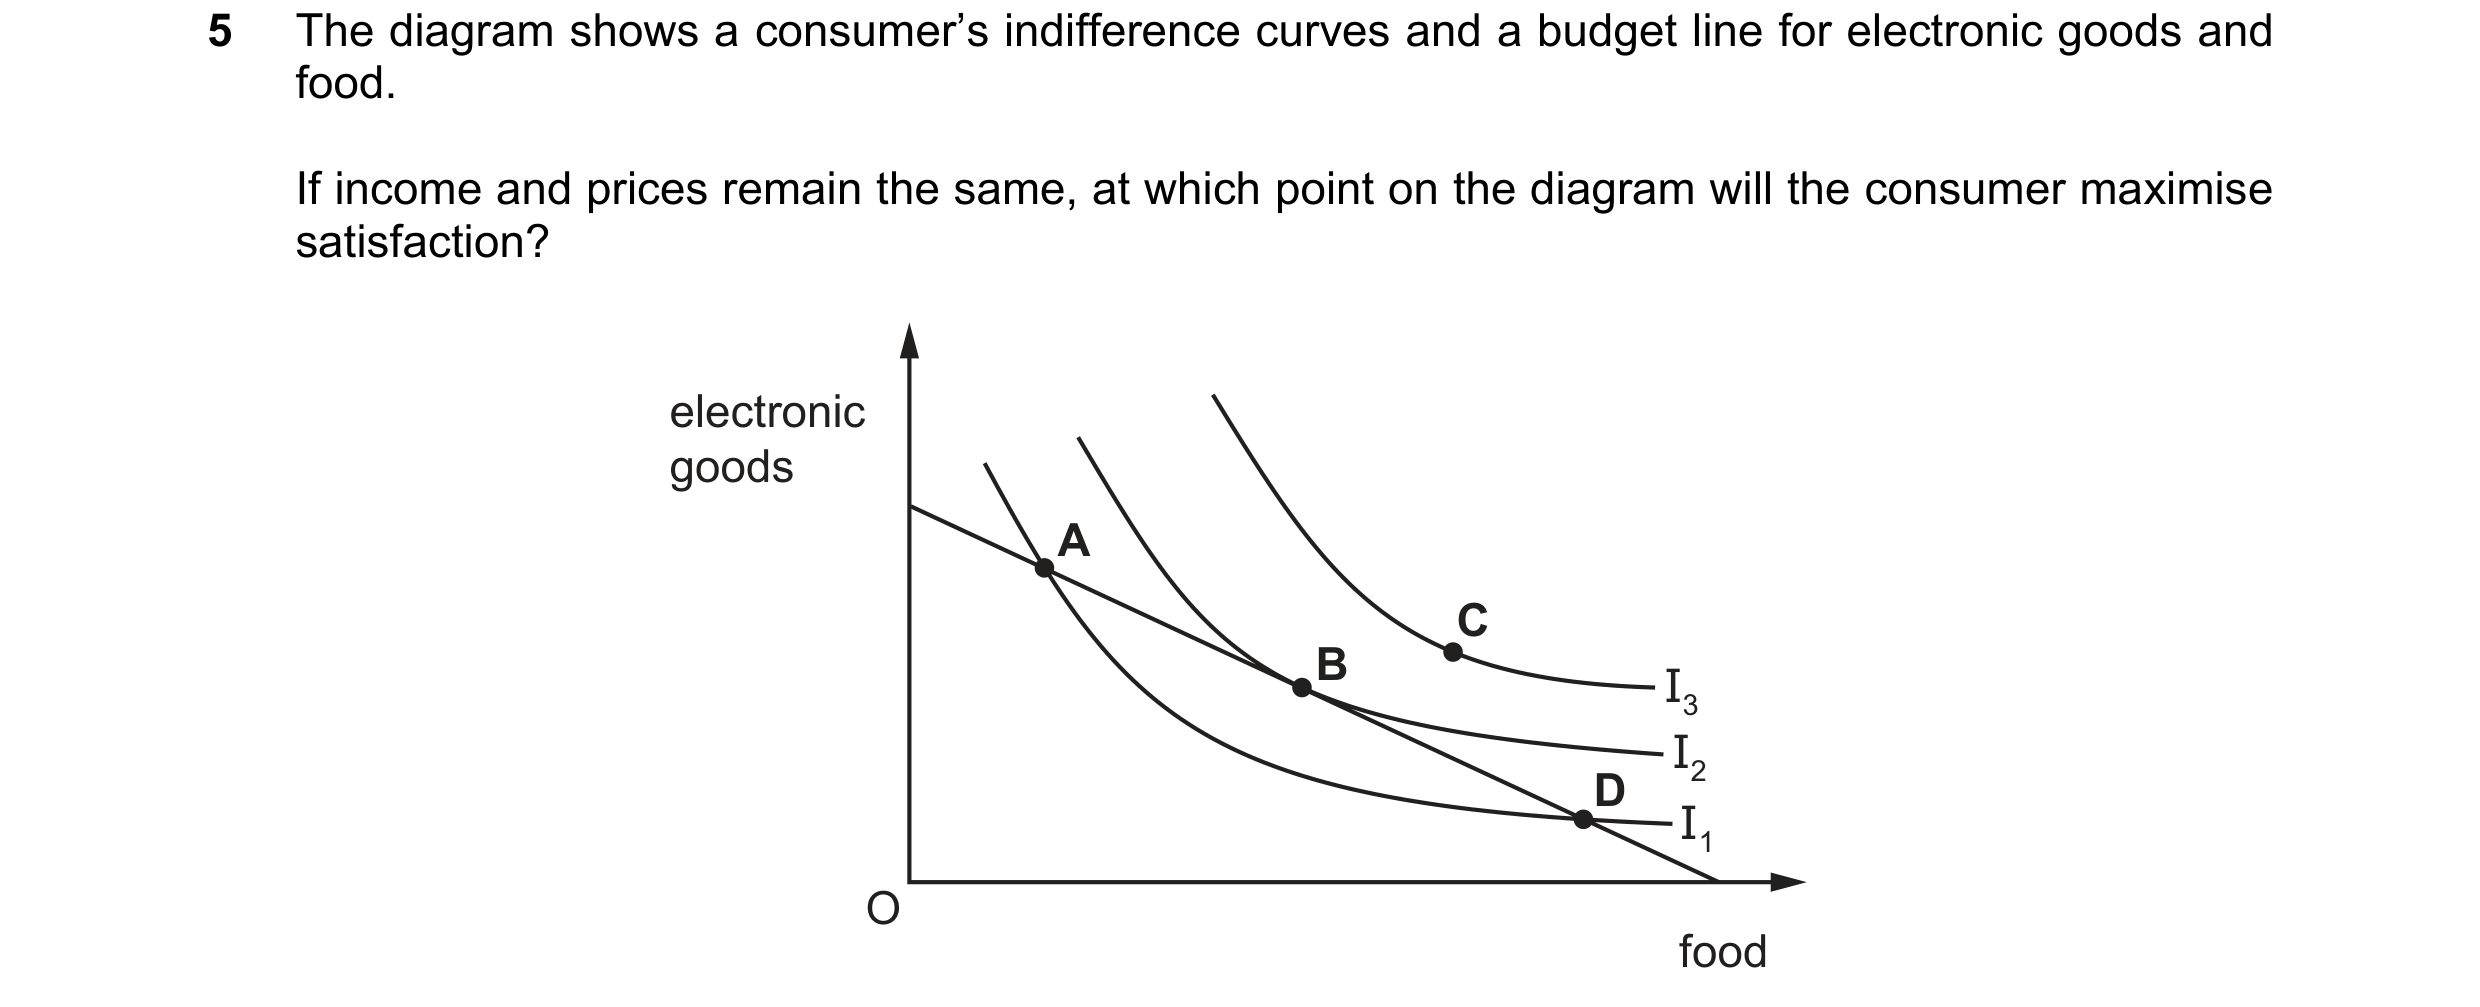
 21 / 32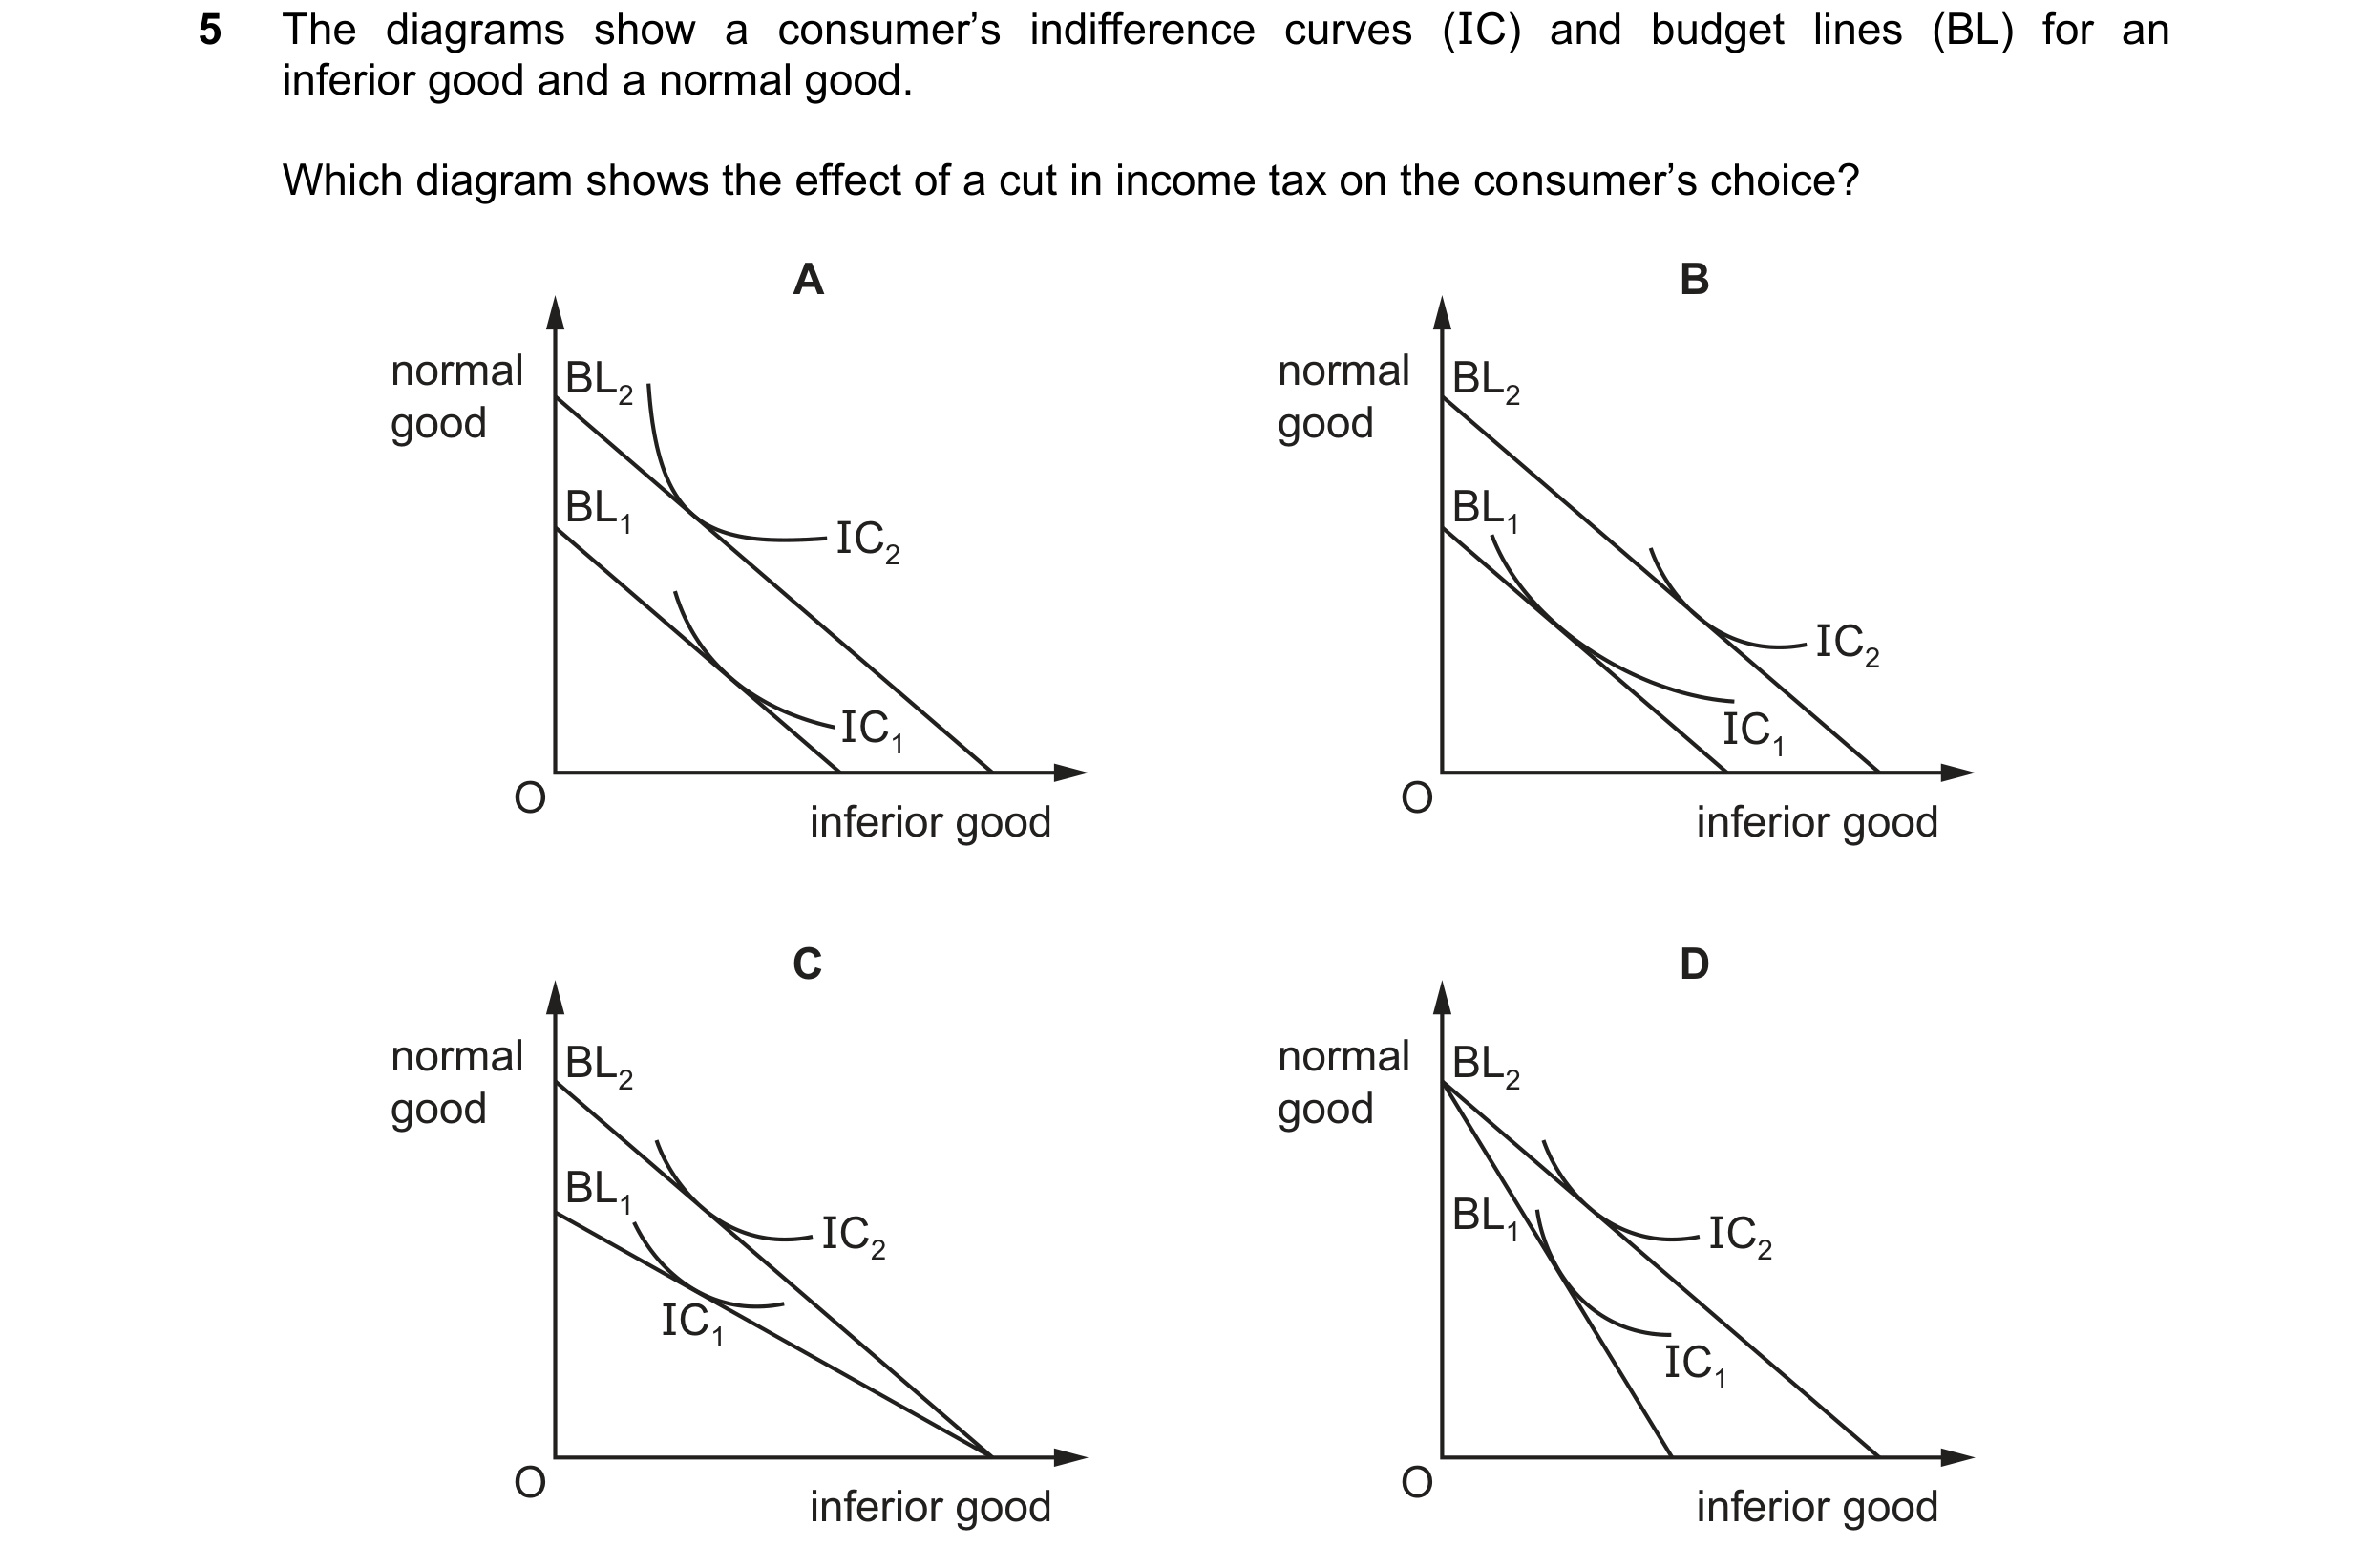
 22 / 32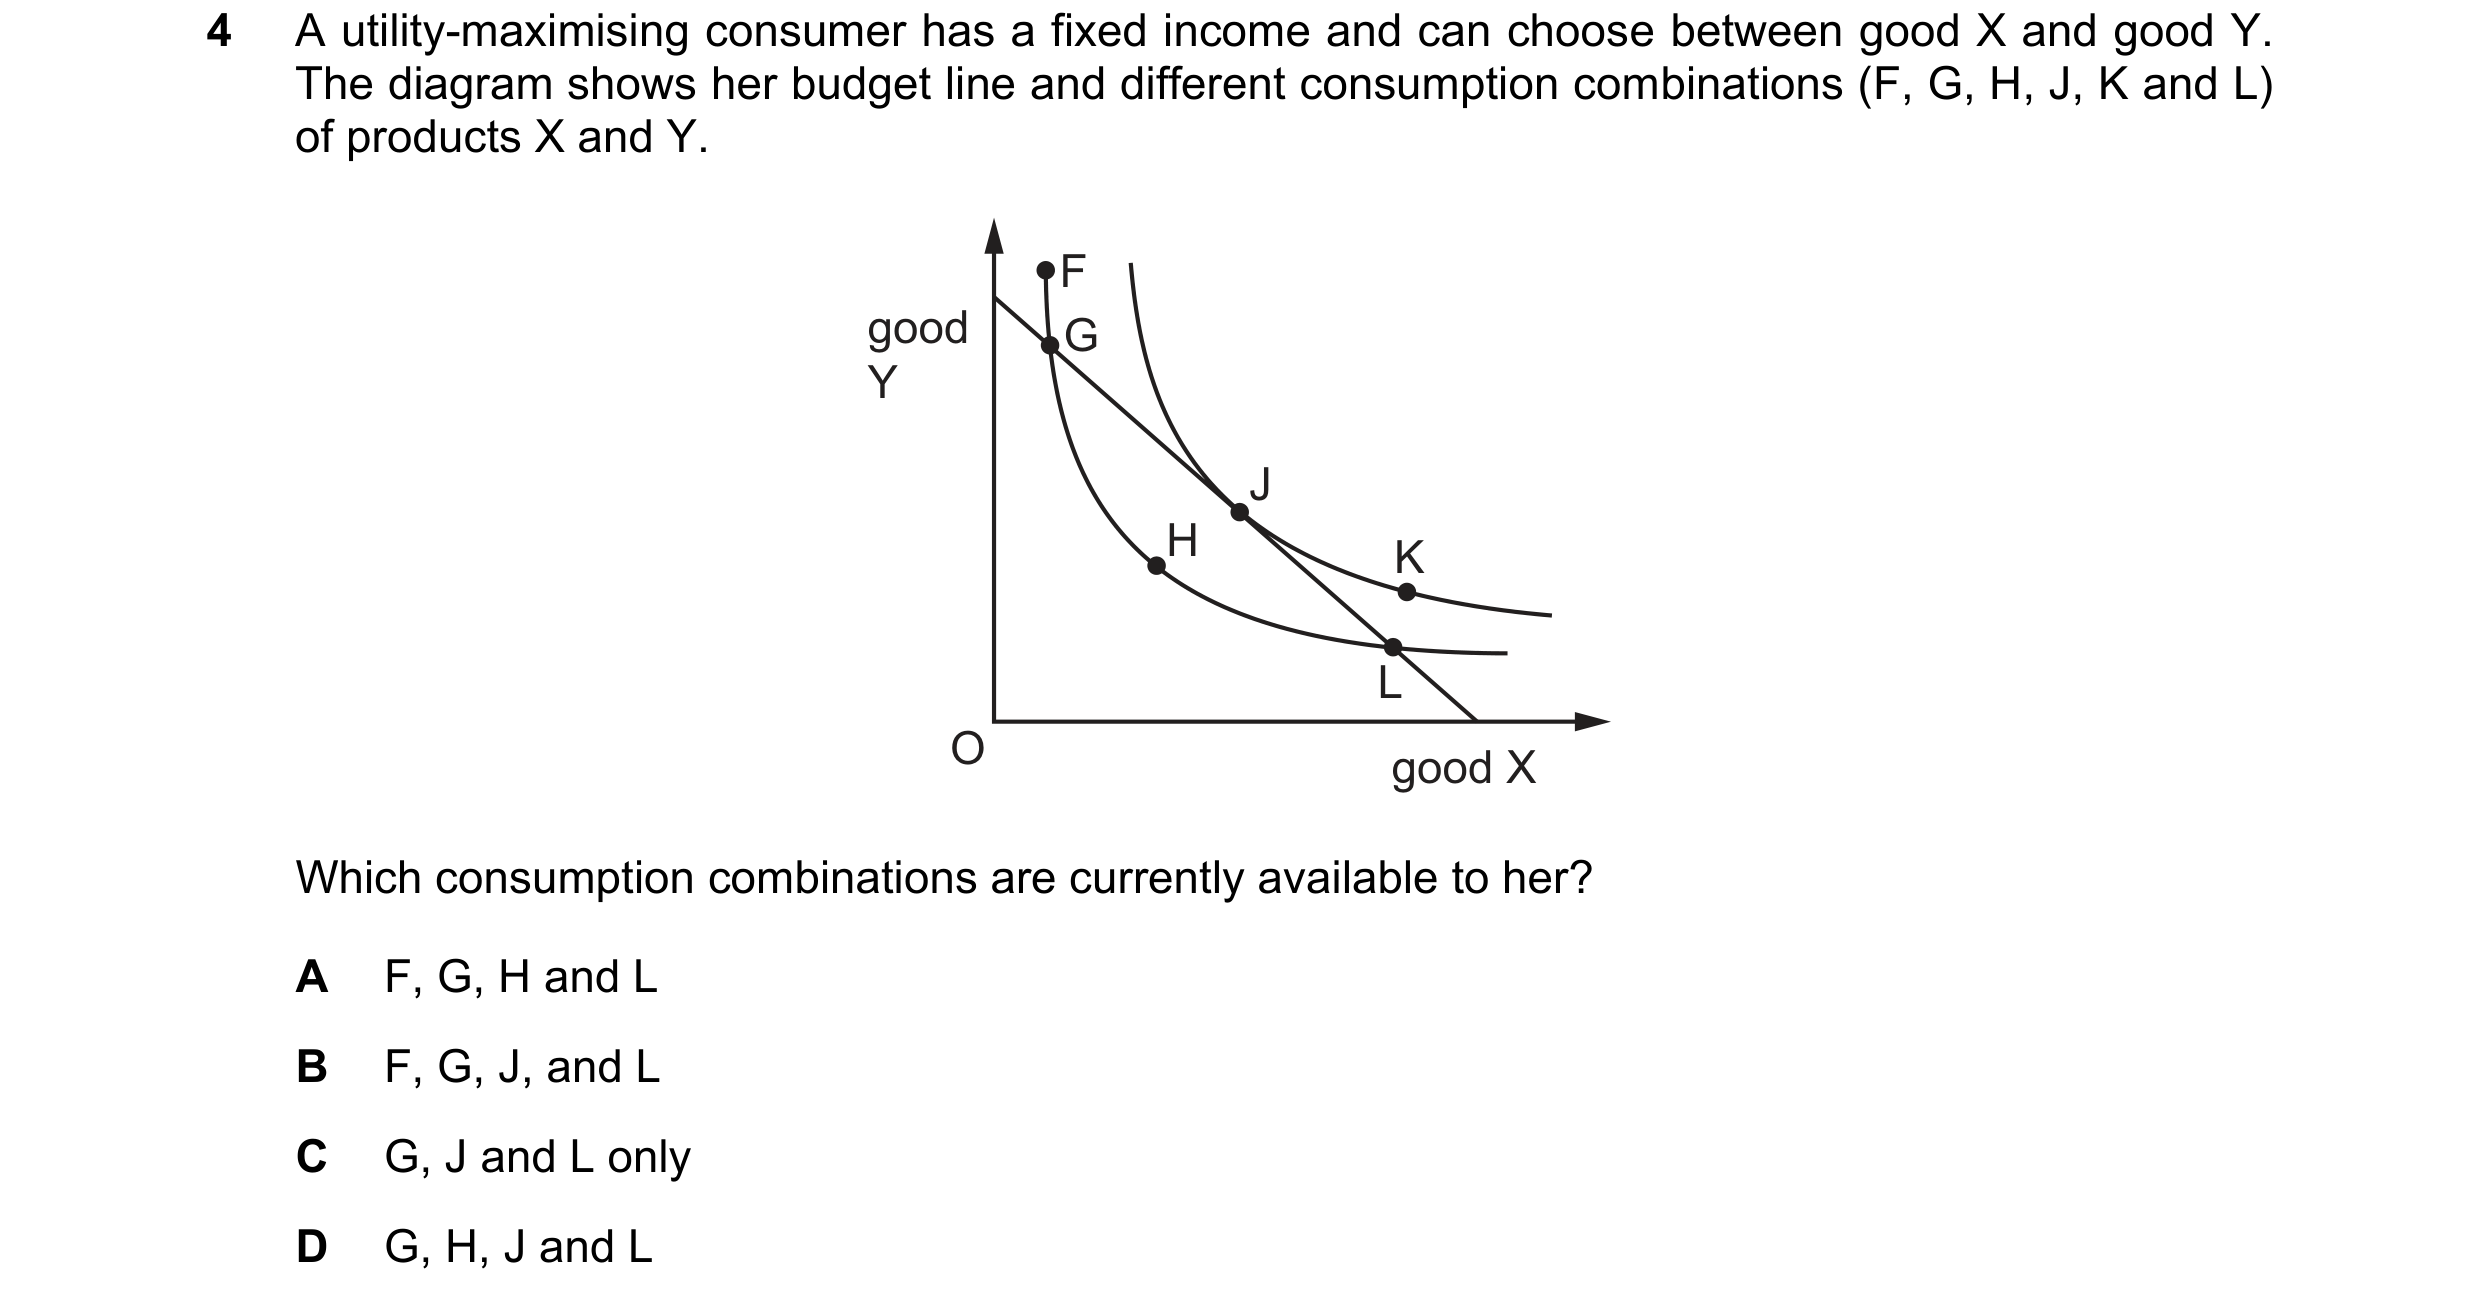
 23 / 32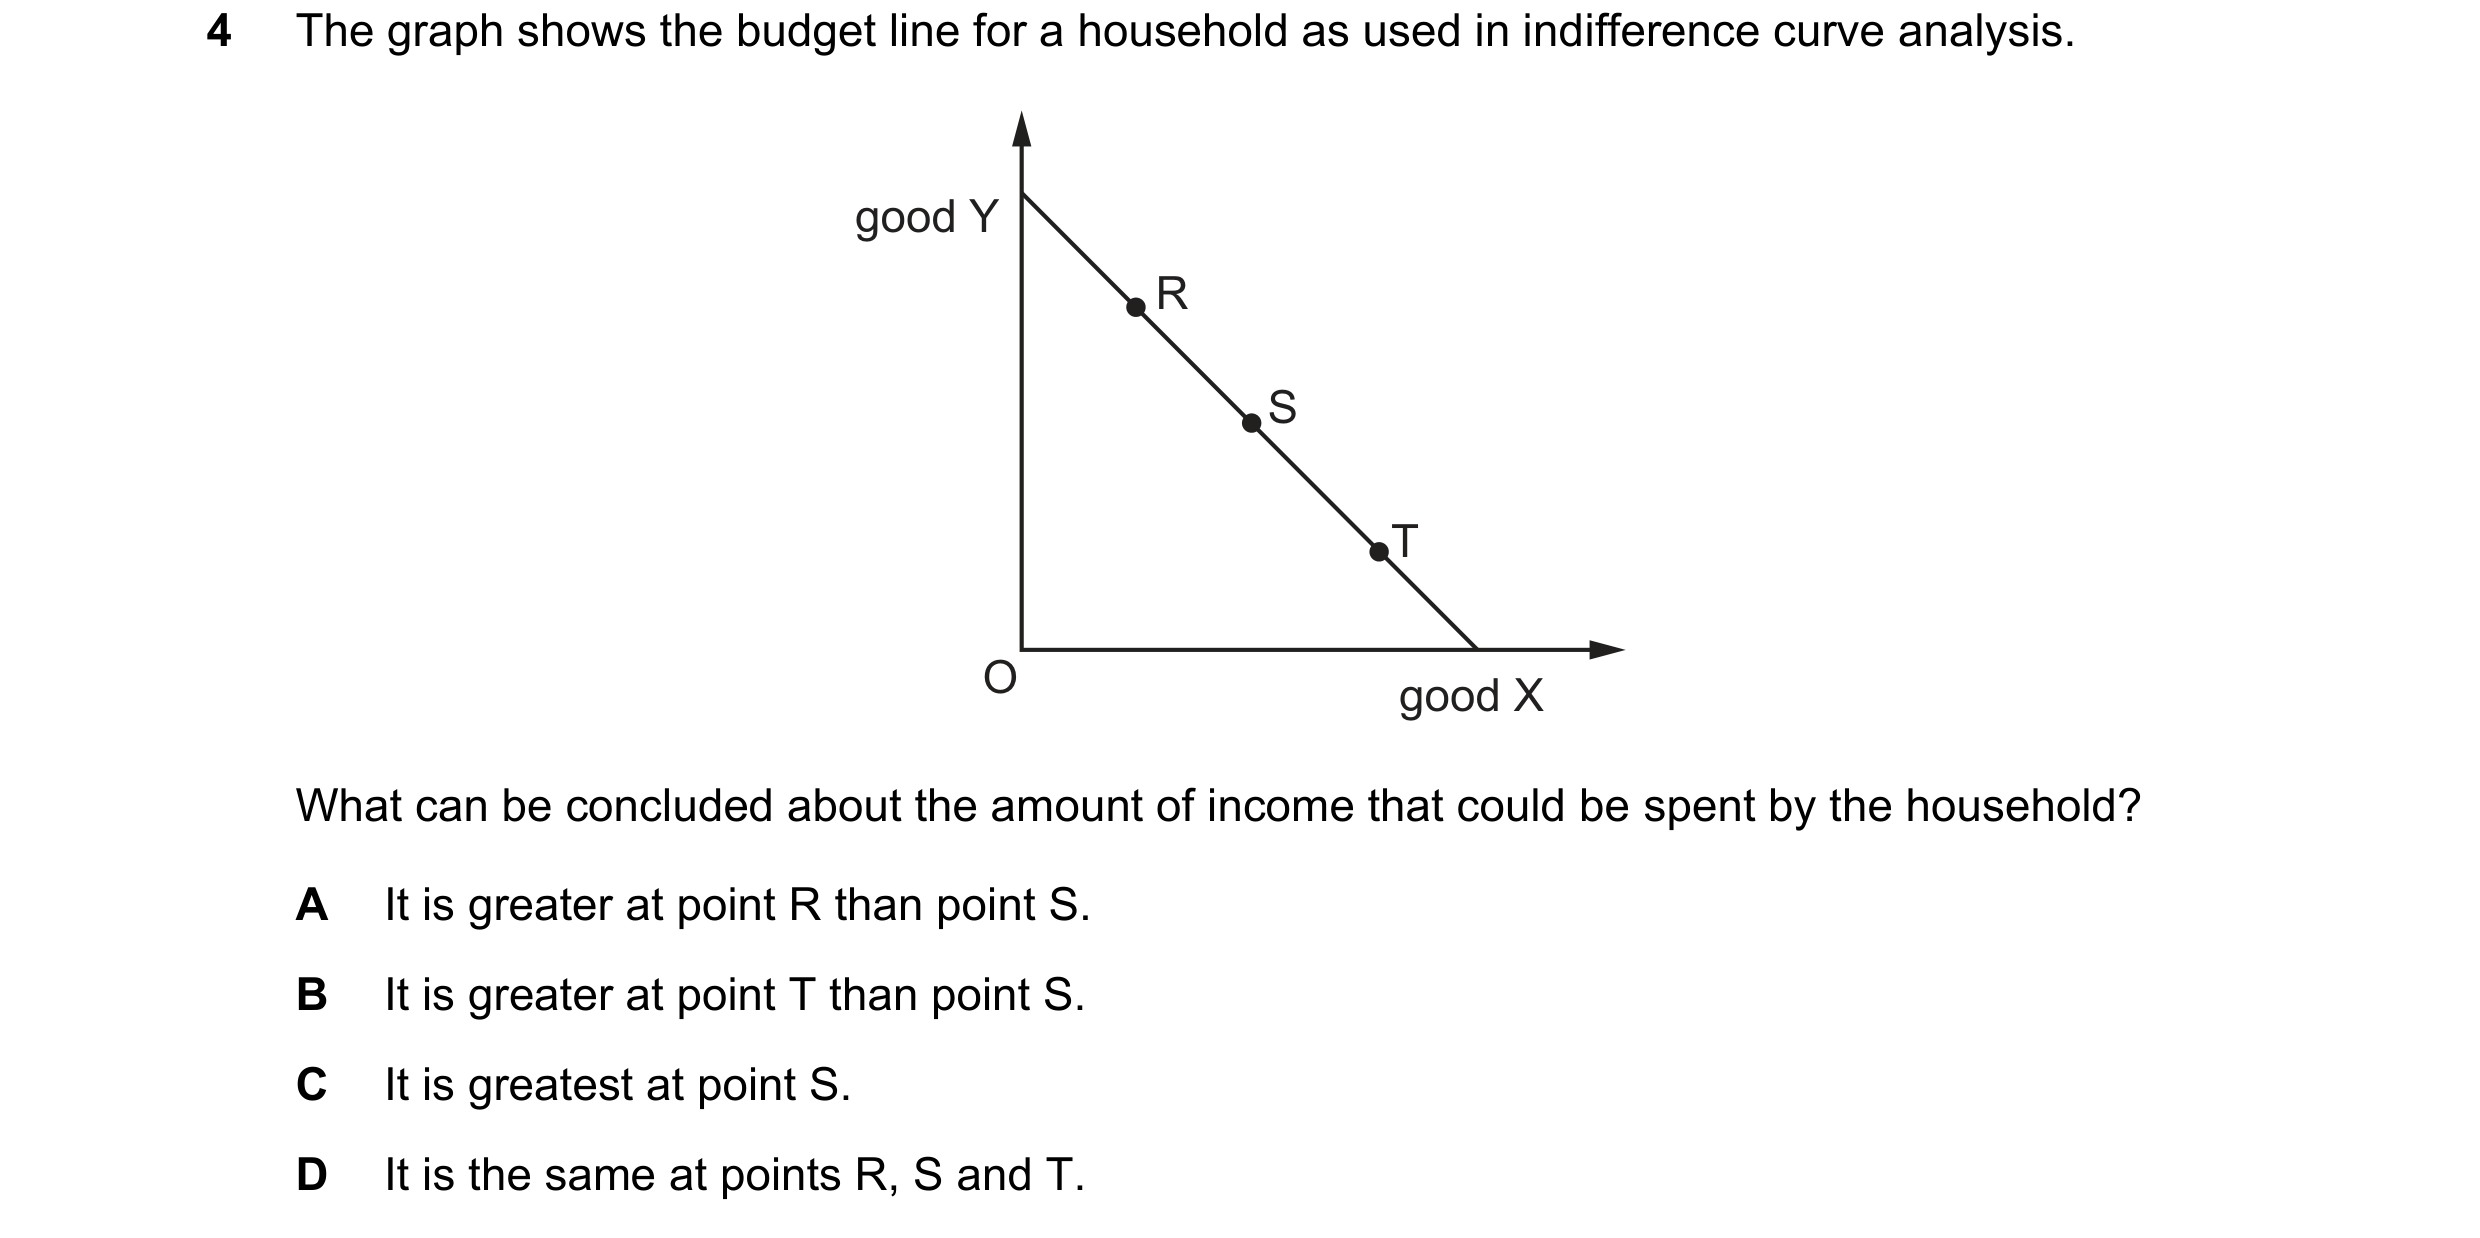

 24 / 32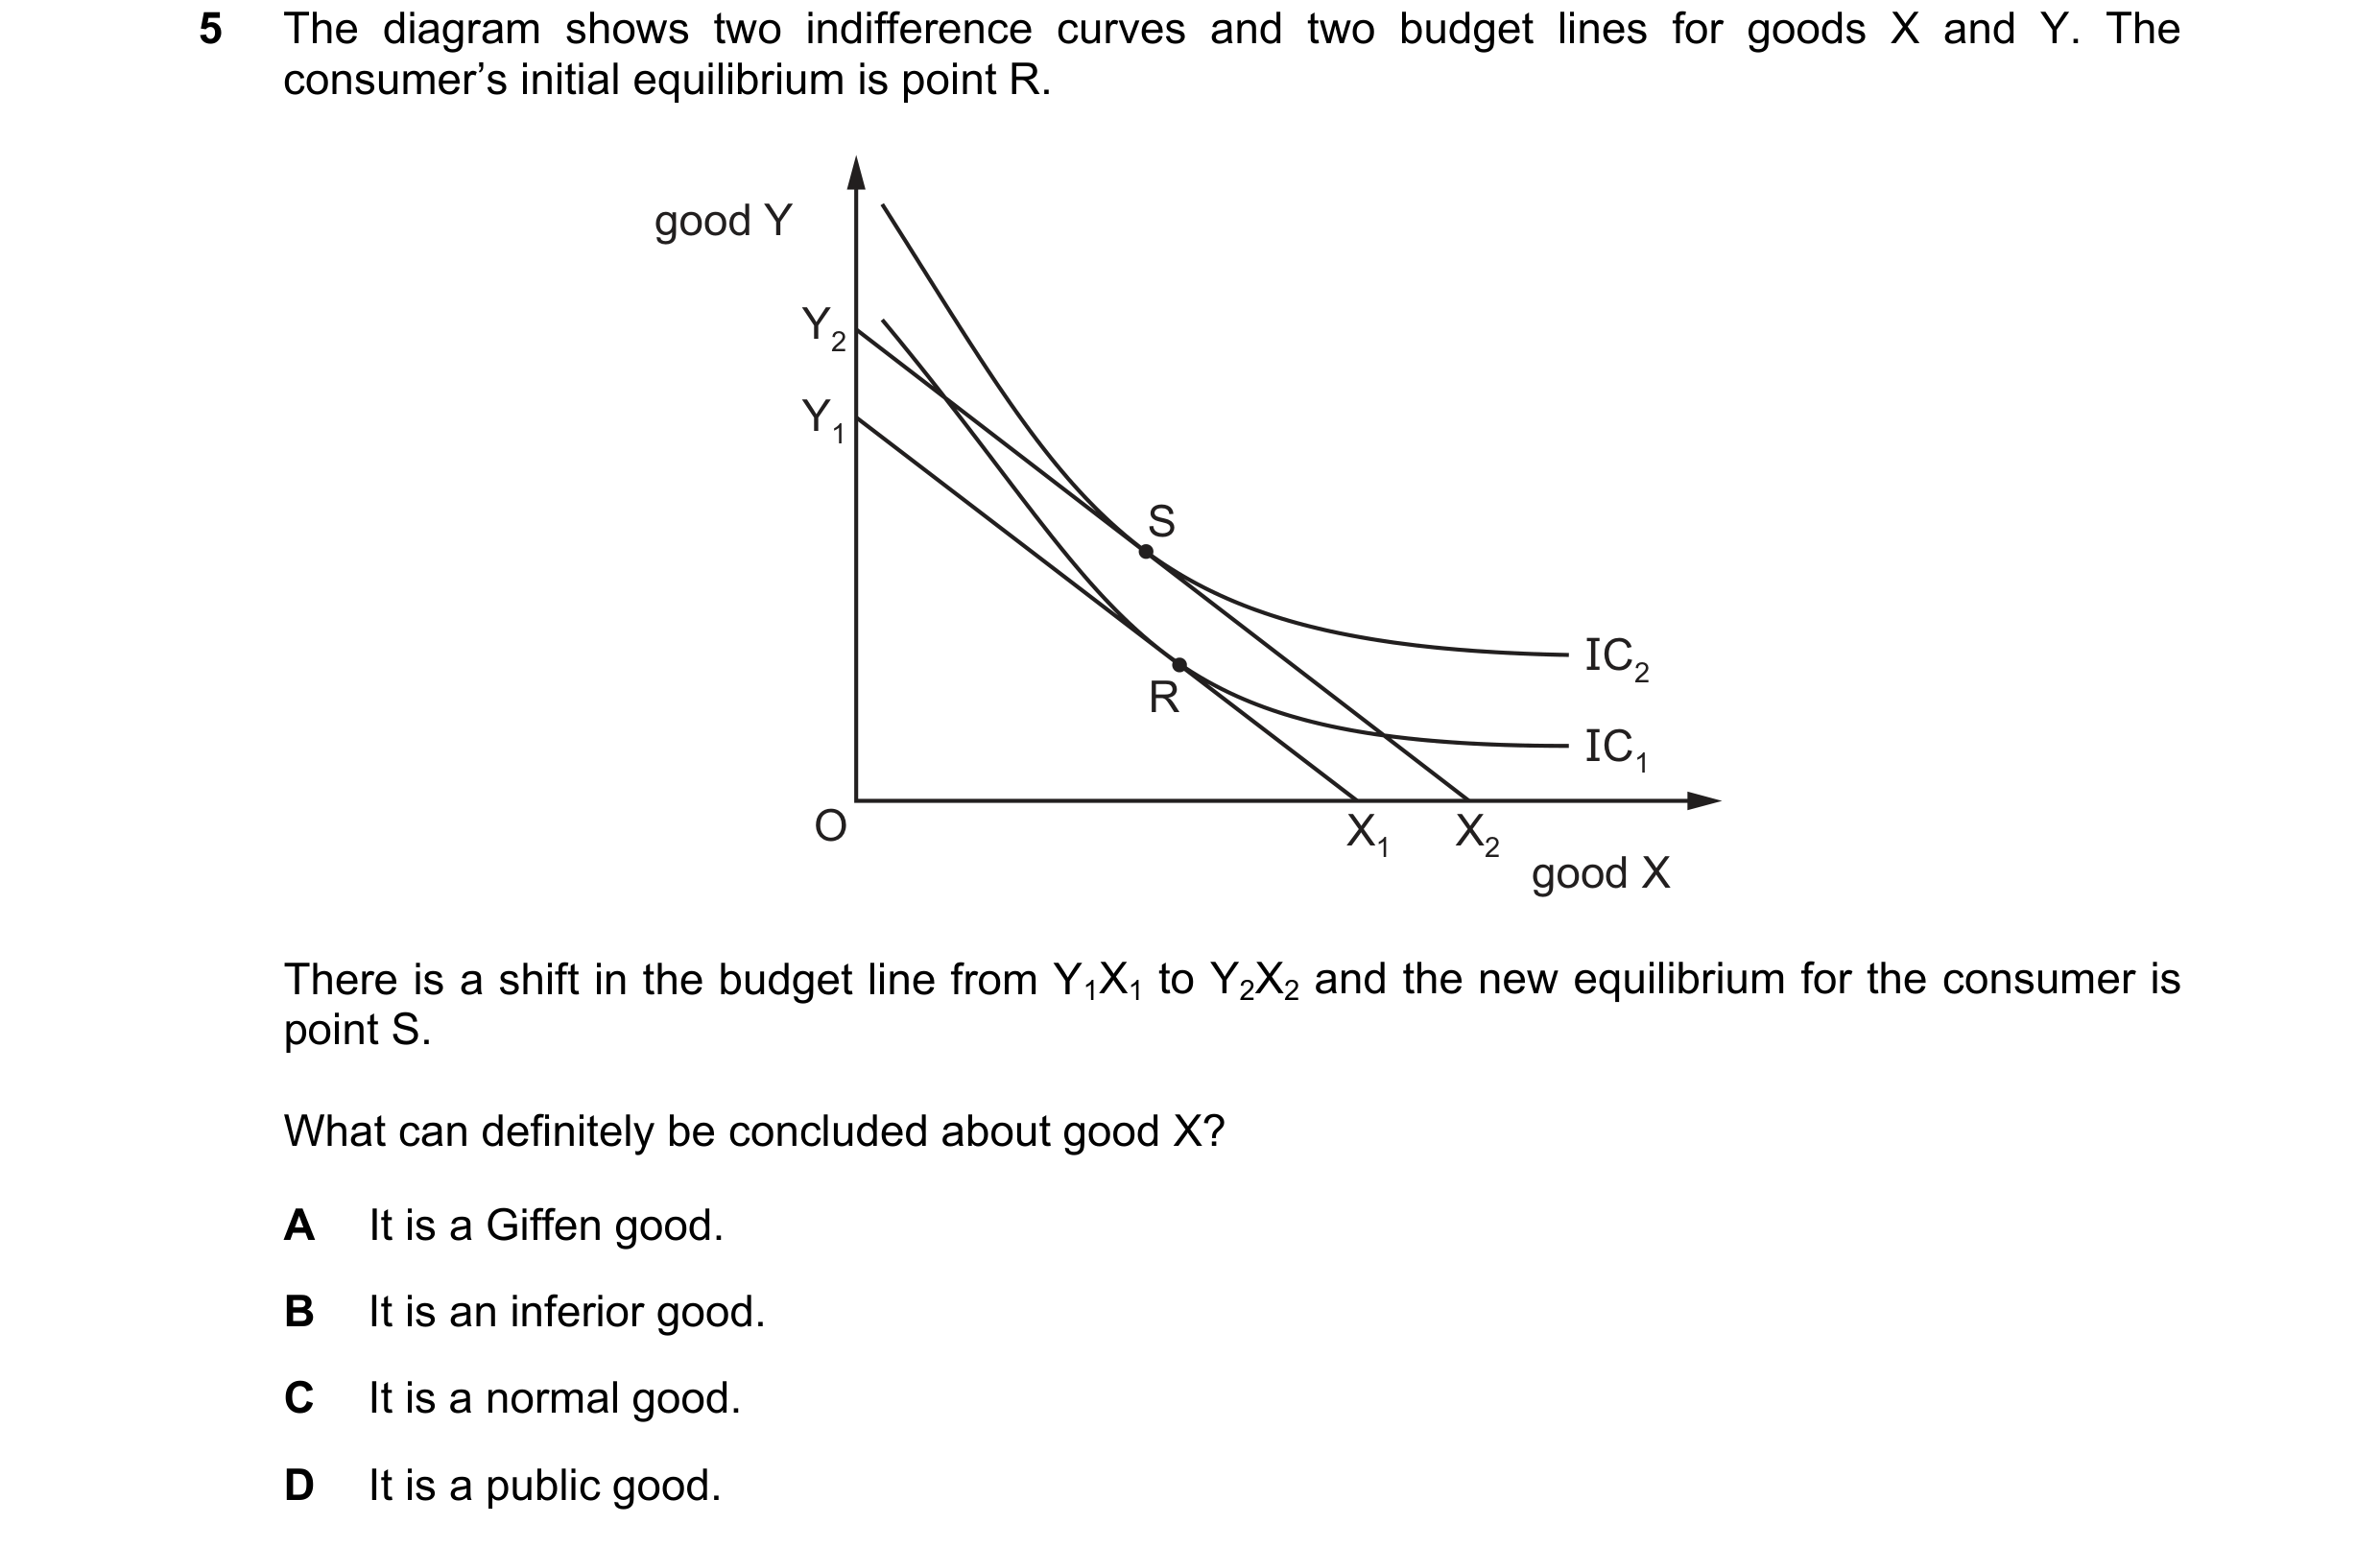
 25 / 32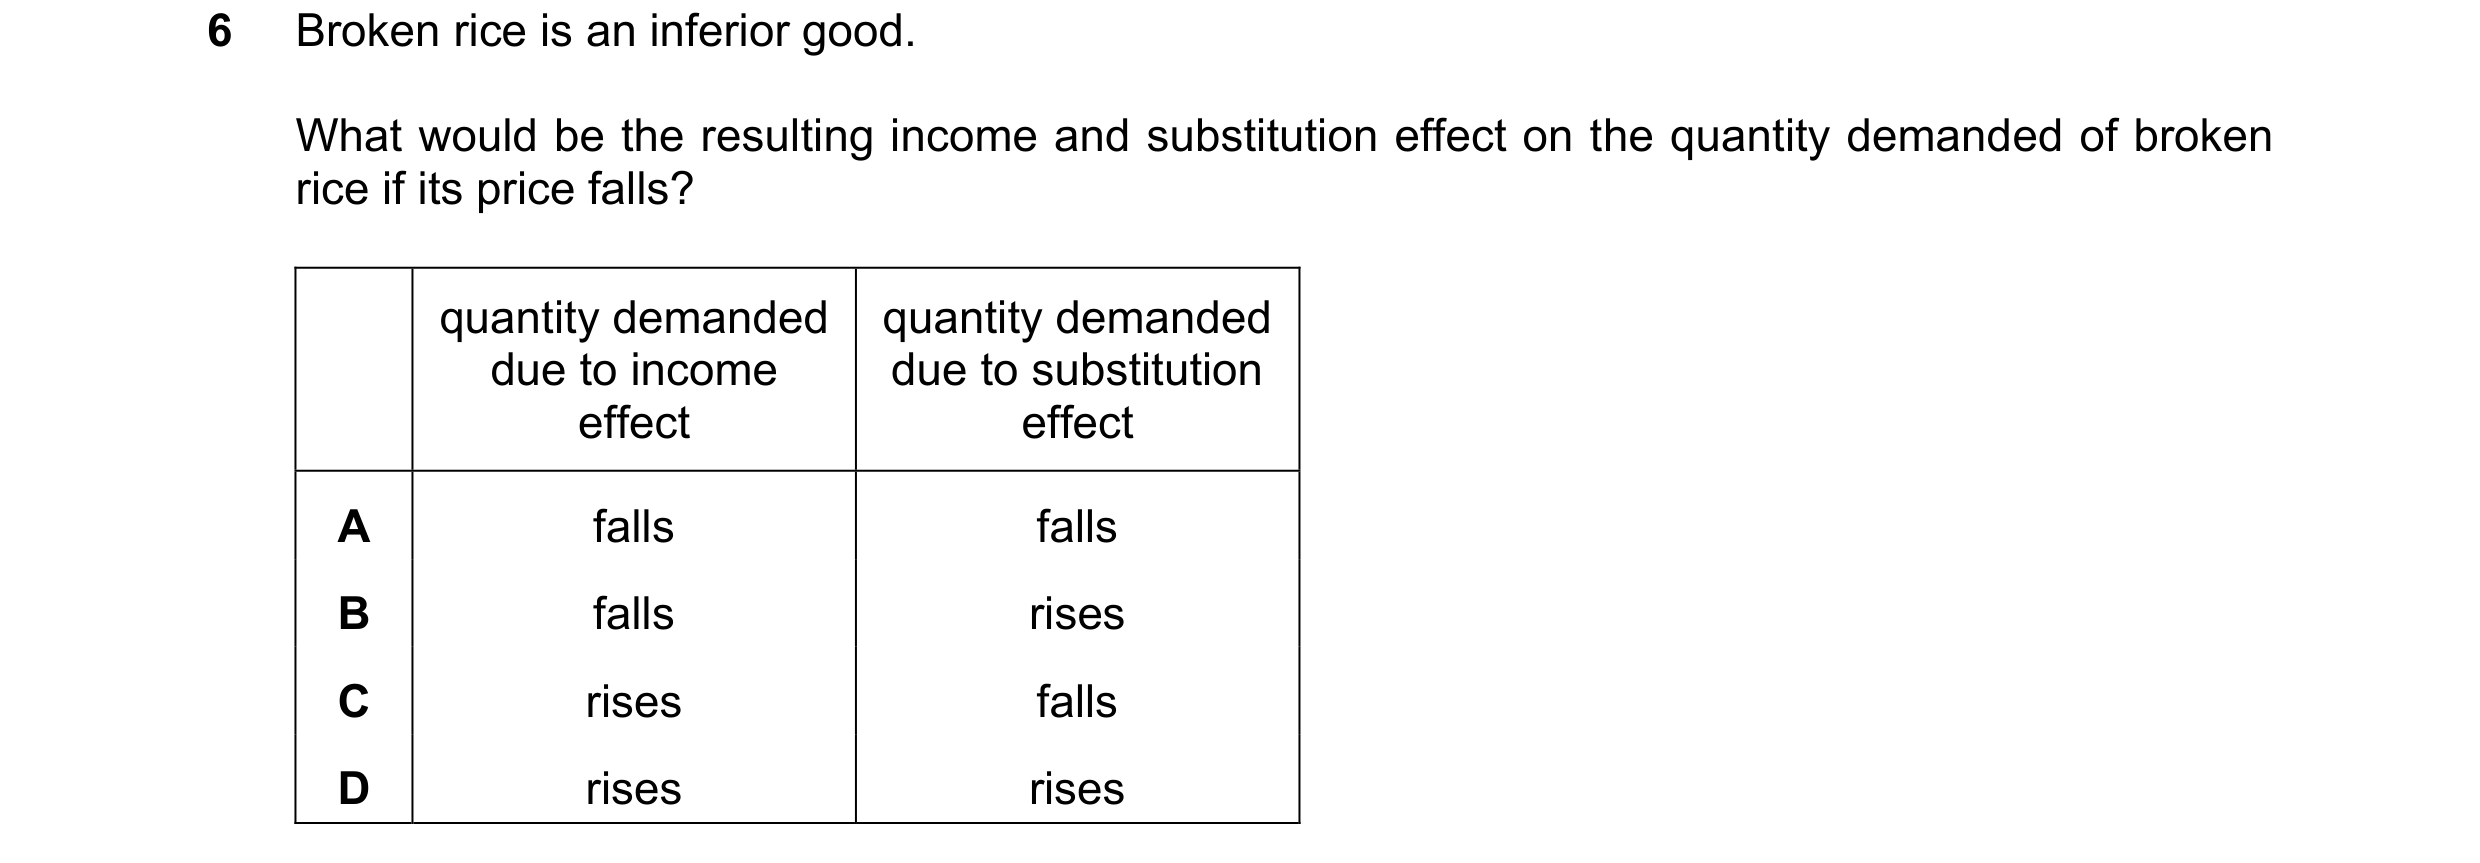
 26 / 32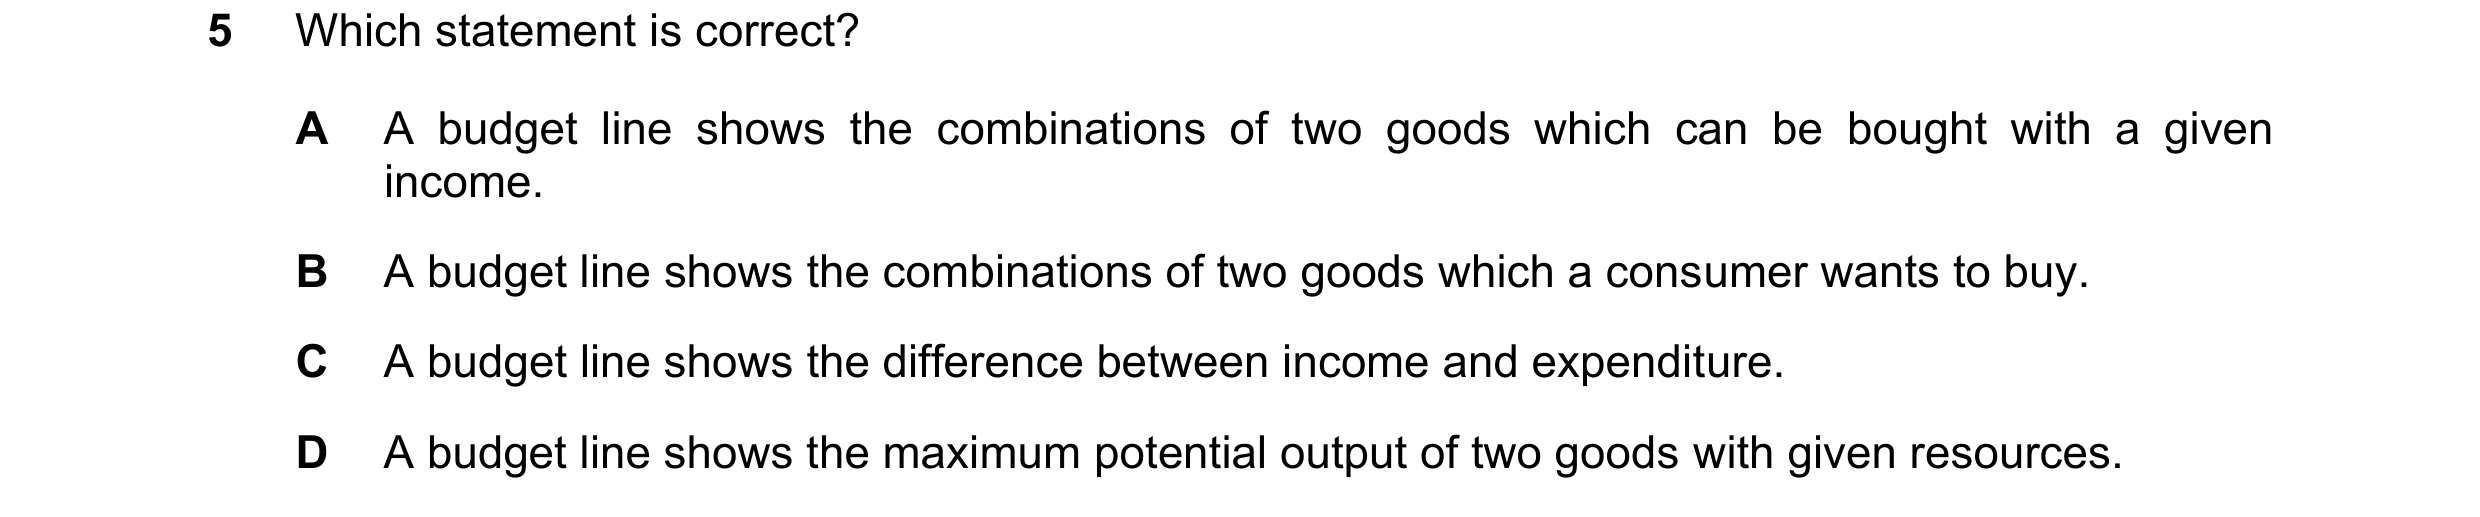
 27 / 32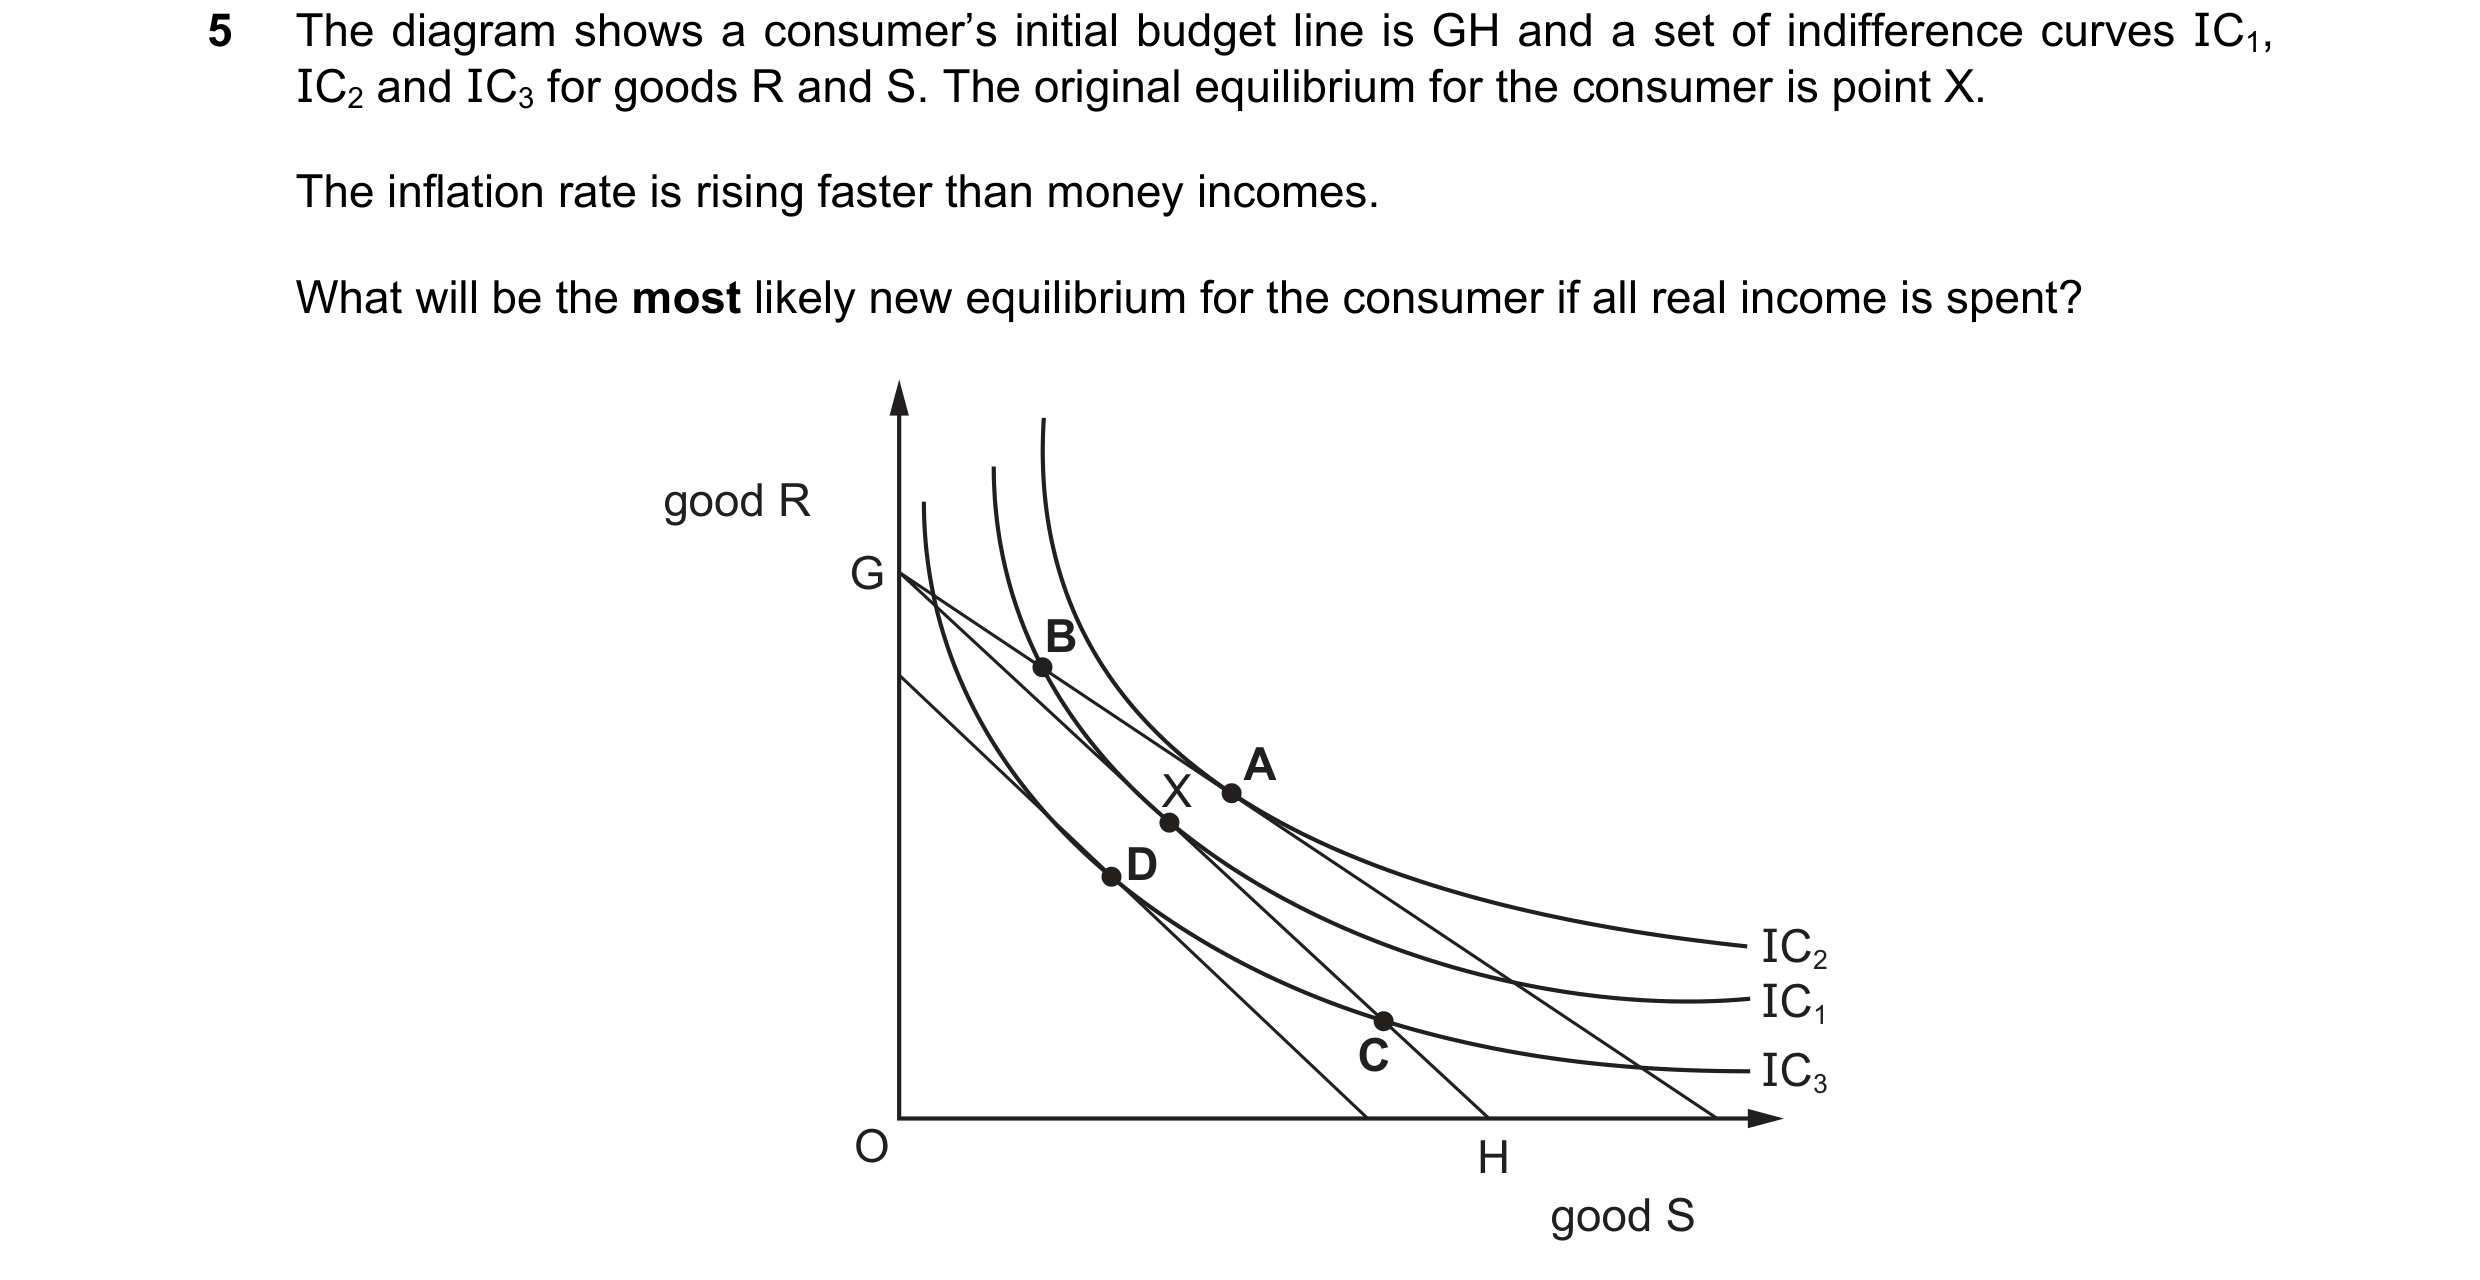
 28 / 32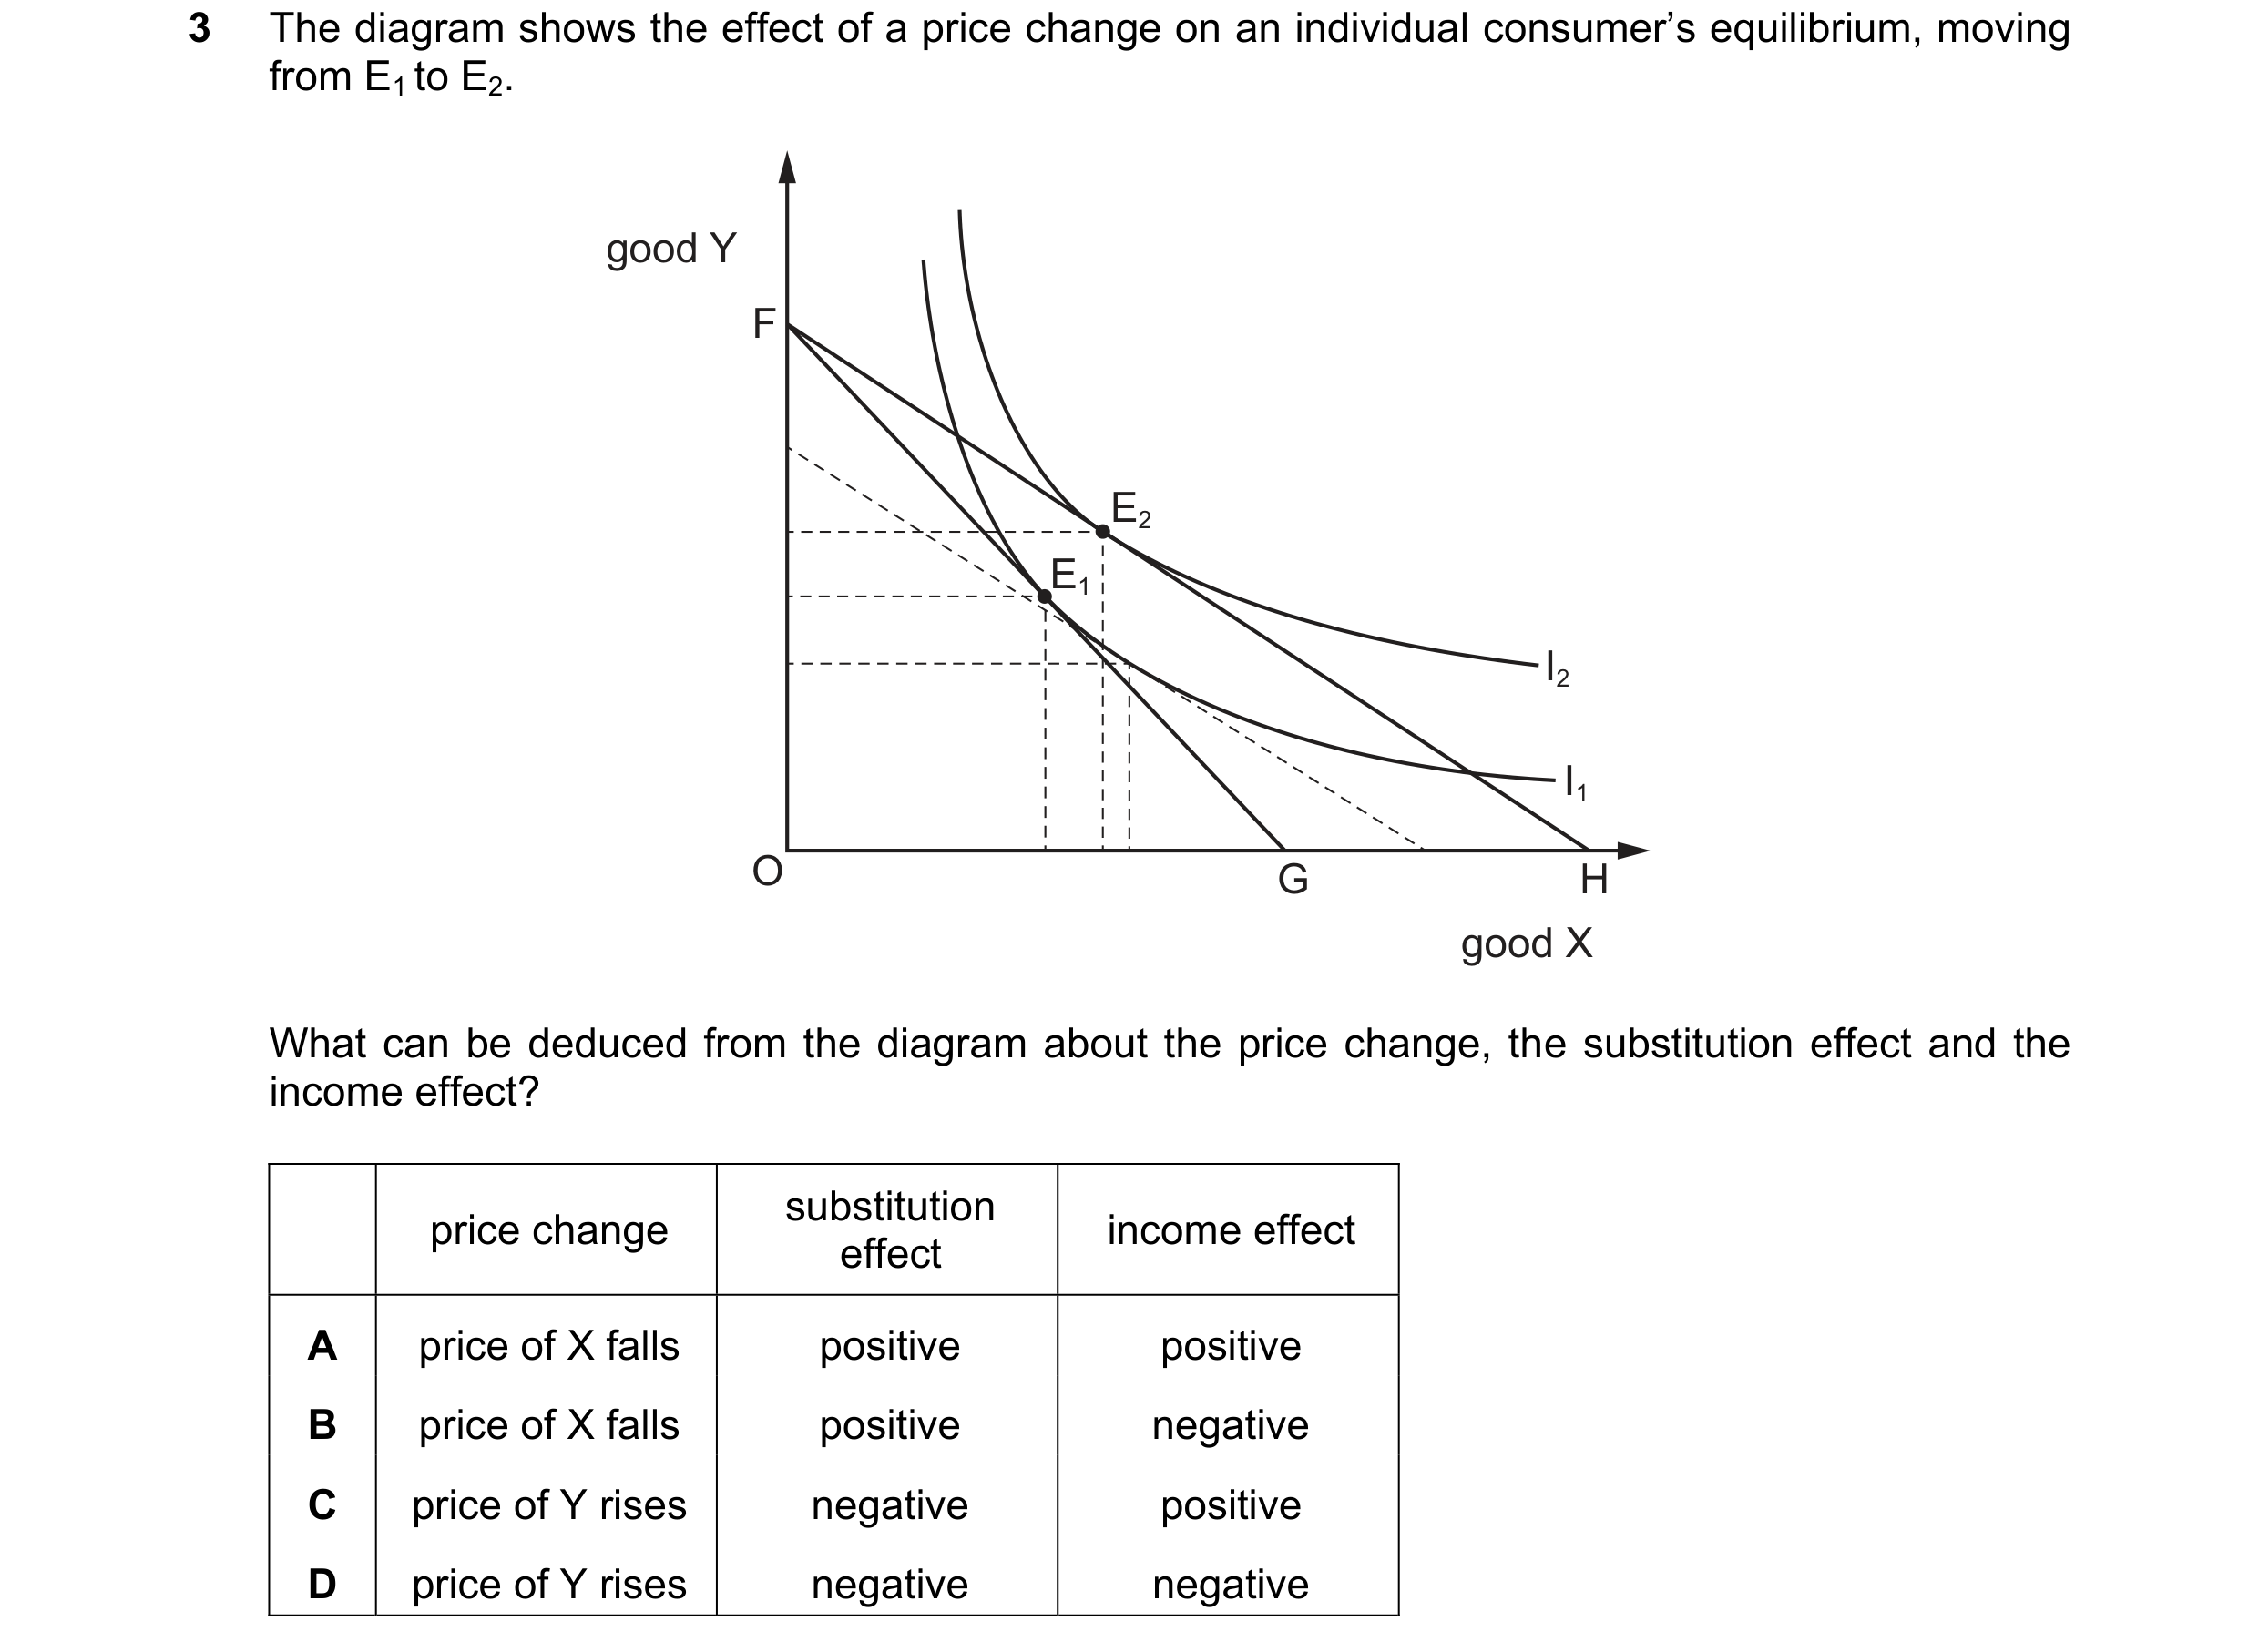
 29 / 32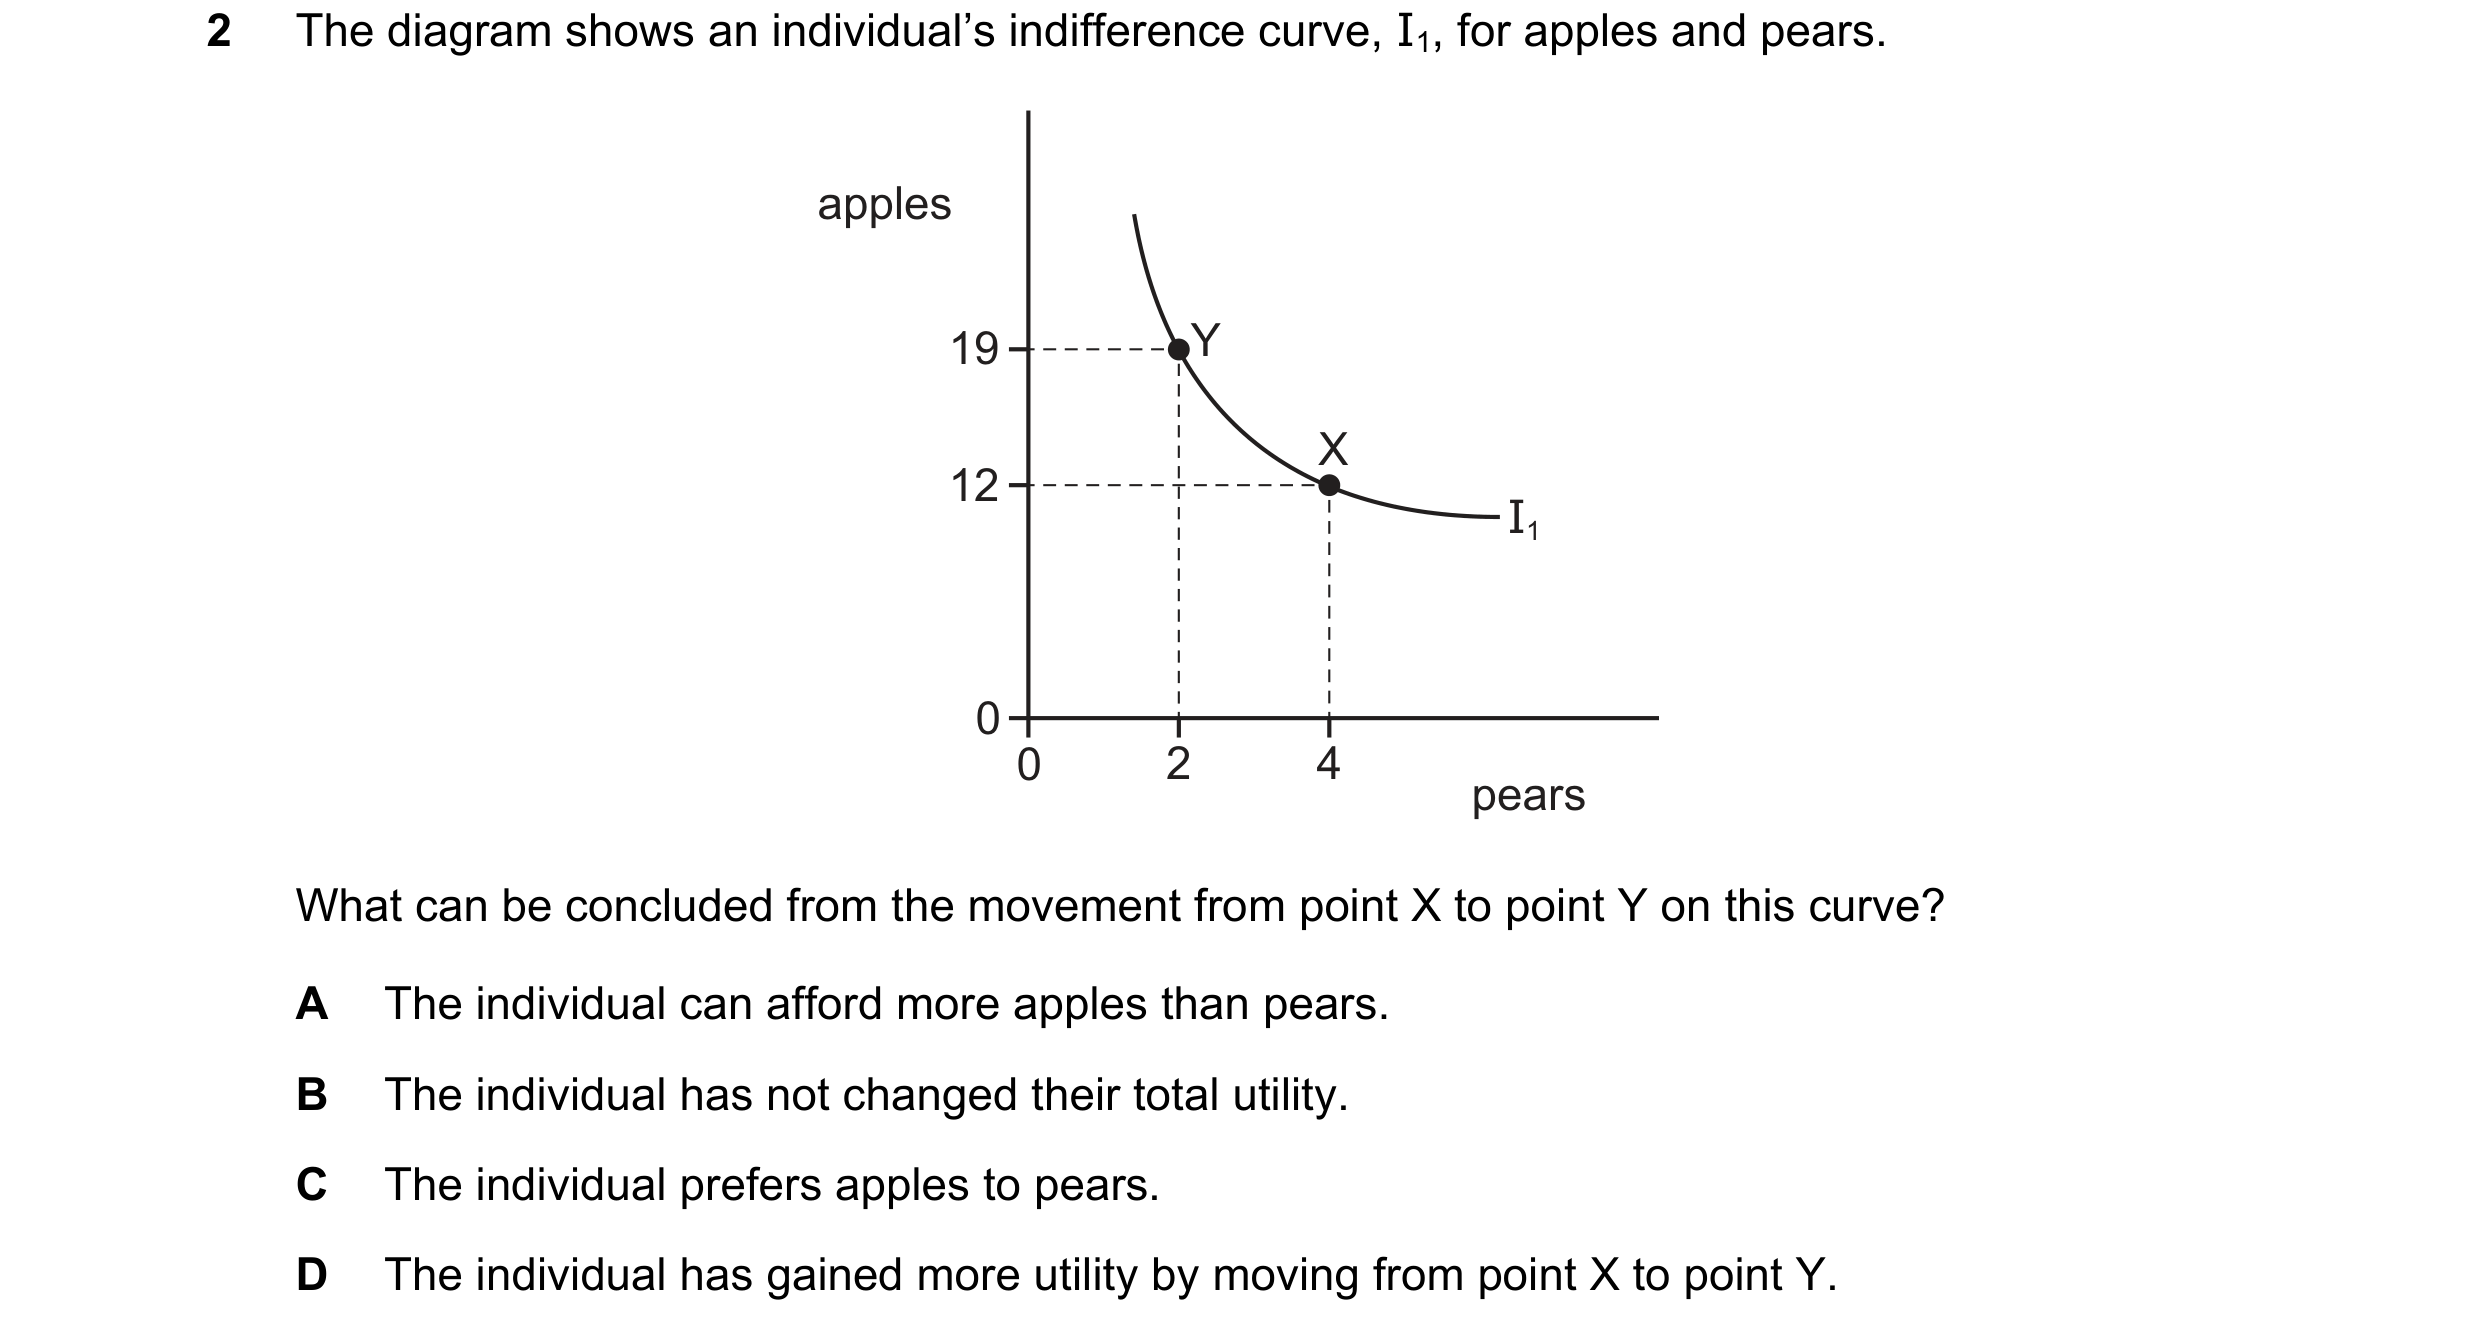

 30 / 32
 31 / 32
 32 / 32