Questions as text
Q1 · What will cause an immediate rise in the size of a country’s labour force? 9708/11 May/June 2006
23 What will cause an immediate rise in the size of a country’s labour force? A an increase in the birth rate B an increase in the age of retirement C an increase in the school leaving age D an increase in the number of redundancies
1 marks
Answer: B
This question in 9708/11 May/June 2006
Q2 · The data in the table are taken from a country’s labour market statistics 9708/11 Oct/Nov 2006
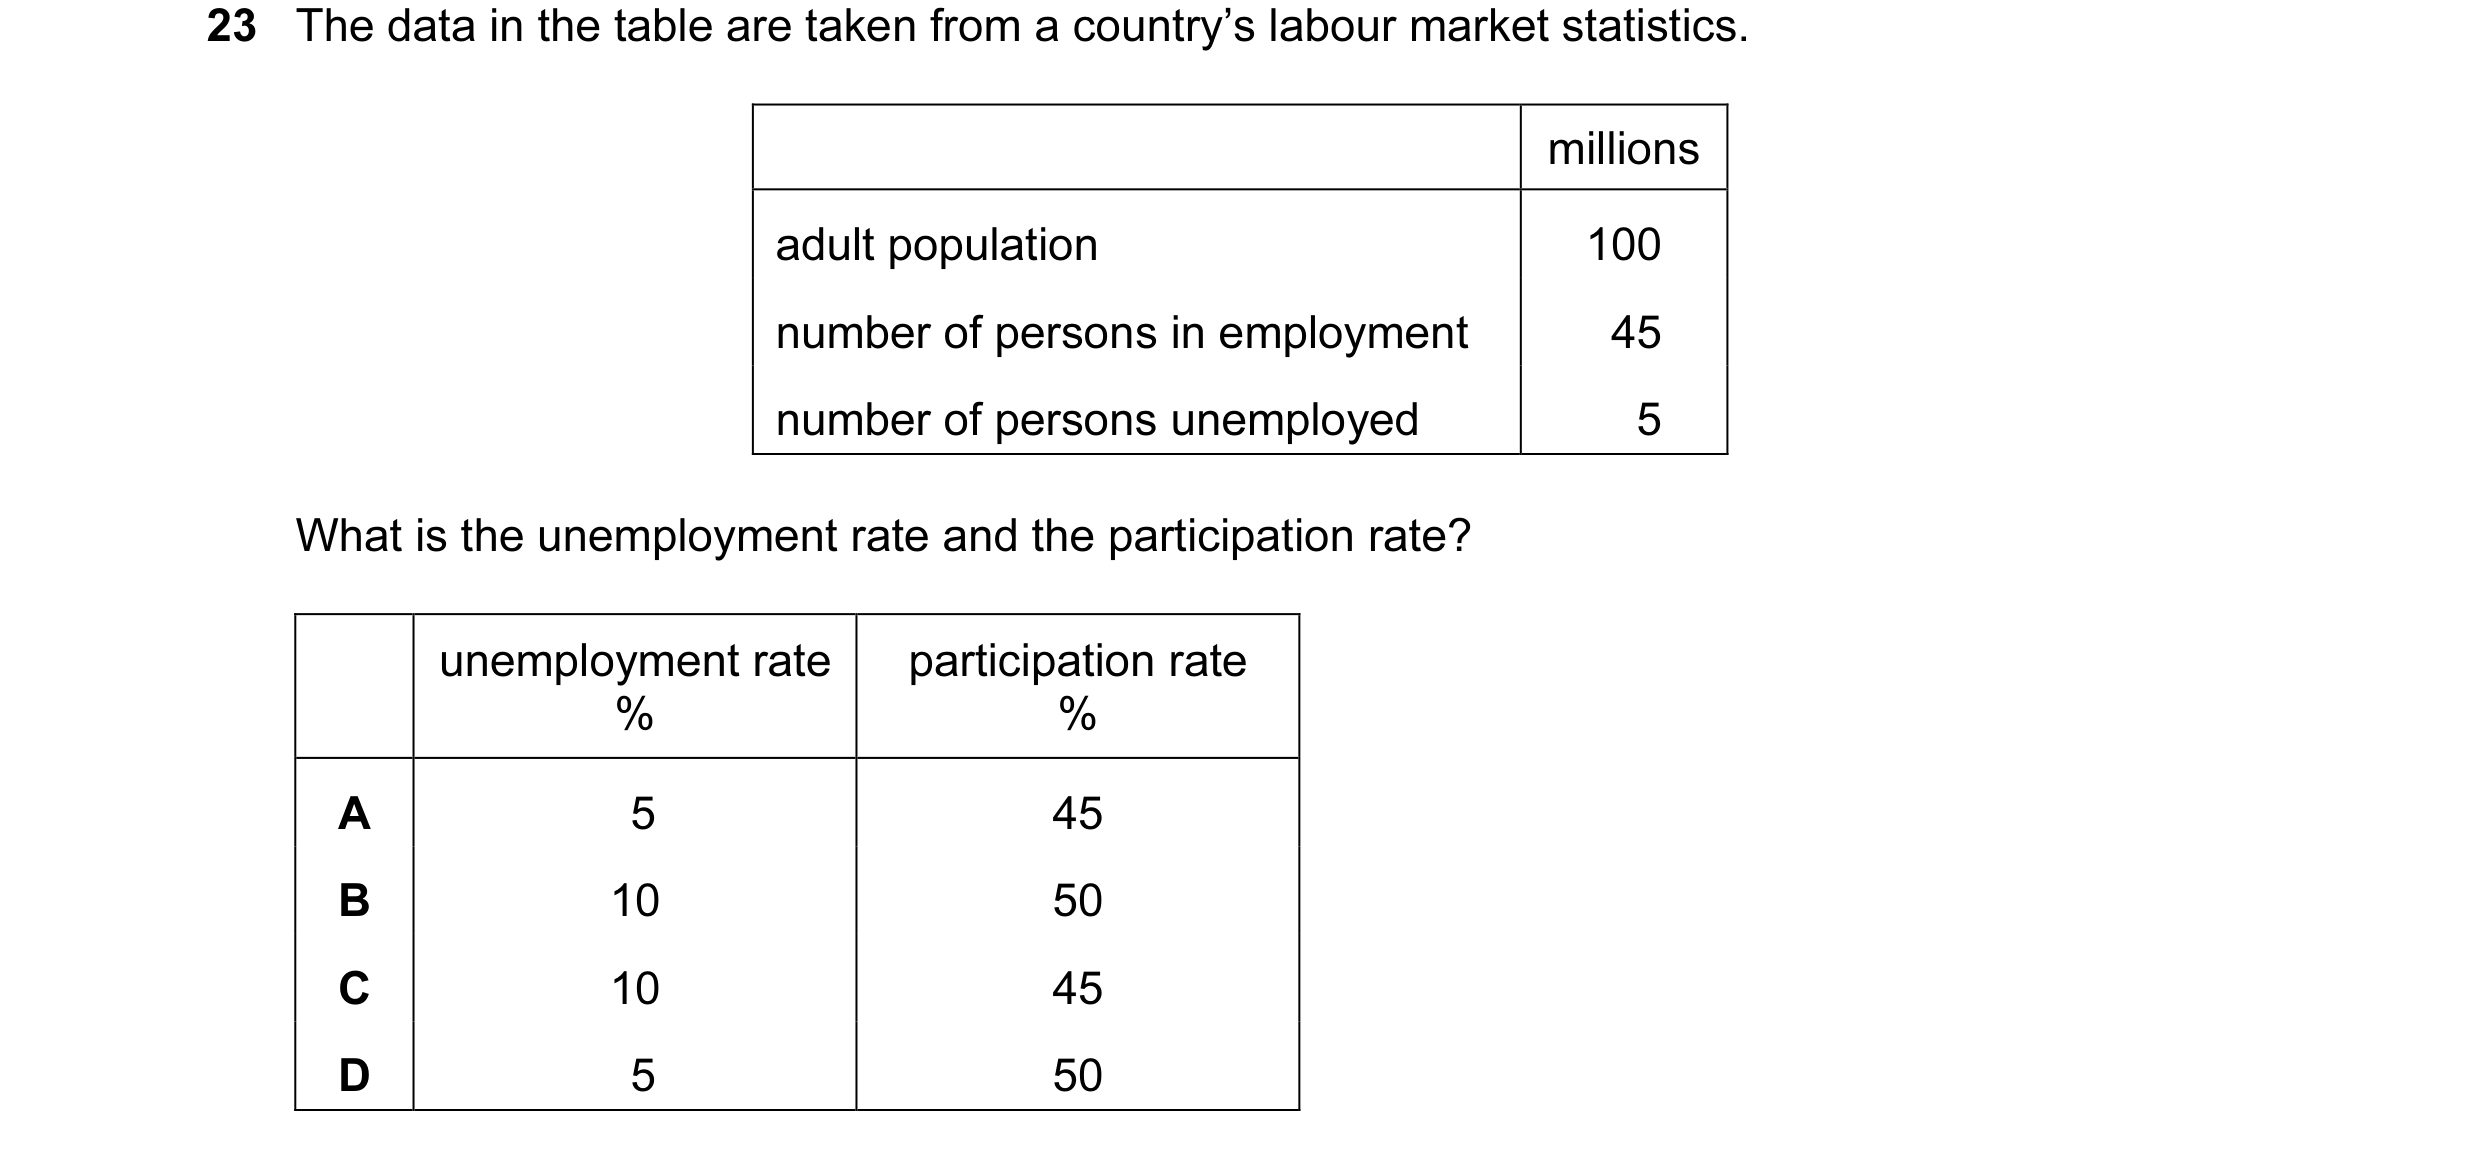
23 The data in the table are taken from a country’s labour market statistics. millions adult population 100 number of persons in employment 45 number of persons unemployed 5 What is the unemployment rate and the participation rate? unemployment rate participation rate % % A 5 45 B 10 50 C 10 45 D 5 50
1 marks
Answer: B
This question in 9708/11 Oct/Nov 2006
Q3 · Company X reduces its workers from 250 to 200 and as a result its output decreases from… 9708/11 May/June 2007
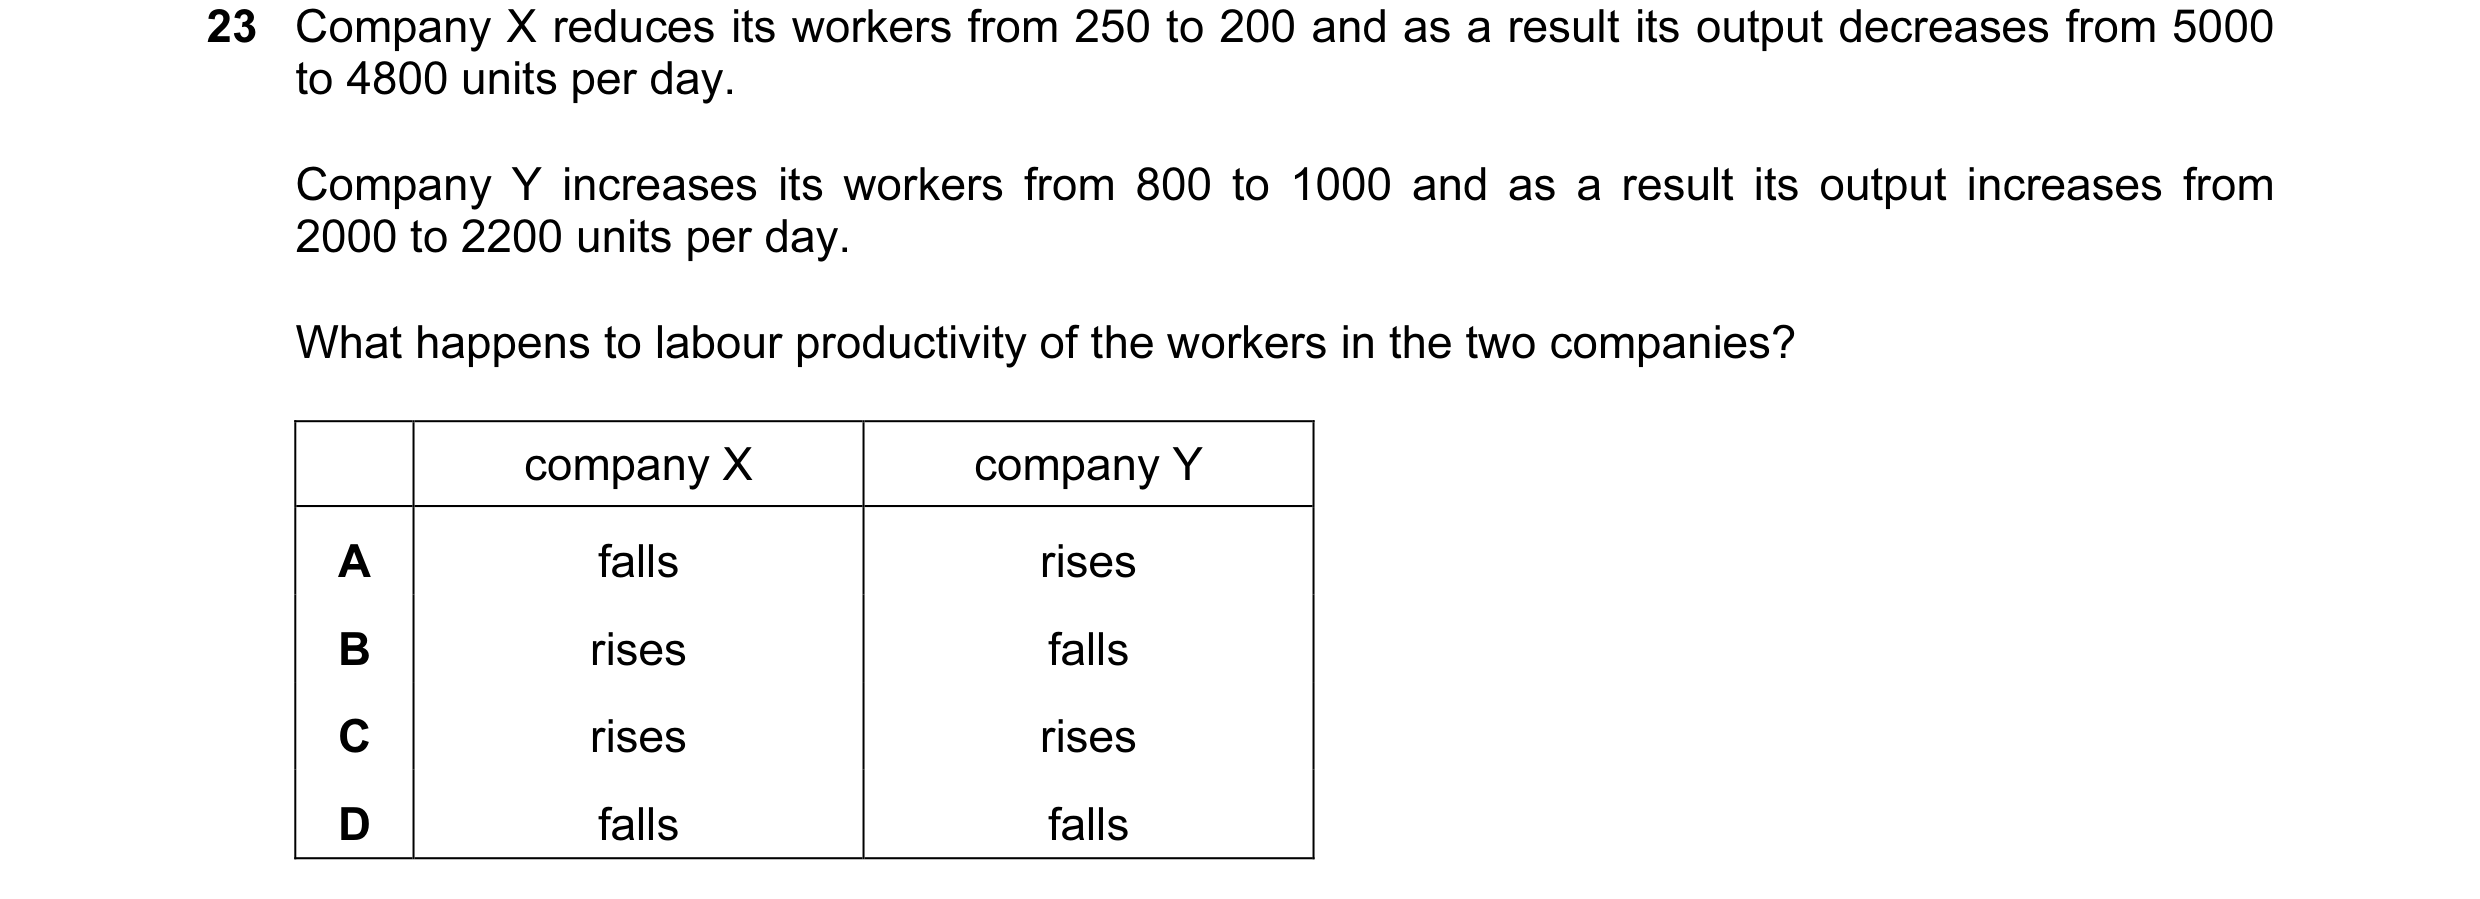
23 Company X reduces its workers from 250 to 200 and as a result its output decreases from 5000 to 4800 units per day. Company Y increases its workers from 800 to 1000 and as a result its output increases from 2000 to 2200 units per day. What happens to labour productivity of the workers in the two companies? company X company Y A falls rises B rises falls C rises rises D falls falls
1 marks
Answer: B
This question in 9708/11 May/June 2007
Q4 · The table gives the % rates of youth unemployment and total unemployment in France and… 9708/11 Oct/Nov 2007
23 The table gives the % rates of youth unemployment and total unemployment in France and the UK in 2001 and 2005. France UK youth total youth total unemployment unemployment unemployment unemployment (%) (%) (%) (%) 2001 19.2 8.7 12 5.2 2005 22.1 10.1 12.5 4.8 What can be concluded from the table? A France and the UK experienced the same trends in unemployment. B France had a higher number of unemployed people than the UK. C The UK used a different definition of unemployment from France. D The UK was more successful than France in controlling unemployment.
1 marks
Answer: D
This question in 9708/11 Oct/Nov 2007
Q5 · The table shows a country’s employment statistics 9708/11 Oct/Nov 2008
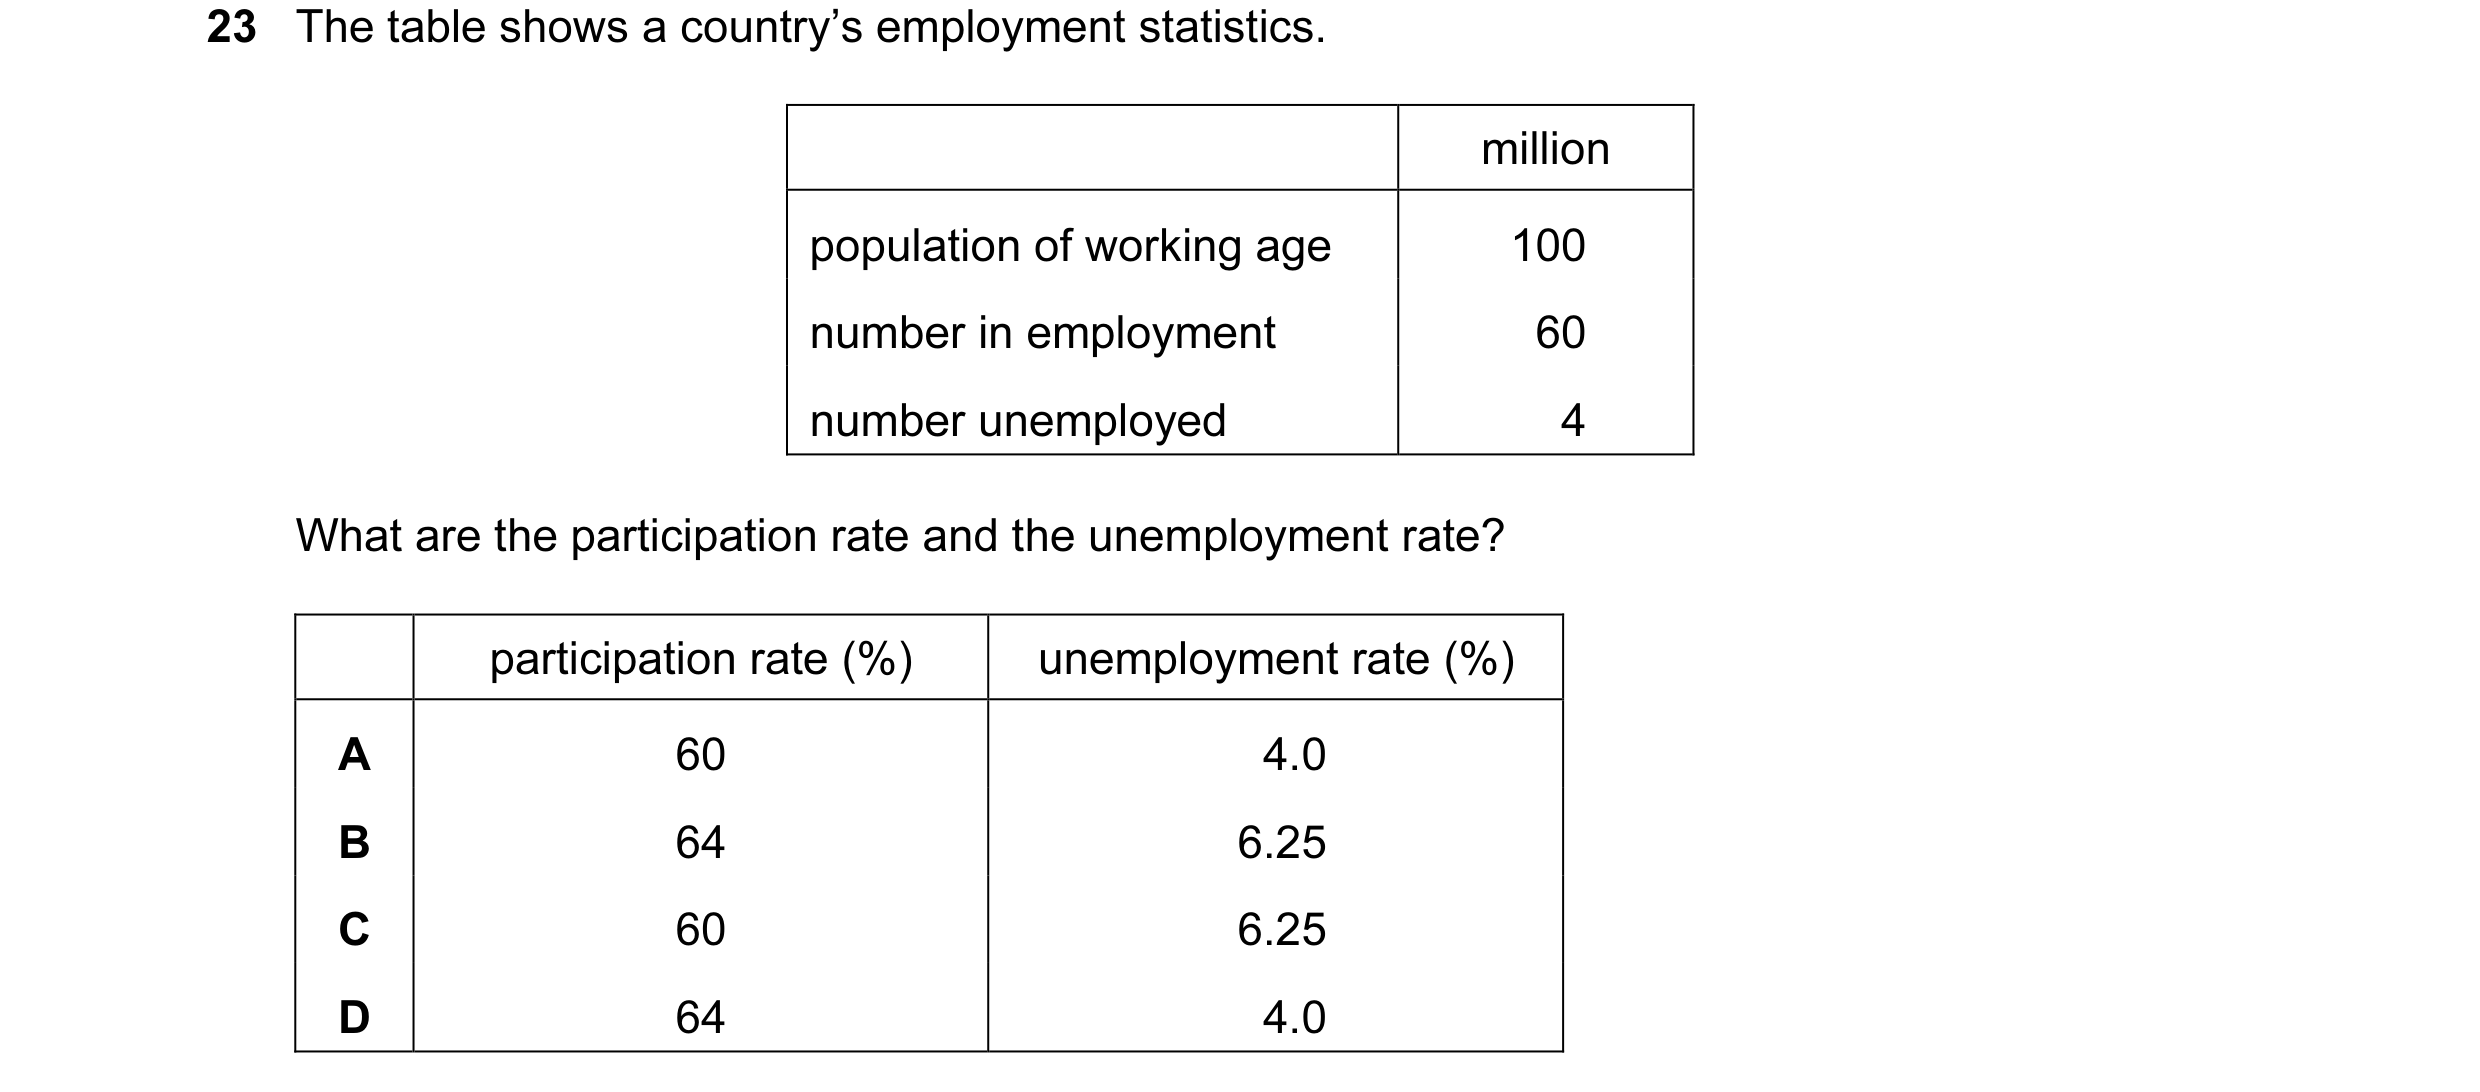
23 The table shows a country’s employment statistics. million population of working age 100 number in employment 60 number unemployed 4 What are the participation rate and the unemployment rate? participation rate (%) unemployment rate (%) A 60 4.0 B 64 6.25 C 60 6.25 D 64 4.0
1 marks
Answer: B
This question in 9708/11 Oct/Nov 2008
Q6 · What will cause an immediate rise in the size of a country’s labour force? 9708/11 May/June 2009
23 What will cause an immediate rise in the size of a country’s labour force? A an increase in the birth rate B an increase in the age of retirement C an increase in the school-leaving age D an increase in the number of redundancies
1 marks
Answer: B
This question in 9708/11 May/June 2009
Q7 · What could lead to an increase in the size of a country’s labour force? 9708/11 Oct/Nov 2009
23 What could lead to an increase in the size of a country’s labour force? A a decrease in unemployment B a decrease in the retirement age C an increase in the participation rate D an increase in the school-leaving age
1 marks
Answer: C
This question in 9708/11 Oct/Nov 2009
Q8 · The graphs show consumer prices and employment for Ireland 9708/11 Oct/Nov 2009
24 The graphs show consumer prices and employment for Ireland. 4 3 consumer prices % increase on a 2 year earlier 1 0 2002 03 04 05 06 07 7.0 6.0 unemployment as % of 5.0 labour force 4.0 2002 03 04 05 06 07 What can be concluded from the graphs? A Between 2003 and 2004, unemployment and prices moved in the same direction. B Prices were at their lowest in 2004. C Prices rose continuously over the period. D The number of unemployed workers fell over the period.
1 marks
Answer: C
This question in 9708/11 Oct/Nov 2009
Q9 · What could lead to an increase in the size of a country’s labour force? 9708/12 Oct/Nov 2009
22 What could lead to an increase in the size of a country’s labour force? A a decrease in unemployment B a decrease in the retirement age C an increase in the participation rate D an increase in the school-leaving age
1 marks
Answer: C
This question in 9708/12 Oct/Nov 2009
Q10 · The graphs show consumer prices and employment for Ireland 9708/12 Oct/Nov 2009
24 The graphs show consumer prices and employment for Ireland. 4 3 consumer prices % increase on a 2 year earlier 1 0 2002 03 04 05 06 07 7.0 6.0 unemployment as % of 5.0 labour force 4.0 2002 03 04 05 06 07 What can be concluded from the graphs? A Between 2003 and 2004, unemployment and prices moved in the same direction. B Prices were at their lowest in 2004. C Prices rose continuously over the period. D The number of unemployed workers fell over the period.
1 marks
Answer: C
This question in 9708/12 Oct/Nov 2009
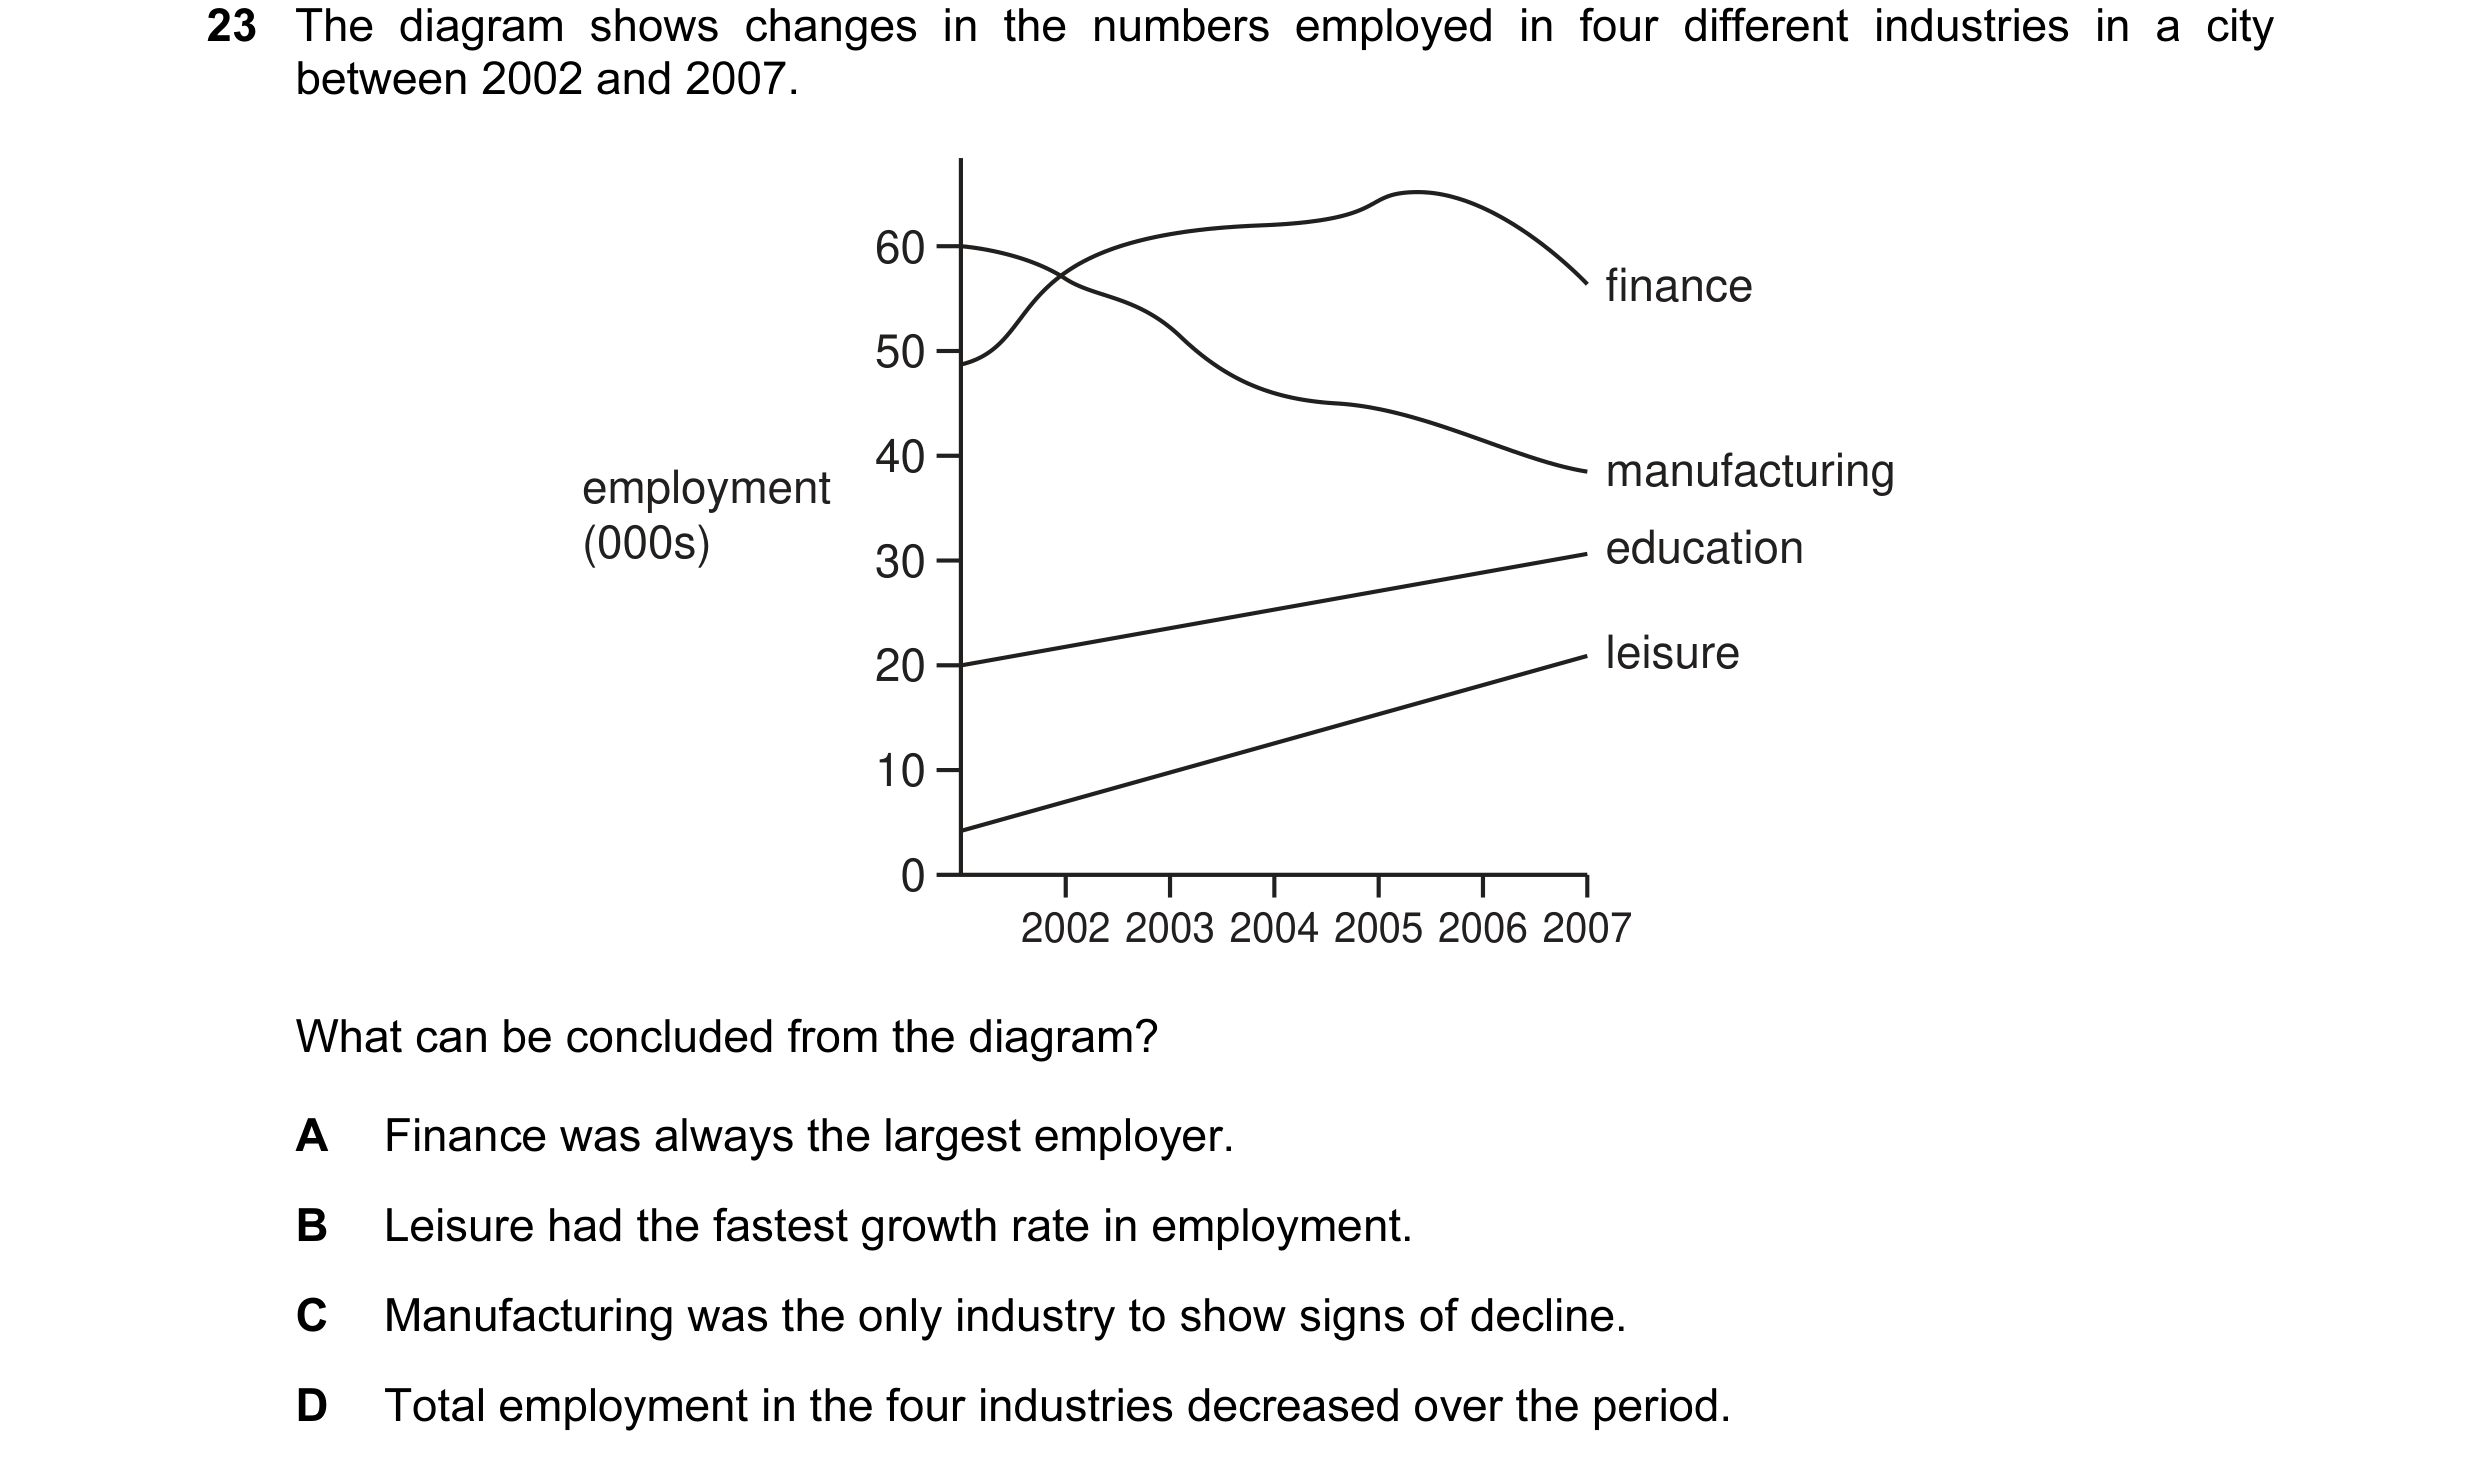
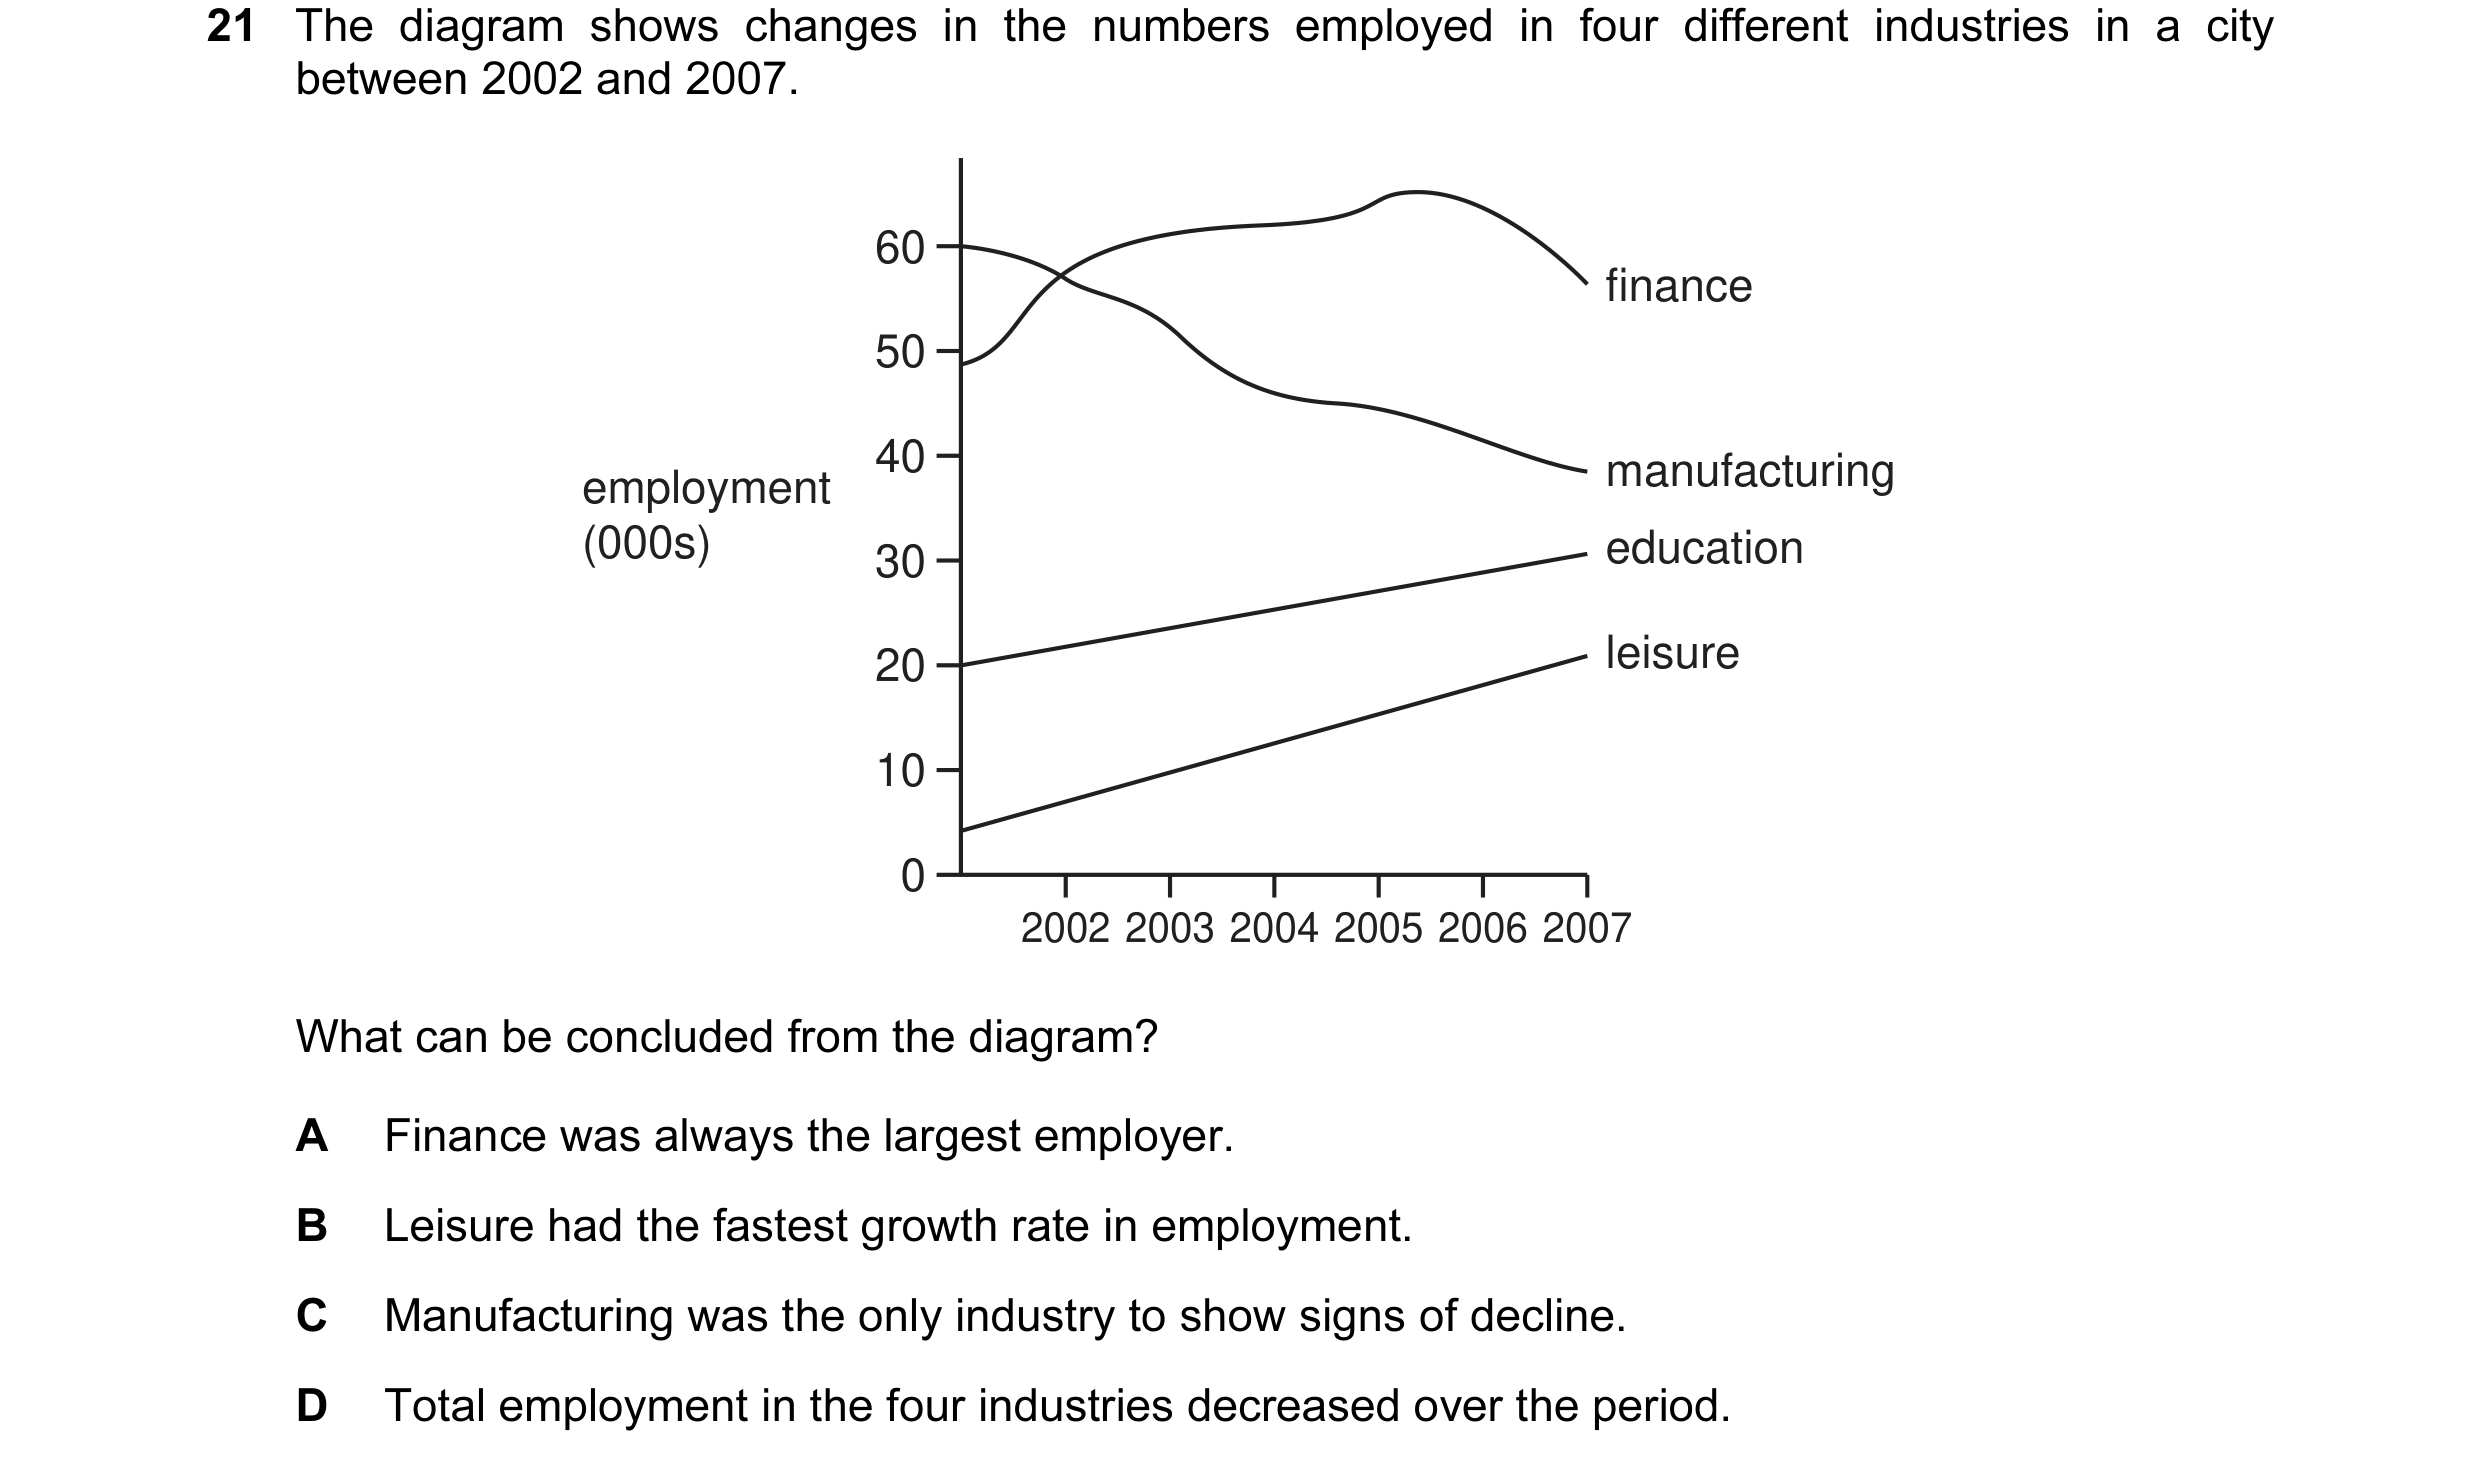
Q11 · The diagram shows changes in the numbers employed in four different industries in a city… 9708/11 May/June 2010
23 The diagram shows changes in the numbers employed in four different industries in a city between 2002 and 2007. 60 finance 50 40 manufacturing employment (000s) 30 education 20 leisure 10 0 2002 2003 2004 2005 2006 2007 What can be concluded from the diagram? A Finance was always the largest employer. B Leisure had the fastest growth rate in employment. C Manufacturing was the only industry to show signs of decline. D Total employment in the four industries decreased over the period.
1 marks
Answer: B
This question in 9708/11 May/June 2010
Q12 · The diagram shows changes in the numbers employed in four different industries in a city… 9708/12 May/June 2010
22 The diagram shows changes in the numbers employed in four different industries in a city between 2002 and 2007. 60 finance 50 40 manufacturing employment (000s) 30 education 20 leisure 10 0 2002 2003 2004 2005 2006 2007 What can be concluded from the diagram? A Finance was always the largest employer. B Leisure had the fastest growth rate in employment. C Manufacturing was the only industry to show signs of decline. D Total employment in the four industries decreased over the period.
1 marks
Answer: B
This question in 9708/12 May/June 2010
Q13 · The diagram shows changes in the numbers employed in four different industries in a city… 9708/13 May/June 2010
21 The diagram shows changes in the numbers employed in four different industries in a city between 2002 and 2007. 60 finance 50 40 manufacturing employment (000s) 30 education 20 leisure 10 0 2002 2003 2004 2005 2006 2007 What can be concluded from the diagram? A Finance was always the largest employer. B Leisure had the fastest growth rate in employment. C Manufacturing was the only industry to show signs of decline. D Total employment in the four industries decreased over the period.
1 marks
Answer: B
This question in 9708/13 May/June 2010
Q14 · What are most likely to be disadvantages found in a market economy? 9708/11 Oct/Nov 2010
2 What are most likely to be disadvantages found in a market economy? A economic growth and state-owned companies B merit goods and free competition C public goods and economic specialisation D unemployment and external costs
1 marks
Answer: D
This question in 9708/11 Oct/Nov 2010
Q15 · What must fall when the rate of unemployment rises? 9708/11 Oct/Nov 2010
23 What must fall when the rate of unemployment rises? A the effectiveness of the use of resources B the level of labour productivity C the number of workers in employment D the size of the labour force
1 marks
Answer: A
This question in 9708/11 Oct/Nov 2010
Q16 · What must fall when the rate of unemployment rises? 9708/12 Oct/Nov 2010
23 What must fall when the rate of unemployment rises? A the effectiveness of the use of resources B the level of labour productivity C the number of workers in employment D the size of the labour force
1 marks
Answer: A
This question in 9708/12 Oct/Nov 2010
Q17 · What must fall when the rate of unemployment rises? 9708/13 Oct/Nov 2010
22 What must fall when the rate of unemployment rises? A the effectiveness of the use of resources B the level of labour productivity C the number of workers in employment D the size of the labour force
1 marks
Answer: A
This question in 9708/13 Oct/Nov 2010
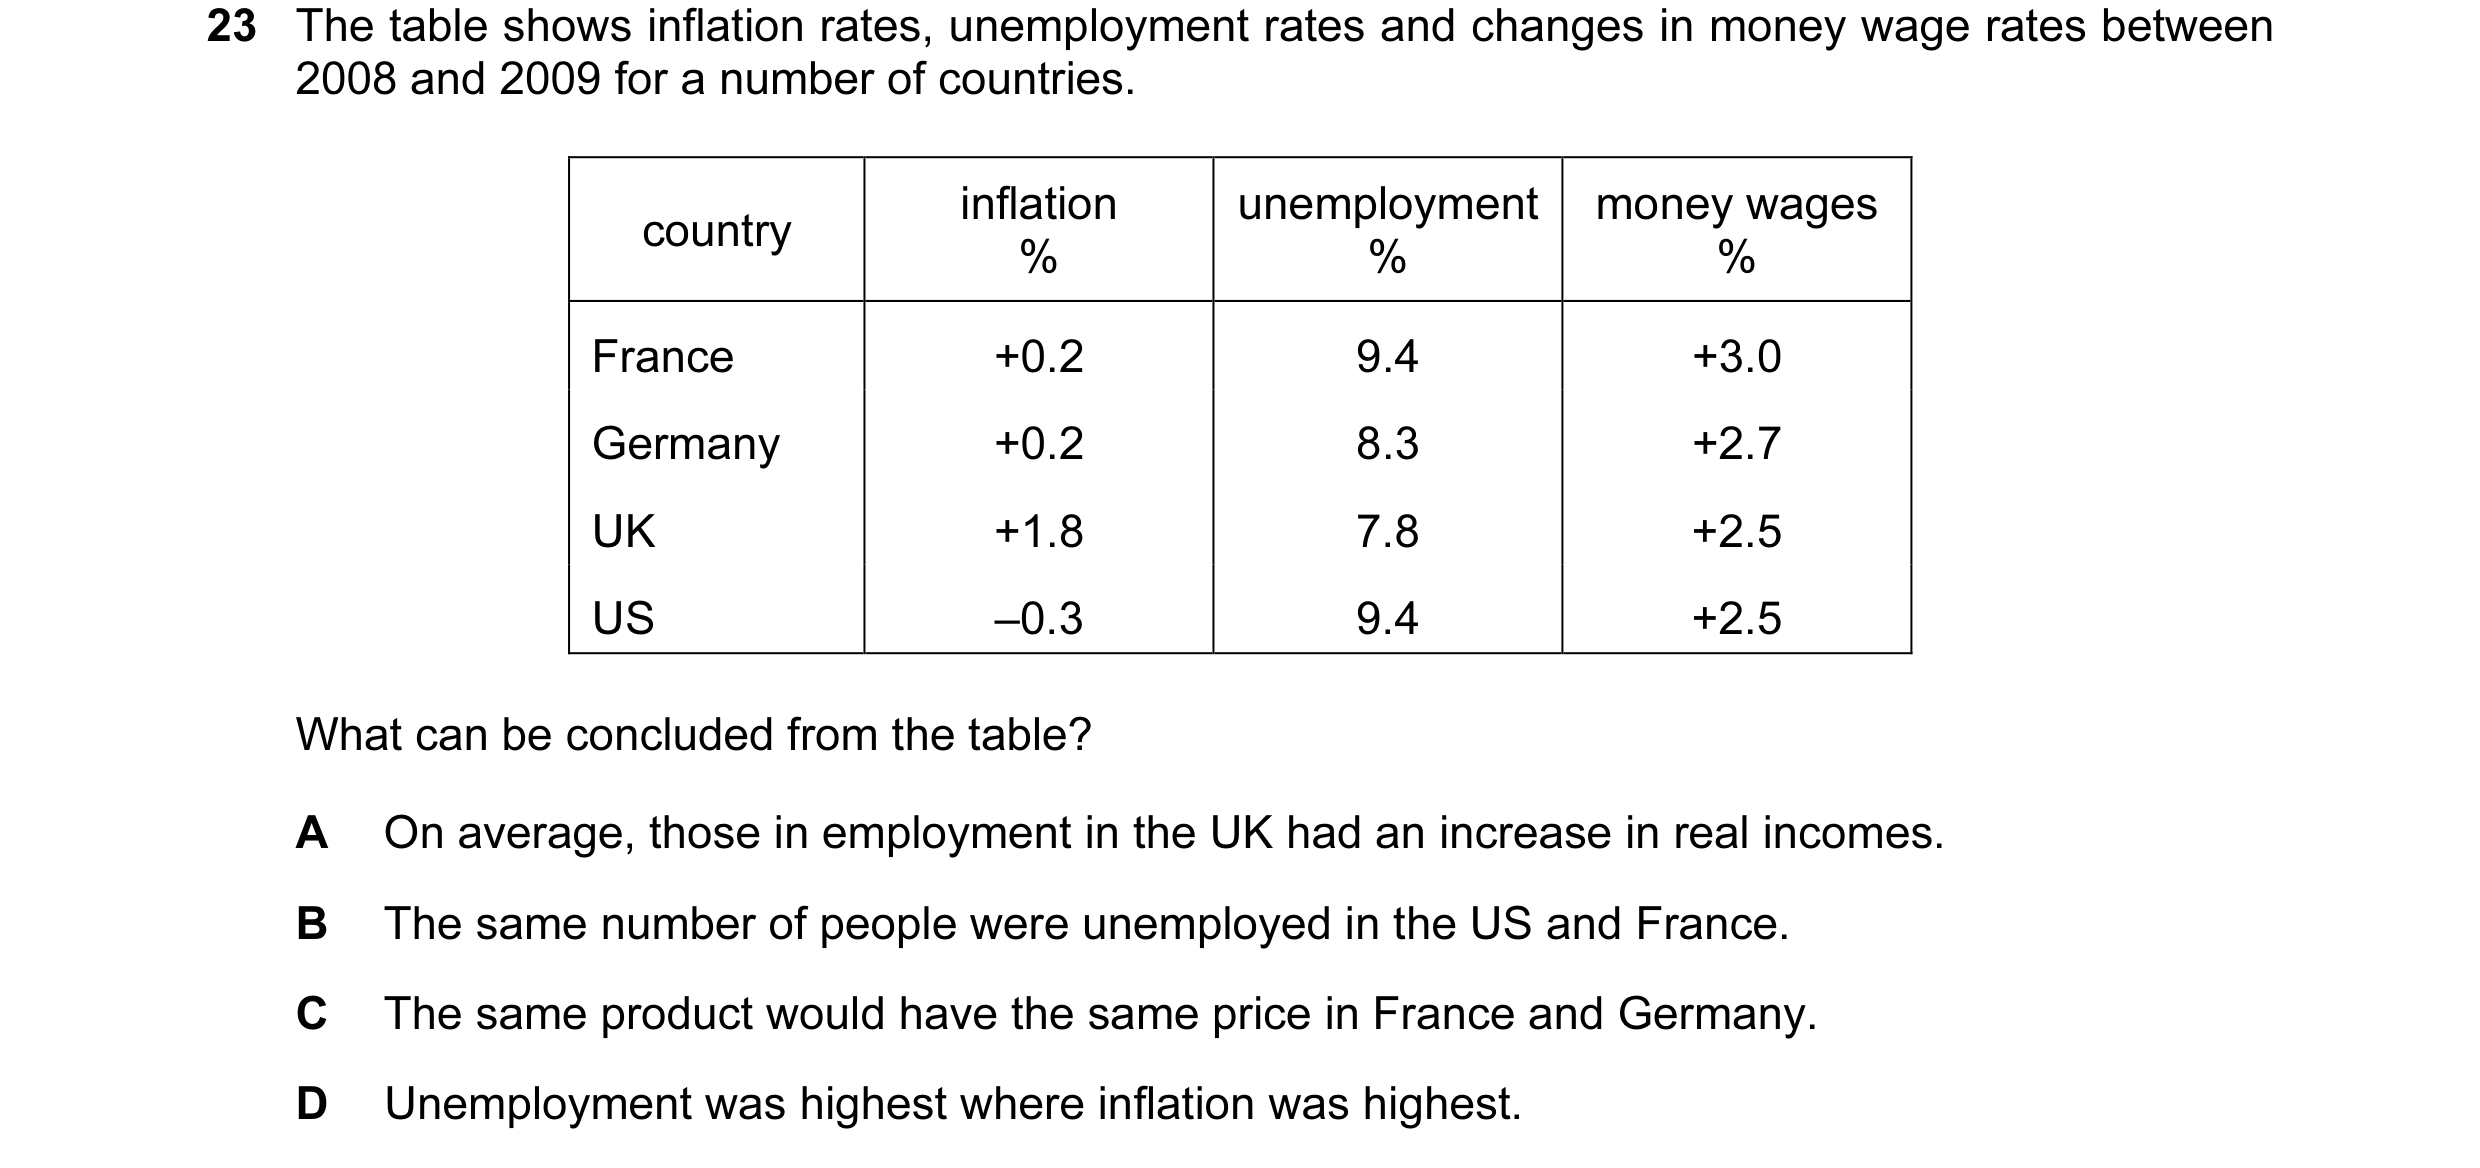
Q18 · The table shows inflation rates, unemployment rates and changes in money wage rates… 9708/11 May/June 2011
23 The table shows inflation rates, unemployment rates and changes in money wage rates between 2008 and 2009 for a number of countries. inflation unemployment money wages country % % % France +0.2 9.4 +3.0 Germany +0.2 8.3 +2.7 UK +1.8 7.8 +2.5 US –0.3 9.4 +2.5 What can be concluded from the table? A On average, those in employment in the UK had an increase in real incomes. B The same number of people were unemployed in the US and France. C The same product would have the same price in France and Germany. D Unemployment was highest where inflation was highest.
1 marks
Answer: A
This question in 9708/11 May/June 2011
Q19 · The table shows inflation rates, unemployment rates and changes in money wage rates… 9708/12 May/June 2011
22 The table shows inflation rates, unemployment rates and changes in money wage rates between 2008 and 2009 for a number of countries. inflation unemployment money wages country % % % France +0.2 9.4 +3.0 Germany +0.2 8.3 +2.7 UK +1.8 7.8 +2.5 US –0.3 9.4 +2.5 What can be concluded from the table? A On average, those in employment in the UK had an increase in real incomes. B The same number of people were unemployed in the US and France. C The same product would have the same price in France and Germany. D Unemployment was highest where inflation was highest.
1 marks
Answer: A
This question in 9708/12 May/June 2011
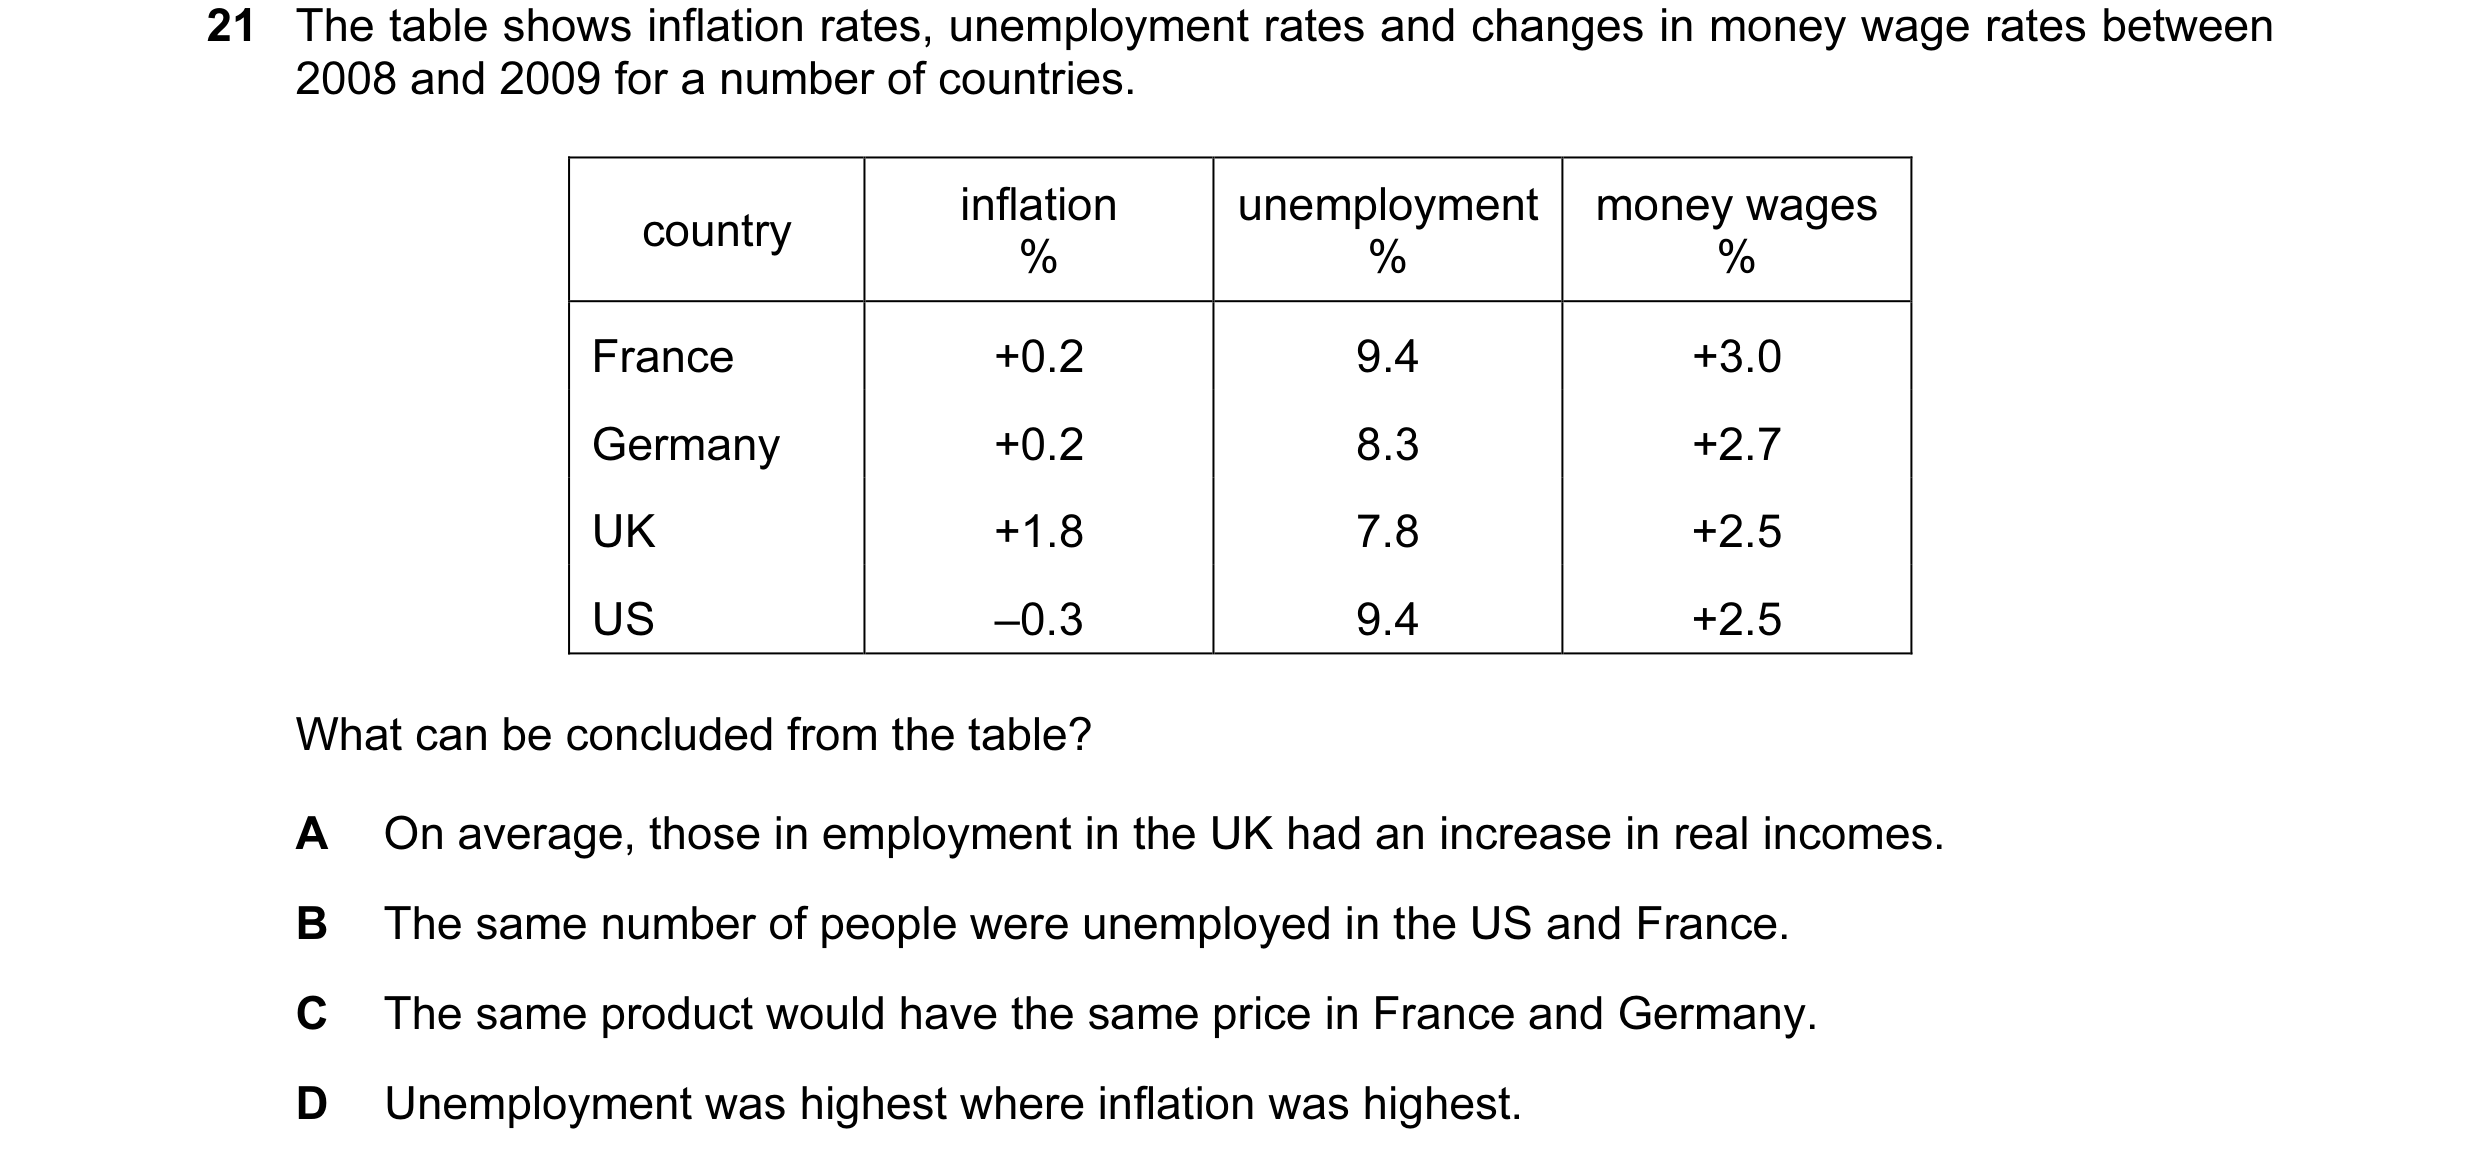
Q20 · The table shows inflation rates, unemployment rates and changes in money wage rates… 9708/13 May/June 2011
21 The table shows inflation rates, unemployment rates and changes in money wage rates between 2008 and 2009 for a number of countries. inflation unemployment money wages country % % % France +0.2 9.4 +3.0 Germany +0.2 8.3 +2.7 UK +1.8 7.8 +2.5 US –0.3 9.4 +2.5 What can be concluded from the table? A On average, those in employment in the UK had an increase in real incomes. B The same number of people were unemployed in the US and France. C The same product would have the same price in France and Germany. D Unemployment was highest where inflation was highest.
1 marks
Answer: A
This question in 9708/13 May/June 2011
Q21 · Unemployment is usually divided into two categories: long-term (more than 12 months) and… 9708/11 Oct/Nov 2011
23 Unemployment is usually divided into two categories: long-term (more than 12 months) and short-term (less than 12 months). The diagram shows the long-term unemployment rate as a percentage of total unemployment for four countries between 2002 and 2007. 70 W 60 X W 50 long-term Y 40 unemployment (% of total) 30 Y X 20 Z Z 10 0 2002 2003 2004 2005 2006 2007 What is correct about unemployment from the diagram? A Country W had the lowest percentage of short-term unemployment. B Country X was least successful in reducing the percentage of long-term unemployment. C Country Y was least successful in reducing the percentage of short-term unemployment. D Country Z had the highest percentage of long-term unemployment.
1 marks
Answer: A
This question in 9708/11 Oct/Nov 2011
Q22 · The table shows the rate of unemployment and population for selected countries in 2009 9708/12 Oct/Nov 2011
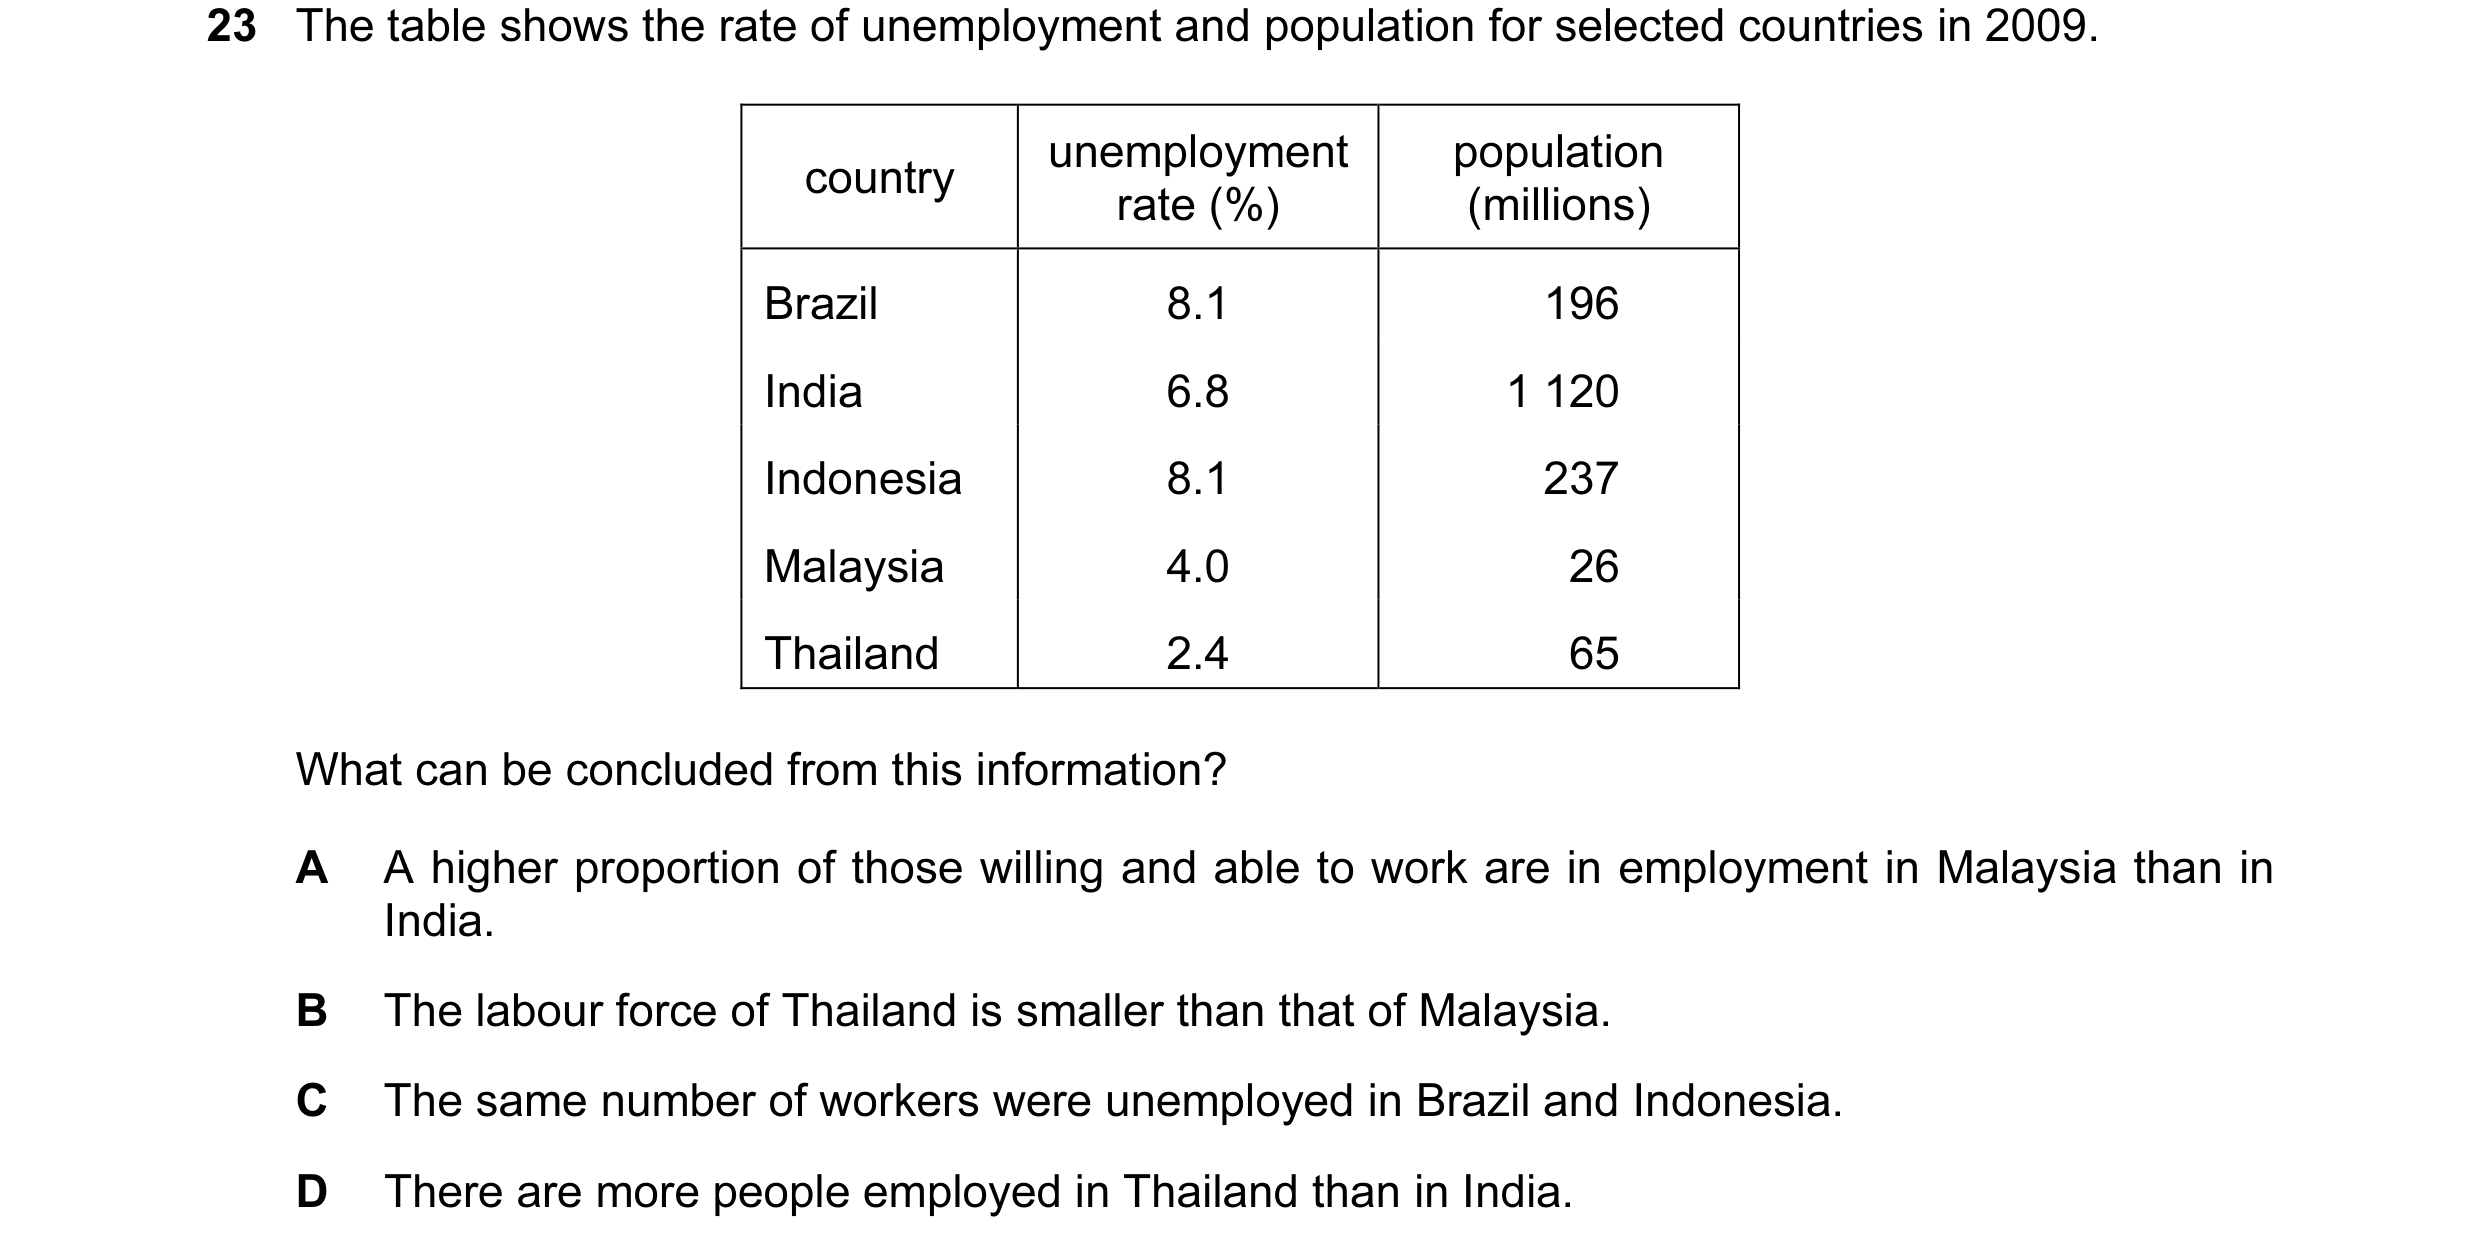
23 The table shows the rate of unemployment and population for selected countries in 2009. unemployment population country rate (%) (millions) Brazil 8.1 196 India 6.8 1 120 Indonesia 8.1 237 Malaysia 4.0 26 Thailand 2.4 65 What can be concluded from this information? A A higher proportion of those willing and able to work are in employment in Malaysia than in India. B The labour force of Thailand is smaller than that of Malaysia. C The same number of workers were unemployed in Brazil and Indonesia. D There are more people employed in Thailand than in India.
1 marks
Answer: A
This question in 9708/12 Oct/Nov 2011
Q23 · Unemployment is usually divided into two categories: long-term (more than 12 months) and… 9708/13 Oct/Nov 2011
21 Unemployment is usually divided into two categories: long-term (more than 12 months) and short-term (less than 12 months). The diagram shows the long-term unemployment rate as a percentage of total unemployment for four countries between 2002 and 2007. 70 W 60 X W 50 long-term Y 40 unemployment (% of total) 30 Y X 20 Z Z 10 0 2002 2003 2004 2005 2006 2007 What is correct about unemployment from the diagram? A Country W had the lowest percentage of short-term unemployment. B Country X was least successful in reducing the percentage of long-term unemployment. C Country Y was least successful in reducing the percentage of short-term unemployment. D Country Z had the highest percentage of long-term unemployment.
1 marks
Answer: A
This question in 9708/13 Oct/Nov 2011
Q24 · The diagram shows a production possibility curve for an economy 9708/13 Oct/Nov 2011
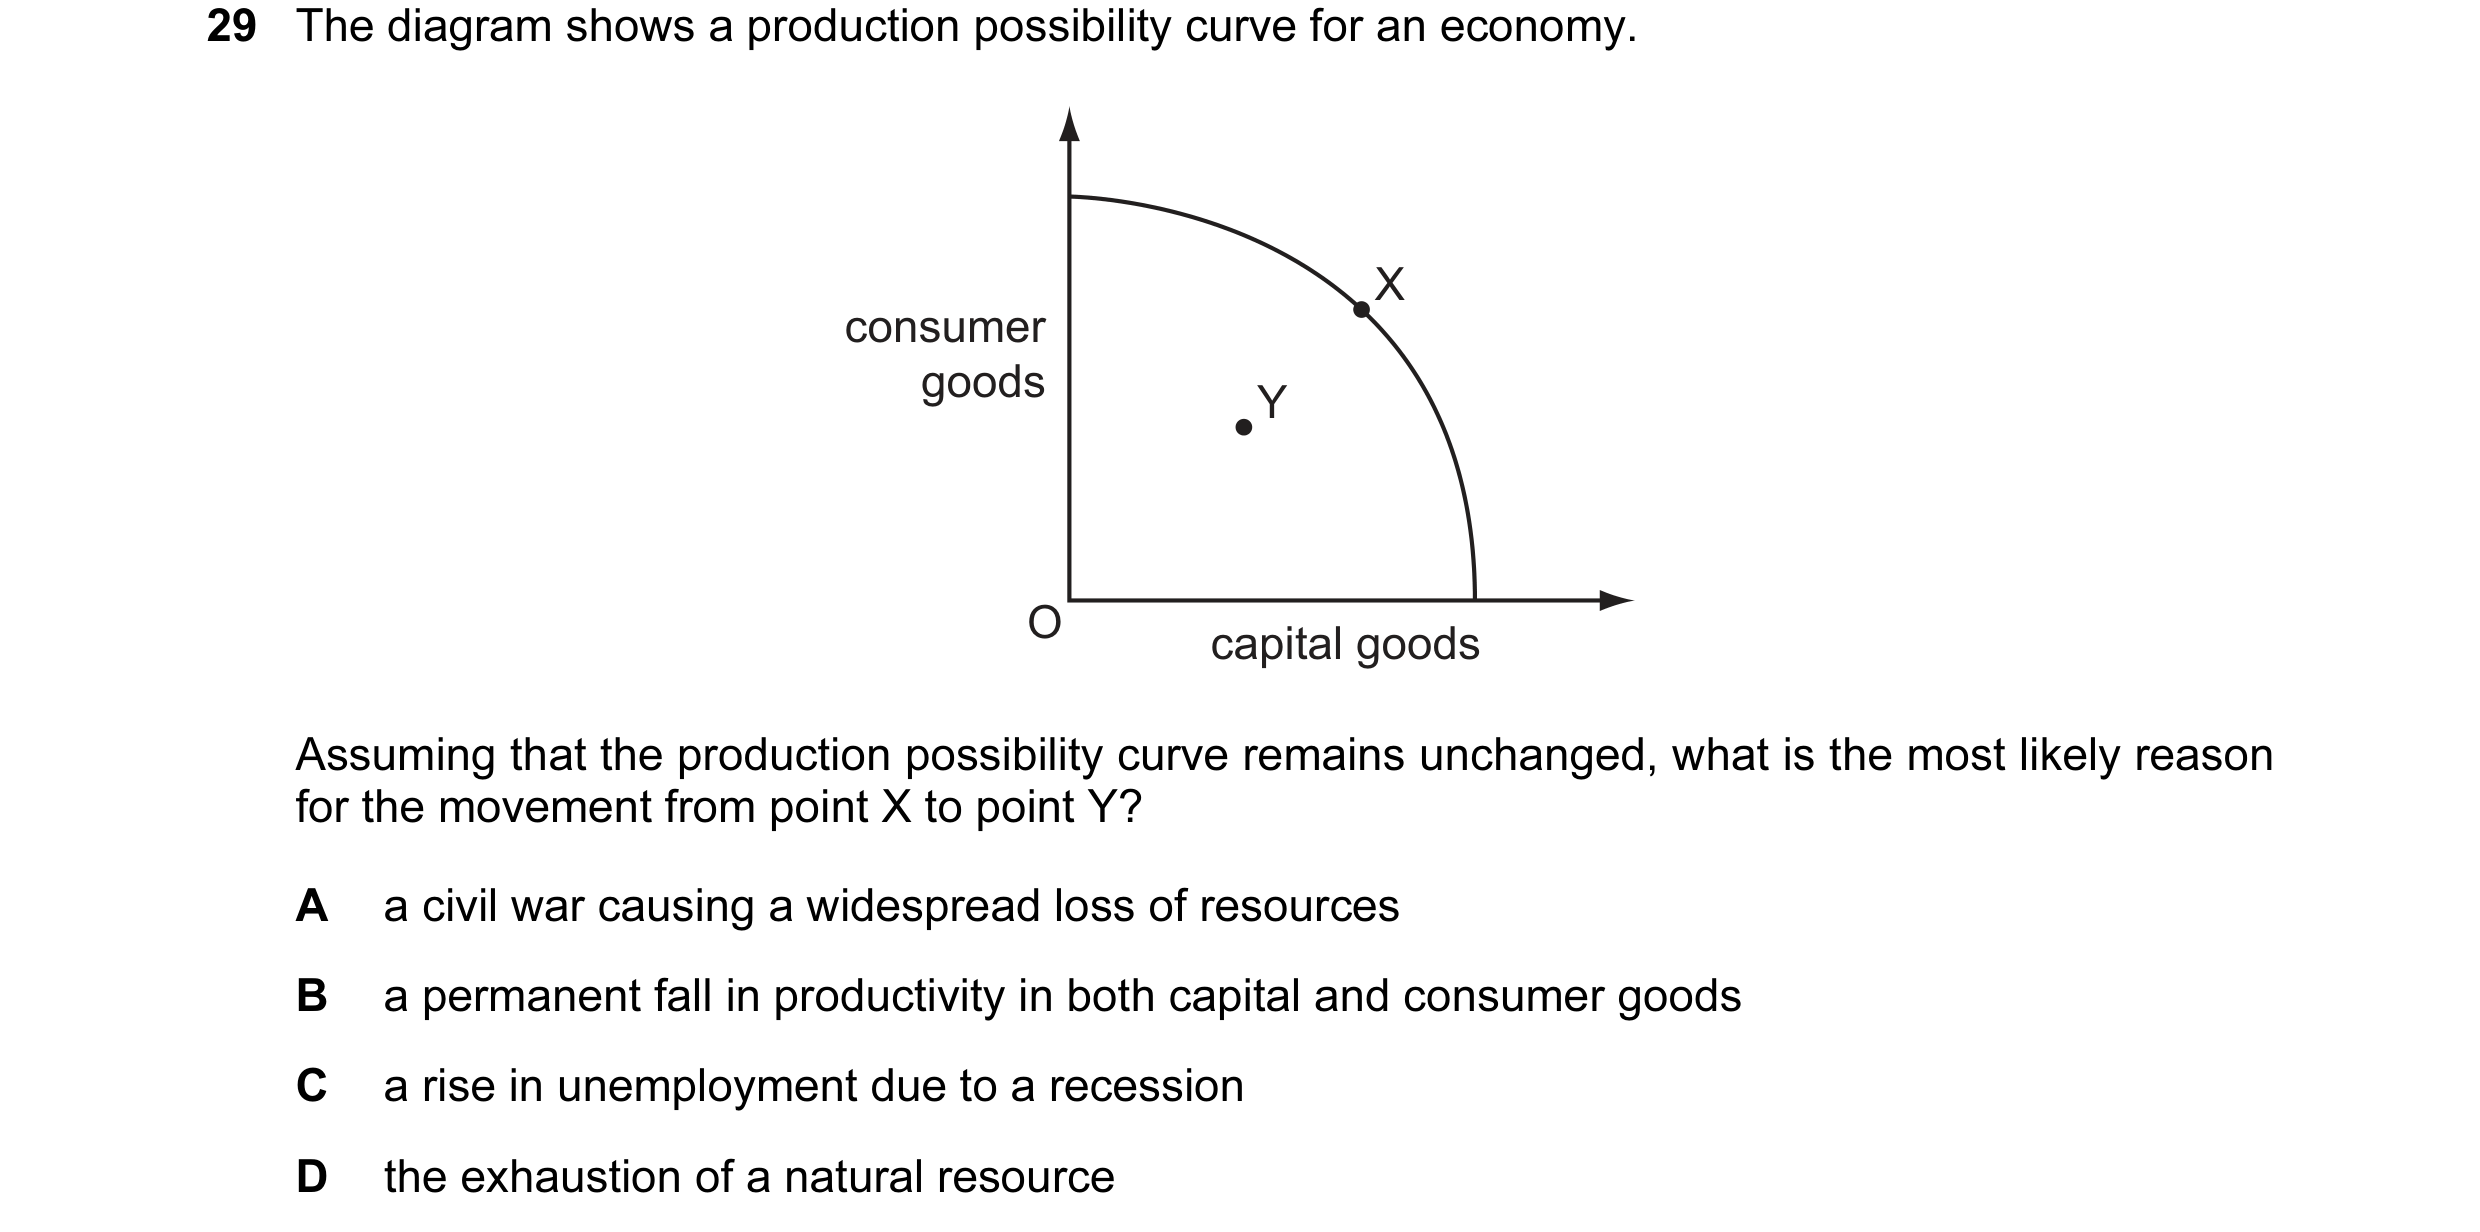
29 The diagram shows a production possibility curve for an economy. X consumer goods Y O capital goods Assuming that the production possibility curve remains unchanged, what is the most likely reason for the movement from point X to point Y? A a civil war causing a widespread loss of resources B a permanent fall in productivity in both capital and consumer goods C a rise in unemployment due to a recession D the exhaustion of a natural resource
1 marks
Answer: C
This question in 9708/13 Oct/Nov 2011
Q25 · The table gives unemployment rates (%) for four countries in 1993 and 2002 9708/11 May/June 2012
23 The table gives unemployment rates (%) for four countries in 1993 and 2002. UK Japan France Italy 1993 10.5 2.5 11.4 10.1 2002 5.0 5.4 8.8 8.5 What can be deduced from the table? A France had the lowest rate of employment in both years. B Italy had the most employed people in 2002. C Japan more than doubled its labour productivity between 1993 and 2002. D The UK created the most jobs between 1993 and 2002.
1 marks
Answer: A
This question in 9708/11 May/June 2012
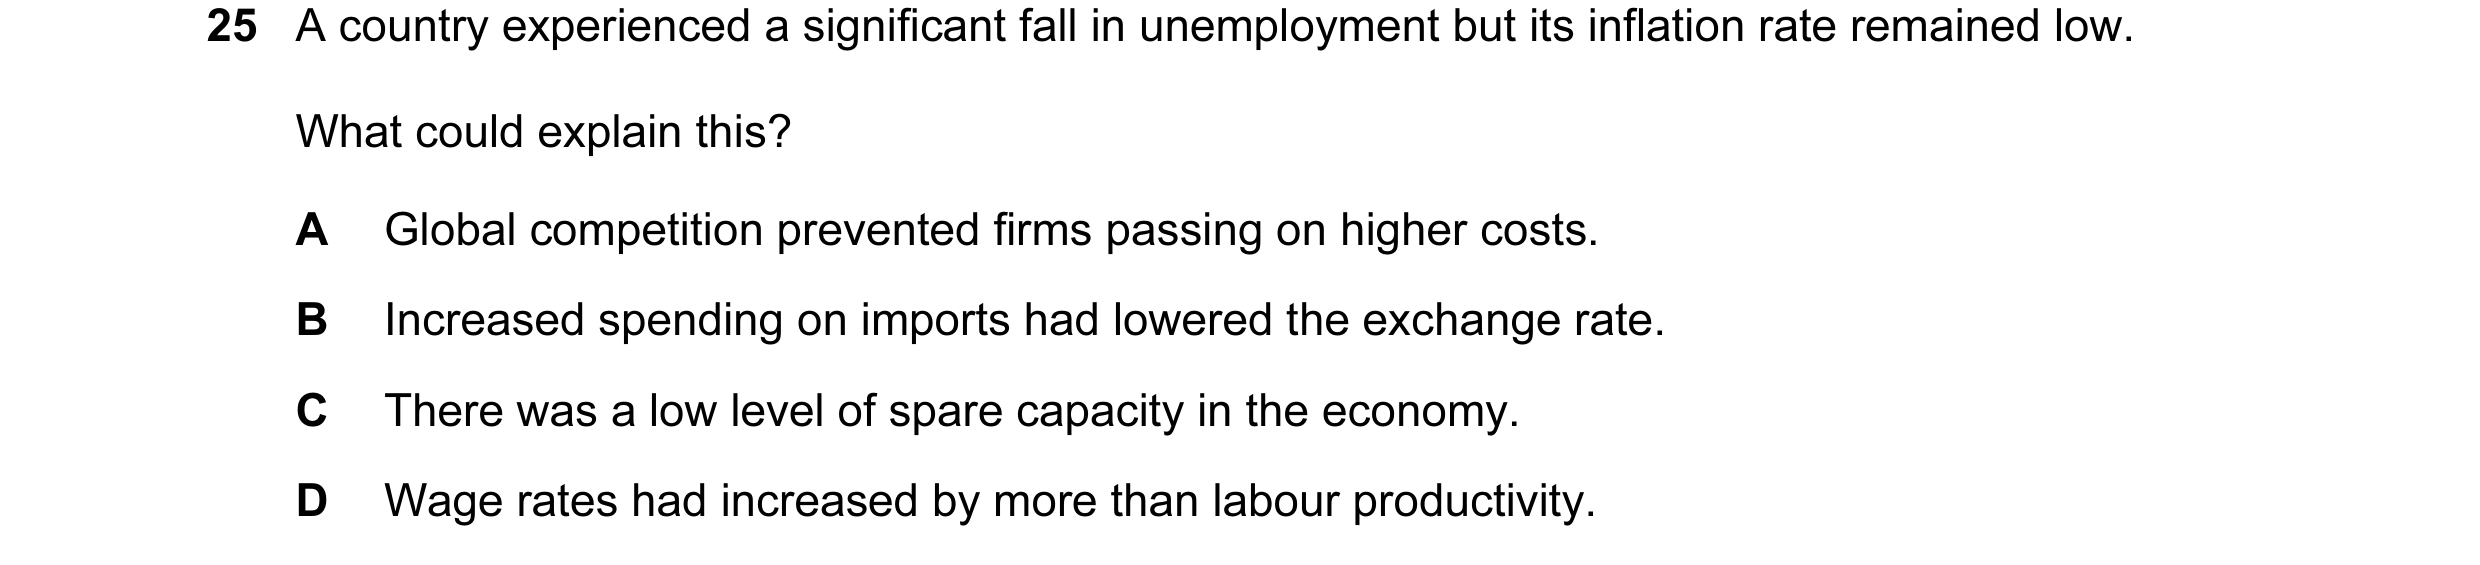
Q26 · A country experienced a significant fall in unemployment but its inflation rate remained… 9708/11 May/June 2012
25 A country experienced a significant fall in unemployment but its inflation rate remained low. What could explain this? A Global competition prevented firms passing on higher costs. B Increased spending on imports had lowered the exchange rate. C There was a low level of spare capacity in the economy. D Wage rates had increased by more than labour productivity.
1 marks
Answer: A
This question in 9708/11 May/June 2012
Q27 · Which change would directly reduce the size of a country’s labour force? 9708/12 May/June 2012
23 Which change would directly reduce the size of a country’s labour force? A Some employees are made redundant. B Some employees change to self-employment. C Some employees retire early. D Some employees switch from full-time to part-time employment.
1 marks
Answer: C
This question in 9708/12 May/June 2012
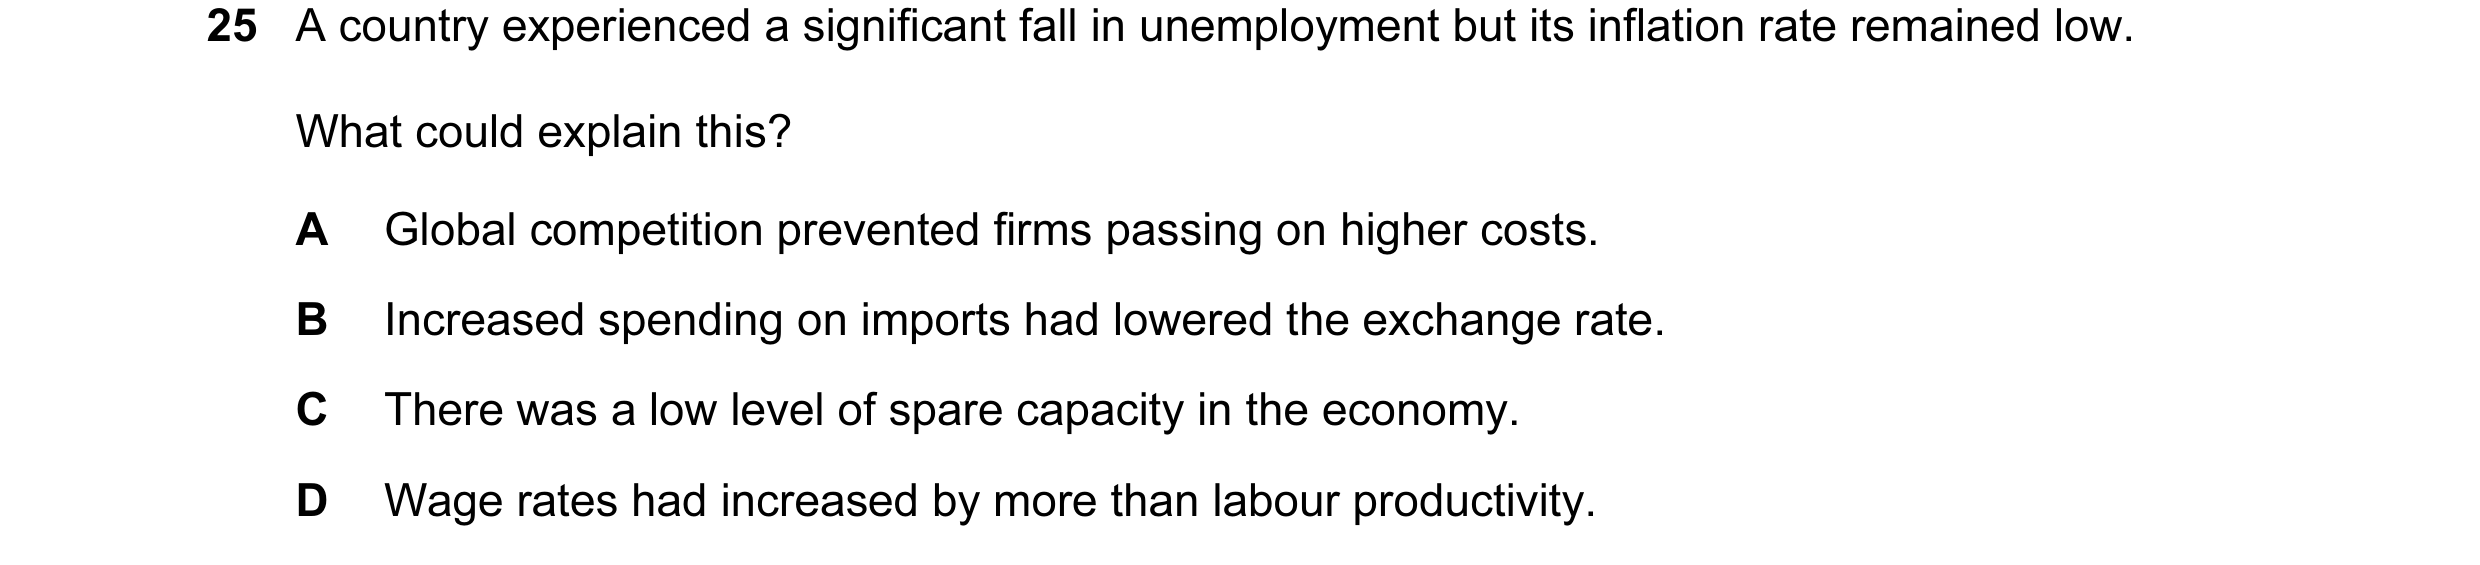
Q28 · A country experienced a significant fall in unemployment but its inflation rate remained… 9708/12 May/June 2012
25 A country experienced a significant fall in unemployment but its inflation rate remained low. What could explain this? A Global competition prevented firms passing on higher costs. B Increased spending on imports had lowered the exchange rate. C There was a low level of spare capacity in the economy. D Wage rates had increased by more than labour productivity.
1 marks
Answer: A
This question in 9708/12 May/June 2012
Q29 · The table gives unemployment rates (%) for four countries in 1993 and 2002 9708/13 May/June 2012
23 The table gives unemployment rates (%) for four countries in 1993 and 2002. UK Japan France Italy 1993 10.5 2.5 11.4 10.1 2002 5.0 5.4 8.8 8.5 What can be deduced from the table? A France had the lowest rate of employment in both years. B Italy had the most employed people in 2002. C Japan more than doubled its labour productivity between 1993 and 2002. D The UK created the most jobs between 1993 and 2002.
1 marks
Answer: A
This question in 9708/13 May/June 2012
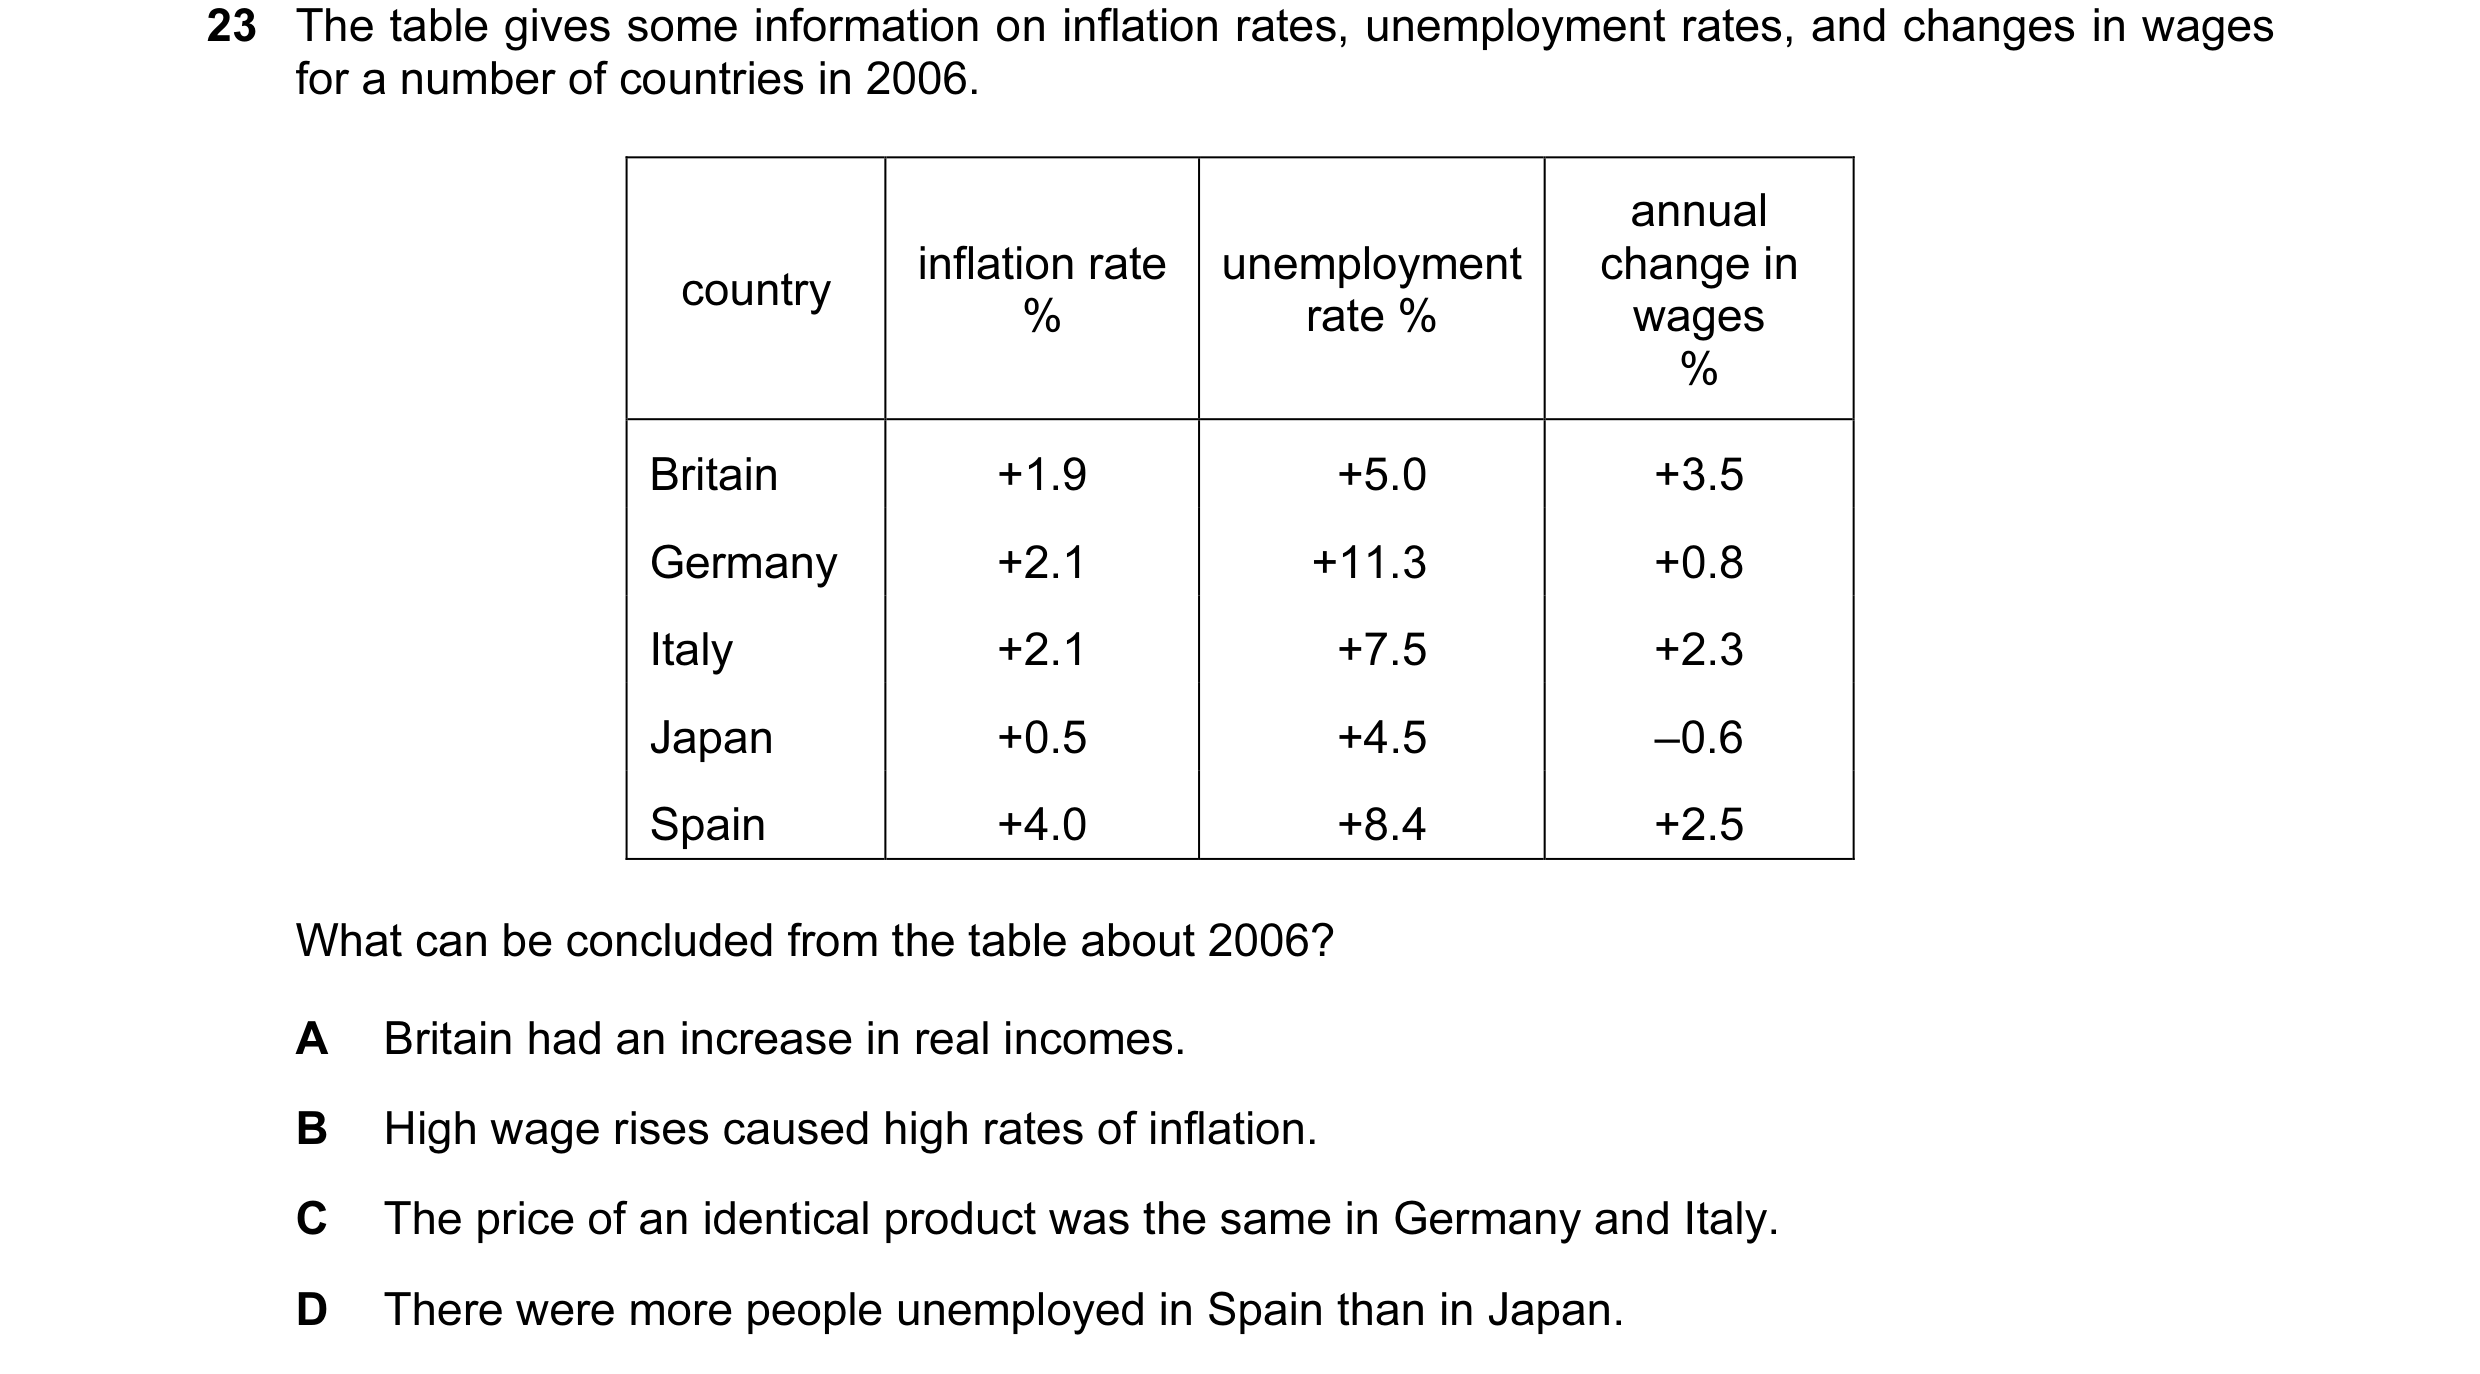
Q30 · The table gives some information on inflation rates, unemployment rates, and changes in… 9708/12 Oct/Nov 2012
23 The table gives some information on inflation rates, unemployment rates, and changes in wages for a number of countries in 2006. annual inflation rate unemployment change in country % rate % wages % Britain +1.9 +5.0 +3.5 Germany +2.1 +11.3 +0.8 Italy +2.1 +7.5 +2.3 Japan +0.5 +4.5 –0.6 Spain +4.0 +8.4 +2.5 What can be concluded from the table about 2006? A Britain had an increase in real incomes. B High wage rises caused high rates of inflation. C The price of an identical product was the same in Germany and Italy. D There were more people unemployed in Spain than in Japan.
1 marks
Answer: A
This question in 9708/12 Oct/Nov 2012
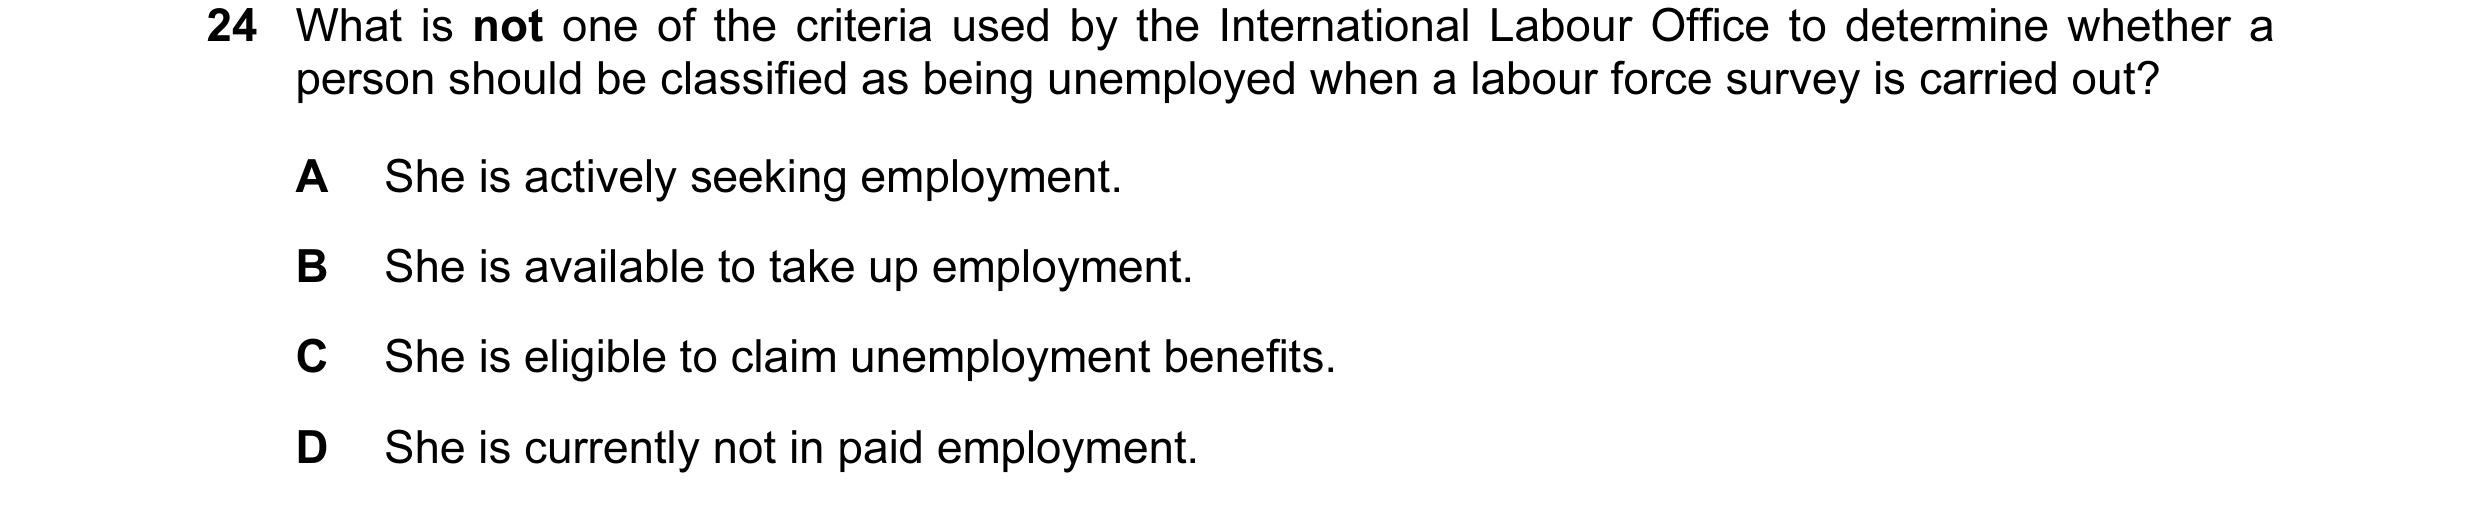
Q31 · What is not one of the criteria used by the International Labour Office to determine… 9708/12 Oct/Nov 2012
24 What is not one of the criteria used by the International Labour Office to determine whether a person should be classified as being unemployed when a labour force survey is carried out? A She is actively seeking employment. B She is available to take up employment. C She is eligible to claim unemployment benefits. D She is currently not in paid employment.
1 marks
Answer: C
This question in 9708/12 Oct/Nov 2012
Q32 · A sudden rise in the price of imported oil caused the annual rate of inflation in a given… 9708/12 Oct/Nov 2012
26 A sudden rise in the price of imported oil caused the annual rate of inflation in a given period to be higher than expected. What might be a likely result of this? A Borrowers would gain. B Real wages would rise. C The balance of trade would improve. D Unemployment would fall.
1 marks
Answer: A
This question in 9708/12 Oct/Nov 2012
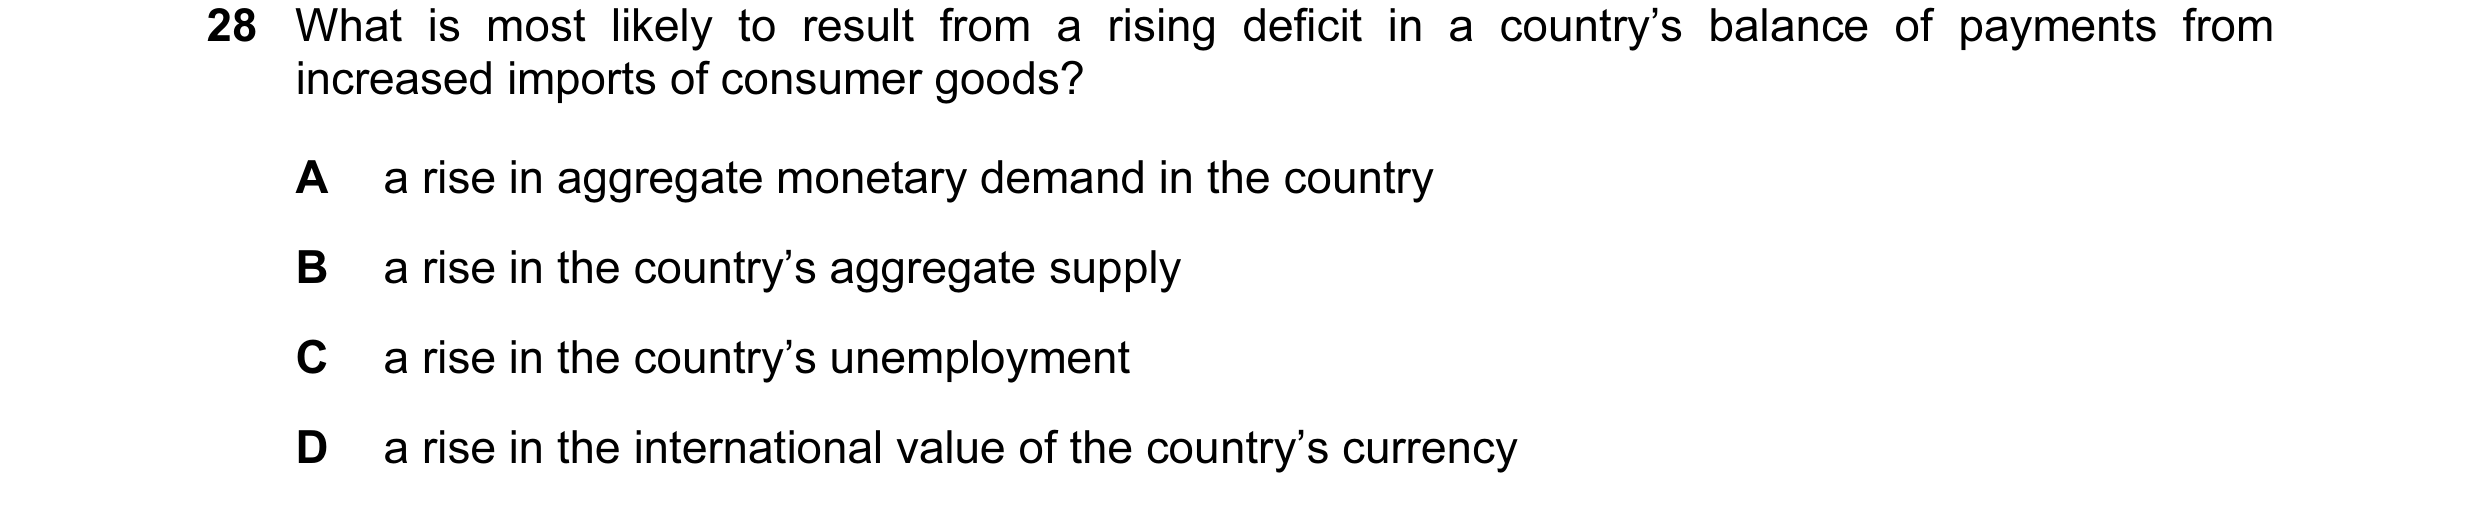
Q33 · What is most likely to result from a rising deficit in a country’s balance of payments… 9708/12 Oct/Nov 2012
28 What is most likely to result from a rising deficit in a country’s balance of payments from increased imports of consumer goods? A a rise in aggregate monetary demand in the country B a rise in the country’s aggregate supply C a rise in the country’s unemployment D a rise in the international value of the country’s currency
1 marks
Answer: C
This question in 9708/12 Oct/Nov 2012
Q34 · The table shows a country’s employment statistics 9708/11 May/June 2013
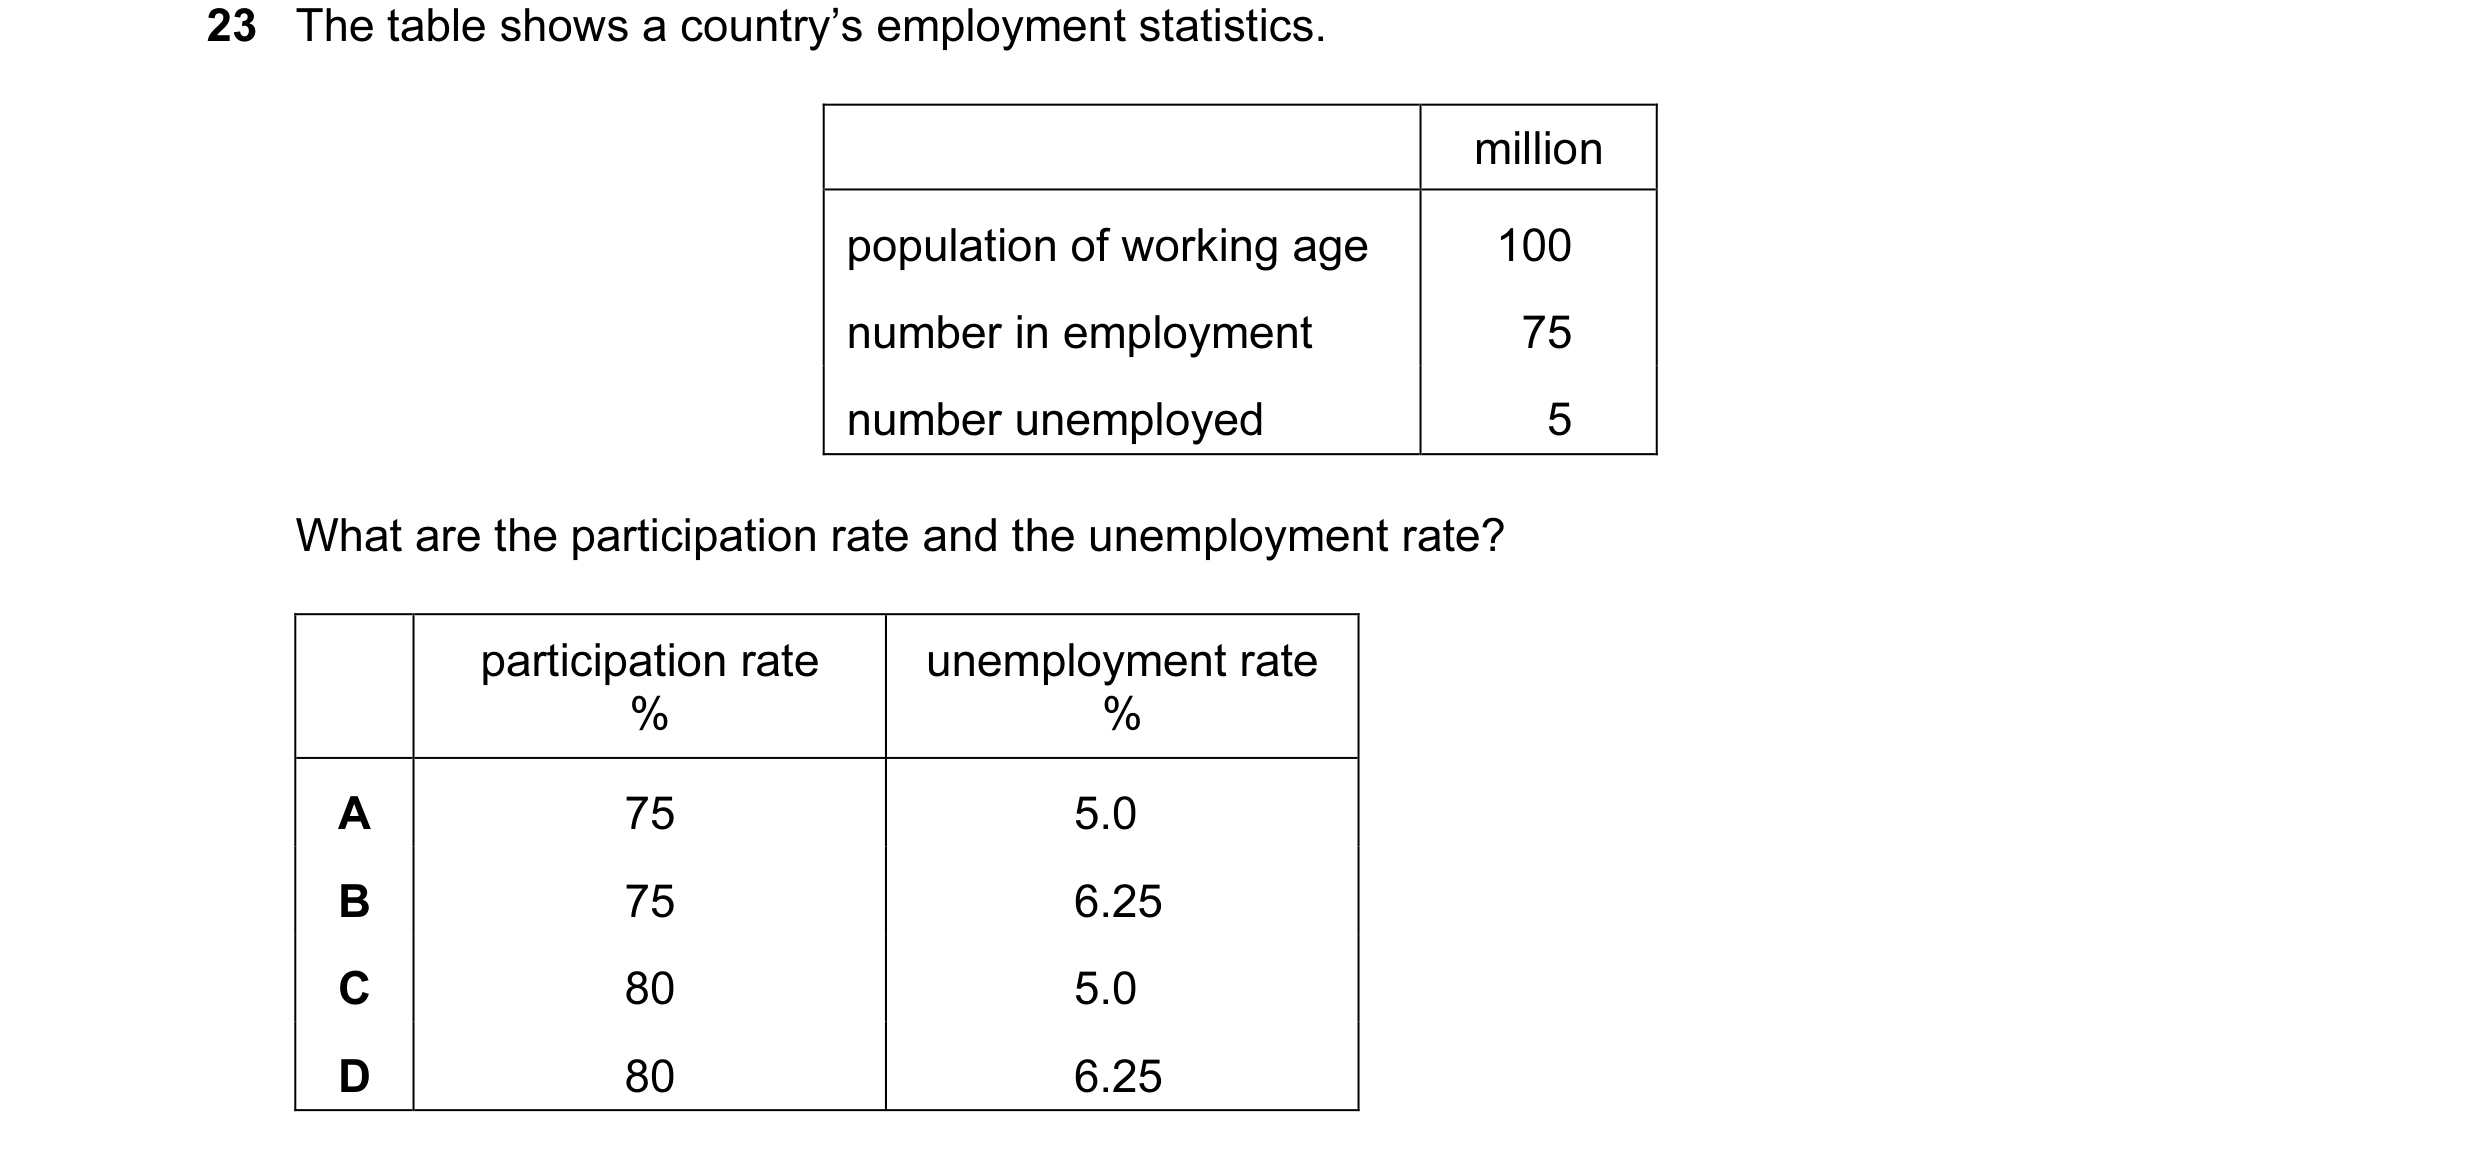
23 The table shows a country’s employment statistics. million population of working age 100 number in employment 75 number unemployed 5 What are the participation rate and the unemployment rate? participation rate unemployment rate % % A 75 5.0 B 75 6.25 C 80 5.0 D 80 6.25
1 marks
Answer: D
This question in 9708/11 May/June 2013
Q35 · The table gives details of the unemployment rates and expenditure on unemployment… 9708/12 May/June 2013
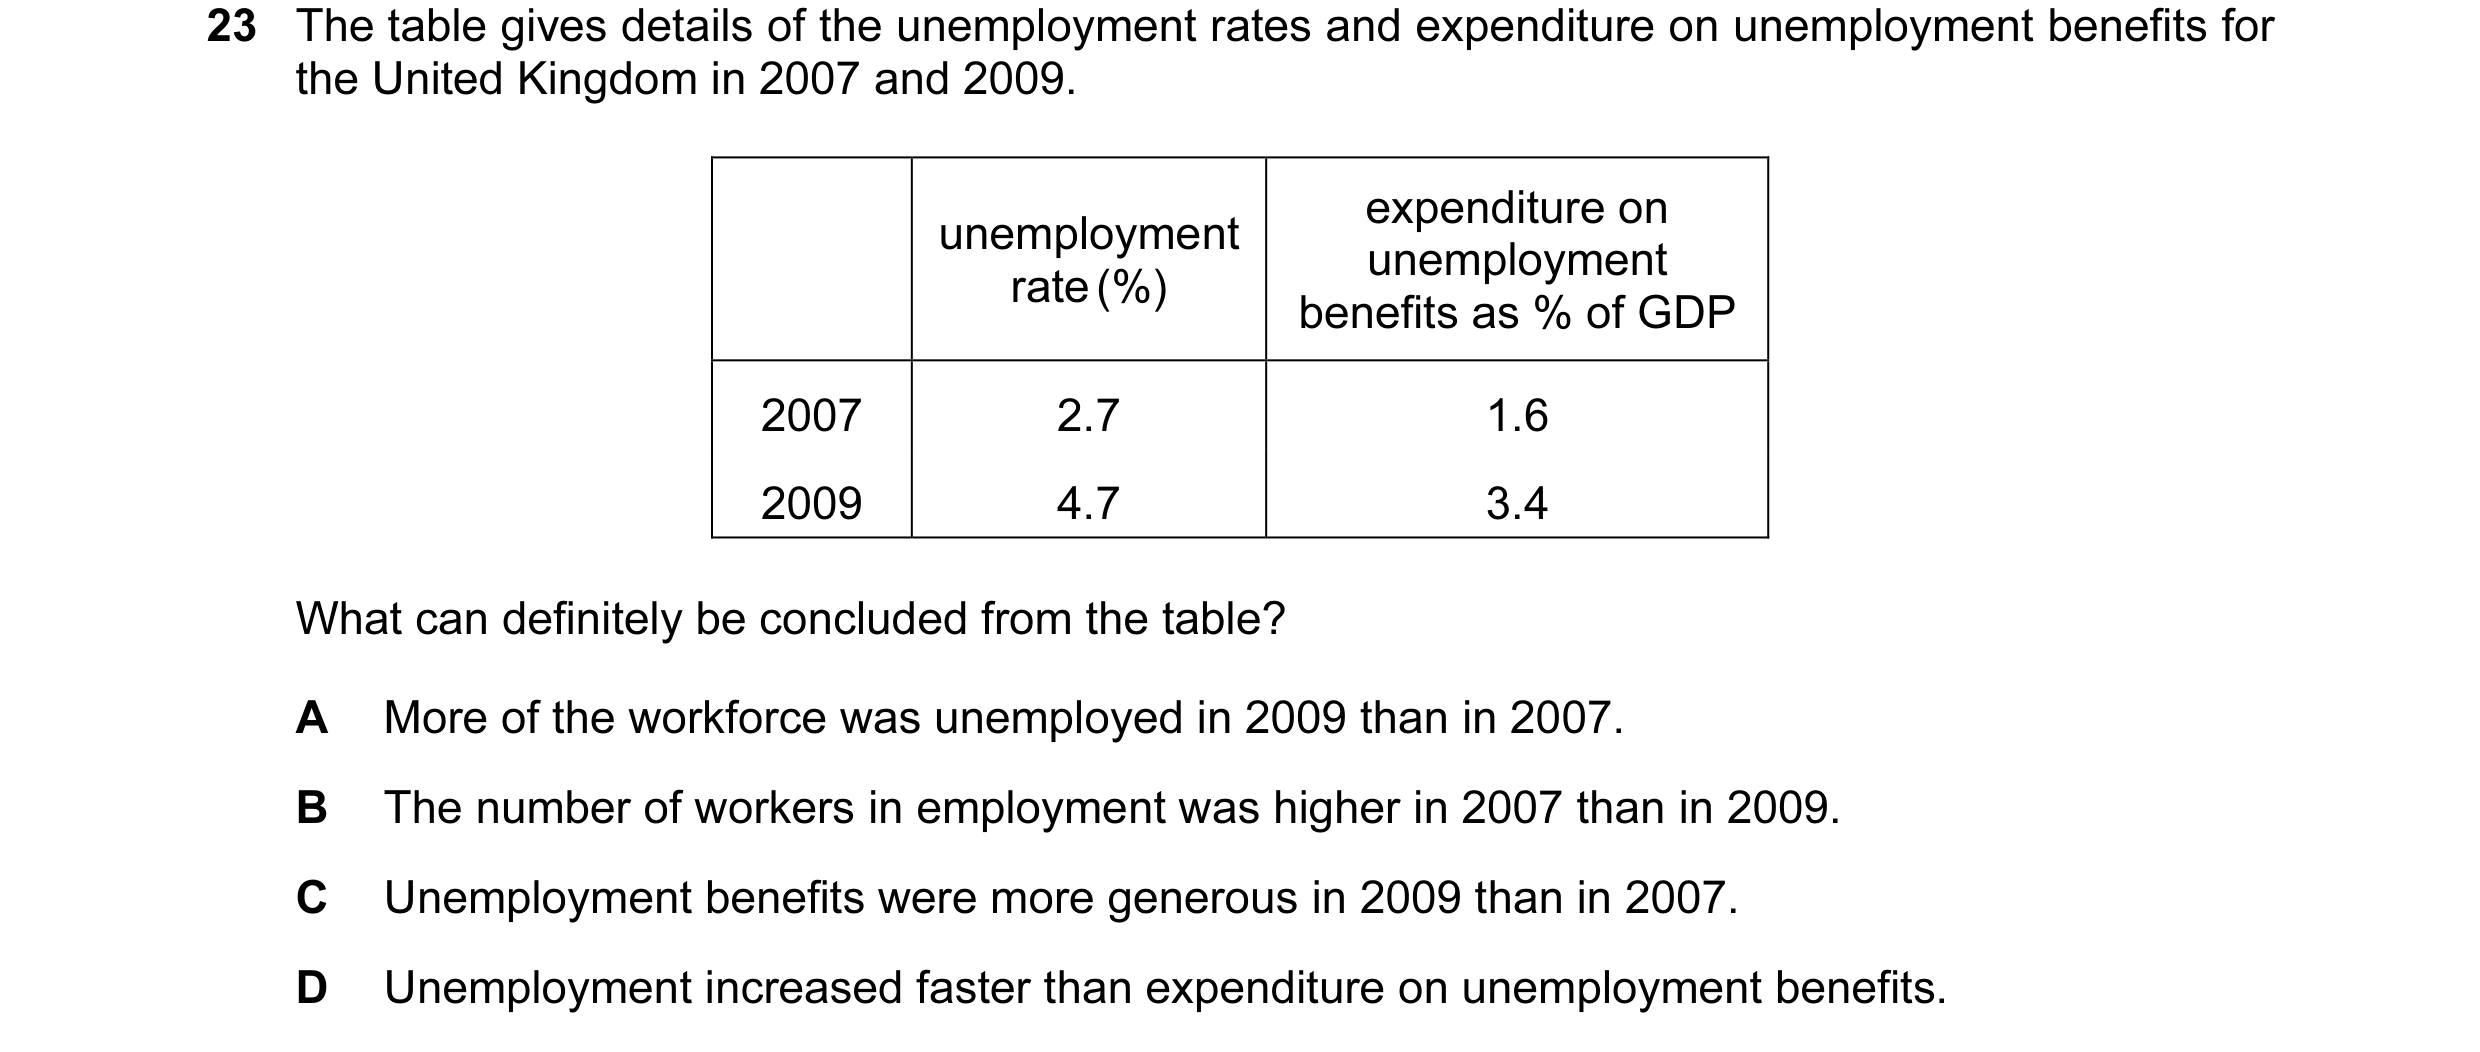
23 The table gives details of the unemployment rates and expenditure on unemployment benefits for the United Kingdom in 2007 and 2009. expenditure on unemployment unemployment rate (%) benefits as % of GDP 2007 2.7 1.6 2009 4.7 3.4 What can definitely be concluded from the table? A More of the workforce was unemployed in 2009 than in 2007. B The number of workers in employment was higher in 2007 than in 2009. C Unemployment benefits were more generous in 2009 than in 2007. D Unemployment increased faster than expenditure on unemployment benefits.
1 marks
Answer: A
This question in 9708/12 May/June 2013
Q36 · A country has a population of 100 million 9708/13 May/June 2013
23 A country has a population of 100 million. 60 million are of working age and 50 million are in the labour force. The country’s unemployment rate is 10%. How many people are employed? A 40 million B 45 million C 50 million D 54 million
1 marks
Answer: B
This question in 9708/13 May/June 2013
Q37 · A country has a population of 500 million 9708/12 Oct/Nov 2013
23 A country has a population of 500 million. 15 million people are unemployed and the country has an unemployment rate of 6 %. What is the size of the labour force? A 90 million B 250 million C 470 million D 485 million
1 marks
Answer: B
This question in 9708/12 Oct/Nov 2013
Q38 · A country has a population of 100 million 9708/13 Oct/Nov 2013
24 A country has a population of 100 million. 5 million people are unemployed and the country has an unemployment rate of 10%. What is the size of the labour force? A 10 million B 50 million C 90 million D 95 million
1 marks
Answer: B
This question in 9708/13 Oct/Nov 2013
Q39 · What is likely to occur as a result of a permanent rise in unemployment resulting in loss… 9708/11 May/June 2014
1 What is likely to occur as a result of a permanent rise in unemployment resulting in loss of skills? A a reduction in the economy’s long-run production possibility B a reduction in the scarcity of resources C an increase in the cost of allocating resources D an increase in the number of adults experiencing the economic problem
1 marks
Answer: A
This question in 9708/11 May/June 2014
Q40 · In 2007 Turkey had a population of 73 m 9708/11 May/June 2014
23 In 2007 Turkey had a population of 73 m. Its labour force was 36 m, of which 12 m were trained for the primary sector and 24 m were trained for the secondary and tertiary sectors. The unemployment rate was 10%. What was the number of people unemployed? A 1.2 m B 2.4 m C 3.6 m D 7.3 m
1 marks
Answer: C
This question in 9708/11 May/June 2014
Q41 · The table shows the unemployment rate and the size of the labour force in four countries… 9708/12 May/June 2014
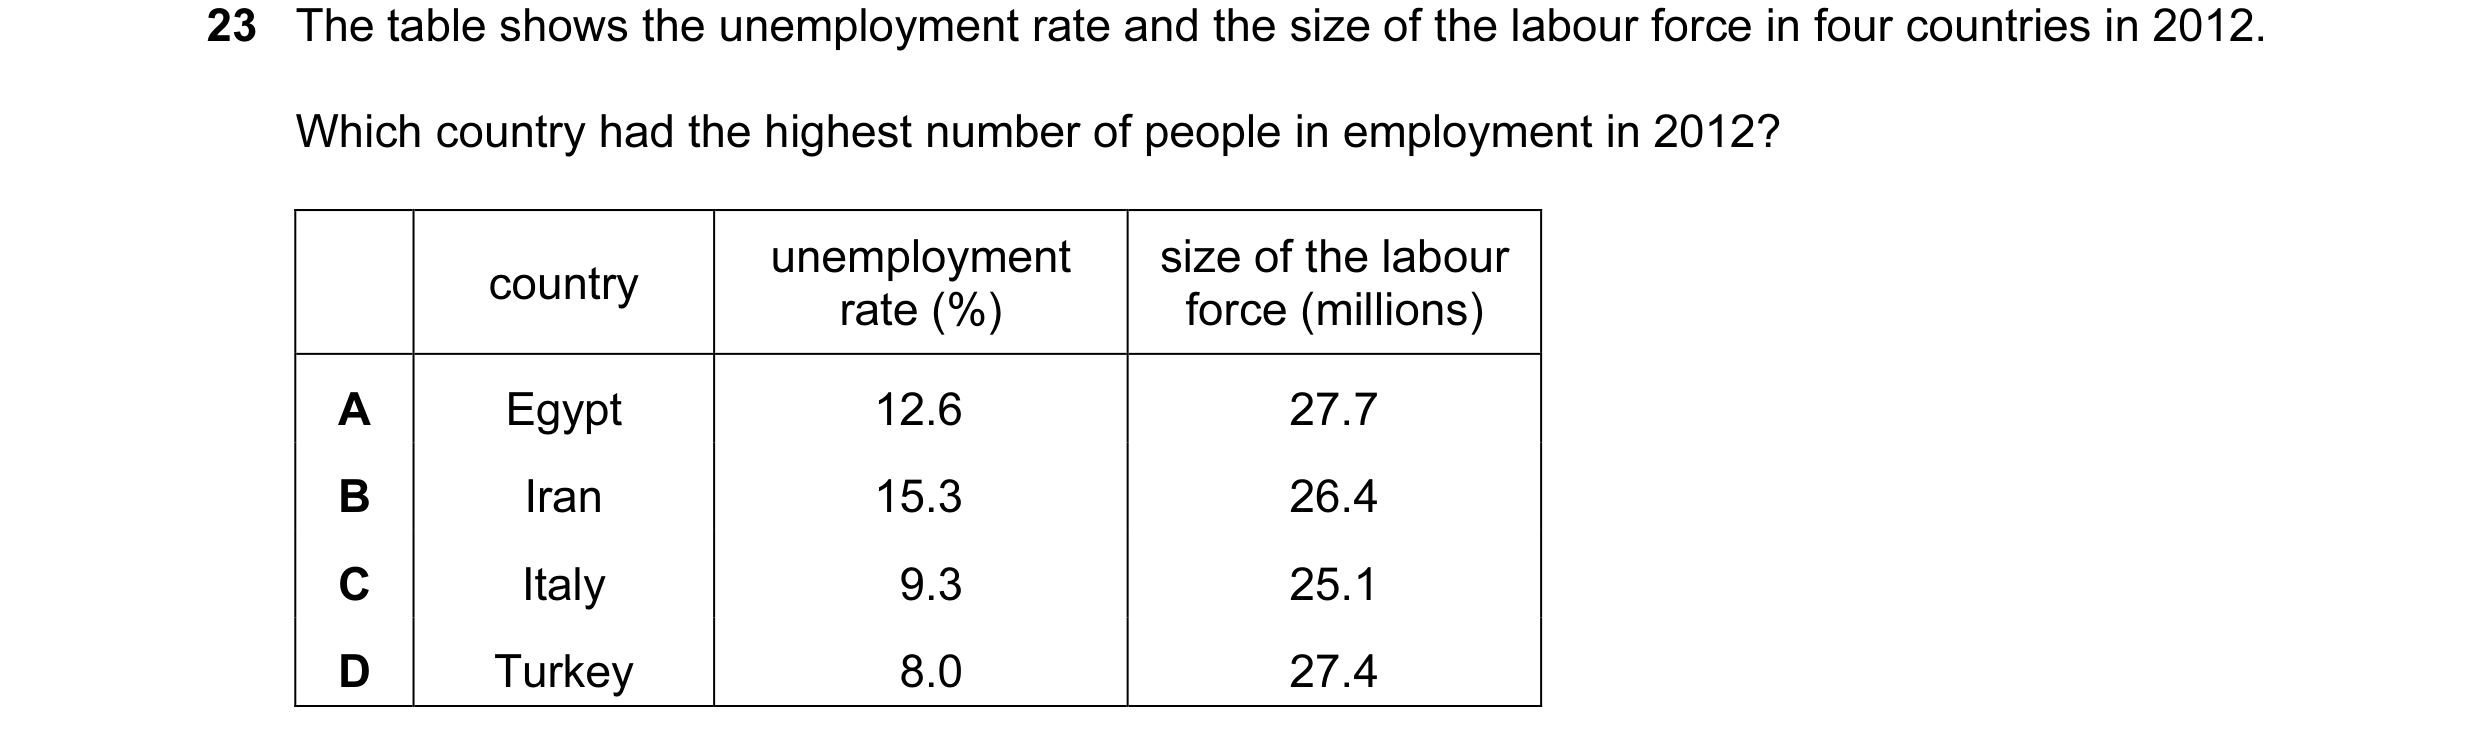
23 The table shows the unemployment rate and the size of the labour force in four countries in 2012. Which country had the highest number of people in employment in 2012? unemployment size of the labour country rate (%) force (millions) A Egypt 12.6 27.7 B Iran 15.3 26.4 C Italy 9.3 25.1 D Turkey 8.0 27.4
1 marks
Answer: D
This question in 9708/12 May/June 2014
Q42 · The table shows a country’s employment statistics 9708/13 May/June 2014
23 The table shows a country’s employment statistics. million population of working age 100 number in employment 60 number unemployed 4 What is the participation rate and the unemployment rate? participation rate unemployment rate % % A 60 4.0 B 60 6.25 C 64 4.0 D 64 6.25
1 marks
Answer: D
This question in 9708/13 May/June 2014
Q43 · Between 2011 and 2013, high street retailers reported that expenditure on home-produced… 9708/11 May/June 2015
27 Between 2011 and 2013, high street retailers reported that expenditure on home-produced and imported goods was reduced. Consumers did not take out loans as the economy was in a recession. What is the likely result of this? A a decline in the deficit in the trade account B a decline in the level of savings C a decline in the terms of trade D a decline in unemployment
1 marks
Answer: A
This question in 9708/11 May/June 2015
Q44 · The diagram shows a production possibility curve for an economy 9708/13 May/June 2015
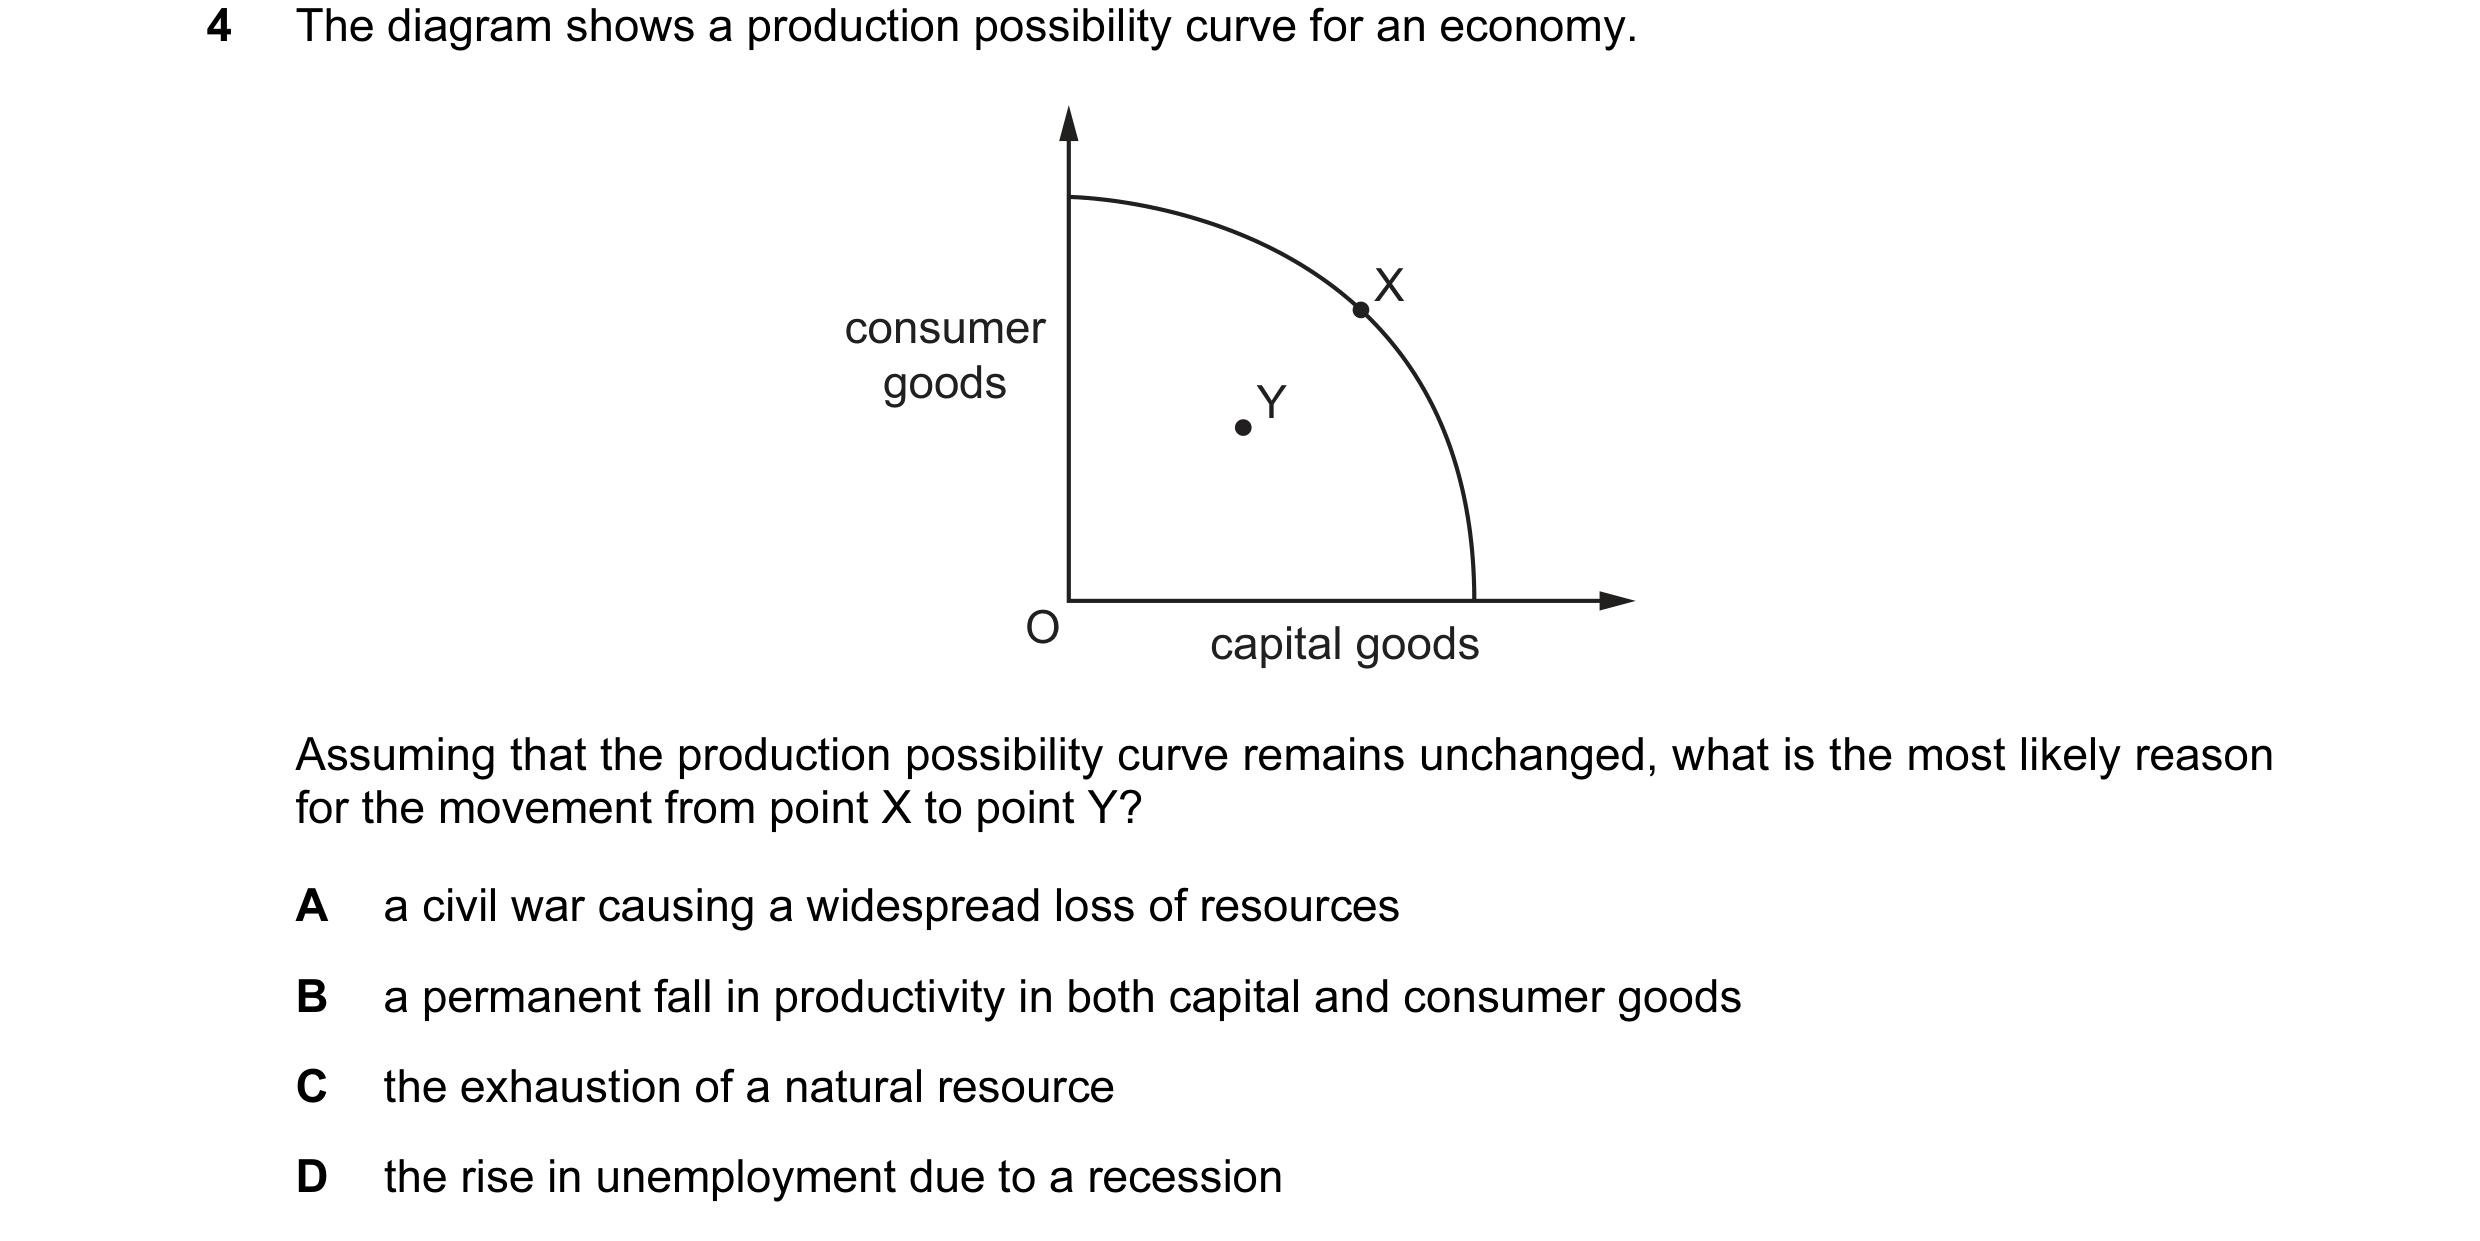
4 The diagram shows a production possibility curve for an economy. X consumer goods Y O capital goods Assuming that the production possibility curve remains unchanged, what is the most likely reason for the movement from point X to point Y? A a civil war causing a widespread loss of resources B a permanent fall in productivity in both capital and consumer goods C the exhaustion of a natural resource D the rise in unemployment due to a recession
1 marks
Answer: D
This question in 9708/13 May/June 2015
Q45 · During a recession, when there was a large fall in national output, the increase in… 9708/11 Oct/Nov 2015
23 During a recession, when there was a large fall in national output, the increase in unemployment in an economy was much lower than expected. What might have accounted for this? A a decrease in labour productivity B a decrease in net outward migration C a decrease in part-time working D a decrease in the number of students
1 marks
Answer: A
This question in 9708/11 Oct/Nov 2015
Q46 · The graph shows changes in the unemployment rates in countries X, Y and Z over the period… 9708/12 Oct/Nov 2015
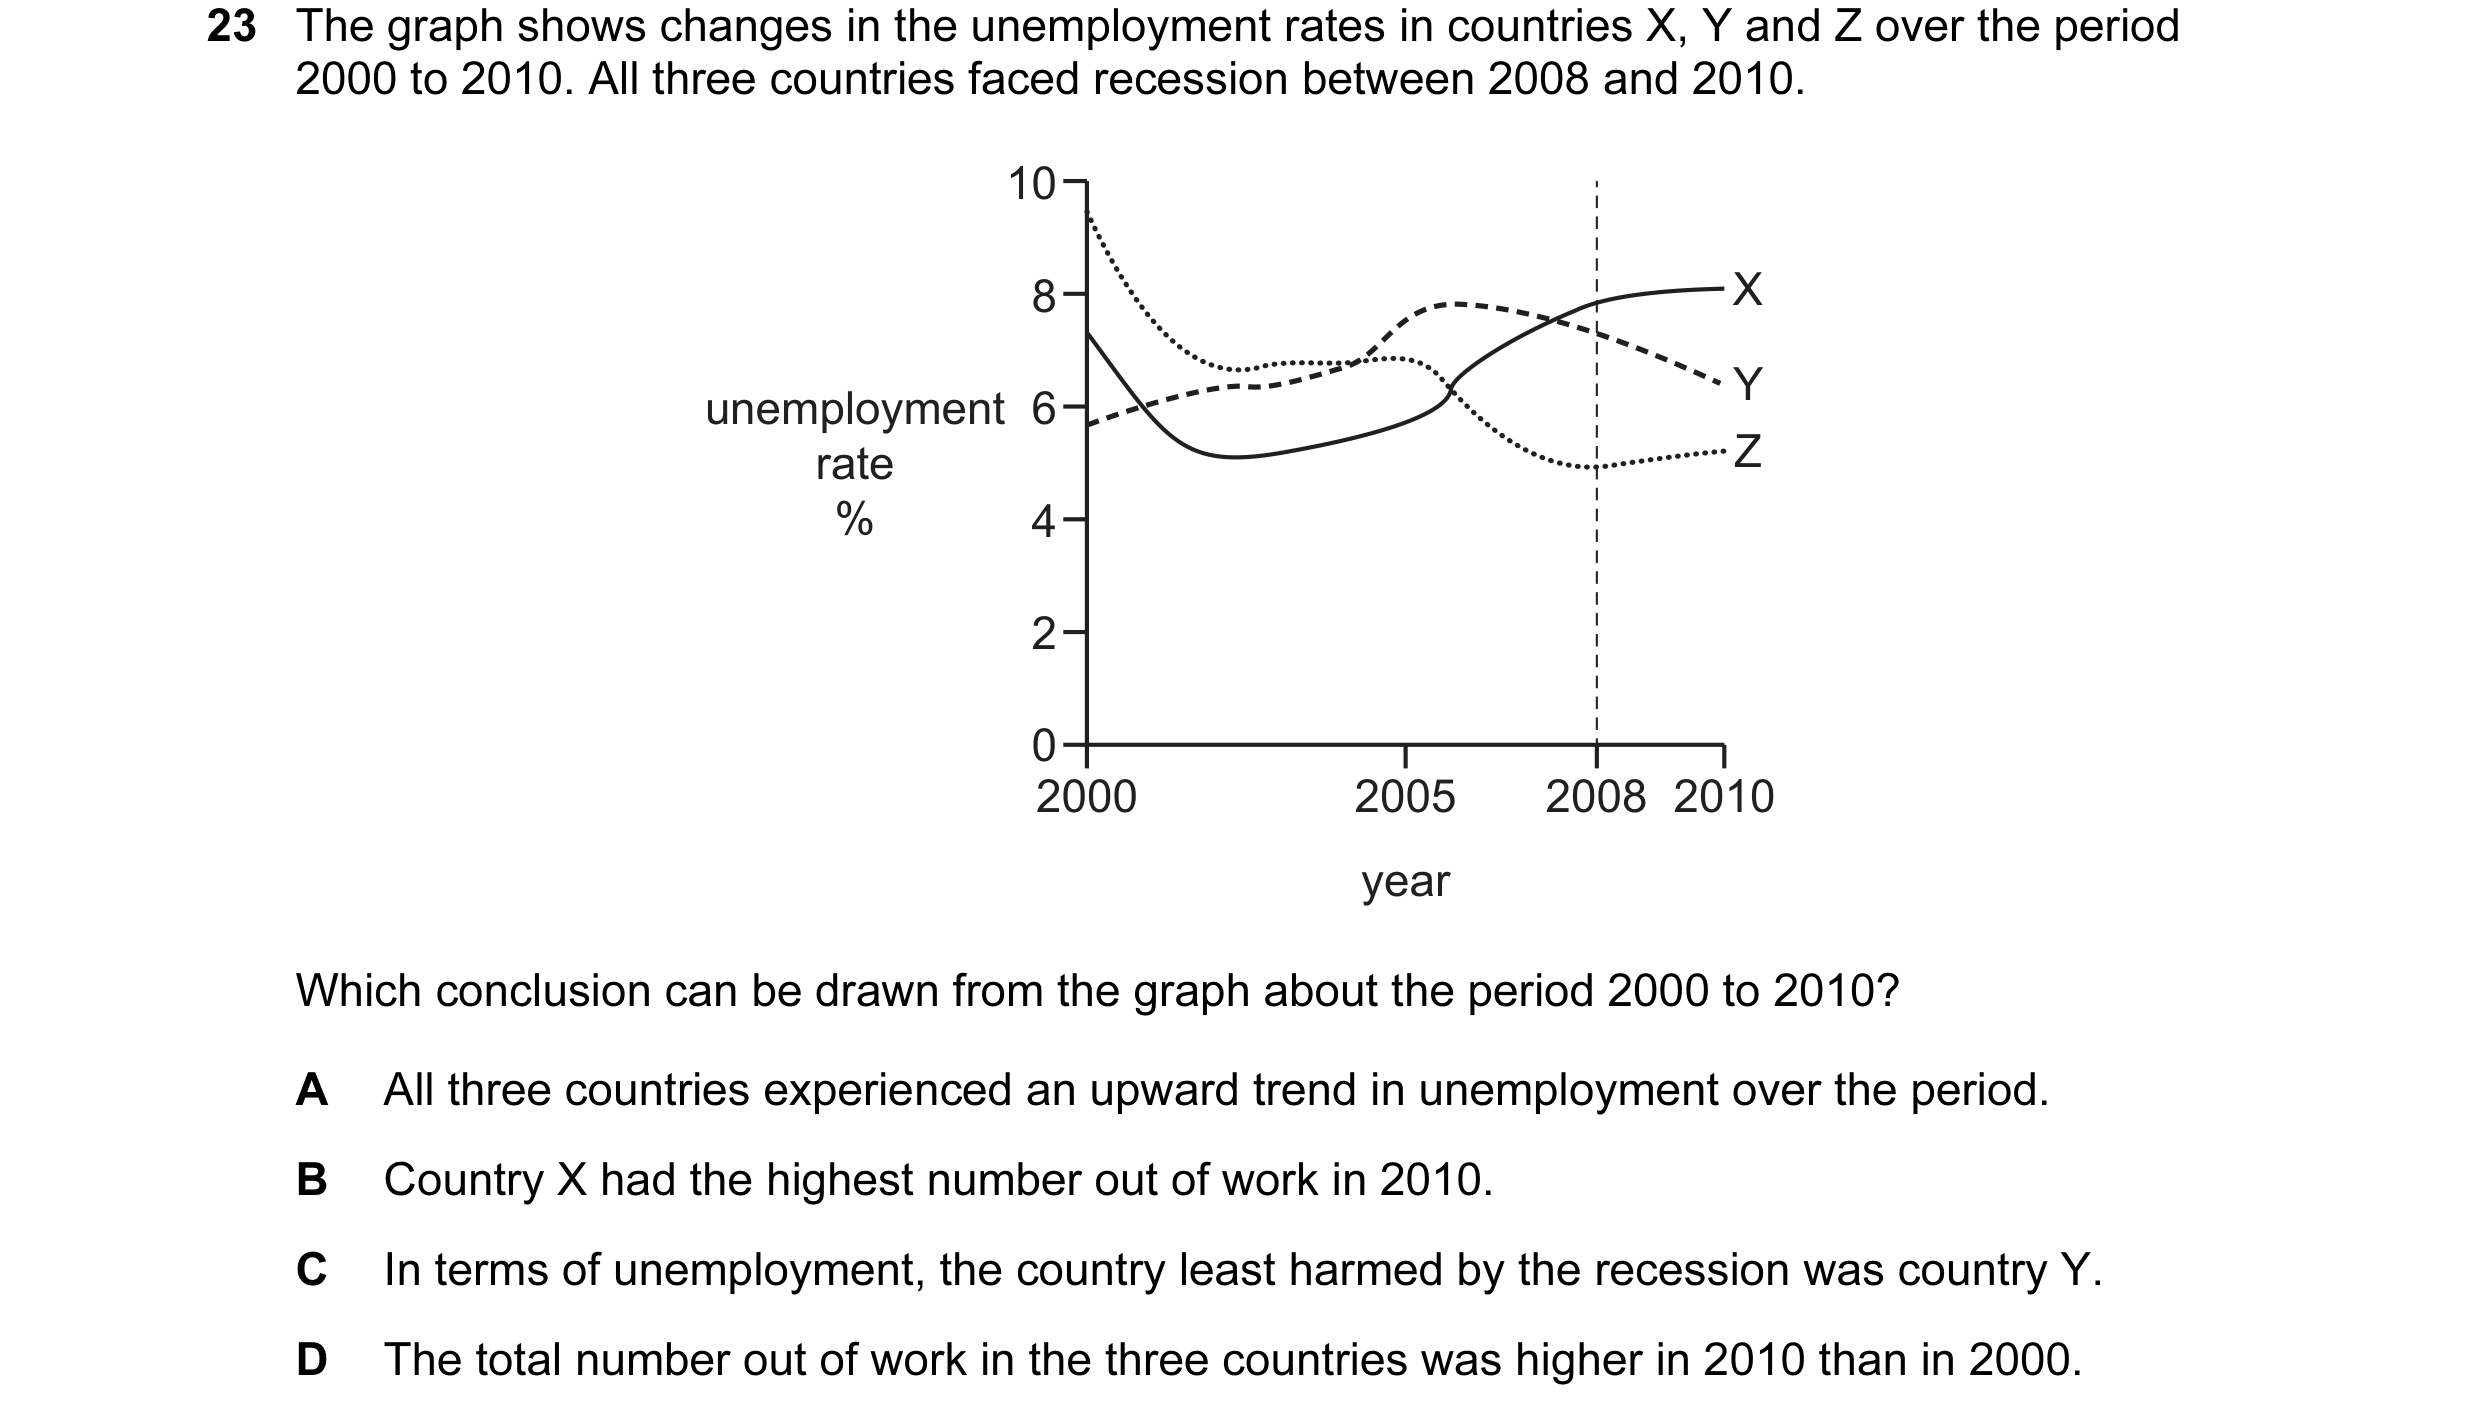
23 The graph shows changes in the unemployment rates in countries X, Y and Z over the period 2000 to 2010. All three countries faced recession between 2008 and 2010. 10 8 X Y unemployment 6 rate Z % 4 2 0 2000 2005 2008 2010 year Which conclusion can be drawn from the graph about the period 2000 to 2010? A All three countries experienced an upward trend in unemployment over the period. B Country X had the highest number out of work in 2010. C In terms of unemployment, the country least harmed by the recession was country Y. D The total number out of work in the three countries was higher in 2010 than in 2000.
1 marks
Answer: C
This question in 9708/12 Oct/Nov 2015
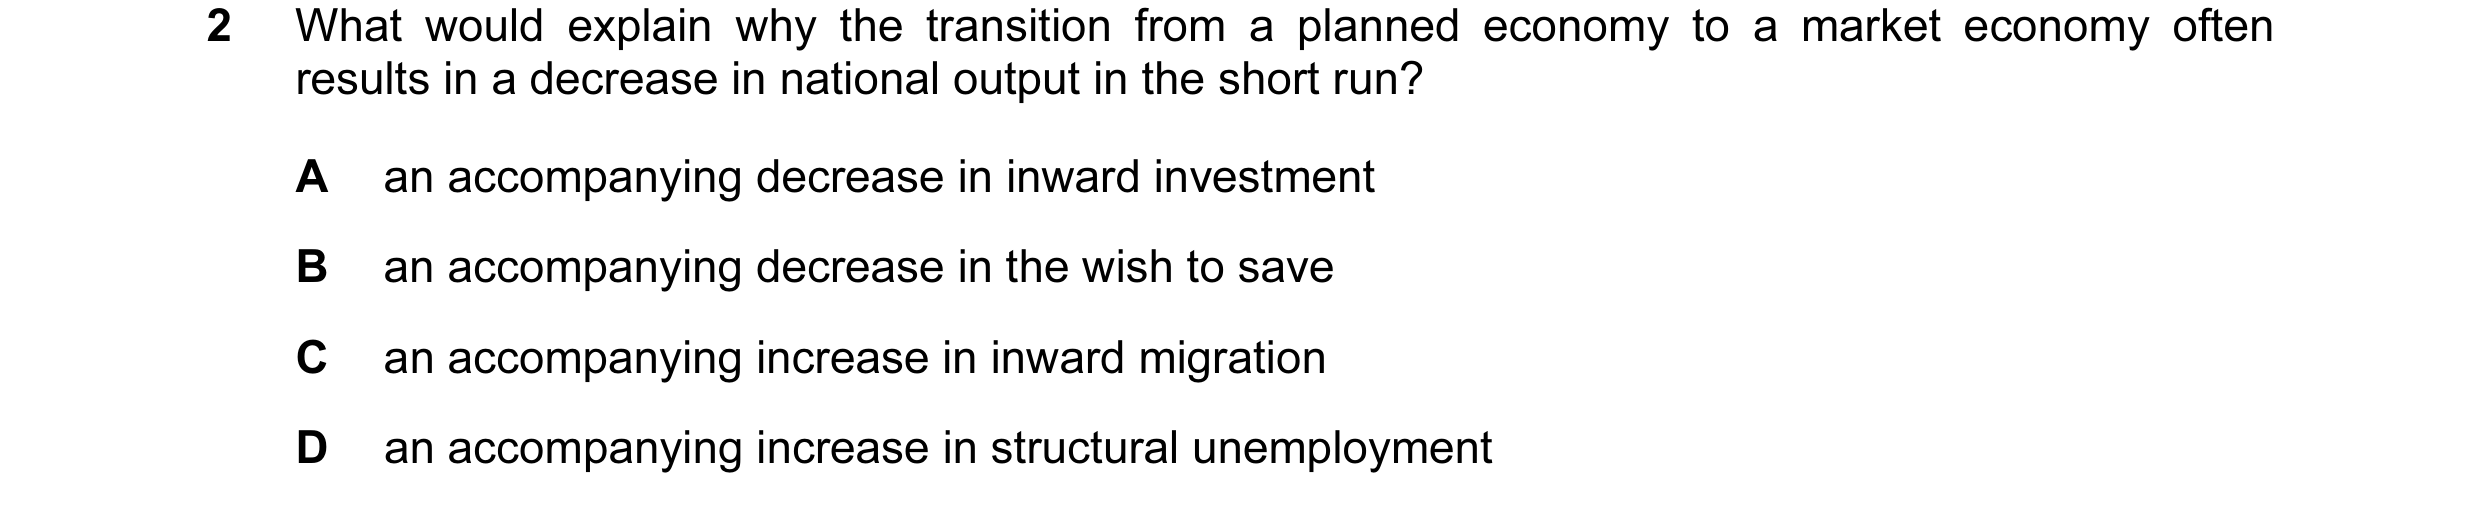
Q47 · What would explain why the transition from a planned economy to a market economy often… 9708/13 Oct/Nov 2015
2 What would explain why the transition from a planned economy to a market economy often results in a decrease in national output in the short run? A an accompanying decrease in inward investment B an accompanying decrease in the wish to save C an accompanying increase in inward migration D an accompanying increase in structural unemployment
1 marks
Answer: D
This question in 9708/13 Oct/Nov 2015
Q48 · The table gives the percentage (%) rates of youth unemployment and total unemployment in… 9708/13 Oct/Nov 2015
23 The table gives the percentage (%) rates of youth unemployment and total unemployment in France and the UK in 2001 and 2005. France UK youth total youth total unemployment unemployment unemployment unemployment (%) (%) (%) (%) 2001 19.2 8.7 12.0 5.2 2005 22.1 10.1 12.5 4.8 What can be concluded from the table? A France and the UK experienced the same trends in unemployment. B France had a higher number of unemployed people than the UK. C The UK used a different definition of unemployment from France. D The UK was more successful than France in controlling unemployment.
1 marks
Answer: D
This question in 9708/13 Oct/Nov 2015
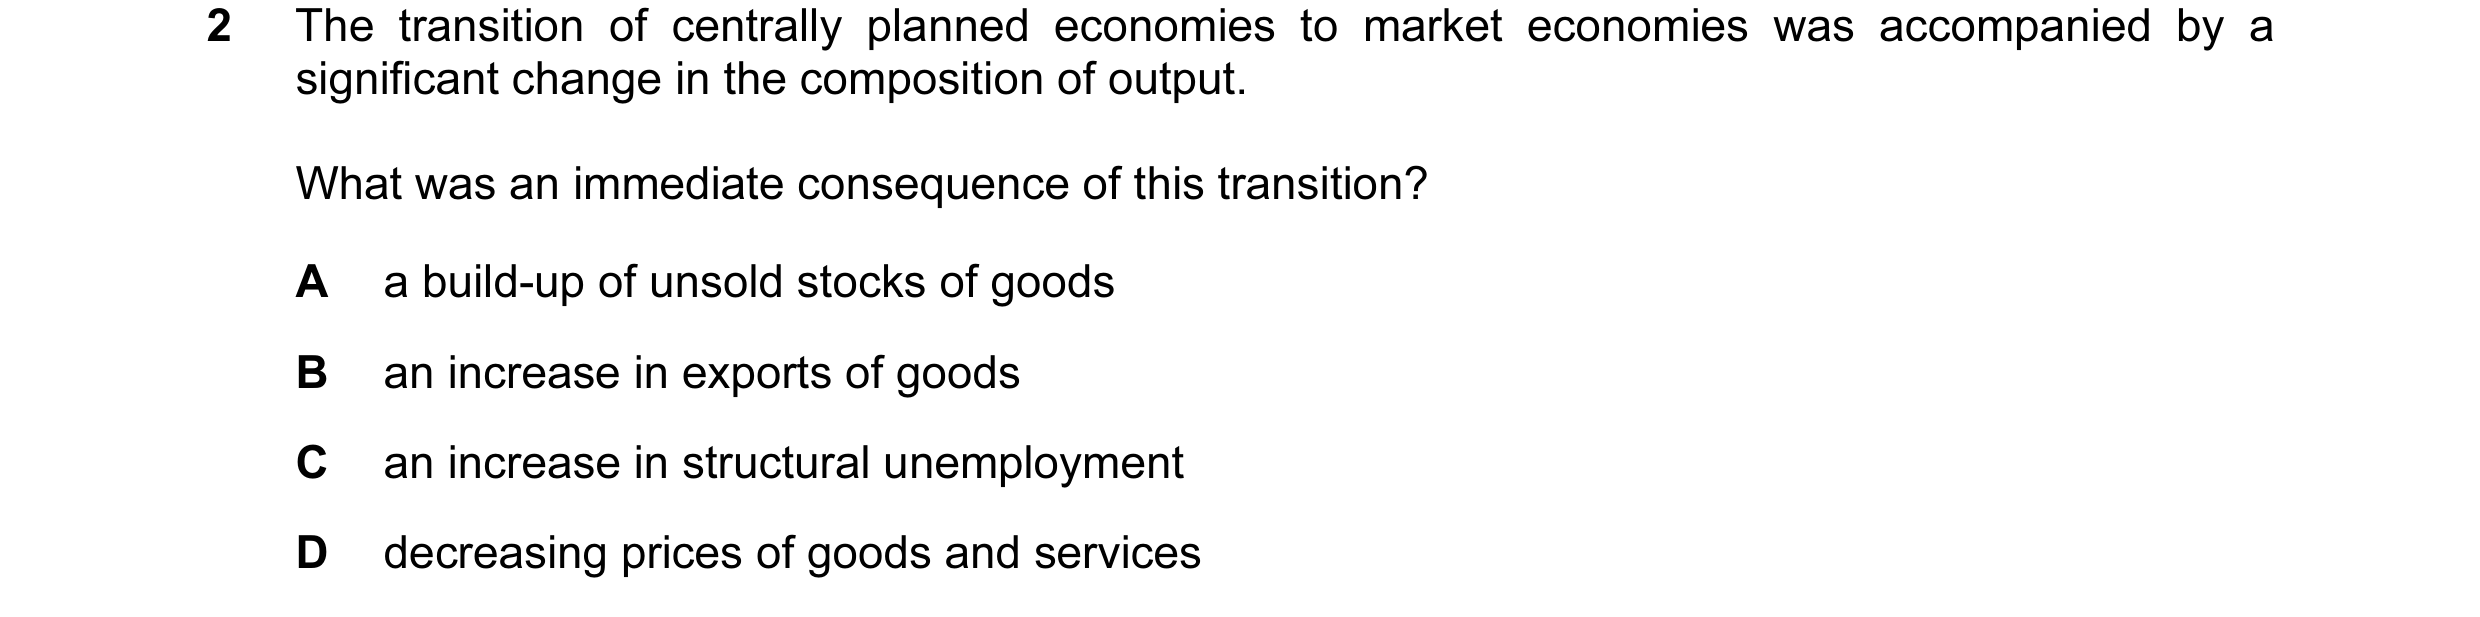
Q49 · The transition of centrally planned economies to market economies was accompanied by a… 9708/11 May/June 2016
2 The transition of centrally planned economies to market economies was accompanied by a significant change in the composition of output. What was an immediate consequence of this transition? A a build-up of unsold stocks of goods B an increase in exports of goods C an increase in structural unemployment D decreasing prices of goods and services
1 marks
Answer: C
This question in 9708/11 May/June 2016
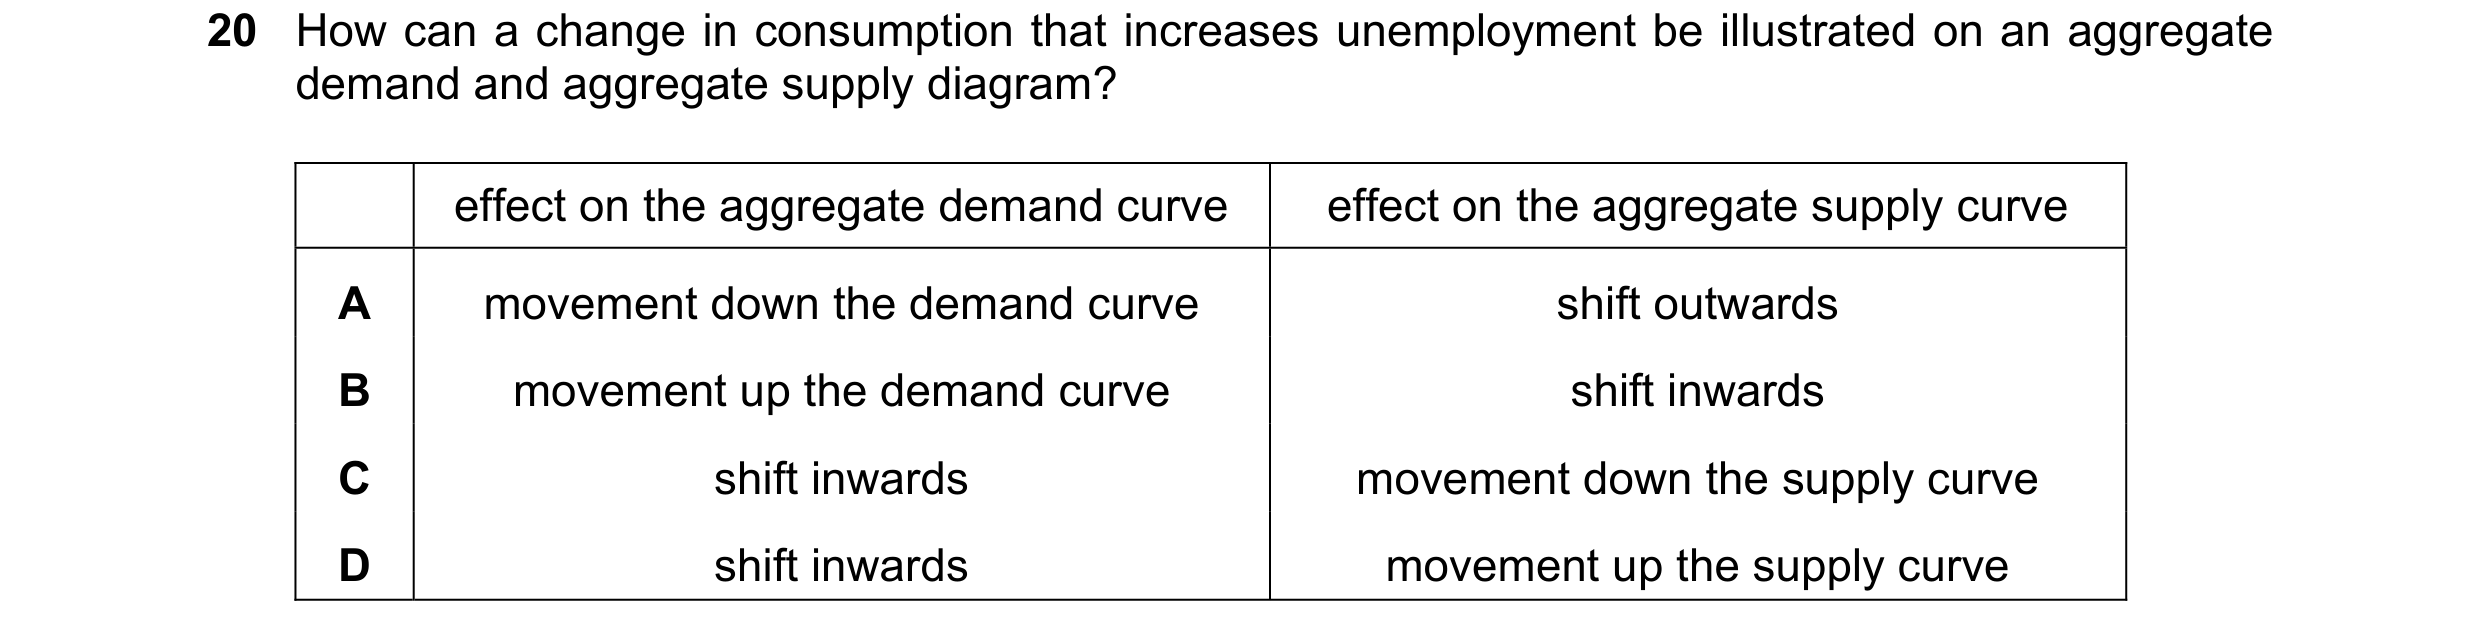
Q50 · How can a change in consumption that increases unemployment be illustrated on an… 9708/12 May/June 2019
20 How can a change in consumption that increases unemployment be illustrated on an aggregate demand and aggregate supply diagram? effect on the aggregate demand curve effect on the aggregate supply curve A movement down the demand curve shift outwards B movement up the demand curve shift inwards C shift inwards movement down the supply curve D shift inwards movement up the supply curve
1 marks
Answer: C
This question in 9708/12 May/June 2019
Q51 · An economy is currently in the position PY shown on the diagram 9708/12 May/June 2019
29 An economy is currently in the position PY shown on the diagram. SRAS price level P AD O Y real GDP Which short-run effects is government spending on education likely to have on unemployment and inflation? unemployment inflation A fall fall B fall rise C rise fall D rise rise
1 marks
Answer: B
This question in 9708/12 May/June 2019
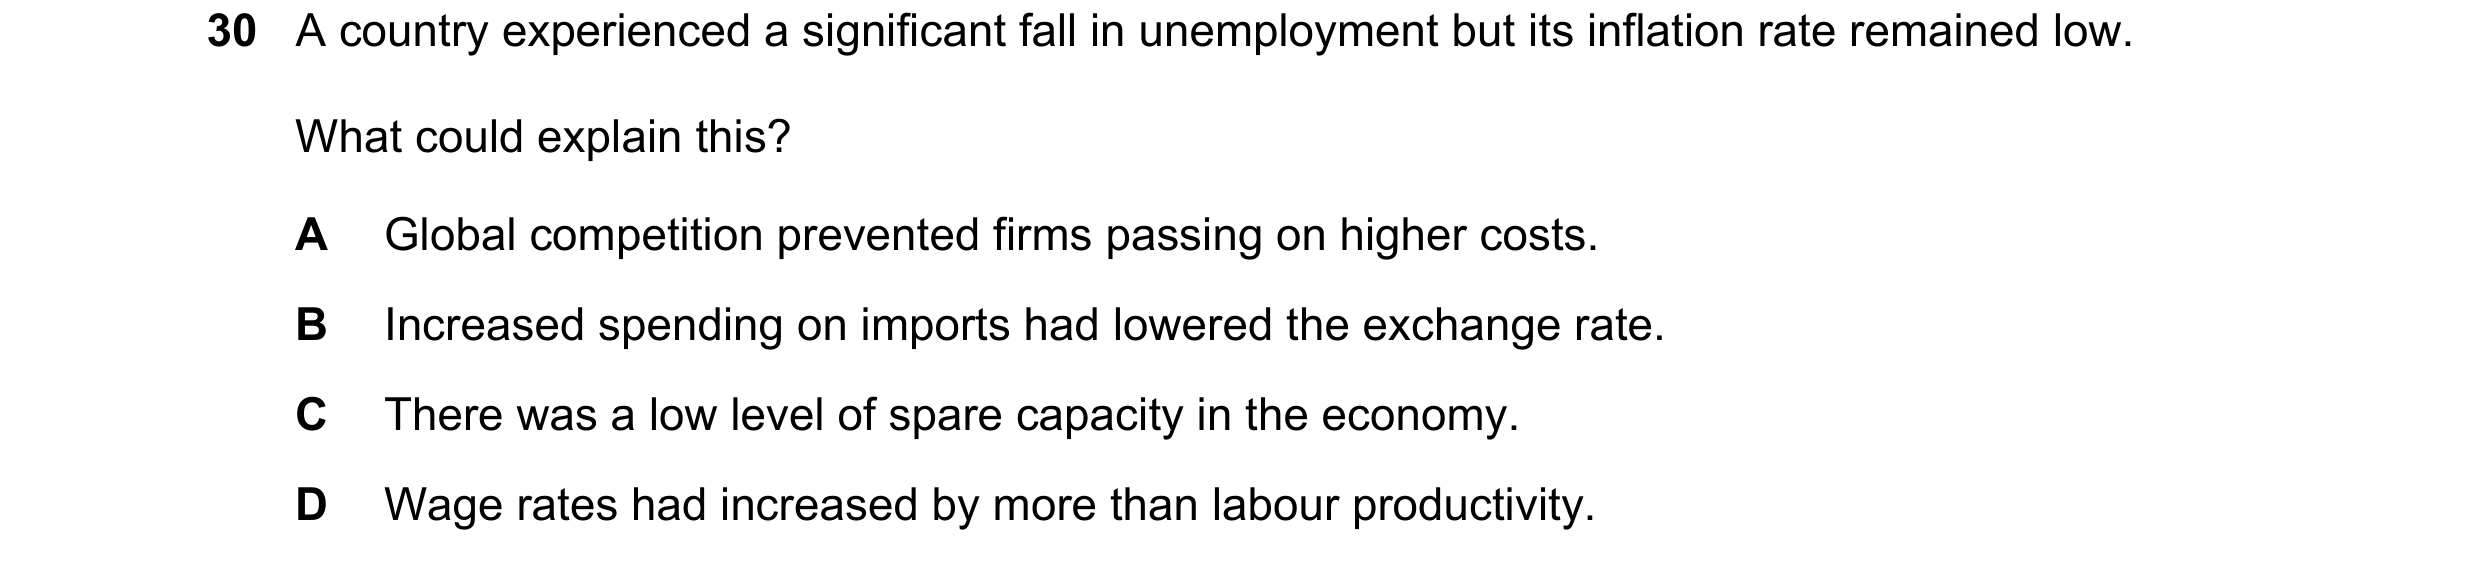
Q52 · A country experienced a significant fall in unemployment but its inflation rate remained… 9708/11 May/June 2020
30 A country experienced a significant fall in unemployment but its inflation rate remained low. What could explain this? A Global competition prevented firms passing on higher costs. B Increased spending on imports had lowered the exchange rate. C There was a low level of spare capacity in the economy. D Wage rates had increased by more than labour productivity.
1 marks
Answer: A
This question in 9708/11 May/June 2020
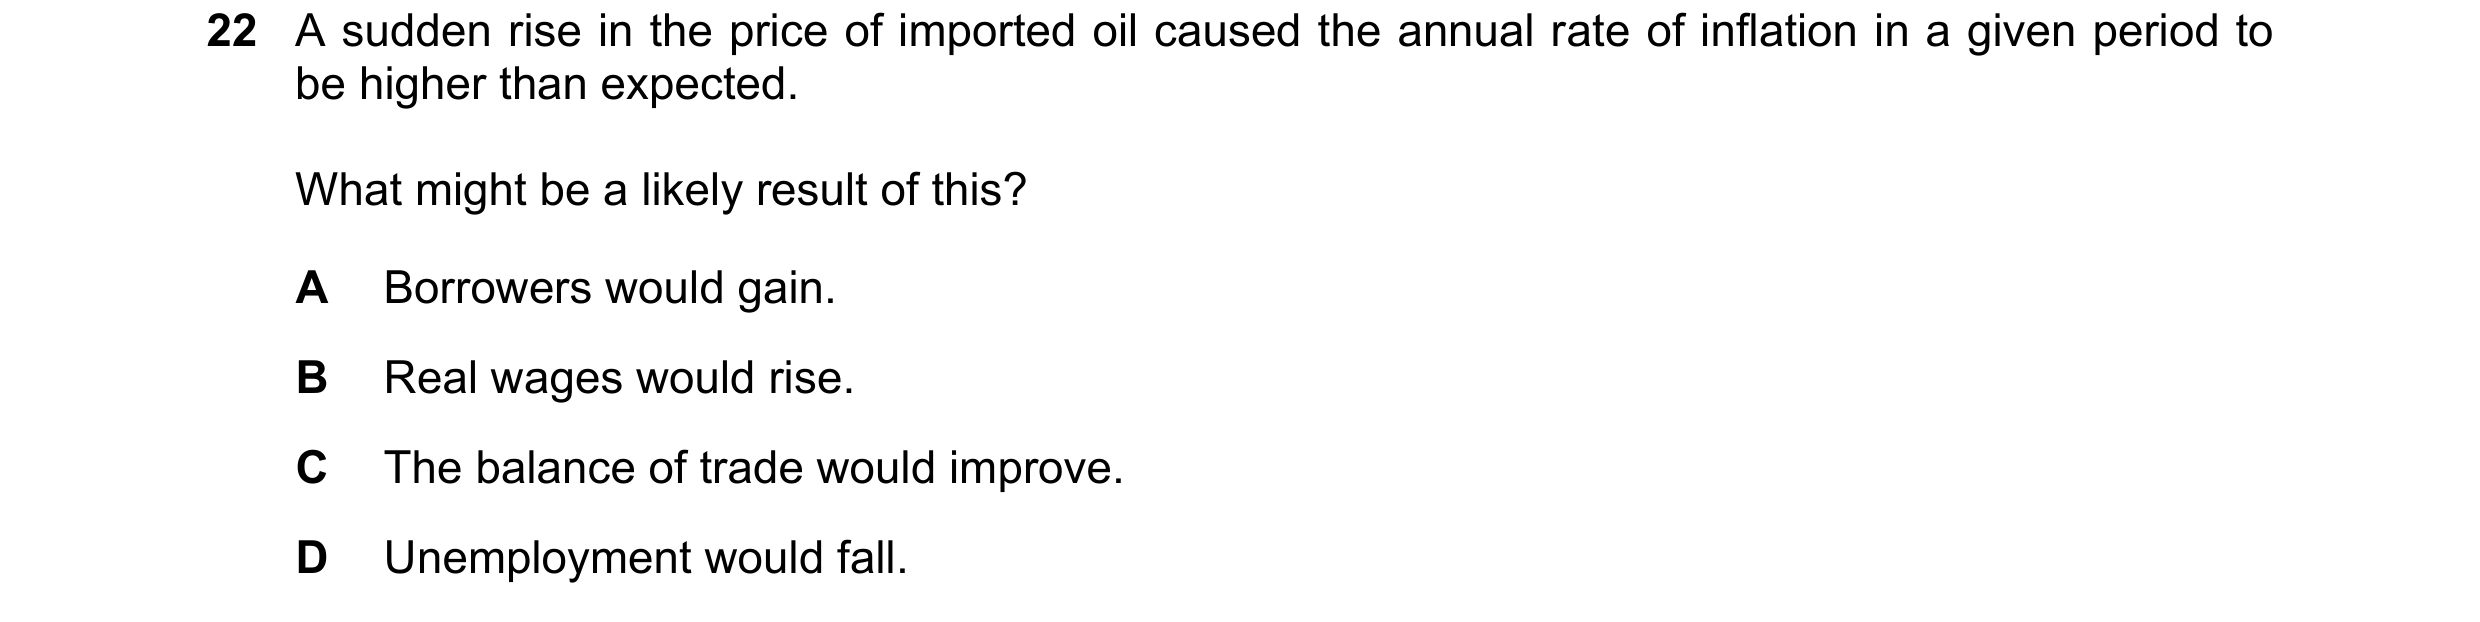
Q53 · A sudden rise in the price of imported oil caused the annual rate of inflation in a given… 9708/13 May/June 2021
22 A sudden rise in the price of imported oil caused the annual rate of inflation in a given period to be higher than expected. What might be a likely result of this? A Borrowers would gain. B Real wages would rise. C The balance of trade would improve. D Unemployment would fall.
1 marks
Answer: A
This question in 9708/13 May/June 2021
Q54 · The graph shows the change in the current account of Belgium’s balance of payments from… 9708/13 Oct/Nov 2021
27 The graph shows the change in the current account of Belgium’s balance of payments from 2016 to 2017. 3.6 US$ billion 0 –2.8 2016 2017 What will be the most likely impact of the change shown by the graph on Belgium’s domestic economy? A a fall in the rate of economic growth B a fall in the foreign currency reserves C a fall in the number of unemployed D a fall in the rate of inflation
1 marks
Answer: C
This question in 9708/13 Oct/Nov 2021
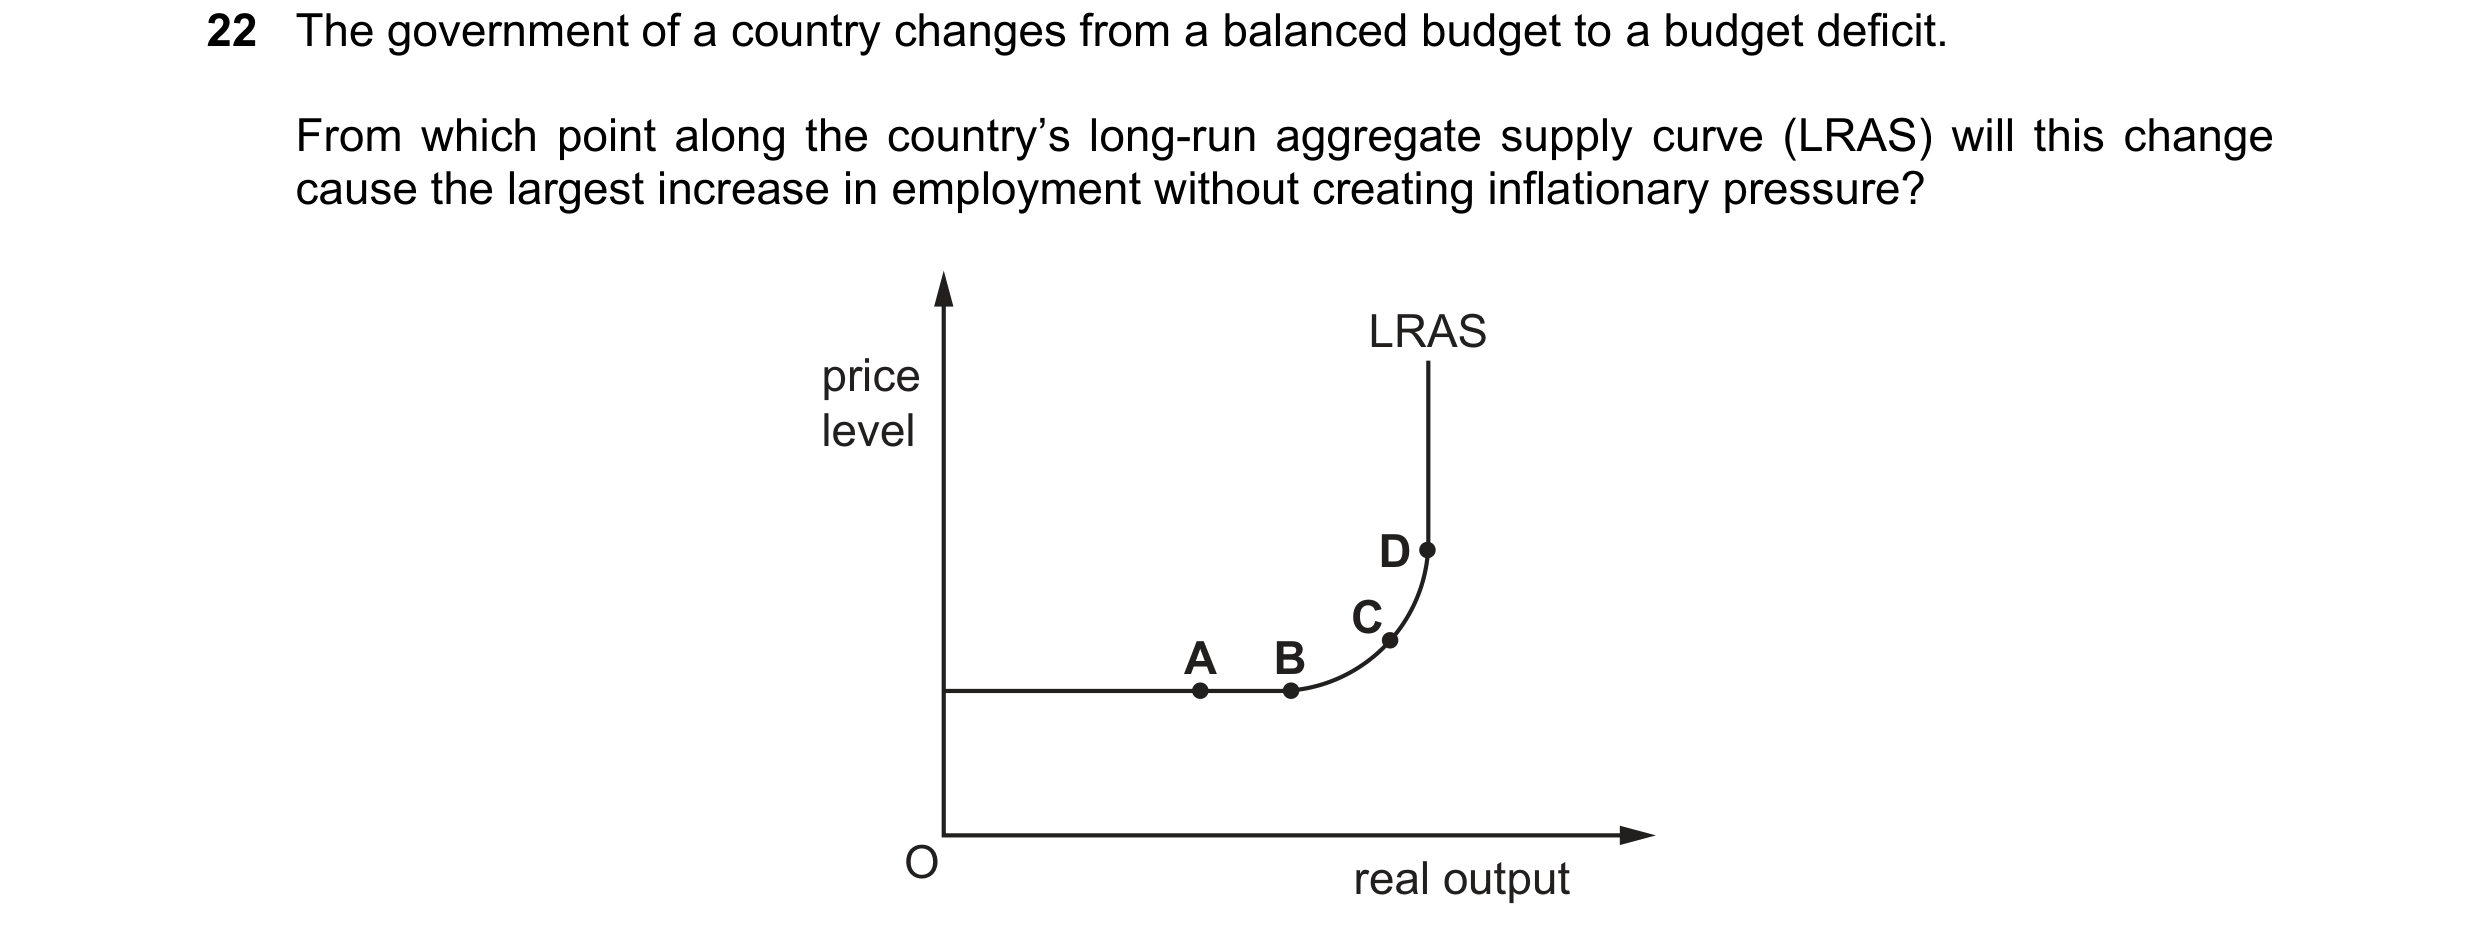
Q55 · The government of a country changes from a balanced budget to a budget deficit 9708/13 Oct/Nov 2022
22 The government of a country changes from a balanced budget to a budget deficit. From which point along the country’s long-run aggregate supply curve (LRAS) will this change cause the largest increase in employment without creating inflationary pressure? LRAS price level D C A B O real output
1 marks
Answer: A
This question in 9708/13 Oct/Nov 2022
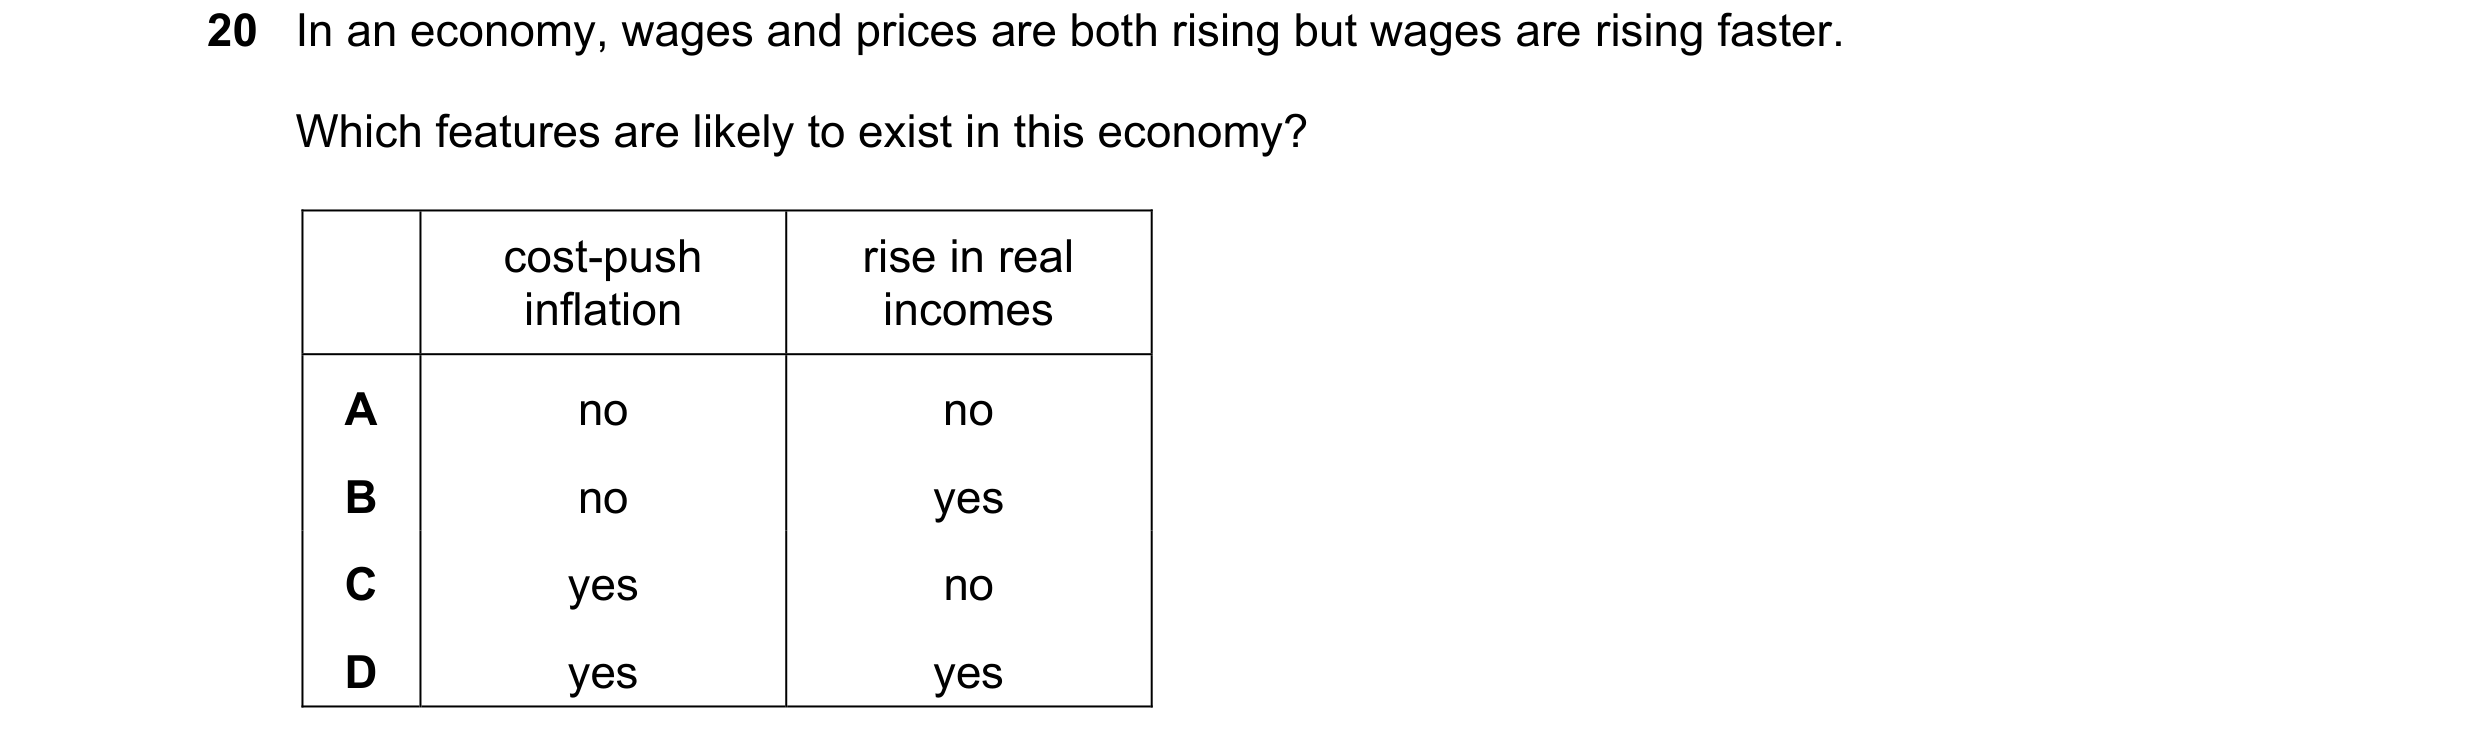
Q56 · In an economy, wages and prices are both rising but wages are rising faster 9708/12 Feb/March 2023
20 In an economy, wages and prices are both rising but wages are rising faster. Which features are likely to exist in this economy? cost-push rise in real inflation incomes A no no B no yes C yes no D yes yes
1 marks
Answer: D
This question in 9708/12 Feb/March 2023
Q57 · The graph gives the percentage unemployed for all people aged 16 and over, and for young… 9708/11 May/June 2023
20 The graph gives the percentage unemployed for all people aged 16 and over, and for young people aged 16–24. 30 percentage 25 unemployed aged 16–24 aged 16–24 aged 16–24 20 15 aged 16 and over aged 16 and over aged 16 and over 10 5 0 2010 2012 2014 2016 2018 2020 year What is the consequence for consumer expenditure on products consumed by the 16–24 age group over the period 2010–2020? A a fall in consumer expenditure across the whole period B an initial fall in consumer expenditure followed by a rise C an initial rise in consumer expenditure followed by a fall D a rise in consumer expenditure across the whole period
1 marks
Answer: C
This question in 9708/11 May/June 2023
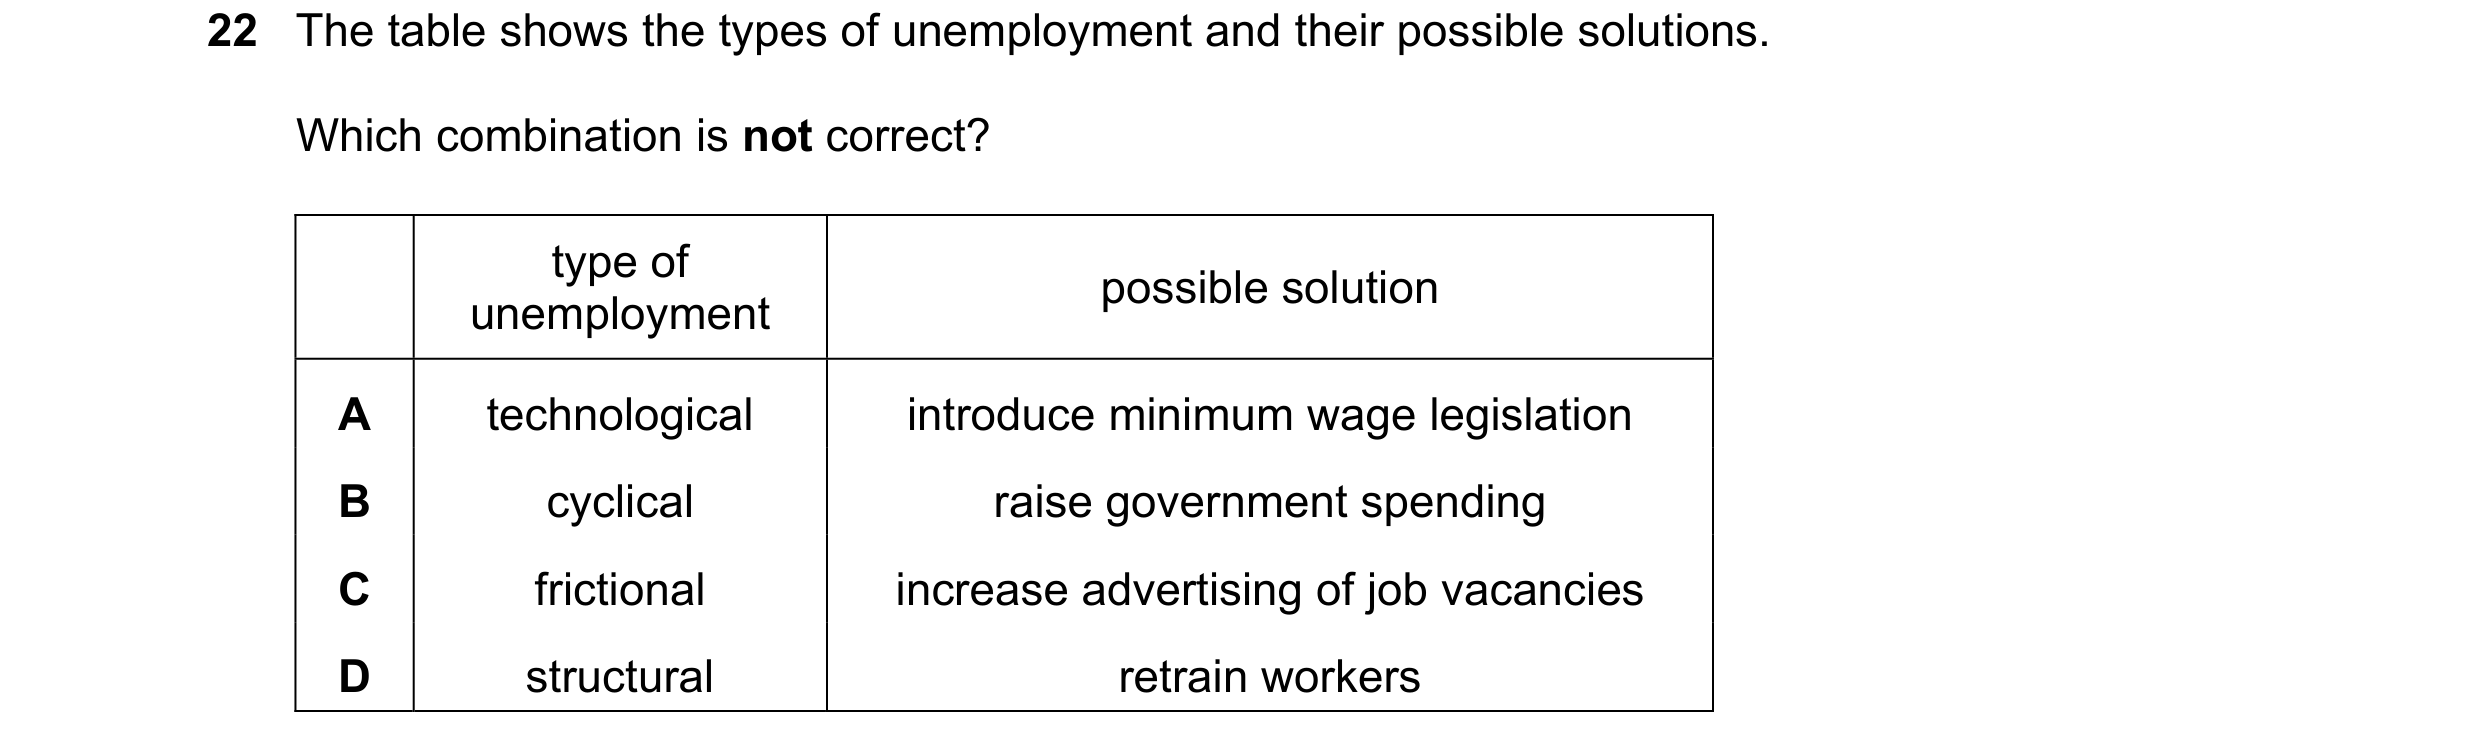
Q58 · The table shows the types of unemployment and their possible solutions 9708/12 May/June 2023
22 The table shows the types of unemployment and their possible solutions. Which combination is not correct? type of possible solution unemployment A technological introduce minimum wage legislation B cyclical raise government spending C frictional increase advertising of job vacancies D structural retrain workers
1 marks
Answer: A
This question in 9708/12 May/June 2023
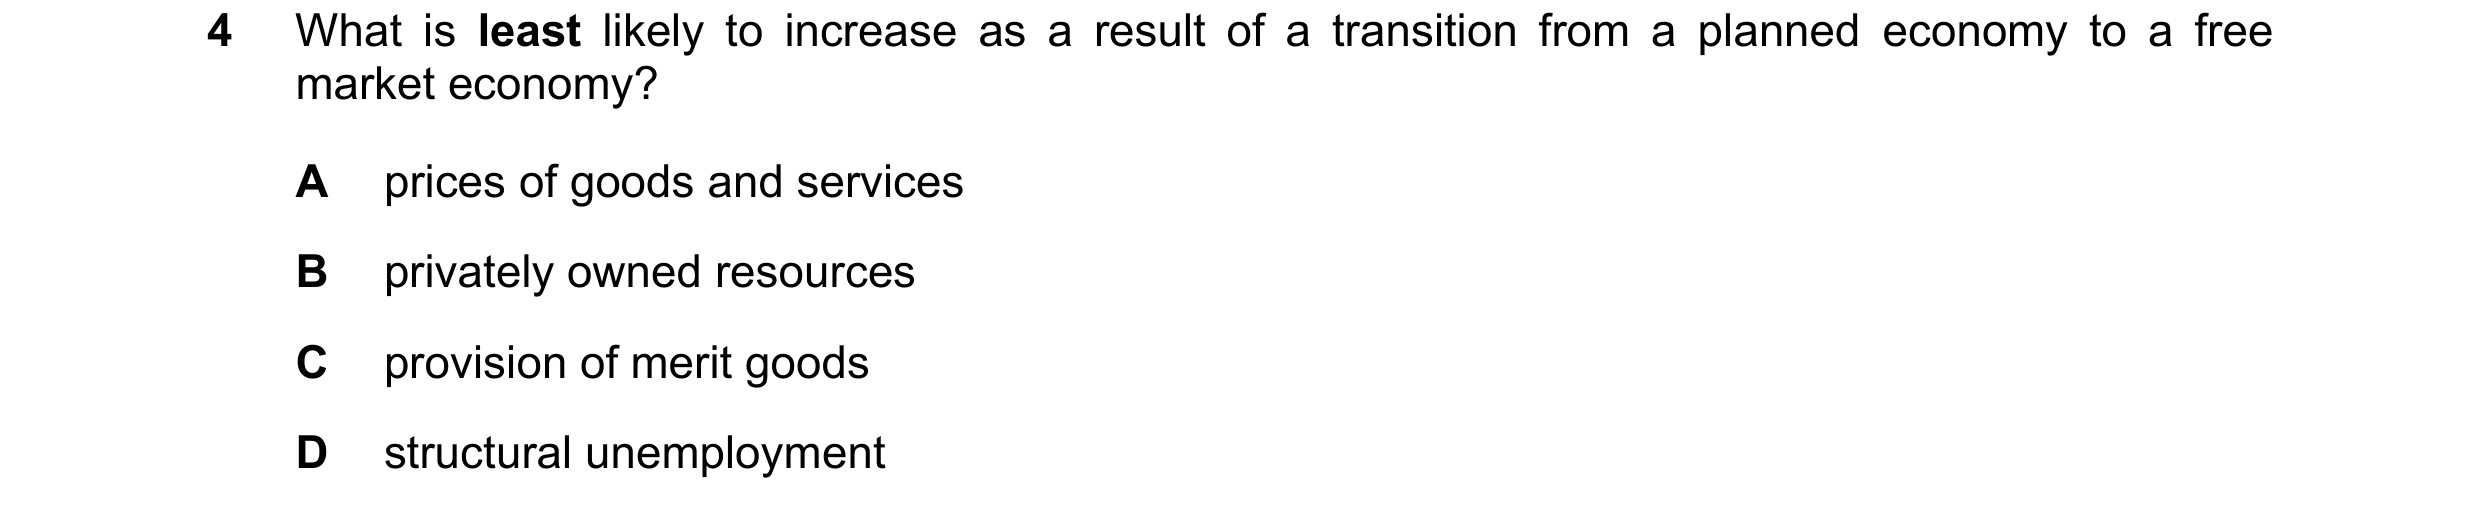
Q59 · What is least likely to increase as a result of a transition from a planned economy to a… 9708/11 Oct/Nov 2023
4 What is least likely to increase as a result of a transition from a planned economy to a free market economy? A prices of goods and services B privately owned resources C provision of merit goods D structural unemployment
1 marks
Answer: C
This question in 9708/11 Oct/Nov 2023
Q60 · Four students have to fill in the gaps in the sentence shown 9708/11 Oct/Nov 2023
18 Four students have to fill in the gaps in the sentence shown. ‘A person is defined as unemployed if they are … 1 … to work at … 2 … wage rate, but cannot find a job despite an active search for work.’ Which student fills gaps 1 and 2 correctly? 1 2 A able below the current B able the current C able, available and willing above the current D able, available and willing the current
1 marks
Answer: D
This question in 9708/11 Oct/Nov 2023
Q61 · What would be the most likely reason for a decrease in frictional unemployment? 9708/11 Oct/Nov 2023
25 What would be the most likely reason for a decrease in frictional unemployment? A more capital-intensive manufacturing B more demand for public sector workers C more government spending on education D more information on labour market vacancies
1 marks
Answer: D
This question in 9708/11 Oct/Nov 2023
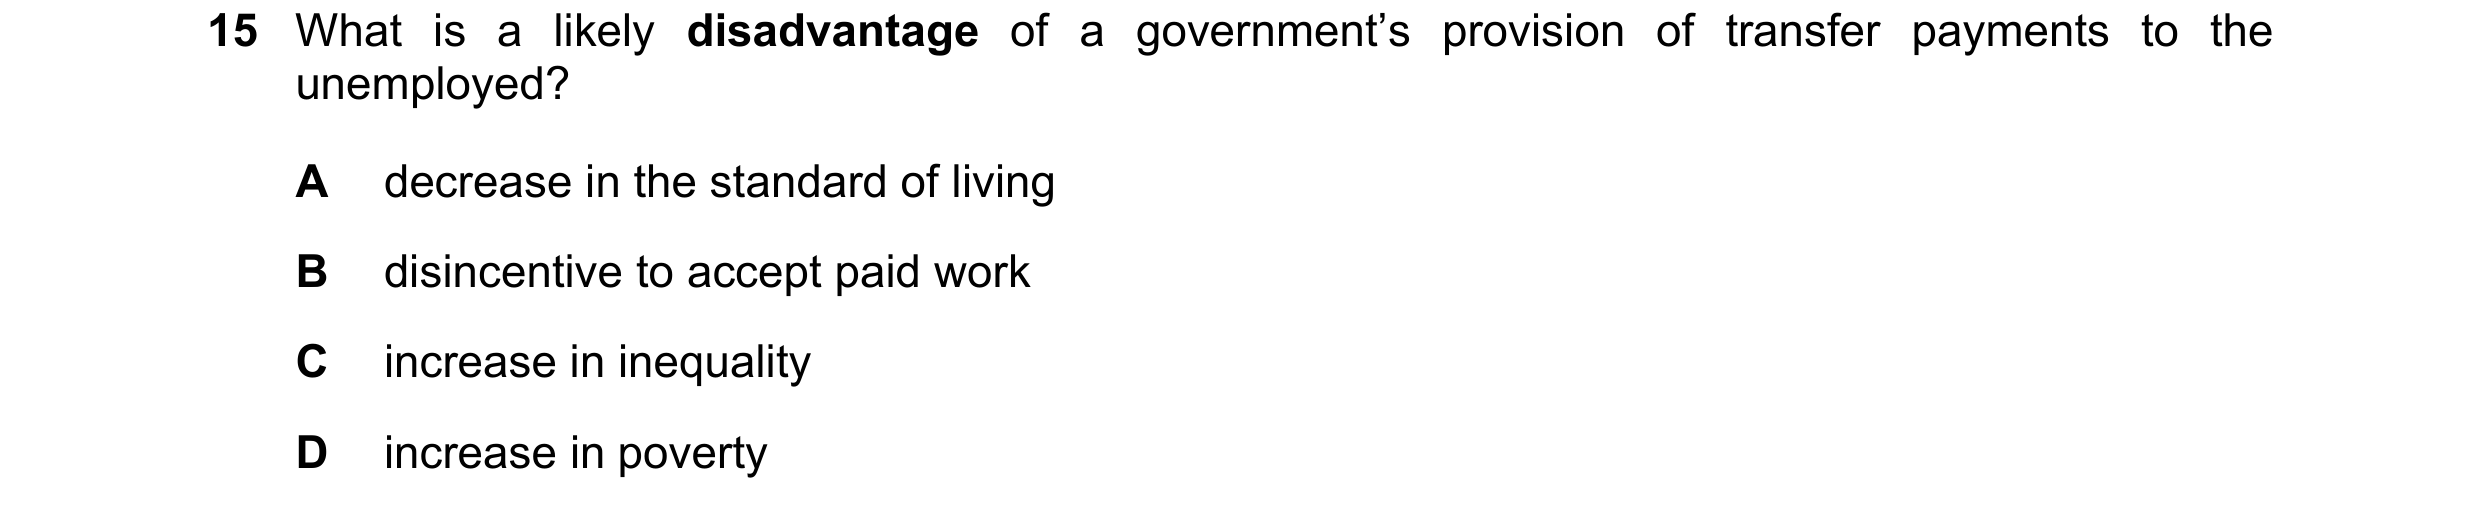
Q62 · What is a likely disadvantage of a government’s provision of transfer payments to the… 9708/13 Oct/Nov 2023
15 What is a likely disadvantage of a government’s provision of transfer payments to the unemployed? A decrease in the standard of living B disincentive to accept paid work C increase in inequality D increase in poverty
1 marks
Answer: B
This question in 9708/13 Oct/Nov 2023
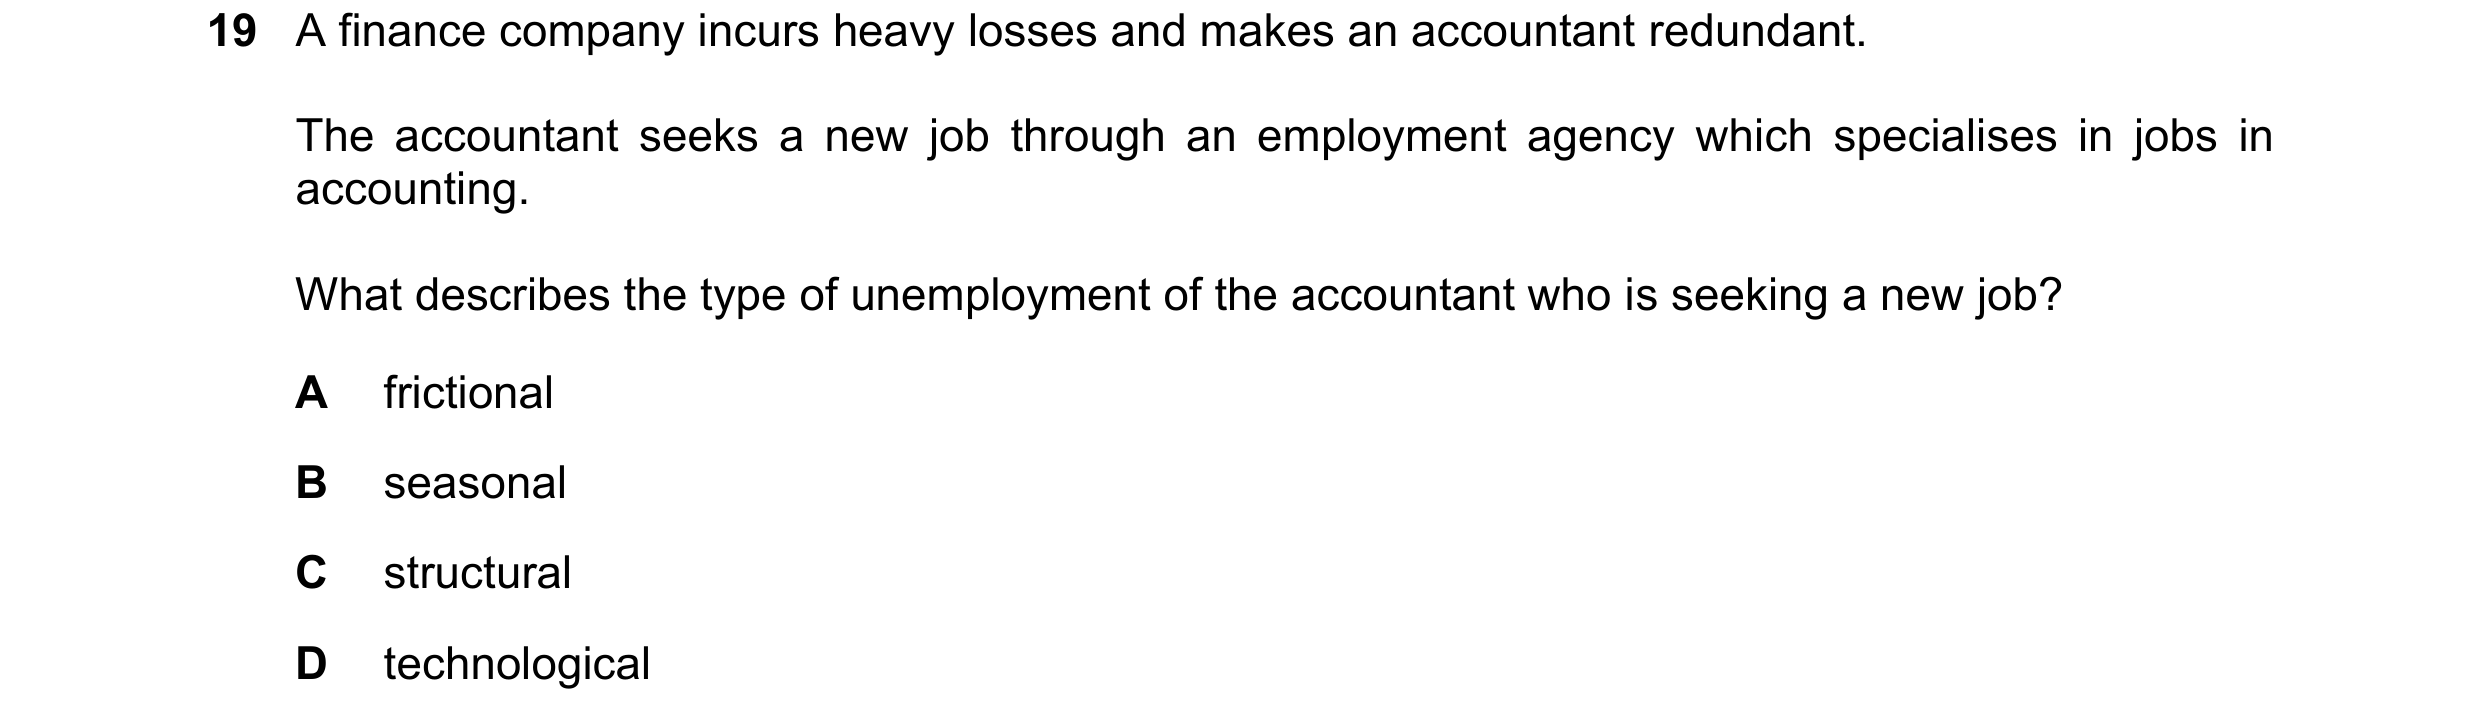
Q63 · A finance company incurs heavy losses and makes an accountant redundant 9708/13 Oct/Nov 2023
19 A finance company incurs heavy losses and makes an accountant redundant. The accountant seeks a new job through an employment agency which specialises in jobs in accounting. What describes the type of unemployment of the accountant who is seeking a new job? A frictional B seasonal C structural D technological
1 marks
Answer: A
This question in 9708/13 Oct/Nov 2023
Q64 · To calculate the unemployment rate, the number unemployed is related to A the total adult… 9708/12 Feb/March 2024
18 To calculate the unemployment rate, the number unemployed is related to A the total adult population aged 18–65. B the number of unemployed who are seeking work. C the total number in full-time employment. D the total population in the labour force.
1 marks
Answer: D
This question in 9708/12 Feb/March 2024
Q65 · Asha is currently unemployed 9708/11 May/June 2024
17 Asha is currently unemployed. She has been offered a job but has decided to decline the offer and search for a better paid job. Which type of unemployment is this? A cyclical B frictional C seasonal D structural
1 marks
Answer: B
This question in 9708/11 May/June 2024
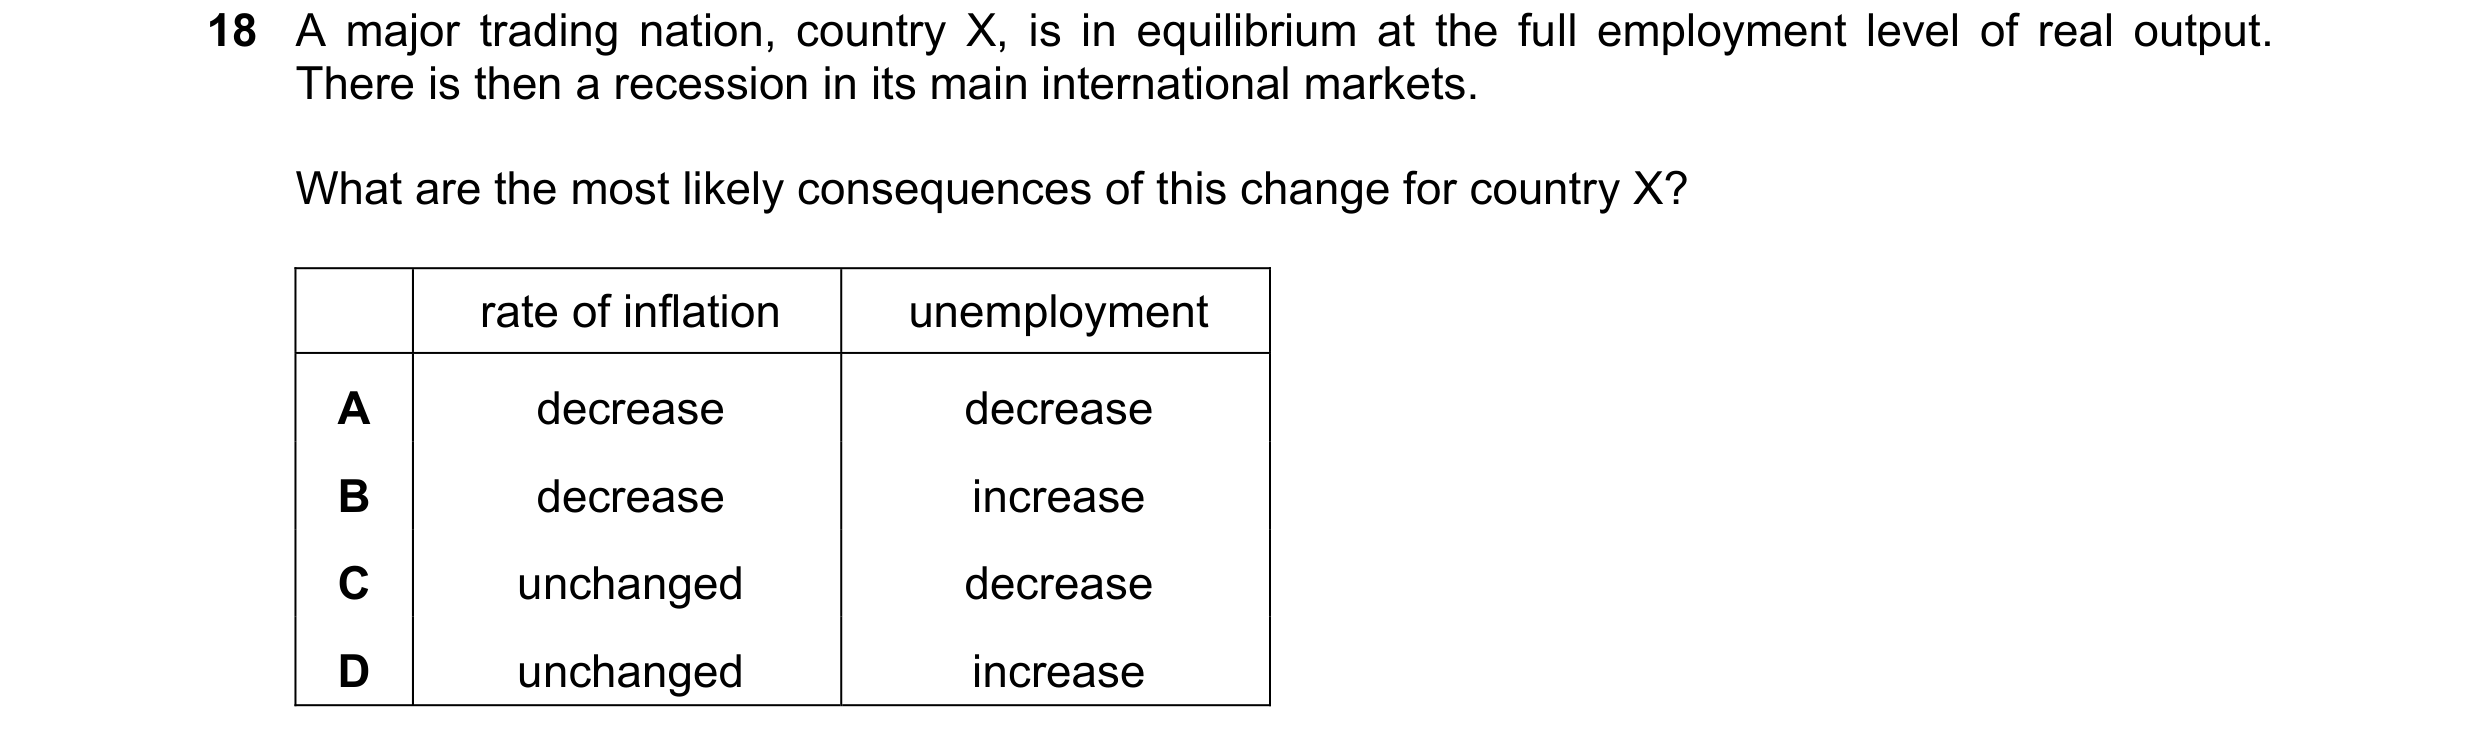
Q66 · A major trading nation, country X, is in equilibrium at the full employment level of real… 9708/11 May/June 2024
18 A major trading nation, country X, is in equilibrium at the full employment level of real output. There is then a recession in its main international markets. What are the most likely consequences of this change for country X? rate of inflation unemployment A decrease decrease B decrease increase C unchanged decrease D unchanged increase
1 marks
Answer: B
This question in 9708/11 May/June 2024
Q67 · What is most likely to decrease if a government uses expansionary fiscal policy? 9708/11 May/June 2024
22 What is most likely to decrease if a government uses expansionary fiscal policy? A a balance of payments deficit B cyclical unemployment C the level of wages D the rate of inflation
1 marks
Answer: B
This question in 9708/11 May/June 2024
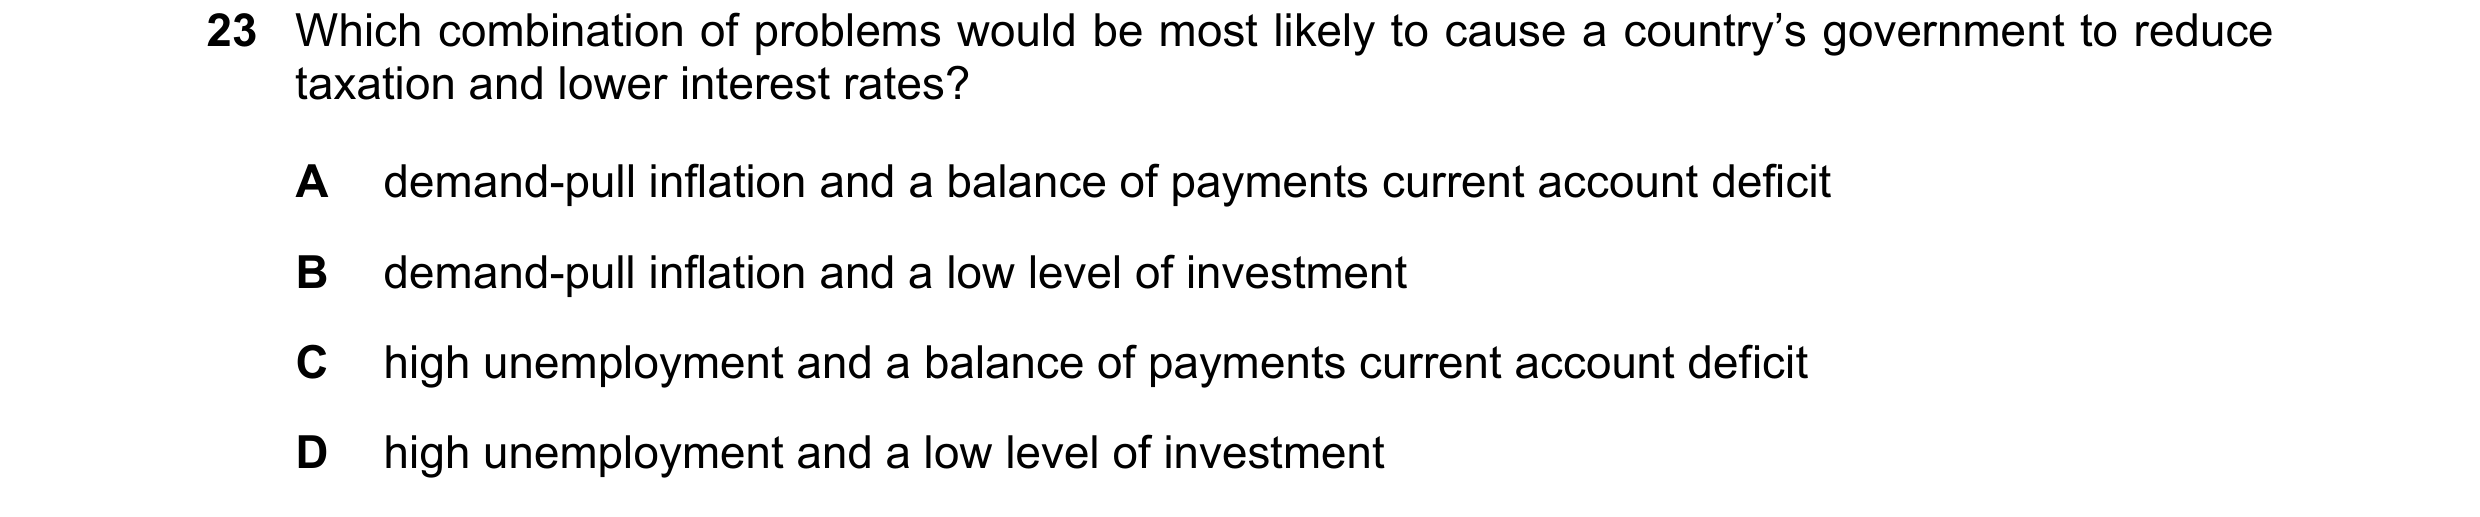
Q68 · Which combination of problems would be most likely to cause a country’s government to… 9708/12 May/June 2024
23 Which combination of problems would be most likely to cause a country’s government to reduce taxation and lower interest rates? A demand-pull inflation and a balance of payments current account deficit B demand-pull inflation and a low level of investment C high unemployment and a balance of payments current account deficit D high unemployment and a low level of investment
1 marks
Answer: D
This question in 9708/12 May/June 2024
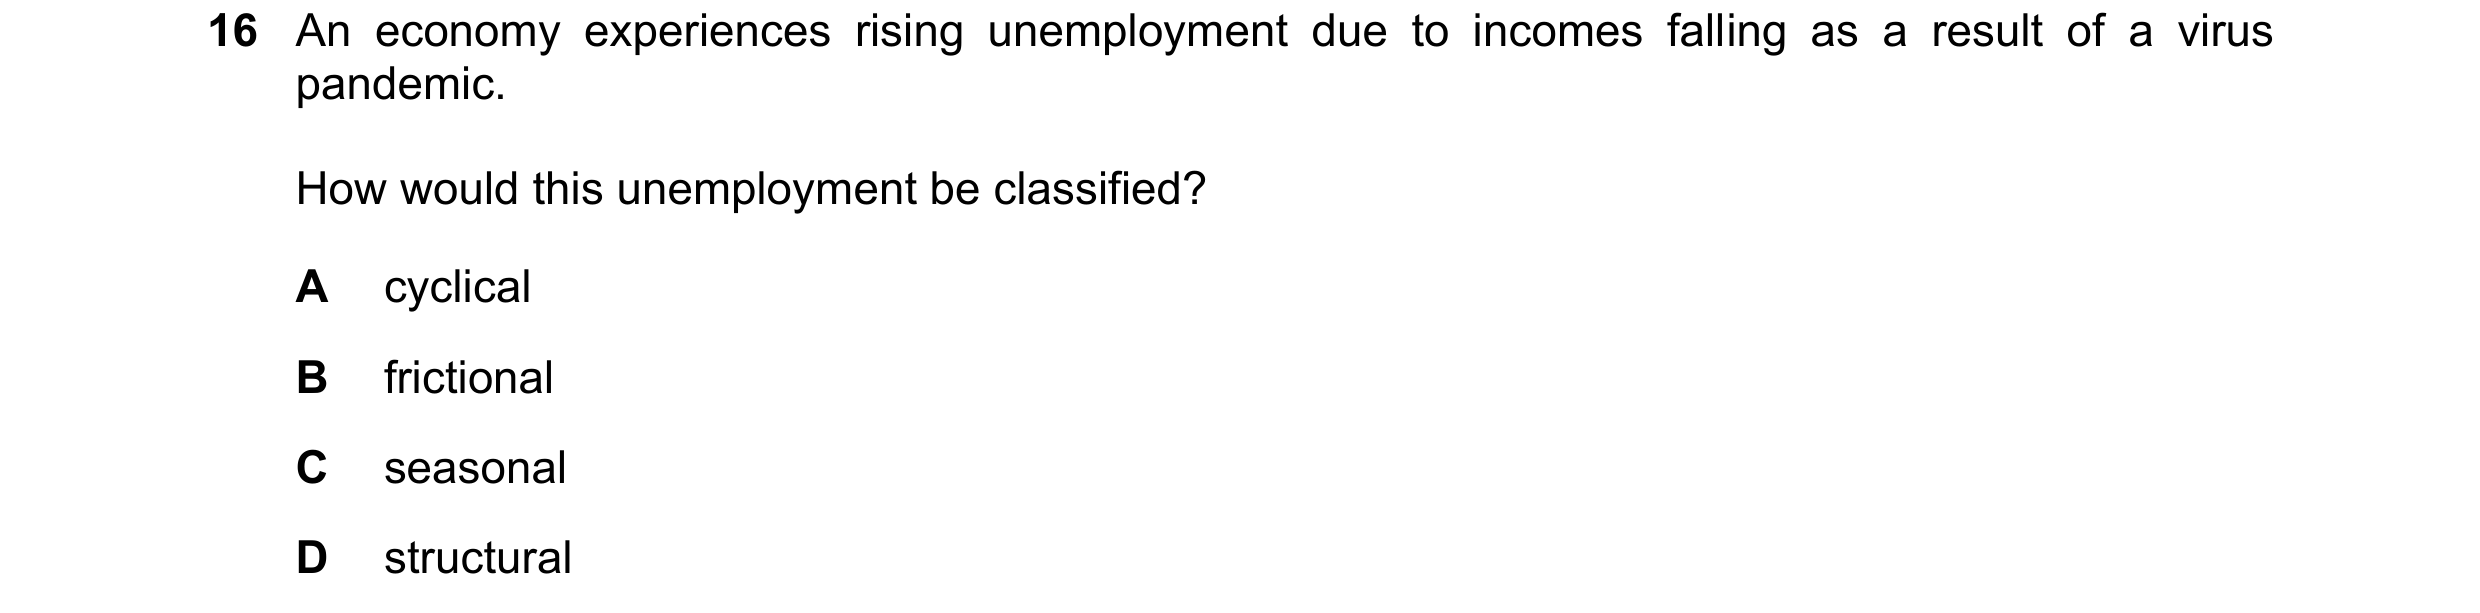
Q69 · An economy experiences rising unemployment due to incomes falling as a result of a virus… 9708/12 Oct/Nov 2024
16 An economy experiences rising unemployment due to incomes falling as a result of a virus pandemic. How would this unemployment be classified? A cyclical B frictional C seasonal D structural
1 marks
Answer: A
This question in 9708/12 Oct/Nov 2024
Q70 · The number of people employed in a country and the level of unemployment both decrease 9708/12 Oct/Nov 2024
23 The number of people employed in a country and the level of unemployment both decrease. What could explain this? A net inward immigration B an increase in the level of unemployment benefits C an increase in the age at which state pensions are payable D an increase in the number of university students
1 marks
Answer: D
This question in 9708/12 Oct/Nov 2024
Q71 · What leads to a rise in frictional unemployment? 9708/13 Oct/Nov 2024
17 What leads to a rise in frictional unemployment? A an economy moving into a period of recession B replacement of workers with computers in the service sector C a change from an agriculturally based economy to an industrial economy D a rise in the number of workers leaving one job to look for another job
1 marks
Answer: D
This question in 9708/13 Oct/Nov 2024
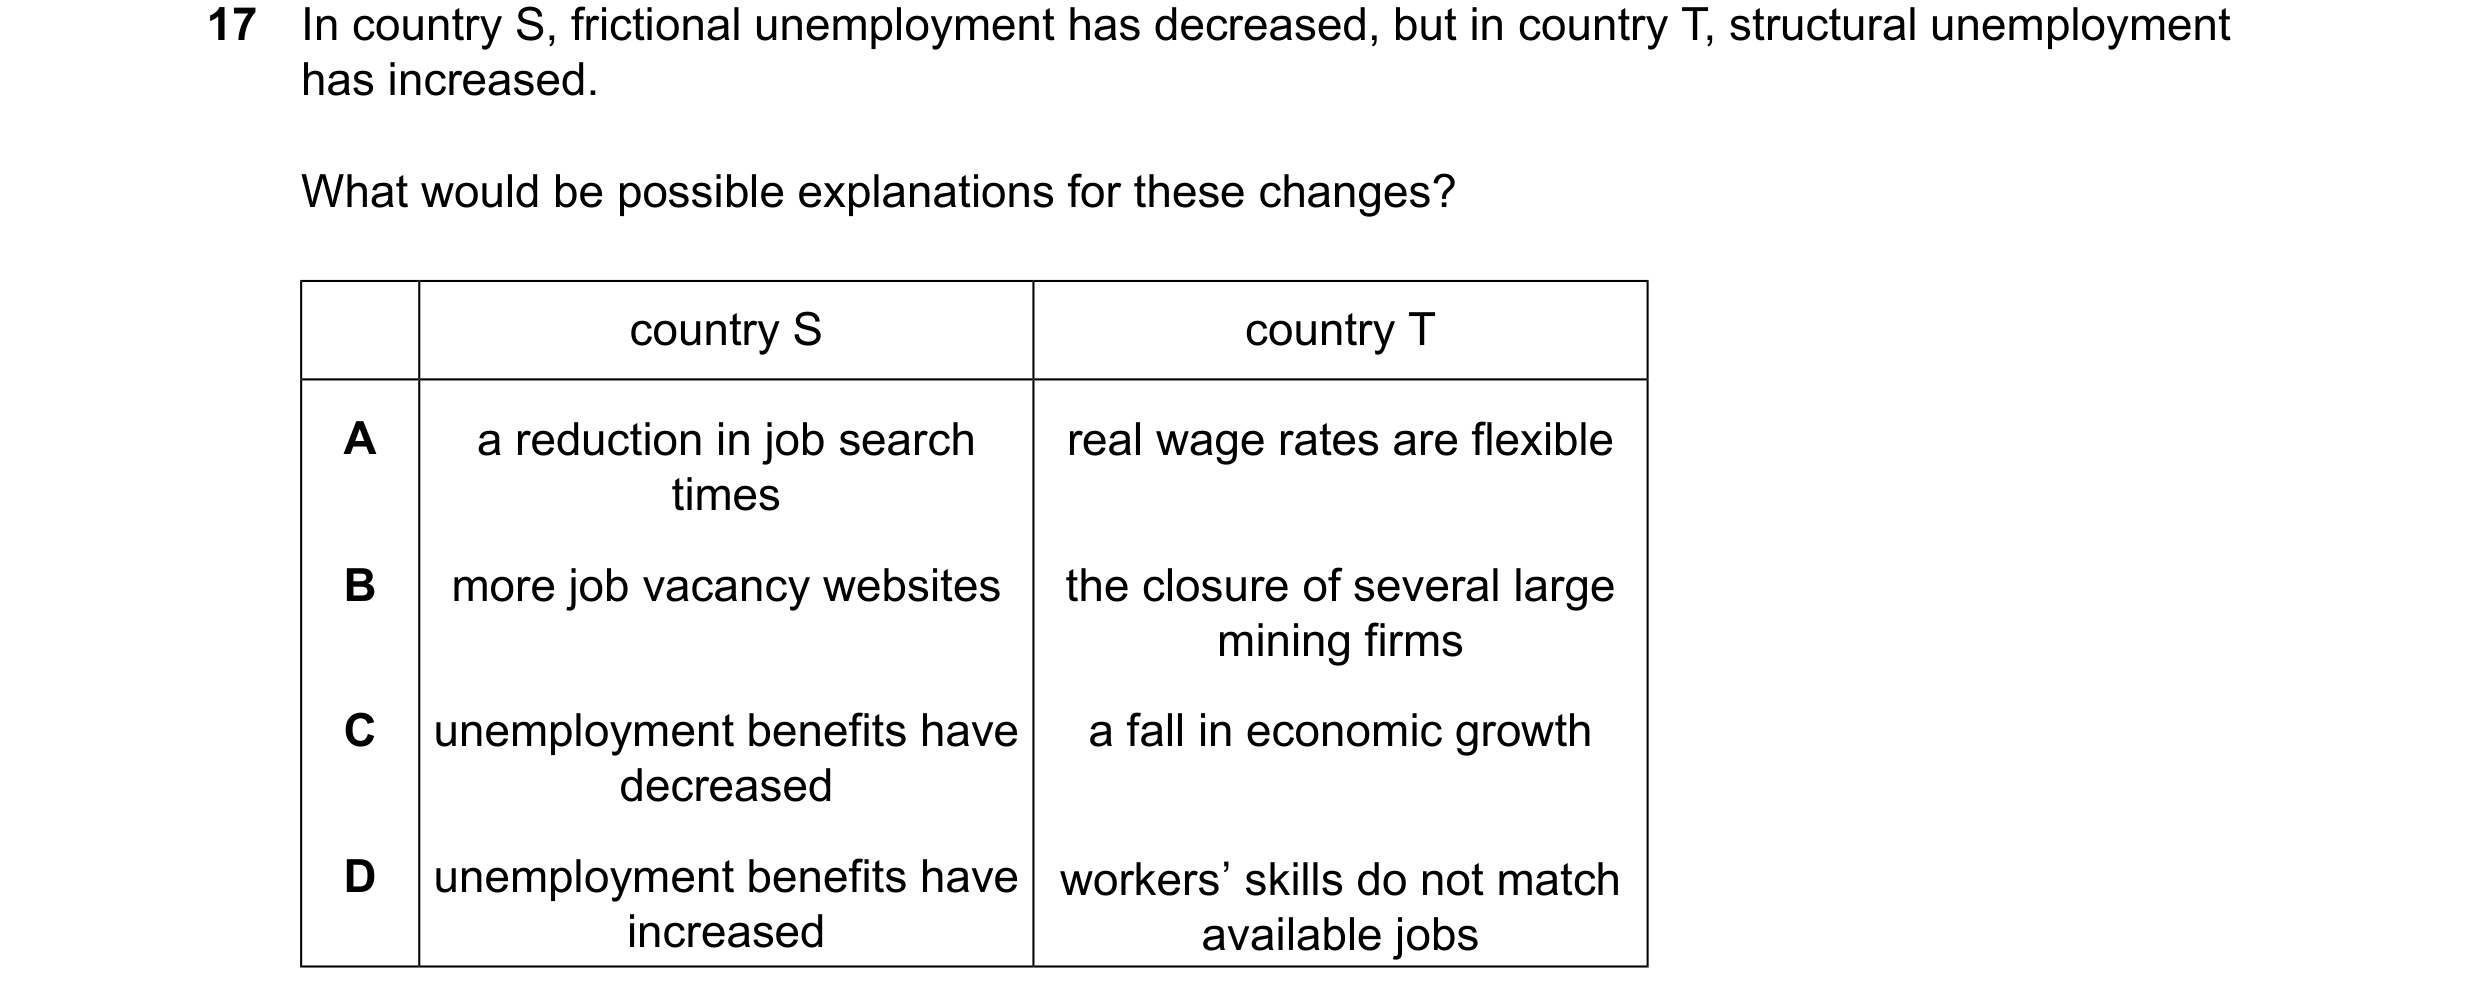
Q72 · In country S, frictional unemployment has decreased, but in country T, structural… 9708/12 Feb/March 2025
17 In country S, frictional unemployment has decreased, but in country T, structural unemployment has increased. What would be possible explanations for these changes? country S country T A a reduction in job search real wage rates are flexible times B more job vacancy websites the closure of several large mining firms C unemployment benefits have a fall in economic growth decreased D unemployment benefits have workers’ skills do not match increased available jobs
1 marks
Answer: B
This question in 9708/12 Feb/March 2025
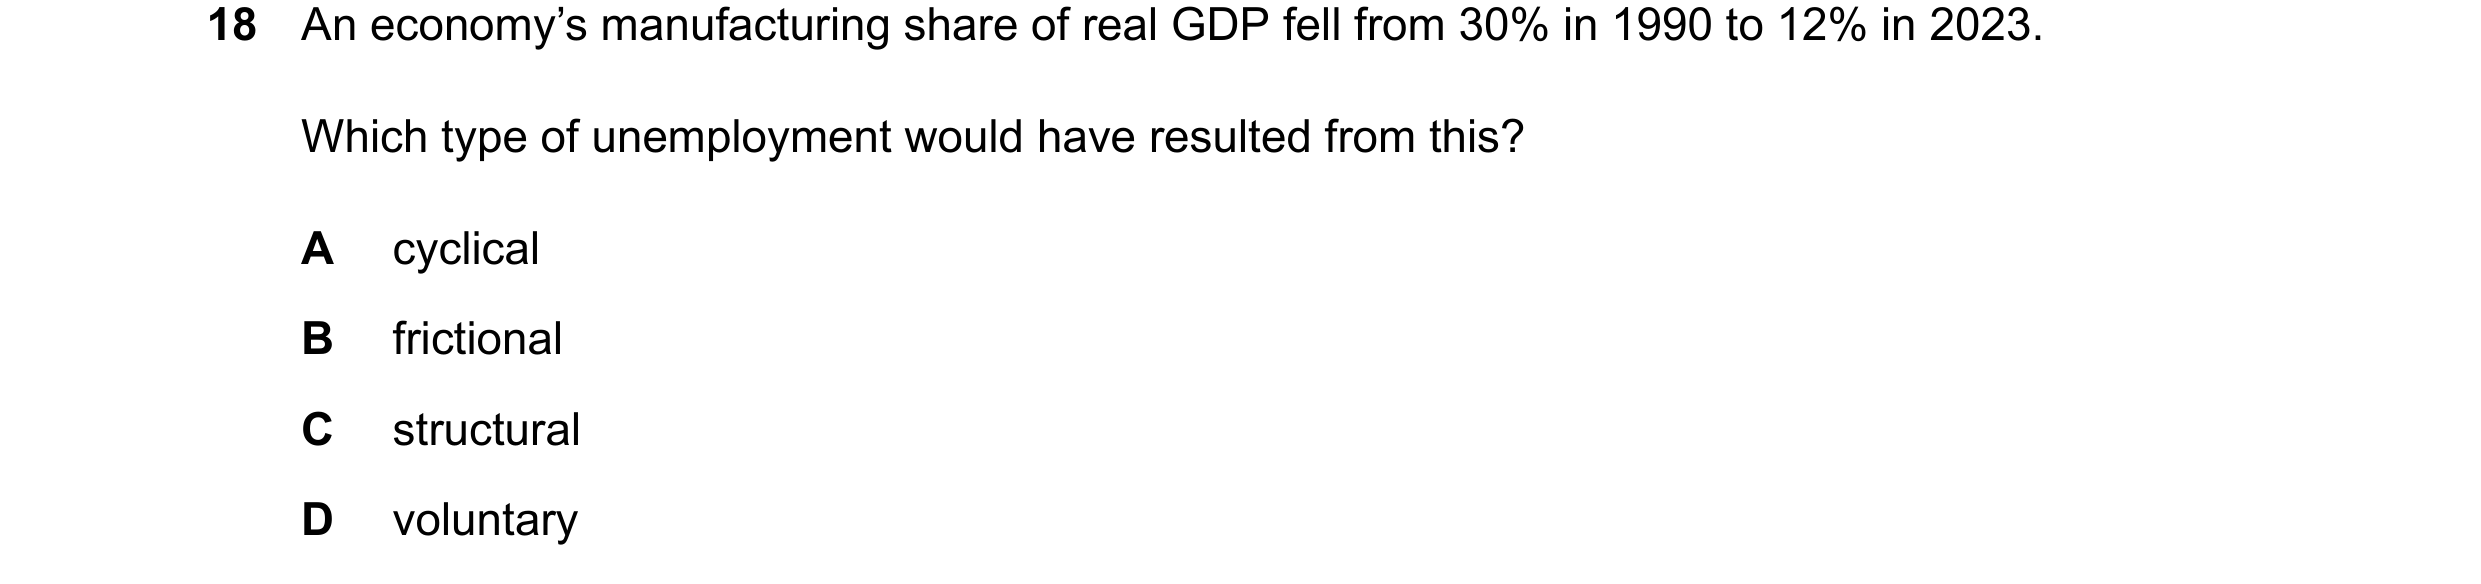
Q73 · An economy’s manufacturing share of real GDP fell from 30% in 1990 to 12% in 2023 9708/11 May/June 2025
18 An economy’s manufacturing share of real GDP fell from 30% in 1990 to 12% in 2023. Which type of unemployment would have resulted from this? A cyclical B frictional C structural D voluntary
1 marks
Answer: C
This question in 9708/11 May/June 2025
Q74 · What is most likely to cause an unemployed worker to be classified as frictionally… 9708/12 May/June 2025
19 What is most likely to cause an unemployed worker to be classified as frictionally unemployed? A lack of relevant skills for vacant jobs B lack of up-to-date job vacancy information C greater use of technology in the production process D an increase in regional pay inequality
1 marks
Answer: B
This question in 9708/12 May/June 2025
Q75 · The table shows some labour market statistics 9708/13 May/June 2025
17 The table shows some labour market statistics. million number of people of working age 45 number of people unemployed 2 number of people in the labour force 40 number of people in the population 80 What is the unemployment rate? A 2.5% B 5% C 6.25% D 12.5%
1 marks
Answer: B
This question in 9708/13 May/June 2025
Q76 · Which statement about supply-side policies is correct? 9708/13 May/June 2025
24 Which statement about supply-side policies is correct? A They solve the problem of demand deficient unemployment. B They do not involve an opportunity cost. C They reduce unemployment but do not affect the price level. D They may reduce regional unemployment.
1 marks
Answer: D
This question in 9708/13 May/June 2025
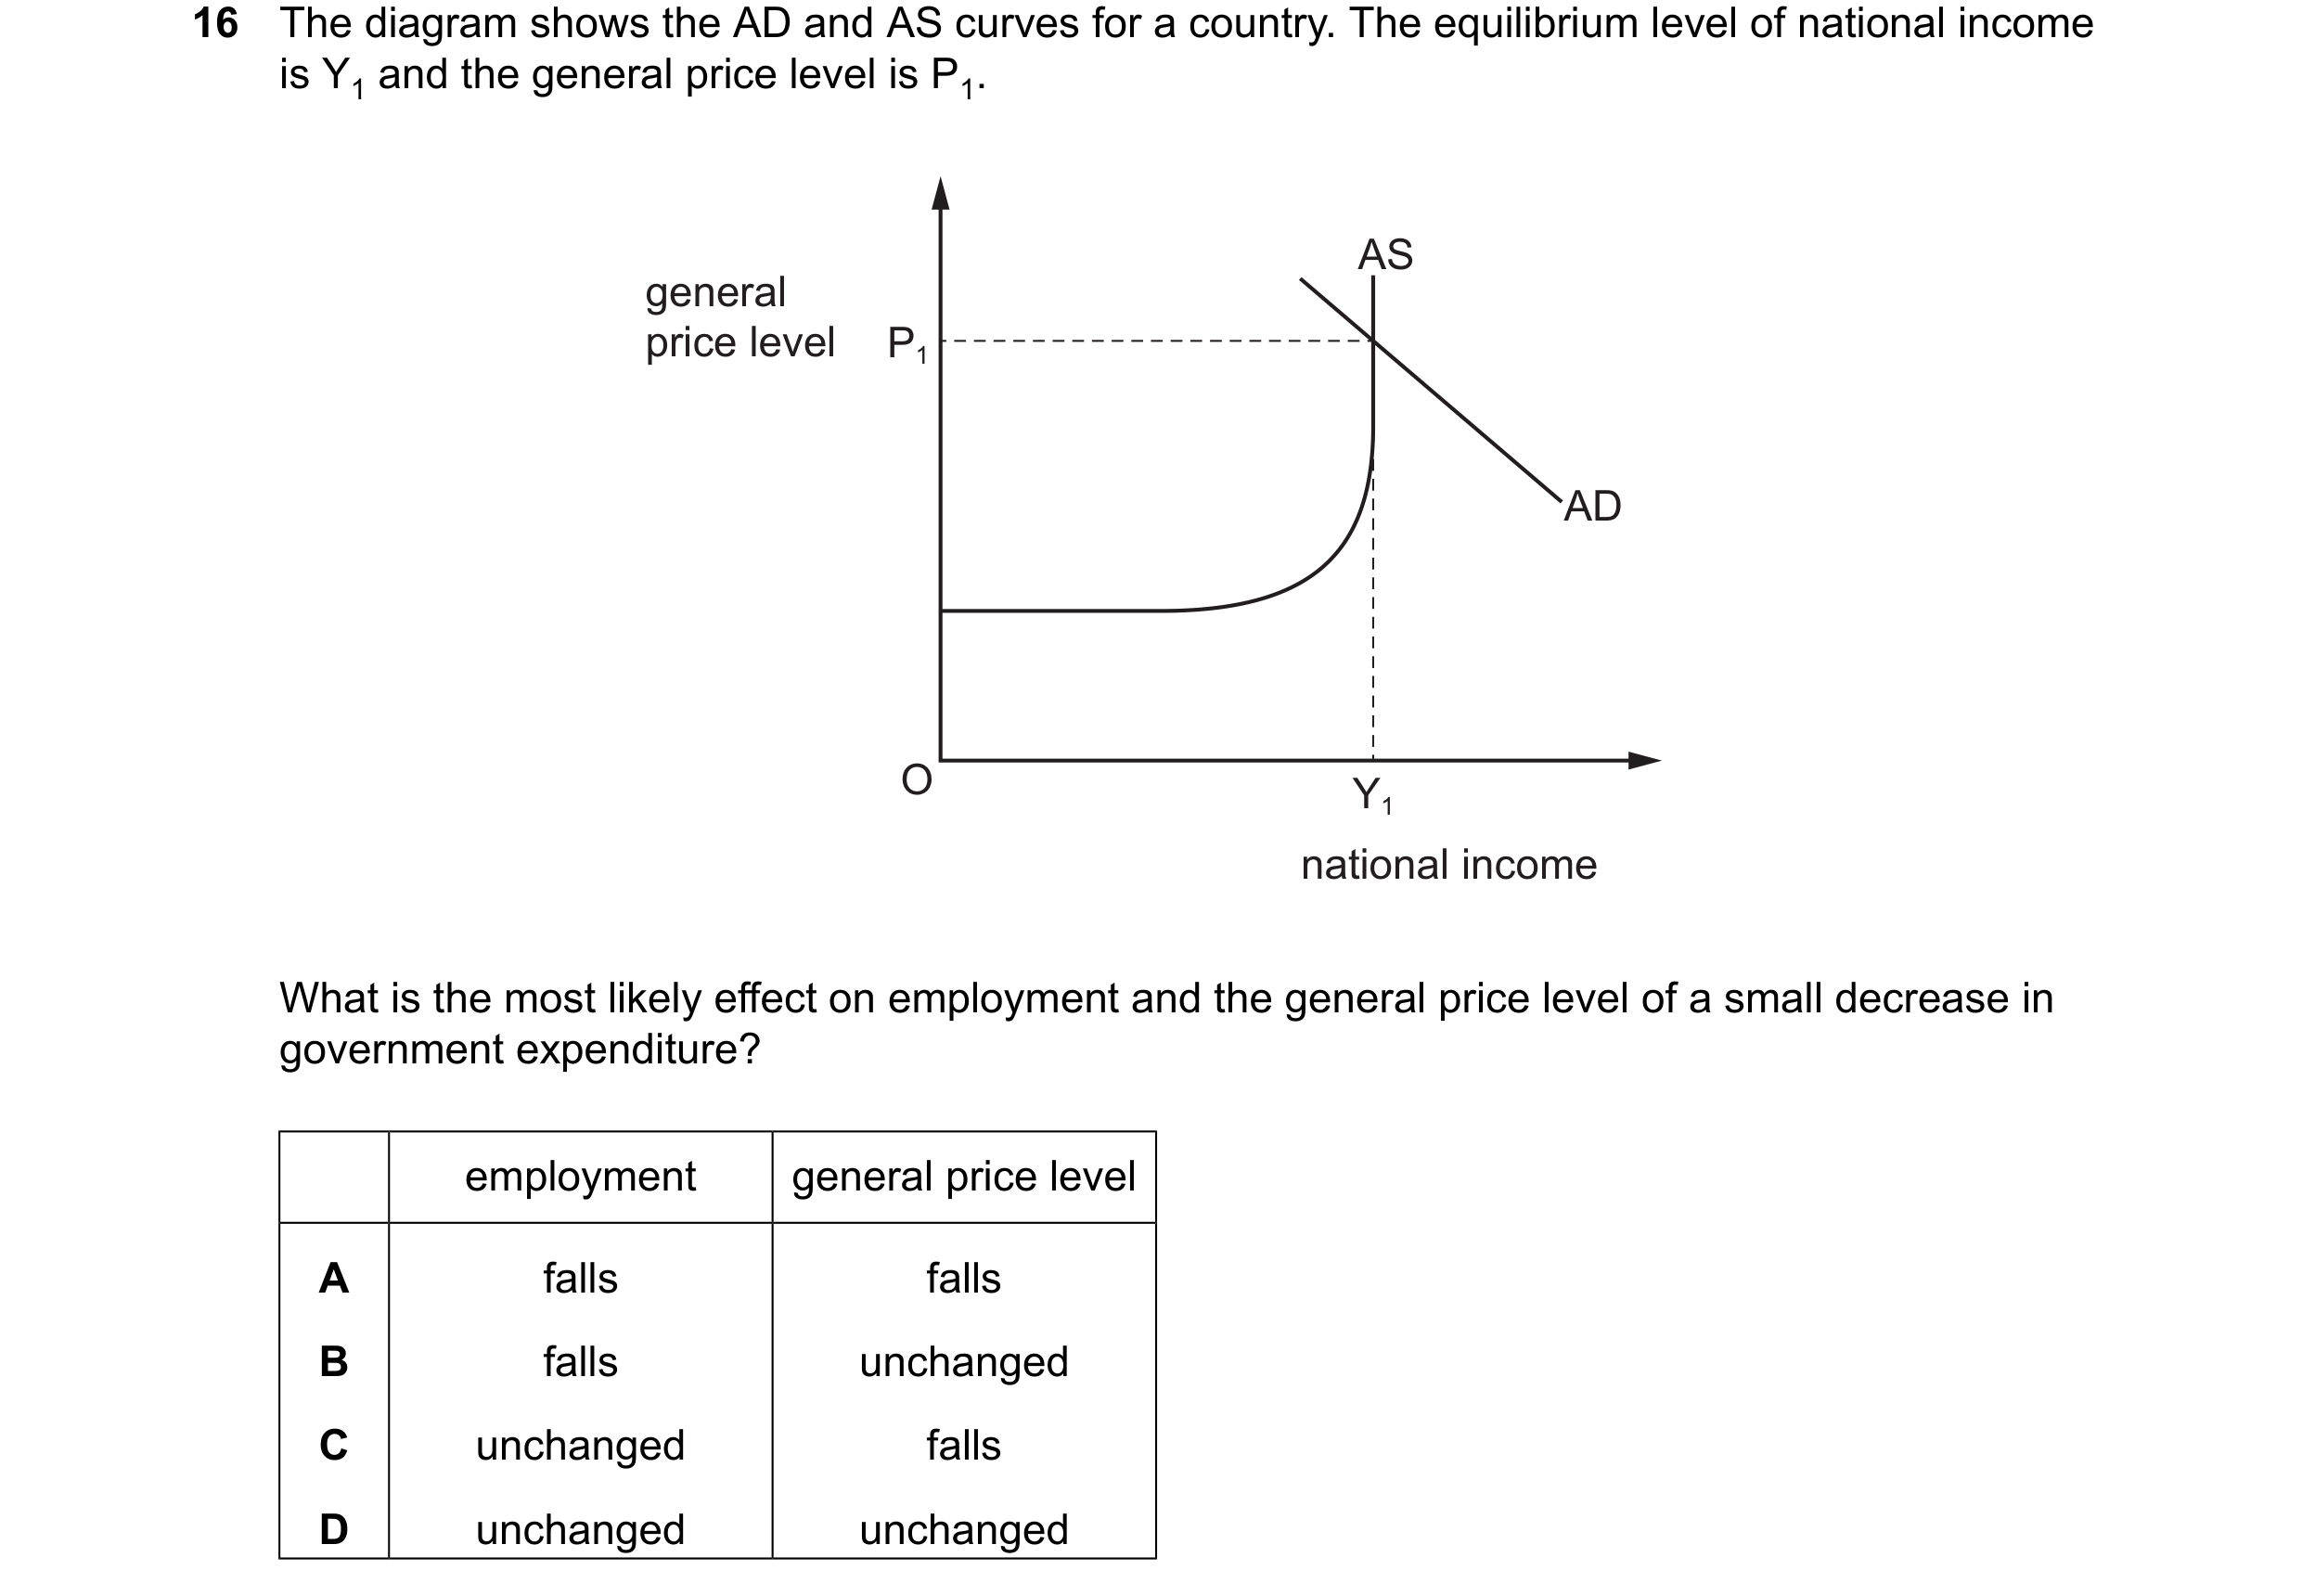
Q77 · The diagram shows the AD and AS curves for a country 9708/12 Oct/Nov 2025
16 The diagram shows the AD and AS curves for a country. The equilibrium level of national income is Y1 and the general price level is P1. AS general price level P1 AD O Y1 national income What is the most likely effect on employment and the general price level of a small decrease in government expenditure? employment general price level A falls falls B falls unchanged C unchanged falls D unchanged unchanged
1 marks
Answer: C
This question in 9708/12 Oct/Nov 2025
Q78 · A steel producer changes to electrically powered furnaces to reduce emissions of… 9708/13 Oct/Nov 2025
21 A steel producer changes to electrically powered furnaces to reduce emissions of greenhouse gases. This results in a loss of jobs. Which type of unemployment is caused? A cyclical B frictional C seasonal D technological
1 marks
Answer: D
This question in 9708/13 Oct/Nov 2025

 1 / 24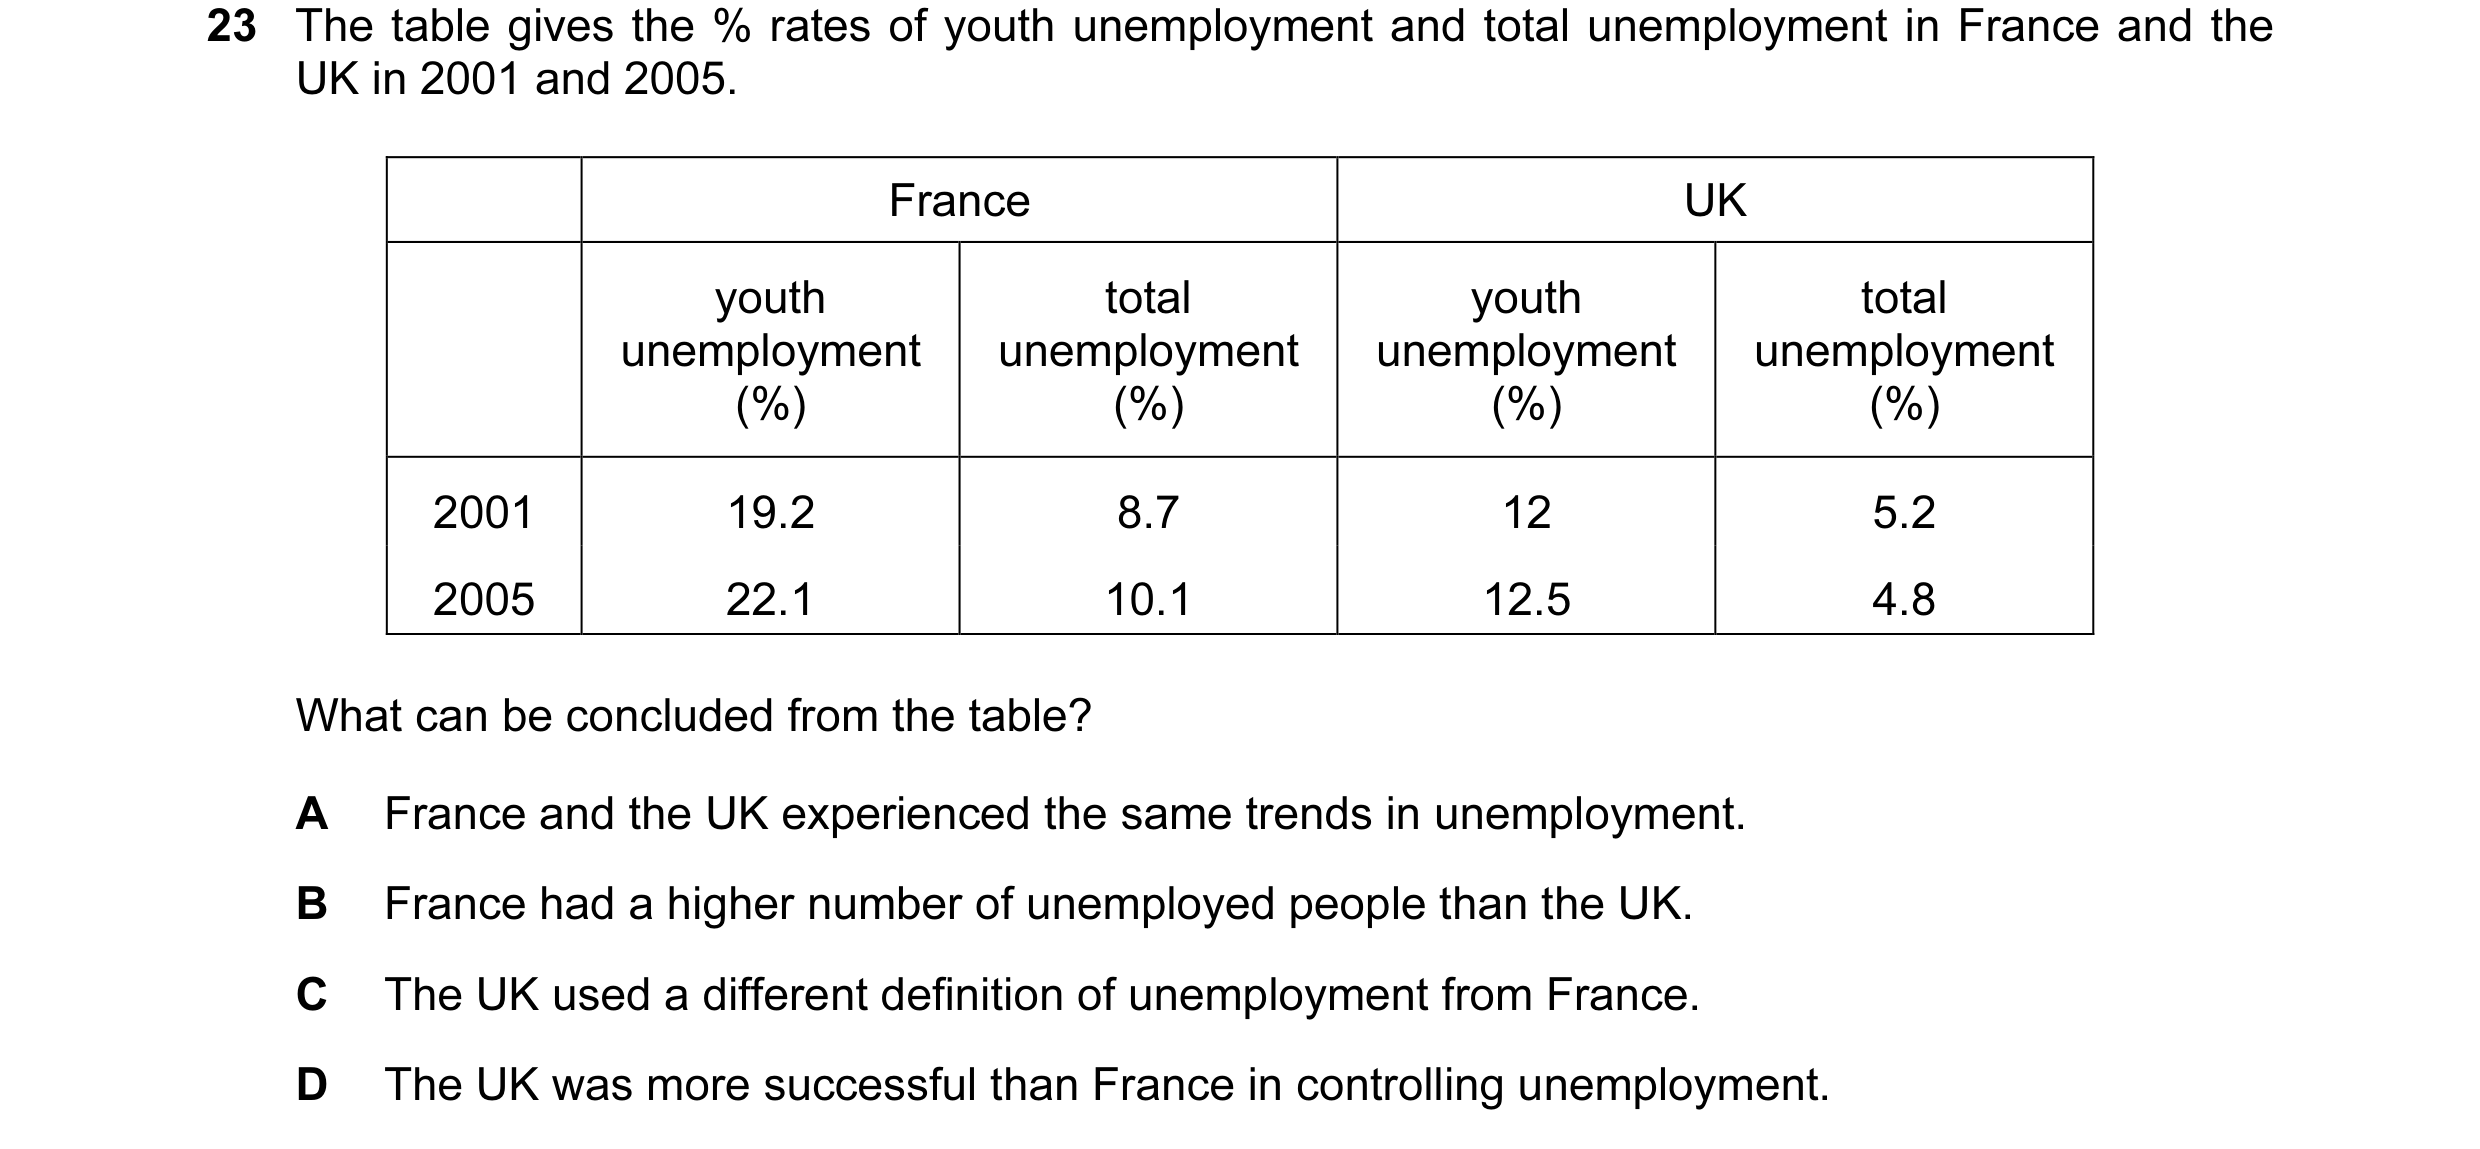

 2 / 24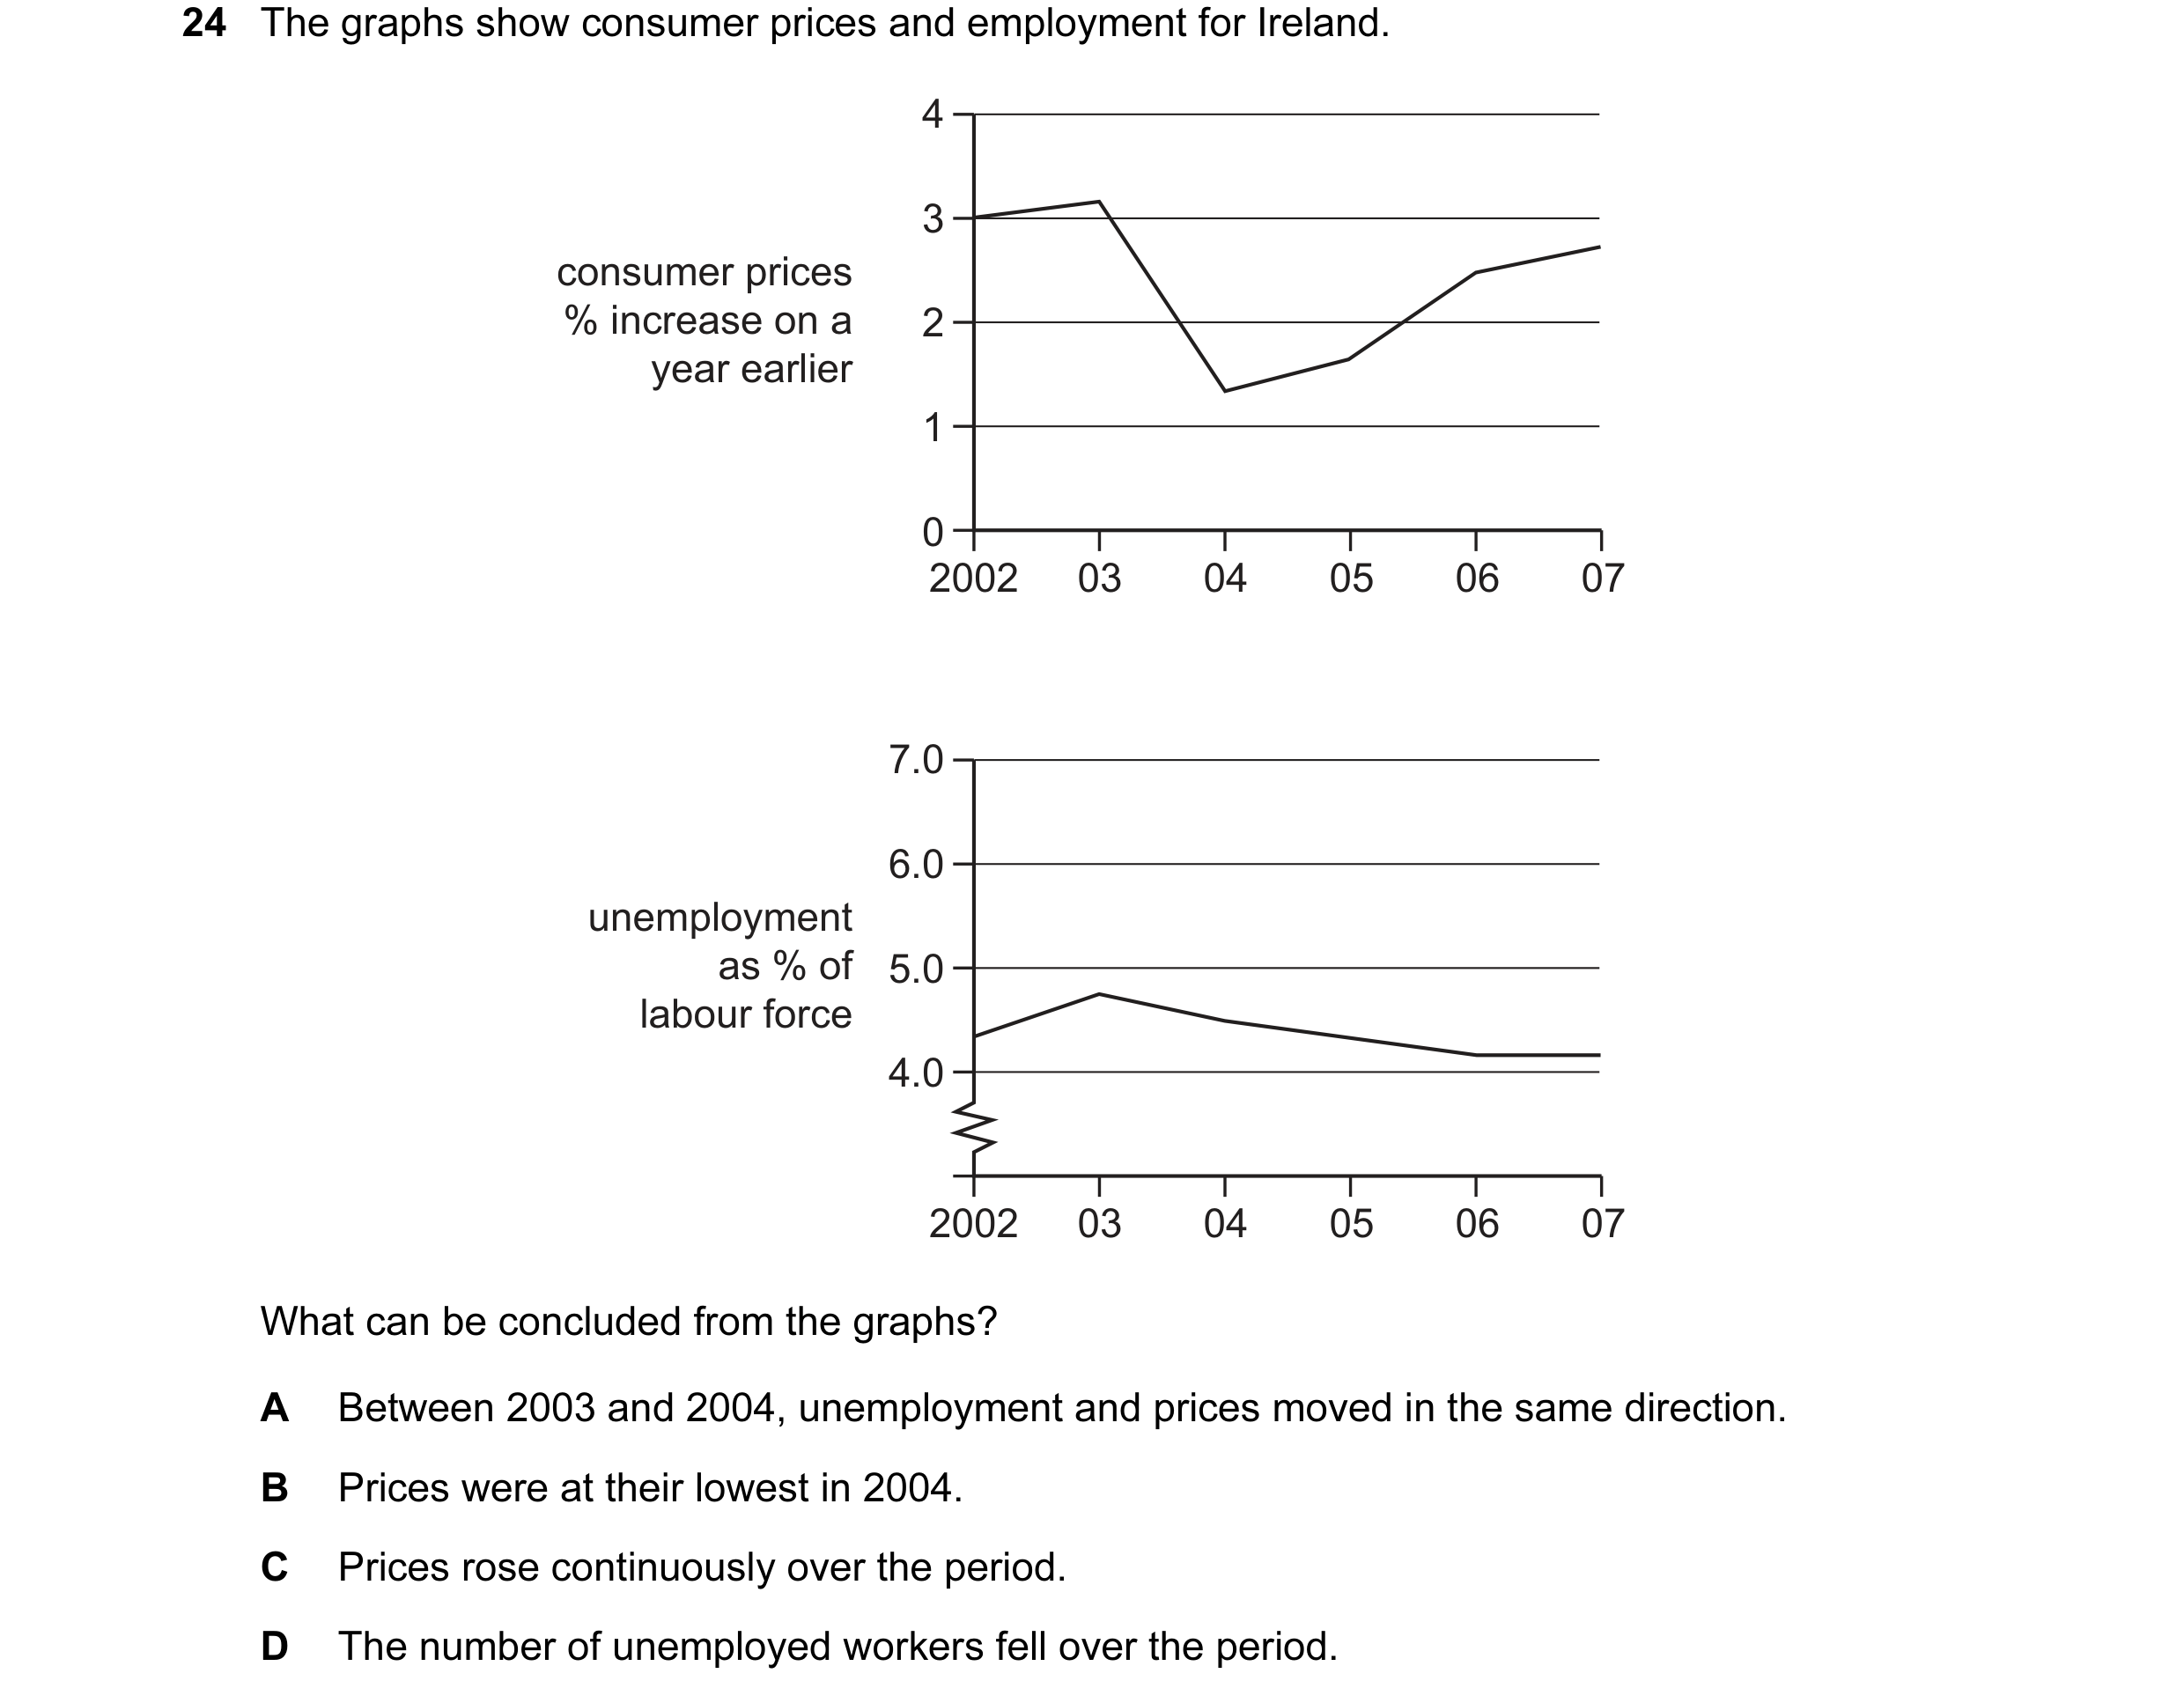
 3 / 24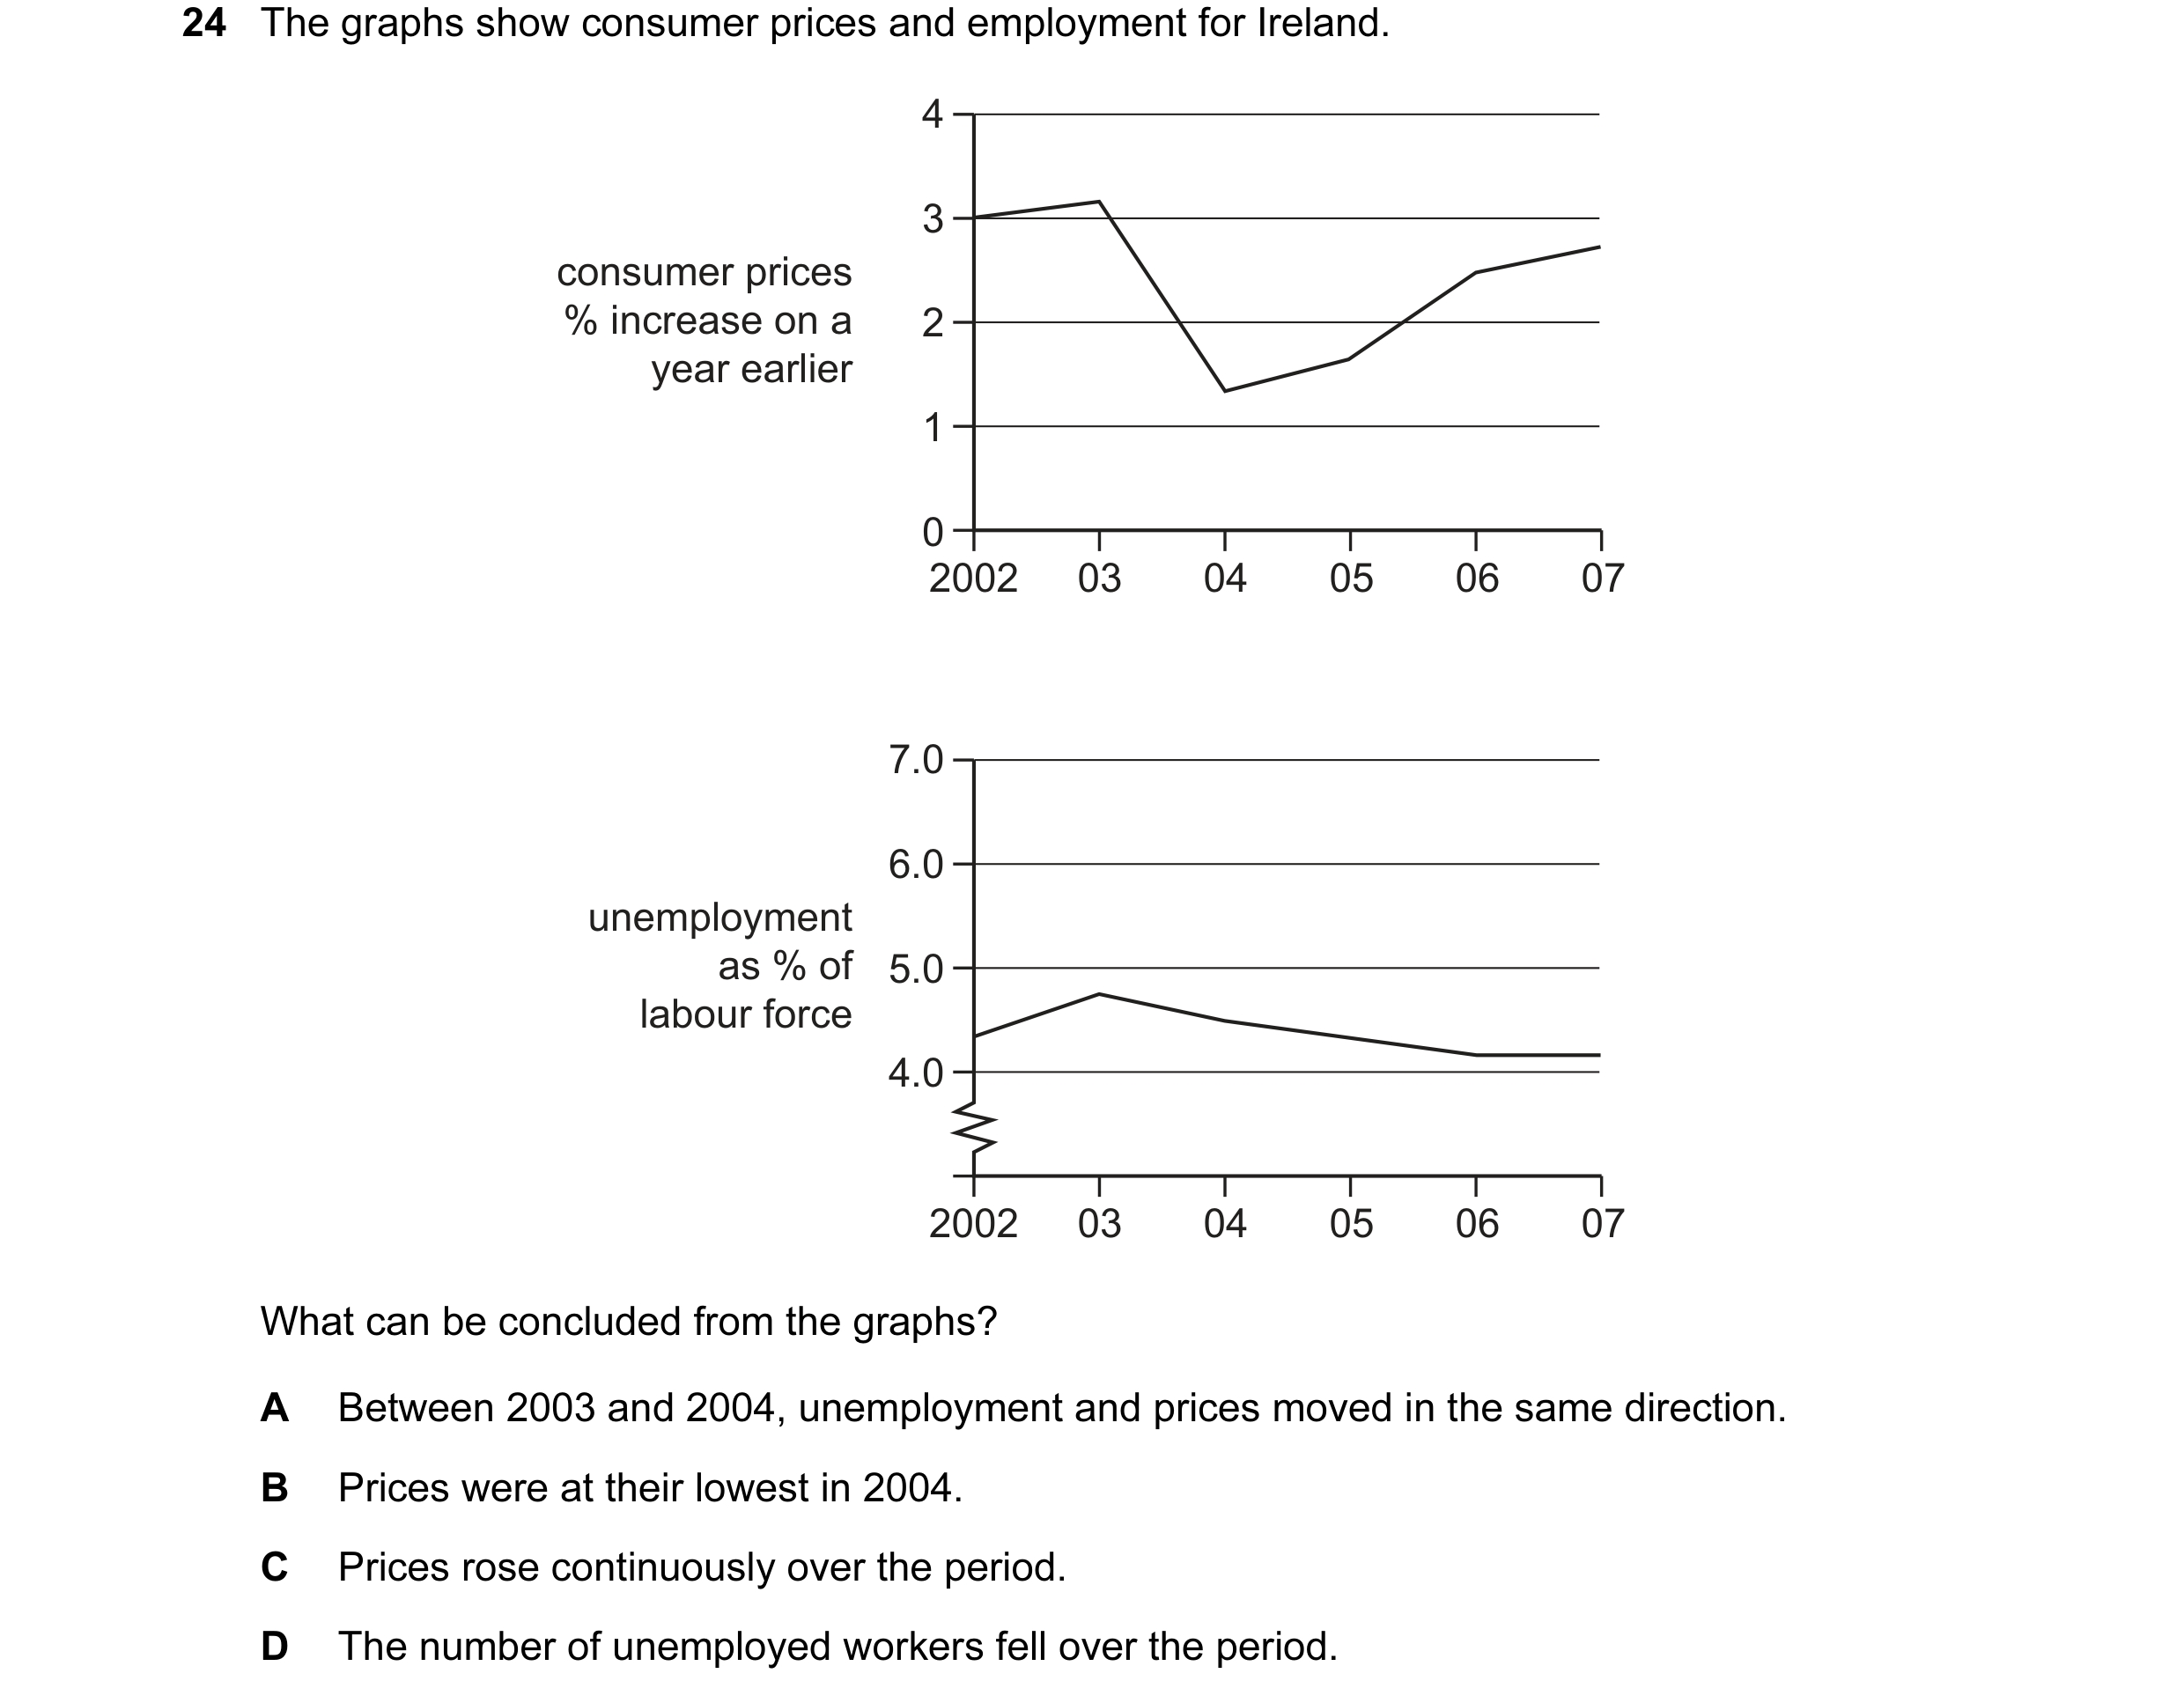
 4 / 24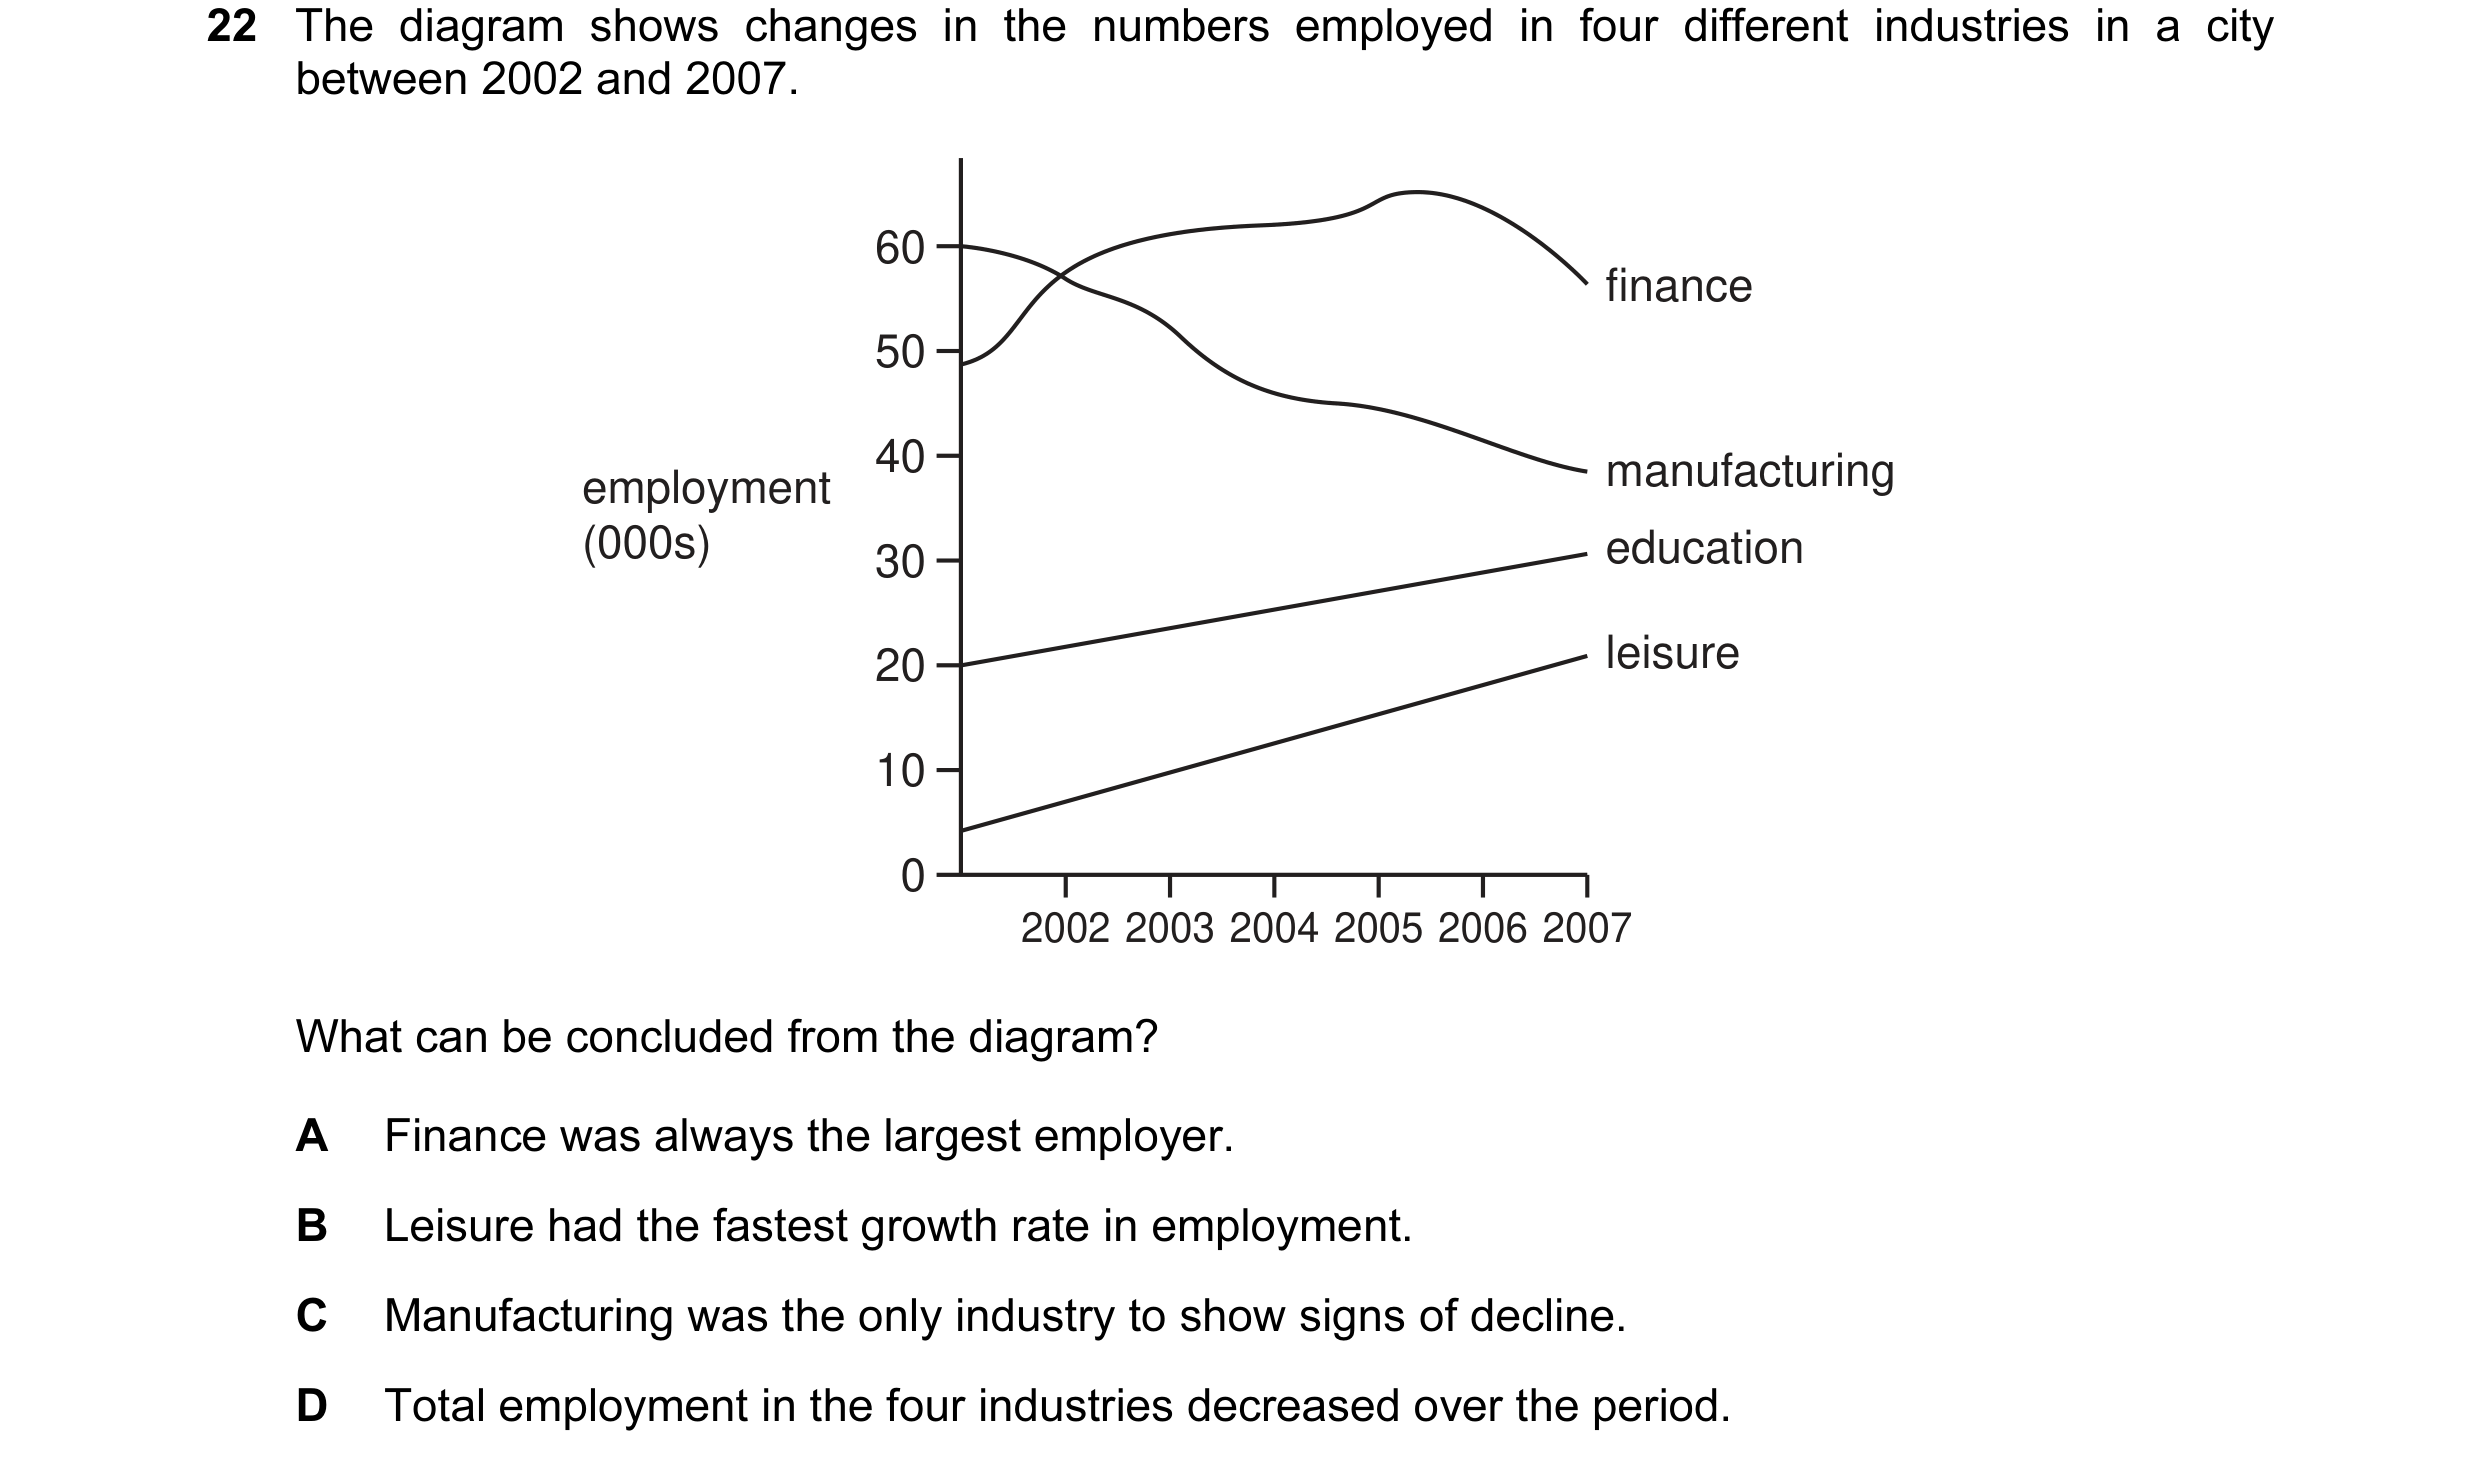
 5 / 24


 6 / 24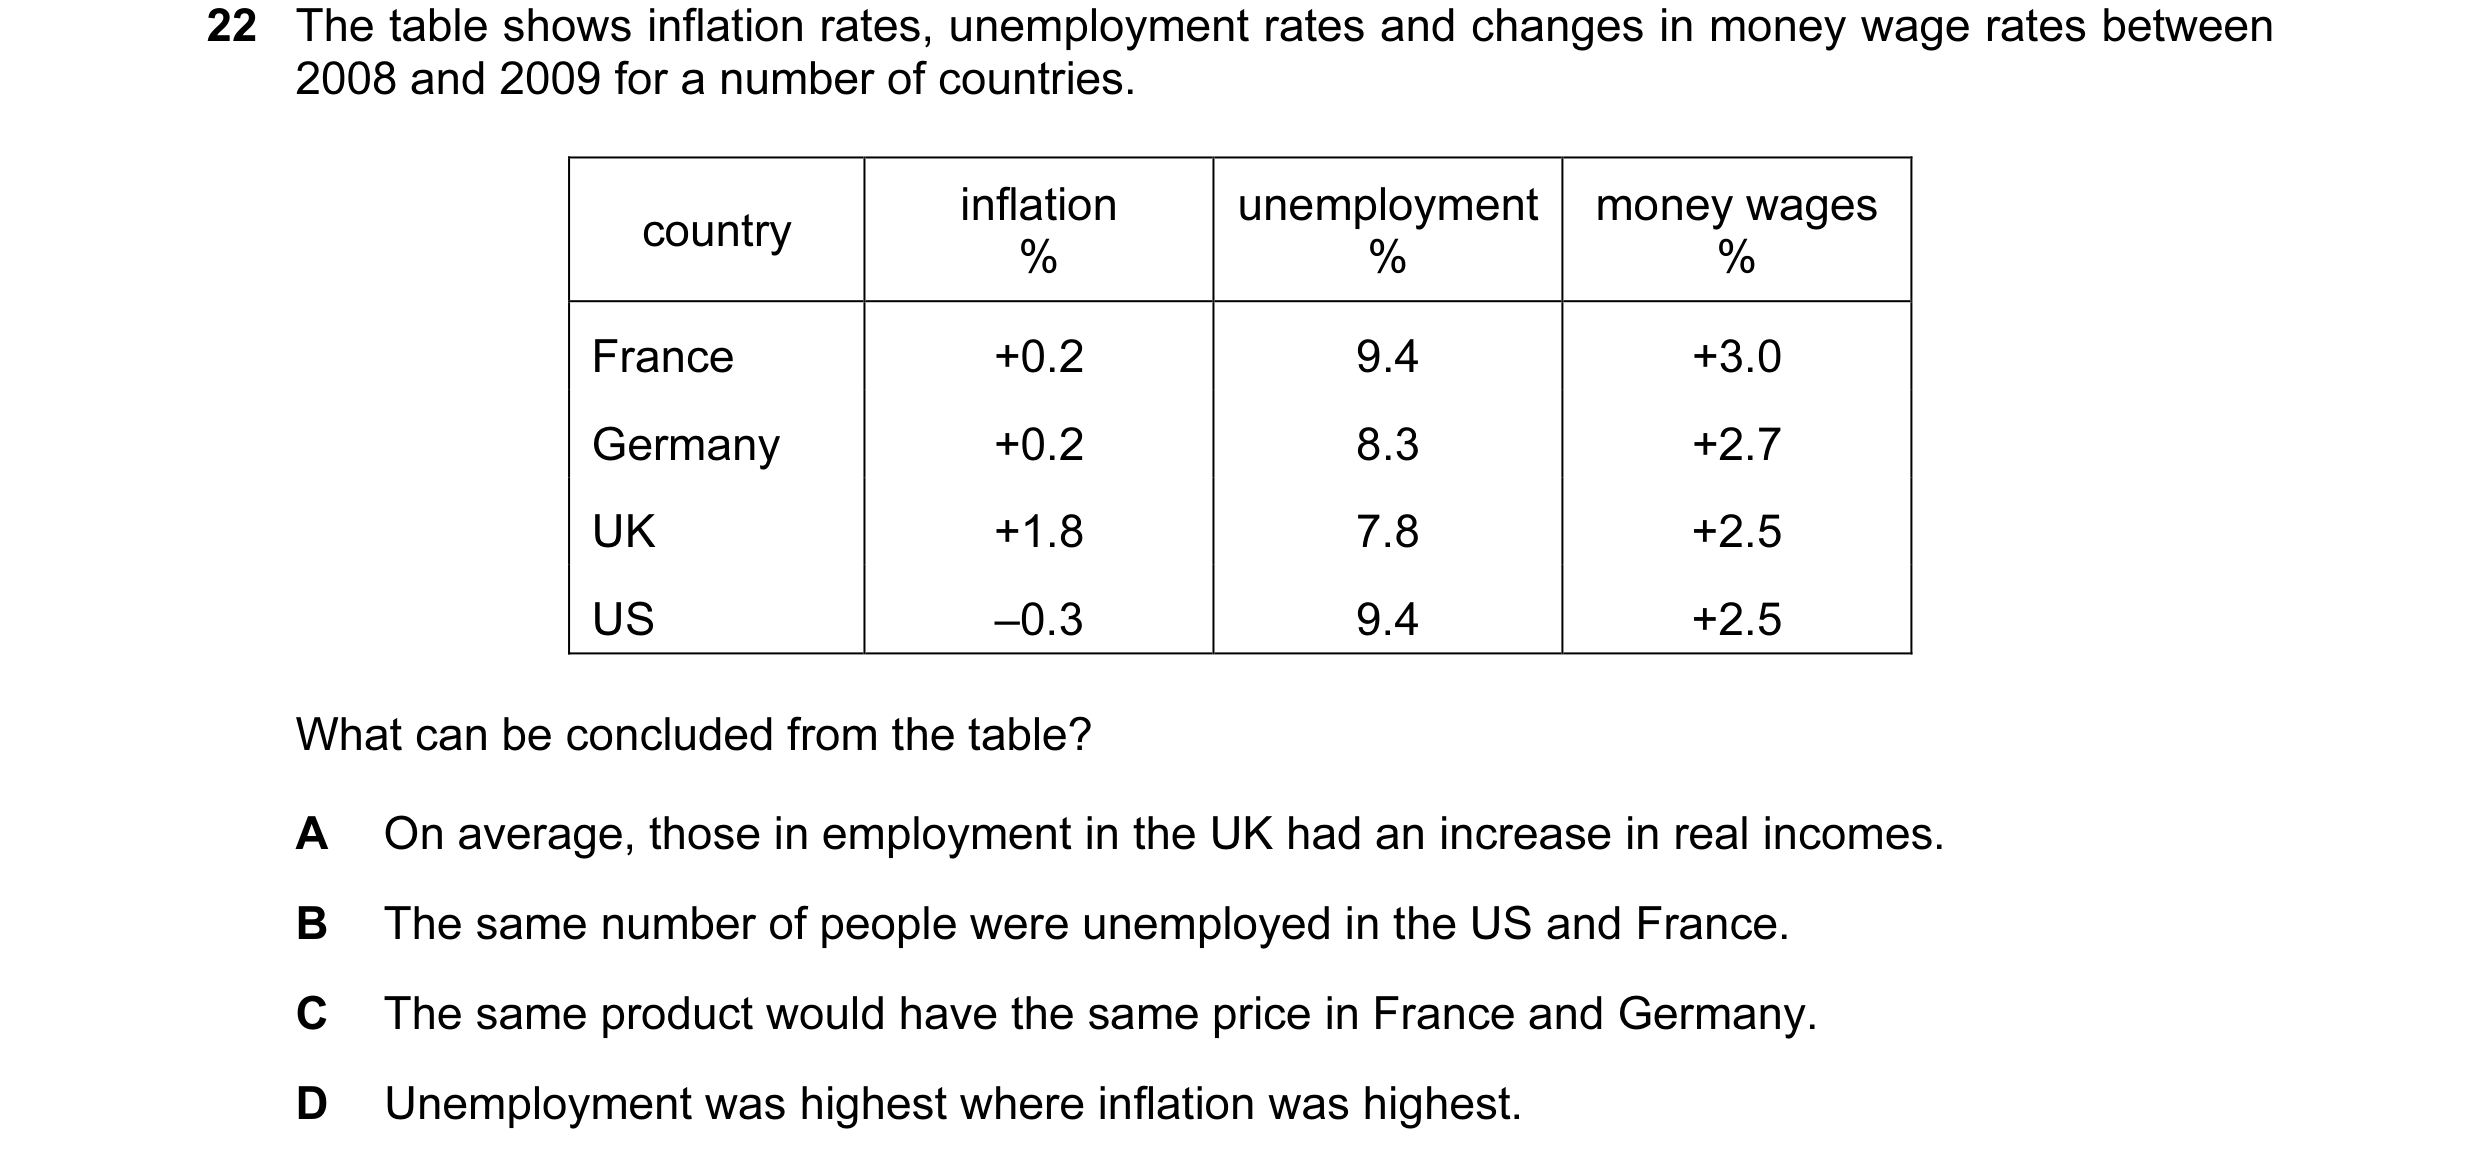
 7 / 24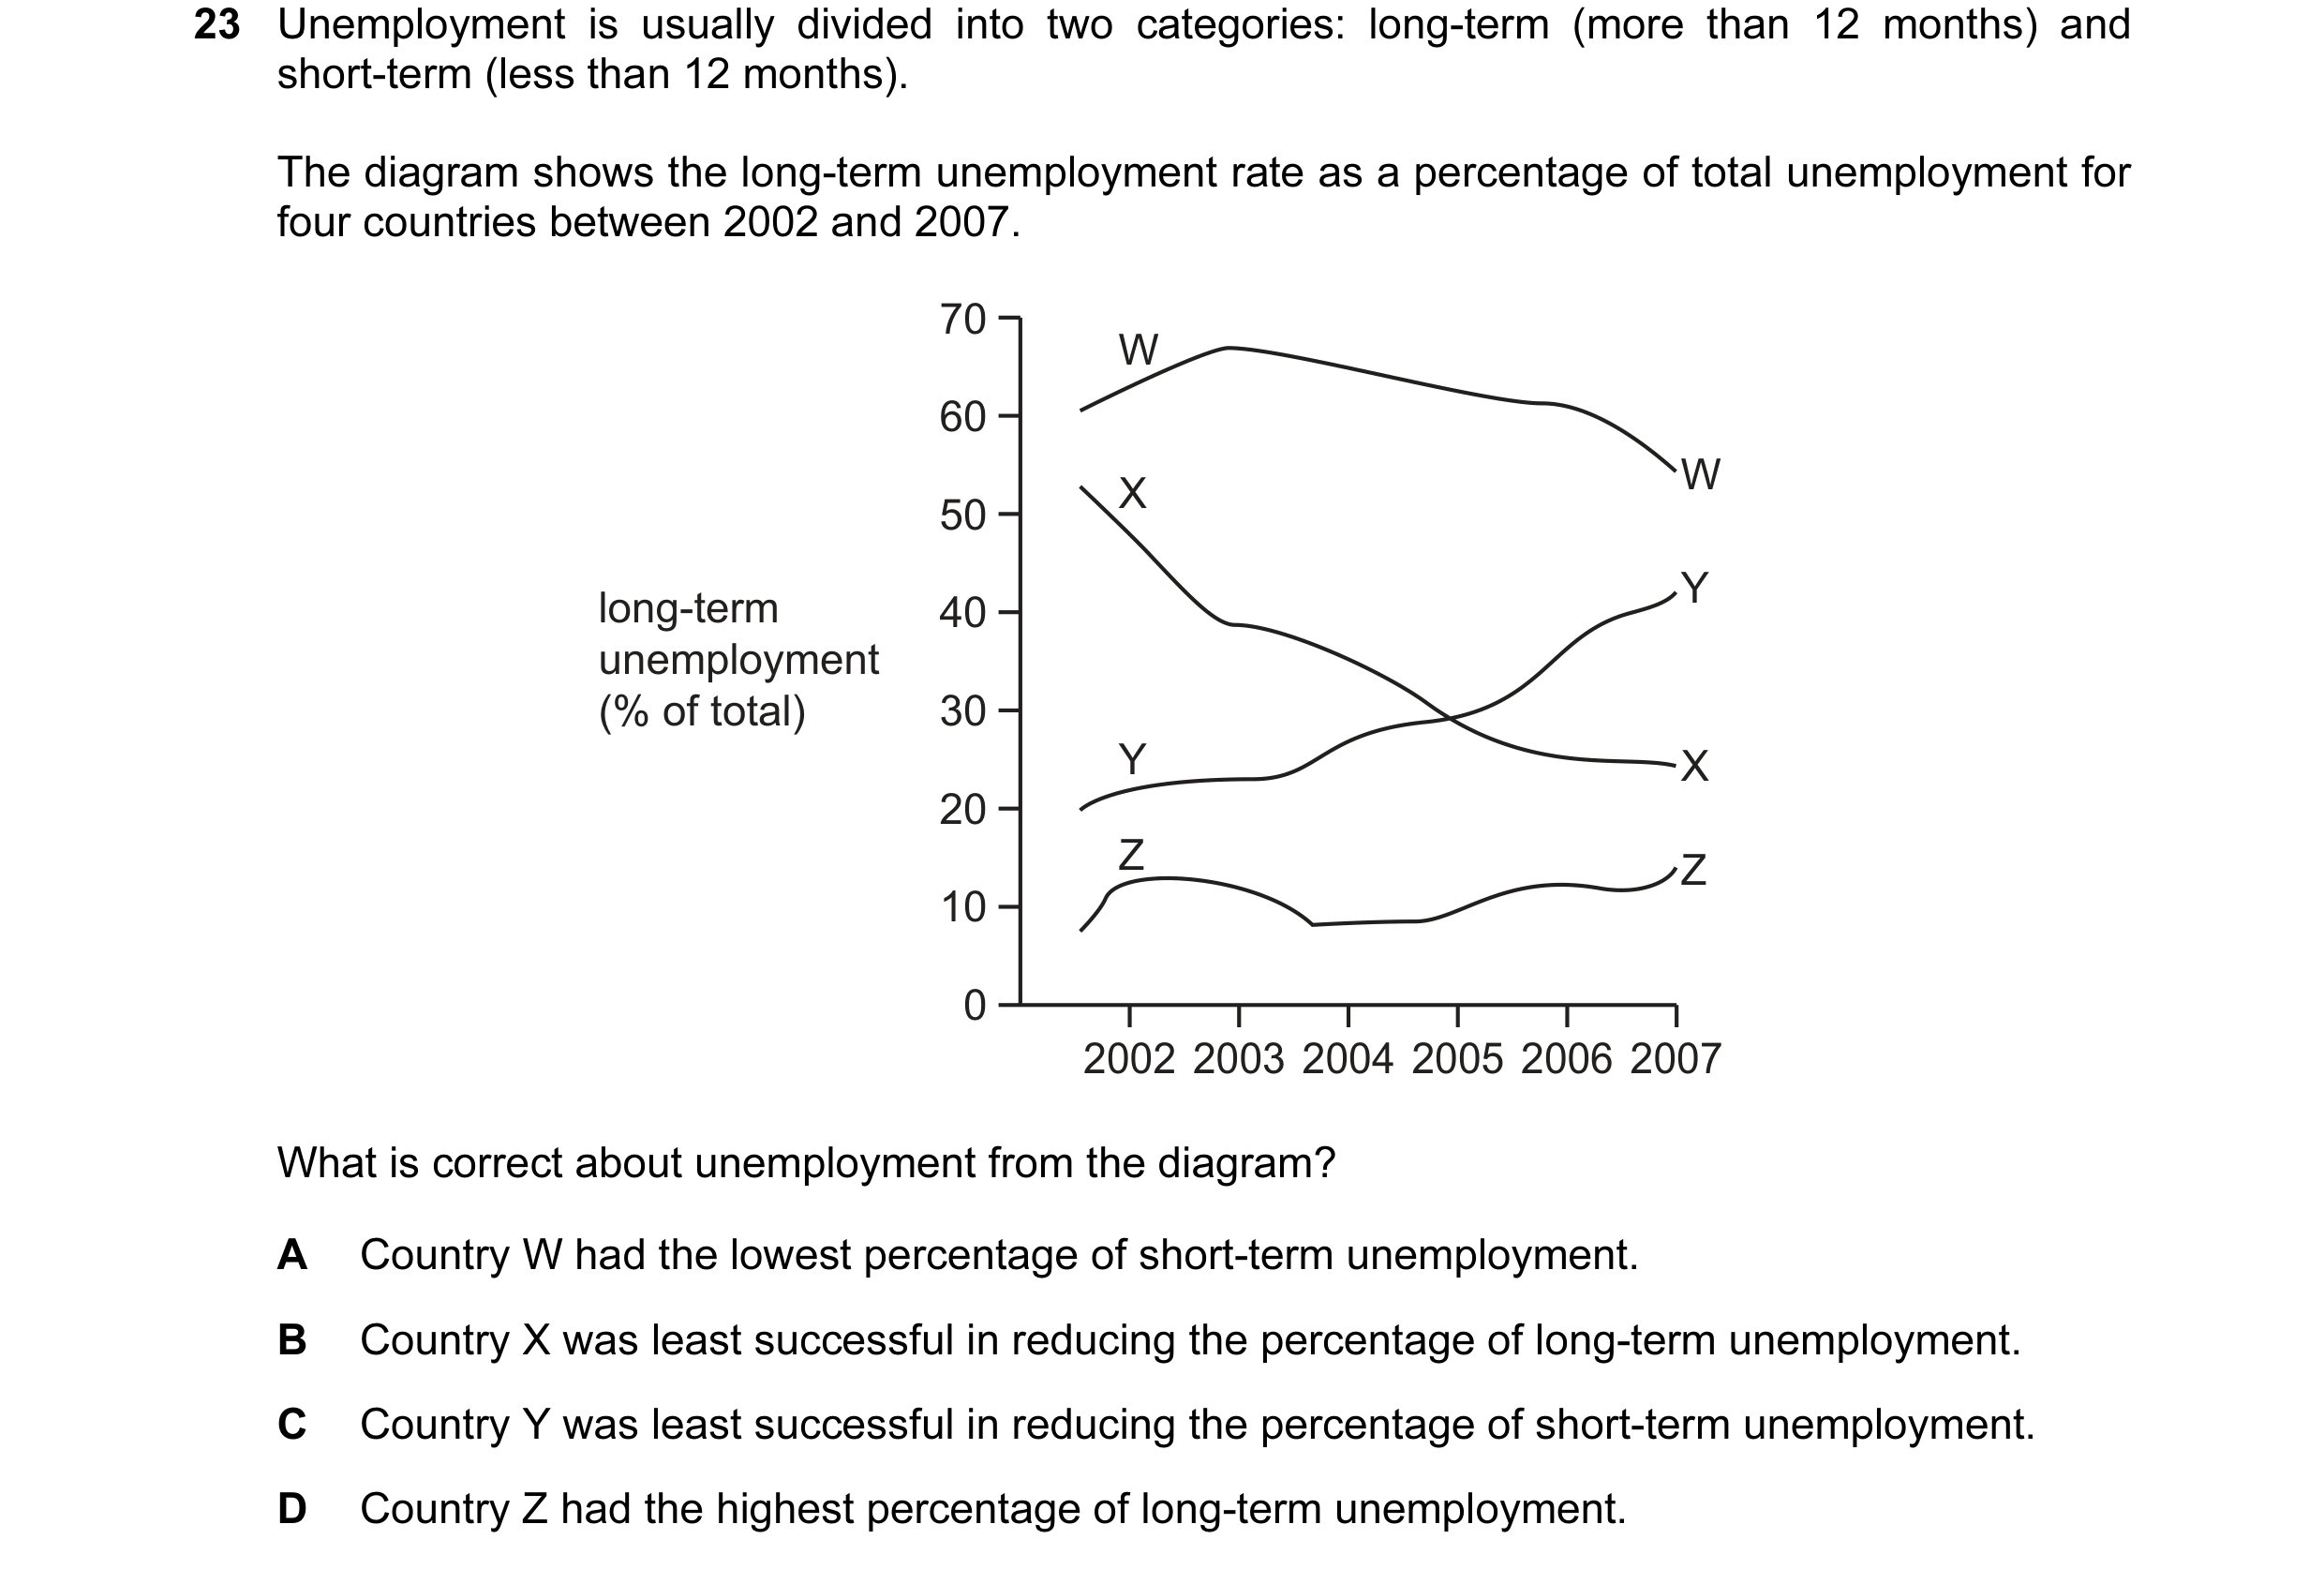
 8 / 24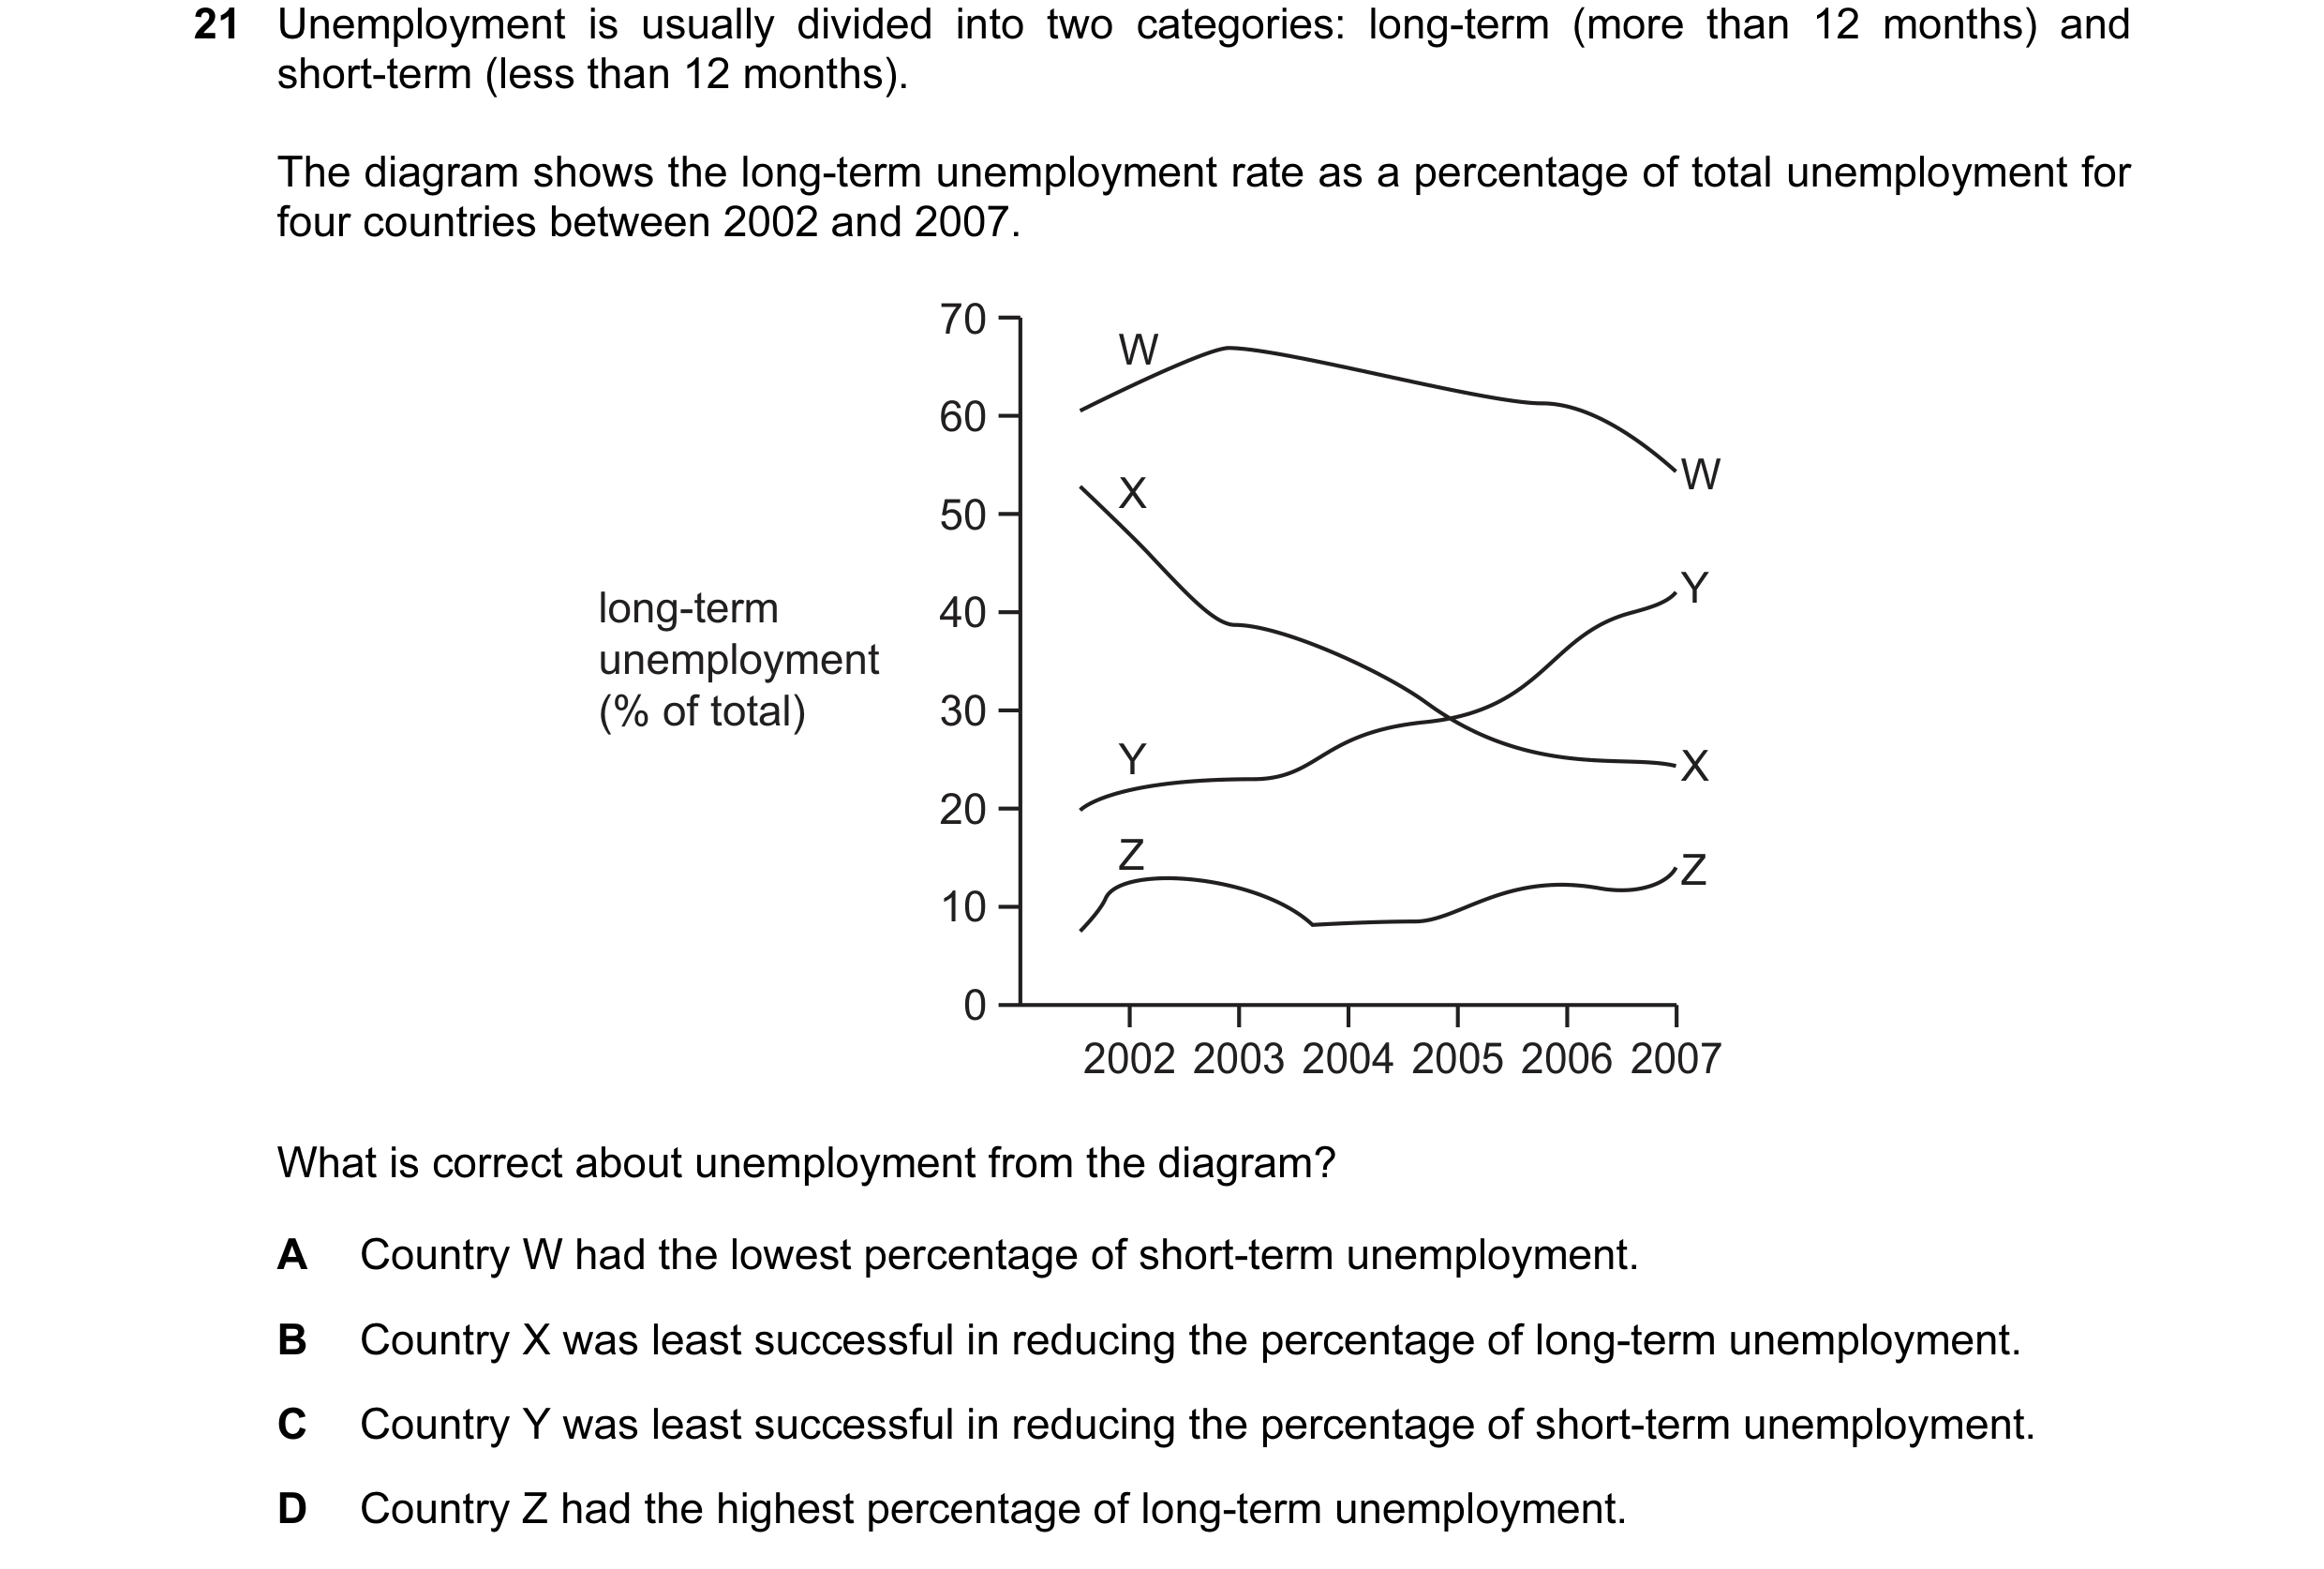
 9 / 24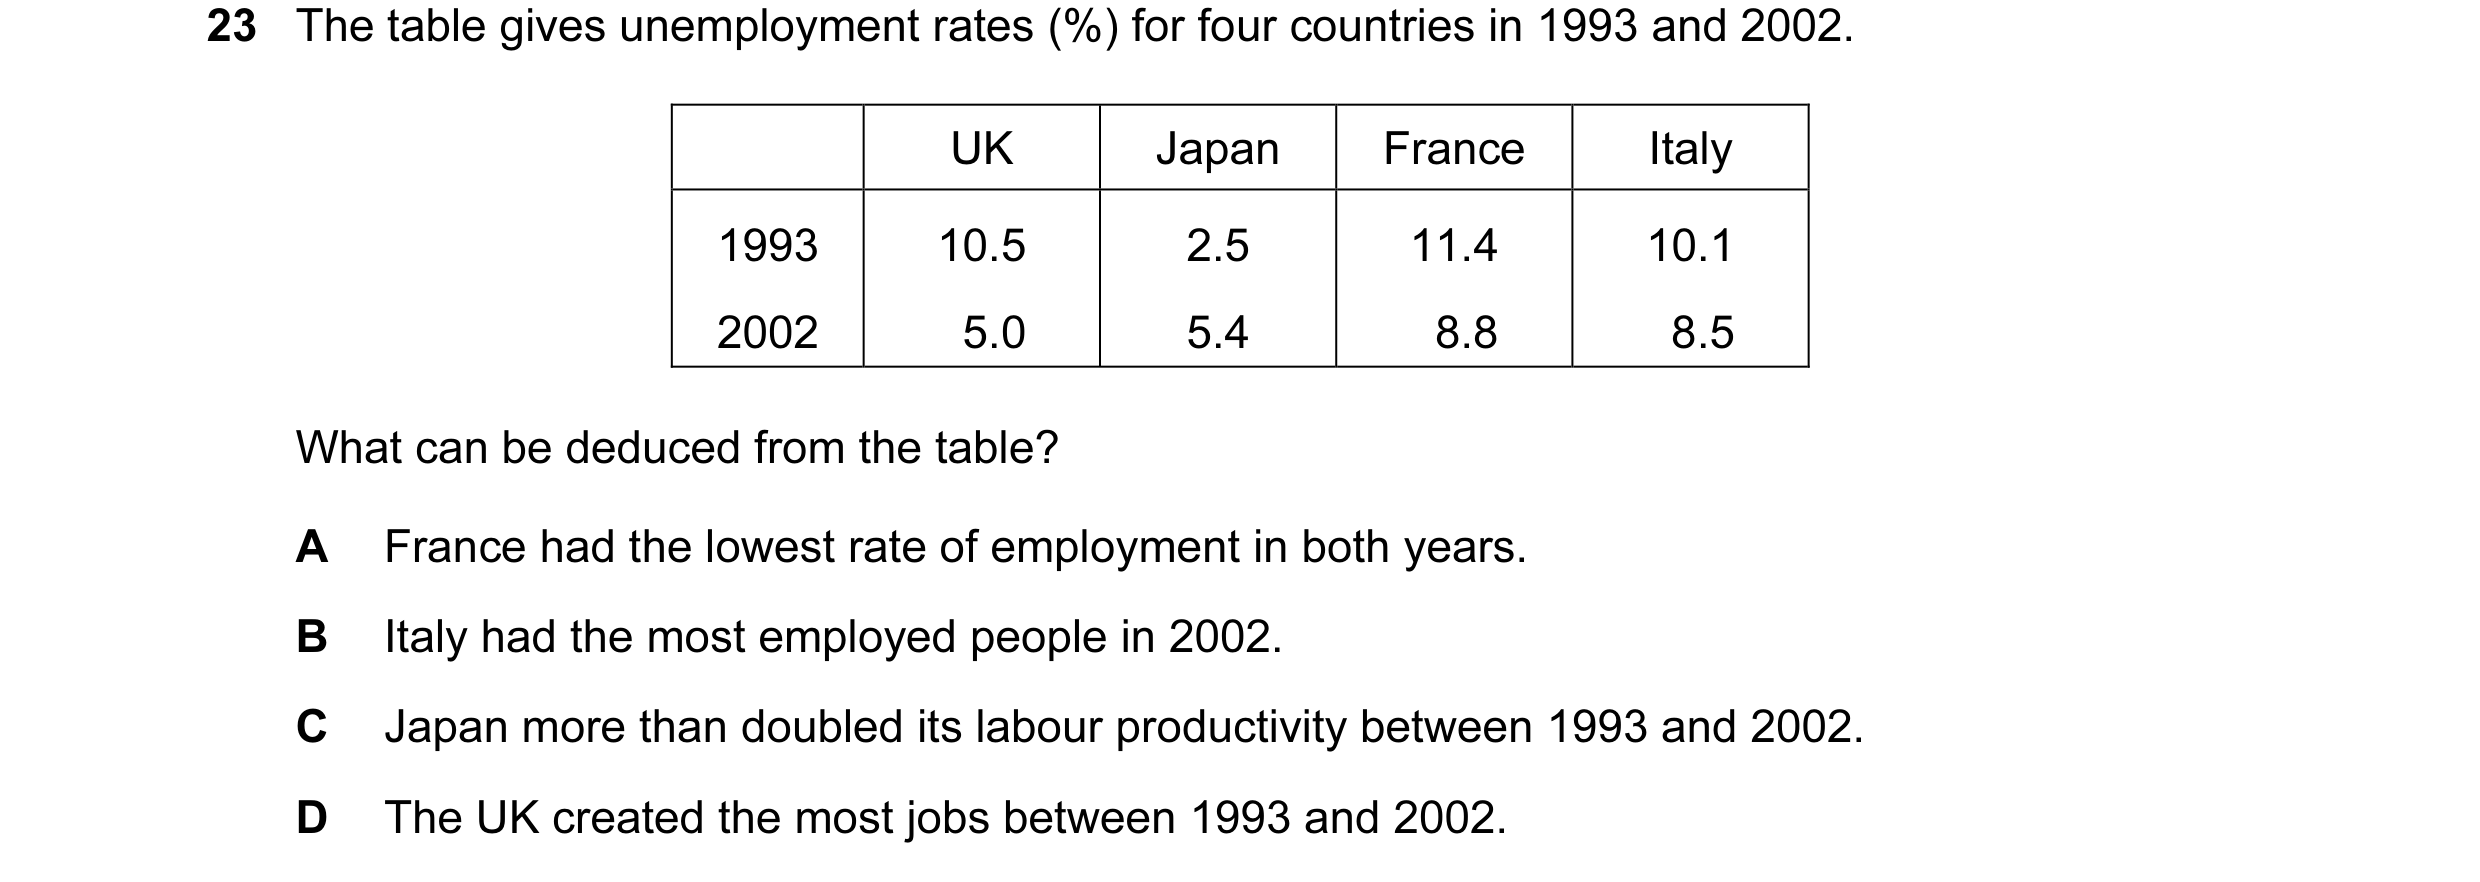

 10 / 24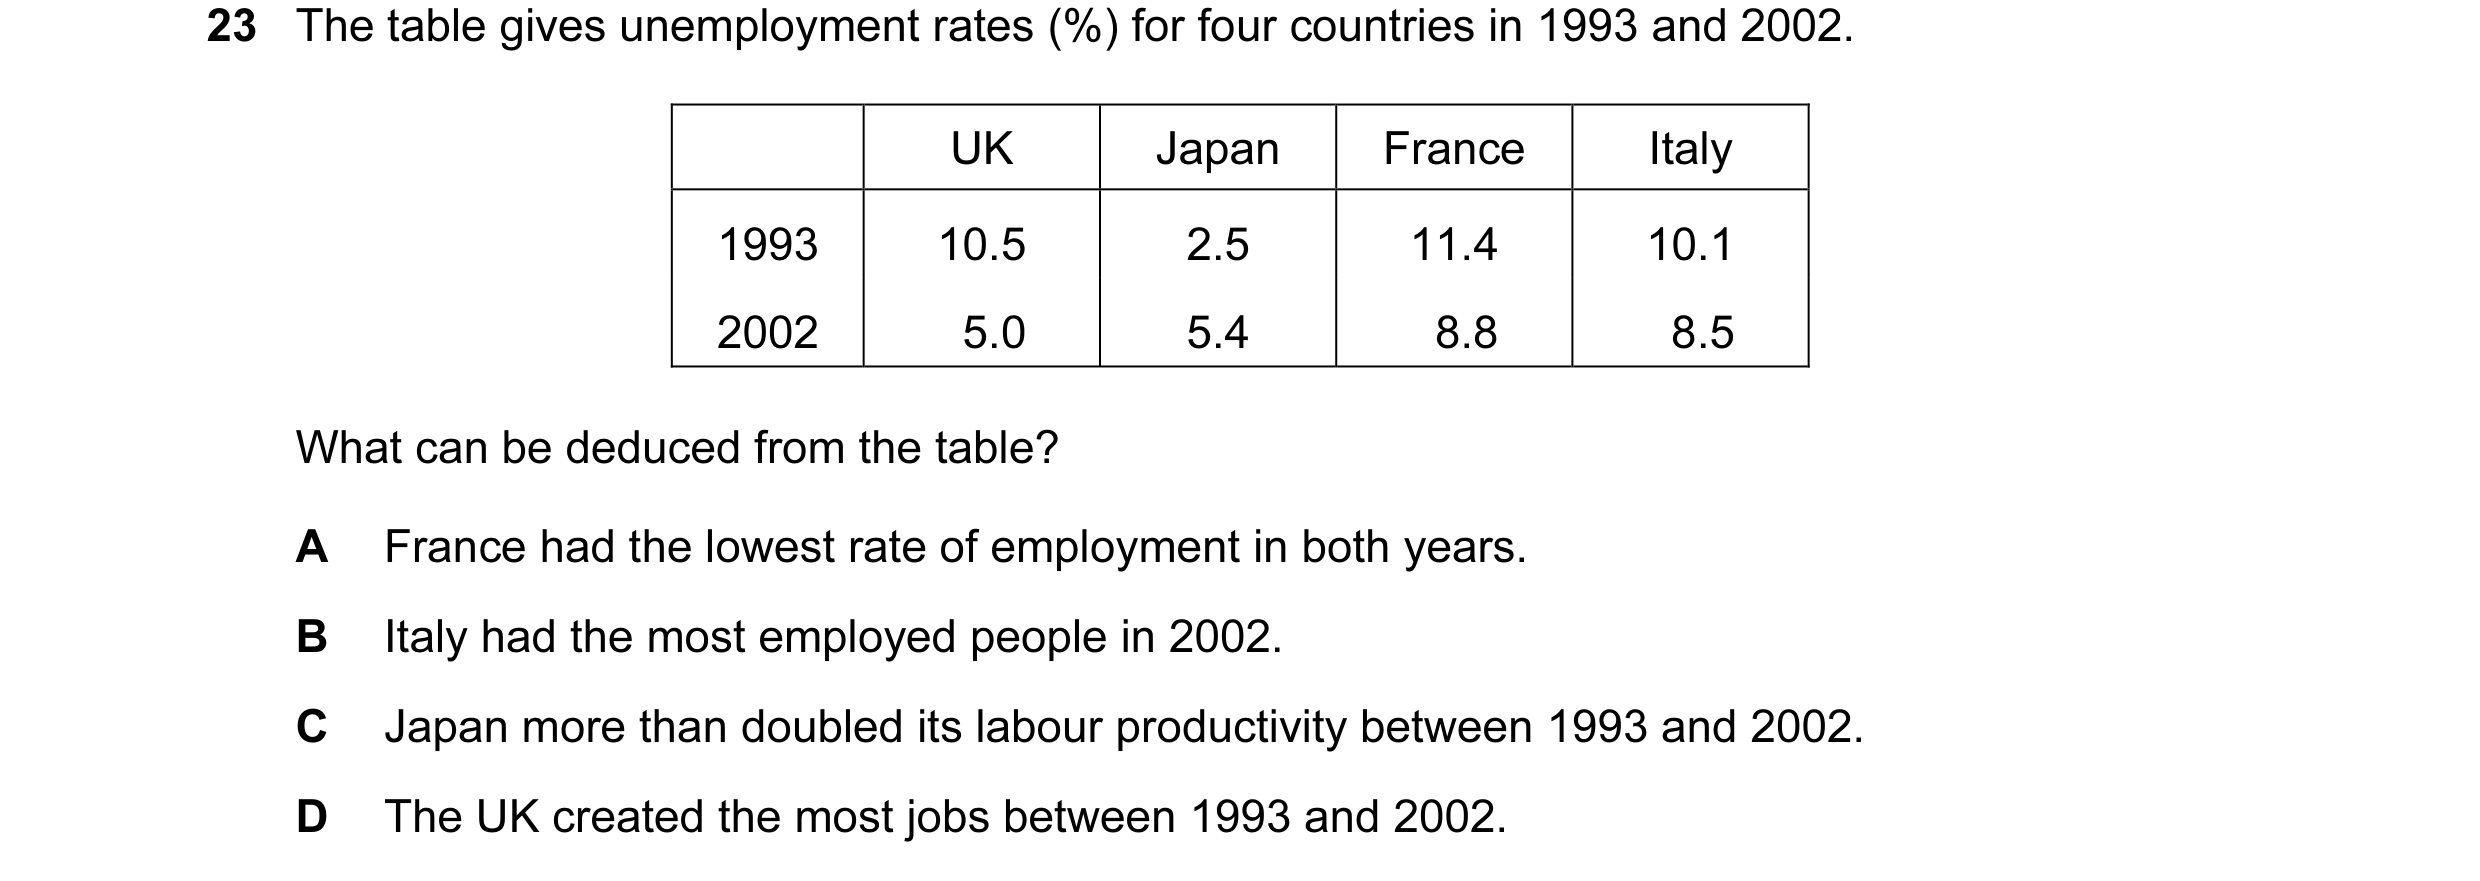
 11 / 24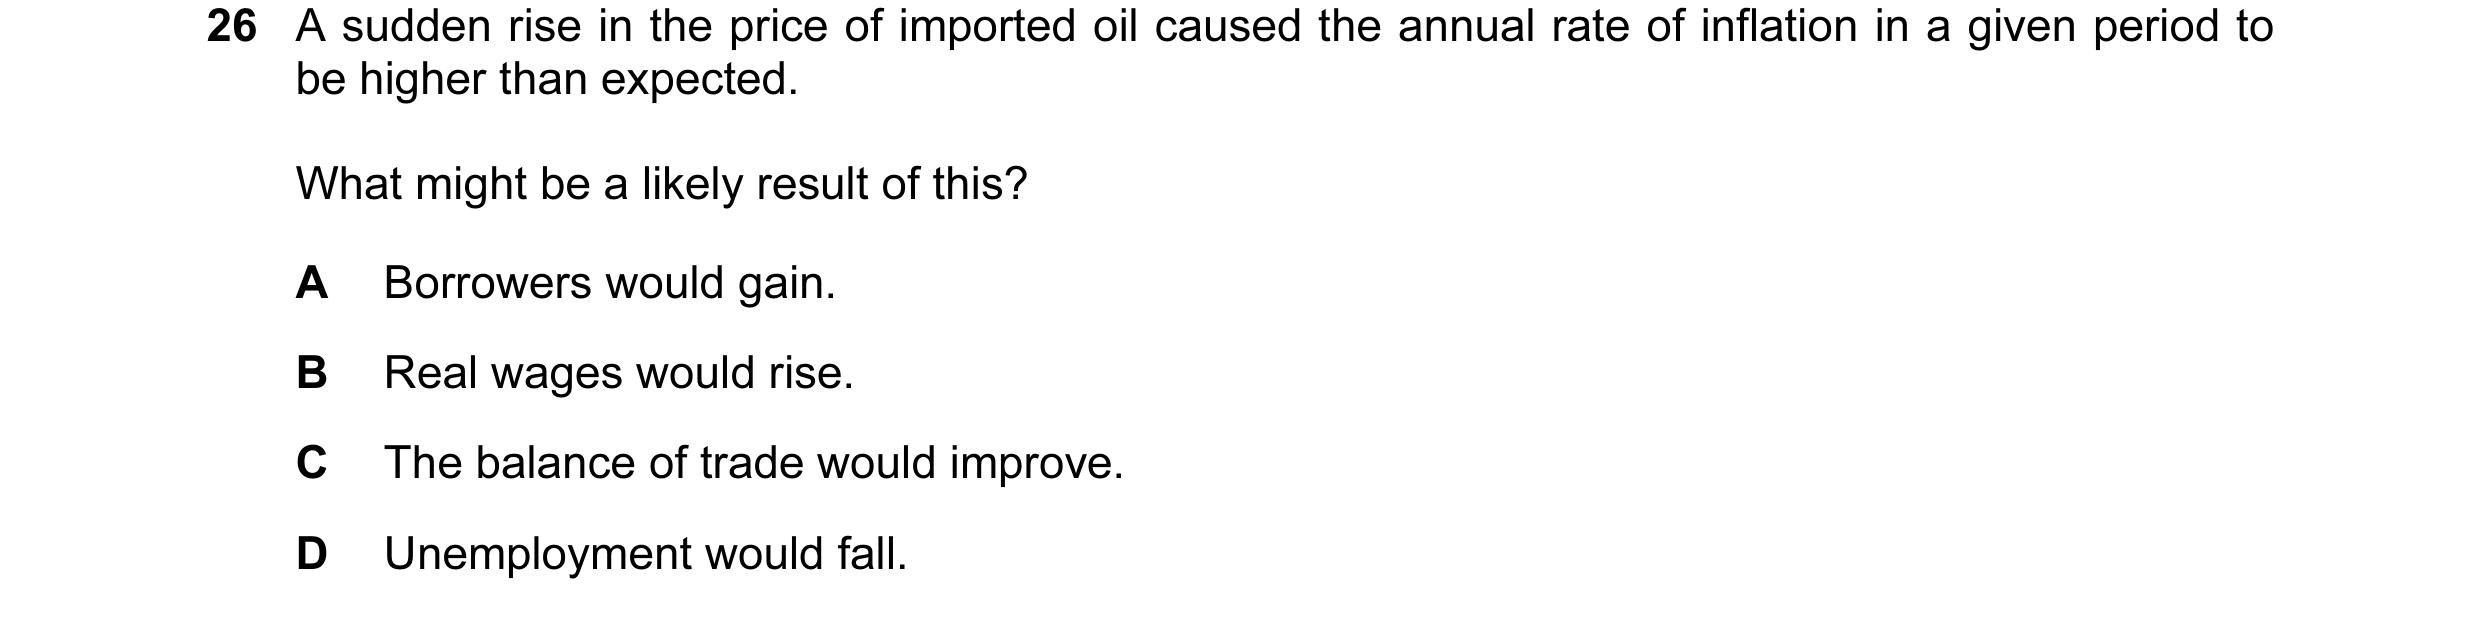
 12 / 24




 13 / 24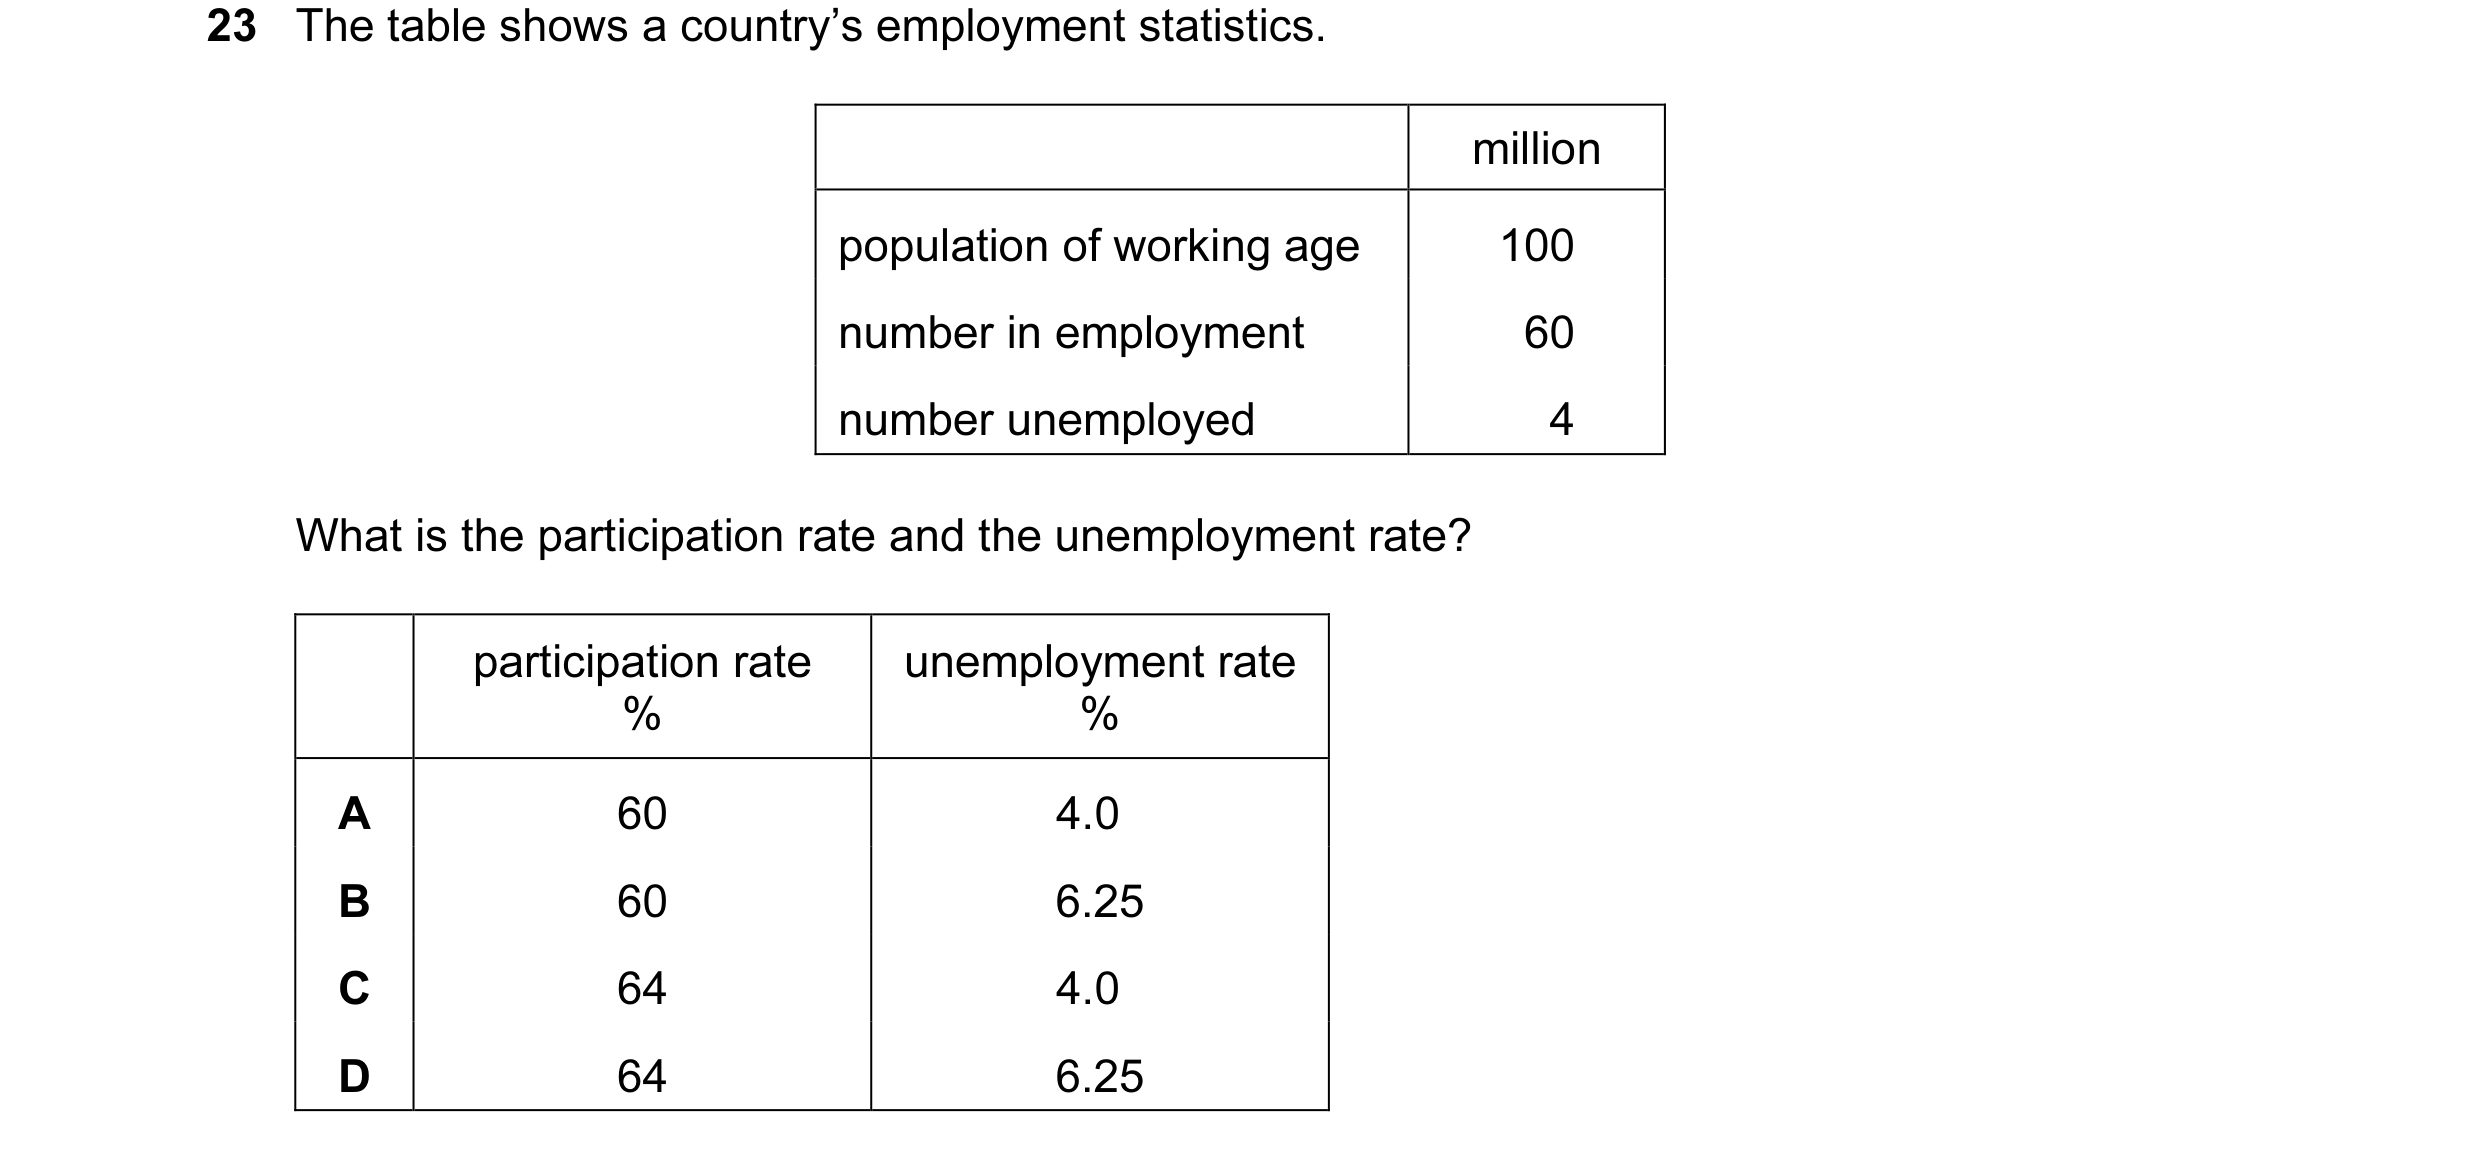
 14 / 24
 15 / 24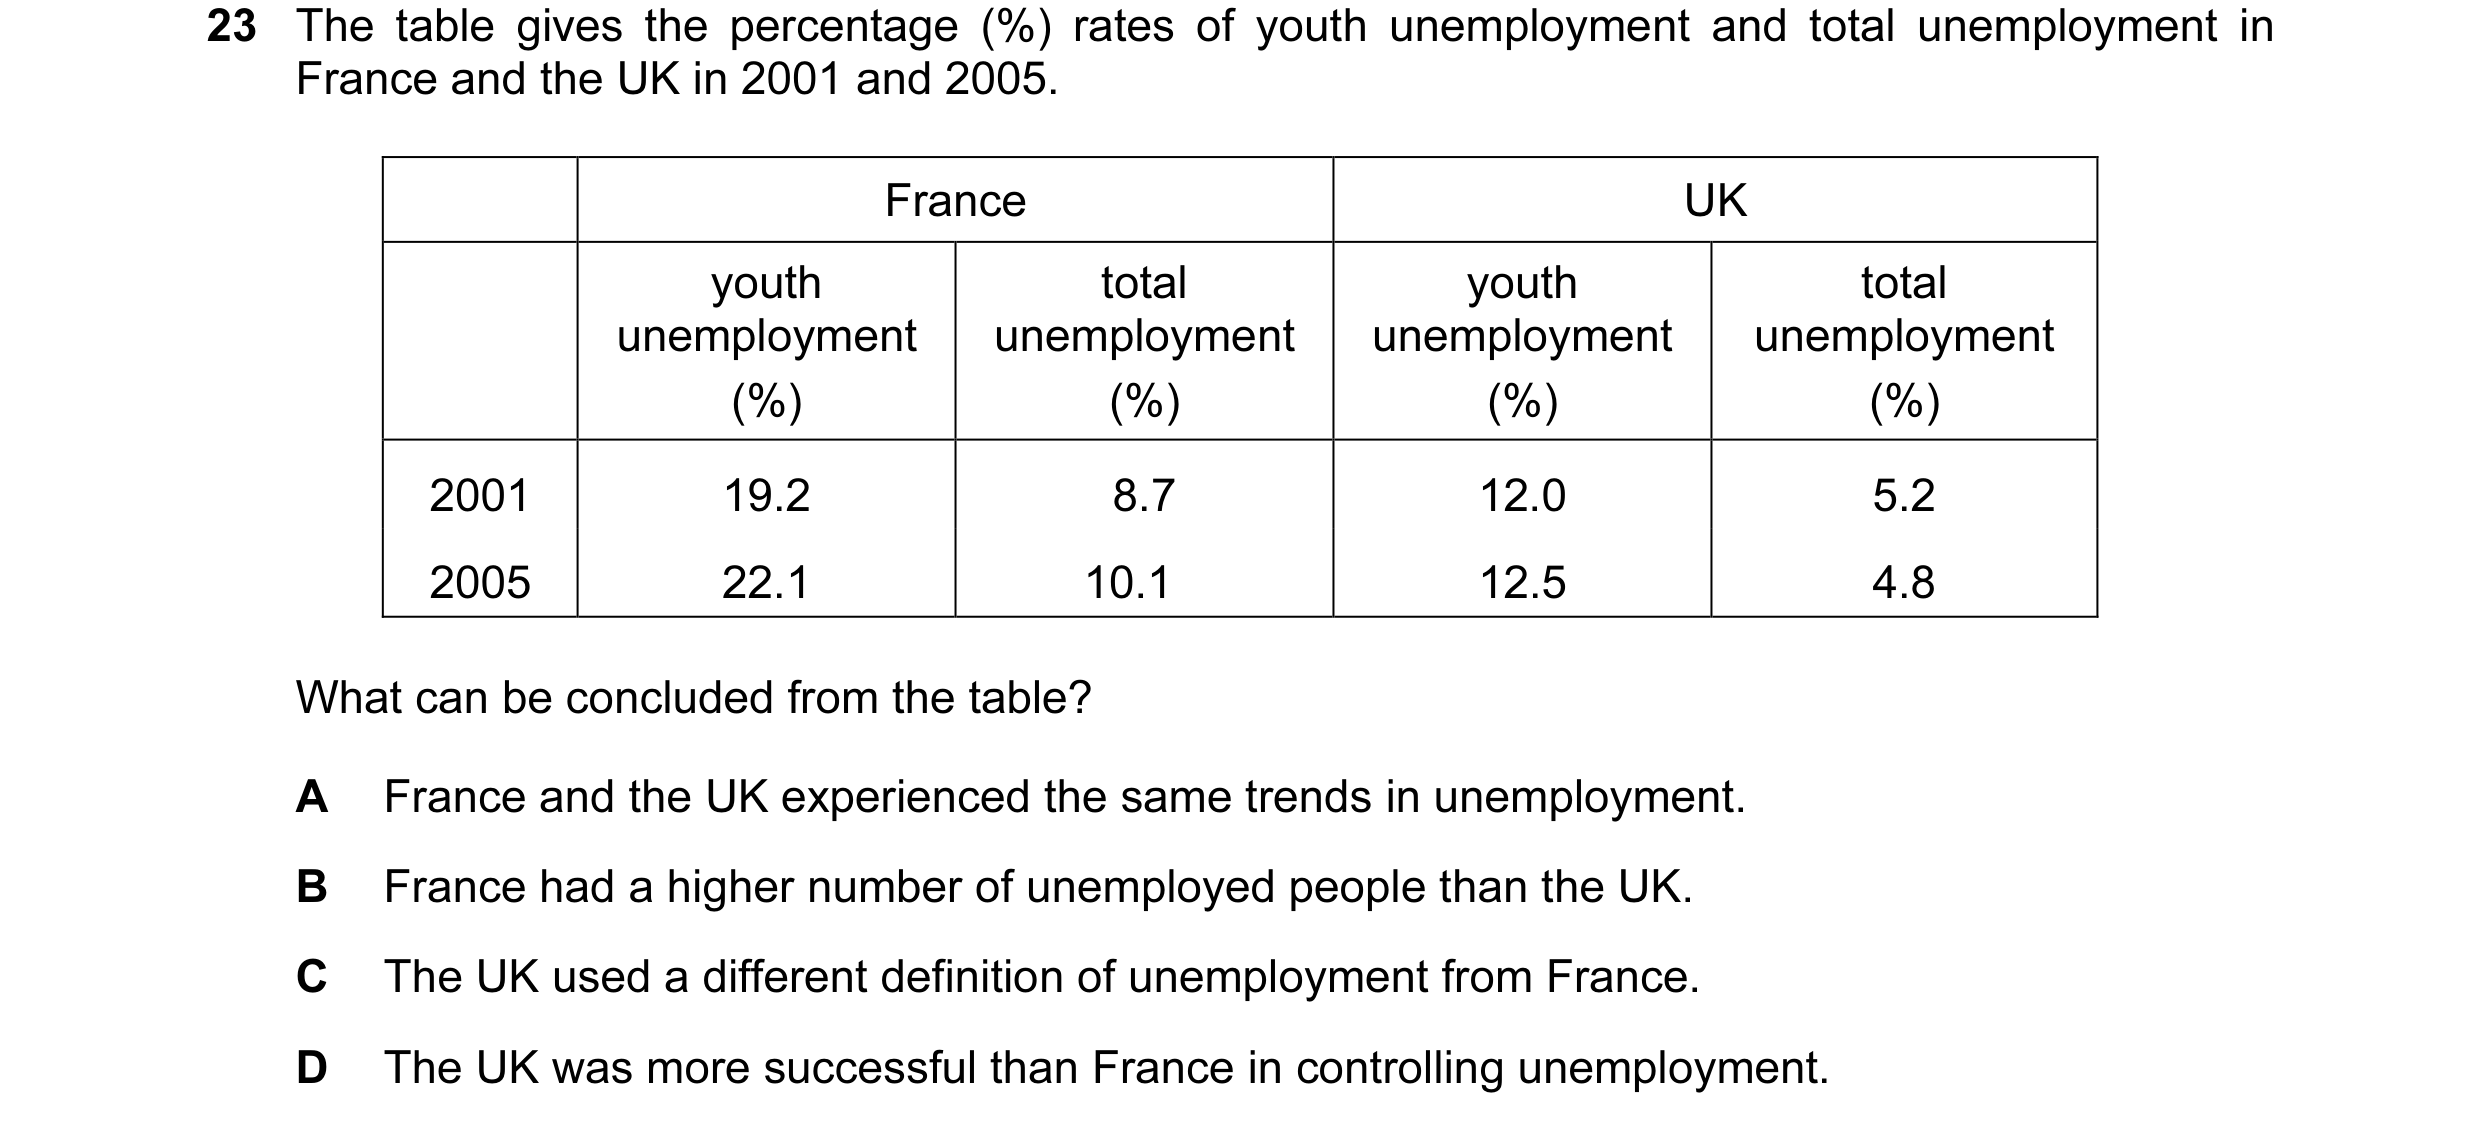
 16 / 24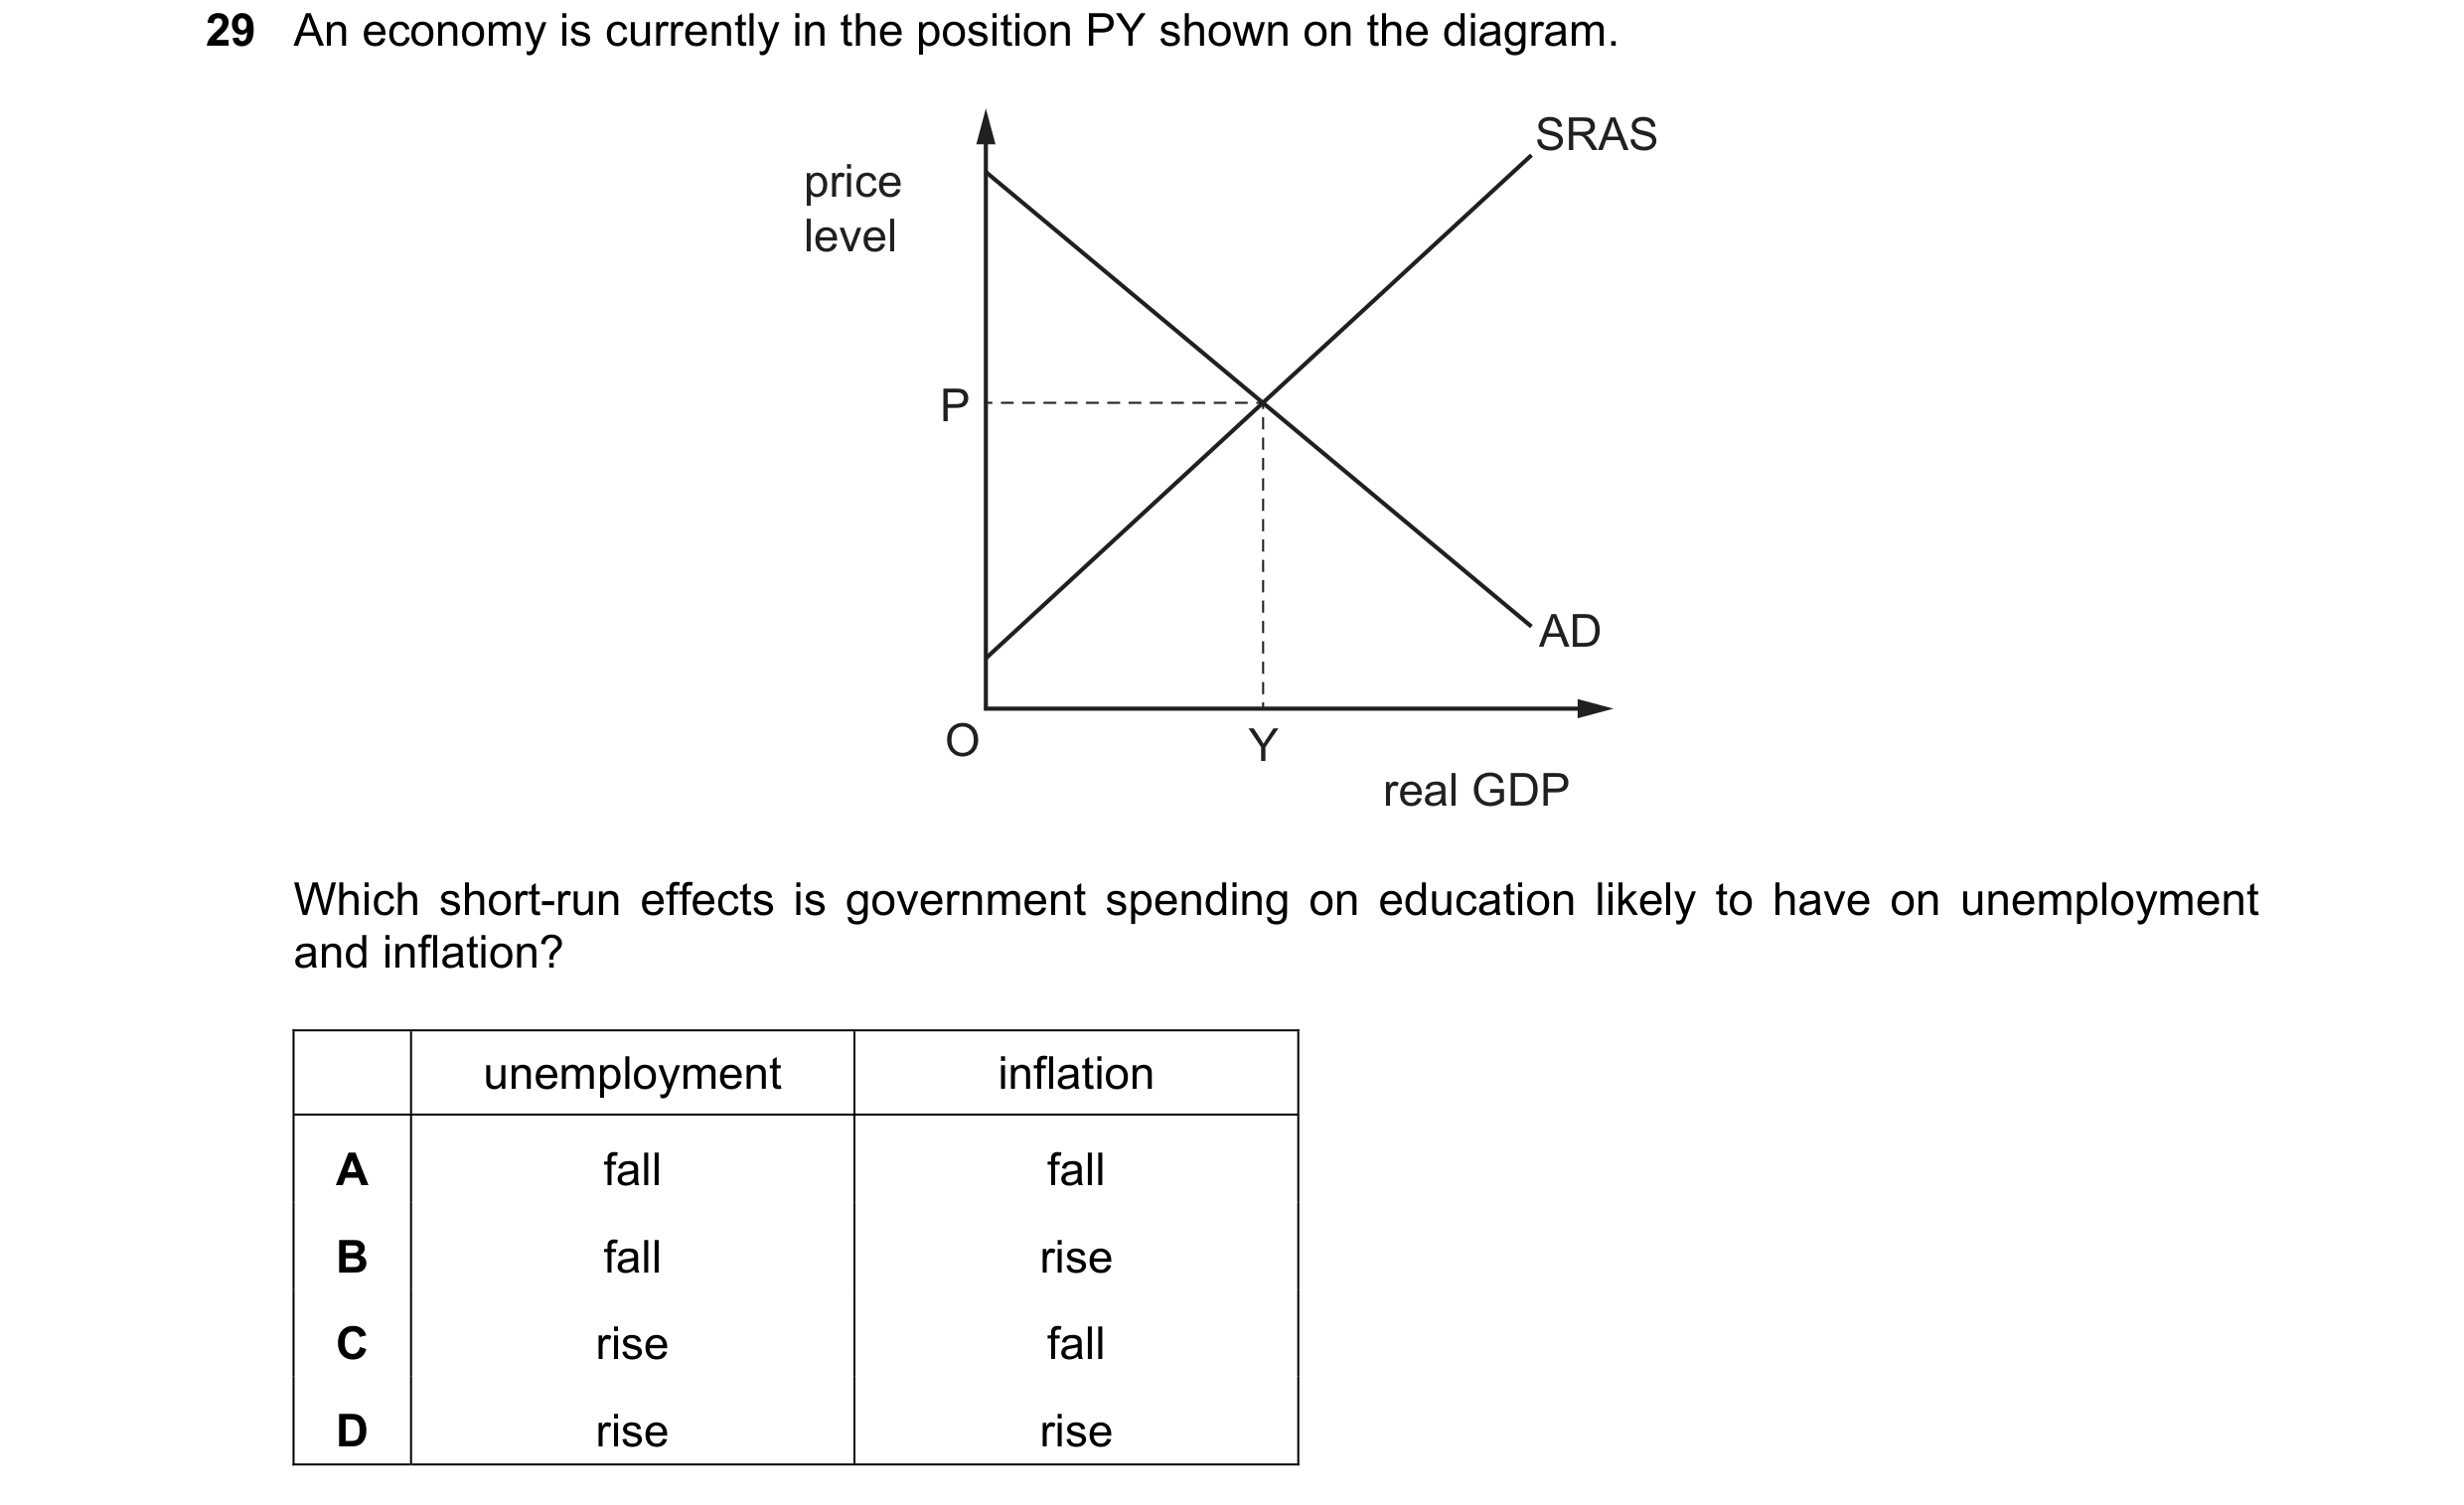
 17 / 24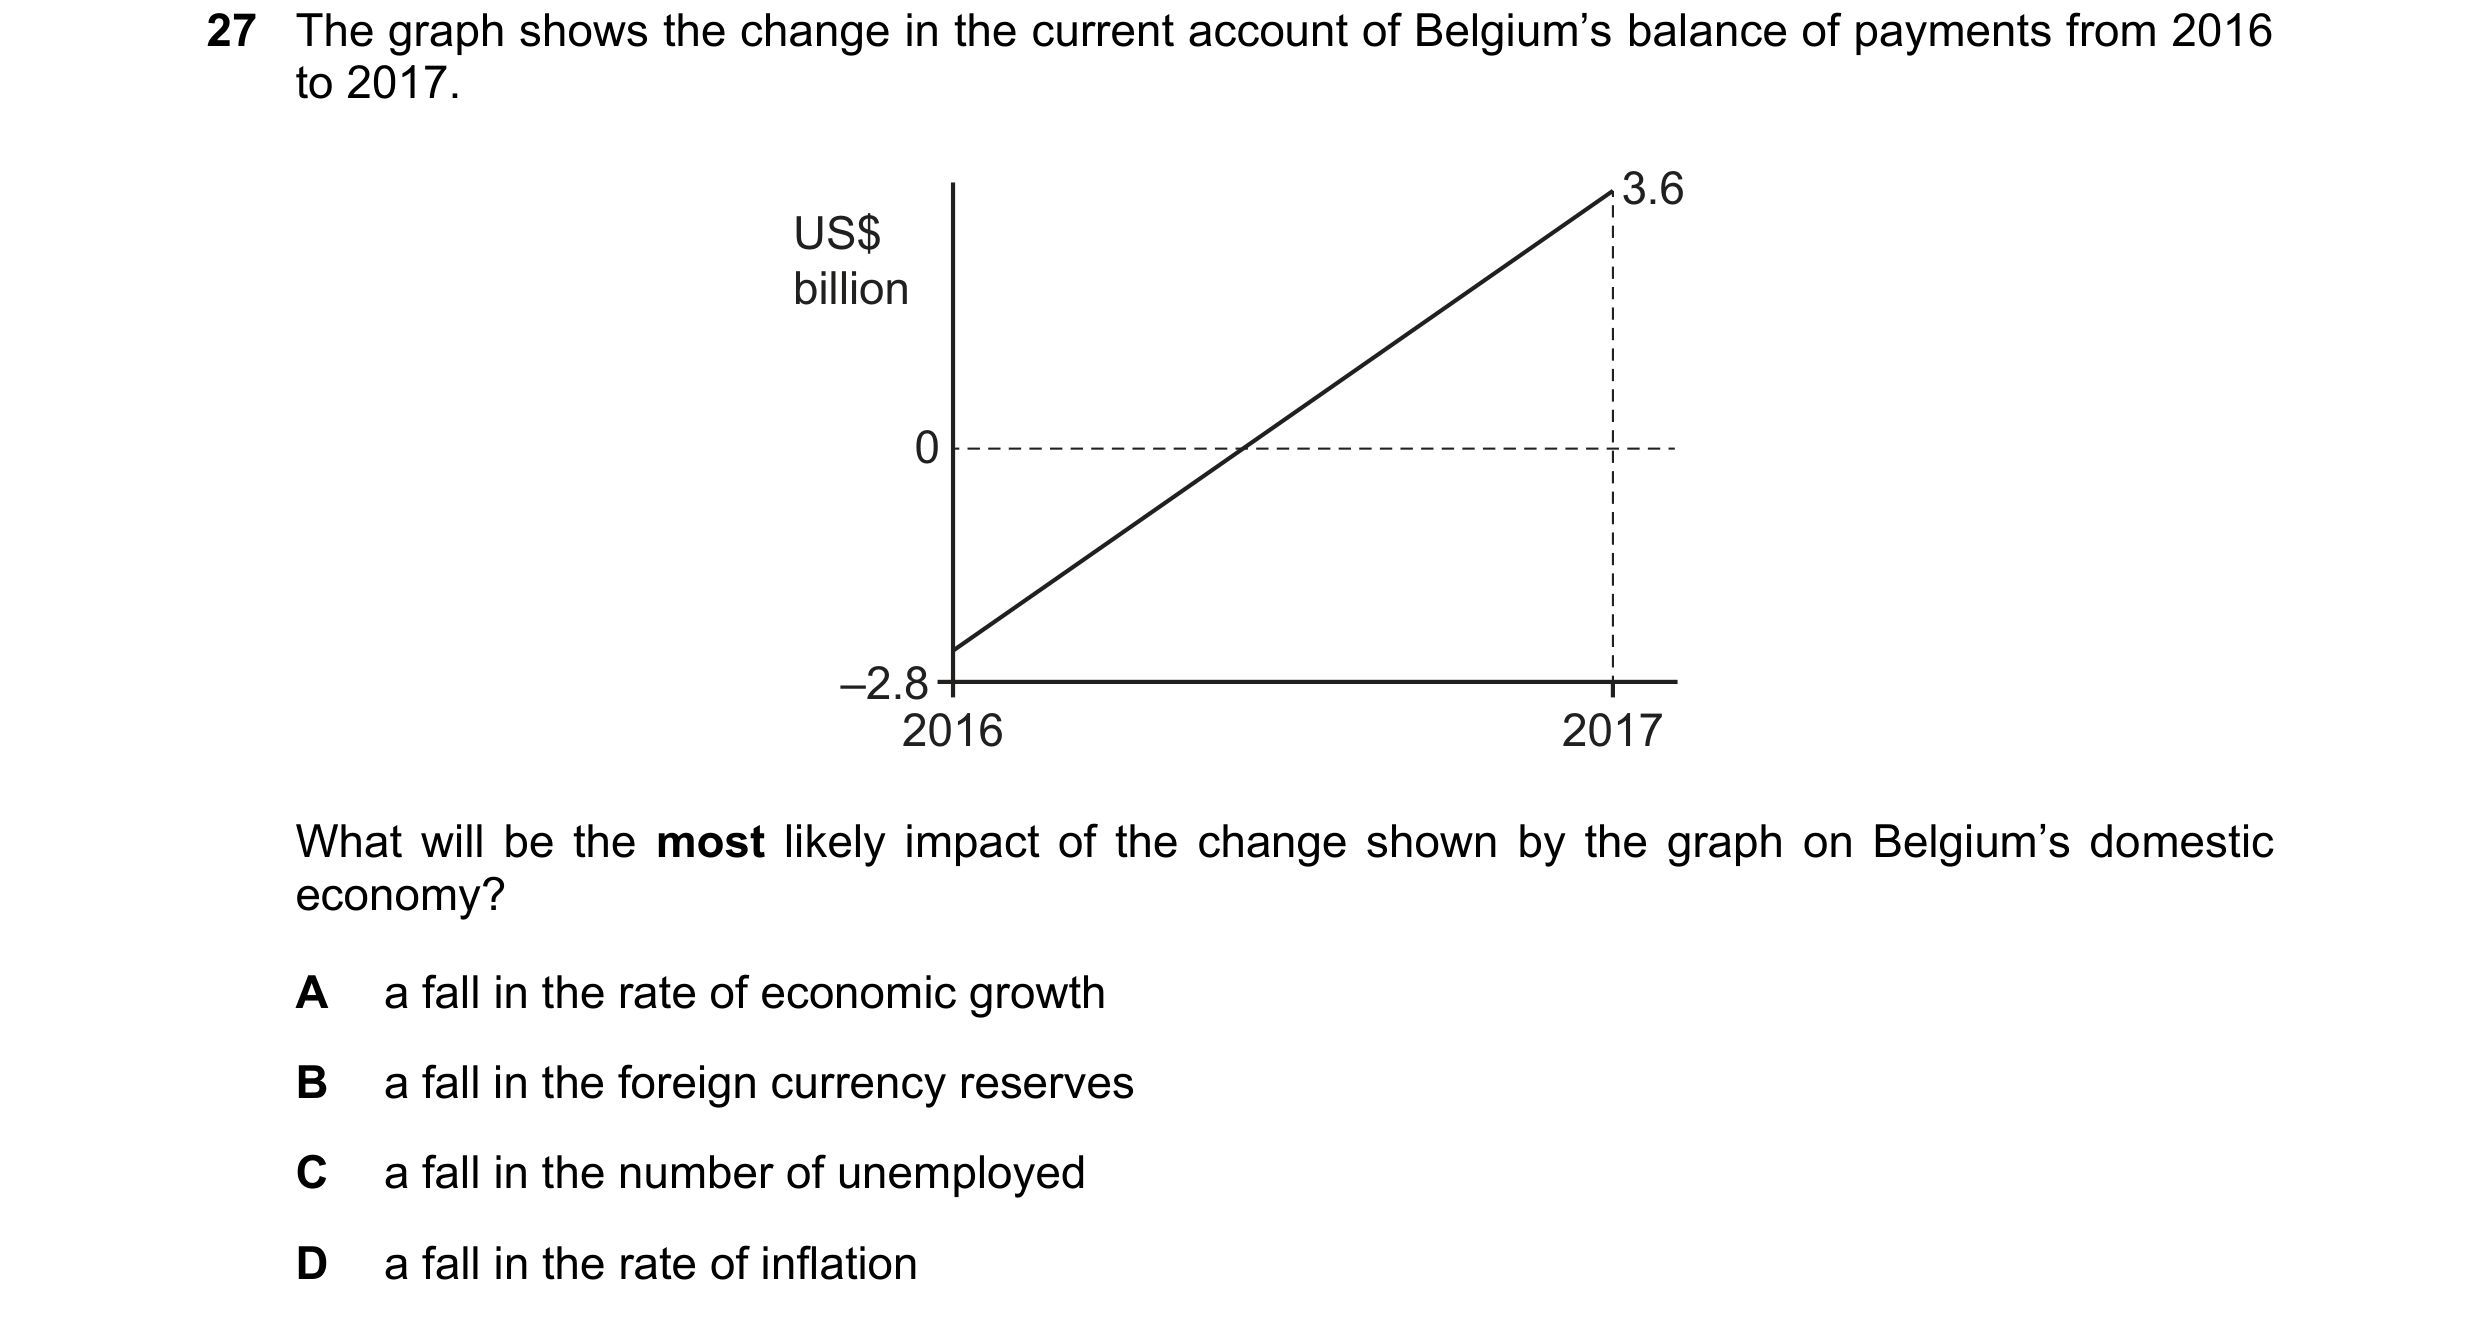
 18 / 24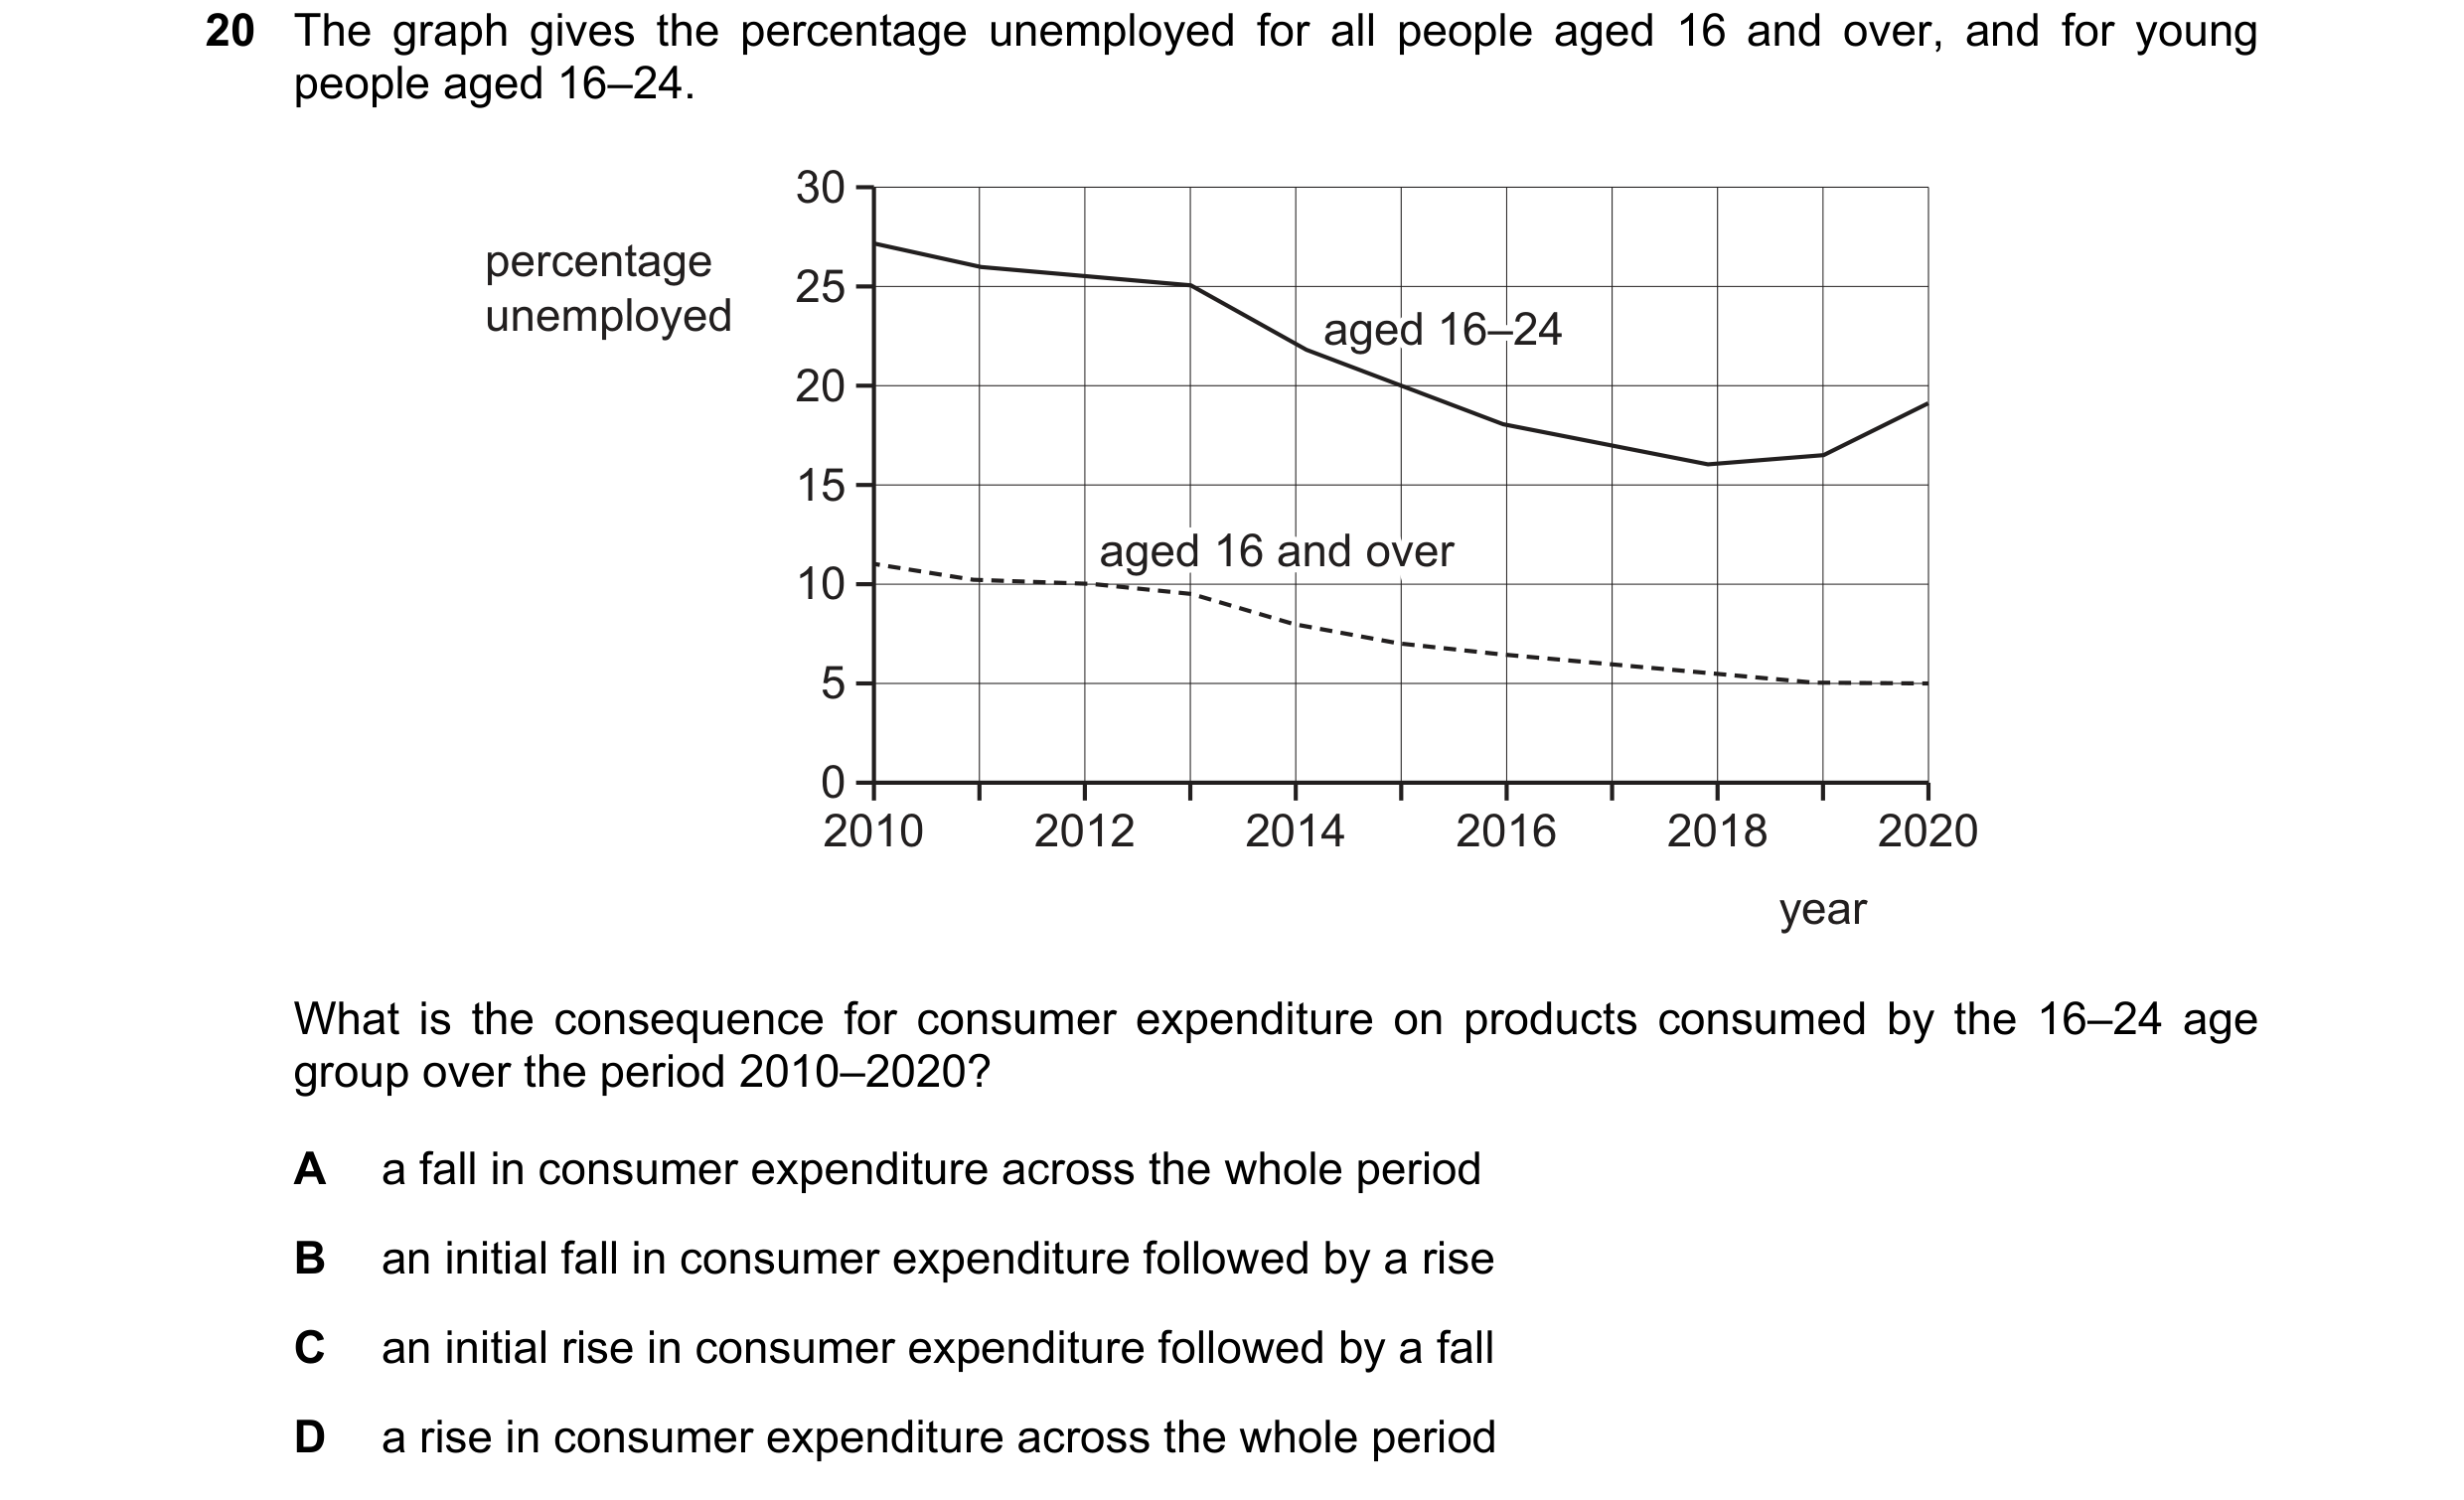
 19 / 24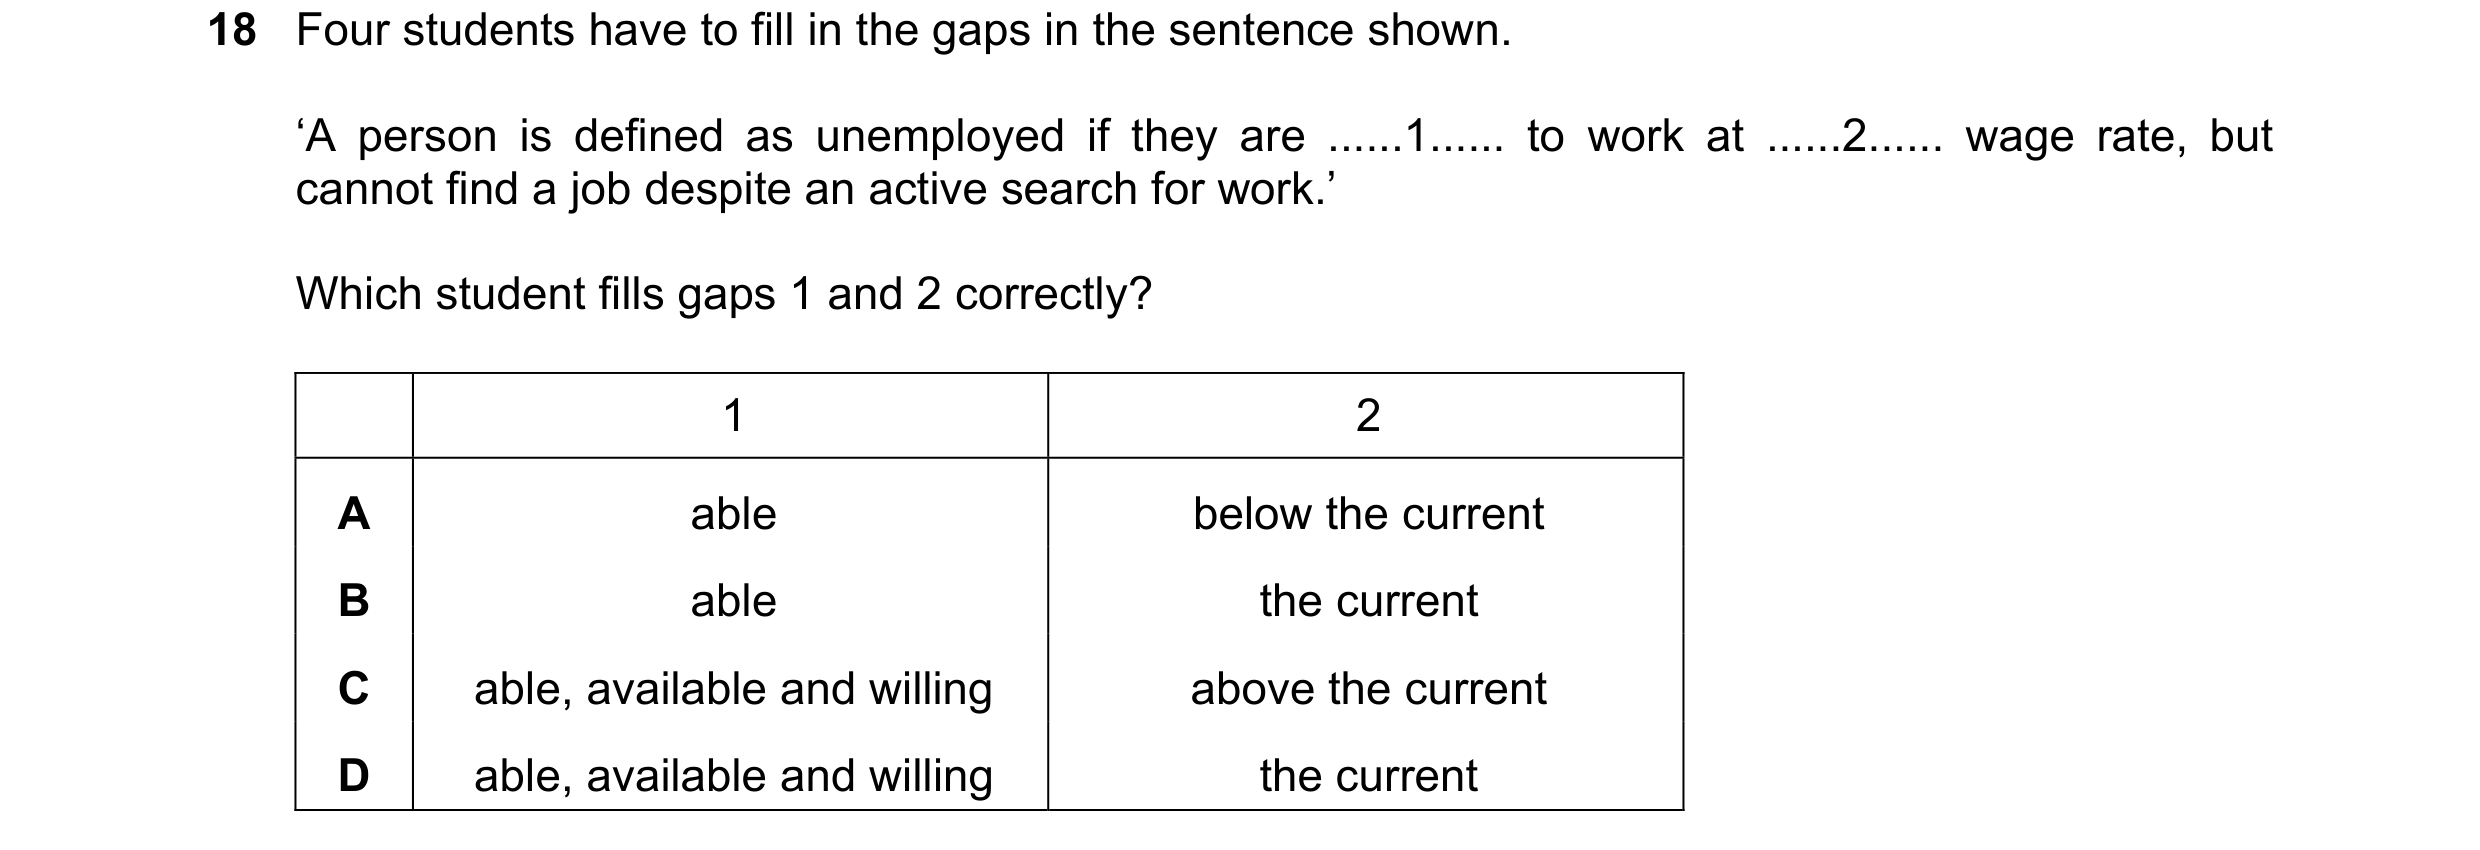

 20 / 24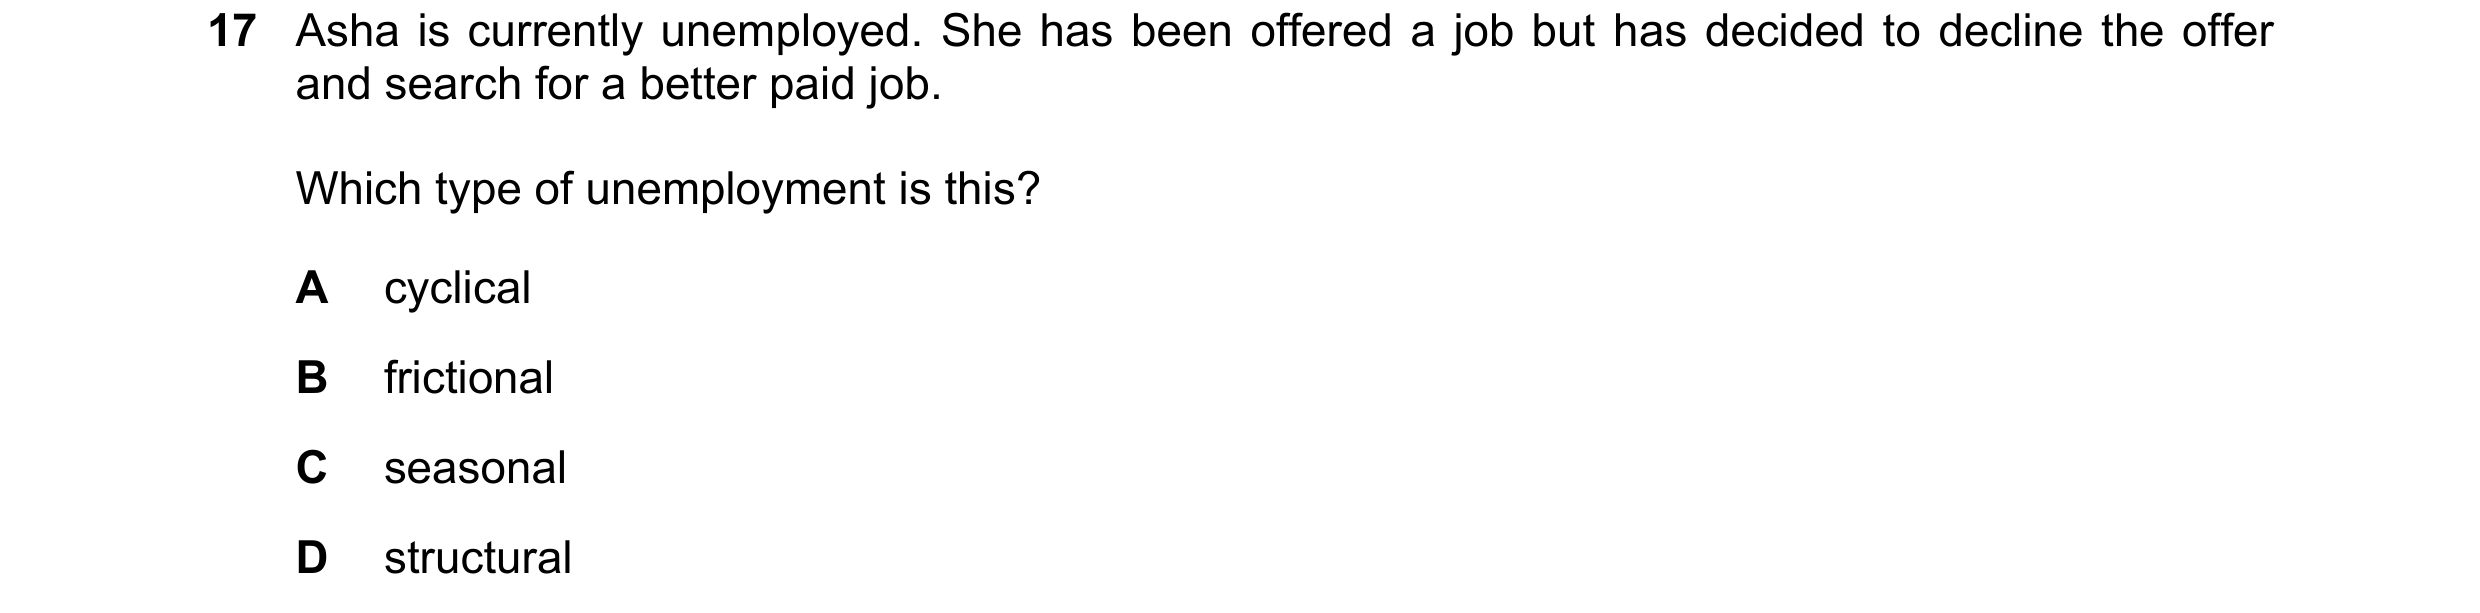

 21 / 24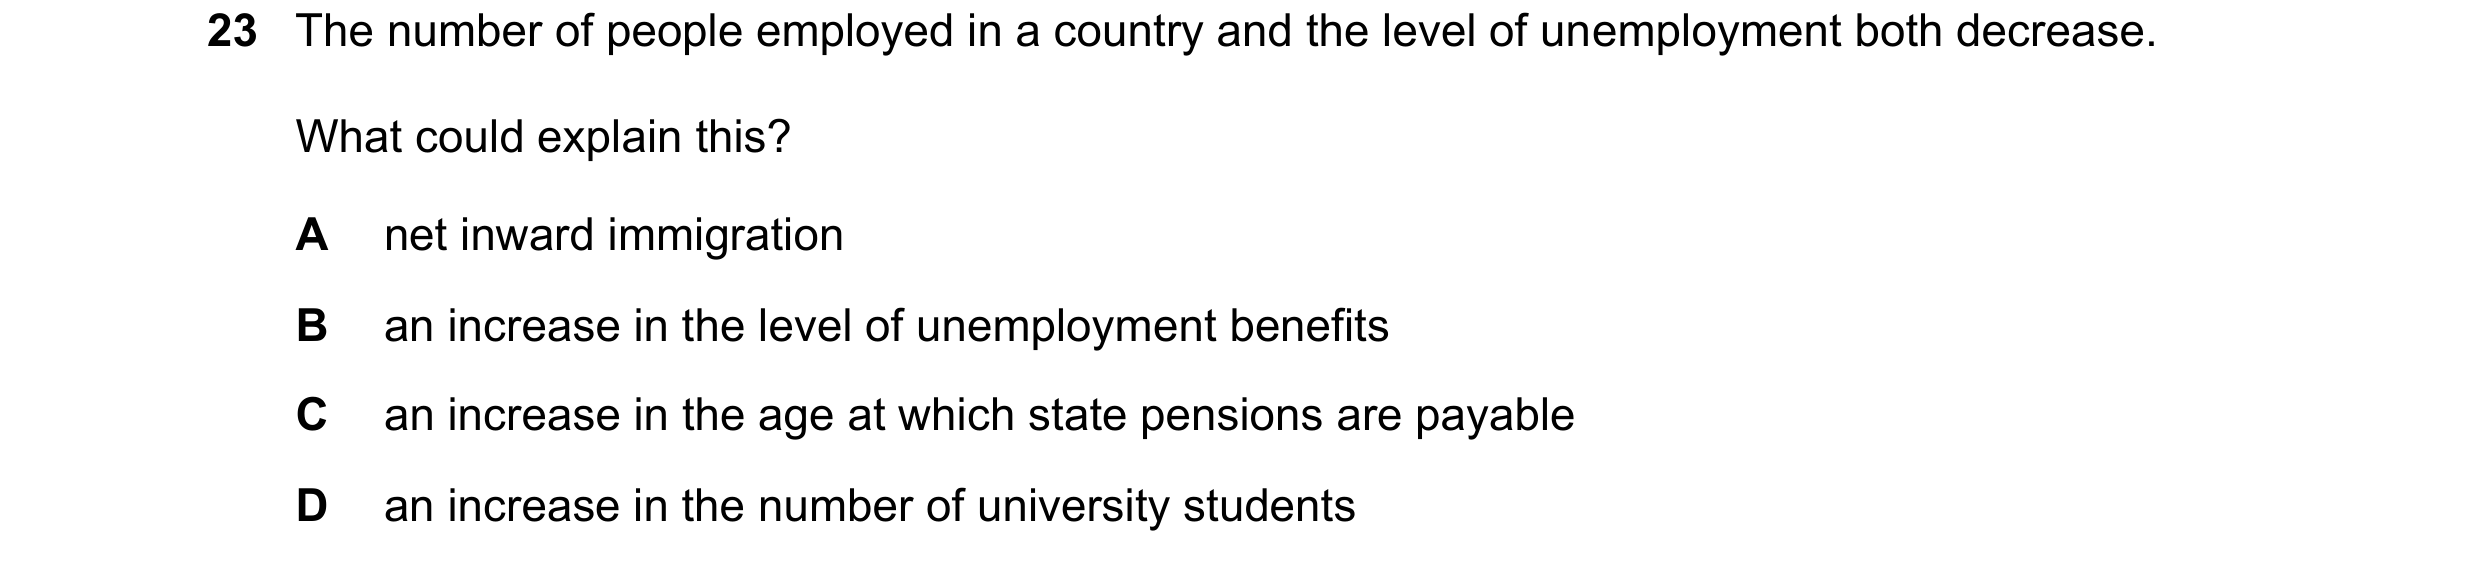

 22 / 24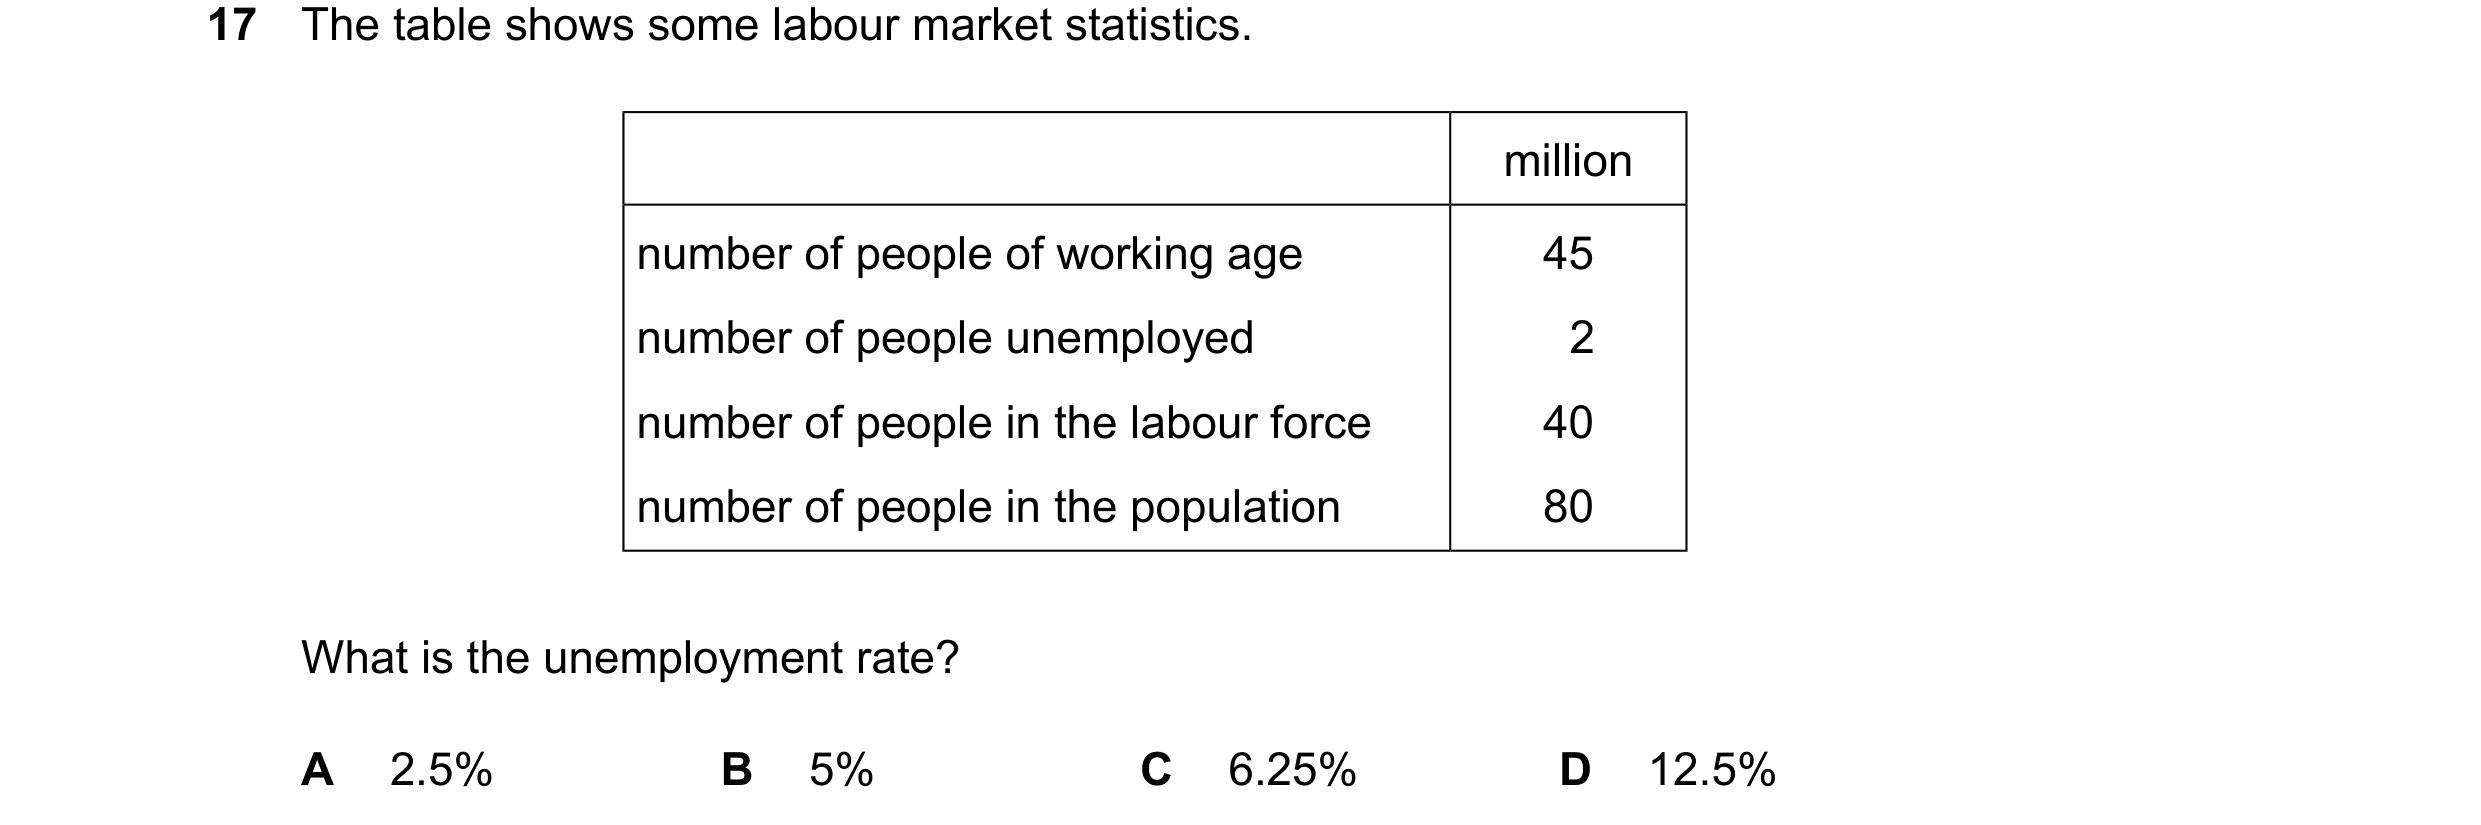

 23 / 24
 24 / 24