Questions as text
Q1 · The diagram illustrates the production possibility curves for an economy in Year 1 (X1… 9708/11 Oct/Nov 2009
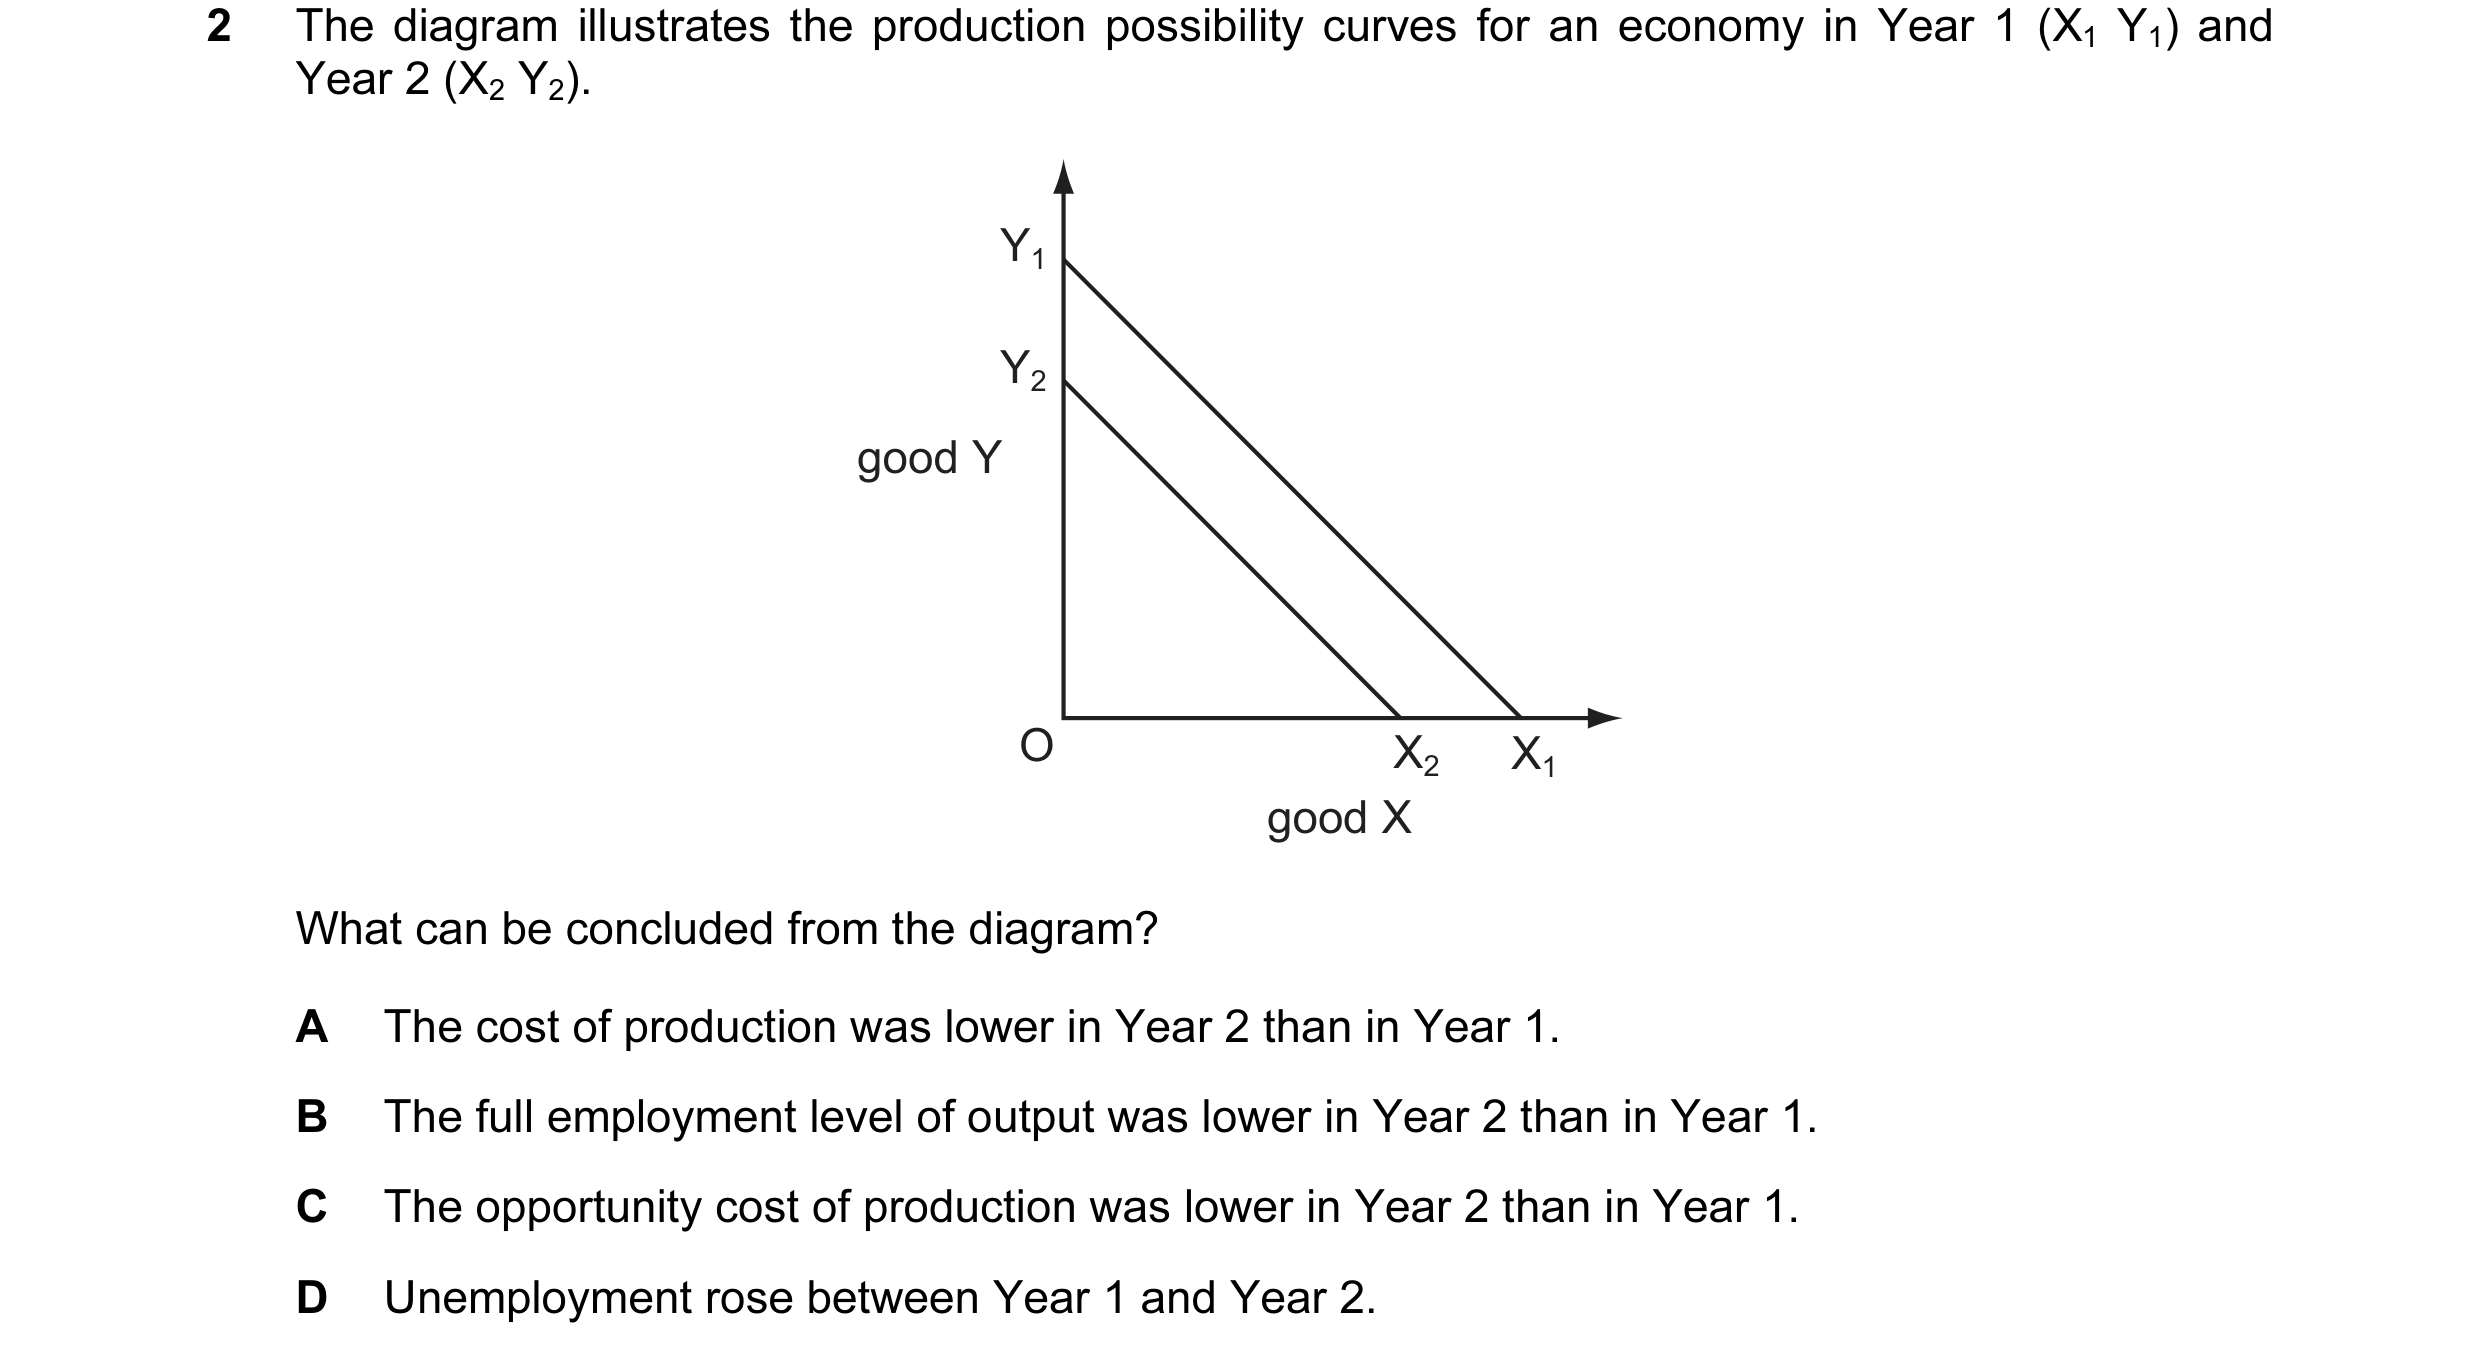
2 The diagram illustrates the production possibility curves for an economy in Year 1 (X1 Y1) and Year 2 (X2 Y2). Y1 Y2 good Y O X2 X1 good X What can be concluded from the diagram? A The cost of production was lower in Year 2 than in Year 1. B The full employment level of output was lower in Year 2 than in Year 1. C The opportunity cost of production was lower in Year 2 than in Year 1. D Unemployment rose between Year 1 and Year 2.
1 marks
Answer: B
This question in 9708/11 Oct/Nov 2009
Q2 · A country increases its labour productivity in the manufacturing industry 9708/13 May/June 2015
23 A country increases its labour productivity in the manufacturing industry. What is least likely to result from this? A higher economic growth B higher levels of exports of manufacturing C lower inflation D lower wage rates in manufacturing
1 marks
Answer: D
This question in 9708/13 May/June 2015
Q3 · The government increases interest rates in order to reduce the rate of inflation 9708/13 Oct/Nov 2018
30 The government increases interest rates in order to reduce the rate of inflation. What will also result from this action? A a depreciation of the country’s currency B a fall in the level of savings C a reduction in economic growth D a reduction in unemployment
1 marks
Answer: C
This question in 9708/13 Oct/Nov 2018
Q4 · The diagram shows a production possibility curve (PPC) 9708/11 May/June 2019
4 The diagram shows a production possibility curve (PPC). It indicates the combinations of consumer goods and capital goods produced by an economy using all its available resources. 50 units of consumer 40 X goods 30 20 PPC 10 0 1 2 3 4 5 units of capital goods What does position X indicate? A a lower ratio of capital to consumer goods is necessary to achieve economic growth B increasing levels of unemployment C insufficient factors of production are available D too many consumer goods are causing a fall in economic growth
1 marks
Answer: C
This question in 9708/11 May/June 2019
Q5 · To improve its financial position a government decided to reduce expenditure on… 9708/11 May/June 2019
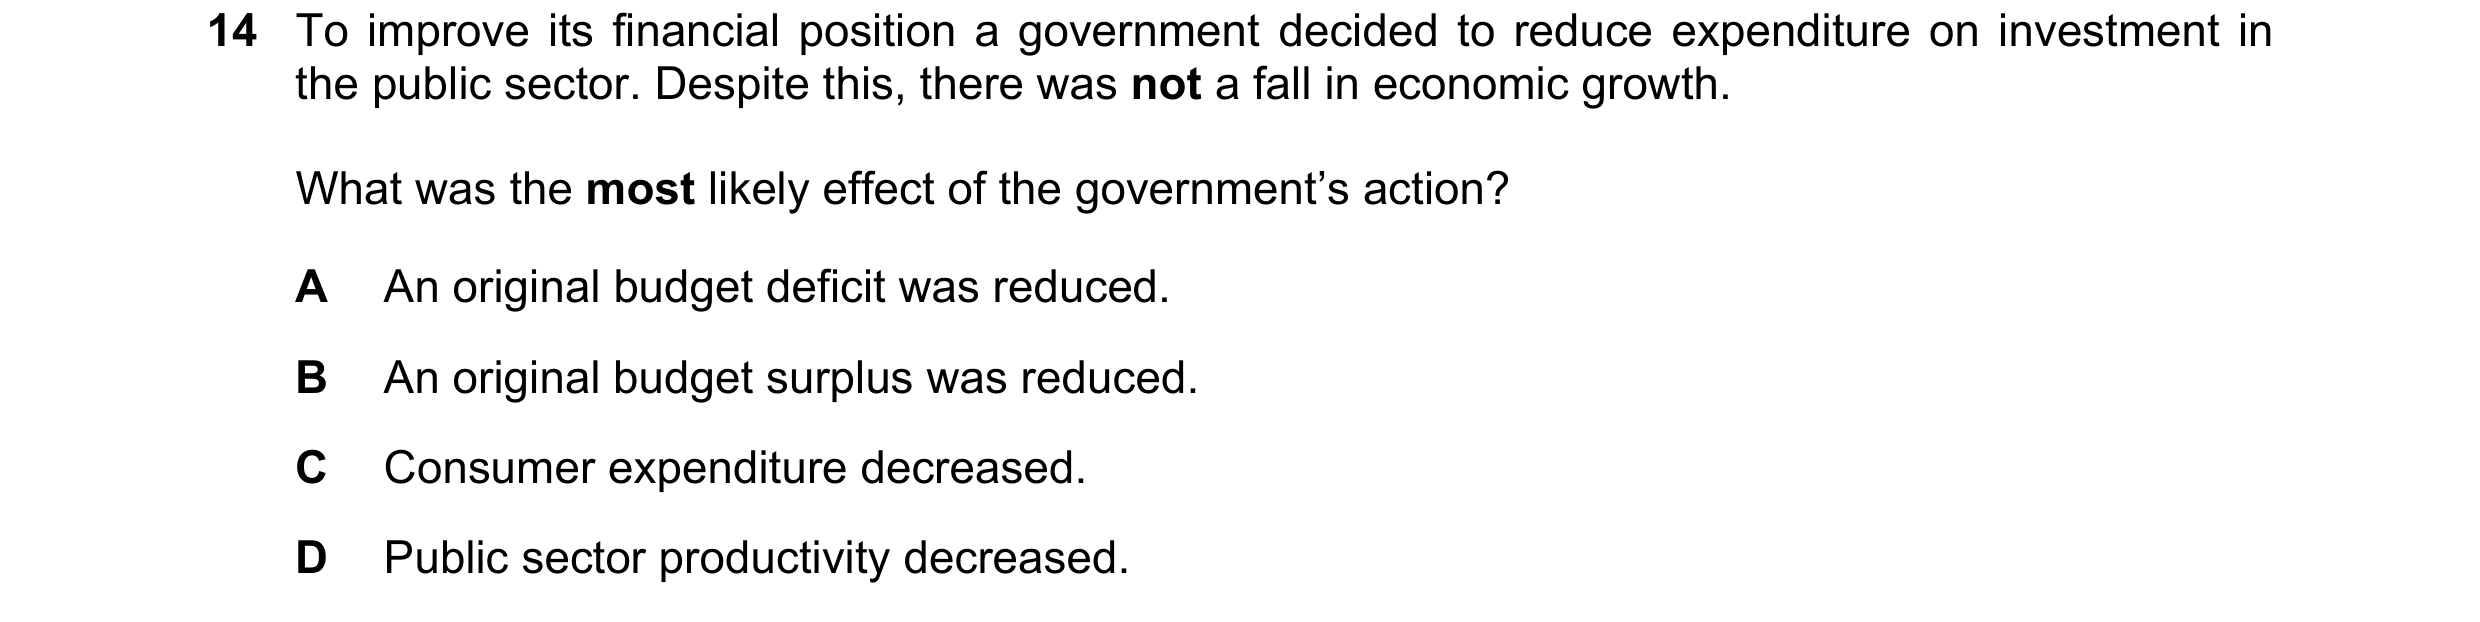
14 To improve its financial position a government decided to reduce expenditure on investment in the public sector. Despite this, there was not a fall in economic growth. What was the most likely effect of the government’s action? A An original budget deficit was reduced. B An original budget surplus was reduced. C Consumer expenditure decreased. D Public sector productivity decreased.
1 marks
Answer: A
This question in 9708/11 May/June 2019
Q6 · The table shows changes in the population, price level and Gross Domestic Product (GDP)… 9708/11 May/June 2019
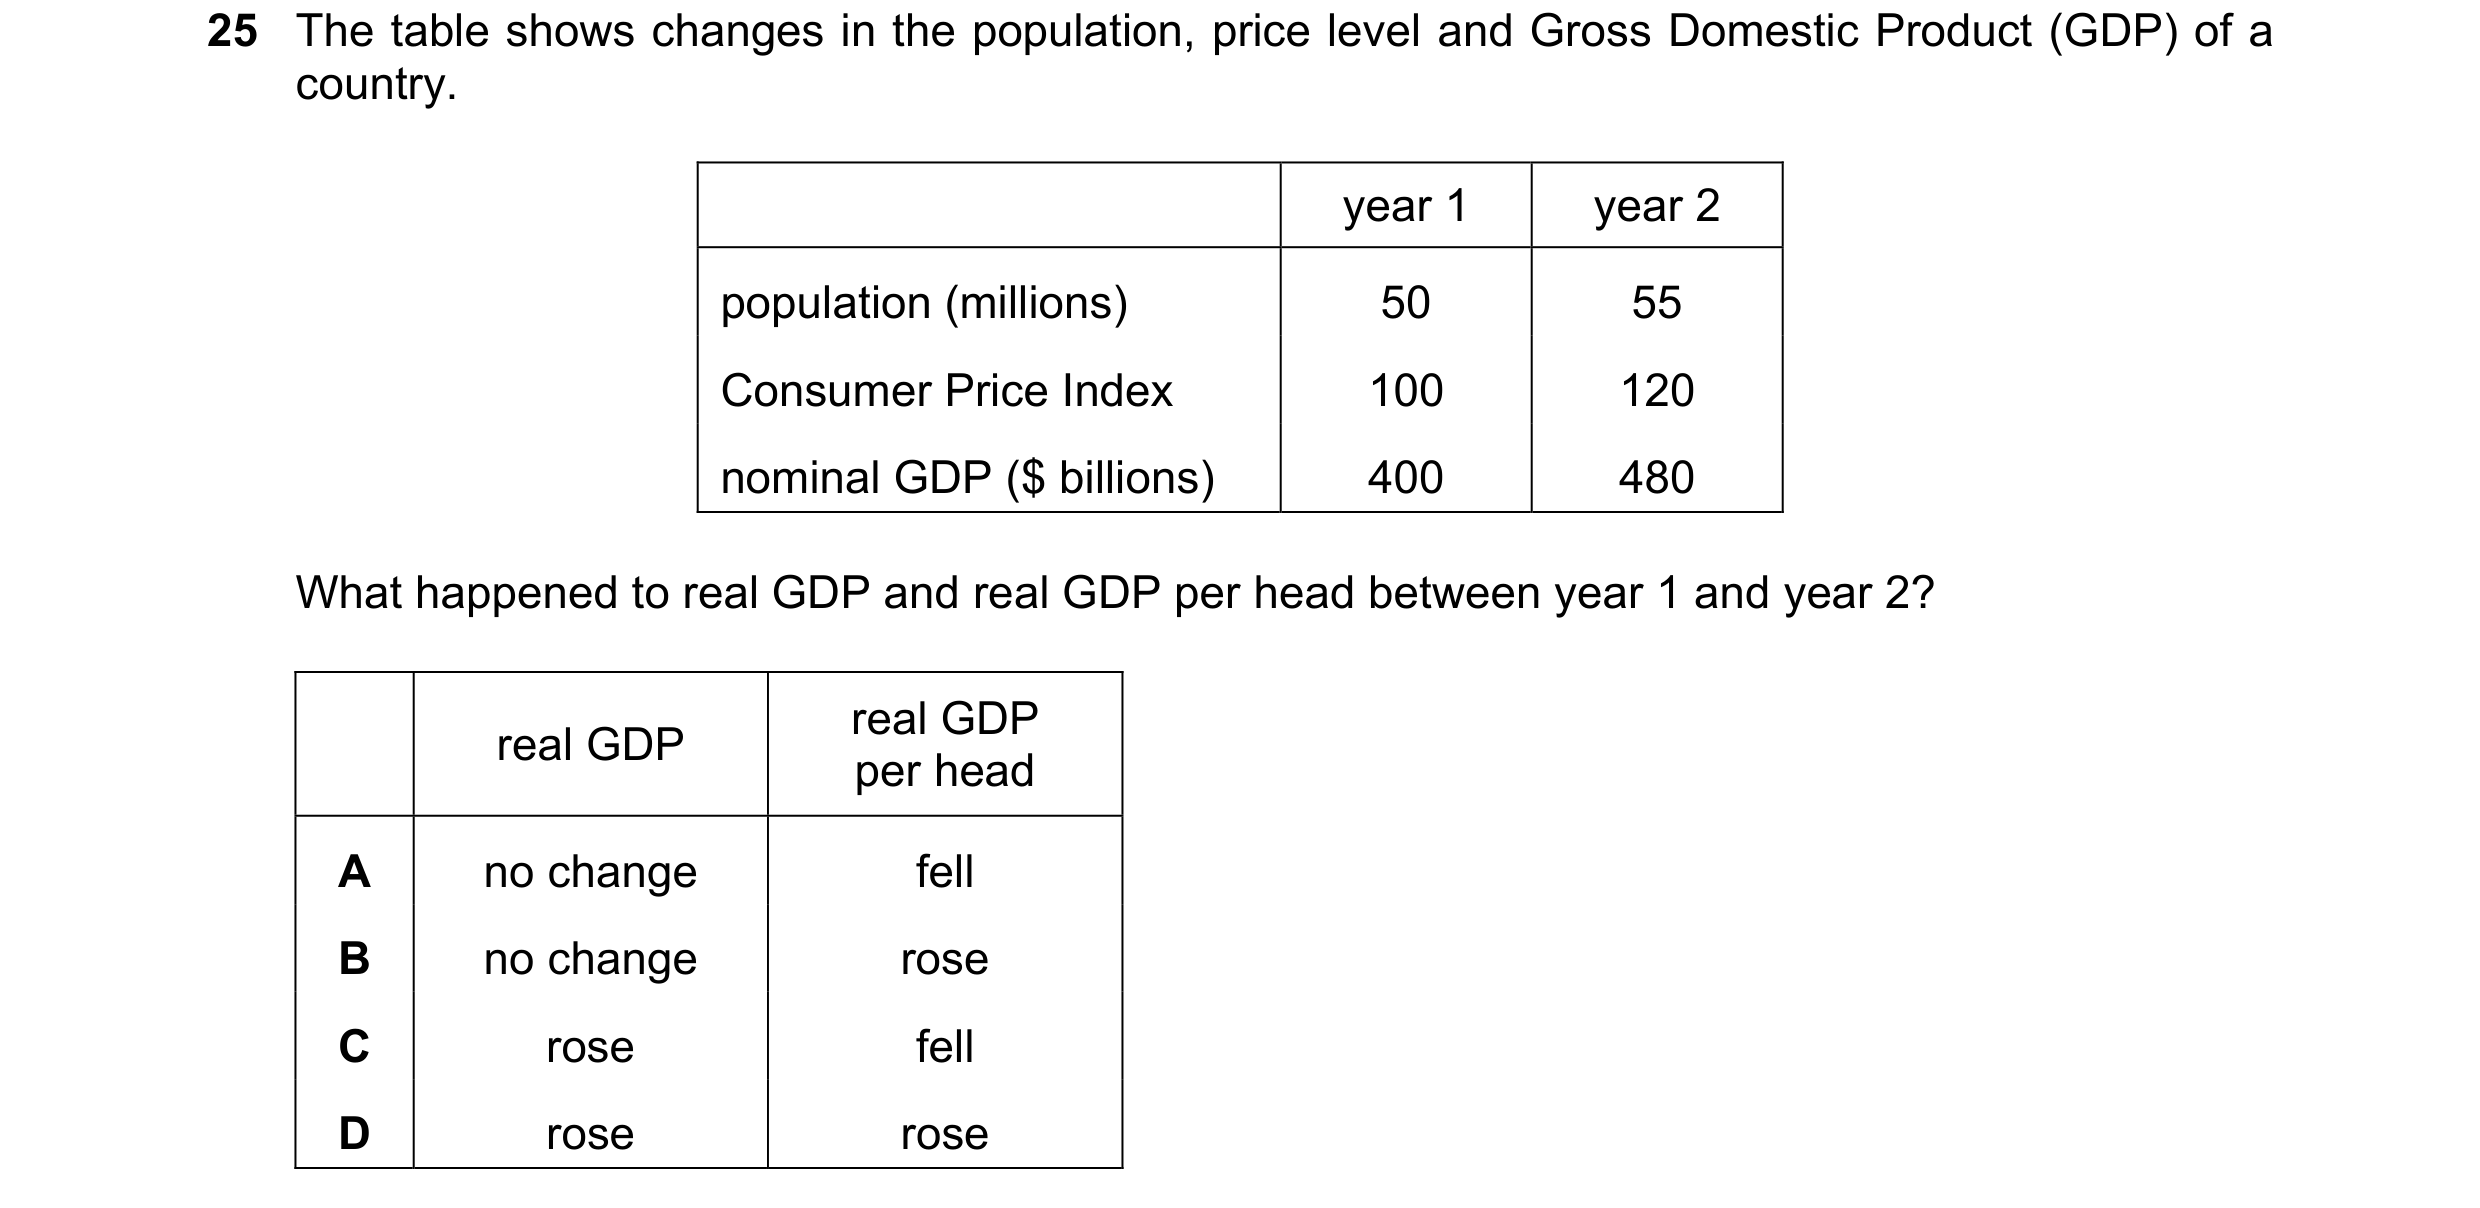
25 The table shows changes in the population, price level and Gross Domestic Product (GDP) of a country. year 1 year 2 population (millions) 50 55 Consumer Price Index 100 120 nominal GDP ($ billions) 400 480 What happened to real GDP and real GDP per head between year 1 and year 2? real GDP real GDP per head A no change fell B no change rose C rose fell D rose rose
1 marks
Answer: A
This question in 9708/11 May/June 2019
Q7 · The diagram shows an economy with an initial equilibrium real output of Y1 at a price… 9708/13 Oct/Nov 2020
21 The diagram shows an economy with an initial equilibrium real output of Y1 at a price level of P1. price AS1 AS2 level P1 AD1 AD2 O Y1 Y2 real output Which combination of events is likely to cause the equilibrium real output to rise to Y2? A an increased budget deficit and a fall in energy costs B an increased budget surplus and a rise in energy costs C an increased trade deficit and a fall in indirect tax D an increased trade surplus and a rise in indirect tax
1 marks
Answer: A
This question in 9708/13 Oct/Nov 2020
Q8 · The diagram shows two production possibility curves for an economy 9708/12 Feb/March 2021
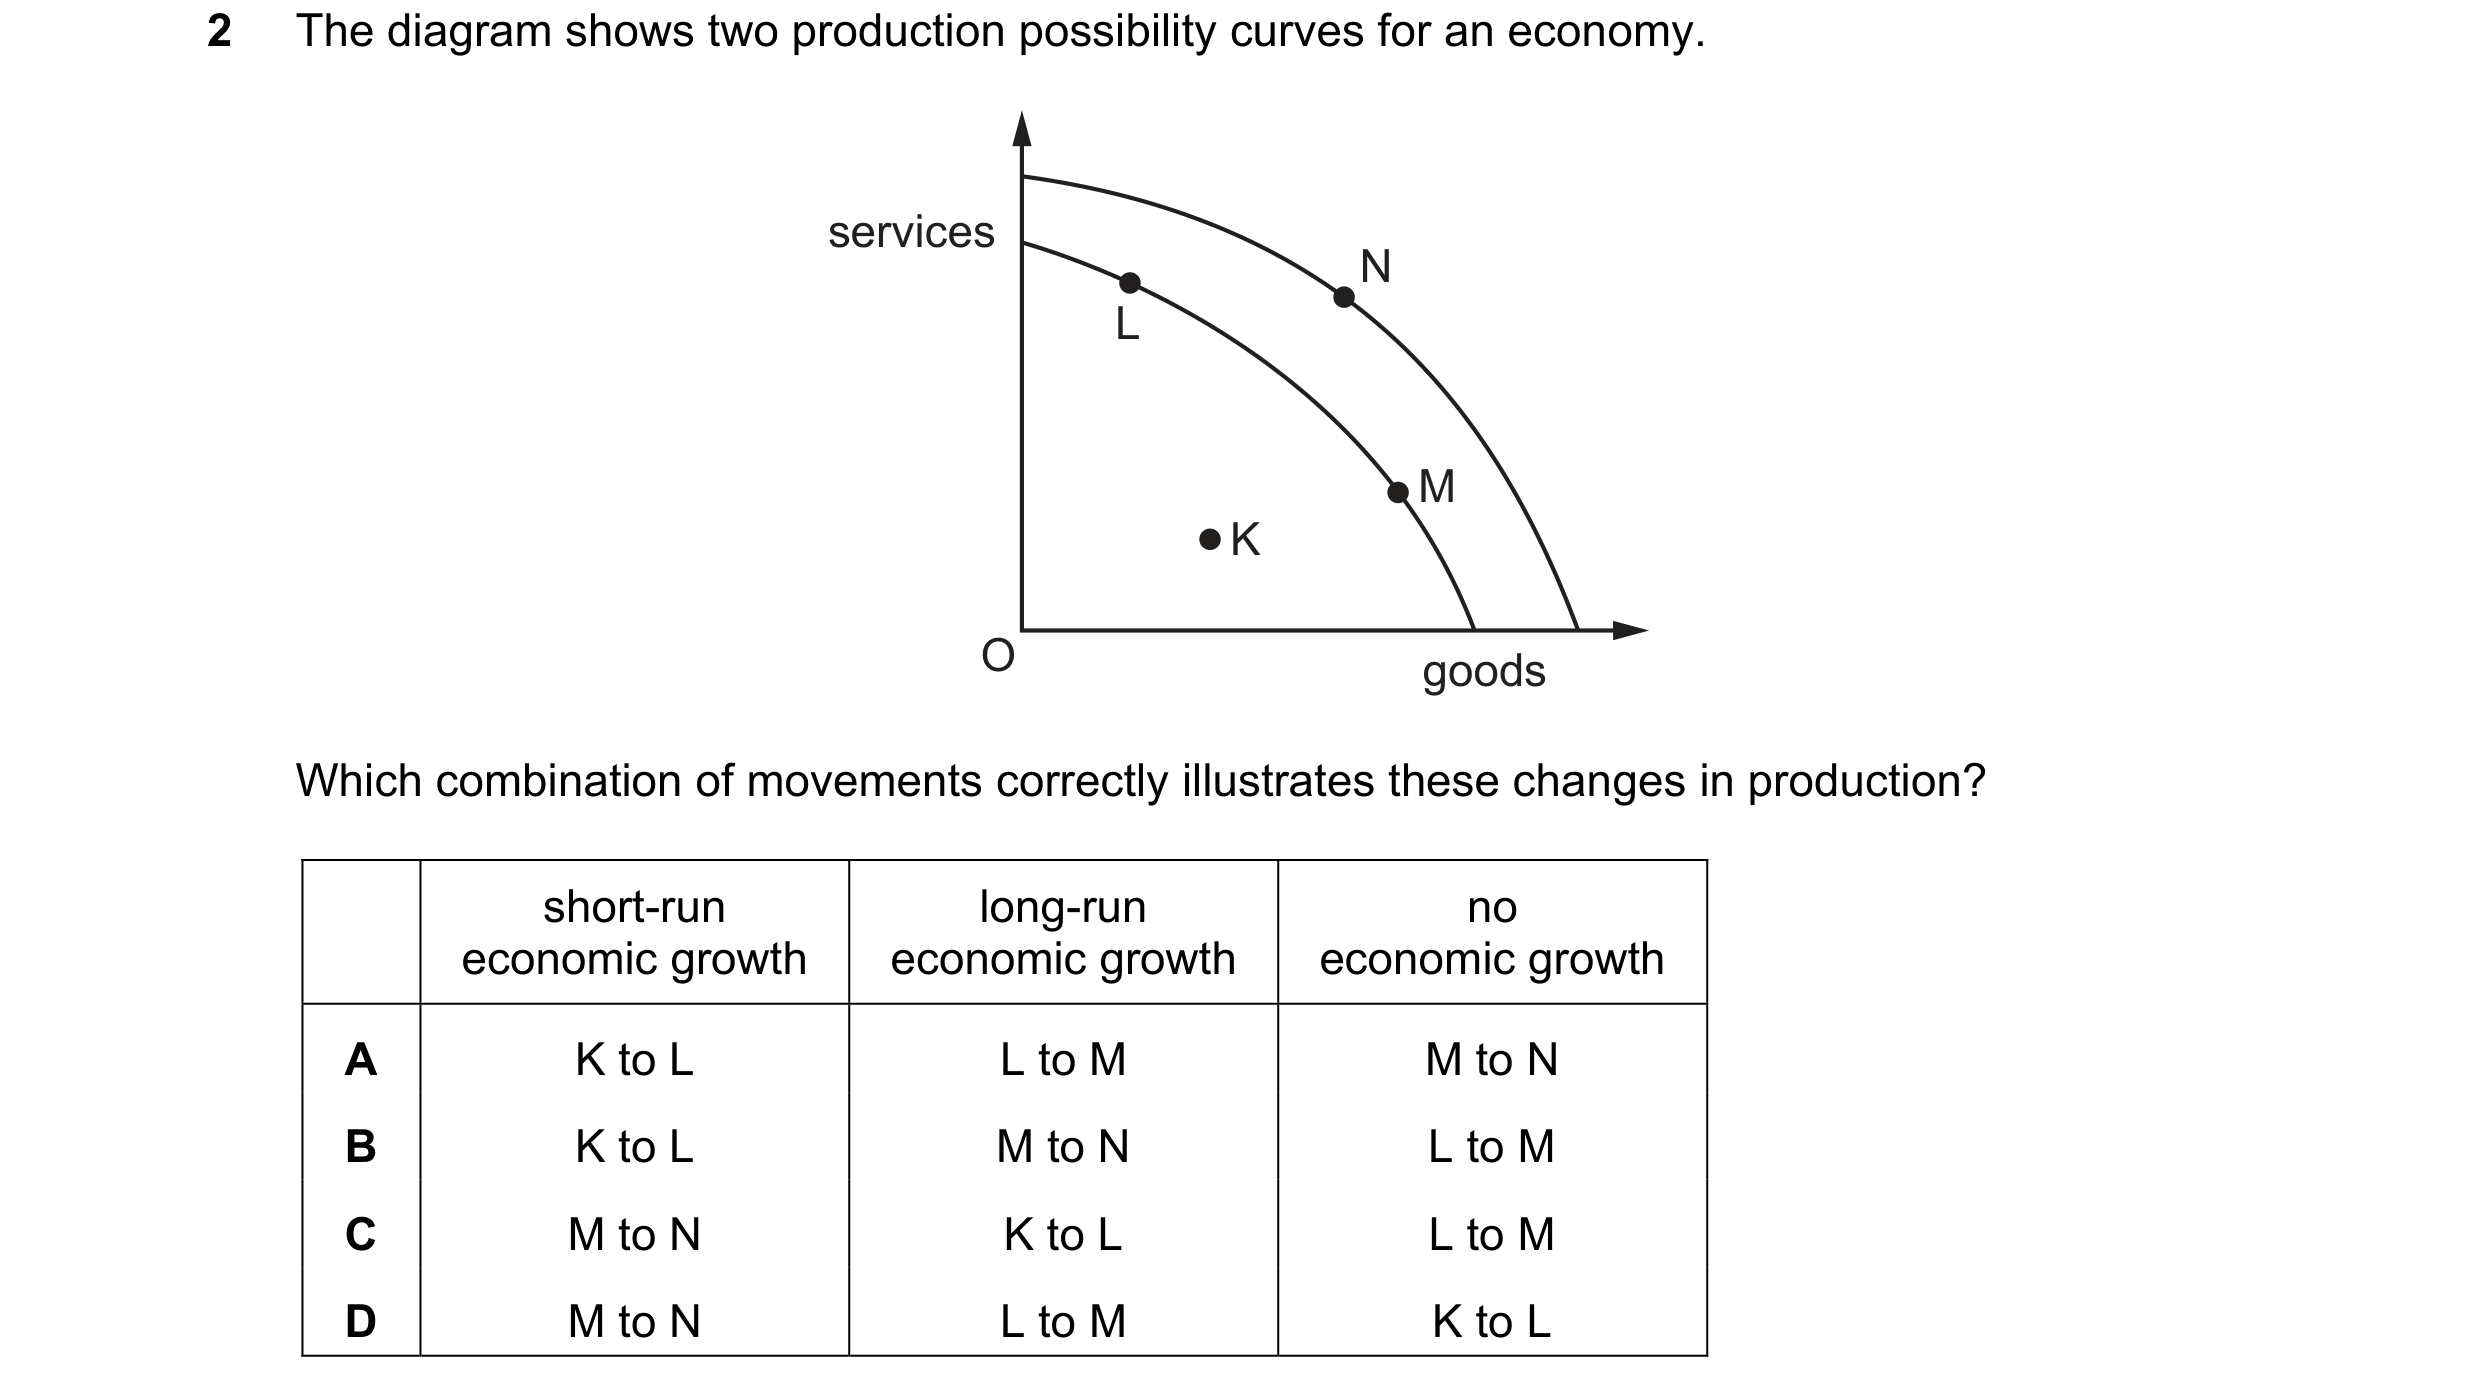
2 The diagram shows two production possibility curves for an economy. services N L M K O goods Which combination of movements correctly illustrates these changes in production? short-run long-run no economic growth economic growth economic growth A K to L L to M M to N B K to L M to N L to M C M to N K to L L to M D M to N L to M K to L
1 marks
Answer: B
This question in 9708/12 Feb/March 2021
Q9 · To improve its financial position, a government decided to reduce expenditure on… 9708/12 Feb/March 2022
14 To improve its financial position, a government decided to reduce expenditure on investment in the public sector. There was not a fall in economic growth. What was the most likely effect of the government’s action? A An original budget deficit was reduced. B An original budget surplus was reduced. C Consumer expenditure decreased. D Public sector productivity decreased.
1 marks
Answer: A
This question in 9708/12 Feb/March 2022
Q10 · The table shows GDP indices for a country over a three-year period 9708/12 Feb/March 2023
29 The table shows GDP indices for a country over a three-year period. year 1 year 2 year 3 real GDP 100 105 106 money GDP 100 107 115 Inflation and economic growth are two macroeconomic policy objectives. Which row gives a correct assessment of the country’s achievement of these two objectives over the period? rate of rate of inflation economic growth A cannot tell positive B declining cannot tell C positive declining D rising negative
1 marks
Answer: C
This question in 9708/12 Feb/March 2023
Q11 · Economic growth leads to increased levels of income and consumption per capita for the… 9708/12 May/June 2023
30 Economic growth leads to increased levels of income and consumption per capita for the adult population. Which circumstances are needed for this to happen in an economy? A a change in technology that maintains the same level of output B an increase in economic efficiency through higher productivity of factor inputs C a policy of progressive taxation to reduce inequalities D a rise in the size of the working population due to immigration
1 marks
Answer: B
This question in 9708/12 May/June 2023
Q12 · The table gives data for an economy 9708/13 May/June 2023
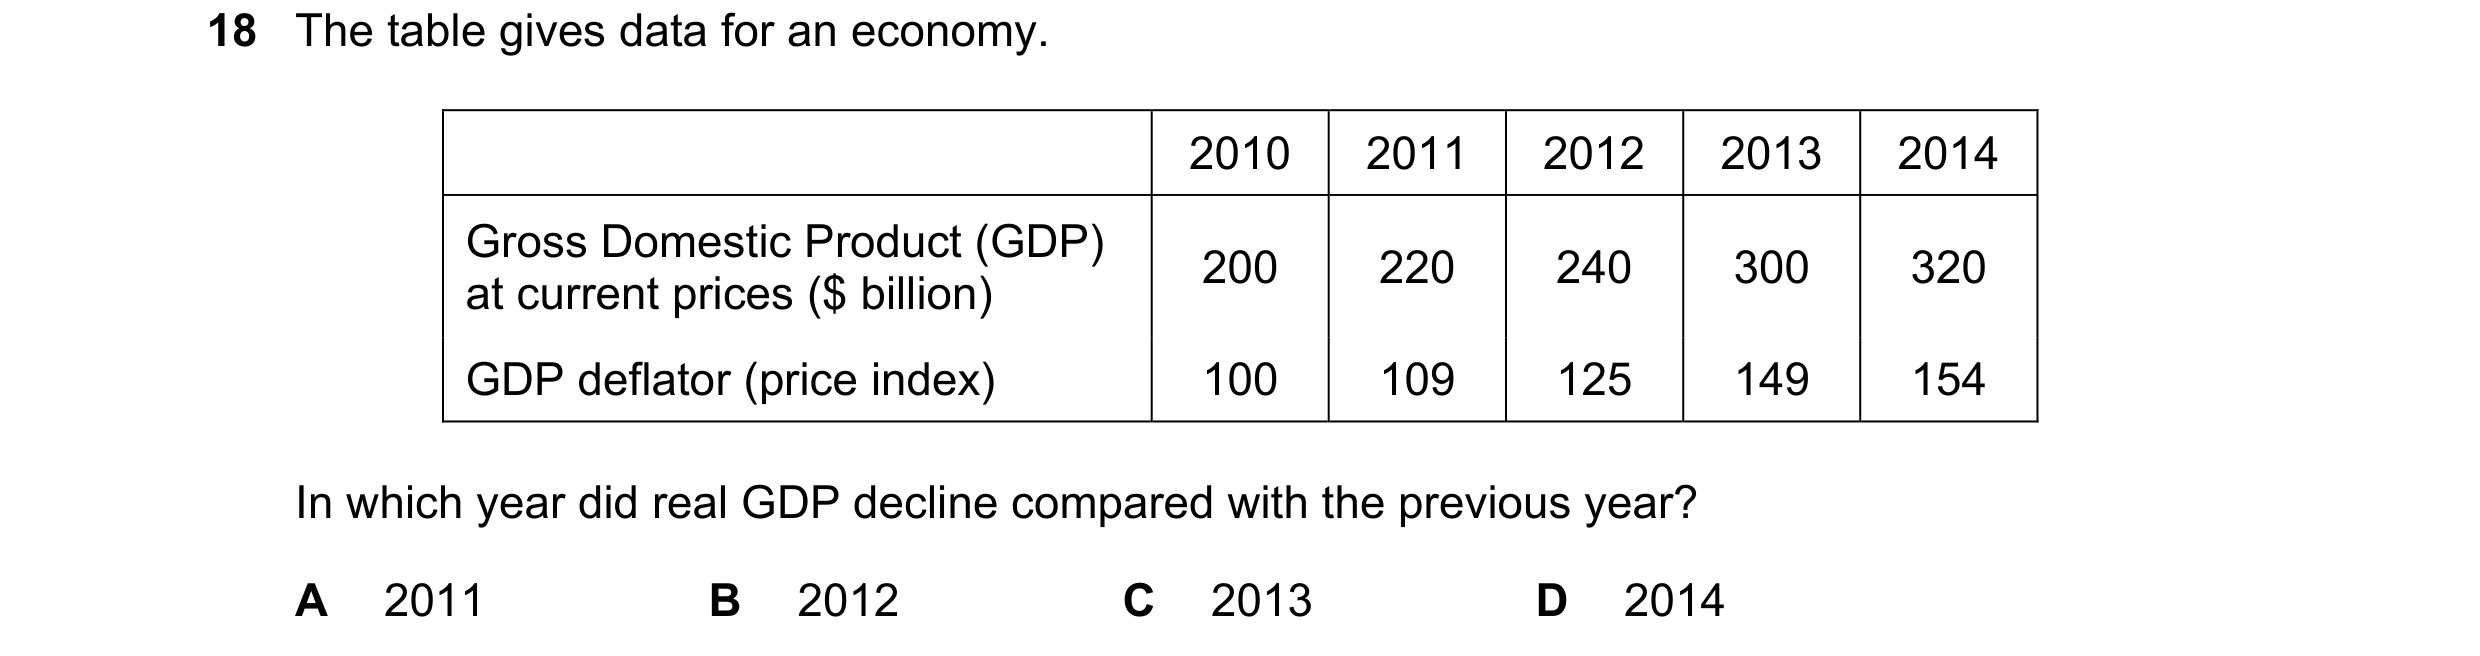
18 The table gives data for an economy. 2010 2011 2012 2013 2014 Gross Domestic Product (GDP) 200 220 240 300 320 at current prices ($ billion) GDP deflator (price index) 100 109 125 149 154 In which year did real GDP decline compared with the previous year? A 2011 B 2012 C 2013 D 2014
1 marks
Answer: B
This question in 9708/13 May/June 2023
Q13 · In year 1, a country’s real GDP was $500 billion 9708/13 May/June 2023
20 In year 1, a country’s real GDP was $500 billion. In year 2, nominal GDP rose to $577.5 billion and the prices increased by 5%. What is the real GDP in year 2? A $4.76 billion B $5 billion C $476 billion D $550 billion
1 marks
Answer: D
This question in 9708/13 May/June 2023
Q14 · Which government action is least likely to prevent a fall in economic growth? 9708/13 May/June 2023
24 Which government action is least likely to prevent a fall in economic growth? A additional controls on commercial banks’ lending B relaxation of rules for immigration of adult population C removal of trade barriers on import of raw materials D training and education of workforce
1 marks
Answer: A
This question in 9708/13 May/June 2023
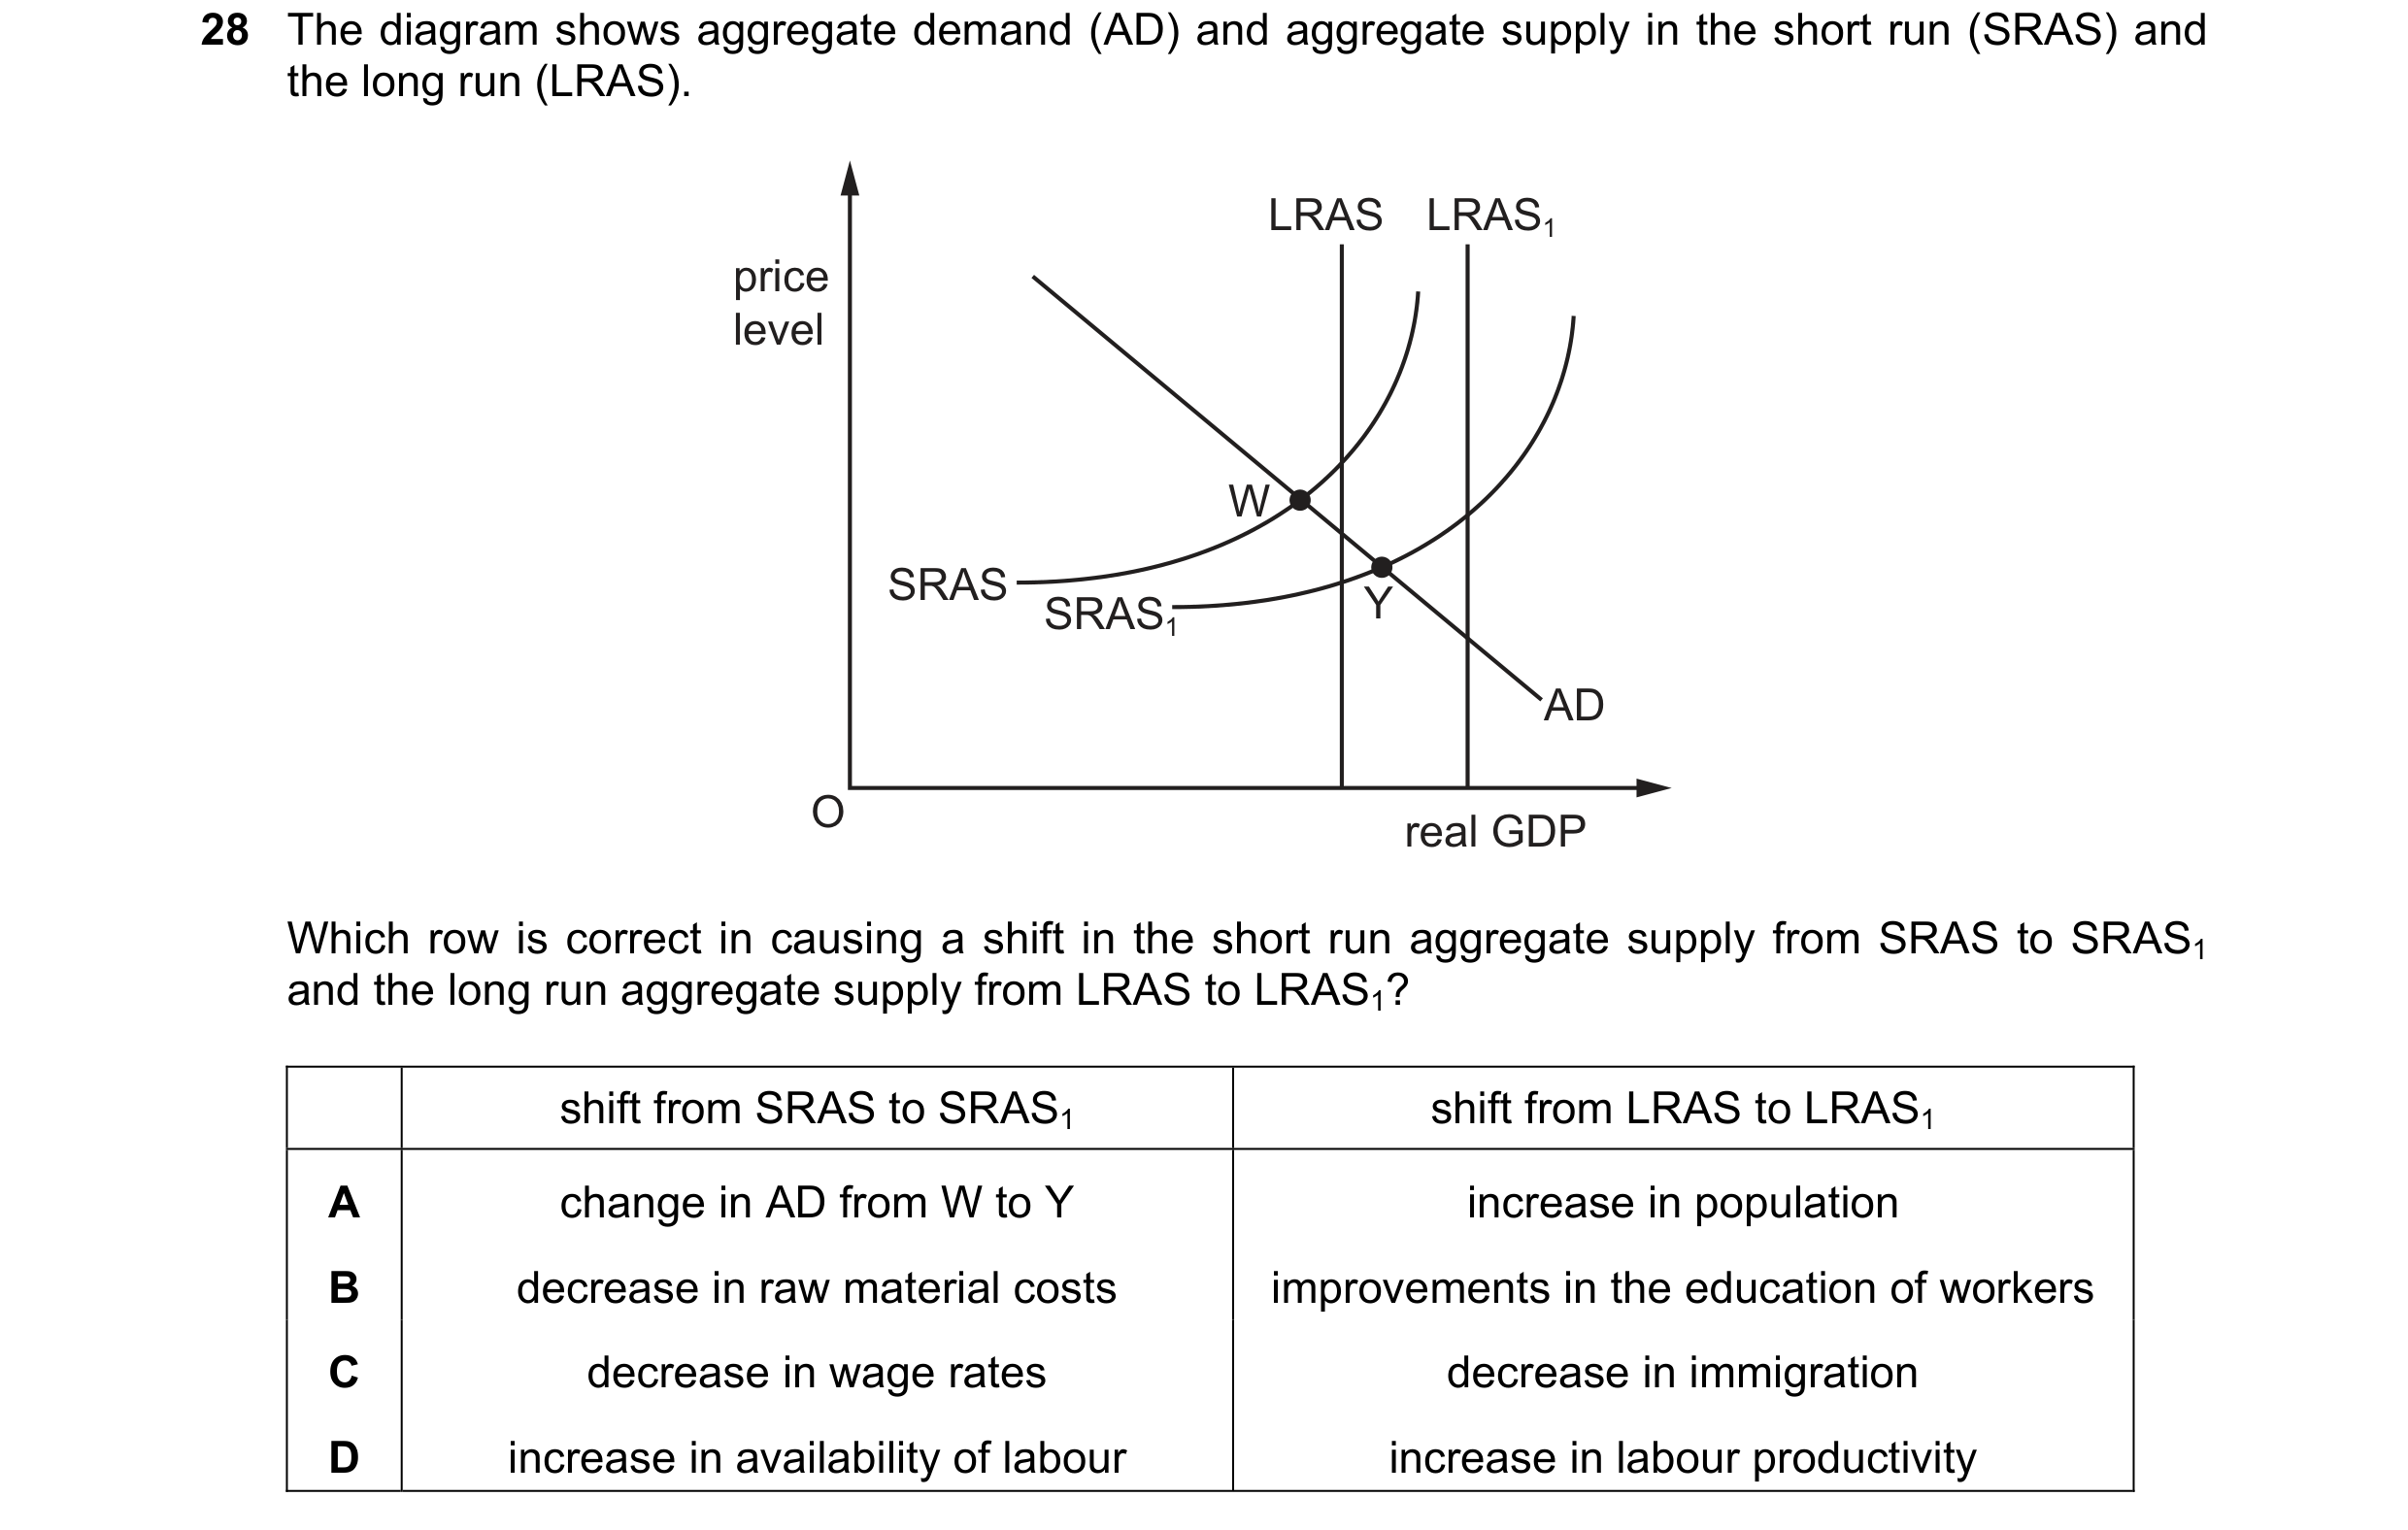
Q15 · The diagram shows aggregate demand (AD) and aggregate supply in the short run (SRAS) and… 9708/13 May/June 2023
28 The diagram shows aggregate demand (AD) and aggregate supply in the short run (SRAS) and the long run (LRAS). LRAS LRAS1 price level W SRAS SRAS1 Y AD O real GDP Which row is correct in causing a shift in the short run aggregate supply from SRAS to SRAS1 and the long run aggregate supply from LRAS to LRAS1? shift from SRAS to SRAS1 shift from LRAS to LRAS1 A change in AD from W to Y increase in population B decrease in raw material costs improvements in the education of workers C decrease in wage rates decrease in immigration D increase in availability of labour increase in labour productivity
1 marks
Answer: B
This question in 9708/13 May/June 2023
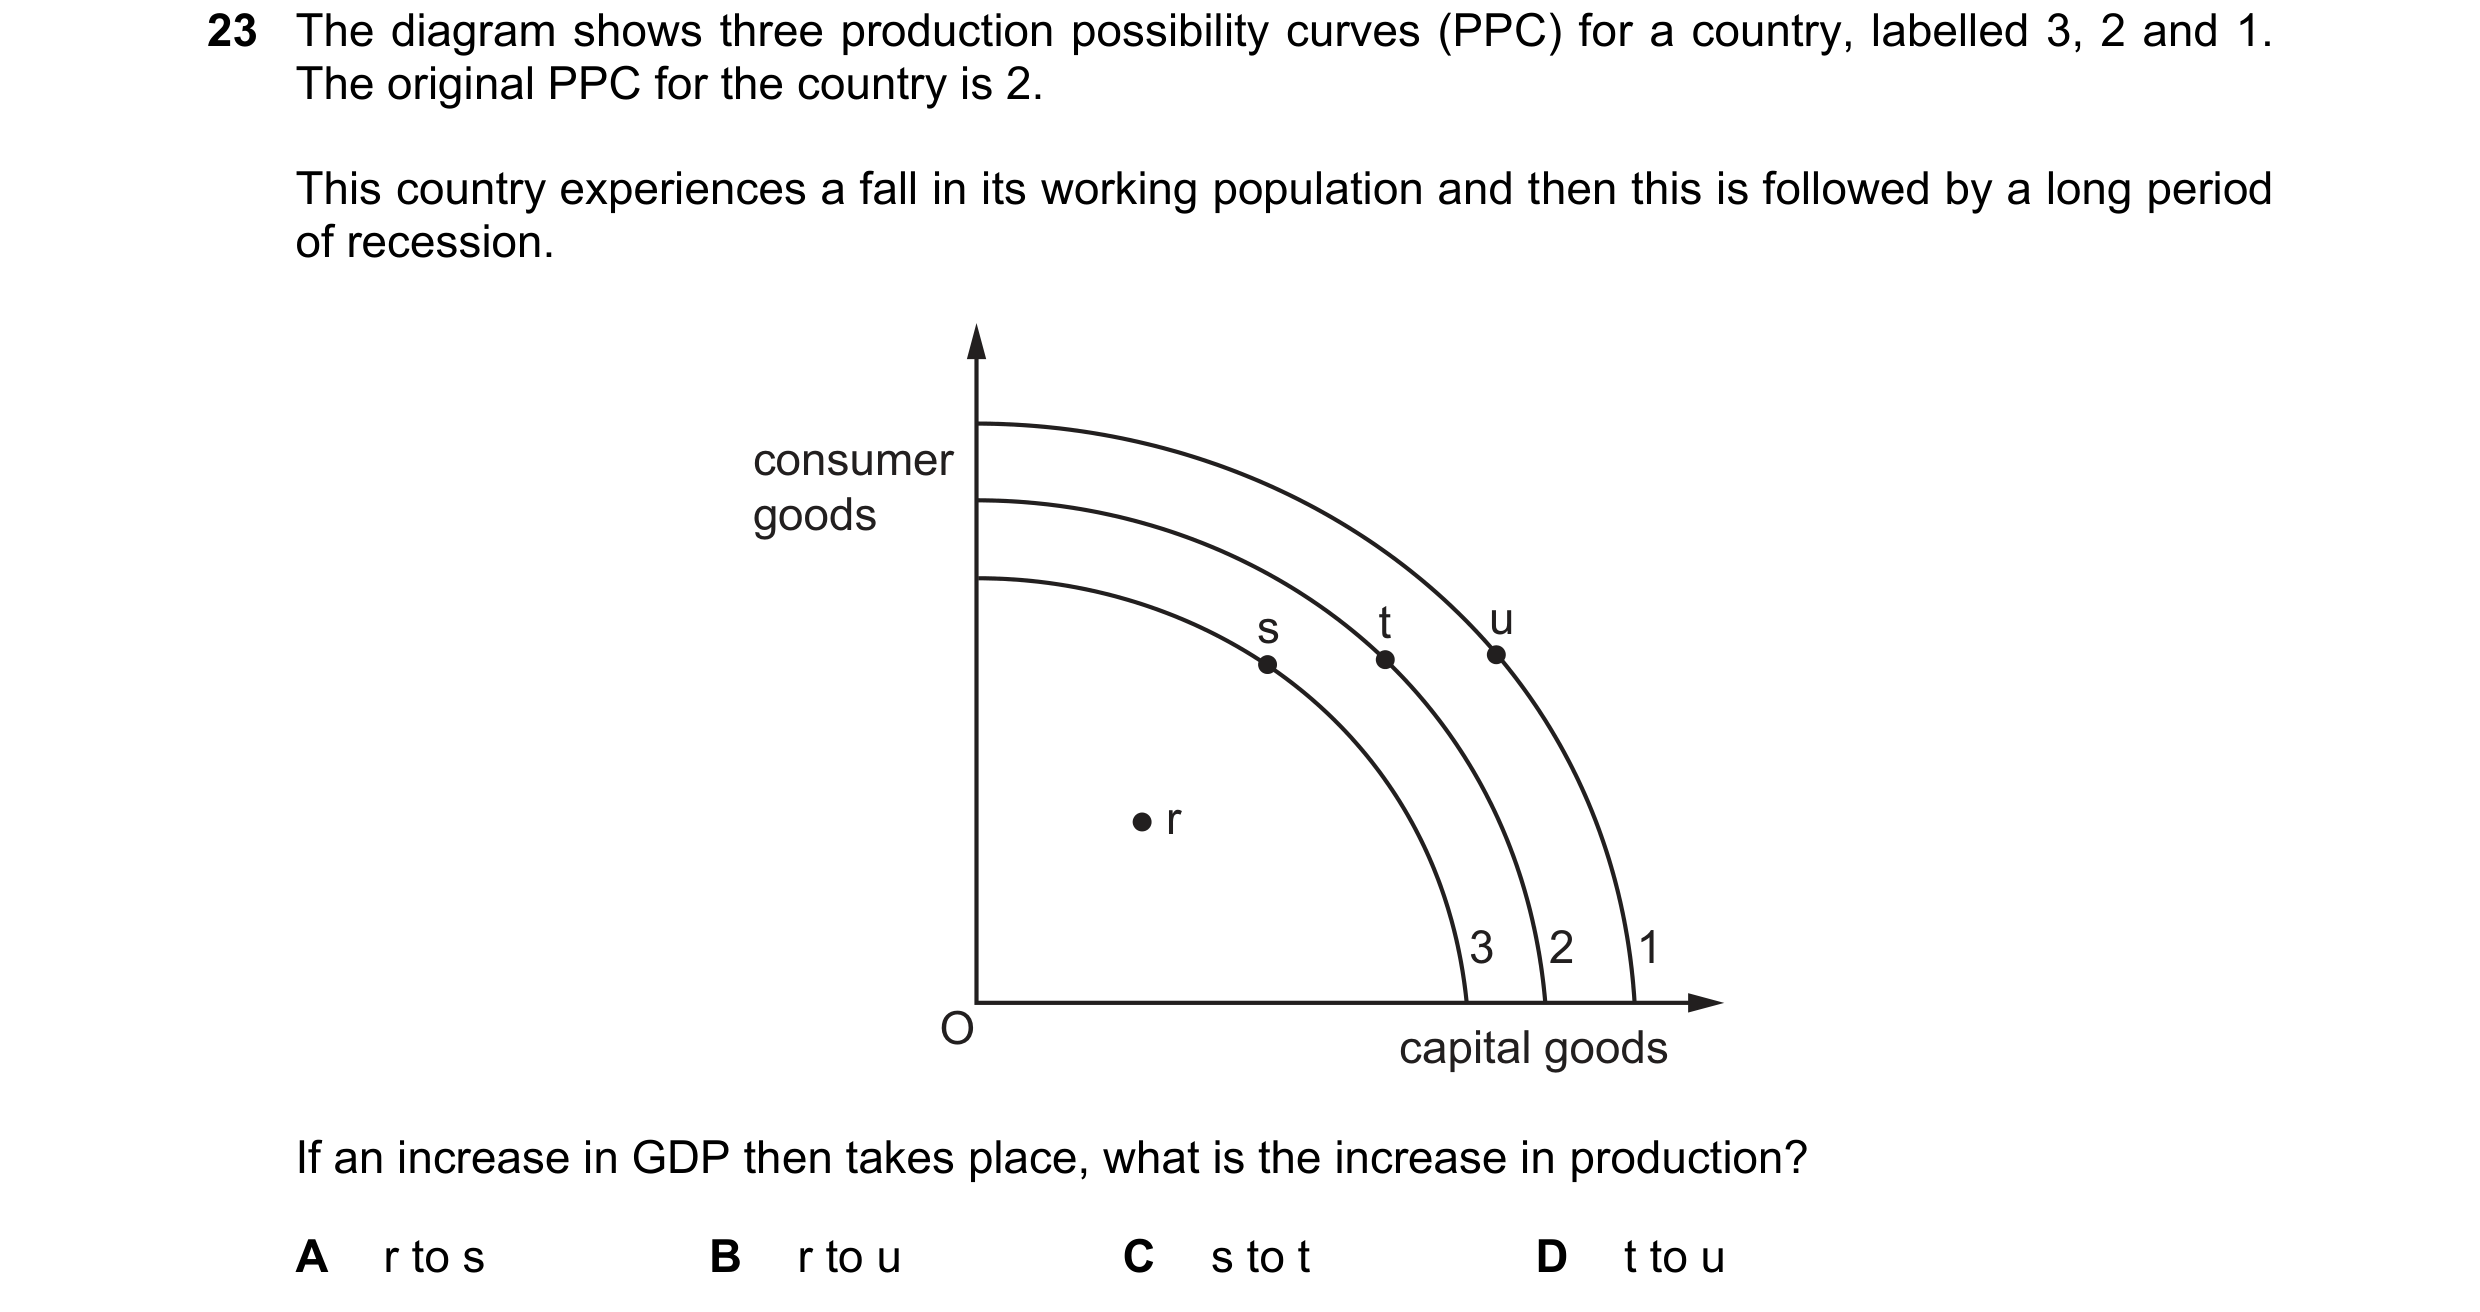
Q16 · The diagram shows three production possibility curves (PPC) for a country, labelled 3, 2… 9708/12 Oct/Nov 2023
23 The diagram shows three production possibility curves (PPC) for a country, labelled 3, 2 and 1. The original PPC for the country is 2. This country experiences a fall in its working population and then this is followed by a long period of recession. consumer goods s t u r 3 2 1 O capital goods If an increase in GDP then takes place, what is the increase in production? A r to s B r to u C s to t D t to u
1 marks
Answer: A
This question in 9708/12 Oct/Nov 2023
Q17 · The table shows real GDP expressed as an index number in each quarter of 2021 9708/12 Feb/March 2024
15 The table shows real GDP expressed as an index number in each quarter of 2021. index of GDP 2021 in real terms (2020 = 100) Q1 99.4 Q2 99.3 Q3 100.1 Q4 100.4 What can be concluded from the table? A Inflation reduced the real value of GDP in the first six months of 2021. B Real GDP was lower at the end of 2021 than 2020. C The economy was in recession at the end of the first six months of 2021. D The standard of living was higher at the end of 2021 than in 2020.
1 marks
Answer: C
This question in 9708/12 Feb/March 2024
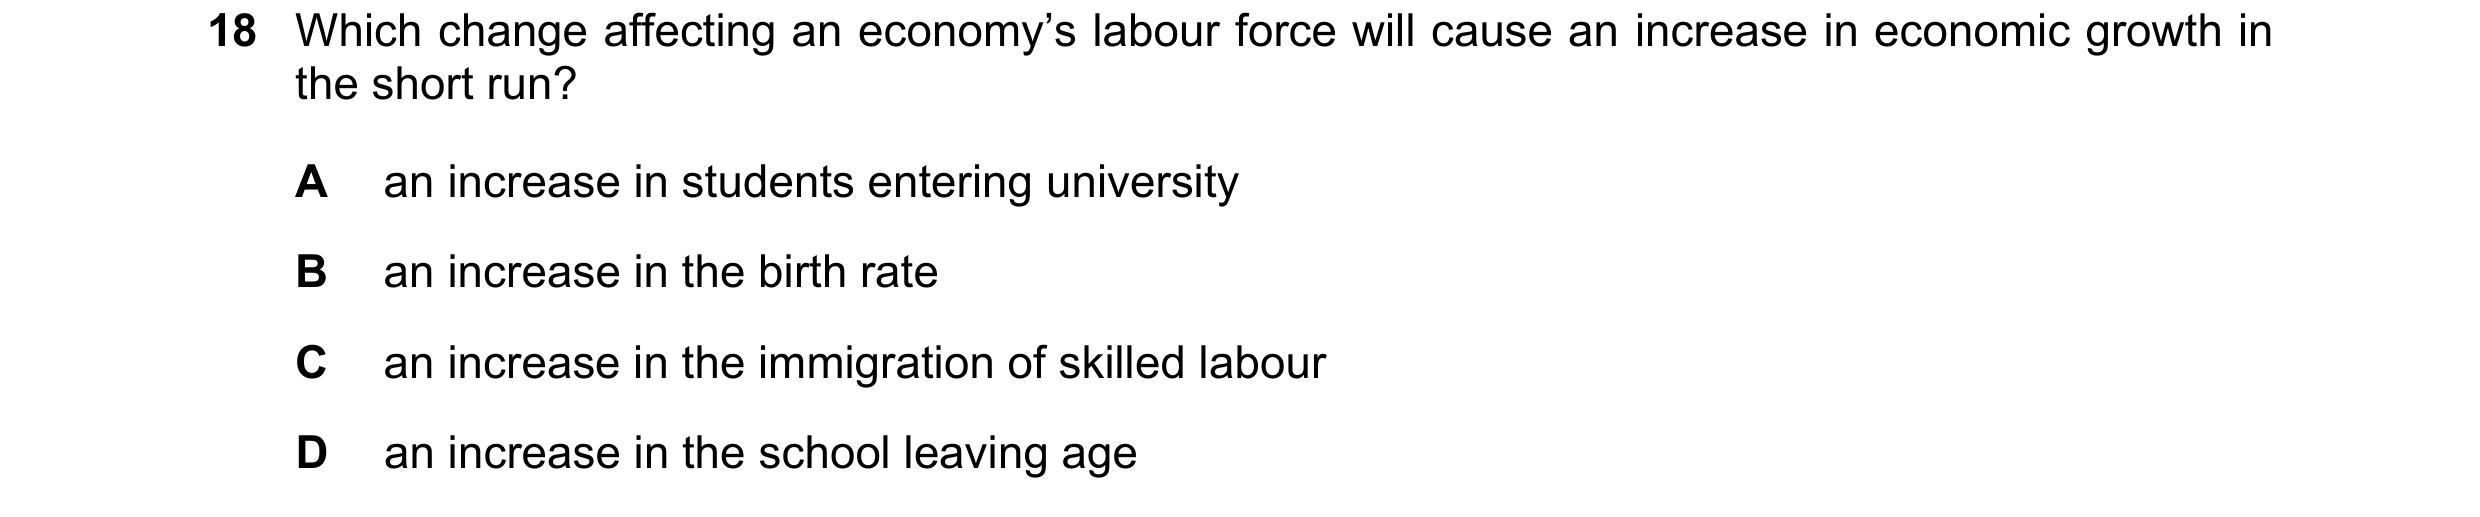
Q18 · Which change affecting an economy’s labour force will cause an increase in economic… 9708/12 May/June 2024
18 Which change affecting an economy’s labour force will cause an increase in economic growth in the short run? A an increase in students entering university B an increase in the birth rate C an increase in the immigration of skilled labour D an increase in the school leaving age
1 marks
Answer: C
This question in 9708/12 May/June 2024
Q19 · What is a cost of negative economic growth? 9708/13 May/June 2024
18 What is a cost of negative economic growth? A deteriorating balance of payments B higher inflation C higher unemployment D increased pollution
1 marks
Answer: C
This question in 9708/13 May/June 2024
Q20 · A country with a constant population experiences a 5% increase in its nominal GDP during… 9708/11 Oct/Nov 2024
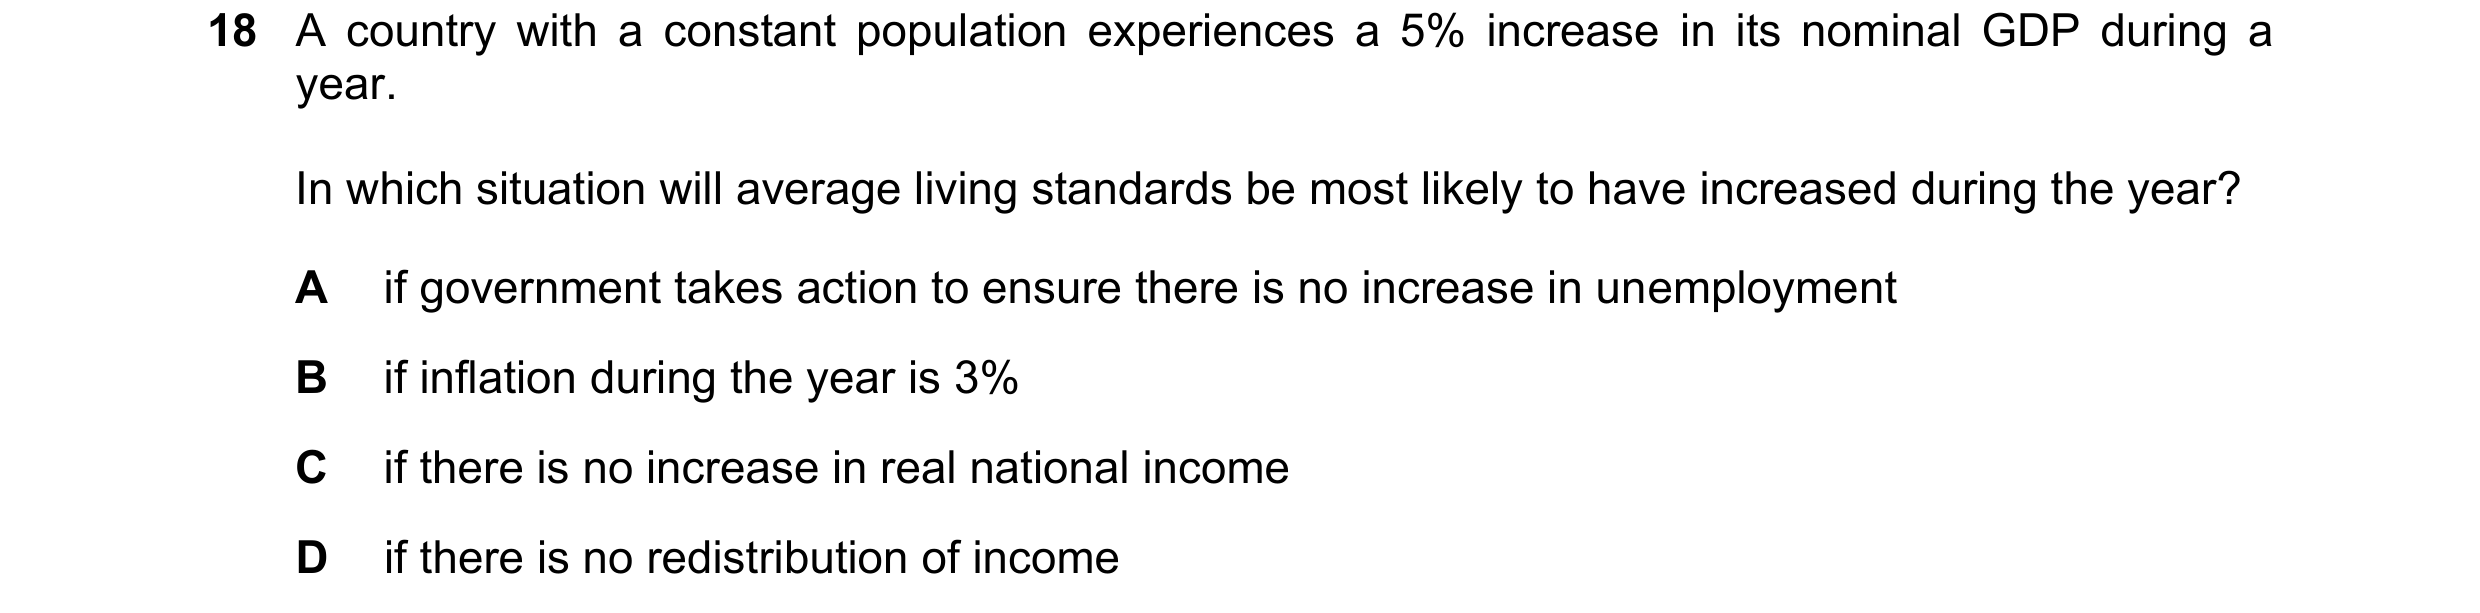
18 A country with a constant population experiences a 5% increase in its nominal GDP during a year. In which situation will average living standards be most likely to have increased during the year? A if government takes action to ensure there is no increase in unemployment B if inflation during the year is 3% C if there is no increase in real national income D if there is no redistribution of income
1 marks
Answer: B
This question in 9708/11 Oct/Nov 2024
Q21 · A country subsidises domestic production of manufactured goods 9708/13 Oct/Nov 2024
24 A country subsidises domestic production of manufactured goods. What is the most likely outcome? A a rise in economic growth B a rise in imports of manufactured goods C a rise in the rate of inflation D a rise in unemployment
1 marks
Answer: A
This question in 9708/13 Oct/Nov 2024
Q22 · High economic growth is often accompanied by a worsening of the current account of the… 9708/12 Feb/March 2025
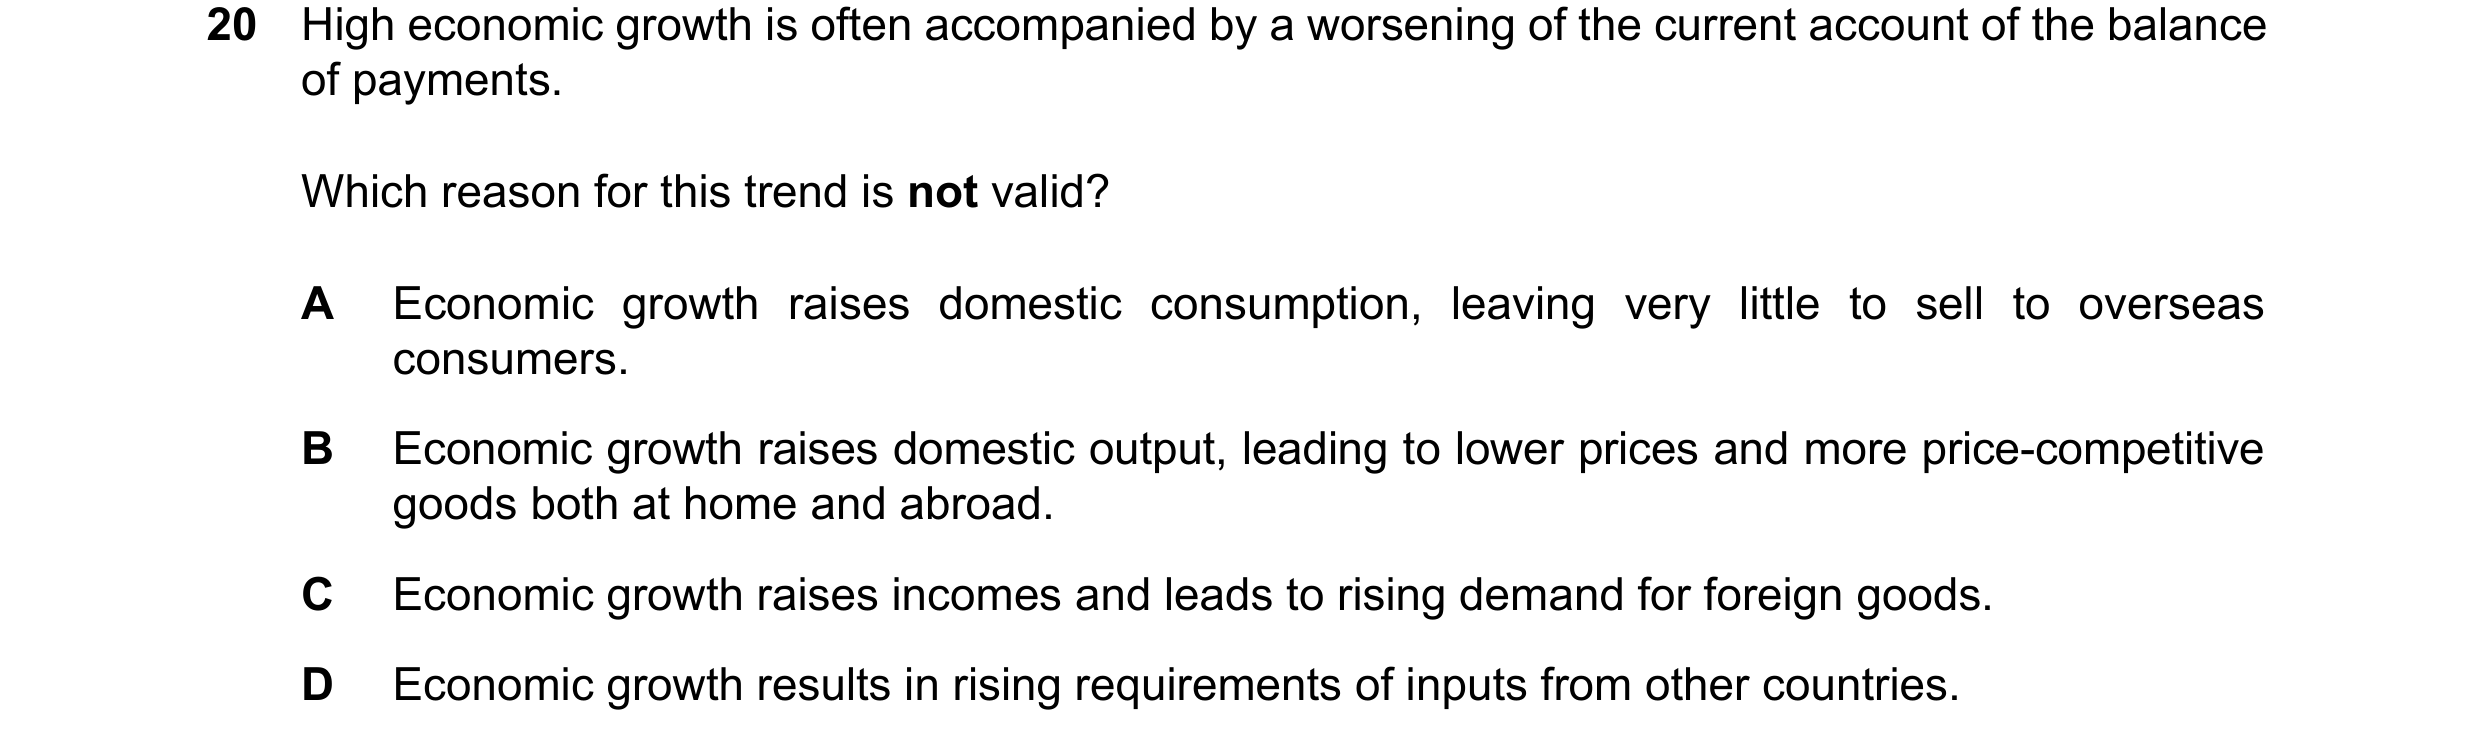
20 High economic growth is often accompanied by a worsening of the current account of the balance of payments. Which reason for this trend is not valid? A Economic growth raises domestic consumption, leaving very little to sell to overseas consumers. B Economic growth raises domestic output, leading to lower prices and more price-competitive goods both at home and abroad. C Economic growth raises incomes and leads to rising demand for foreign goods. D Economic growth results in rising requirements of inputs from other countries.
1 marks
Answer: B
This question in 9708/12 Feb/March 2025
Q23 · The diagram shows a country’s production possibilities 9708/13 May/June 2025
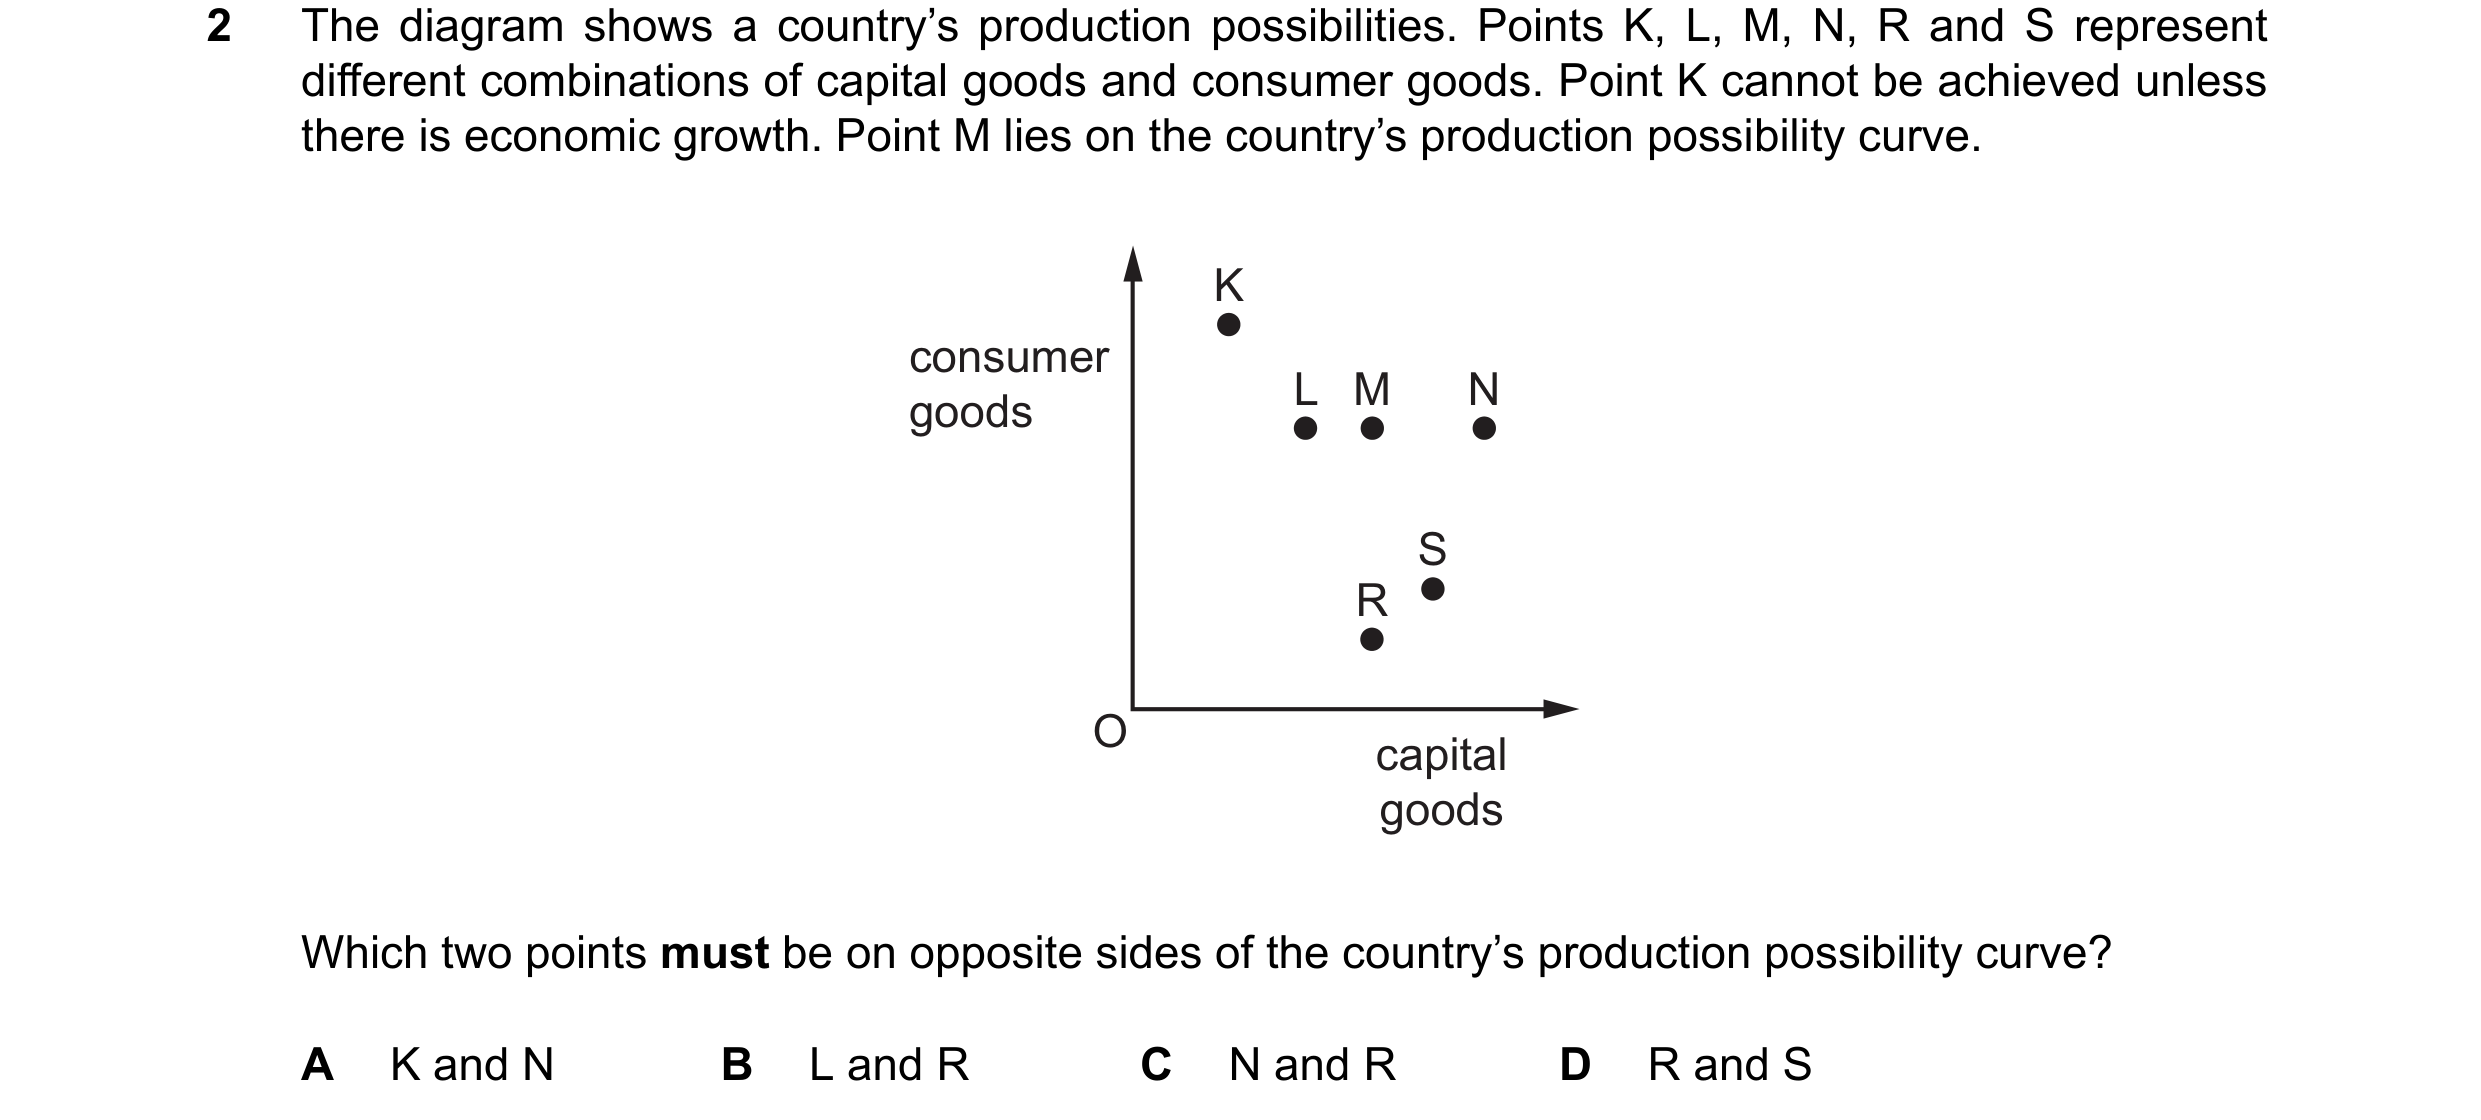
2 The diagram shows a country’s production possibilities. Points K, L, M, N, R and S represent different combinations of capital goods and consumer goods. Point K cannot be achieved unless there is economic growth. Point M lies on the country’s production possibility curve. K consumer L M N goods S R O capital goods Which two points must be on opposite sides of the country’s production possibility curve? A K and N B L and R C N and R D R and S
1 marks
Answer: C
This question in 9708/13 May/June 2025
Q24 · What is the most likely consequence of economic growth? 9708/13 May/June 2025
20 What is the most likely consequence of economic growth? A a fall in the price of raw materials B a rise in youth unemployment C a worsening current account balance D reduced demand-pull inflationary pressures
1 marks
Answer: C
This question in 9708/13 May/June 2025
Q25 · What is not a likely reason for a government having the objective of economic growth? 9708/12 Oct/Nov 2025
20 What is not a likely reason for a government having the objective of economic growth? A to improve living standards B to improve business confidence C to increase inflationary pressures D to increase consumer choice
1 marks
Answer: C
This question in 9708/12 Oct/Nov 2025
Q26 · What is the least likely consequence of rapid economic growth? 9708/12 Oct/Nov 2025
25 What is the least likely consequence of rapid economic growth? A high levels of pollution B large deficit on the current account of the balance of payments C large deficit in the government’s budget balance D more congestion on the roads
1 marks
Answer: C
This question in 9708/12 Oct/Nov 2025
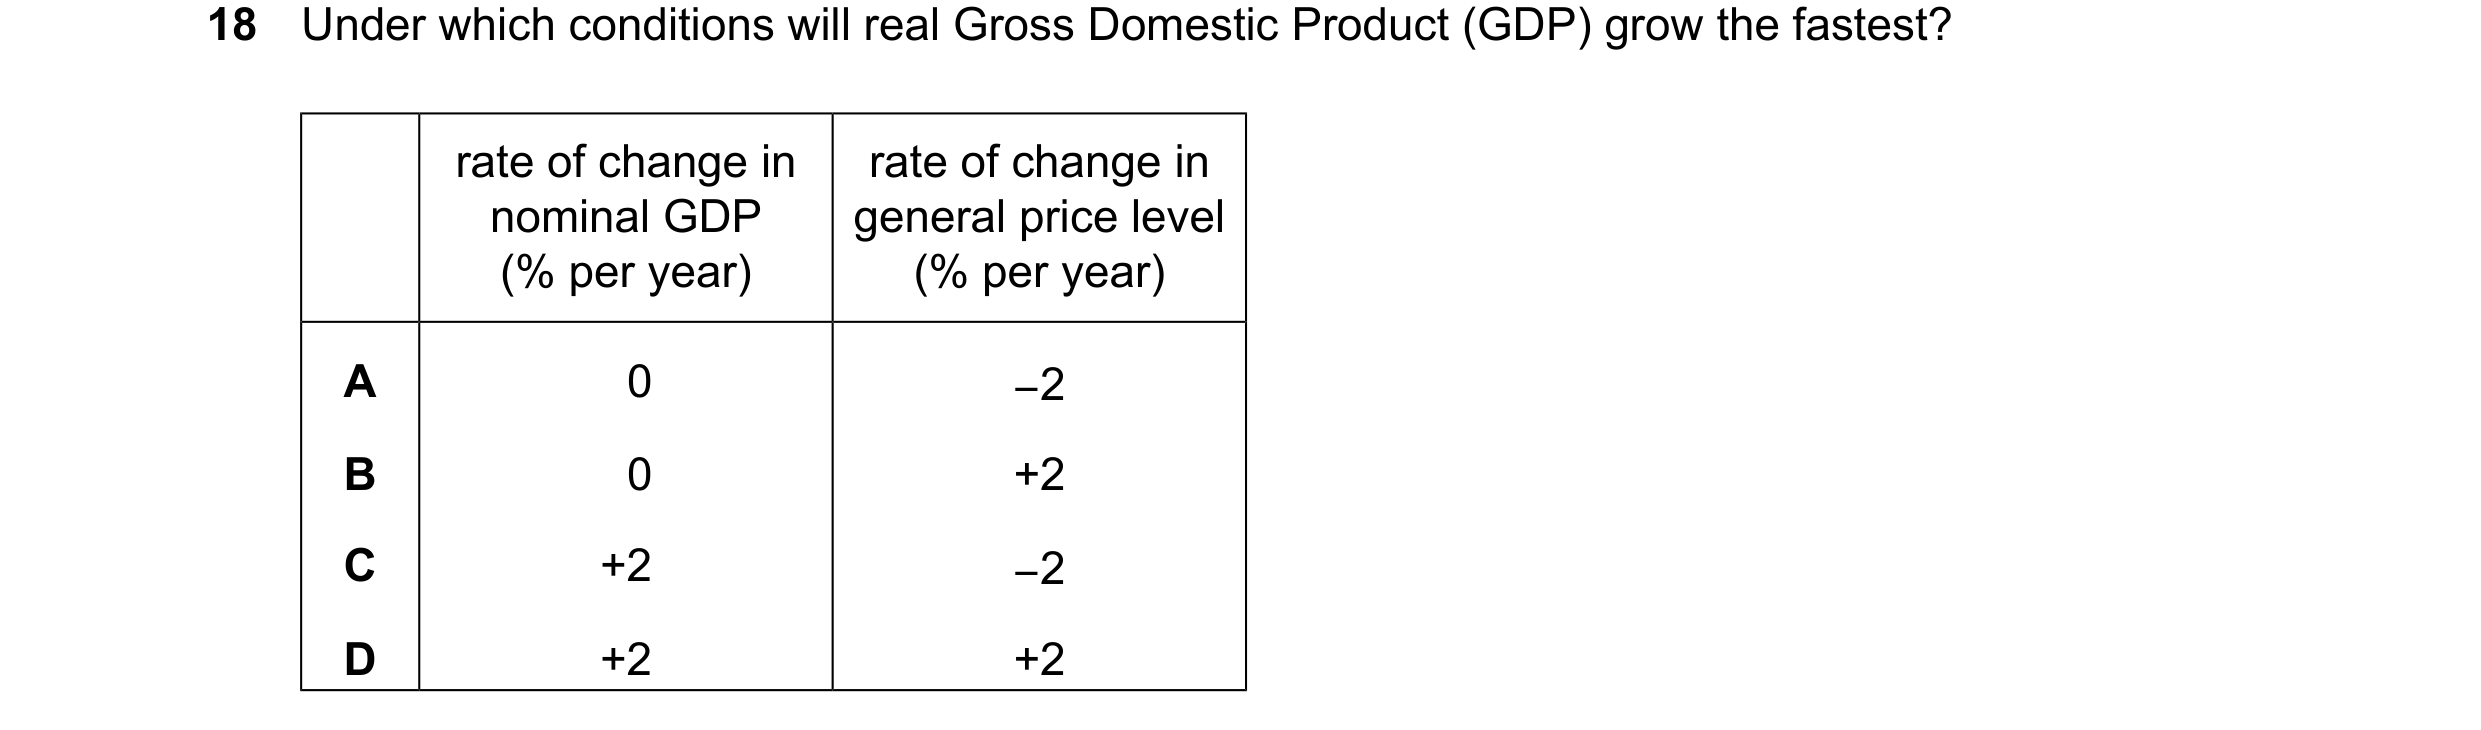
Q27 · Under which conditions will real Gross Domestic Product (GDP) grow the fastest? 9708/13 Oct/Nov 2025
18 Under which conditions will real Gross Domestic Product (GDP) grow the fastest? rate of change in rate of change in nominal GDP general price level (% per year) (% per year) A 0 −2 B 0 +2 C +2 −2 D +2 +2
1 marks
Answer: C
This question in 9708/13 Oct/Nov 2025
 1 / 8
1 / 8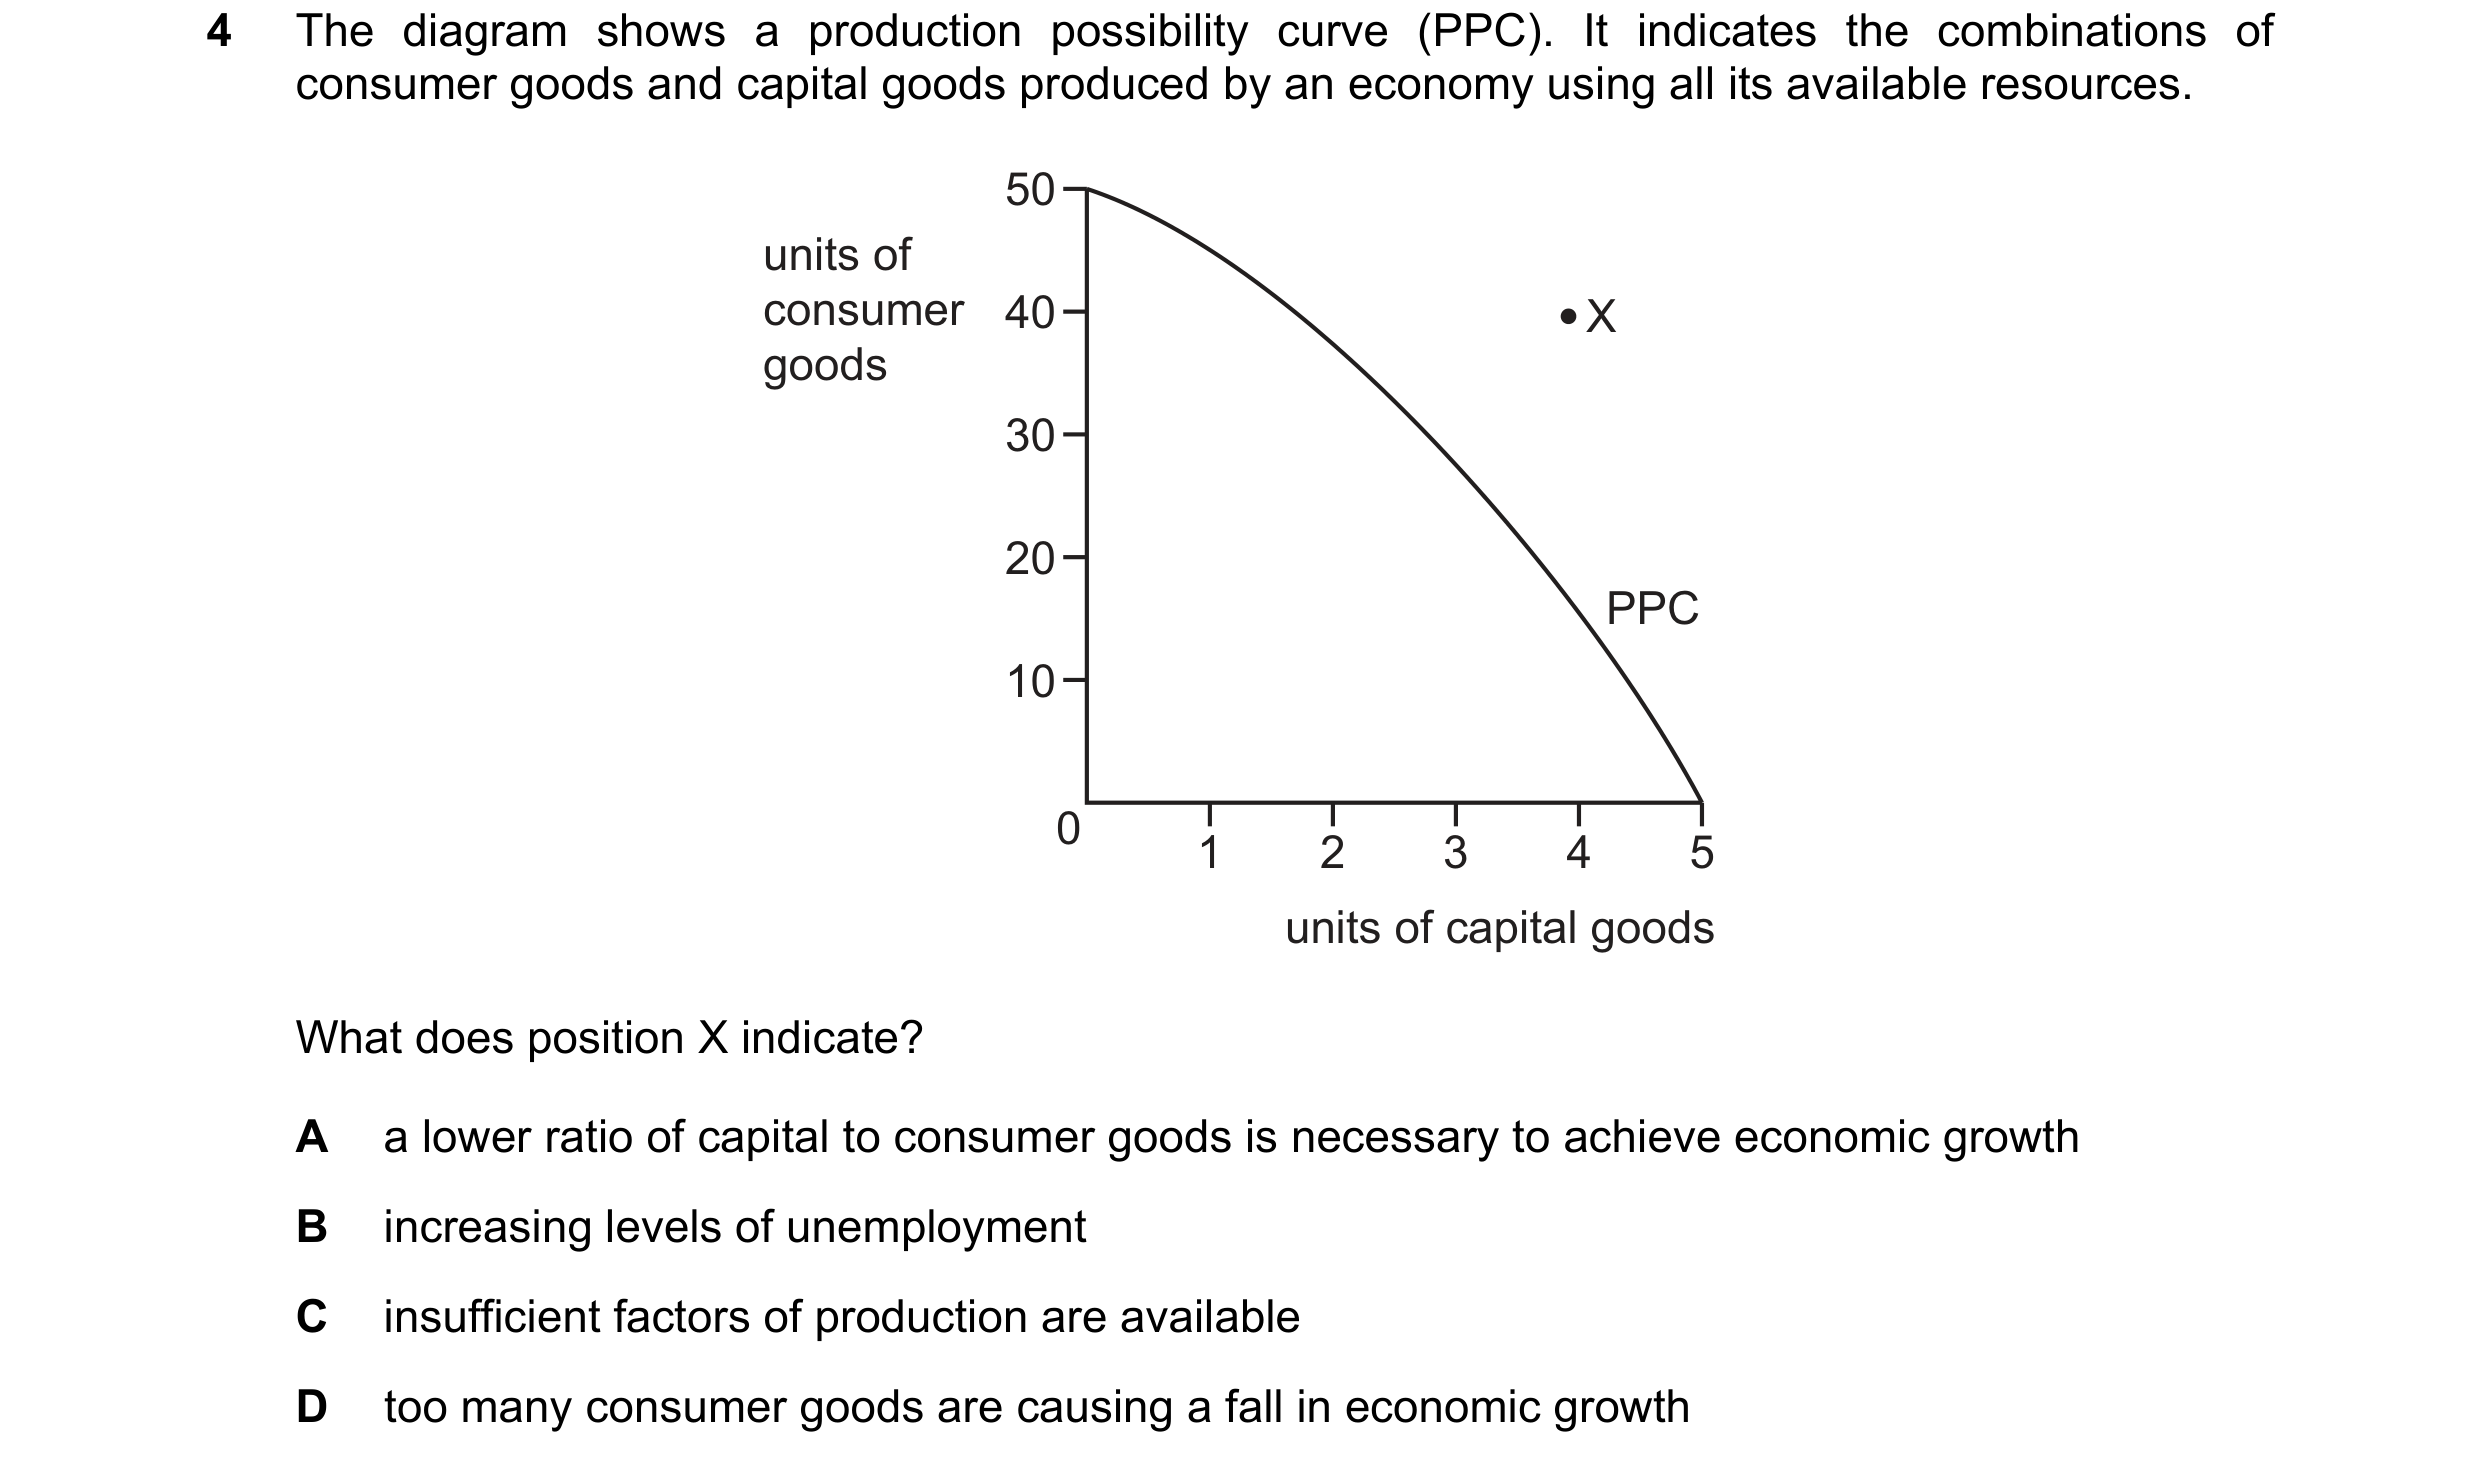
 2 / 8
2 / 8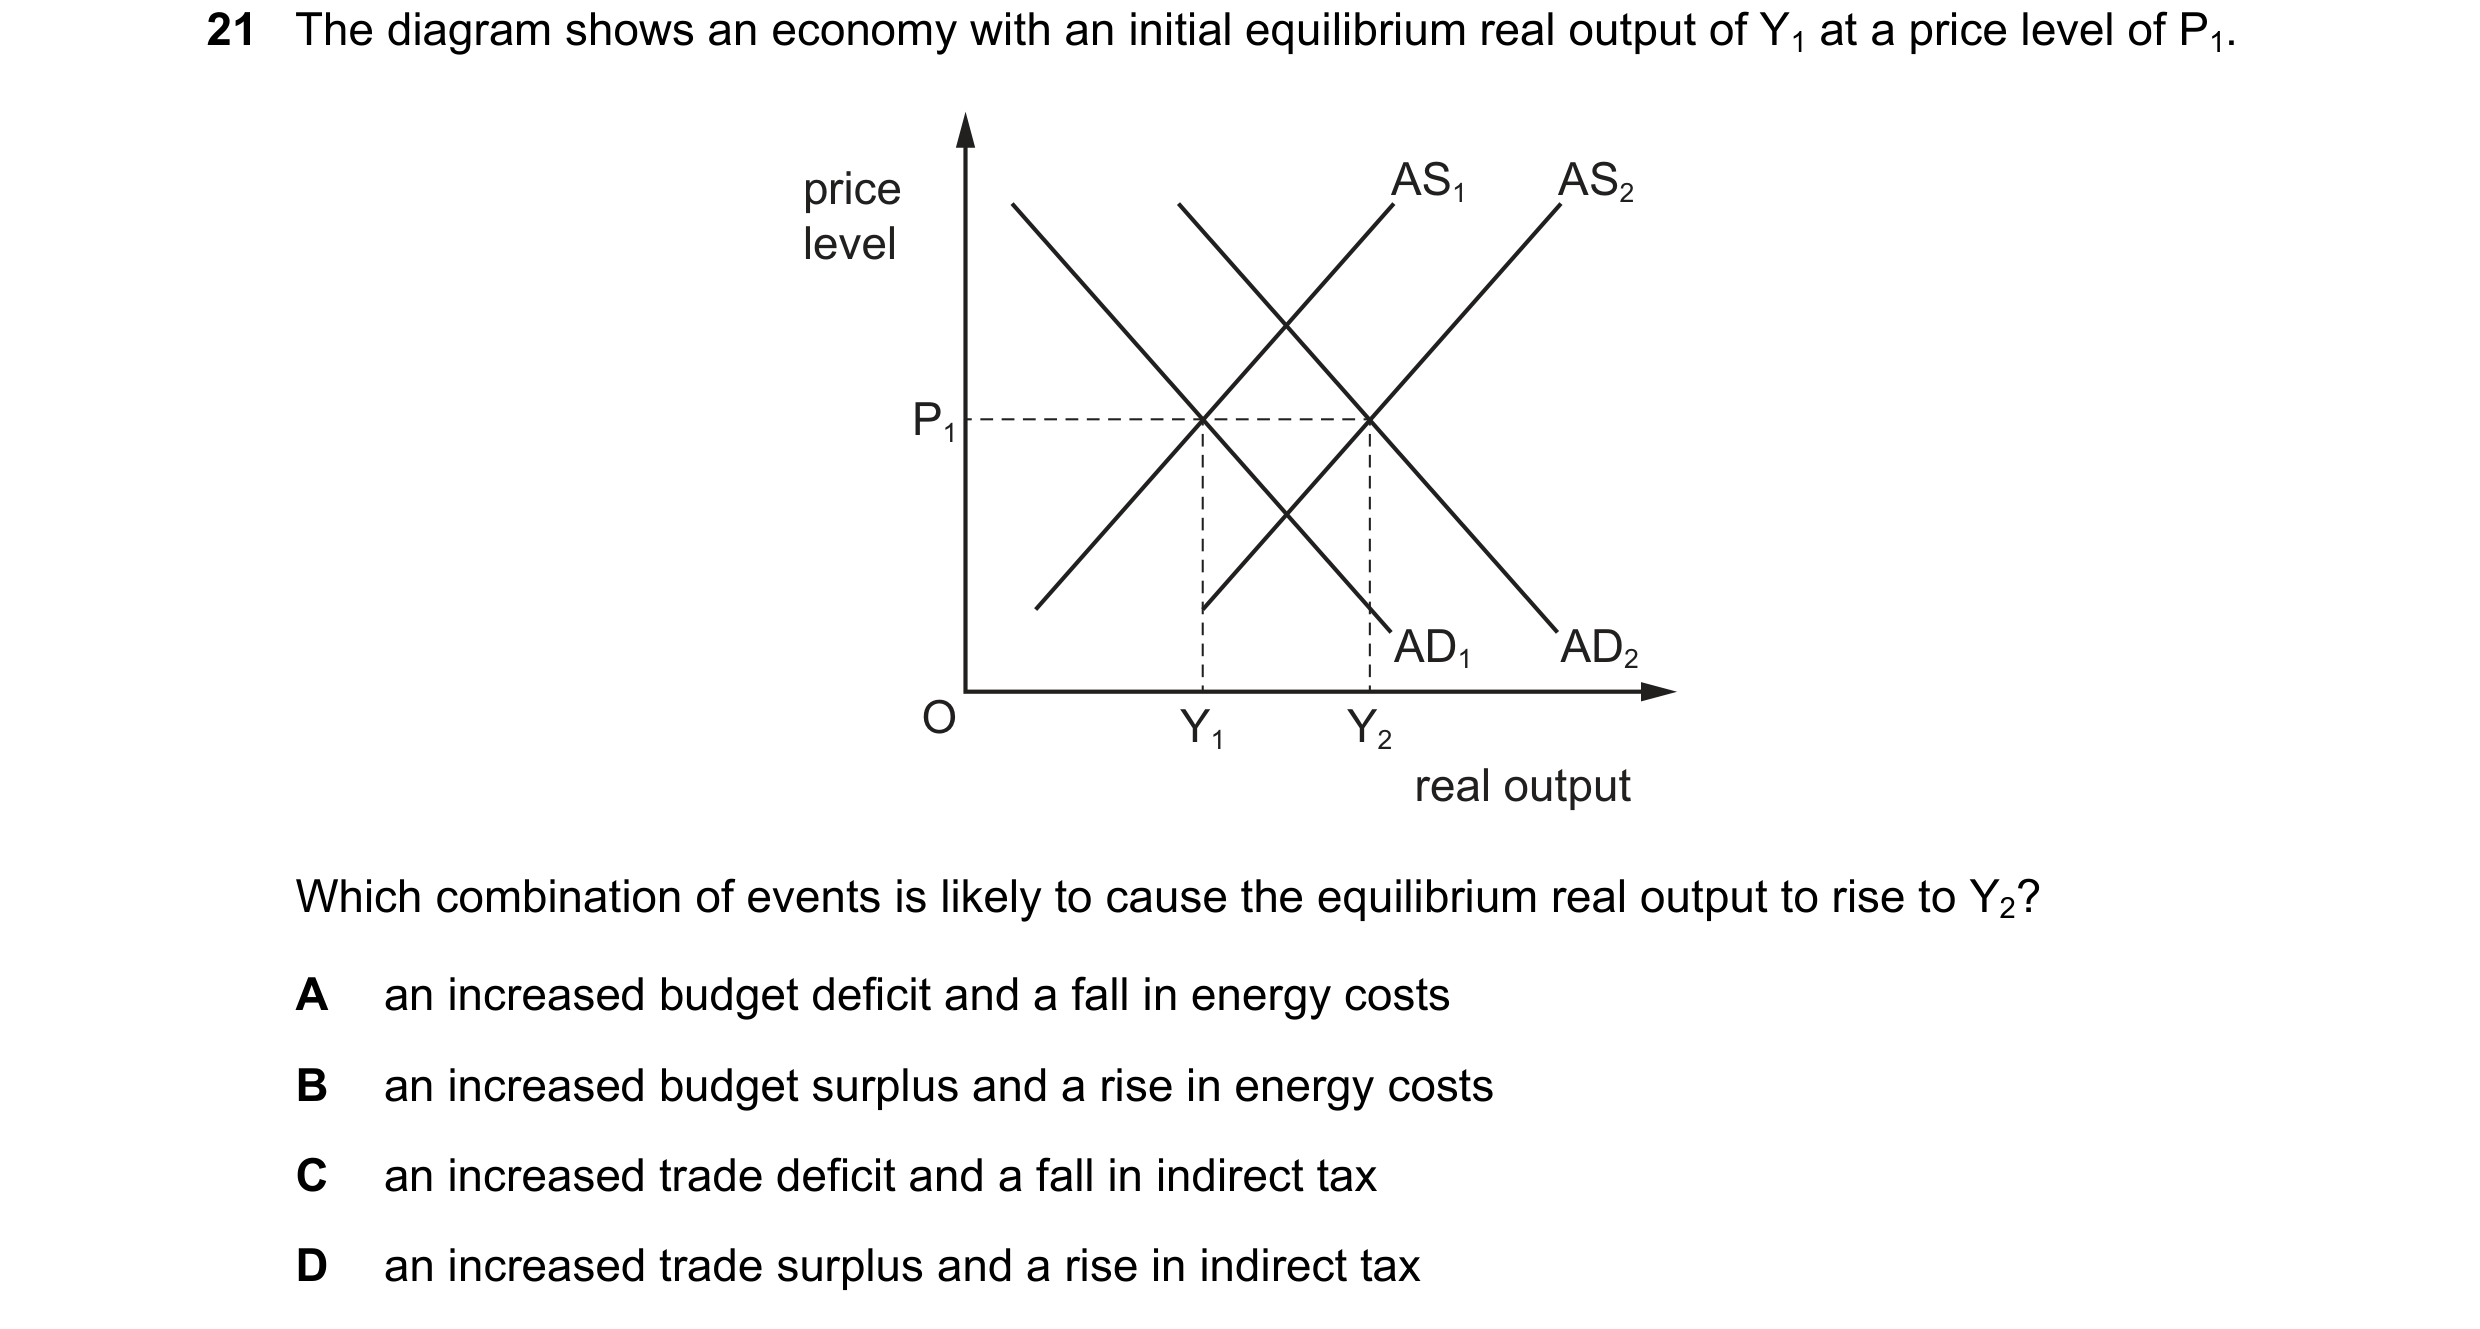
 3 / 8
3 / 8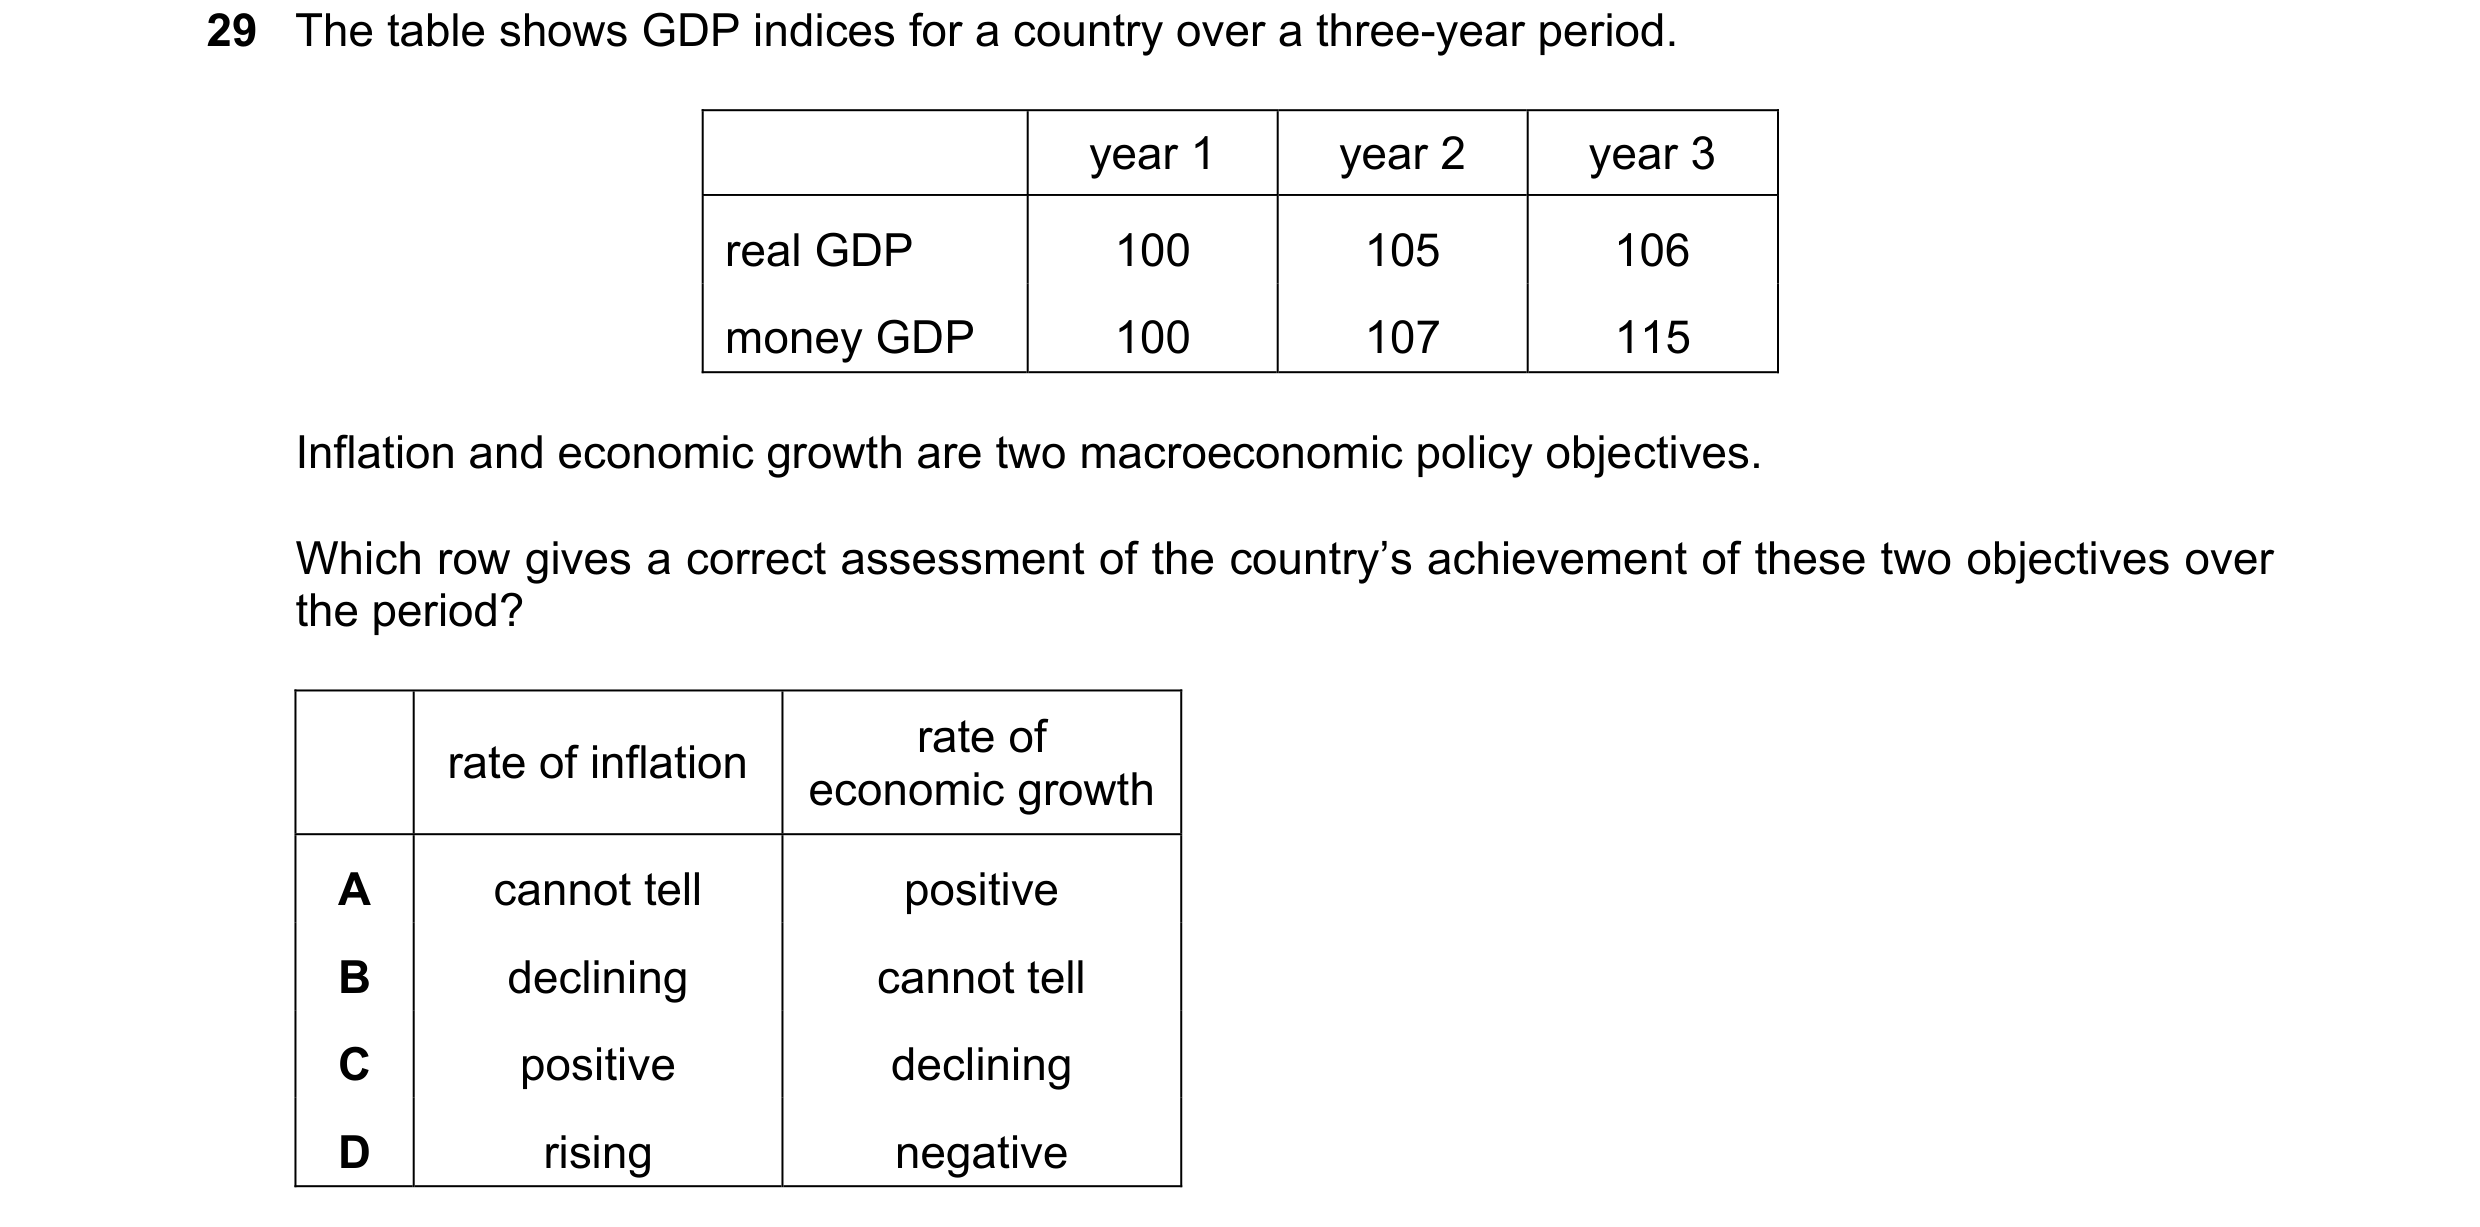
 4 / 8
4 / 8
 5 / 8
5 / 8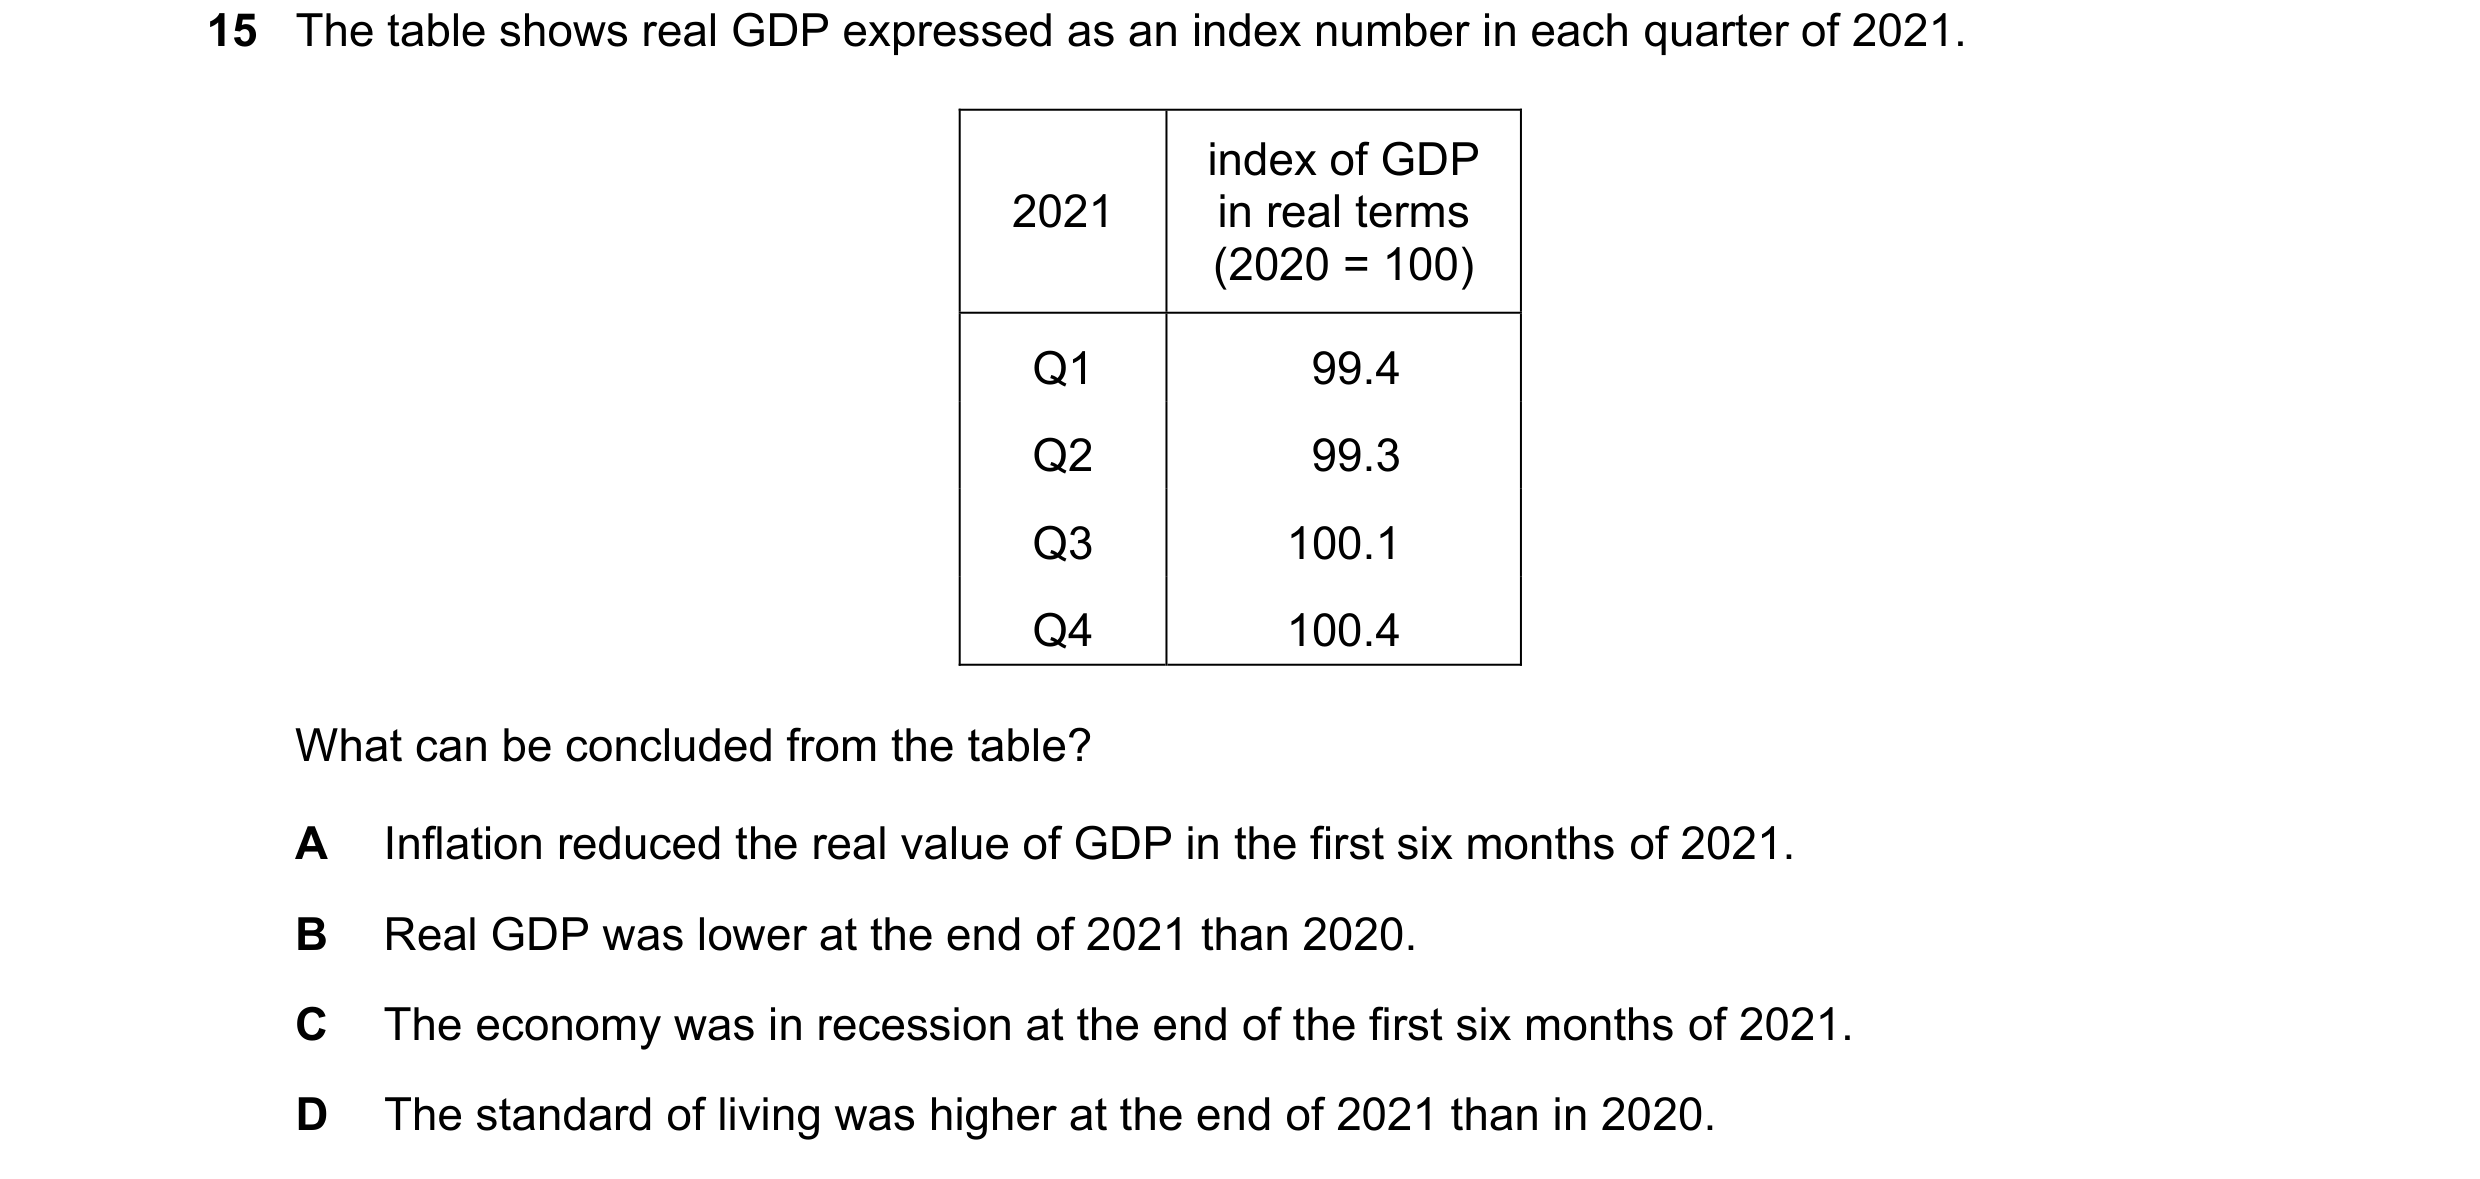

 6 / 8
6 / 8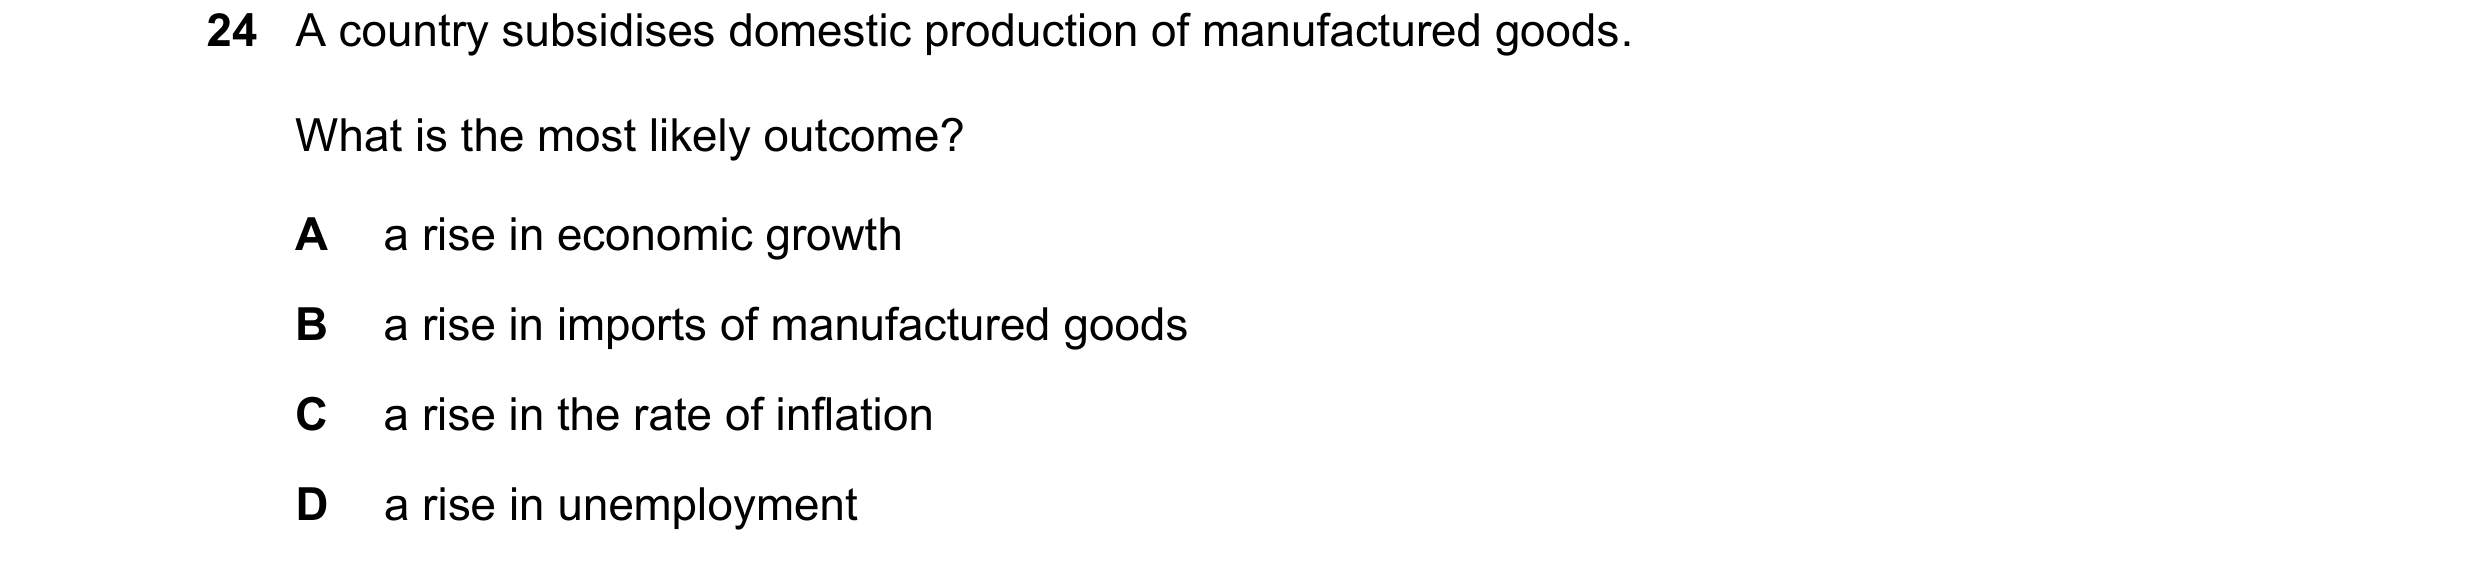
 7 / 8
7 / 8

 8 / 8
8 / 8