Questions as text
Q1 · The table gives the national income of a country over six years 9708/31 Oct/Nov 2009
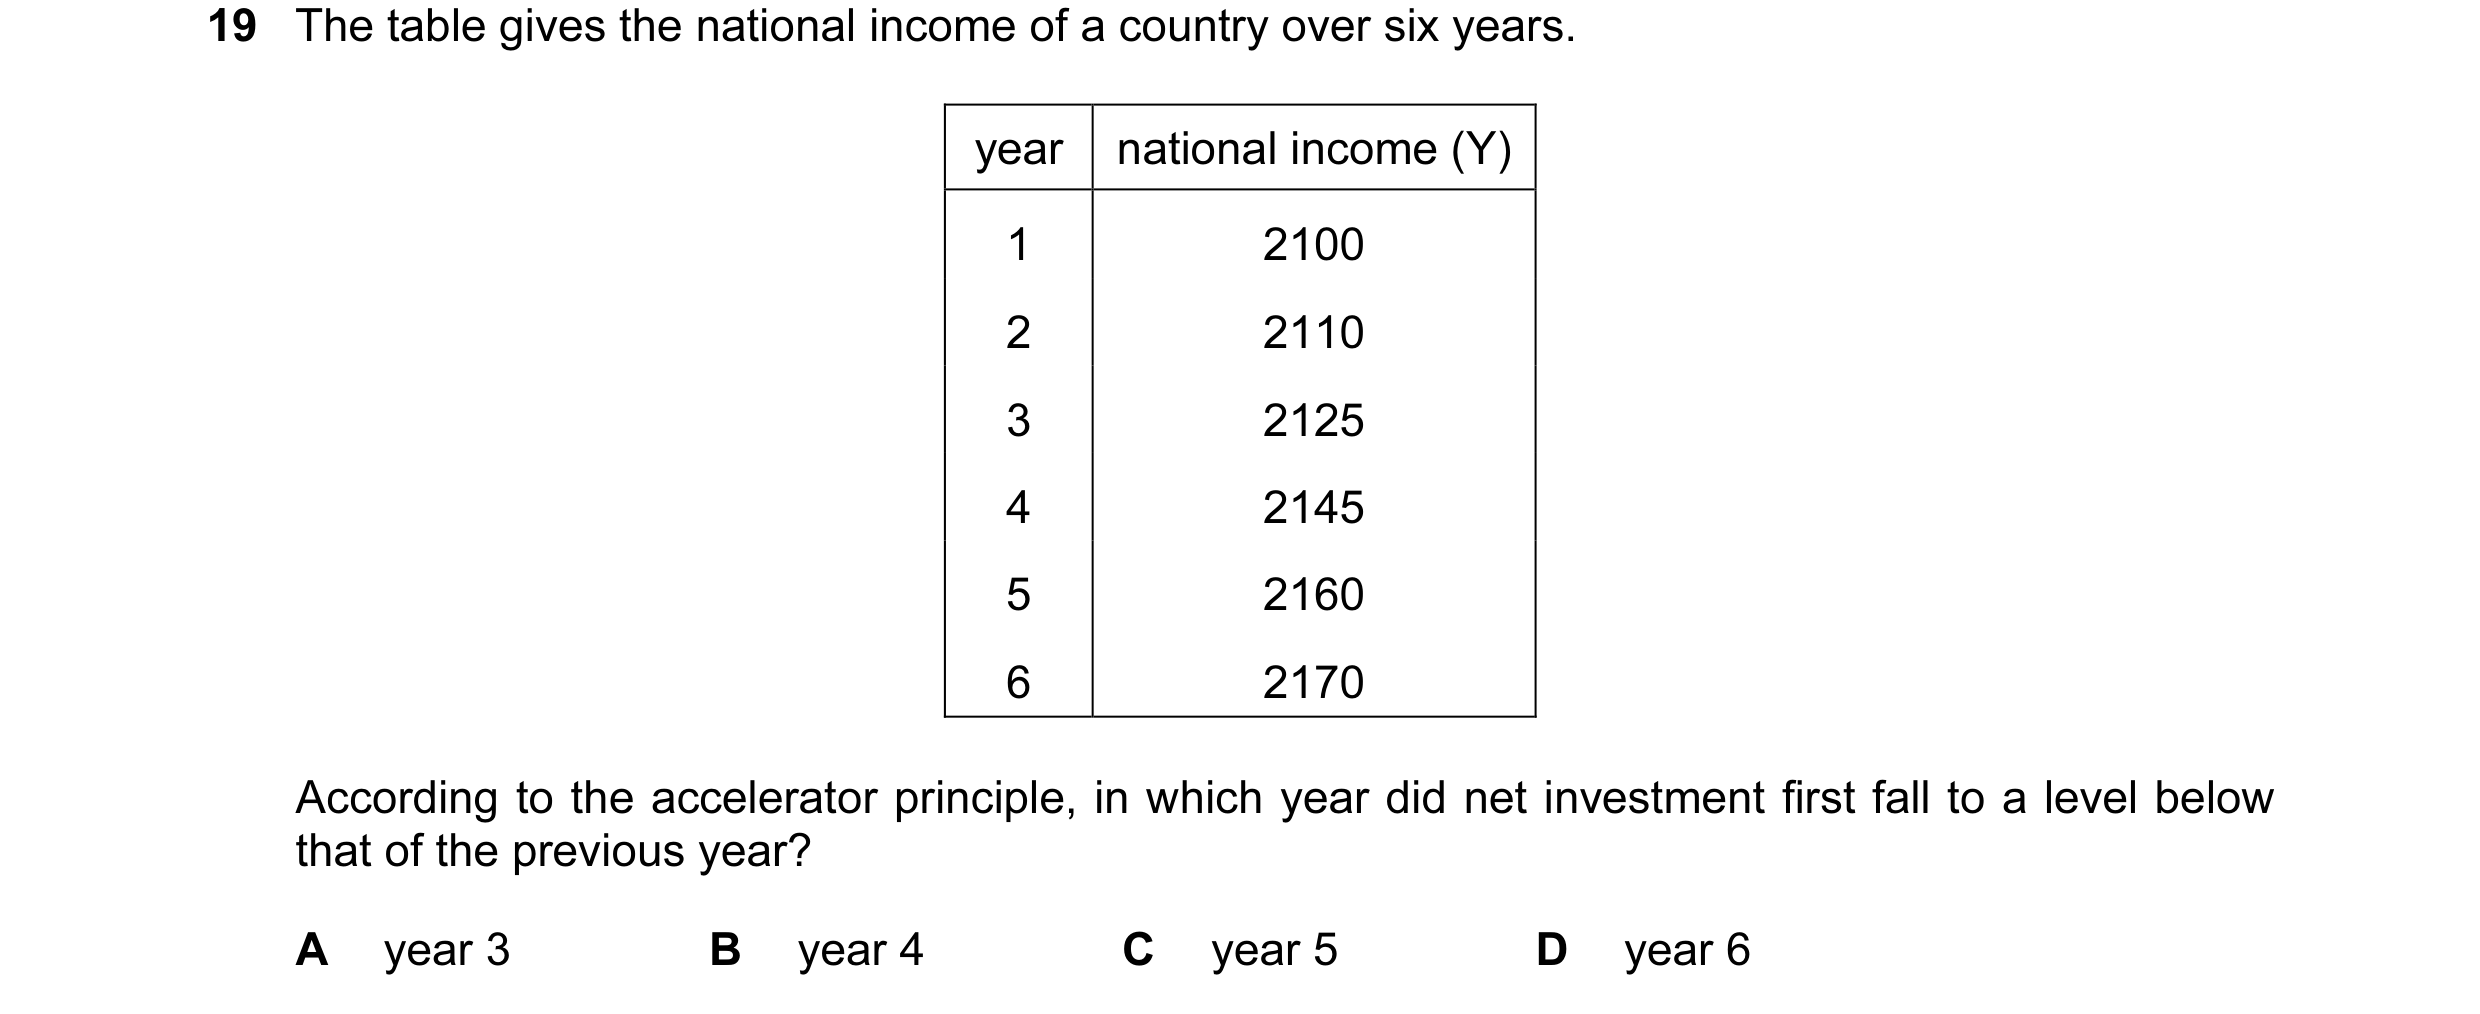
19 The table gives the national income of a country over six years. year national income (Y) 1 2100 2 2110 3 2125 4 2145 5 2160 6 2170 According to the accelerator principle, in which year did net investment first fall to a level below that of the previous year? A year 3 B year 4 C year 5 D year 6
1 marks
Answer: C
This question in 9708/31 Oct/Nov 2009
Q2 · What is most likely to be the impact on economic growth and on the rate of inflation in… 9708/31 Oct/Nov 2009
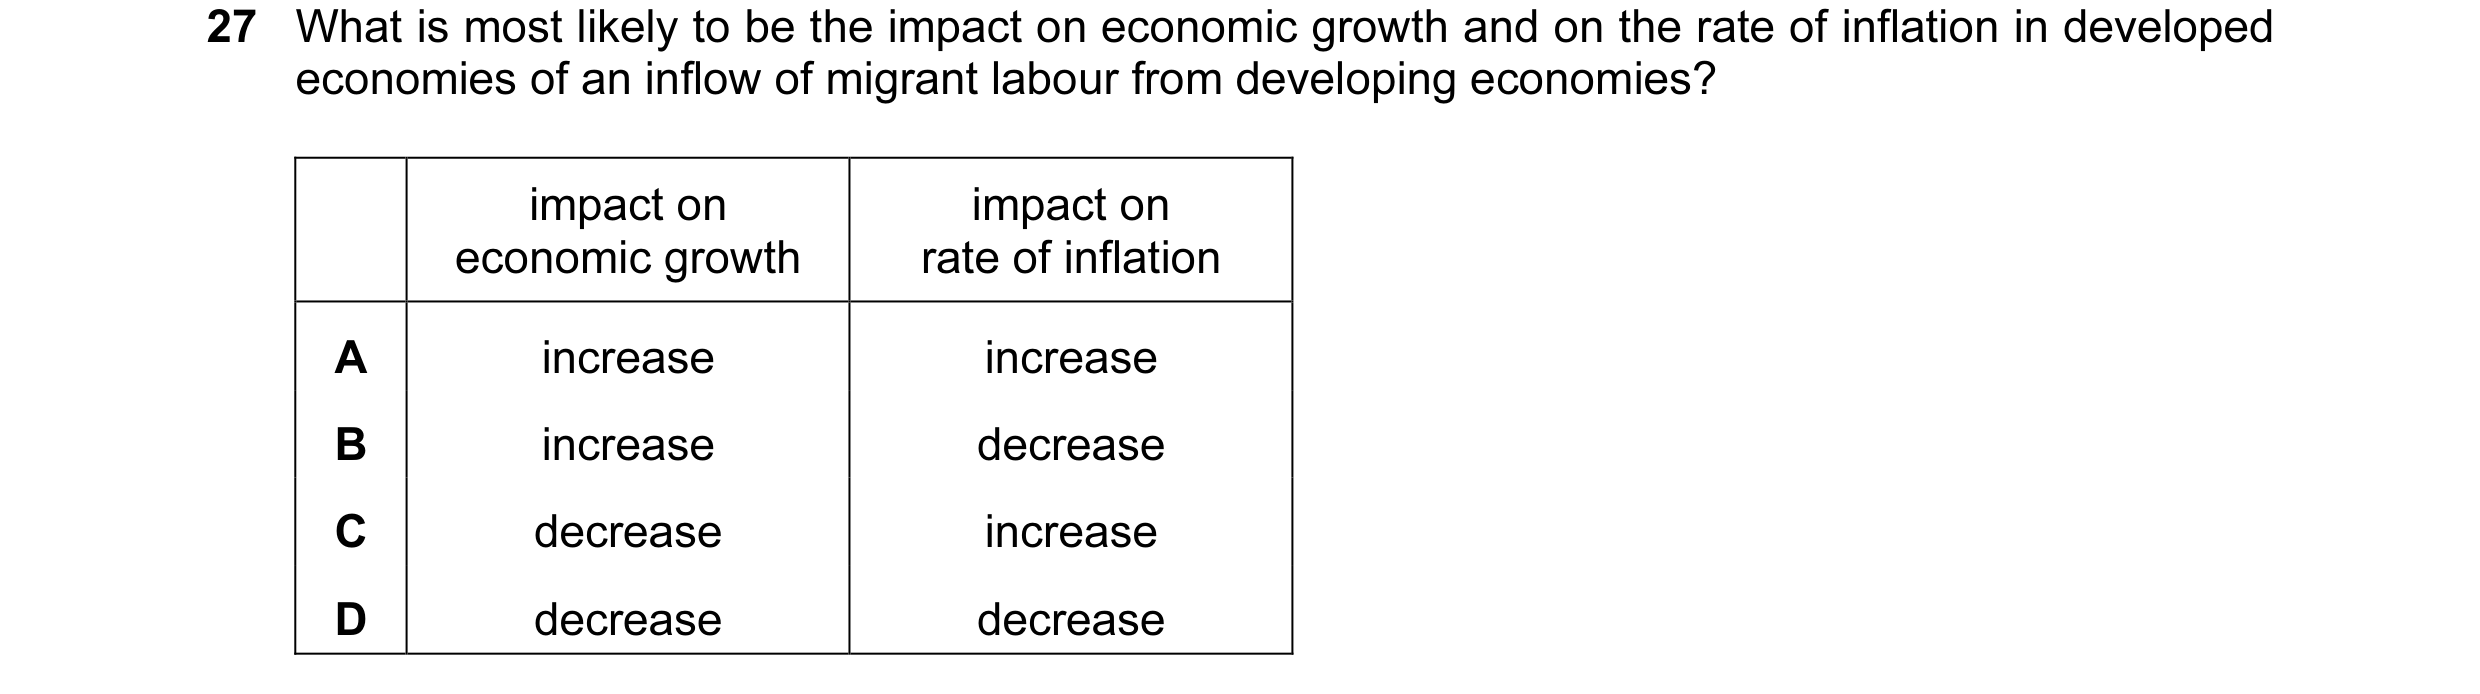
27 What is most likely to be the impact on economic growth and on the rate of inflation in developed economies of an inflow of migrant labour from developing economies? impact on impact on economic growth rate of inflation A increase increase B increase decrease C decrease increase D decrease decrease
1 marks
Answer: B
This question in 9708/31 Oct/Nov 2009
Q3 · The chart shows the rates of economic growth and unemployment in a country for the period… 9708/33 Oct/Nov 2011
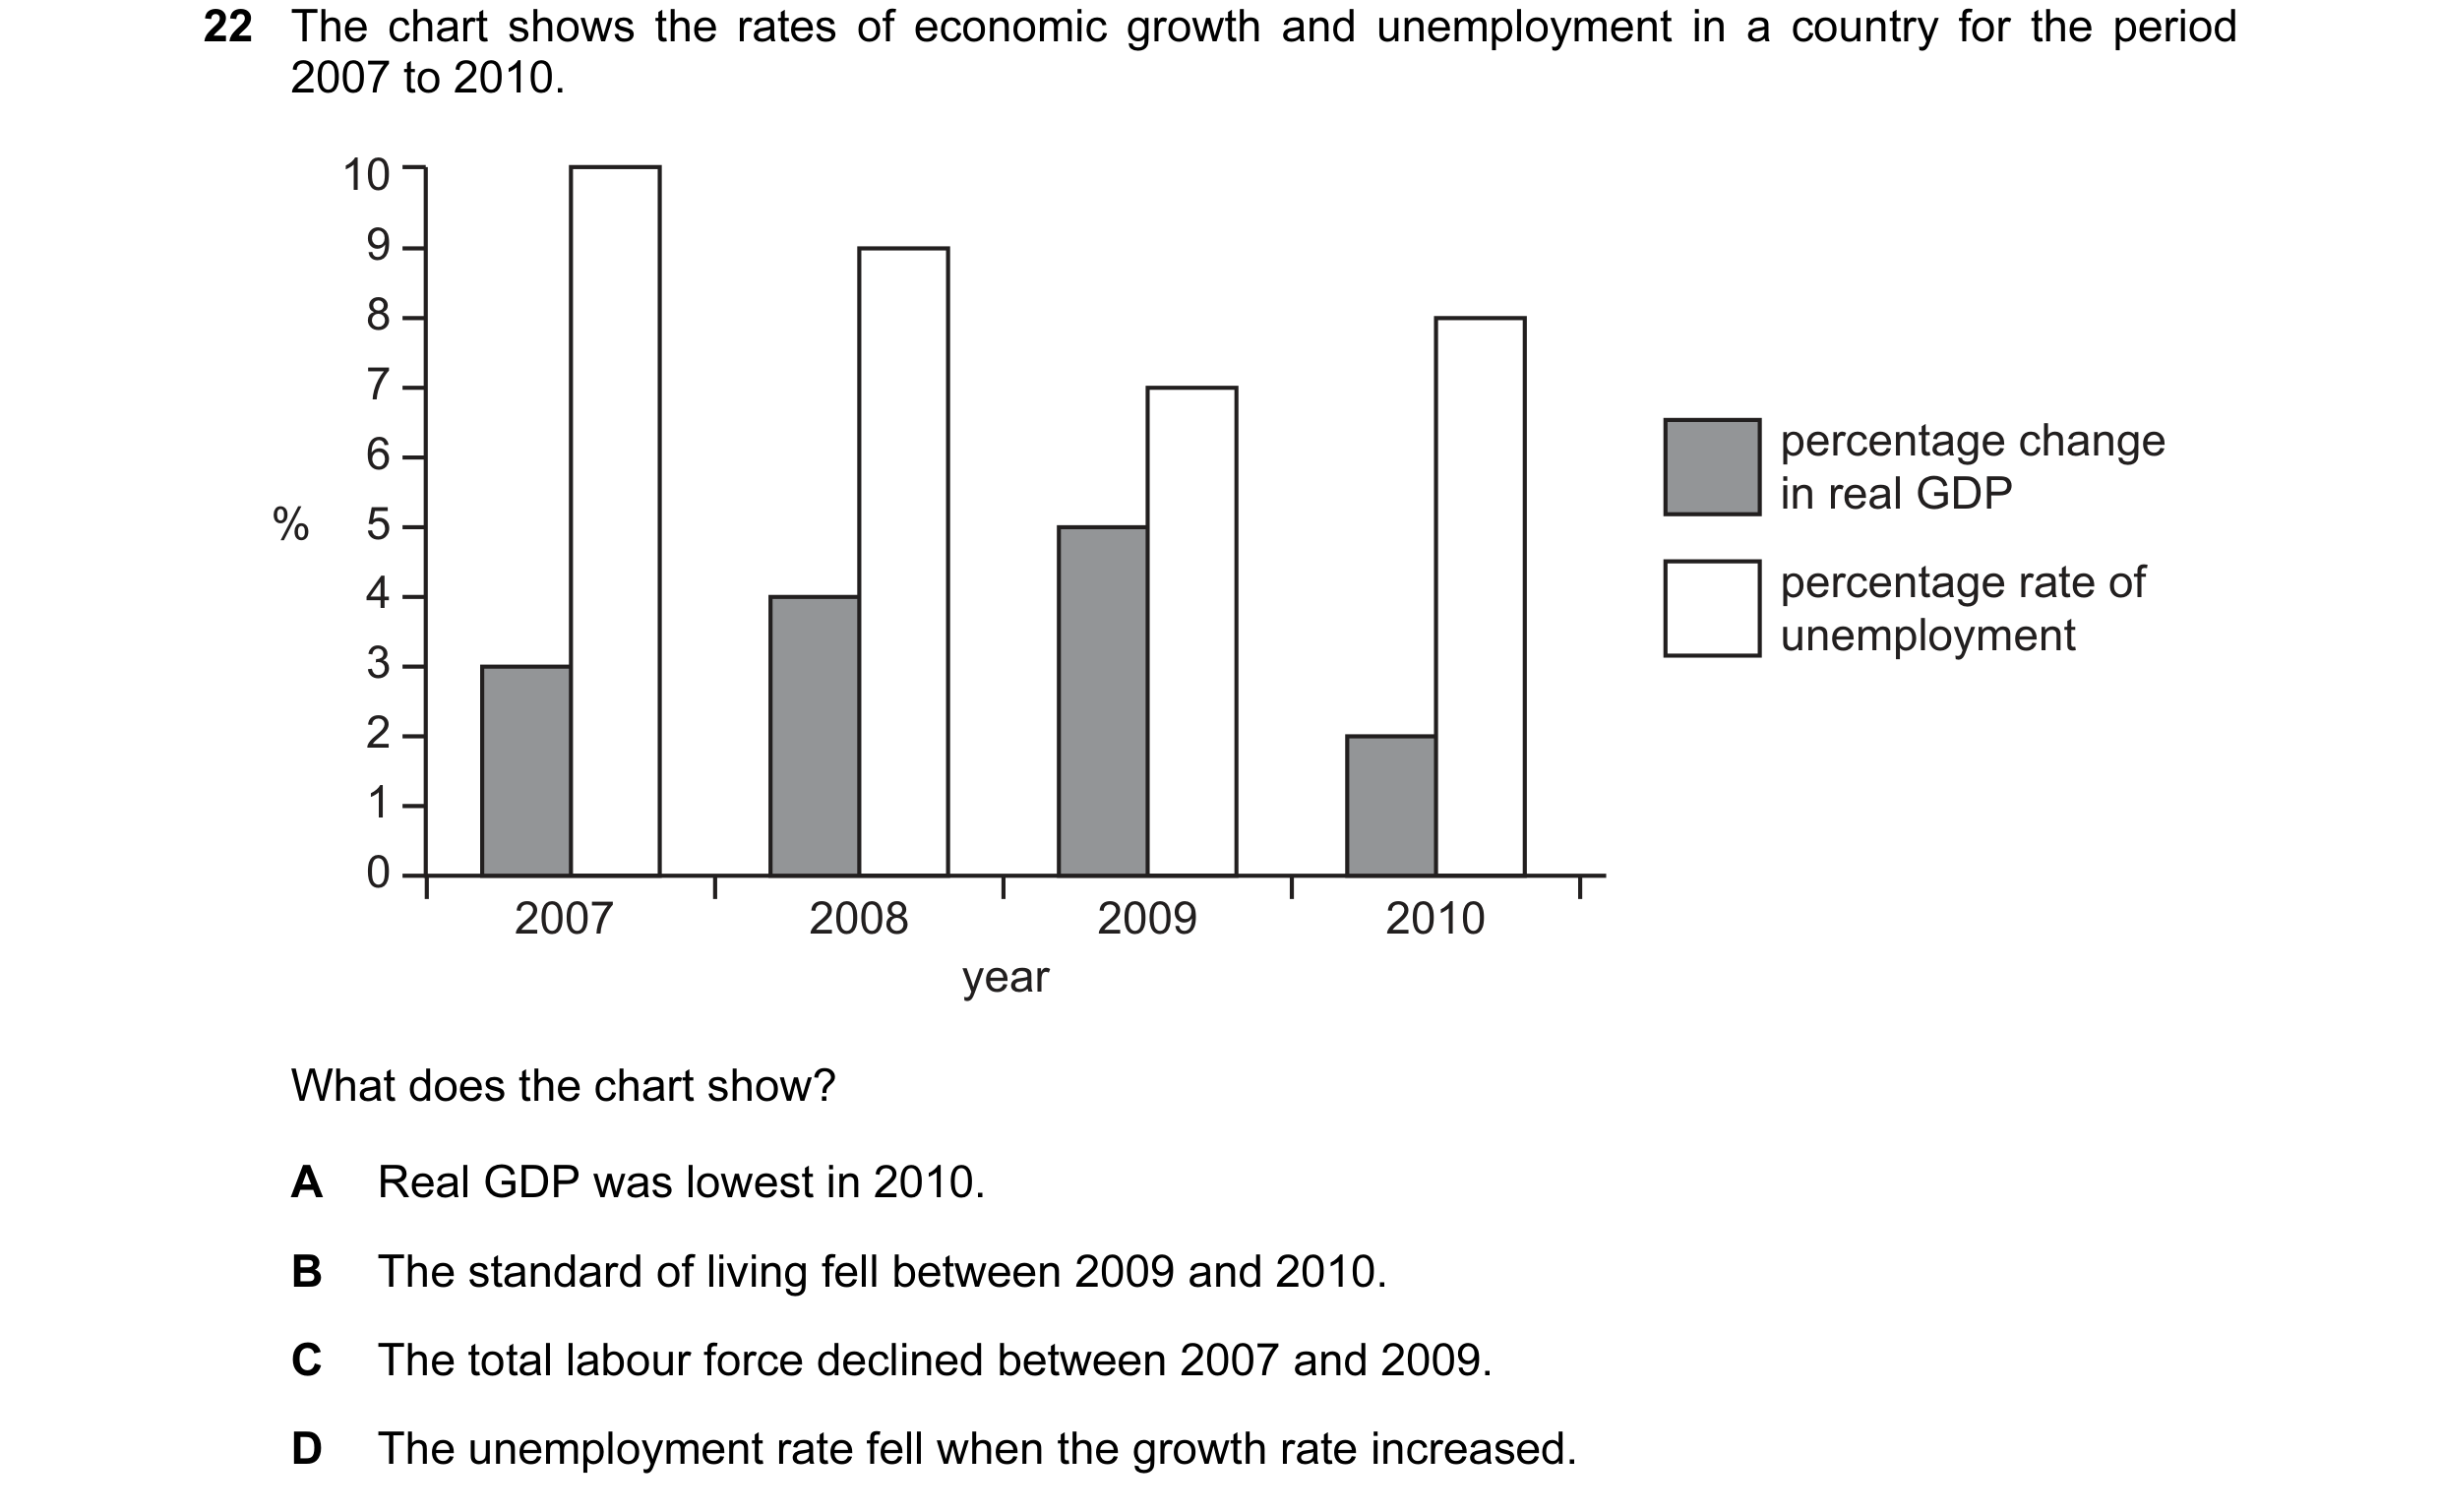
22 The chart shows the rates of economic growth and unemployment in a country for the period 2007 to 2010. 10 9 8 7 6 percentage change in real GDP % 5 4 percentage rate of unemployment 3 2 1 0 2007 2008 2009 2010 year What does the chart show? A Real GDP was lowest in 2010. B The standard of living fell between 2009 and 2010. C The total labour force declined between 2007 and 2009. D The unemployment rate fell when the growth rate increased.
1 marks
Answer: D
This question in 9708/33 Oct/Nov 2011
Q4 · The graphs indicate economic performance in a country between 2007 and 2010 9708/31 May/June 2012
18 The graphs indicate economic performance in a country between 2007 and 2010. annual % increase in annual % increase annual % increase in industrial production in consumer prices GDP 12 6 16 8 12 4 % % 8 % 4 2 4 0 0 0 07 08 09 10 07 08 09 10 07 08 09 10 Which conclusion may be drawn from the graphs? A Between 2007 and 2008 industrial production and GDP fell but prices rose. B Between 2008 and 2009 the rates of growth of industrial production, GDP and prices all increased. C GDP and industrial production were at their lowest in 2008. D At no time did industrial production, GDP or prices fall.
1 marks
Answer: D
This question in 9708/31 May/June 2012
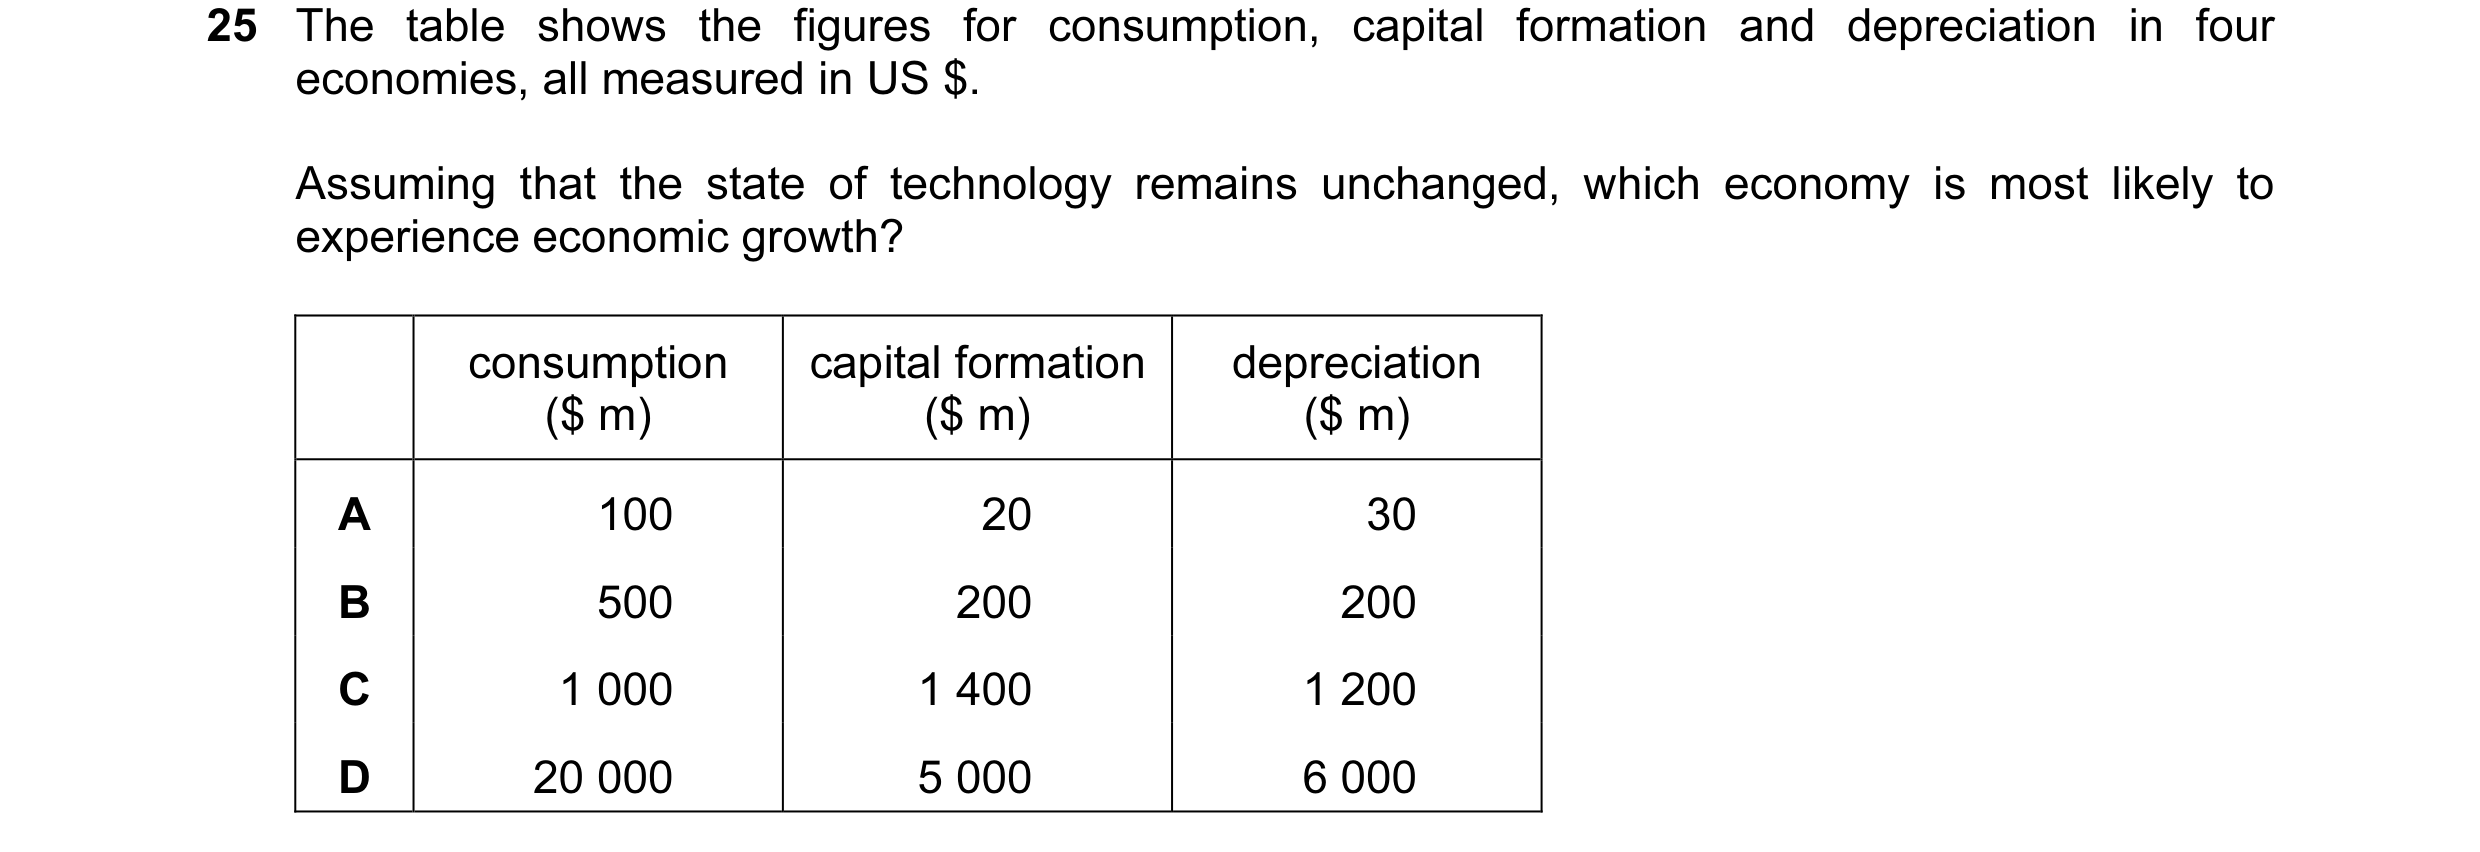
Q5 · The table shows the figures for consumption, capital formation and depreciation in four… 9708/31 May/June 2012
25 The table shows the figures for consumption, capital formation and depreciation in four economies, all measured in US $. Assuming that the state of technology remains unchanged, which economy is most likely to experience economic growth? consumption capital formation depreciation ($ m) ($ m) ($ m) A 100 20 30 B 500 200 200 C 1 000 1 400 1 200 D 20 000 5 000 6 000
1 marks
Answer: C
This question in 9708/31 May/June 2012
Q6 · What would be most likely to stimulate long-run growth in an economy? 9708/32 May/June 2013
25 What would be most likely to stimulate long-run growth in an economy? A employment protection legislation B government policy to raise aggregate demand C technical innovations by firms D the development of trade unions
1 marks
Answer: C
This question in 9708/32 May/June 2013
Q7 · The diagram sets out how an increase in the rate of growth of national income can lead to… 9708/33 May/June 2013
18 The diagram sets out how an increase in the rate of growth of national income can lead to a further increase in national income. increase in operation of change in operation of increase in national income … 1 … … 2 … … 3 … national income growth rate What must be inserted into the diagram at points 1, 2 and 3? 1 2 3 A the accelerator induced investment the accelerator B the accelerator induced investment the multiplier C the multiplier autonomous investment the accelerator D the multiplier autonomous investment the multiplier
1 marks
Answer: B
This question in 9708/33 May/June 2013
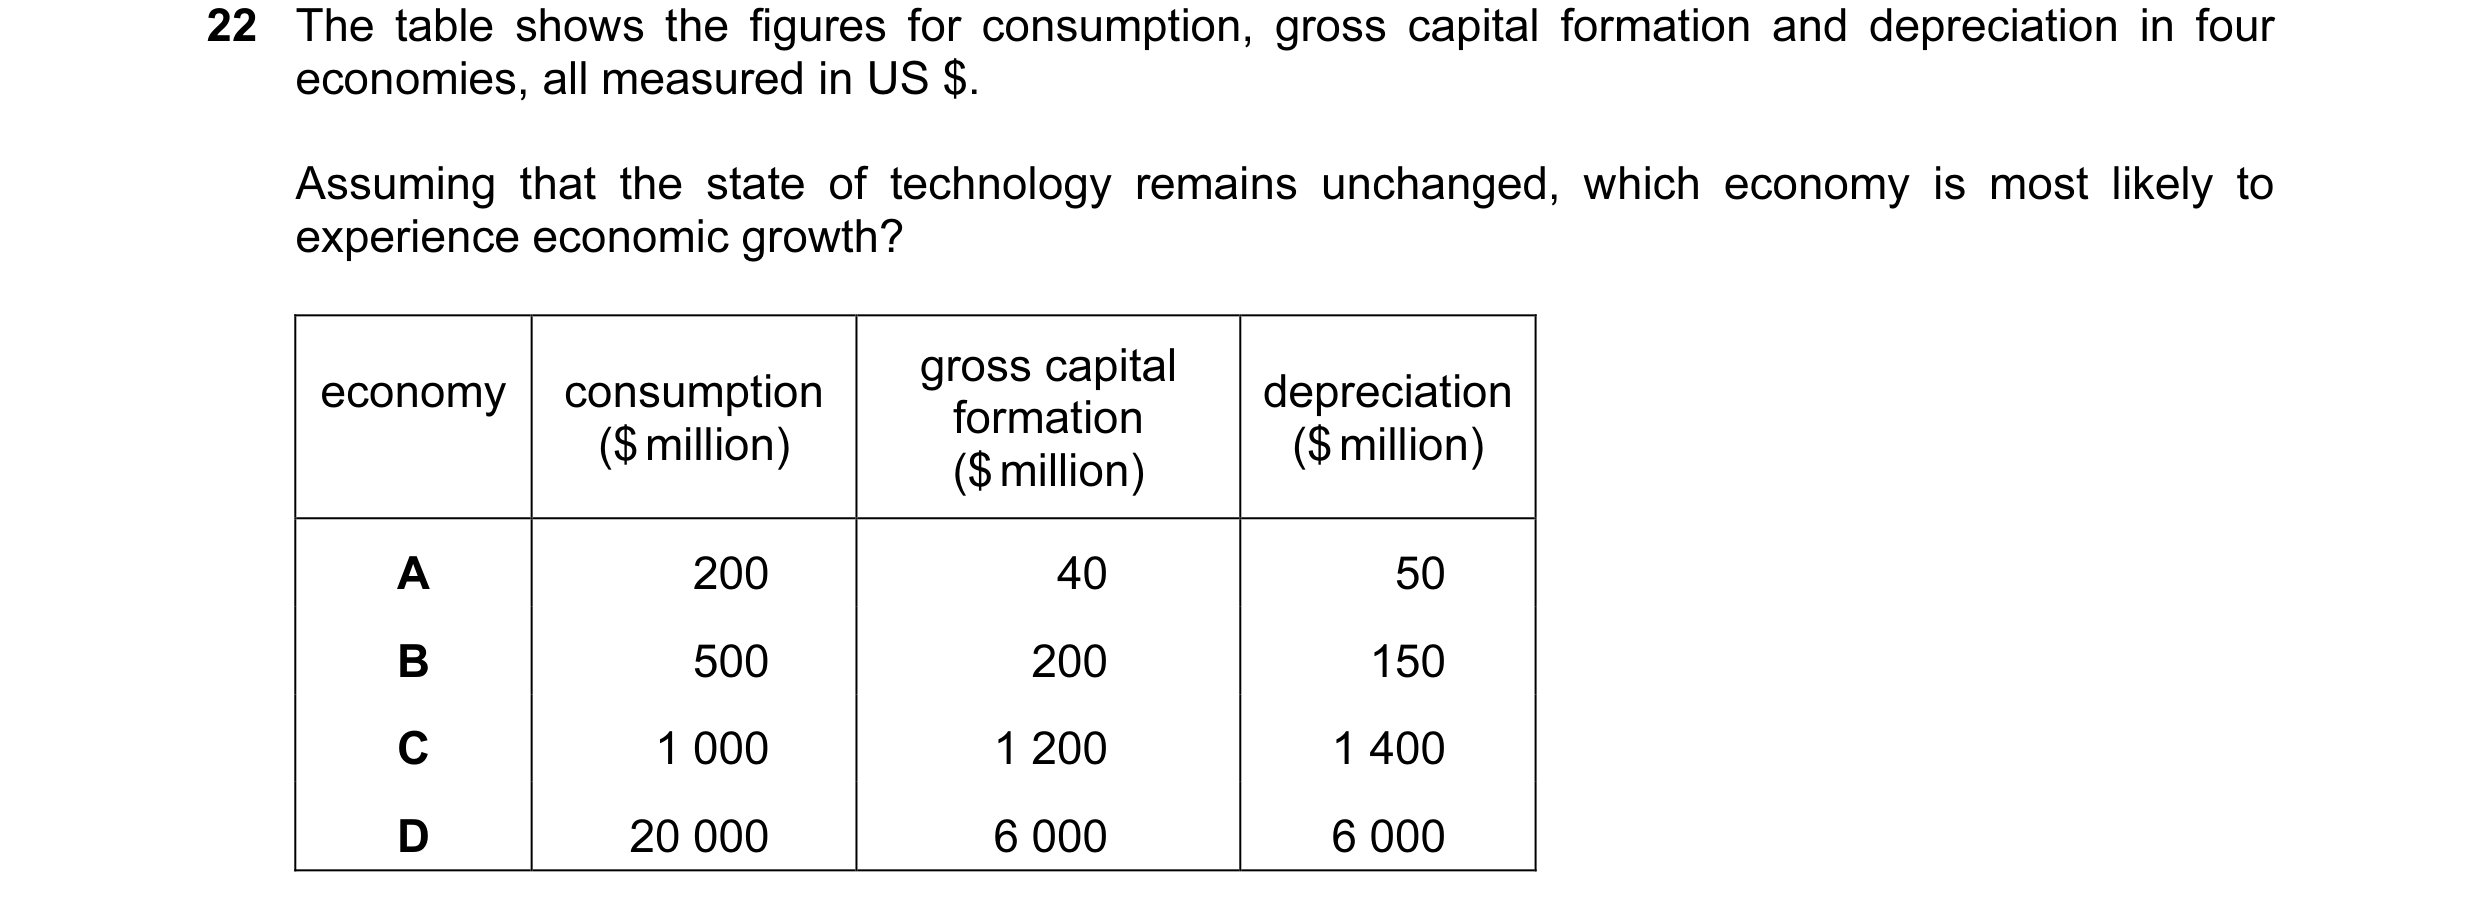
Q8 · The table shows the figures for consumption, gross capital formation and depreciation in… 9708/33 Oct/Nov 2015
22 The table shows the figures for consumption, gross capital formation and depreciation in four economies, all measured in US $. Assuming that the state of technology remains unchanged, which economy is most likely to experience economic growth? gross capital economy consumption depreciation formation ($ million) ($ million) ($ million) A 200 40 50 B 500 200 150 C 1 000 1 200 1 400 D 20 000 6 000 6 000
1 marks
Answer: B
This question in 9708/33 Oct/Nov 2015
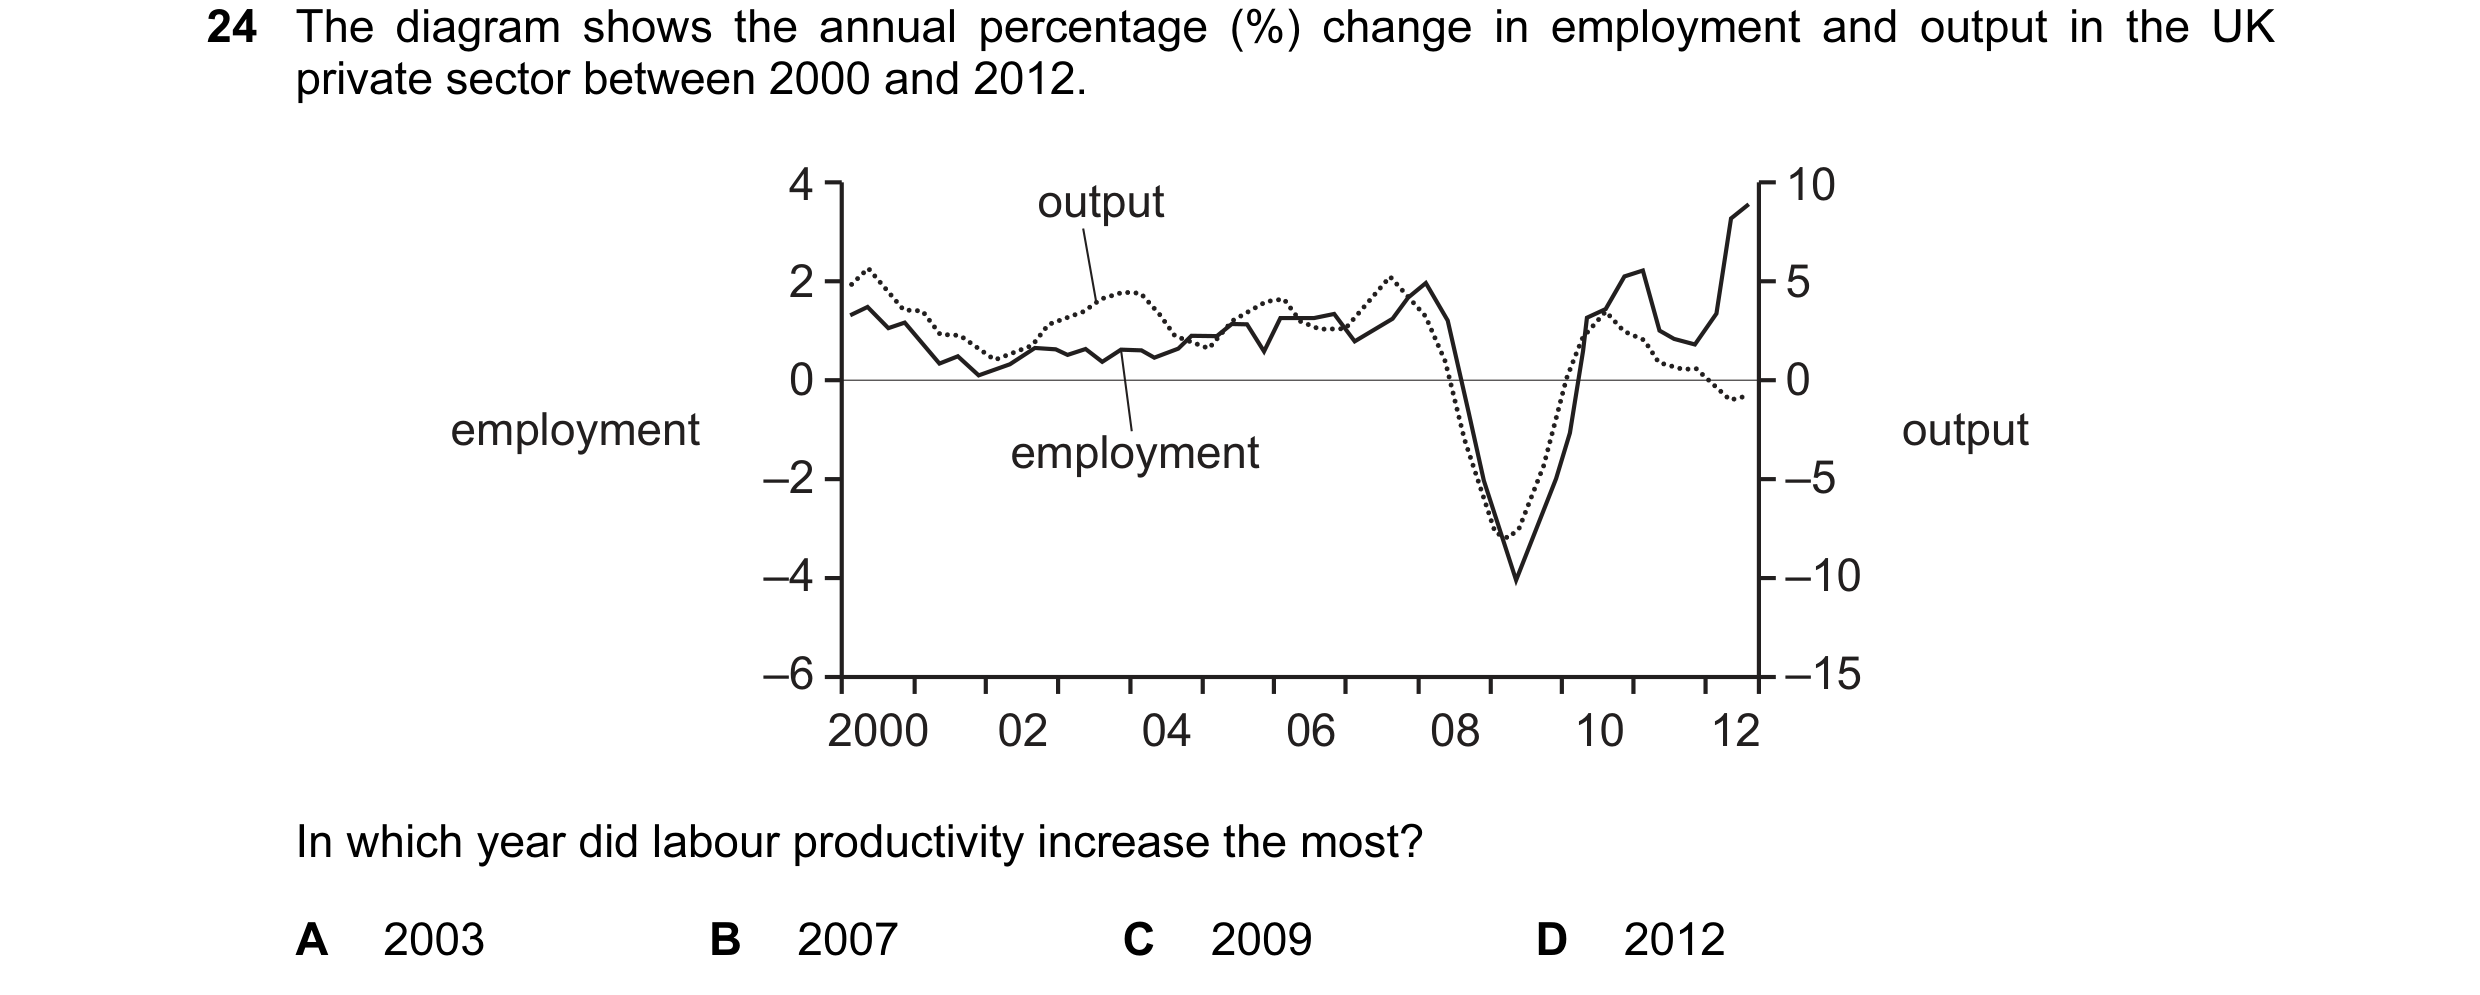
Q9 · The diagram shows the annual percentage (%) change in employment and output in the UK… 9708/32 May/June 2016
24 The diagram shows the annual percentage (%) change in employment and output in the UK private sector between 2000 and 2012. 4 output 10 2 5 0 0 employment output employment –2 –5 –4 –10 –6 –15 2000 02 04 06 08 10 12 In which year did labour productivity increase the most? A 2003 B 2007 C 2009 D 2012
1 marks
Answer: A
This question in 9708/32 May/June 2016
Q10 · The table shows real GDP per head measured in $US for countries X and Y over a three year… 9708/33 May/June 2016
20 The table shows real GDP per head measured in $US for countries X and Y over a three year period. country 2011 2012 2013 X 100 110 121 Y 200 210 231 What can definitely be concluded from the data? A Each country had the same rate of economic growth between 2011 and 2012. B Growth in real GDP per head was higher in country X than in country Y between 2011 and 2012. C Population growth was higher in country X than in country Y between 2012 and 2013. D The average price level was higher in country X than in country Y throughout the period.
1 marks
Answer: B
This question in 9708/33 May/June 2016
Q11 · The graphs below show percentage changes in money GDP and consumer prices in a country… 9708/32 May/June 2017
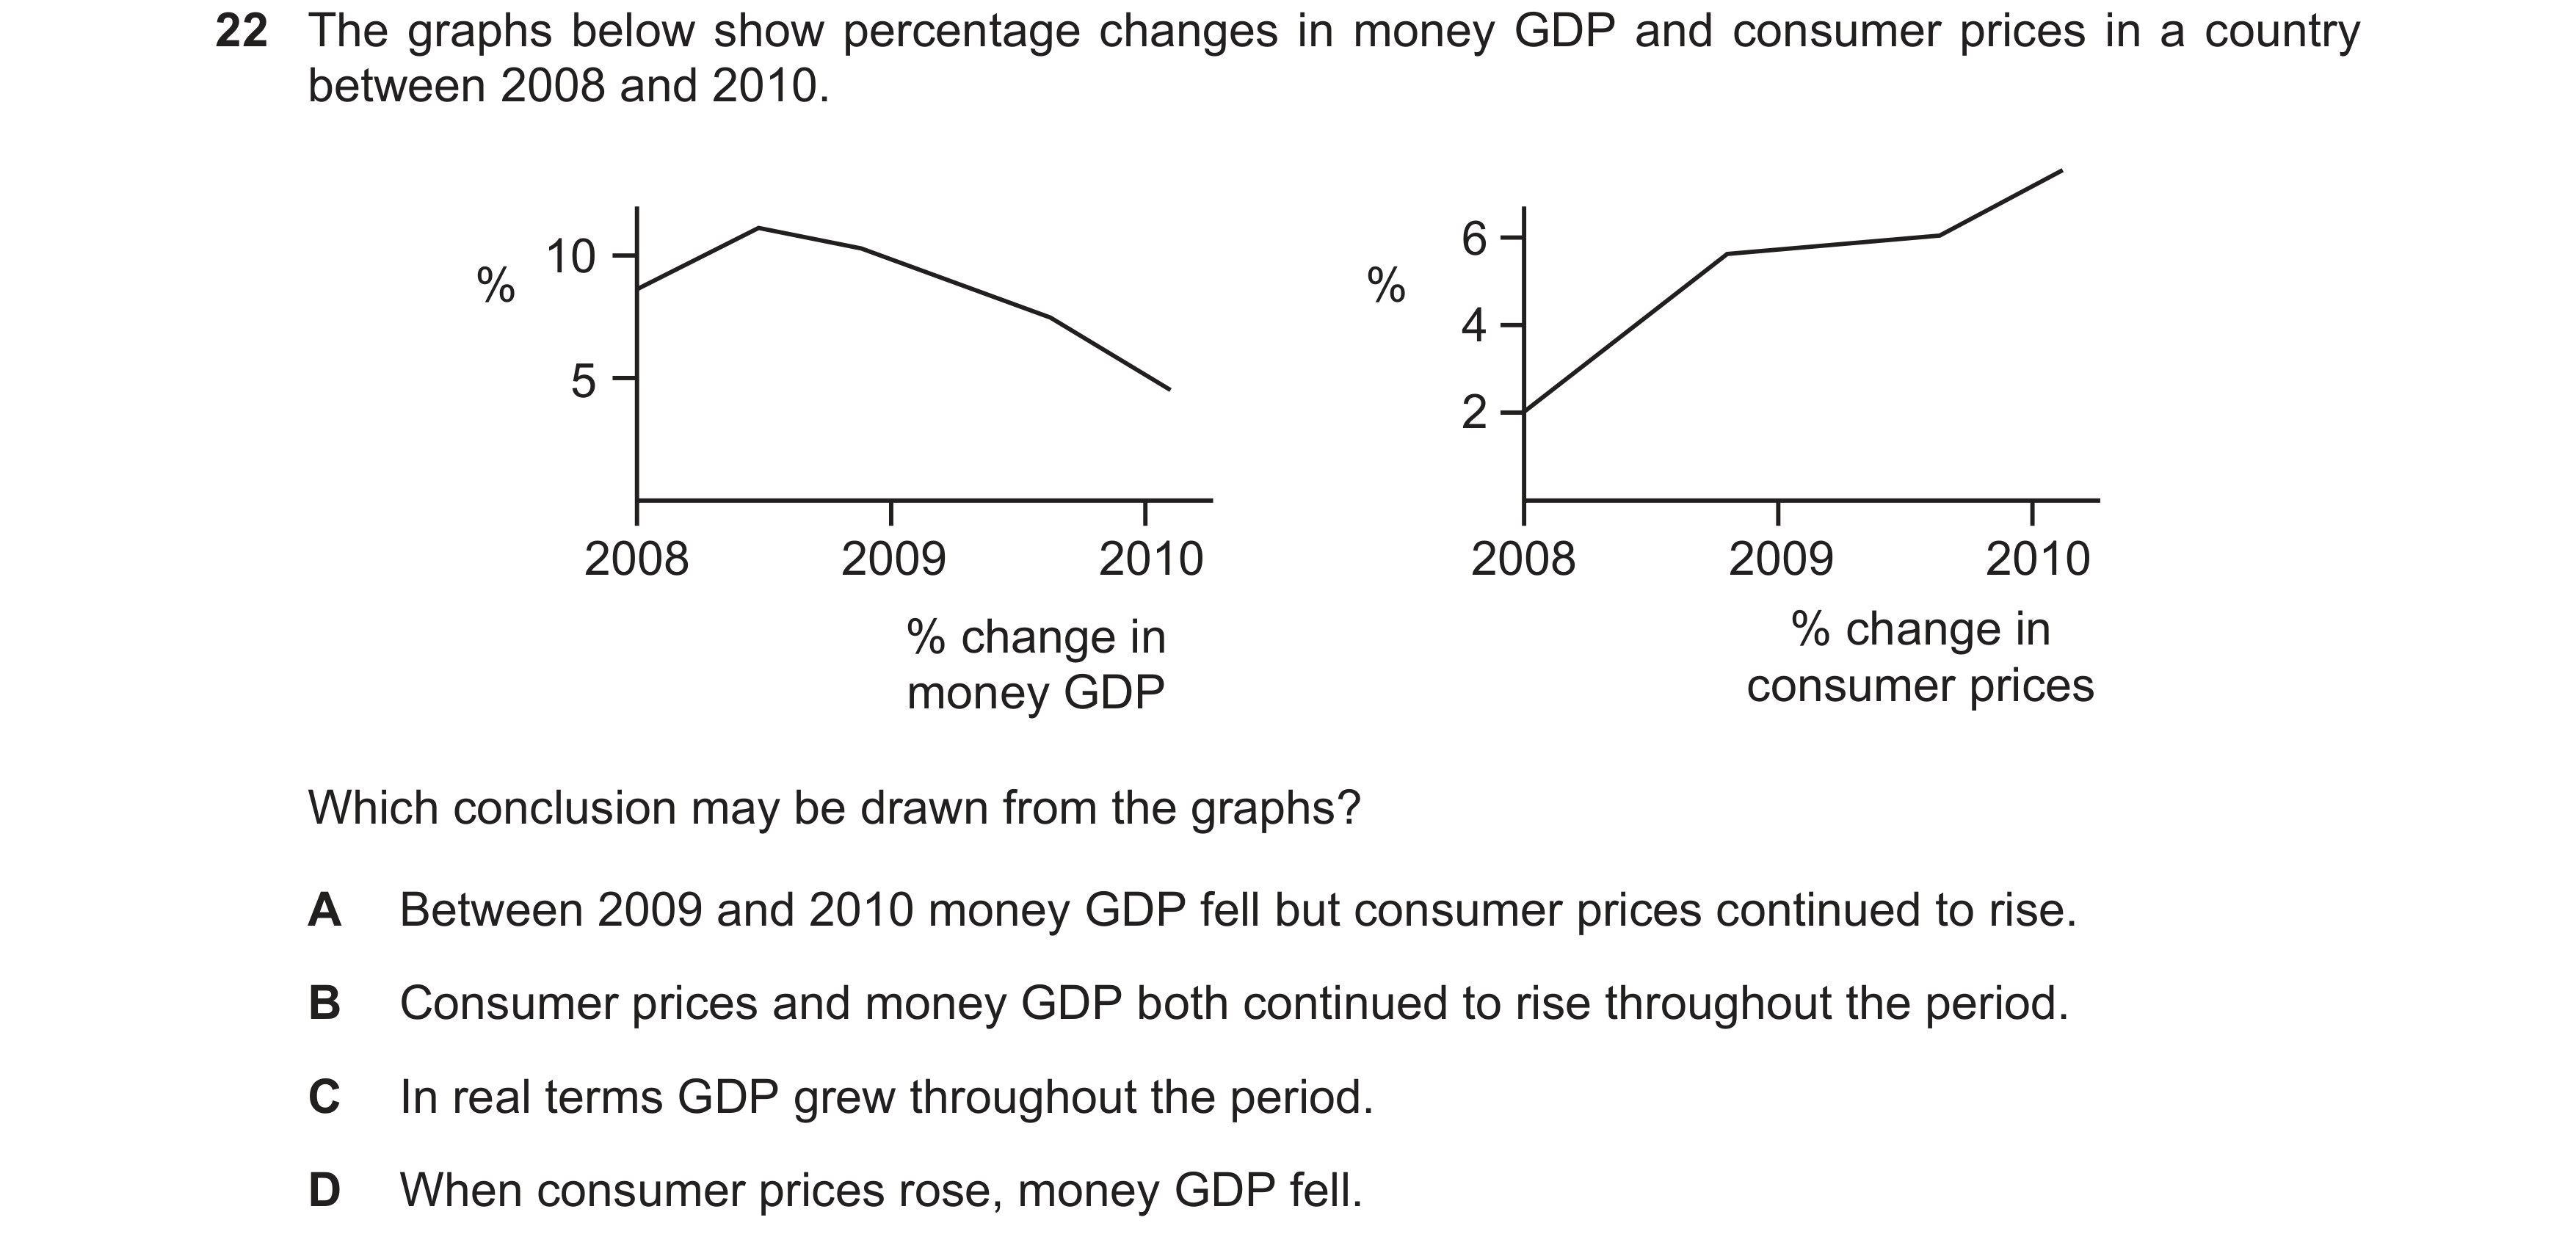
22 The graphs below show percentage changes in money GDP and consumer prices in a country between 2008 and 2010. 6 10 % % 4 5 2 2008 2009 2010 2008 2009 2010 % change in % change in money GDP consumer prices Which conclusion may be drawn from the graphs? A Between 2009 and 2010 money GDP fell but consumer prices continued to rise. B Consumer prices and money GDP both continued to rise throughout the period. C In real terms GDP grew throughout the period. D When consumer prices rose, money GDP fell.
1 marks
Answer: B
This question in 9708/32 May/June 2017
Q12 · Between 2014 and 2015 the Polish economy expanded at a rate of 3.3% 9708/33 May/June 2017
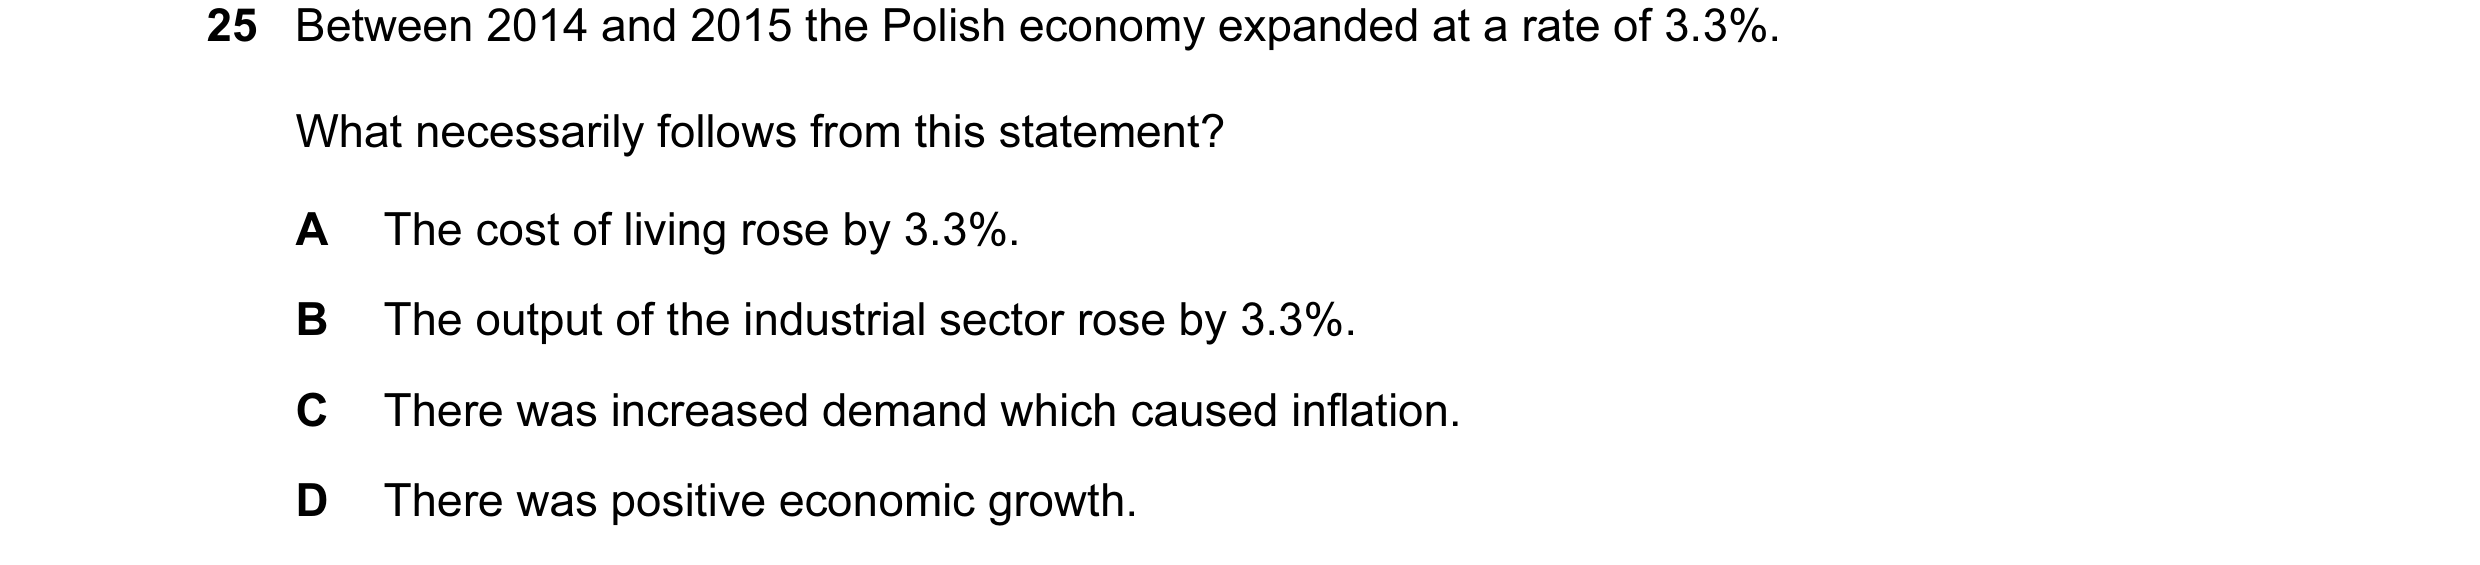
25 Between 2014 and 2015 the Polish economy expanded at a rate of 3.3%. What necessarily follows from this statement? A The cost of living rose by 3.3%. B The output of the industrial sector rose by 3.3%. C There was increased demand which caused inflation. D There was positive economic growth.
1 marks
Answer: D
This question in 9708/33 May/June 2017
Q13 · The graphs indicate economic performance in a country between 2011 and 2014 9708/33 May/June 2017
26 The graphs indicate economic performance in a country between 2011 and 2014. annual % increase in annual % increase annual % increase industrial production in consumer prices in GDP 12 6 16 % % % 8 12 4 8 4 2 4 0 0 0 11 12 13 14 11 12 13 14 11 12 13 14 year year year Which conclusion may be drawn from the graphs? A Between 2011 and 2012 industrial production and GDP fell but prices rose. B Between 2012 and 2013 the rates of growth of industrial production, GDP and prices all increased. C GDP and industrial production were at their lowest in 2012. D At no time between 2011 and 2014 did industrial production, GDP or prices fall.
1 marks
Answer: D
This question in 9708/33 May/June 2017
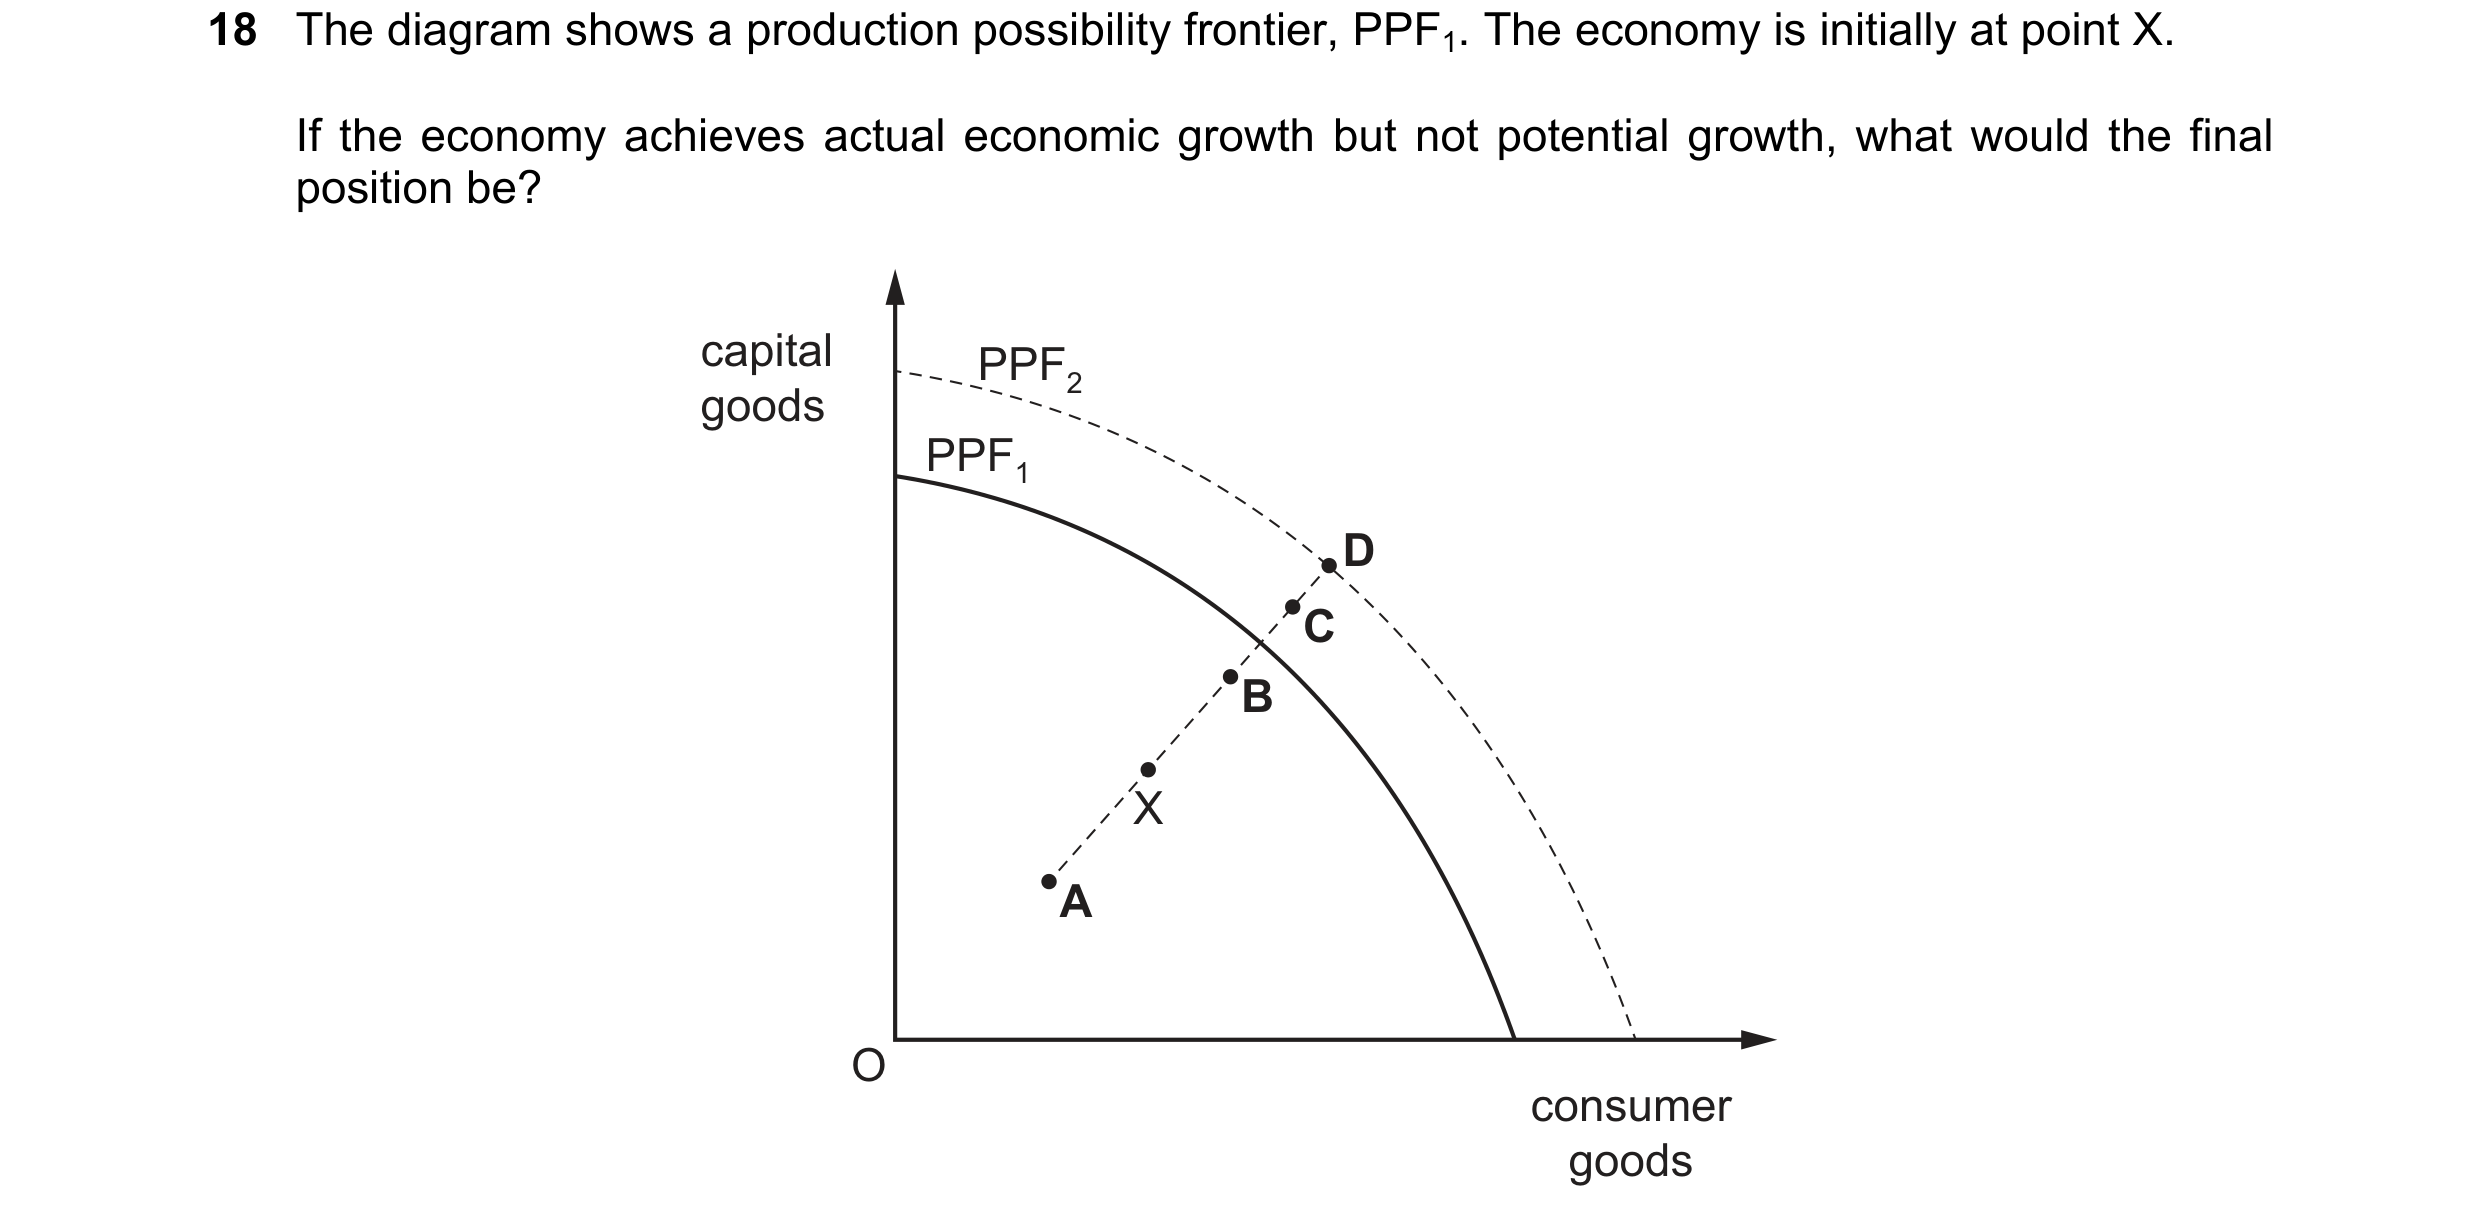
Q14 · The diagram shows a production possibility frontier, PPF1 9708/32 Feb/March 2019
18 The diagram shows a production possibility frontier, PPF1. The economy is initially at point X. If the economy achieves actual economic growth but not potential growth, what would the final position be? capital PPF2 goods PPF1 D C B X A O consumer goods
1 marks
Answer: B
This question in 9708/32 Feb/March 2019
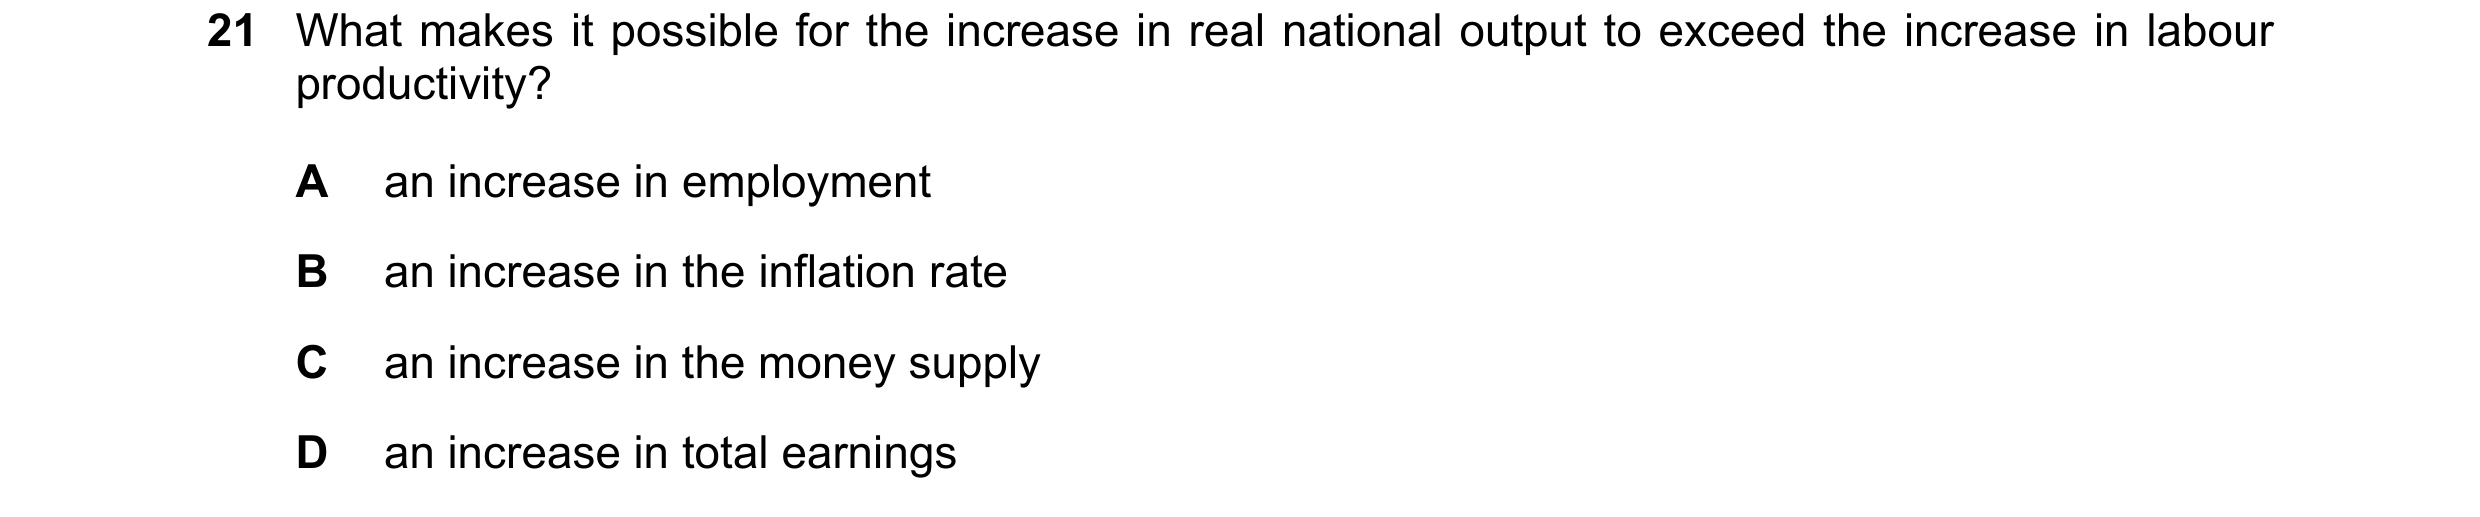
Q15 · What makes it possible for the increase in real national output to exceed the increase in… 9708/32 May/June 2019
21 What makes it possible for the increase in real national output to exceed the increase in labour productivity? A an increase in employment B an increase in the inflation rate C an increase in the money supply D an increase in total earnings
1 marks
Answer: A
This question in 9708/32 May/June 2019
Q16 · The table shows the annual percentage (%) change in China’s GDP and the contribution of… 9708/32 May/June 2019
22 The table shows the annual percentage (%) change in China’s GDP and the contribution of some of its component parts between 2006 and 2012. 2006 2007 2008 2009 2010 2011 2012 GDP 12.7 14.2 9.6 9.2 10.4 9.3 7.7 consumption 5.1 5.6 4.2 4.6 4.5 5.2 4.2 investment 5.5 6.0 4.5 8.1 5.5 4.5 3.9 net exports 2.1 2.6 0.9 –3.5 0.4 –0.4 –0.4 What can be concluded about China’s economy between 2006 and 2012? A China’s current account was in surplus more years than it was in deficit. B China’s economic rate of growth fell in more years than it rose. C China’s growth was greater overall in consumer goods than in capital goods. D China’s standard of living rose at a decreasing rate.
1 marks
Answer: B
This question in 9708/32 May/June 2019
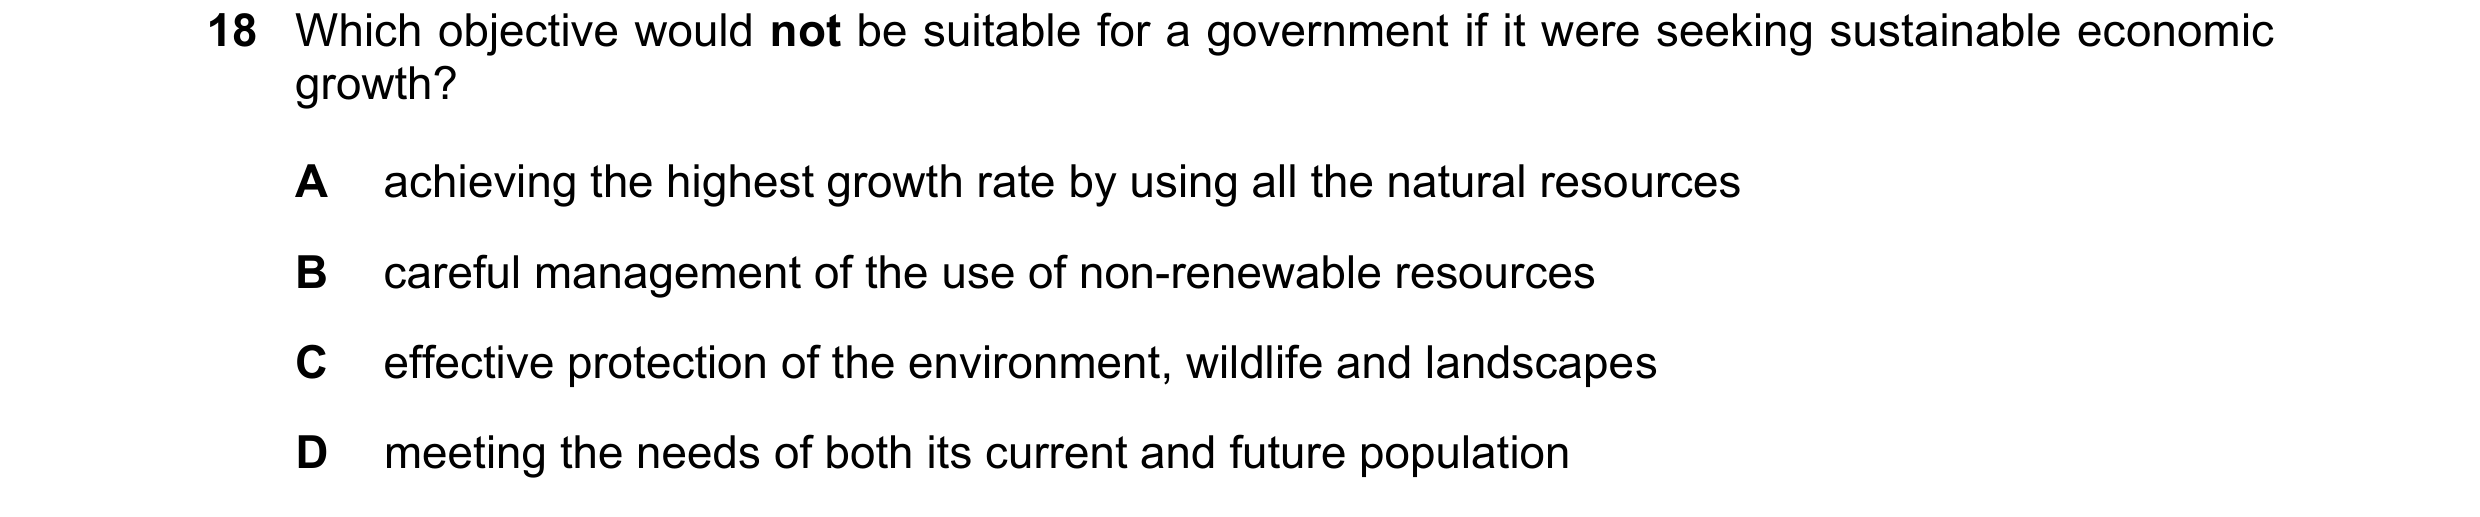
Q17 · Which objective would not be suitable for a government if it were seeking sustainable… 9708/32 May/June 2021
18 Which objective would not be suitable for a government if it were seeking sustainable economic growth? A achieving the highest growth rate by using all the natural resources B careful management of the use of non-renewable resources C effective protection of the environment, wildlife and landscapes D meeting the needs of both its current and future population
1 marks
Answer: A
This question in 9708/32 May/June 2021
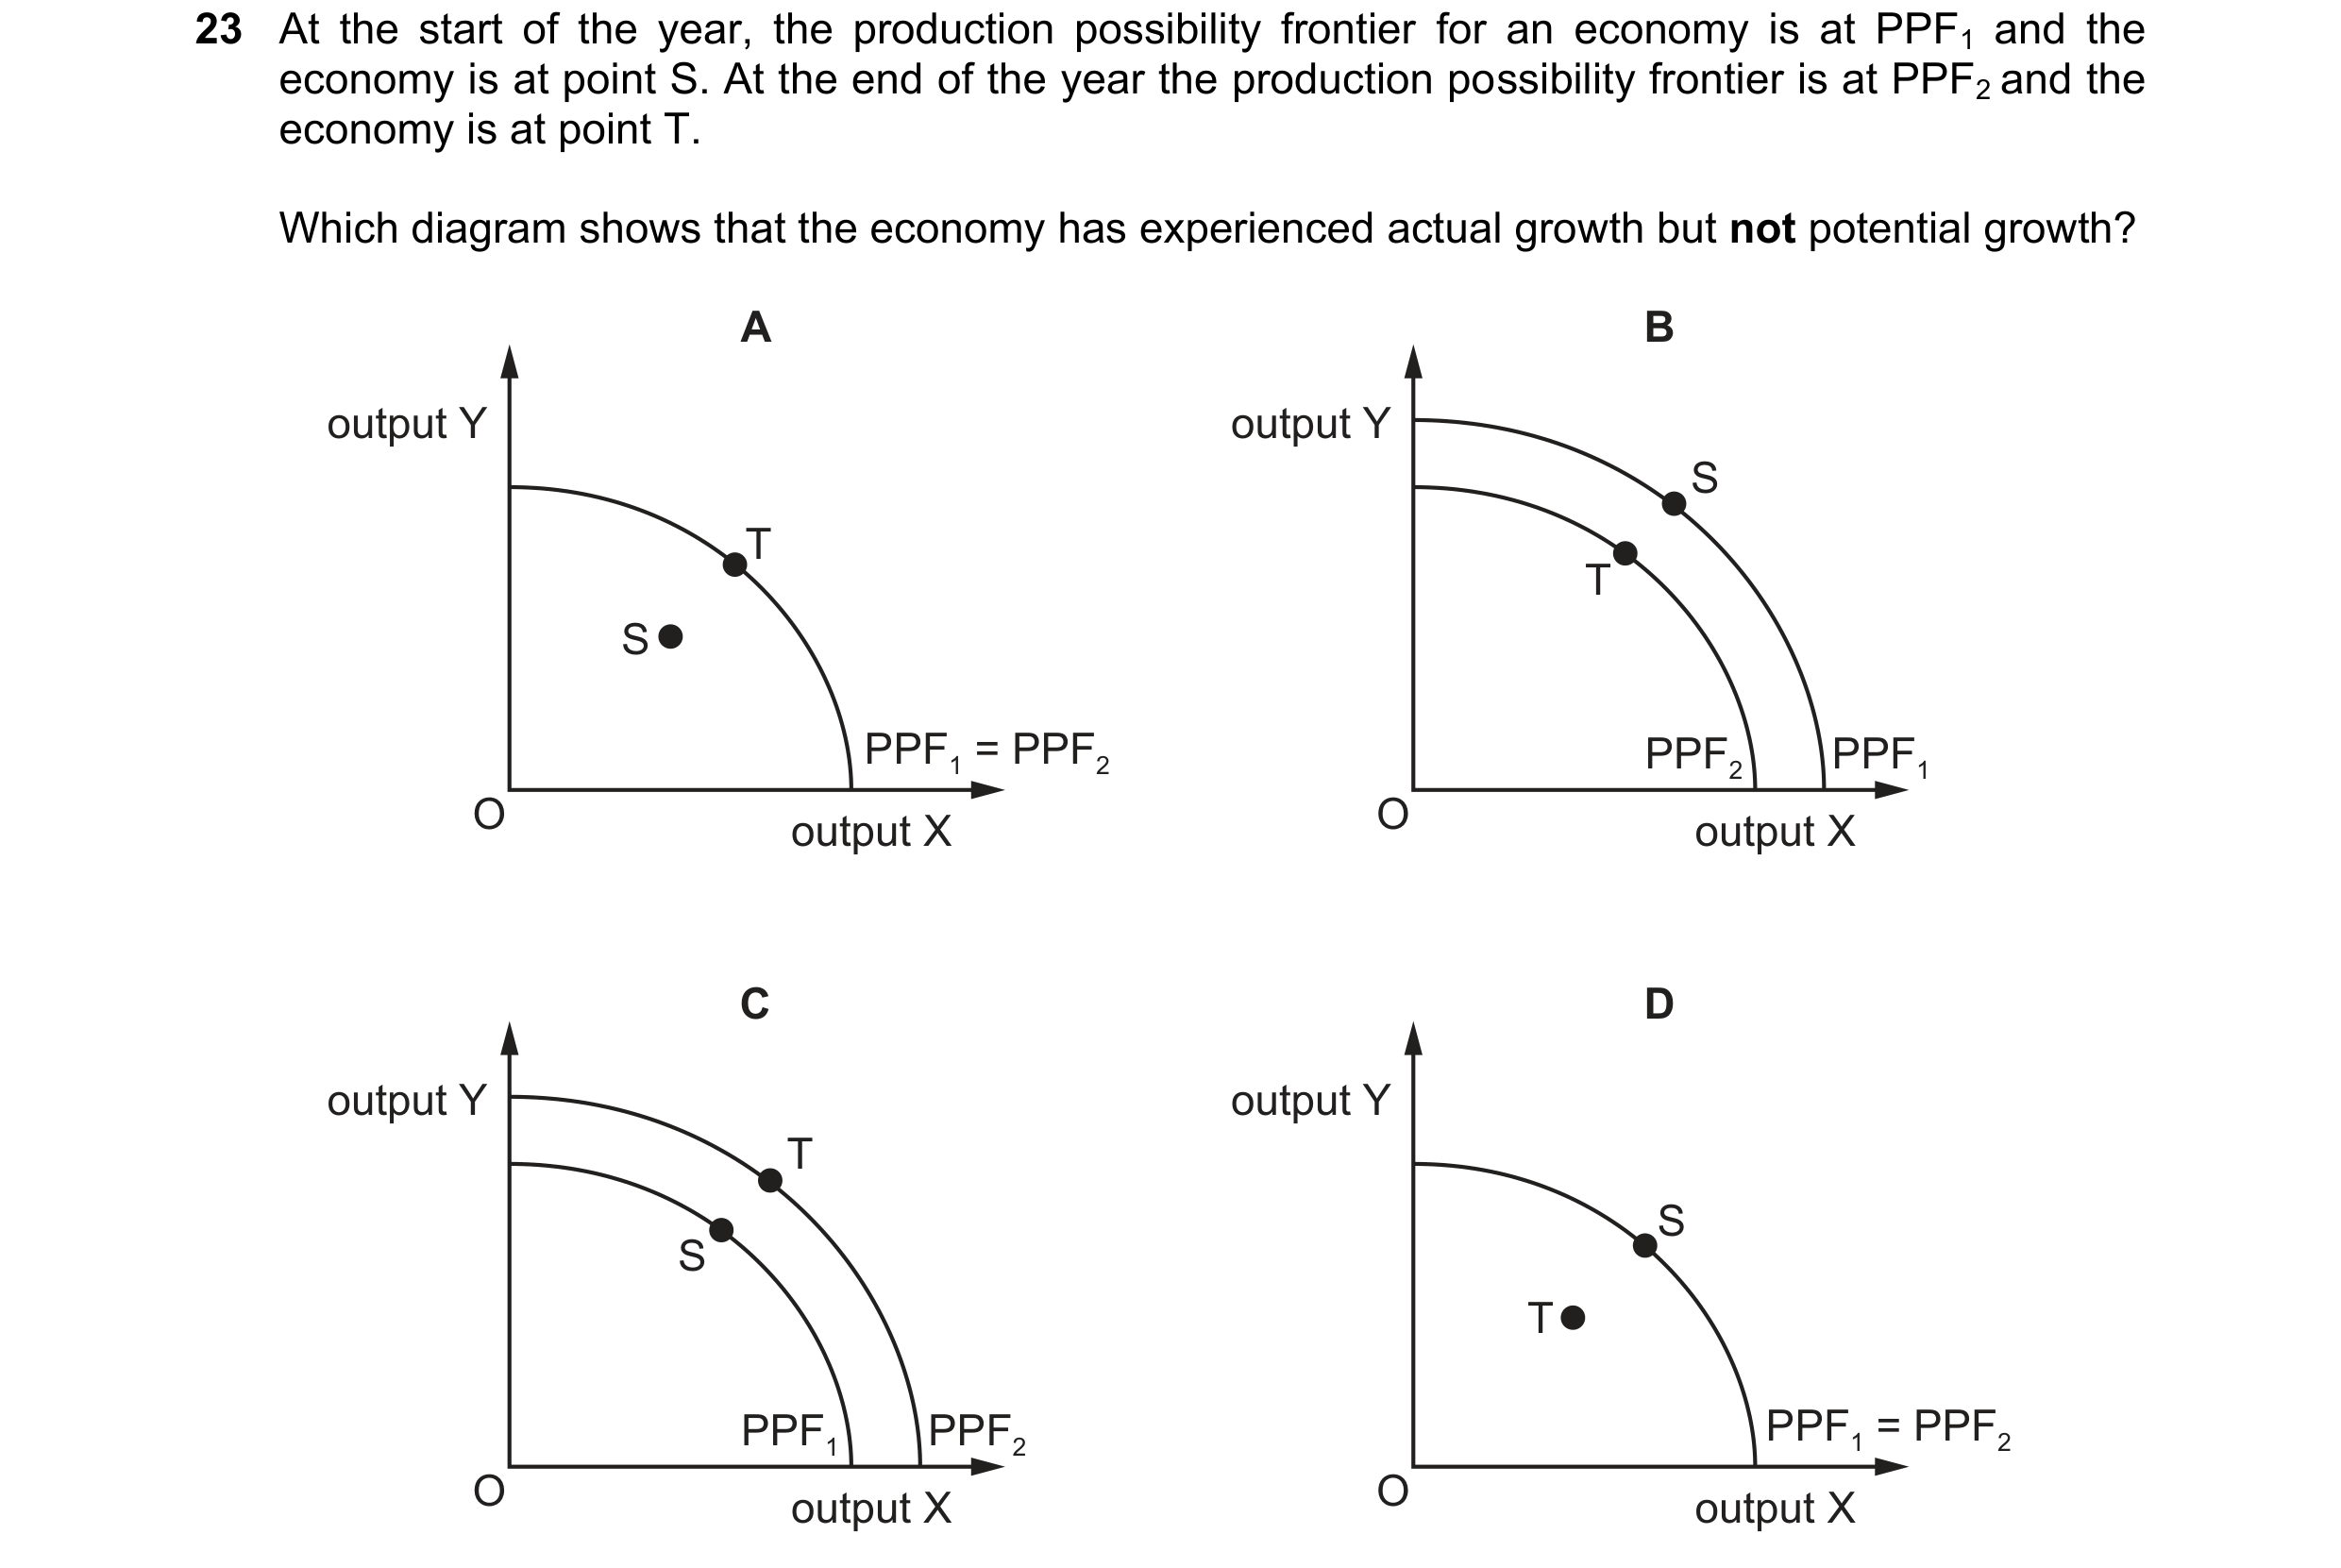
Q18 · At the start of the year, the production possibility frontier for an economy is at PPF1… 9708/32 May/June 2021
23 At the start of the year, the production possibility frontier for an economy is at PPF1 and the economy is at point S. At the end of the year the production possibility frontier is at PPF2 and the economy is at point T. Which diagram shows that the economy has experienced actual growth but not potential growth? A B output Y output Y S T T S PPF1 = PPF2 PPF2 PPF1 O output X O output X C D output Y output Y T S S T PPF1 PPF2 PPF1 = PPF2 O output X O output X
1 marks
Answer: A
This question in 9708/32 May/June 2021
Q19 · Which statement about economic growth is not correct? 9708/32 Oct/Nov 2021
18 Which statement about economic growth is not correct? A Economic growth creates costs as well as benefits. B Long-term economic growth is measured by calculating the percentage increase in GDP for one year. C Short-term economic growth can be represented by a shift from a point within a production possibility curve to a point on the curve. D Sustainable economic growth is growth that does not reduce the resources available to future generations.
1 marks
Answer: B
This question in 9708/32 Oct/Nov 2021
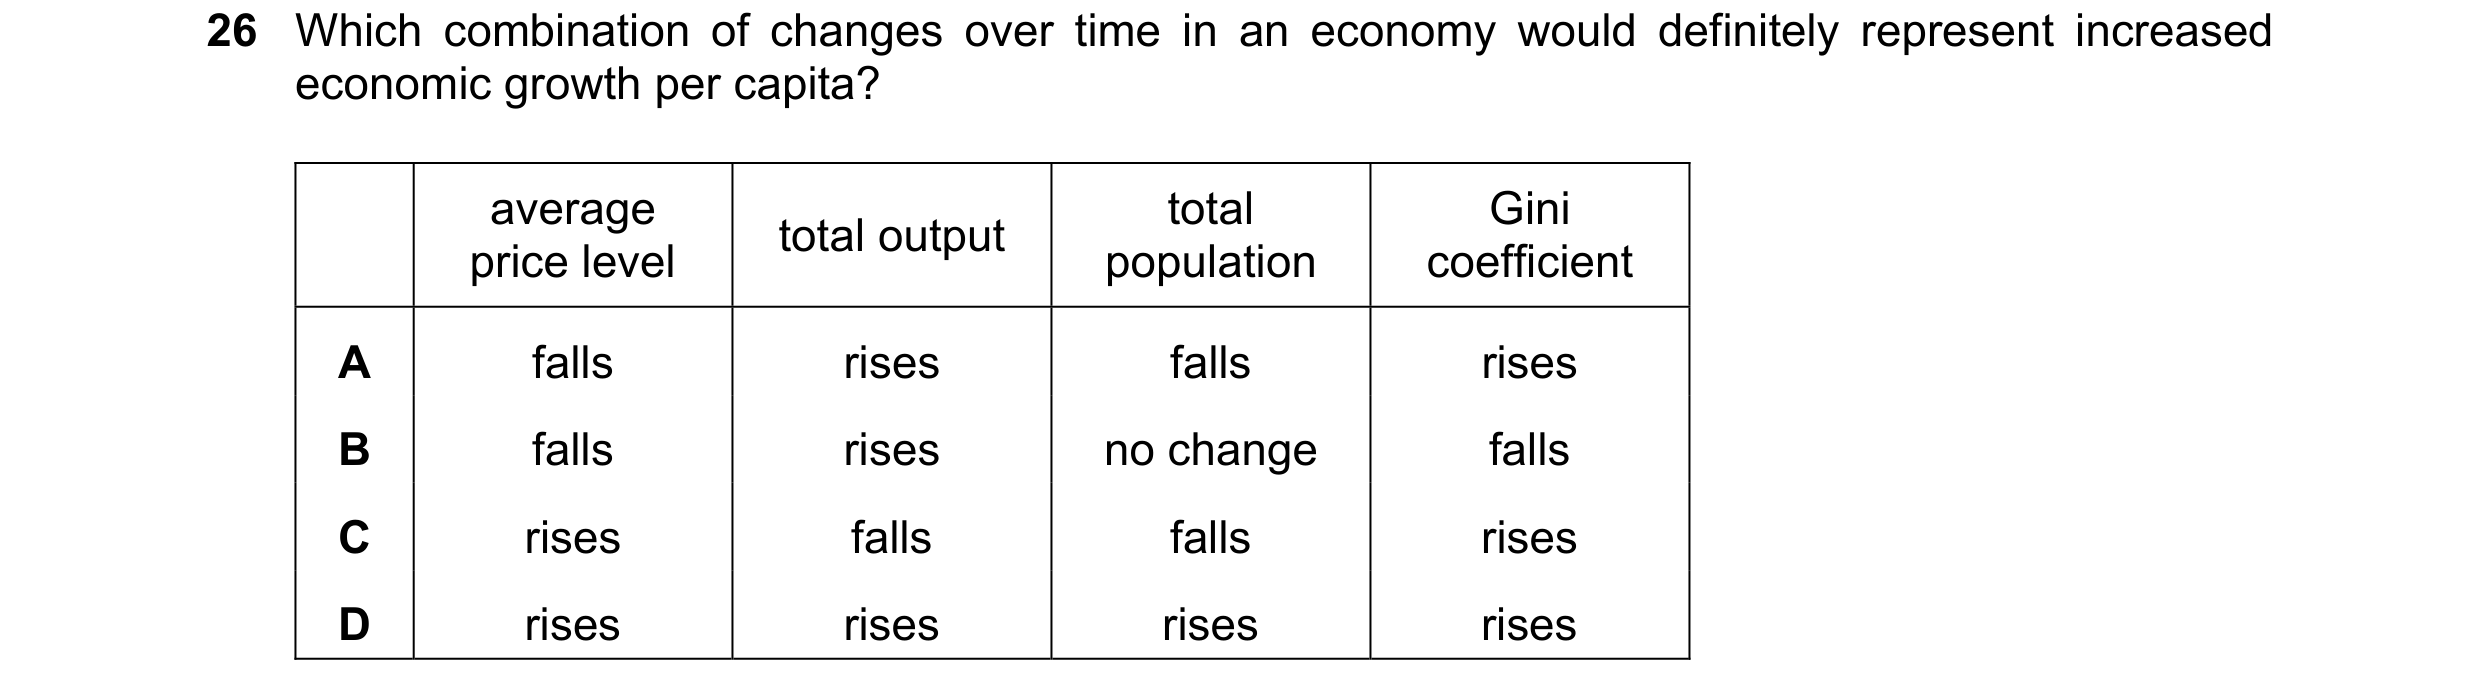
Q20 · Which combination of changes over time in an economy would definitely represent increased… 9708/32 Oct/Nov 2022
26 Which combination of changes over time in an economy would definitely represent increased economic growth per capita? average total Gini total output price level population coefficient A falls rises falls rises B falls rises no change falls C rises falls falls rises D rises rises rises rises
1 marks
Answer: A
This question in 9708/32 Oct/Nov 2022
Q21 · Which statement best describes demand-induced investment? 9708/32 May/June 2023
18 Which statement best describes demand-induced investment? A It is spending on capital goods by firms because the rate of growth in demand for final goods and services increases. B It is spending on capital goods by firms because the cost of borrowing has fallen. C It is spending on capital goods by firms because they want to access new technology to improve the output per worker. D It is spending on new capital goods by firms replacing old and obsolete capital goods.
1 marks
Answer: A
This question in 9708/32 May/June 2023
Q22 · What is central to economic growth but not necessarily to economic development? 9708/32 May/June 2023
30 What is central to economic growth but not necessarily to economic development? A an expansion of the range of economic choices available to individuals B an increase in Gross Domestic Product C the eradication of absolute poverty D the satisfaction of basic needs amongst the whole population
1 marks
Answer: B
This question in 9708/32 May/June 2023
 1 / 7
1 / 7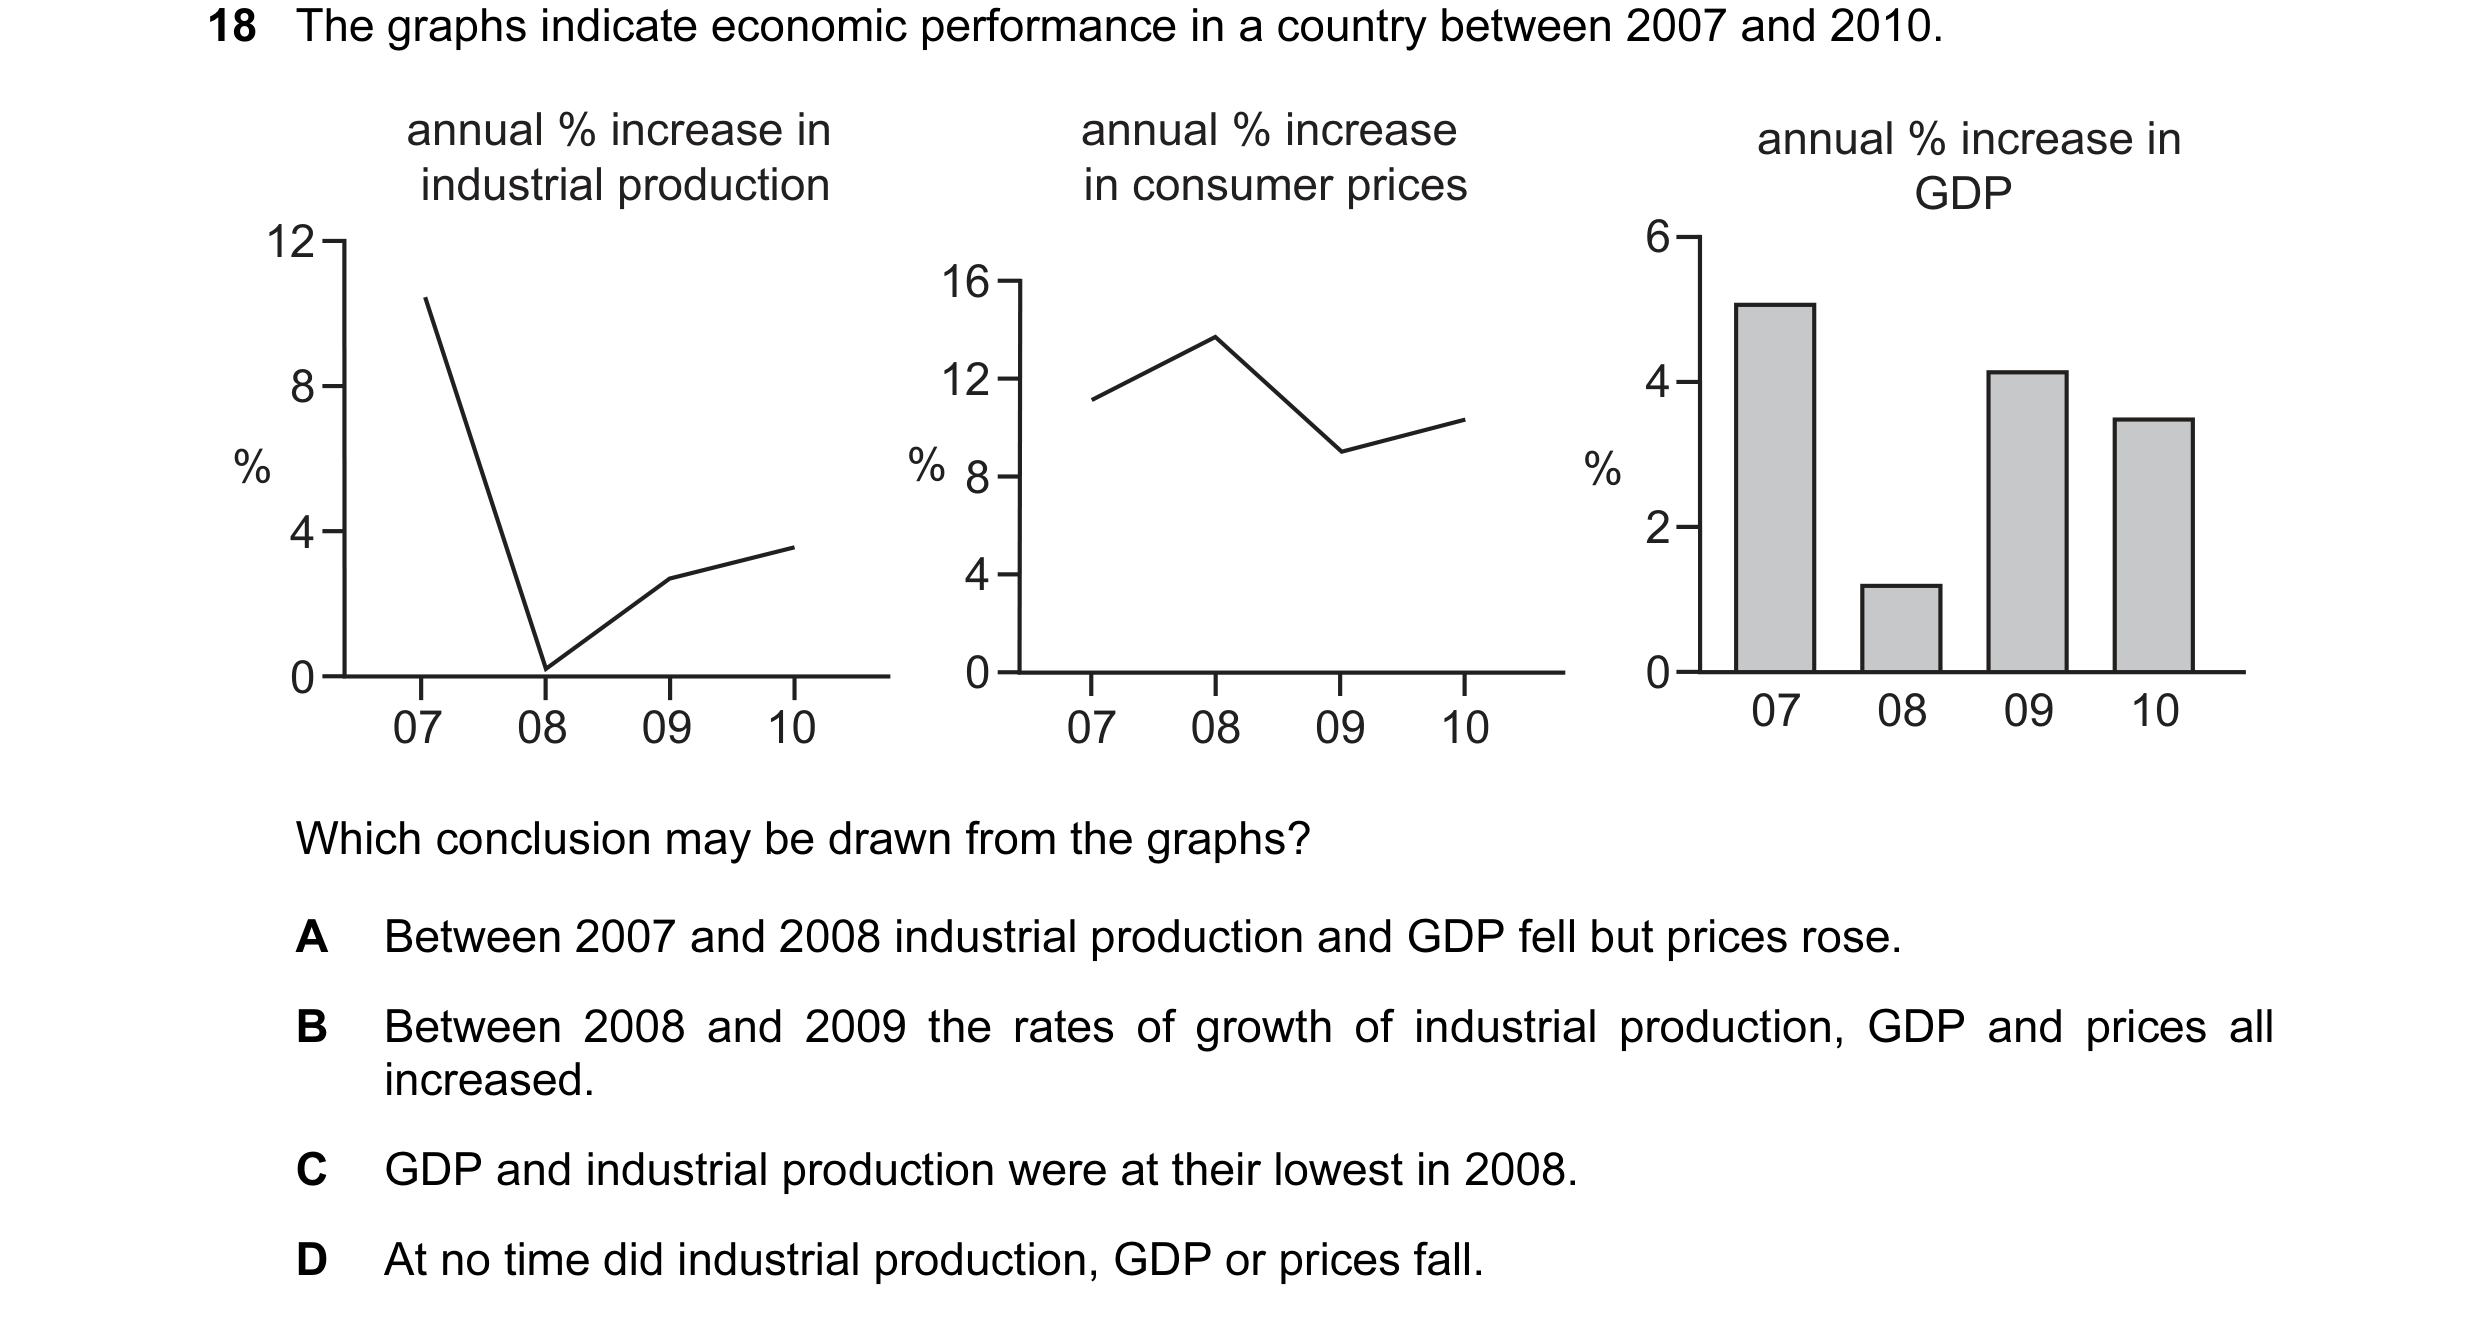
 2 / 7
2 / 7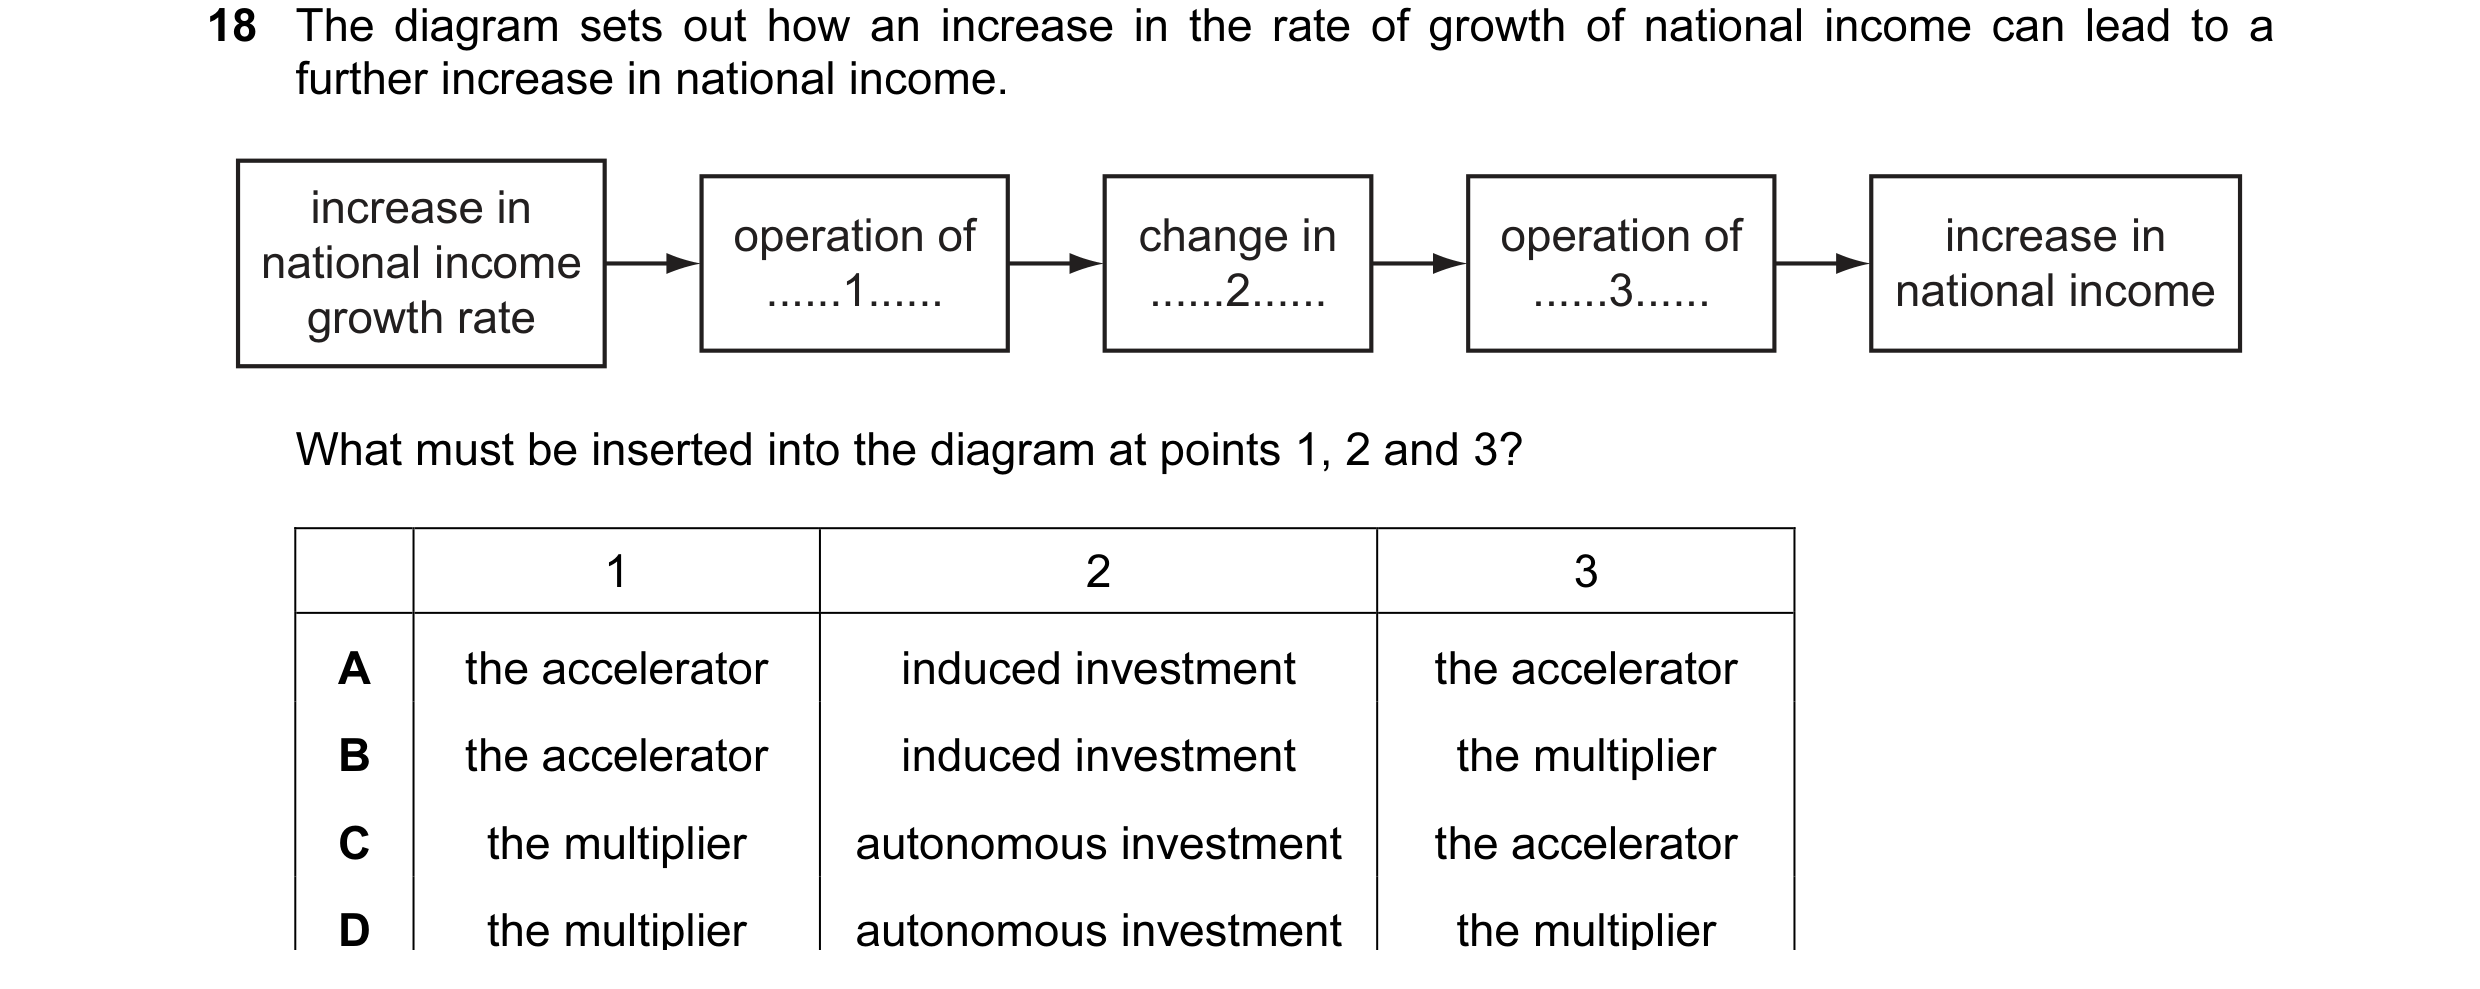
 3 / 7
3 / 7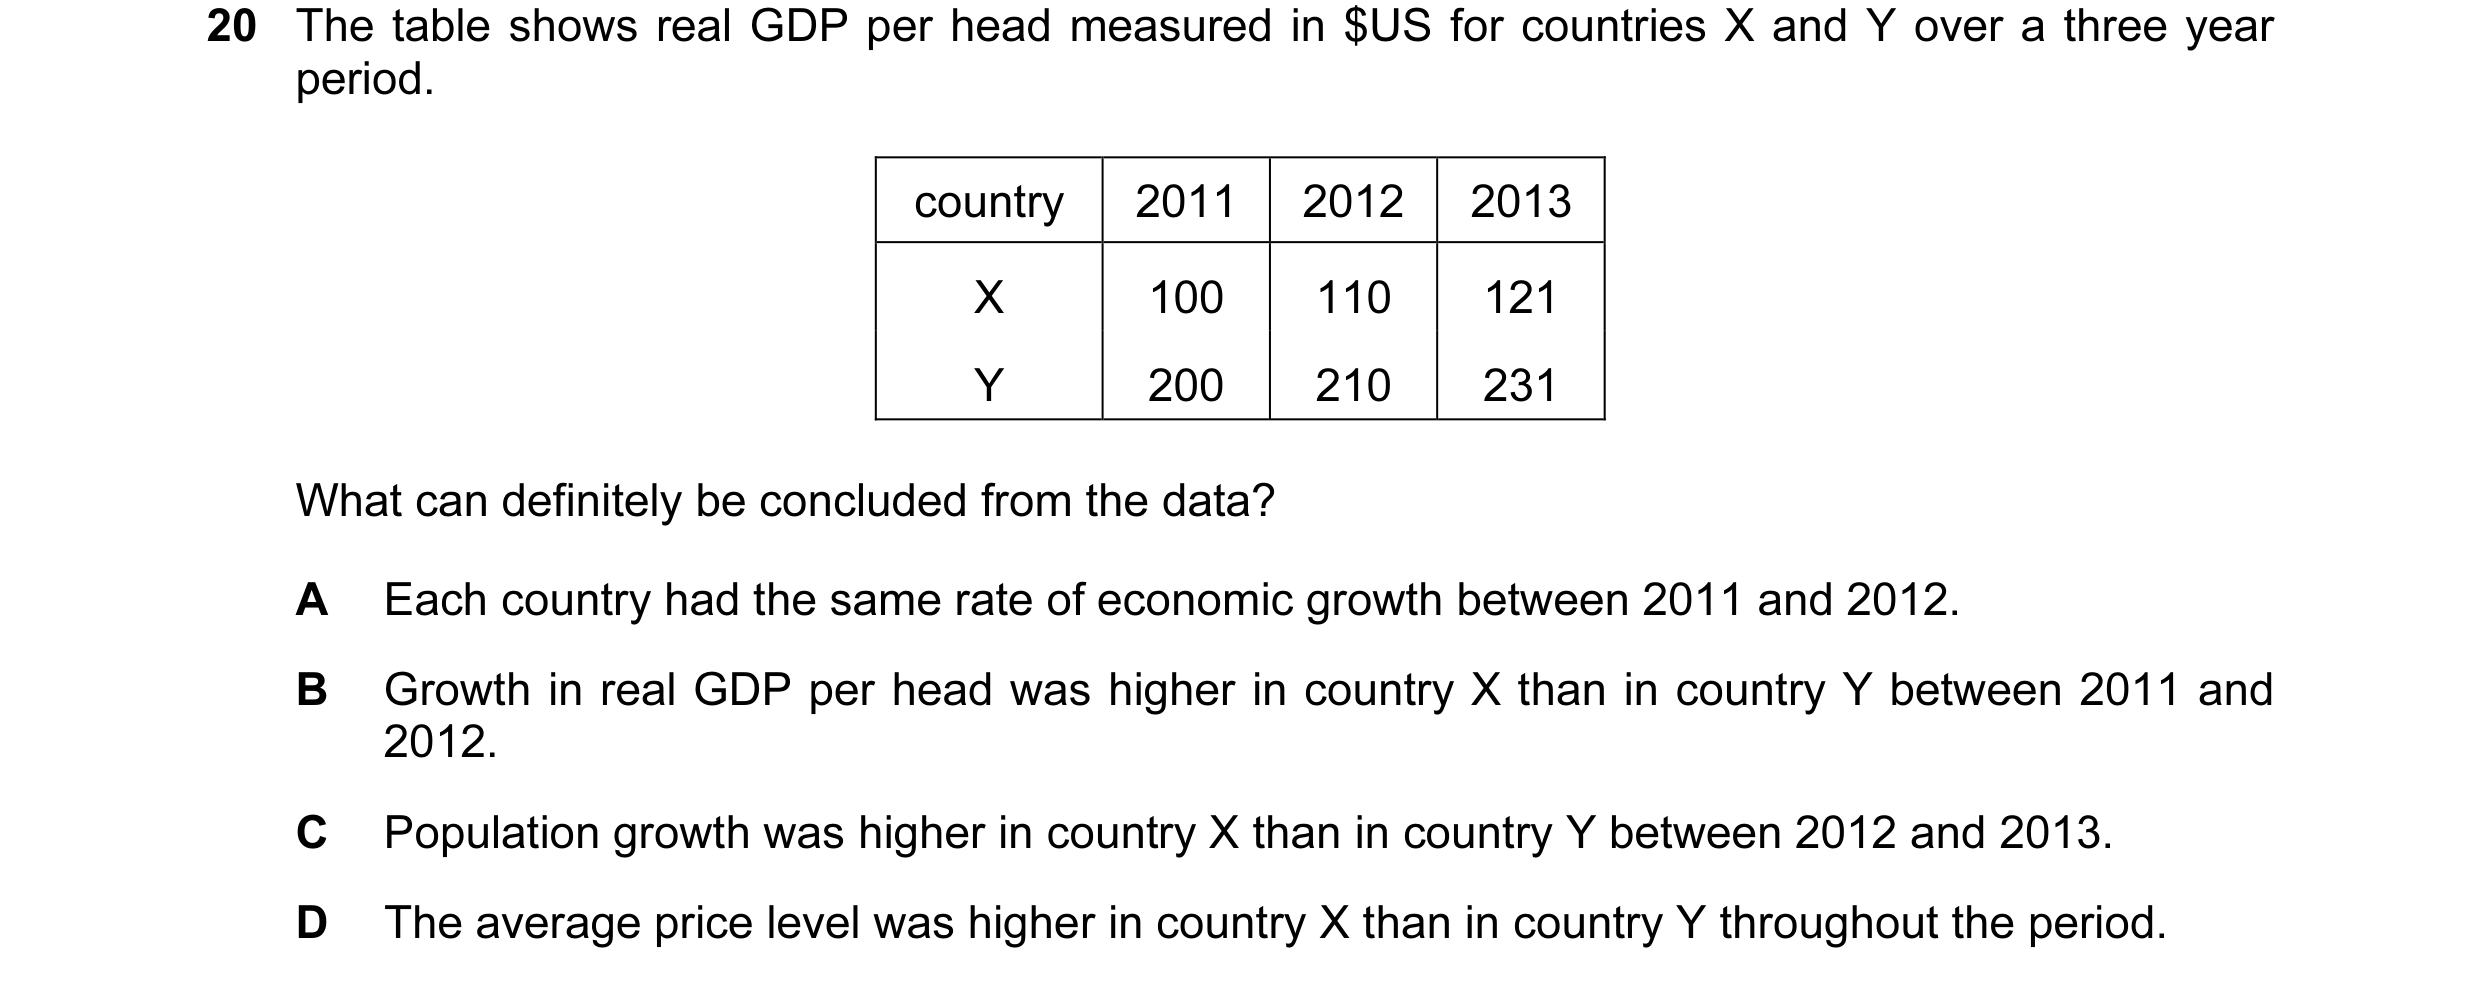
 4 / 7
4 / 7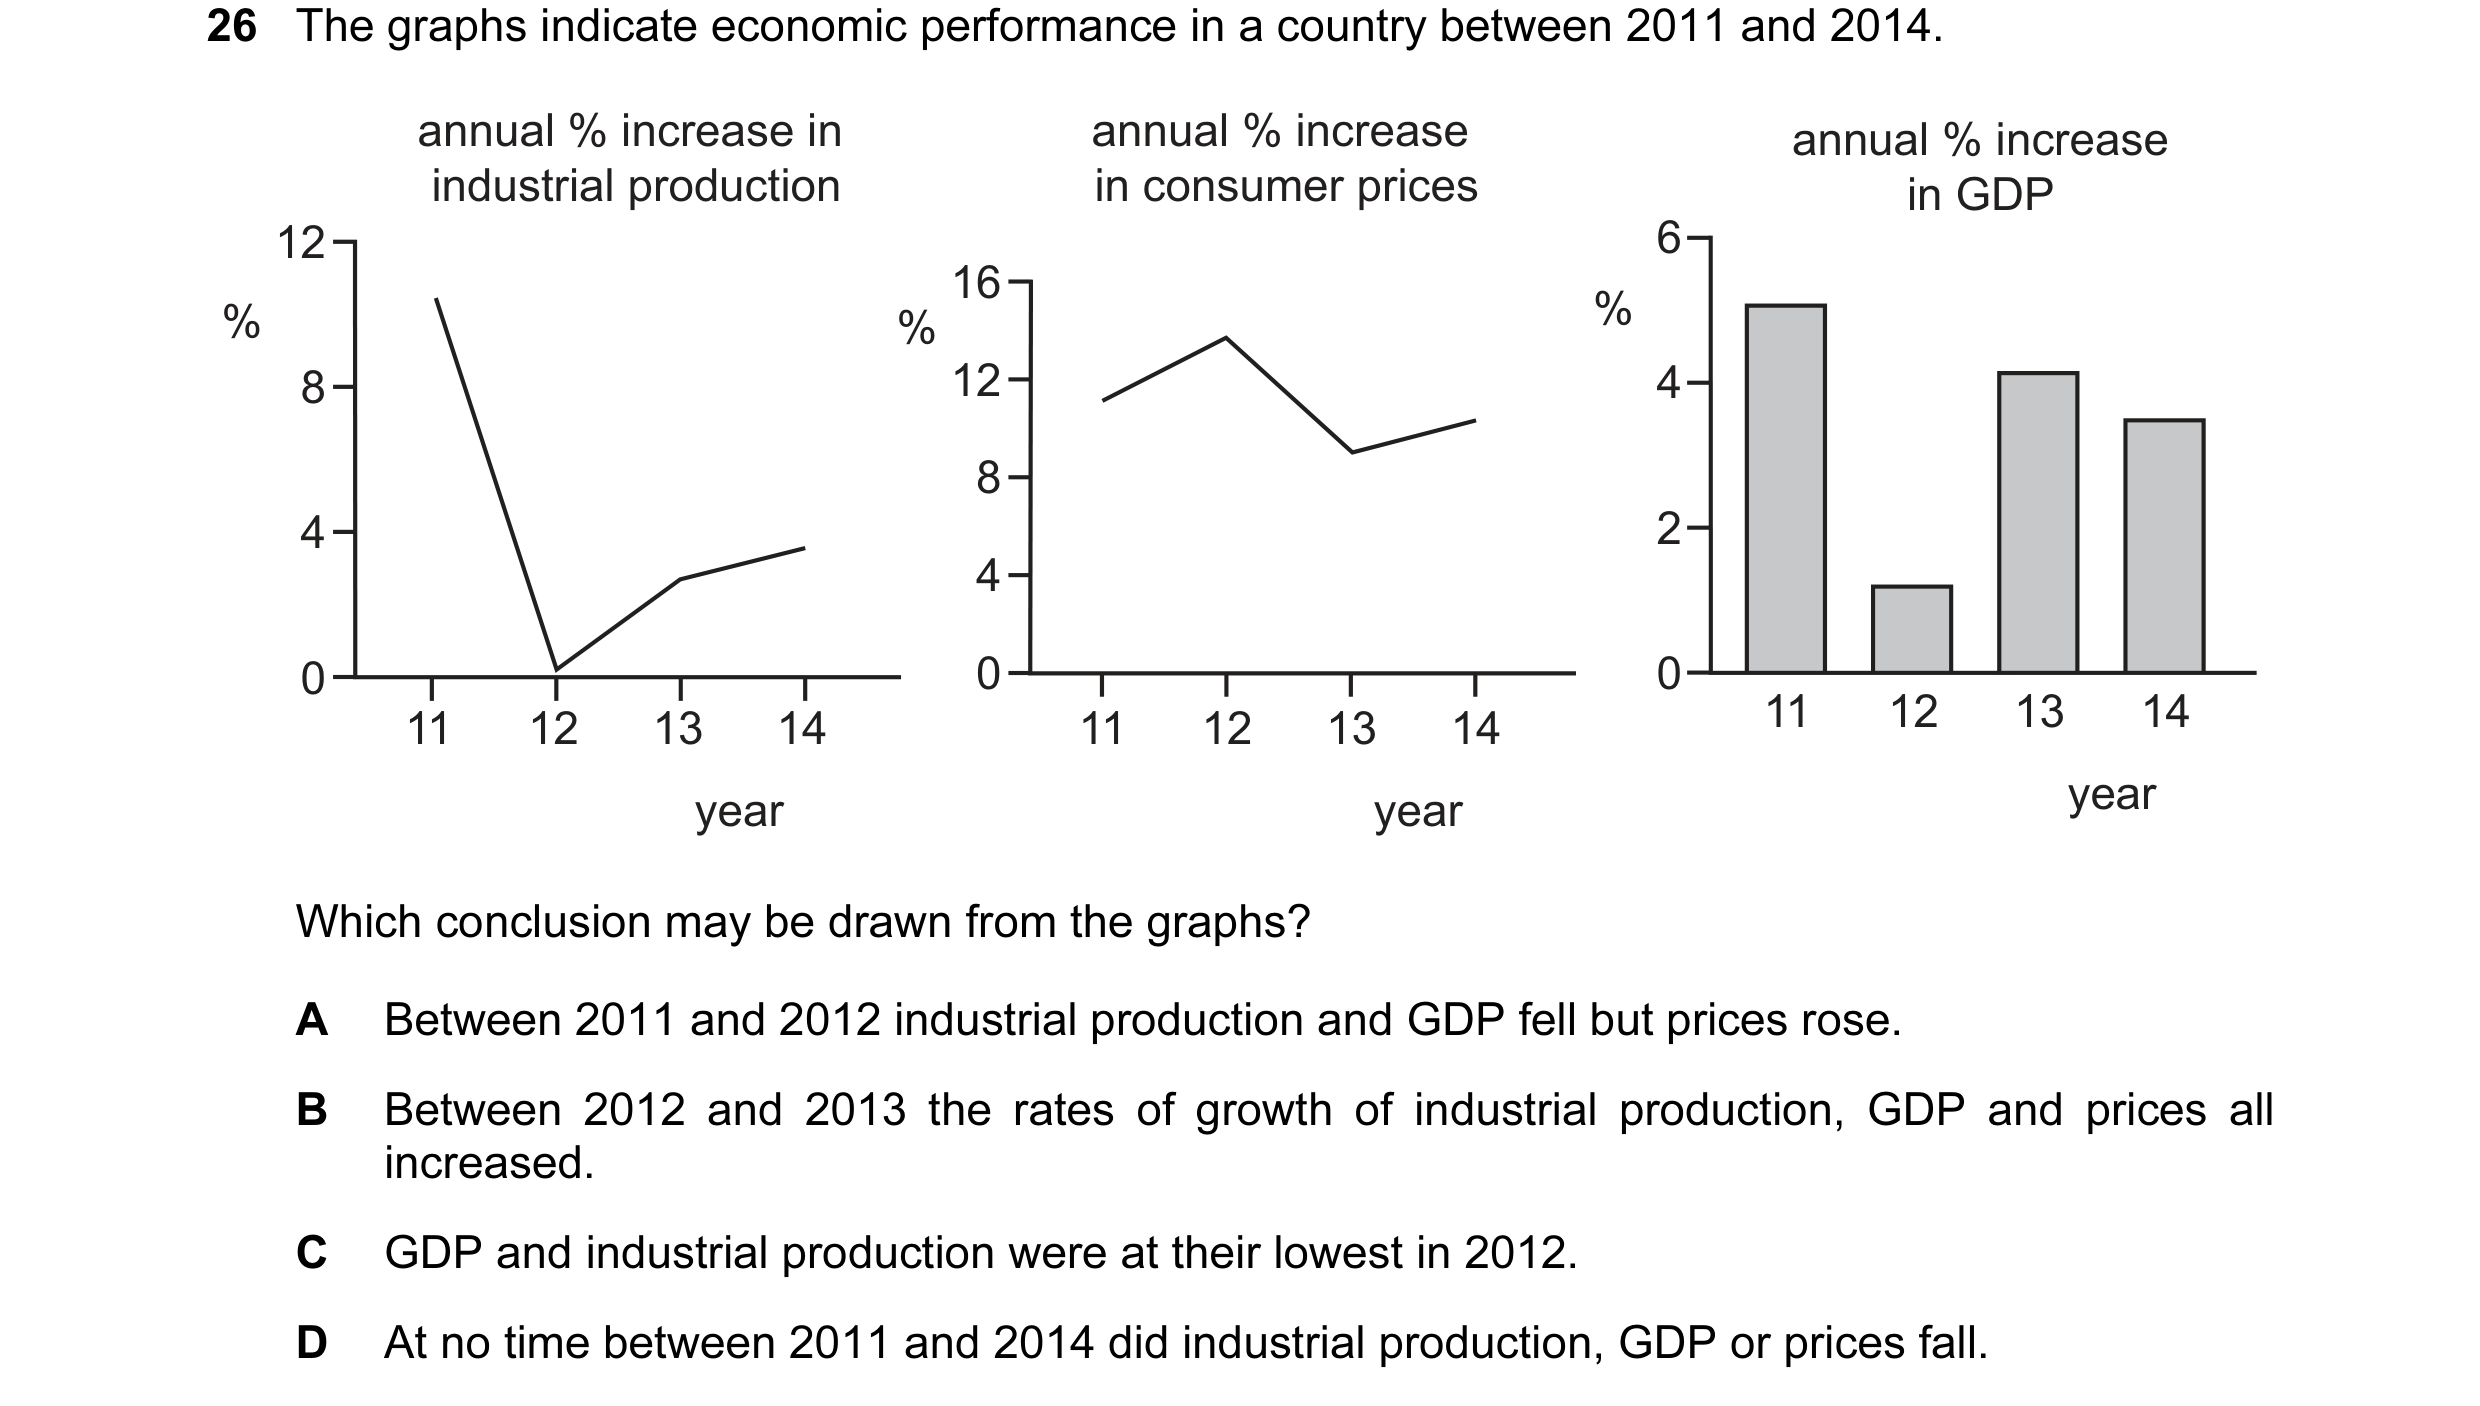
 5 / 7
5 / 7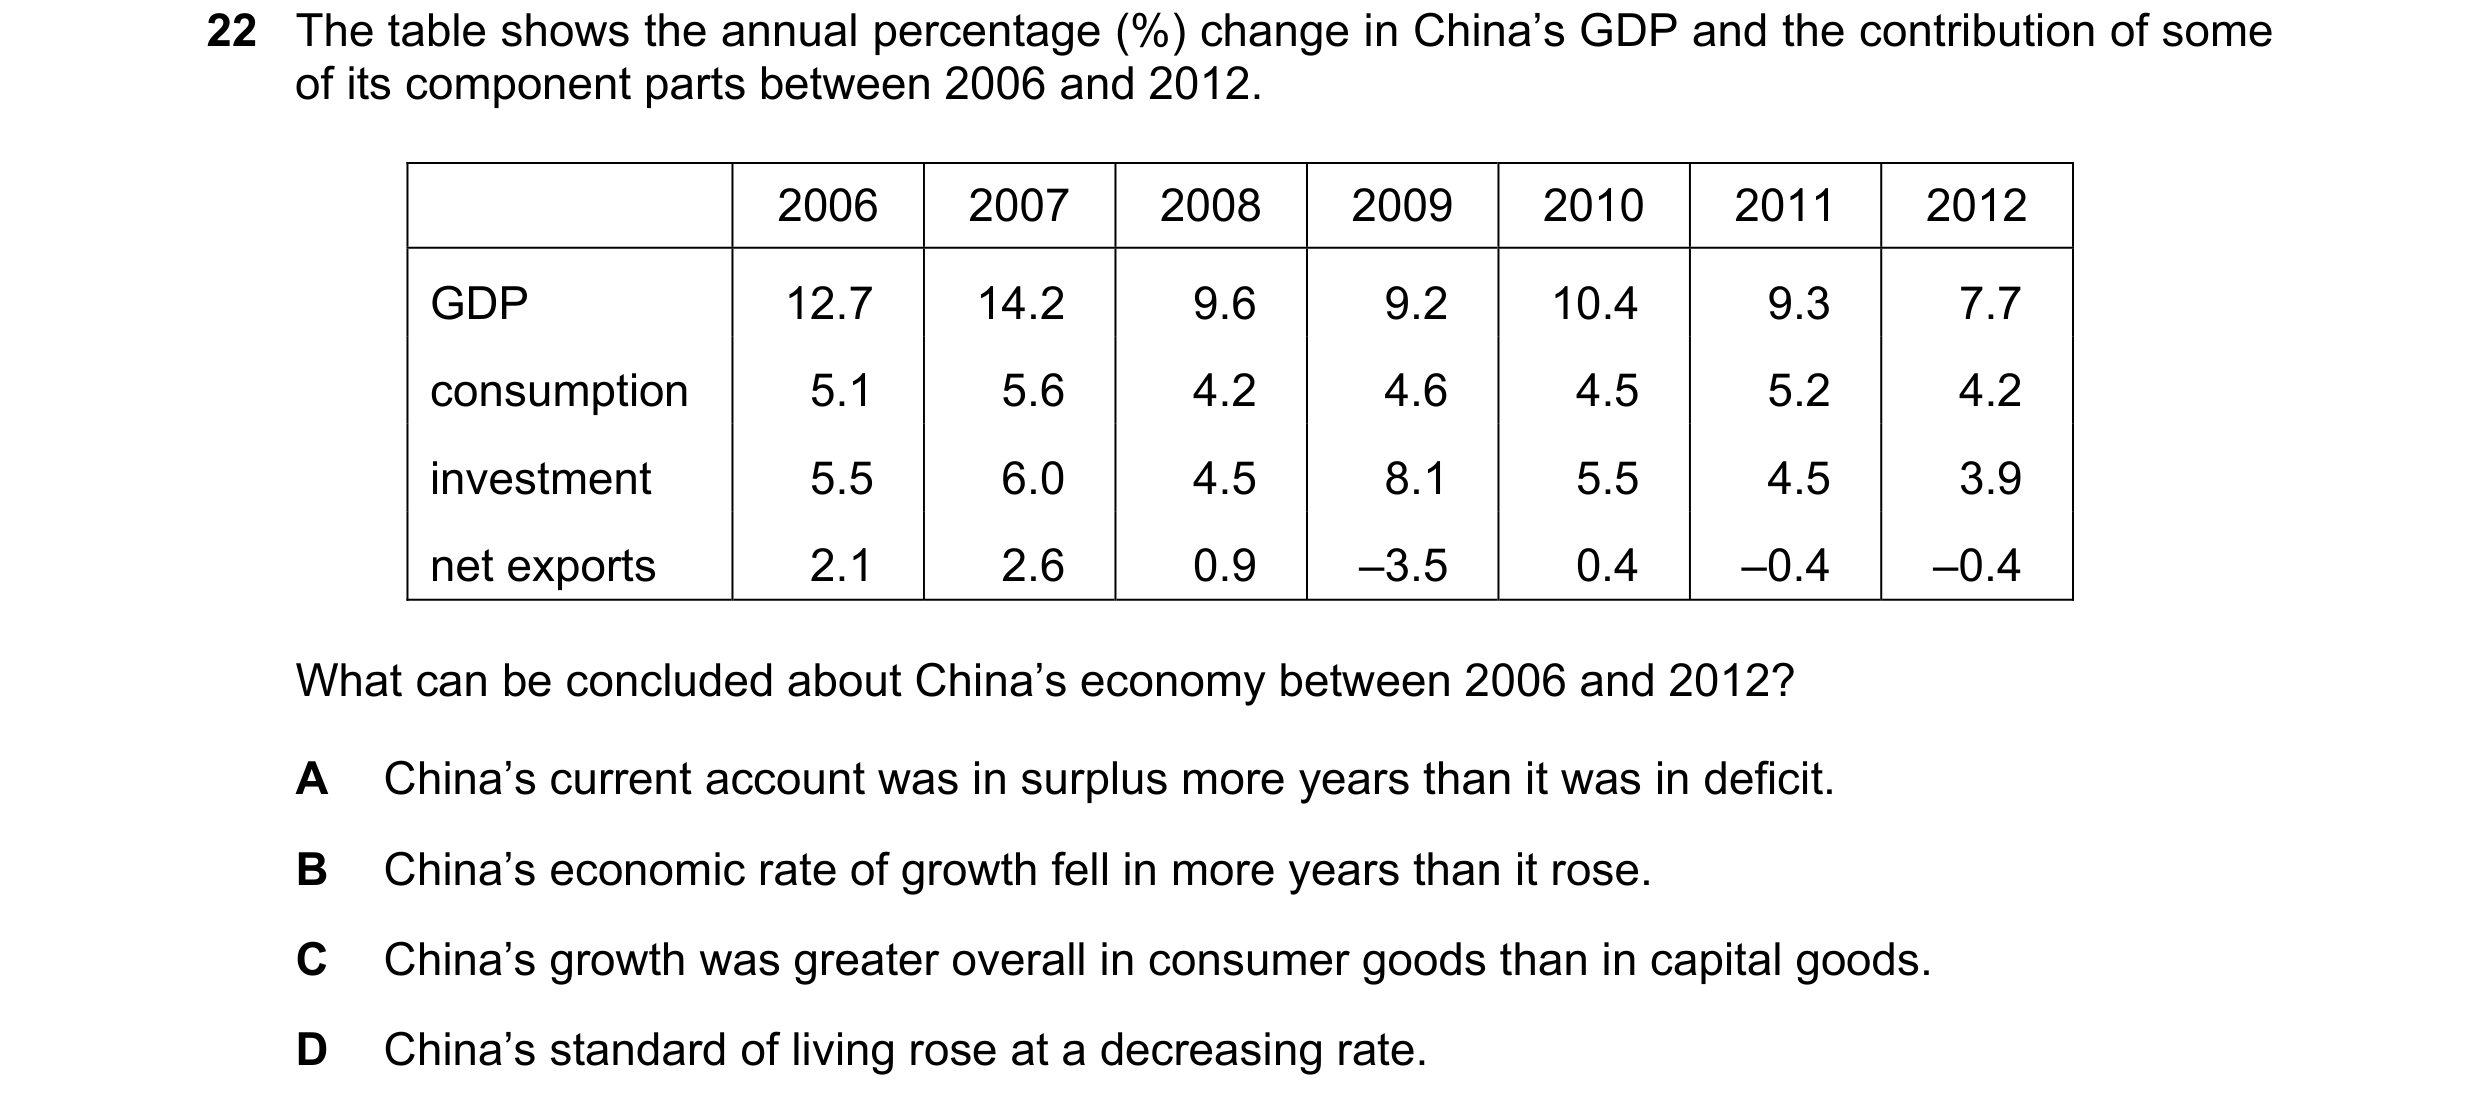
 6 / 7
6 / 7
 7 / 7
7 / 7