Questions as text
Q1 · Use the following words or phrases to complete the flow chart about the structures the… 0653/43 Oct/Nov 2017
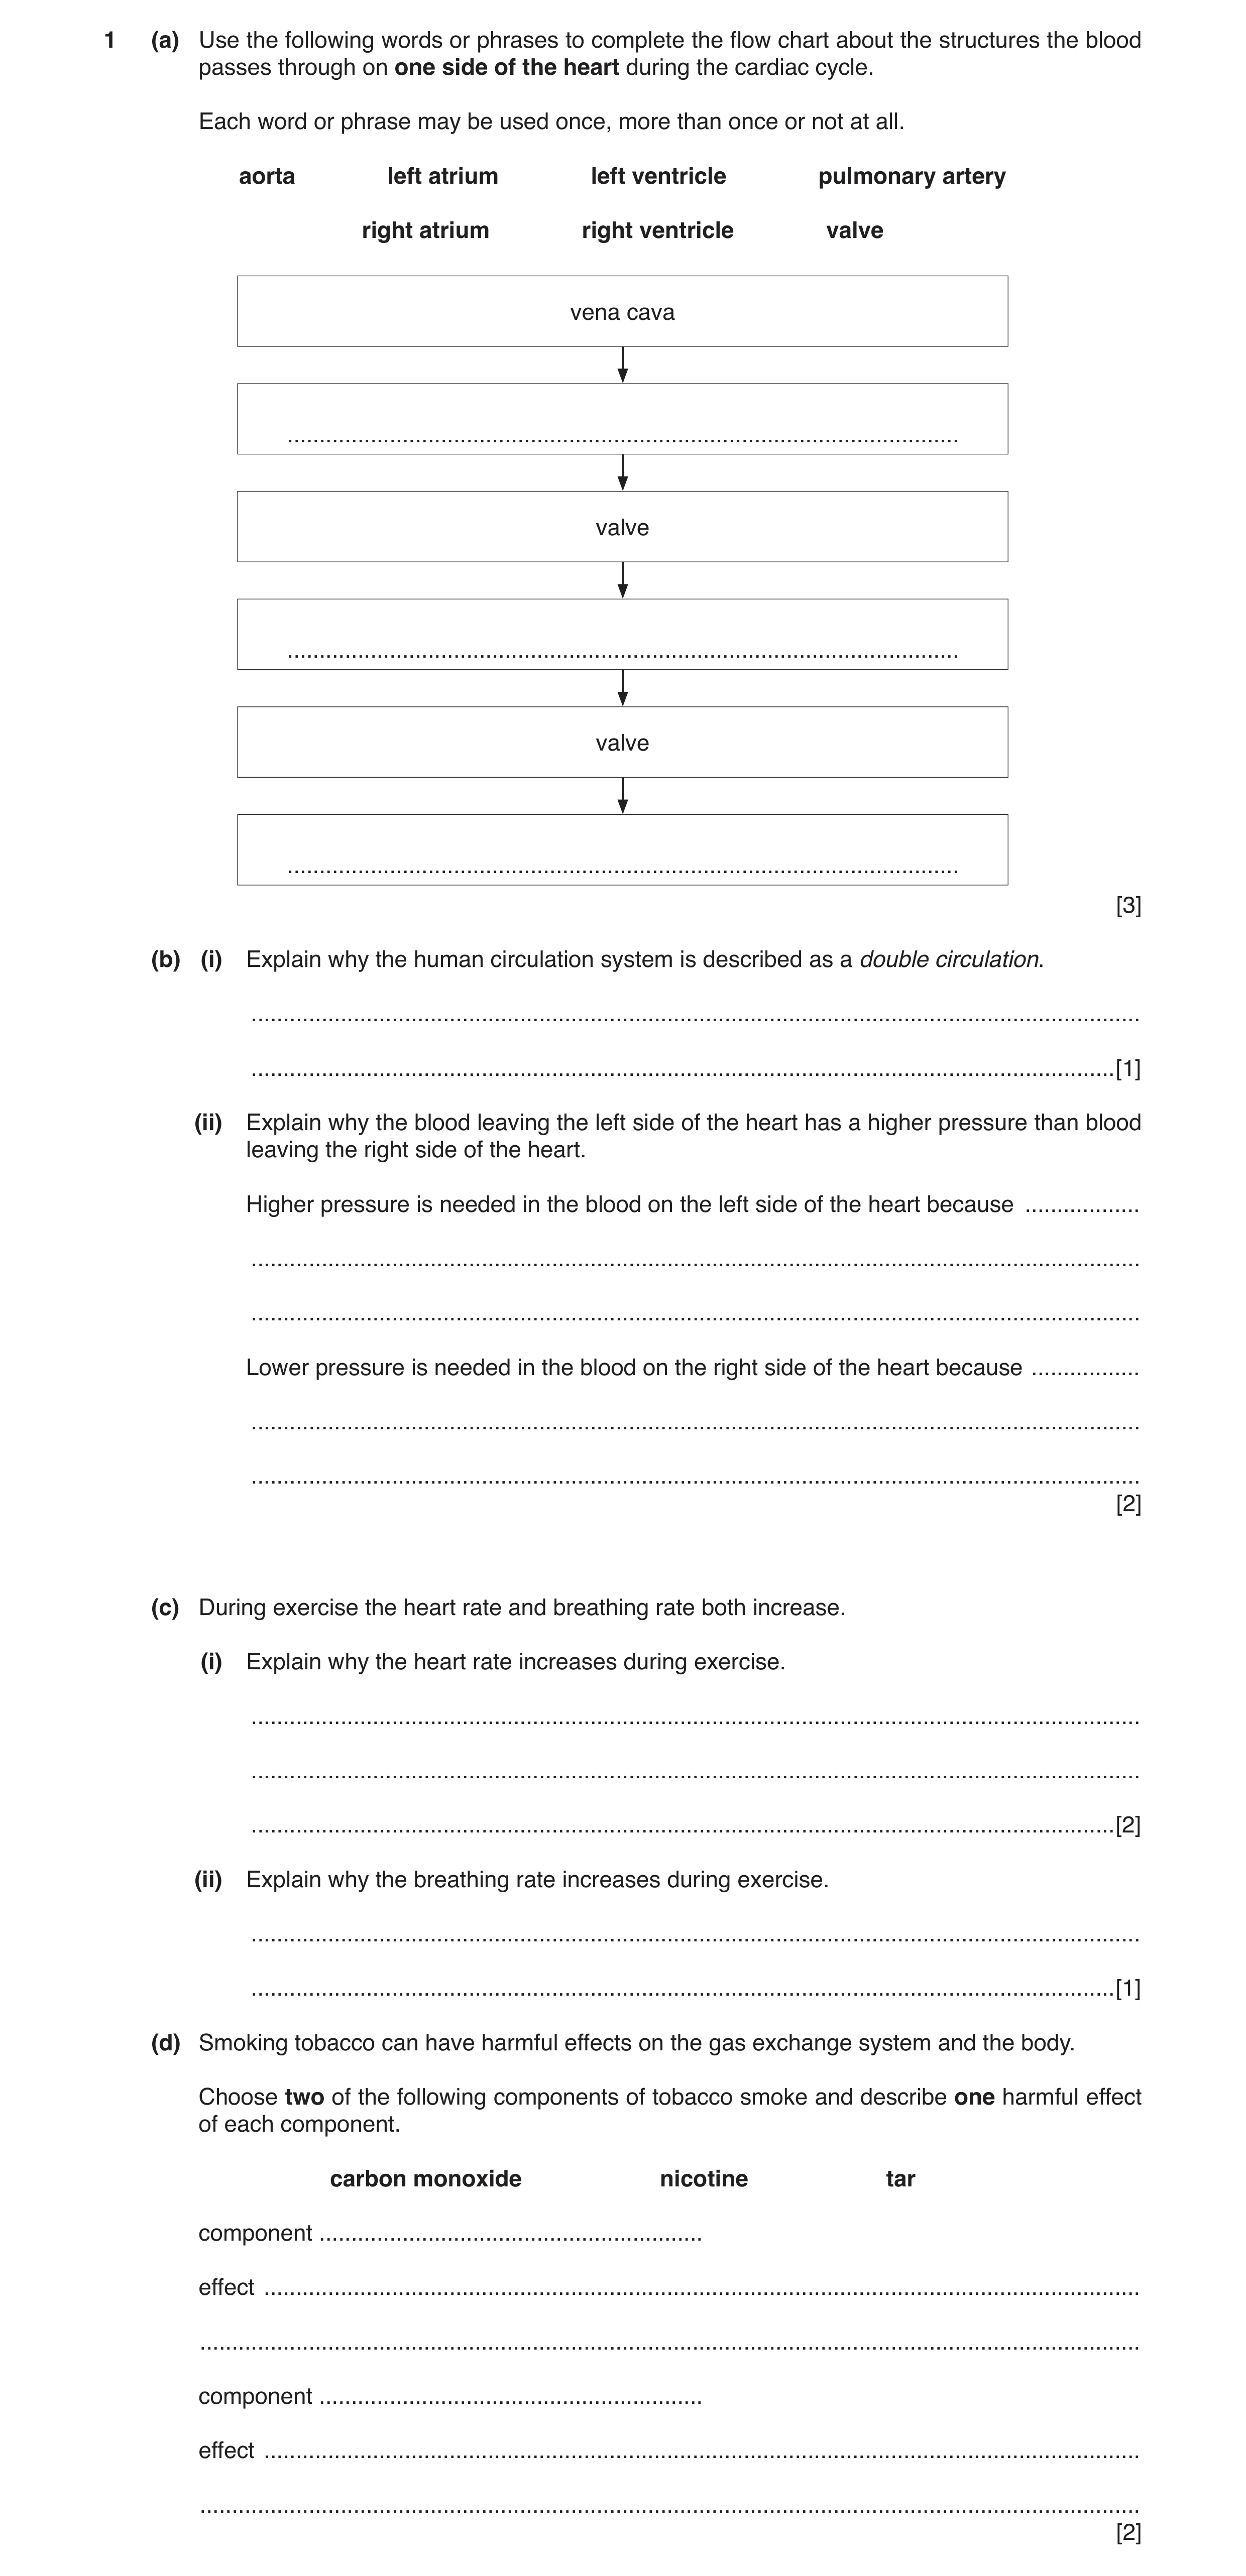
1 (a) Use the following words or phrases to complete the flow chart about the structures the blood passes through on one side of the heart during the cardiac cycle. Each word or phrase may be used once, more than once or not at all. aorta left atrium left ventricle pulmonary artery right atrium right ventricle valve vena cava … valve … valve … [3] (b) (i) Explain why the human circulation system is described as a double circulation. … … [1] (ii) Explain why the blood leaving the left side of the heart has a higher pressure than blood leaving the right side of the heart. Higher pressure is needed in the blood on the left side of the heart because … … … Lower pressure is needed in the blood on the right side of the heart because … … … [2] (c) During exercise the heart rate and breathing rate both increase. (i) Explain why the heart rate increases during exercise. … … … [2] (ii) Explain why the breathing rate increases during exercise. … … [1] (d) Smoking tobacco can have harmful effects on the gas exchange system and the body. Choose two of the following components of tobacco smoke and describe one harmful effect of each component. carbon monoxide nicotine tar component … effect … … component … effect … … [2]
11 marks
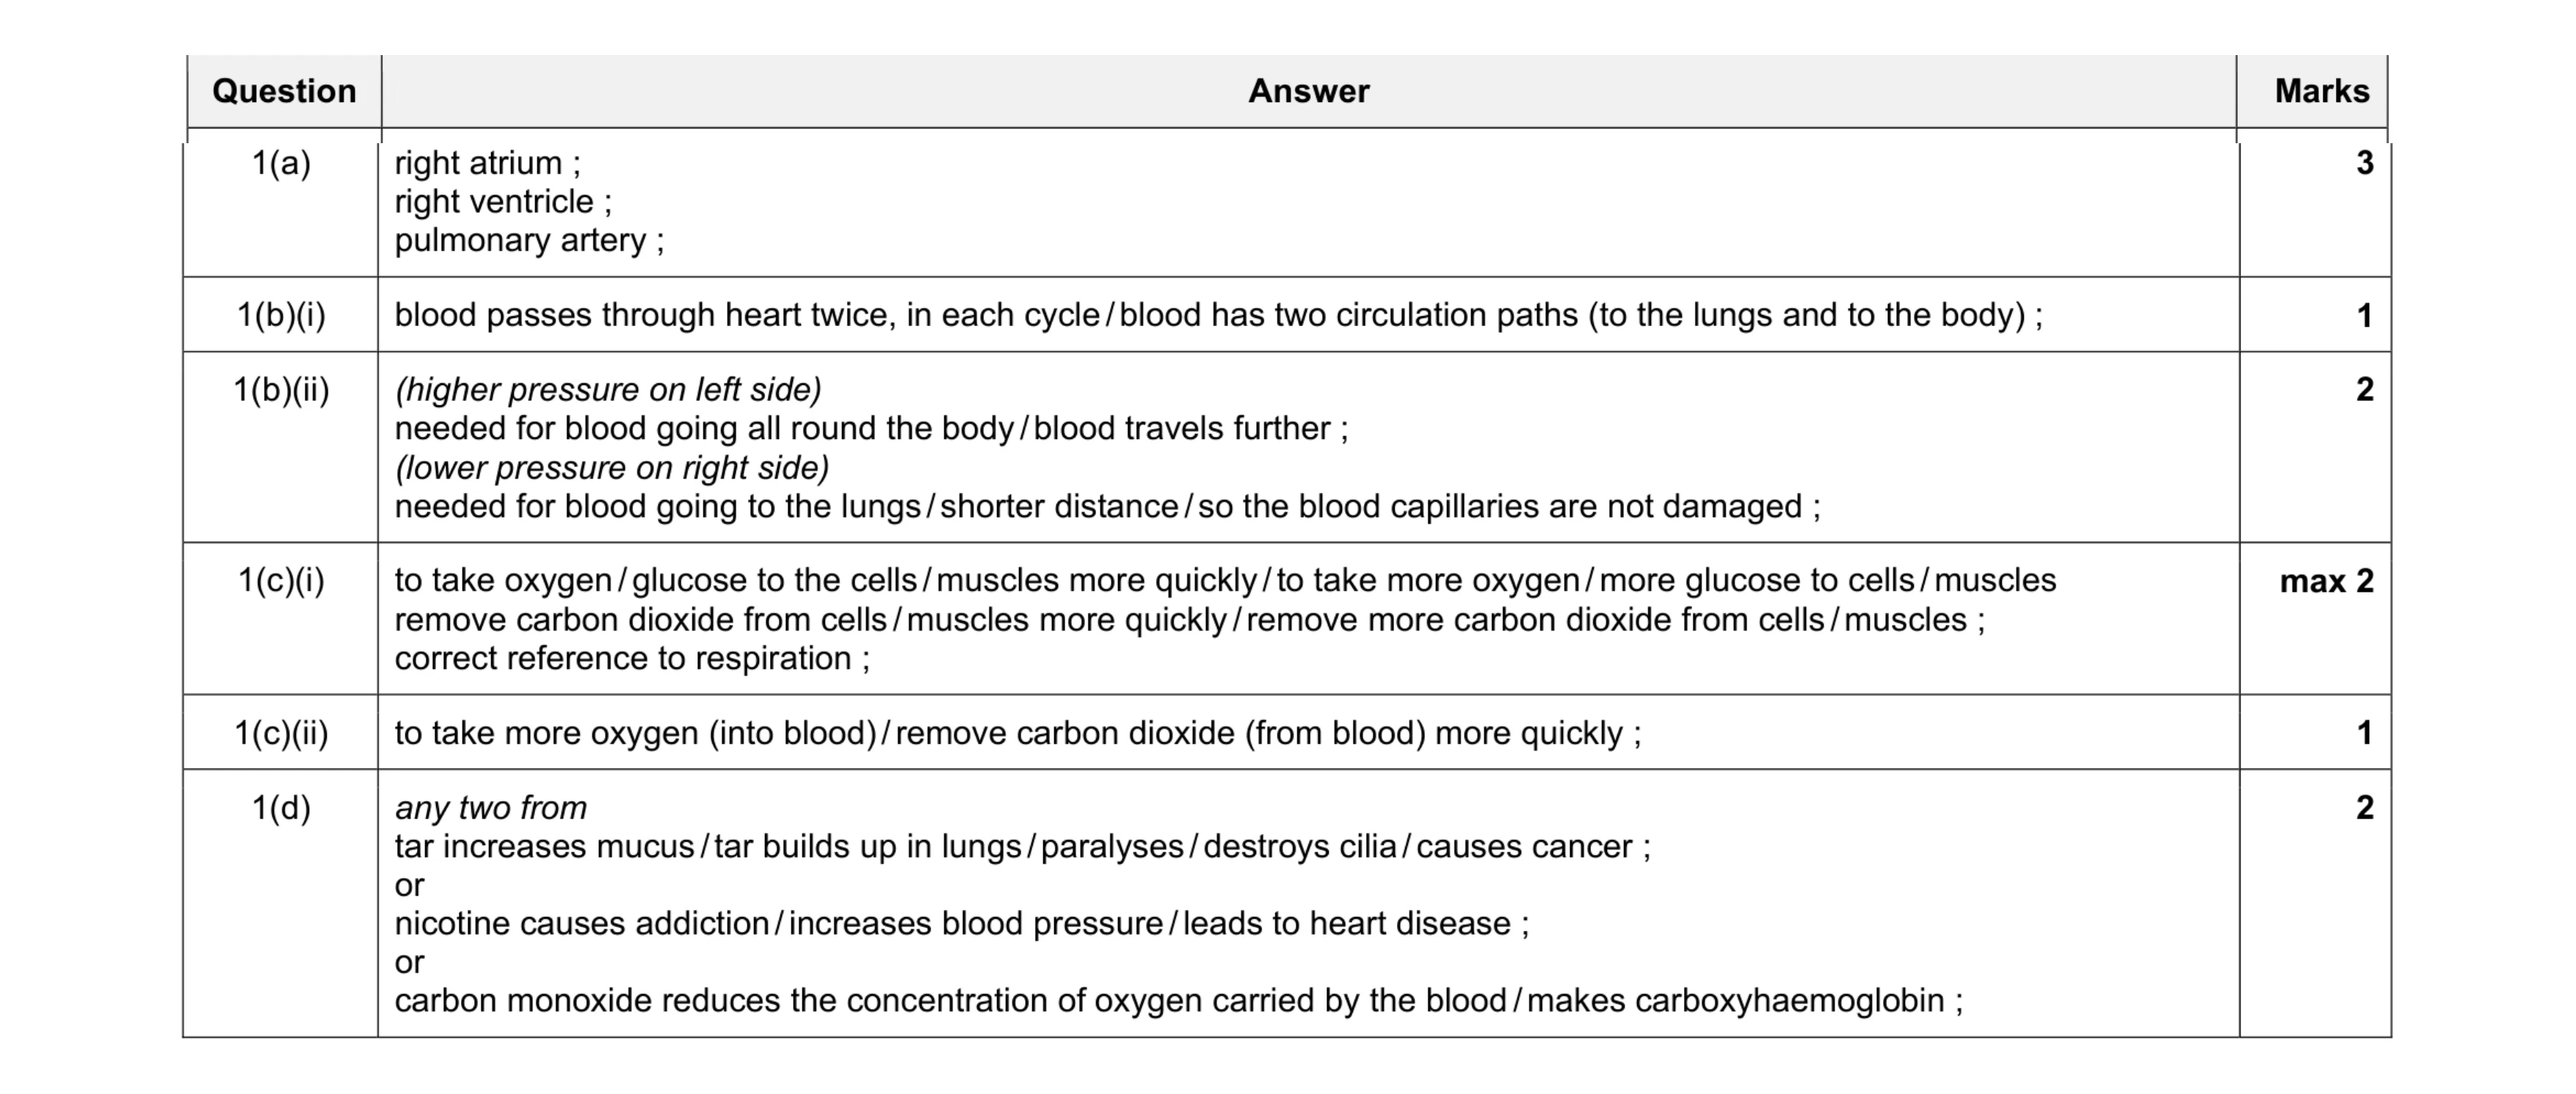
Mark scheme: 1(a) right atrium ; right ventricle ; pulmonary artery ; 3 1(b)(i) blood passes through heart twice, in each cycle / blood has two circulation paths (to the lungs and to the body) ; 1 1(b)(ii) (higher pressure on left side) needed for blood going all round the body / blood travels further ; (lower pressure on right side) needed for blood going to the lungs / shorter distance / so the blood capillaries are not damaged ; 2 1(c)(i) to take oxygen / glucose to the cells / muscles more quickly / to take more oxygen / more glucose to cells / muscles remove carbon dioxide from cells / muscles more quickly / remove more carbon dioxide from cells / muscles ; correct reference to respiration ; max 2 1(c)(ii) to take more oxygen (into blood) / remove carbon dioxide (from blood) more quickly ; 1 1(d) any two from tar increases mucus / tar builds up in lungs / paralyses / destroys cilia / causes cancer ; or nicotine causes addiction / increases blood pressure / leads to heart disease ; or carbon monoxide reduces the concentration of oxygen carried by the blood / makes carboxyhaemoglobin ; 2
This question in 0653/43 Oct/Nov 2017
Q2 · During inspiration air passes through different parts of the airway to reach the alveoli 0653/42 May/June 2018
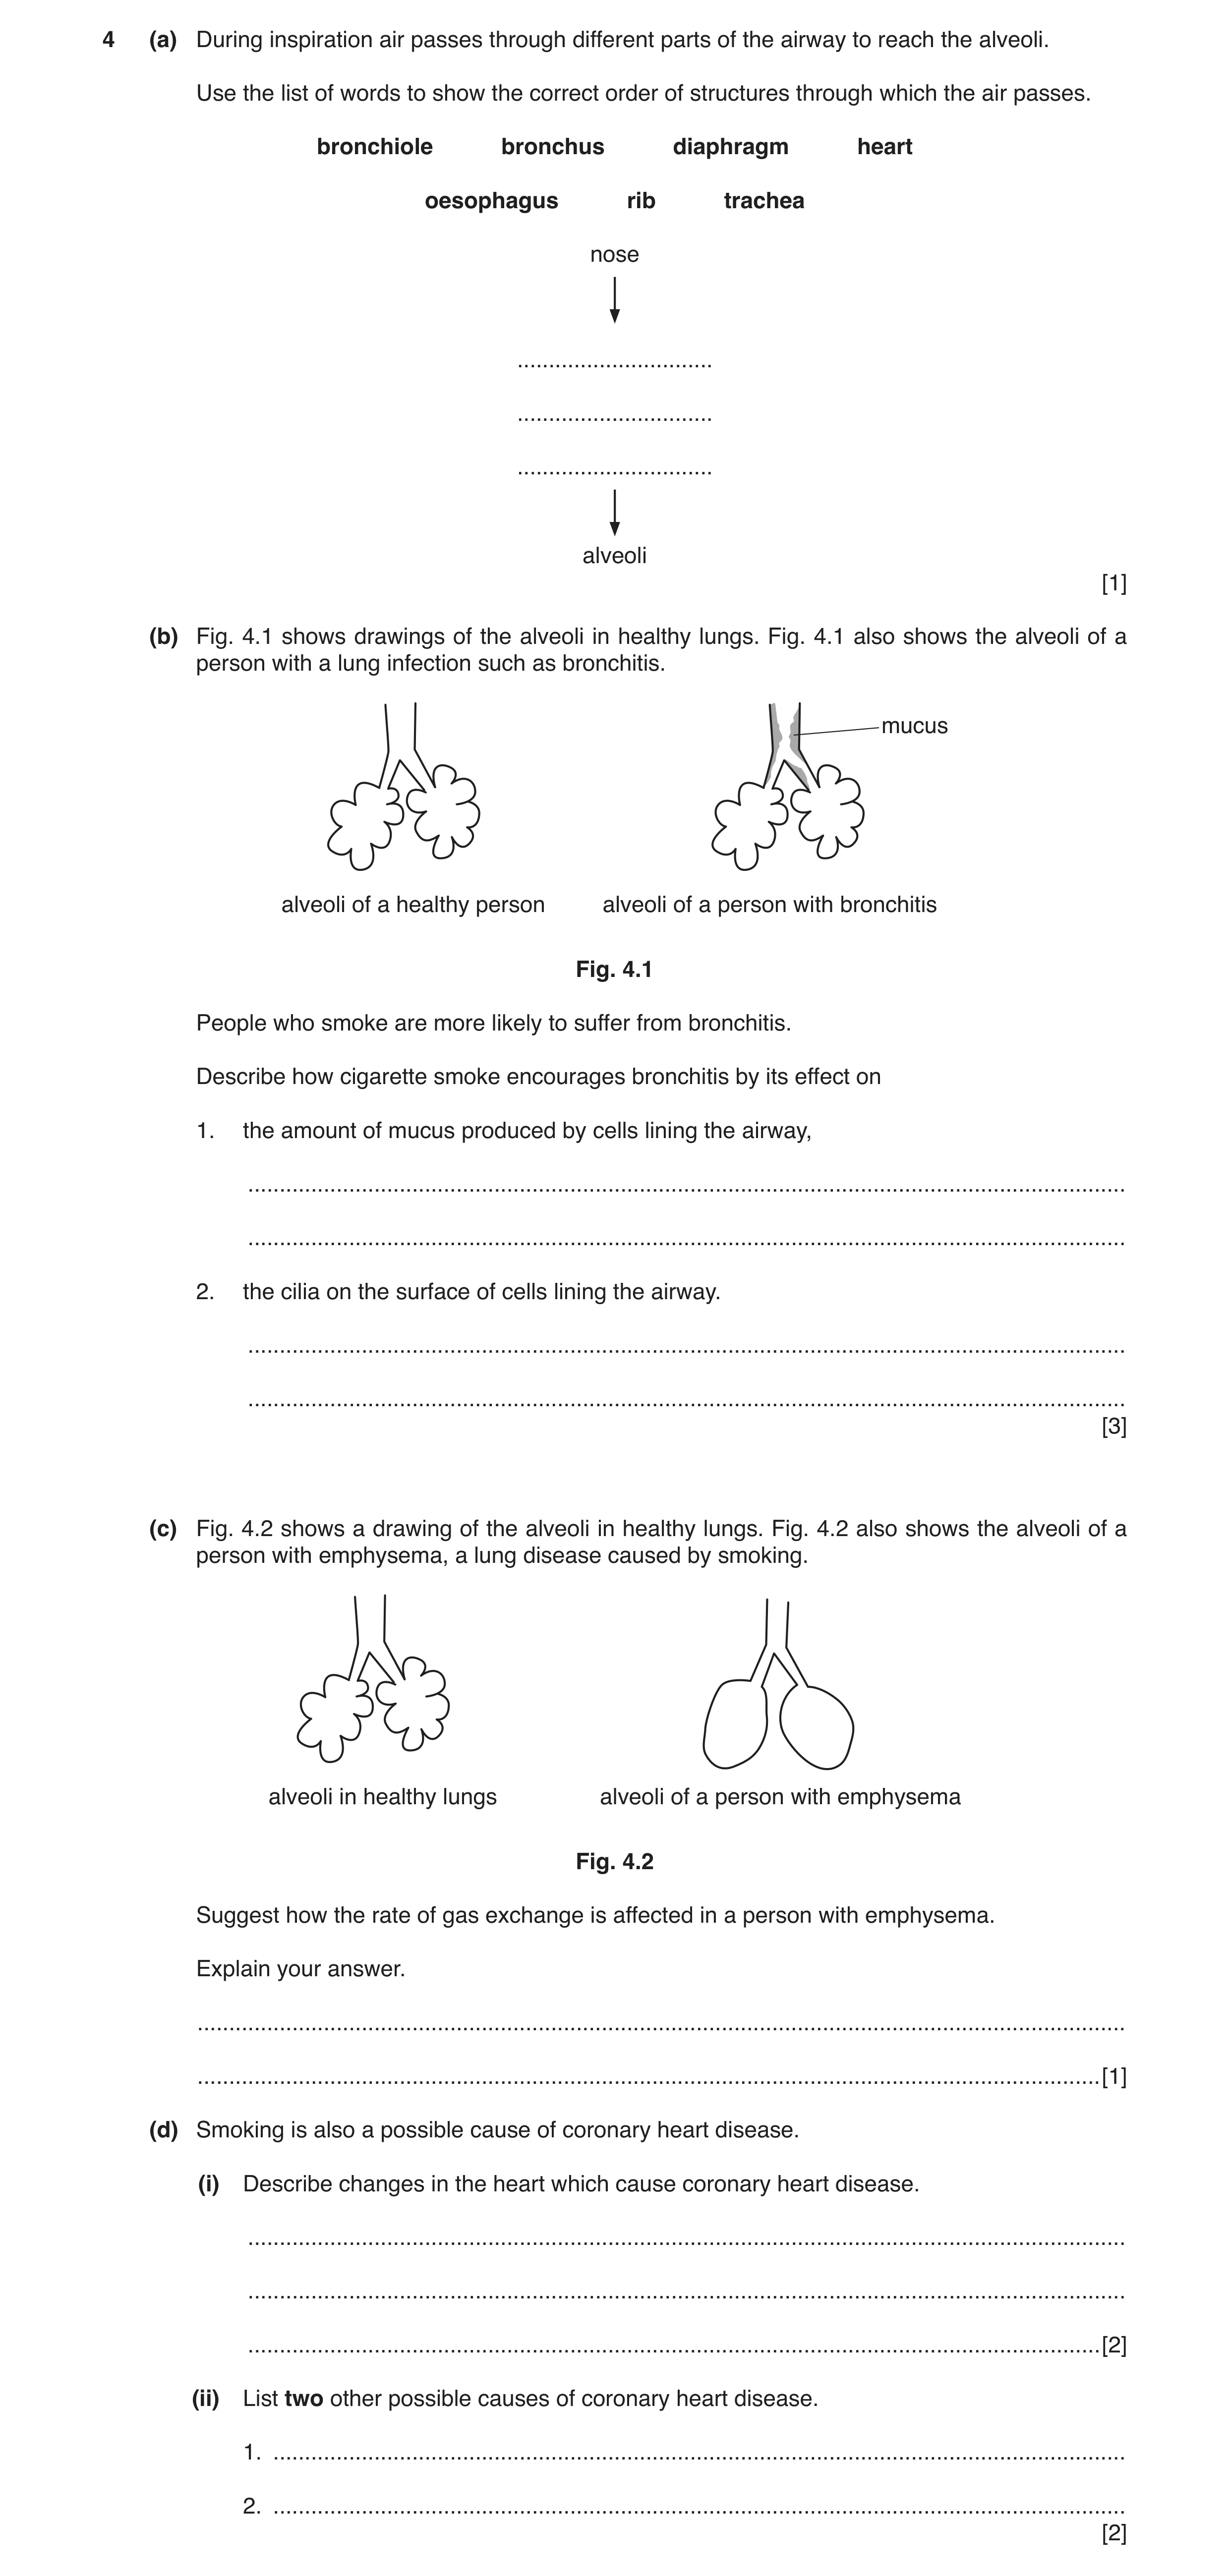
4 (a) During inspiration air passes through different parts of the airway to reach the alveoli. Use the list of words to show the correct order of structures through which the air passes. bronchiole bronchus diaphragm heart oesophagus rib trachea nose … … … alveoli [1] (b) Fig. 4.1 shows drawings of the alveoli in healthy lungs. Fig. 4.1 also shows the alveoli of a person with a lung infection such as bronchitis. mucus alveoli of a healthy person alveoli of a person with bronchitis Fig. 4.1 People who smoke are more likely to suffer from bronchitis. Describe how cigarette smoke encourages bronchitis by its effect on 1. the amount of mucus produced by cells lining the airway, … … 2. the cilia on the surface of cells lining the airway. … … [3] (c) Fig. 4.2 shows a drawing of the alveoli in healthy lungs. Fig. 4.2 also shows the alveoli of a person with emphysema, a lung disease caused by smoking. alveoli in healthy lungs alveoli of a person with emphysema Fig. 4.2 Suggest how the rate of gas exchange is affected in a person with emphysema. Explain your answer. … … [1] (d) Smoking is also a possible cause of coronary heart disease. (i) Describe changes in the heart which cause coronary heart disease. … … … [2] (ii) List two other possible causes of coronary heart disease. 1. … 2. … [2]
9 marks
Mark scheme: 4(a) trachea, bronchus, bronchiole ; 1 4(b) effect on mucus mucus production increases ; effect on cilia cilia become paralysed / damaged ; cannot remove mucus from airway / away from lungs ; 3 4(c) (rate of gas exchange reduced) reduced area (for gas exchange in alveoli) ; 1 4(d)(i) narrowing / blockage of coronary arteries ; due to fatty deposits / plaque ; 2 4(d)(ii) high fat diet ; stress ; 2
This question in 0653/42 May/June 2018
Q3 · A diagram of the human gas exchange system 0653/43 May/June 2018
7 (a) Fig. 7.1 shows a diagram of the human gas exchange system. Fig. 7.1 On Fig. 7.1 use label lines to identify (i) the larynx, [1] (ii) a bronchiole. [1] (b) Fig. 7.2 shows a diagram of an alveolus in the lungs. wall of capillary plasma alveolus oxygen red blood cell Fig. 7.2 (i) Describe two features of a gas exchange surface which are visible in Fig. 7.2. 1. … 2. … [2] (ii) Oxygen diffuses into the blood at the alveoli. Explain why oxygen diffuses from the alveoli into the blood. … … … [1] (c) Describe how the gas exchange system is protected by mucus and cilia. mucus … … cilia … … [2] (d) The blood leaving the heart from the left ventricle has a greater pressure than the blood leaving the right ventricle. Explain why this difference in pressure is needed. … … … … [2]
9 marks
Mark scheme: 7(a)(i) larynx correctly labelled ; 1 7(a)(ii) any bronchiole correctly labelled ; 1 7(b)(i) thin wall / short diffusion distance ; good blood supply ; 2 Question Answer Marks 7(b)(ii) down concentration gradient owtte ; 1 7(c) mucus traps pathogens / dust ; cilia (beat upwards to) remove the mucus ; 2 7(d) (blood leaving left ventricle) has to go all round the body ; blood leaving right ventricle only has to go to lungs / high pressure in lung capillaries would damage them ; 2
This question in 0653/43 May/June 2018
Q4 · Simple diagrams of the human and plant transport systems 0653/43 Oct/Nov 2019
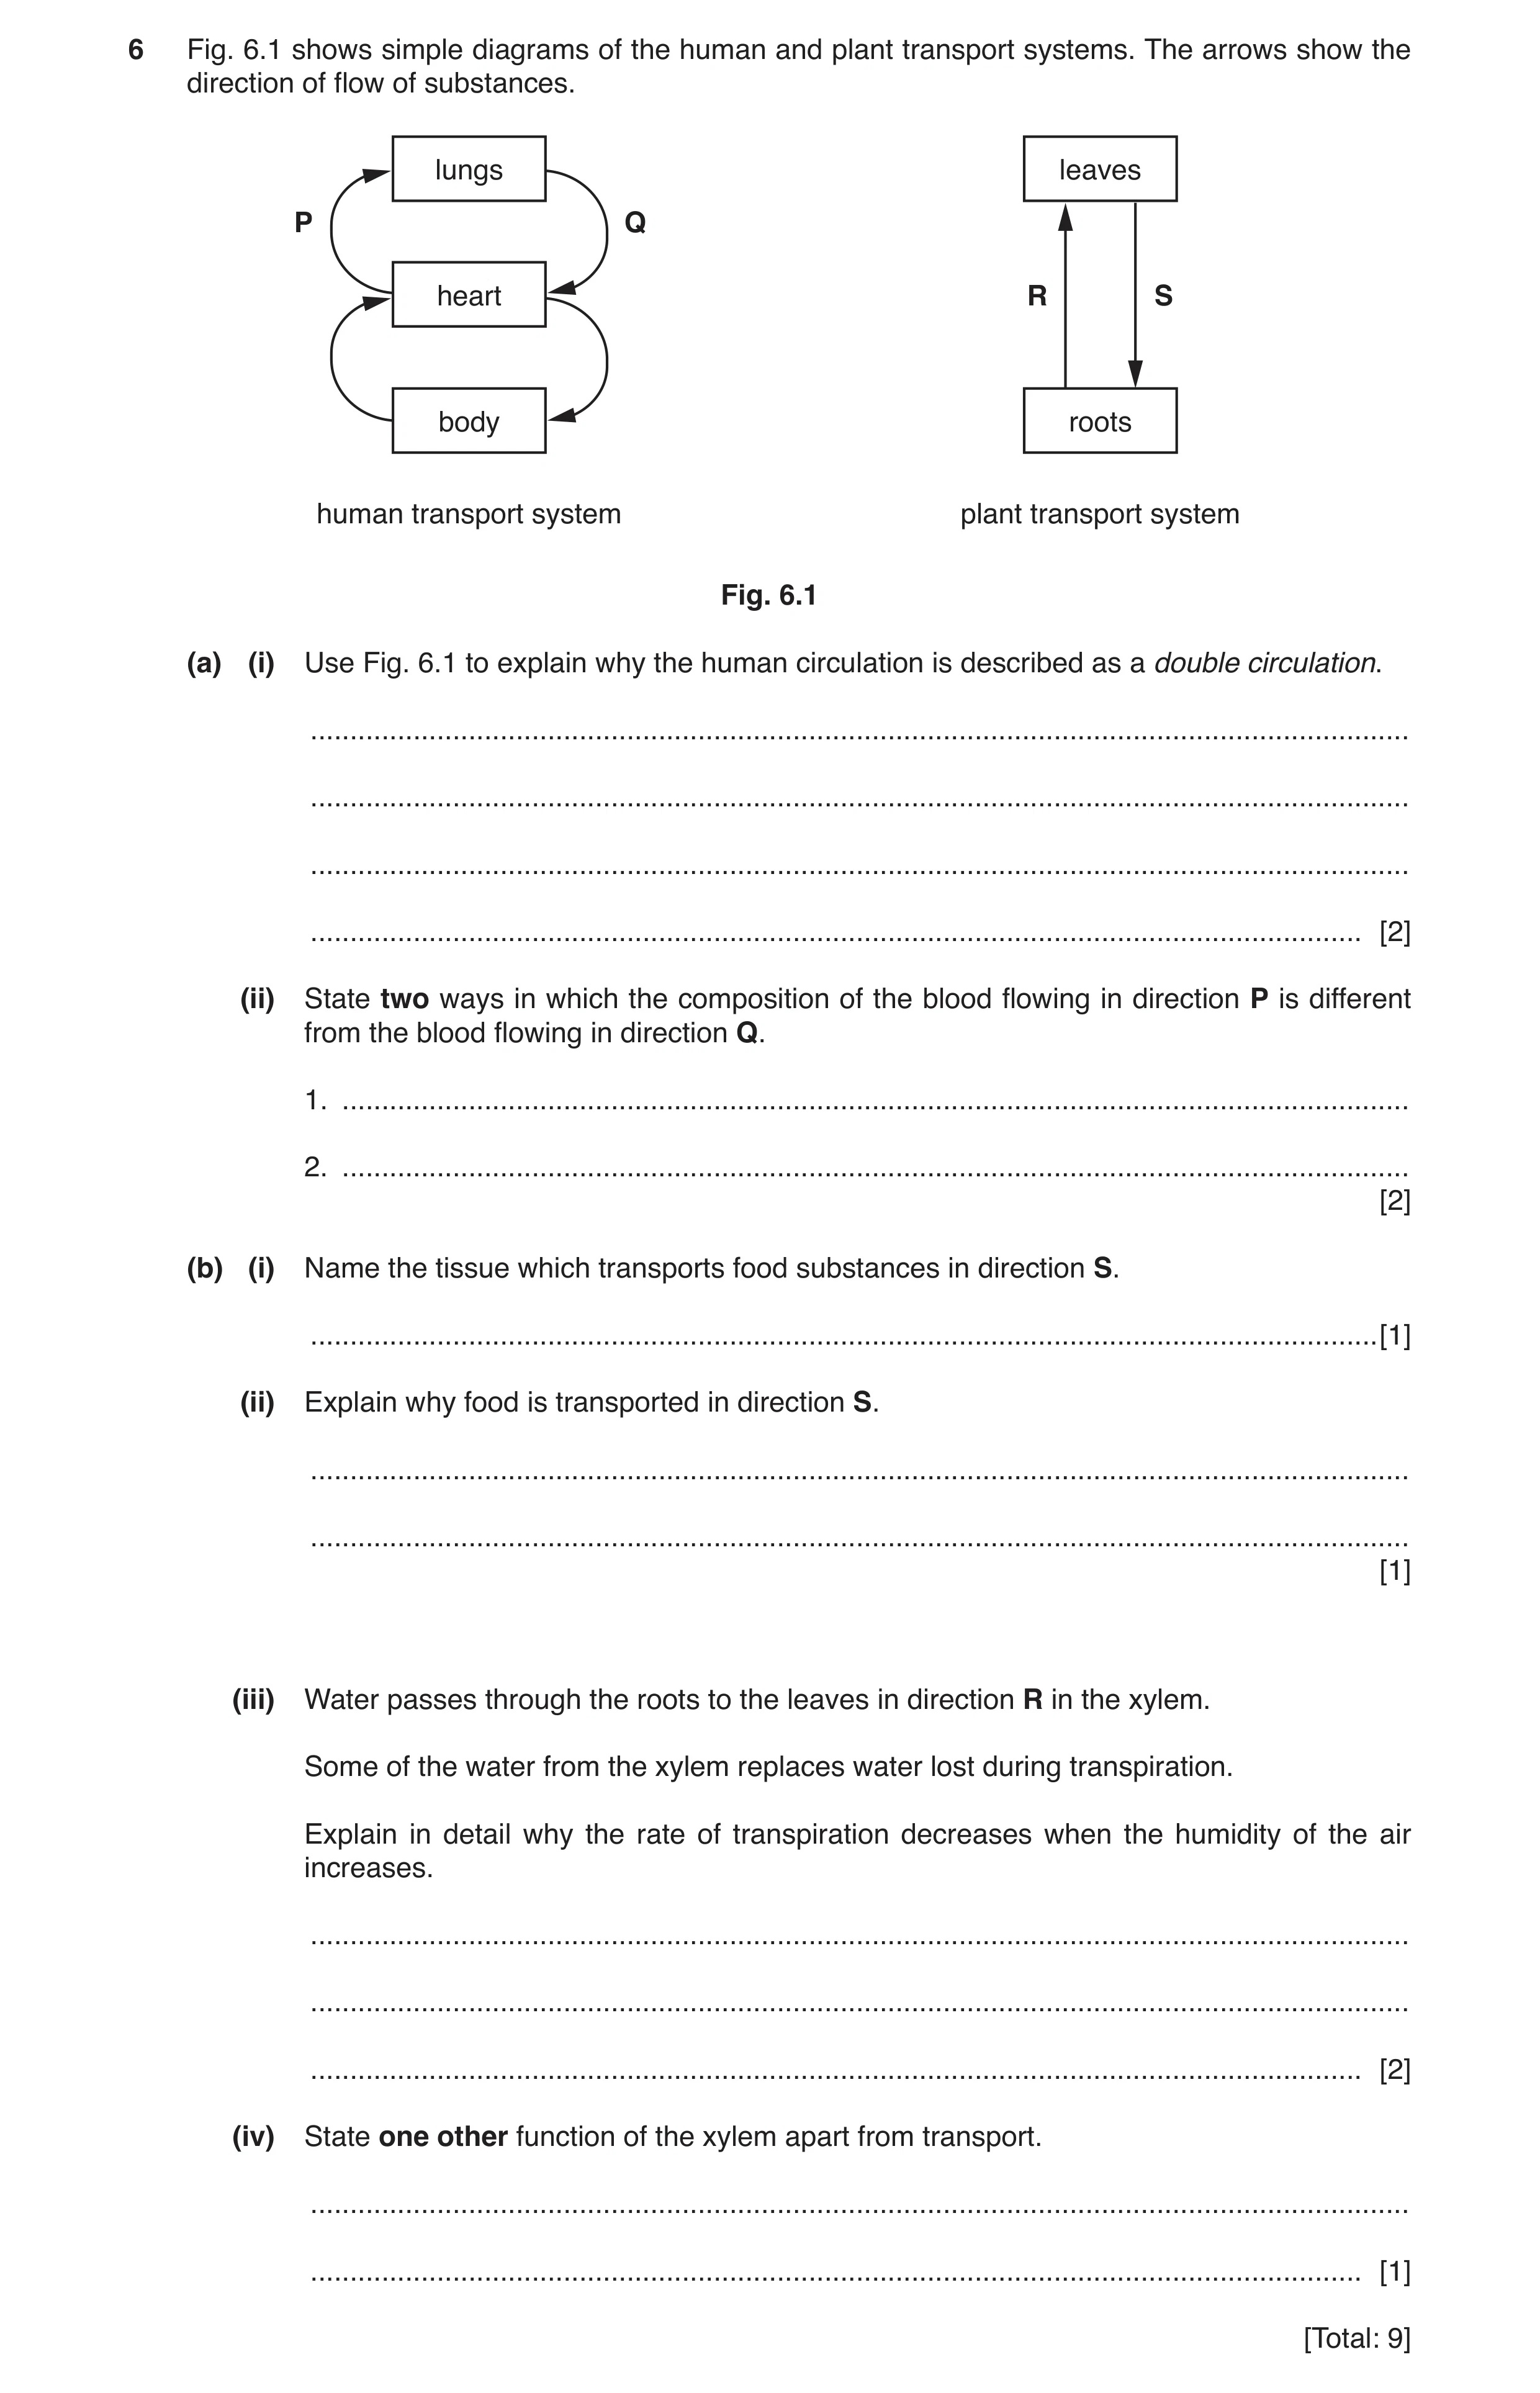
6 Fig. 6.1 shows simple diagrams of the human and plant transport systems. The arrows show the direction of flow of substances. lungs leaves P Q heart R S body roots human transport system plant transport system Fig. 6.1 (a) (i) Use Fig. 6.1 to explain why the human circulation is described as a double circulation. … … … … [2] (ii) State two ways in which the composition of the blood flowing in direction P is different from the blood flowing in direction Q. 1. … 2. … [2] (b) (i) Name the tissue which transports food substances in direction S. … [1] (ii) Explain why food is transported in direction S. … … [1] (iii) Water passes through the roots to the leaves in direction R in the xylem. Some of the water from the xylem replaces water lost during transpiration. Explain in detail why the rate of transpiration decreases when the humidity of the air increases. … … … [2] (iv) State one other function of the xylem apart from transport. … … [1] [Total: 9]
9 marks
Mark scheme: 6(a)(i) any two from: blood passes through the heart twice (for each complete circulation) ; circulation (from heart) to lungs / pulmonary circulation ; circulation (from heart) to body / systemic circulation ; 2 6(a)(ii) more carbon dioxide in P / less carbon dioxide in Q ; less oxygen in P / more oxygen in Q ; 2 6(b)(i) phloem ; 1 6(b)(ii) food is made in the leaves (so has to be transported to the roots) ; 1 6(b)(iii) (less transpiration because) increased concentration of water vapour in the air / reduced difference in water potential ; (so) less diffusion of water vapour through the stomata ; 2 Question Answer Marks 6(b)(iv) support ; 1
This question in 0653/43 Oct/Nov 2019
Q5 · Red blood cells and white blood cells 0653/43 Oct/Nov 2020
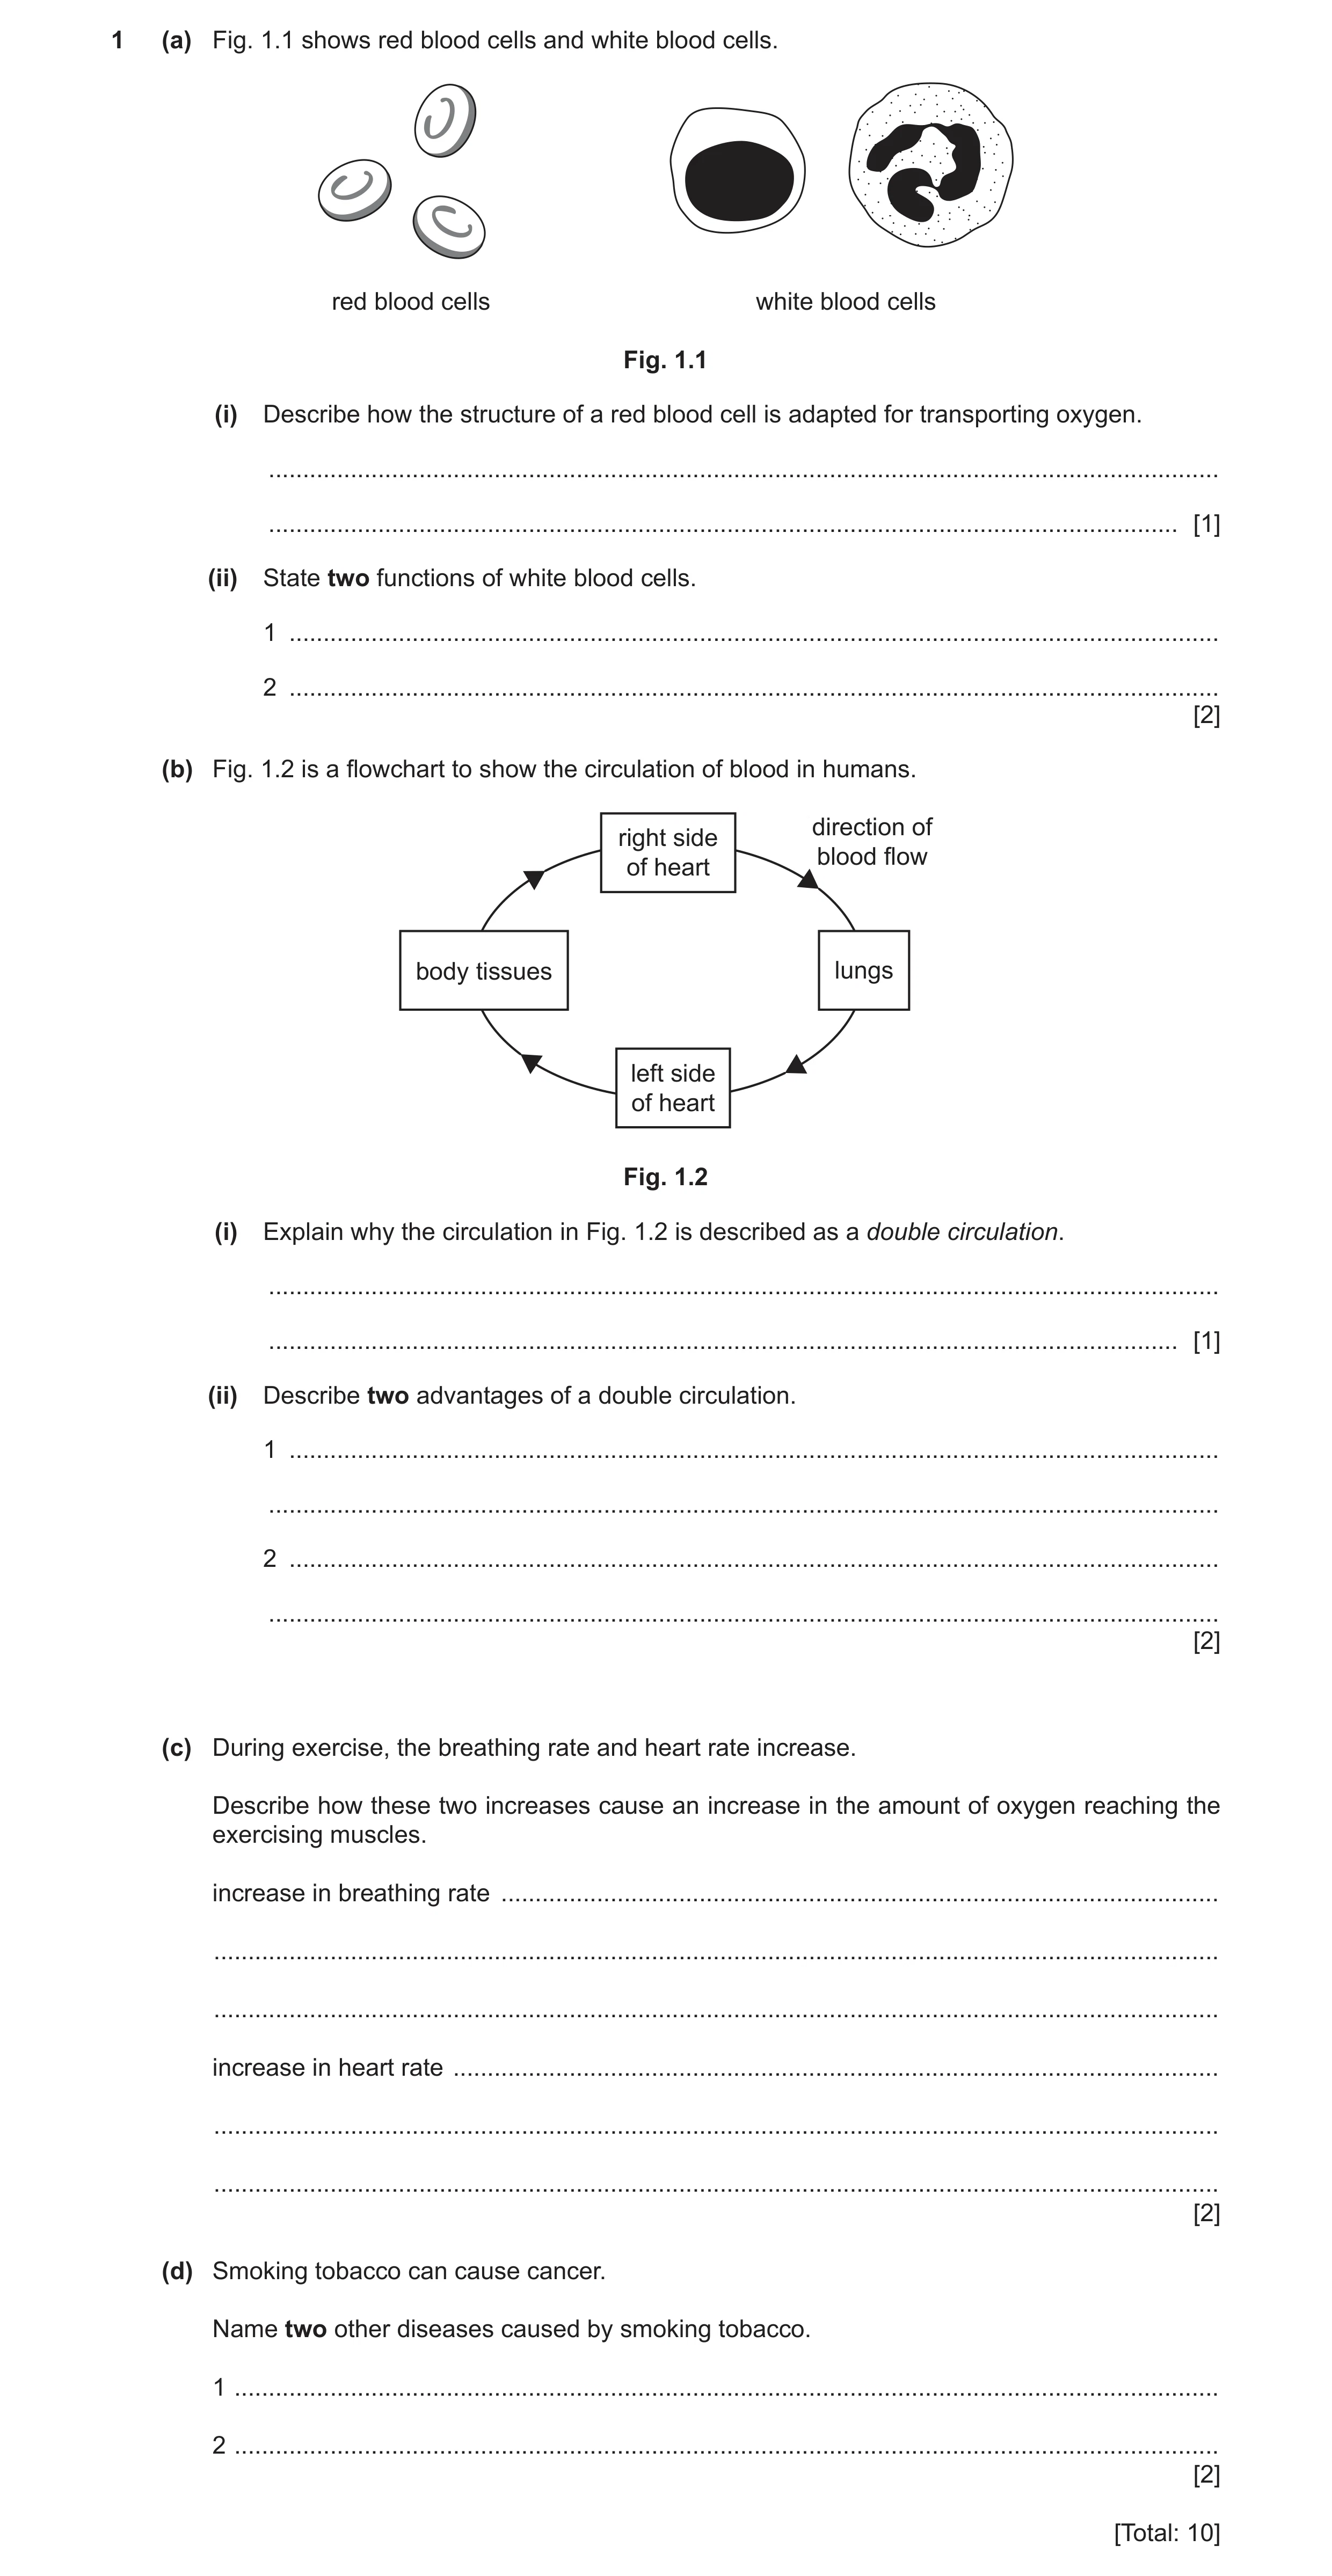
1 (a) Fig. 1.1 shows red blood cells and white blood cells. red blood cells white blood cells Fig. 1.1 (i) Describe how the structure of a red blood cell is adapted for transporting oxygen. … … [1] (ii) State two functions of white blood cells. 1 … 2 … [2] (b) Fig. 1.2 is a flowchart to show the circulation of blood in humans. direction of right side blood flow of heart body tissues lungs left side of heart Fig. 1.2 (i) Explain why the circulation in Fig. 1.2 is described as a double circulation. … … [1] (ii) Describe two advantages of a double circulation. 1 … … 2 … … [2] (c) During exercise, the breathing rate and heart rate increase. Describe how these two increases cause an increase in the amount of oxygen reaching the exercising muscles. increase in breathing rate … … … increase in heart rate … … … [2] (d) Smoking tobacco can cause cancer. Name two other diseases caused by smoking tobacco. 1 … 2 … [2] [Total: 10]
10 marks
Mark scheme: 1(a)(i) any one from: biconcave disc / large surface area (to volume ratio) for maximum oxygen absorption ; no nucleus so more space for oxygen transport ; contains haemoglobin ; 1 1(a)(ii) produce antibodies ; phagocytosis ; 2 1(b)(i) there is a circulation to the lungs and a circulation to the body (tissues) ; 1 1(b)(ii) any two from: enables blood to go to the body tissues at high pressure ; enables blood to go the lungs at low pressure ; keeps oxygenated blood separate from deoxygenated blood ; enables faster blood flow ; 2 1(c) (increase in breathing rate) enables more oxygen to, diffuse into / enter, the blood (at the lungs) ; (increase in heart rate) transports oxygenated blood faster ; 2 1(d) coronary heart disease (CHD) ; COPD ; 2
This question in 0653/43 Oct/Nov 2020
Q6 · A photomicrograph of a cross-section of an artery 0653/41 May/June 2021
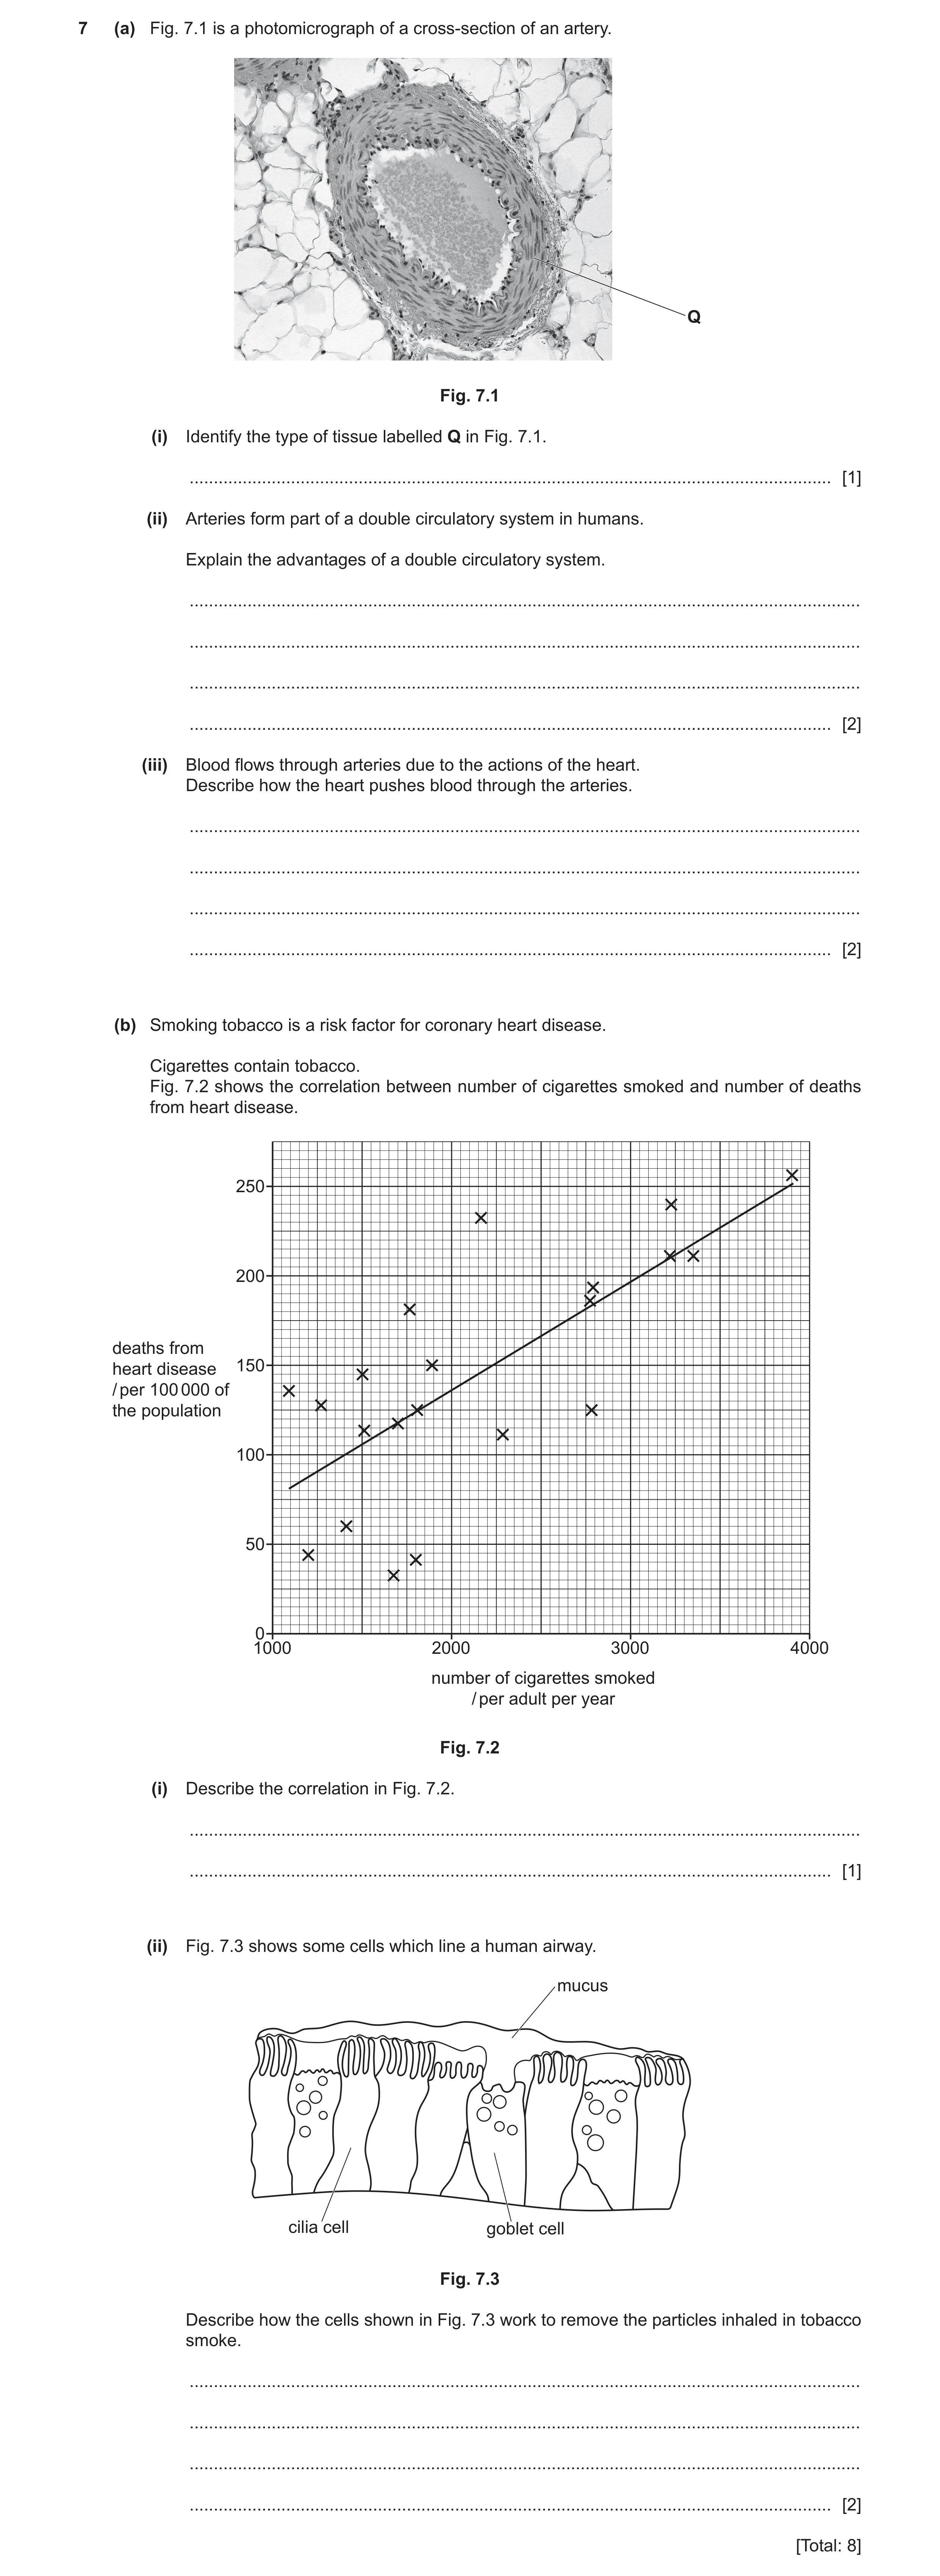
7 (a) Fig. 7.1 is a photomicrograph of a cross-section of an artery. Q Fig. 7.1 (i) Identify the type of tissue labelled Q in Fig. 7.1. … [1] (ii) Arteries form part of a double circulatory system in humans. Explain the advantages of a double circulatory system. … … … … [2] (iii) Blood flows through arteries due to the actions of the heart. Describe how the heart pushes blood through the arteries. … … … … [2] (b) Smoking tobacco is a risk factor for coronary heart disease. Cigarettes contain tobacco. Fig. 7.2 shows the correlation between number of cigarettes smoked and number of deaths from heart disease. 250 200 deaths from heart disease 150 / per 100 000 of the population 100 50 0 1000 2000 3000 4000 number of cigarettes smoked / per adult per year Fig. 7.2 (i) Describe the correlation in Fig. 7.2. … … [1] (ii) Fig. 7.3 shows some cells which line a human airway. mucus cilia cell goblet cell Fig. 7.3 Describe how the cells shown in Fig. 7.3 work to remove the particles inhaled in tobacco smoke. … … … … [2] [Total: 8]
8 marks
Mark scheme: 7(a)(i) muscle / elastic tissue ; 1 7(a)(ii) any two from: oxygenated blood is kept separate from deoxygenated blood ; blood pressure to body is higher ; blood pressure to lungs is lower ; 2 7(a)(iii) reference to contraction ; (contraction of) muscles in ventricle (wall) ; 2 7(b)(i) as the number of cigarettes smoked increases so do the number of deaths ; 1 7(b)(ii) any two from: the goblet cells, secrete / produce (sticky) mucus ; the mucus traps, particles / microbes / dust ; cilia move (to remove) the mucus (containing particles) ; 2
This question in 0653/41 May/June 2021
Q7 · A healthy human heart and a damaged human heart 0653/42 May/June 2022
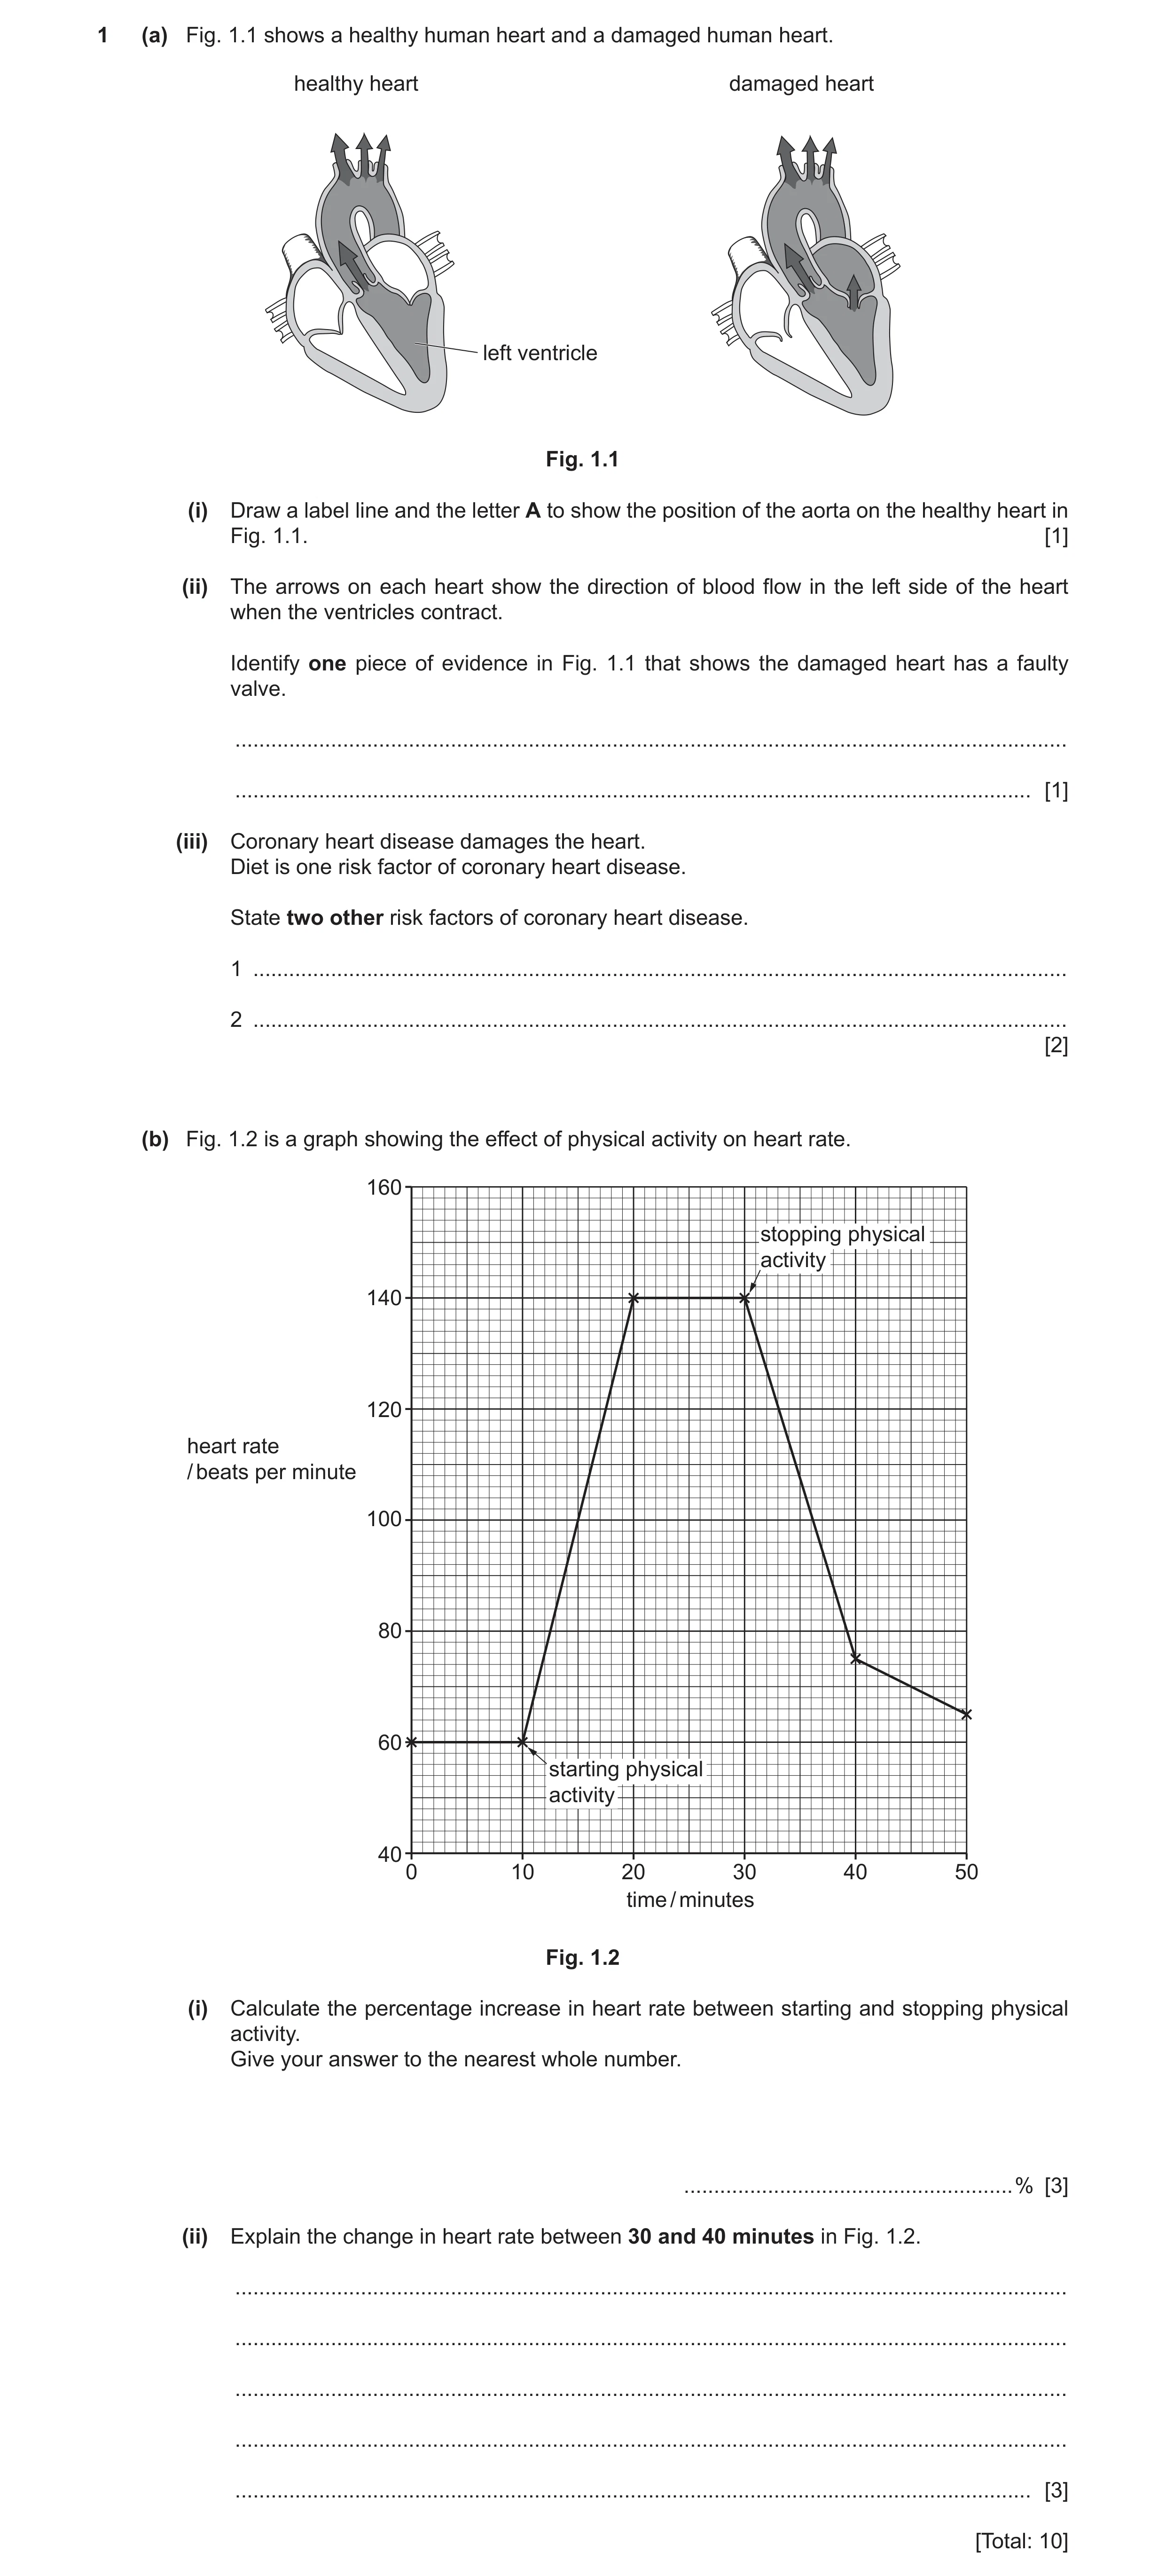
1 (a) Fig. 1.1 shows a healthy human heart and a damaged human heart. healthy heart damaged heart left ventricle Fig. 1.1 (i) Draw a label line and the letter A to show the position of the aorta on the healthy heart in Fig. 1.1. [1] (ii) The arrows on each heart show the direction of blood flow in the left side of the heart when the ventricles contract. Identify one piece of evidence in Fig. 1.1 that shows the damaged heart has a faulty valve. … … [1] (iii) Coronary heart disease damages the heart. Diet is one risk factor of coronary heart disease. State two other risk factors of coronary heart disease. 1 … 2 … [2] (b) Fig. 1.2 is a graph showing the effect of physical activity on heart rate. 160 stopping physical activity 140 120 heart rate / beats per minute 100 80 60 starting physical activity 40 0 10 20 30 40 50 time / minutes Fig. 1.2 (i) Calculate the percentage increase in heart rate between starting and stopping physical activity. Give your answer to the nearest whole number. … % [3] (ii) Explain the change in heart rate between 30 and 40 minutes in Fig. 1.2. … … … … … [3] [Total: 10]
10 marks
Mark scheme: 1(a)(i) label to aorta on healthy heart ; 1 1(a)(ii) blood flowing, backwards / into (left) atrium ; 1 1(a)(iii) any two from: stress ; smoking ; genetic predisposition ; age ; gender ; AVP ; 2 1(b)(i) 80 60 100 ; 133.33333 ; 133 ; 3 1(b)(ii) any three from: heart rate decreases ; less energy required / less muscular contraction ; less oxygen needs to be transported to muscles ; (due to) decreased respiration (rate) ; AVP ; 3
This question in 0653/42 May/June 2022
Q8 · The structure of a human heart 0653/41 Oct/Nov 2022
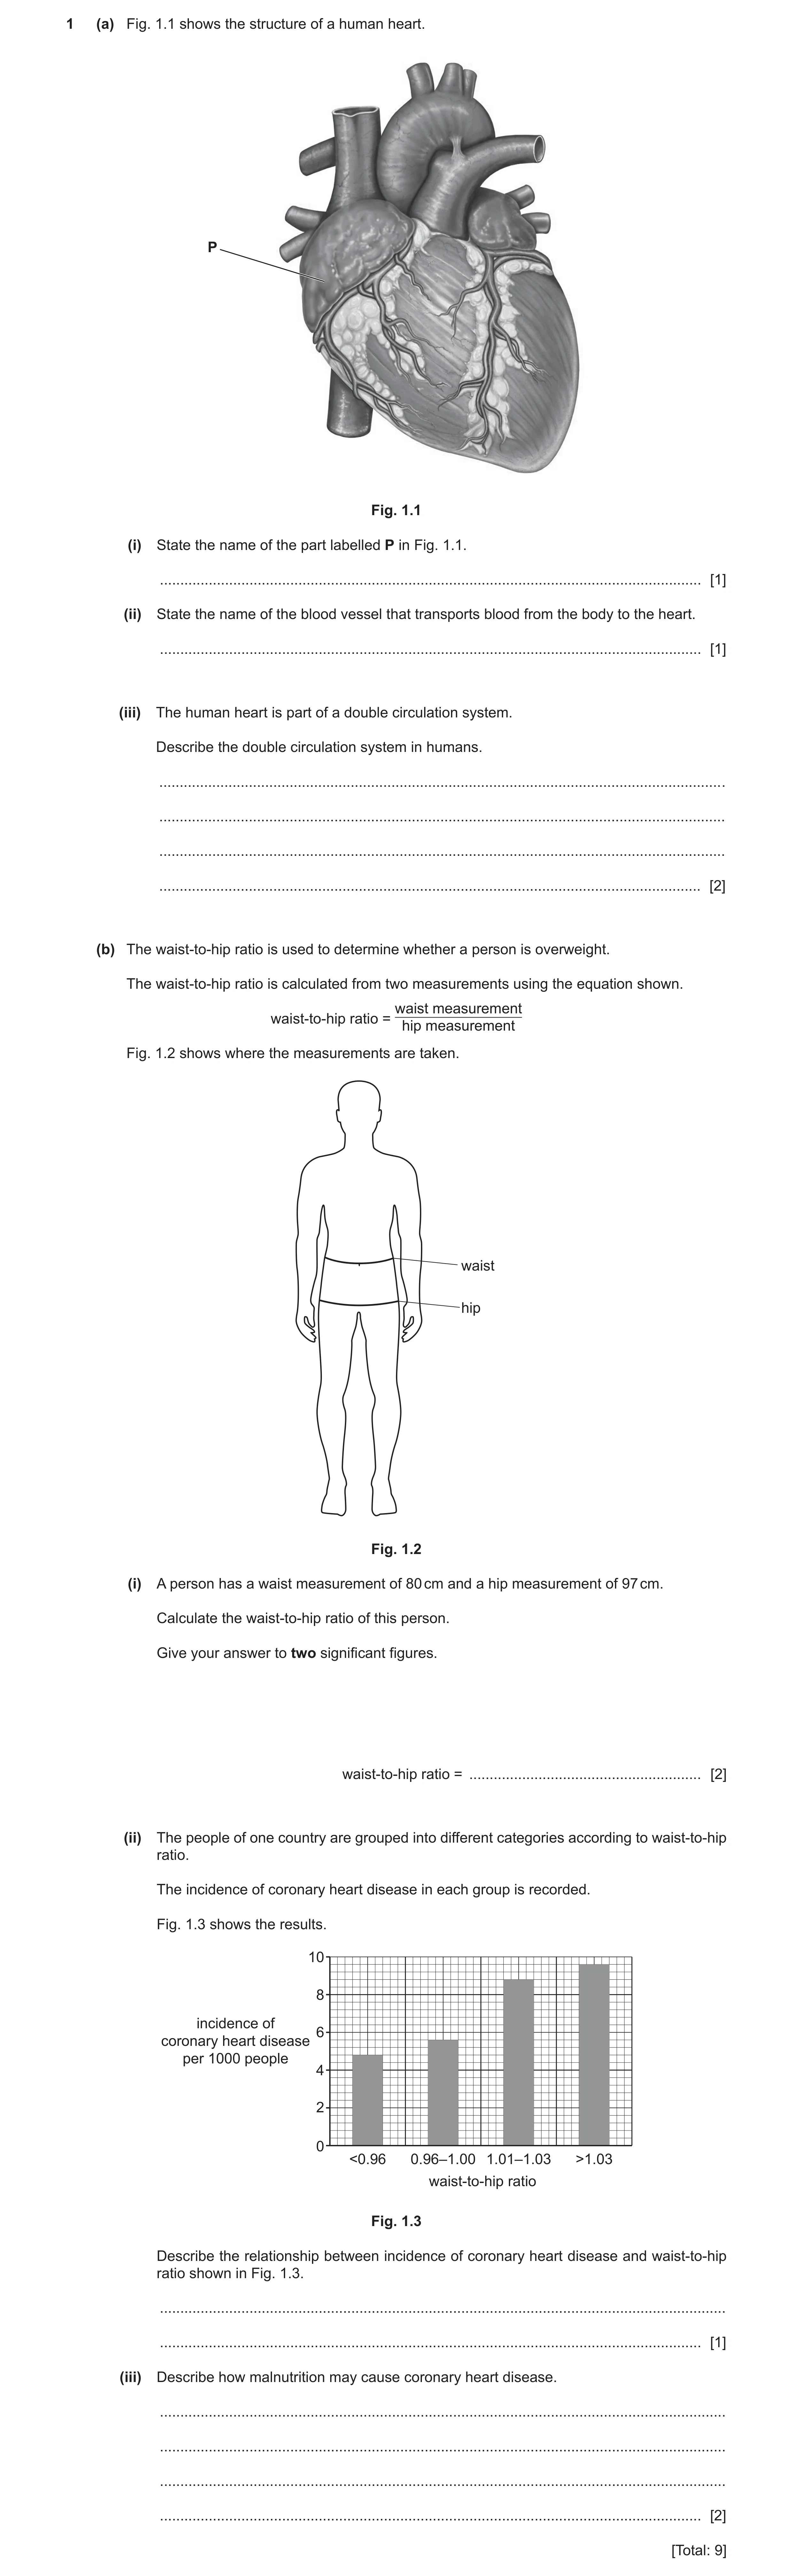
1 (a) Fig. 1.1 shows the structure of a human heart. P Fig. 1.1 (i) State the name of the part labelled P in Fig. 1.1. … [1] (ii) State the name of the blood vessel that transports blood from the body to the heart. … [1] (iii) The human heart is part of a double circulation system. Describe the double circulation system in humans. … … … … [2] (b) The waist-to-hip ratio is used to determine whether a person is overweight. The waist-to-hip ratio is calculated from two measurements using the equation shown. waist measurement waist-to-hip ratio = hip measurement Fig. 1.2 shows where the measurements are taken. waist hip Fig. 1.2 (i) A person has a waist measurement of 80 cm and a hip measurement of 97 cm. Calculate the waist-to-hip ratio of this person. Give your answer to two significant figures. waist-to-hip ratio = … [2] (ii) The people of one country are grouped into different categories according to waist-to-hip ratio. The incidence of coronary heart disease in each group is recorded. Fig. 1.3 shows the results. 10 8 incidence of 6 coronary heart disease per 1000 people 4 2 0 <0.96 0.96–1.00 1.01–1.03 >1.03 waist-to-hip ratio Fig. 1.3 Describe the relationship between incidence of coronary heart disease and waist-to-hip ratio shown in Fig. 1.3. … … [1] (iii) Describe how malnutrition may cause coronary heart disease. … … … … [2] [Total: 9]
9 marks
Mark scheme: Question Answer Marks 1(a)(i) (right) atrium ; 1 1(a)(ii) vena cava ; 1 1(a)(iii) any two from: 2 blood passes through the heart twice (in one circuit of the body) ; the idea that one circulation is to lungs ; the idea that one circulation is to the body (tissues) ; 1(b)(i) 80 ÷ 97 / 0.824742268 ; 2 0.82 ; 1(b)(ii) (incidence of) coronary heart disease increases with increased waist-to-hip ratio ; 1 1(b)(iii) high fat diet / obesity ; 2 causes blockage of coronary artery ;
This question in 0653/41 Oct/Nov 2022
Q9 · The circulatory system of frogs and the circulatory system of humans 0653/41 May/June 2023
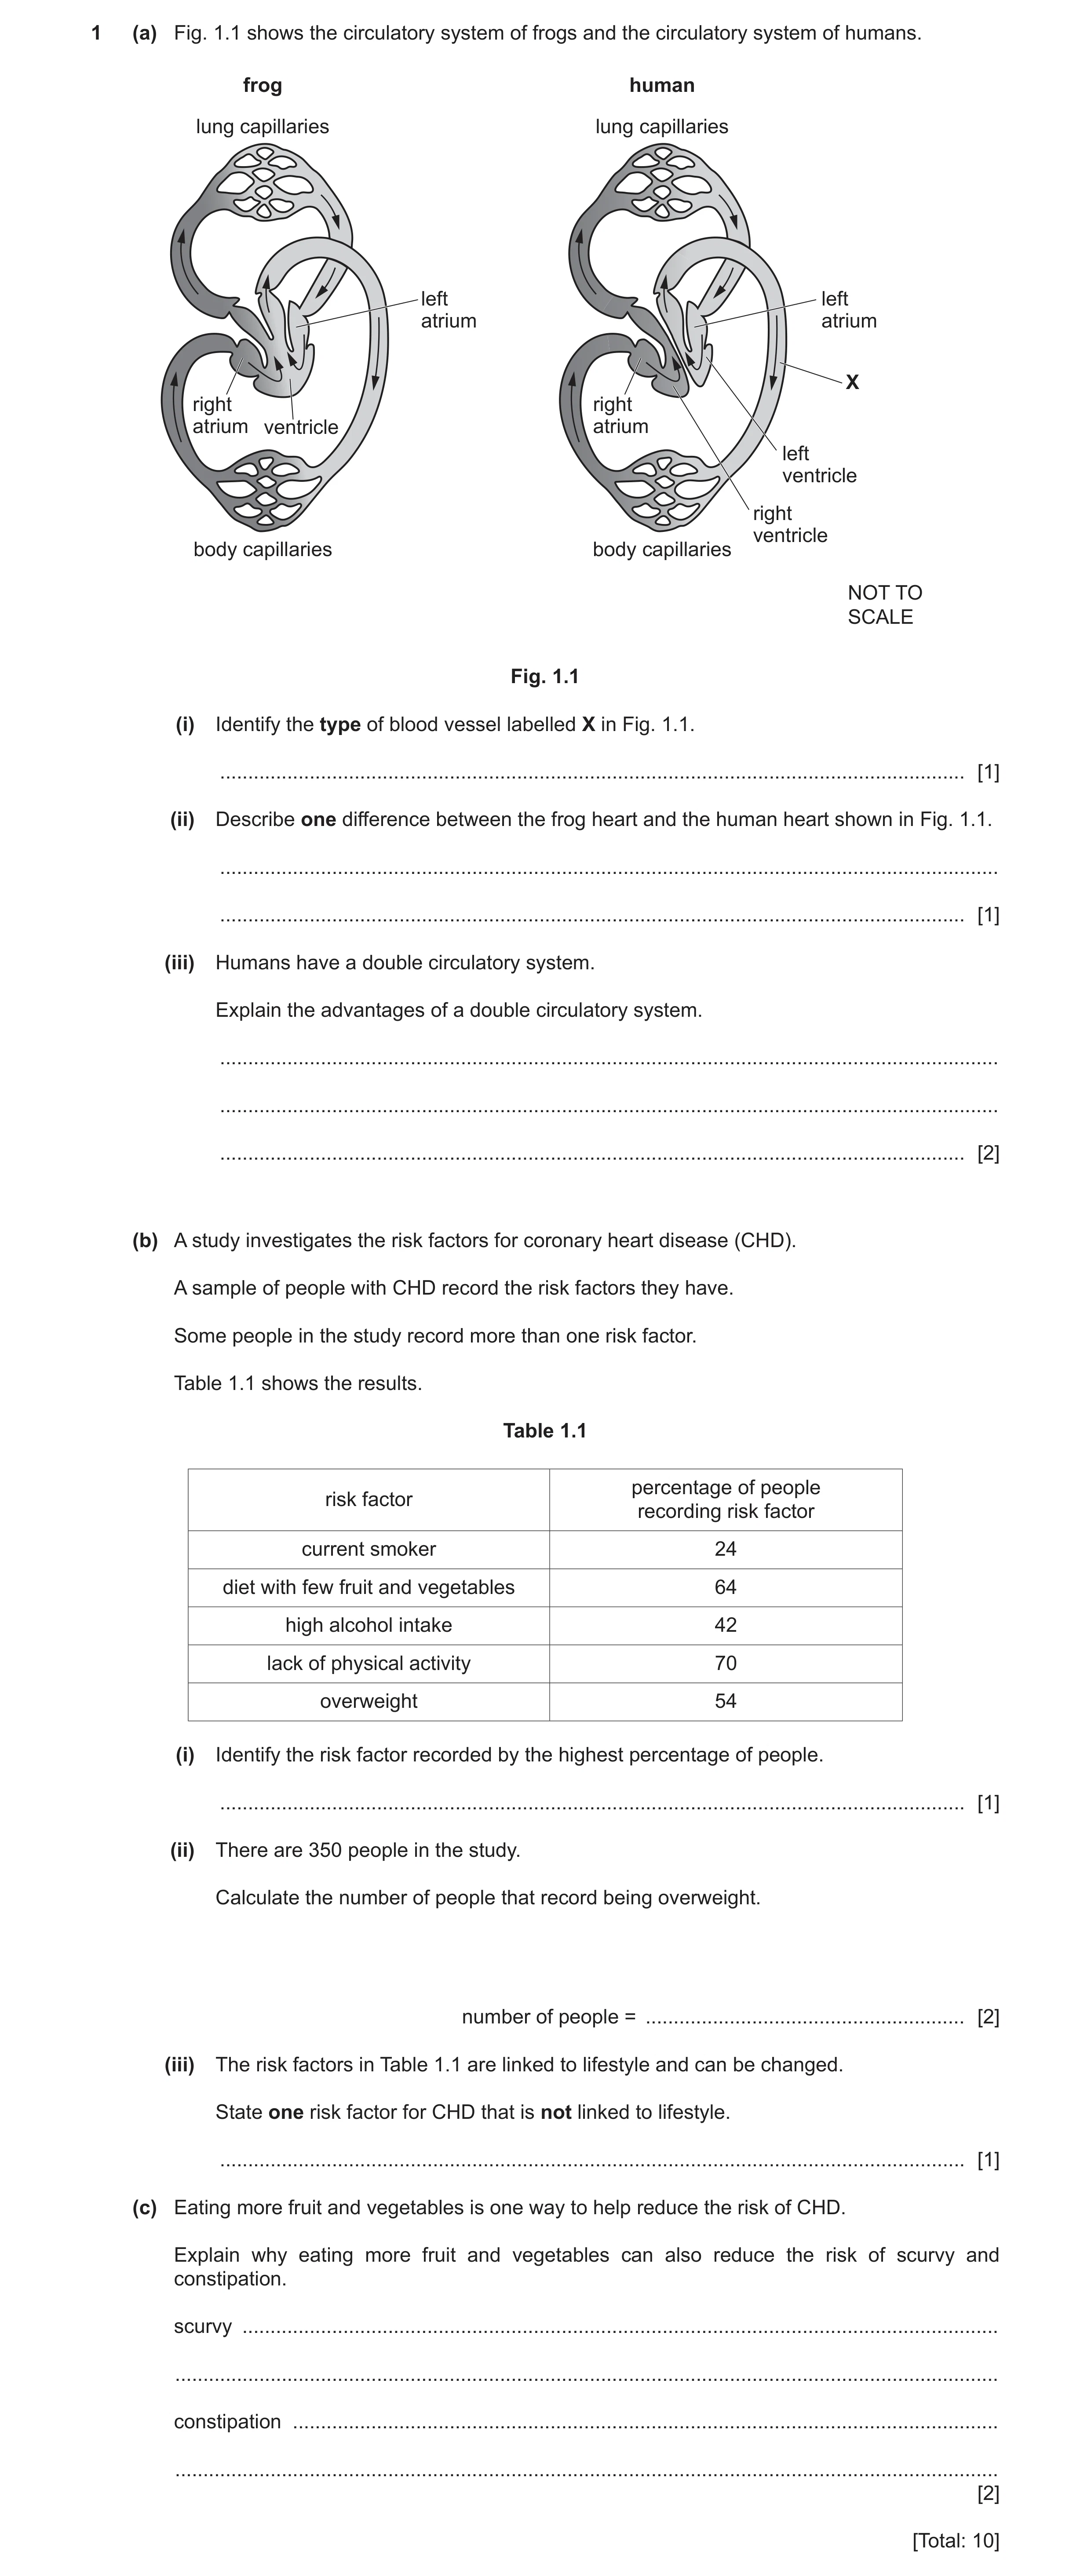
1 (a) Fig. 1.1 shows the circulatory system of frogs and the circulatory system of humans. frog human lung capillaries lung capillaries left left atrium atrium X right right atrium ventricle atrium left ventricle right ventricle body capillaries body capillaries NOT TO SCALE Fig. 1.1 (i) Identify the type of blood vessel labelled X in Fig. 1.1. … [1] (ii) Describe one difference between the frog heart and the human heart shown in Fig. 1.1. … … [1] (iii) Humans have a double circulatory system. Explain the advantages of a double circulatory system. … … … [2] (b) A study investigates the risk factors for coronary heart disease (CHD). A sample of people with CHD record the risk factors they have. Some people in the study record more than one risk factor. Table 1.1 shows the results. Table 1.1 percentage of people risk factor recording risk factor current smoker 24 diet with few fruit and vegetables 64 high alcohol intake 42 lack of physical activity 70 overweight 54 (i) Identify the risk factor recorded by the highest percentage of people. … [1] (ii) There are 350 people in the study. Calculate the number of people that record being overweight. number of people = … [2] (iii) The risk factors in Table 1.1 are linked to lifestyle and can be changed. State one risk factor for CHD that is not linked to lifestyle. … [1] (c) Eating more fruit and vegetables is one way to help reduce the risk of CHD. Explain why eating more fruit and vegetables can also reduce the risk of scurvy and constipation. scurvy … … constipation … … [2] [Total: 10]
10 marks
Mark scheme: 1(a)(i) artery ; 1 1(a)(ii) any one from: frog has only 3 chambers / frog has one ventricle ; humans have four chambers / humans have two ventricles ; no septum in frog / AW ; 1 1(a)(iii) oxygenated and deoxygenated blood kept separate ; high blood pressure around body / low blood pressure to lungs ; 2 1(b)(i) (lack of) physical activity ; 1 1(b)(ii) (54 350) ÷ 100 ; 189 ; 2 1(b)(iii) age / genetics / inheritance ; 1 1(c) scurvy – (fruit and vegetables) are a source of Vit C / Vit C prevents scurvy ; constipation – (vegetables) are a source of fibre / fibre needed for bulk ; 2
This question in 0653/41 May/June 2023
Q10 · The structure of the human heart 0653/43 May/June 2023
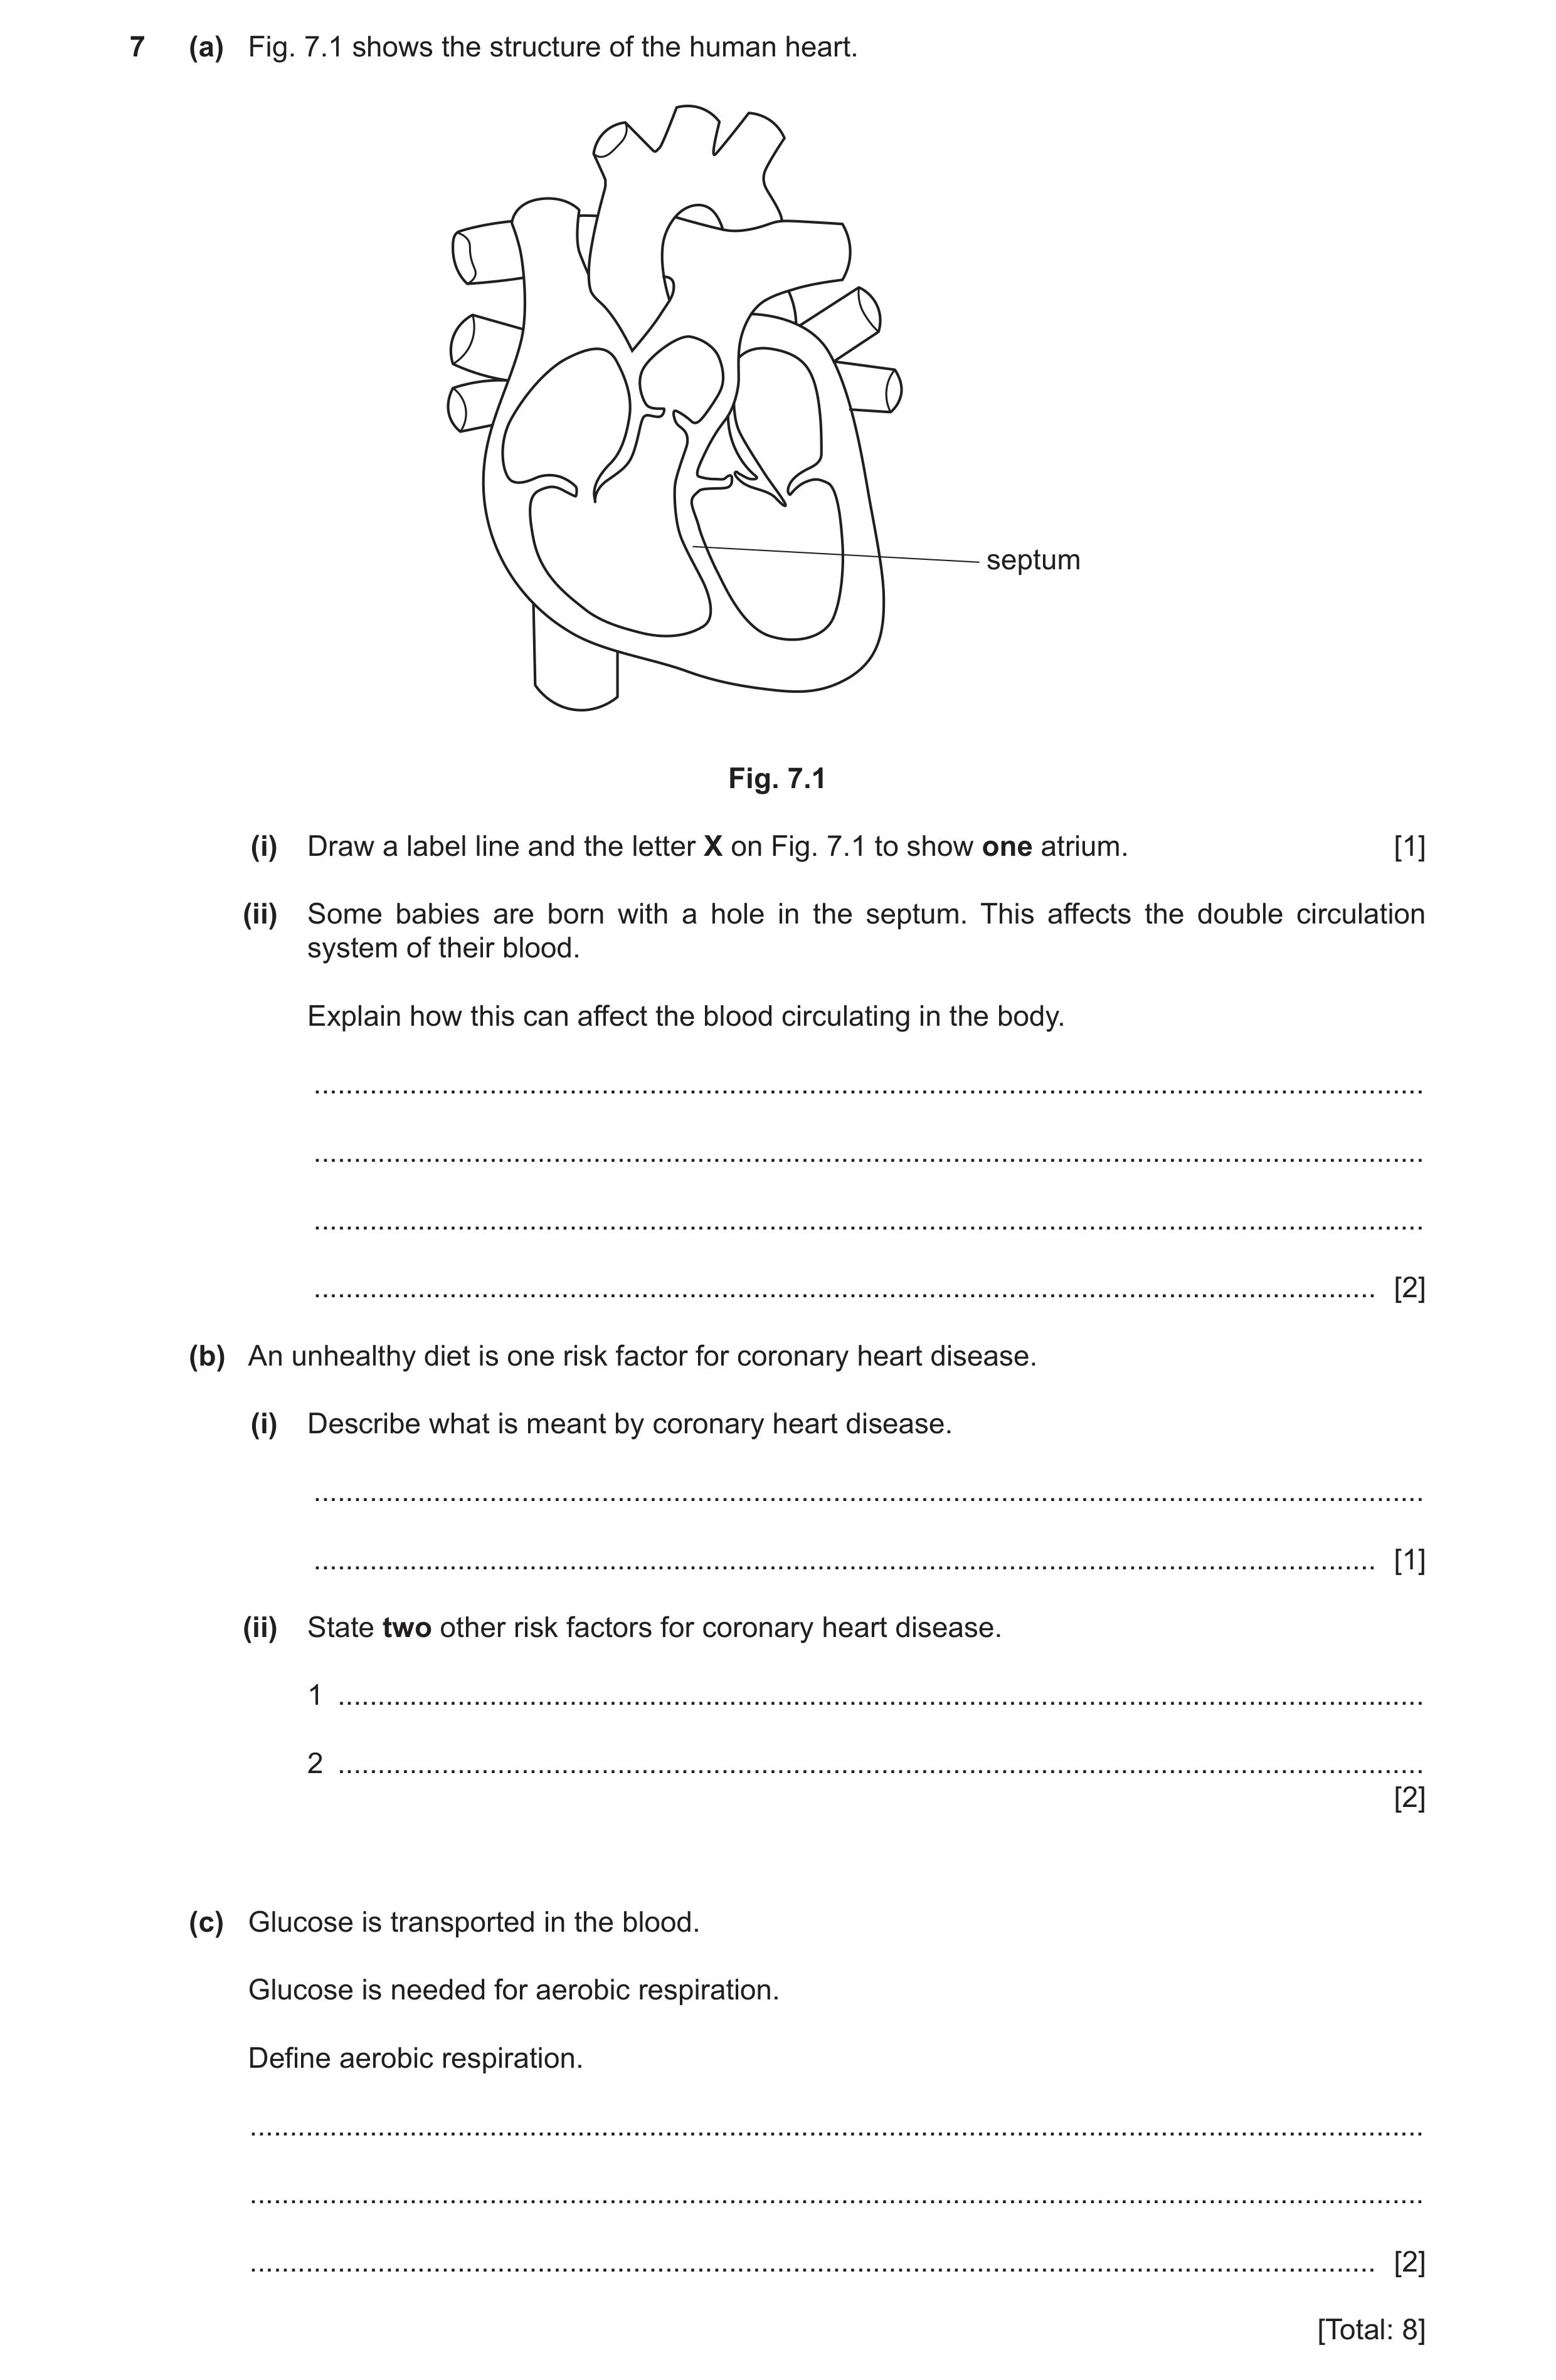
7 (a) Fig. 7.1 shows the structure of the human heart. septum Fig. 7.1 (i) Draw a label line and the letter X on Fig. 7.1 to show one atrium. [1] (ii) Some babies are born with a hole in the septum. This affects the double circulation system of their blood. Explain how this can affect the blood circulating in the body. … … … … [2] (b) An unhealthy diet is one risk factor for coronary heart disease. (i) Describe what is meant by coronary heart disease. … … [1] (ii) State two other risk factors for coronary heart disease. 1 … 2 … [2] (c) Glucose is transported in the blood. Glucose is needed for aerobic respiration. Define aerobic respiration. … … … [2] [Total: 8]
8 marks
Mark scheme: 7(a)(i) either atrium labelled ; 1 7(a)(ii) any two from: mixing of blood from lungs and body ; less oxygen transported (to body) ; decrease in blood pressure (to body) ; AVP, e.g. reduction in (aerobic) respiration in cells ; max 2 7(b)(i) blockage of coronary artery ; 1 7(b)(ii) any two from: stress ; smoking ; genetic predisposition ; age ; gender / sex ; AVP, e.g. lack of exercise ; 2 Question Answer Marks 7(c) (respiration is a) reaction with oxygen ; breakdown of nutrient (molecules) to release energy ; 2
This question in 0653/43 May/June 2023
Q11 · The double circulatory system in humans 0653/42 May/June 2024
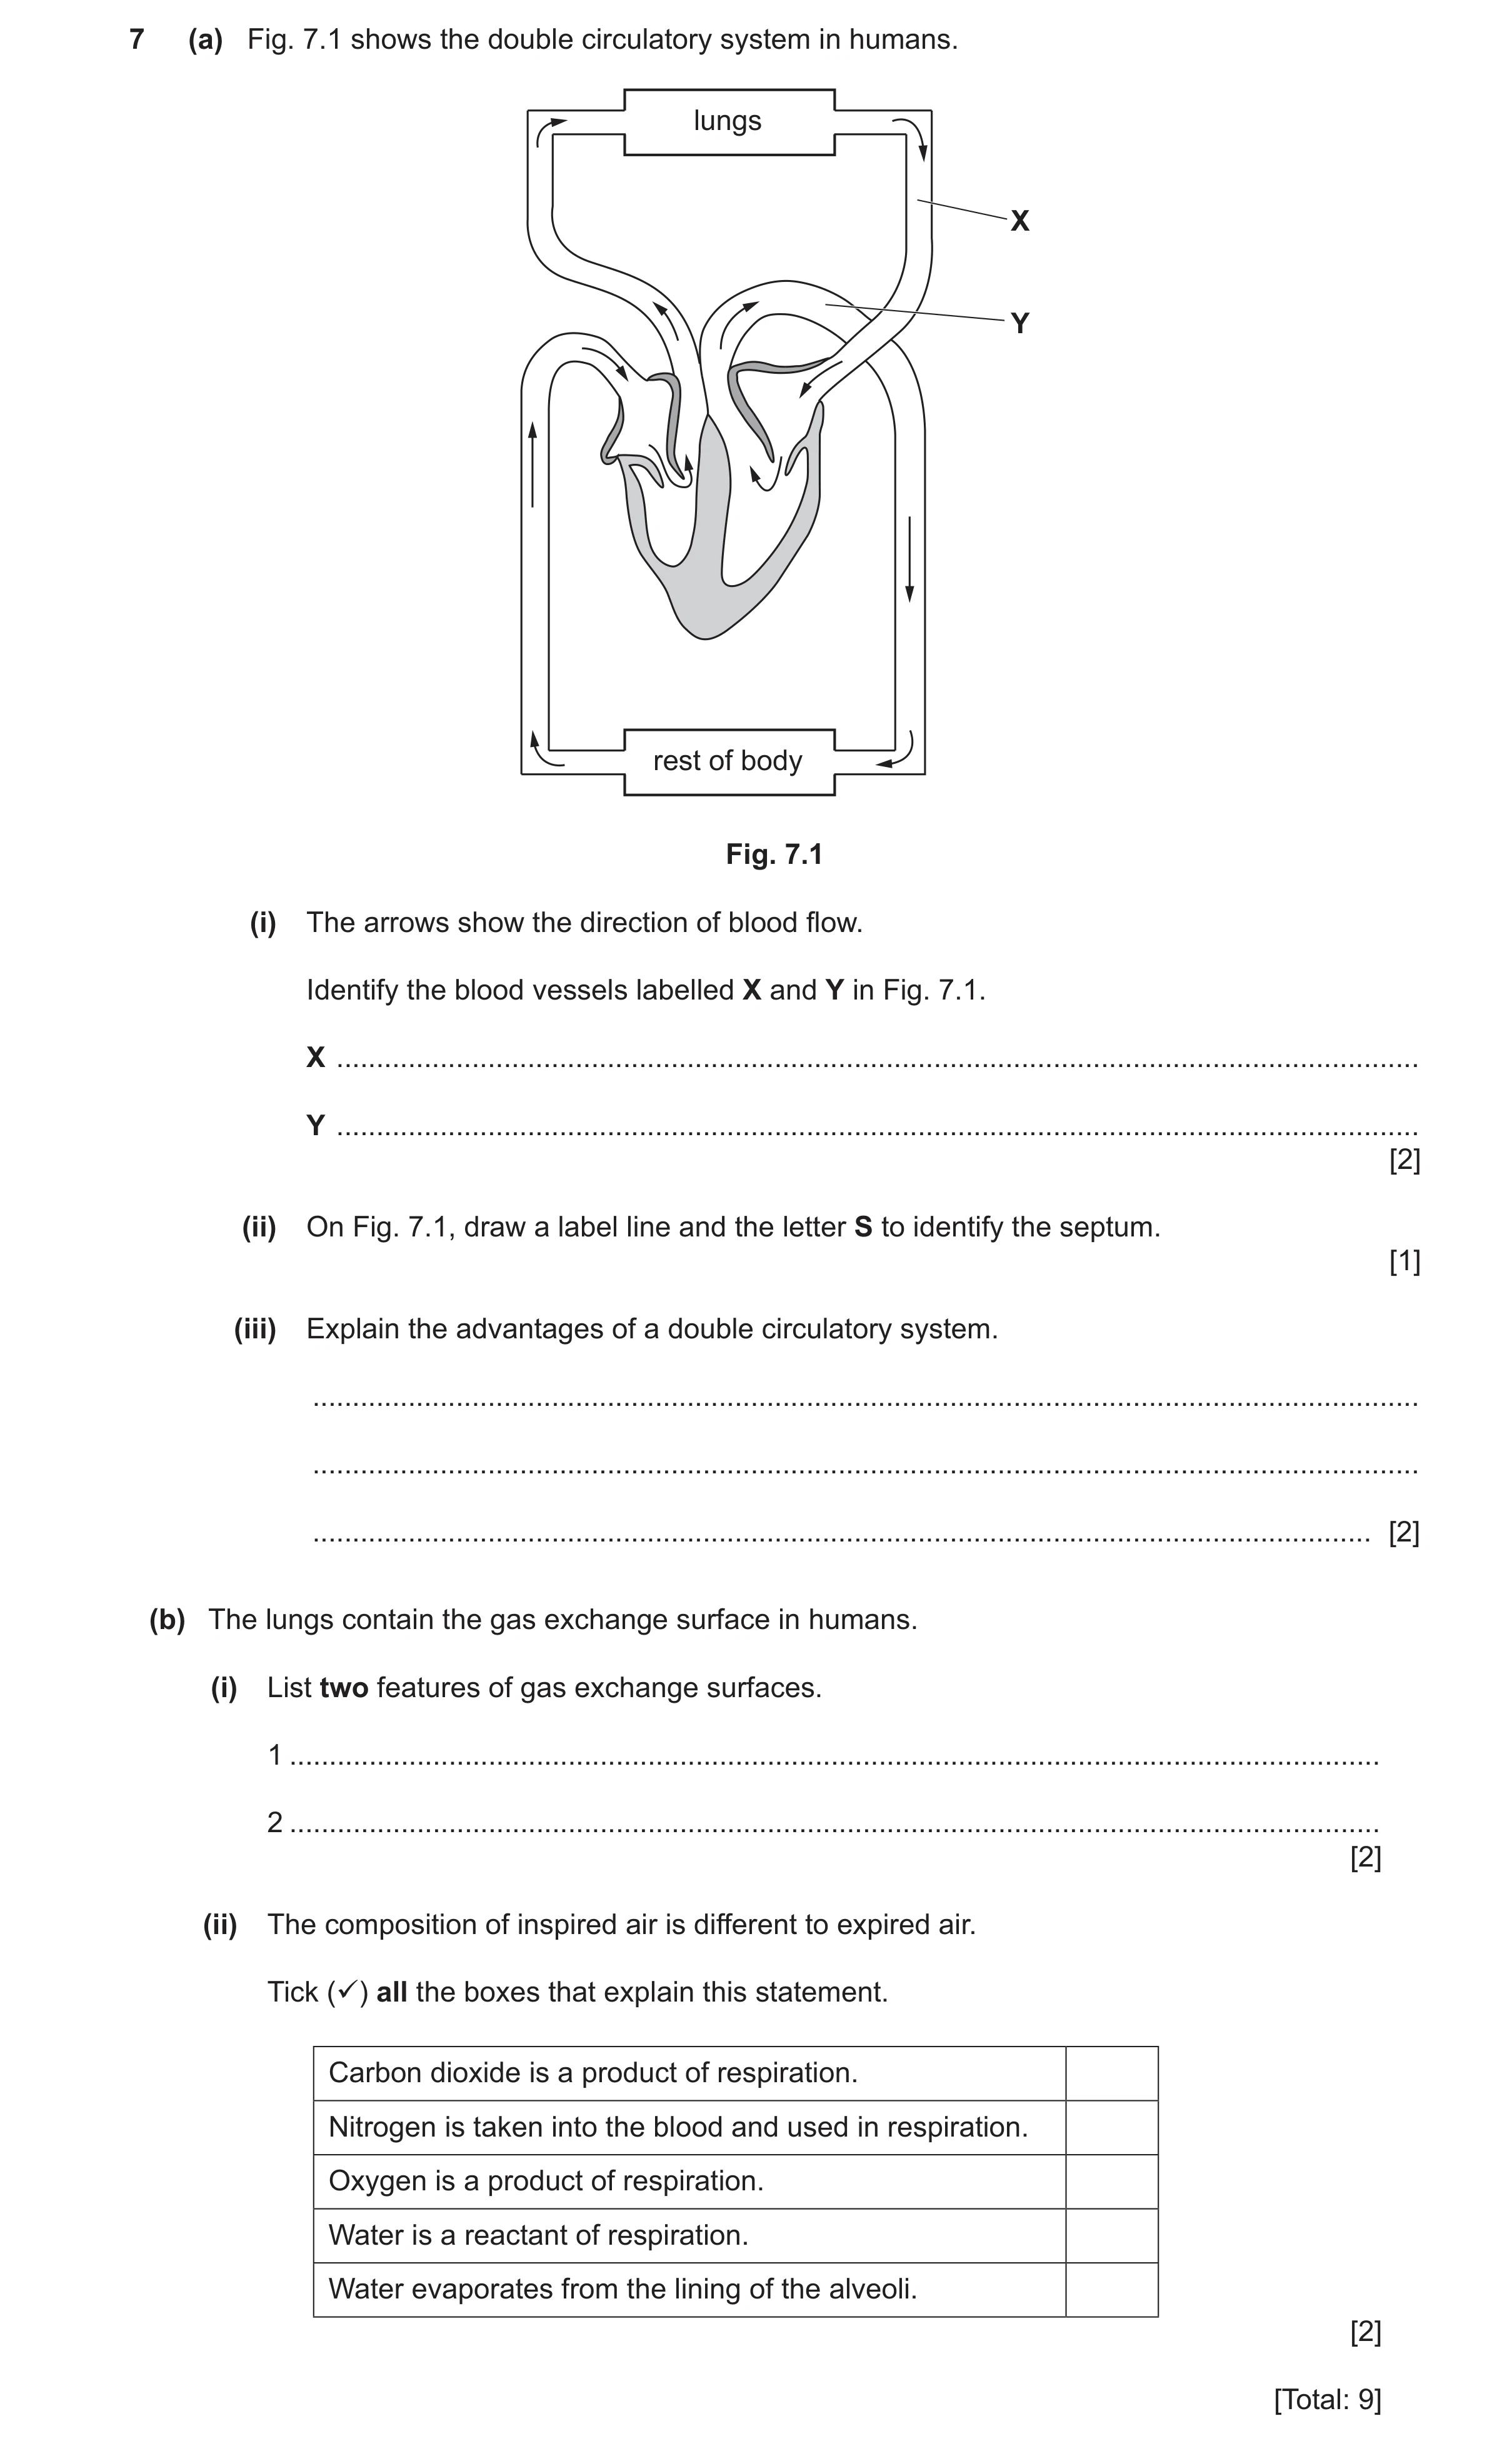
7 (a) Fig. 7.1 shows the double circulatory system in humans. lungs X Y rest of body Fig. 7.1 (i) The arrows show the direction of blood flow. Identify the blood vessels labelled X and Y in Fig. 7.1. X … Y … [2] (ii) On Fig. 7.1, draw a label line and the letter S to identify the septum. [1] (iii) Explain the advantages of a double circulatory system. … … … [2] (b) The lungs contain the gas exchange surface in humans. (i) List two features of gas exchange surfaces. 1 … 2 … [2] (ii) The composition of inspired air is different to expired air. Tick () all the boxes that explain this statement. Carbon dioxide is a product of respiration. Nitrogen is taken into the blood and used in respiration. Oxygen is a product of respiration. Water is a reactant of respiration. Water evaporates from the lining of the alveoli. [2] [Total: 9]
9 marks
Mark scheme: 7(a)(i) X pulmonary vein ; Y aorta ; 2 7(a)(ii) septum labelled ; 1 7(a)(iii) separates blood with and without oxygen ; blood to lungs at lower pressure or blood to body at higher pressure ; 2 Question Answer Marks 7(b)(i) any two from: large surface / large area ; thin (surface) ; good blood supply ; good ventilation ; AVP, e.g. moist ; 2 7(b)(ii) Carbon dioxide is a product of respiration. ; Water evaporates from the lining of the alveoli. ; three ticks and two correct = 1 mark three ticks and one correct = 0 marks more than three ticks = 0 marks 2
This question in 0653/42 May/June 2024
Q12 · A diagram of the double circulatory system in humans 0653/43 Oct/Nov 2024
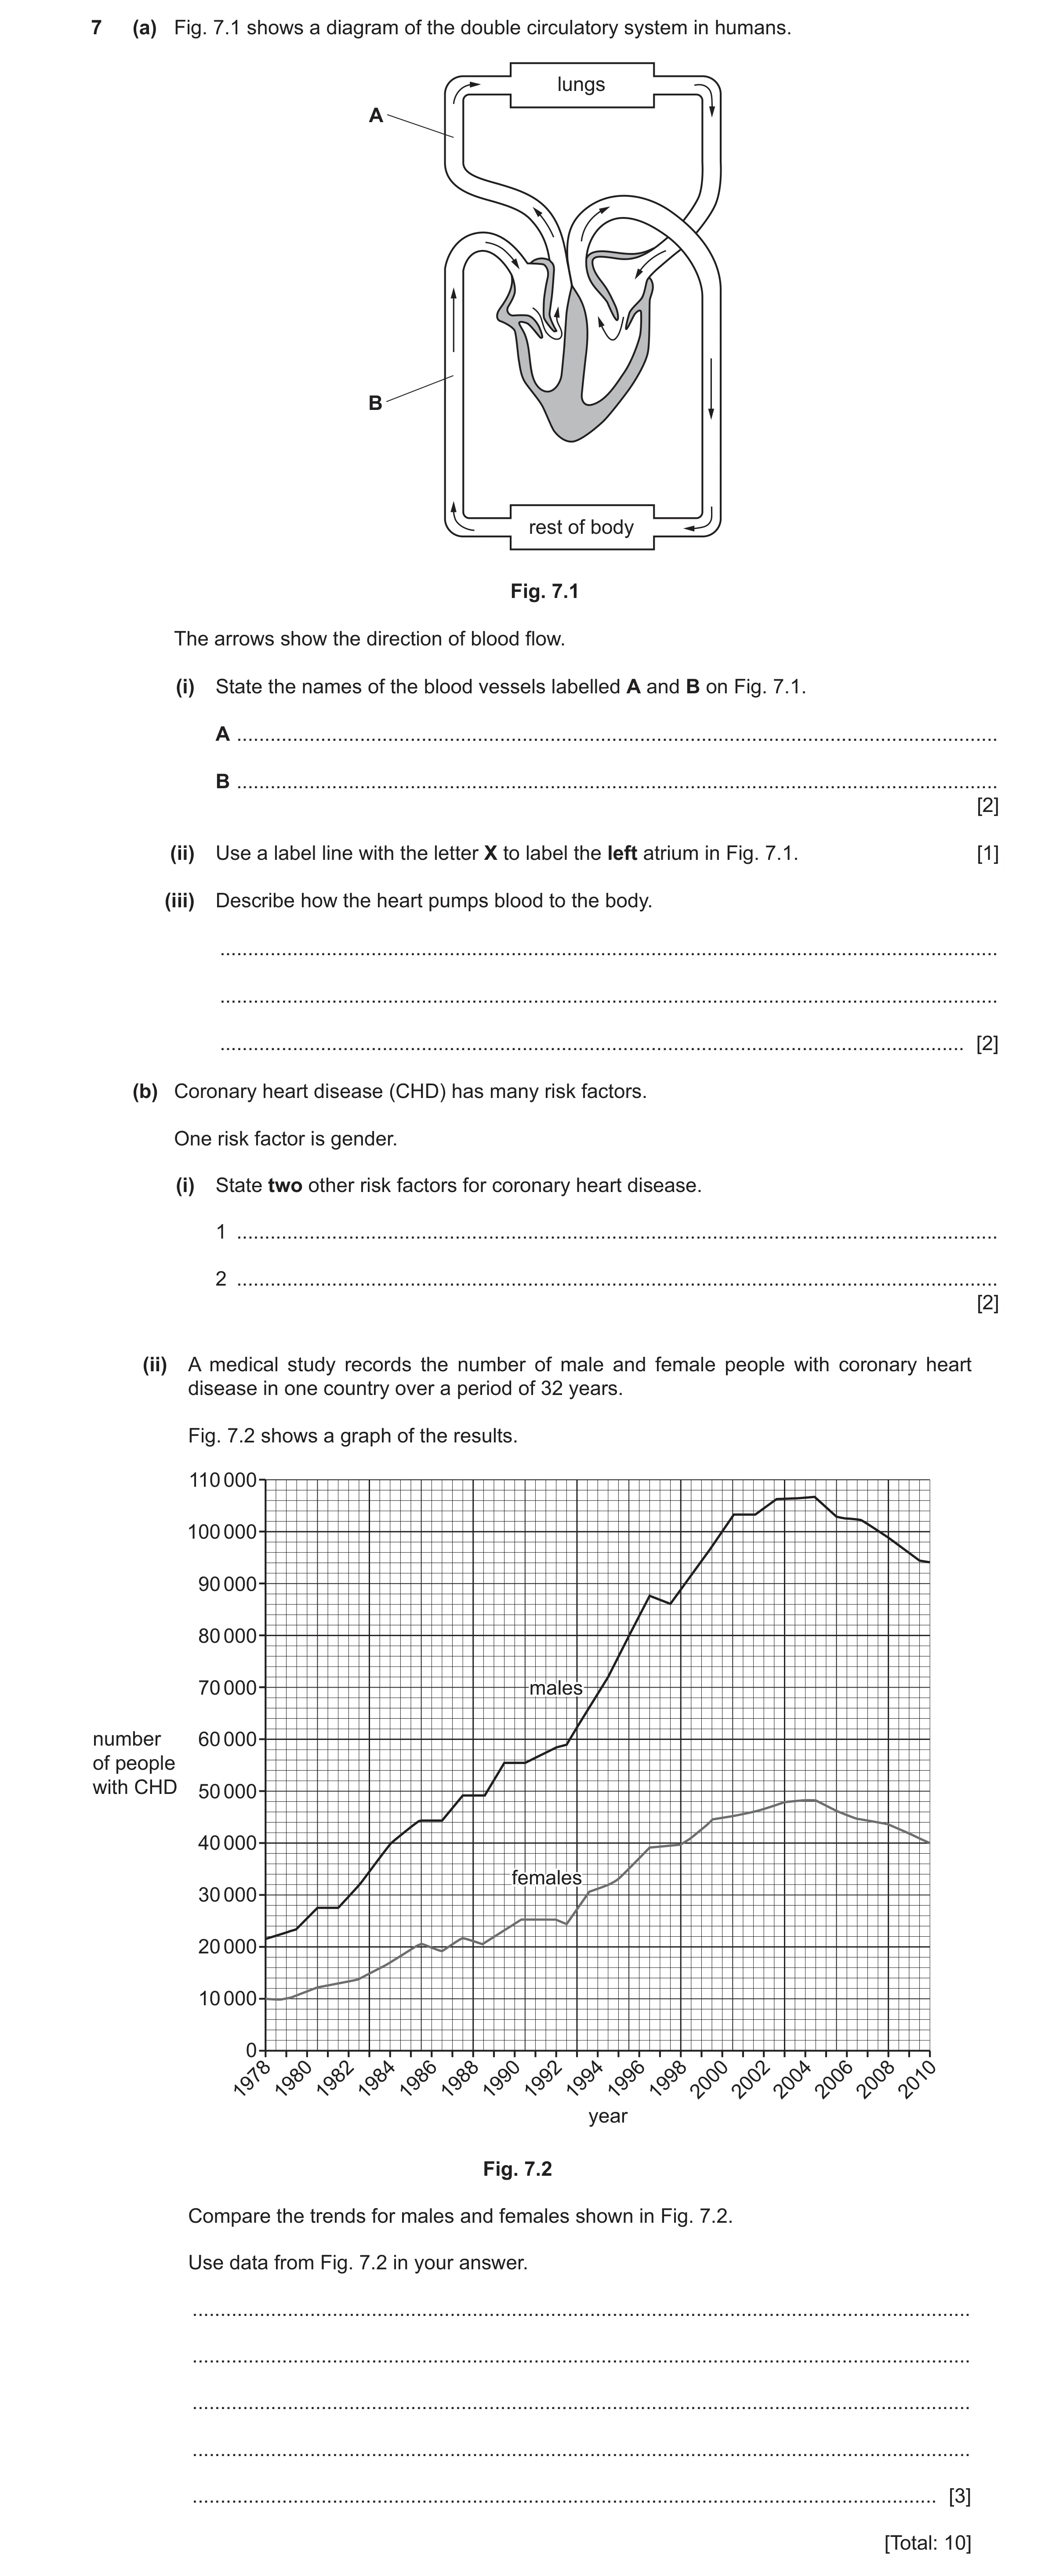
7 (a) Fig. 7.1 shows a diagram of the double circulatory system in humans. lungs A B rest of body Fig. 7.1 The arrows show the direction of blood flow. (i) State the names of the blood vessels labelled A and B on Fig. 7.1. A … B … [2] (ii) Use a label line with the letter X to label the left atrium in Fig. 7.1. [1] (iii) Describe how the heart pumps blood to the body. … … … [2] (b) Coronary heart disease (CHD) has many risk factors. One risk factor is gender. (i) State two other risk factors for coronary heart disease. 1 … 2 … [2] (ii) A medical study records the number of male and female people with coronary heart disease in one country over a period of 32 years. Fig. 7.2 shows a graph of the results. 110 000 100 000 90 000 80 000 70 000 malesmales number 60 000 of people with CHD 50 000 40 000 femalesfemales 30 000 20 000 10 000 0 19781980198219841986198819901992199419961998200020022004200620082010 year Fig. 7.2 Compare the trends for males and females shown in Fig. 7.2. Use data from Fig. 7.2 in your answer. … … … … … [3] [Total: 10]
10 marks
Mark scheme: 7(a)(i) A pulmonary artery ; 2 B vena cava ; 7(a)(ii) left atrium labelled ; 1 7(a)(iii) reference to contraction ; 2 (muscles of) ventricles (contract) ; 7(b)(i) any two from: 2 diet ; stress ; smoking ; genetic predisposition ; age ; AVP ; 7(b)(ii) any two from: 3 both / male / female / number of people increasing AND then decreasing ; males higher (than females) ORA ; AVP ; plus one for: correct use of supporting data, e.g. both graphs reach peak in 2004 / 10 000 females and 22 000 males in 1978 ;
This question in 0653/43 Oct/Nov 2024
![Question 3: (a) Fig. 7.1 shows a diagram of the human gas exchange system. Fig. 7.1 On Fig. 7.1 use label lines to identify (i) the larynx, [1] (ii) a …](https://img.pastlit.com/crops/6ef42b4e-1070-48b4-b72f-0c77fc4fe51f/q7.webp)
 11
11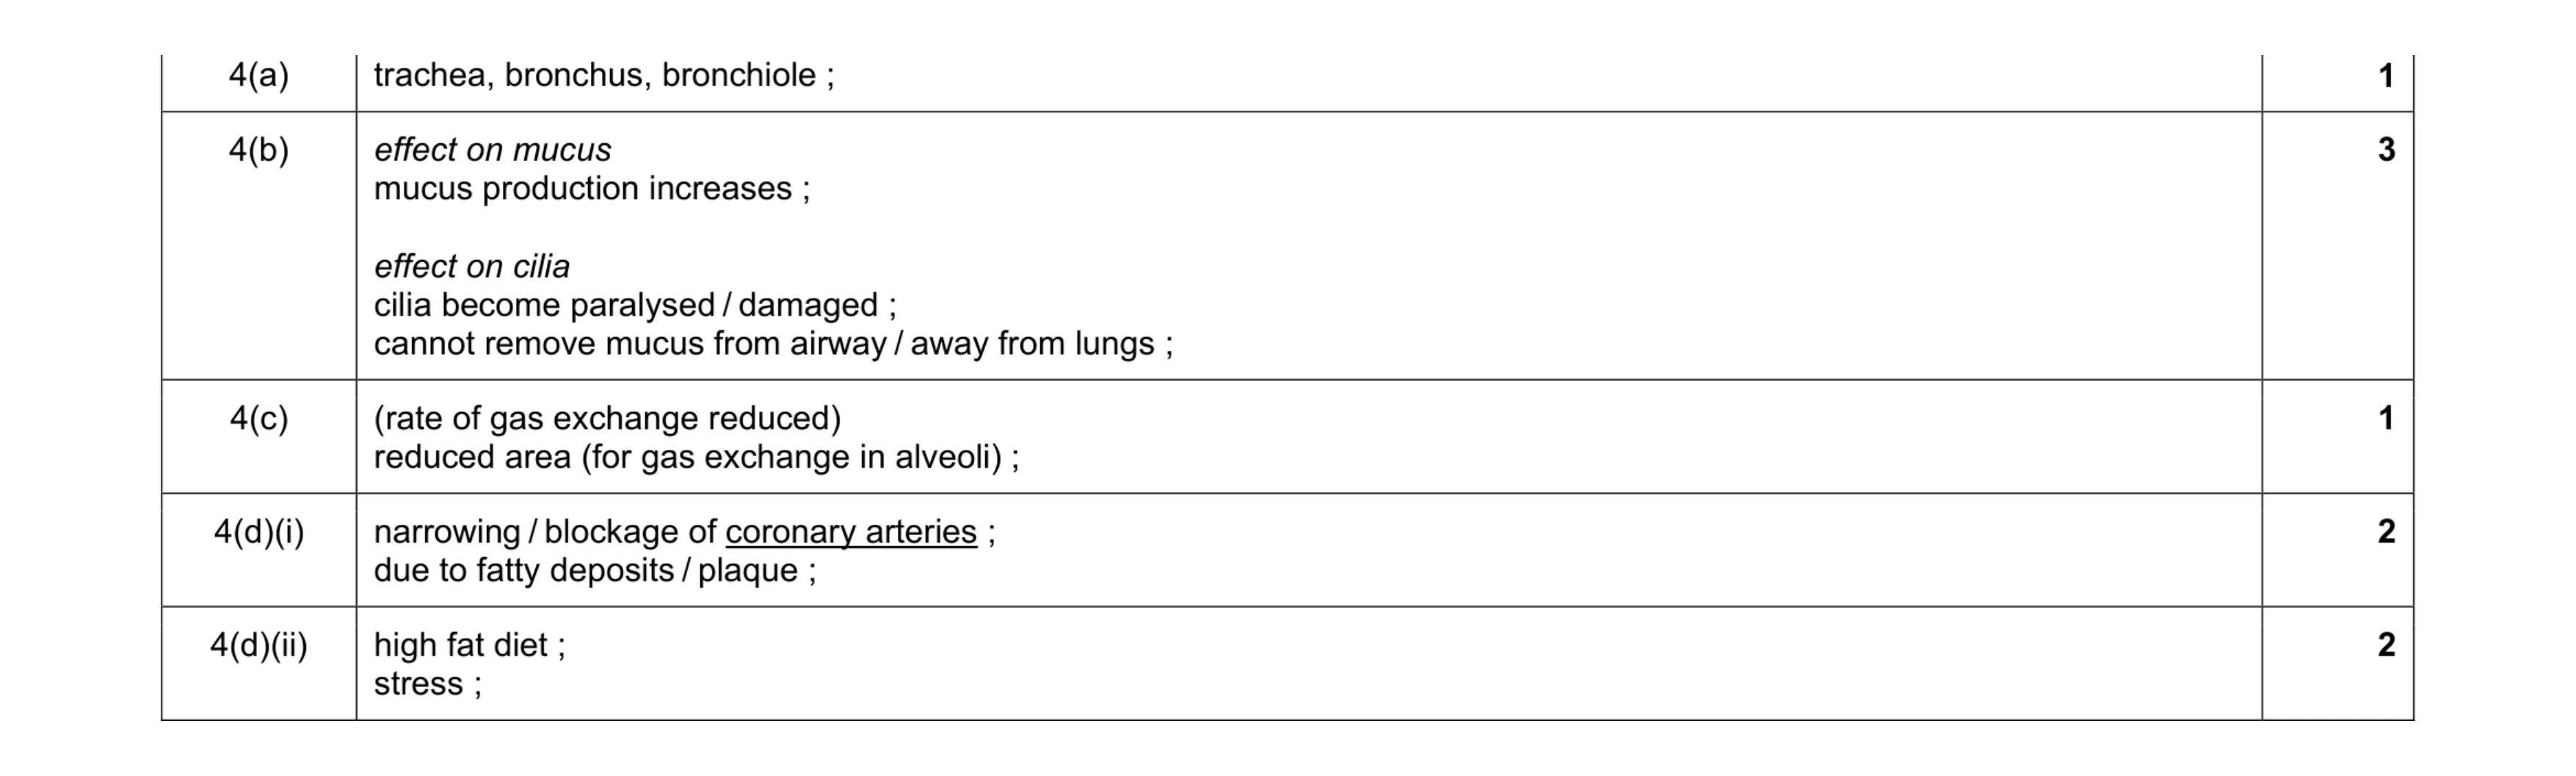 9
9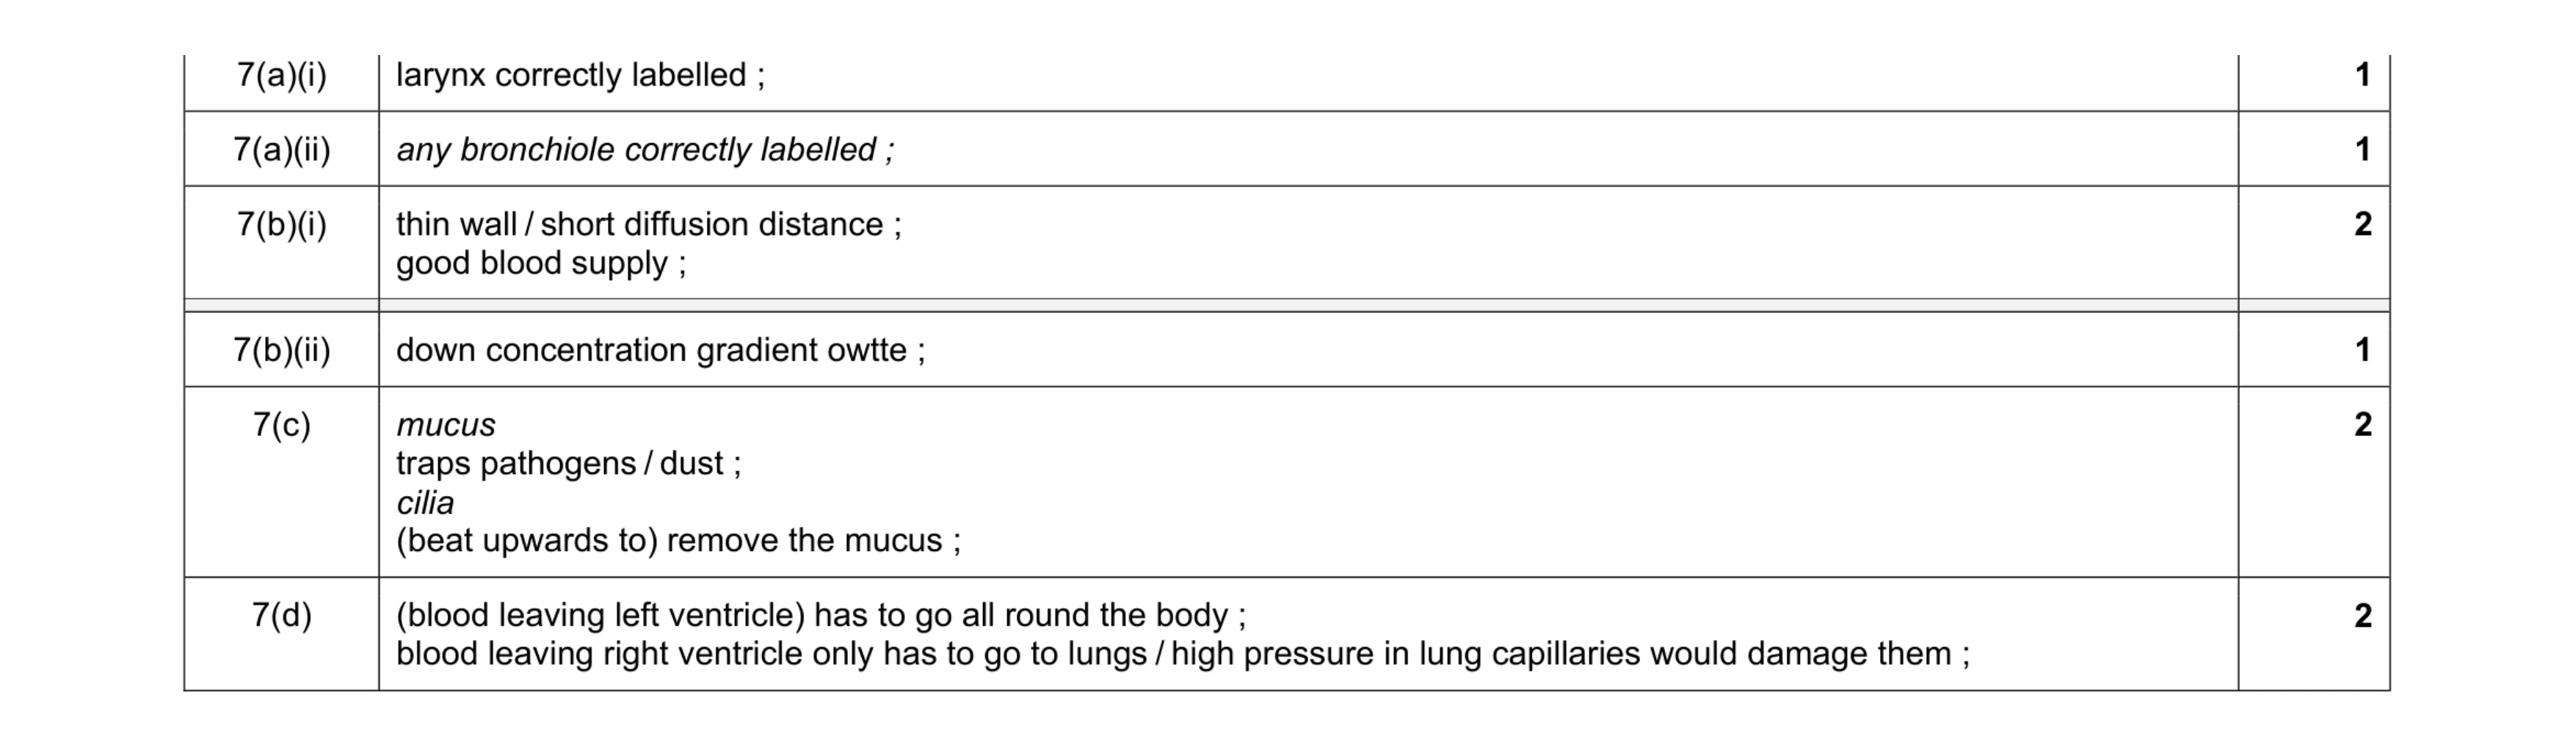 9
9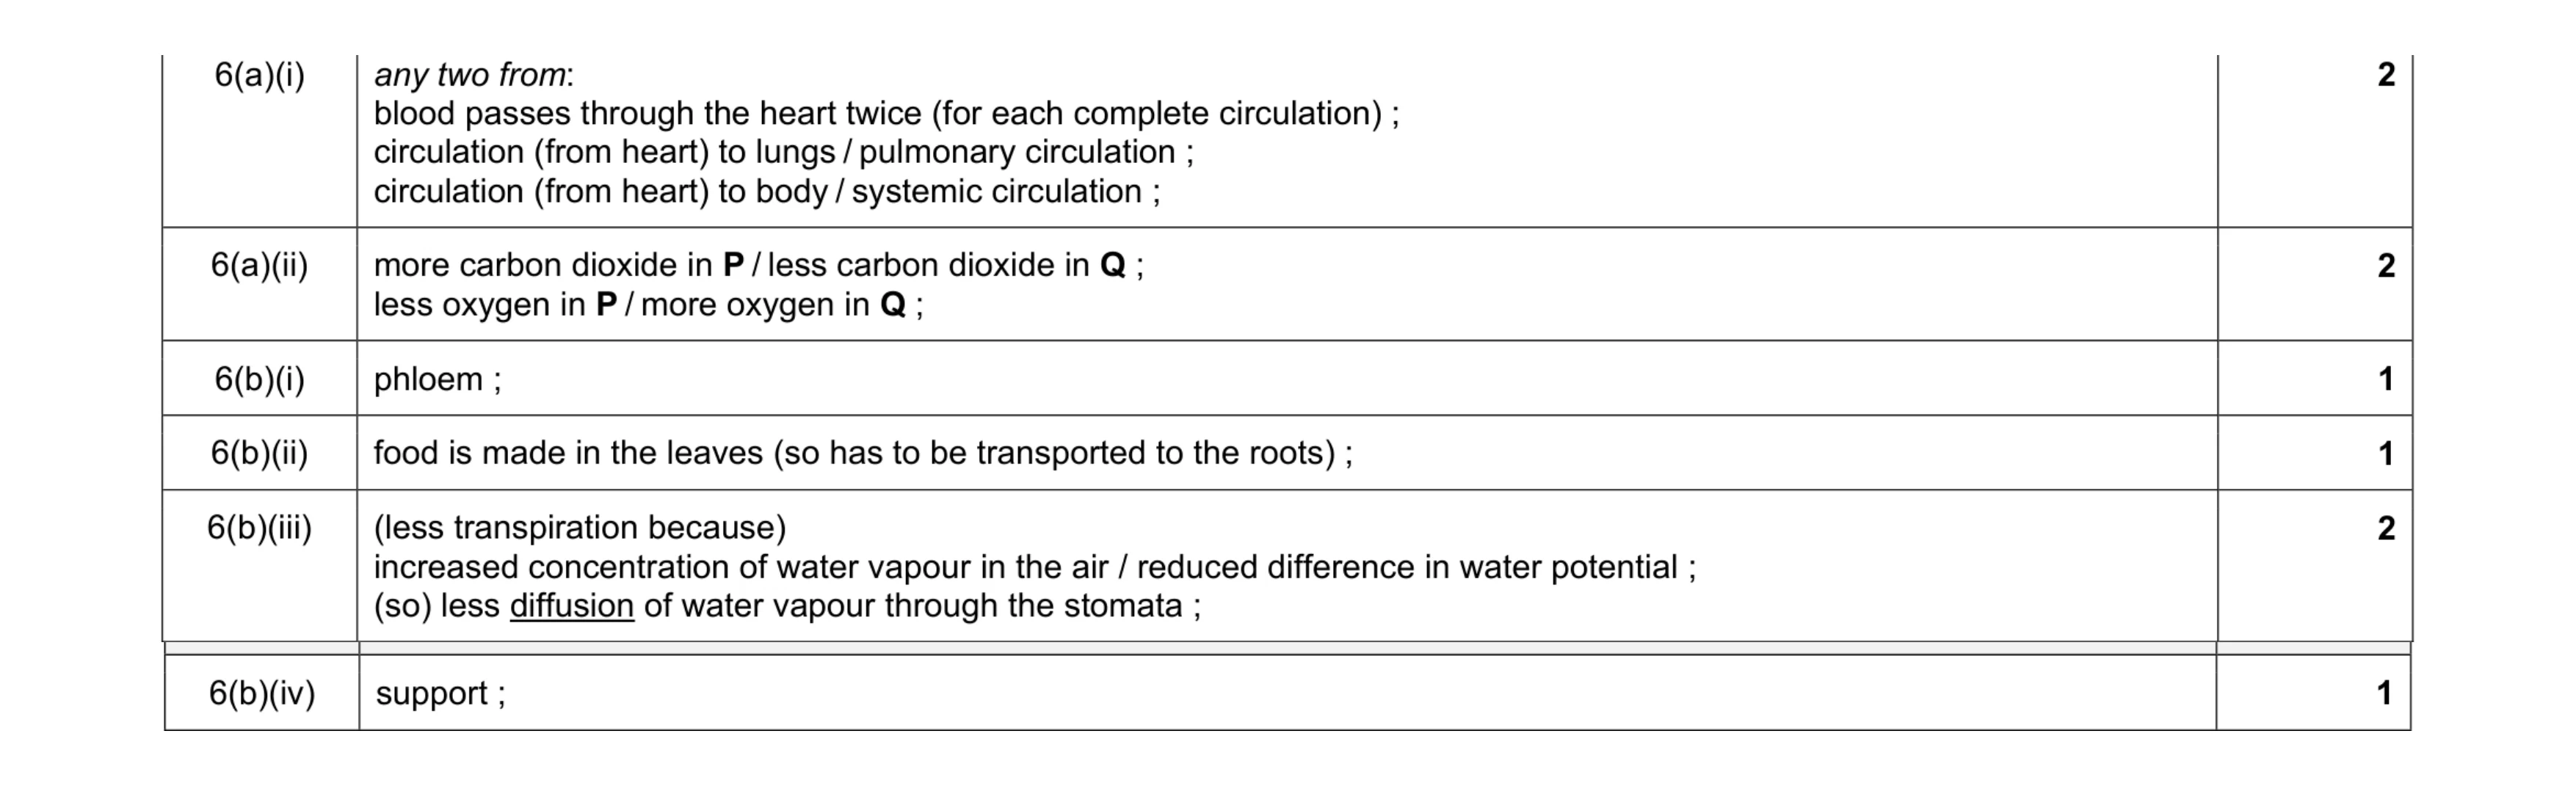 9
9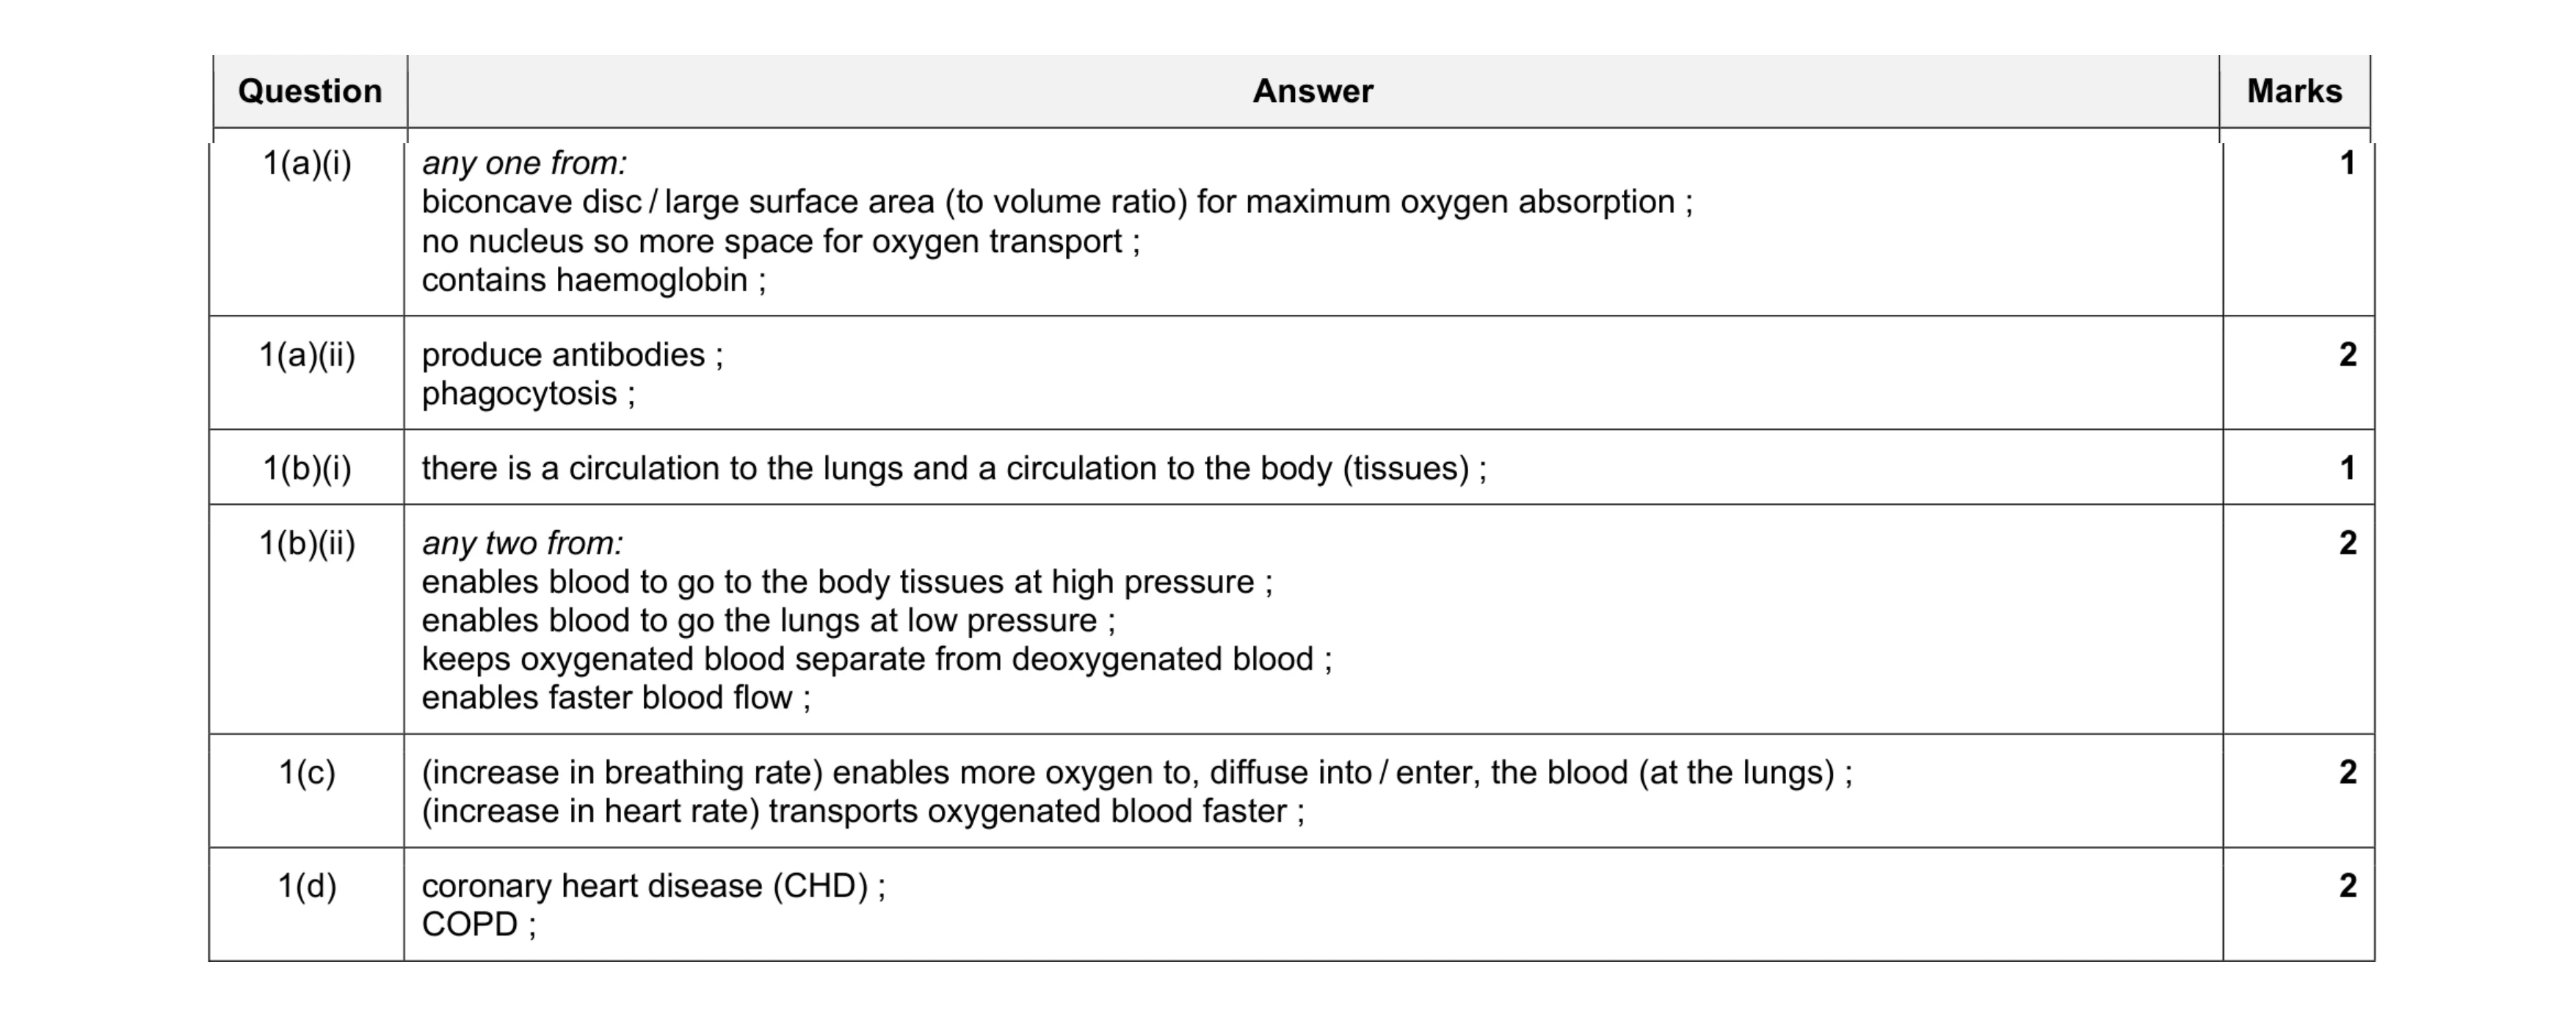 10
10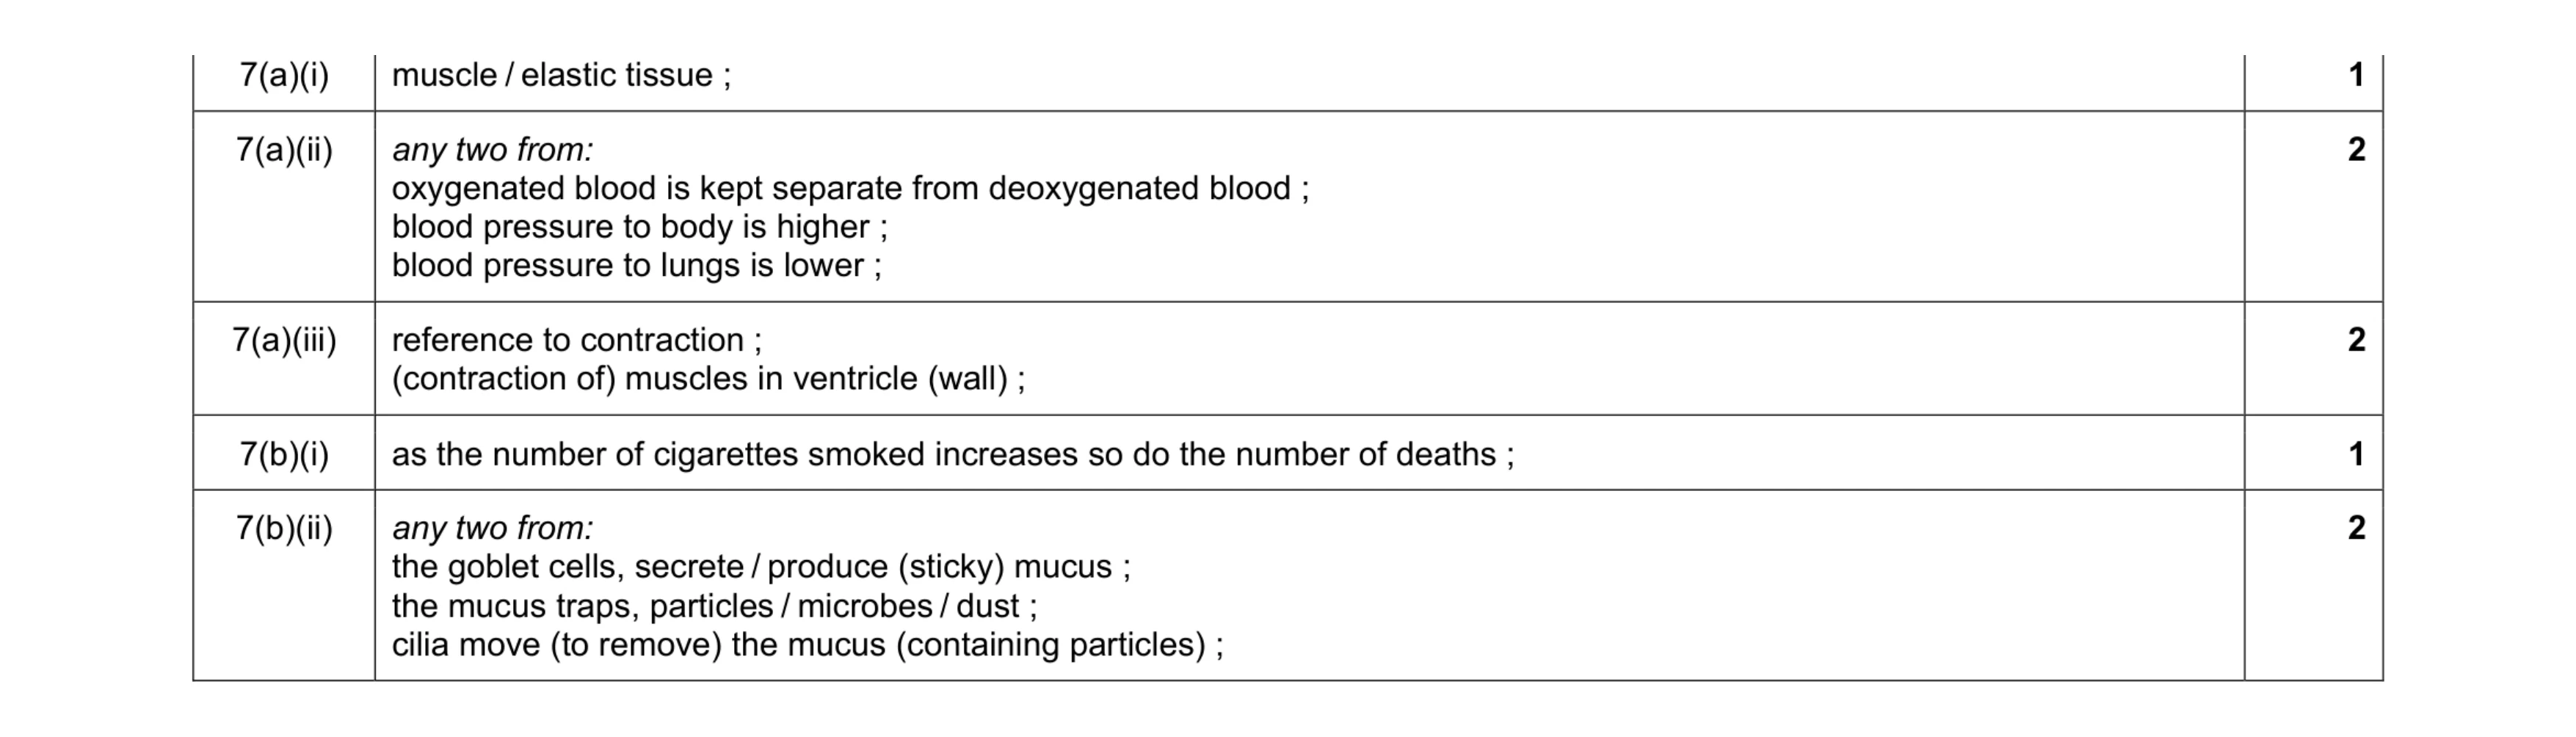 8
8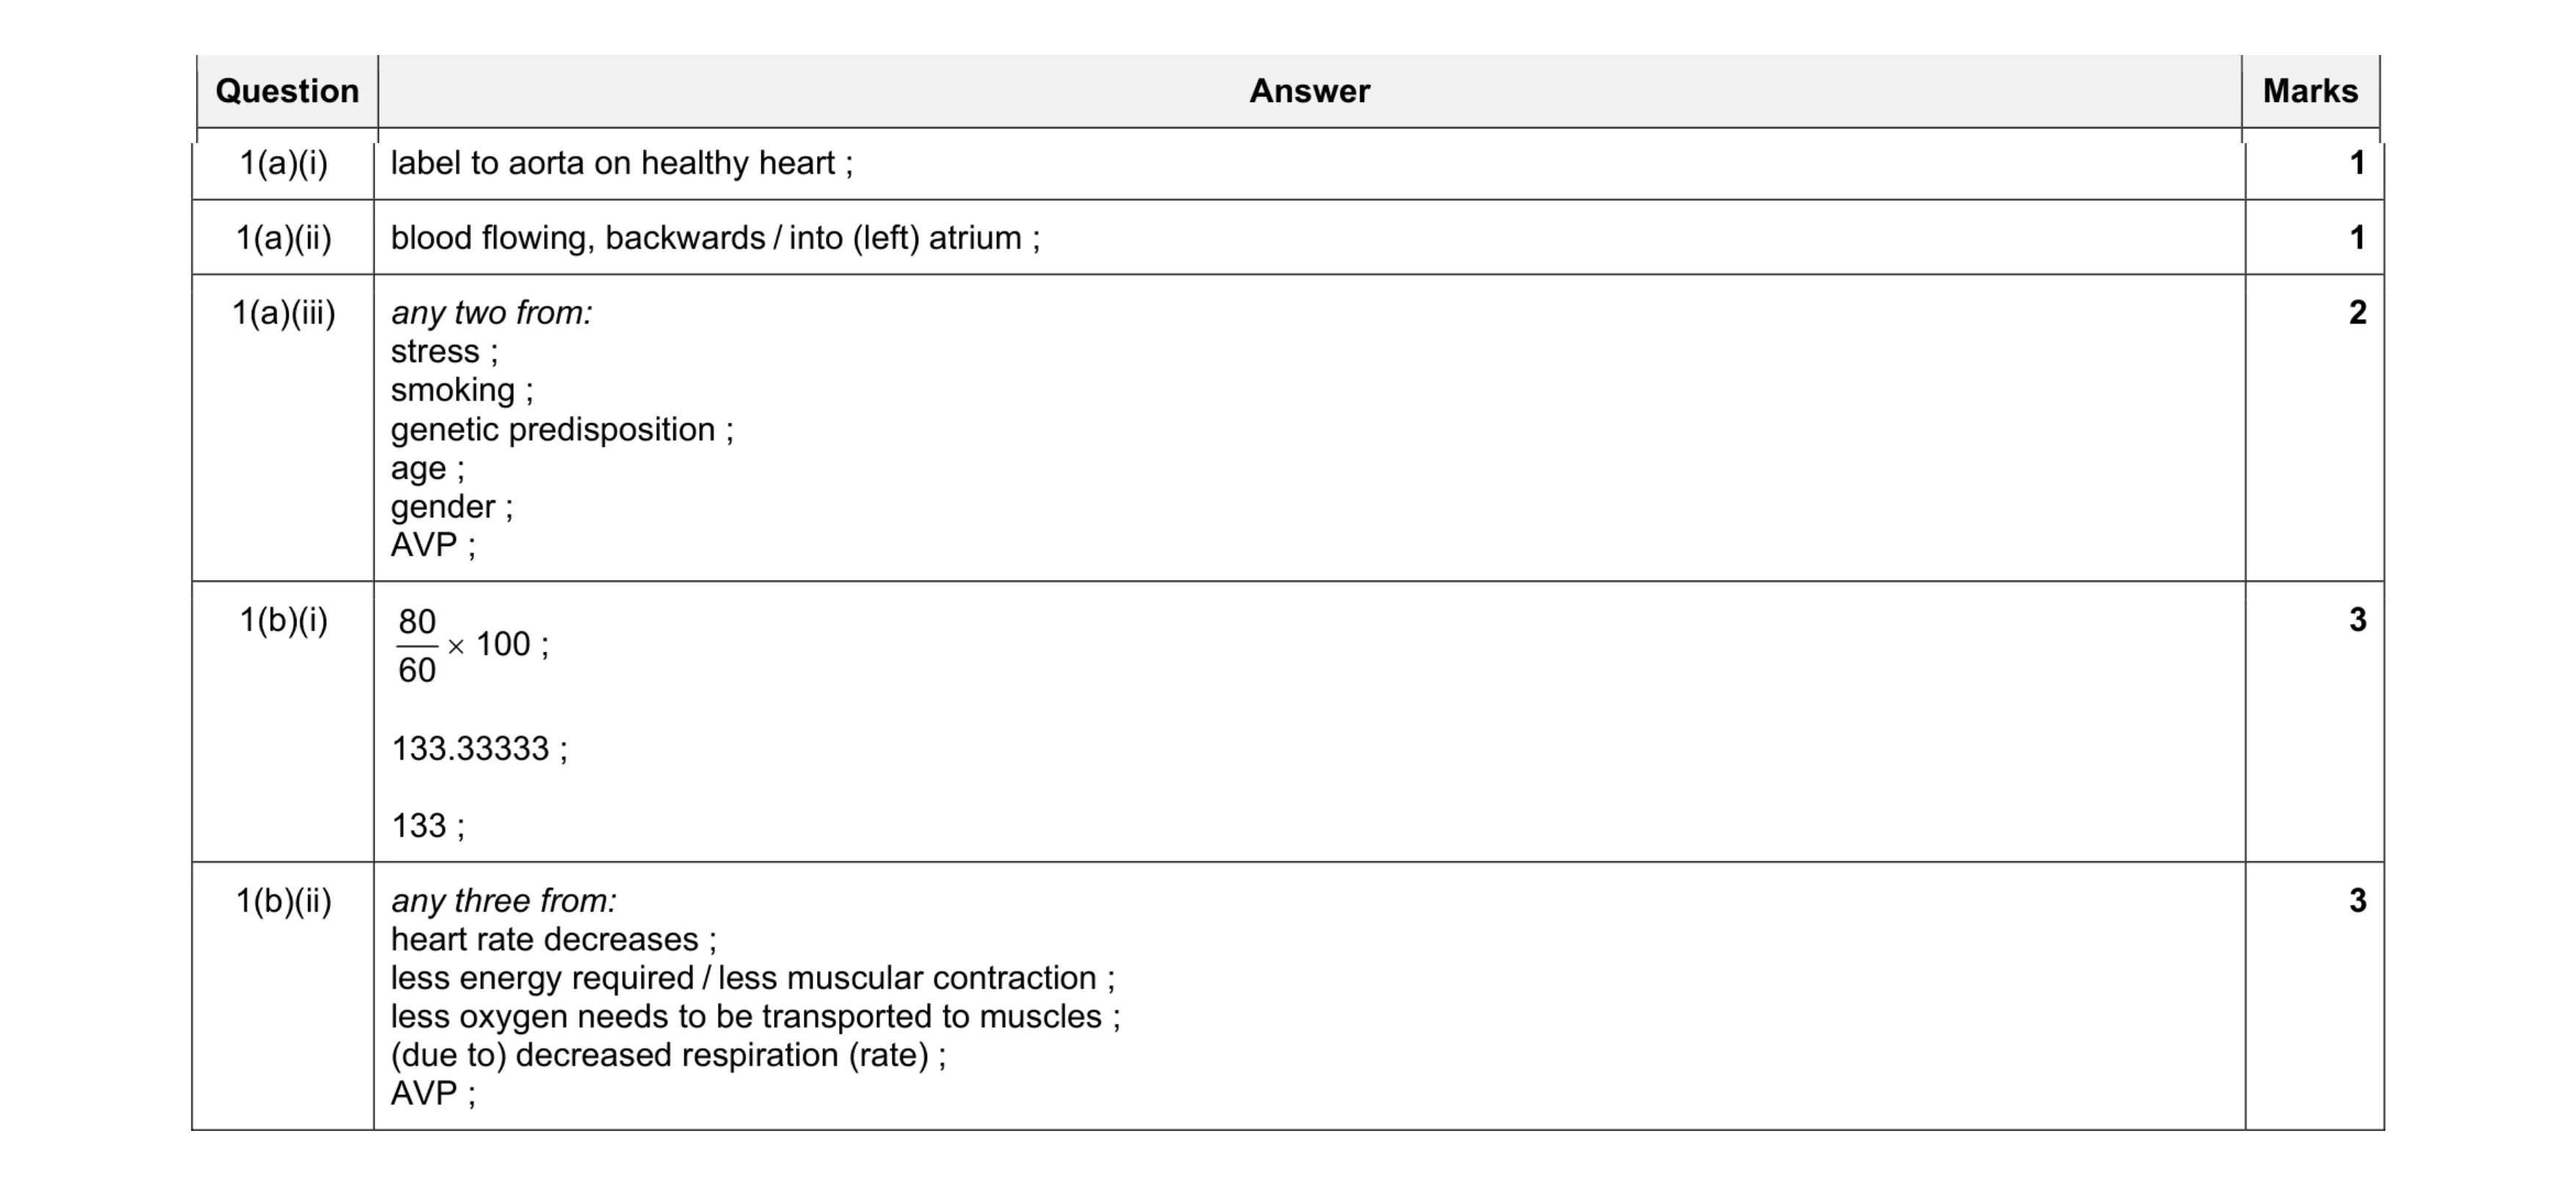 10
10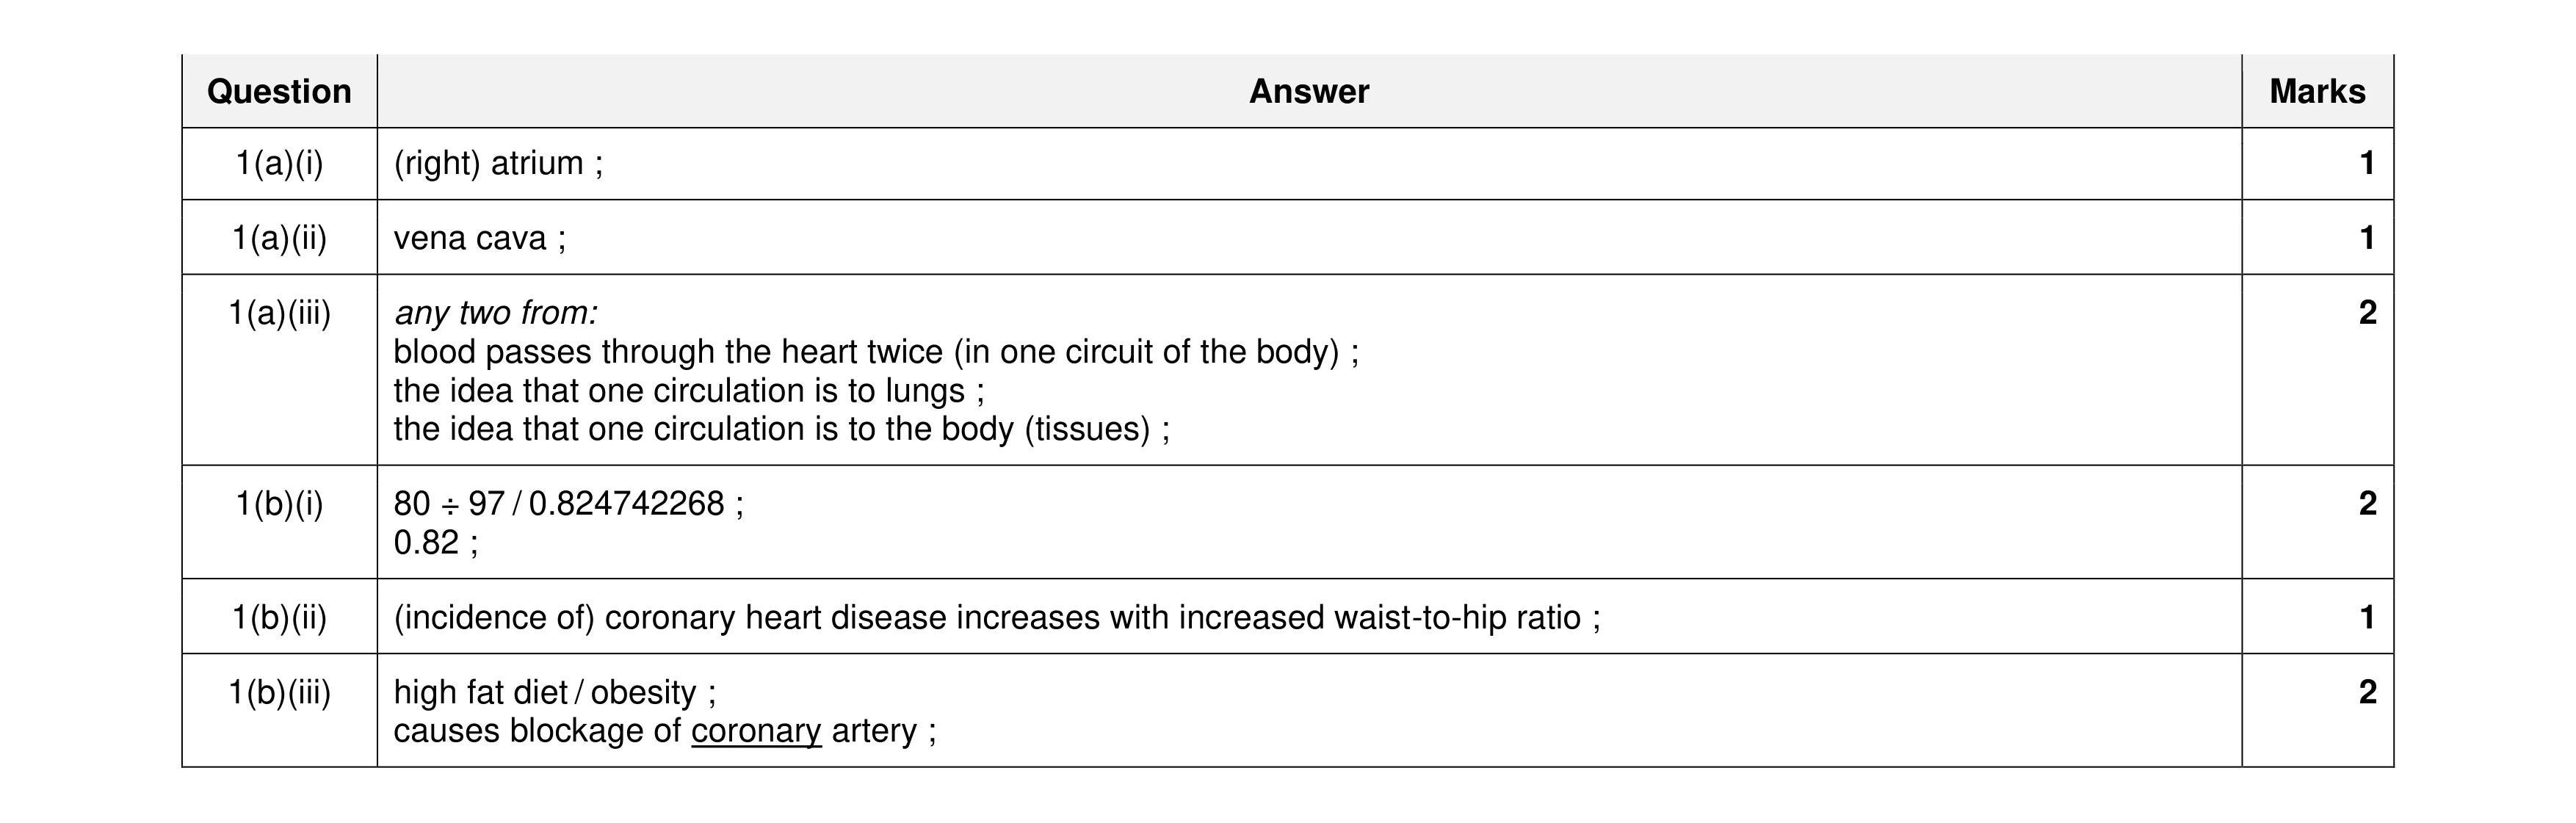 9
9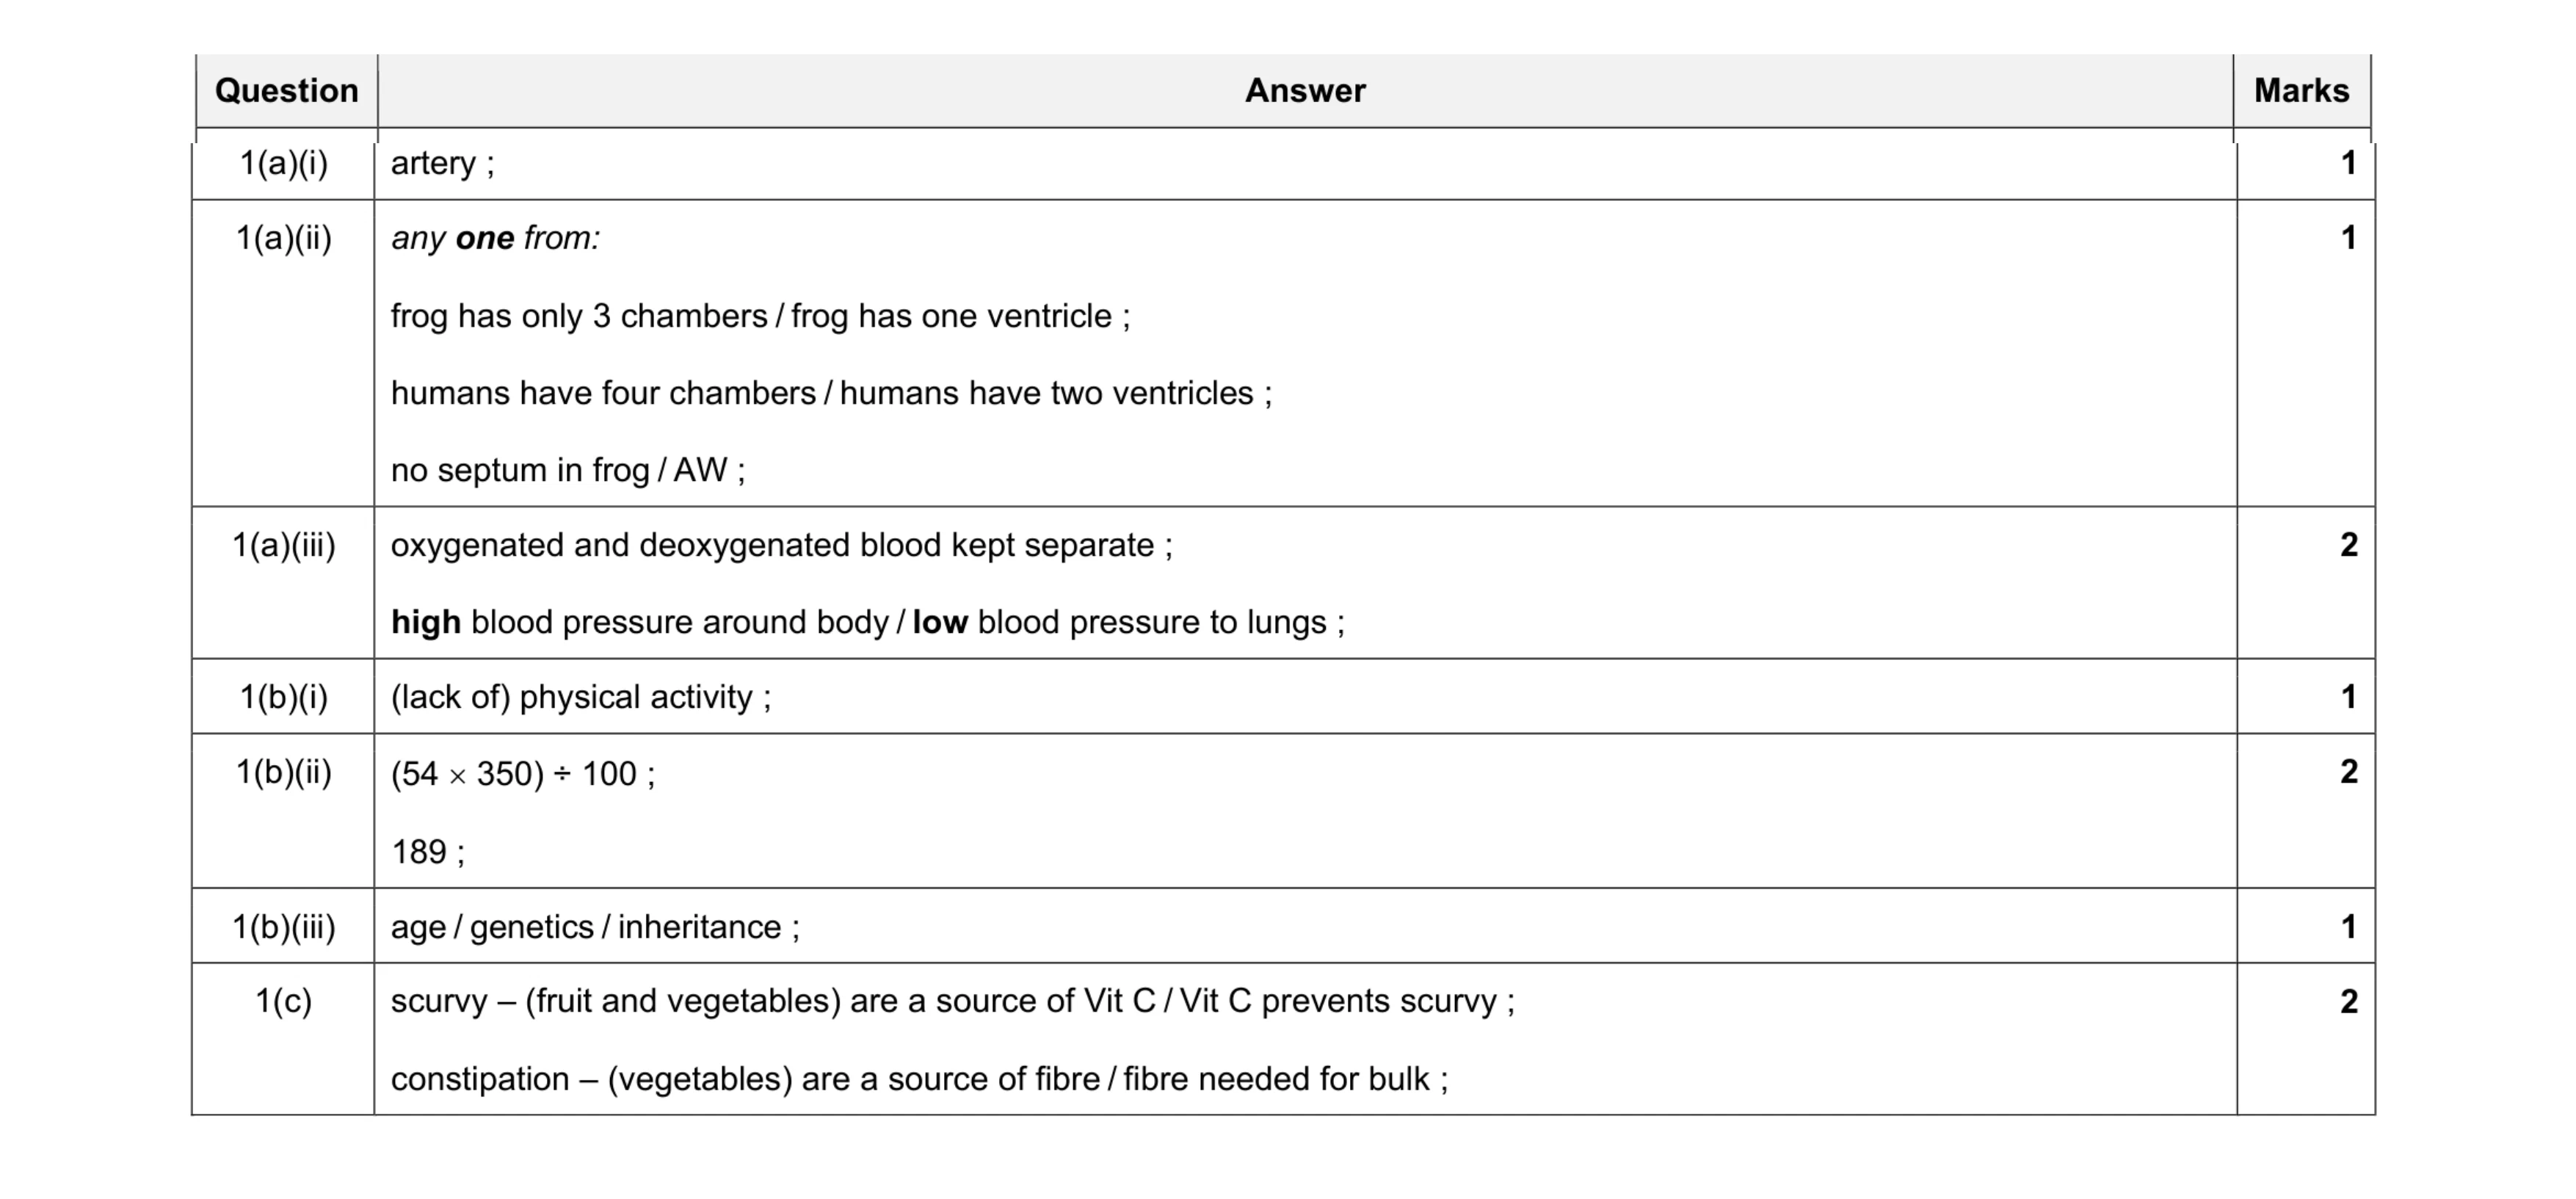 10
10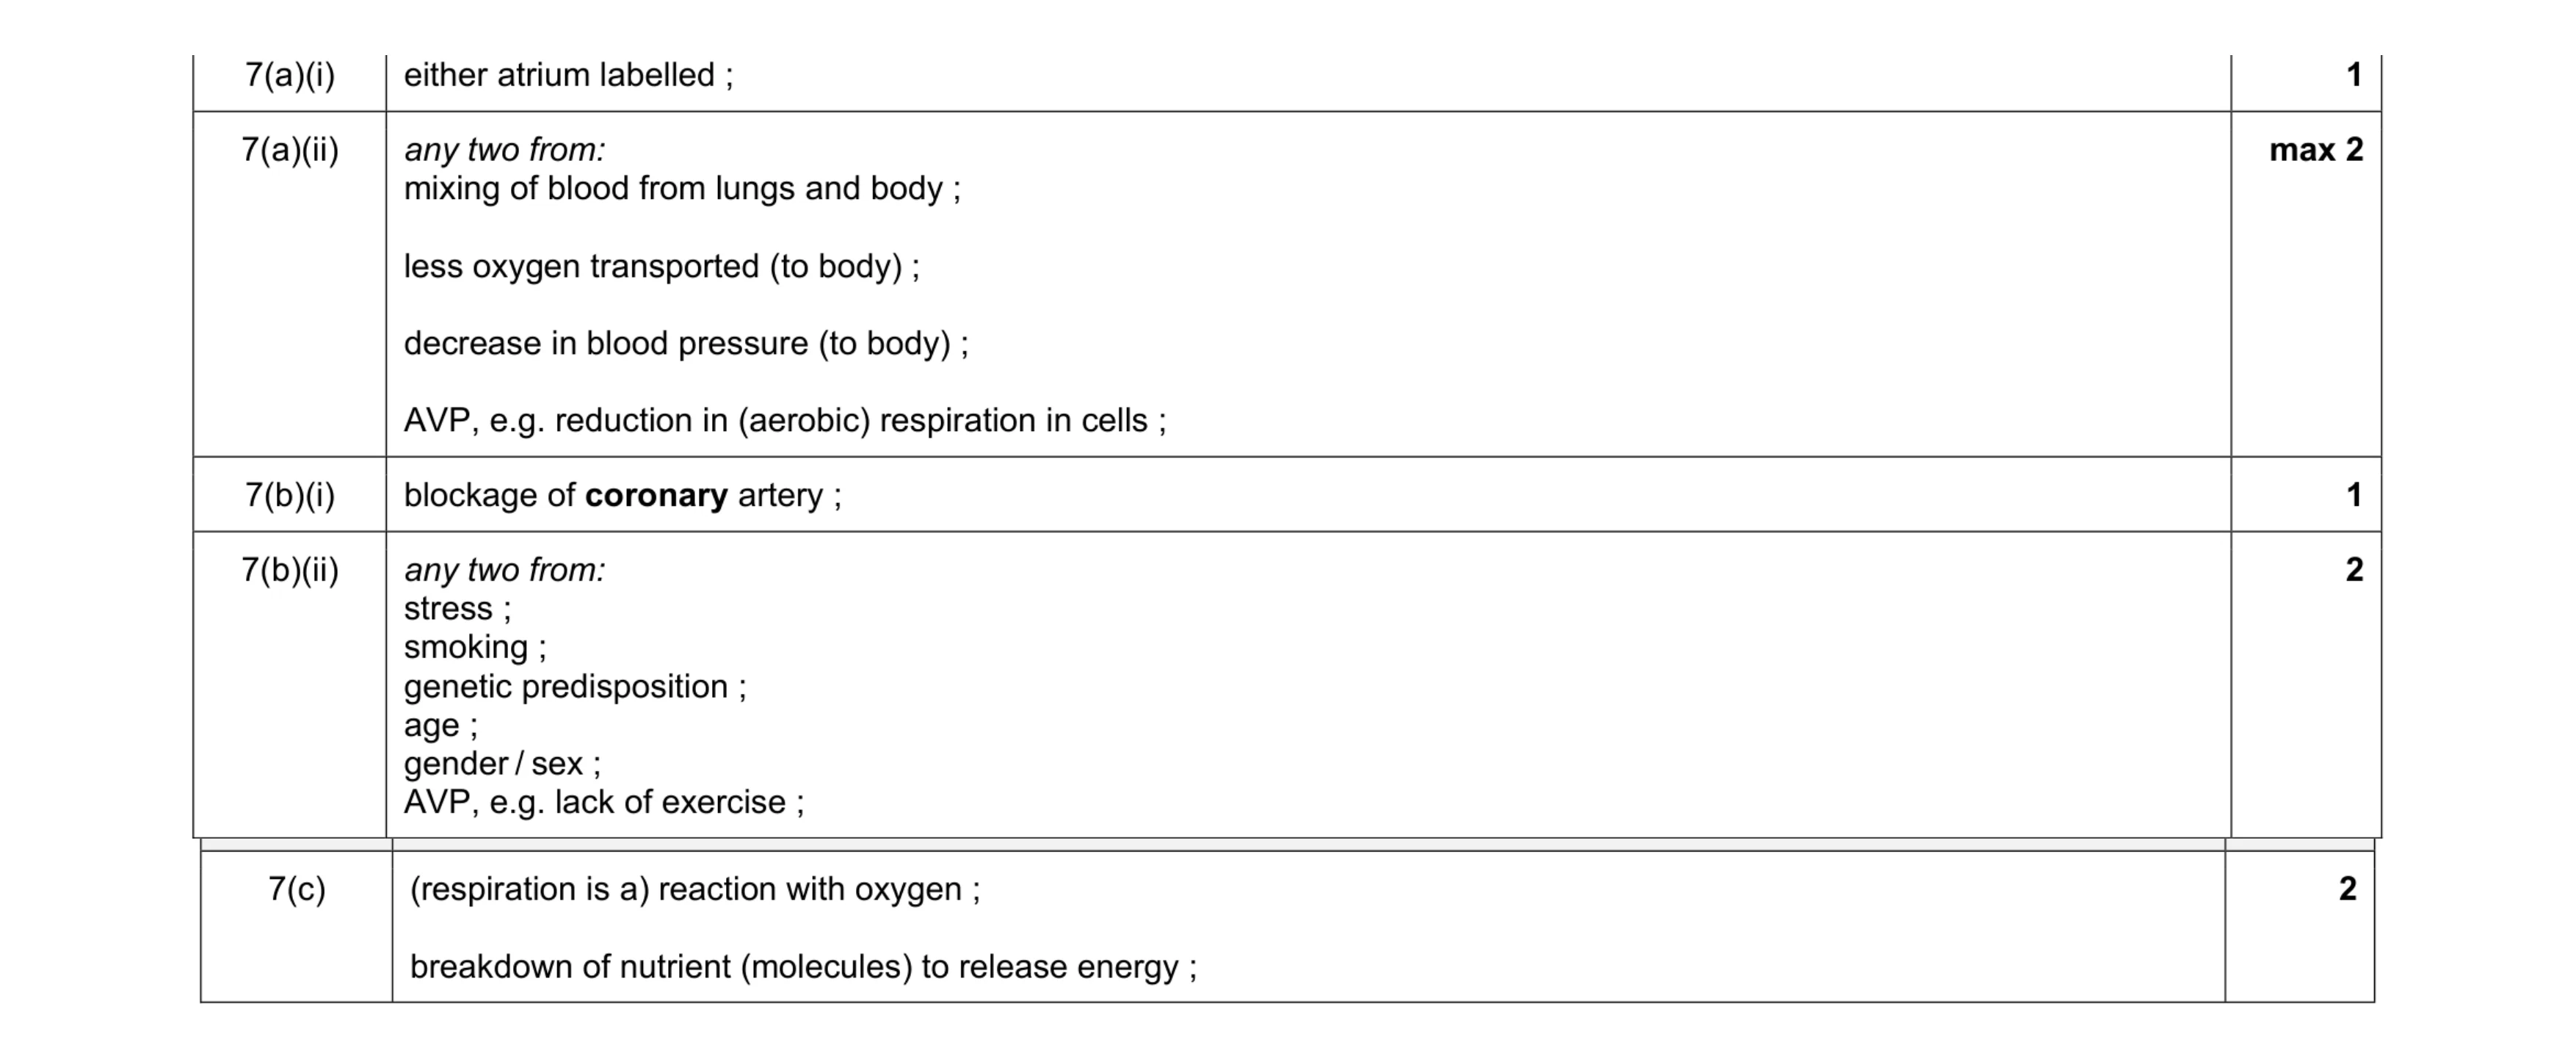 8
8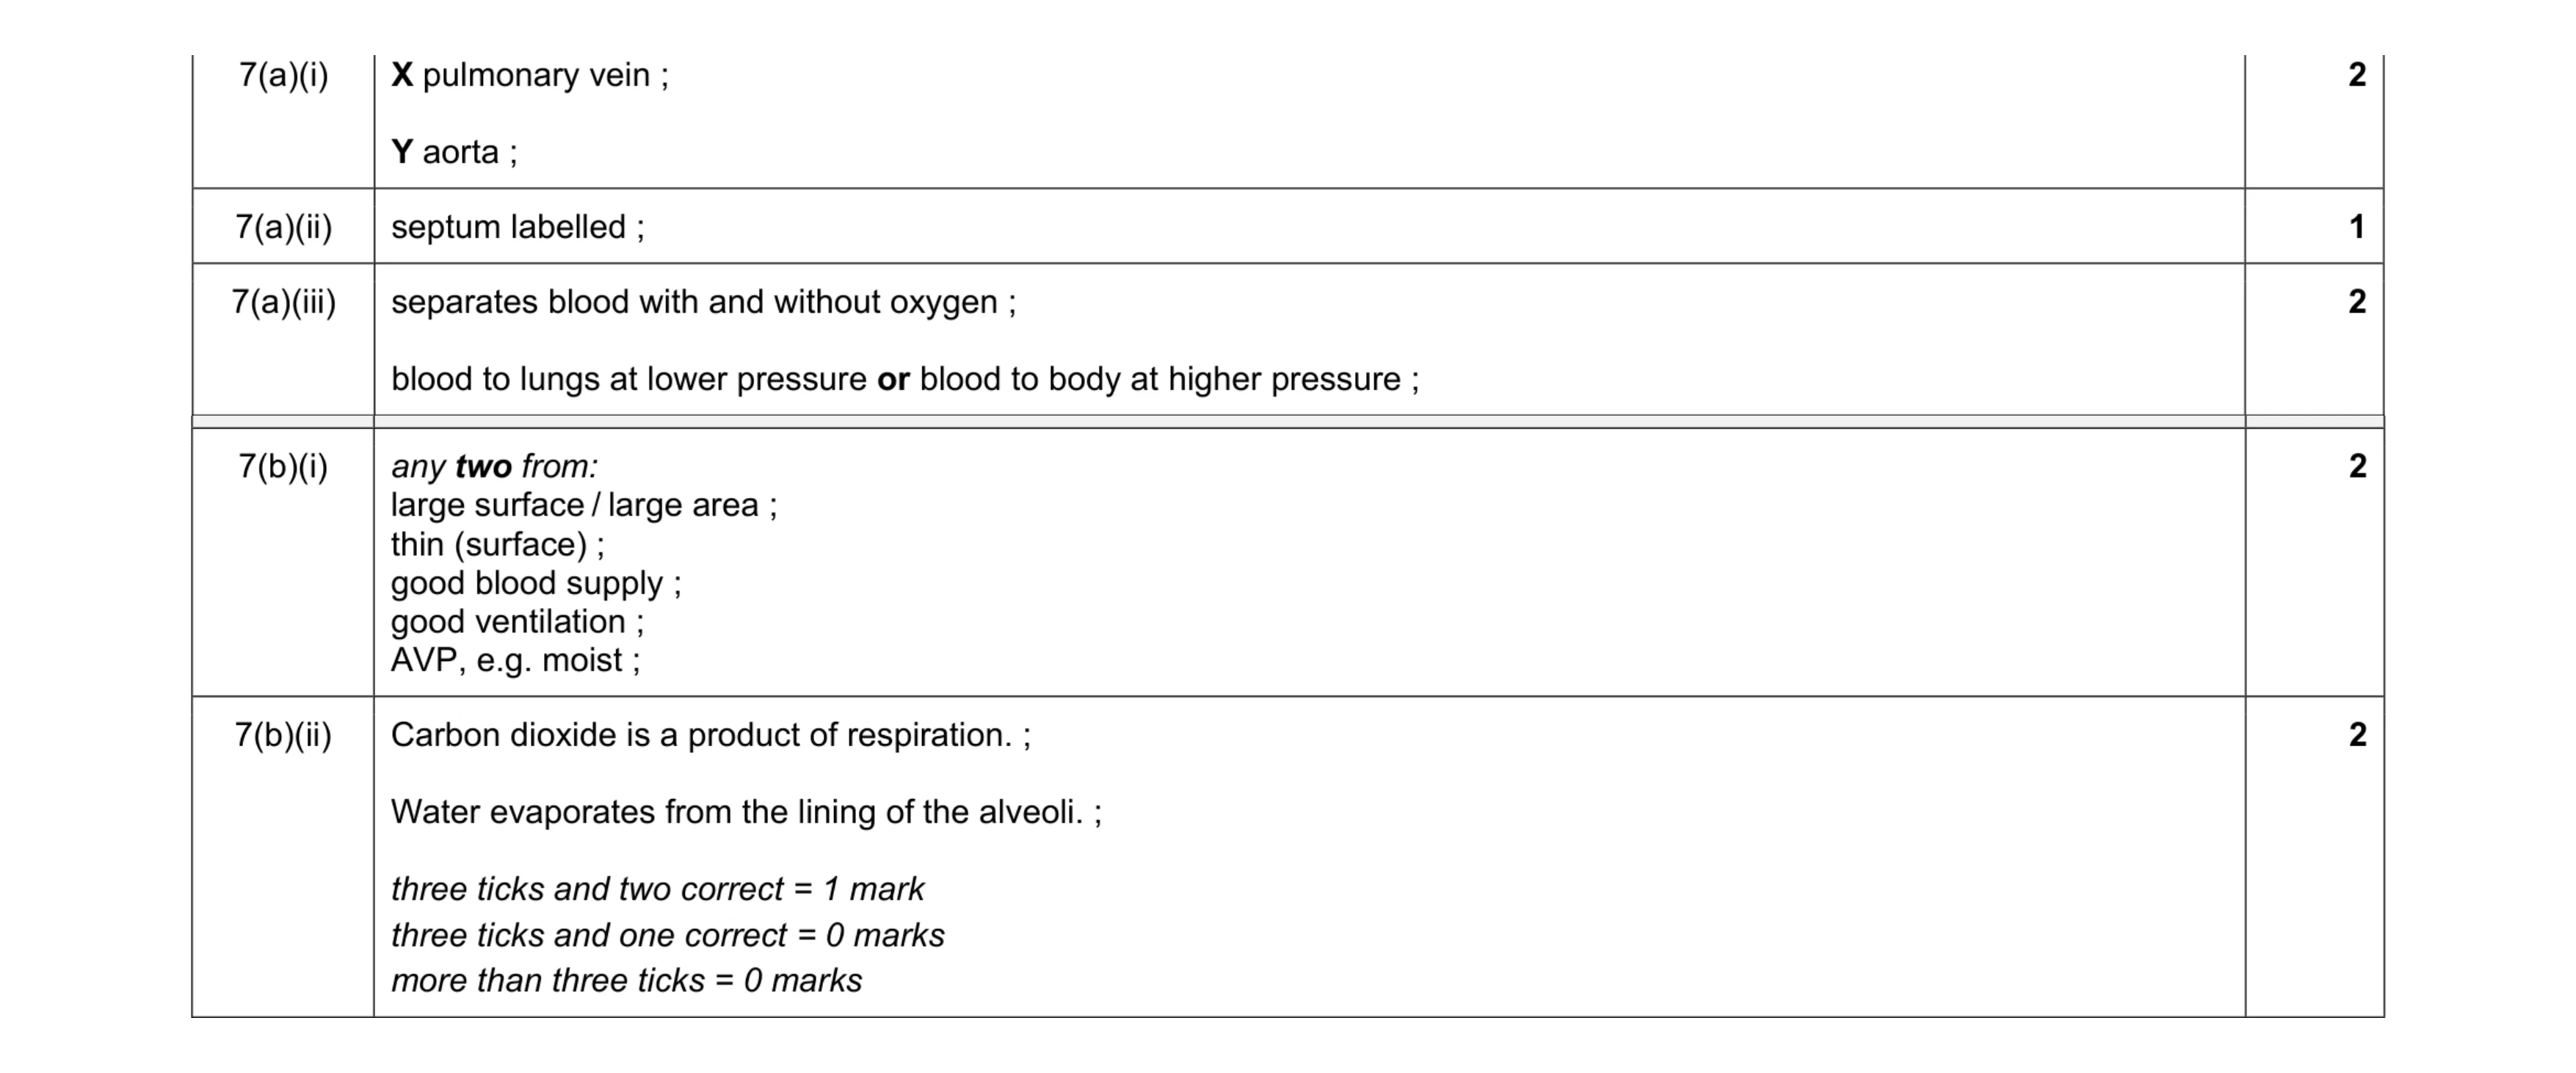 9
9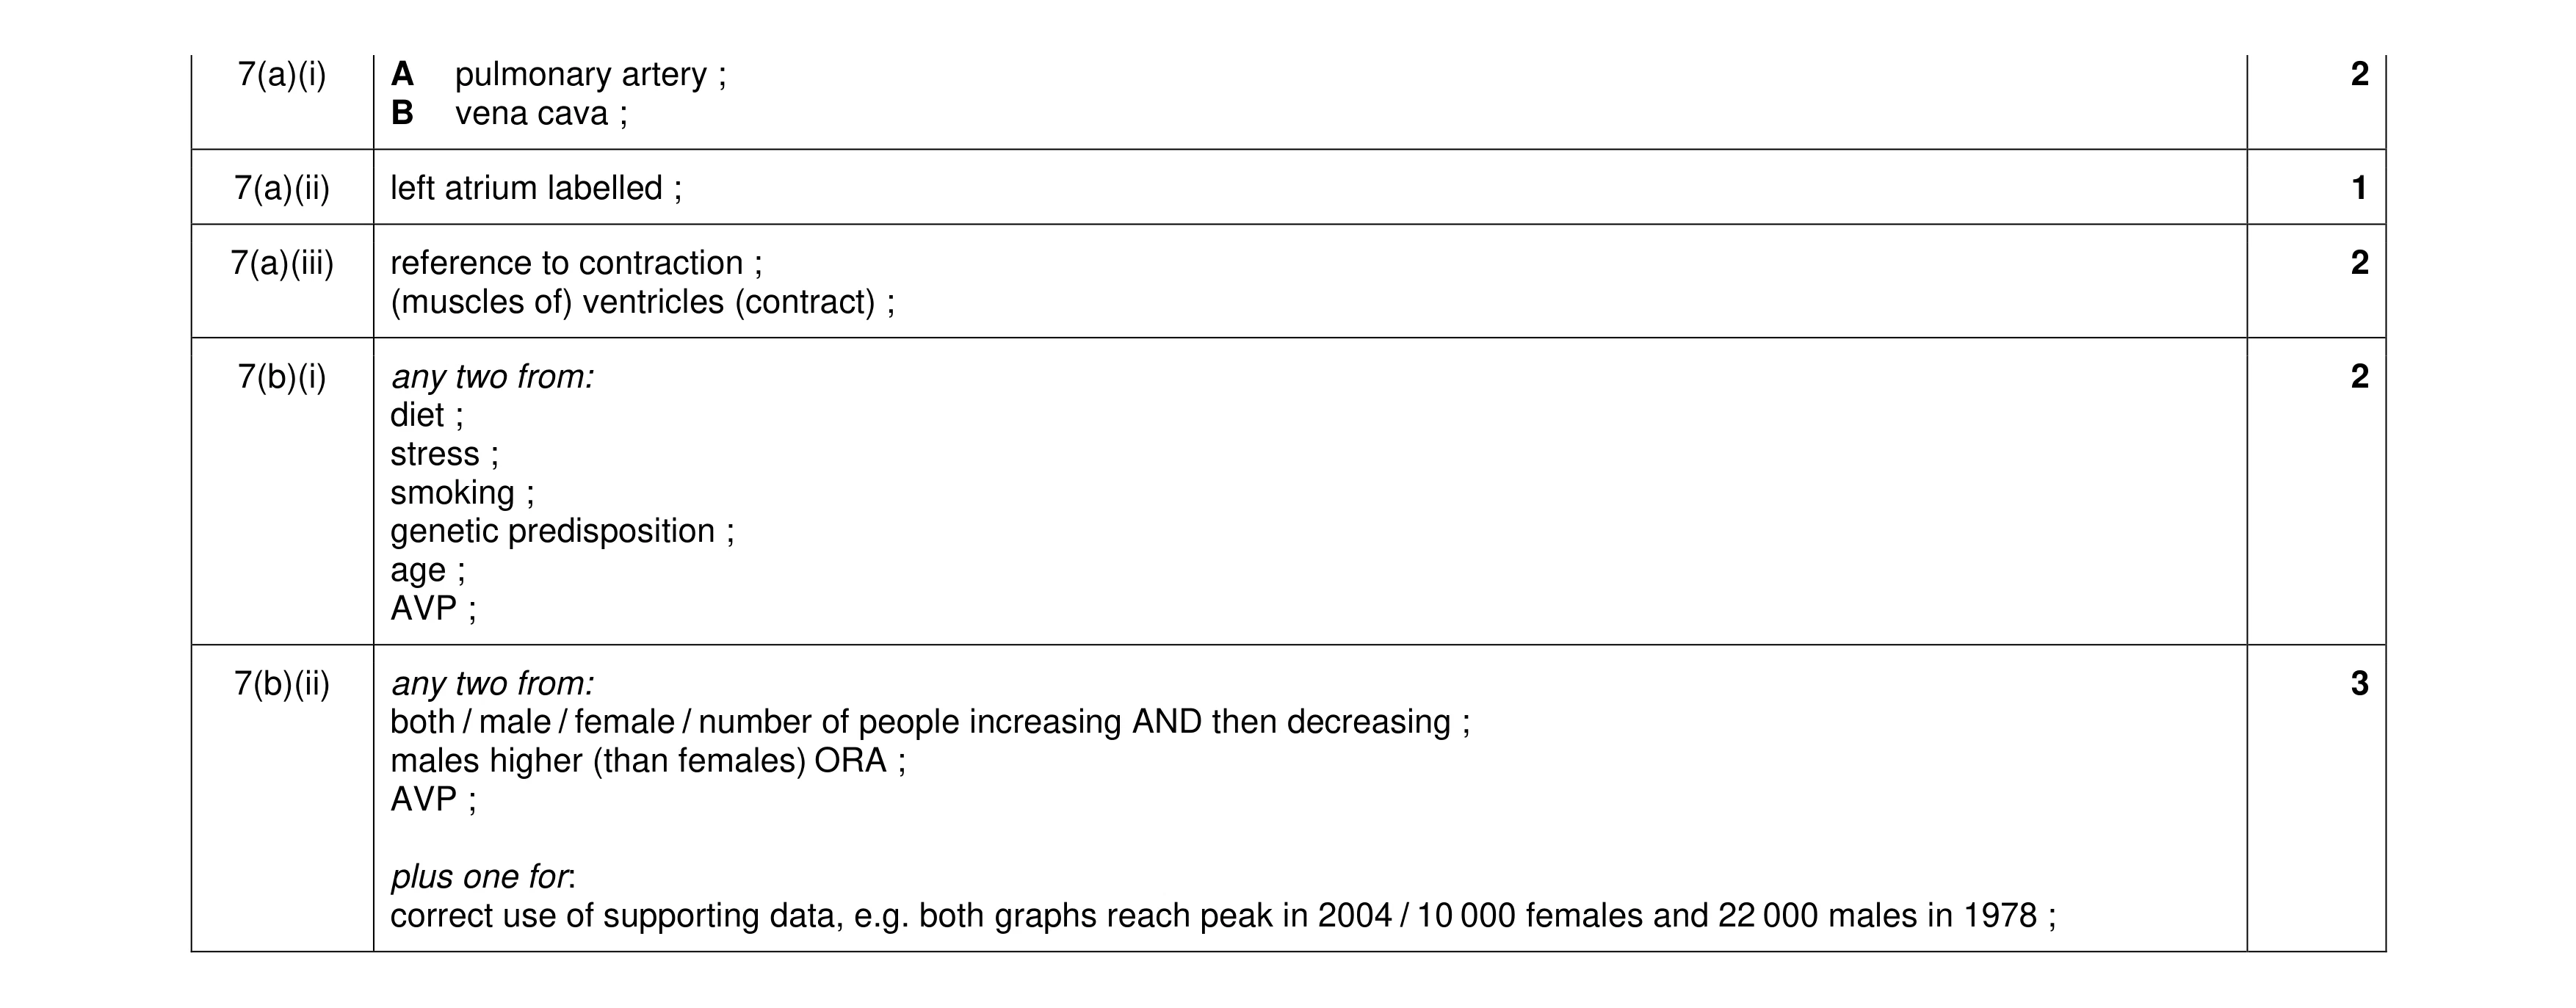 10
10