Questions as text
Q1 · Photographs B and C (Insert) show places where renewable energy sources have been… 0460/22 Feb/March 2017
6 Photographs B and C (Insert) show places where renewable energy sources have been developed. (a) Identify the renewable energy source in each photograph. Photograph B … Photograph C … [2] (b) Using evidence from the photographs, suggest why some local people might be for these developments and other local people might be against them. Suggest why local people might be for the developments. … … … … … … … … … [3] Suggest why local people might be against the developments. … … … … … … … … … [3] [Total: 8 marks] Additional Pages If you use the following lined pages to complete the answer(s) to any question(s), the question number(s) must be clearly shown. … … … … … … … … … … … … … … … … … … … … … … … … … … … … … … … … … … … … … … … … … … … … … … … … …
8 marks
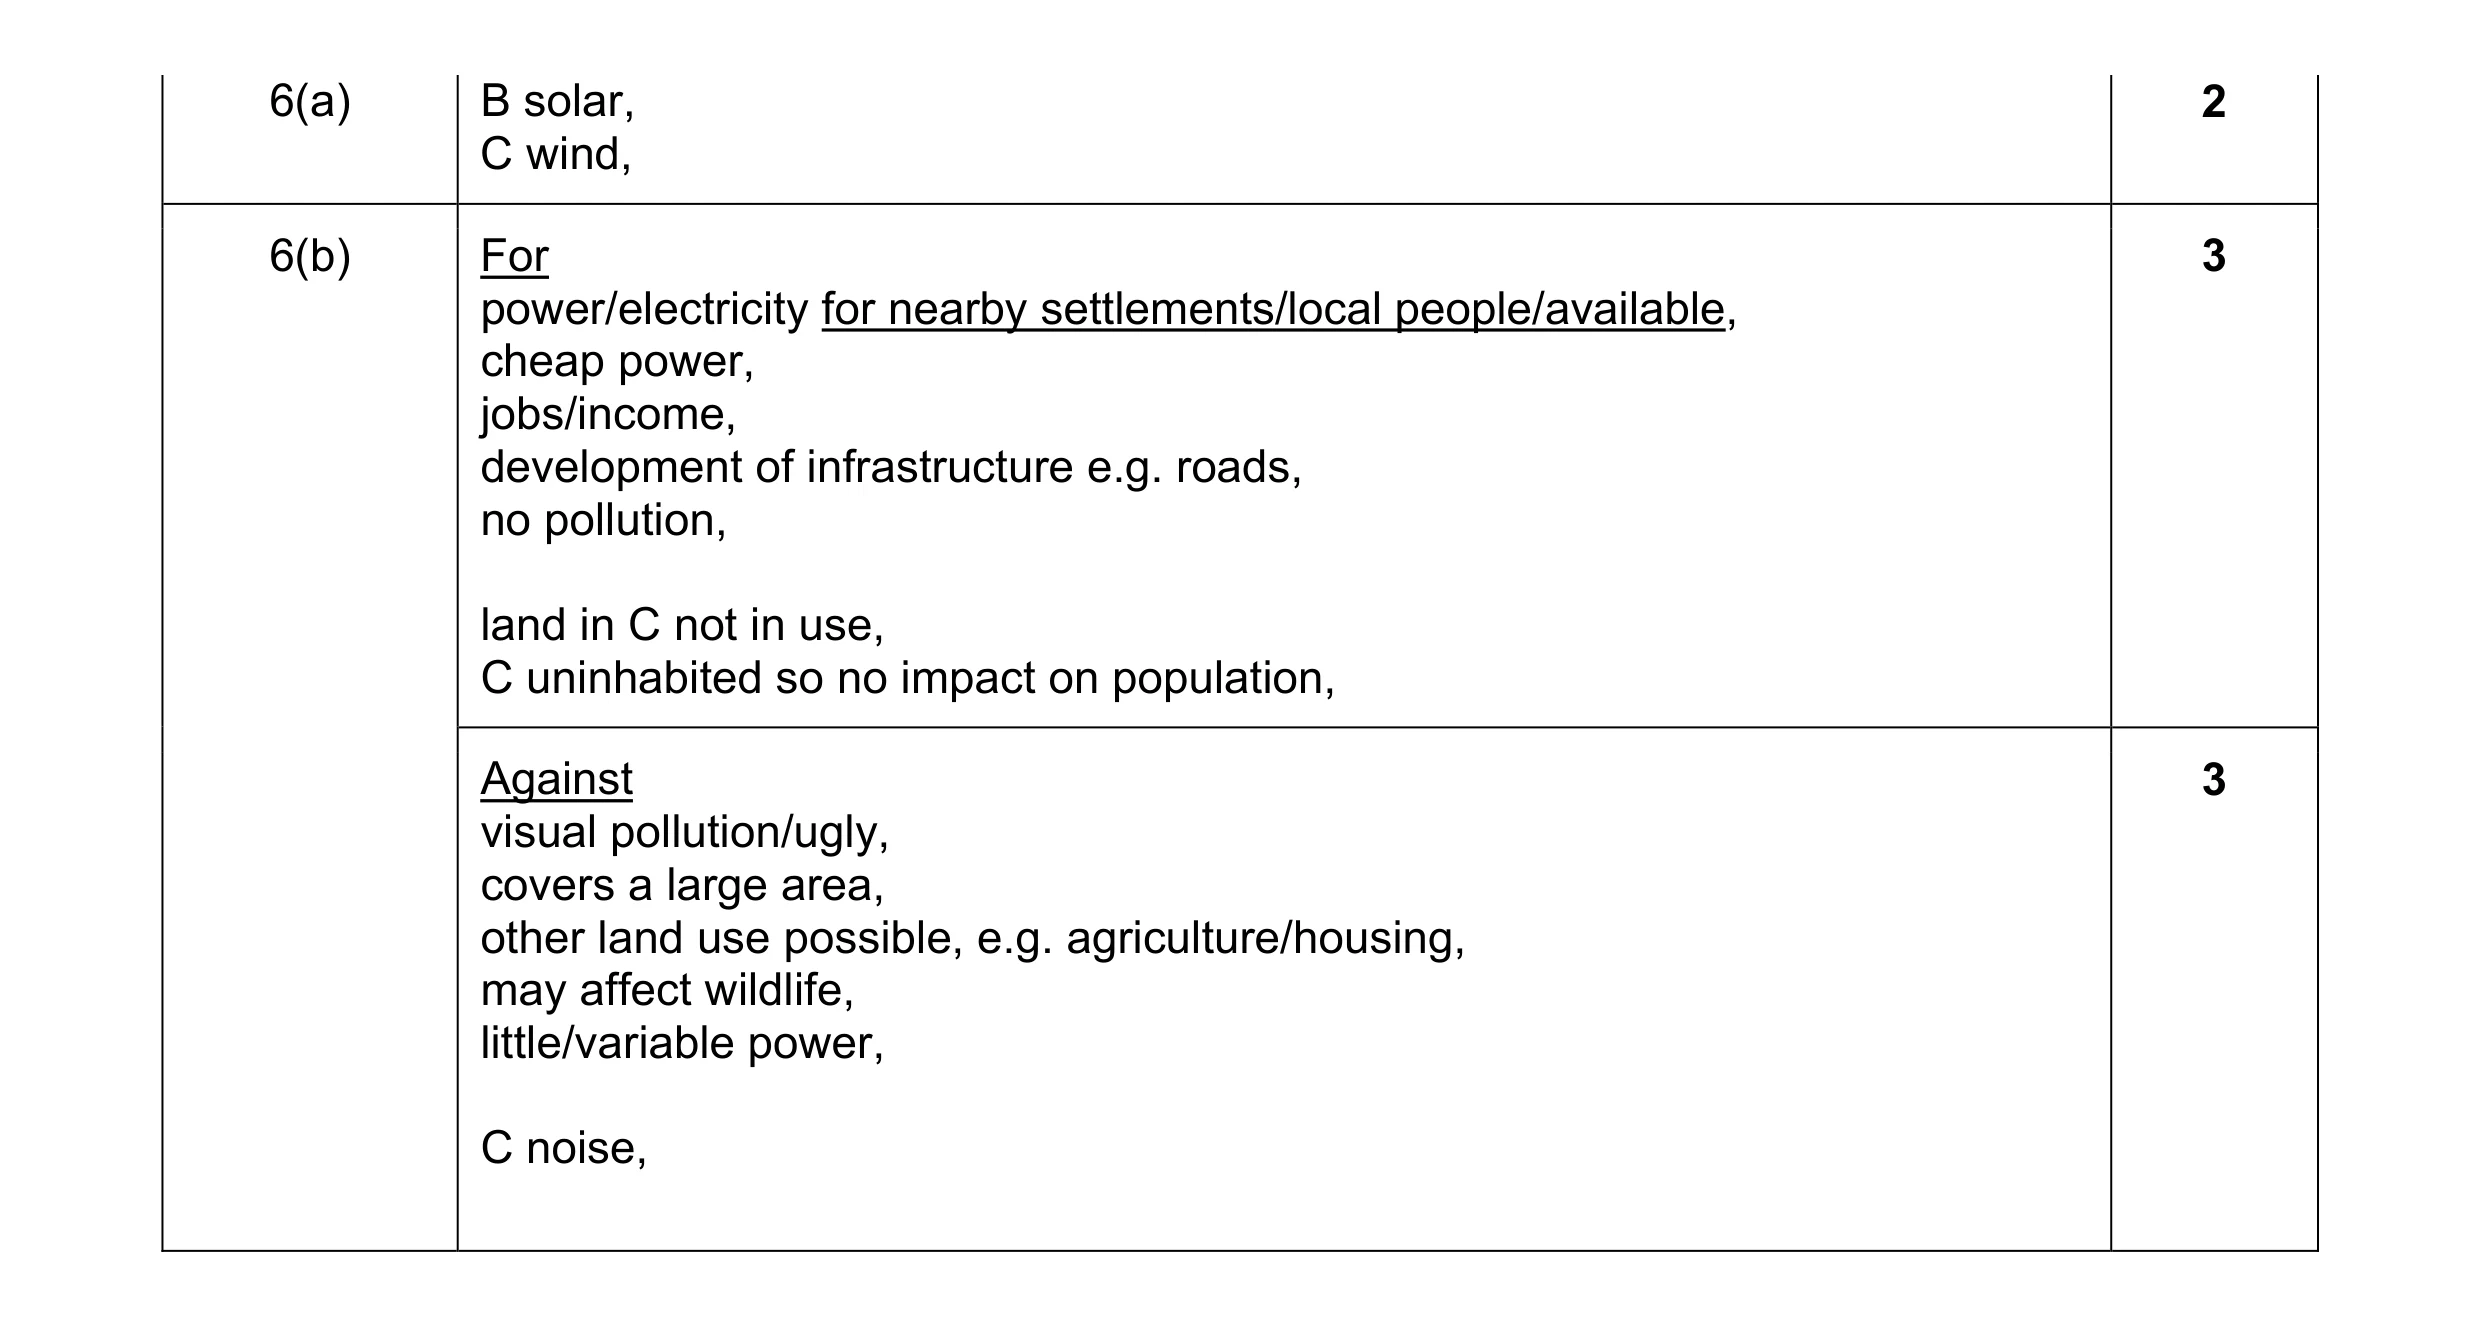
Mark scheme: 6(a) B solar, 2 C wind, 6(b) For 3 power/electricity for nearby settlements/local people/available, cheap power, jobs/income, development of infrastructure e.g. roads, no pollution, land in C not in use, C uninhabited so no impact on population, Against 3 visual pollution/ugly, covers a large area, other land use possible, e.g. agriculture/housing, may affect wildlife, little/variable power, C noise,
This question in 0460/22 Feb/March 2017
Q2 · Name the type of renewable source of electricity generation that: (i) comes from… 0460/23 May/June 2017
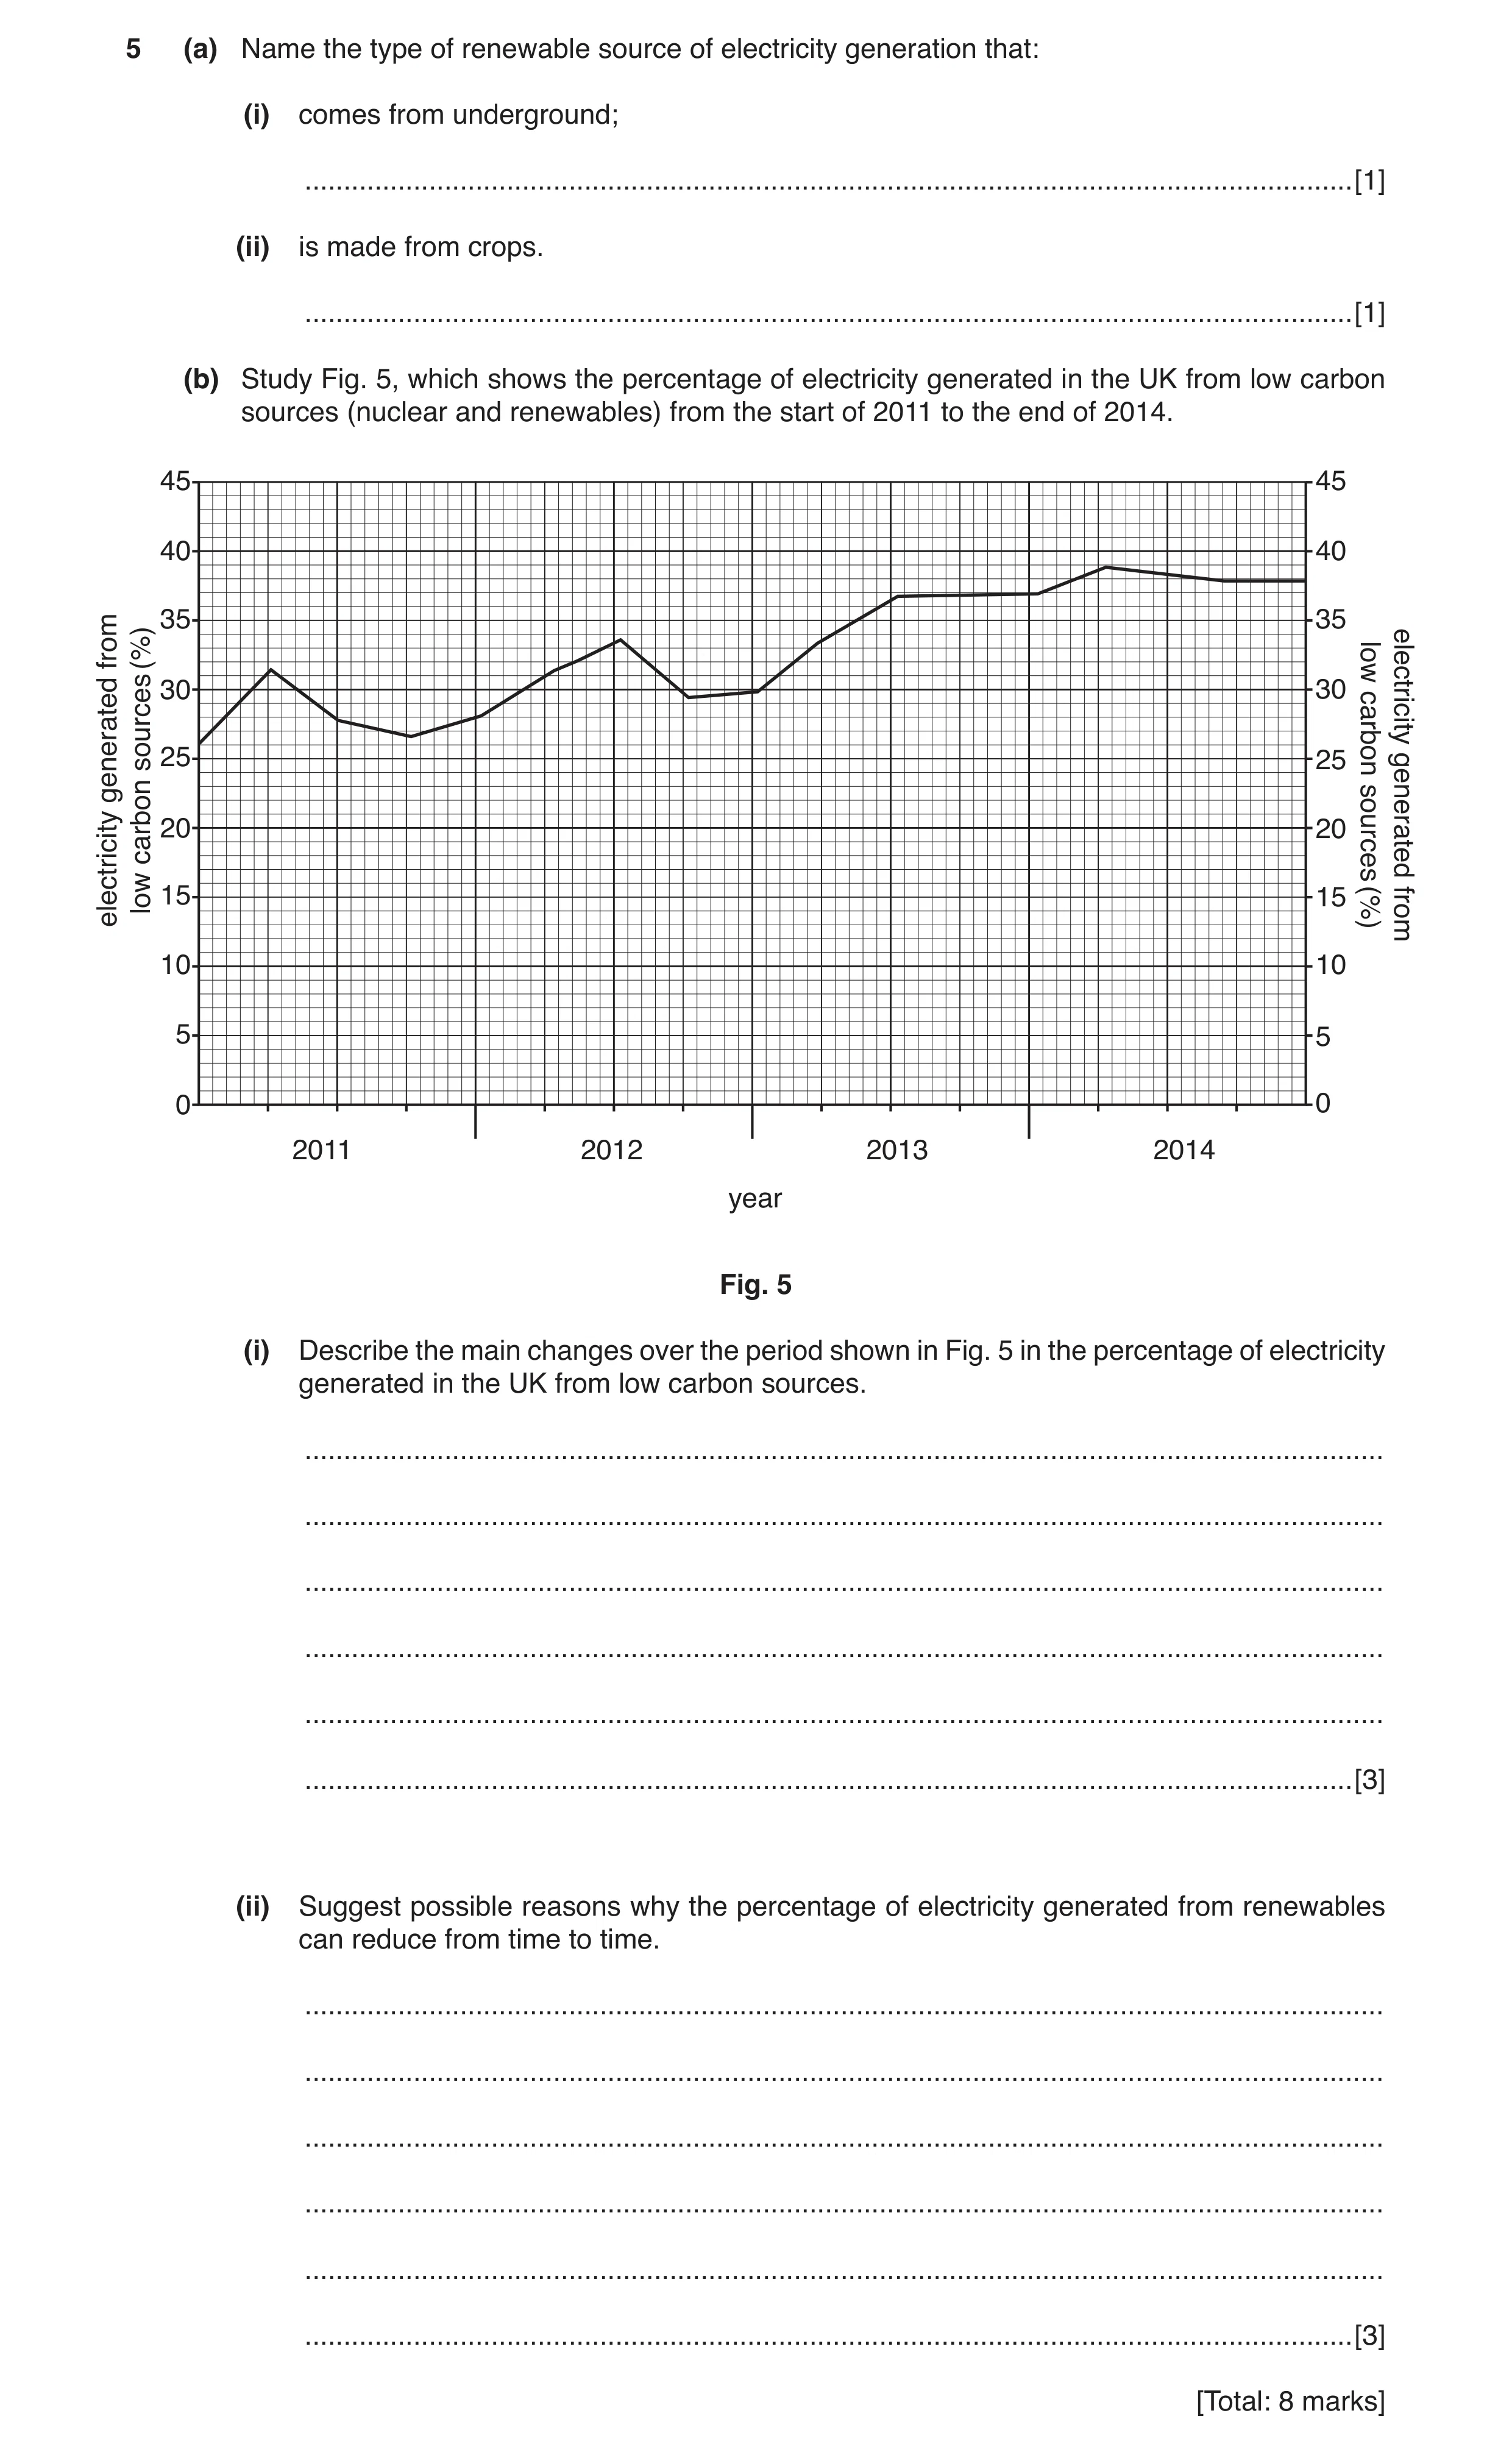
5 (a) Name the type of renewable source of electricity generation that: (i) comes from underground; … [1] (ii) is made from crops. … [1] (b) Study Fig. 5, which shows the percentage of electricity generated in the UK from low carbon sources (nuclear and renewables) from the start of 2011 to the end of 2014. 45 45 40 40 35 35from(%) low 30 30 electricity 25 25 carbongeneratedsources 20 20 carbon sourcesgenerated low15 15electricity (%)from 10 10 5 5 0 0 2011 2012 2013 2014 year Fig. 5 (i) Describe the main changes over the period shown in Fig. 5 in the percentage of electricity generated in the UK from low carbon sources. … … … … … … [3] (ii) Suggest possible reasons why the percentage of electricity generated from renewables can reduce from time to time. … … … … … … [3] [Total: 8 marks]
8 marks
Mark scheme: 5(a)(i) geothermal, 1 5(a)(ii) biofuel/biomass/biogas, 1 5(b)(i) overall increase, 3 by 12%/from 26% to 38%, fluctuated, 2011 increase then decrease, 2012 increase then decrease, 2013 increase (then stable), 2014 stable, peak (early) 2014, 5(b)(ii) period of calm stops generation of electricity by wind, 3 strong winds stop generation of electricity by wind, solar power reduces in cloudy/low sun periods, solar power reduces at night, HEP stops if river freezes, HEP stops during drought, (some) biofuel is seasonal/affected by crop failure, Increased use of other sources/named source,
This question in 0460/23 May/June 2017
Q3 · Annual average solar radiation in South Africa 0460/22 Oct/Nov 2017
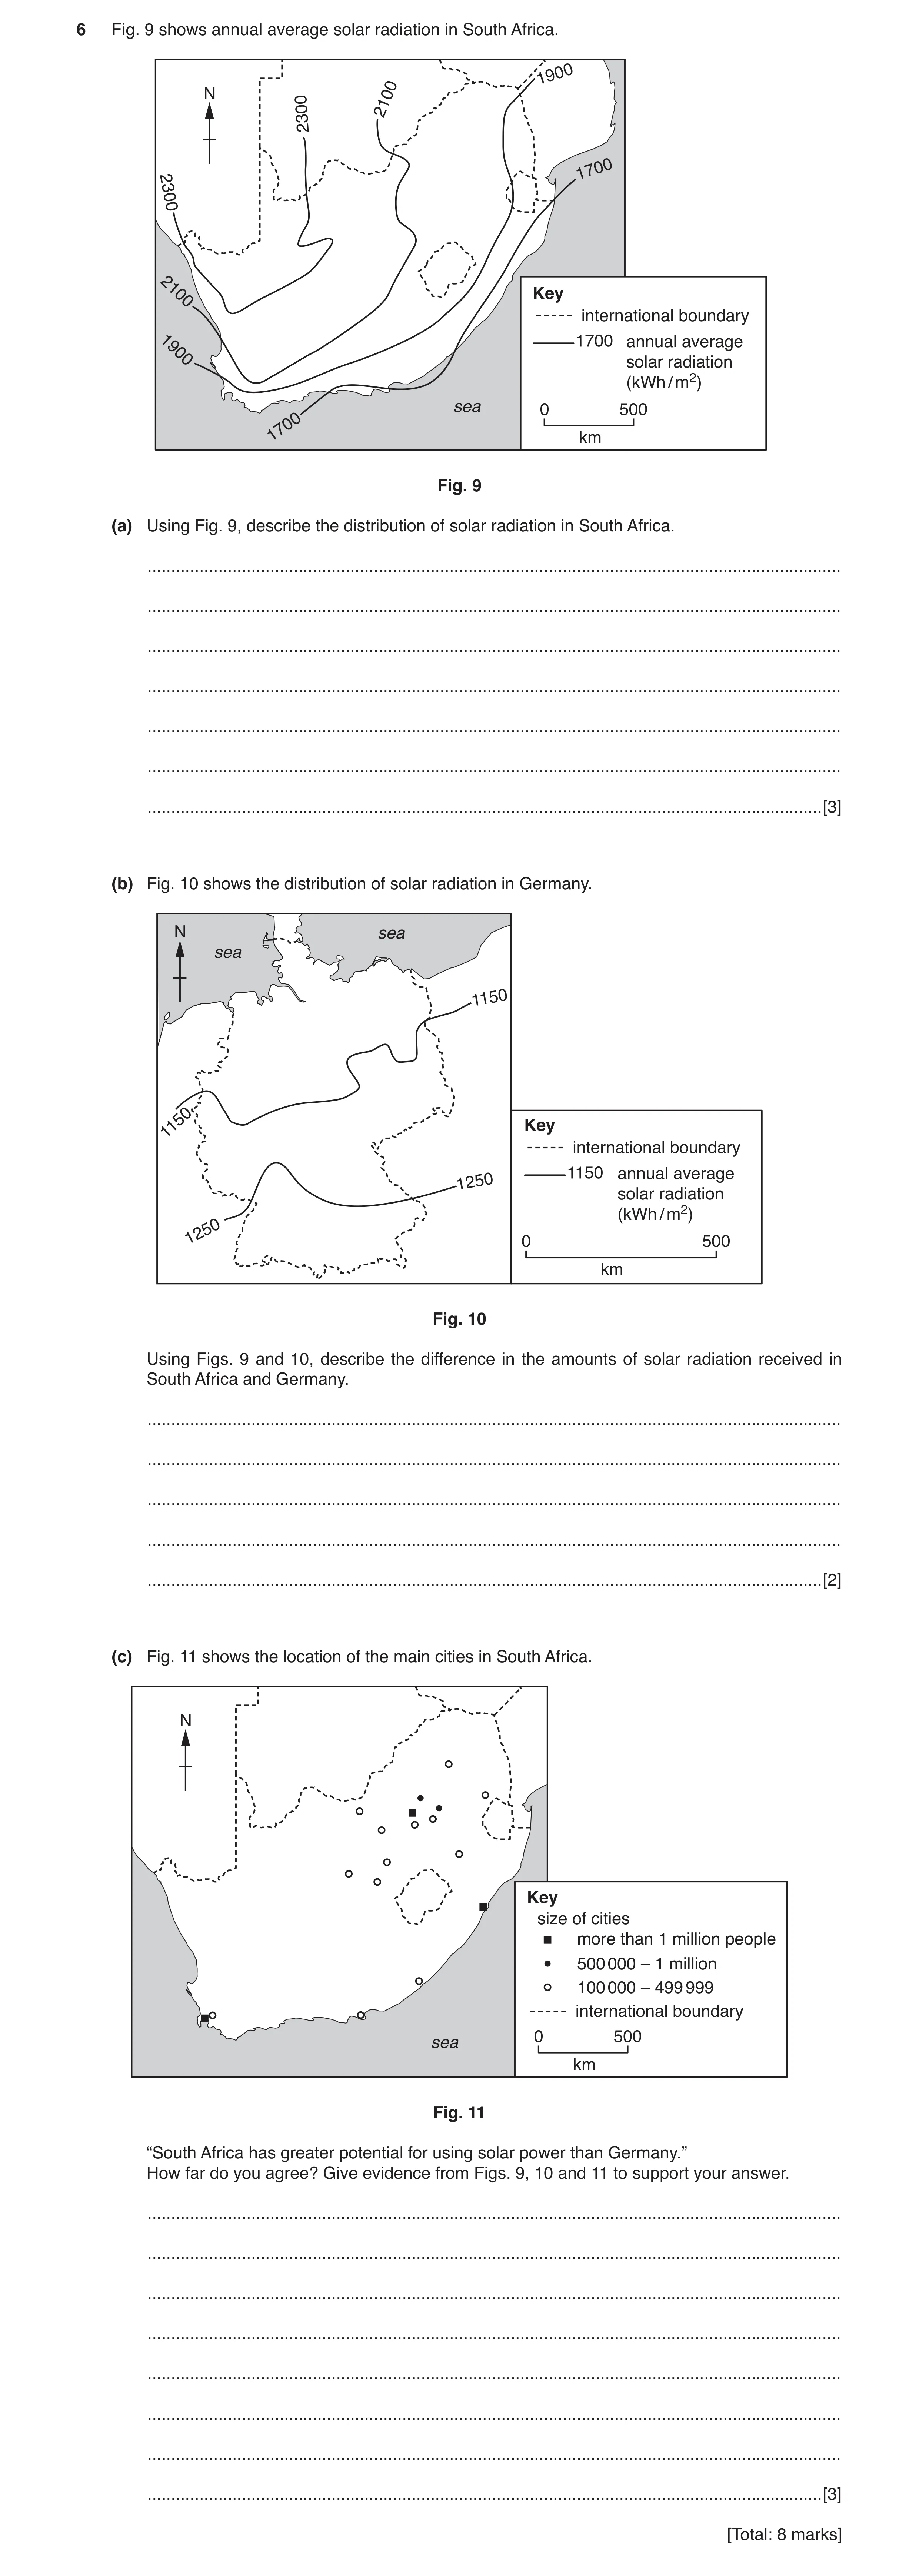
6 Fig. 9 shows annual average solar radiation in South Africa. 1900 N 2100 2300 1700 2300 Key 2100 international boundary 1900 1700 annualsolar radiationaverage (kWh / m2) sea 0 500 1700 km Fig. 9 (a) Using Fig. 9, describe the distribution of solar radiation in South Africa. … … … … … … … [3] (b) Fig. 10 shows the distribution of solar radiation in Germany. N sea sea 1150 Key 1150 international boundary 1150 annual average 1250 solar radiation (kWh / m2) 1250 0 500 km Fig. 10 Using Figs. 9 and 10, describe the difference in the amounts of solar radiation received in South Africa and Germany. … … … … … [2] (c) Fig. 11 shows the location of the main cities in South Africa. N Key size of cities more than 1 million people 500 000 – 1 million 100 000 – 499 999 international boundary 0 500 sea km Fig. 11 “South Africa has greater potential for using solar power than Germany.” How far do you agree? Give evidence from Figs. 9, 10 and 11 to support your answer. … … … … … … … … [3] [Total: 8 marks]
8 marks
Mark scheme: 6(a) high(er)(est) in NW/WNW/W, 3 low(er)(est) in E/ESE/SE, least/lower along coast/highest/higher inland (comparative needed), use of a figure to support any of the above statements max 1 (e.g. 1 700 kWh/(m2) in SE), 6(b) Germany lower, 2 highest in Germany lower than highest in South Africa, lowest in Germany lower than lowest in South Africa, all of Germany lower than lowest in South Africa, Germany smaller differences/range of values, Germany increases to south + South Africa increases to NW/WNW/W, Or emphasis on South Africa. 6(c) (For) 3 SA has high solar radiation values, SA has higher solar radiation then Germany, area with cities/population has high solar radiation/1 650–2 100 kWh/(m2) /more than Germany, (e.g. Johannesburg area) large area to generate solar power, (Against) area with few cities/population has high(est) solar radiation/over 2 100 kWh/(m2), (north west) area with cities/population has low(est) solar radiation, (coast) (Either) discussion of transmission costs/distances,
This question in 0460/22 Oct/Nov 2017
Q4 · Information about a coal-fired power station at Kalundborg in Denmark and its links with… 0460/21 Oct/Nov 2018
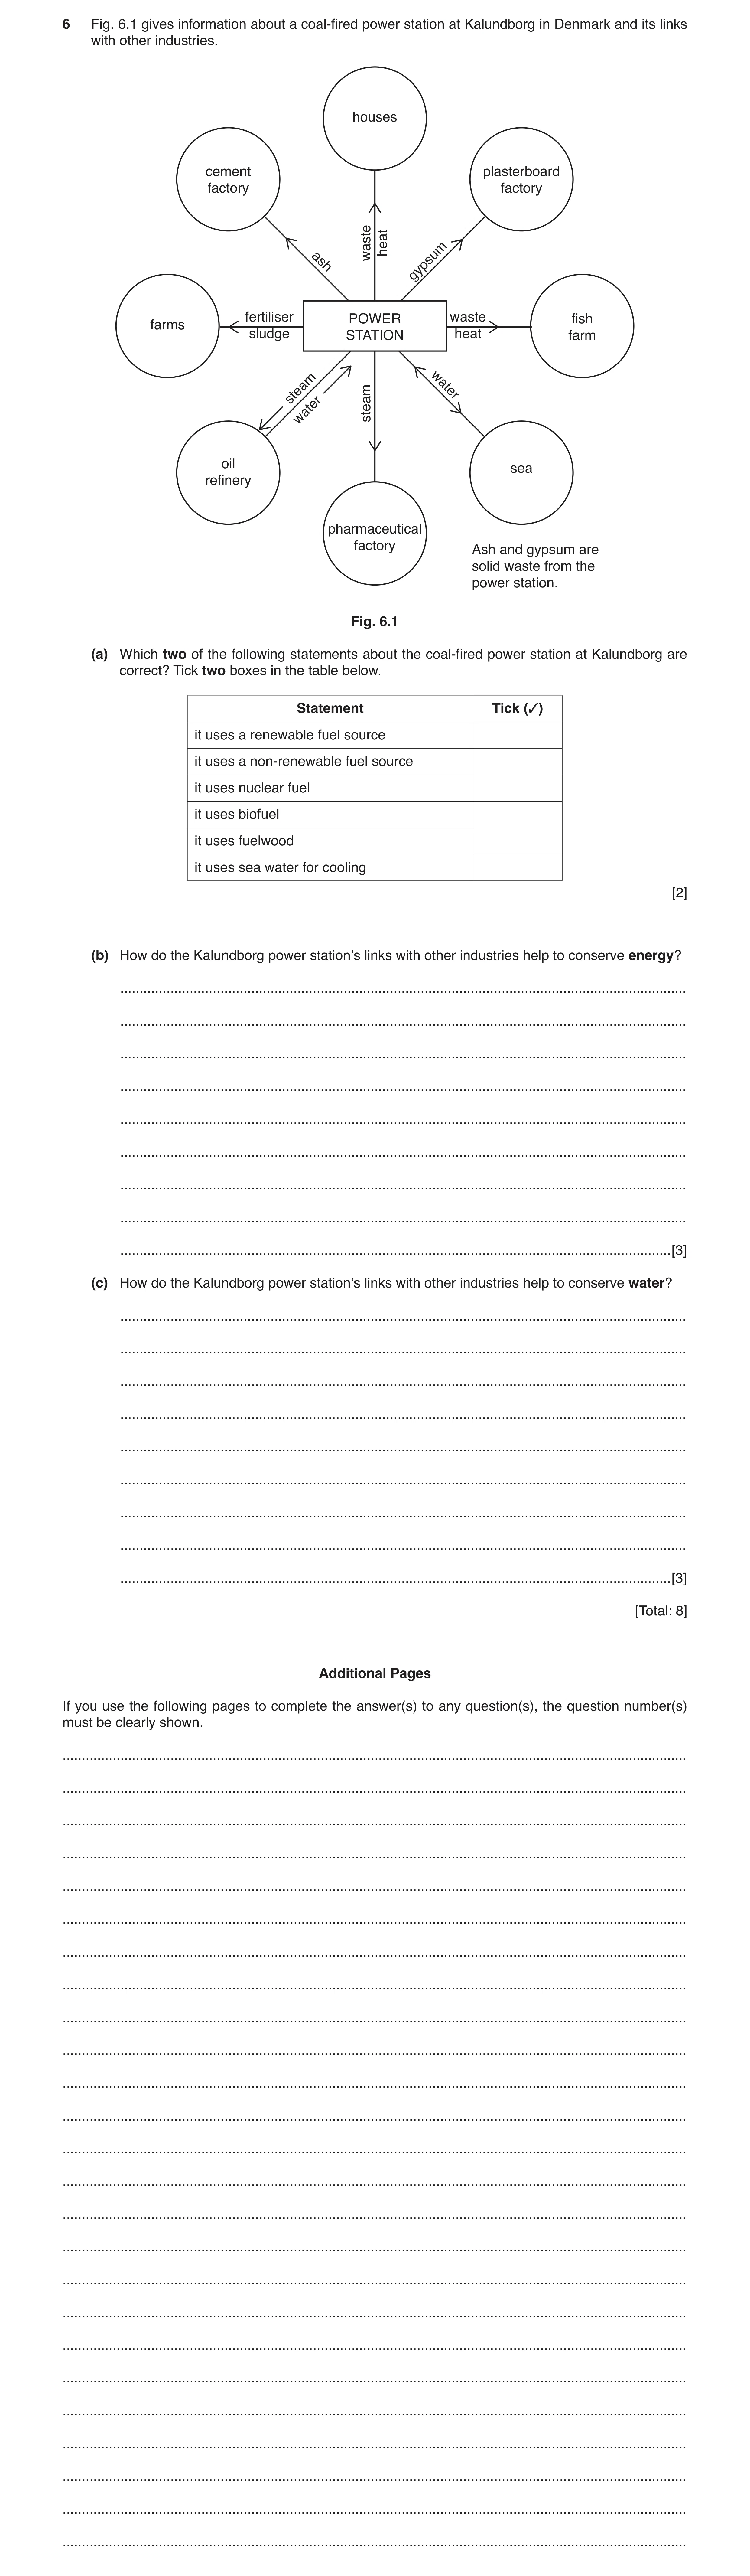
6 Fig. 6.1 gives information about a coal-fired power station at Kalundborg in Denmark and its links with other industries. houses cement plasterboard factory factory heat waste ash gypsum fertiliser POWER waste fish farms sludge STATION heat farm steam water steam water oil sea refinery pharmaceutical factory Ash and gypsum are solid waste from the power station. Fig. 6.1 (a) Which two of the following statements about the coal-fired power station at Kalundborg are correct? Tick two boxes in the table below. Statement Tick (3) it uses a renewable fuel source it uses a non-renewable fuel source it uses nuclear fuel it uses biofuel it uses fuelwood it uses sea water for cooling [2] (b) How do the Kalundborg power station’s links with other industries help to conserve energy? … … … … … … … … … [3] (c) How do the Kalundborg power station’s links with other industries help to conserve water? … … … … … … … … … [3] [Total: 8] Additional Pages If you use the following pages to complete the answer(s) to any question(s), the question number(s) must be clearly shown. … … … … … … … … … … … … … … … … … … … … … … … … …
8 marks
Mark scheme: 6(a) it uses a non-renewable fuel source 2 it uses sea water for cooling 6(b) heat/energy to houses 3 heat/energy to fish farms steam to oil refinery steam to pharmaceutical factory 6(c) water re-cycled/re-used 3 steam to oil refinery water from oil refinery water to sea water from sea
This question in 0460/21 Oct/Nov 2018
Question 5 0460/23 Oct/Nov 2018
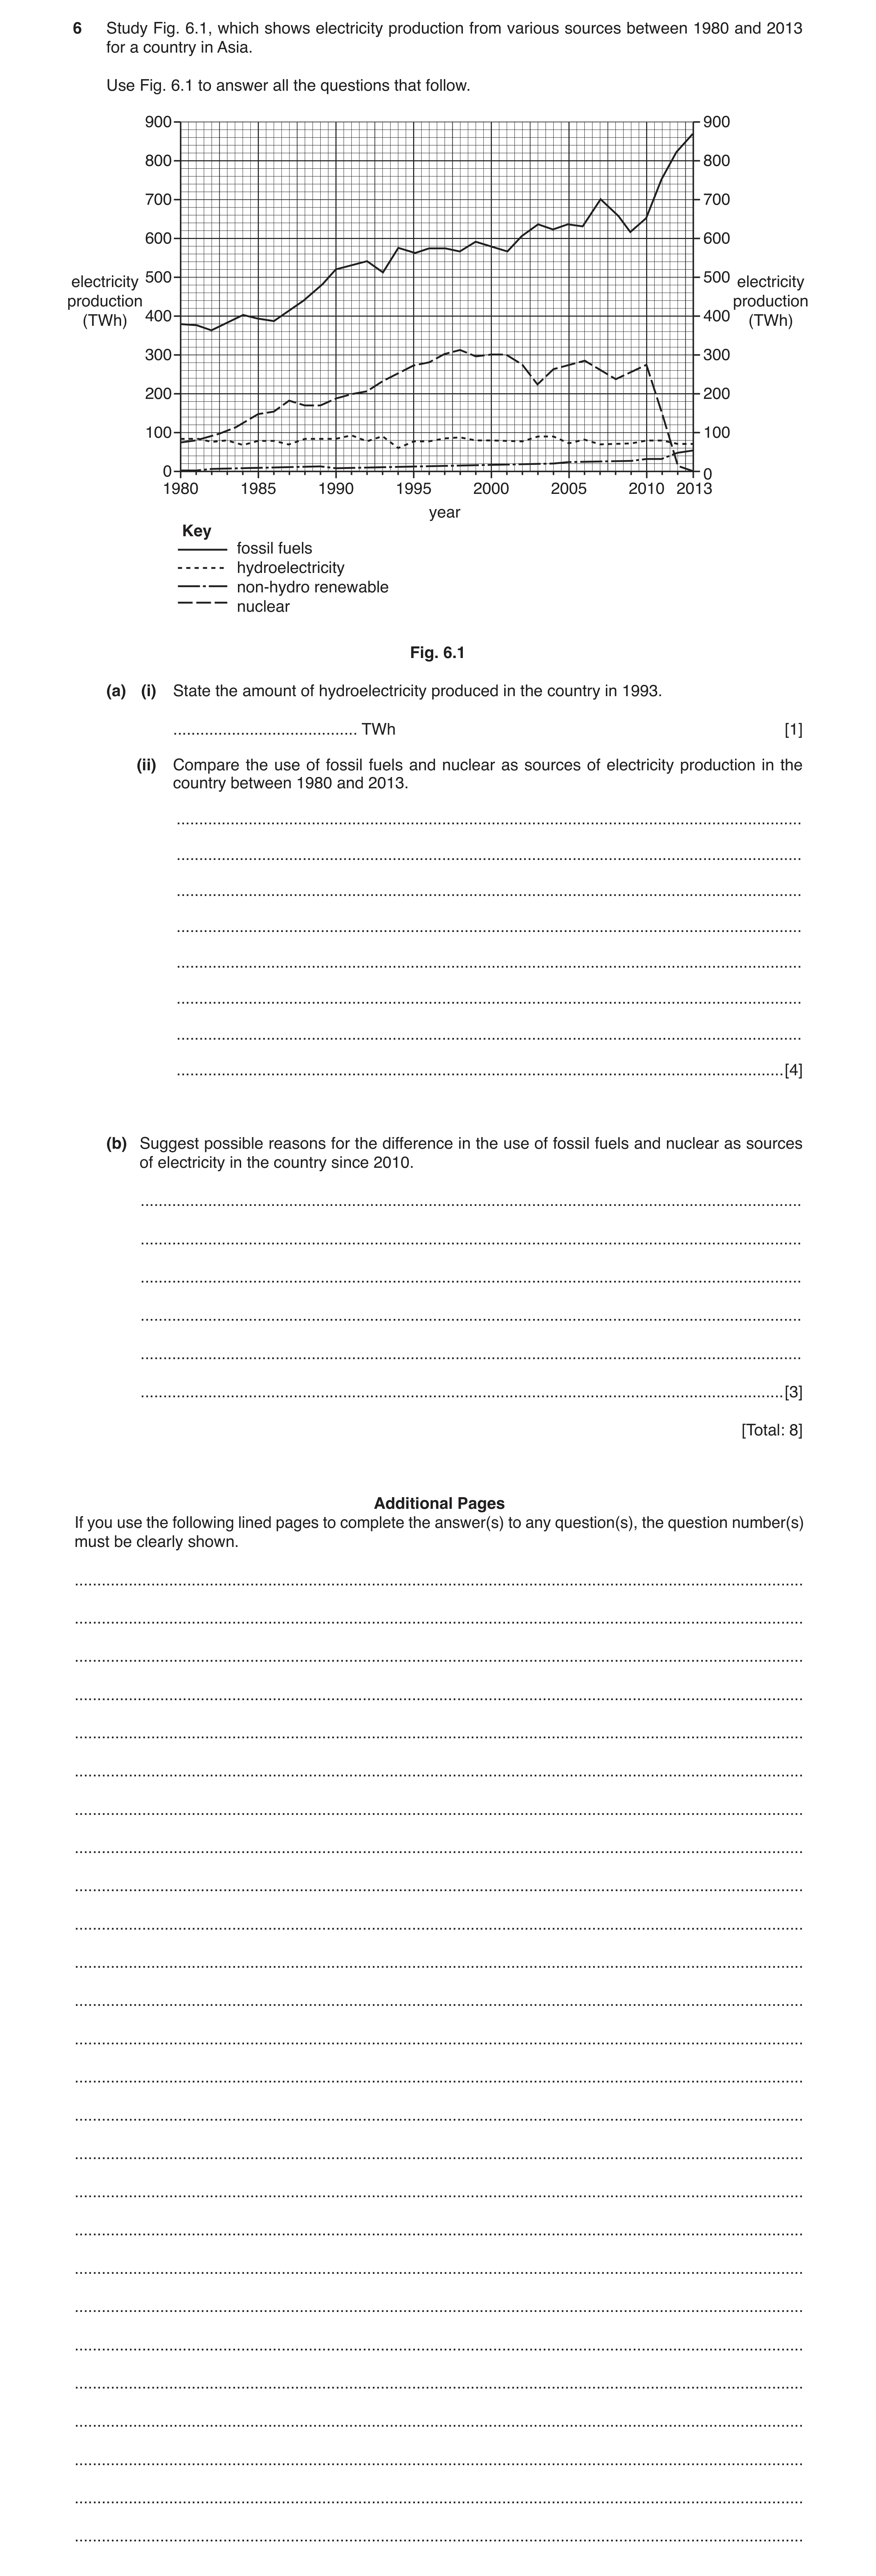
6 Study Fig. 6.1, which shows electricity production from various sources between 1980 and 2013 for a country in Asia. Use Fig. 6.1 to answer all the questions that follow. 900 900 800 800 700 700 600 600 500 500 electricity electricity production production 400 400 (TWh) (TWh) 300 300 200 200 100 100 0 0 1980 1985 1990 1995 2000 2005 2010 2013 year Key fossil fuels hydroelectricity non-hydro renewable nuclear Fig. 6.1 (a) (i) State the amount of hydroelectricity produced in the country in 1993. … TWh [1] (ii) Compare the use of fossil fuels and nuclear as sources of electricity production in the country between 1980 and 2013. … … … … … … … … [4] (b) Suggest possible reasons for the difference in the use of fossil fuels and nuclear as sources of electricity in the country since 2010. … … … … … … [3] [Total: 8] Additional Pages If you use the following lined pages to complete the answer(s) to any question(s), the question number(s) must be clearly shown. … … … … … … … … … … … … … … … … … … … … … … … … … …
8 marks
Mark scheme: 6(a)(i) 85–90 (TWh) 1 6(a)(ii) fossil fuels more than nuclear 4 both rose from 1980 to any date up to 2000 both fluctuated/unstable 1998–2007/2008/2009/2010 fossil fuels increased and nuclear decreased since 2010 fossil fuels increased and nuclear decreased/ceased paired data showing difference = 1 6(b) Nuclear 3 policy change to replace nuclear leak/danger/harm/waste damage by earthquake/tsunami/other stations reached end of their lives Fossil fuels new source of fossil fuels found improvements in mining technology make up for decrease in nuclear Both fossil fuels cheaper/nuclear more expensive more concern about radioactive leaks than global warming
This question in 0460/23 Oct/Nov 2018
Q6 · Electricity generation from HEP (hydroelectric power) and other renewables in the USA… 0460/22 Feb/March 2020
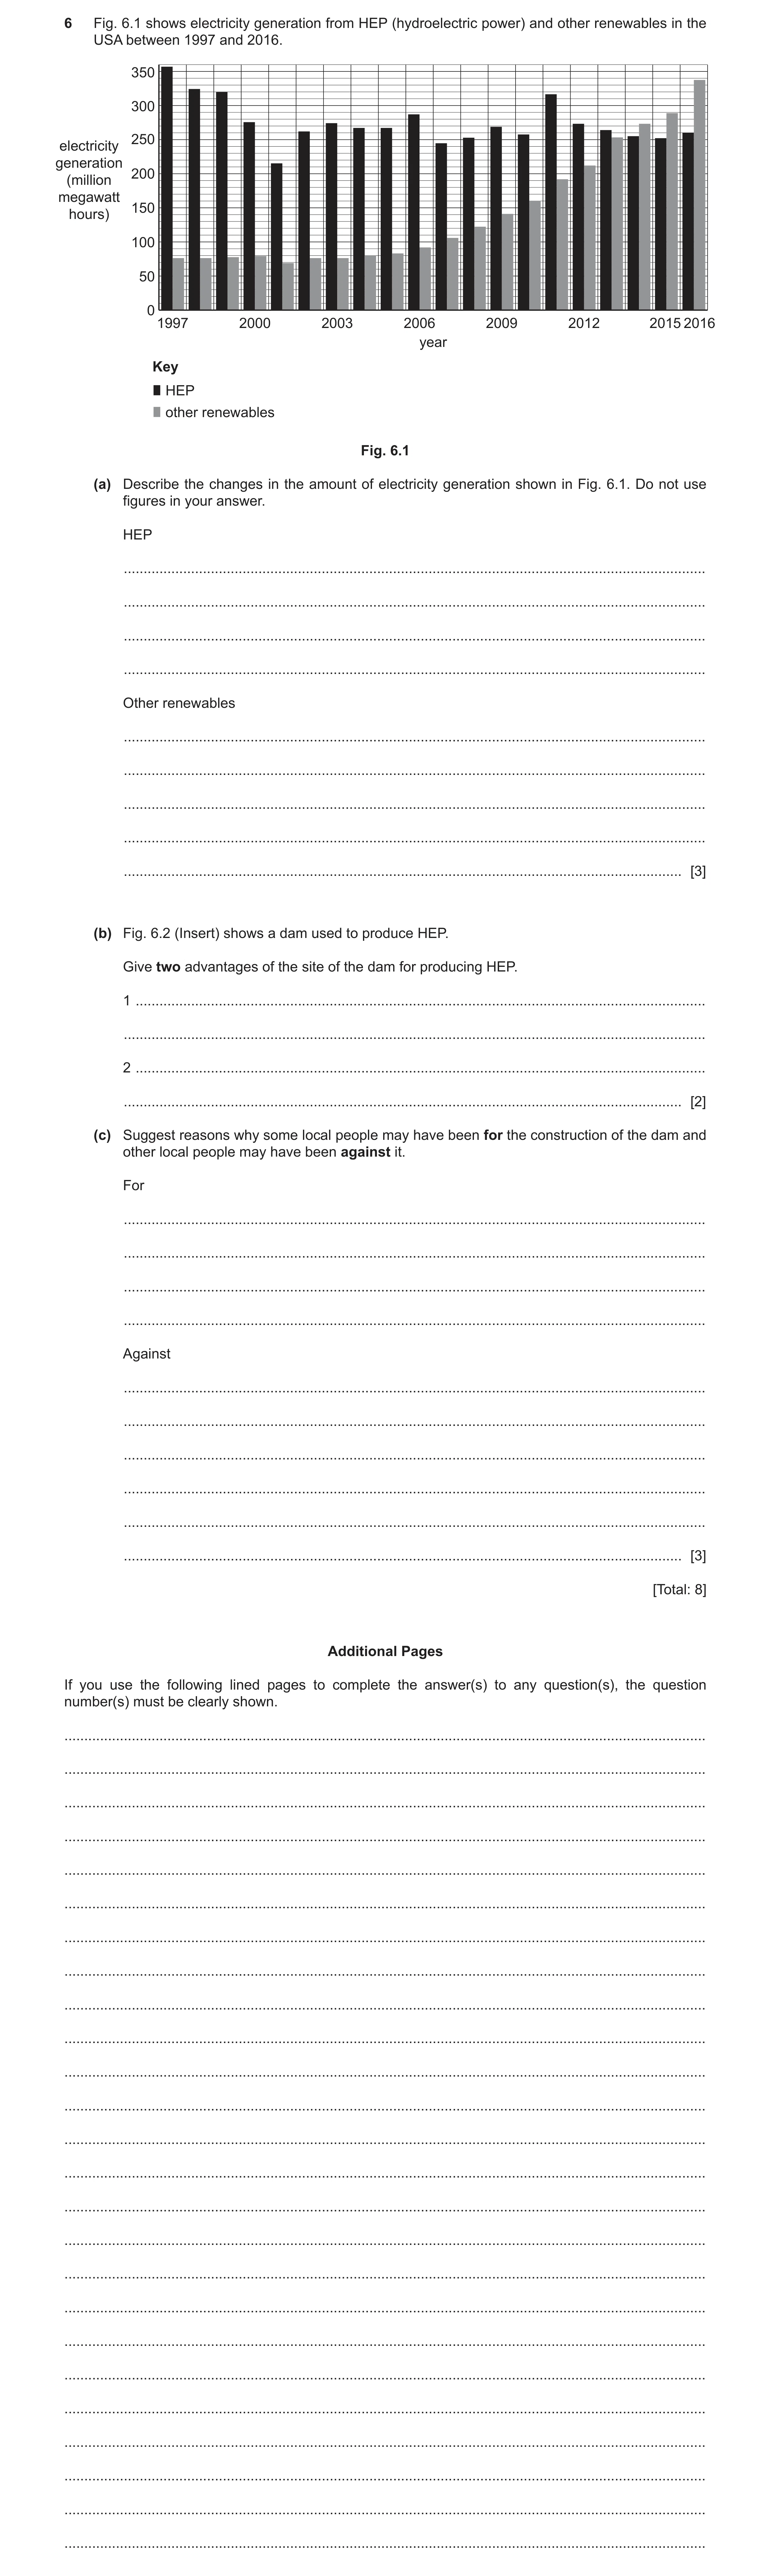
6 Fig. 6.1 shows electricity generation from HEP (hydroelectric power) and other renewables in the USA between 1997 and 2016. 350 300 250 electricity generation 200 (million megawatt 150 hours) 100 50 0 1997 2000 2003 2006 2009 2012 2015 2016 year Key HEP other renewables Fig. 6.1 (a) Describe the changes in the amount of electricity generation shown in Fig. 6.1. Do not use figures in your answer. HEP … … … … Other renewables … … … … … [3] (b) Fig. 6.2 (Insert) shows a dam used to produce HEP. Give two advantages of the site of the dam for producing HEP. 1 … … 2 … … [2] (c) Suggest reasons why some local people may have been for the construction of the dam and other local people may have been against it. For … … … … Against … … … … … … [3] [Total: 8] Additional Pages If you use the following lined pages to complete the answer(s) to any question(s), the question number(s) must be clearly shown. … … … … … … … … … … … … … … … … … … … … … … … … …
8 marks
Mark scheme: 6(a) Hydroelectricity 3 fluctuated (year to year)/variable/not stable, overall decrease/overall little change, Other renewables steady/low until 2004/2005/2006/2007,) steady then increased alone/overall increased from 2004/2005/2006/2007, ) increase alone = 1 Reserve one mark for each. 6(b) narrow/deep valley, 2 steep slopes (for head of water), sparse population/few buildings, mountainous therefore high rainfall, 6(c) For 3 supply of electricity/energy, supply of water, employment, development of tourism/lake for recreation, development of new road, Against loss of/flooding of housing/agricultural land/roads/habitats, visual pollution, construction noise, expense of construction, cultural reasons, Reserve one mark for each.
This question in 0460/22 Feb/March 2020
Q7 · Energy consumption in the USA in 2007 and 2016 0460/21 May/June 2020
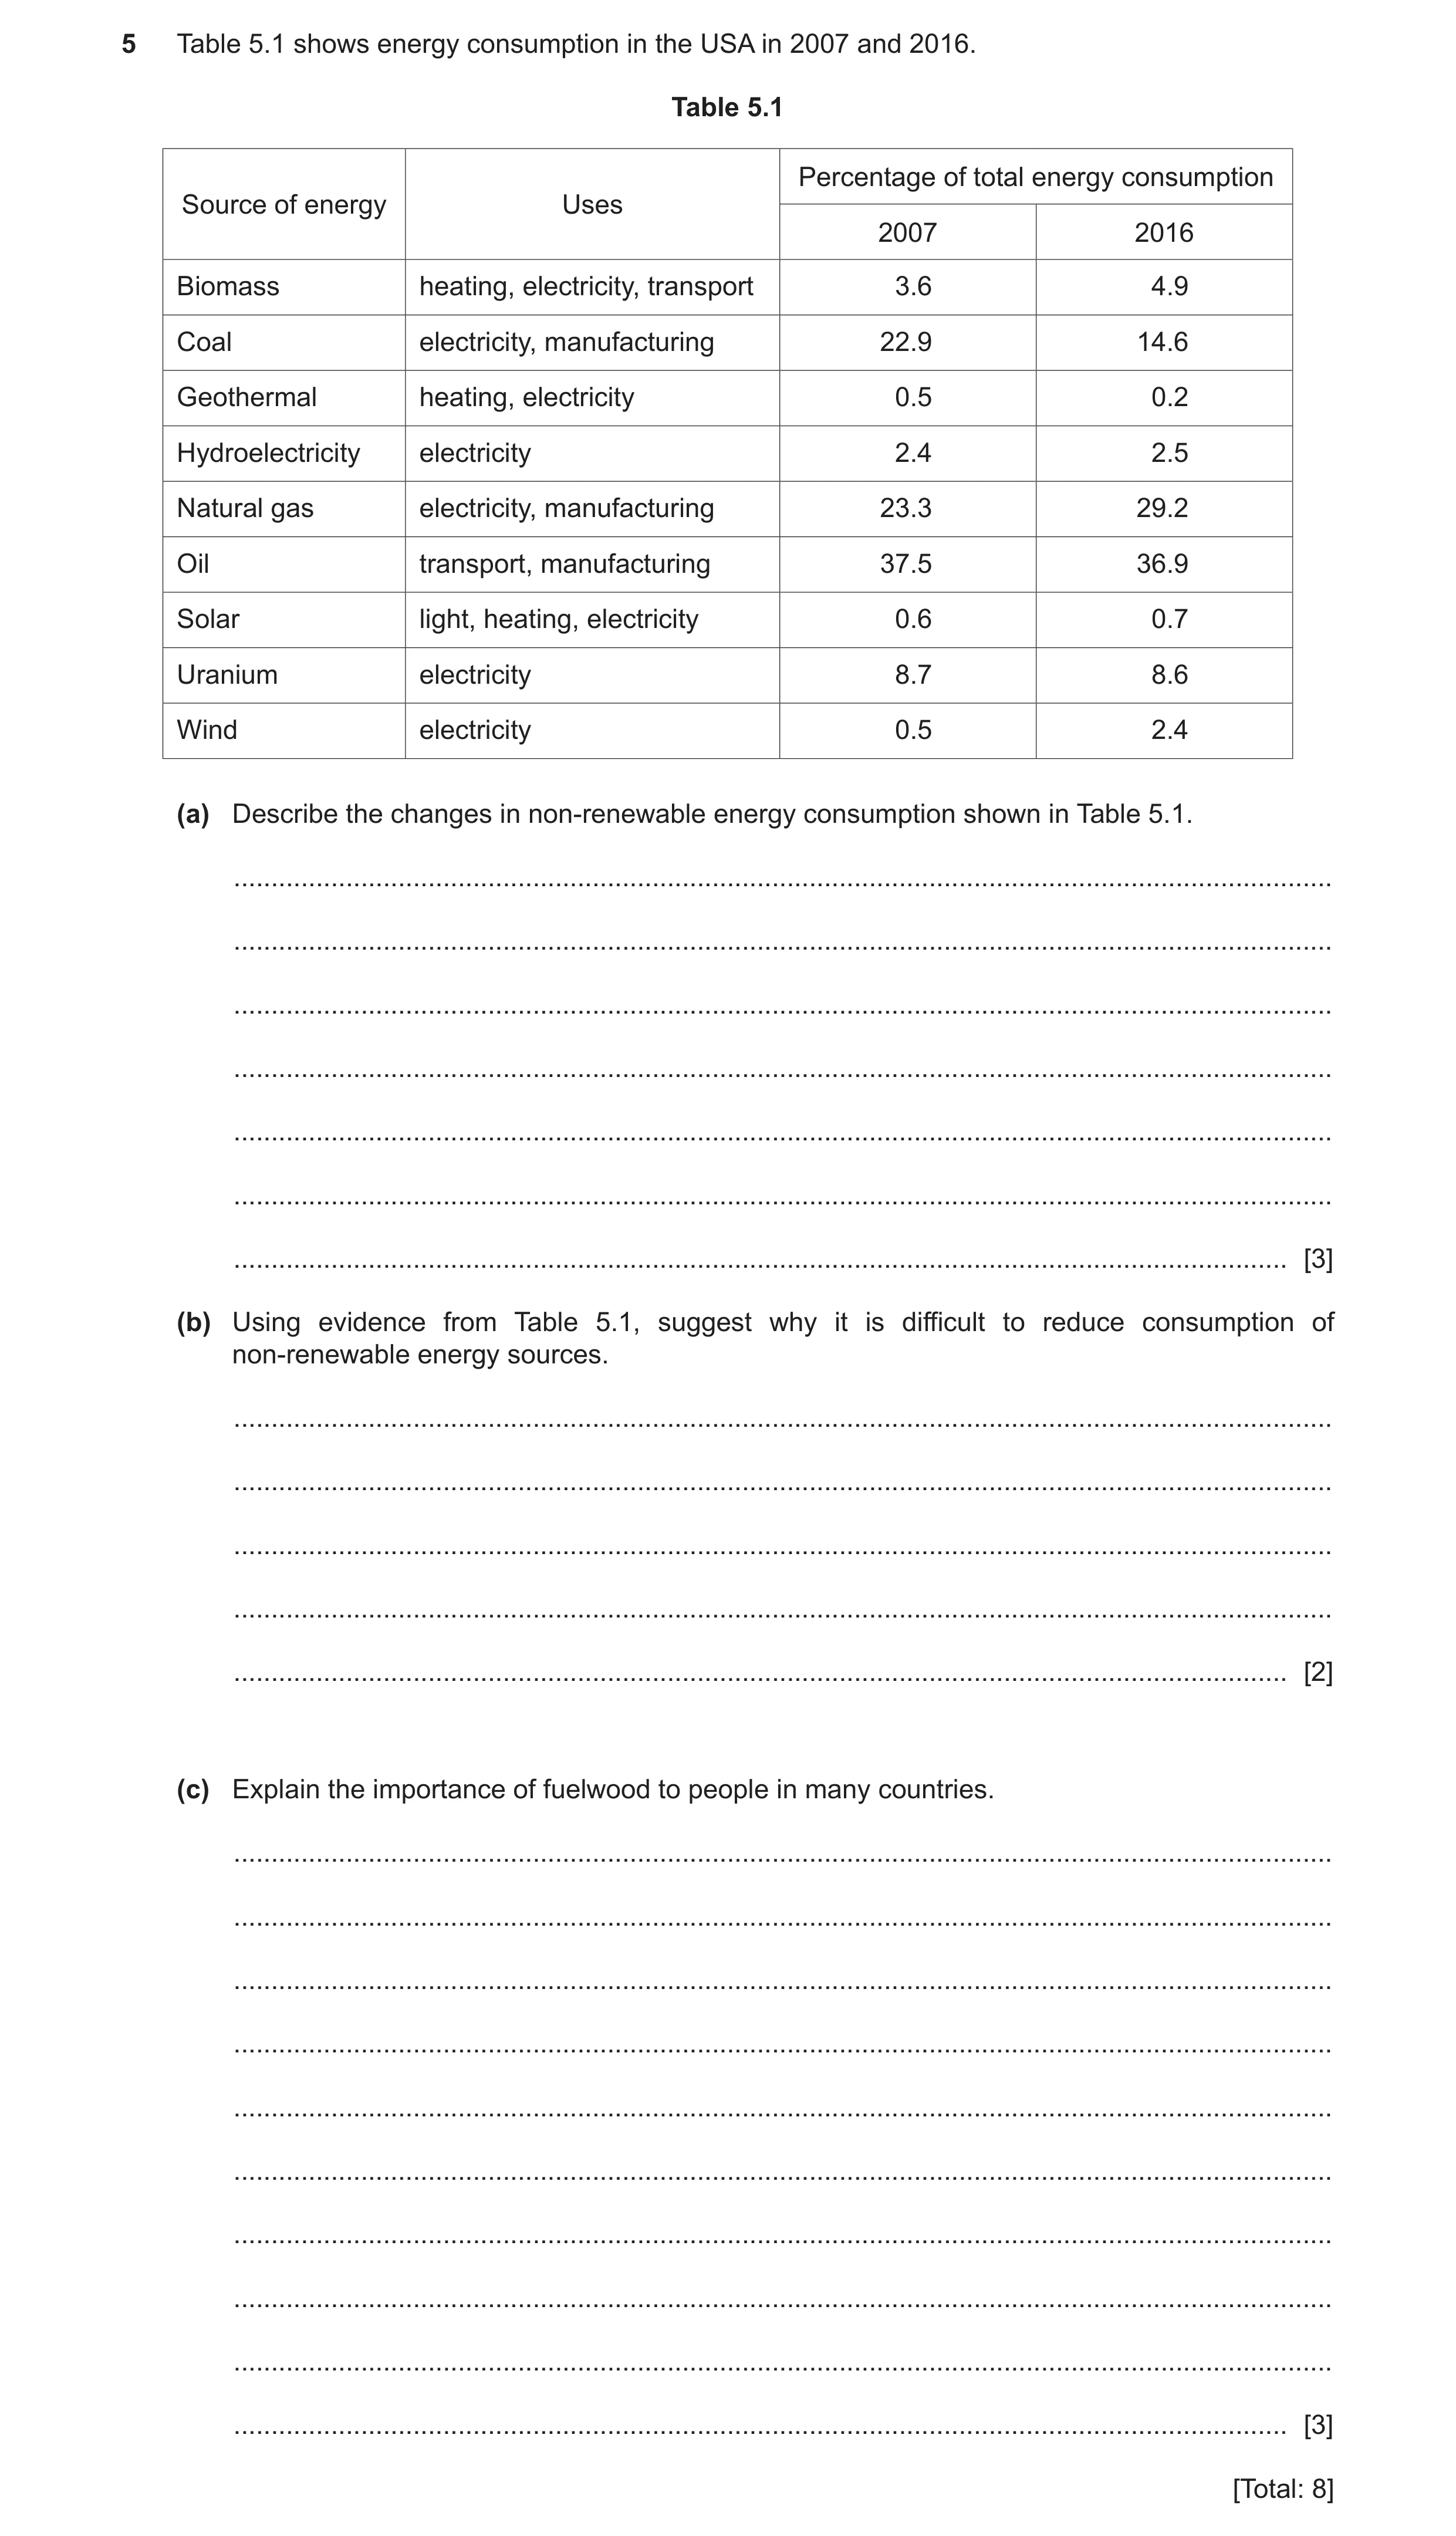
5 Table 5.1 shows energy consumption in the USA in 2007 and 2016. Table 5.1 Percentage of total energy consumption Source of energy Uses 2007 2016 Biomass heating, electricity, transport 3.6 4.9 Coal electricity, manufacturing 22.9 14.6 Geothermal heating, electricity 0.5 0.2 Hydroelectricity electricity 2.4 2.5 Natural gas electricity, manufacturing 23.3 29.2 Oil transport, manufacturing 37.5 36.9 Solar light, heating, electricity 0.6 0.7 Uranium electricity 8.7 8.6 Wind electricity 0.5 2.4 (a) Describe the changes in non-renewable energy consumption shown in Table 5.1. … … … … … … … [3] (b) Using evidence from Table 5.1, suggest why it is difficult to reduce consumption of non-renewable energy sources. … … … … … [2] (c) Explain the importance of fuelwood to people in many countries. … … … … … … … … … … [3] [Total: 8]
8 marks
Mark scheme: 5(a) variable, 3 coal decrease, gas increase, petroleum (small) decrease/steady, uranium (small) increase/steady, 5(b) used in transport, 2 used in manufacturing, few/no other sources for these uses, 5(c) important in LEDCs 3 important in rural areas, may be free to the user, does not require high technology equipment, fuel for heating and cooking, can be renewable/sustainable in some areas there is little wood left, can be sold by the roadside cash crop,
This question in 0460/21 May/June 2020
Q8 · In 2017, 36% of Germany’s electricity was generated from renewable energy sources and 64%… 0460/23 May/June 2020
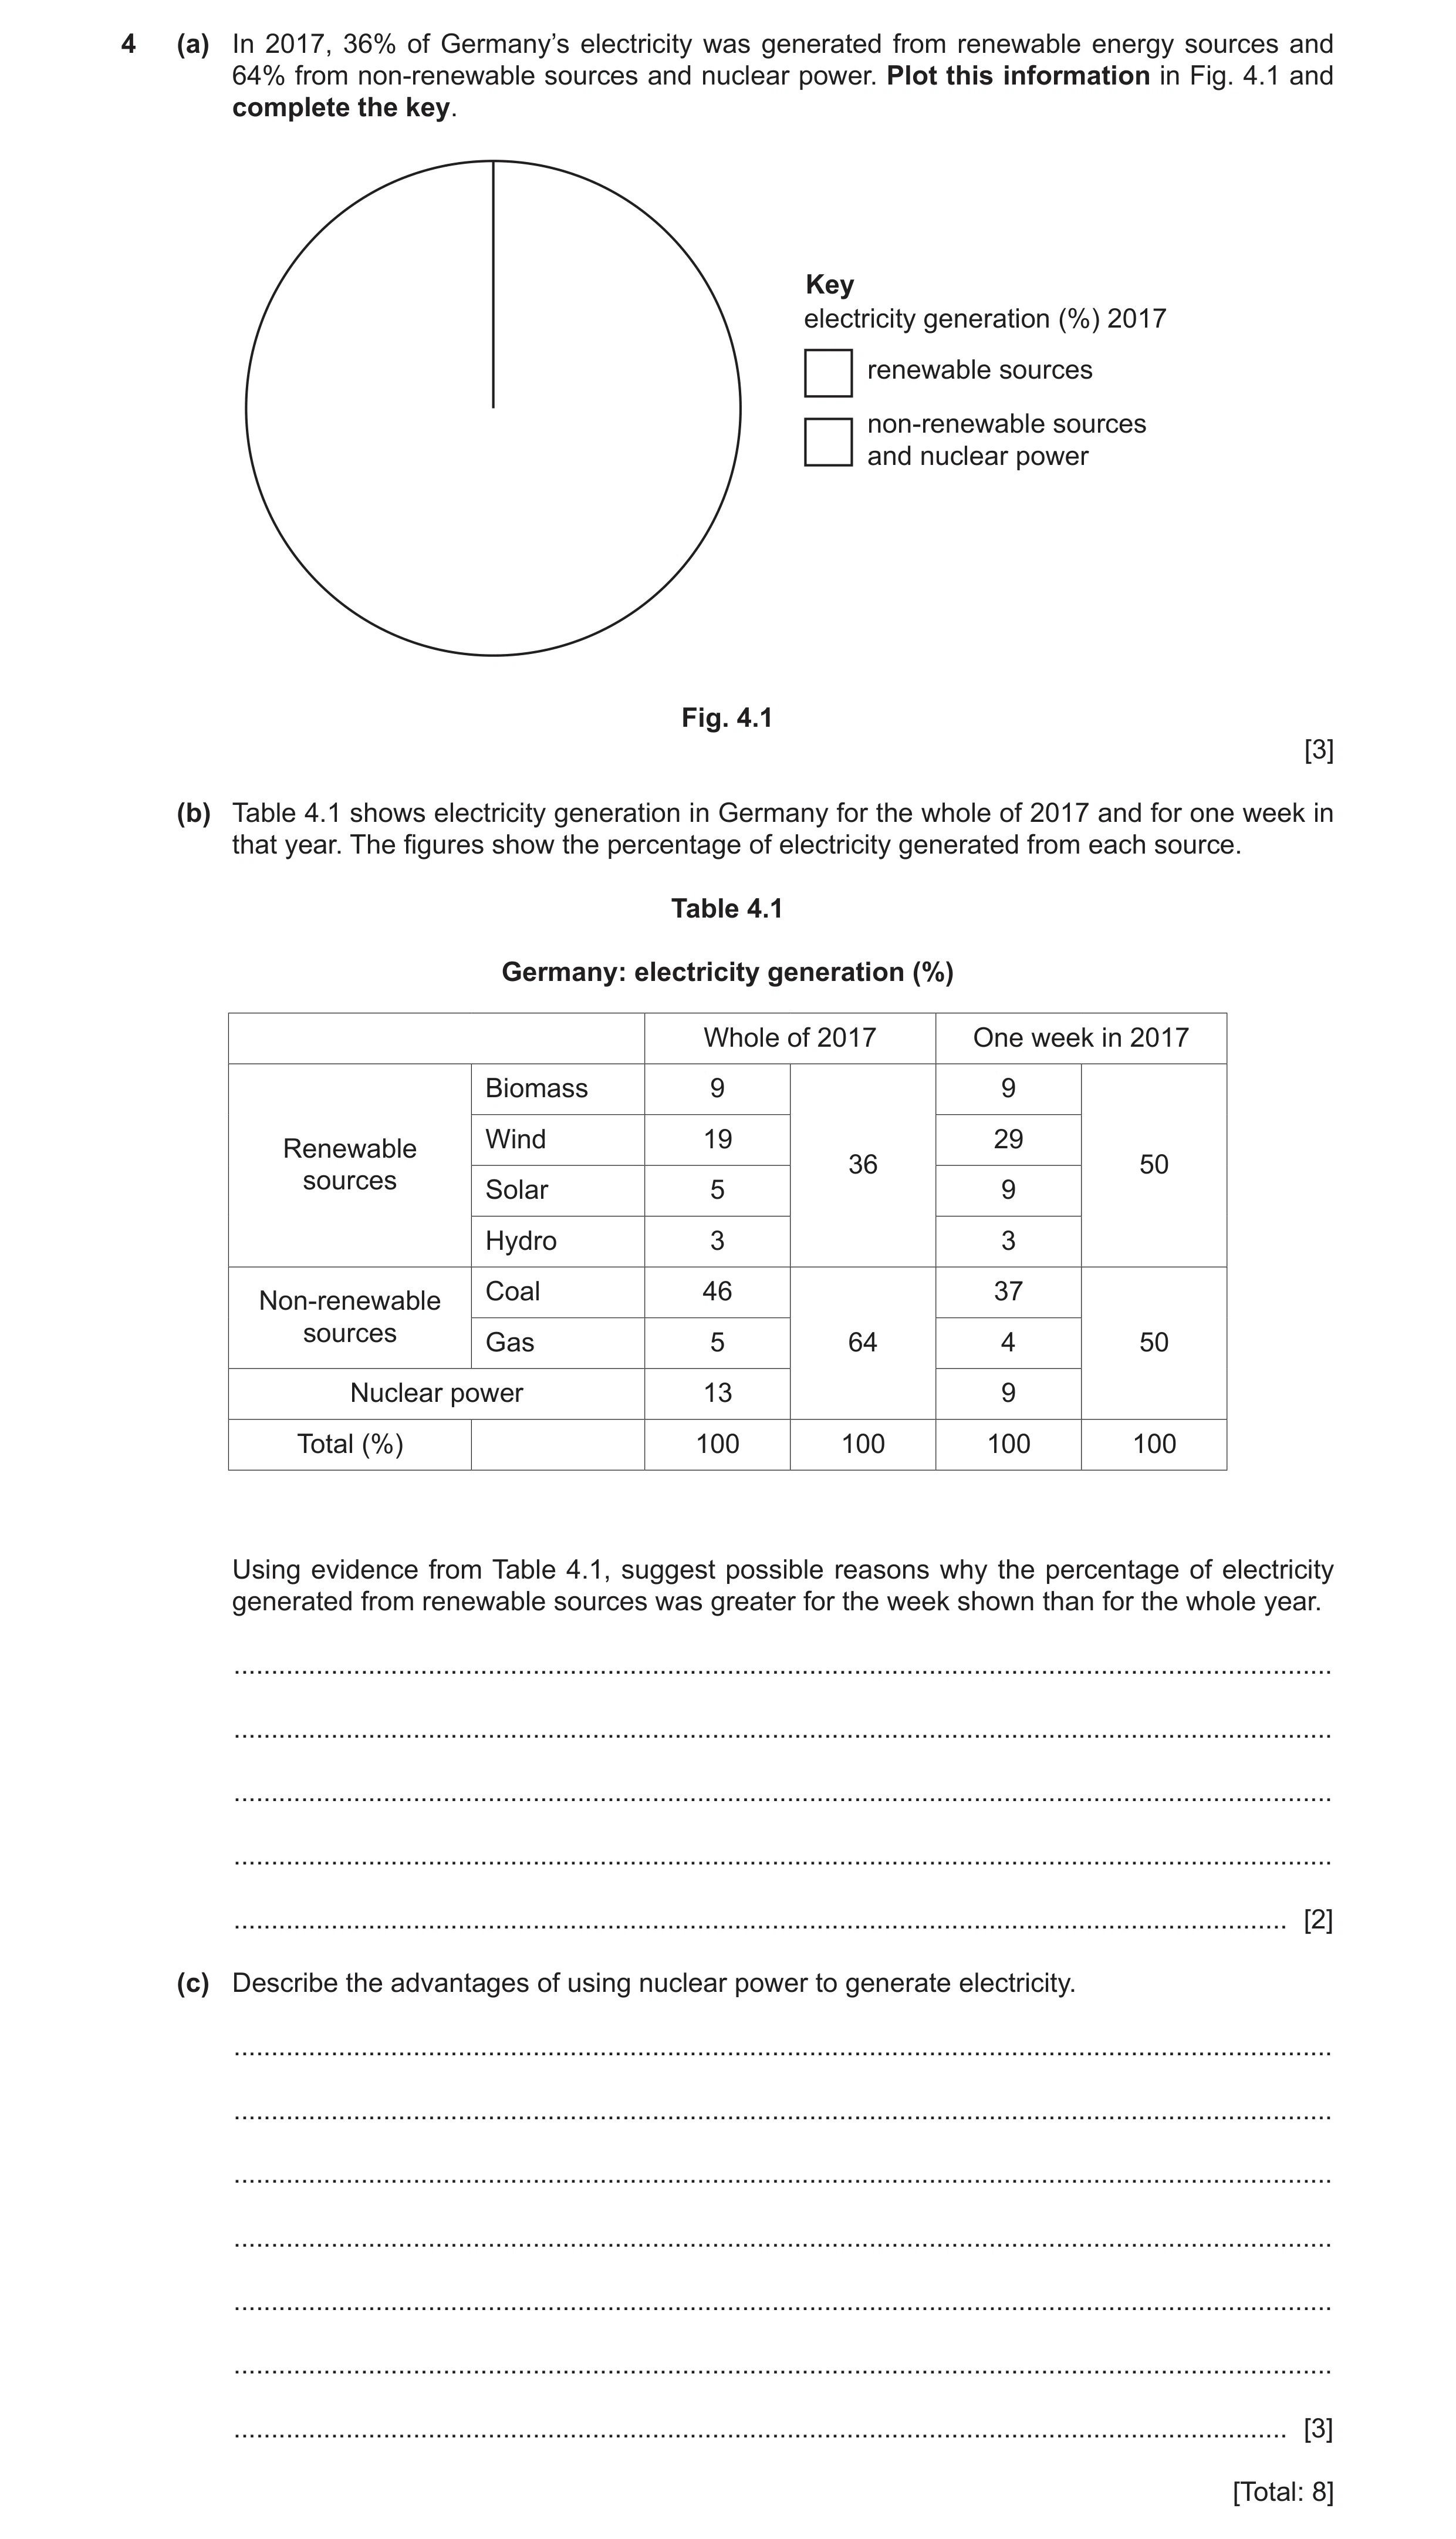
4 (a) In 2017, 36% of Germany’s electricity was generated from renewable energy sources and 64% from non-renewable sources and nuclear power. Plot this information in Fig. 4.1 and complete the key. Key electricity generation (%) 2017 renewable sources non-renewable sources and nuclear power Fig. 4.1 [3] (b) Table 4.1 shows electricity generation in Germany for the whole of 2017 and for one week in that year. The figures show the percentage of electricity generated from each source. Table 4.1 Germany: electricity generation (%) Whole of 2017 One week in 2017 Biomass 9 9 Wind 19 29 Renewable 36 50 sources Solar 5 9 Hydro 3 3 Coal 46 37 Non-renewable sources Gas 5 64 4 50 Nuclear power 13 9 Total (%) 100 100 100 100 Using evidence from Table 4.1, suggest possible reasons why the percentage of electricity generated from renewable sources was greater for the week shown than for the whole year. … … … … … [2] (c) Describe the advantages of using nuclear power to generate electricity. … … … … … … … [3] [Total: 8]
8 marks
Mark scheme: 4(a) smaller sector plotted at 128–131° = 2, 3 smaller sector plotted at 126–133° = 1, key used correctly with renewables as the smaller sector = 1 4(b) more wind that week, 2 more sun that week, allowed sources to be switched from nuclear/coal, 4(c) only small amounts of uranium/fuel needed (to generate large amounts of 3 power), uranium will not run out in the foreseeable future, does not produce greenhouse gases/acid rain, improved regulation and safety record,
This question in 0460/23 May/June 2020
Question 9 0460/22 Feb/March 2021
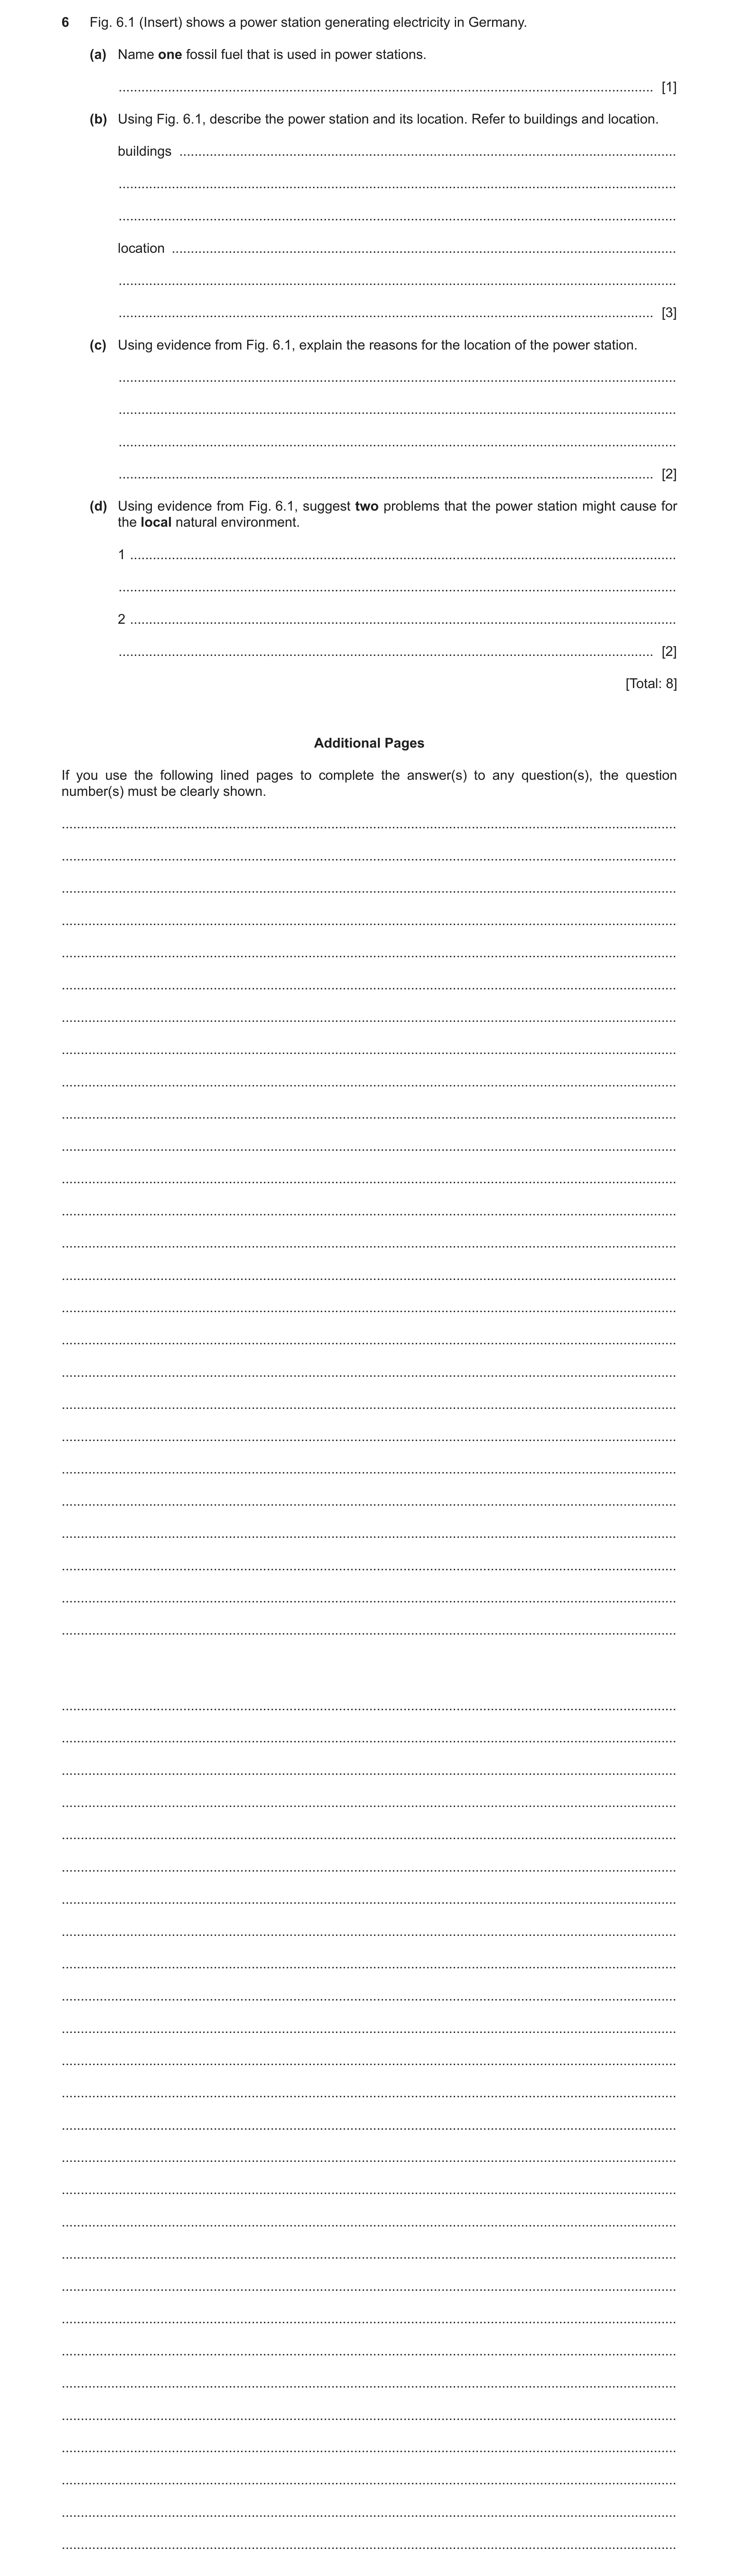
6 Fig. 6.1 (Insert) shows a power station generating electricity in Germany. (a) Name one fossil fuel that is used in power stations. … [1] (b) Using Fig. 6.1, describe the power station and its location. Refer to buildings and location. buildings … … … location … … … [3] (c) Using evidence from Fig. 6.1, explain the reasons for the location of the power station. … … … … [2] (d) Using evidence from Fig. 6.1, suggest two problems that the power station might cause for the local natural environment. 1 … … 2 … … [2] [Total: 8] Additional Pages If you use the following lined pages to complete the answer(s) to any question(s), the question number(s) must be clearly shown. … … … … … … … … … … … … … … … … … … … … … … … … … … … … … … … … … … … … … … … … … … … … … … … … … … … … …
8 marks
Mark scheme: 6(a) coal/oil/gas, 1 6(b) Buildings 3 chimneys, (cooling) towers, rectangular/cylindrical, tall/multi-storey buildings, flat roofs, cover a large area, close to each other, Location near river, near road/railway, flat, near agricultural land/fields, Reserve one mark for each. 6(c) space/flat land for large buildings/room for expansion/ease of construction, 2 river for water/transport/waste disposal, railway/road for raw materials/transport, settlement for labour, 6(d) heating/pollution of river water, 2 reduce aquatic life/fish, acid rain/air pollution/smoke, visual pollution,
This question in 0460/22 Feb/March 2021
Q10 · Which two of the following are non-renewable fuels? 0460/22 May/June 2021
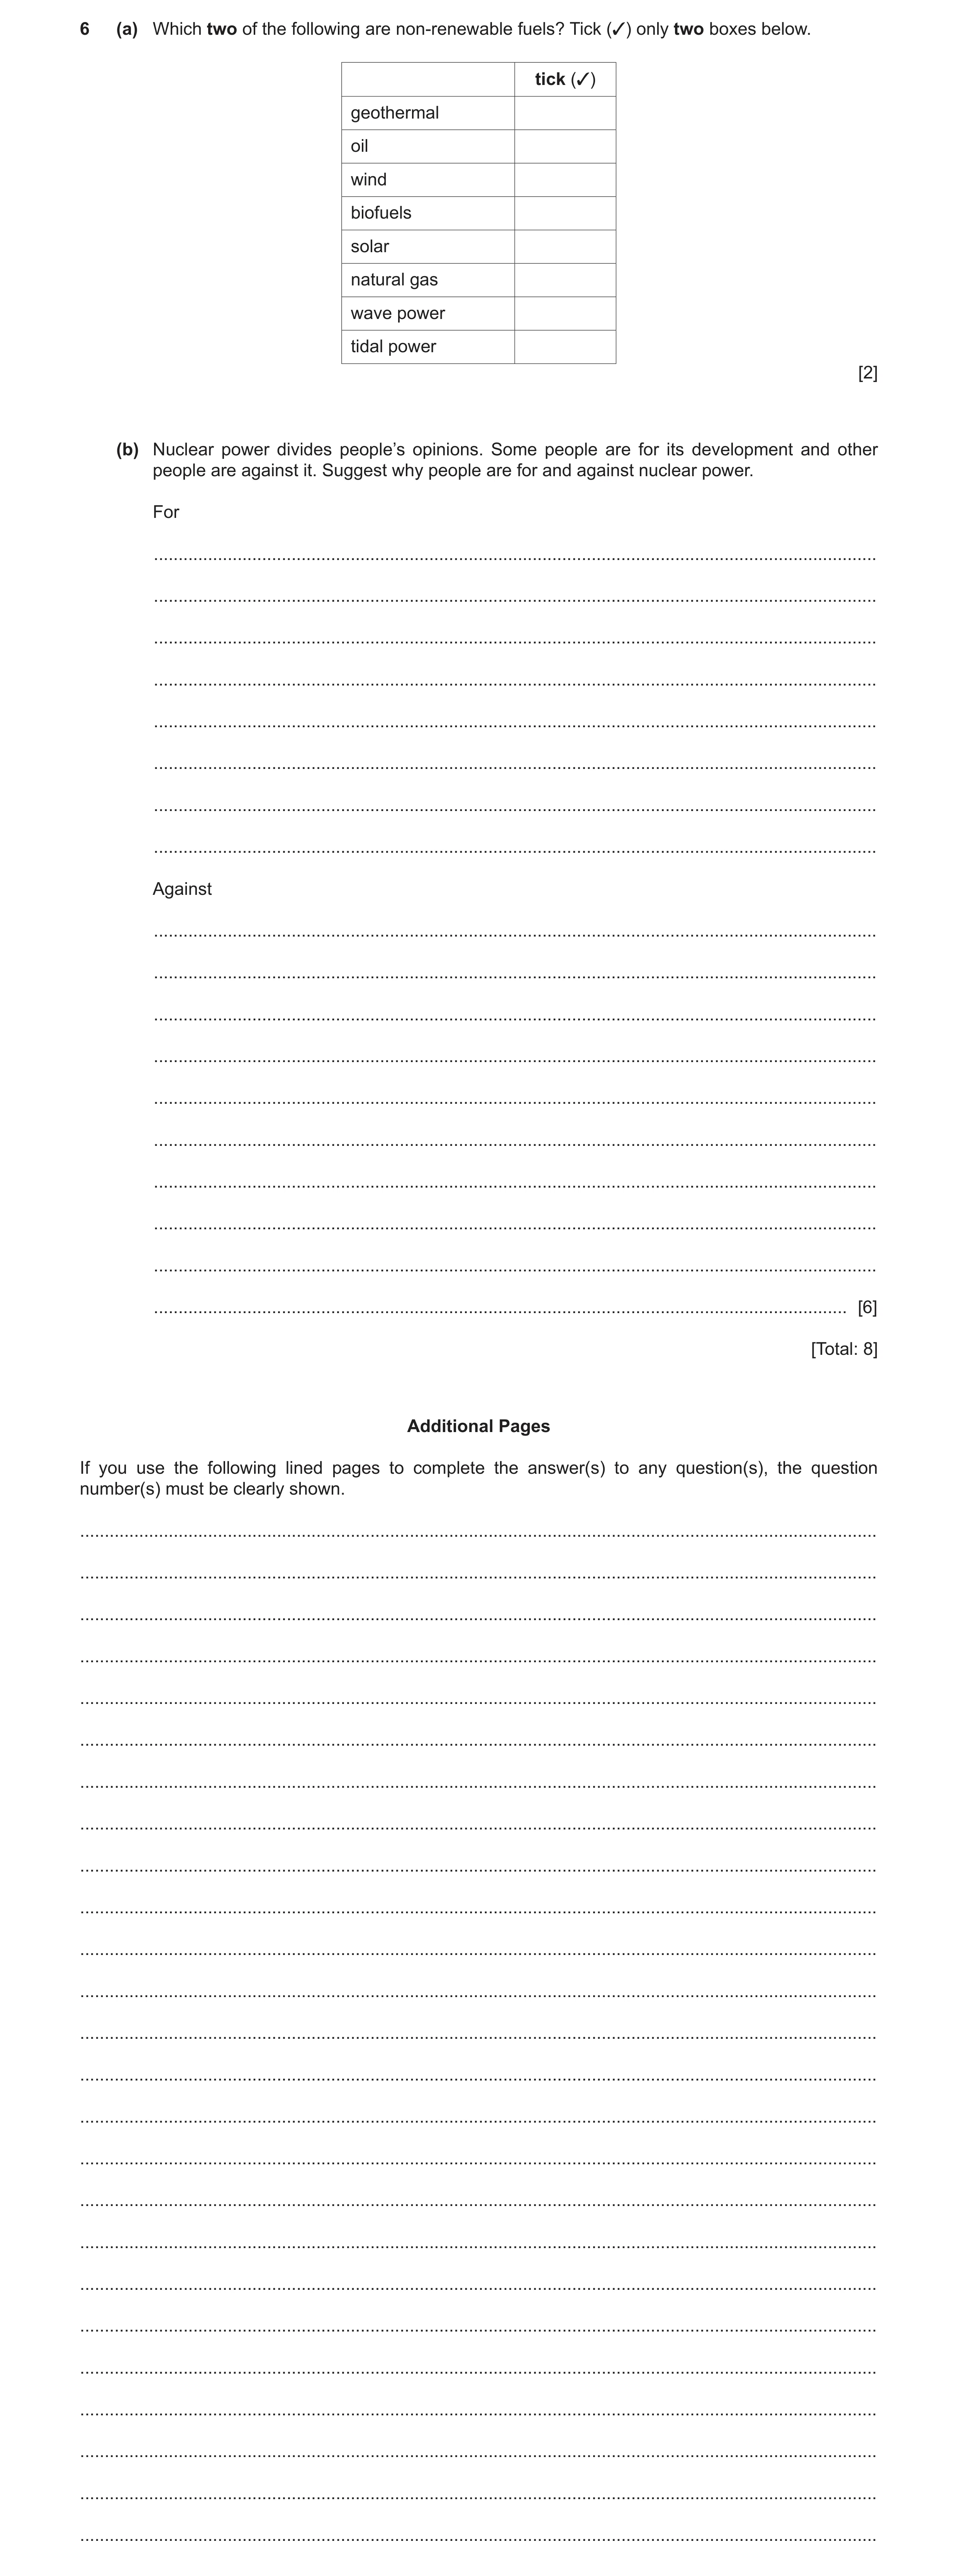
6 (a) Which two of the following are non-renewable fuels? Tick (✓) only two boxes below. tick (✓) geothermal oil wind biofuels solar natural gas wave power tidal power [2] (b) Nuclear power divides people’s opinions. Some people are for its development and other people are against it. Suggest why people are for and against nuclear power. For … … … … … … … … Against … … … … … … … … … … [6] [Total: 8] Additional Pages If you use the following lined pages to complete the answer(s) to any question(s), the question number(s) must be clearly shown. … … … … … … … … … … … … … … … … … … … … … … … … …
8 marks
Mark scheme: 6(a) oil, 2 natural gas, 6(b) For 6 small amounts of fuel to produce large amounts of energy, fuel/uranium will last a long time, does not produce greenhouse gases/global warming/climate change,/CO2, does not produce acid rain, not weather dependent, jobs, diversify energy mix, Against concerns about: safety/danger/health issues/radiation leakage/history of accidents/explosions, waste: long-lived/disposal issues/contaminating the environment/the points listed in point one if not already credited, cost of building/equipment, cost of decommissioning, link to nuclear weapons, security issues/terrorism, Reserve two marks for each part.
This question in 0460/22 May/June 2021
Question 11 0460/23 Oct/Nov 2022
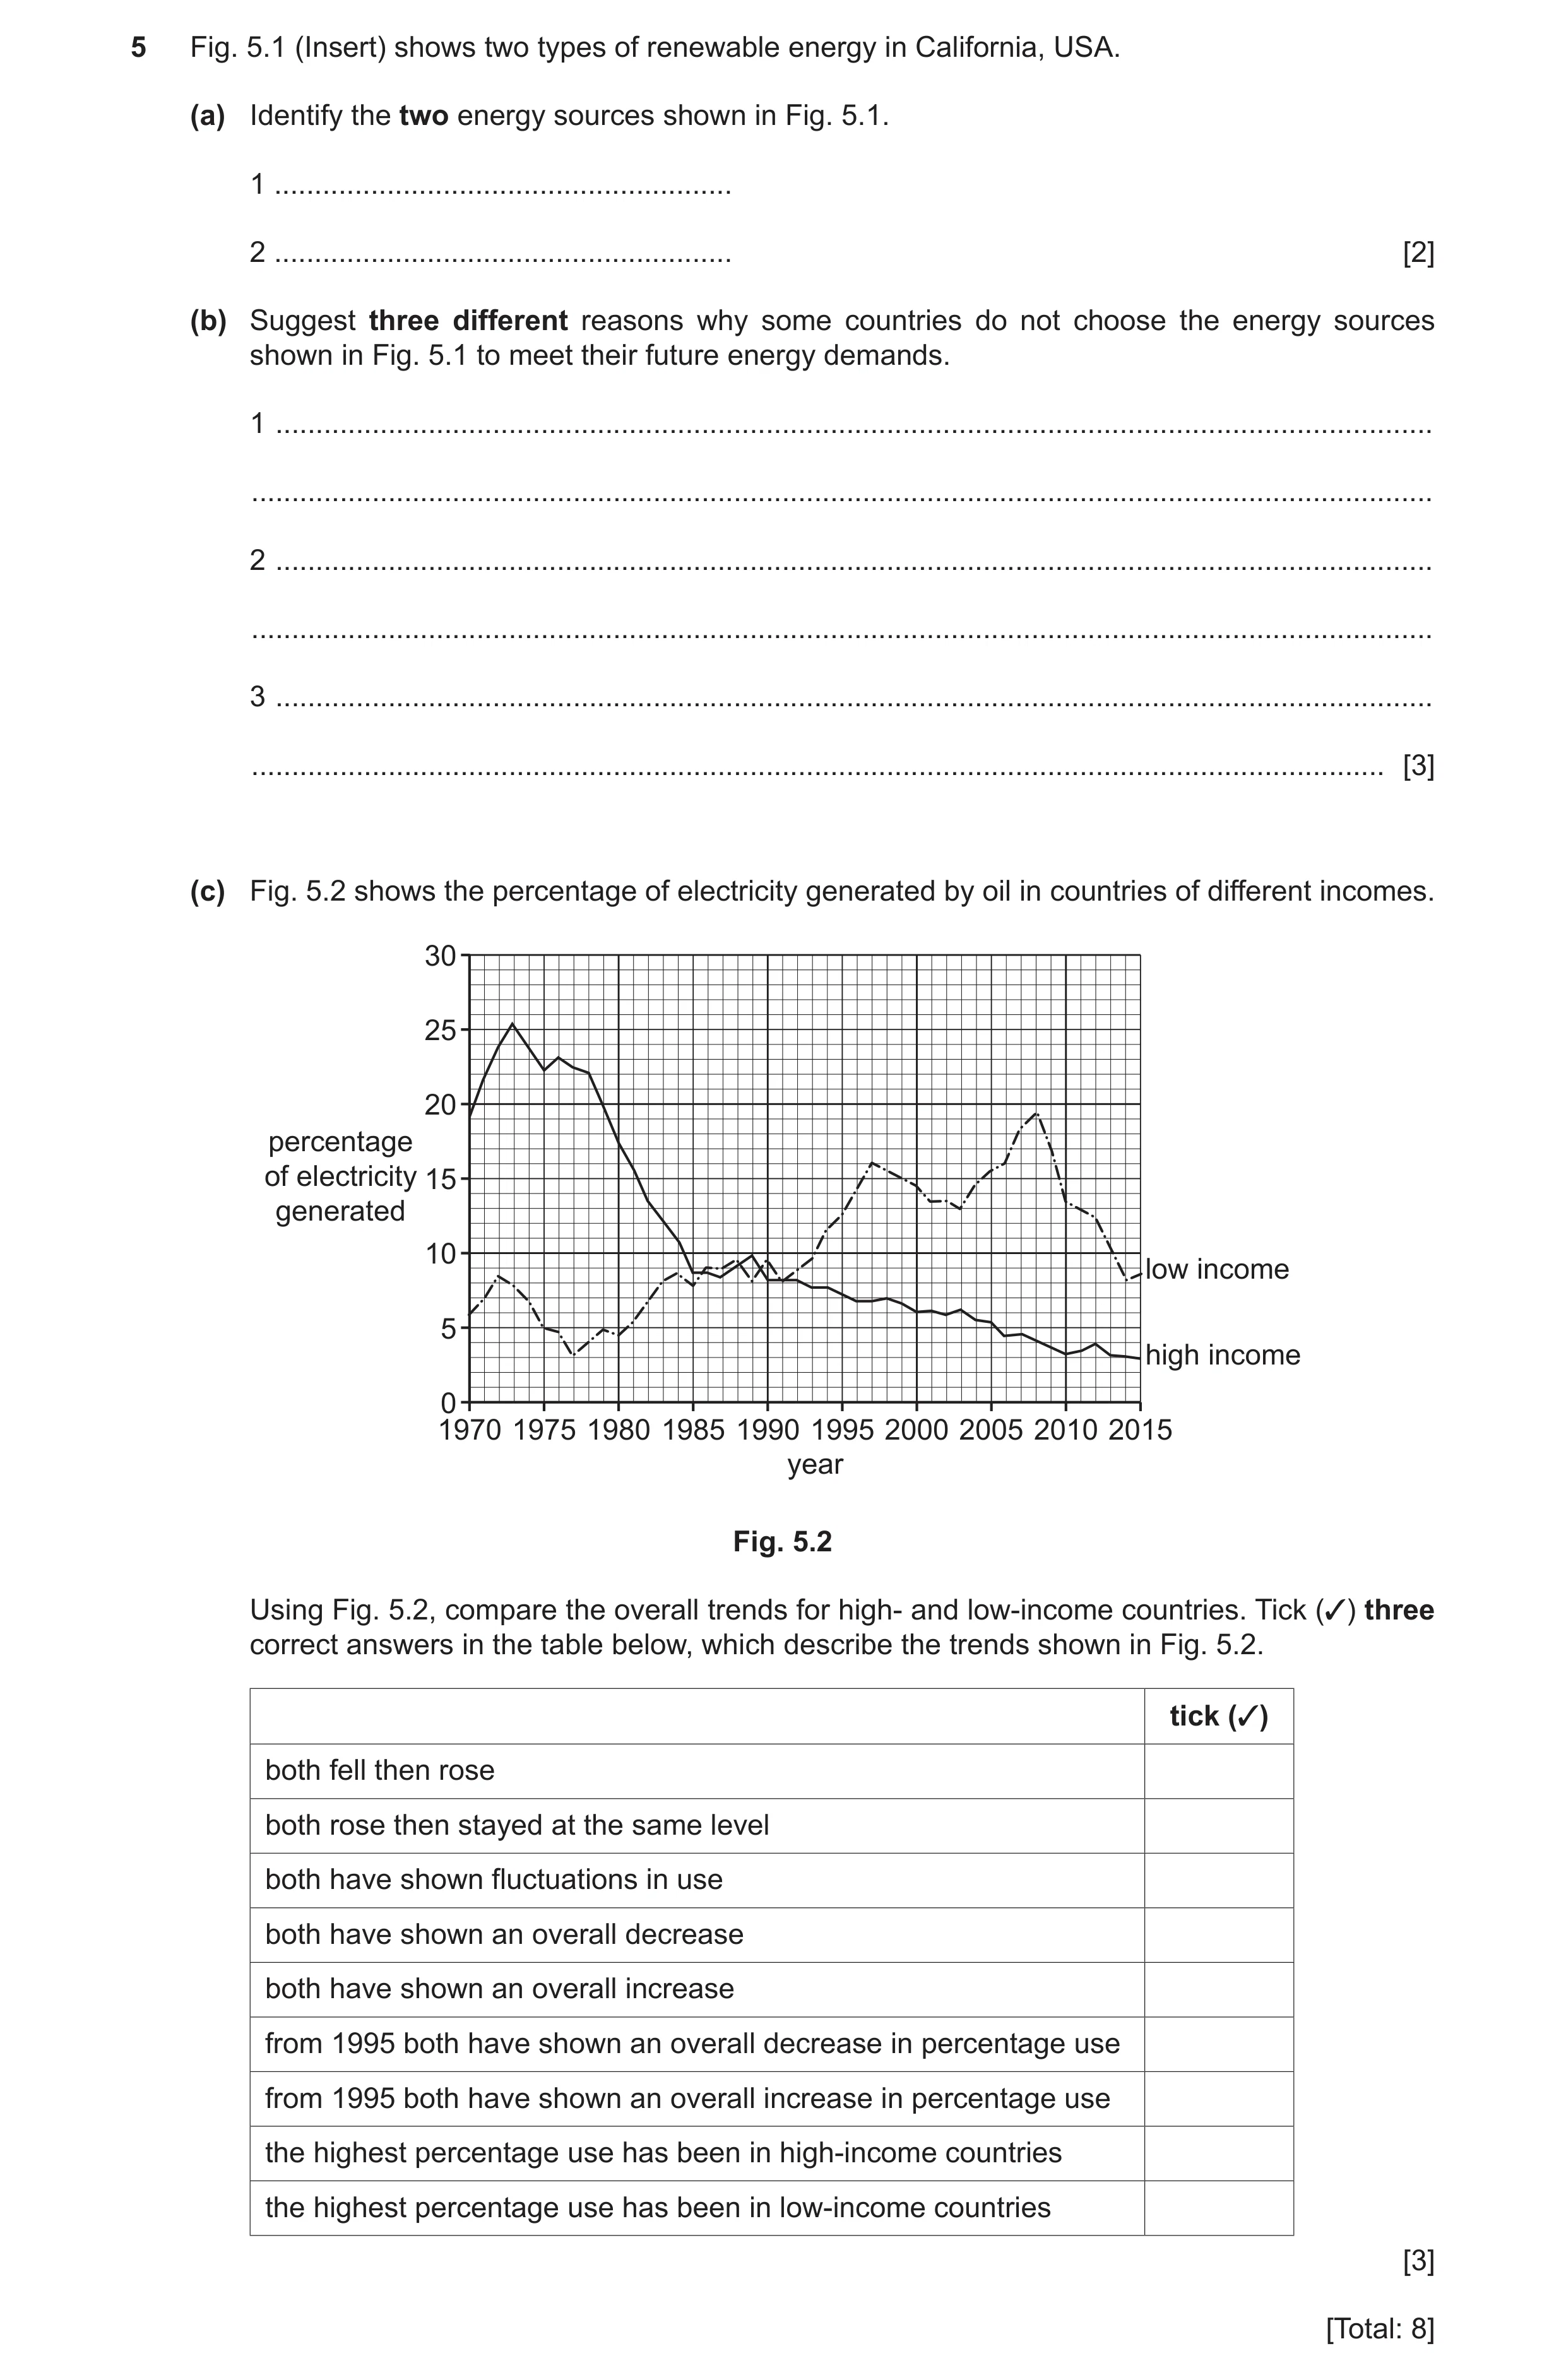
5 Fig. 5.1 (Insert) shows two types of renewable energy in California, USA. (a) Identify the two energy sources shown in Fig. 5.1. 1 … 2 … [2] (b) Suggest three different reasons why some countries do not choose the energy sources shown in Fig. 5.1 to meet their future energy demands. 1 … … 2 … … 3 … … [3] (c) Fig. 5.2 shows the percentage of electricity generated by oil in countries of different incomes. 30 25 20 percentage of electricity 15 generated 10 low income 5 high income 0 1970 1975 1980 1985 1990 1995 2000 2005 2010 2015 year Fig. 5.2 Using Fig. 5.2, compare the overall trends for high- and low-income countries. Tick (3) three correct answers in the table below, which describe the trends shown in Fig. 5.2. tick (3) both fell then rose both rose then stayed at the same level both have shown fluctuations in use both have shown an overall decrease both have shown an overall increase from 1995 both have shown an overall decrease in percentage use from 1995 both have shown an overall increase in percentage use the highest percentage use has been in high-income countries the highest percentage use has been in low-income countries [3] [Total: 8]
8 marks
Mark scheme: 5(a) Solar/sun/light; 2 Wind. 5(b) Lack of sunshine; 3 Lack of winds; Cannot afford to build/expensive to build/cost of installation/fossil fuels are cheaper/cost of energy storage; Using other renewables/nuclear/HEP/geothermal; Do not generate enough power/needs back-up; Large stock of fossil fuels; Land not available/large amount of land required. 5(c) Both have shown fluctuations; 3 From 1995 both have shown an overall decrease; Highest percentage use has been in high income countries.
This question in 0460/23 Oct/Nov 2022
Question 12 0460/23 May/June 2024
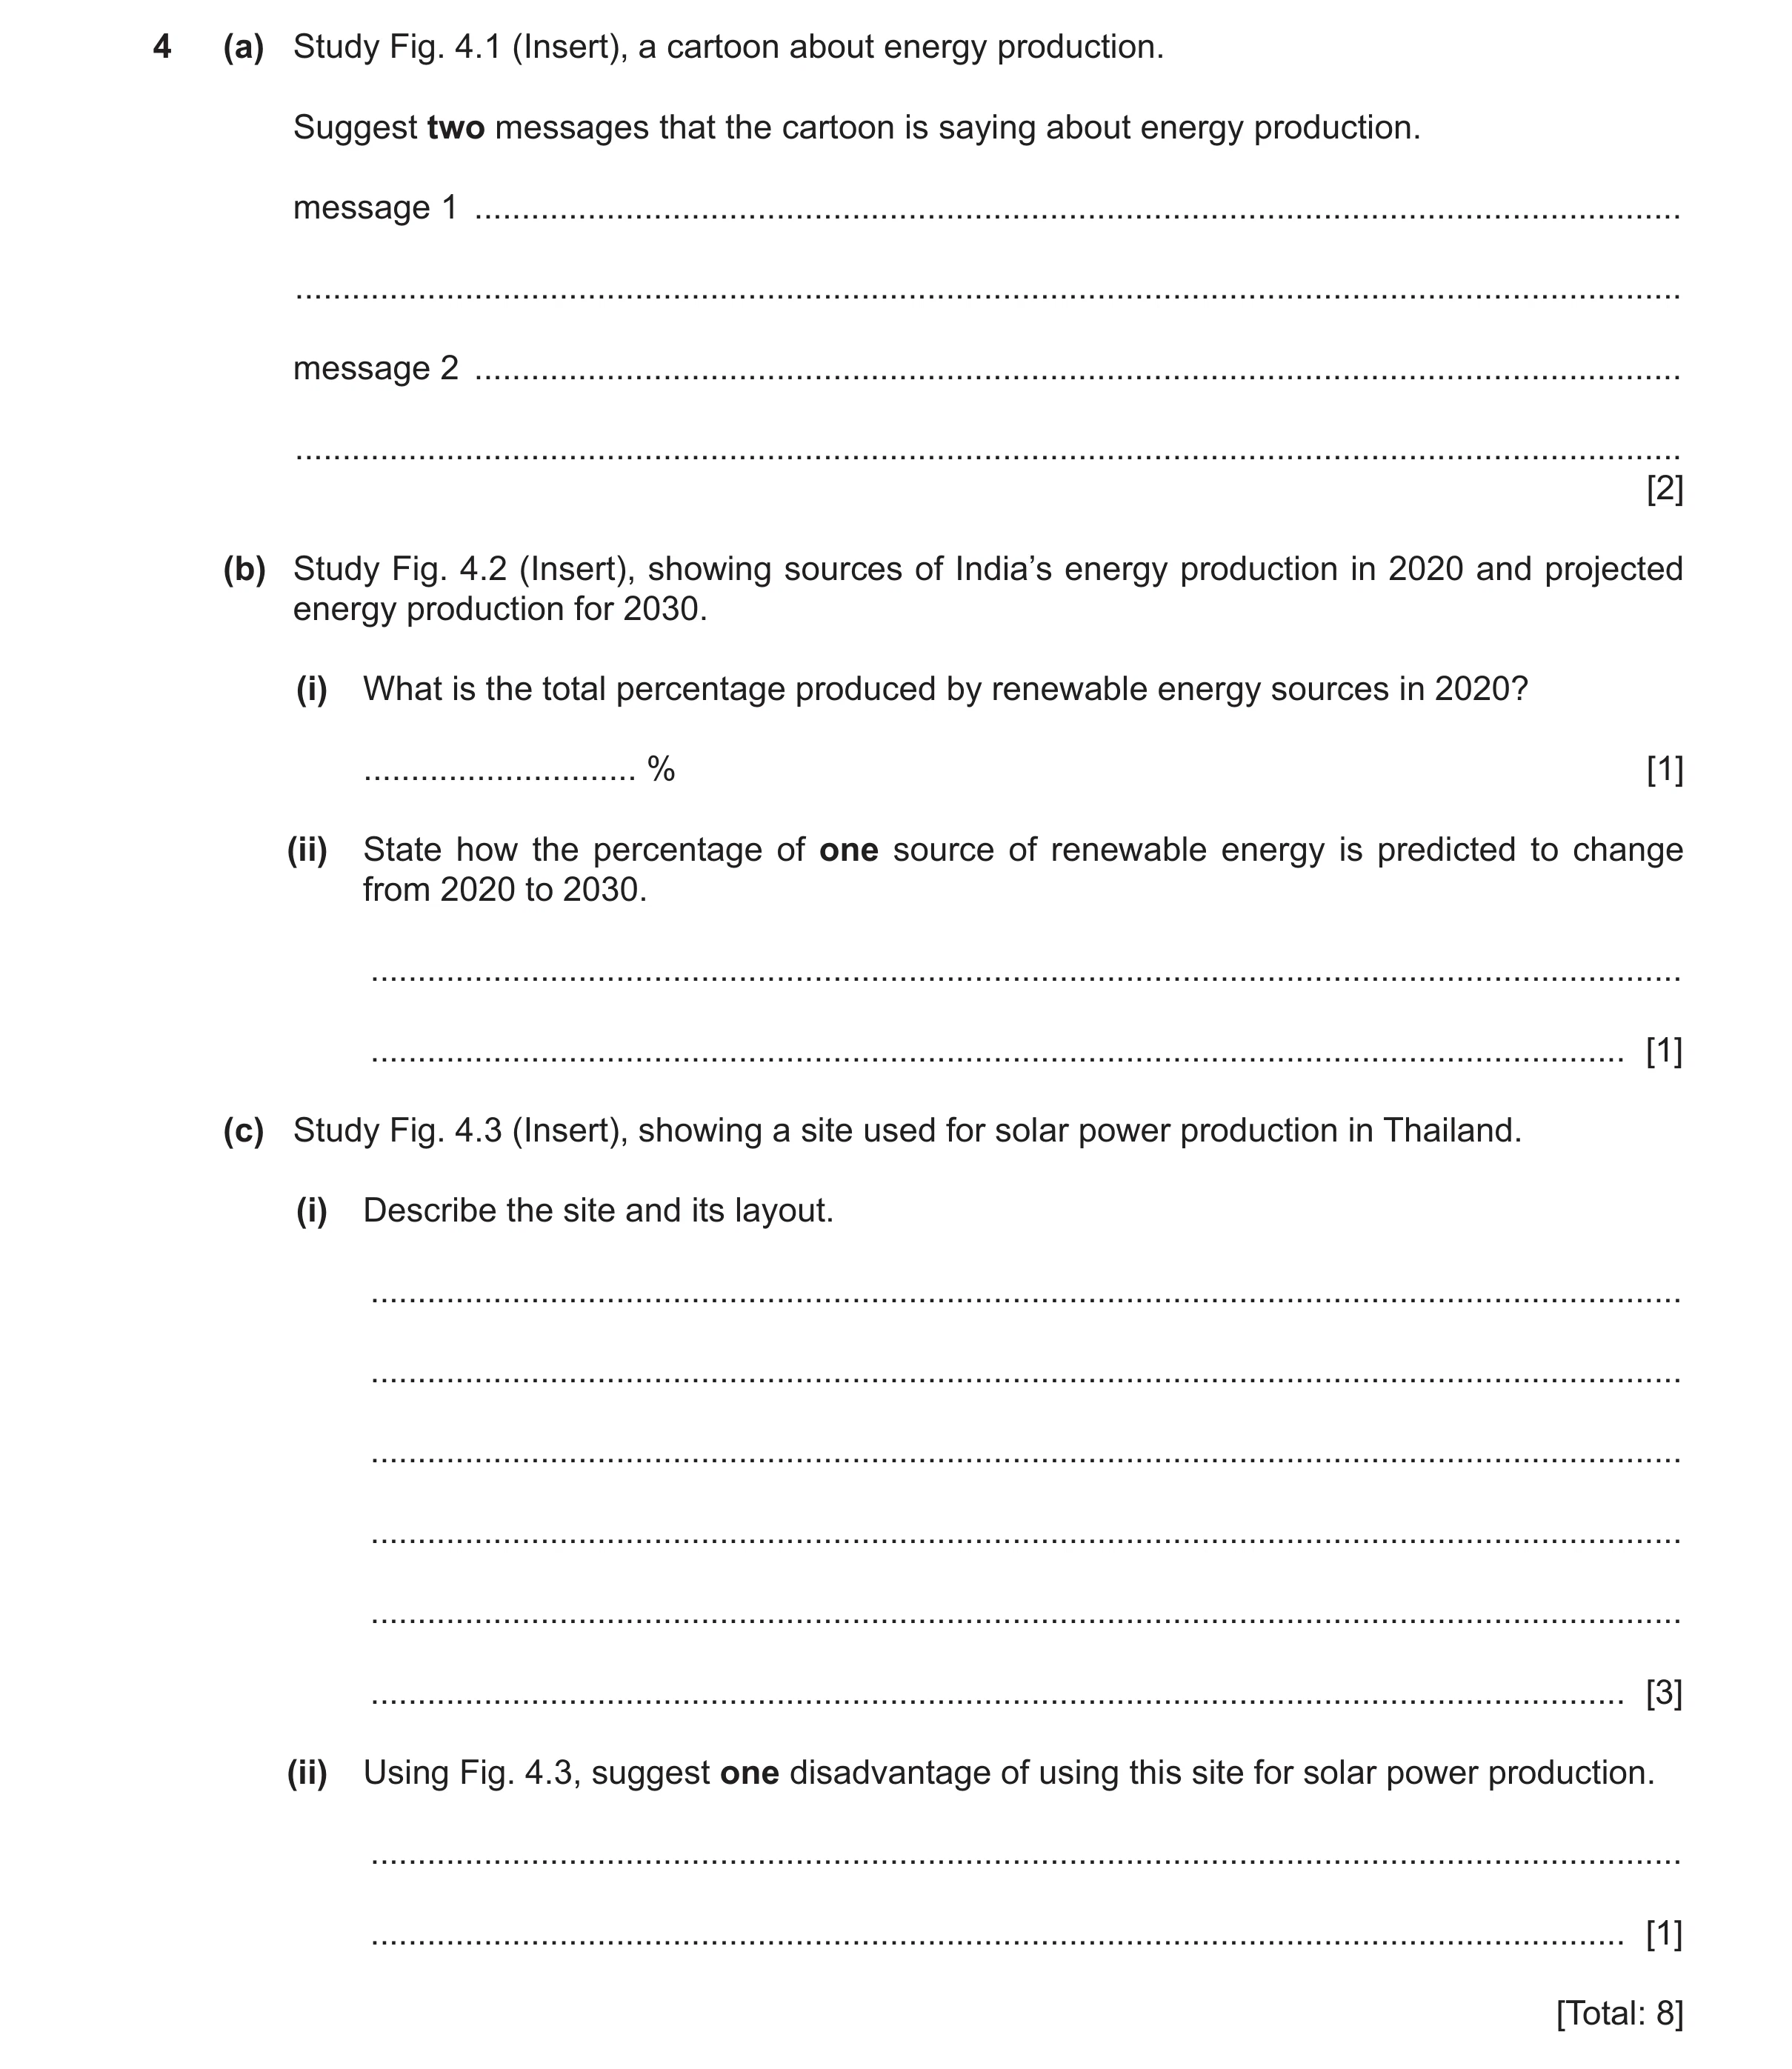
4 (a) Study Fig. 4.1 (Insert), a cartoon about energy production. Suggest two messages that the cartoon is saying about energy production. message 1 … … message 2 … … [2] (b) Study Fig. 4.2 (Insert), showing sources of India’s energy production in 2020 and projected energy production for 2030. (i) What is the total percentage produced by renewable energy sources in 2020? … % [1] (ii) State how the percentage of one source of renewable energy is predicted to change from 2020 to 2030. … … [1] (c) Study Fig. 4.3 (Insert), showing a site used for solar power production in Thailand. (i) Describe the site and its layout. … … … … … … [3] (ii) Using Fig. 4.3, suggest one disadvantage of using this site for solar power production. … … [1] [Total: 8]
8 marks
Mark scheme: 4(a) Fossil fuels/ non renewables are bad/dirty/unsafe/not environmentally friendly. 2 OR Wind power/renewables are good/clean/safe/environmentally friendly; Renewable energy is more sustainable than fossil fuels/non renewables; Fossil fuels/non renewables produce CO2 emissions/pollute the air/land; Renewable energy/wind power does not produce CO2/pollute the air/land; Fossil fuels/non renewables are out of date/will run out/ finite/renewable energy/wind power is infinite/will not run out; There is more polluting energy than clean energy; CO2 is hazardous to the environment. 4(b)(i) 35(%) 1 4(b)(ii) Solar has increased; 1 Wind has increased; HEP has decreased; Biofuels have decreased. Note: Responses need the direction of change. 4(c)(i) Flat land/gentle gradient; 3 Open site/no obstructions; Large/extensive/covers a large area; Rectangular blocks; Panels in straight lines/rows; Evenly spaced; Facing same direction; Three major blocks; Straight roads/roads connecting blocks/roads providing access/between /dividing panels/panels along side of road/surrounded by road; Room for expansion/being extended; Each sector has (white) huts; Surrounded by farmland/fields. 4(c)(ii) Land can’t be used for anything else (e.g. building/farming); 1 Visually intrusive; Takes up a large area of land/space; Uses up (valuable) farmland; Prone to flooding.
This question in 0460/23 May/June 2024
Q13 · What is meant by the term renewable energy? 0460/23 May/June 2025
6 (a) (i) What is meant by the term renewable energy? … … [1] (ii) Name a source of renewable energy. … [1] (b) Fig. 6.1 (Insert) shows the proportion of the total energy produced from renewable sources in different countries. Using Fig. 6.1, describe the variation in renewable energy production. … … … … … … [3] (c) Explain why some countries do not use renewable energy. … … … … … … [3] [Total: 8] Additional pages If you use the following pages to complete the answer to any question, the question number must be clearly shown. … … … … … … … … … … … … … … … … … … … … … … … … … … … … … … … … … … … … … … … … … … … … … … … … The boundaries and names shown, the designations used and the presentation of material on any maps contained in this question paper/insert do not imply official endorsement or acceptance by Cambridge Assessment International Education concerning the legal status of any country, territory, or area or any of its authorities, or of the delimitation of its frontiers or boundaries.
8 marks
Mark scheme: 6(a)(i) Will not run out/is replenished/can be reused/is infinite 1 6(a)(ii) Geothermal 1 Wind HEP/river Wave/tidal/sea Solar/sun Biofuel/biomass/wood 6(b) Uneven distribution/varies from low to high. 3 High(er) levels/most renewable energy Along the Equator; E/NE/centre of South America; Central Africa/middle of Africa; SE Oceania; NE of North America. Moderate levels/some renewable energy N of North America; N of South America/Central America; Europe. Low(er) levels/least renewable energy Asia; N Africa; Oceania; S of North America; S of South America. 6(c) Thermal power stations already built/operating; 3 Fossil fuels/non-renewables are available/cheaper; Not enough money/expensive to set up/distribute/repair/maintain/employ specialist labour; Unreliable/unsuitable sites/limited by cloud cover/lack of sun/wind/water; Visual/noise pollution; Difficult/expensive to store; Small-scale/cannot satisfy demand; Can lead to relocation of population; Takes up large quantities of land/lack of space; Some countries prioritise economy over environment.
This question in 0460/23 May/June 2025
 23 / 26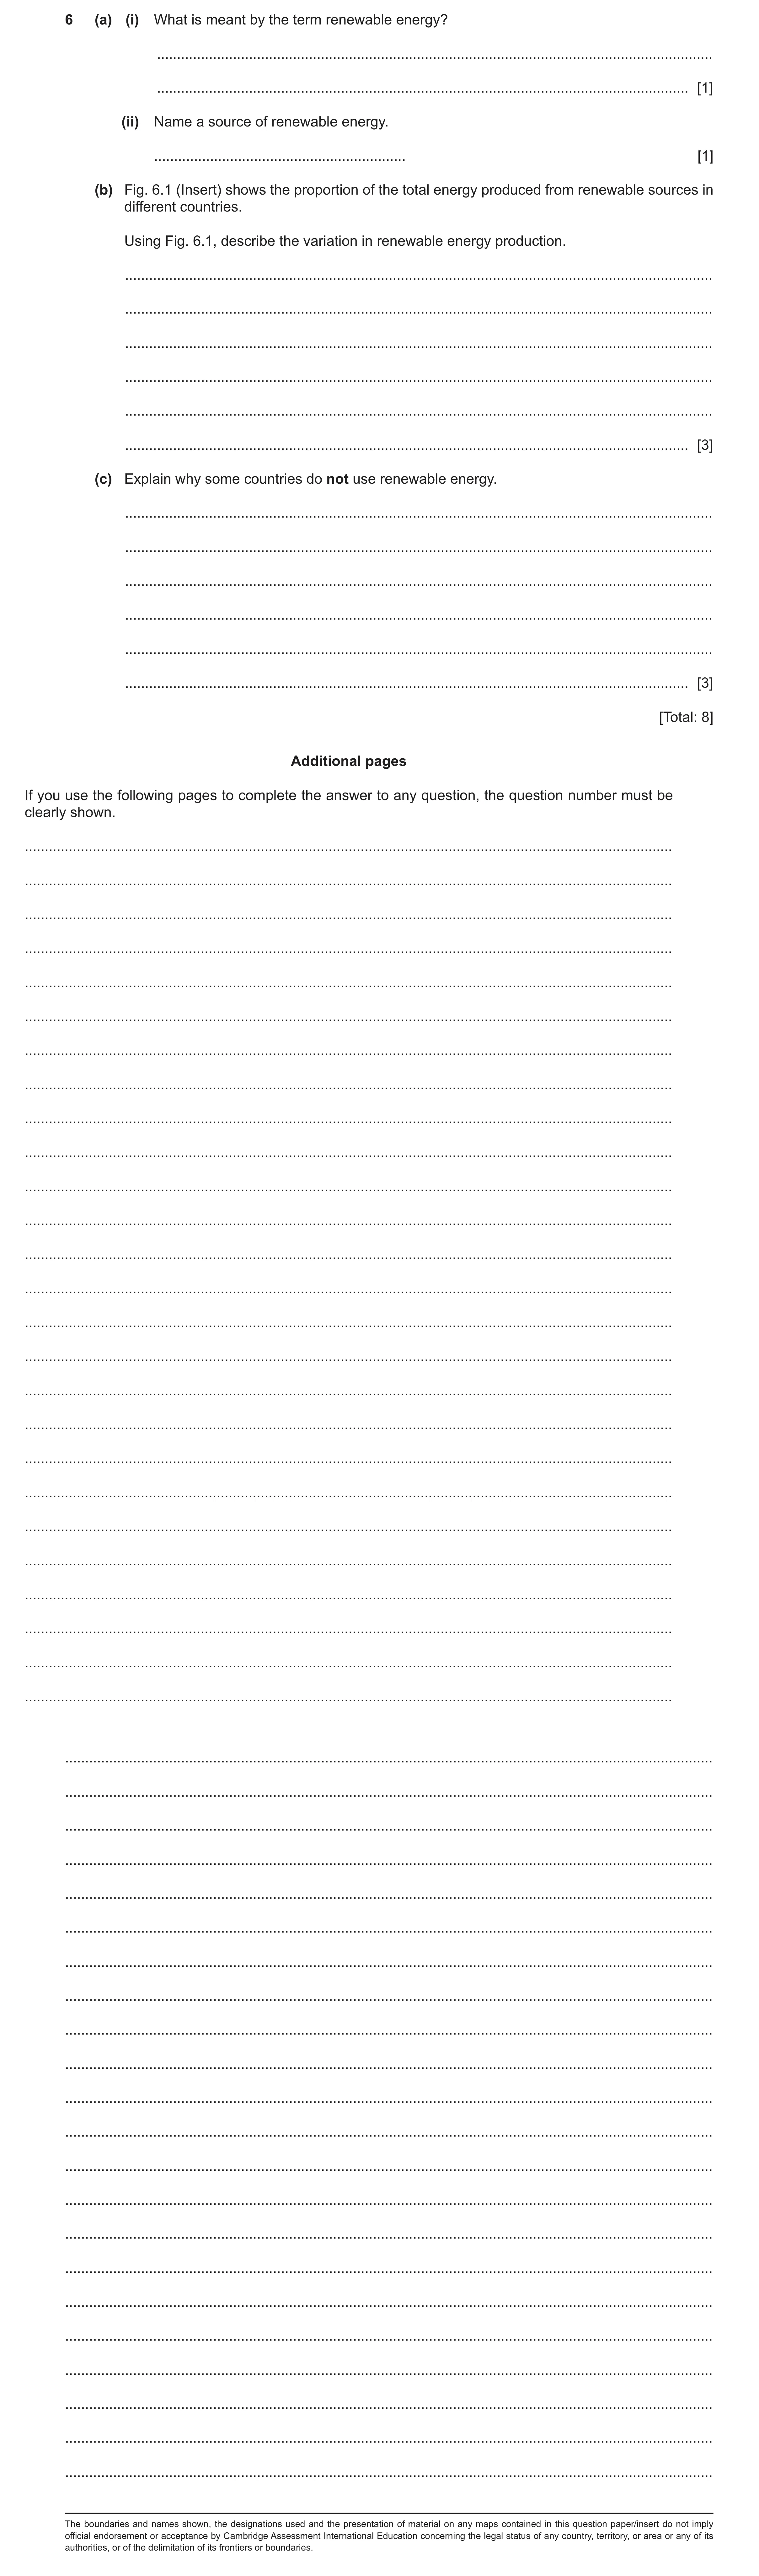
 8
8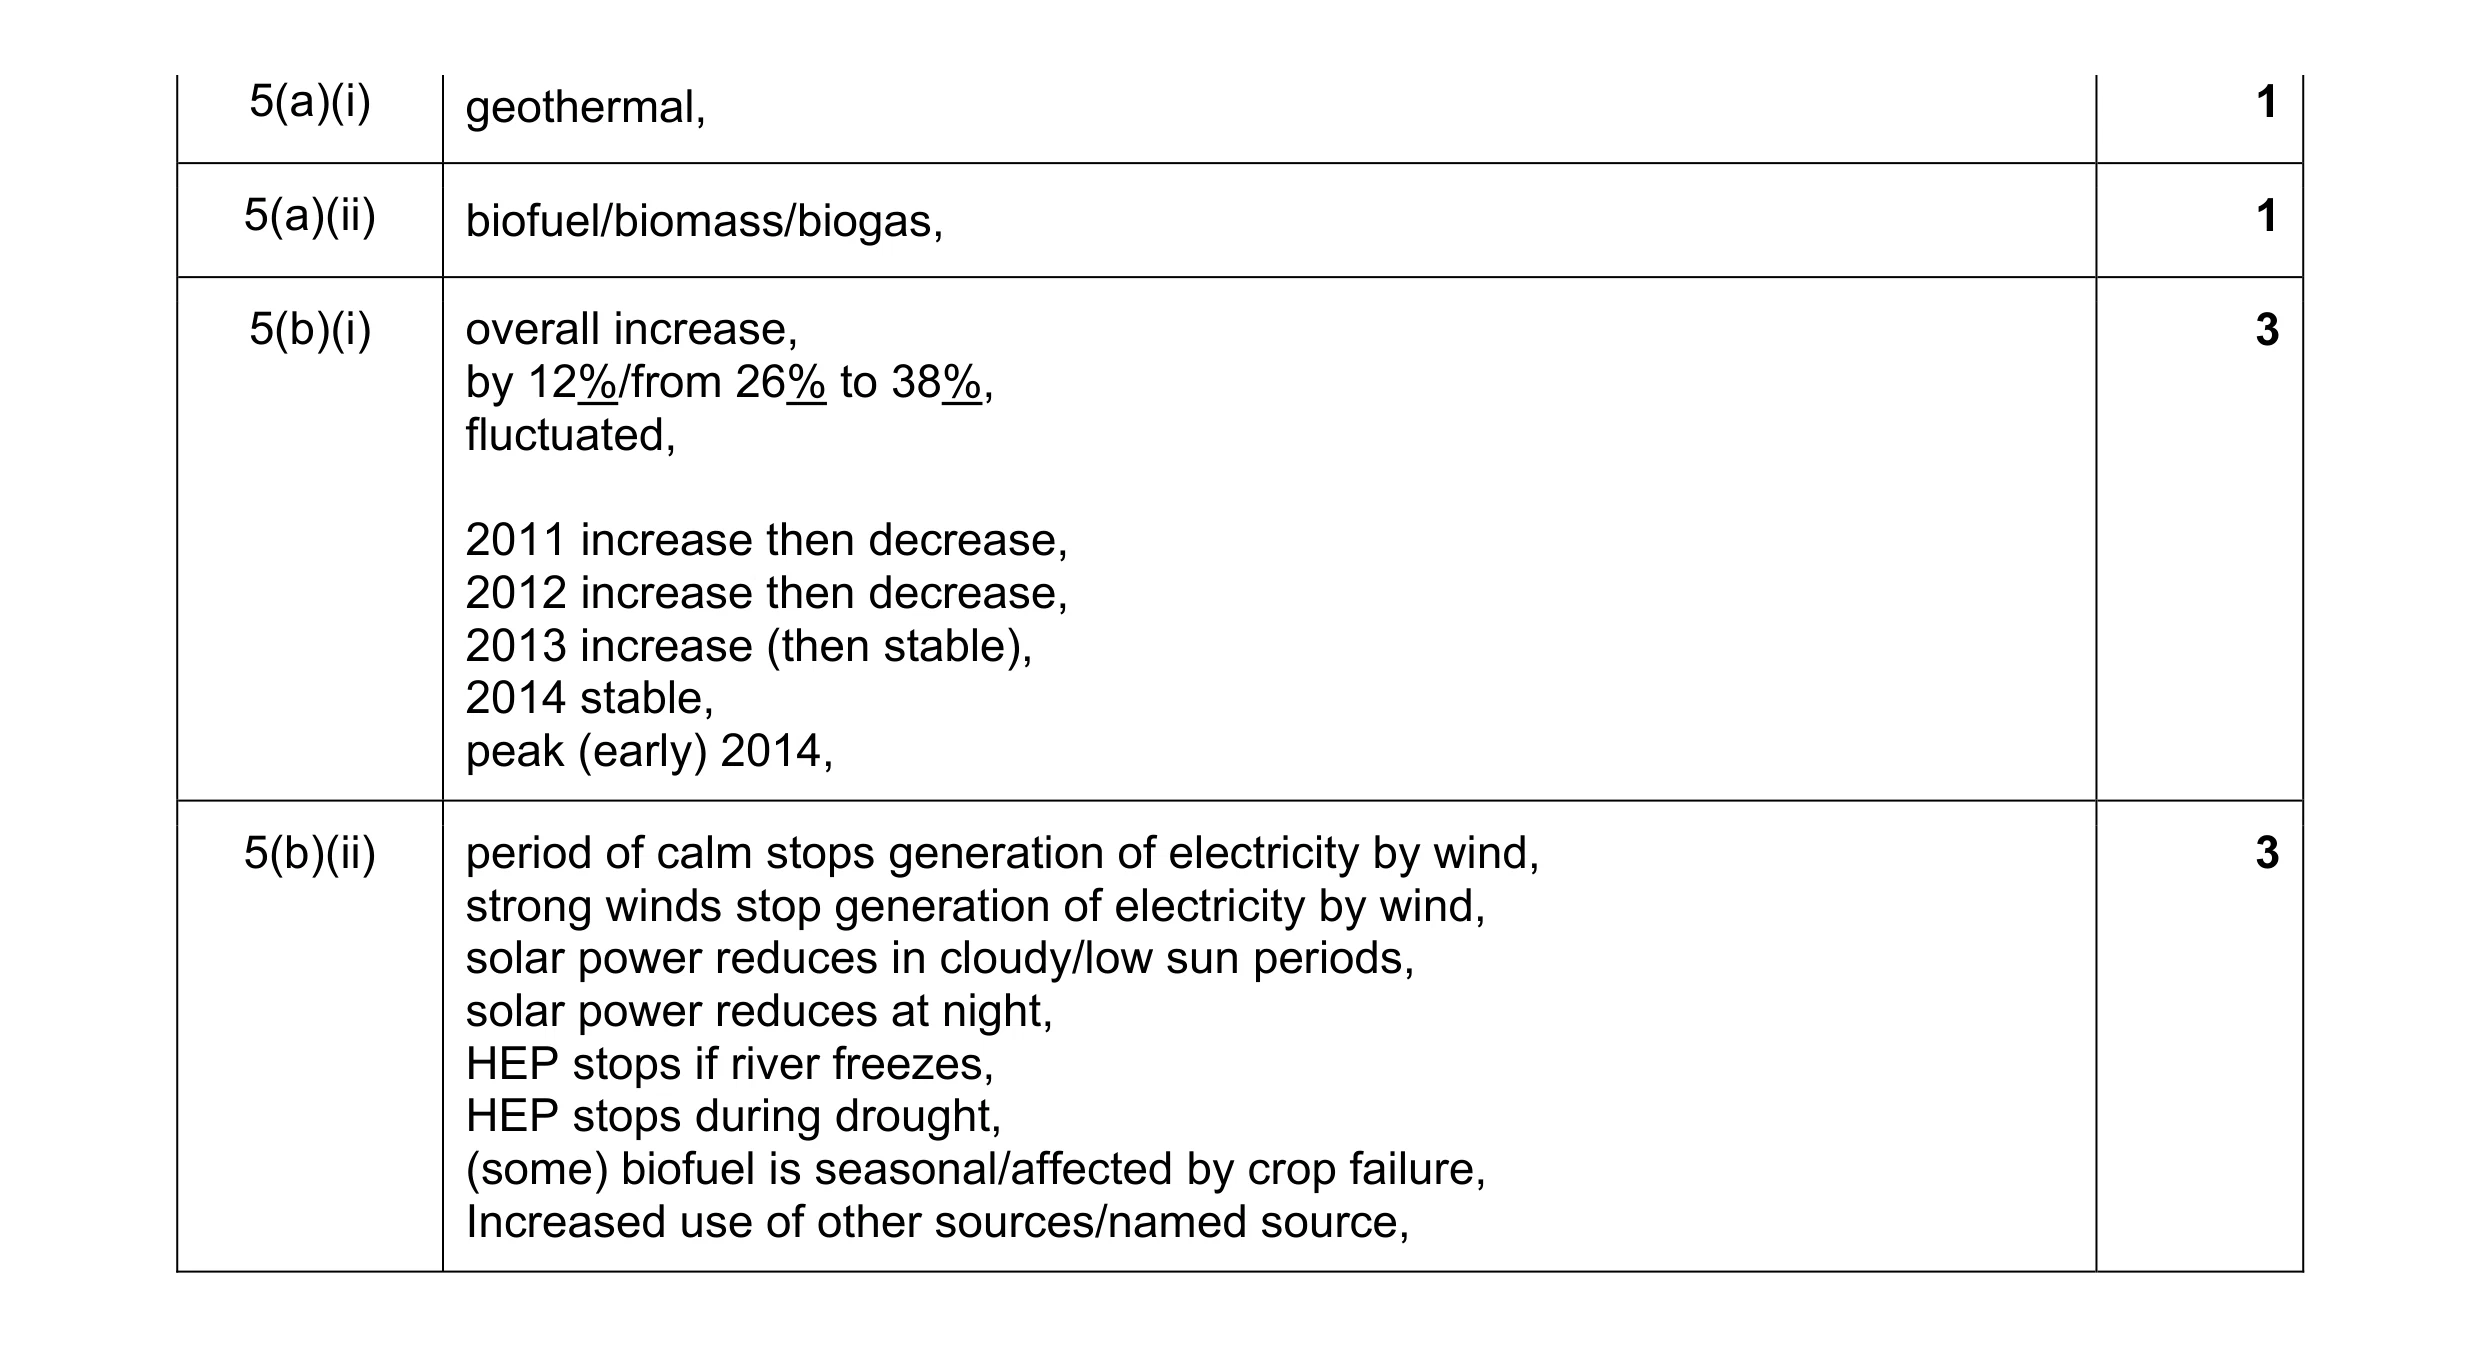 8
8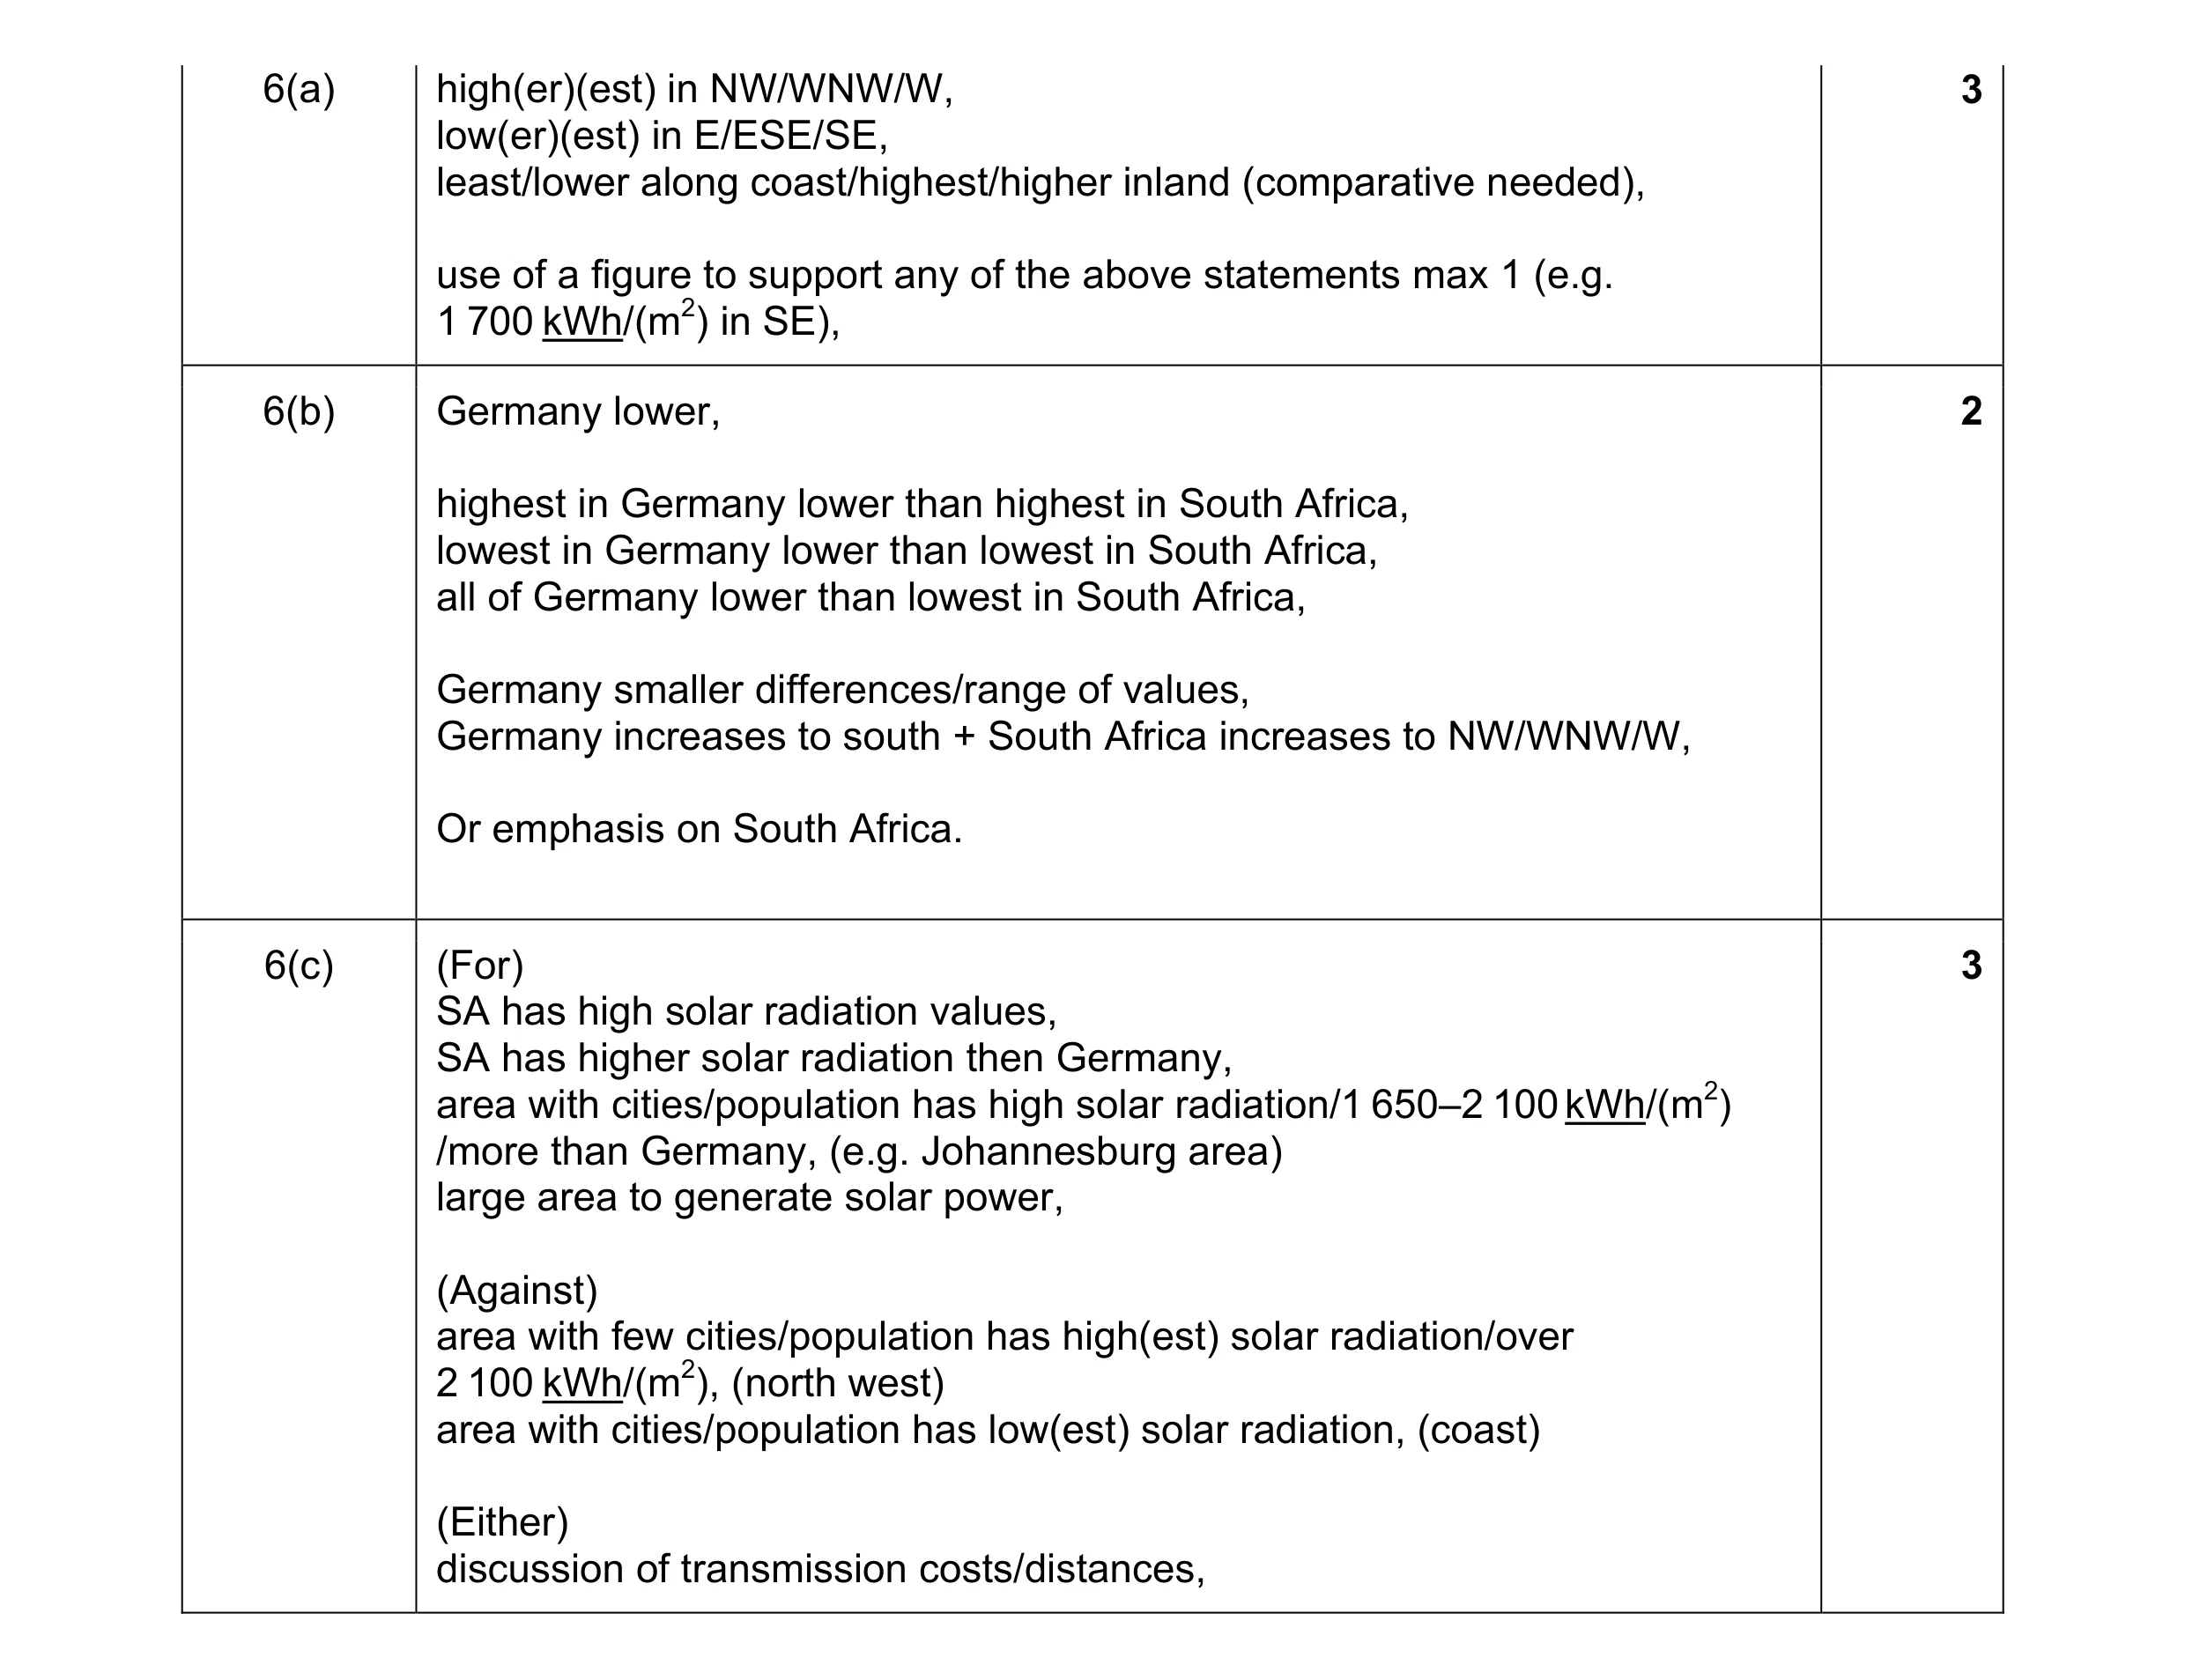 8
8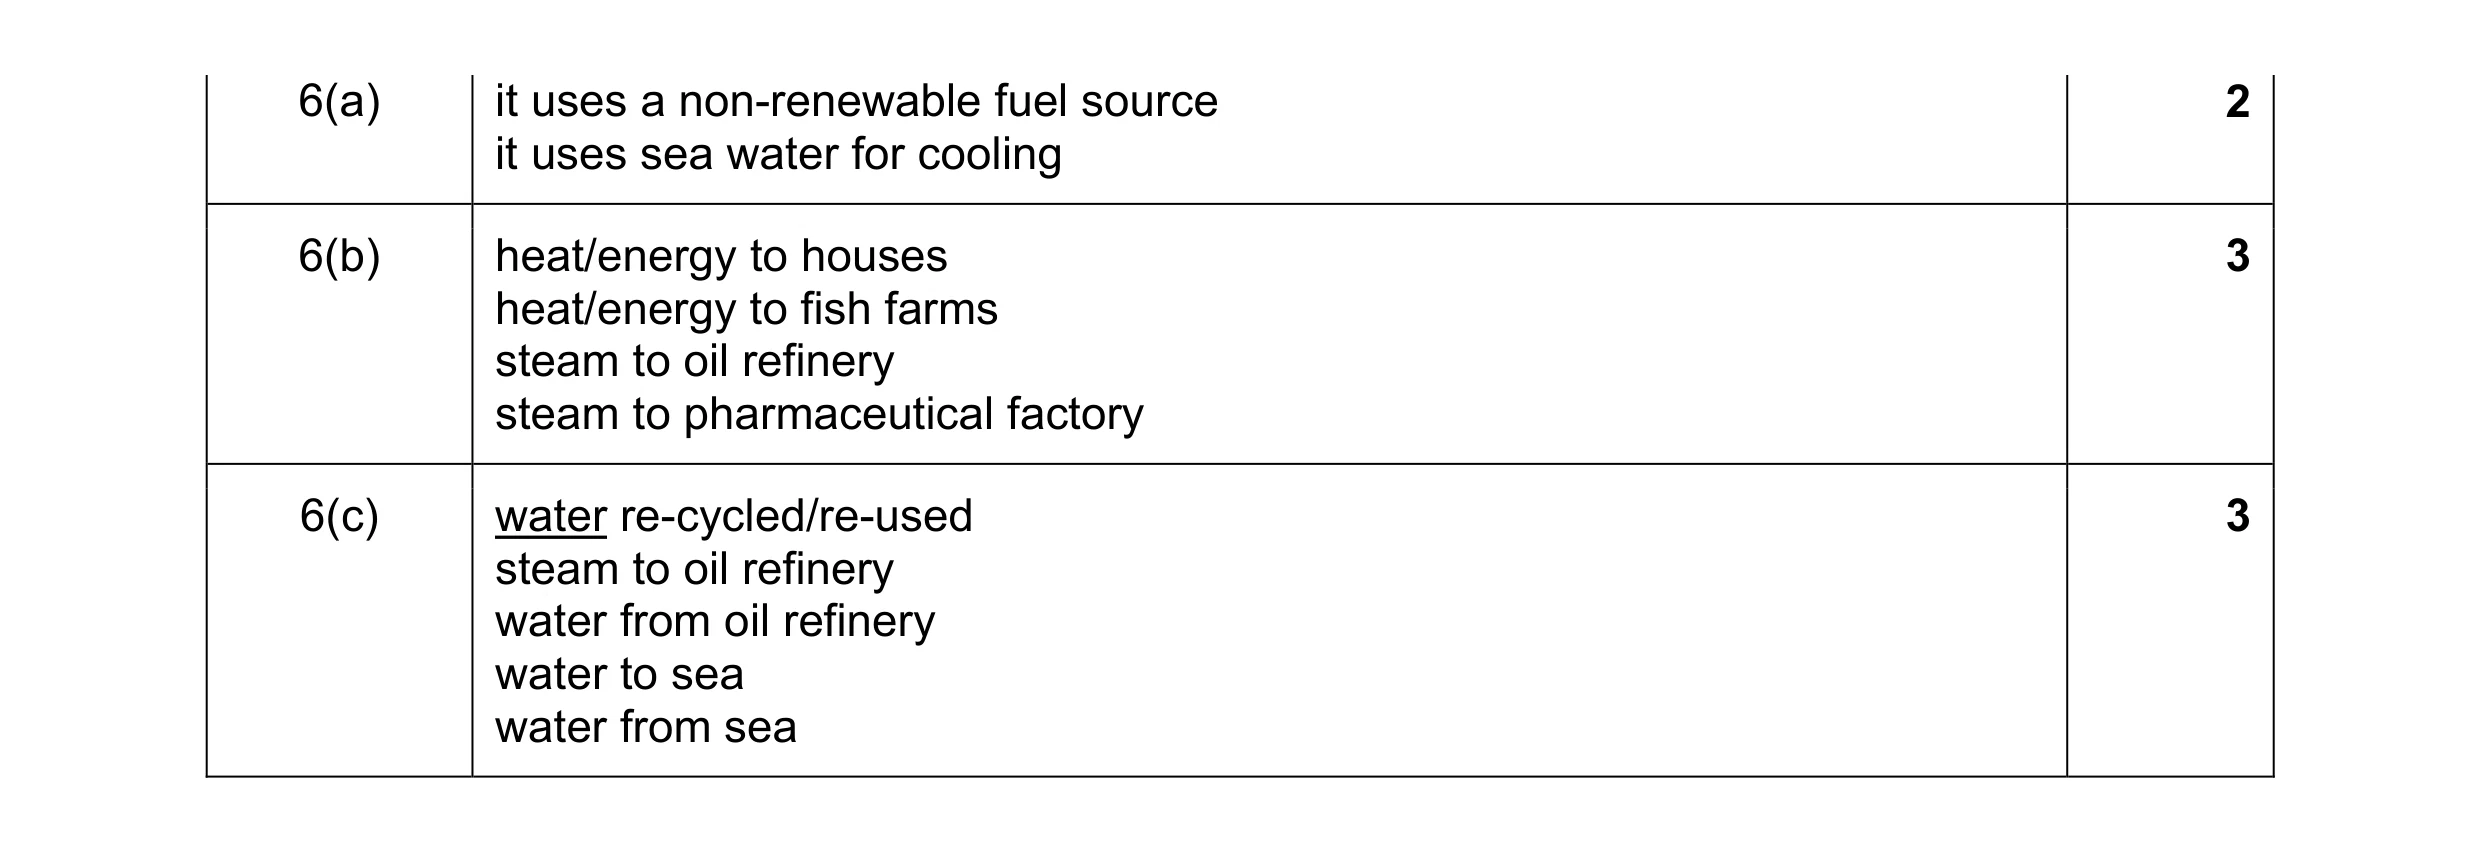 8
8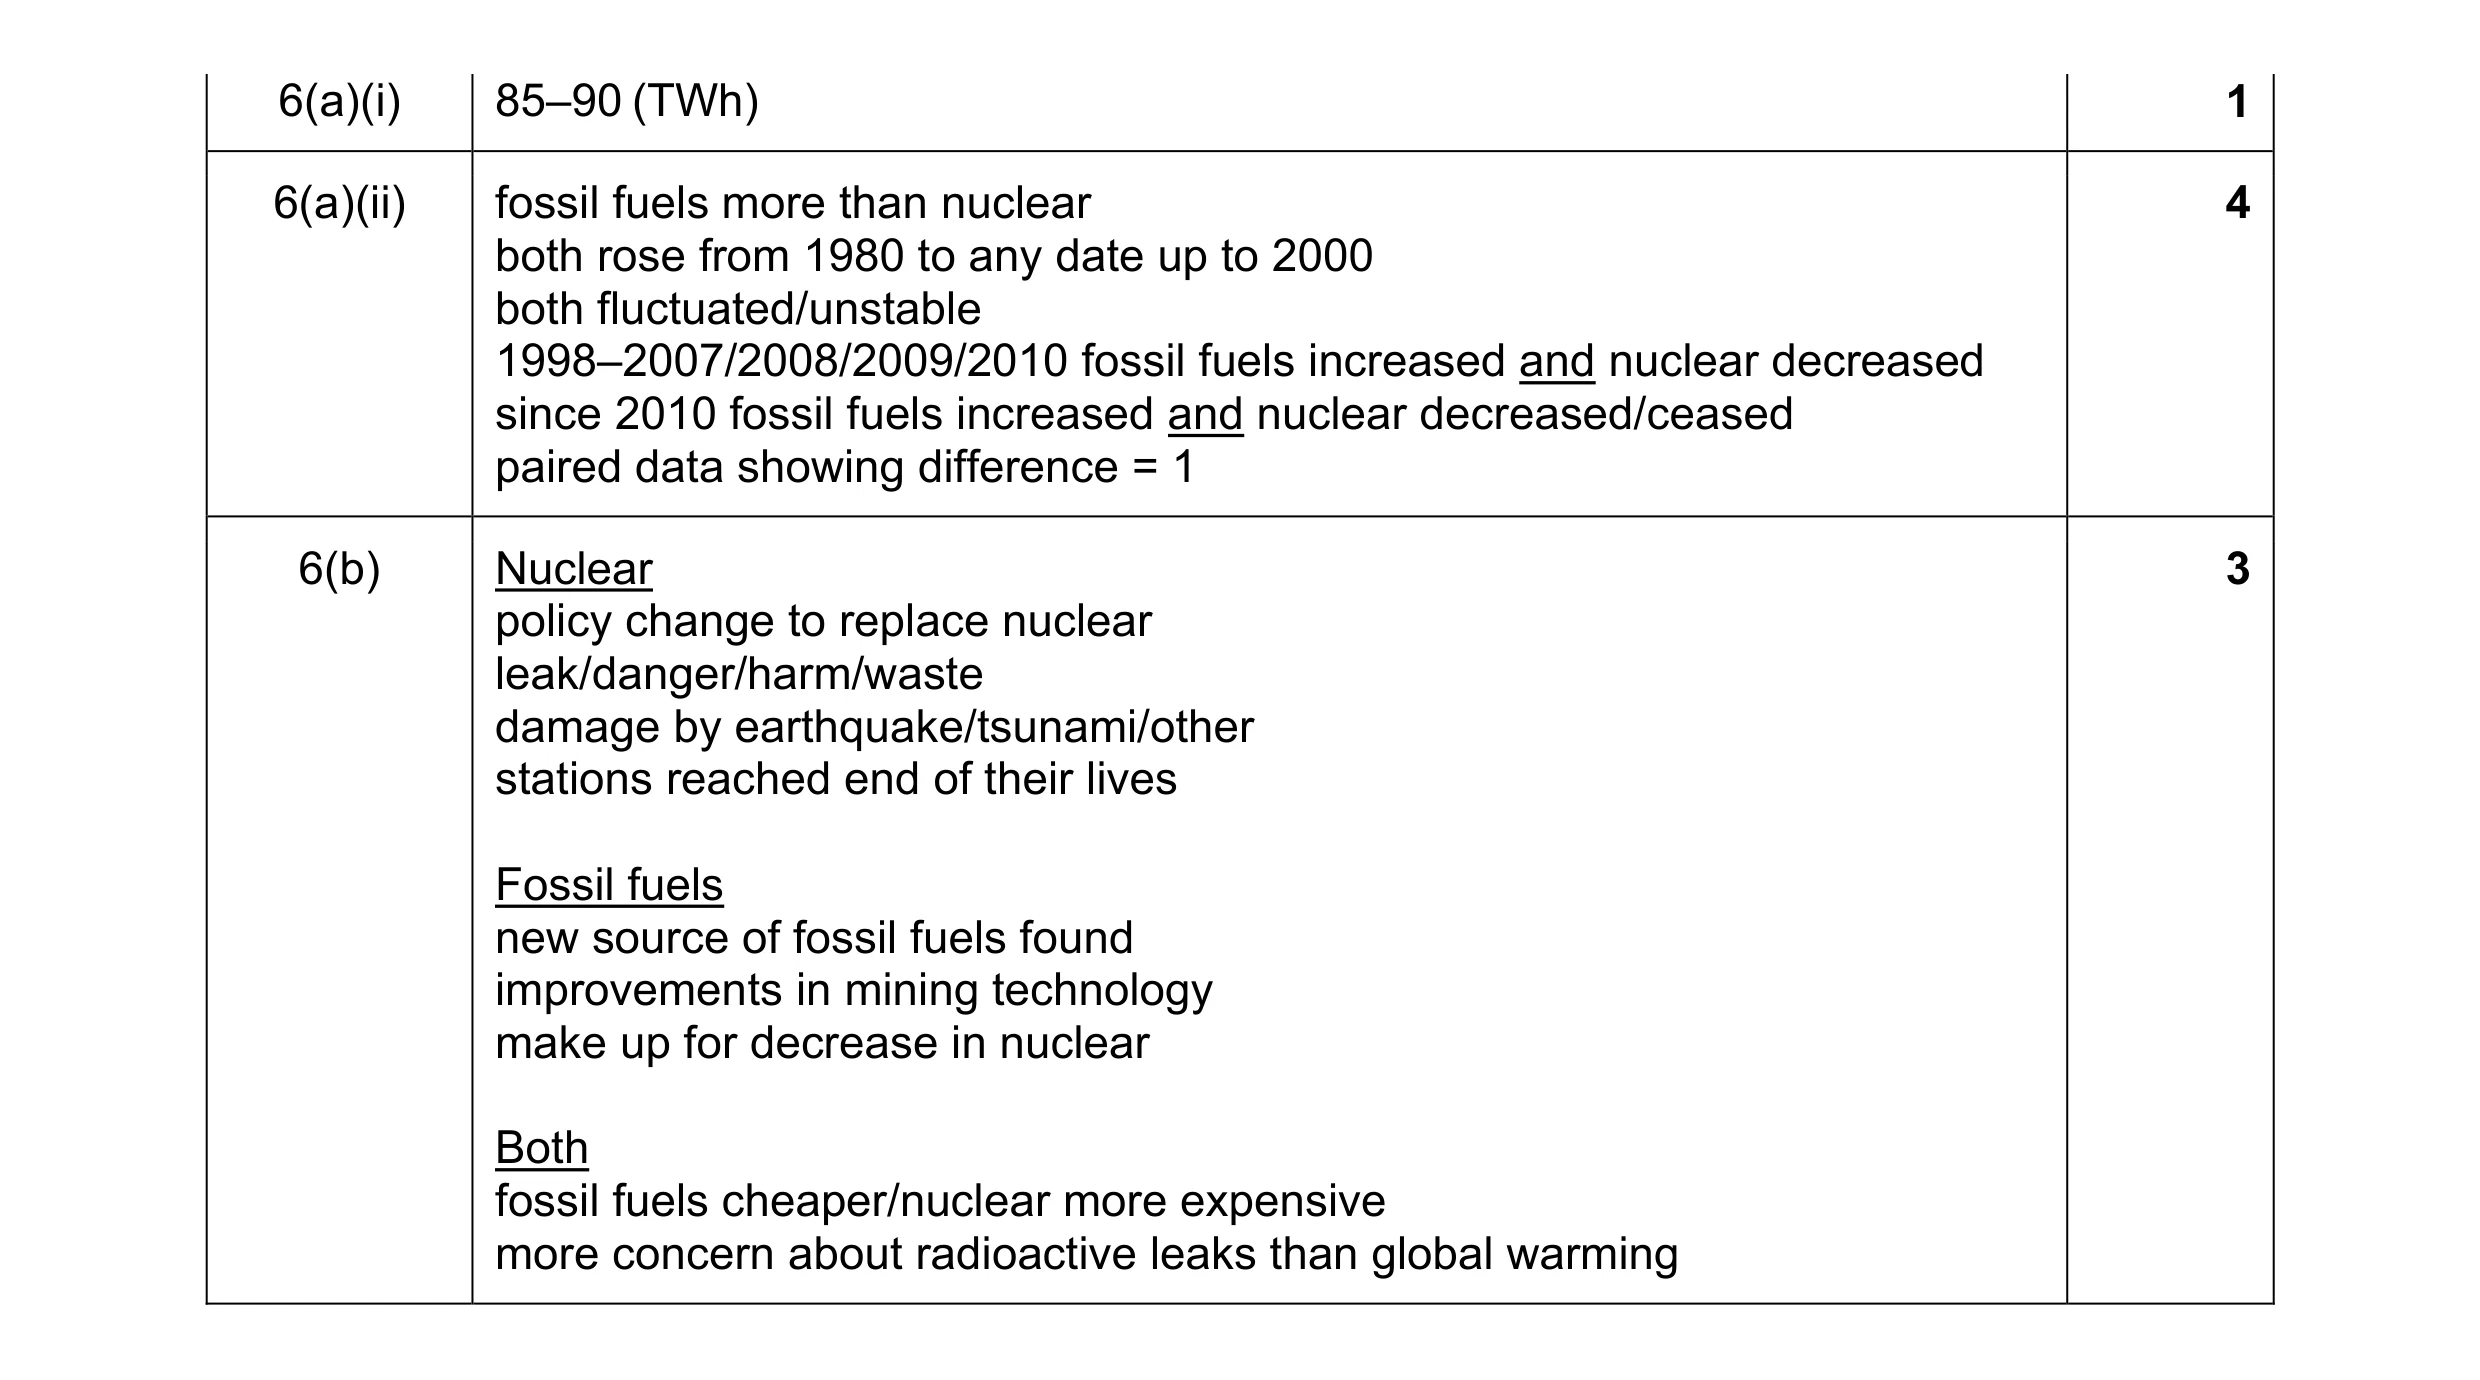 8
8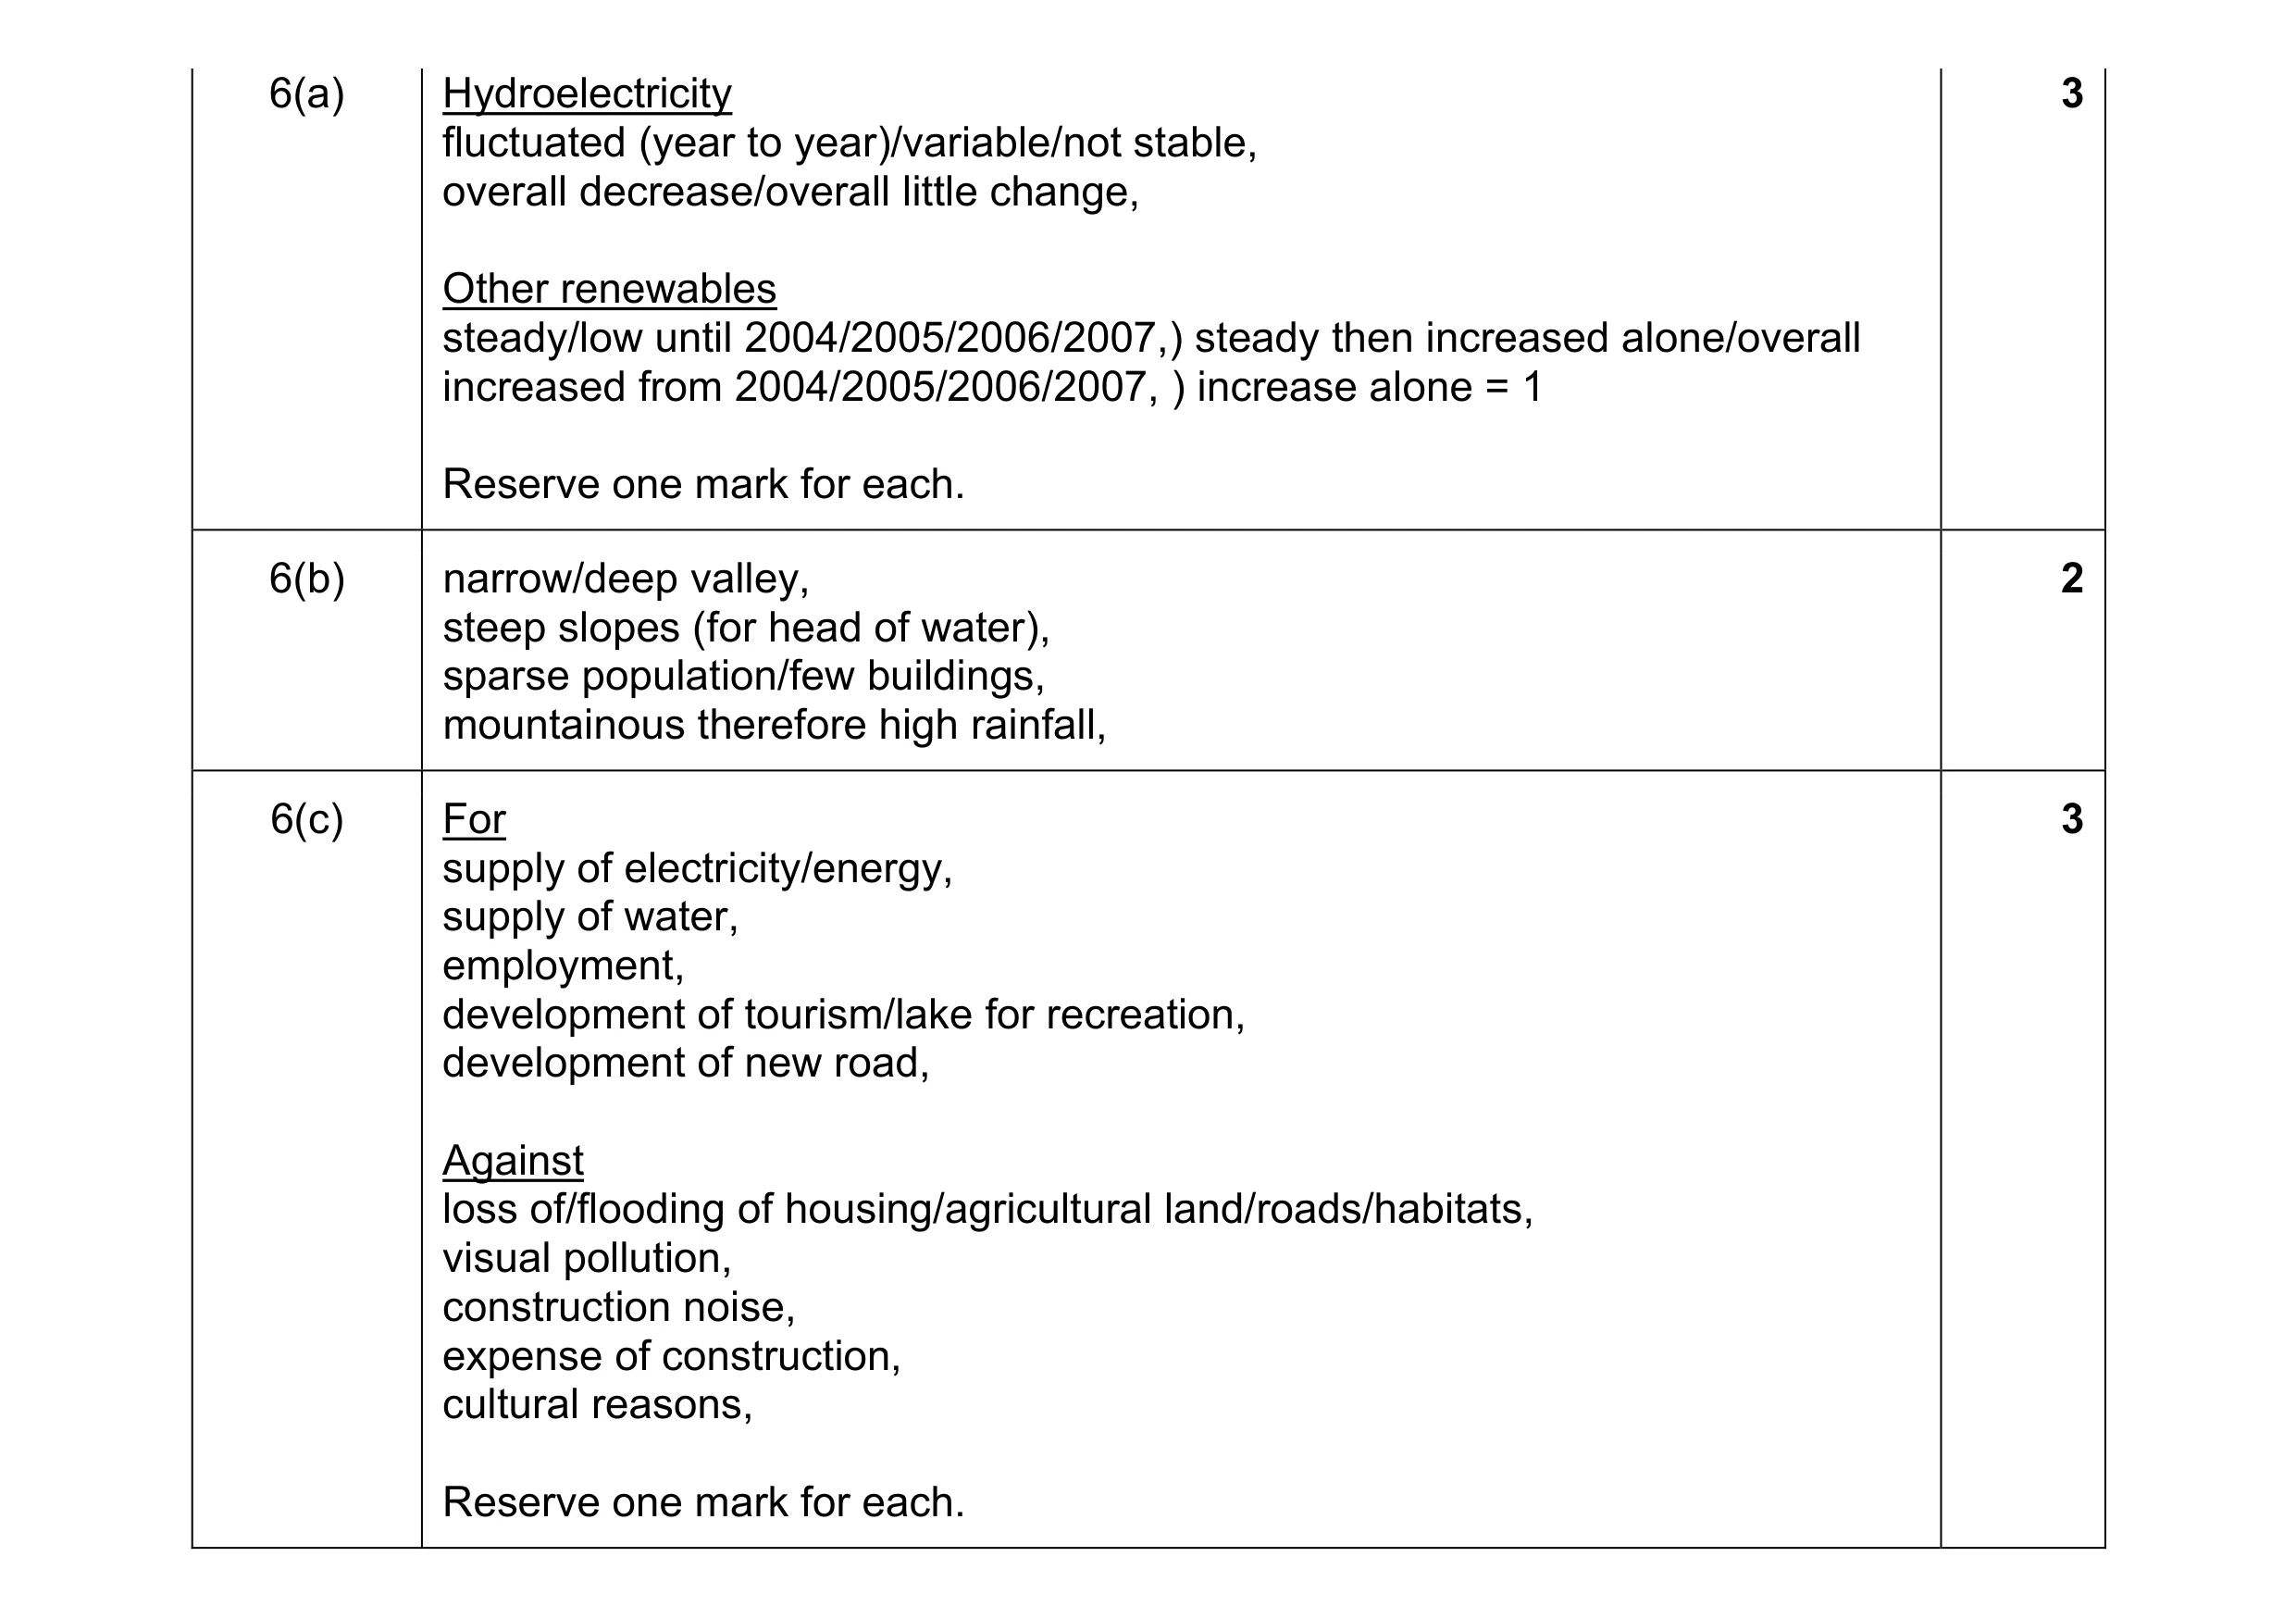 8
8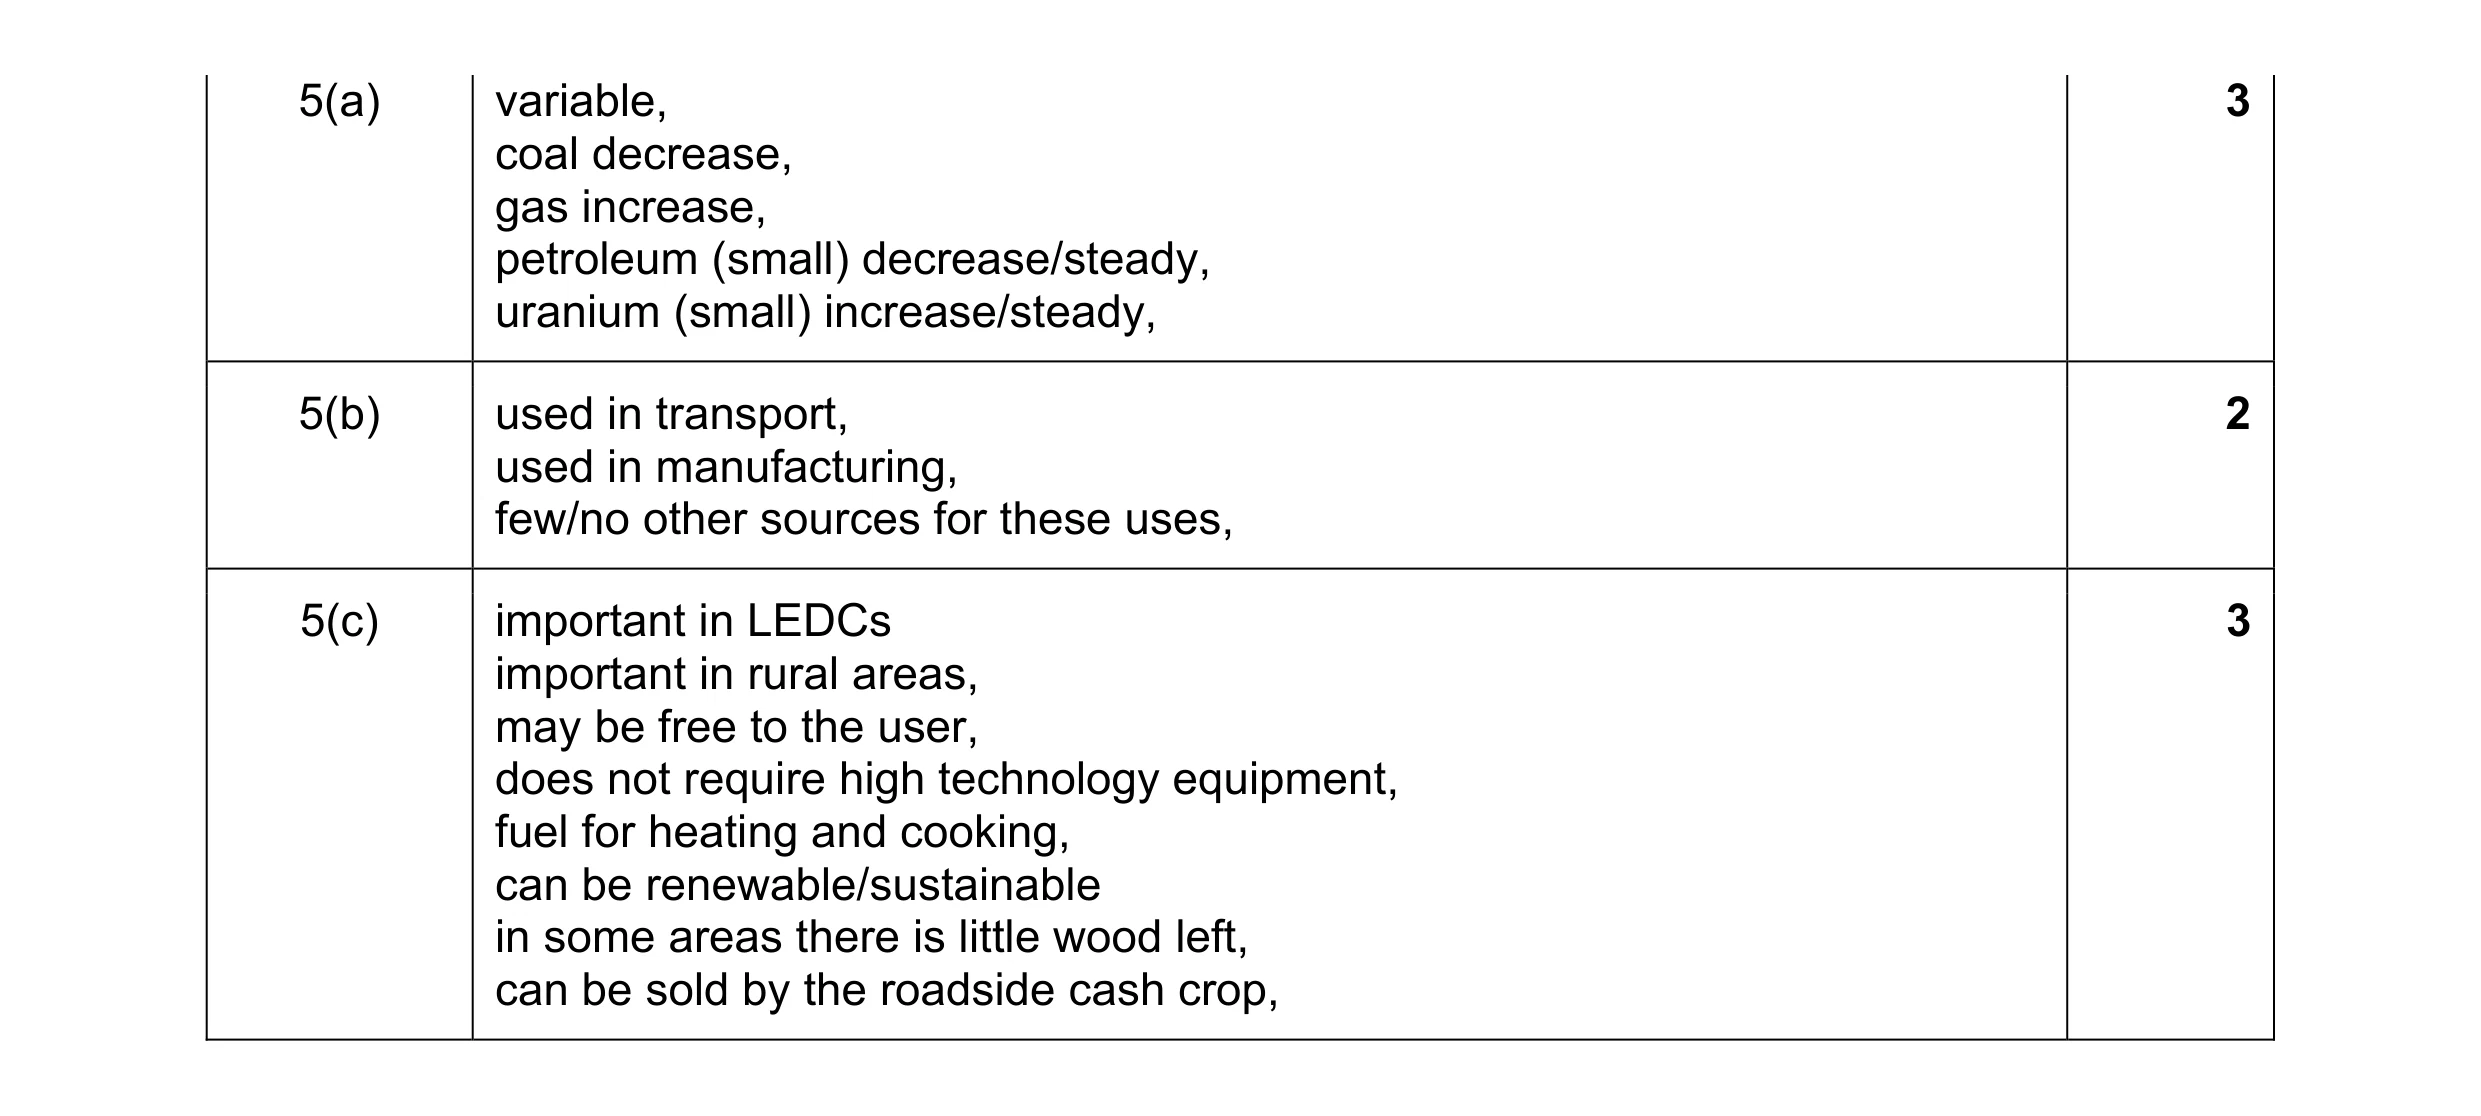 8
8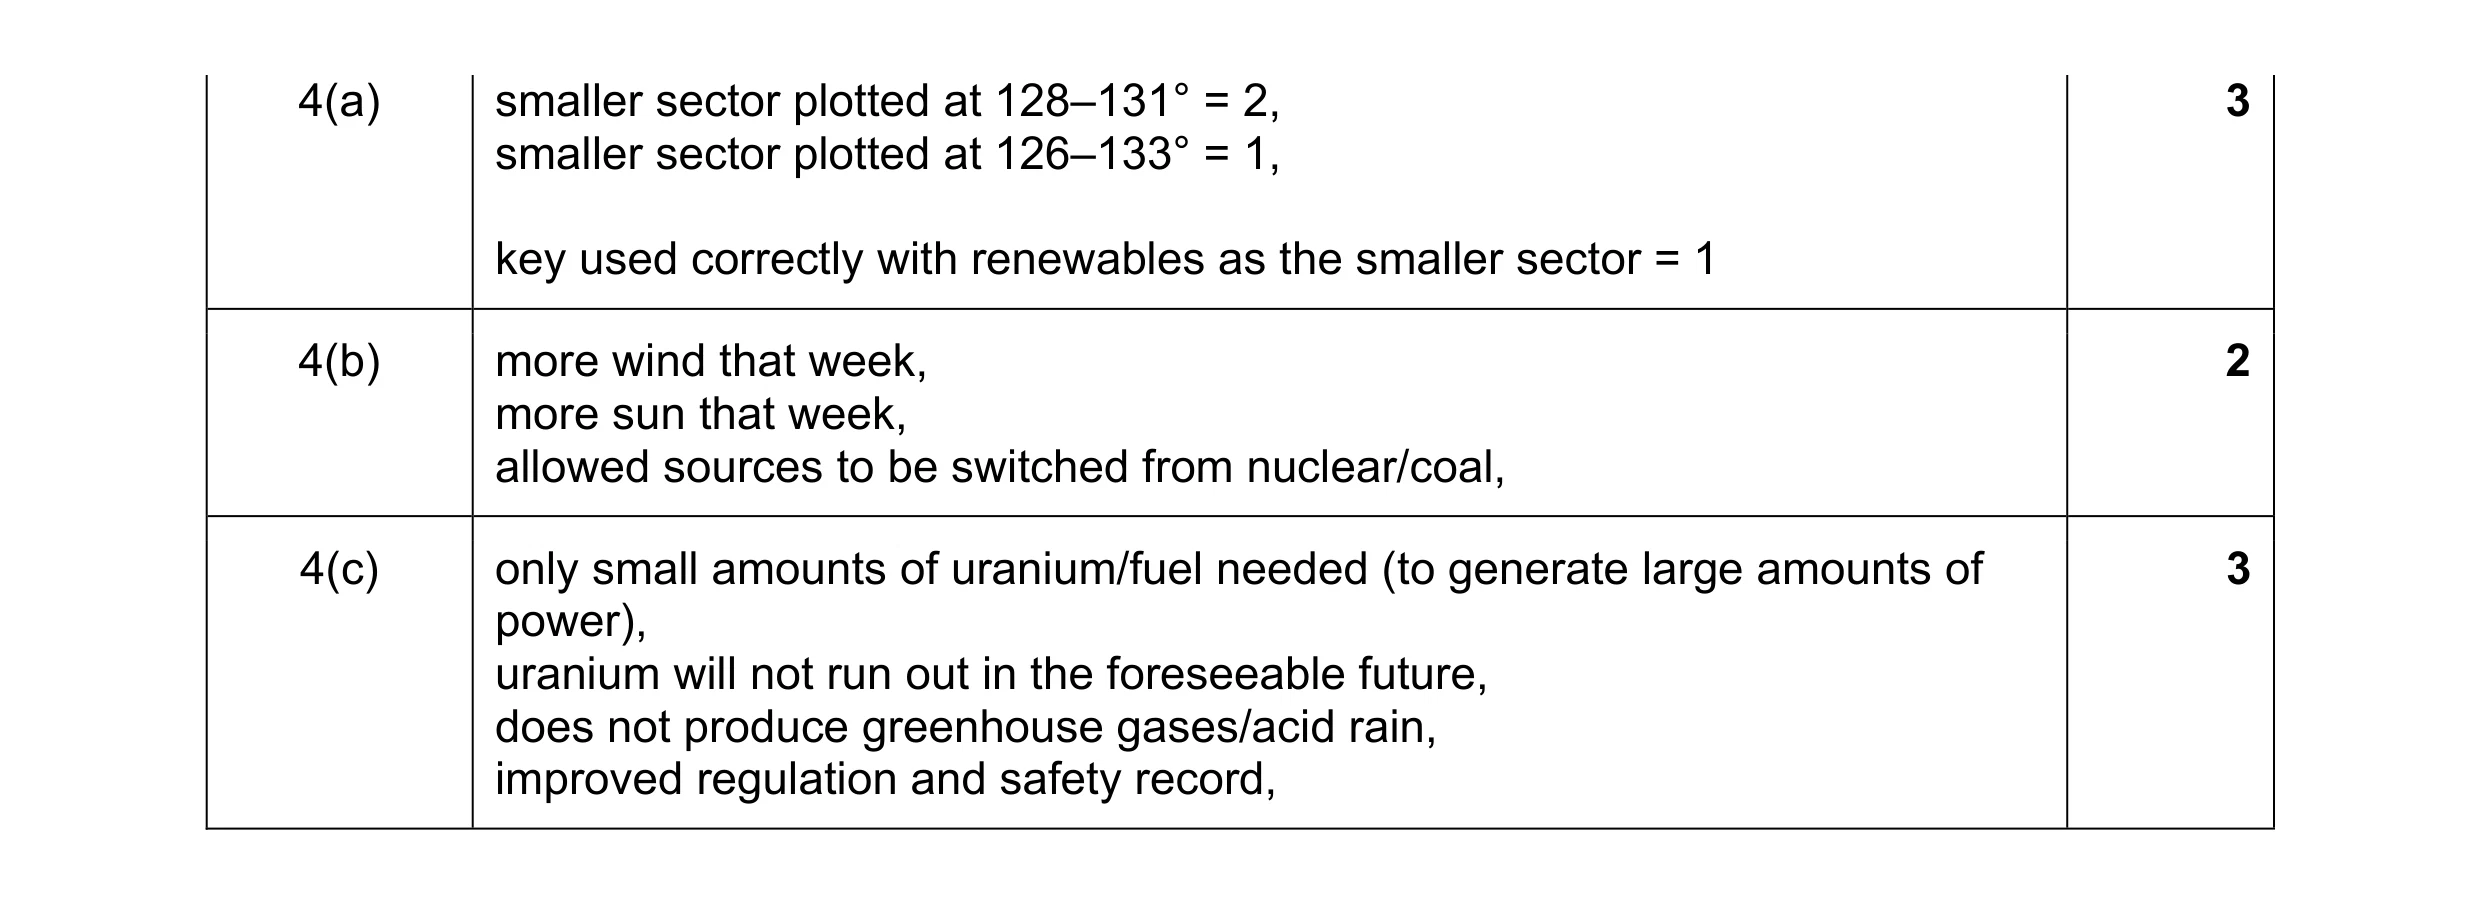 8
8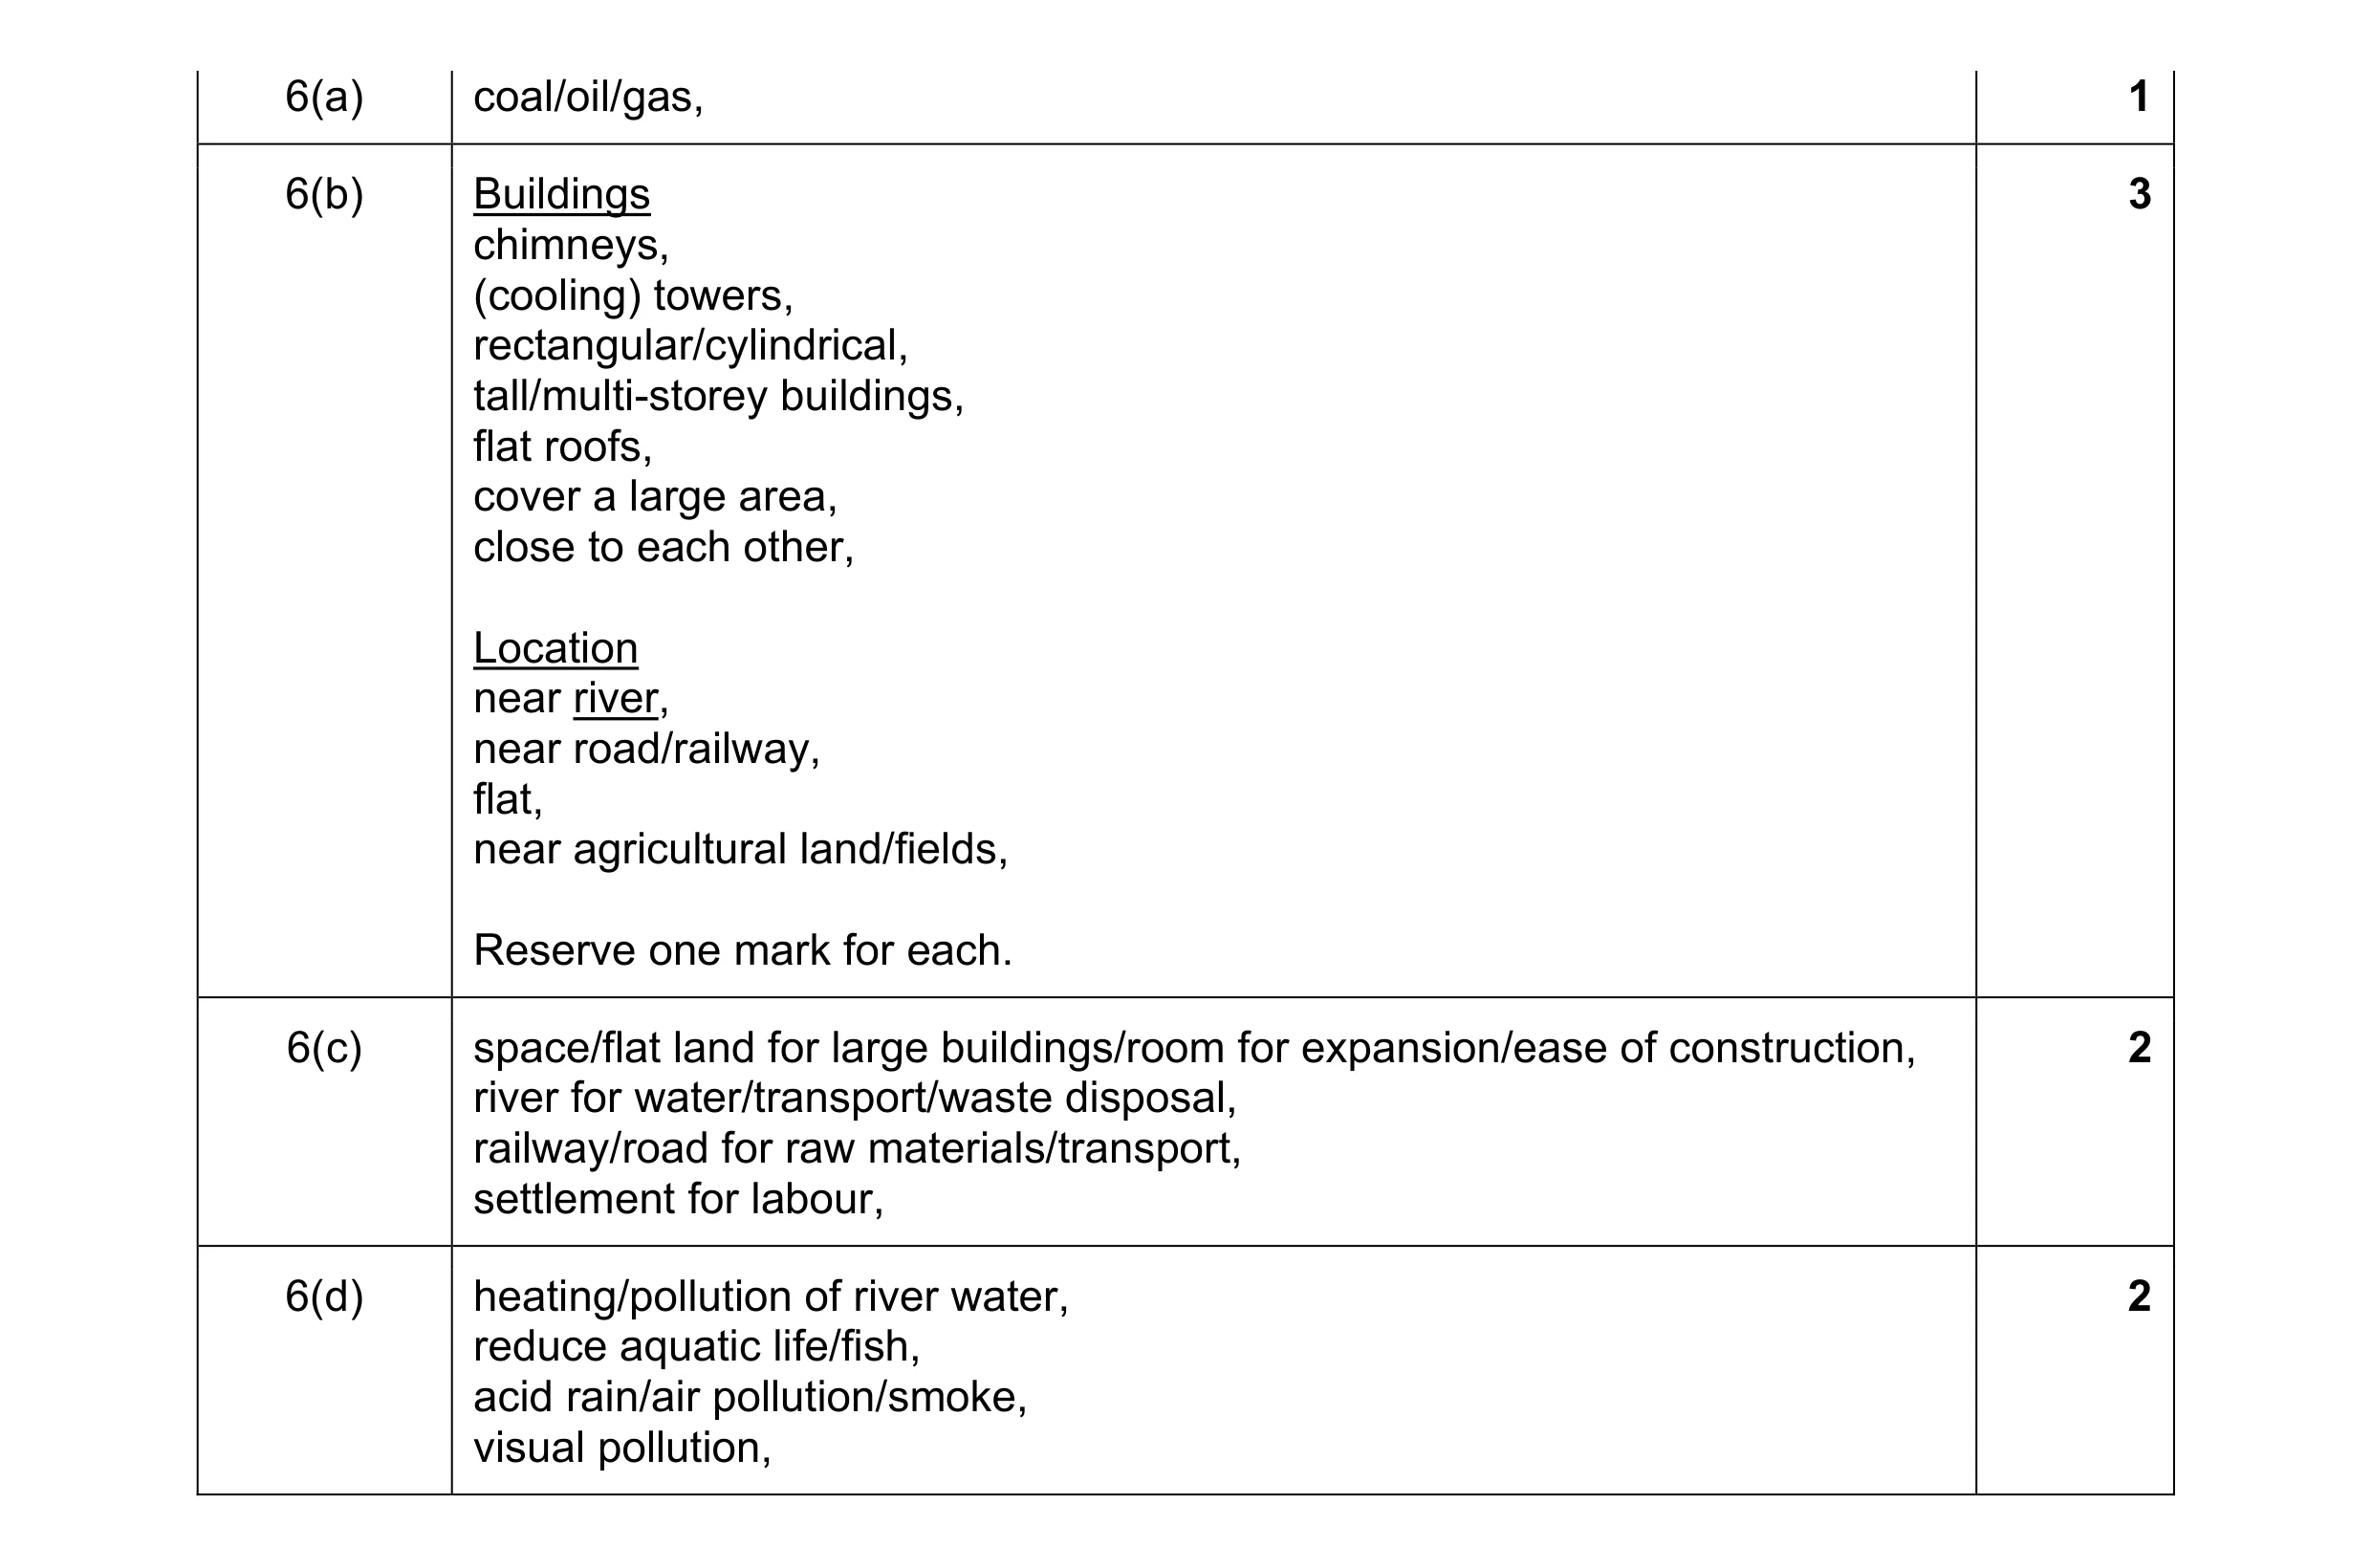 8
8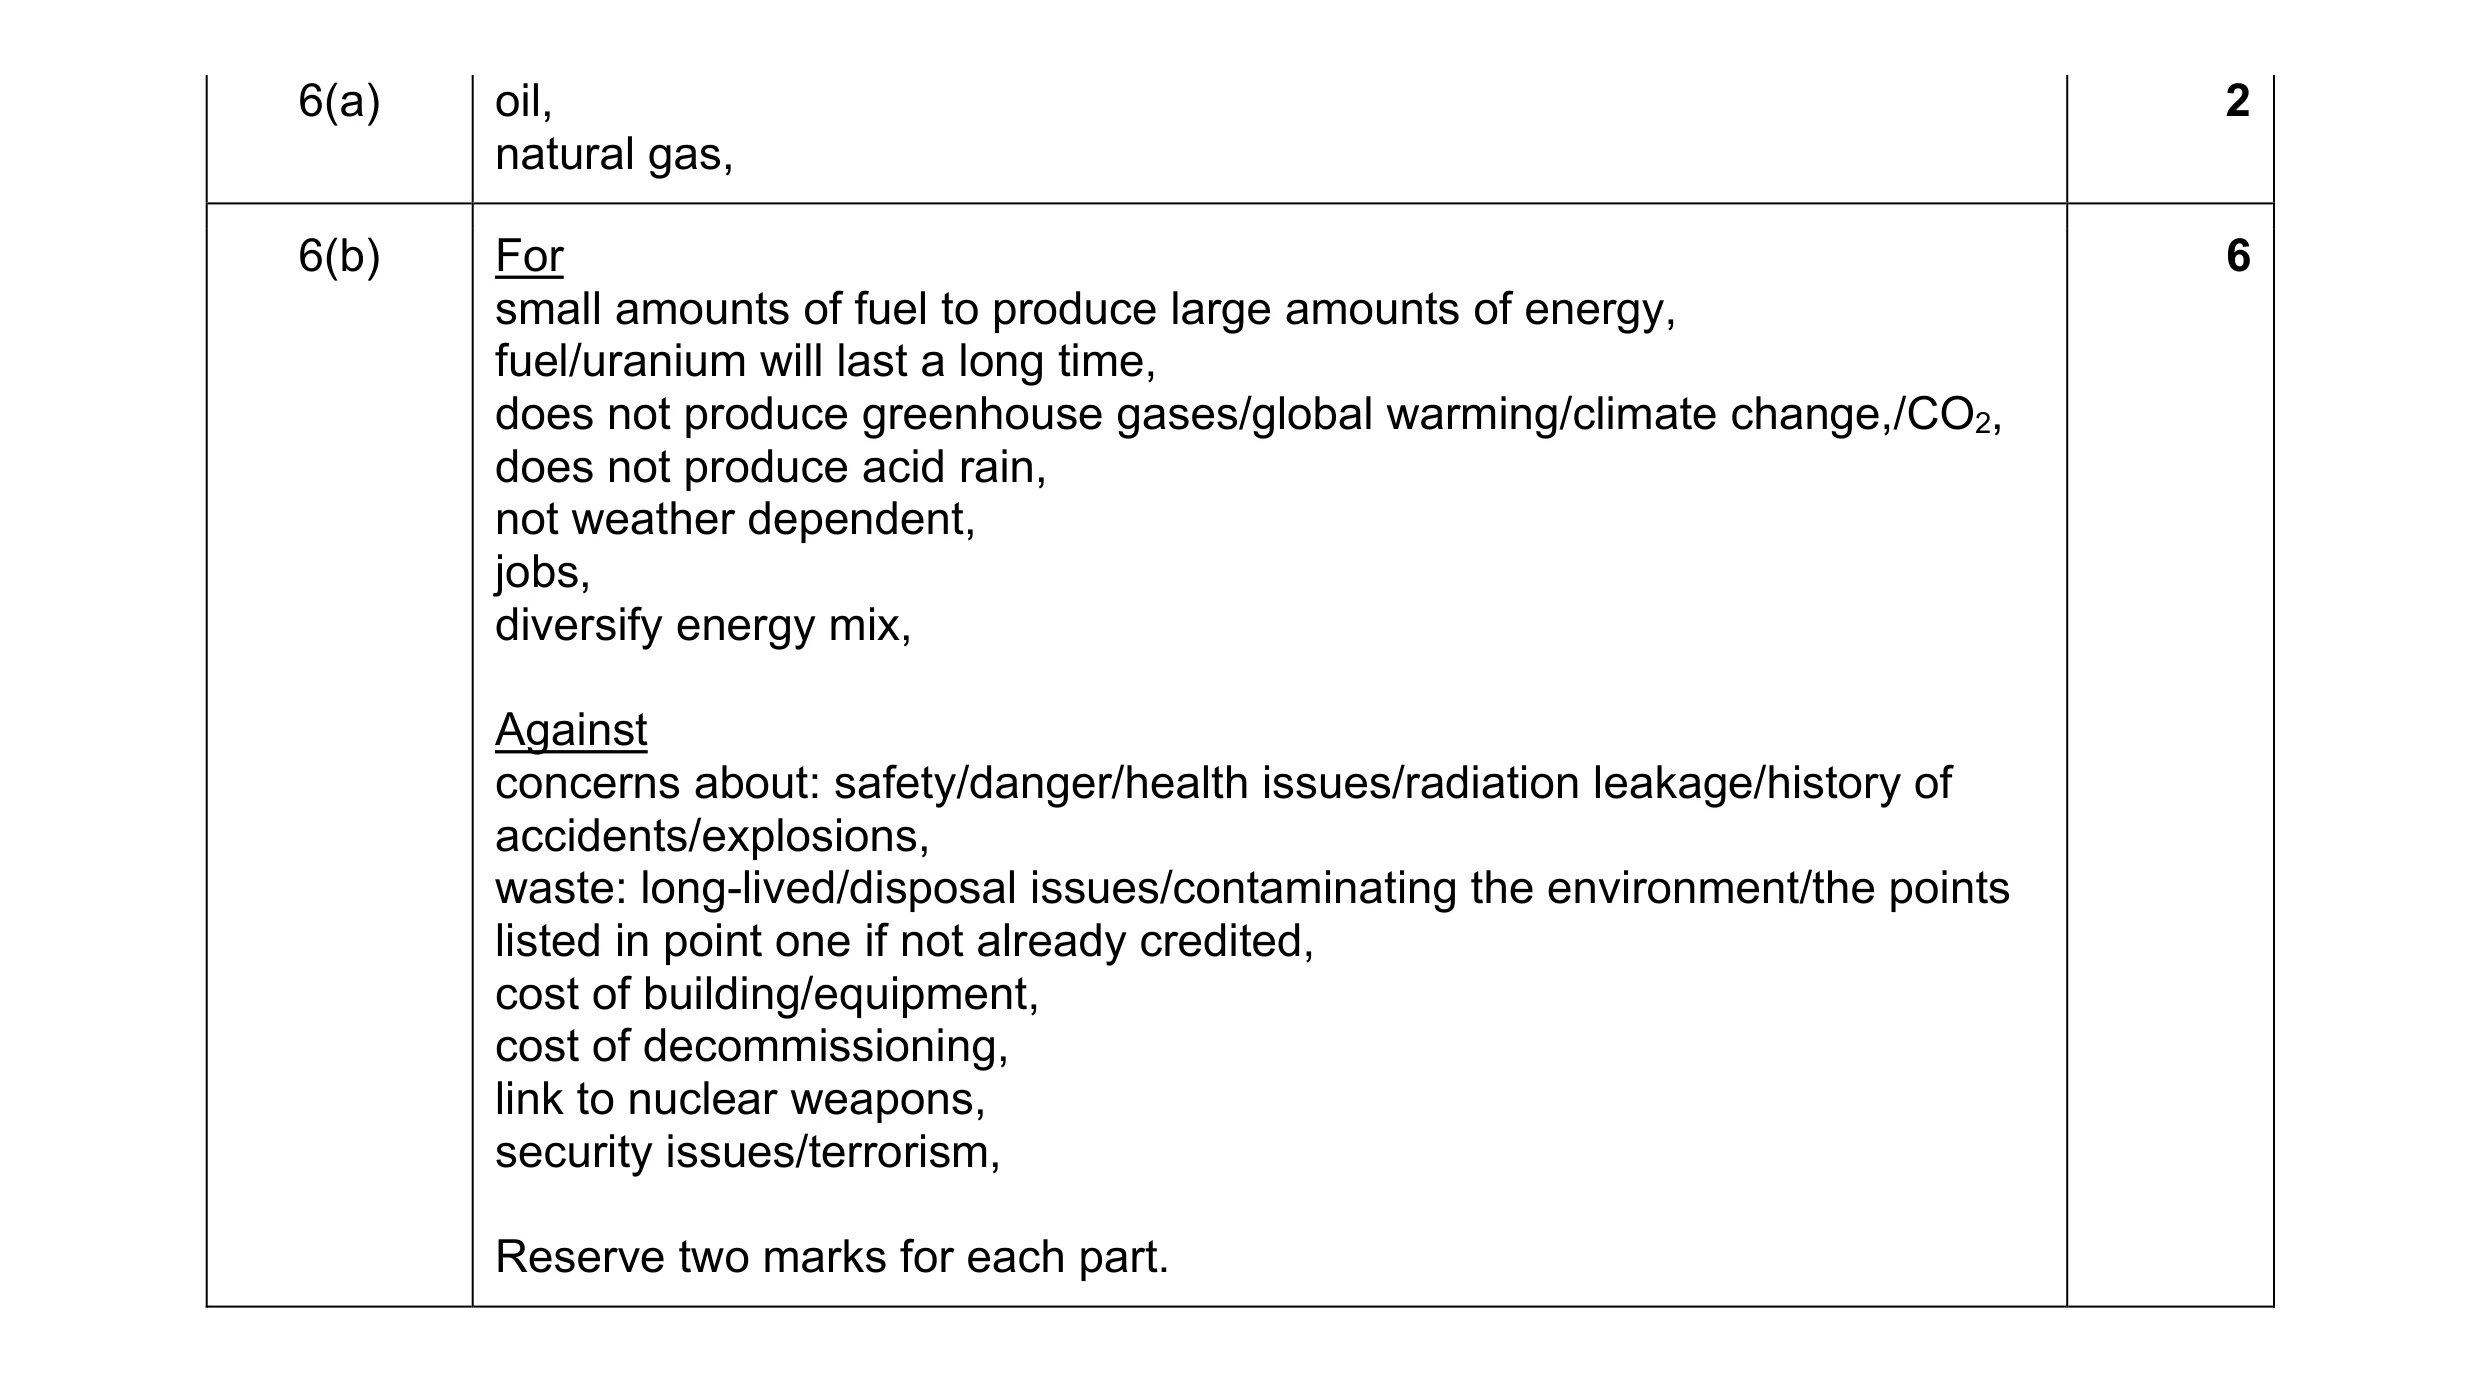 8
8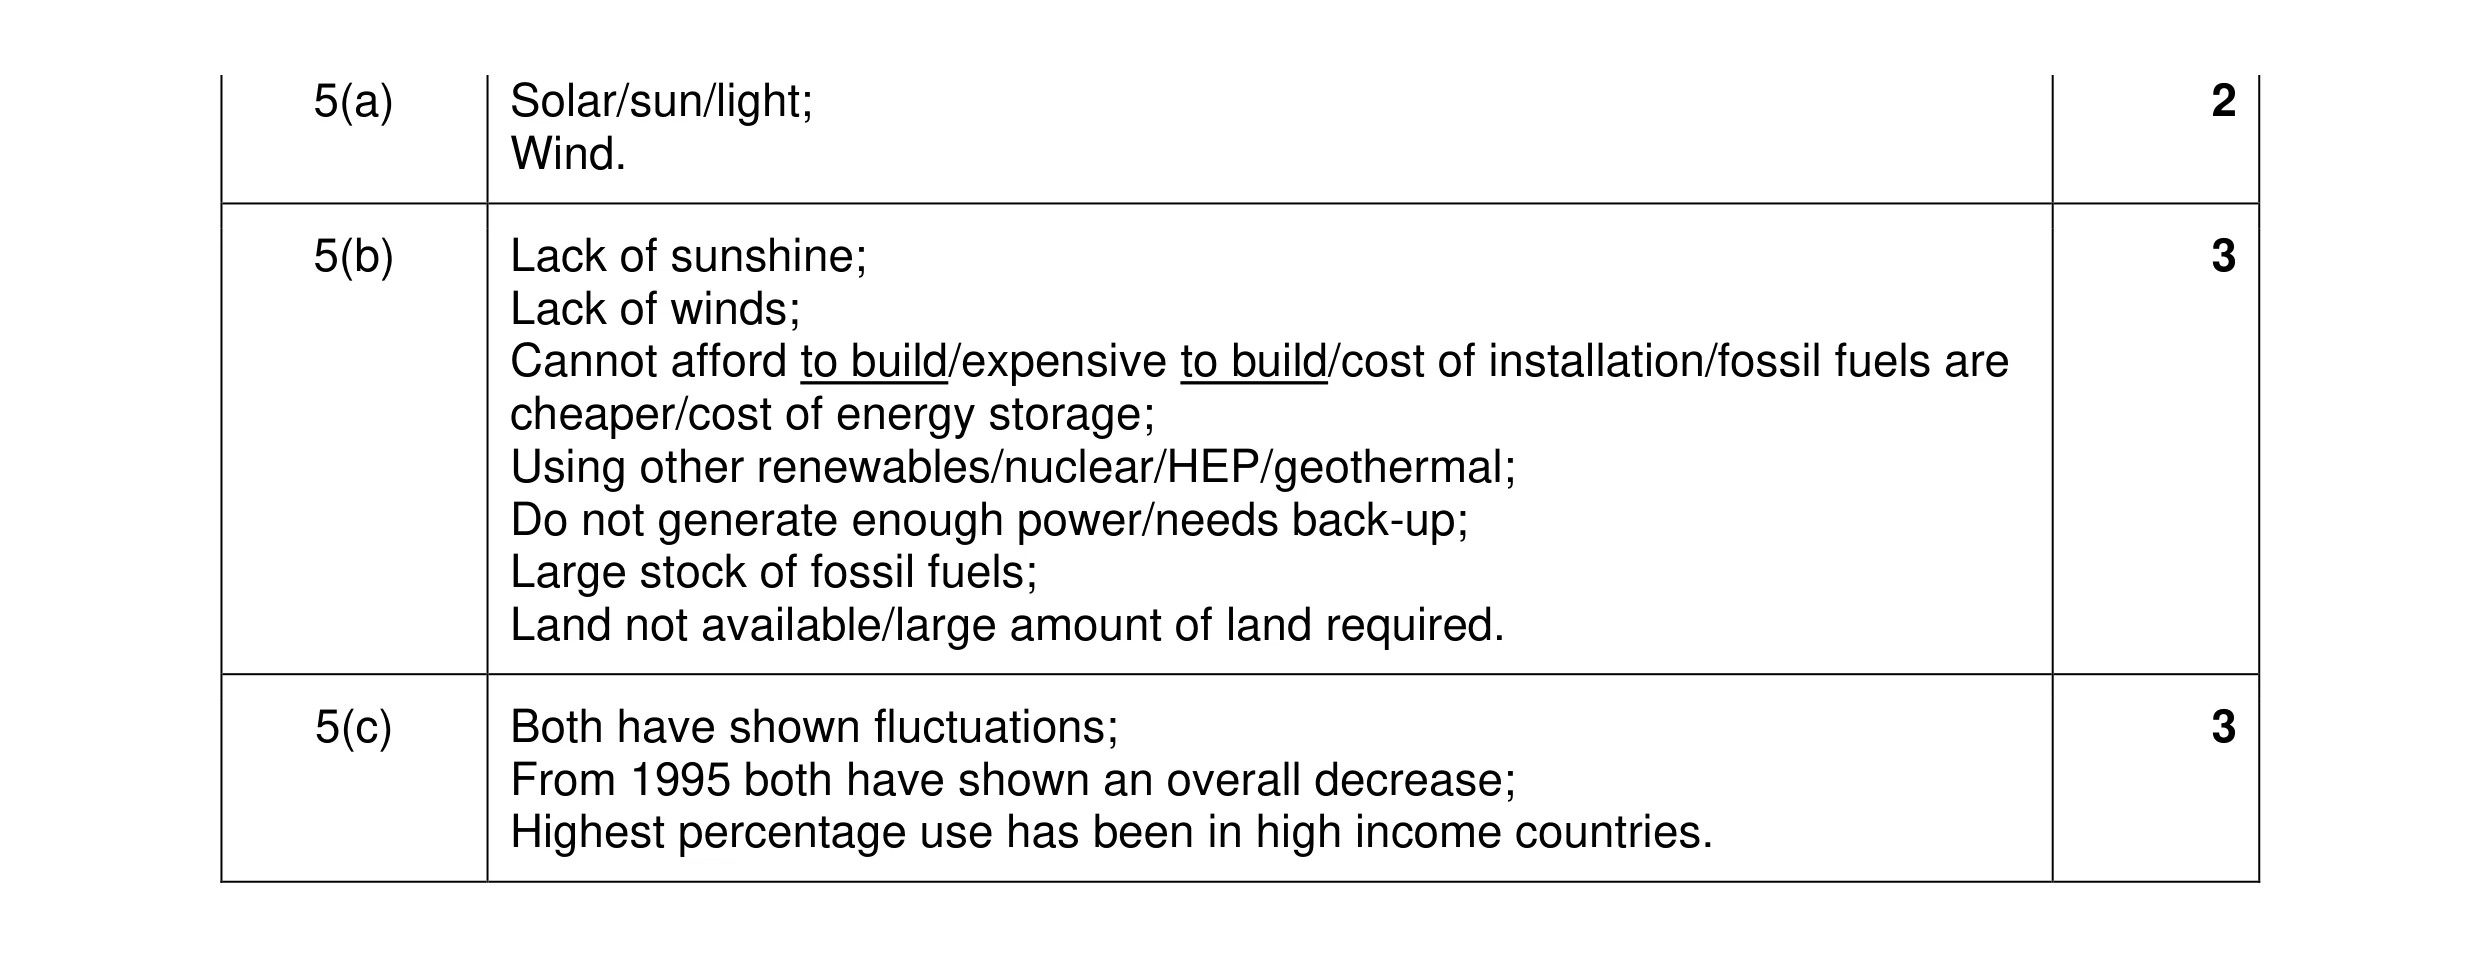 8
8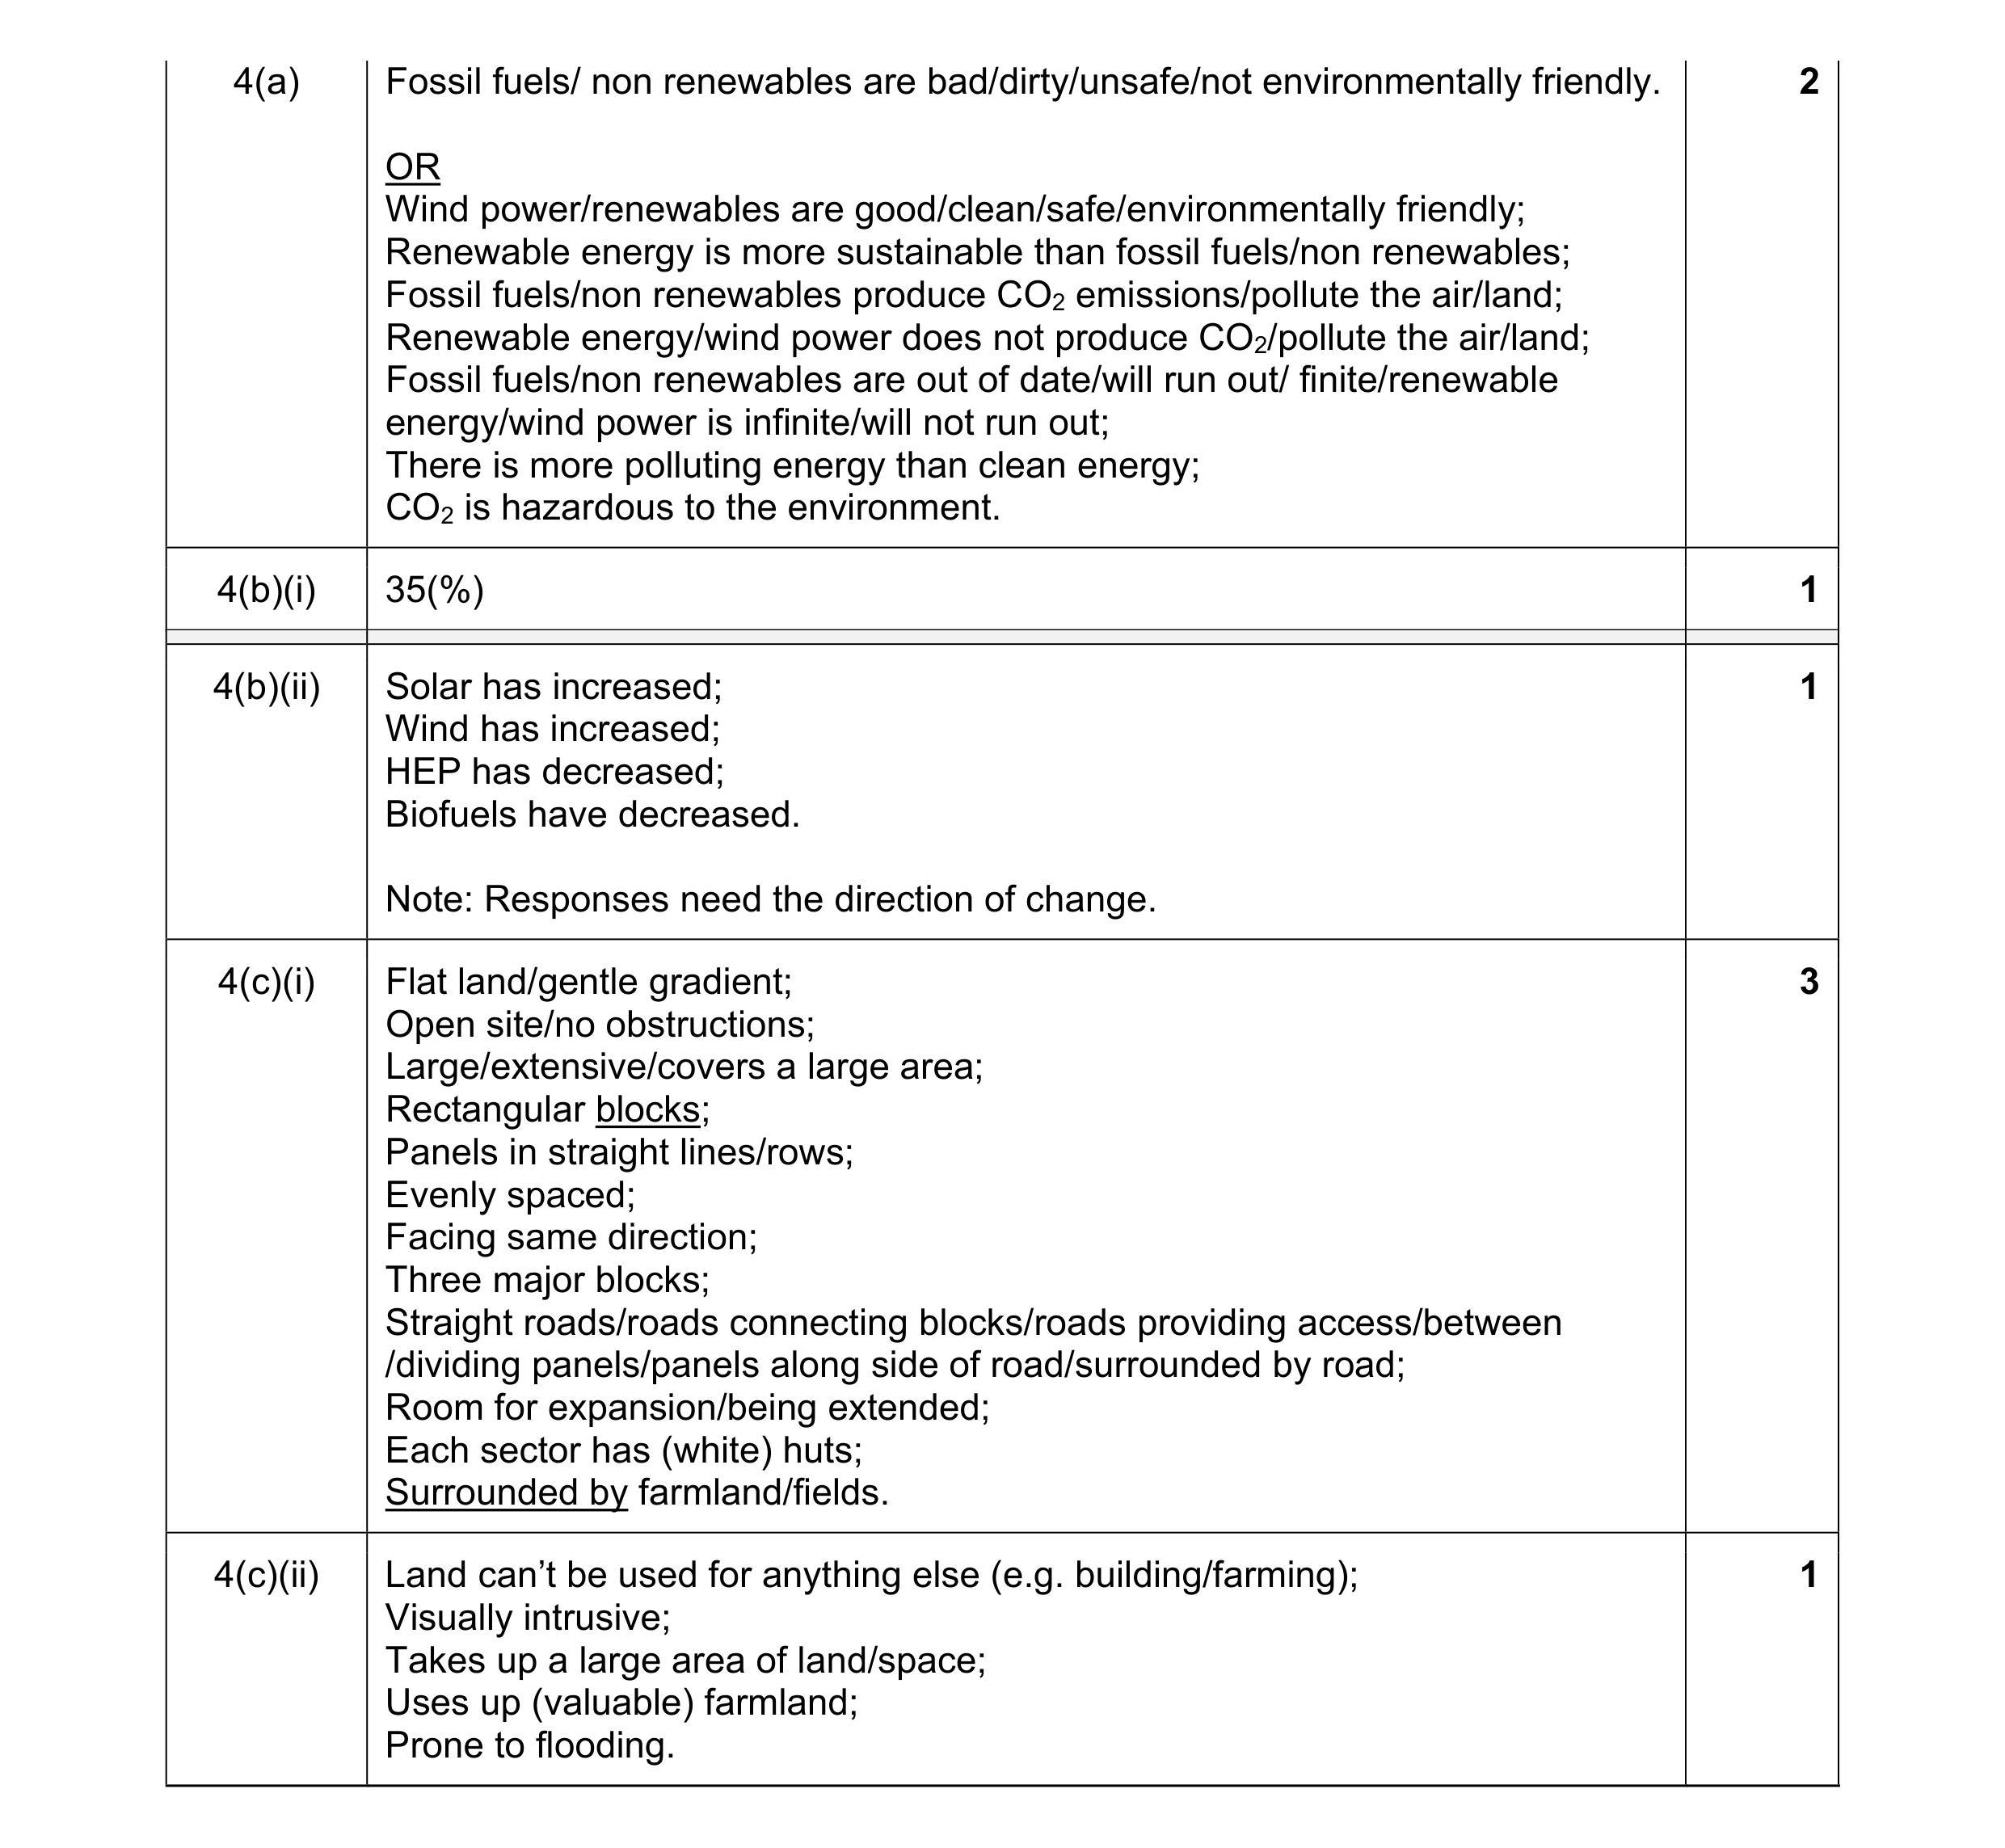 8
8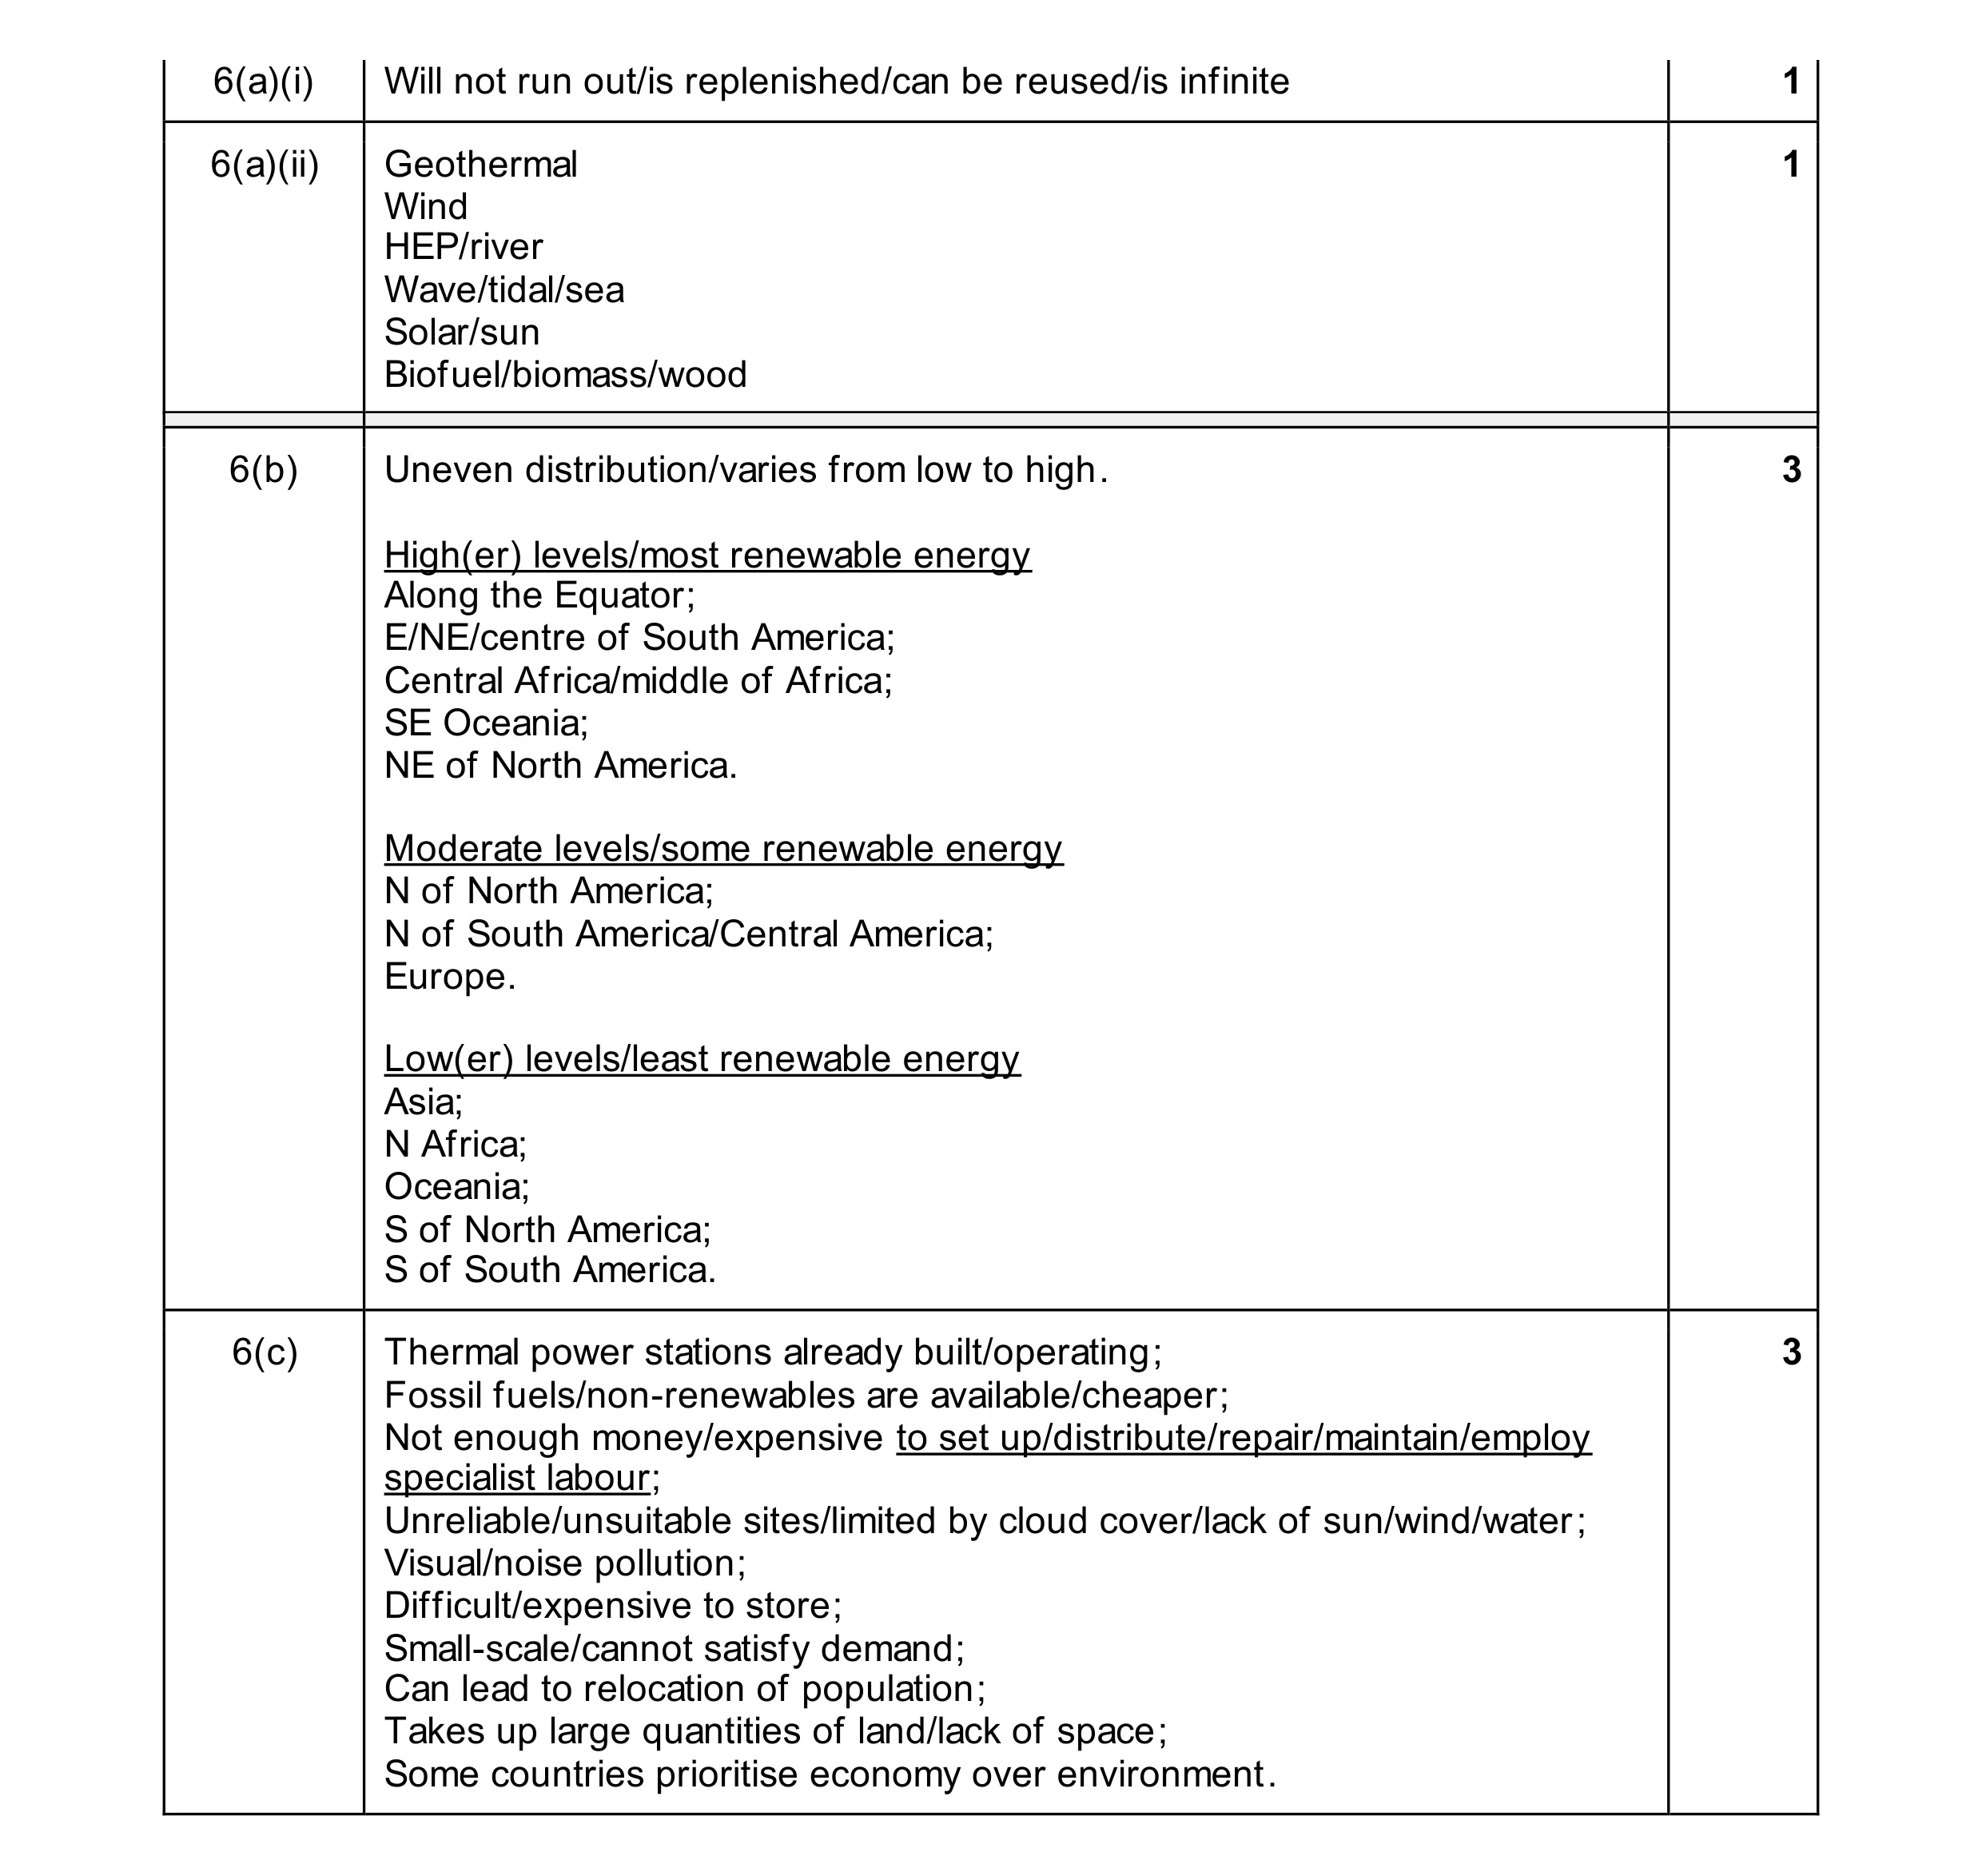 8
8