Cambridge IGCSE Geography 0460 — 2017 Oct/Nov Paper 2 · Variant 2
0460/22/O/N/17 · 6 questions · 60 marks · ≈68 min
The question paper and its mark scheme, free to read here and free to download. This is Cambridge’s own paper, exactly as it was sat.
Question paper20 pages





Mark scheme5 pages
Answers below. Sit the paper first if you are practising.
Questions as text
Q1 · Study the map extract for Bordalen, Norway
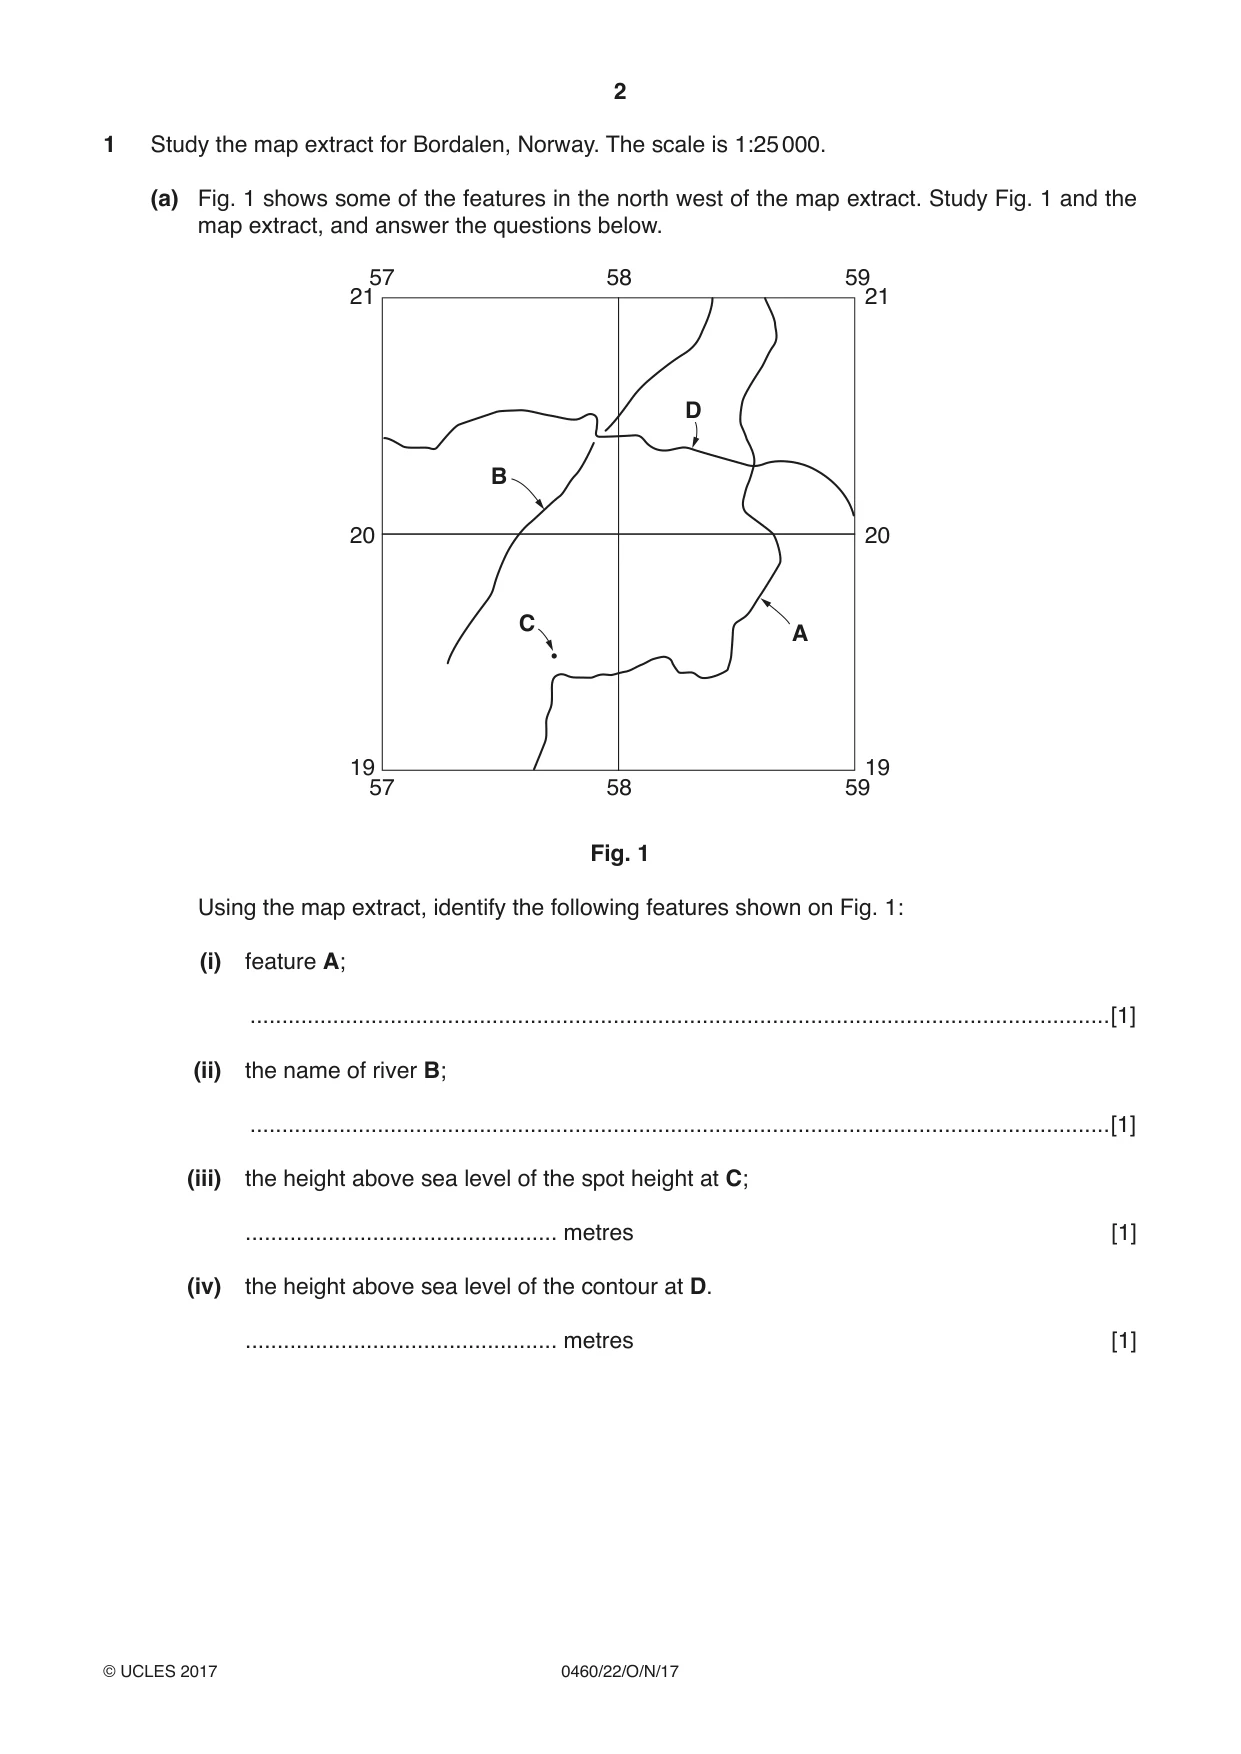
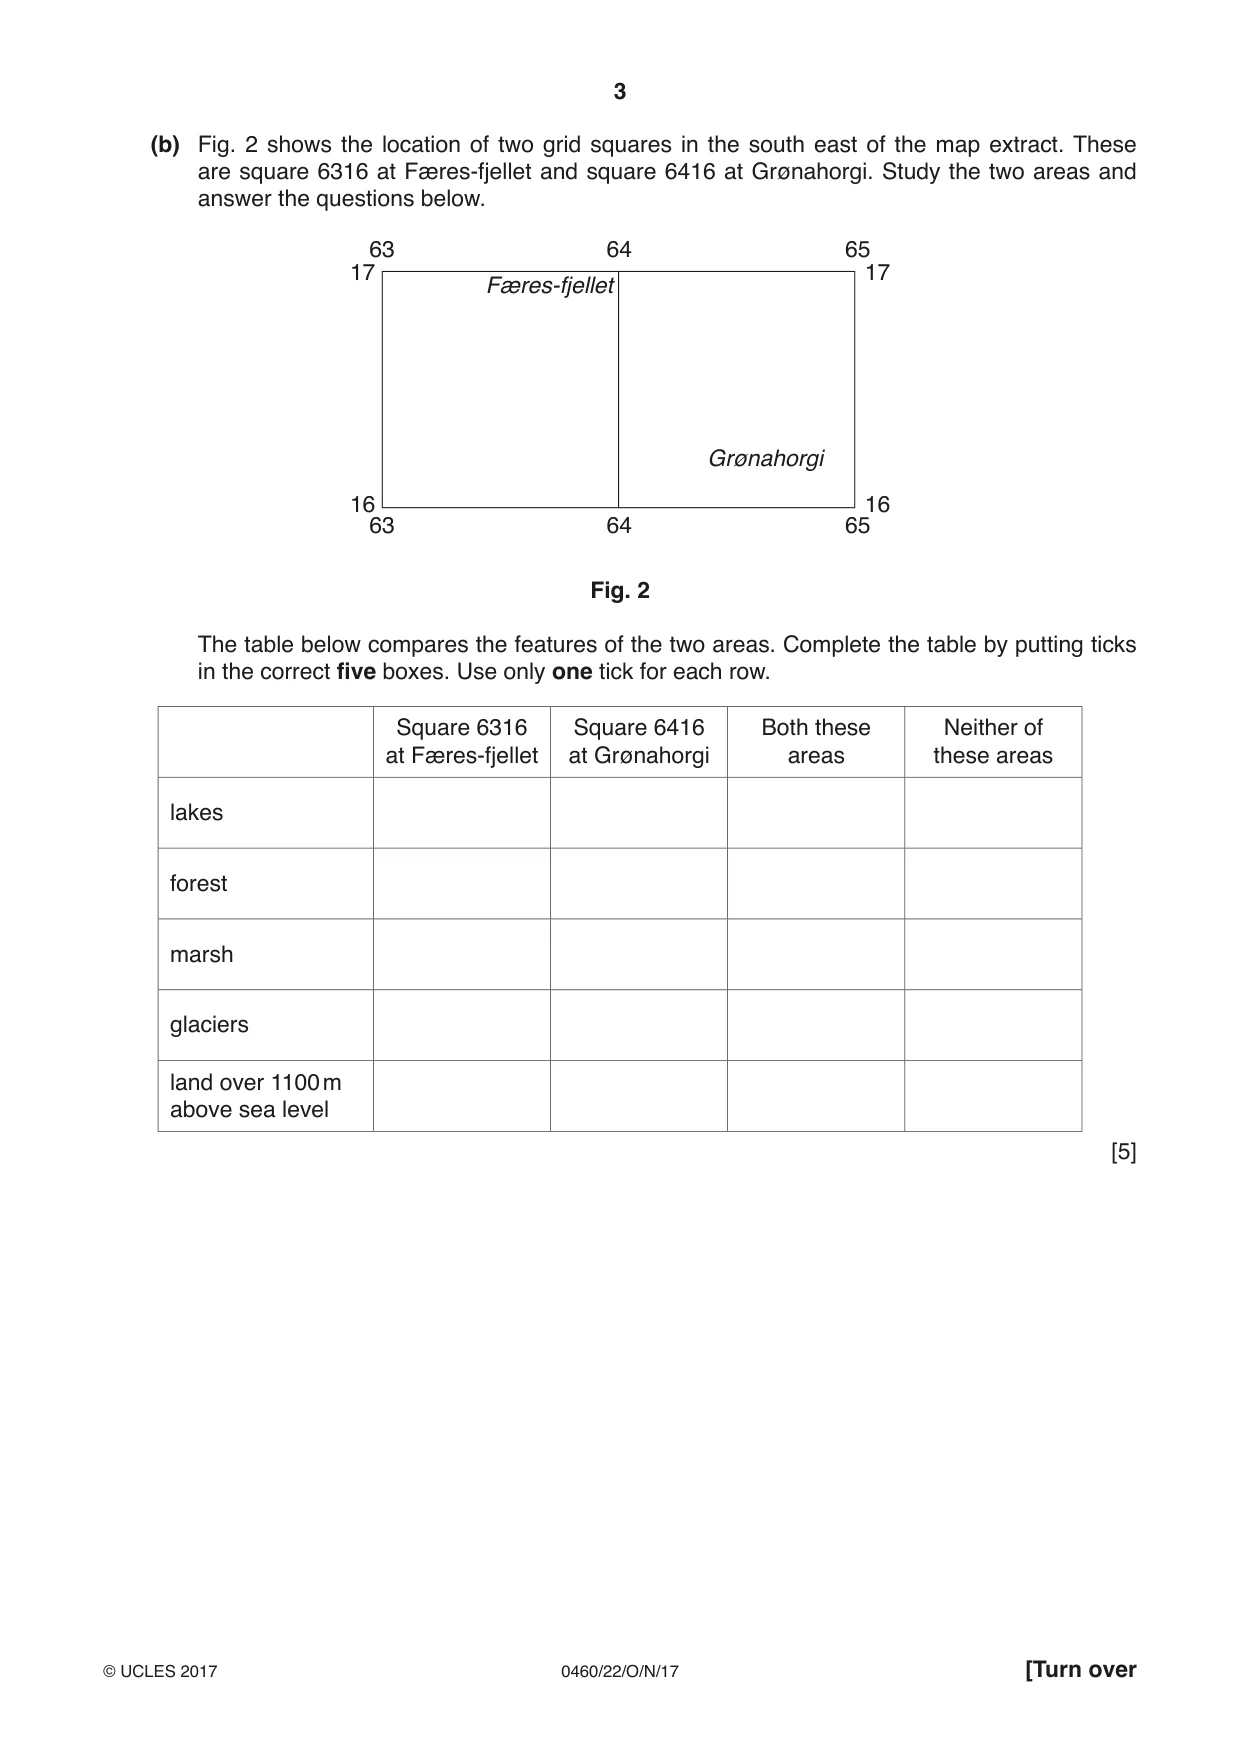
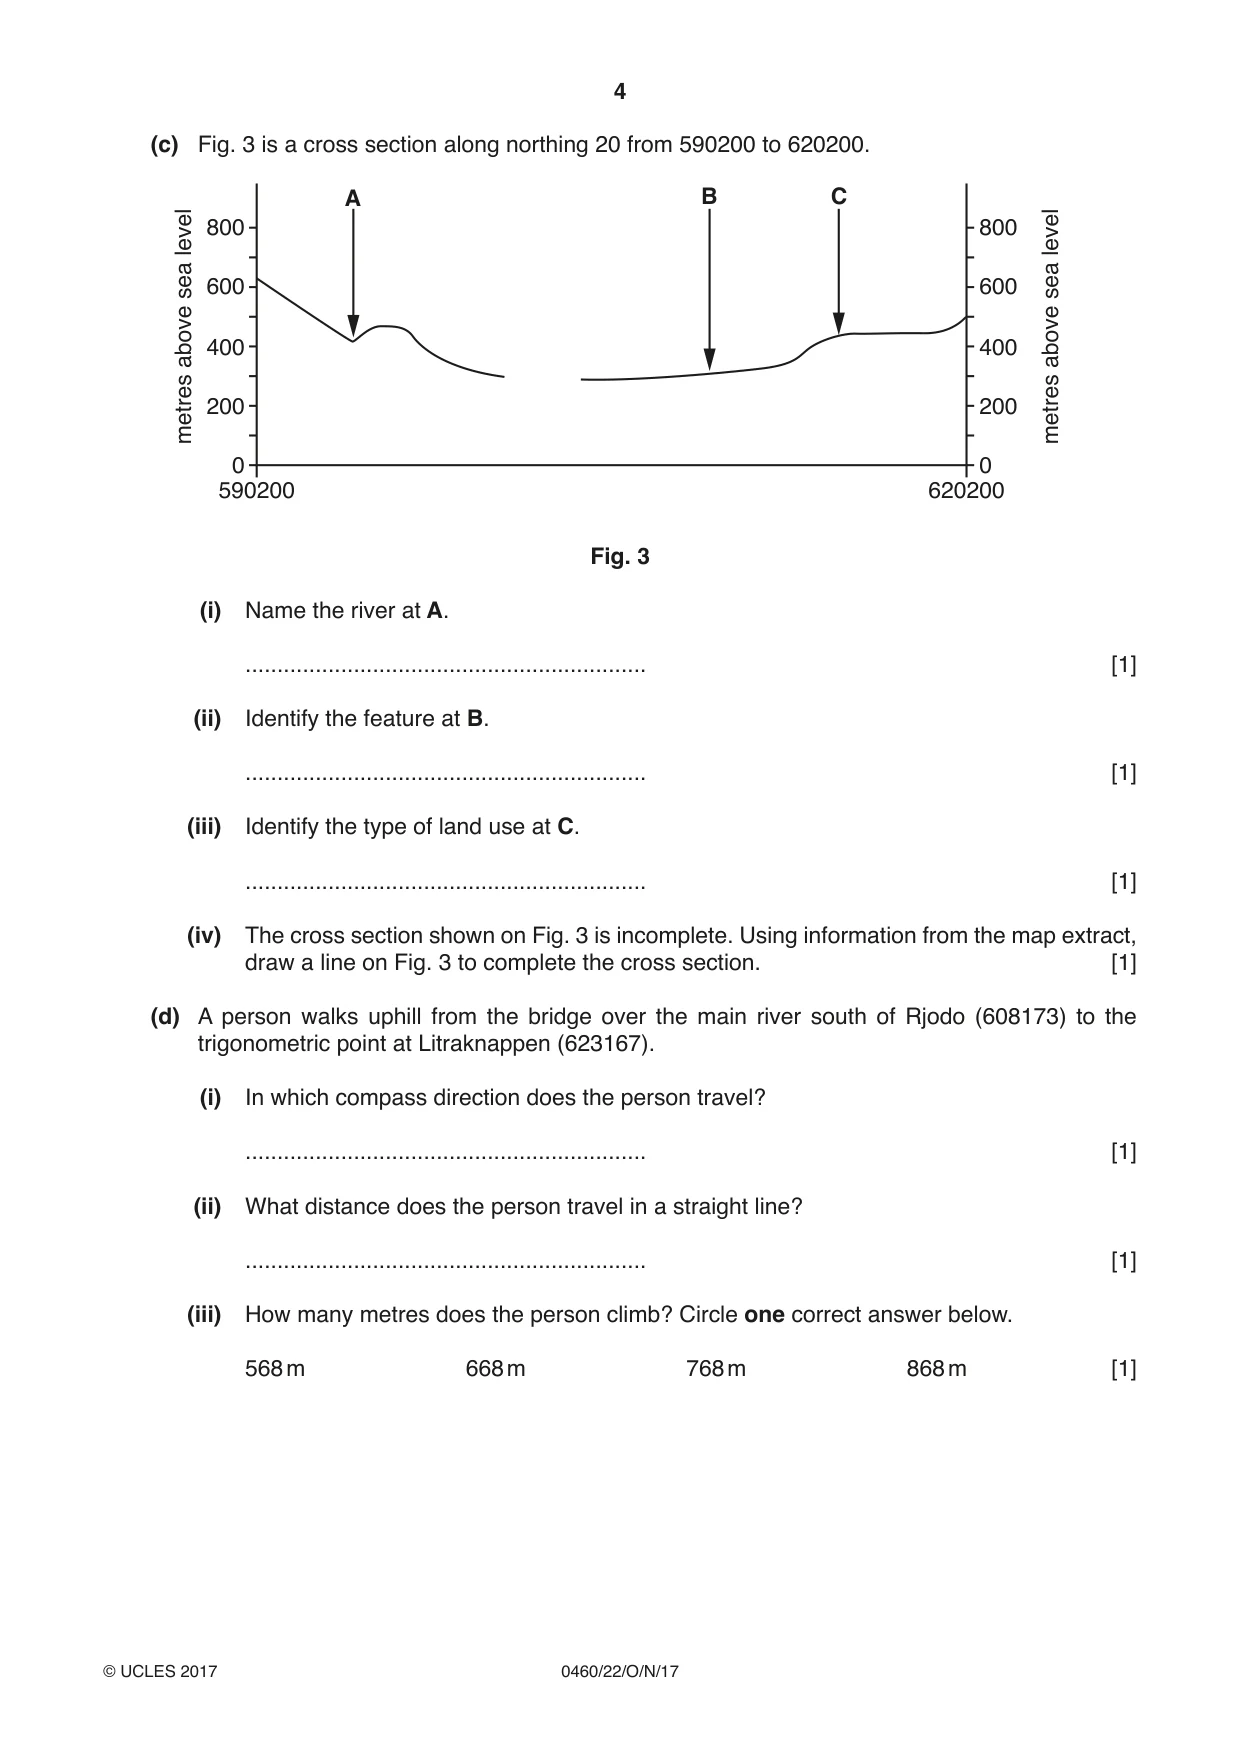
1 Study the map extract for Bordalen, Norway. The scale is 1:25 000. (a) Fig. 1 shows some of the features in the north west of the map extract. Study Fig. 1 and the map extract, and answer the questions below. 57 58 59 21 21 D B 20 20 C A 19 19 57 58 59 Fig. 1 Using the map extract, identify the following features shown on Fig. 1: (i) feature A; .......................................................................................................................................[1] (ii) the name of river B; .......................................................................................................................................[1] (iii) the height above sea level of the spot height at C; ................................................. metres [1] (iv) the height above sea level of the contour at D. ................................................. metres [1] (b) Fig. 2 shows the location of two grid squares in the south east of the map extract. These are square 6316 at Færes-fjellet and square 6416 at Grønahorgi. Study the two areas and answer the questions below. 63 64 65 17 17 Færes-fjellet Grønahorgi 16 16 63 64 65 Fig. 2 The table below compares the features of the two areas. Complete the table by putting ticks in the correct five boxes. Use only one tick for each row. Square 6316 Square 6416 Both these Neither of at Færes-fjellet at Grønahorgi areas these areas lakes forest marsh glaciers land over 1100 m above sea level [5] (c) Fig. 3 is a cross section along northing 20 from 590200 to 620200. A B C level 800 800 level sea 600 600 sea above 400 400 above 200 200 metres metres 0 0 590200 620200 Fig. 3 (i) Name the river at A. ............................................................... [1] (ii) Identify the feature at B. ............................................................... [1] (iii) Identify the type of land use at C. ............................................................... [1] (iv) The cross section shown on Fig. 3 is incomplete. Using information from the map extract, draw a line on Fig. 3 to complete the cross section. [1] (d) A person walks uphill from the bridge over the main river south of Rjodo (608173) to the trigonometric point at Litraknappen (623167). (i) In which compass direction does the person travel? ............................................................... [1] (ii) What distance does the person travel in a straight line? ............................................................... [1] (iii) How many metres does the person climb? Circle one correct answer below. 568 m 668 m 768 m 868 m [1] (e) Describe the distribution of farms and houses shown on the map. ................................................................................................................................................... ................................................................................................................................................... ................................................................................................................................................... ................................................................................................................................................... ................................................................................................................................................... ................................................................................................................................................... ................................................................................................................................................... ...............................................................................................................................................[4] [Total: 20 marks]
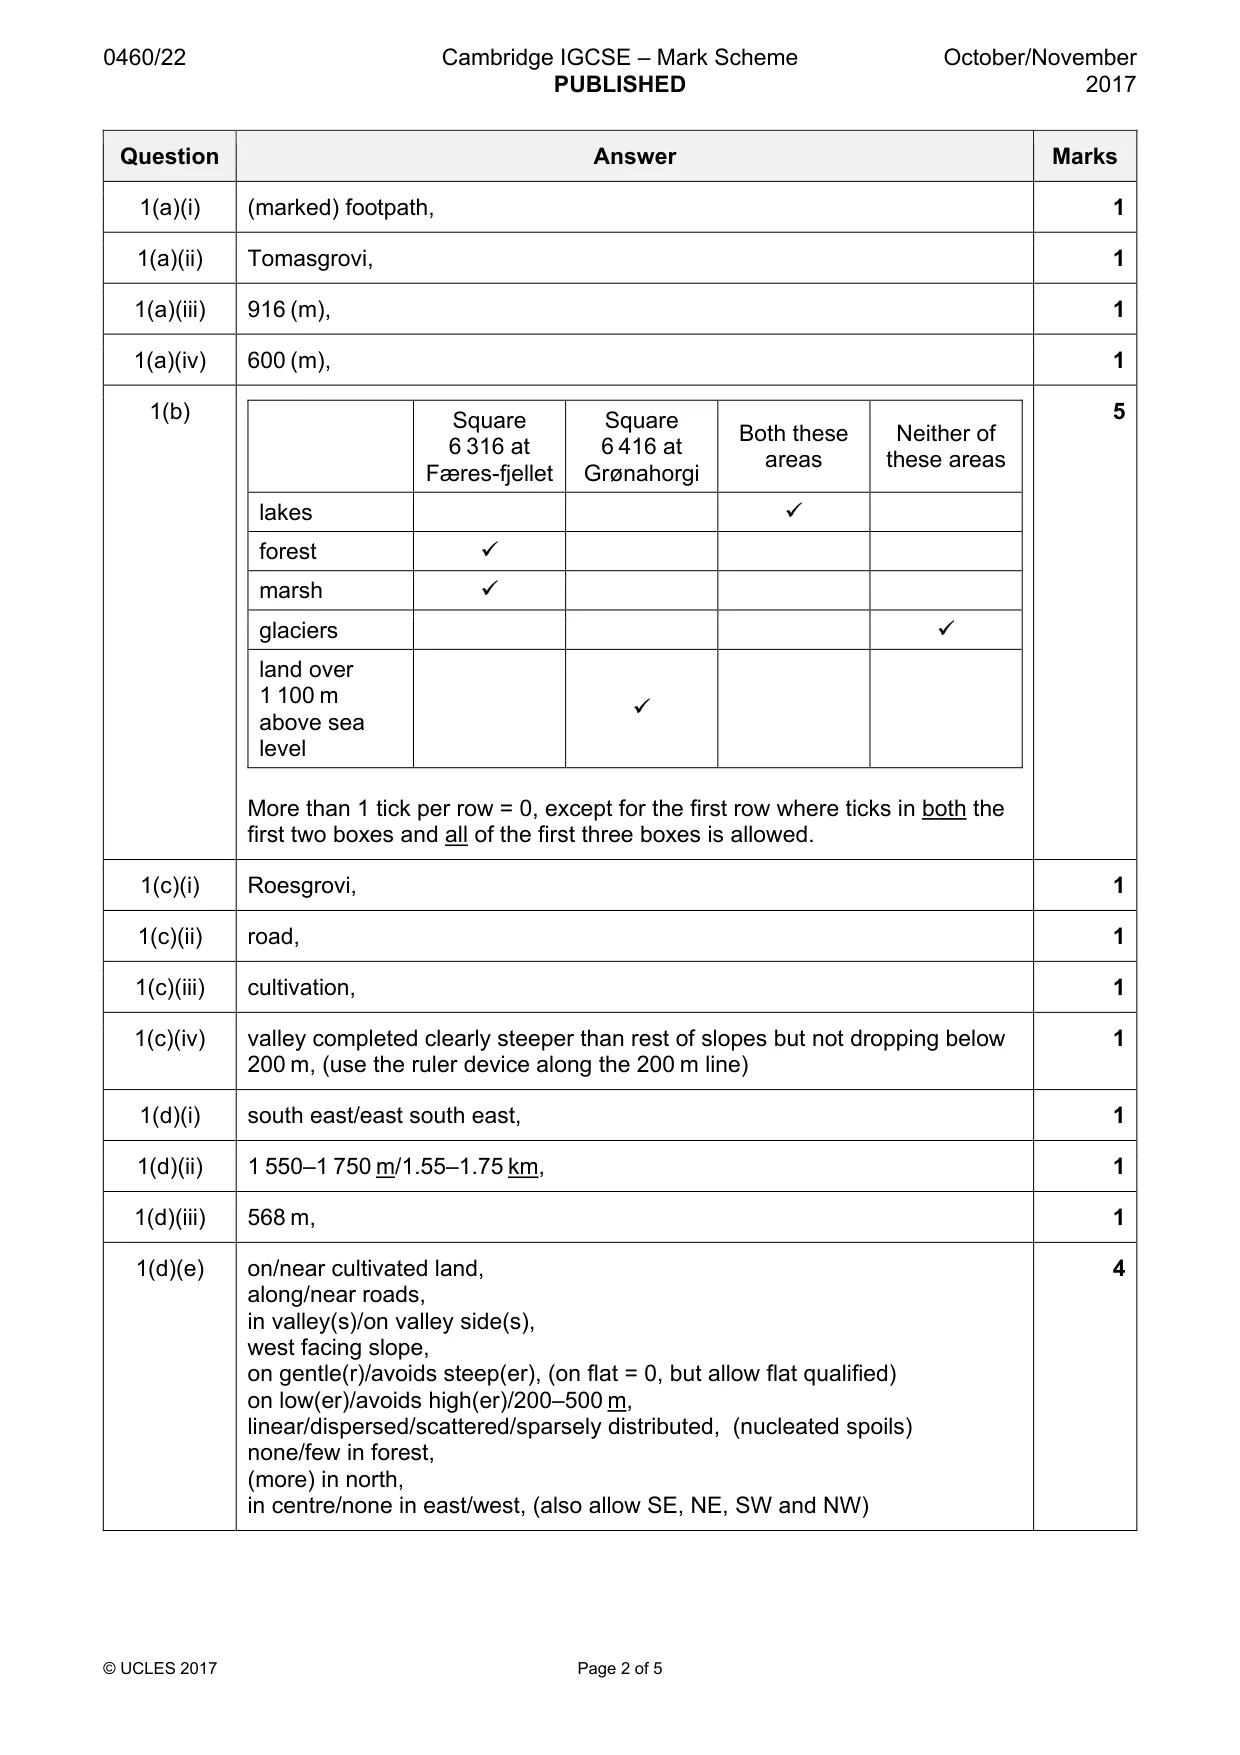
Mark scheme: Question Answer Marks 1(a)(i) (marked) footpath, 1 1(a)(ii) Tomasgrovi, 1 1(a)(iii) 916 (m), 1 1(a)(iv) 600 (m), 1 1(b) 5 Square Square Both these Neither of 6 316 at 6 416 at areas these areas Færes-fjellet Grønahorgi lakes 9 forest 9 marsh 9 glaciers 9 land over 1 100 m 9 above sea level More than 1 tick per row = 0, except for the first row where ticks in both the first two boxes and all of the first three boxes is allowed. 1(c)(i) Roesgrovi, 1 1(c)(ii) road, 1 1(c)(iii) cultivation, 1 1(c)(iv) valley completed clearly steeper than rest of slopes but not dropping below 1 200 m, (use the ruler device along the 200 m line) 1(d)(i) south east/east south east, 1 1(d)(ii) 1 550–1 750 m/1.55–1.75 km, 1 1(d)(iii) 568 m, 1 1(d)(e) on/near cultivated land, 4 along/near roads, in valley(s)/on valley side(s), west facing slope, on gentle(r)/avoids steep(er), (on flat = 0, but allow flat qualified) on low(er)/avoids high(er)/200–500 m, linear/dispersed/scattered/sparsely distributed, (nucleated spoils) none/few in forest, (more) in north, in centre/none in east/west, (also allow SE, NE, SW and NW)
Q2 · Information about population change and population migration in four urban areas in the…
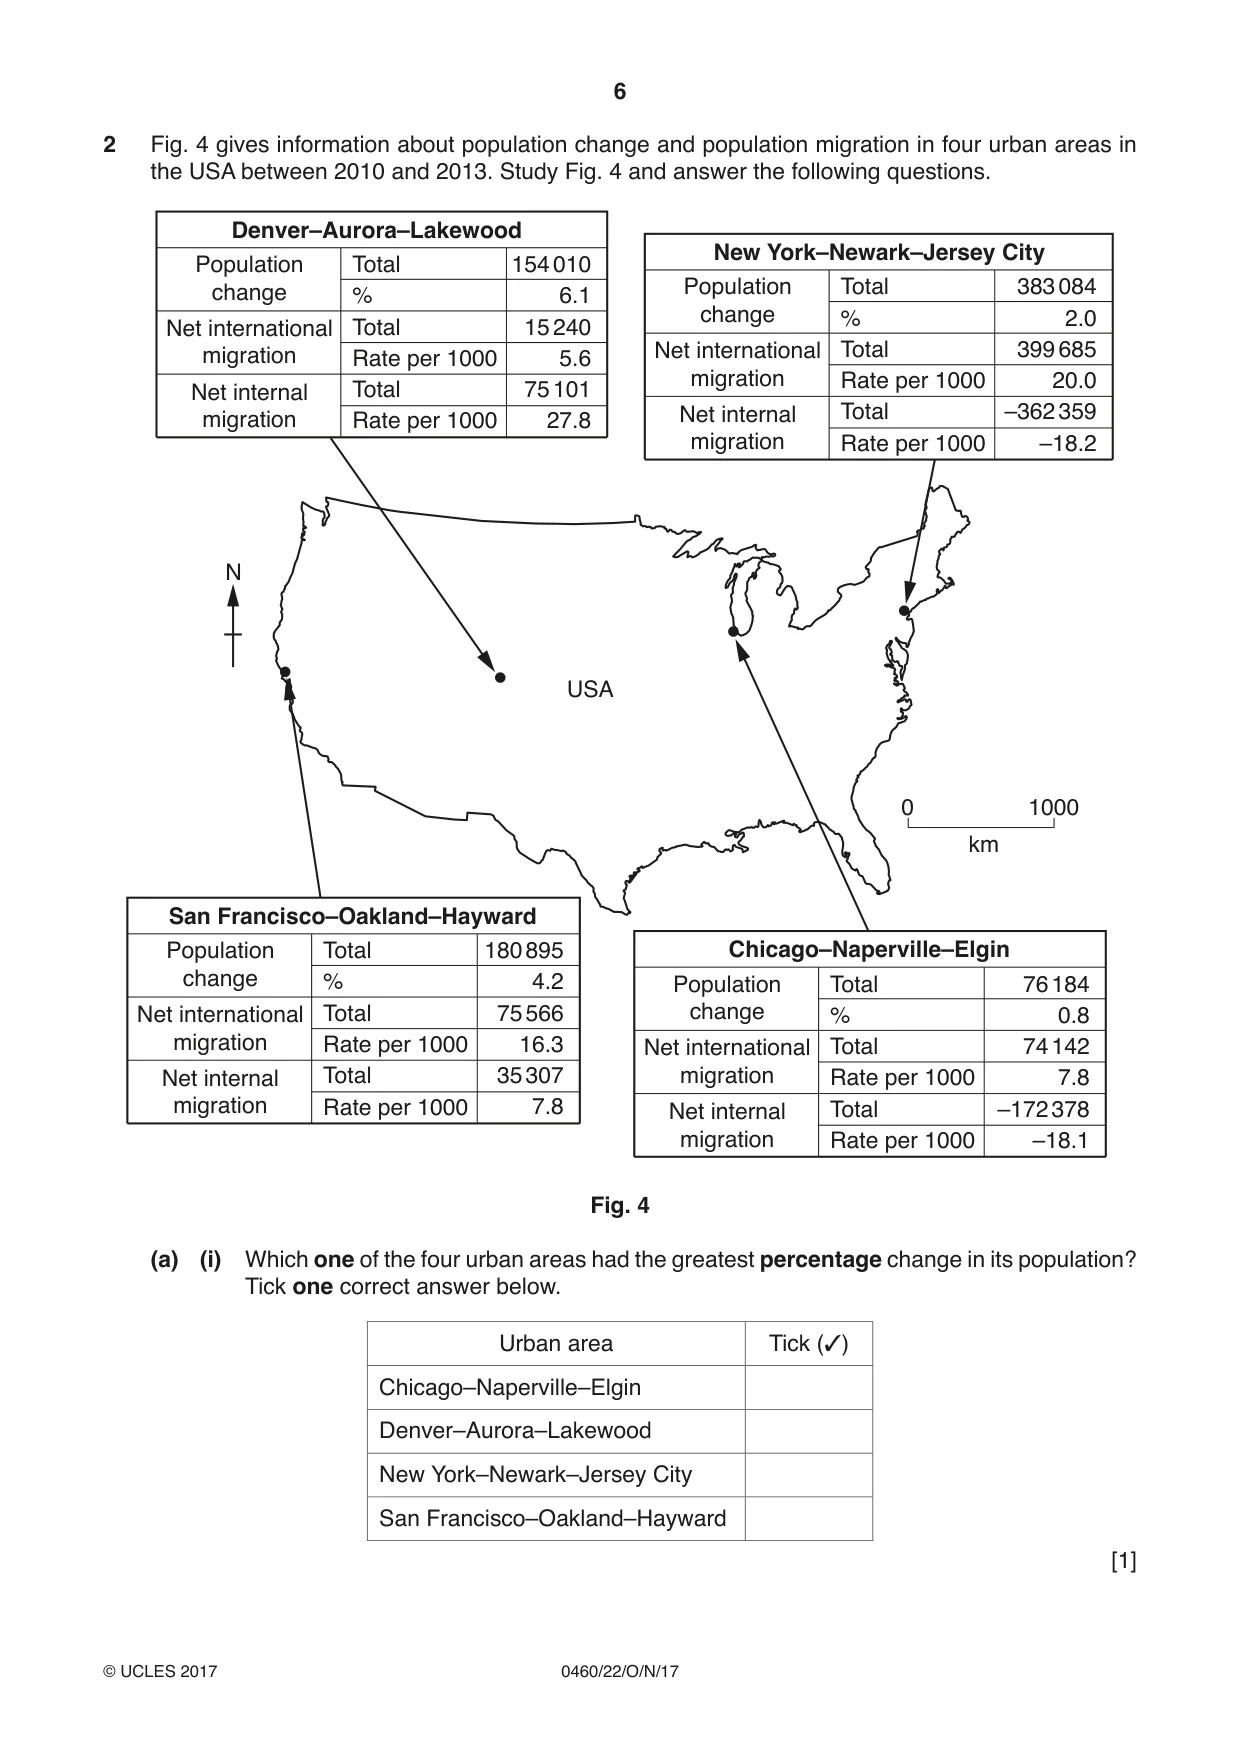
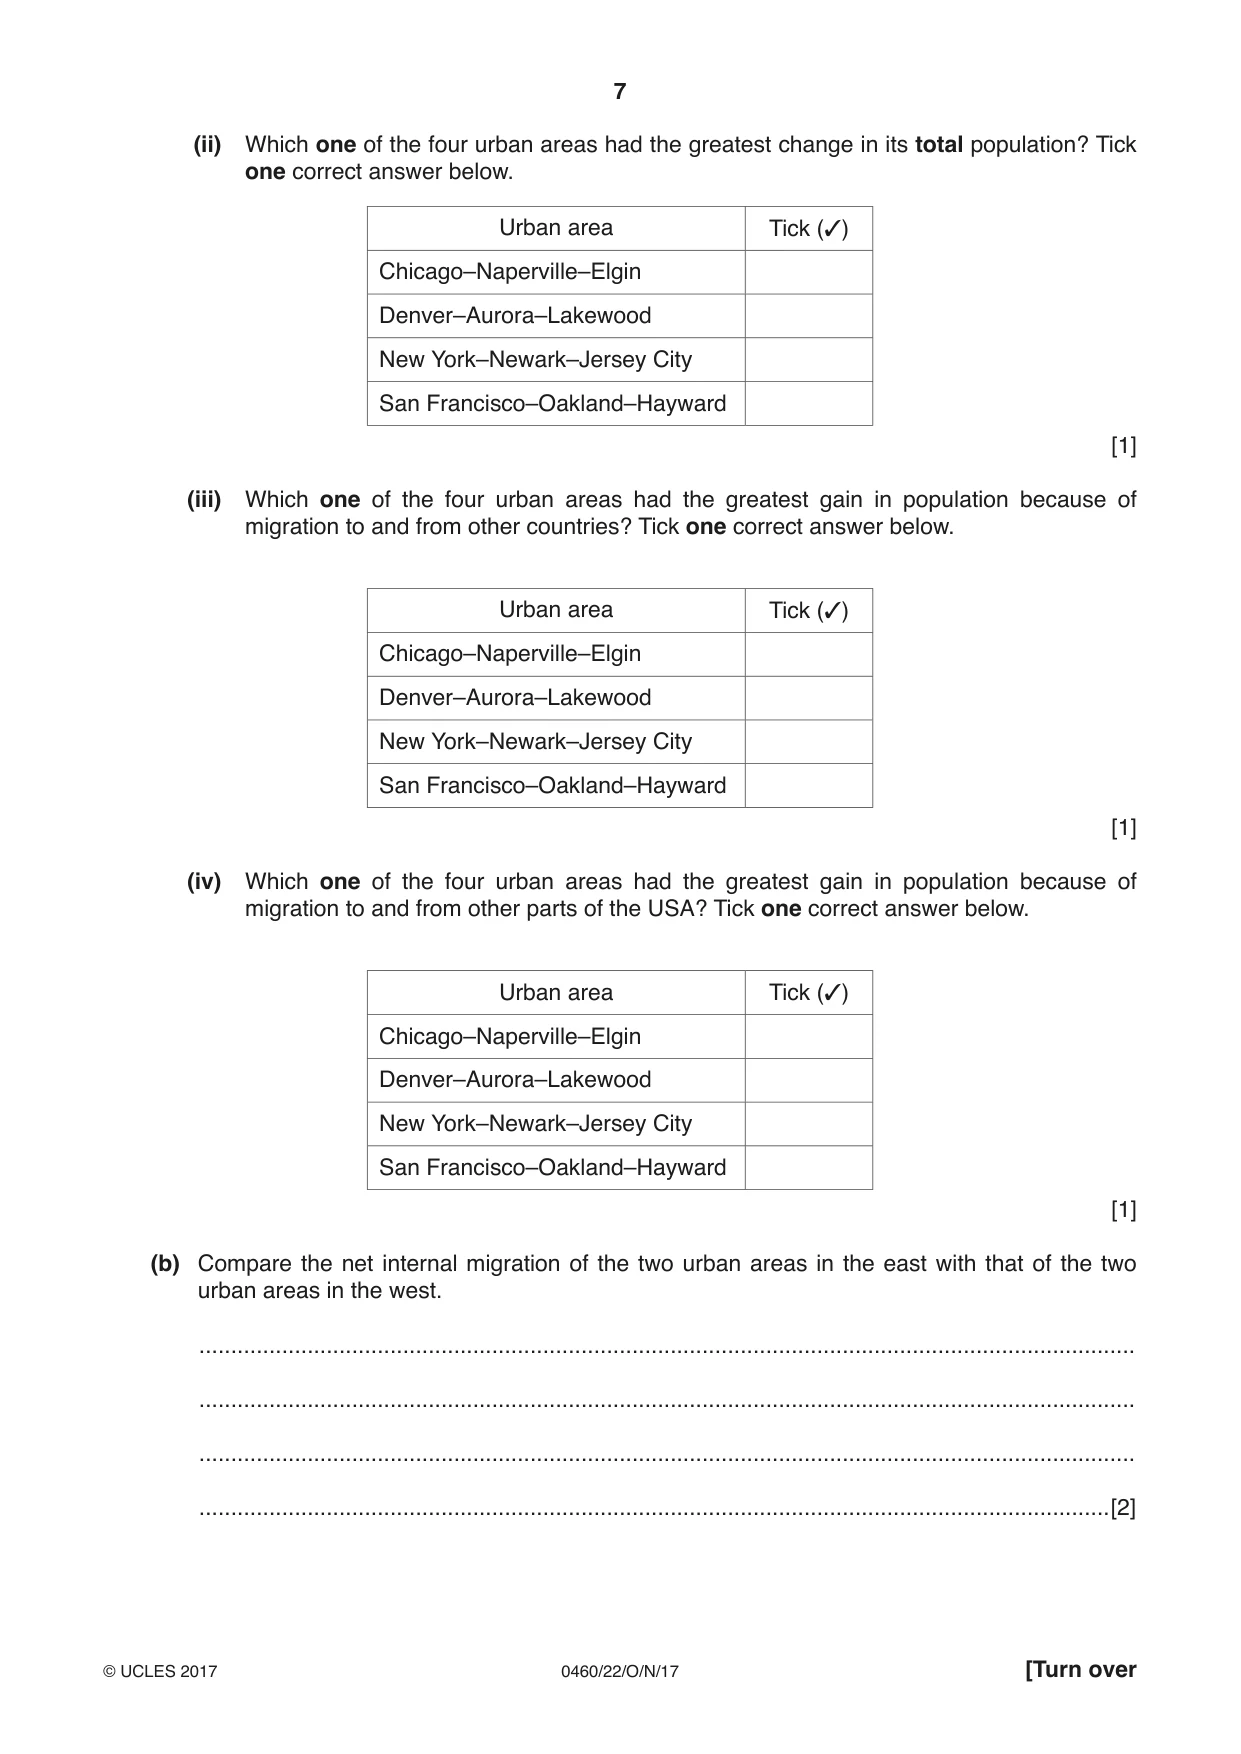
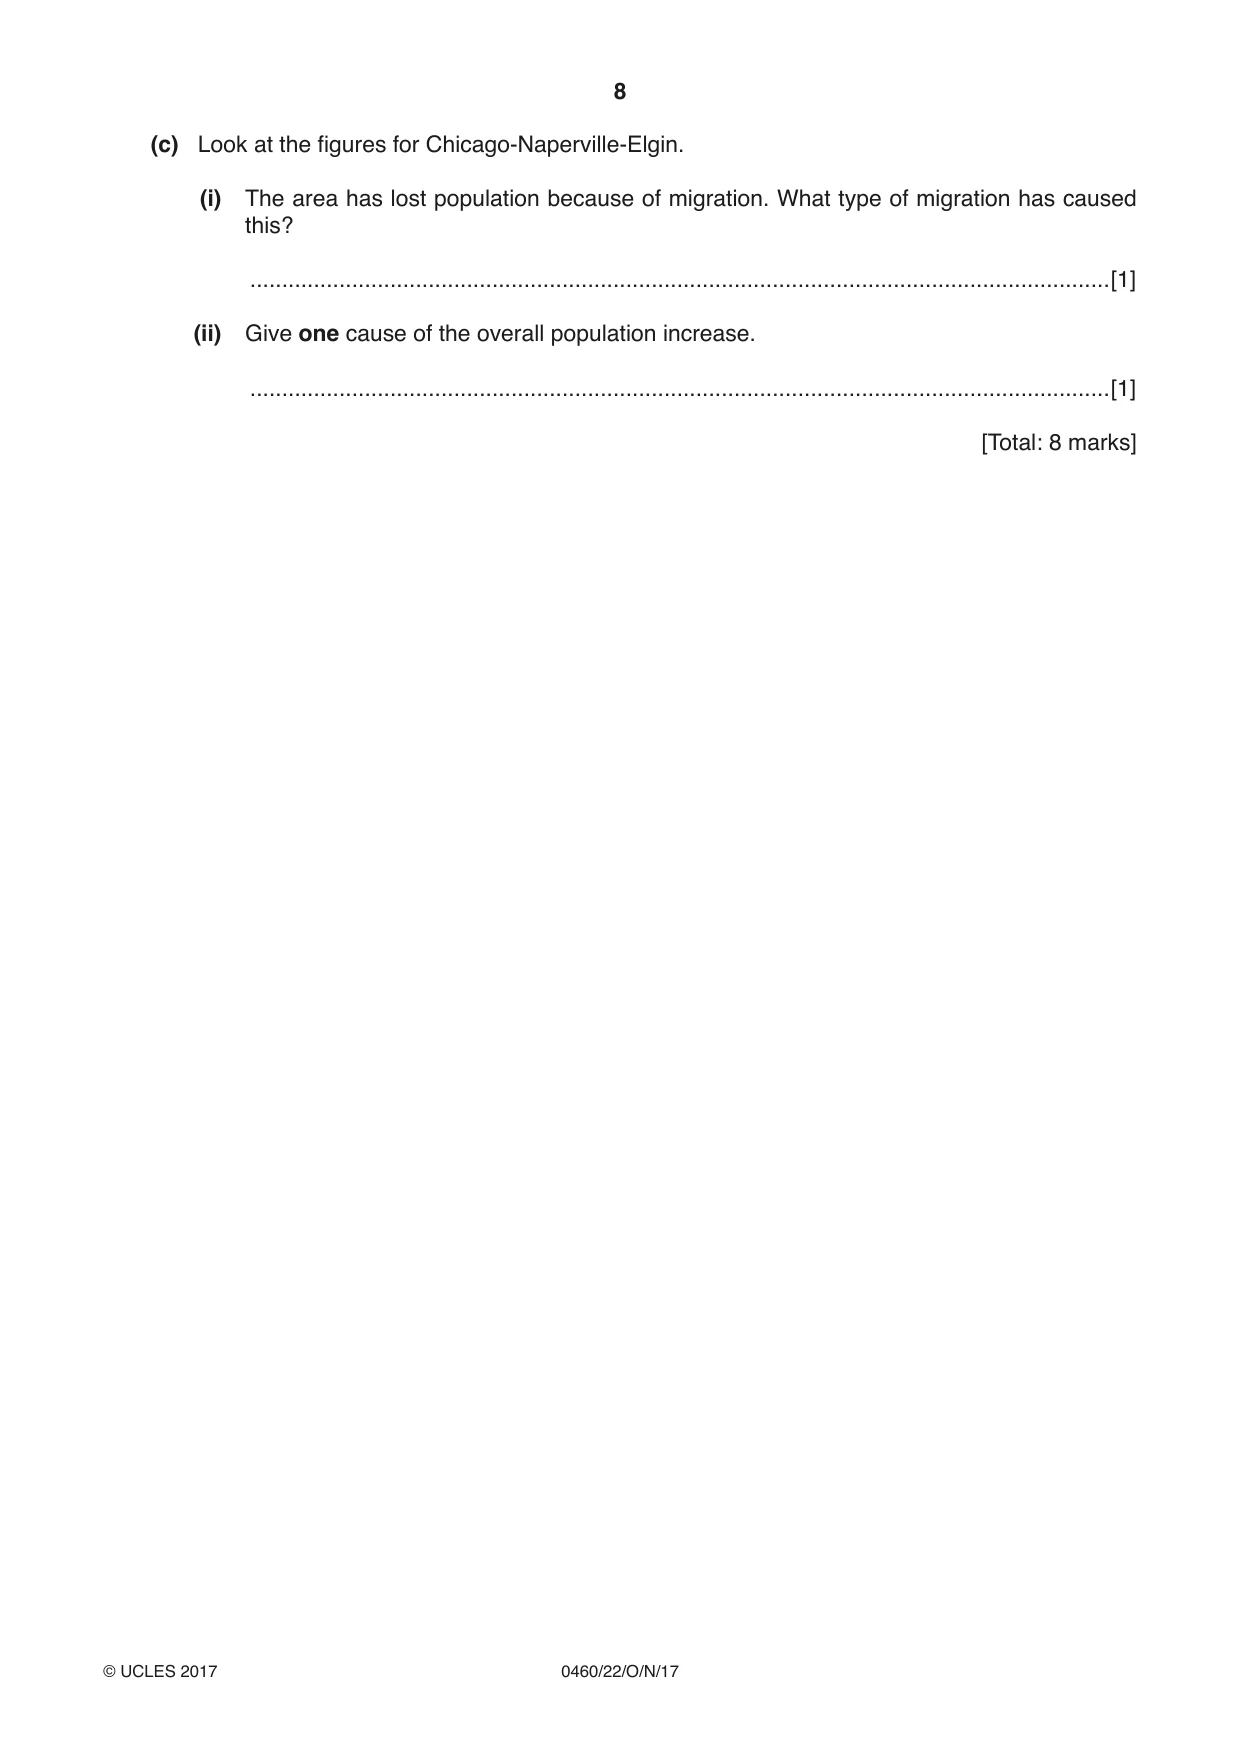
2 Fig. 4 gives information about population change and population migration in four urban areas in the USA between 2010 and 2013. Study Fig. 4 and answer the following questions. Denver–Aurora–Lakewood New York–Newark–Jersey City Population Total 154 010 change % 6.1 Population Total 383 084 change % 2.0 Net international Total 15 240 migration Rate per 1000 5.6 Net international Total 399 685 migration Rate per 1000 20.0 Net internal Total 75 101 migration Rate per 1000 27.8 Net internal Total –362 359 migration Rate per 1000 –18.2 N USA 0 1000 km San Francisco–Oakland–Hayward Population Total 180 895 Chicago–Naperville–Elgin change % 4.2 Population Total 76 184 Net international Total 75 566 change % 0.8 migration Rate per 1000 16.3 Net international Total 74 142 Net internal Total 35 307 migration Rate per 1000 7.8 migration Rate per 1000 7.8 Net internal Total –172 378 migration Rate per 1000 –18.1 Fig. 4 (a) (i) Which one of the four urban areas had the greatest percentage change in its population? Tick one correct answer below. Urban area Tick (3) Chicago–Naperville–Elgin Denver–Aurora–Lakewood New York–Newark–Jersey City San Francisco–Oakland–Hayward [1] (ii) Which one of the four urban areas had the greatest change in its total population? Tick one correct answer below. Urban area Tick (3) Chicago–Naperville–Elgin Denver–Aurora–Lakewood New York–Newark–Jersey City San Francisco–Oakland–Hayward [1] (iii) Which one of the four urban areas had the greatest gain in population because of migration to and from other countries? Tick one correct answer below. Urban area Tick (3) Chicago–Naperville–Elgin Denver–Aurora–Lakewood New York–Newark–Jersey City San Francisco–Oakland–Hayward [1] (iv) Which one of the four urban areas had the greatest gain in population because of migration to and from other parts of the USA? Tick one correct answer below. Urban area Tick (3) Chicago–Naperville–Elgin Denver–Aurora–Lakewood New York–Newark–Jersey City San Francisco–Oakland–Hayward [1] (b) Compare the net internal migration of the two urban areas in the east with that of the two urban areas in the west. ................................................................................................................................................... ................................................................................................................................................... ................................................................................................................................................... ...............................................................................................................................................[2] (c) Look at the figures for Chicago-Naperville-Elgin. (i) The area has lost population because of migration. What type of migration has caused this? .......................................................................................................................................[1] (ii) Give one cause of the overall population increase. .......................................................................................................................................[1] [Total: 8 marks]
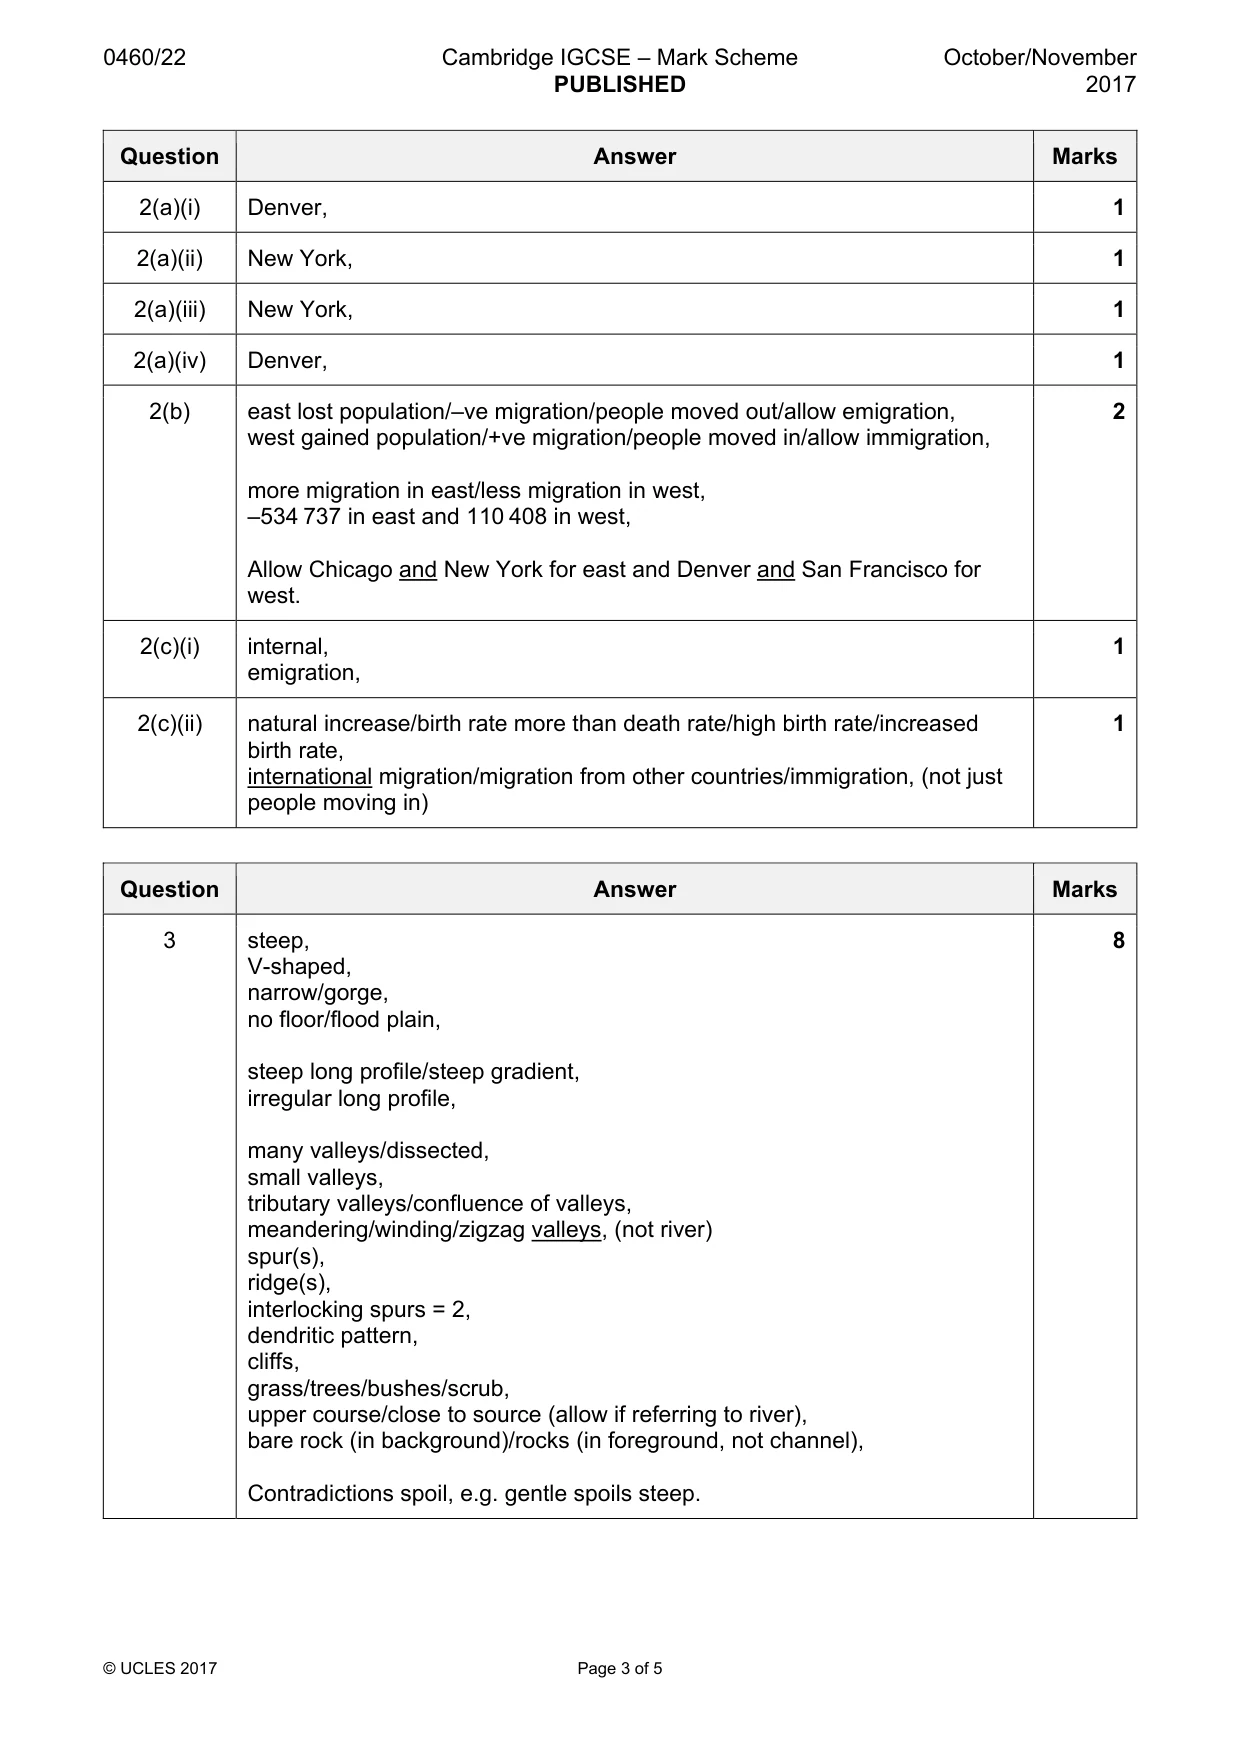
Mark scheme: 2(a)(i) Denver, 1 2(a)(ii) New York, 1 2(a)(iii) New York, 1 2(a)(iv) Denver, 1 2(b) east lost population/–ve migration/people moved out/allow emigration, 2 west gained population/+ve migration/people moved in/allow immigration, more migration in east/less migration in west, –534 737 in east and 110 408 in west, Allow Chicago and New York for east and Denver and San Francisco for west. 2(c)(i) internal, 1 emigration, 2(c)(ii) natural increase/birth rate more than death rate/high birth rate/increased 1 birth rate, international migration/migration from other countries/immigration, (not just people moving in)
Q3 · Photograph A (Insert) shows a mountain landscape
3 Photograph A (Insert) shows a mountain landscape. Describe the river valleys shown in the photograph. Refer to: • the shape of the cross profiles; • the long profiles; • any other features of the landscape. .......................................................................................................................................................... .......................................................................................................................................................... .......................................................................................................................................................... .......................................................................................................................................................... .......................................................................................................................................................... .......................................................................................................................................................... .......................................................................................................................................................... .......................................................................................................................................................... .......................................................................................................................................................... .......................................................................................................................................................... .......................................................................................................................................................... .......................................................................................................................................................... .......................................................................................................................................................... .......................................................................................................................................................... .......................................................................................................................................................... .......................................................................................................................................................... .......................................................................................................................................................... .......................................................................................................................................................... .......................................................................................................................................................... .......................................................................................................................................................... ......................................................................................................................................................[8] [Total: 8 marks]
Mark scheme: 3 steep, 8 V-shaped, narrow/gorge, no floor/flood plain, steep long profile/steep gradient, irregular long profile, many valleys/dissected, small valleys, tributary valleys/confluence of valleys, meandering/winding/zigzag valleys, (not river) spur(s), ridge(s), interlocking spurs = 2, dendritic pattern, cliffs, grass/trees/bushes/scrub, upper course/close to source (allow if referring to river), bare rock (in background)/rocks (in foreground, not channel), Contradictions spoil, e.g. gentle spoils steep.
Q4 · The climate of a place in Africa
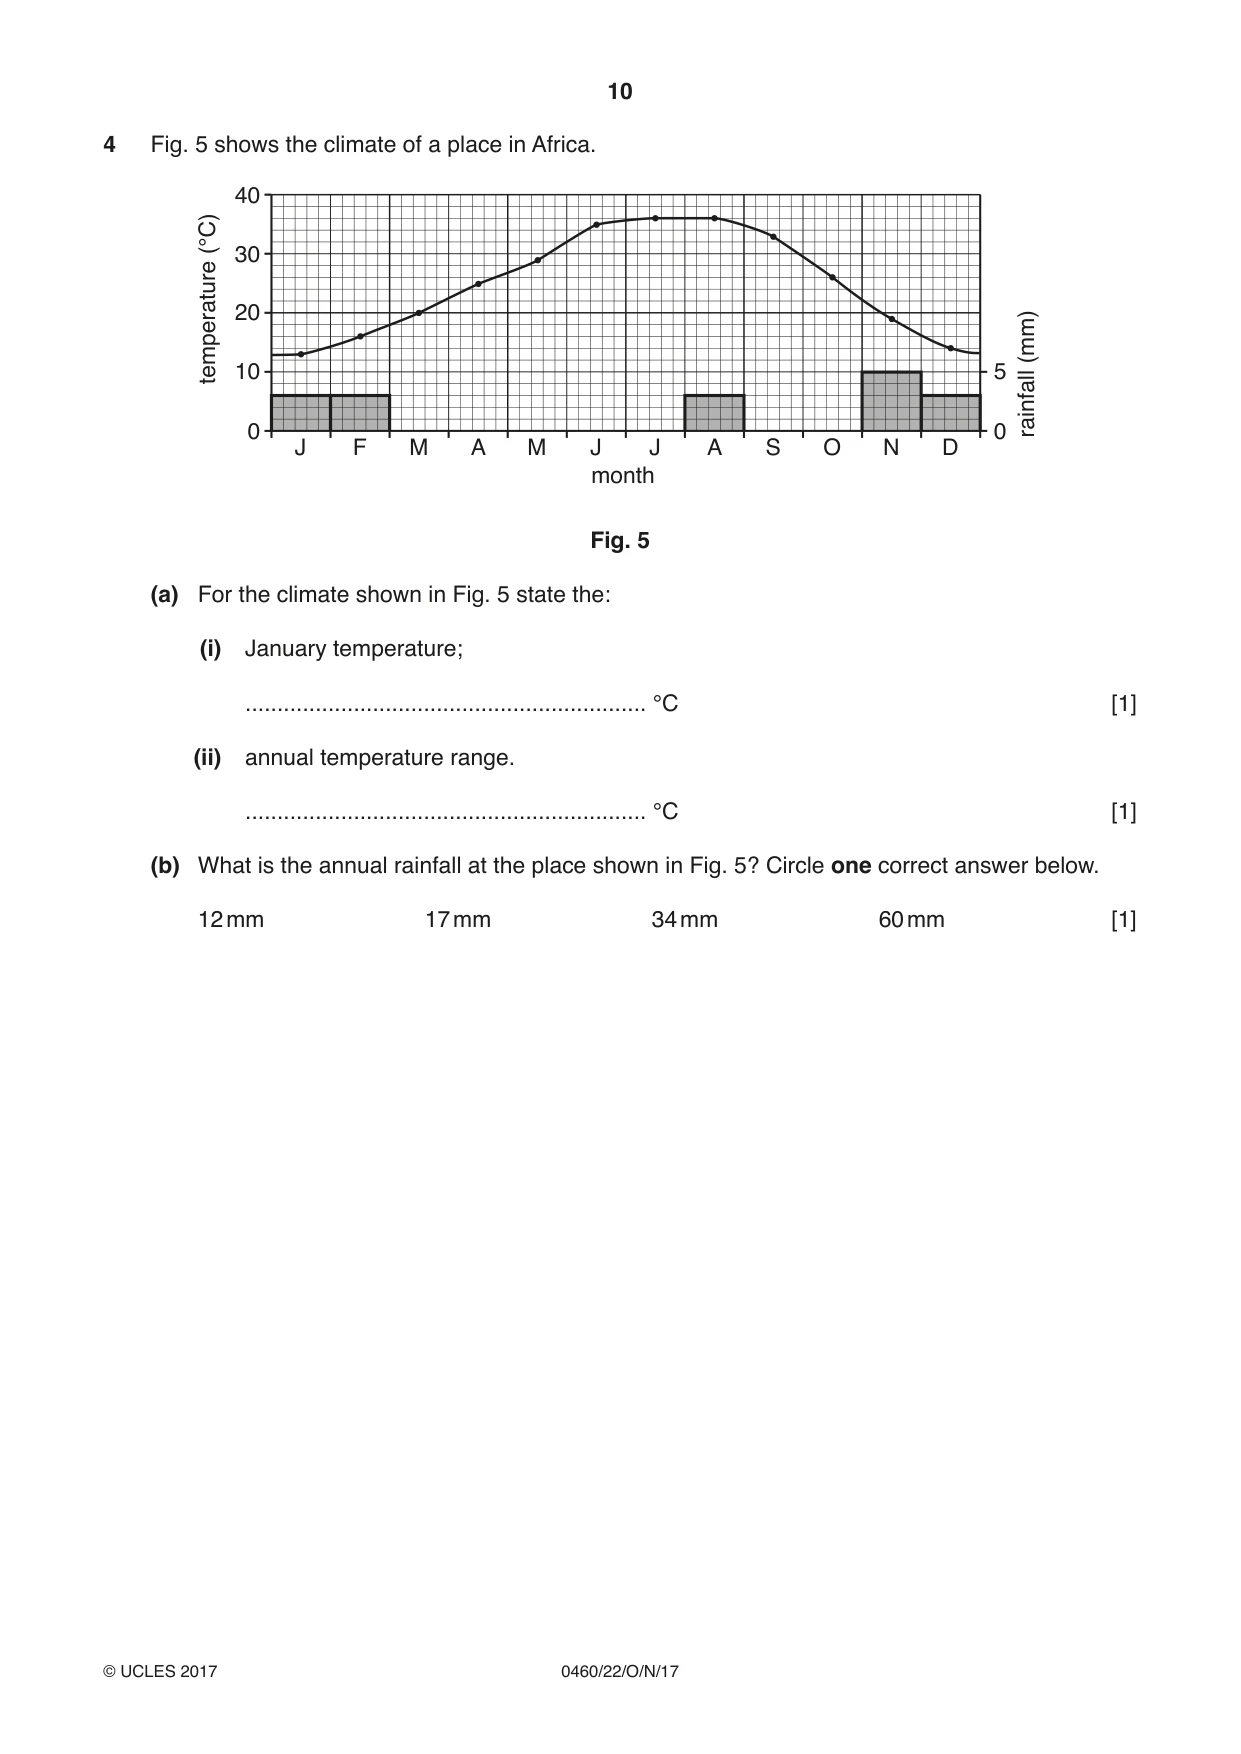
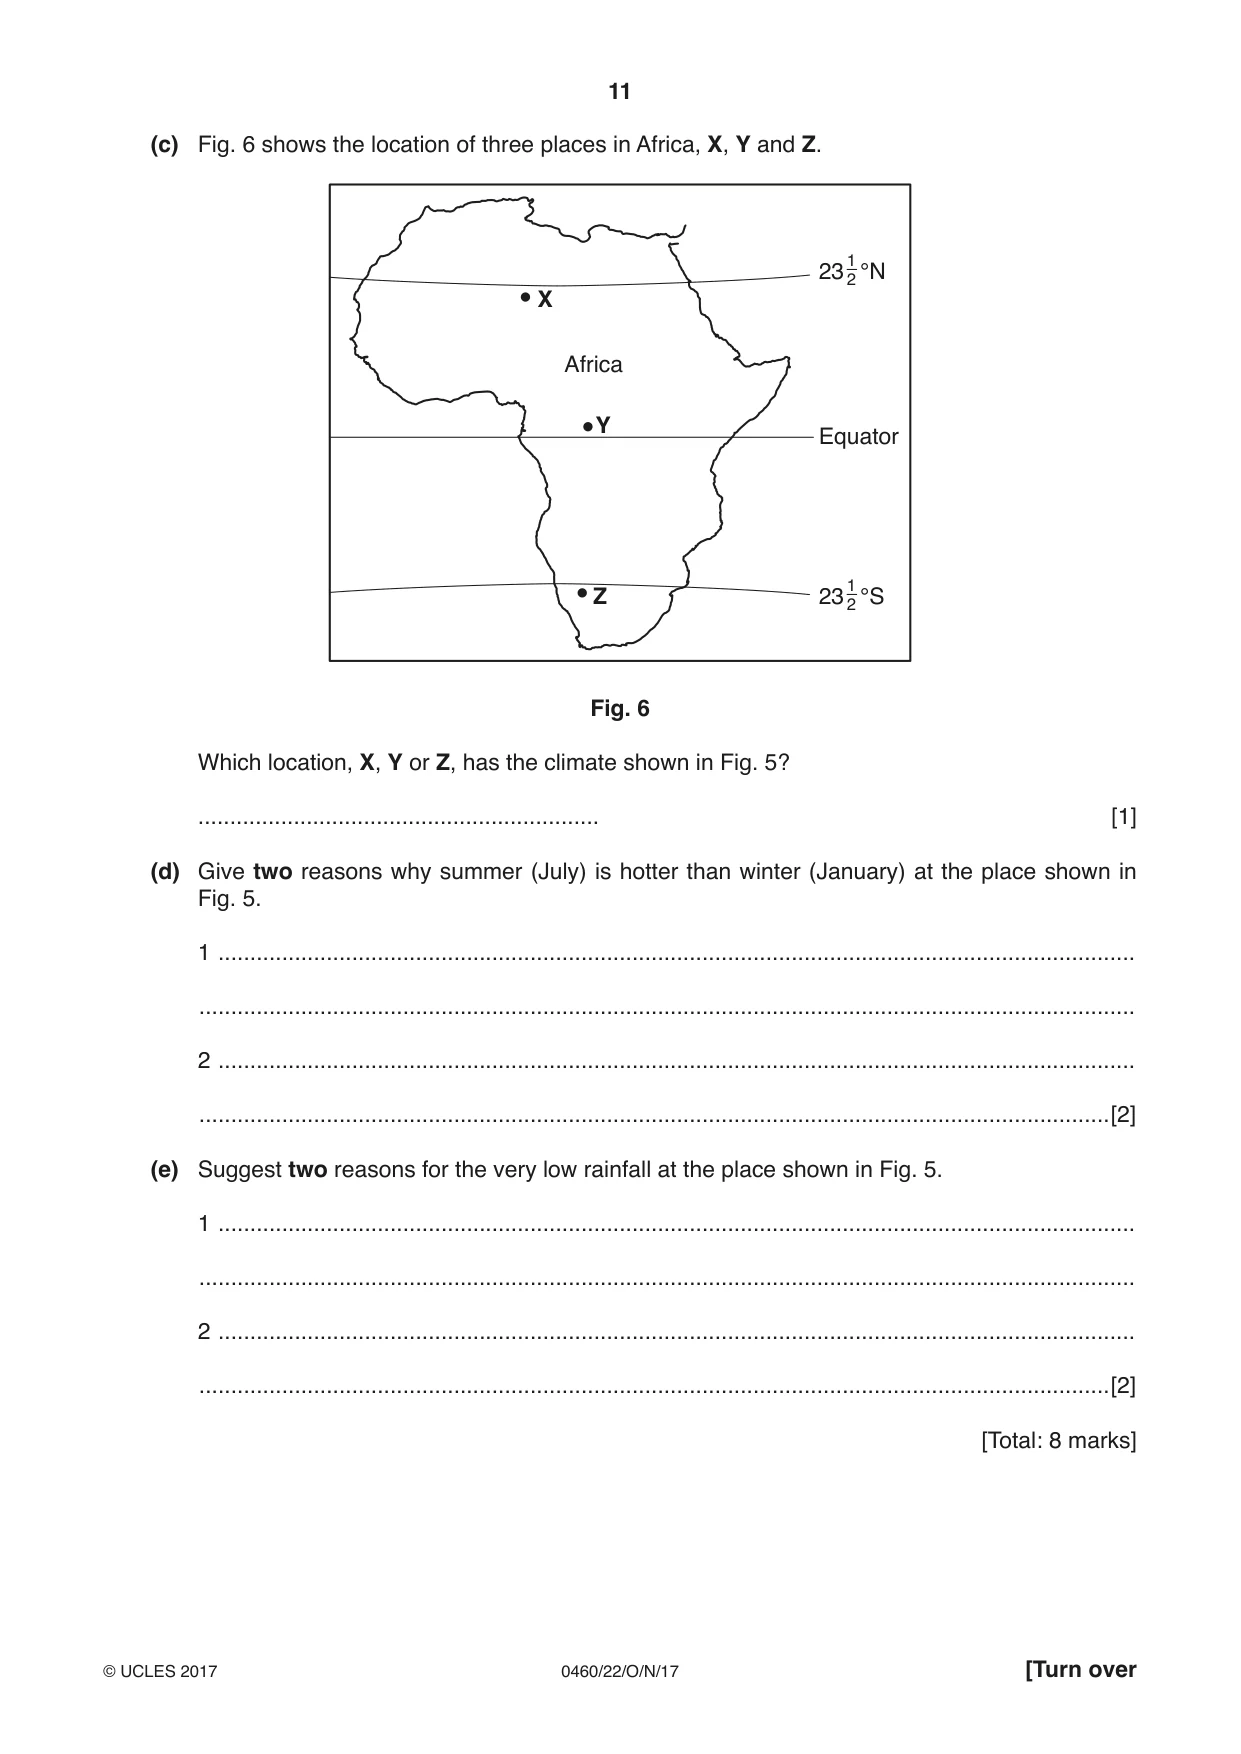
4 Fig. 5 shows the climate of a place in Africa. 40 (°C) 30 20 (mm) temperature 10 5 rainfall 0 0 J F M A M J J A S O N D month Fig. 5 (a) For the climate shown in Fig. 5 state the: (i) January temperature; ............................................................... °C [1] (ii) annual temperature range. ............................................................... °C [1] (b) What is the annual rainfall at the place shown in Fig. 5? Circle one correct answer below. 12 mm 17 mm 34 mm 60 mm [1] (c) Fig. 6 shows the location of three places in Africa, X, Y and Z. 23 12 °N X Africa Y Equator Z 23 12 °S Fig. 6 Which location, X, Y or Z, has the climate shown in Fig. 5? ............................................................... [1] (d) Give two reasons why summer (July) is hotter than winter (January) at the place shown in Fig. 5. 1 ................................................................................................................................................ ................................................................................................................................................... 2 ................................................................................................................................................ ...............................................................................................................................................[2] (e) Suggest two reasons for the very low rainfall at the place shown in Fig. 5. 1 ................................................................................................................................................ ................................................................................................................................................... 2 ................................................................................................................................................ ...............................................................................................................................................[2] [Total: 8 marks]
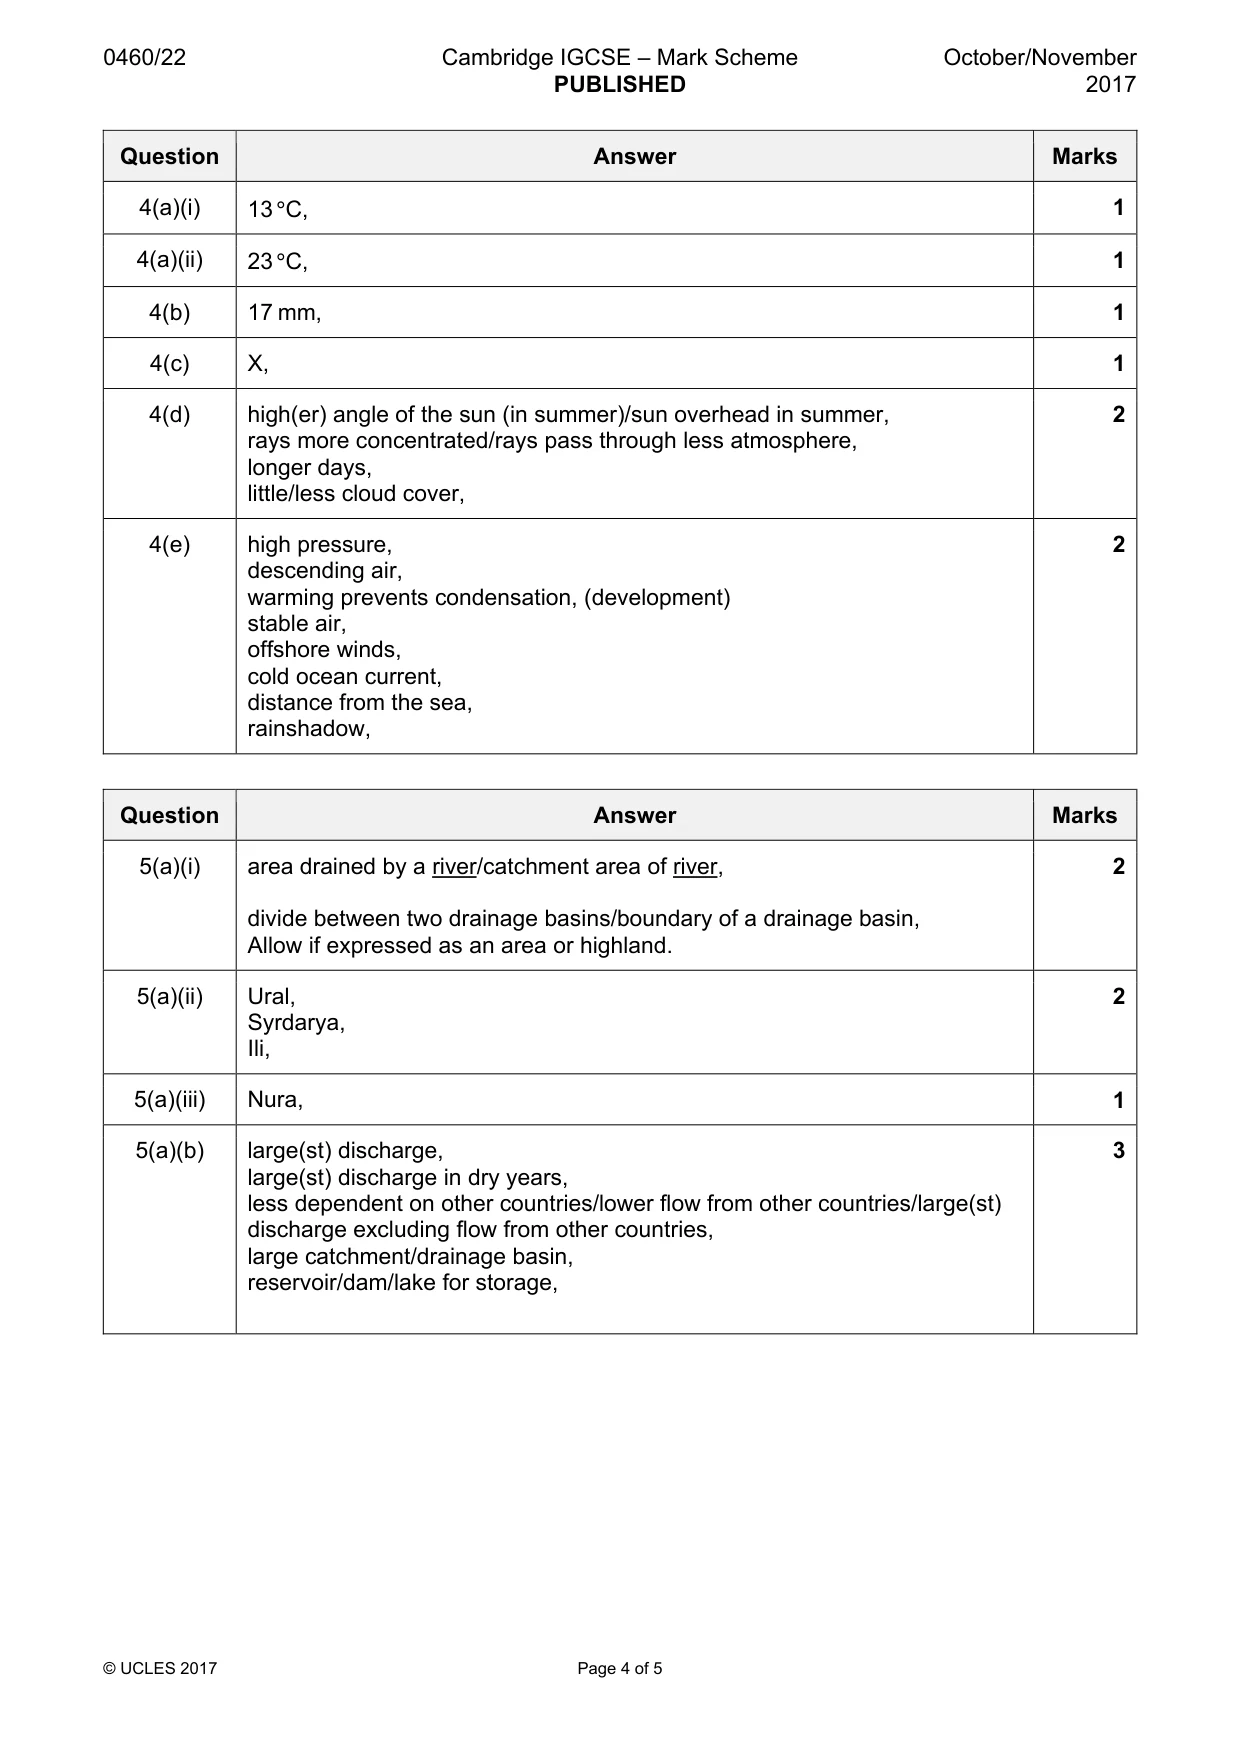
Mark scheme: 4(a)(i) 13 °C, 1 4(a)(ii) 23 °C, 1 4(b) 17 mm, 1 4(c) X, 1 4(d) high(er) angle of the sun (in summer)/sun overhead in summer, 2 rays more concentrated/rays pass through less atmosphere, longer days, little/less cloud cover, 4(e) high pressure, 2 descending air, warming prevents condensation, (development) stable air, offshore winds, cold ocean current, distance from the sea, rainshadow,
Q5 · The rivers and drainage basins of Kazakhstan
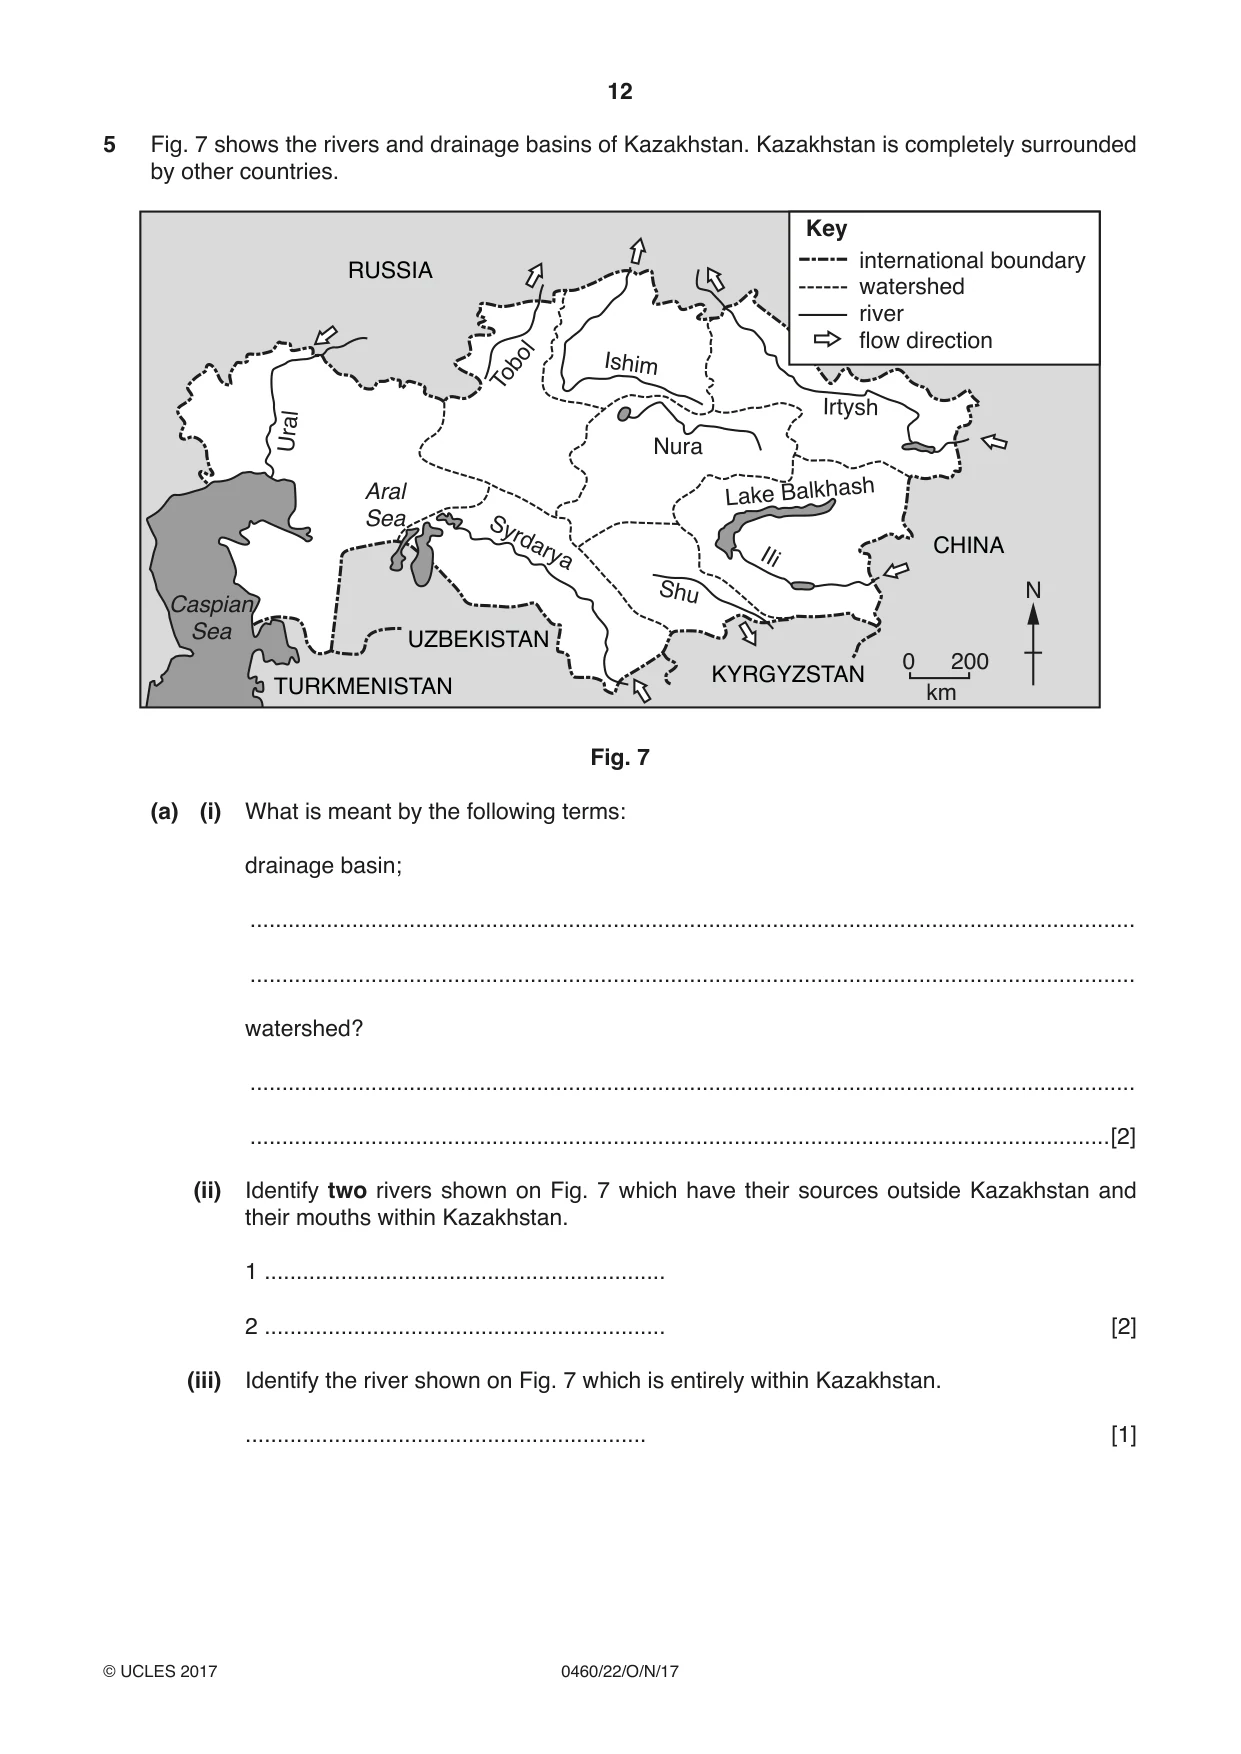
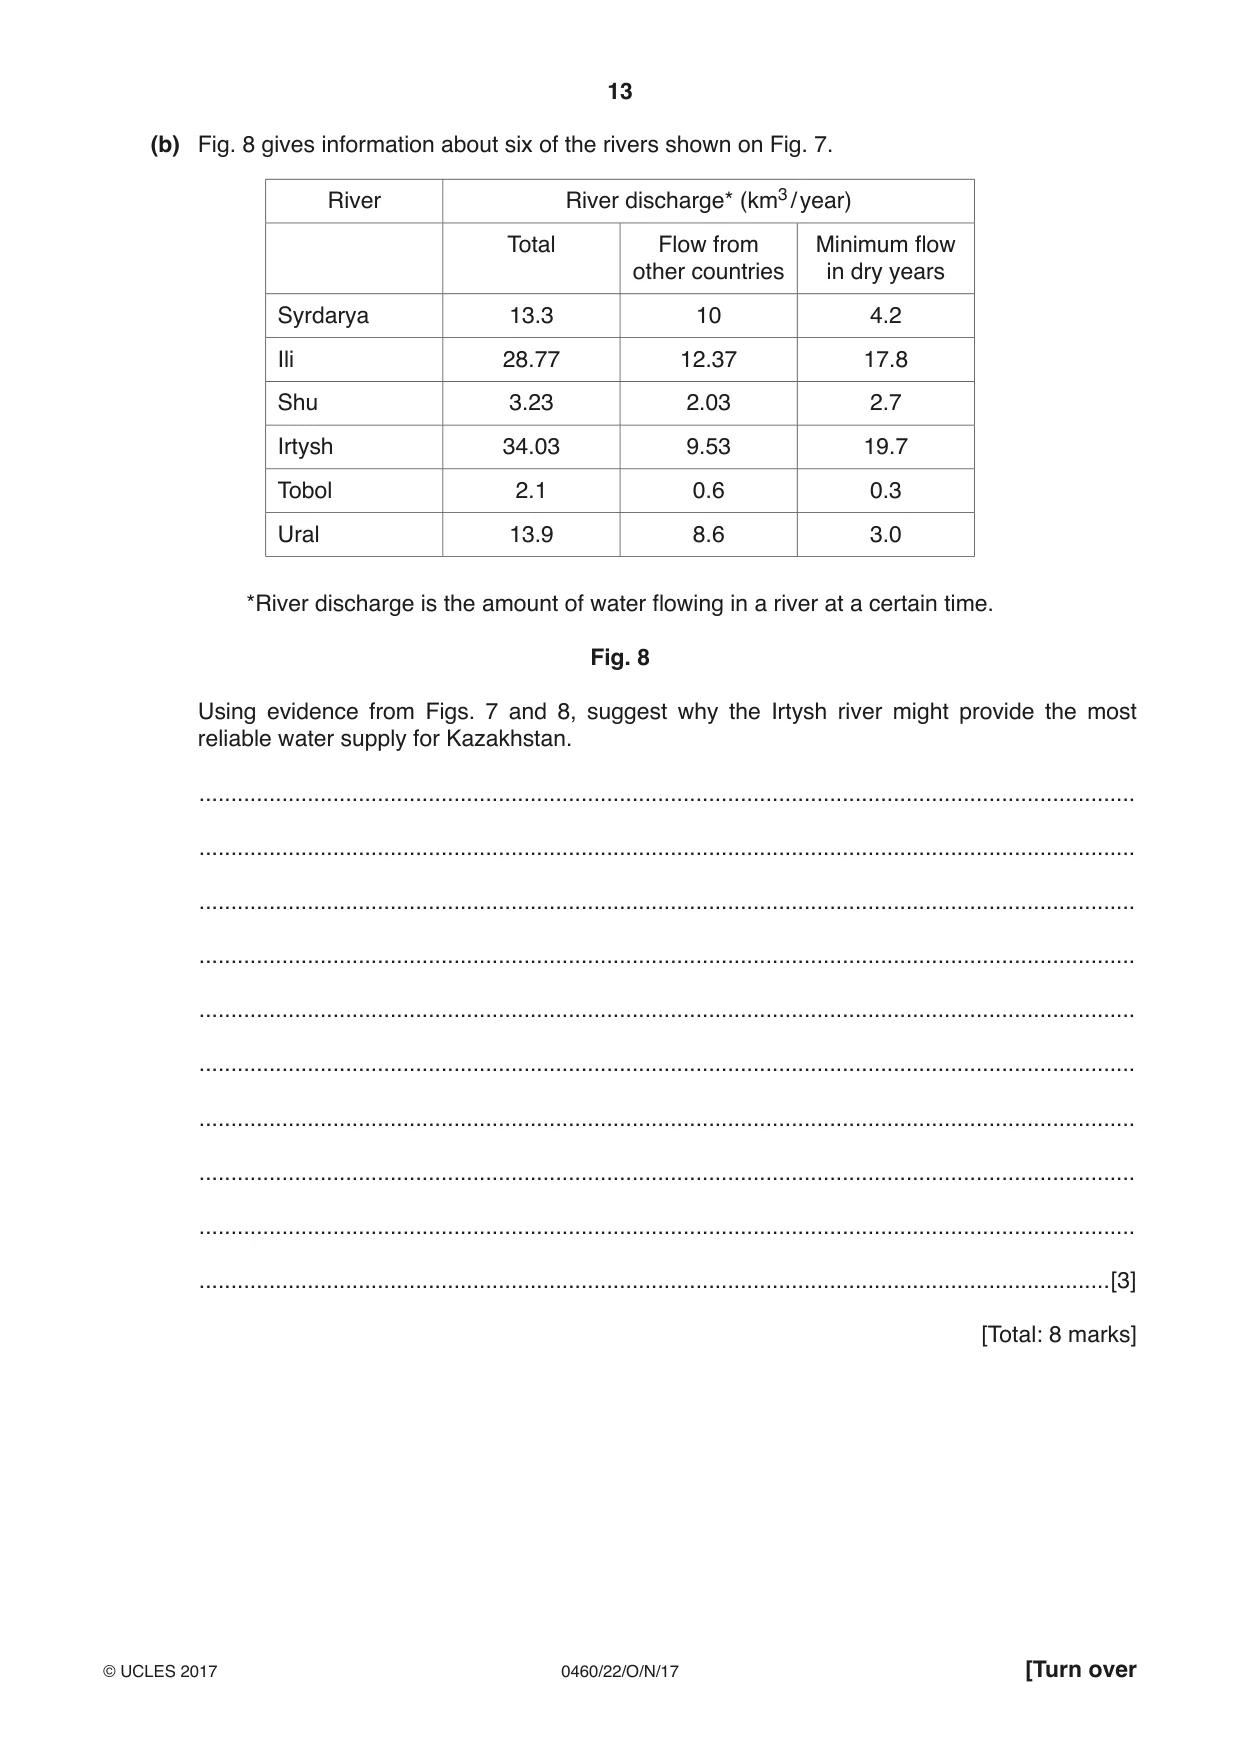
5 Fig. 7 shows the rivers and drainage basins of Kazakhstan. Kazakhstan is completely surrounded by other countries. Key international boundary RUSSIA watershed river flow direction Ishim Tobol Irtysh Ural Nura Aral Lake Balkhash Sea CHINA Syrdarya IIi Shu N Caspian Sea UZBEKISTAN 0 200 KYRGYZSTAN TURKMENISTAN km Fig. 7 (a) (i) What is meant by the following terms: drainage basin; ........................................................................................................................................... ........................................................................................................................................... watershed? ........................................................................................................................................... .......................................................................................................................................[2] (ii) Identify two rivers shown on Fig. 7 which have their sources outside Kazakhstan and their mouths within Kazakhstan. 1 ............................................................... 2 ............................................................... [2] (iii) Identify the river shown on Fig. 7 which is entirely within Kazakhstan. ............................................................... [1] (b) Fig. 8 gives information about six of the rivers shown on Fig. 7. River River discharge* (km3 / year) Total Flow from Minimum flow other countries in dry years Syrdarya 13.3 10 4.2 Ili 28.77 12.37 17.8 Shu 3.23 2.03 2.7 Irtysh 34.03 9.53 19.7 Tobol 2.1 0.6 0.3 Ural 13.9 8.6 3.0 *River discharge is the amount of water flowing in a river at a certain time. Fig. 8 Using evidence from Figs. 7 and 8, suggest why the Irtysh river might provide the most reliable water supply for Kazakhstan. ................................................................................................................................................... ................................................................................................................................................... ................................................................................................................................................... ................................................................................................................................................... ................................................................................................................................................... ................................................................................................................................................... ................................................................................................................................................... ................................................................................................................................................... ................................................................................................................................................... ...............................................................................................................................................[3] [Total: 8 marks]
Mark scheme: 5(a)(i) area drained by a river/catchment area of river, 2 divide between two drainage basins/boundary of a drainage basin, Allow if expressed as an area or highland. 5(a)(ii) Ural, 2 Syrdarya, Ili, 5(a)(iii) Nura, 1 5(a)(b) large(st) discharge, 3 large(st) discharge in dry years, less dependent on other countries/lower flow from other countries/large(st) discharge excluding flow from other countries, large catchment/drainage basin, reservoir/dam/lake for storage,
Q6 · Annual average solar radiation in South Africa
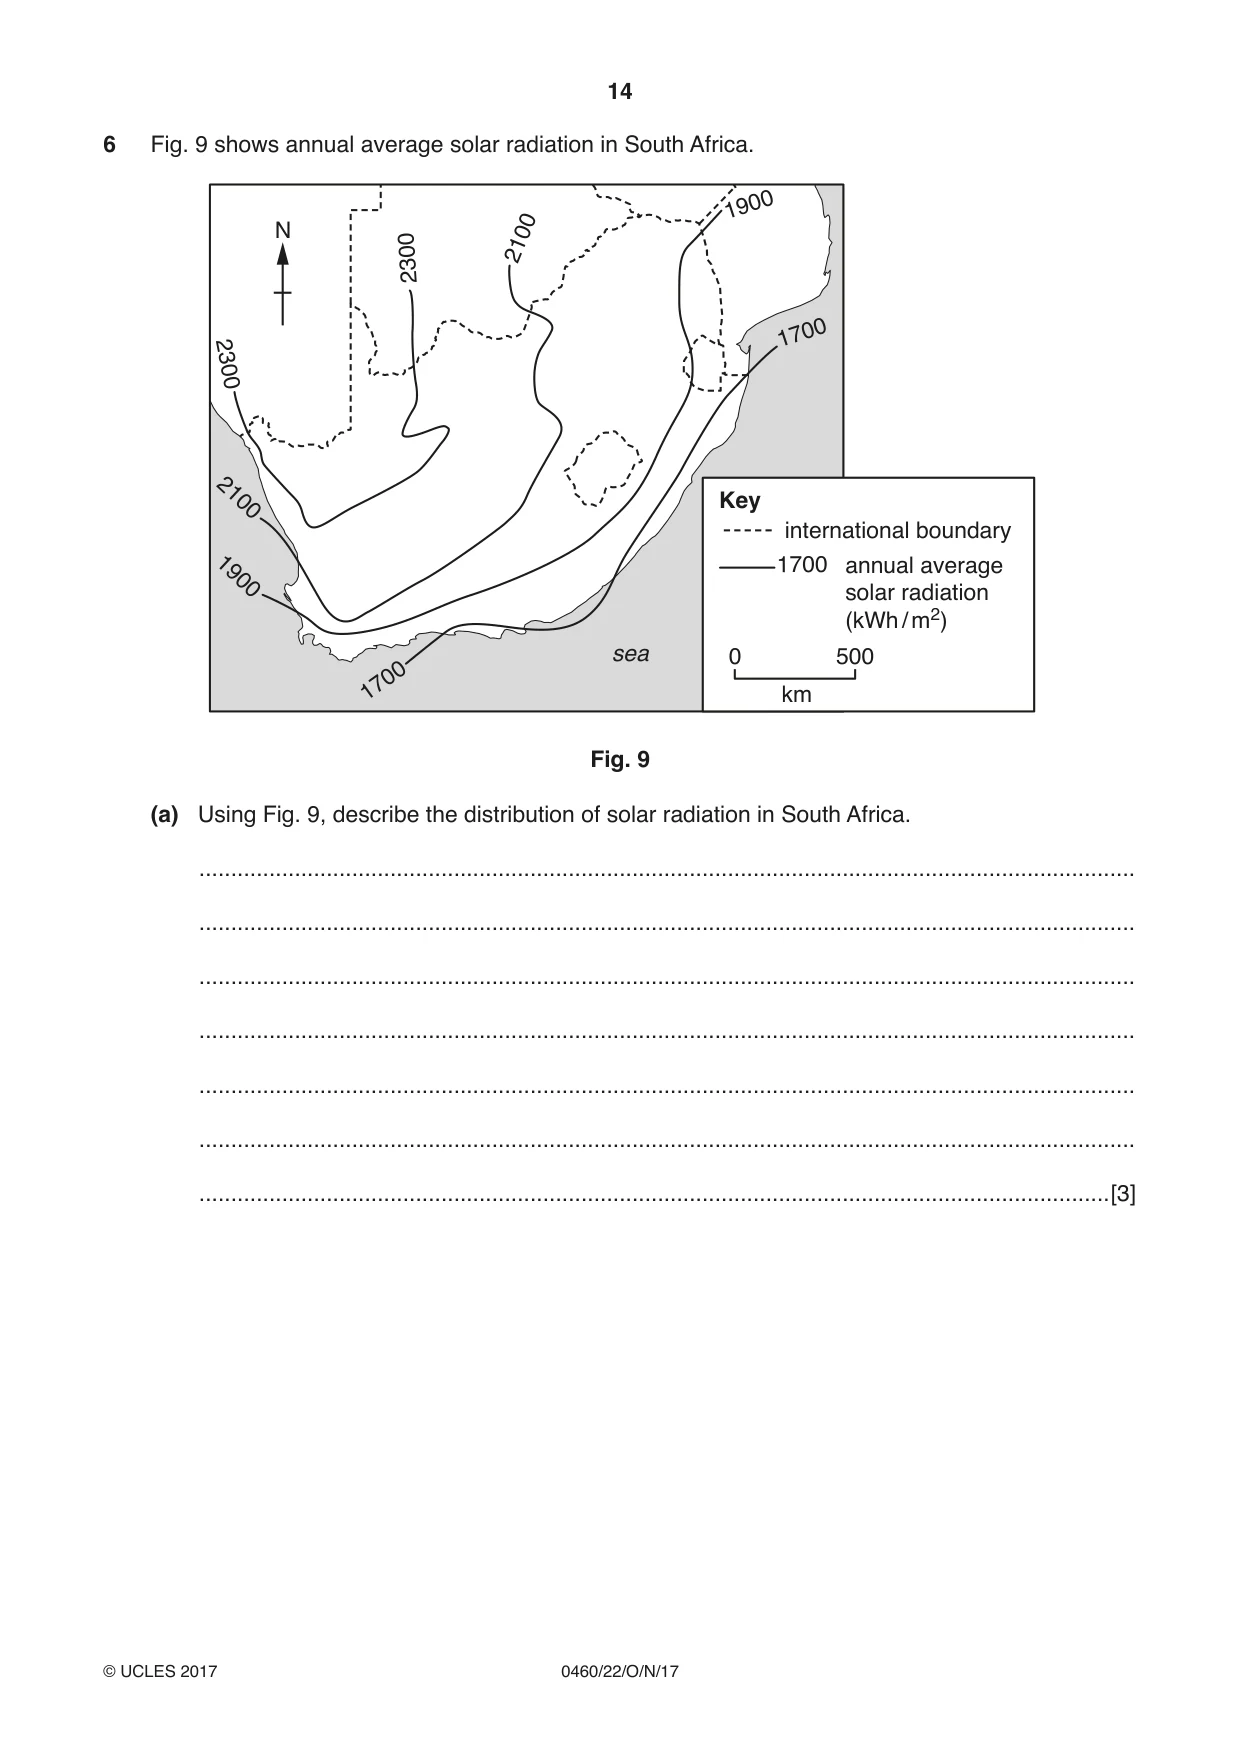
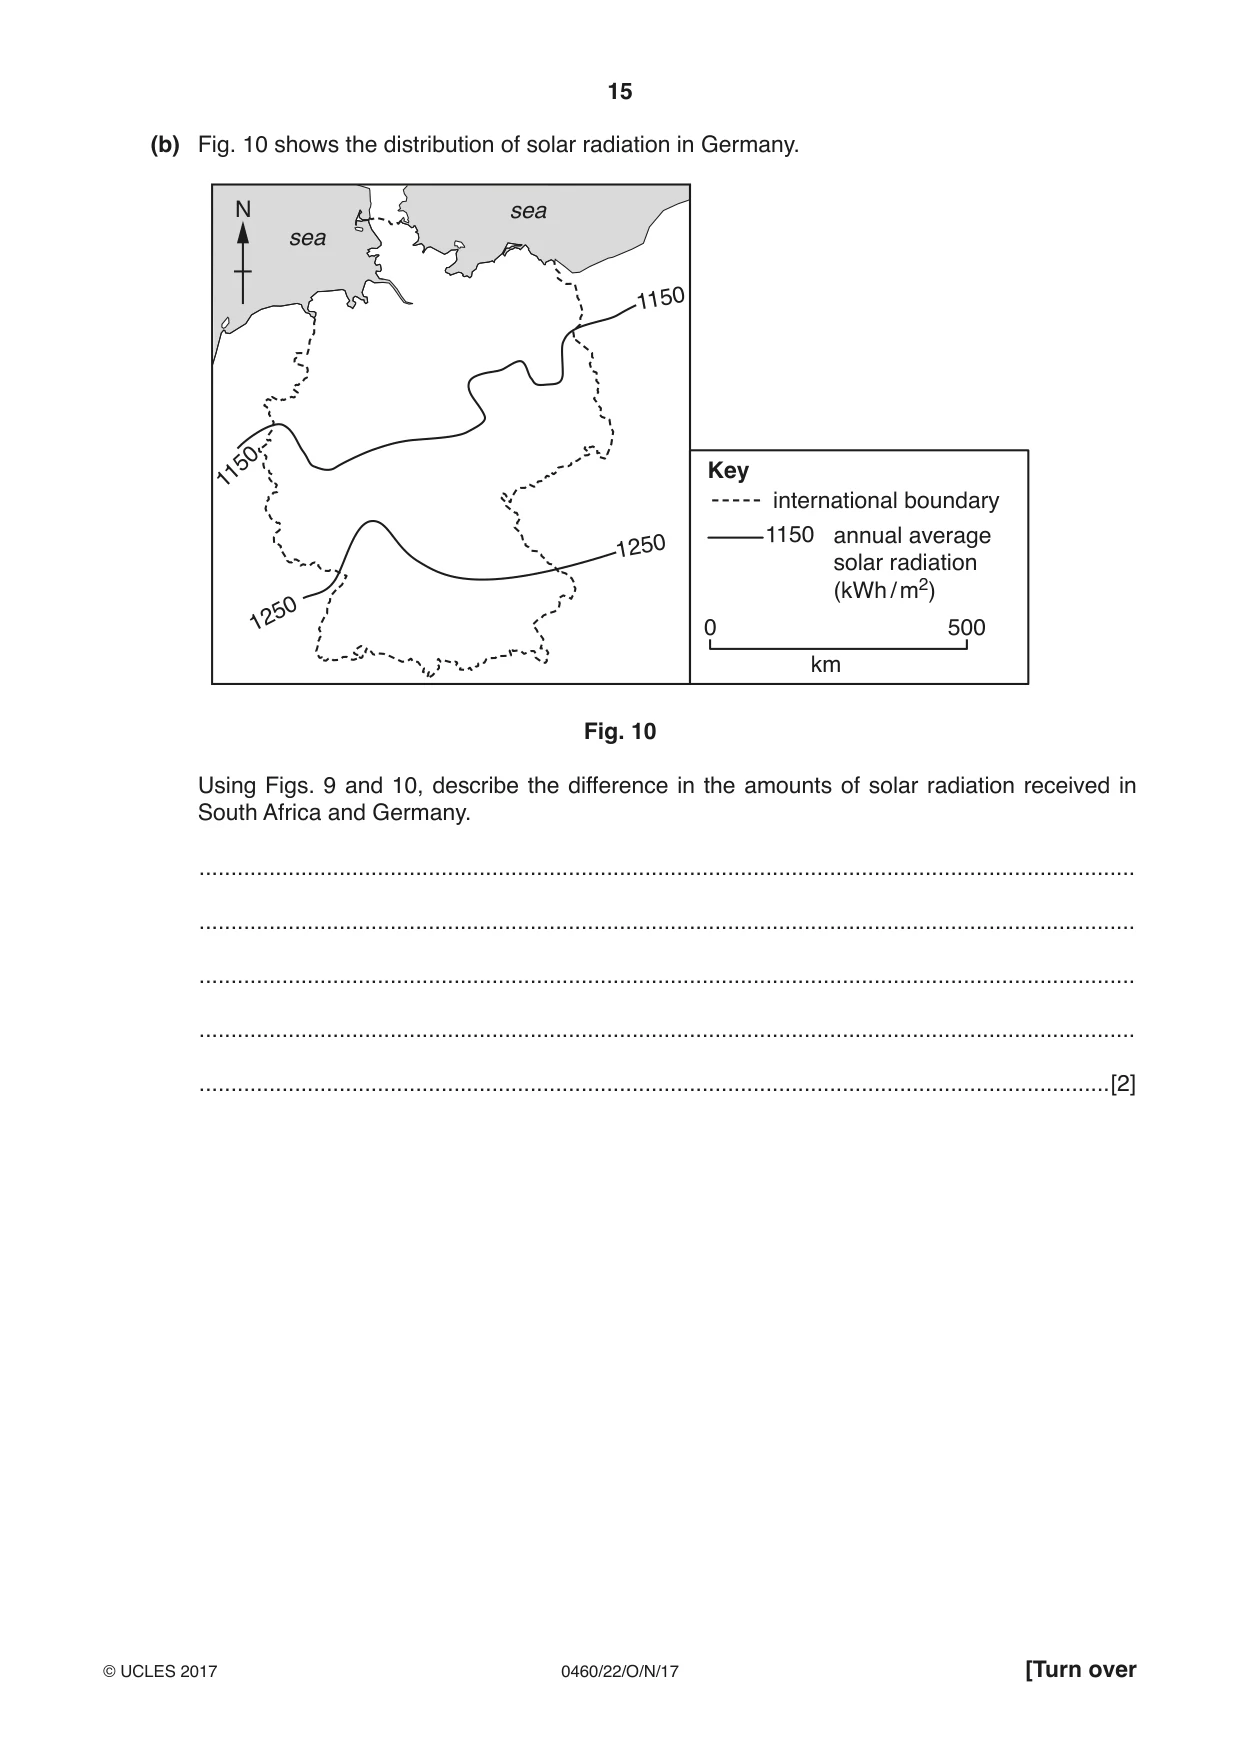
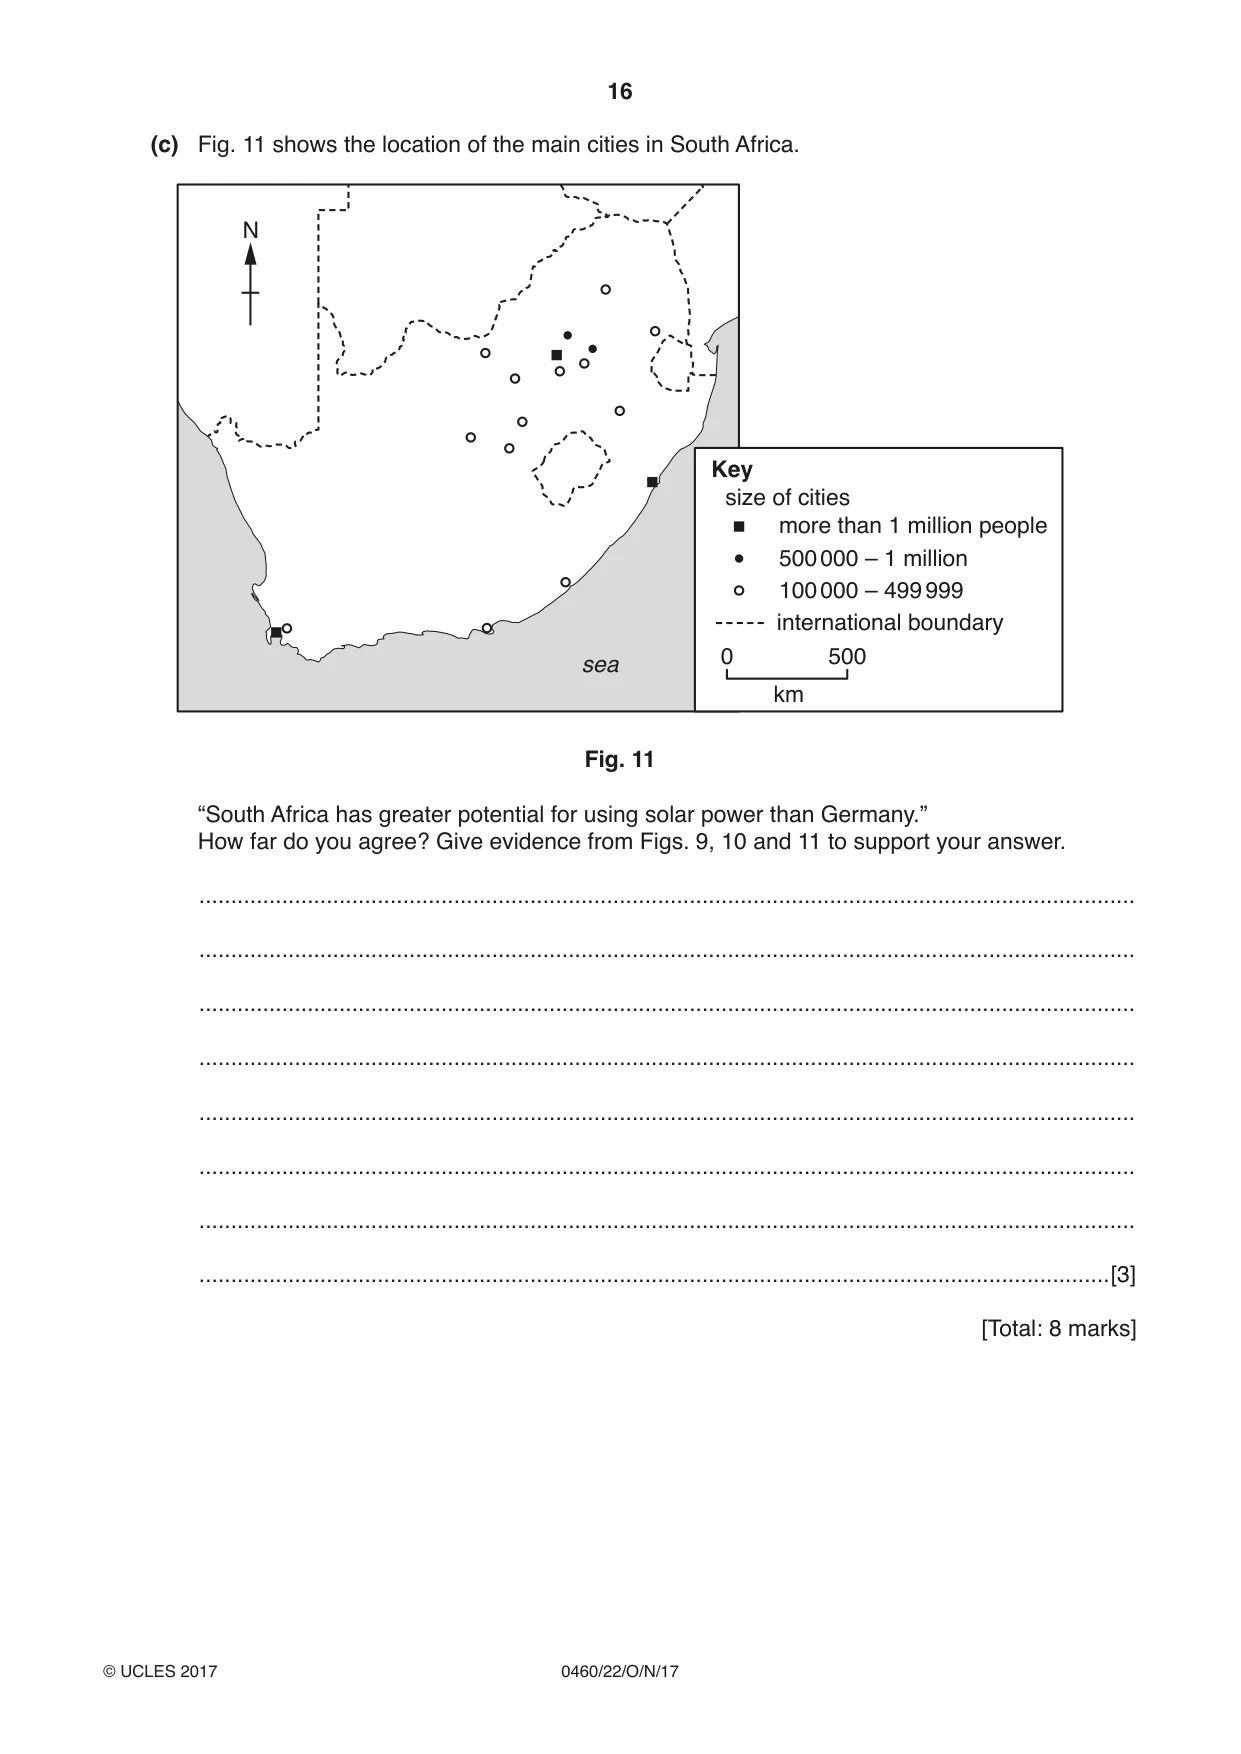
6 Fig. 9 shows annual average solar radiation in South Africa. 1900 N 2100 2300 1700 2300 Key 2100 international boundary 1900 1700 annualsolar radiationaverage (kWh / m2) sea 0 500 1700 km Fig. 9 (a) Using Fig. 9, describe the distribution of solar radiation in South Africa. ................................................................................................................................................... ................................................................................................................................................... ................................................................................................................................................... ................................................................................................................................................... ................................................................................................................................................... ................................................................................................................................................... ...............................................................................................................................................[3] (b) Fig. 10 shows the distribution of solar radiation in Germany. N sea sea 1150 Key 1150 international boundary 1150 annual average 1250 solar radiation (kWh / m2) 1250 0 500 km Fig. 10 Using Figs. 9 and 10, describe the difference in the amounts of solar radiation received in South Africa and Germany. ................................................................................................................................................... ................................................................................................................................................... ................................................................................................................................................... ................................................................................................................................................... ...............................................................................................................................................[2] (c) Fig. 11 shows the location of the main cities in South Africa. N Key size of cities more than 1 million people 500 000 – 1 million 100 000 – 499 999 international boundary 0 500 sea km Fig. 11 “South Africa has greater potential for using solar power than Germany.” How far do you agree? Give evidence from Figs. 9, 10 and 11 to support your answer. ................................................................................................................................................... ................................................................................................................................................... ................................................................................................................................................... ................................................................................................................................................... ................................................................................................................................................... ................................................................................................................................................... ................................................................................................................................................... ...............................................................................................................................................[3] [Total: 8 marks]
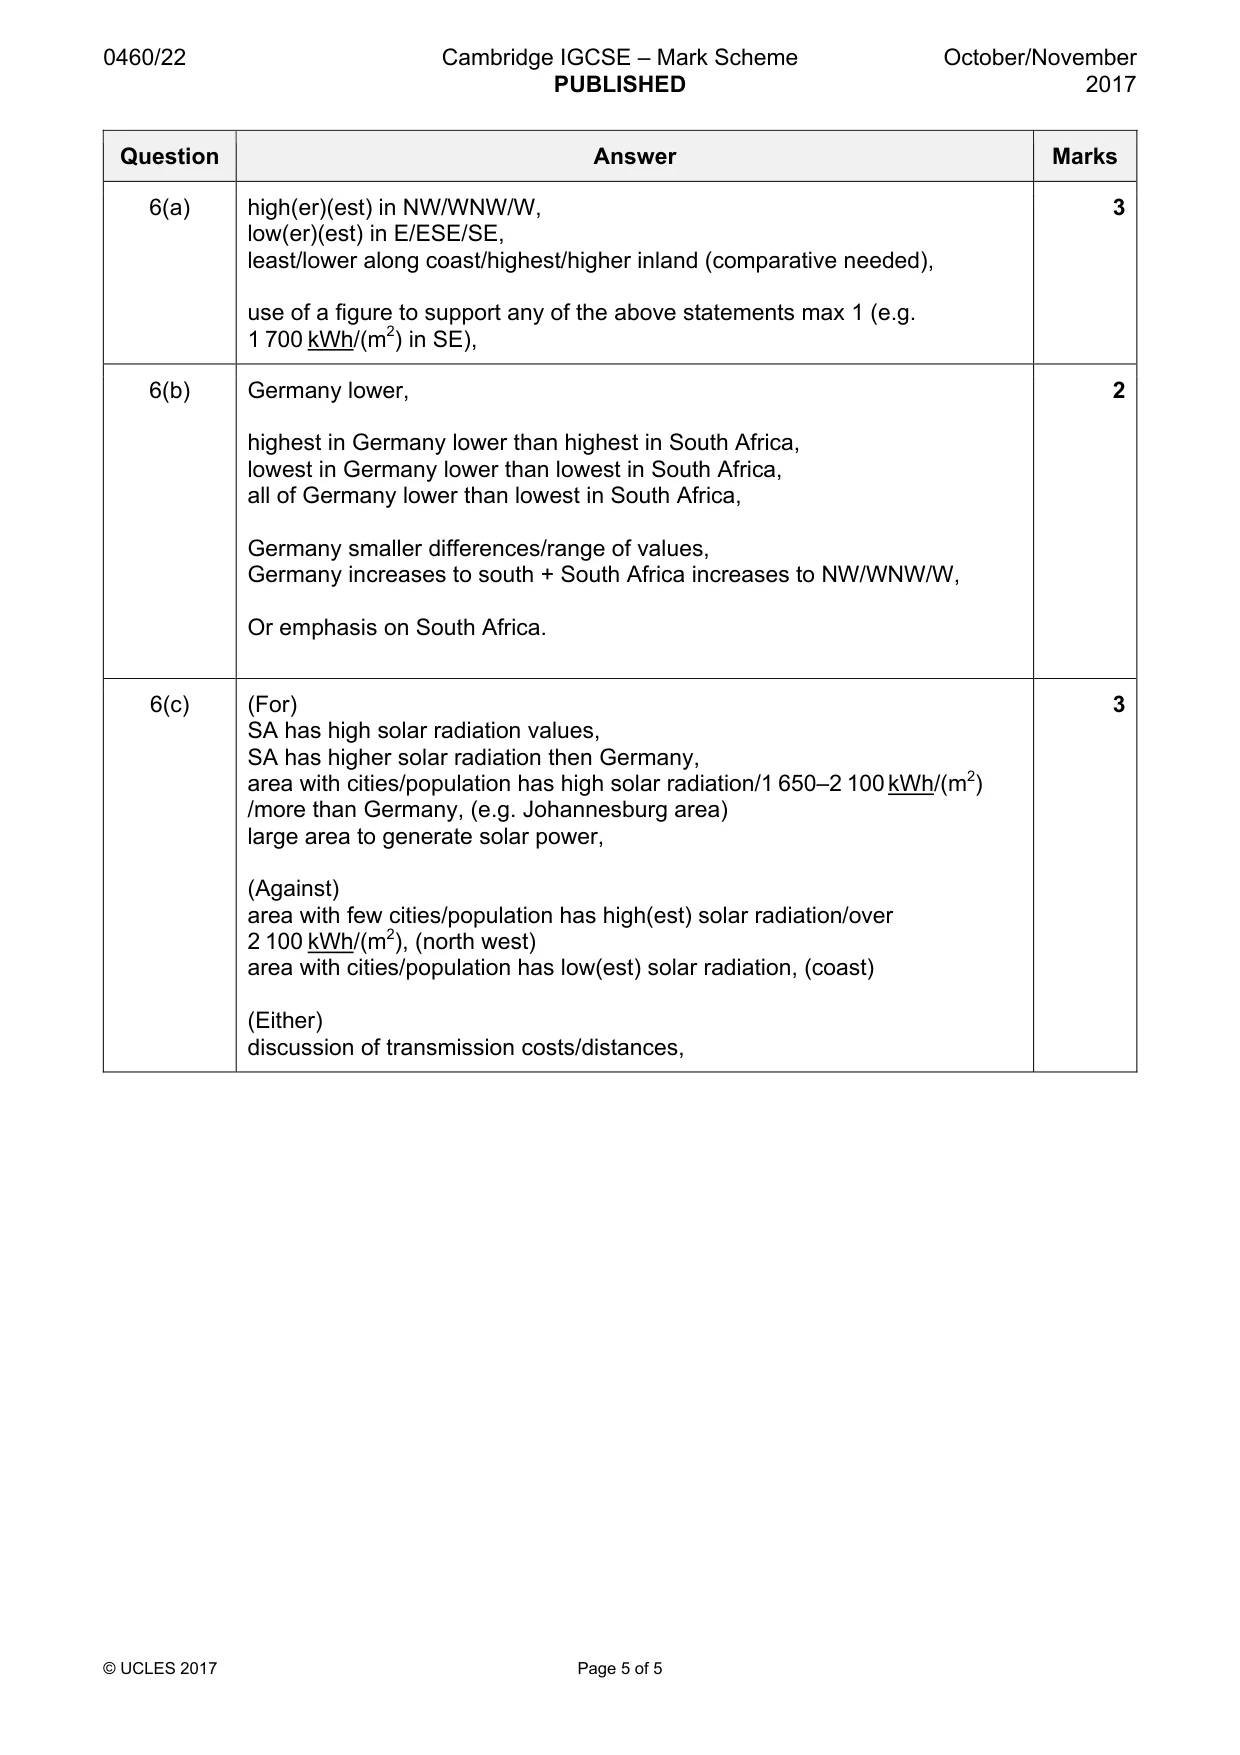
Mark scheme: 6(a) high(er)(est) in NW/WNW/W, 3 low(er)(est) in E/ESE/SE, least/lower along coast/highest/higher inland (comparative needed), use of a figure to support any of the above statements max 1 (e.g. 1 700 kWh/(m2) in SE), 6(b) Germany lower, 2 highest in Germany lower than highest in South Africa, lowest in Germany lower than lowest in South Africa, all of Germany lower than lowest in South Africa, Germany smaller differences/range of values, Germany increases to south + South Africa increases to NW/WNW/W, Or emphasis on South Africa. 6(c) (For) 3 SA has high solar radiation values, SA has higher solar radiation then Germany, area with cities/population has high solar radiation/1 650–2 100 kWh/(m2) /more than Germany, (e.g. Johannesburg area) large area to generate solar power, (Against) area with few cities/population has high(est) solar radiation/over 2 100 kWh/(m2), (north west) area with cities/population has low(est) solar radiation, (coast) (Either) discussion of transmission costs/distances,
What was in this paper
The subtopics covered by these 6 questions, and how many questions each got. Open one in a new tab to see every Cambridge question on it.
What you needed in this session
Cambridge’s own grade thresholds for 2017 Oct/Nov, Paper 2 · Variant 2. A higher threshold means an easier paper — the bar moves with how the cohort did.