Cambridge IGCSE Geography 0460 — 2020 May/June Paper 2 · Variant 1
0460/21/M/J/20 · 6 questions · 60 marks · ≈68 min
The question paper and its mark scheme, free to read here and free to download. This is Cambridge’s own paper, exactly as it was sat.
Question paper20 pages

Mark scheme7 pages
Answers below. Sit the paper first if you are practising.
Questions as text
Q1 · Study the map extract for Stoumont, Belgium
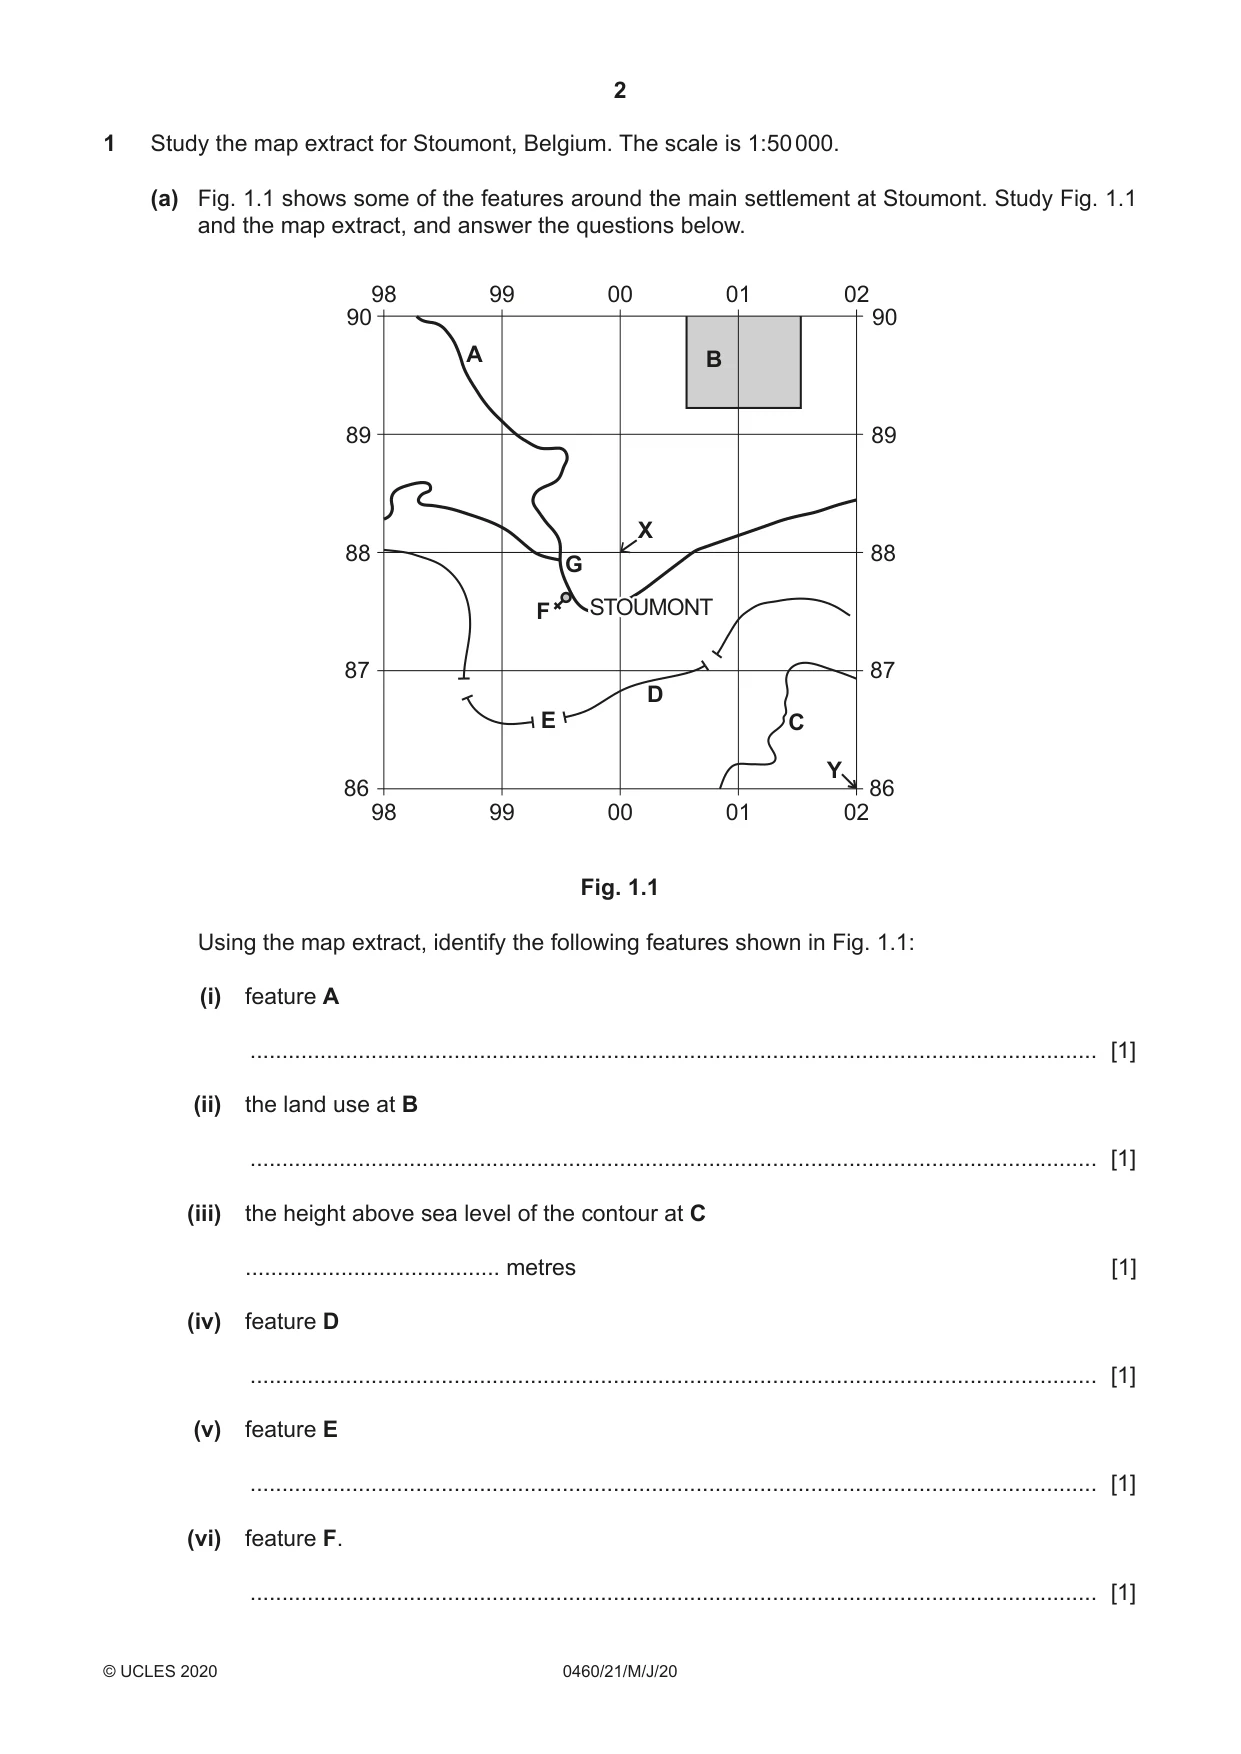
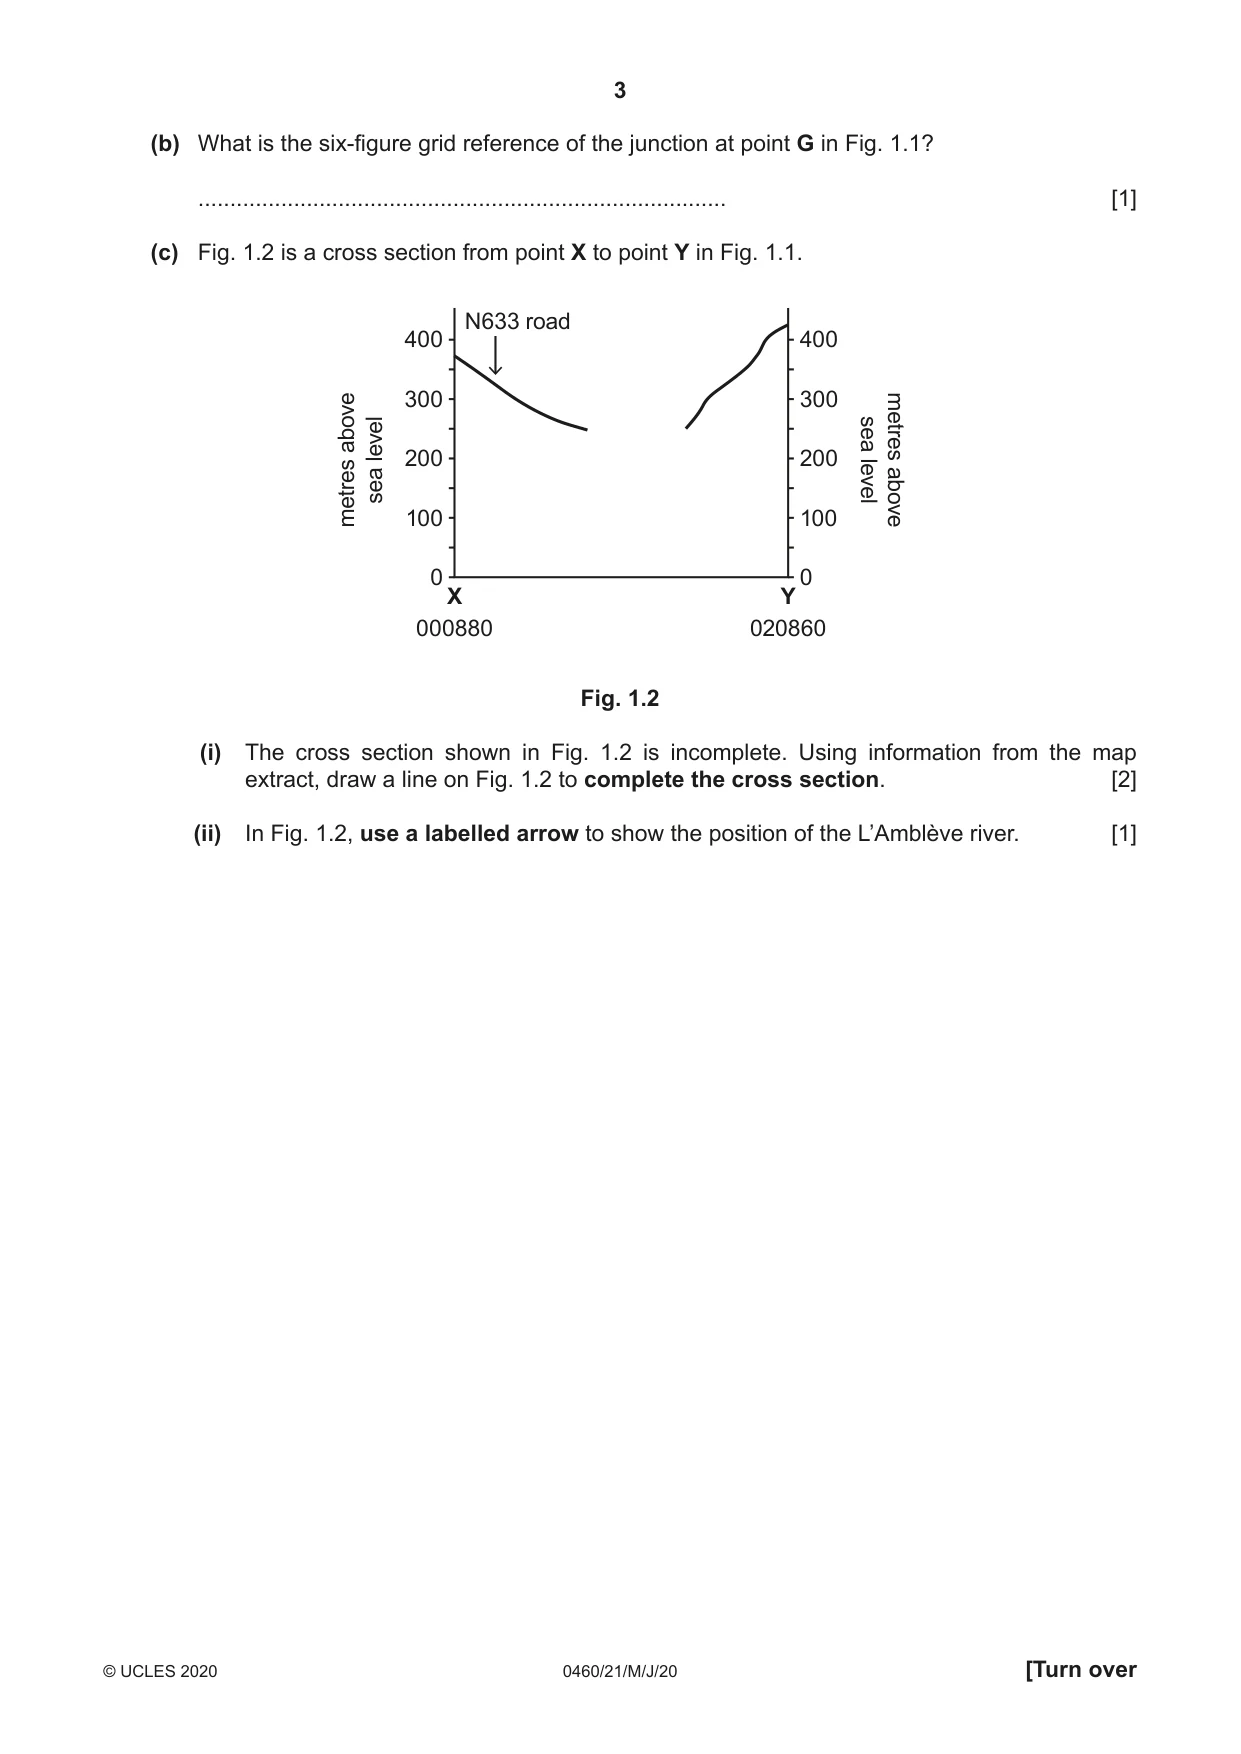
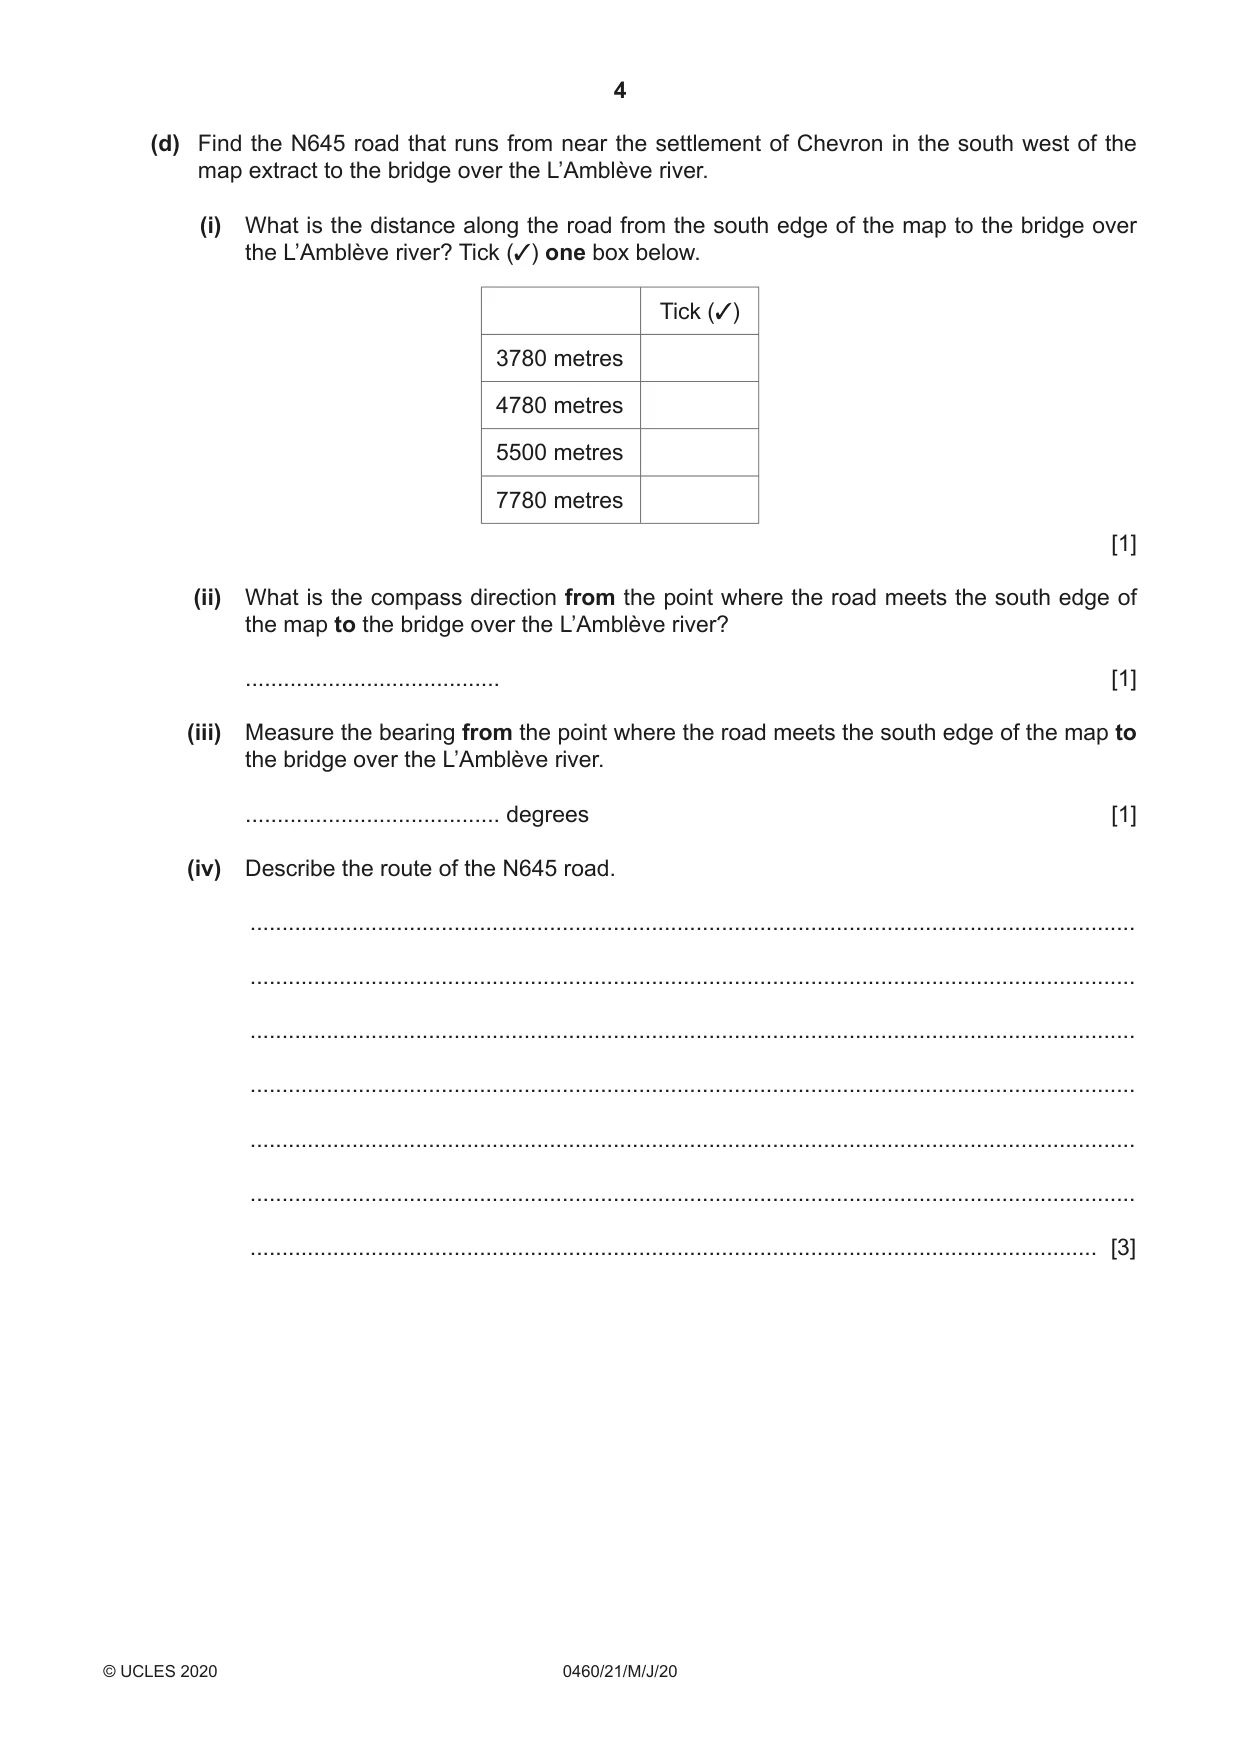
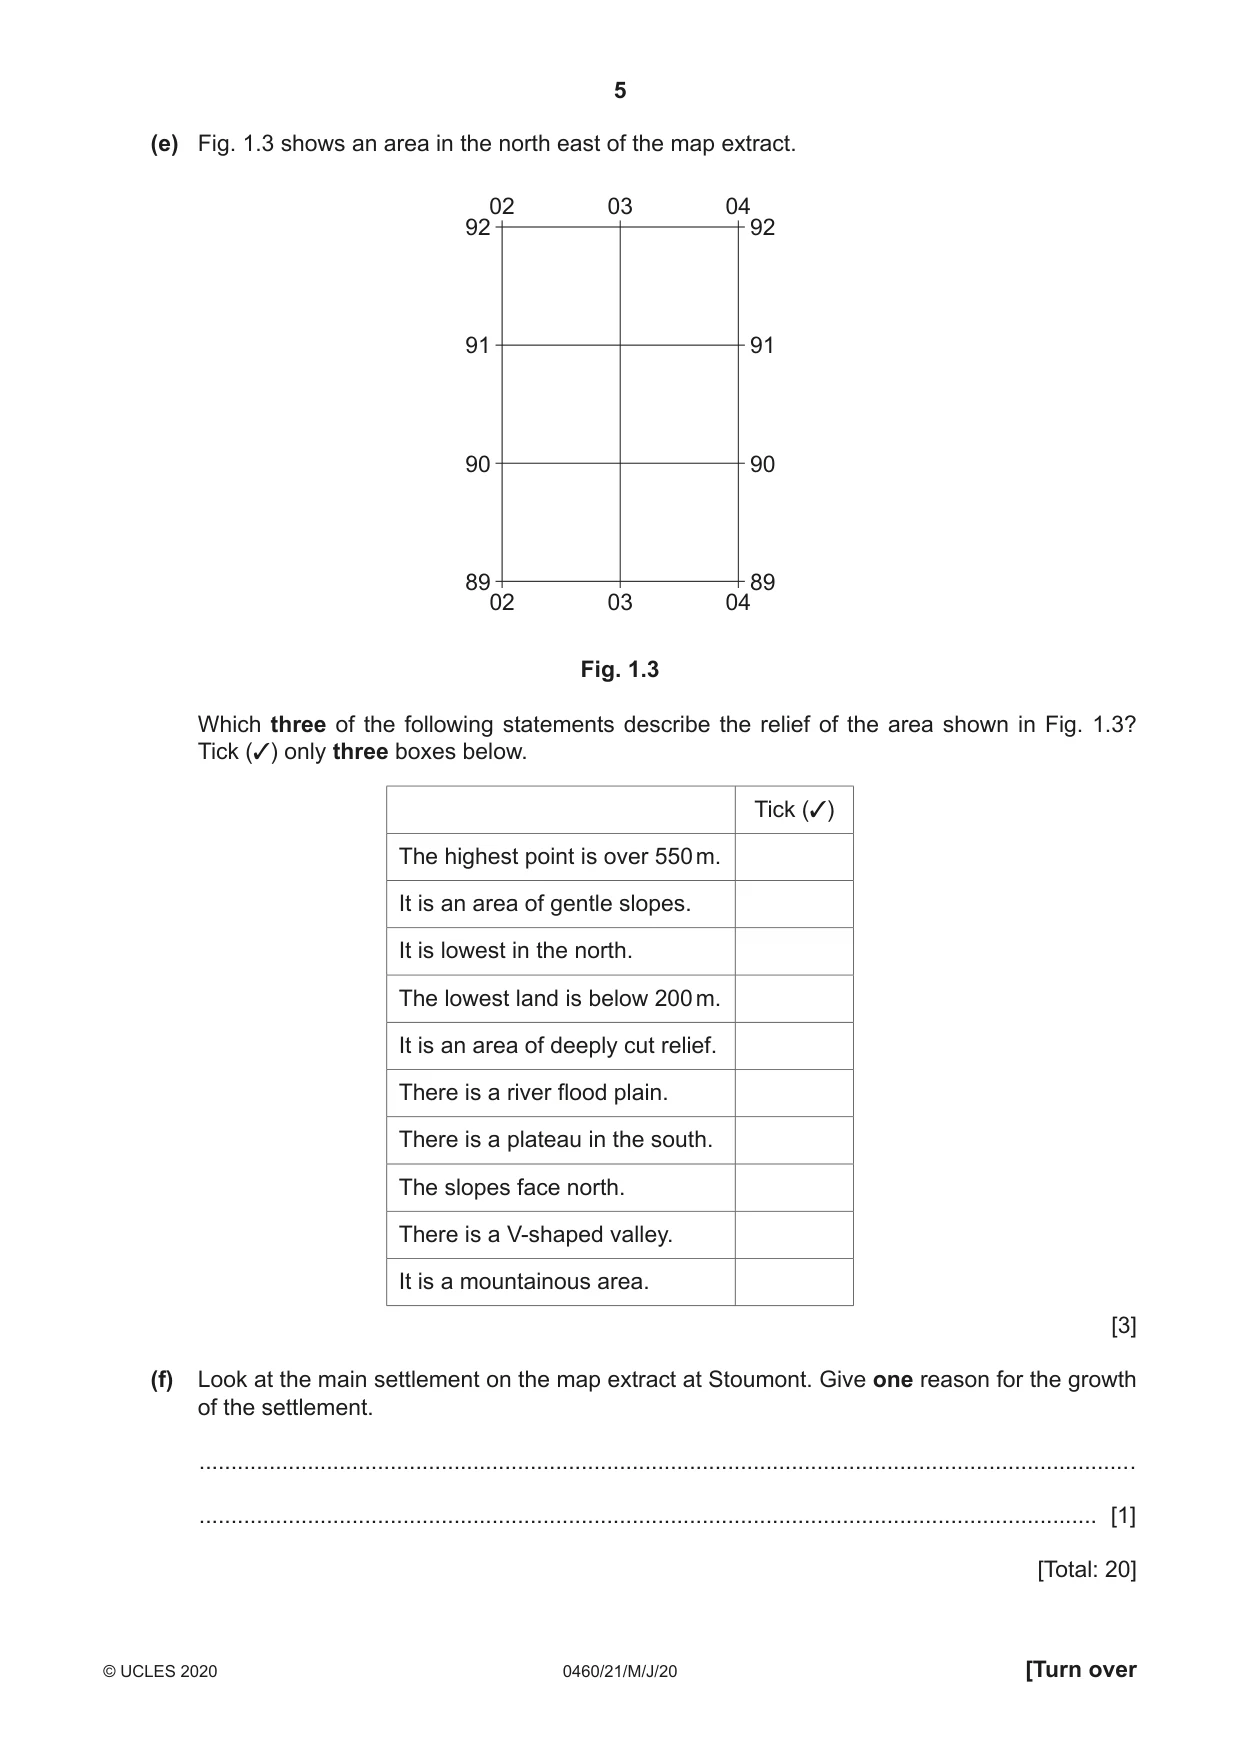
1 Study the map extract for Stoumont, Belgium. The scale is 1:50 000. (a) Fig. 1.1 shows some of the features around the main settlement at Stoumont. Study Fig. 1.1 and the map extract, and answer the questions below. 98 99 00 01 02 90 90 A B 89 89 X 88 88 G F STOUMONT 87 87 D E C Y 86 86 98 99 00 01 02 Fig. 1.1 Using the map extract, identify the following features shown in Fig. 1.1: (i) feature A ..................................................................................................................................... [1] (ii) the land use at B ..................................................................................................................................... [1] (iii) the height above sea level of the contour at C ........................................ metres [1] (iv) feature D ..................................................................................................................................... [1] (v) feature E ..................................................................................................................................... [1] (vi) feature F. ..................................................................................................................................... [1] (b) What is the six-figure grid reference of the junction at point G in Fig. 1.1? ................................................................................... [1] (c) Fig. 1.2 is a cross section from point X to point Y in Fig. 1.1. N633 road 400 400 300 300 above level seametres 200 200 metressea 100 100 levelabove 0 0 X Y 000880 020860 Fig. 1.2 (i) The cross section shown in Fig. 1.2 is incomplete. Using information from the map extract, draw a line on Fig. 1.2 to complete the cross section. [2] (ii) In Fig. 1.2, use a labelled arrow to show the position of the L’Amblève river. [1] (d) Find the N645 road that runs from near the settlement of Chevron in the south west of the map extract to the bridge over the L’Amblève river. (i) What is the distance along the road from the south edge of the map to the bridge over the L’Amblève river? Tick (3) one box below. Tick (3) 3780 metres 4780 metres 5500 metres 7780 metres [1] (ii) What is the compass direction from the point where the road meets the south edge of the map to the bridge over the L’Amblève river? ........................................ [1] (iii) Measure the bearing from the point where the road meets the south edge of the map to the bridge over the L’Amblève river. ........................................ degrees [1] (iv) Describe the route of the N645 road. ........................................................................................................................................... ........................................................................................................................................... ........................................................................................................................................... ........................................................................................................................................... ........................................................................................................................................... ........................................................................................................................................... ..................................................................................................................................... [3] (e) Fig. 1.3 shows an area in the north east of the map extract. 02 03 04 92 92 91 91 90 90 89 89 02 03 04 Fig. 1.3 Which three of the following statements describe the relief of the area shown in Fig. 1.3? Tick (3) only three boxes below. Tick (3) The highest point is over 550 m. It is an area of gentle slopes. It is lowest in the north. The lowest land is below 200 m. It is an area of deeply cut relief. There is a river flood plain. There is a plateau in the south. The slopes face north. There is a V-shaped valley. It is a mountainous area. [3] (f) Look at the main settlement on the map extract at Stoumont. Give one reason for the growth of the settlement. ................................................................................................................................................... ............................................................................................................................................. [1] [Total: 20]
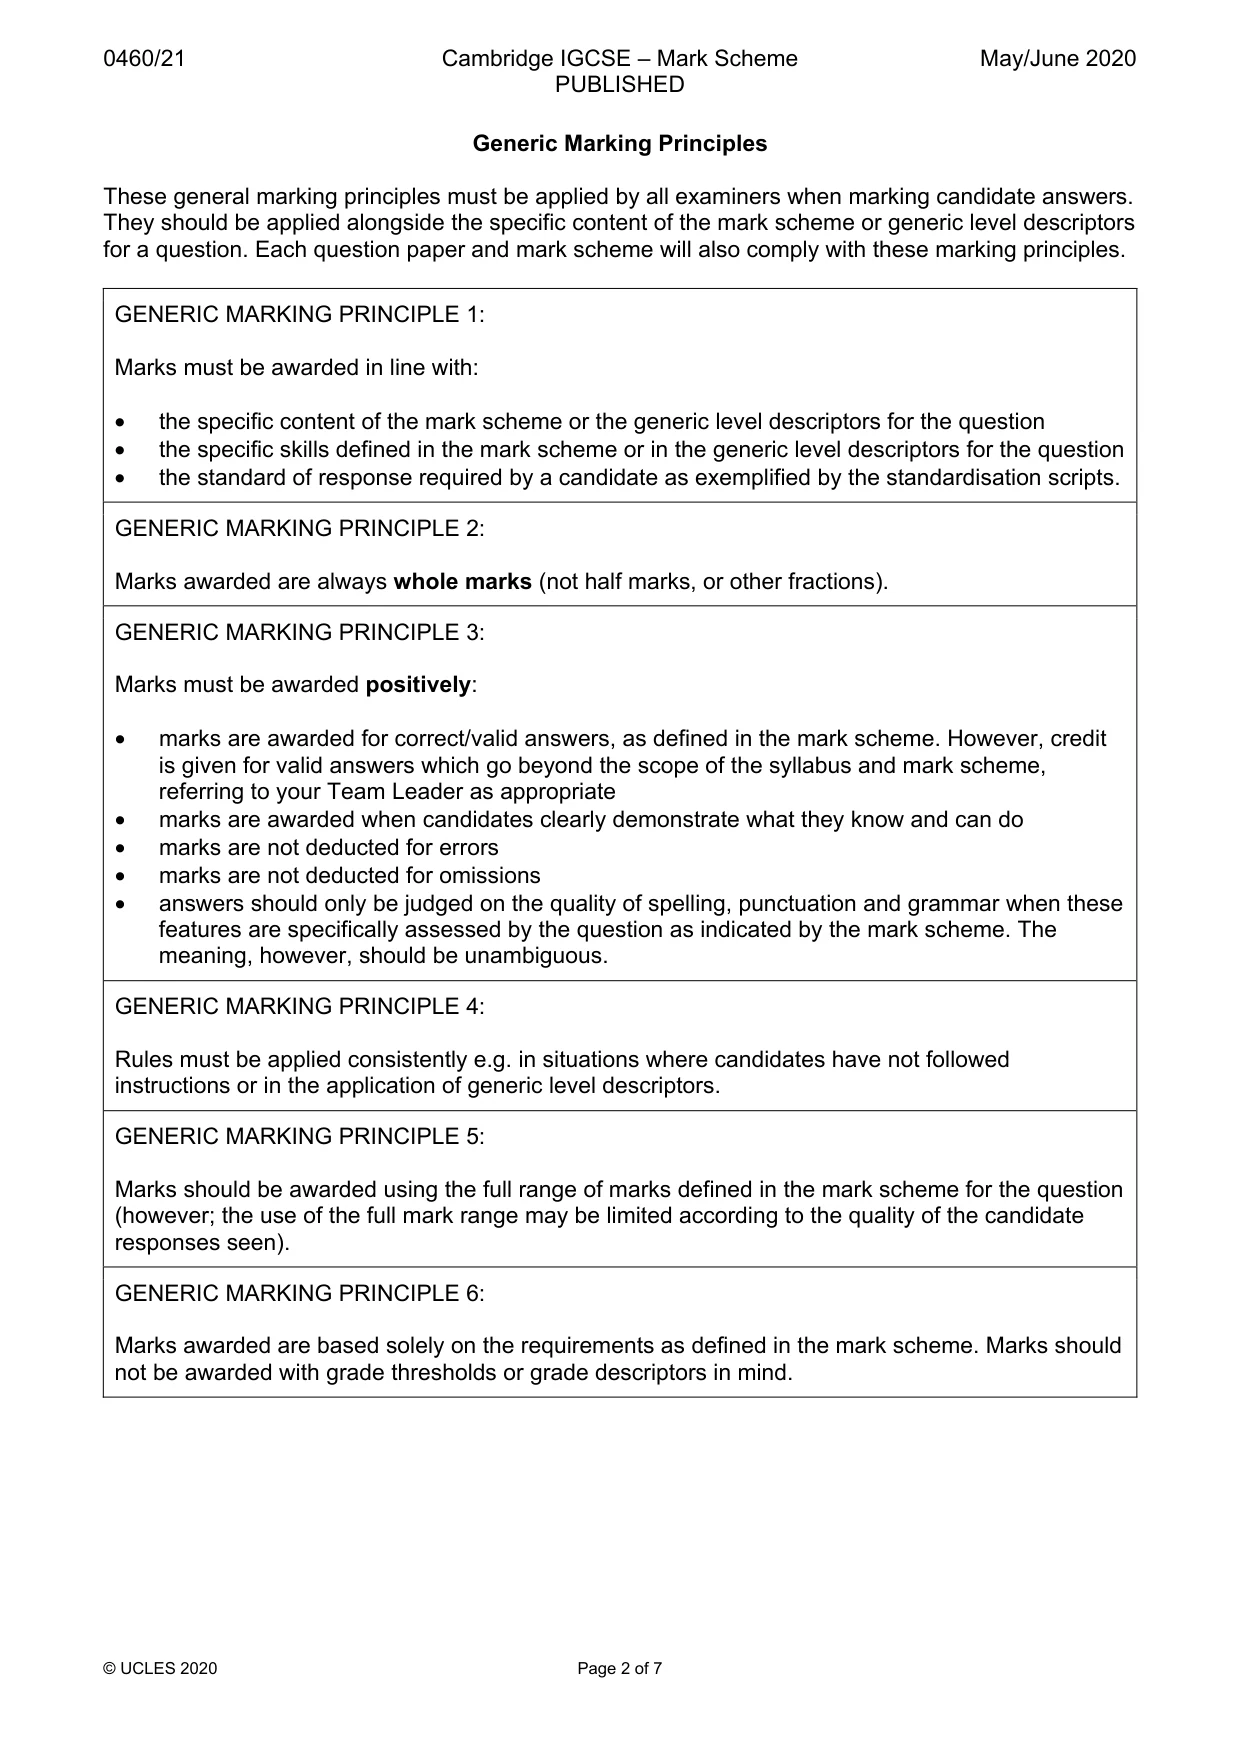
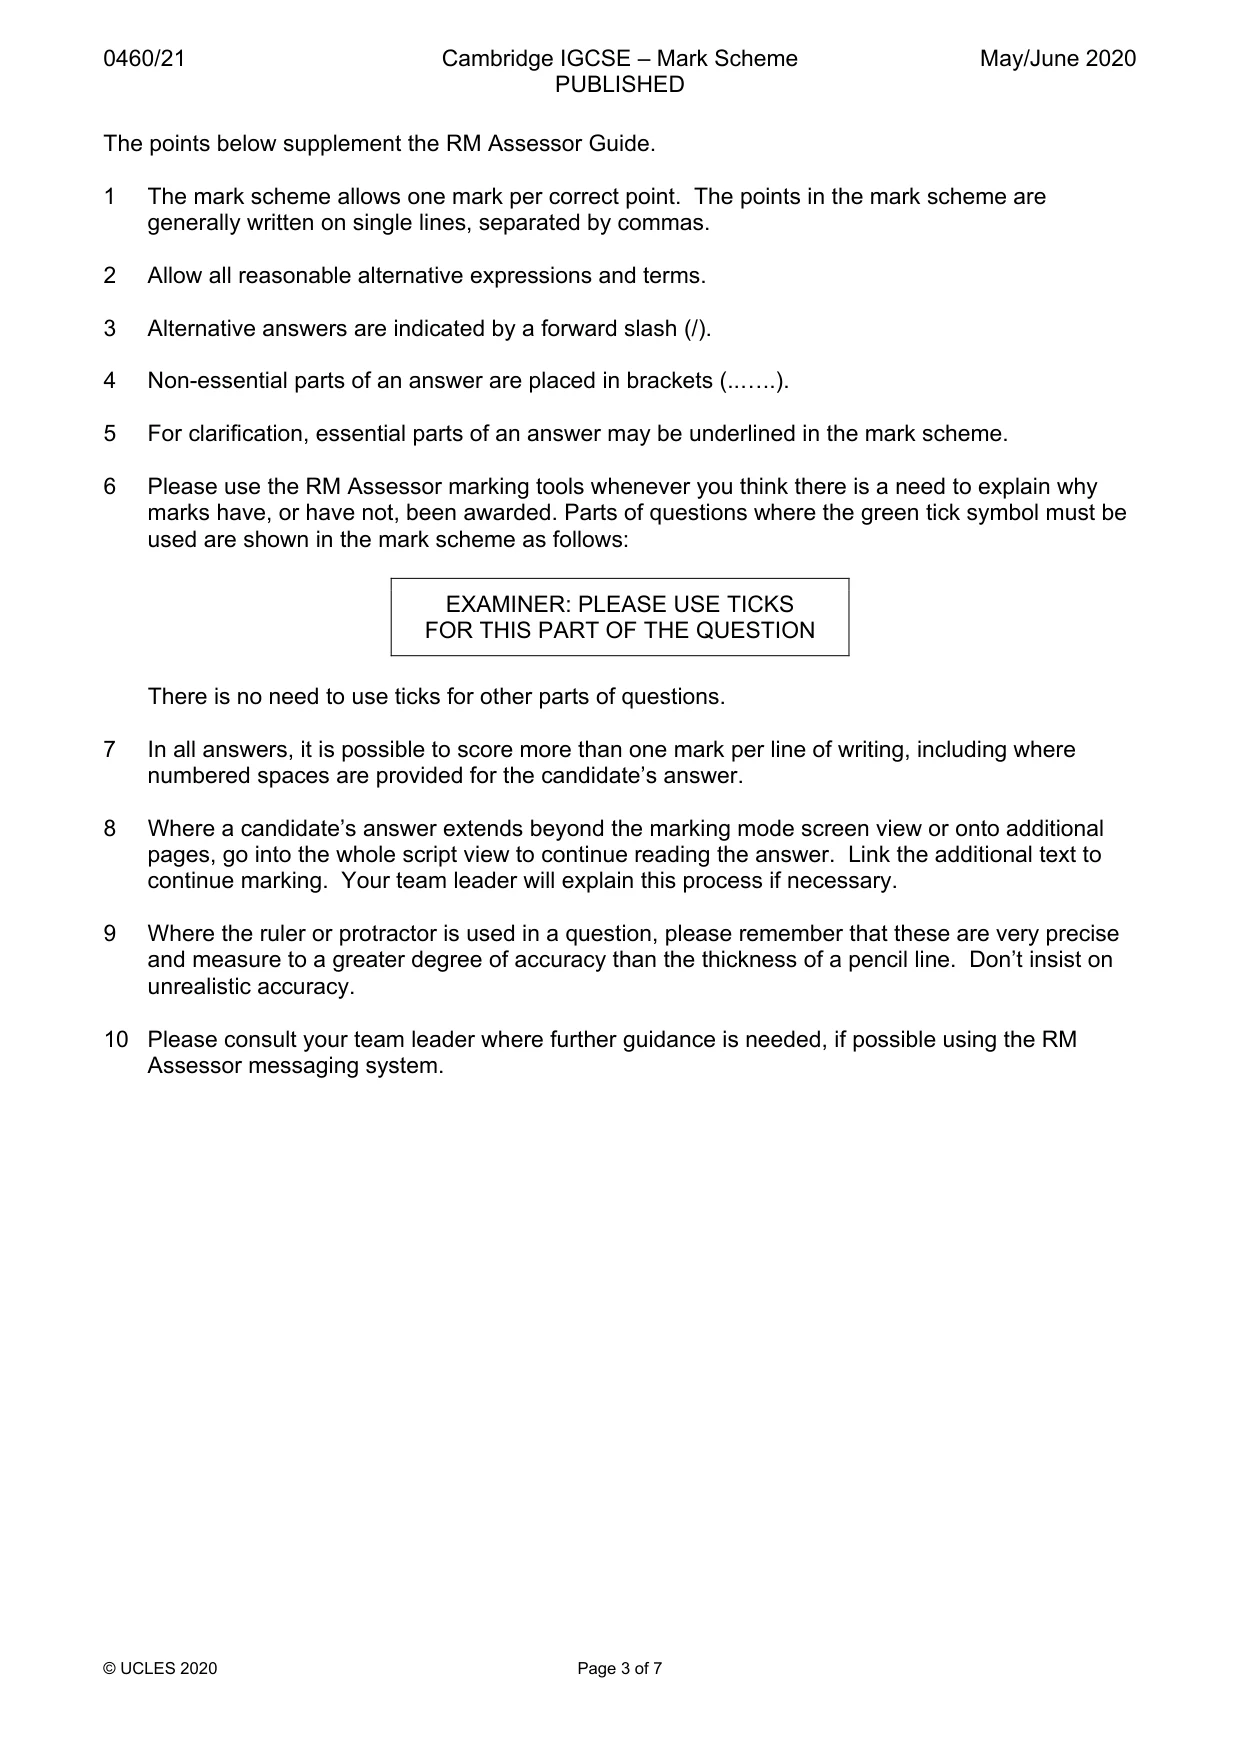
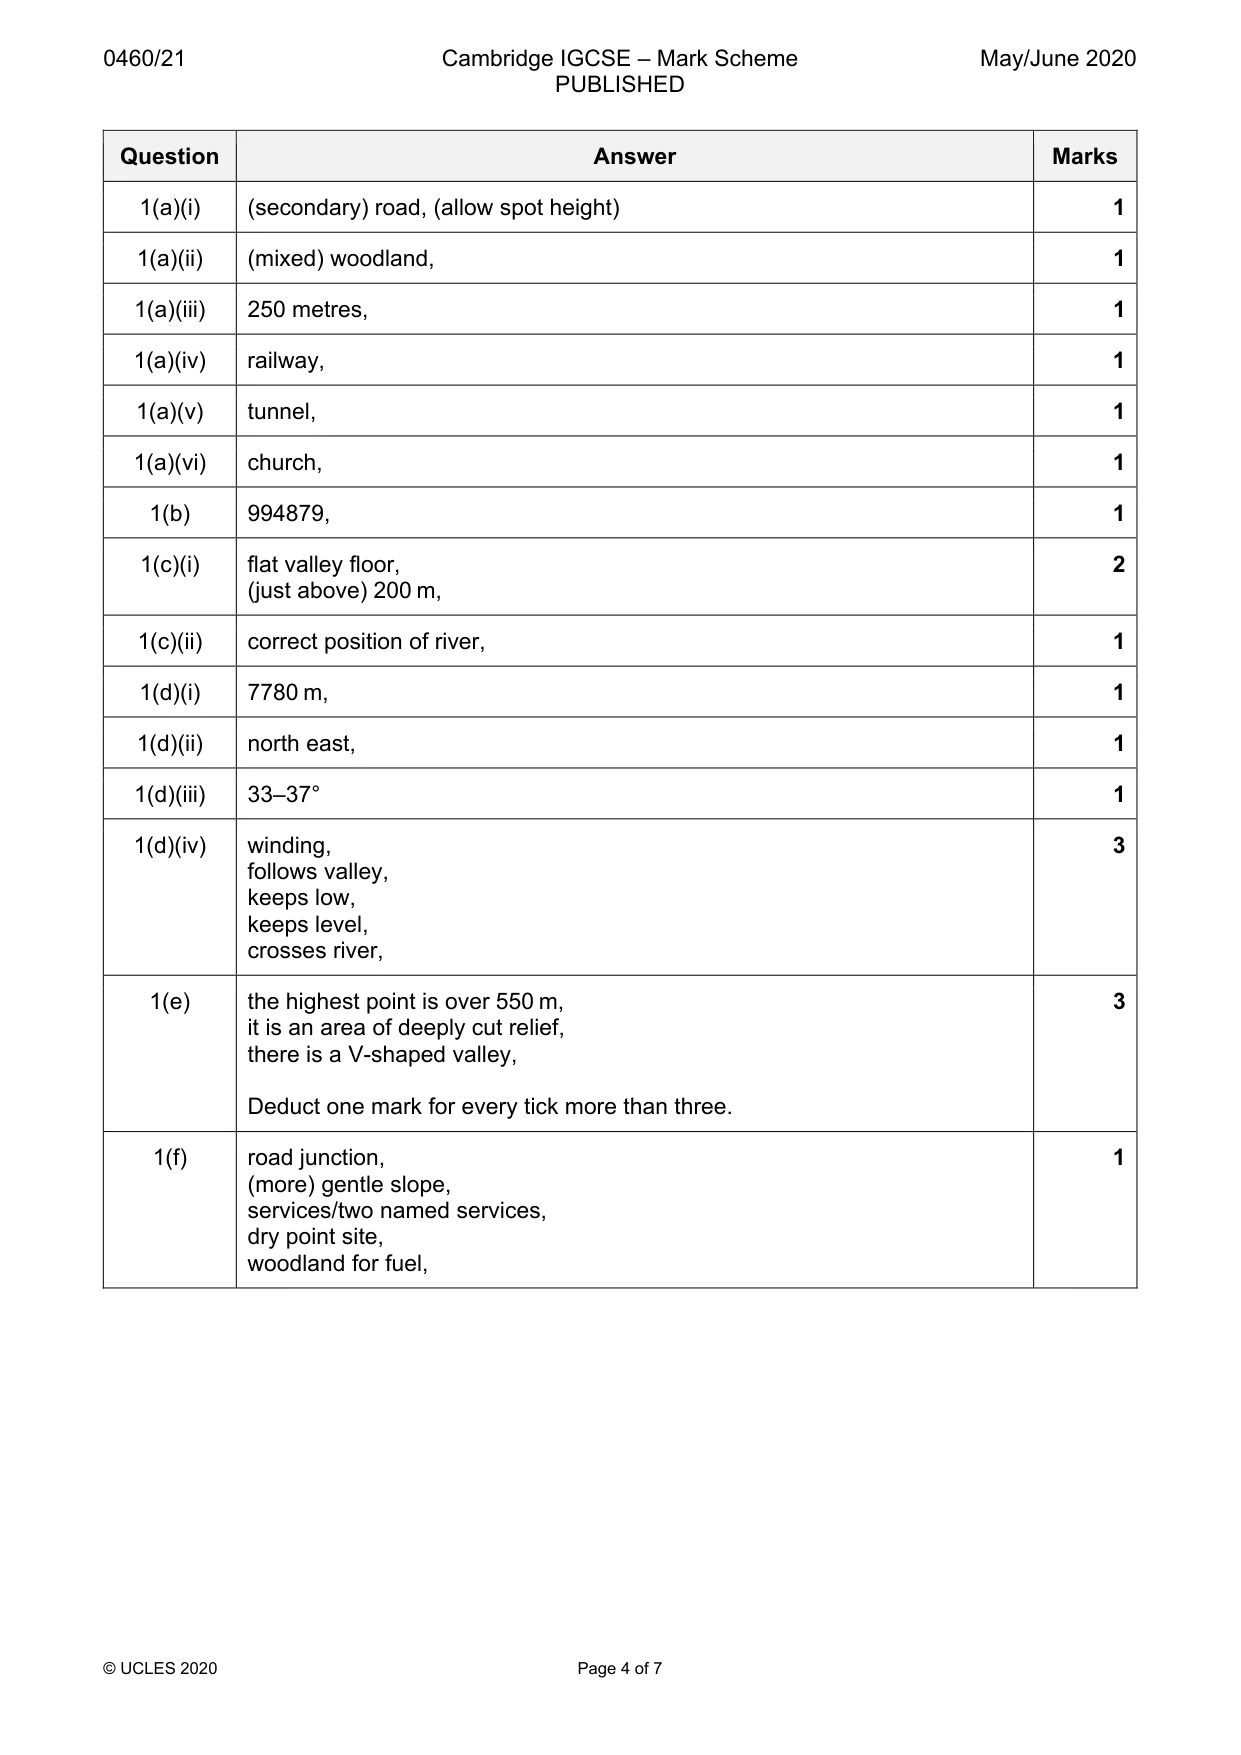
Mark scheme: Question Answer Marks 1(a)(i) (secondary) road, (allow spot height) 1 1(a)(ii) (mixed) woodland, 1 1(a)(iii) 250 metres, 1 1(a)(iv) railway, 1 1(a)(v) tunnel, 1 1(a)(vi) church, 1 1(b) 994879, 1 1(c)(i) flat valley floor, 2 (just above) 200 m, 1(c)(ii) correct position of river, 1 1(d)(i) 7780 m, 1 1(d)(ii) north east, 1 1(d)(iii) 33–37° 1 1(d)(iv) winding, 3 follows valley, keeps low, keeps level, crosses river, 1(e) the highest point is over 550 m, 3 it is an area of deeply cut relief, there is a V-shaped valley, Deduct one mark for every tick more than three. 1(f) road junction, 1 (more) gentle slope, services/two named services, dry point site, woodland for fuel,
Q2 · The estimated population growth of the continents between 1960 and 2100
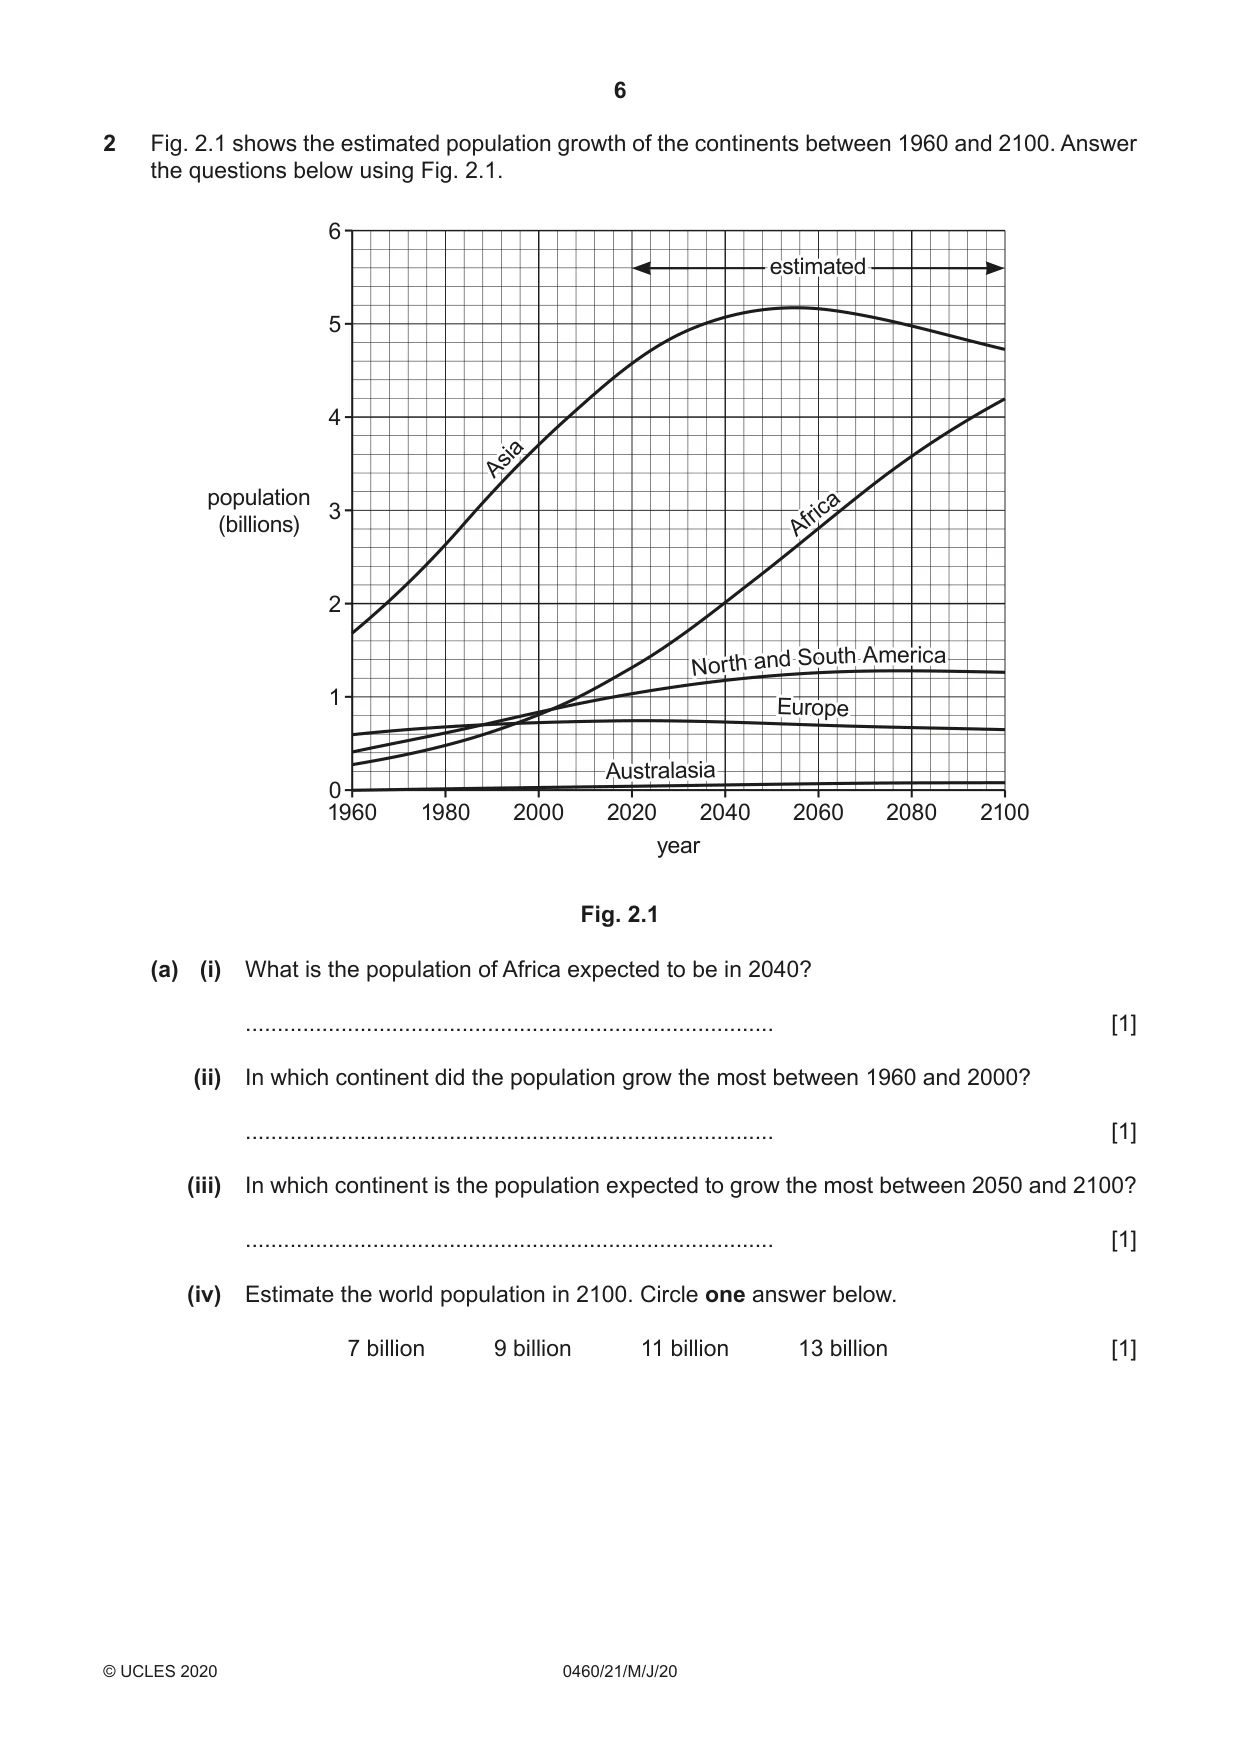
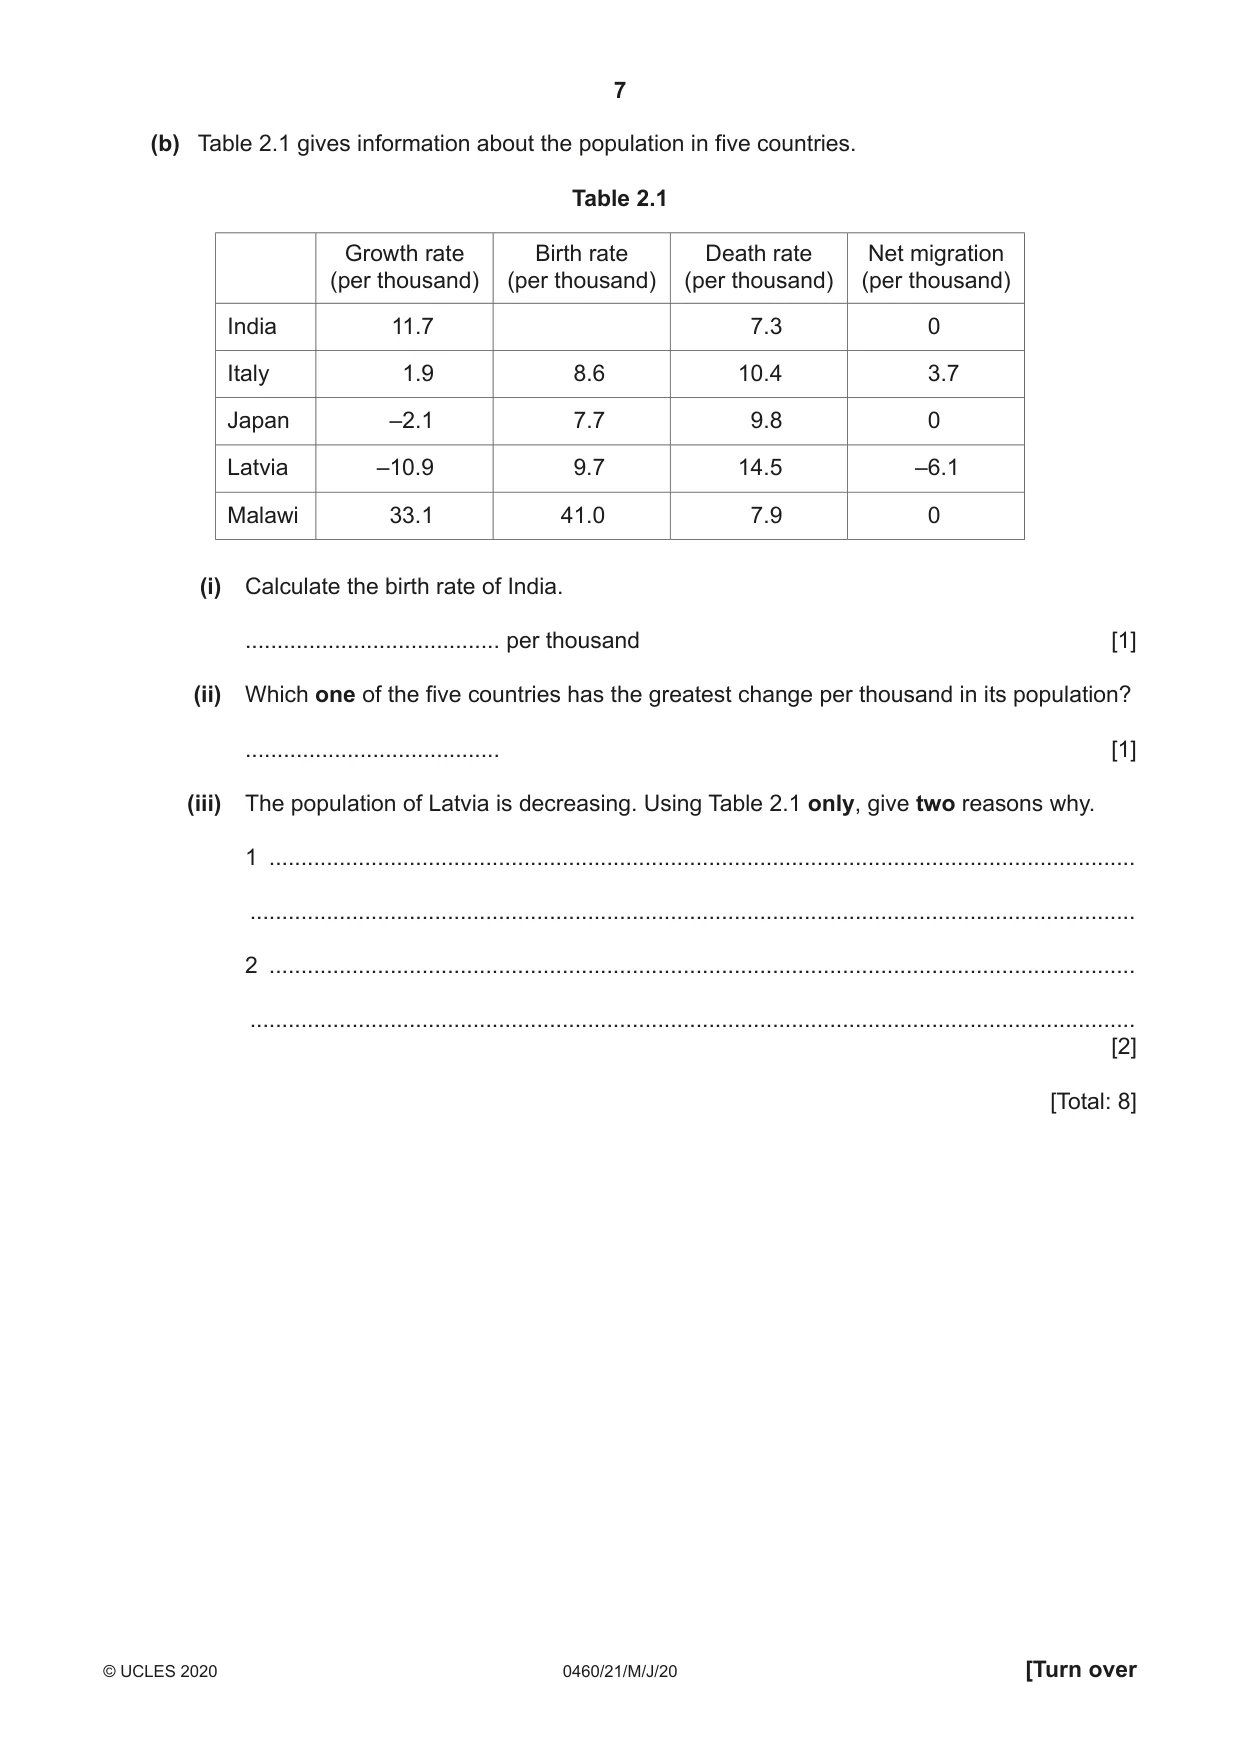
2 Fig. 2.1 shows the estimated population growth of the continents between 1960 and 2100. Answer the questions below using Fig. 2.1. 6 estimated 5 4 Asia population 3 (billions) Africa 2 and South America North 1 Europe Australasia 0 1960 1980 2000 2020 2040 2060 2080 2100 year Fig. 2.1 (a) (i) What is the population of Africa expected to be in 2040? ................................................................................... [1] (ii) In which continent did the population grow the most between 1960 and 2000? ................................................................................... [1] (iii) In which continent is the population expected to grow the most between 2050 and 2100? ................................................................................... [1] (iv) Estimate the world population in 2100. Circle one answer below. 7 billion 9 billion 11 billion 13 billion [1] (b) Table 2.1 gives information about the population in five countries. Table 2.1 Growth rate Birth rate Death rate Net migration (per thousand) (per thousand) (per thousand) (per thousand) India 11.7 7.3 0 Italy 1.9 8.6 10.4 3.7 Japan –2.1 7.7 9.8 0 Latvia –10.9 9.7 14.5 –6.1 Malawi 33.1 41.0 7.9 0 (i) Calculate the birth rate of India. ........................................ per thousand [1] (ii) Which one of the five countries has the greatest change per thousand in its population? ........................................ [1] (iii) The population of Latvia is decreasing. Using Table 2.1 only, give two reasons why. 1 ........................................................................................................................................ ........................................................................................................................................... 2 ........................................................................................................................................ ........................................................................................................................................... [2] [Total: 8]
Mark scheme: 2(a)(i) 2 billion, 1 2(a)(ii) Asia, 1 2(a)(iii) Africa, 1 2(a)(iv) 11 billion, 1 2(b)(i) 19.0 1 2(b)(ii) Malawi, 1 2(b)(iii) emigration, 2 low birth rate/death rate > birth rate,
Question 3
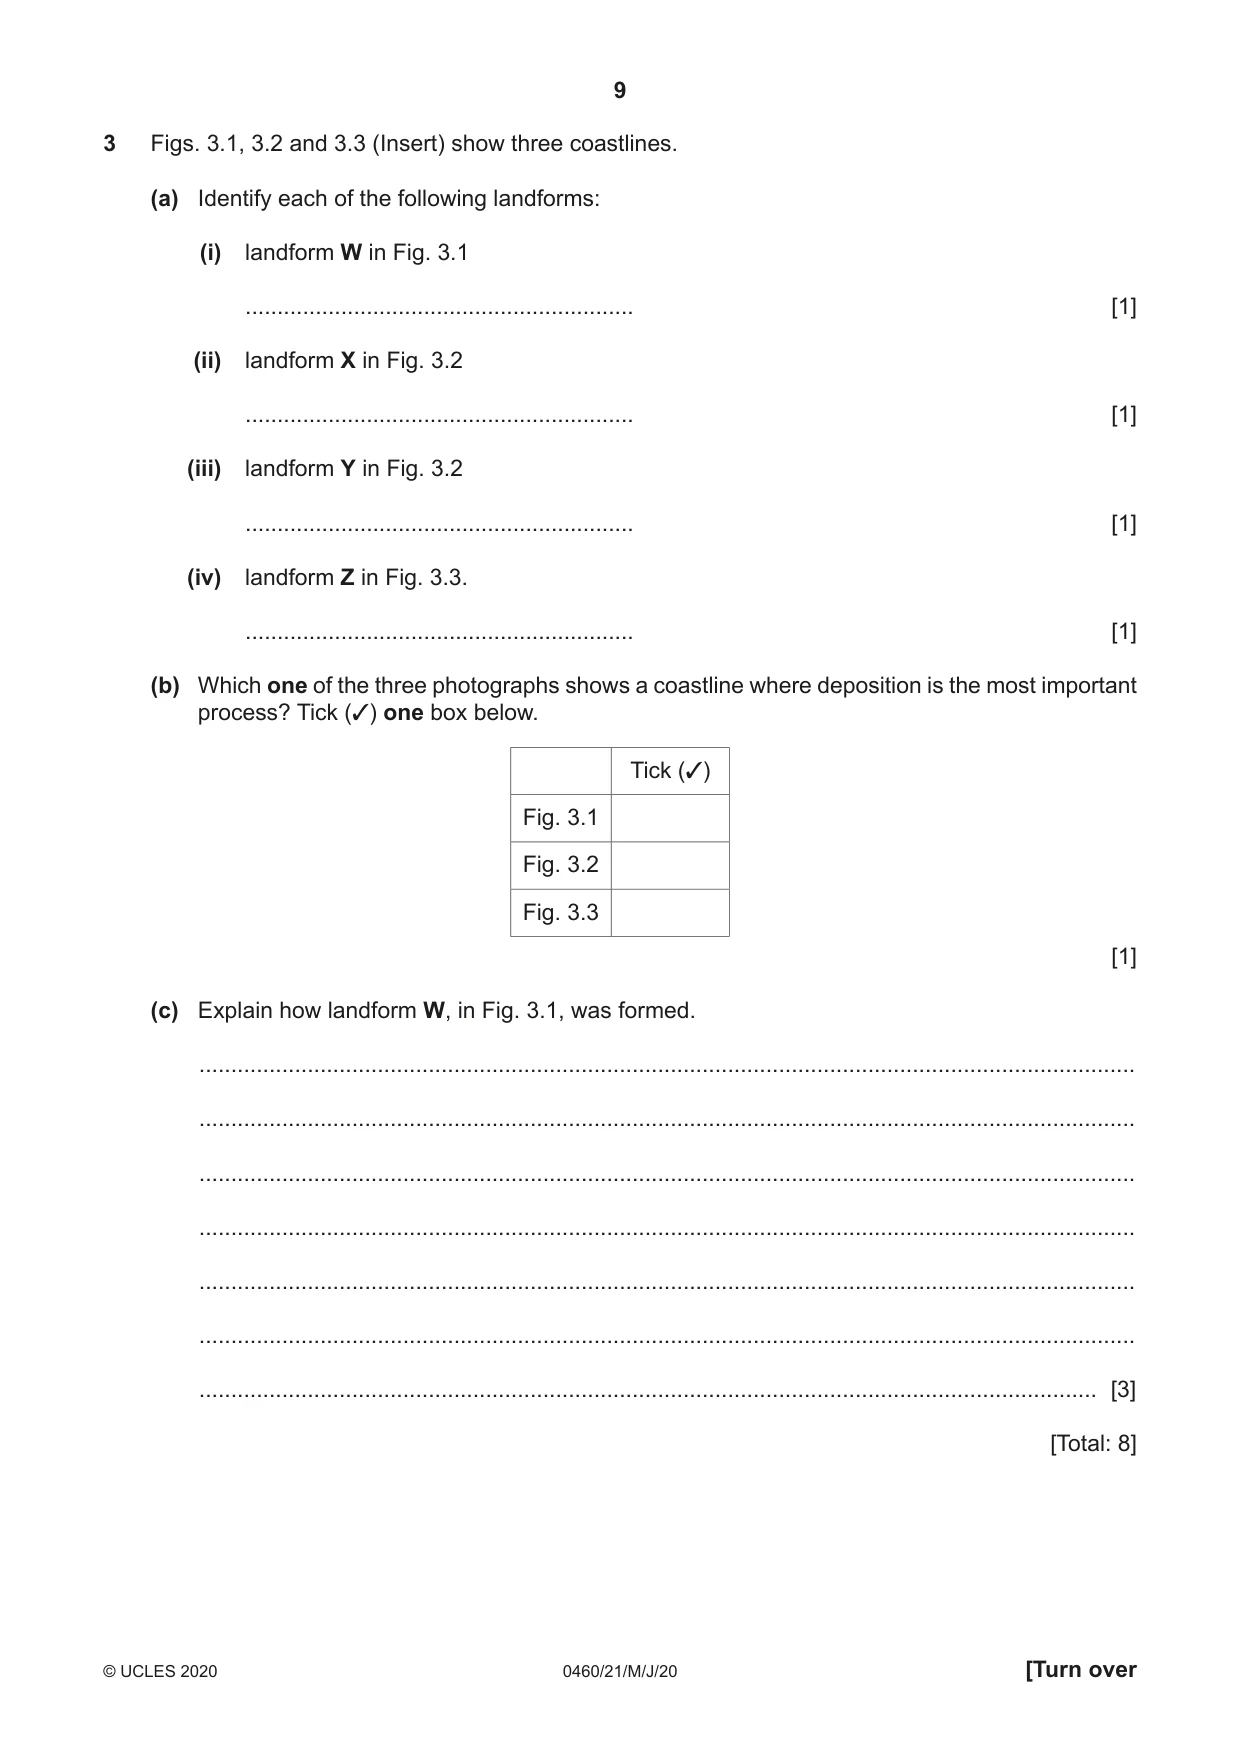
3 Figs. 3.1, 3.2 and 3.3 (Insert) show three coastlines. (a) Identify each of the following landforms: (i) landform W in Fig. 3.1 ............................................................. [1] (ii) landform X in Fig. 3.2 ............................................................. [1] (iii) landform Y in Fig. 3.2 ............................................................. [1] (iv) landform Z in Fig. 3.3. ............................................................. [1] (b) Which one of the three photographs shows a coastline where deposition is the most important process? Tick (3) one box below. Tick (3) Fig. 3.1 Fig. 3.2 Fig. 3.3 [1] (c) Explain how landform W, in Fig. 3.1, was formed. ................................................................................................................................................... ................................................................................................................................................... ................................................................................................................................................... ................................................................................................................................................... ................................................................................................................................................... ................................................................................................................................................... ............................................................................................................................................. [3] [Total: 8]
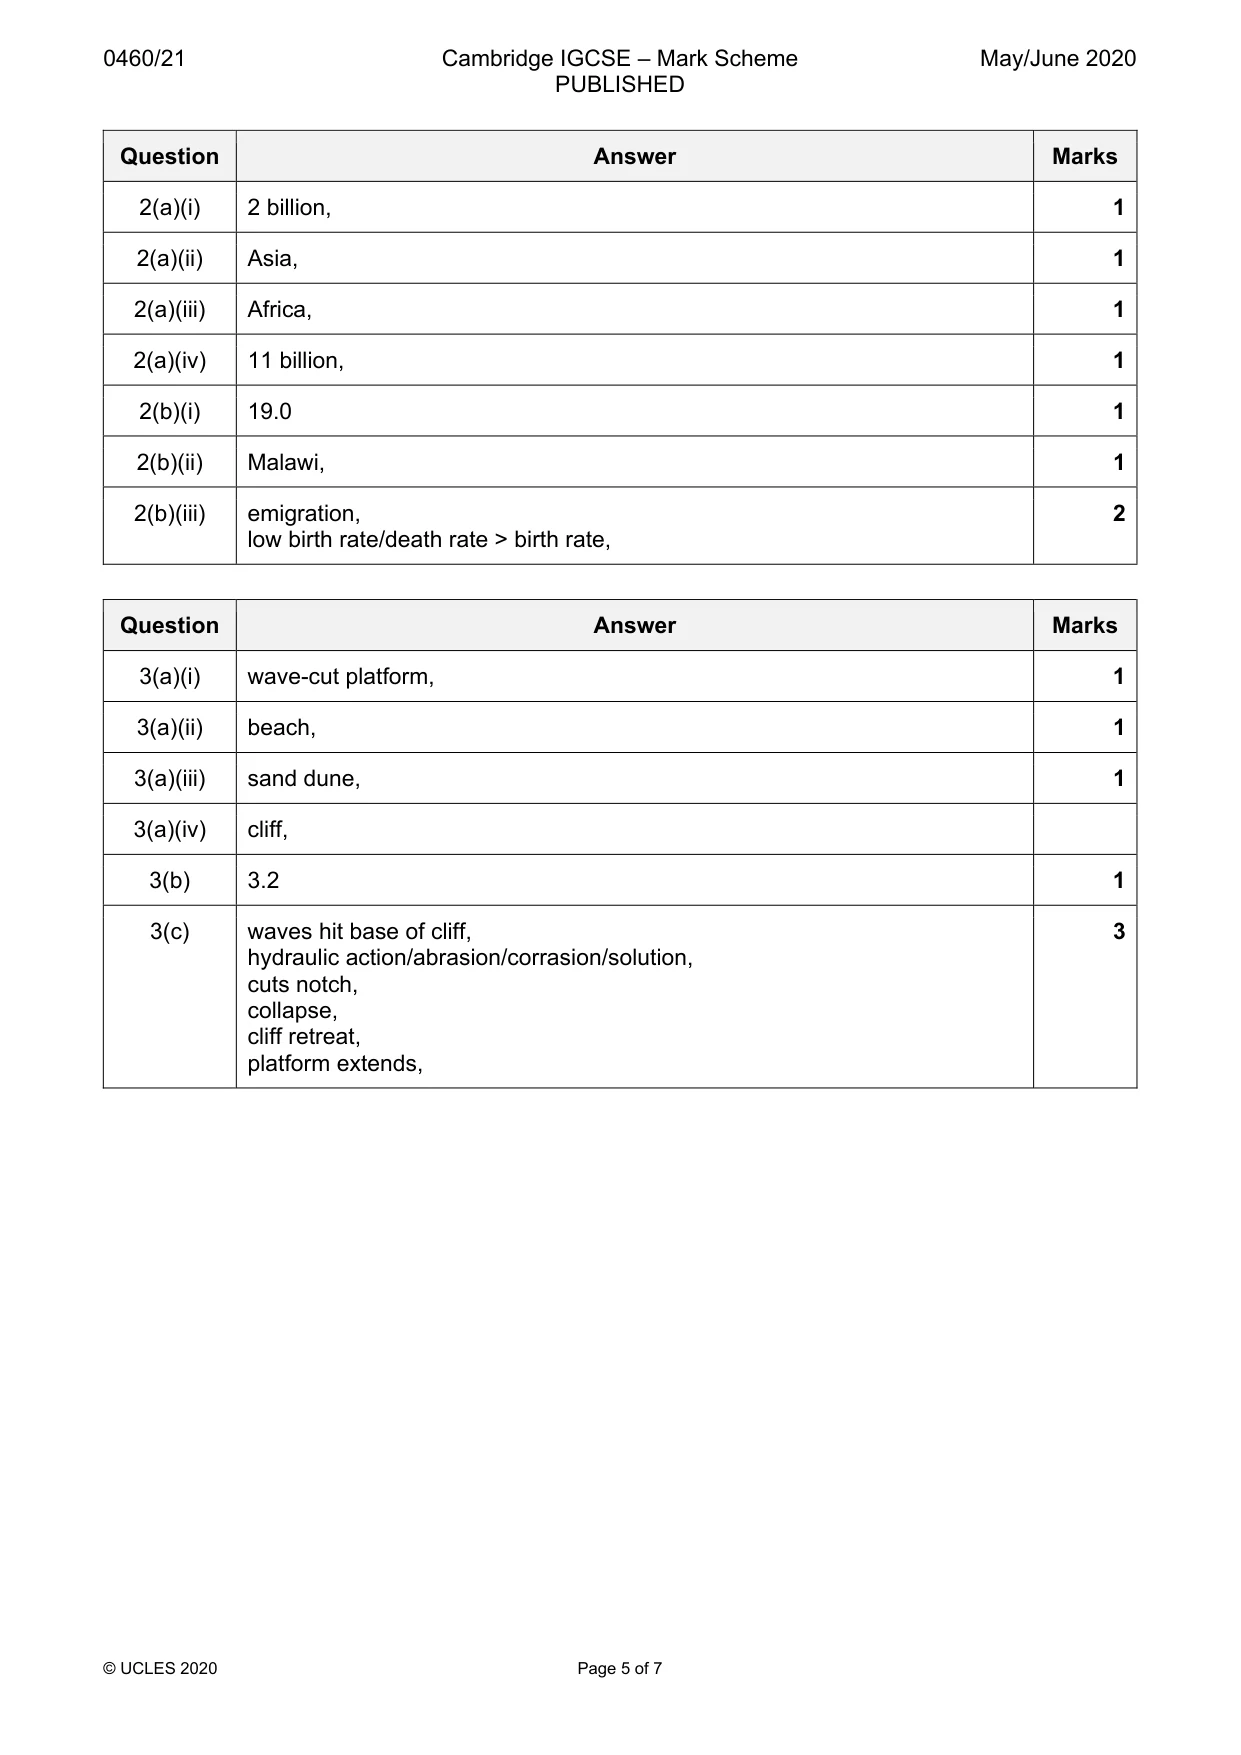
Mark scheme: 3(a)(i) wave-cut platform, 1 3(a)(ii) beach, 1 3(a)(iii) sand dune, 1 3(a)(iv) cliff, 3(b) 3.2 1 3(c) waves hit base of cliff, 3 hydraulic action/abrasion/corrasion/solution, cuts notch, collapse, cliff retreat, platform extends,
Q4 · The annual rainfall totals for ten years for a place with a hot desert climate and a…
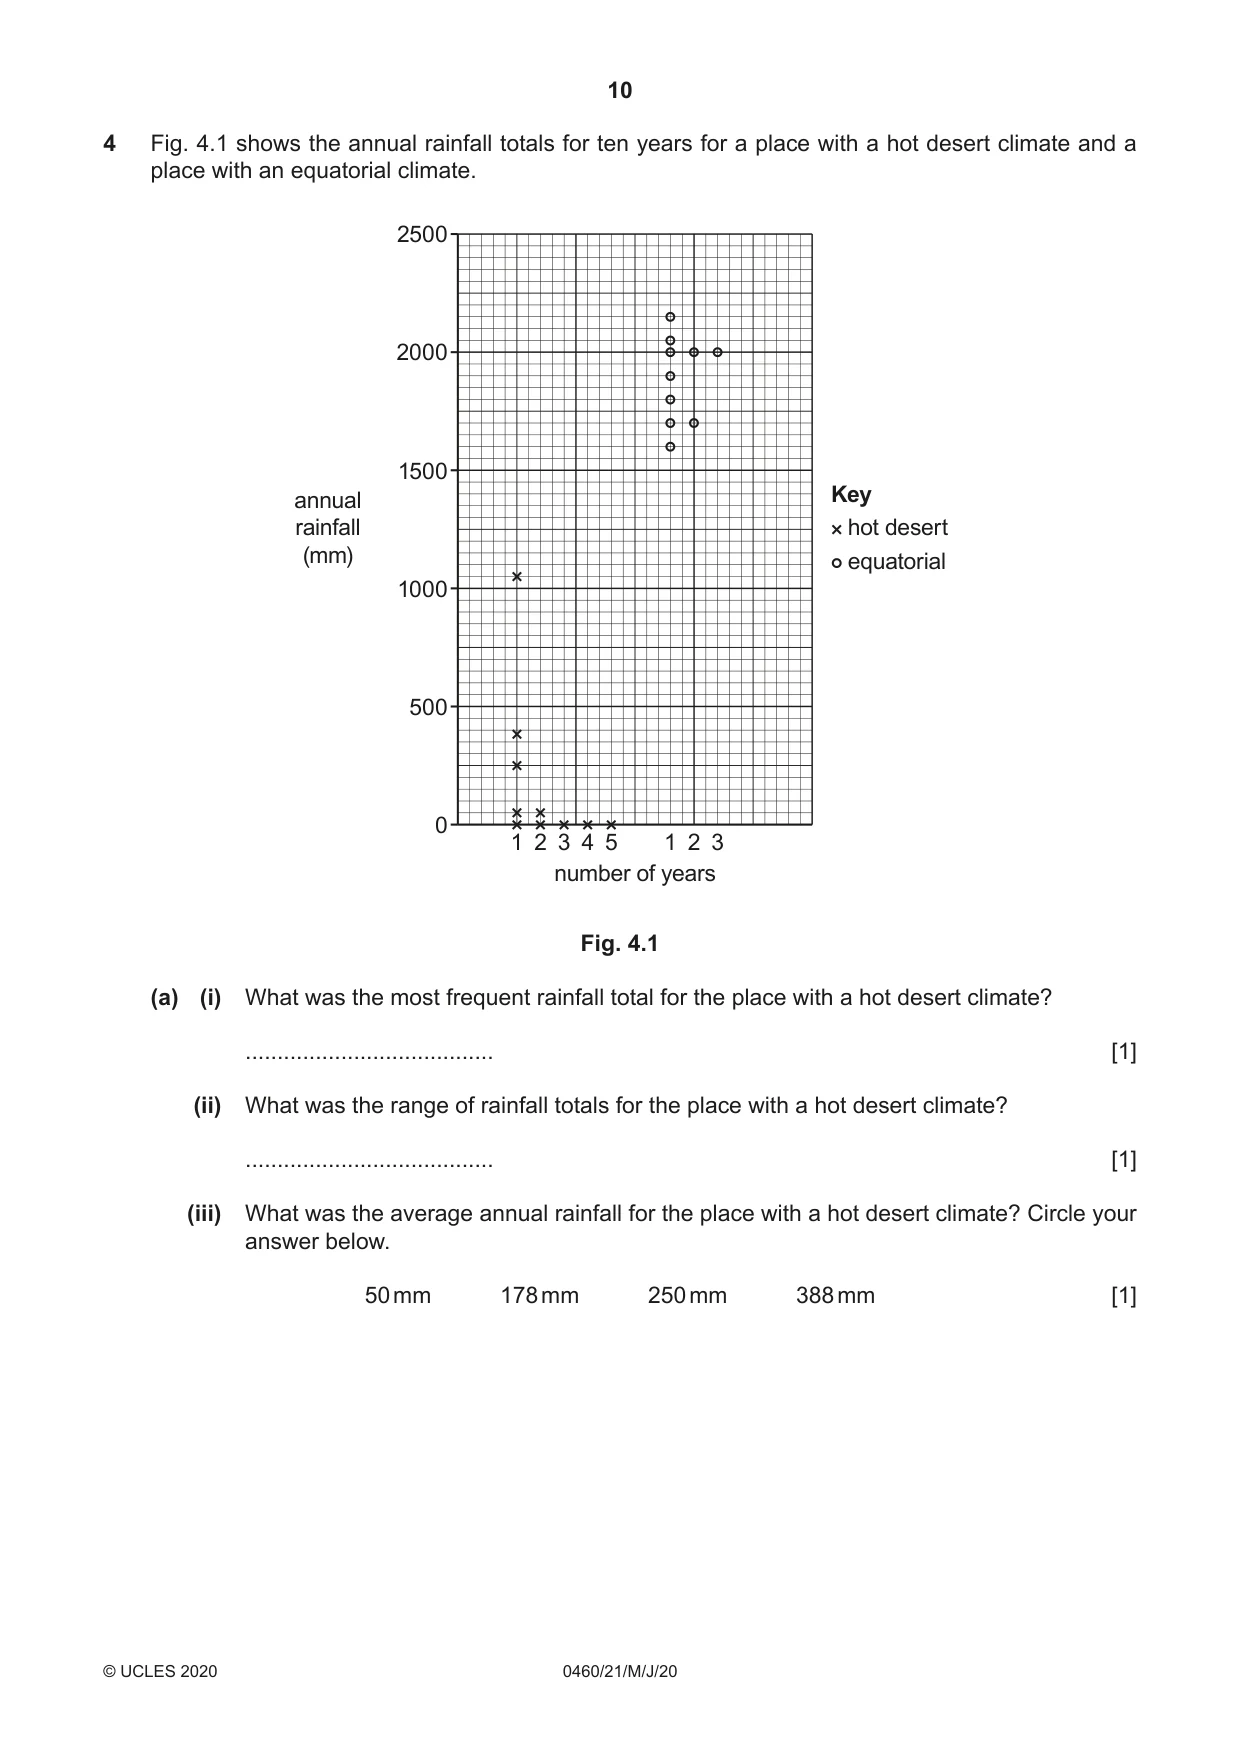
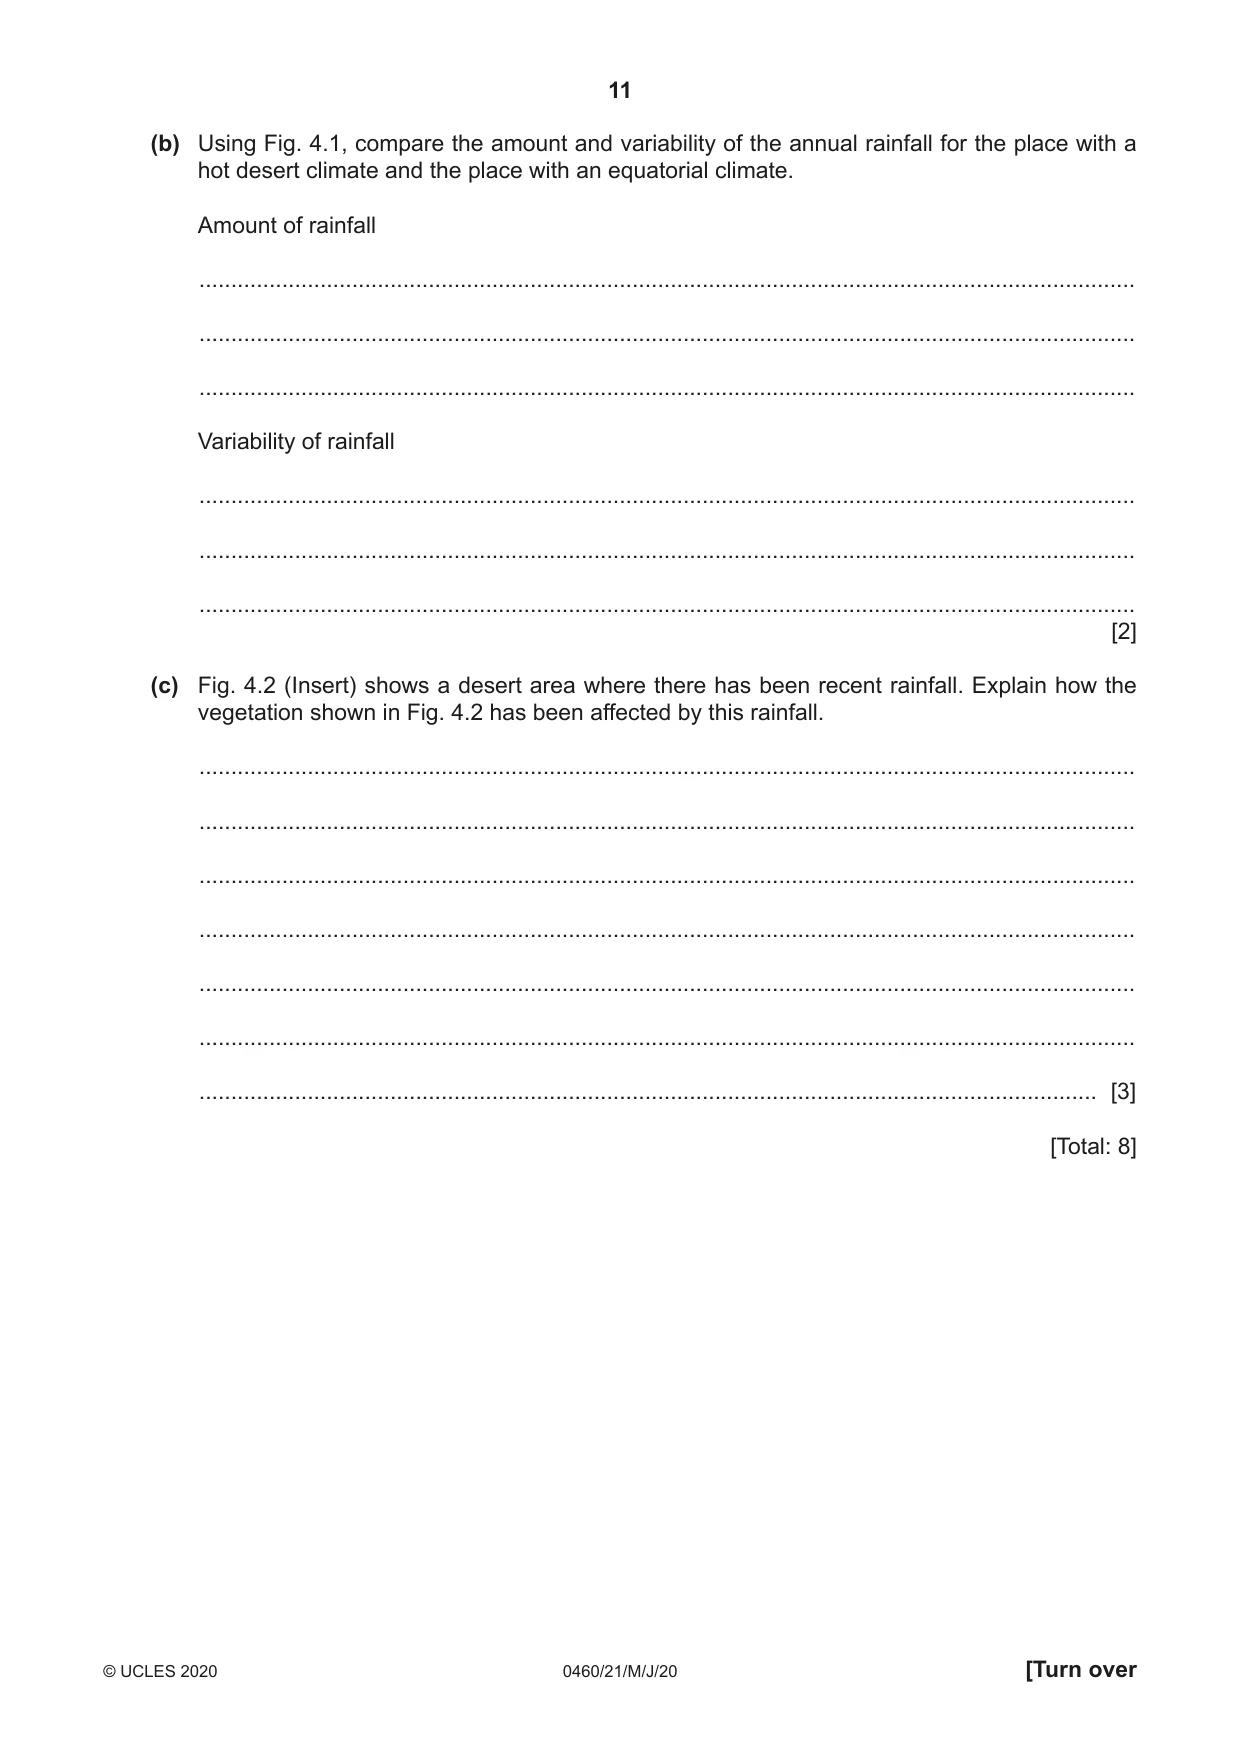
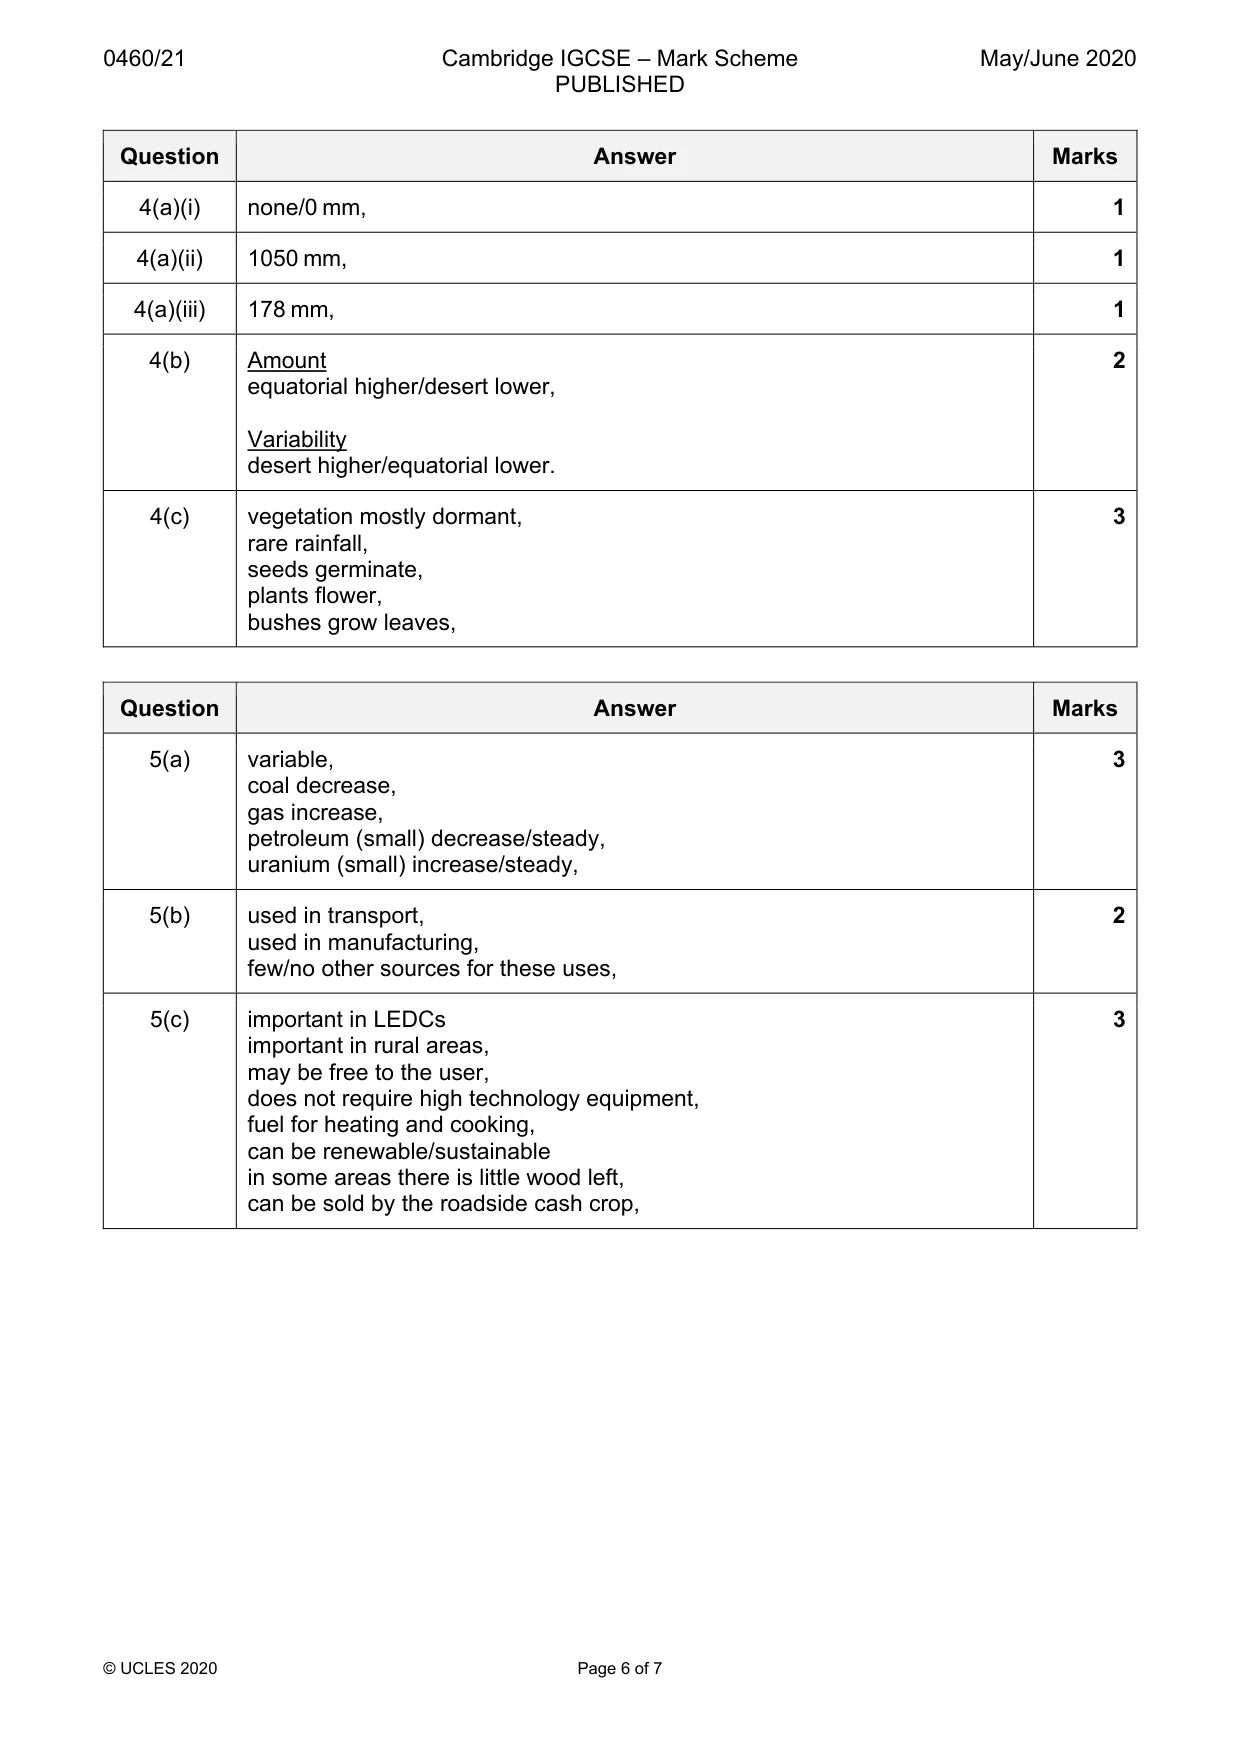
4 Fig. 4.1 shows the annual rainfall totals for ten years for a place with a hot desert climate and a place with an equatorial climate. 2500 2000 1500 annual Key rainfall hot desert (mm) equatorial 1000 500 0 1 2 3 4 5 1 2 3 number of years Fig. 4.1 (a) (i) What was the most frequent rainfall total for the place with a hot desert climate? ....................................... [1] (ii) What was the range of rainfall totals for the place with a hot desert climate? ....................................... [1] (iii) What was the average annual rainfall for the place with a hot desert climate? Circle your answer below. 50 mm 178 mm 250 mm 388 mm [1] (b) Using Fig. 4.1, compare the amount and variability of the annual rainfall for the place with a hot desert climate and the place with an equatorial climate. Amount of rainfall ................................................................................................................................................... ................................................................................................................................................... ................................................................................................................................................... Variability of rainfall ................................................................................................................................................... ................................................................................................................................................... ................................................................................................................................................... [2] (c) Fig. 4.2 (Insert) shows a desert area where there has been recent rainfall. Explain how the vegetation shown in Fig. 4.2 has been affected by this rainfall. ................................................................................................................................................... ................................................................................................................................................... ................................................................................................................................................... ................................................................................................................................................... ................................................................................................................................................... ................................................................................................................................................... ............................................................................................................................................. [3] [Total: 8]
Mark scheme: 4(a)(i) none/0 mm, 1 4(a)(ii) 1050 mm, 1 4(a)(iii) 178 mm, 1 4(b) Amount 2 equatorial higher/desert lower, Variability desert higher/equatorial lower. 4(c) vegetation mostly dormant, 3 rare rainfall, seeds germinate, plants flower, bushes grow leaves,
Q5 · Energy consumption in the USA in 2007 and 2016
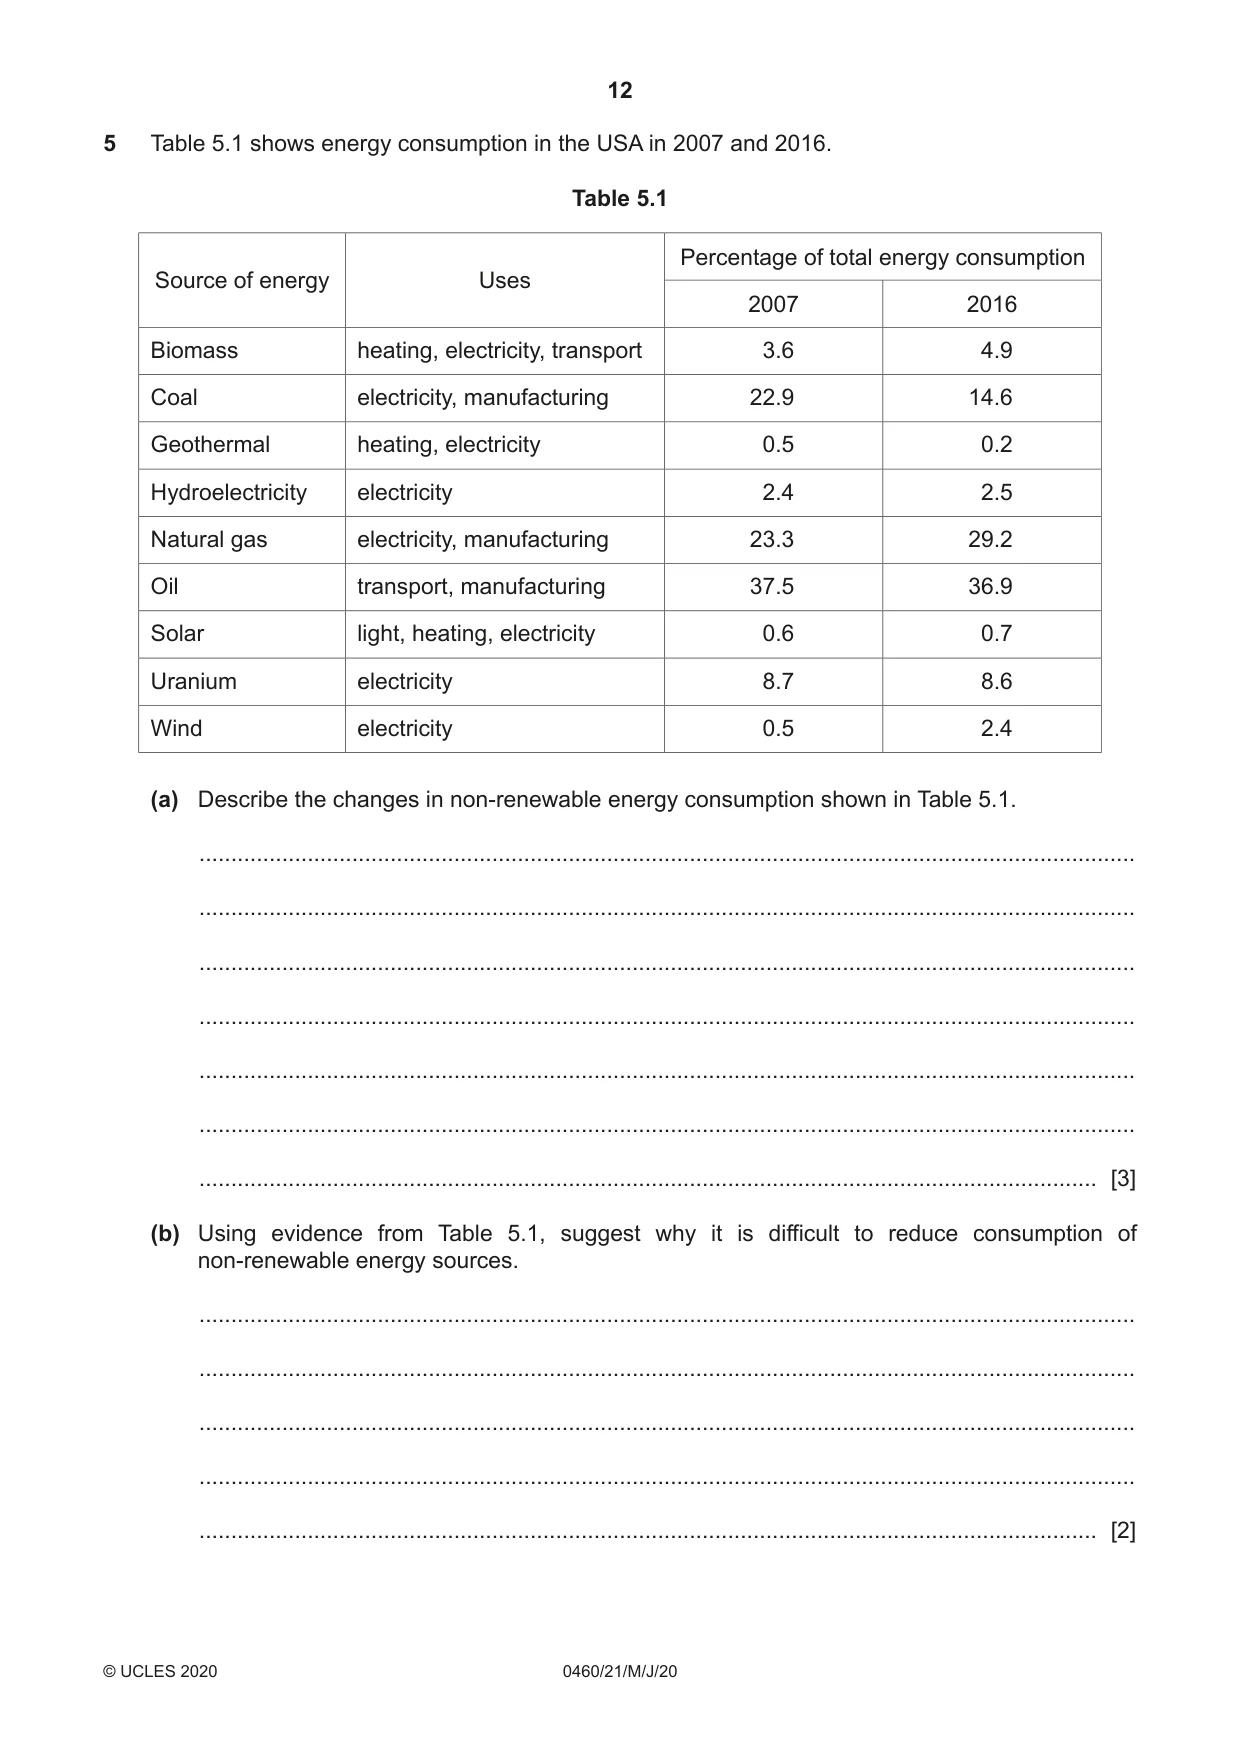
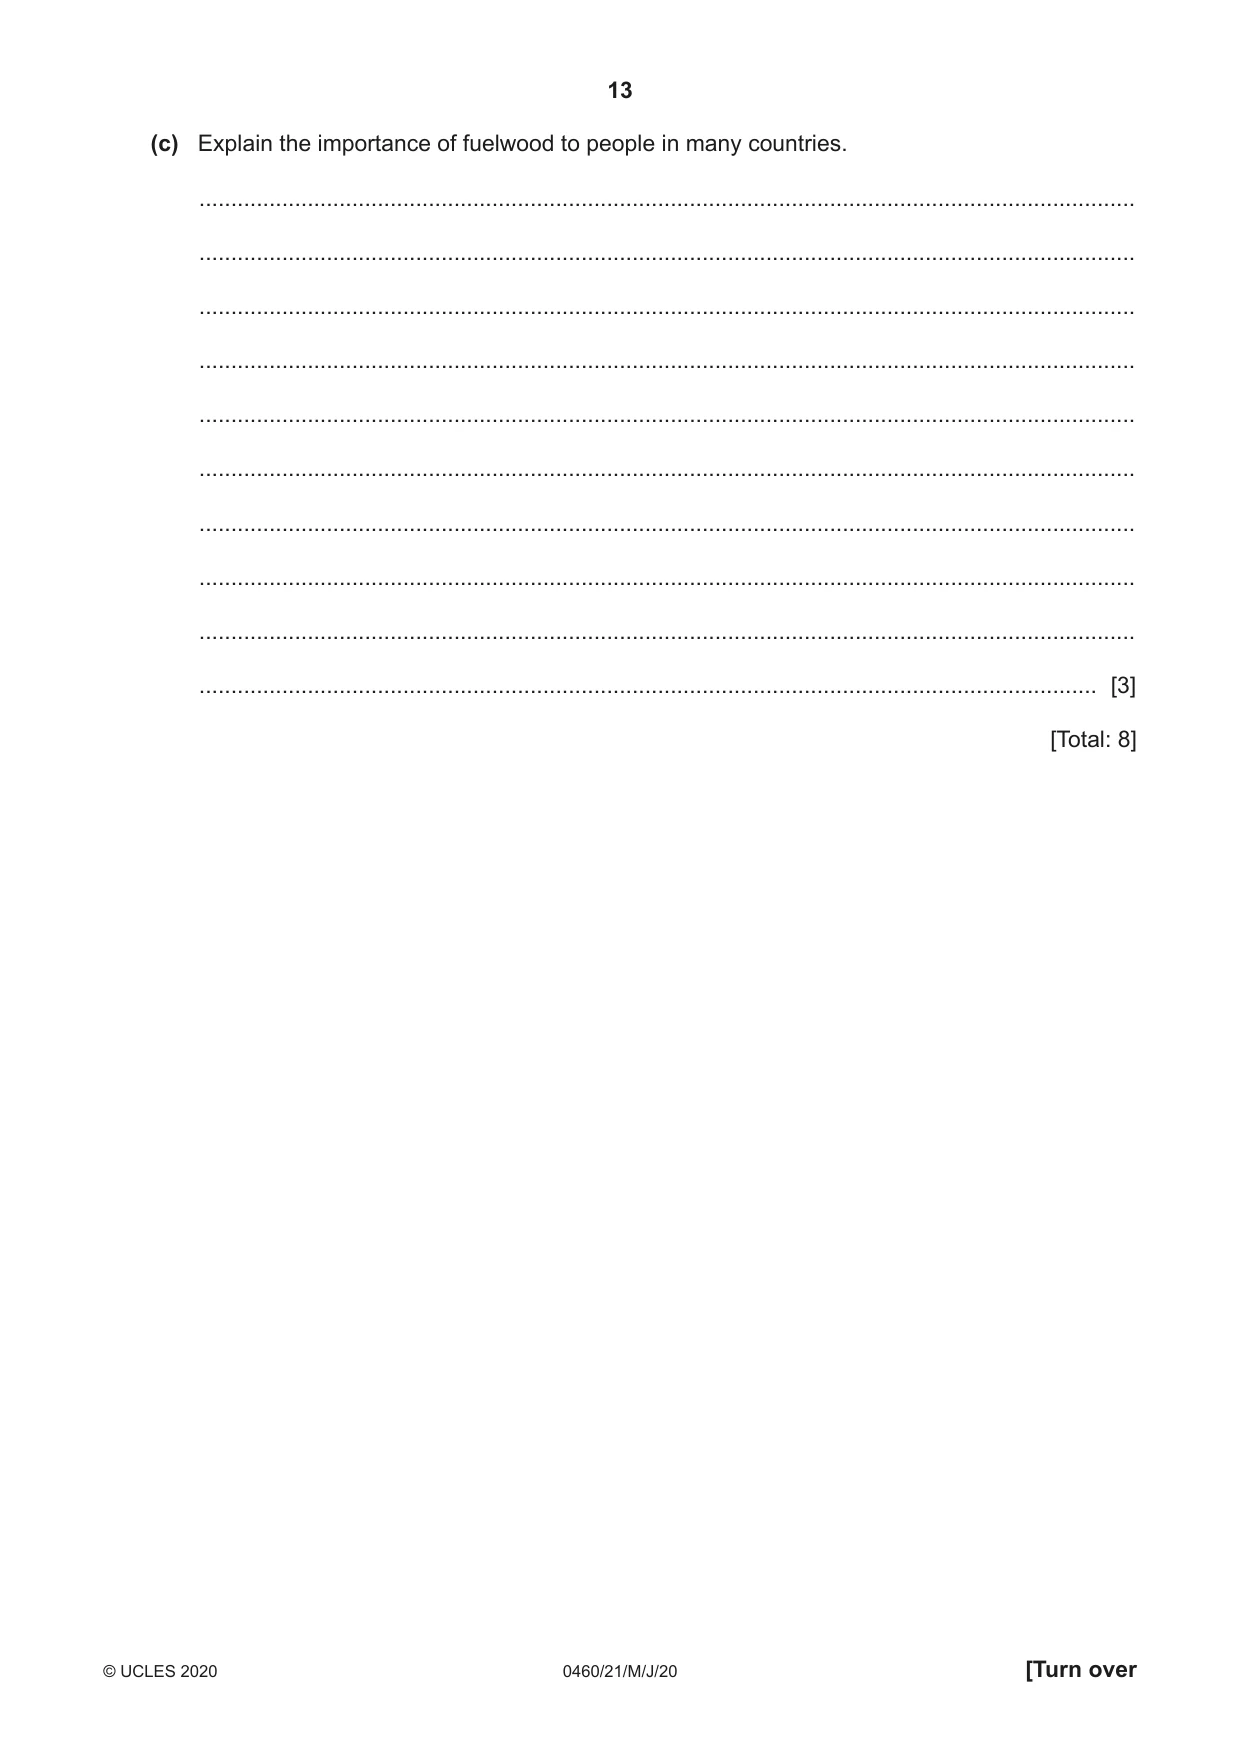
5 Table 5.1 shows energy consumption in the USA in 2007 and 2016. Table 5.1 Percentage of total energy consumption Source of energy Uses 2007 2016 Biomass heating, electricity, transport 3.6 4.9 Coal electricity, manufacturing 22.9 14.6 Geothermal heating, electricity 0.5 0.2 Hydroelectricity electricity 2.4 2.5 Natural gas electricity, manufacturing 23.3 29.2 Oil transport, manufacturing 37.5 36.9 Solar light, heating, electricity 0.6 0.7 Uranium electricity 8.7 8.6 Wind electricity 0.5 2.4 (a) Describe the changes in non-renewable energy consumption shown in Table 5.1. ................................................................................................................................................... ................................................................................................................................................... ................................................................................................................................................... ................................................................................................................................................... ................................................................................................................................................... ................................................................................................................................................... ............................................................................................................................................. [3] (b) Using evidence from Table 5.1, suggest why it is difficult to reduce consumption of non-renewable energy sources. ................................................................................................................................................... ................................................................................................................................................... ................................................................................................................................................... ................................................................................................................................................... ............................................................................................................................................. [2] (c) Explain the importance of fuelwood to people in many countries. ................................................................................................................................................... ................................................................................................................................................... ................................................................................................................................................... ................................................................................................................................................... ................................................................................................................................................... ................................................................................................................................................... ................................................................................................................................................... ................................................................................................................................................... ................................................................................................................................................... ............................................................................................................................................. [3] [Total: 8]
Mark scheme: 5(a) variable, 3 coal decrease, gas increase, petroleum (small) decrease/steady, uranium (small) increase/steady, 5(b) used in transport, 2 used in manufacturing, few/no other sources for these uses, 5(c) important in LEDCs 3 important in rural areas, may be free to the user, does not require high technology equipment, fuel for heating and cooking, can be renewable/sustainable in some areas there is little wood left, can be sold by the roadside cash crop,
Q6 · The United Nations Children’s Fund (UNICEF) is a United Nations programme which provides…
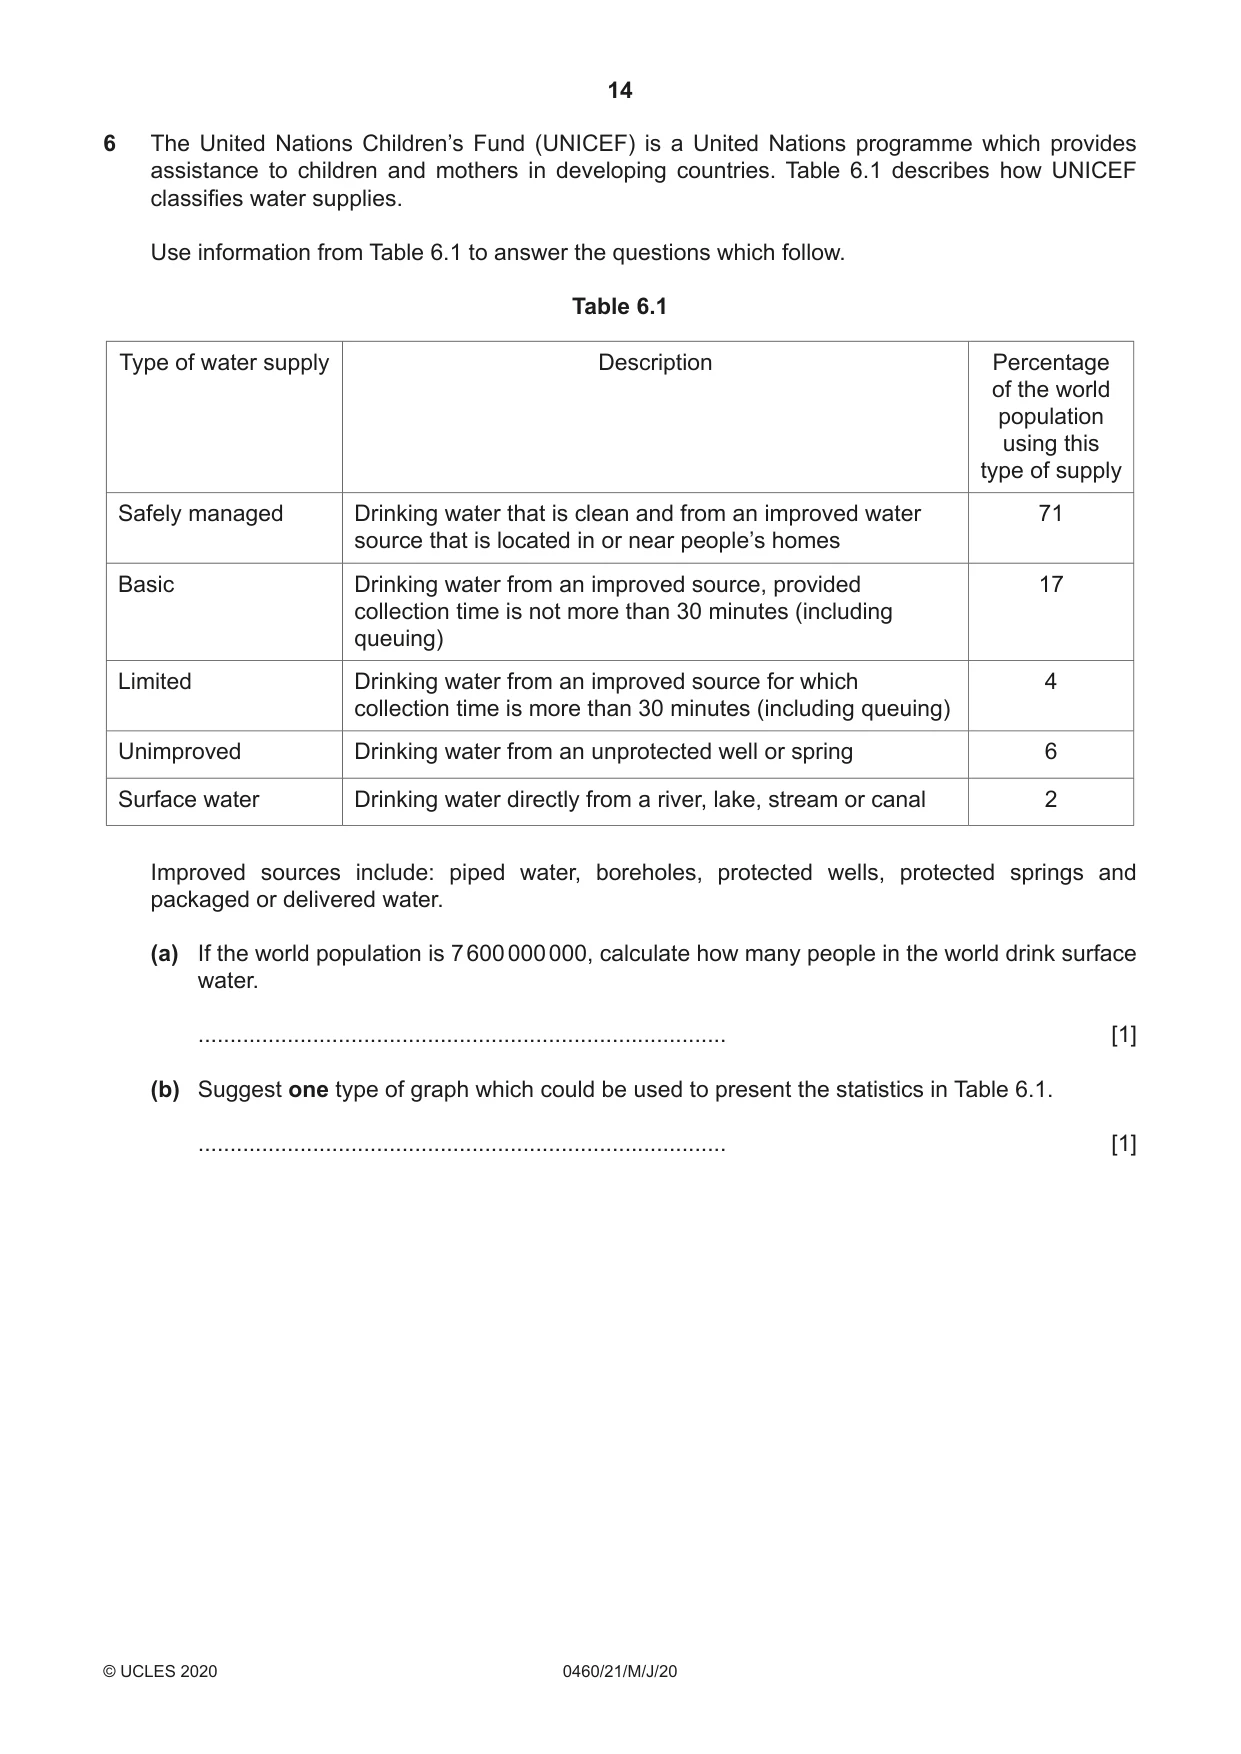
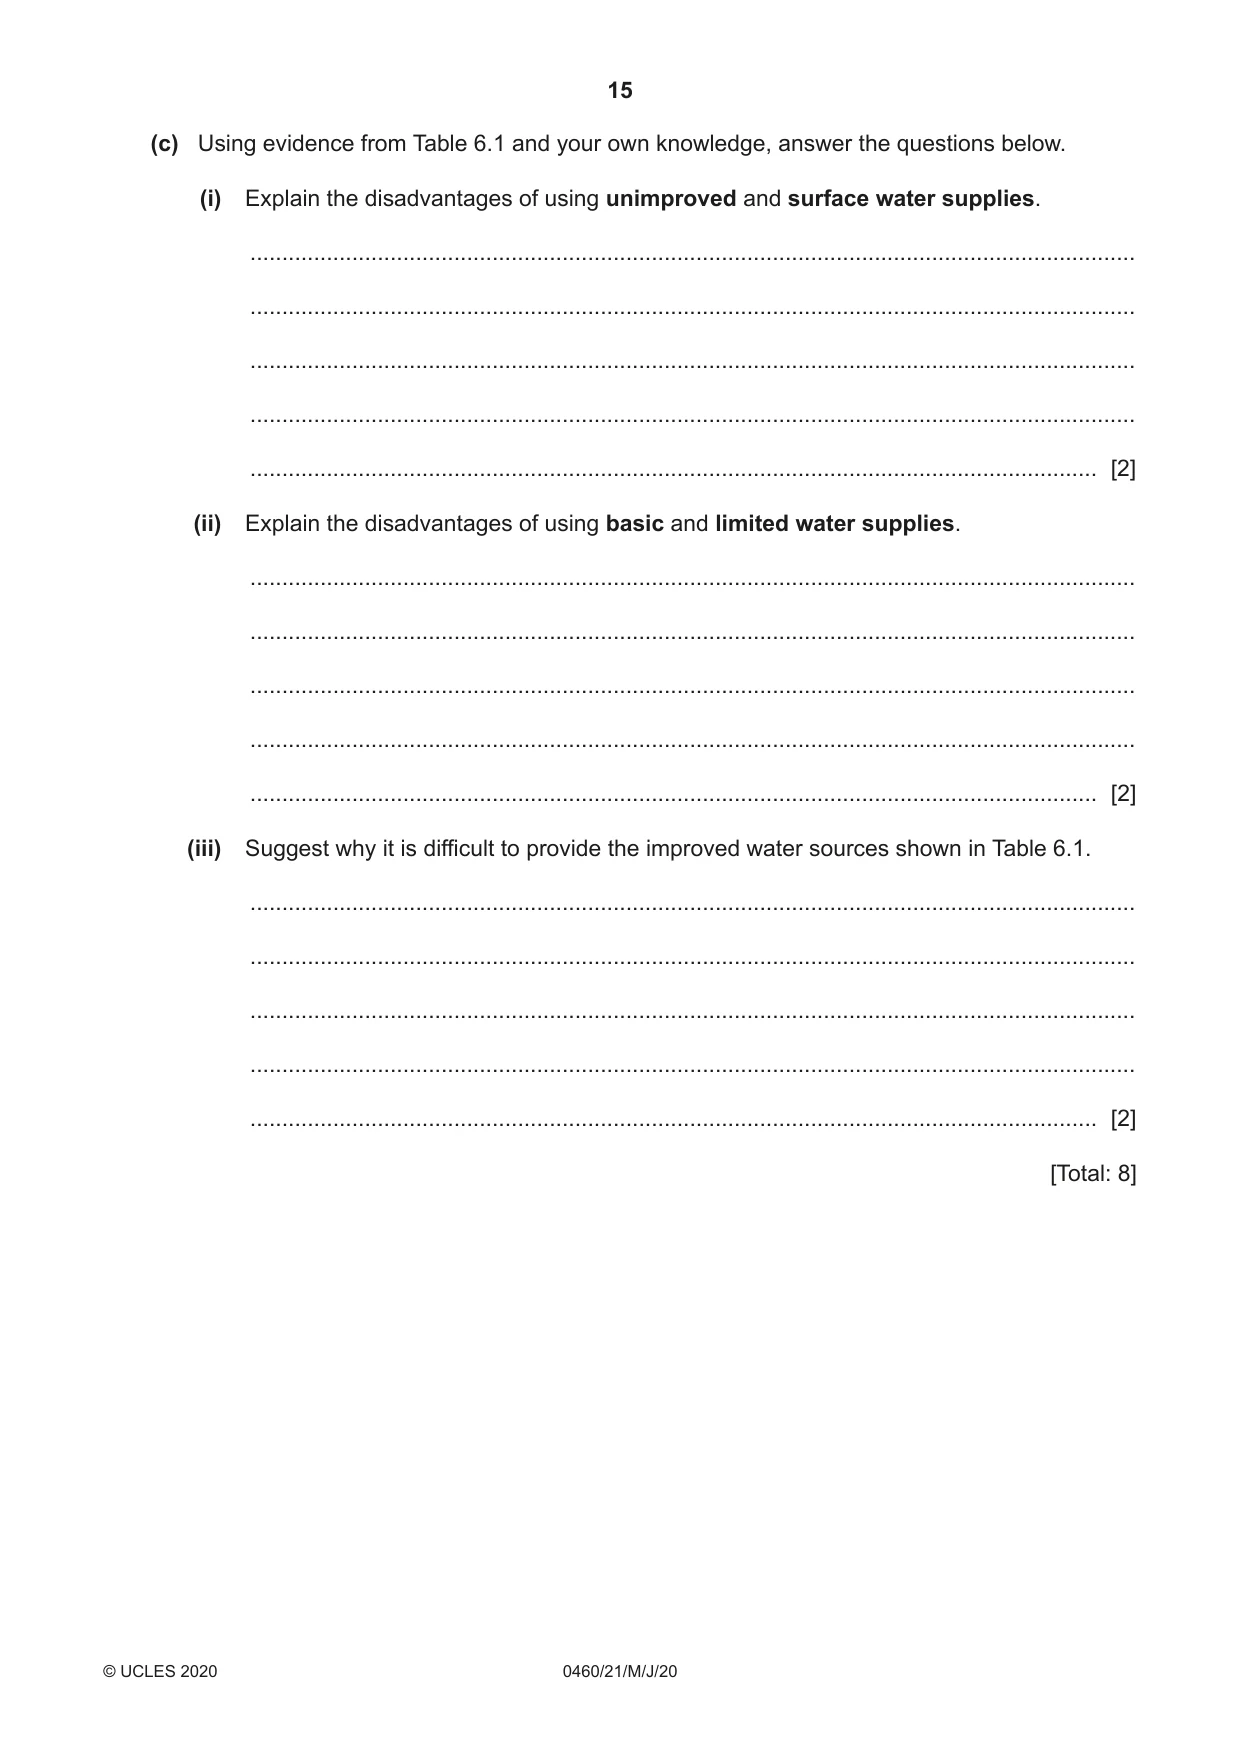
6 The United Nations Children’s Fund (UNICEF) is a United Nations programme which provides assistance to children and mothers in developing countries. Table 6.1 describes how UNICEF classifies water supplies. Use information from Table 6.1 to answer the questions which follow. Table 6.1 Type of water supply Description Percentage of the world population using this type of supply Safely managed Drinking water that is clean and from an improved water 71 source that is located in or near people’s homes Basic Drinking water from an improved source, provided 17 collection time is not more than 30 minutes (including queuing) Limited Drinking water from an improved source for which 4 collection time is more than 30 minutes (including queuing) Unimproved Drinking water from an unprotected well or spring 6 Surface water Drinking water directly from a river, lake, stream or canal 2 Improved sources include: piped water, boreholes, protected wells, protected springs and packaged or delivered water. (a) If the world population is 7 600 000 000, calculate how many people in the world drink surface water. ................................................................................... [1] (b) Suggest one type of graph which could be used to present the statistics in Table 6.1. ................................................................................... [1] (c) Using evidence from Table 6.1 and your own knowledge, answer the questions below. (i) Explain the disadvantages of using unimproved and surface water supplies. ........................................................................................................................................... ........................................................................................................................................... ........................................................................................................................................... ........................................................................................................................................... ..................................................................................................................................... [2] (ii) Explain the disadvantages of using basic and limited water supplies. ........................................................................................................................................... ........................................................................................................................................... ........................................................................................................................................... ........................................................................................................................................... ..................................................................................................................................... [2] (iii) Suggest why it is difficult to provide the improved water sources shown in Table 6.1. ........................................................................................................................................... ........................................................................................................................................... ........................................................................................................................................... ........................................................................................................................................... ..................................................................................................................................... [2] [Total: 8] Additional Pages If you use the following lined pages to complete the answer(s) to any question(s), the question number(s) must be clearly shown. .................................................................................................................................................................. .................................................................................................................................................................. .................................................................................................................................................................. .................................................................................................................................................................. .................................................................................................................................................................. .................................................................................................................................................................. .................................................................................................................................................................. .................................................................................................................................................................. .................................................................................................................................................................. .................................................................................................................................................................. .................................................................................................................................................................. .................................................................................................................................................................. .................................................................................................................................................................. .................................................................................................................................................................. .................................................................................................................................................................. .................................................................................................................................................................. .................................................................................................................................................................. .................................................................................................................................................................. .................................................................................................................................................................. .................................................................................................................................................................. .................................................................................................................................................................. .................................................................................................................................................................. .................................................................................................................................................................. .................................................................................................................................................................. ..................................................................................................................................................................
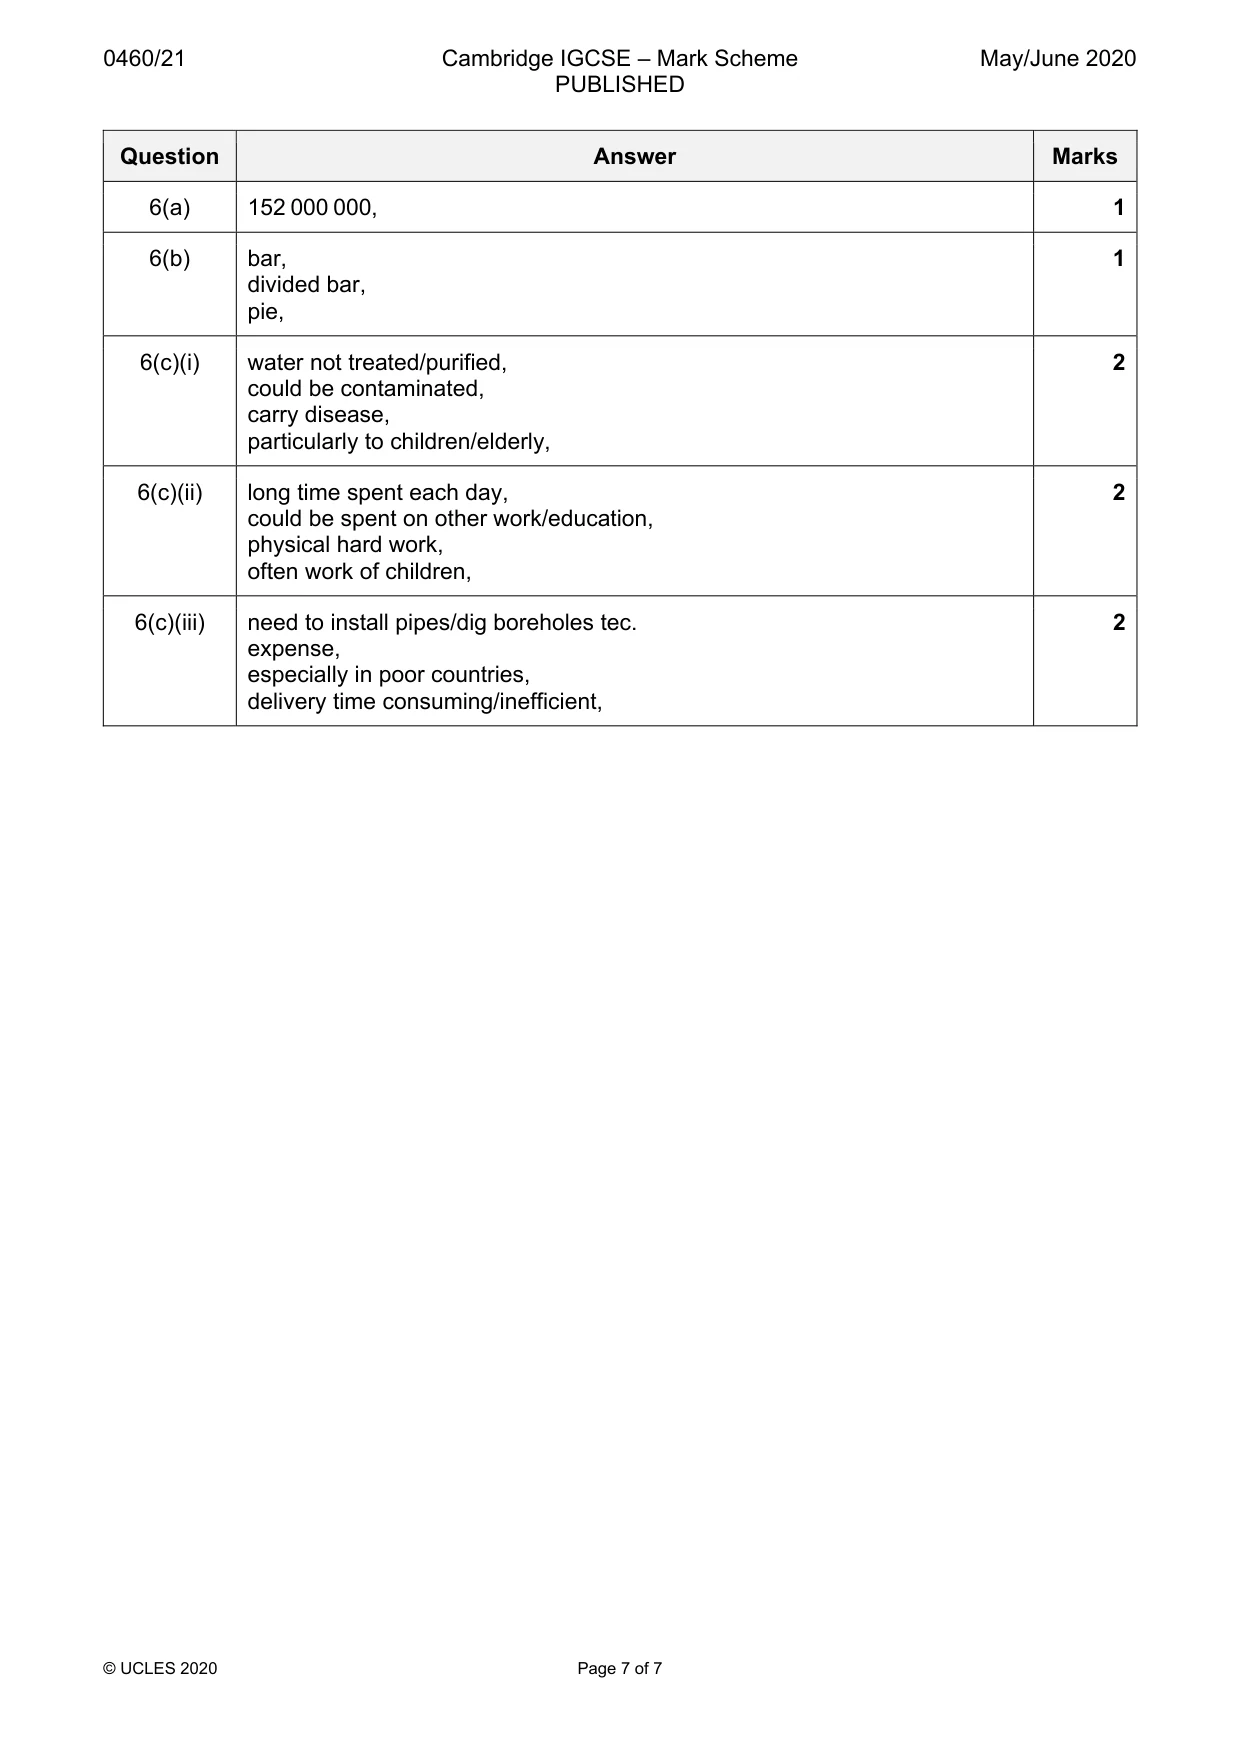
Mark scheme: 6(a) 152 000 000, 1 6(b) bar, 1 divided bar, pie, 6(c)(i) water not treated/purified, 2 could be contaminated, carry disease, particularly to children/elderly, 6(c)(ii) long time spent each day, 2 could be spent on other work/education, physical hard work, often work of children, 6(c)(iii) need to install pipes/dig boreholes tec. 2 expense, especially in poor countries, delivery time consuming/inefficient,
What was in this paper
The subtopics covered by these 6 questions, and how many questions each got. Open one in a new tab to see every Cambridge question on it.