Questions as text
Q1 · A sequence of tasks that are required to complete a project 9626/32 Feb/March 2017
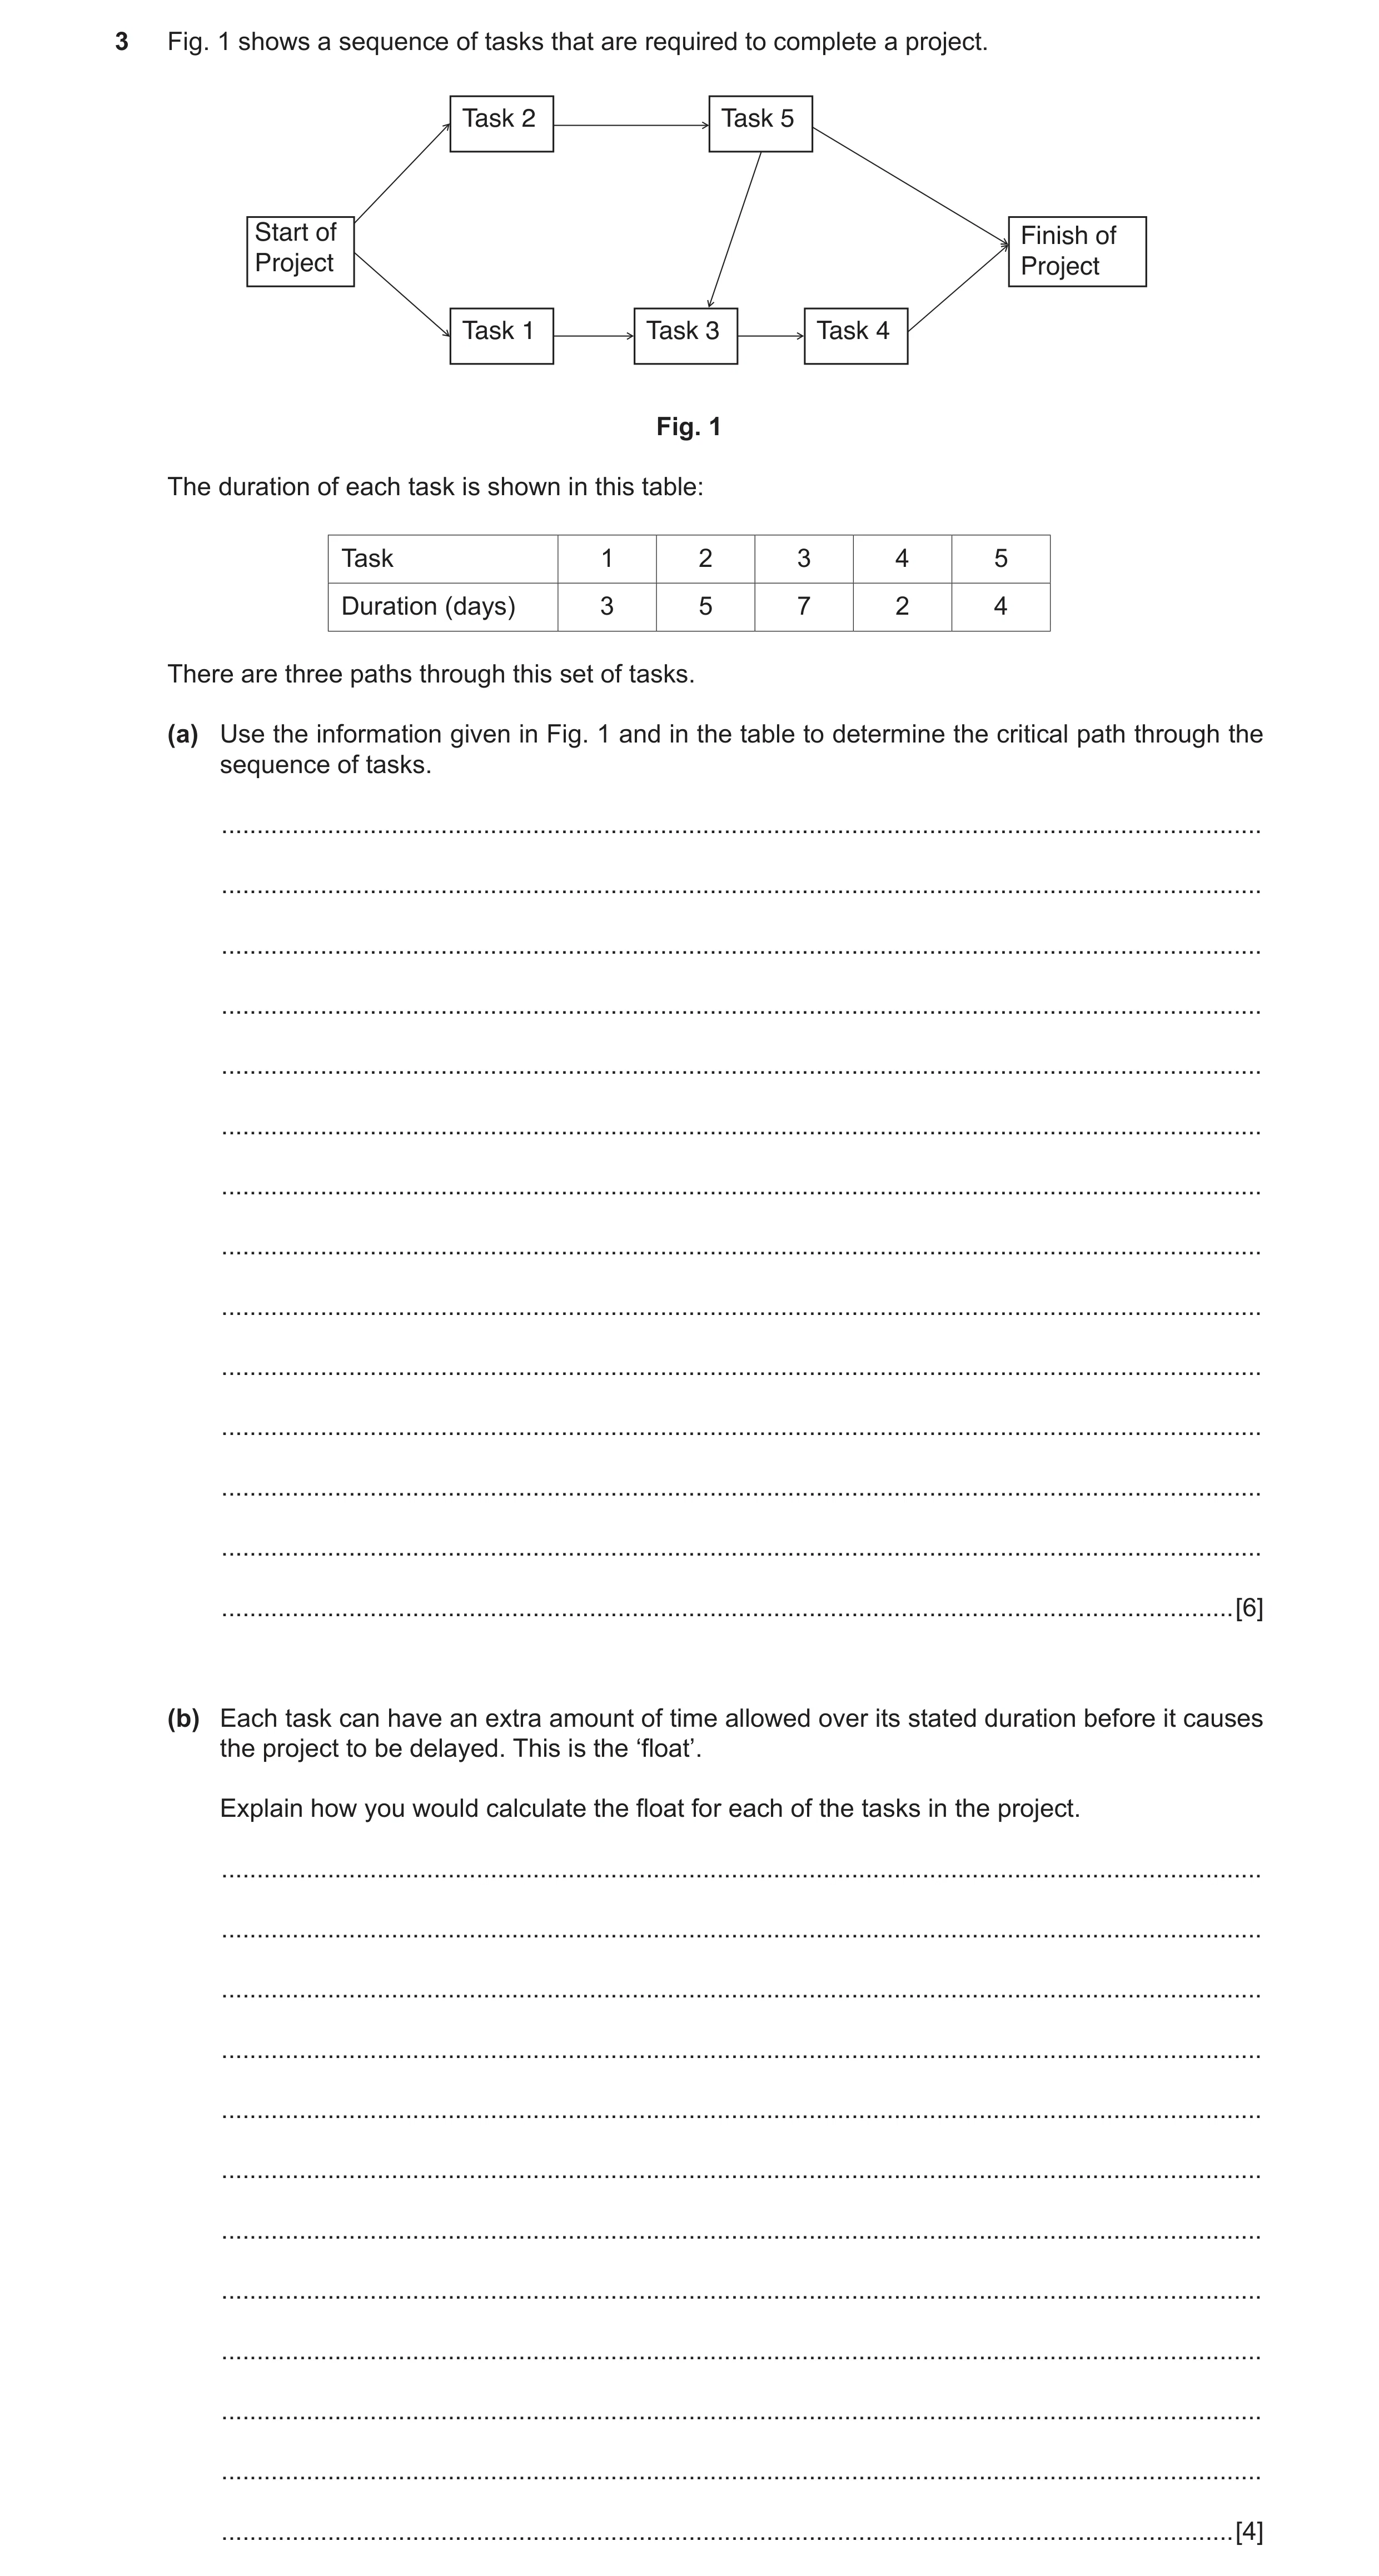
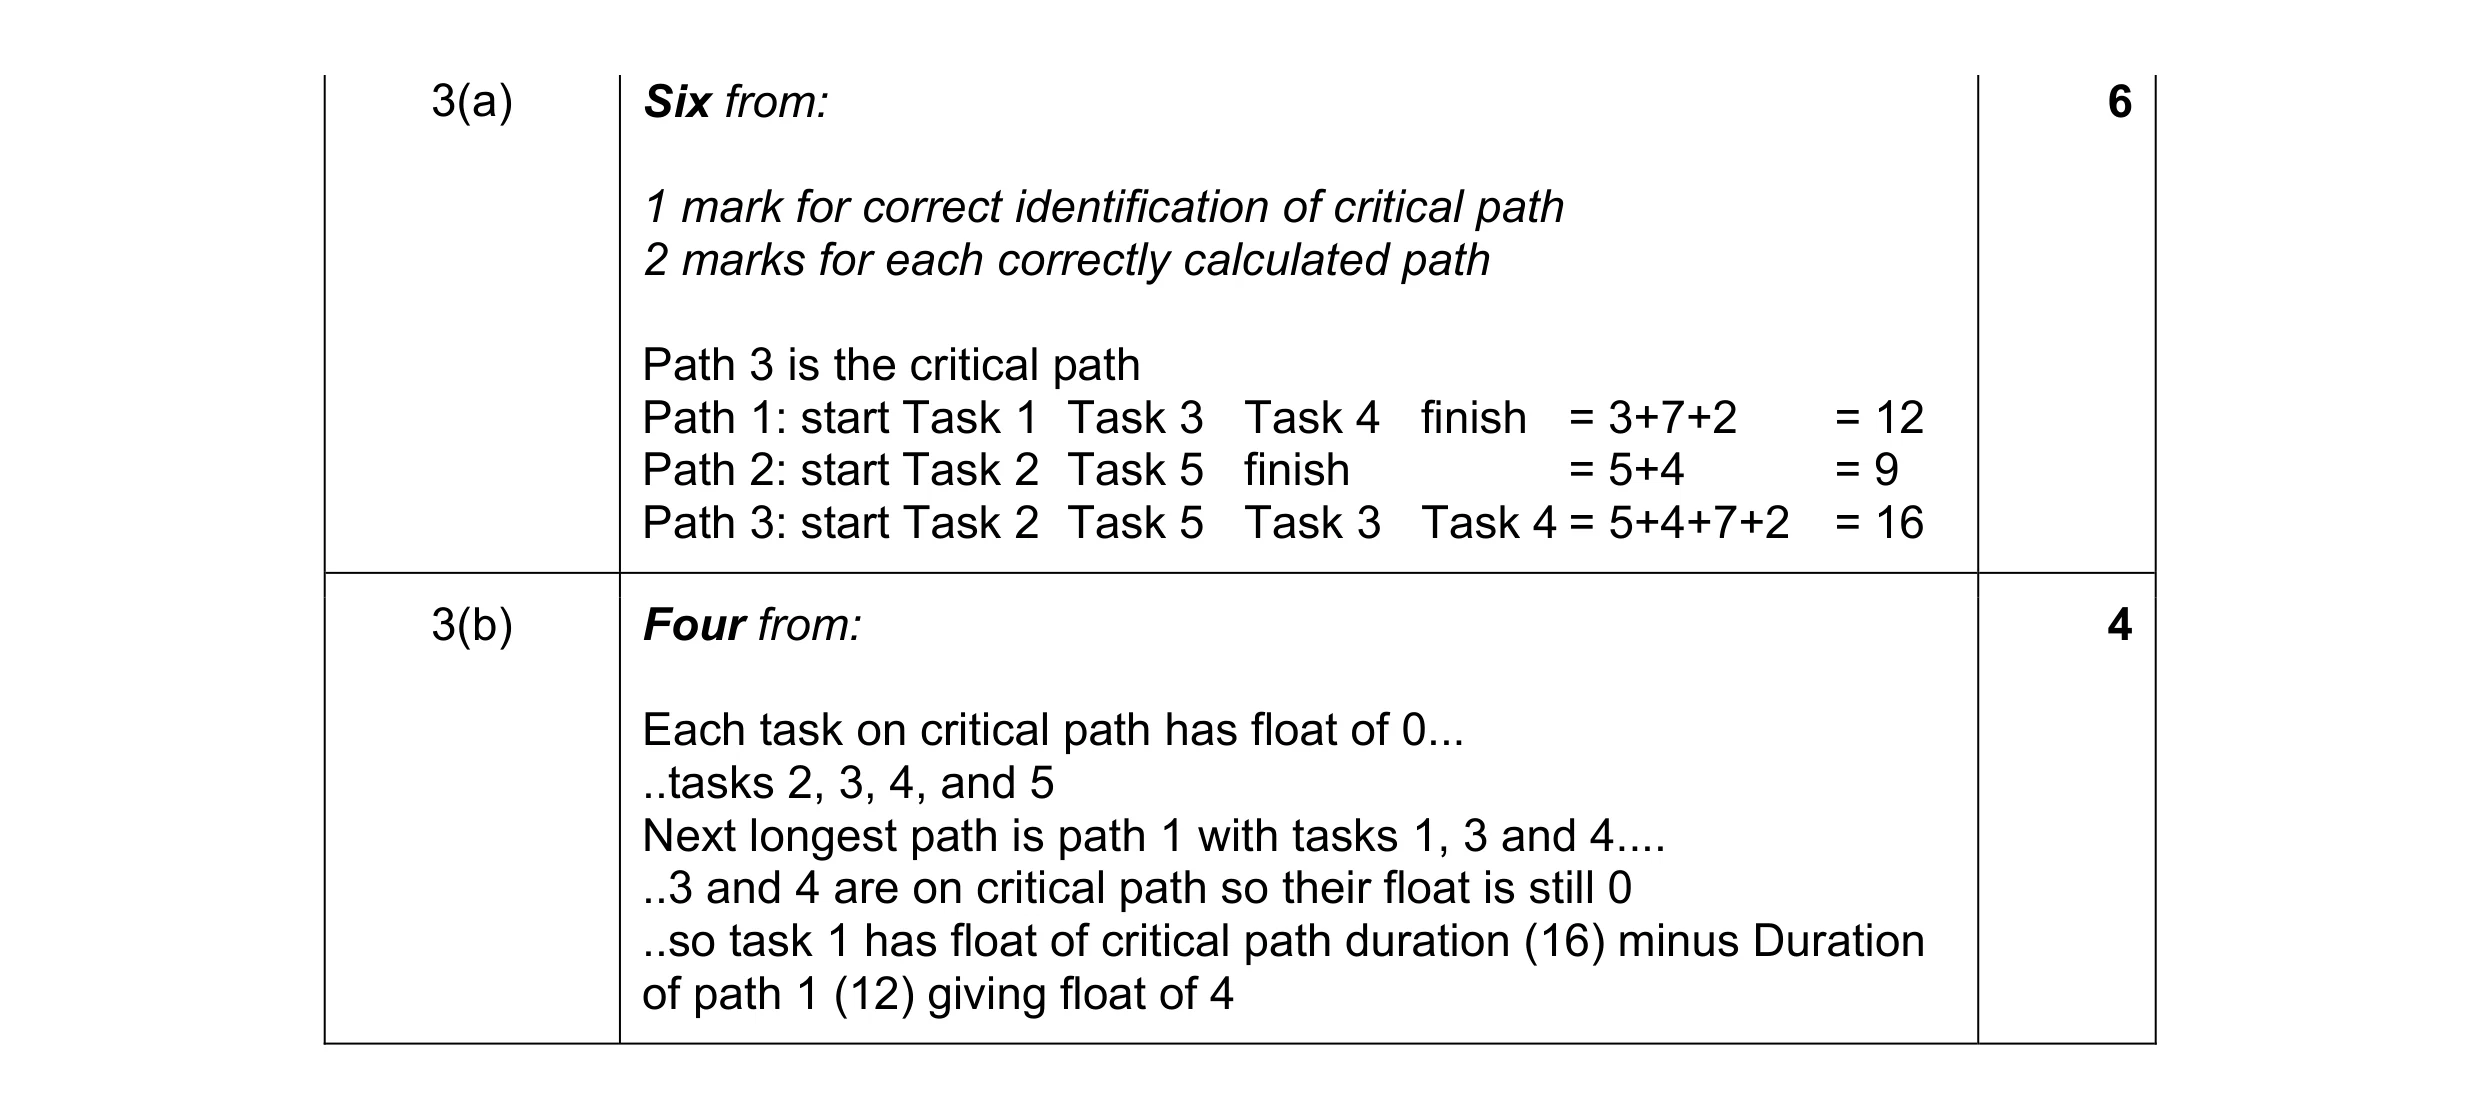
3 Fig. 1 shows a sequence of tasks that are required to complete a project. Task 2 Task 5 Start of Finish of Project Project Task 1 Task 3 Task 4 Fig. 1 The duration of each task is shown in this table: Task 1 2 3 4 5 Duration (days) 3 5 7 2 4 There are three paths through this set of tasks. (a) Use the information given in Fig. 1 and in the table to determine the critical path through the sequence of tasks. … … … … … … … … … … … … … … [6] (b) Each task can have an extra amount of time allowed over its stated duration before it causes the project to be delayed. This is the ‘float’. Explain how you would calculate the float for each of the tasks in the project. … … … … … … … … … … … … [4]
10 marks
Mark scheme: 3(a) Six from: 6 1 mark for correct identification of critical path 2 marks for each correctly calculated path Path 3 is the critical path Path 1: start Task 1 Task 3 Task 4 finish = 3+7+2 = 12 Path 2: start Task 2 Task 5 finish = 5+4 = 9 Path 3: start Task 2 Task 5 Task 3 Task 4 = 5+4+7+2 = 16 3(b) Four from: 4 Each task on critical path has float of 0... ..tasks 2, 3, 4, and 5 Next longest path is path 1 with tasks 1, 3 and 4 … ..3 and 4 are on critical path so their float is still 0 ..so task 1 has float of critical path duration (16) minus Duration of path 1 (12) giving float of 4
This question in 9626/32 Feb/March 2017
Q2 · A report about the computer system of a company is to be written 9626/32 May/June 2017
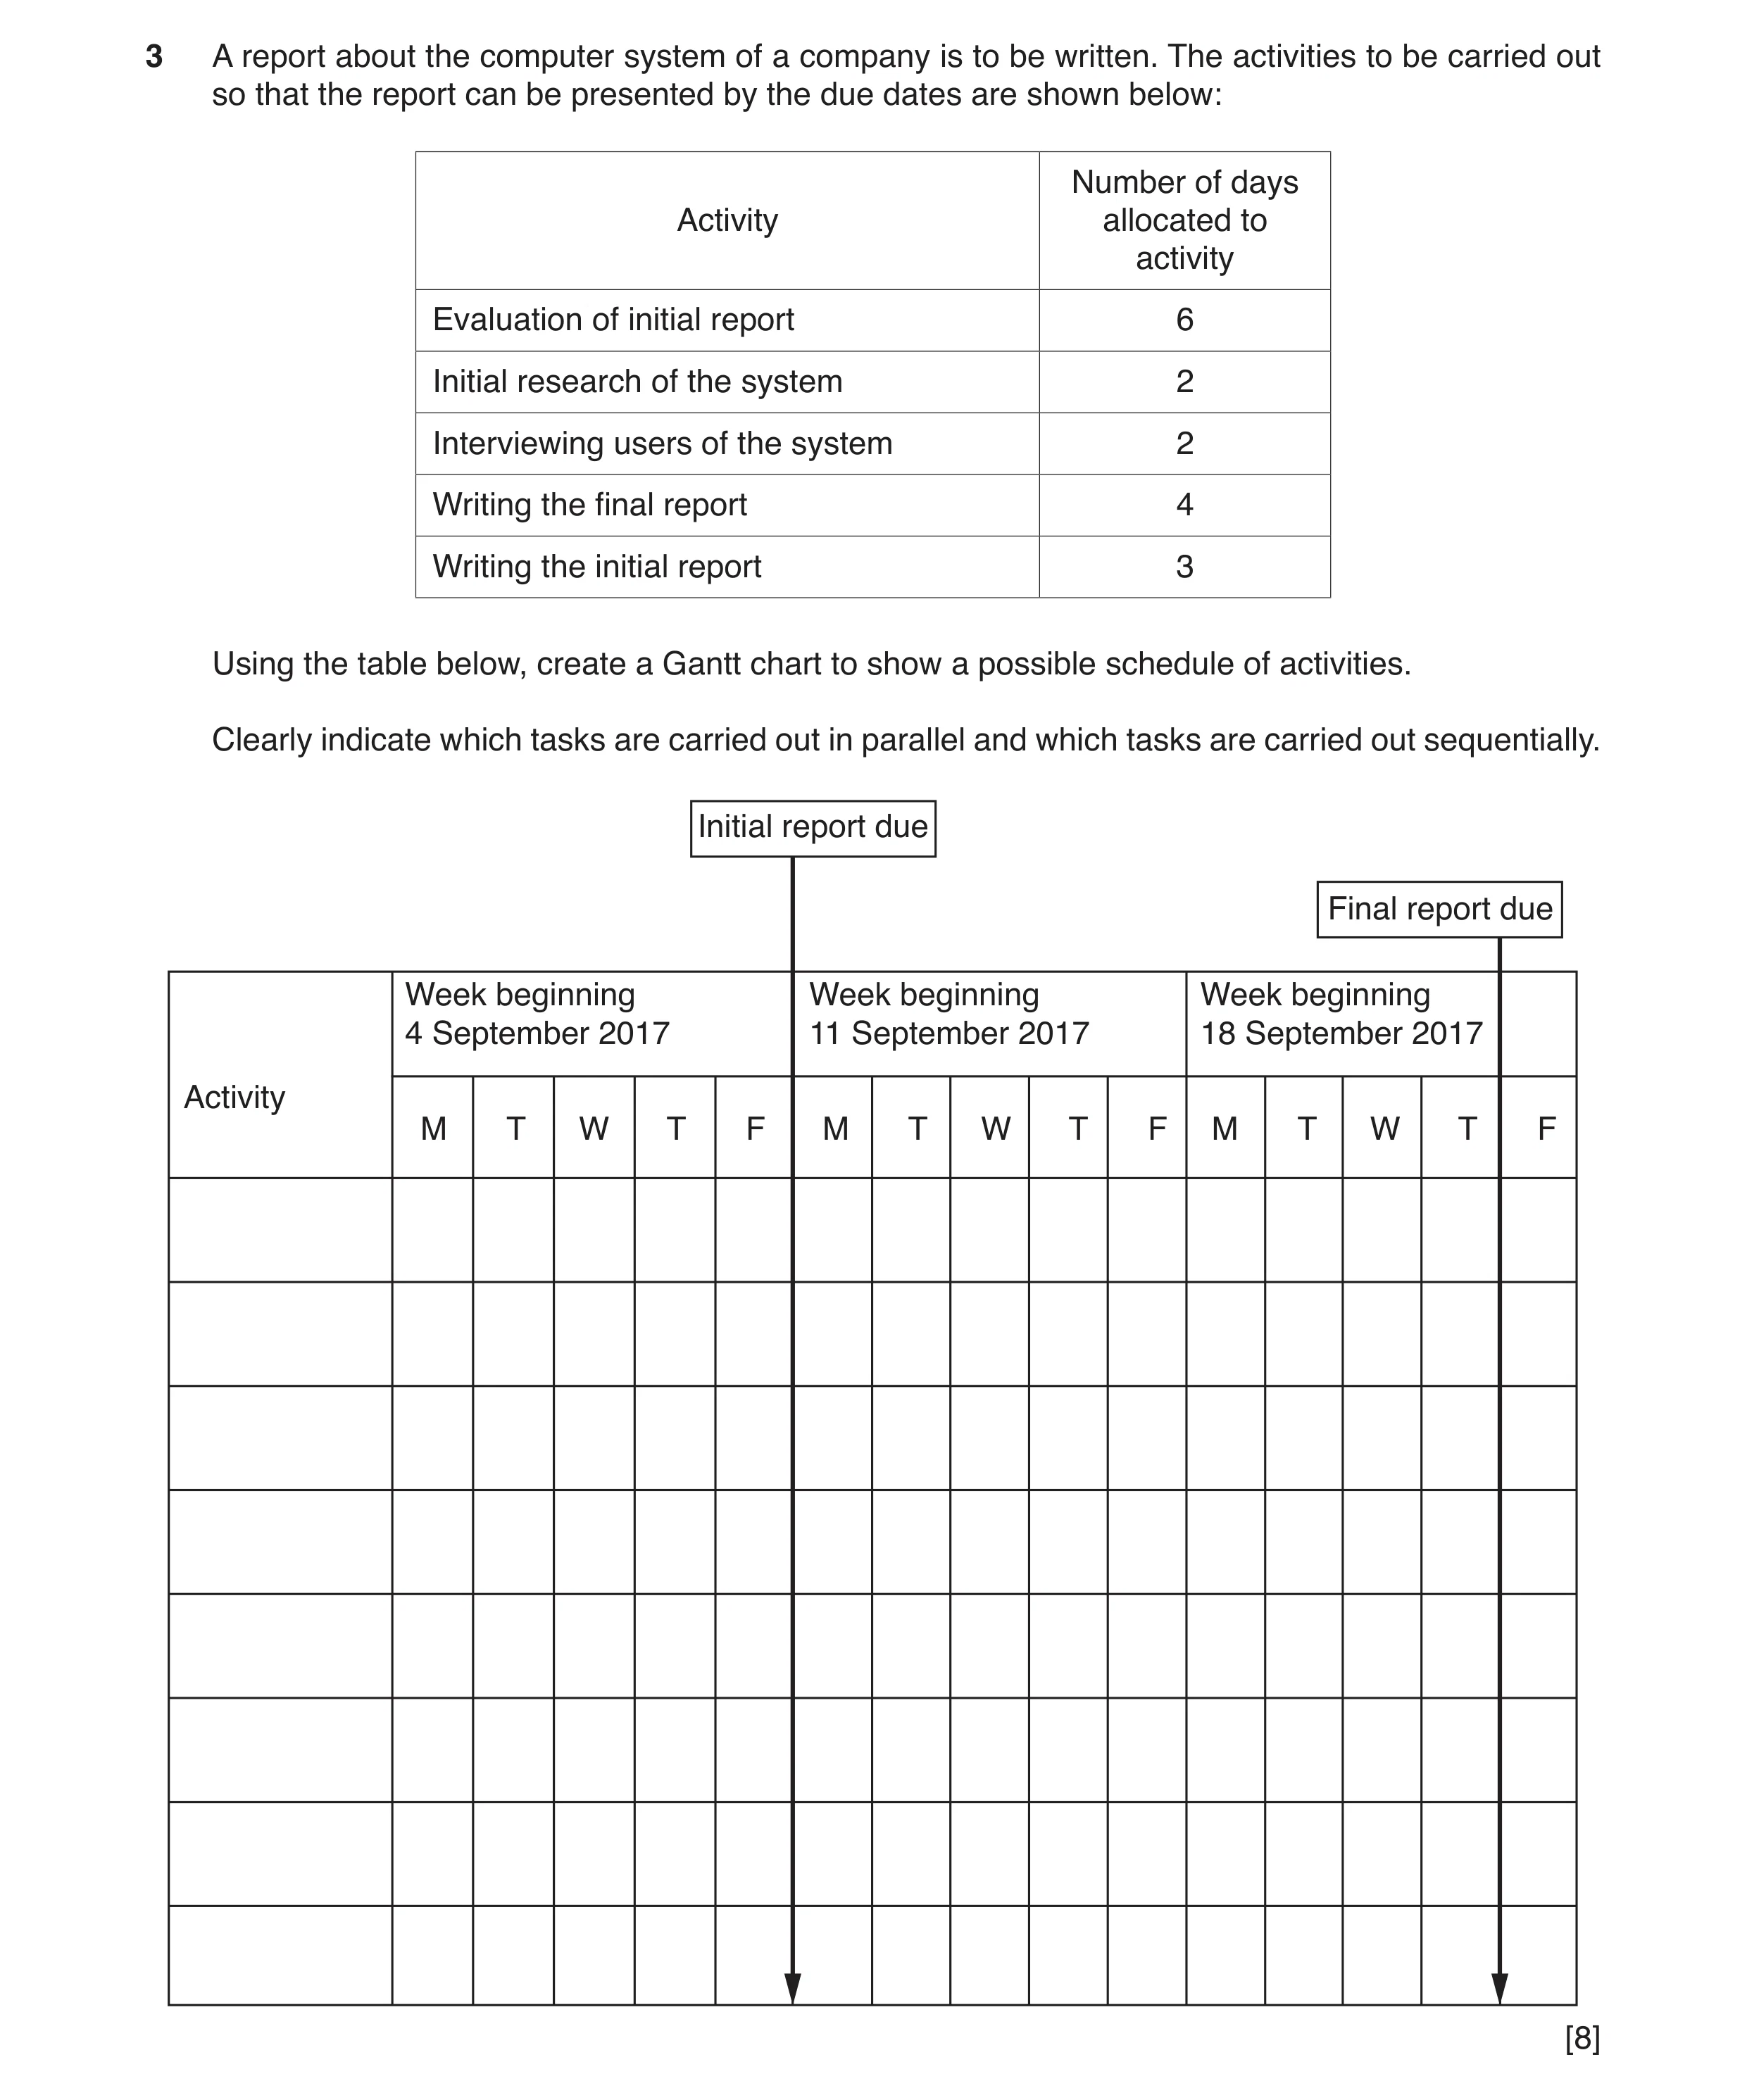
3 A report about the computer system of a company is to be written. The activities to be carried out so that the report can be presented by the due dates are shown below: Number of days Activity allocated to activity Evaluation of initial report 6 Initial research of the system 2 Interviewing users of the system 2 Writing the final report 4 Writing the initial report 3 Using the table below, create a Gantt chart to show a possible schedule of activities. Clearly indicate which tasks are carried out in parallel and which tasks are carried out sequentially. Initial report due Final report due Week beginning Week beginning Week beginning 4 September 2017 11 September 2017 18 September 2017 Activity M T W T F M T W T F M T W T F [8]
8 marks
Mark scheme: 3 Eight from: 8 All 5 correct labels/abbreviations in activity column 1 mark All 5 tasks in most appropriate order in chart 1 mark All 5 correct lengths of activity 2 marks 4 correct lengths of activity 1 mark less than 4 correct 0 marks Initial research/interview users in parallel and write initial report starts after initial research 1 mark Sequential tasks shown 1 mark (evaluation must start after write initial report) Initial report end before/on due date/1st Friday 1 mark Final report end on before/due date/2nd Thursday 1 mark E.g.
This question in 9626/32 May/June 2017
Q3 · The tasks, and the time allowed for each task, for the building of a new house are shown… 9626/33 Oct/Nov 2017
8 The tasks, and the time allowed for each task, for the building of a new house are shown in the table below. Task ID Task Duration (days) A lay the foundations 3 B build the external walls 4 C put on roof 7 D install external doors and windows 2 E make doors and windows 5 F install utilities 6 G paint interior 5 H install interior walls 3 I install interior doors 2 J finish exterior 4 These tasks must be carried out in this order: A, B, C, D, H, I and J. Task E can be carried out at the same time as Tasks A, B and C but must be carried out before Task D. Task F must be carried out after task C and before task I but can be done at the same time as tasks D and H. Task G must be done after tasks F, H and I but can be done at the same time as task J. (a) Draw an activity network diagram for building the new house. [8] (b) Use your activity network diagram to calculate the critical path through the tasks. … … … … … … … … … … … [4]
12 marks
Mark scheme: 8(a) A suitable activity network diagram would be e.g.: 8 Eight from: A, B, C D, H, I and J shown in correct sequence 1 mark E shown running parallel to A, B, C and D 1 mark F starting at/after C 1 mark F ending before/going to I 1 mark F shown in parallel to D and H 1 mark G shown starting after/from I 1 mark G shown in parallel to J 1 mark All correct arrows 1 mark START and FINISH points shown 1 mark 8(b) Four from: 4 Route 1 A+B+C+D+H+I+J is 3+4+7+2+3+2+4 = 25 Route 2 E+D+H+I+J is 5+2+3+2+4 = 16 Route 3 E+D+H+I+G is 5+2+3+2+5 = 17 Route 4 A+B+C+F+I+J is 3+4+7+6+2+4 = 26 Route 5 A+B+C+F+I+G is 3+4+7+6+2+5 = 27 The critical path is A to B to C to F to I to G at 27 days.
This question in 9626/33 Oct/Nov 2017
Q4 · Project management involves decision-making 9626/33 Oct/Nov 2017
9 Project management involves decision-making. Describe how you would use software tools to assist in decision-making. … … … … … … … … … … … [4]
4 marks
Mark scheme: 9 Four from: 4 Use options to sort/rank/choose between alternative choices Allows collaborative working/shared documents to reach decisions in a team Use of visual/graphics to present choices Use of IF-THEN/truth tables/‘fuzzy’ logic to deal with ‘partial’ truths Use of ‘uncertainty’ analysis/‘sensitivity’ analysis for assigning Use of mind-mapping software to show decision-trees.
This question in 9626/33 Oct/Nov 2017
Q5 · A building project has a number of activities, F, G, H, I, J and K, that need to be… 9626/32 Feb/March 2018
4 A building project has a number of activities, F, G, H, I, J and K, that need to be carried out between the stages A, B, C, D and E. Fig. 2 shows a Project Evaluation and Review Technique (PERT) chart for the building project. C F I 2 months 3 K months 4 months J A D E 3 months 5 G H months 3months B Fig. 2 (a) The building project has a series of milestones to help the managers monitor the progress of the project. Identify the first two milestones in this project. … … [1] (b) Describe the critical path through this project. … … … … … [2] To create the PERT chart, managers first produced a Gantt chart. (c) On the grid below, draw and label the Gantt chart from which the PERT chart in Fig. 2 would have been derived. [5]
8 marks
Mark scheme: 4(a) One mark for both milestones: 1 A and C 4(b) Two from: 2 Critical path made up of activities F, I and J / A to C C to D and D to E Totalling 4 + 2 + 3 = 9 months. 4(c) Five from: 5 Max 2 from: Activities on Y axis and labelled Time on X axis and labelled Milestones identified Max 3 marks from: All activities shown correctly 3 marks 5 activities shown correctly 2 marks 4 activities shown correctly 1 mark Less than 4 shown 0 marks
This question in 9626/32 Feb/March 2018
Q6 · Analyse the use of project scheduling tools to organise a project to create a road bridge 9626/33 Oct/Nov 2018
12 Analyse the use of project scheduling tools to organise a project to create a road bridge. … … … … … … … … … … … … … … [6]
6 marks
Mark scheme: 12 Six from: 6 Tool that allows planning and executing a project from inception to completion Can provide tracking of workers/builders/who is doing what and when Can show if anyone is missing deadlines Can move tasks reschedule/around/interchange tasks Allows flexibility to cope with e.g. unforeseen problems Can allow resources to be sourced/allocated/delivered at appropriate times Project scheduling tools can make simple projects more complex than they need to be Project scheduling tools can be expensive/costly for small projects.
This question in 9626/33 Oct/Nov 2018
Q7 · A table of tasks for a building project 9626/32 May/June 2019
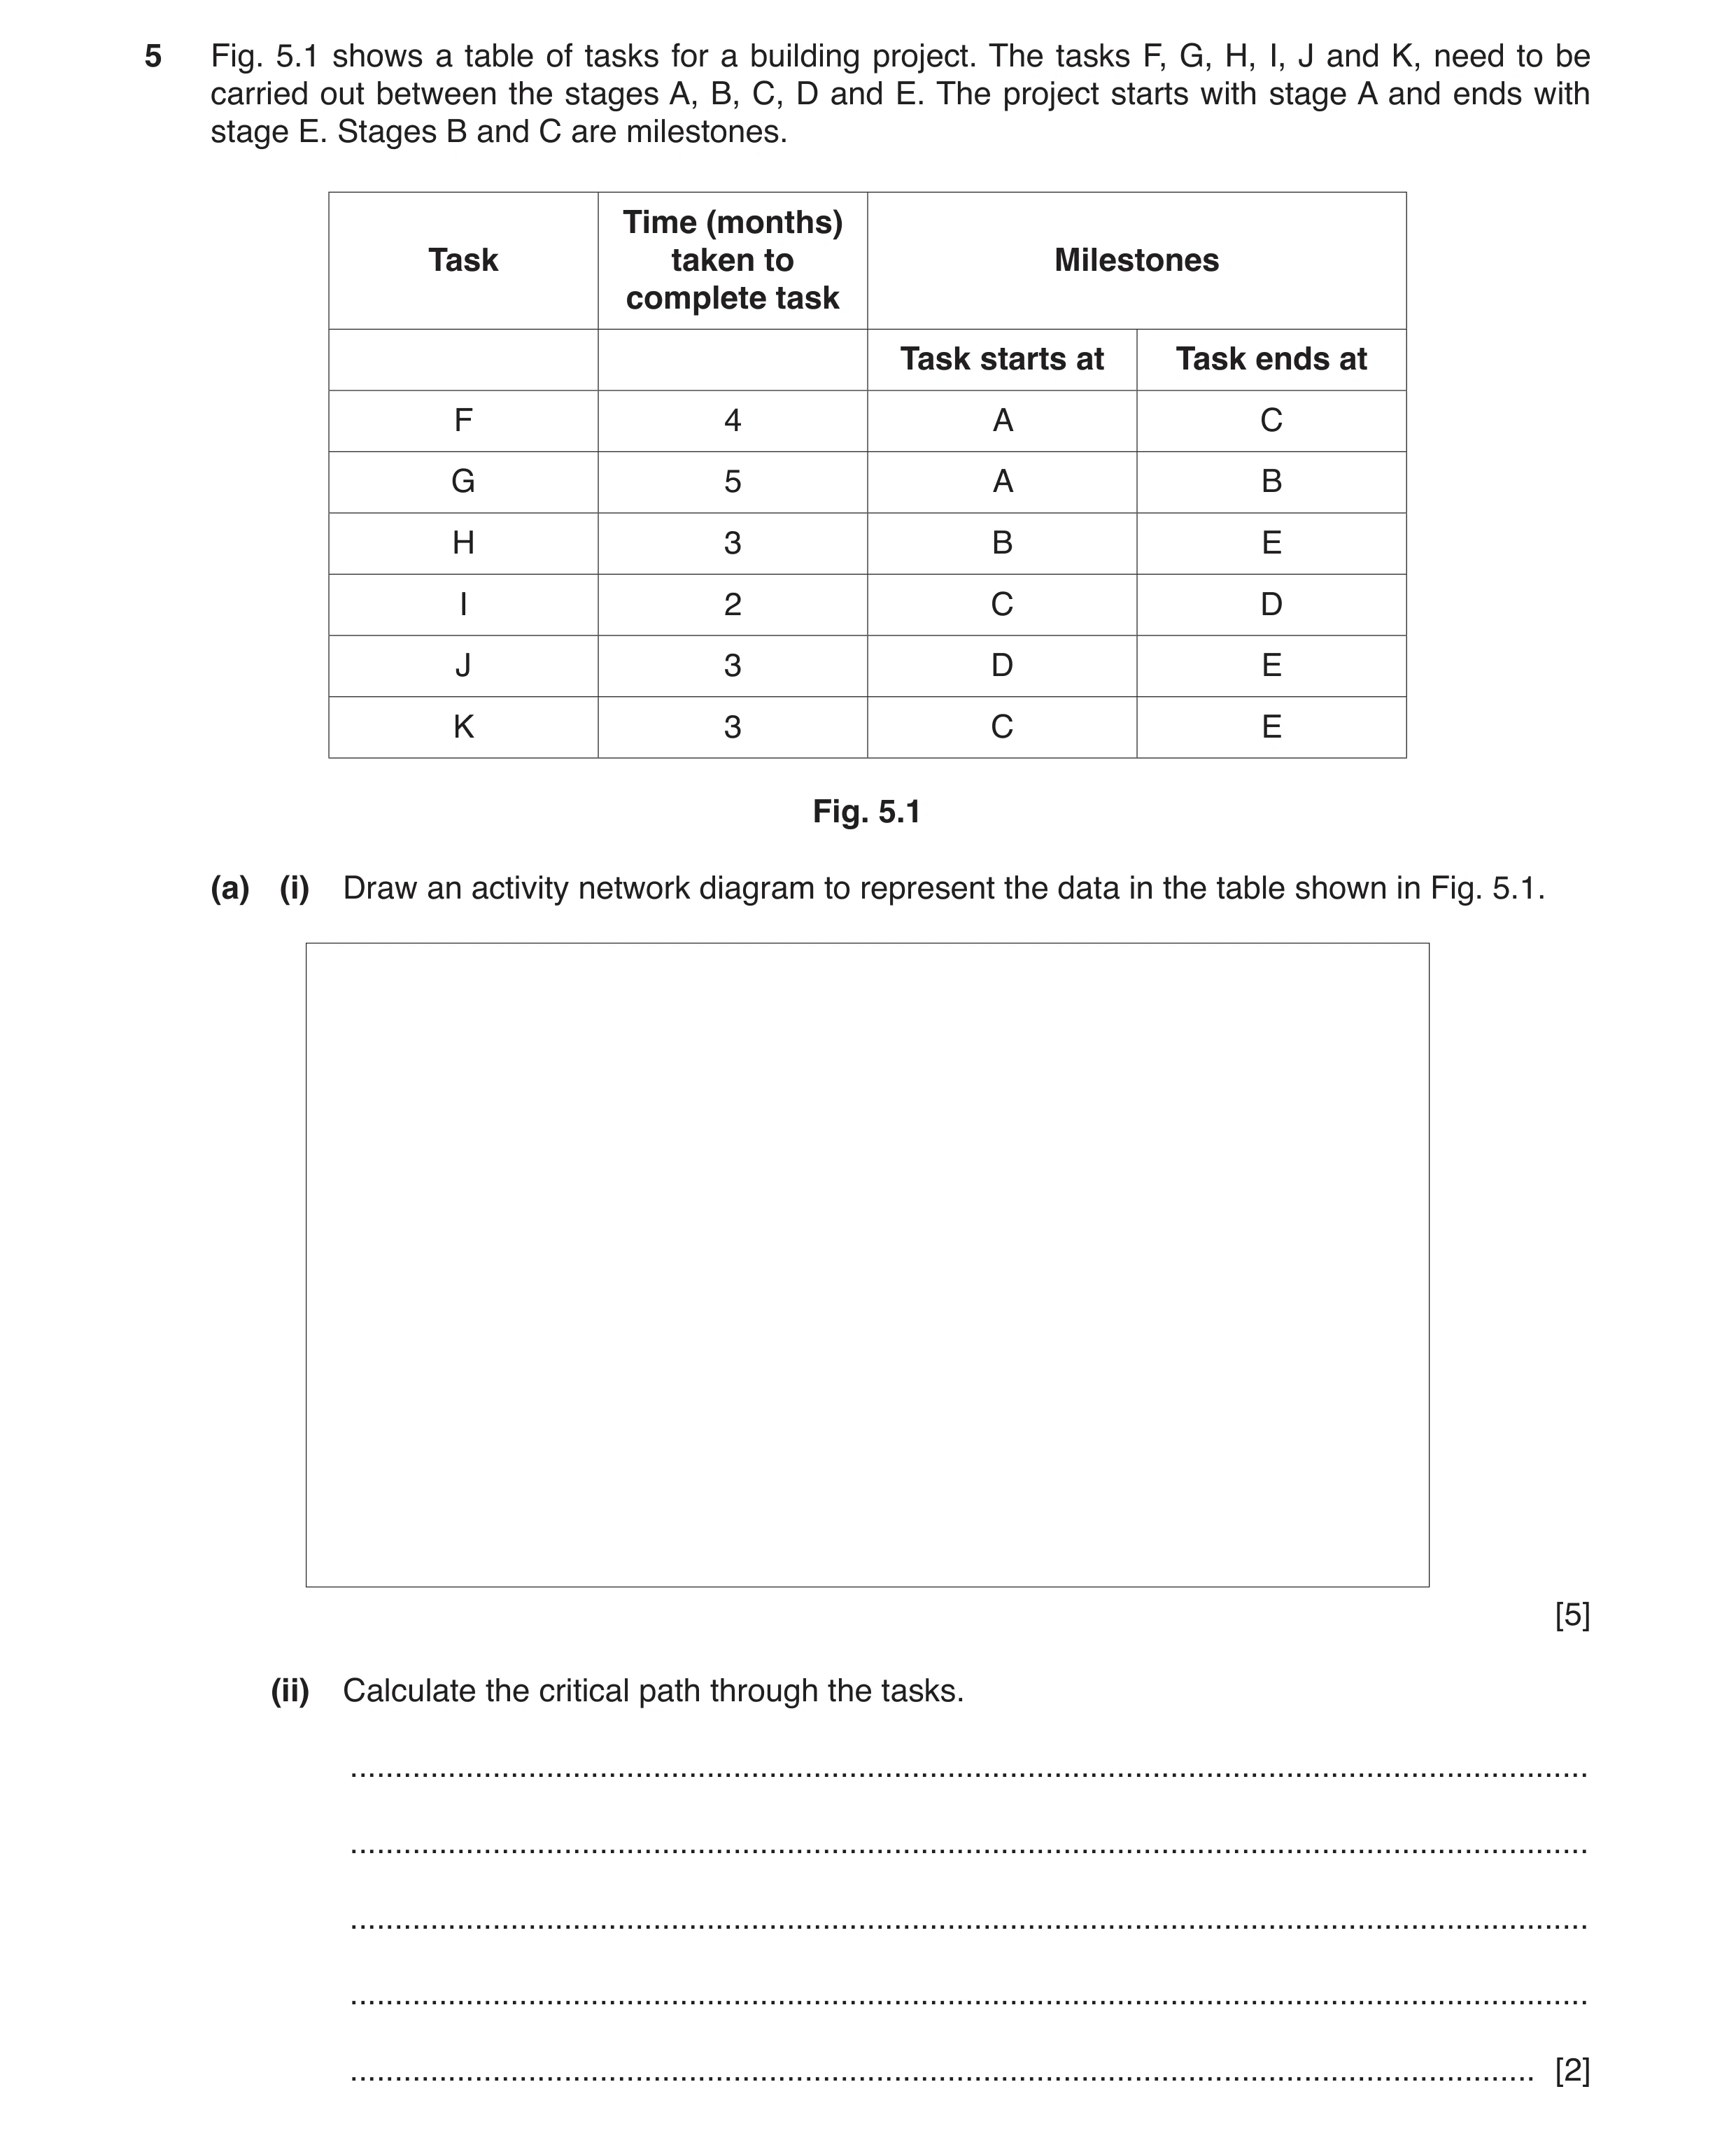
5 Fig. 5.1 shows a table of tasks for a building project. The tasks F, G, H, I, J and K, need to be carried out between the stages A, B, C, D and E. The project starts with stage A and ends with stage E. Stages B and C are milestones. Time (months) Task taken to Milestones complete task Task starts at Task ends at F 4 A C G 5 A B H 3 B E I 2 C D J 3 D E K 3 C E Fig. 5.1 (a) (i) Draw an activity network diagram to represent the data in the table shown in Fig. 5.1. [5] (ii) Calculate the critical path through the tasks. … … … … … [2]
7 marks
Mark scheme: 5(a)(i) A suitable diagram could be: 5 Mark allocation: 3 marks for all milestones linked correctly 2 marks for 4 milestones linked correctly 1 mark for 3 milestones linked correctly 1 mark for all correct timings 1 mark for all correct tasks. 5(a)(ii) The critical path is F + I + J 1 mark 2 4 + 2 + 3 = (9 months) 1 mark
This question in 9626/32 May/June 2019
Q8 · A software company has employed a team of programmers to create a new computer game 9626/31 Oct/Nov 2019
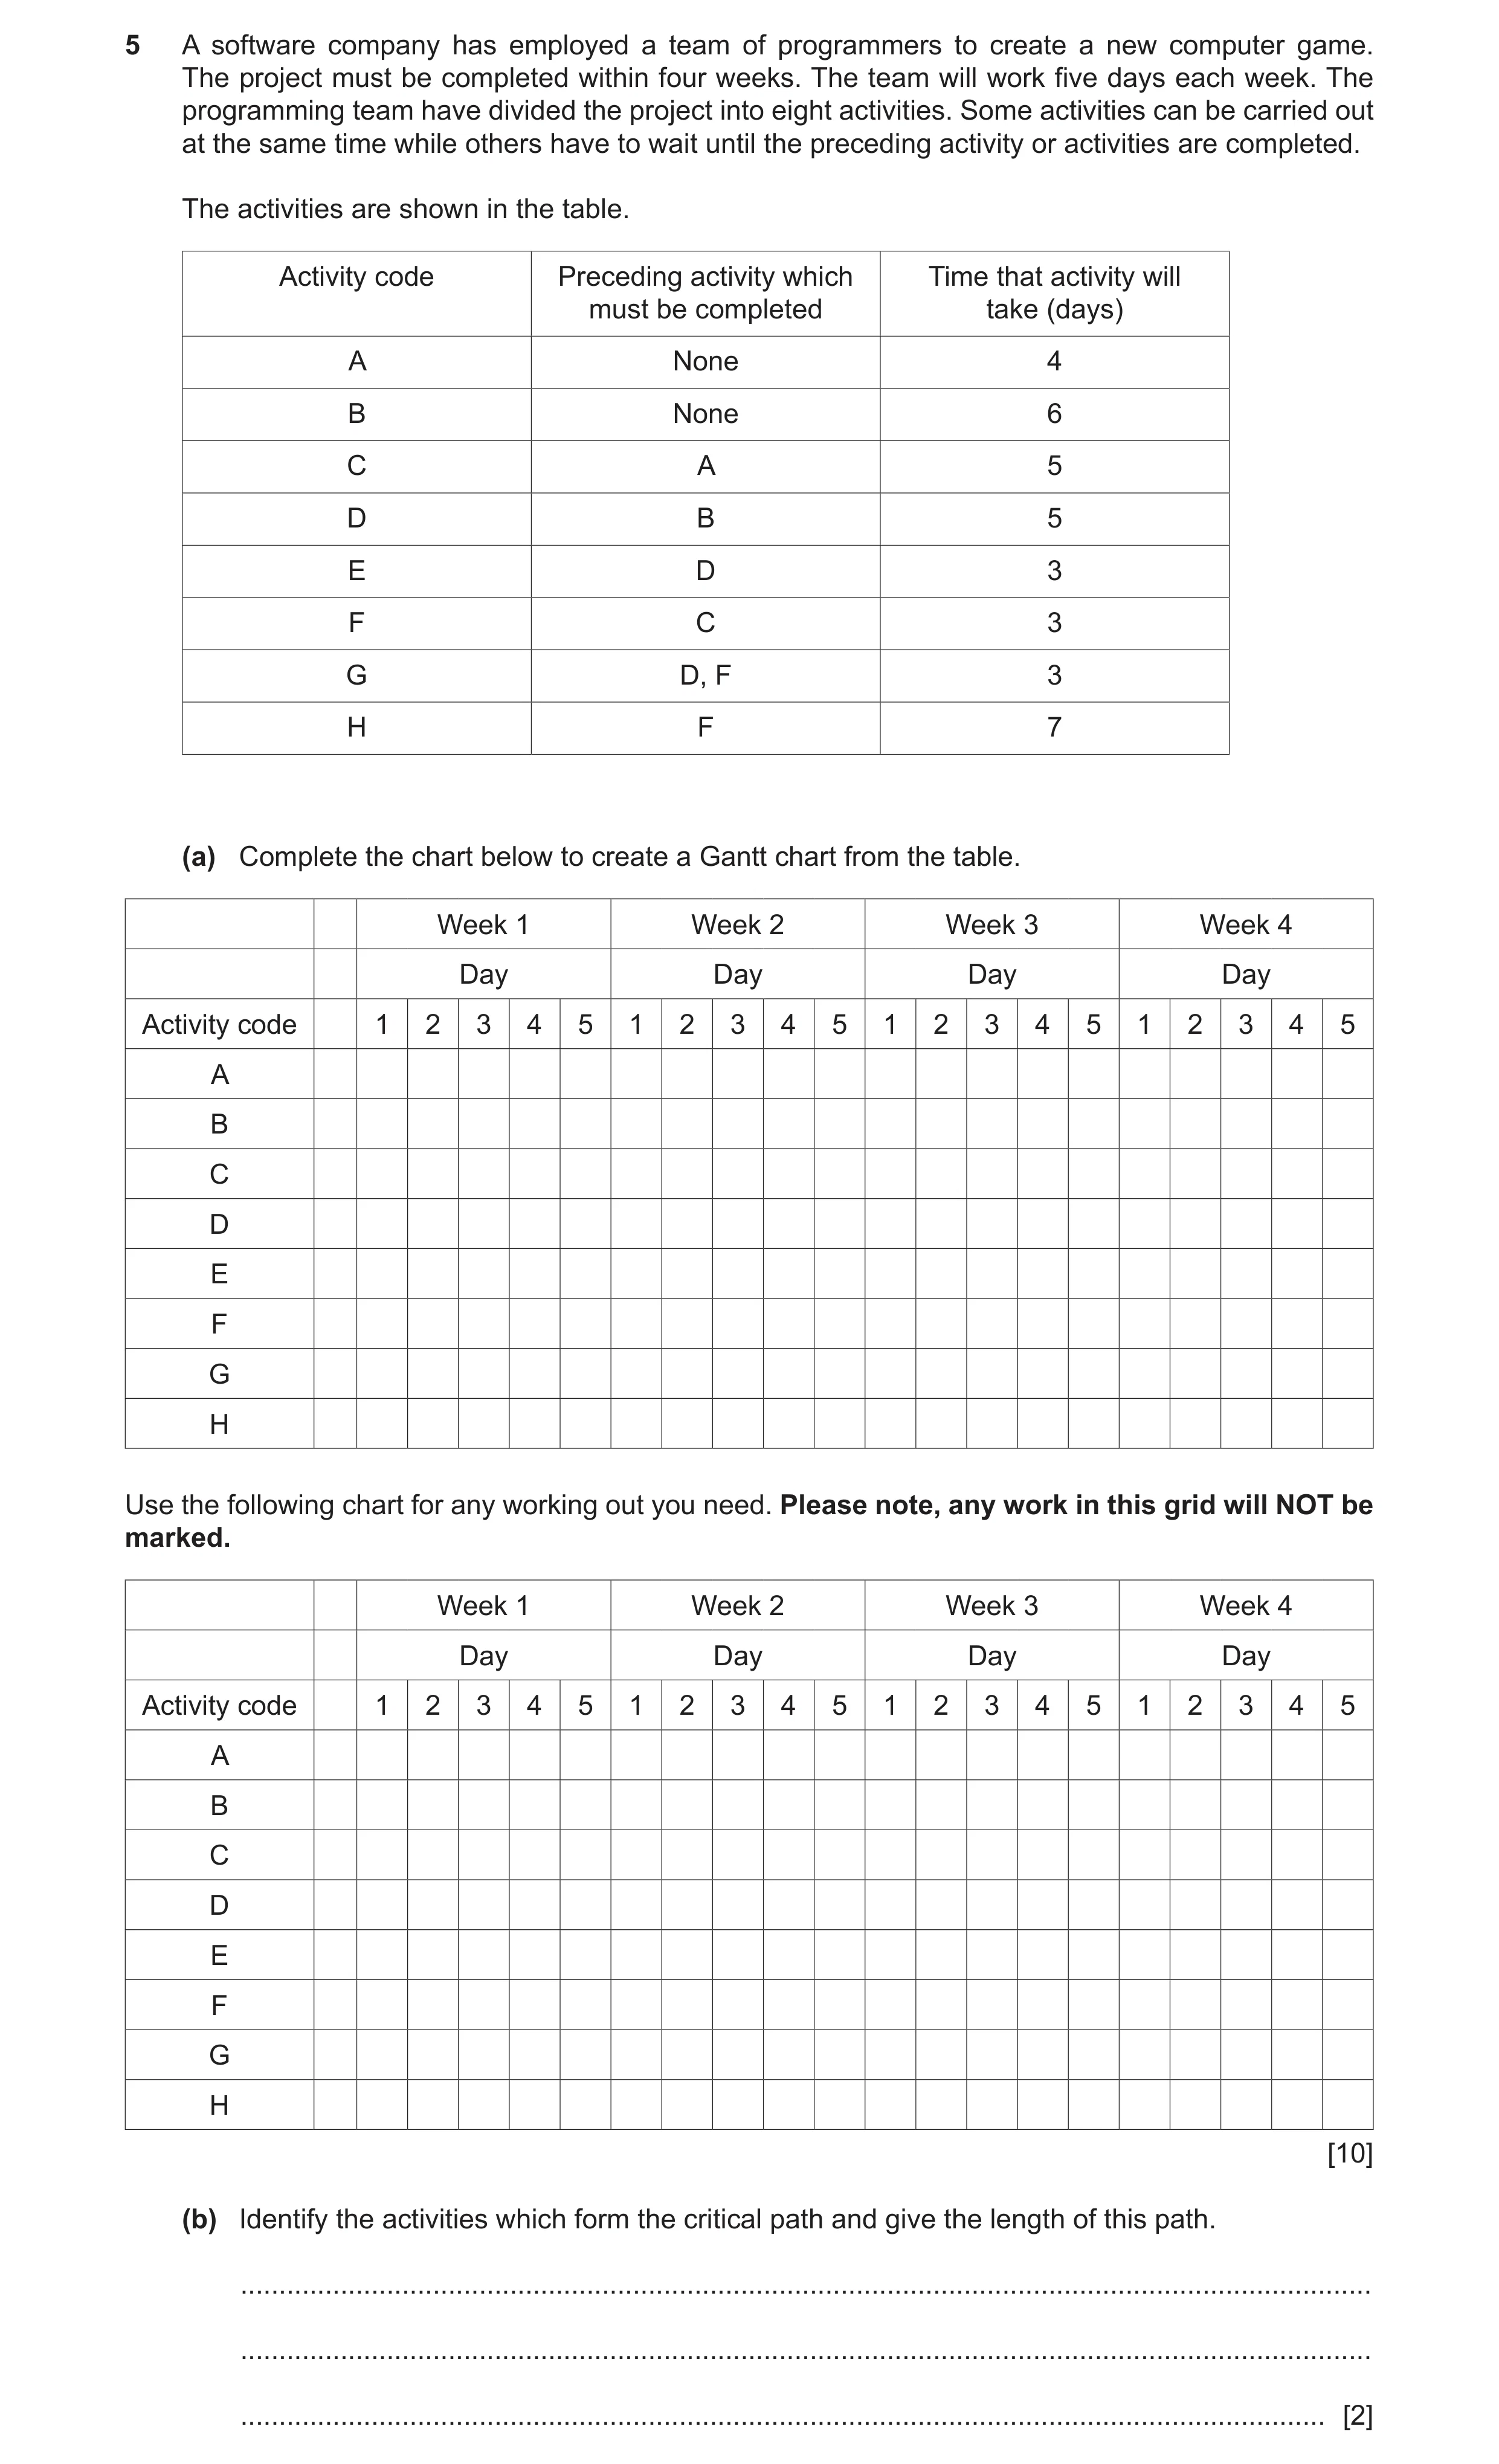
5 A software company has employed a team of programmers to create a new computer game. The project must be completed within four weeks. The team will work five days each week. The programming team have divided the project into eight activities. Some activities can be carried out at the same time while others have to wait until the preceding activity or activities are completed. The activities are shown in the table. Activity code Preceding activity which Time that activity will must be completed take (days) A None 4 B None 6 C A 5 D B 5 E D 3 F C 3 G D, F 3 H F 7 (a) Complete the chart below to create a Gantt chart from the table. Week 1 Week 2 Week 3 Week 4 Day Day Day Day Activity code 1 2 3 4 5 1 2 3 4 5 1 2 3 4 5 1 2 3 4 5 A B C D E F G H Use the following chart for any working out you need. Please note, any work in this grid will NOT be marked. Week 1 Week 2 Week 3 Week 4 Day Day Day Day Activity code 1 2 3 4 5 1 2 3 4 5 1 2 3 4 5 1 2 3 4 5 A B C D E F G H [10] (b) Identify the activities which form the critical path and give the length of this path. … … … [2]
12 marks
Mark scheme: 5(a) Ten from: 10 Week 1 Week 2 Week 3 Week 4 Day Day Day Day Activity code 1 2 3 4 5 1 2 3 4 5 1 2 3 4 5 1 2 3 4 5 A B C D E F G H (Critical path is white and shown for part (b)) Marks allocated as follows: Correct positioning of activities A and B on Week 1 Day 1 Correct length of activity B at Week 1 Day 1 to Week 2 Day 1 (6 working days) Correct positioning of activity C after activity A Correct length of activity C at Week 1 day 5 to Week 2 day 4 (5 working days) Correct positioning of activity D after activity B Correct length of activity D at Week 2 day 2 to Week 3 day 1 (5 working days) Correct positioning of activity E after activity D Correct length of activity E at 3 days (Week 3 day 2 to Week 3 day 4) Correct positioning of activity F after activity C Correct length of activity F at 3 days Correct positioning of activity G after activity F (D has already ended) Correct length of activity G at 3 days Correct positioning of activity H after activity F Correct length of activity H at 7 days (Week 3 day 3 to week 4 day 4). 5(b) Activities A, C, F and H – 1 mark 2 Length is 19 days – 1 mark
This question in 9626/31 Oct/Nov 2019
Q9 · A software company has employed a team of programmers to create a new computer game 9626/33 Oct/Nov 2019
5 A software company has employed a team of programmers to create a new computer game. The project must be completed within four weeks. The team will work five days each week. The programming team have divided the project into eight activities. Some activities can be carried out at the same time while others have to wait until the preceding activity or activities are completed. The activities are shown in the table. Activity code Preceding activity which Time that activity will must be completed take (days) A None 4 B None 6 C A 5 D B 5 E D 3 F C 3 G D, F 3 H F 7 (a) Complete the chart below to create a Gantt chart from the table. Week 1 Week 2 Week 3 Week 4 Day Day Day Day Activity code 1 2 3 4 5 1 2 3 4 5 1 2 3 4 5 1 2 3 4 5 A B C D E F G H Use the following chart for any working out you need. Please note, any work in this grid will NOT be marked. Week 1 Week 2 Week 3 Week 4 Day Day Day Day Activity code 1 2 3 4 5 1 2 3 4 5 1 2 3 4 5 1 2 3 4 5 A B C D E F G H [10] (b) Identify the activities which form the critical path and give the length of this path. … … … [2]
12 marks
Mark scheme: 5(a) Ten from: 10 Week 1 Week 2 Week 3 Week 4 Day Day Day Day Activity code 1 2 3 4 5 1 2 3 4 5 1 2 3 4 5 1 2 3 4 5 A B C D E F G H (Critical path is white and shown for part (b)) Marks allocated as follows: Correct positioning of activities A and B on Week 1 Day 1 Correct length of activity B at Week 1 Day 1 to Week 2 Day 1 (6 working days) Correct positioning of activity C after activity A Correct length of activity C at Week 1 day 5 to Week 2 day 4 (5 working days) Correct positioning of activity D after activity B Correct length of activity D at Week 2 day 2 to Week 3 day 1 (5 working days) Correct positioning of activity E after activity D Correct length of activity E at 3 days (Week 3 day 2 to Week 3 day 4) Correct positioning of activity F after activity C Correct length of activity F at 3 days Correct positioning of activity G after activity F (D has already ended) Correct length of activity G at 3 days Correct positioning of activity H after activity F Correct length of activity H at 7 days (Week 3 day 3 to week 4 day 4). 5(b) Activities A, C, F and H – 1 mark 2 Length is 19 days – 1 mark
This question in 9626/33 Oct/Nov 2019
Q10 · Explain how project management tools can be used to help when allocating resources in a… 9626/32 May/June 2020
4 Explain how project management tools can be used to help when allocating resources in a project. … … … … … … … … … … … … … … … … … … … … [8]
8 marks
Mark scheme: 4 Eight from: 8 Use of critical path analysis/method to show tasks that require resources. Use of critical path analysis/method identify the time required for each task. Use of critical path analysis/method to identify priority of tasks. Use of resource levelling / resolving resource conflicts to allocate resources/ stages/phases/deliverable task identification. Use of resource levelling/ resolving resource conflicts to allocate identify demand for resources. Create Project Resource Allocation Matrix/PRAM to show the allocation resources against tasks. Use of Gantt charts to identify resource requirements. Use of collaborative calendars to deploy staff. Strength, Weakness, Opportunities, Threats/SWOT analysis to identify where to deploy resources.
This question in 9626/32 May/June 2020
Q11 · Explain how project management tools can be used when planning a project 9626/32 Oct/Nov 2020
7 (a) Explain how project management tools can be used when planning a project. … … … … … … … … … … … … … … … … … … … … [8] (b) Discuss the advantages and disadvantages of using online project management software. … … … … … … … … … … … … … … … … … … … … [8]
16 marks
Mark scheme: 7(a) Eight from: 8 WBS/work breakdown structure technique to divide project/activities into smaller activities Use of network/arrow diagrams showing connected activities Used to represent the interdependencies of activities Used to represent the order of activities Show the start date of activity Show the end date of activity Use Program/Project Evaluation and Review Technique/PERT Use estimates of time/optimistic/realistic/pessimistic estimates of time taken for activities (to identify critical path) Use of critical path method to set out monitor/show progress of project Use of critical path analysis to calculate ‘floats’ for tasks/project Show longest time that will/could be taken for project Allow resources to be allocated efficiently Allow costs to be calculated/allocated Gantt charts can be used to show activities/different colours for activities. 7(b) Eight from: 8 Advantages: Data is centralised on a company server/storage subsystem not on an individual computer Can be accessed on different devices so team members can work remotely/on site/when mobile Updates to project are shared (immediately) between users/Project Manager and team Status updates are immediate/notifications are immediate when project is updated/altered/amended Project members can collaborate in a project regardless of their physical location Communications and discussions can be in real-time regardless of location Email notifications can be set up to occur automatically/integrated into the software Compatibility with other project management tools tends to be assured Can control access to activities/parts of project using access lists/permission rights Backups can be automatically created at required/set intervals Disadvantages: (Some) functionality may be missing/reduced compared to specialised software e.g. resource levelling/Gantt chart creation Internet connection is required so location may be limited Requires compatible device/web browser/software Security/privacy/data integrity issues may arise due to use of internet/public telecommunications systems May not be compatible with off-line software so projects may need updating/modification when transferred Use of internet may be a distraction to project team members. Must have at least one of each for full marks. One mark available for reasoned conclusion.
This question in 9626/32 Oct/Nov 2020
Q12 · Planners often draw diagrams of the stages in a project so that a critical path can be… 9626/33 Oct/Nov 2020
10 Planners often draw diagrams of the stages in a project so that a critical path can be calculated. (a) Describe what must be included in a diagram so that the critical path of a project can be calculated. … … … … … … … … … … … … … … [6] (b) Describe three outcomes that can be determined from a critical path analysis of a project. 1 … … … 2 … … … 3 … … … [3]
9 marks
Mark scheme: 10(a) Six from: 6 List of all the activities needed to complete/finish the project A breakdown of e.g. resource allocation/work schedules Duration of each activity Dependencies between activities in the project End points of each activity and what can be completed at that point (Specific)Measurable/observable milestones during the project Duration of project including float variables. 10(b) Three from: 3 A visual/graphical representation of the whole project Earliest/latest start dates for project tasks/activities in project Longest path/time that will be taken for project Expected project end date Any near/almost critical paths that may be possible alternatives in project The shortest possible time to complete the project.
This question in 9626/33 Oct/Nov 2020
Q13 · A new house is to be built and a project has been set up to oversee its construction 9626/32 Feb/March 2021
9 A new house is to be built and a project has been set up to oversee its construction. Project management software will be used to estimate the costs. (a) Describe three costs that should be considered for inclusion in the project management software. … … … … … … … [3] (b) Explain how project management software tools could be used to estimate the costs of building the new house. … … … … … … … … … … … … … … [6]
9 marks
Mark scheme: 9(a) Three from e.g.: 3 Cost of the human activity/labour/skills needed/used to carry out each task Cost of the materials/resources that need to be purchased for carrying out each task Cost of equipment/tools/software required for each task Contingency costs to cover unexpected activities/risks Cost of any insurance needed to cover project failures. 9(b) Six from: 6 Comparing costs with those of similar house building projects previously completed/analogous estimating/top down estimating Estimating costs using historical/statistical data/data sets from several similar projects and extrapolating to fit current project details/parametric estimating Averaging the costs of several estimates to produce costs for current project/’three-point’ estimating Calculating the cost of every activity in detail and using the results to calculate total cost with accuracy/bottom up estimating Using PERT estimates by calculation/formula Most likely cost with project having no difficulties Worst possible cost estimate with project tasks all going wrong Can produce an optimistic cost with all tasks succeeding better than expected PERT ’three-point’ estimating used to eliminate bias/uncertainties/risks of other methods Providing an estimate of time taken for each task, allowing costs of personnel and equipment hire to be calculated.
This question in 9626/32 Feb/March 2021
Question 14 9626/31 May/June 2021
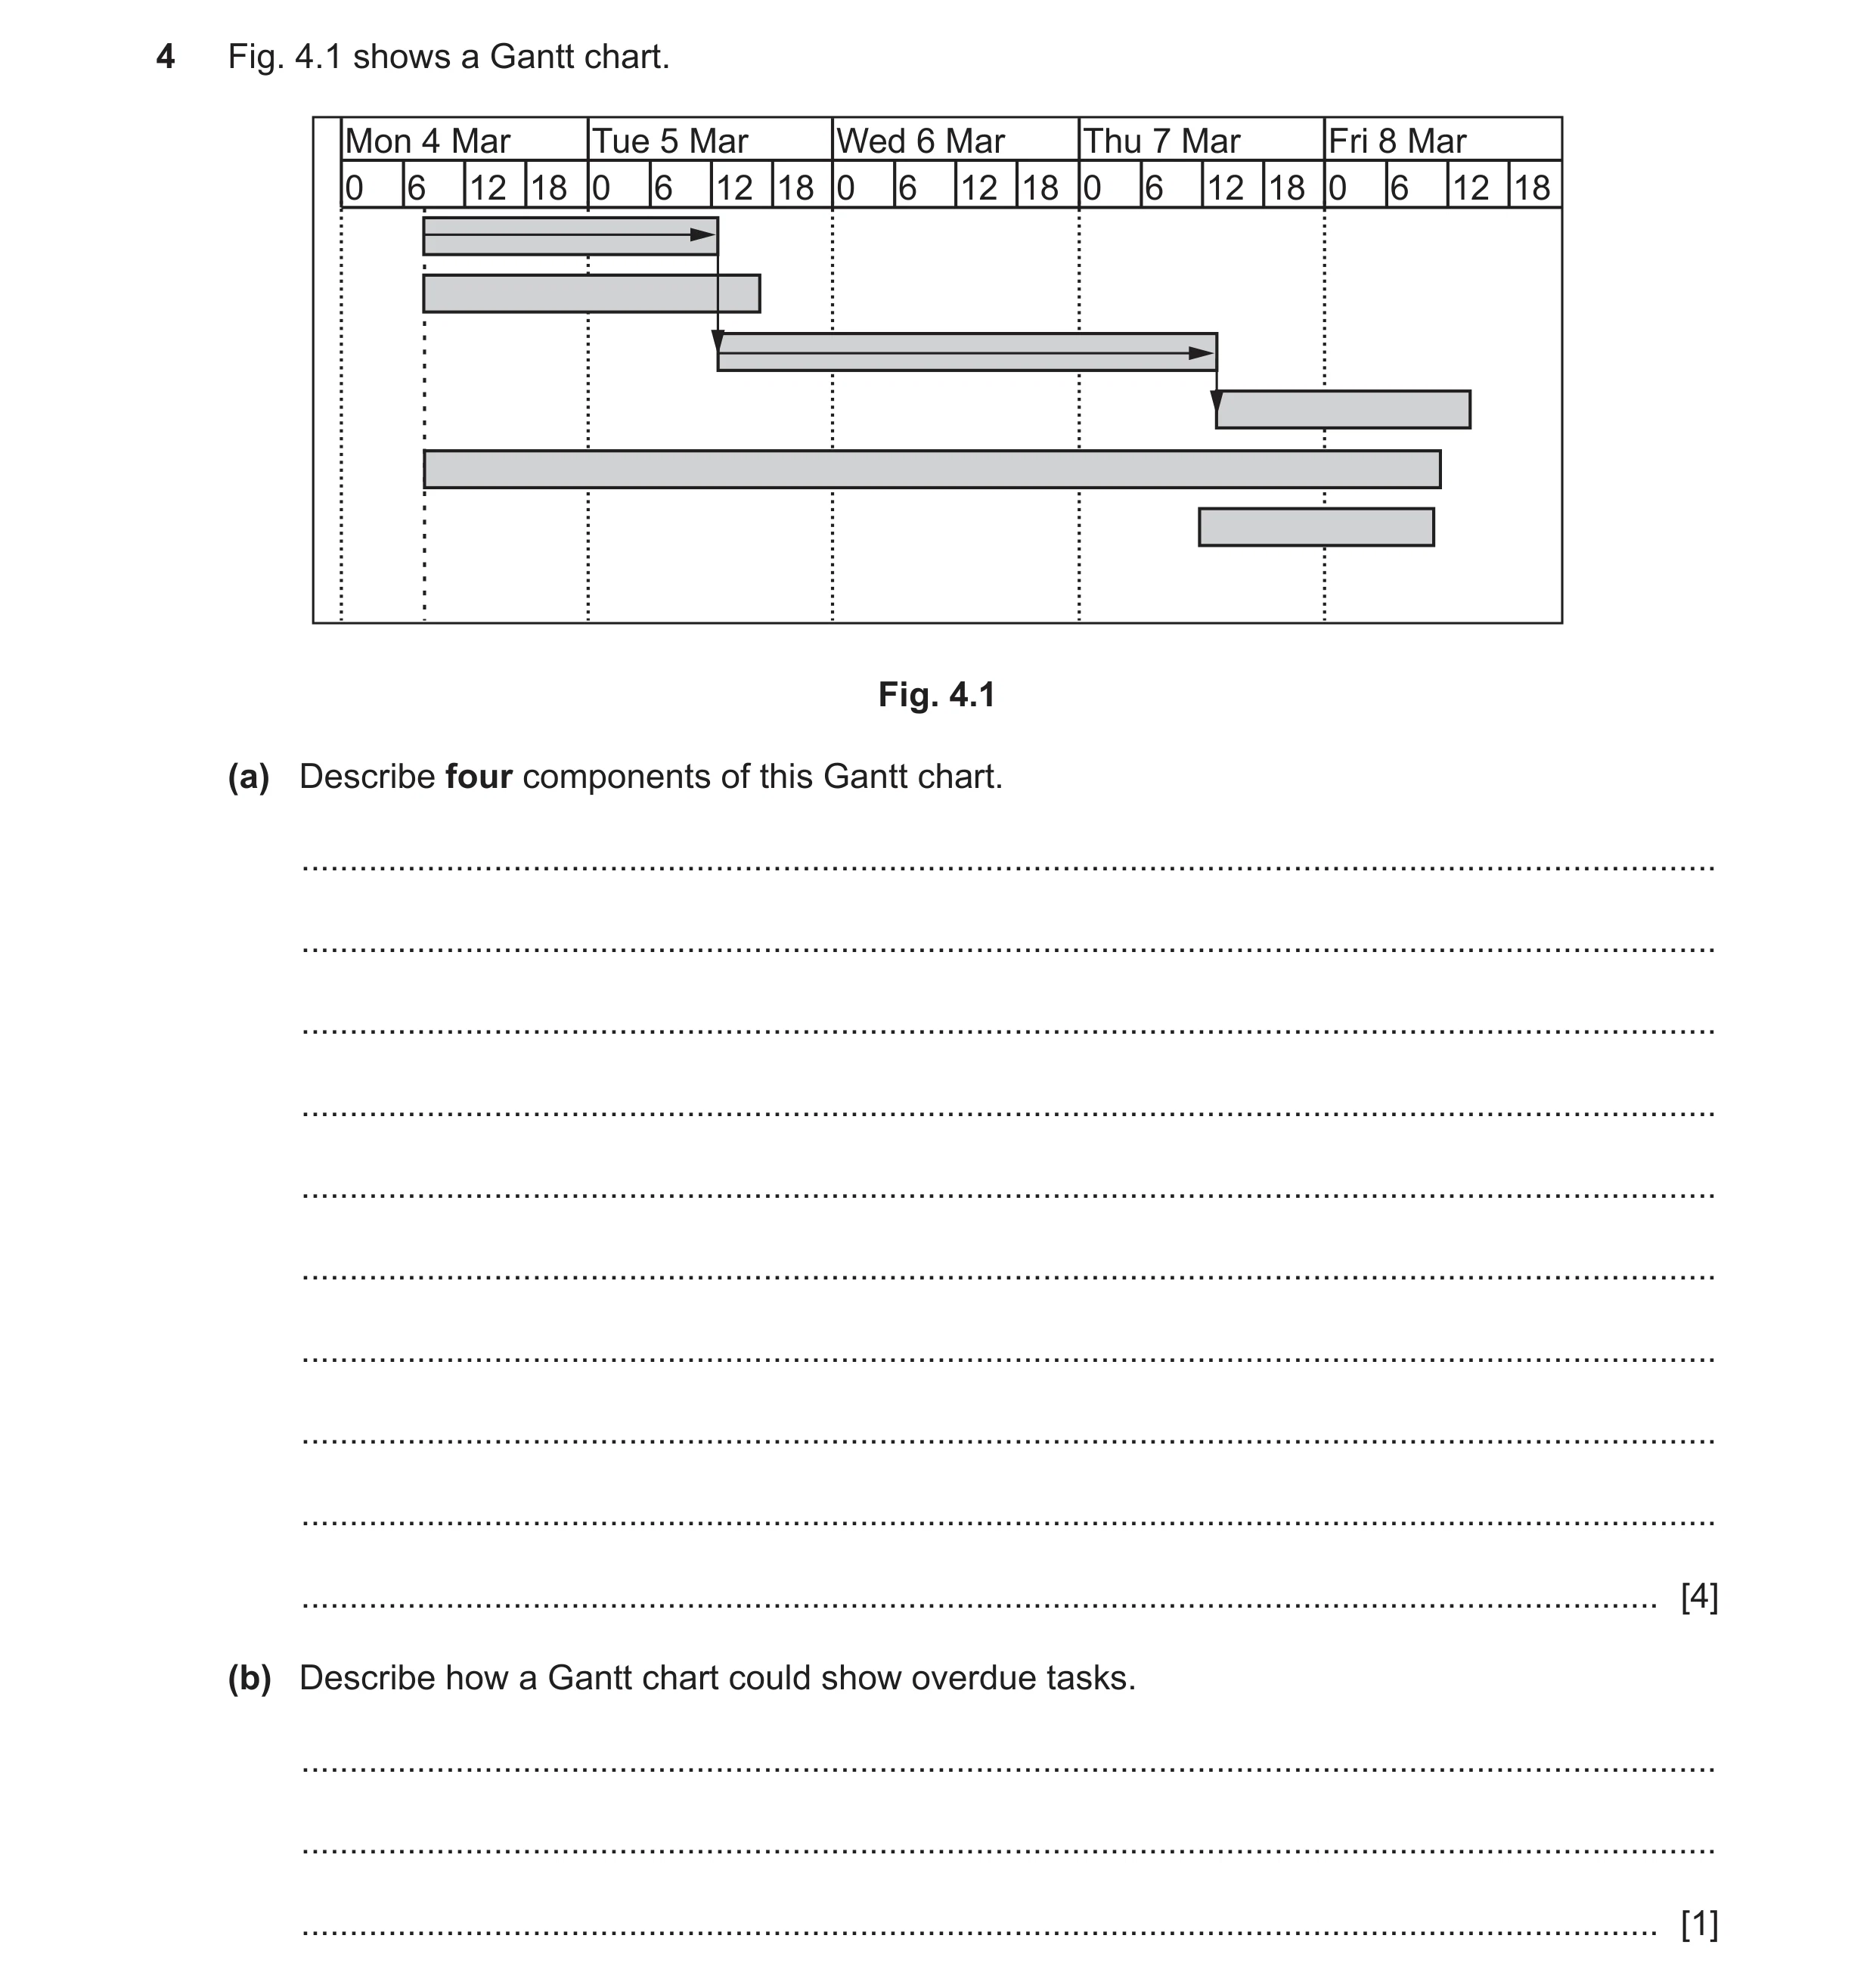
4 Fig. 4.1 shows a Gantt chart. Mon 4 Mar Tue 5 Mar Wed 6 Mar Thu 7 Mar Fri 8 Mar 0 6 12 18 0 6 12 18 0 6 12 18 0 6 12 18 0 6 12 18 Fig. 4.1 (a) Describe four components of this Gantt chart. … … … … … … … … … … [4] (b) Describe how a Gantt chart could show overdue tasks. … … … [1]
5 marks
Mark scheme: 4(a) Four from: 4 Timeline for displaying/showing the duration in hours, days, weeks, months and quarters Milestone to show a due date/finish of a phase of a project Bars to show full duration of tasks Arrows to show dependencies of tasks Critical path shown by arrows Dateline showing the current date/time. 4(b) One from: 1 E.g. Use of a percentage bar within the task bar Use of a red line on the chart Different colours of bars can be used.
This question in 9626/31 May/June 2021
Question 15 9626/33 May/June 2021
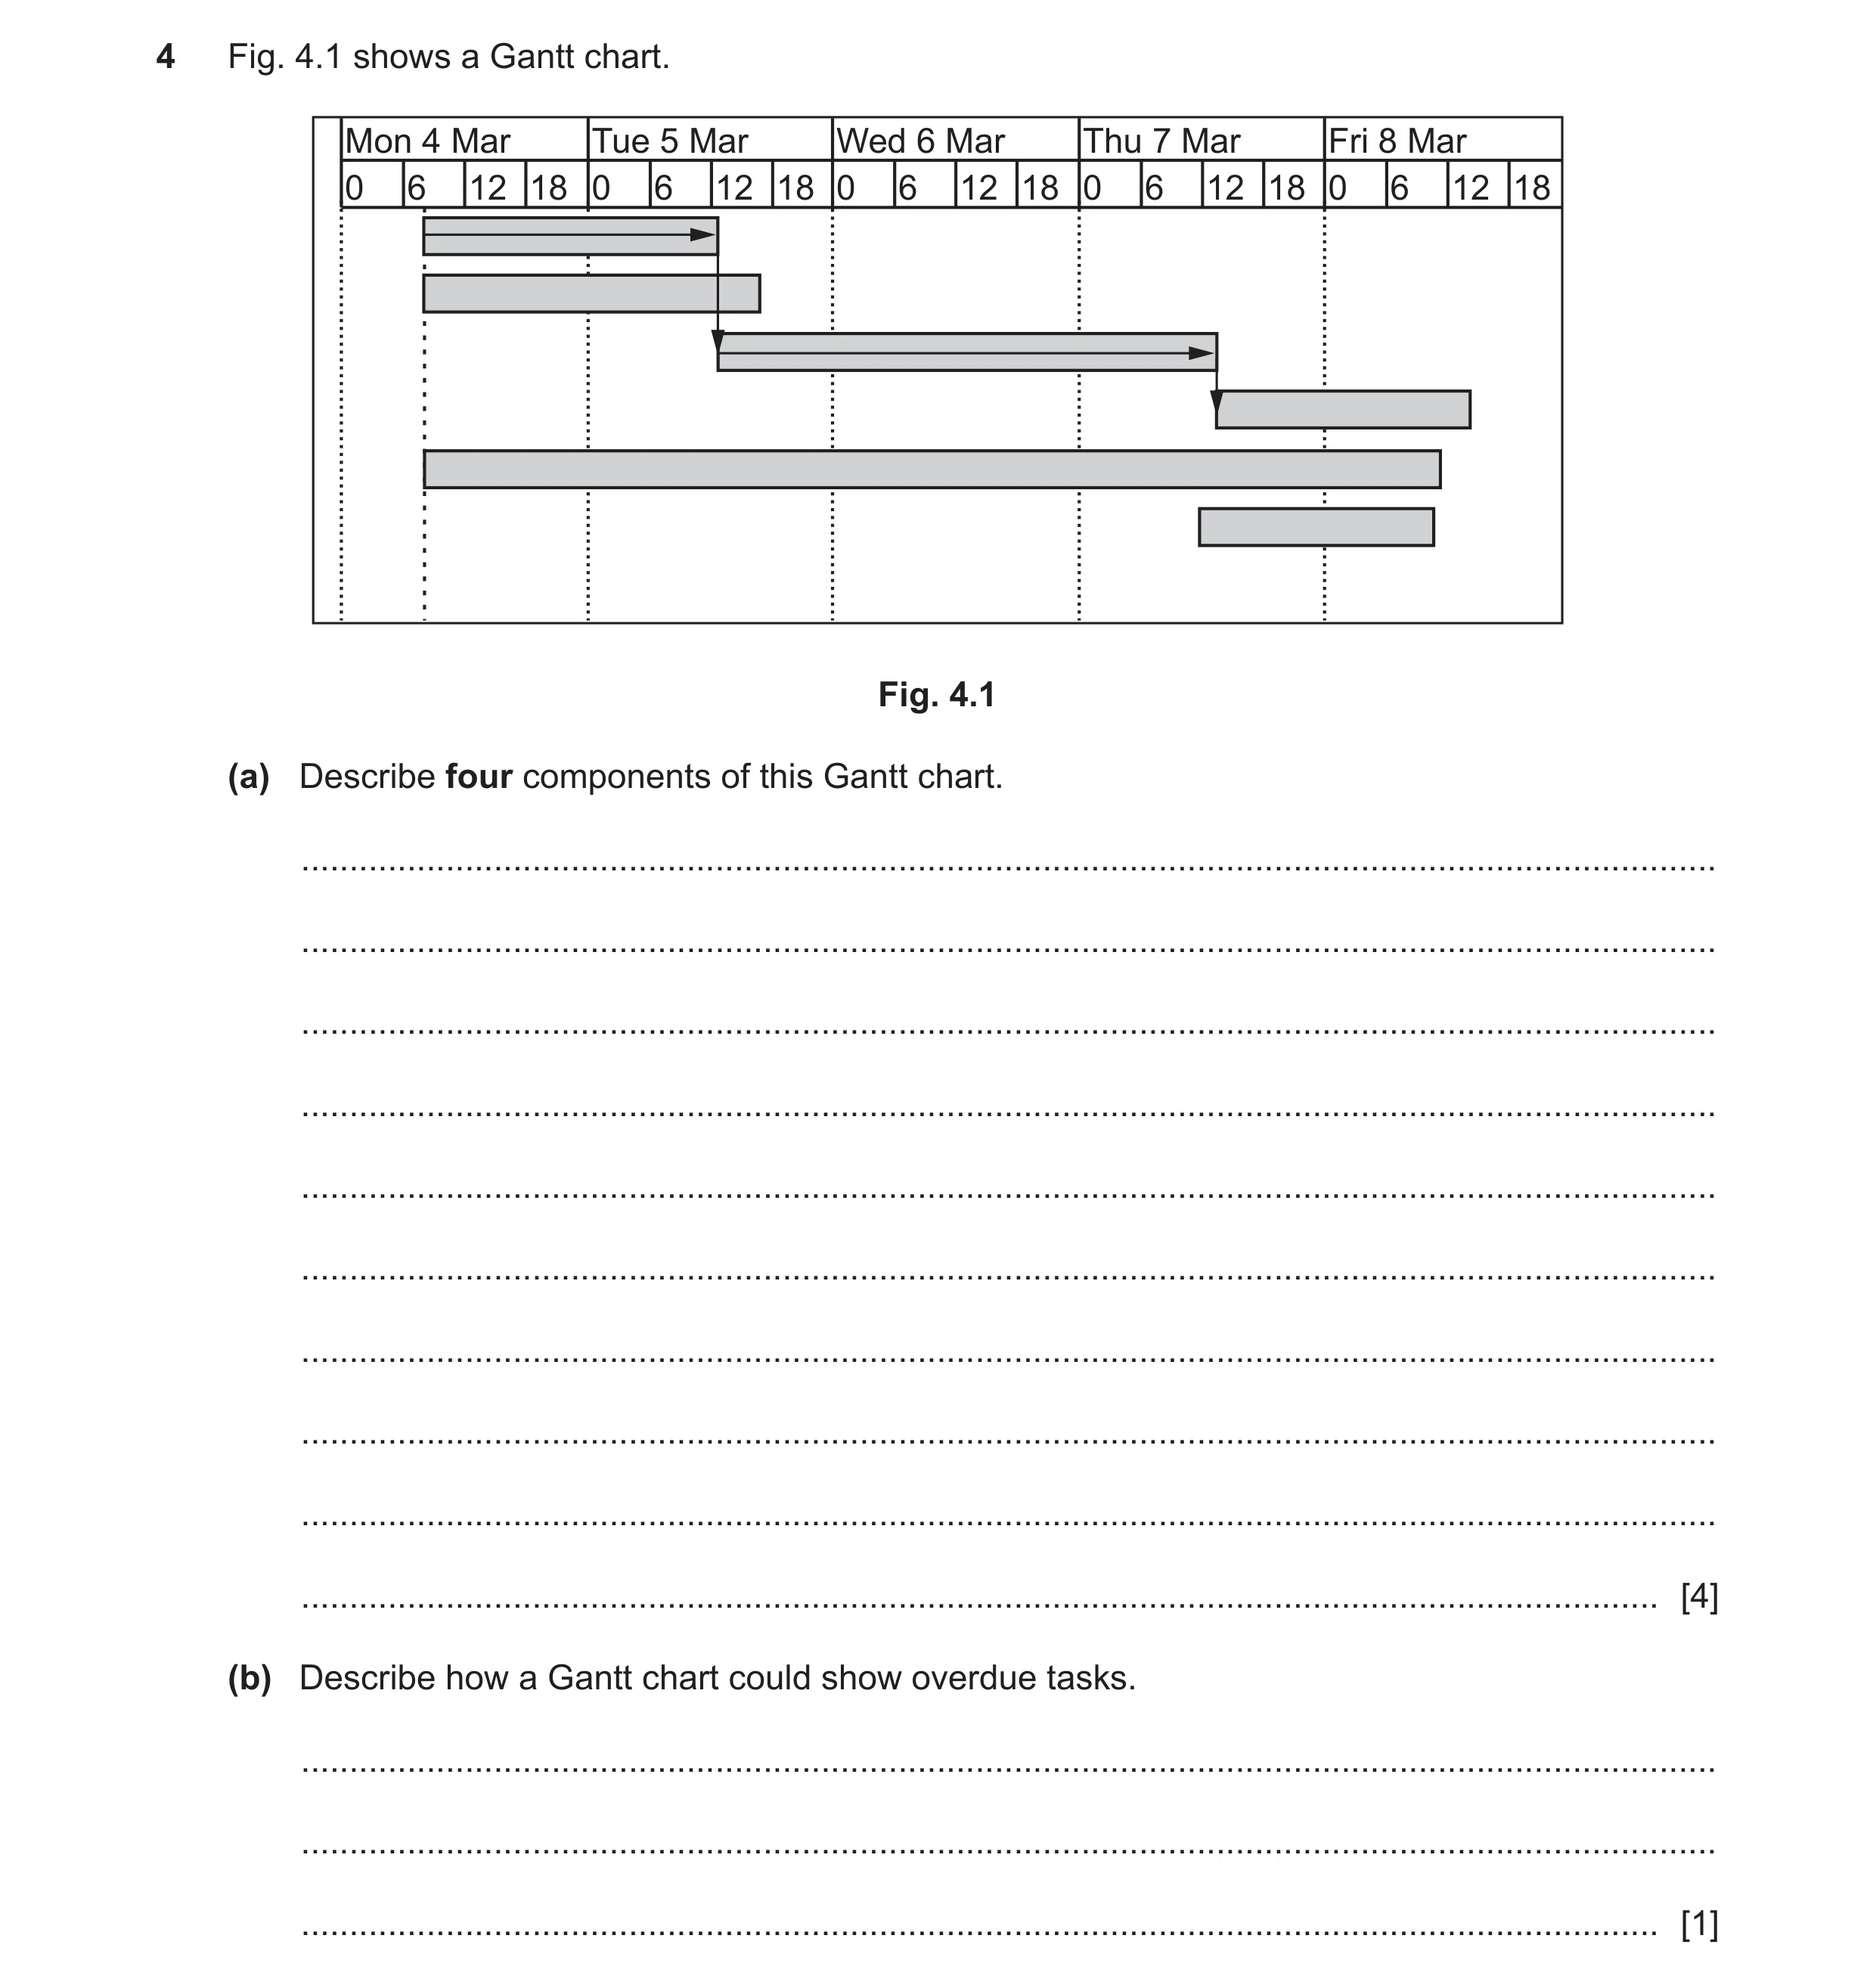
4 Fig. 4.1 shows a Gantt chart. Mon 4 Mar Tue 5 Mar Wed 6 Mar Thu 7 Mar Fri 8 Mar 0 6 12 18 0 6 12 18 0 6 12 18 0 6 12 18 0 6 12 18 Fig. 4.1 (a) Describe four components of this Gantt chart. … … … … … … … … … … [4] (b) Describe how a Gantt chart could show overdue tasks. … … … [1]
5 marks
Mark scheme: 4(a) Four from: 4 Timeline for displaying/showing the duration in hours, days, weeks, months and quarters Milestone to show a due date/finish of a phase of a project Bars to show full duration of tasks Arrows to show dependencies of tasks Critical path shown by arrows Dateline showing the current date/time. 4(b) One from: 1 E.g. Use of a percentage bar within the task bar Use of a red line on the chart Different colours of bars can be used.
This question in 9626/33 May/June 2021
Q16 · Gantt charts are used in project management 9626/31 Oct/Nov 2021
9 Gantt charts are used in project management. Describe the features of a Gantt chart. … … … … … … … … … … … … … … [6]
6 marks
Mark scheme: 9 Six from e.g.: 6 Timeline/table to show the times/schedule/progress for each task Timeline/table to show subtasks Timescale to represent time intervals for chart in days/weeks/months/hours Current date to show today’s date on the chart Milestones shown as checkpoints/task completion dates (Gantt) bar showing task as graphic representing task duration Bars showing planned start/end dates Labels/notes/bars showing contingency/slack time Colours representing e.g. finished/completed tasks Annotations/lines representing critical path.
This question in 9626/31 Oct/Nov 2021
Q17 · Gantt charts are used in project management 9626/33 Oct/Nov 2021
9 Gantt charts are used in project management. Describe the features of a Gantt chart. … … … … … … … … … … … … … … [6]
6 marks
Mark scheme: 9 Six from e.g.: 6 Timeline/table to show the times/schedule/progress for each task Timeline/table to show subtasks Timescale to represent time intervals for chart in days/weeks/months/hours Current date to show today’s date on the chart Milestones shown as checkpoints/task completion dates (Gantt) bar showing task as graphic representing task duration Bars showing planned start/end dates Labels/notes/bars showing contingency/slack time Colours representing e.g. finished/completed tasks Annotations/lines representing critical path.
This question in 9626/33 Oct/Nov 2021
Q18 · Analyse the use of the critical path method in project management 9626/32 May/June 2022
9 Analyse the use of the critical path method in project management. … … … … … … … … … … … … … … … … … … … … [8]
8 marks
Mark scheme: 9 Analyse: examine in detail to show meaning, identify elements and the relationship between them. Max two from: Method of scheduling tasks in a project Used to determine longest path/route through a project/how quickly a project can be completed Eight from: Reduces the risk of delays by involving all managers in details of planning so all are aware of the overall project details Allows resources required for each activity to be made available at the appropriate time which reduces costs Task/activities can be scheduled in parallel/simultaneously to reduce overall duration of project Determines/shows the dependencies of the activities/tasks… …so focus can be on the critical ones to improve chances of project success/activities that are required before others can start can be prioritised Use of ‘floats’ in timings can accommodate/allow for unexpected delays/minimise effect of unexpected external factors Complex activities/tasks are difficult to represent on a network diagram/diagram becomes very large and difficult to comprehend easily Charts/diagrams for large projects may be difficult to access easily away from office computers/on mobile devices External factors may change so the critical path analysis has to be redone/amended/may no longer apply Relies on estimates of task/activity duration so whole process can be invalid if estimates are wrong/inaccurate Resource details are limited so other methods of charting resources need to be used.
This question in 9626/32 May/June 2022
Q19 · A Work Breakdown Structure (WBS), included in the Performance Evaluation and Review… 9626/32 Feb/March 2023
7 A Work Breakdown Structure (WBS), included in the Performance Evaluation and Review Technique (PERT), is created during the planning of a project. (a) Explain the purpose of a WBS. … … … … … … [2] (b) Describe the characteristics of a well designed WBS. … … … … … … … … … … [4]
6 marks
Mark scheme: 7(a) Two from: 2 • Hierarchical/layered/graphical description of the scope of a project/project scope to show to e.g., stakeholders/project participants/developers/management/team leaders • Describes in detail all the work required in all the stages of a project so that everyone knows what is/has to be done • Describes the planned outcomes of the project so that they can be tested/evaluated in later stages • Each layer describes all/100% of layers below/following it so that it is known what is/has been done to reach the stage. 7(b) Four from: 4 • Content/descriptions can be easily understood by all participants • Content/work can be managed/divided into manageable units – Content/work units independent/separate from each other o so work/responsibility can be assigned to individuals o so can be clearly assigned to individuals • Duration of work can be estimated/shown giving time for completion/allowing costs to be determined • Content/work is measurable allowing start/end dates/time to be estimated calculated • Content/work units can be integrated/collected together with other units to create whole project • WBS is adaptable to cope with amendments/alterations/changes to project scope.
This question in 9626/32 Feb/March 2023
Q20 · Describe each of these project management terms 9626/32 May/June 2023
8 Describe each of these project management terms. (a) dependencies … … … … … … [2] (b) deliverables … … … … … … [2] (c) tasks … … … … … … [2]
6 marks
Mark scheme: 8(a) Two from: 2 The reliance of one project entity/task/activity upon another Link between tasks (in a project) Can be resource-based where e.g. not enough personnel/machinery/devices/space to carry out both task simultaneously/only one set of resources available Can be logical-based where e.g. one task has to carried out before another/enables the start of next task e.g. create design before assembly/implementation before testing Can be due to preferences of project manager for one task to be before another/one task to follow another e.g. create logo before slogan. 8(b) Two from: 2 A tangible/physical/intangible/logical output/goods/service/outcome Created/produced as a result of a project Created/produced from work/activity/task during a project Must be a product agreed by internal/external stakeholder(s) Must help to achieve the objectives of the project. 8(c) Two from: 2 (Collection of) activities Produces an outcome/deliverable/completes a project Definable part/component/process (of a project) Must be completed in a set time frame Related single/complete units of work Related (within a project) Derived from/defined by the stated deliverables.
This question in 9626/32 May/June 2023
Q21 · A project to create a new computer game has been divided into the tasks shown in the table 9626/32 Oct/Nov 2024
4 A project to create a new computer game has been divided into the tasks shown in the table. Task Follows on Expected duration Task number from task(s) (weeks) 1 Design the game 6 2 Code the game 1, 4 18 3 Test the game code 2 13 4 Create the user interface for the game 1 12 5 Release the game to the public 3, 7 6 6 Design the documentation for the game 1 6 7 Create the documentation for the game 6 20 (a) Using the information in the table, draw a PERT (Performance Evaluation and Review Technique) chart for the project in the space below: [5] (b) Describe the benefits of using a PERT chart. … … … … … … … … [3]
8 marks
Mark scheme: 4(a) Five from: 5 • Correct / appropriate / accepted symbol used for tasks 1 mark • All tasks shown / labelled with name / task number 1 mark • All tasks shown with duration 1 mark • At least 3 tasks correctly linked 1 mark • All tasks correctly linked 1 mark • Task 2 shown dependent on / following both tasks 1 and 4 1 mark An example PERT is: 4(a) Accept alternative symbols for nodes. e.g.: Accept alternative types of PERT charts. 4(b) Three from: 3 • (Clearly) identifies the dependencies between tasks / simultaneous / concurrent tasks • Can show / display / enable calculation of the critical path • Can show / display timing variations in each task • Can enable calculation of float within / whole task • Can help to coordinate / organise tasks within a project.
This question in 9626/32 Oct/Nov 2024
Q22 · Performance Evaluation and Review Technique (PERT) charts are used when planning a project 9626/32 Feb/March 2025
6 Performance Evaluation and Review Technique (PERT) charts are used when planning a project. (a) Describe each of these components of a PERT chart. (i) float … … … [1] (ii) milestone … … … [1] (b) In a project, tasks are linked to each other by dependencies. (i) One type of dependency is when a task cannot start until other tasks are fully completed and finished. Describe two other types of dependency that can be found in a project. … … … … … … [2] (ii) Describe two uses of dependencies in PERT charts. … … … … … … [2]
6 marks
Mark scheme: 6(a)(i) One mark per bullet point to a maximum of one mark. 1 • contingency time • amount of time a task can be delayed before affecting the start time of next task / dependent tasks • amount of time a project can be delayed without affecting the final finish time. 6(a)(ii) One mark per bullet point to a maximum of one mark. 1 • point in time (in a project) when tasks / activities / criteria are met / reference point • marker at significant point / stage in project / change in project conditions. 6(b)(i) One mark per bullet point to a maximum of two marks. 2 • Finish-to-Finish dependency / task cannot end until another task also ends • Start-to-Start dependency / cannot start until another starts • Start-to-Finish dependency / one task cannot finish until another task has started. 6(b)(ii) One mark per bullet point to a maximum of two marks. 2 • shows / inform managers the order in which tasks should be carried out • enables allocation of resources • helps to avoid delays (in the project) • enables construction of Gannt charts • enables calculation of critical path.
This question in 9626/32 Feb/March 2025
Q23 · Performance Evaluation and Review Technique (PERT) charts are used when planning a project 9626/32 May/June 2025
7 Performance Evaluation and Review Technique (PERT) charts are used when planning a project. PERT charts can be drawn either as activity-on-node diagrams or as activity-on-arrow diagrams. Compare, by commenting on the similarities and differences, activity-on-node and activity-on-arrow PERT diagrams. … … … … … … … … … … … … … … [6]
6 marks
Mark scheme: 7 SIX from: 6 b FIVE from: Similarities: • both are graphical representations • Both show tasks (needed to complete a project) • Both show the order of tasks • Both show milestones in a project • Both have start / end points • Both show timings • Both used arrows / arrowed connectors to show flow of a project • both can show the critical path through a project • both show dependencies Max FIVE from: Differences: • activity-on-node diagram shows tasks at the node (1st) – in boxes (1) – containing timings (1) • activity-on-arrow diagram shows milestones at the nodes (1st) – in circles (1) • activity-on-arrow diagram shows tasks on the arrows Max FIVE from: Comparisons: • Activity-on-node diagrams focus on the tasks whereas activity-on-arrow diagrams focus on the milestones • Is only one PERT chart for the project with activity-on-node // can have multiple sub-PERTS with activity-on-arrow • Calculating critical path is easier with activity-on-node • Activity-on-node diagrams are less cluttered / easier to read / understand / interpret (than activity-on-arrow diagrams) • Activity-on-node diagrams are easier to insert tasks / amend / change / add to (than activity-on-arrow diagrams)
This question in 9626/32 May/June 2025
Q24 · The Critical Path Method (CPM) and Gantt charts are used in project management 9626/32 Oct/Nov 2025
3 The Critical Path Method (CPM) and Gantt charts are used in project management. Compare CPM with Gantt charts. Your answer must include both similarities and differences. … … … … … … … … … … … … [5]
5 marks
Mark scheme: 3 Five from: 5 Max 4 from: Similarities: Both: • Are visual / graphical representations of project • Show routes through project / tasks • Show timings / durations of tasks • Show total time of project • Show dependencies between tasks • Can show milestones • Can show critical path Max 4 from: Differences: • CPM shown as network diagram with linked nodes // Gantt is horizontal bar chart • CPM shows critical and non-critical paths • CPM calculates project duration / Gantt chart shows // visualizes how project progress • CPM does not show required resources // Gantt chart does / can show required resources • CPM show activities on network diagram without timescale // Gantt chart plots activities on a timescale
This question in 9626/32 Oct/Nov 2025
Q25 · A work flow shows how a task is carried out and completed in a project 9626/33 Oct/Nov 2025
2 A work flow shows how a task is carried out and completed in a project. (a) Describe two elements that should be included in a project work flow. … … … … … … [2] Project managers can use project management software to create and use work flows during a project. (b) Describe how work flow is used by a project manager. … … … … … … … … … … [4]
6 marks
Mark scheme: 2(a) Two from: 2 • The steps needed to complete a task / activity • The resources needed for each step • The team members / workers needed for each step • How the team members / worker interact with each other • Indication of order of tasks / jobs 2(b) Four from: 4 • Used to show critical path within a project • Used to decide / shows the order of tasks • Shows where resources should be allocated • Shows where / how / which staff / workers should be allocated • Shows when resources should be allocated / made available • Used to calculate the cost of each activity / task • Used to automatically send orders for resources • Used to generate alerts / reminders (used to link to calendar / diary of managers / team members / workers)
This question in 9626/33 Oct/Nov 2025
 3 / 27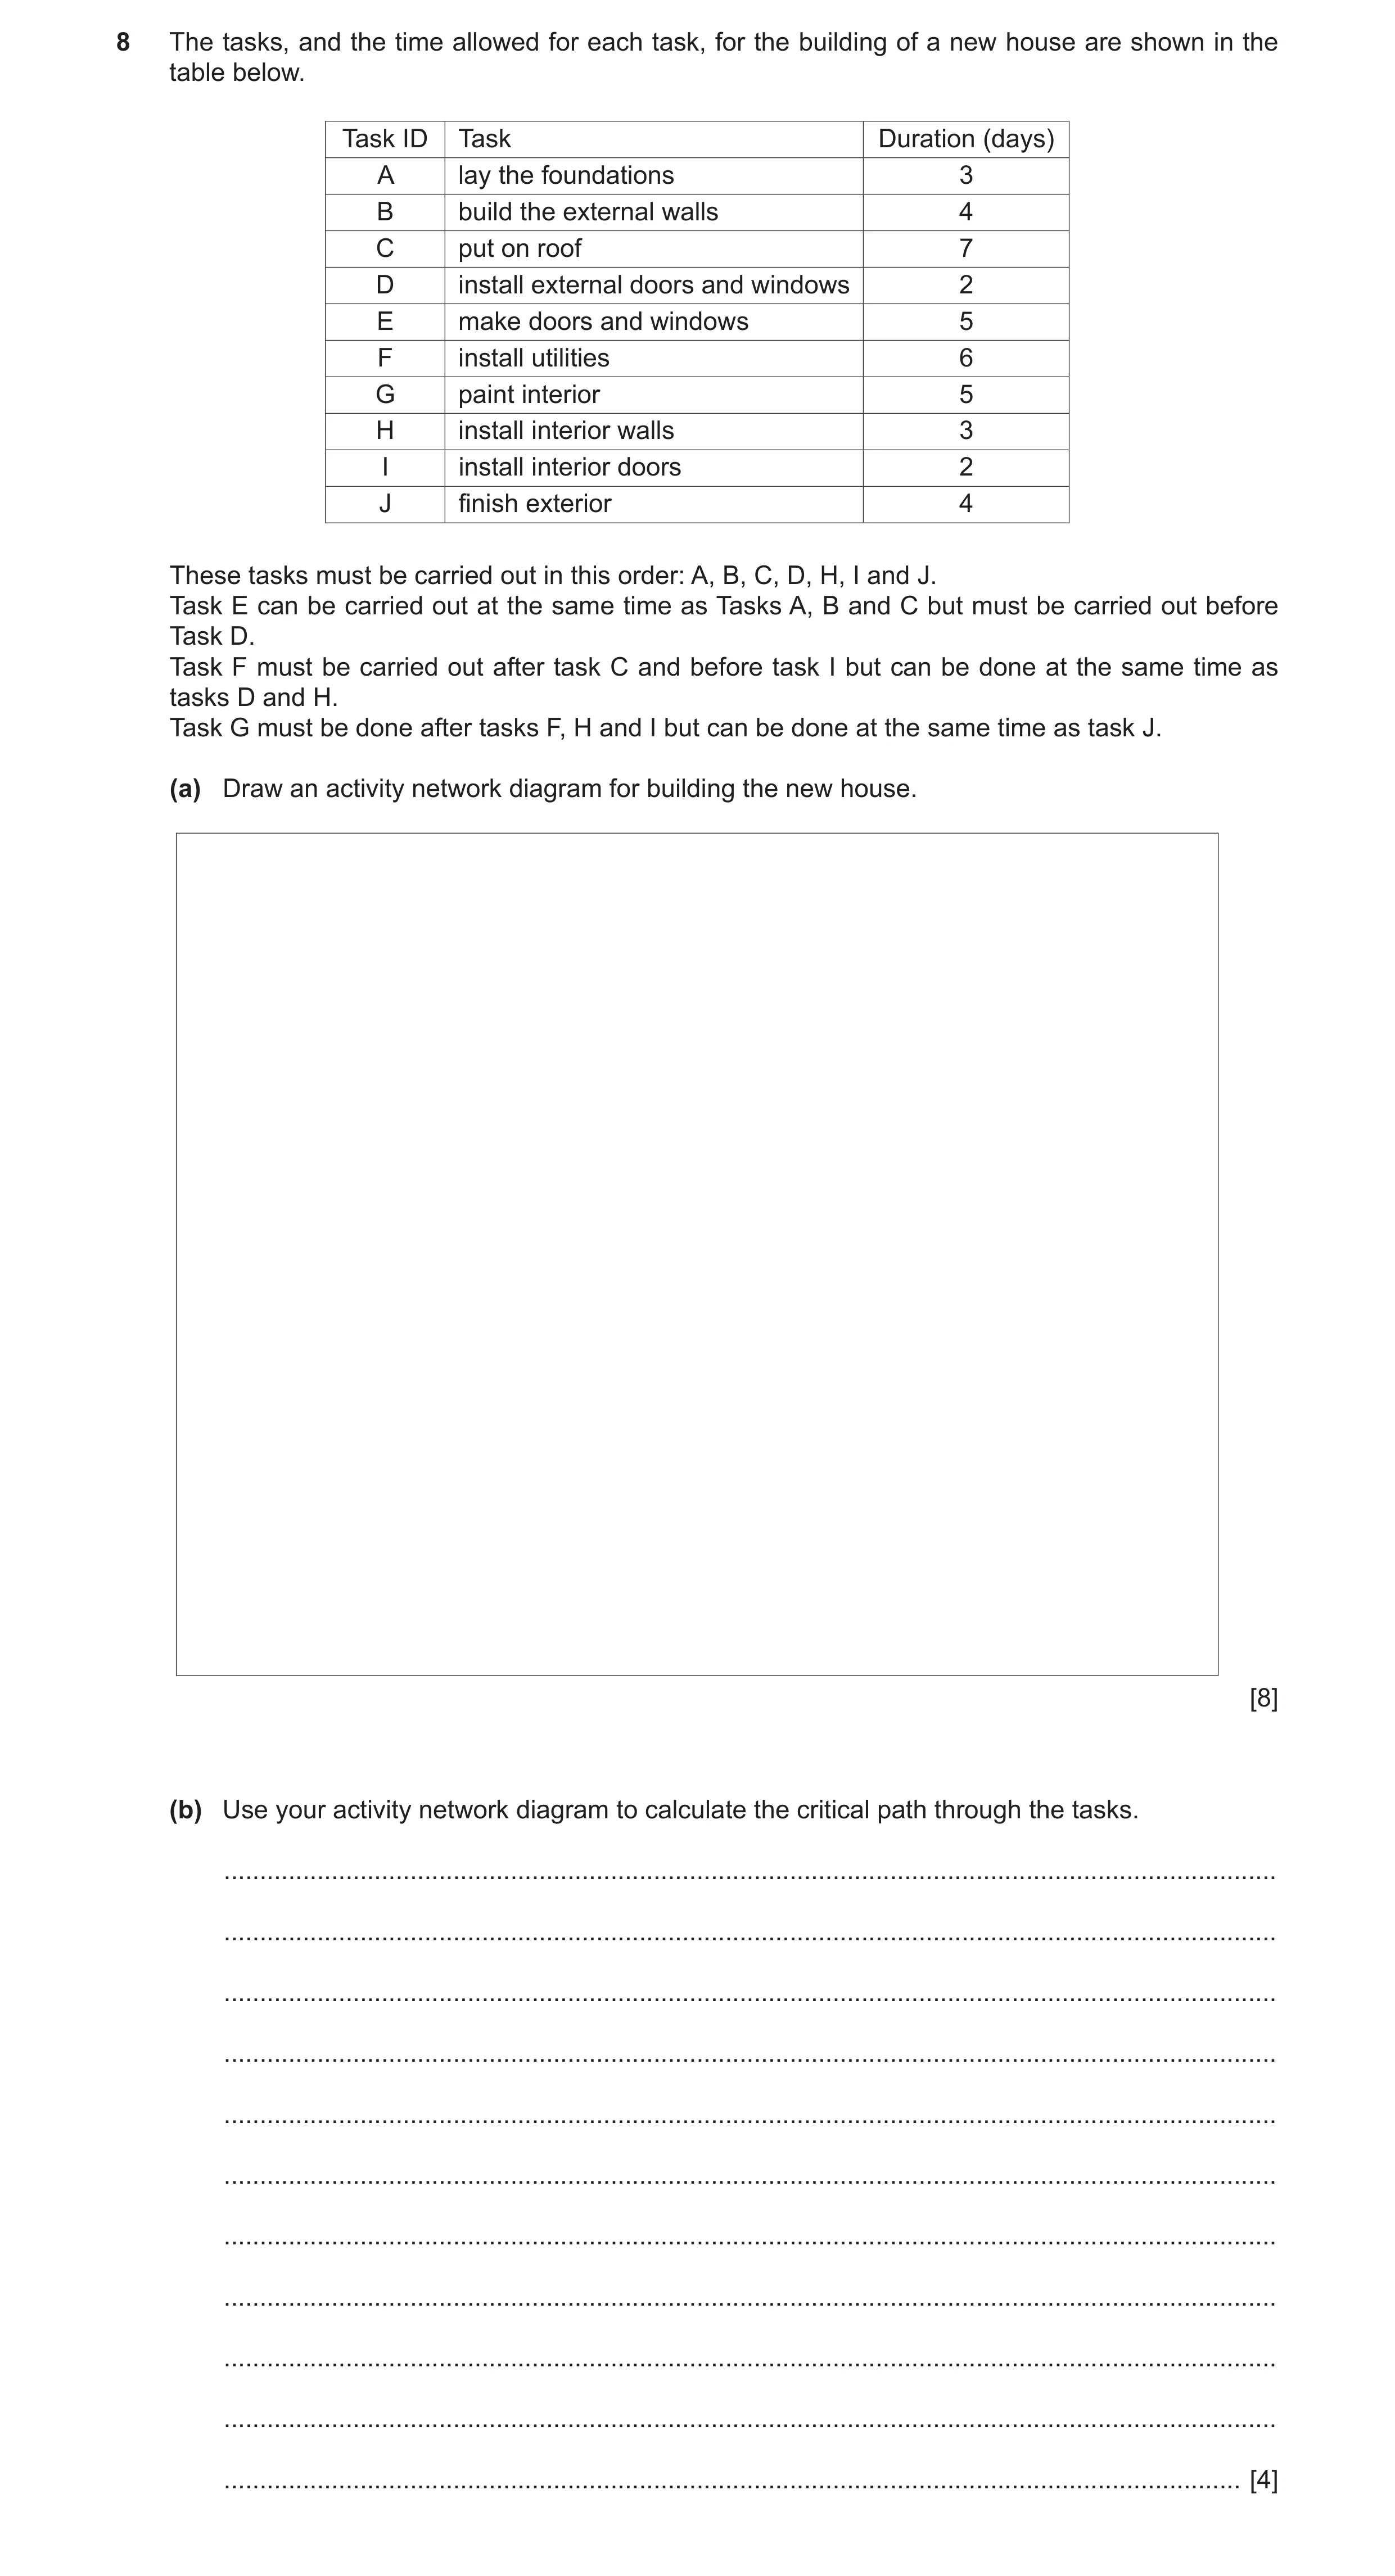
 5 / 27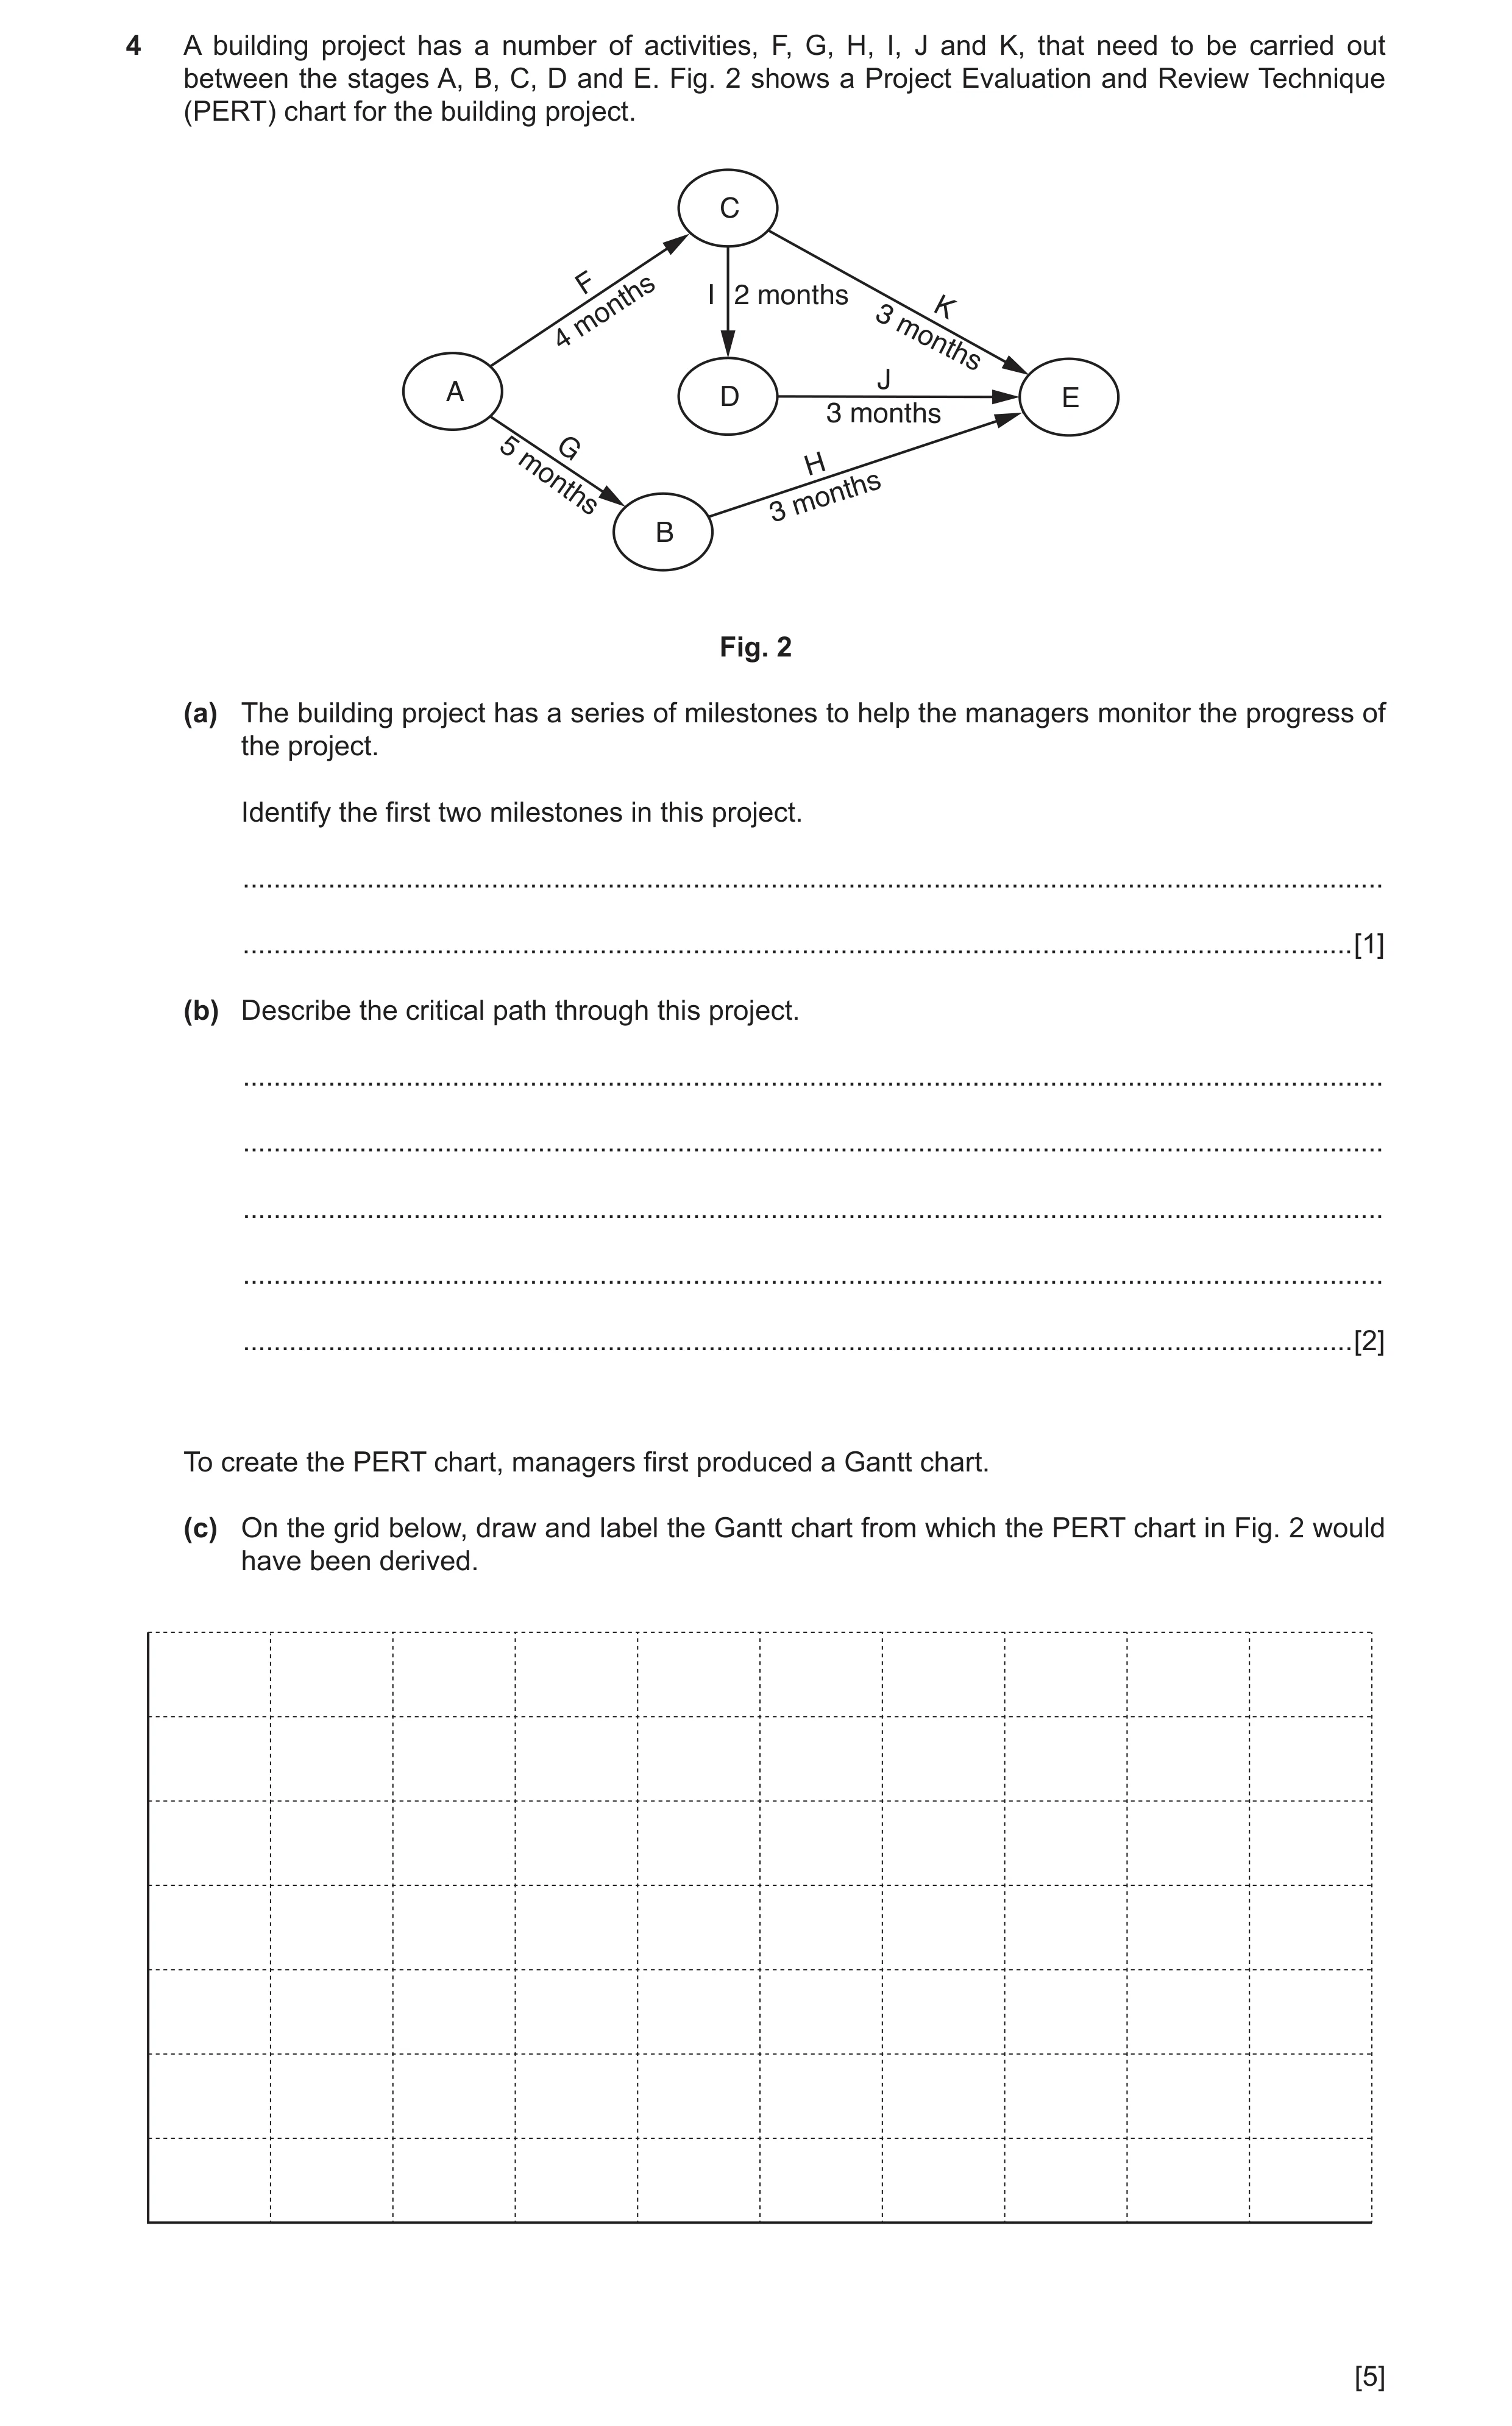
 7 / 27
 8 / 27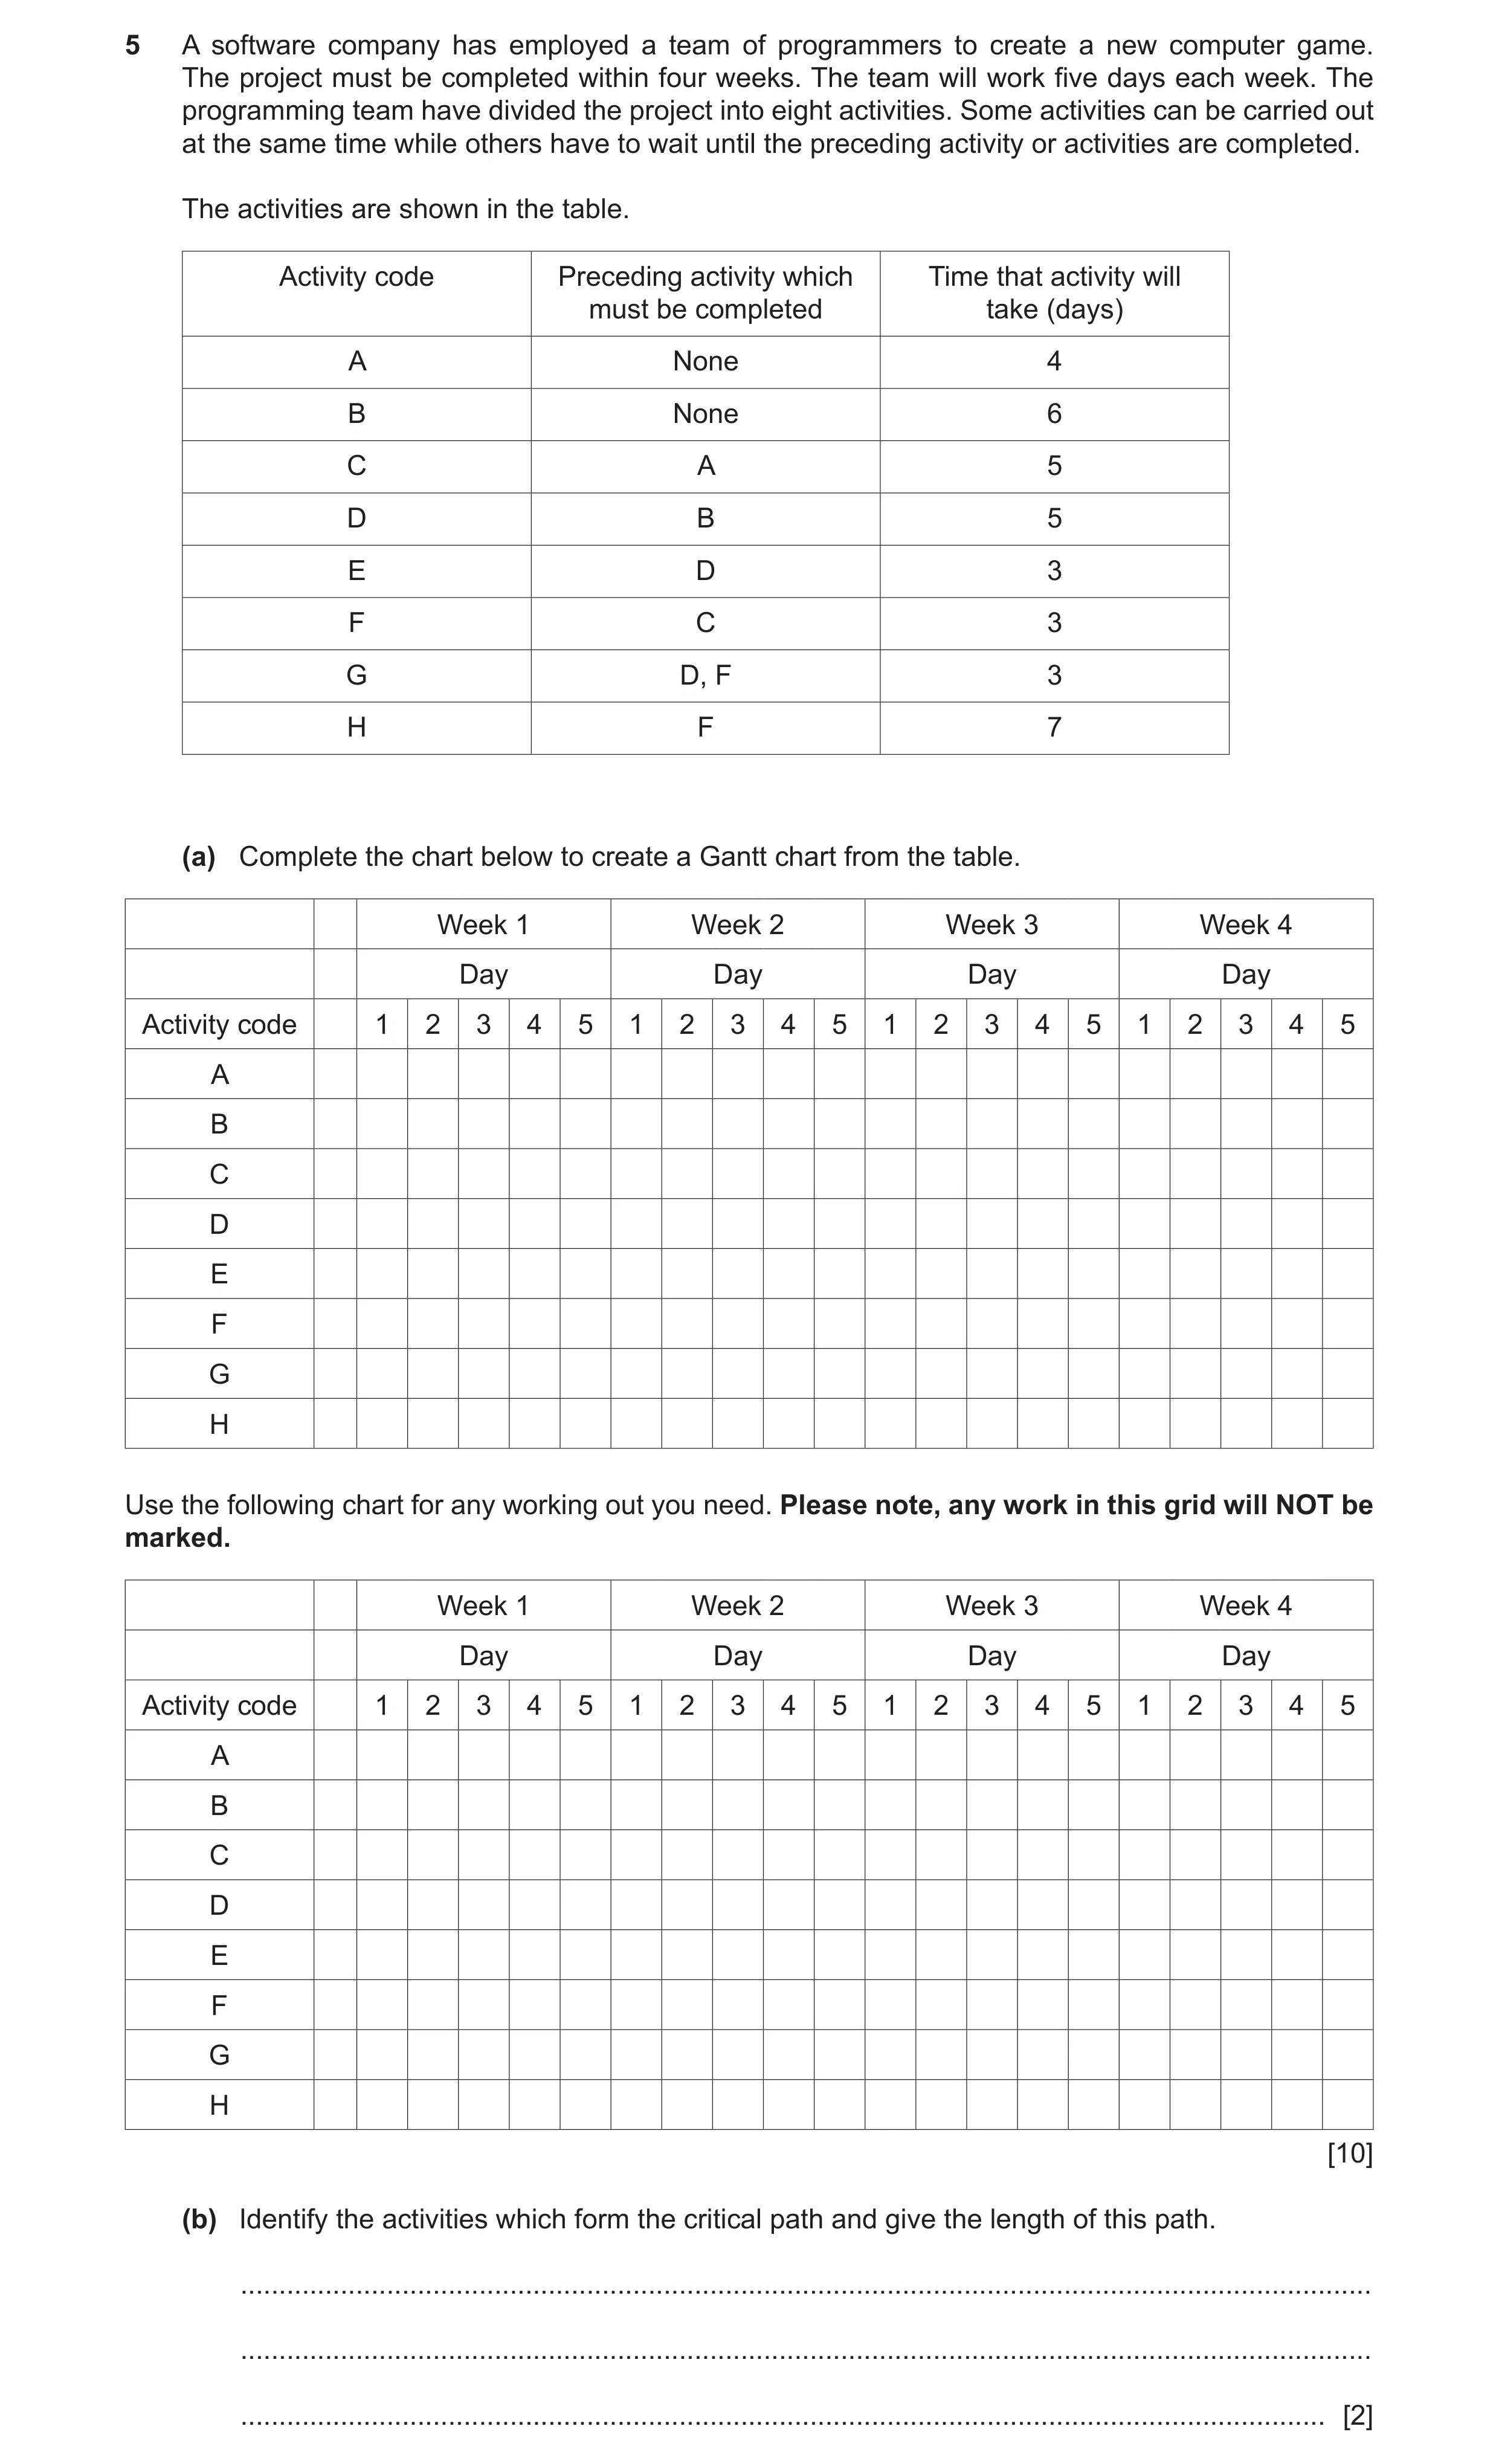
 12 / 27
 14 / 27
 15 / 27
 16 / 27
 17 / 27
 18 / 27
 19 / 27
 20 / 27
 21 / 27
 22 / 27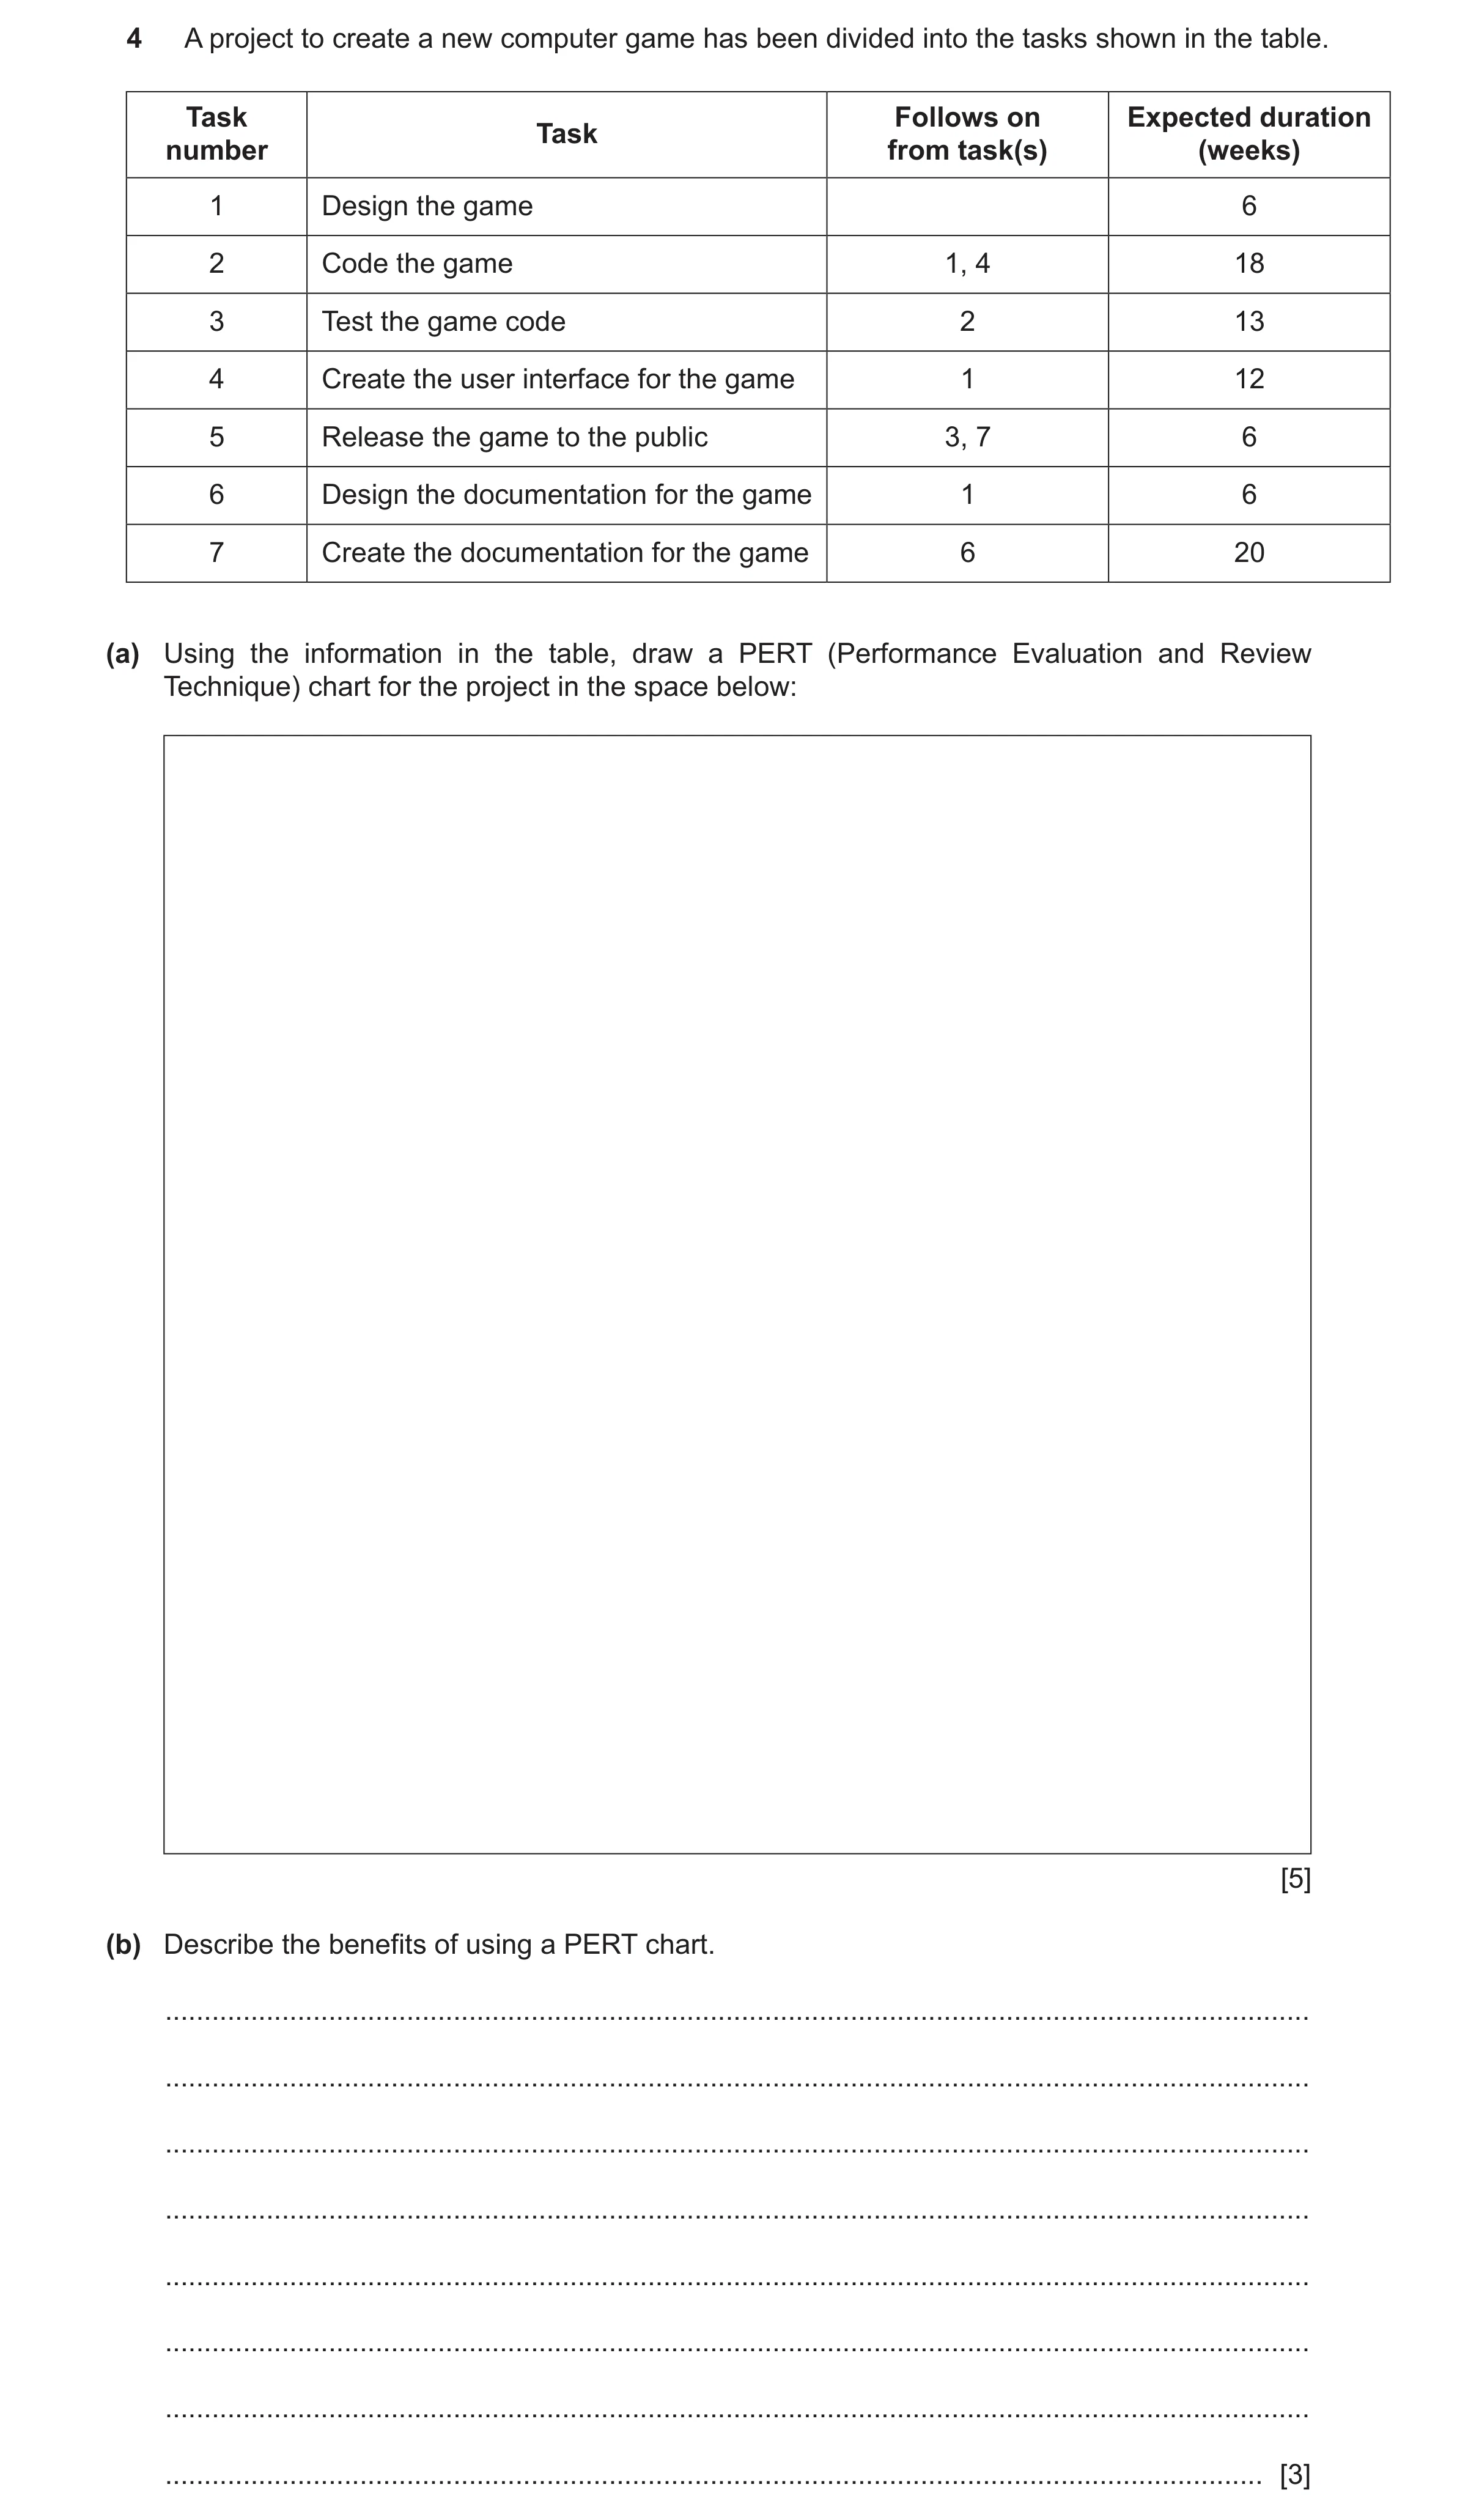
 24 / 27
 25 / 27
 26 / 27
 27 / 27
 10
10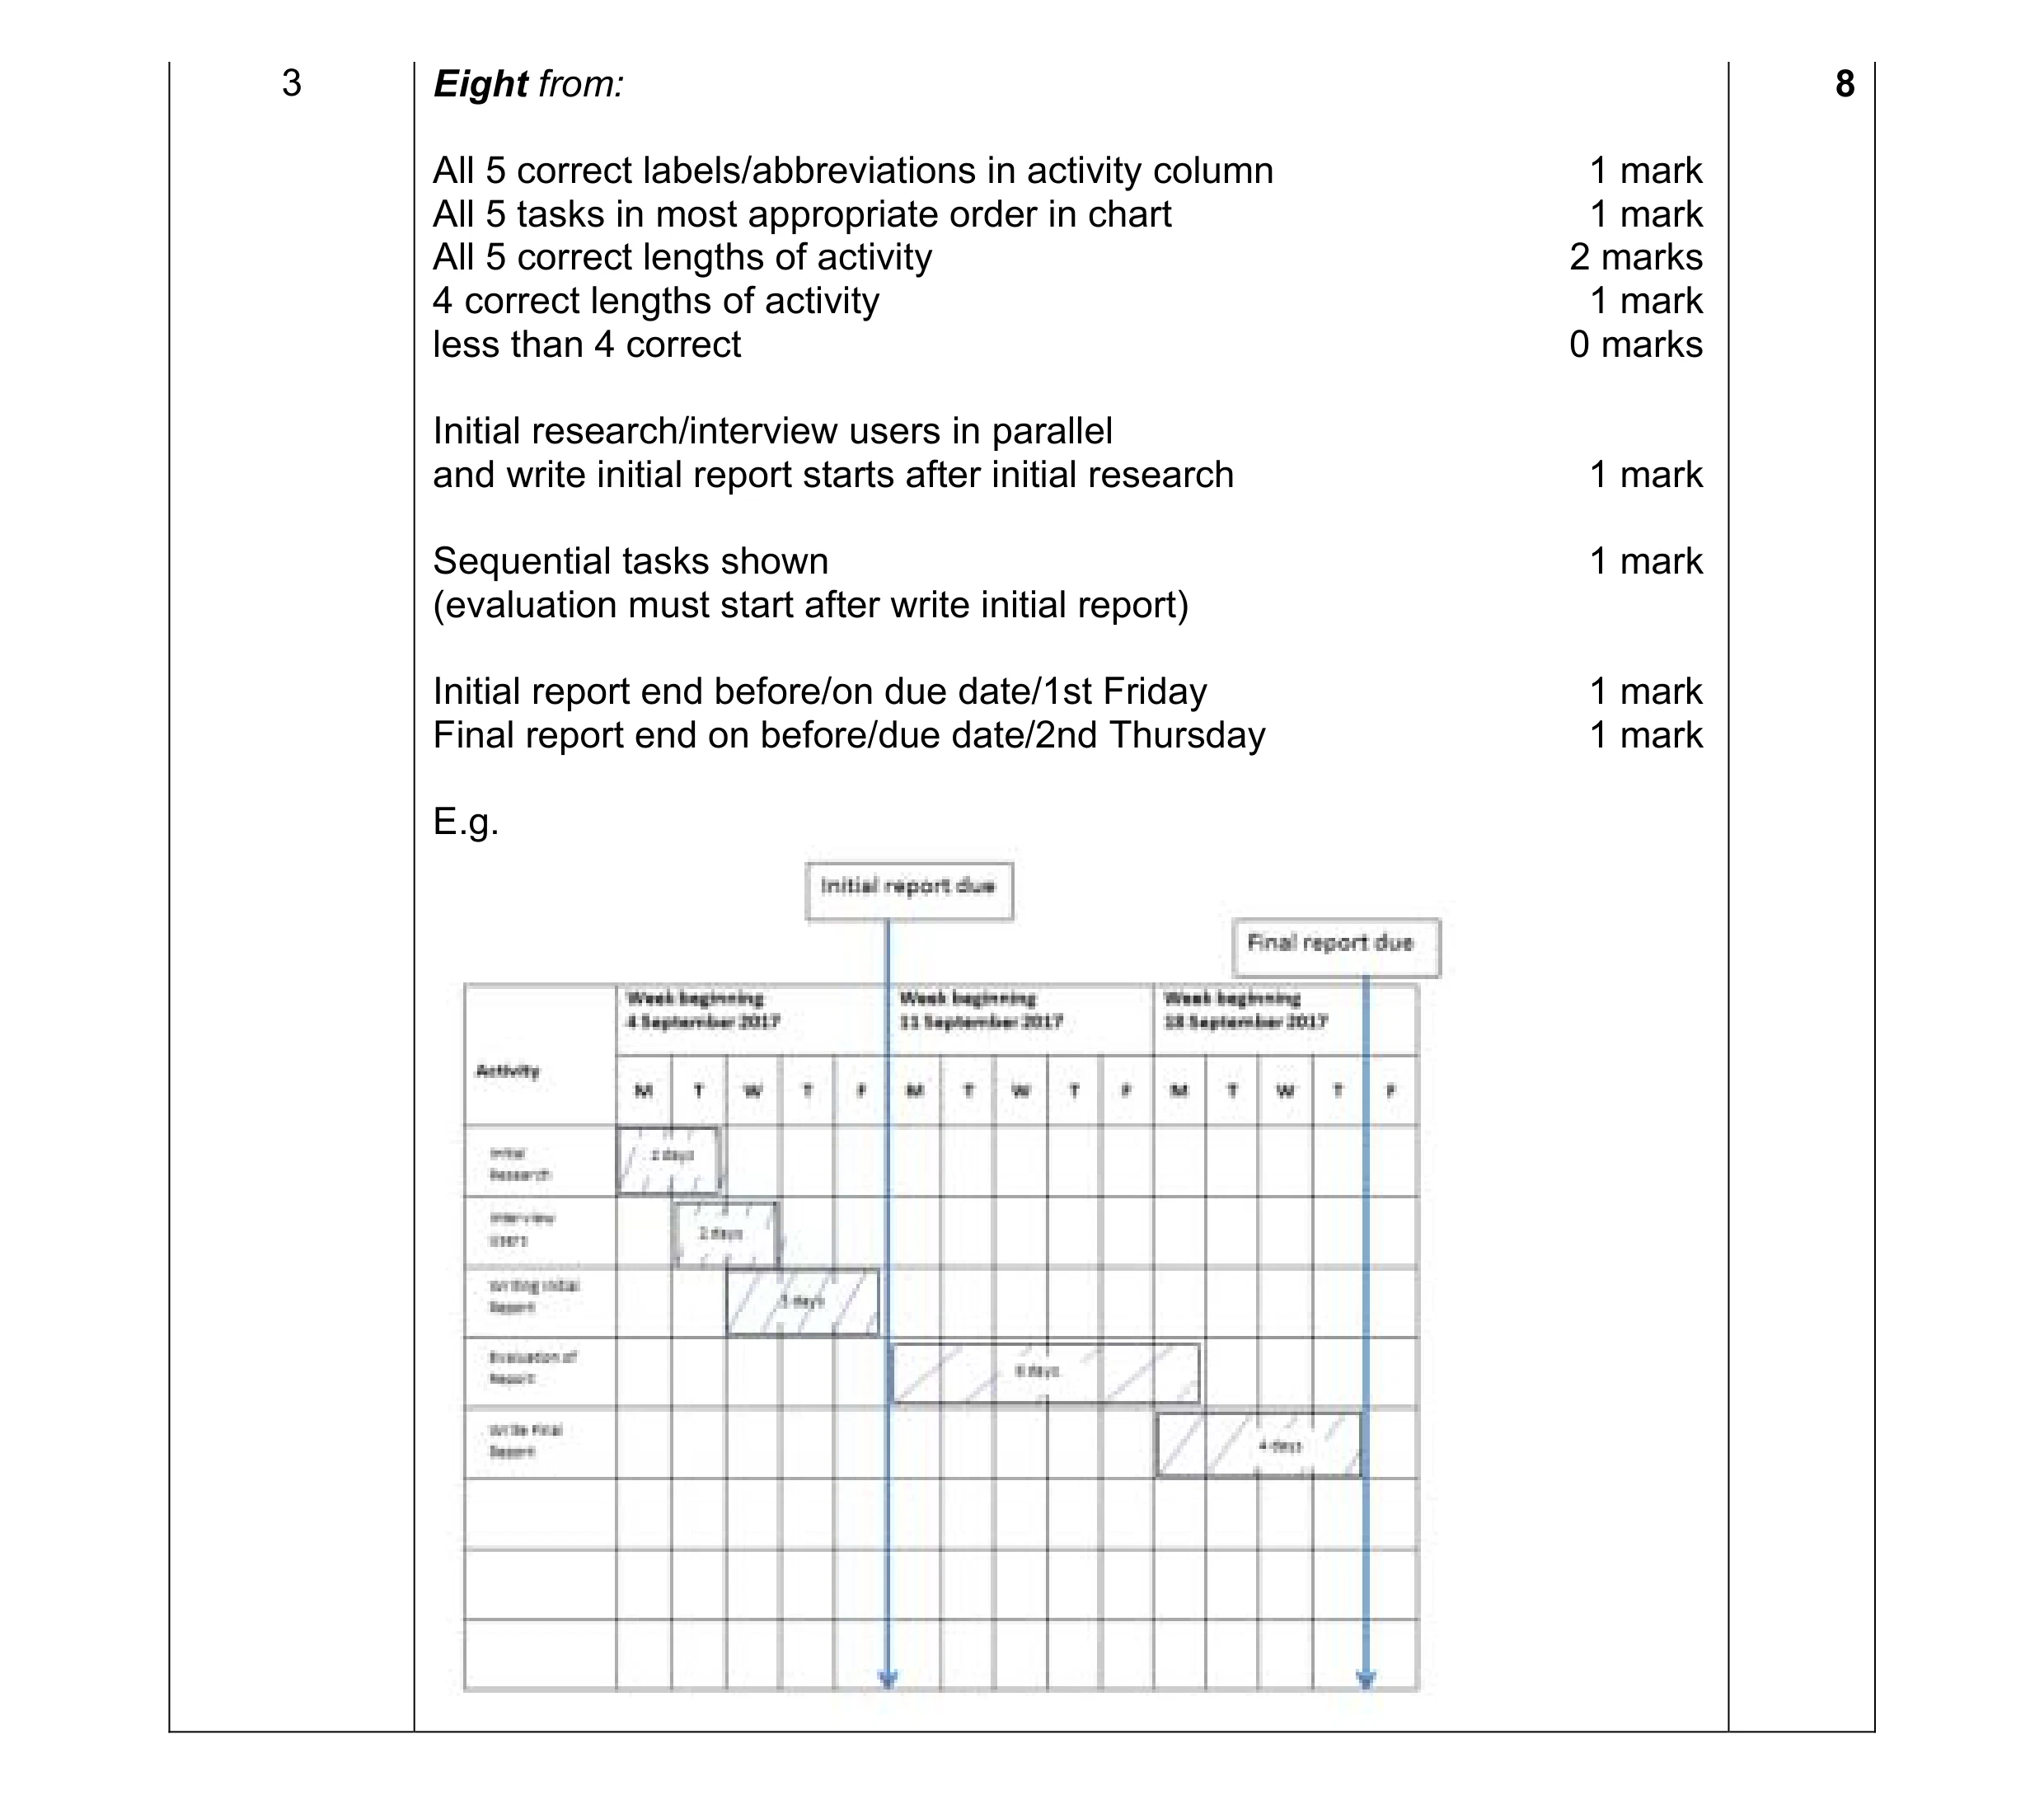 8
8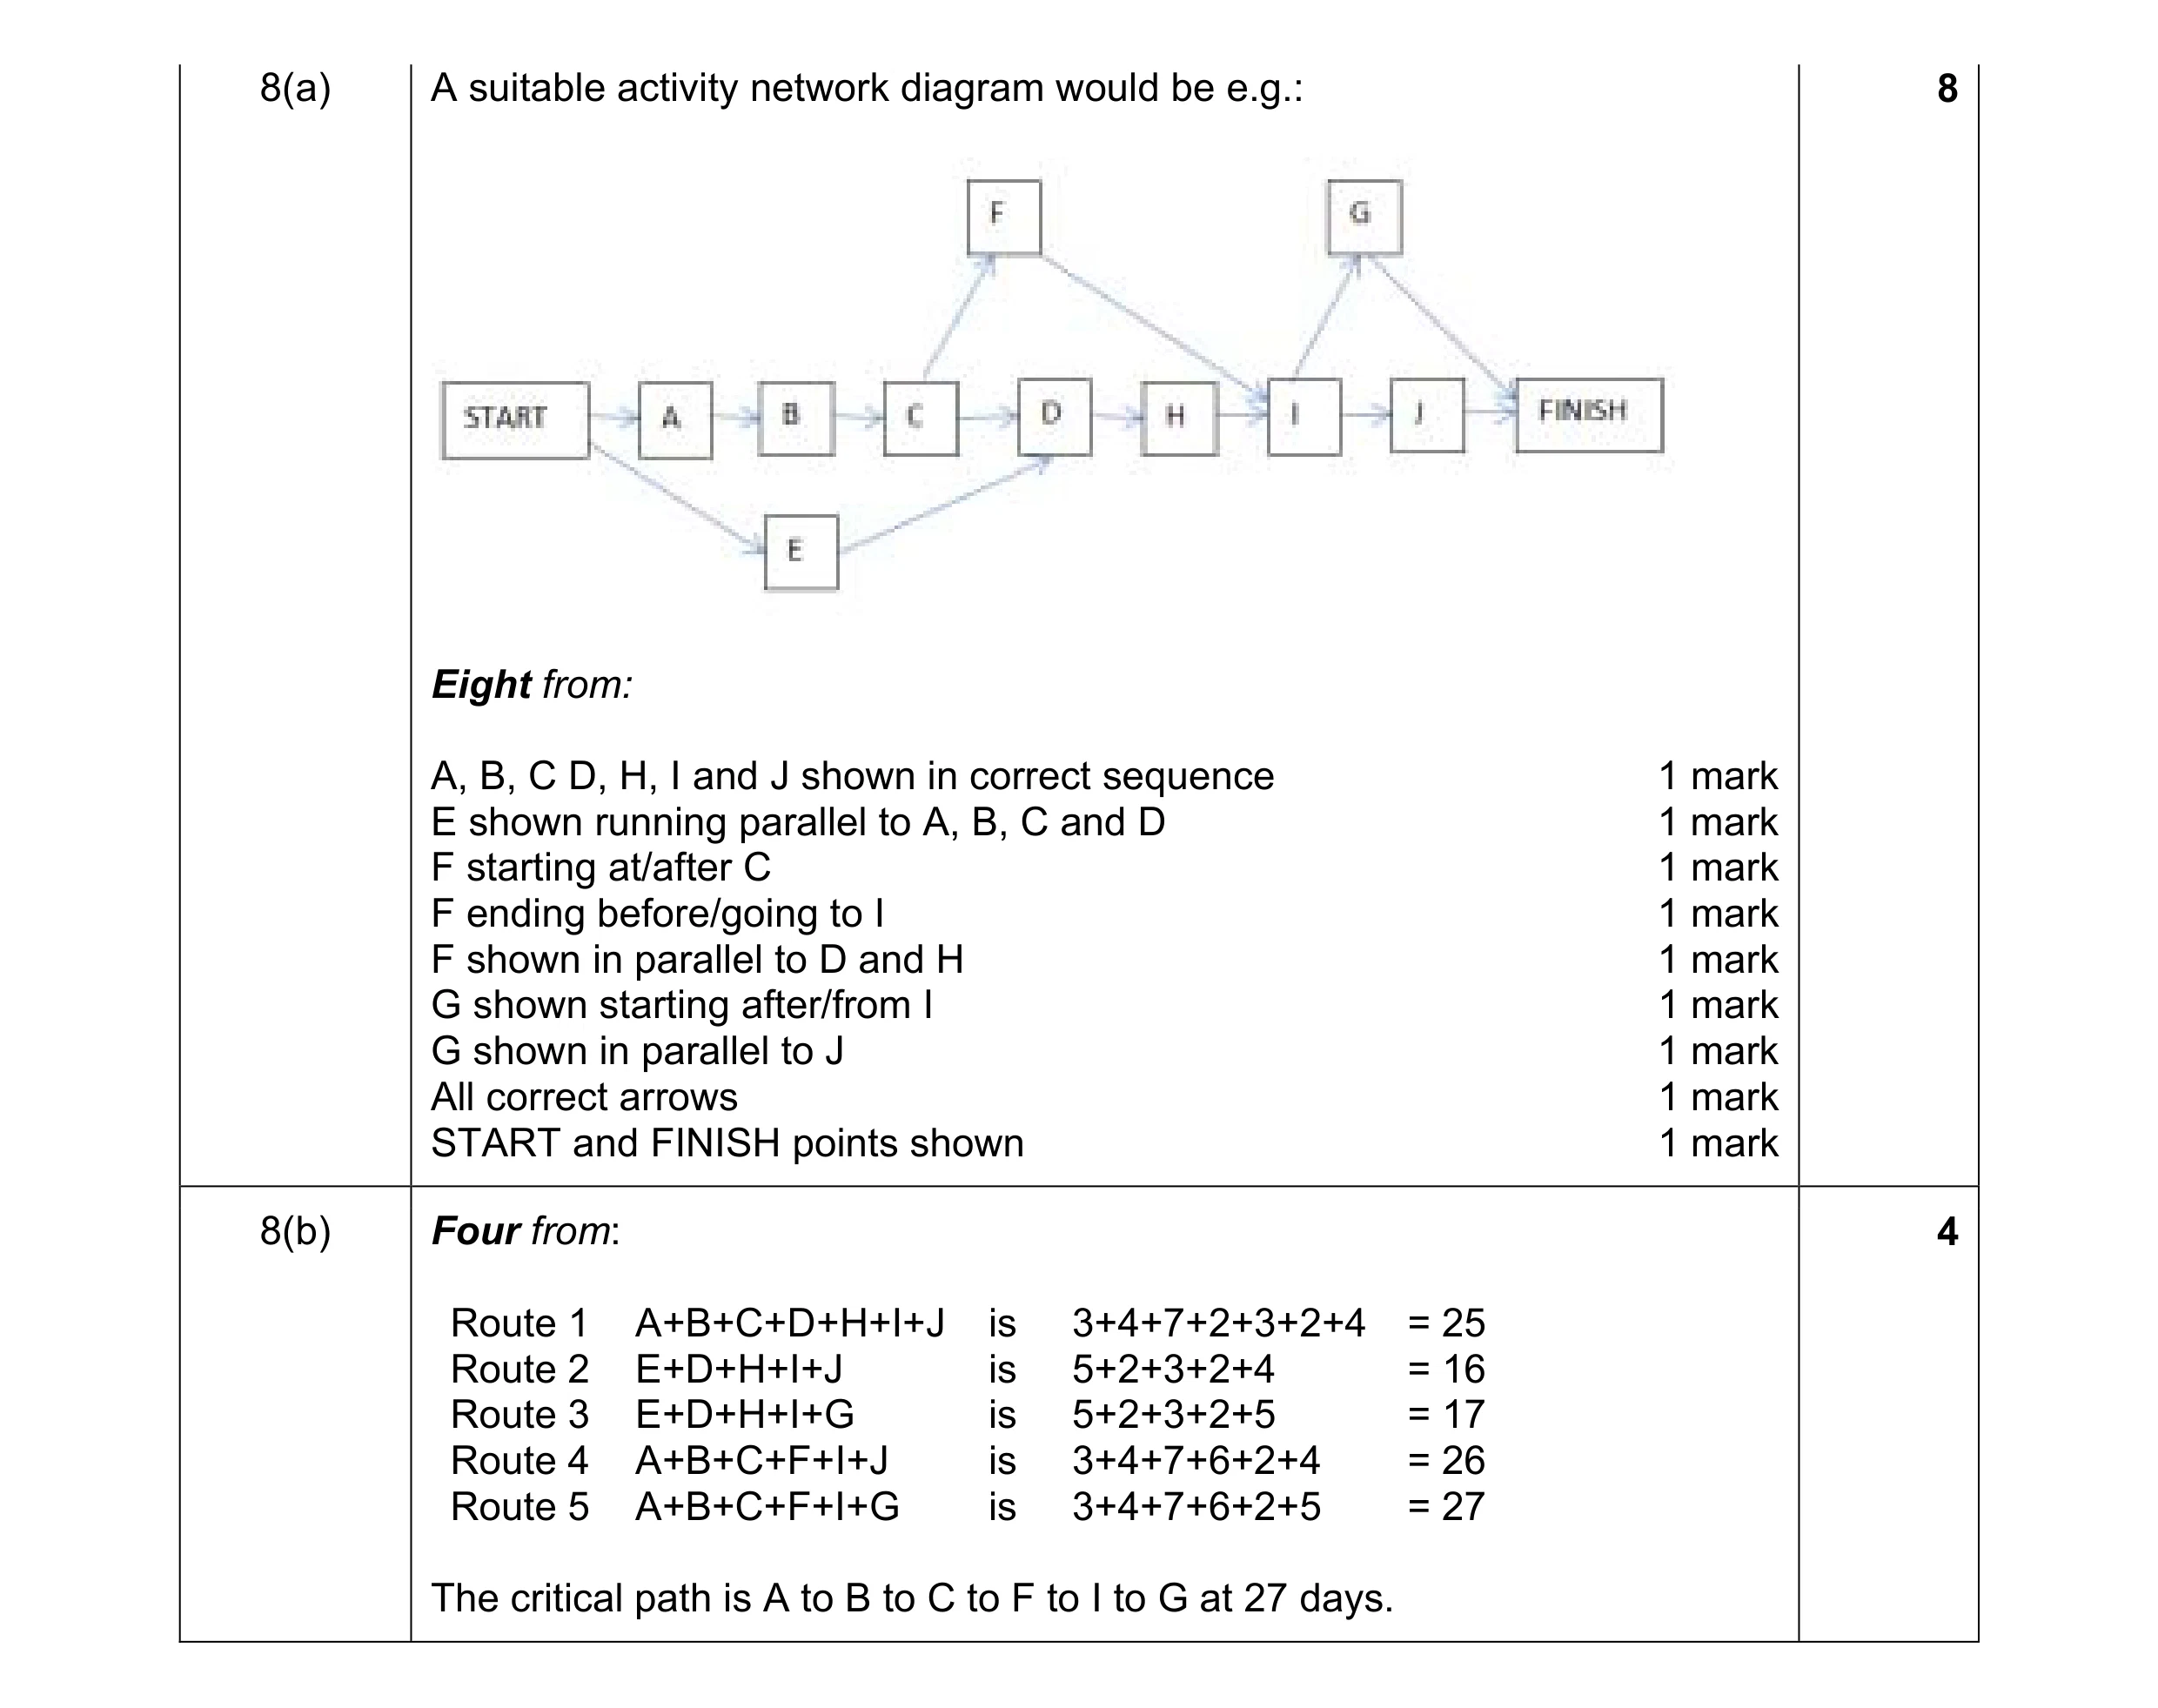 12
12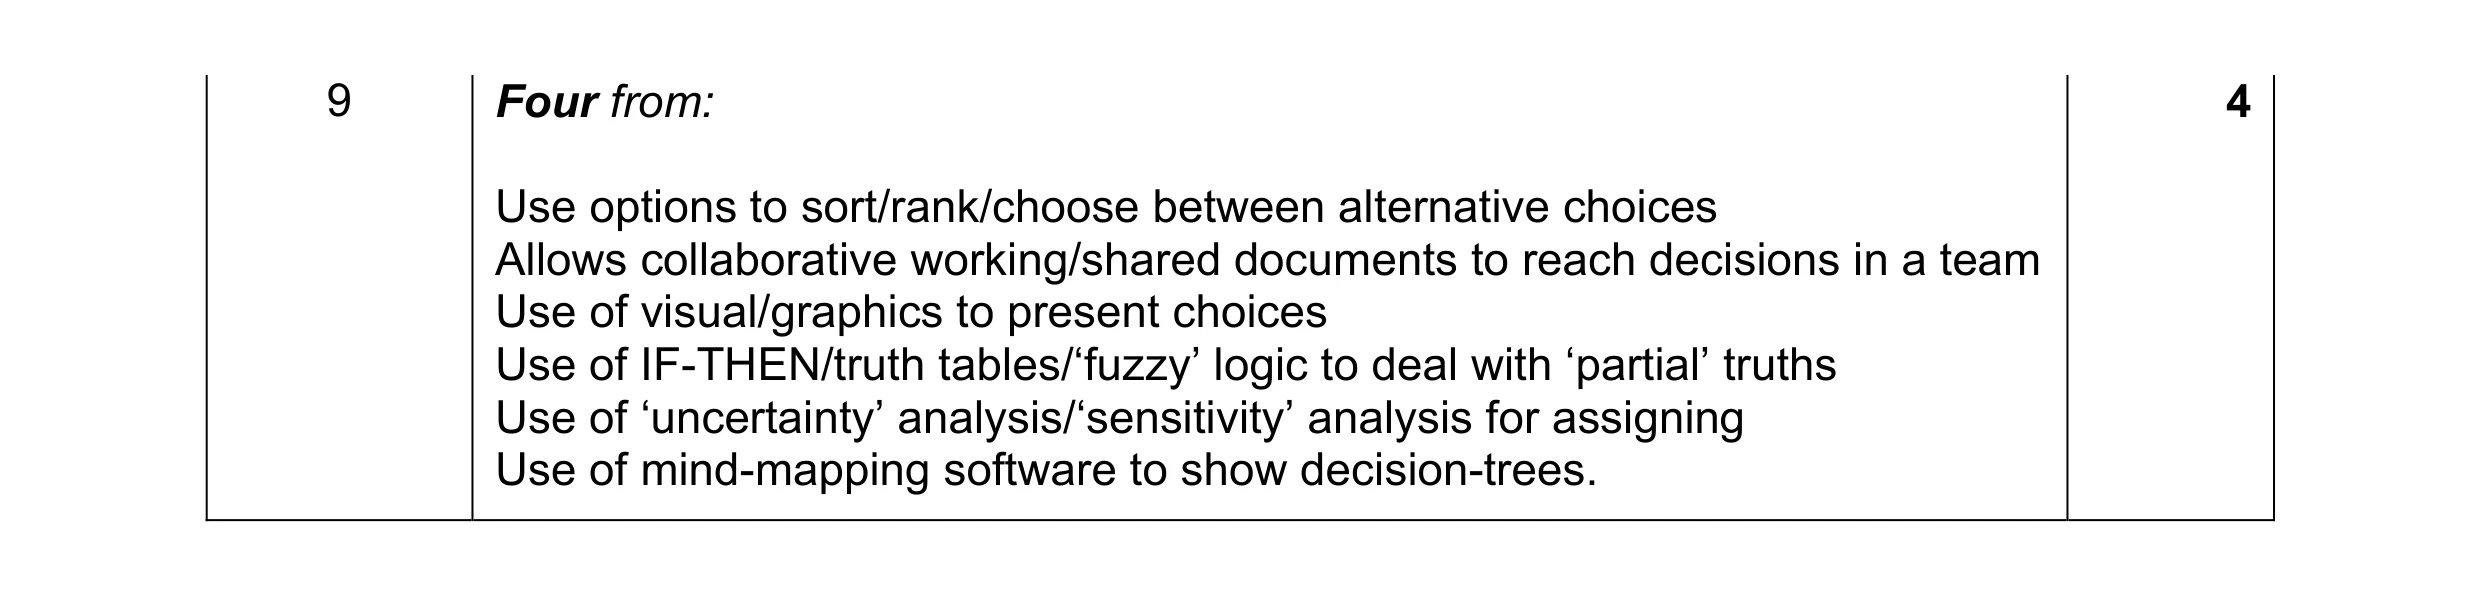 4
4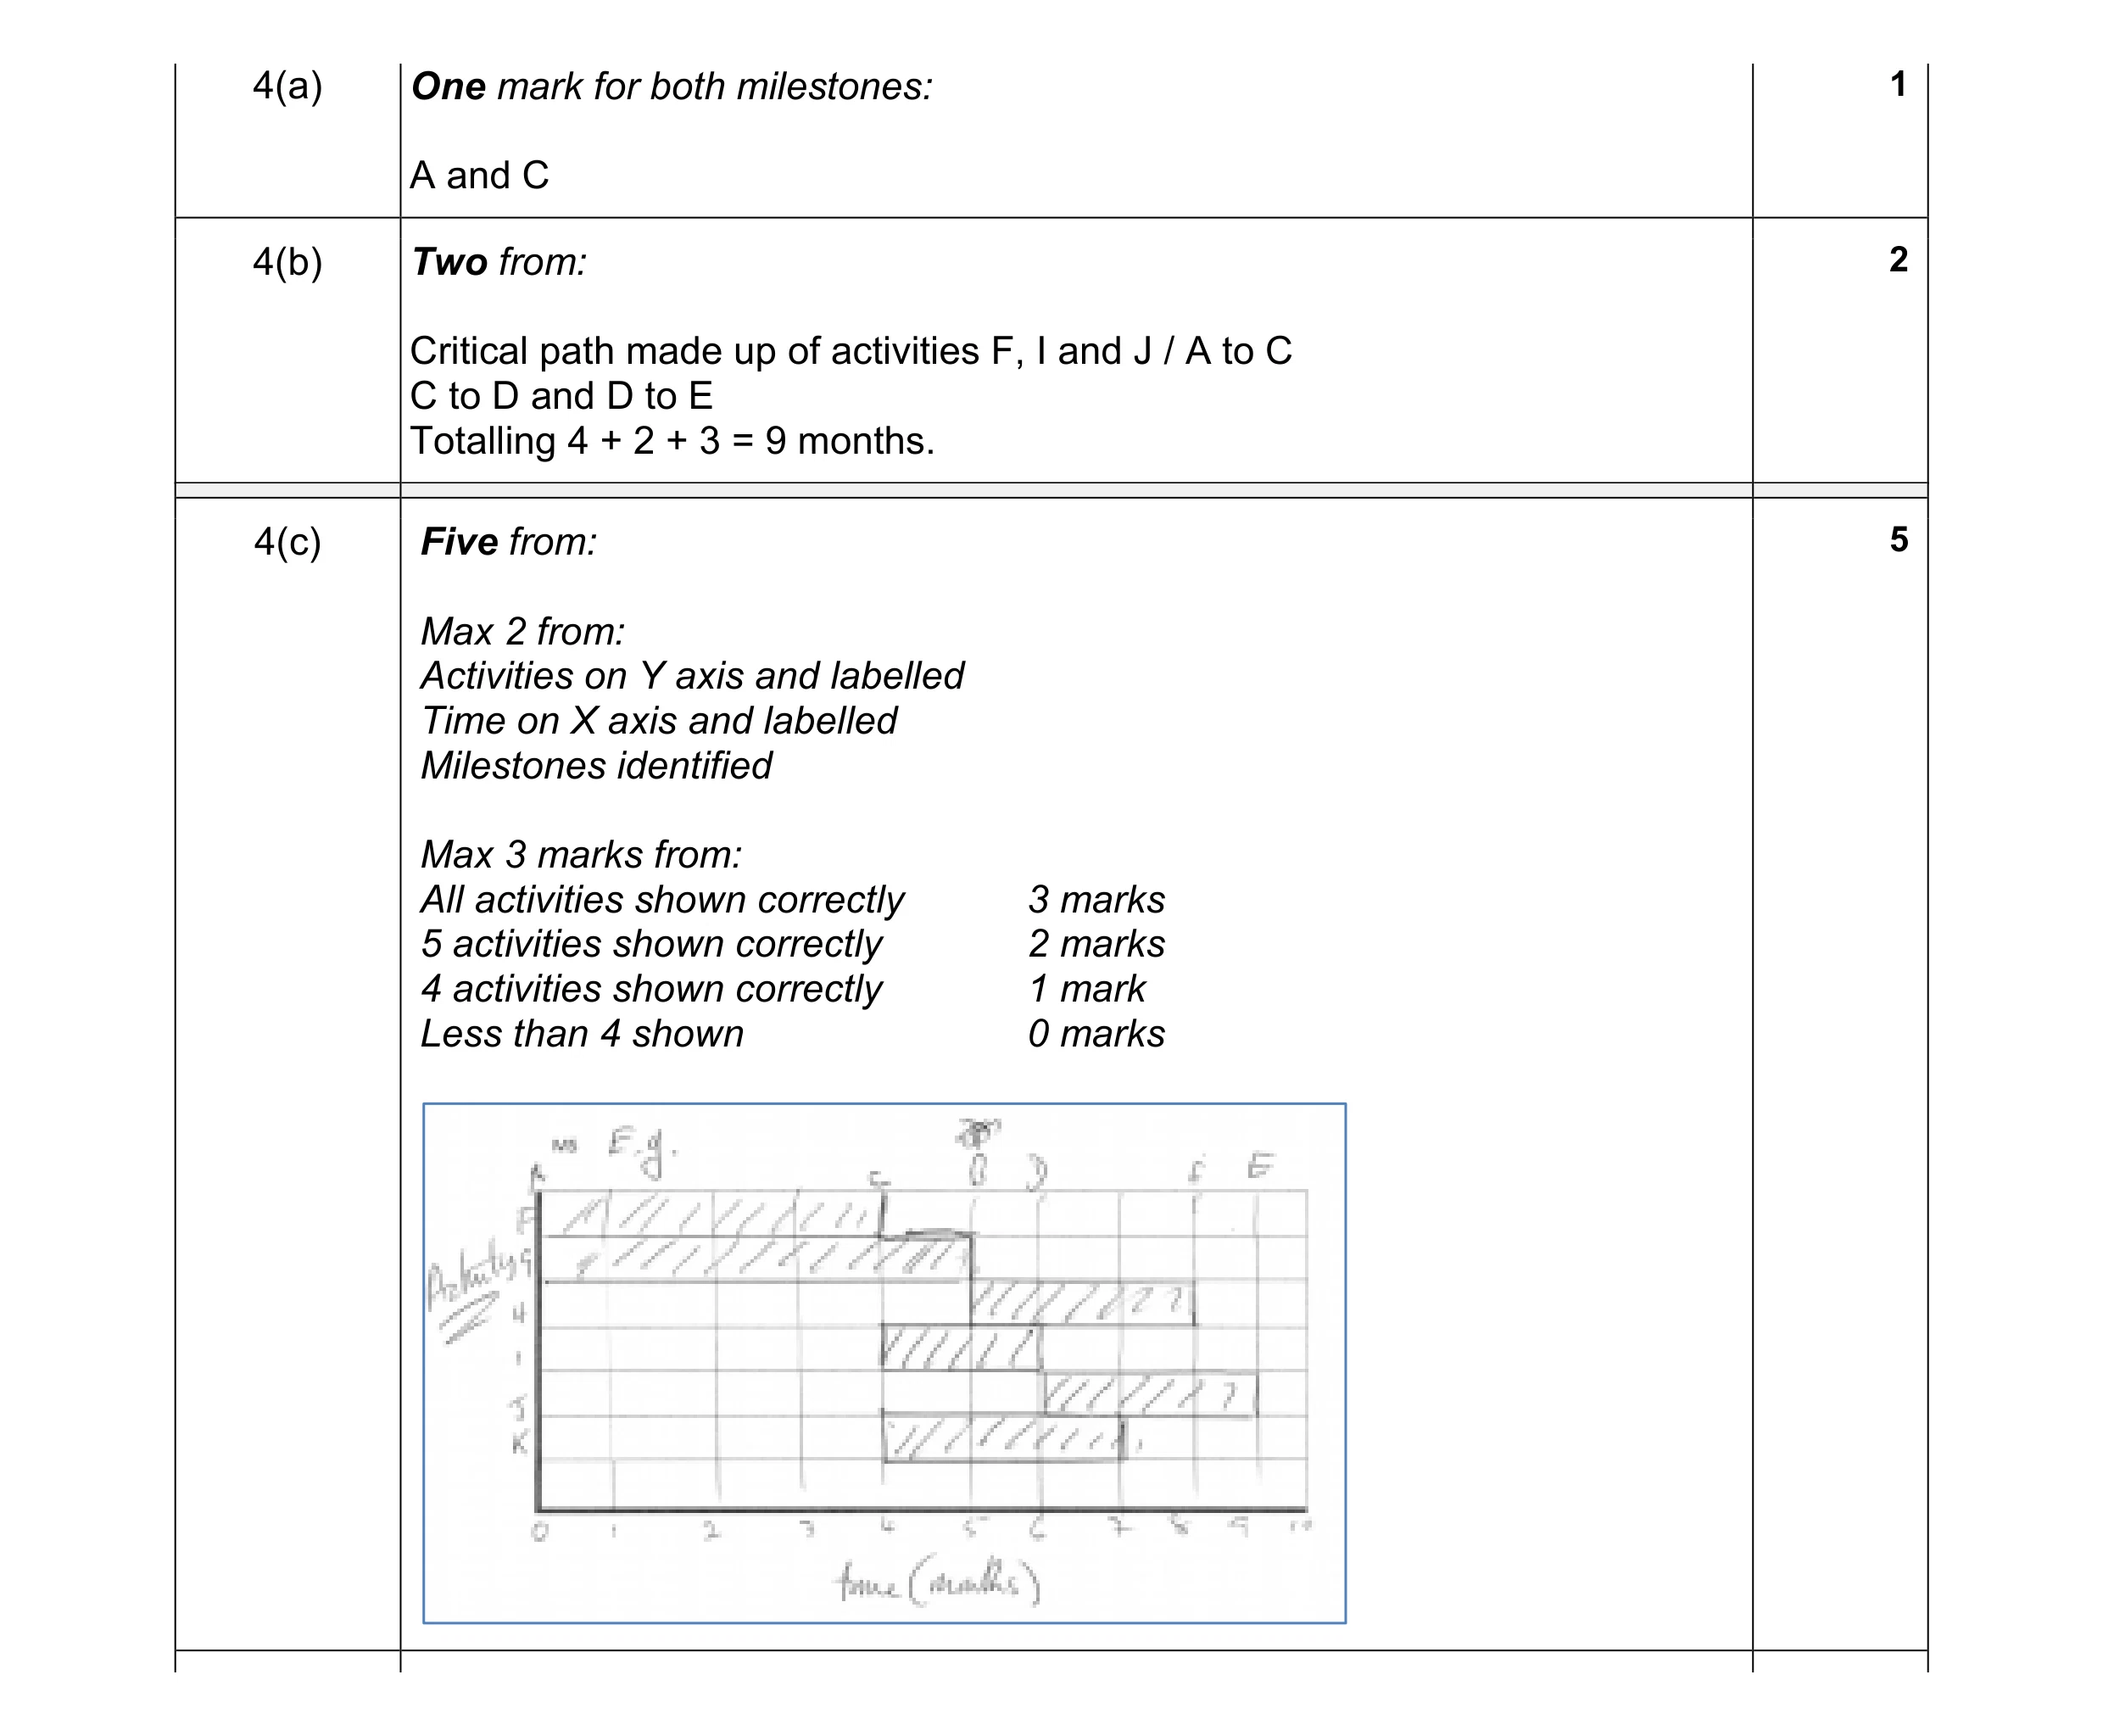 8
8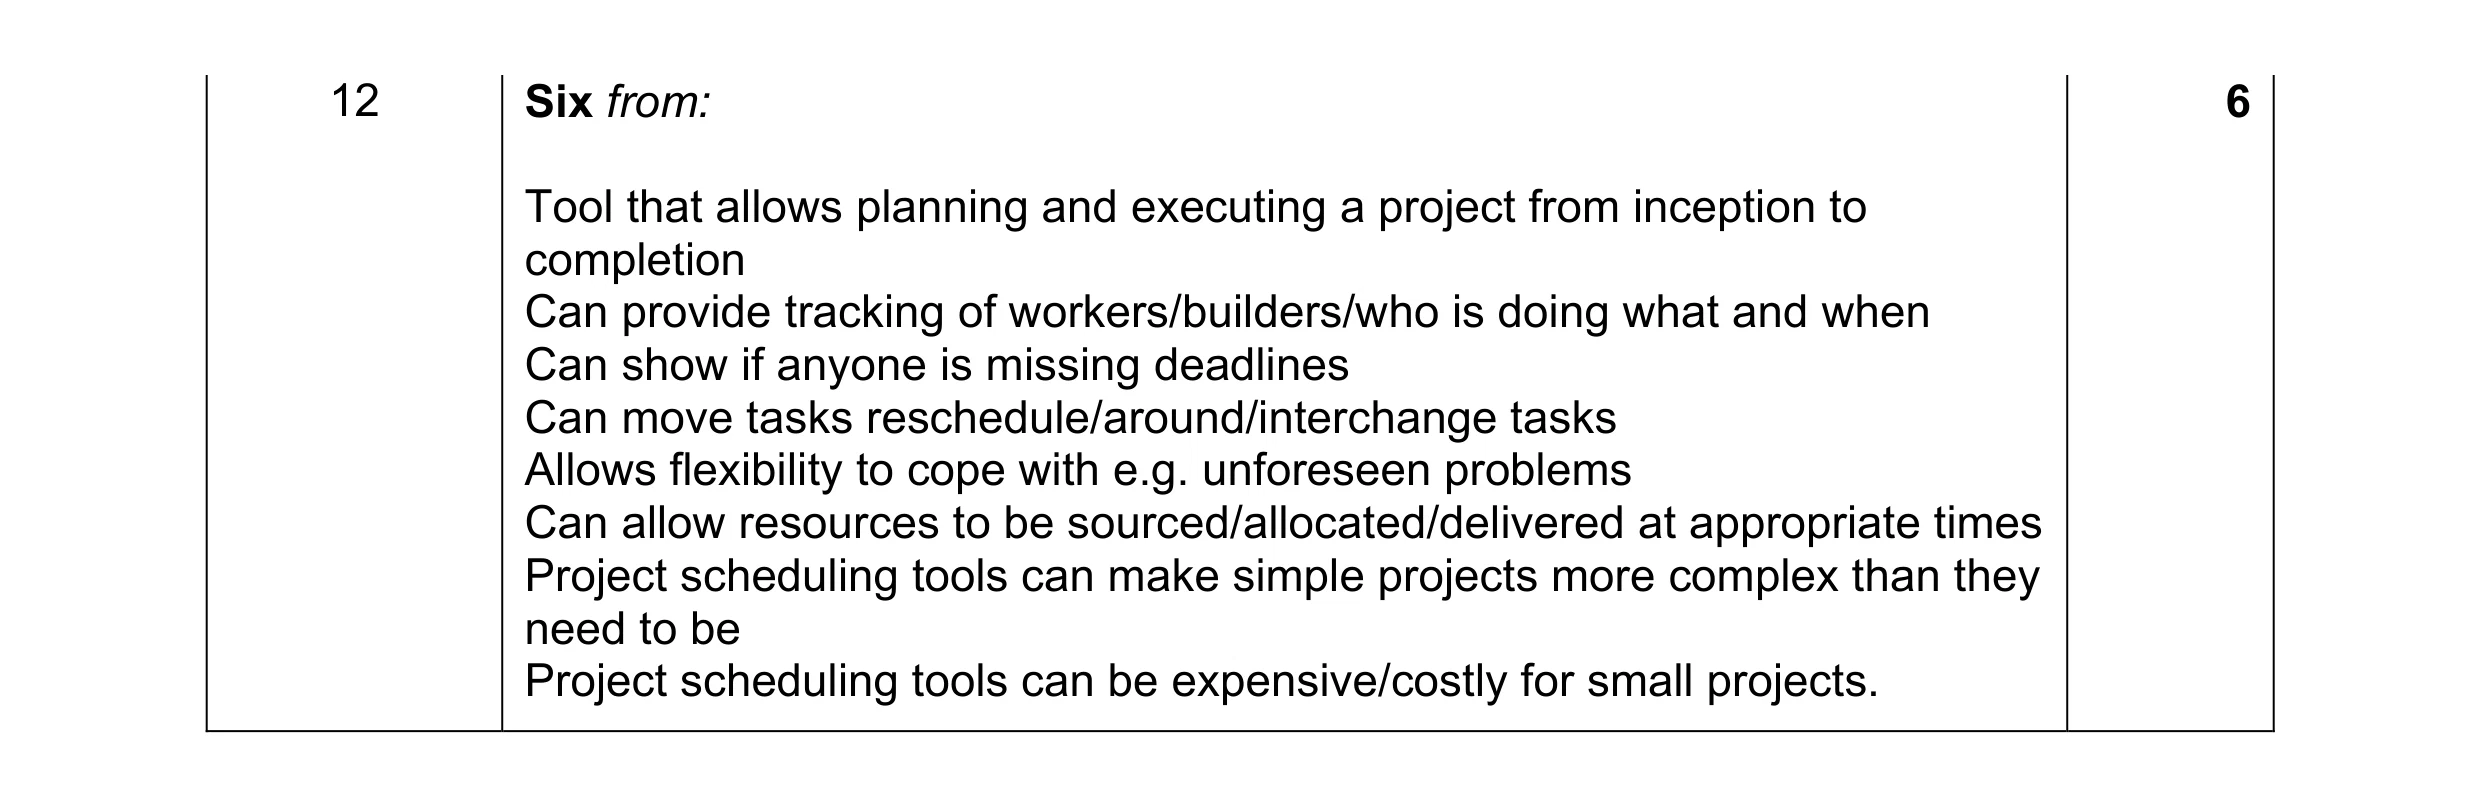 6
6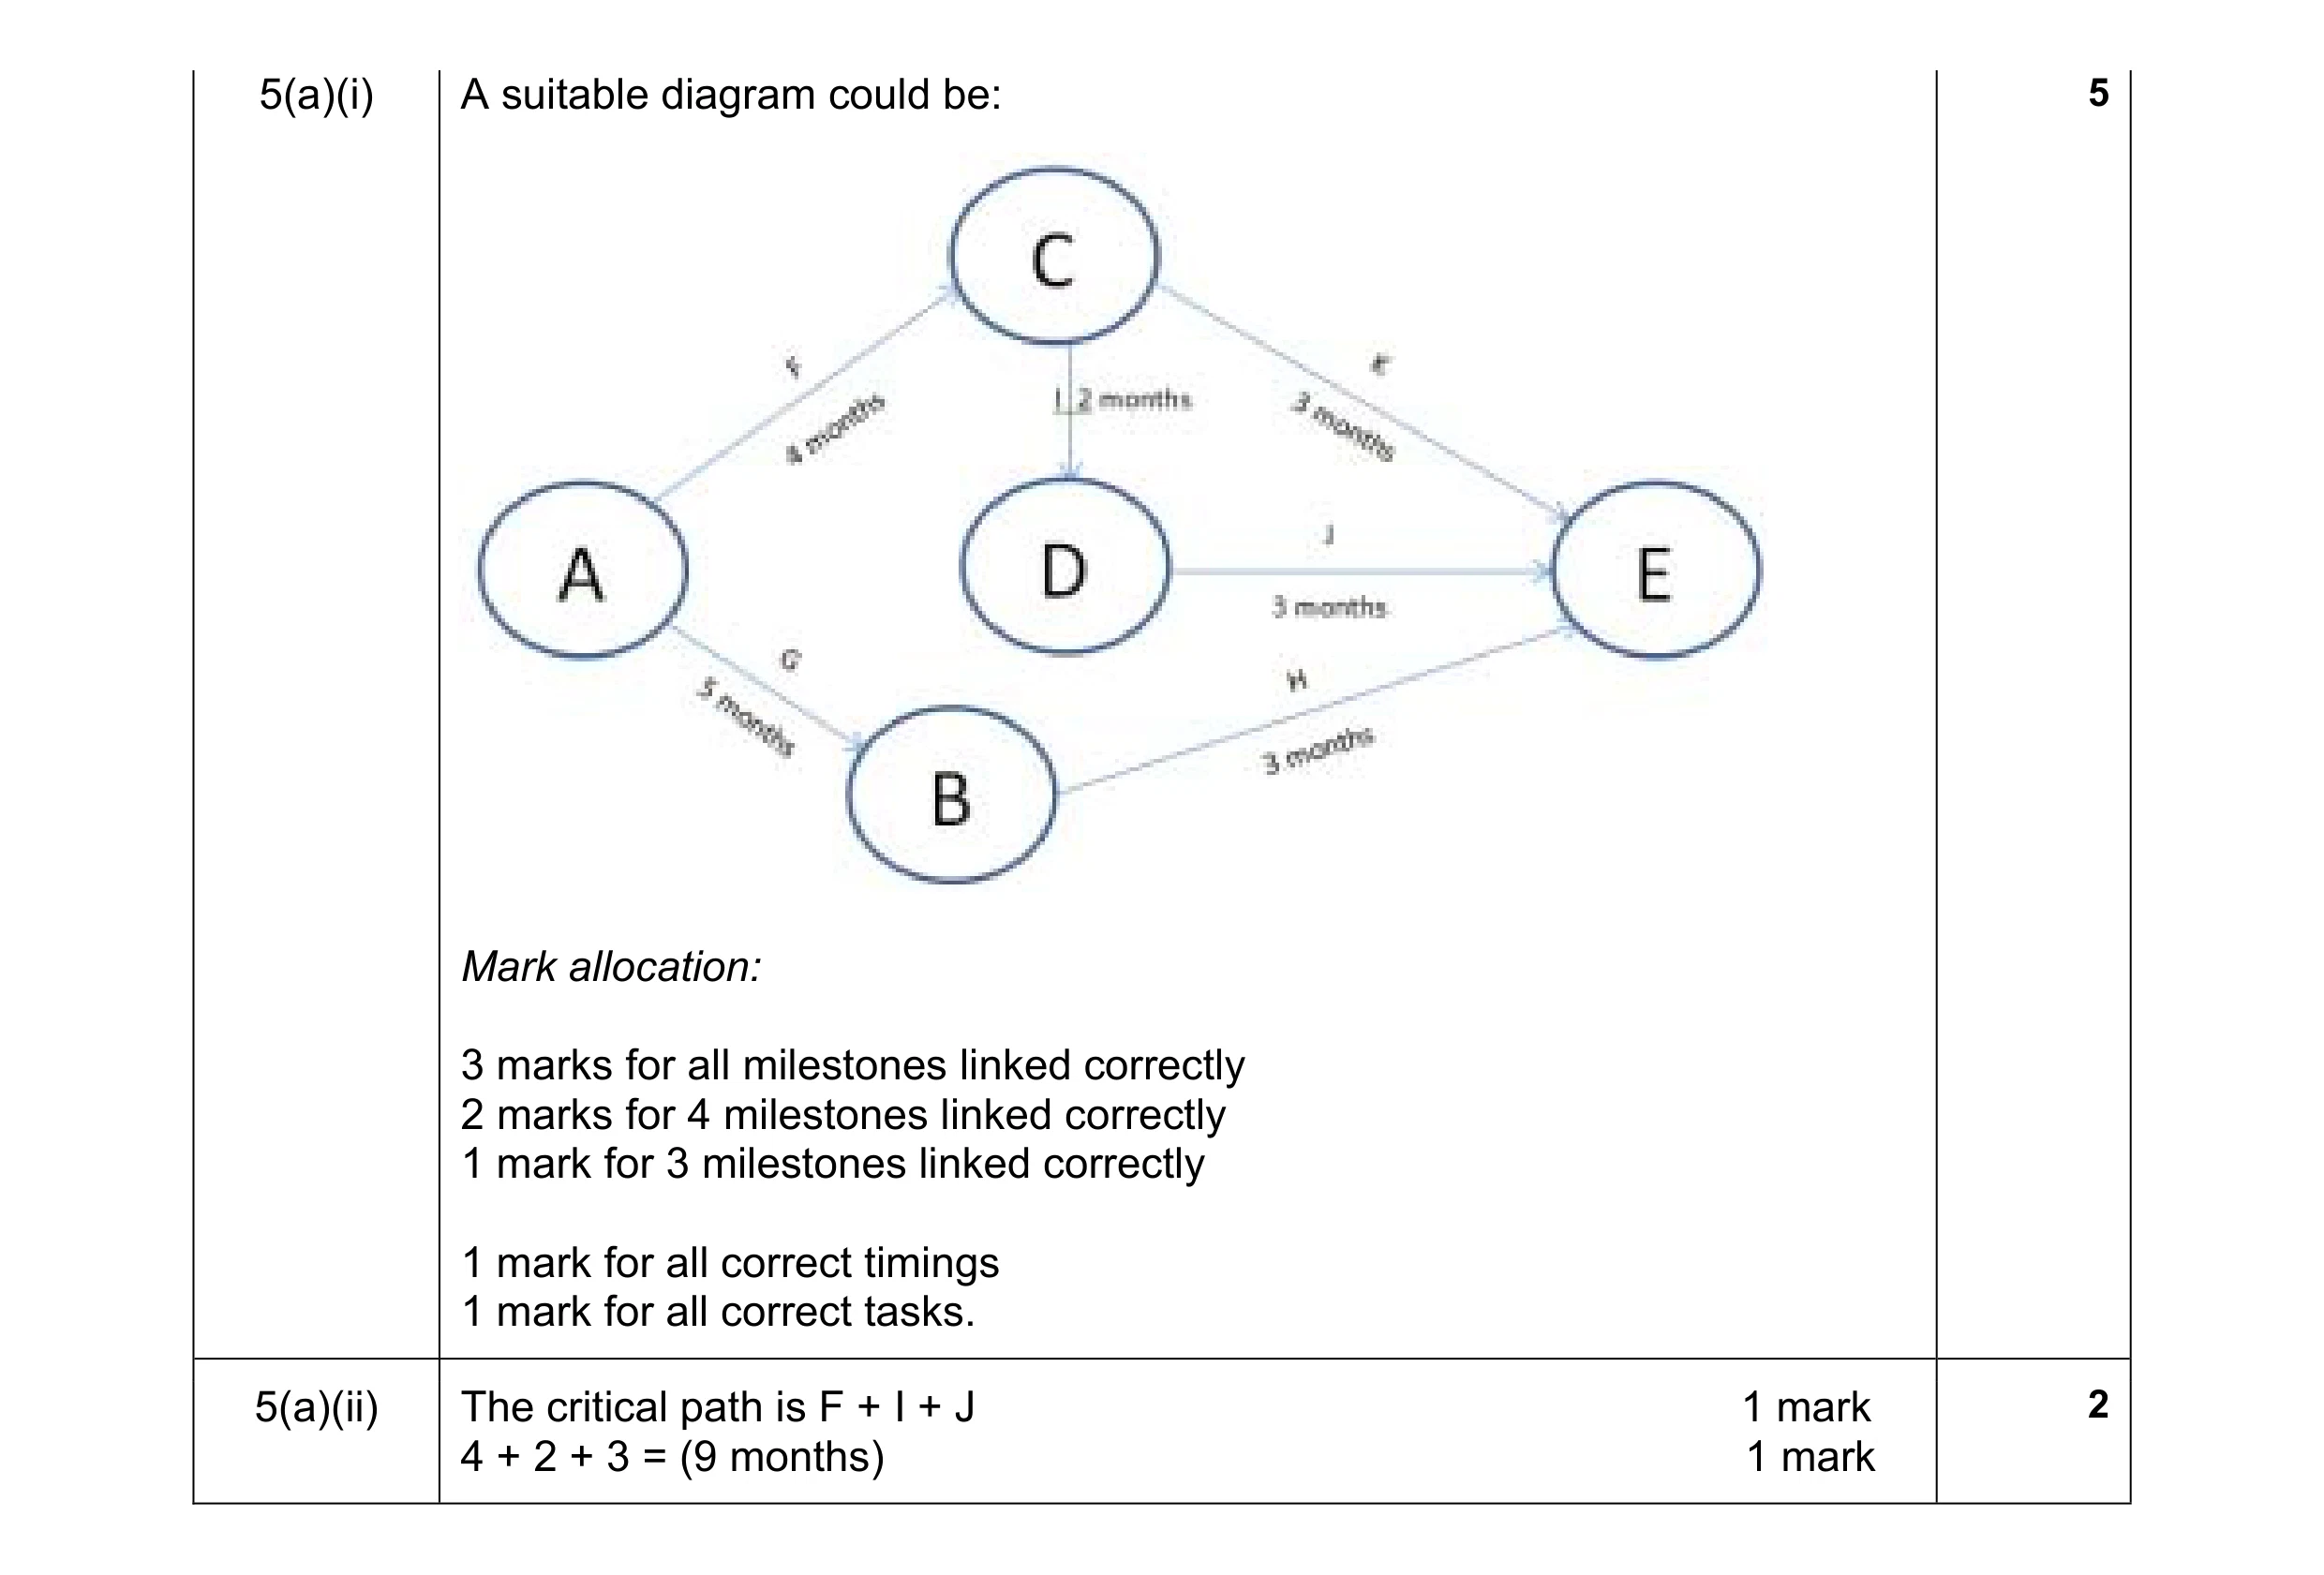 7
7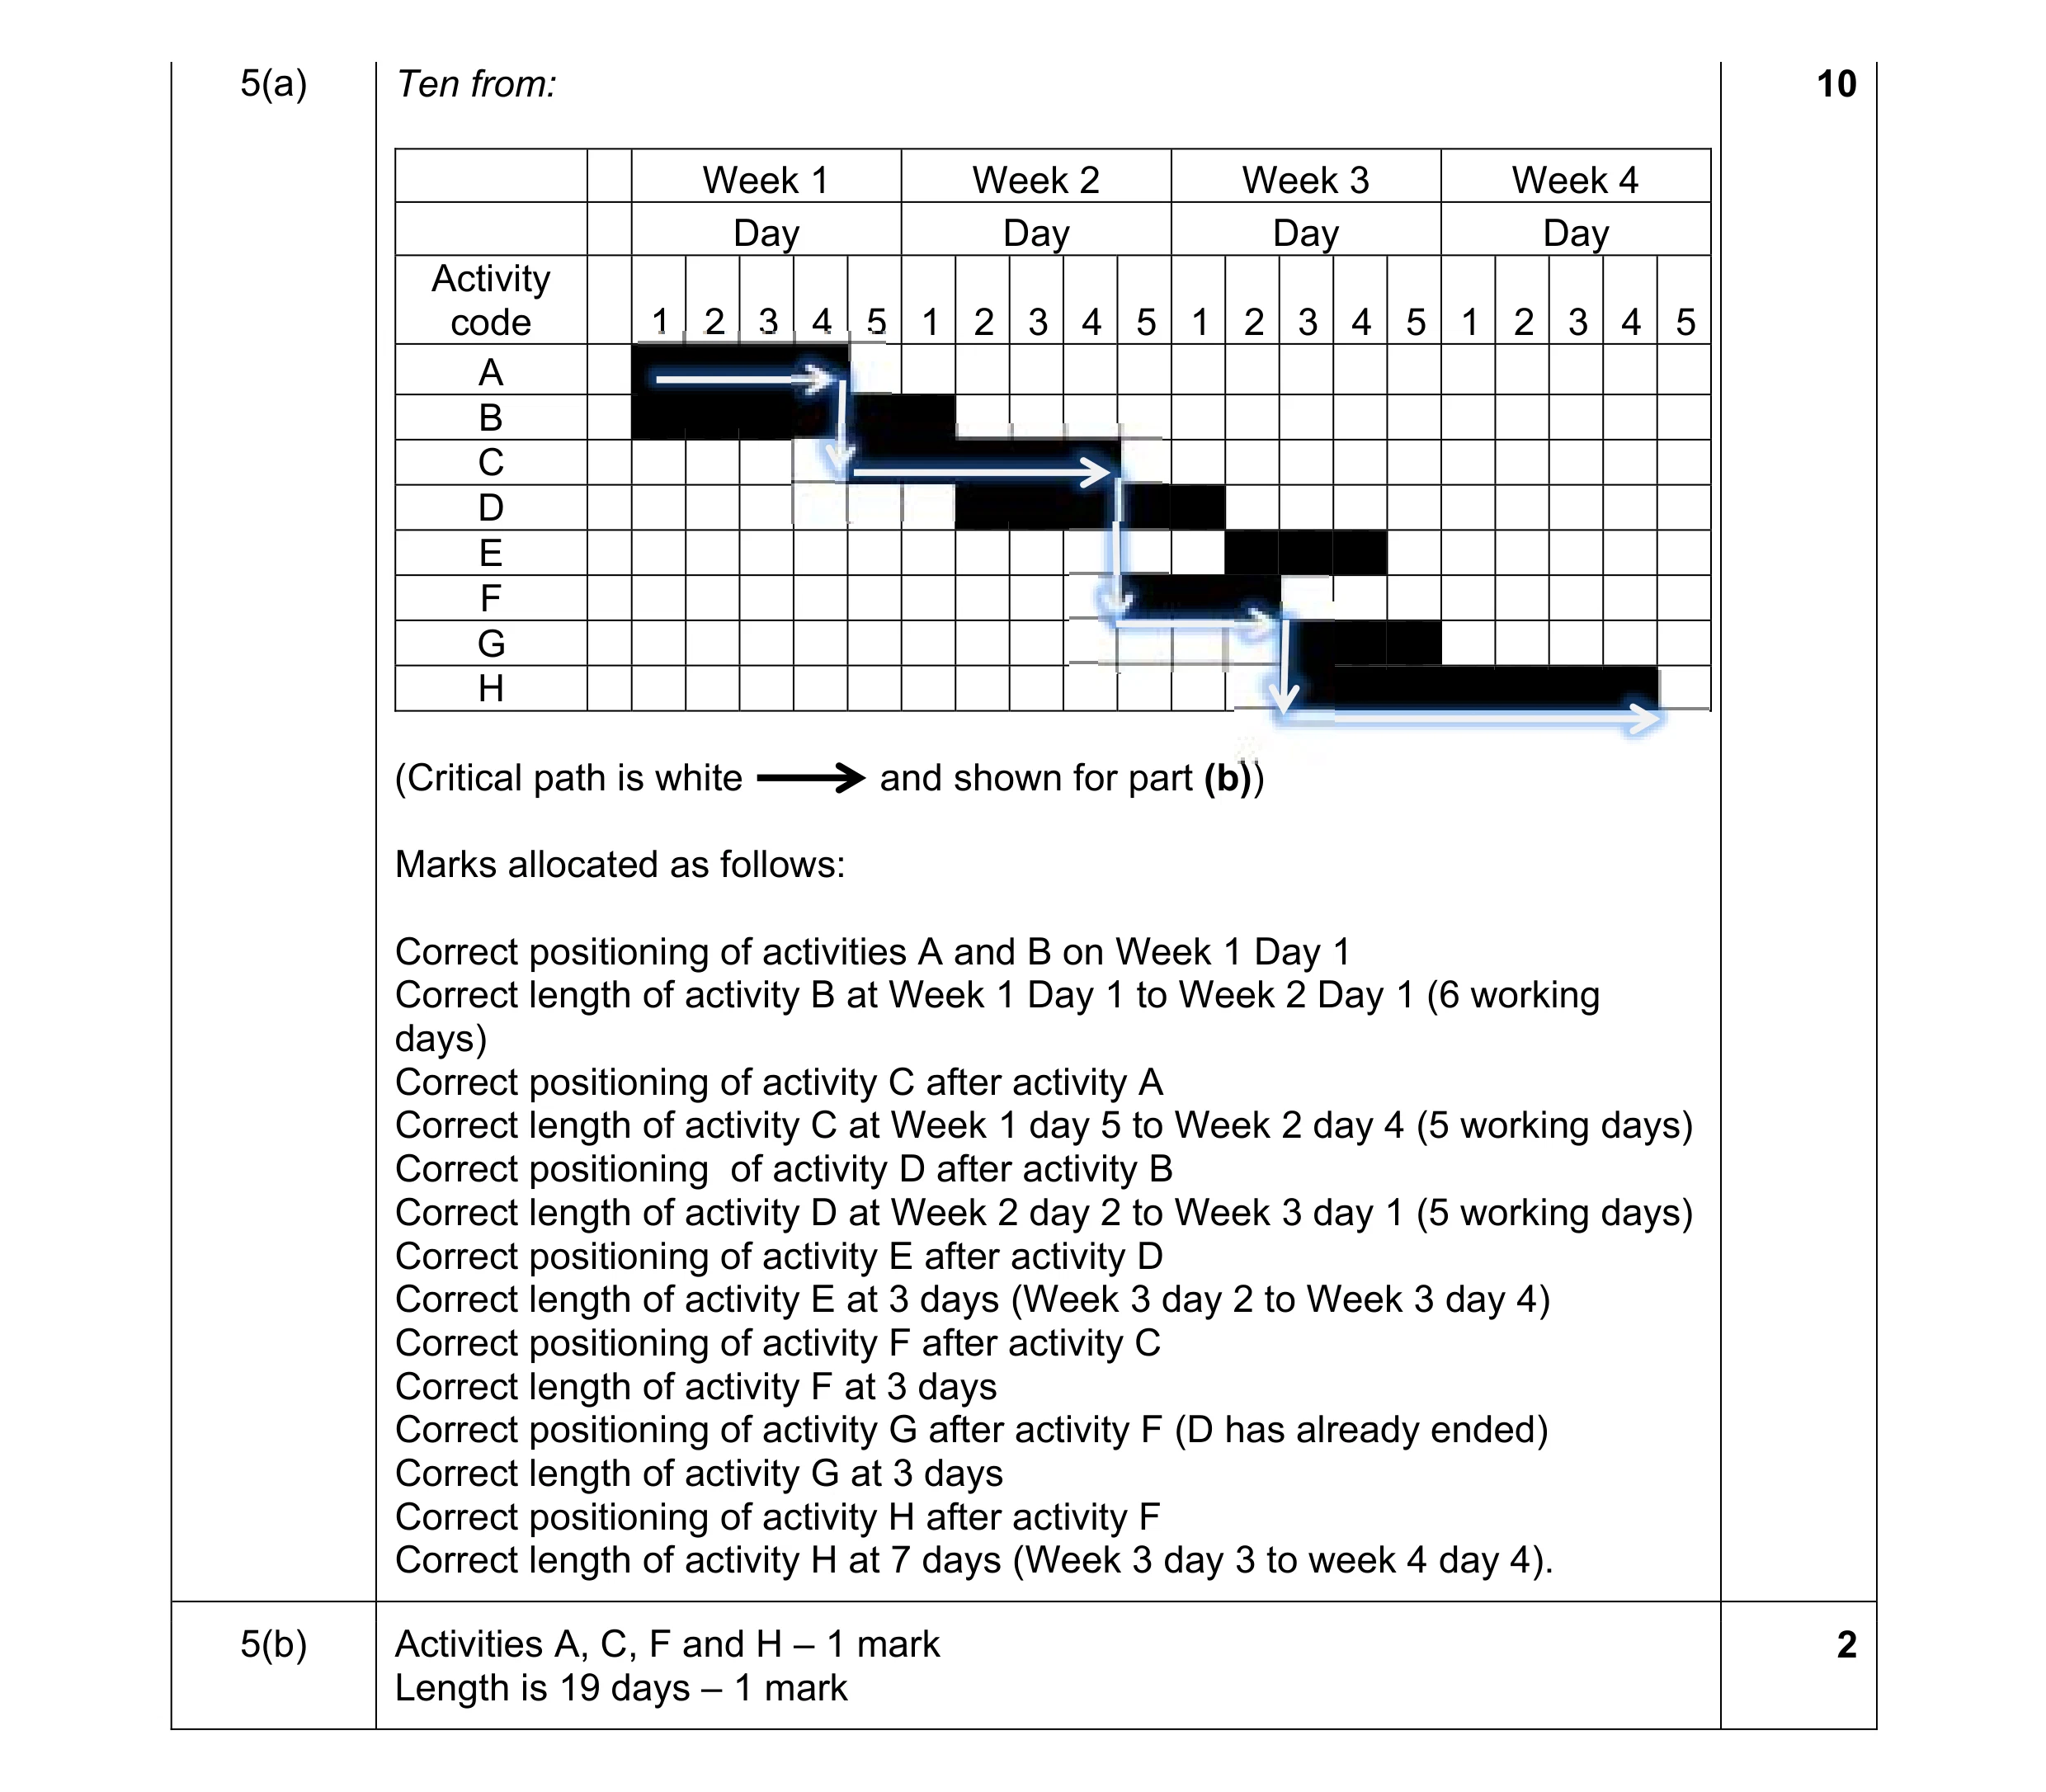 12
12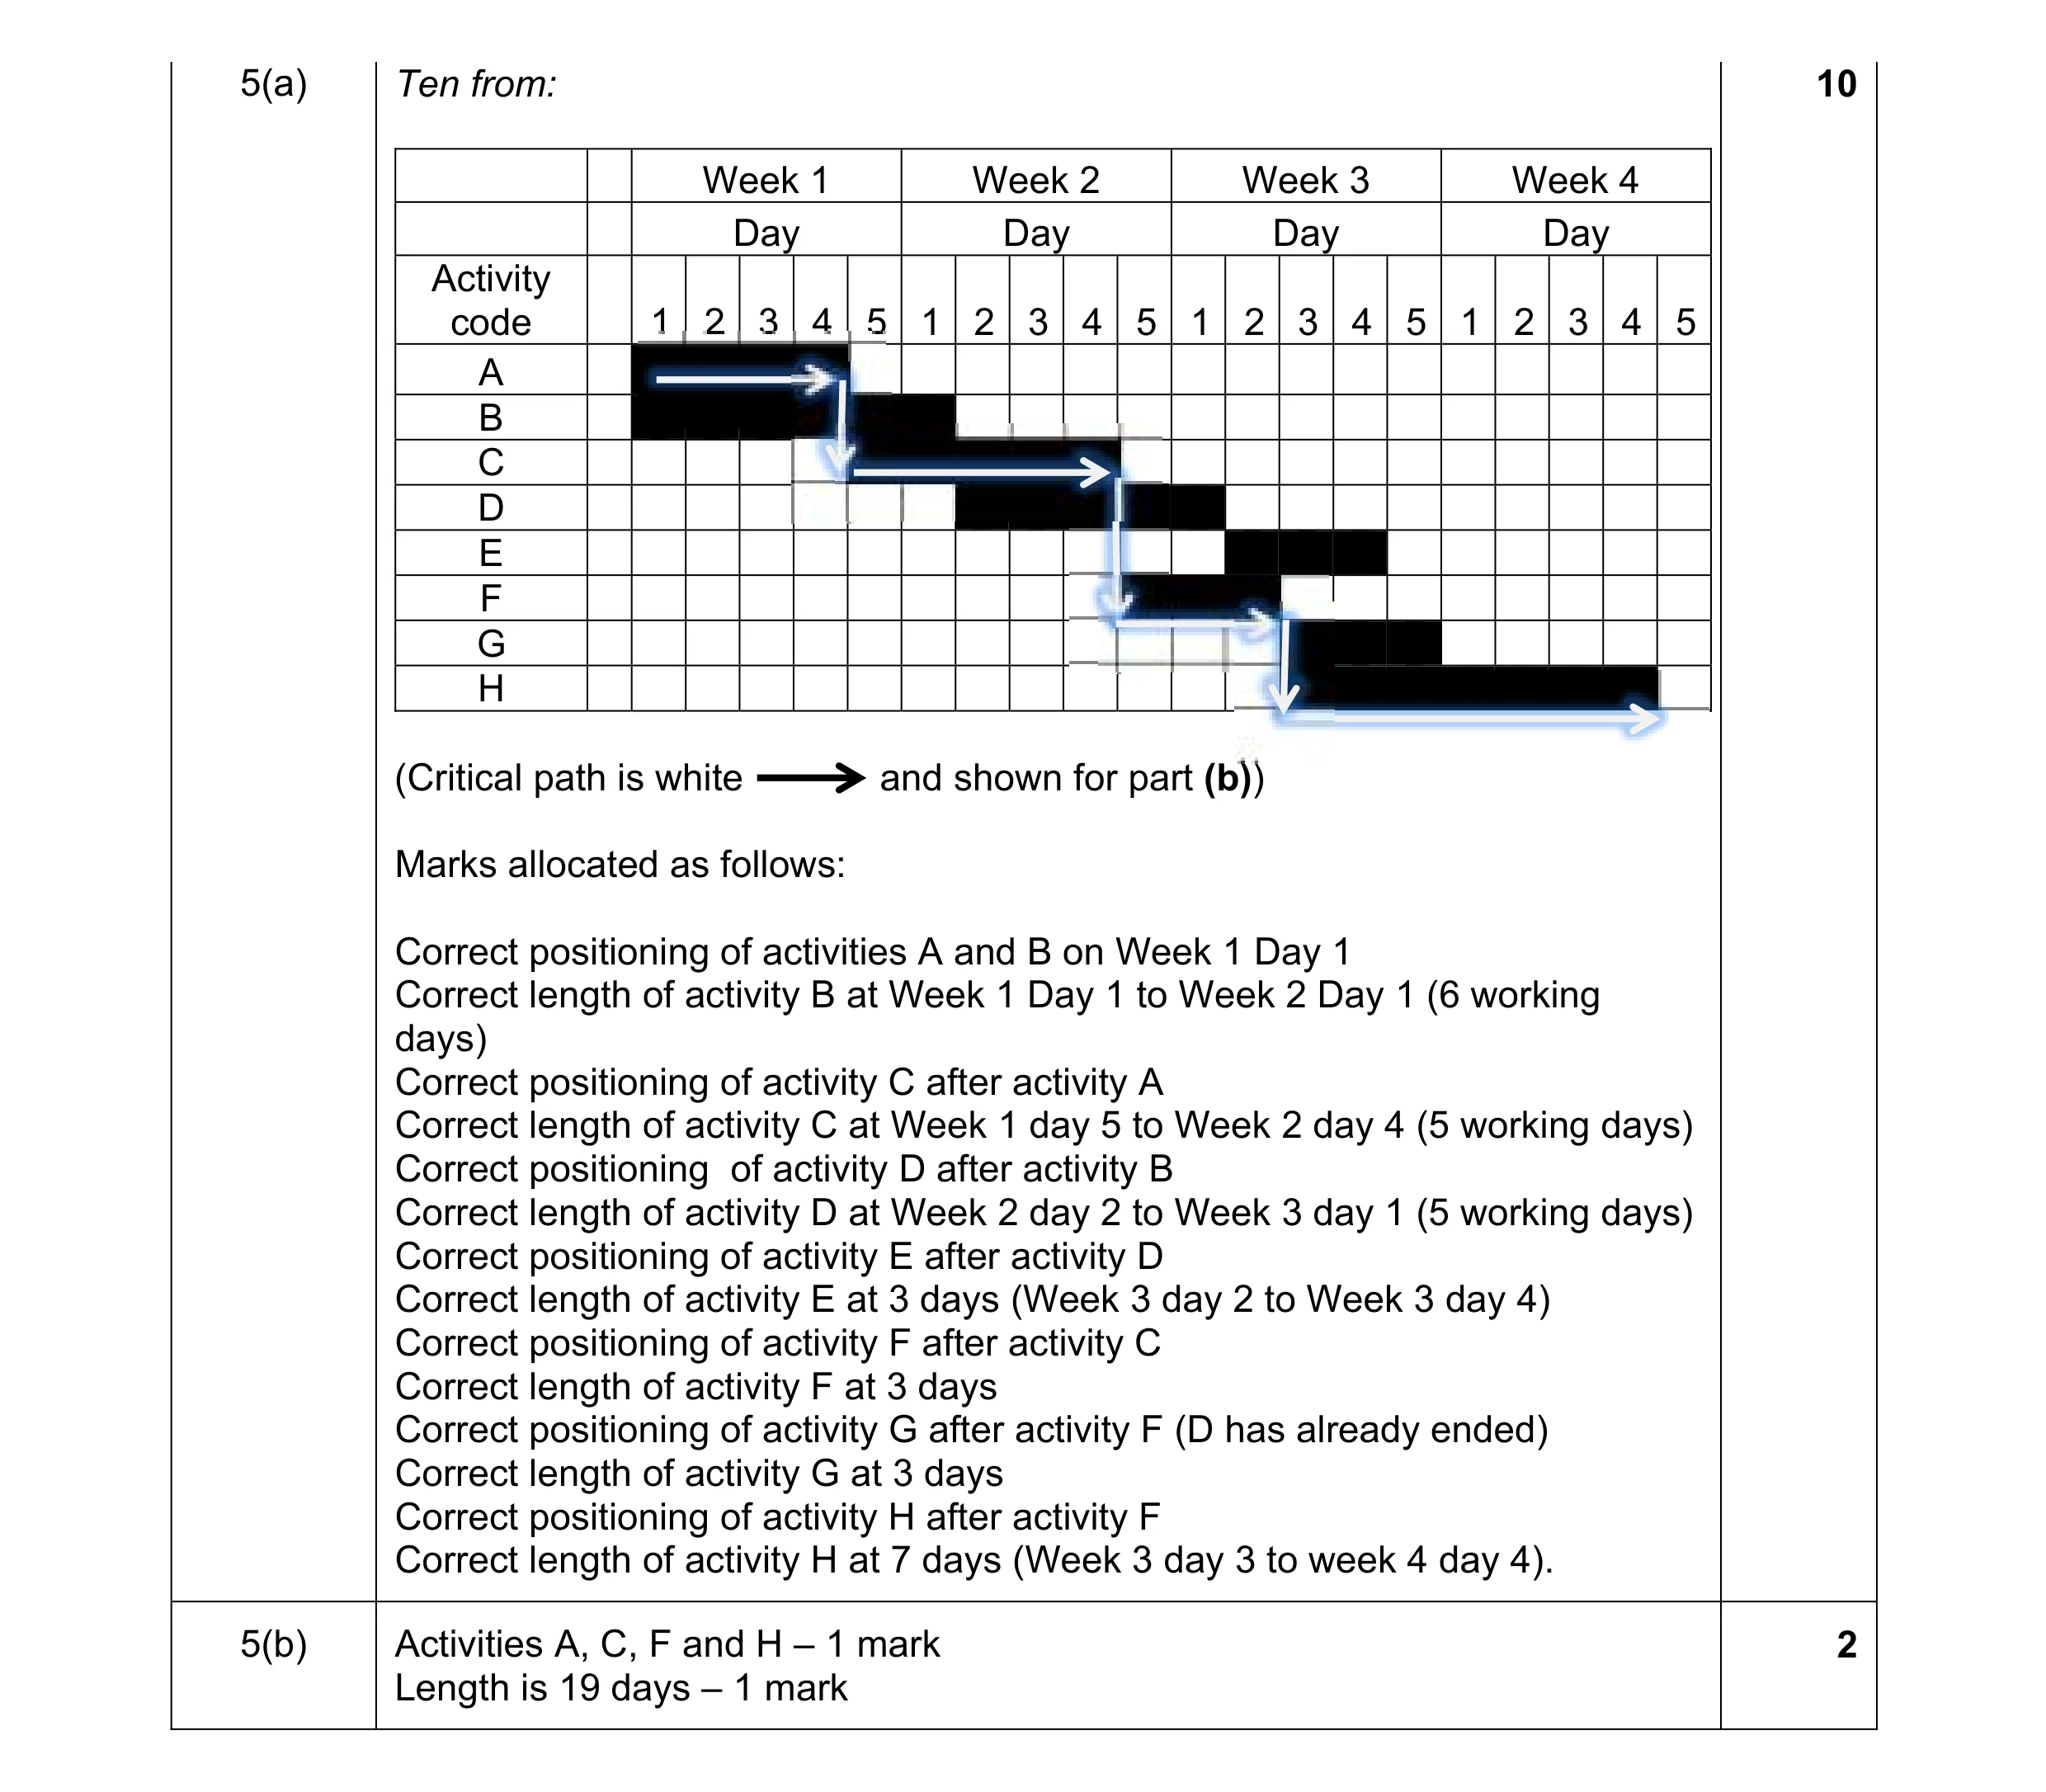 12
12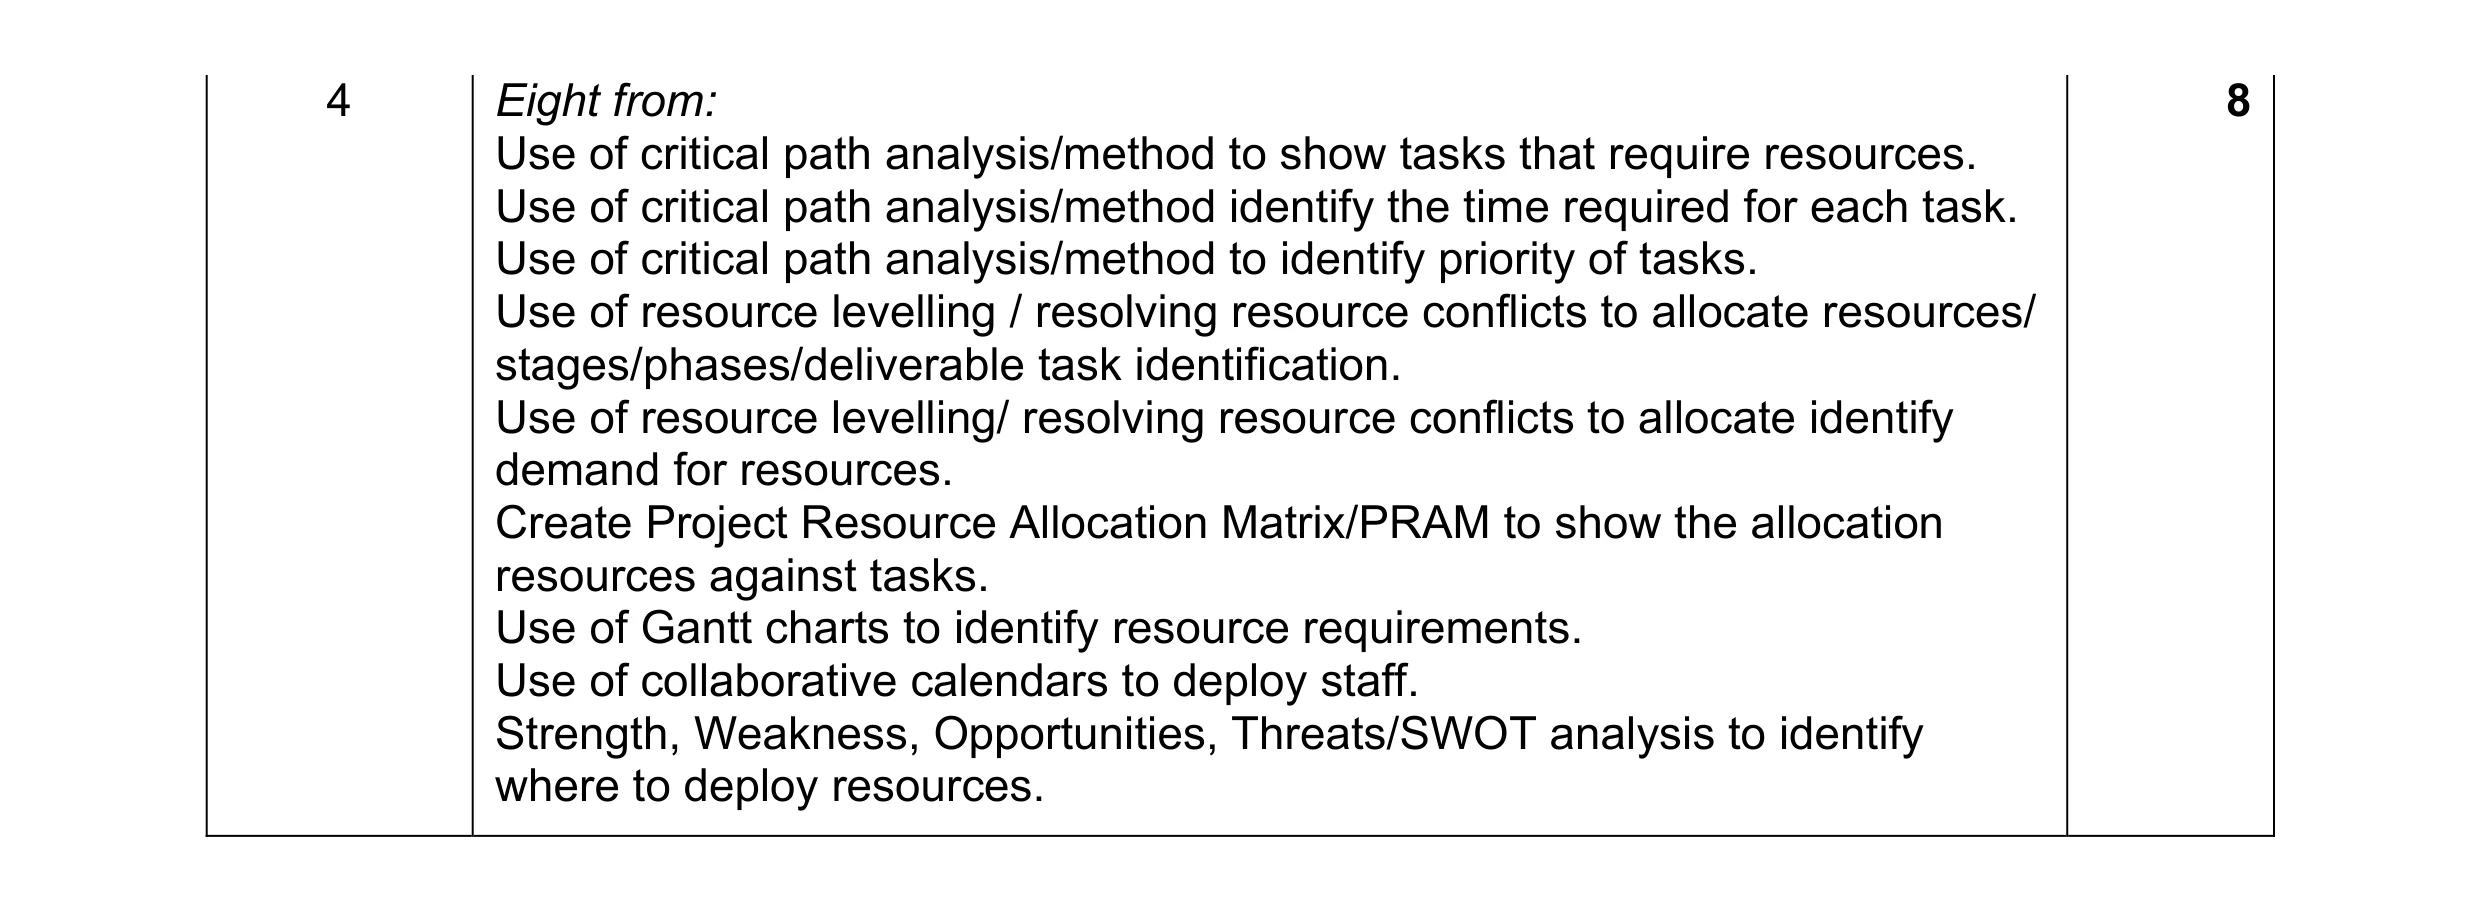 8
8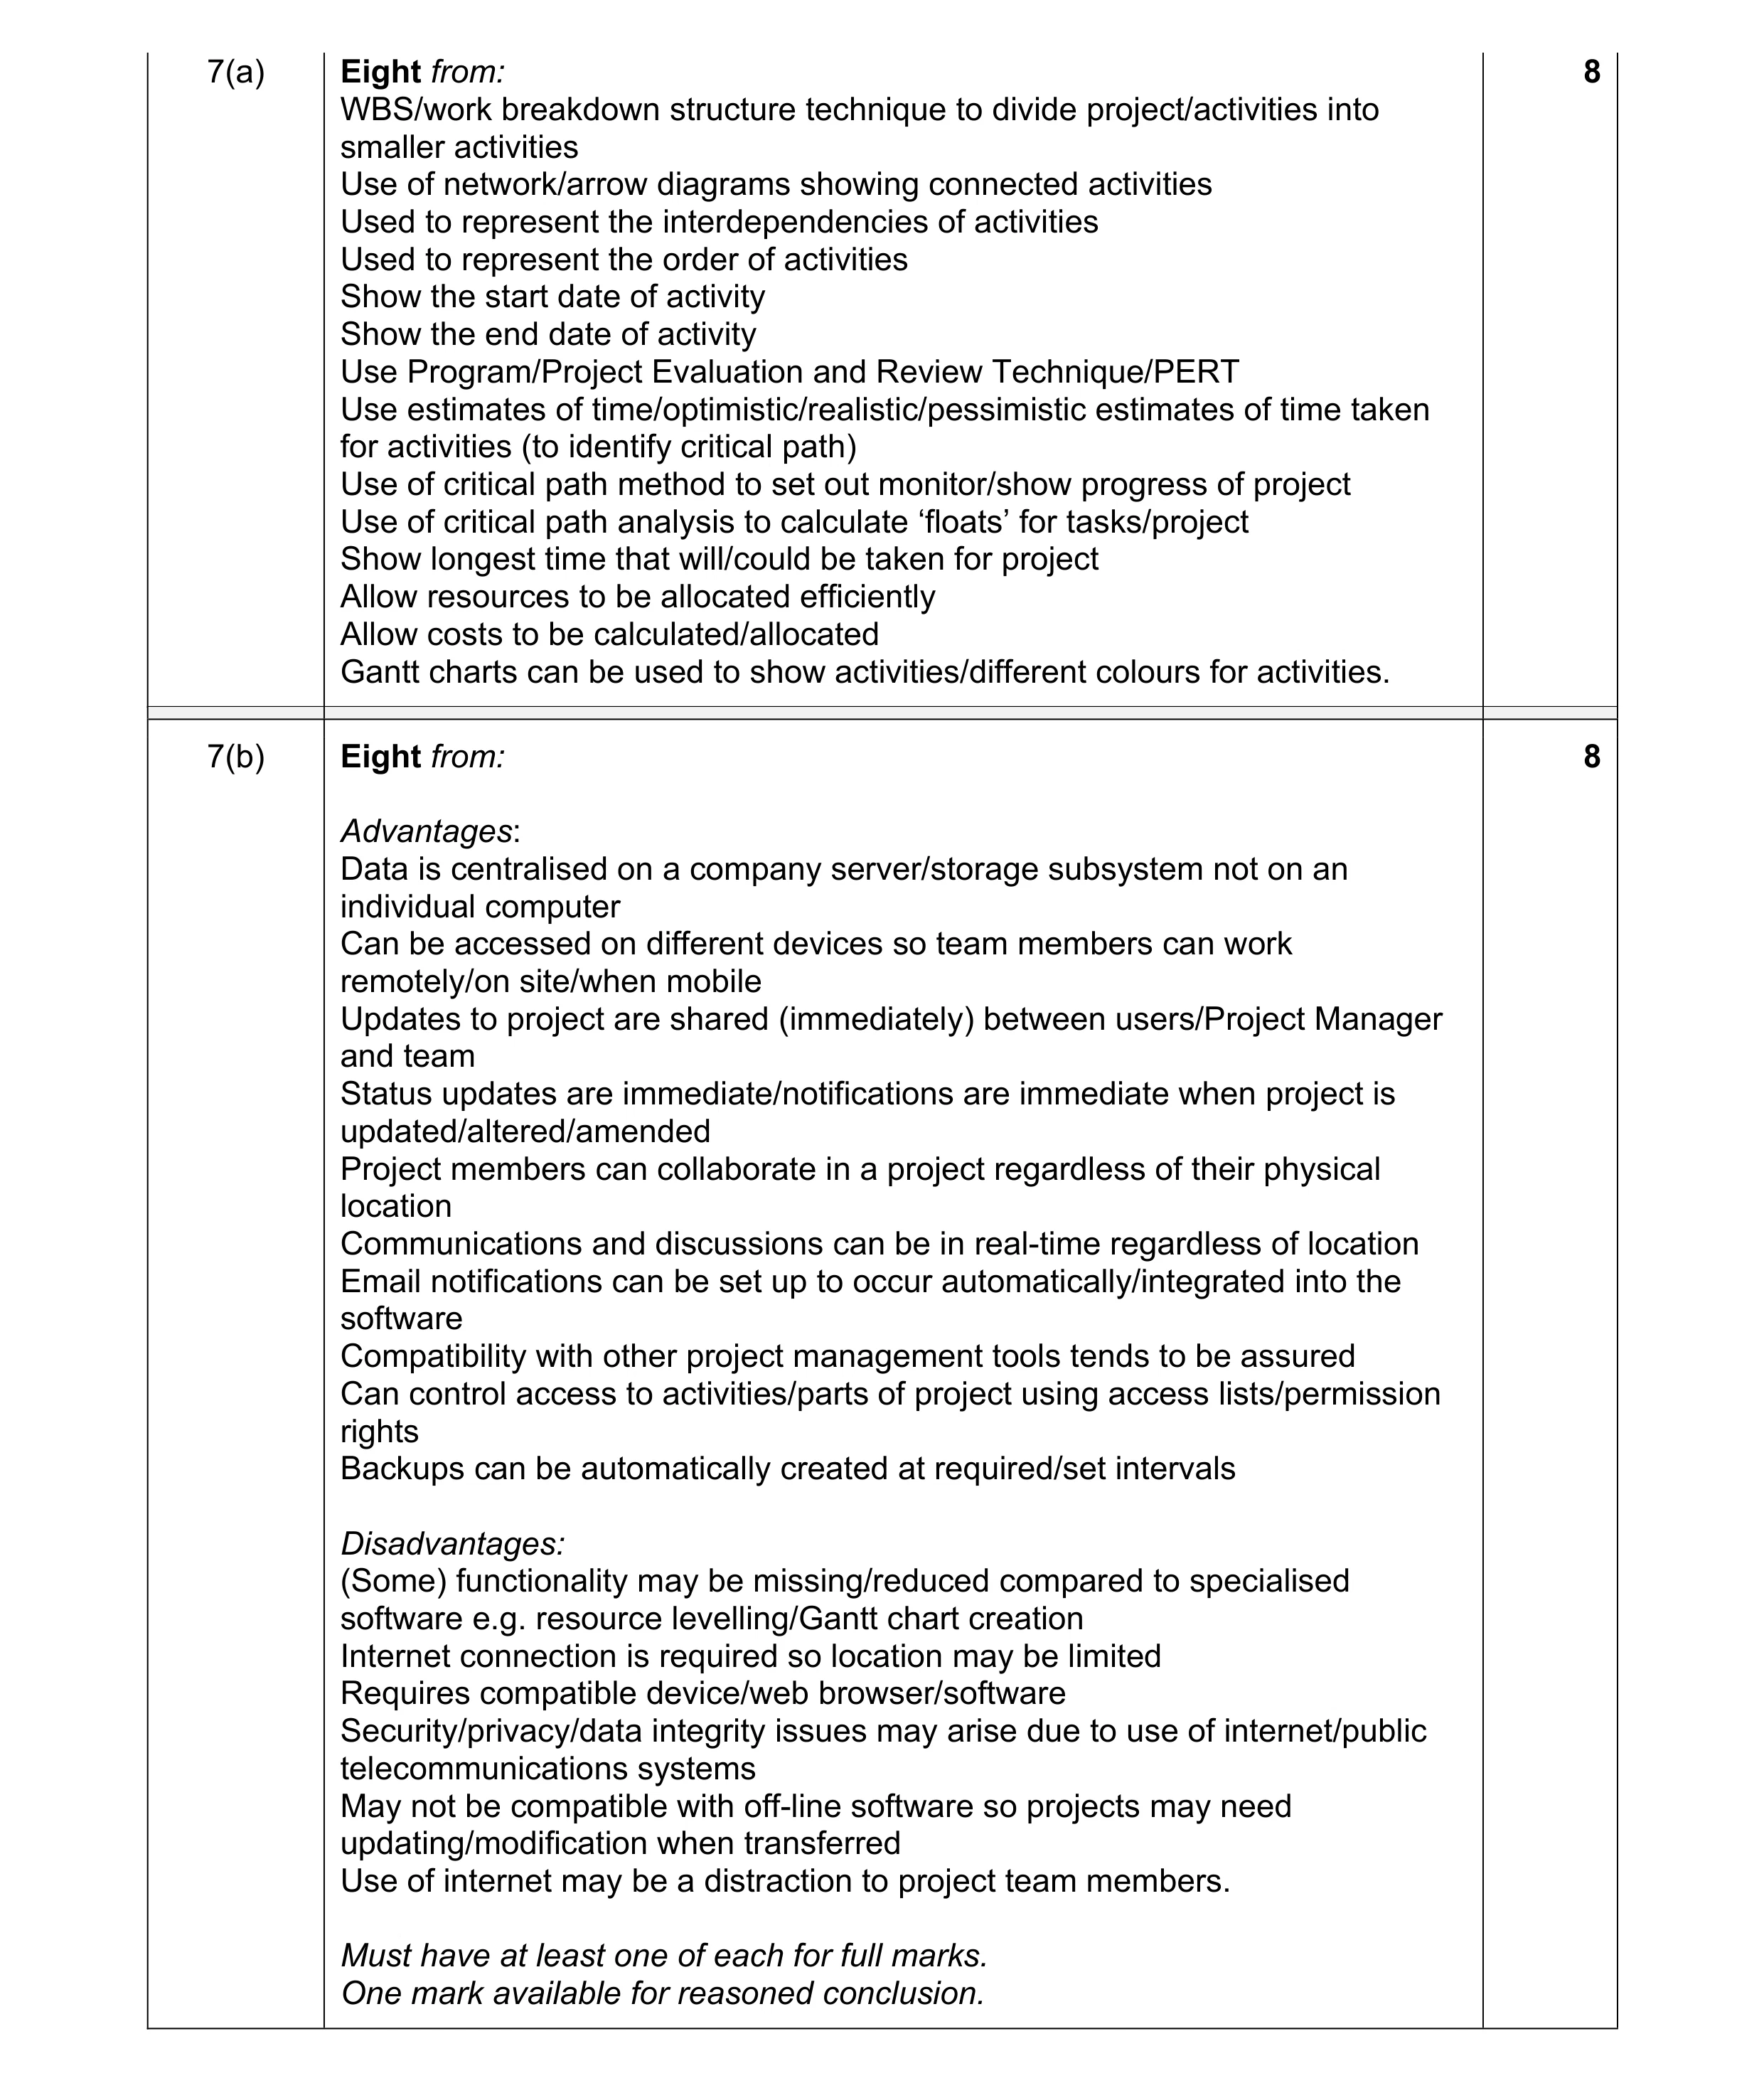 16
16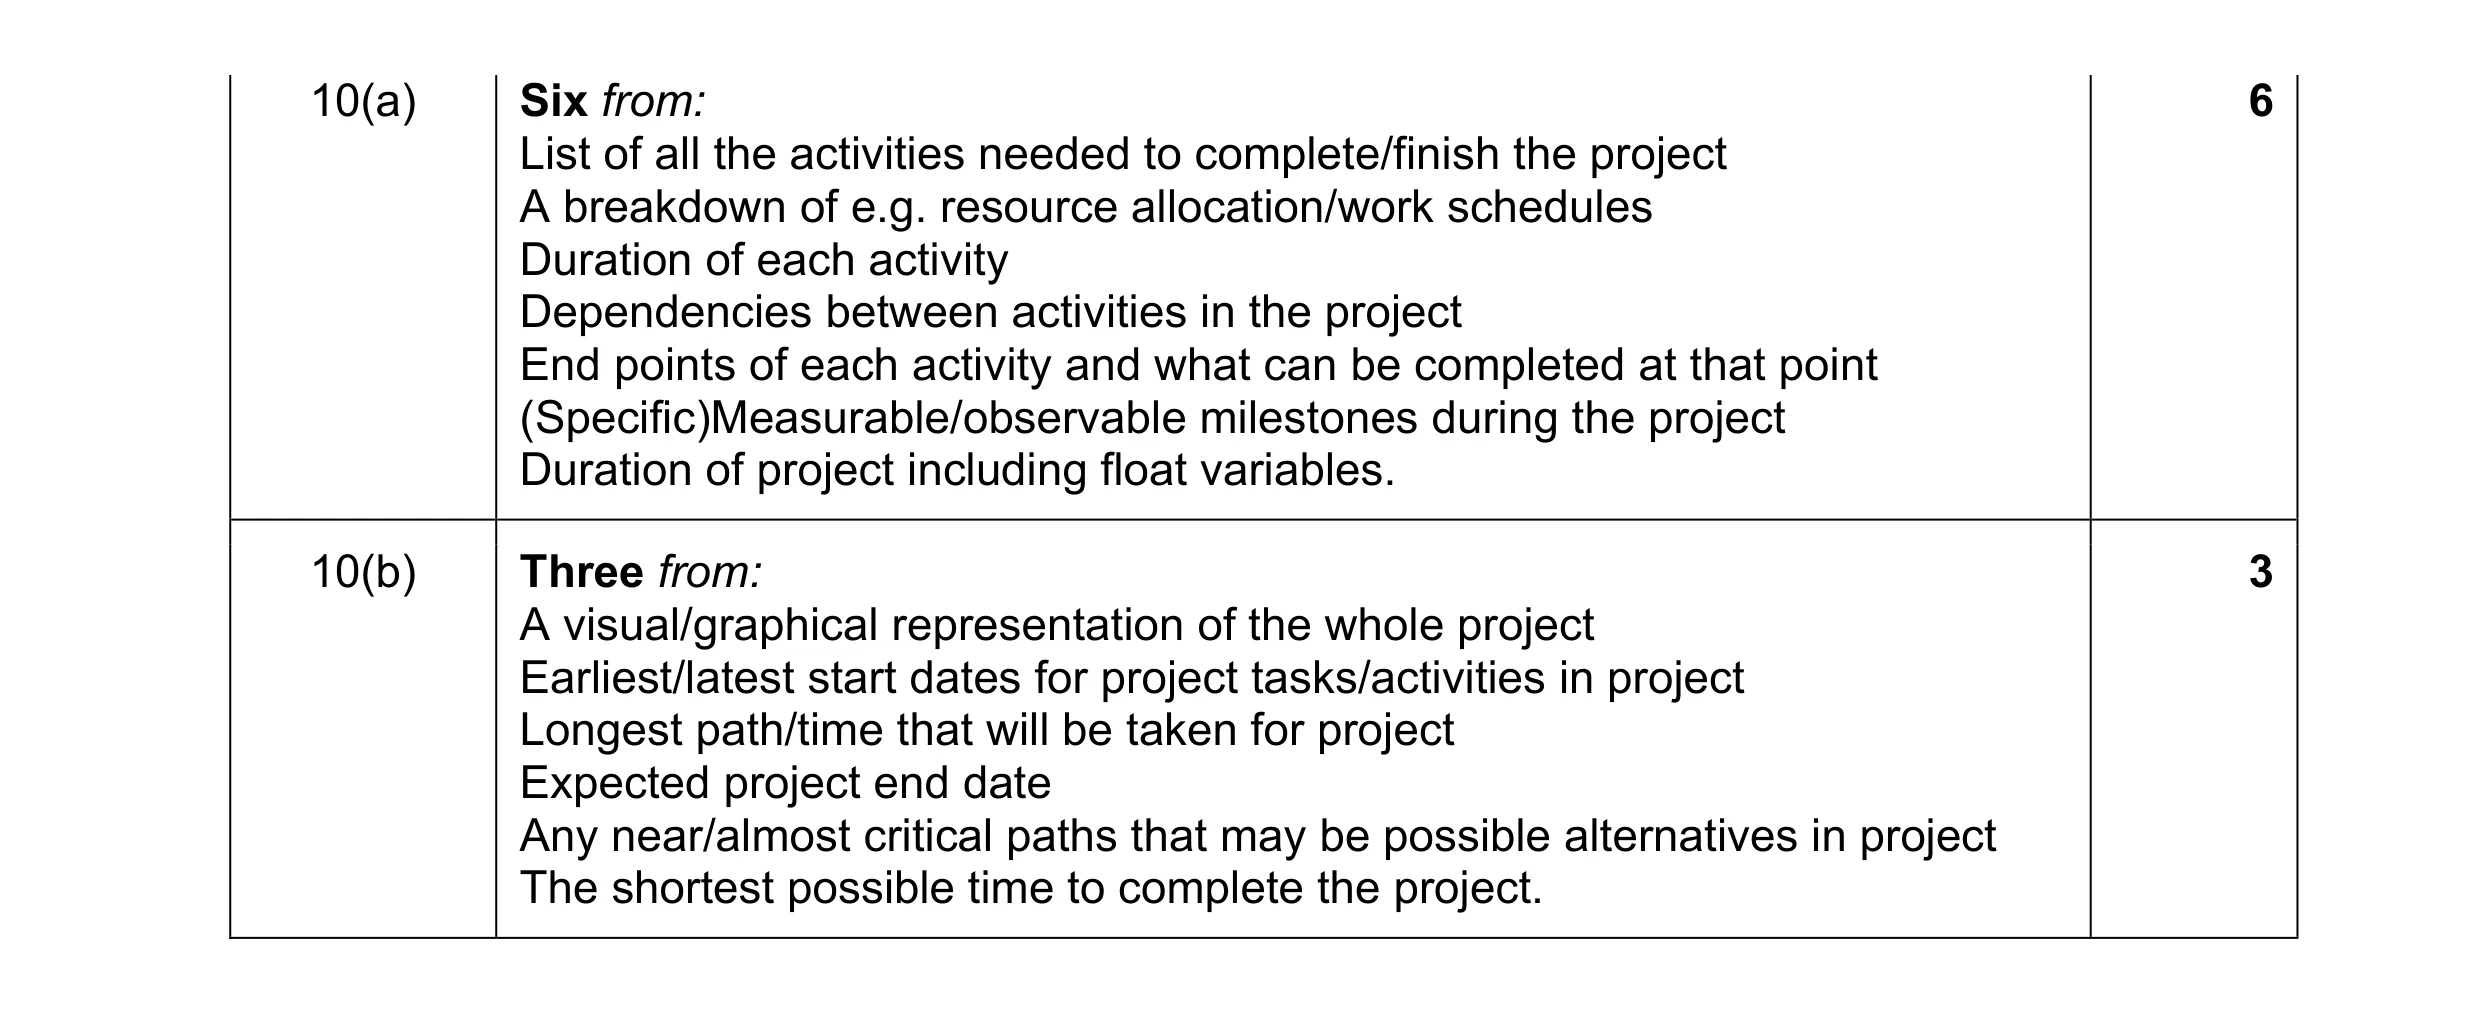 9
9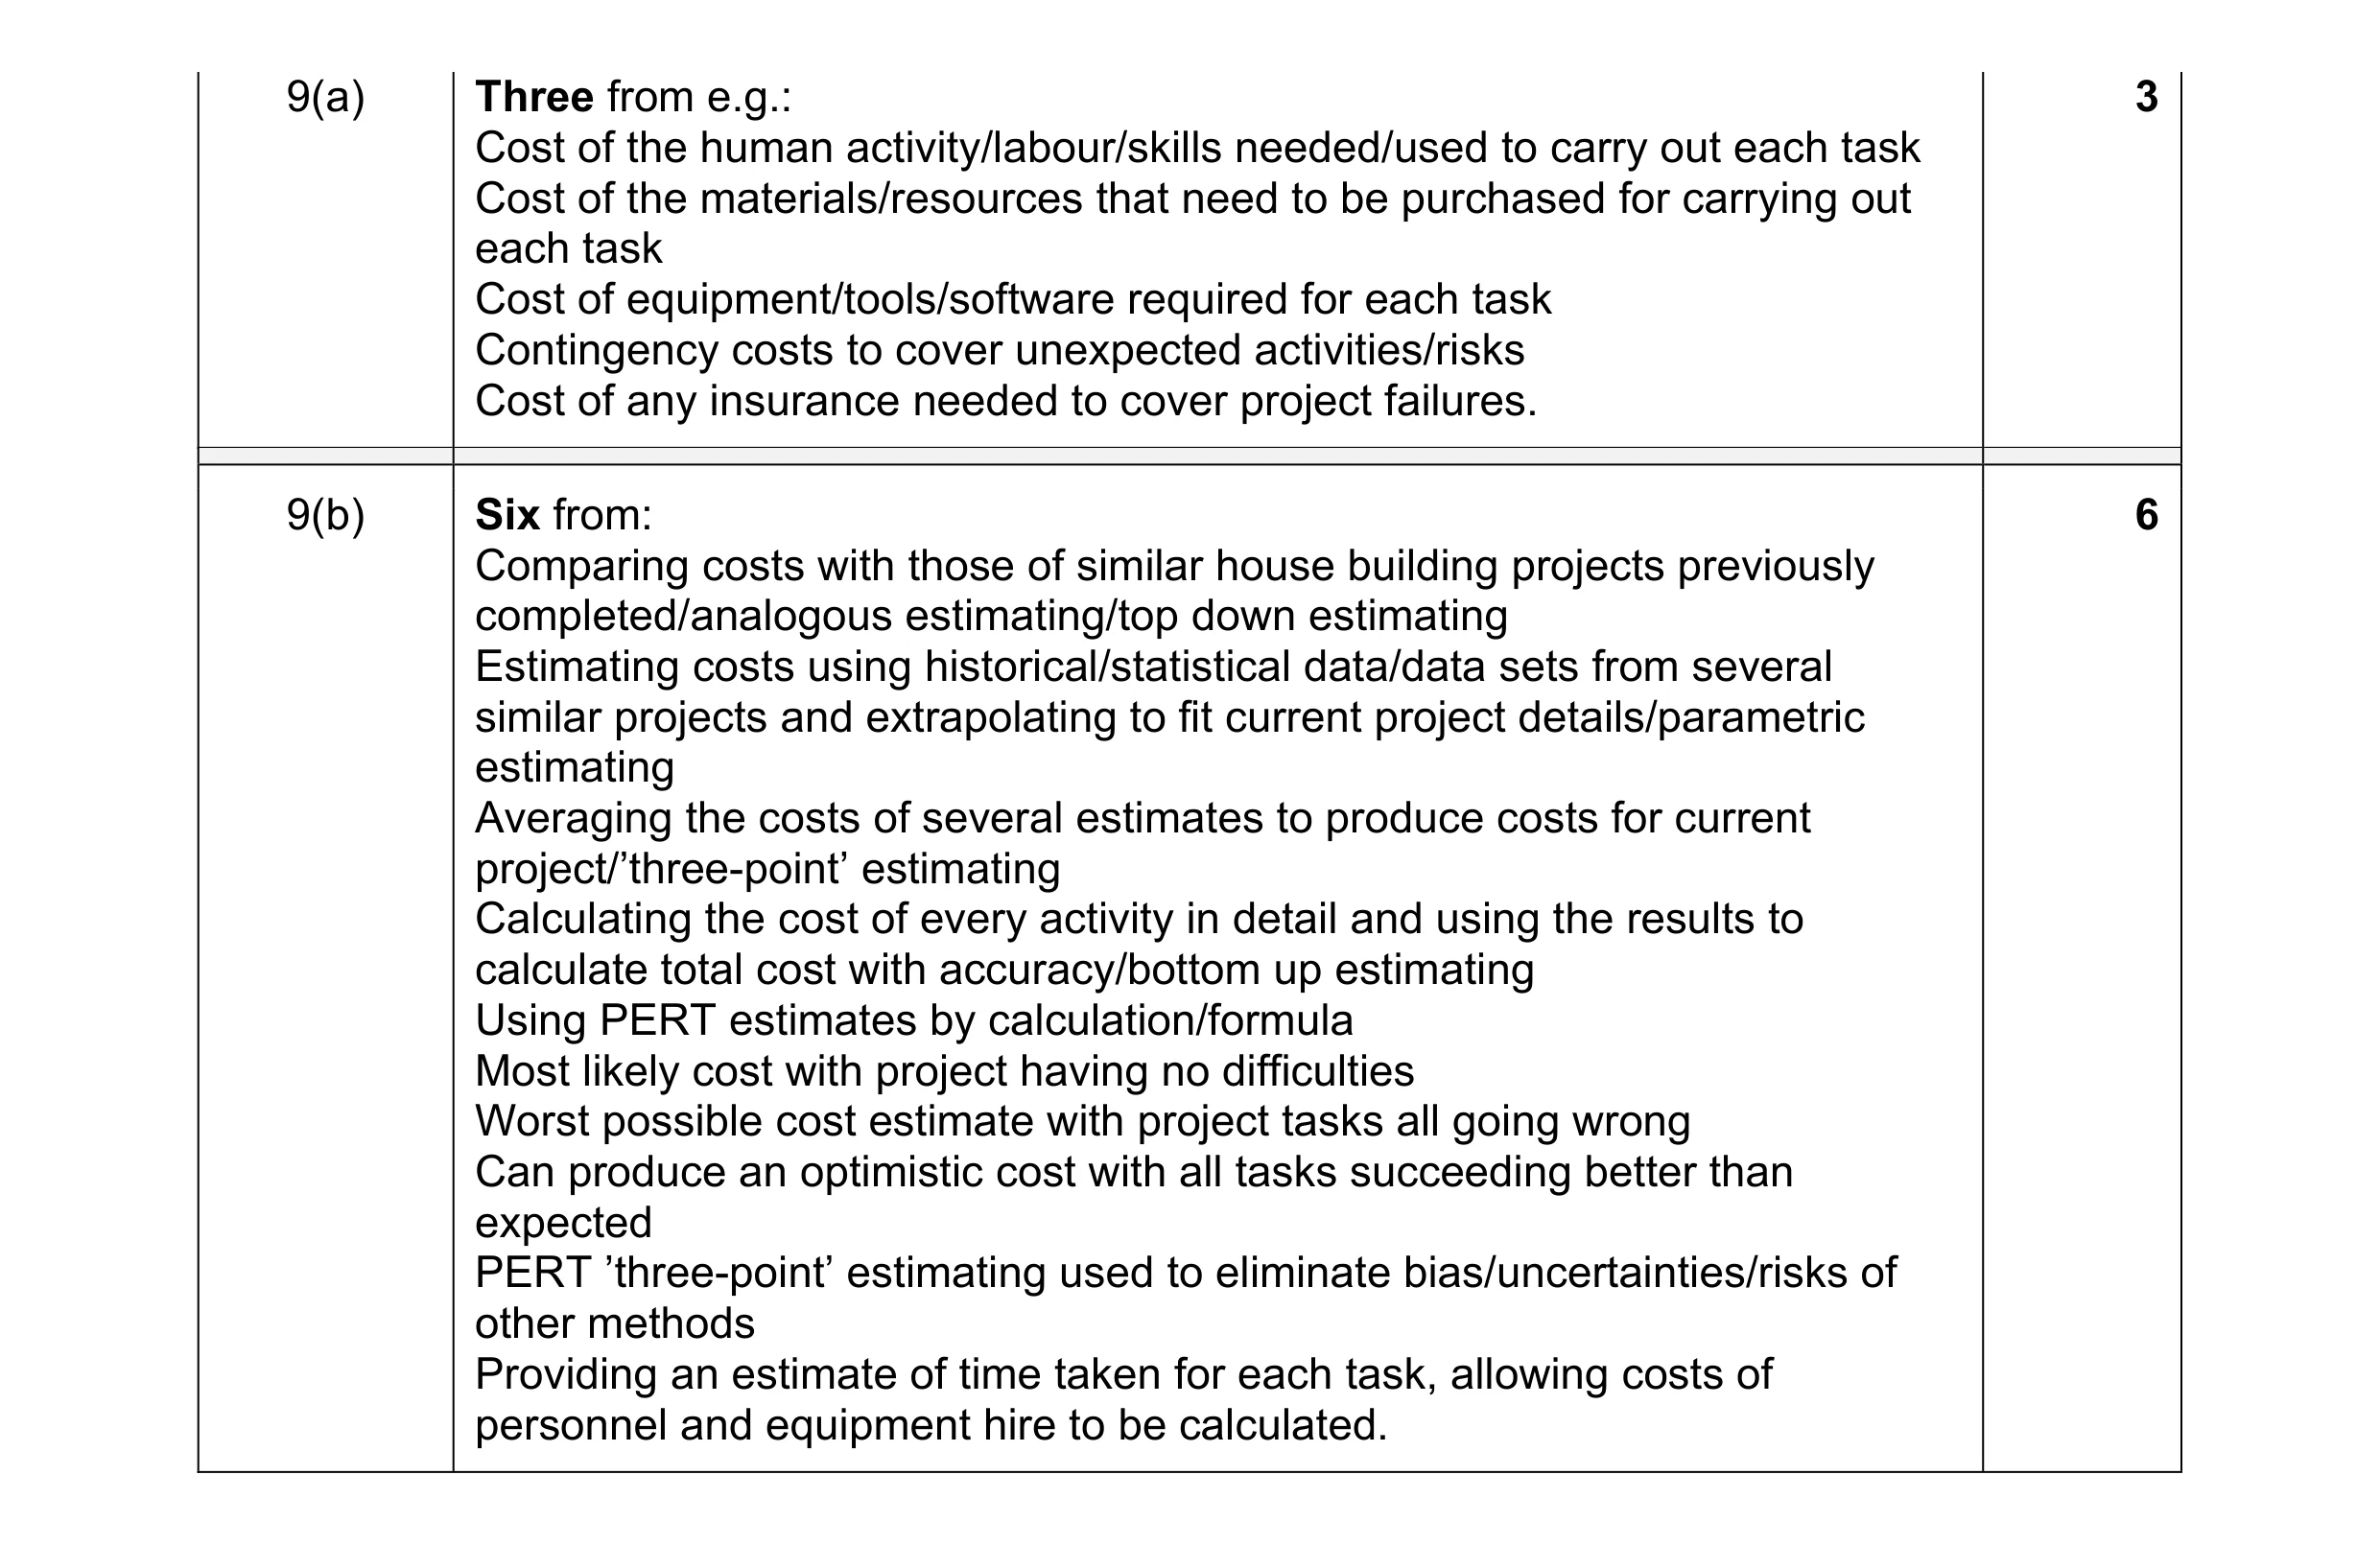 9
9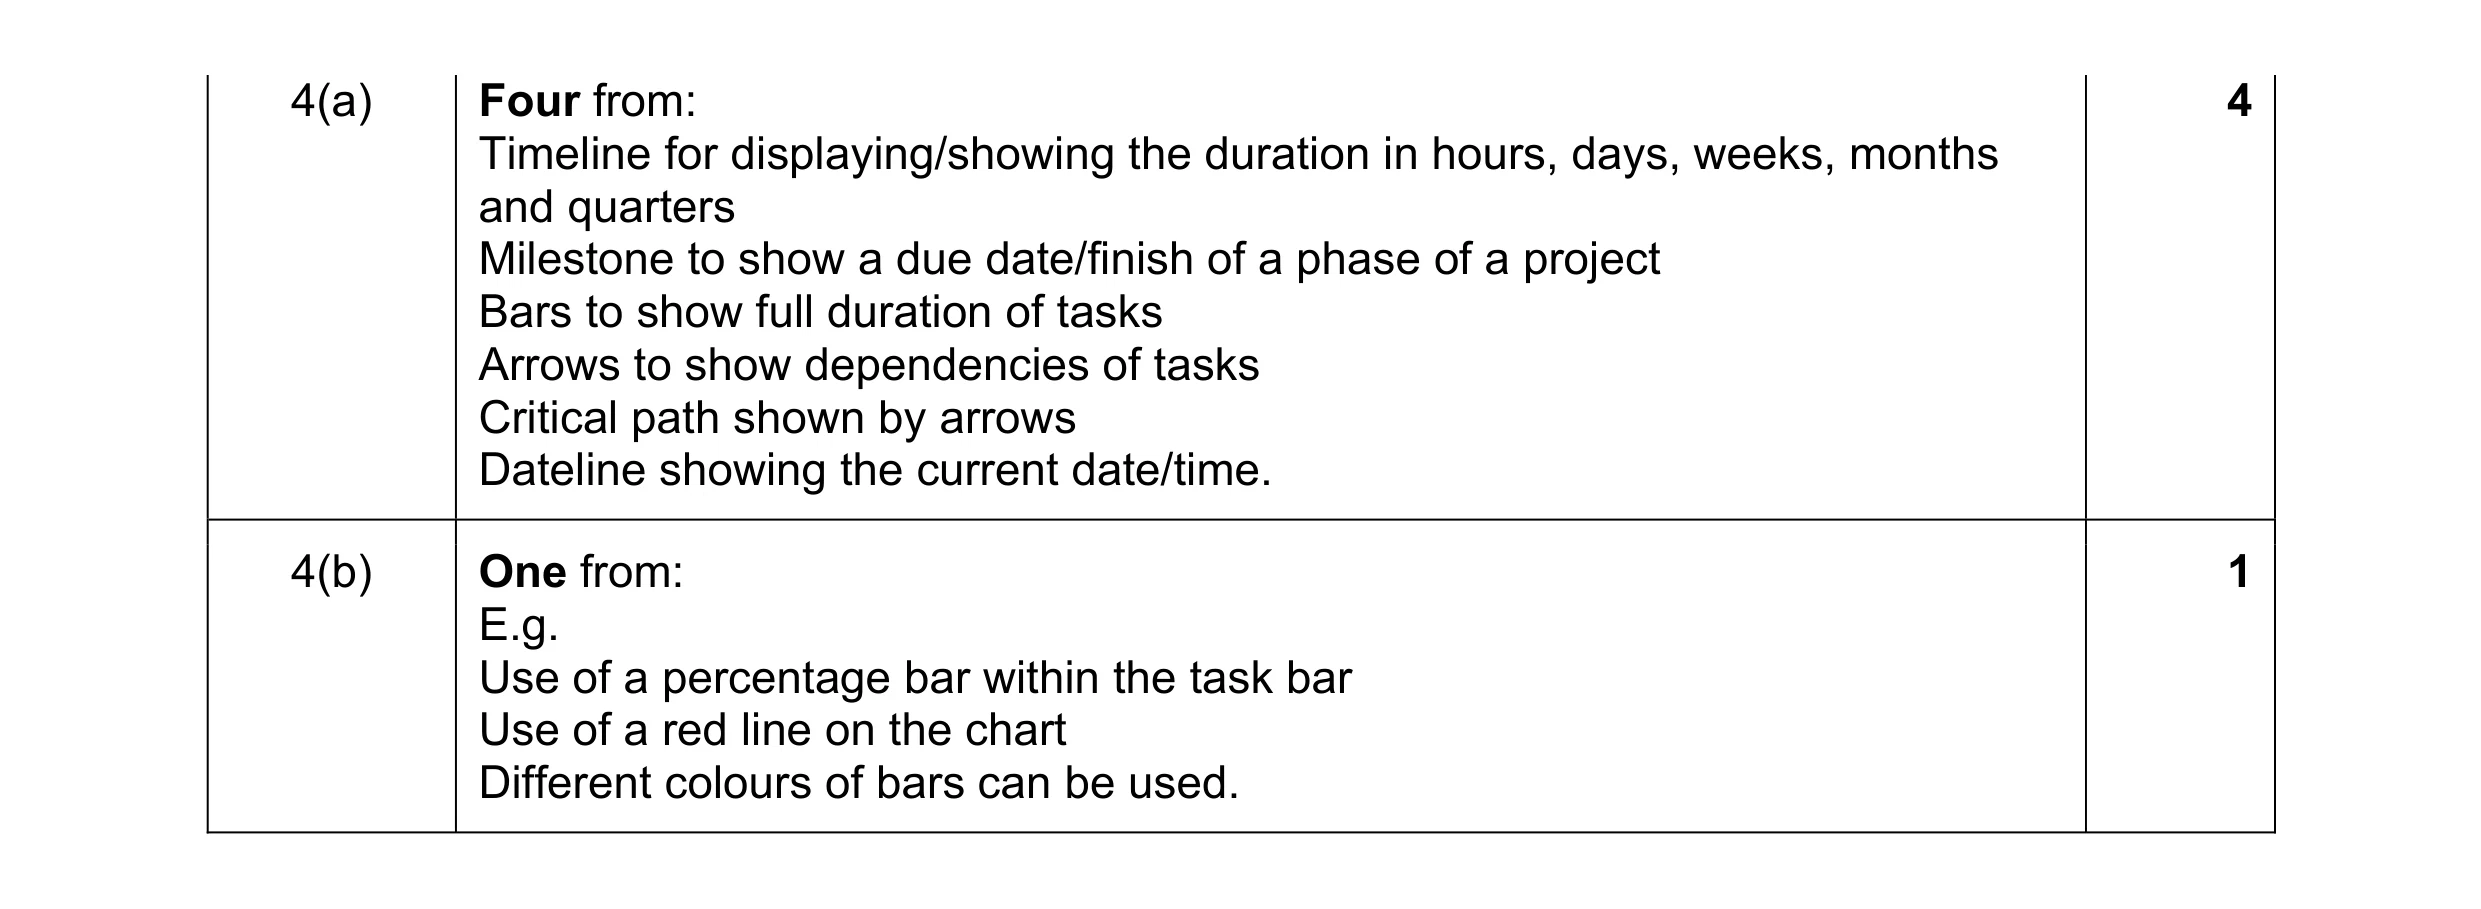 5
5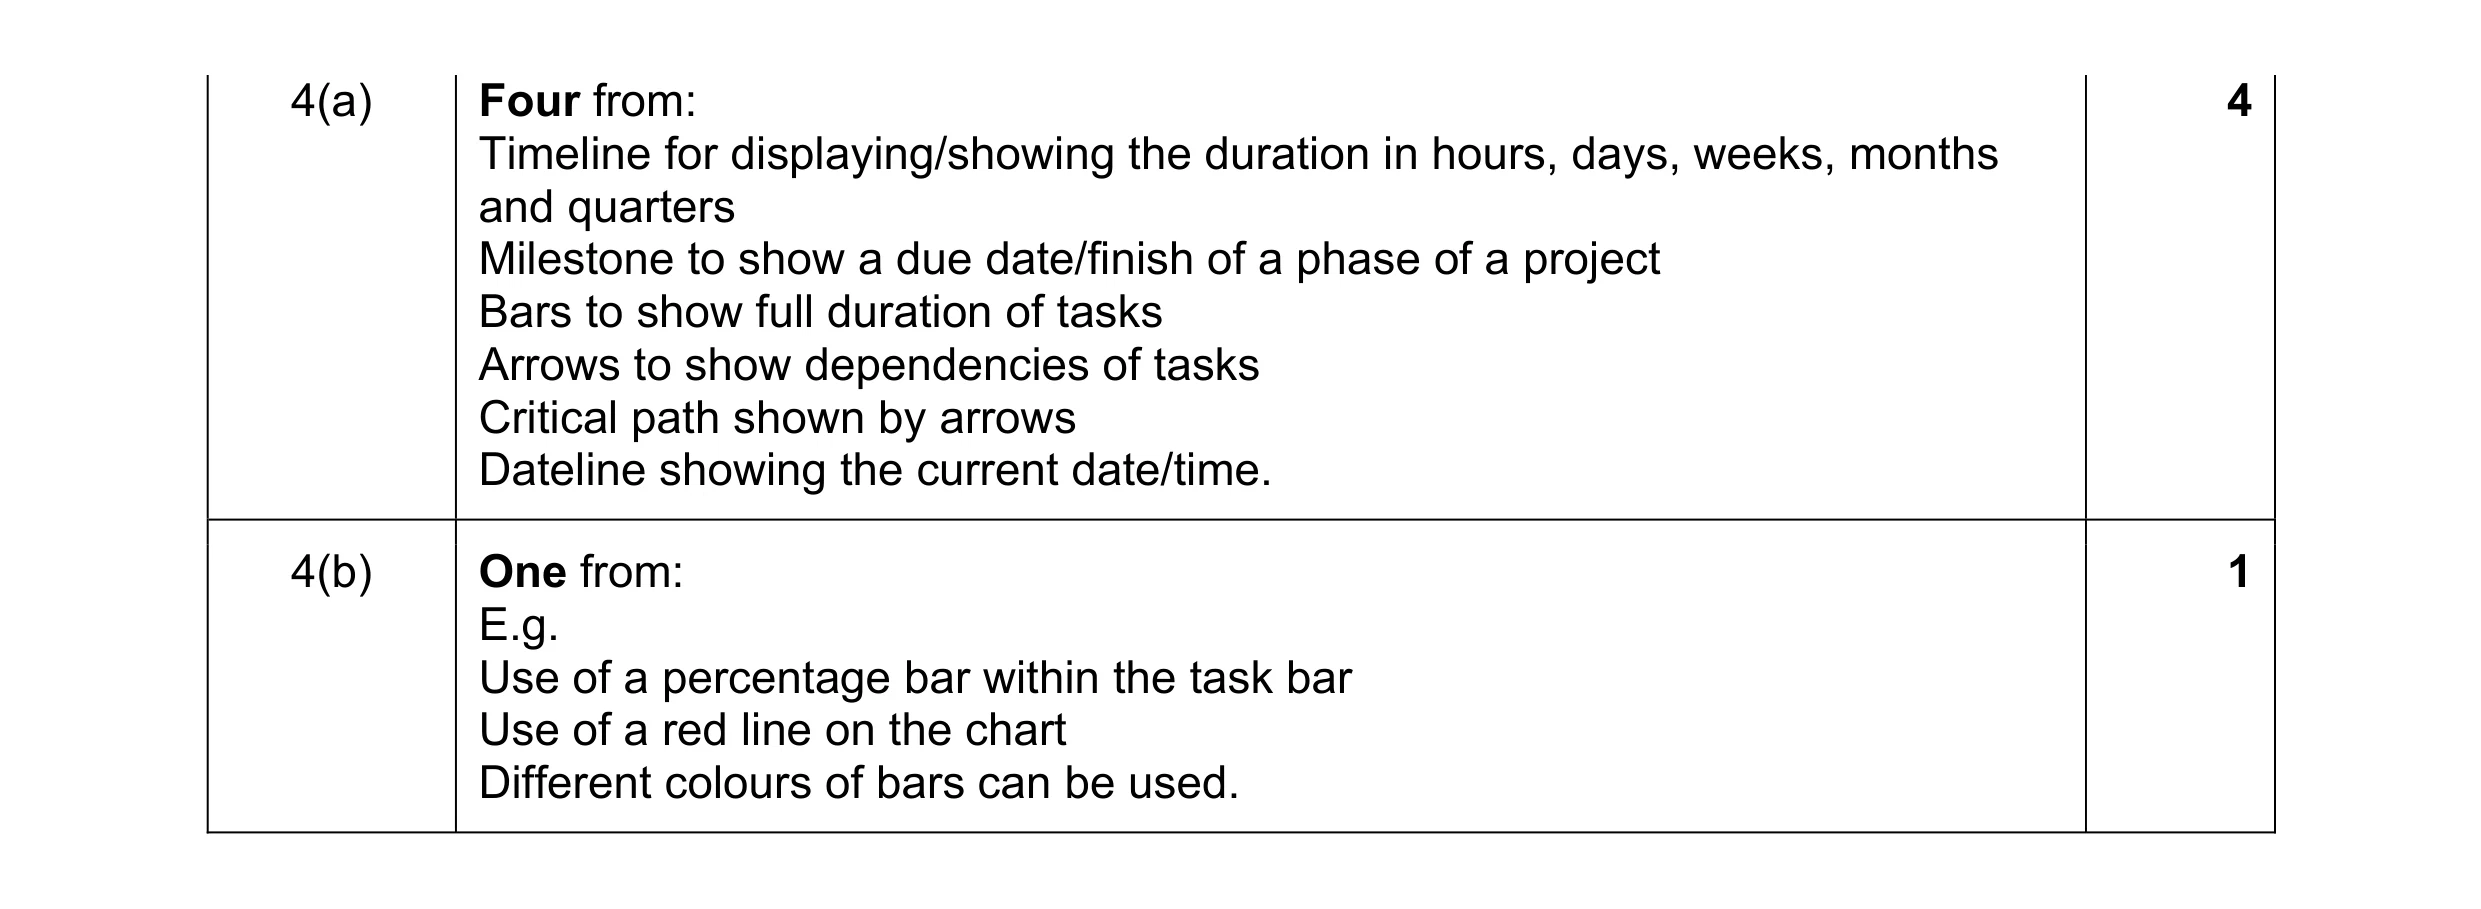 5
5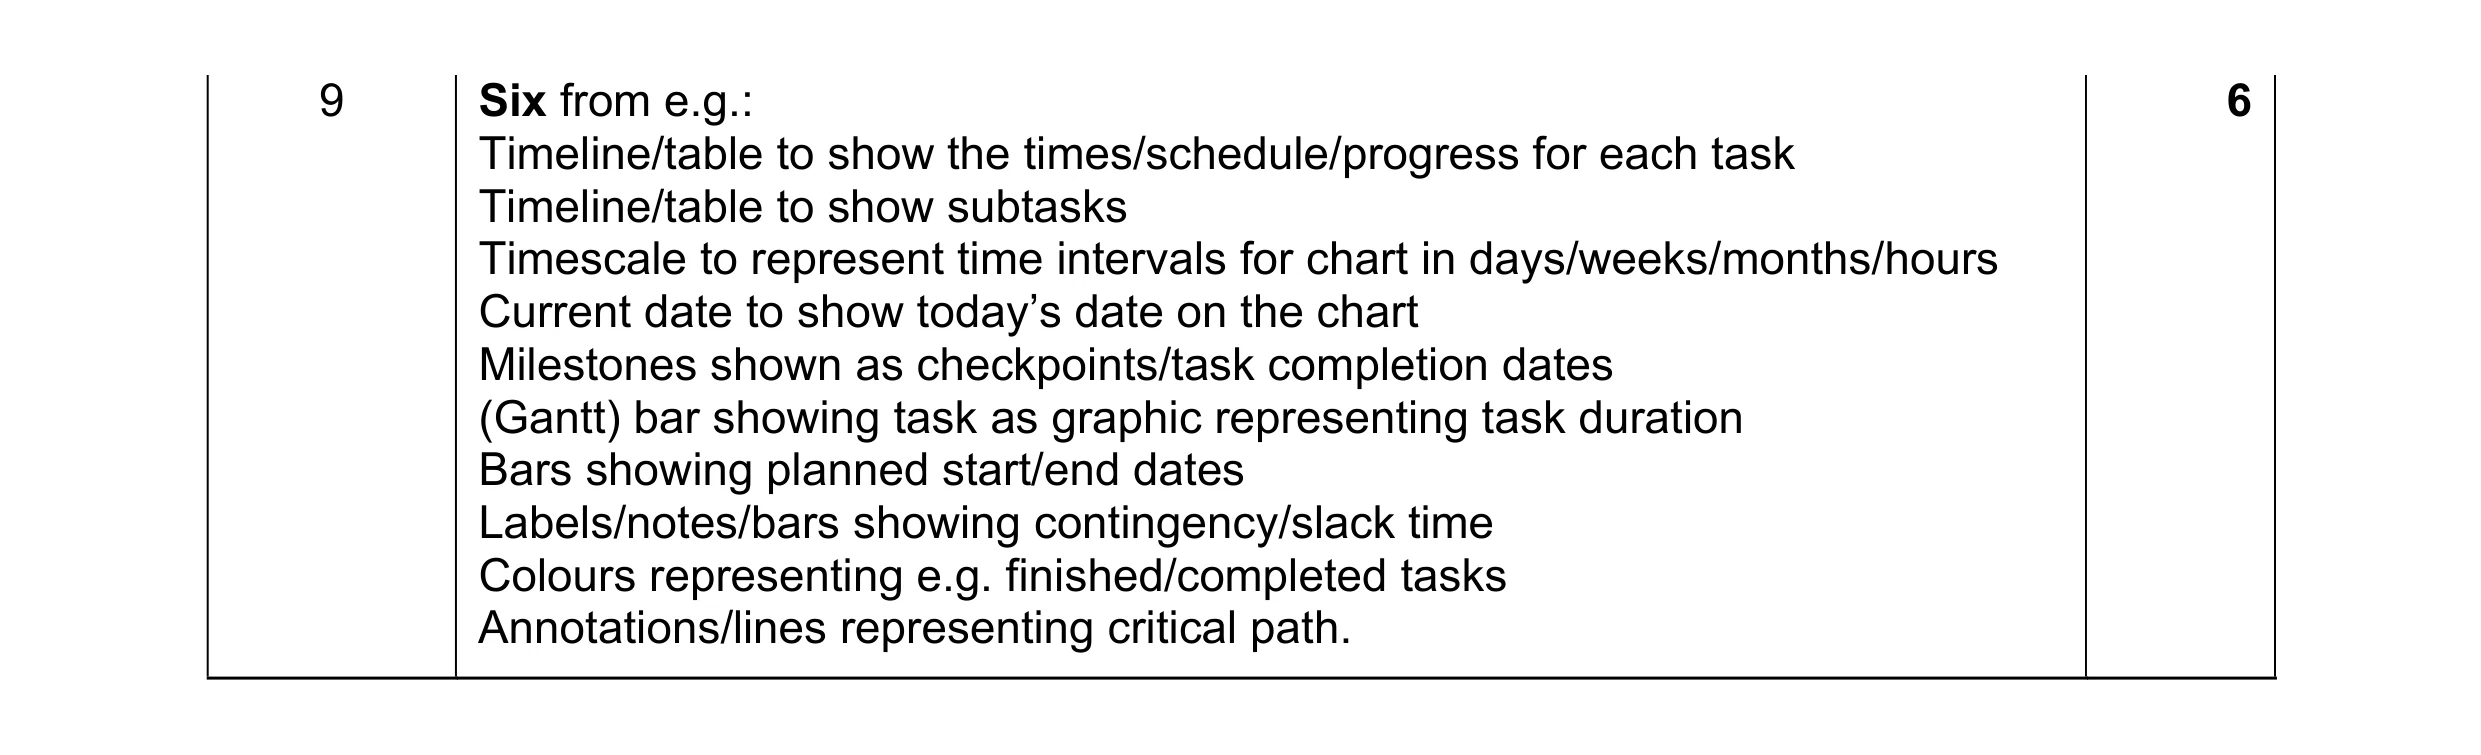 6
6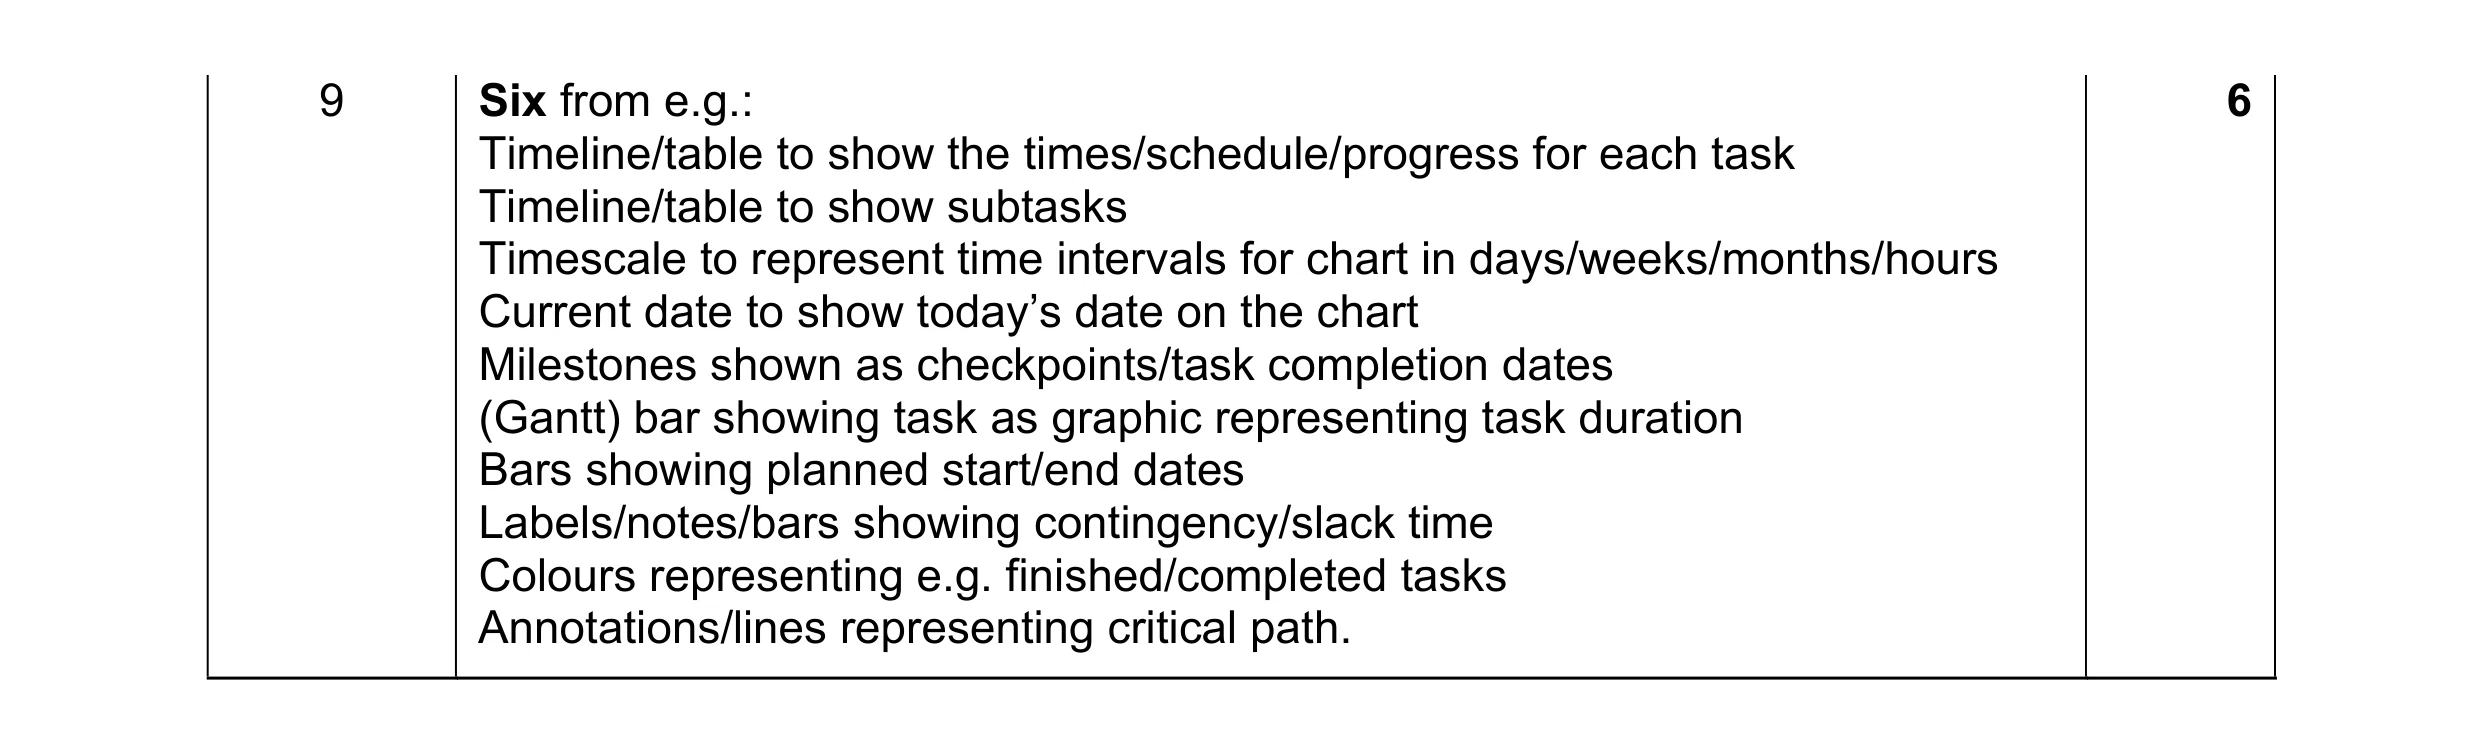 6
6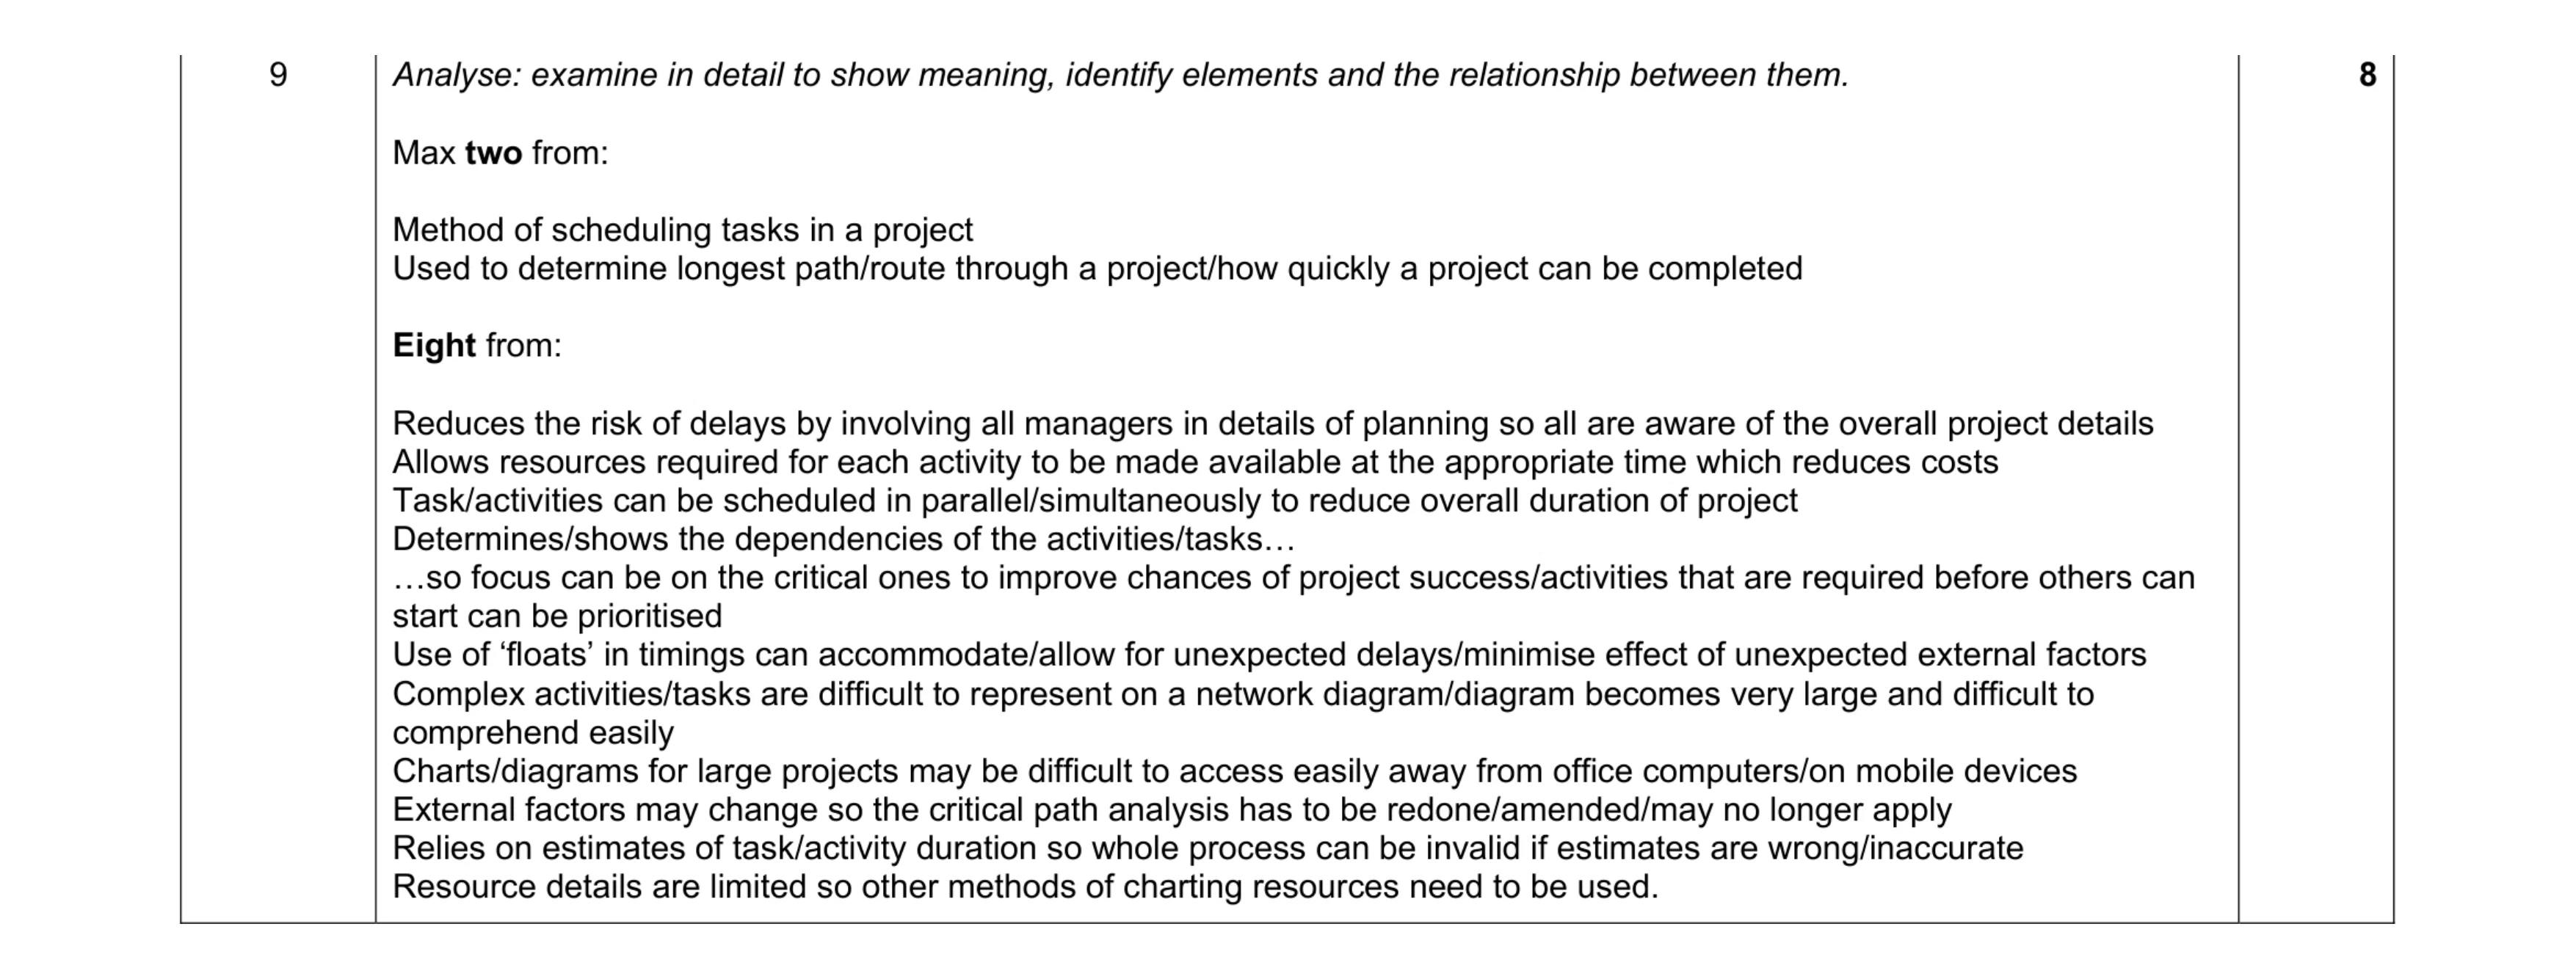 8
8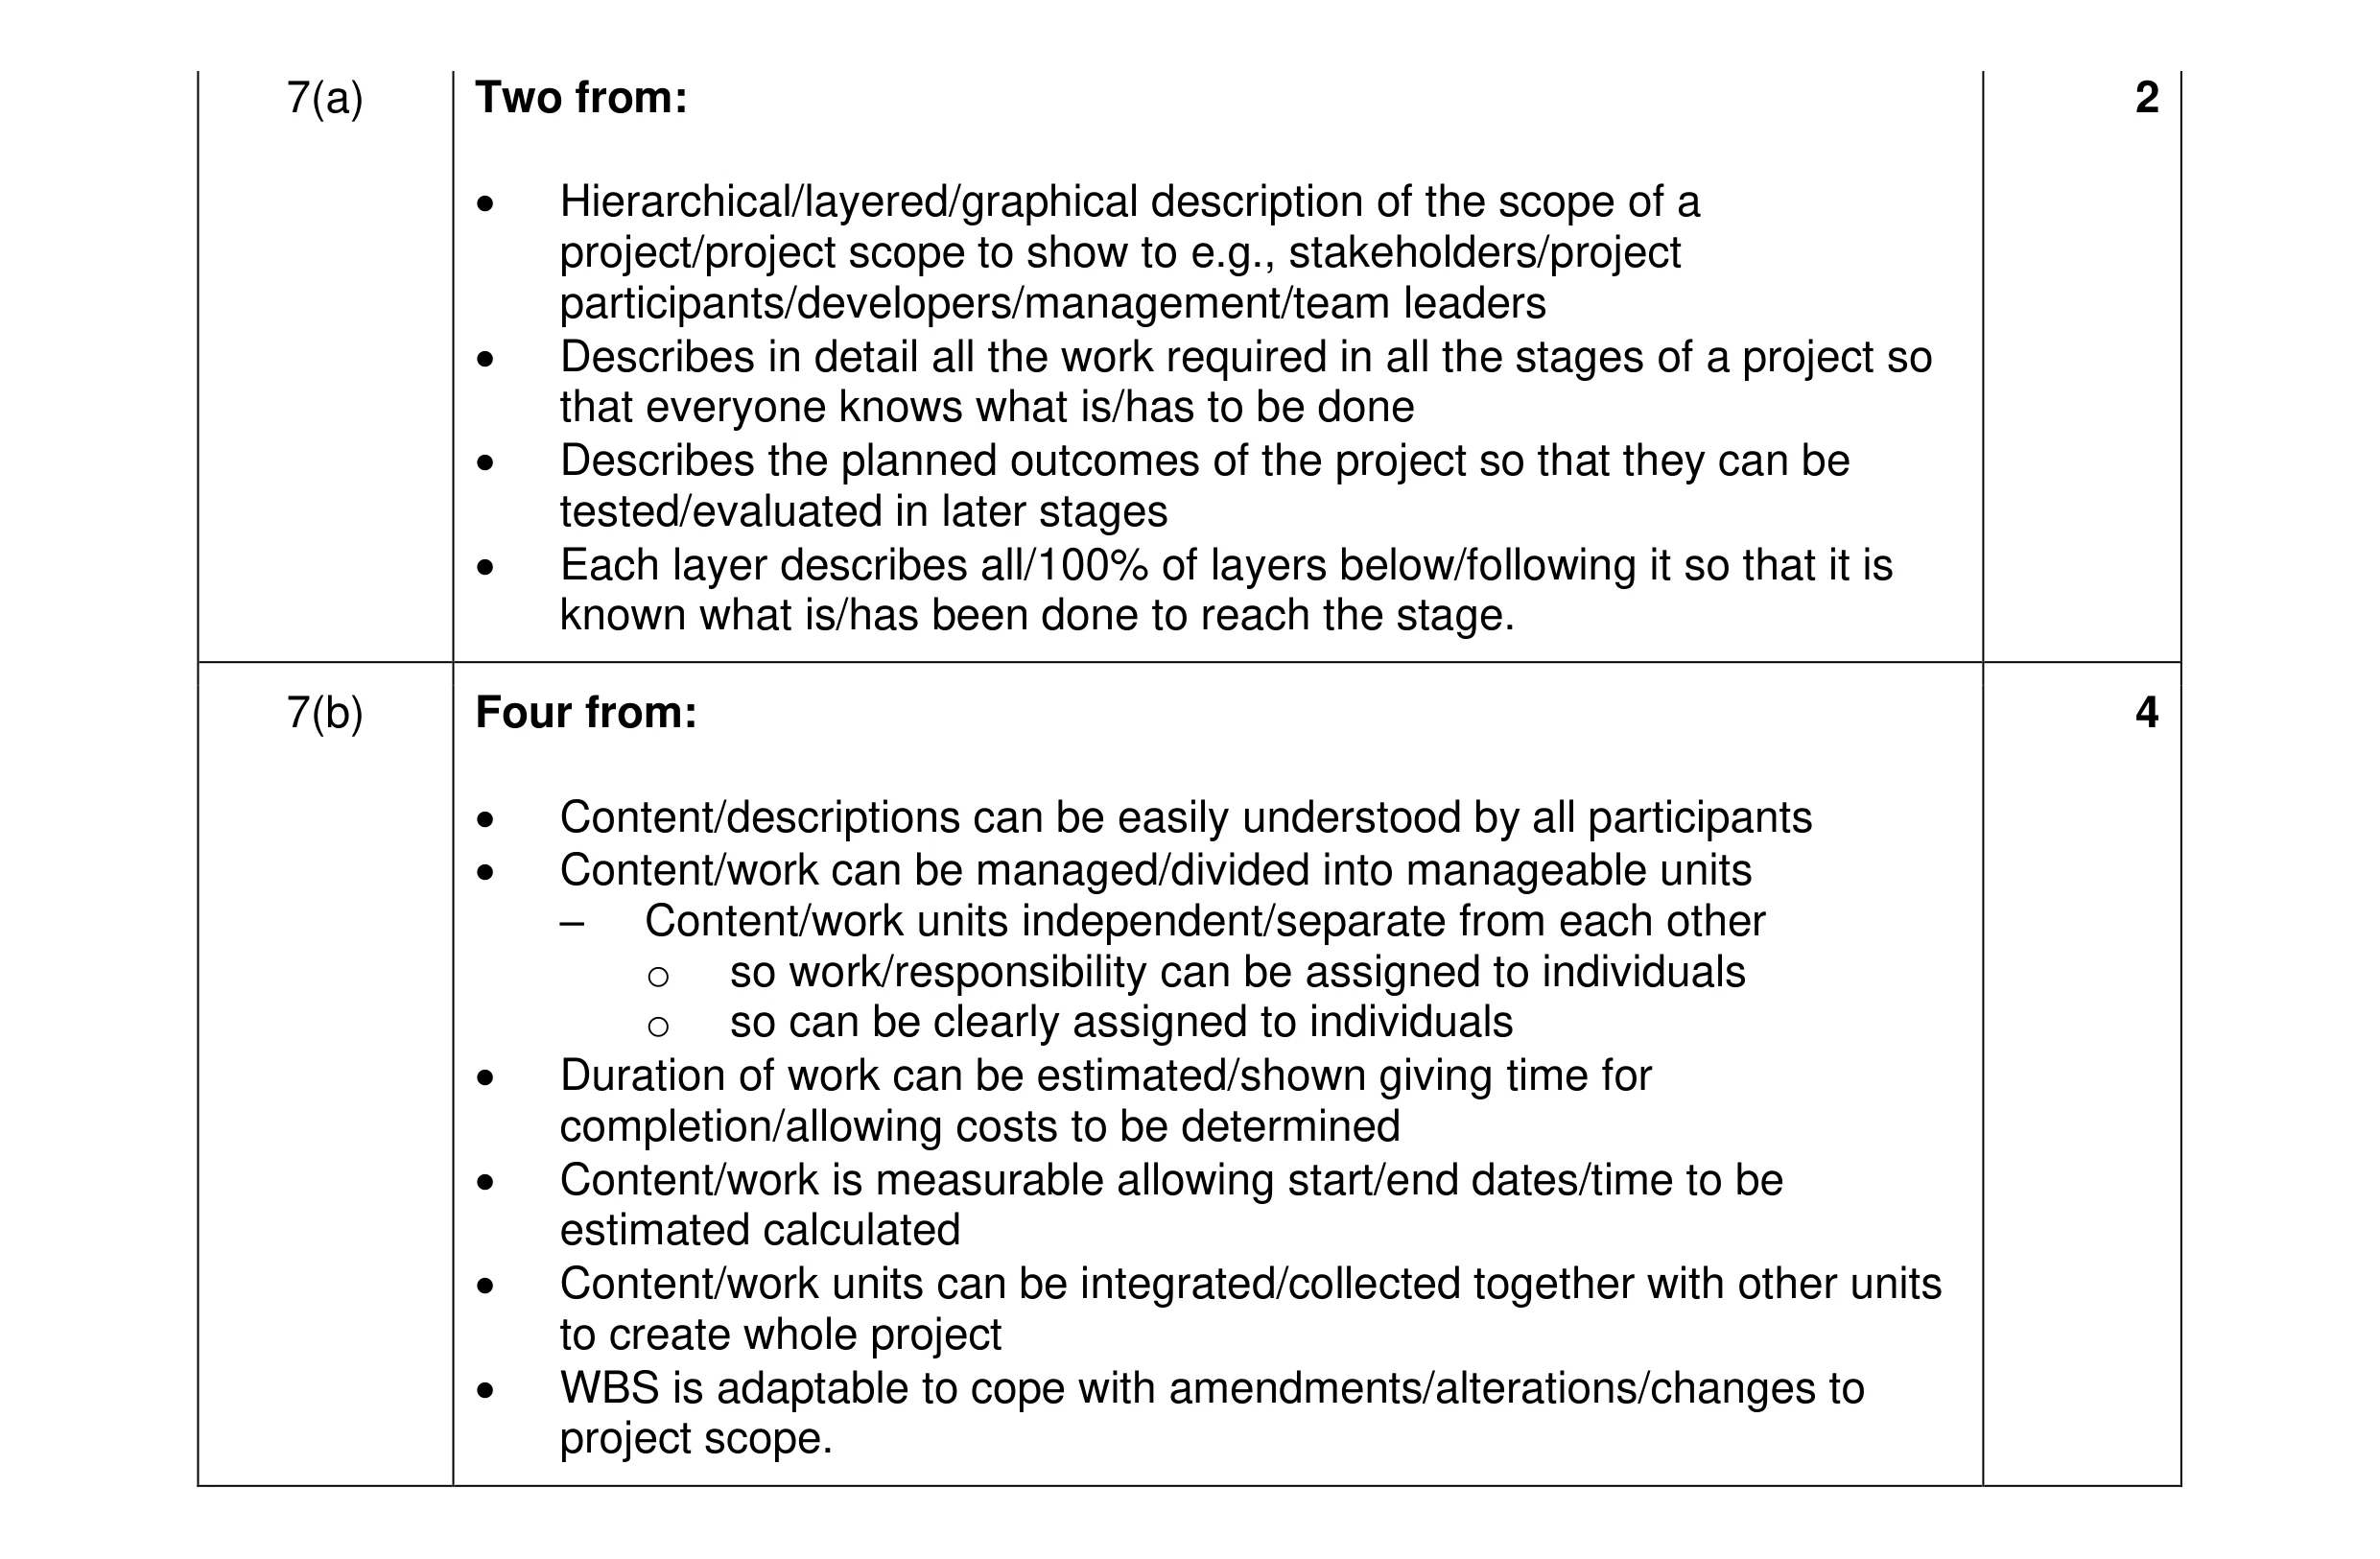 6
6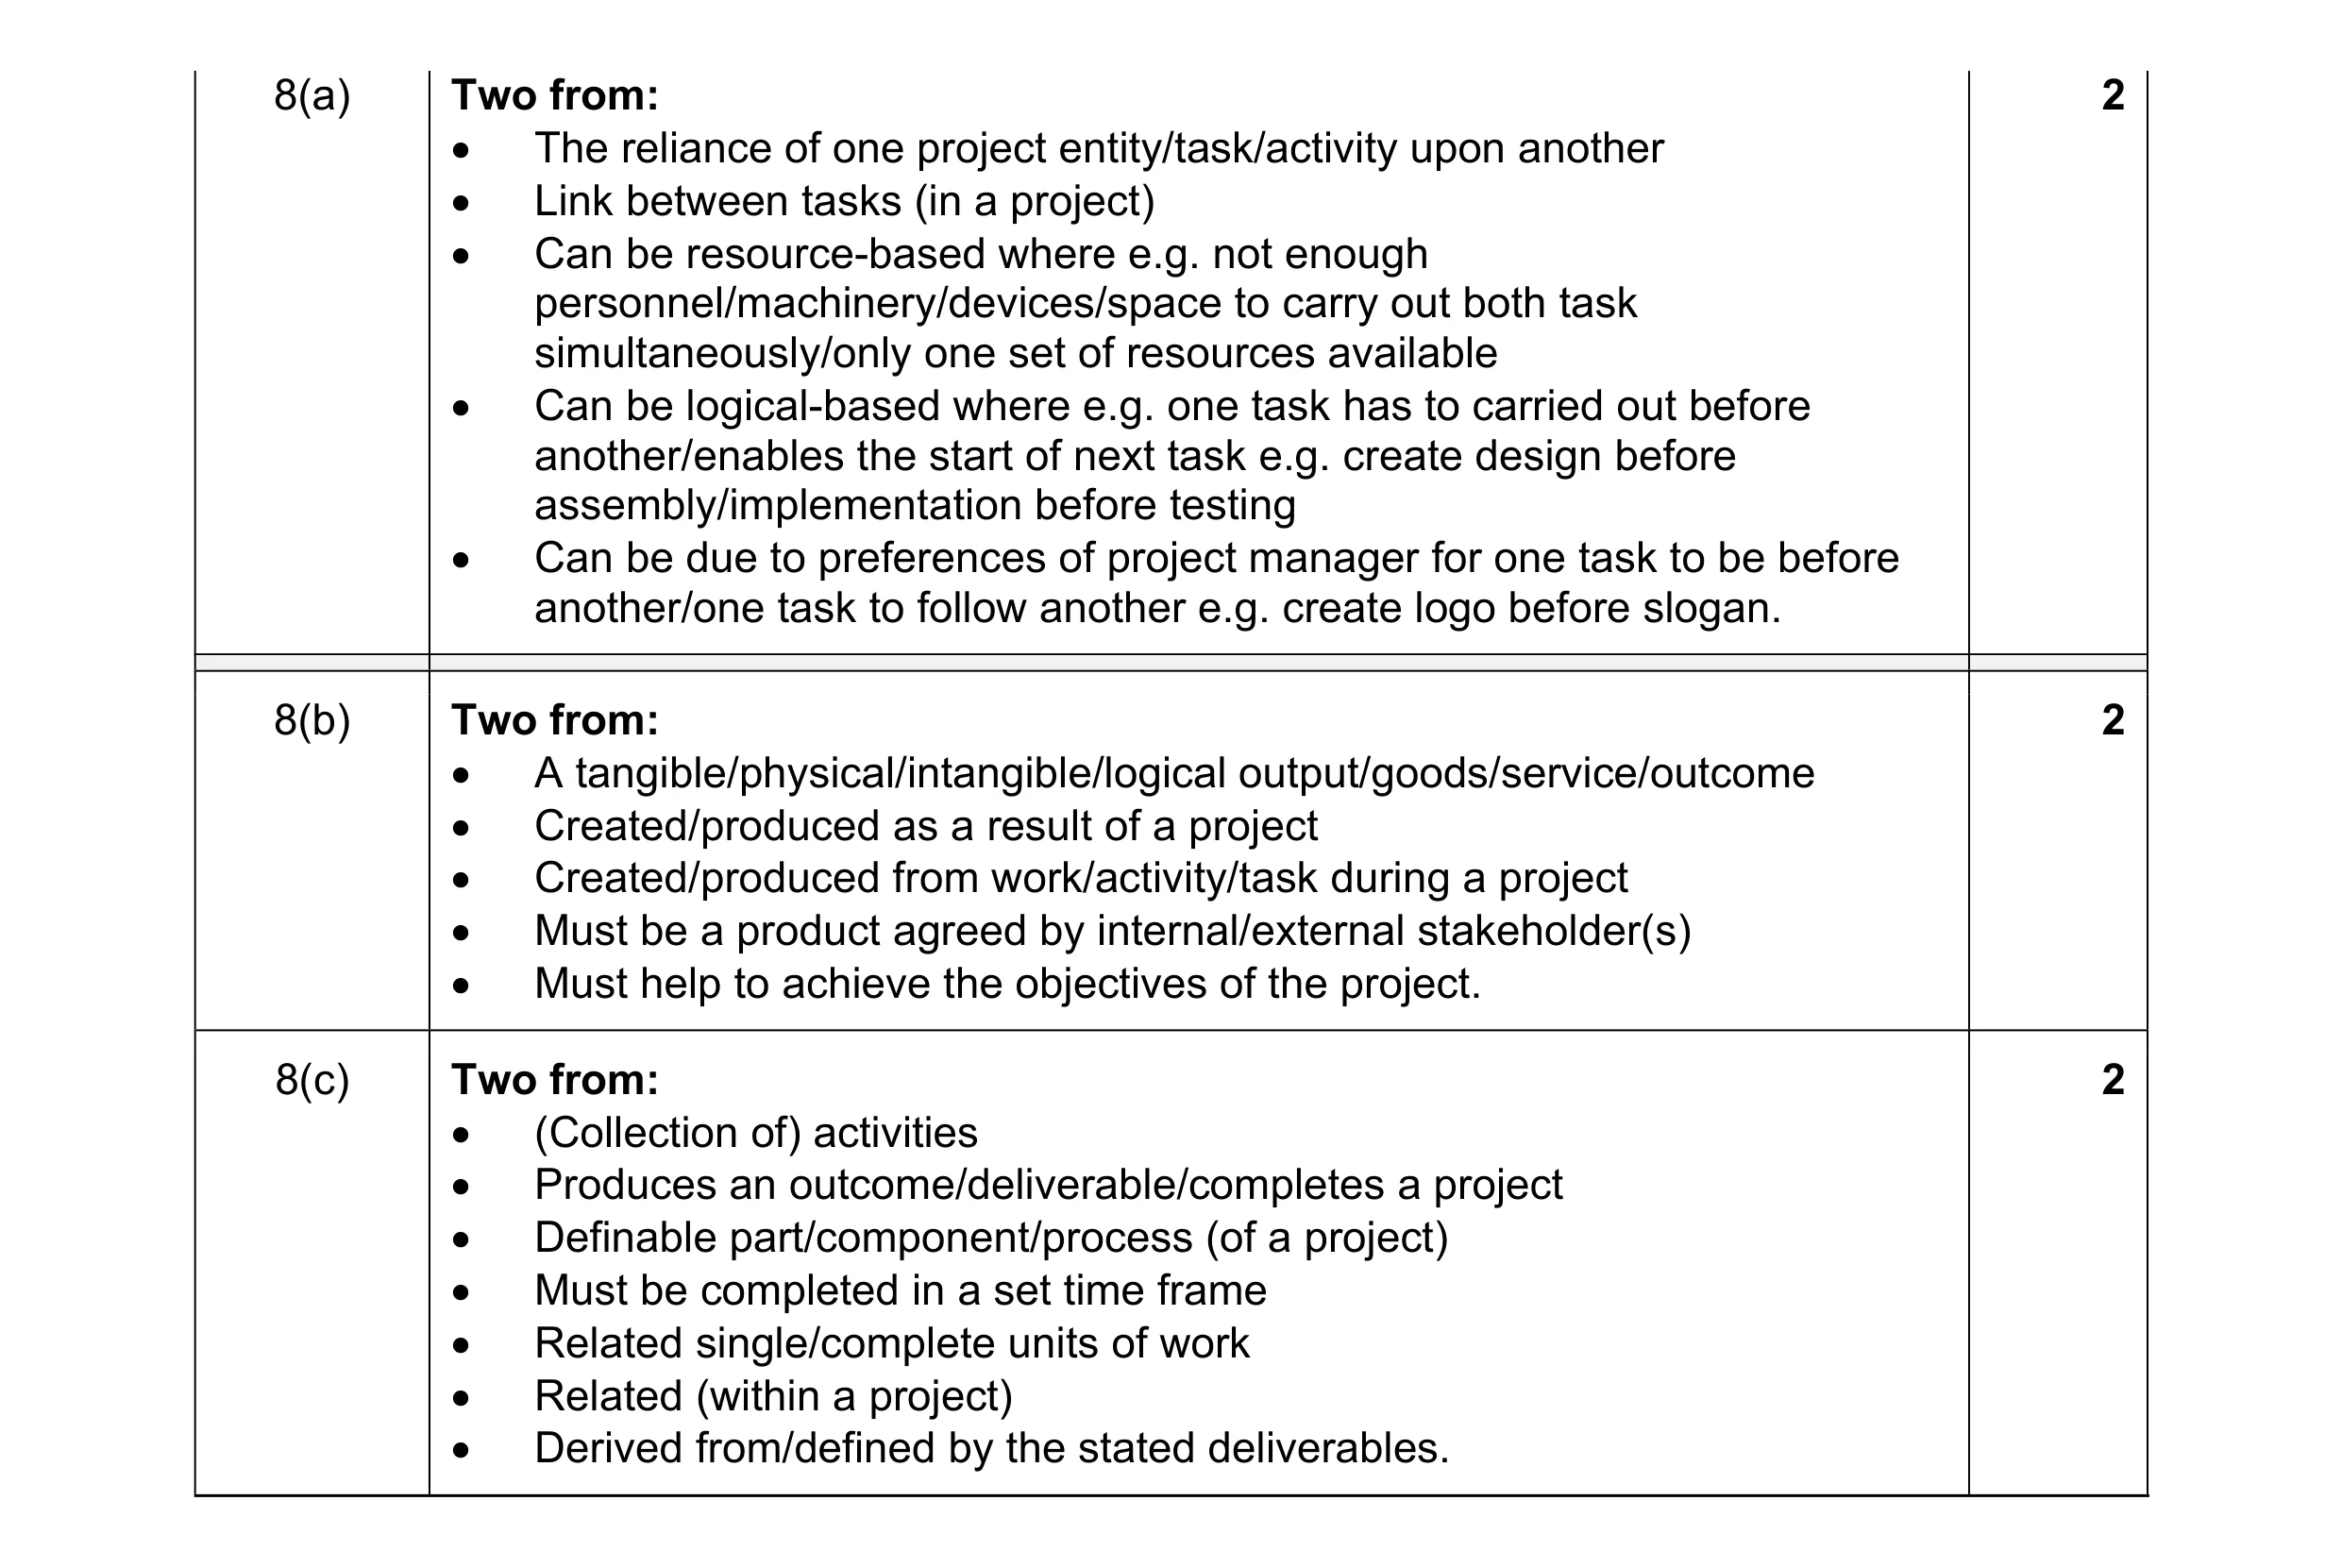 6
6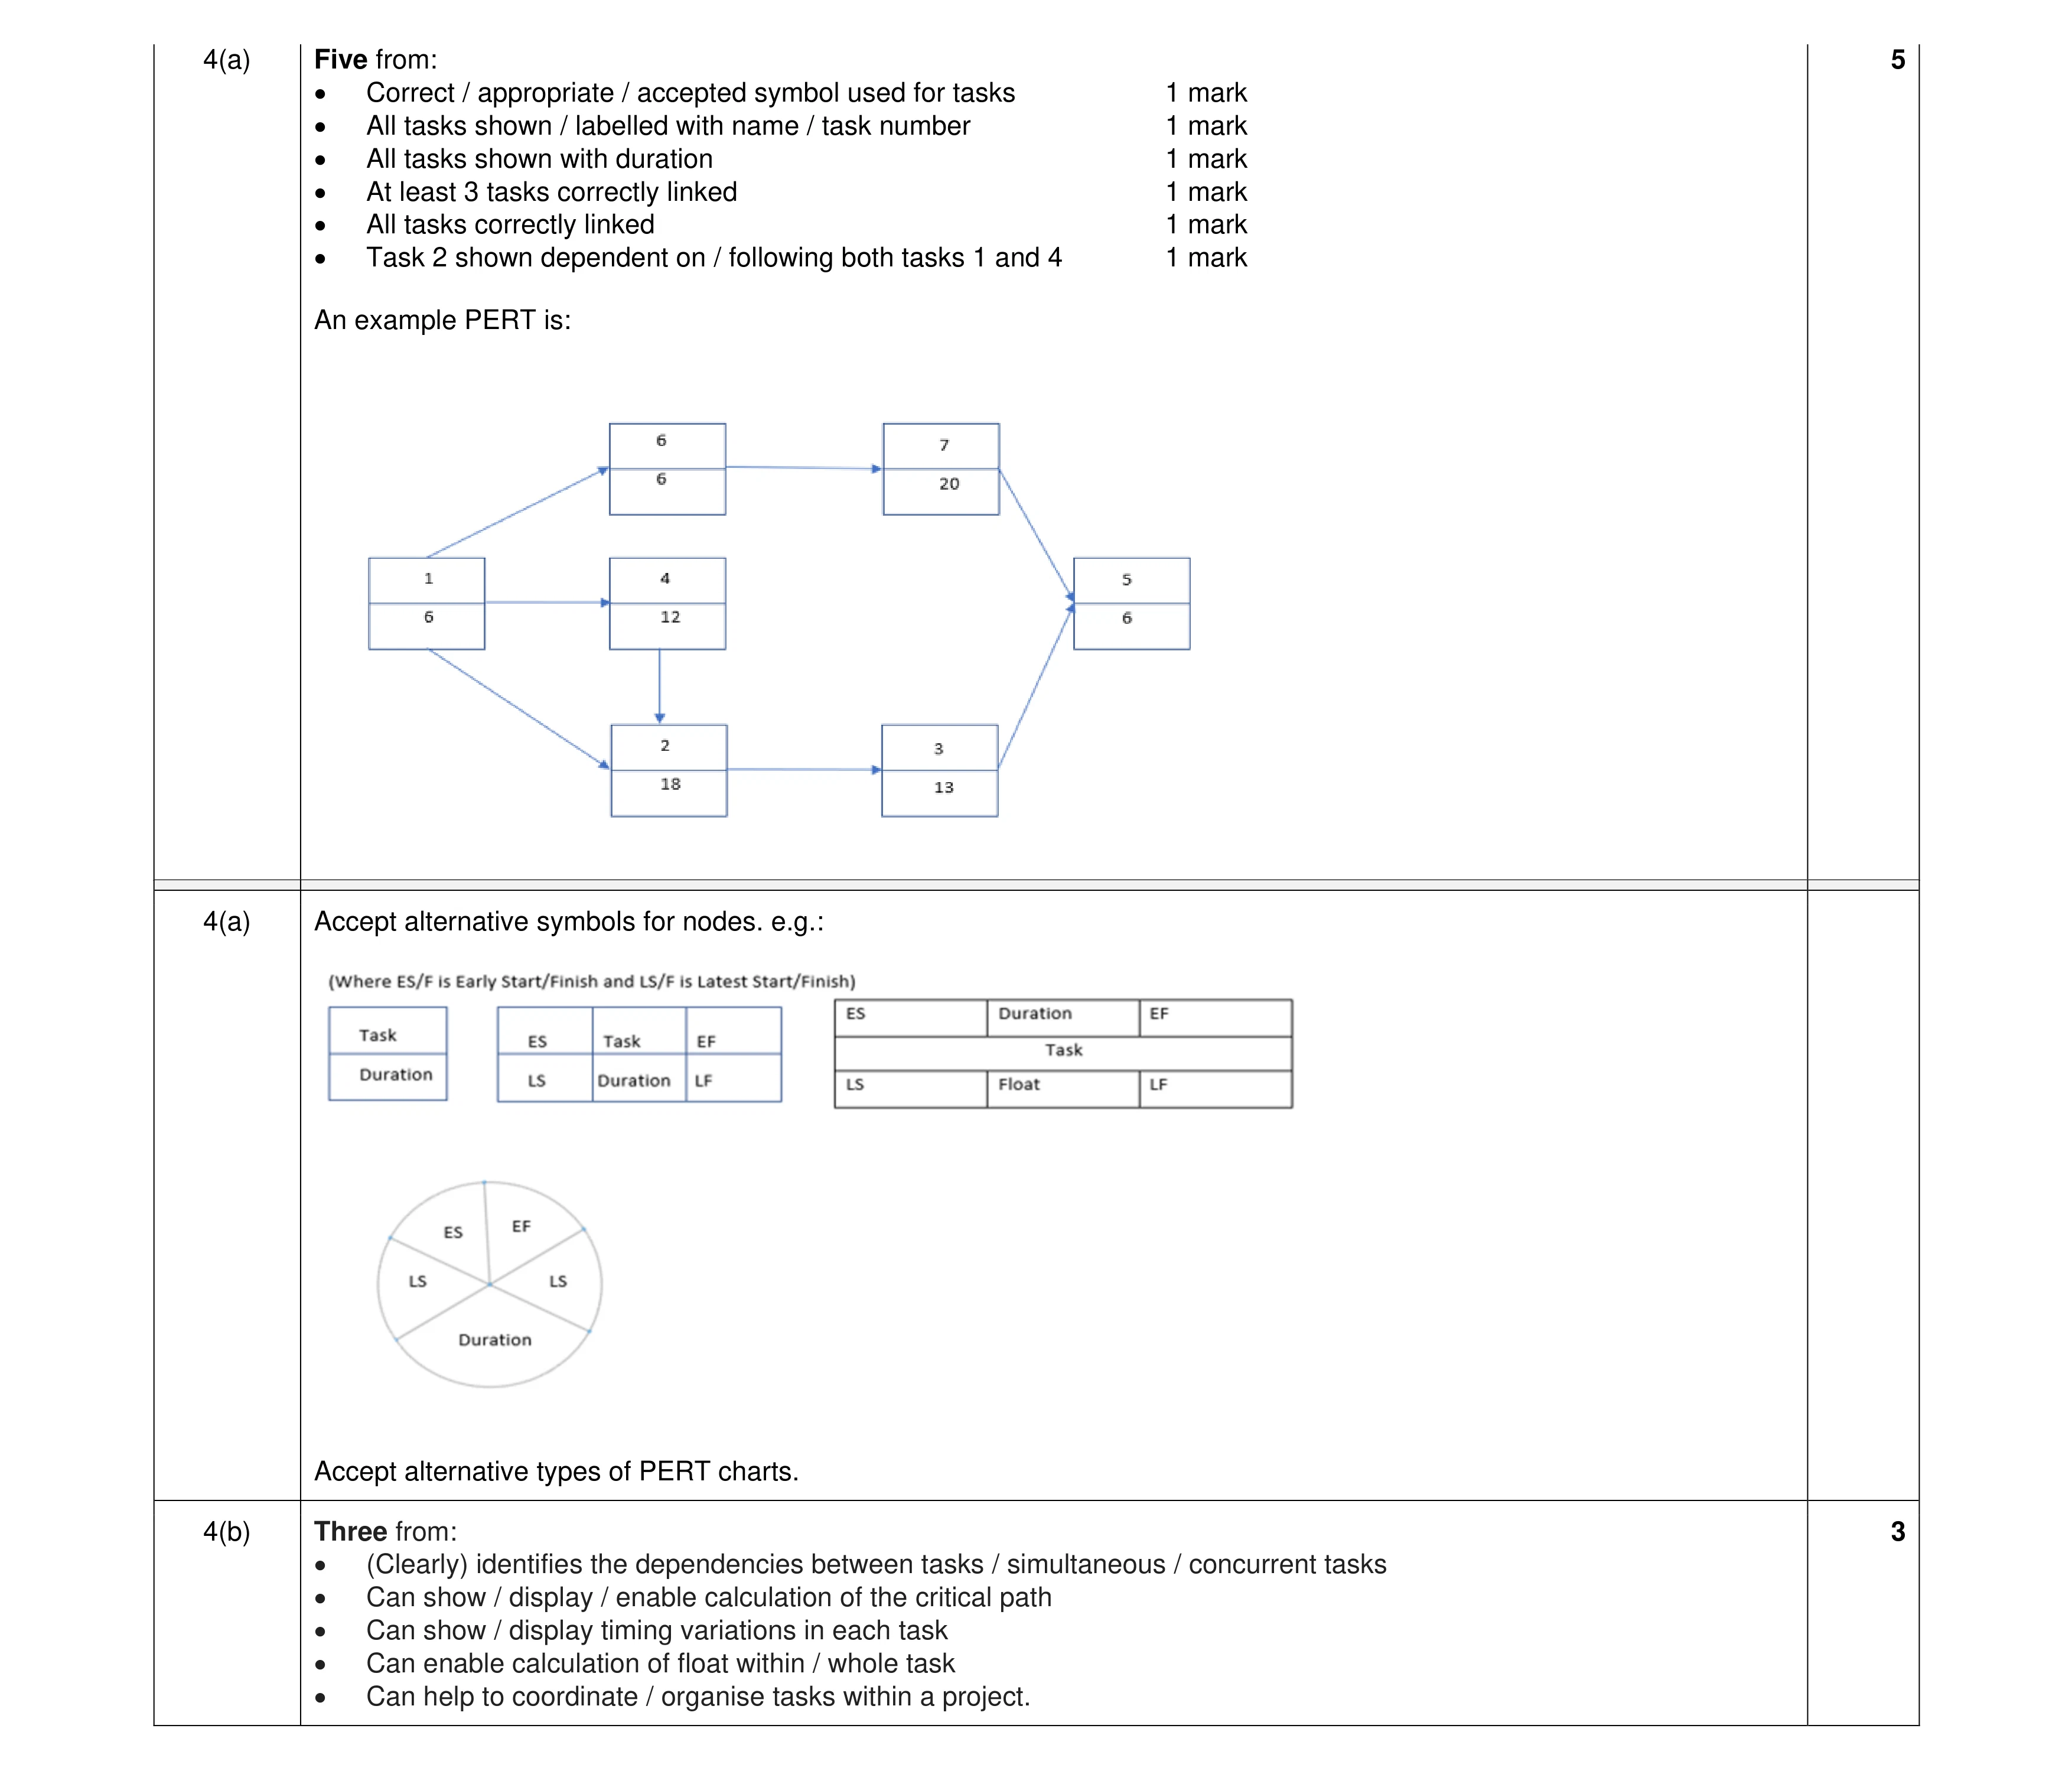 8
8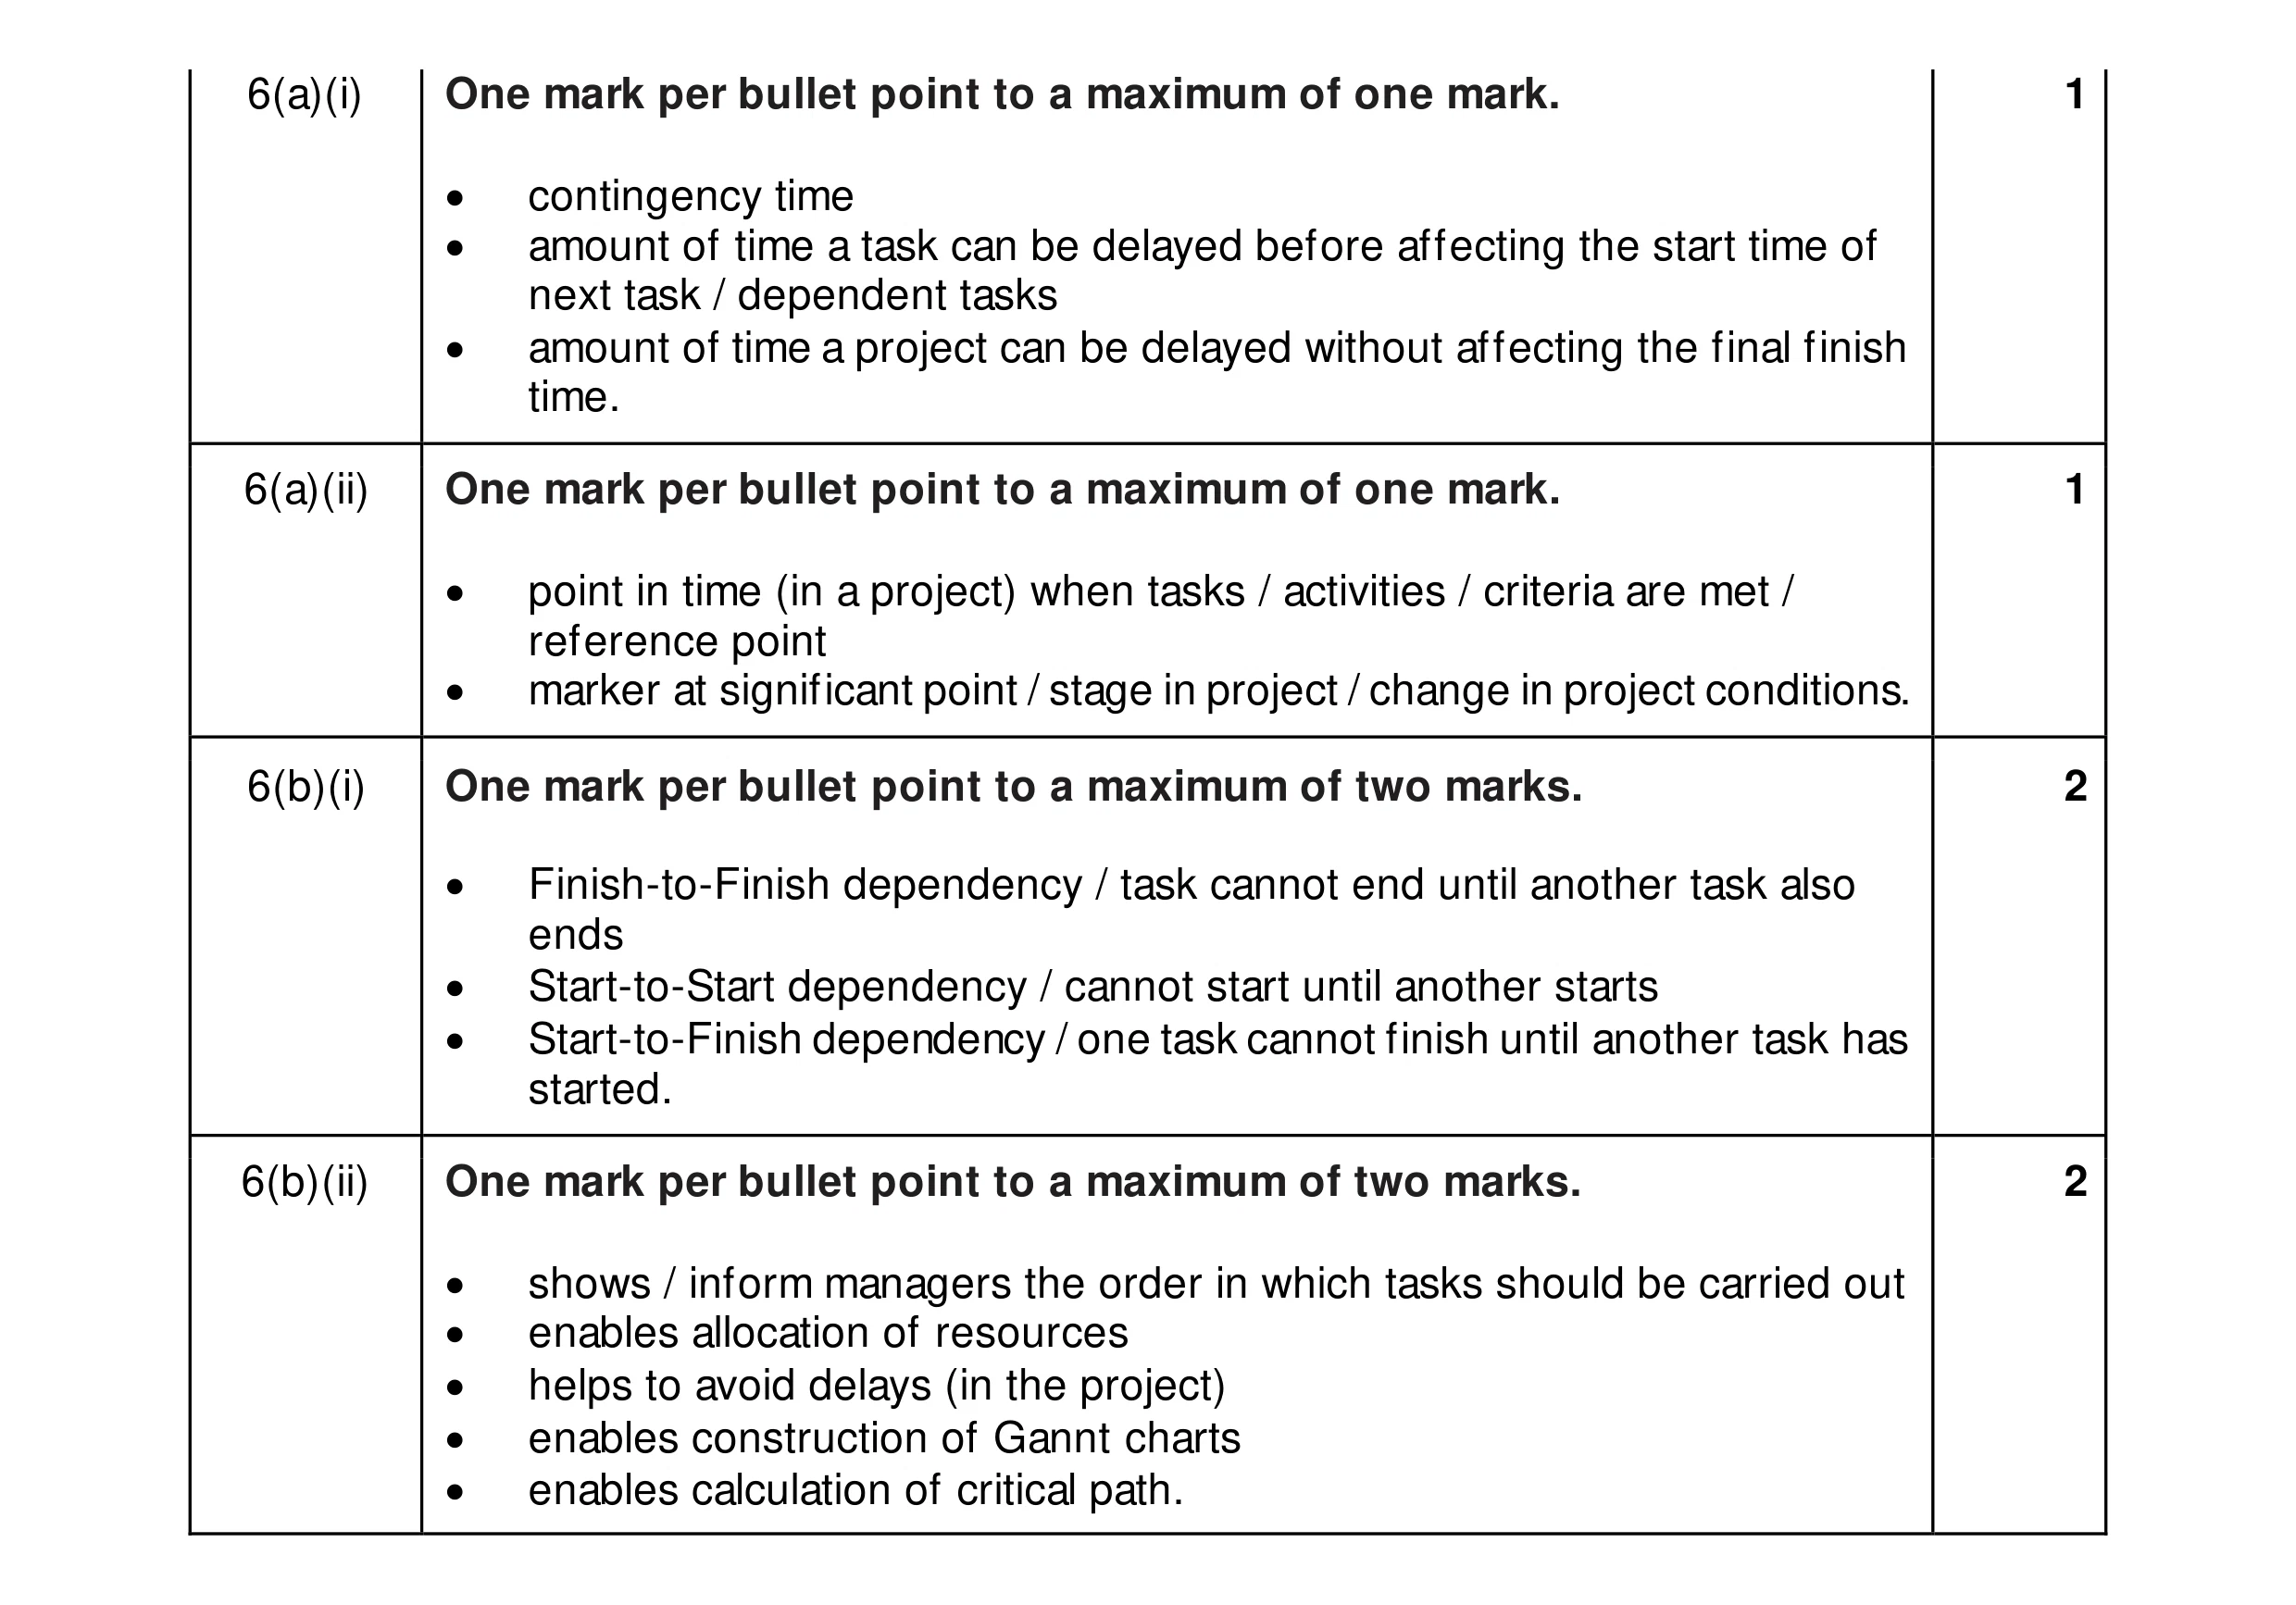 6
6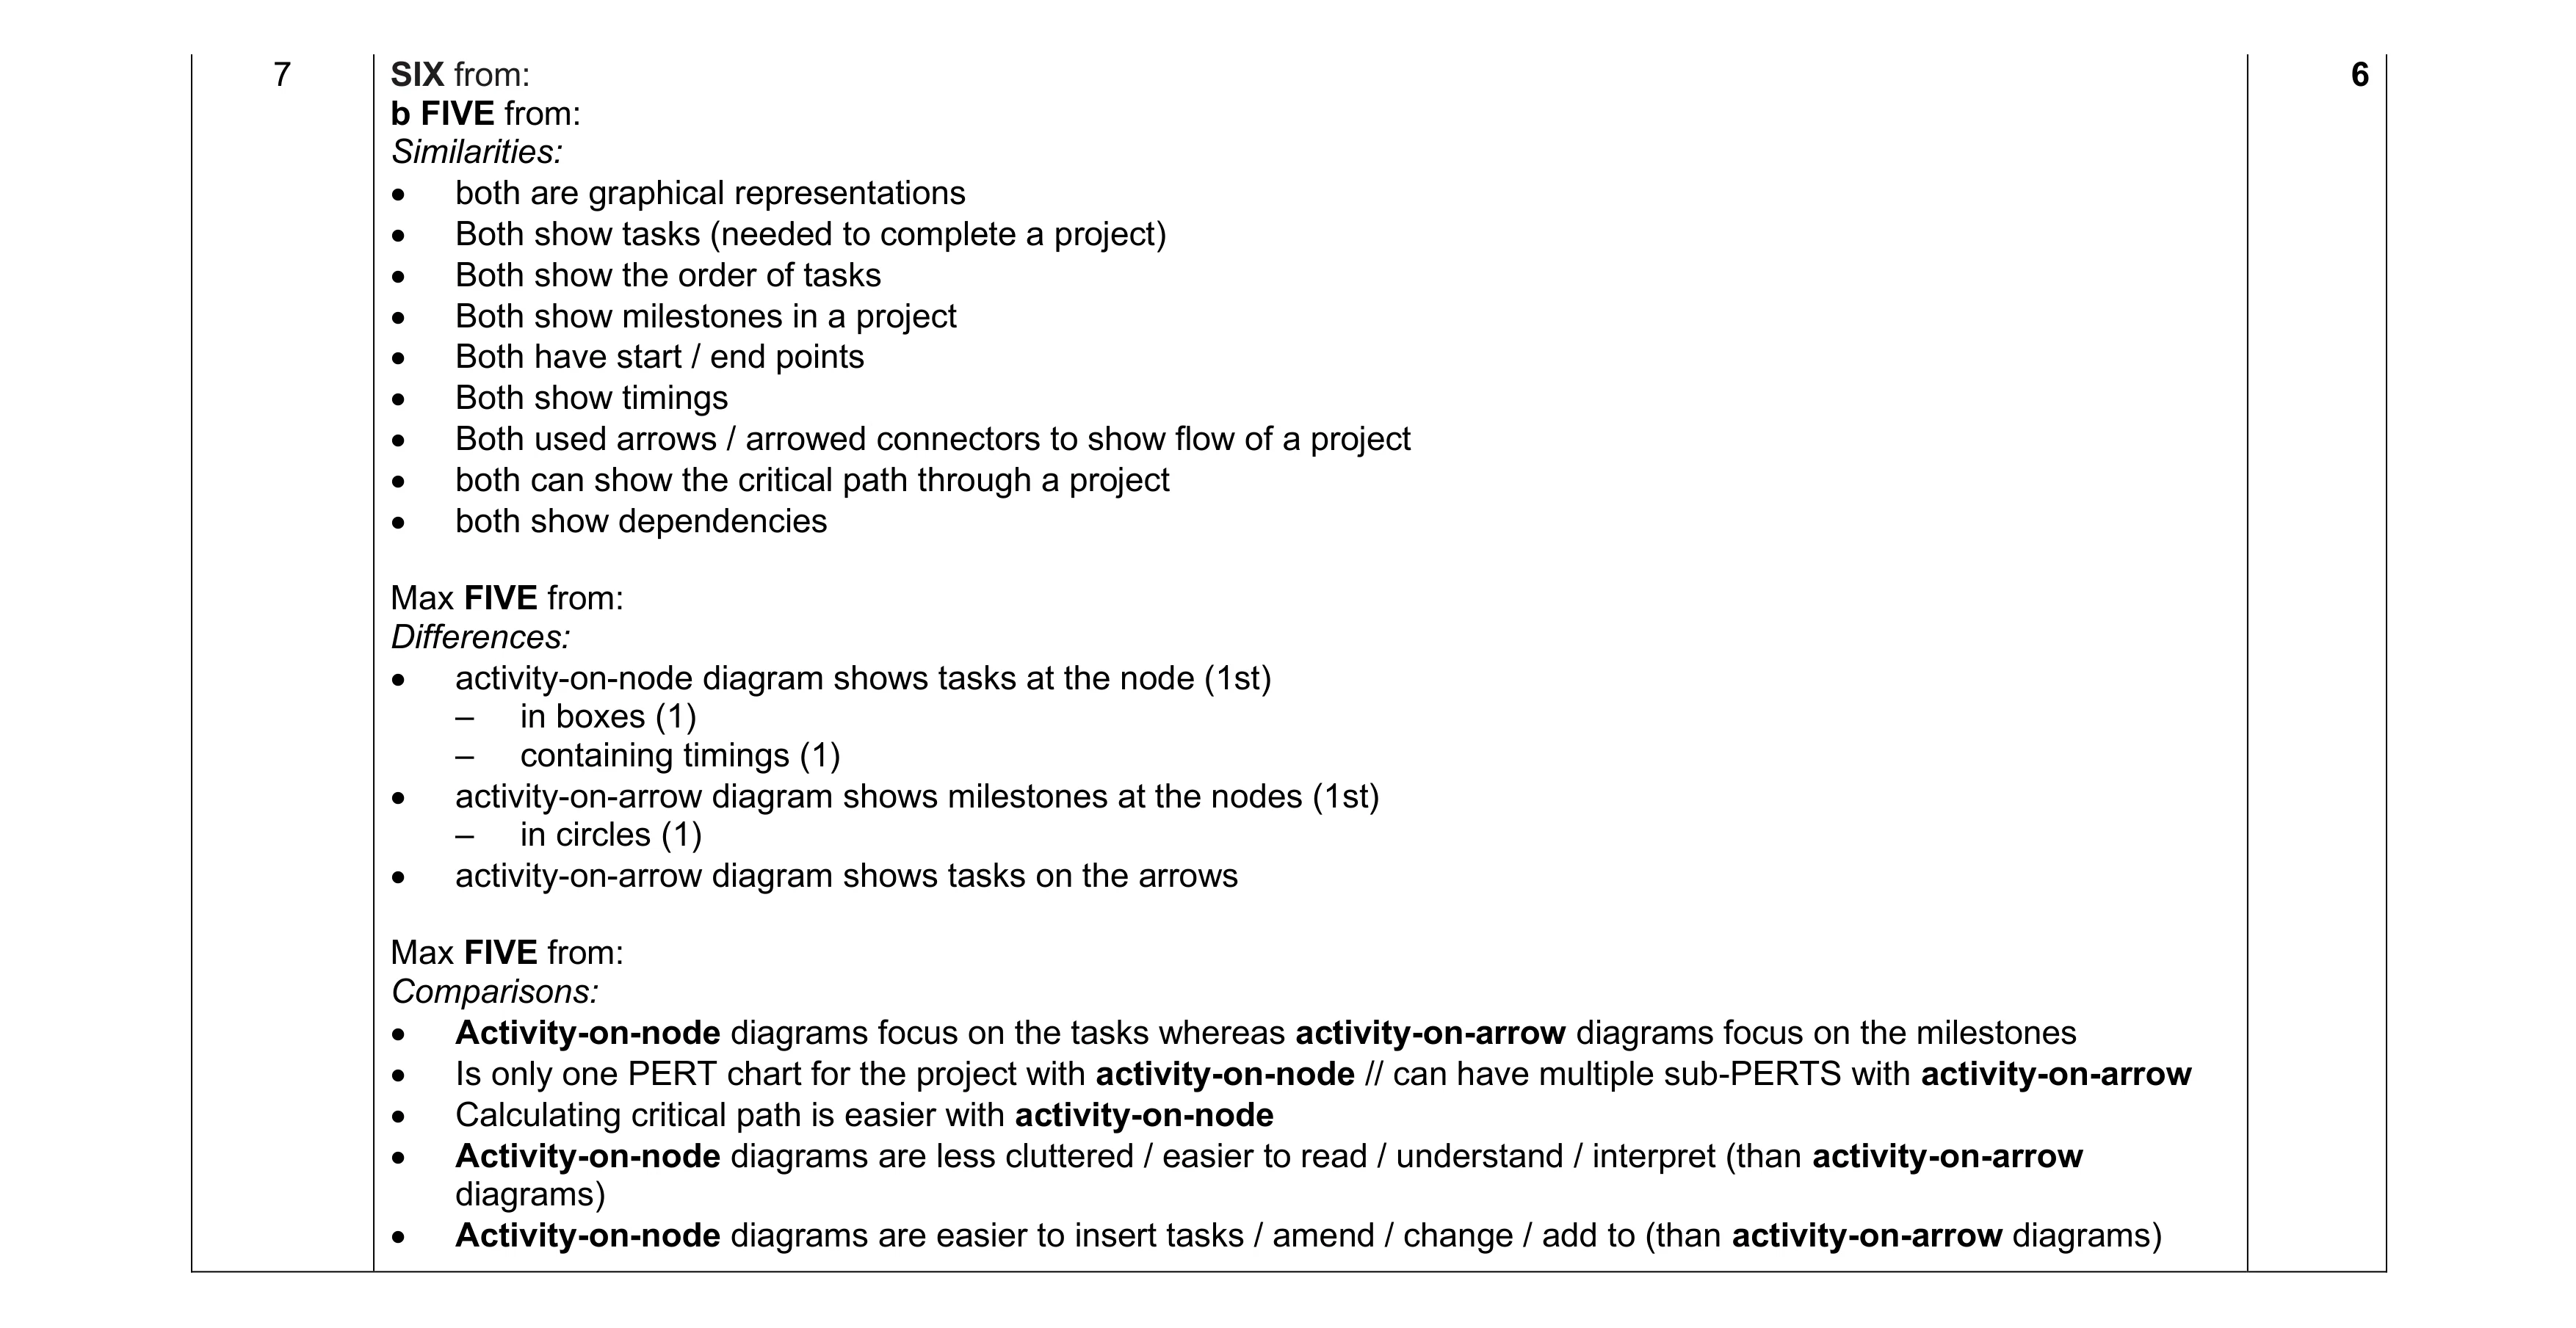 6
6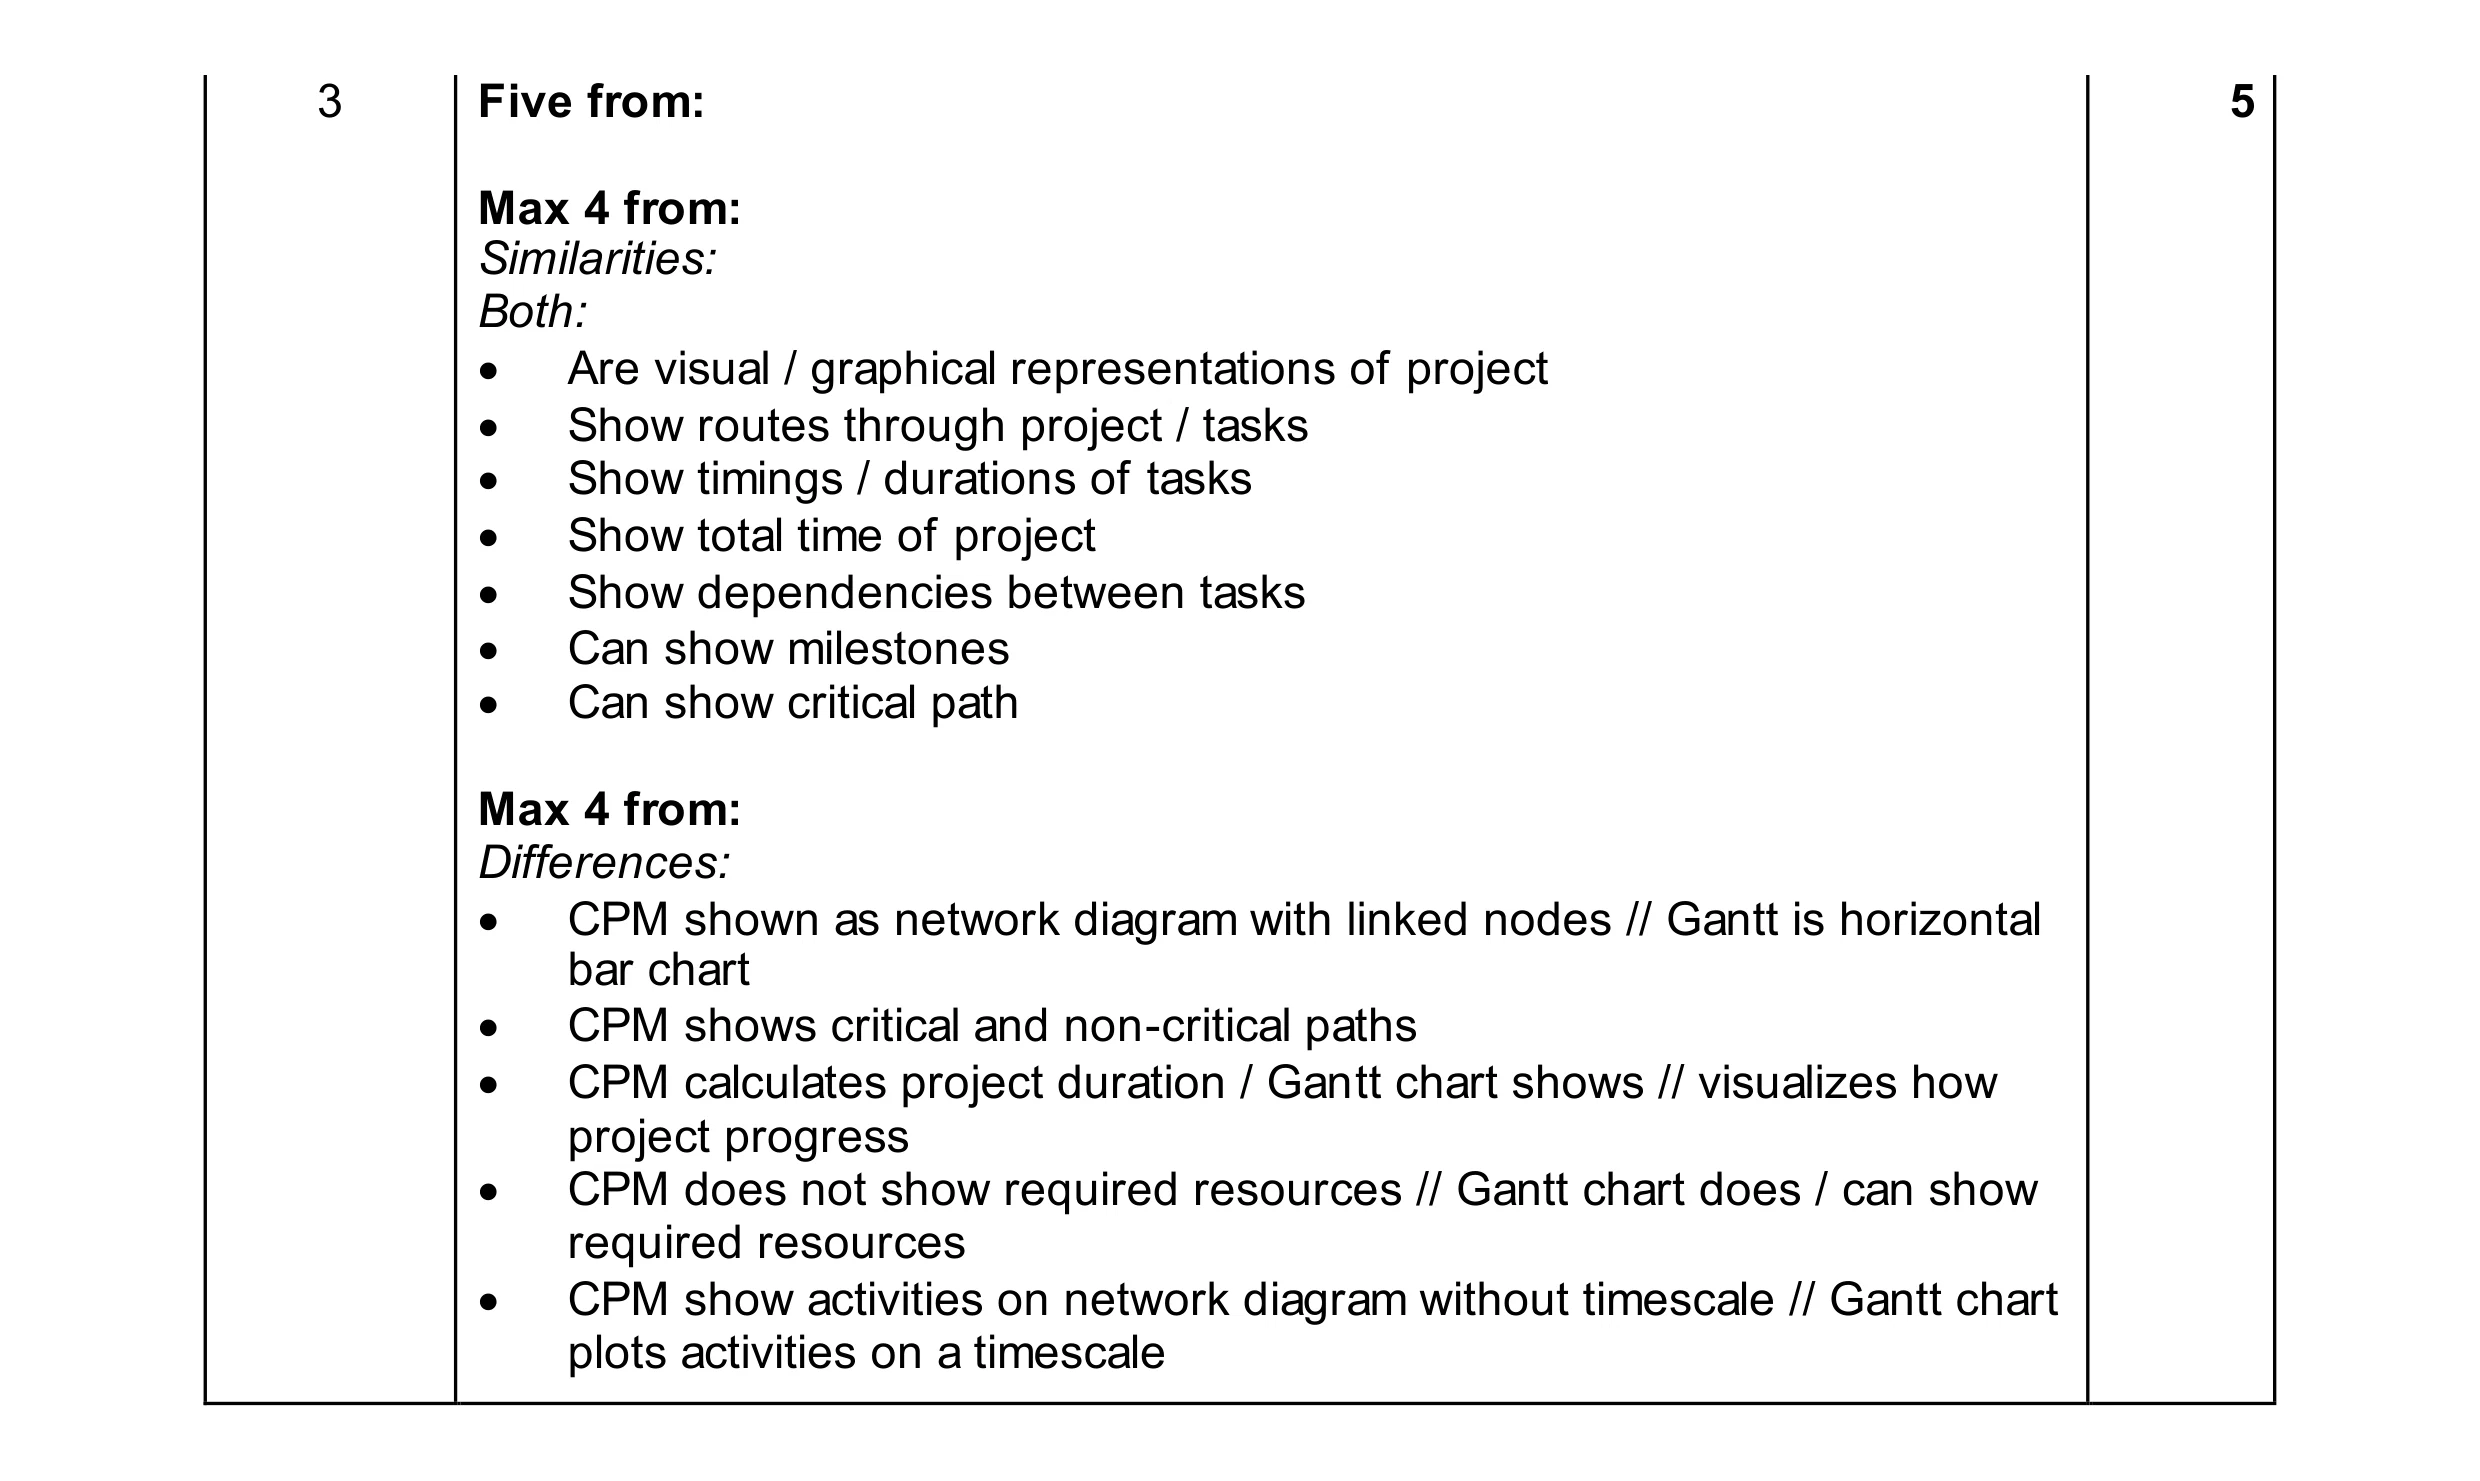 5
5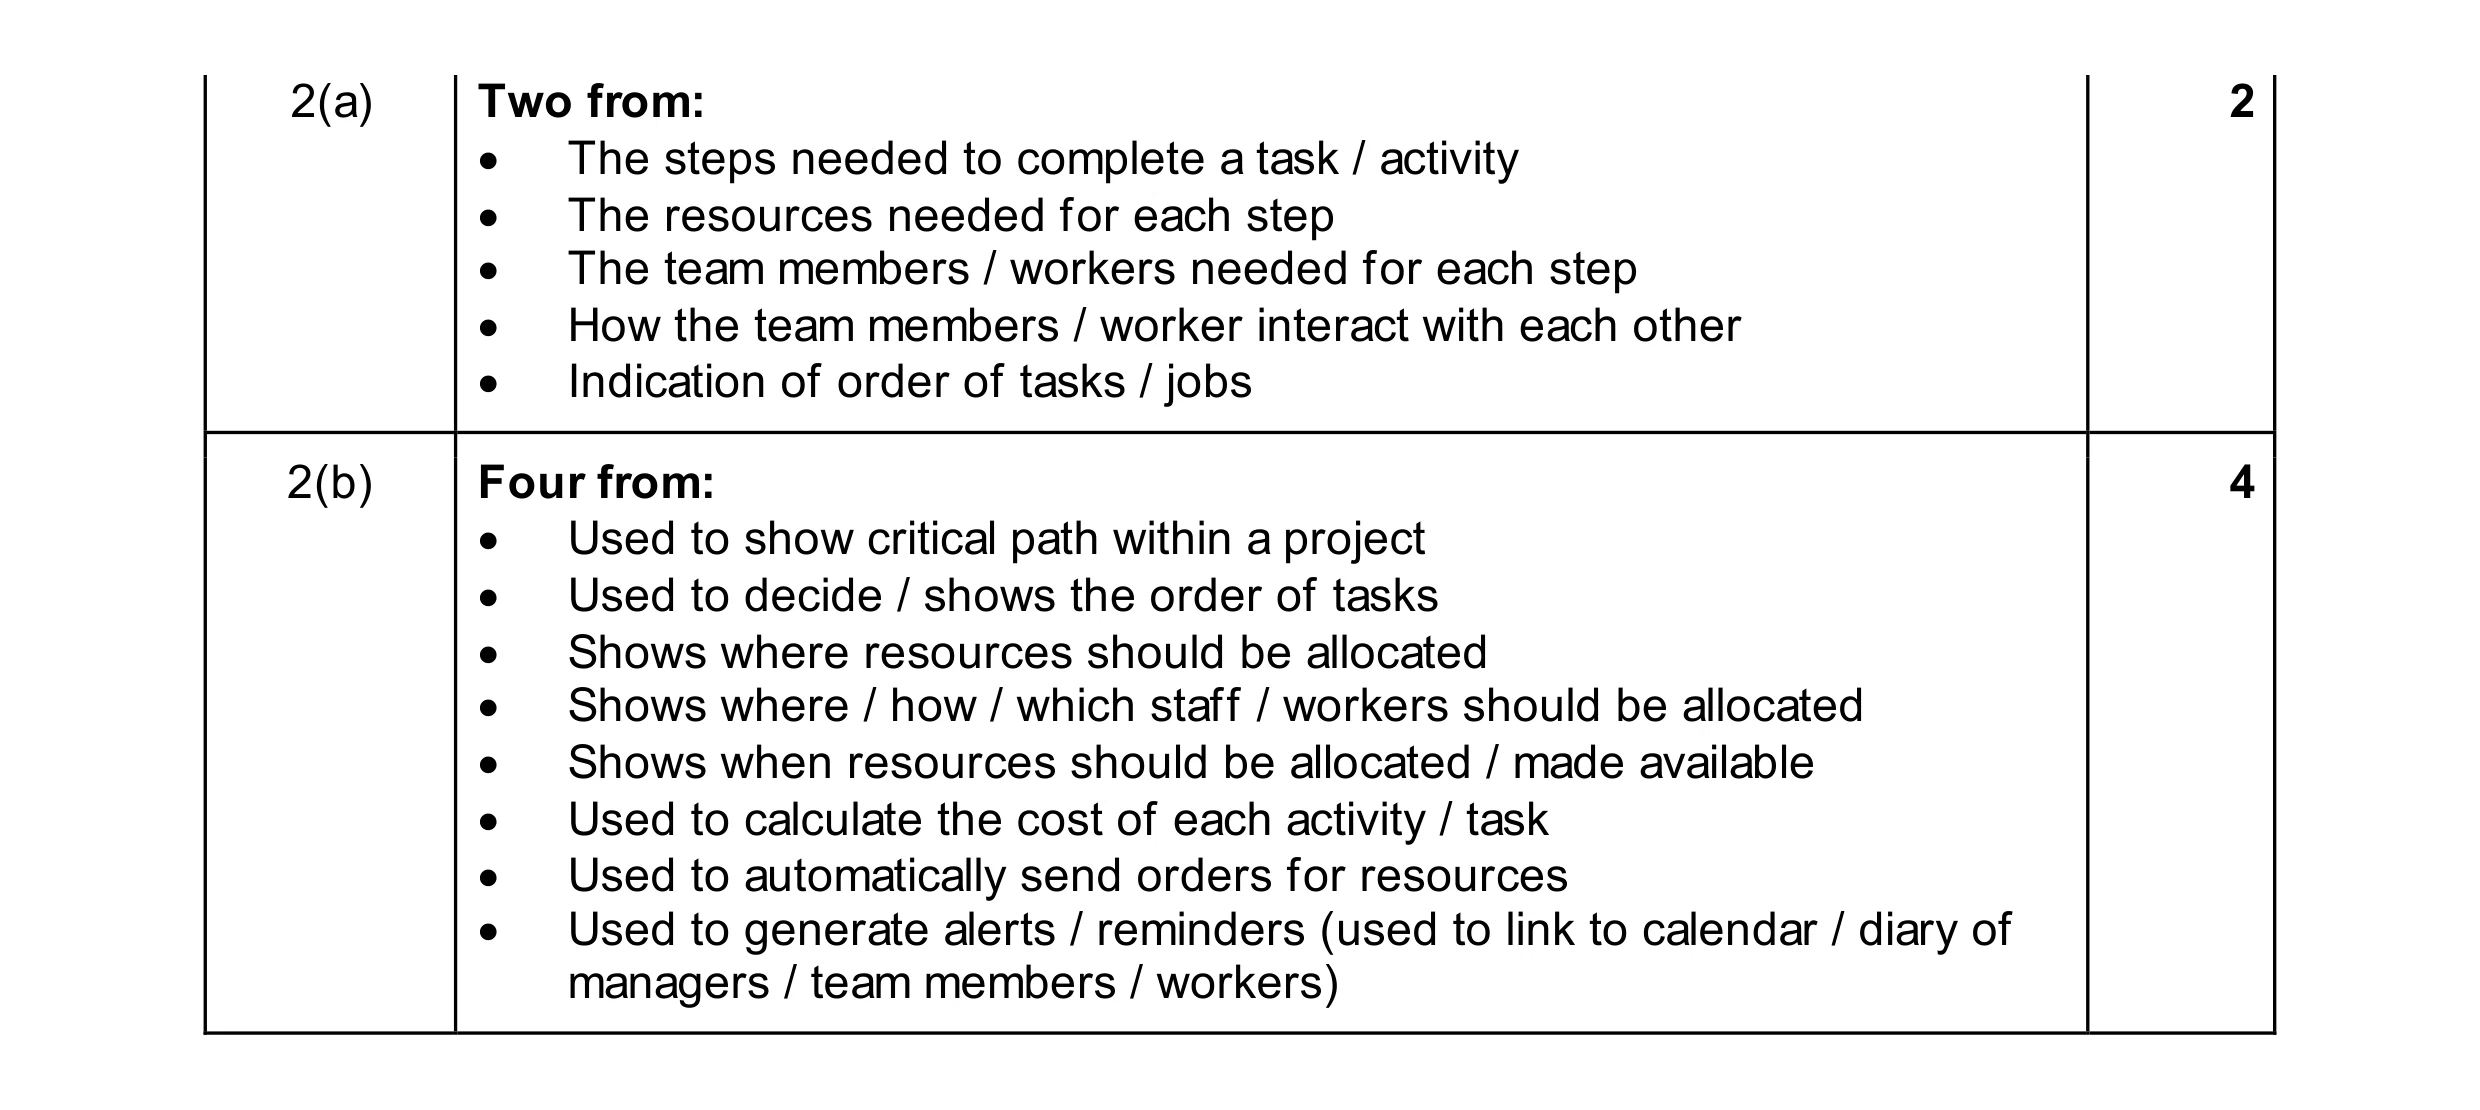 6
6