Questions as text
Q1 · The table gives the national income of a country over six years 9708/31 Oct/Nov 2009
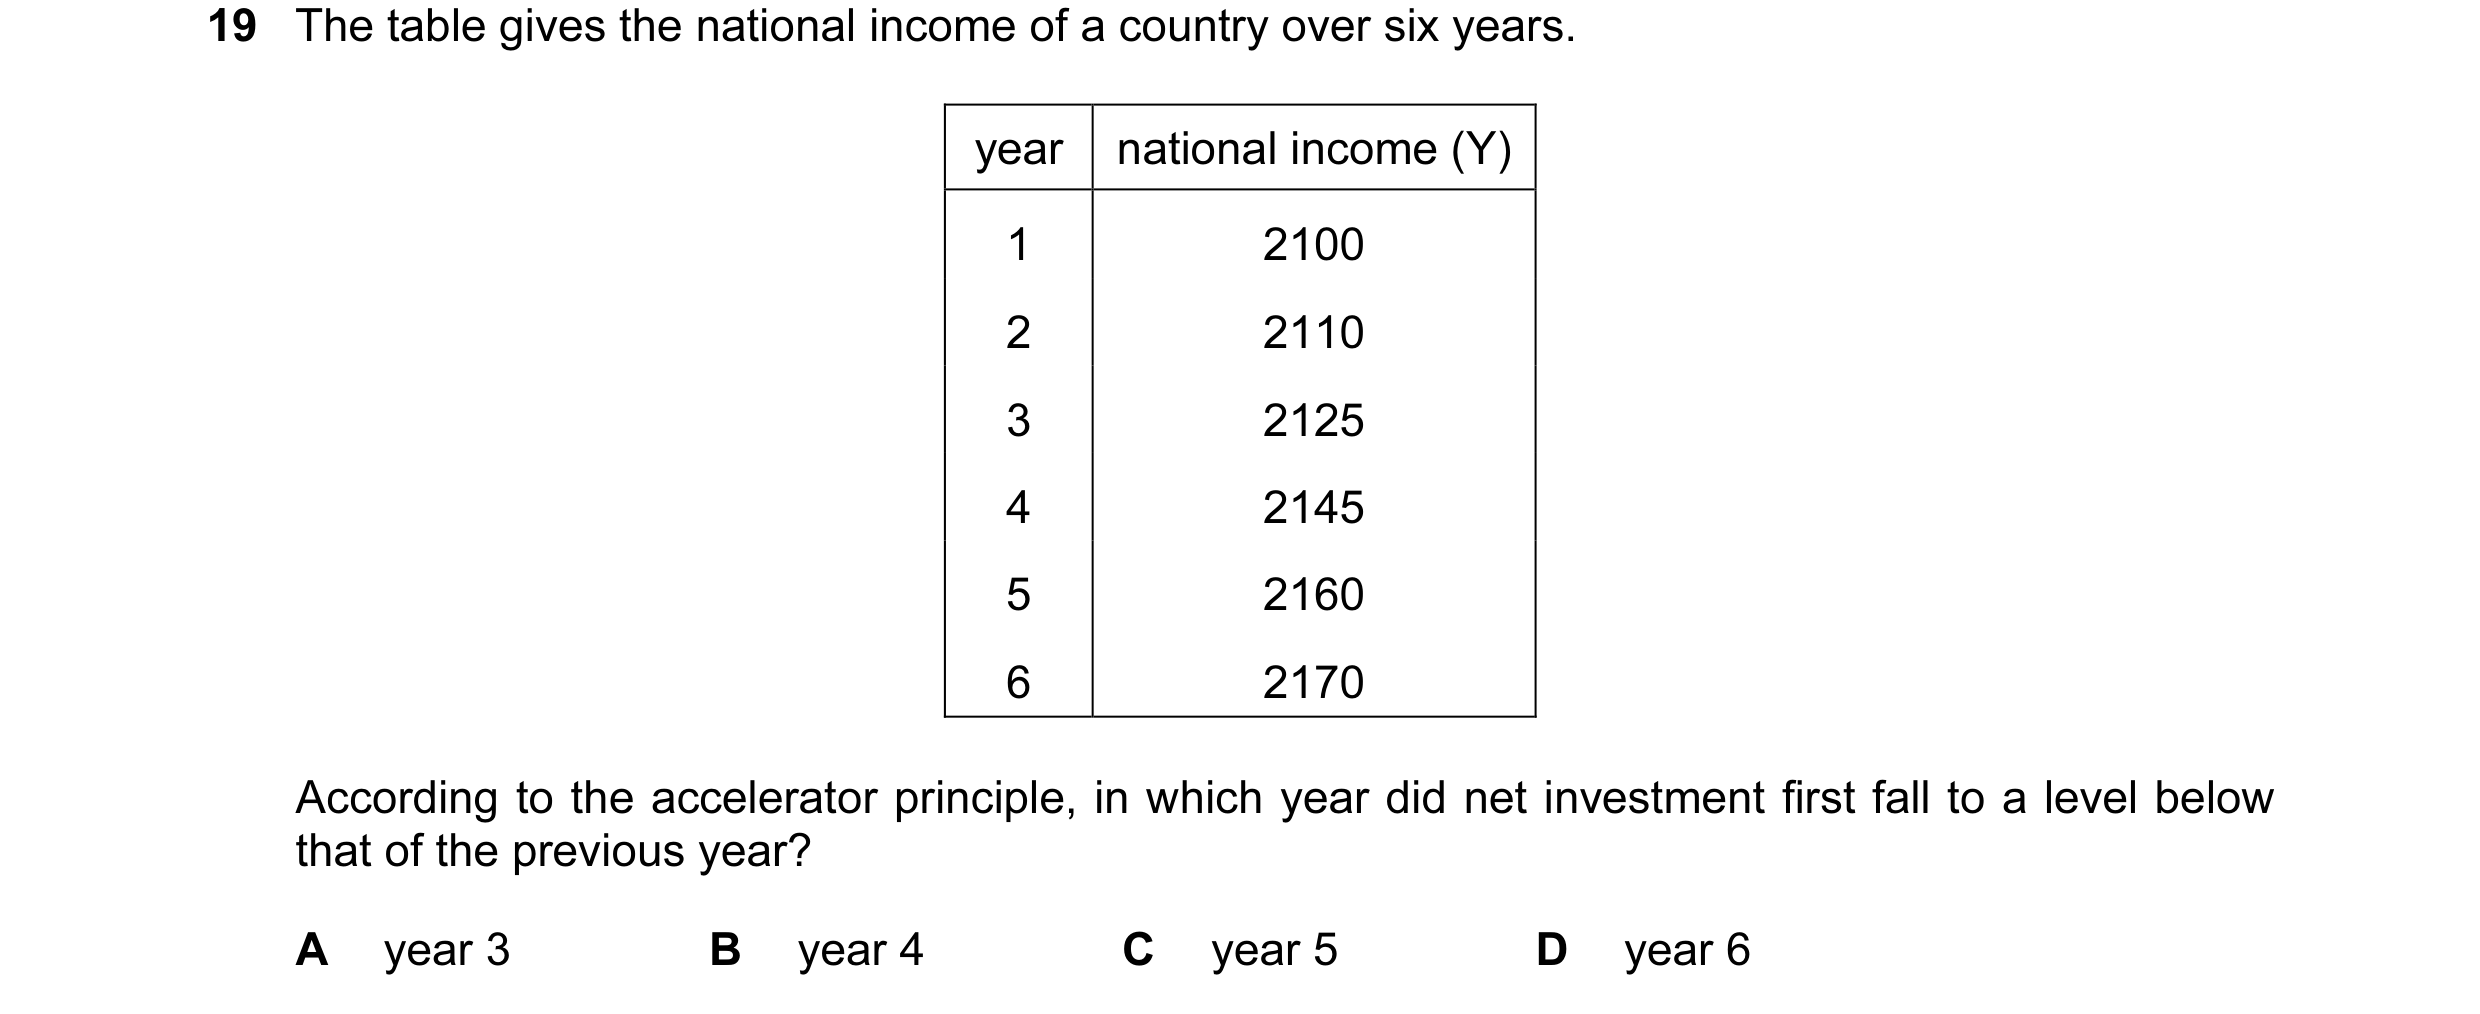
19 The table gives the national income of a country over six years. year national income (Y) 1 2100 2 2110 3 2125 4 2145 5 2160 6 2170 According to the accelerator principle, in which year did net investment first fall to a level below that of the previous year? A year 3 B year 4 C year 5 D year 6
1 marks
Answer: C
This question in 9708/31 Oct/Nov 2009
Q2 · The table gives the national income of a country over six years 9708/32 Oct/Nov 2009
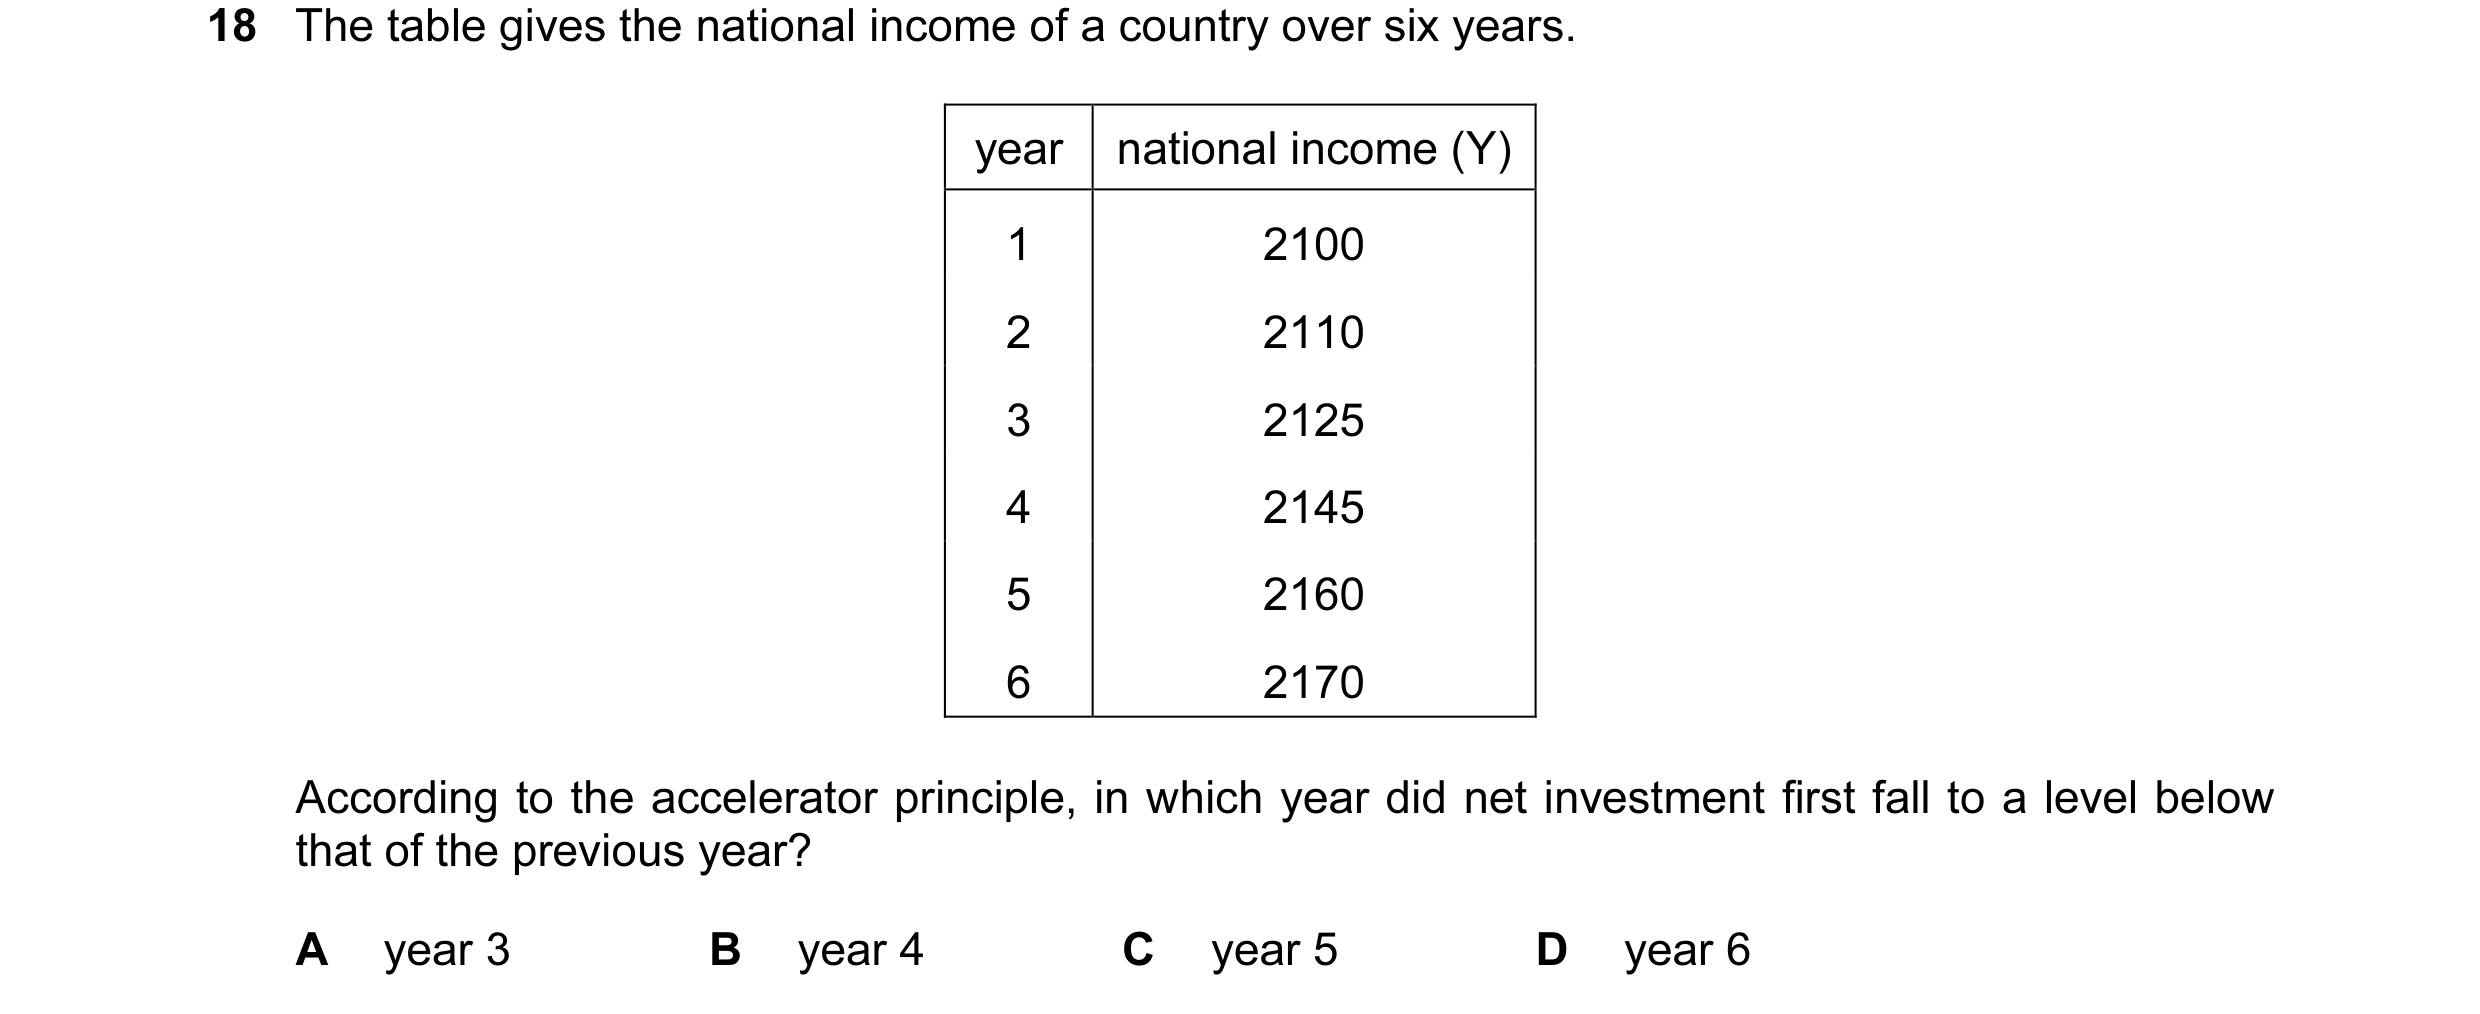
18 The table gives the national income of a country over six years. year national income (Y) 1 2100 2 2110 3 2125 4 2145 5 2160 6 2170 According to the accelerator principle, in which year did net investment first fall to a level below that of the previous year? A year 3 B year 4 C year 5 D year 6
1 marks
Answer: C
This question in 9708/32 Oct/Nov 2009
Q3 · In the diagram AS1 is an economy’s long-run aggregate supply curve 9708/31 May/June 2010
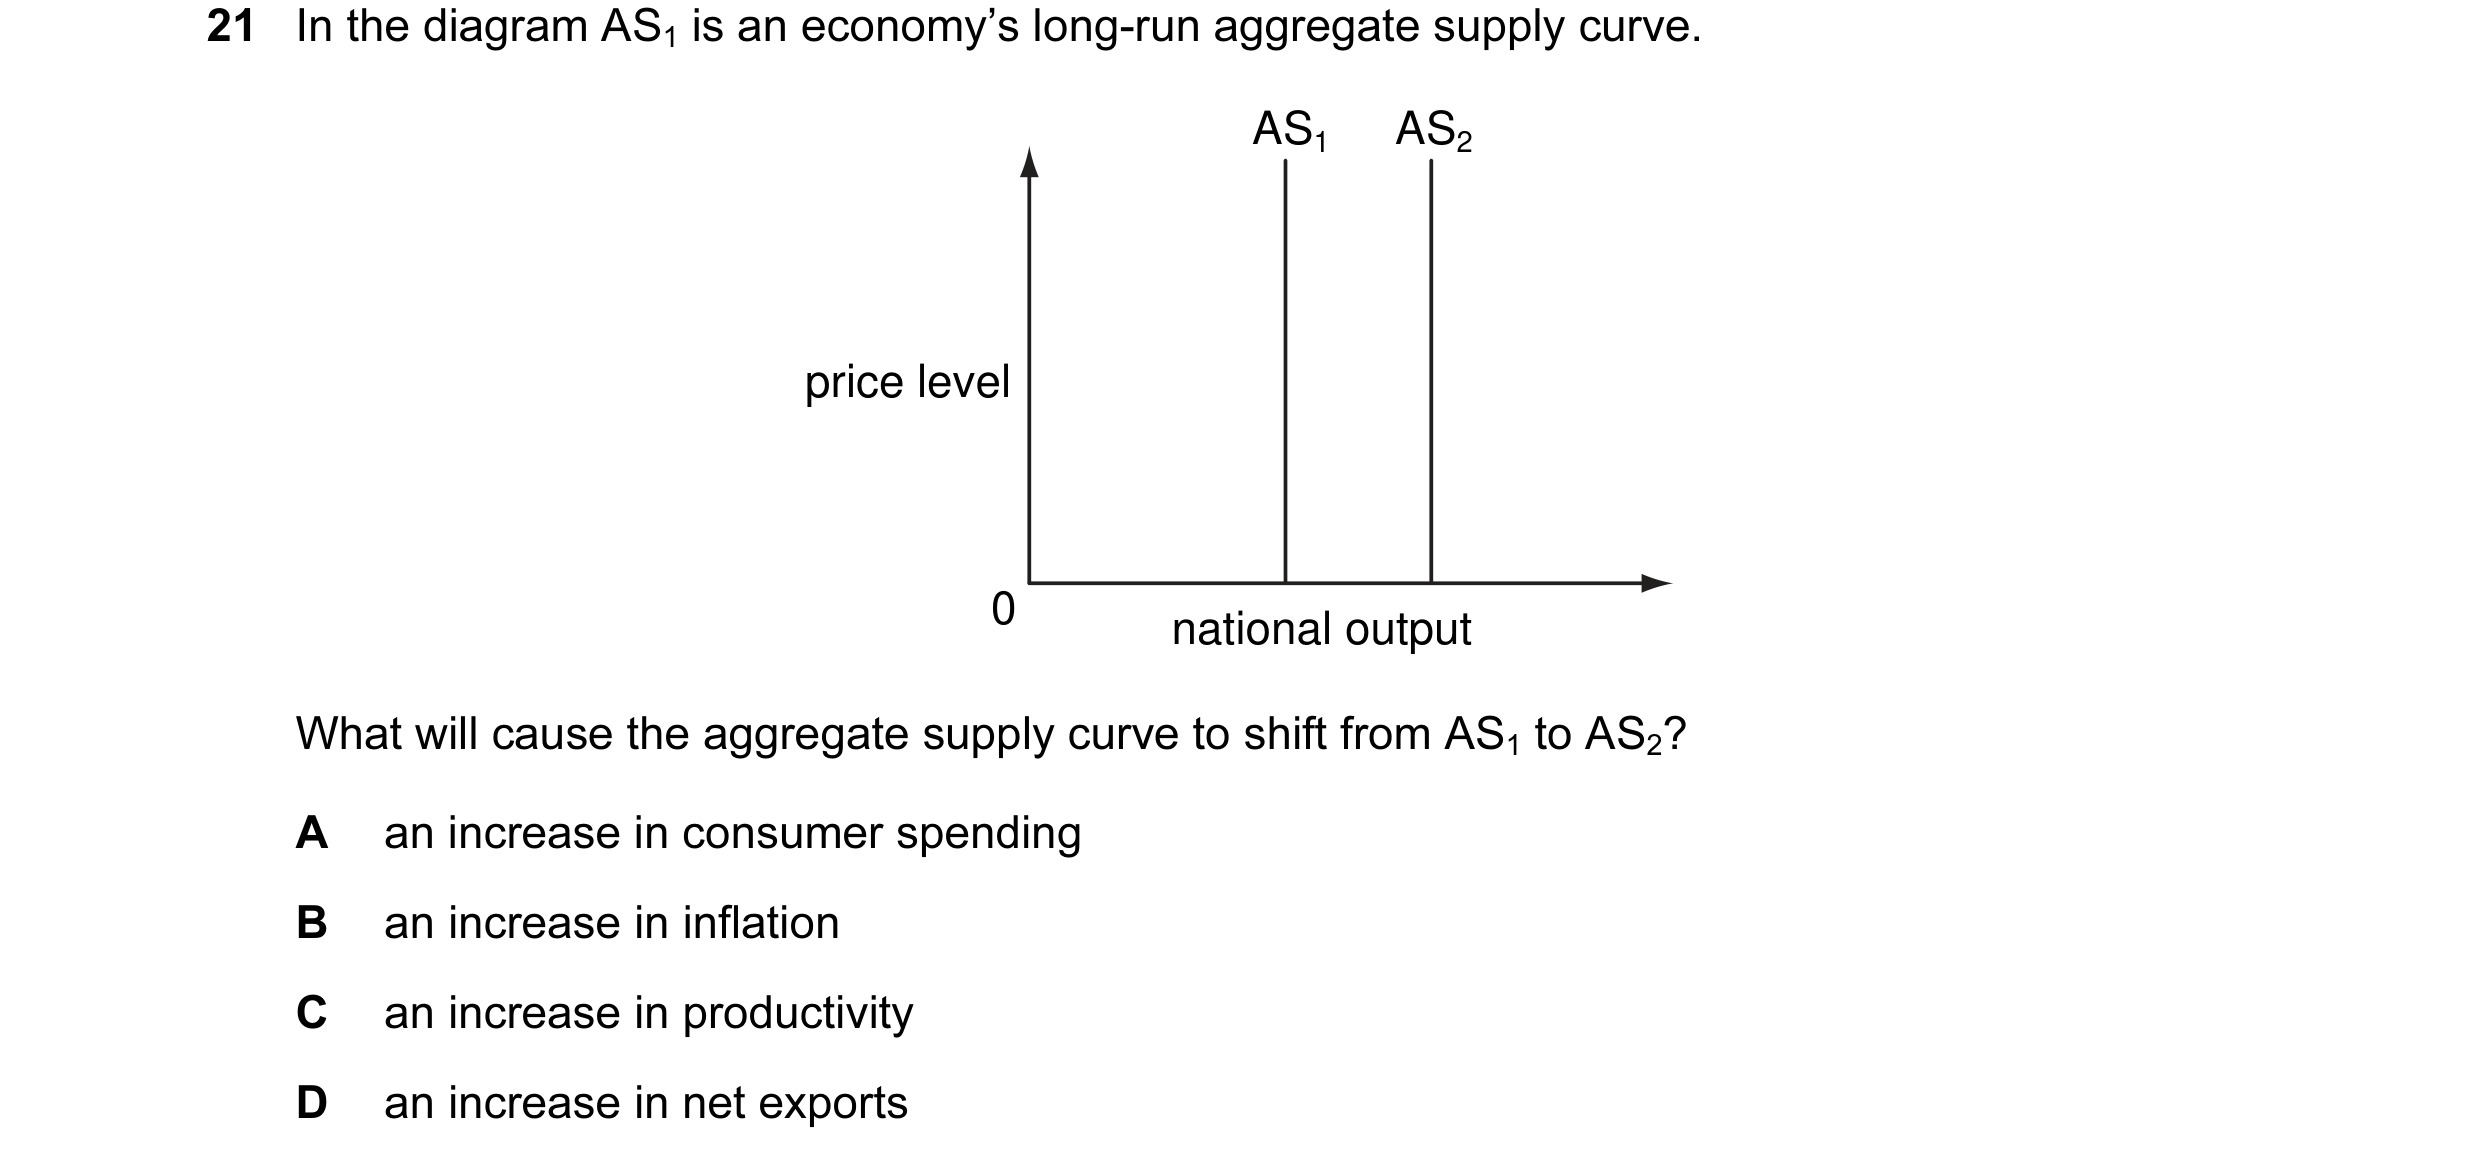
21 In the diagram AS1 is an economy’s long-run aggregate supply curve. AS1 AS2 price level 0 national output What will cause the aggregate supply curve to shift from AS1 to AS2? A an increase in consumer spending B an increase in inflation C an increase in productivity D an increase in net exports
1 marks
Answer: C
This question in 9708/31 May/June 2010
Q4 · What is an unavoidable cost of long-run economic growth? 9708/31 Oct/Nov 2010
26 What is an unavoidable cost of long-run economic growth? A an increase in inflation B an increase in the working hours of the population C a sacrifice of potential present consumption D greater inequality in the distribution of income
1 marks
Answer: C
This question in 9708/31 Oct/Nov 2010
Q5 · What is an unavoidable cost of long-run economic growth? 9708/32 Oct/Nov 2010
26 What is an unavoidable cost of long-run economic growth? A an increase in inflation B an increase in the working hours of the population C a sacrifice of potential present consumption D greater inequality in the distribution of income
1 marks
Answer: C
This question in 9708/32 Oct/Nov 2010
Q6 · What is an unavoidable cost of long-run economic growth? 9708/33 Oct/Nov 2010
25 What is an unavoidable cost of long-run economic growth? A an increase in inflation B an increase in the working hours of the population C a sacrifice of potential present consumption D greater inequality in the distribution of income
1 marks
Answer: C
This question in 9708/33 Oct/Nov 2010
Q7 · Which cause of economic growth would involve the least cost for present and future… 9708/31 May/June 2011
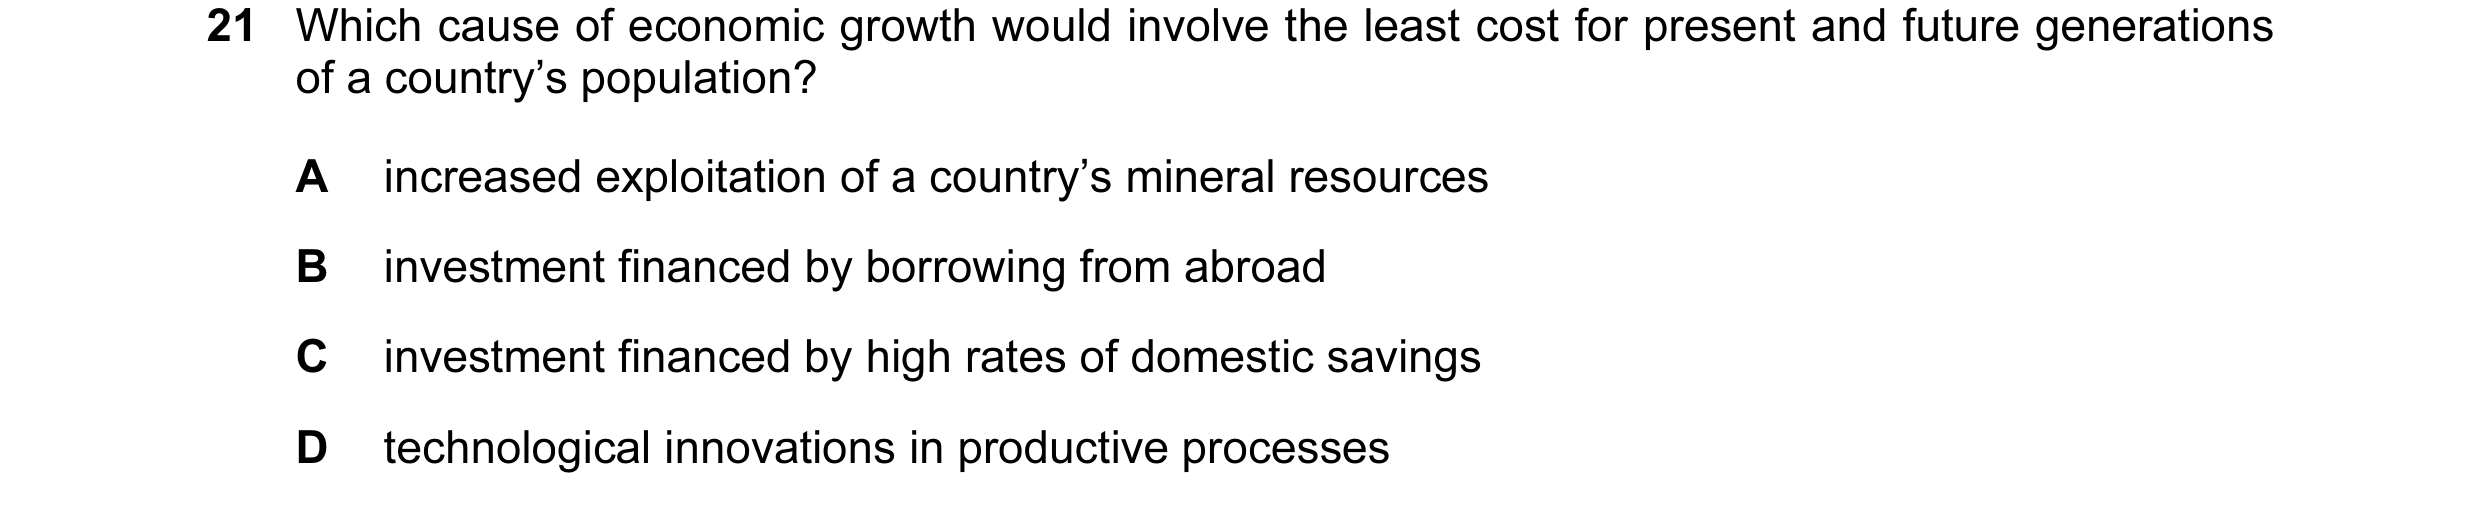
22 Which cause of economic growth would involve the least cost for present and future generations of a country’s population? A increased exploitation of a country’s mineral resources B investment financed by borrowing from abroad C investment financed by high rates of domestic savings D technological innovations in productive processes
1 marks
Answer: D
This question in 9708/31 May/June 2011
Q8 · Which cause of economic growth would involve the least cost for present and future… 9708/32 May/June 2011
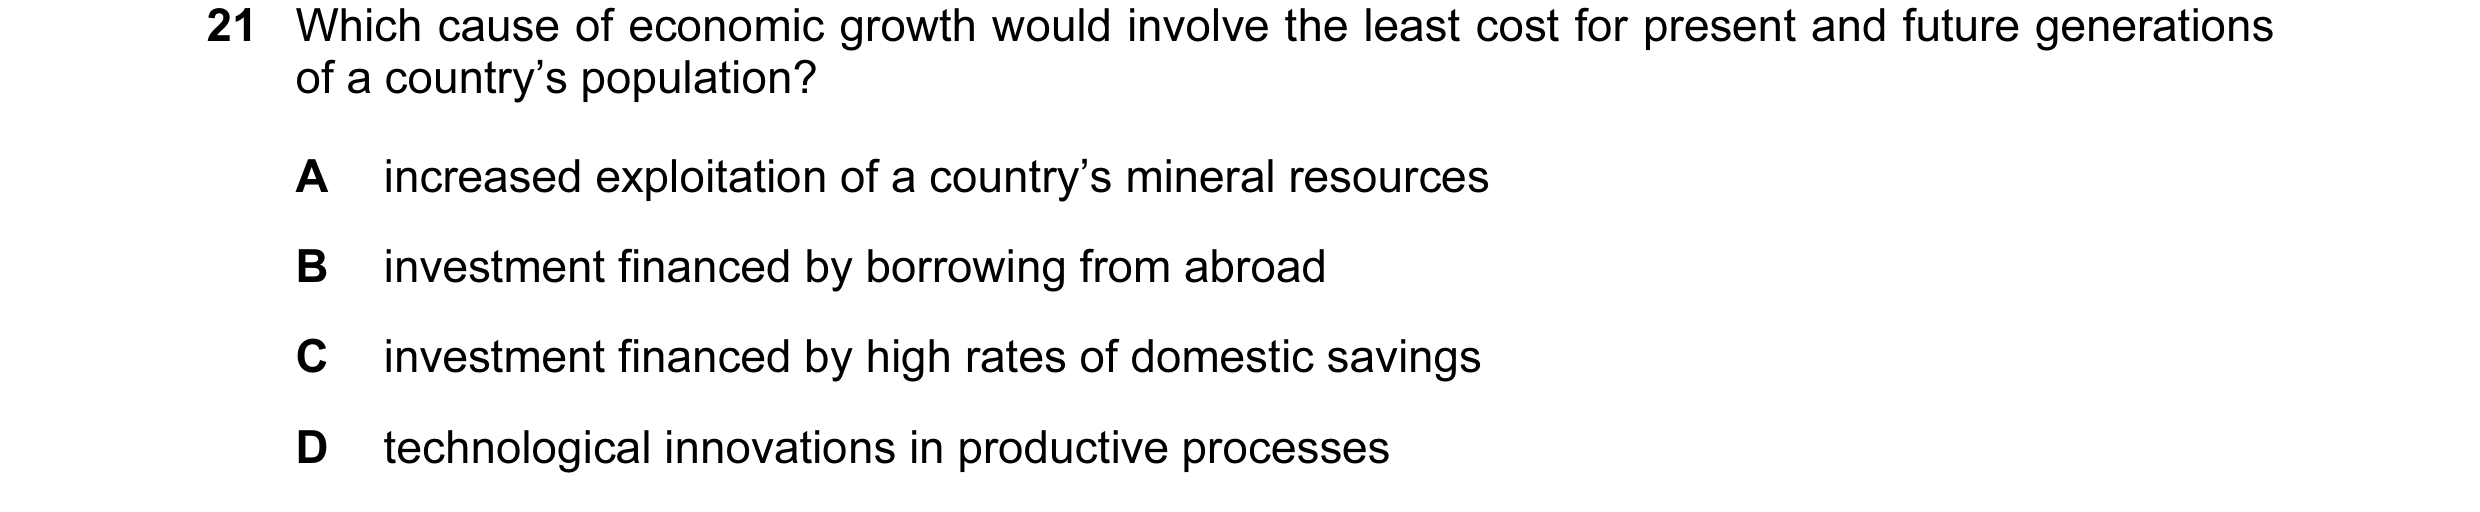
21 Which cause of economic growth would involve the least cost for present and future generations of a country’s population? A increased exploitation of a country’s mineral resources B investment financed by borrowing from abroad C investment financed by high rates of domestic savings D technological innovations in productive processes
1 marks
Answer: D
This question in 9708/32 May/June 2011
Q9 · Which cause of economic growth would involve the least cost for present and future… 9708/33 May/June 2011
21 Which cause of economic growth would involve the least cost for present and future generations of a country’s population? A increased exploitation of a country’s mineral resources B investment financed by borrowing from abroad C investment financed by high rates of domestic savings D technological innovations in productive processes
1 marks
Answer: D
This question in 9708/33 May/June 2011
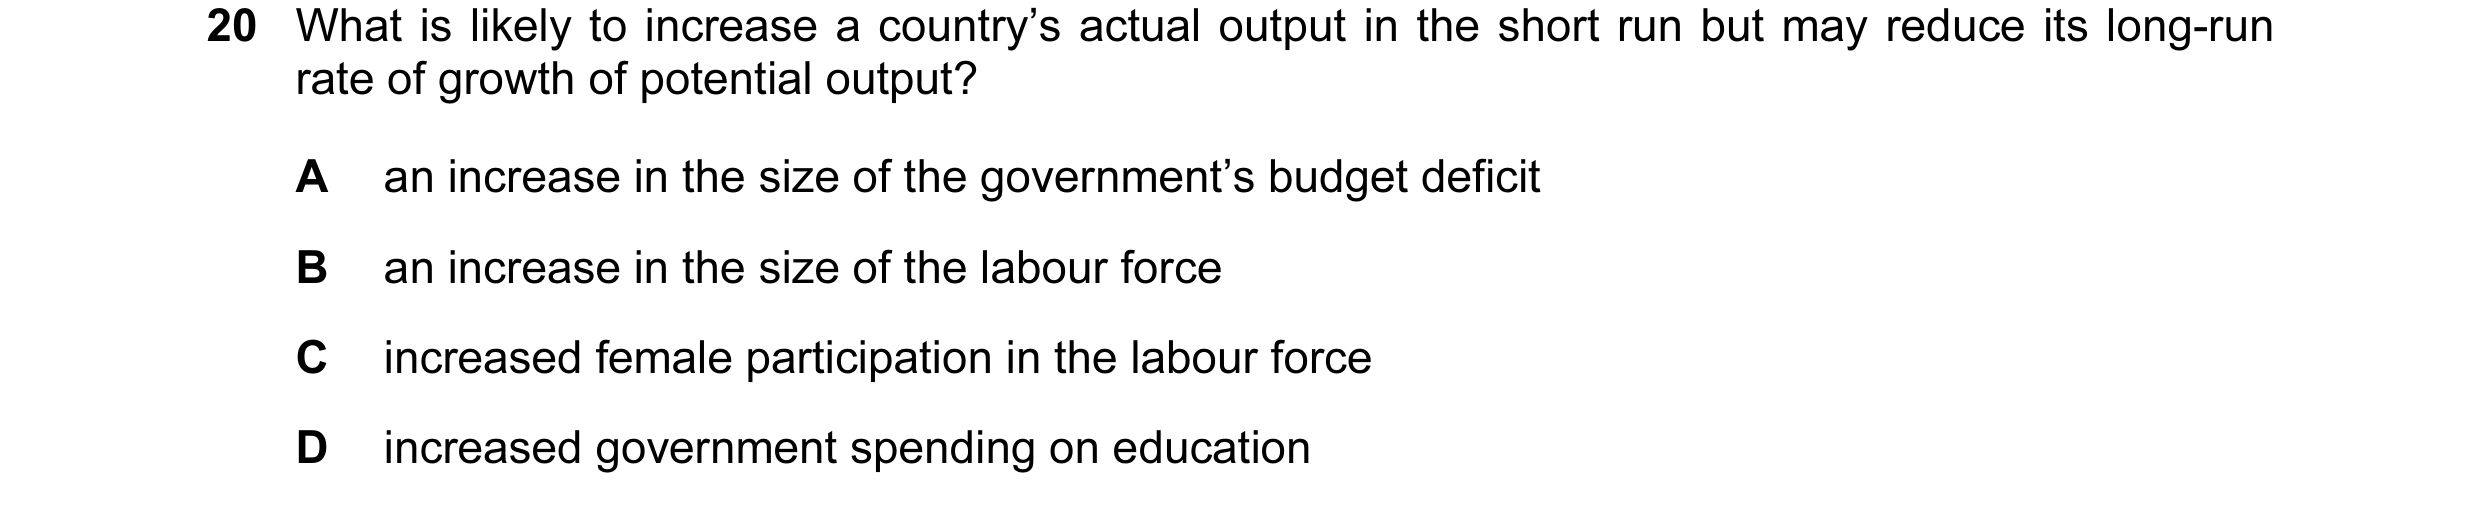
Q10 · What is likely to increase a country’s actual output in the short run but may reduce its… 9708/31 Oct/Nov 2011
21 What is likely to increase a country’s actual output in the short run but may reduce its long-run rate of growth of potential output? A an increase in the size of the government’s budget deficit B an increase in the size of the labour force C increased female participation in the labour force D increased government spending on education
1 marks
Answer: A
This question in 9708/31 Oct/Nov 2011
Q11 · The chart shows the rates of economic growth and unemployment in a country for the period… 9708/31 Oct/Nov 2011
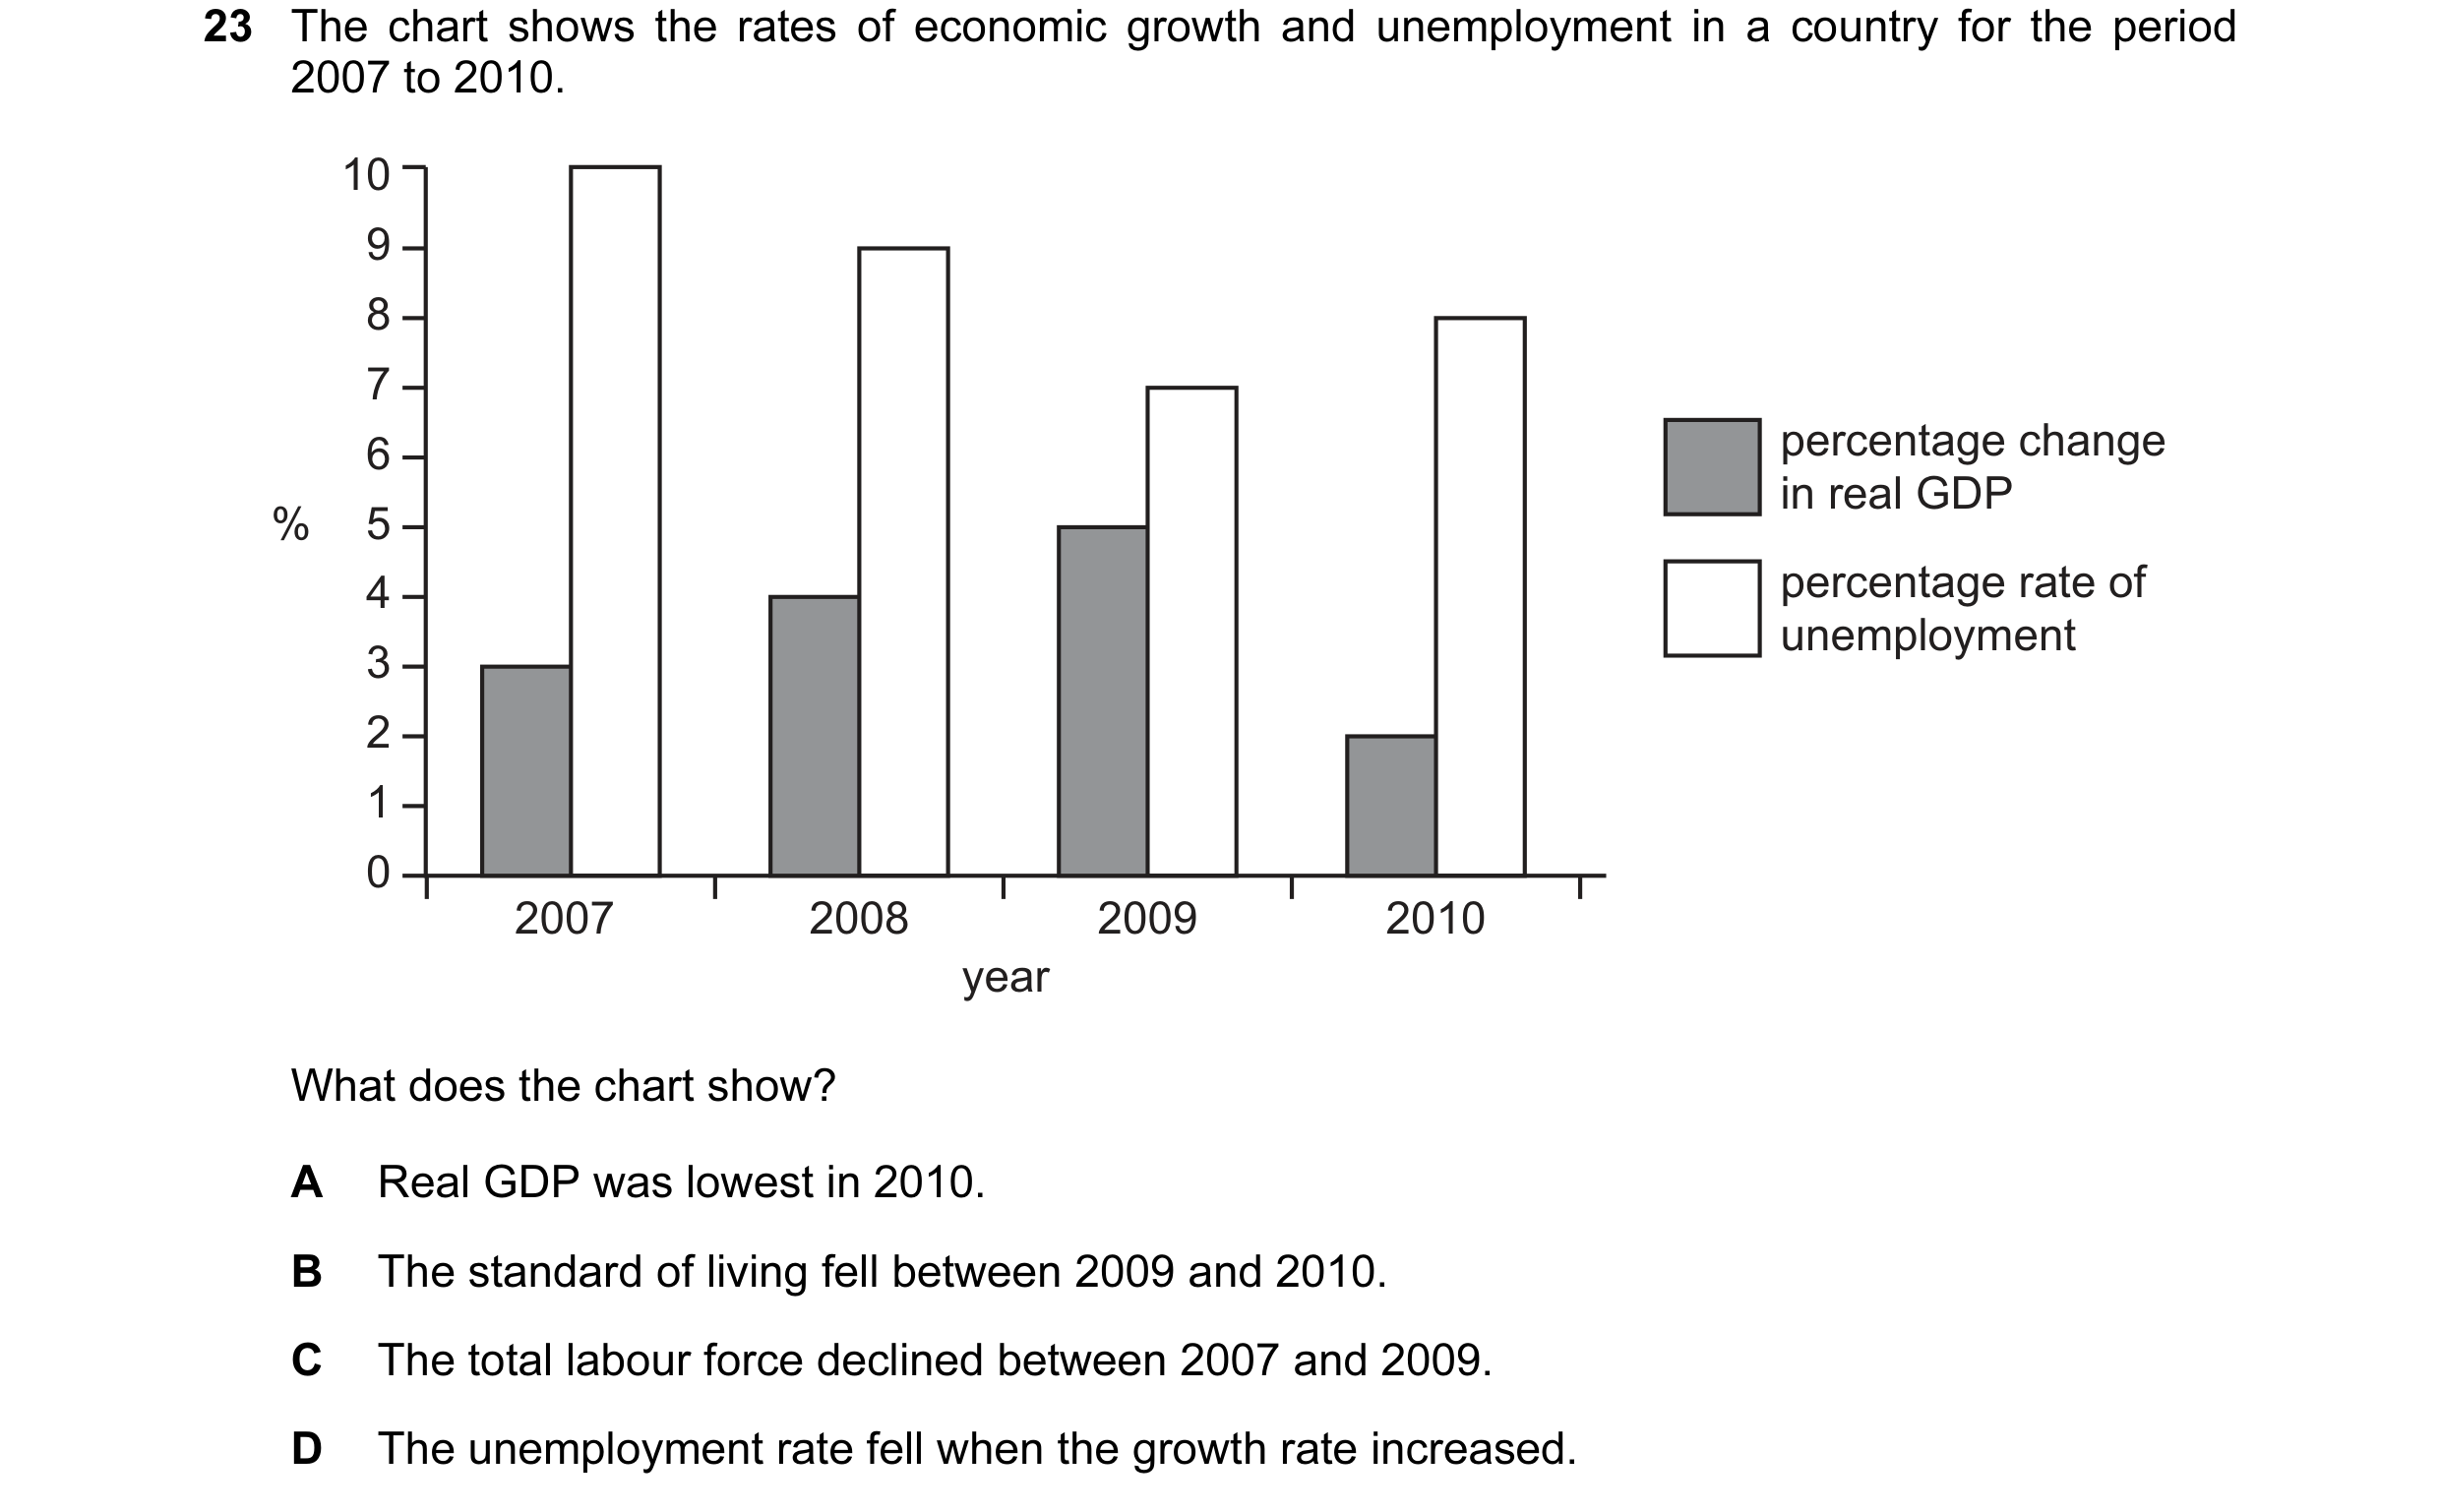
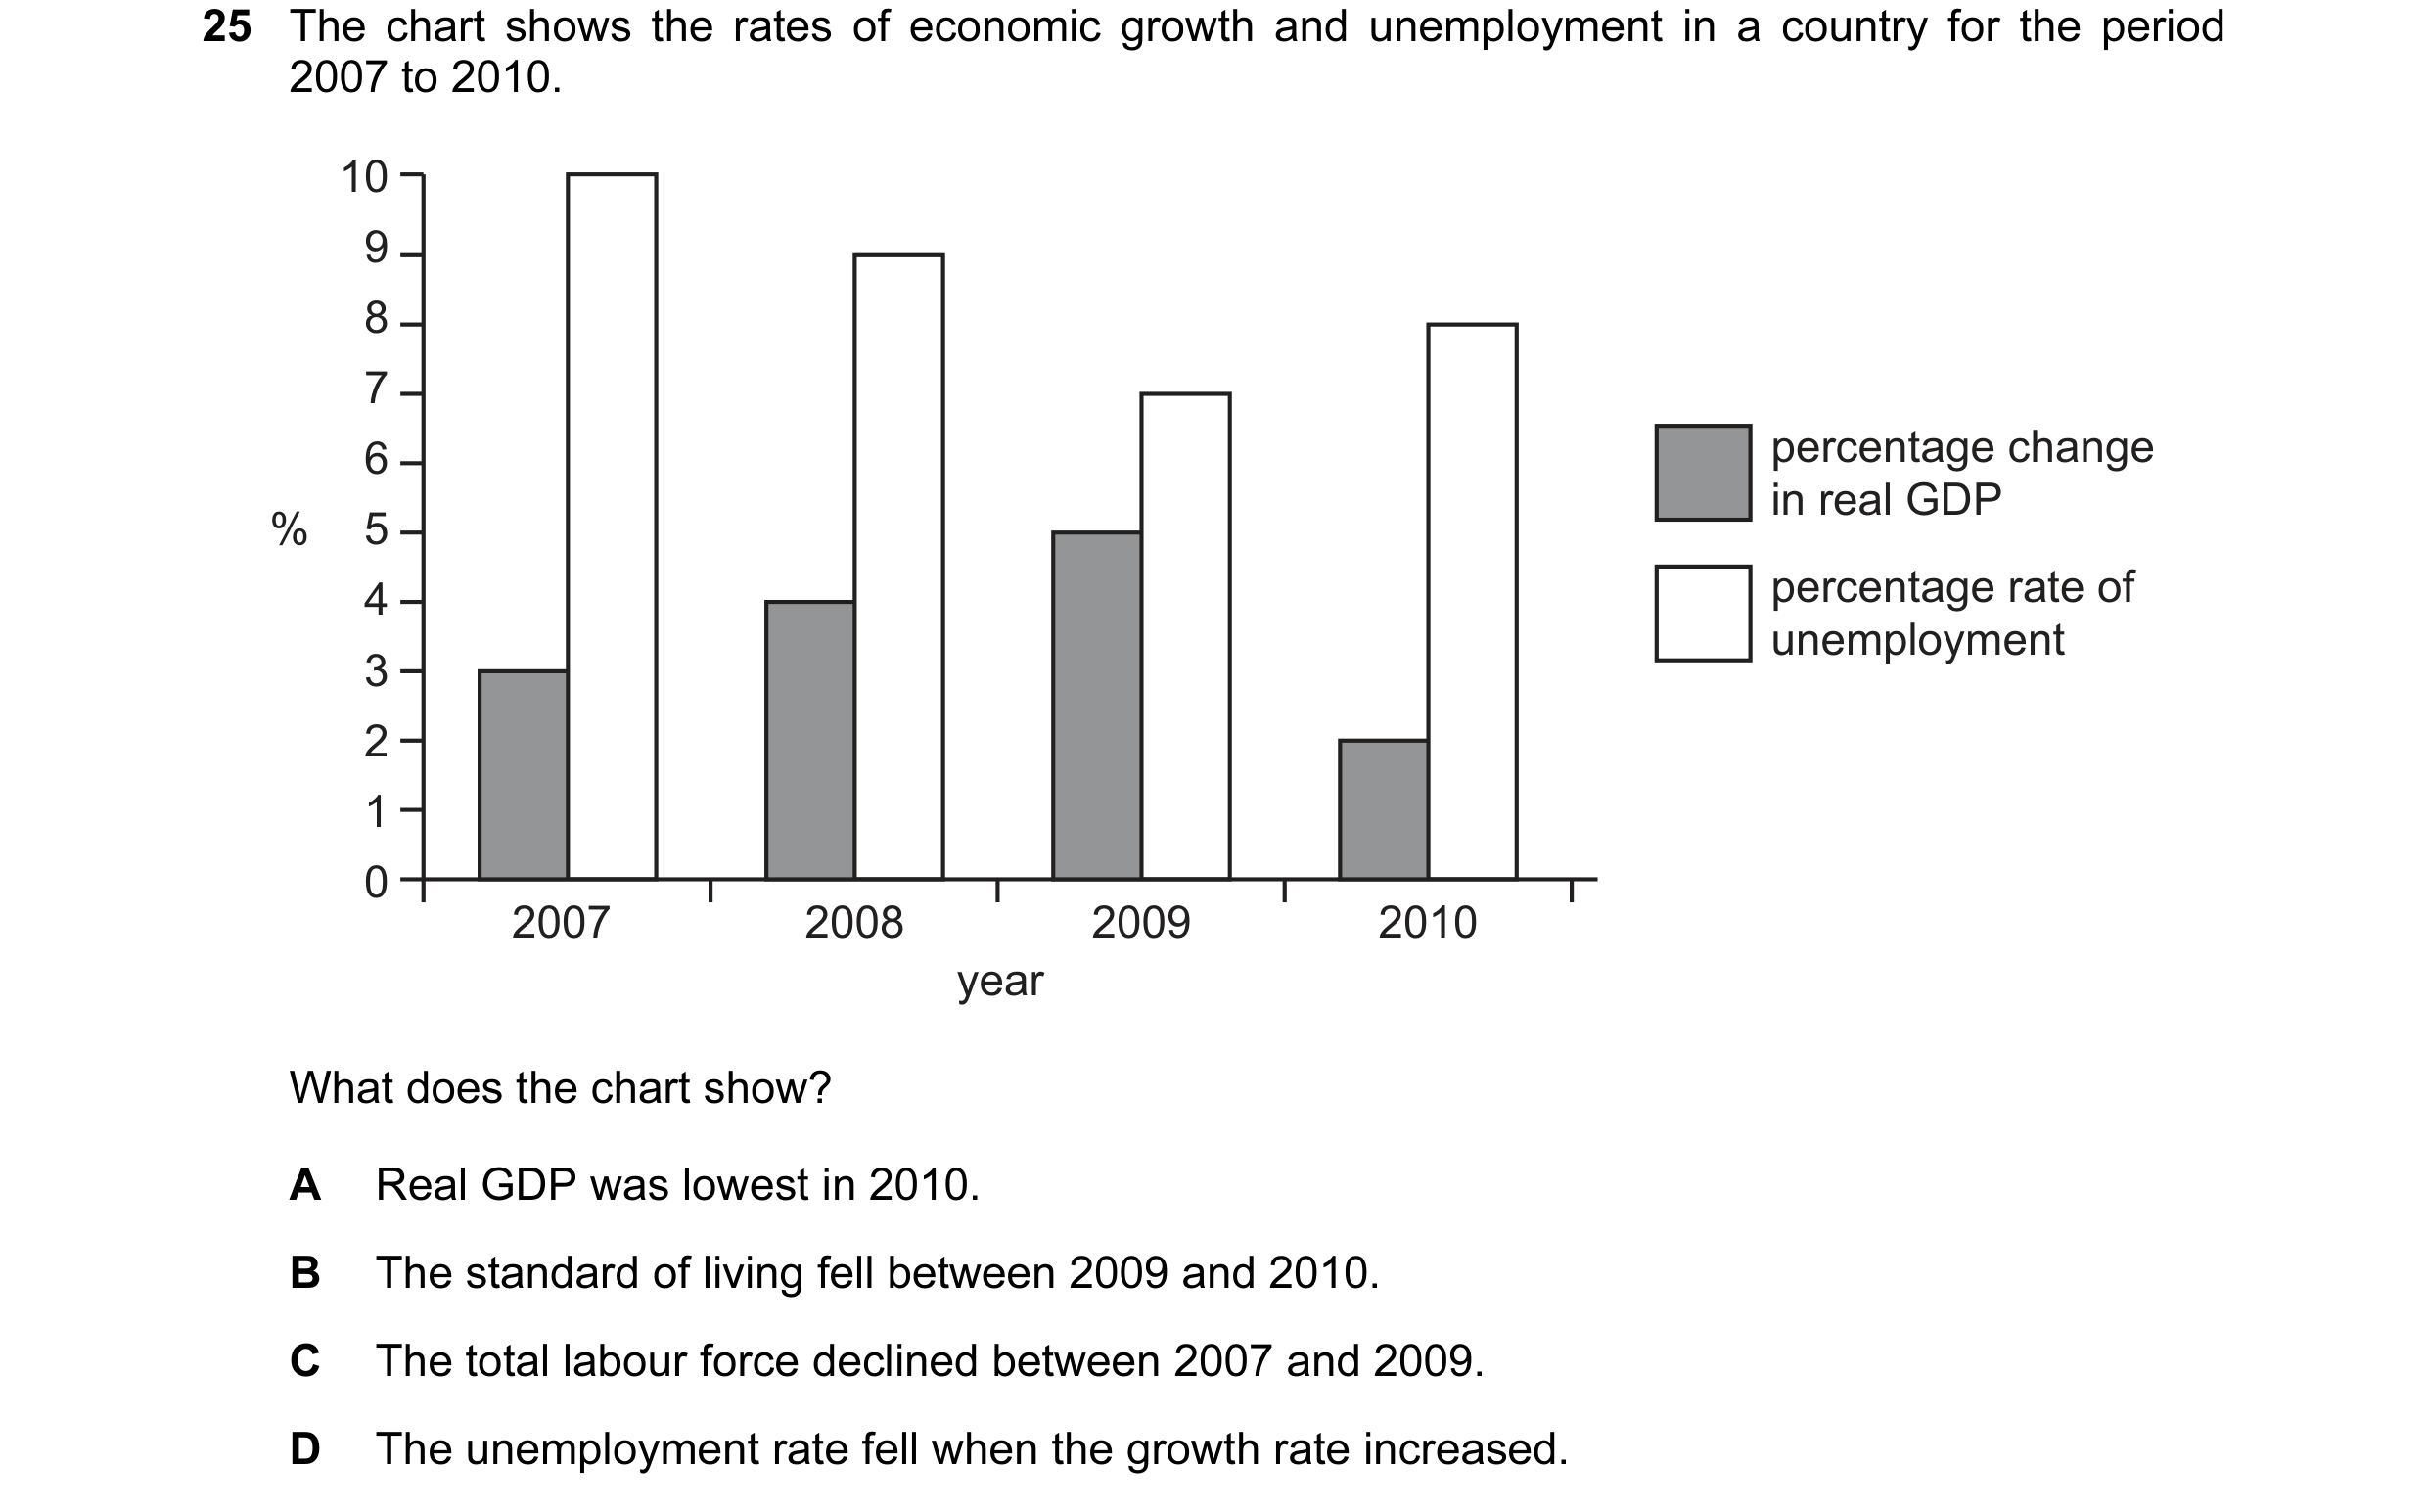
23 The chart shows the rates of economic growth and unemployment in a country for the period 2007 to 2010. 10 9 8 7 6 percentage change in real GDP % 5 4 percentage rate of unemployment 3 2 1 0 2007 2008 2009 2010 year What does the chart show? A Real GDP was lowest in 2010. B The standard of living fell between 2009 and 2010. C The total labour force declined between 2007 and 2009. D The unemployment rate fell when the growth rate increased.
1 marks
Answer: D
This question in 9708/31 Oct/Nov 2011
Q12 · Why are high and variable rates of inflation likely to be harmful to long-run economic… 9708/31 Oct/Nov 2011
24 Why are high and variable rates of inflation likely to be harmful to long-run economic growth? A They hide relative price changes leading to a misallocation of resources. B They increase the real burden of household debt leading to lower consumption. C They lead to an increase in the household saving ratio. D They result in an increase in real interest rates.
1 marks
Answer: A
This question in 9708/31 Oct/Nov 2011
Q13 · What is likely to increase a country’s actual output in the short run but may reduce its… 9708/33 Oct/Nov 2011
20 What is likely to increase a country’s actual output in the short run but may reduce its long-run rate of growth of potential output? A an increase in the size of the government’s budget deficit B an increase in the size of the labour force C increased female participation in the labour force D increased government spending on education
1 marks
Answer: A
This question in 9708/33 Oct/Nov 2011
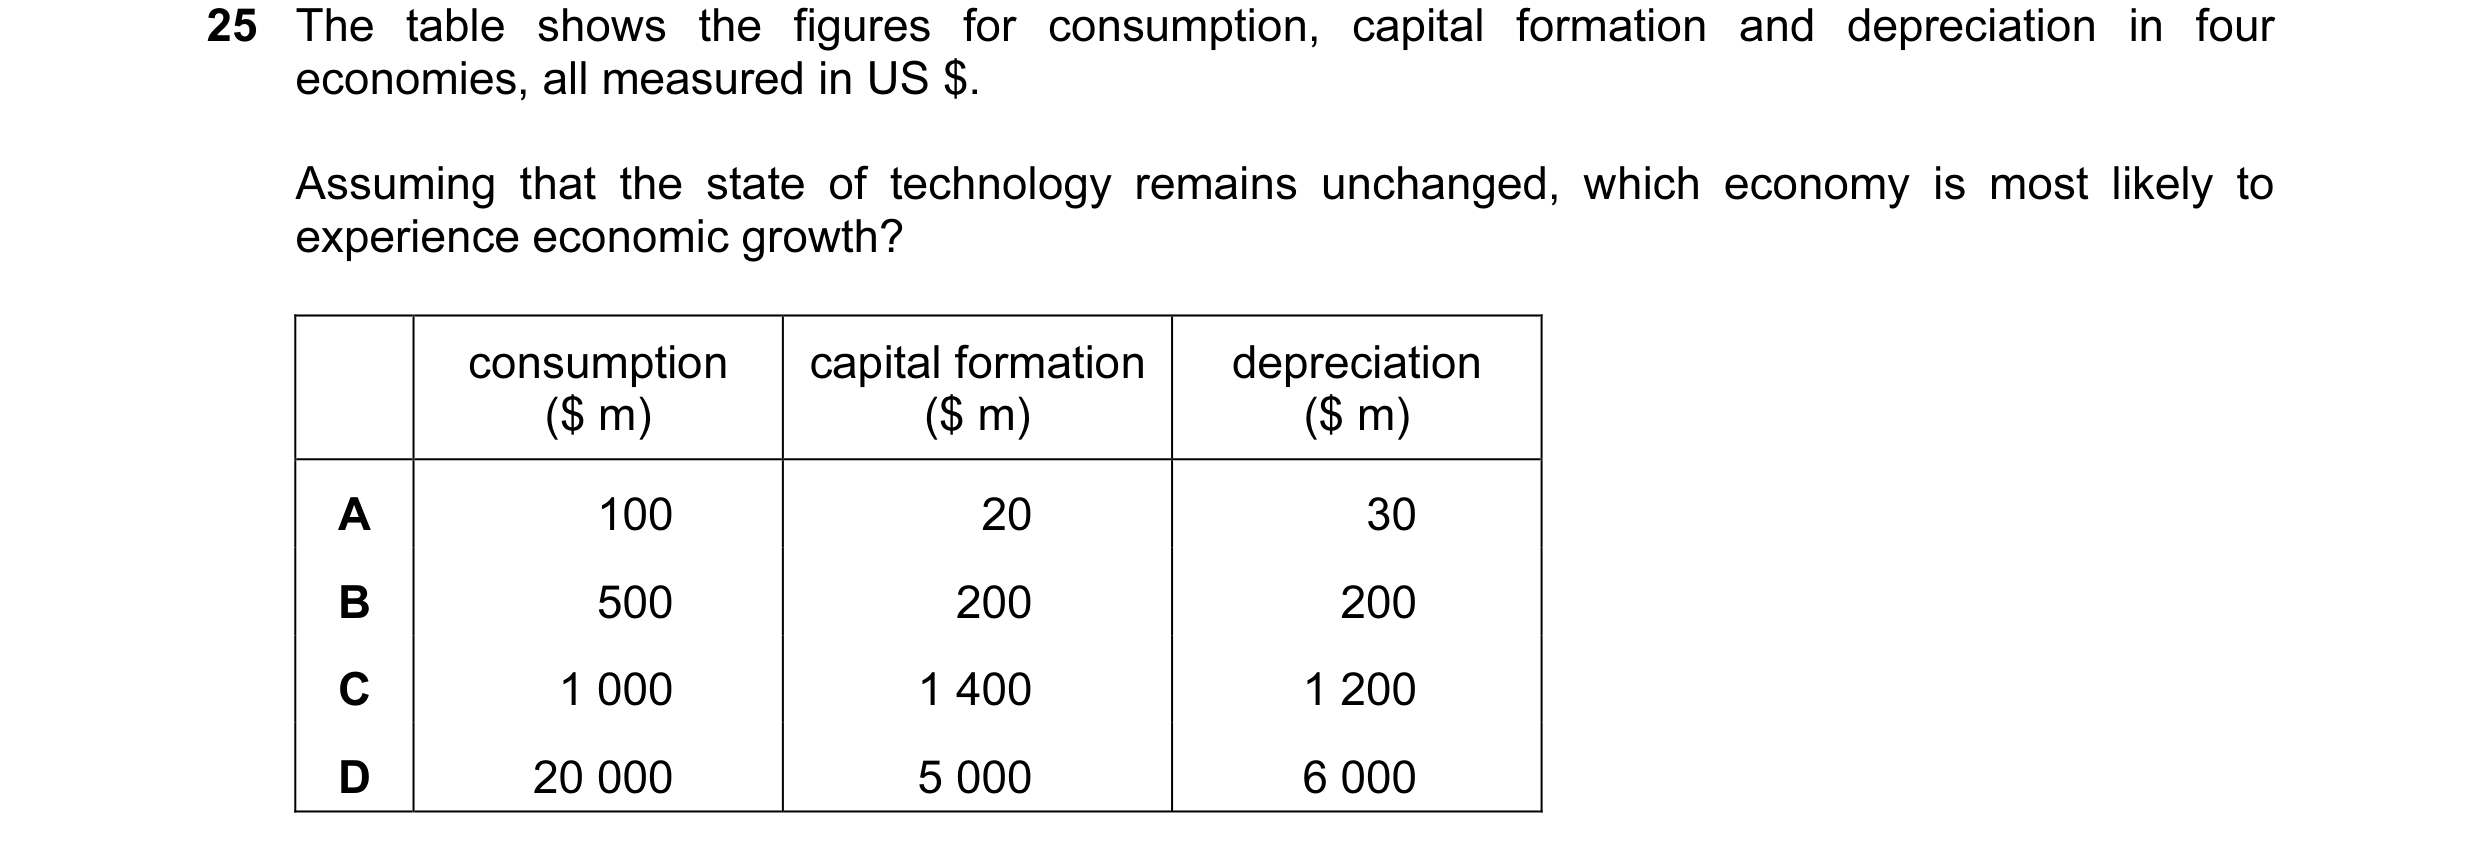
Q14 · The table shows the figures for consumption, capital formation and depreciation in four… 9708/31 May/June 2012
25 The table shows the figures for consumption, capital formation and depreciation in four economies, all measured in US $. Assuming that the state of technology remains unchanged, which economy is most likely to experience economic growth? consumption capital formation depreciation ($ m) ($ m) ($ m) A 100 20 30 B 500 200 200 C 1 000 1 400 1 200 D 20 000 5 000 6 000
1 marks
Answer: C
This question in 9708/31 May/June 2012
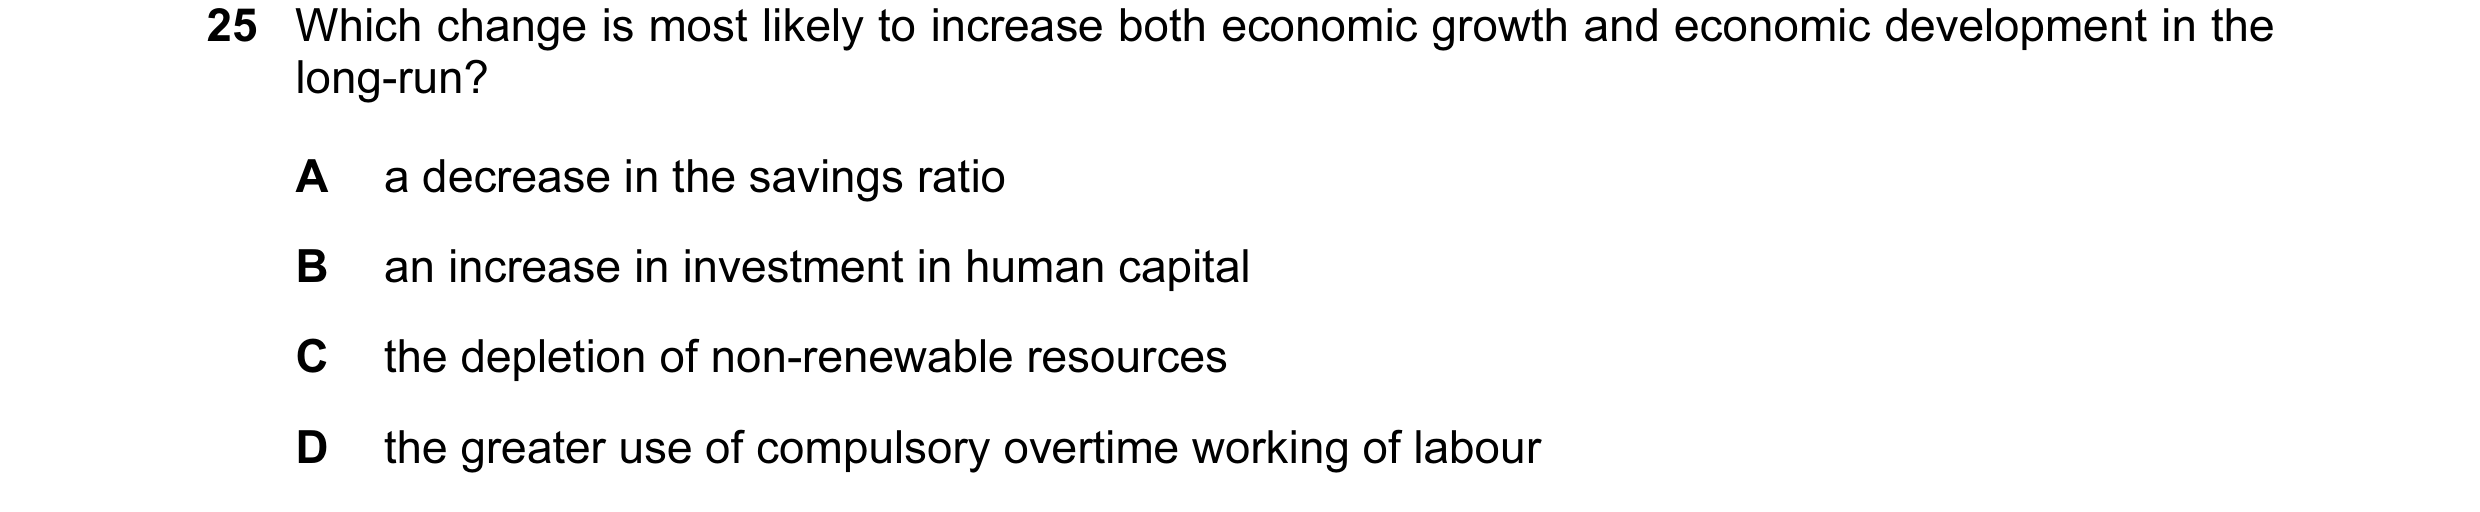
Q15 · Which change is most likely to increase both economic growth and economic development in… 9708/32 May/June 2012
25 Which change is most likely to increase both economic growth and economic development in the long-run? A a decrease in the savings ratio B an increase in investment in human capital C the depletion of non-renewable resources D the greater use of compulsory overtime working of labour
1 marks
Answer: B
This question in 9708/32 May/June 2012
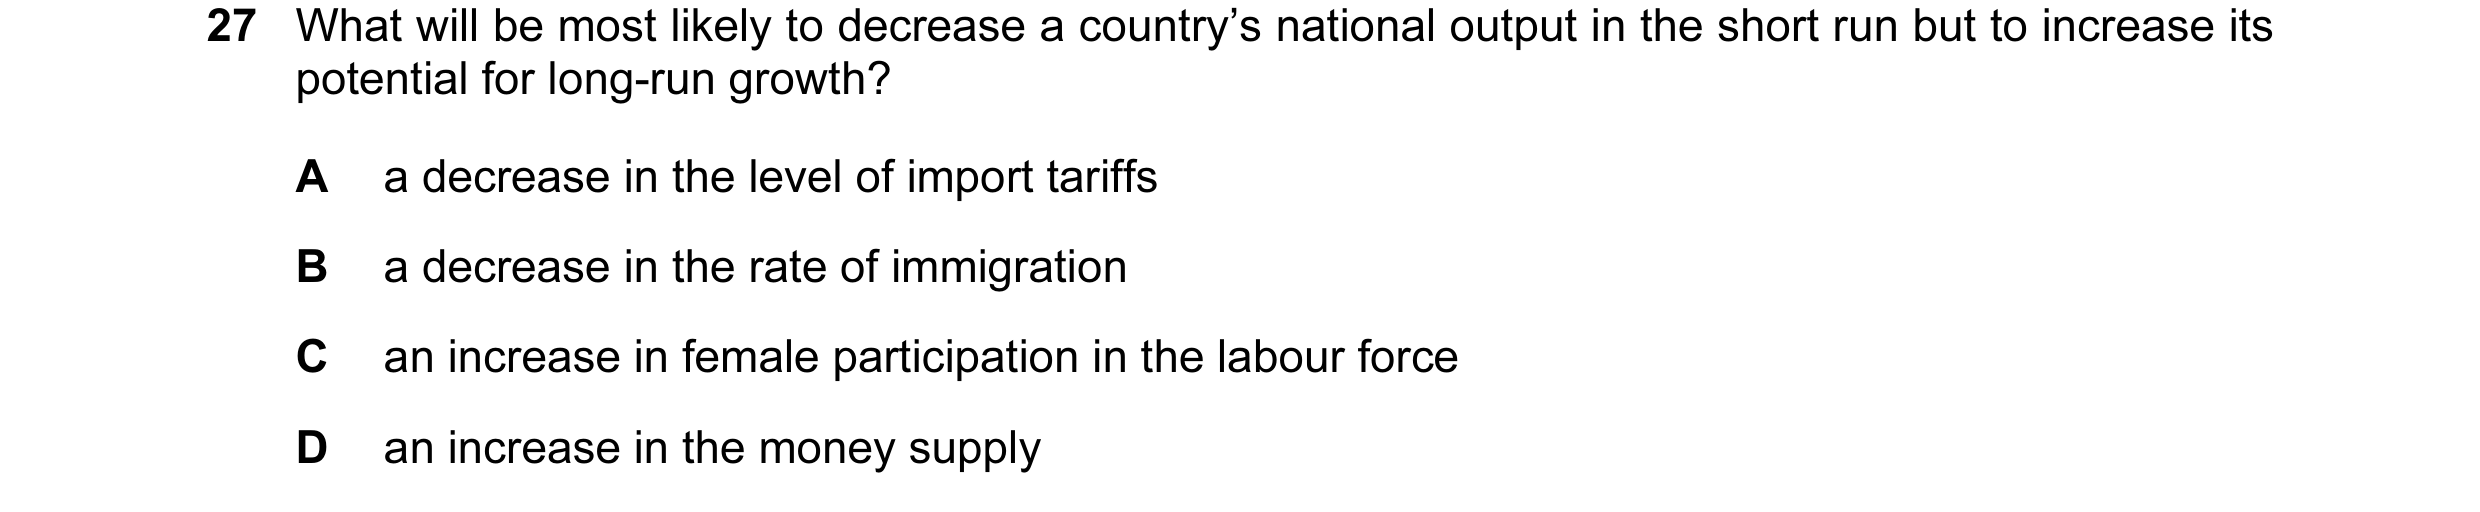
Q16 · What will be most likely to decrease a country’s national output in the short run but to… 9708/32 May/June 2012
27 What will be most likely to decrease a country’s national output in the short run but to increase its potential for long-run growth? A a decrease in the level of import tariffs B a decrease in the rate of immigration C an increase in female participation in the labour force D an increase in the money supply
1 marks
Answer: A
This question in 9708/32 May/June 2012
Q17 · The table shows the figures for consumption, capital formation and depreciation in four… 9708/33 May/June 2012
25 The table shows the figures for consumption, capital formation and depreciation in four economies, all measured in US $. Assuming that the state of technology remains unchanged, which economy is most likely to experience economic growth? consumption capital formation depreciation ($ m) ($ m) ($ m) A 100 20 30 B 500 200 200 C 1 000 1 400 1 200 D 20 000 5 000 6 000
1 marks
Answer: C
This question in 9708/33 May/June 2012
Q18 · The table gives the national income of a country over six years 9708/32 Oct/Nov 2012
19 The table gives the national income of a country over six years. year national income (Y) 1 2100 2 2110 3 2125 4 2135 5 2140 6 2135 According to the accelerator principle, in which year did net investment first fall to a level below that of the previous year? A year 3 B year 4 C year 5 D year 6
1 marks
Answer: B
This question in 9708/32 Oct/Nov 2012
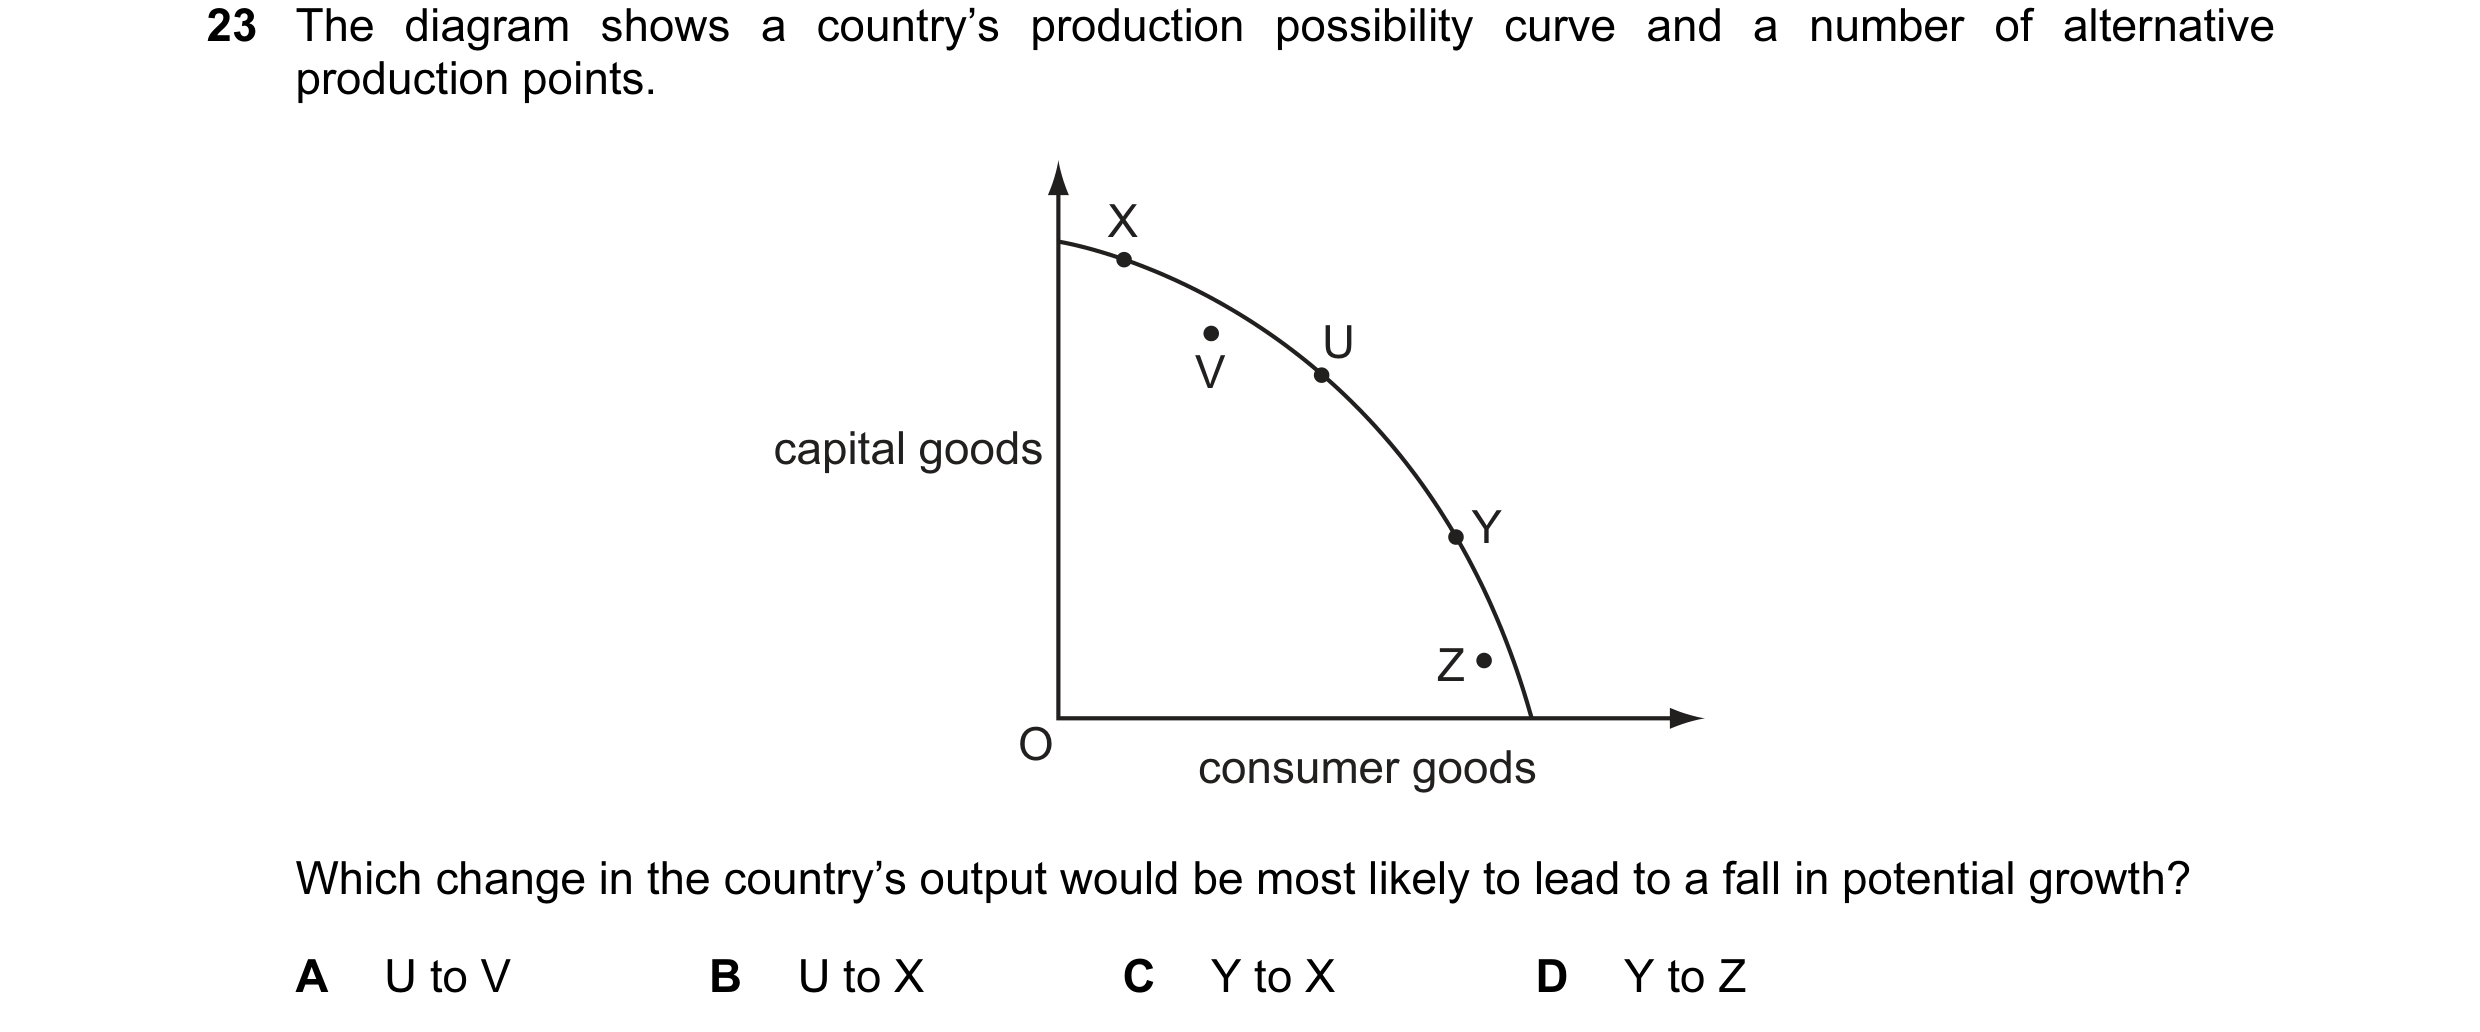
Q19 · The diagram shows a country’s production possibility curve and a number of alternative… 9708/32 Oct/Nov 2012
23 The diagram shows a country’s production possibility curve and a number of alternative production points. X U V capital goods Y Z O consumer goods Which change in the country’s output would be most likely to lead to a fall in potential growth? A U to V B U to X C Y to X D Y to Z
1 marks
Answer: D
This question in 9708/32 Oct/Nov 2012
Q20 · What will assist a country’s potential growth in national output? 9708/32 Oct/Nov 2012
26 What will assist a country’s potential growth in national output? A an increase in cyclical unemployment B an increase in the rate of inflation C an increase in the government's budget deficit D increased participation in the labour force
1 marks
Answer: D
This question in 9708/32 Oct/Nov 2012
Q21 · How can cyclical growth, as opposed to long-run economic growth, be shown on a diagram? 9708/33 Oct/Nov 2012
24 How can cyclical growth, as opposed to long-run economic growth, be shown on a diagram? A an inward shift in a production possibility curve B an outward shift in a production possibility curve C a movement from a point inside a production possibility curve to a point on the curve D a movement from a point outside a production possibility curve to a point on the curve
1 marks
This question in 9708/33 Oct/Nov 2012
Q22 · In the long run, productive potential in an economy grows at an average rate of 3 % per… 9708/33 Oct/Nov 2012
25 In the long run, productive potential in an economy grows at an average rate of 3 % per year. In a particular year actual growth is zero because of a fall in domestic consumption. What is likely to occur? A an increase in unemployment B an increase in the rate of inflation C an increase in the trade deficit D a reduction in the government budget deficit
1 marks
This question in 9708/33 Oct/Nov 2012
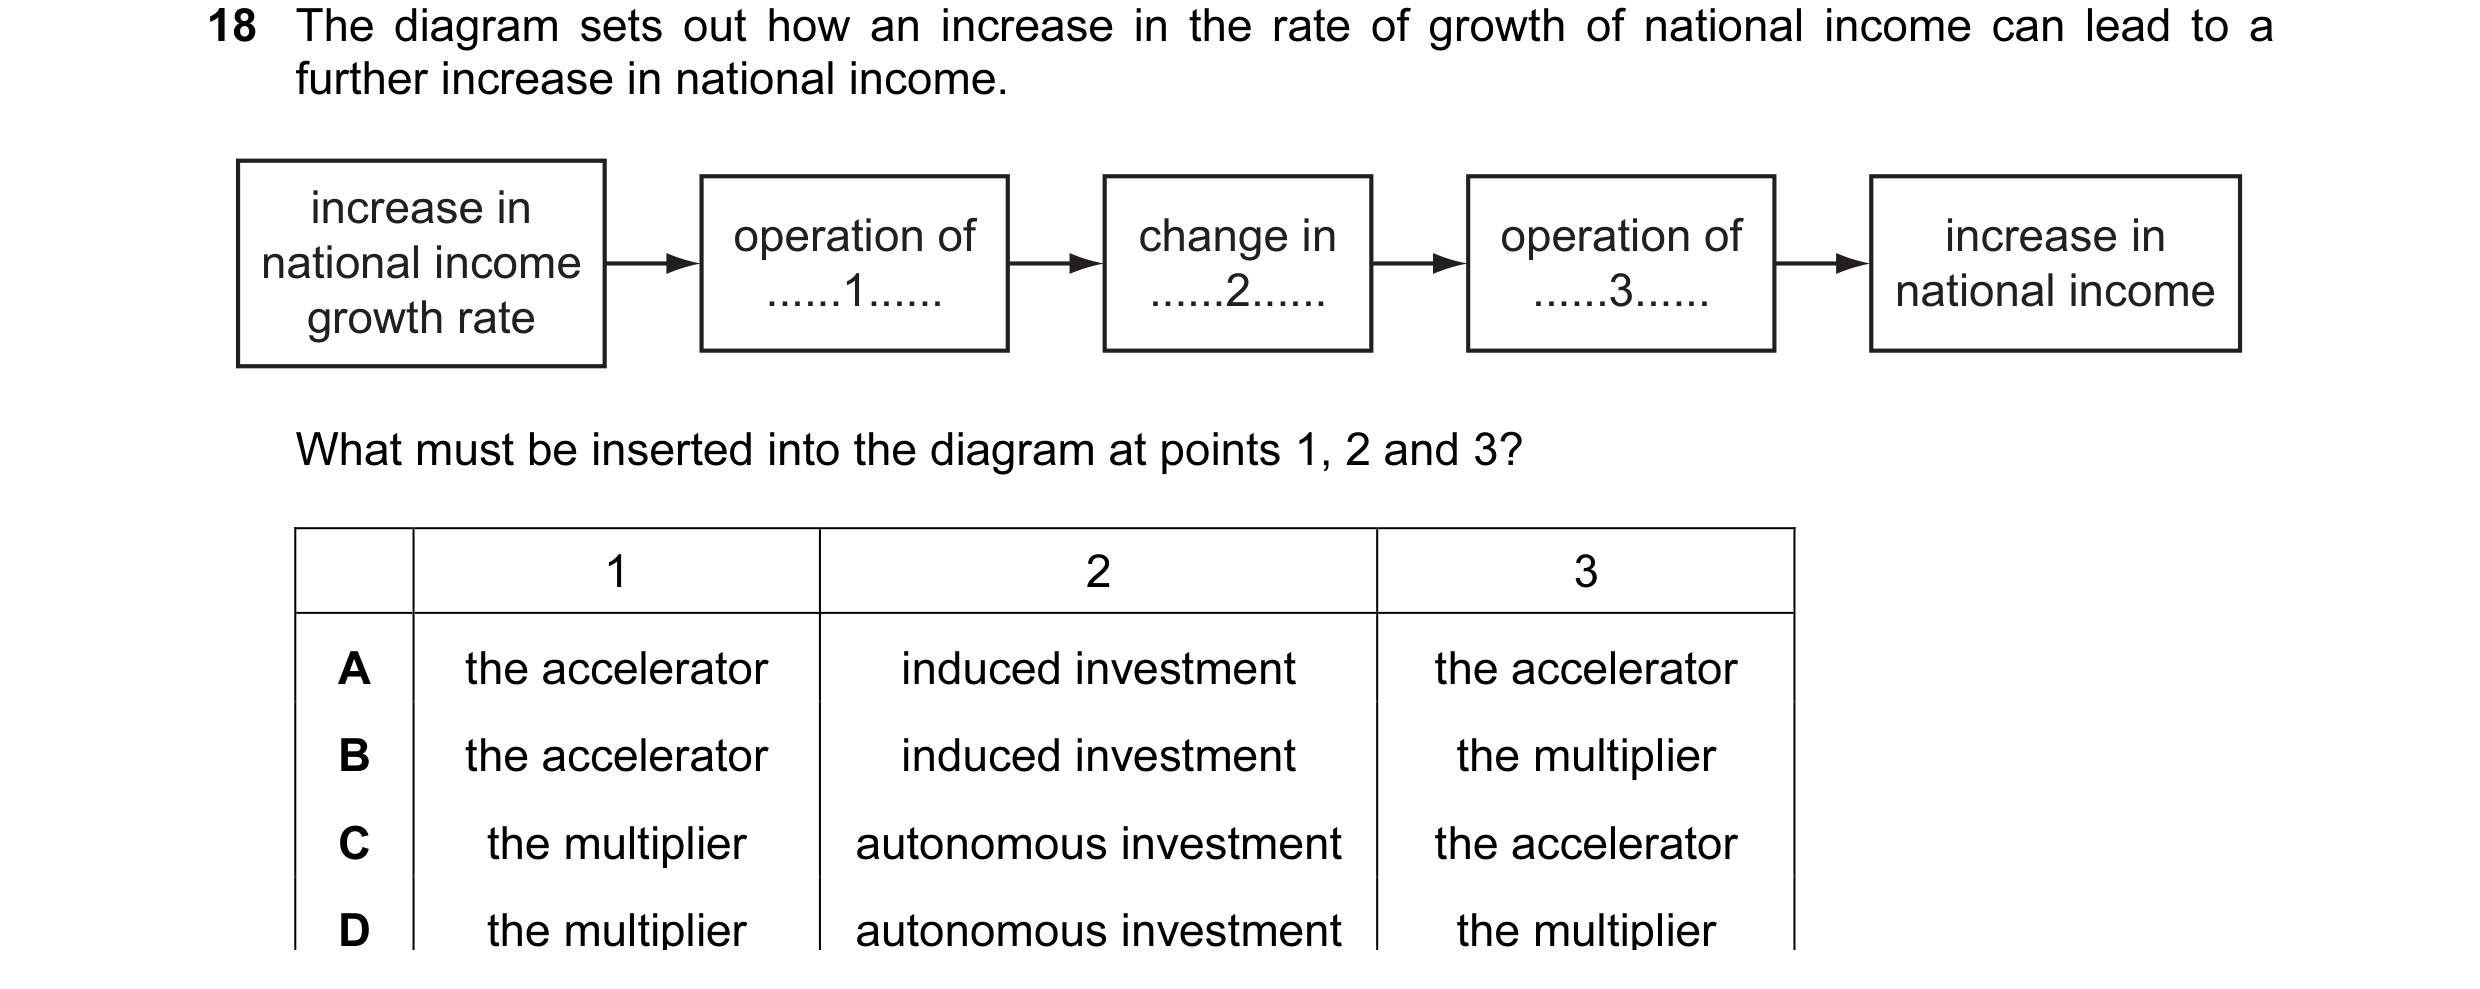
Q23 · The diagram sets out how an increase in the rate of growth of national income can lead to… 9708/31 May/June 2013
18 The diagram sets out how an increase in the rate of growth of national income can lead to a further increase in national income. increase in operation of change in operation of increase in national income … 1 … … 2 … … 3 … national income growth rate What must be inserted into the diagram at points 1, 2 and 3? 1 2 3 A the accelerator induced investment the accelerator B the accelerator induced investment the multiplier C the multiplier autonomous investment the accelerator D the multiplier autonomous investment the multiplier
1 marks
Answer: B
This question in 9708/31 May/June 2013
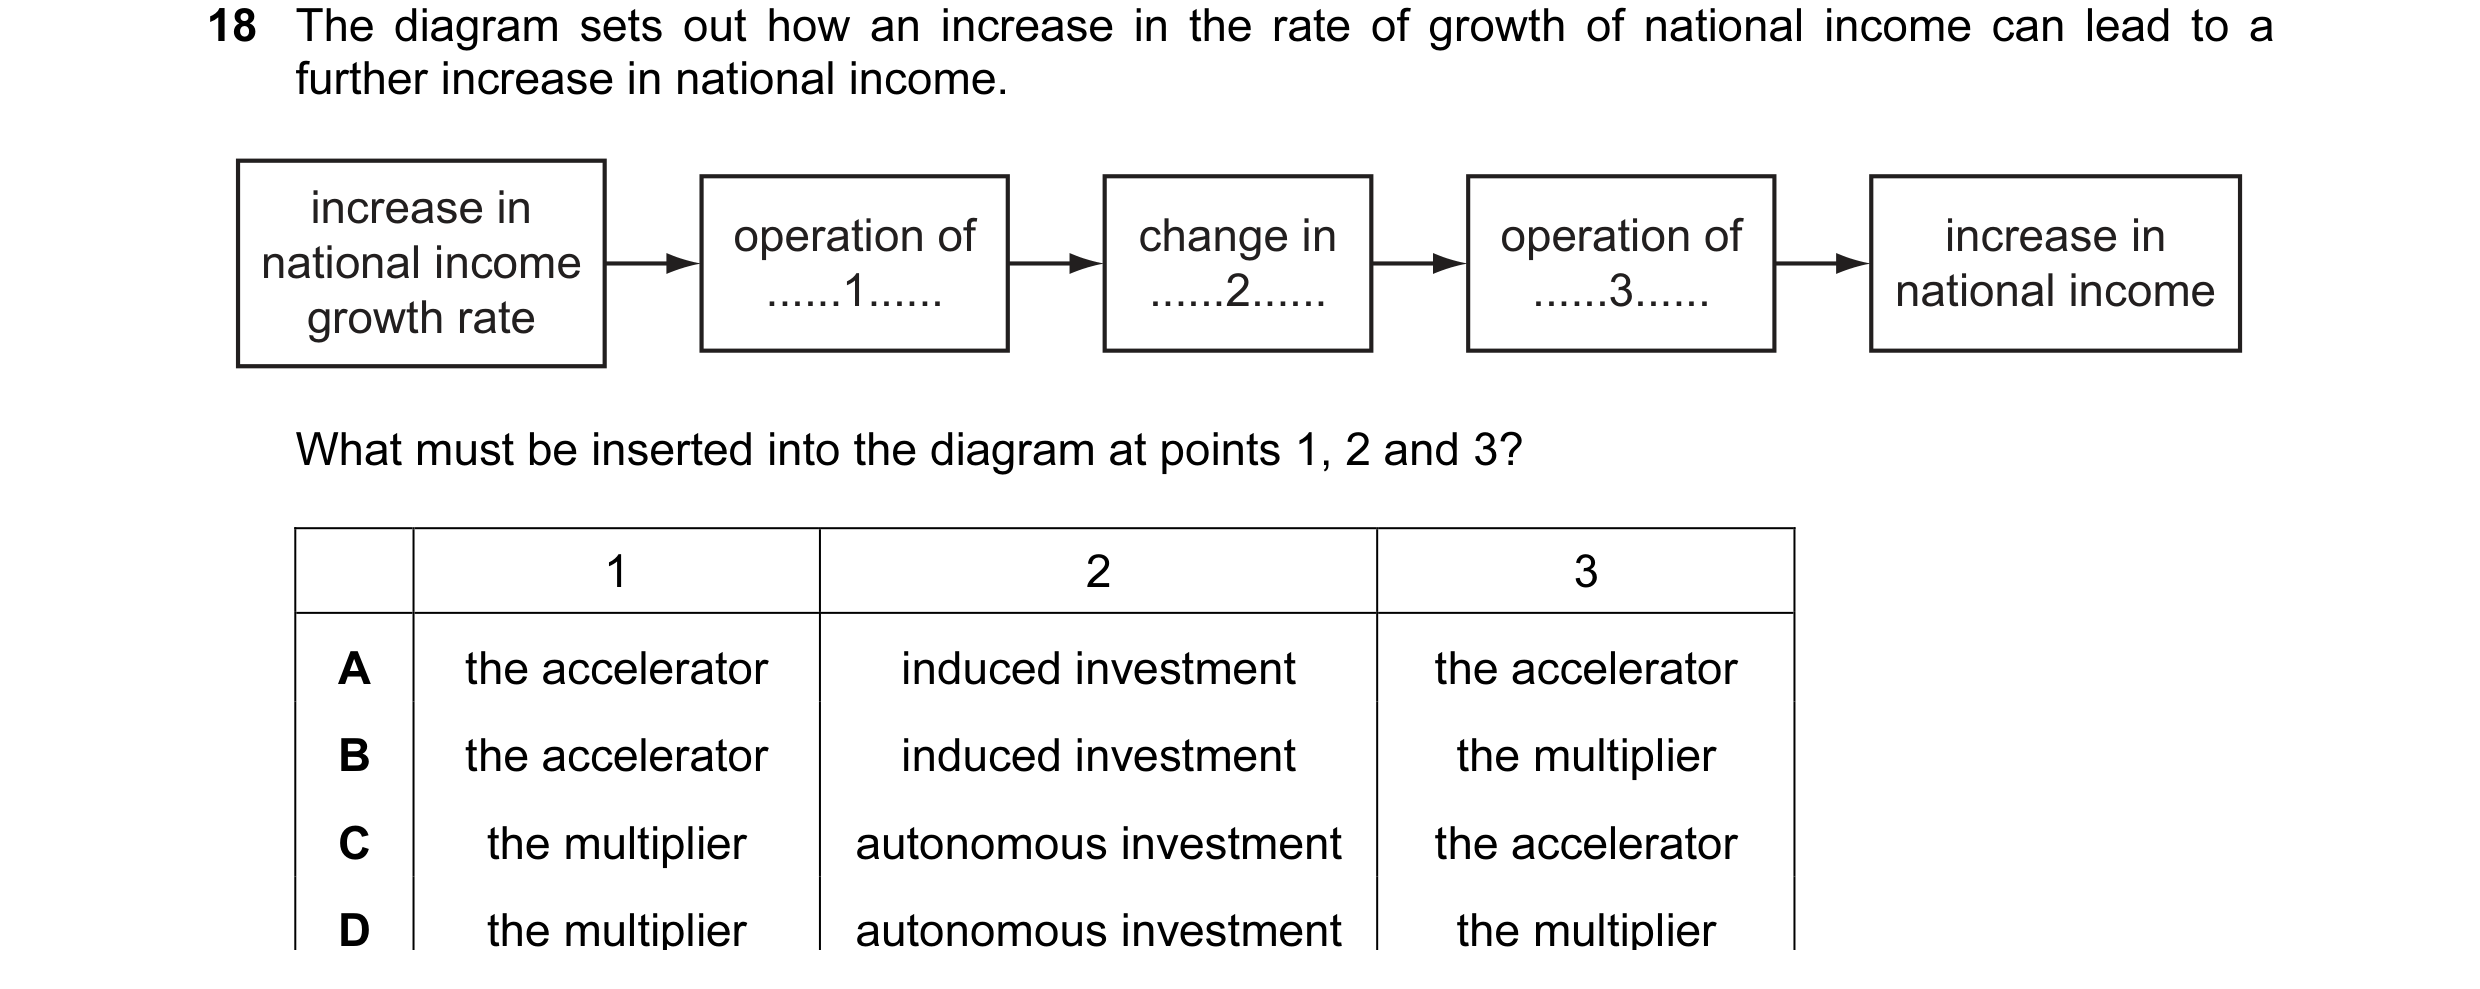
Q24 · The diagram sets out how an increase in the rate of growth of national income can lead to… 9708/33 May/June 2013
18 The diagram sets out how an increase in the rate of growth of national income can lead to a further increase in national income. increase in operation of change in operation of increase in national income … 1 … … 2 … … 3 … national income growth rate What must be inserted into the diagram at points 1, 2 and 3? 1 2 3 A the accelerator induced investment the accelerator B the accelerator induced investment the multiplier C the multiplier autonomous investment the accelerator D the multiplier autonomous investment the multiplier
1 marks
Answer: B
This question in 9708/33 May/June 2013
Q25 · The table gives the growth rate of nominal GDP, the population growth rate and the rate… 9708/31 Oct/Nov 2013
23 The table gives the growth rate of nominal GDP, the population growth rate and the rate of inflation in one year for four countries. Which country had the greatest growth in average living standards? nominal GDP growth population growth rate rate of inflation rate % % % A 6 1 3 B 8 2 4 C 10 3 4 D 15 3 10
1 marks
Answer: C
This question in 9708/31 Oct/Nov 2013
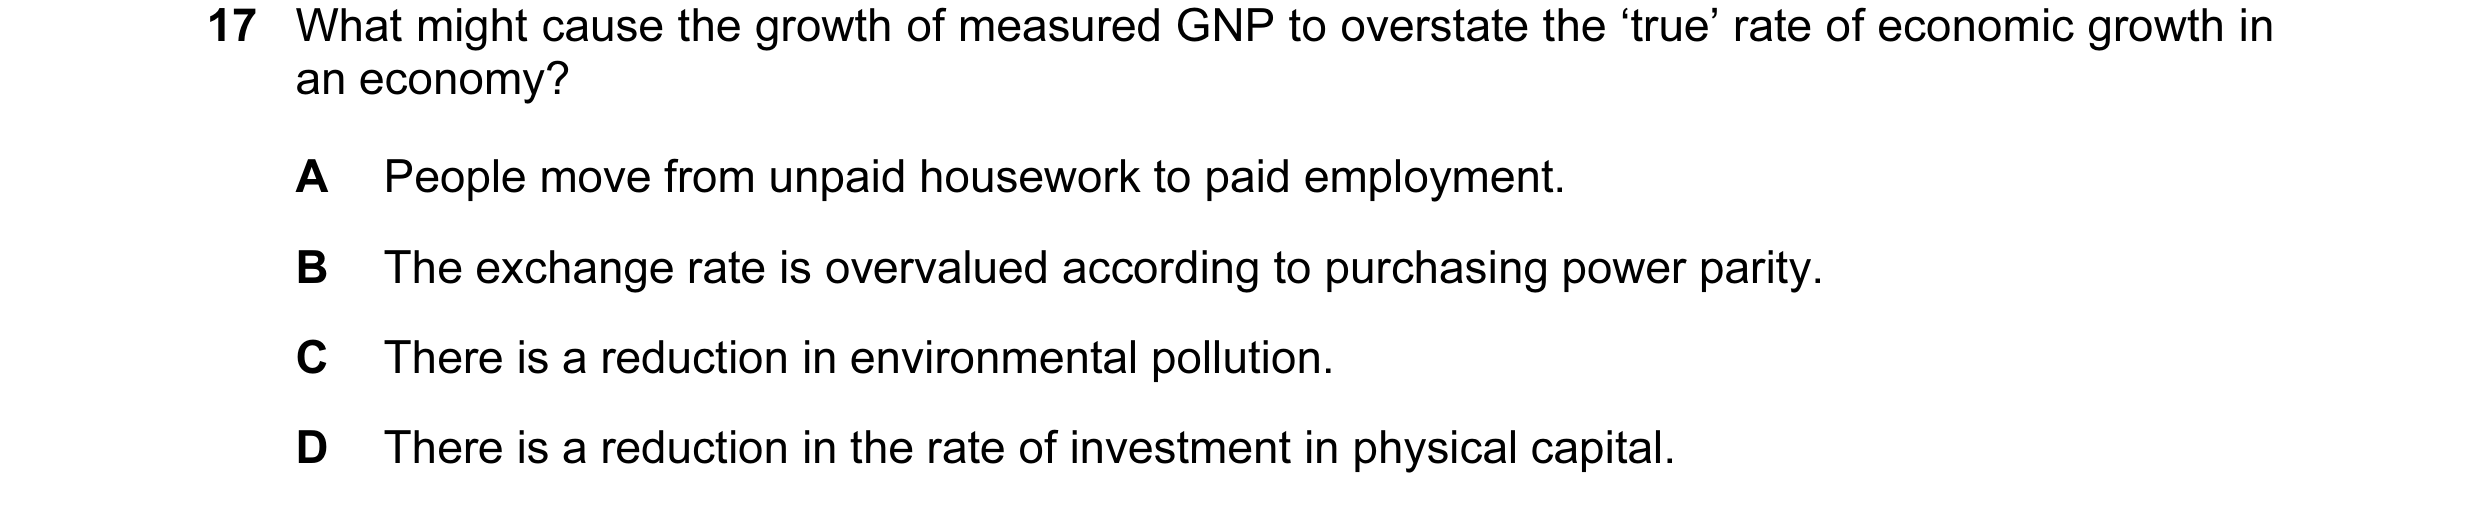
Q26 · What might cause the growth of measured GNP to overstate the ‘true’ rate of economic… 9708/32 Oct/Nov 2013
17 What might cause the growth of measured GNP to overstate the ‘true’ rate of economic growth in an economy? A People move from unpaid housework to paid employment. B The exchange rate is overvalued according to purchasing power parity. C There is a reduction in environmental pollution. D There is a reduction in the rate of investment in physical capital.
1 marks
Answer: A
This question in 9708/32 Oct/Nov 2013
Q27 · What is most likely to contribute to high long-term growth rates of GNP per head? 9708/32 Oct/Nov 2013
22 What is most likely to contribute to high long-term growth rates of GNP per head? A government imposition of maximum prices for particular goods B high rates of trade union membership amongst the labour force C high ratios of saving to GNP D restrictions on inward foreign investment
1 marks
Answer: C
This question in 9708/32 Oct/Nov 2013
Q28 · What would increase an economy’s actual output but not its potential output? 9708/32 Oct/Nov 2013
25 What would increase an economy’s actual output but not its potential output? A an increase in the capital available to the labour force B an increase in the labour force’s skill level C an increase in the number in the labour force D an increase in the proportion of the labour force employed
1 marks
Answer: D
This question in 9708/32 Oct/Nov 2013
Q29 · A government aims to achieve steady and stable growth, in line with the economy’s… 9708/32 Oct/Nov 2013
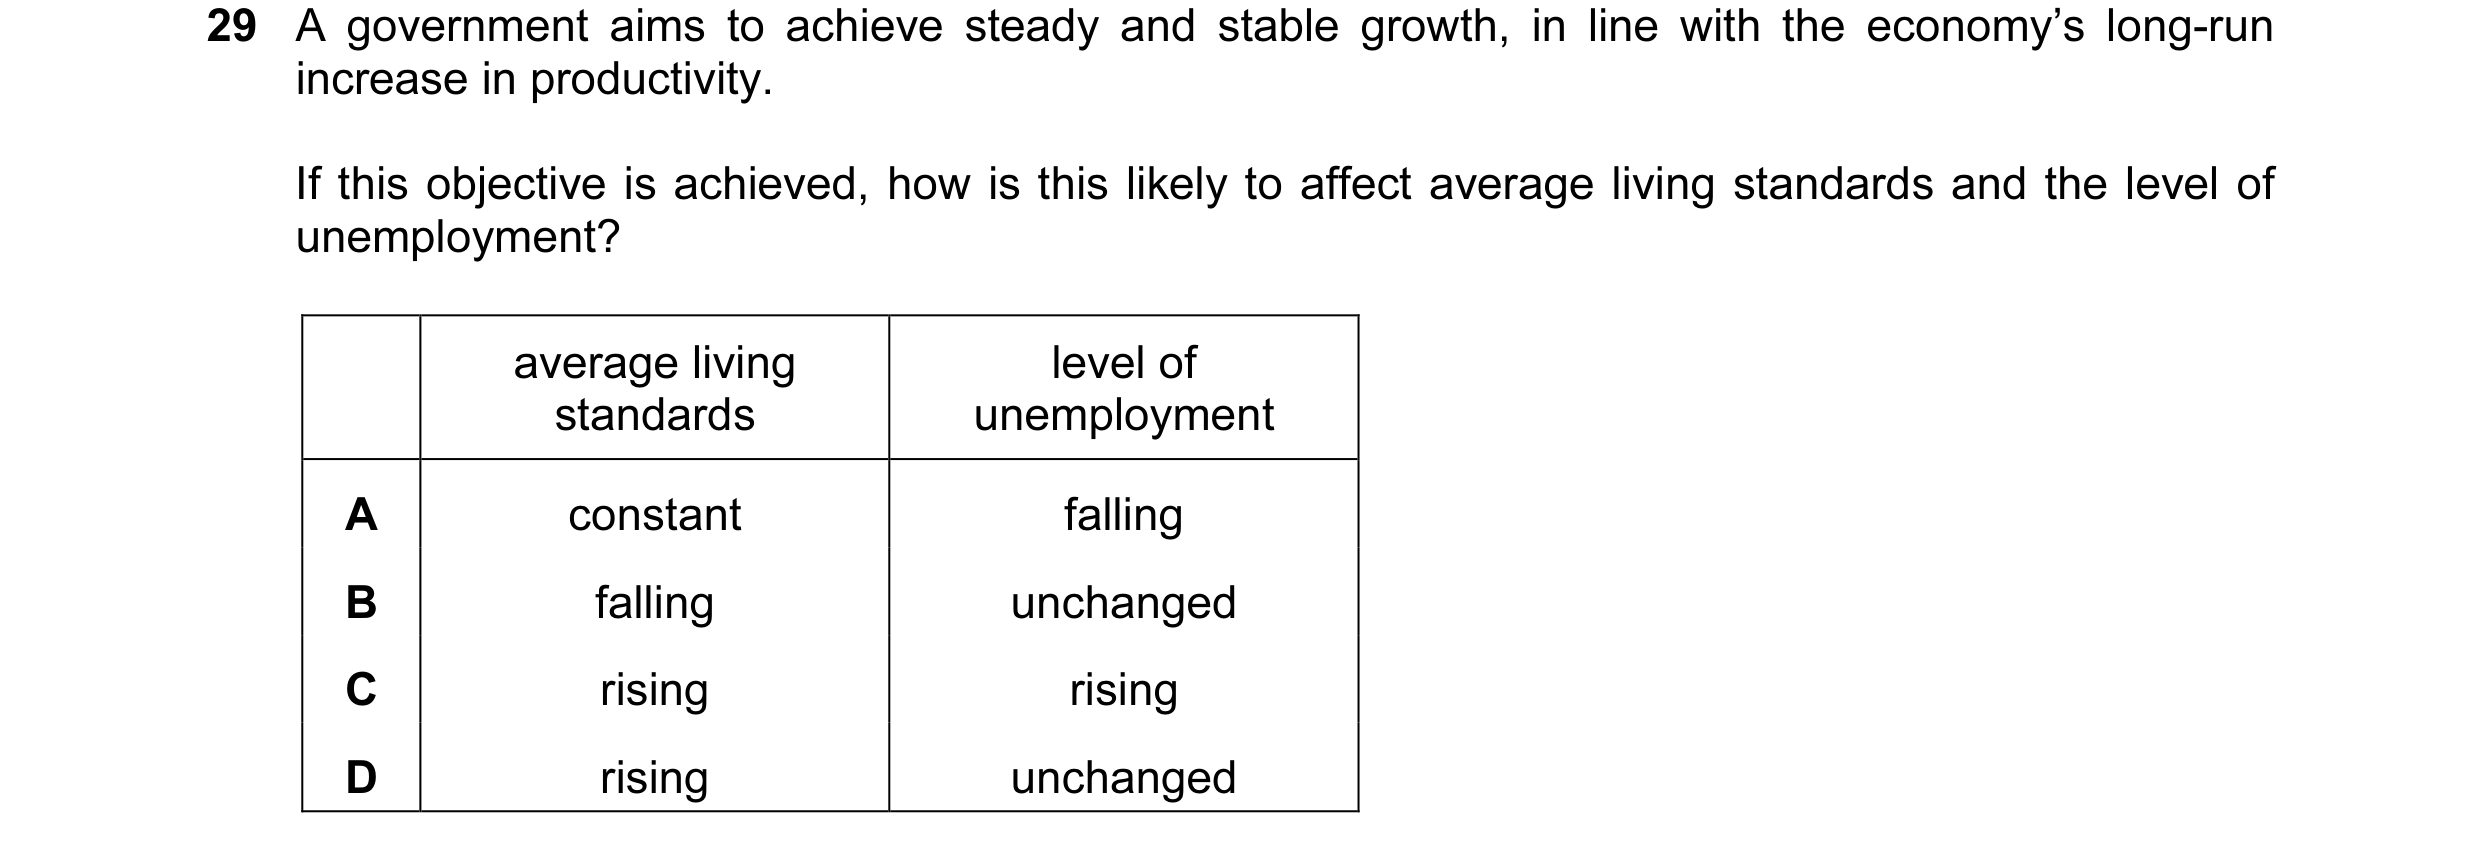
29 A government aims to achieve steady and stable growth, in line with the economy’s long-run increase in productivity. If this objective is achieved, how is this likely to affect average living standards and the level of unemployment? average living level of standards unemployment A constant falling B falling unchanged C rising rising D rising unchanged
1 marks
Answer: D
This question in 9708/32 Oct/Nov 2013
Q30 · Why is a high ratio of government debt to GDP likely to cause a decline in a country’s… 9708/33 Oct/Nov 2013
26 Why is a high ratio of government debt to GDP likely to cause a decline in a country’s economic growth? A Higher taxes to pay the interest charges on the debt will reduce the country’s money supply. B It will cause the growth in actual output to fall behind the country’s long-term rate of growth. C It will increase the cost of borrowing to both the government and the private sector. D It will weaken the country’s competitiveness by increasing unit labour costs.
1 marks
Answer: C
This question in 9708/33 Oct/Nov 2013
Q31 · Which policy would be most likely to improve a country’s prospects of achieving a higher… 9708/33 Oct/Nov 2013
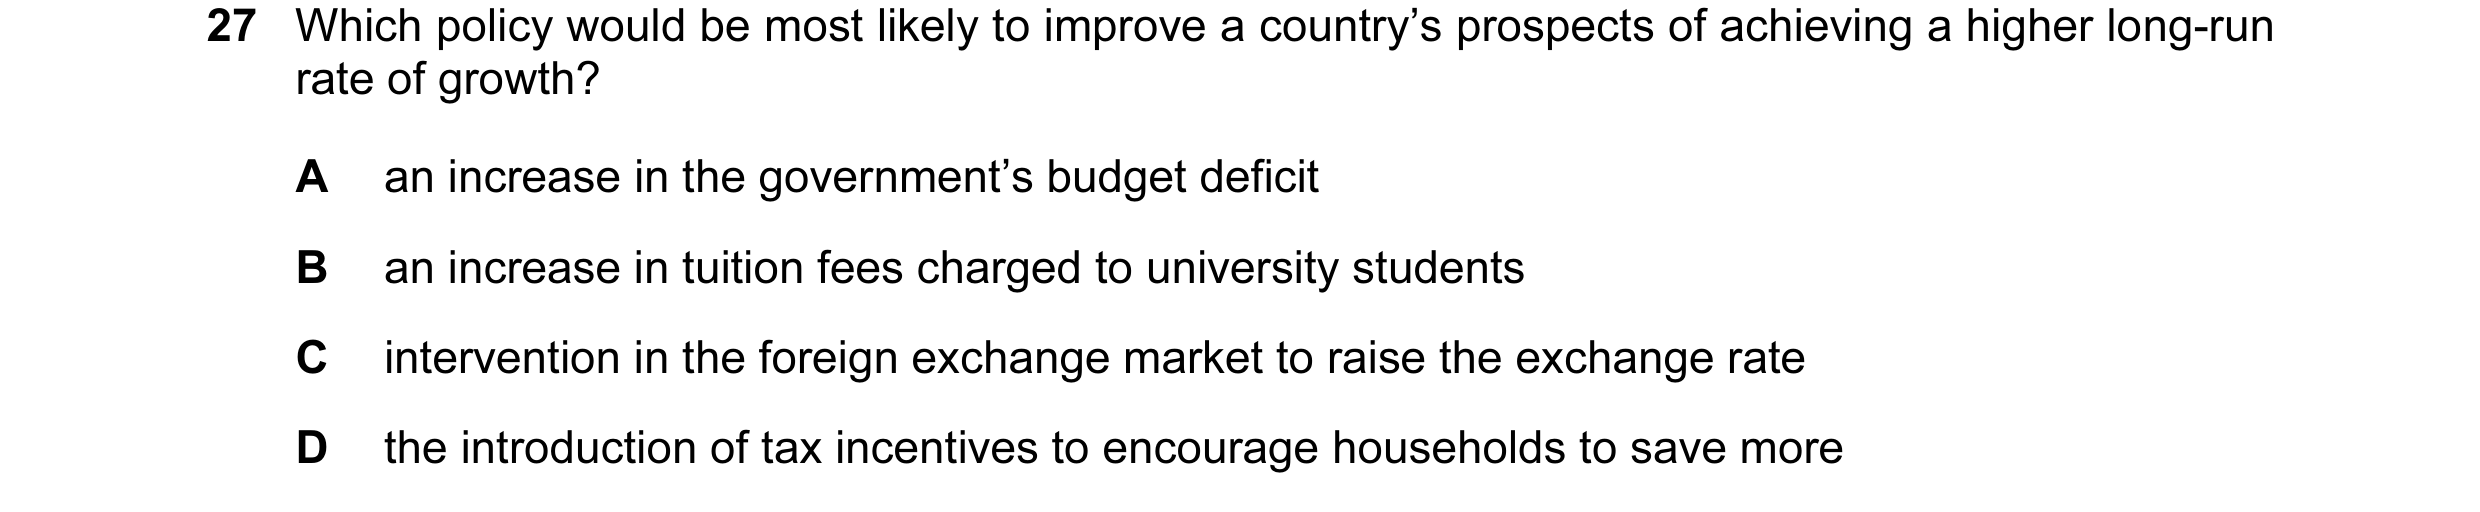
27 Which policy would be most likely to improve a country’s prospects of achieving a higher long-run rate of growth? A an increase in the government’s budget deficit B an increase in tuition fees charged to university students C intervention in the foreign exchange market to raise the exchange rate D the introduction of tax incentives to encourage households to save more
1 marks
Answer: D
This question in 9708/33 Oct/Nov 2013
Q32 · What would be most likely to increase a country’s long-run trend rate of growth? 9708/31 Oct/Nov 2014
24 What would be most likely to increase a country’s long-run trend rate of growth? A an appreciation of the currency B an increase in import tariffs C an increase in the money supply D a reduction in the ratio of Government Debt to GDP
1 marks
Answer: D
This question in 9708/31 Oct/Nov 2014
Q33 · The chart shows the rates of economic growth and unemployment in a country for the period… 9708/31 Oct/Nov 2014
25 The chart shows the rates of economic growth and unemployment in a country for the period 2007 to 2010. 10 9 8 7 6 percentage change in real GDP % 5 4 percentage rate of unemployment 3 2 1 0 2007 2008 2009 2010 year What does the chart show? A Real GDP was lowest in 2010. B The standard of living fell between 2009 and 2010. C The total labour force declined between 2007 and 2009. D The unemployment rate fell when the growth rate increased.
1 marks
Answer: D
This question in 9708/31 Oct/Nov 2014
Q34 · What is most likely to cause a decrease in a country's long-run rate of economic growth? 9708/33 Oct/Nov 2014
24 What is most likely to cause a decrease in a country's long-run rate of economic growth? A an ageing population B increased inward migration C a decrease in the government's budget deficit D a decrease in the share of agriculture in the country's GDP
1 marks
Answer: A
This question in 9708/33 Oct/Nov 2014
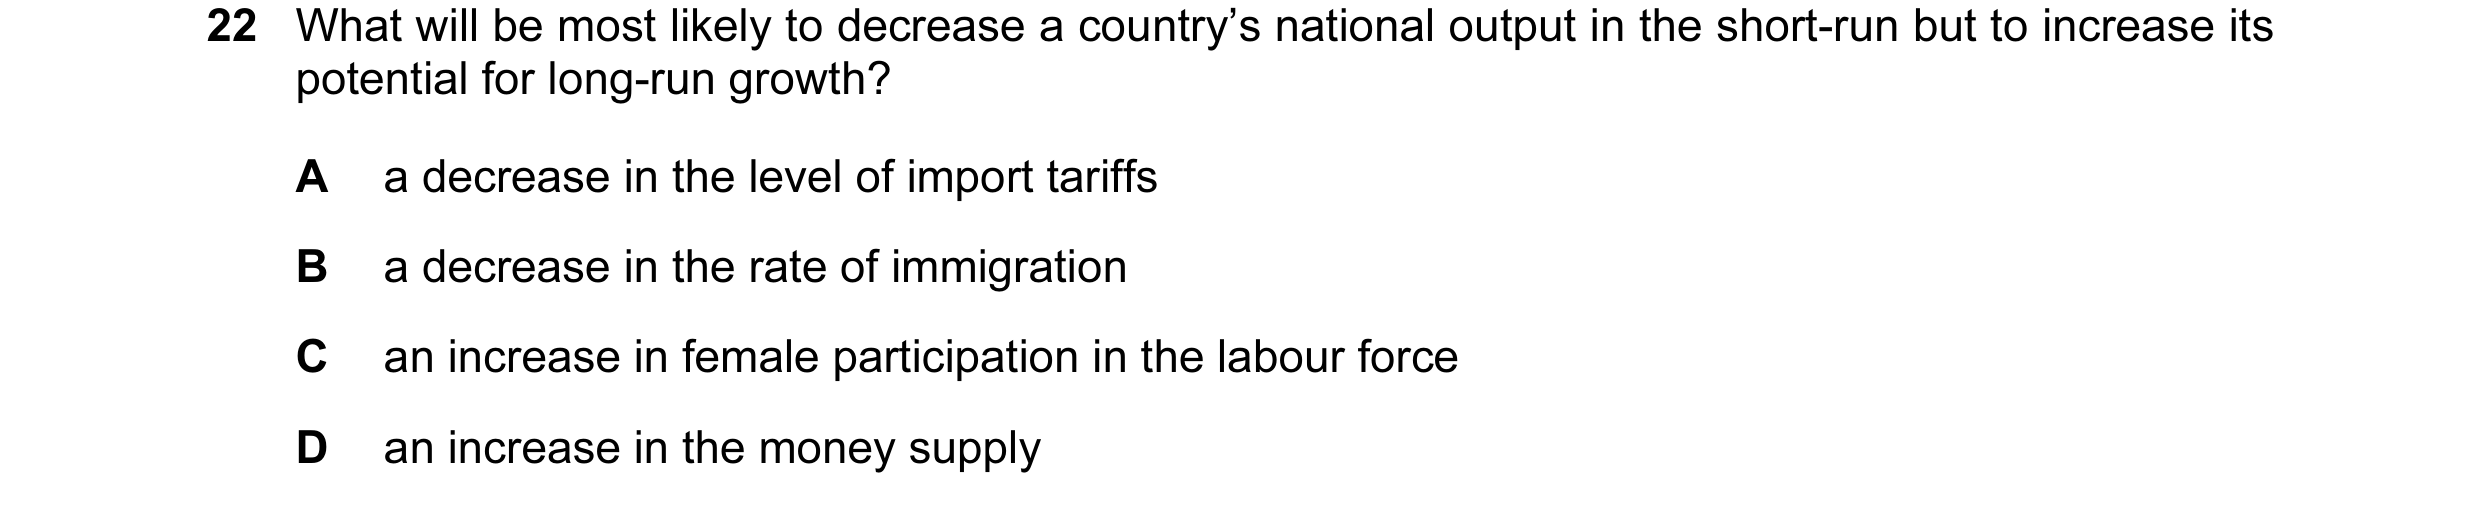
Q35 · What will be most likely to decrease a country’s national output in the short-run but to… 9708/31 May/June 2015
22 What will be most likely to decrease a country’s national output in the short-run but to increase its potential for long-run growth? A a decrease in the level of import tariffs B a decrease in the rate of immigration C an increase in female participation in the labour force D an increase in the money supply
1 marks
Answer: A
This question in 9708/31 May/June 2015
Q36 · An economy is experiencing economic growth 9708/32 May/June 2015
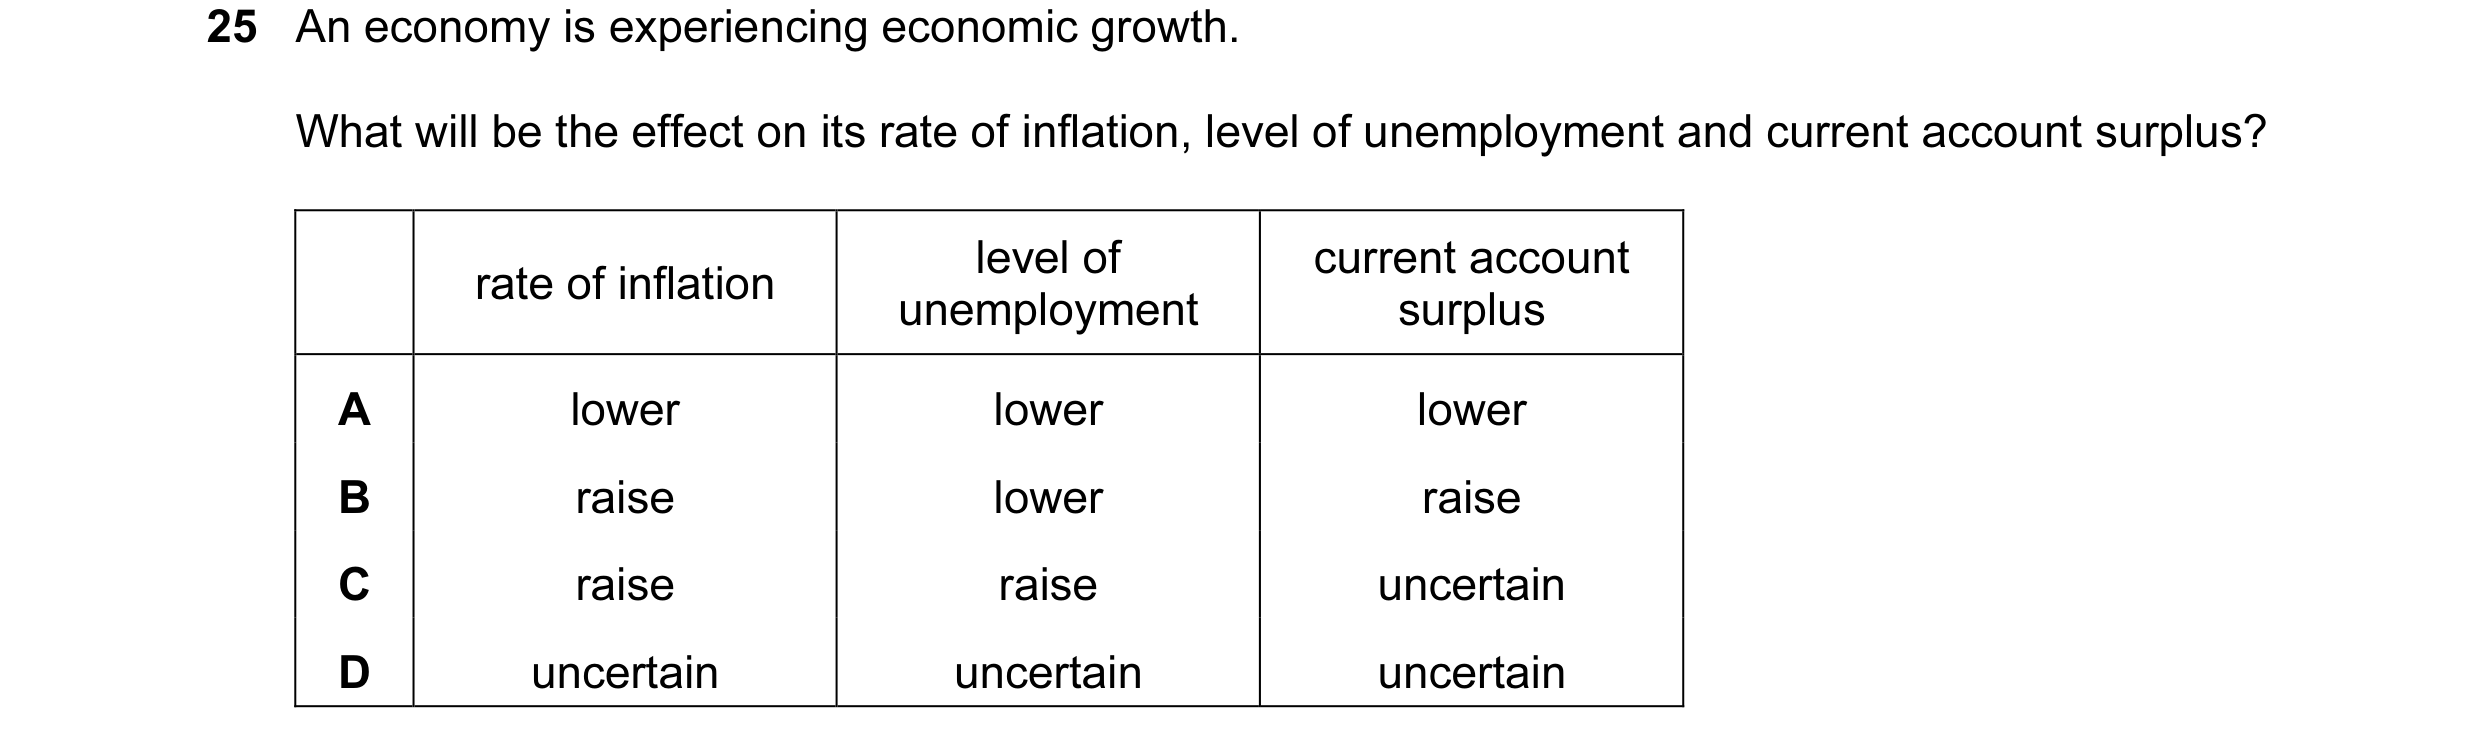
25 An economy is experiencing economic growth. What will be the effect on its rate of inflation, level of unemployment and current account surplus? level of current account rate of inflation unemployment surplus A lower lower lower B raise lower raise C raise raise uncertain D uncertain uncertain uncertain
1 marks
Answer: D
This question in 9708/32 May/June 2015
Q37 · The diagram shows a country’s production possibility curve and a number of alternative… 9708/32 May/June 2015
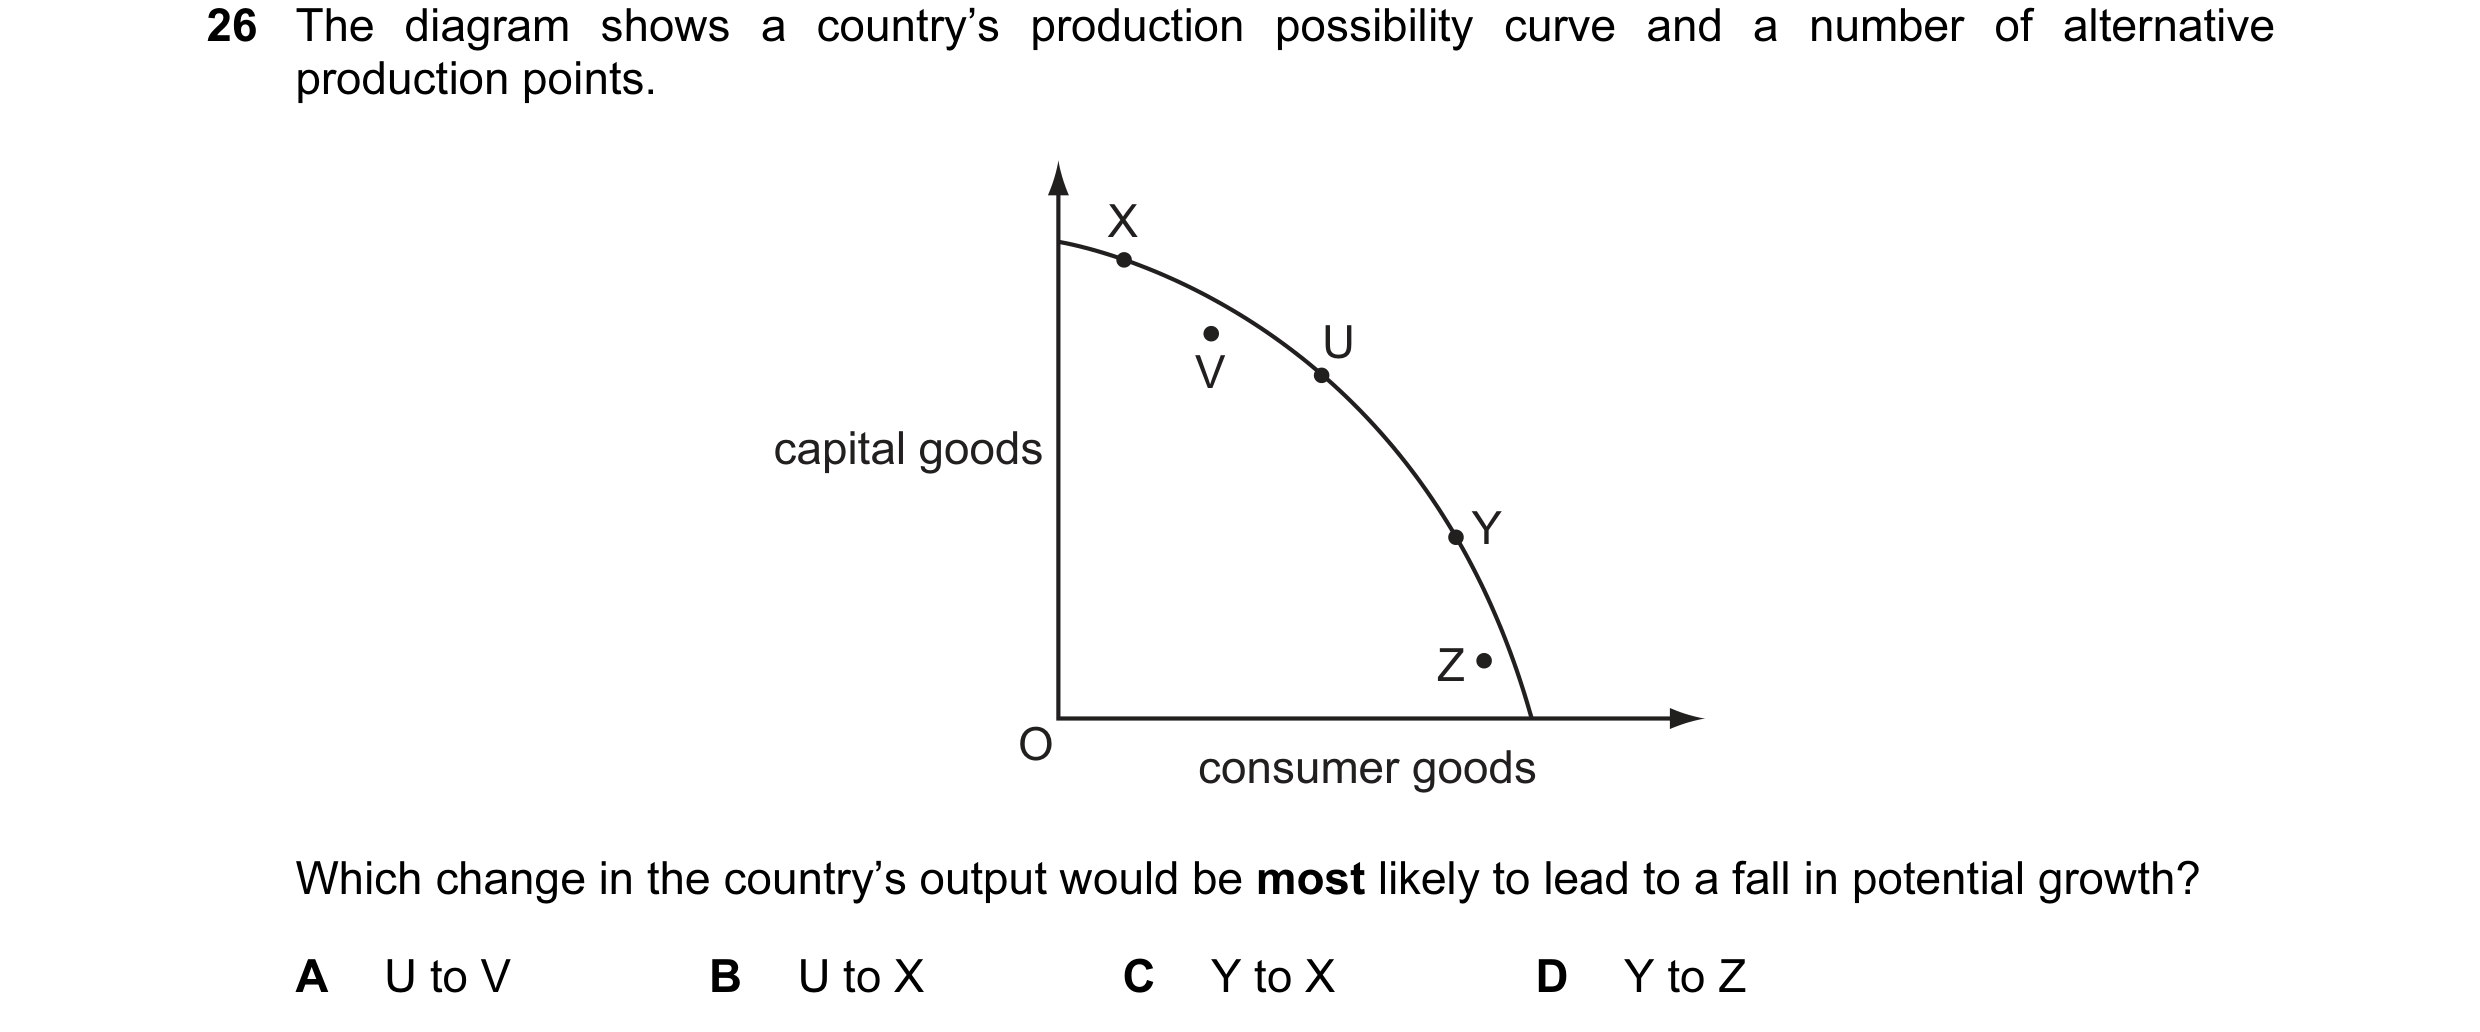
26 The diagram shows a country’s production possibility curve and a number of alternative production points. X U V capital goods Y Z O consumer goods Which change in the country’s output would be most likely to lead to a fall in potential growth? A U to V B U to X C Y to X D Y to Z
1 marks
Answer: D
This question in 9708/32 May/June 2015
Q38 · The table shows the figures for consumption, capital formation and depreciation in four… 9708/32 Oct/Nov 2015
22 The table shows the figures for consumption, capital formation and depreciation in four economies, all measured in US $. Assuming that the state of technology remains unchanged, which economy is most likely to experience economic growth? capital consumption capital formation economy depreciation ($ million) ($ million) ($ million) A 100 10 20 B 500 200 100 C 1 000 1 200 1 400 D 20 000 5 000 6 000
1 marks
Answer: B
This question in 9708/32 Oct/Nov 2015
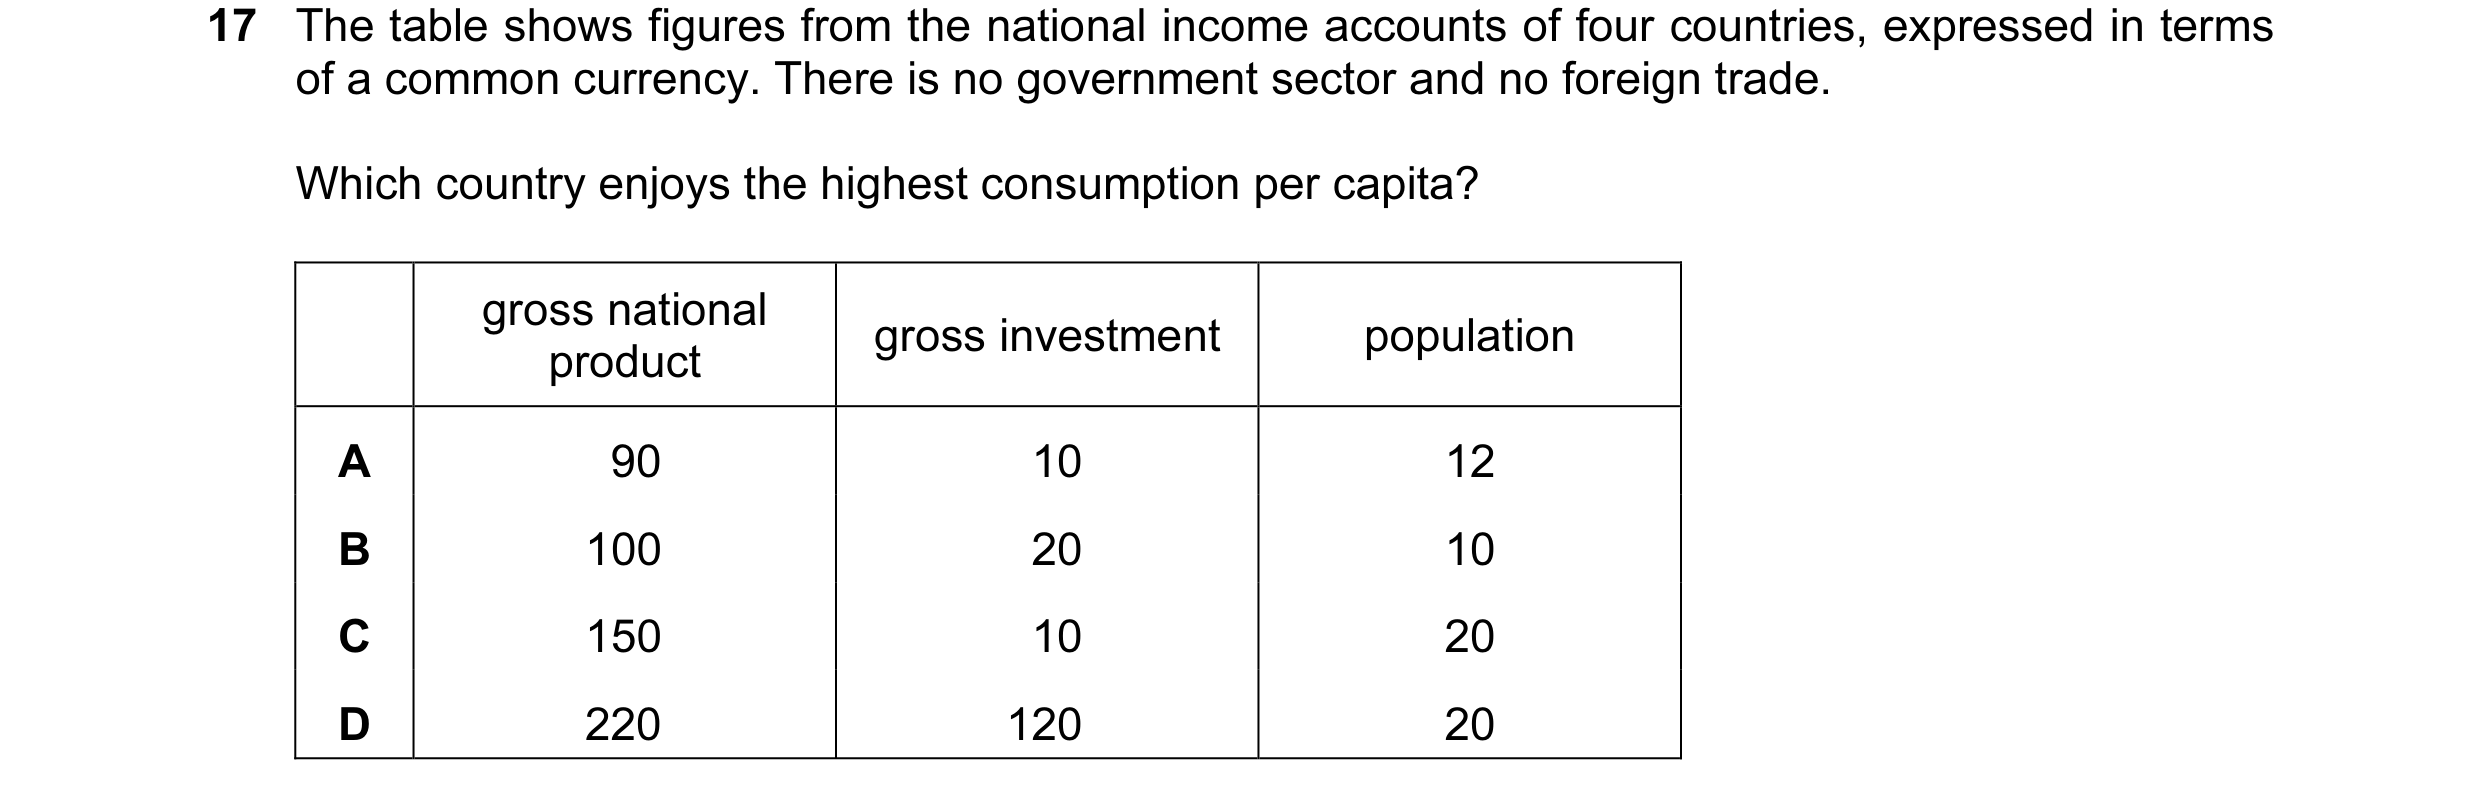
Q39 · The table shows figures from the national income accounts of four countries, expressed in… 9708/33 Oct/Nov 2015
17 The table shows figures from the national income accounts of four countries, expressed in terms of a common currency. There is no government sector and no foreign trade. Which country enjoys the highest consumption per capita? gross national gross investment population product A 90 10 12 B 100 20 10 C 150 10 20 D 220 120 20
1 marks
Answer: B
This question in 9708/33 Oct/Nov 2015
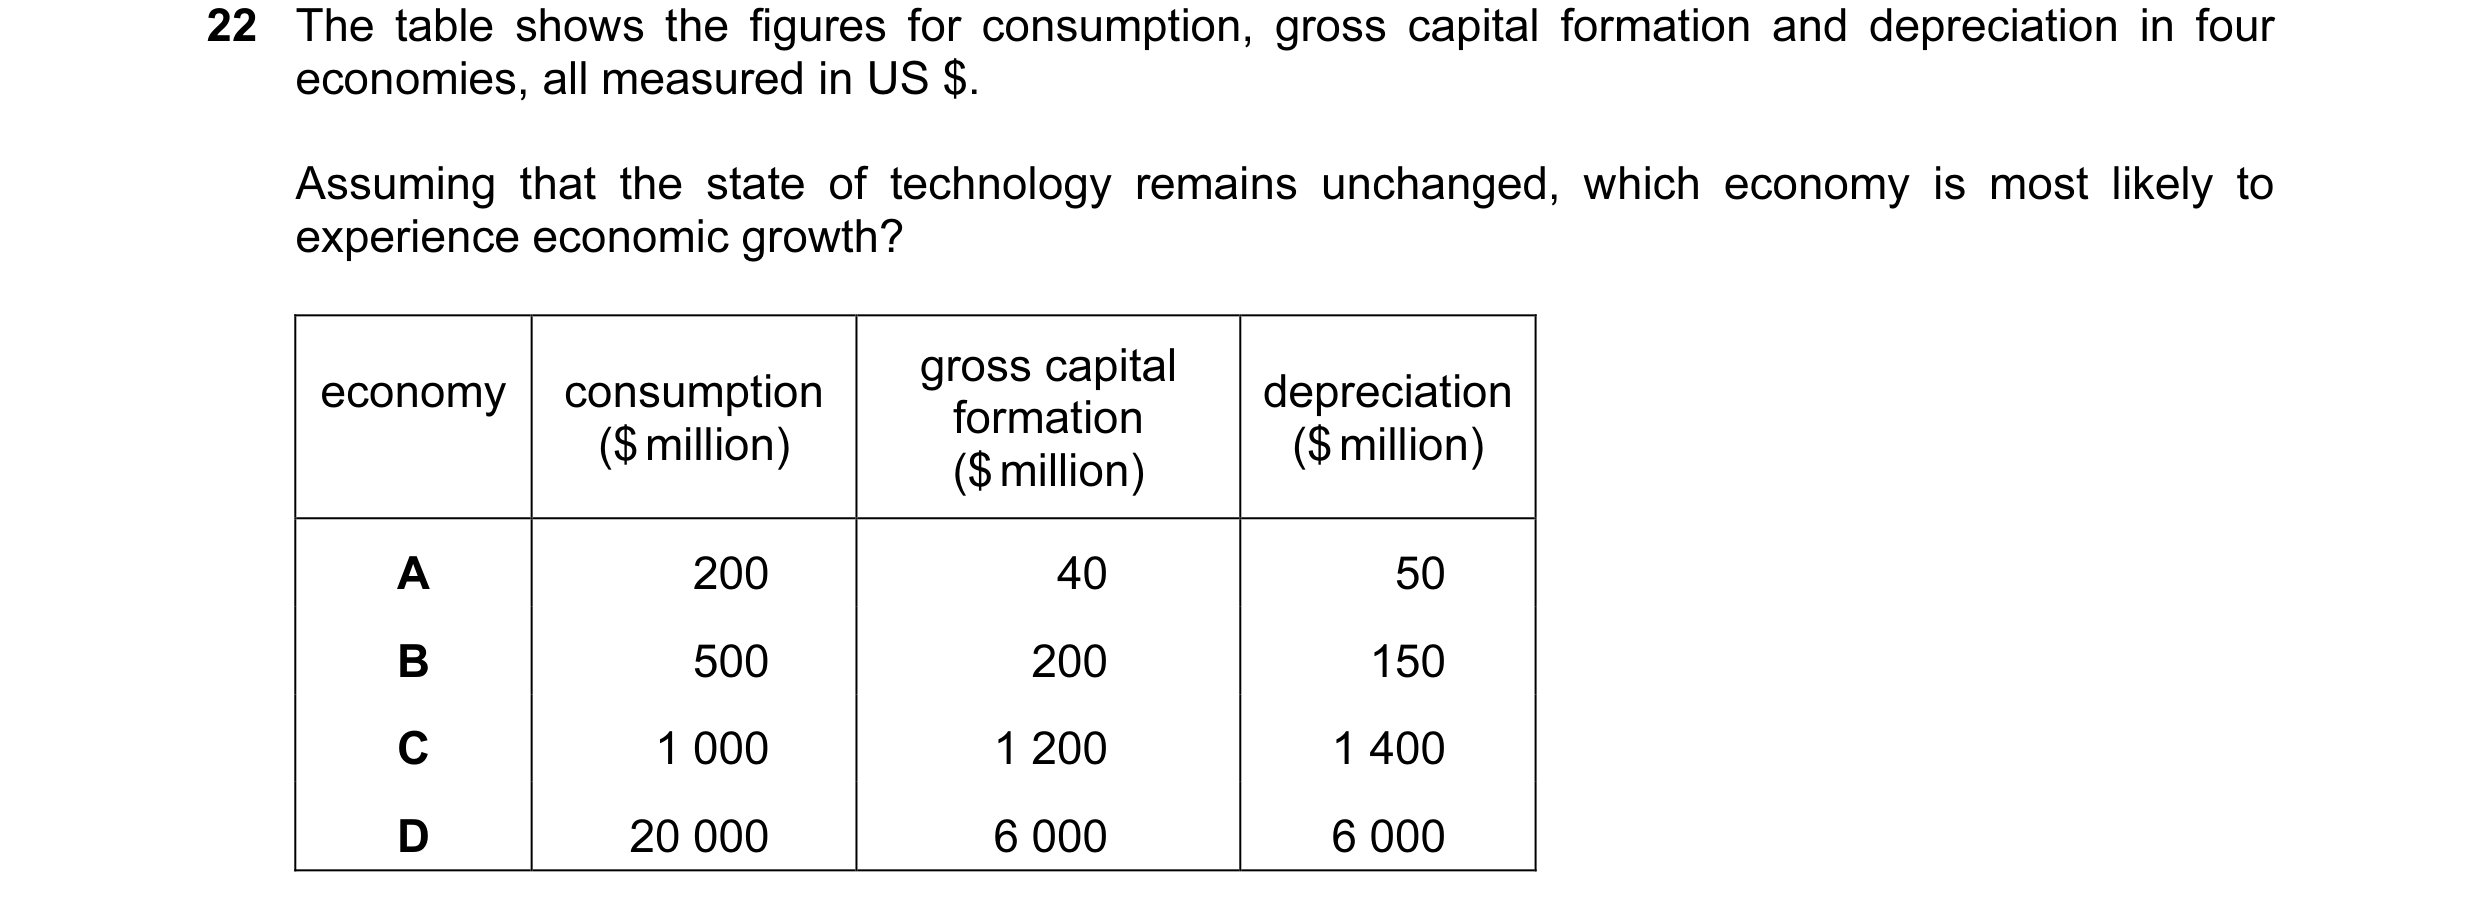
Q40 · The table shows the figures for consumption, gross capital formation and depreciation in… 9708/33 Oct/Nov 2015
22 The table shows the figures for consumption, gross capital formation and depreciation in four economies, all measured in US $. Assuming that the state of technology remains unchanged, which economy is most likely to experience economic growth? gross capital economy consumption depreciation formation ($ million) ($ million) ($ million) A 200 40 50 B 500 200 150 C 1 000 1 200 1 400 D 20 000 6 000 6 000
1 marks
Answer: B
This question in 9708/33 Oct/Nov 2015
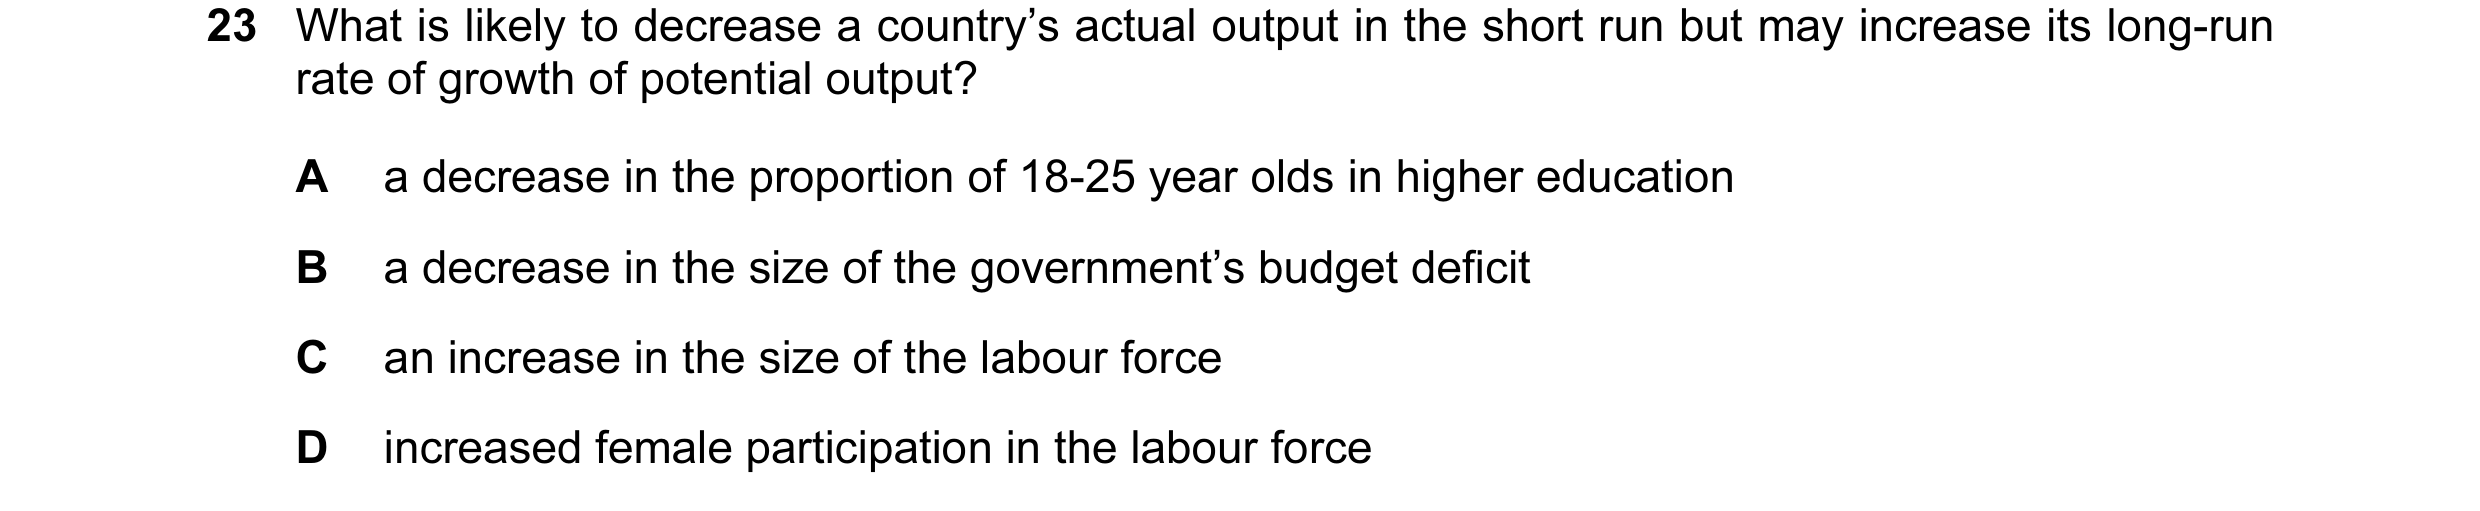
Q41 · What is likely to decrease a country’s actual output in the short run but may increase… 9708/33 Oct/Nov 2015
23 What is likely to decrease a country’s actual output in the short run but may increase its long-run rate of growth of potential output? A a decrease in the proportion of 18-25 year olds in higher education B a decrease in the size of the government’s budget deficit C an increase in the size of the labour force D increased female participation in the labour force
1 marks
Answer: B
This question in 9708/33 Oct/Nov 2015
Q42 · Which change is most likely to increase both economic growth and economic development in… 9708/32 May/June 2016
22 Which change is most likely to increase both economic growth and economic development in the long run? A a decrease in the saving ratio B an increase in investment in human capital C the depletion of non-renewable resources D the greater use of compulsory overtime working of labour
1 marks
Answer: B
This question in 9708/32 May/June 2016
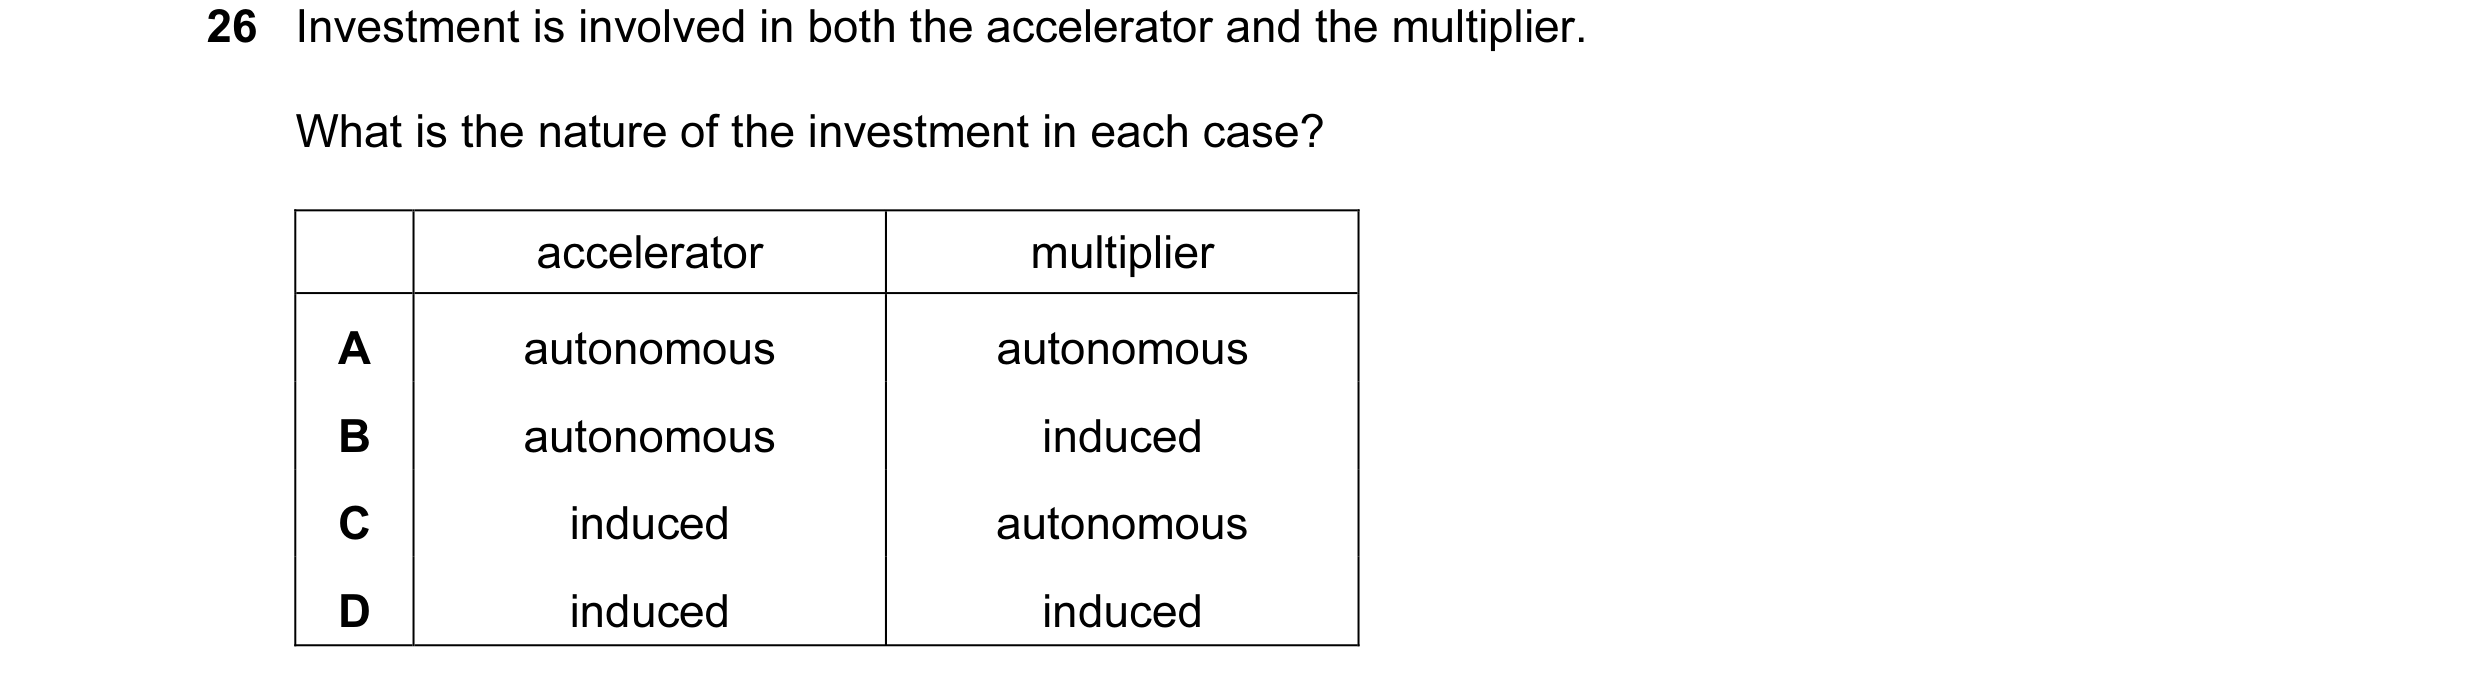
Q43 · Investment is involved in both the accelerator and the multiplier 9708/33 May/June 2016
26 Investment is involved in both the accelerator and the multiplier. What is the nature of the investment in each case? accelerator multiplier A autonomous autonomous B autonomous induced C induced autonomous D induced induced
1 marks
Answer: C
This question in 9708/33 May/June 2016
Q44 · What is the aim of stabilisation policy? 9708/33 May/June 2016
28 What is the aim of stabilisation policy? A to keep the exchange rate stable B to keep the price level stable C to reduce fluctuations in interest rates D to reduce fluctuations in national output
1 marks
Answer: D
This question in 9708/33 May/June 2016
Q45 · What is the main objective of supply-side policies? 9708/33 May/June 2016
30 What is the main objective of supply-side policies? A to bring a country’s potential output up to the level of its actual output B to ensure a budget surplus C to ensure that the composition of output matches the pattern of demand D to increase potential output by increasing efficiency
1 marks
Answer: D
This question in 9708/33 May/June 2016
Q46 · What has not accompanied global economic growth over the last twenty five years? 9708/32 Oct/Nov 2016
28 What has not accompanied global economic growth over the last twenty five years? A a depletion of non-renewable resources B decreased international trade C growing urbanisation D increased atmospheric pollution
1 marks
Answer: B
This question in 9708/32 Oct/Nov 2016
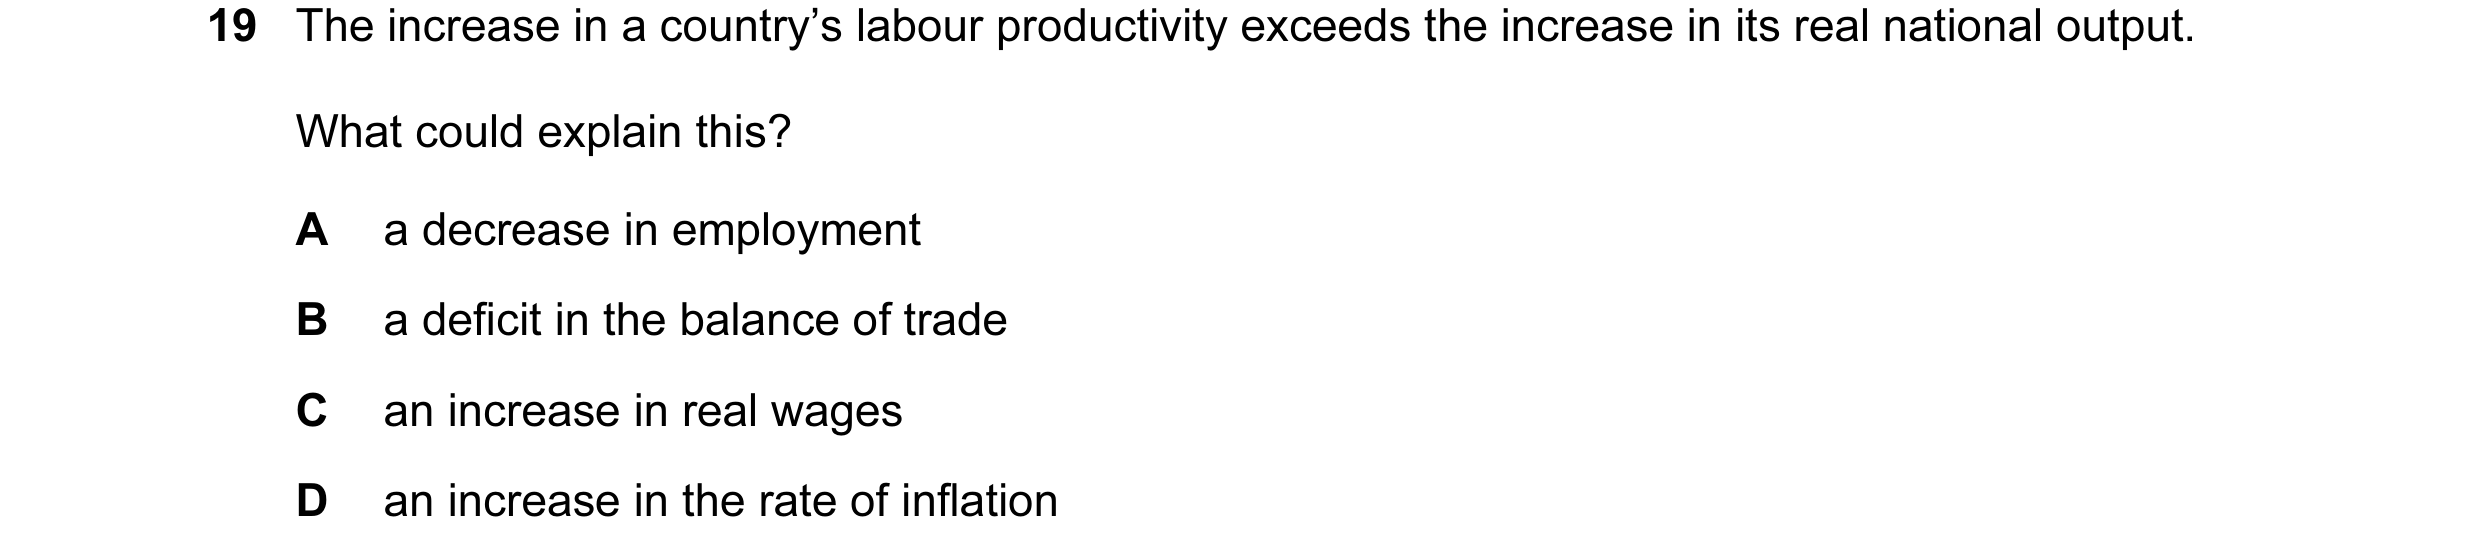
Q47 · The increase in a country’s labour productivity exceeds the increase in its real national… 9708/33 Oct/Nov 2016
19 The increase in a country’s labour productivity exceeds the increase in its real national output. What could explain this? A a decrease in employment B a deficit in the balance of trade C an increase in real wages D an increase in the rate of inflation
1 marks
Answer: A
This question in 9708/33 Oct/Nov 2016
Q48 · The table shows the annual percentage (%) change in China’s GDP and the contribution of… 9708/33 Oct/Nov 2016
20 The table shows the annual percentage (%) change in China’s GDP and the contribution of some of its component parts between 2006 and 2012. 2006 2007 2008 2009 2010 2011 2012 GDP 12.7 14.2 9.6 9.2 10.4 9.3 7.7 consumption 5.1 5.6 4.2 4.6 4.5 5.2 4.2 investment 5.5 6.0 4.5 8.1 5.5 4.5 3.9 net exports 2.1 2.6 0.9 –3.5 0.4 –0.4 –0.4 What can be concluded about China’s economy between 2006 and 2012? A China’s current account was in surplus more years than it was in deficit. B China’s economic rate of growth fell in more years than it rose. C China’s growth was greater overall in consumer goods than in capital goods. D China’s standard of living rose at a decreasing rate.
1 marks
Answer: B
This question in 9708/33 Oct/Nov 2016
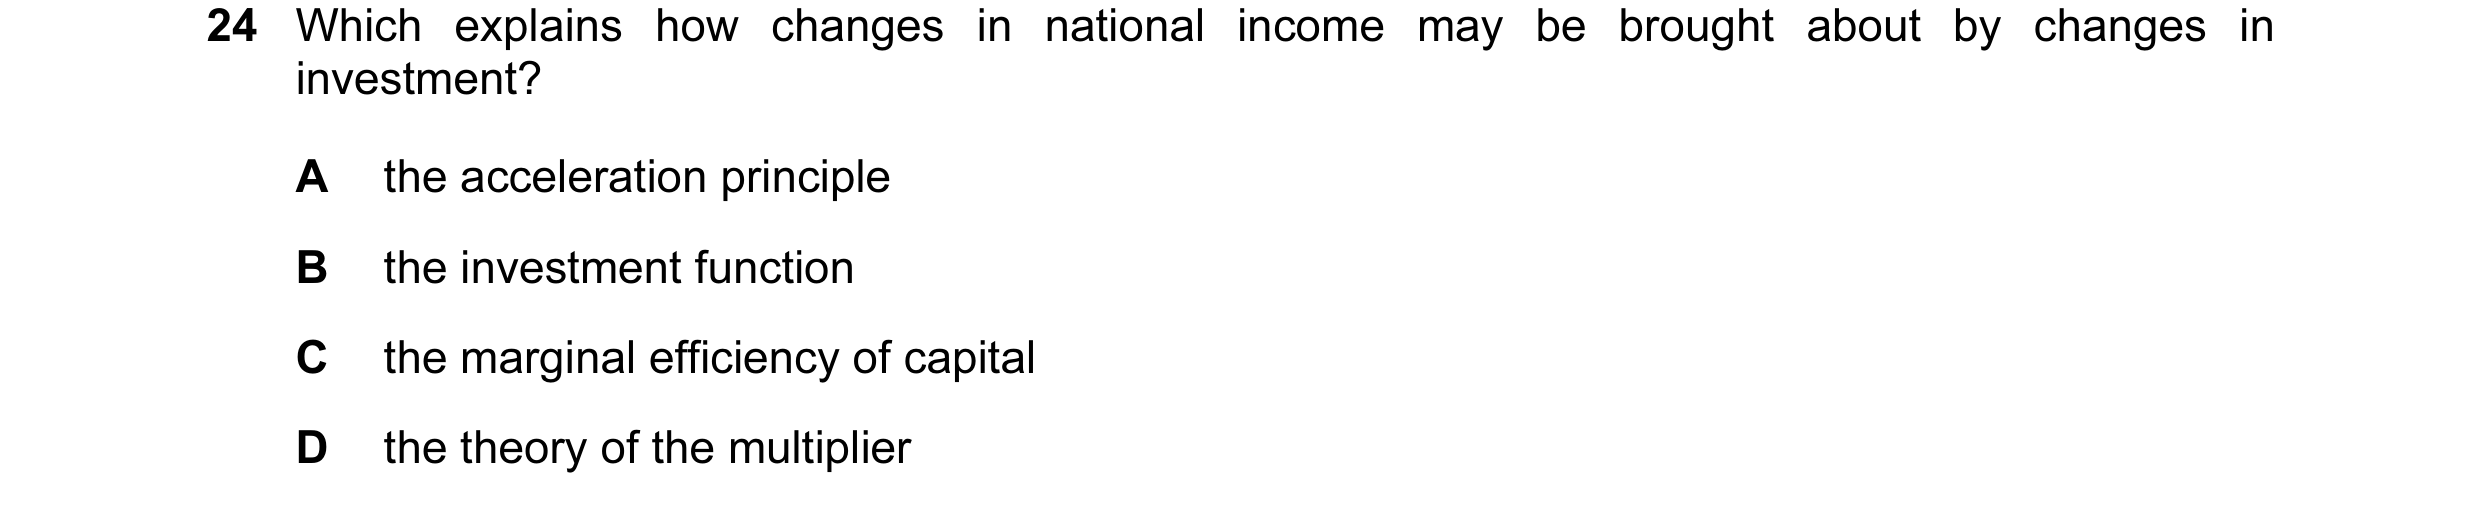
Q49 · Which explains how changes in national income may be brought about by changes in… 9708/33 Oct/Nov 2016
24 Which explains how changes in national income may be brought about by changes in investment? A the acceleration principle B the investment function C the marginal efficiency of capital D the theory of the multiplier
1 marks
Answer: D
This question in 9708/33 Oct/Nov 2016
Q50 · On a diagram showing a production possibility curve, what definitely represents long-run… 9708/32 Oct/Nov 2018
19 On a diagram showing a production possibility curve, what definitely represents long-run economic growth? A a change in the slope of the curve B a movement from a point below the frontier to a point on the curve C a movement from one point to another along a given curve D an outward shift of the curve
1 marks
Answer: D
This question in 9708/32 Oct/Nov 2018
Q51 · When is economic growth most likely to promote economic development? 9708/32 Oct/Nov 2018
20 When is economic growth most likely to promote economic development? A when it achieves maximum rates of extraction of raw materials B when it concentrates on increasing production C when it discovers valuable new resources in remote natural environments D when it provides the funds to finance cleaner production processes
1 marks
Answer: D
This question in 9708/32 Oct/Nov 2018
Q52 · What will be the most likely consequence of an increase in the dependency ratio? 9708/32 Oct/Nov 2019
23 What will be the most likely consequence of an increase in the dependency ratio? A a decrease in GDP per head B a decrease in labour productivity C an increase in the labour force D an increase in unemployment
1 marks
Answer: A
This question in 9708/32 Oct/Nov 2019
Q53 · Which statement is correct? 9708/32 Oct/Nov 2019
24 Which statement is correct? A Economic development is necessary for economic growth. B Economic growth and economic development are directly proportional. C Economic growth enables economic development. D Economic growth is always sustainable.
1 marks
Answer: C
This question in 9708/32 Oct/Nov 2019
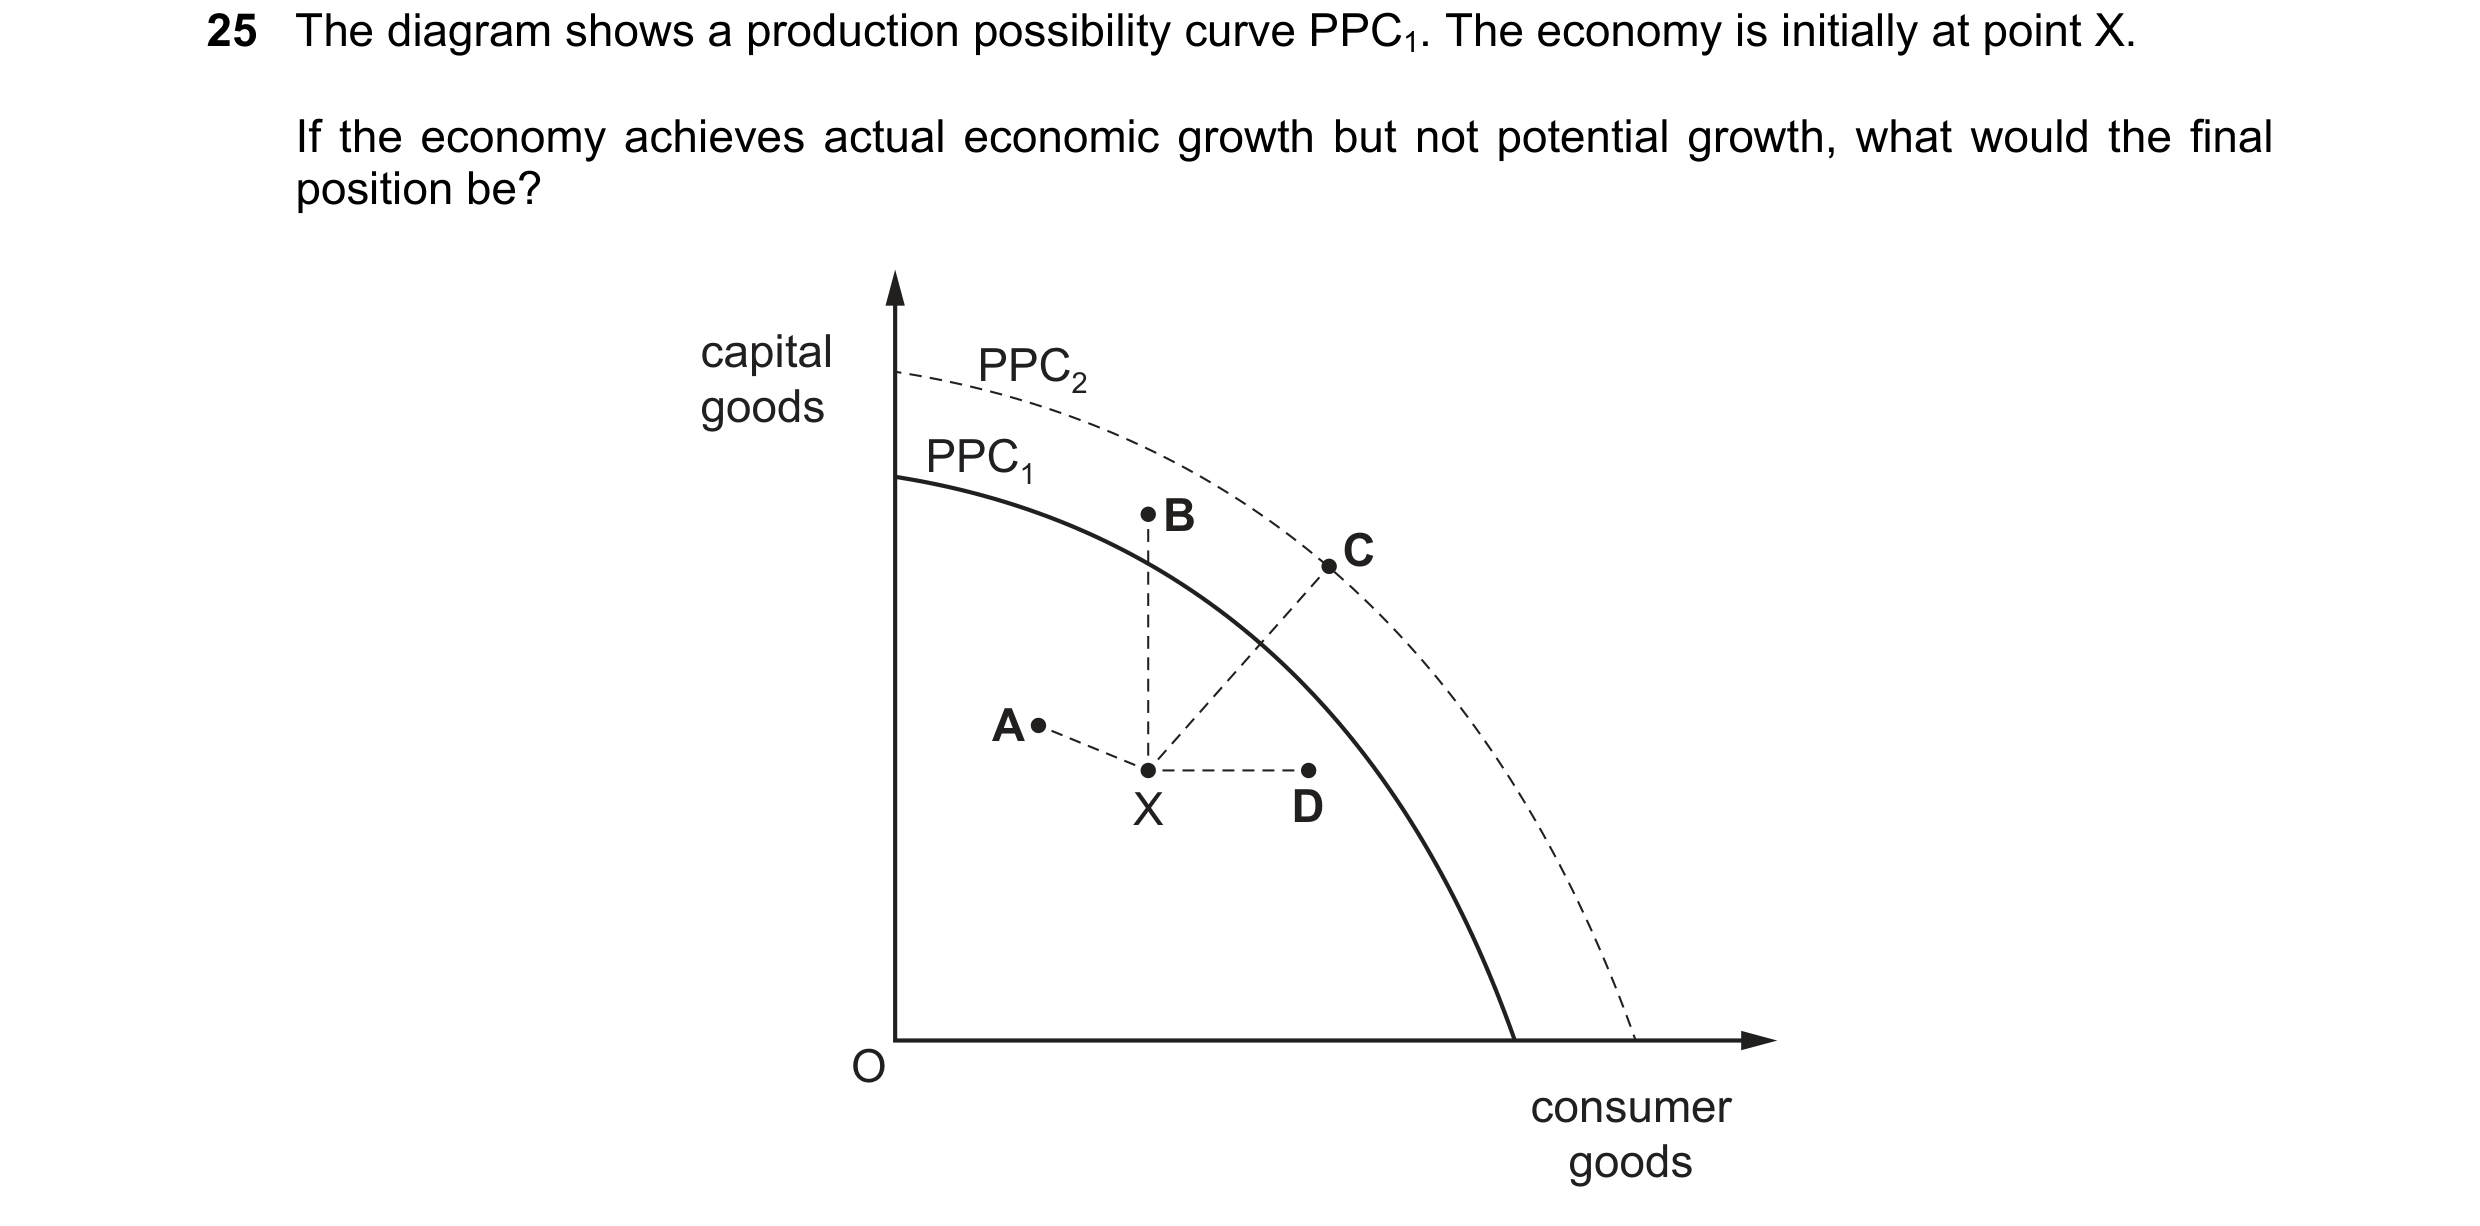
Q54 · The diagram shows a production possibility curve PPC1 9708/32 Oct/Nov 2019
25 The diagram shows a production possibility curve PPC1. The economy is initially at point X. If the economy achieves actual economic growth but not potential growth, what would the final position be? capital PPC2 goods PPC1 B C A X D O consumer goods
1 marks
Answer: D
This question in 9708/32 Oct/Nov 2019
Q55 · What is most likely to be the biggest contribution to sustainable economic growth in a… 9708/32 Feb/March 2020
18 What is most likely to be the biggest contribution to sustainable economic growth in a developed economy? A a movement of people from rural to urban areas B an increase in technical training C an increase in the size of the population D rising consumer credit levels
1 marks
Answer: B
This question in 9708/32 Feb/March 2020
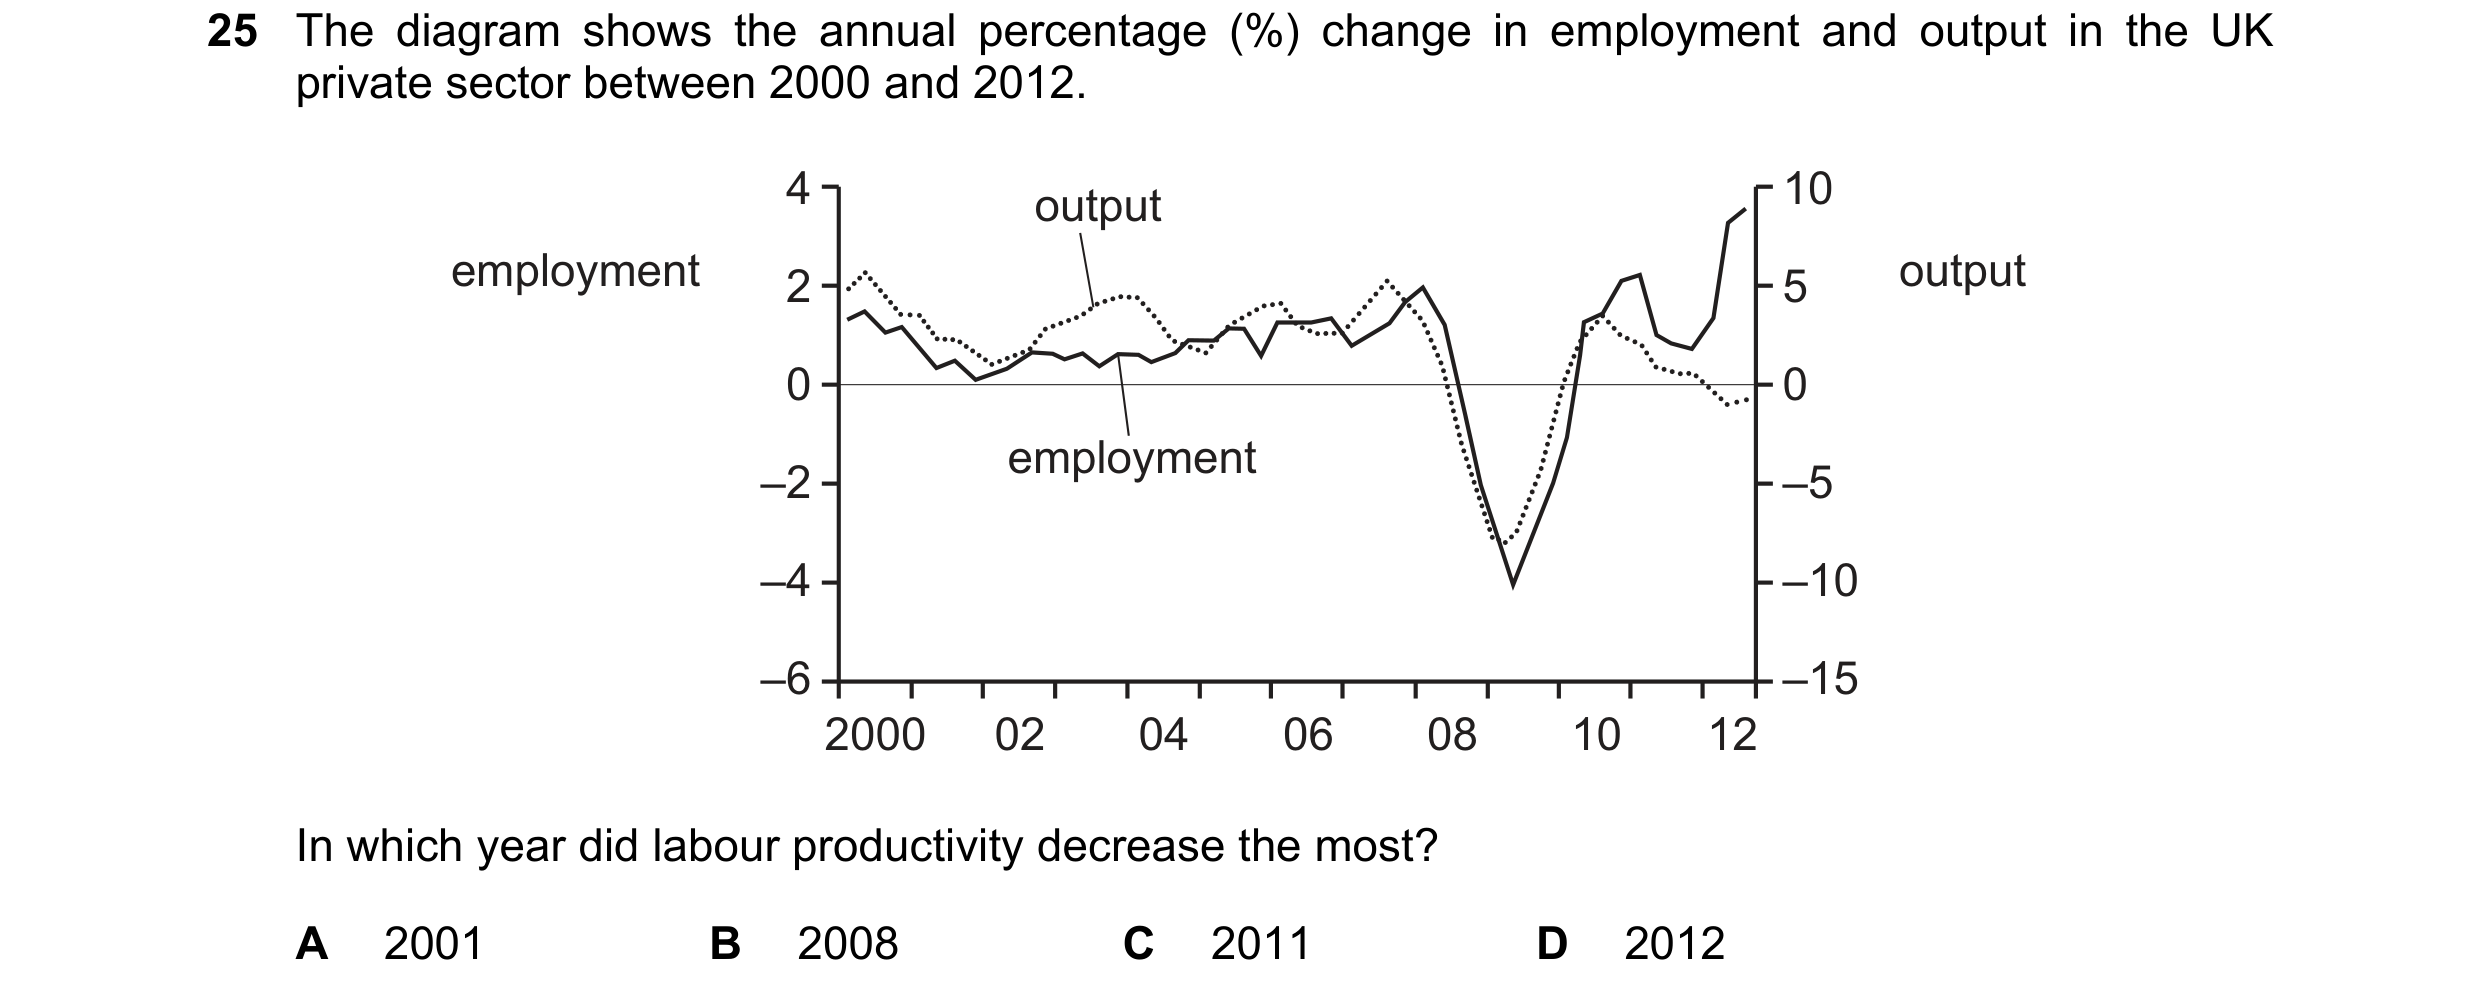
Q56 · The diagram shows the annual percentage (%) change in employment and output in the UK… 9708/32 Feb/March 2020
25 The diagram shows the annual percentage (%) change in employment and output in the UK private sector between 2000 and 2012. 4 output 10 employment 2 5 output 0 0 employment –2 –5 –4 –10 –6 –15 2000 02 04 06 08 10 12 In which year did labour productivity decrease the most? A 2001 B 2008 C 2011 D 2012
1 marks
Answer: D
This question in 9708/32 Feb/March 2020
Q57 · What may prevent a government achieving a faster rate of growth of real GDP? 9708/32 Feb/March 2020
30 What may prevent a government achieving a faster rate of growth of real GDP? A Consumption and investment expenditure are interest rate elastic. B The consumer price index is below its target set by the central bank. C The economy is operating on the long-run aggregate supply curve. D There is a large negative output gap in the economy.
1 marks
Answer: C
This question in 9708/32 Feb/March 2020
Q58 · According to the accelerator theory, what would cause investment in an economy to be… 9708/31 Oct/Nov 2020
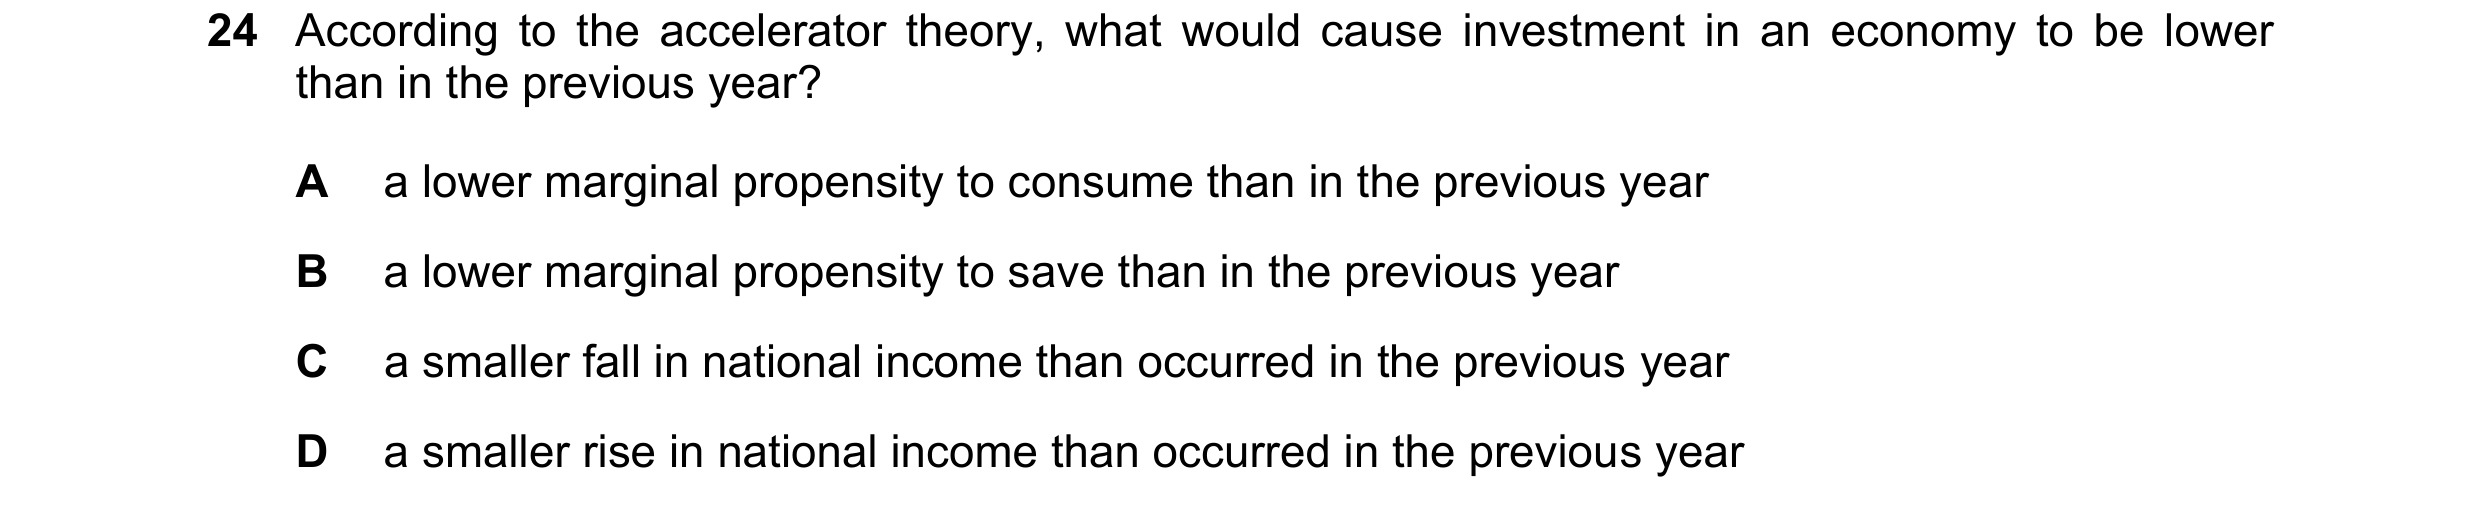
24 According to the accelerator theory, what would cause investment in an economy to be lower than in the previous year? A a lower marginal propensity to consume than in the previous year B a lower marginal propensity to save than in the previous year C a smaller fall in national income than occurred in the previous year D a smaller rise in national income than occurred in the previous year
1 marks
Answer: D
This question in 9708/31 Oct/Nov 2020
Q59 · What would most likely result from a sustained increase in real GDP in an economy? 9708/31 Oct/Nov 2020
27 What would most likely result from a sustained increase in real GDP in an economy? A a decrease in the government’s budget deficit B a decrease in output per worker C an increase in a balance of payments surplus D an increase in frictional unemployment
1 marks
Answer: A
This question in 9708/31 Oct/Nov 2020
Q60 · The diagram shows an economy in short-run equilibrium with price level P2 and output… 9708/31 Oct/Nov 2020
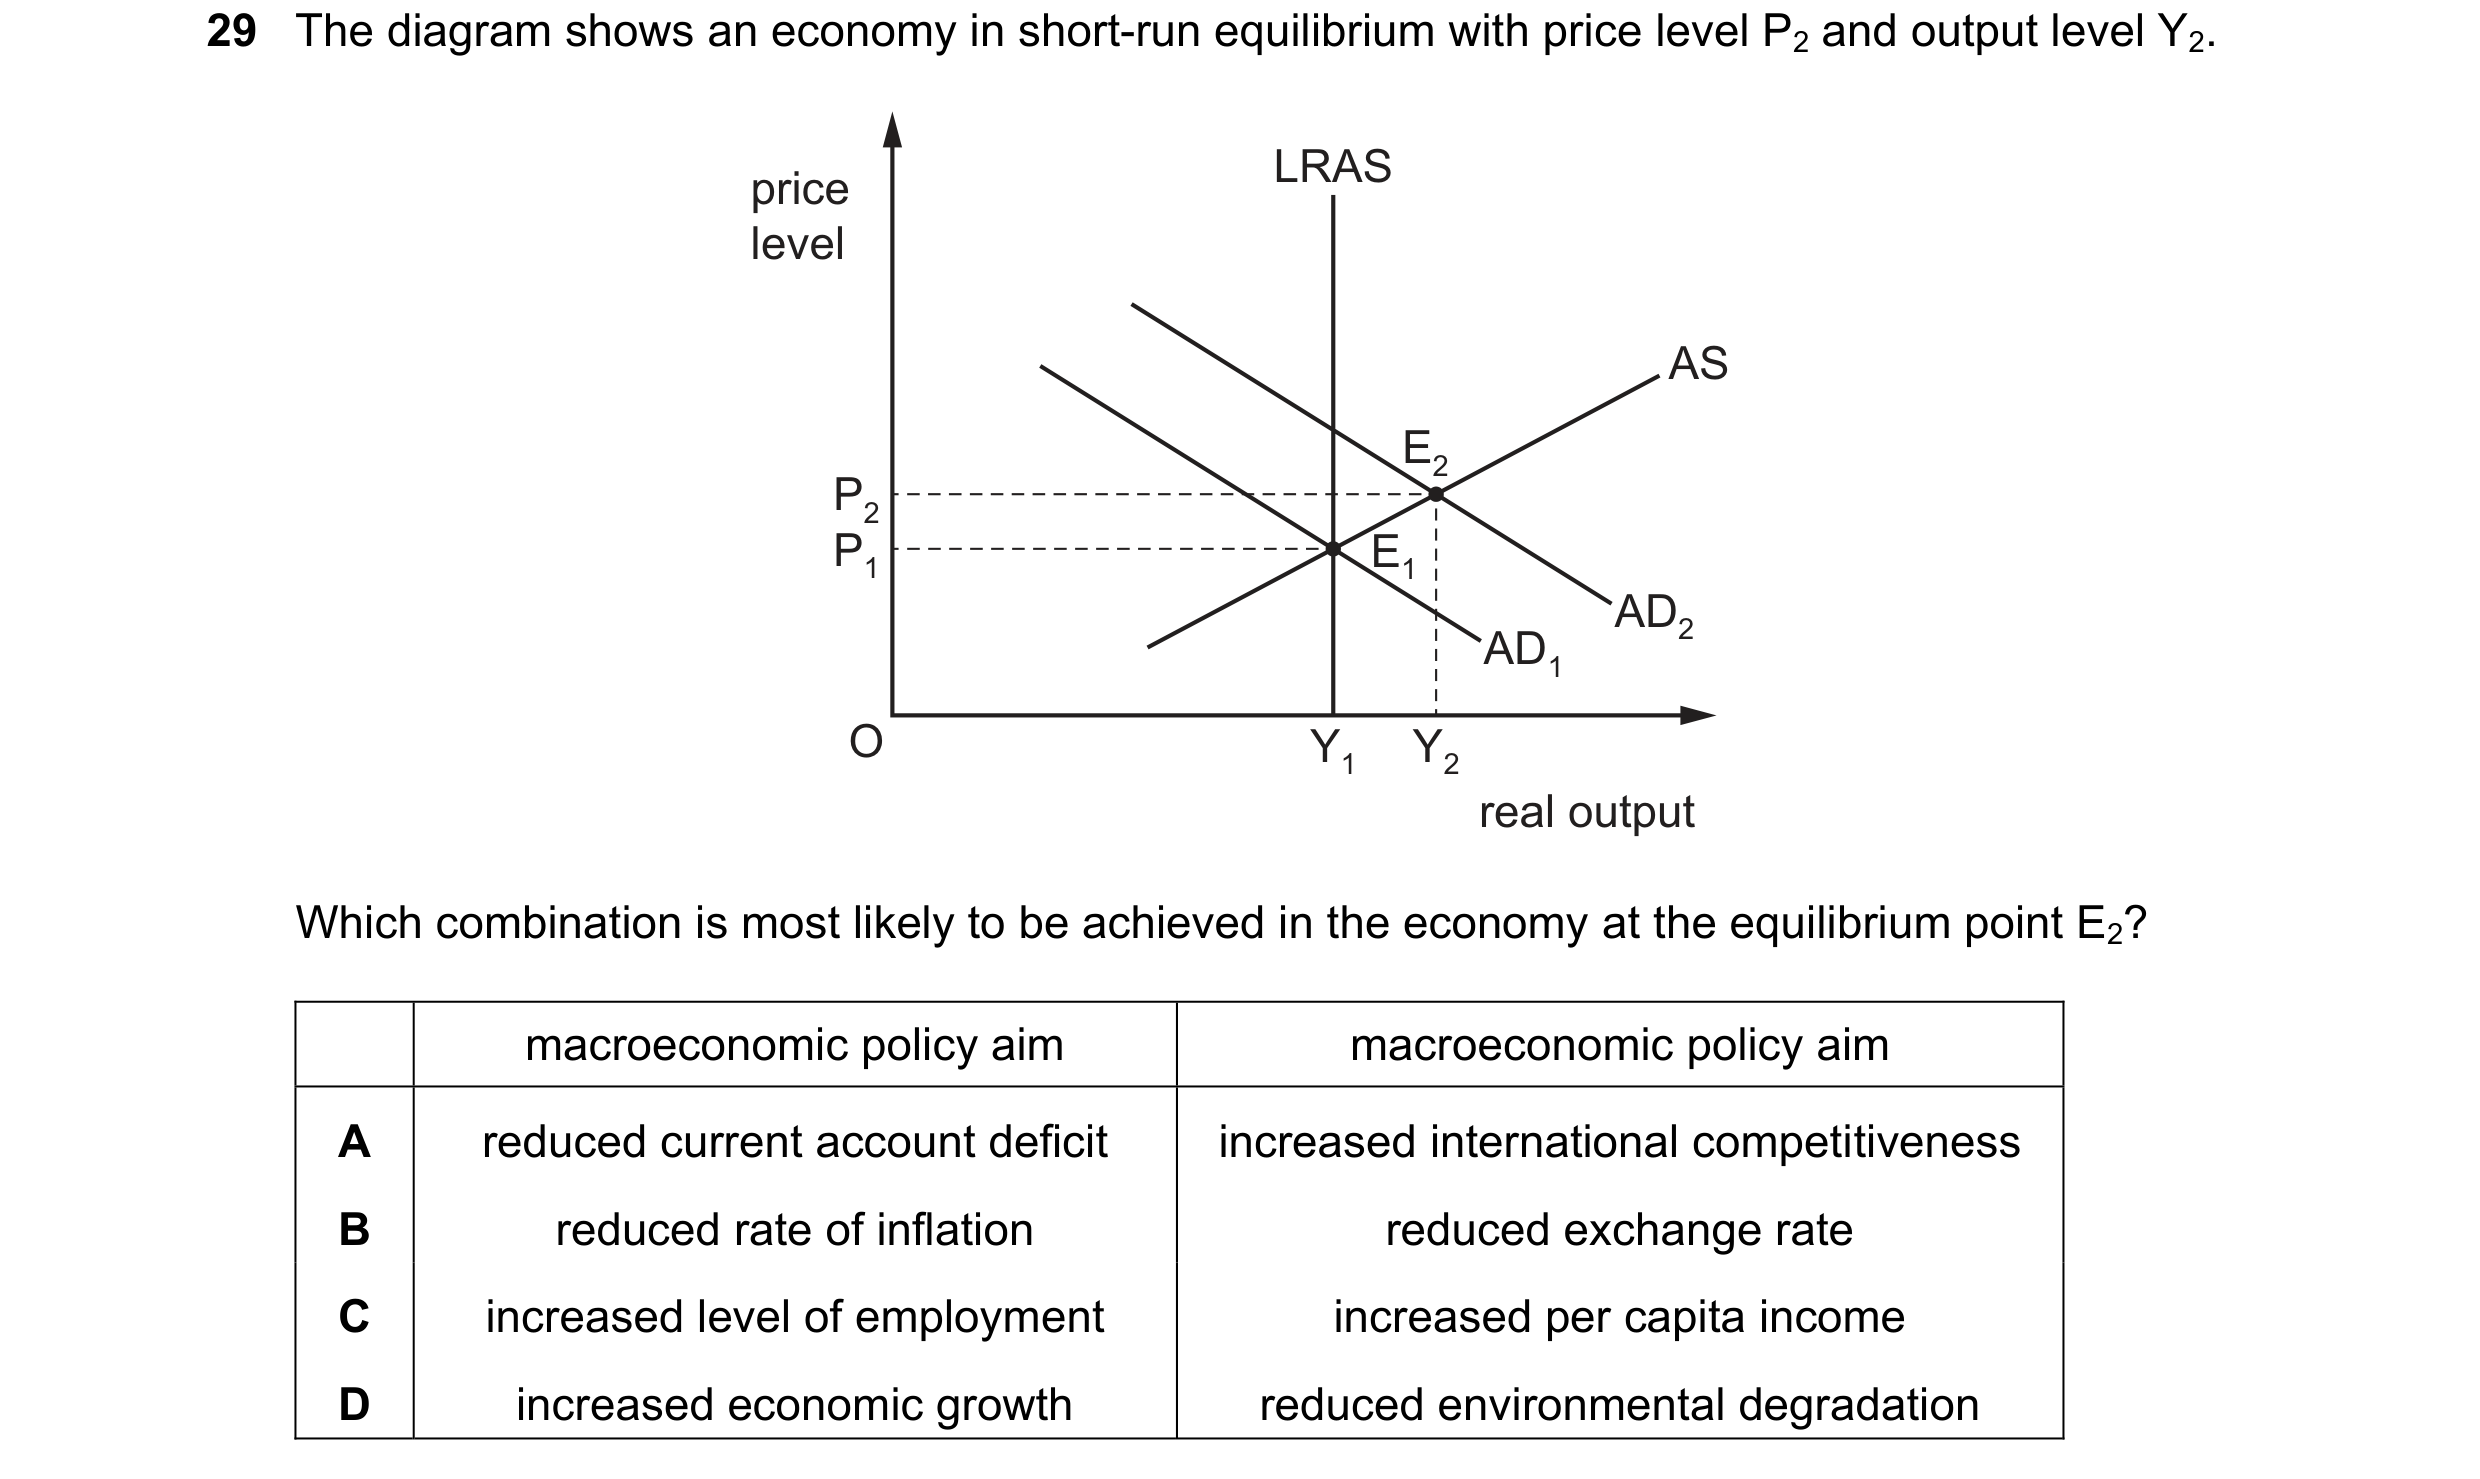
29 The diagram shows an economy in short-run equilibrium with price level P2 and output level Y2. LRAS price level AS E2 P2 P1 E1 AD2 AD1 O Y1 Y2 real output Which combination is most likely to be achieved in the economy at the equilibrium point E2? macroeconomic policy aim macroeconomic policy aim A reduced current account deficit increased international competitiveness B reduced rate of inflation reduced exchange rate C increased level of employment increased per capita income D increased economic growth reduced environmental degradation
1 marks
Answer: C
This question in 9708/31 Oct/Nov 2020
Q61 · The accelerator principle refers to a relationship between investment and A the level of… 9708/32 Oct/Nov 2020
22 The accelerator principle refers to a relationship between investment and A the level of GDP. B changes in GDP. C the level of interest rates. D changes in interest rates.
1 marks
Answer: B
This question in 9708/32 Oct/Nov 2020
Q62 · Statement 1: A market economy is inherently unstable and the government must play a… 9708/32 Oct/Nov 2020
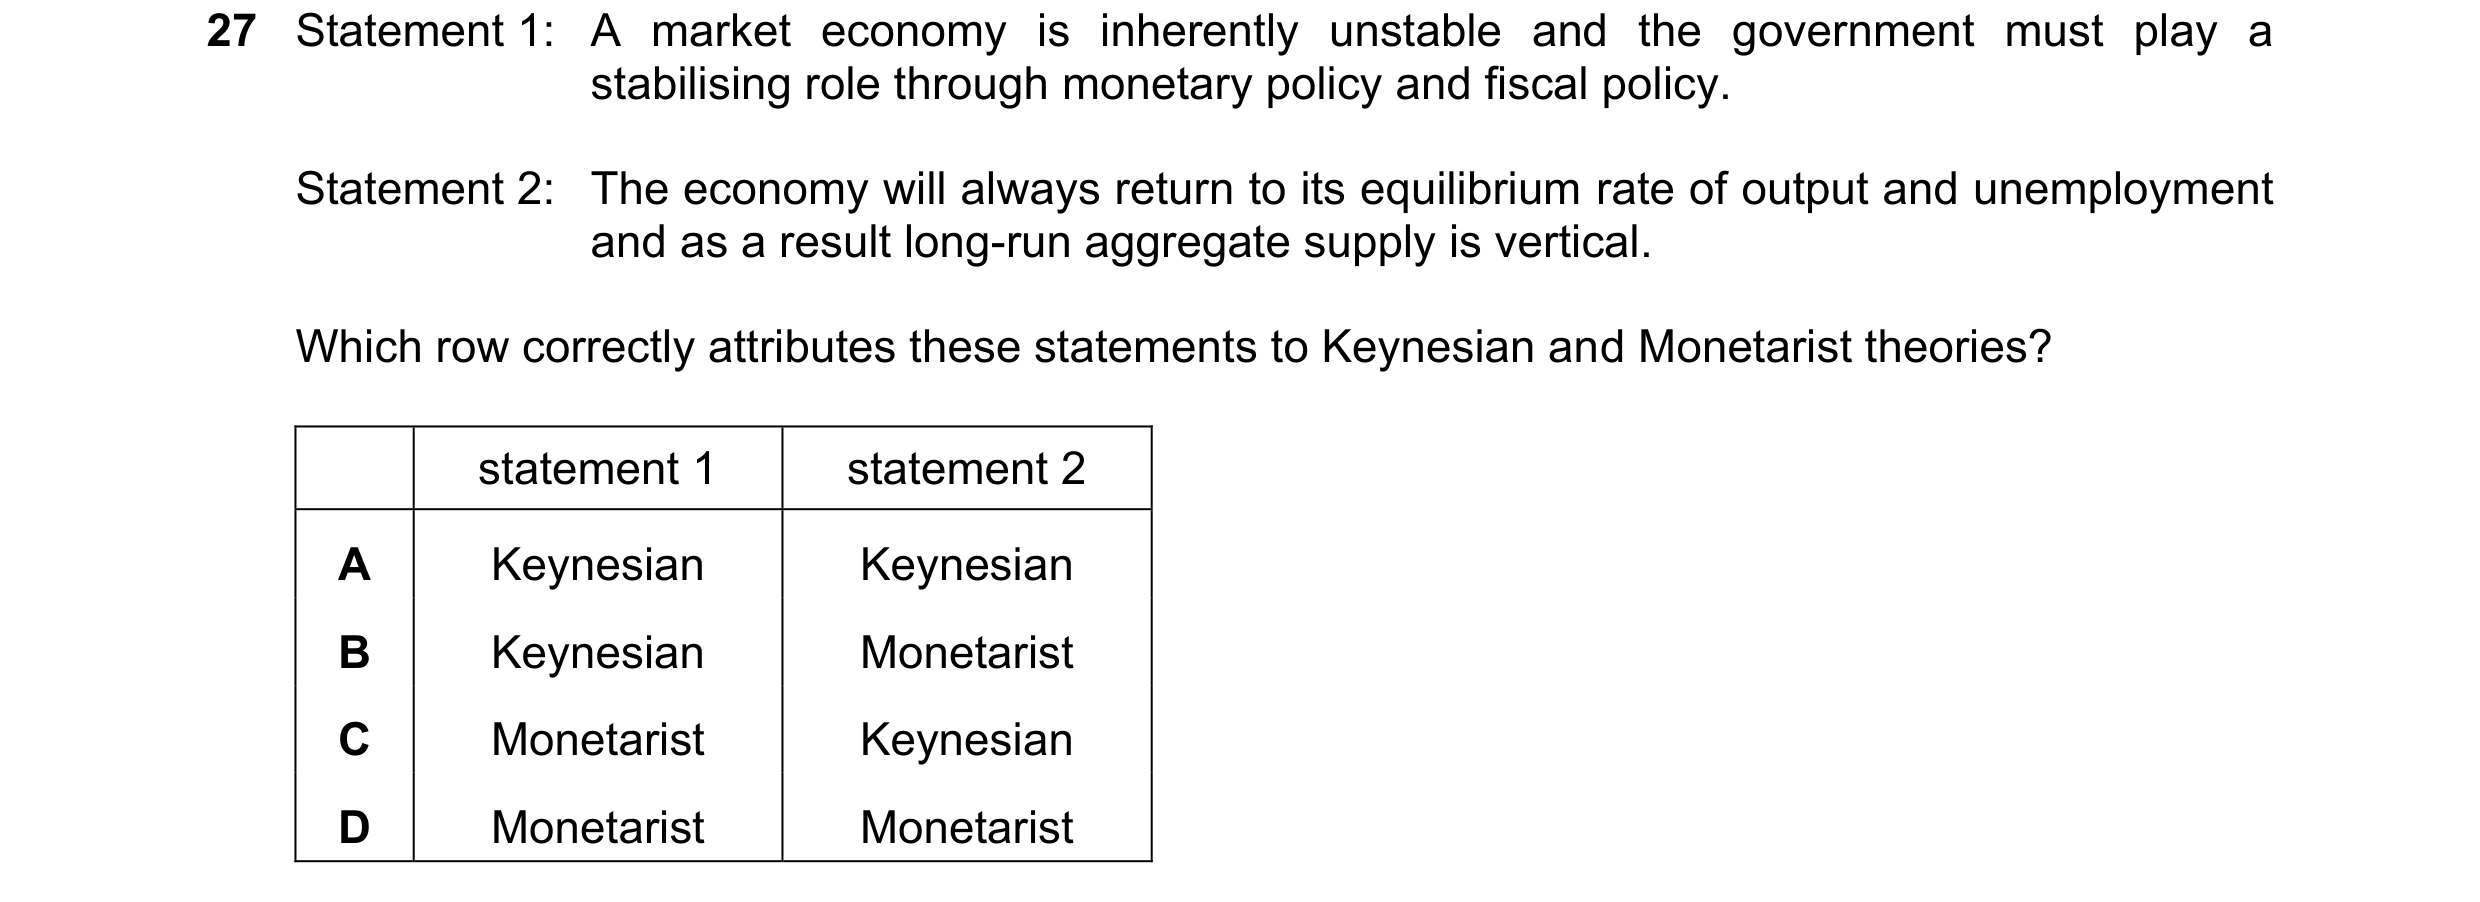
27 Statement 1: A market economy is inherently unstable and the government must play a stabilising role through monetary policy and fiscal policy. Statement 2: The economy will always return to its equilibrium rate of output and unemployment and as a result long-run aggregate supply is vertical. Which row correctly attributes these statements to Keynesian and Monetarist theories? statement 1 statement 2 A Keynesian Keynesian B Keynesian Monetarist C Monetarist Keynesian D Monetarist Monetarist
1 marks
Answer: B
This question in 9708/32 Oct/Nov 2020
Q63 · The graphs below show percentage changes in money GDP and consumer prices in a country… 9708/32 Oct/Nov 2020
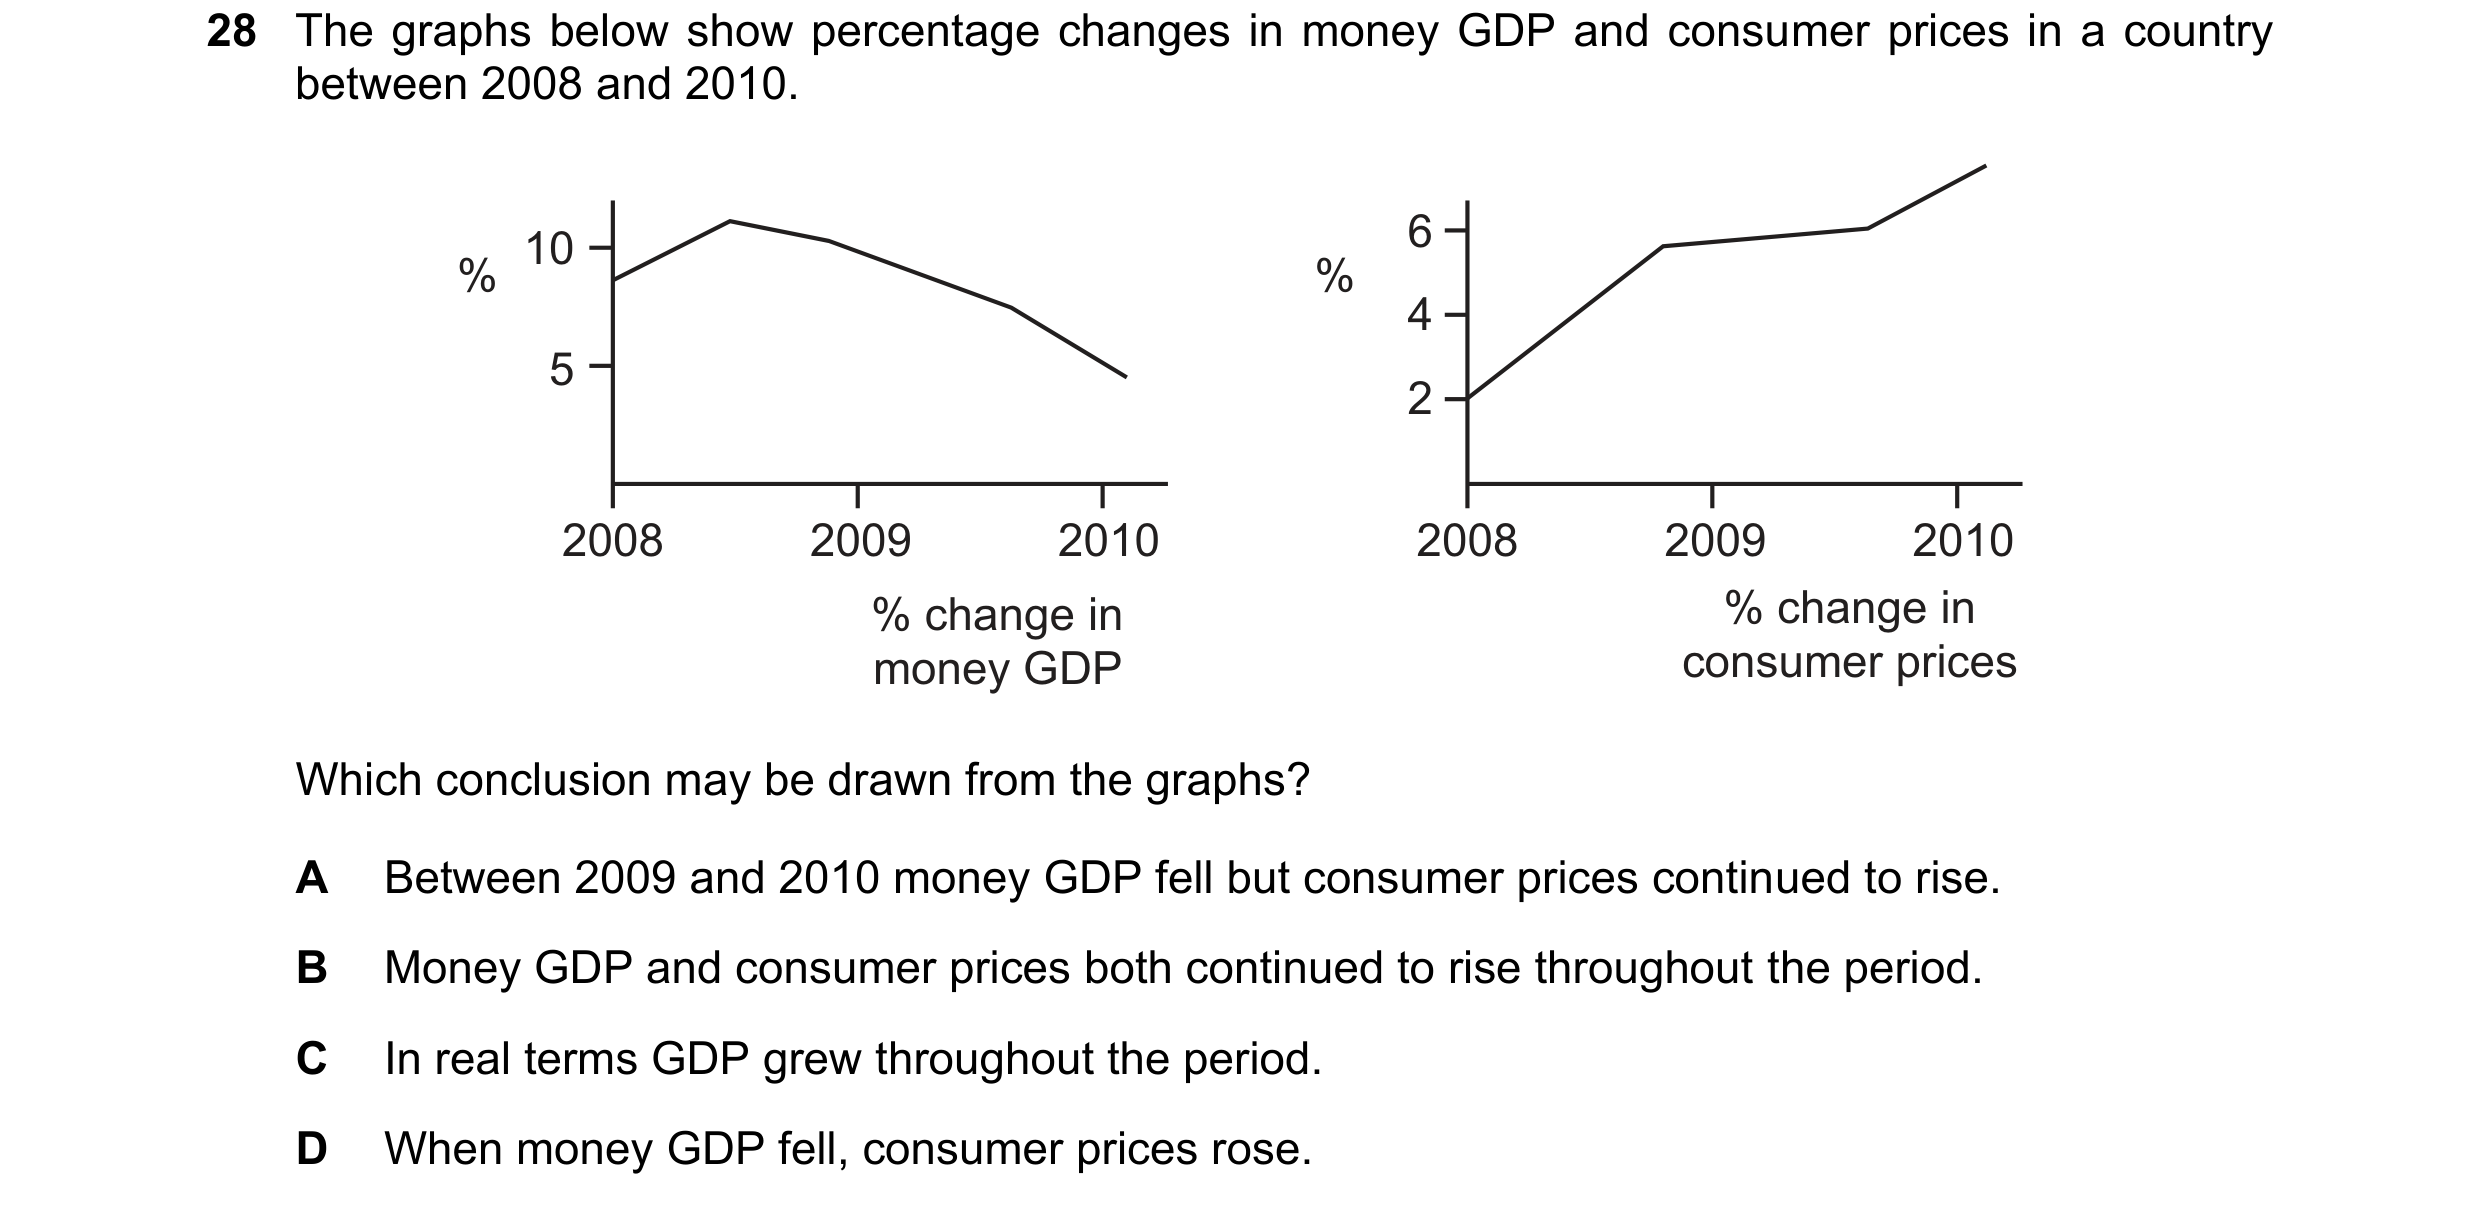
28 The graphs below show percentage changes in money GDP and consumer prices in a country between 2008 and 2010. 10 6 % % 4 5 2 2008 2009 2010 2008 2009 2010 % change in % change in money GDP consumer prices Which conclusion may be drawn from the graphs? A Between 2009 and 2010 money GDP fell but consumer prices continued to rise. B Money GDP and consumer prices both continued to rise throughout the period. C In real terms GDP grew throughout the period. D When money GDP fell, consumer prices rose.
1 marks
Answer: B
This question in 9708/32 Oct/Nov 2020
Q64 · Which influence is least likely to promote sustainable economic growth in a developing… 9708/32 Feb/March 2021
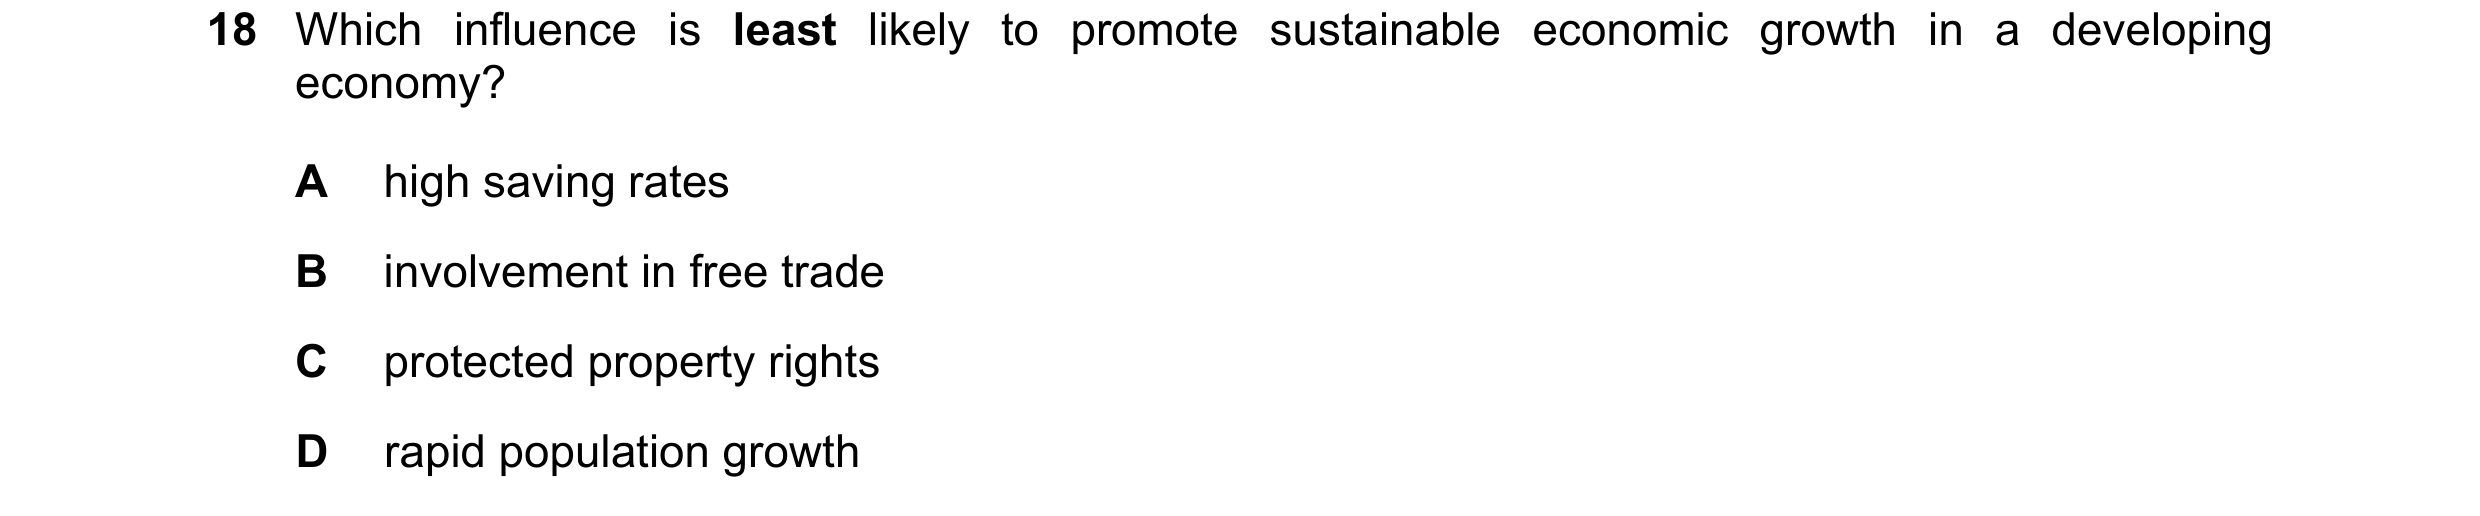
18 Which influence is least likely to promote sustainable economic growth in a developing economy? A high saving rates B involvement in free trade C protected property rights D rapid population growth
1 marks
Answer: D
This question in 9708/32 Feb/March 2021
Q65 · The Measure of Economic Welfare (MEW) is often regarded as a better measure of economic… 9708/31 May/June 2021
20 The Measure of Economic Welfare (MEW) is often regarded as a better measure of economic welfare than Gross Domestic Product (GDP) per head. What is additionally included in the calculation for MEW? A the cost of paid work B the cost of producing armaments C the estimated cost of damage to the environment D the negative impact on the shadow economy
1 marks
Answer: C
This question in 9708/31 May/June 2021
Q66 · Which objective would not be suitable for a government if it were seeking sustainable… 9708/32 May/June 2021
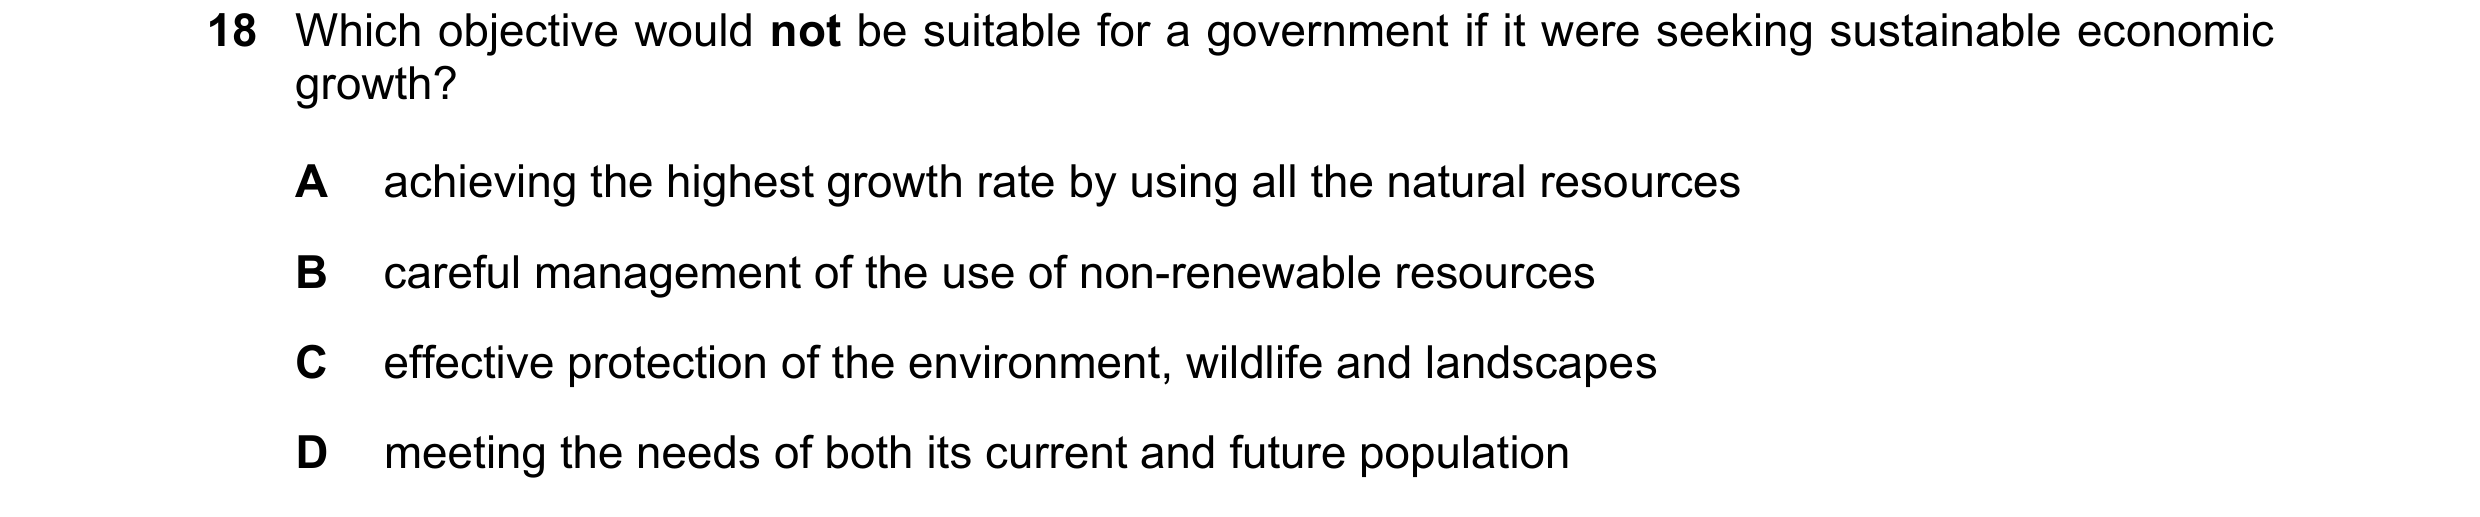
18 Which objective would not be suitable for a government if it were seeking sustainable economic growth? A achieving the highest growth rate by using all the natural resources B careful management of the use of non-renewable resources C effective protection of the environment, wildlife and landscapes D meeting the needs of both its current and future population
1 marks
Answer: A
This question in 9708/32 May/June 2021
Q67 · Which statement about economic growth is not correct? 9708/32 Oct/Nov 2021
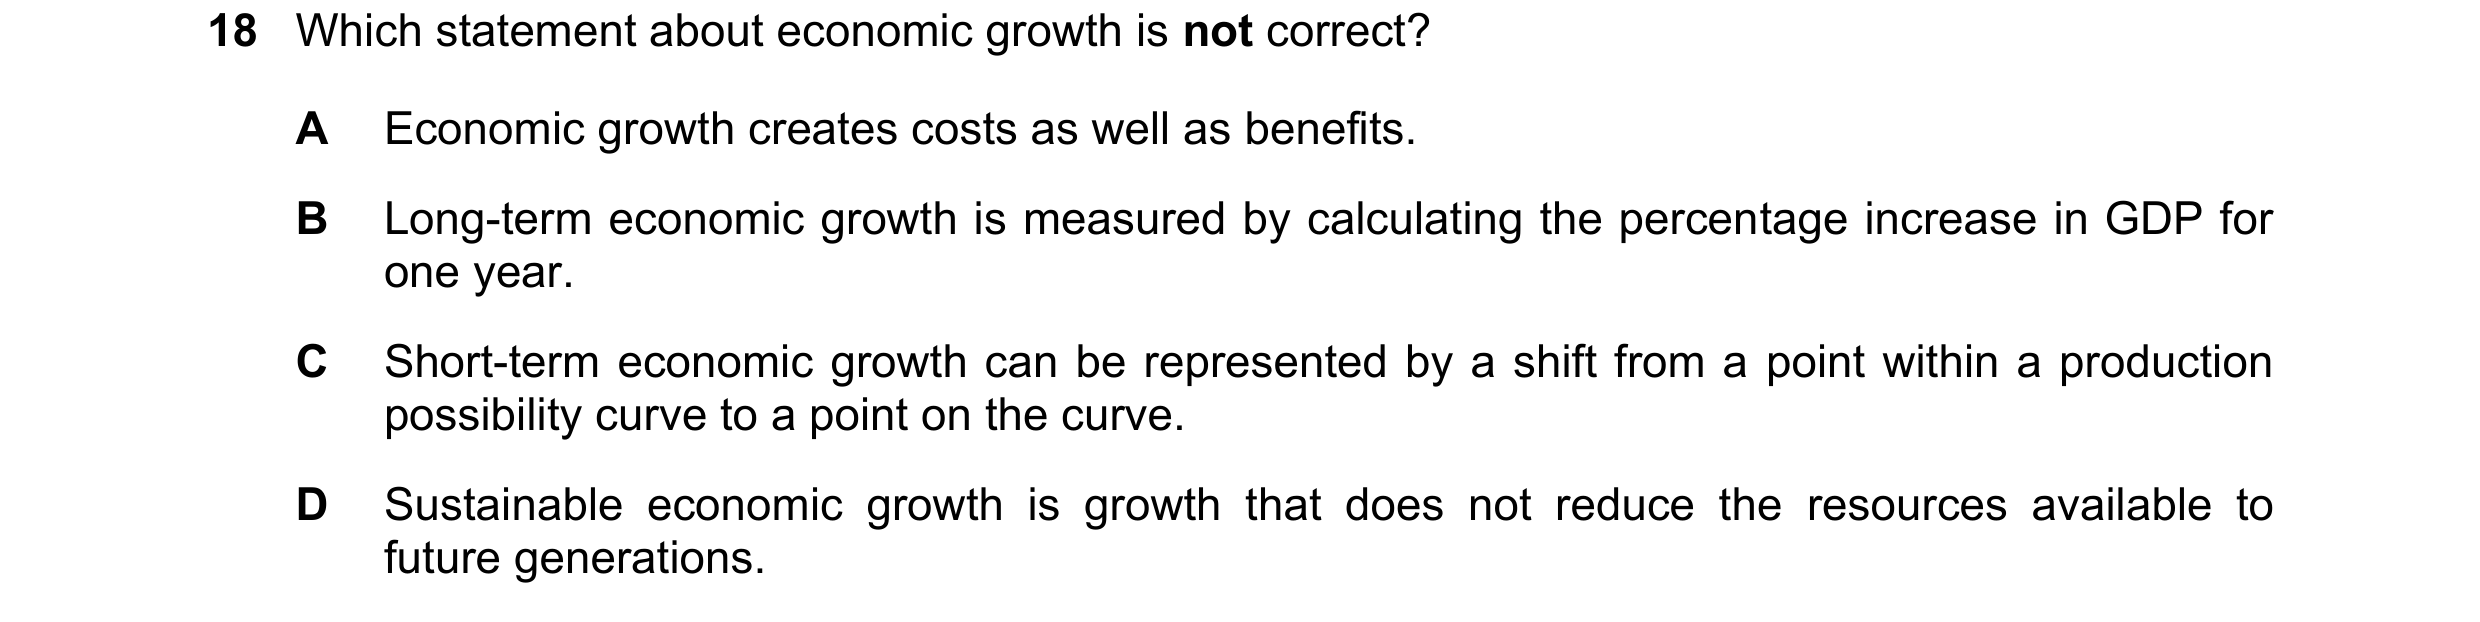
18 Which statement about economic growth is not correct? A Economic growth creates costs as well as benefits. B Long-term economic growth is measured by calculating the percentage increase in GDP for one year. C Short-term economic growth can be represented by a shift from a point within a production possibility curve to a point on the curve. D Sustainable economic growth is growth that does not reduce the resources available to future generations.
1 marks
Answer: B
This question in 9708/32 Oct/Nov 2021
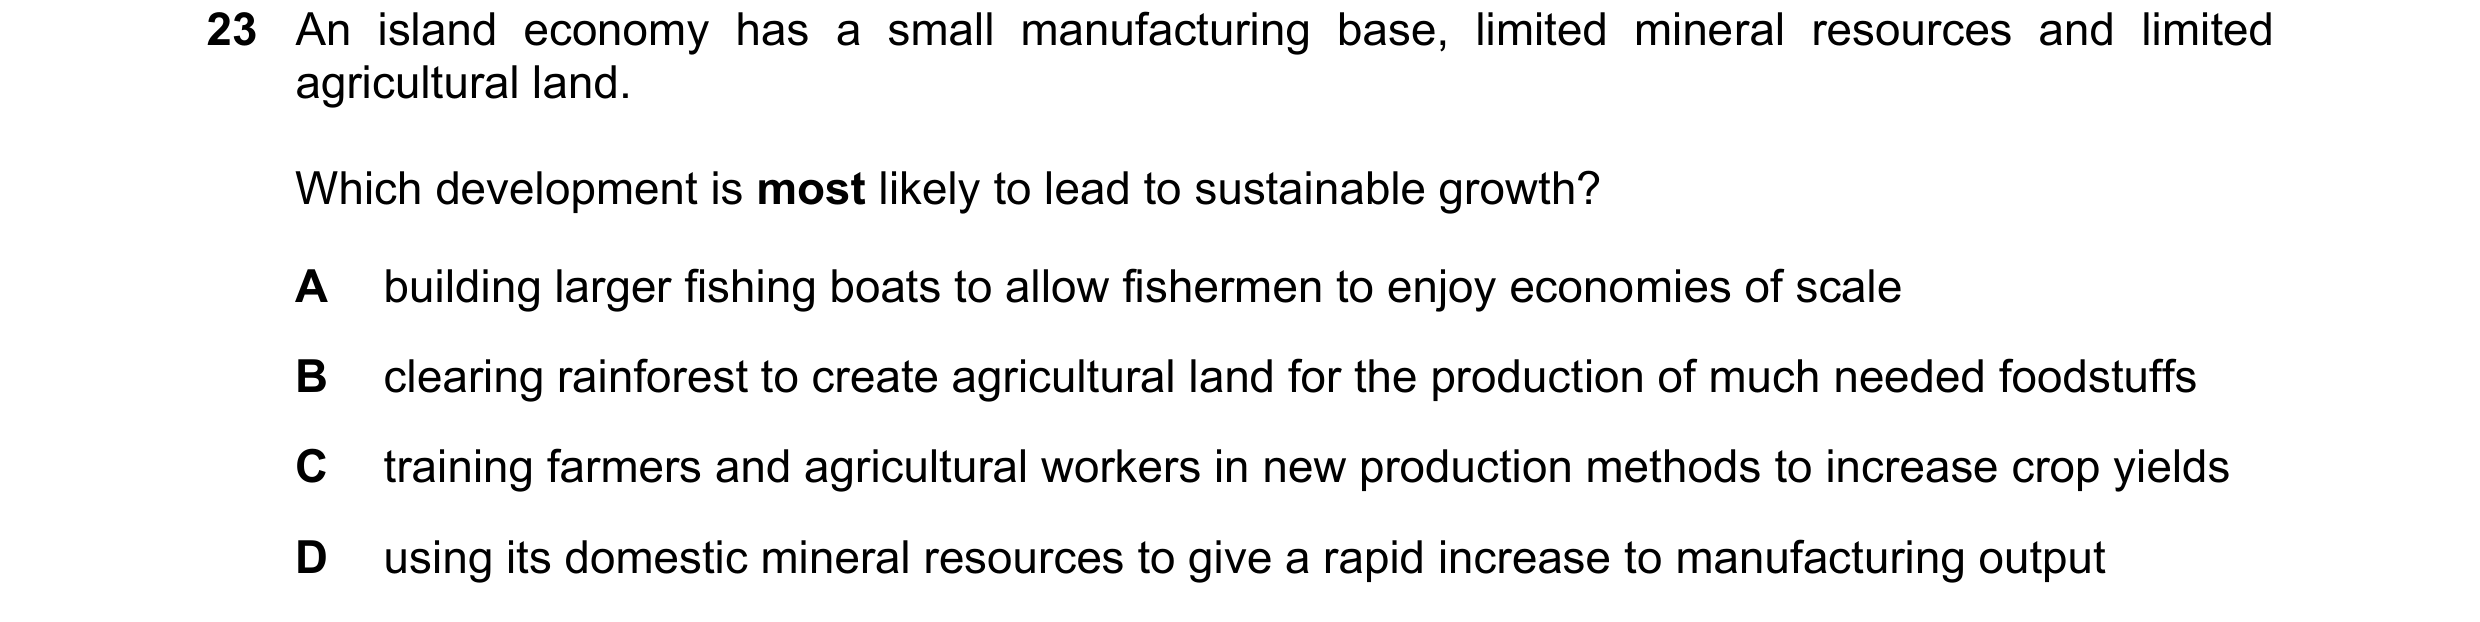
Q68 · An island economy has a small manufacturing base, limited mineral resources and limited… 9708/32 Oct/Nov 2021
23 An island economy has a small manufacturing base, limited mineral resources and limited agricultural land. Which development is most likely to lead to sustainable growth? A building larger fishing boats to allow fishermen to enjoy economies of scale B clearing rainforest to create agricultural land for the production of much needed foodstuffs C training farmers and agricultural workers in new production methods to increase crop yields D using its domestic mineral resources to give a rapid increase to manufacturing output
1 marks
Answer: C
This question in 9708/32 Oct/Nov 2021
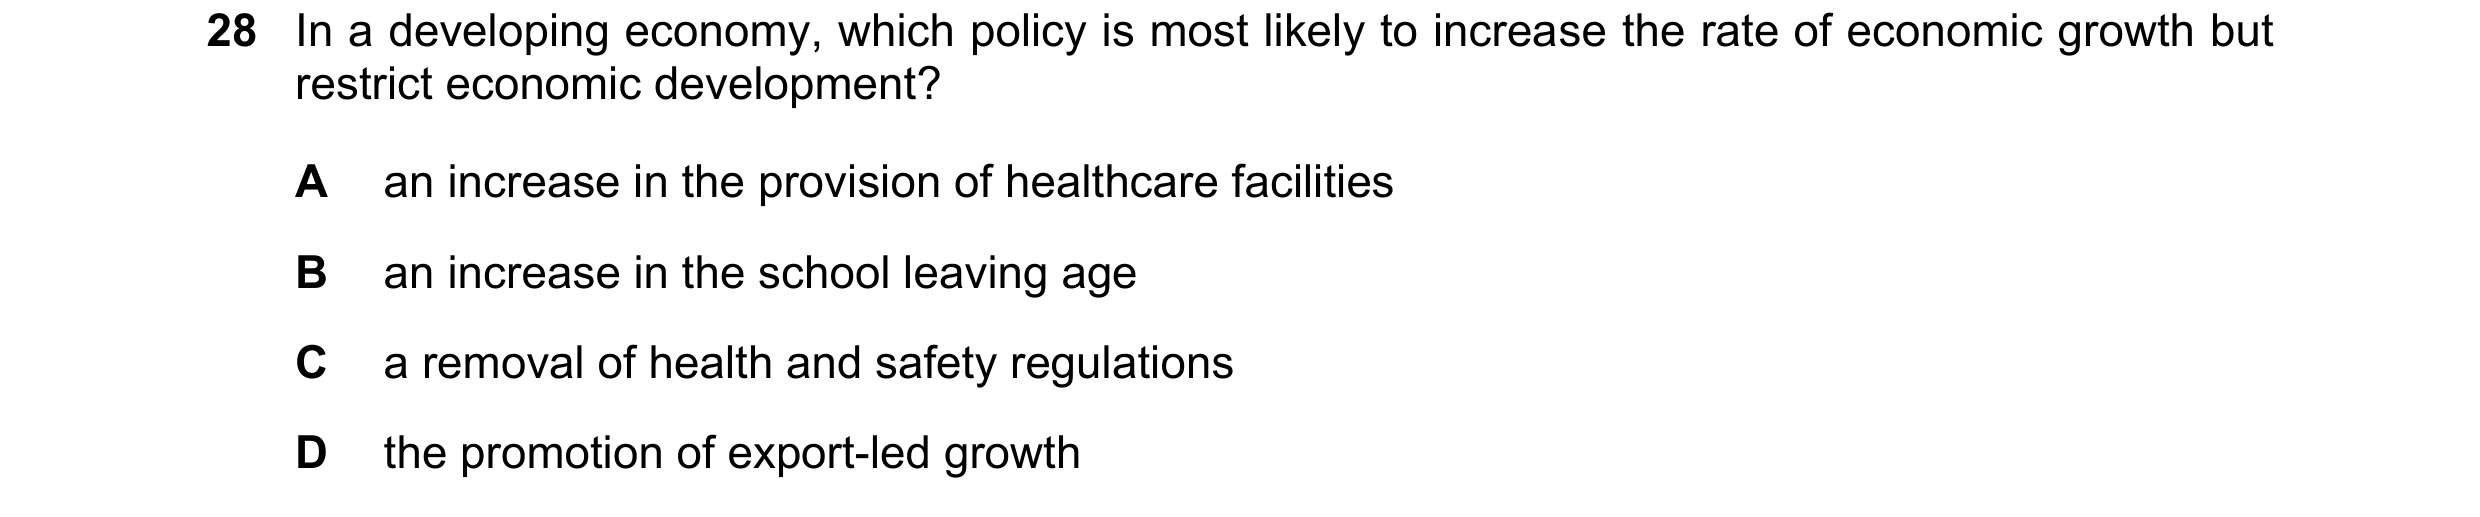
Q69 · In a developing economy, which policy is most likely to increase the rate of economic… 9708/32 Oct/Nov 2021
28 In a developing economy, which policy is most likely to increase the rate of economic growth but restrict economic development? A an increase in the provision of healthcare facilities B an increase in the school leaving age C a removal of health and safety regulations D the promotion of export-led growth
1 marks
Answer: C
This question in 9708/32 Oct/Nov 2021
Q70 · The table shows the annual percentage economic growth rates of three countries from 2012… 9708/31 May/June 2022
18 The table shows the annual percentage economic growth rates of three countries from 2012 to 2018. annual percentage change in real GDP Brazil % Japan % Spain % 2012 1.9 1.5 –2.9 2013 3.0 2.0 –1.7 2014 0.5 0.4 1.4 2015 –3.5 1.2 3.7 2016 –3.3 0.6 3.2 2017 1.1 1.9 3.0 2018 1.1 0.8 2.6 What can be concluded from the table? A Brazil was in the downturn of its trade cycle in 2015. B Japan’s real GDP was at its smallest in 2014. C Spain experienced the worst recession of the period. D Spain was in the downturn of its trade cycle in 2014.
1 marks
Answer: A
This question in 9708/31 May/June 2022
Q71 · What is most likely to be found in an economy with a positive output gap? 9708/31 May/June 2022
24 What is most likely to be found in an economy with a positive output gap? A a higher potential than actual GDP B high unemployment C inflation D low labour costs
1 marks
Answer: C
This question in 9708/31 May/June 2022
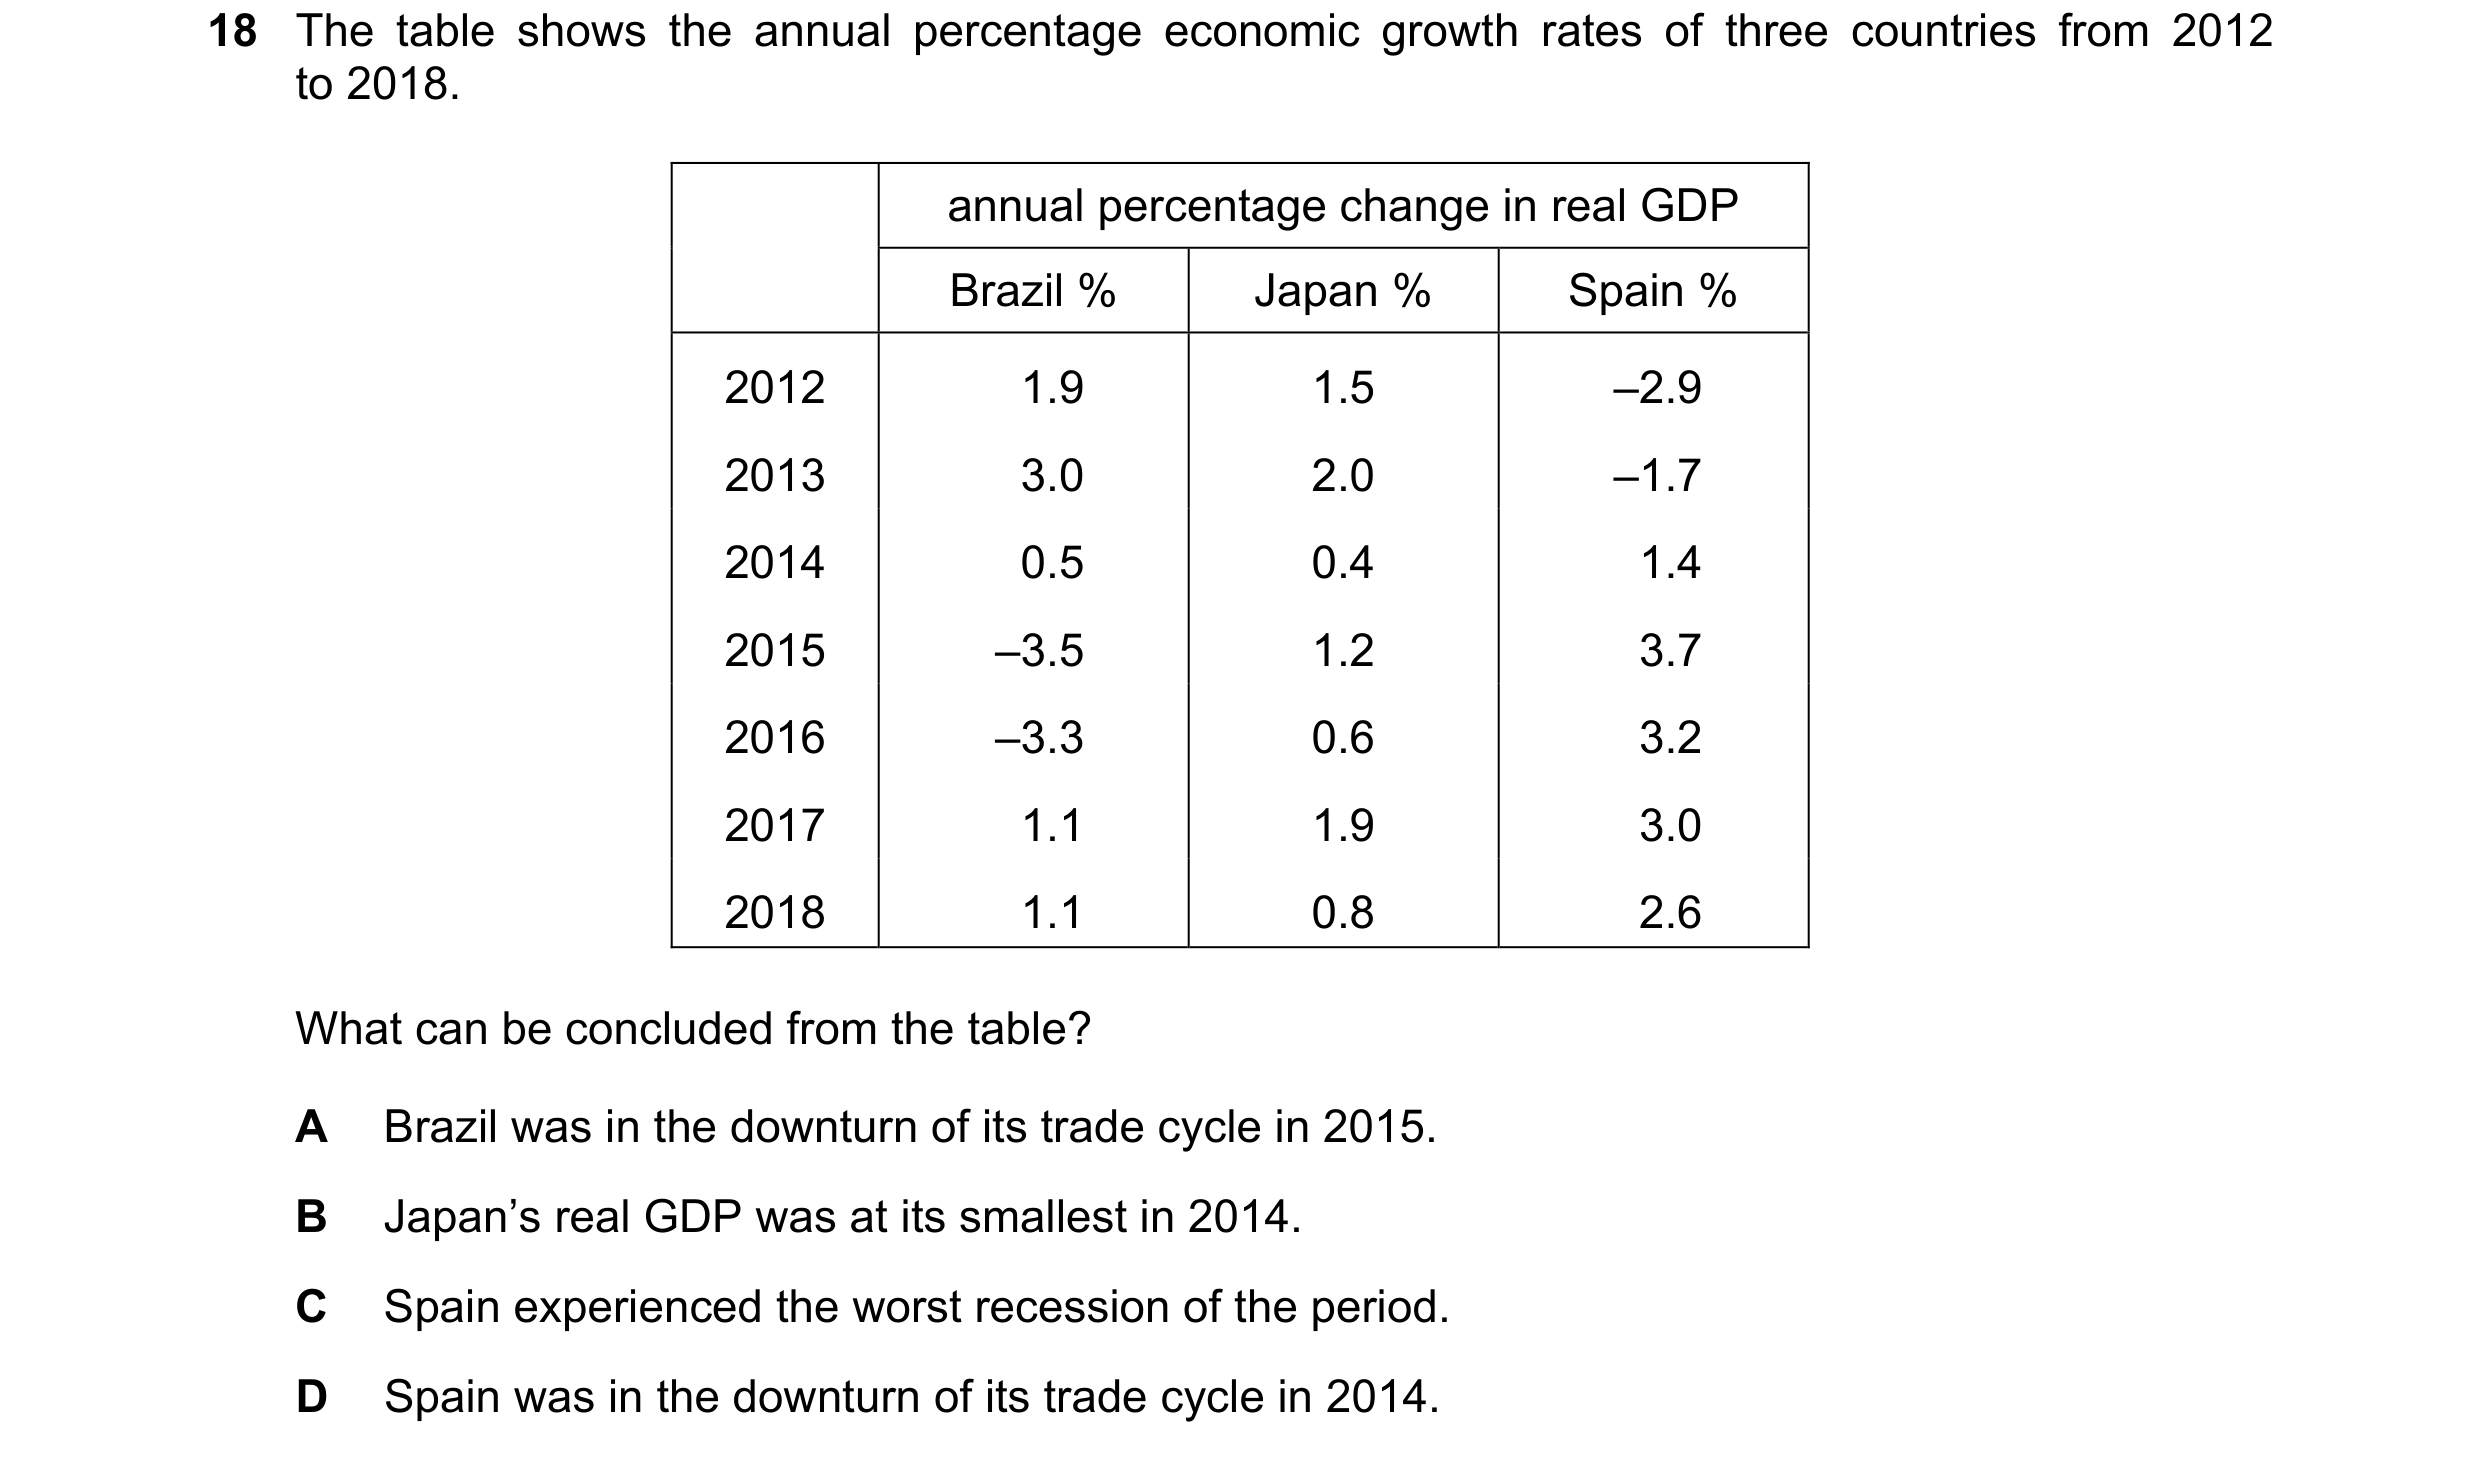
Q72 · The table shows the annual percentage economic growth rates of three countries from 2012… 9708/33 May/June 2022
18 The table shows the annual percentage economic growth rates of three countries from 2012 to 2018. annual percentage change in real GDP Brazil % Japan % Spain % 2012 1.9 1.5 –2.9 2013 3.0 2.0 –1.7 2014 0.5 0.4 1.4 2015 –3.5 1.2 3.7 2016 –3.3 0.6 3.2 2017 1.1 1.9 3.0 2018 1.1 0.8 2.6 What can be concluded from the table? A Brazil was in the downturn of its trade cycle in 2015. B Japan’s real GDP was at its smallest in 2014. C Spain experienced the worst recession of the period. D Spain was in the downturn of its trade cycle in 2014.
1 marks
Answer: A
This question in 9708/33 May/June 2022
Q73 · What is most likely to be found in an economy with a positive output gap? 9708/33 May/June 2022
24 What is most likely to be found in an economy with a positive output gap? A a higher potential than actual GDP B high unemployment C inflation D low labour costs
1 marks
Answer: C
This question in 9708/33 May/June 2022
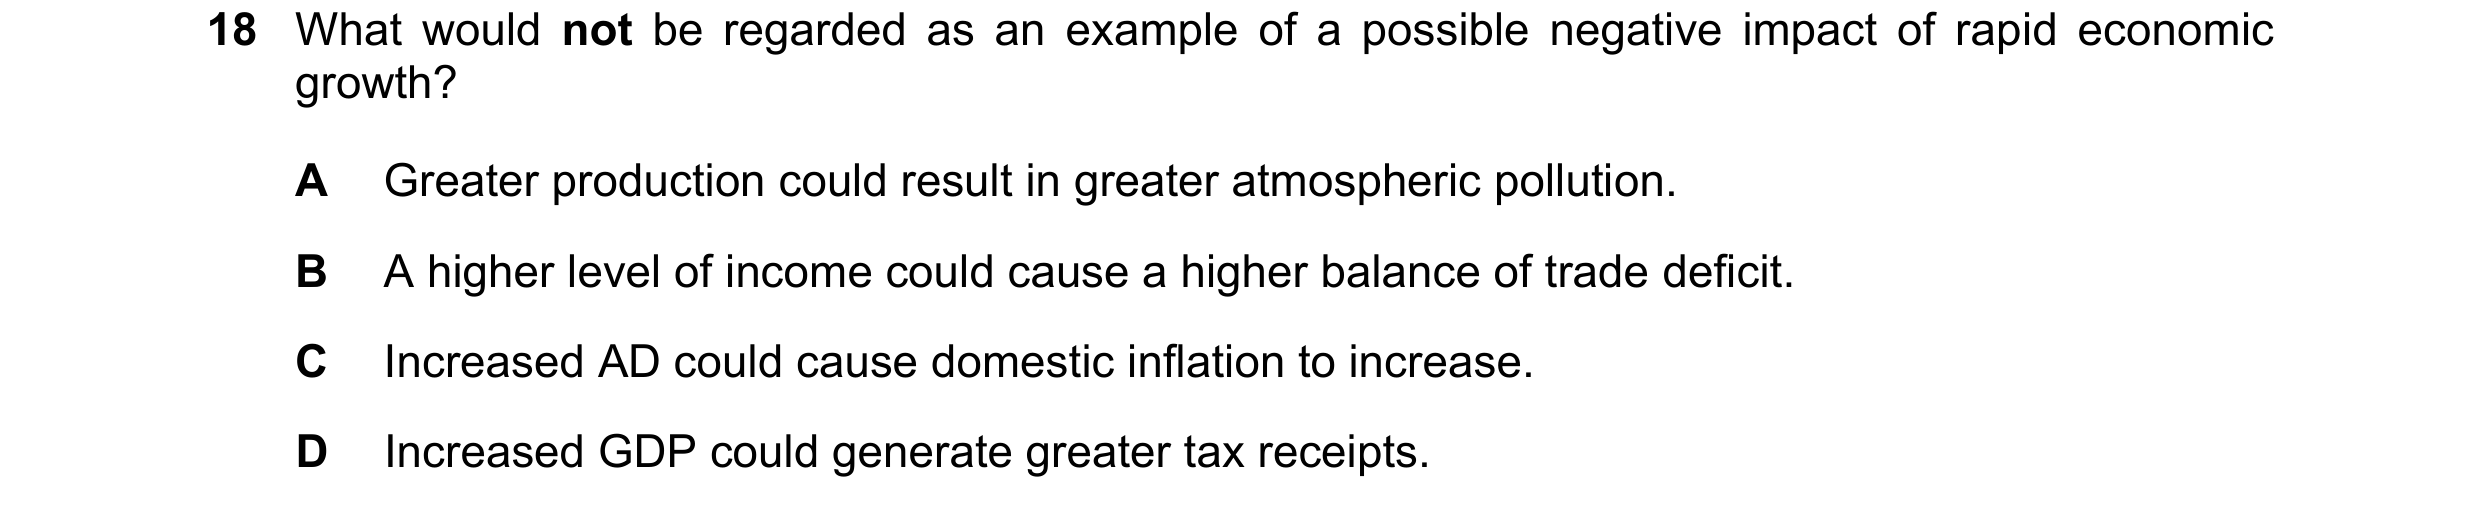
Q74 · What would not be regarded as an example of a possible negative impact of rapid economic… 9708/31 Oct/Nov 2022
18 What would not be regarded as an example of a possible negative impact of rapid economic growth? A Greater production could result in greater atmospheric pollution. B A higher level of income could cause a higher balance of trade deficit. C Increased AD could cause domestic inflation to increase. D Increased GDP could generate greater tax receipts.
1 marks
Answer: D
This question in 9708/31 Oct/Nov 2022
Q75 · What will decrease if an open economy experiences a positive output gap? 9708/31 Oct/Nov 2022
24 What will decrease if an open economy experiences a positive output gap? A general price level B import spending C spare capacity D wage rates
1 marks
Answer: C
This question in 9708/31 Oct/Nov 2022
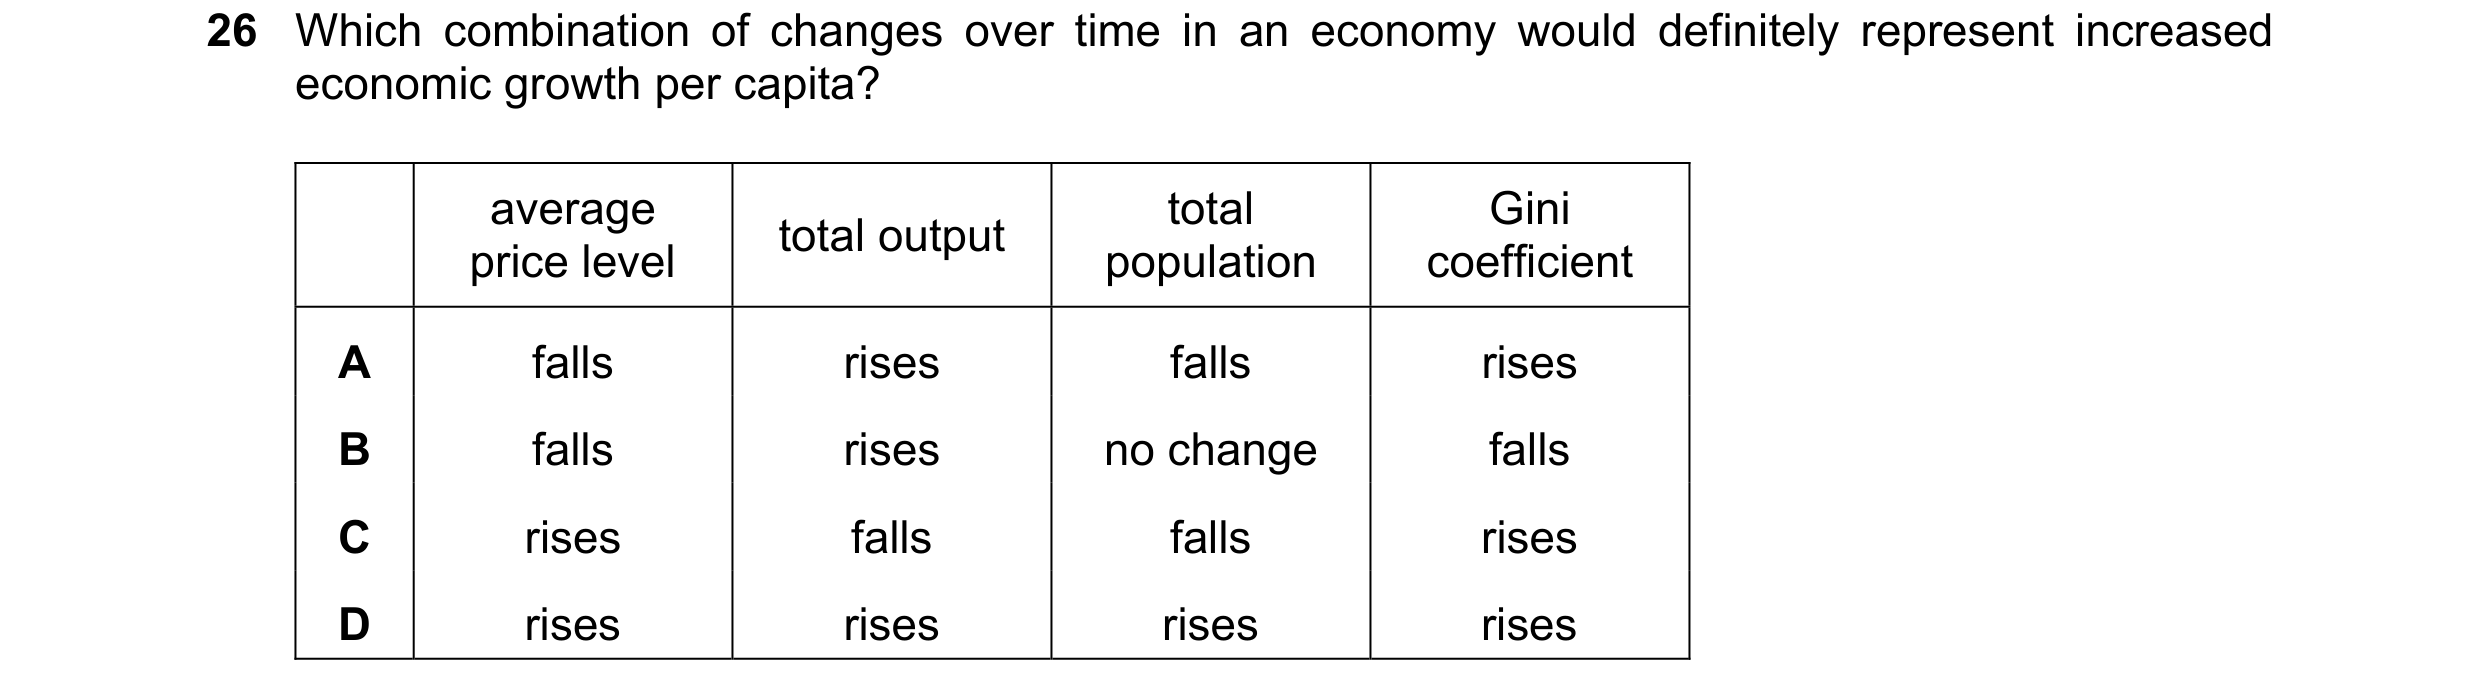
Q76 · Which combination of changes over time in an economy would definitely represent increased… 9708/32 Oct/Nov 2022
26 Which combination of changes over time in an economy would definitely represent increased economic growth per capita? average total Gini total output price level population coefficient A falls rises falls rises B falls rises no change falls C rises falls falls rises D rises rises rises rises
1 marks
Answer: A
This question in 9708/32 Oct/Nov 2022
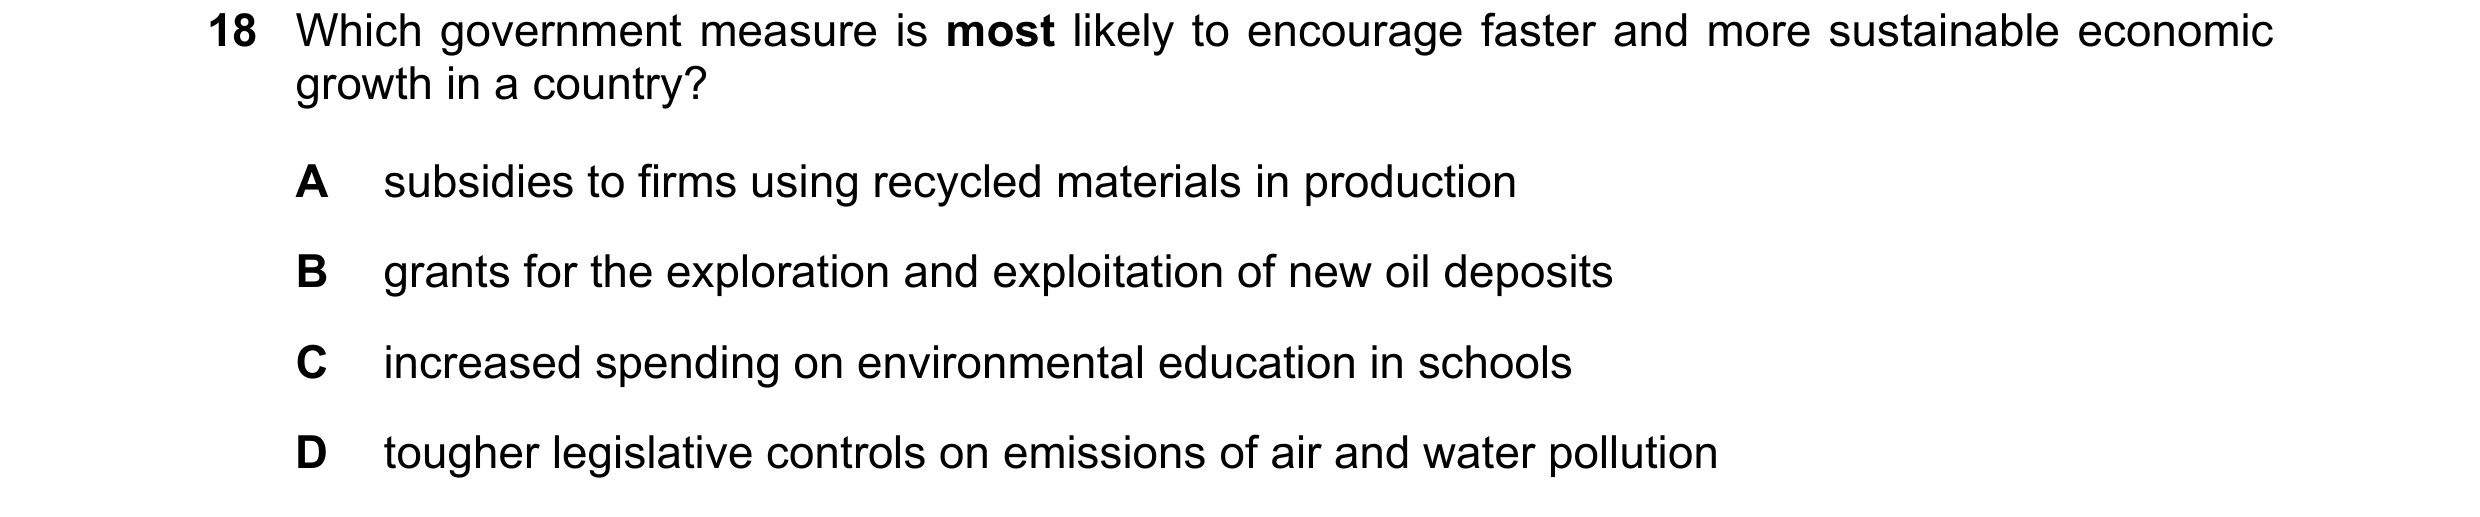
Q77 · Which government measure is most likely to encourage faster and more sustainable economic… 9708/33 Oct/Nov 2022
18 Which government measure is most likely to encourage faster and more sustainable economic growth in a country? A subsidies to firms using recycled materials in production B grants for the exploration and exploitation of new oil deposits C increased spending on environmental education in schools D tougher legislative controls on emissions of air and water pollution
1 marks
Answer: A
This question in 9708/33 Oct/Nov 2022
Q78 · What is most likely to lead to an increase in labour productivity? 9708/33 Oct/Nov 2022
22 What is most likely to lead to an increase in labour productivity? A encouraging women to enter the workforce B increasing automation C raising the retirement age D reducing the division of labour
1 marks
Answer: B
This question in 9708/33 Oct/Nov 2022
Q79 · The table shows real GDP and unemployment for an economy 9708/33 Oct/Nov 2022
26 The table shows real GDP and unemployment for an economy. economic indicators 2019 2021 real GDP ($ billions) 40 000 38 000 unemployment (millions) 2 3 What can be concluded from the data? A Demand-pull inflation is likely to increase. B Potential output is likely to increase. C The balance of payments deficit is likely to increase. D The budget deficit is likely to increase.
1 marks
Answer: D
This question in 9708/33 Oct/Nov 2022
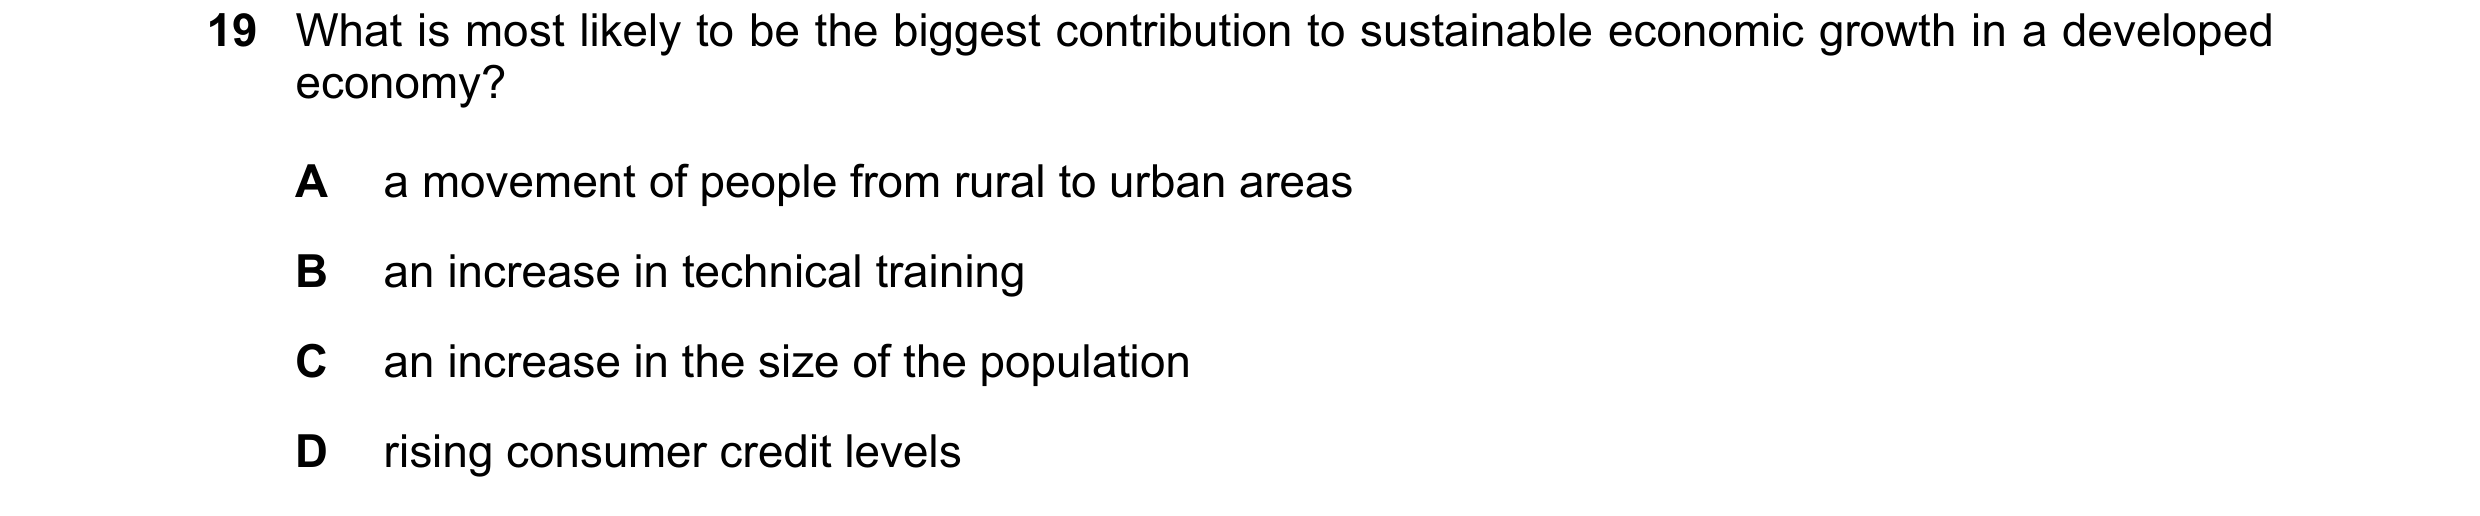
Q80 · What is most likely to be the biggest contribution to sustainable economic growth in a… 9708/32 Feb/March 2023
19 What is most likely to be the biggest contribution to sustainable economic growth in a developed economy? A a movement of people from rural to urban areas B an increase in technical training C an increase in the size of the population D rising consumer credit levels
1 marks
Answer: B
This question in 9708/32 Feb/March 2023
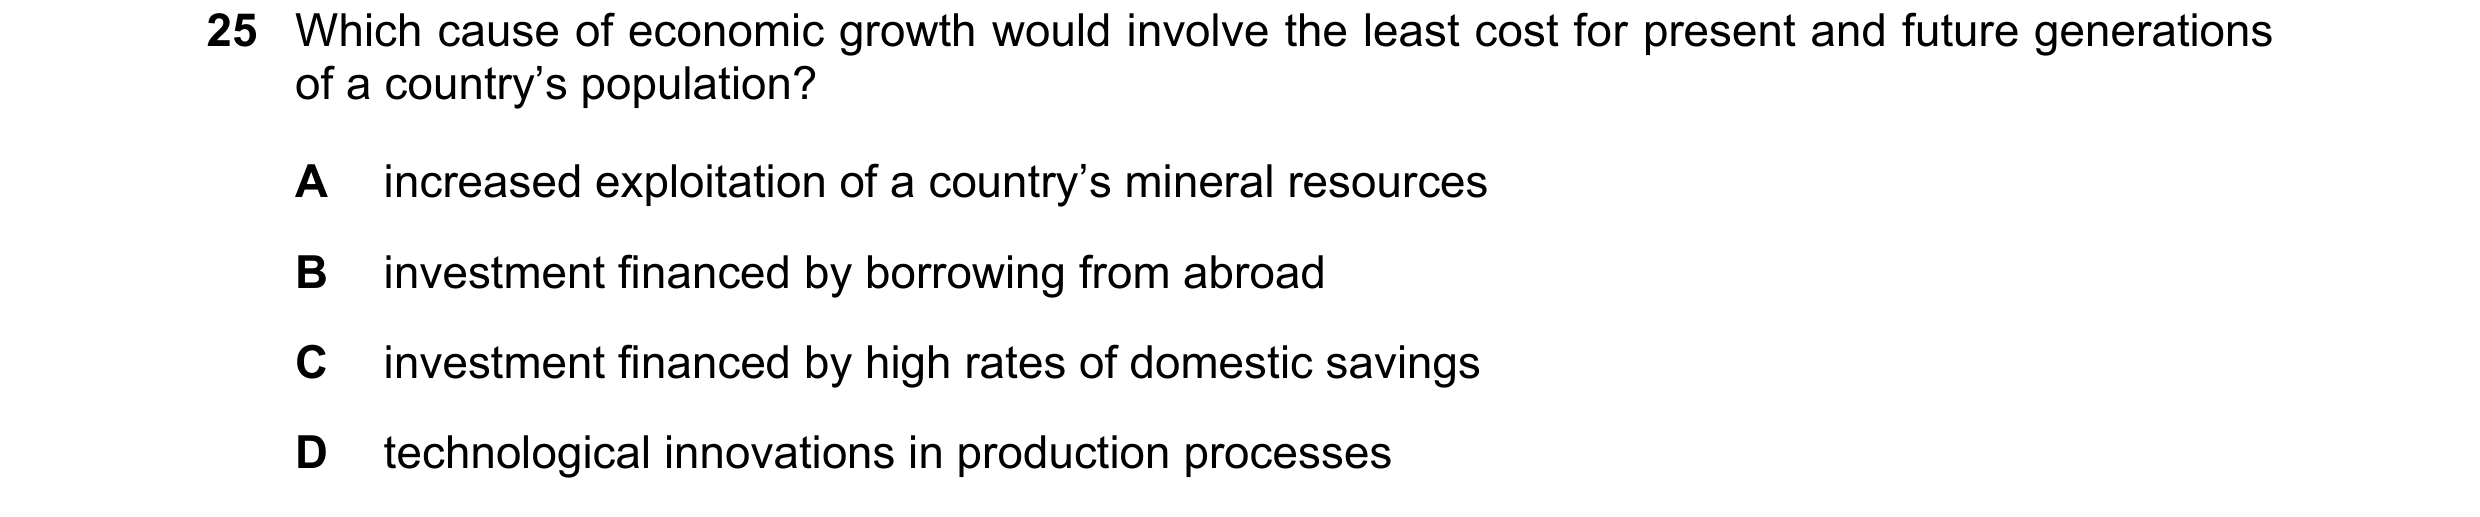
Q81 · Which cause of economic growth would involve the least cost for present and future… 9708/32 Feb/March 2023
25 Which cause of economic growth would involve the least cost for present and future generations of a country’s population? A increased exploitation of a country’s mineral resources B investment financed by borrowing from abroad C investment financed by high rates of domestic savings D technological innovations in production processes
1 marks
Answer: D
This question in 9708/32 Feb/March 2023
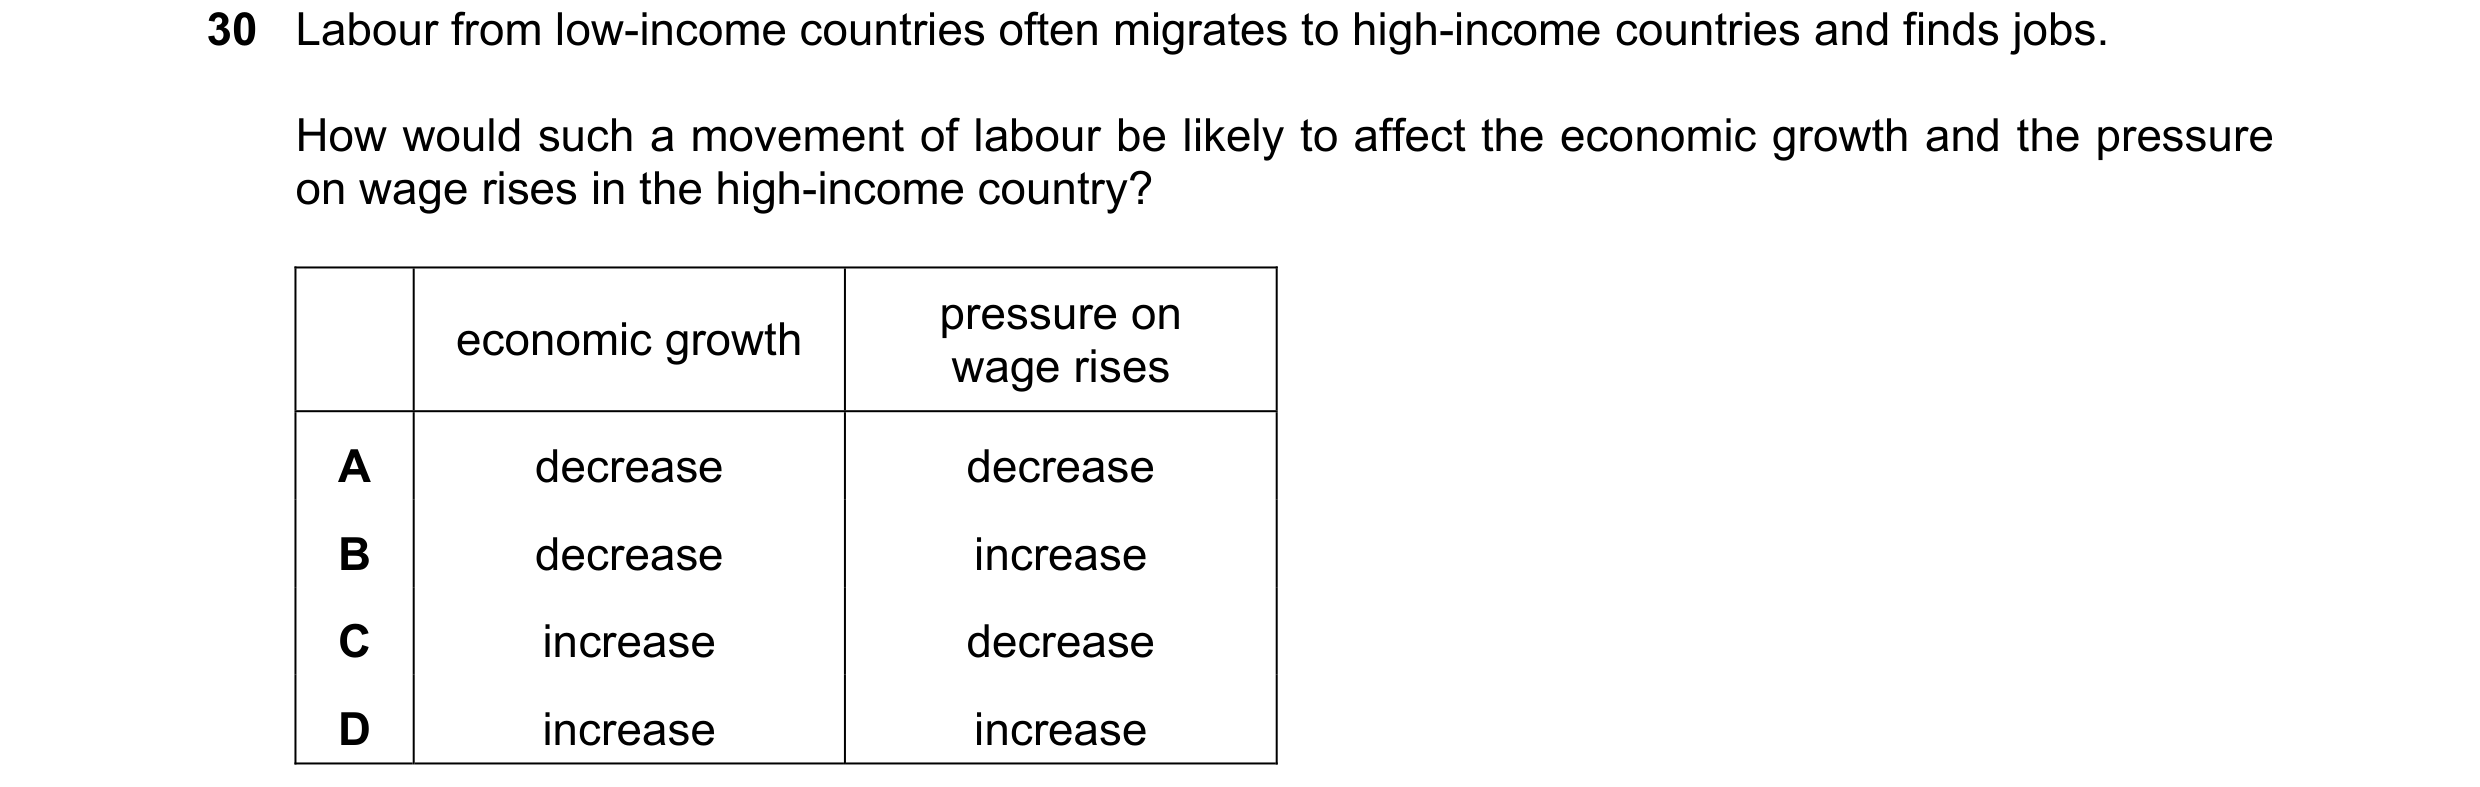
Q82 · Labour from low-income countries often migrates to high-income countries and finds jobs 9708/32 Feb/March 2023
30 Labour from low-income countries often migrates to high-income countries and finds jobs. How would such a movement of labour be likely to affect the economic growth and the pressure on wage rises in the high-income country? pressure on economic growth wage rises A decrease decrease B decrease increase C increase decrease D increase increase
1 marks
Answer: C
This question in 9708/32 Feb/March 2023
Q83 · A government wishes to support growth in the economy’s fishing industry 9708/31 May/June 2023
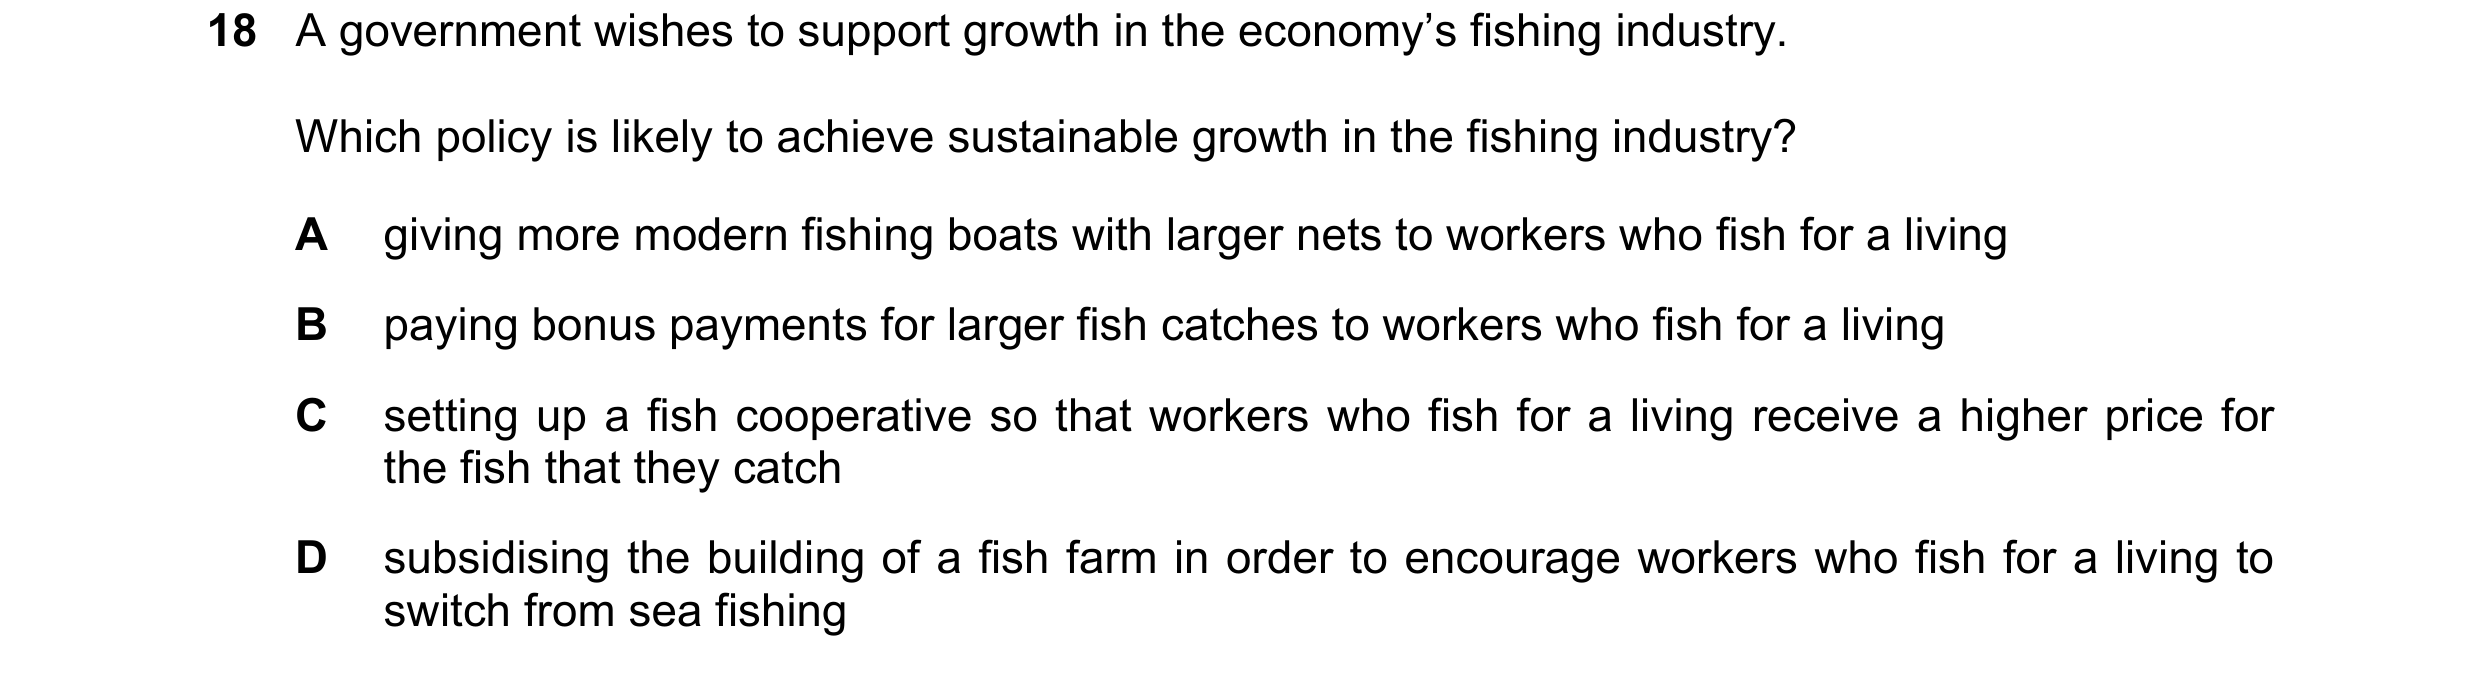
18 A government wishes to support growth in the economy’s fishing industry. Which policy is likely to achieve sustainable growth in the fishing industry? A giving more modern fishing boats with larger nets to workers who fish for a living B paying bonus payments for larger fish catches to workers who fish for a living C setting up a fish cooperative so that workers who fish for a living receive a higher price for the fish that they catch D subsidising the building of a fish farm in order to encourage workers who fish for a living to switch from sea fishing
1 marks
Answer: D
This question in 9708/31 May/June 2023
Q84 · A government wishes to support growth in the economy’s fishing industry 9708/33 May/June 2023
18 A government wishes to support growth in the economy’s fishing industry. Which policy is likely to achieve sustainable growth in the fishing industry? A giving more modern fishing boats with larger nets to workers who fish for a living B paying bonus payments for larger fish catches to workers who fish for a living C setting up a fish cooperative so that workers who fish for a living receive a higher price for the fish that they catch D subsidising the building of a fish farm in order to encourage workers who fish for a living to switch from sea fishing
1 marks
Answer: D
This question in 9708/33 May/June 2023
Q85 · Which cause of economic growth is most likely to ensure that the growth is sustainable? 9708/31 Oct/Nov 2023
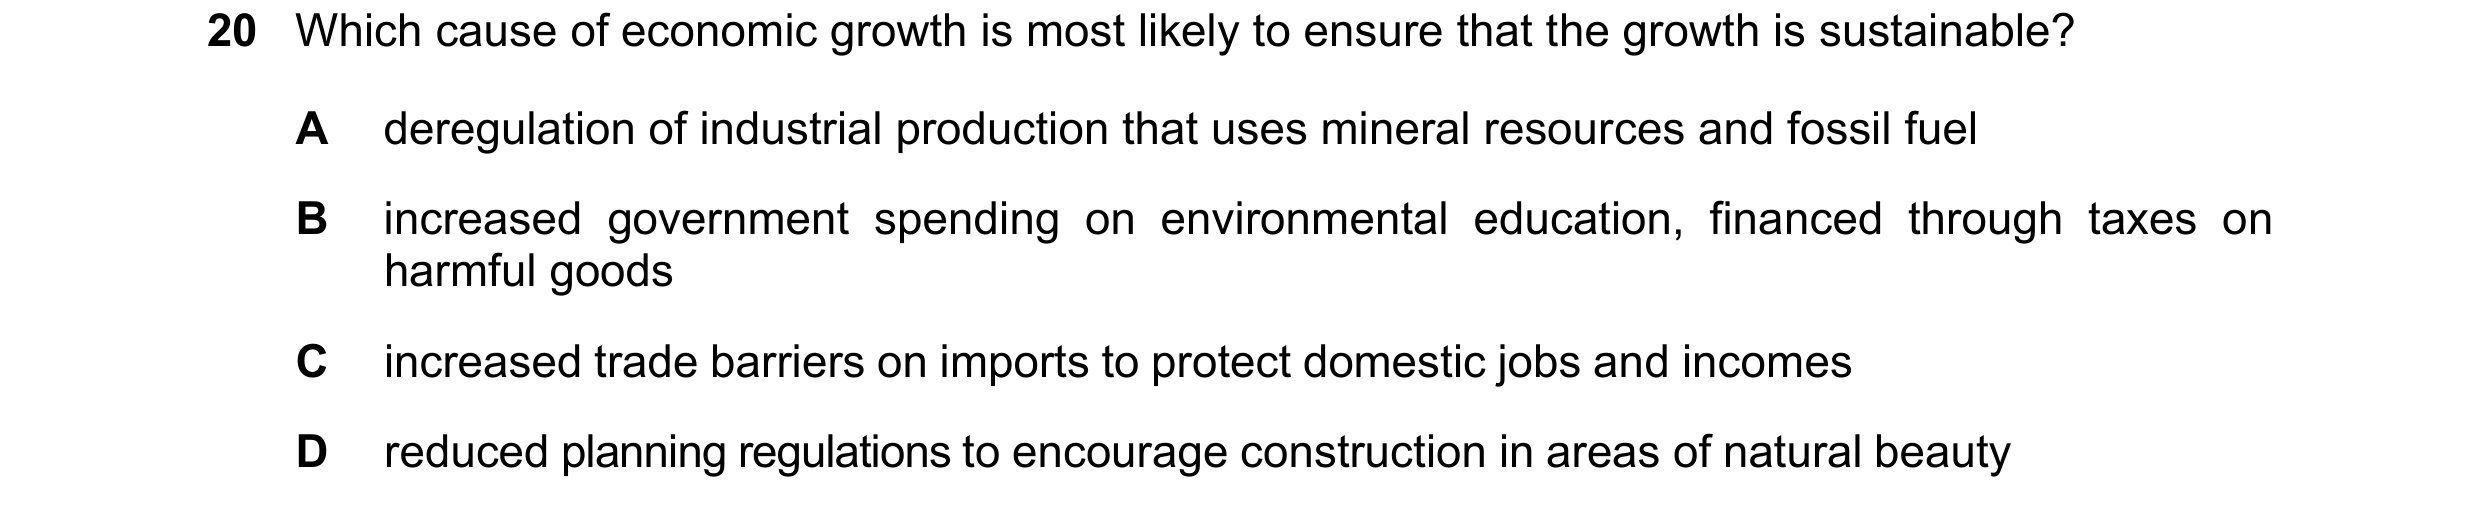
20 Which cause of economic growth is most likely to ensure that the growth is sustainable? A deregulation of industrial production that uses mineral resources and fossil fuel B increased government spending on environmental education, financed through taxes on harmful goods C increased trade barriers on imports to protect domestic jobs and incomes D reduced planning regulations to encourage construction in areas of natural beauty
1 marks
Answer: B
This question in 9708/31 Oct/Nov 2023
Q86 · What is the basic assumption underlying the accelerator theory? 9708/31 Oct/Nov 2023
22 What is the basic assumption underlying the accelerator theory? A Investment depends on the level of business confidence. B Investment depends on the level of savings. C Investment depends on the rate of change in national income. D Investment depends on the rate of change of interest rates.
1 marks
Answer: C
This question in 9708/31 Oct/Nov 2023
Q87 · Which adjustment is made to gross domestic product (GDP) to calculate a measure of… 9708/31 Oct/Nov 2023
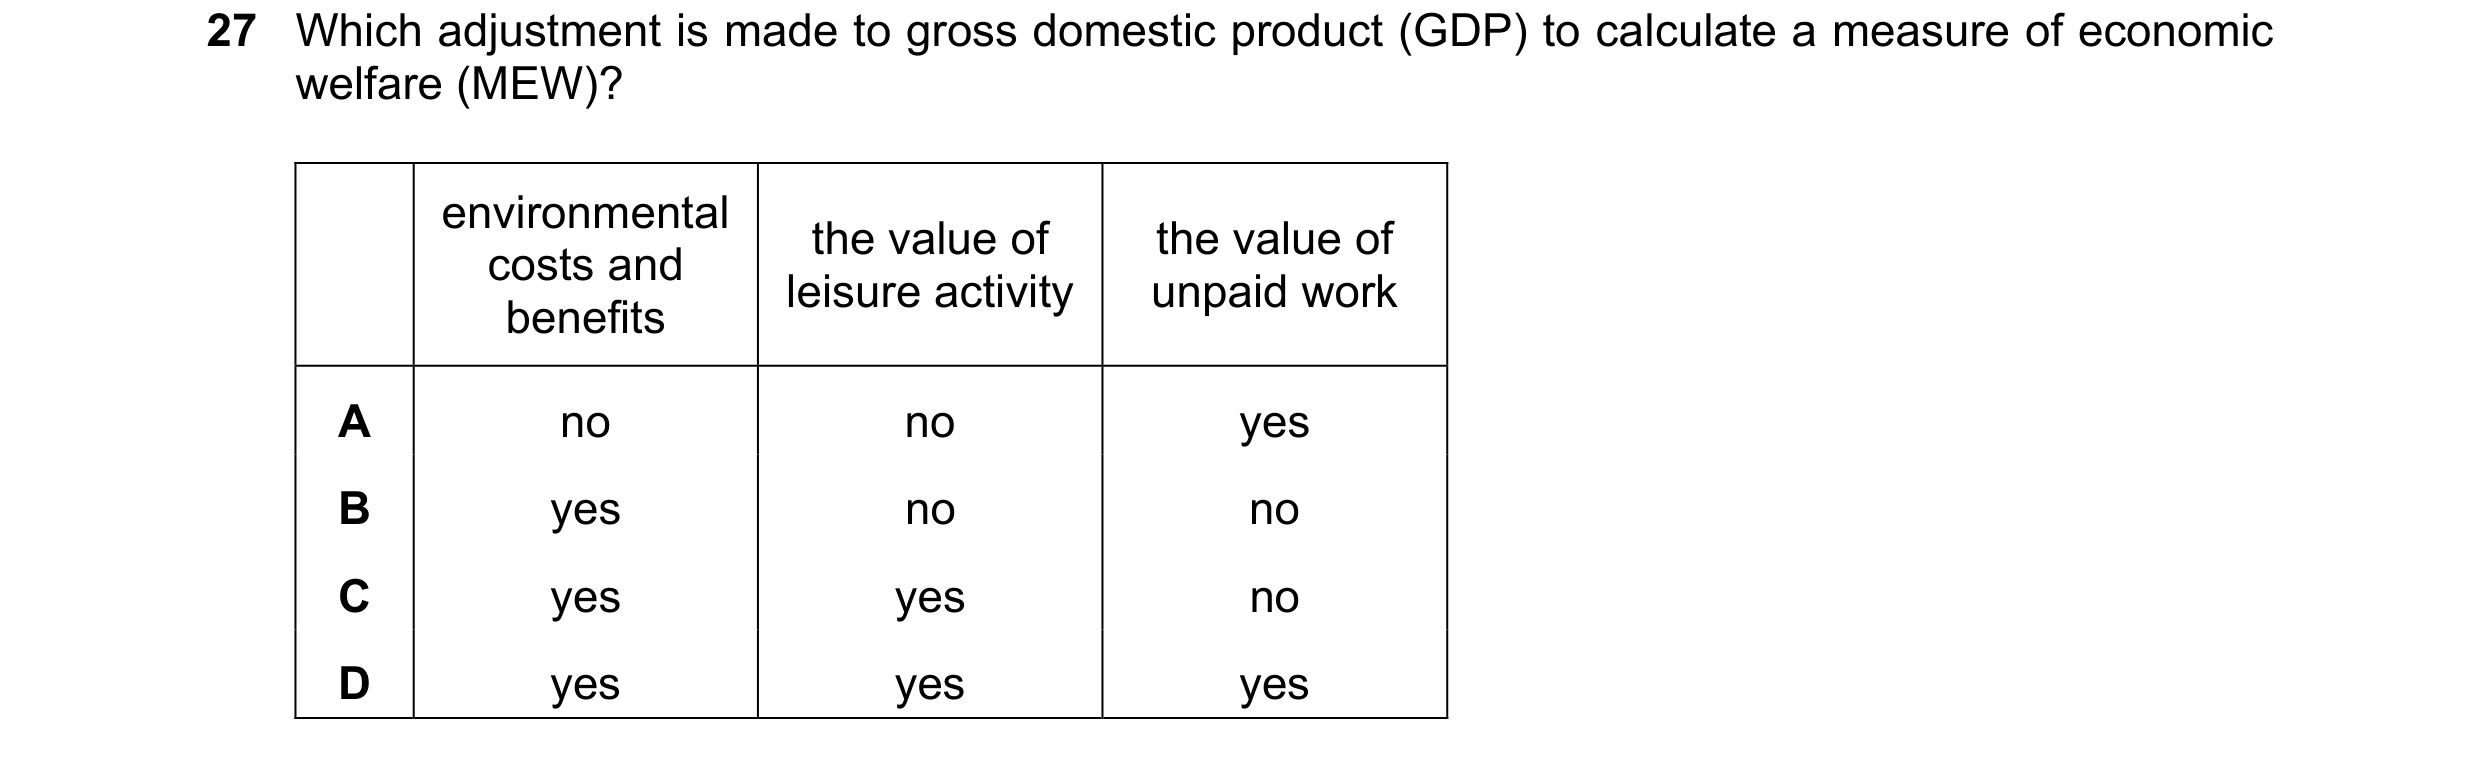
27 Which adjustment is made to gross domestic product (GDP) to calculate a measure of economic welfare (MEW)? environmental the value of the value of costs and leisure activity unpaid work benefits A no no yes B yes no no C yes yes no D yes yes yes
1 marks
Answer: D
This question in 9708/31 Oct/Nov 2023
Q88 · In its 2020 population census, China reported that the total population was just below… 9708/33 Oct/Nov 2023
19 In its 2020 population census, China reported that the total population was just below 1.4 billion. The birth rate had continued to decline, the number of those reaching retirement age had increased and the percentage size of the workforce had decreased. Which change of policy would most quickly sustain China’s economic growth in view of these population changes? A Allow more immigration of labour. B Encourage women to leave work to have more children. C Increase research in technology to improve labour productivity. D Tax the labour force more to pay for the increasing number of pensions.
1 marks
Answer: A
This question in 9708/33 Oct/Nov 2023
Q89 · What, according to the accelerator principle, will cause the level of investment to fall? 9708/33 Oct/Nov 2023
21 What, according to the accelerator principle, will cause the level of investment to fall? A a decrease in confidence B a decrease in the rate of growth of national income C an increase in the price of capital equipment D an increase in the rate of interest
1 marks
Answer: B
This question in 9708/33 Oct/Nov 2023
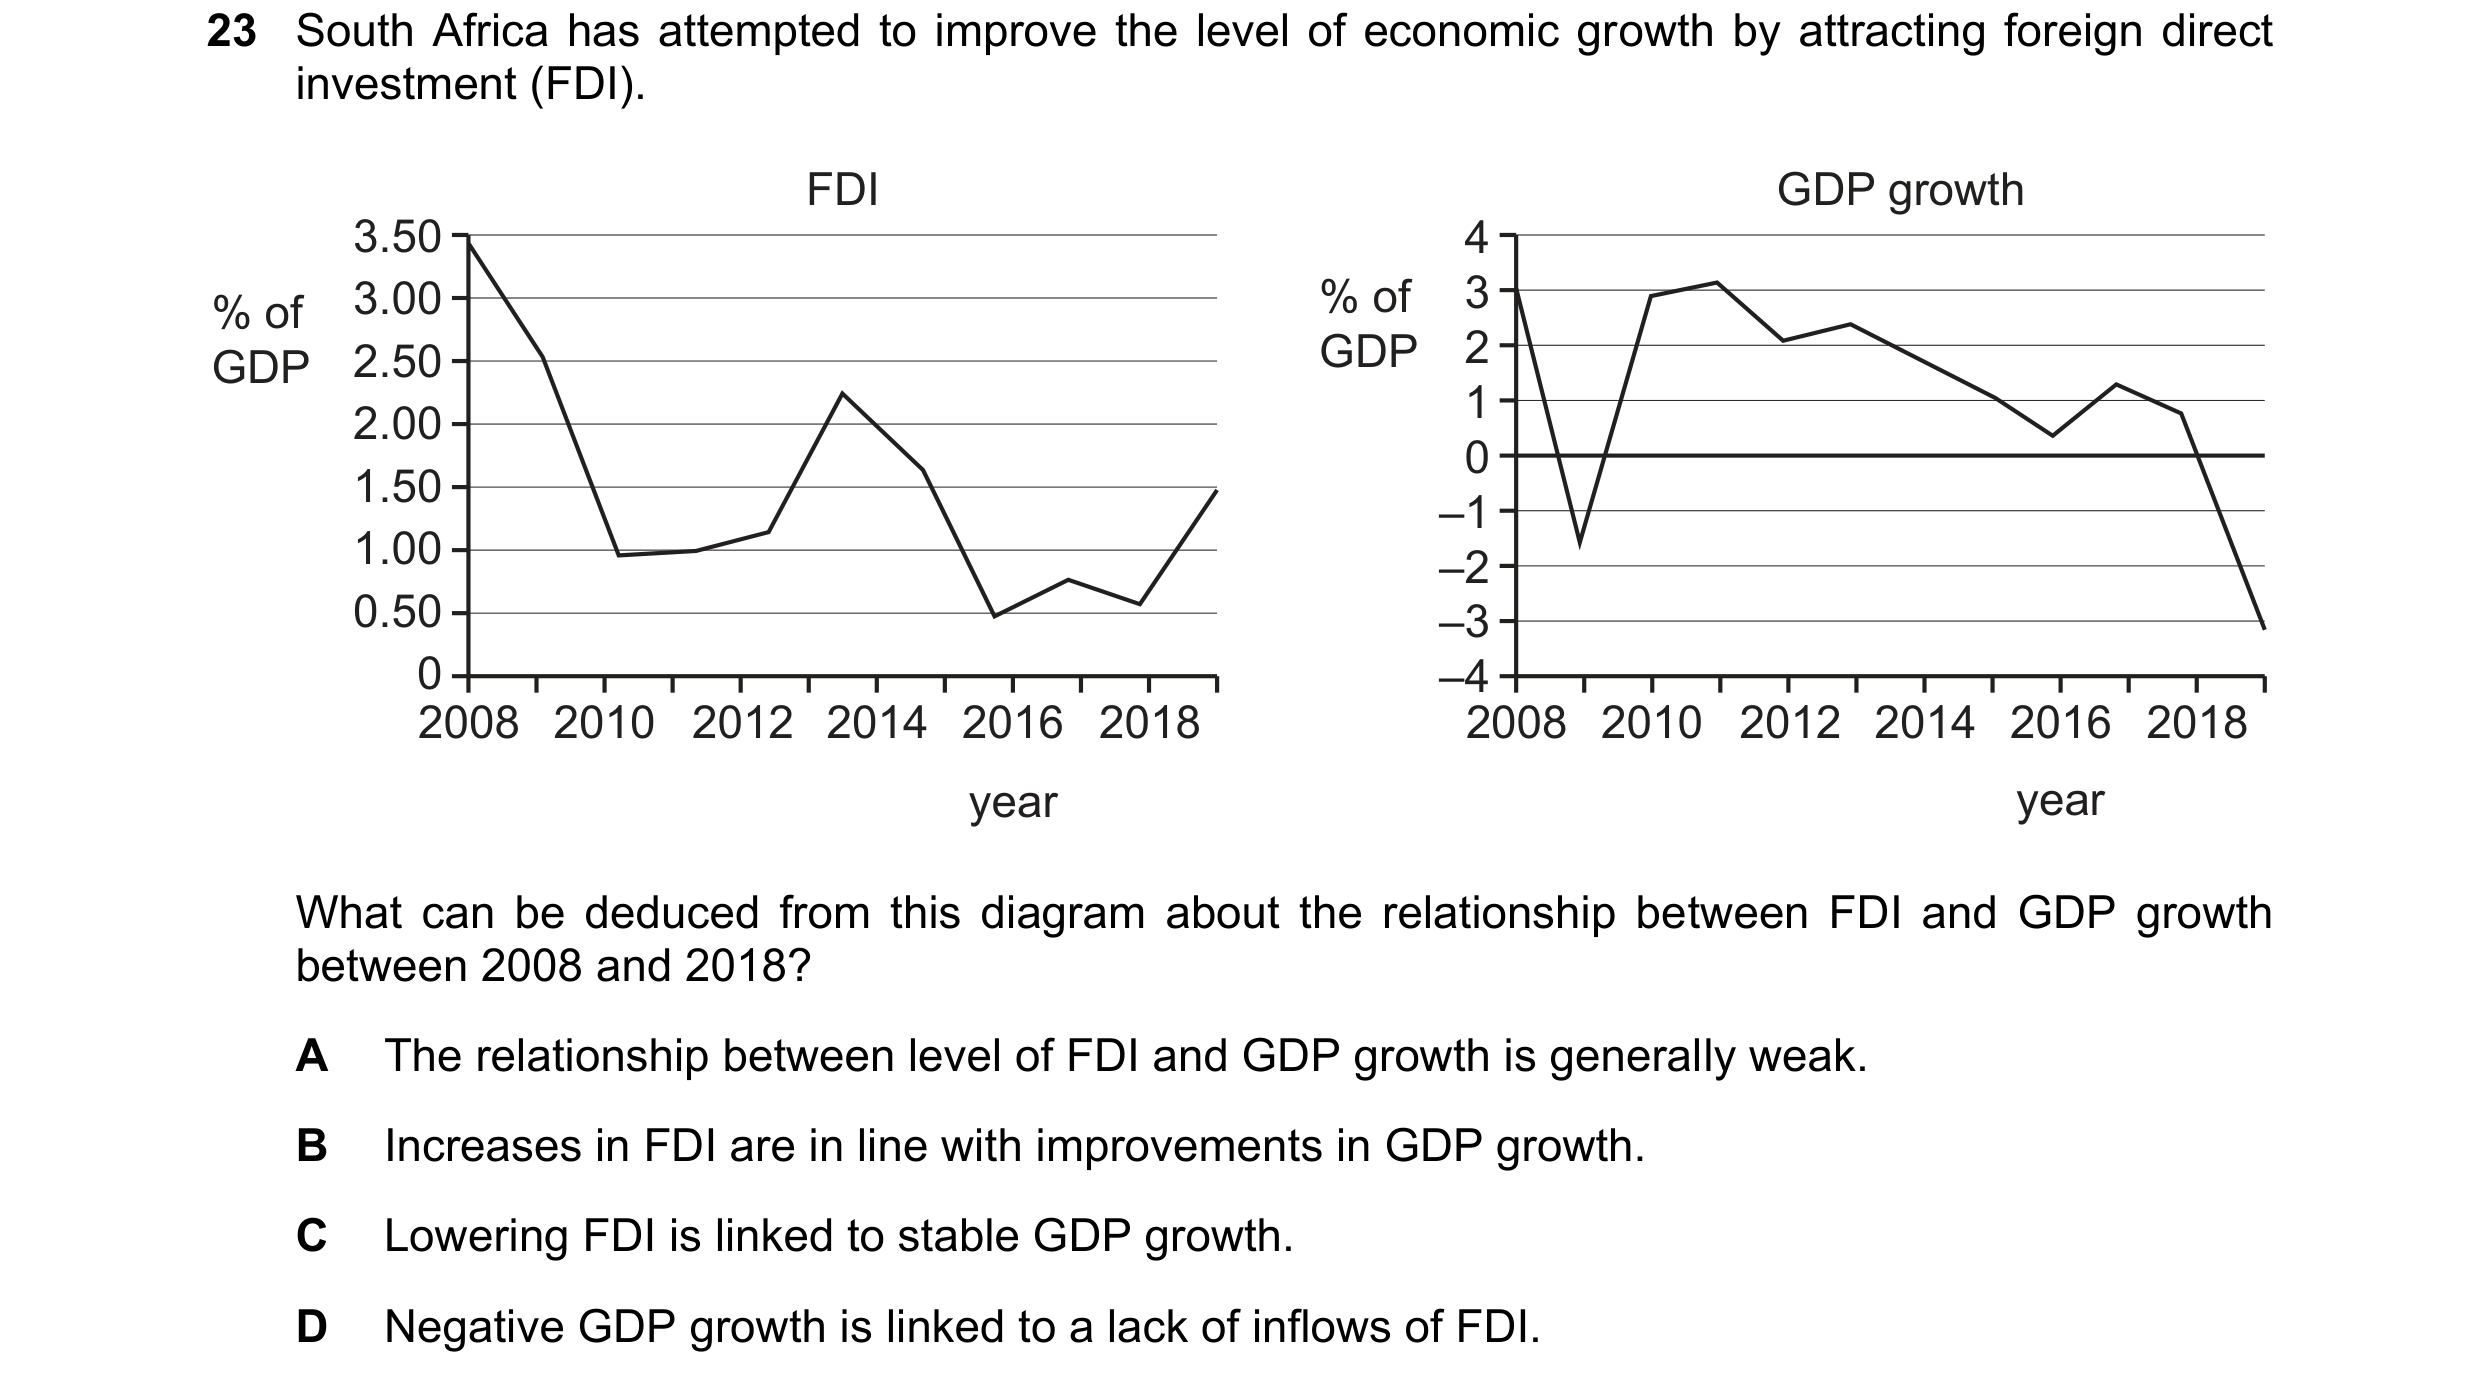
Q90 · South Africa has attempted to improve the level of economic growth by attracting foreign… 9708/33 Oct/Nov 2023
23 South Africa has attempted to improve the level of economic growth by attracting foreign direct investment (FDI). FDI GDP growth 3.50 4 % of 3.00 % of 3 GDP 2.50 GDP 2 1 2.00 0 1.50 –1 1.00 –2 0.50 –3 0 –4 2008 2010 2012 2014 2016 2018 2008 2010 2012 2014 2016 2018 year year What can be deduced from this diagram about the relationship between FDI and GDP growth between 2008 and 2018? A The relationship between level of FDI and GDP growth is generally weak. B Increases in FDI are in line with improvements in GDP growth. C Lowering FDI is linked to stable GDP growth. D Negative GDP growth is linked to a lack of inflows of FDI.
1 marks
Answer: A
This question in 9708/33 Oct/Nov 2023
Q91 · The diagram shows an economy’s production possibility curve 9708/32 Feb/March 2025
16 The diagram shows an economy’s production possibility curve. output of capital Y goods X O output of consumer goods What causes a movement from point X to point Y? A a positive output gap B a recession C actual economic growth D potential economic growth
1 marks
Answer: C
This question in 9708/32 Feb/March 2025
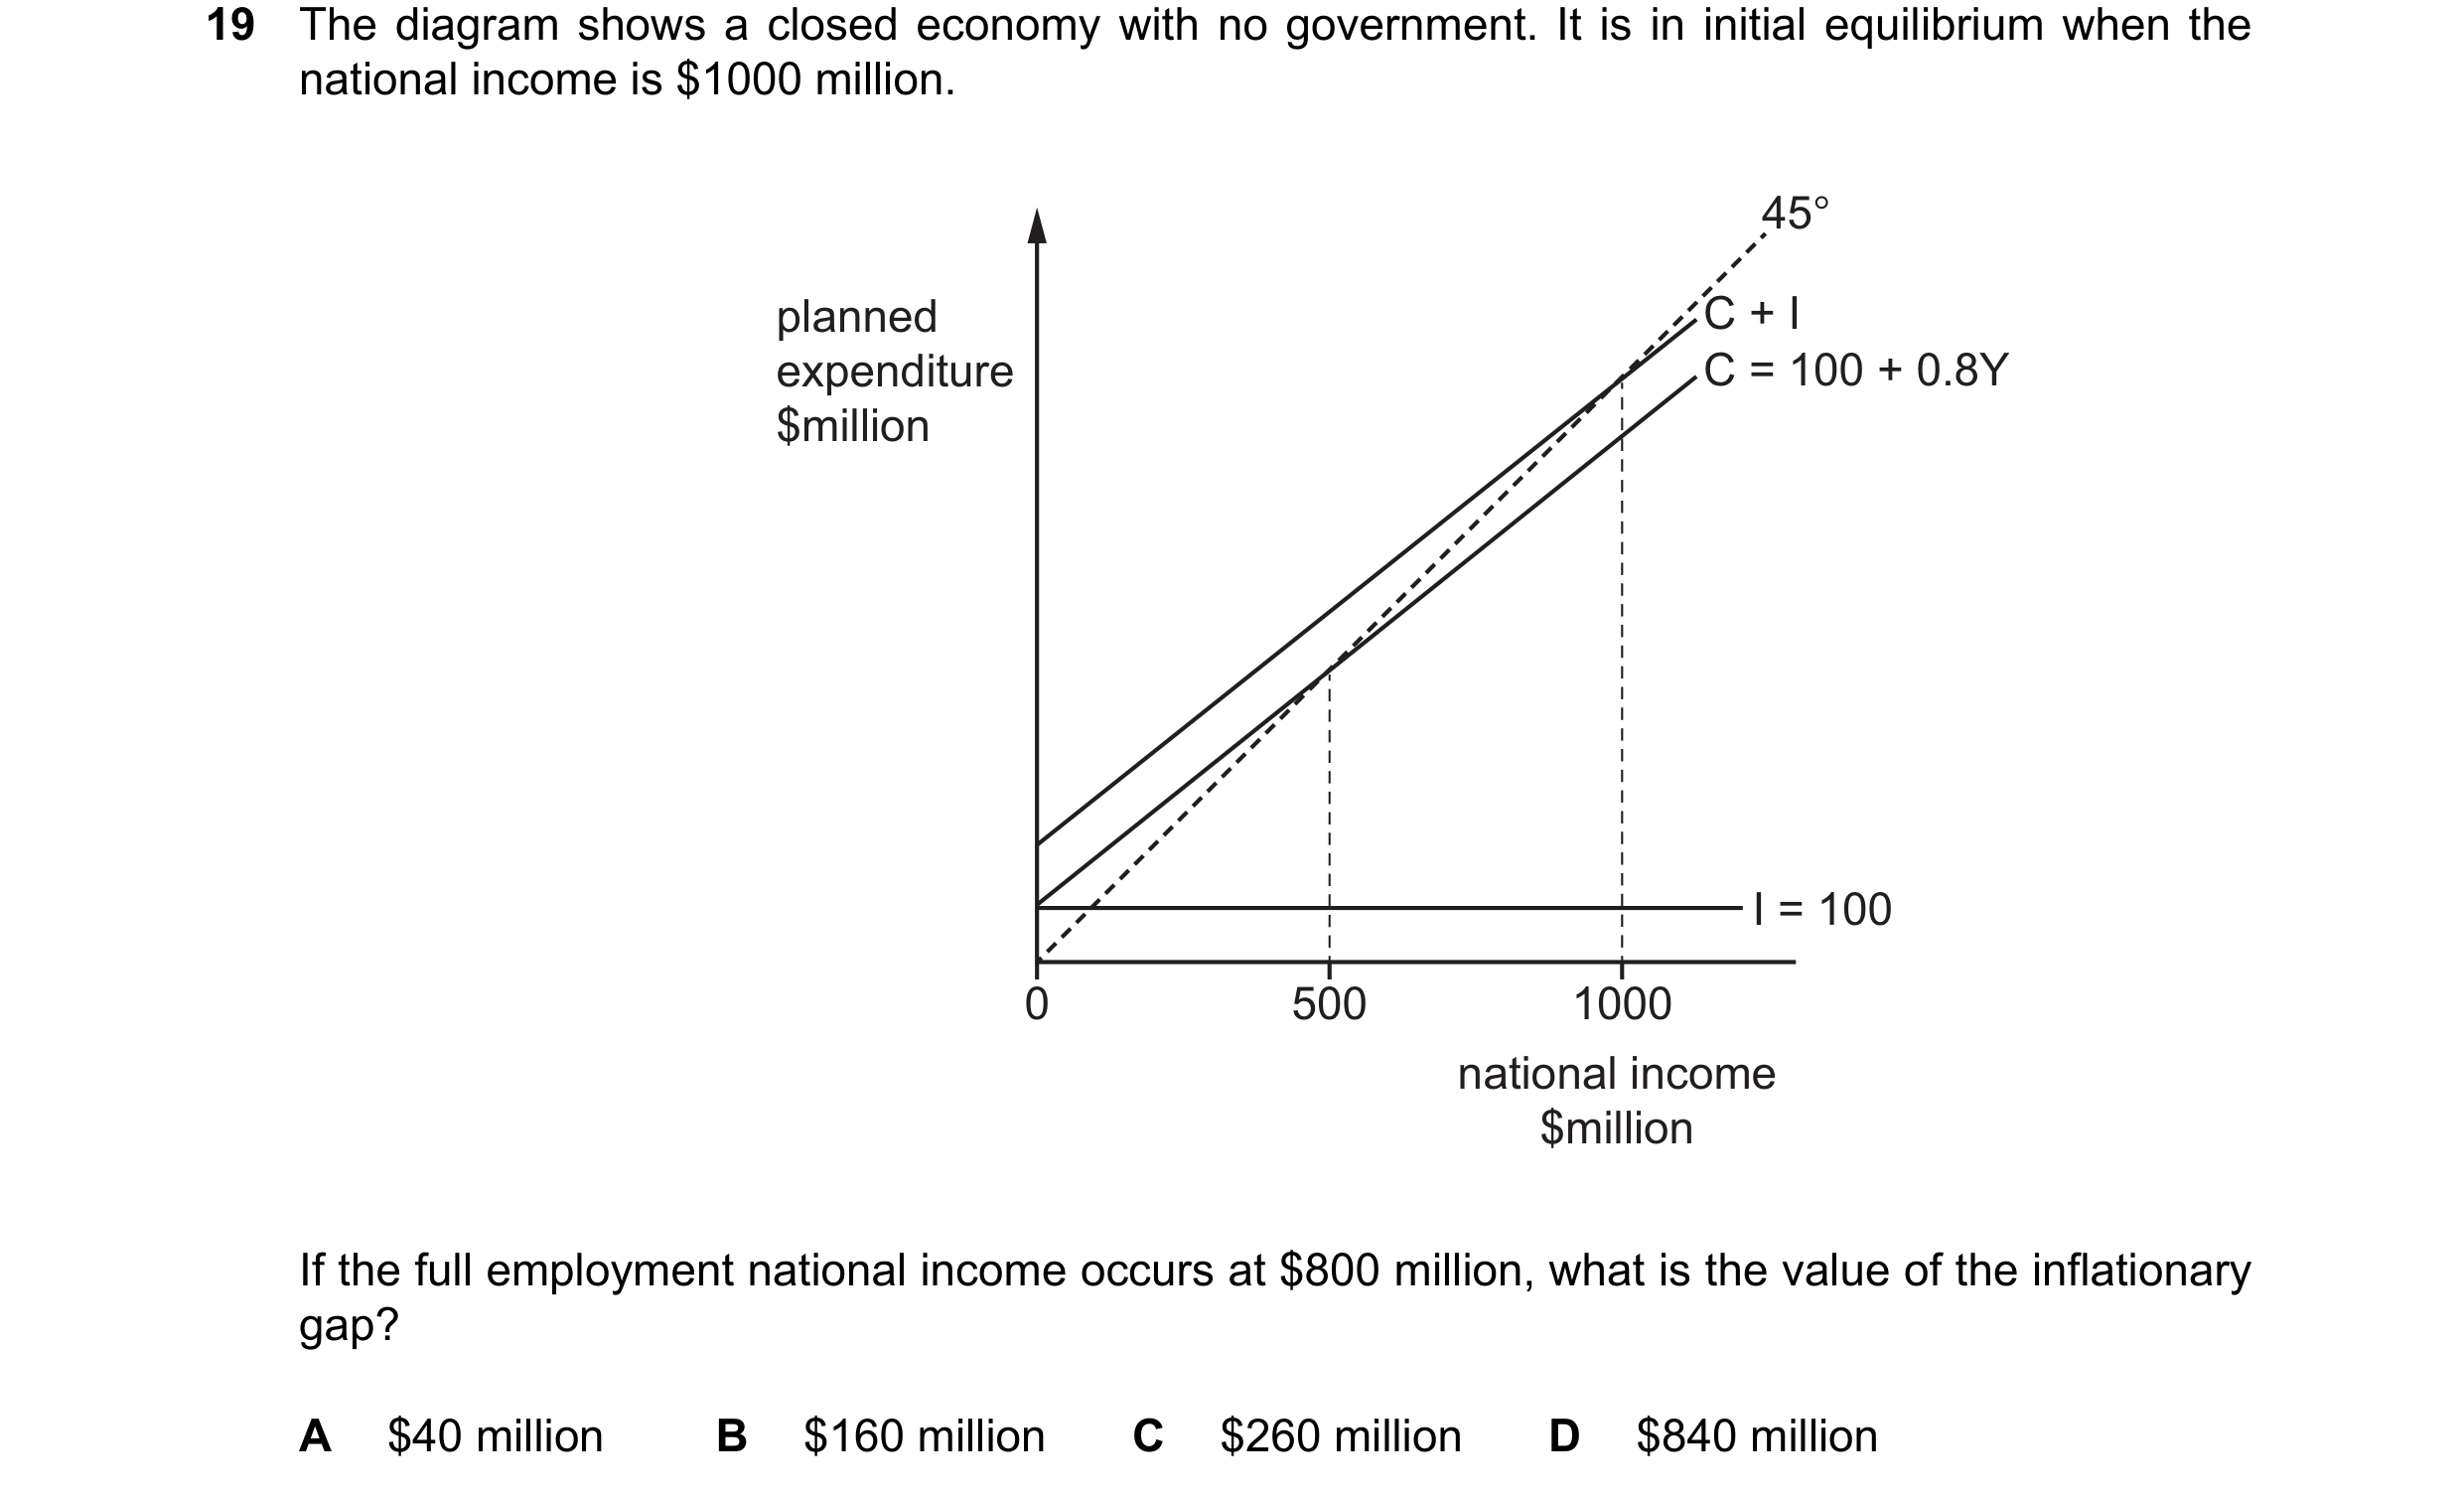
Q92 · The diagram shows a closed economy with no government 9708/32 Feb/March 2025
19 The diagram shows a closed economy with no government. It is in initial equilibrium when the national income is $1000 million. 45° planned C + I expenditure C = 100 + 0.8Y $million I = 100 0 500 1000 national income $million If the full employment national income occurs at $800 million, what is the value of the inflationary gap? A $40 million B $160 million C $260 million D $840 million
1 marks
Answer: A
This question in 9708/32 Feb/March 2025
 1 / 22


 2 / 22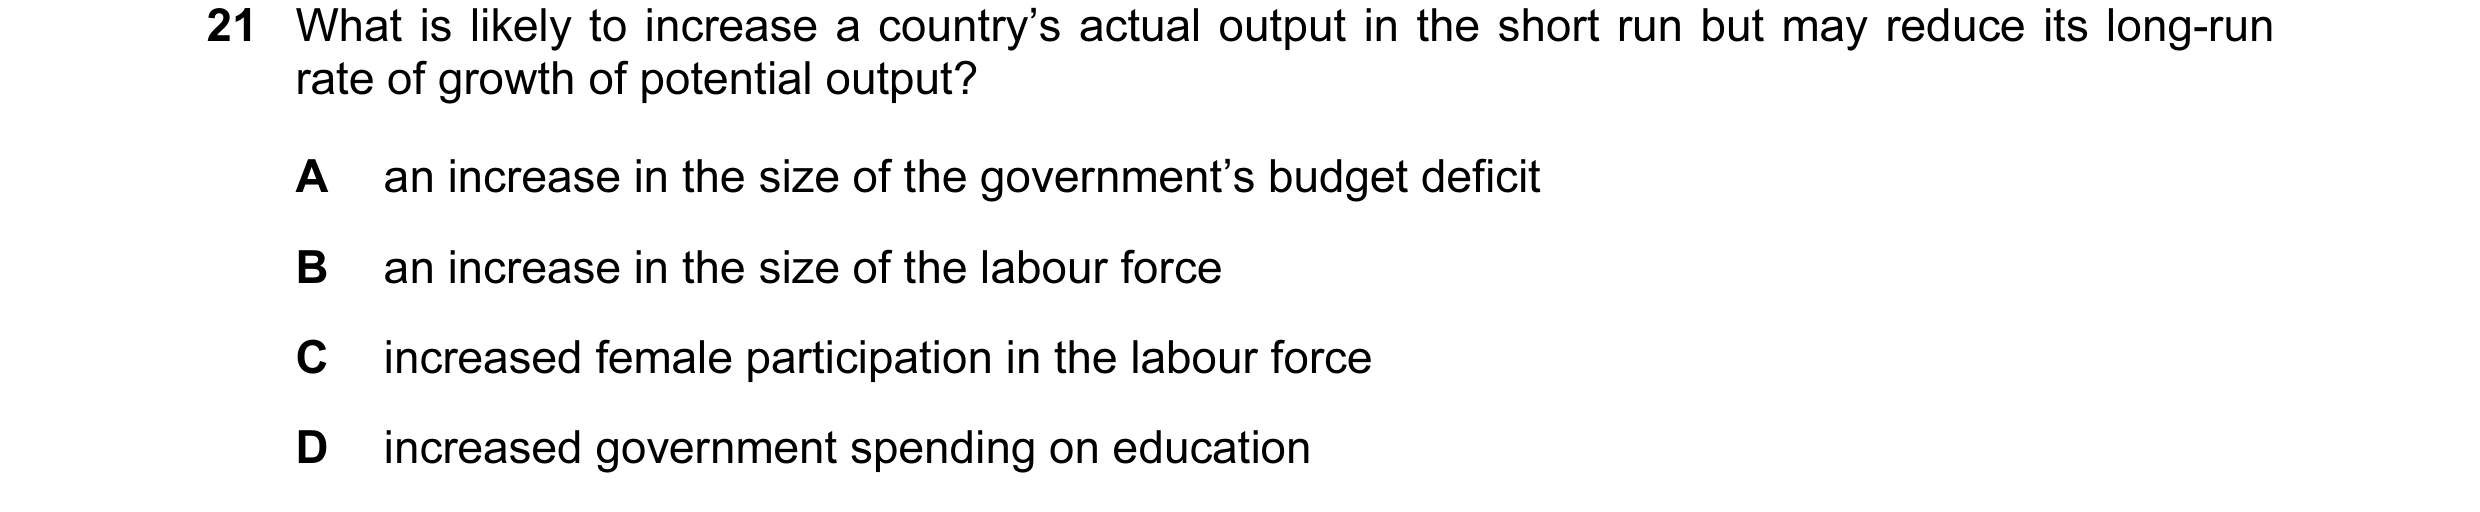

 3 / 22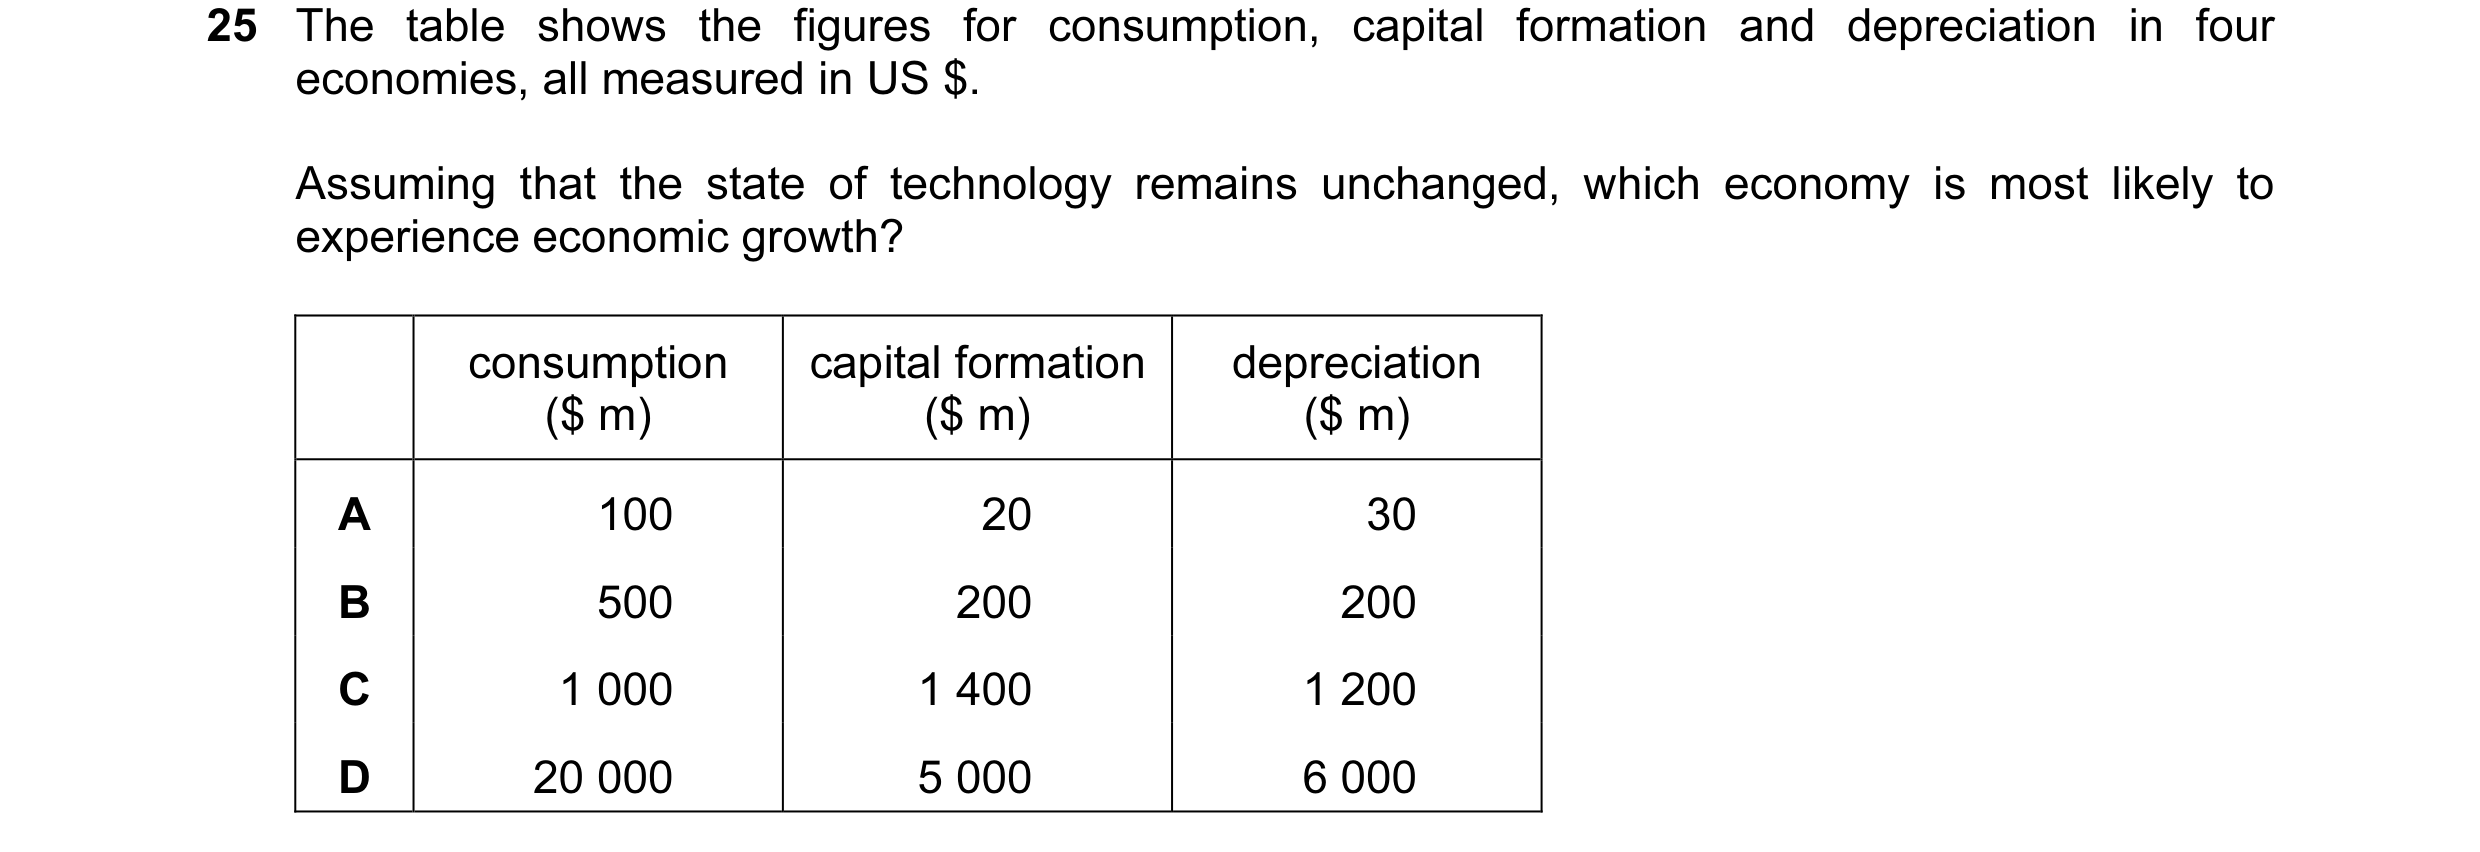
 4 / 22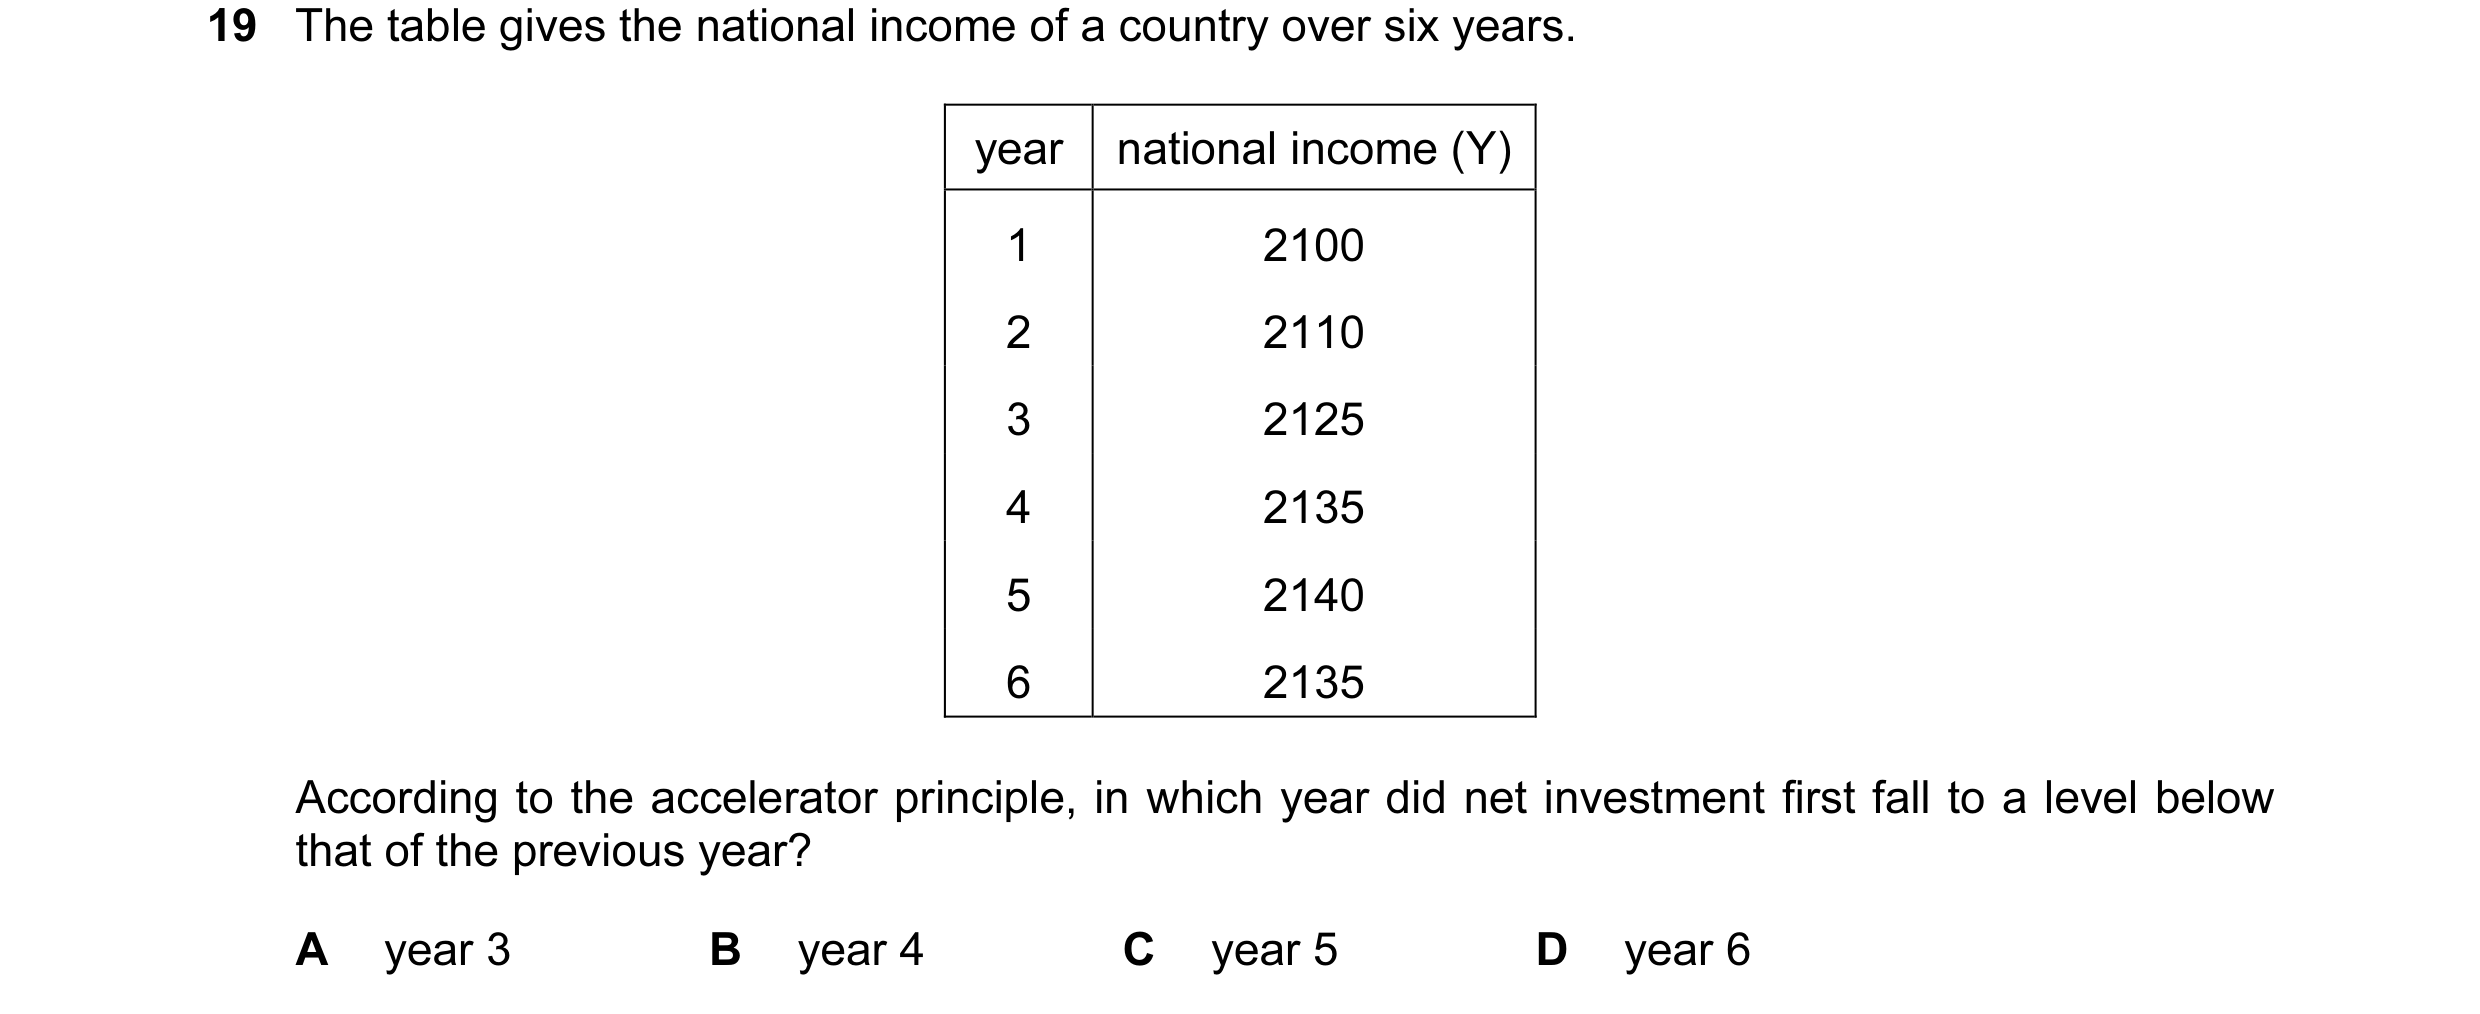

 5 / 22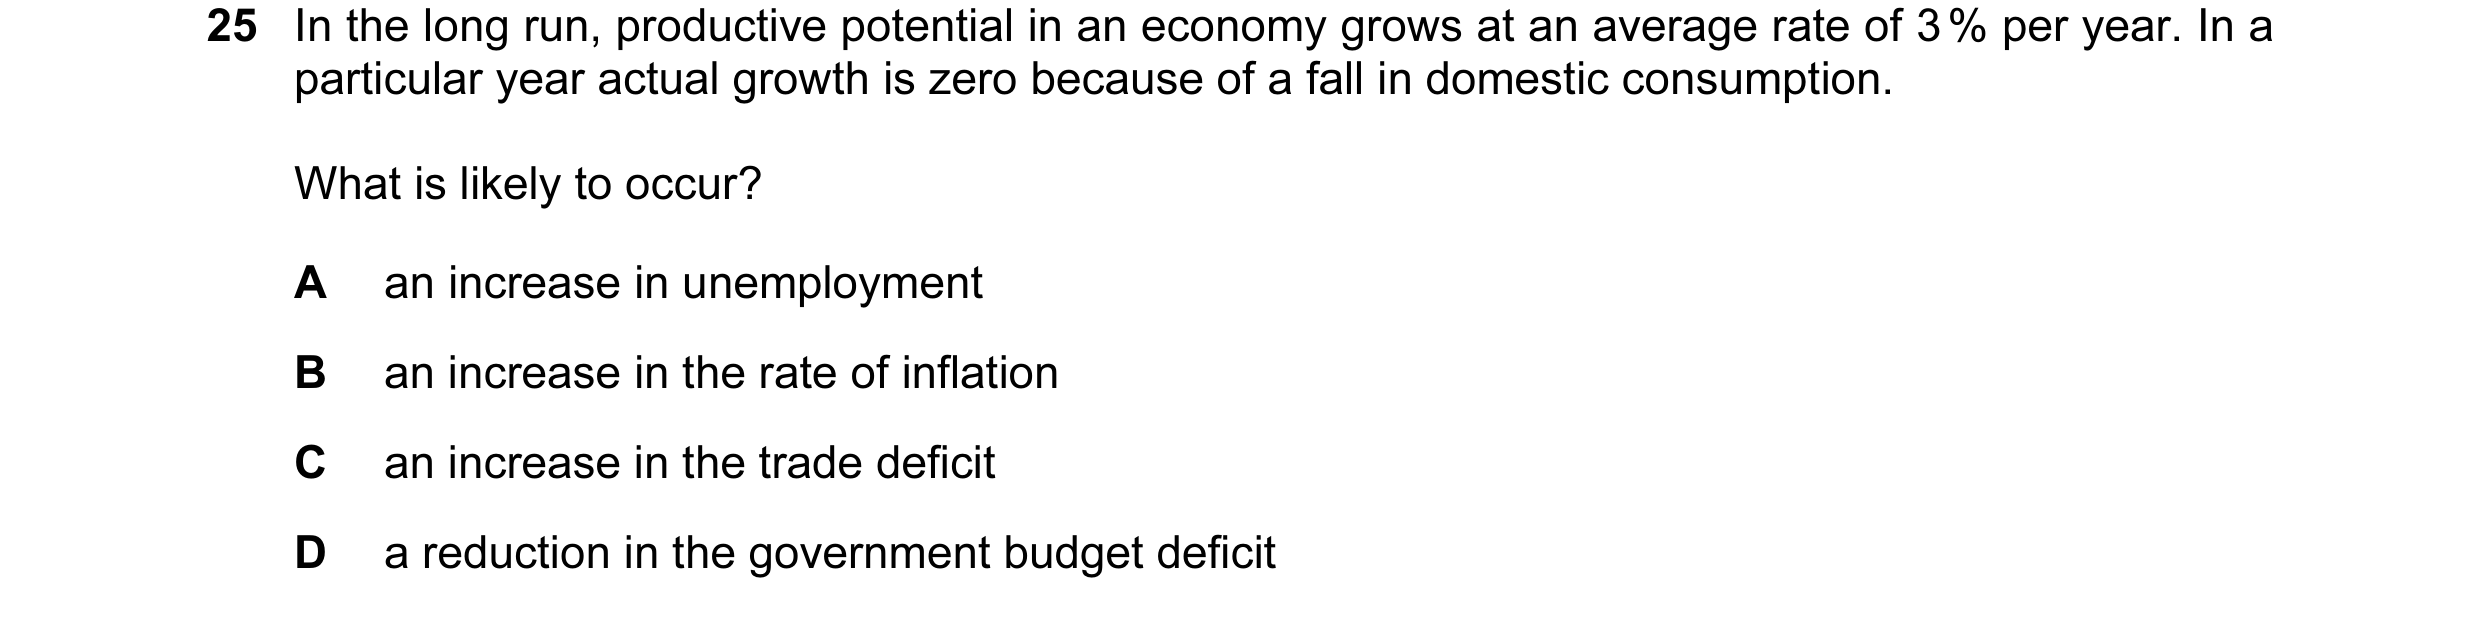
 6 / 22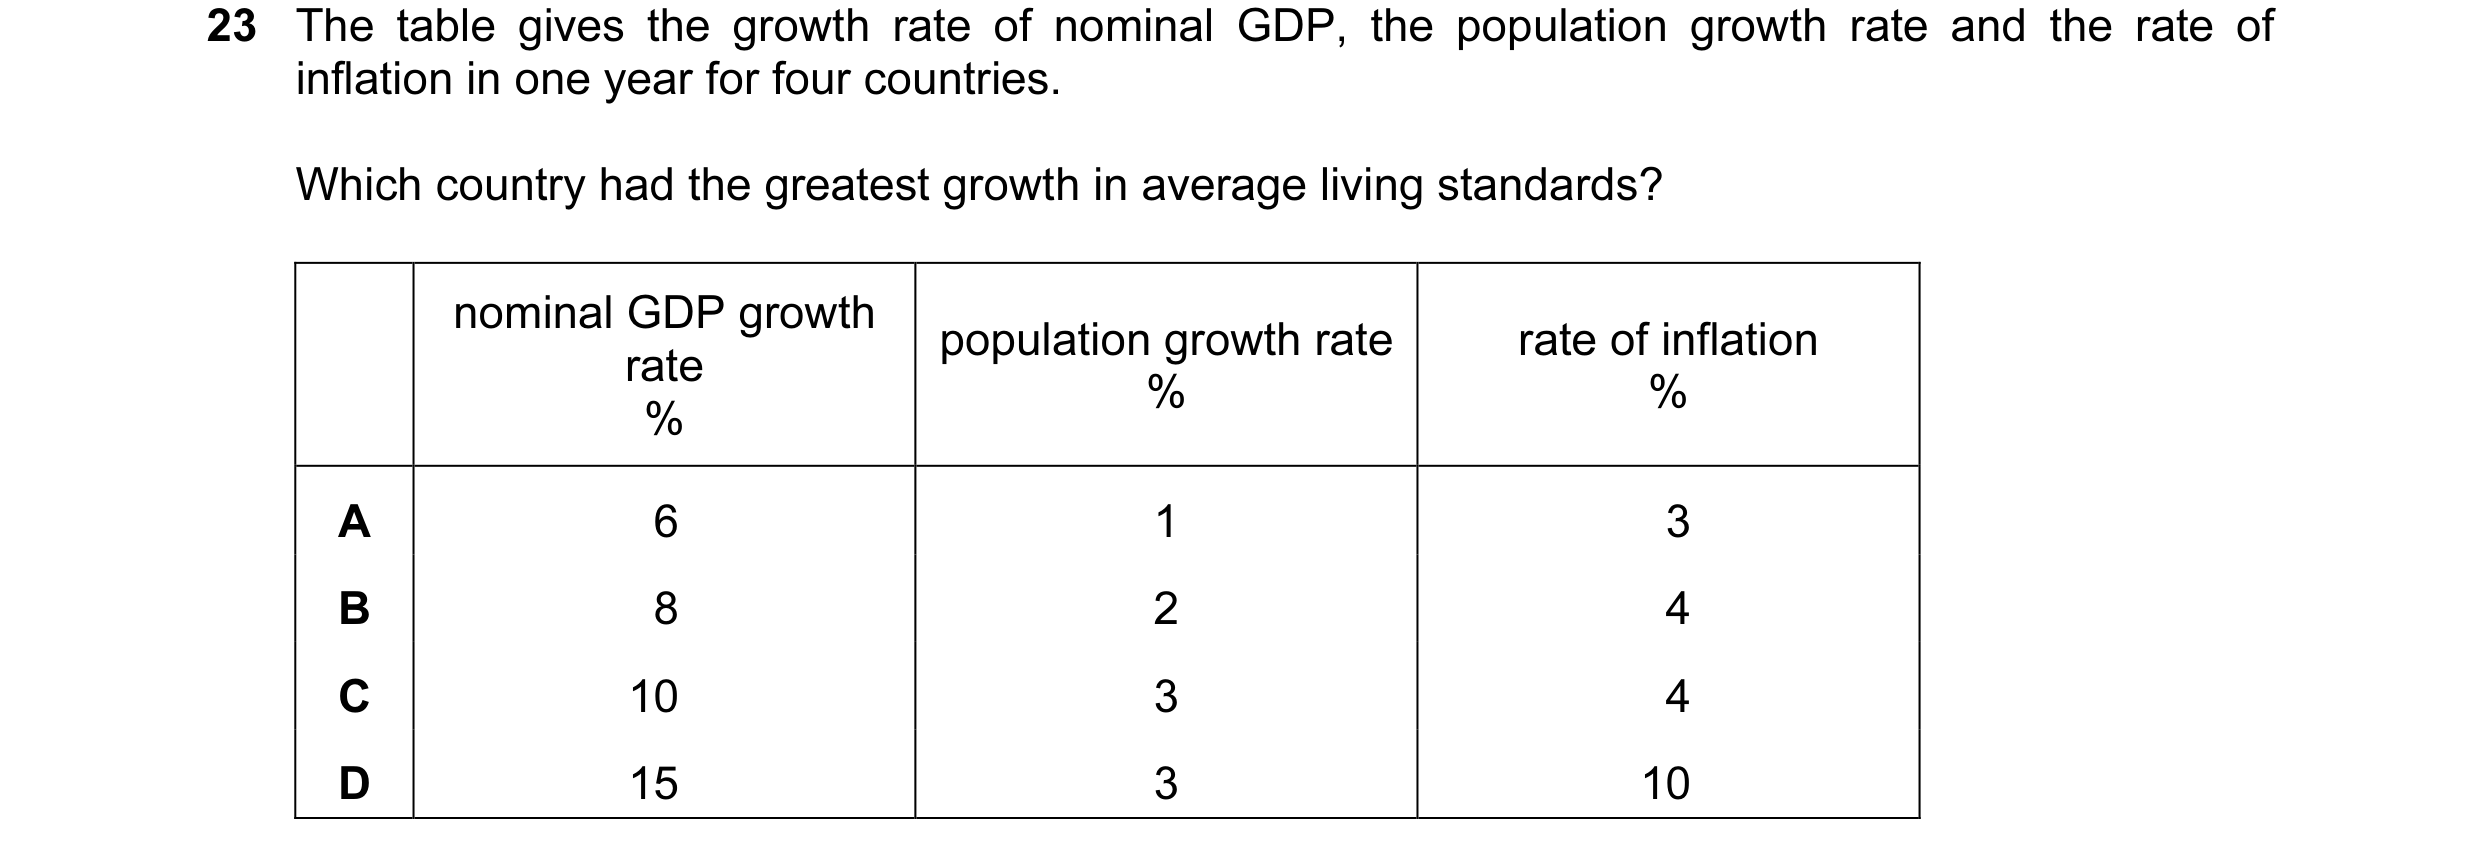


 7 / 22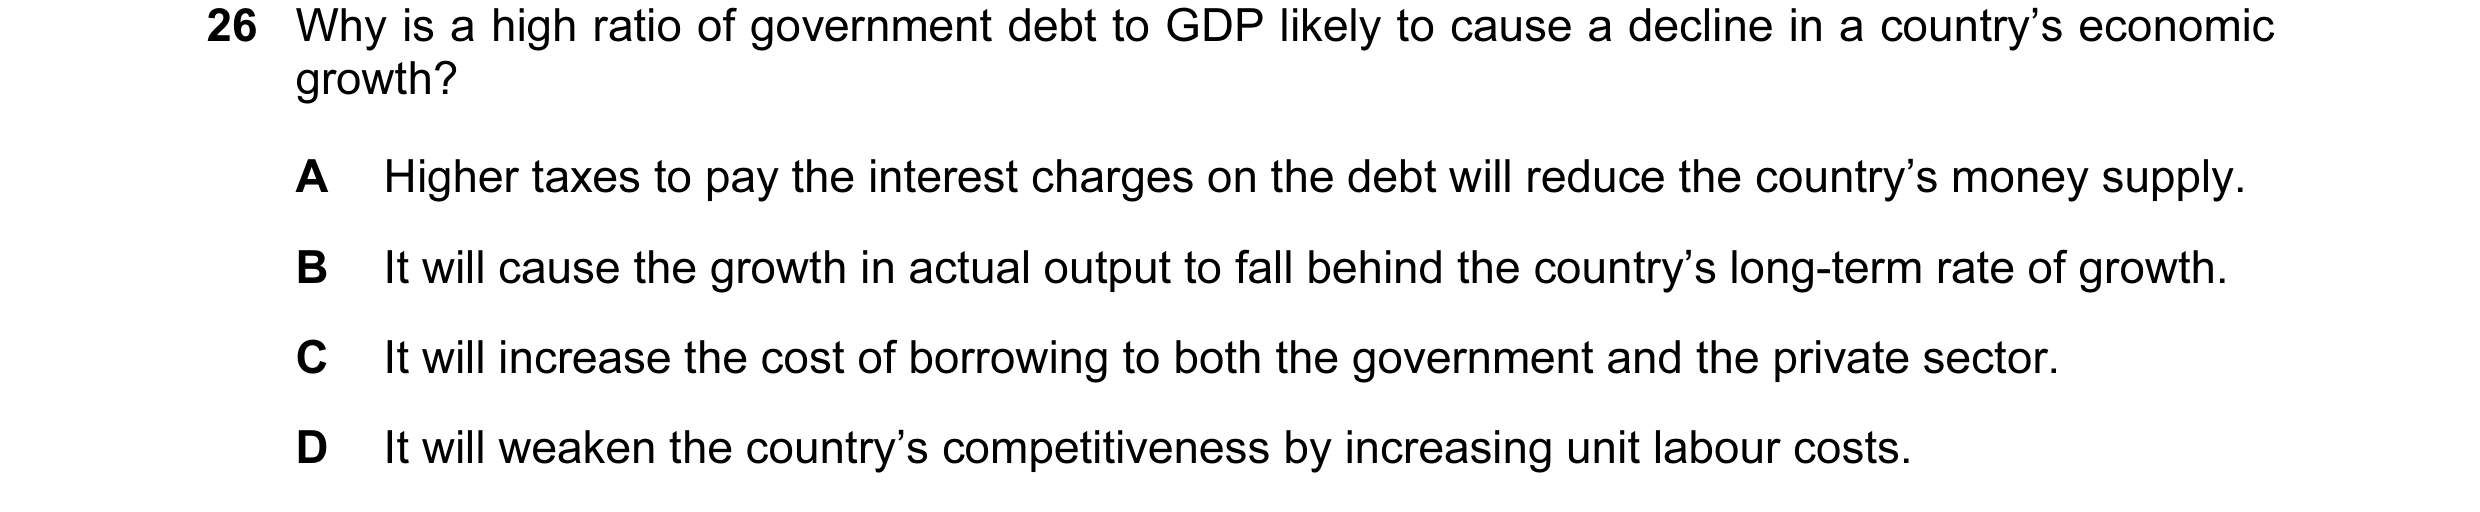

 8 / 22
 9 / 22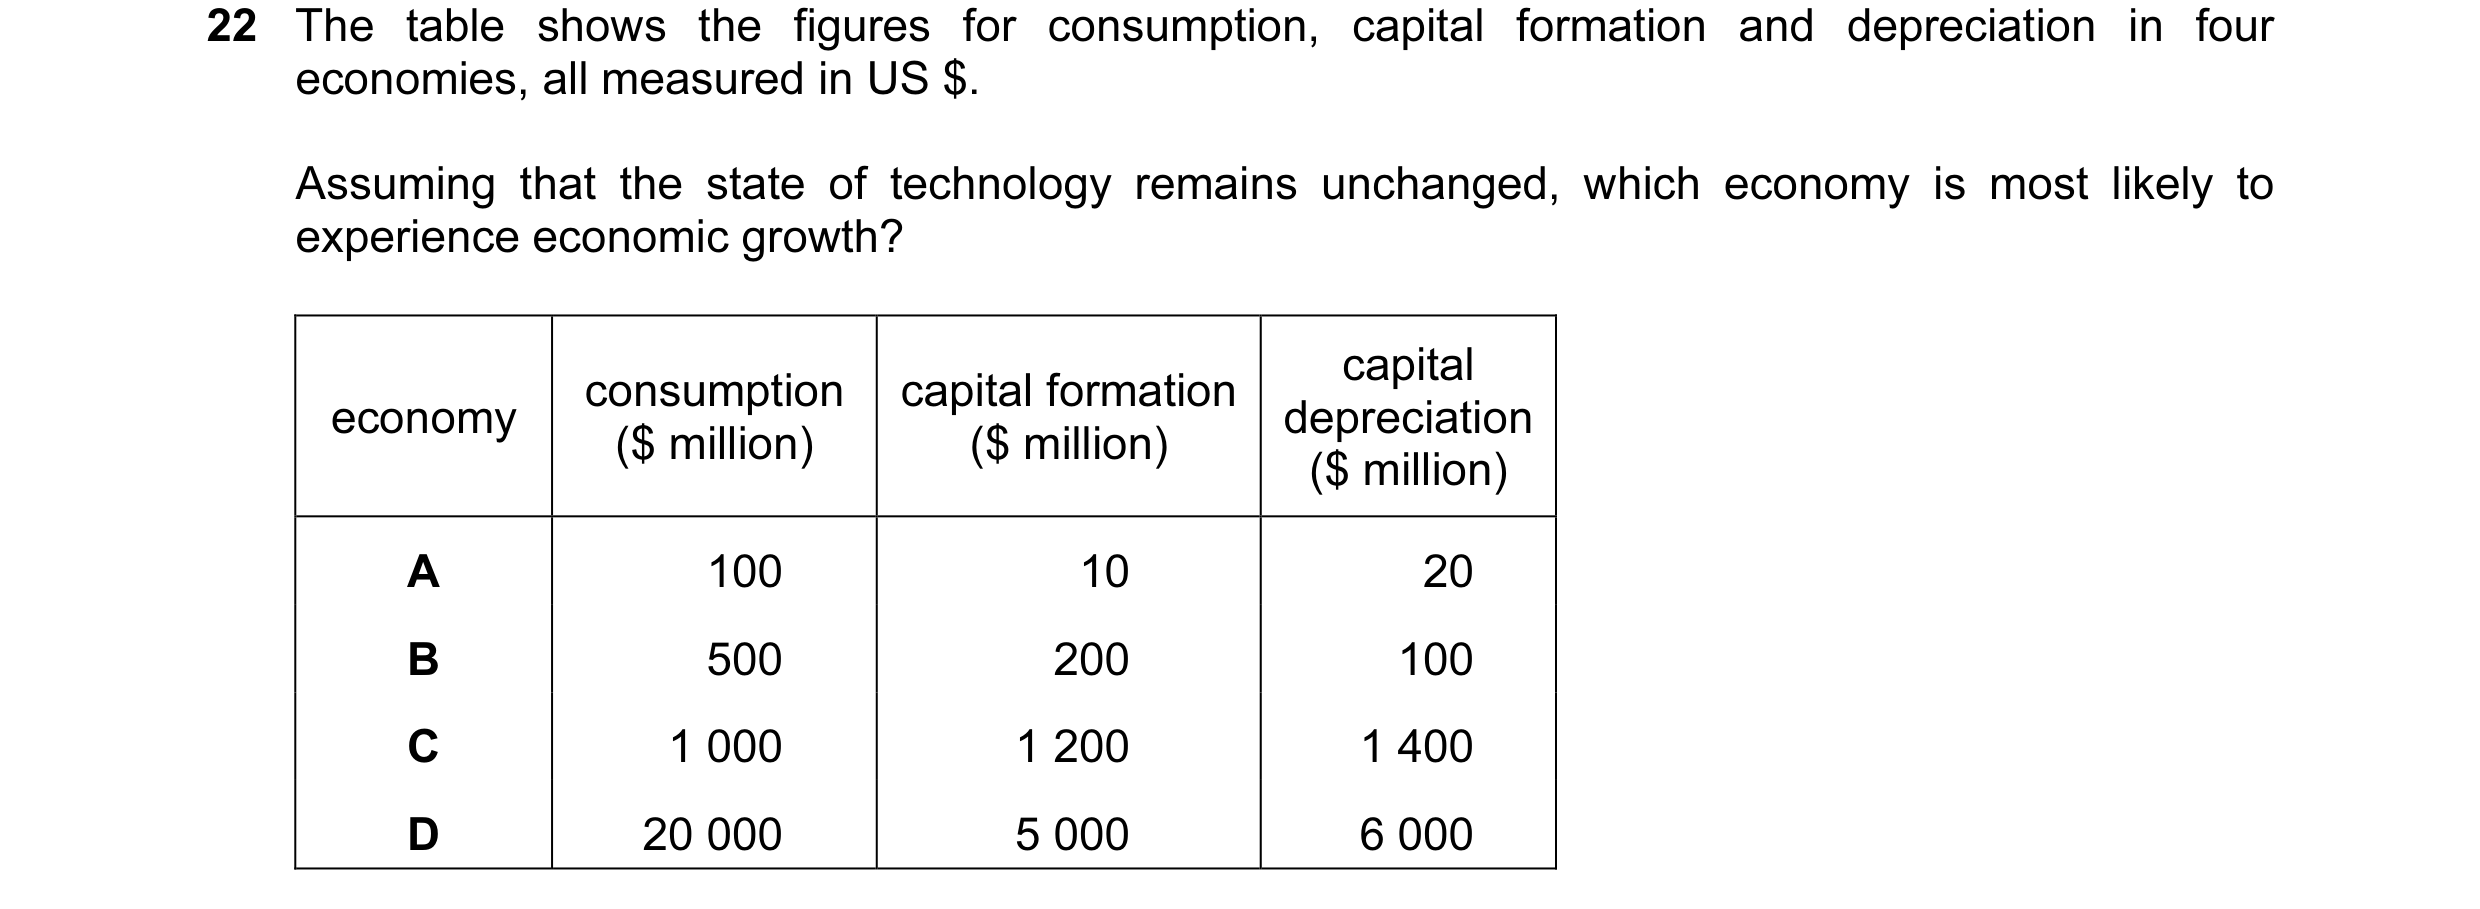
 10 / 22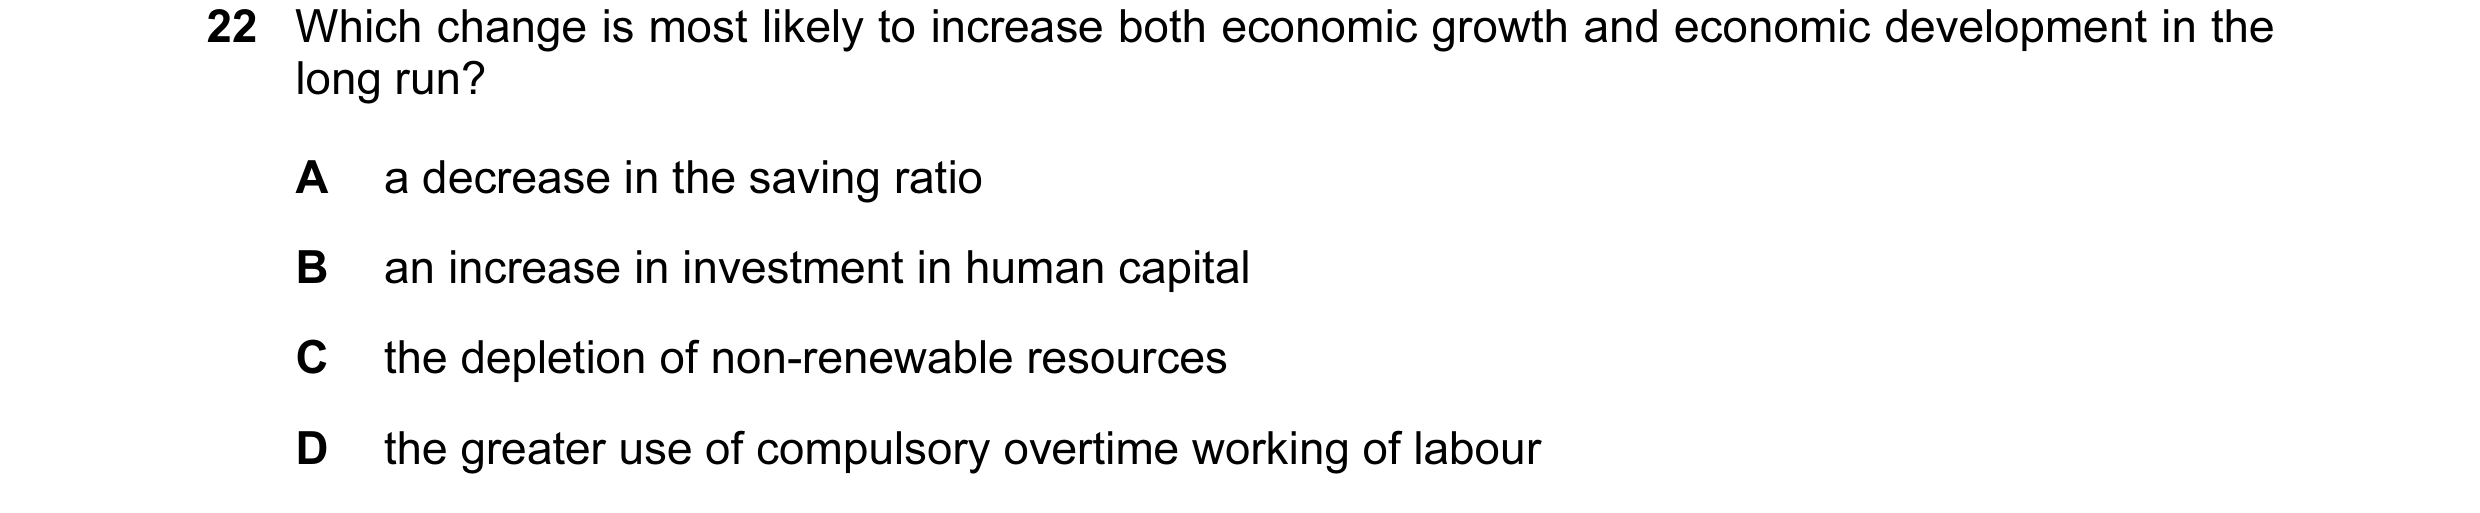



 11 / 22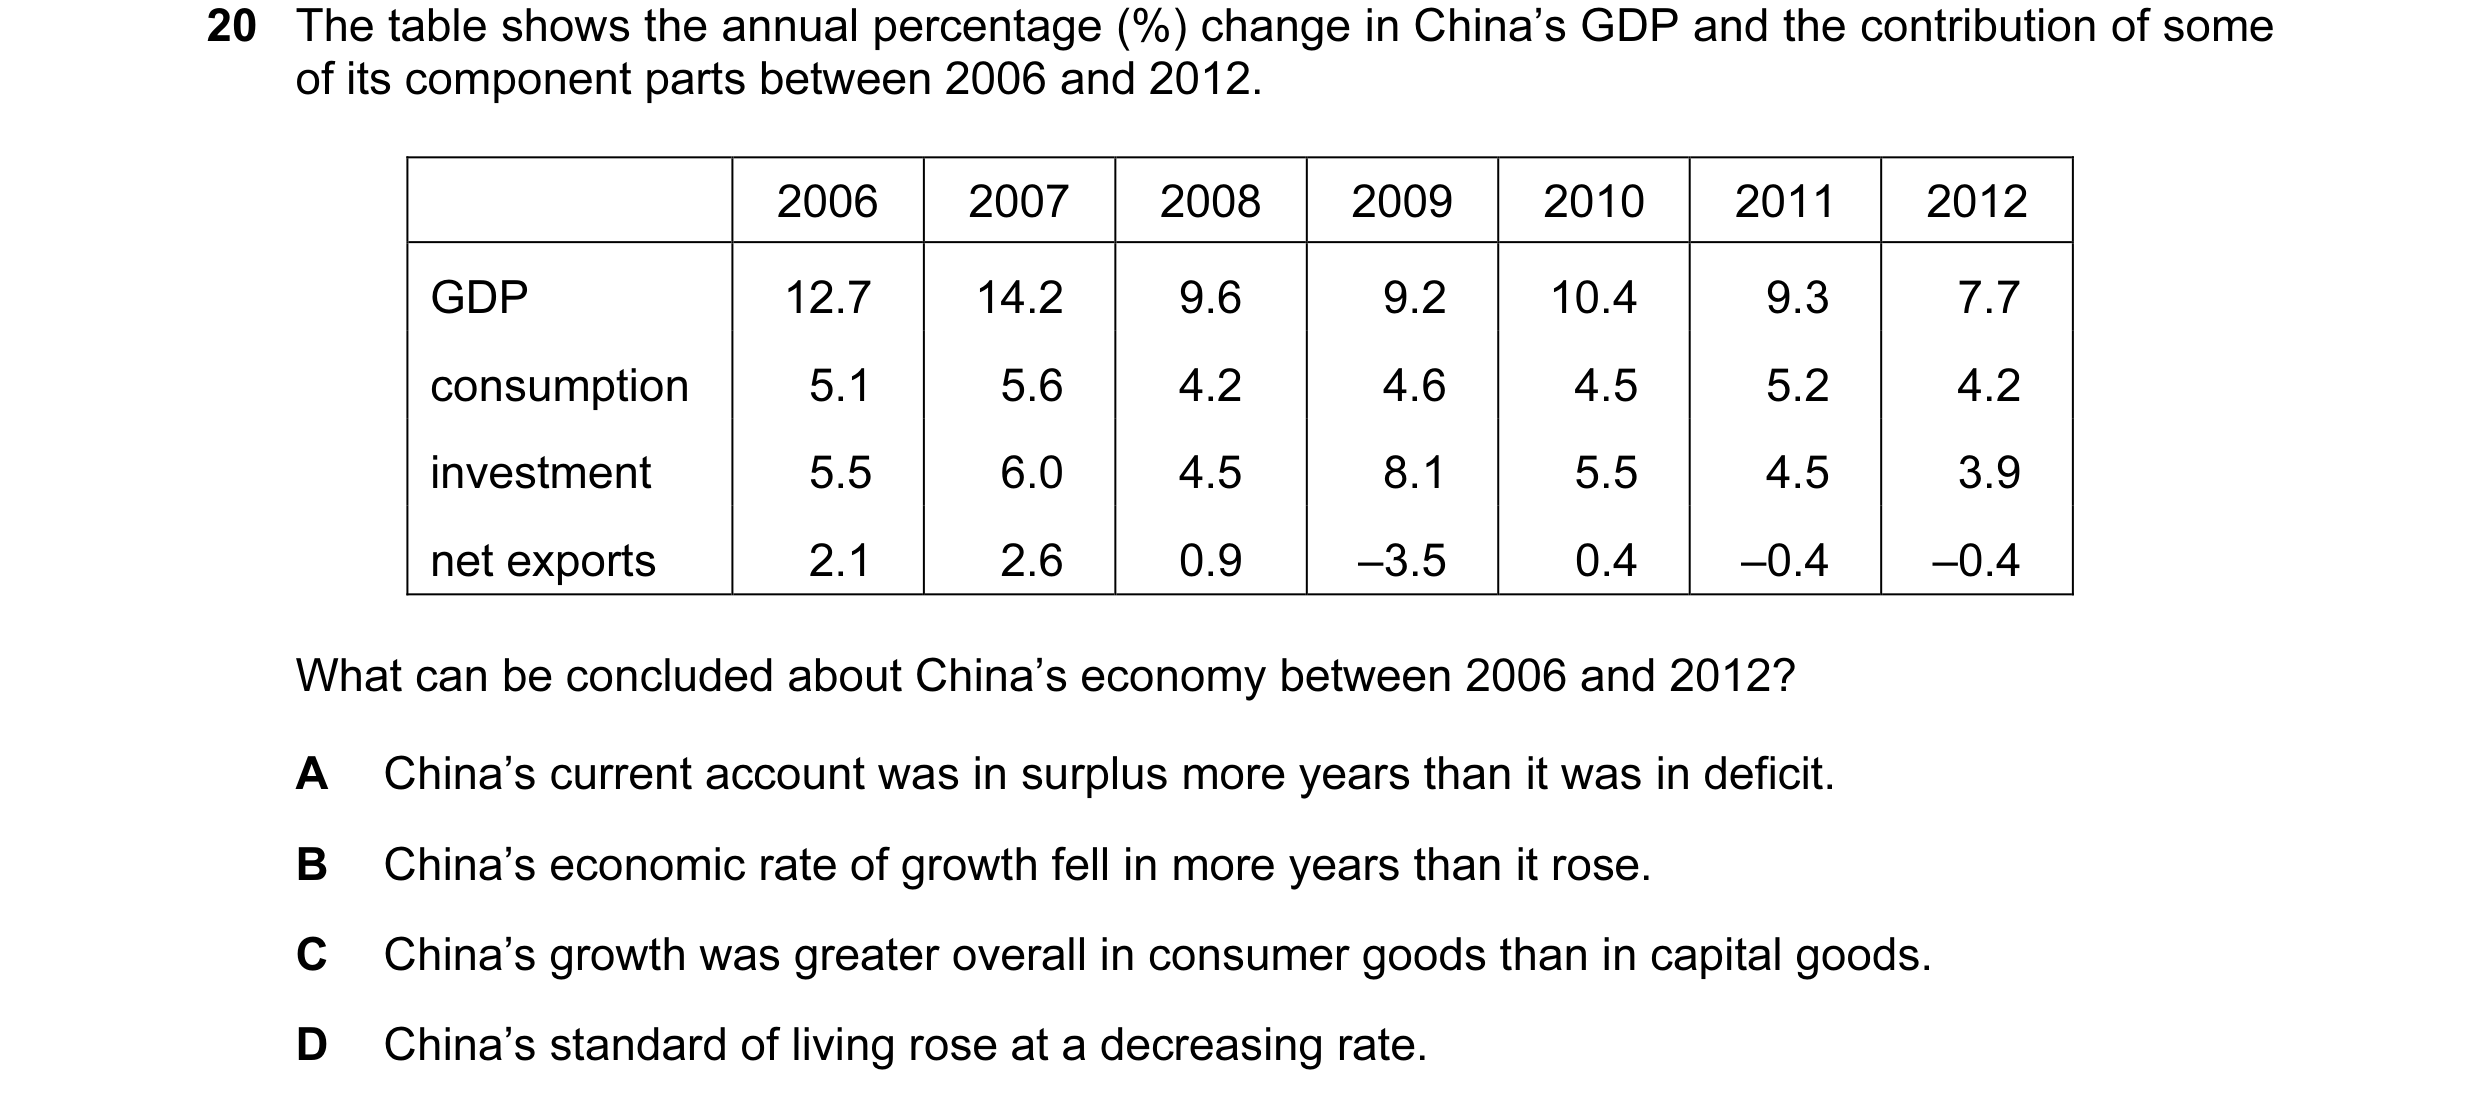

 12 / 22
 13 / 22

 14 / 22
 15 / 22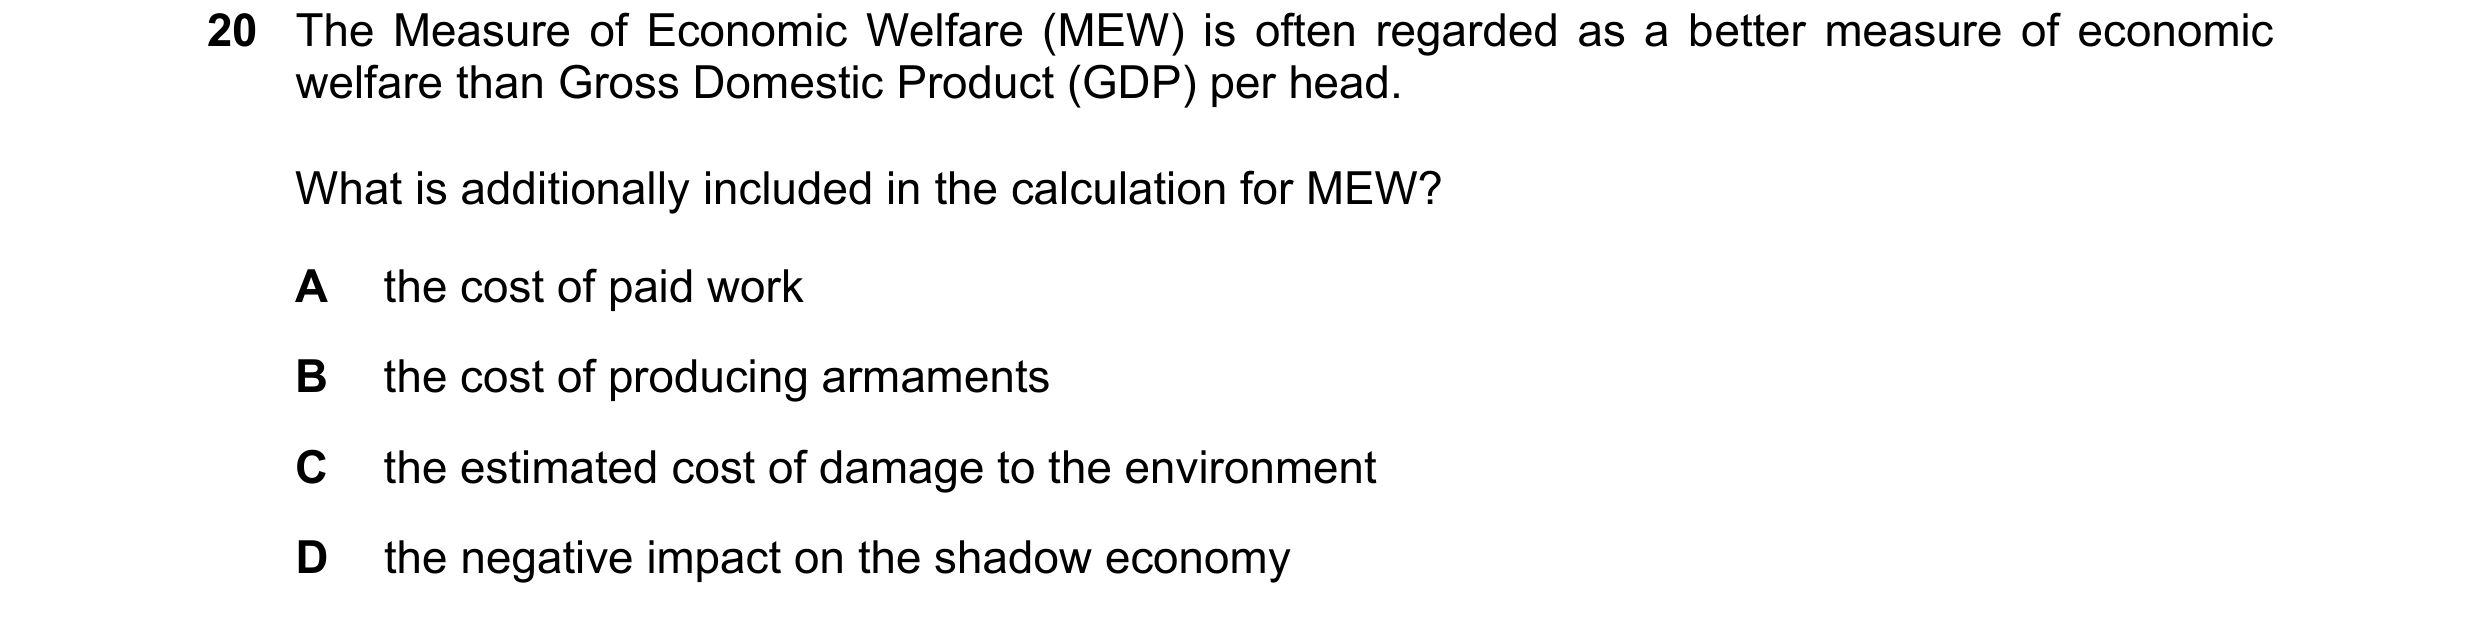
 16 / 22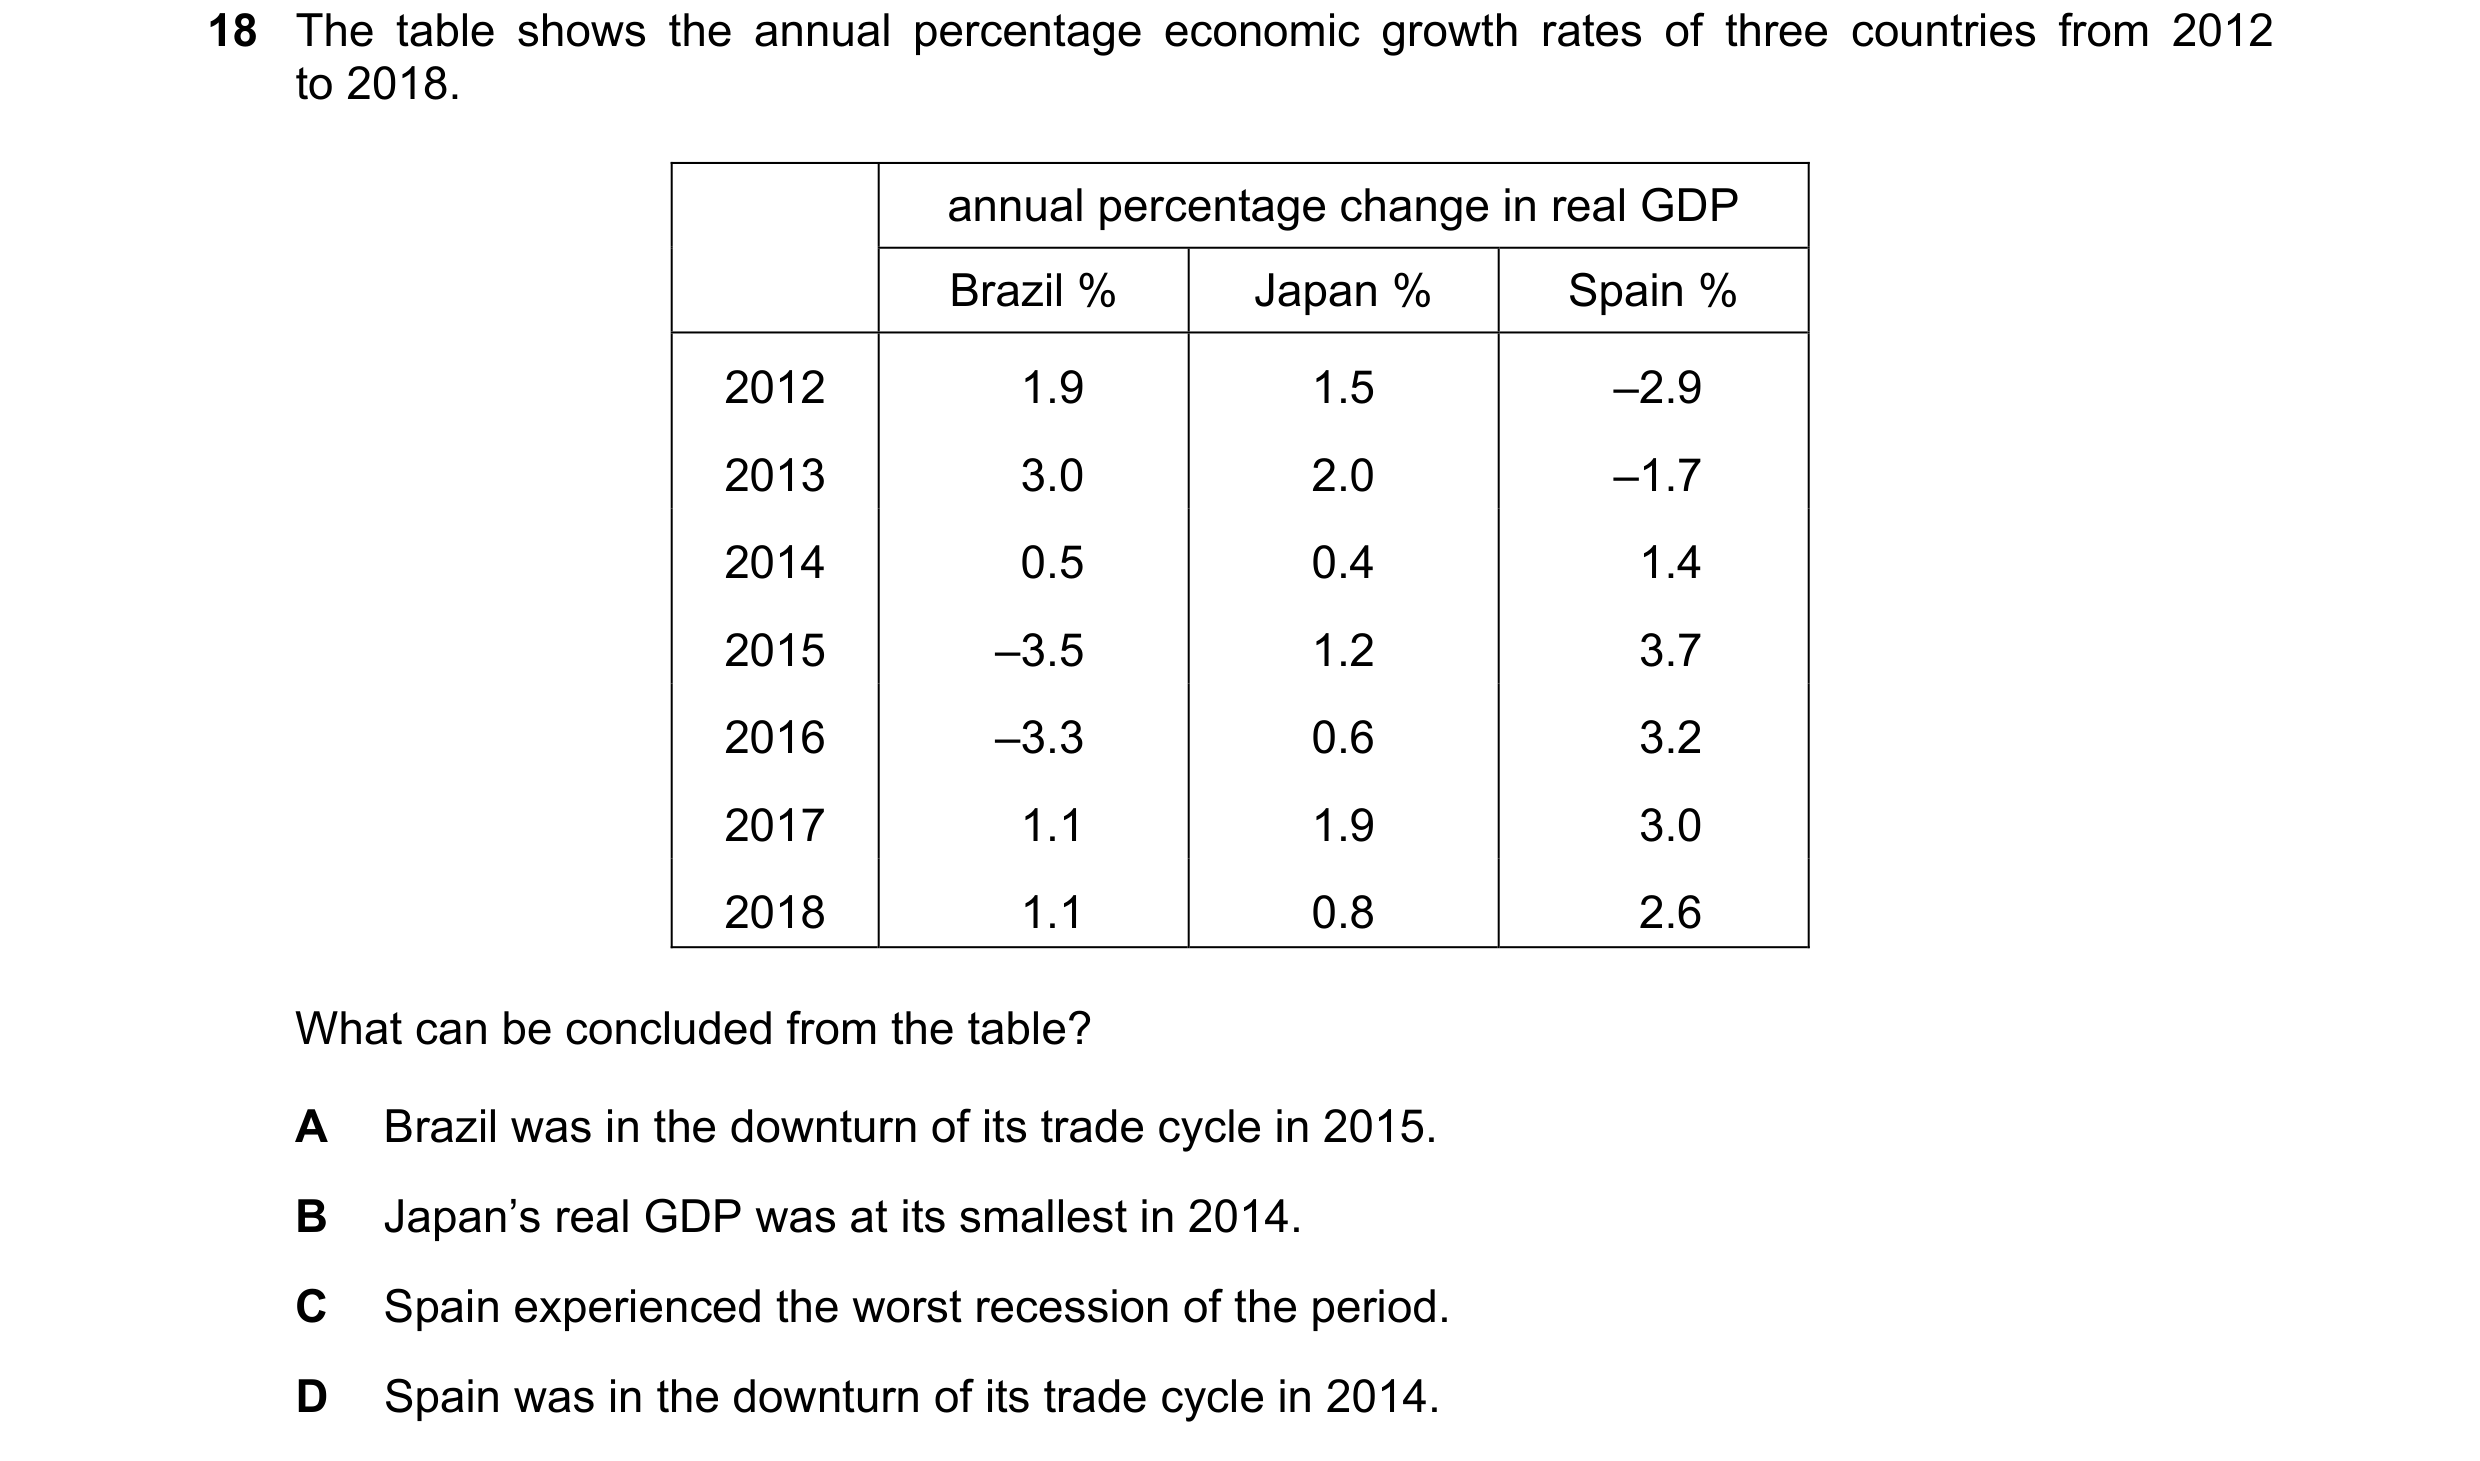

 17 / 22

 18 / 22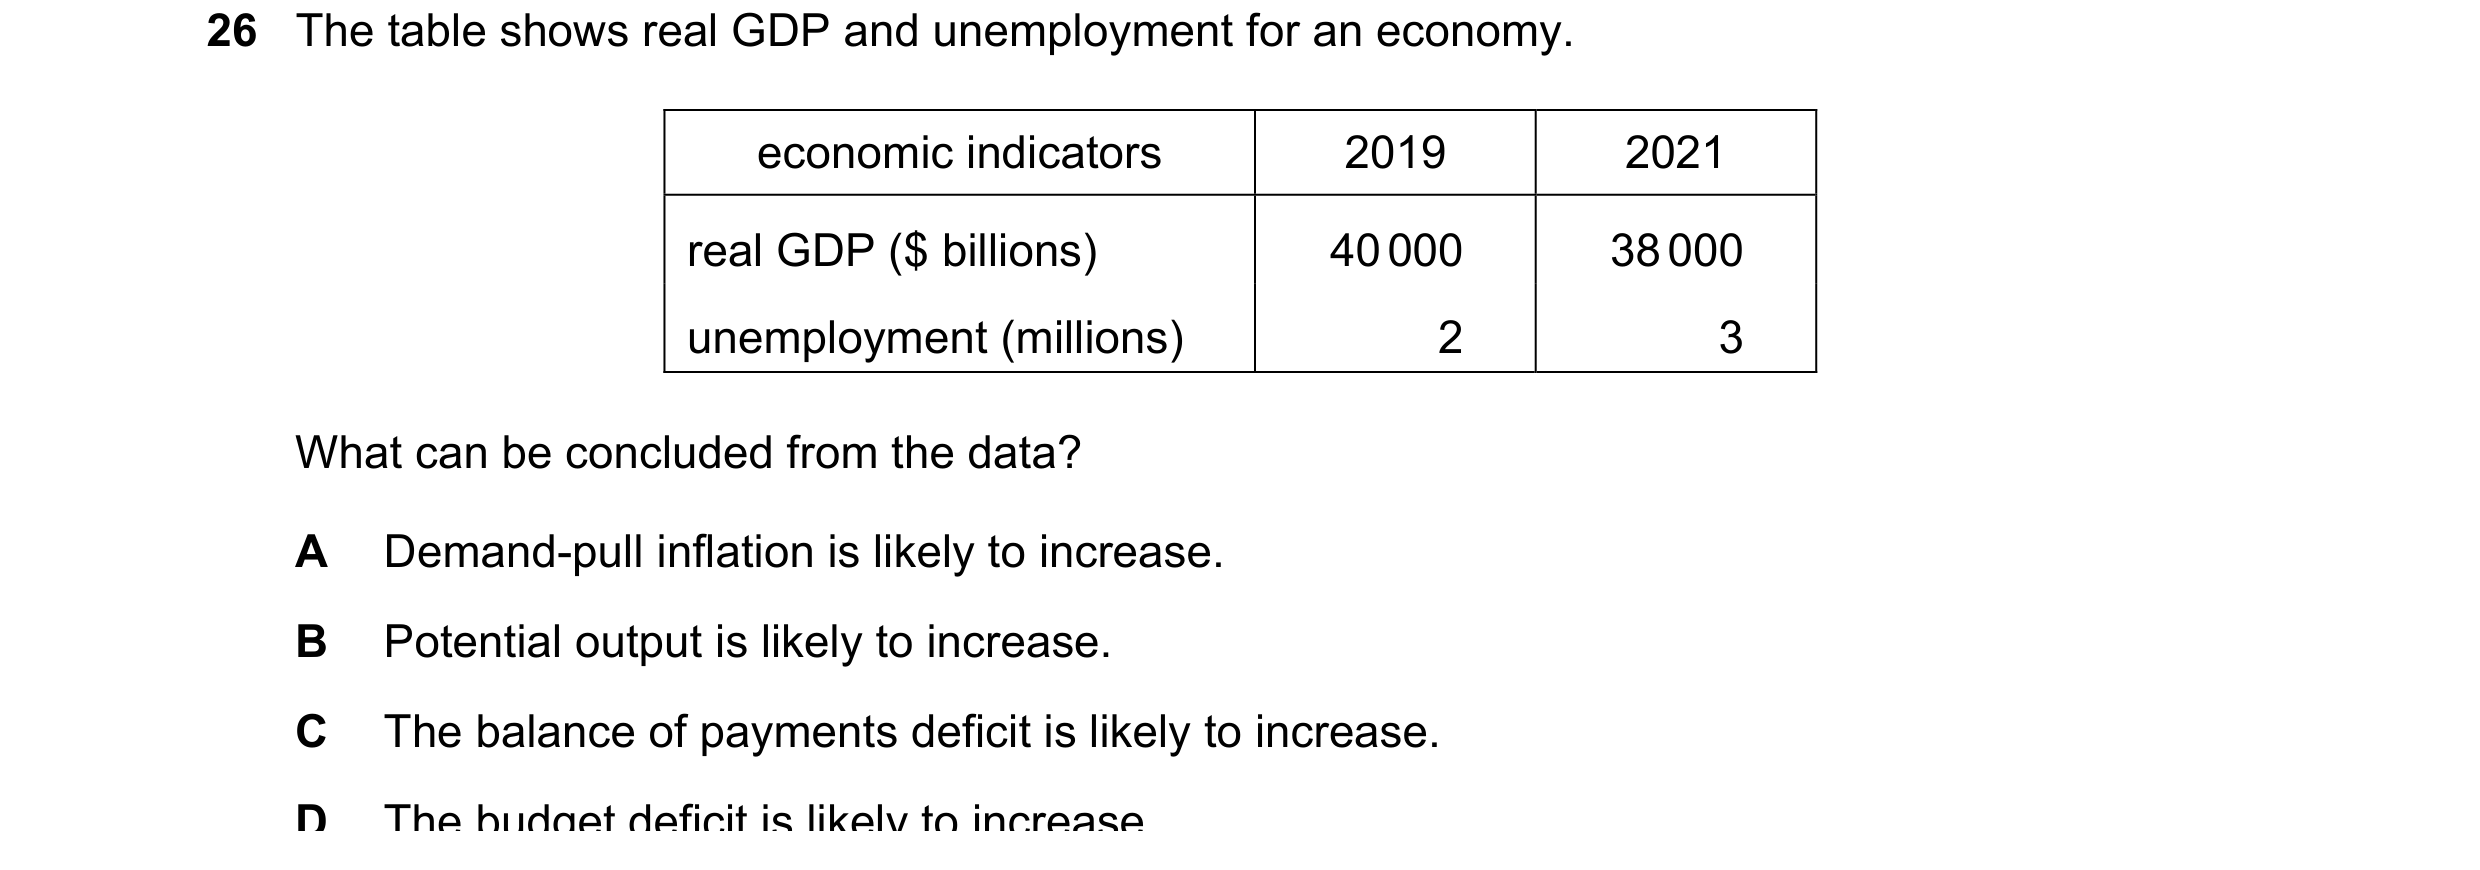
 19 / 22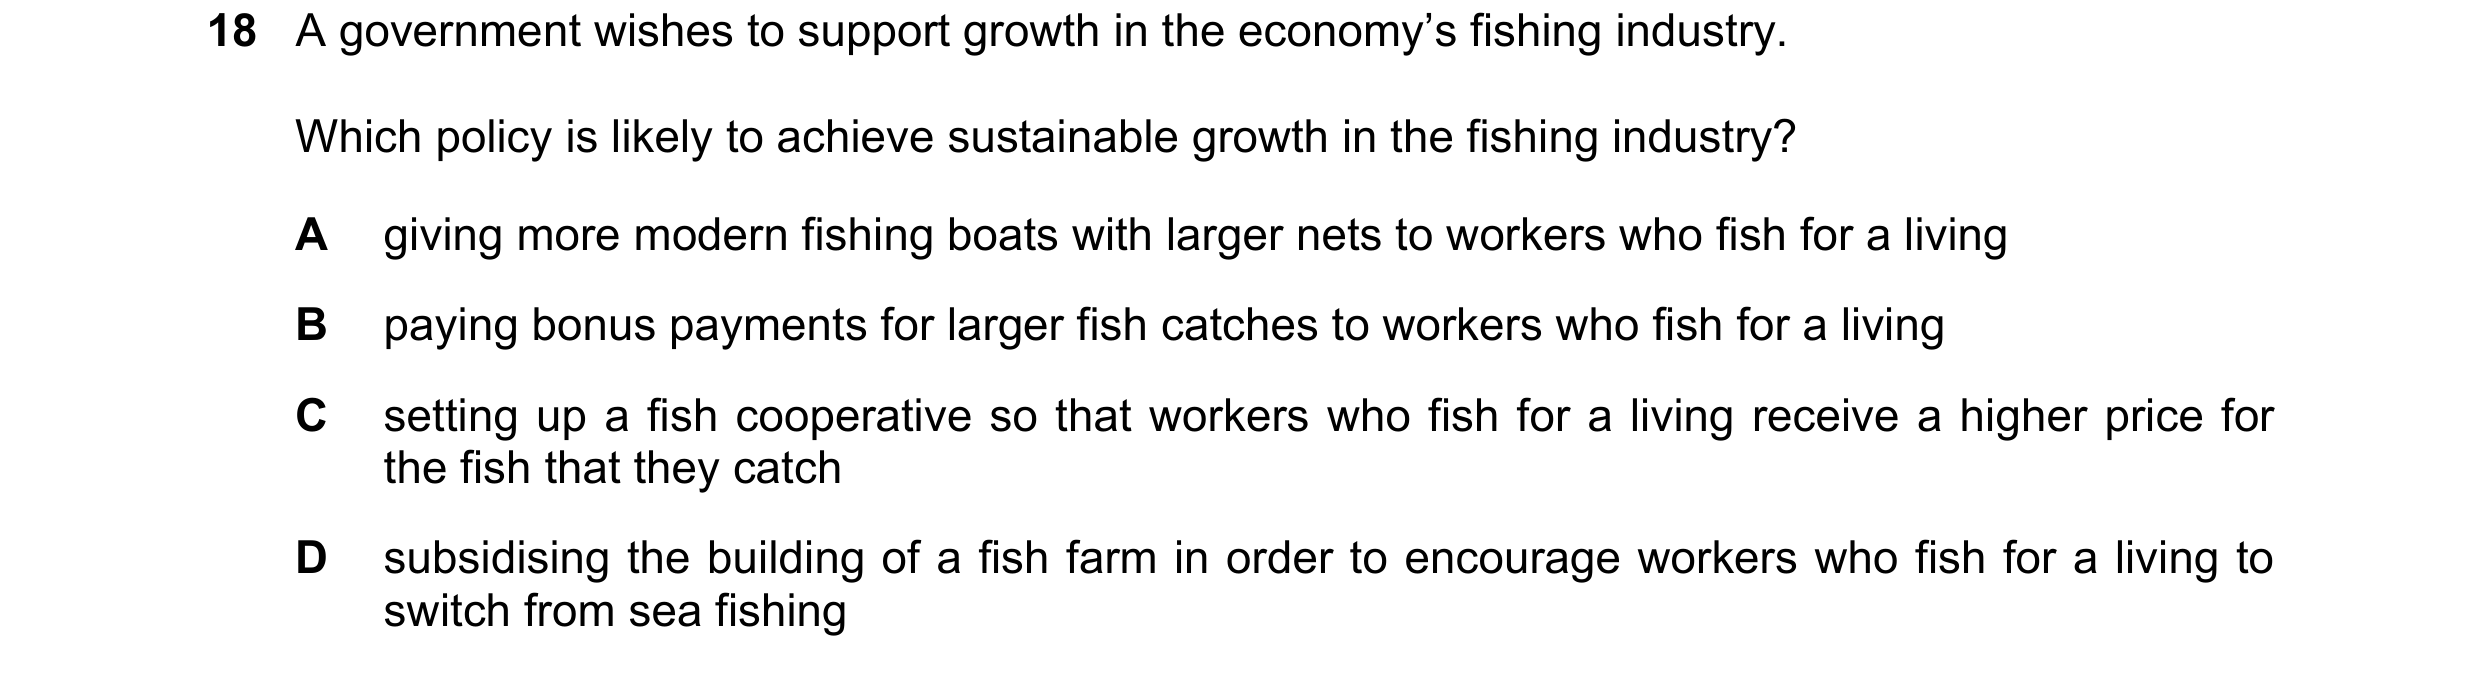

 20 / 22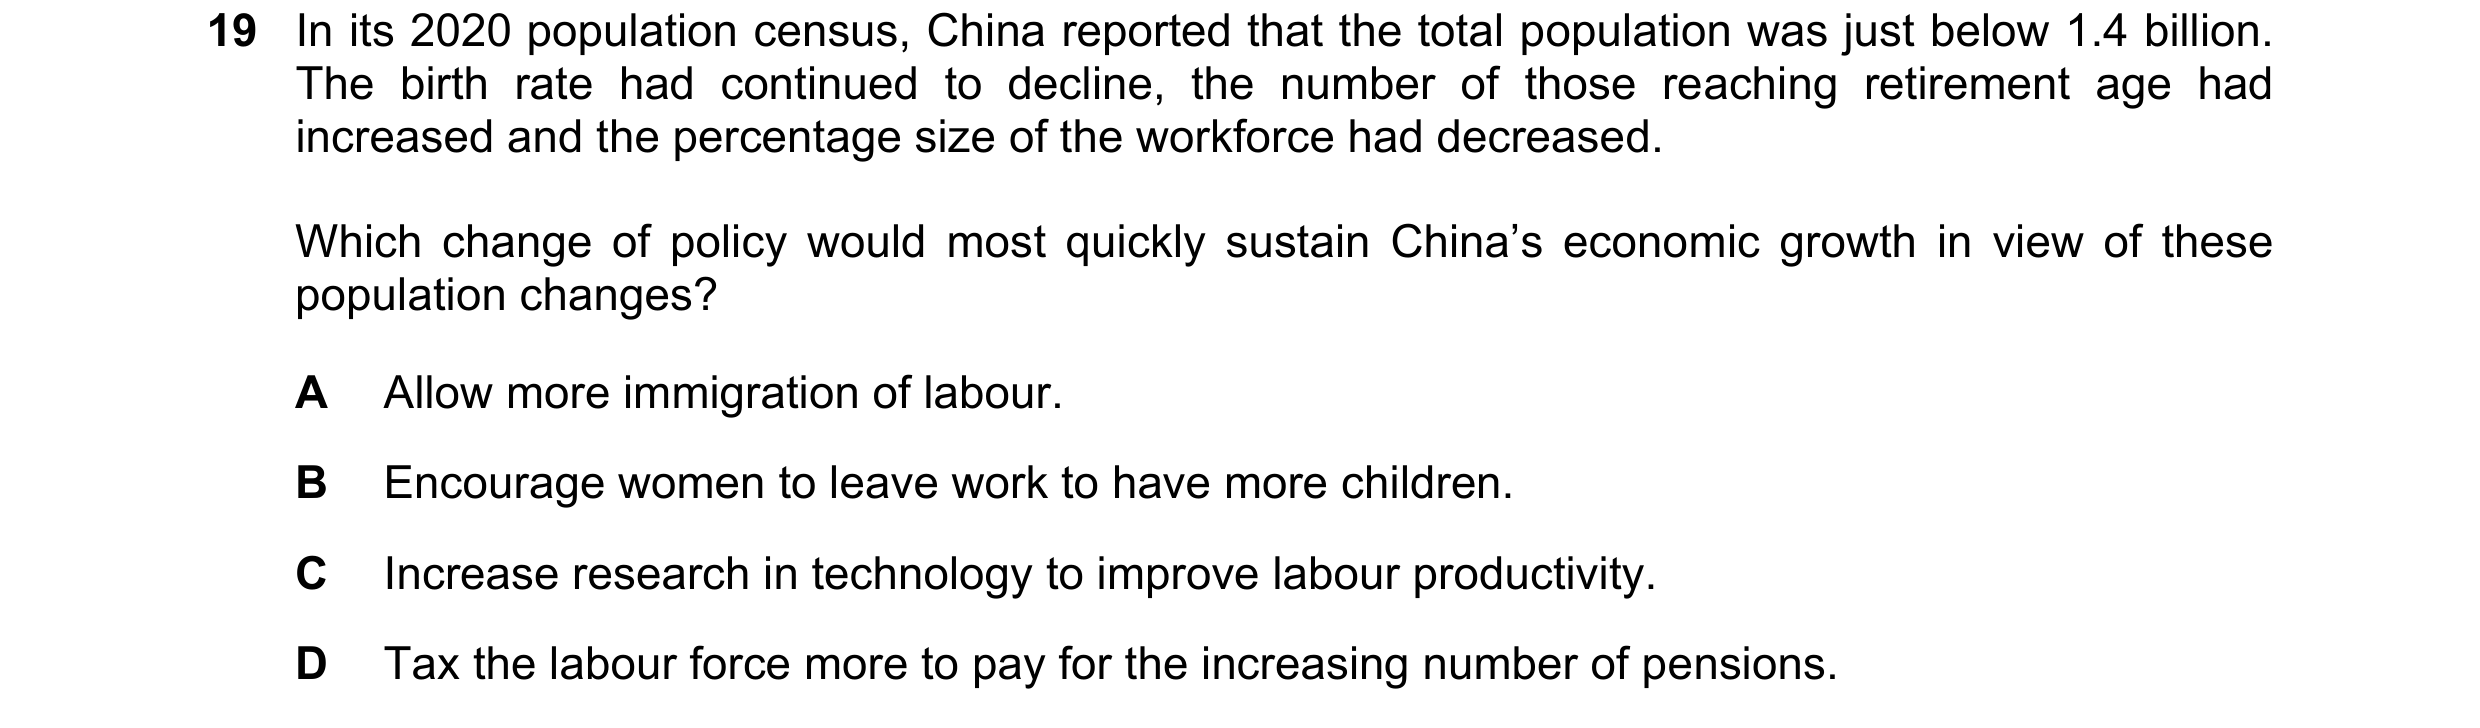

 21 / 22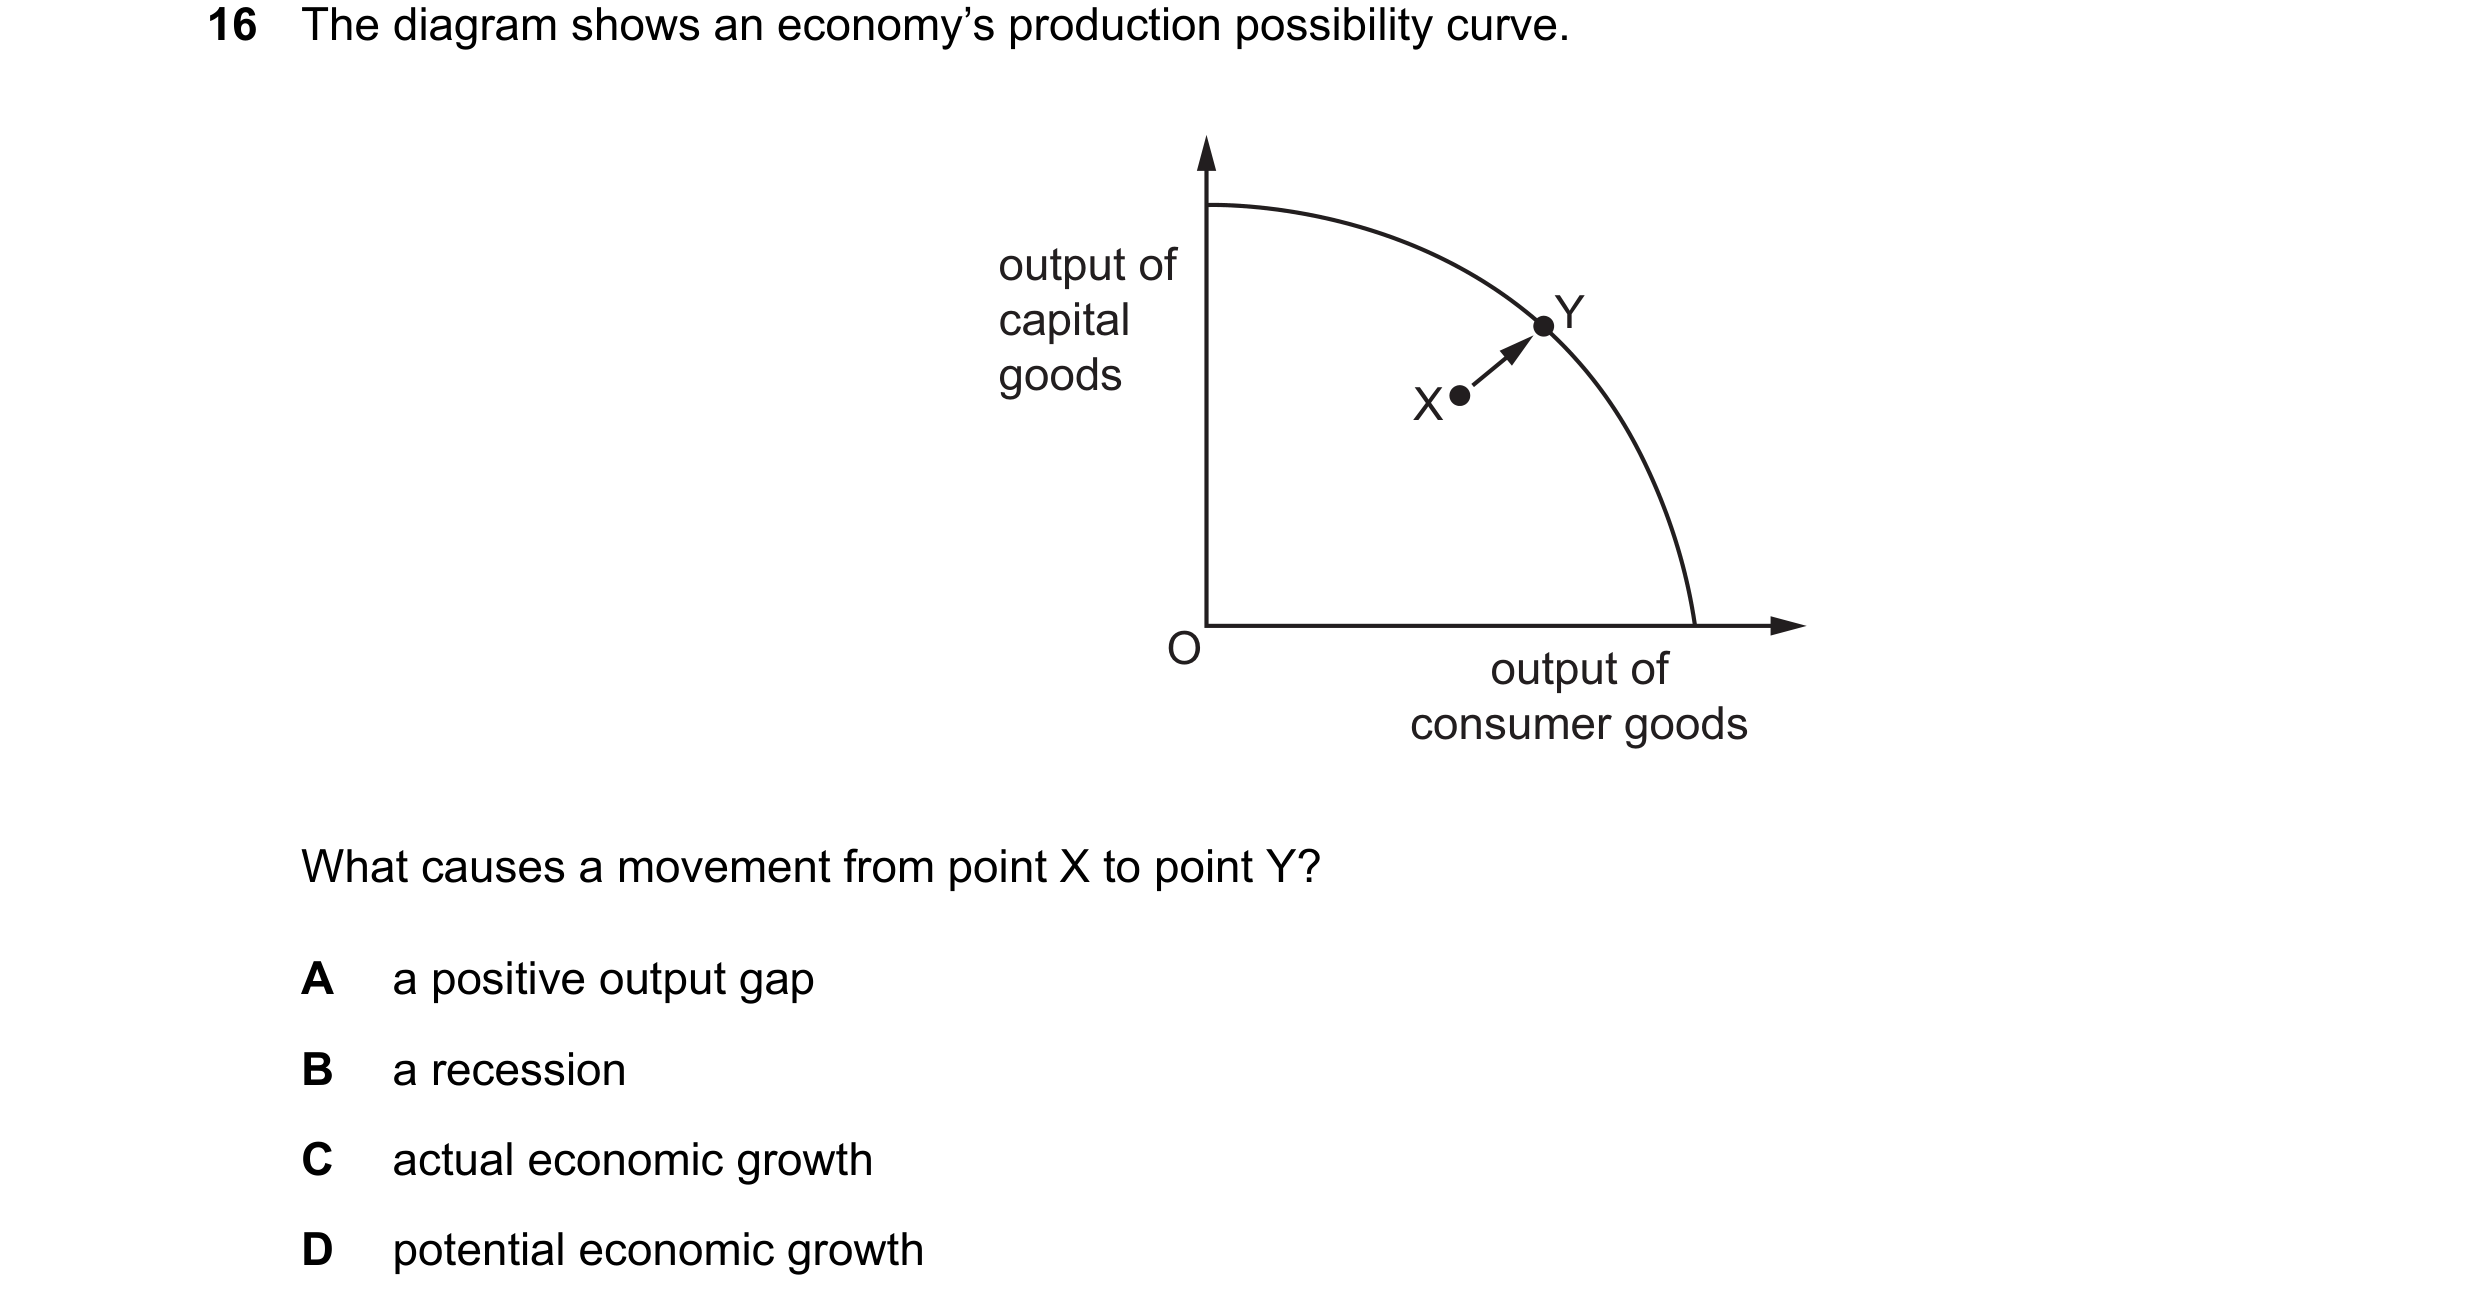
 22 / 22