Questions as text
Q1 · A food web in a garden 0653/41 May/June 2018
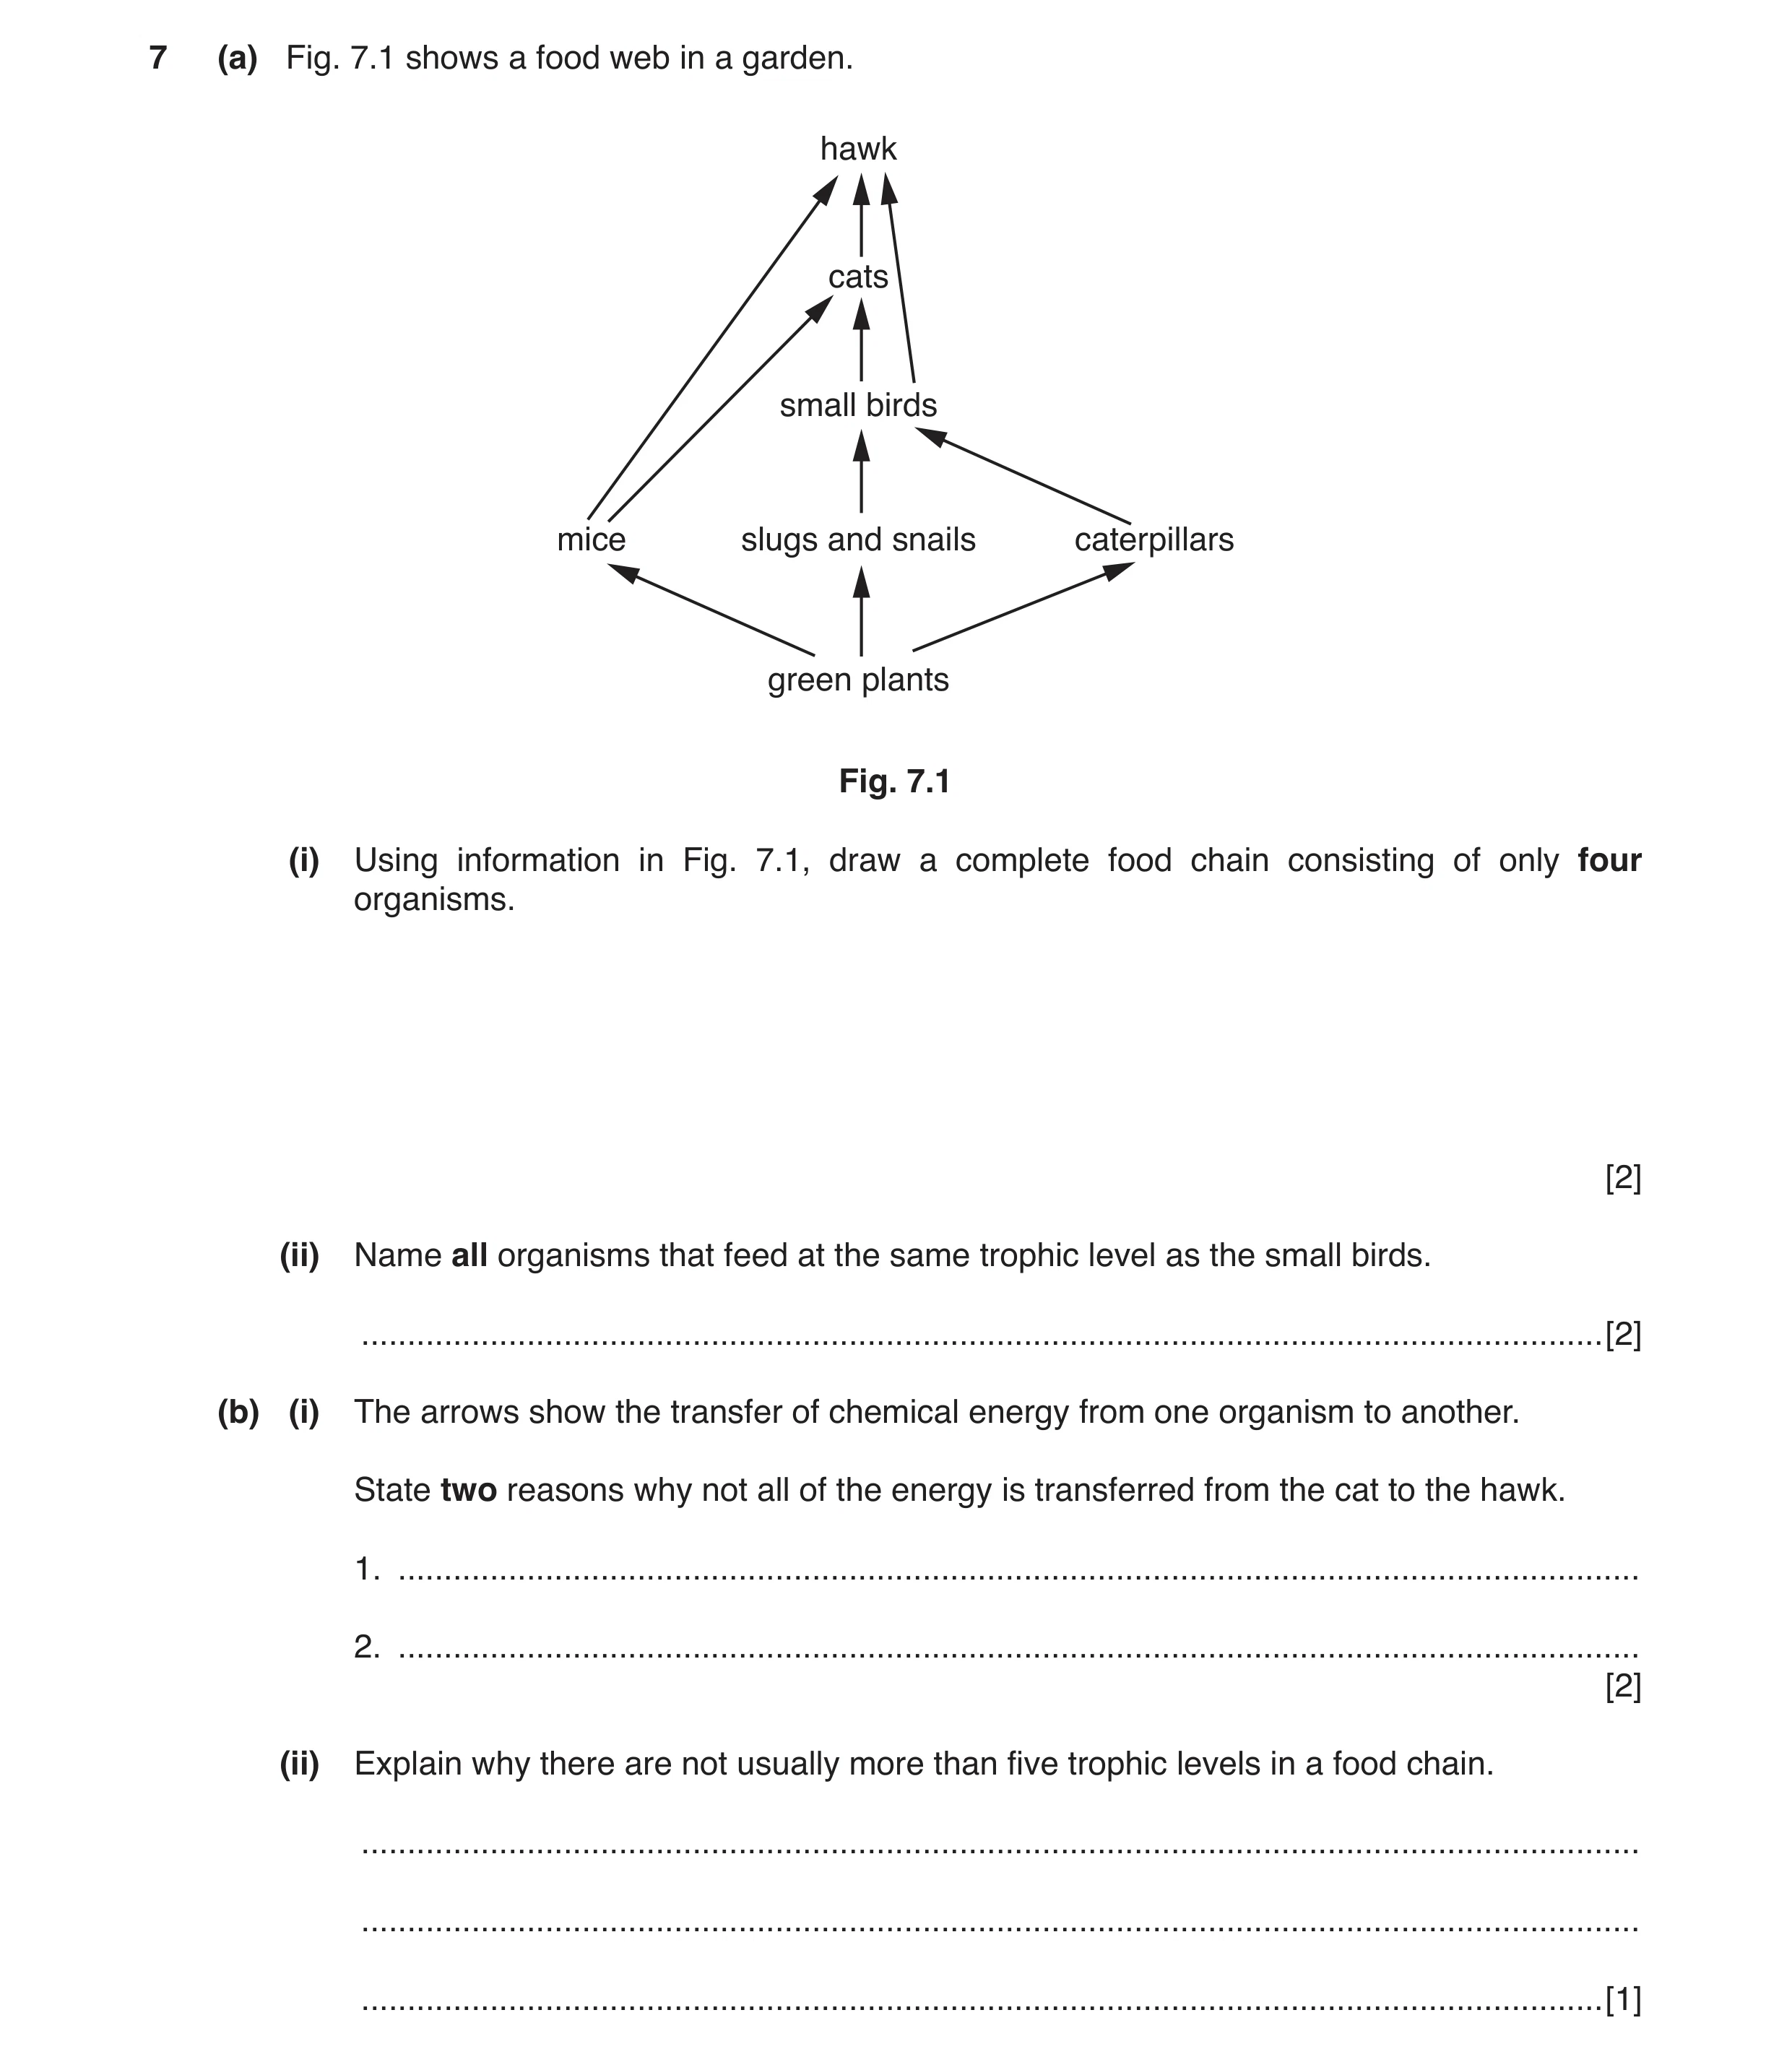
7 (a) Fig. 7.1 shows a food web in a garden. hawk cats small birds mice slugs and snails caterpillars green plants Fig. 7.1 (i) Using information in Fig. 7.1, draw a complete food chain consisting of only four organisms. [2] (ii) Name all organisms that feed at the same trophic level as the small birds. … [2] (b) (i) The arrows show the transfer of chemical energy from one organism to another. State two reasons why not all of the energy is transferred from the cat to the hawk. 1. … 2. … [2] (ii) Explain why there are not usually more than five trophic levels in a food chain. … … … [1]
7 marks
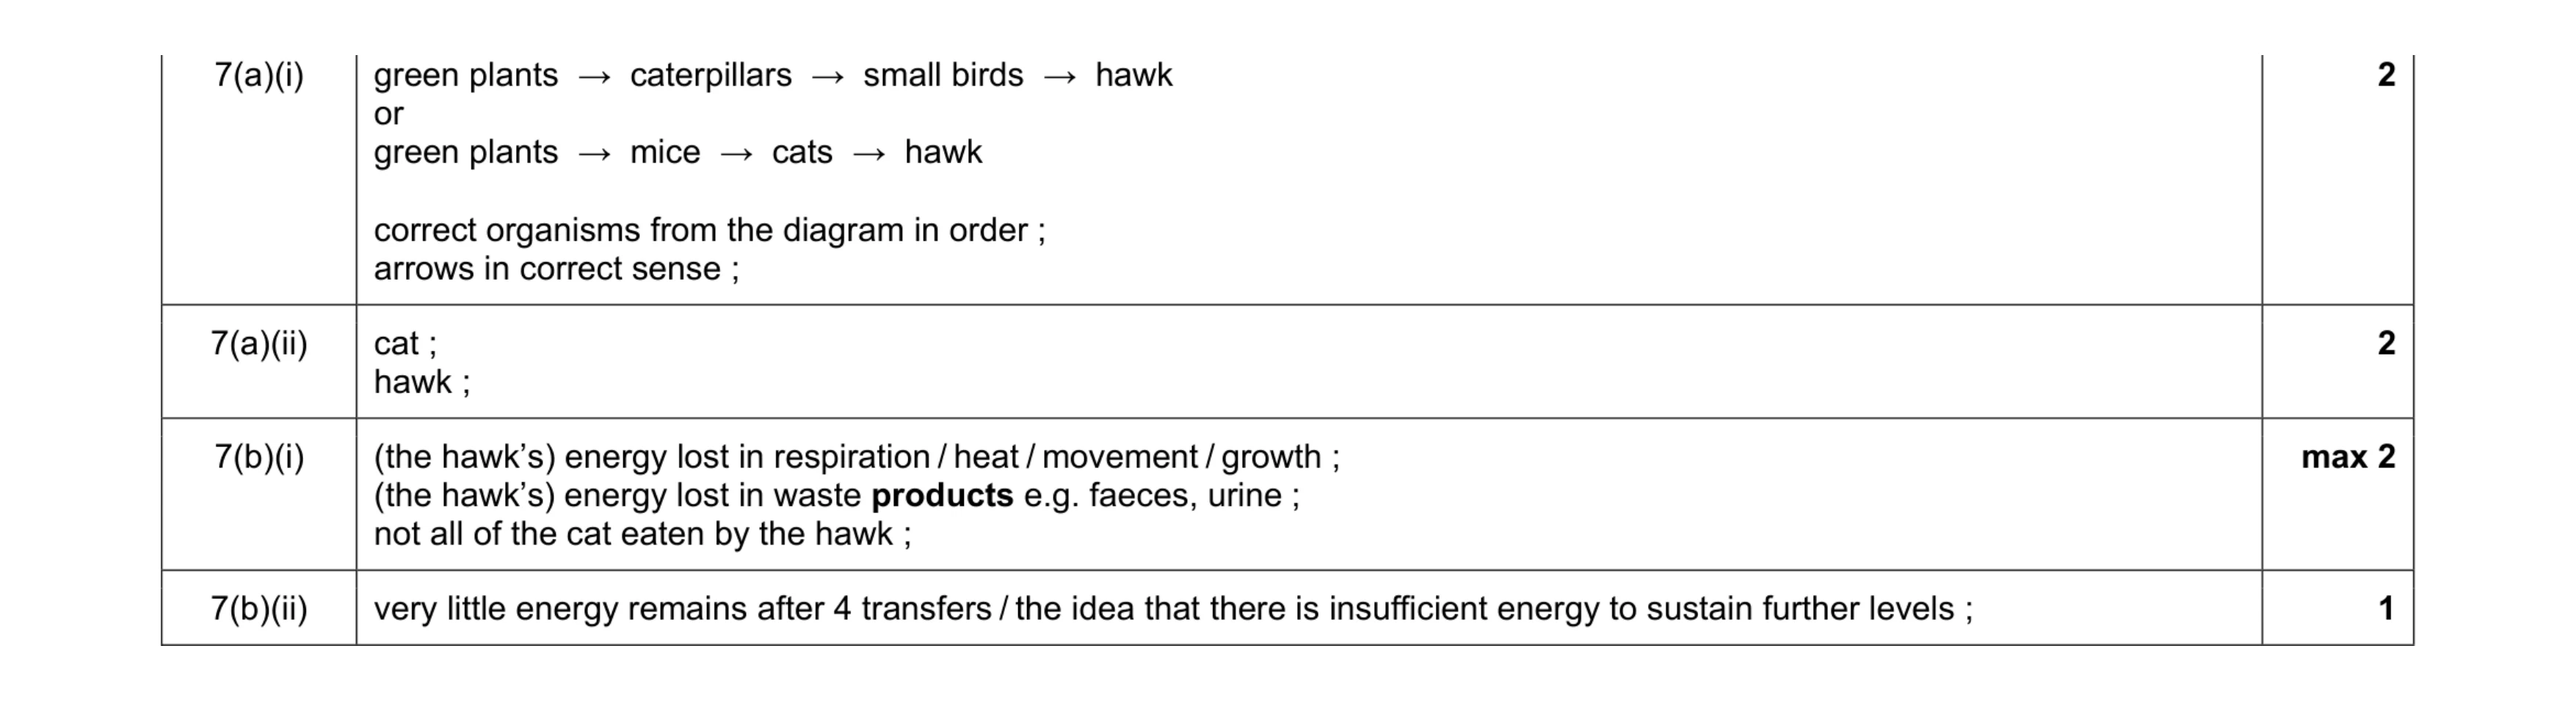
Mark scheme: 7(a)(i) green plants → caterpillars → small birds → hawk or green plants → mice → cats → hawk correct organisms from the diagram in order ; arrows in correct sense ; 2 7(a)(ii) cat ; hawk ; 2 7(b)(i) (the hawk’s) energy lost in respiration / heat / movement / growth ; (the hawk’s) energy lost in waste products e.g. faeces, urine ; not all of the cat eaten by the hawk ; max 2 7(b)(ii) very little energy remains after 4 transfers / the idea that there is insufficient energy to sustain further levels ; 1
This question in 0653/41 May/June 2018
Q2 · An aquatic food web 0653/41 Oct/Nov 2018
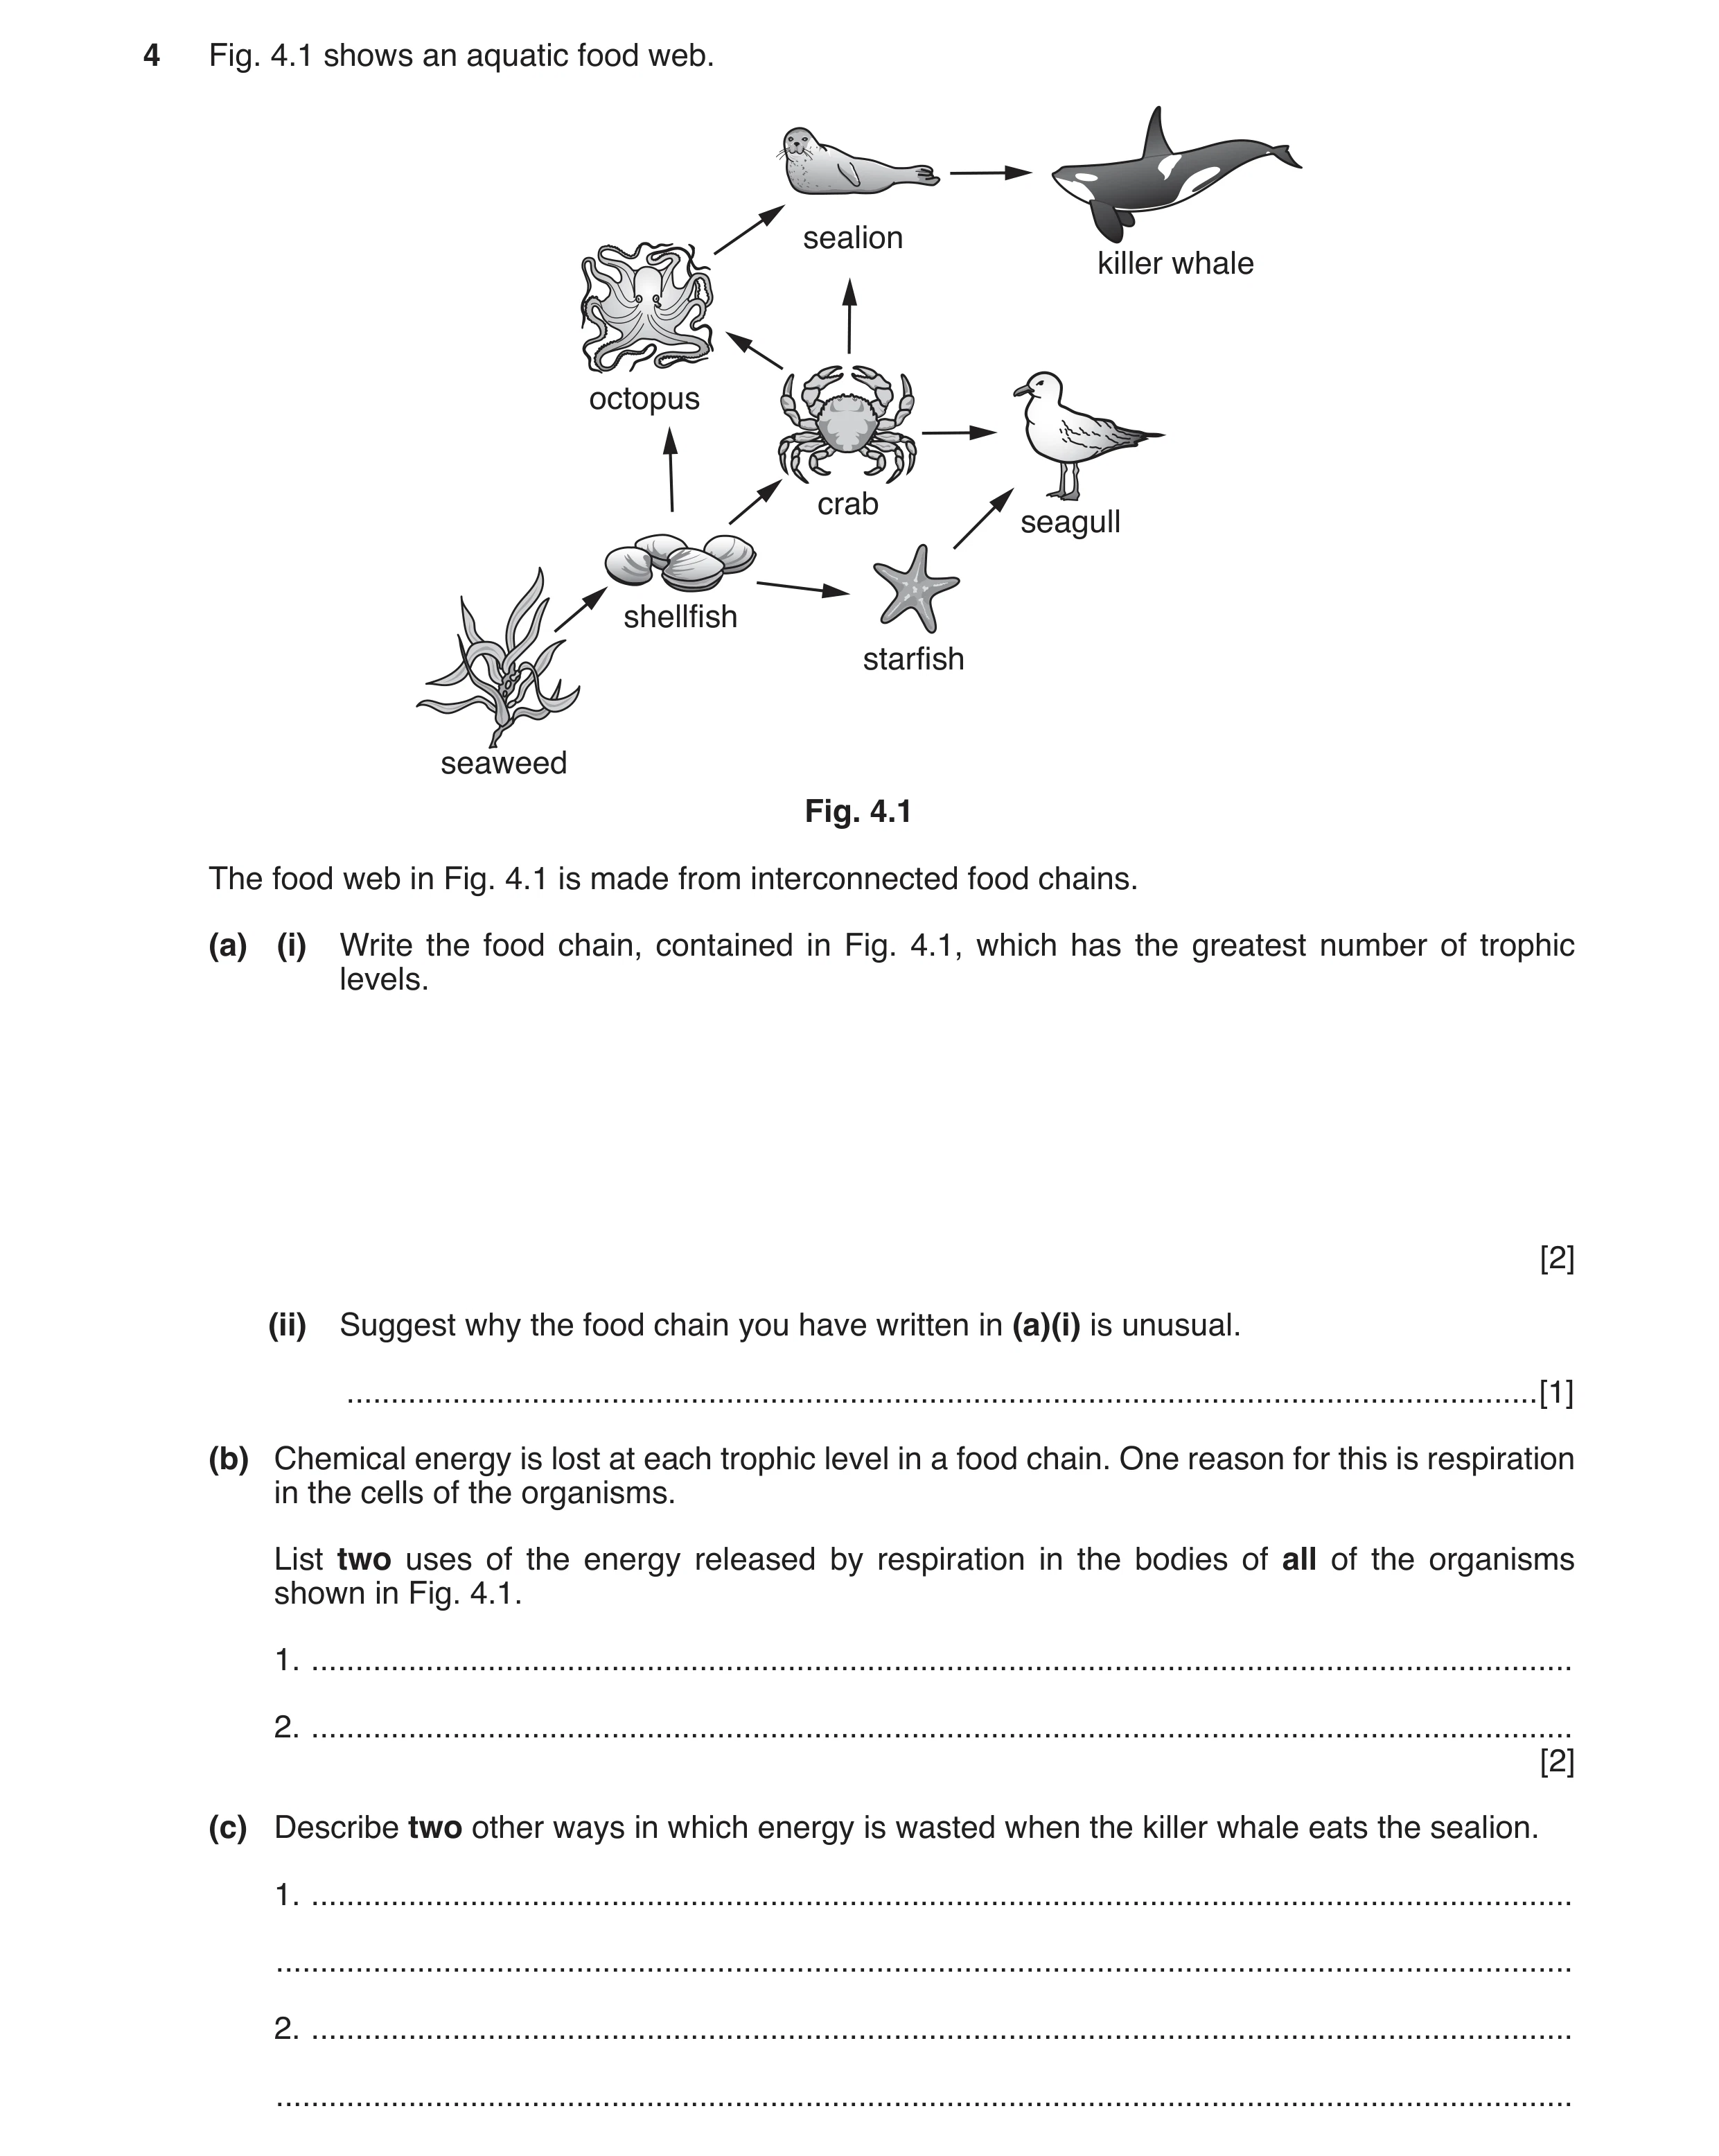
4 Fig. 4.1 shows an aquatic food web. sealion killer whale octopus crab seagull shellfish starfish seaweed Fig. 4.1 The food web in Fig. 4.1 is made from interconnected food chains. (a) (i) Write the food chain, contained in Fig. 4.1, which has the greatest number of trophic levels. [2] (ii) Suggest why the food chain you have written in (a)(i) is unusual. … [1] (b) Chemical energy is lost at each trophic level in a food chain. One reason for this is respiration in the cells of the organisms. List two uses of the energy released by respiration in the bodies of all of the organisms shown in Fig. 4.1. 1. … 2. … [2] (c) Describe two other ways in which energy is wasted when the killer whale eats the sealion. 1. … … 2. … …
7 marks
Mark scheme: 4(a)(i) 2 4(a)(ii) consists of more than 4 trophic levels ; 1 4(b) protein synthesis / building up molecules ; cell division ; growth ; Max 2 2 4(c) not all eaten ; not all digested / absorbed / egestion / lost in faeces ; excretion / lost in urine ; Max 2 2
This question in 0653/41 Oct/Nov 2018
Q3 · A simplified version of the carbon cycle 0653/42 Oct/Nov 2018
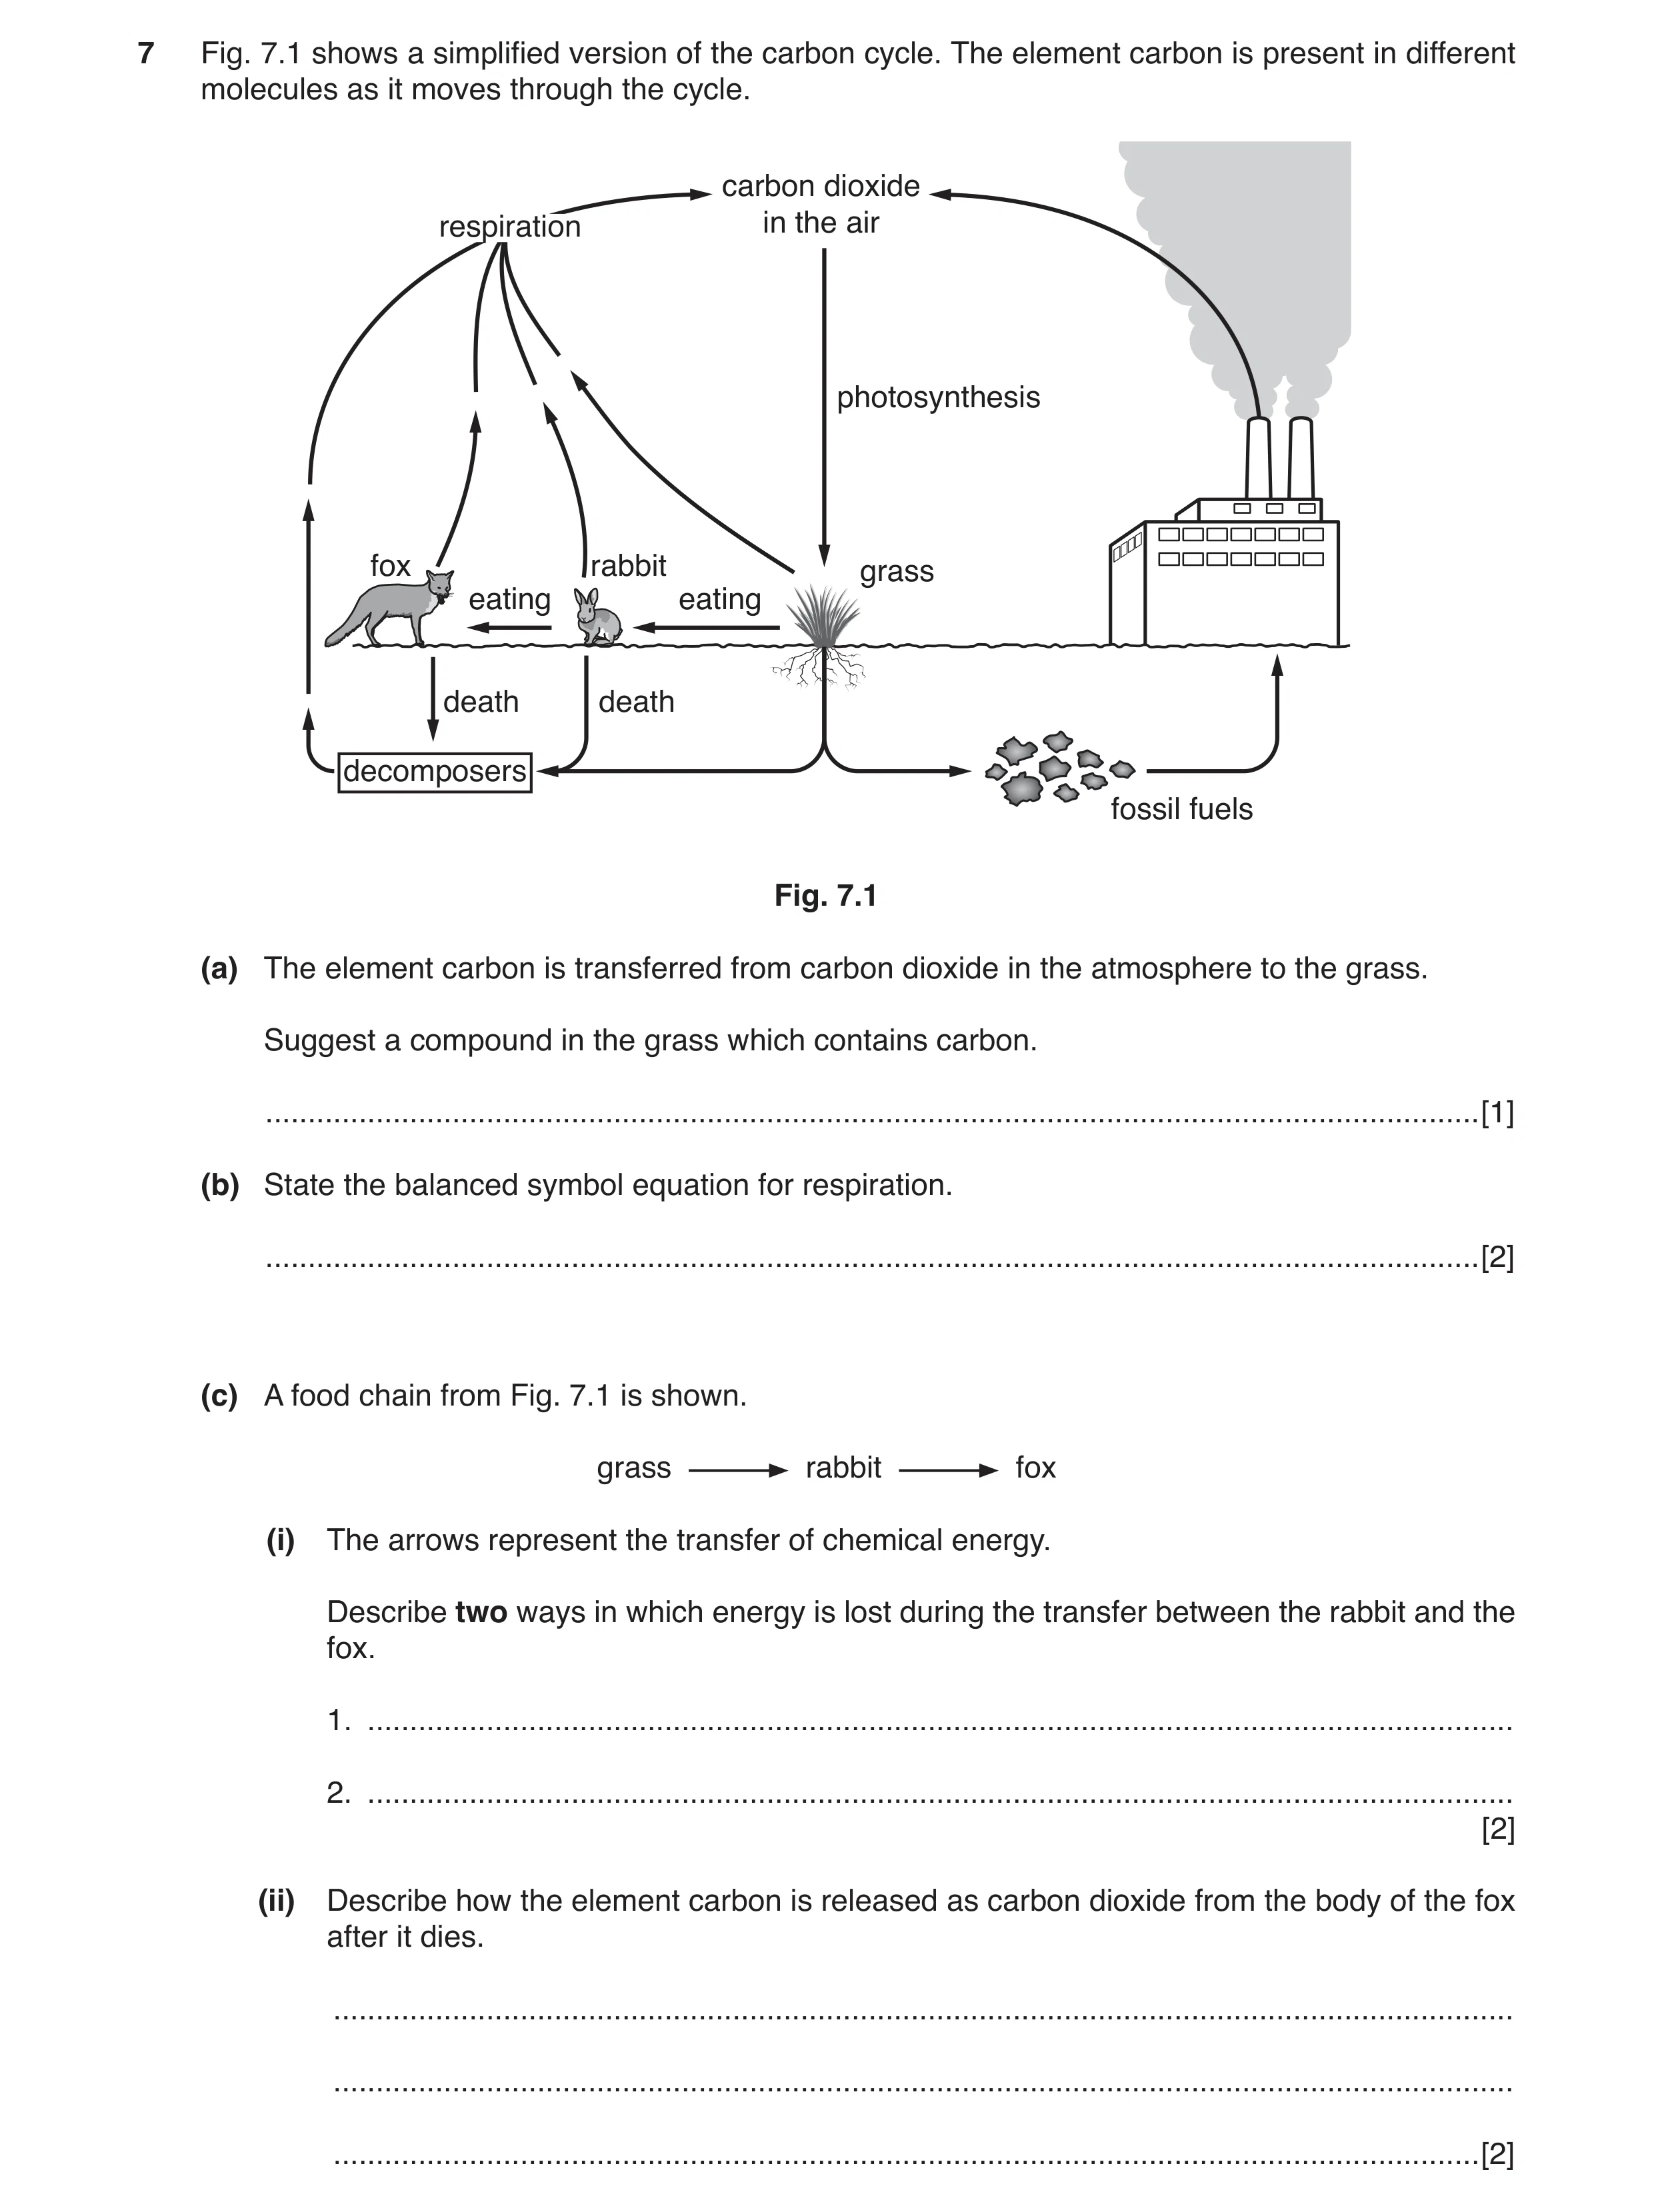
7 Fig. 7.1 shows a simplified version of the carbon cycle. The element carbon is present in different molecules as it moves through the cycle. carbon dioxide respiration in the air photosynthesis fox rabbit grass eating eating death death decomposers fossil fuels Fig. 7.1 (a) The element carbon is transferred from carbon dioxide in the atmosphere to the grass. Suggest a compound in the grass which contains carbon. … [1] (b) State the balanced symbol equation for respiration. … [2] (c) A food chain from Fig. 7.1 is shown. grass rabbit fox (i) The arrows represent the transfer of chemical energy. Describe two ways in which energy is lost during the transfer between the rabbit and the fox. 1. … 2. … [2] (ii) Describe how the element carbon is released as carbon dioxide from the body of the fox after it dies. … … … [2]
7 marks
Mark scheme: 7(a) glucose / starch / sugar ; 1 7(b) C6H12O6 + 6O2 → 6CO2 + 6H2O 1 mark for formulae ; 1 mark for balanced ; 2 7(c)(i) any two from not all of the rabbit is eaten ; not all of the rabbit is digested / absorbed by the fox / egestion in fox ; excretion / production / loss of urine in fox ; some energy wasted as heat / respiration / carbon dioxide in fox ; Max 2 2 7(c)(ii) decomposers / named type of decomposer e.g. bacteria / fungi ; feed on / break down (carbon compounds in the fox’s) body ; carbon dioxide released by respiration (of decomposers) ; Max 2 2
This question in 0653/42 Oct/Nov 2018
Q4 · During sexual reproduction in flowering plants, both pollination and fertilisation take… 0653/41 Oct/Nov 2020
7 During sexual reproduction in flowering plants, both pollination and fertilisation take place. (a) Describe fertilisation in a flower. … … … [2] (b) Fig. 7.1 shows a diagram of a wind-pollinated flower X and a diagram of an insect-pollinated flower Y. anther anther flower X flower Y Fig. 7.1 (i) Describe how the anthers of X are adapted for wind pollination. … … … [2] (ii) Give two pieces of evidence in Fig. 7.1 that show that Y is an insect-pollinated flower. 1 … 2 … [2] (c) Explain why flowering plants are called producers. … … … [2] (d) Producers are the first trophic level of every food chain. Explain why food chains usually have fewer than five trophic levels. … … … [2] [Total: 10]
10 marks
Mark scheme: 7(a) correct reference to, fusion / joining / combining ; of nuclei of pollen and ovule ; 2 7(b)(i) (anthers) are long ; hang outside the flower ; 2 Question Answer Marks 7(b)(ii) any two from: the reproductive organs / anther (and stigma), are inside the flower ; large petals ; the stigma is above the anther ; 2 7(c) (they are) organisms that make (their own) nutrients ; using light energy / by photosynthesis ; 2 7(d) any two from: energy is lost / wasted, throughout the food chain ; not enough energy to support many higher levels ; further detail, e.g. by respiration (heat), excretion, death ; 2
This question in 0653/41 Oct/Nov 2020
Q5 · Define the term ecosystem 0653/42 May/June 2021
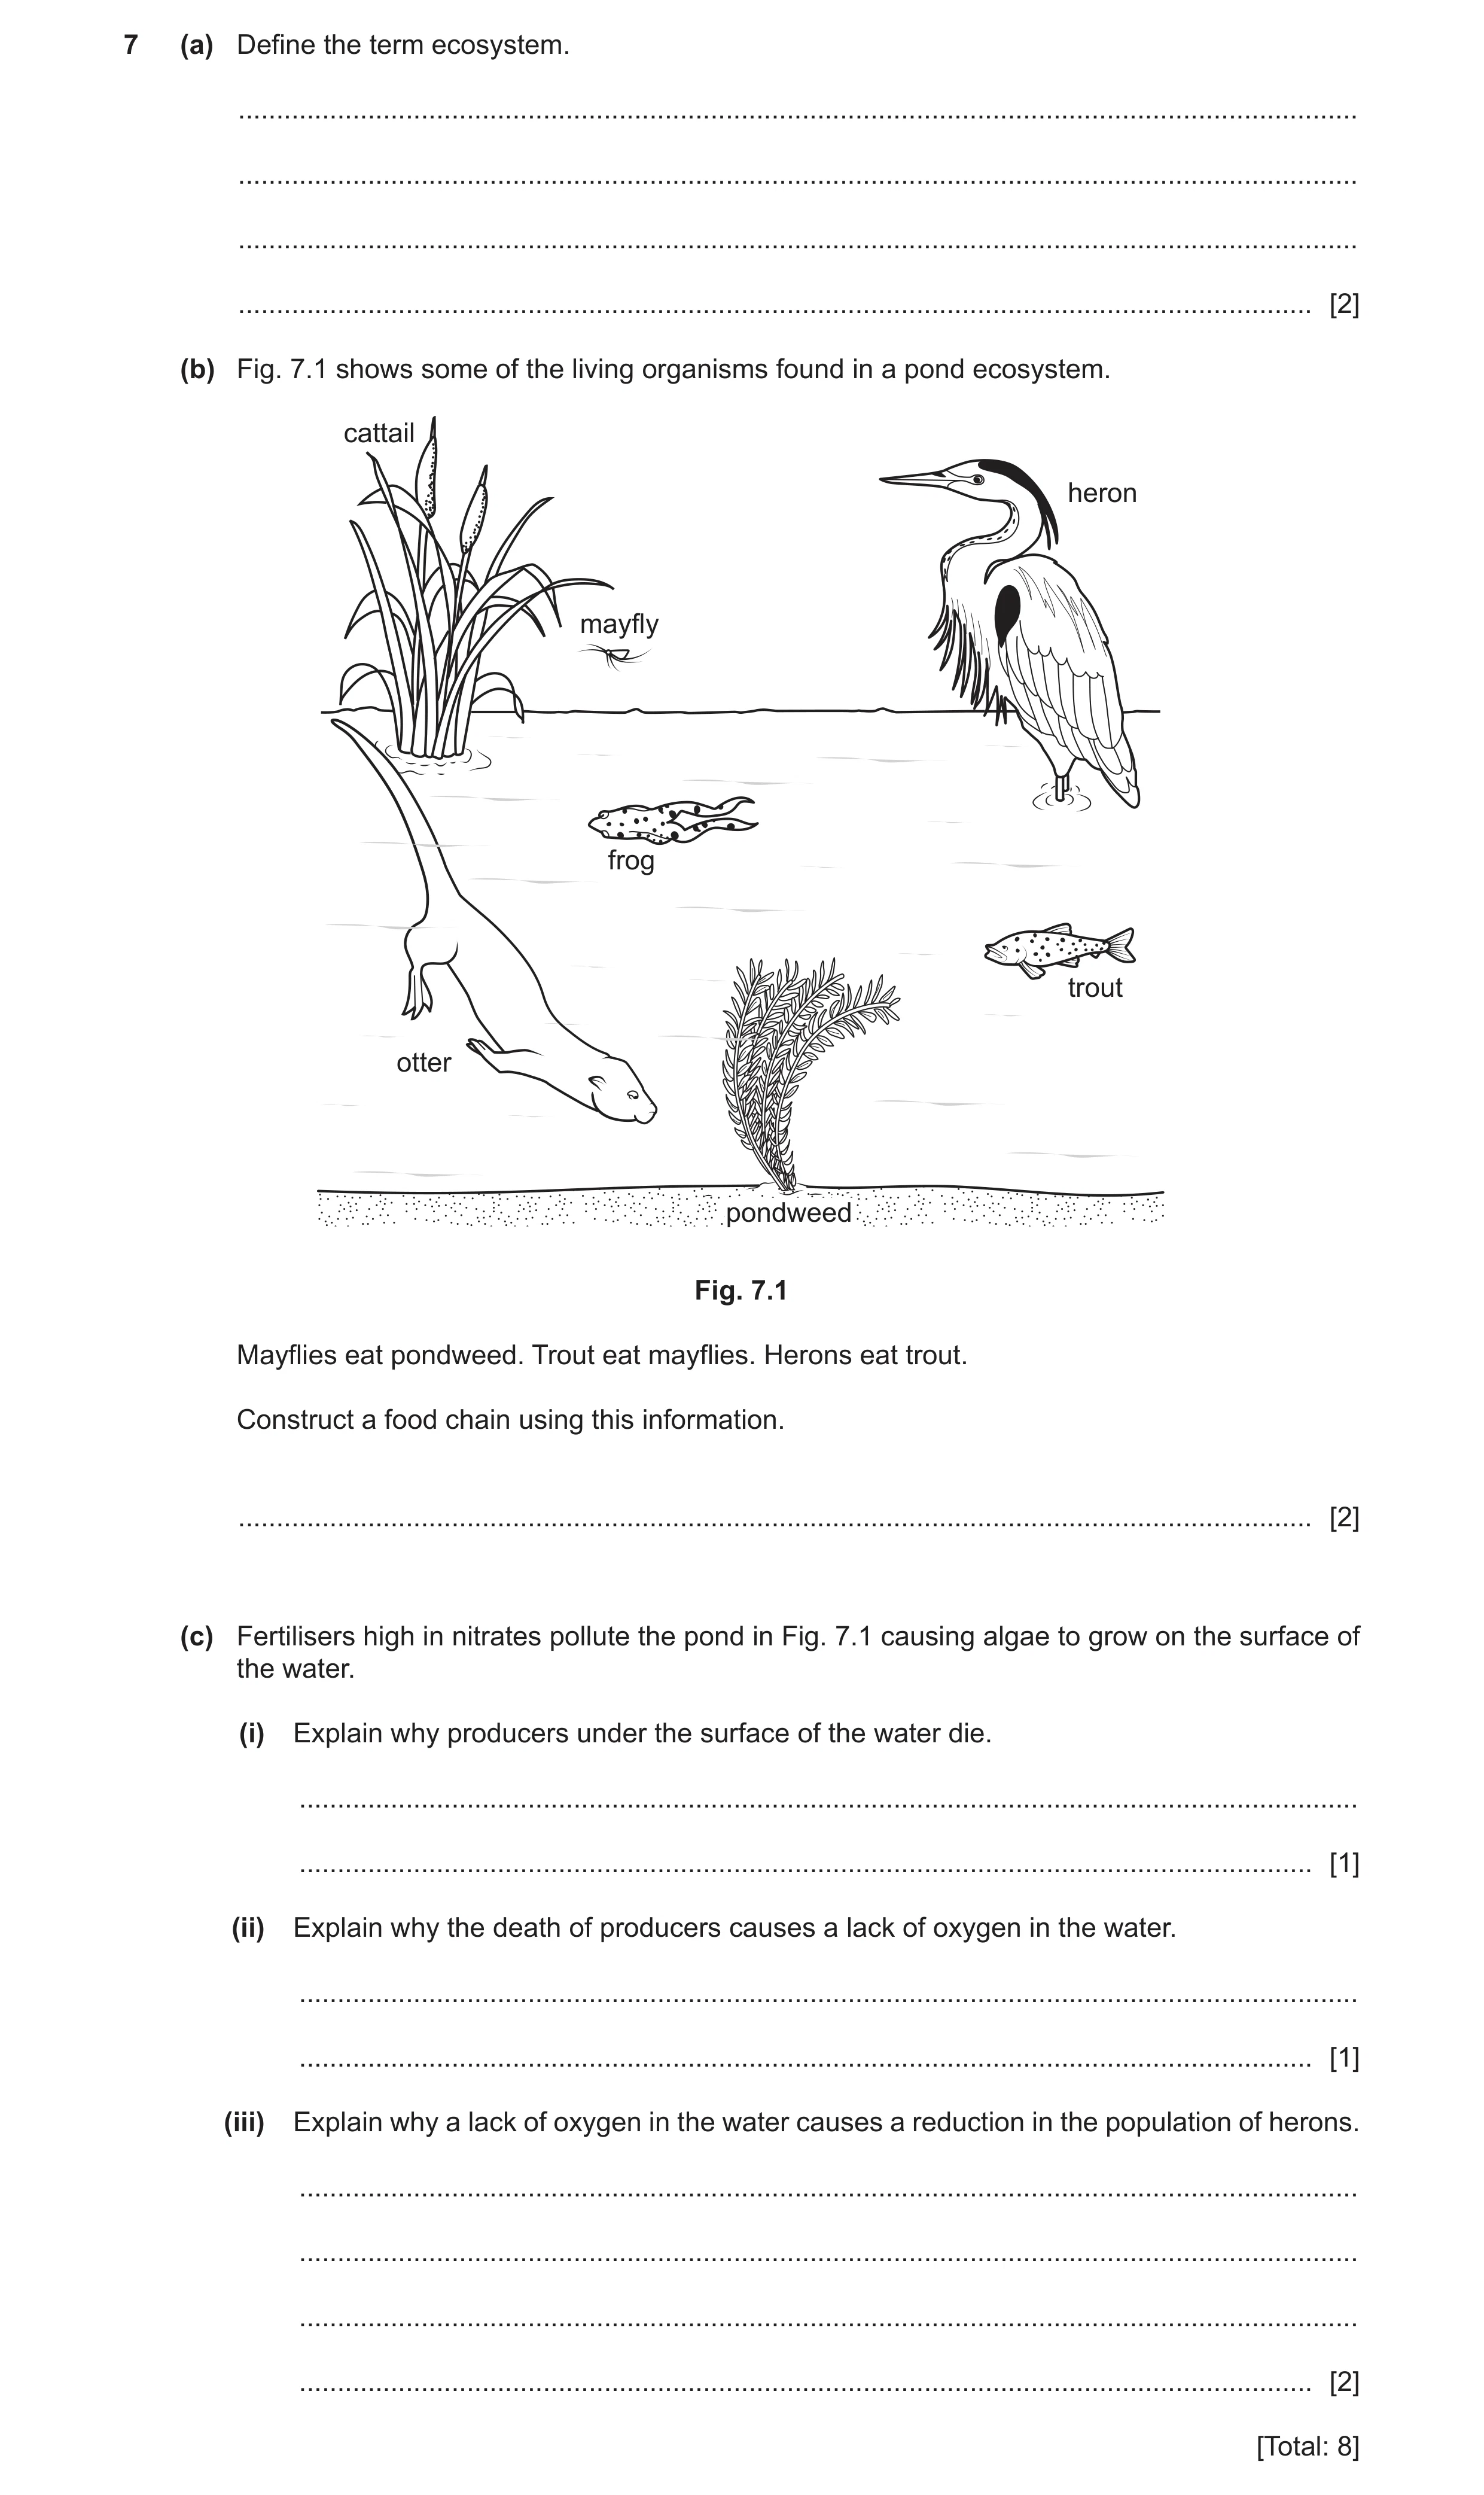
7 (a) Define the term ecosystem. … … … … [2] (b) Fig. 7.1 shows some of the living organisms found in a pond ecosystem. cattail heron mayfly frog trout otter pondweed Fig. 7.1 Mayflies eat pondweed. Trout eat mayflies. Herons eat trout. Construct a food chain using this information. … [2] (c) Fertilisers high in nitrates pollute the pond in Fig. 7.1 causing algae to grow on the surface of the water. (i) Explain why producers under the surface of the water die. … … [1] (ii) Explain why the death of producers causes a lack of oxygen in the water. … … [1] (iii) Explain why a lack of oxygen in the water causes a reduction in the population of herons. … … … … [2] [Total: 8]
8 marks
Mark scheme: 7(a) unit containing all organisms and their environment ; interacting together ; 2 7(b) pondweed → mayfly → trout → heron ;; one mark for organisms in correct order one mark for arrows 2 7(c)(i) light blocked so no photosynthesis / no light available for photosynthesis ; 1 7(c)(ii) reference to decomposition / respiration / decomposers, uses up oxygen ; 1 7(c)(iii) trout / fish, die ; heron has lost food source ; 2
This question in 0653/42 May/June 2021
Q6 · Part of a food web 0653/42 Feb/March 2022
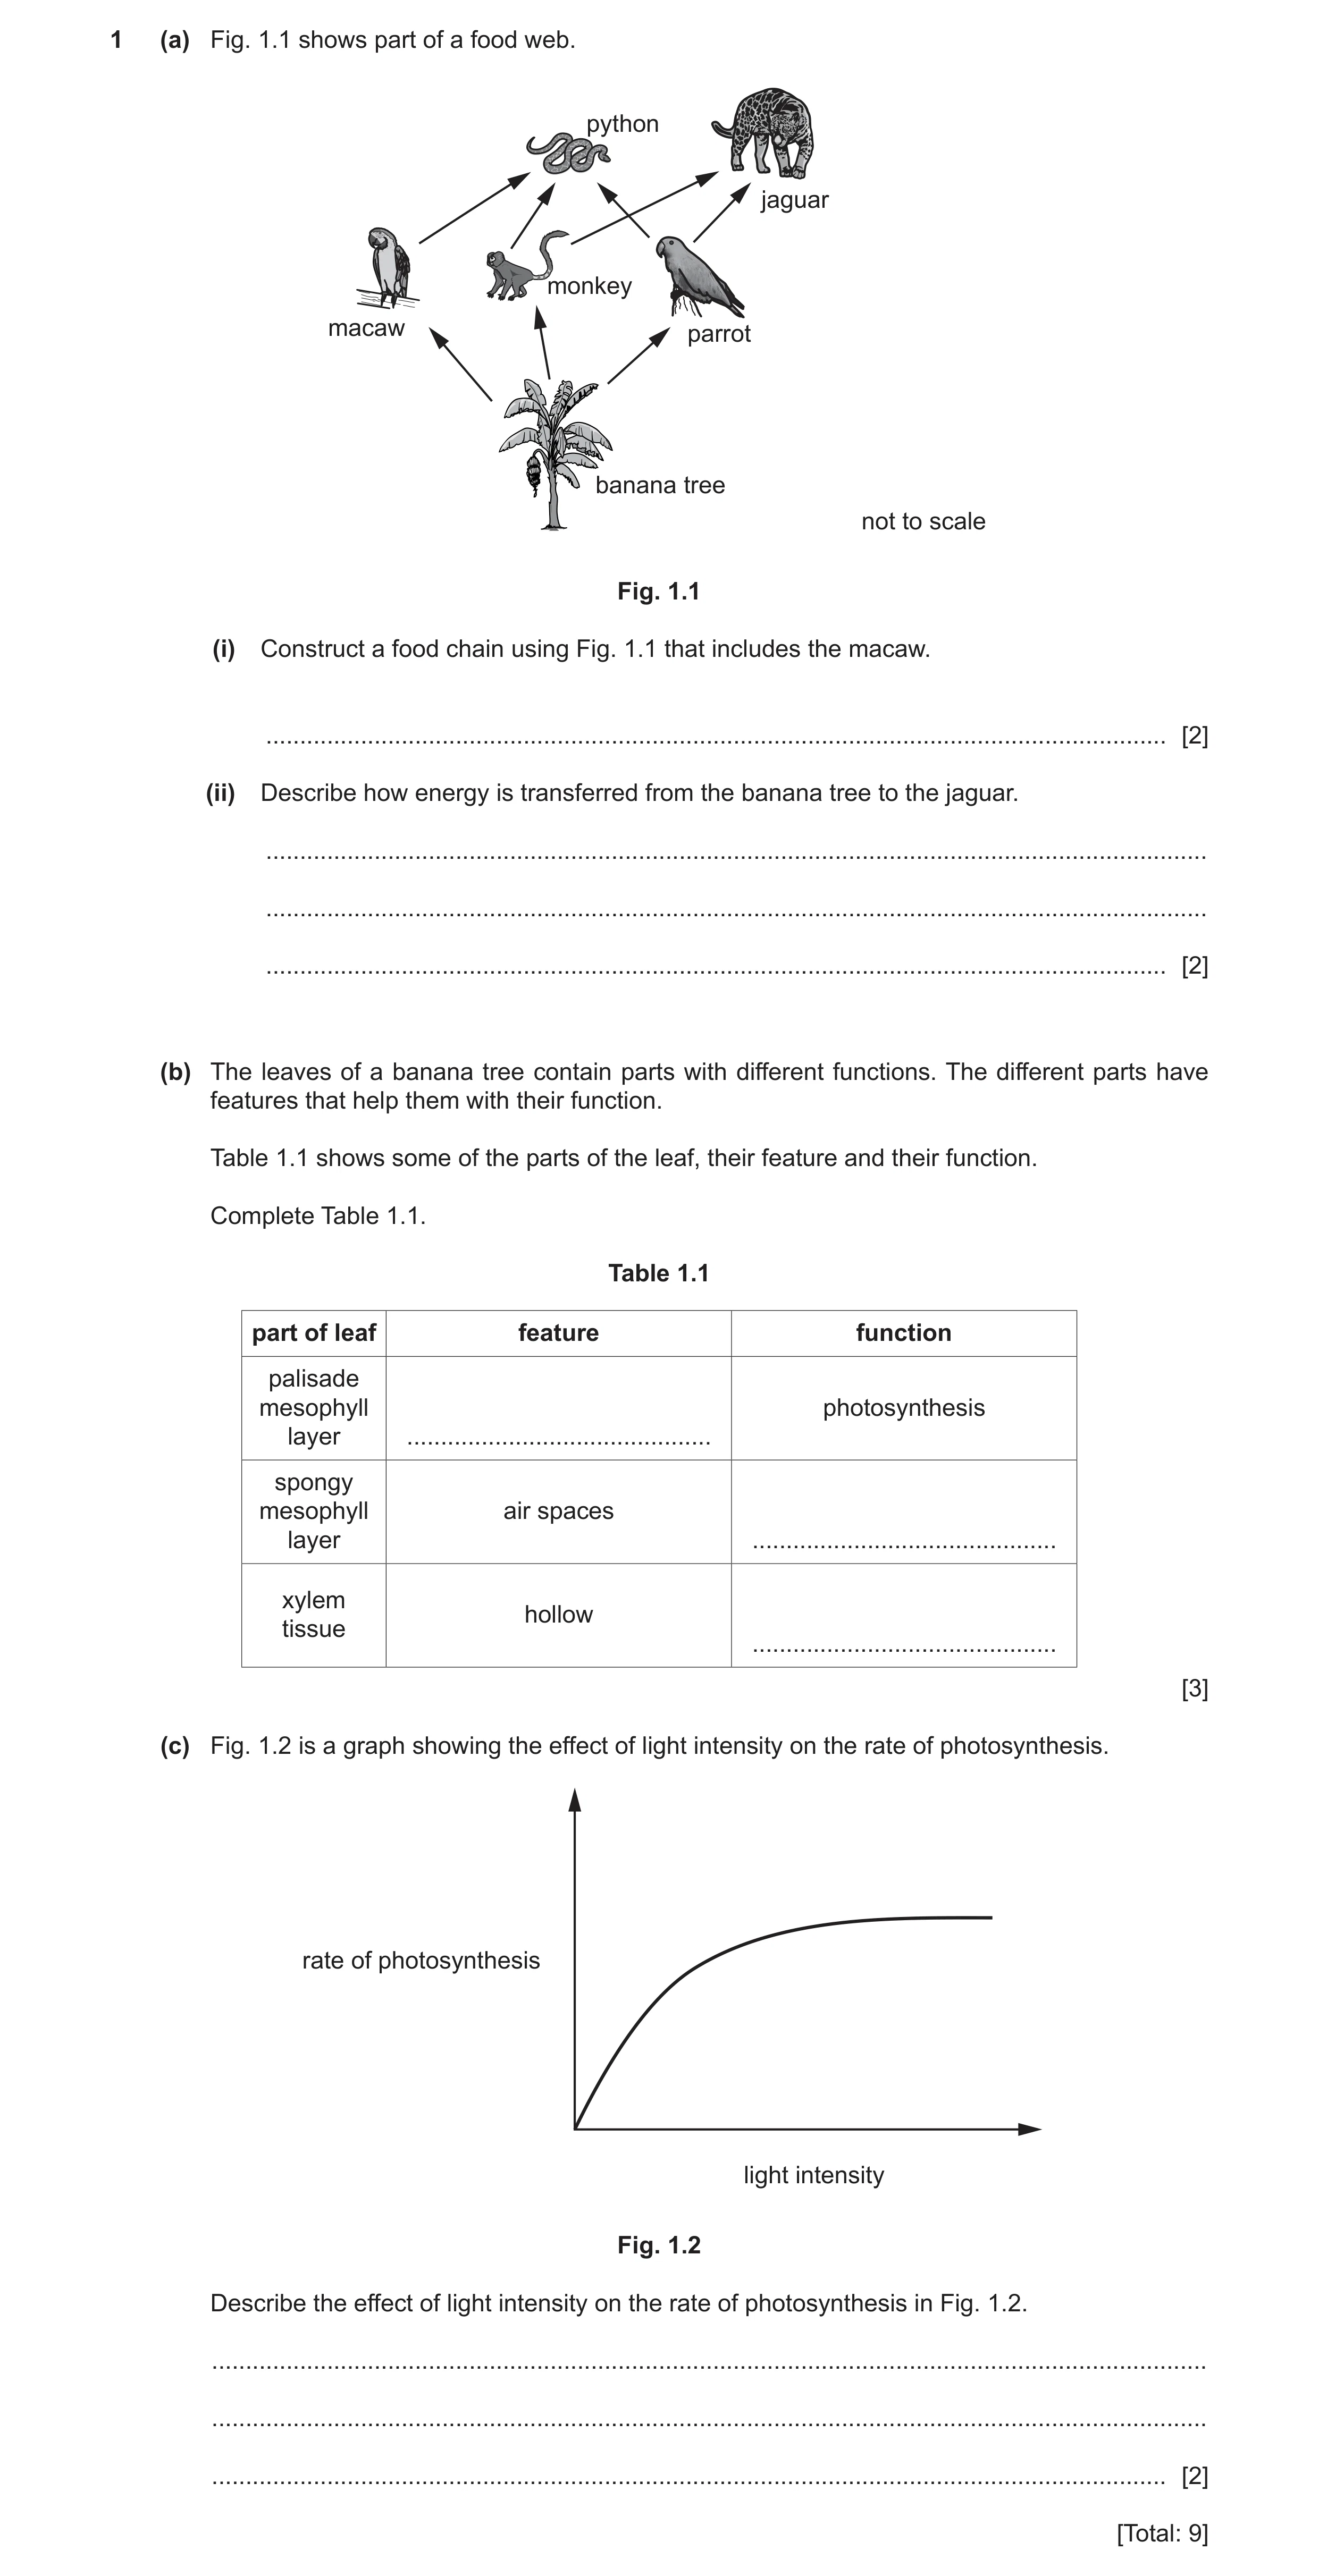
1 (a) Fig. 1.1 shows part of a food web. python jaguar monkey macaw parrot banana tree not to scale Fig. 1.1 (i) Construct a food chain using Fig. 1.1 that includes the macaw. … [2] (ii) Describe how energy is transferred from the banana tree to the jaguar. … … … [2] (b) The leaves of a banana tree contain parts with different functions. The different parts have features that help them with their function. Table 1.1 shows some of the parts of the leaf, their feature and their function. Complete Table 1.1. Table 1.1 part of leaf feature function palisade mesophyll photosynthesis layer … spongy mesophyll air spaces layer … xylem hollow tissue … [3] (c) Fig. 1.2 is a graph showing the effect of light intensity on the rate of photosynthesis. rate of photosynthesis light intensity Fig. 1.2 Describe the effect of light intensity on the rate of photosynthesis in Fig. 1.2. … … … [2] [Total: 9]
9 marks
Mark scheme: 1(a)(i) banana tree → macaw → python ;; one mark for correct order one mark for arrows in correct direction 1(a)(ii) banana eaten by monkey and/or parrot ; monkey and/or parrot eaten by jaguar ; 2 1(b) part of leaf feature function palisade mesophyll layer (many) chloroplasts (photosynthesis) spongy mesophyll layer (air spaces) gas exchange xylem tissue (hollow) transport of water / support ;;; 3 1(c) as light intensity increases the rate of photosynthesis increases ; then levels off / owtte ; 2
This question in 0653/42 Feb/March 2022
Question 7 0653/42 May/June 2022
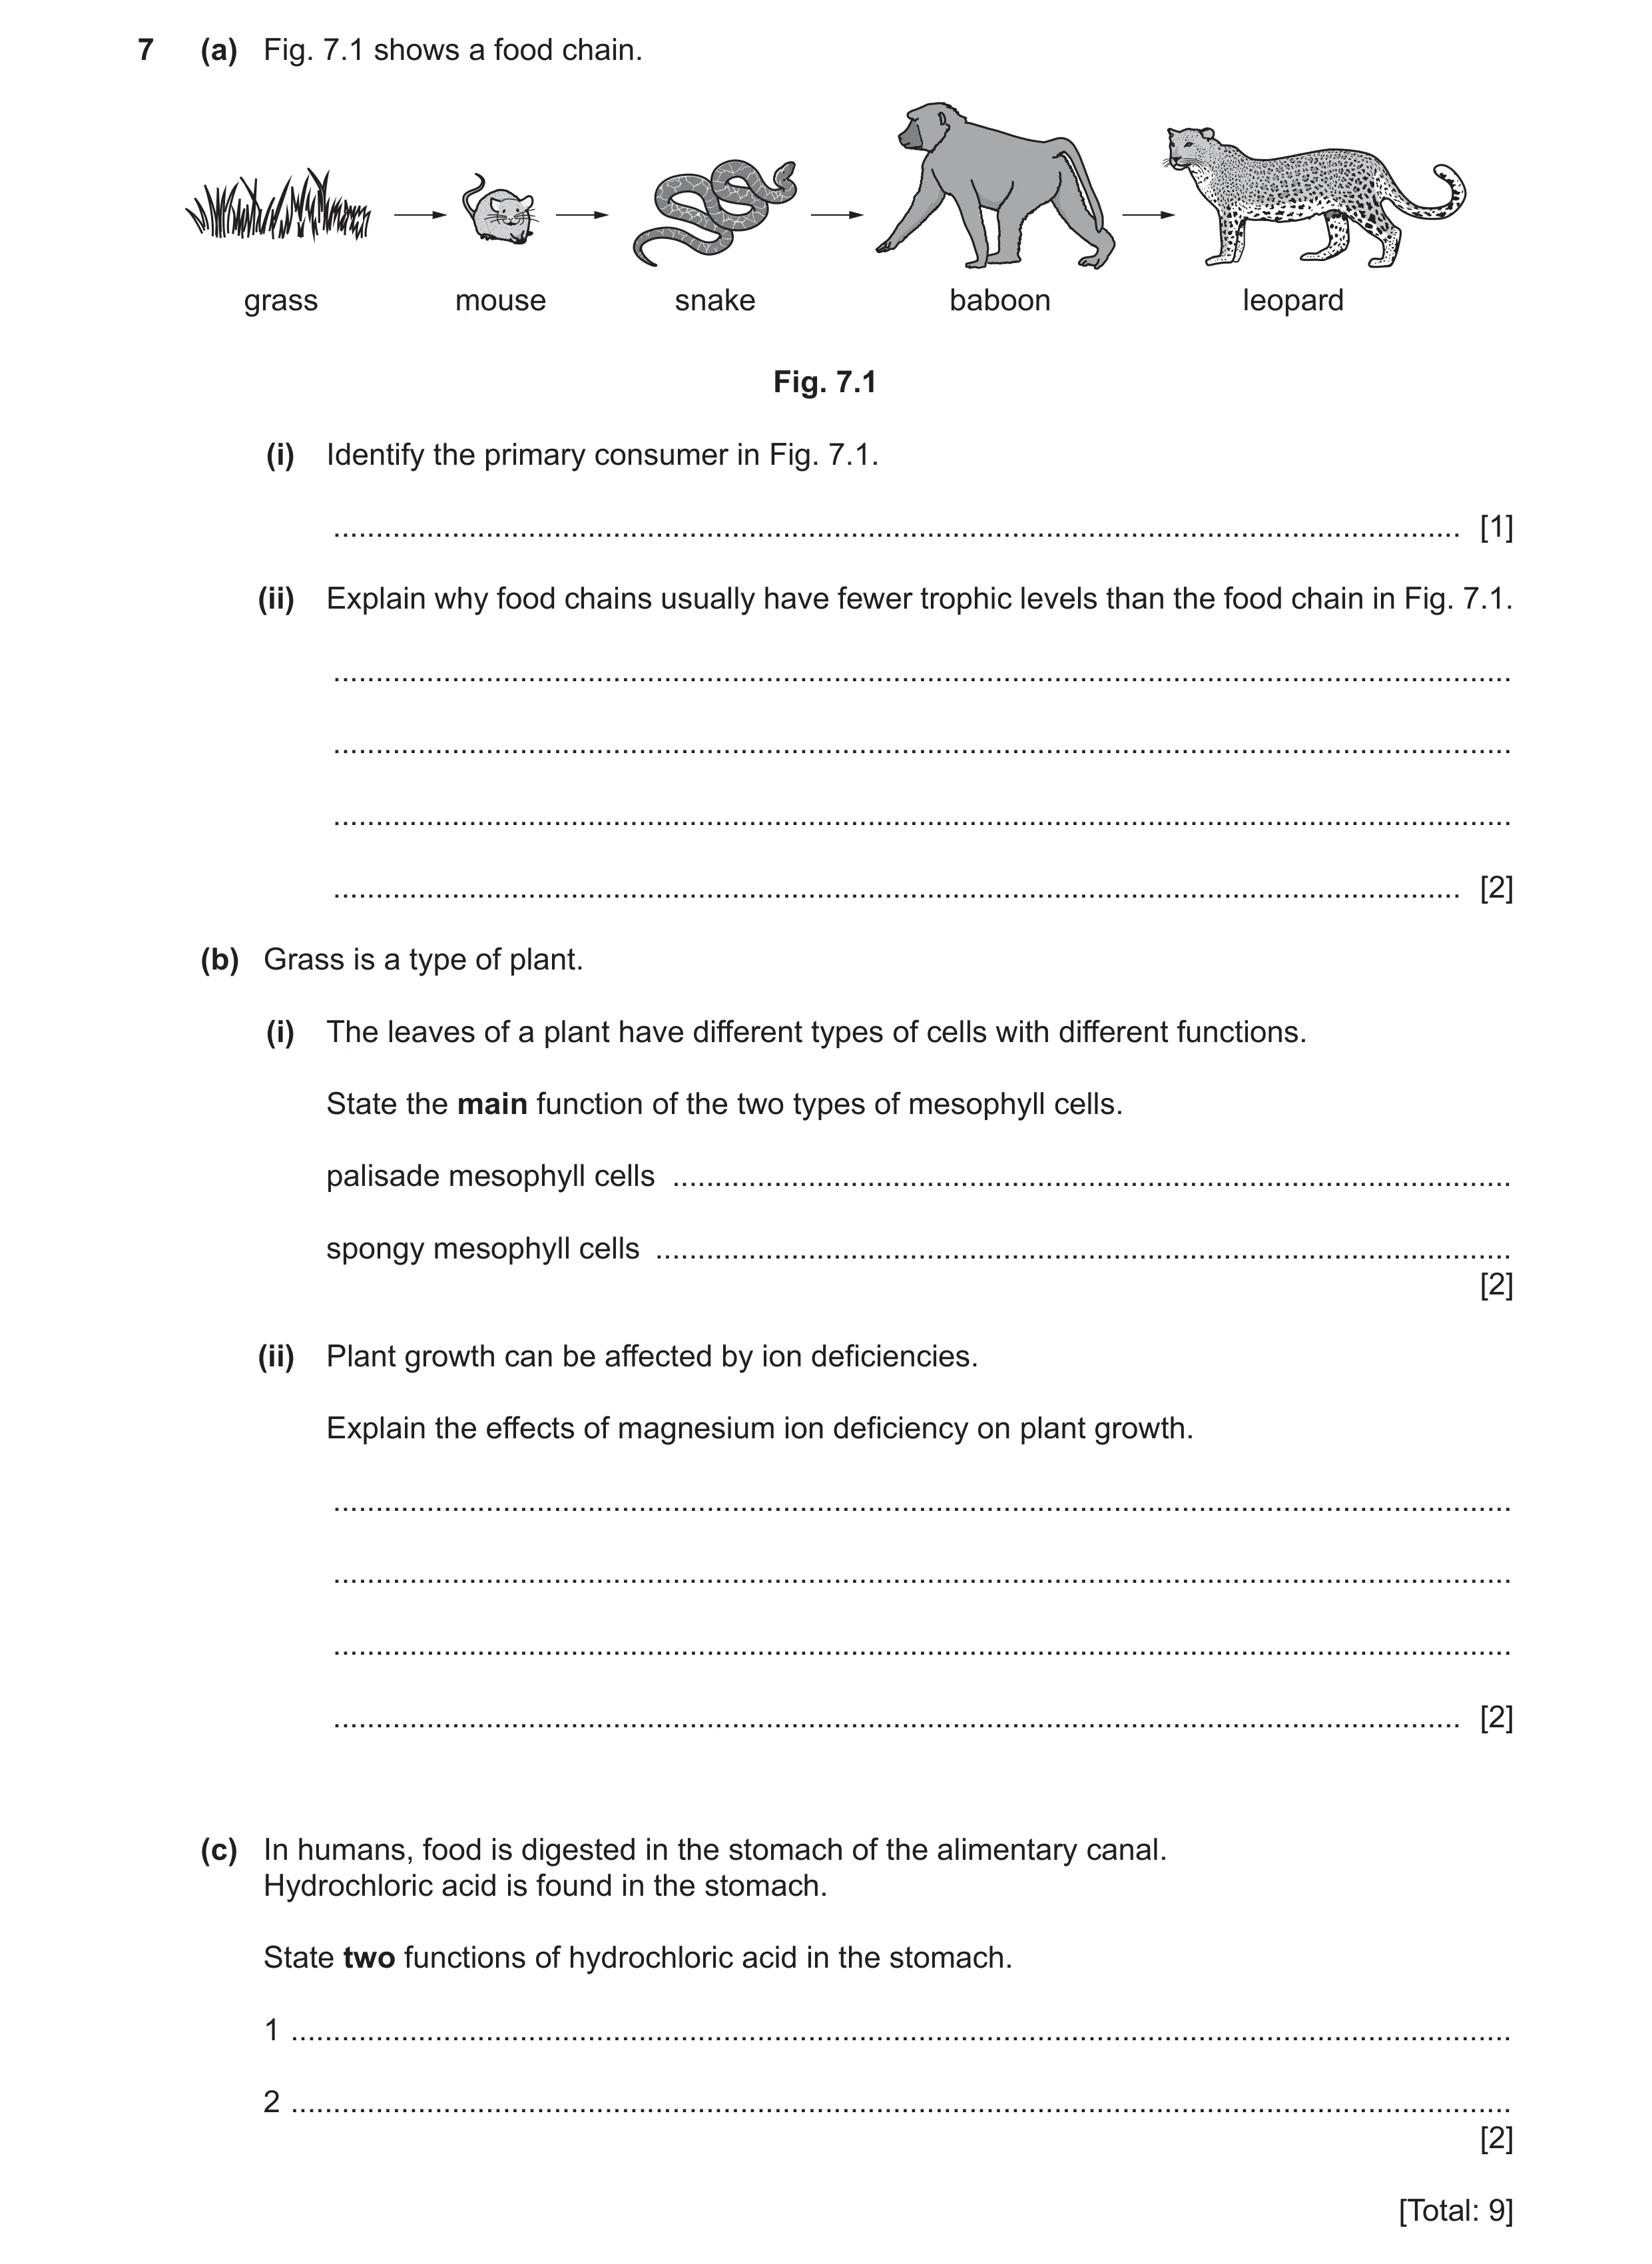
7 (a) Fig. 7.1 shows a food chain. grass mouse snake baboon leopard Fig. 7.1 (i) Identify the primary consumer in Fig. 7.1. … [1] (ii) Explain why food chains usually have fewer trophic levels than the food chain in Fig. 7.1. … … … … [2] (b) Grass is a type of plant. (i) The leaves of a plant have different types of cells with different functions. State the main function of the two types of mesophyll cells. palisade mesophyll cells … spongy mesophyll cells … [2] (ii) Plant growth can be affected by ion deficiencies. Explain the effects of magnesium ion deficiency on plant growth. … … … … [2] (c) In humans, food is digested in the stomach of the alimentary canal. Hydrochloric acid is found in the stomach. State two functions of hydrochloric acid in the stomach. 1 … 2 … [2] [Total: 9]
9 marks
Mark scheme: 7(a)(i) mouse ; 1 7(a)(ii) any two from: energy lost between trophic levels ; named example of energy loss ; so not enough energy to sustain more levels ; 2 7(b)(i) palisade mesophyll cells – photosynthesis ; spongy mesophyll cells – gas exchange ; 2 7(b)(ii) magnesium needed to synthesise chlorophyll / (less Mg means) plant becomes pale / yellow or less growth ; chlorophyll is needed for photosynthesis ; 2 7(c) kill bacteria ; provide (acidic) pH for enzymes ; 2
This question in 0653/42 May/June 2022
Q8 · An insect-pollinated flower cut open to show the internal structures 0653/42 Feb/March 2023
1 (a) Fig. 1.1 shows an insect-pollinated flower cut open to show the internal structures. anther stigma Fig. 1.1 (i) On Fig. 1.1, draw a label line and the letter X to identify the part that contains ovules. [1] (ii) Describe two visible features that show the flower in Fig. 1.1 is adapted for insect pollination. 1 … … 2 … … [2] (b) Fig. 1.2 shows pollen grains from different plants as seen using a microscope. Y Fig. 1.2 Use evidence from Fig. 1.2 to describe how pollen grain Y is adapted for insect pollination. … … [1] (c) A student investigates phototropism in plants. The student places a plant near a window. The plant is left for one week. Fig. 1.3 shows the plant before the investigation starts and after one week by the window. plant before plant after one week direction of light from window Fig. 1.3 Complete these sentences to explain the response of the plant to light. Auxin spreads from the … to other parts of the plant. There is unequal … of auxin in response to light. The plant stem grows faster on the side with less light. This is because auxin stimulates more cell … on this side. [3] (d) (i) Explain why plants are found at the first trophic level of a food chain. … … … [2] (ii) Explain why not all the energy in plants is transferred to the next trophic level. … … … [2] [Total: 11]
11 marks
Mark scheme: Question Answer Marks 1(a)(i) ovary labelled ; 1 1(a)(ii) anther inside flower / stigma / reproductive organs inside flower ; 2 large / long, petals ; 1(b) spikes (to stick to insect) ; 1 1(c) shoot tip ; 3 distribution / spread ; elongation ; 1(d)(i) any two from: 2 producers ; make their own food ; reference to photosynthesis ; do not consume other life forms ; 1(d)(ii) any two from: 2 lost as heat / respiration ; not all (parts of) plant are eaten ; not all is digested / energy remnants in faeces ;
This question in 0653/42 Feb/March 2023
Question 9 0653/42 Oct/Nov 2023
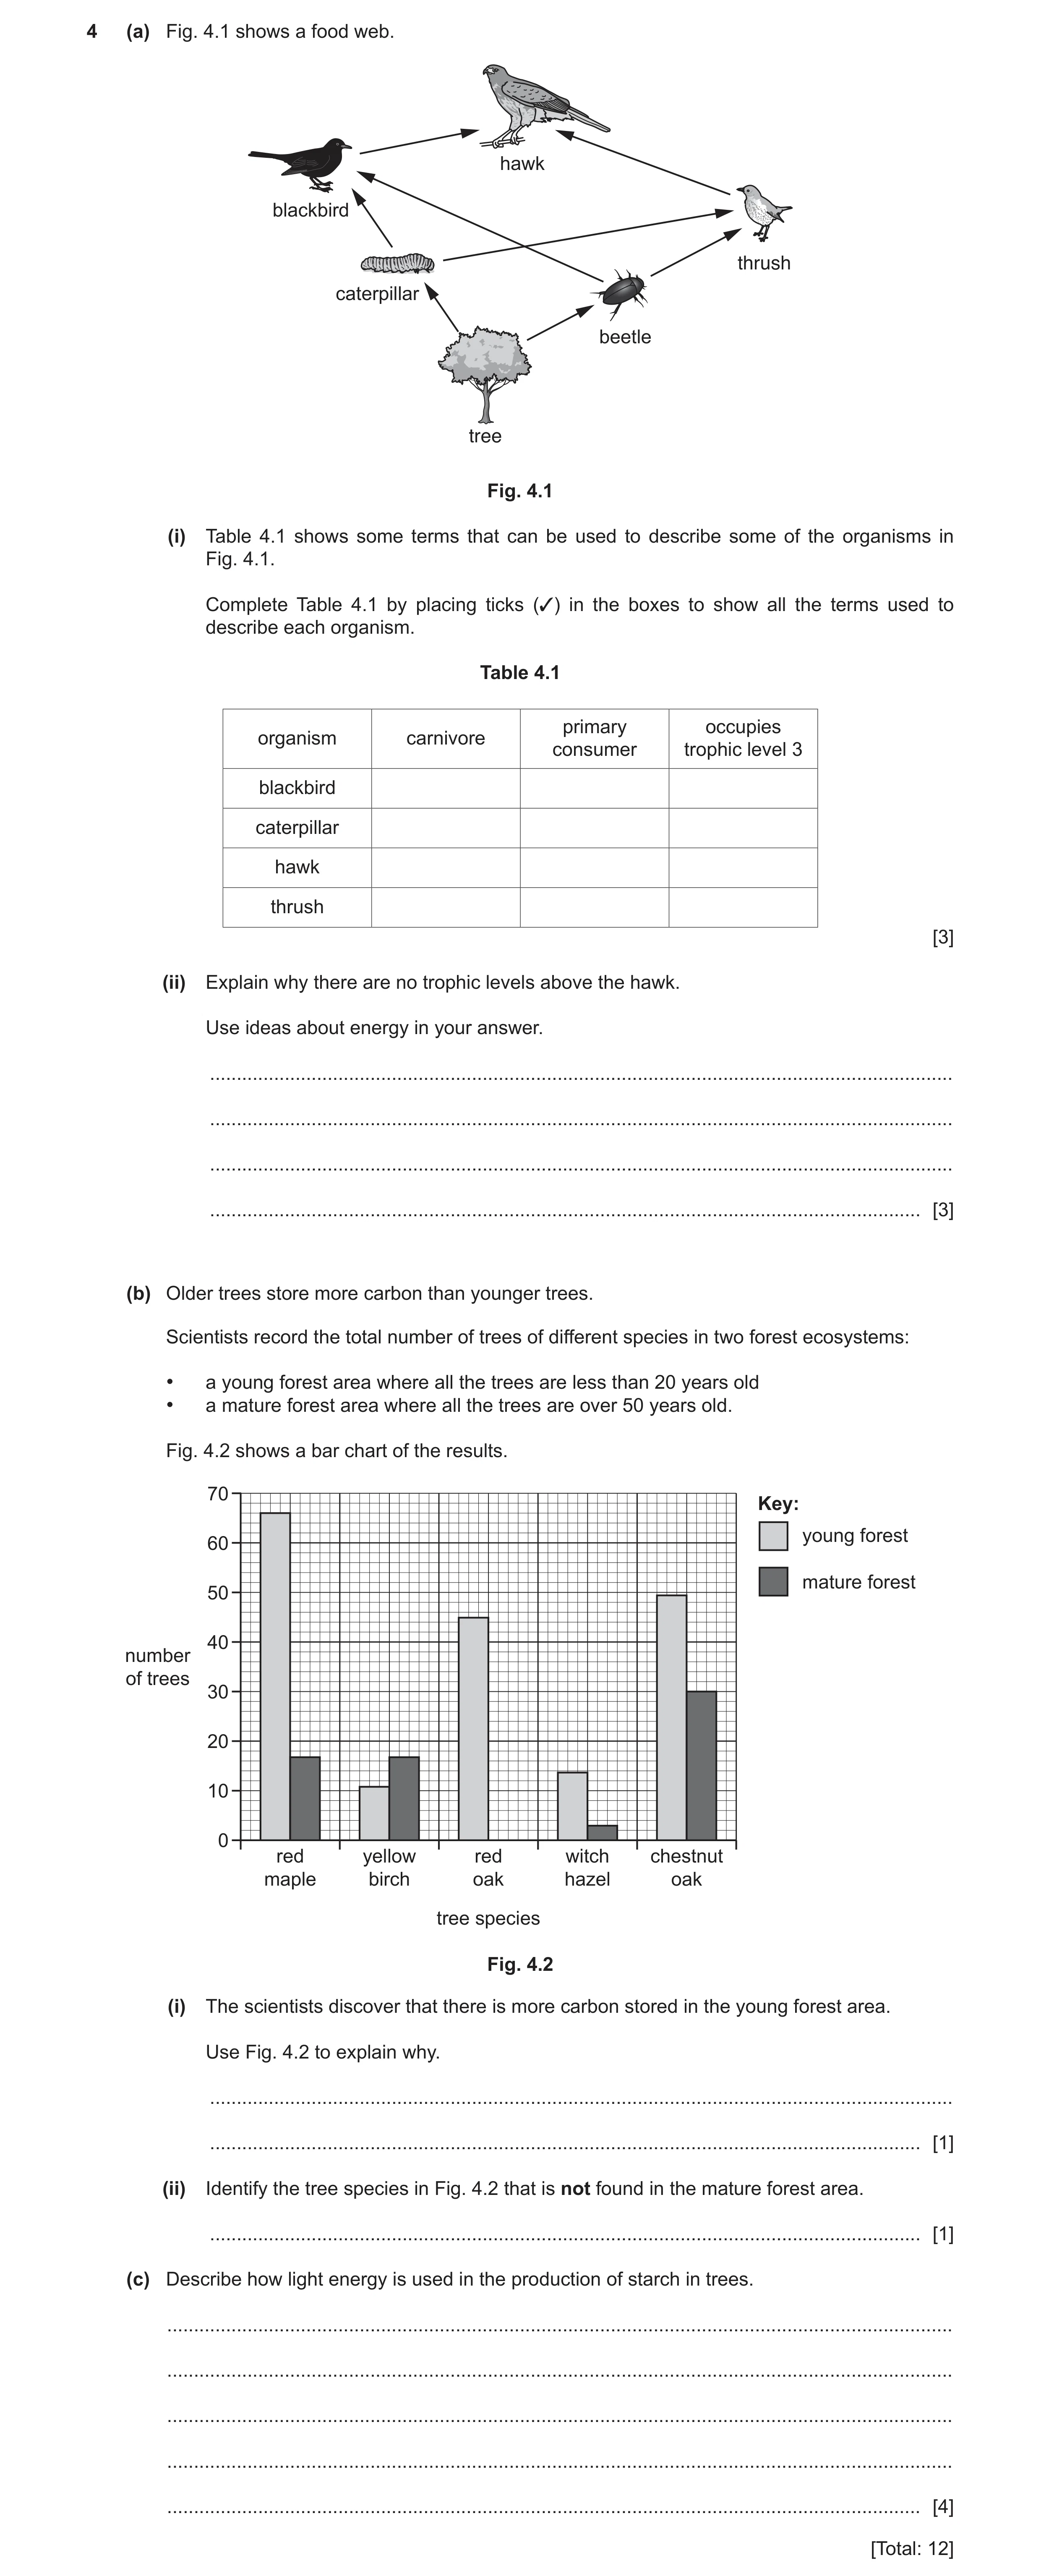
4 (a) Fig. 4.1 shows a food web. hawk blackbird thrush caterpillar beetle tree Fig. 4.1 (i) Table 4.1 shows some terms that can be used to describe some of the organisms in Fig. 4.1. Complete Table 4.1 by placing ticks (3) in the boxes to show all the terms used to describe each organism. Table 4.1 primary occupies organism carnivore consumer trophic level 3 blackbird caterpillar hawk thrush [3] (ii) Explain why there are no trophic levels above the hawk. Use ideas about energy in your answer. … … … … [3] (b) Older trees store more carbon than younger trees. Scientists record the total number of trees of different species in two forest ecosystems: • a young forest area where all the trees are less than 20 years old • a mature forest area where all the trees are over 50 years old. Fig. 4.2 shows a bar chart of the results. 70 Key: young forest 60 mature forest 50 40 number of trees 30 20 10 0 red yellow red witch chestnut maple birch oak hazel oak tree species Fig. 4.2 (i) The scientists discover that there is more carbon stored in the young forest area. Use Fig. 4.2 to explain why. … … [1] (ii) Identify the tree species in Fig. 4.2 that is not found in the mature forest area. … [1] (c) Describe how light energy is used in the production of starch in trees. … … … … … [4] [Total: 12]
12 marks
Mark scheme: 4(a)(i) 3 organism carnivore primary consumer occupies trophic level 3 blackbird ✓ ✓ caterpillar ✓ hawk ✓ thrush ✓ ✓ carnivore column ; primary consumer column ; trophic level 3 column ; 4(a)(ii) any three from: 3 hawk is trophic level 4 / idea that next level is trophic level 5 ; not enough energy (to support another level) ; energy lost between each trophic level OR only a percentage of energy is transferred between trophic levels ; example of energy loss ; 4(b)(i) greater number of trees in the young forest area ; 1 4(b)(ii) red oak ; 1 4(c) glucose converted to starch / glucose is stored as starch ; 4 plus any three from: (light energy is) transferred to chemical energy ; by chlorophyll ; (takes place in) chloroplasts ; used in photosynthesis ; used to synthesise carbohydrates / glucose ; AVP ;
This question in 0653/42 Oct/Nov 2023
Q10 · The pathway taken by water through a plant 0653/41 May/June 2024
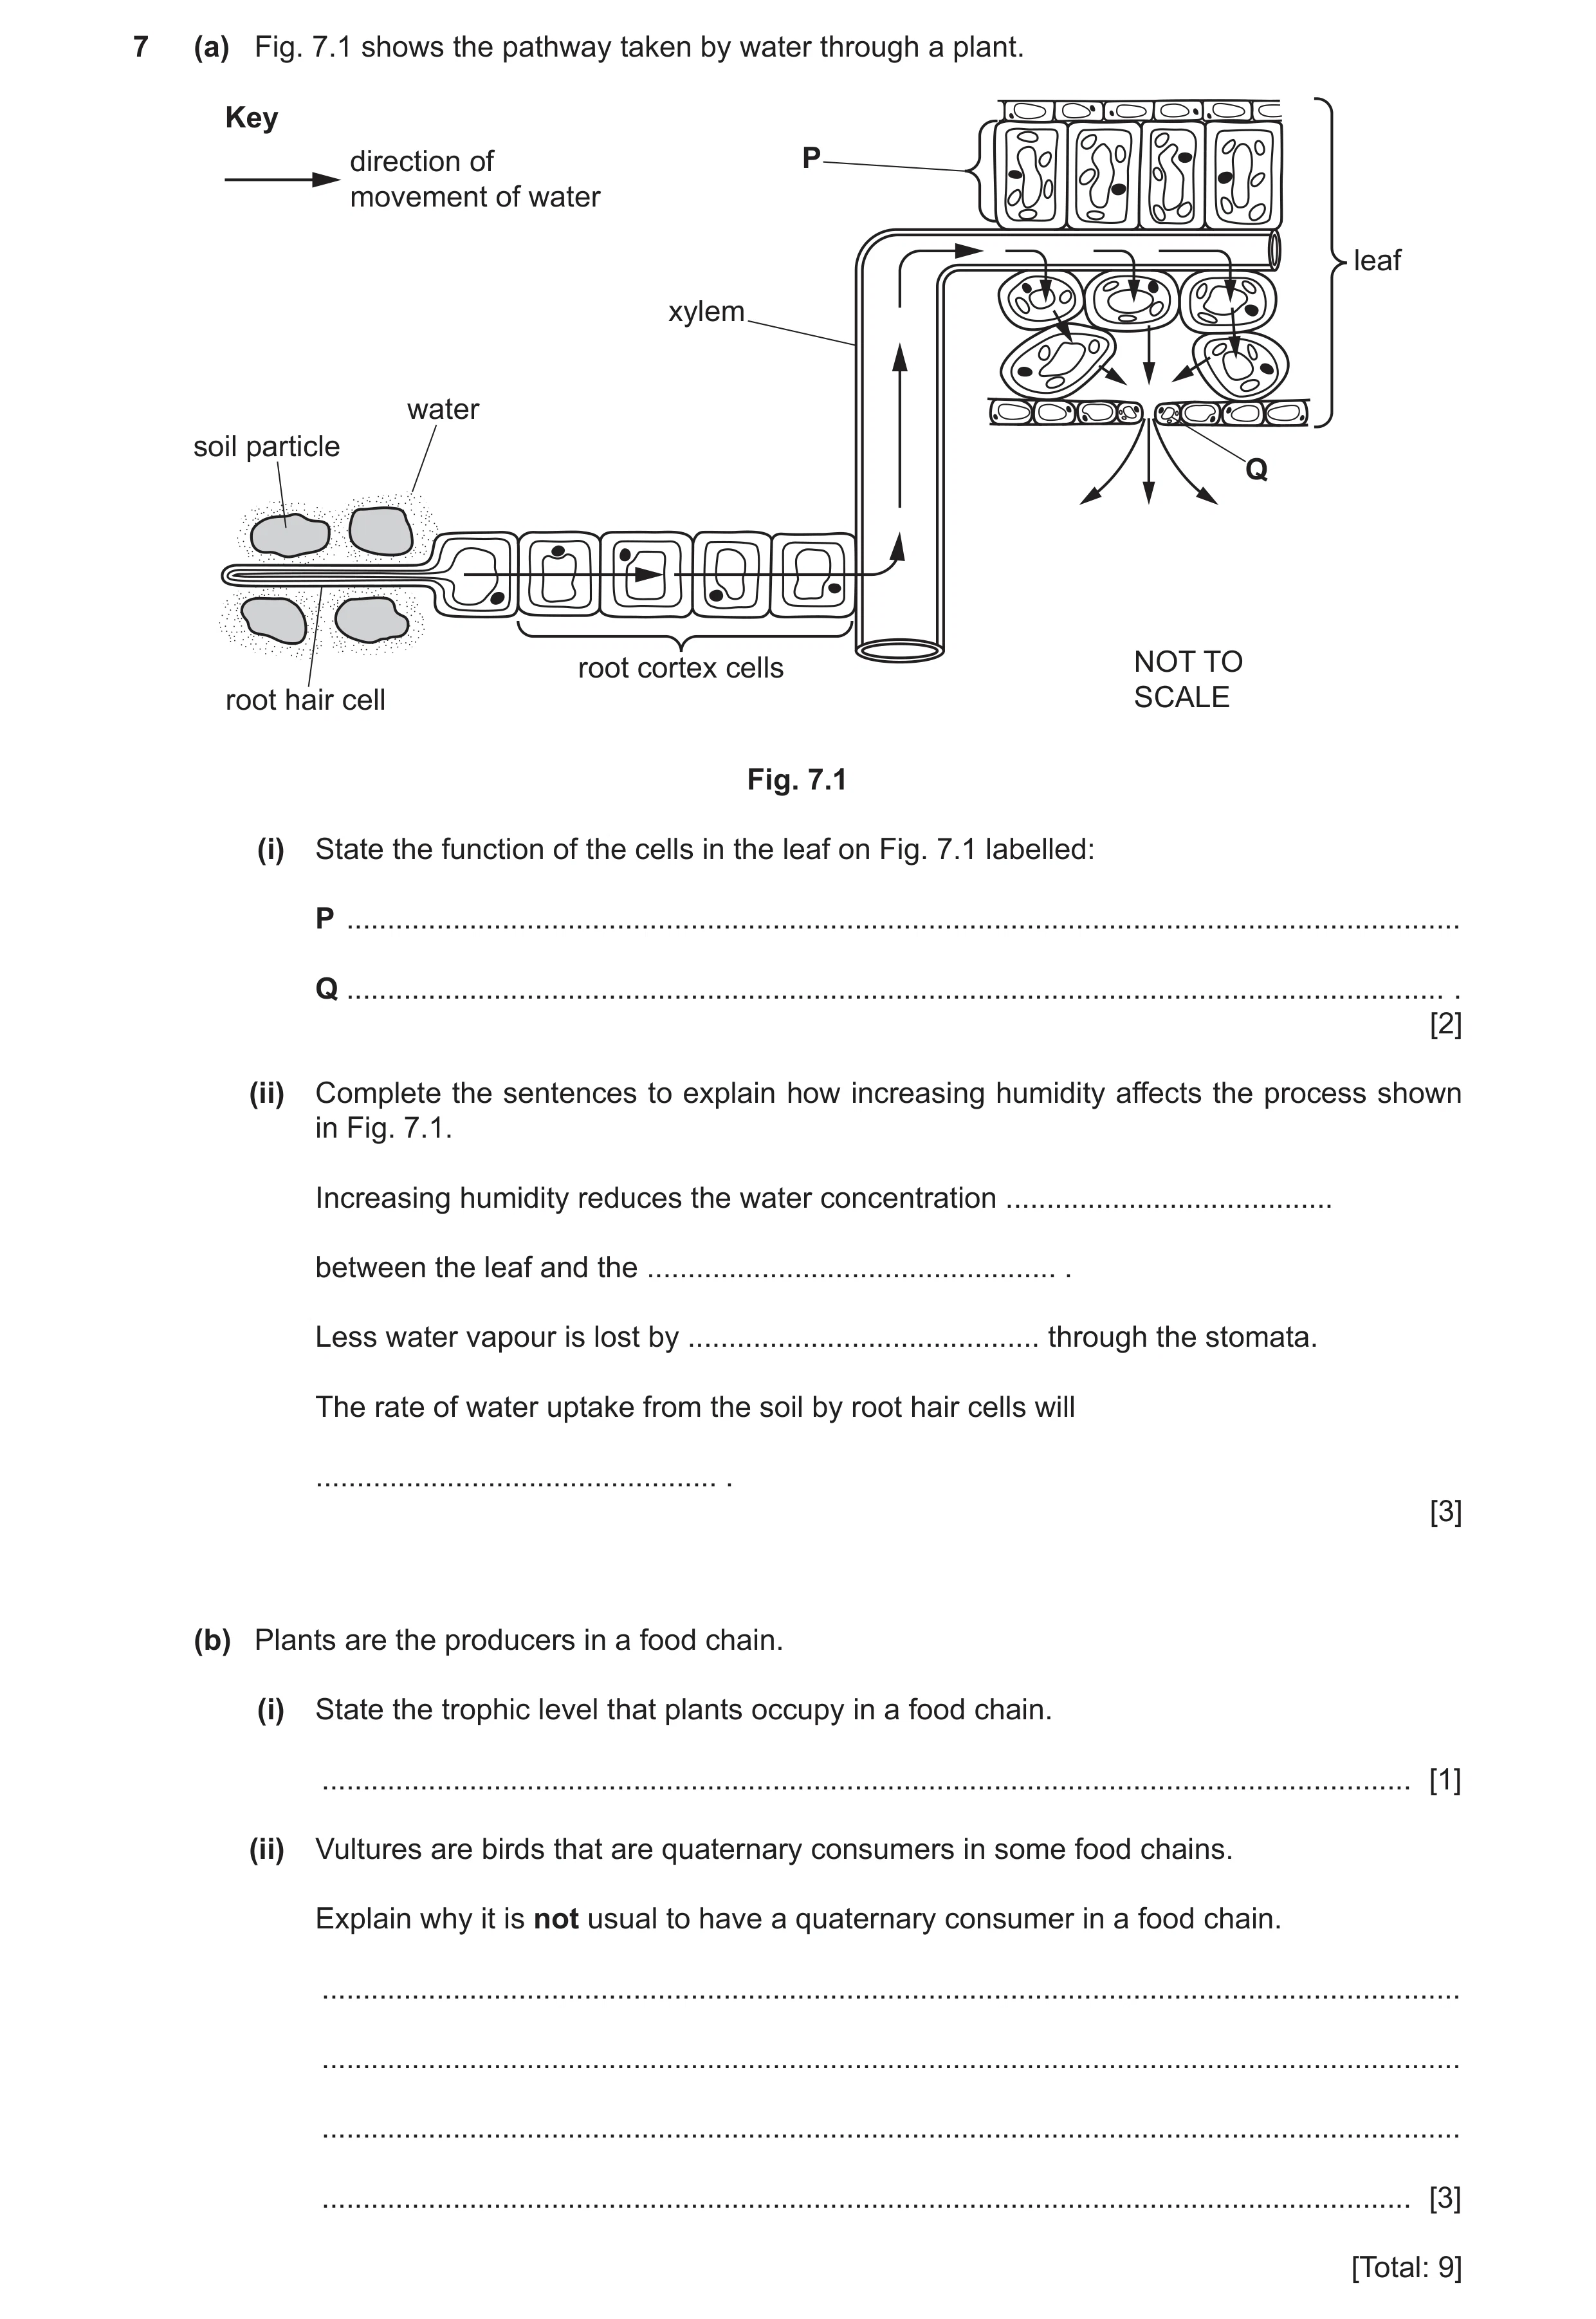
7 (a) Fig. 7.1 shows the pathway taken by water through a plant. Key direction of P movement of water leaf xylem water soil particle Q root cortex cells NOT TO root hair cell SCALE Fig. 7.1 (i) State the function of the cells in the leaf on Fig. 7.1 labelled: P … Q … . [2] (ii) Complete the sentences to explain how increasing humidity affects the process shown in Fig. 7.1. Increasing humidity reduces the water concentration … between the leaf and the … . Less water vapour is lost by … through the stomata. The rate of water uptake from the soil by root hair cells will … . [3] (b) Plants are the producers in a food chain. (i) State the trophic level that plants occupy in a food chain. … [1] (ii) Vultures are birds that are quaternary consumers in some food chains. Explain why it is not usual to have a quaternary consumer in a food chain. … … … … [3] [Total: 9]
9 marks
Mark scheme: 7(a)(i) P photosynthesis ; Q gas exchange ; 2 7(a)(ii) gradient and atmosphere ; diffusion ; decrease ; 3 7(b)(i) one / 1 ; 1 7(b)(ii) any three from: vulture is on trophic level 5 ; energy is lost at each trophic level ; named example of energy lost, e.g., heat / respiration / excretion / protein synthesis / metabolism / not all organism is eaten ; not enough energy (for quaternary consumer) ; 3
This question in 0653/41 May/June 2024
Question 11 0653/43 Oct/Nov 2024
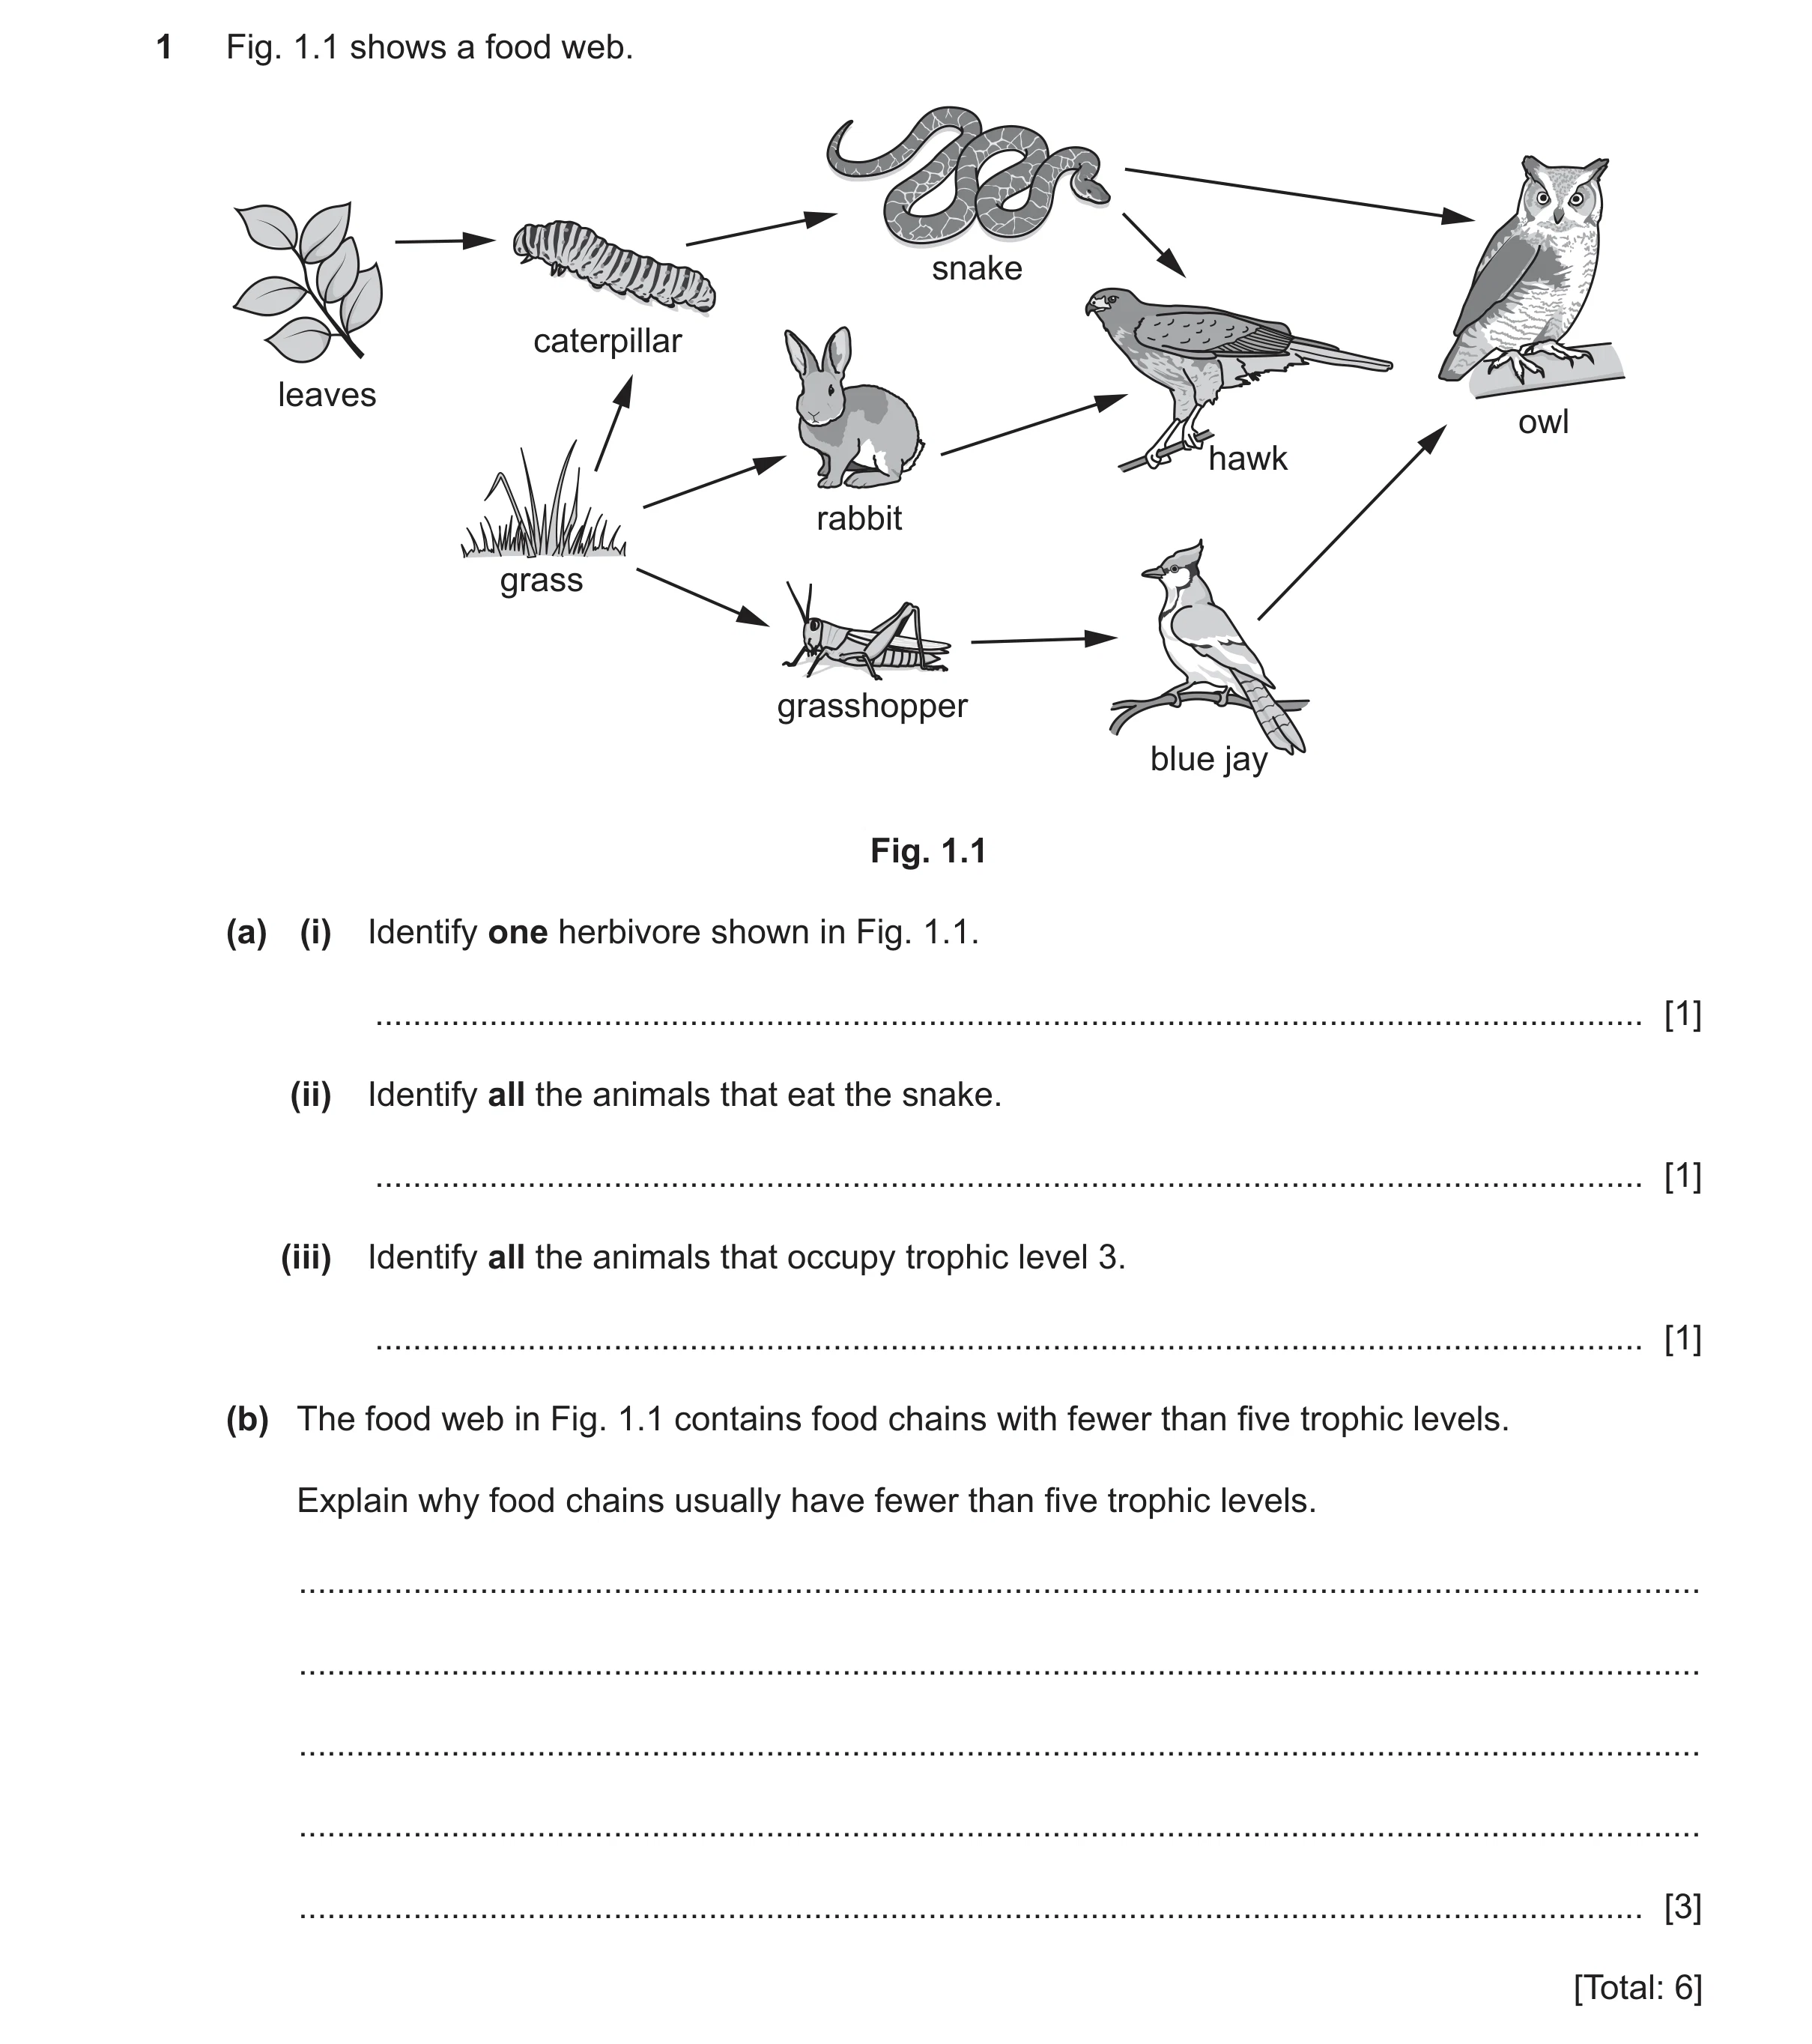
1 Fig. 1.1 shows a food web. snake caterpillar leaves owl hawk rabbit grass grasshopper blue jay Fig. 1.1 (a) (i) Identify one herbivore shown in Fig. 1.1. … [1] (ii) Identify all the animals that eat the snake. … [1] (iii) Identify all the animals that occupy trophic level 3. … [1] (b) The food web in Fig. 1.1 contains food chains with fewer than five trophic levels. Explain why food chains usually have fewer than five trophic levels. … … … … … [3] [Total: 6]
6 marks
Mark scheme: Question Answer Marks 1(a)(i) grasshopper / rabbit / caterpillar ; 1 1(a)(ii) hawk AND owl ; 1 1(a)(iii) snake AND hawk AND (blue) jay ; 1 1(b) energy is lost at each trophic level ; 3 named example of energy loss, e.g. heat / respiration / excretion / protein synthesis / metabolism / not all organism is eaten ; not enough energy left (to support trophic level five) ;
This question in 0653/43 Oct/Nov 2024
 1 / 14
 2 / 14
 3 / 14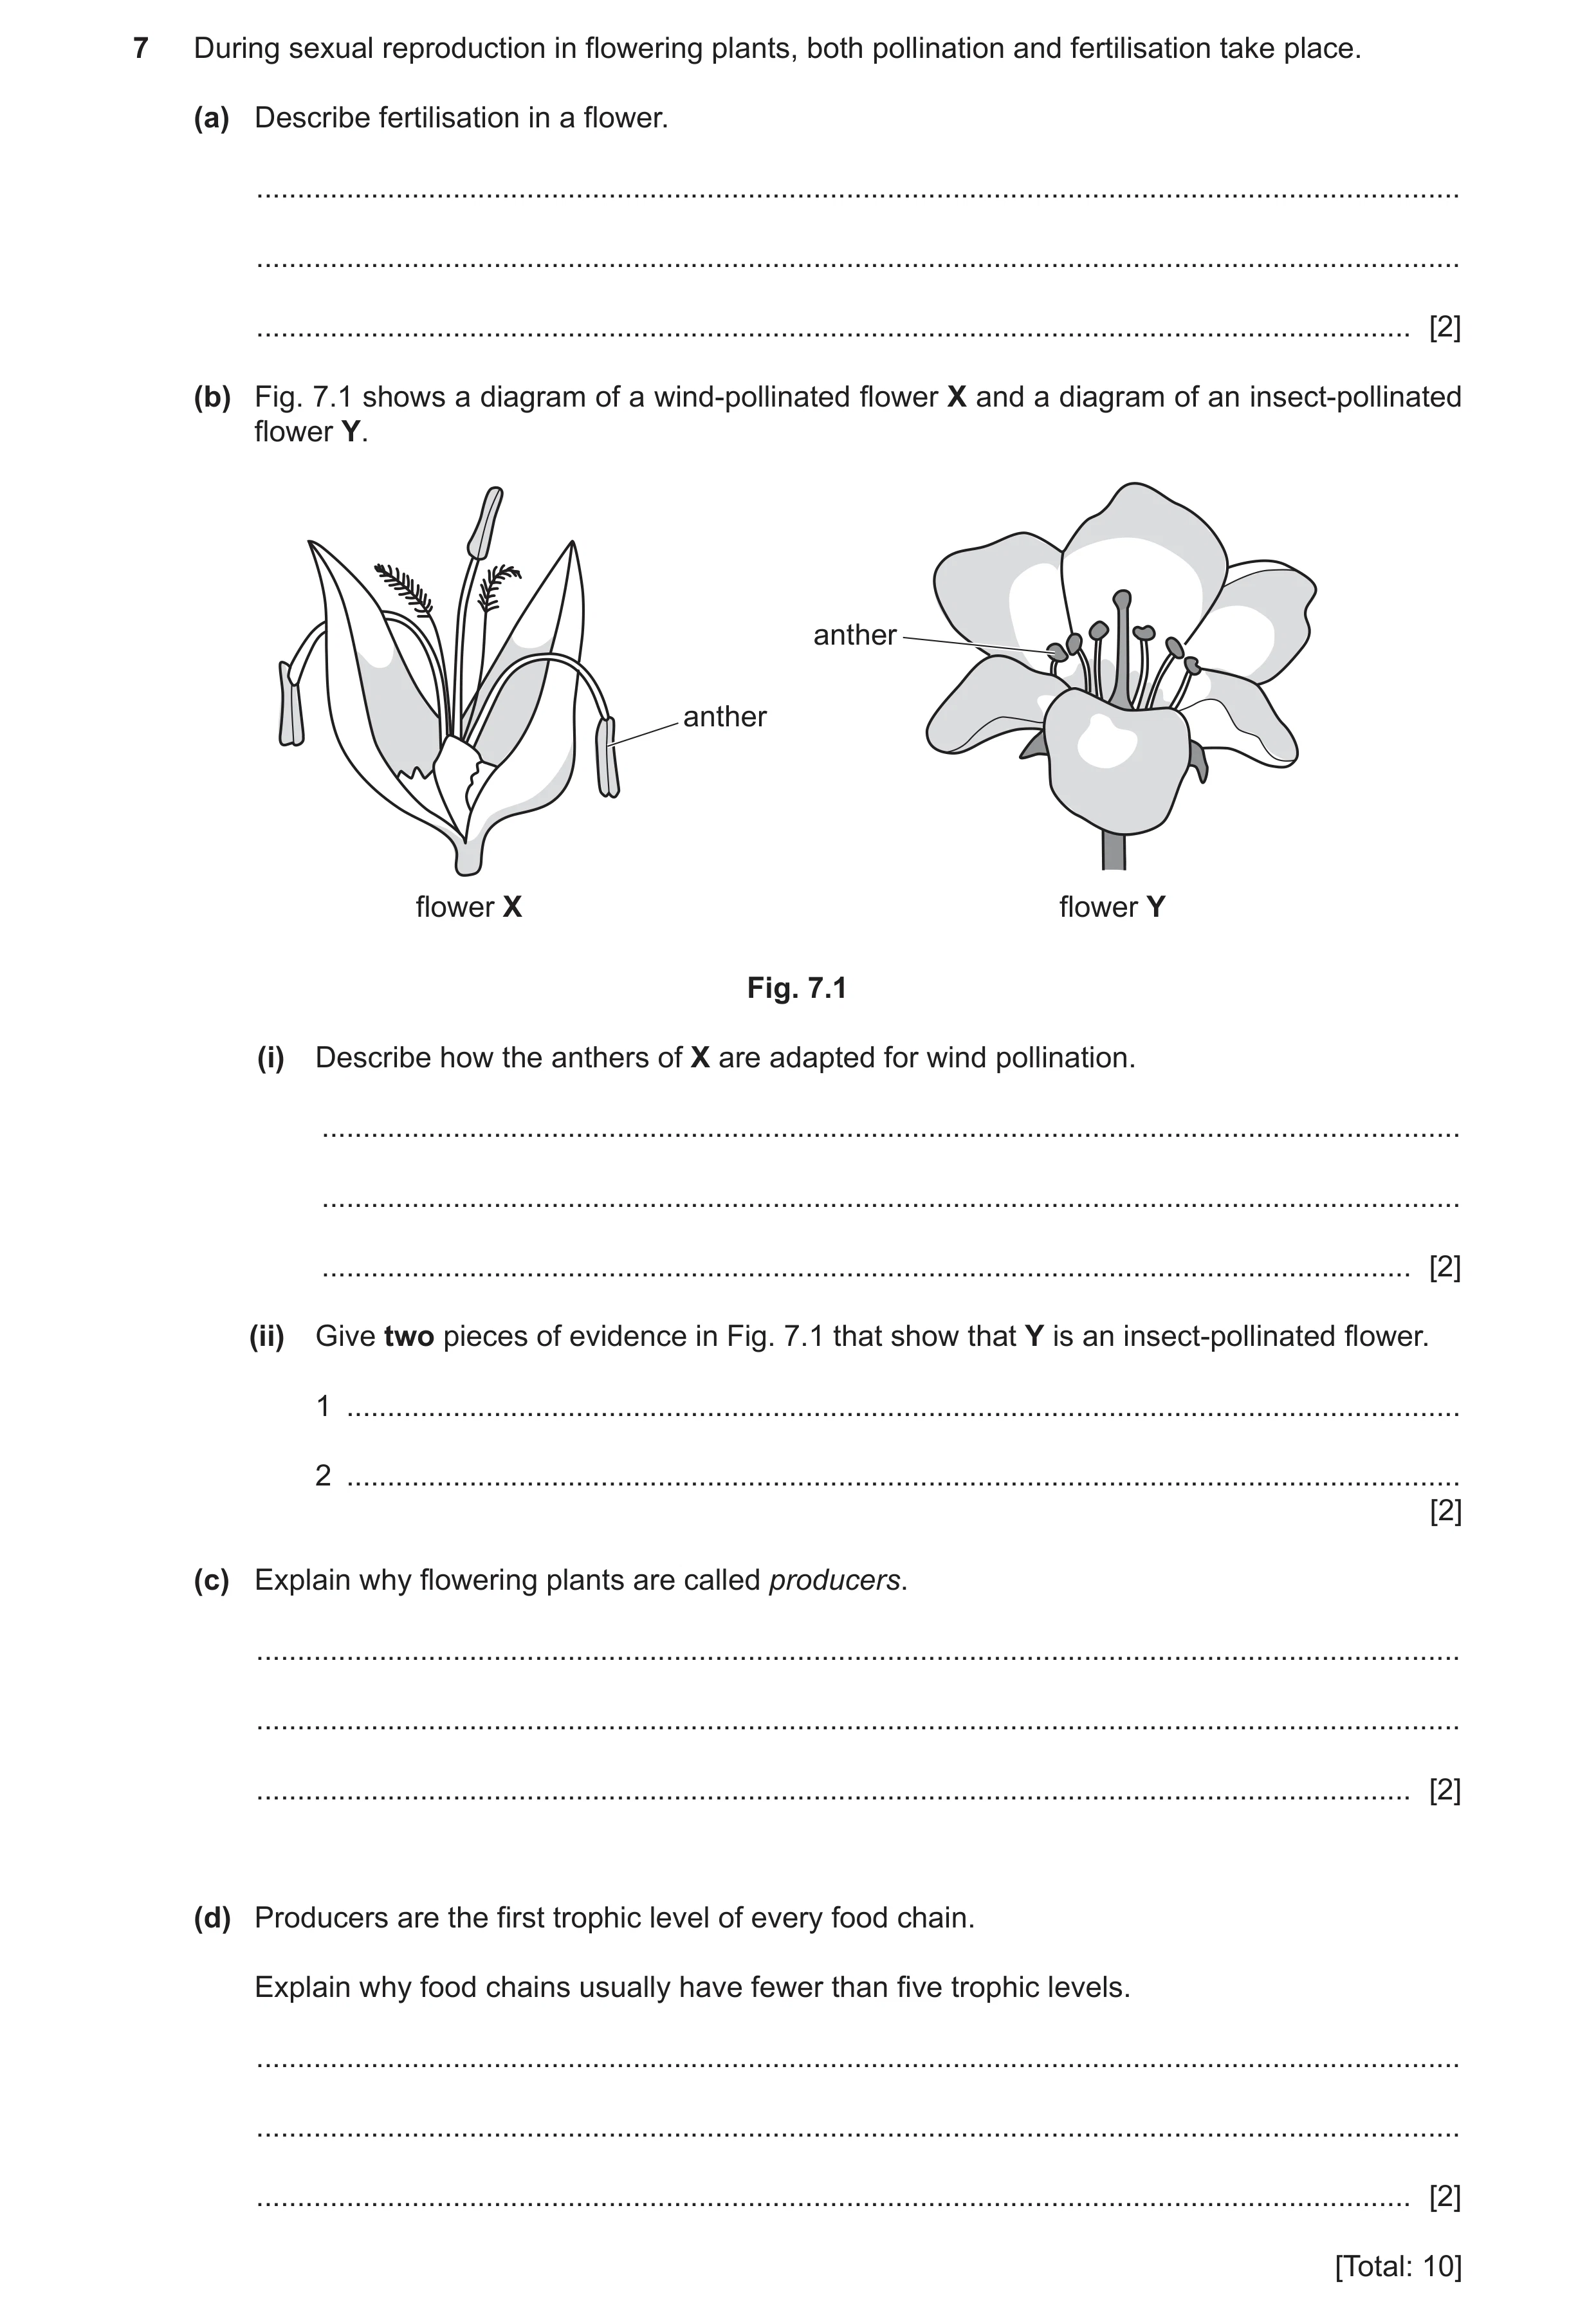
 8 / 14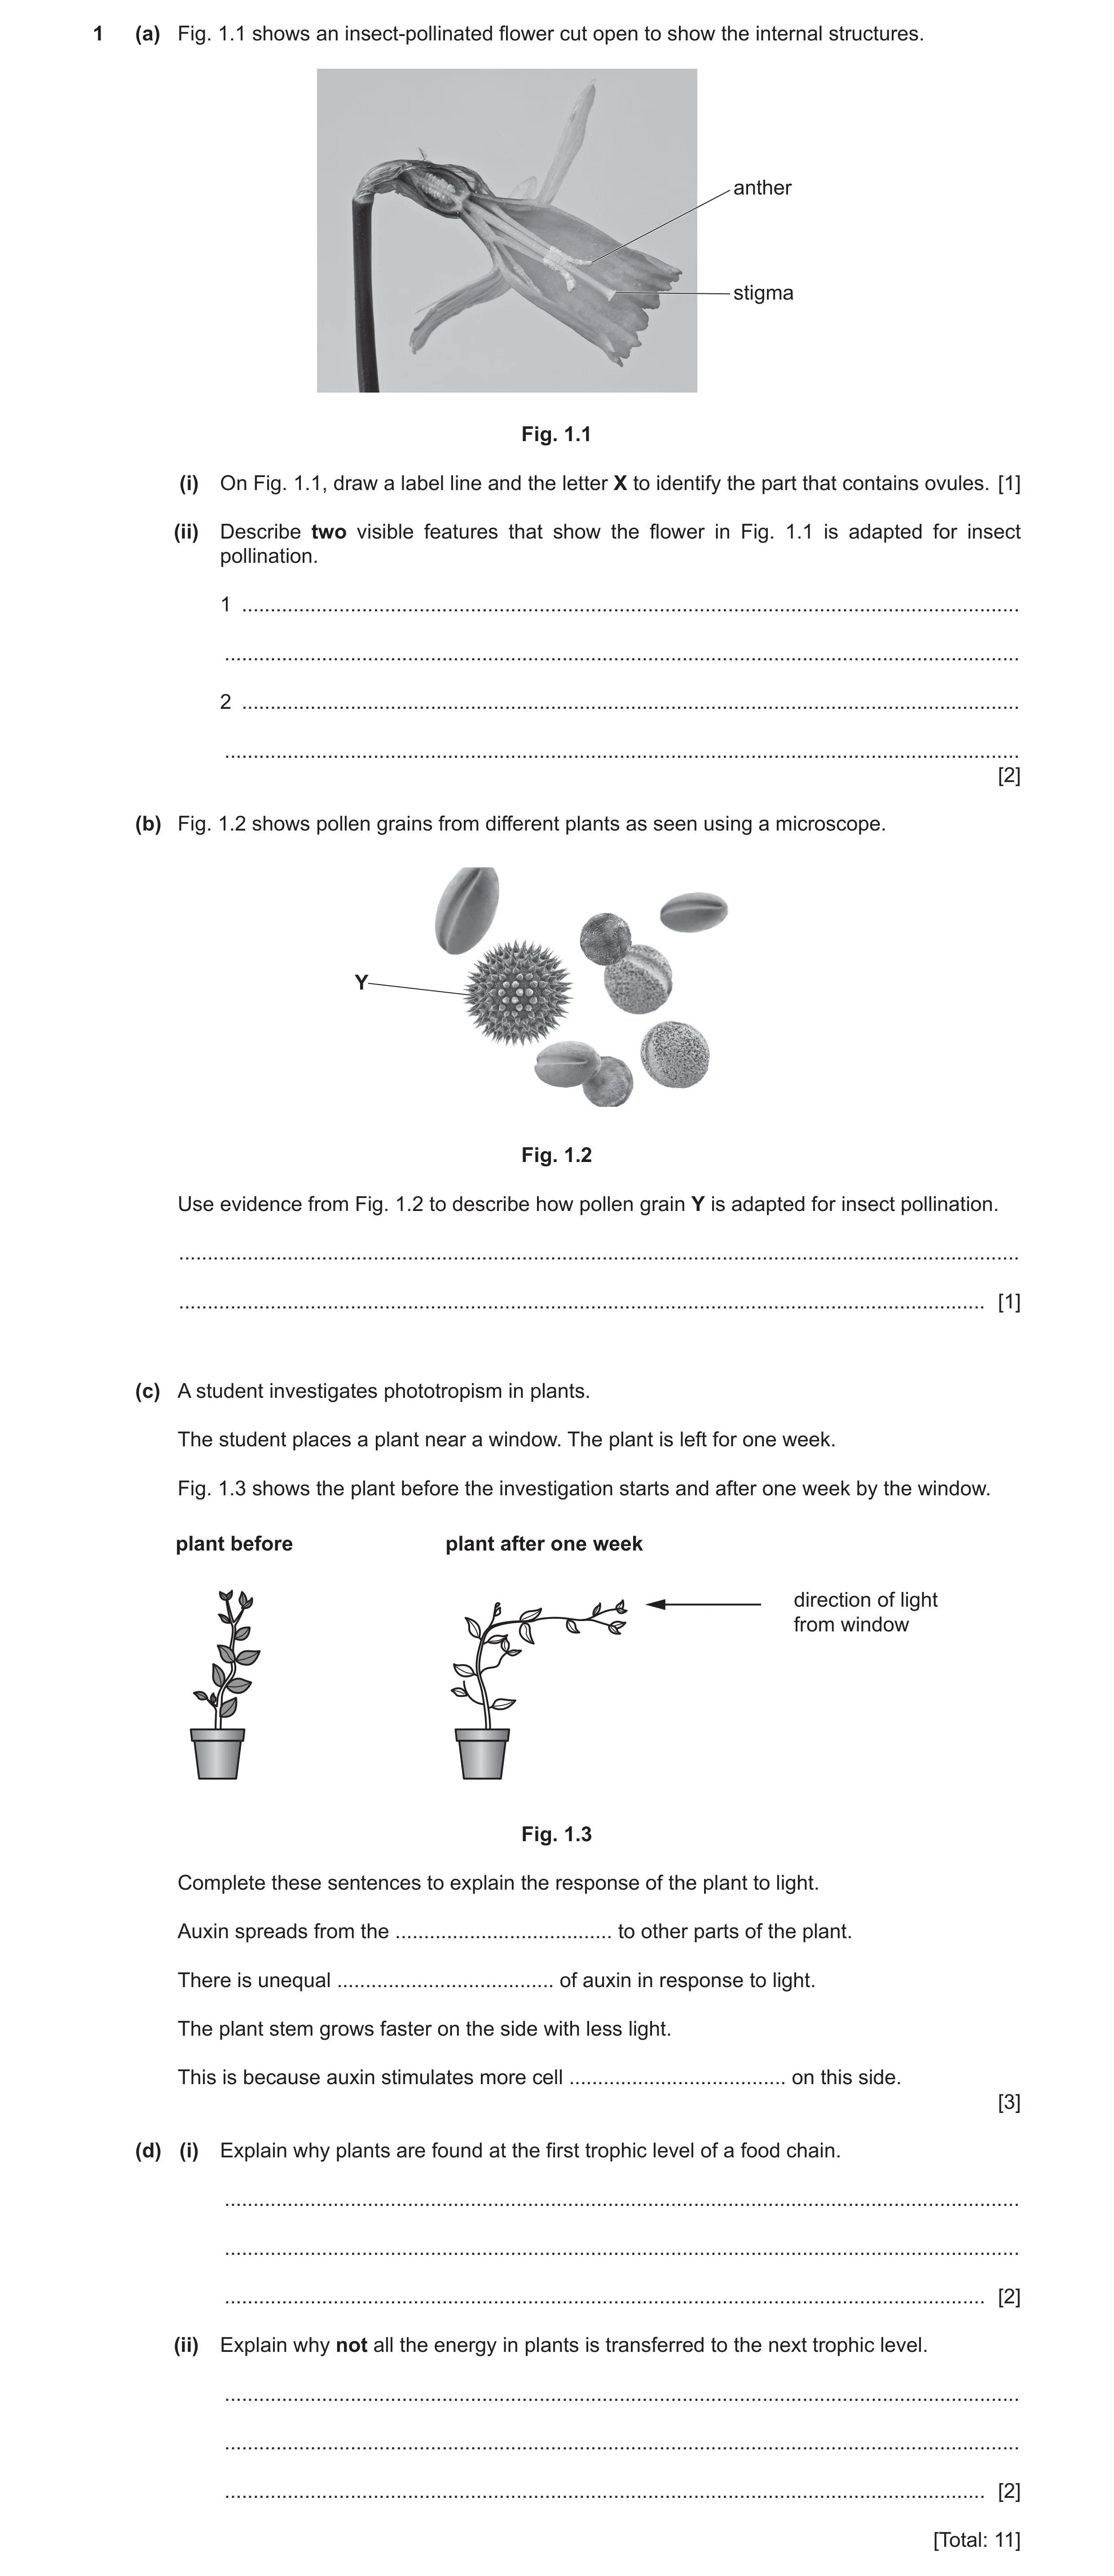
 14 / 14
 7
7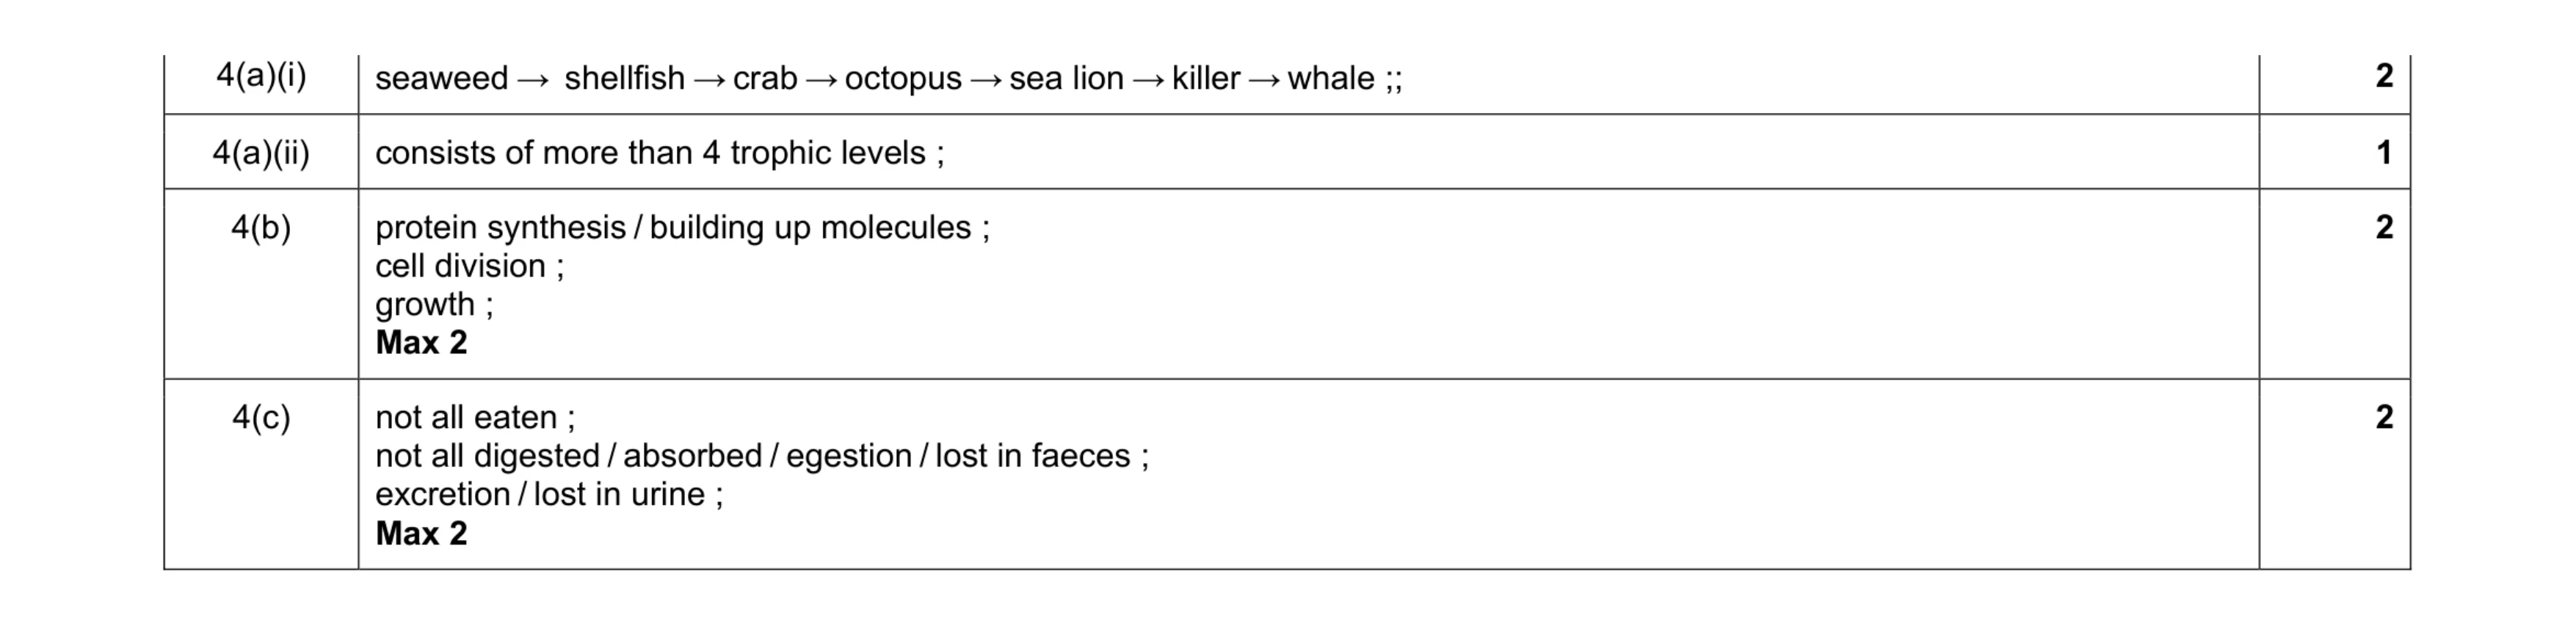 7
7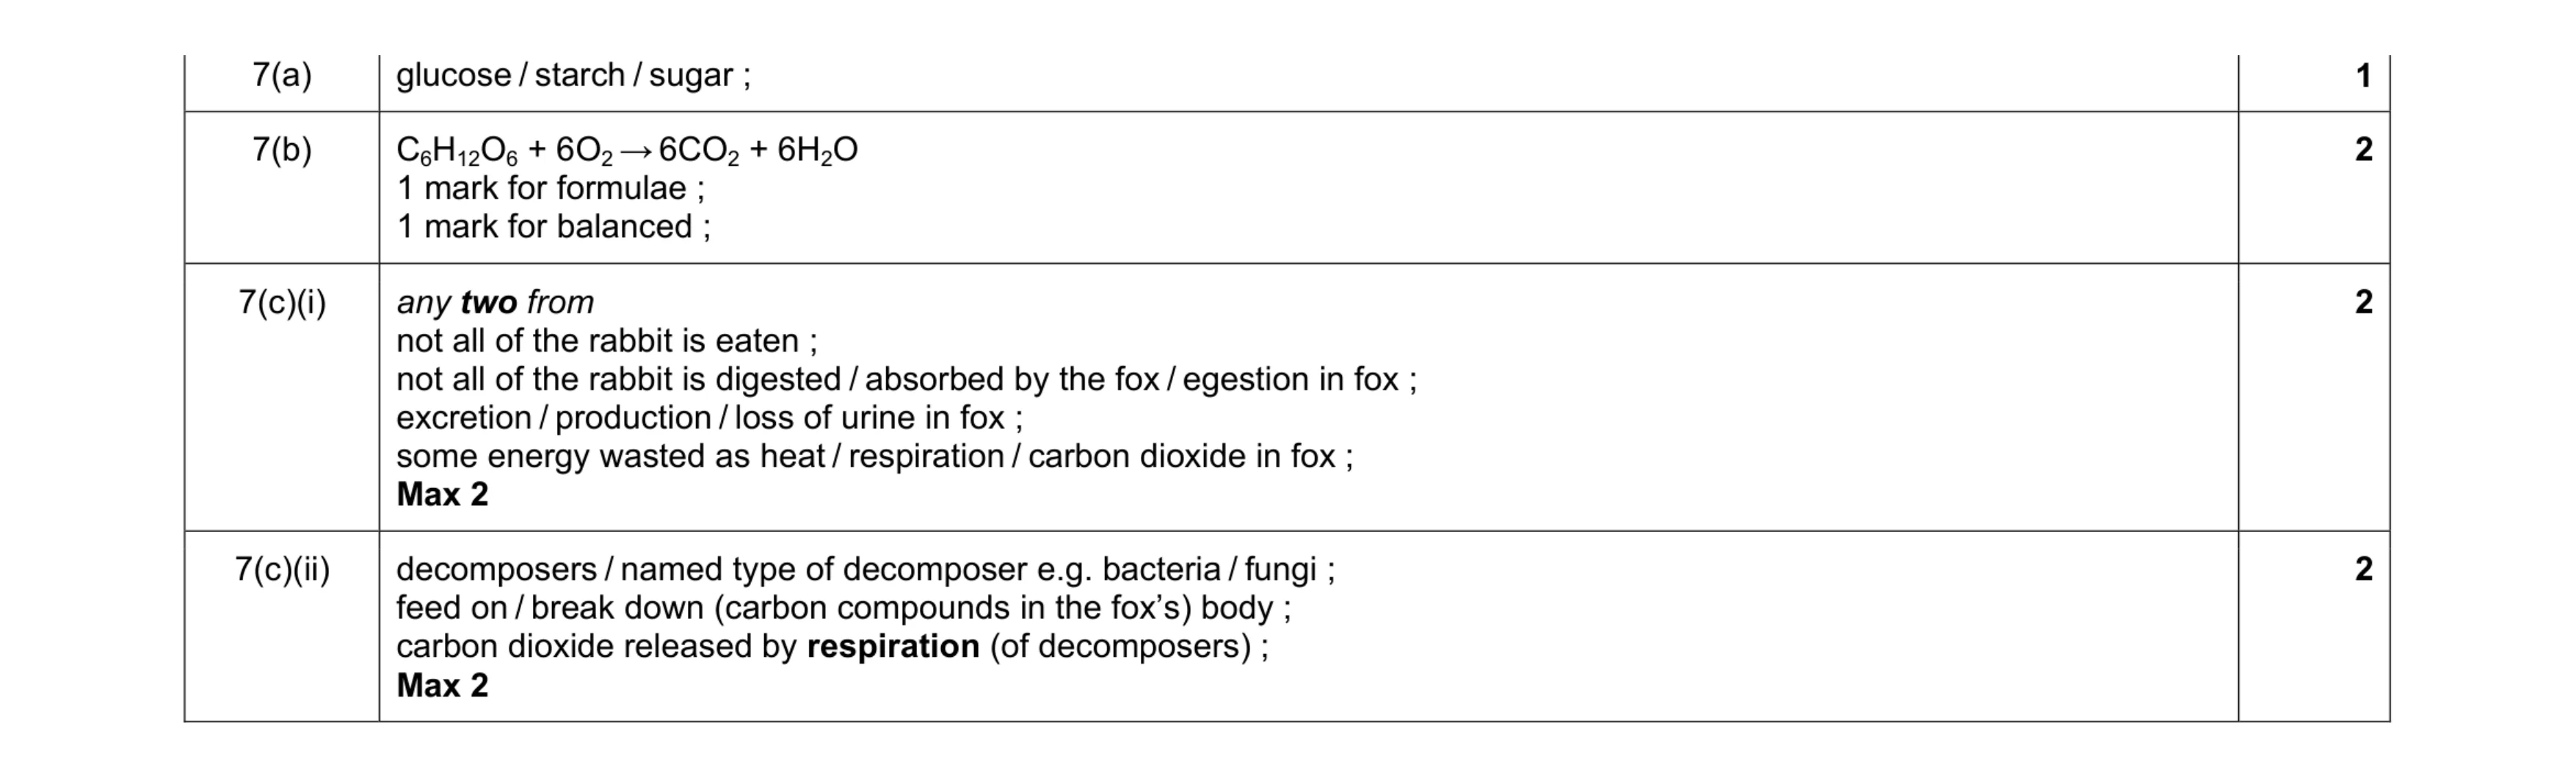 7
7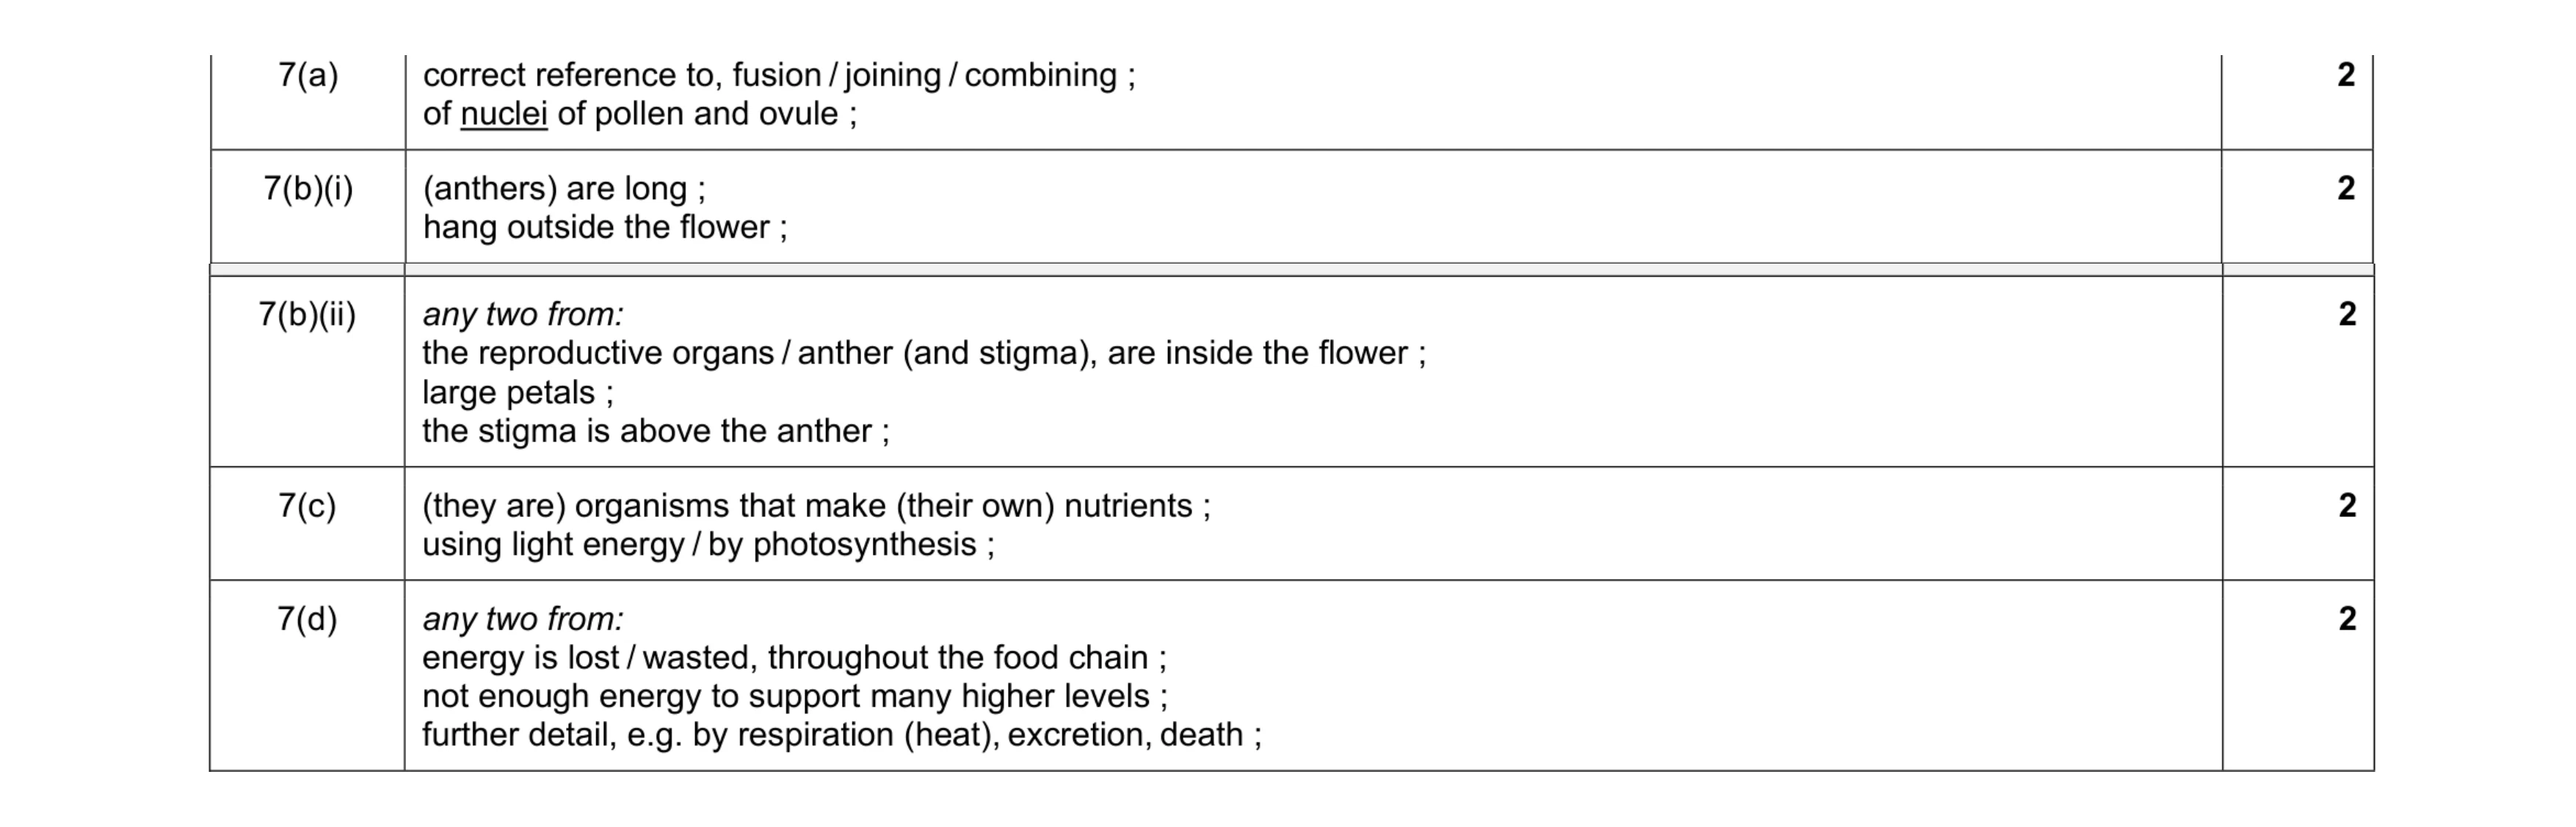 10
10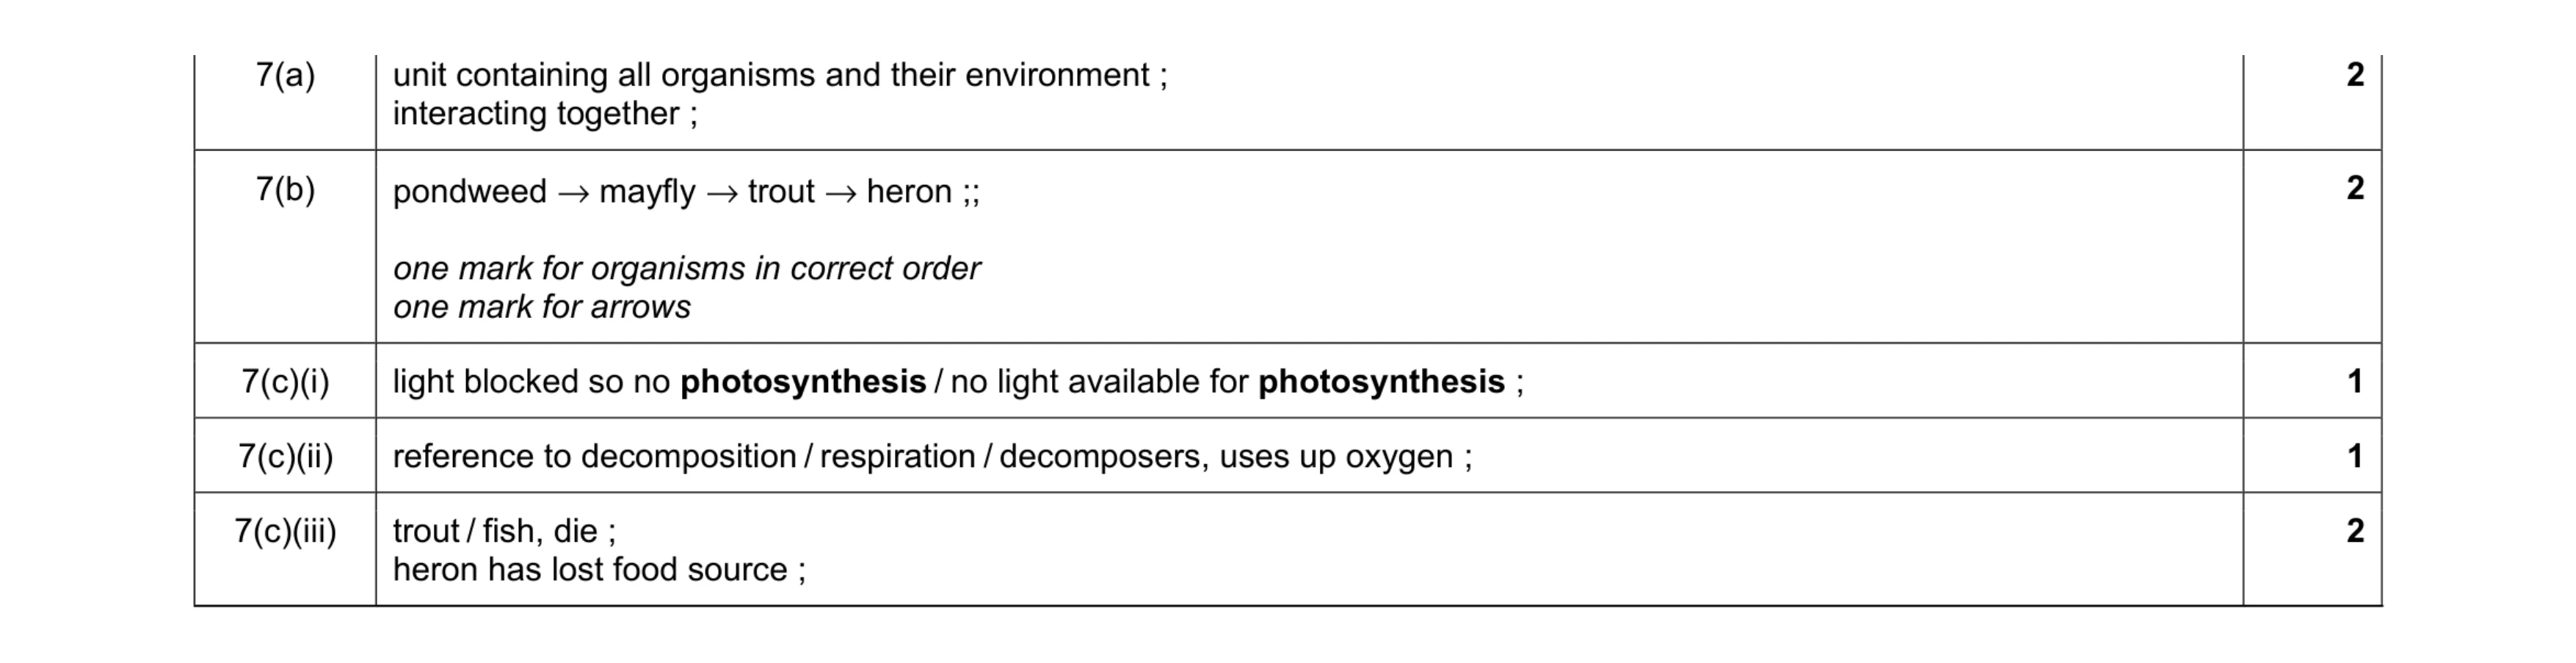 8
8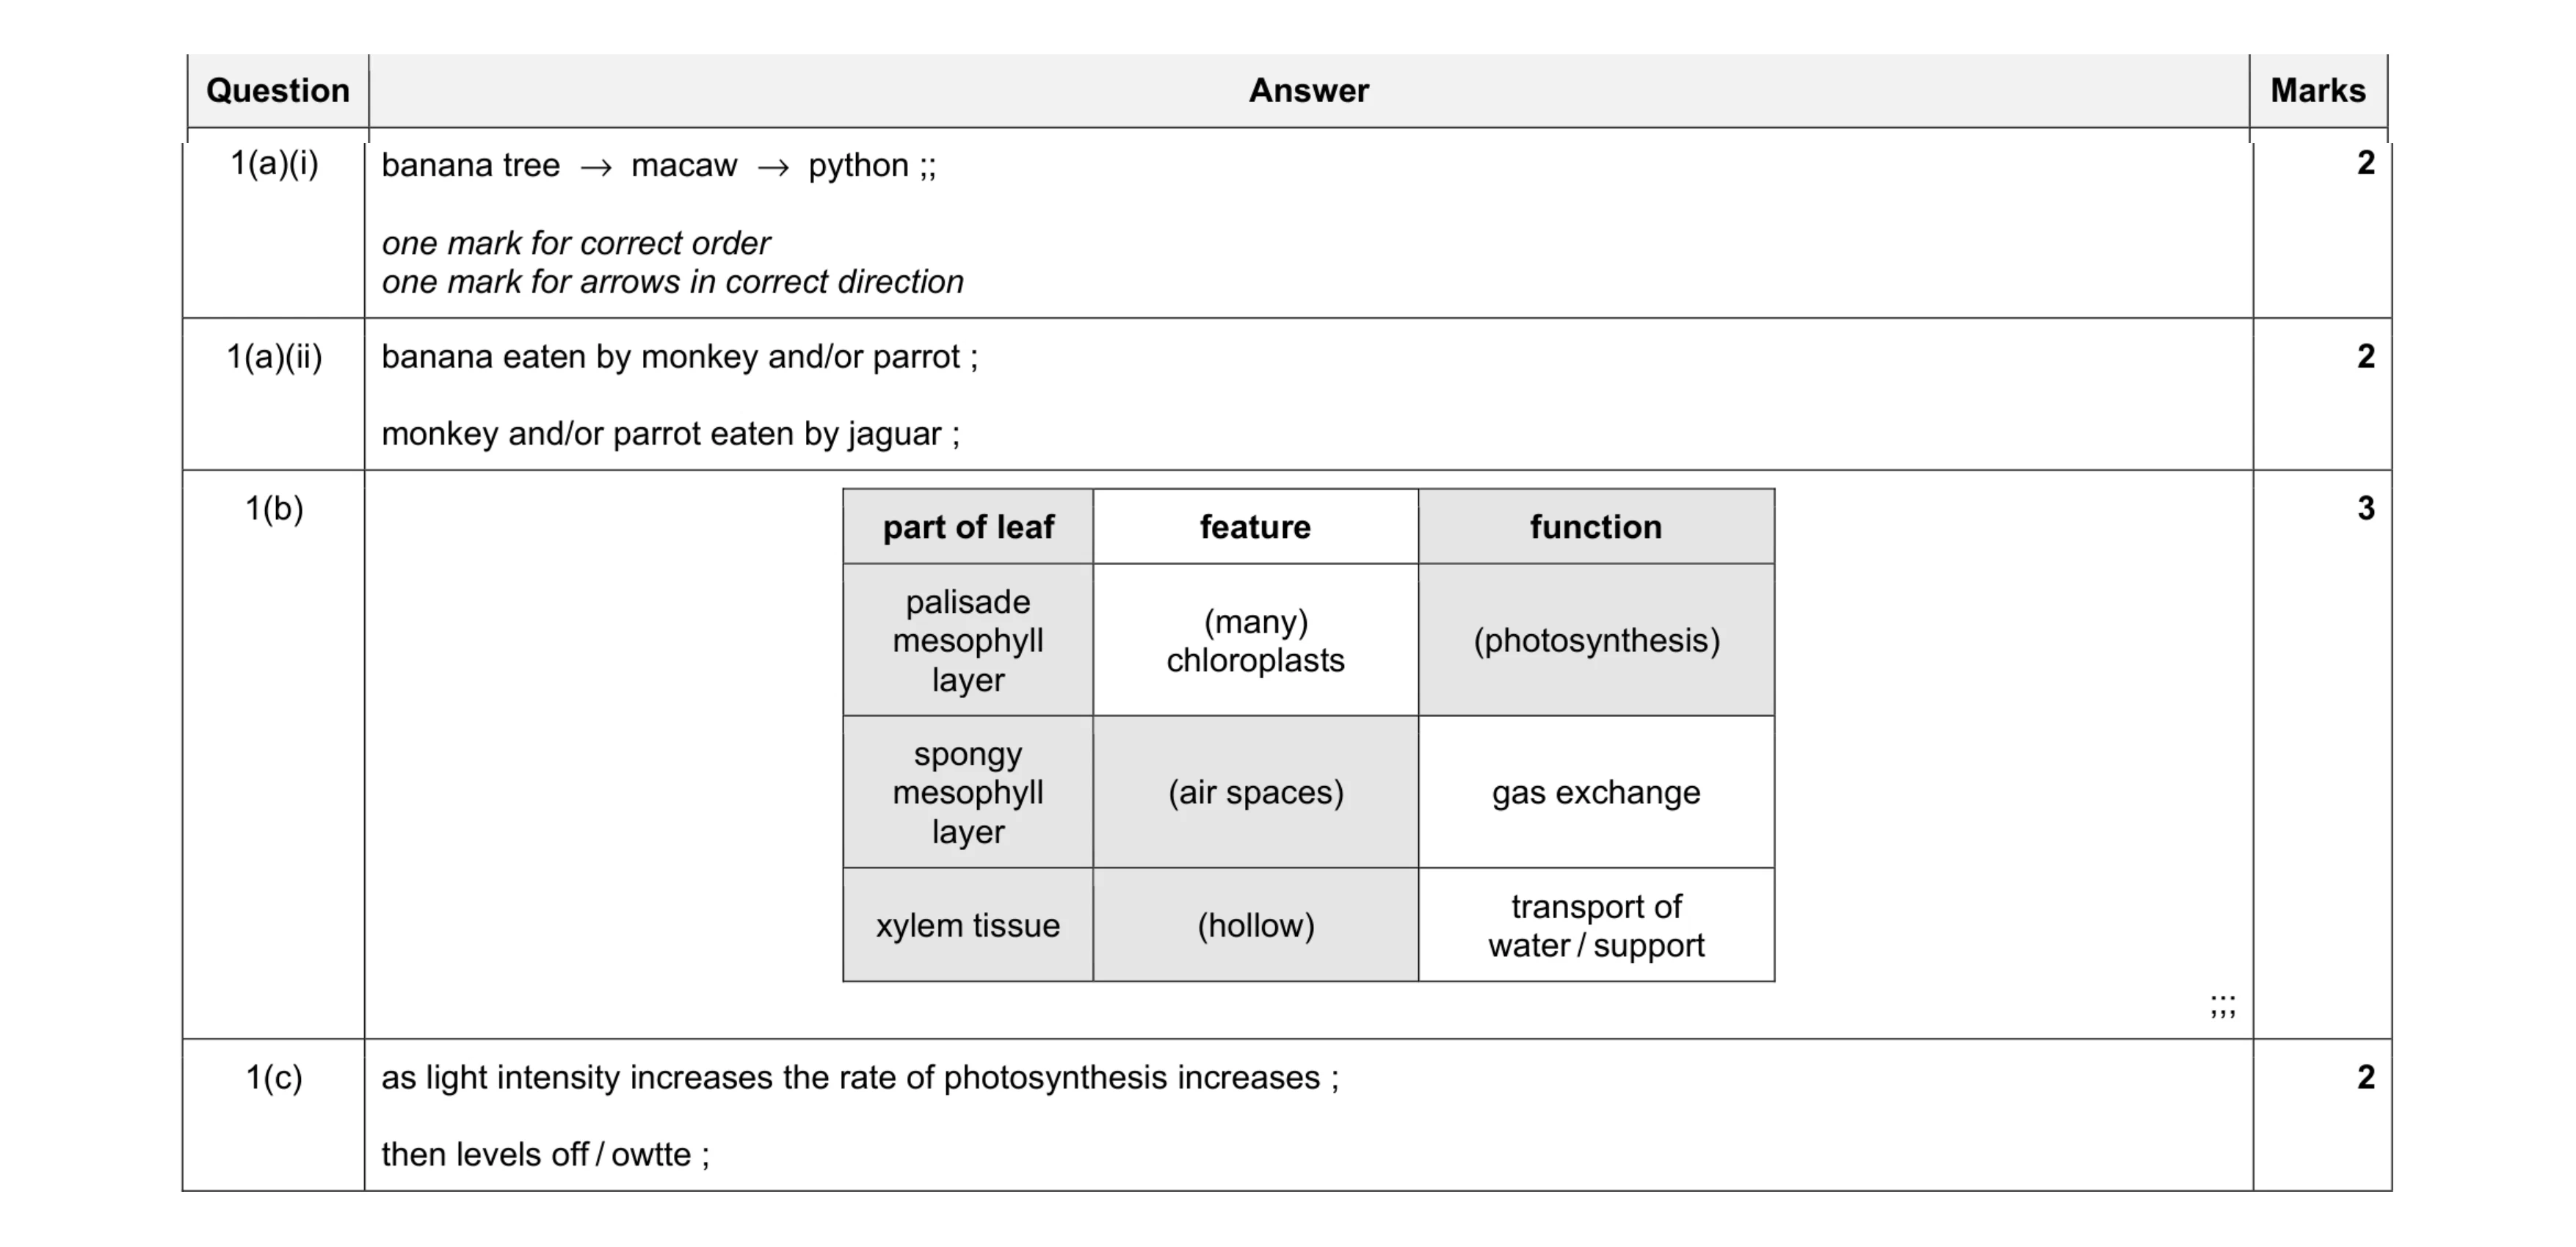 9
9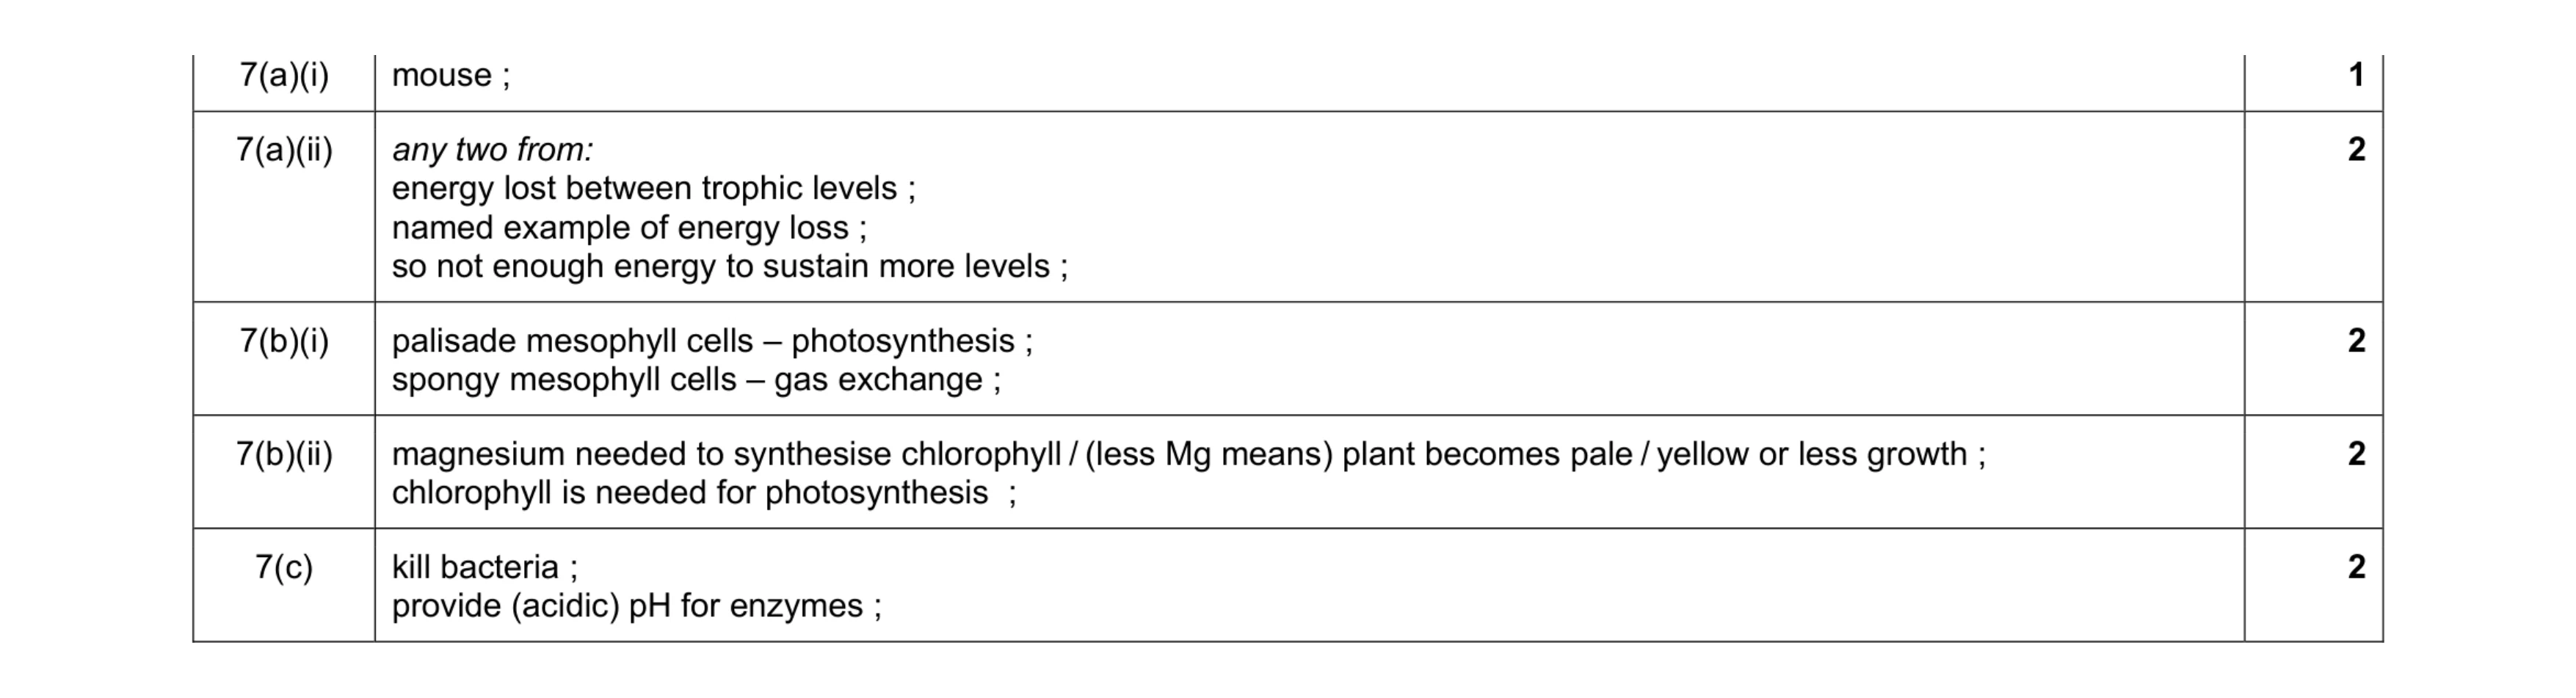 9
9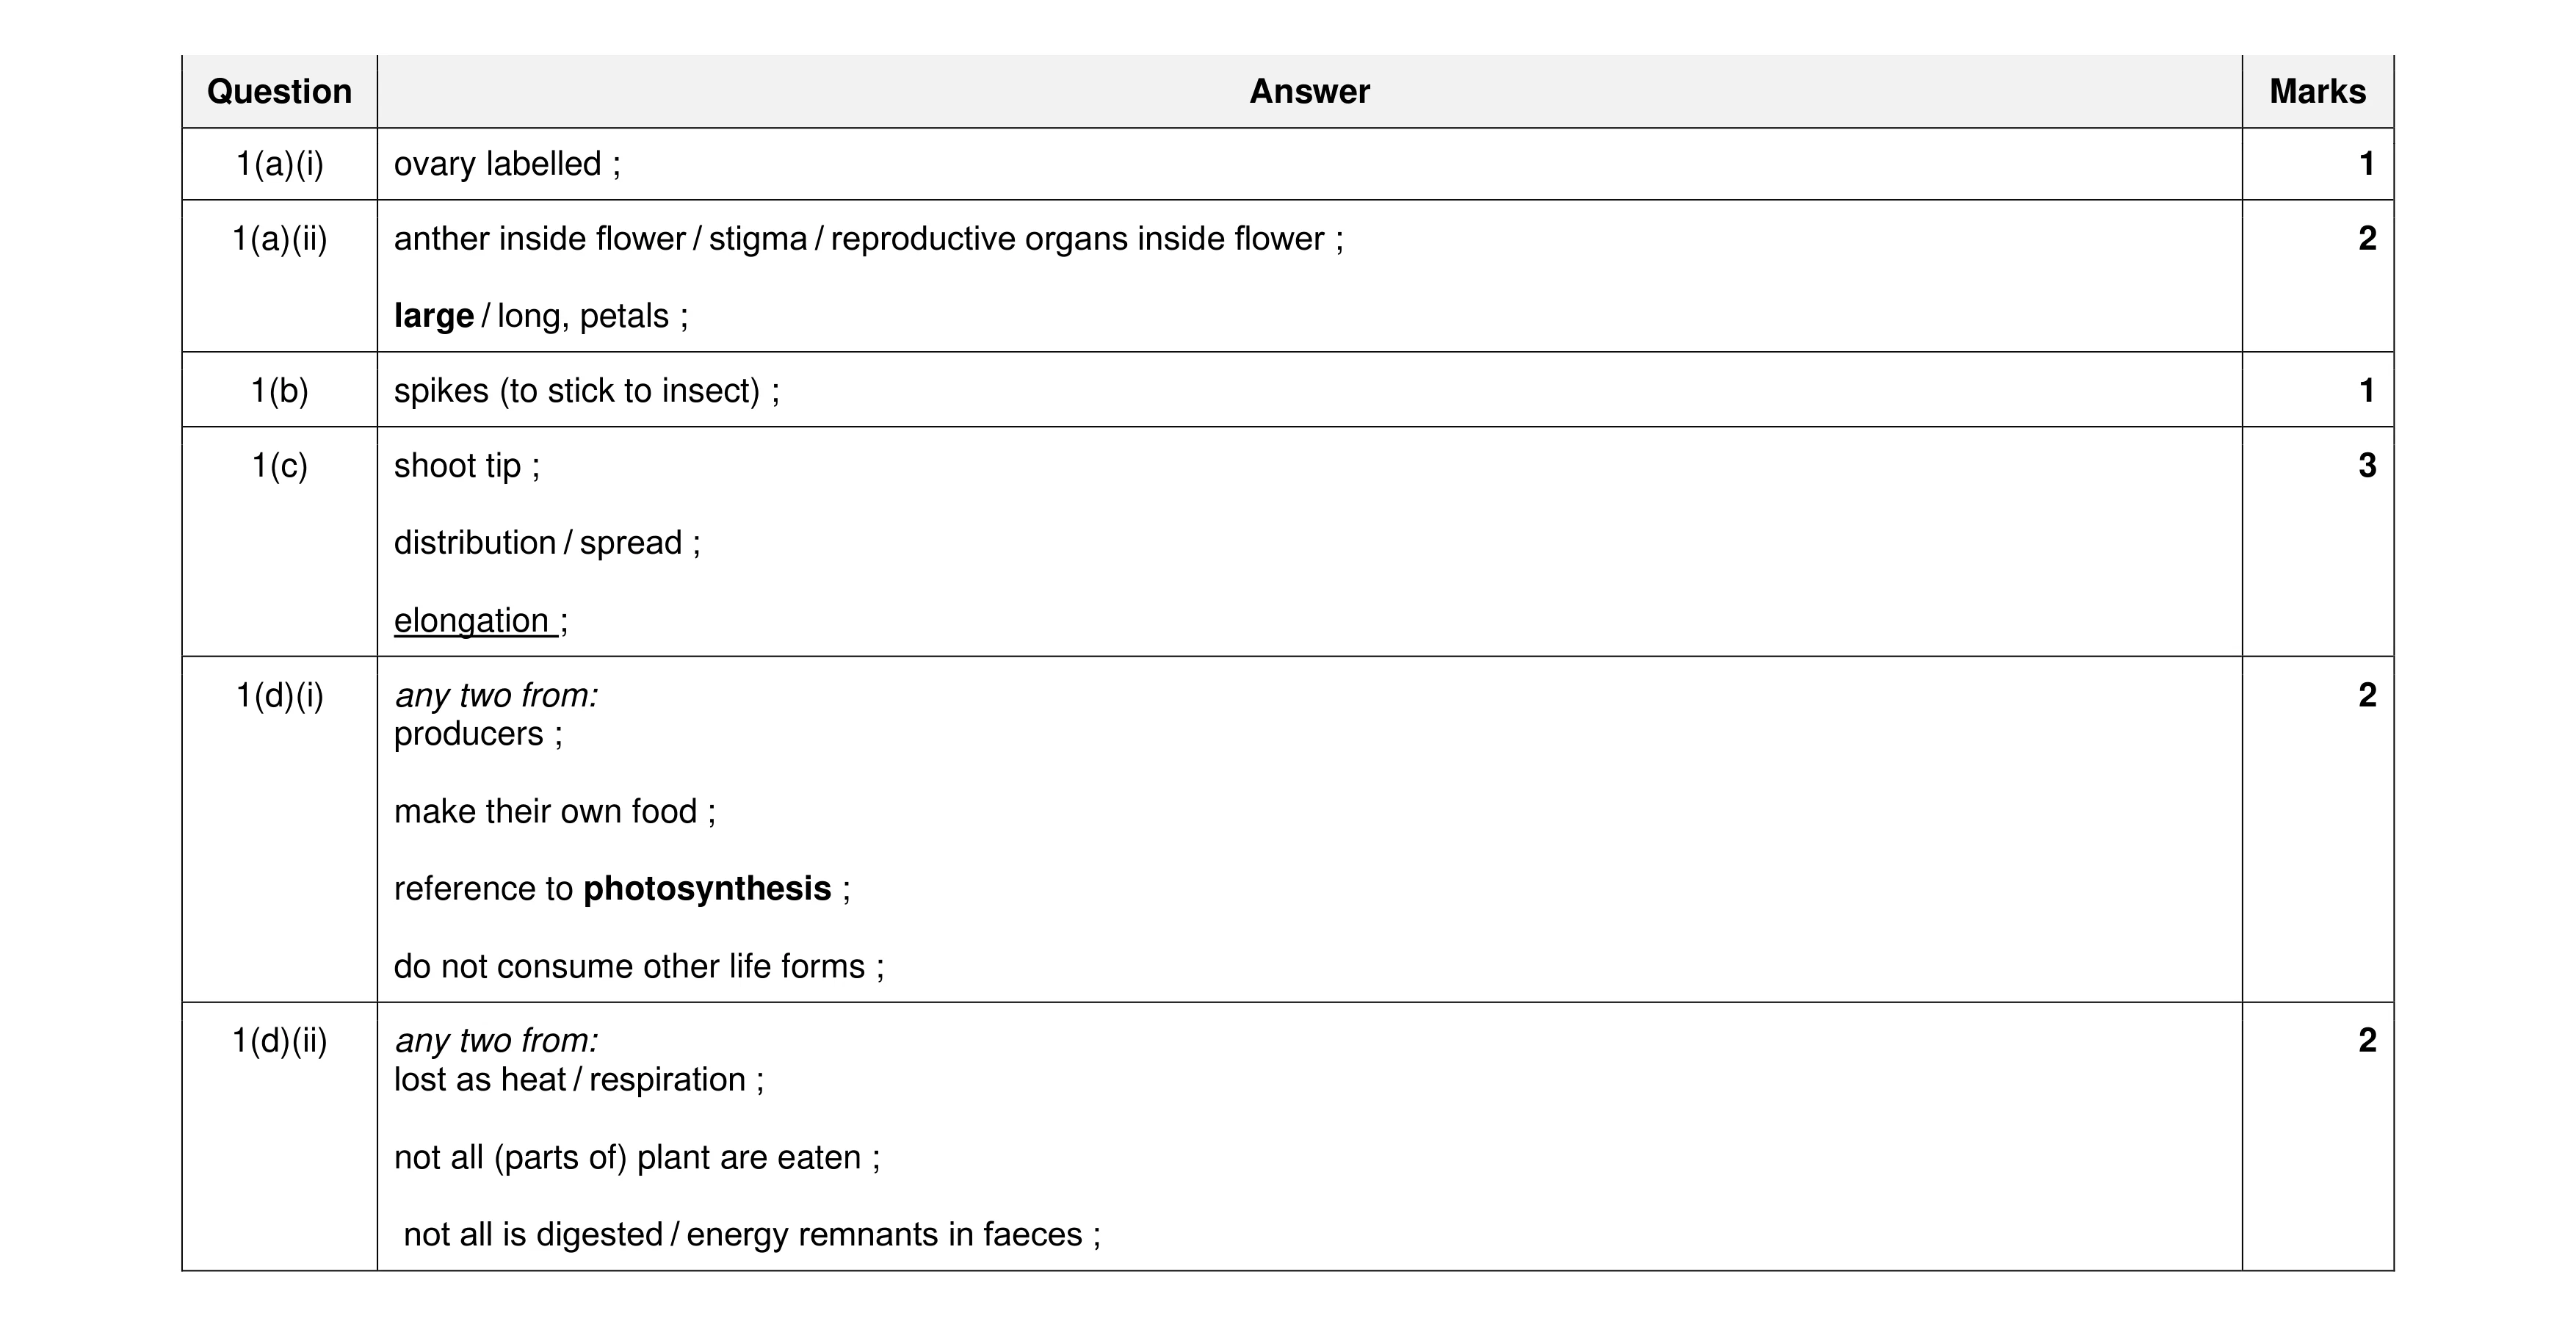 11
11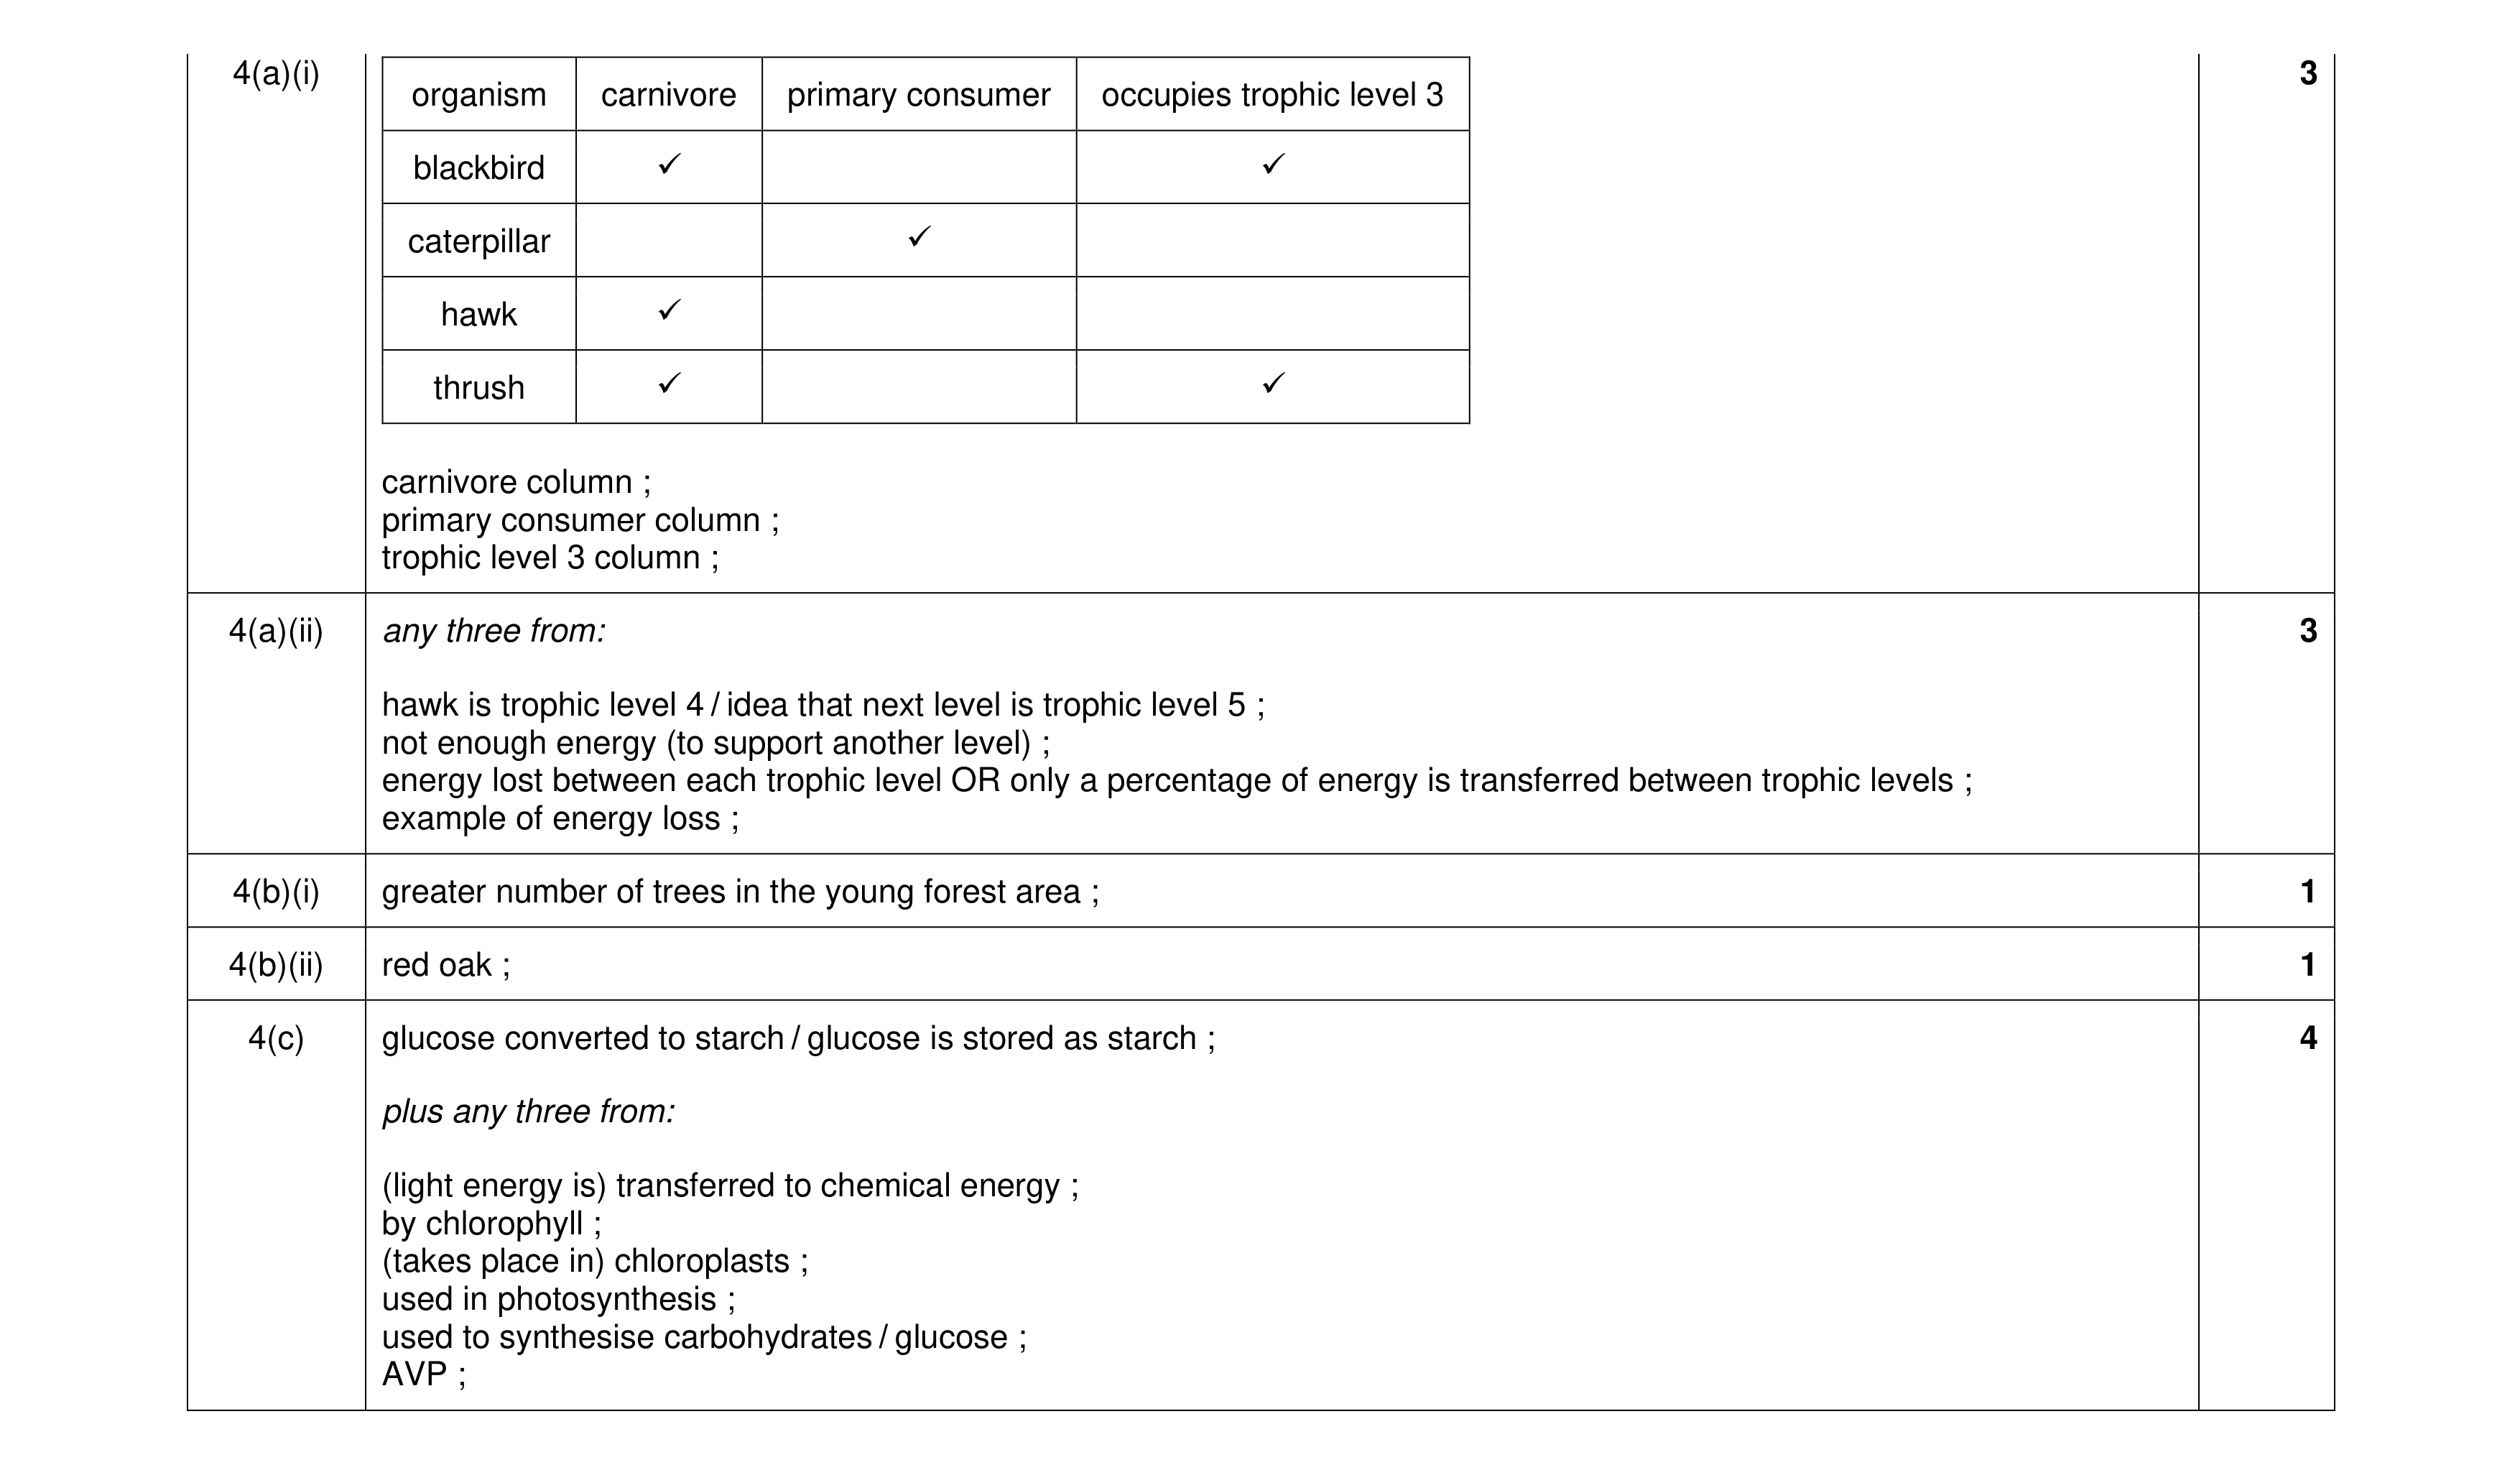 12
12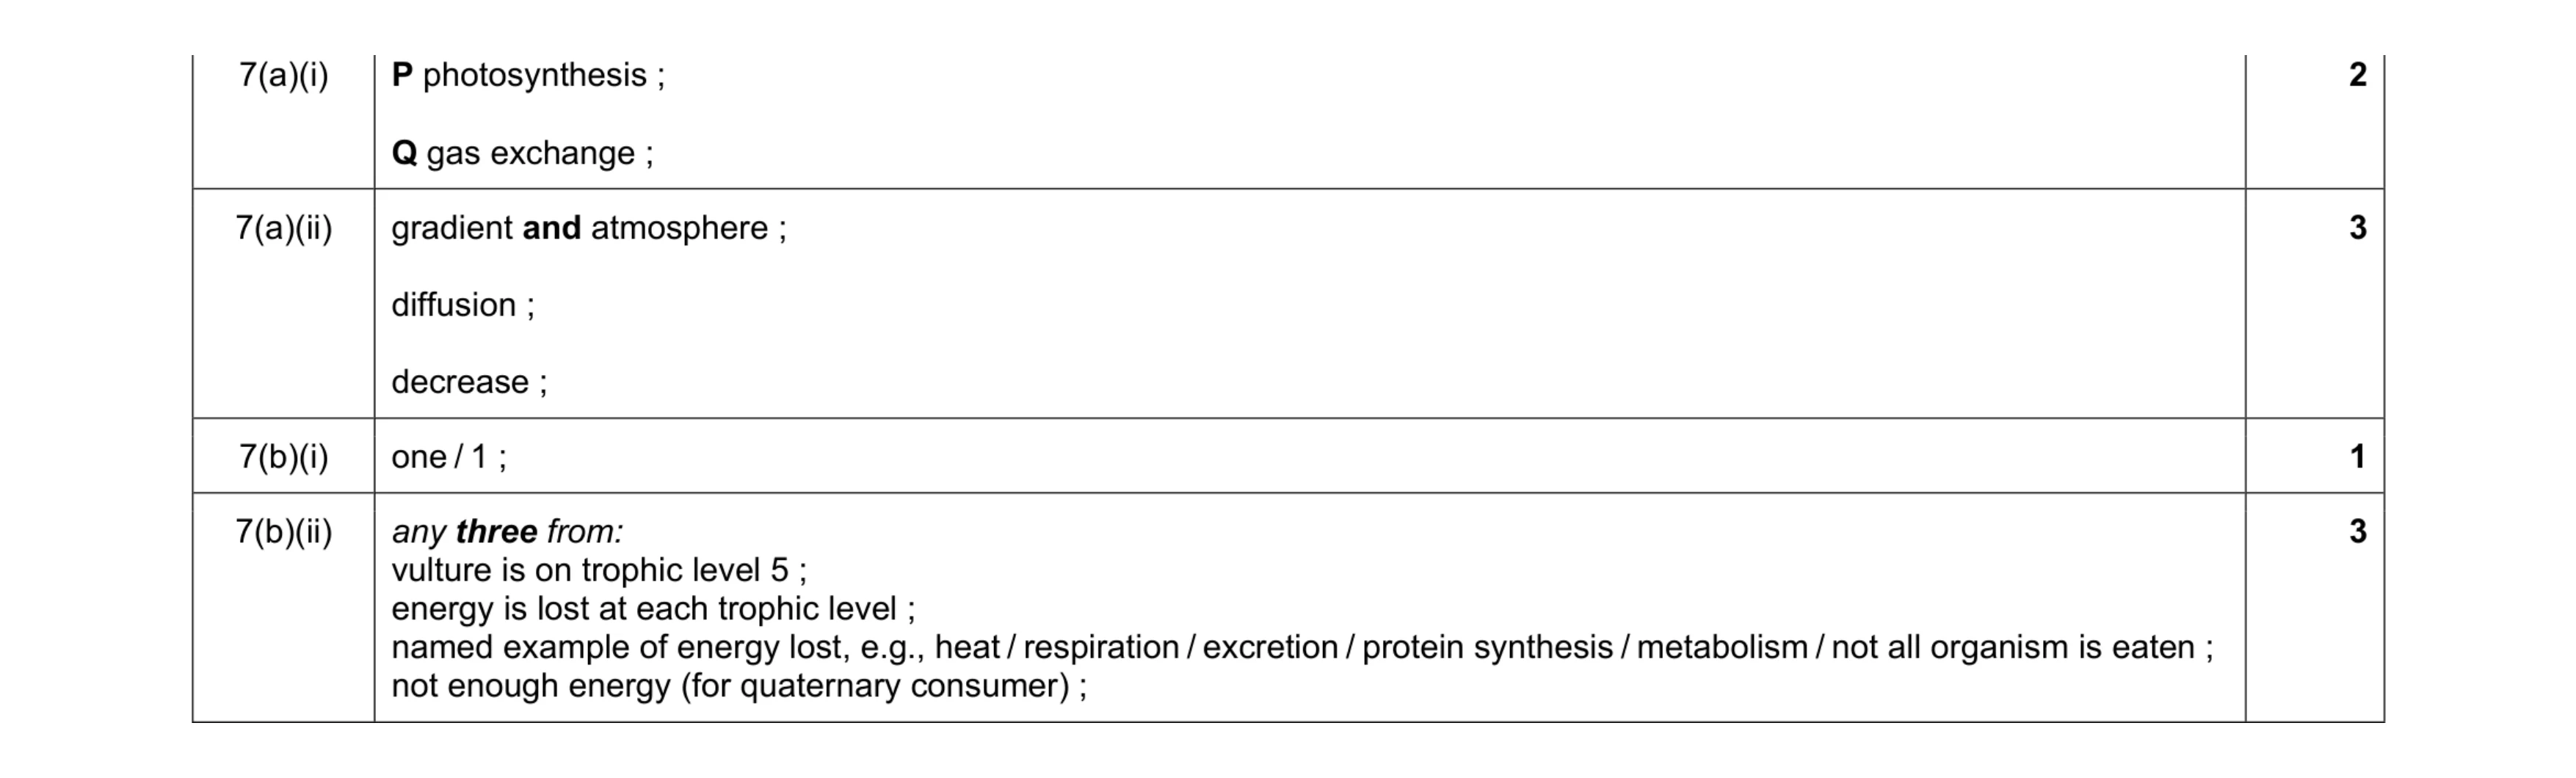 9
9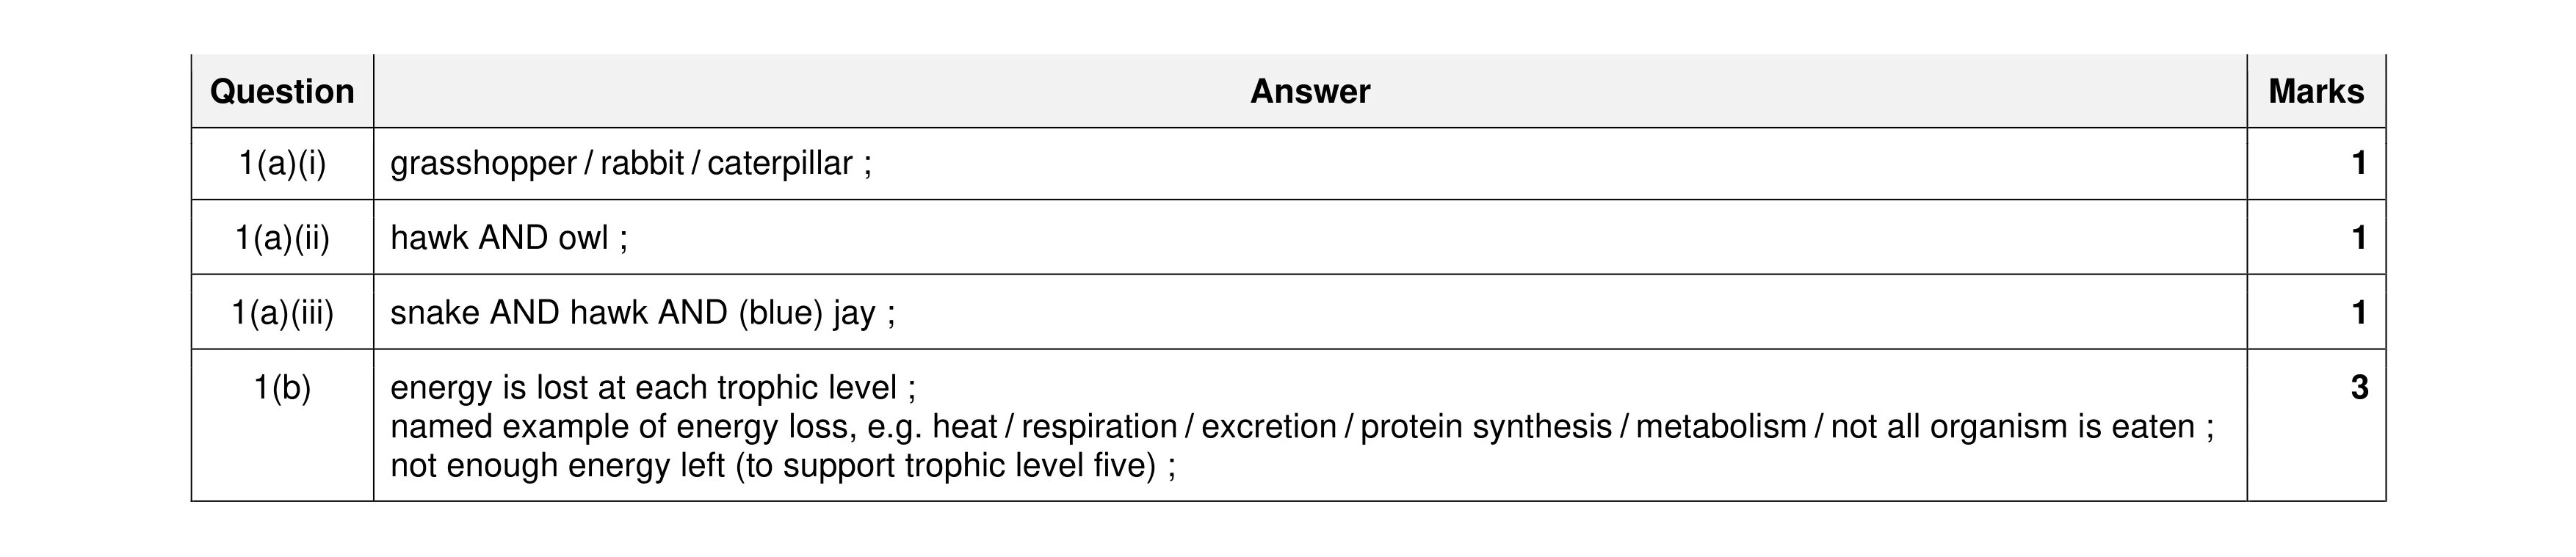 6
6