Questions as text
Q1 · Spain has had one of the highest unemployment rates in Europe 0455/22 May/June 2017
7 Spain has had one of the highest unemployment rates in Europe. Moreover, 3.5 million of those unemployed had been out of work for at least a year by 2015. The Spanish Government has introduced a range of policy measures, including increased government spending, to reduce unemployment and poverty. It has also tried to help firms make the supply of their products more elastic. (a) Identify two problems that prevent a worker finding employment. [2] (b) Explain two costs of long-term unemployment to those who are unemployed. [4] (c) Analyse why price elasticity of supply can differ between products. [6] (d) Discuss whether increasing government spending will reduce poverty. [8]
20 marks
Mark scheme: 7(a) Identify two problems that prevent a worker finding employment. • lack of information on jobs available • lack of vacancies/low demand for labour • lack of skills/qualifications /experience/occupational mobility • lack of geographical mobility • possible age/gender/race/disability discrimination 2 Do not accept sickness/idleness. 7(b) Explain two costs of long-term unemployment to those who are unemployed. 1 mark each for each of two costs identified: • loss of income • reduced ability to get a job • reduced confidence/self-worth • decline in health • reduced ability to educate children • loss of skills 1 mark each for each of two explanations given: • the unemployed may receive unemployment benefits which are usually lower than wages or may receive no income/may experience poverty • will lose out on training by not keeping up with advances in technology • unemployment reduces confidence which makes it harder for someone to get another job • unemployment can lead to mental health problems/may increase physical illness due to less nutritious diet and poor housing • lower income may mean children of the unemployed will receive less education which will reduce their chances of getting a job 4 Question Answer Marks Guidance 7(c) Analyse why price elasticity of supply can differ between products. • Products which can be produced quickly (1) will have elastic supply (1) • Products which can be stored/non-perishable (1) will have elastic supply (1) • Products which are made with raw materials in short supply (1) will have inelastic supply (1) • Products made by firms with spare capacity/mobile resources/have a low cost of altering production/low cost of attracting resources into the industry (1) may have elastic supply (1) 6 Vice versa is acceptable i.e. some products may have inelastic supply. Note: can accept low cost of production for the last bullet point. 7(d) Discuss whether increasing government spending will reduce poverty Up to 5 marks for why it may: • Increased government spending on benefits (1) will enable the poor to purchase basic necessities (1) • Increased government spending on education (1) will increase skills (1) increasing employment (1) raising wages (1) • Increased government spending may increase total demand (1) may raise GDP per head (1) • Increased government spending on healthcare (1) may keep people healthier (1) increasing their ability to earn income (1) • Increased government spending on infrastructure (1) will create jobs (1) increase income (1) Up to 5 marks for why it may not: • Increased government spending may cause inflation (1) reduce ability of poor to purchase basic necessities (1) • Increased government spending on benefits may increase reliance on benefits (1) which in the long term may reduce a person’s earning potential (1) • Increased government spending may be financed by higher taxation (1) not increasing total demand (1) • Increased government spending on education may not improve the quality of education (1) may be in wrong areas (1) 8 A response may develop a mixture of relevant points to achieve up to 5 marks on either side. Maximum of 2 marks on each side of the discussion for a list- like approach.
This question in 0455/22 May/June 2017
Q2 · In 2015, the island of Puerto Rico announced it was considering ending some of its trade… 0455/23 Oct/Nov 2017
5 In 2015, the island of Puerto Rico announced it was considering ending some of its trade embargoes. Its government was also reviewing the amount it was planning to spend. Incomes have been increasing in Puerto Rico with some workers doing better than others. There have also been changes on the micro level, with elasticities of demand and supply changing in some markets. (a) Identify two reasons why a government may place an embargo on the import of a product. [2] (b) Explain two reasons why some young workers may earn more than some old workers. [4] (c) Analyse the factors that can make the supply of a product more price-elastic. [6] (d) Discuss whether a decrease in government spending will benefit an economy. [8]
20 marks
Mark scheme: 5(a) Identify two reasons why a government may place an embargo on the import of a product. 1 mark each for each of two reasons identified: • to improve the current account position • to prevent the import of a harmful product • to retaliate against another country’s embargo • to protect domestic employment / infant industry / high unemployment. 2 Question Answer Marks Guidance 5(b) Explain two reasons why some young workers may earn more than some old workers. 1 mark each for each of two reasons identified: • may be more qualified • may be more skilled • may be more up to date with the latest technology • may be more mobile • may work longer hours / less time off for illness • firms discriminate against older workers • work primarily in tertiary industry rather than primary. 1 mark each for each of two explanations: • people with high qualifications are in short supply • people with more skills may be more productive • demand is likely to be high for people who have good technical skills • workers who can change occupations and locations will have more choice of jobs • young workers may be less likely to work part-time / more likely to work overtime. • old workers perceived to be less productive. 4 Accept an argument why some old workers may earn less than some young workers. 5(c) Analyse the factors that may make the supply of a product more price-elastic. The production period may decrease (1) e.g. due to advances in technology (1) making it easier to alter the quantity produced (1). The time period available (1) easier to adjust supply in longer time period (1). It may become easier to store the product (1) e.g. due to the building of more storage facilities (1) making it easier to bring more products onto the market or withdraw them from the market (1). More sources of a raw material may be found (1) giving greater flexibility of supply (1). Mobility of factors of production (1) able to substitute between products being produced (1). Ability to source additional resources /output (1) at similar cost retaining profit margins (1). Lack of barriers to entry (1) enables new firms to enter the market (1). 6 Question Answer Marks Guidance 5(d) Discuss whether a decrease in government spending will benefit an economy. Up to 5 marks for why it might: Lower government spending may reduce total demand (1) lower inflation / demand-pull inflation (1). Lower government spending on e.g. benefits, public sector wages (1) may reduce spending on imports (1) improve the current account position (1). Lower government spending on benefits may encourage the incentive to work (1) reduce unemployment (1). Lower government spending may enable the government to cut taxes (1) increase the incentive to invest (1) the incentive to work (1) disposable income increases (1) increase output (1). Lower government spending may allow growth of the private sector (1) by the release of resources (1). Up to 5 marks for why it might not: May cause cyclical unemployment (1) by reducing total demand (1). If spending on education is cut (1) may reduce the quality / skills / productivity of labour force (1) this may lower output (1) cause structural unemployment (1). Lower government subsidies (1) to infant industries may worsen the current account position (1) may reduce supply (1) cause cost-push inflation (1). Lower government spending on education and healthcare (1) may lower living standards (1) increase poverty (1). 8
This question in 0455/23 Oct/Nov 2017
Q3 · In England football stadiums are usually built and financed by the private sector, but in… 0455/21 May/June 2018
2 In England football stadiums are usually built and financed by the private sector, but in some countries the stadiums are built and financed by the government. Many football stadiums in the English Premier League are full on match days. In the short run the supply of seats is perfectly inelastic. The football clubs could actually raise prices, still sell their tickets and so raise their profits. Premier League footballers currently receive very high wages. (a) Define perfectly inelastic supply. [2] (b) Explain two reasons why a firm may not aim to earn maximum profit. [4] (c) Analyse why Premier League footballers receive very high wages. [6] (d) Discuss whether or not a government should spend some of its tax revenue on building sports stadiums. [8]
20 marks
Mark scheme: 2(a) Define perfectly inelastic supply. A change in price causes no change in supply (2). Correct formula (1). A PES of 0 (1). 2 2(b) Explain TWO reasons why a firm may NOT aim to earn maximum profit. A firm may be trying to grow (1) to capture a larger share of the market/to increase pay and status of managers (1). A firm may be trying to maximise sales revenue (1) to make it easier to grow/gain market share (1). A firm may be aiming for a reasonable but not maximum profit/profit satisficing (1) in order to pursue other goals (1). e.g. raising wages to keep workers happy (1). A firm may not know what output will maximise profit (1) due to lack of information about costs/demand (1). A firm may be trying to survive (1) in difficult situations (1). May be in public sector/charity (1) and thus have goals related to social welfare/reducing inequalities (1). 4 2(c) Analyse why Premier League footballers receive very high wages. High demand (1) due to high demand for the services of footballers (1) many people want to watch football matches in stadiums (1) on television (1). Football clubs receive high incomes (1) compete for players (1). Low supply (1) have to be skilled (1) not many possess the skills (1). Premier League players may have strong bargaining power (1) through strong professional organisation/trade union/agents (1). To compensate for negative aspects of the job (1) e.g. risk of personal injury (1) other relevant example (1). 6 Up to 2 marks for a relevant diagram – 1 for high demand and 1 for low supply. Max 4 marks if no specific application to footballers. Question Answer Marks Guidance 2(d) Discuss whether or not a government should spend some of its tax revenue on building sports stadiums. Up to 5 marks for why it should: Building sports stadiums may encourage people to participate in sport (1) increase health/living standards (1). It can generate jobs (1) increase incomes (1) reduce poverty (1). Sports stadiums and sporting events may attract foreign tourists (1) improve the current account of the balance of payments (1). Generate government revenue which could be spent on e.g. health (1). Up to 5 marks for why it should not: It will involve an opportunity cost (1) the tax revenue could be used on e.g. education (1). It may generate external costs (1) e.g. noise suffered by local residents (1). The private sector may be more efficient in building the stadiums (1) profit motive (1) . Wasteful use of government funds (1) since benefits may be mainly private benefits (1). Those who visit the sports stadiums may be richer (1) than some of the taxpayers (1) redistribution of income from the poor to the rich (1). Could result in a budget deficit (1) or need to raise taxes (1). 8 Accept, but do not expect, references to public and merit goods.
This question in 0455/21 May/June 2018
Q4 · The price of dental treatment is increasing in most countries 0455/23 Oct/Nov 2018
3 The price of dental treatment is increasing in most countries. For example, the average price of filling a tooth is $180 in the US. The number of dentists is increasing in the US. The largest proportion of the US labour force is employed in the tertiary sector. Price changes have an impact on the supply of products in the tertiary sector as well as in the primary and secondary sectors. (a) Identify two reasons why someone may choose to train to become a dentist. [2] (b) Explain two reasons why manufactured goods are usually in more price-elastic supply than agricultural goods. [4] (c) Analyse the advantages of an increase in a country’s labour force. [6] (d) Discuss whether or not a government should provide free dental treatment. [8]
20 marks
Mark scheme: 3(a) Identify two reasons why someone may choose to train to become a dentist. High pay (1) fringe benefits (1) job security (1) good working conditions/environment (1) Interest/vocation/passion/high job satisfaction (1) high status (1). 2 3(b) Explain two reasons why manufactured goods are usually in more price elastic supply than agricultural goods. The difference in the time it takes to produce the goods (1) it is usually quicker to make manufactured goods/it takes time for crops to grow and/or animals to be raised (1). May have more skilled workers (1) more flexible in adjusting to changes in demand (1). May have more mobile factors of production (1) e.g. land itself is geographically immobile (1). The difference in storage time (1) it is usually easier to store manufactured goods (1). 4 3(c) Analyse the advantages of an increase in a country’s labour force. A larger labour force increases (potential) output (1) if the increased labour force are employed (1) output will rise (1) higher GDP/economic growth will occur (1). Tax revenue will rise (1) enables increase in government expenditure on e.g. education and health (1) the level of dependency may fall (1). New workers may bring new skills to the labour force (1) labour productivity may rise (1) the new workers may be more geographically mobile (1) occupationally mobile (1) may attract MNCs (1). Higher labour supply (1) may reduce wages (1) reduce cost-push inflation/lower prices (1). Higher output results in increased exports (1) improving balance of payments on current account (1). 6 3(d) Discuss whether or not a government should provide free dental treatment. Up to 5 marks for why it should: Some low paid people may not be able to afford dental treatment (1) it is an essential service (1) reduces poverty (1) enables people to spend on other essential goods/services e.g. education (1). Dental treatment can improve the health of the population (1) raising the productivity of workers (1) increasing output (1) raising living standards (1) providing an external benefit (1). Some people may not appreciate the true benefits of dental treatment to themselves (1). The government’s main motive may be to promote economic welfare (1). Up to 5 marks for why it should not: It may increase government spending (1) It will involve an opportunity cost (1) e.g. higher spending on education/raise taxes to cover cost/results in budget deficit (1). The private sector is motivated by the profit motive (1) may provide a better service (1) be more responsive to consumer demand (1). Some dental treatment is cosmetic (1) not an essential service (1). Rich people able to pay for private treatment (1) waste of government resources in supporting low income families/children (1). People may not take care of their teeth (1) as treatment is free (1) resulting in more resources devoted to dental treatment (1). People who do not need treatment may go to the dentist (1) wasting resources (1). 8 Each point may be credited only once, on either side of an argument, but separate development as to how/why the outcome may differ is to be rewarded. Reward but do not expect reference to dental treatment being a merit good and being under-consumed.
This question in 0455/23 Oct/Nov 2018
Q5 · Iceland’s Economic Structure The people of Iceland once depended on farming and fishing… 0455/23 May/June 2019
1 Iceland’s Economic Structure The people of Iceland once depended on farming and fishing as their main source of income. By 2008, the Icelandic economy was also very heavily dependent on its financial sector. However, the country is now well-known internationally for tourism. Even though the primary sector now only employs a small proportion of the country’s labour force, the influence of this sector in policy-making is very strong. For example, in the fishing industry, there are many government regulations. Regulations that restrict foreign investment in the fishing industry both protect domestic fisherman and the stock of fish in Icelandic waters. Regulation also affects the price elasticity of supply (PES) of fish. The quantity of fish supplied tends to change by a smaller percentage than the change in its price. From 2002 to 2007, Iceland’s annual economic growth rate averaged 5%. In 2006, Iceland’s Gross Domestic Product (GDP) was US$17 billion and in 2007 it grew by 9%. This high growth rate was due to the increased availability of bank loans and also the increasing income of its major trading partners, including the European Union (EU) and Norway. It was during this period of rapid economic growth that the financial sector became an important part of the Icelandic economy. The major commercial banks supported increased consumer spending and major construction projects which improved the standard of living of Icelanders. In addition, commercial banks also expanded into international markets. The international markets were growing rapidly between 2002 and 2007 which brought more money back into the Icelandic financial sector. However, Iceland faced a major financial crisis in 2008 where all three of its major privately-owned commercial banks failed. This led to falling overall levels of output and increased unemployment. Fig. 1.1 shows the economic growth rate and unemployment rate in Iceland from 2002 to 2014. 12 10 8 6 4 2 0 2002 2003 2004 2005 2006 2007 20082008 2009 20102010 2011 2012 2013 2014 –2 –4 –6 Unemployment rate (% of total labour force) Economic growth rate (% change in GDP) Fig. 1.1 Economic growth rate and unemployment rate in Iceland from 2002 to 2014 The recovery from 2010 to 2017 was initially possible due to loans obtained from international organisations. More recently, it was also due to successful tourism campaigns that have made Iceland a ‘must-see’ destination for tourists. (a) Identify, using information from the extract, two industries that are in the primary sector of the Icelandic economy. [2] (b) Explain, using information from the extract, two reasons for government regulation of the fishing industry in Iceland. [4] (c) Explain, using information from the extract, two reasons, apart from changes in employment, for Iceland’s high economic growth rate from 2002 to 2007. [4] (d) Calculate, using information from the extract, Iceland’s GDP in 2007. [2] (e) Analyse, using Fig. 1.1, the relationship between changes in the economic growth rate and the unemployment rate over the period shown. [5] (f) Explain, using information from the extract, whether the supply of Iceland’s fish is price-elastic or price-inelastic. [2] (g) Discuss the advantages and disadvantages of the activities of commercial banks to an economy. [5] (h) Discuss whether or not a growth in tourism is an advantage to a country such as Iceland. [6]
30 marks
Mark scheme: 1(a) Identify, using information from the extract, two industries that are in the primary sector of the Icelandic economy. • farming • fishing 2 1(b) Explain, using information from the extract, two reasons for government regulation of the fishing industry in Iceland. Protect domestic fishermen (1) to ensure they have a stable income (1) to ensure that jobs are preserved (1) can compete with foreign fishermen (1). Protect the stock of fish (1) to ensure sustainability of fish stocks (1) for future generations (1). 4 1(c) Explain, using information from the extract, two reasons, apart from changes in employment, for Iceland’s high growth rate from 2002–2007. • increased availability of bank loans (1) more borrowing (1) to fund consumption (1) and to fund investments (1). • increasing income of its major trading partners, including the European Union and Norway (1) Iceland can now export more to their trading partners (1) increase net exports / external demand / aggregate demand (1) 4 1(d) Calculate, using information from the extract, Iceland’s GDP in 2007. $18.53 billion (2) 18.53 or working e.g. $17bn × 0.09 = $1.53bn (1) 2 Question Answer Marks Guidance 1(e) Analyse, using Fig 1.1, the relationship between changes in the economic growth rate and the unemployment rate over the period shown. They both rose over the period (1) showing a positive relationship (1) unexpected (1) evidence from the data e.g. the unemployment rose from approx. 3.4 to 5% (1) the economic growth rate rose from 0.5 to 1.8% (1) Unemployment rate was relatively constant from 2002 to 2008 (1) while economic growth fluctuated (1). Unemployment was relatively stable from 2009 to 2014 (1). Between 2007 and 2009 the fall in the economic growth rate (1) to a negative value / recession (1) while there was a rise in the rate of unemployment (1). From 2009 to 2014 economic growth increased (1) and unemployment fell (1) the trends are moving in opposite directions (1) as would be expected (1) high economic growth rate should create more jobs (1). Between 2002 and 2004 there’s a significant increase in the economic growth rate (1) while there was only a slight fall in the unemployment rate (1). 5 No marks for a descriptive approach e.g. identifying the growth rate or the unemployment rate for specific years. 1(f) Explain, using information from the extract, whether the supply of Iceland’s fish is price-elastic or price-inelastic. It is price-inelastic (1) because the quantity of fish supplied tends to change by a smaller percentage than the change in its price (1). 2 Question Answer Marks Guidance 1(g) Discuss the advantages and disadvantages of the activities of commercial banks to an economy. Up to 3 marks for advantages to an economy: Lending (1) to consumers (1) enabling them to increase consumption (1) raising their living standards (1) and to firms (1) allowing them to invest (1) increase employment (1) increase output (1) expand into international markets (1) improve the current account of the balance of payments (1). Attract MNCs (1) by providing a range of services to these companies (1). Banks employ many people (1) keeping unemployment low (1) Up to 3 marks for disadvantages to an economy: May encourage saving (1) decreasing consumption/total demand (1) Banks may fail (1) losing customers’ money (1) risking damage to the economy / recession (1). May lend to risky businesses (1) which may cause fluctuations in output (1). May lend to individuals who cannot repay (1) pushing them into debt (1). May charge high interest rates (1) to gain high profits (1) which will increase firms’ costs of production (1) and make it difficult for individuals to repay (1). May lend for purchase of imports (1) worsening the current account (1) Risk of inflation (1) if banks lend too much (1). 5 Question Answer Marks Guidance 1(h) Discuss whether or not a growth in tourism is an advantage to a country such as Iceland. Up to 4 marks for why it might be: Tourism is an export of services (1) bringing in foreign currency (1) improving the current account balance (1). Tourism may increase government tax revenue (1) this could be spent on e.g. education (1). Tourism increases the demand for goods and services (1) creating employment/reducing unemployment (1) e.g. in hotels/restaurants/shops (1) increases output / contributes to economic growth (1). Tourism may attract MNCs/foreign investment (1) e.g. foreign hotel chains may set up in the country (1). More revenue from tourism may result in a rise in the exchange rate (1) this may reduce the price of imports (1) Less reliance on primary / secondary sector (1) benefits of diversification (1). Up to 4 marks for why it might not be: Tourism may create external costs (1) example e.g. pollution (1). Tourism may deplete resources (1) e.g. water (1). Tourism may place a strain on infrastructure, e.g. transport systems (1) Tourism jobs may be low-paid (1) low skilled (1) seasonal (1). Foreign firms may send profits home (1) foreign hotels may bring own employees (1). A high exchange rate may reduce exports / international competitiveness (1). Tourism may increase demand in the economy (1) pushing up the prices the local population have to pay / creating inflation (1). 6
This question in 0455/23 May/June 2019
Q6 · Driverless cars and advances in technology It is predicted that driverless cars, powered… 0455/22 Oct/Nov 2019
1 Driverless cars and advances in technology It is predicted that driverless cars, powered by electricity, will be on the roads by 2030. Driverless cars have already been tried out on the roads in some cities, including Pittsburgh in the USA. It is thought that driverless cars will reduce accidents, will have lower repair costs and will create less pollution. At first, the supply of driverless cars may exceed the demand, but it is expected that they will soon grow in popularity. As more driverless cars come into use, the demand for bus travel and petrol stations may decline, and some taxi drivers may be made redundant. In contrast, the increased access to transport that driverless cars will give to people, including the elderly, is likely to increase demand for out of town restaurants and places of entertainment. It has been forecast that the technology being developed in connection with driverless cars will make the supply of them elastic. It is predicted that an 8% rise in the price of driverless cars would cause a 20% rise in the quantity supplied. Advances in technology and the replacement of workers by machines are forecast to destroy 80 million jobs in the USA. Job losses are also forecast in other countries and trade unions are likely to be less able to resist these due to a fall in membership and governments reducing the power of trade unions. Among the jobs thought to be at risk are accountants, train drivers and financial advisers. Demand for workers in other occupations, including doctors and dentists, may increase but there is a risk that unemployment may rise. The more educated workers are, the more easily they can move from one occupation to another. Table 1.1 shows education spending as a percentage (%) of GDP and the unemployment rate in selected countries. Table 1.1 Education spending and the unemployment rate in selected countries Education spending Unemployment rate Country as a % of GDP (%) Argentina 5.3 8.0 Brazil 5.8 13.5 Ghana 6.5 12.0 New Zealand 7.3 4.8 South Africa 6.0 26.0 USA 8.2 4.7 Jobs selling houses and flats may decline but it is expected that the demand for building workers may increase. Some people welcome house building in their area but others oppose it. (a) Identify, from the extract, two pairs of substitutes. [2] (b) Explain, using information from the extract, whether the market for driverless cars is expected to be in equilibrium in 2030. [2] (c) Calculate, using information from the extract, the price elasticity of supply (PES) of driverless cars. [2] (d) Explain, using information from the extract, two external costs that driverless cars could reduce. [4] (e) Analyse, using Table 1.1, the relationship between educational spending and the unemployment rate. [5] (f) Discuss whether or not an increase in house building will benefit the people who live in the area. [5] (g) Explain, using information from the extract, two reasons why the power of trade unions may decline in the future. [4] (h) Discuss whether or not a rise in unemployment is harmful. [6]
30 marks
Mark scheme: 1(a) Identify, from the extract, two pairs of substitutes. • Driverless cars and bus travel • Driverless cars and taxi travel • Bus travel and taxi travel • Machines / advanced technology and workers 2 1(b) Explain, using information form the extract, whether the market for driverless cars is expected to be in equilibrium in 2030. No (1) supply is expected to exceed demand (1). 2 1(c) Calculate, using information from the extract, the price elasticity of supply (PES) of driverless cars. 2.5 (2). Correct working: 20% / 8% OR 20 / 8 (1). 2 1(d) Explain, using information from the extract, two external costs that driverless cars could reduce. • accidents (1) people are injured and killed as a result of other people’s driving / accidents impose costs on hospitals and healthcare / less human error / driverless cars reduce the death rate / accidents can cause traffic congestion / fewer accidents may reduce cost of repairs (1) • pollution (1) cars emit carbon dioxide / pollution causes health problems / driverless cars are more environmentally friendly / use electricity which causes less pollution (1) • lower cost of insurance to (other) drivers (1) as a result of less accidents / lower cost of repairs (1) 4 Question Answer Marks Guidance 1(e) Analyse, using Table 1.1, the relationship between educational spending and the unemployment rate. Expected relationship – a country that spends more (a high proportion) of their GDP on education would have a low unemployment rate / a country with a higher unemployment rate is likely to spend less on education / it is an inverse relationship (1). Reasons for expected relationship – workers would be likely to be more skilled and productive / higher unemployment may result in less tax revenue to spend on education (1). Evidence in support of expected relationship – e.g. New Zealand or US (1) highest spenders and lowest unemployment rates (1). Evidence against expected relationship – e.g. Argentina or South Africa (1) Argentina spends a lower proportion than Ghana and Brazil but has a lower unemployment rate / South Africa spends more a higher proportion than Argentina and Brazil but has a higher unemployment rate (1). 5 A pattern of analysis is expected in response to this type of question. If there is no expected pattern of analysis, the following may be worthy of some reward, e.g.: • it is not a consistent relationship (1) • there are other influences on the unemployment rate (1) However, do not reward simple statements (repetition) of the figures given in the table. For example, USA spends 8.2% on education and has an unemployment rate of 4.7%, is not to be rewarded. Question Answer Marks Guidance 1(f) Discuss whether or not an increase in house building will benefit the people who live in the area. Up to 3 marks for why it might: House building may create jobs (1) lower unemployment (1) generate income / raise wages / raise living standards (1). House building will increase the supply of housing (1) the lower price of housing (1) makes houses more affordable (1) fewer homeless (1). May attract more firms to set up in the area (1) more services may be provided (1) due to more people living in the area / larger labour force (1). May save travel time for those working nearby (1) reduce pollution / congestion (1). Up to 3 marks for why it might not: House building may cause external costs (1) examples (2). More houses may reduce the value of people’s homes (1) reduce their wealth (1). There is an opportunity cost (1) the area used could have been used for e.g. school buildings (1). Demand for extra services may not be met (1). Jobs may only be temporary / seasonal unemployment (1). More housing may create overcrowding in the area. (1). 5 Apply this example to all questions with the command word DISCUSS (1(g), 1(h), 2(d), 3(d), 4(d) and 5(d)) Each point may be credited only once, on either side of an argument, but separate development as to how/why the outcome may differ is rewarded. Generic example Mark Tax revenue may decrease « 1 ... because of reason e.g. incomes may be lower. 1 Tax revenue may increase because incomes may be higher i.e. reverse of a previous argument. 0 Tax revenue may increase because of a different reason i.e. not the reverse of a previous argument e.g. government spending on subsidies may stimulate the economy more than spending on education. 1 Question Answer Marks Guidance 1(g) Explain, using information from the extract, two reasons why the power of trade unions may decline in the future. Fall in membership (1) lower funds / less bargaining power (1). Rise in unemployment / workers being replaced by machines (1) trade unions may be reluctant to take industrial action for fear that members will be replaced by unemployed / non-member workers (1). Government may reduce the power of trade unions (1) making it harder for trade unions to protect workers’ rights (1). Movement from primary to tertiary sector (1) which may be less unionised / better working conditions (1). 4 Some points may be interchangeable e.g. rise in unemployment (1) resulting in fall in membership (1). Question Answer Marks Guidance 1(h) Discuss whether or not a rise in unemployment is harmful. Up to 4 marks for why it is: Output is likely to fall (1) incomes will decline / poverty increase (1) living standards will fall (1) lower total (aggregate) demand (1). Tax revenue will fall (1) government may have to cut spending on e.g. education and healthcare (1). Government may increase tax rates (1) which may create disincentive effect (1). The government will have to spend more on unemployment benefit (1) this will involve an opportunity cost (1) may result in a budget deficit (1). Unemployed workers may lose skills / become out of date (1) may need retraining (1). May increase emigration (1) lose skilled workers (1). May cause social problems e.g. crime / mental health problems (1). Up to 4 marks for why it is not: Inflation may fall (1) due to lower total (aggregate) demand (1). Firms may find it easier to recruit new workers (1) this will make it easier to expand (1) at lower wage costs (1). Productivity may be higher (1) more skilled workers kept (1). Unemployment may give the unemployed time to search for a better job (1) eventually raises their incomes (1). Rise may only be temporary (1). May reduce demand for imports (1) improve current account of the balance of payments (1). May be less pollution with lower output (1). 6 Reward but do not expect reference to a downward multiplier effect and/or not reaching productive capacity.
This question in 0455/22 Oct/Nov 2019
Q7 · In May 2017, the price of olive oil rose by more than 10% 0455/22 Oct/Nov 2019
5 In May 2017, the price of olive oil rose by more than 10%. This was caused by a drought in Greece, Italy, Spain and Tunisia, the major producing countries. Global supply was forecast to fall by 14% in 2017. Demand for olive oil fell in Europe, but rose in a number of other countries including Australia, Brazil and China. Some basic food items, including bread and rice, are taxed in some countries but are subsidised in other countries. (a) Identify two examples of land used in growing agricultural crops. [2] (b) Explain why the concept of price elasticity of supply (PES) may be useful to a government in deciding whether to subsidise the production of a product. [4] (c) Analyse why the demand for a product may be higher in one country than in another country. [6] (d) Discuss whether or not the government should influence the production of basic food items, such as bread or rice. [8]
20 marks
Mark scheme: 5(a) Identify two examples of land used in growing agricultural crops. • soil • water • natural fertiliser • seeds • weather 2 Note: land on its own is insufficient, but the area of land or farmland can be rewarded. 5(b) Explain why the concept of price elasticity of supply (PES) may be useful to a government in deciding whether to subsidise the production of a product. A subsidy is aimed at increasing supply / lowering price (1). If supply is elastic, supply will change by a greater (1) percentage (1) than price. Should subsidise production of the product (1). If supply is inelastic, supply will change by a smaller (1) percentage (1) than price. Should not subsidise production of the product (1). 4 Note: supply change is greater/smaller than price change (1) supply changes by a greater/smaller percentage than price (2) 5(c) Analyse why the demand for a product may be higher in one country than in another country. Incomes may be higher (1) allowing people to buy more of the product (1). There may be a larger population (1) more potential buyers (1). The product may be more to the taste of people in that country (1) example e.g. falafel is popular in the middle east (1). The product may be more heavily advertised (1) which may increase the attractiveness of the product (1). Price may be lower (1) due to lower costs of production / government subsidy / lower (indirect) taxes (1). Price of substitutes may be higher (1) example (1). Credit may be more available / interest rate lower (1) making it easier for people to borrow to buy the product (1). 6 Question Answer Marks Guidance 5(d) Discuss whether or not the government should influence the production of basic food items, such as bread or rice. Up to 5 marks for why it should: The poor may spend a higher proportion of their income on food (1) a subsidy on food (1) may reduce poverty (1) lower indirect tax may reduce poverty (1) lower price (1) basic food items / bread / rice may be regarded to be a basic necessity (1) There may be market failure (1) bread may be overconsumed (1) this may cause obesity (1) a tax will raise price (1) this may discourage demand for basic food items / bread / rice (1) reduce obesity (1) it may also reduce wastage (1). Regulation may be needed (1) to ensure the basic food / bread / rice is produced under clean conditions / with safe ingredients (1). Basic food items / bread / rice may be produced by a monopoly (1) which could use its power to restrict supply (1) push up price (1) regulation may be need to prevent this (1). Demand for basic food items / bread / rice may be inelastic (1) firms may take advantage of this to push up price (1). Up to 5 marks for why it should not: Market forces may produce an efficient output (1) the profit motive (1) may encourage producers to respond to changes in consumer demand (1) surpluses and shortages will be eliminated by changes in prices (1). There may be a high level of competition in the industry (1) encouraging producers to make basic food items / bread / rice of a high quality (1). An indirect tax will be regressive (1) fall more heavily on the poor (1). A subsidy will involve an opportunity cost (1) example (1). Reducing an indirect tax will lower tax revenue (1) lowering government’s ability to spend on e.g. healthcare (1). Government discouragement of production of basic items may result in more being imported (1) which will harm the balance of payments (1). 8 Reward but do not expect reference to price controls.
This question in 0455/22 Oct/Nov 2019
Q8 · The main industries in the Seychelles, an island country in the Indian ocean, are tourism… 0455/22 Feb/March 2020
2 The main industries in the Seychelles, an island country in the Indian ocean, are tourism and fishing. The price elasticity of supply of fish is affected by the relatively short time that fish can be stored. Economic goods and free goods play a role in both fishing and tourism. With rises in the skills of workers and an increase in enterprise, GDP per head has increased by more than seven times over the last fifty years. (a) State the formula for calculating the price elasticity of supply (PES). [2] (b) Explain how opportunity cost is different for economic goods and free goods. [4] (c) Analyse, using a production possibility curve (PPC) diagram, the effect of an increase in enterprise on an economy. [6] (d) Discuss whether or not skilled workers are always paid more than unskilled workers. [8]
20 marks
Mark scheme: 2(a) State the formula for calculating the price elasticity of supply (PES). % change in quantity supplied % change in price (2). OR Percentage change in quantity supplied divided by percentage change in price (2). 2(b) Explain how opportunity cost is different for economic goods and free goods. Logical explanation which might include: Economic goods have an opportunity cost (1) resources are used to produce them / resources have alternative uses / if resources are used to produce one economic good, they cannot be used to produce another good / in limited supply (1). Free goods do not have an opportunity cost (1) resources are not used to produce them / there is no restriction on their supply (1). 4 One mark for each of two differences identified and one mark for each explanation. Question Answer Marks Guidance 2(c) Analyse, using a production possibility curve (PPC) diagram, the effect of an increase in enterprise on an economy. Up to 4 marks for the diagram: Axes correctly labelled (1). Initial curve drawn as a curve / downward sloping line to the axes (1). New curve drawn as a curve / downward sloping line to the axes (1). Shift to the right indicated by arrow or lettering (1). Up to 2 marks for coherent analysis which might include: Enterprise is a factor of production / resource (1) there will be more risk takers / decision makers / firms (1) more enterprise increases productive capacity / potential / maximum output that can be produced / causes economic growth (1). 6 Question Answer Marks Guidance 2(d) Discuss whether or not skilled workers are always paid more than unskilled workers. In assessing each answer, use the table opposite. Why they might be: • skilled workers may be in shorter supply as they may require training and qualifications • skilled workers may be in inelastic supply and demand for them may be inelastic • skilled workers may be in higher demand as they will be more productive • skilled workers may have stronger bargaining power • skilled workers may be more likely to work in the tertiary sector • Skilled workers may be more mobile. Why they might not be: • skilled workers may have less experience and may be in less promoted positions • skilled workers may be in declining industries • skilled workers may place more importance on non-wage factors when deciding what jobs to do • skilled workers in poorer countries may have lower wages than some unskilled workers in richer countries. Example of a Level 3 answer: Skilled workers may be paid more than unskilled workers as they have more qualifications and/or experience, so demand may be high compared to supply. Supply could be low due to long training required to learn skills, so the labour market would be more competitive and skilled workers higher paid. Demand for the products skilled workers provide may be higher, so their pay could be higher due to higher derived demand. Also, they may belong to stronger trade unions which have more bargaining power to negotiate for higher pay. 8 Accept responses from the viewpoint of why unskilled workers may be paid more. Level Description Marks 3 A reasoned discussion which accurately examines both sides of the economic argument, making use of economic information and clear and logical analysis to evaluate economic issues and situations. One side of the argument may have more depth than the other, but overall both sides of the argument are considered and developed. There is thoughtful evaluation of economic concepts, terminology, information and/or data appropriate to the question. The discussion may also point out the possible uncertainties of alternative decisions and outcomes. 6–8 Question Answer Marks Guidance 2(d) It is also possible that unskilled workers could be higher paid. This is because their work may be dangerous, e.g. miners, so the supply of workers willing to do the job may be lower and firms have to pay more to attract workers. Long working hours (less leisure time) and poor working conditions mean unskilled workers may be higher paid, and if the work is boring and very few people are willing to do the job. For example, cleaners in the US are paid much higher wages than cleaners in India as the number of people willing to accept a job as a cleaner in the US is very low. There is even a possibility that unskilled workers could be paid higher than skilled workers. Principal Examiner comment: This is a strong L3 response. It is a two-sided answer with depth and logical links. For example, the candidate links qualifications and experience to demand for and supply of workers, as well as linking demand for workers with demand for the products they produce. The candidate discusses some of the key influences on wage determination. Level Description Marks 2 A reasoned discussion which makes use of economic information and clear analysis to evaluate economic issues and situations. The answer may lack some depth and development may be one- sided. There is relevant use of economic concepts, terminology, information and data appropriate to the question. 3–5 1 There is a simple attempt at using economic definitions and terminology. Some reference may be made to economic theory, with occasional understanding. 1–2 0 A mark of zero should be awarded for no creditable content. 0
This question in 0455/22 Feb/March 2020
Q9 · Two of Uzbekistan’s main industries are cotton and gas 0455/22 Oct/Nov 2021
3 Two of Uzbekistan’s main industries are cotton and gas. Uzbekistan is the world’s seventh largest producer, and fifth largest exporter, of cotton. The Uzbek government has tried to influence the cotton industry’s price elasticity of supply. It has also nearly ended the use of child labour in cotton production. The country’s output of gas increased by 7% in 2018 and its average cost of gas production fell. (a) Identify two determinants of price elasticity of supply. [2] (b) Explain two advantages to an economy of ending child labour. [4] (c) Analyse how average cost can change as output increases. [6] (d) Discuss whether or not an economy would benefit from allocating more of its resources to agriculture. [8]
20 marks
Mark scheme: 3(a) Identify two determinants of price elasticity of supply. Two from: • ability to store • level of stocks • perishability • production time • level of spare capacity • cost of altering supply • time period under consideration – short/long run 2 Accept weather. 3(b) Explain two advantages to an economy of ending child labour. Logical explanation which might include: Enable children to be educated (1) raise productivity / workers’ skills / literacy rates / long run economic growth (1). Improve children’s health (1) increase life expectancy / raise living standards (1). Reduce cycle of poverty (1) children will later gain higher paid jobs (1). Raise wages (1) due to reduced supply of cheap labour (1). Remove international bans / encourage more foreign tourists (1) increase exports (1). Increase job opportunities for adults (1) lower unemployment / increase employment of adults (1). 4 One mark each for each of two advantages identified and one mark each for each of two explanations. Question Answer Marks Guidance 3(c) Analyse how average cost can change as output increases. Average cost may fall due to economies of scale (1) example of an economy of scale e.g. financial economy (1) explanation of the example (up to 2 marks) e.g. banks may charge lower interest rates (1) reducing firms’ cost of borrowing (1). Another example e.g. buying economy (1) explanation of the example (up to 2 marks) e.g. able to buy in bulk (1) and receive a discount (1). Higher output may enable fixed costs to be spread over a larger output (1) which may reduce average fixed costs (1) whether average total cost will fall will depend on what happens to average fixed cost plus average variable cost (1). Average cost may rise due to diseconomies of scale (1) example e.g. managerial economy (1) explanation of the example (up to 2 marks) e.g. difficulty of keeping control of a large organisation (1) leading to more mistakes / poor decision making (1). Another example e.g. poor labour relations (1) explanation of the example (up to 2 marks) e.g. lack of contact between workers and managers (1) may be strikes (1). 6 Nothing for reference to causes of changes in total costs e.g. employing more workers will increase wages paid. Question Answer Marks Guidance 3(d) Discuss whether or not an economy would benefit from allocating more of its resources to agriculture. In assessing each answer, use the table opposite. Why it might: • specialisation may increase efficiency, raise output, increase exports • may improve the current account of the balance of payments • imports of food may be reduced, reduced reliance on other countries for basic necessities • health and safety standards may be maintained • the industry is labour intensive in some countries and so may reduce unemployment Why it might not: • wages in the industry tend to be relatively low • the supply of agricultural products can fluctuate significantly due to changes in weather conditions • opportunity cost of fewer resources for manufacturing goods and for services • demand for manufactured goods and for services tend to rise more as income increases • agriculture uses up considerable amounts of water. 8 Level Description Marks 3 A reasoned discussion which accurately examines both sides of the economic argument, making use of economic information and clear and logical analysis to evaluate economic issues and situations. One side of the argument may have more depth than the other, but overall, both sides of the argument are considered and developed. There is thoughtful evaluation of economic concepts, terminology, information and/or data appropriate to the question. The discussion may also point out the possible uncertainties of alternative decisions and outcomes. 6–8 2 A reasoned discussion which makes use of economic information and clear analysis to evaluate economic issues and situations. The answer may lack some depth and development may be one-sided. There is relevant use of economic concepts, terminology, information and data appropriate to the question. 3–5 1 There is a simple attempt at u sing economic definitions and terminology. Some reference may be made to economic theory, with occasional understanding. 1–2 Question Answer Marks Guidance 3(d) Level Description Marks 0 A mark of zero should be awarded for no creditable content. 0
This question in 0455/22 Oct/Nov 2021
Q10 · Advances in technology have changed how trees (wood) are cut down, transported and used… 0455/22 Oct/Nov 2022
4 Advances in technology have changed how trees (wood) are cut down, transported and used in the manufacture of furniture, such as tables. Wood is in inelastic supply. Wood can be supplied in all economic systems. However, public goods are not supplied in a market economic system. (a) Define inelastic supply. [2] (b) Explain why public goods would not be supplied in a market economic system. [4] (c) Analyse, using a demand and supply diagram, the effect on the market for furniture of an increase in the price of wood. [6] (d) Discuss whether or not advances in technology will benefit a country’s population. [8]
20 marks
Mark scheme: 4(a) Define inelastic supply. 2 Allow one mark for PES = 0. Quantity supplied / supply changes by a smaller percentage change than price (2). Supply changing by less than price / PES less than 1 / PES < 1 / supply unresponsive to change in price (1). 4(b) Explain why public goods would not be supplied in a 4 No marks for examples. market economic system. Logical explanation which might include: Public goods are non-excludable (1) it is not possible to stop people who are not prepared to pay for them, from consuming them (1) free rider problem (1). Public goods are non-rival (1) if supplied for one, supplied for everyone and so cannot charge additional consumers (1). Private sector firms are profit motivated (1) they will not produce products if they cannot get revenue from them (1) would make a loss (1). 4(c) Analyse, using a demand and supply diagram, the 6 effect on the market for furniture of an increase in the price of wood. Coherent analysis which might include: Up to 4 marks for the diagram: D&S diagram: Axes correctly labelled – price and quantity or p and q (1). Original demand and supply curves correctly labelled (1). New supply curve shifted to the left (1). Equilibriums – shown by lines P1 and Q1 and P2 and Q2 or equilibrium points E1 and E2 (1). Up to 2 marks for coherent analysis which might include: Would increase costs of production (1) raise price / reduce Accept increase in price or fall in quantity on their own but quantity (traded) (1). not an increase in price of wood or fall in quantity of wood. 4(d) Discuss whether or not advances in technology will 8 Level Description Marks benefit a country’s population. 3 A reasoned discussion which 6–8 In assessing each answer, use the table opposite. accurately examines both sides of the economic argument, making use of Why it might: economic information and clear and • may reduce costs of production logical analysis to evaluate economic • may increase significance of technical economies of issues and situations. One side of the argument may have more depth than scale the other, but overall both sided of the • may lower prices argument are considered and • may make the country’s firms more internationally developed. There is thoughtful competitive evaluation of economic concepts, • may promote globalisation terminology, information and/or data • may encourage firms to expand and take on more appropriate to the question. The workers discussion may also point out the • economic growth may increase incomes possible uncertainties of alternative • may increase quality – less subject to human error decisions and outcomes. • may create new products • may improve working conditions 2 A reasoned discussion which makes 3–5 • may extend education through online learning. use of economic information and clear analysis to evaluate economic issues and situations. The answer may lack Why it might not: some depth and development may be • may increase unemployment one-sided. There is relevant use of • may make products more standardised / not produced economic concepts, terminology, to individual needs information and data appropriate to • may increase stress the question. • may be over dependence on technology which can fail • may increase fraud 1 There is a simple attempt at using 1–2 • may cause negative externalities e.g. fracking. economic definitions and terminology. Some reference may be made to economic theory, with occasional understanding. 0 A mark of zero should be awarded for 0 no creditable content.
This question in 0455/22 Oct/Nov 2022
Q11 · Calculate the price elasticity of supply of Ecuador’s oil 0455/23 Oct/Nov 2022
1 (a) Calculate the price elasticity of supply of Ecuador’s oil. [1] (b) Identify two key resource allocation questions. [2] (c) State why sunshine has no opportunity cost. [2] (d) Explain two reasons why Ecuador experienced a recession between 2014 and 2016. [4] (e) Analyse how building more roads can increase a country’s economic growth rate. [4] (f) Analyse the relationship between GDP per head and car ownership. [5] (g) Discuss whether or not the profits of Ecuador’s textile firms are likely to have increased between 2016 and 2019. [6] (h) Discuss whether or not Ecuador benefits from the emigration of some of its workers. [6]
30 marks
Mark scheme: Question Answer Marks Guidance 1(a) Calculate the price elasticity of supply of Ecuador’s oil. 1 Do not accept 16% 0.16 (1). 1(b) Identify two key resource allocation questions. 2 Do not accept: How much to produce or for whom to produce What to produce / produce less of one product and more of another product / less oil and more textiles (1). How to produce it / how products are made / using fewer capital goods (1). 1(c) State why sunshine has no opportunity cost. 2 It is a free good (1). In unlimited supply / not scarce / a renewable source of energy (1). Does not take resources to produce it / nothing needs to be sacrificed to use it / no alternative / substitute so no opportunity cost (1). It is there naturally (1). 1(d) Explain two reasons why Ecuador experienced a 4 One mark for each of two reasons identified and one mark recession between 2014 and 2016. for each explanation. Logical explanation which might include: Fall in demand for exports [of oil] (1) lower export revenue / increase current account deficit / lower output of oil / lower total demand / lower GDP (1). Decrease in government spending (1) lower employment / lower output / lower income from benefits / lower total demand / lower GDP (1). 1(e) Analyse how building more roads can increase a 4 country’s economic growth rate. Building more roads would increase employment )1) lower unemployment (1) increase demand for road building materials (1) increase in government spending on roads (1) increase incomes (1) leading to higher demand / expenditure on goods and services e.g. education / cars (1). Less congestion (1) easier to transport goods / better infrastructure (1) quicker to work / increases labour mobility / longer working hours / more productive / efficient workforce (1) output rises (1). Lower transport costs (1) encourage firms to increase output / attract MNCs / foreign investment (1). Lower costs may increase international competitiveness (1) increase demand for country’s exports (1). 1(f) Analyse the relationship between GDP per head and car 5 There must be a comparison between countries and/or GDP ownership. per head and car ownership. Merely describing the data gets no marks as it is not analysis. Coherent analysis which might include: A direct comparison between two countries e.g. GDP per Overview head is higher in Switzerland than Senegal and car Generally, a direct relationship / the higher the income, the ownership is higher in Switzerland than Senegal is worth the higher the car ownership / the lower the income, the lower 2 marks. the car ownership (1). Supporting evidence – two comparison examples Senegal has the lowest GDP per head and the lowest car ownership (1). Ecuador has the second lowest GDP per head and the second lowest car ownership / Spain has higher GDP per head and car ownership than Uruguay (1) Exception New Zealand / Switzerland (1) Switzerland has a higher GDP per head but lower car ownership than New Zealand (1). OR Switzerland has highest GDP per head but only second highest car ownership (1) OR New Zealand has second highest GDP per head but highest car ownership (1). Comments Higher income would increase ability to purchase cars / high income countries often have more than one car per household (1) For exception other influences on demand e.g. cost of public transport / road space / congestions (1). 1(g) Discuss whether or not the profits of Ecuador’s textile 6 Apply this example to all questions with the command firms are likely to have increased between 2016 and word DISCUSS 2019. (1g, 1h, 2d, 3d, 4d and 5d) Award up to 4 marks for logical reasons why they Each point may be credited only once, on either side of an might, which may include: argument, but separate development as to how/why the Incomes / household spending increased in Ecuador (1) outcome may differ is rewarded. increasing demand for textiles (1) revenue increases (1). Generic example Mark Costs of production may have fallen (1) due to lower transport costs (1)’. Tax revenue may decrease… 1 Increase in scale of production (1) increased ability to take ...because of reason e.g. incomes may be lower. 1 advantage of economies of scale (1) average cost falls (1) profits may rise if prices unchanged but costs fall / profit is Tax revenue may increase because incomes 0 revenue – costs (1). may be higher i.e. reverse of a previous argument. Low increase in wage costs (1) revenue may have increased by more than costs (1). Tax revenue may increase because of a 1 different reason i.e. not the reverse of a previous Incomes abroad may have increased (1) increasing demand argument e.g. government spending on for Ecuadorean textiles (1) especially of luxury textiles (1). subsidies may stimulate the economy more than spending on education. Award up to 4 marks for logical reasons why they might not, which may include: The firms may have lost skilled workers abroad (1) which could have reduced productivity (1) increased costs / production falls (1). Strong competition from abroad (1) they may have lost sales to competitors (1) reducing revenue and or prices (1). Low wage increase (1) workers may leave industry / lower productivity (1) trade unions / workers may take action (1) may strike / disrupting the firms’ supply/ lead to higher costs (1). 1(h) Discuss whether or not Ecuador benefits from the 6 emigration of some of its workers. Award up to 4 marks for logical reasons why it might, which may include: Some may be unskilled (1), may have been unemployed (1) others leaving jobs create vacancies to be filled by unemployed (1) and so the government would spend less on unemployment benefit / more for other public spending (1) less poverty as a result (1). Some may be trained abroad (1) and may bring back skills and ideas into the country (1) increasing output (1). Some may send money home (1) improve the current account balance (1) will increase spending / total demand (1) leading to economic growth (1). Net emigration results in lower population / reduces overpopulation (1) less depletion of resources / pollution / shortage of resources e.g. housing (1). Award up to 4 marks for logical reasons why it might not, which may include: May lose skilled workers (1) lower productivity (1) low quality products / reduce output / economic growth (1) a relatively high proportion of people lost (1) makes it more difficult to attract MNCs (1). If some will not support families at home (1) dependency ratio will rise (1) place more burden on the government (1). Large proportion / 3 million already working abroad (1) shortage of workers / large reduction in size of labour force / increase (unit) wage costs (1) less income (1) less government tax revenue (1) less government spending e.g. education, health (1). Younger workers emigrating (1) leads to an ageing population (1).
This question in 0455/23 Oct/Nov 2022
Q12 · Calculate Australia’s unemployment rate in 2021 0455/21 May/June 2023
1 (a) Calculate Australia’s unemployment rate in 2021. [1] (b) Identify two substitutes for coal. [2] (c) Explain one economy of scale that could benefit a coal-mining firm. [2] (d) Explain two influences on the price elasticity of supply of coal. [4] (e) Draw a demand and supply diagram to show how setting a maximum price below the equilibrium price will affect a market. [4] (f) Analyse whether large coal-producing countries are likely to be net exporters of coal. [5] (g) Discuss whether or not an increase in the size of its coal industry will benefit the Australian economy. [6] (h) Discuss whether or not Australia is likely to have a budget deficit in 2026. [6]
30 marks
Mark scheme: 1(a) Calculate Australia’s unemployment rate in 2021. 4% Allow 4 without percentage 1(b) Identify two substitutes for coal. Two from: gas offshore wind / wind power solar power / panels 2 1(c) Explain one economy of scale that could benefit a coal- mining firm. Managerial / labour economy (1) employing specialist workers e.g. mining engineers (1). Technical economy (1) employing efficient / technologically advanced equipment e.g. drones (1). External economy of scale (1) example e.g. skilled labour force (1). 2 One mark for the economy of scale identified and one mark for an explanation. 1(d) Explain two influences on the price elasticity of supply of coal. Storage time (1) expensive to store so inelastic supply (1). Construction of new mine / production time (1) takes a long time, so inelastic supply (1). Stocks (1) may make supply elastic (1). 4 One mark each for each of two influences identified and one mark each for each of two explanations. Question Answer Marks Guidance 1(e) Draw a demand and supply diagram to show how setting a maximum price below the equilibrium price will affect a market. Demand and supply diagram: Axes correctly labelled – price and quantity or p and q (1). Demand and supply curves correctly labelled (1). Price line set below the equilibrium (1). Demand shown as greater than supply (1) e.g. has the two dotted lines downwards (it does not have to be labelled Qs and Qd). 4 Note: Accept unlabelled price line / line drawn only to demand curve. Accept shortage if correctly identified on the diagram. Do not accept demand greater than supply if demand and supply curves are incorrectly drawn Question Answer Marks Guidance 1(f) Analyse whether large coal-producing countries are likely to be net exporters of coal. Coherent analysis which might include: Expected outcome: Large coal producing countries may have a surplus to sell / may have grown their production in order to sell abroad (1) most of the evidence supports this relationship (1) Supporting evidence: Five of the seven countries consume less coal than they produce (1) calculation e.g. US could have exported 11 million tonnes / Australia could have exported 394 million tonnes or simply the difference (1). Analysis: Countries that produce more coal than they consume may benefit from economies of scale / can export because their prices are low (1). Exceptions: China or India are an exception (1) as they consumed more coal than they produced (1). Analysis: they may have been net importers (1) since had used up stocks of coal / need more energy as a developing country (1) may not be able to export coal if world demand for coal is low / countries may both import and export coal (1). 5 Responses do not have to be in the format suggested but they should address the expected / normal outcome, offer supporting evidence of that, highlight any exceptions to that, and analyse the overall data. Question Answer Marks Guidance 1(g) Discuss whether or not an increase in the size of its coal industry will benefit the Australian economy. Award up to 4 marks for logical reasons why it might, which may include: may increase GDP / economic growth (1) increasing living standards / raise incomes / reduce poverty (1) may reduce unemployment (1) structural unemployment (1) may improve current account position / have a surplus (1) as Australia seems to be a net exporter of coal (1) may increase tax revenue (1) increasing government’s ability to spend (1) economies of scale (1) result in lower prices for households and industries (1). Award up to 4 marks for logical reasons why it might not, which may include: may increase pollution (1) lowering living standards / cause health issues (1) reduce tourism / negative impact on current account (1) other forms of power may not be developed (1) example (1) some workers may leave other jobs (1) these jobs may have better working conditions (1) coal mining is a relatively dangerous industry (1) so life expectancy may be reduced / creates chronic illnesses / workers unable to work (1). Global demand for coal may fall (1) impact upon Australia e.g. unsold stock (1). May rapidly deplete stocks (1) leading to lower exports (1) and less employment (1). 6 Apply this example to all questions with the command word DISCUSS (1g, 1h, 2d, 3d, 4d and 5d) Each point may be credited only once, on either side of an argument, but separate development as to how/why the outcome may differ is rewarded. Generic example Mark Tax revenue may decrease … 1 … because of reason e.g. incomes may be lower. 1 Tax revenue may increase because incomes may be higher i.e. reverse of a previous argument. 0 Tax revenue may increase because of a different reason i.e. not the reverse of a previous argument e.g. government spending on subsidies may stimulate the economy more than spending on education. 1 Question Answer Marks Guidance 1(h) Discuss whether or not Australia is likely to have a budget deficit in 2026. Award up to 4 marks for logical reasons why it might, which may include: unemployment is forecast to increase (1) so there may be more government spending on unemployment benefits (1) less income tax revenue (1) there may be more government spending on retraining unemployed workers (1) some of the rise in population may result in more government spending (1) e.g. on pensions / healthcare / education (up to 2 marks) budget deficit in previous years (1) would mean interest would have to be paid on the debt that has built up (1). Award up to 4 marks for logical reasons why it might not, which may include: population and the labour force are forecast to increase (1) so there may be more taxpayers / fewer claiming benefits (1) tax revenue may rise (1) due to higher profits / higher tax rates (1) GDP is forecast to increase (1) more people in work (1) which would be likely to increase direct and indirect tax revenue (1) state support for industries may fall (1) may have been high in 2021 due to Covid-19 (1). 6
This question in 0455/21 May/June 2023
Q13 · One reason why the price of houses in cities such as Hong Kong, London, and New York is… 0455/21 Oct/Nov 2023
5 One reason why the price of houses in cities such as Hong Kong, London, and New York is very high, is the low price elasticity of supply of houses. Trade unions in some of these cities are calling for more affordable housing for workers. Governments are also trying to implement various microeconomic policy measures to reduce the price of houses. In addition, the stability of the housing market can impact upon the effectiveness of monetary policy. (a) Identify two monetary policy measures. [2] (b) Explain two microeconomic policy measures that can be taken by a government to reduce the price of a product. [4] (c) Analyse the key determinants of price elasticity of supply of a product. [6] (d) Discuss whether or not trade unions benefit workers. [8]
20 marks
Mark scheme: 5(a) Identify two monetary policy measures. 2 Accept, but do not expect, quantitative easing as an alternative to money supply. If more than two measures Changes in: interest rates (1) money supply (1) foreign are given, consider the first three. exchange rates (1). 5(b) Explain two microeconomic policy measures that can be 4 Examples could be related to any market – does not taken by a government to reduce the price of a product. have to be housing market. Logical explanation which might include: If more than two policy measures are given, consider the first three. • maximum prices (1) e.g. maximum rents / rent controls (1) • subsidies (1) reduce cost of production (1) e.g. housing subsidies (1) • nationalisation (1) government sets lower prices (1) • direct provision of goods (1) increase supply of goods (1) e.g. government providing public housing (1) • regulation (1) e.g. prohibiting foreign house buying (1) reduce demand (1) • deregulation (1) allowing more firms in the market / more competition (1) • lower (sales) taxes (1) if sellers reduce prices as a result (1). 5(c) Analyse the key determinants of price elasticity of supply of 6 Also accept an approach based on why PES may be a product. inelastic as shown in third bullet point. Coherent analysis which might include: • availability of stocks (1) finished goods which are unsold (1) with a high level of stocks, supply will be elastic (1) • level of spare capacity (1) factors of production available but unused (1) e.g. workers not working full time (1) supply will be more elastic if levels of spare capacity are high (1) • time period under consideration (1) short run / long run (1) short run has inelastic supply (1) with at least one fixed factor of production (1) which makes it more difficult to produce (1) long run has elastic supply (1) when all factors of production are variable (1) making it easier to produce more (1) • difficulty of production process / length of production time (1) produce that is easy to produce will be more elastic (1) e.g. bread is easier to produce compared to a smartphone (1). 5(d) Discuss whether or not trade unions benefit workers. 8 Level Description Marks In assessing each answer, use the table opposite. 3 A reasoned discussion which 6–8 accurately examines both sides of the Why they might: economic argument, making use of economic information and clear and • collective bargaining can result in higher wages logical analysis to evaluate economic • better working hours and working conditions can be issues and situations. One side of the negotiated argument may have more depth than • trade unions may protect employment giving more job the other, but overall both sided of the security argument are considered and • trade unions may influence governments to give favourable developed. There is thoughtful policies for workers, e.g. maternity pay evaluation of economic concepts, • trade unions may provide services for workers e.g. training. terminology, information and / or data appropriate to the question. The Why they might not: discussion may also point out the possible uncertainties of alternative • higher wages negotiated by trade unions may increase decisions and outcomes. costs of production, firms may reduce number of workers to cut costs 2 A reasoned discussion which makes 3–5 • may promote industrial actions / strikes, reducing use of economic information and clear productivity, reducing wages of workers analysis to evaluate economic issues • may reduce competitiveness of the economy, reducing and situations. The answer may lack investment and therefore reducing the demand for workers. some depth and development may be • workers may not agree with the objectives of a trade union one-sided. There is relevant use of • workers may feel that the fees to join a trade union are too economic concepts, terminology, high compared to the benefits they could receive from information and data appropriate to the membership. question. 5(d) Level Description Marks 1 There is a simple attempt at using 1–2 economic definitions and terminology. Some reference may be made to economic theory, with occasional understanding. 0 A mark of zero should be awarded for 0 no creditable content.
This question in 0455/21 Oct/Nov 2023
Q14 · In the US, the supply of meat from emus, a large bird, is price-elastic 0455/22 Oct/Nov 2023
4 In the US, the supply of meat from emus, a large bird, is price-elastic. Recently, US farmers have switched to keeping other livestock and growing crops that changed their demand for labour. US farmers are influenced by the subsidies the government provides for the production of selected food items. Some people are reluctant to become farm workers as they think living standards are low in rural areas. (a) Define elastic supply. [2] (b) Explain two reasons why a government may subsidise food production. [4] (c) Analyse what influences a farmer’s demand for labour. [6] (d) Discuss whether or not people living in cities have a higher living standard than those living in rural areas. [8]
20 marks
Mark scheme: 4(a) Define elastic supply. 2 The percentage change in quantity supplied is greater than the percentage change in price (2). Change in supply is greater than the change in price / PES > 1 (1). 4(b) Explain two reasons why a government may subsidise 4 One mark each for each of two reasons identified and one food production. mark each for each of two explanations. Logical explanation which might include: Increase output (1) overcome a shortage (1). Reduce price / cost (1) help consumers / reduce poverty / give access to a basic necessity / make food more affordable (1). Increase quality (1) improve nutrition / increase health of population / raise life expectancy (1). Increase incomes of farmers / farm workers (1) raise their living standards of farmers / stop farmers going out of business (1). Reduce imports of food / increase exports of food (1) improve the current account of the balance of payments / agriculture is a strategic industry / reduce dependency on other countries for an essential good (1). Increase employment / reduce unemployment (1) help in rural areas (1). 4(c) Analyse what influences a farmer’s demand for labour. 6 Coherent analysis which might include: Demand for the food they produce (1) derived demand / a higher demand for food will encourage farmers to expand their output / employ more workers (1) more profits earned (1). Wage rates (1) the lower the wage rate, the less it will cost to employ workers (1). Skills of workers (1) the more skilled workers are, the more productive they will be (1). Price of other factors of production / costs of production (1) if the price of e.g. agricultural drones falls, demand for labour may fall (1). Productivity of other factors of production (1) advances in technology may result in farm workers being replaced by machinery (1). Type of farming (1) some farming is more labour-intensive / capital-intensive (1). Size of farm (1) large farms likely to employ more (1). Subsidies (1) subsides may encourage a farmer to expand output and employ more workers (1). Seasons (1) demand for labour is likely to be higher during harvesting (1). 4(d) Discuss whether or not people living in cities have a 8 The answer may be from the view of why people living in higher living standard than those living in rural areas. rural areas may have a higher living standard. In assessing each answer, use the table opposite. Level Description Marks Why they might: 3 A reasoned discussion which 6–8 • may be more job opportunities accurately examines both sides of the • may be higher incomes economic argument, making use of • may be more forms of entertainment economic information and clear and • may be shorter distance to schools and shops logical analysis to evaluate economic • may be more access to healthcare facilities issues and situations. One side of the • may be better quality education/ healthcare. argument may have more depth than the other, but overall, both sides of the Why they might not: argument are considered and • may be more traffic congestion developed. There is thoughtful • may be overcrowding evaluation of economic concepts, • air and noise pollution levels may be higher terminology, information and/or data • stress may be high appropriate to the question. The • higher cost of living in cities. discussion may also point out the possible uncertainties of alternative decisions and outcomes. 2 A reasoned discussion which makes 3–5 use of economic information and clear analysis to evaluate economic issues and situations. The answer may lack some depth and development may be one-sided. There is relevant use of economic concepts, terminology, information and data appropriate to the question. 4(d) Level Description Marks 1 There is a simple attempt at using 1–2 economic definitions and terminology. Some reference may be made to economic theory, with occasional understanding. 0 A mark of zero should be awarded for 0 no creditable content.
This question in 0455/22 Oct/Nov 2023
Q15 · Calculate the average wage paid in Denmark in 2020 0455/22 Feb/March 2024
1 (a) Calculate the average wage paid in Denmark in 2020. [1] (b) Identify two possible opportunity costs of a Danish person using their leisure time to cycle. [2] (c) Explain one way that living standards are measured in Denmark. [2] (d) Explain two reasons why the supply of ships is price-inelastic. [4] (e) Analyse the relationship between government spending and GDP in Denmark. [4] (f) Analyse, using a demand and supply diagram, how an increase in the birth rate would affect the market for toys. [5] (g) Discuss whether or not a surplus on the current account of its balance of payments would benefit the Danish economy. [6] (h) Discuss whether or not more people working from home will benefit an economy. [6]
30 marks
Mark scheme: Question Answer Marks Guidance 1(a) Calculate the average wage paid in Denmark. 1 Accept 84 000. $84 000 (1). 1(b) Identify two opportunity costs of a Danish person using 2 their leisure time to cycle. Playing golf (1) jogging (1). 1(c) Explain one way that living standards are measured in 2 One mark for a way identified and one mark for an Denmark. explanation. Identification Do not accept GDP. HDI / average wages / income / GDP per head leisure hours (1). Explanation HDI includes GDP per head / income / education / health/life expectancy / average wages / income / GDP per head influences the goods and services which can be purchased / leisure hours may affect physical / mental health (1). 1(d) Explain two reasons why the supply of ships is price- 4 One mark each for each of two reasons identified and one inelastic. mark for each of two explanations. Logical explanation which might include: Ignore comments on PED. They take a long time to produce (1) so supply cannot be adjusted quickly (1). They are expensive to store (1) take up a large space / likely to be few or no spare ships to sell / low inventories / difficult to keep for future sales / if prices fall will have to sell ships as nowhere to store them (1). 1(e) Analyse the relationship between government spending 4 Responses do not have to be in the format suggested but and GDP in Denmark. they should address the expected/normal relationship, offer supporting evidence of that, highlight any exceptions to that, Coherent analysis which might include: and analyse the overall data. Expected relationship: Higher government spending would be expected to be associated with a higher GDP / move in the same direction / Government spending will always be lower than GDP (1) positive relationship / direct relationship (1). Supporting evidence up to 2 marks: 2015 – 2018 government spending and GDP rose / (1) 2019 – 2021 government spending and GDP rose (1). Government spending and GDP rose over the period / government spending and GDP was lowest at the start of the period / 2015 and was highest at the end of the period 2021 (1). Analysis of expected relationship up to 2 marks: Higher government spending will increase total (aggregate) demand which will add to GDP (1) may be higher government spending on education/training/healthcare/subsidies which can raise productivity and output (1) higher GDP may increase tax revenue which can be used to increase government spending (1). Exception: 2018 – 2019 / 2018 / 2019 (1) government spending rose but GDP fell (1). Analysis of exception: A government may spend more when GDP falls in a bid to stimulate an increase in GDP (1). 1(f) Analyse, using a demand and supply diagram, how an 5 increase in the birth rate would affect the market for toys. Coherent analysis which might include: D&S diagram up to 4 marks: Axes correctly labelled – price and quantity or p and q (1). Original demand and supply curves correctly labelled (1). New demand curve shifted to the right (1). Equilibriums – shown by lines P1 and Q1 and P2 and Q2 or equilibrium points marked as E1 and E2 (1). Written analysis up to 1 mark: An increase in the birth rate would increase the number of children who parents may buy toys for / more consumers / higher demand (1) the higher demand will raise price / increase quantity (traded) (1). 1(g) Discuss whether or not a surplus on the current 6 Apply this example to all questions with the command account of its balance of payments would benefit the word DISCUSS Danish economy. (1g, 1h, 2d, 3d, 4d and 5d) Award up to 4 marks for logical reasons why it might, which Each point may be credited only once, on either side of an may include: argument, but separate development as to how/why the • exports exceed imports / credit items have a higher outcome may differ is rewarded. value than debit items (1) and so adds to total (aggregate) demand (1) which may increase GDP (1) Generic example Mark • it can increase employment (1) which may increase incomes (1) Tax revenue may decrease… 1 • may attract foreign investment (1) as may be taken to be a sign of a strong economy (1) ...because of reason e.g. incomes may be lower. 1 • may raise the exchange rate (1) which can enable exports to exchange for more imports (1). Tax revenue may increase because incomes 0 may be higher i.e. reverse of a previous Award up to 4 marks for logical reasons why it might not, argument. which may include: • it means more products are produced than consumed / Tax revenue may increase because of a 1 reduces availability of products / reduces consumer different reason i.e. not the reverse of a previous choice (1) reduce potential living standards (1) may argument e.g. government spending on contribute to resource depletion (1) subsidies may stimulate the economy more than • it may add to inflationary pressure (1) especially if the spending on education. economy is close to full employment (1). • demand for the currency will exceed the supply of the currency (1) this may raise the exchange rate (1) make exports less internationally competitive (1) which can reduce the surplus / cause a deficit in the long run (1). 1(h) Discuss whether or not more people working from home 6 Note 1 mark for recognising productivity may change. So, if will benefit an economy. a candidate writes productivity may increase and may decrease, award 1 mark. Two further marks could be gained Award up to 4 marks for logical reasons why it might, which if a candidate explains why productivity may increase and may include: why it may decrease. • may raise productivity / efficiency / quality of output (1) as workers may be less tired / less stressed / saves Note: 1 mark for productivity increase or decrease and 1 transport costs as a result of not having to travel to work mark for GDP increase or decrease. (1) may work longer hours (1) increase GDP (1) • may increase the quantity of labour (1) more people e.g. those with dependents may be able to work / more flexible hours (1) as save time travelling (1) • workers may be happier (1) and so may stay with firms longer (1) which would reduce the cost of recruiting workers (1) • pollution may be reduced (1) traffic congestion may be reduced (1) less need for transport infrastructure (1) reduce external costs (1) improve health (1) • firms’ costs may fall (1) as less need for office space (1) • may reduce conflict between workers (1) may reduce chances of industrial action (1). Award up to 4 marks for logical reasons why it might not, which may include: • transport firms may experience a fall in demand / revenue / less people travelling (1) which may create unemployment of e.g. bus drivers (1) • restaurants/cafes may have to close down in city centres (1) which may create unemployment of e.g. waiters (1) reduce tax revenue (1) 1(h) • may reduce productivity / efficiency/ quality of output (1) reduce GDP (1) as workers may be distracted by e.g. small children / become lazy / may work fewer hours / may have poor internet connection (1) may not be supervised (1) may not co-ordinate with other workers / communication problems (1).
This question in 0455/22 Feb/March 2024
Q16 · South Korea makes use of both economic goods and free goods 0455/22 Feb/March 2025
2 South Korea makes use of both economic goods and free goods. Its output includes products with both elastic and inelastic supply. The country is building the world’s first floating city, estimated to cost $180m. This is to cope with rising sea levels caused by climate change. Governments take a number of measures to reduce greenhouse gases which contribute to climate change, including banning the burning of wood to heat homes. (a) Identify a difference between economic goods and free goods. [2] (b) Explain how opportunity cost will influence a government’s decision on whether to spend tax revenue on a large infrastructure project. [4] (c) Analyse the influences on whether supply of a product is elastic or inelastic. [6] (d) Discuss whether or not a government should ban the burning of wood to heat homes. [8]
20 marks
Mark scheme: 2(a) Identify a difference between economic goods and free goods. 2 No marks for examples. Economic goods use up resources / need factors of production to One mark for economic goods and one mark produce them (1) free goods do not (1) for free goods. Economic goods are scarce / in limited supply (1) free goods are in unlimited supply (1). Economic goods have an opportunity cost (1) free goods do not (1). 2(b) Explain how opportunity cost will influence a government’s 4 decision on whether to spend tax revenue on a large infrastructure project. Logical explanation which might include: Opportunity cost is the (next) best alternative (1) forgone / given up (1). Tax revenue is limited (1) if a government spends some of it on an infrastructure project, it will not be able to spend on something else / could use the money to spend on something else (1) an example (1). Governments have to decide on their priorities / consider which form of spending will provide the greatest benefit (1) reason why spending on infrastructure may be the best option / may not be the best option (1). 2(c) Analyse the influences on whether supply of a product is elastic or 6 inelastic. Coherent analysis which might include: Elasticity of supply is a measure of the responsiveness of supply to a change in price / formula / elastic supply is when pes is > 1/ inelastic supply is when pes <1 (1). Elastic supply occurs when supply changes by a greater percentage than the change in price / inelastic supply is when supply changes by a smaller percentage than the change in price (1). Whether the product can be stored / non-perishable (1) if it can be, it will be elastic (1) able to adjust supply quickly to changes in price (1) as if price rises, goods can be taken out of storage (1). Whether the production time is short (1) if so, output can be increased quickly to take advantage of higher prices (1). Cost of altering supply (1) if it is costly to alter the supply, supply is likely to be inelastic (1). Whether there are unemployed resources / level of capacity (1) if there are, supply can be adjusted by taking on more resources (1). Whether resources / factors of production are mobile (1) if they can change use / location (1). Time (1) supply usually becomes more elastic, the longer the time period (1). Level of competition (1) supply is likely to be more elastic in a competitive than in a monopoly market (1). 2(d) Discuss whether or not a government should ban the burning of 8 Level Description Marks wood to heat homes. 3 A reasoned discussion 6–8 In assessing each answer, use the table opposite. which accurately examines both sides of the Why it should: economic argument, • reduce external costs / pollution making use of economic • correct market failure / information failure information and clear and • improve people’s health logical analysis to evaluate • protect forests economic issues and • replace wood with a more environmentally-friendly fuel situations. One side of the • wood could be used for other purposes argument may have more depth than the other, but Why it should not: overall both sides of the • wood may be bought mainly by the poor, increase poverty argument are considered • other sources of fuel may be more expensive and developed. There is • may be difficult to enforce thoughtful evaluation of • may cause unemployment economic concepts, • may be better to tax wood as a fuel, could use revenue to subsidise terminology, information more environmentally-friendly sources of fuel and/or data appropriate to • some alternative fuels may be more polluting. the question. The discussion may also point out the possible uncertainties of alternative decisions and outcomes. 2(b) Level Description Marks 2 A reasoned discussion 3–5 which makes use of economic information and clear analysis to evaluate economic issues and situations. The answer may lack some depth and development may be one- sided. There is relevant use of economic concepts, terminology, information and data appropriate to the question. 1 There is a simple attempt 1–2 at using economic definitions and terminology. Some reference may be made to economic theory, with occasional understanding. 0 A mark of zero should be 0 awarded for no creditable content.
This question in 0455/22 Feb/March 2025
 1 / 7
1 / 7 2 / 7
2 / 7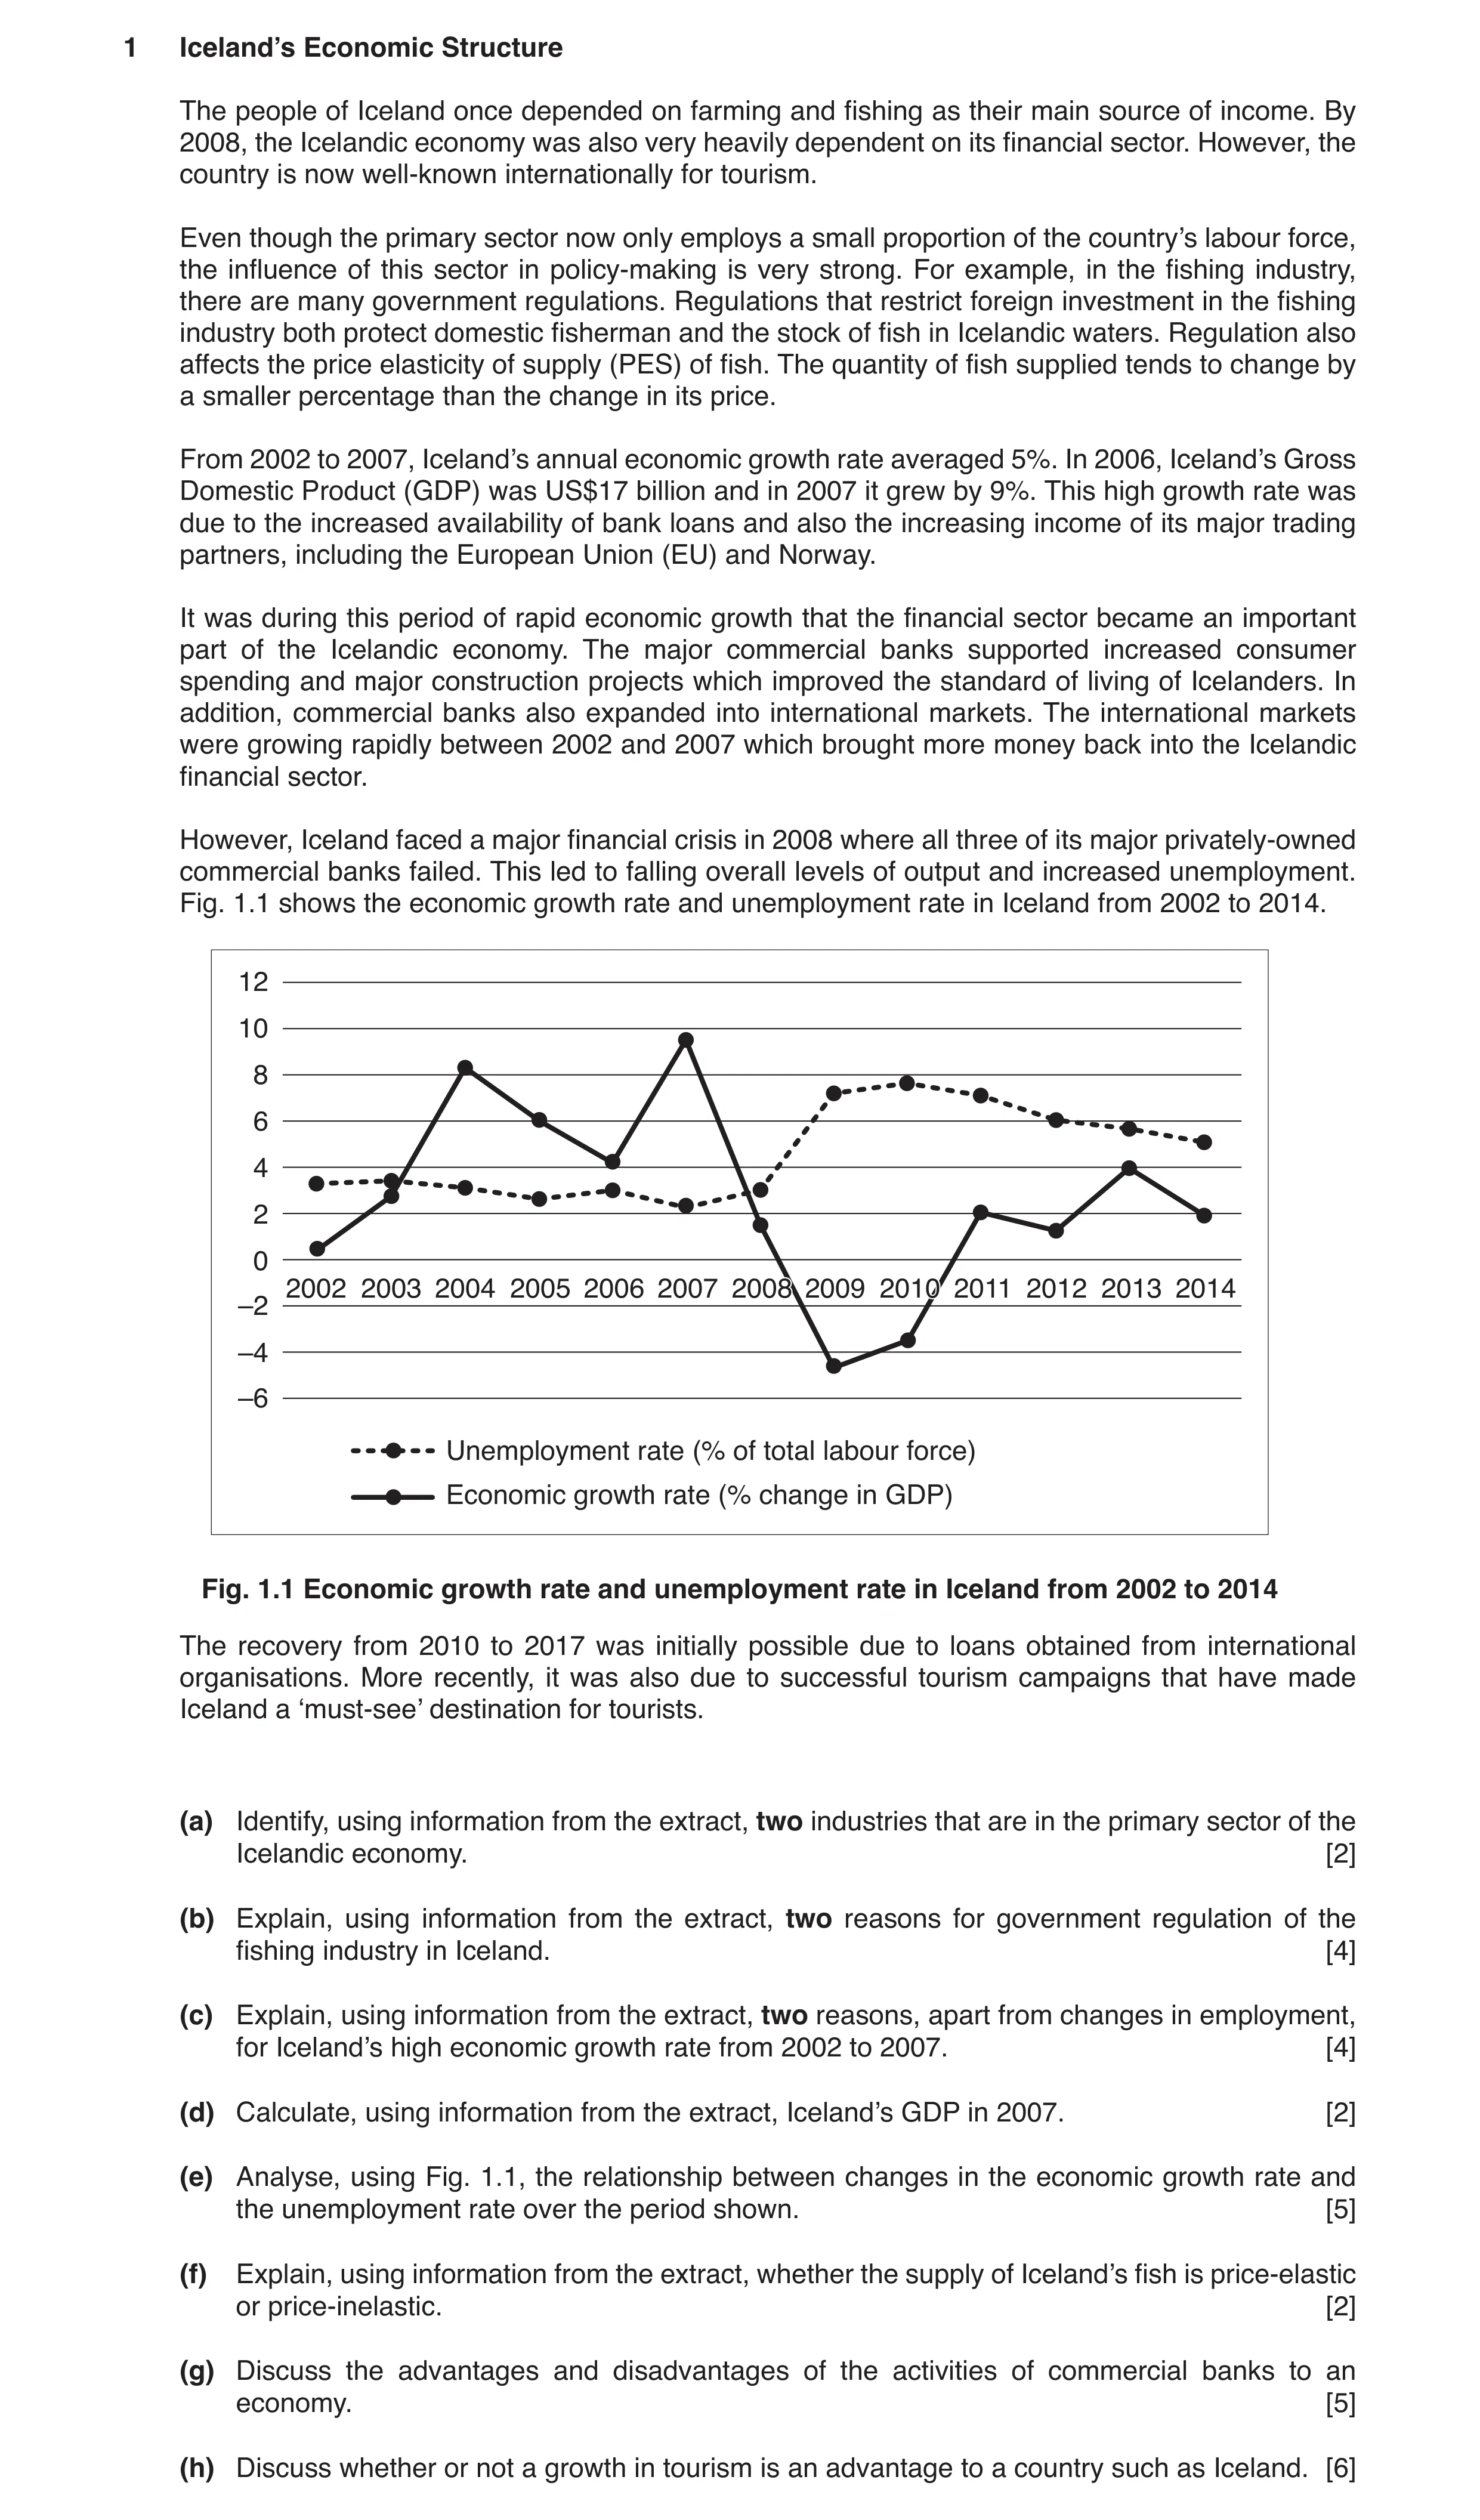
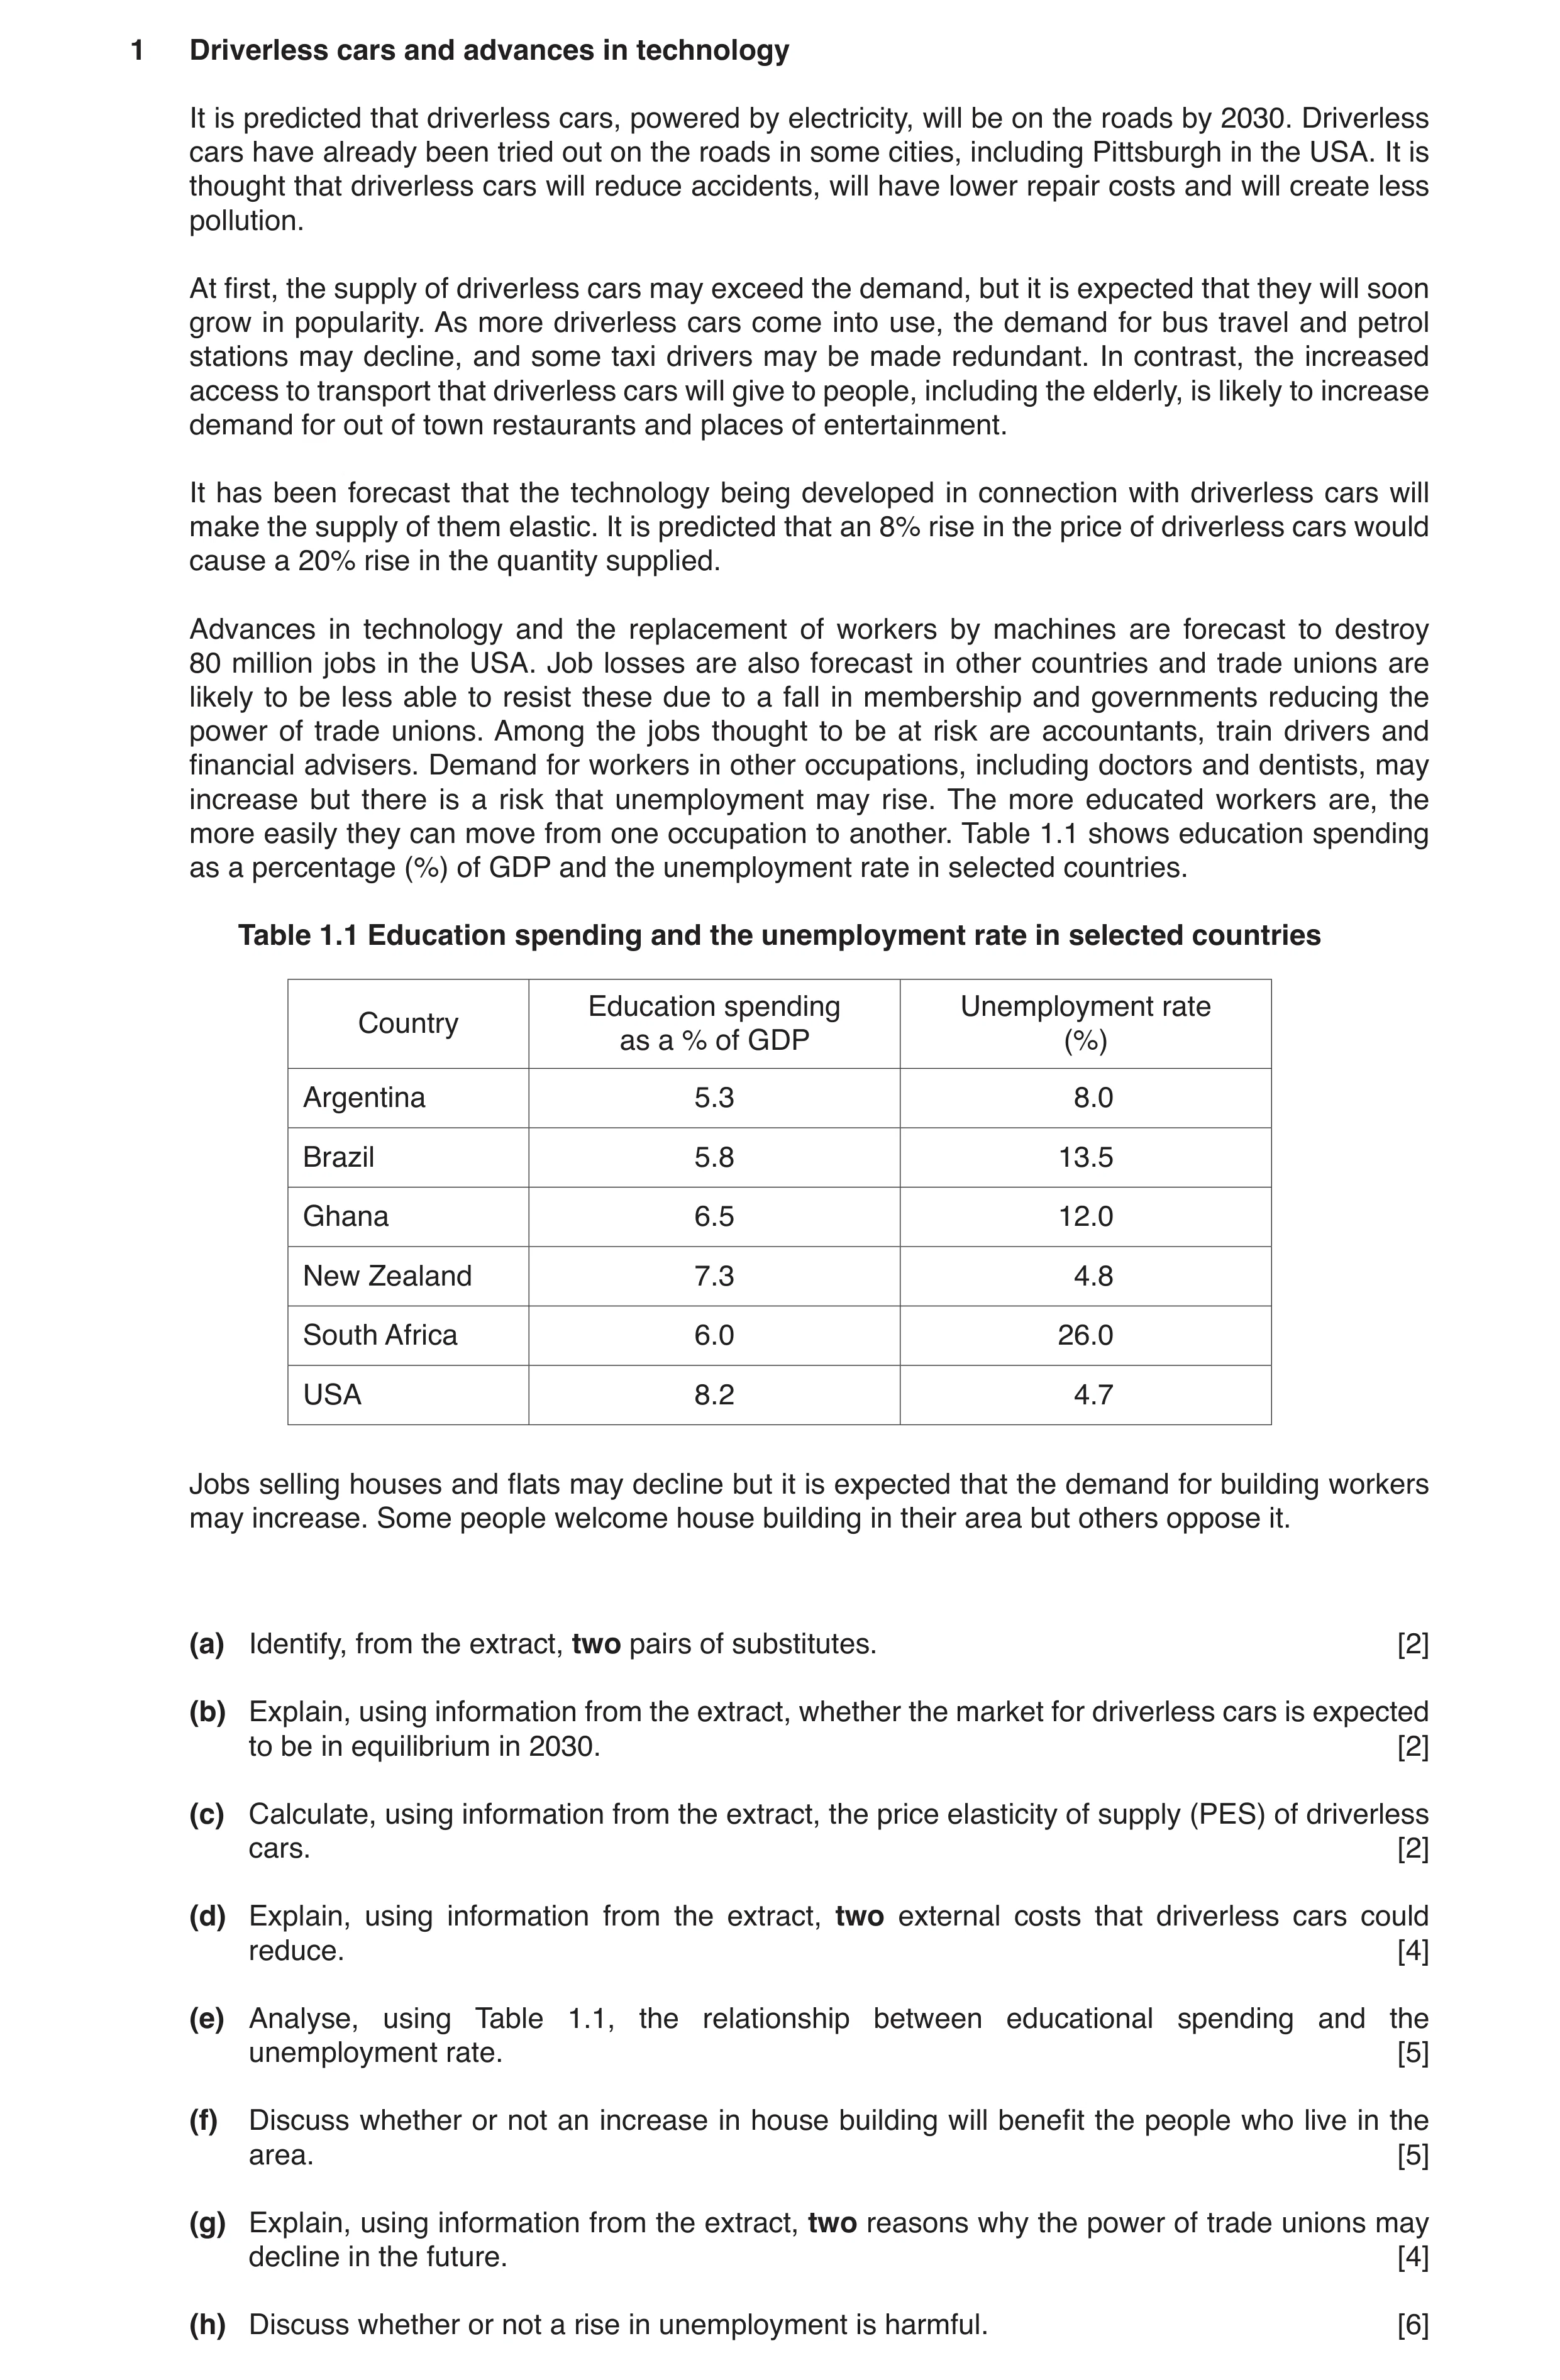
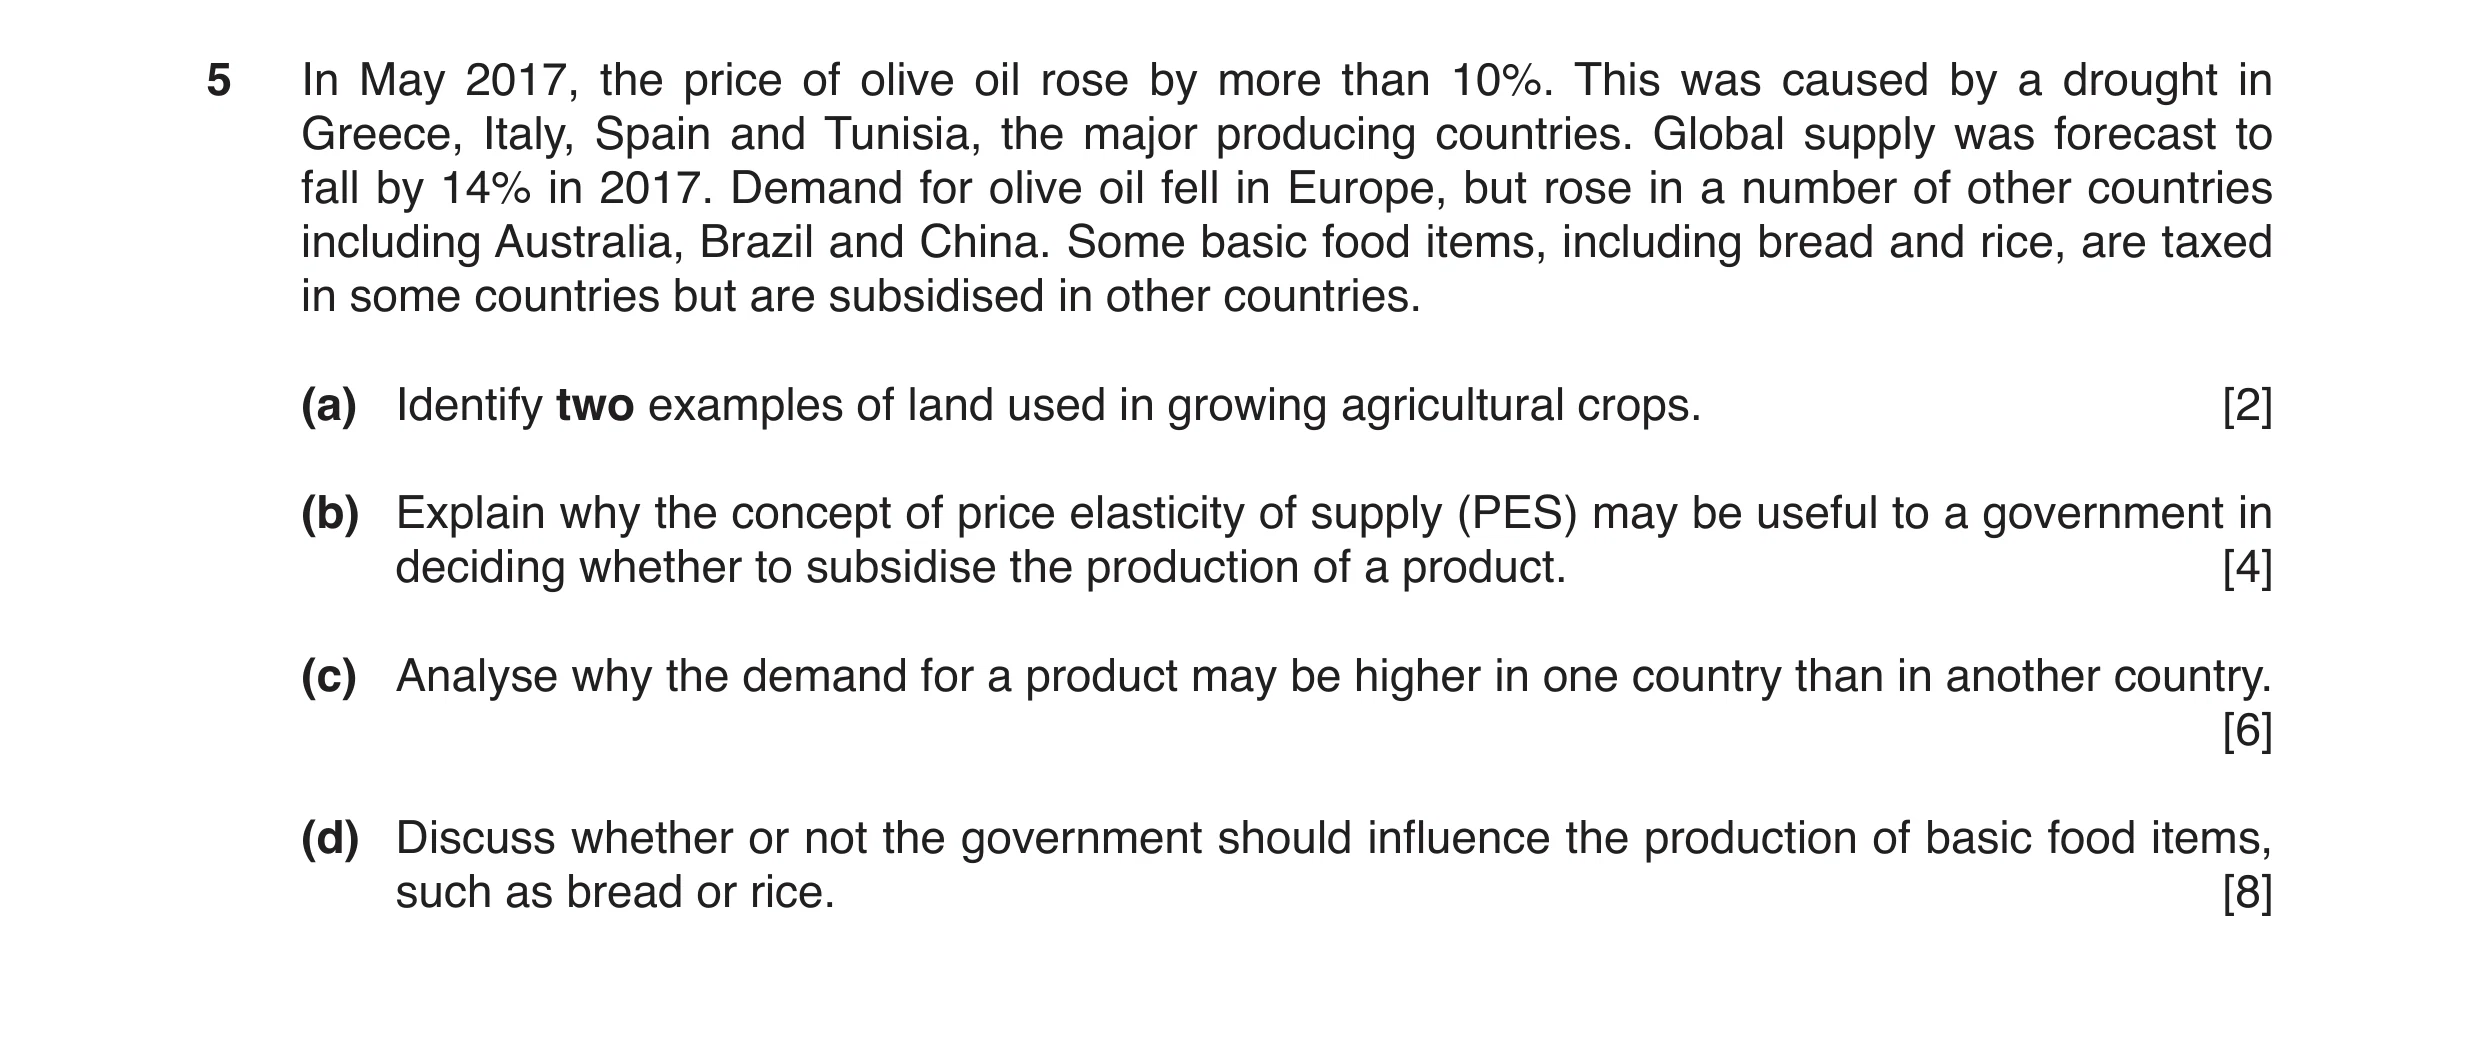 4 / 7
4 / 7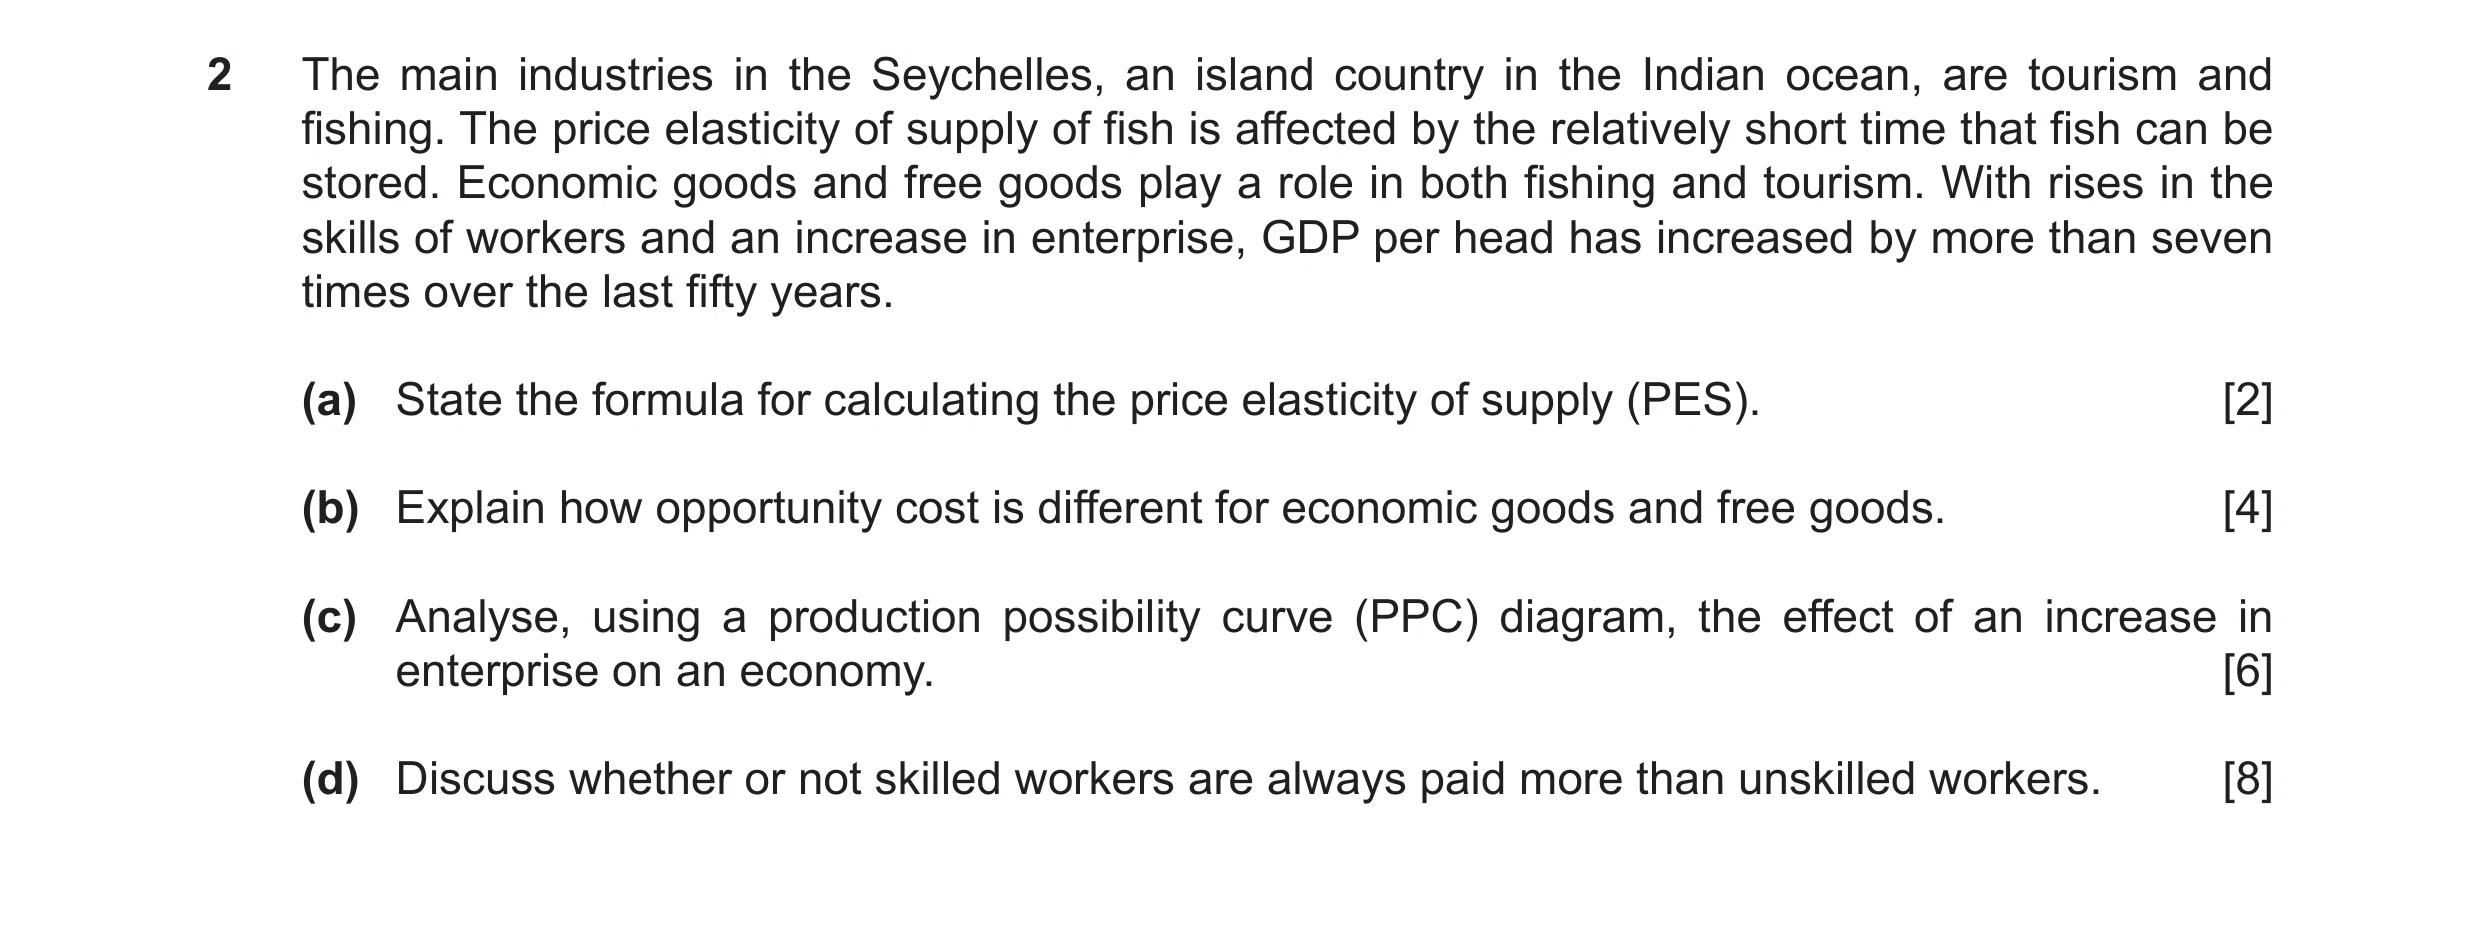
 5 / 7
5 / 7![Question 11: (a) Calculate the price elasticity of supply of Ecuador’s oil. [1] (b) Identify two key resource allocation questions. [2] (c) State why su…](https://img.pastlit.com/crops/23ae5604-fbfe-4bc2-8158-2b705635eae3/q1.webp)
![Question 12: (a) Calculate Australia’s unemployment rate in 2021. [1] (b) Identify two substitutes for coal. [2] (c) Explain one economy of scale that c…](https://img.pastlit.com/crops/98fc39f6-25f7-4ed0-b403-3fea1f534b68/q1.webp)
 6 / 7
6 / 7
![Question 15: (a) Calculate the average wage paid in Denmark in 2020. [1] (b) Identify two possible opportunity costs of a Danish person using their leis…](https://img.pastlit.com/crops/aeaa1c35-3314-4a56-8d2d-0e647b3282e2/q1.webp)
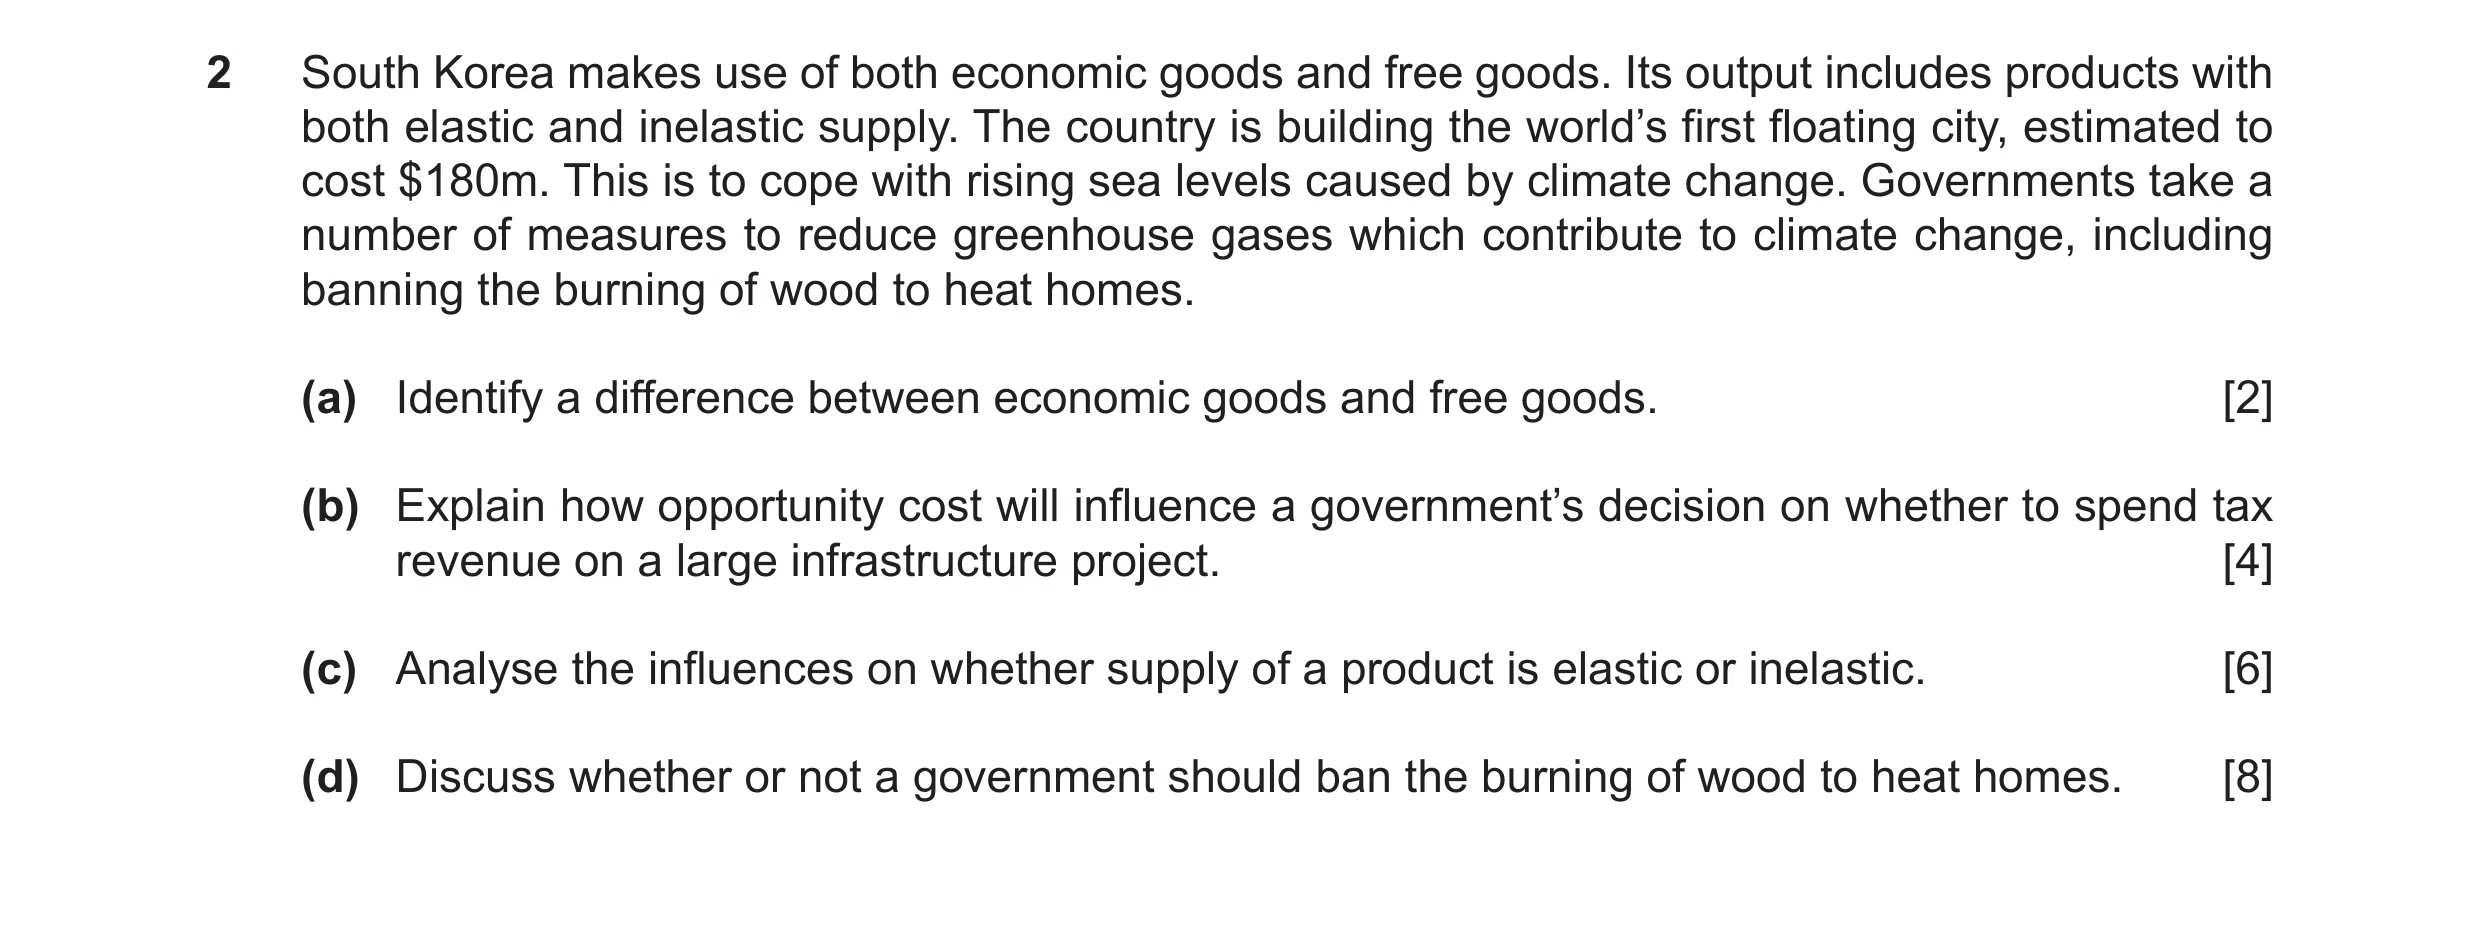 7 / 7
7 / 7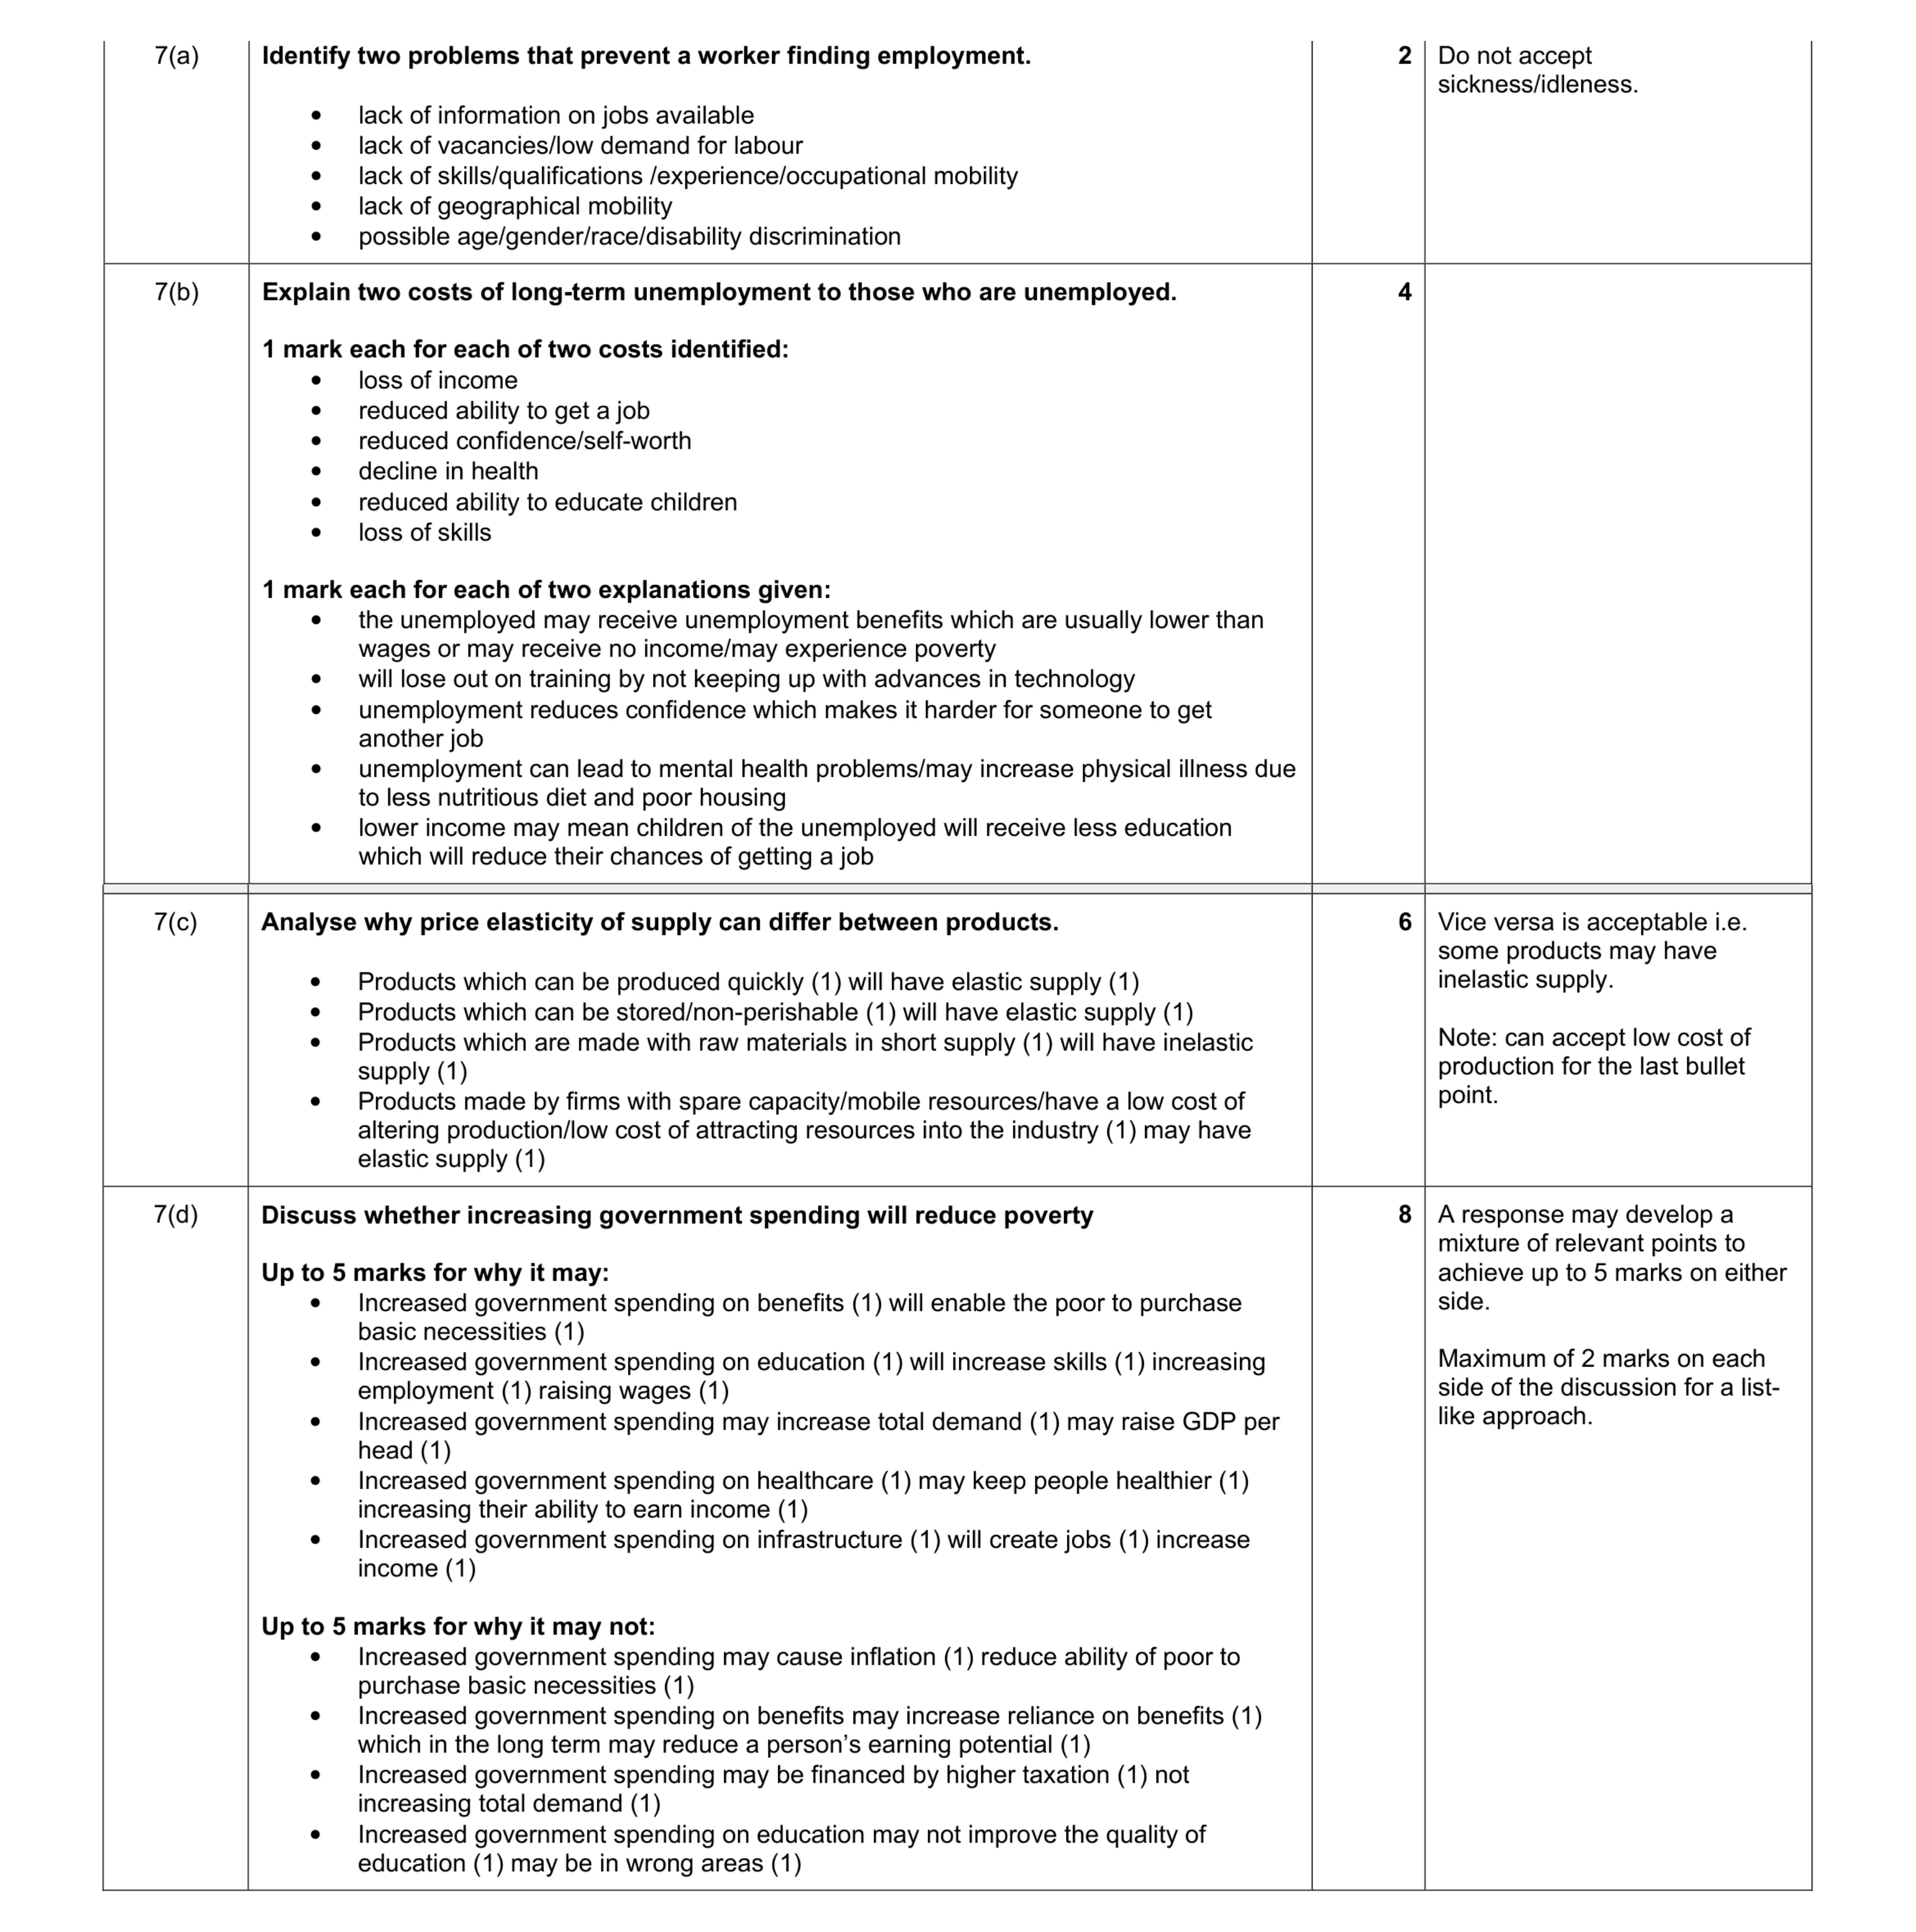 20
20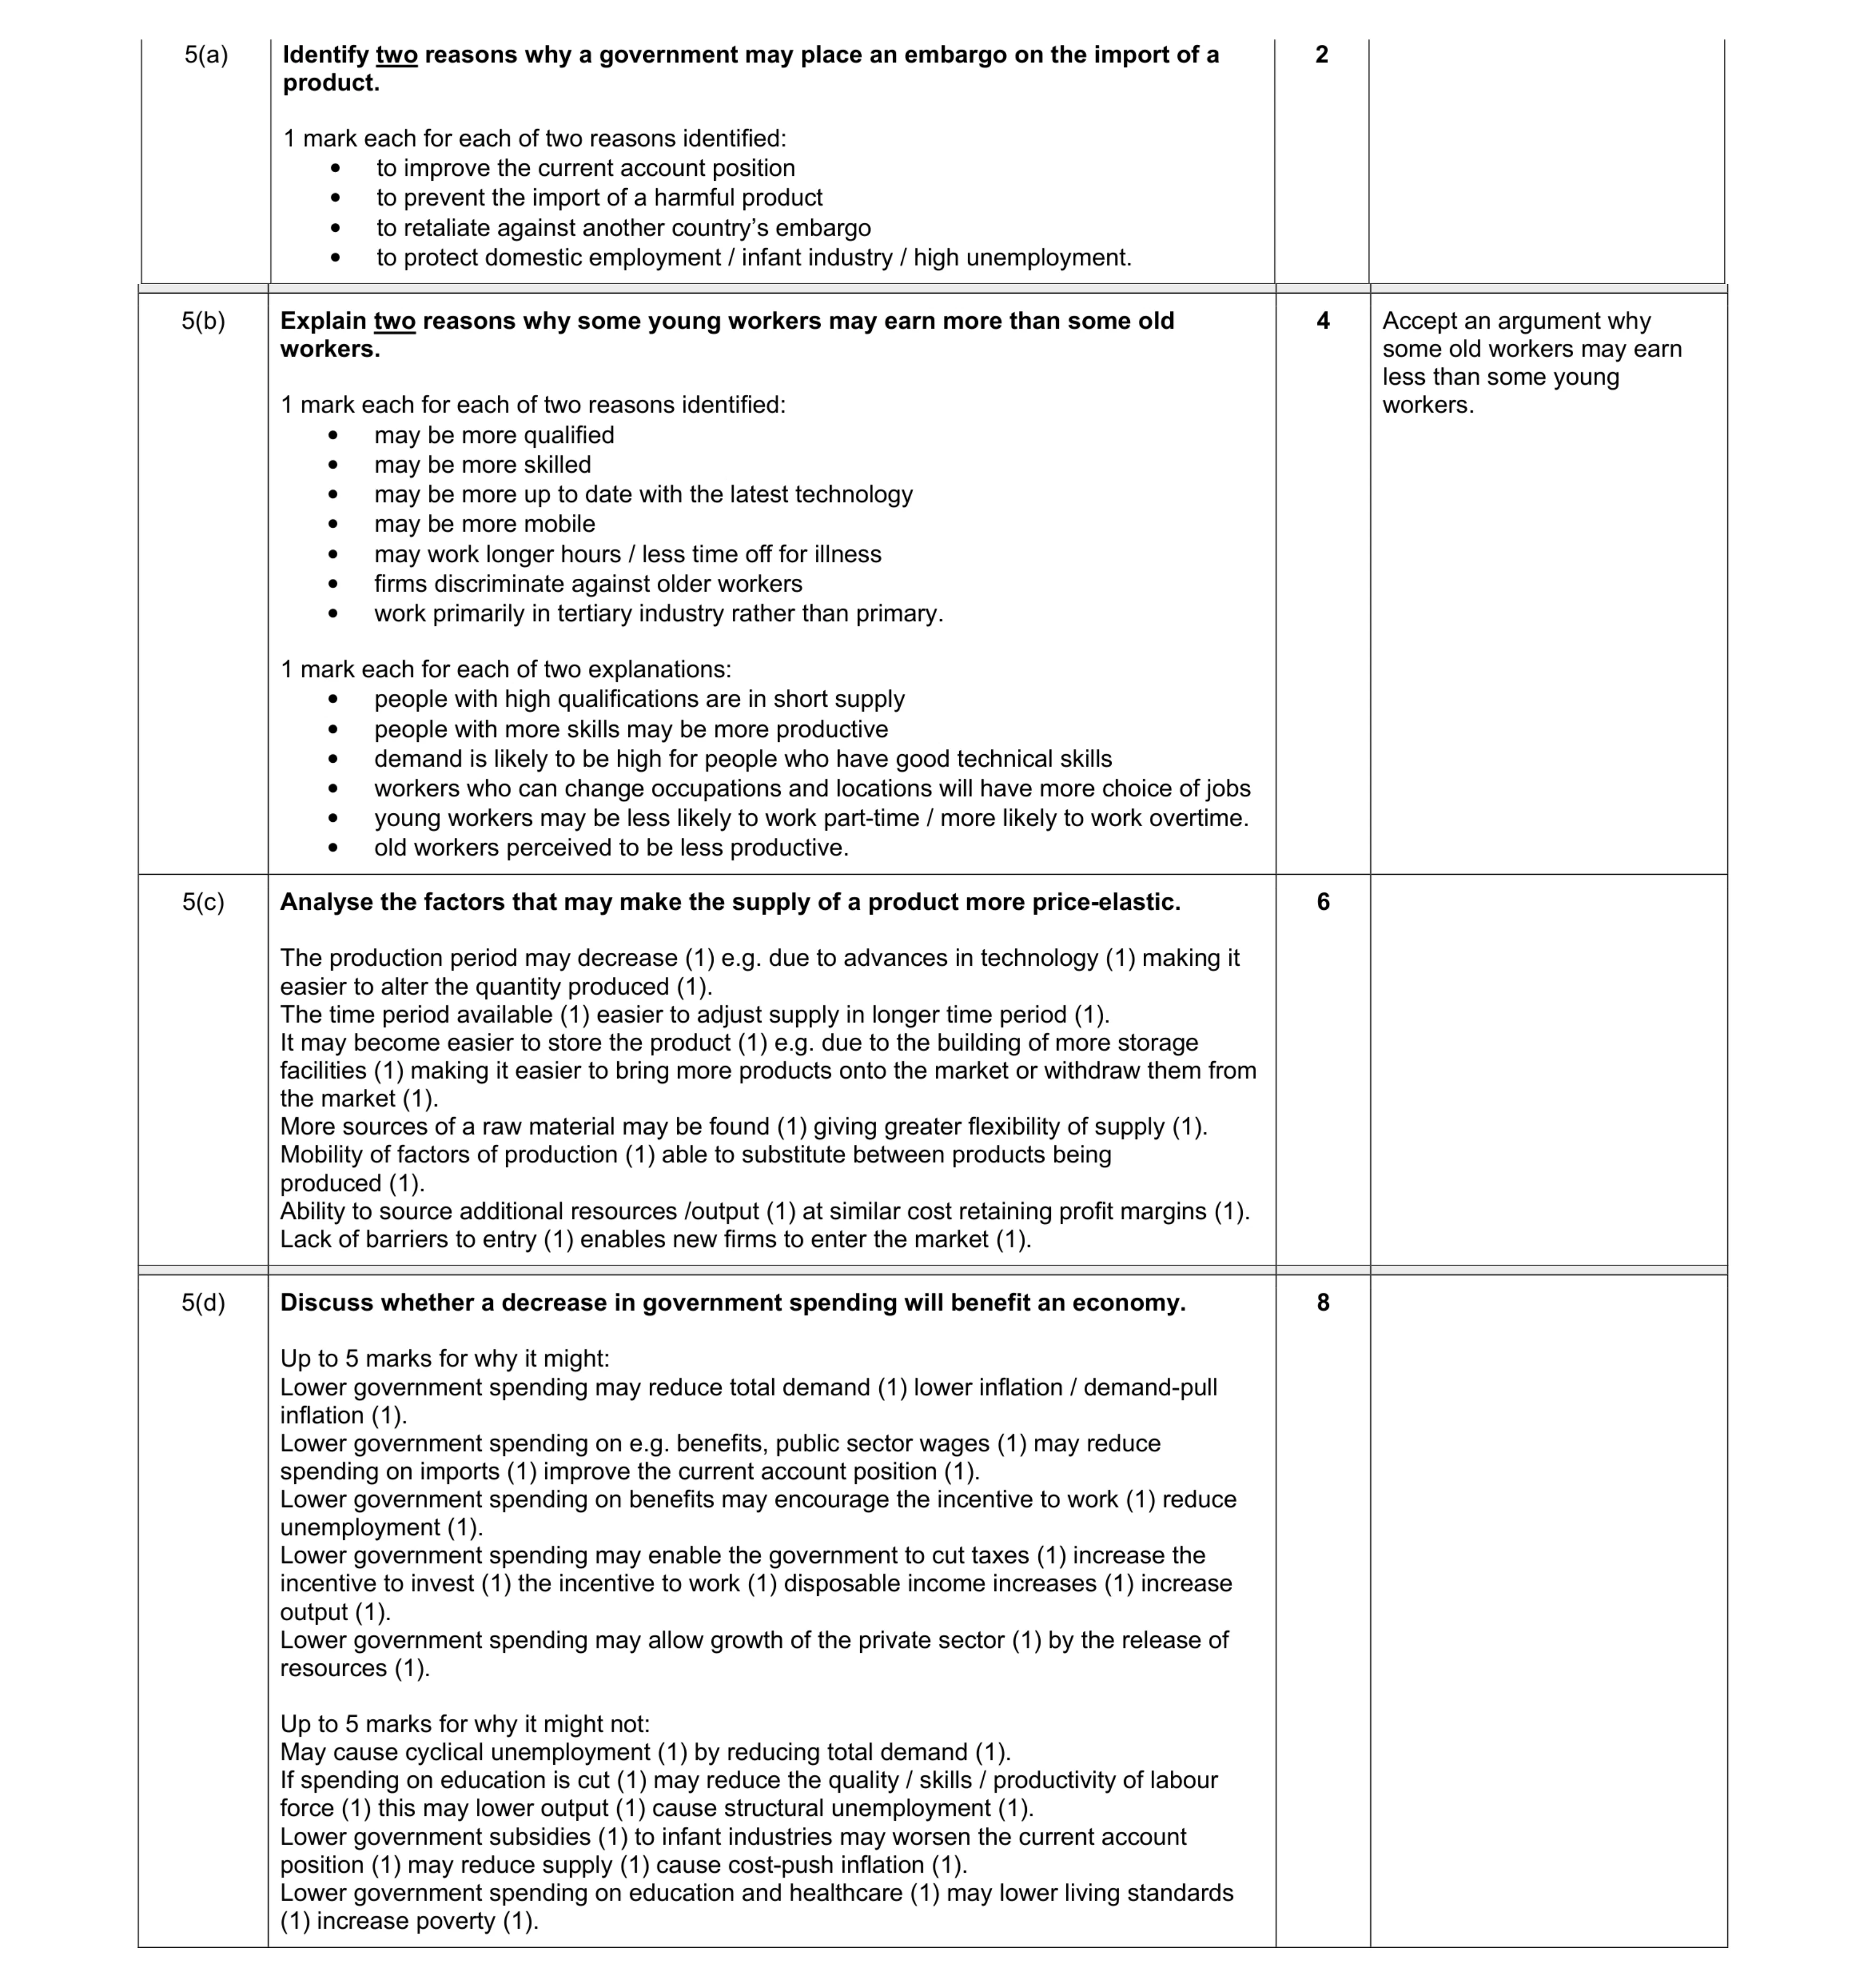 20
20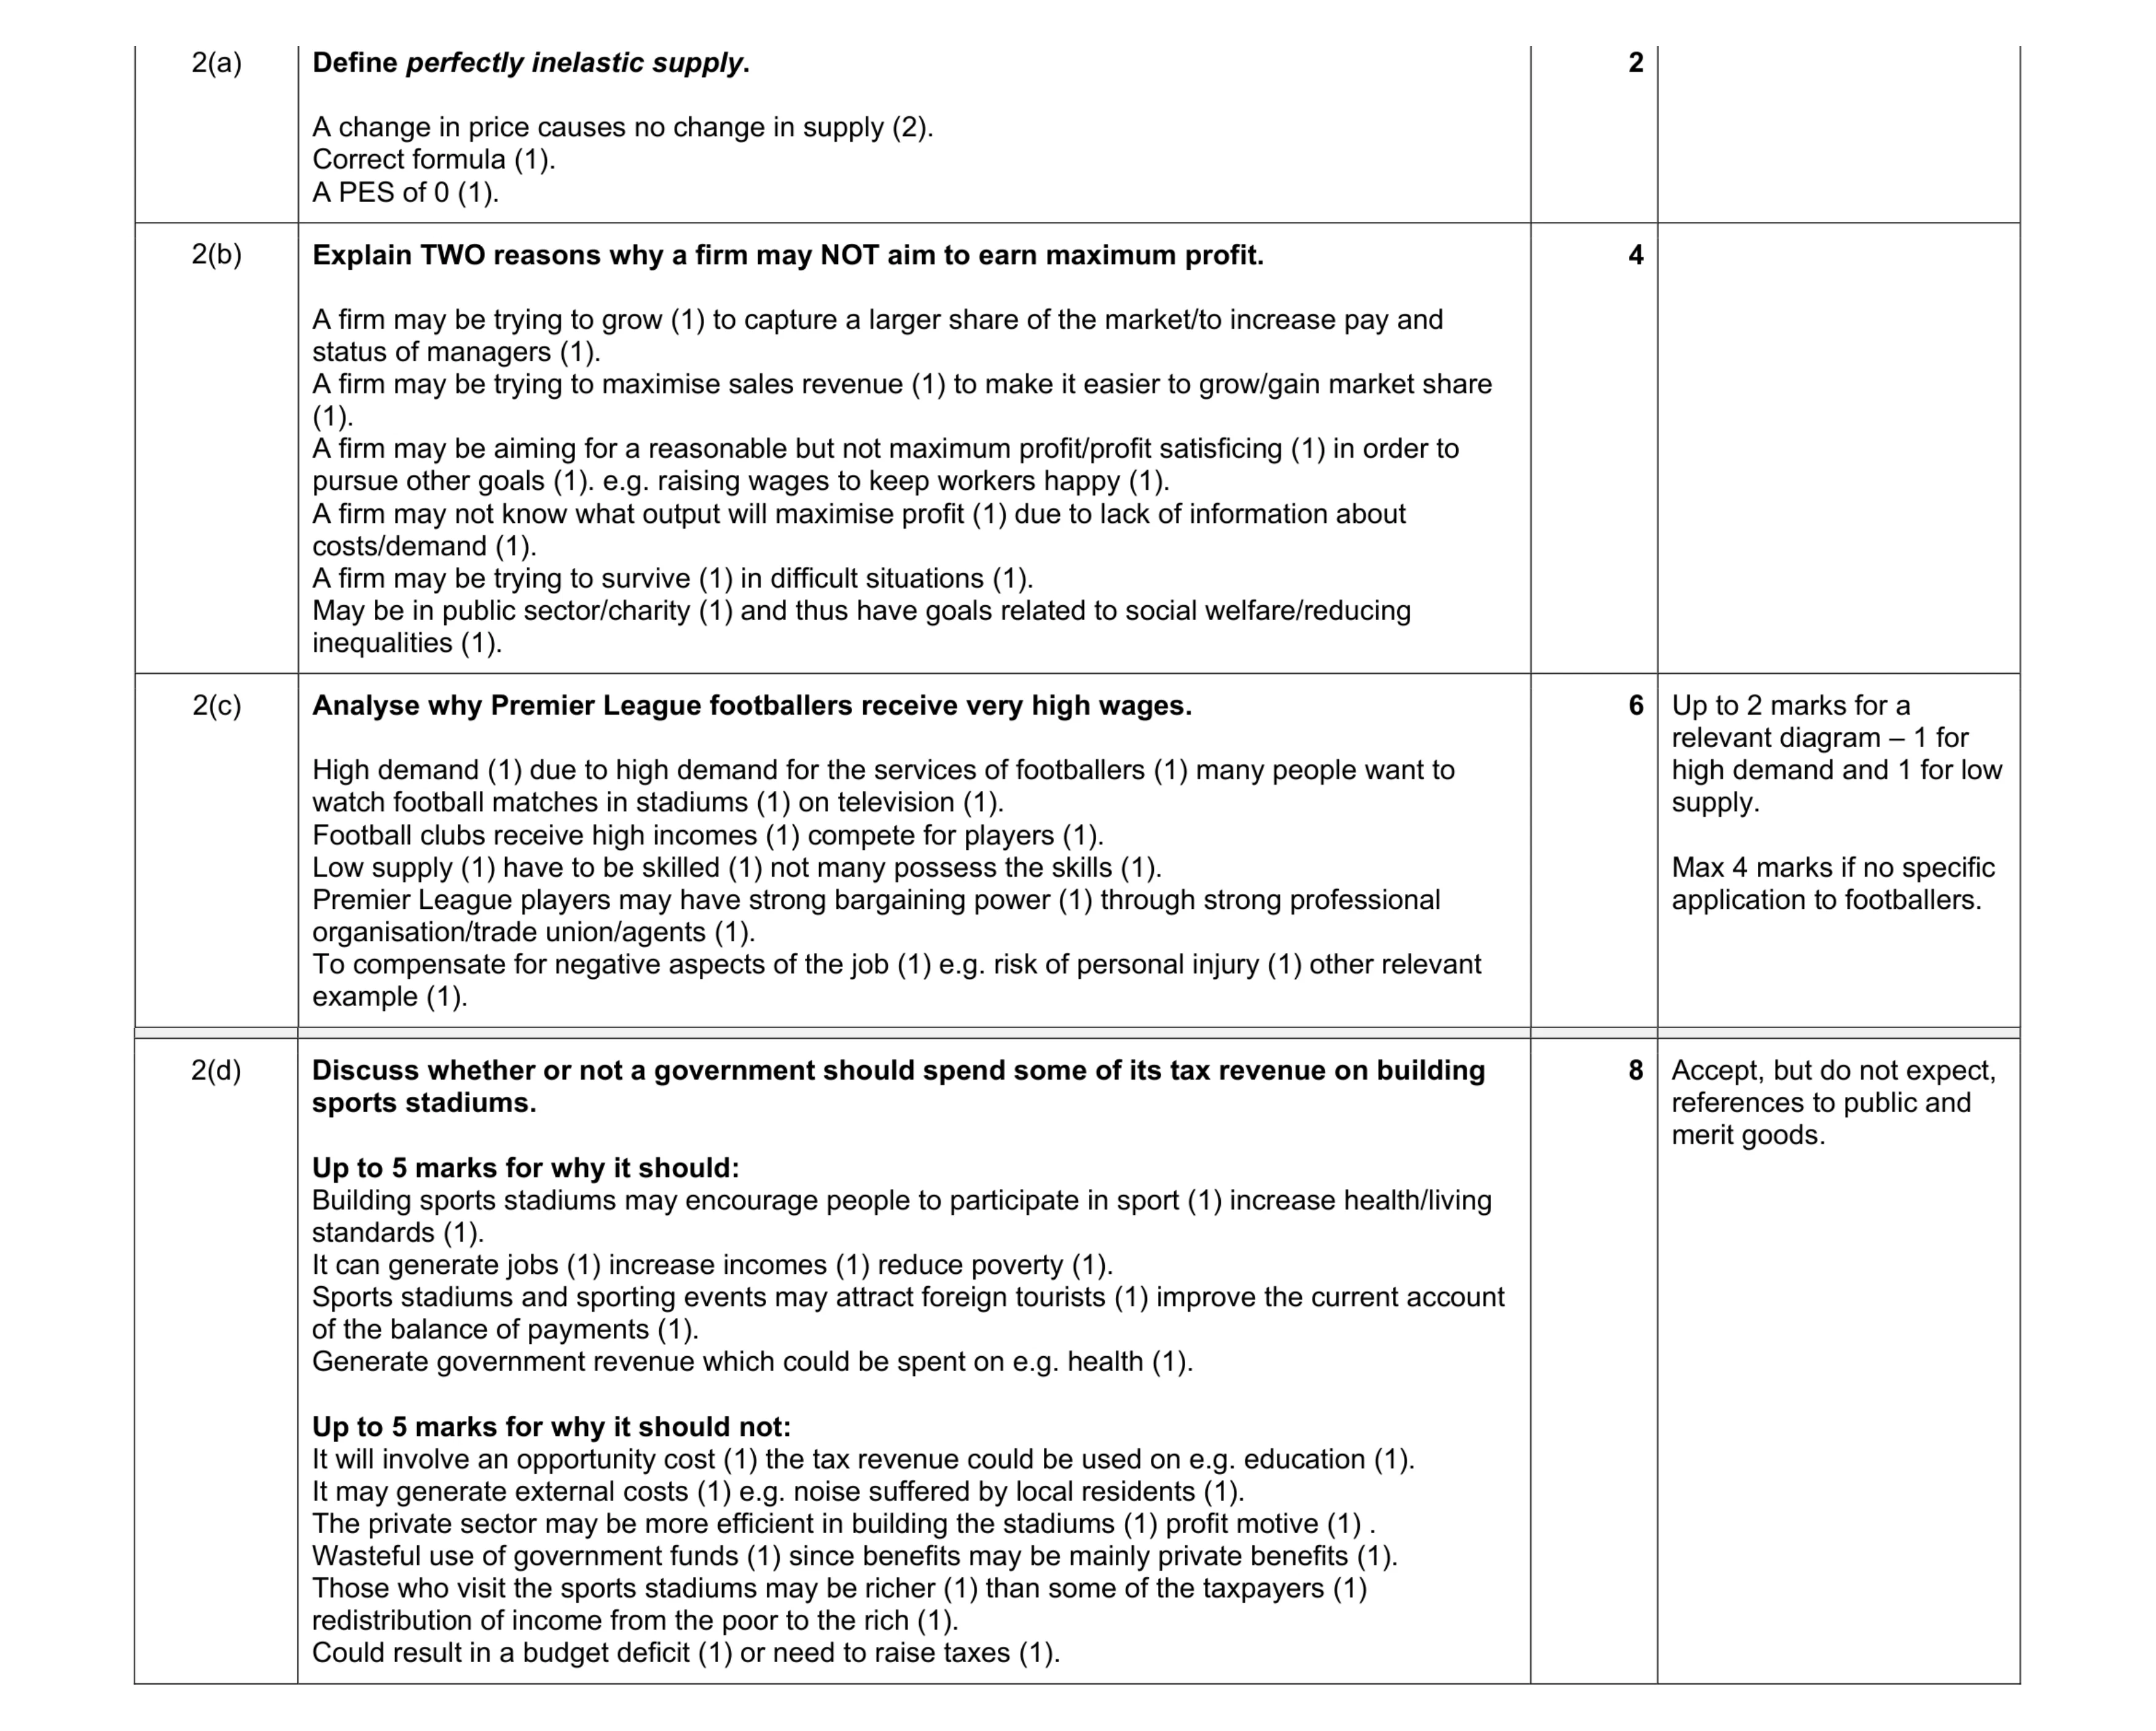 20
20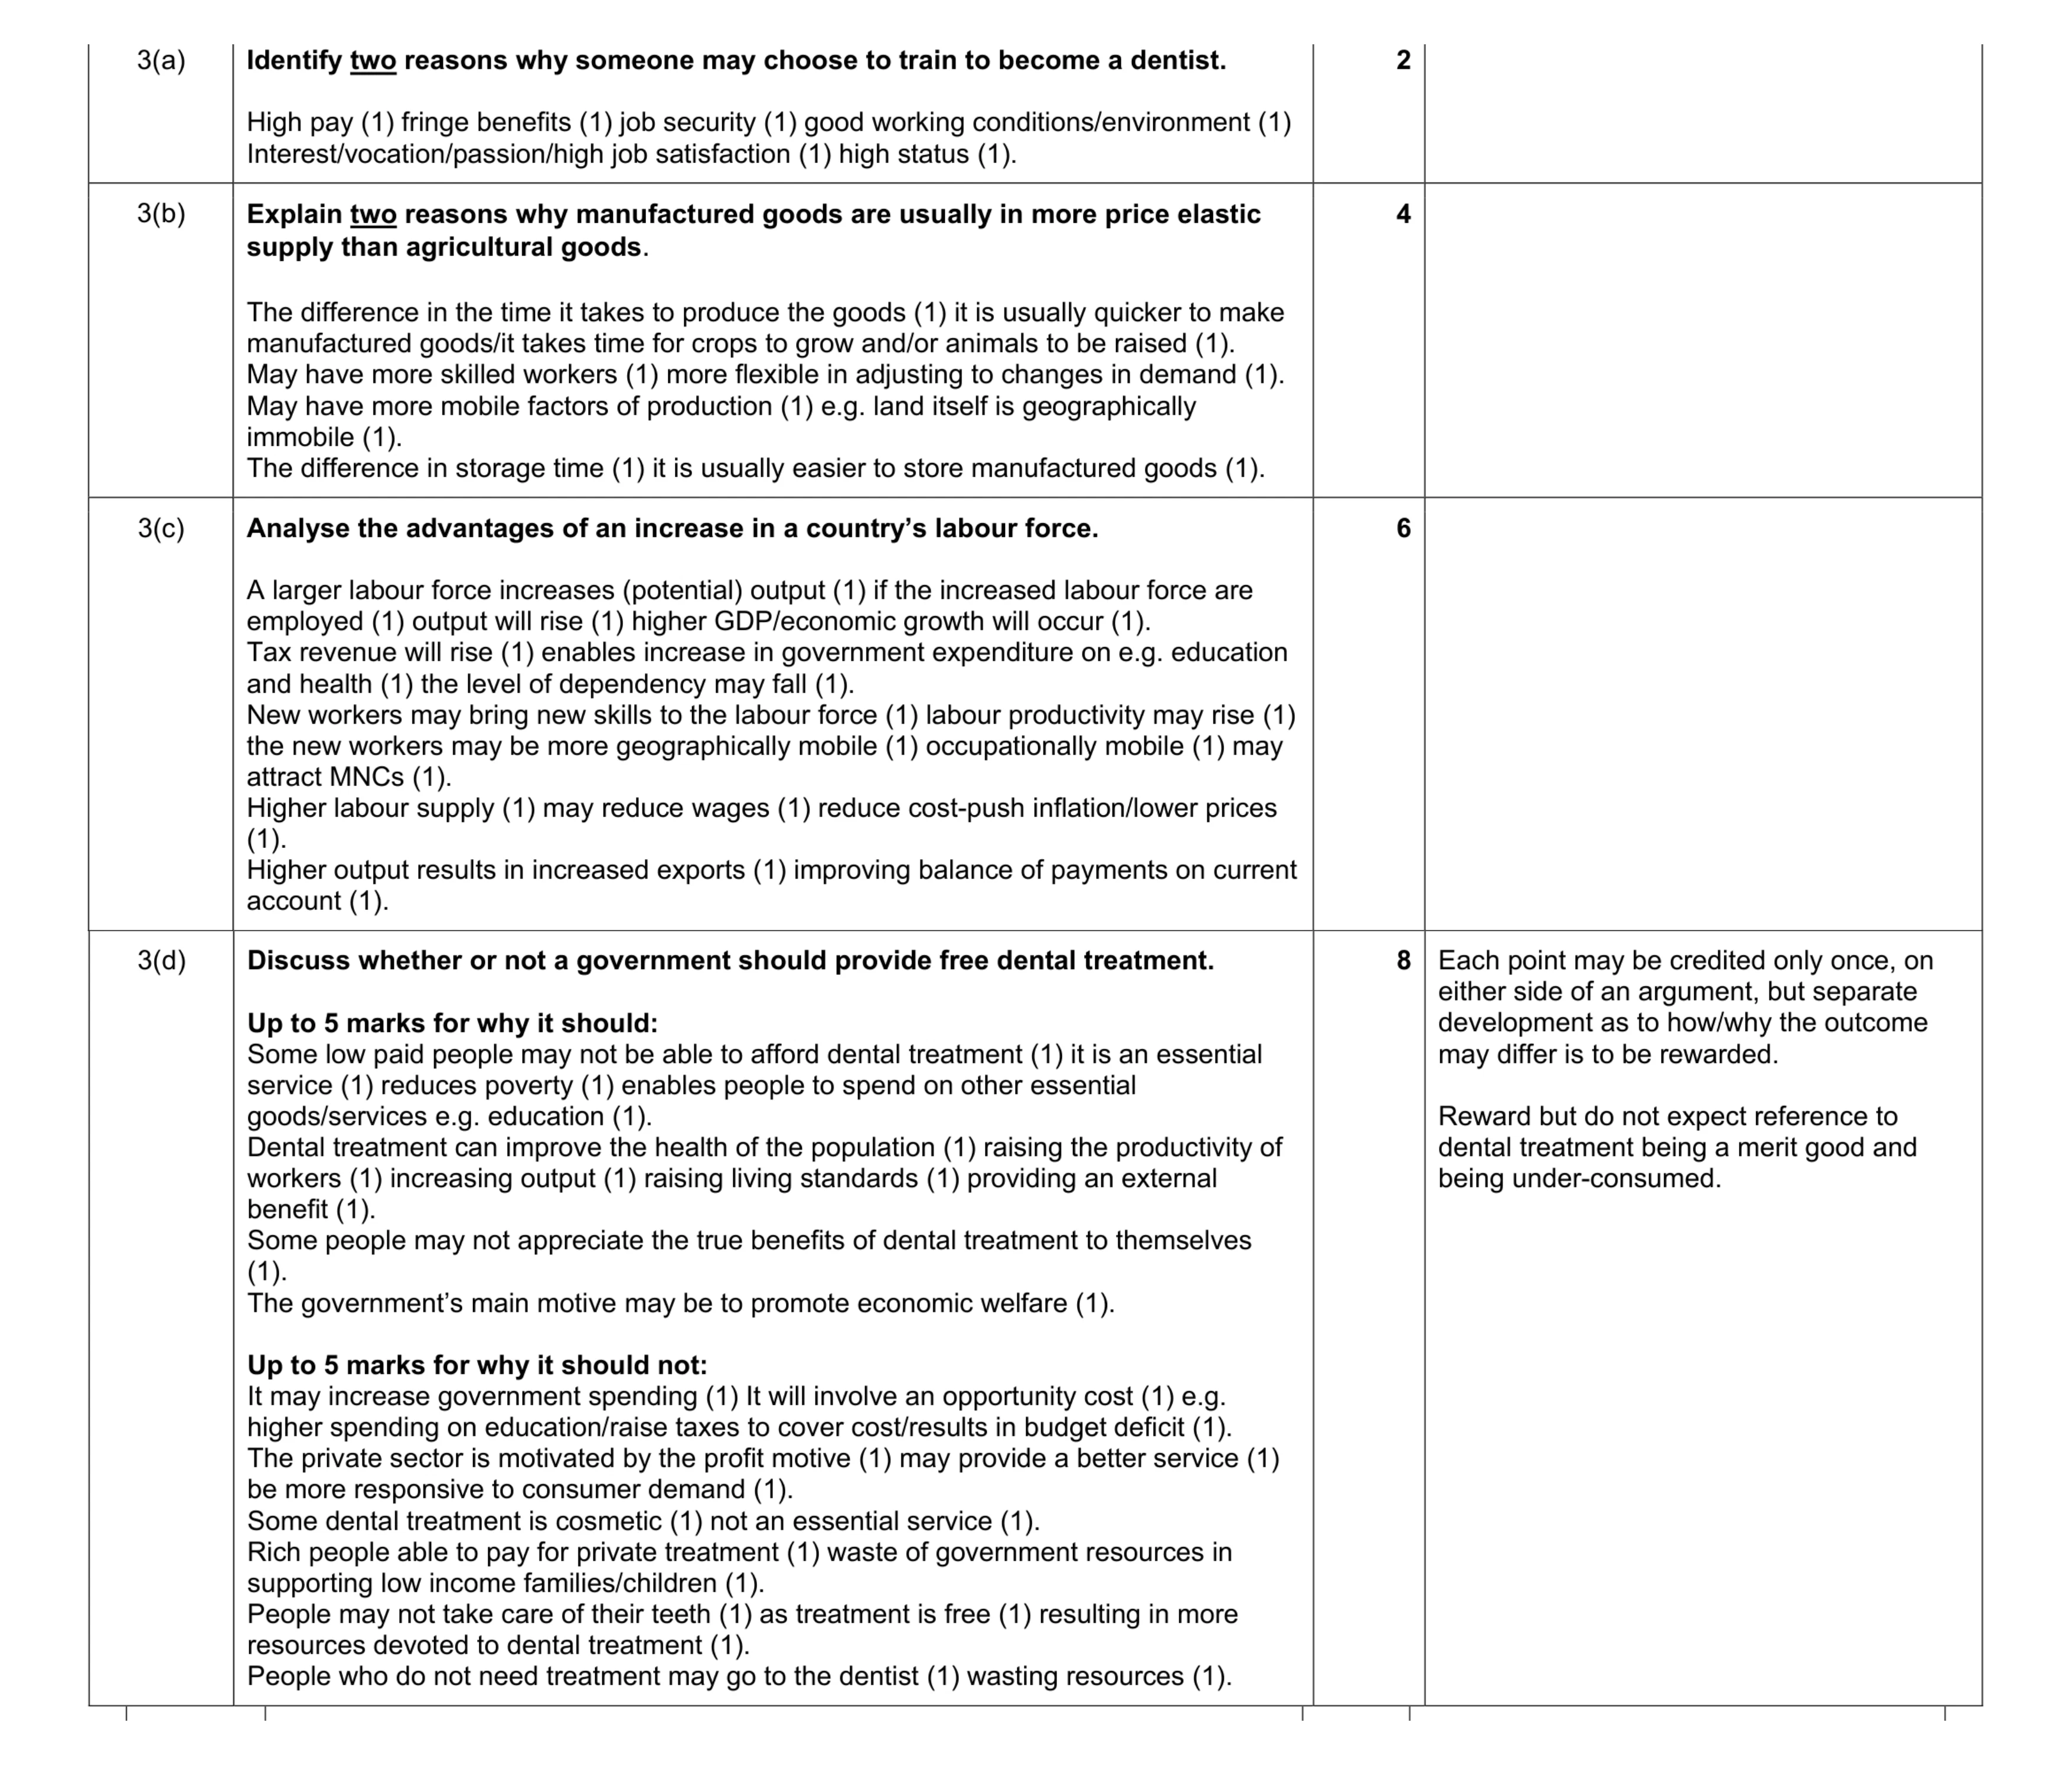 20
20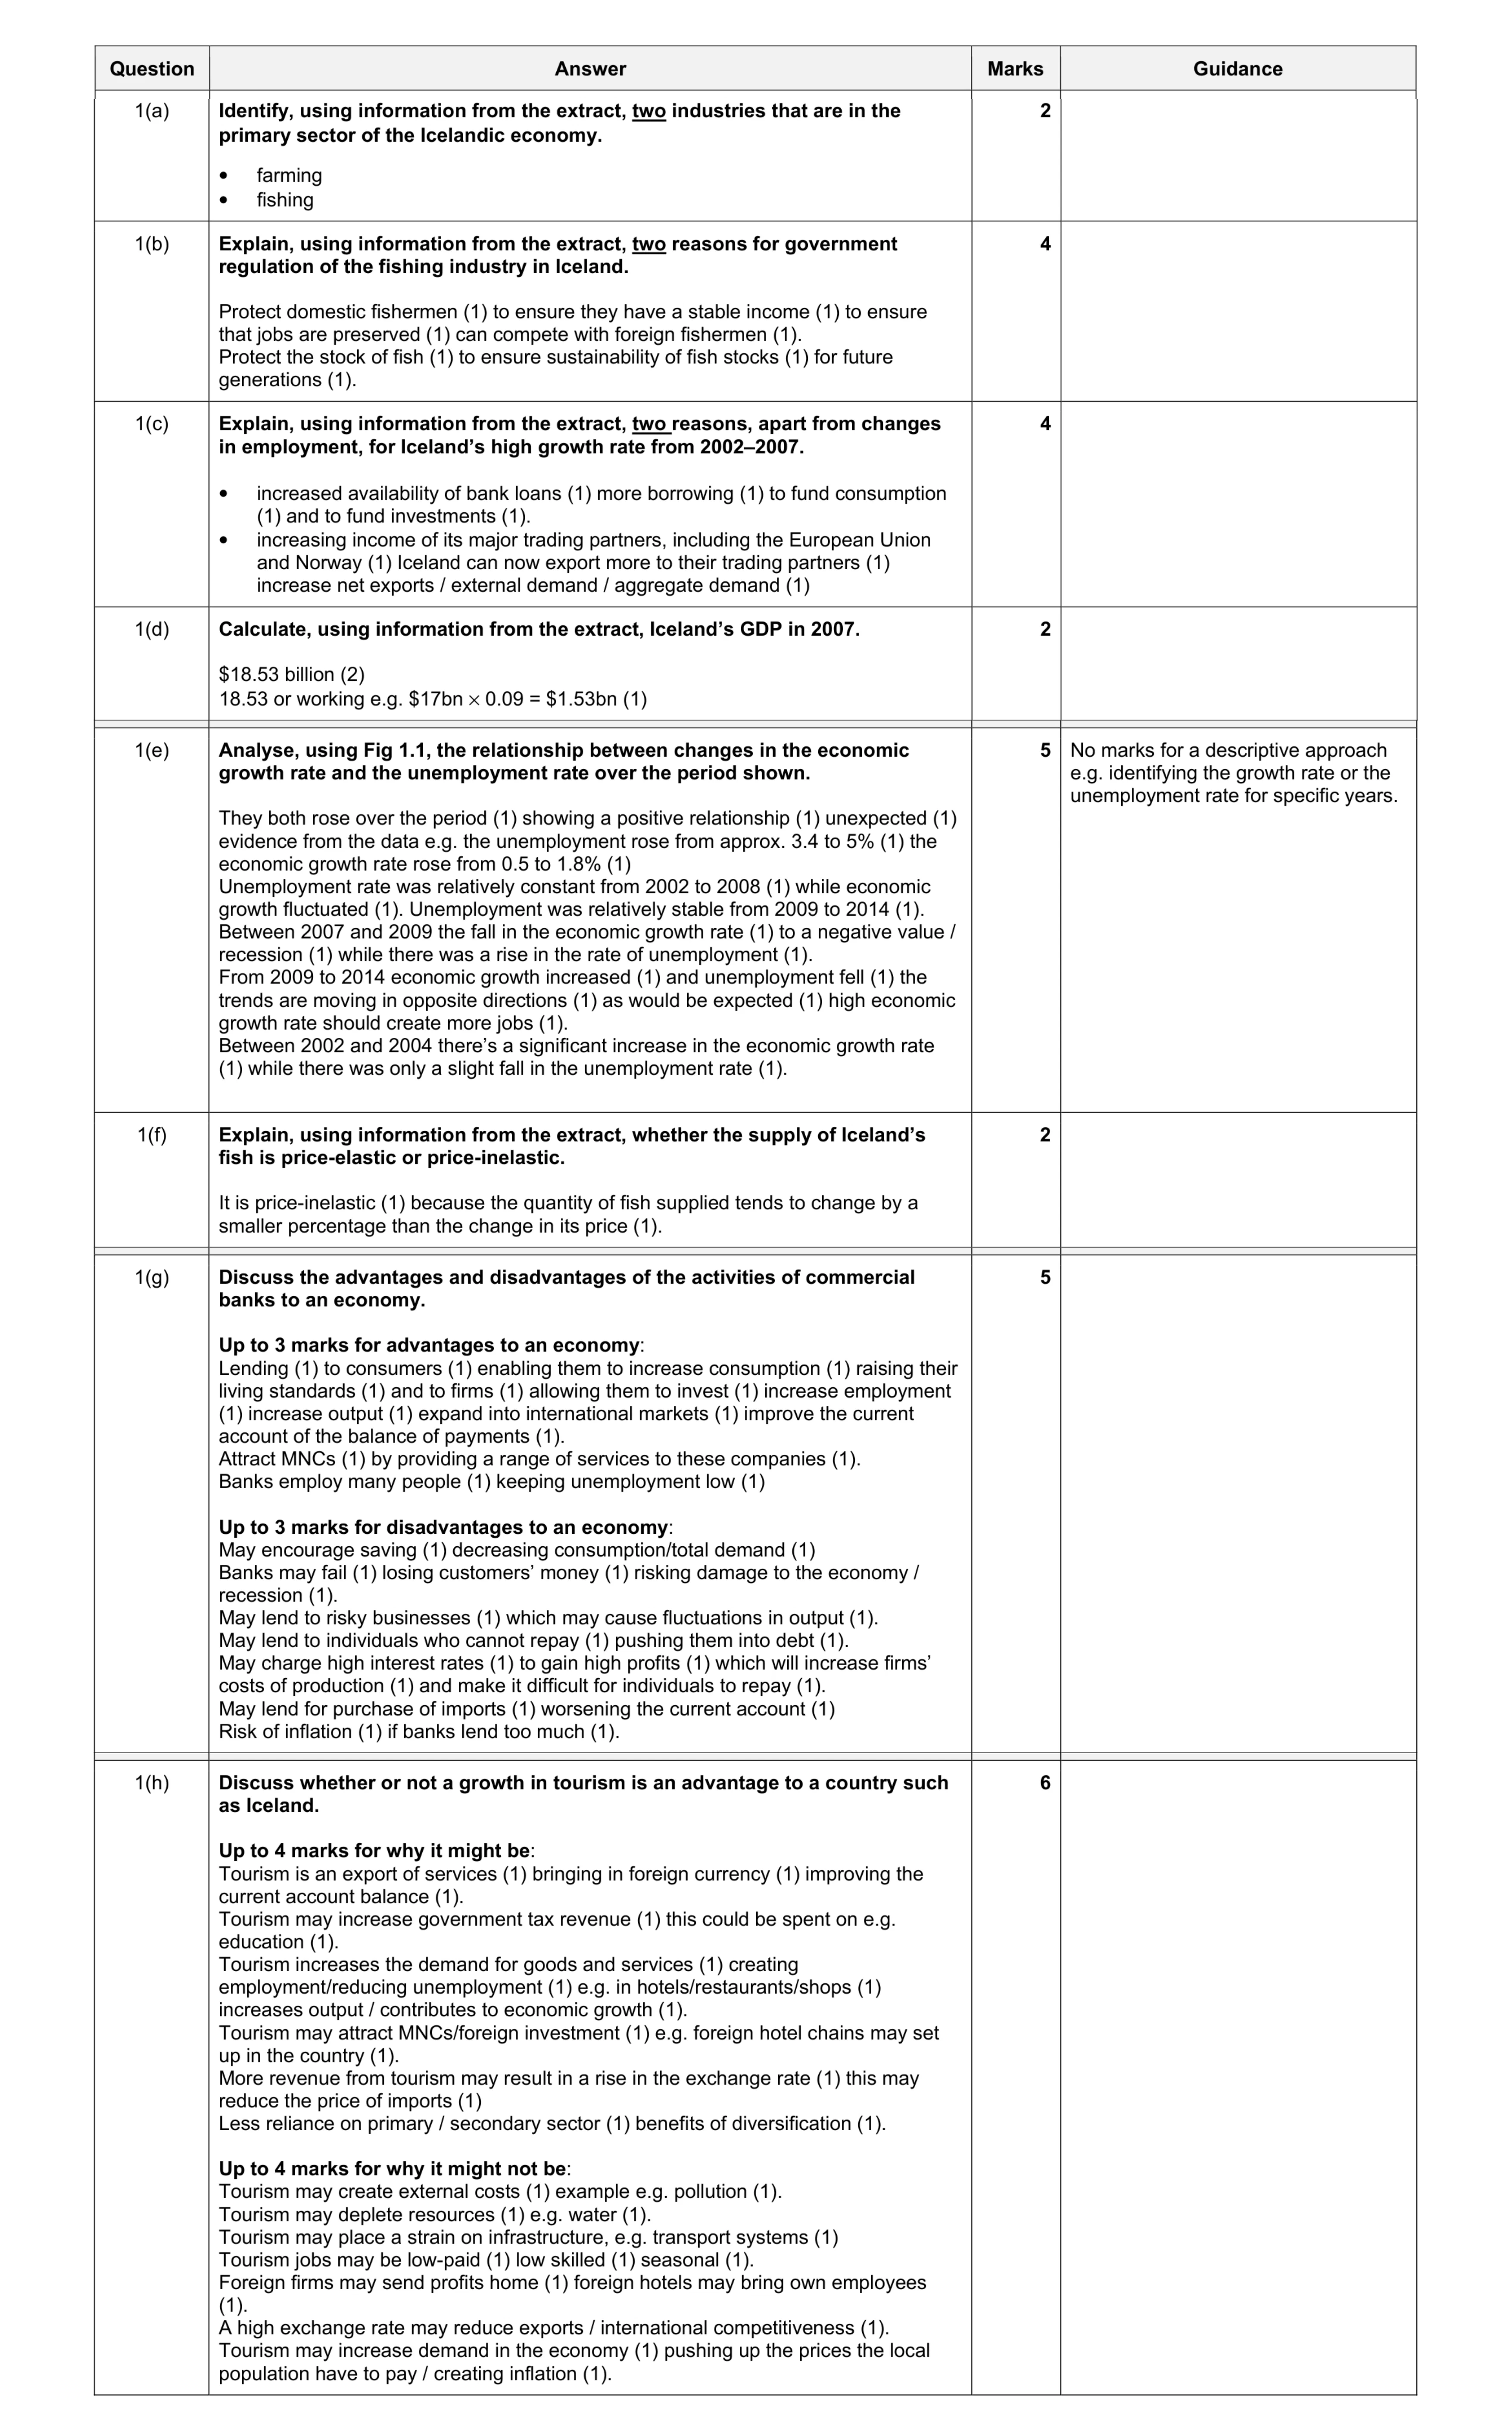 30
30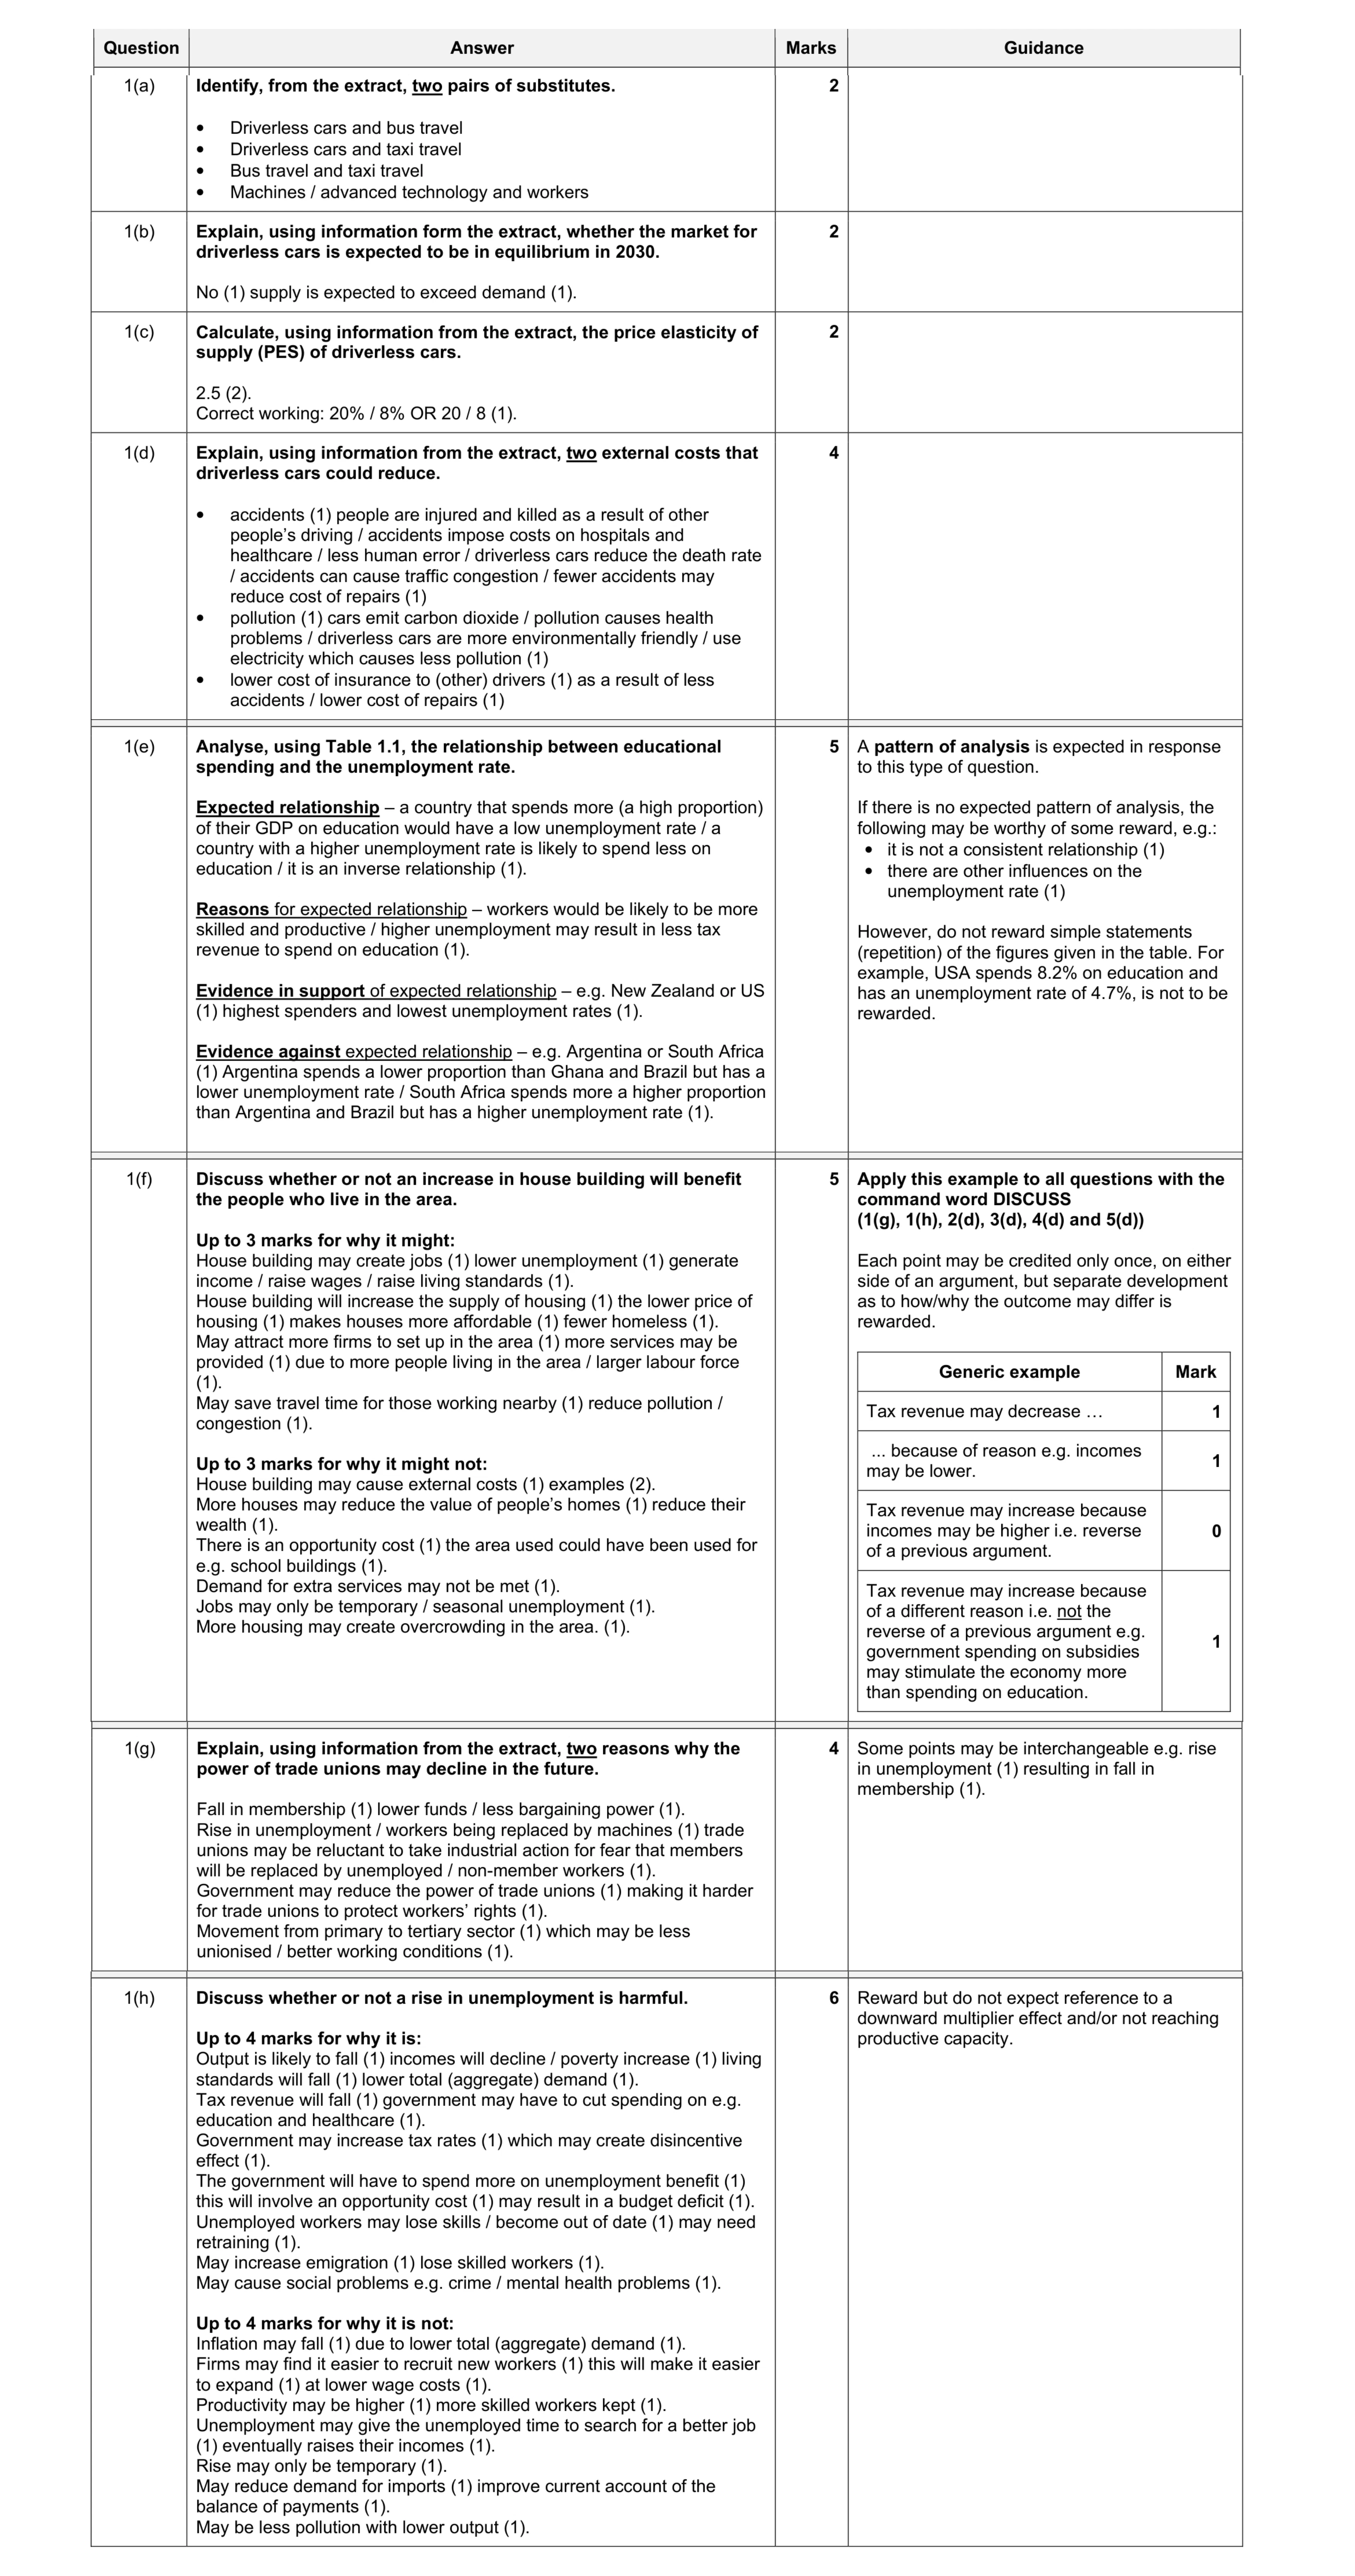 30
30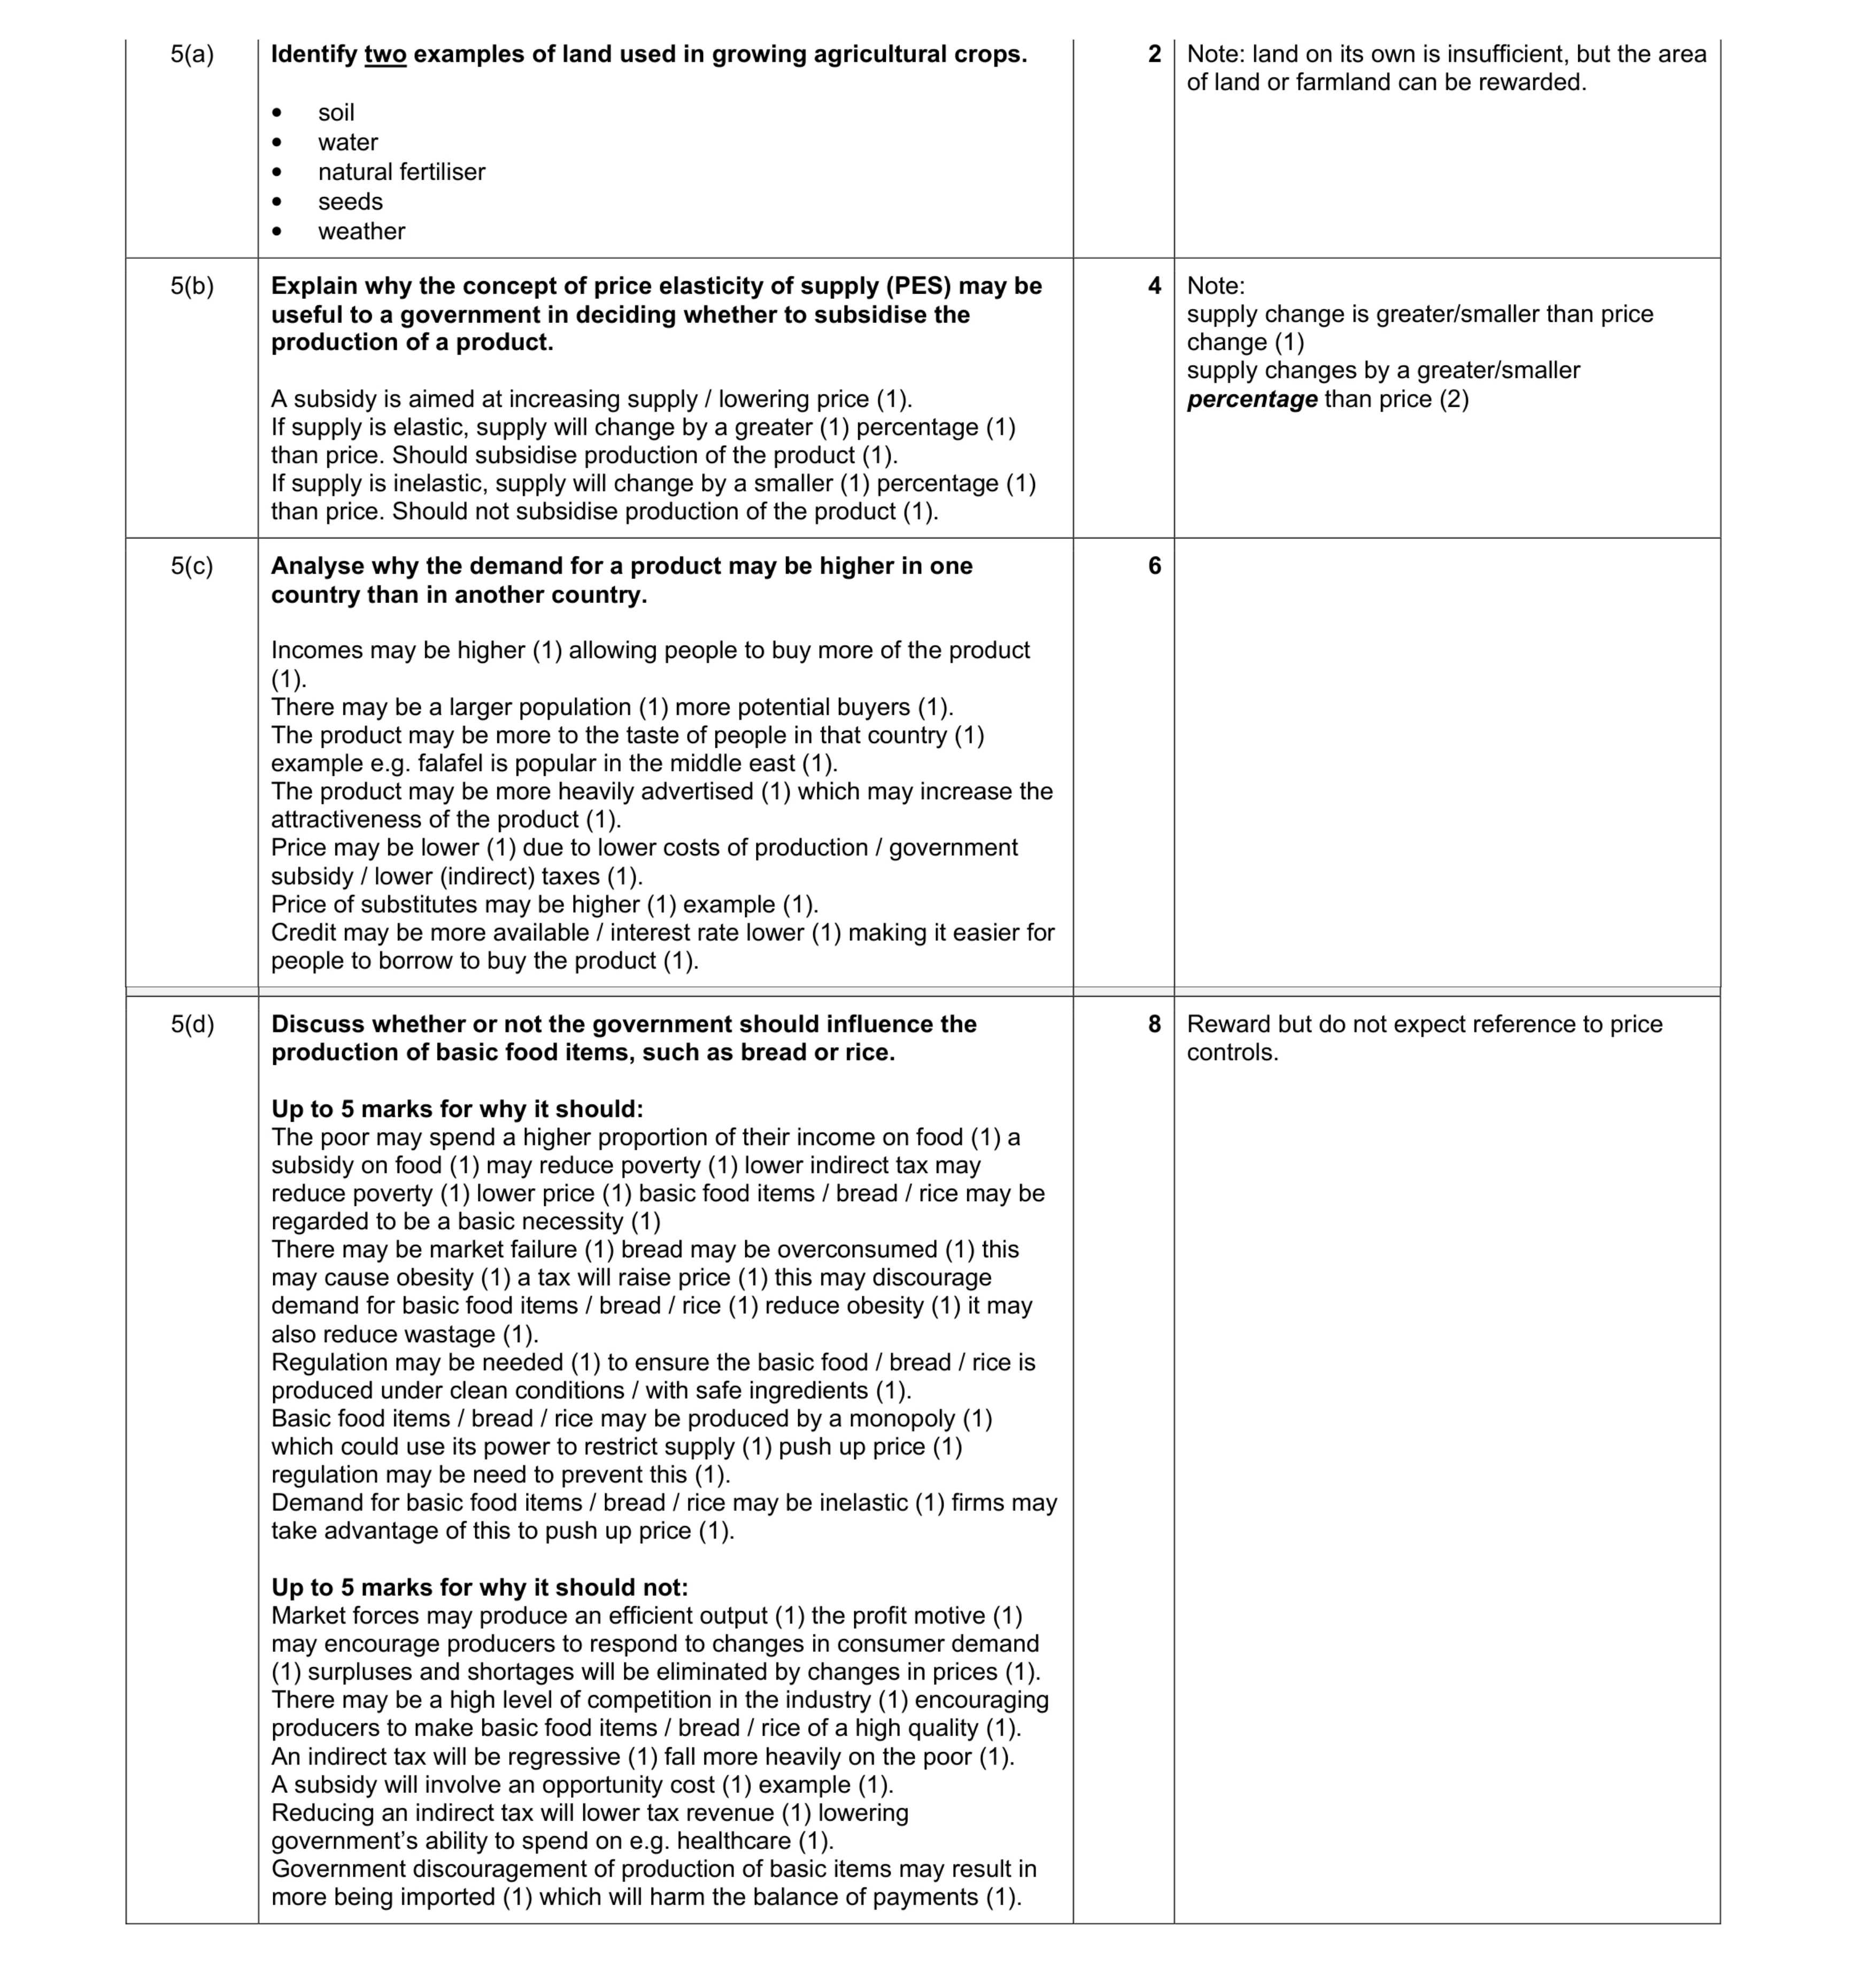 20
20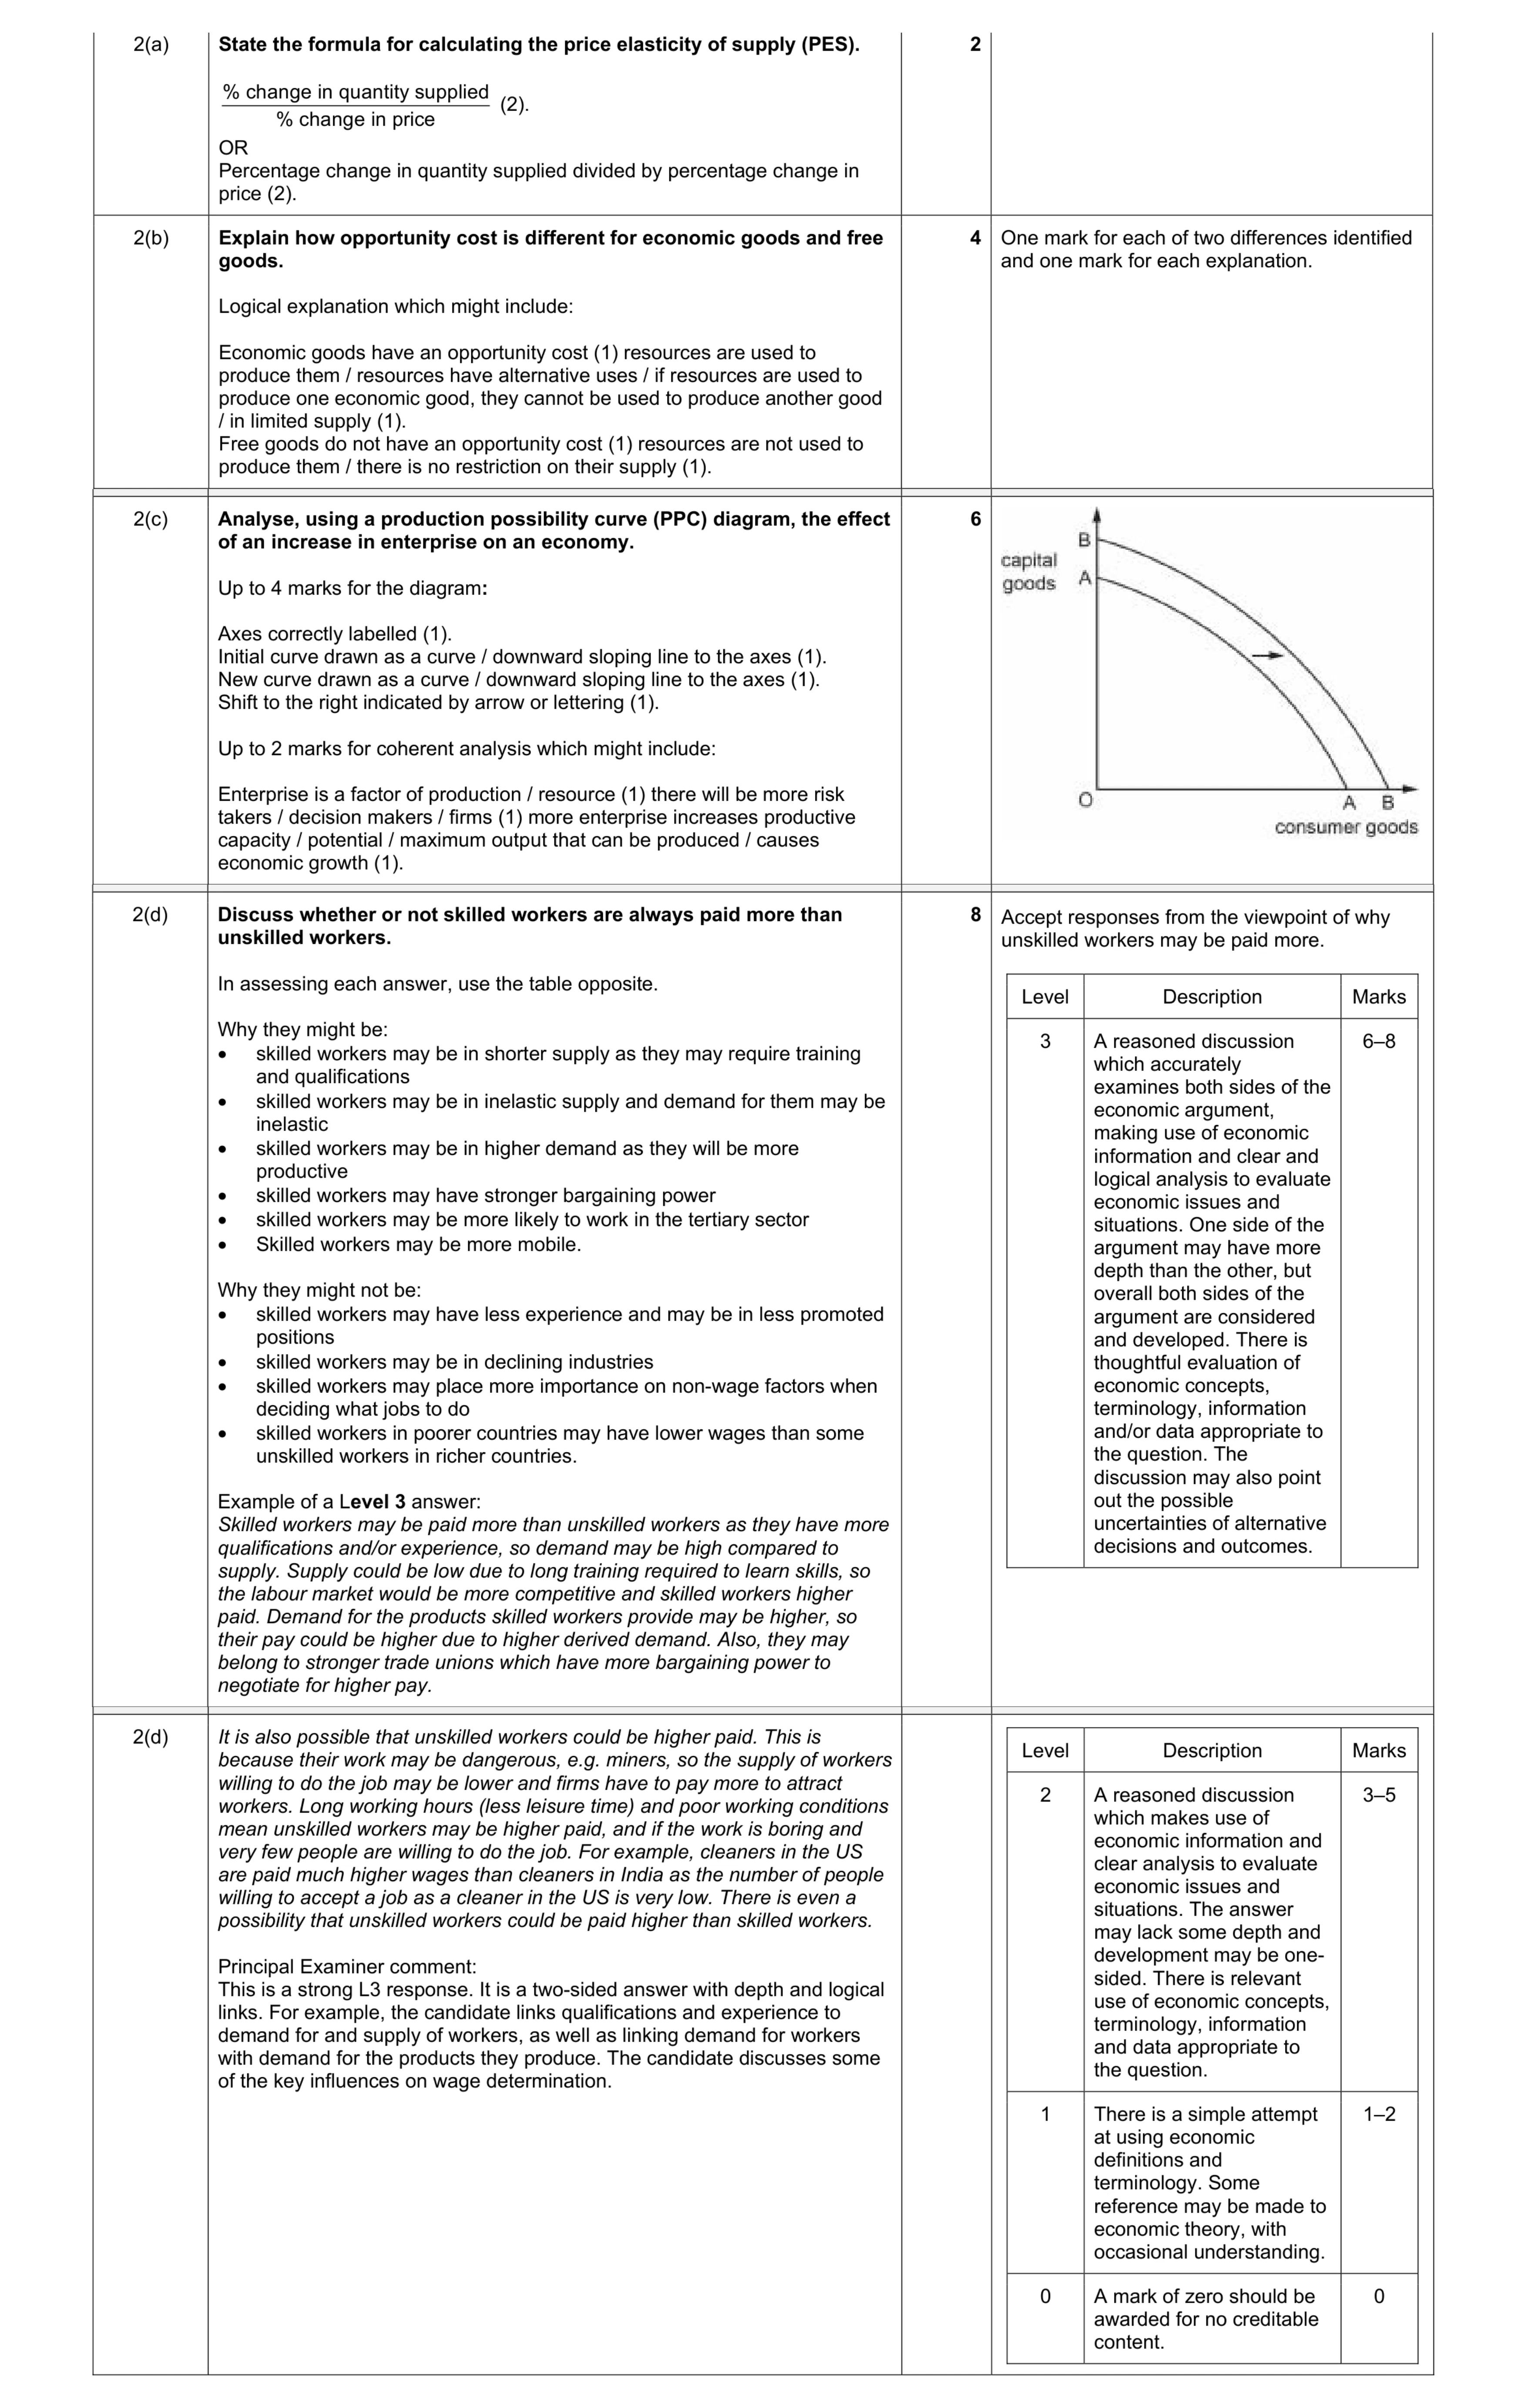 20
20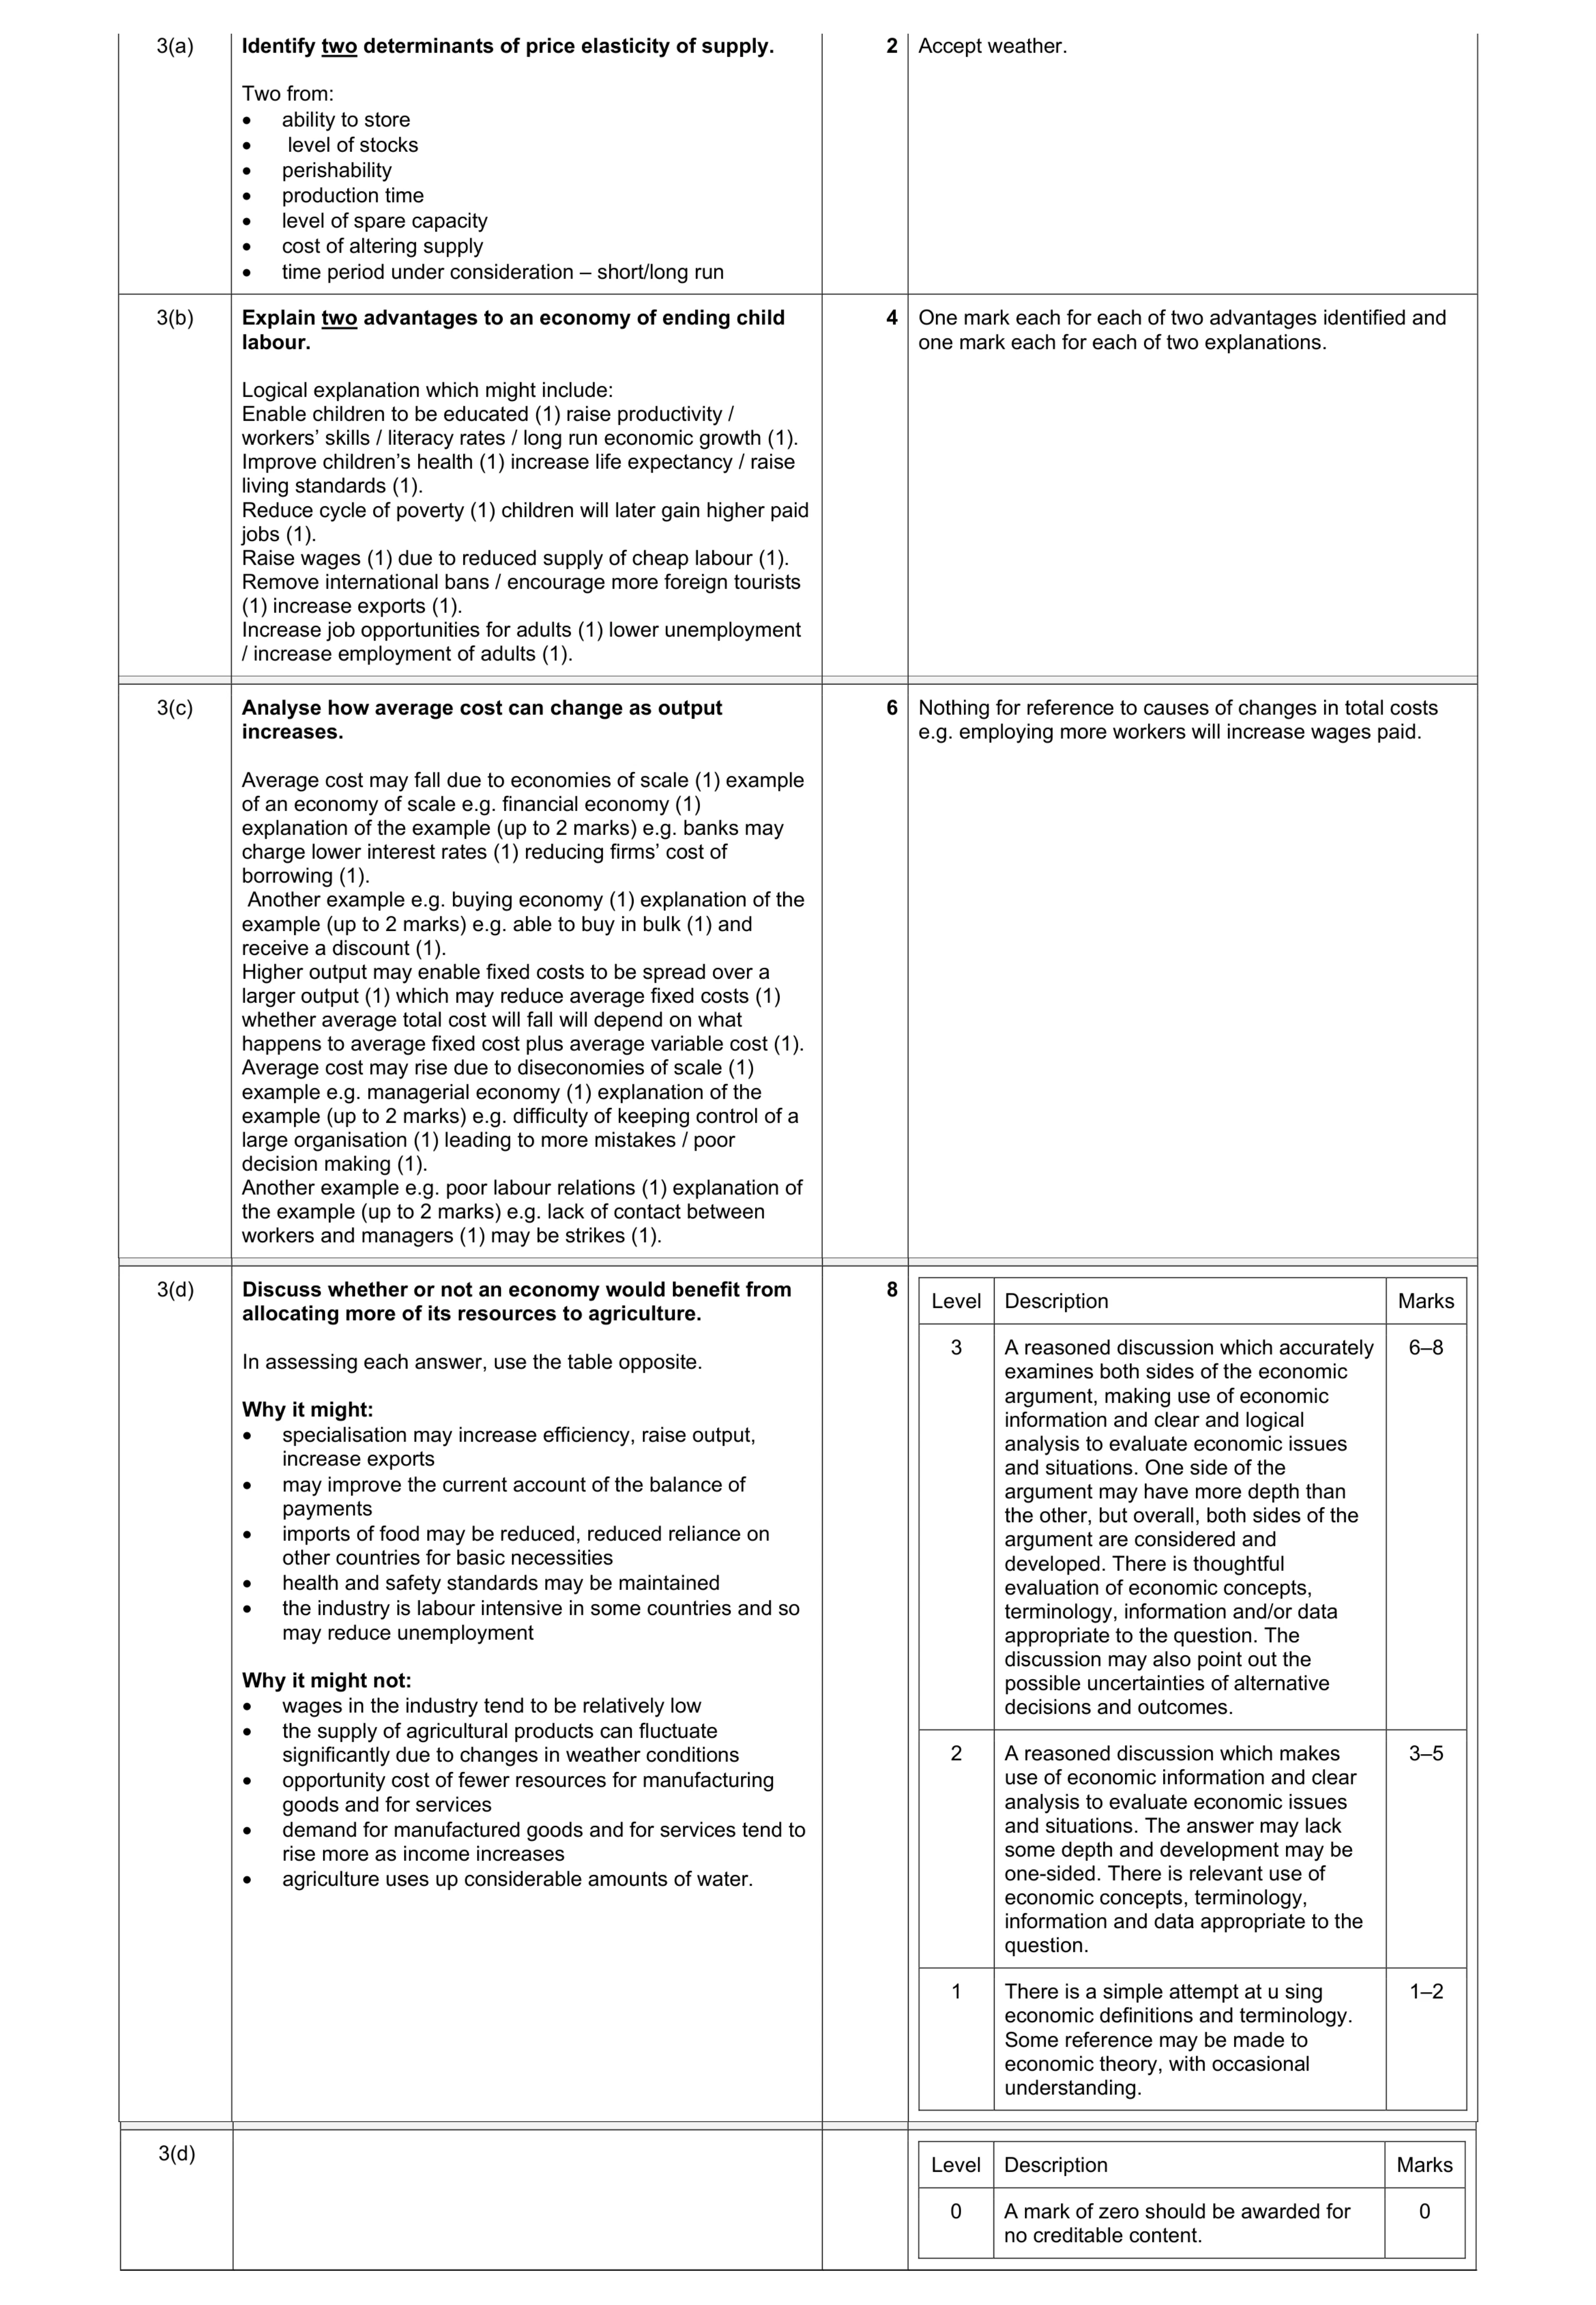 20
20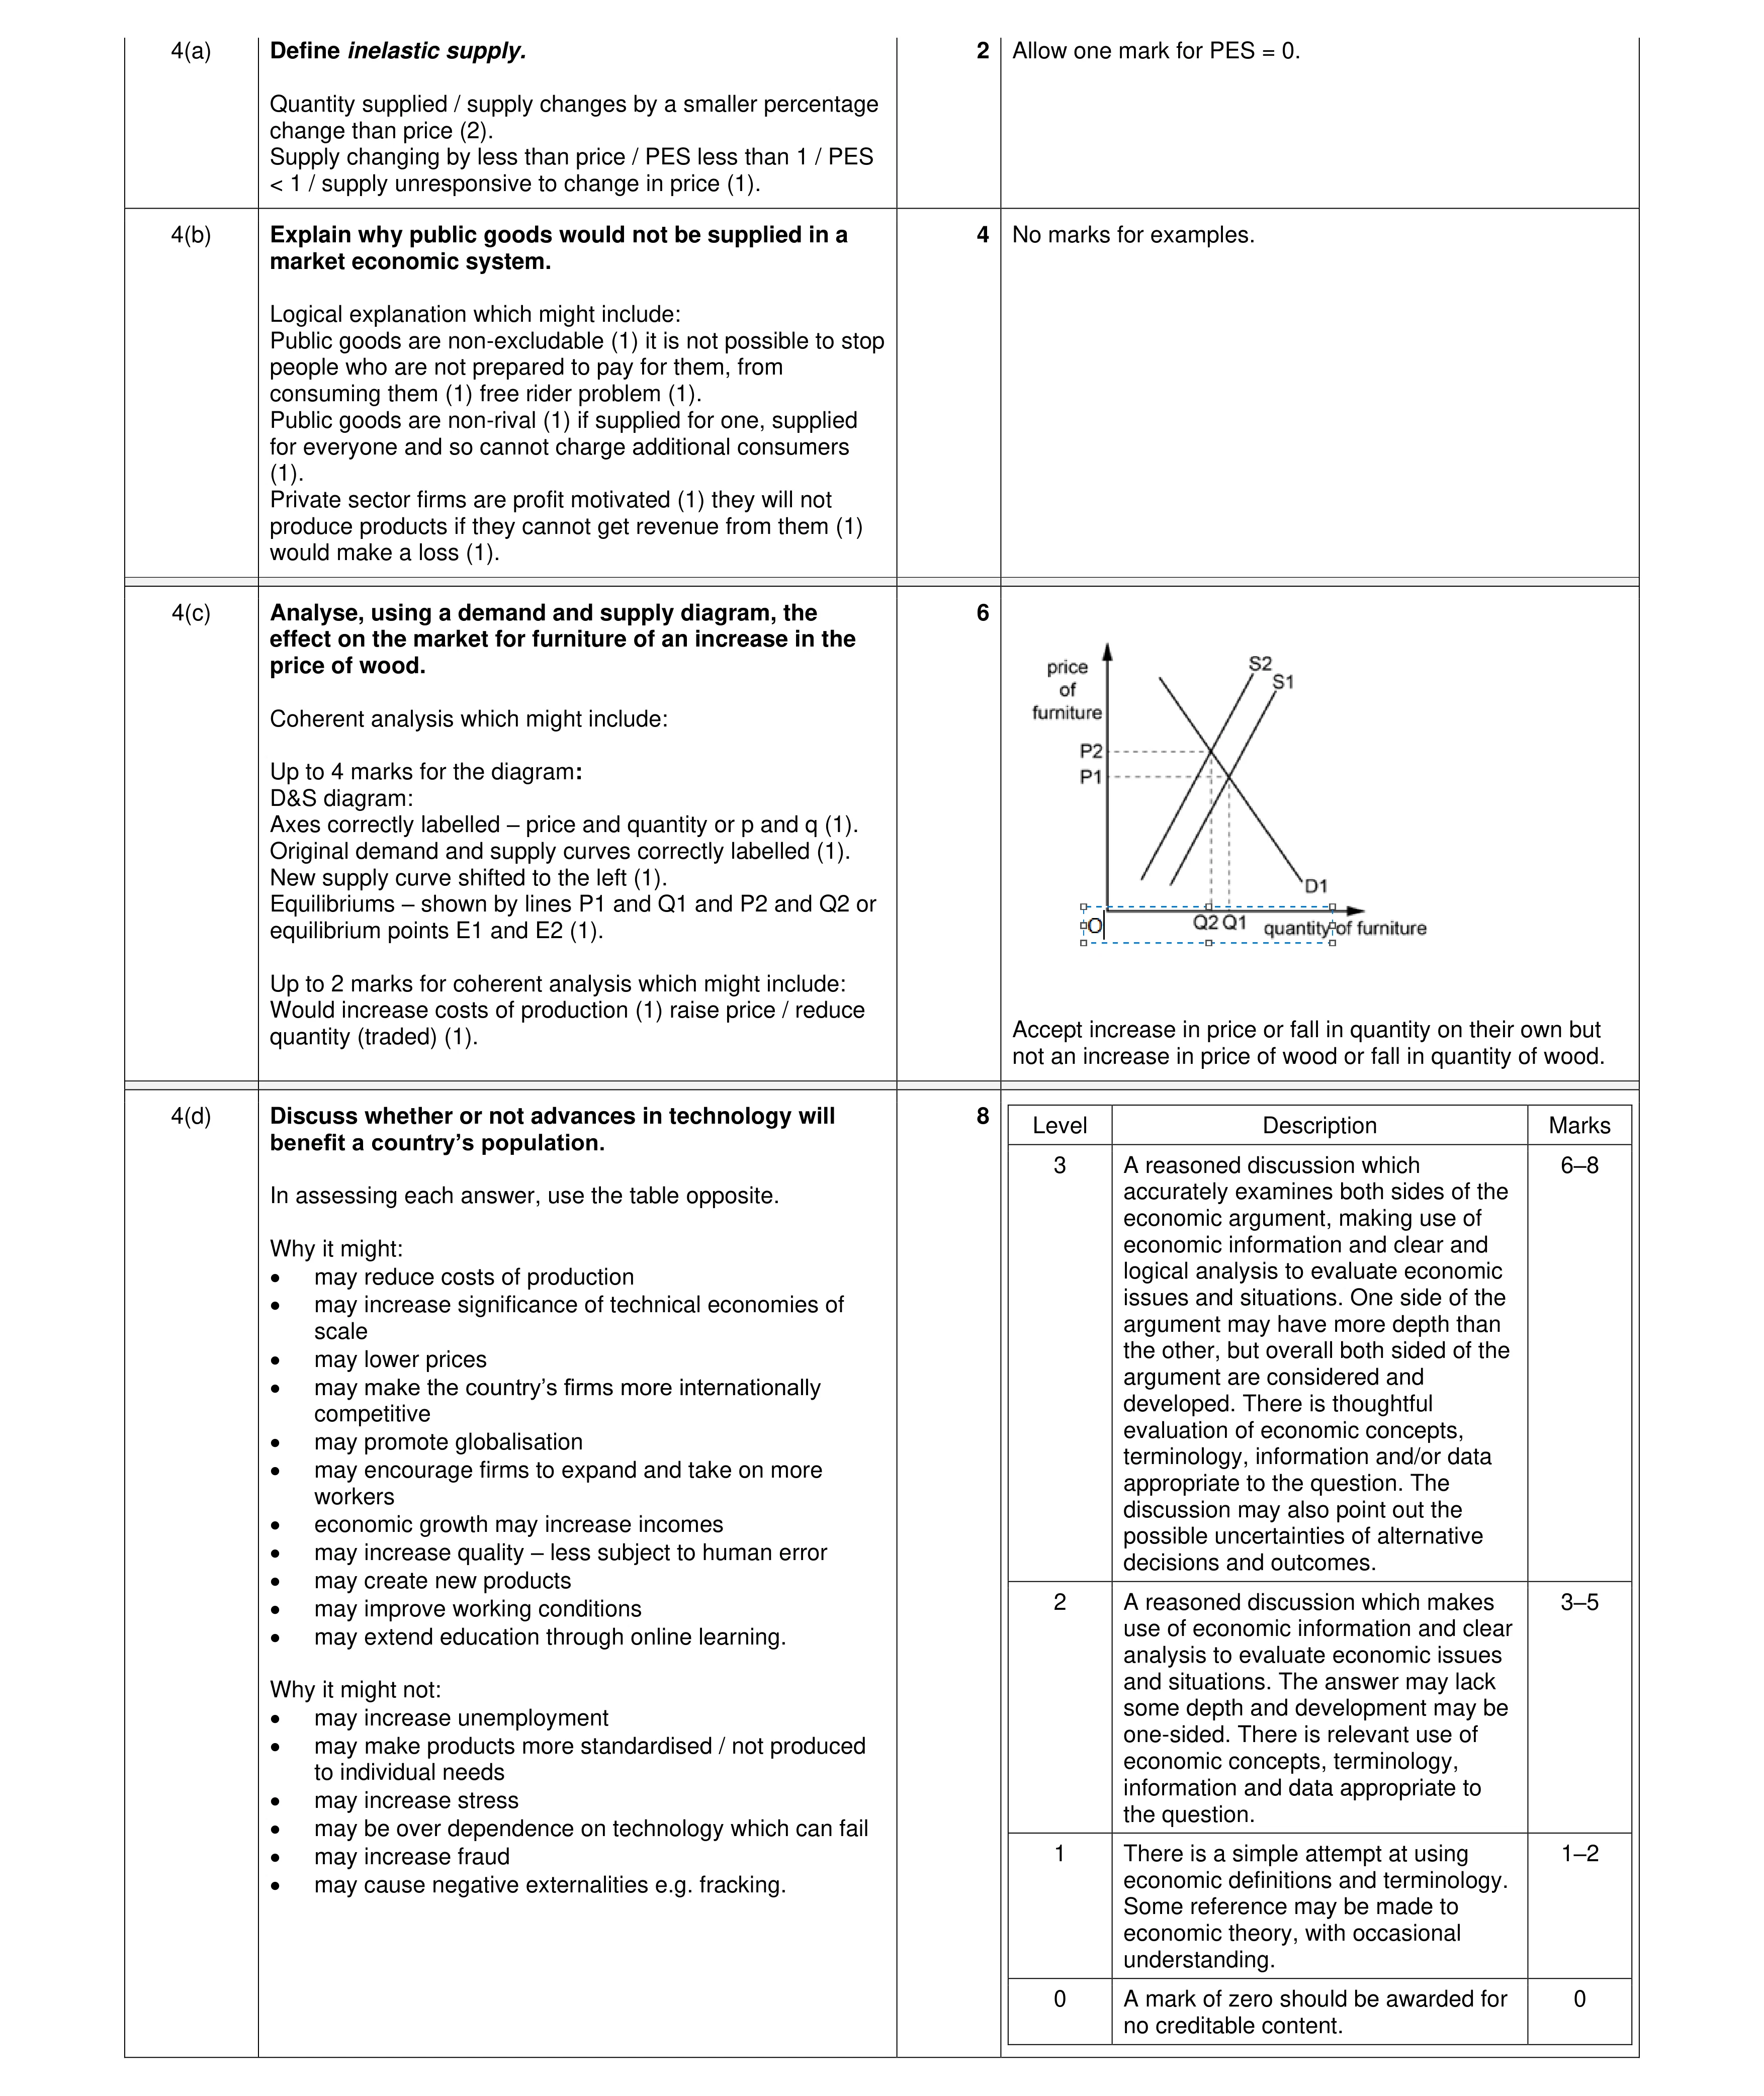 20
20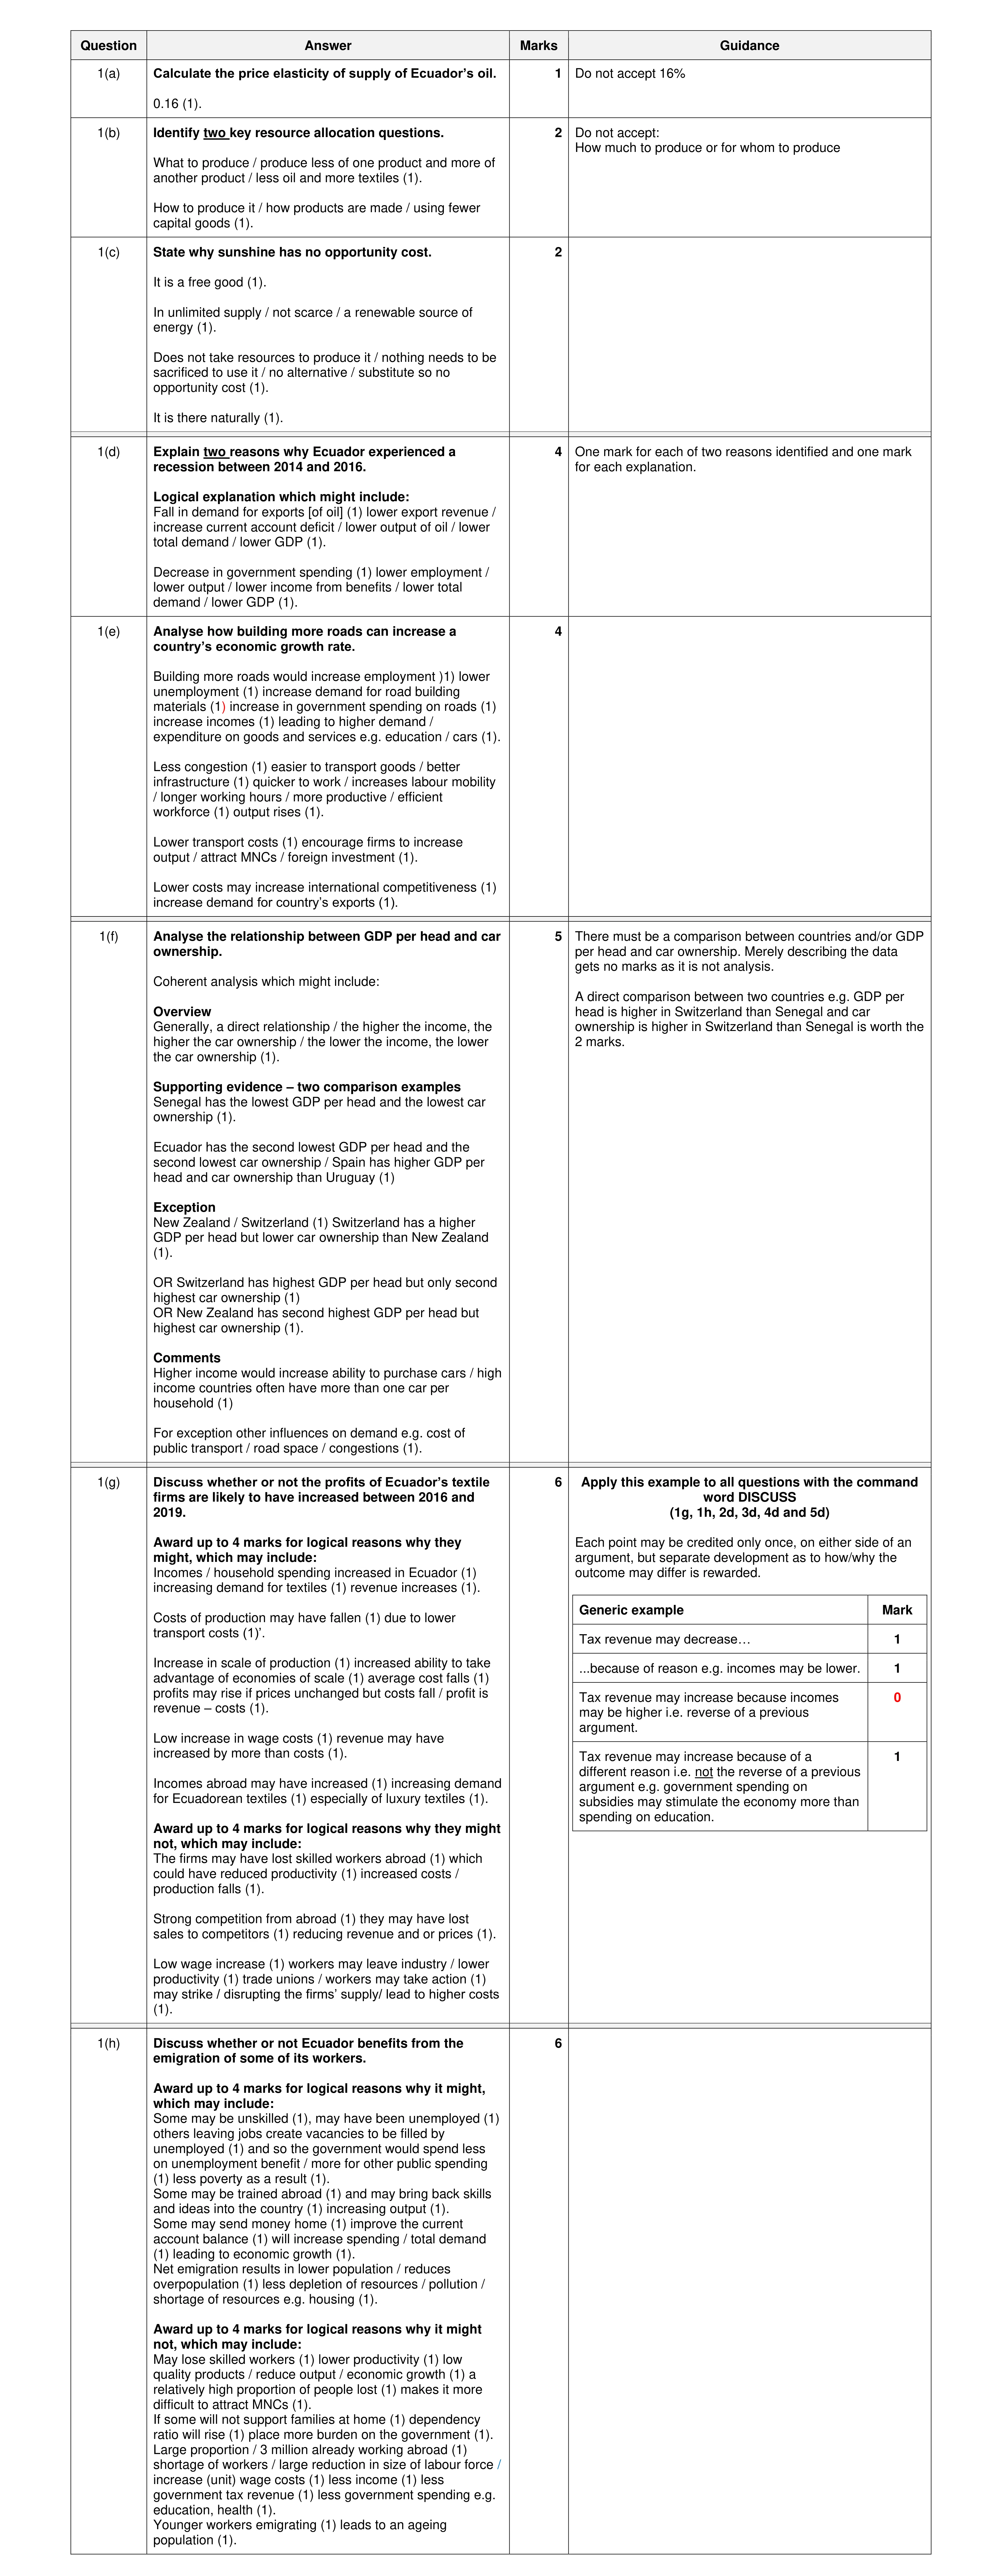 30
30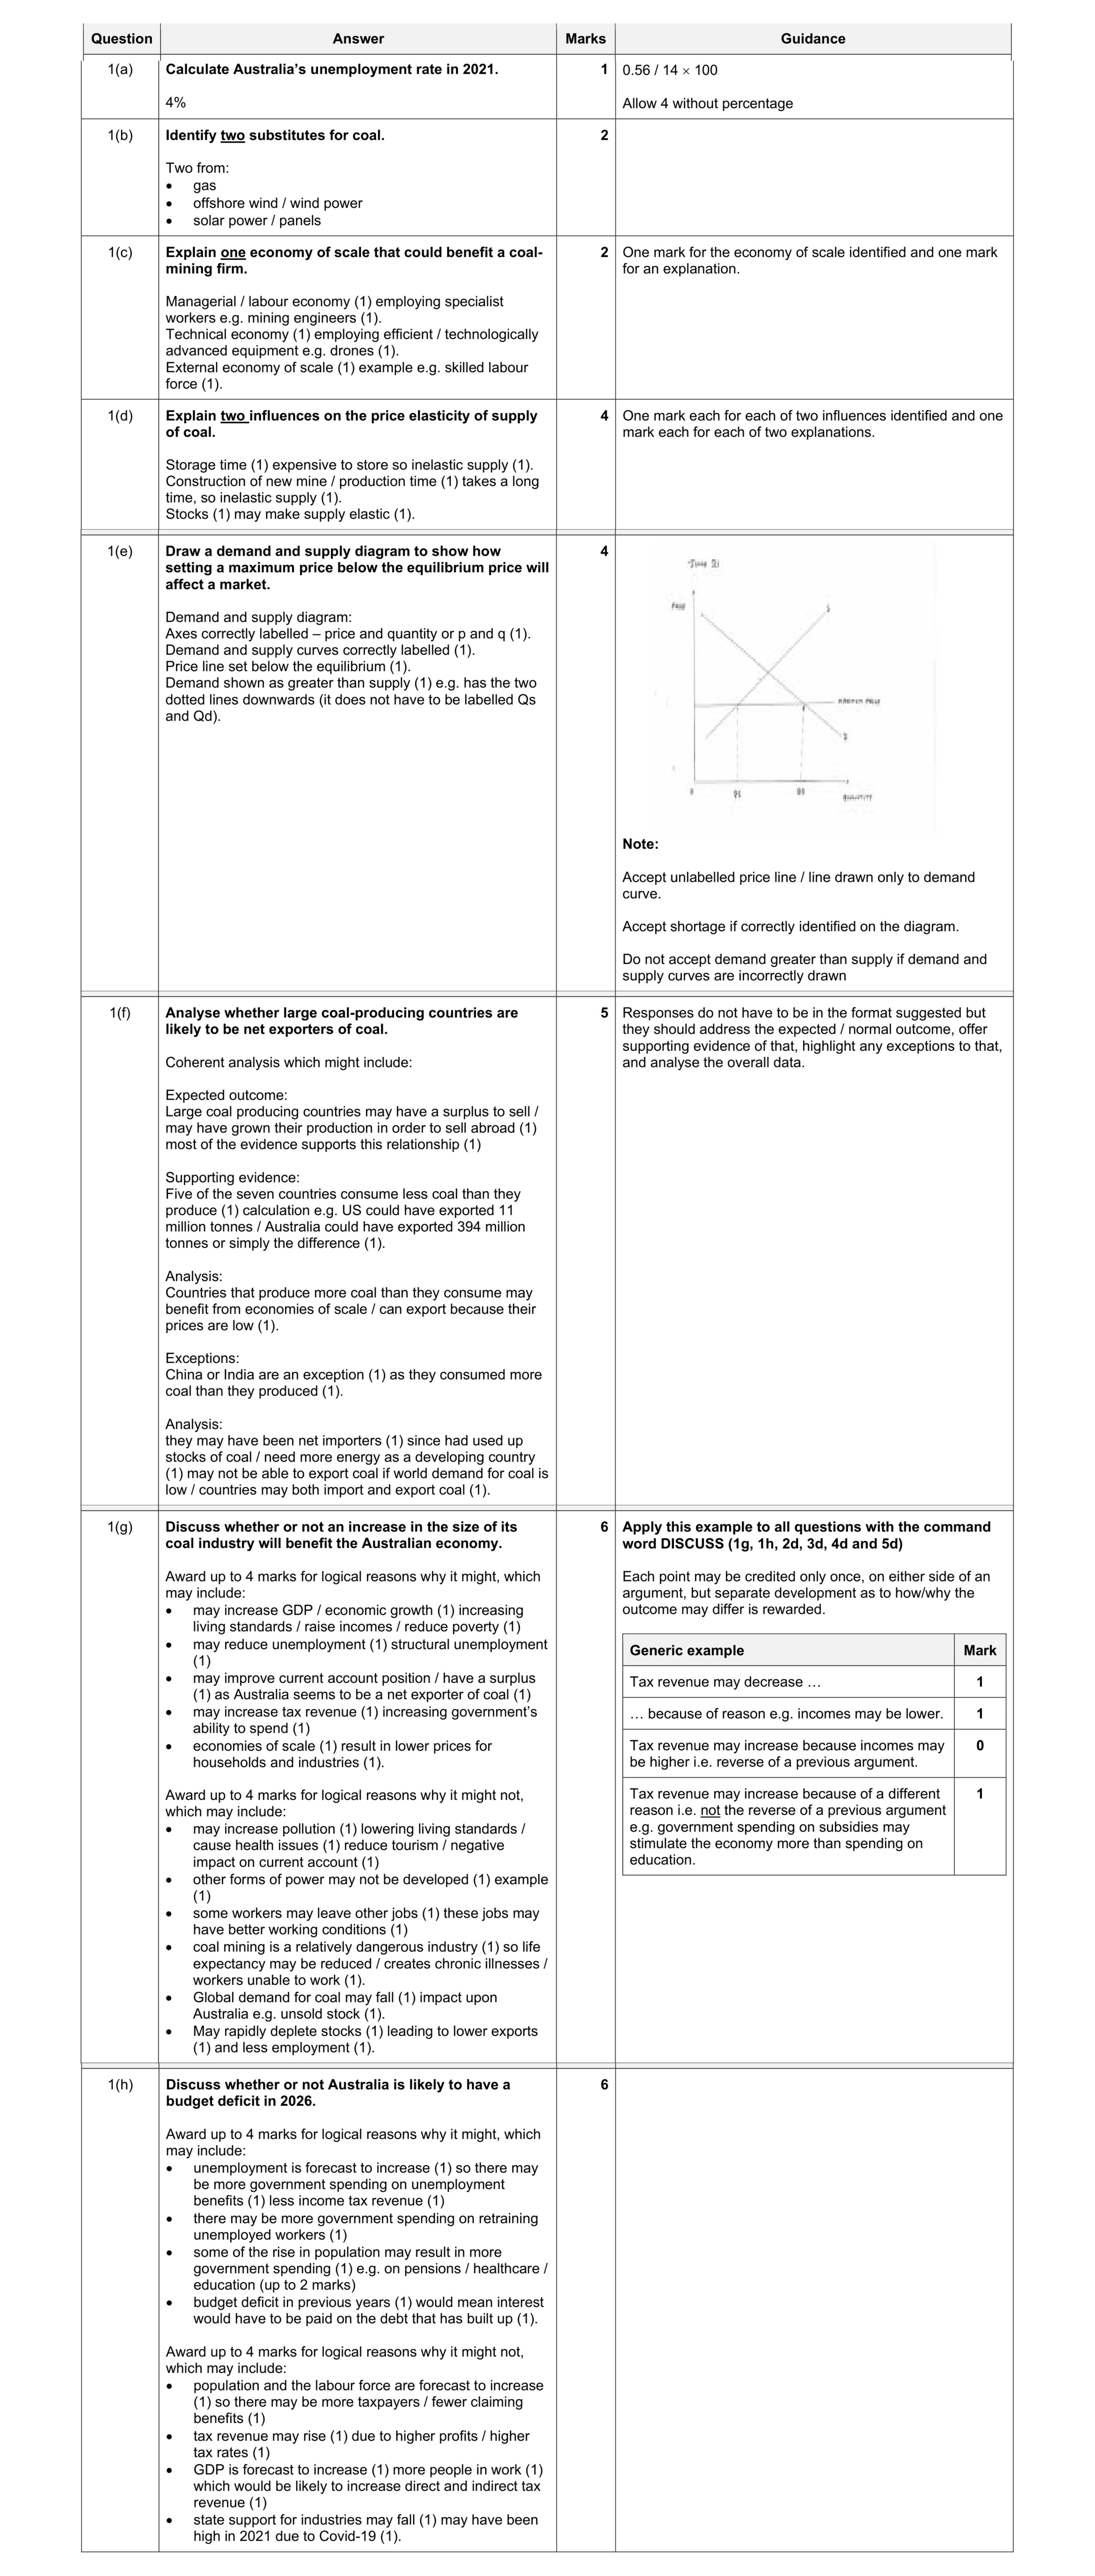 30
30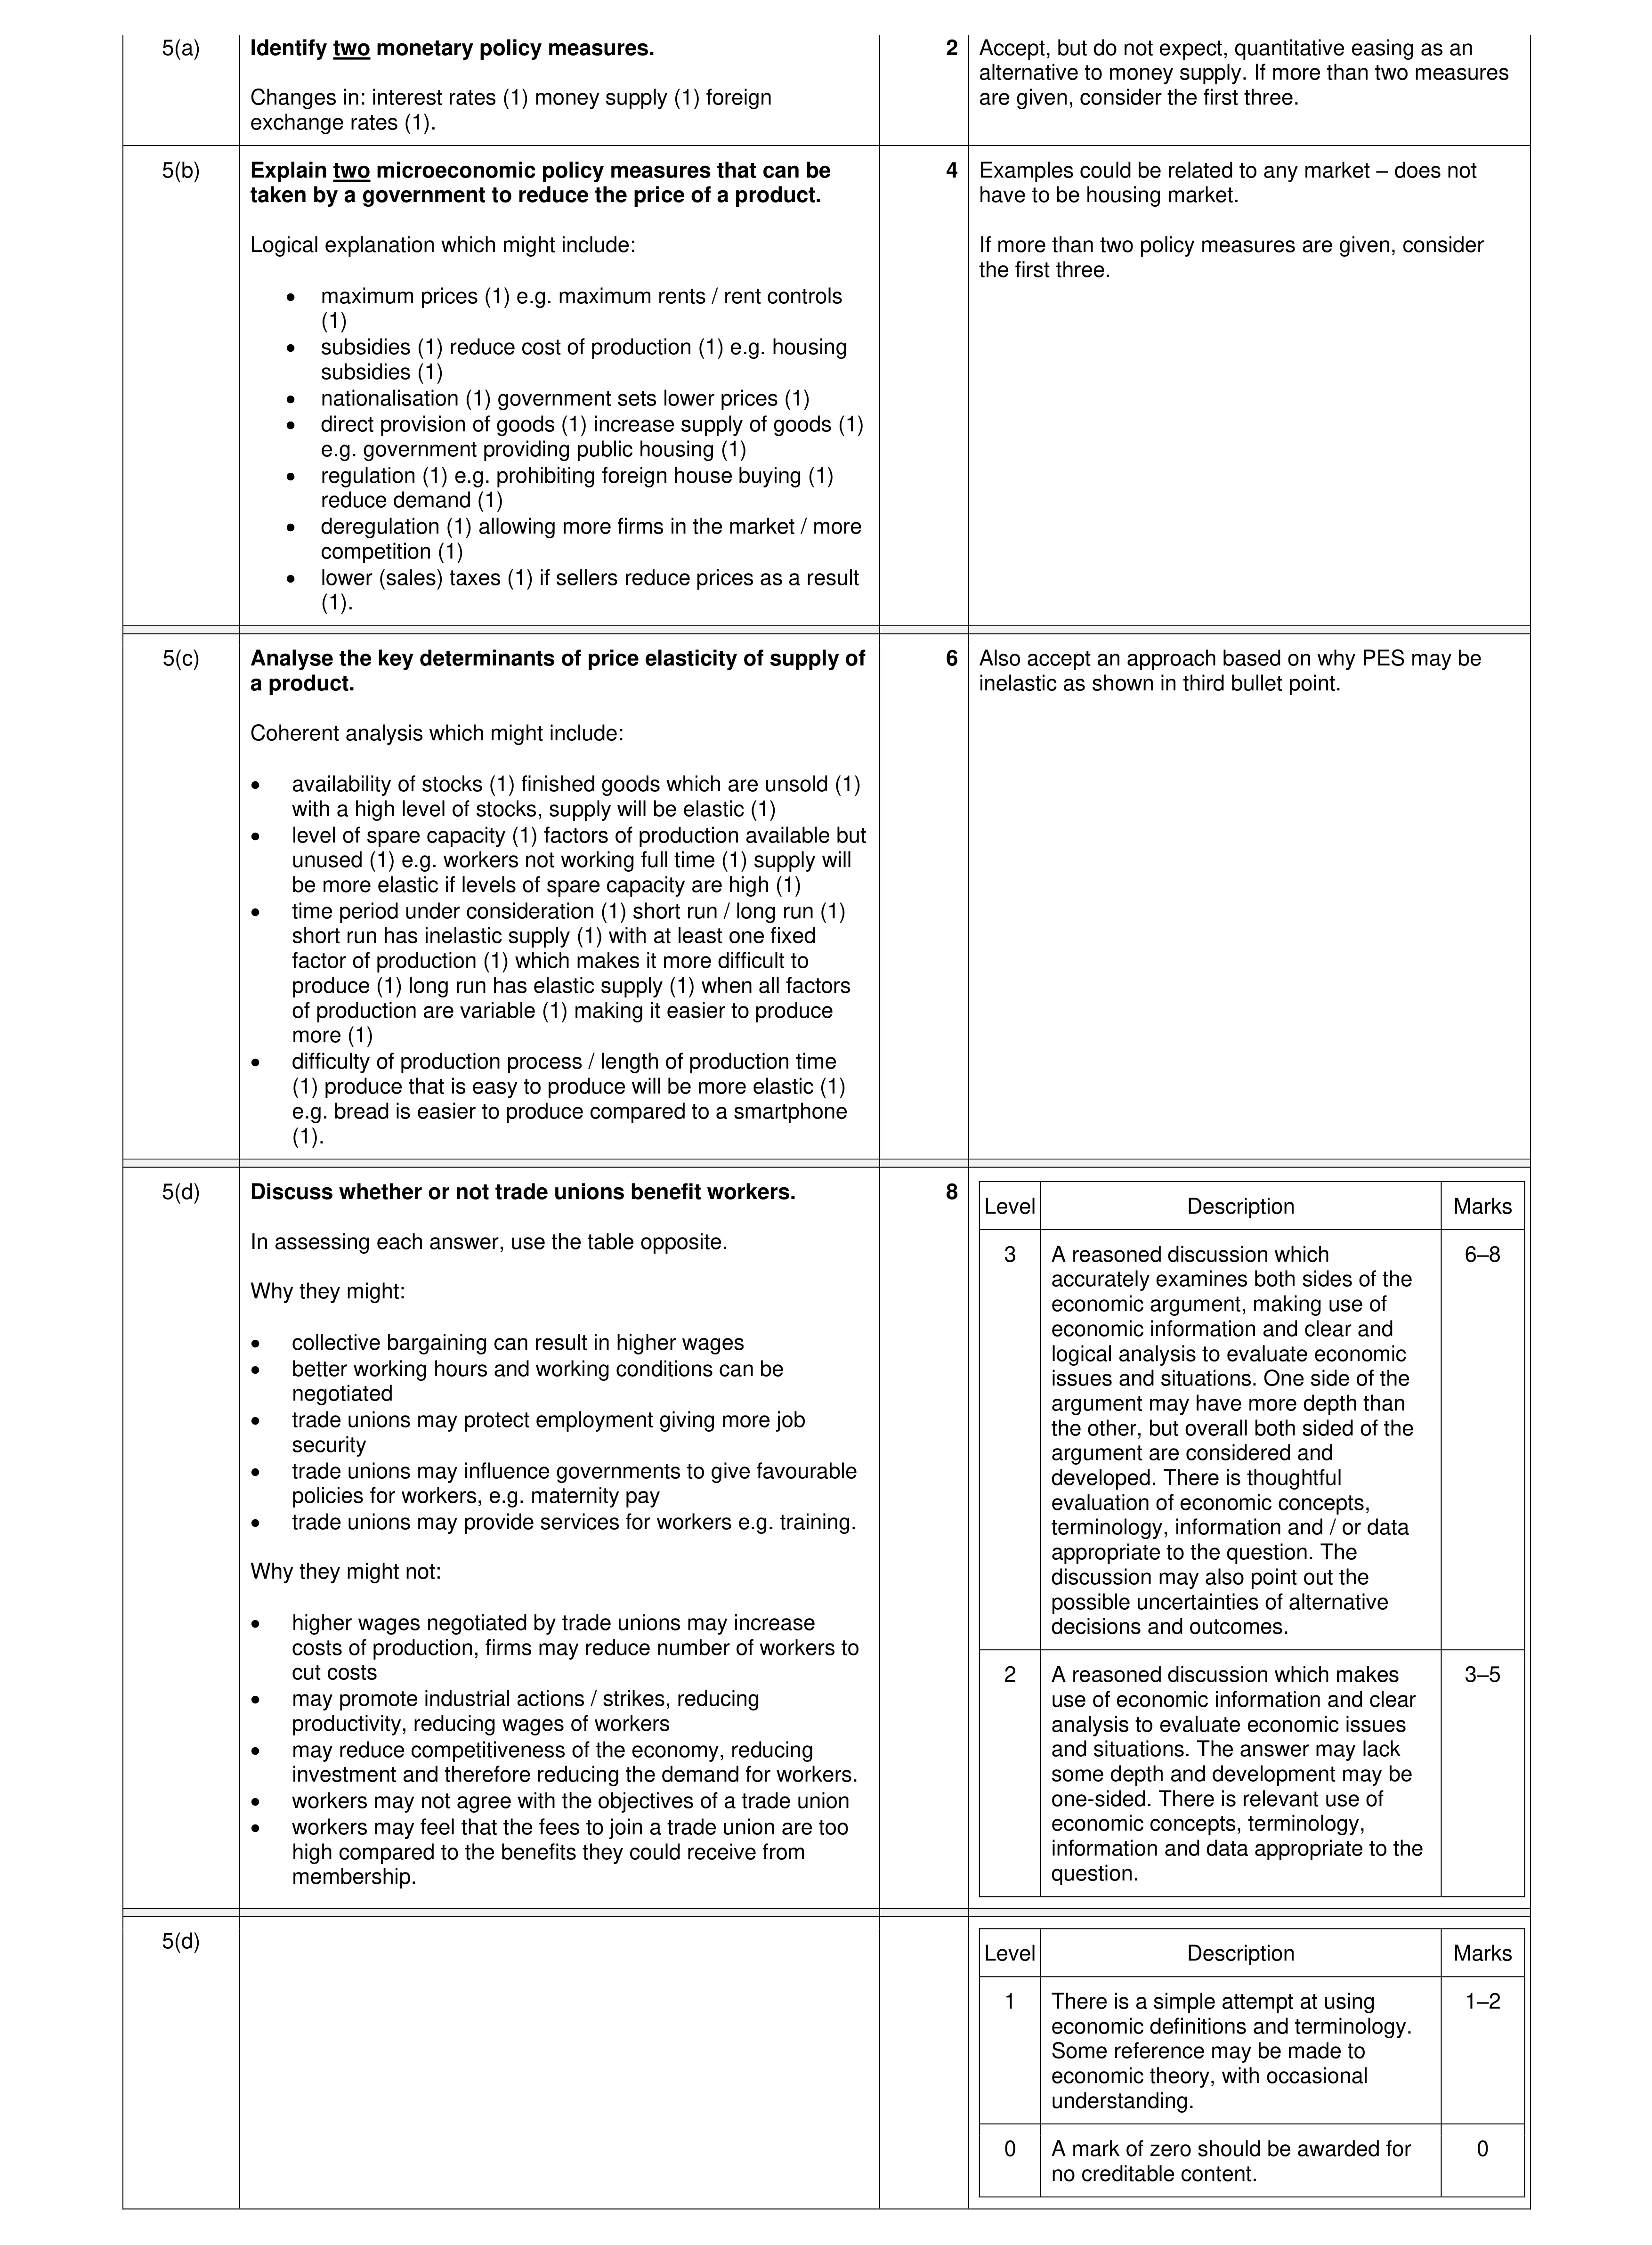 20
20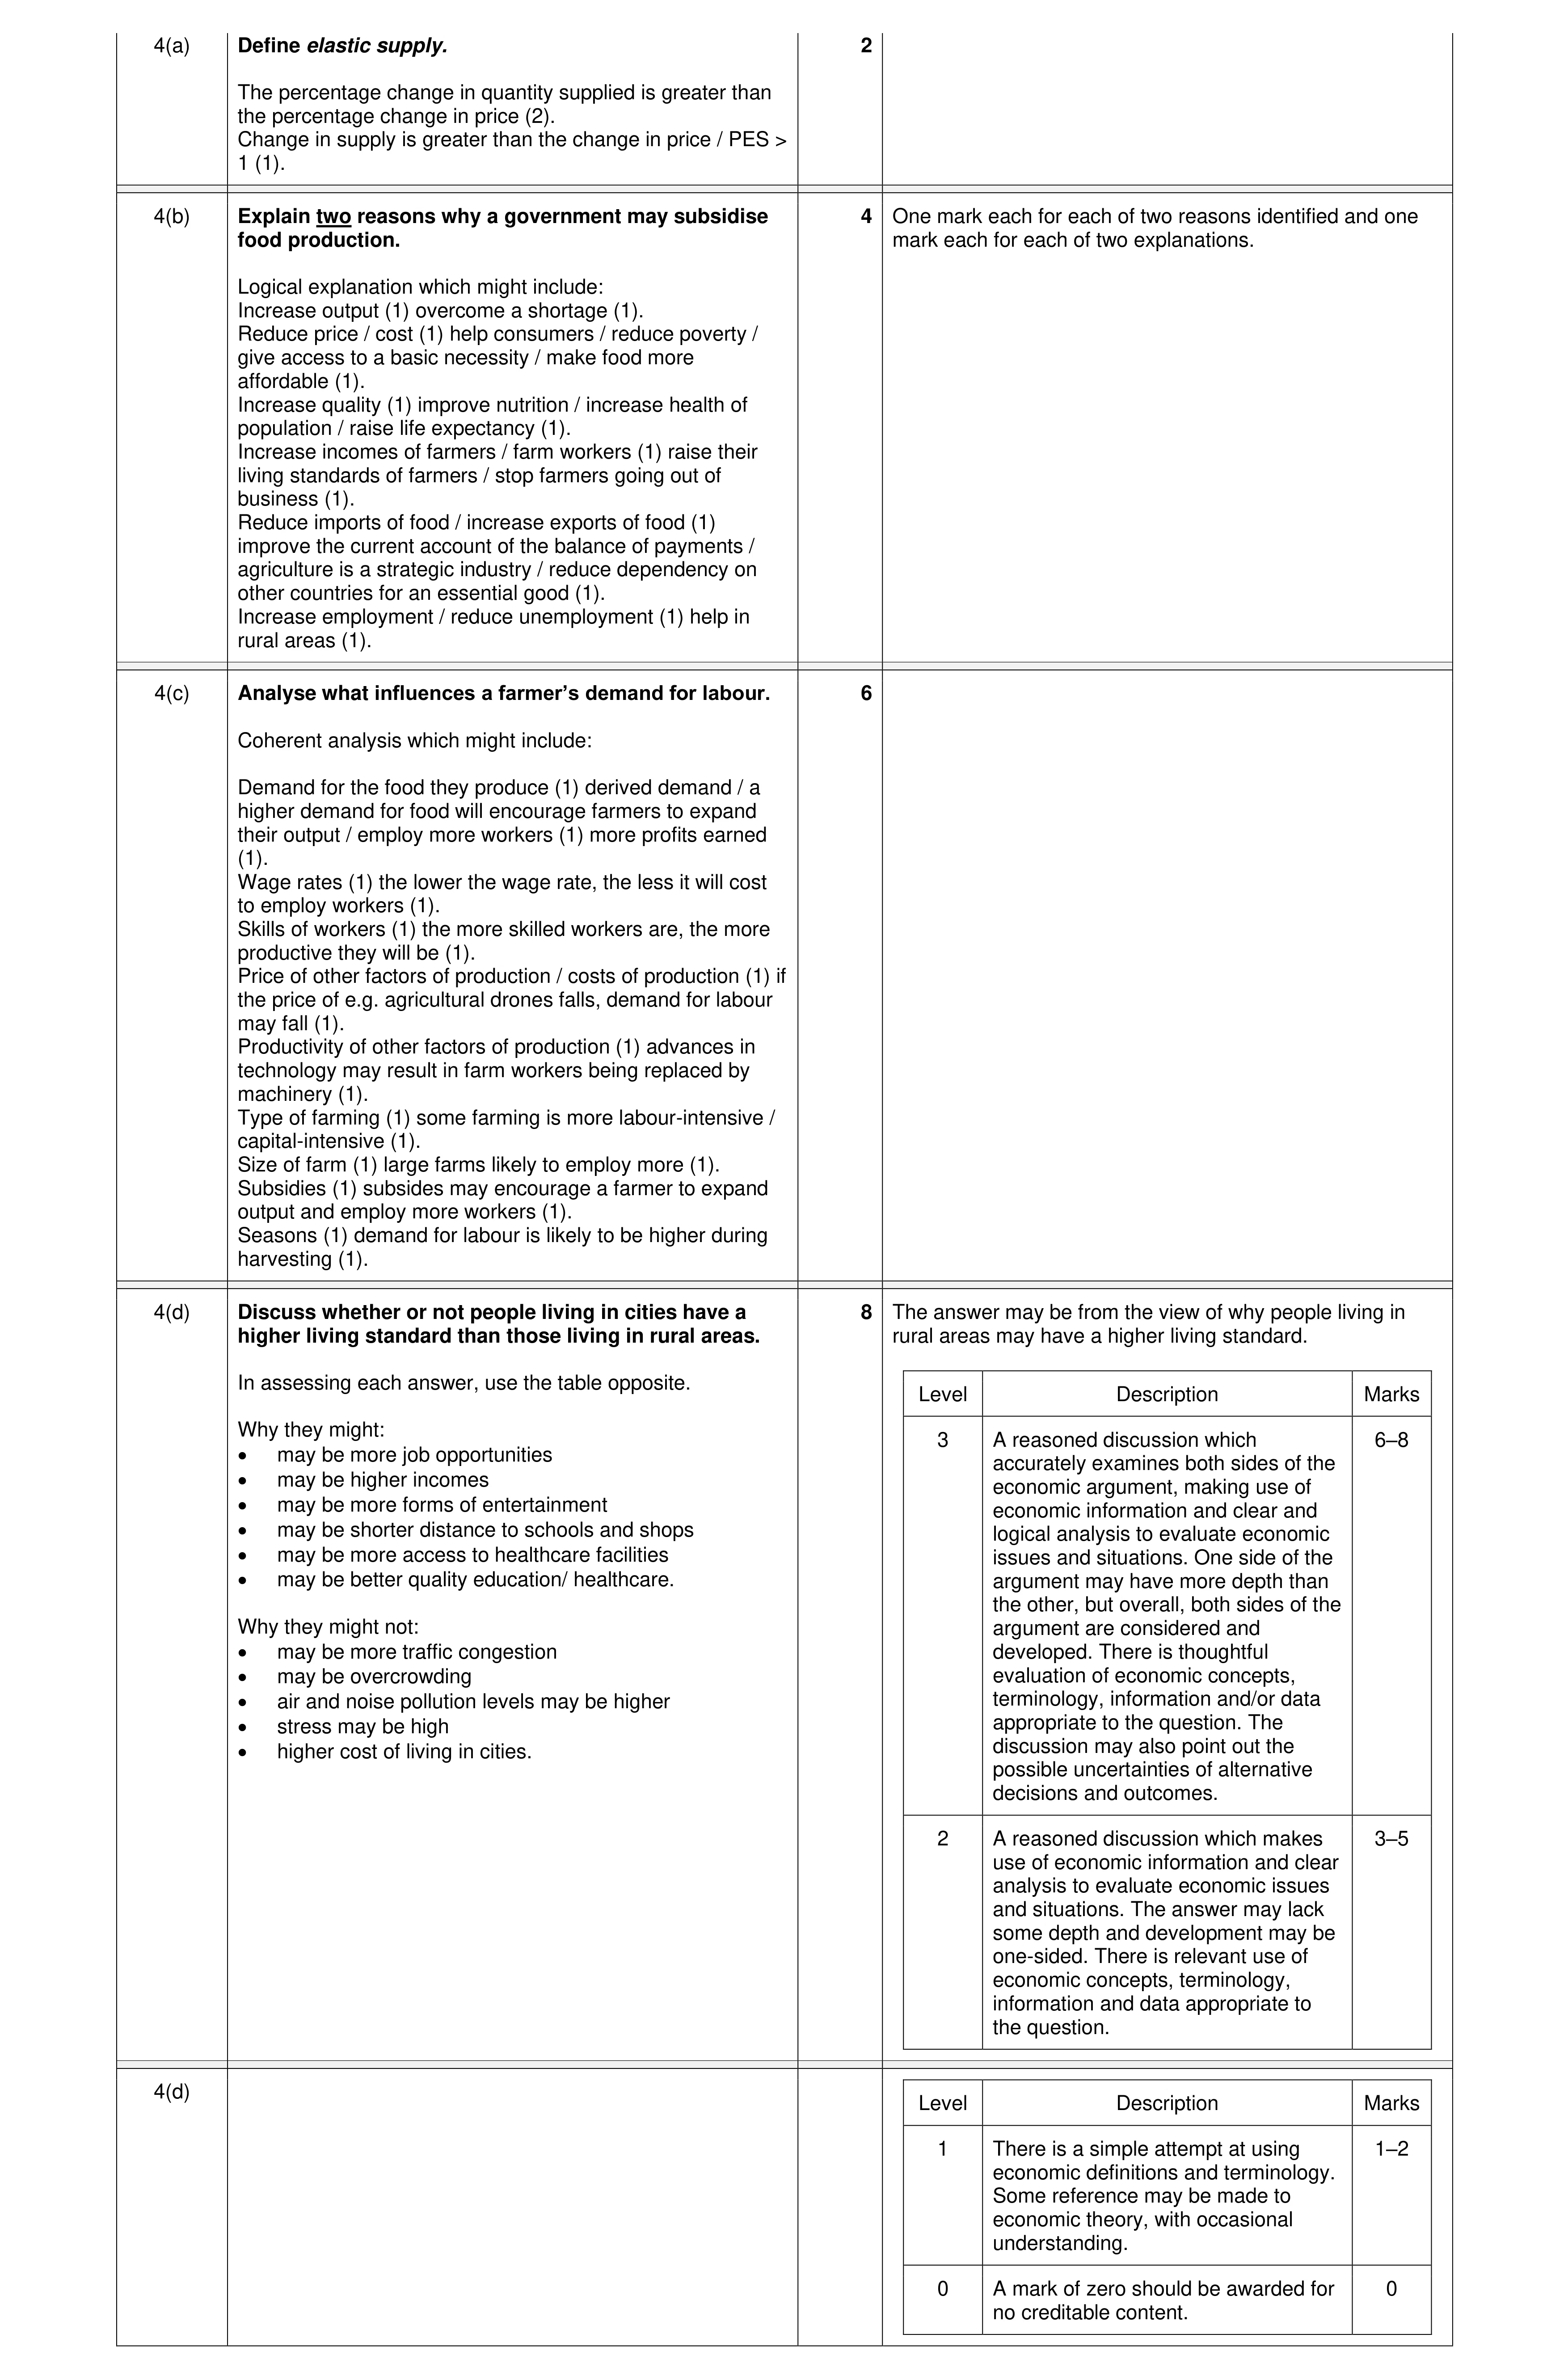 20
20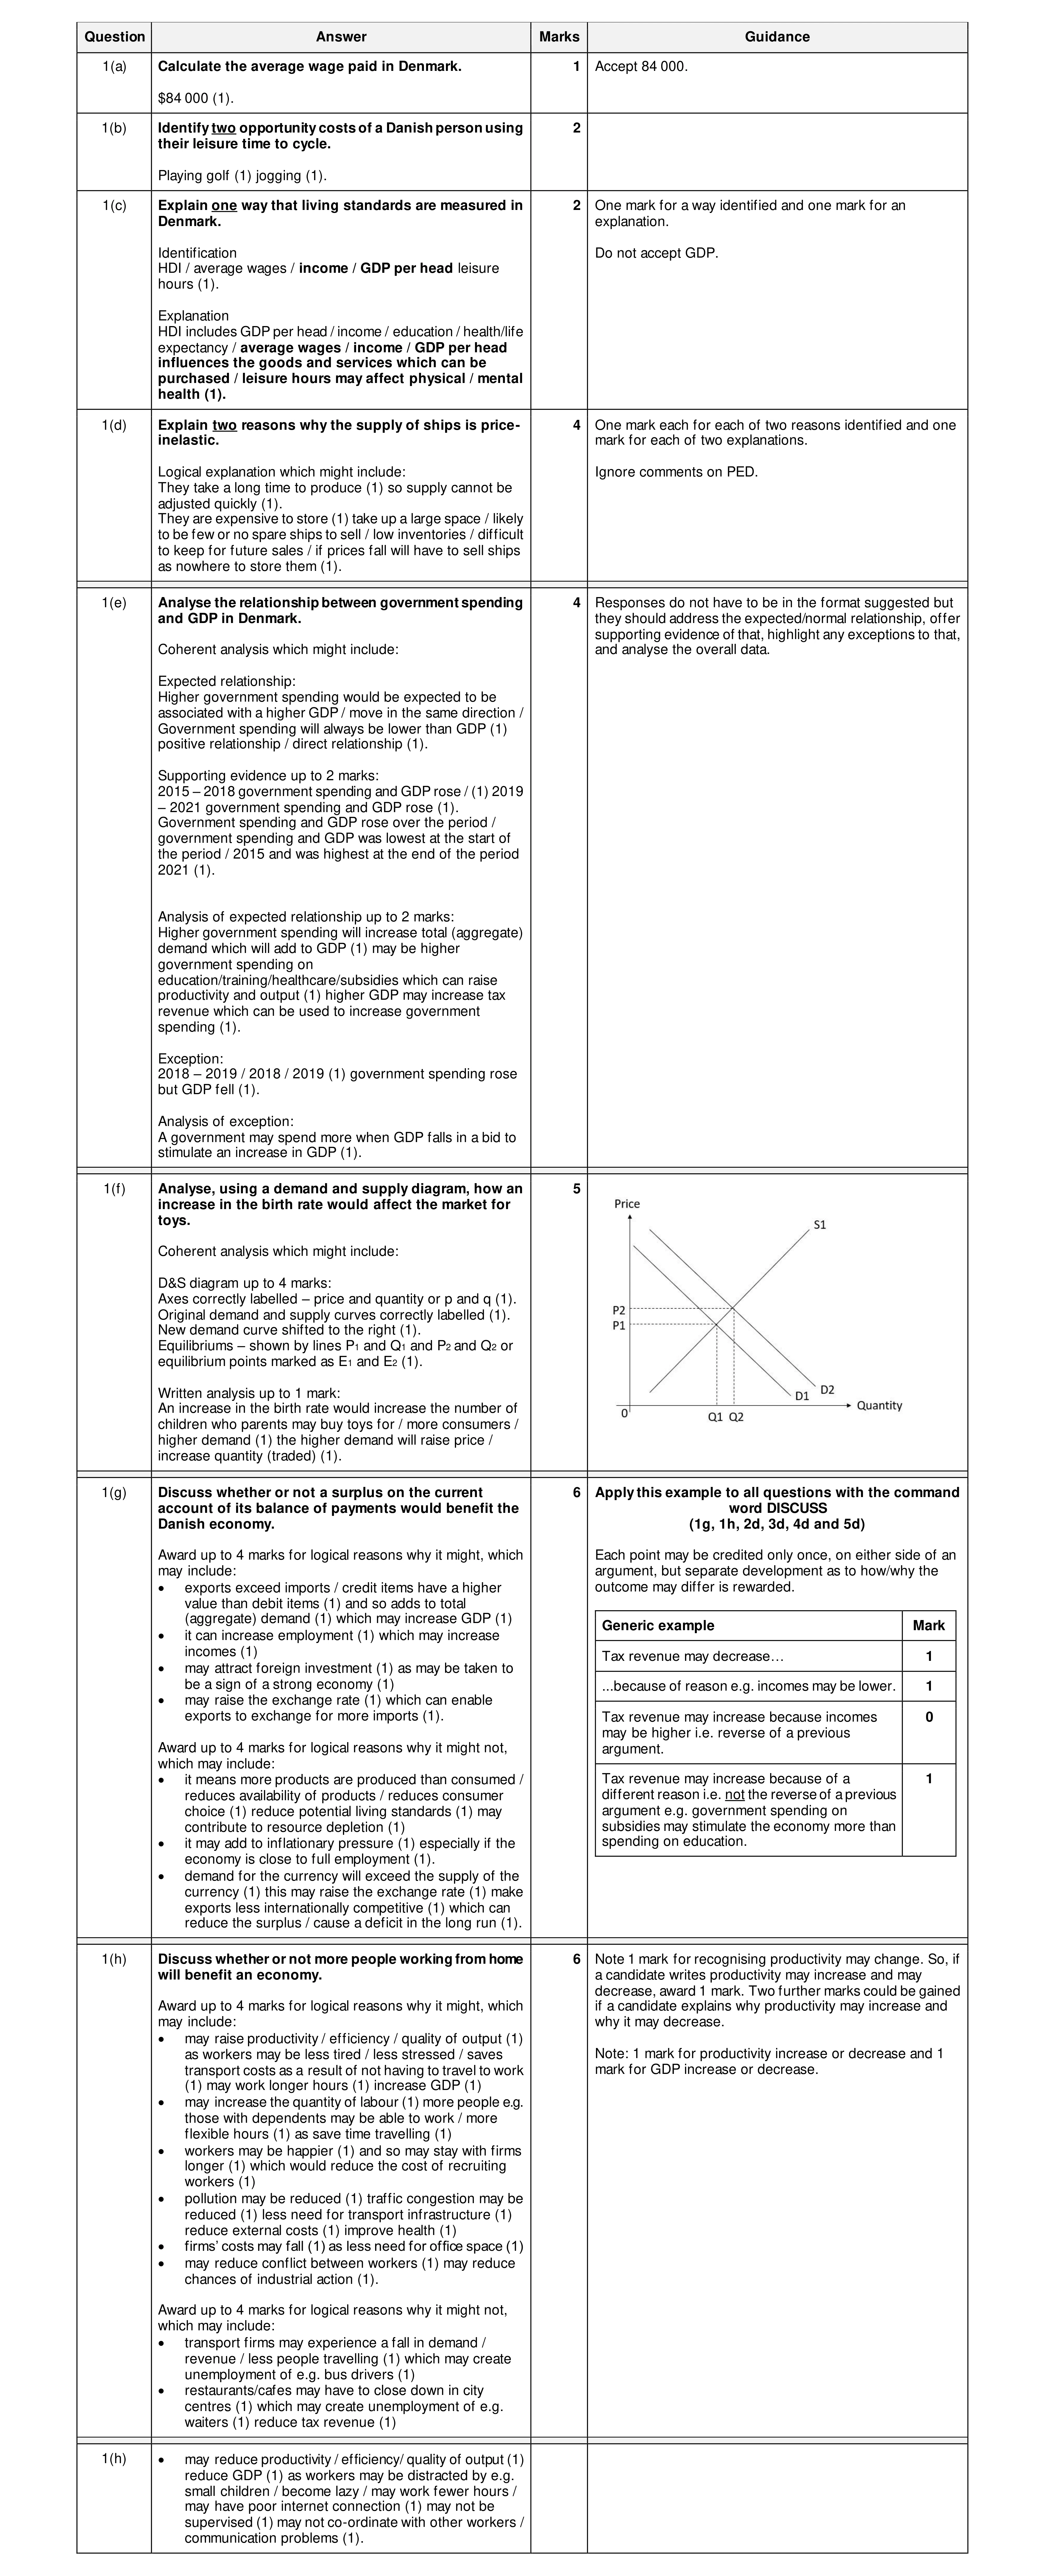 30
30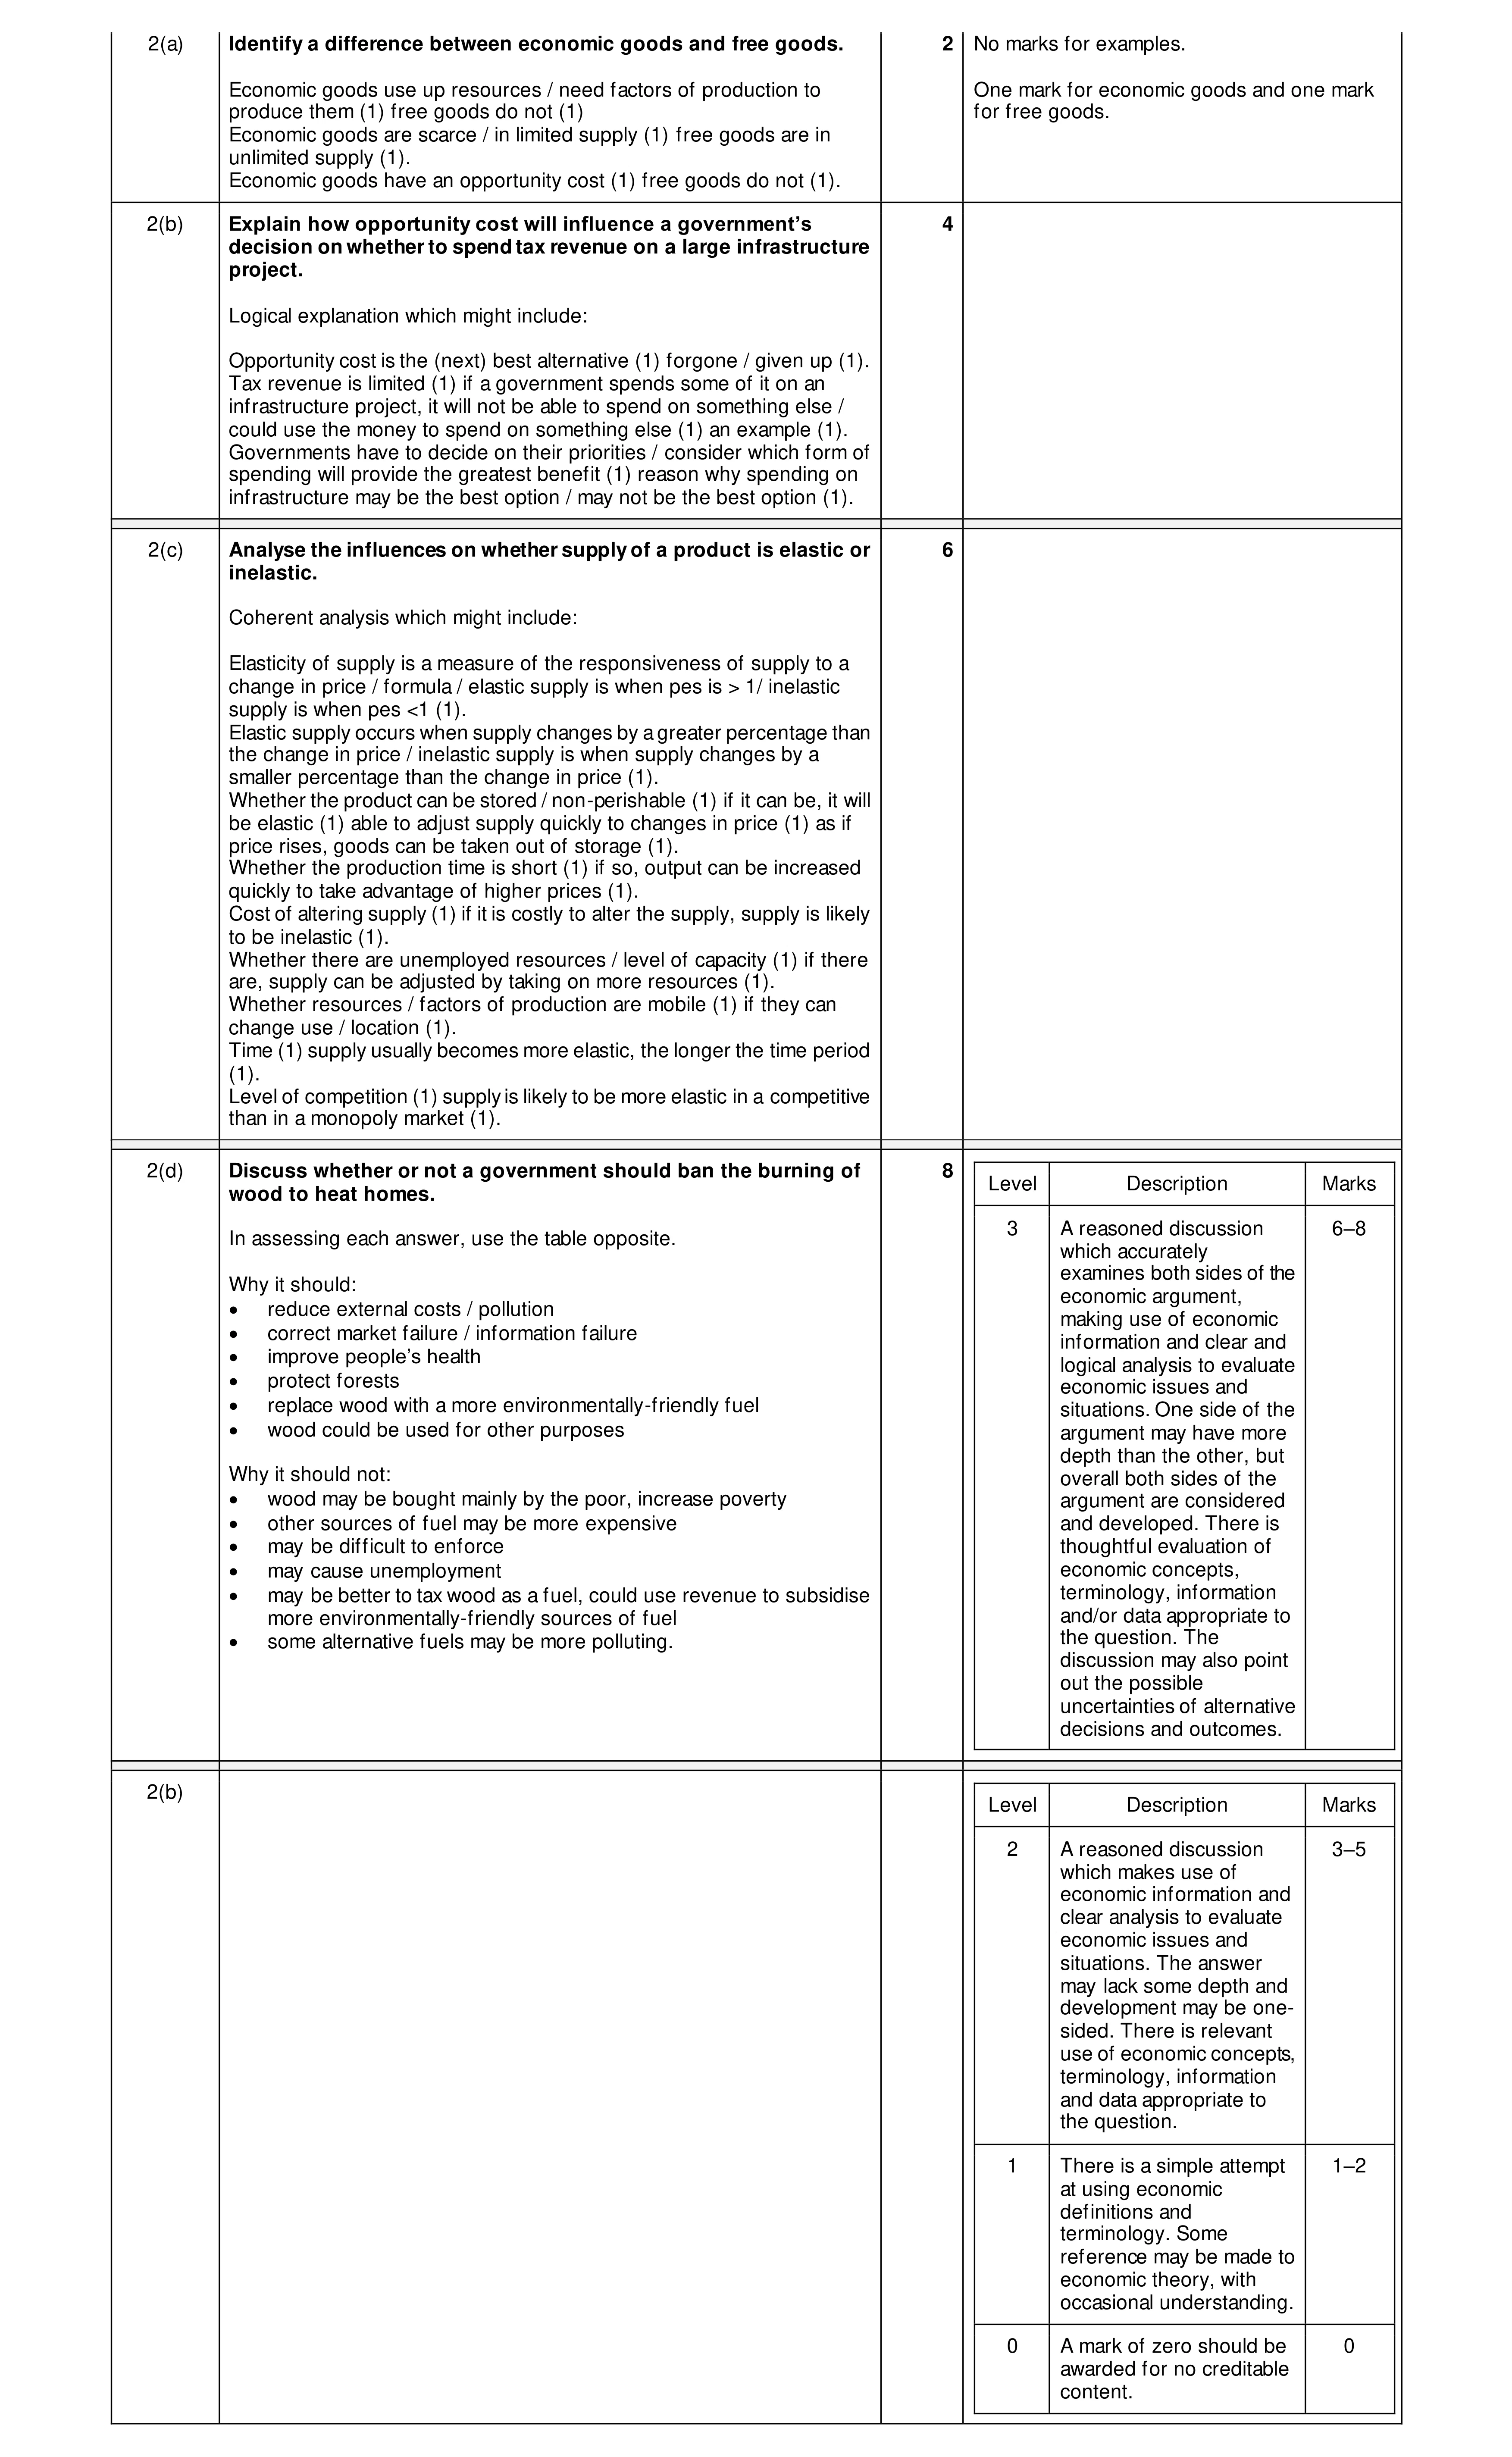 20
20