Questions as text
Q1 · An economy’s GDP per capita grows over a certain period of time, but its development when… 9708/31 Oct/Nov 2009
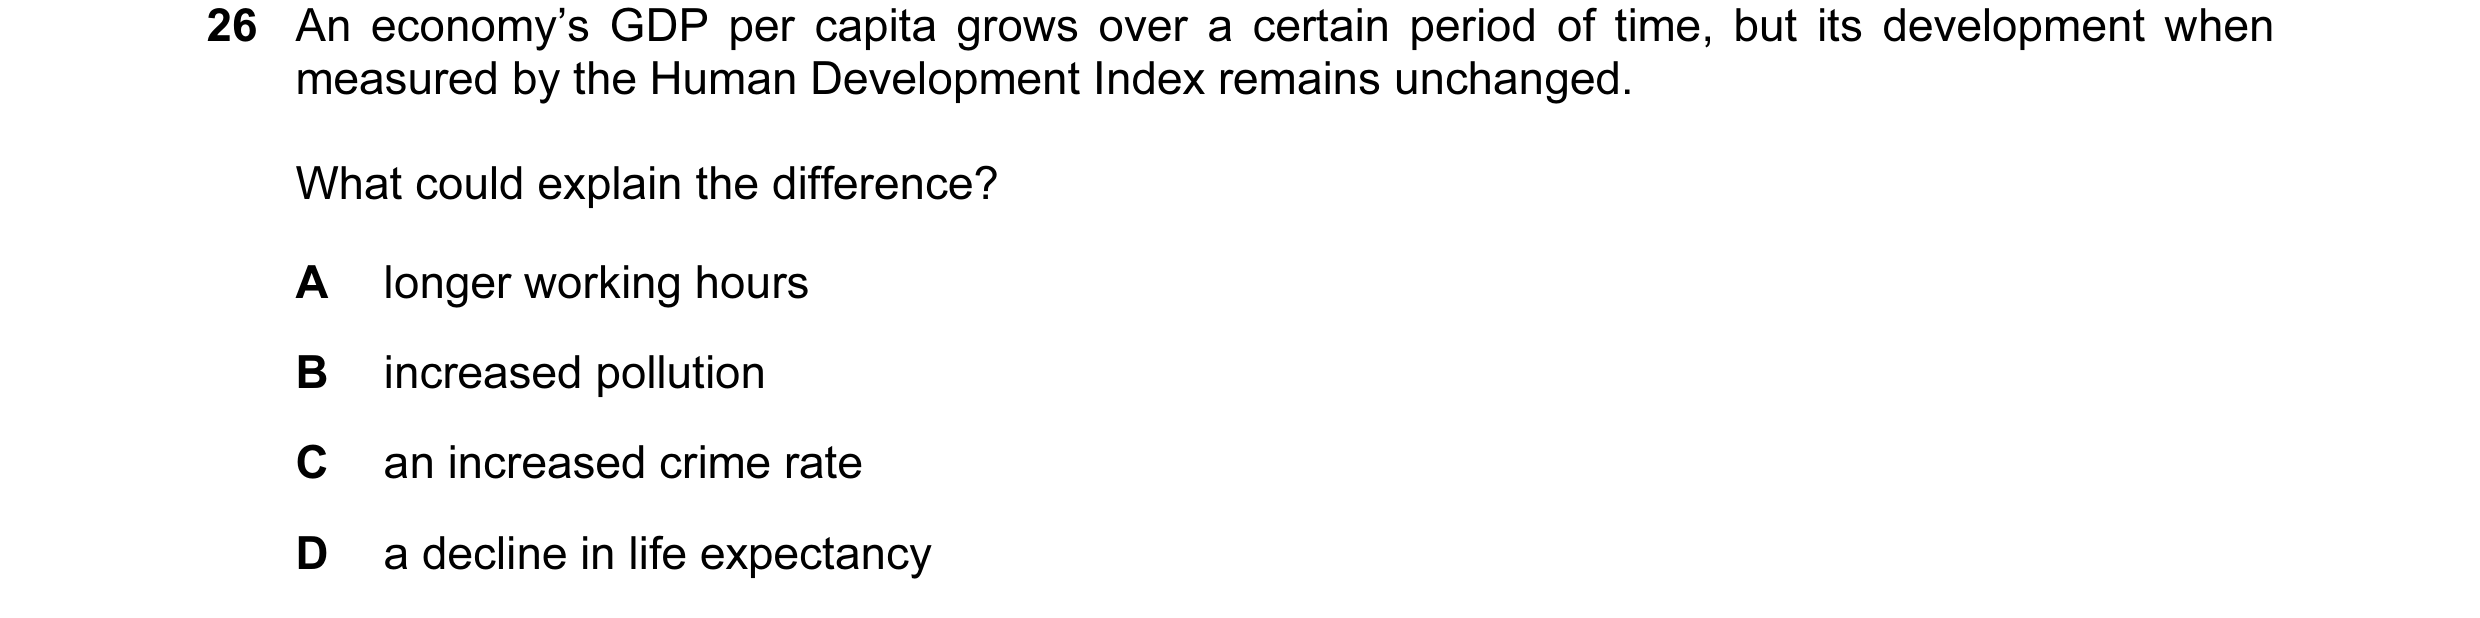
26 An economy’s GDP per capita grows over a certain period of time, but its development when measured by the Human Development Index remains unchanged. What could explain the difference? A longer working hours B increased pollution C an increased crime rate D a decline in life expectancy
1 marks
Answer: D
This question in 9708/31 Oct/Nov 2009
Q2 · An economy’s GDP per capita grows over a certain period of time, but its development when… 9708/32 Oct/Nov 2009
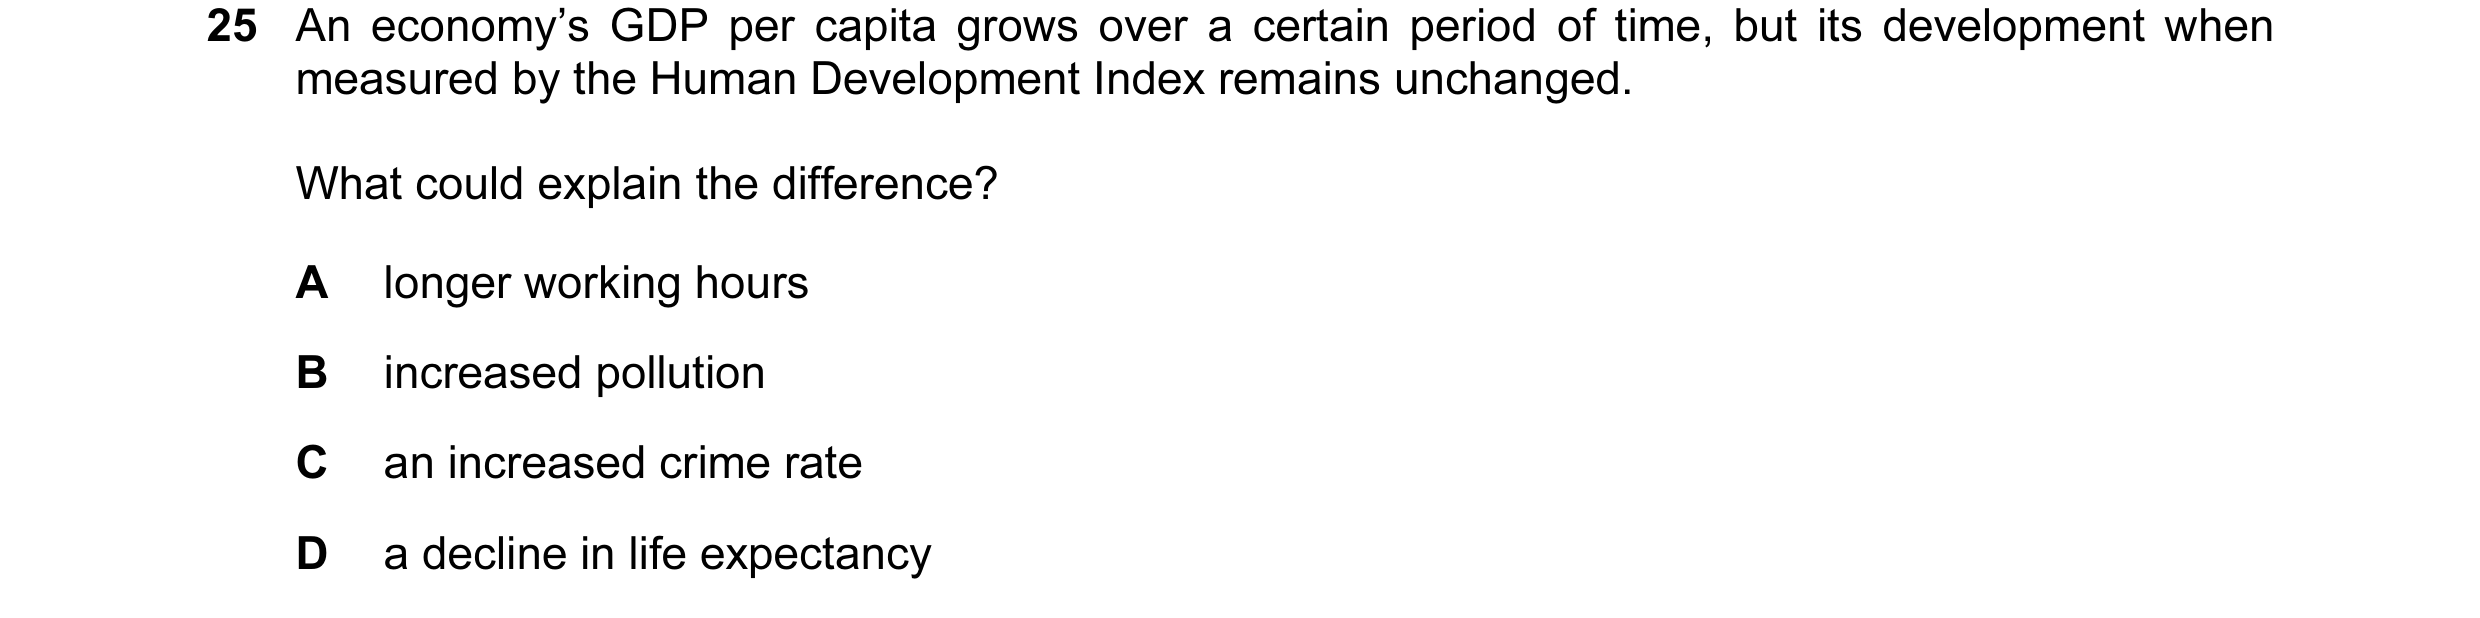
25 An economy’s GDP per capita grows over a certain period of time, but its development when measured by the Human Development Index remains unchanged. What could explain the difference? A longer working hours B increased pollution C an increased crime rate D a decline in life expectancy
1 marks
Answer: D
This question in 9708/32 Oct/Nov 2009
Q3 · What could explain why the terms of trade of most developing economies tend to worsen… 9708/32 May/June 2010
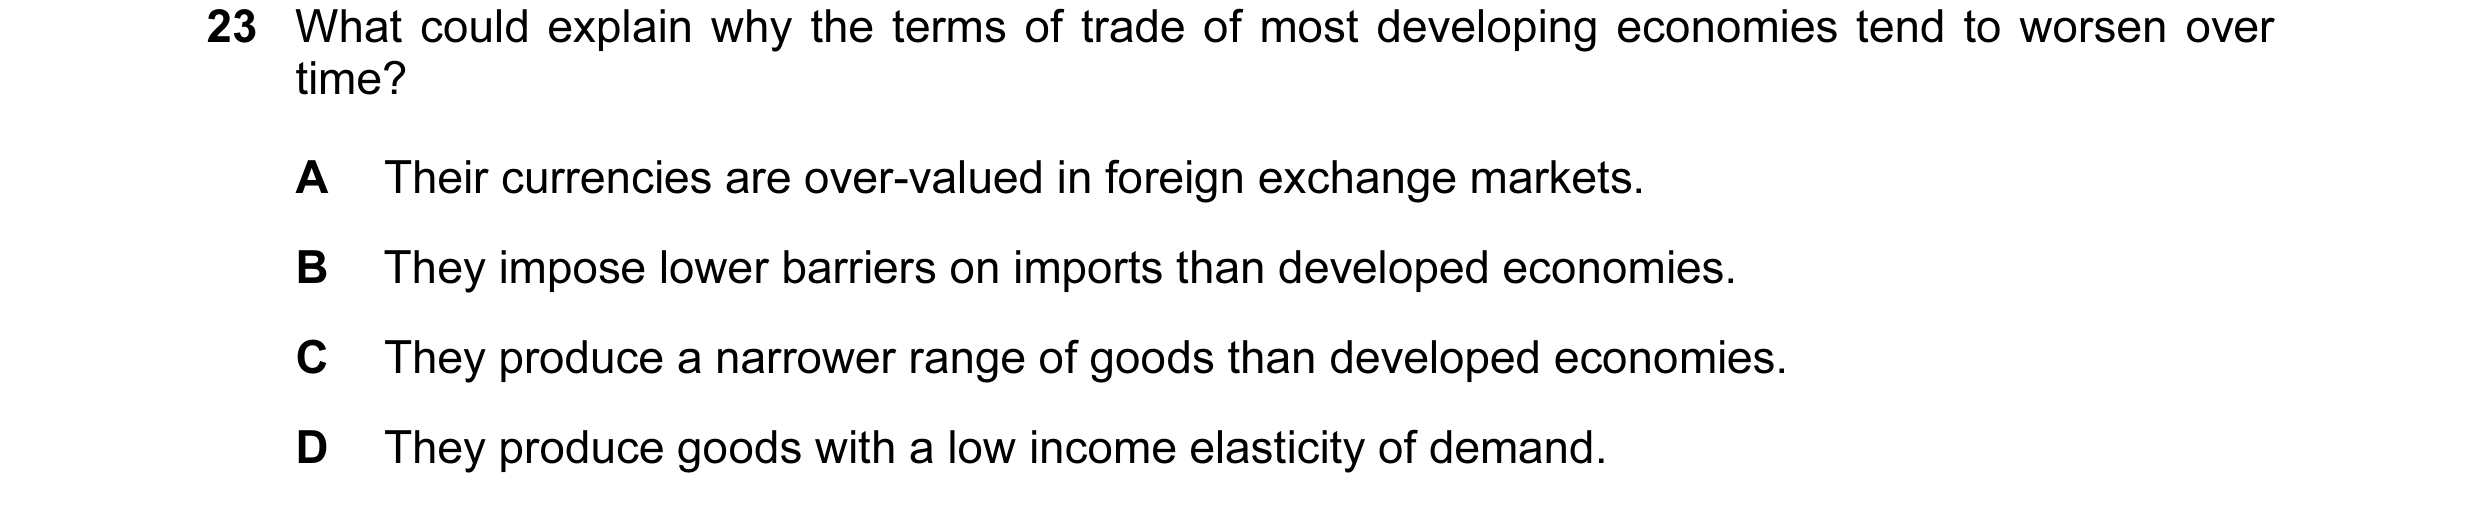
23 What could explain why the terms of trade of most developing economies tend to worsen over time? A Their currencies are over-valued in foreign exchange markets. B They impose lower barriers on imports than developed economies. C They produce a narrower range of goods than developed economies. D They produce goods with a low income elasticity of demand.
1 marks
Answer: D
This question in 9708/32 May/June 2010
Q4 · Which feature of the Indian economy could explain why the purchasing power parity… 9708/31 Oct/Nov 2010
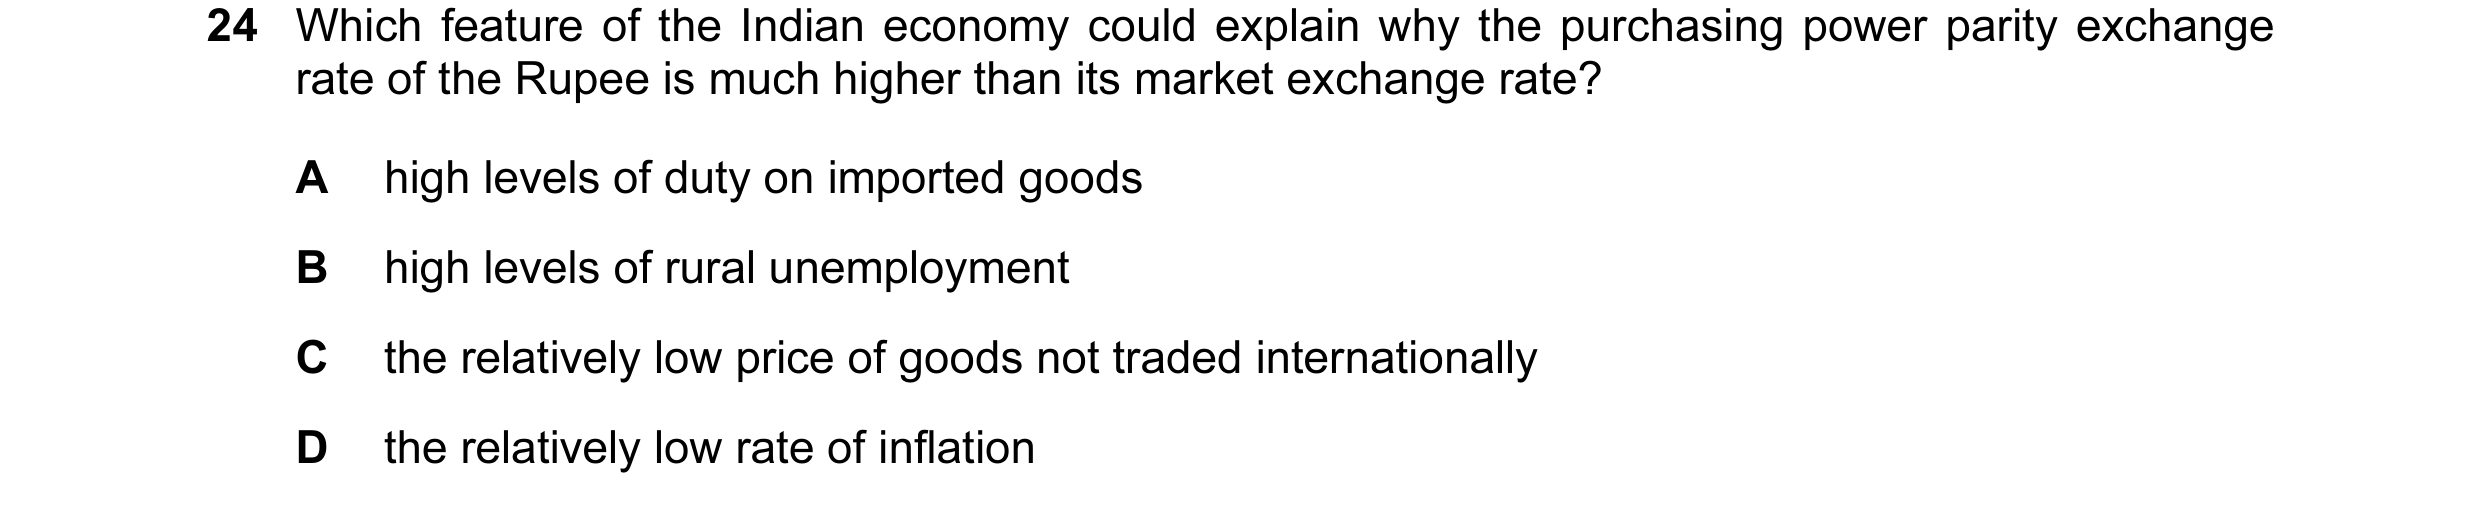
24 Which feature of the Indian economy could explain why the purchasing power parity exchange rate of the Rupee is much higher than its market exchange rate? A high levels of duty on imported goods B high levels of rural unemployment C the relatively low price of goods not traded internationally D the relatively low rate of inflation
1 marks
Answer: C
This question in 9708/31 Oct/Nov 2010
Q5 · Which characteristics are usually found in developing countries? 9708/31 May/June 2011
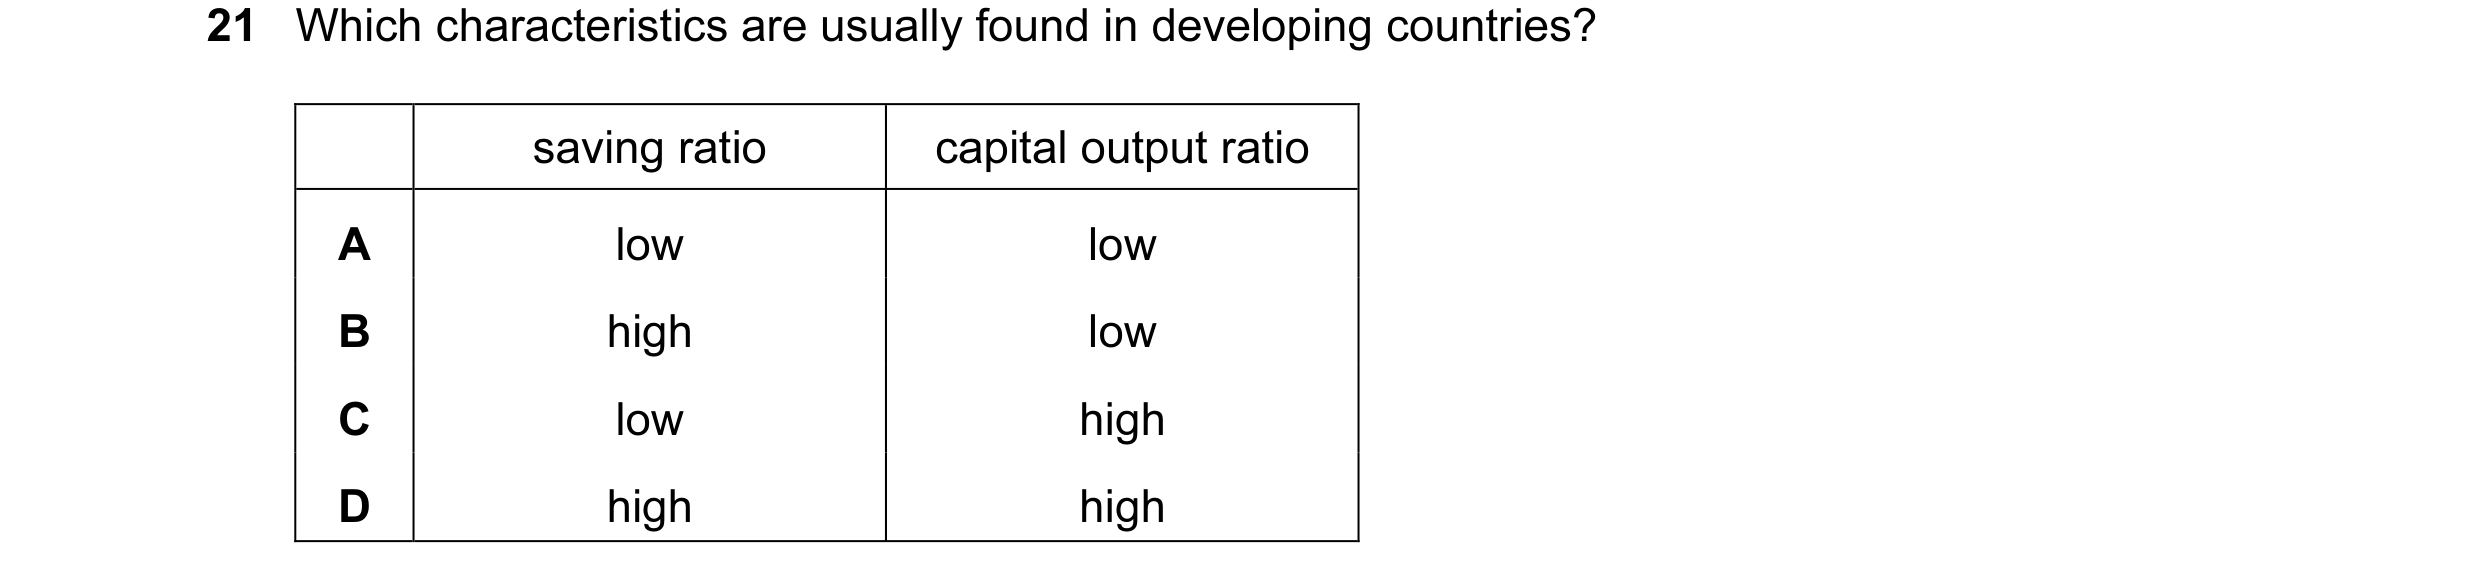
21 Which characteristics are usually found in developing countries? saving ratio capital output ratio A low low B high low C low high D high high
1 marks
Answer: A
This question in 9708/31 May/June 2011
Q6 · Which characteristics are usually found in developing countries? 9708/32 May/June 2011
20 Which characteristics are usually found in developing countries? saving ratio capital output ratio A low low B high low C low high D high high
1 marks
Answer: A
This question in 9708/32 May/June 2011
Q7 · Which characteristics are usually found in developing countries? 9708/33 May/June 2011
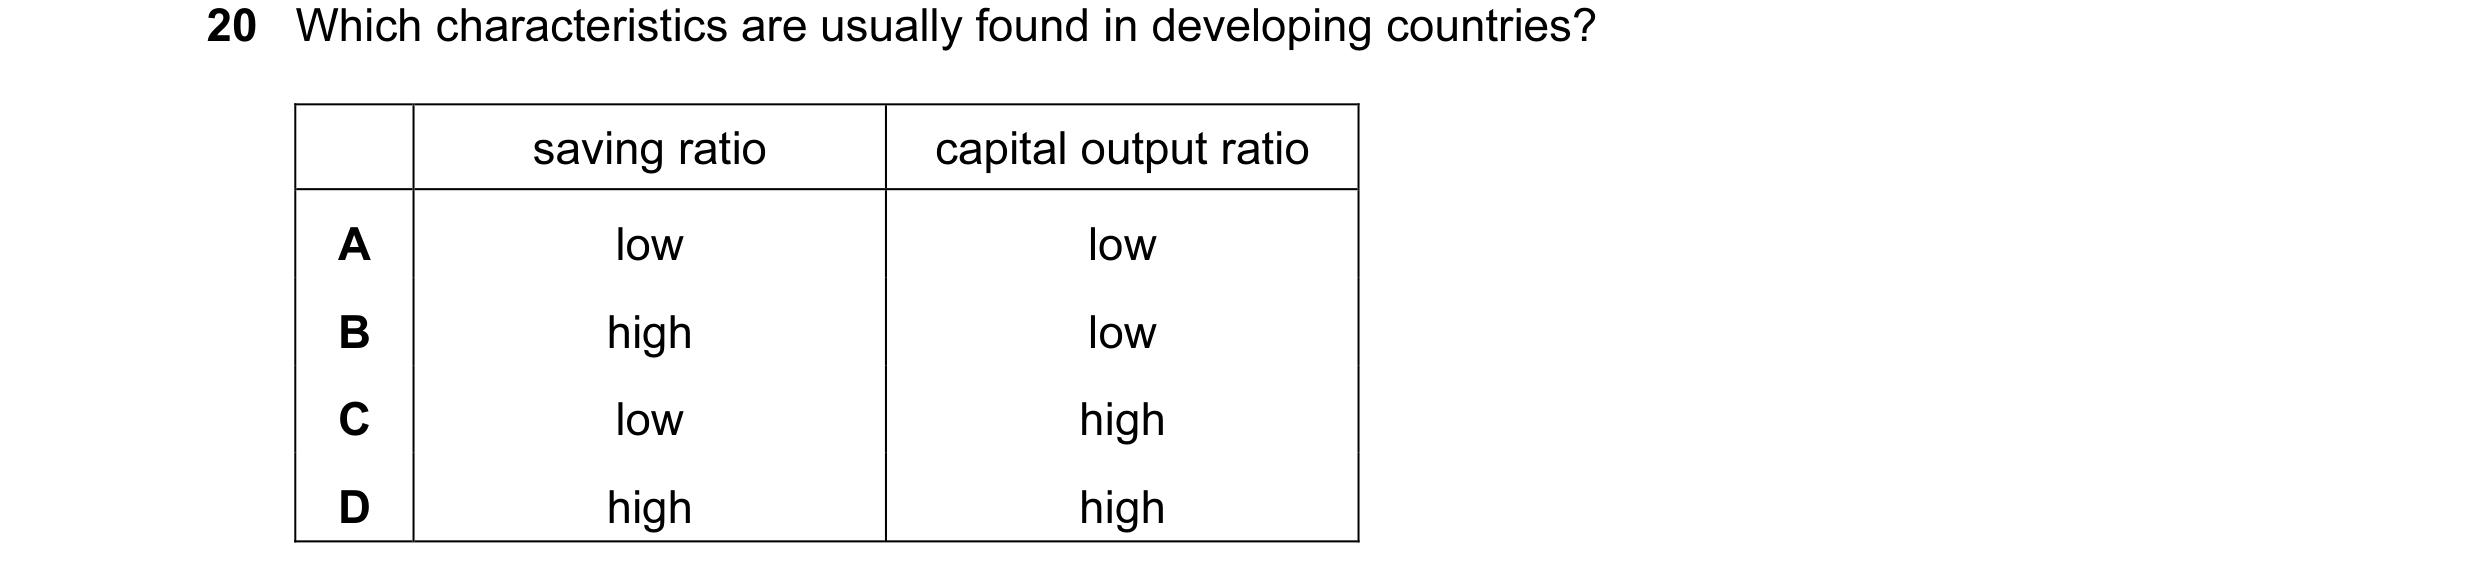
20 Which characteristics are usually found in developing countries? saving ratio capital output ratio A low low B high low C low high D high high
1 marks
Answer: A
This question in 9708/33 May/June 2011
Q8 · What is typically associated with a relatively low level of income per capita in a… 9708/31 Oct/Nov 2011
20 What is typically associated with a relatively low level of income per capita in a country? A a high rate of saving B a low rate of economic growth in past periods C a low rate of inflation D a low rate of population growth
1 marks
Answer: B
This question in 9708/31 Oct/Nov 2011
Q9 · Which change would directly affect a country’s Human Development Index? 9708/32 Oct/Nov 2011
16 Which change would directly affect a country’s Human Development Index? A a change in average hours worked by the labour force B a change in life expectancy of the population C a change in the level of carbon dioxide emissions D a change in the size of the population
1 marks
Answer: B
This question in 9708/32 Oct/Nov 2011
Q10 · What is typically associated with a relatively low level of income per capita in a… 9708/33 Oct/Nov 2011
19 What is typically associated with a relatively low level of income per capita in a country? A a high rate of saving B a low rate of economic growth in past periods C a low rate of inflation D a low rate of population growth
1 marks
Answer: B
This question in 9708/33 Oct/Nov 2011
Q11 · An economy’s GDP per capita grows over a certain period of time, but its development when… 9708/33 Oct/Nov 2012
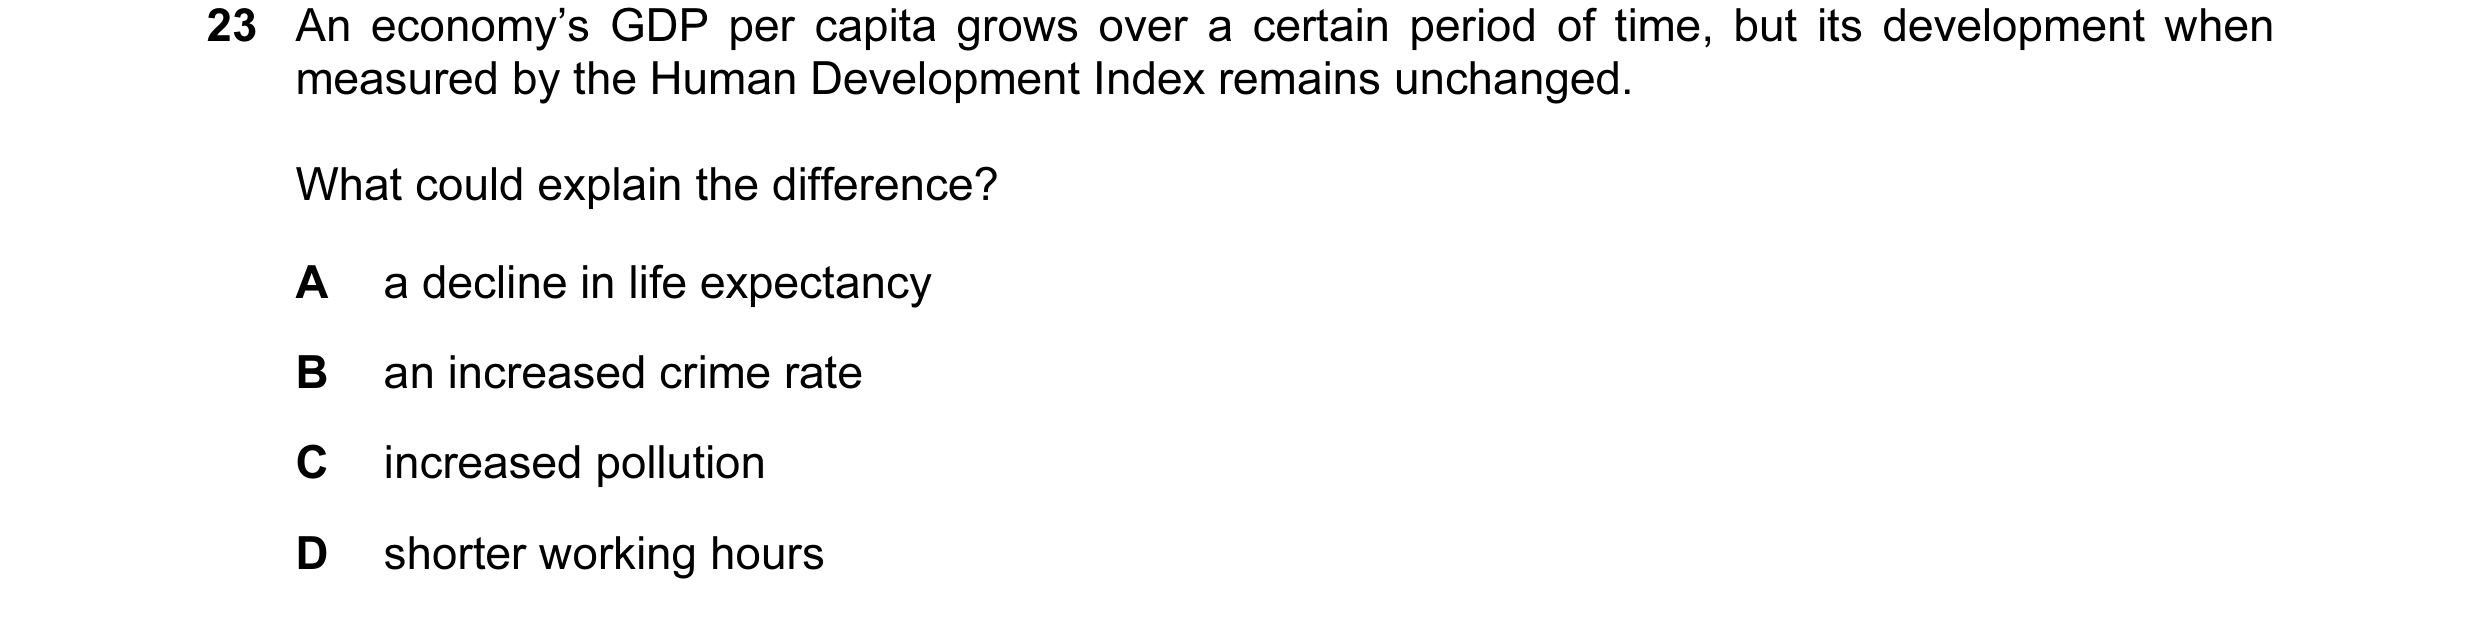
23 An economy’s GDP per capita grows over a certain period of time, but its development when measured by the Human Development Index remains unchanged. What could explain the difference? A a decline in life expectancy B an increased crime rate C increased pollution D shorter working hours
1 marks
This question in 9708/33 Oct/Nov 2012
Q12 · What adjustments to real GNP per head might make it a more reliable indicator when… 9708/31 May/June 2013
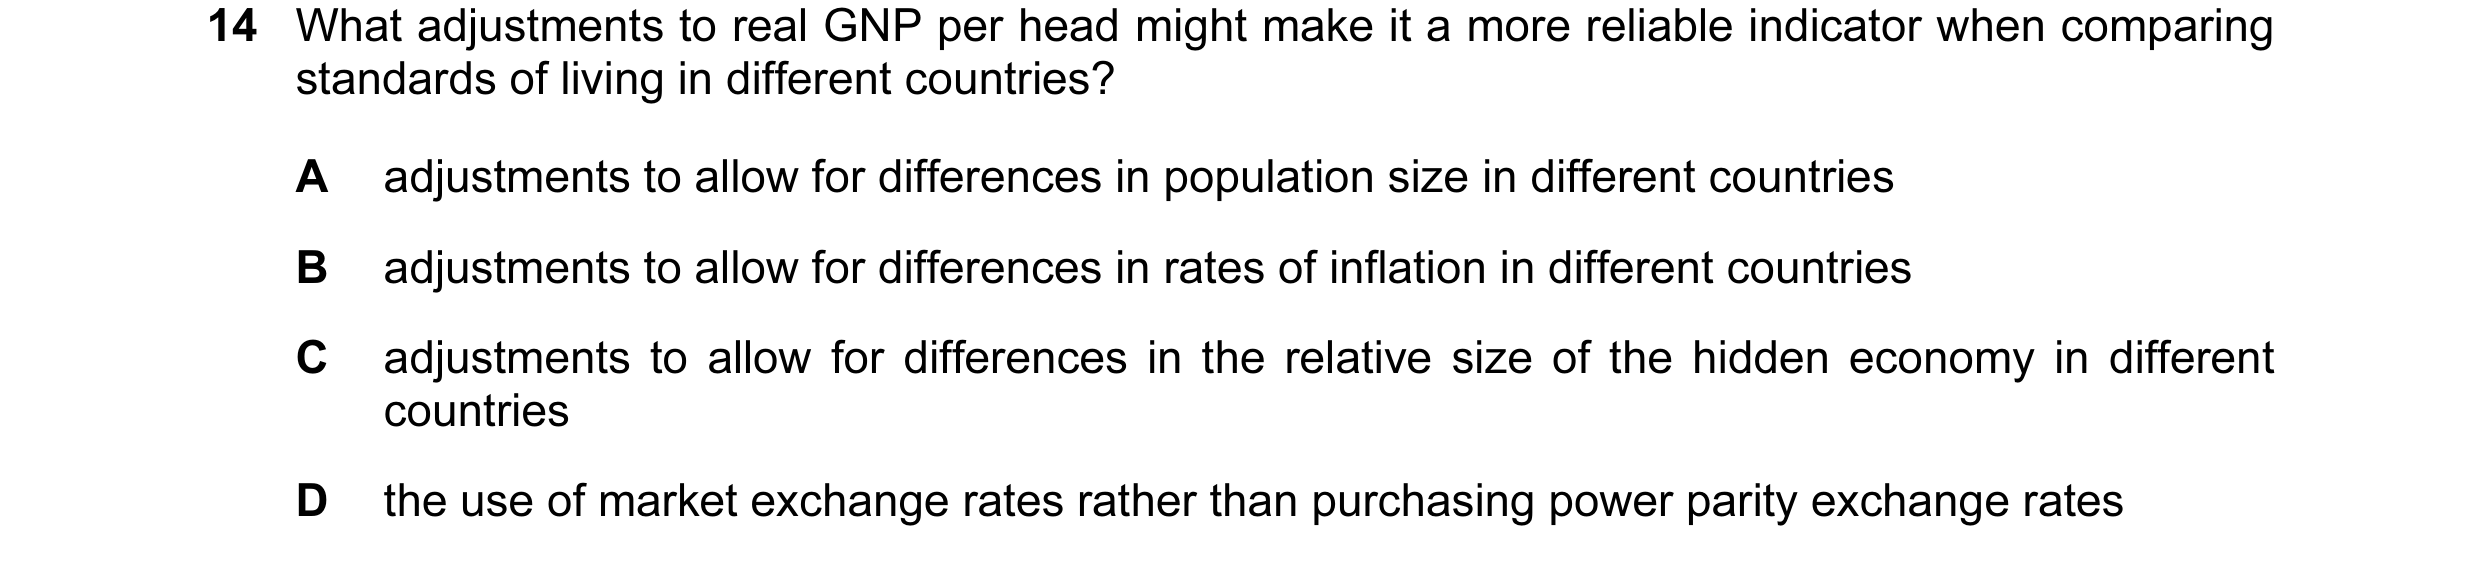
14 What adjustments to real GNP per head might make it a more reliable indicator when comparing standards of living in different countries? A adjustments to allow for differences in population size in different countries B adjustments to allow for differences in rates of inflation in different countries C adjustments to allow for differences in the relative size of the hidden economy in different countries D the use of market exchange rates rather than purchasing power parity exchange rates
1 marks
Answer: C
This question in 9708/31 May/June 2013
Q13 · Which combination is usually found in developing countries? 9708/31 May/June 2013
22 Which combination is usually found in developing countries? A a low birth rate and a dominant primary sector B capital intensive production and a rapidly growing population C external debt and a low death rate D labour intensive production and a low rate of saving
1 marks
Answer: D
This question in 9708/31 May/June 2013
Q14 · The table gives the percentage of employment in the primary, secondary and tertiary… 9708/31 May/June 2013
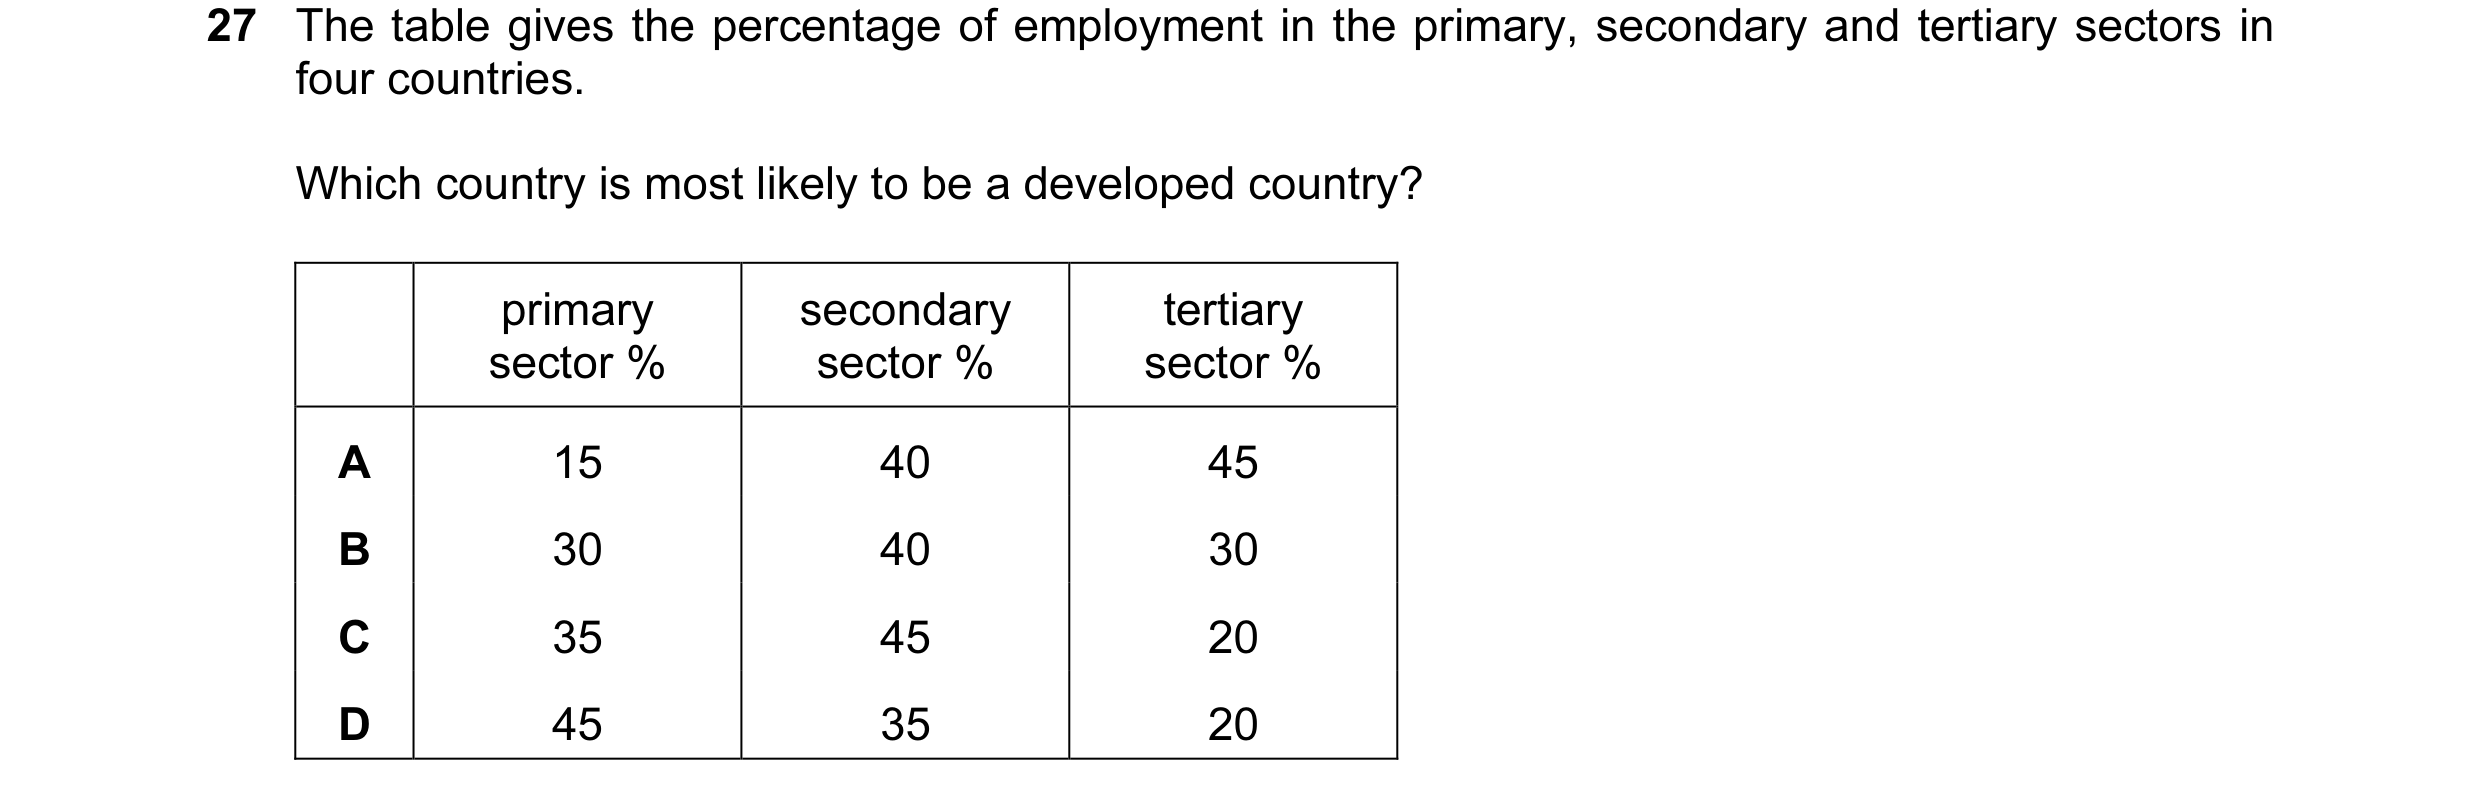
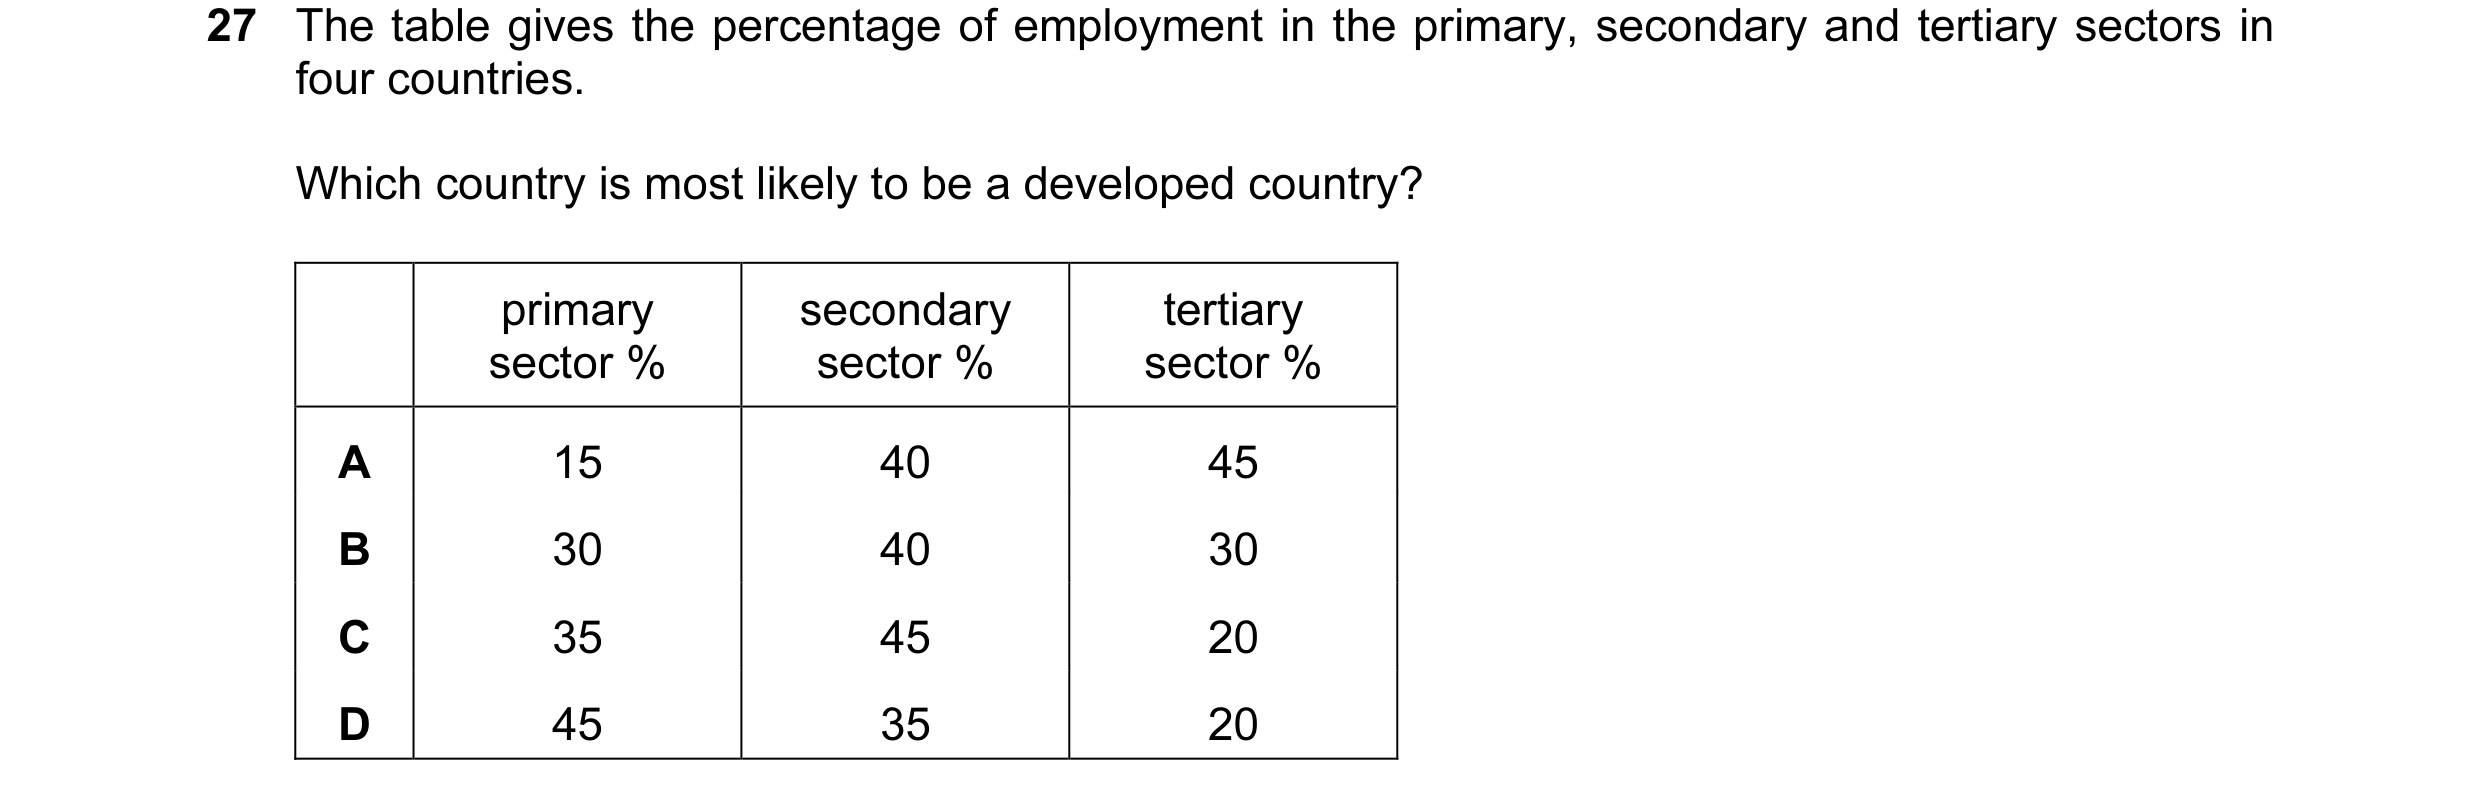
27 The table gives the percentage of employment in the primary, secondary and tertiary sectors in four countries. Which country is most likely to be a developed country? primary secondary tertiary sector % sector % sector % A 15 40 45 B 30 40 30 C 35 45 20 D 45 35 20
1 marks
Answer: A
This question in 9708/31 May/June 2013
Q15 · The table gives the percentage of employment in the primary, secondary and tertiary… 9708/32 May/June 2013
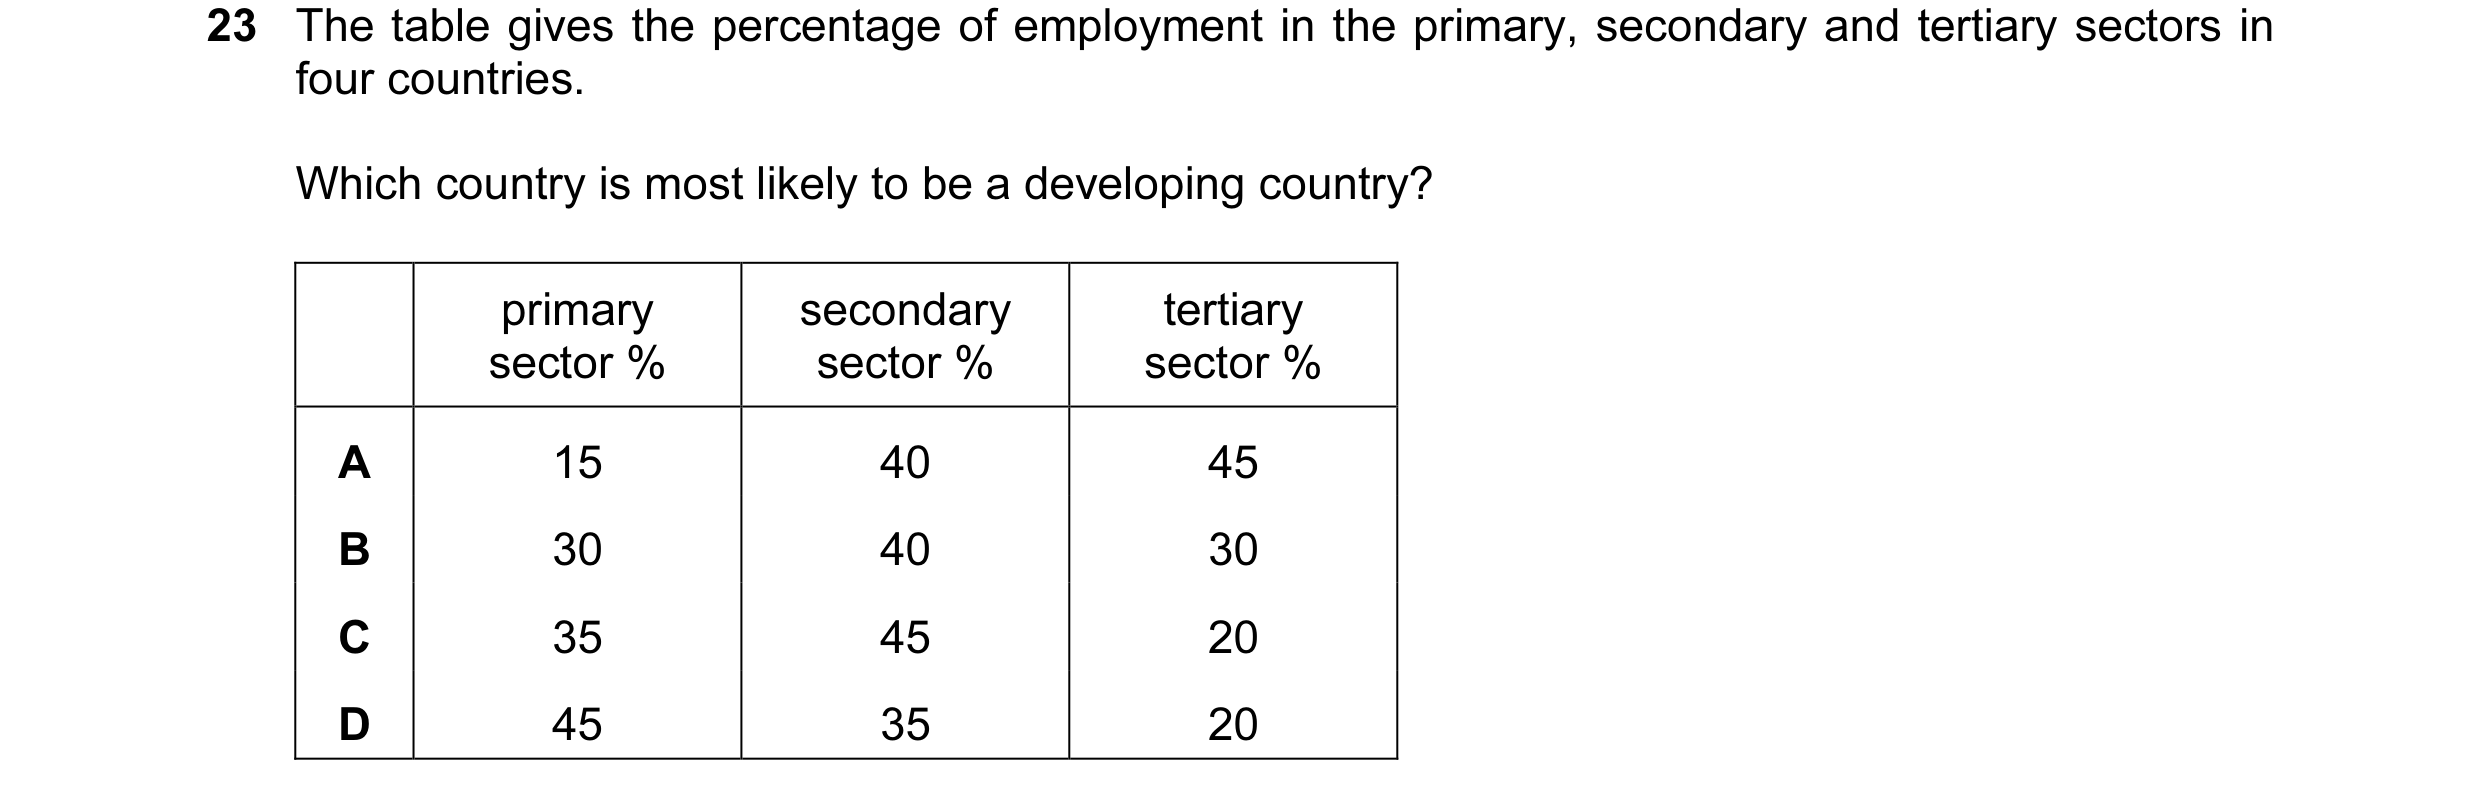
23 The table gives the percentage of employment in the primary, secondary and tertiary sectors in four countries. Which country is most likely to be a developing country? primary secondary tertiary sector % sector % sector % A 15 40 45 B 30 40 30 C 35 45 20 D 45 35 20
1 marks
Answer: D
This question in 9708/32 May/June 2013
Q16 · What adjustments to real GNP per head might make it a more reliable indicator when… 9708/33 May/June 2013
14 What adjustments to real GNP per head might make it a more reliable indicator when comparing standards of living in different countries? A adjustments to allow for differences in population size in different countries B adjustments to allow for differences in rates of inflation in different countries C adjustments to allow for differences in the relative size of the hidden economy in different countries D the use of market exchange rates rather than purchasing power parity exchange rates
1 marks
Answer: C
This question in 9708/33 May/June 2013
Q17 · Which combination is usually found in developing countries? 9708/33 May/June 2013
22 Which combination is usually found in developing countries? A a low birth rate and a dominant primary sector B capital intensive production and a rapidly growing population C external debt and a low death rate D labour intensive production and a low rate of saving
1 marks
Answer: D
This question in 9708/33 May/June 2013
Q18 · The table gives the percentage of employment in the primary, secondary and tertiary… 9708/33 May/June 2013
27 The table gives the percentage of employment in the primary, secondary and tertiary sectors in four countries. Which country is most likely to be a developed country? primary secondary tertiary sector % sector % sector % A 15 40 45 B 30 40 30 C 35 45 20 D 45 35 20
1 marks
Answer: A
This question in 9708/33 May/June 2013
Q19 · How are the weights applied to the different indicators used to construct the United… 9708/31 Oct/Nov 2013
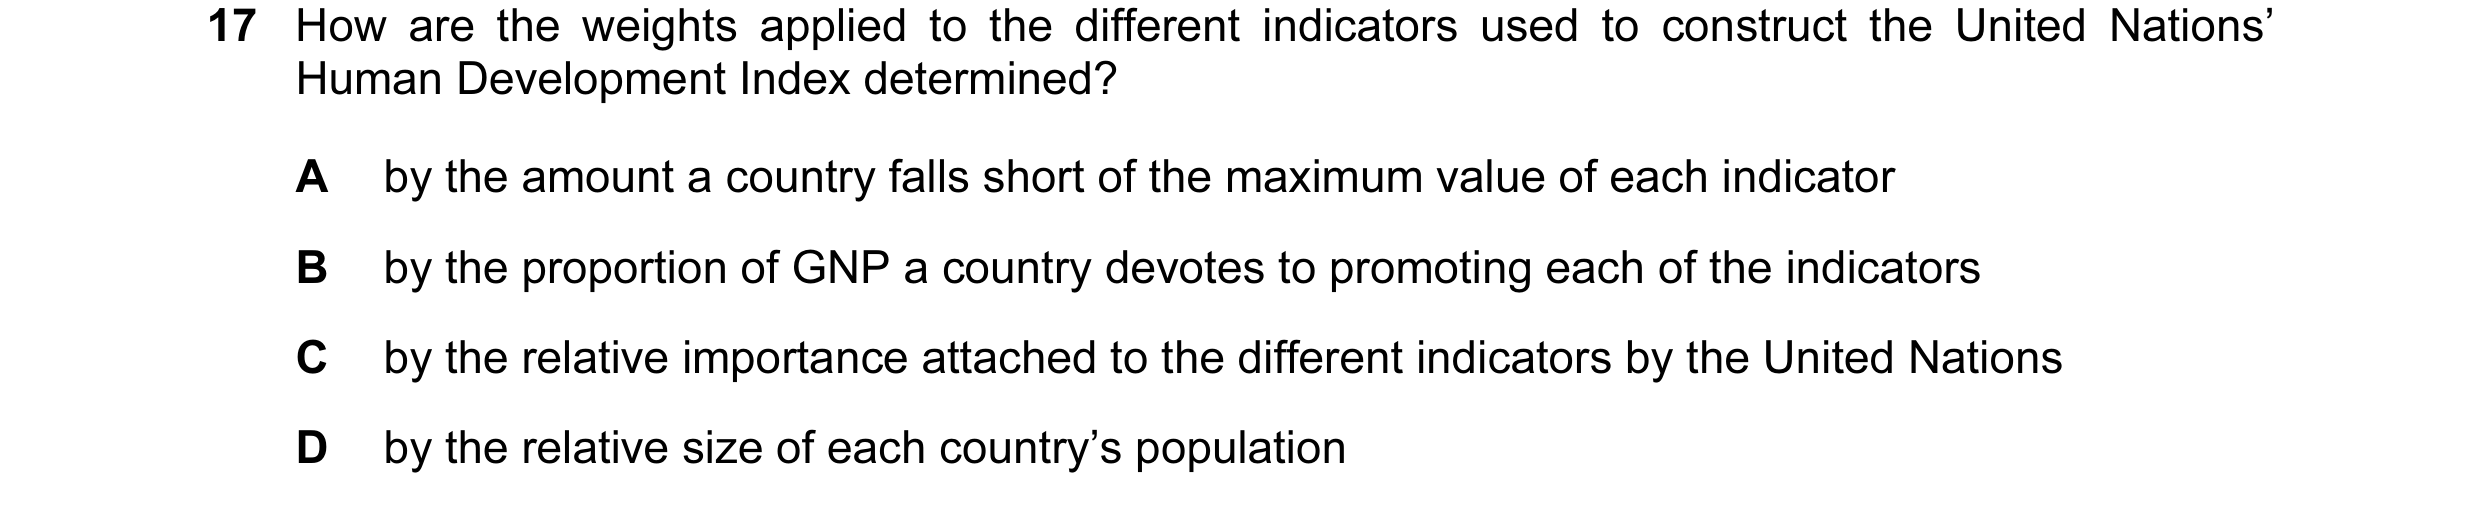
17 How are the weights applied to the different indicators used to construct the United Nations’ Human Development Index determined? A by the amount a country falls short of the maximum value of each indicator B by the proportion of GNP a country devotes to promoting each of the indicators C by the relative importance attached to the different indicators by the United Nations D by the relative size of each country’s population
1 marks
Answer: C
This question in 9708/31 Oct/Nov 2013
Q20 · Which combination is usually found in developing countries? 9708/33 Oct/Nov 2013
16 Which combination is usually found in developing countries? A a high birth rate and a dominant primary sector B capital intensive production and a low rate of saving C labour intensive production and a declining population D net inward migration and a low death rate
1 marks
Answer: A
This question in 9708/33 Oct/Nov 2013
Q21 · The World Bank publishes statistics on changes in the number of people in the world who… 9708/33 Oct/Nov 2013
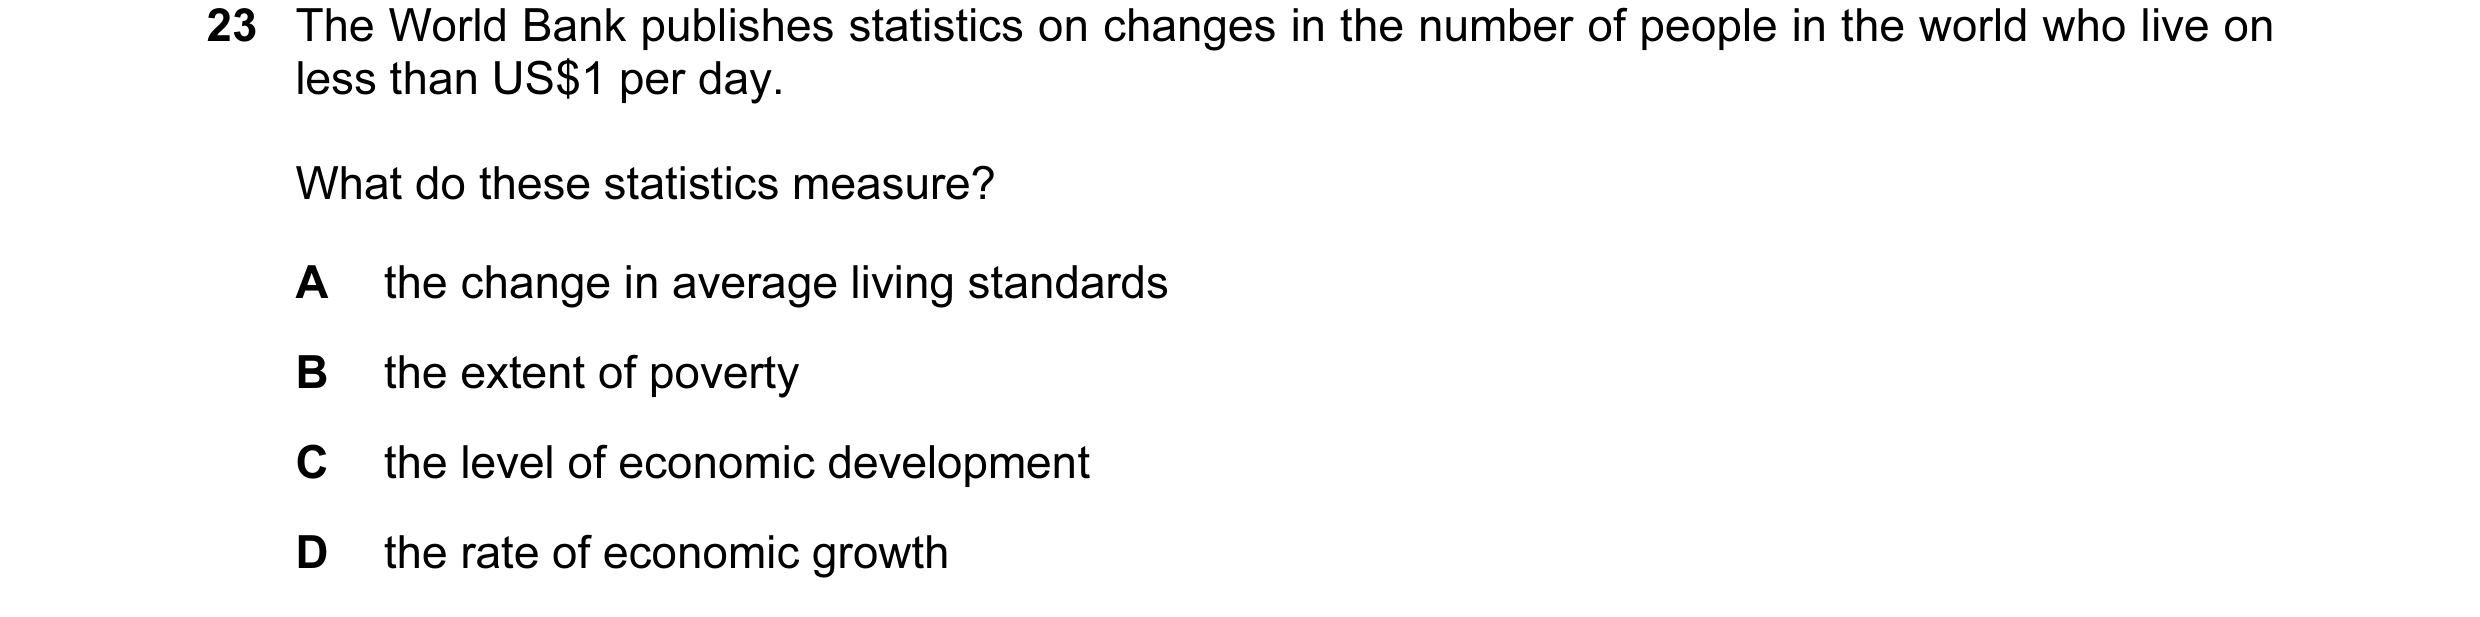
23 The World Bank publishes statistics on changes in the number of people in the world who live on less than US$1 per day. What do these statistics measure? A the change in average living standards B the extent of poverty C the level of economic development D the rate of economic growth
1 marks
Answer: B
This question in 9708/33 Oct/Nov 2013
Q22 · Which of the following are characteristics of most developing economies? 9708/33 Oct/Nov 2013
24 Which of the following are characteristics of most developing economies? government average debt: GDP ratio propensity to save A high high B high low C low high D low low
1 marks
Answer: B
This question in 9708/33 Oct/Nov 2013
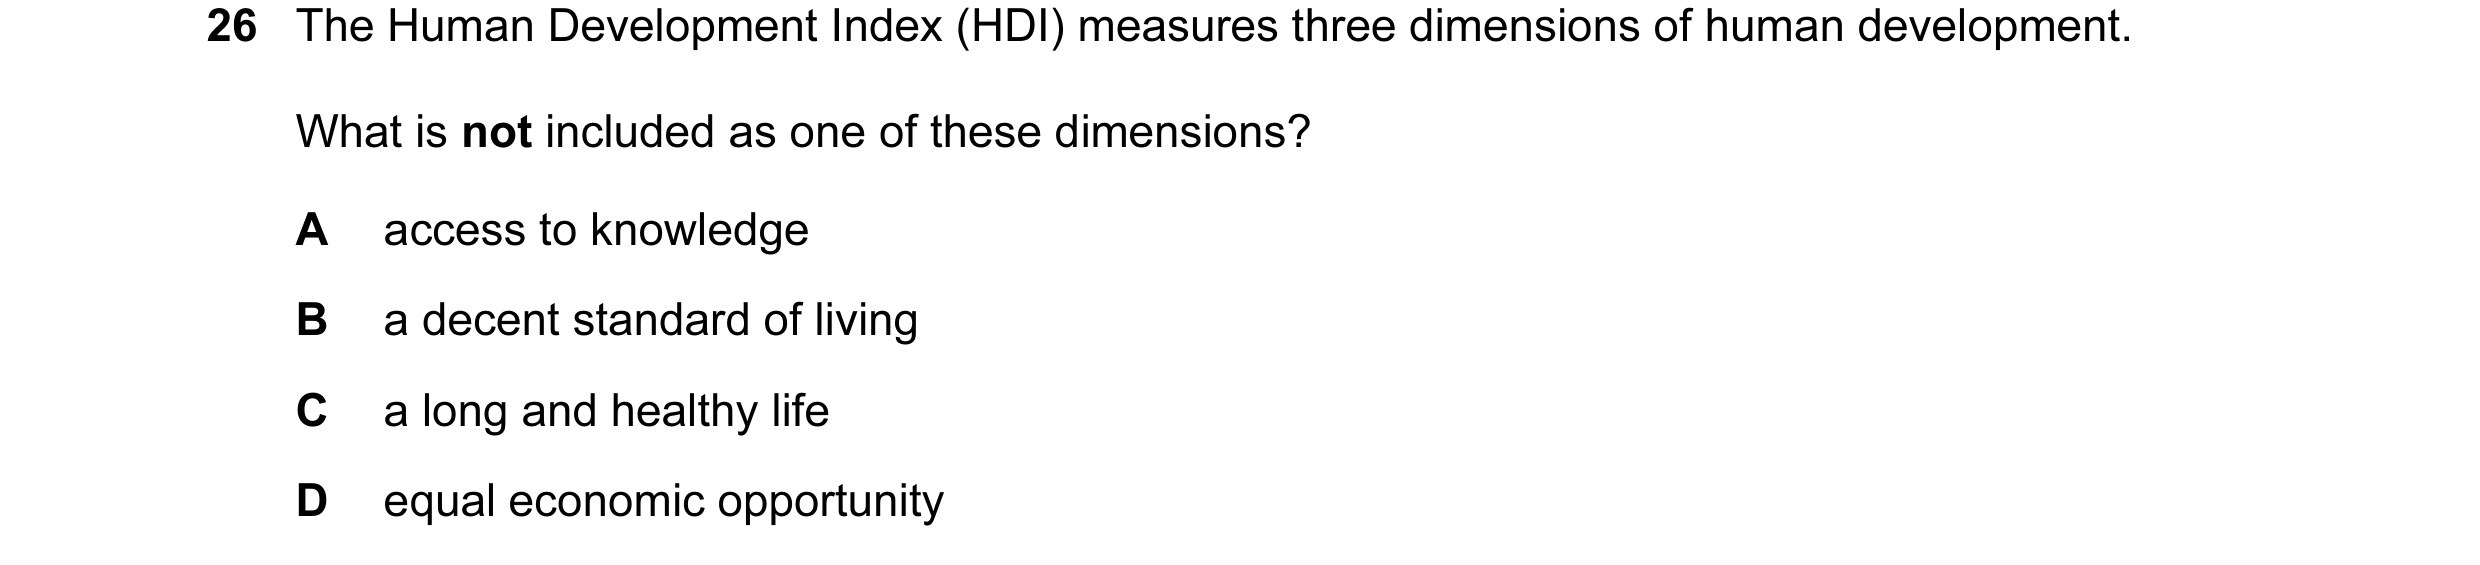
Q23 · The Human Development Index (HDI) measures three dimensions of human development 9708/33 Oct/Nov 2014
26 The Human Development Index (HDI) measures three dimensions of human development. What is not included as one of these dimensions? A access to knowledge B a decent standard of living C a long and healthy life D equal economic opportunity
1 marks
Answer: D
This question in 9708/33 Oct/Nov 2014
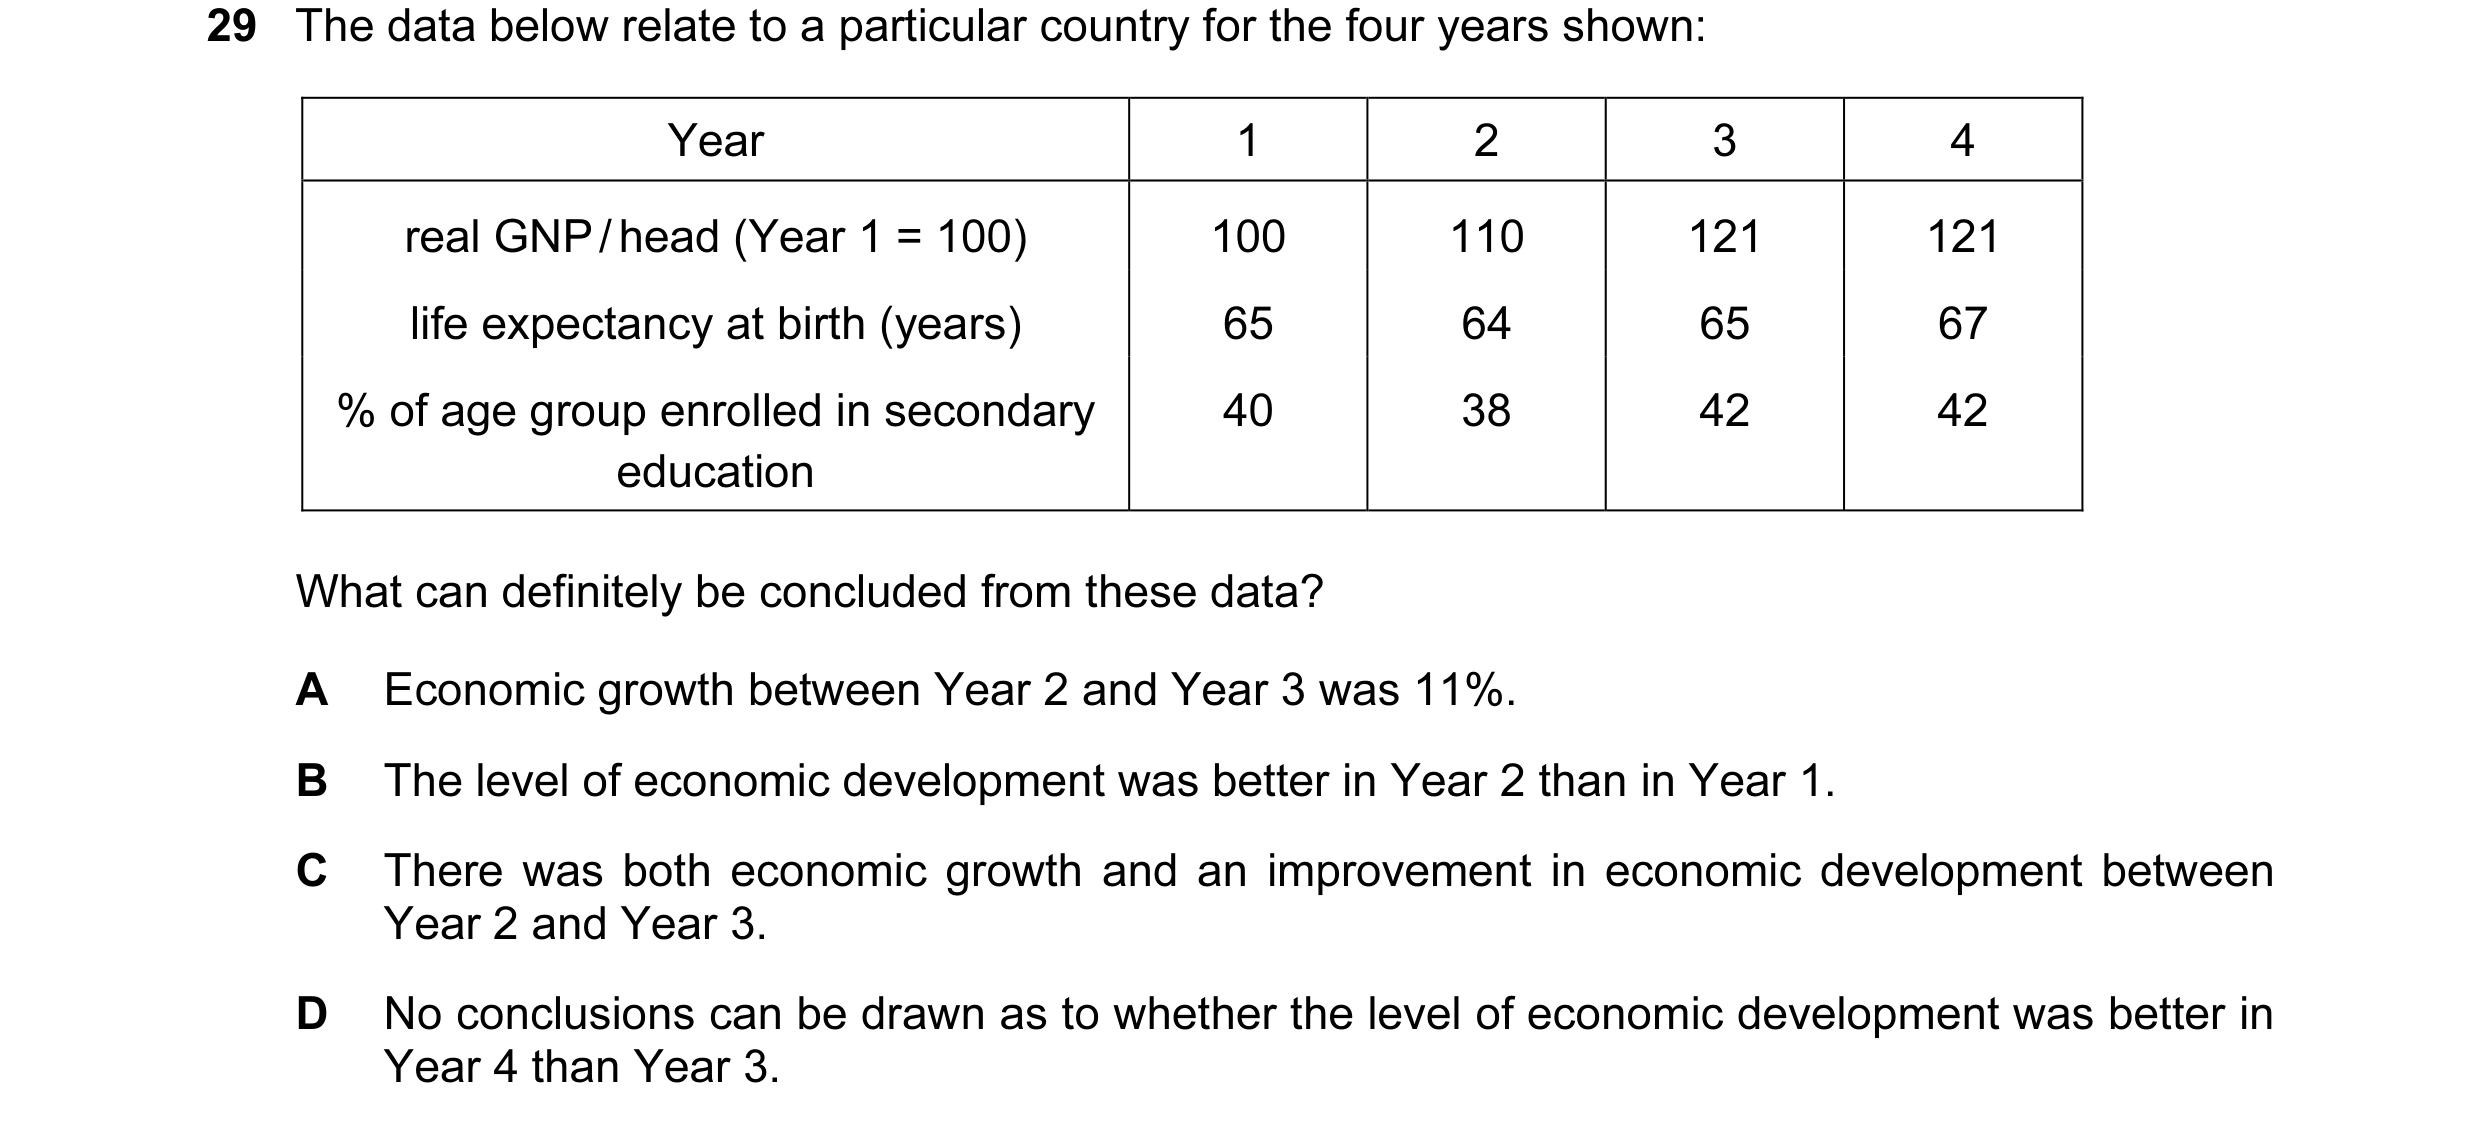
Q24 · The data below relate to a particular country for the four years shown: Year 1 2 3 4 real… 9708/32 May/June 2015
29 The data below relate to a particular country for the four years shown: Year 1 2 3 4 real GNP / head (Year 1 = 100) 100 110 121 121 life expectancy at birth (years) 65 64 65 67 % of age group enrolled in secondary 40 38 42 42 education What can definitely be concluded from these data? A Economic growth between Year 2 and Year 3 was 11%. B The level of economic development was better in Year 2 than in Year 1. C There was both economic growth and an improvement in economic development between Year 2 and Year 3. D No conclusions can be drawn as to whether the level of economic development was better in Year 4 than Year 3.
1 marks
Answer: C
This question in 9708/32 May/June 2015
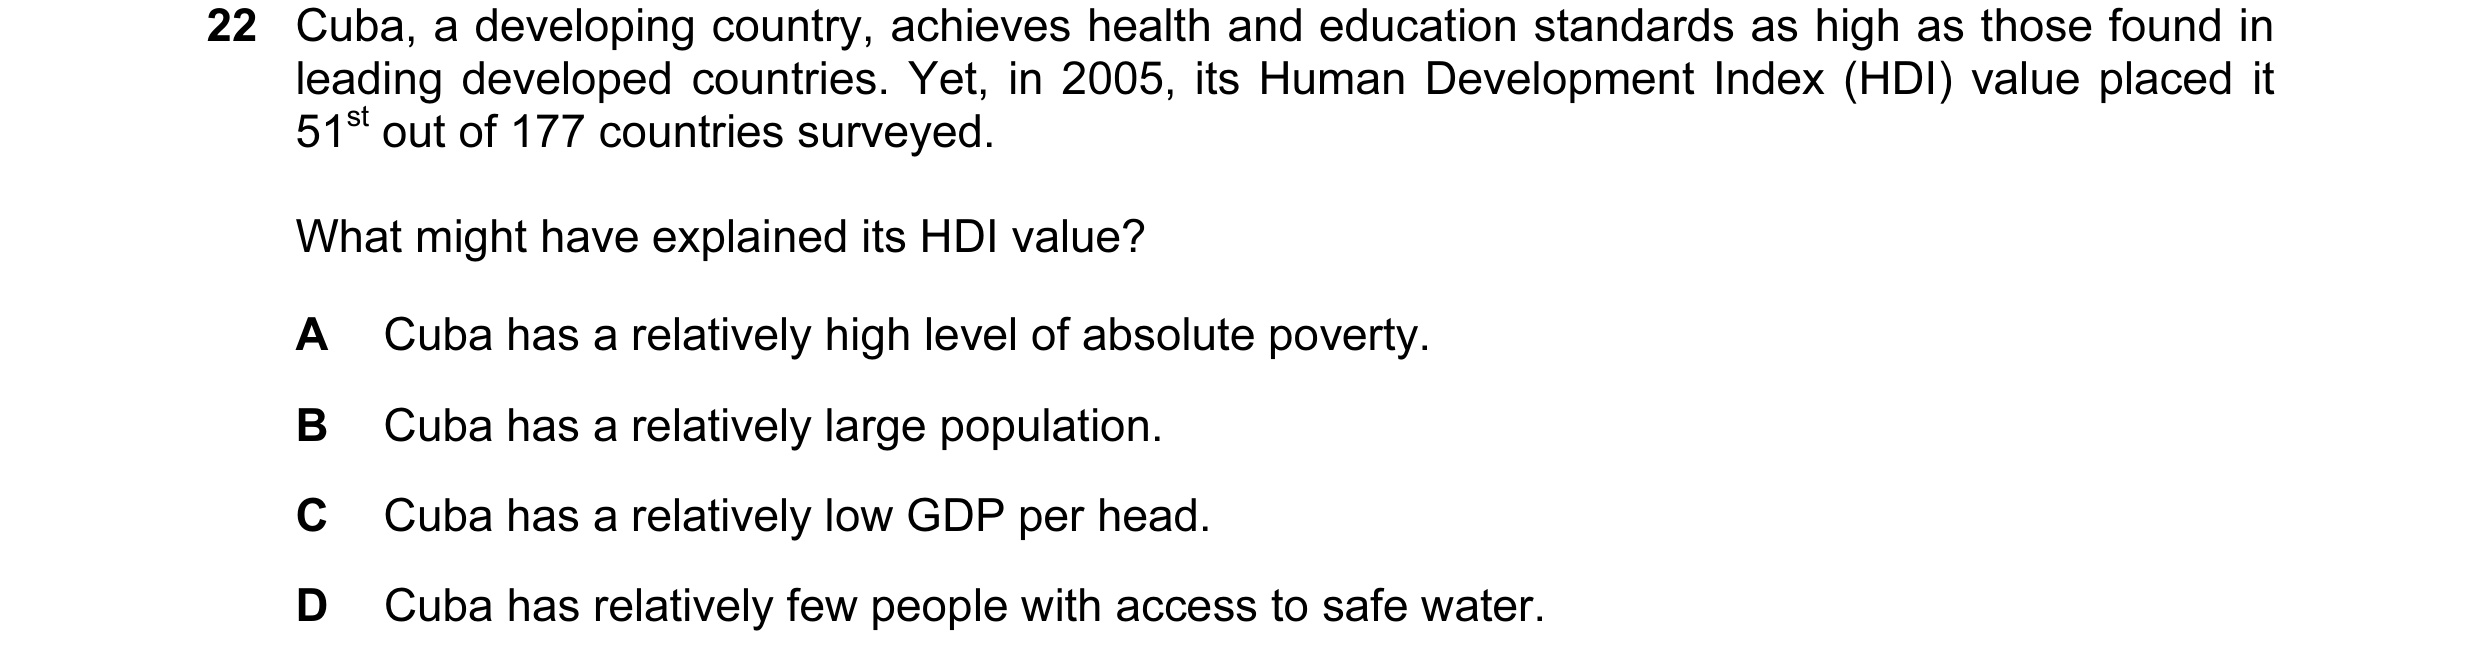
Q25 · Cuba, a developing country, achieves health and education standards as high as those… 9708/31 Oct/Nov 2015
22 Cuba, a developing country, achieves health and education standards as high as those found in leading developed countries. Yet, in 2005, its Human Development Index (HDI) value placed it 51st out of 177 countries surveyed. What might have explained its HDI value? A Cuba has a relatively high level of absolute poverty. B Cuba has a relatively large population. C Cuba has a relatively low GDP per head. D Cuba has relatively few people with access to safe water.
1 marks
This question in 9708/31 Oct/Nov 2015
Q26 · Which characteristics are most commonly found in developing countries? 9708/31 Oct/Nov 2015
23 Which characteristics are most commonly found in developing countries? saving ratio capital-output ratio A low low B high low C low high D high high
1 marks
This question in 9708/31 Oct/Nov 2015
Q27 · Gross Domestic Product (GDP) per head is an indicator sometimes used to compare living… 9708/32 Oct/Nov 2015
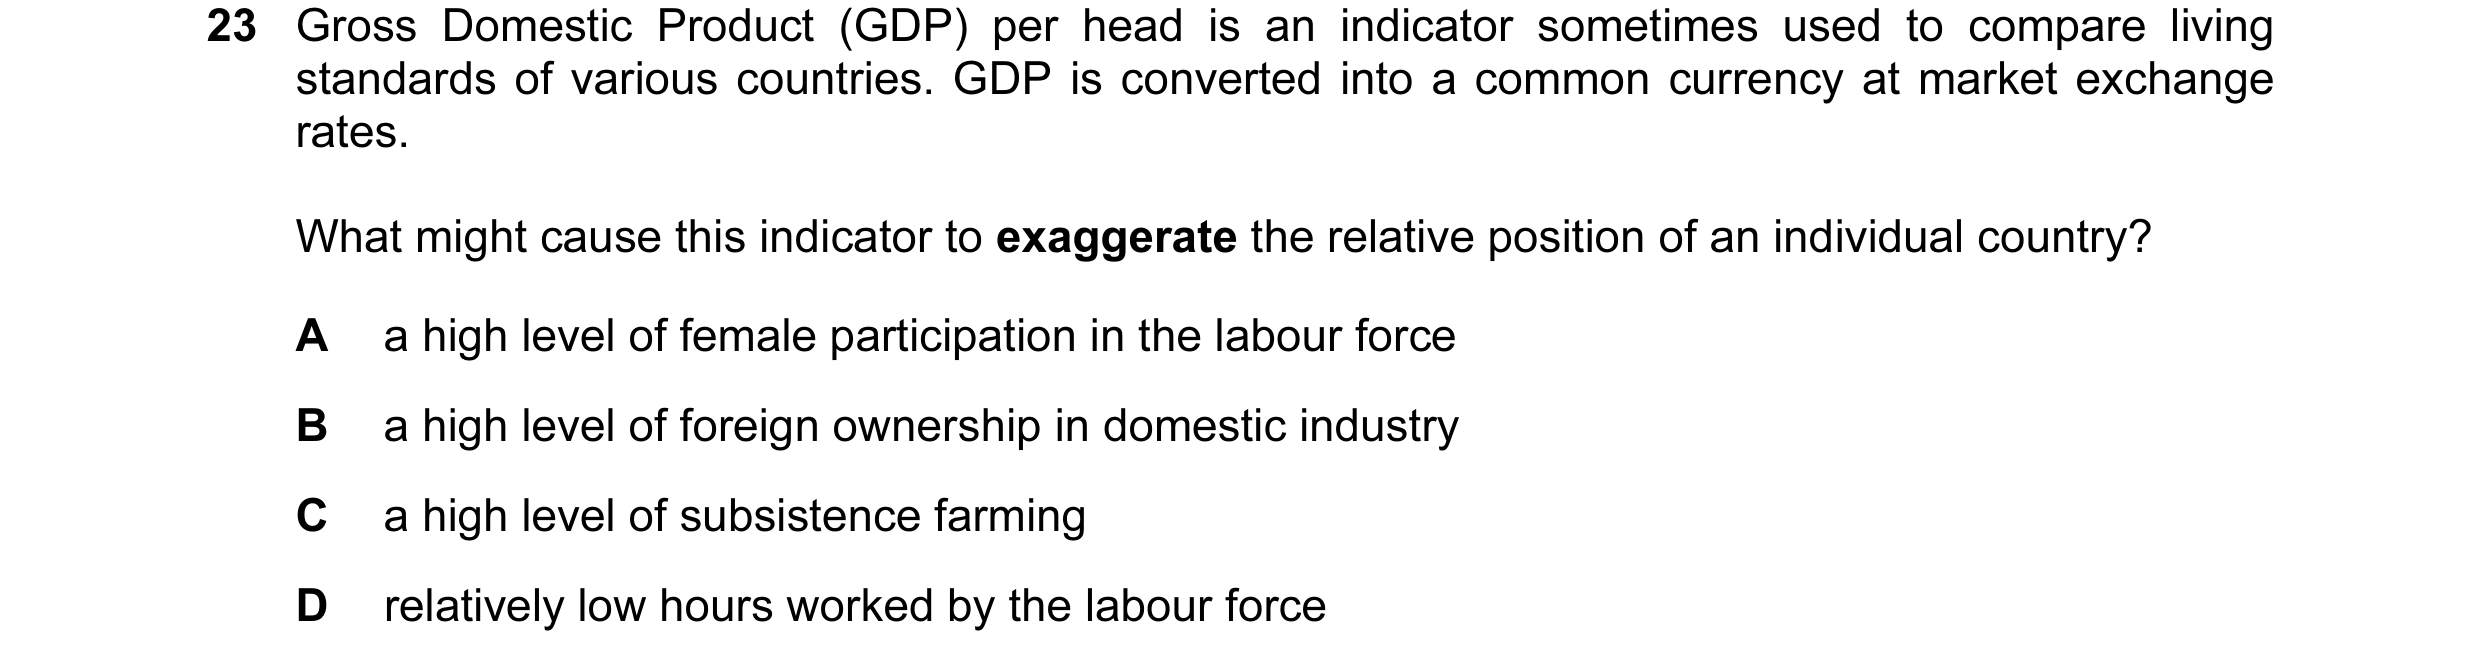
23 Gross Domestic Product (GDP) per head is an indicator sometimes used to compare living standards of various countries. GDP is converted into a common currency at market exchange rates. What might cause this indicator to exaggerate the relative position of an individual country? A a high level of female participation in the labour force B a high level of foreign ownership in domestic industry C a high level of subsistence farming D relatively low hours worked by the labour force
1 marks
Answer: B
This question in 9708/32 Oct/Nov 2015
Q28 · In 2012 a United Nations report calculated the stock of wealth of 20 countries in terms… 9708/32 May/June 2016
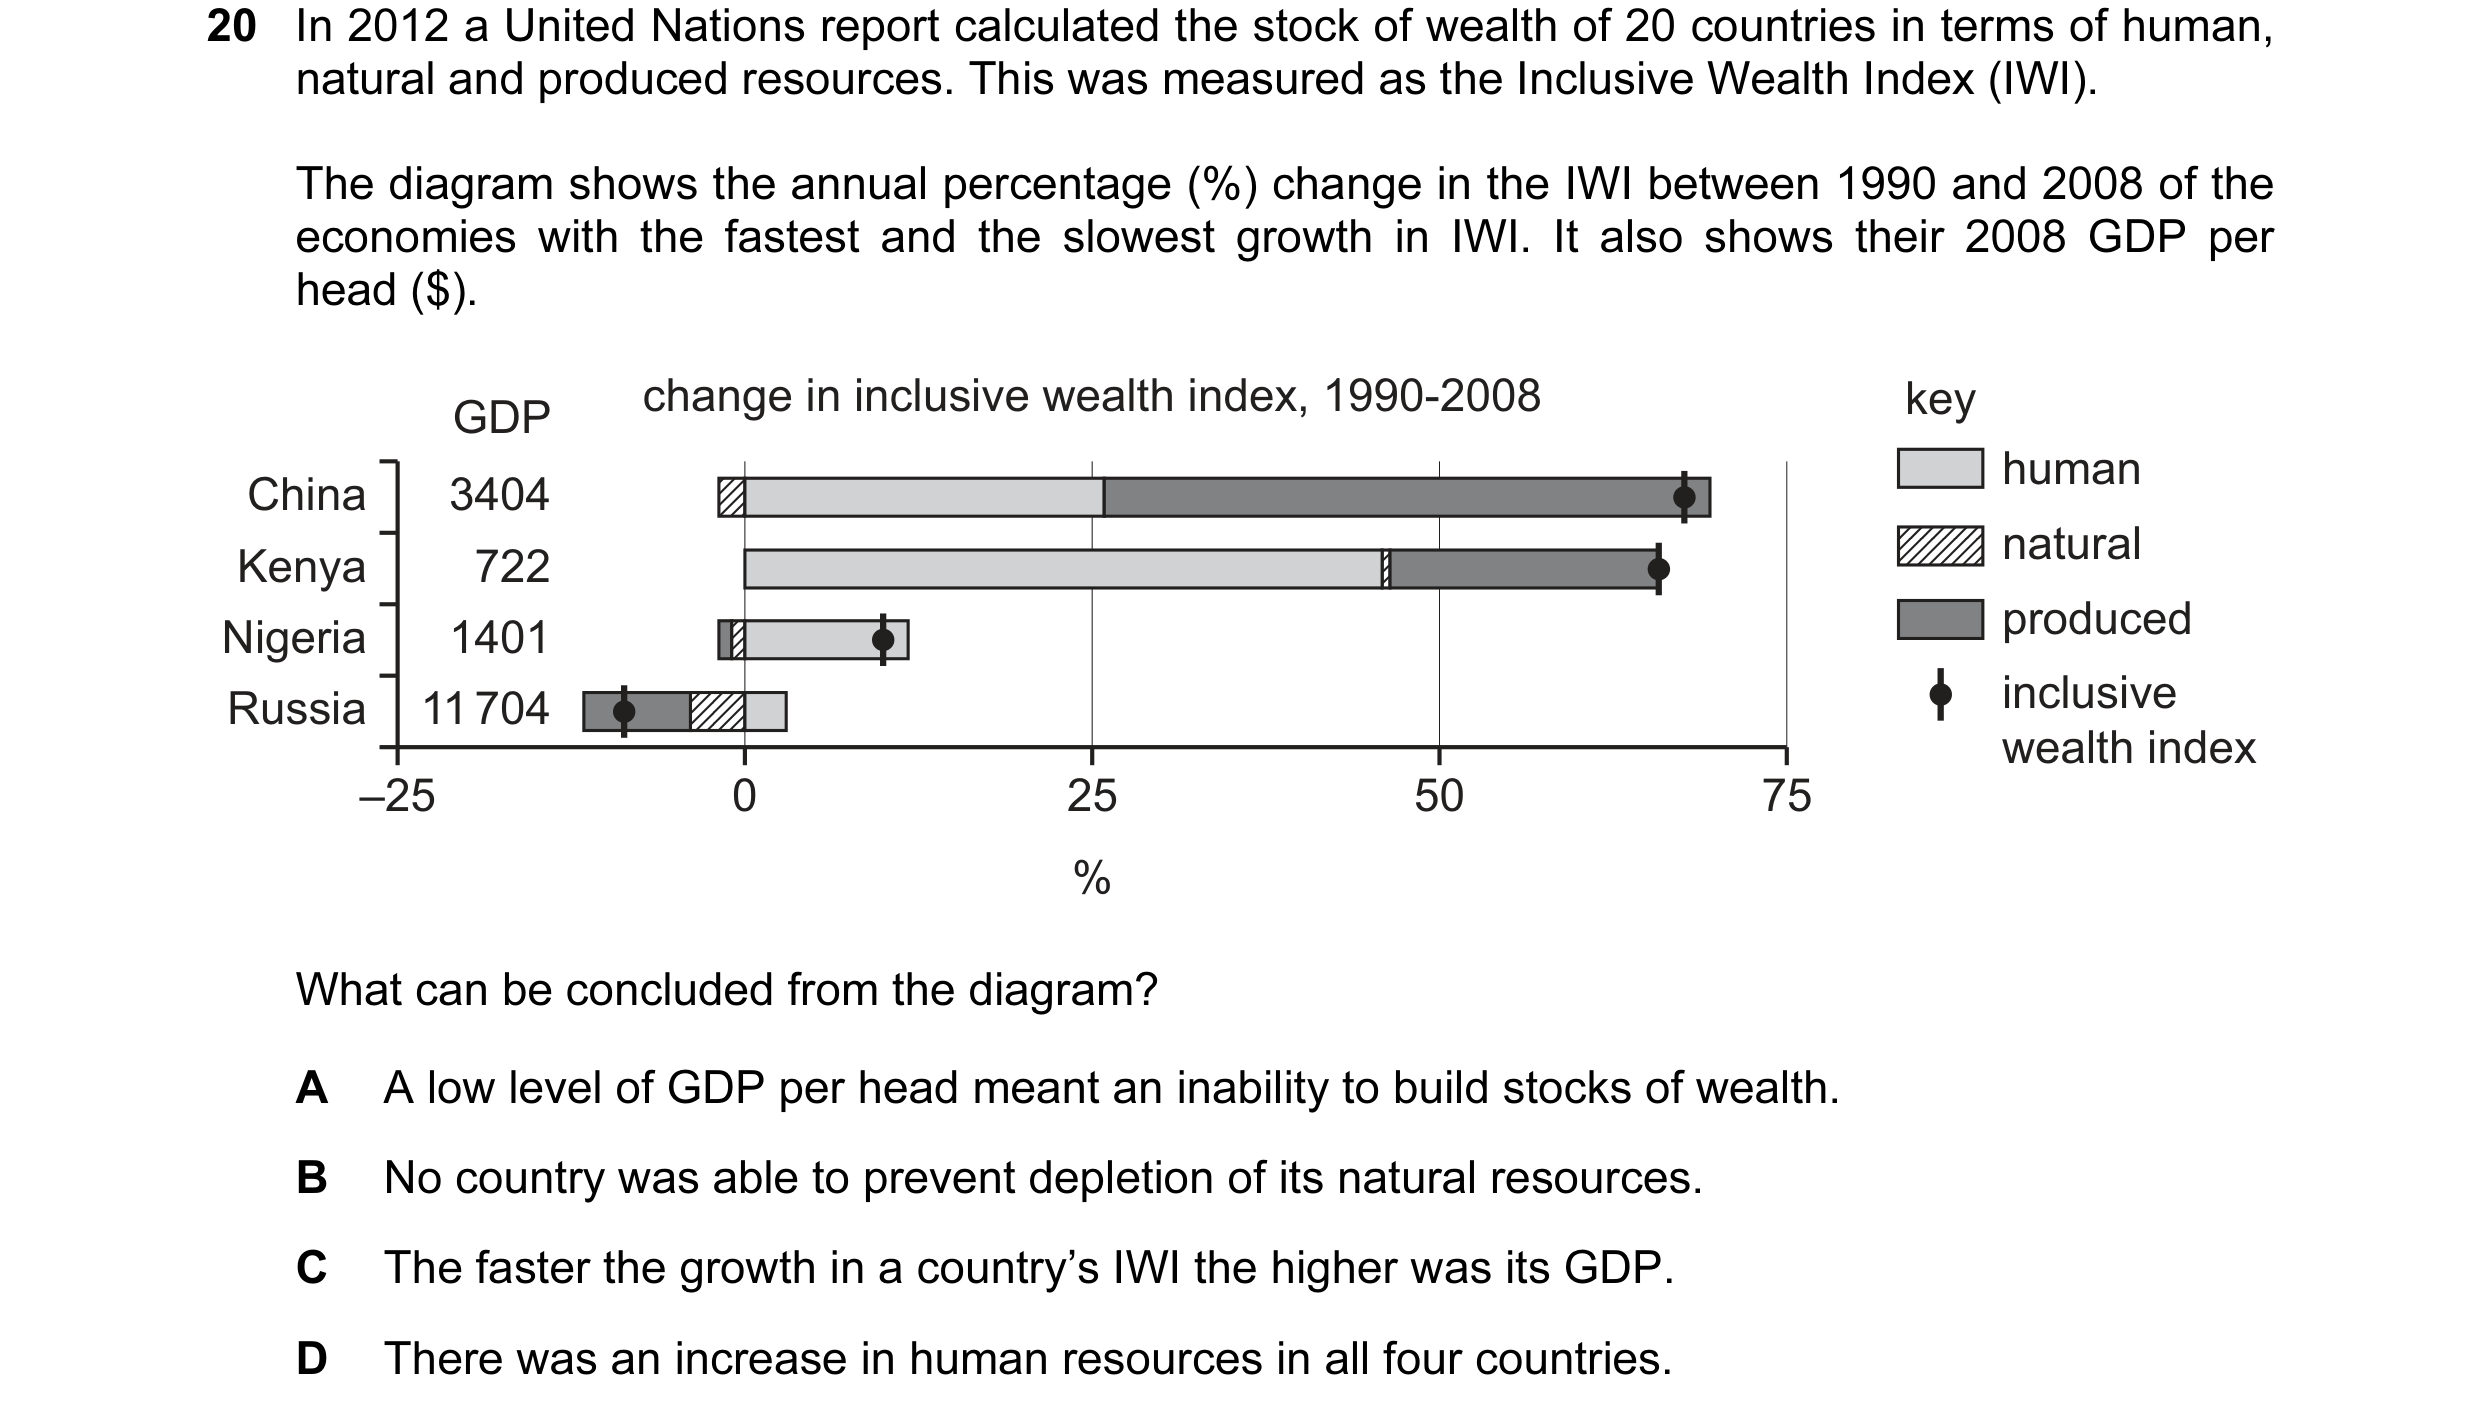
20 In 2012 a United Nations report calculated the stock of wealth of 20 countries in terms of human, natural and produced resources. This was measured as the Inclusive Wealth Index (IWI). The diagram shows the annual percentage (%) change in the IWI between 1990 and 2008 of the economies with the fastest and the slowest growth in IWI. It also shows their 2008 GDP per head ($). change in inclusive wealth index, 1990-2008 key GDP human China 3404 natural Kenya 722 Nigeria 1401 produced Russia 11 704 inclusive wealth index –25 0 25 50 75 % What can be concluded from the diagram? A A low level of GDP per head meant an inability to build stocks of wealth. B No country was able to prevent depletion of its natural resources. C The faster the growth in a country’s IWI the higher was its GDP. D There was an increase in human resources in all four countries.
1 marks
Answer: D
This question in 9708/32 May/June 2016
Q29 · Which combination is usually found in less developed economies? 9708/32 May/June 2016
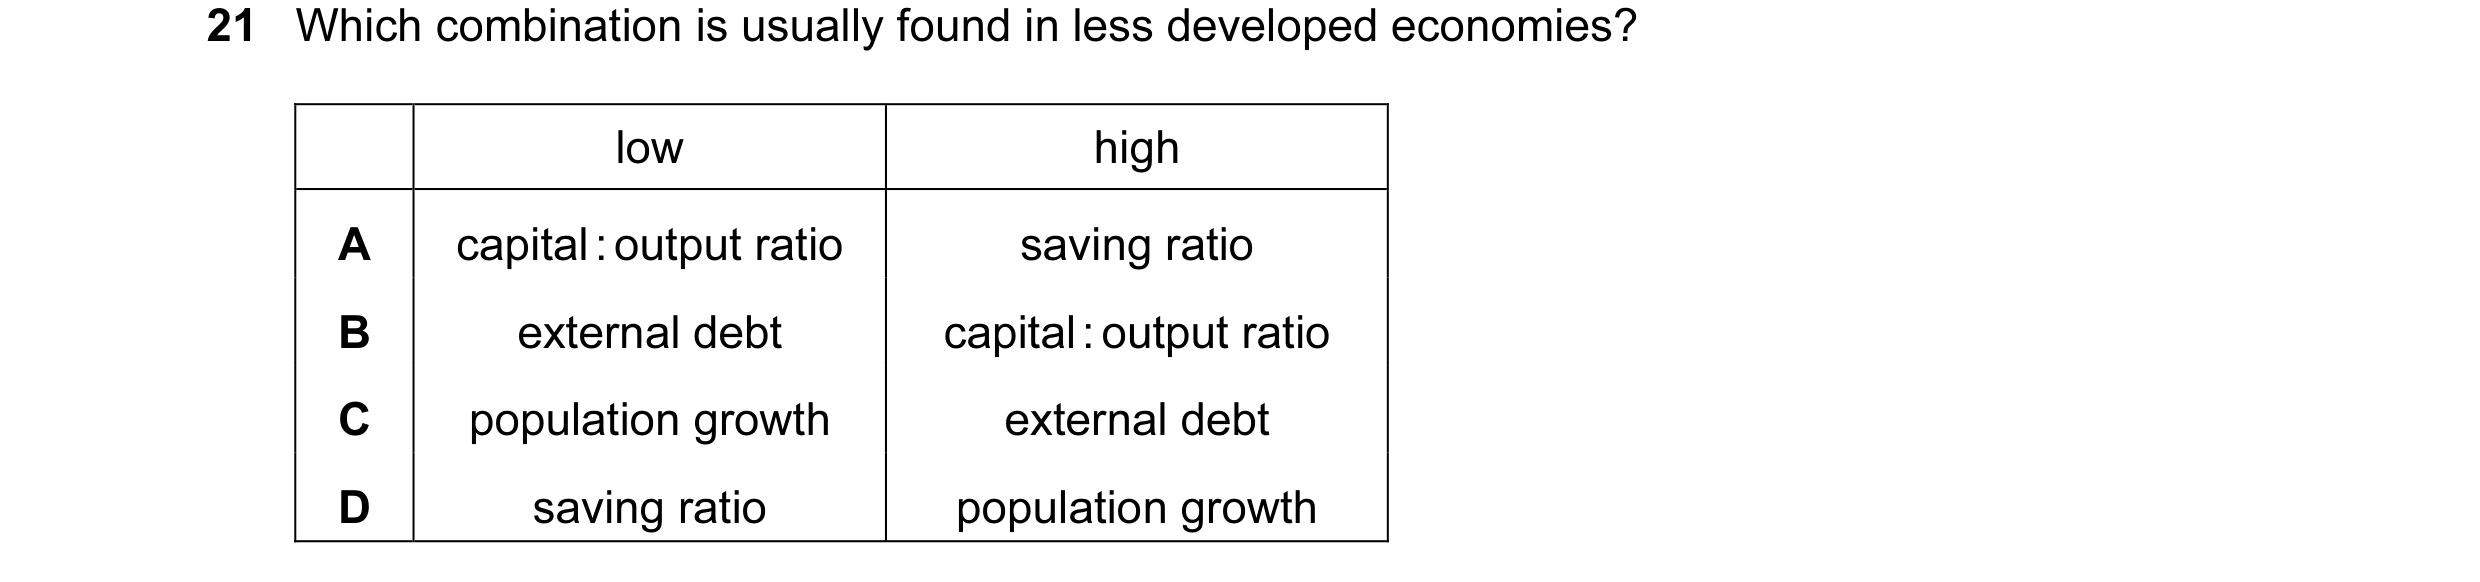
21 Which combination is usually found in less developed economies? low high A capital : output ratio saving ratio B external debt capital : output ratio C population growth external debt D saving ratio population growth
1 marks
Answer: D
This question in 9708/32 May/June 2016
Q30 · Which combination is usually found in developing countries? 9708/33 May/June 2016
21 Which combination is usually found in developing countries? A a low birth rate and a dominant primary sector B capital-intensive production and a rapidly growing population C external debt and a low death rate D labour-intensive production and a low rate of saving
1 marks
Answer: D
This question in 9708/33 May/June 2016
Q31 · The table refers to changes in the percentage age distribution in a developing country… 9708/33 May/June 2016
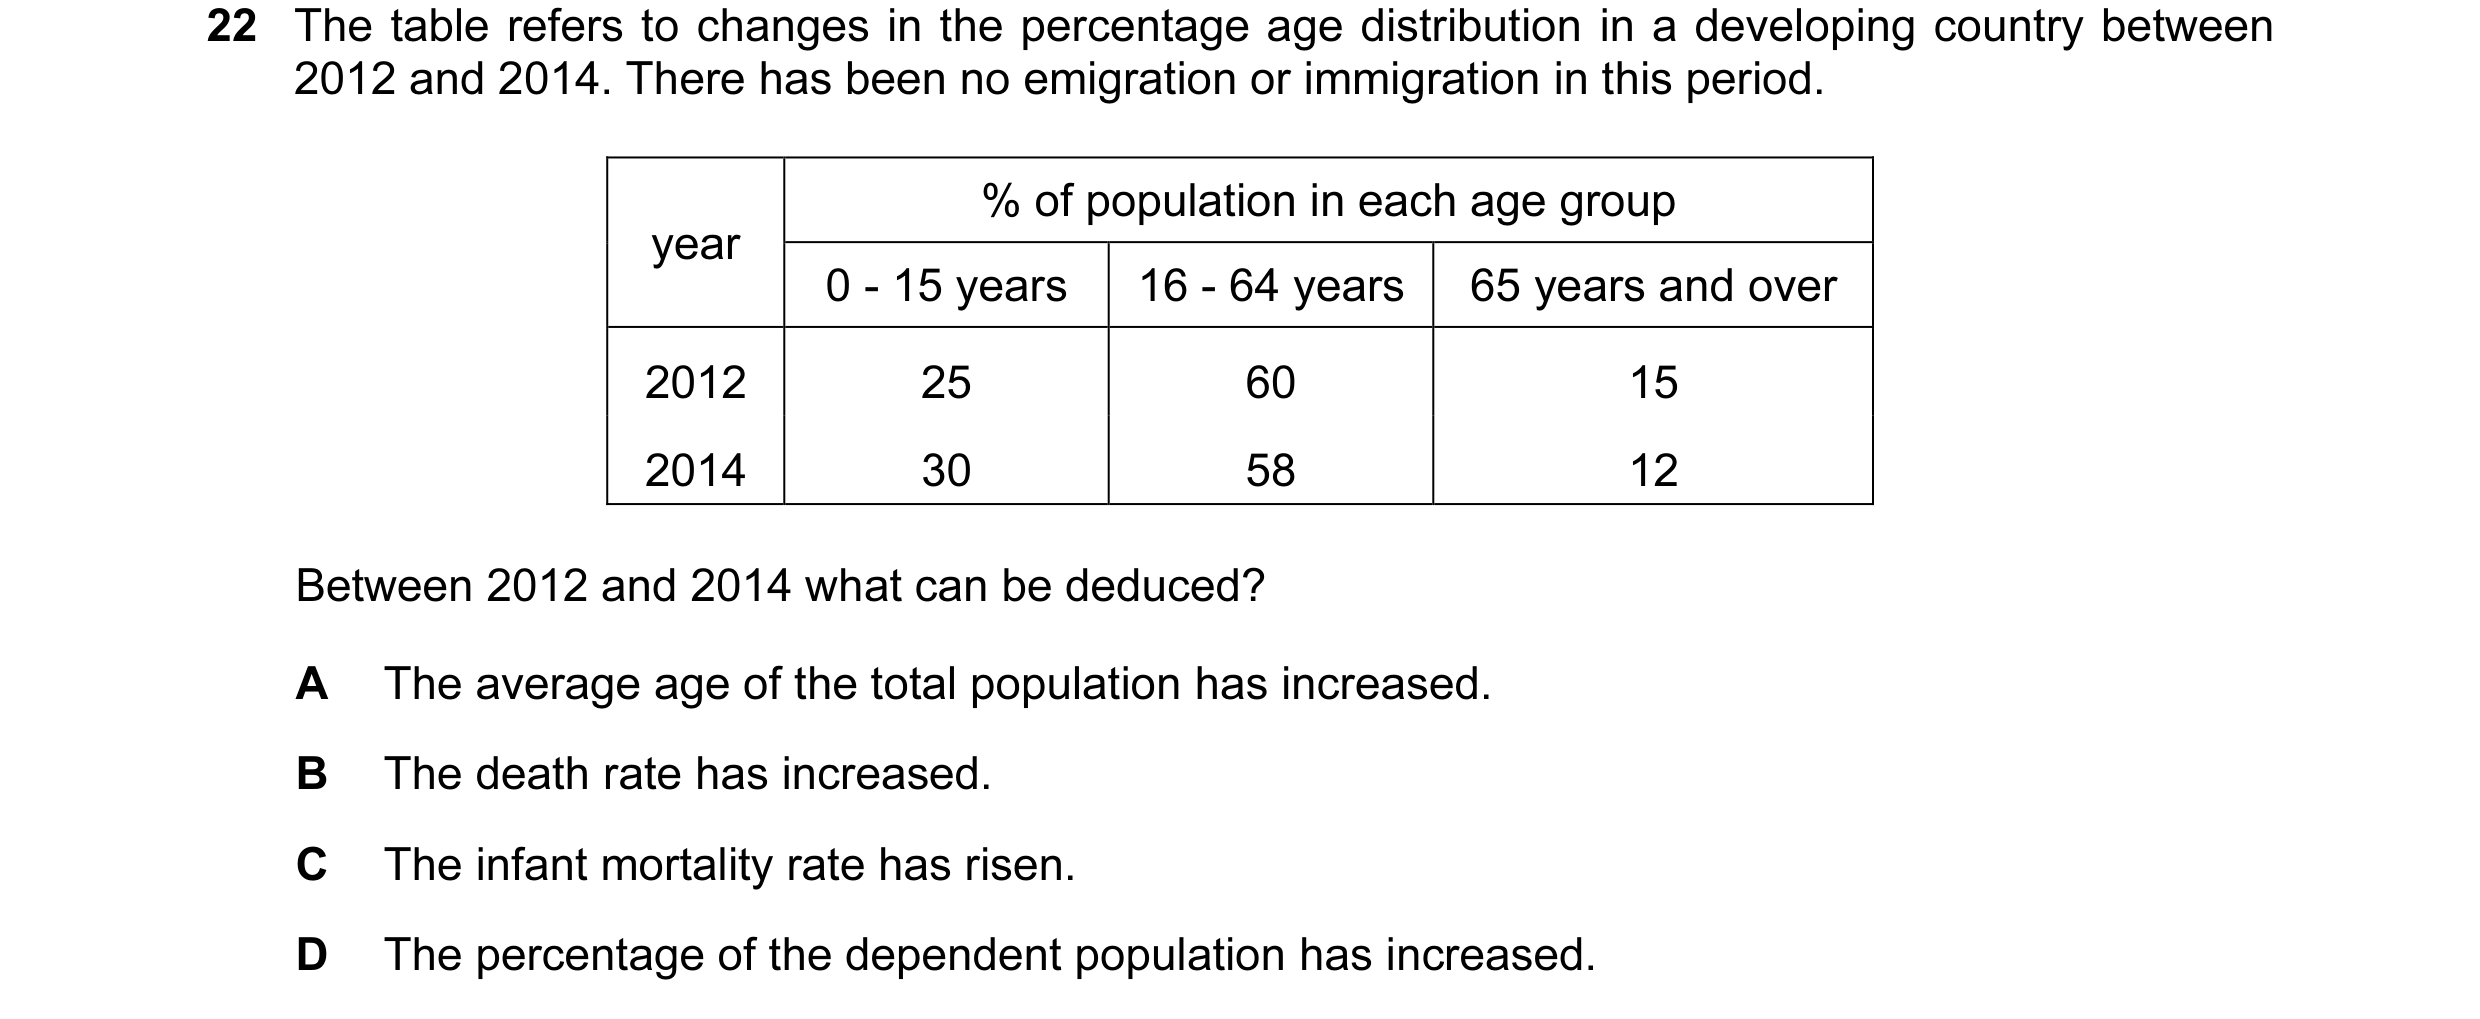
22 The table refers to changes in the percentage age distribution in a developing country between 2012 and 2014. There has been no emigration or immigration in this period. % of population in each age group year 0 - 15 years 16 - 64 years 65 years and over 2012 25 60 15 2014 30 58 12 Between 2012 and 2014 what can be deduced? A The average age of the total population has increased. B The death rate has increased. C The infant mortality rate has risen. D The percentage of the dependent population has increased.
1 marks
Answer: D
This question in 9708/33 May/June 2016
Q32 · What is a common characteristic of developing economies? 9708/32 Oct/Nov 2016
21 What is a common characteristic of developing economies? A a relatively small agricultural sector B extensive underemployment C high saving rates D stable export earnings
1 marks
Answer: B
This question in 9708/32 Oct/Nov 2016
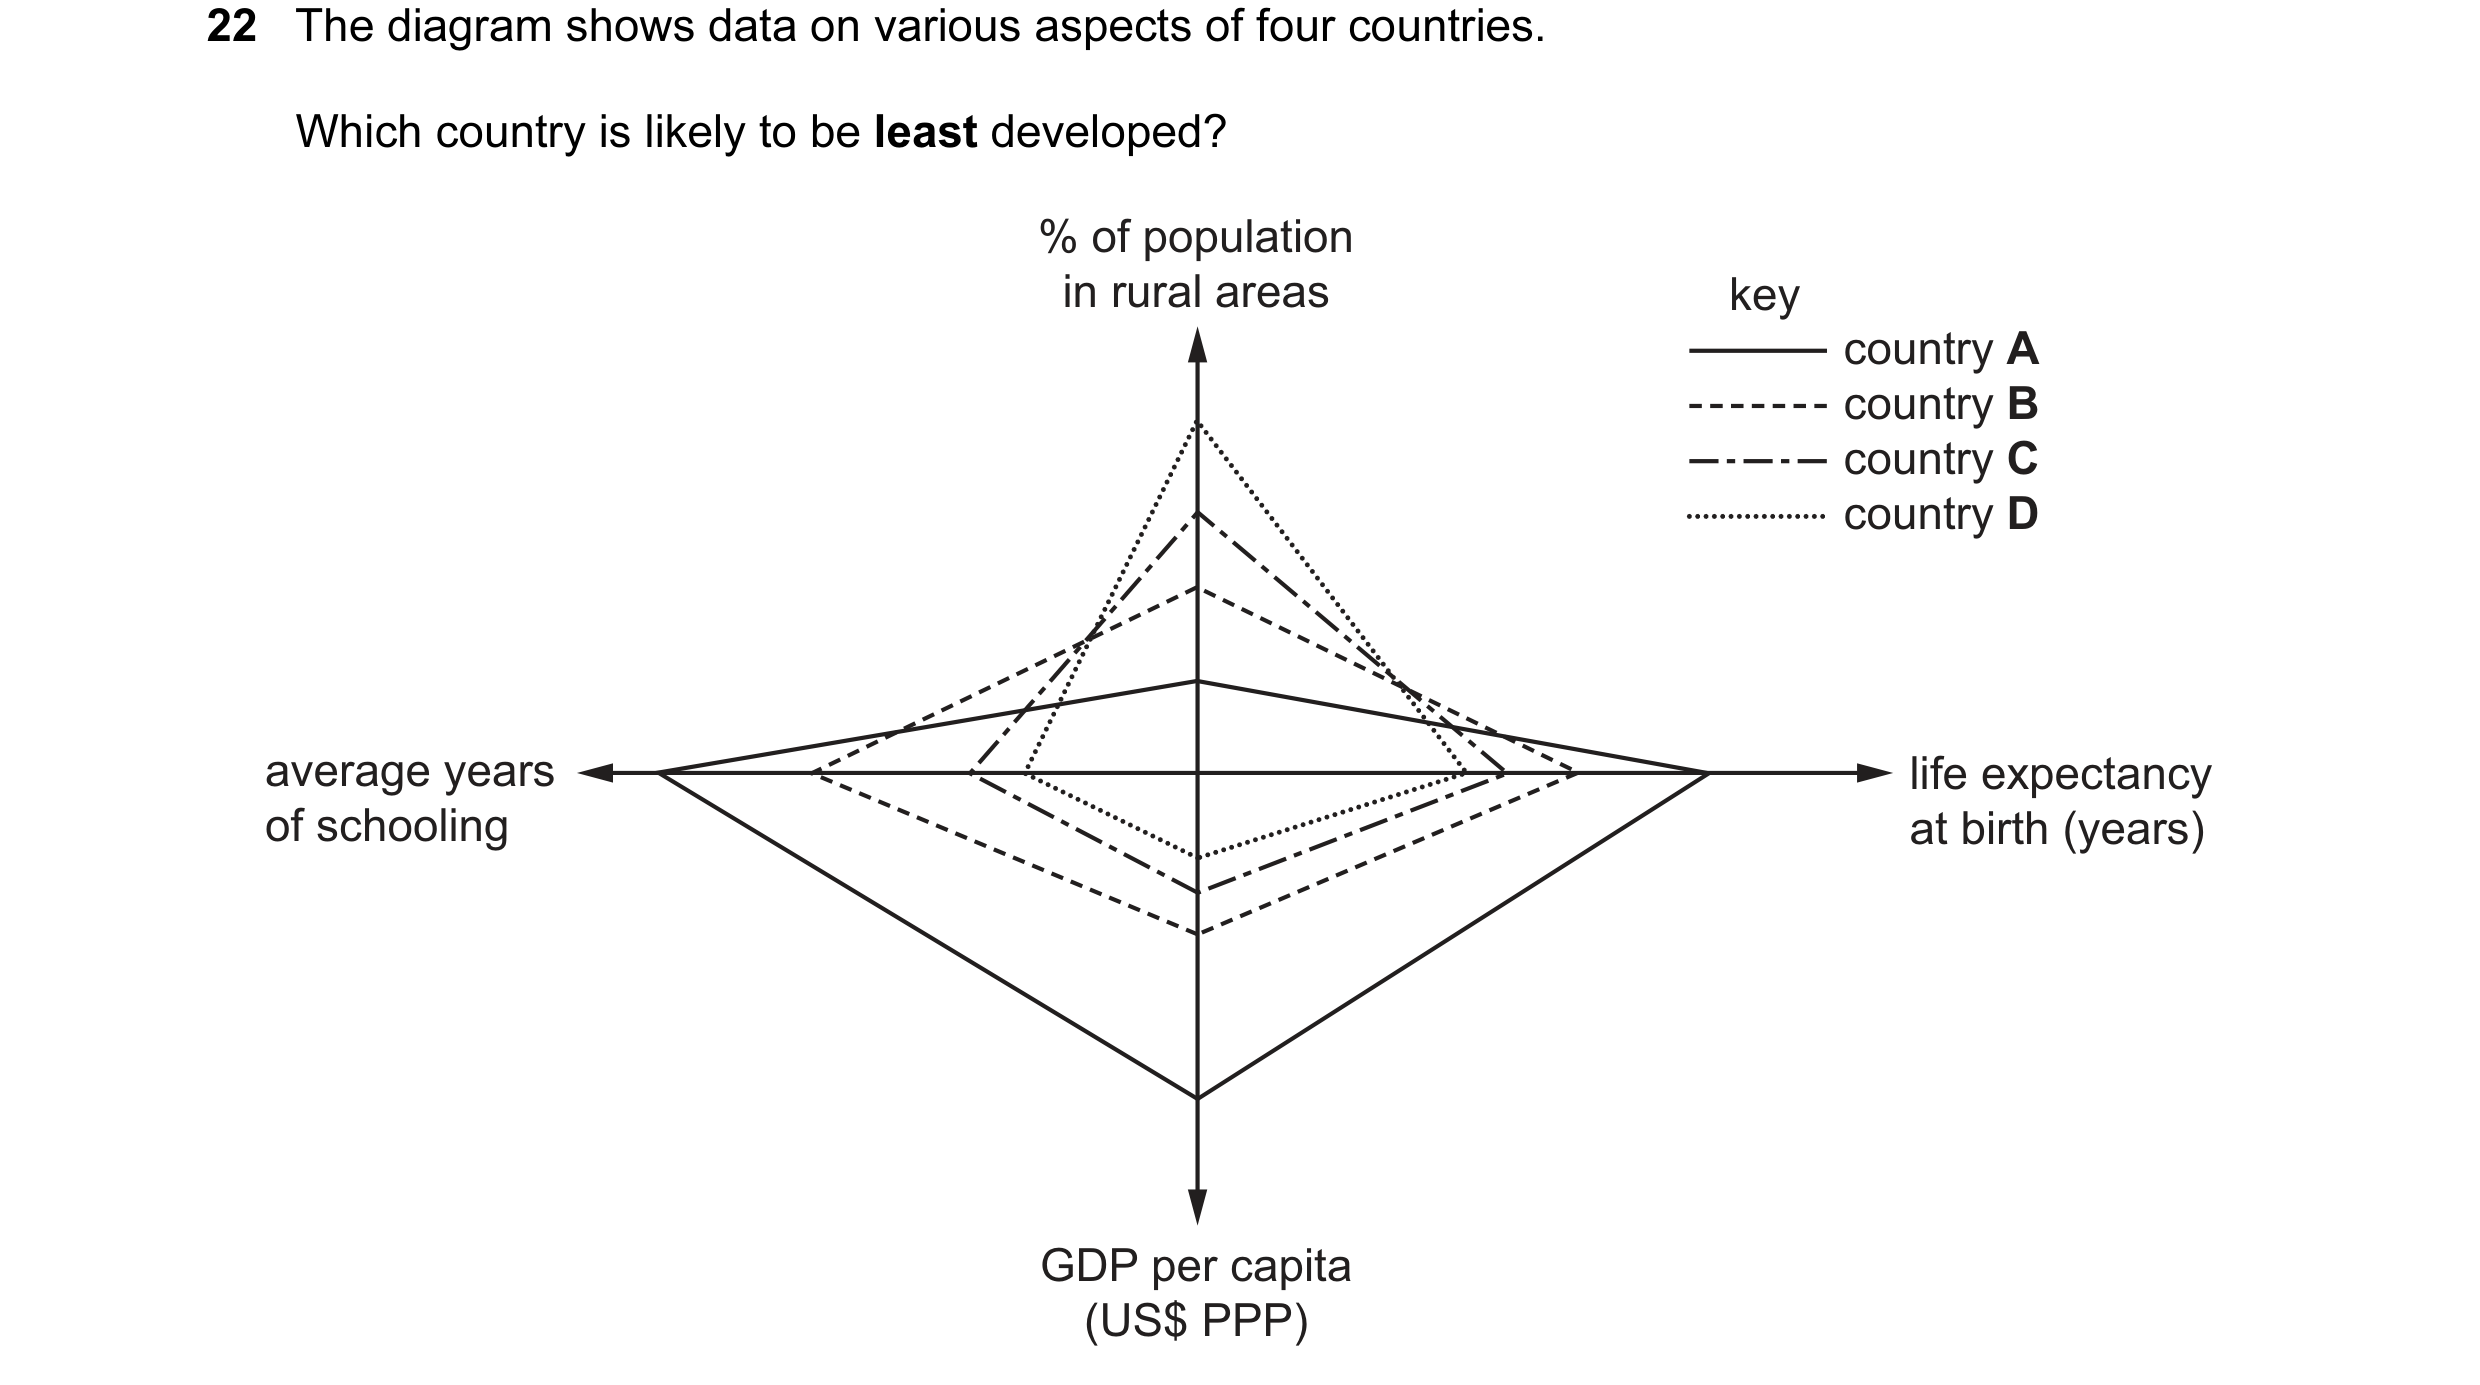
Q33 · The diagram shows data on various aspects of four countries 9708/32 Oct/Nov 2016
22 The diagram shows data on various aspects of four countries. Which country is likely to be least developed? % of population in rural areas key country A country B country C country D average years life expectancy of schooling at birth (years) GDP per capita (US$ PPP)
1 marks
Answer: D
This question in 9708/32 Oct/Nov 2016
Q34 · National income statistics show that real GDP per head is 25% higher in country X than in… 9708/33 Oct/Nov 2016
22 National income statistics show that real GDP per head is 25% higher in country X than in country Y. Why might this difference exaggerate the gap in average living standards between the two countries? A Country X has a higher rate of inflation than country Y. B Country X has a larger population than country Y. C The proportion of services that people provide for themselves is higher in country Y. D The proportion of the country’s industry owned by foreign firms is higher in country Y.
1 marks
Answer: C
This question in 9708/33 Oct/Nov 2016
Q35 · What is typically associated with a relatively low level of income per capita in a… 9708/32 May/June 2017
20 What is typically associated with a relatively low level of income per capita in a country? A low exports B low inflation C low investment D low population
1 marks
Answer: C
This question in 9708/32 May/June 2017
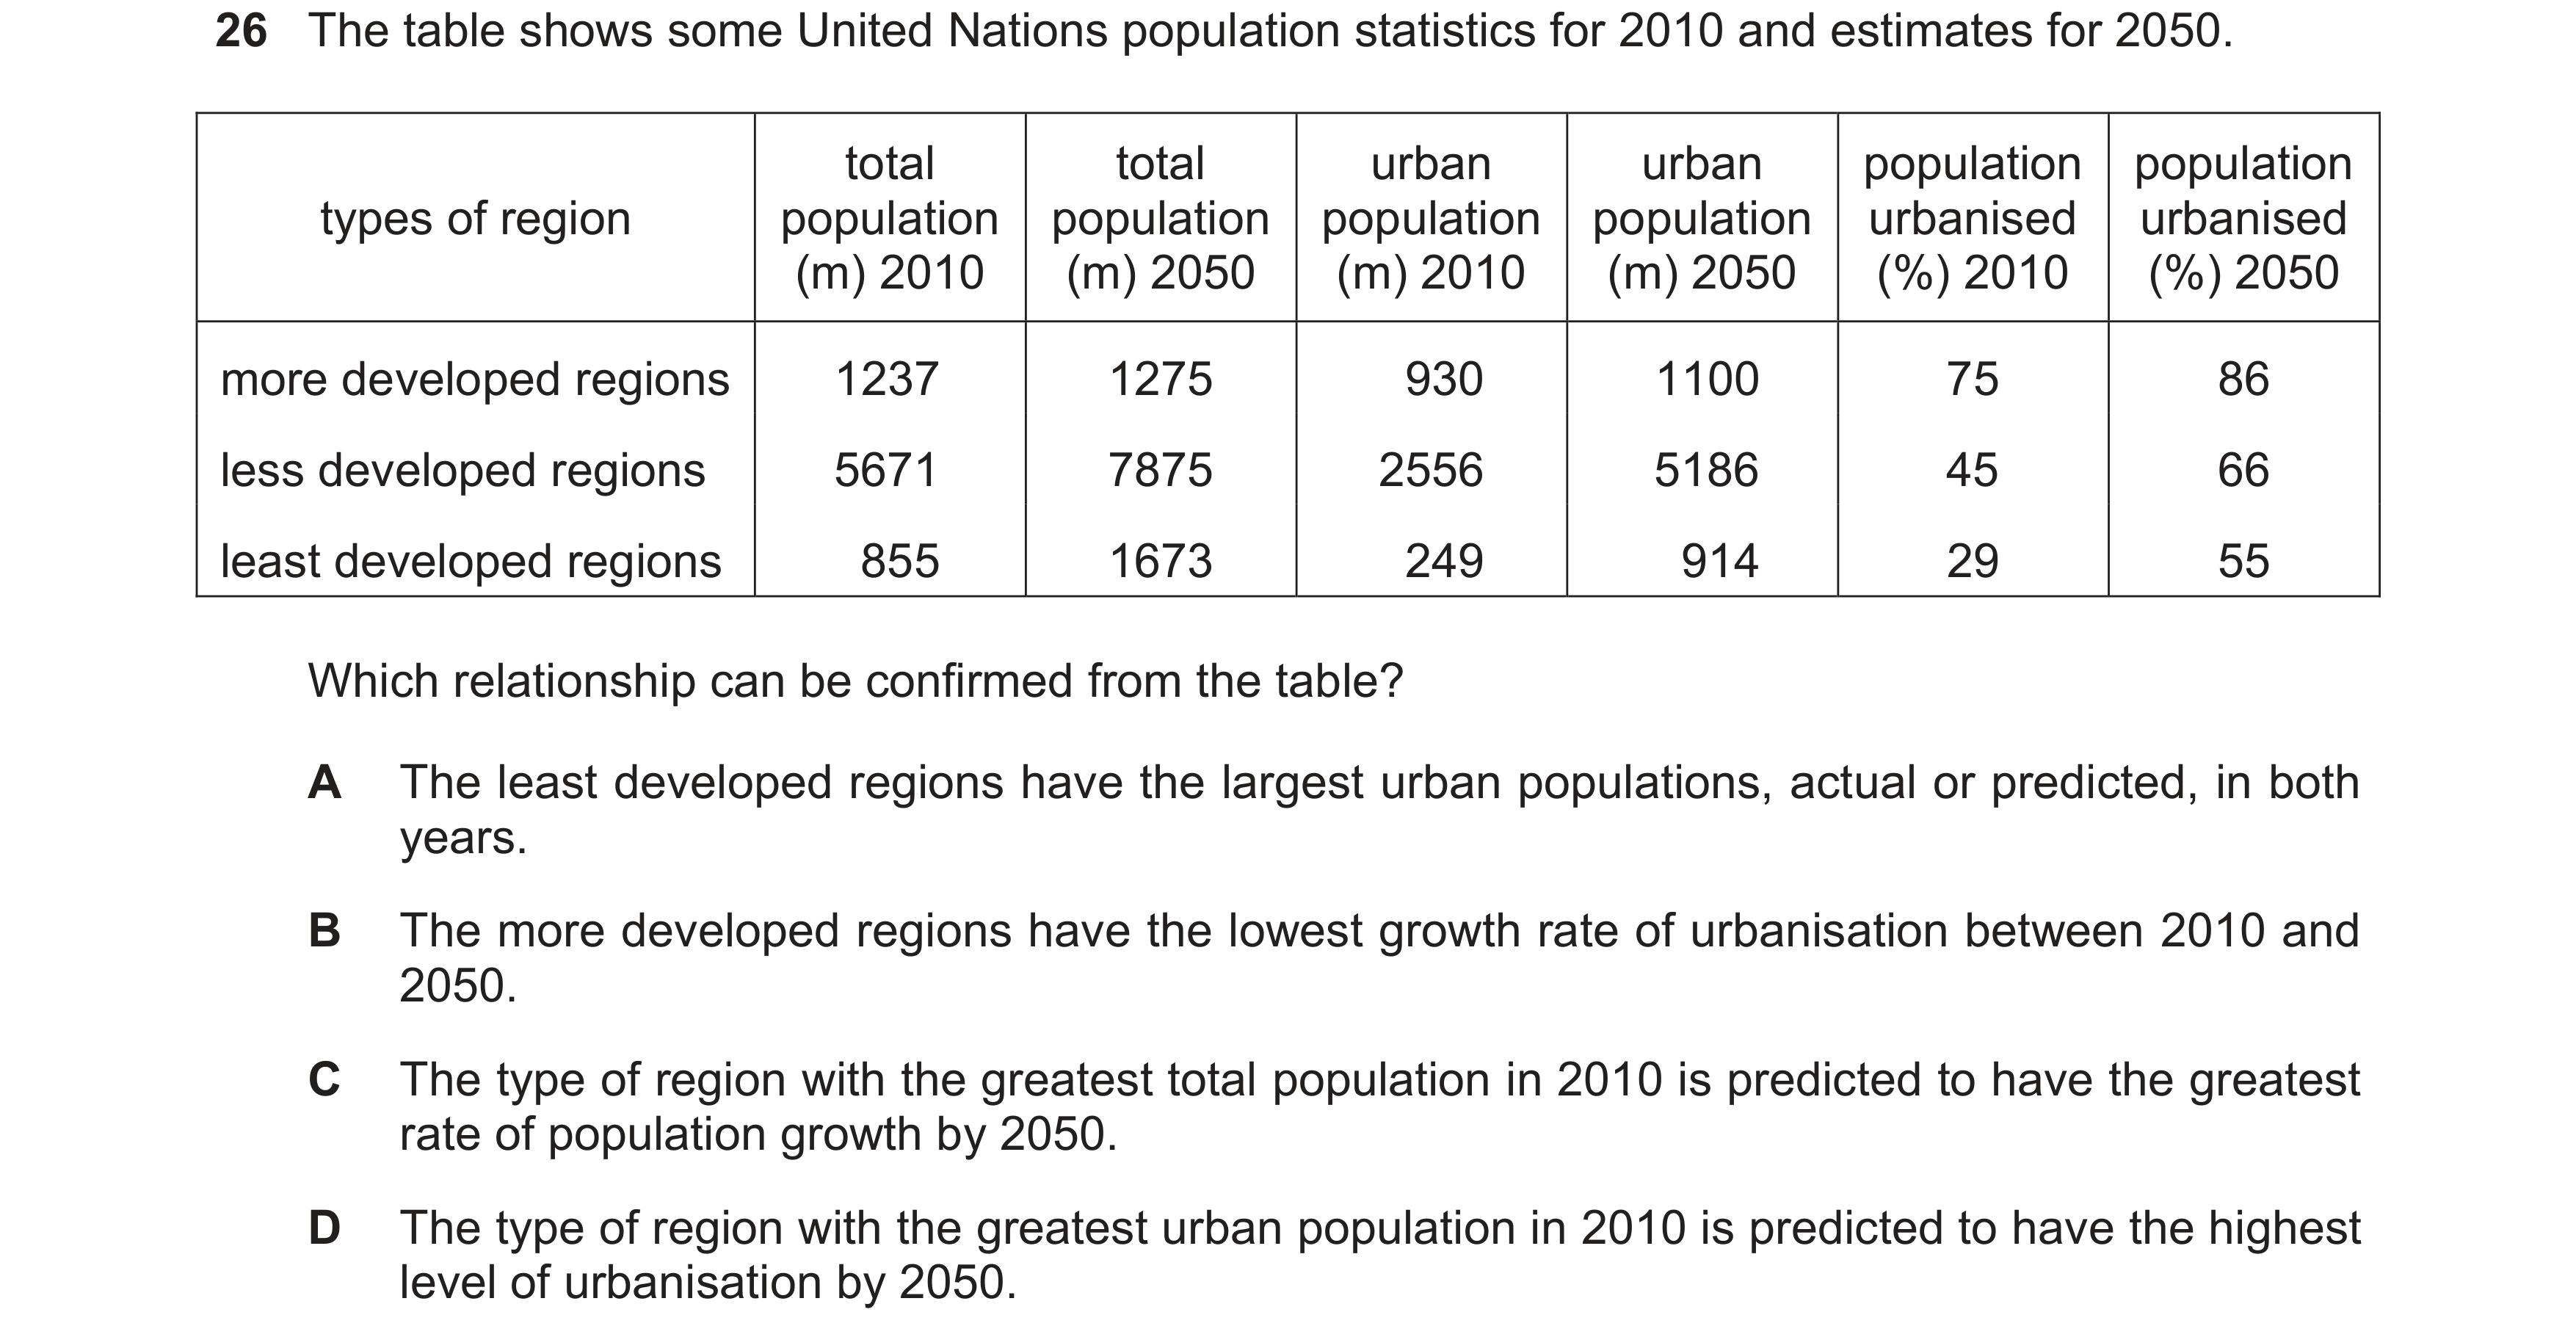
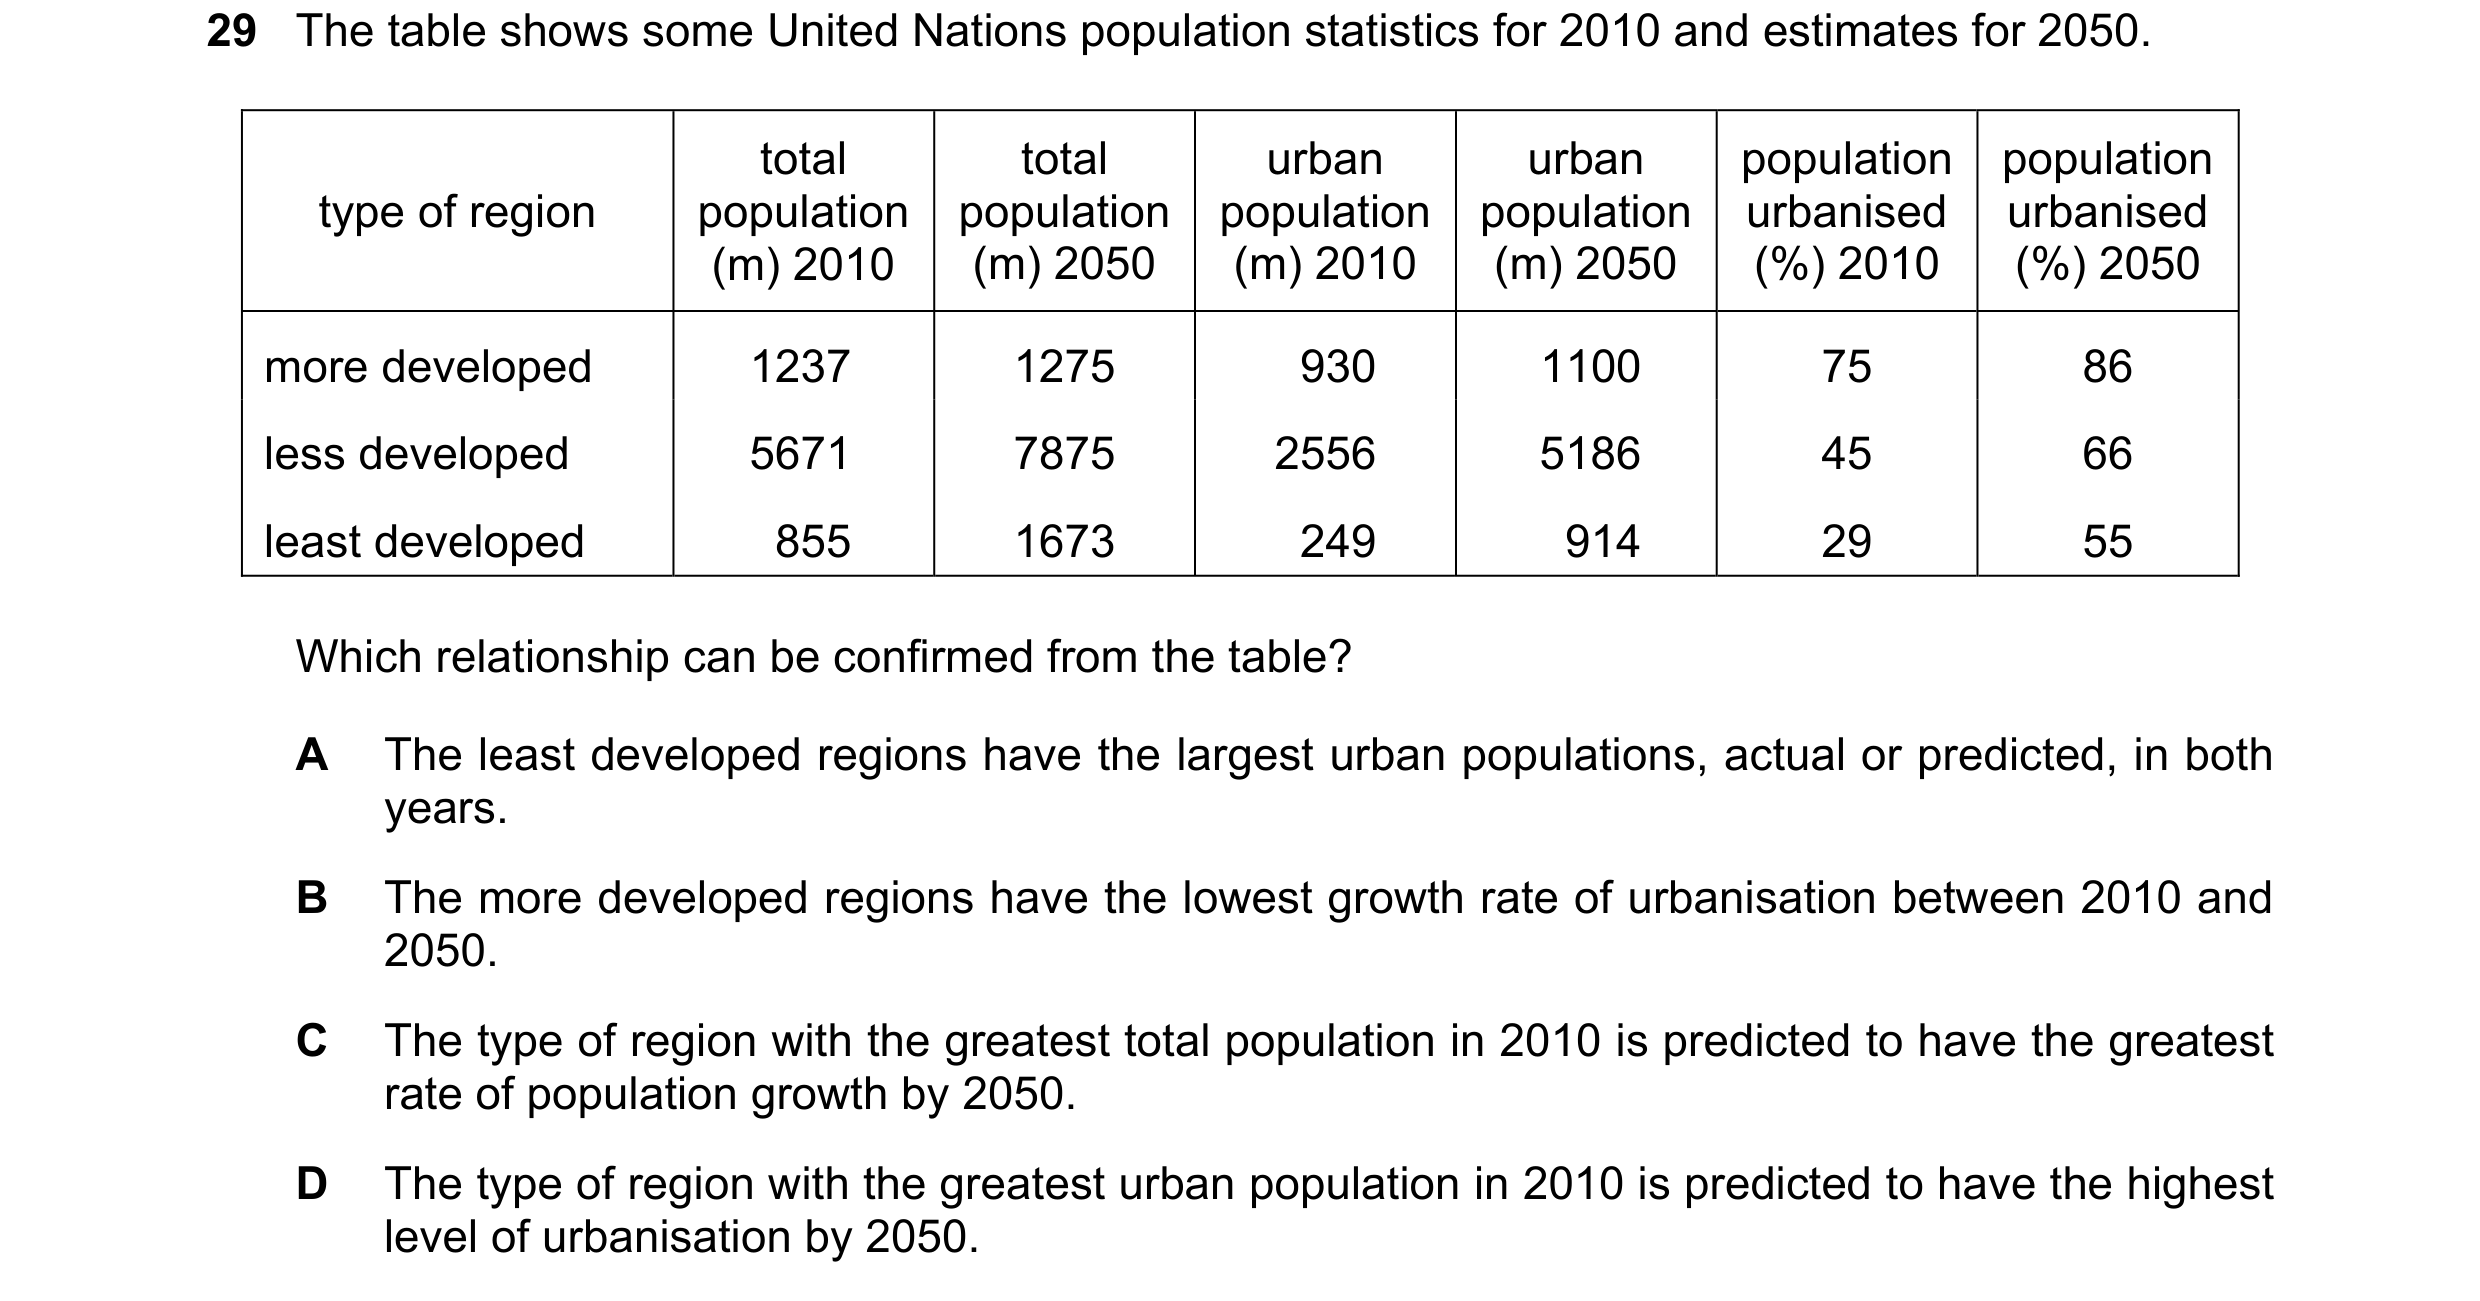
Q36 · The table shows some United Nations population statistics for 2010 and estimates for 2050 9708/32 May/June 2017
26 The table shows some United Nations population statistics for 2010 and estimates for 2050. total total urban urban population population types of region population population population population urbanised urbanised (m) 2010 (m) 2050 (m) 2010 (m) 2050 (%) 2010 (%) 2050 more developed regions 1237 1275 930 1100 75 86 less developed regions 5671 7875 2556 5186 45 66 least developed regions 855 1673 249 914 29 55 Which relationship can be confirmed from the table? A The least developed regions have the largest urban populations, actual or predicted, in both years. B The more developed regions have the lowest growth rate of urbanisation between 2010 and 2050. C The type of region with the greatest total population in 2010 is predicted to have the greatest rate of population growth by 2050. D The type of region with the greatest urban population in 2010 is predicted to have the highest level of urbanisation by 2050.
1 marks
Answer: B
This question in 9708/32 May/June 2017
Q37 · What are the variables identified on the axes of a Kuznets curve diagram? 9708/33 May/June 2017
23 What are the variables identified on the axes of a Kuznets curve diagram? vertical (Y) axis variable horizontal (X) axis variable A cumulative % of income cumulative % of families B measure of inequality income per capita C measure of standard of living economic growth rate D tax revenue tax rate
1 marks
Answer: B
This question in 9708/33 May/June 2017
Q38 · Country X’s living standards were compared with country Y’s living standards using real… 9708/32 Oct/Nov 2018
22 Country X’s living standards were compared with country Y’s living standards using real GNP per head converted into US dollars. Country X was ranked above country Y. Which factor might have caused this ranking to be incorrect? A Actual market exchange rates were used rather than purchasing power parity rates. B Government spending on transfer payments was higher in country Y than in country X. C Inflation was higher in country X than in country Y. D The distribution of income was more unequal in country X than in country Y.
1 marks
Answer: A
This question in 9708/32 Oct/Nov 2018
Q39 · What does the Kuznets curve represent? 9708/32 Feb/March 2019
22 What does the Kuznets curve represent? A changes in income inequality over time B changes in the Human Development Index over time C changes in the Multidimensional Poverty Index over time D the inverse of a Lorenz curve
1 marks
Answer: A
This question in 9708/32 Feb/March 2019
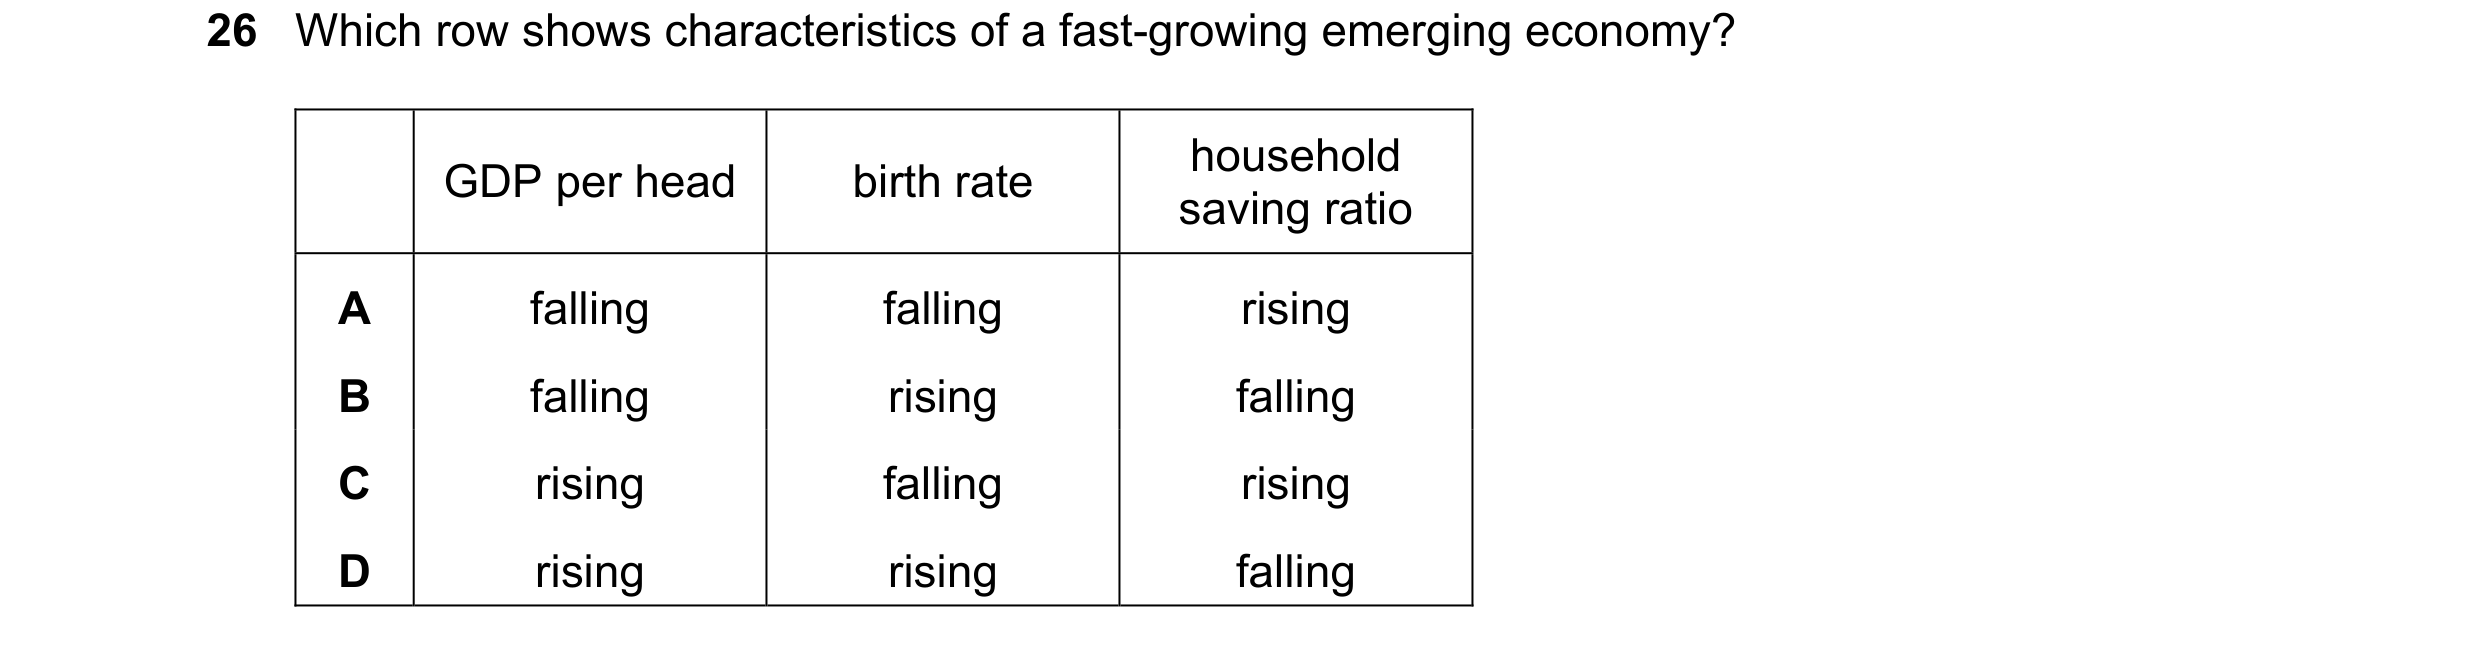
Q40 · Which row shows characteristics of a fast-growing emerging economy? 9708/32 Feb/March 2019
26 Which row shows characteristics of a fast-growing emerging economy? household GDP per head birth rate saving ratio A falling falling rising B falling rising falling C rising falling rising D rising rising falling
1 marks
Answer: C
This question in 9708/32 Feb/March 2019
Q41 · The graphs show the Human Development Index and its component parts for Zimbabwe 9708/32 May/June 2019
20 The graphs show the Human Development Index and its component parts for Zimbabwe. Human Development Index education index 0.55 0.6 0.5 0.55 0.5 0.45 0.45 0.4 0.4 0.35 0.35 0.3 0.3 1990 2000 2005 2010 2011 2012 2013 1990 2000 2005 2010 2011 2012 2013 1995 1995 life expectancy GNI per capita, ppp (2011 ppp) 0.55 0.6 0.5 0.55 0.5 0.45 0.45 0.4 0.4 0.35 0.35 0.3 0.3 1990 2000 2005 2010 2011 2012 2013 1990 2000 2005 2010 2011 2012 2013 1995 1995 Between 2005–2010, which components of HDI have comparable changes to its overall change? A education and GNI per capita B education and life expectancy C education, GNI per capita and life expectancy D GNI per capita and life expectancy
1 marks
Answer: B
This question in 9708/32 May/June 2019
Q42 · What will be the most likely consequence of an increase in the dependency ratio? 9708/32 Oct/Nov 2019
23 What will be the most likely consequence of an increase in the dependency ratio? A a decrease in GDP per head B a decrease in labour productivity C an increase in the labour force D an increase in unemployment
1 marks
Answer: A
This question in 9708/32 Oct/Nov 2019
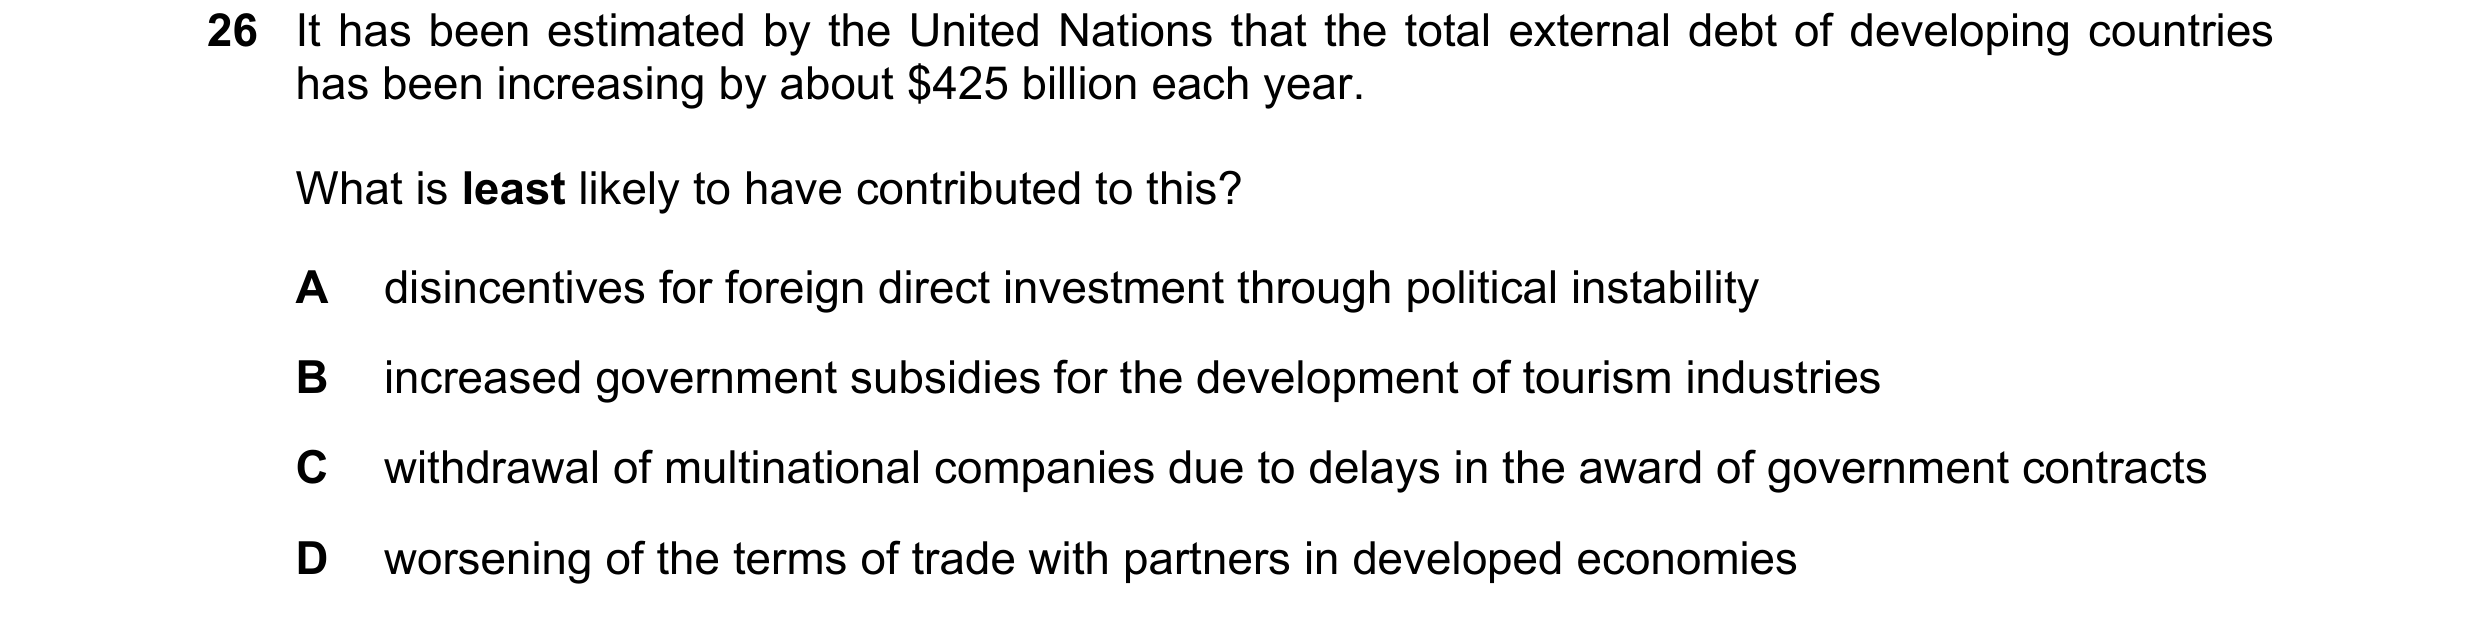
Q43 · It has been estimated by the United Nations that the total external debt of developing… 9708/32 Oct/Nov 2019
26 It has been estimated by the United Nations that the total external debt of developing countries has been increasing by about $425 billion each year. What is least likely to have contributed to this? A disincentives for foreign direct investment through political instability B increased government subsidies for the development of tourism industries C withdrawal of multinational companies due to delays in the award of government contracts D worsening of the terms of trade with partners in developed economies
1 marks
Answer: B
This question in 9708/32 Oct/Nov 2019
Q44 · Workers in poor countries are often less productive than workers using the same… 9708/32 Oct/Nov 2019
30 Workers in poor countries are often less productive than workers using the same technology in rich countries. What would be most likely to remedy this situation? A an increase in the saving ratio in poor countries B increased freedom of migration from poor countries to rich countries C increased investment in education in poor countries D the removal of trade barriers imposed by rich countries on imports from poor countries
1 marks
Answer: C
This question in 9708/32 Oct/Nov 2019
Q45 · The table shows economic data for four different countries for 2015 9708/32 Feb/March 2020
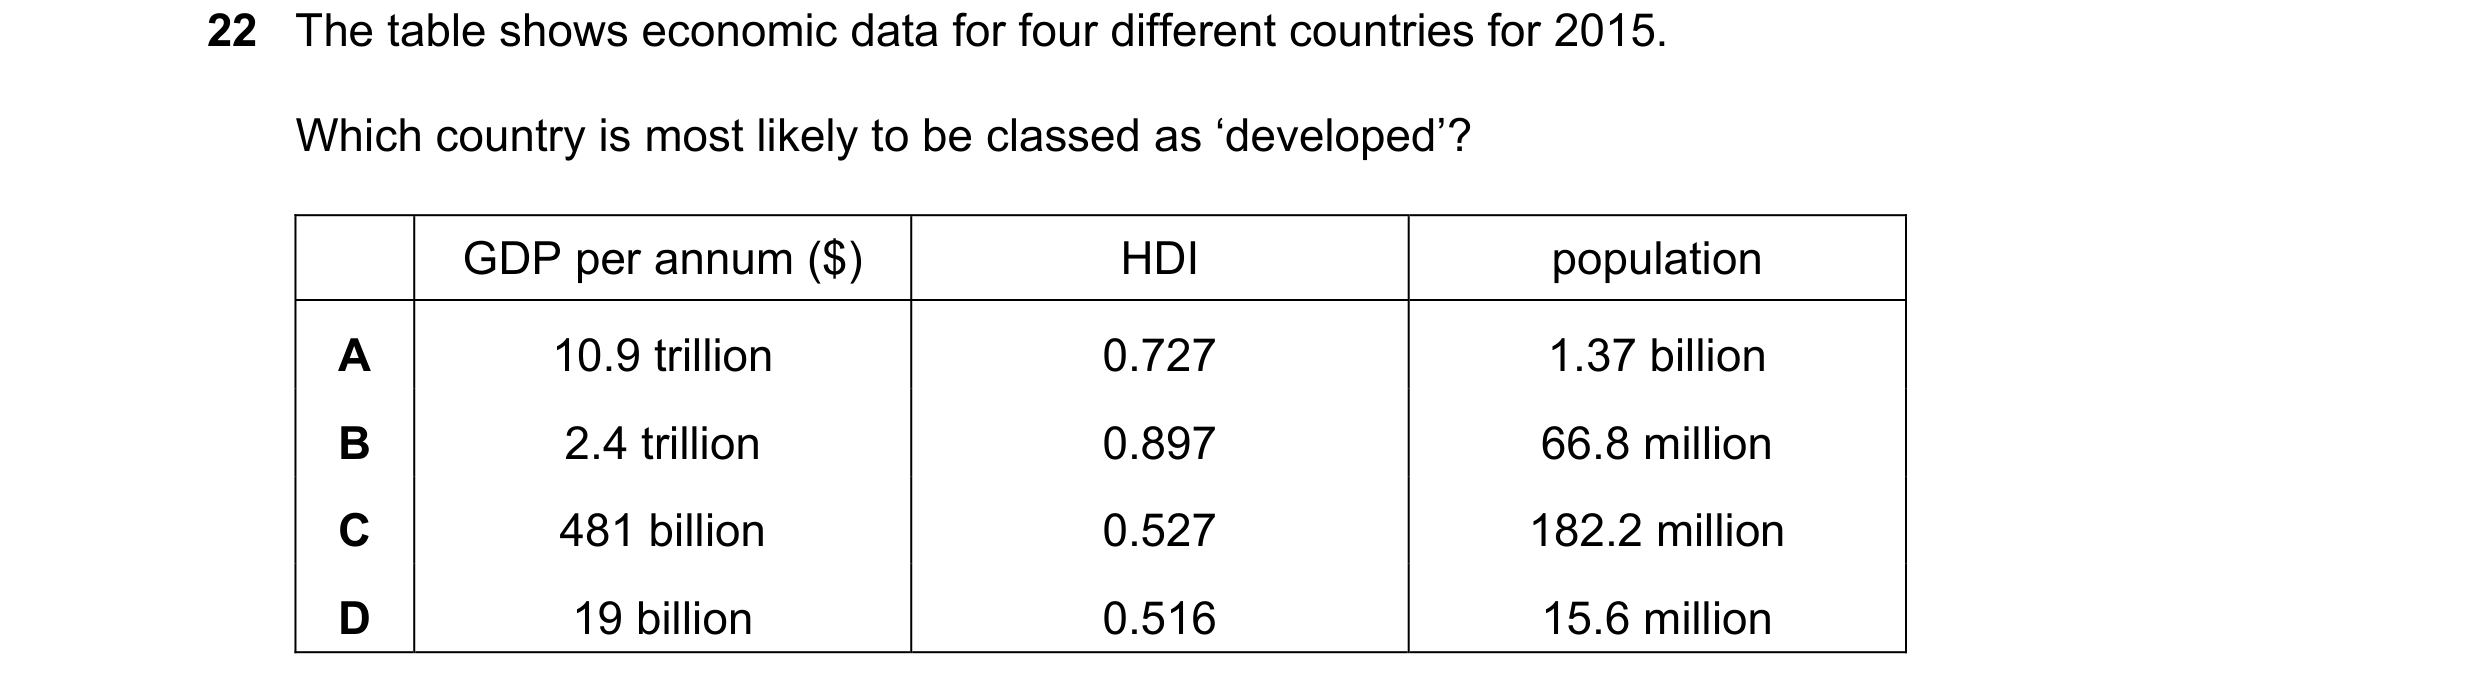
22 The table shows economic data for four different countries for 2015. Which country is most likely to be classed as ‘developed’? GDP per annum ($) HDI population A 10.9 trillion 0.727 1.37 billion B 2.4 trillion 0.897 66.8 million C 481 billion 0.527 182.2 million D 19 billion 0.516 15.6 million
1 marks
Answer: B
This question in 9708/32 Feb/March 2020
Q46 · What is not included in the Human Development Index? 9708/31 Oct/Nov 2020
18 What is not included in the Human Development Index? A infant mortality rates B gross national income per capita C life expectancy at birth D mean years of schooling
1 marks
Answer: A
This question in 9708/31 Oct/Nov 2020
Q47 · In 2012 a United Nations report calculated the stock of wealth of 20 countries in terms… 9708/31 Oct/Nov 2020
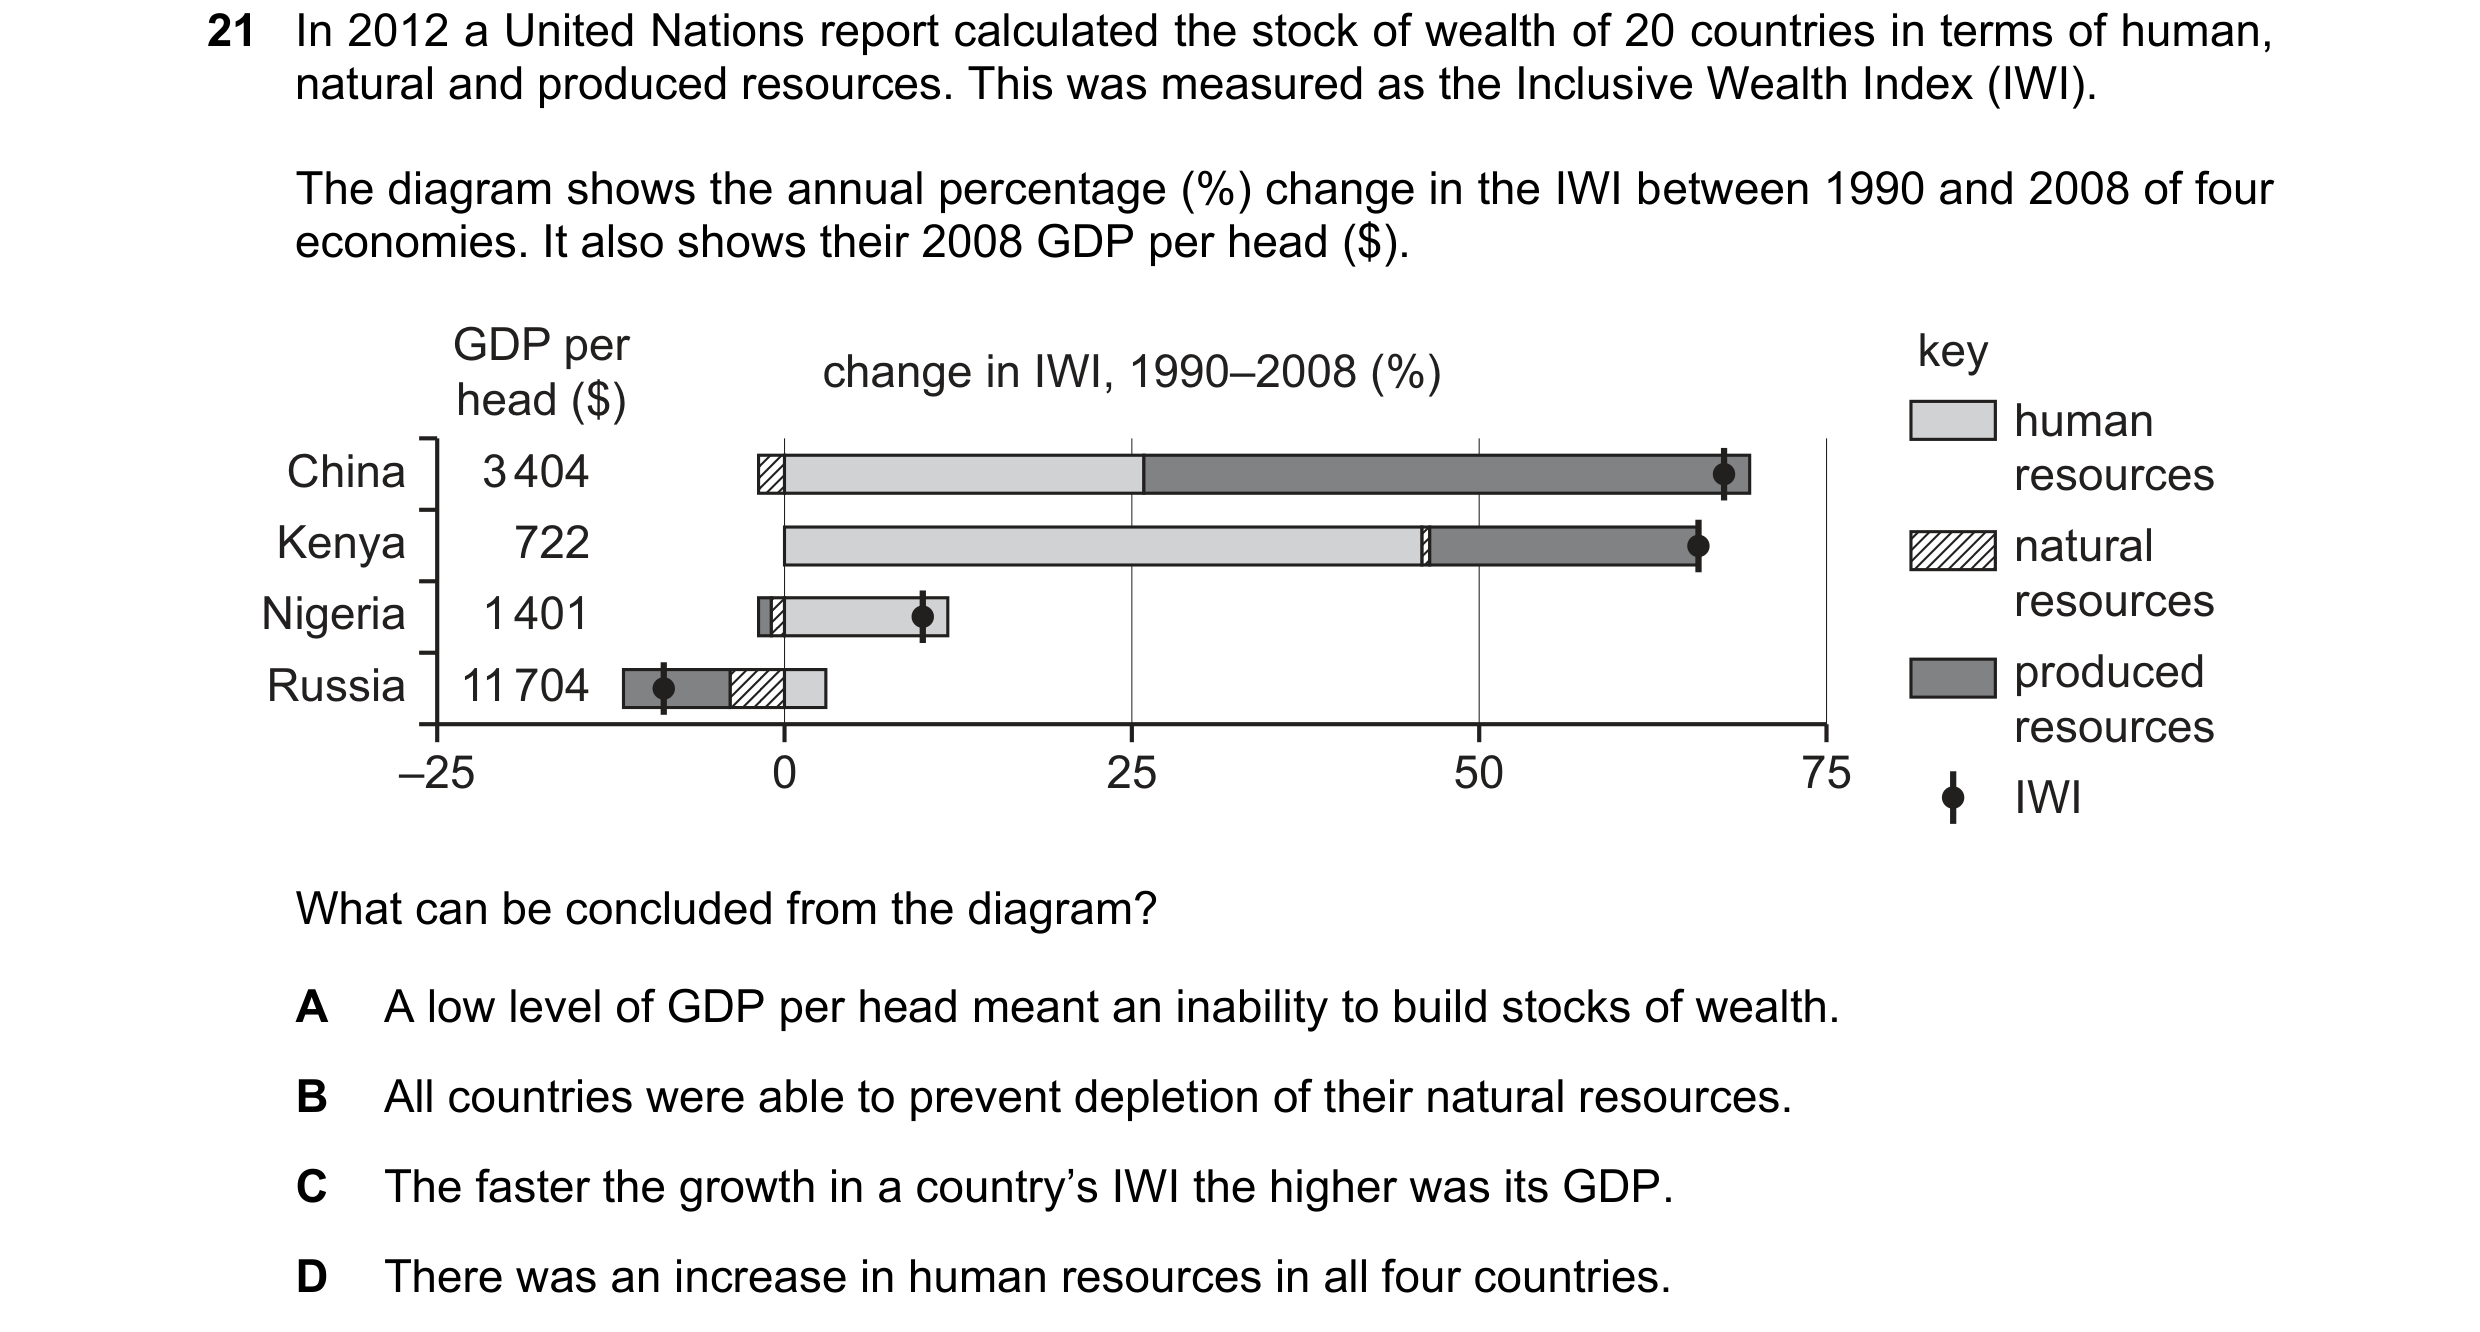
21 In 2012 a United Nations report calculated the stock of wealth of 20 countries in terms of human, natural and produced resources. This was measured as the Inclusive Wealth Index (IWI). The diagram shows the annual percentage (%) change in the IWI between 1990 and 2008 of four economies. It also shows their 2008 GDP per head ($). GDP per key change in IWI, 1990–2008 (%) head ($) human China 3 404 resources Kenya 722 natural Nigeria 1 401 resources Russia 11 704 produced resources –25 0 25 50 75 IWI What can be concluded from the diagram? A A low level of GDP per head meant an inability to build stocks of wealth. B All countries were able to prevent depletion of their natural resources. C The faster the growth in a country’s IWI the higher was its GDP. D There was an increase in human resources in all four countries.
1 marks
Answer: D
This question in 9708/31 Oct/Nov 2020
Q48 · The table shows factors that influence living standards 9708/32 Oct/Nov 2020
18 The table shows factors that influence living standards. Which country would be most likely to have the lowest Human Development Index (HDI)? homicide infant life mean years (murder) rate mortality rate GNI per expectancy at of schooling (per 100 000 (per 100 000 capita (PPP$) birth (years) people) live births) A 13 1 80 4 42 500 B 8 25 75 15 14 500 C 8 3 68 12 18 000 D 7 5 58 41 8 400
1 marks
Answer: D
This question in 9708/32 Oct/Nov 2020
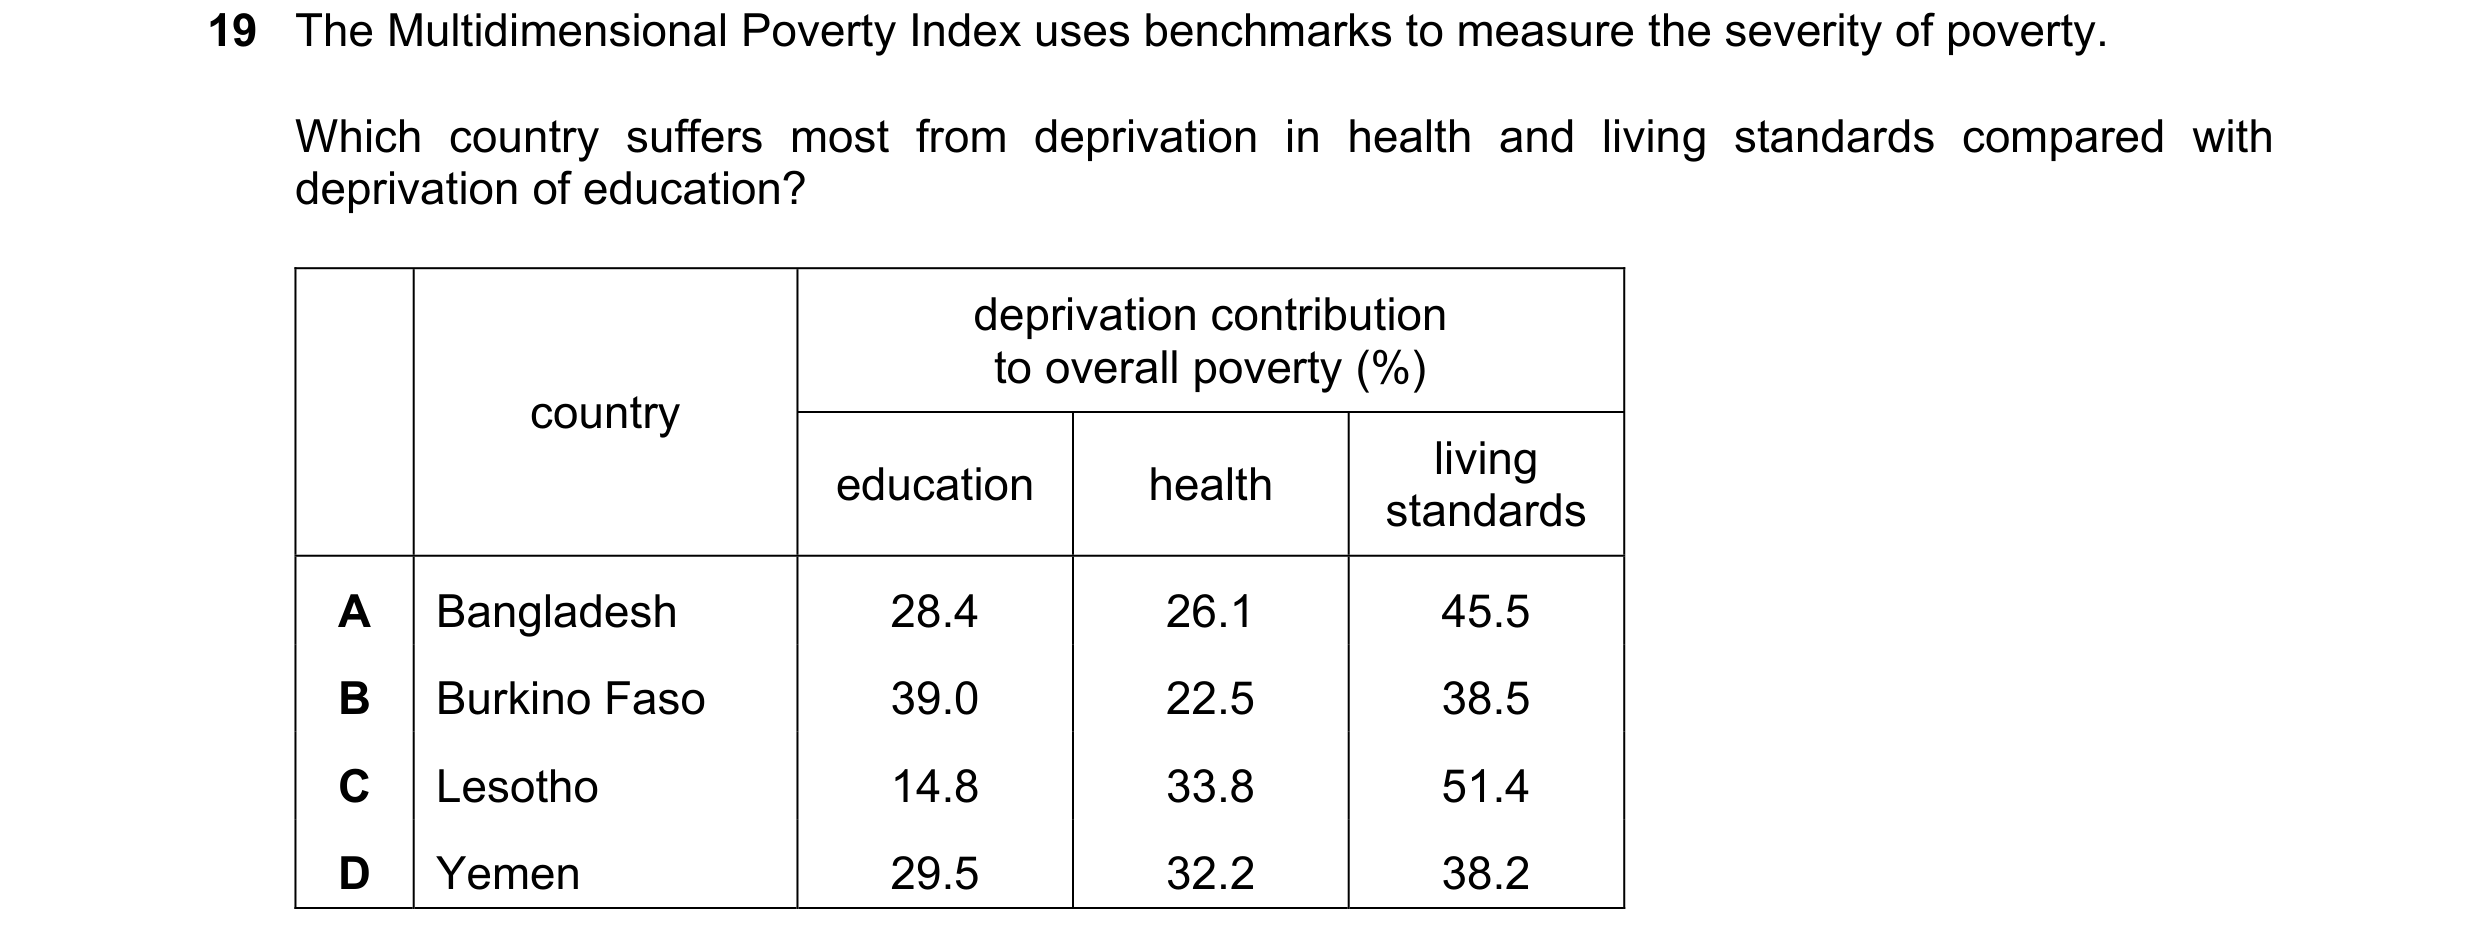
Q49 · The Multidimensional Poverty Index uses benchmarks to measure the severity of poverty 9708/33 Oct/Nov 2020
19 The Multidimensional Poverty Index uses benchmarks to measure the severity of poverty. Which country suffers most from deprivation in health and living standards compared with deprivation of education? deprivation contribution to overall poverty (%) country living education health standards A Bangladesh 28.4 26.1 45.5 B Burkino Faso 39.0 22.5 38.5 C Lesotho 14.8 33.8 51.4 D Yemen 29.5 32.2 38.2
1 marks
Answer: C
This question in 9708/33 Oct/Nov 2020
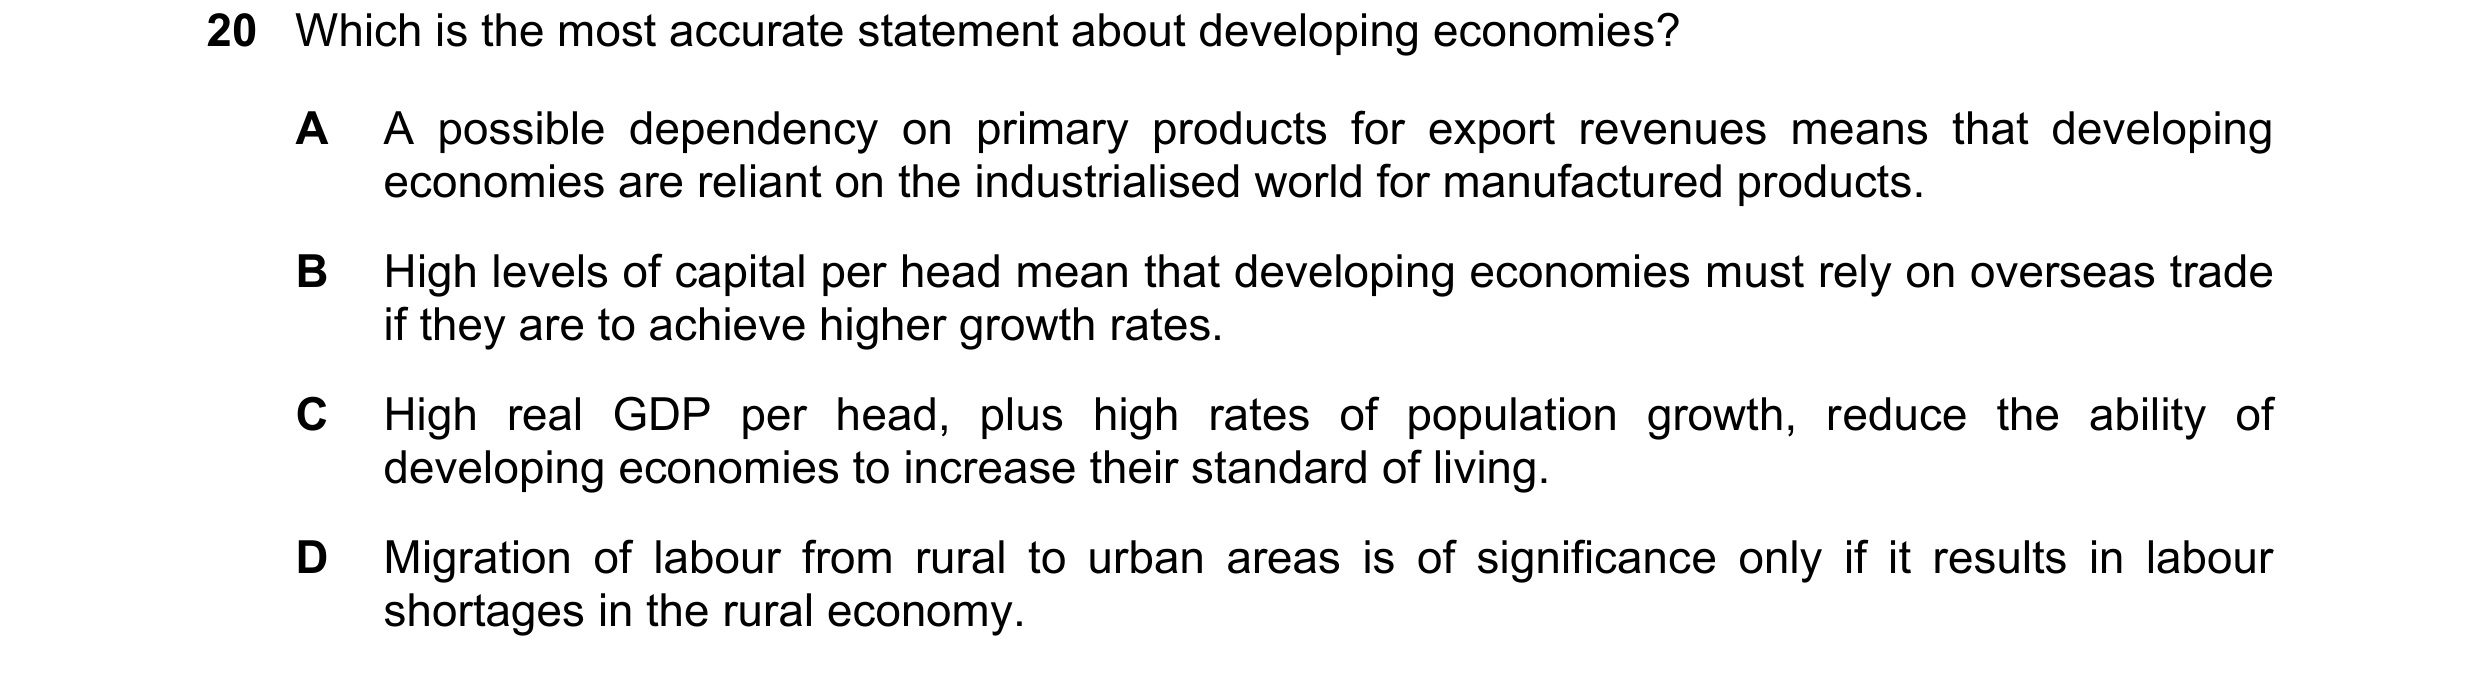
Q50 · Which is the most accurate statement about developing economies? 9708/33 Oct/Nov 2020
20 Which is the most accurate statement about developing economies? A A possible dependency on primary products for export revenues means that developing economies are reliant on the industrialised world for manufactured products. B High levels of capital per head mean that developing economies must rely on overseas trade if they are to achieve higher growth rates. C High real GDP per head, plus high rates of population growth, reduce the ability of developing economies to increase their standard of living. D Migration of labour from rural to urban areas is of significance only if it results in labour shortages in the rural economy.
1 marks
Answer: A
This question in 9708/33 Oct/Nov 2020
Q51 · The diagram shows the relative position of two countries X and Y on a Kuznets curve 9708/31 May/June 2021
19 The diagram shows the relative position of two countries X and Y on a Kuznets curve. inequality X Y O income per head What does the diagram indicate? A Country X collects more income tax than country Y. B Country X has a higher national income than country Y. C Country Y has less income inequality than country X. D Country Y is less economically developed than country X.
1 marks
Answer: C
This question in 9708/31 May/June 2021
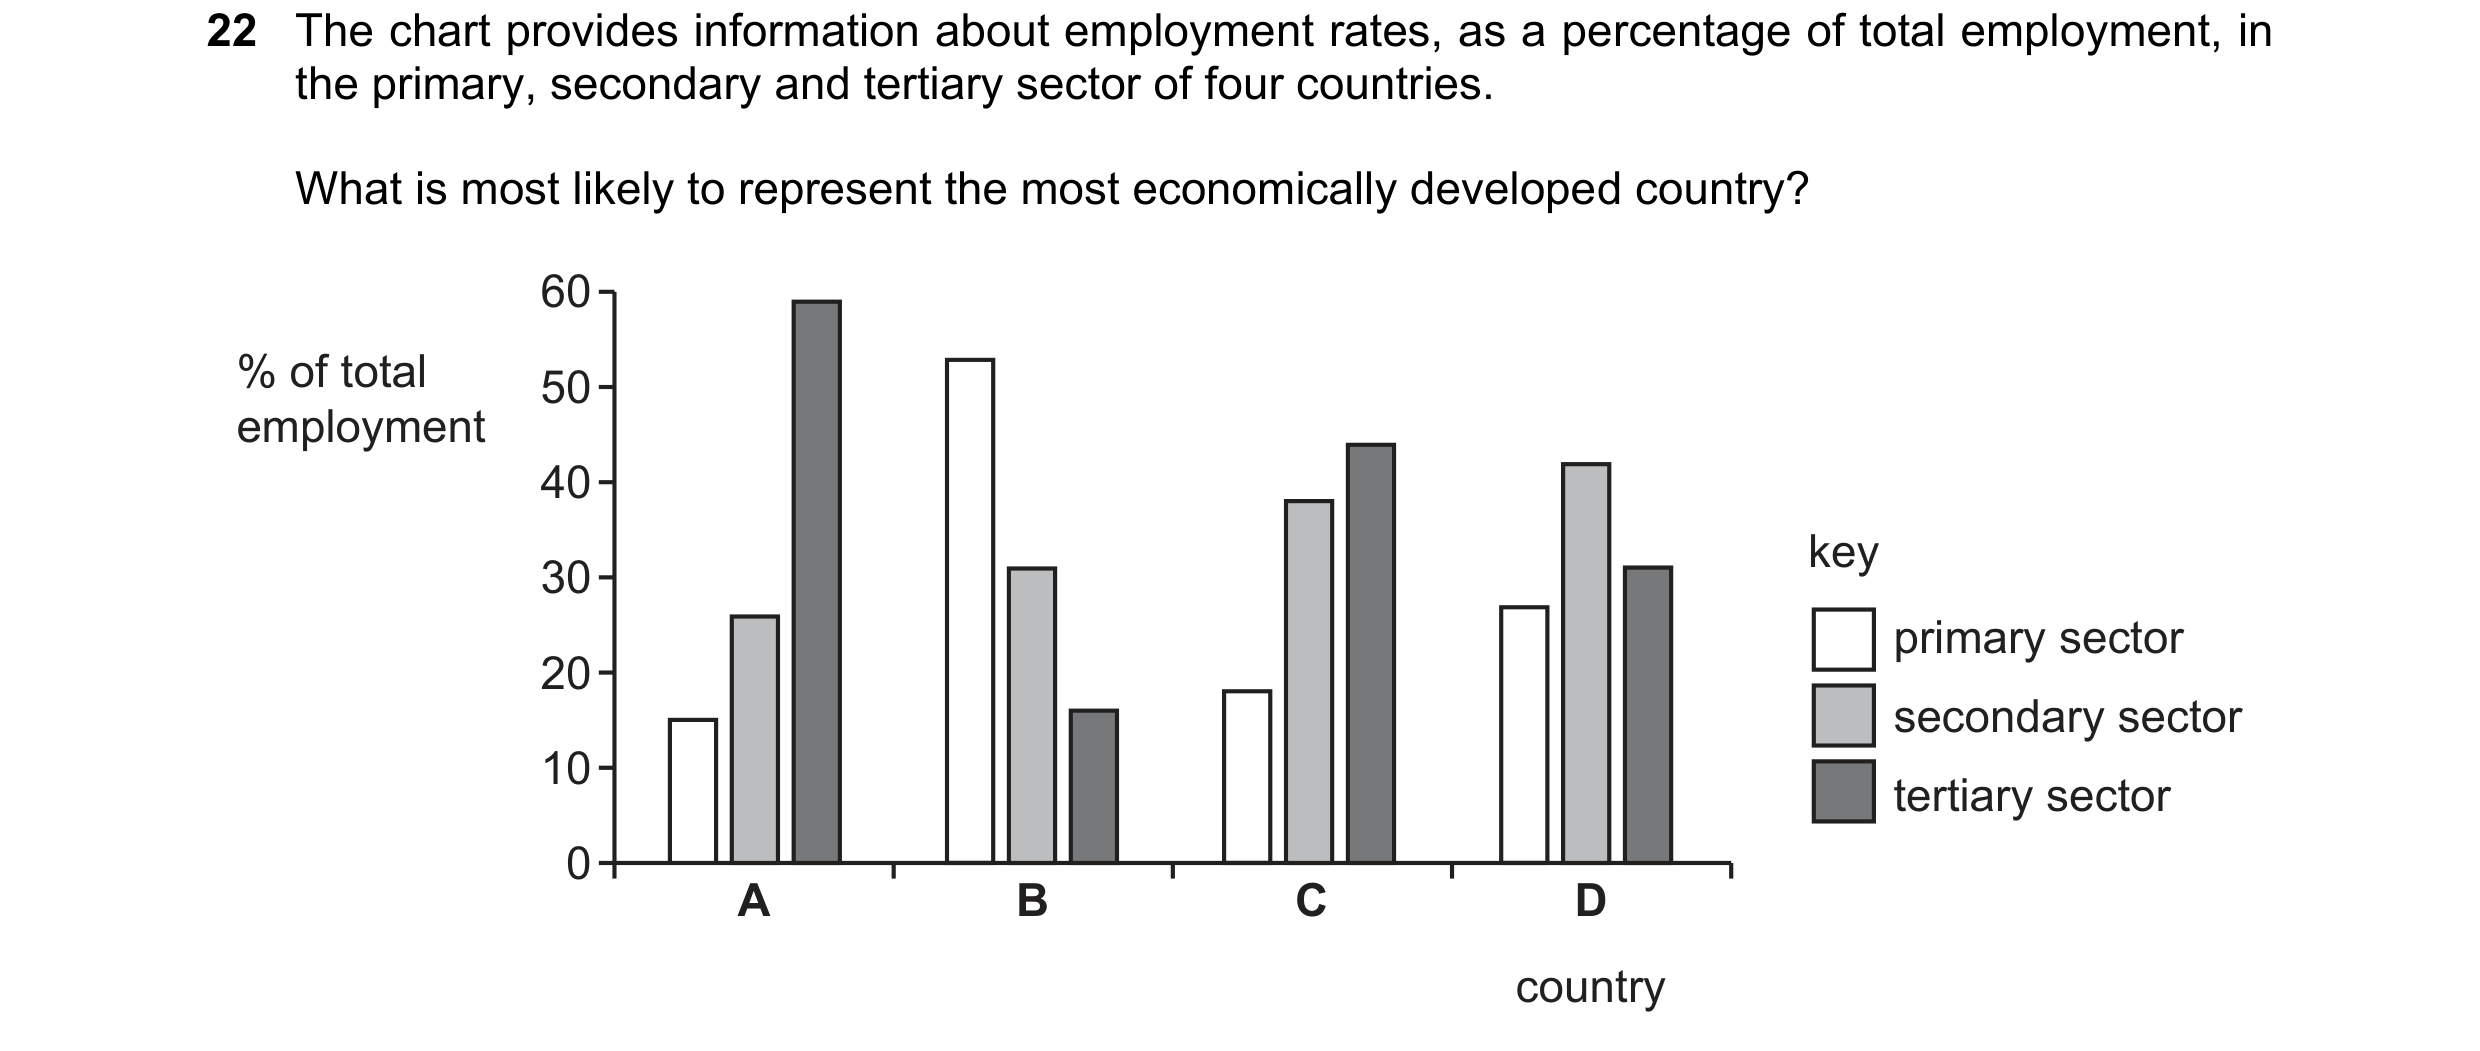
Q52 · The chart provides information about employment rates, as a percentage of total… 9708/31 May/June 2021
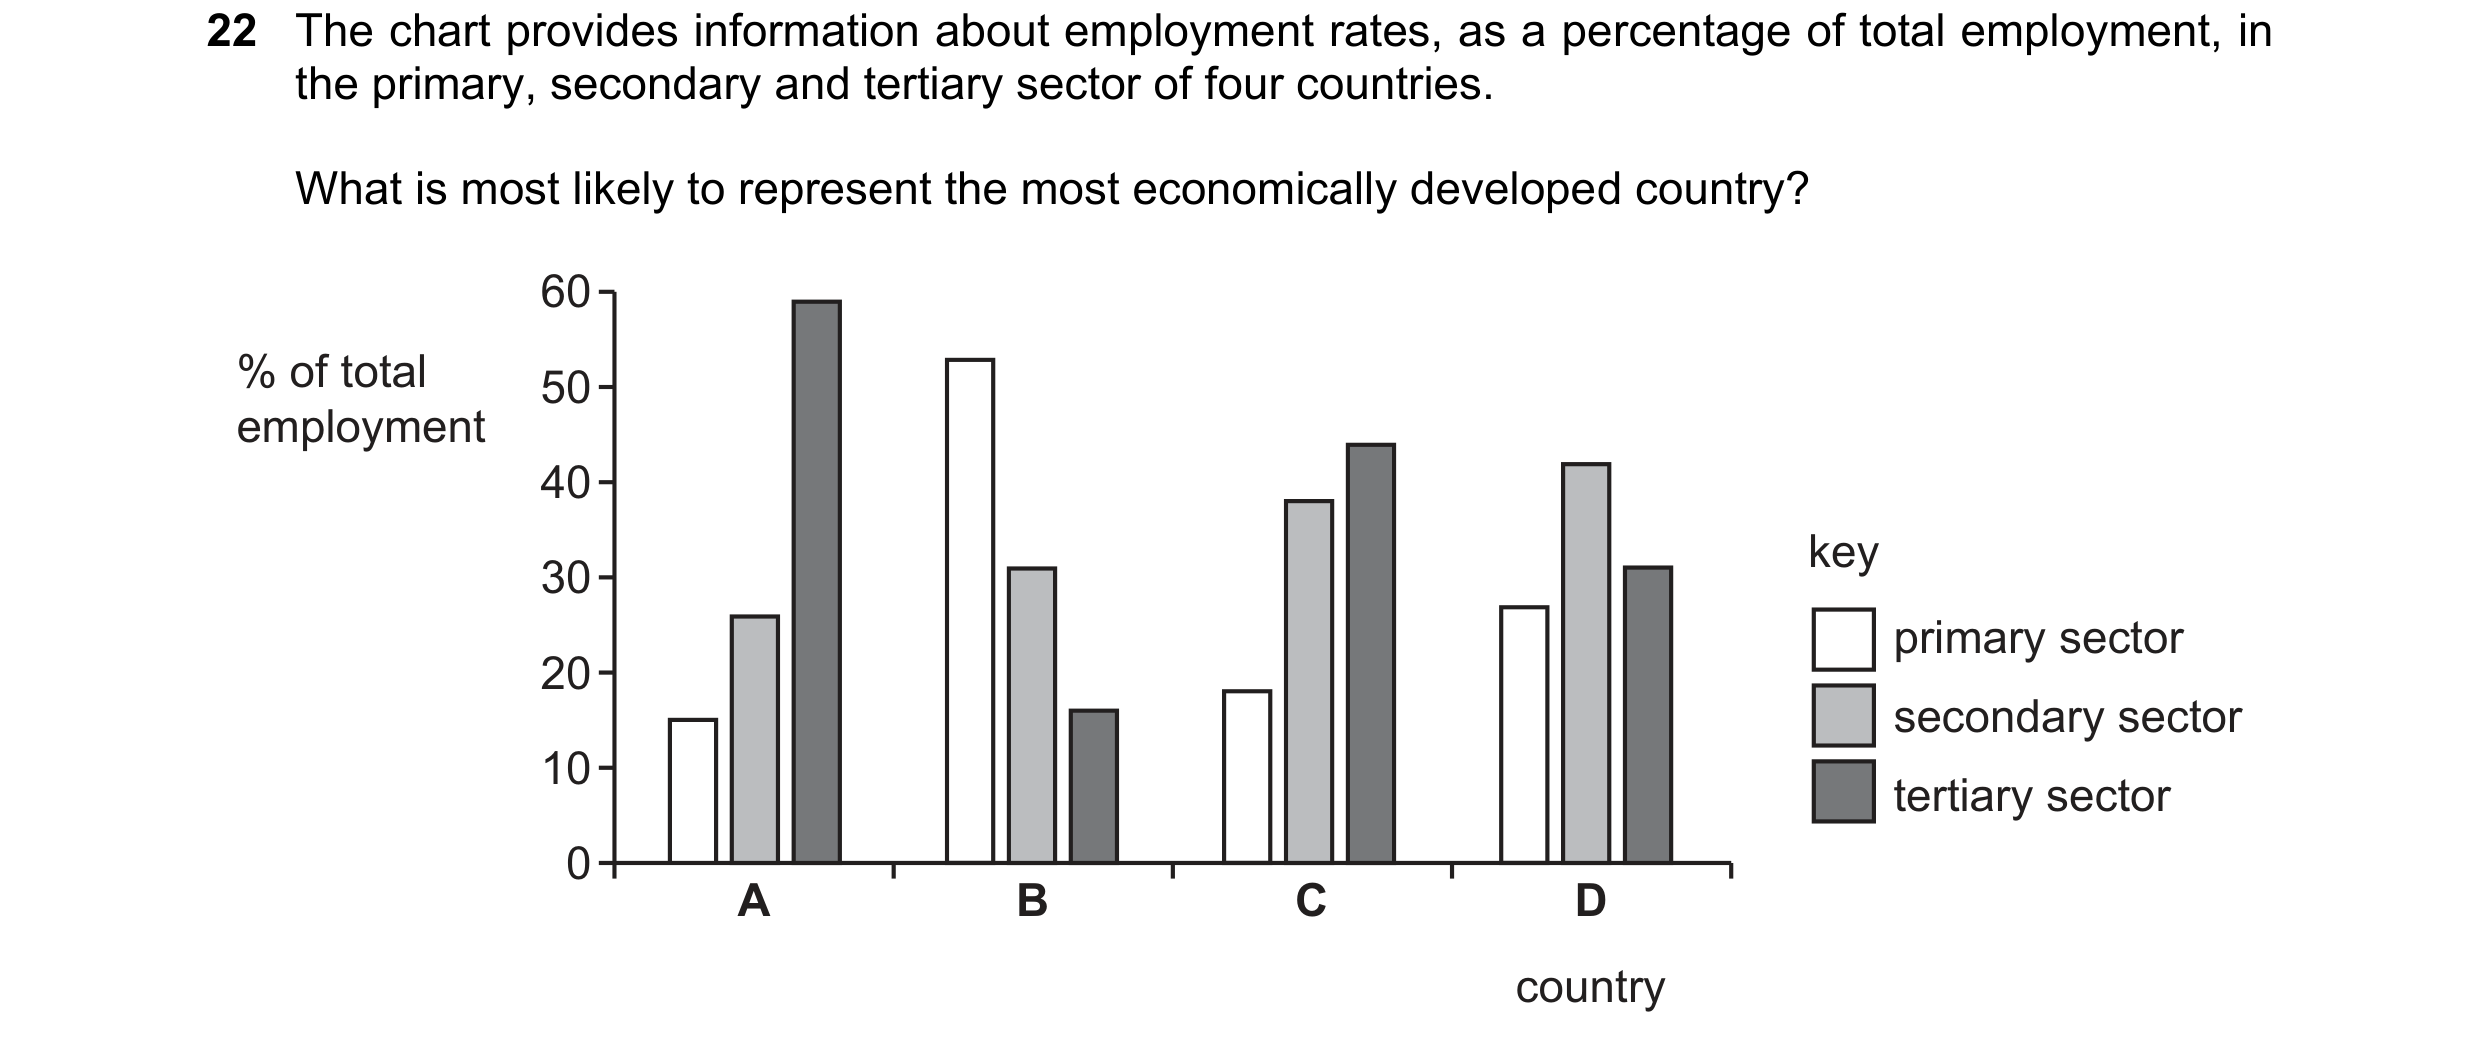
22 The chart provides information about employment rates, as a percentage of total employment, in the primary, secondary and tertiary sector of four countries. What is most likely to represent the most economically developed country? 60 % of total 50 employment 40 key 30 primary sector 20 secondary sector 10 tertiary sector 0 A B C D country
1 marks
Answer: A
This question in 9708/31 May/June 2021
Q53 · Some individuals seek to increase their share of existing wealth without creating new… 9708/32 May/June 2021
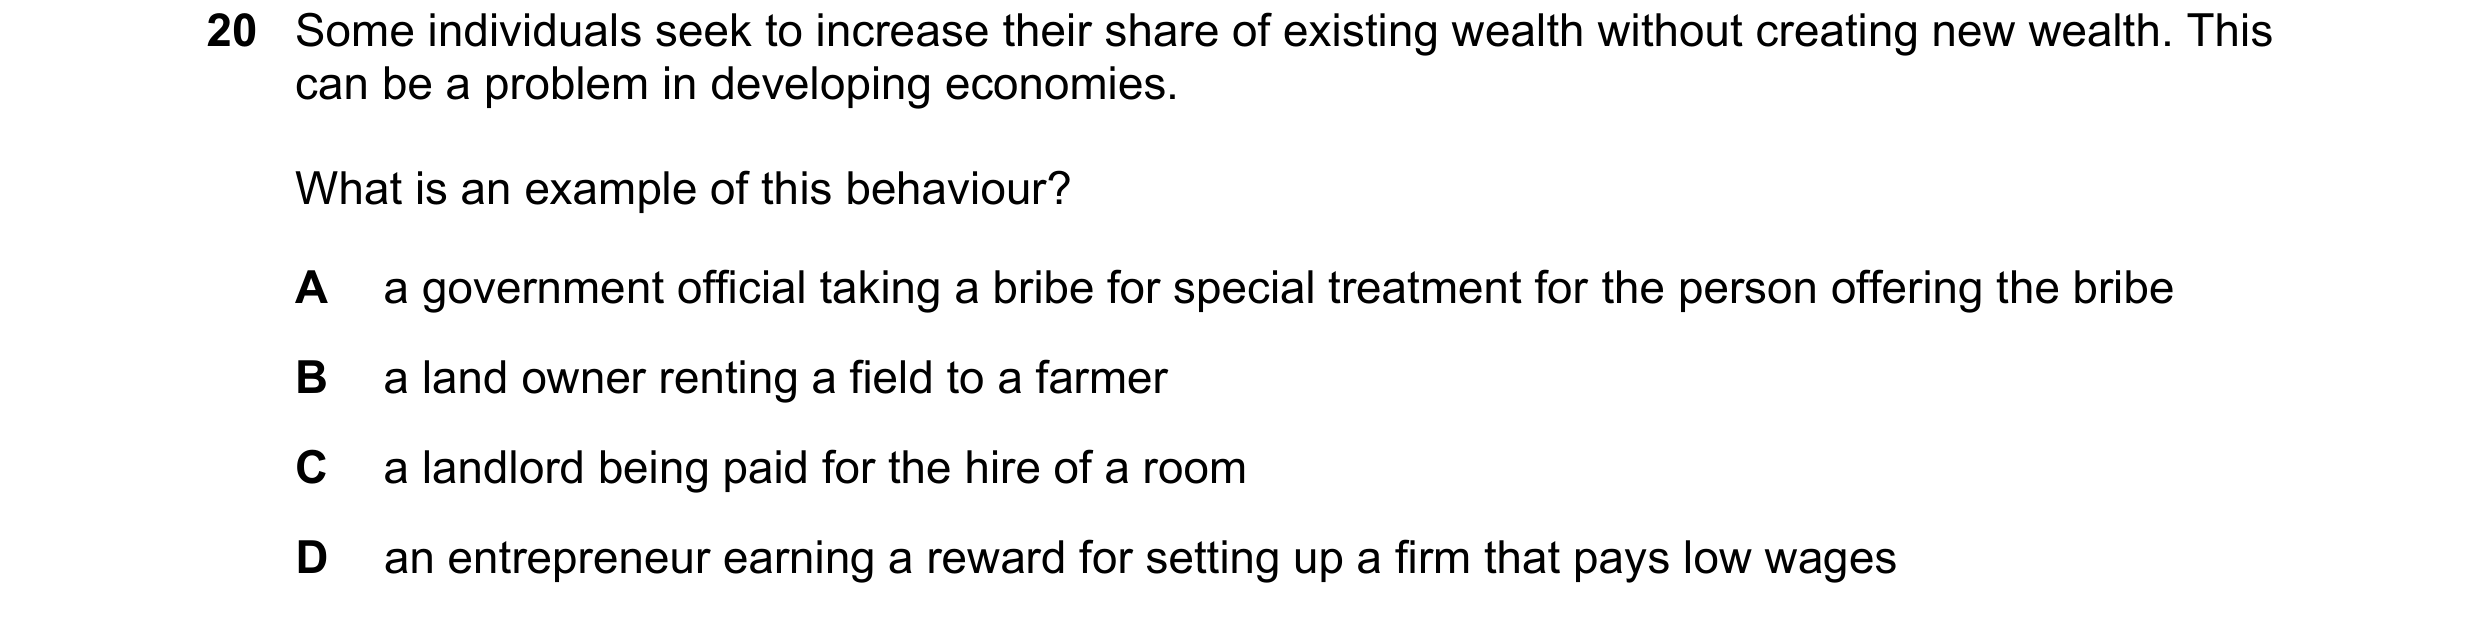
20 Some individuals seek to increase their share of existing wealth without creating new wealth. This can be a problem in developing economies. What is an example of this behaviour? A a government official taking a bribe for special treatment for the person offering the bribe B a land owner renting a field to a farmer C a landlord being paid for the hire of a room D an entrepreneur earning a reward for setting up a firm that pays low wages
1 marks
Answer: A
This question in 9708/32 May/June 2021
Q54 · The diagram shows the relative position of two countries X and Y on a Kuznets curve 9708/33 May/June 2021
19 The diagram shows the relative position of two countries X and Y on a Kuznets curve. inequality X Y O income per head What does the diagram indicate? A Country X collects more income tax than country Y. B Country X has a higher national income than country Y. C Country Y has less income inequality than country X. D Country Y is less economically developed than country X.
1 marks
Answer: C
This question in 9708/33 May/June 2021
Q55 · The chart provides information about employment rates, as a percentage of total… 9708/33 May/June 2021
22 The chart provides information about employment rates, as a percentage of total employment, in the primary, secondary and tertiary sector of four countries. What is most likely to represent the most economically developed country? 60 % of total 50 employment 40 key 30 primary sector 20 secondary sector 10 tertiary sector 0 A B C D country
1 marks
Answer: A
This question in 9708/33 May/June 2021
Q56 · The diagram shows the Kuznets curve 9708/31 Oct/Nov 2021
19 The diagram shows the Kuznets curve. income inequality Q R P S O per capita income Which statement is correct with respect to the description of an economy and the corresponding letter on the Kuznets curve? A P is a market economy. B Q is a developed economy. C R is a developing economy. D S is an economy with a Gini coefficient = 0.
1 marks
Answer: D
This question in 9708/31 Oct/Nov 2021
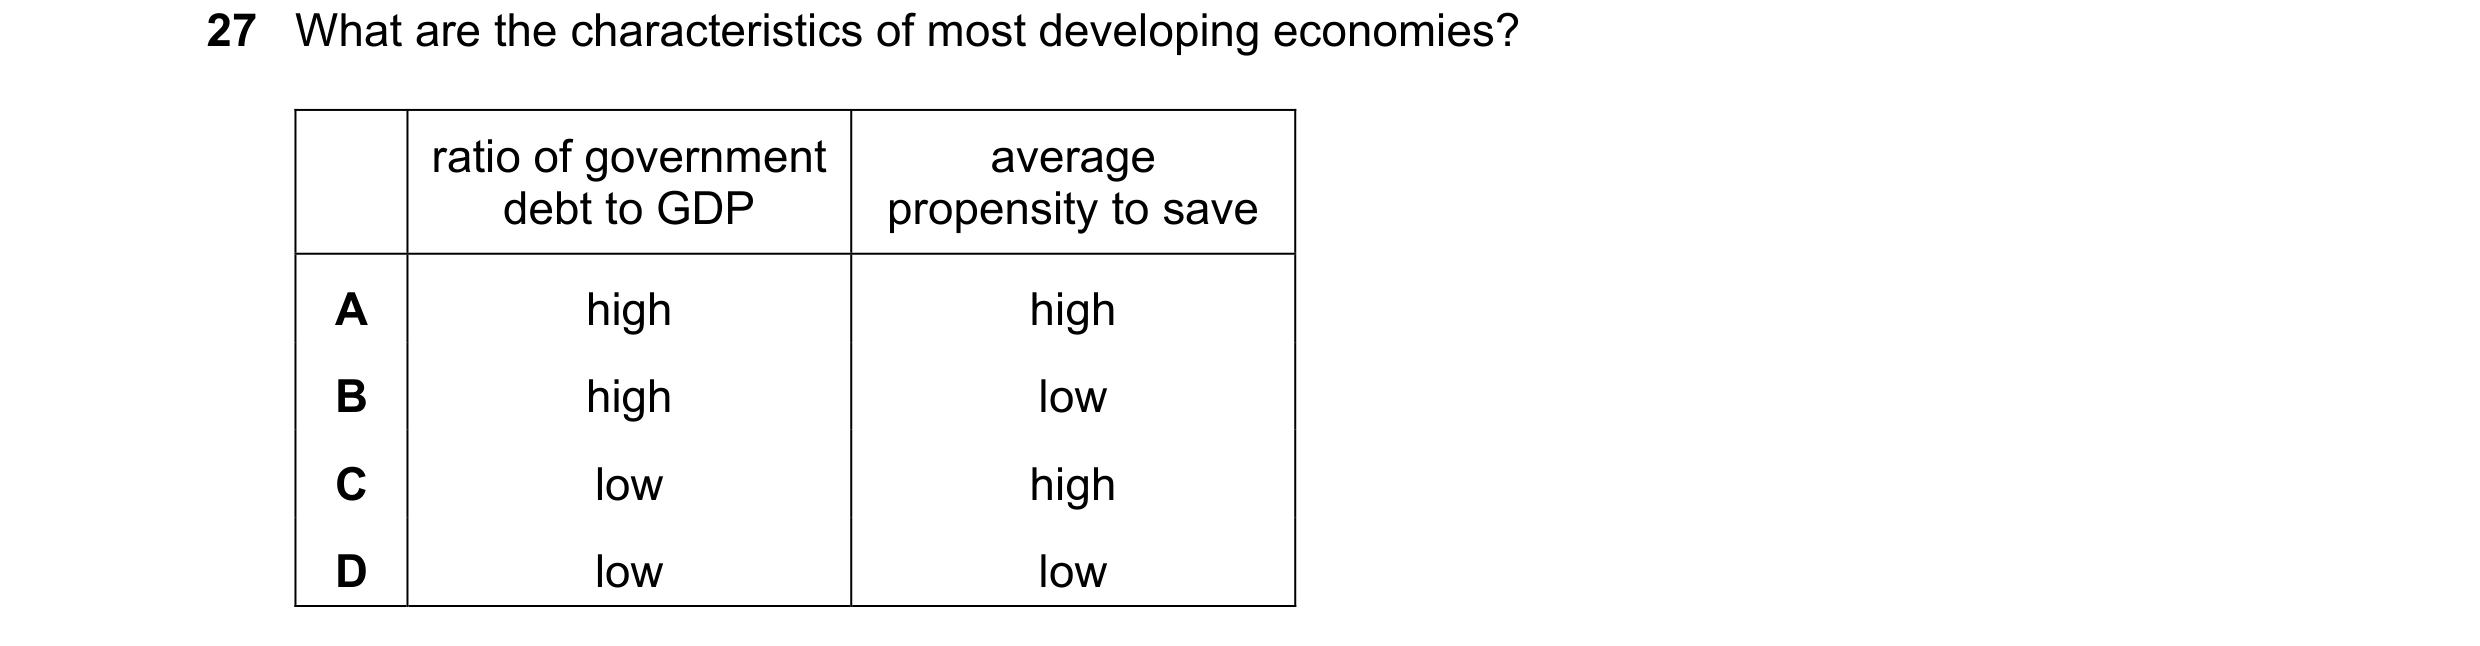
Q57 · What are the characteristics of most developing economies? 9708/31 Oct/Nov 2021
27 What are the characteristics of most developing economies? ratio of government average debt to GDP propensity to save A high high B high low C low high D low low
1 marks
Answer: B
This question in 9708/31 Oct/Nov 2021
Q58 · What could cause the official statistics for the national income per head of a developing… 9708/31 May/June 2022
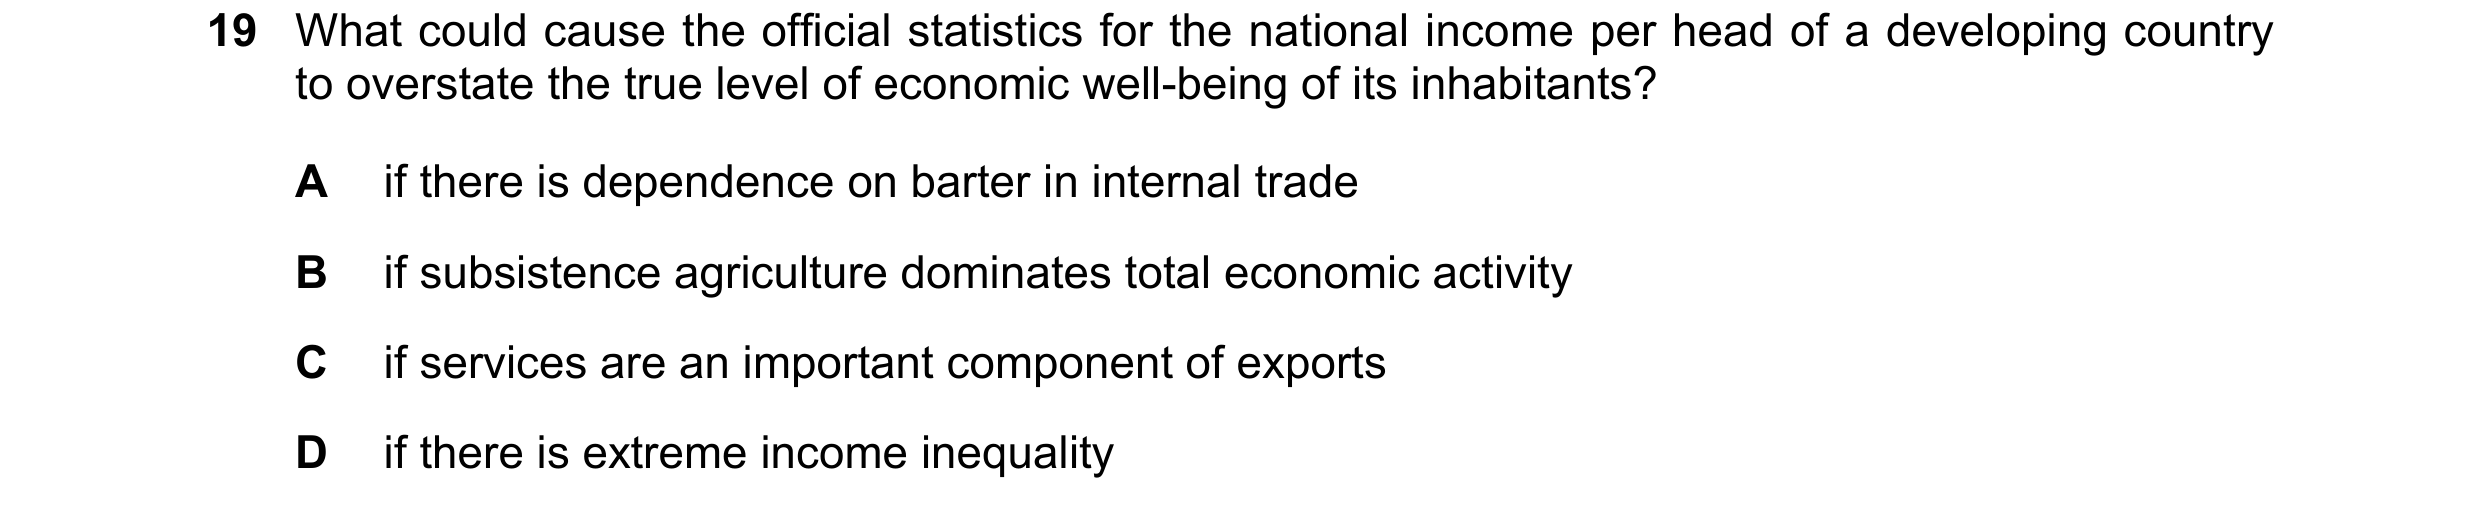
19 What could cause the official statistics for the national income per head of a developing country to overstate the true level of economic well-being of its inhabitants? A if there is dependence on barter in internal trade B if subsistence agriculture dominates total economic activity C if services are an important component of exports D if there is extreme income inequality
1 marks
Answer: D
This question in 9708/31 May/June 2022
Q59 · What could cause the official statistics for the national income per head of a developing… 9708/33 May/June 2022
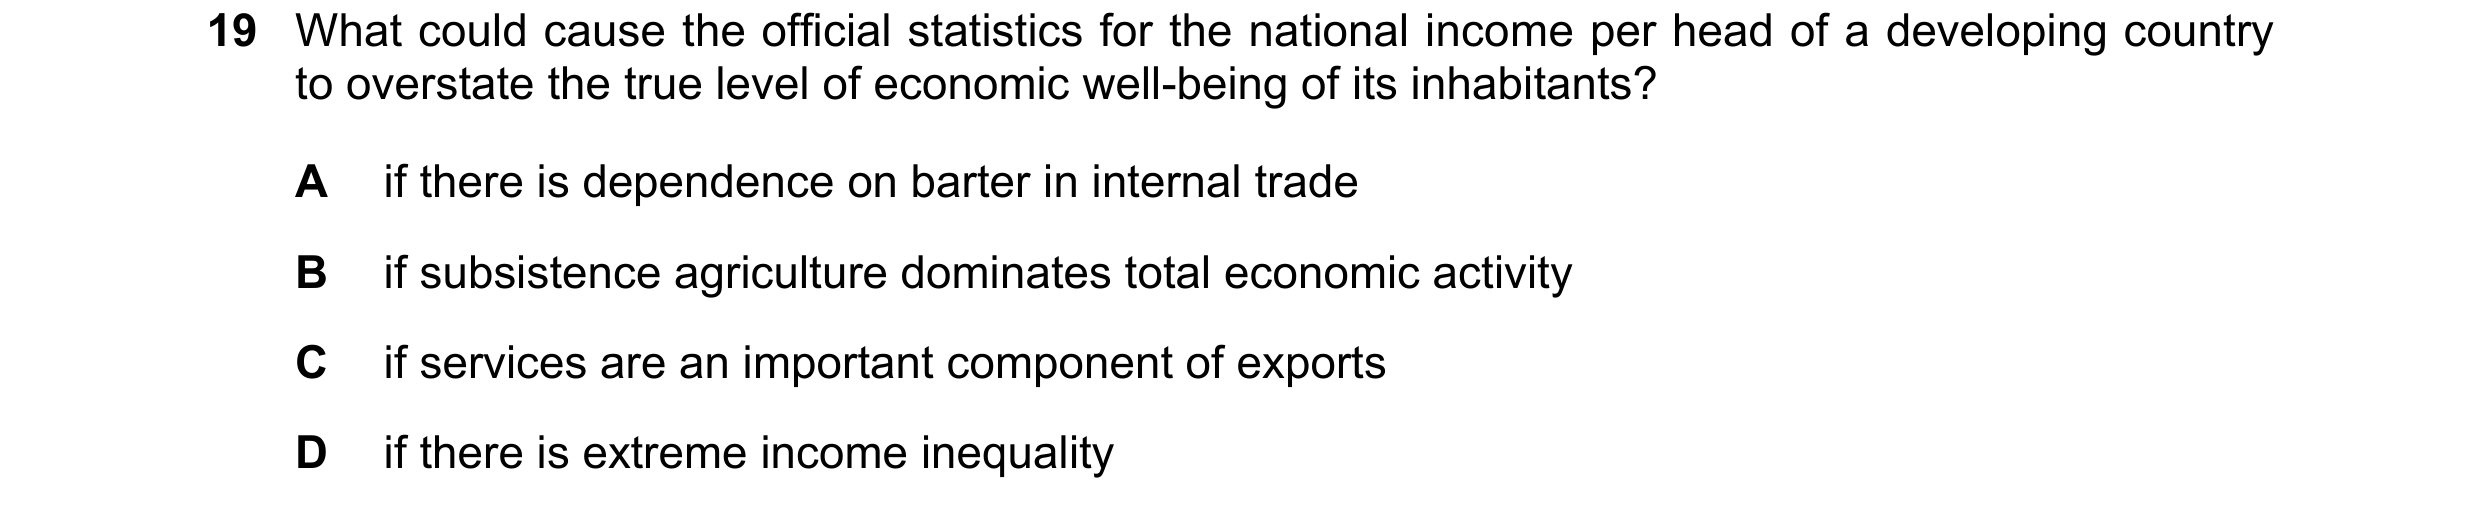
19 What could cause the official statistics for the national income per head of a developing country to overstate the true level of economic well-being of its inhabitants? A if there is dependence on barter in internal trade B if subsistence agriculture dominates total economic activity C if services are an important component of exports D if there is extreme income inequality
1 marks
Answer: D
This question in 9708/33 May/June 2022
Q60 · Which combination indicates that GDP per capita is likely to be an accurate indicator of… 9708/31 Oct/Nov 2022
20 Which combination indicates that GDP per capita is likely to be an accurate indicator of living standards in a country over time? hidden economy quality of goods and income distribution as % of GDP services produced A equal large constant B unequal large improving C equal small improving D unequal small constant
1 marks
Answer: C
This question in 9708/31 Oct/Nov 2022
Q61 · The diagram shows data on various aspects of four countries 9708/33 Oct/Nov 2022
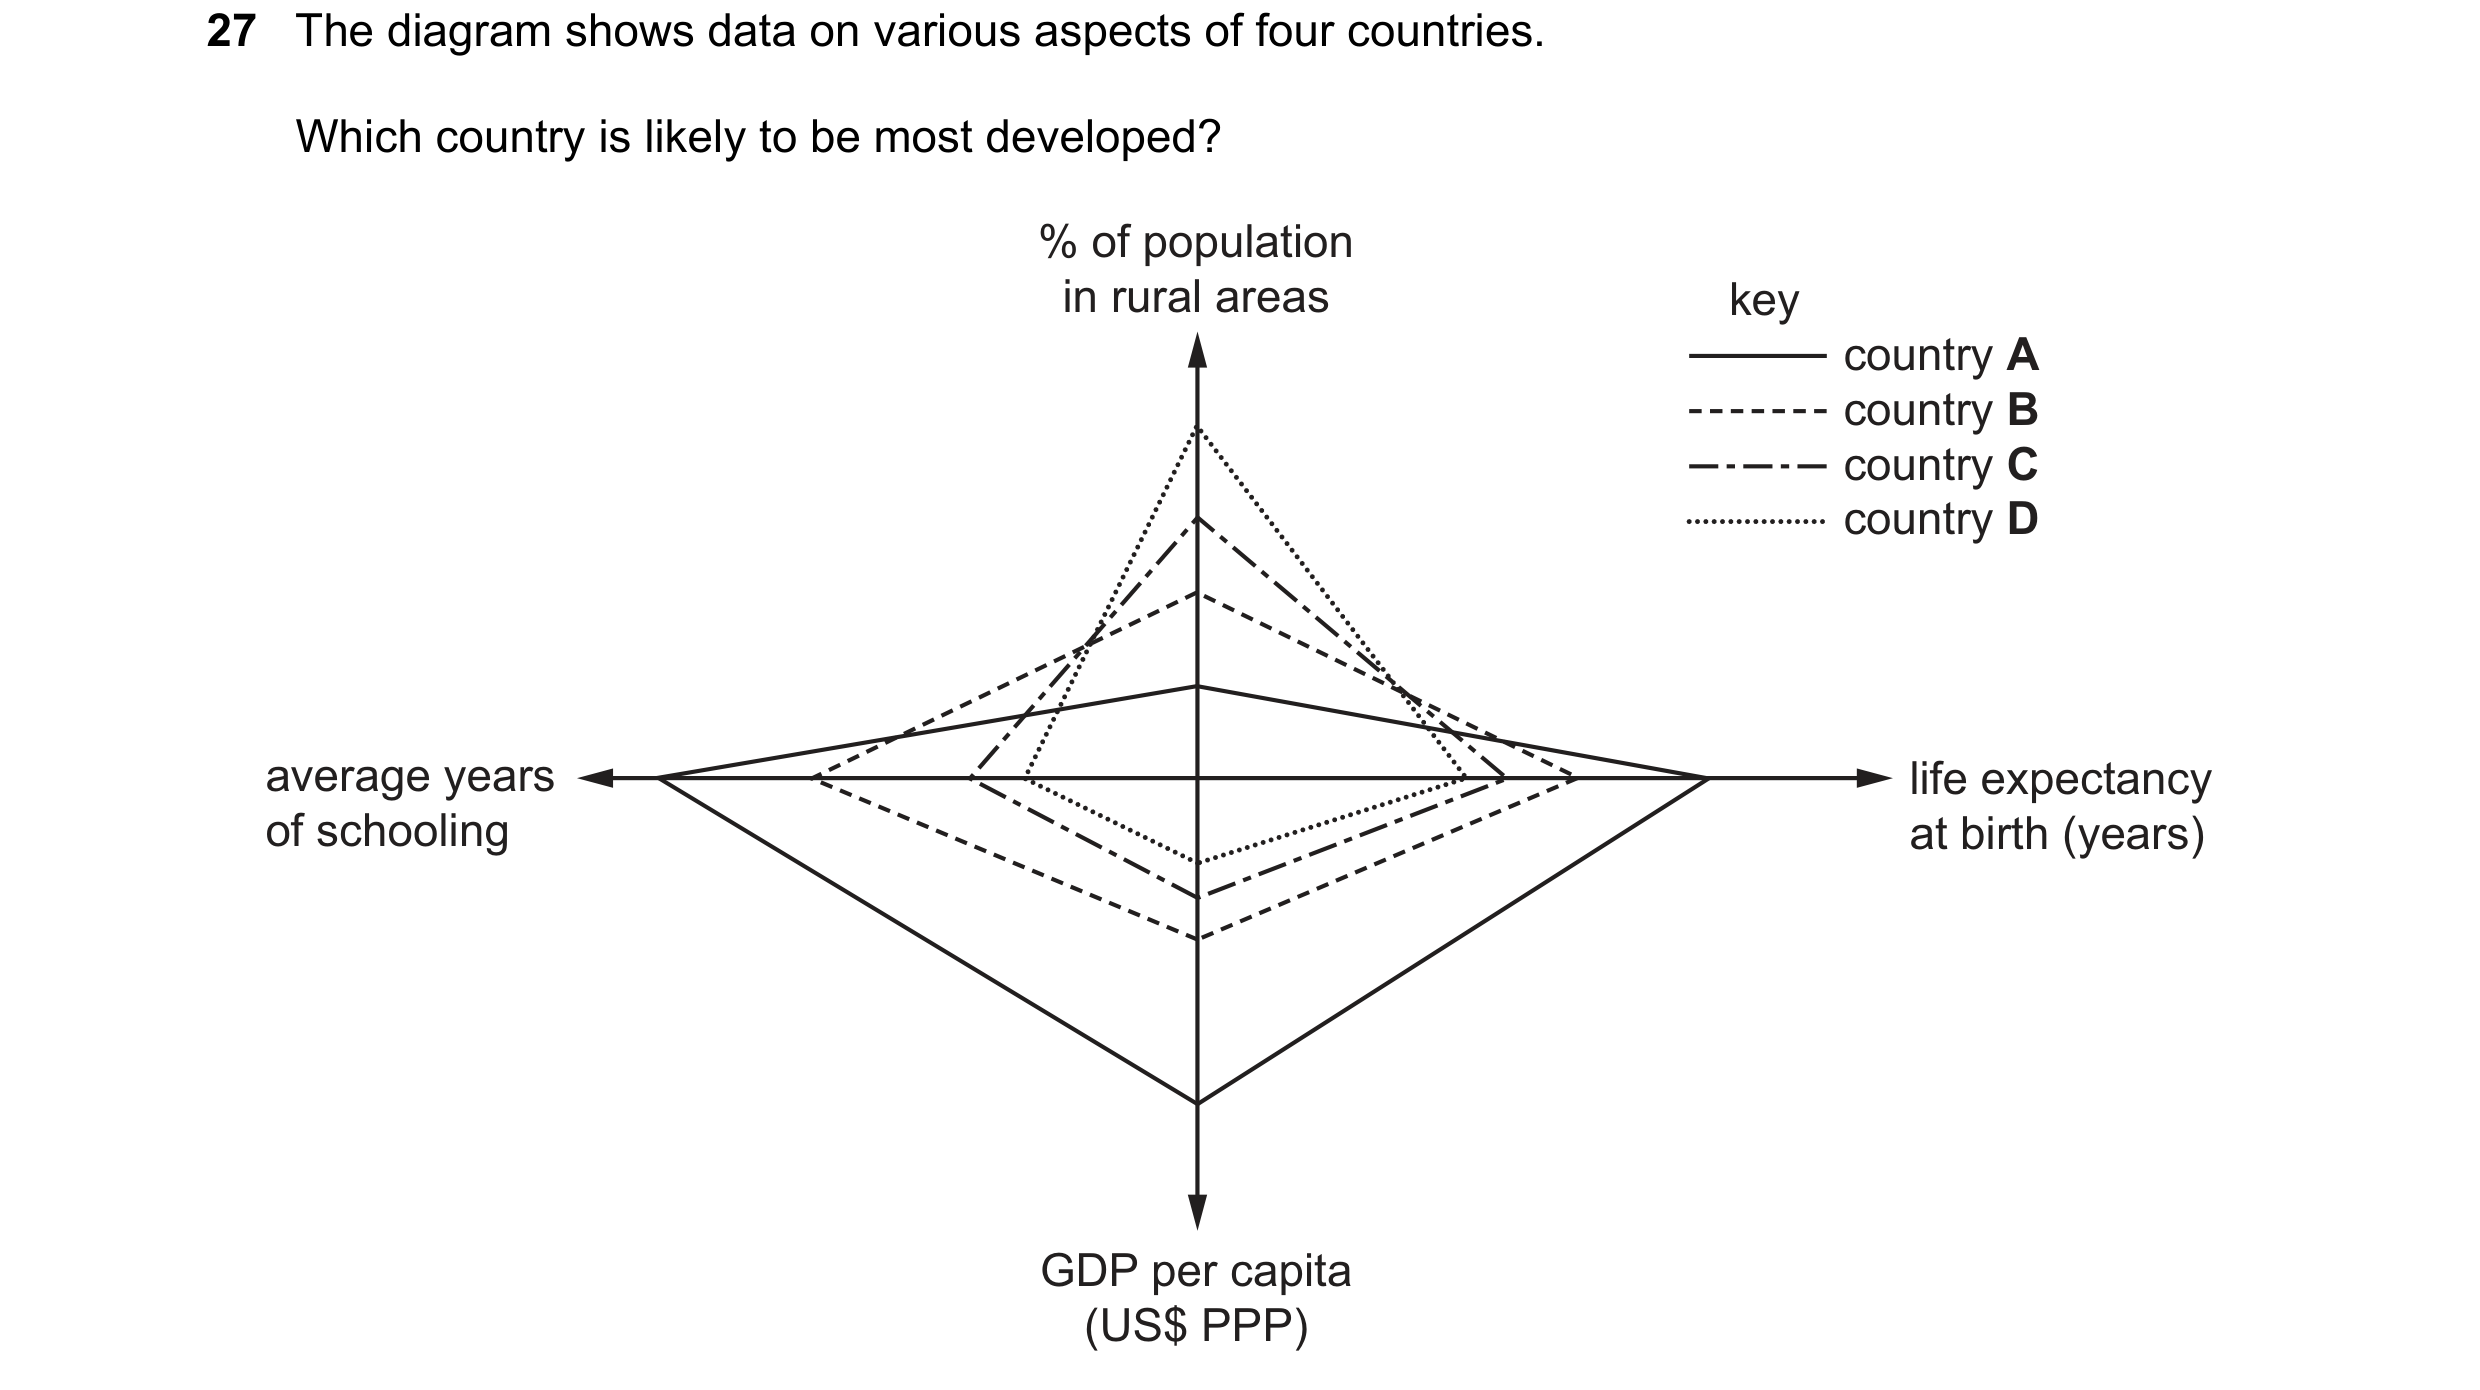
27 The diagram shows data on various aspects of four countries. Which country is likely to be most developed? % of population in rural areas key country A country B country C country D average years life expectancy of schooling at birth (years) GDP per capita (US$ PPP)
1 marks
Answer: A
This question in 9708/33 Oct/Nov 2022
Q62 · Which additional components may be included when measuring economic development that are… 9708/32 Feb/March 2023
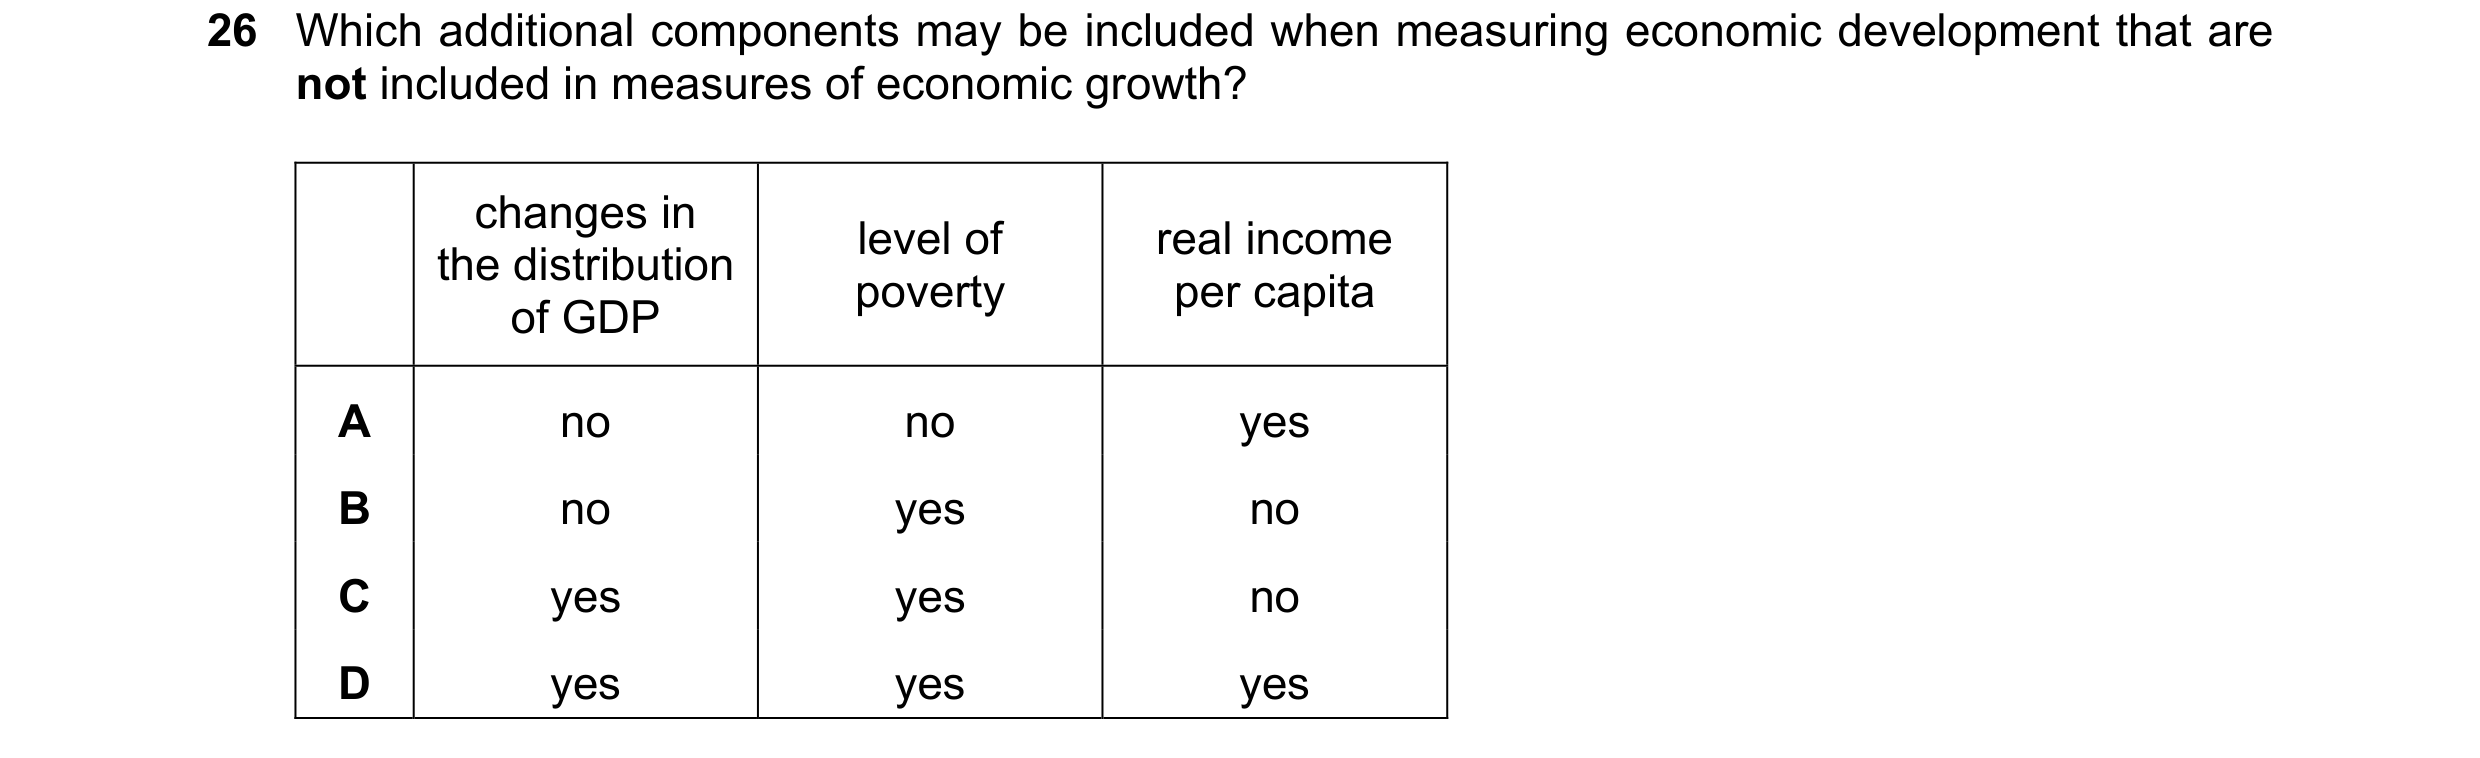
26 Which additional components may be included when measuring economic development that are not included in measures of economic growth? changes in level of real income the distribution poverty per capita of GDP A no no yes B no yes no C yes yes no D yes yes yes
1 marks
Answer: C
This question in 9708/32 Feb/March 2023
Q63 · Which curve is shown in the diagram? 9708/32 Feb/March 2023
27 Which curve is shown in the diagram? income inequality O income per capita A Kuznets curve B Laffer curve C Lorenz curve D Phillips curve
1 marks
Answer: A
This question in 9708/32 Feb/March 2023
Q64 · Which indicator is least likely to be used when measuring the comparative economic… 9708/32 Feb/March 2023
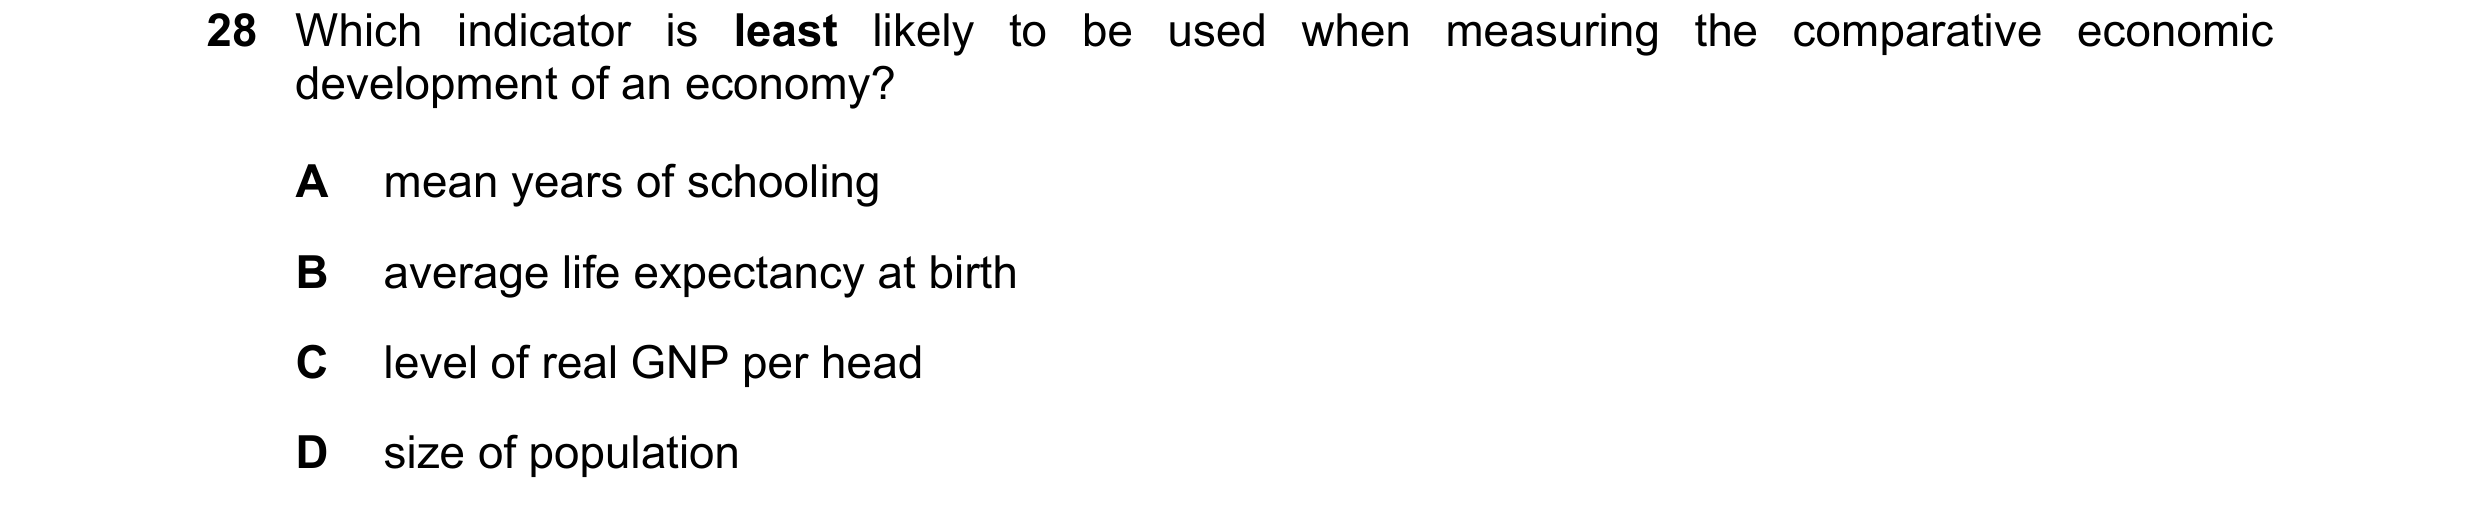
28 Which indicator is least likely to be used when measuring the comparative economic development of an economy? A mean years of schooling B average life expectancy at birth C level of real GNP per head D size of population
1 marks
Answer: D
This question in 9708/32 Feb/March 2023
Q65 · The table shows some United Nations population statistics for 2010 and estimates for 2050 9708/31 May/June 2023
29 The table shows some United Nations population statistics for 2010 and estimates for 2050. total total urban urban population population type of region population population population population urbanised urbanised (m) 2010 (m) 2050 (m) 2010 (m) 2050 (%) 2010 (%) 2050 more developed 1237 1275 930 1100 75 86 less developed 5671 7875 2556 5186 45 66 least developed 855 1673 249 914 29 55 Which relationship can be confirmed from the table? A The least developed regions have the largest urban populations, actual or predicted, in both years. B The more developed regions have the lowest growth rate of urbanisation between 2010 and 2050. C The type of region with the greatest total population in 2010 is predicted to have the greatest rate of population growth by 2050. D The type of region with the greatest urban population in 2010 is predicted to have the highest level of urbanisation by 2050.
1 marks
Answer: B
This question in 9708/31 May/June 2023
Q66 · The table shows the Human Development Index (HDI) values for India in 2014 and 2020 9708/32 May/June 2023
27 The table shows the Human Development Index (HDI) values for India in 2014 and 2020. HDI value 2014 0.60 2020 0.64 Which conclusion is most likely to be drawn from the table about the change in the HDI value from 2014 to 2020? A India had a fall in life expectancy at birth. B India had a fall in real national income per head. C India had a rise in environmental pollution and crime rates. D India had a rise in the mean years of schooling of the adult population.
1 marks
Answer: D
This question in 9708/32 May/June 2023
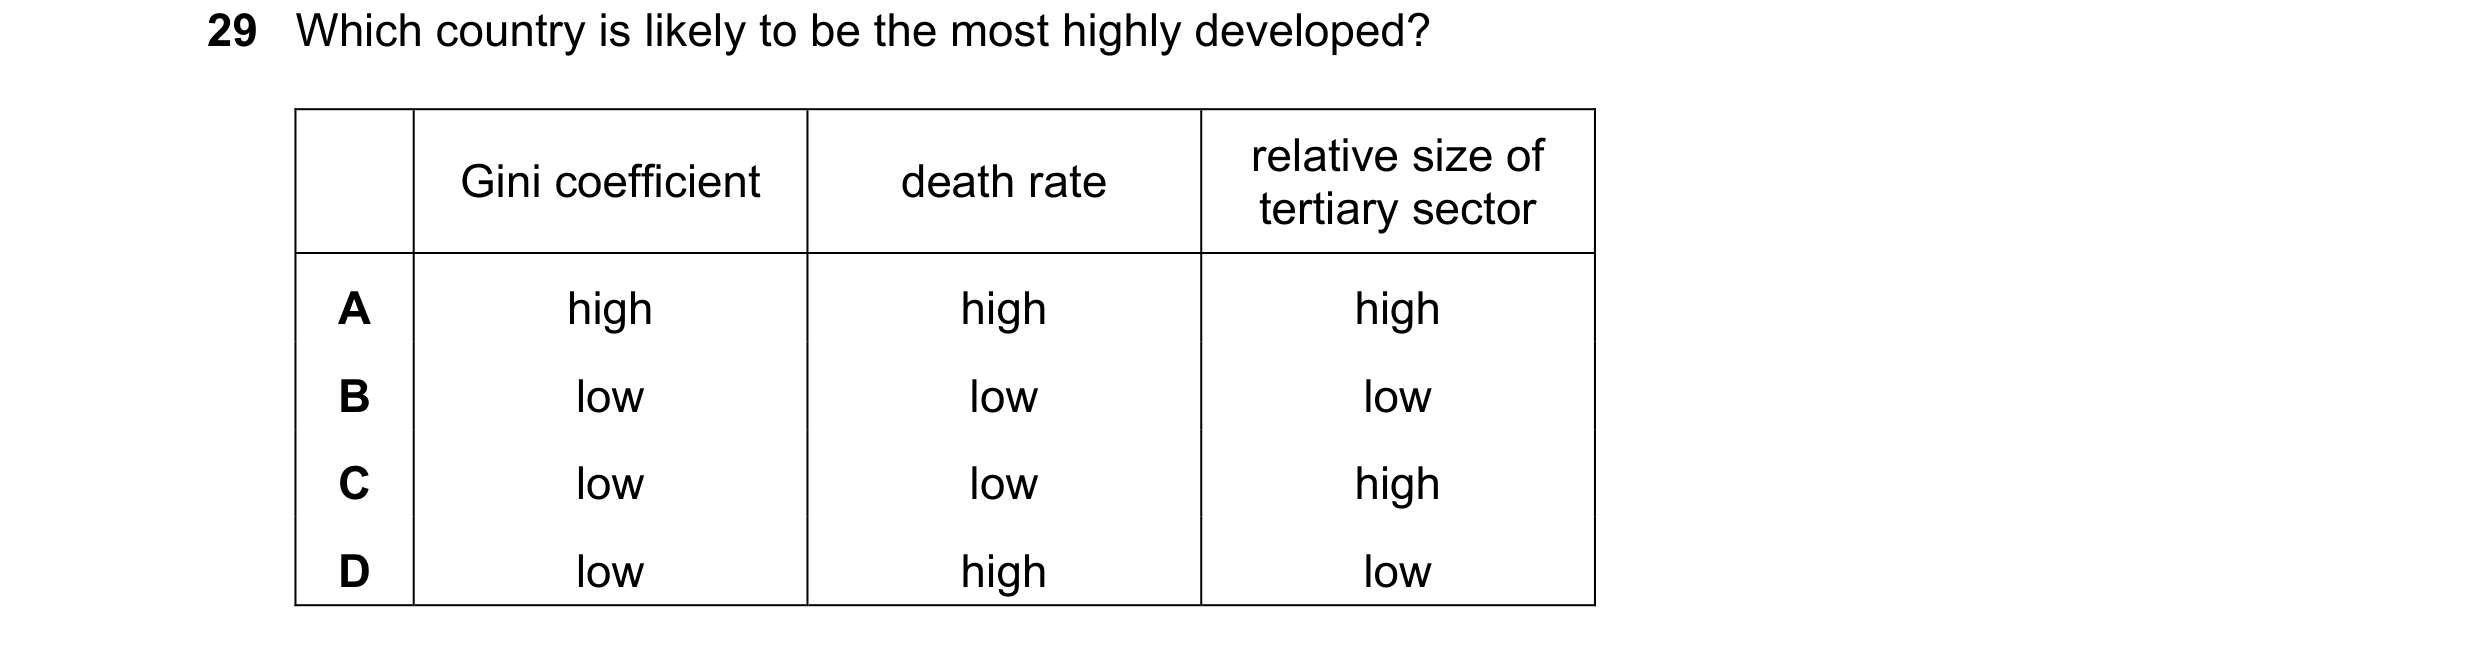
Q67 · Which country is likely to be the most highly developed? 9708/32 May/June 2023
29 Which country is likely to be the most highly developed? relative size of Gini coefficient death rate tertiary sector A high high high B low low low C low low high D low high low
1 marks
Answer: C
This question in 9708/32 May/June 2023
Q68 · To indicate the changing income distribution, the Kuznets curve plots gross domestic… 9708/33 May/June 2023
27 To indicate the changing income distribution, the Kuznets curve plots gross domestic product per capita against an economic variable X. What is variable X? A the exchange rate B the level of income inequality C the price level D the rate of interest
1 marks
Answer: B
This question in 9708/33 May/June 2023
Q69 · The table shows some United Nations population statistics for 2010 and estimates for 2050 9708/33 May/June 2023
29 The table shows some United Nations population statistics for 2010 and estimates for 2050. total total urban urban population population type of region population population population population urbanised urbanised (m) 2010 (m) 2050 (m) 2010 (m) 2050 (%) 2010 (%) 2050 more developed 1237 1275 930 1100 75 86 less developed 5671 7875 2556 5186 45 66 least developed 855 1673 249 914 29 55 Which relationship can be confirmed from the table? A The least developed regions have the largest urban populations, actual or predicted, in both years. B The more developed regions have the lowest growth rate of urbanisation between 2010 and 2050. C The type of region with the greatest total population in 2010 is predicted to have the greatest rate of population growth by 2050. D The type of region with the greatest urban population in 2010 is predicted to have the highest level of urbanisation by 2050.
1 marks
Answer: B
This question in 9708/33 May/June 2023
Q70 · Purchasing power parity (PPP) allows a comparison of the purchasing power in two countries 9708/31 Oct/Nov 2023
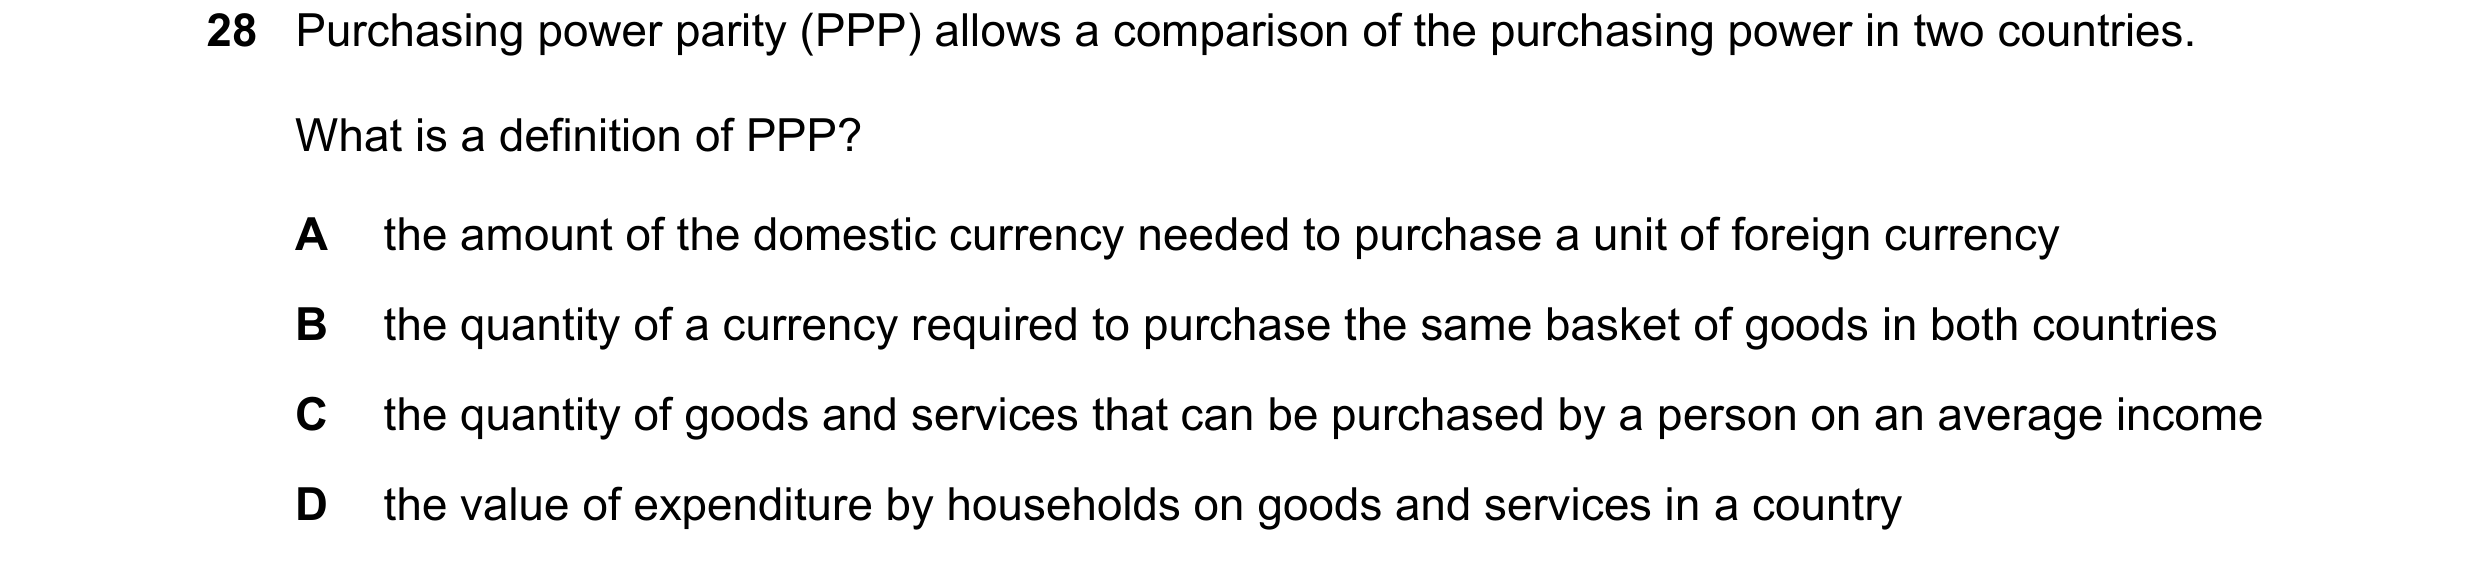
28 Purchasing power parity (PPP) allows a comparison of the purchasing power in two countries. What is a definition of PPP? A the amount of the domestic currency needed to purchase a unit of foreign currency B the quantity of a currency required to purchase the same basket of goods in both countries C the quantity of goods and services that can be purchased by a person on an average income D the value of expenditure by households on goods and services in a country
1 marks
Answer: B
This question in 9708/31 Oct/Nov 2023
Q71 · Which row correctly identifies the characteristics of a low-income economy? 9708/33 Oct/Nov 2023
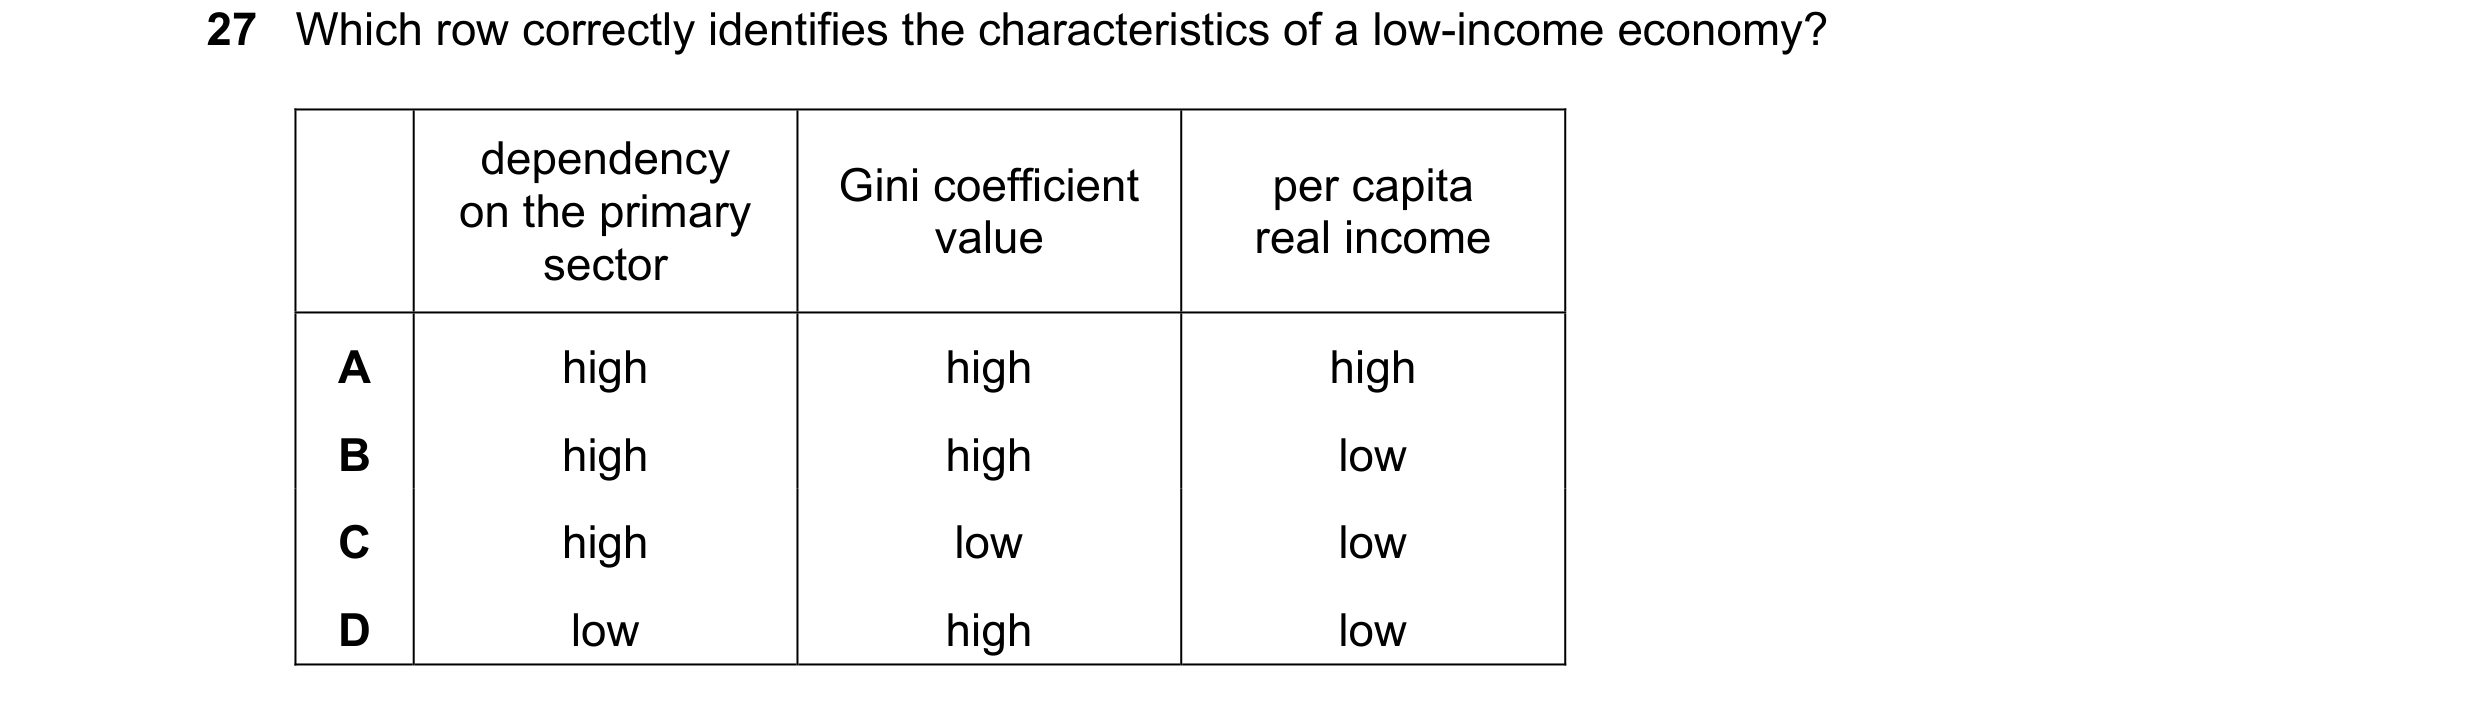
27 Which row correctly identifies the characteristics of a low-income economy? dependency Gini coefficient per capita on the primary value real income sector A high high high B high high low C high low low D low high low
1 marks
Answer: B
This question in 9708/33 Oct/Nov 2023
Q72 · Under which circumstances will low wages and low-cost land in a low-income country not… 9708/33 Oct/Nov 2023
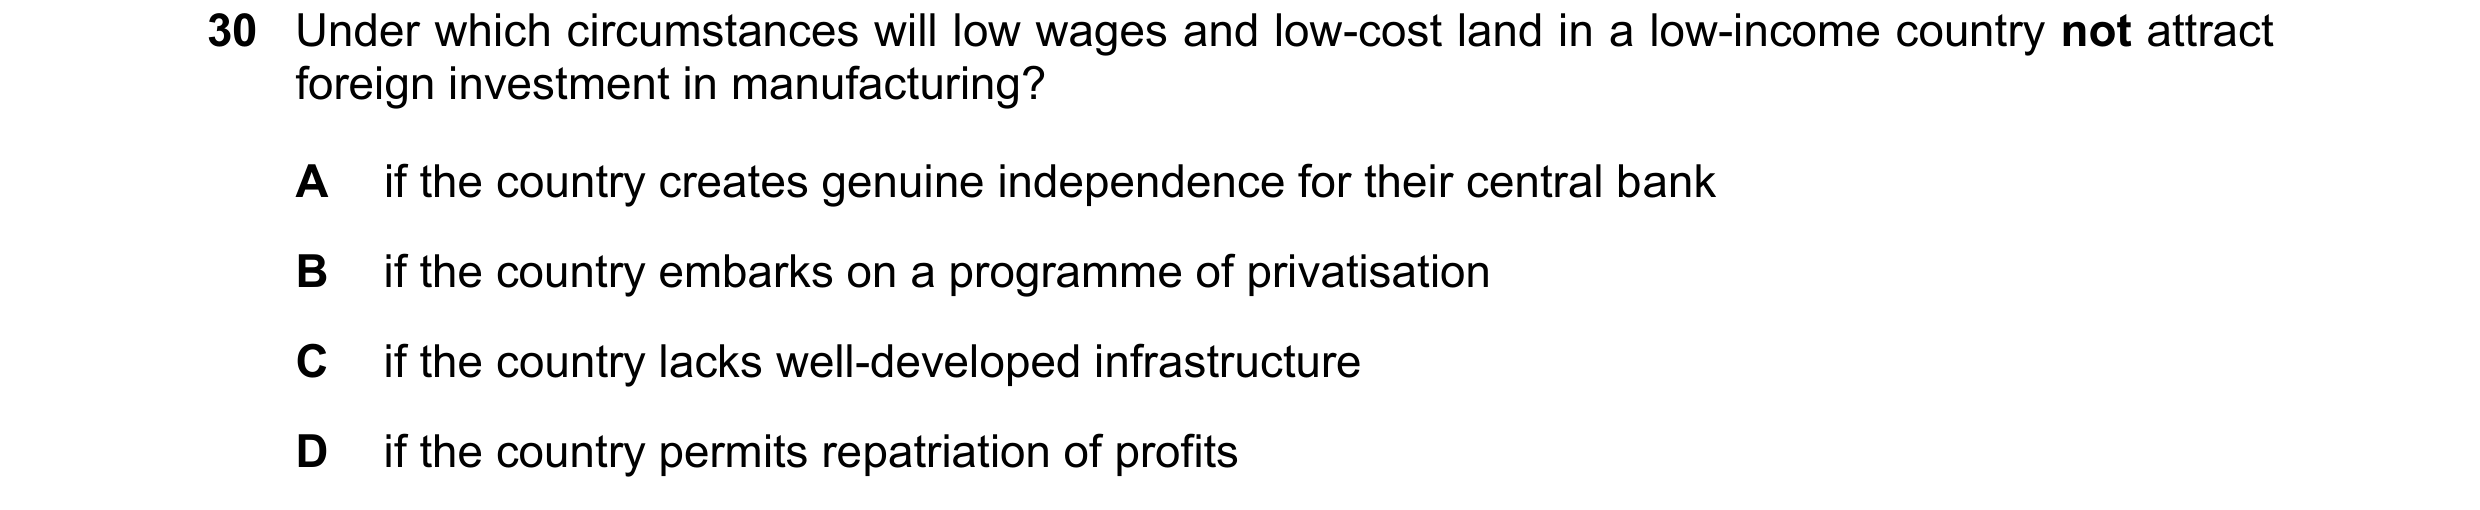
30 Under which circumstances will low wages and low-cost land in a low-income country not attract foreign investment in manufacturing? A if the country creates genuine independence for their central bank B if the country embarks on a programme of privatisation C if the country lacks well-developed infrastructure D if the country permits repatriation of profits
1 marks
Answer: C
This question in 9708/33 Oct/Nov 2023
Q73 · The table shows the GDP and population of four countries 9708/31 May/June 2024
28 The table shows the GDP and population of four countries. Which country is most likely to have the lowest standard of living? GDP population country US$ billion million A Bangladesh 206.7 153.5 B India 2989.1 1147.9 C Nigeria 292.7 138.3 D South Africa 467.1 43.8
1 marks
Answer: A
This question in 9708/31 May/June 2024
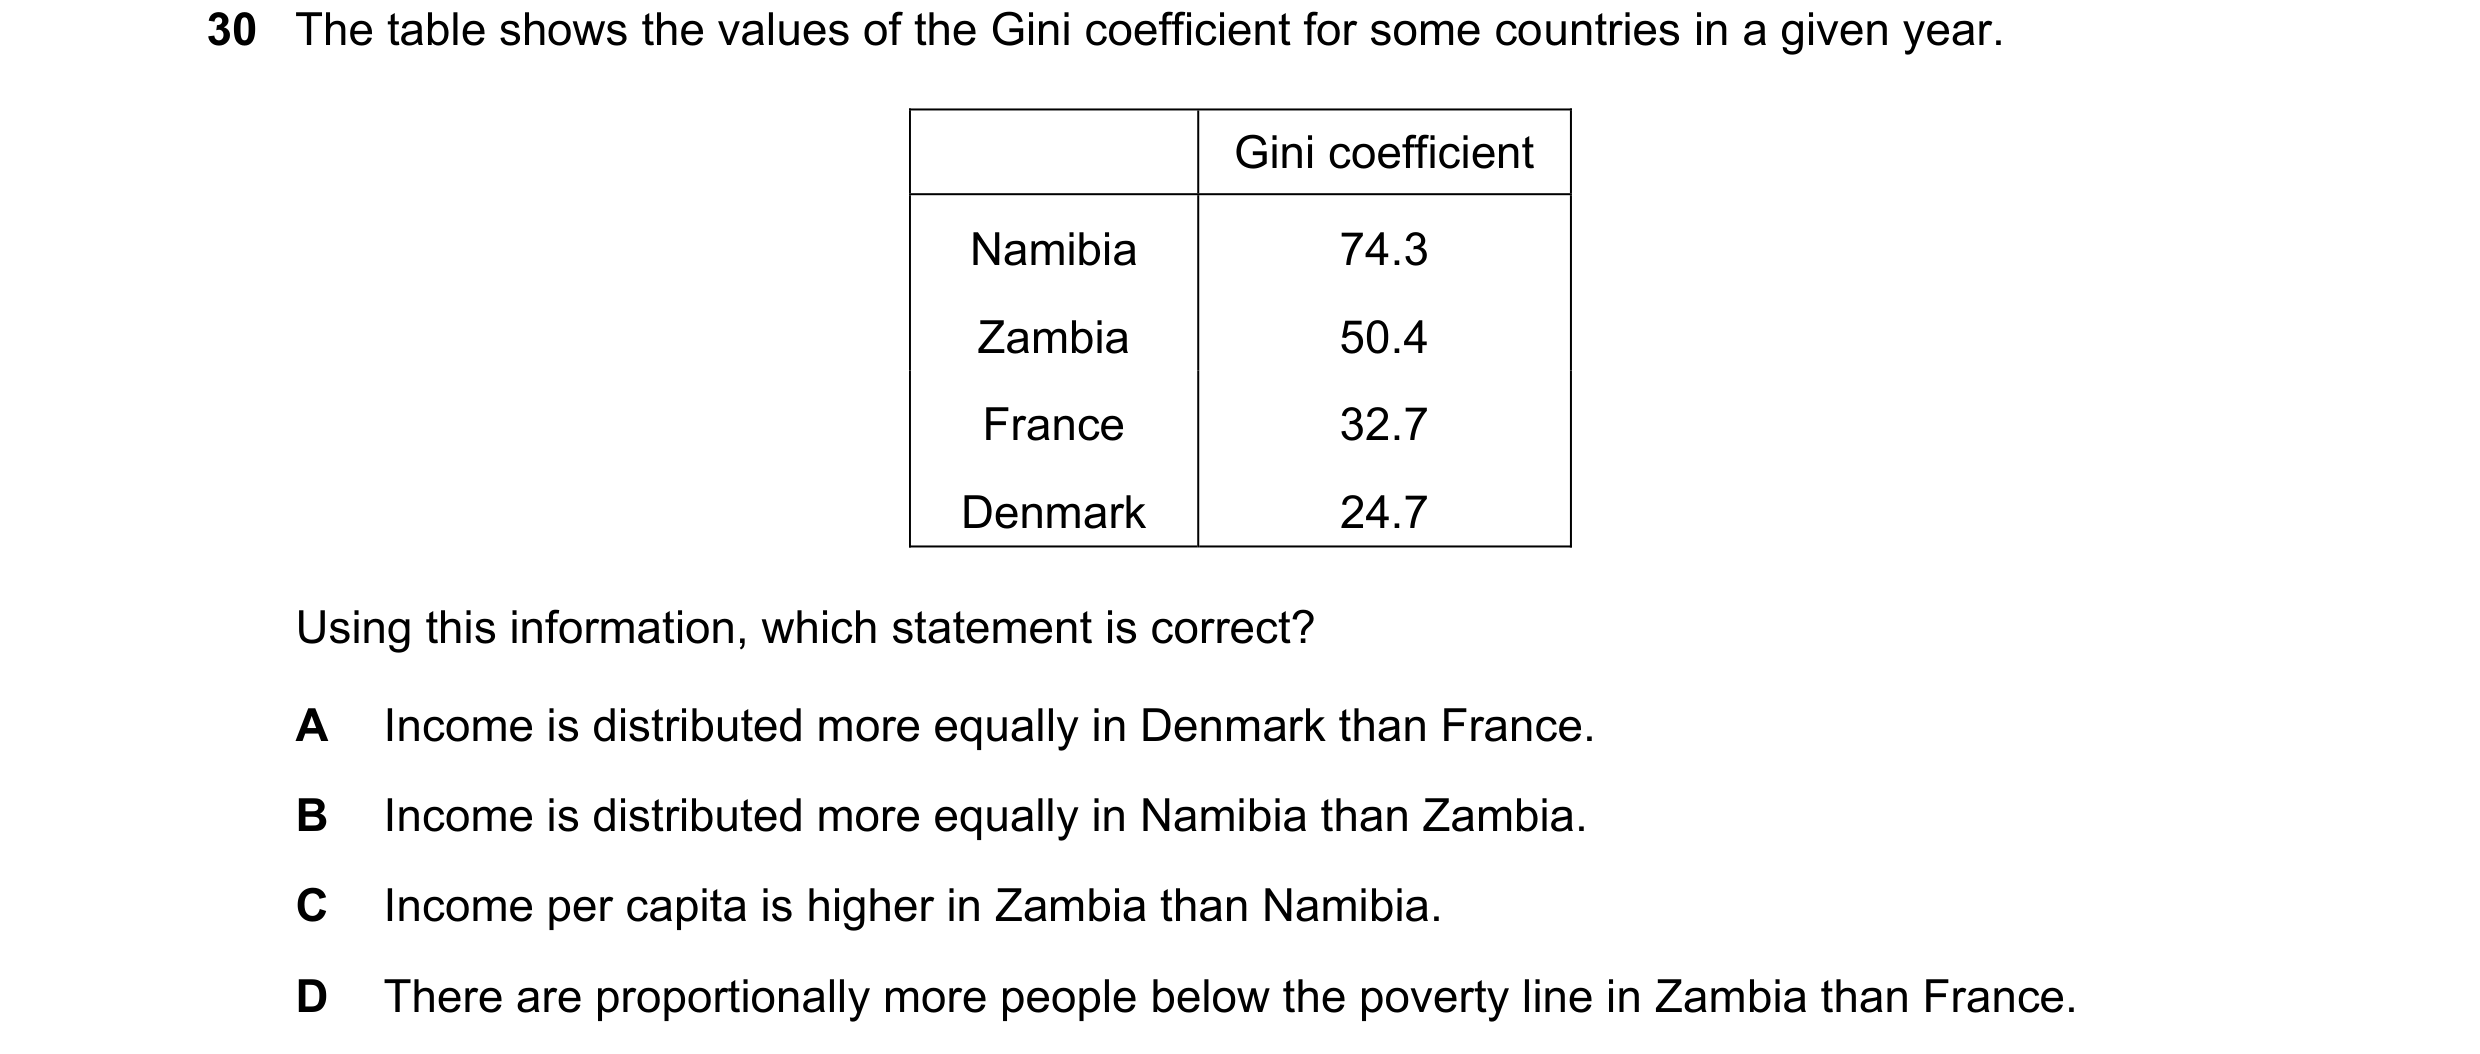
Q74 · The table shows the values of the Gini coefficient for some countries in a given year 9708/31 May/June 2024
30 The table shows the values of the Gini coefficient for some countries in a given year. Gini coefficient Namibia 74.3 Zambia 50.4 France 32.7 Denmark 24.7 Using this information, which statement is correct? A Income is distributed more equally in Denmark than France. B Income is distributed more equally in Namibia than Zambia. C Income per capita is higher in Zambia than Namibia. D There are proportionally more people below the poverty line in Zambia than France.
1 marks
Answer: A
This question in 9708/31 May/June 2024
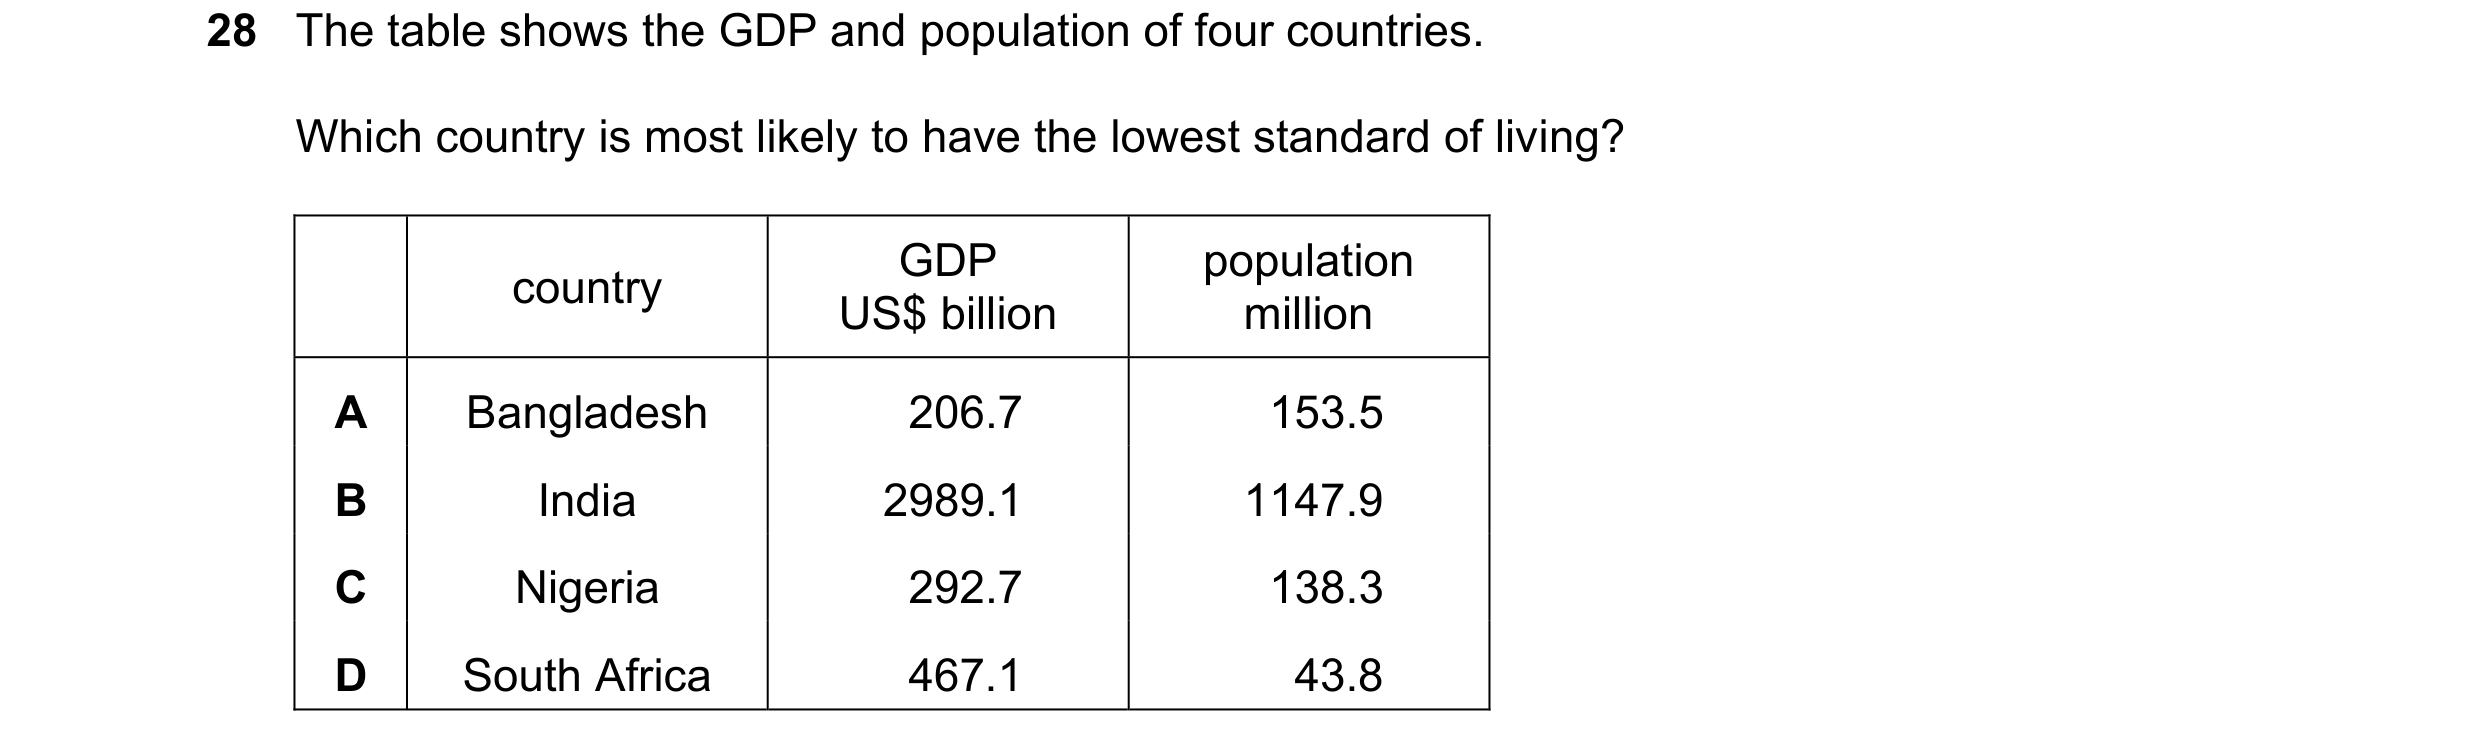
Q75 · The table shows the GDP and population of four countries 9708/33 May/June 2024
28 The table shows the GDP and population of four countries. Which country is most likely to have the lowest standard of living? GDP population country US$ billion million A Bangladesh 206.7 153.5 B India 2989.1 1147.9 C Nigeria 292.7 138.3 D South Africa 467.1 43.8
1 marks
Answer: A
This question in 9708/33 May/June 2024
Q76 · The table shows the values of the Gini coefficient for some countries in a given year 9708/33 May/June 2024
30 The table shows the values of the Gini coefficient for some countries in a given year. Gini coefficient Namibia 74.3 Zambia 50.4 France 32.7 Denmark 24.7 Using this information, which statement is correct? A Income is distributed more equally in Denmark than France. B Income is distributed more equally in Namibia than Zambia. C Income per capita is higher in Zambia than Namibia. D There are proportionally more people below the poverty line in Zambia than France.
1 marks
Answer: A
This question in 9708/33 May/June 2024
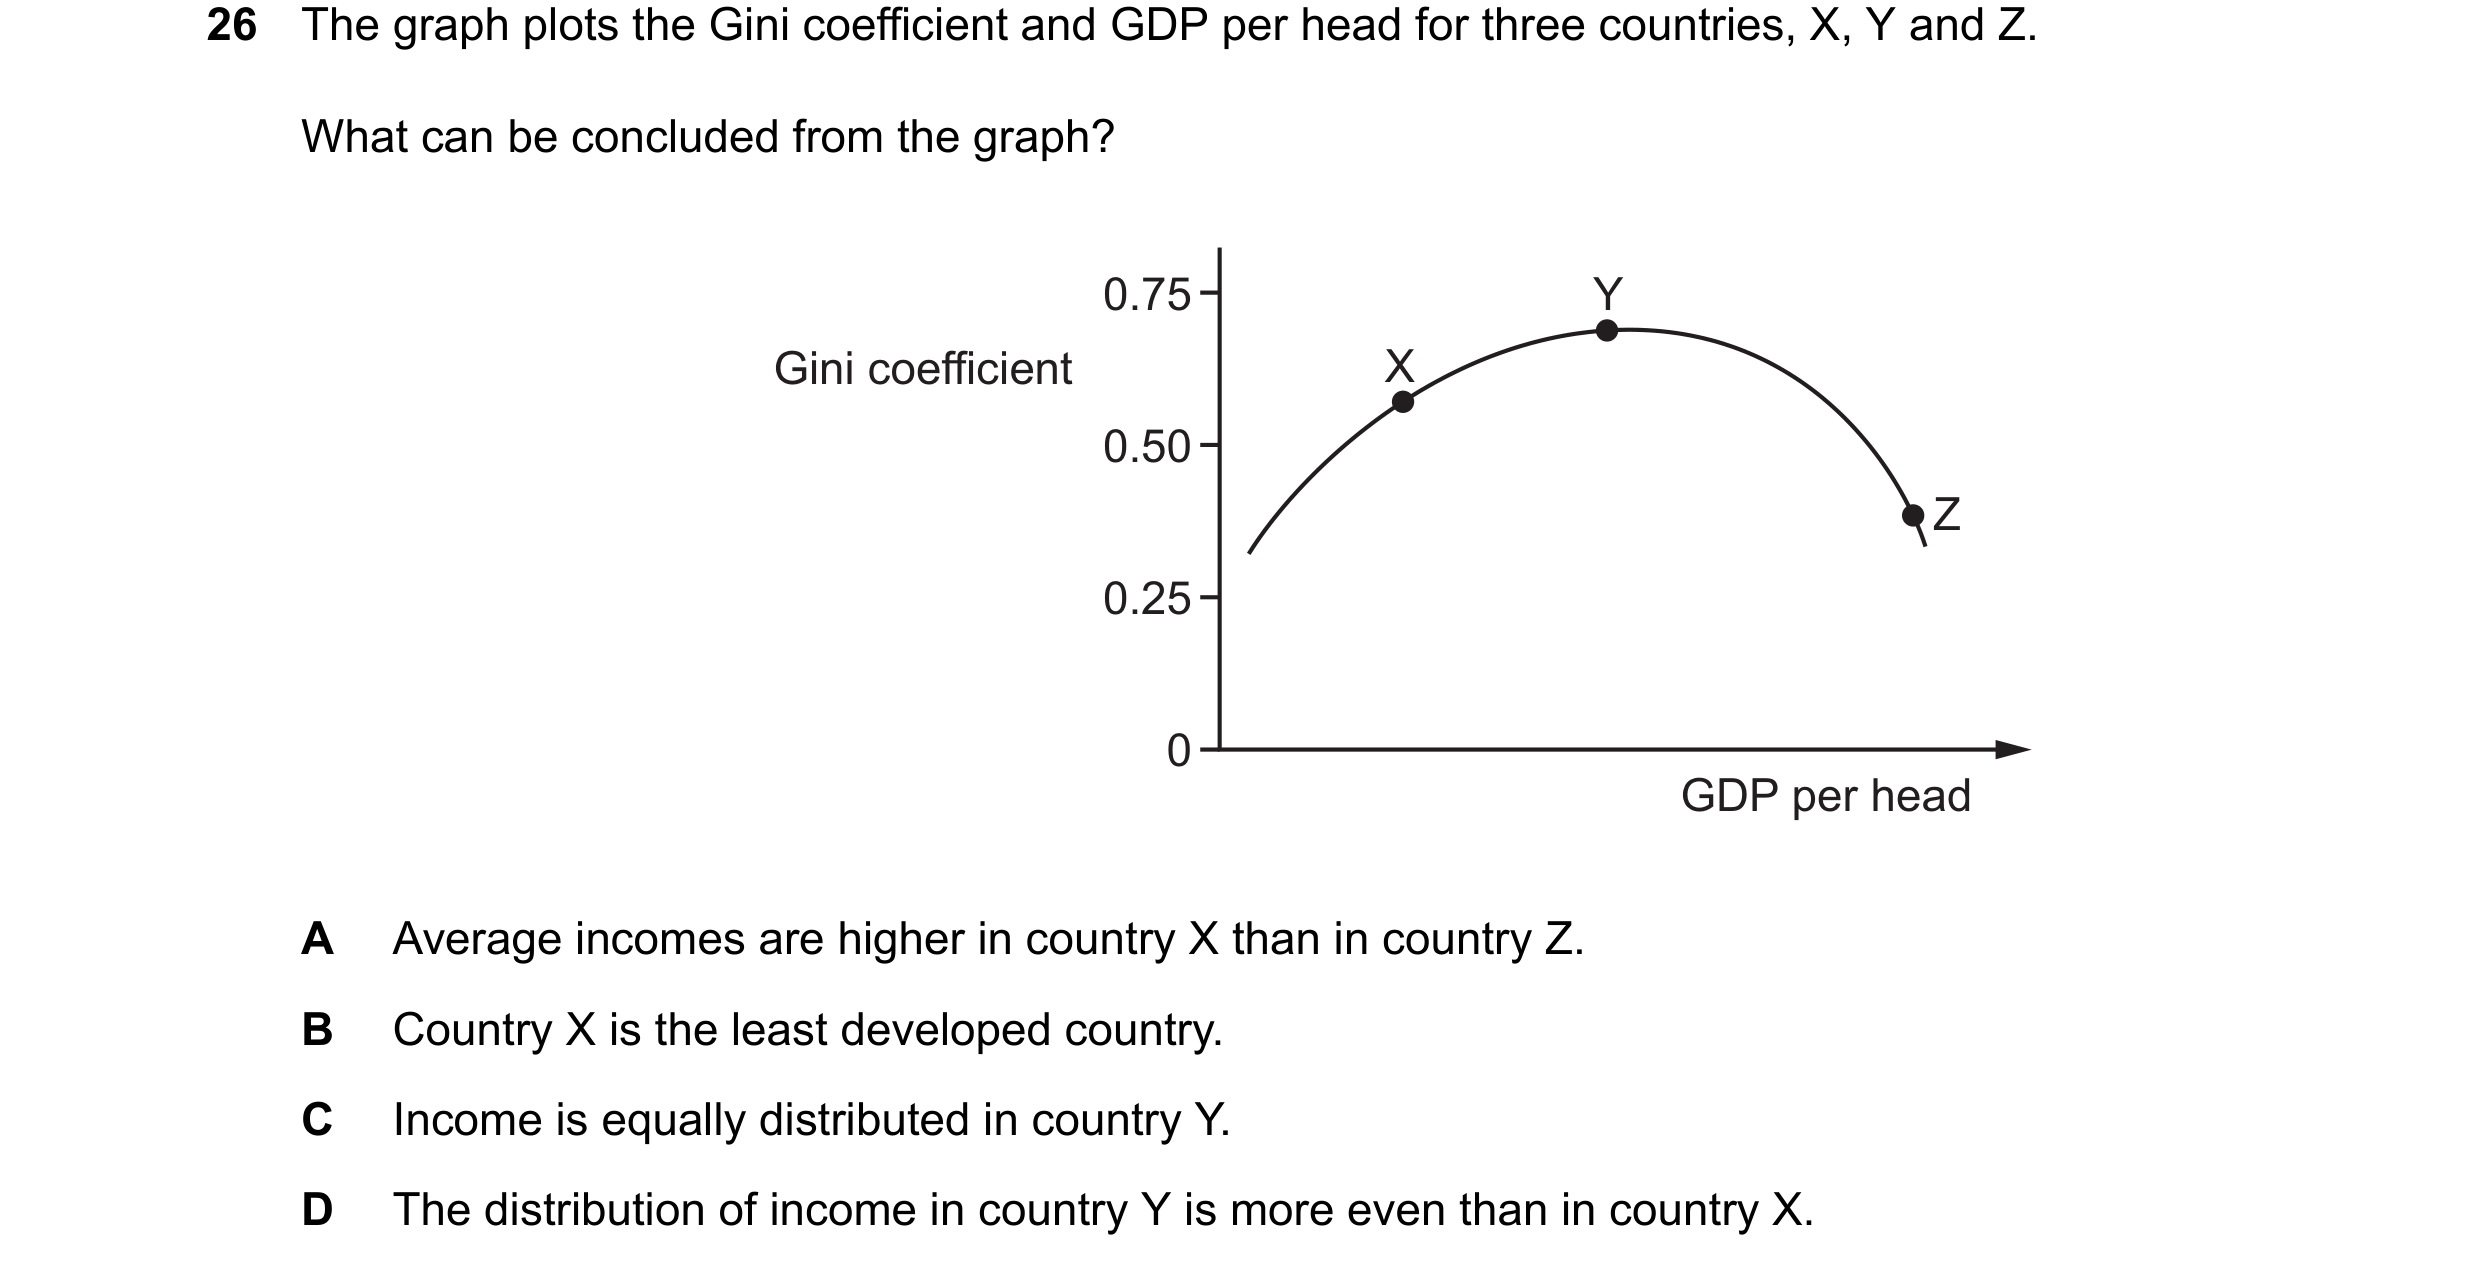
Q77 · The graph plots the Gini coefficient and GDP per head for three countries, X, Y and Z 9708/32 Feb/March 2025
26 The graph plots the Gini coefficient and GDP per head for three countries, X, Y and Z. What can be concluded from the graph? 0.75 Y Gini coefficient X 0.50 Z 0.25 0 GDP per head A Average incomes are higher in country X than in country Z. B Country X is the least developed country. C Income is equally distributed in country Y. D The distribution of income in country Y is more even than in country X.
1 marks
Answer: B
This question in 9708/32 Feb/March 2025
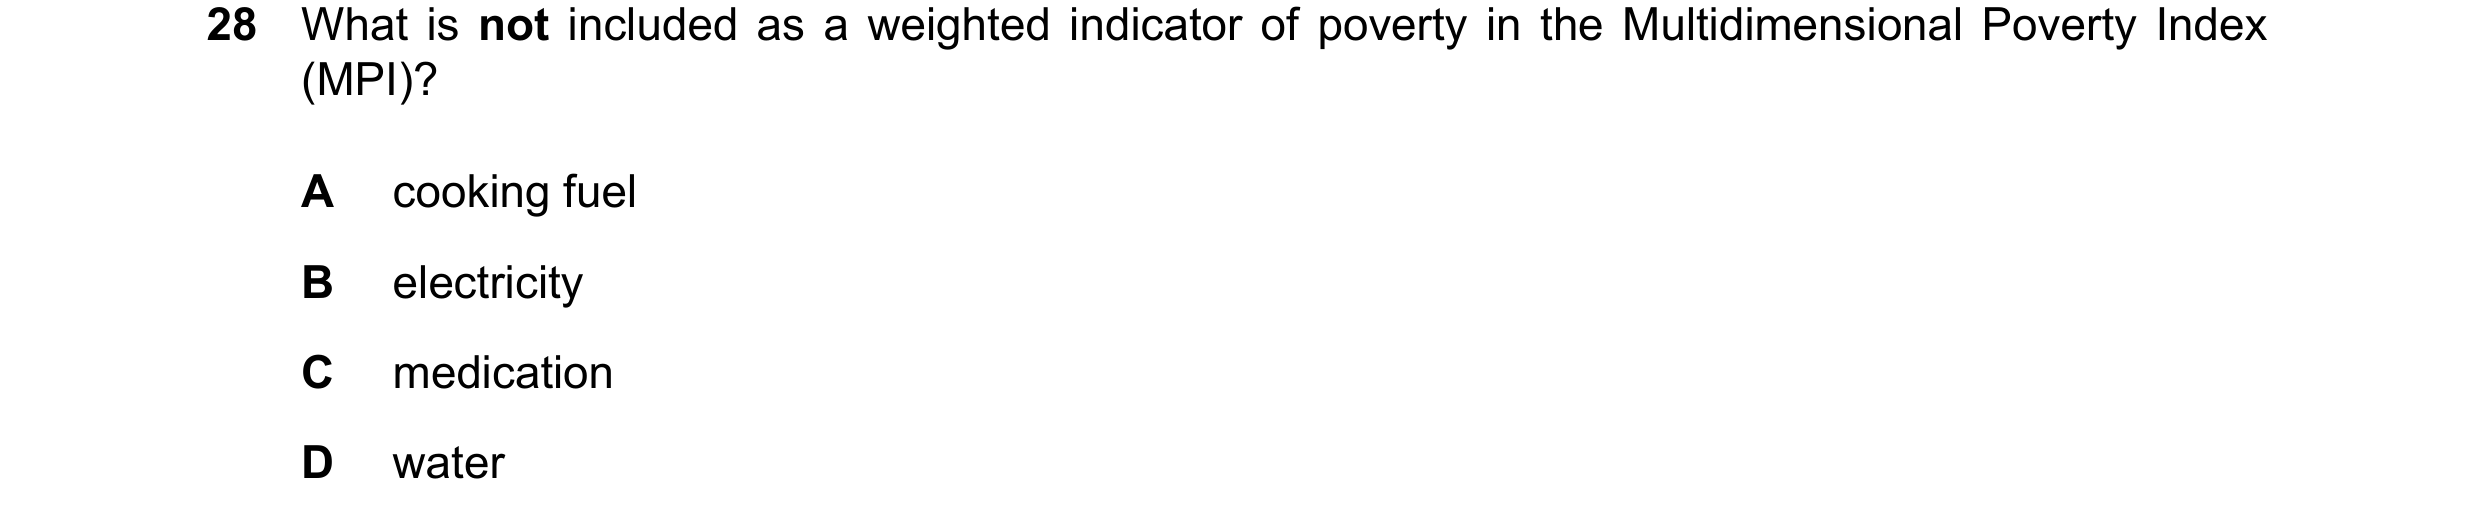
Q78 · What is not included as a weighted indicator of poverty in the Multidimensional Poverty… 9708/32 Feb/March 2025
28 What is not included as a weighted indicator of poverty in the Multidimensional Poverty Index (MPI)? A cooking fuel B electricity C medication D water
1 marks
Answer: C
This question in 9708/32 Feb/March 2025
 1 / 21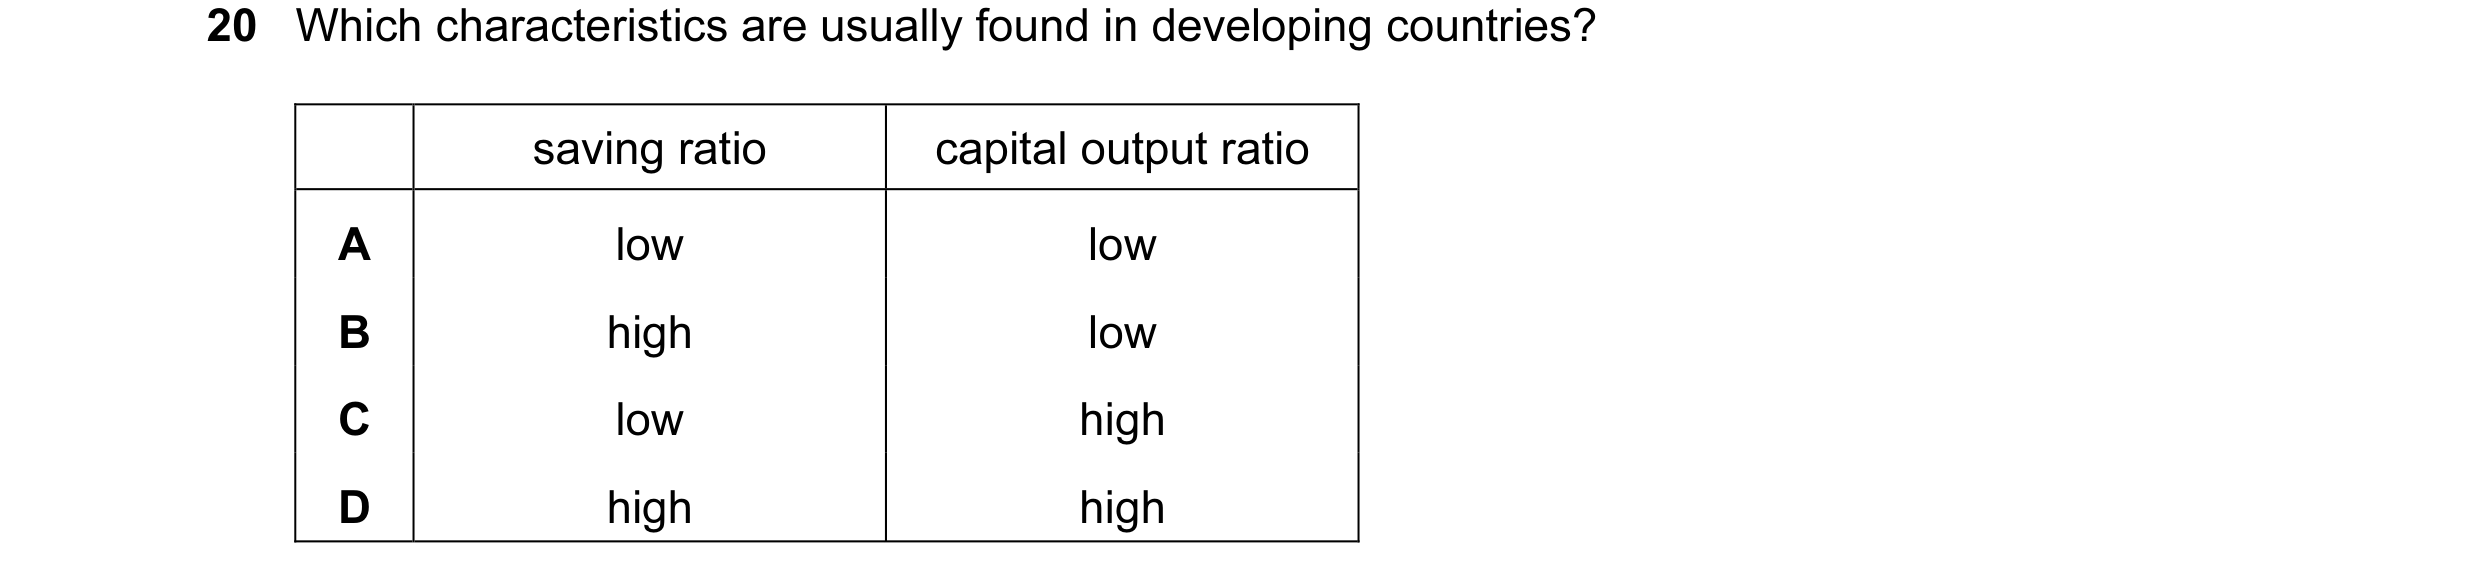



 2 / 21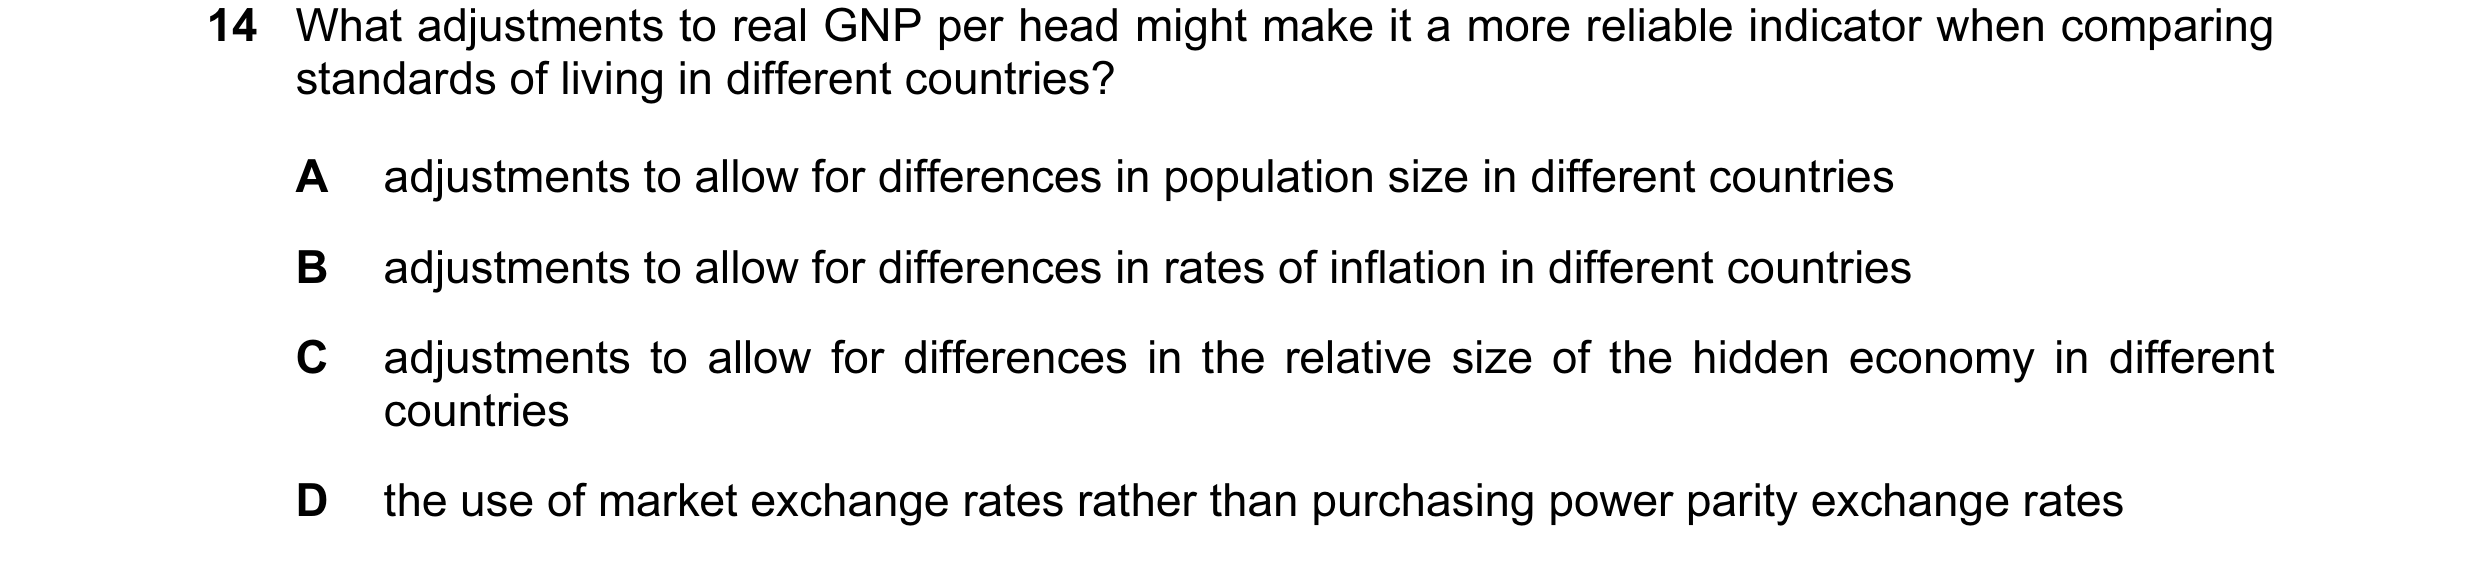

 3 / 21

 4 / 21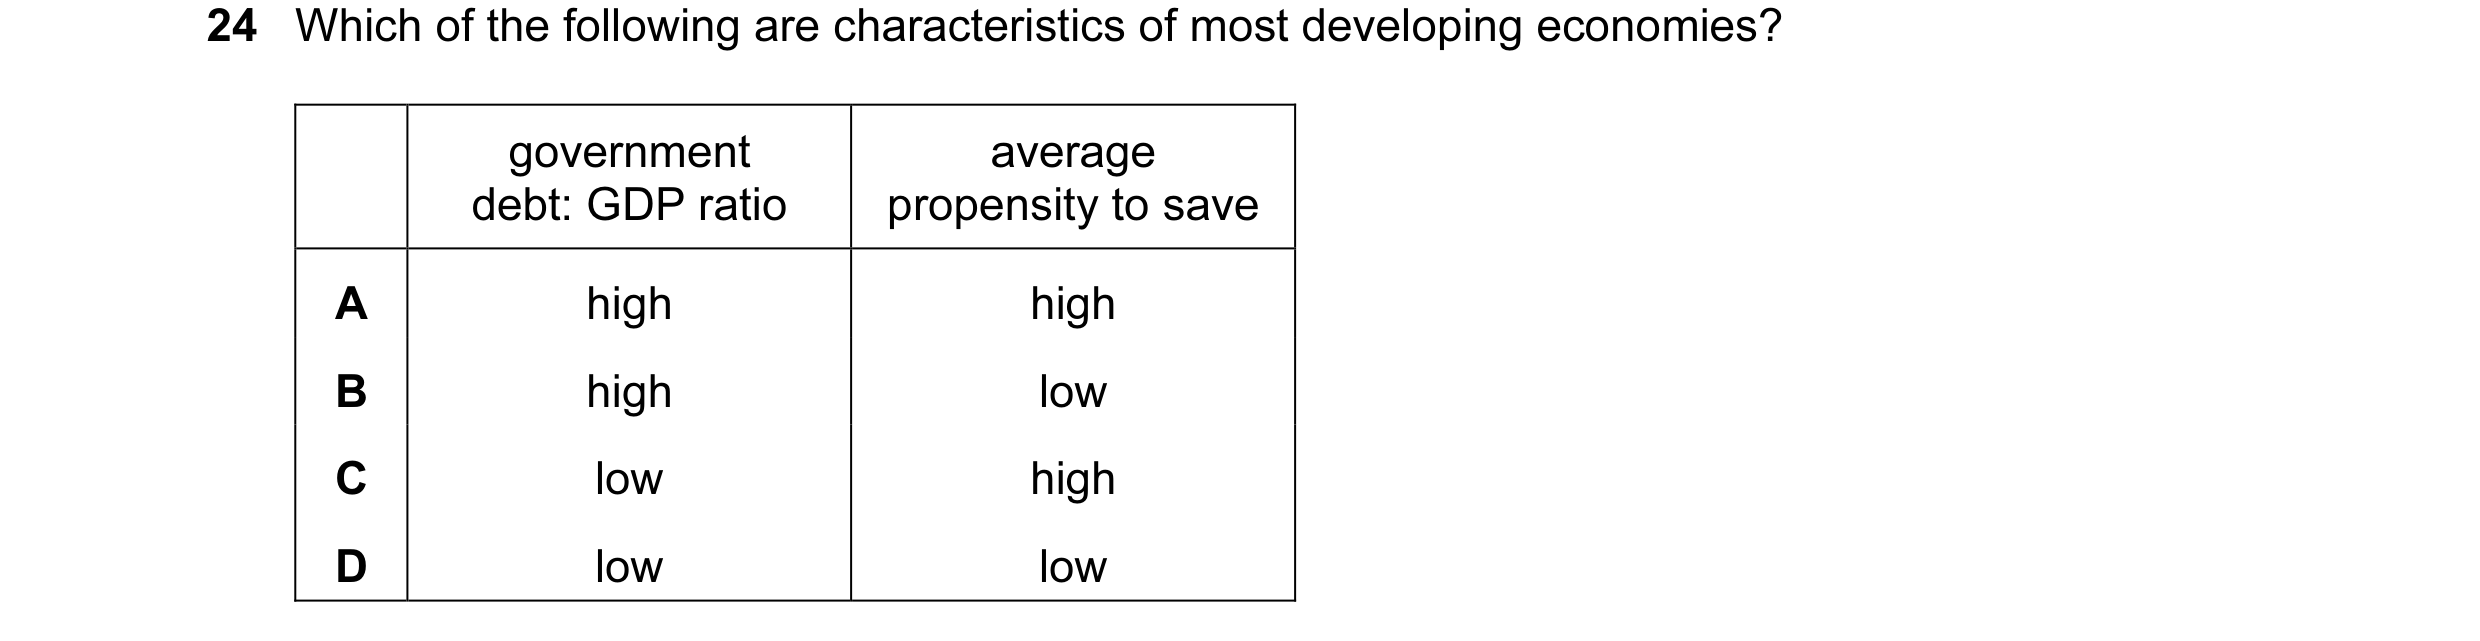
 5 / 21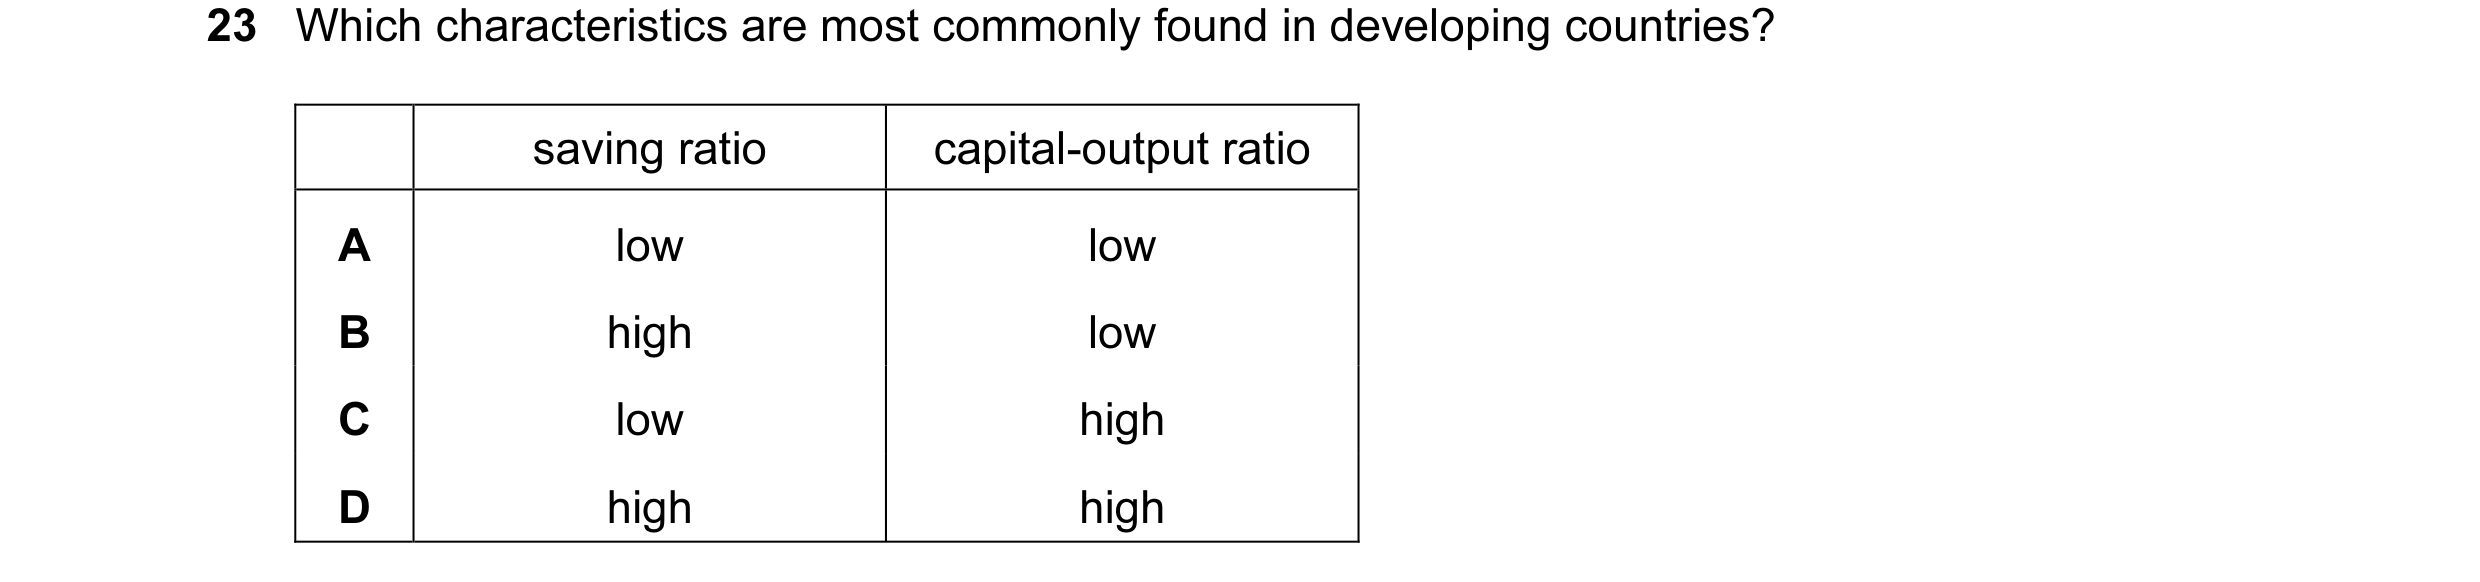
 6 / 21

 7 / 21

 8 / 21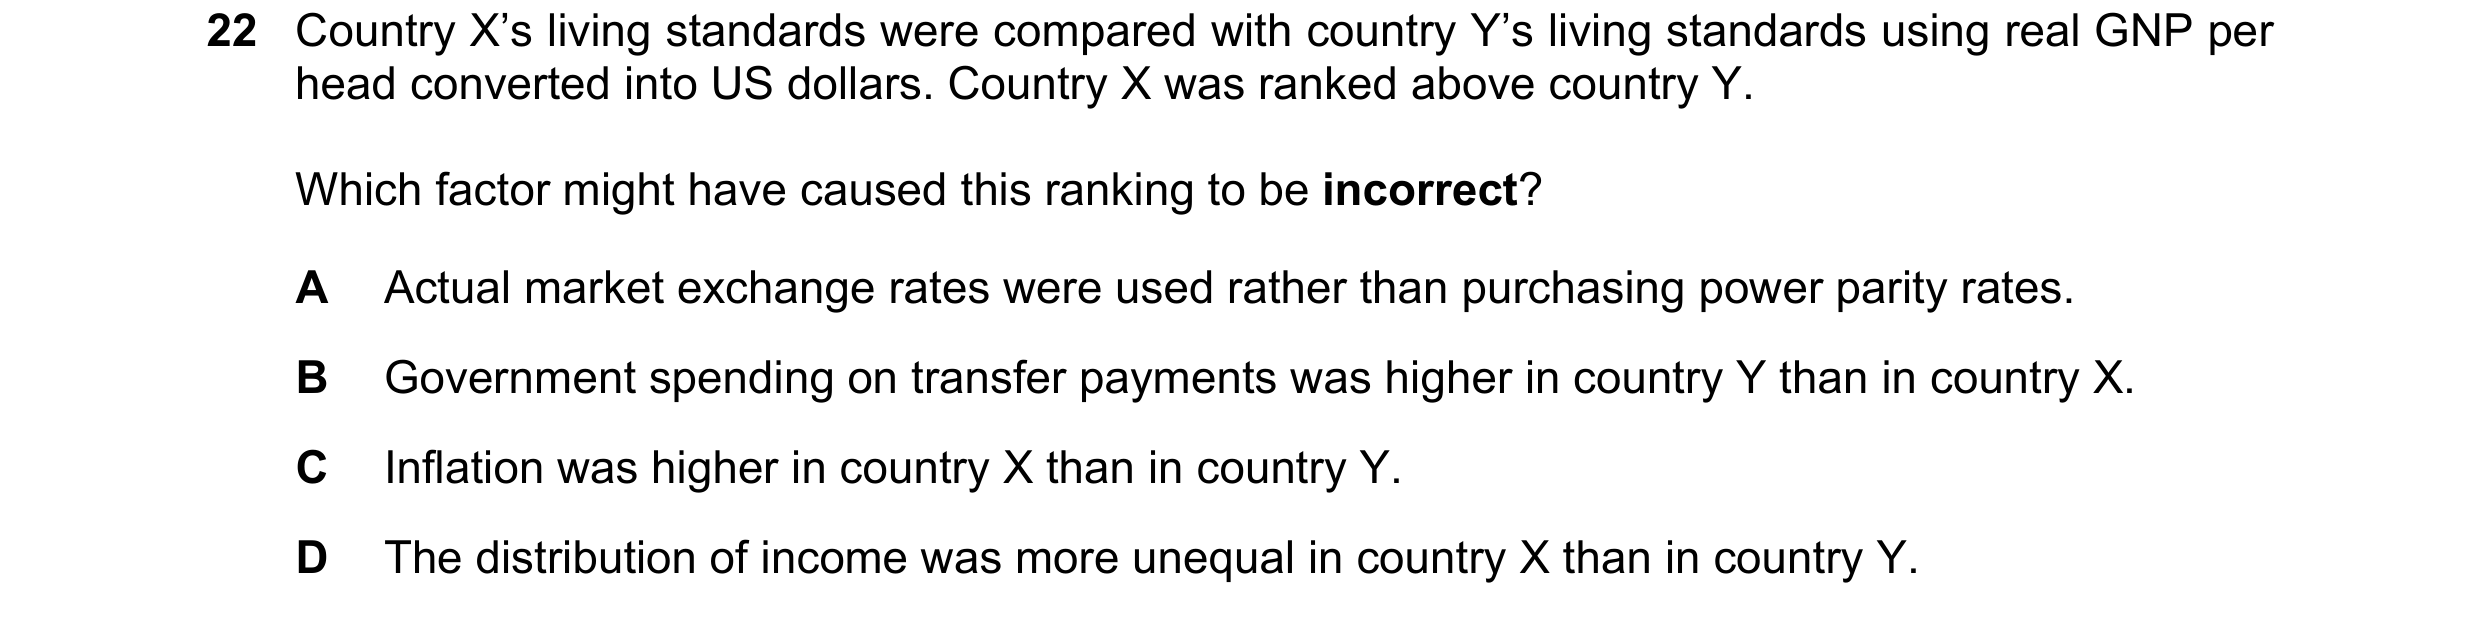

 9 / 21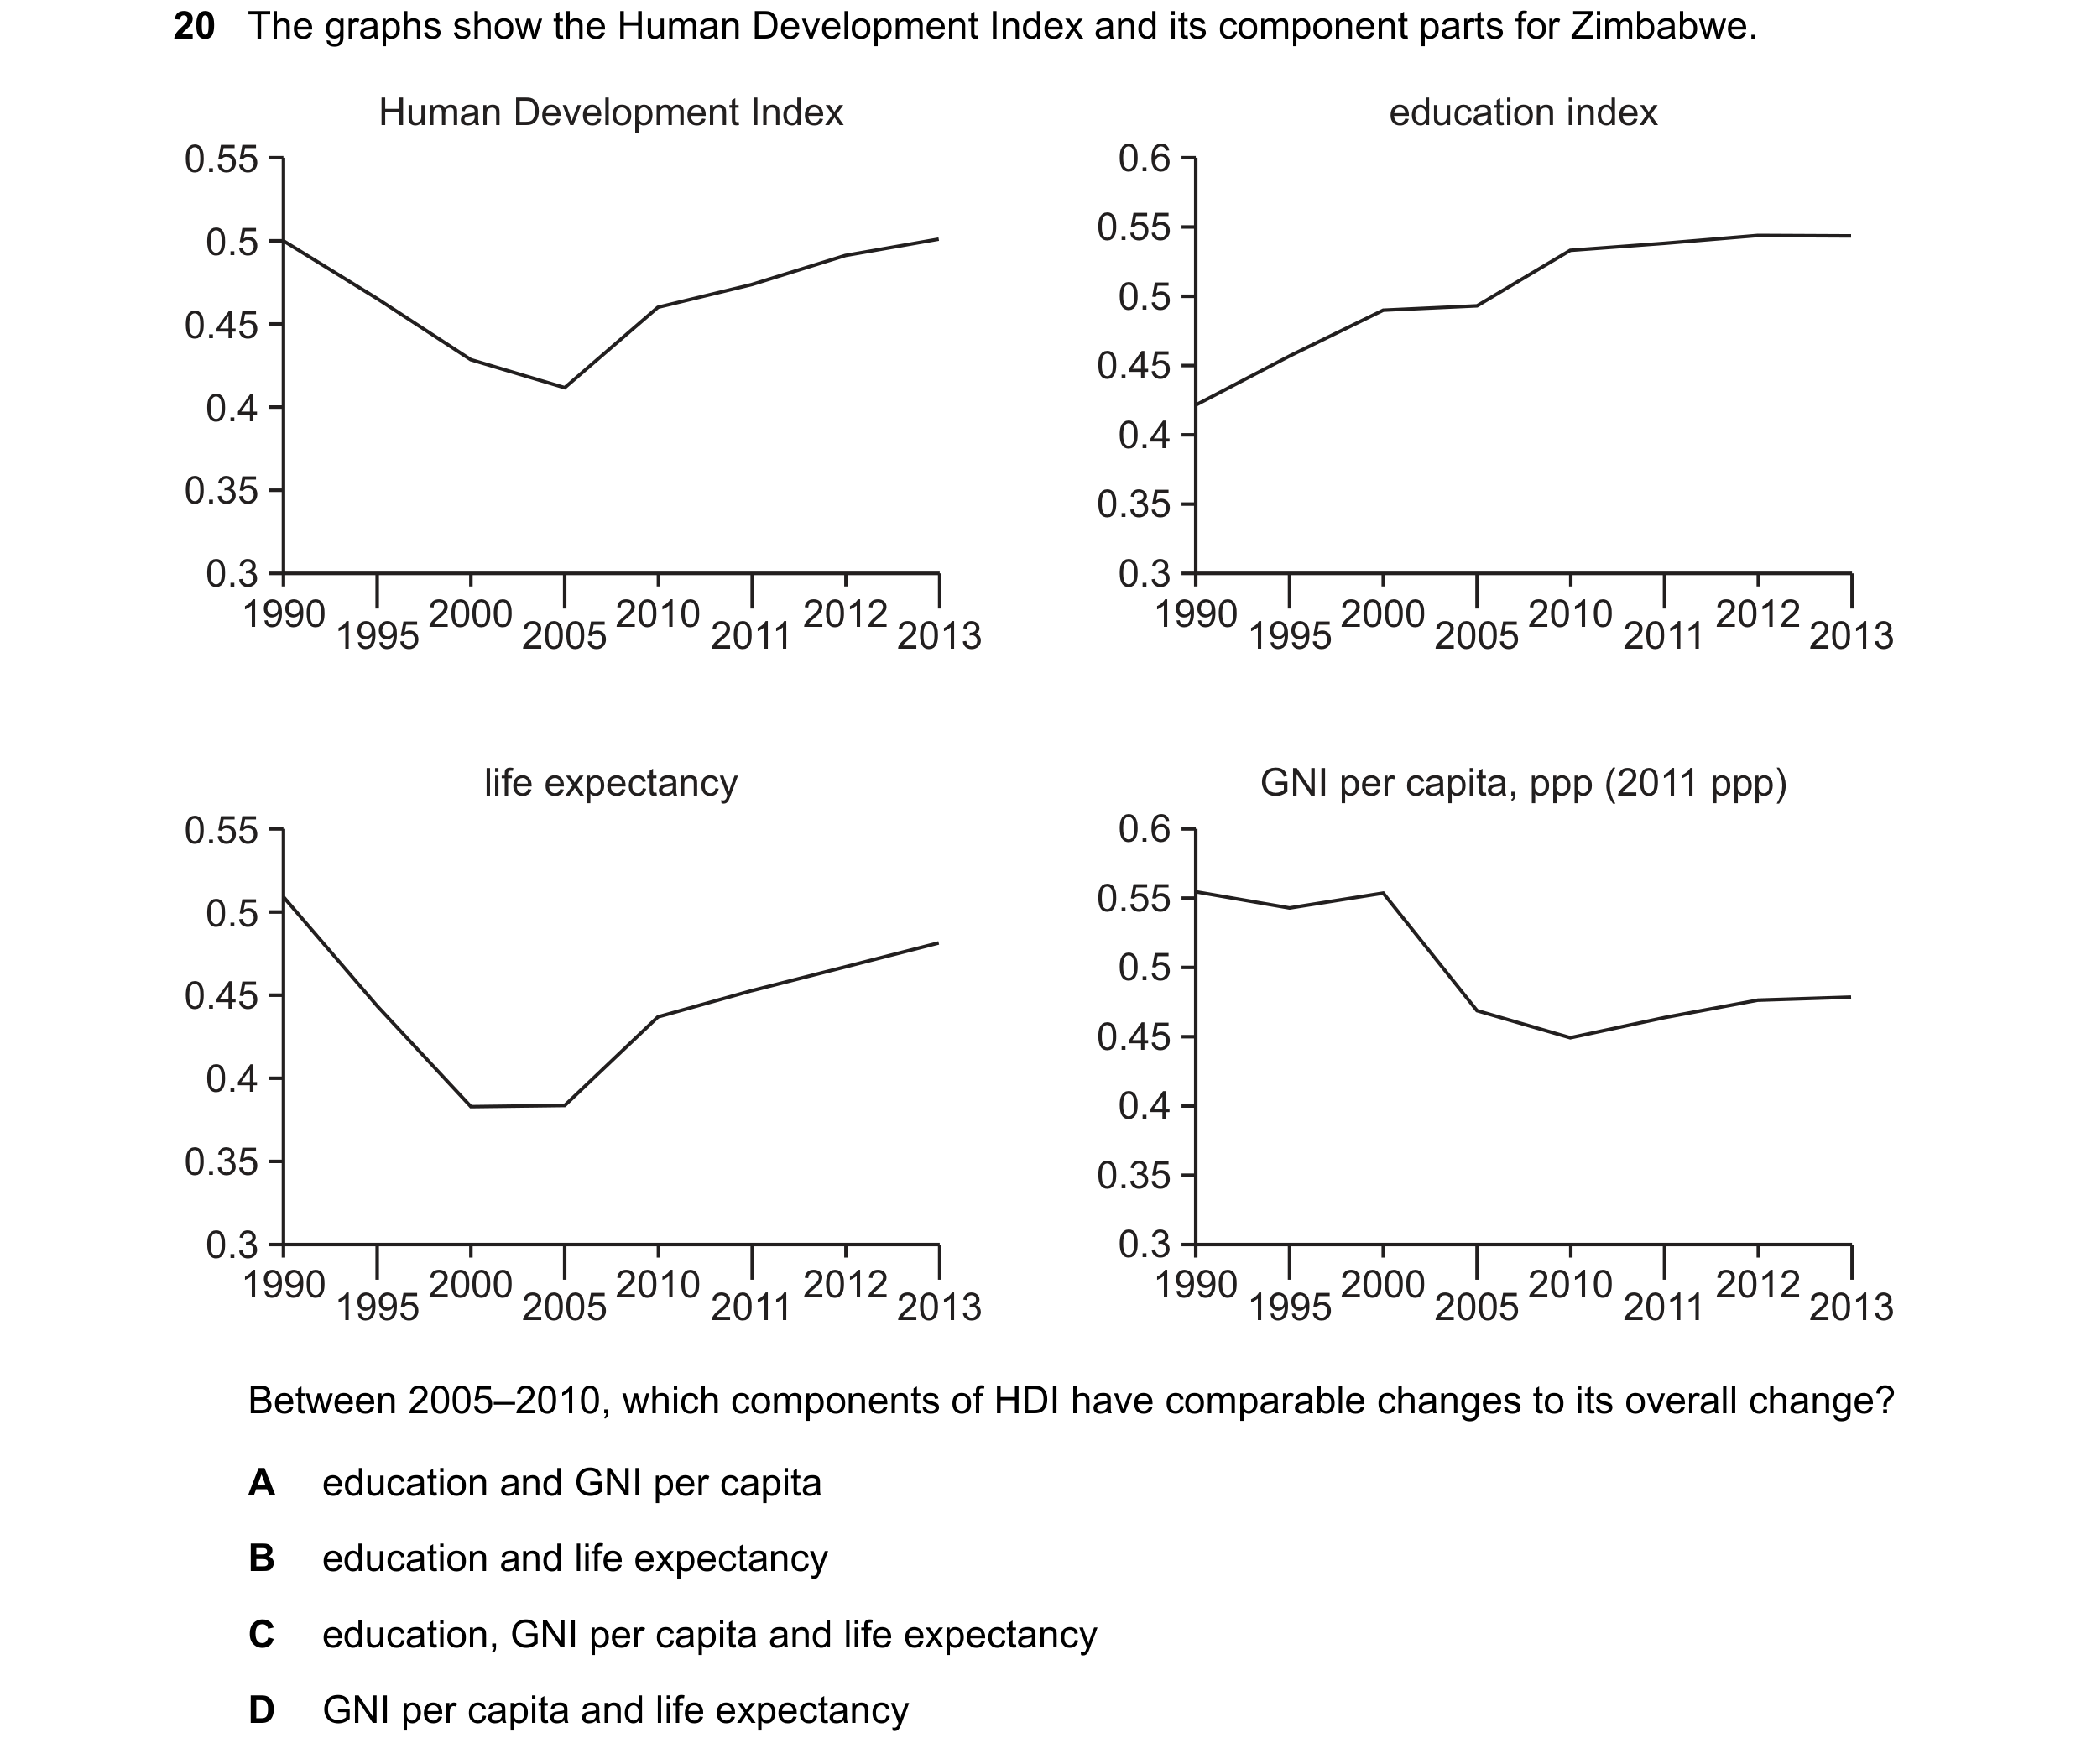

 10 / 21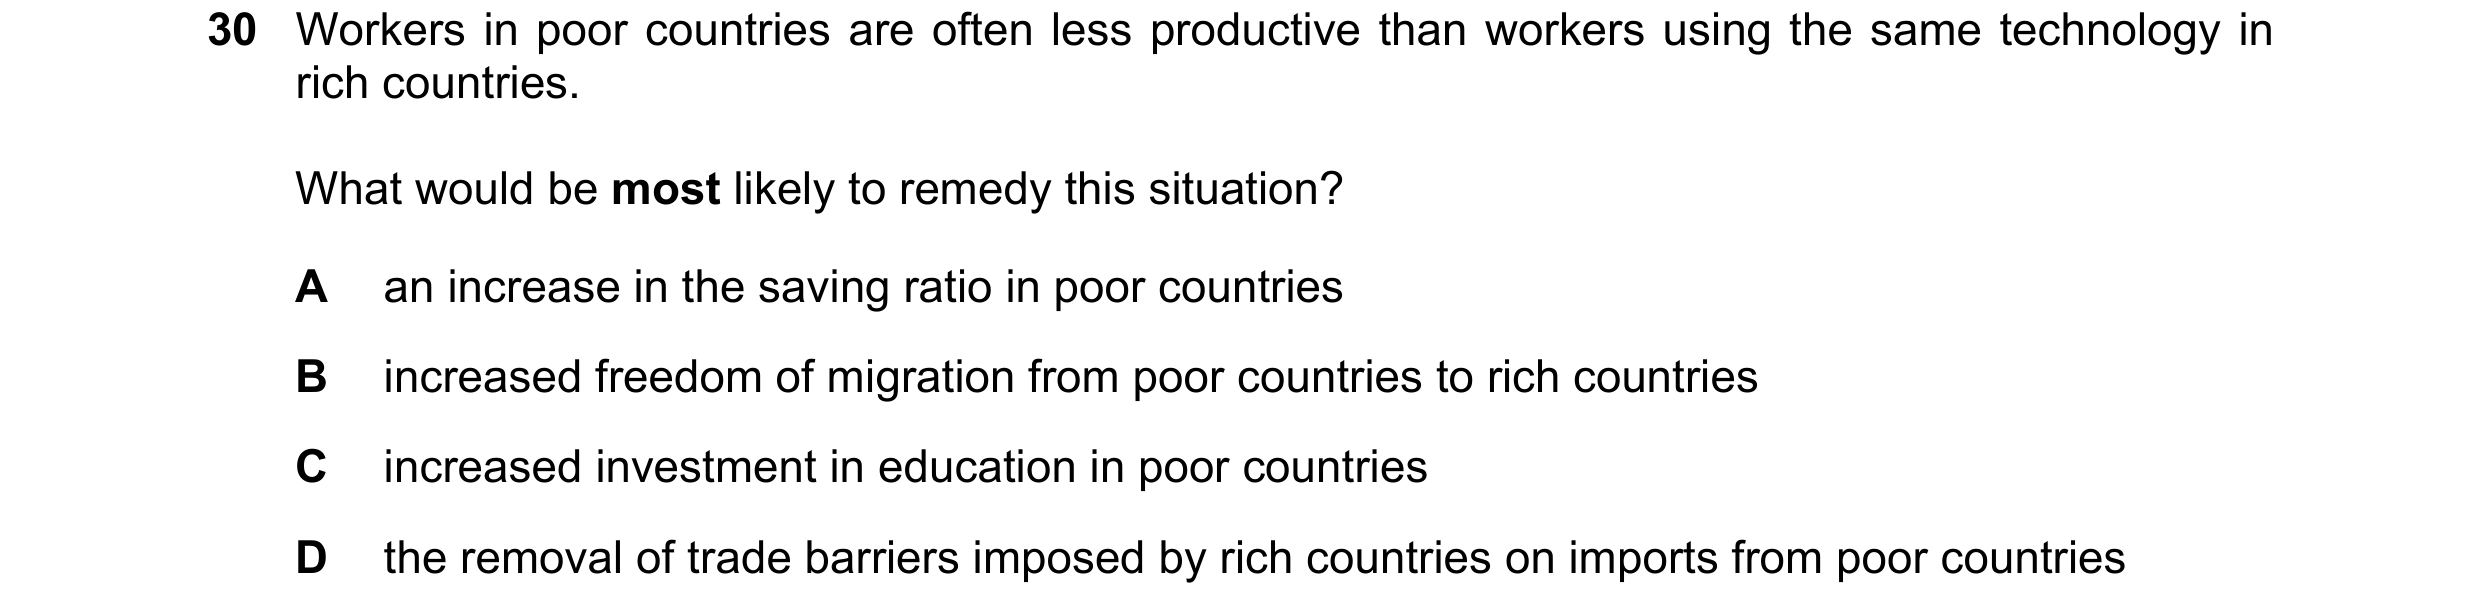

 11 / 21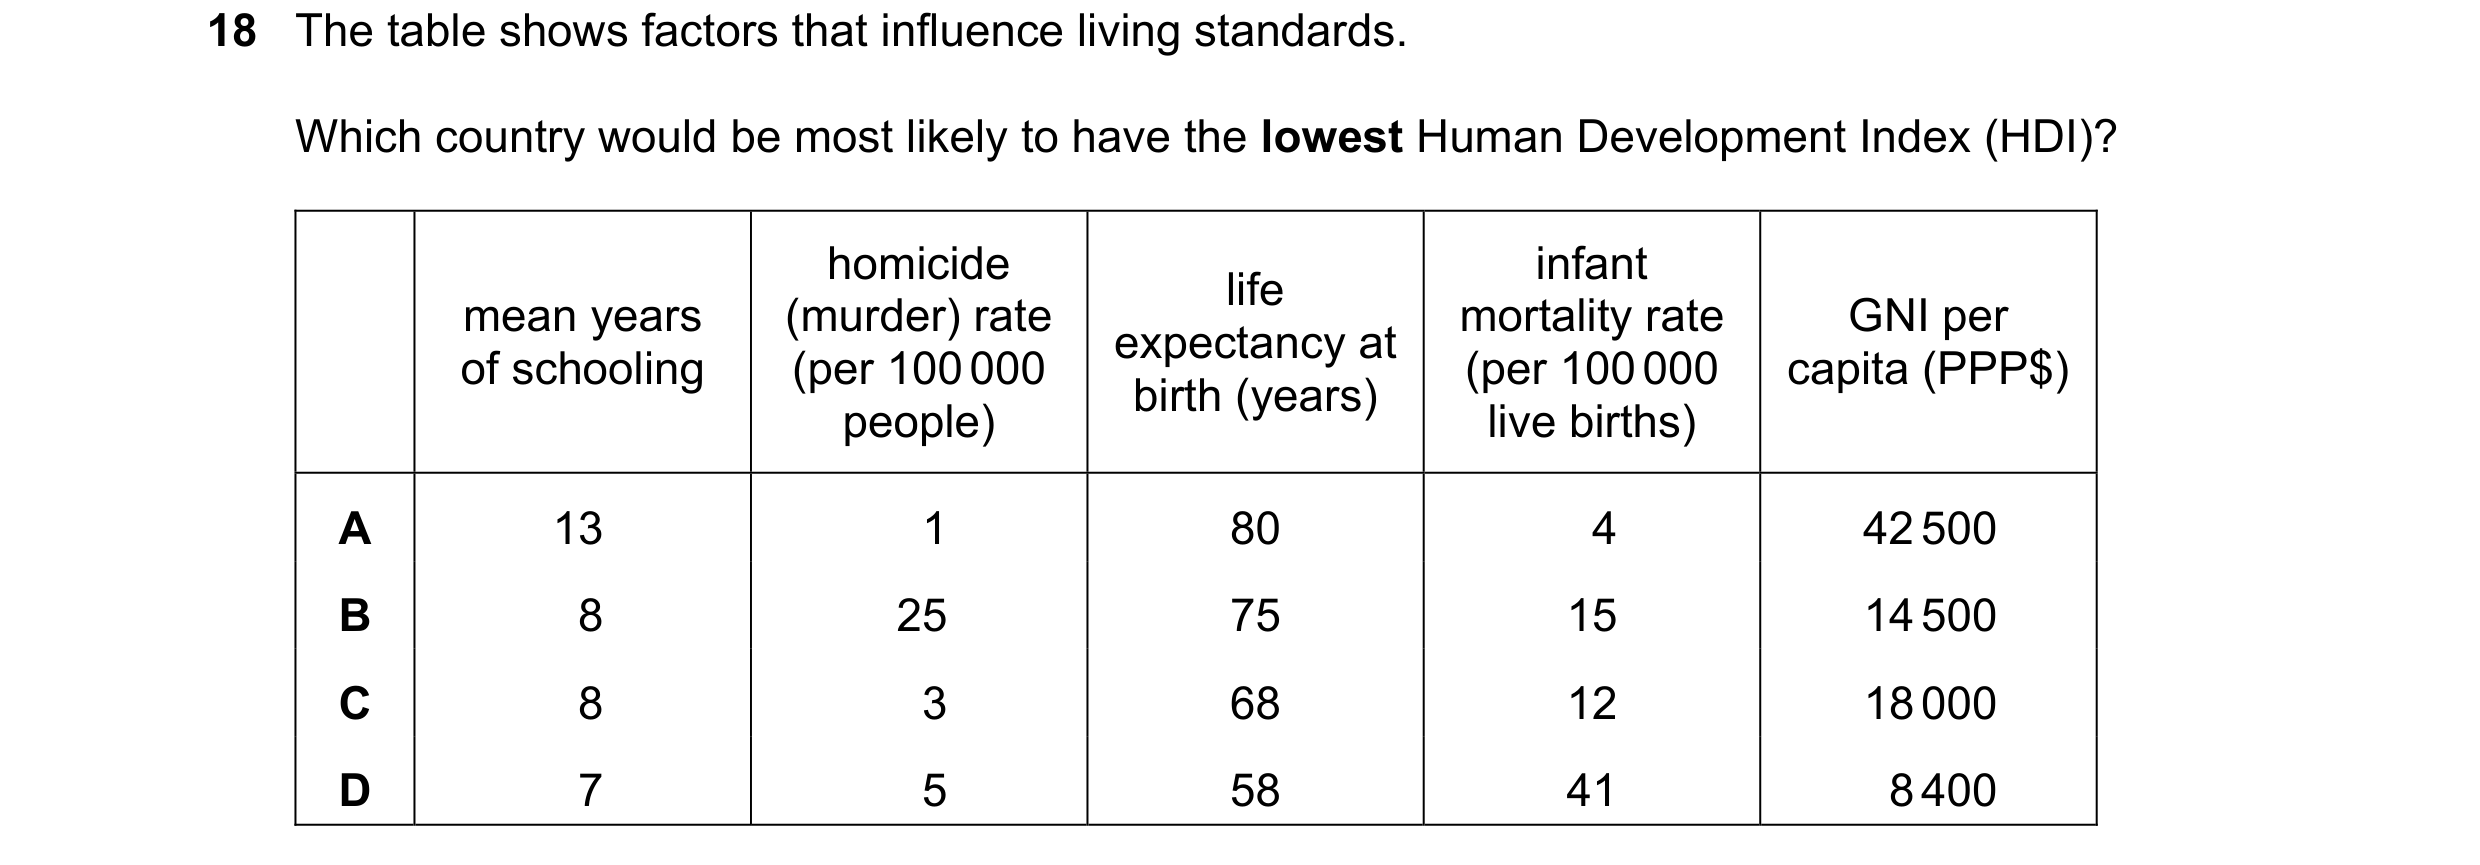
 12 / 21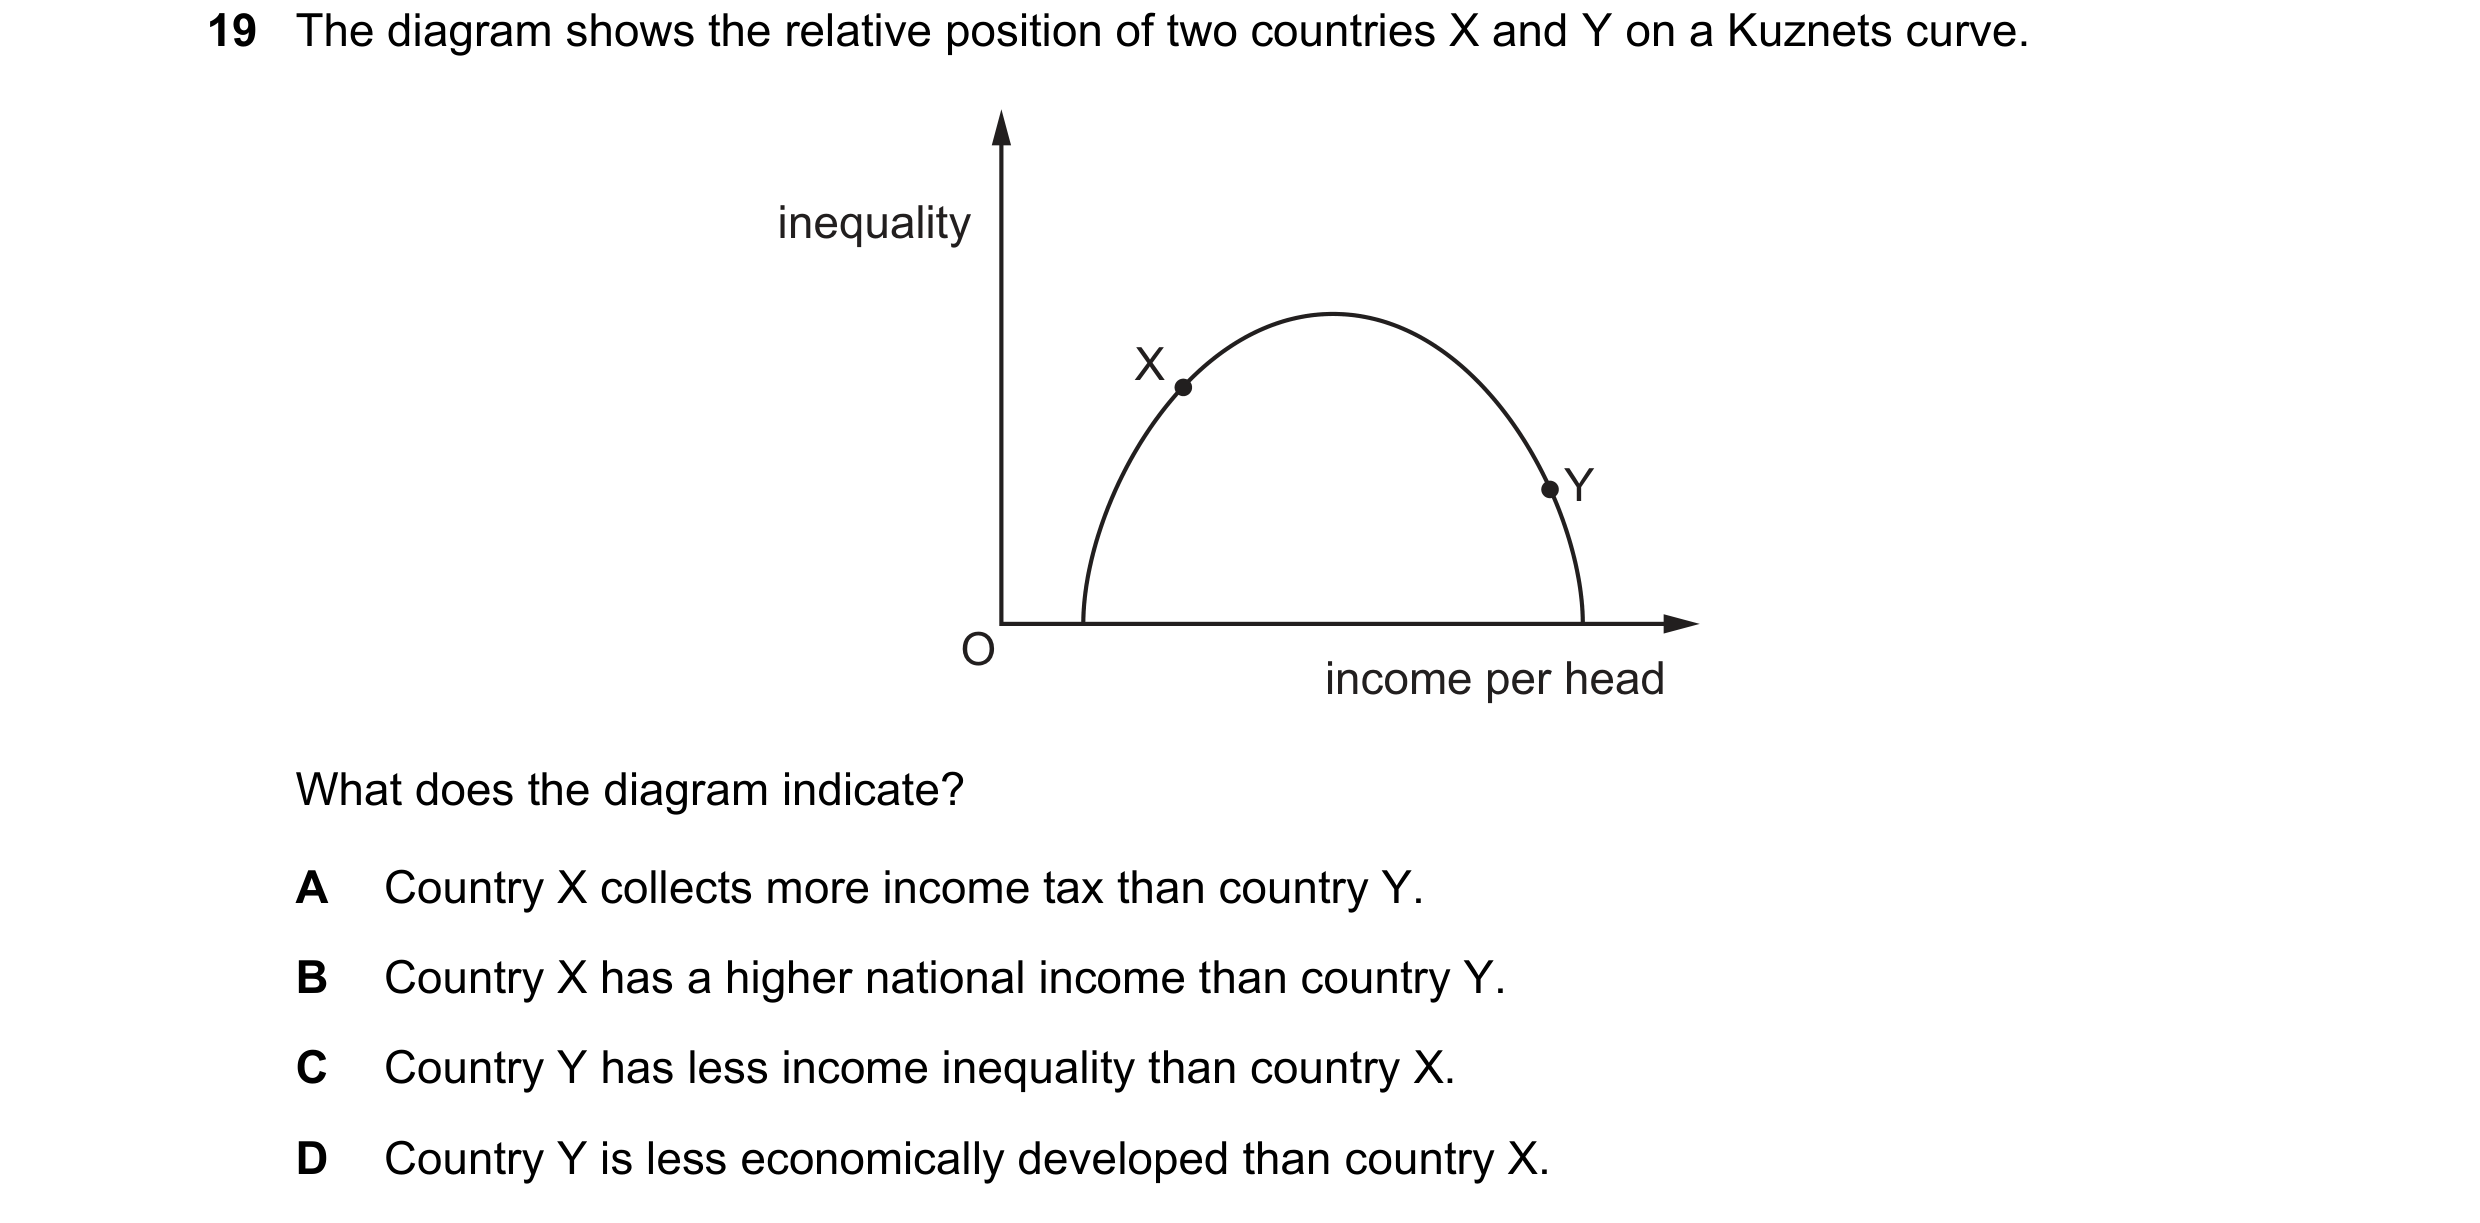
 13 / 21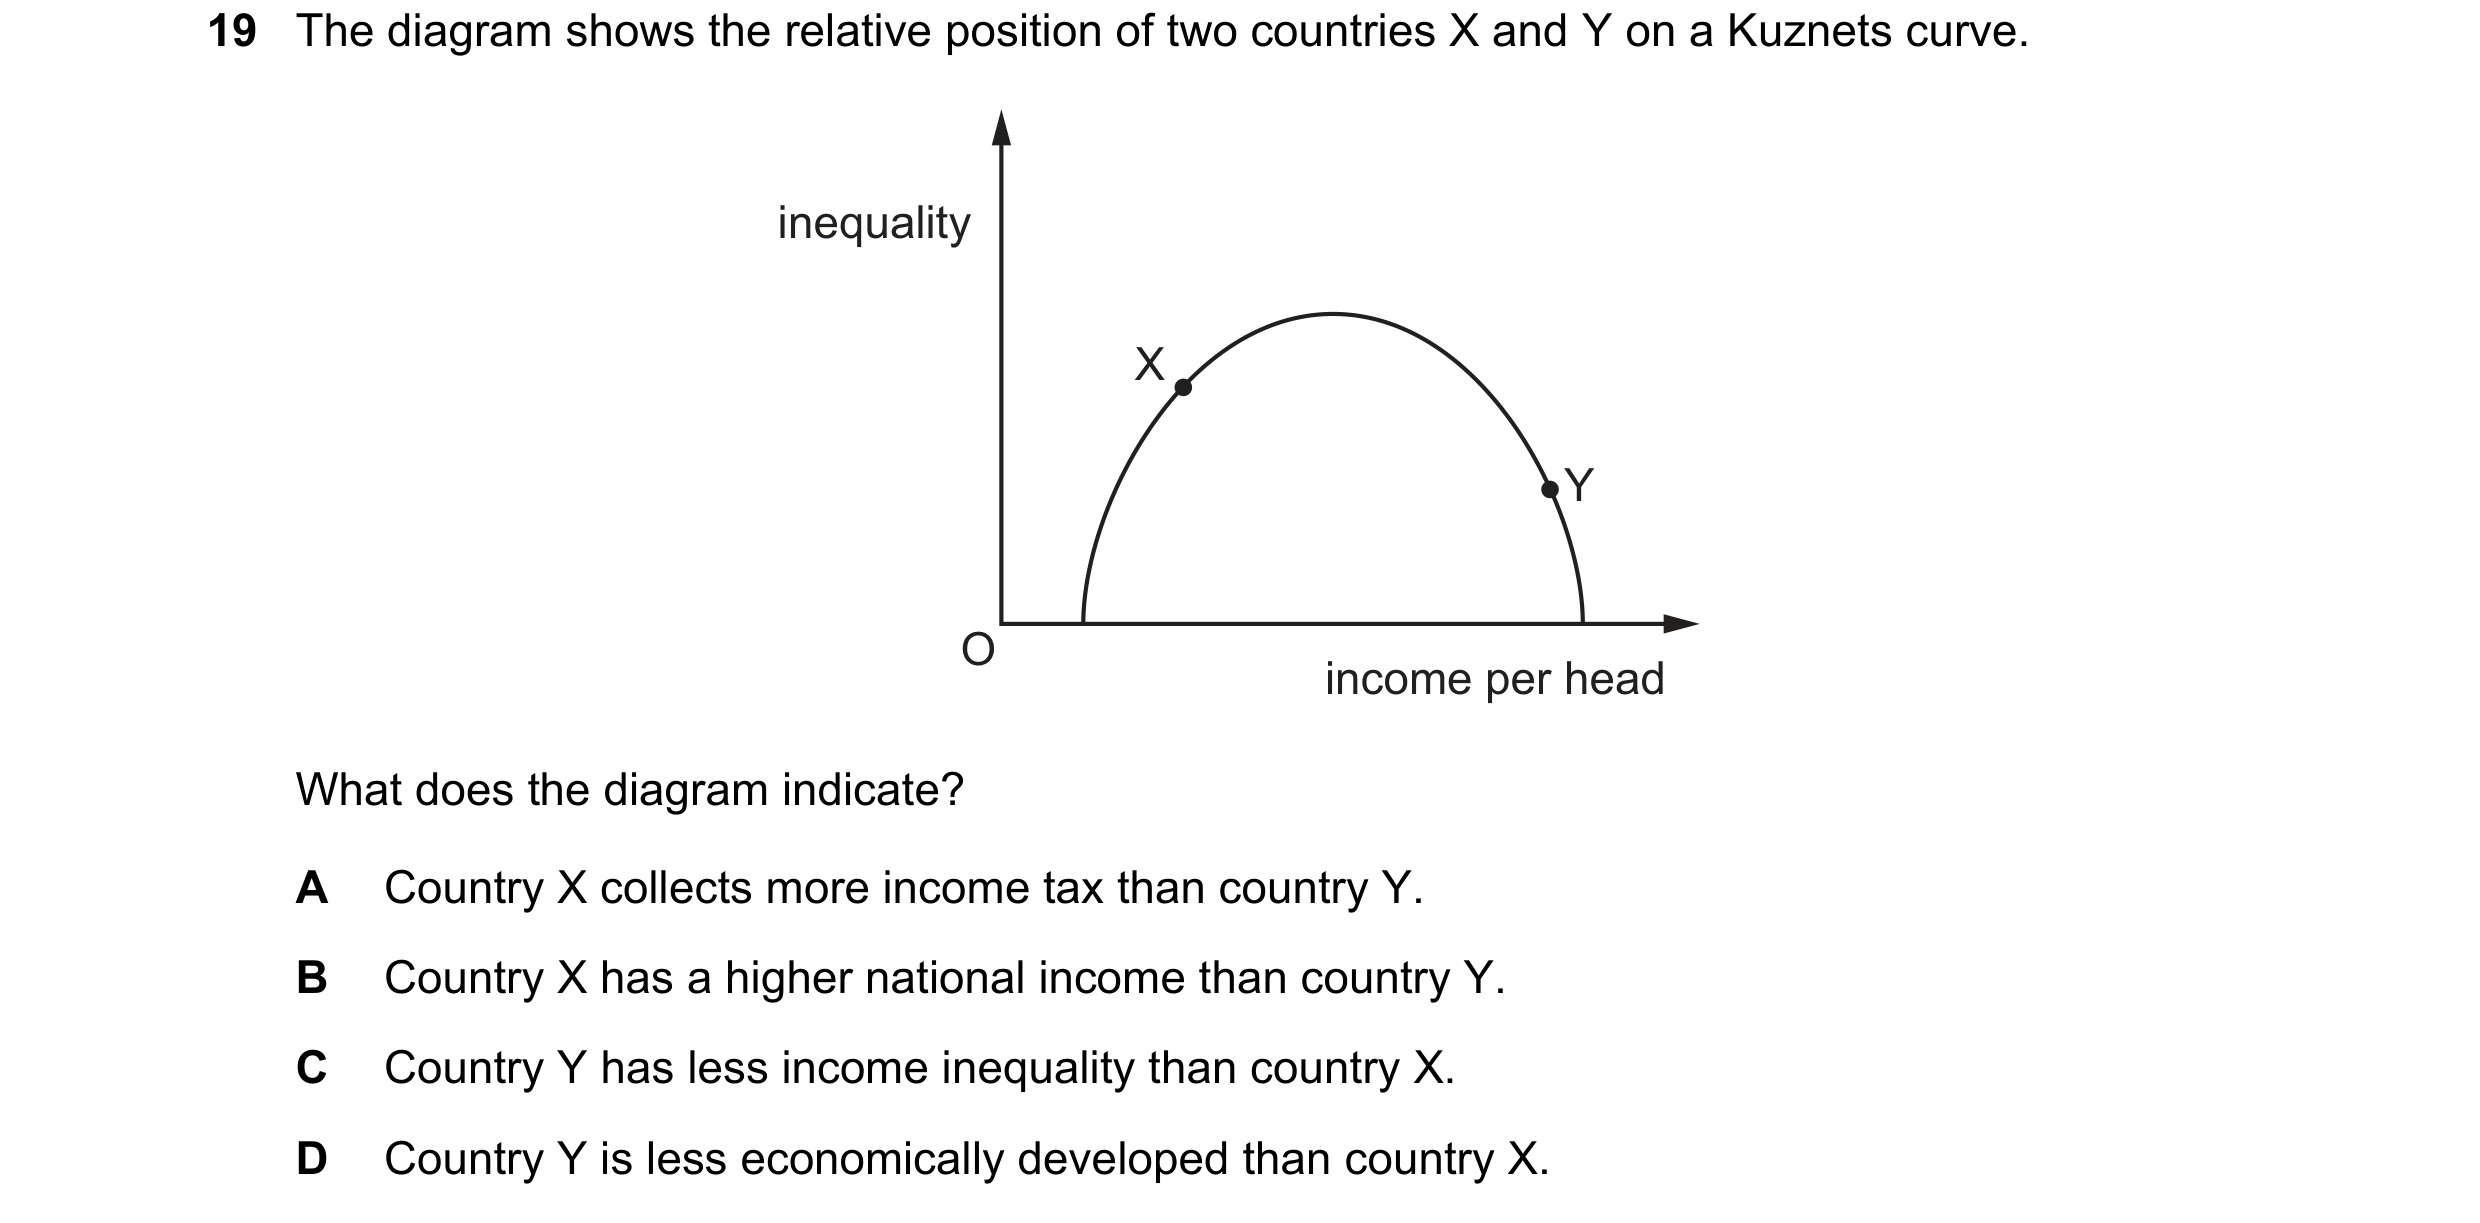
 14 / 21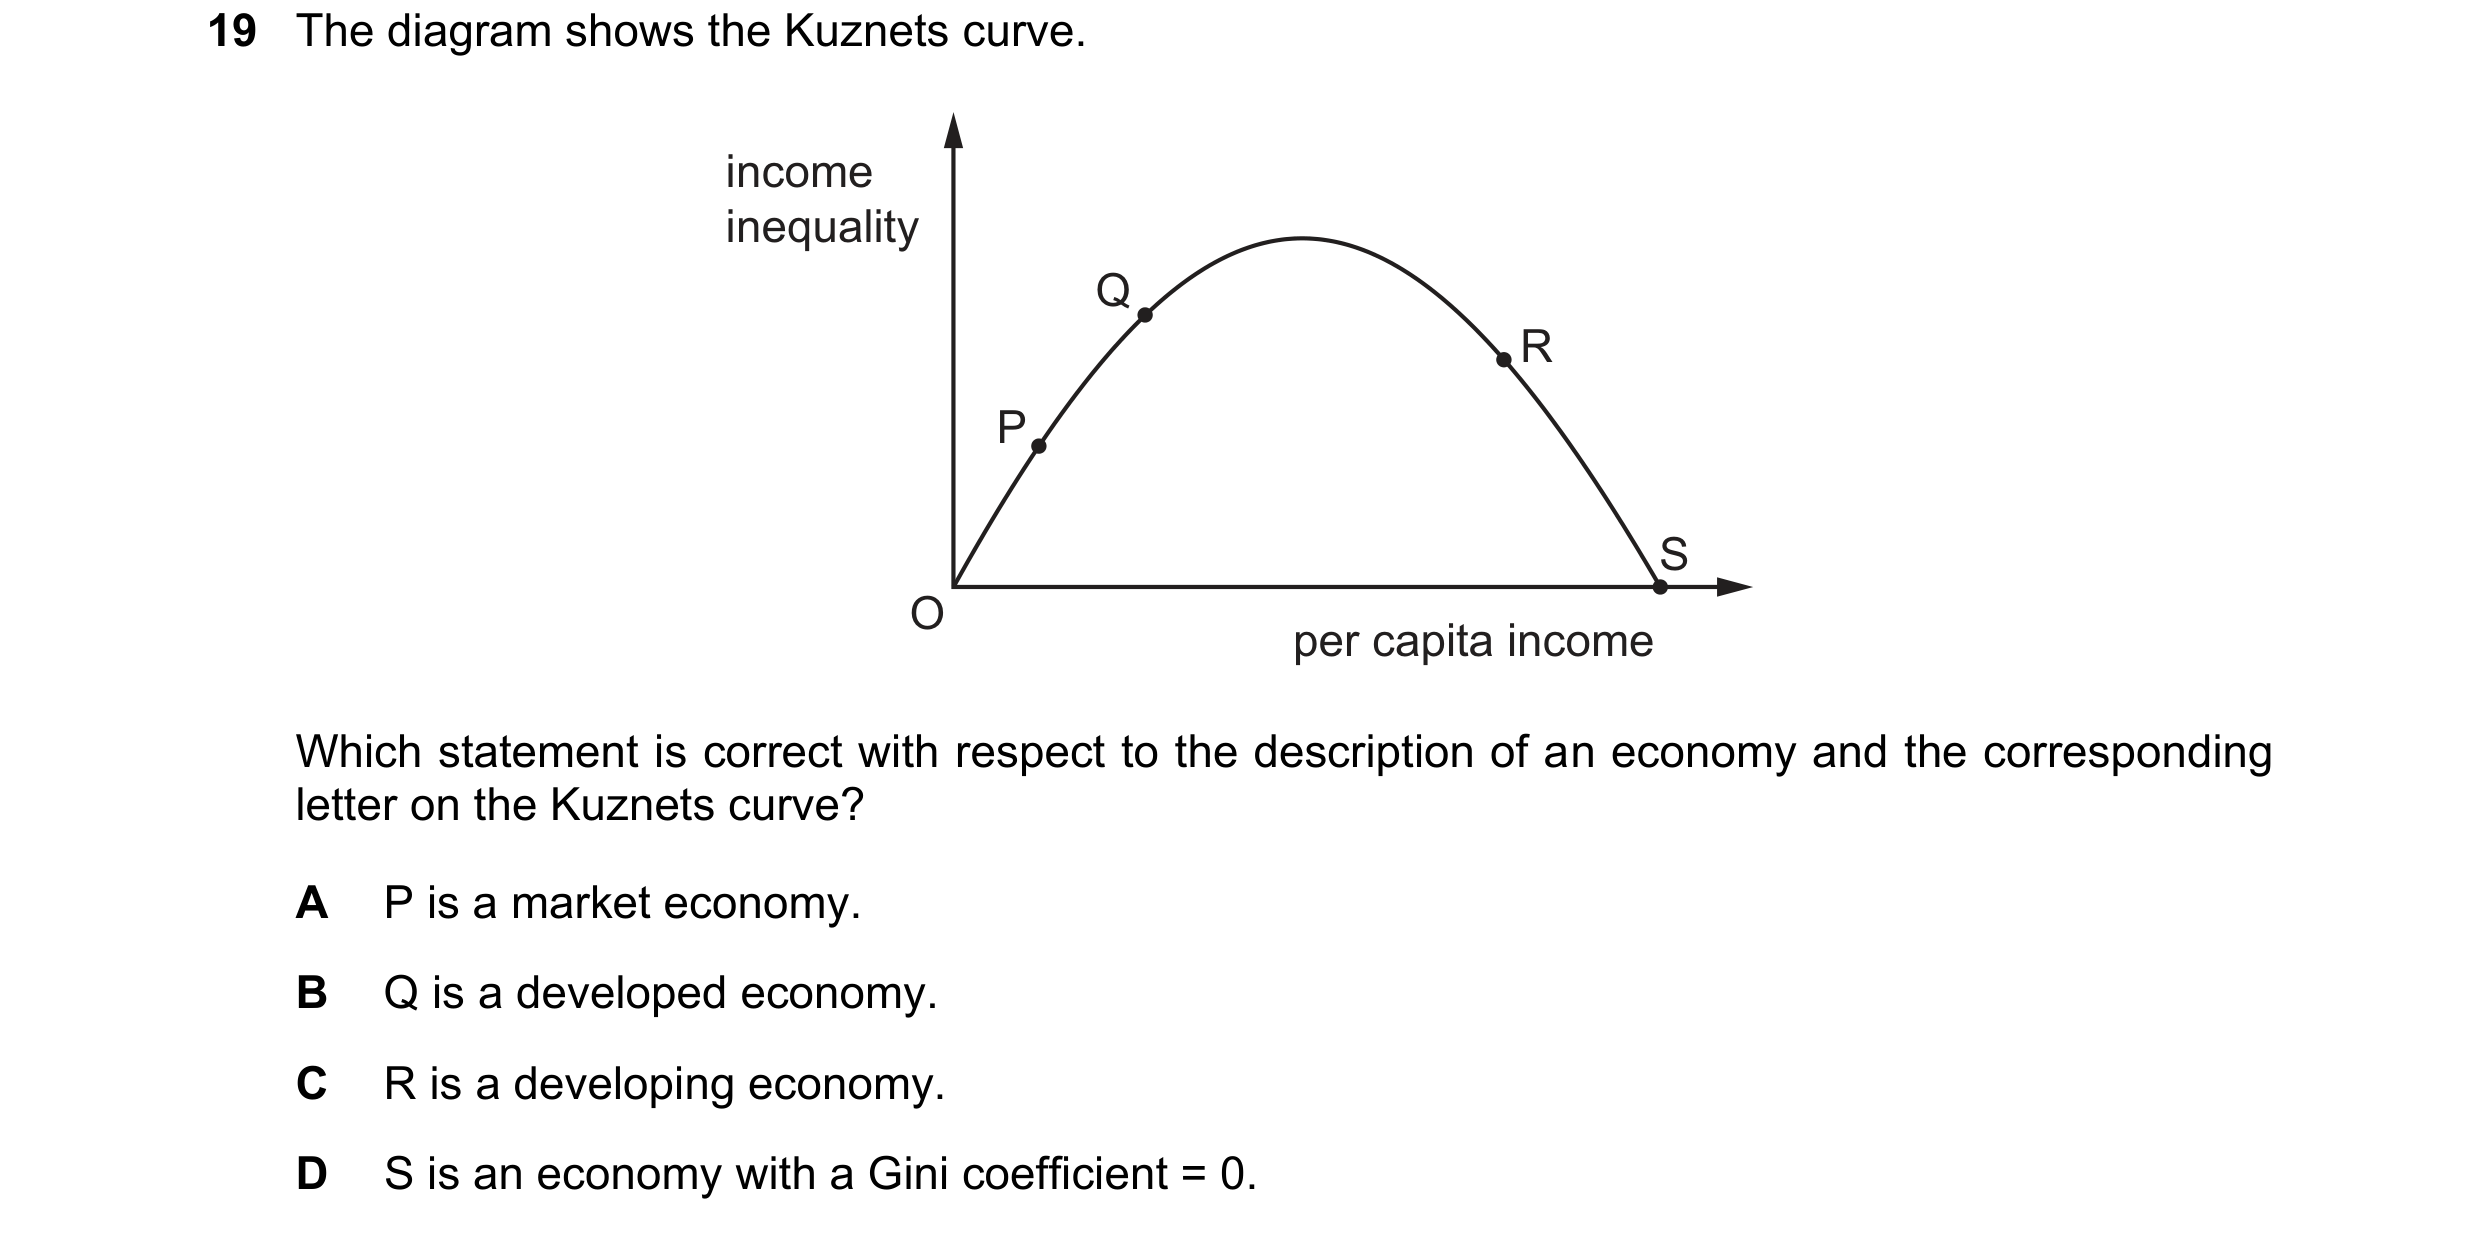
 15 / 21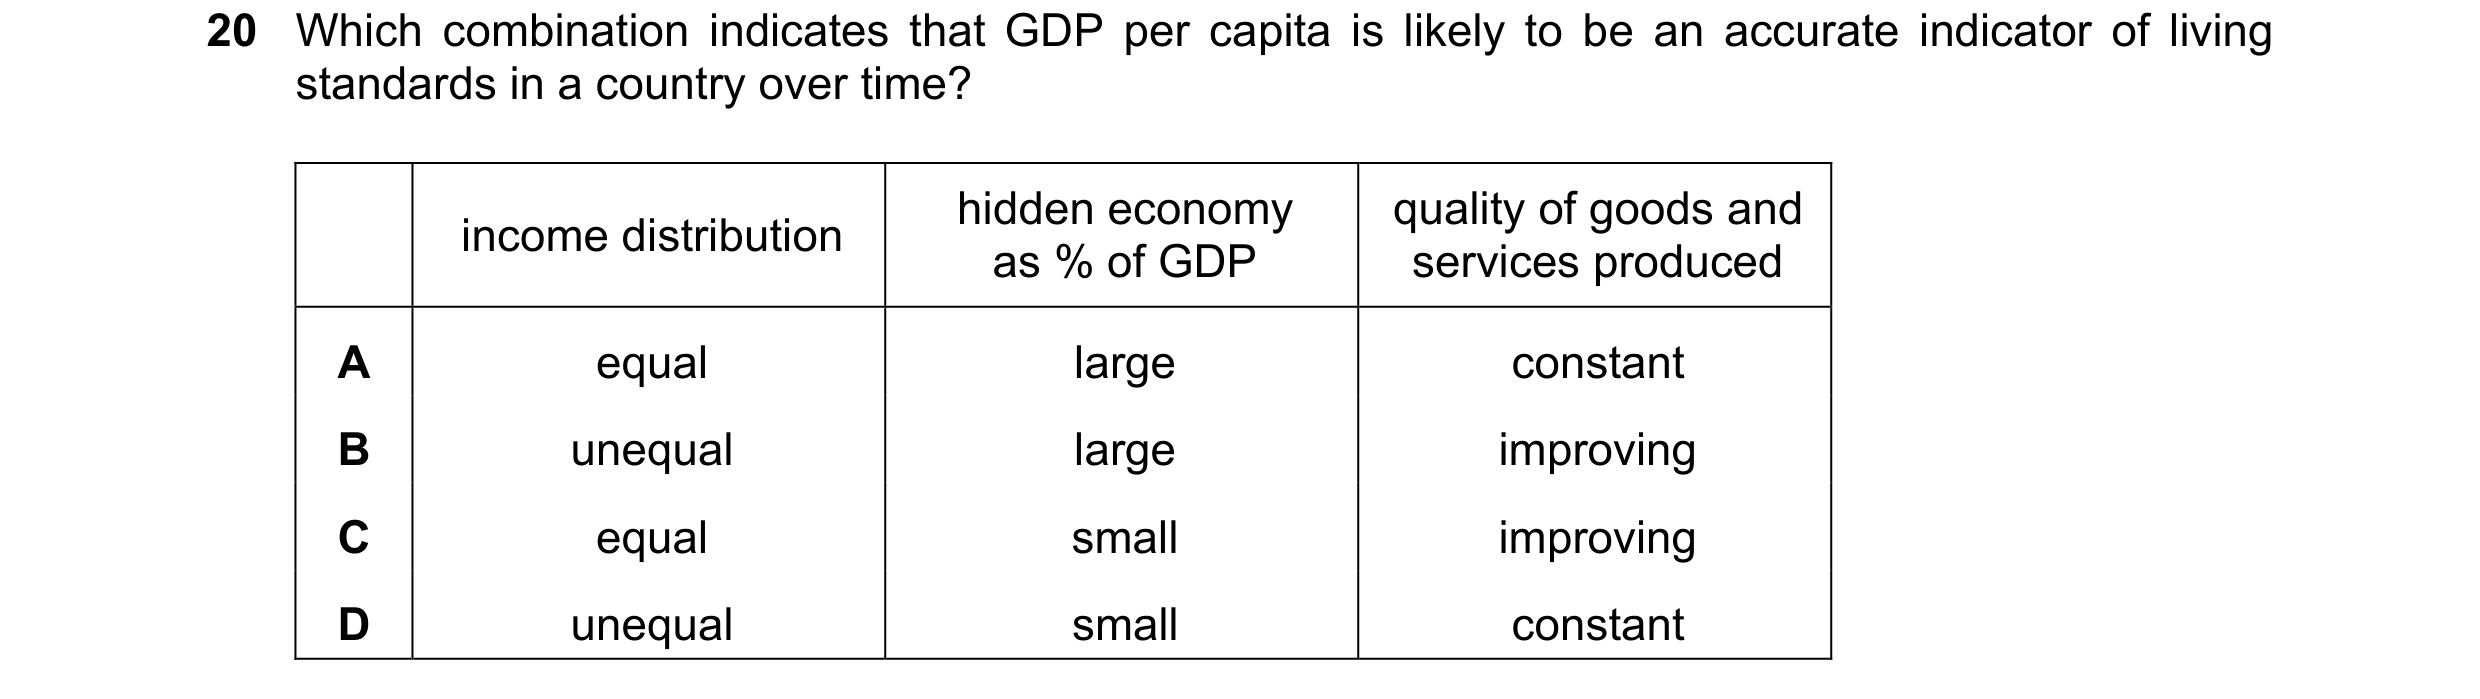
 16 / 21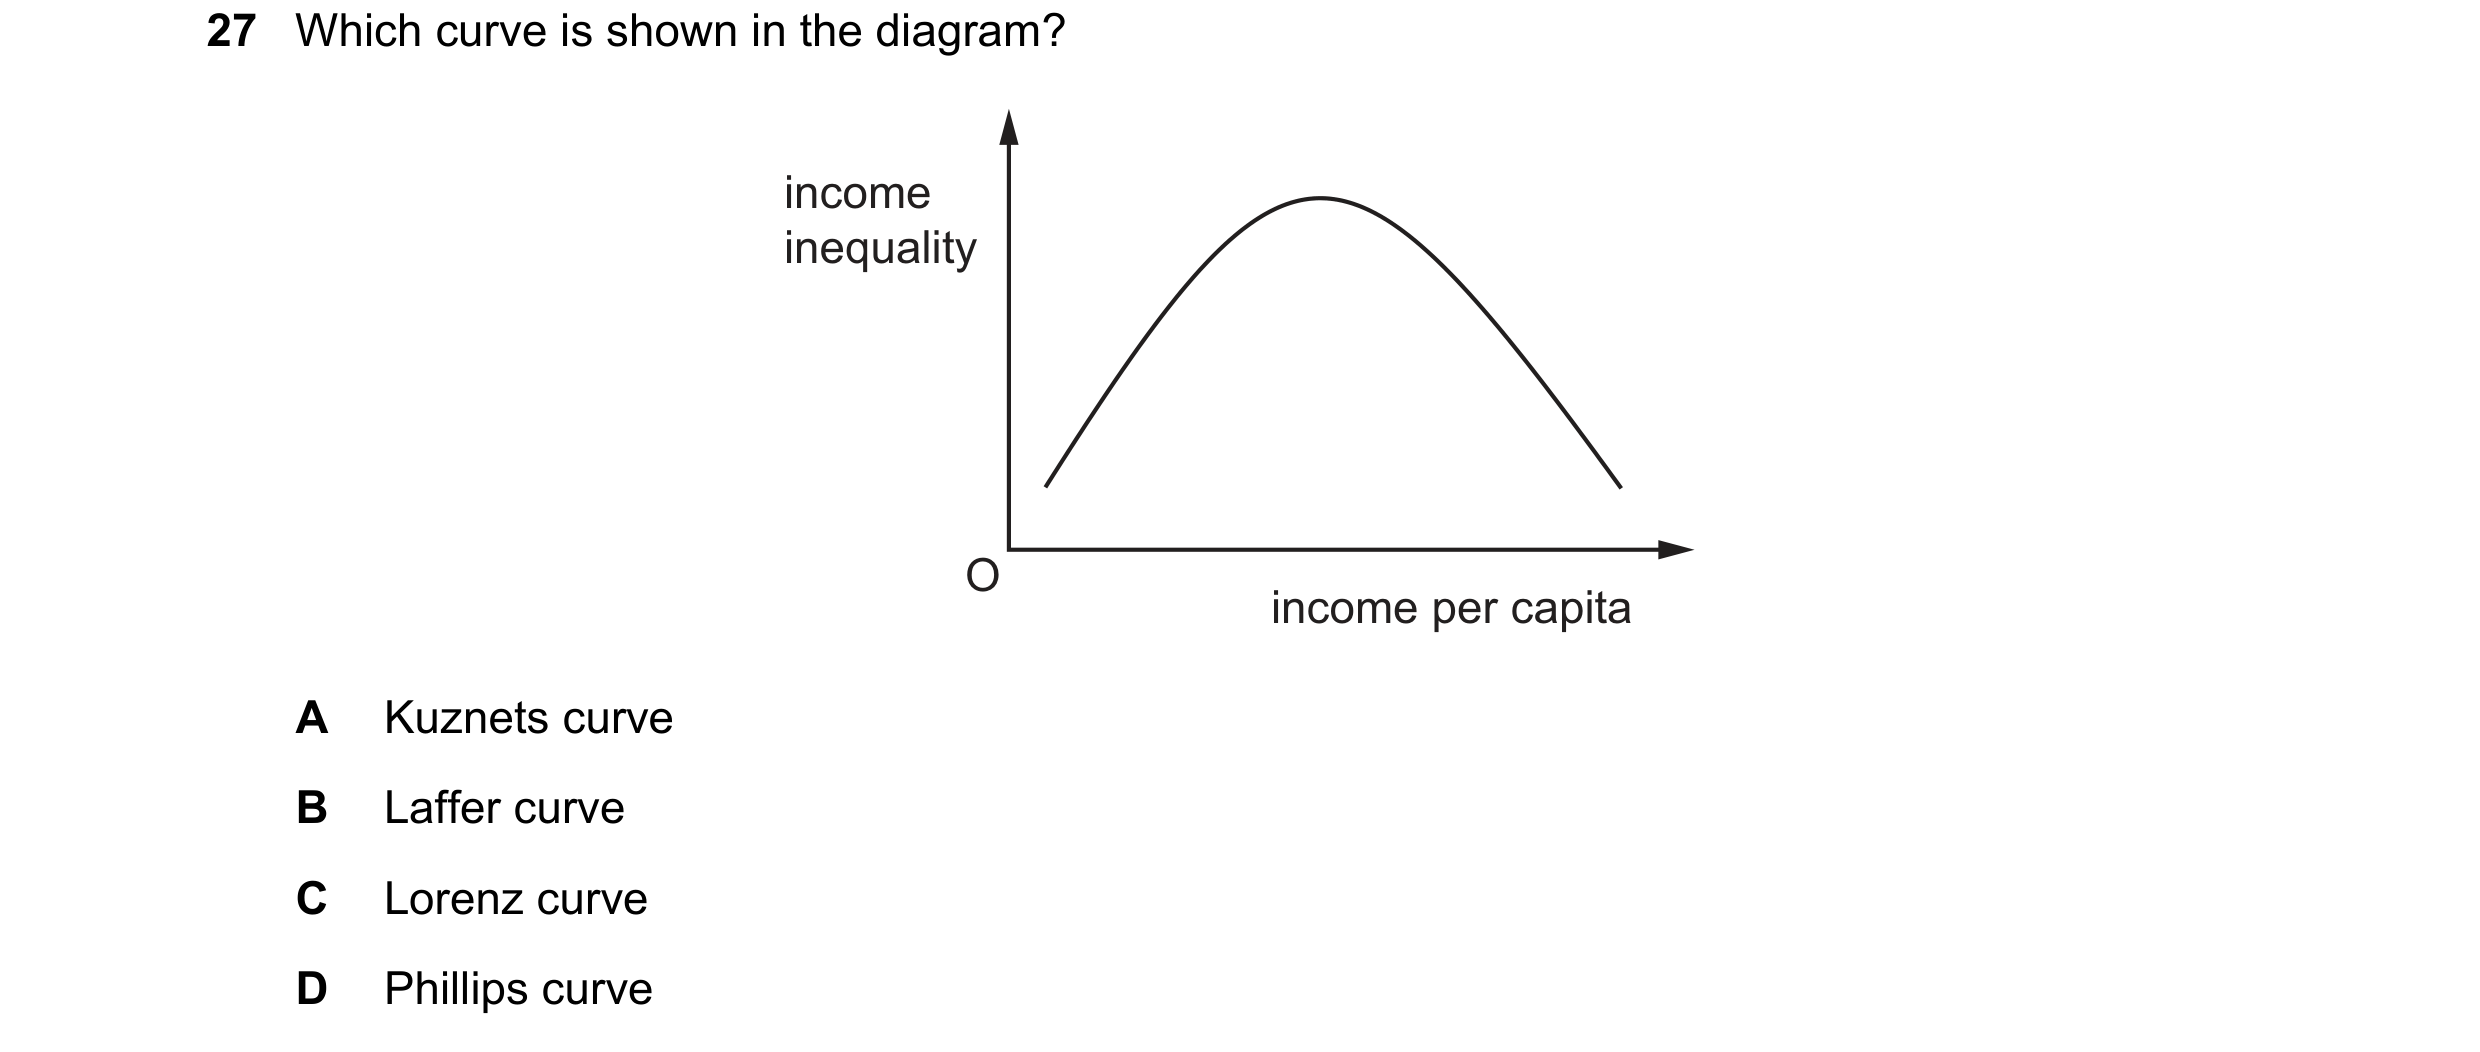
 17 / 21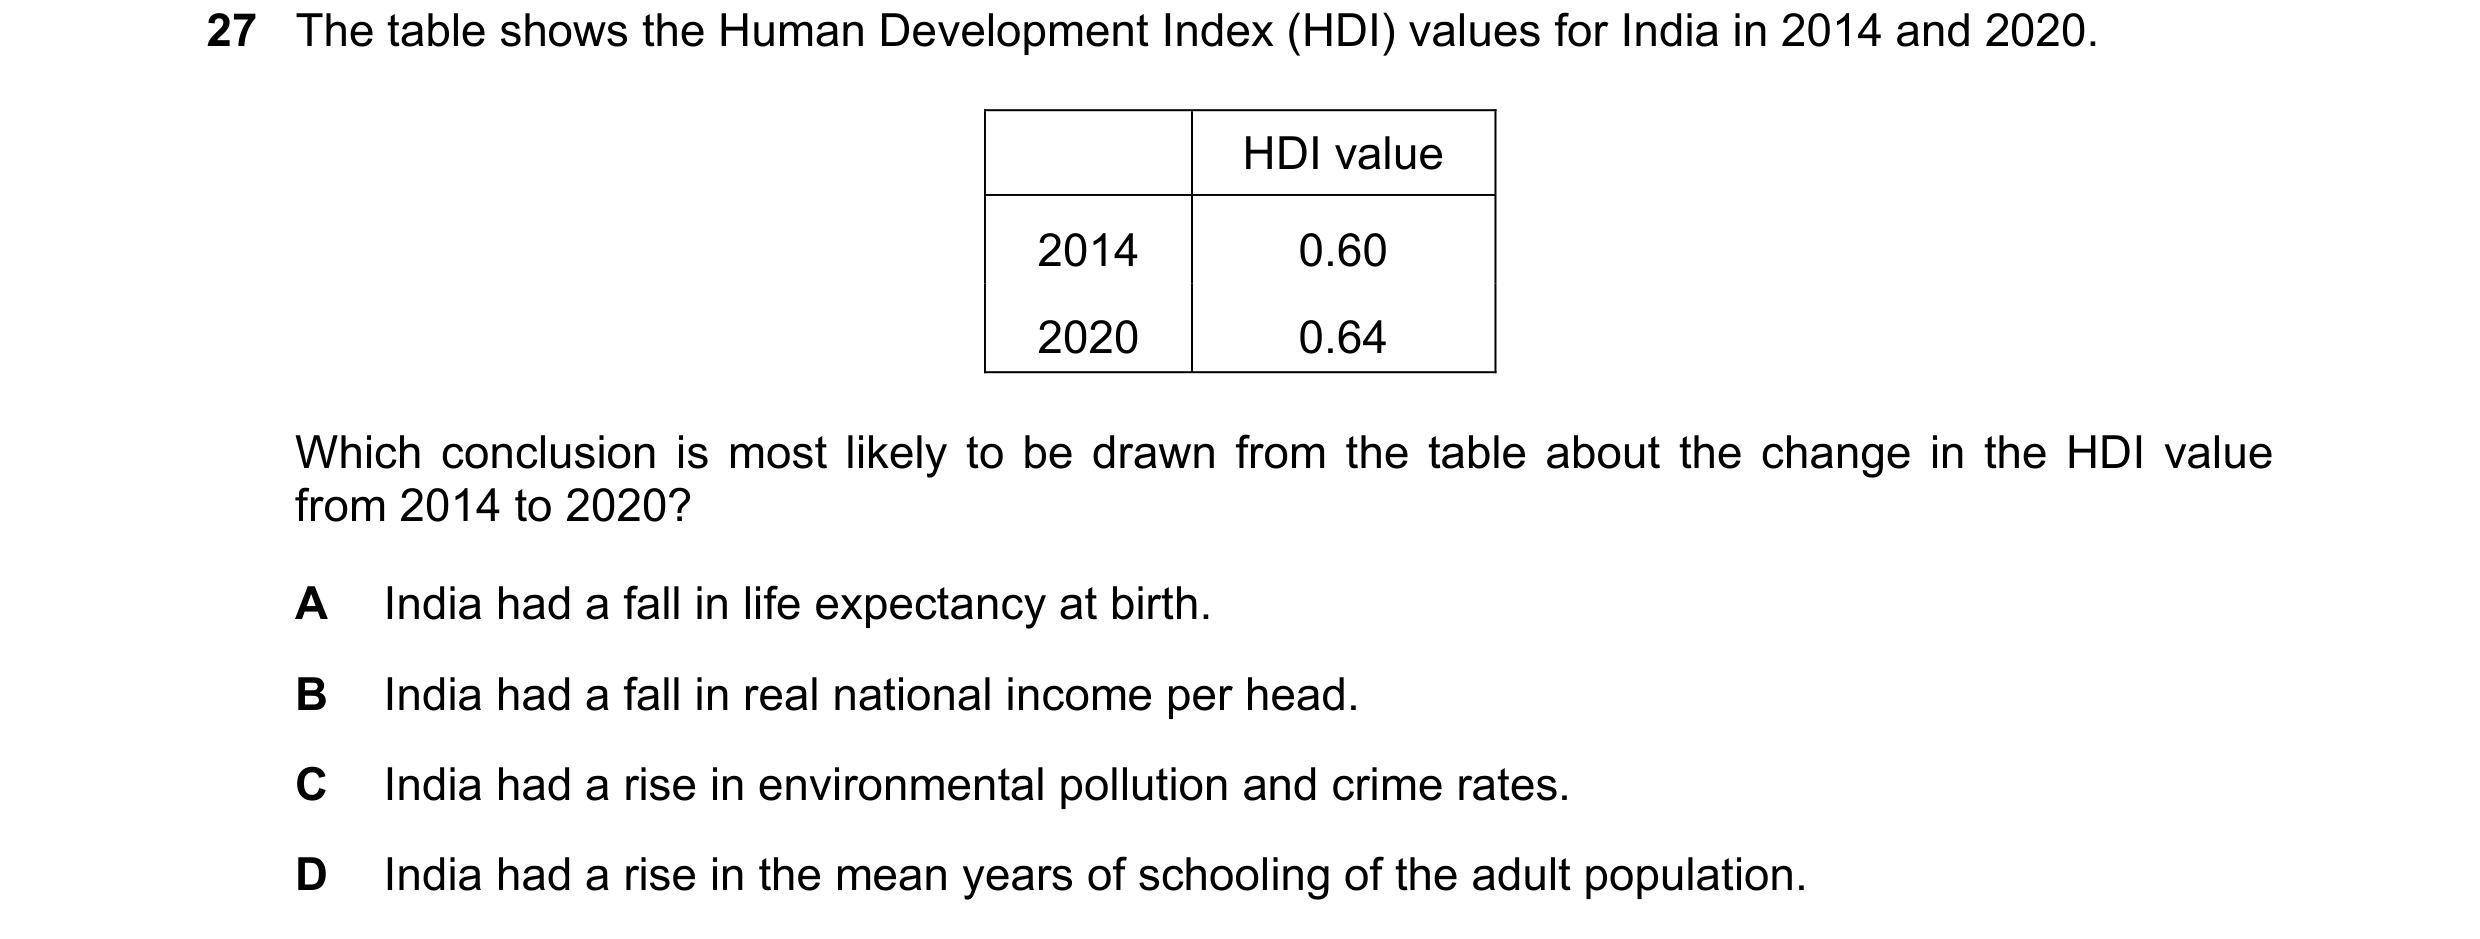
 18 / 21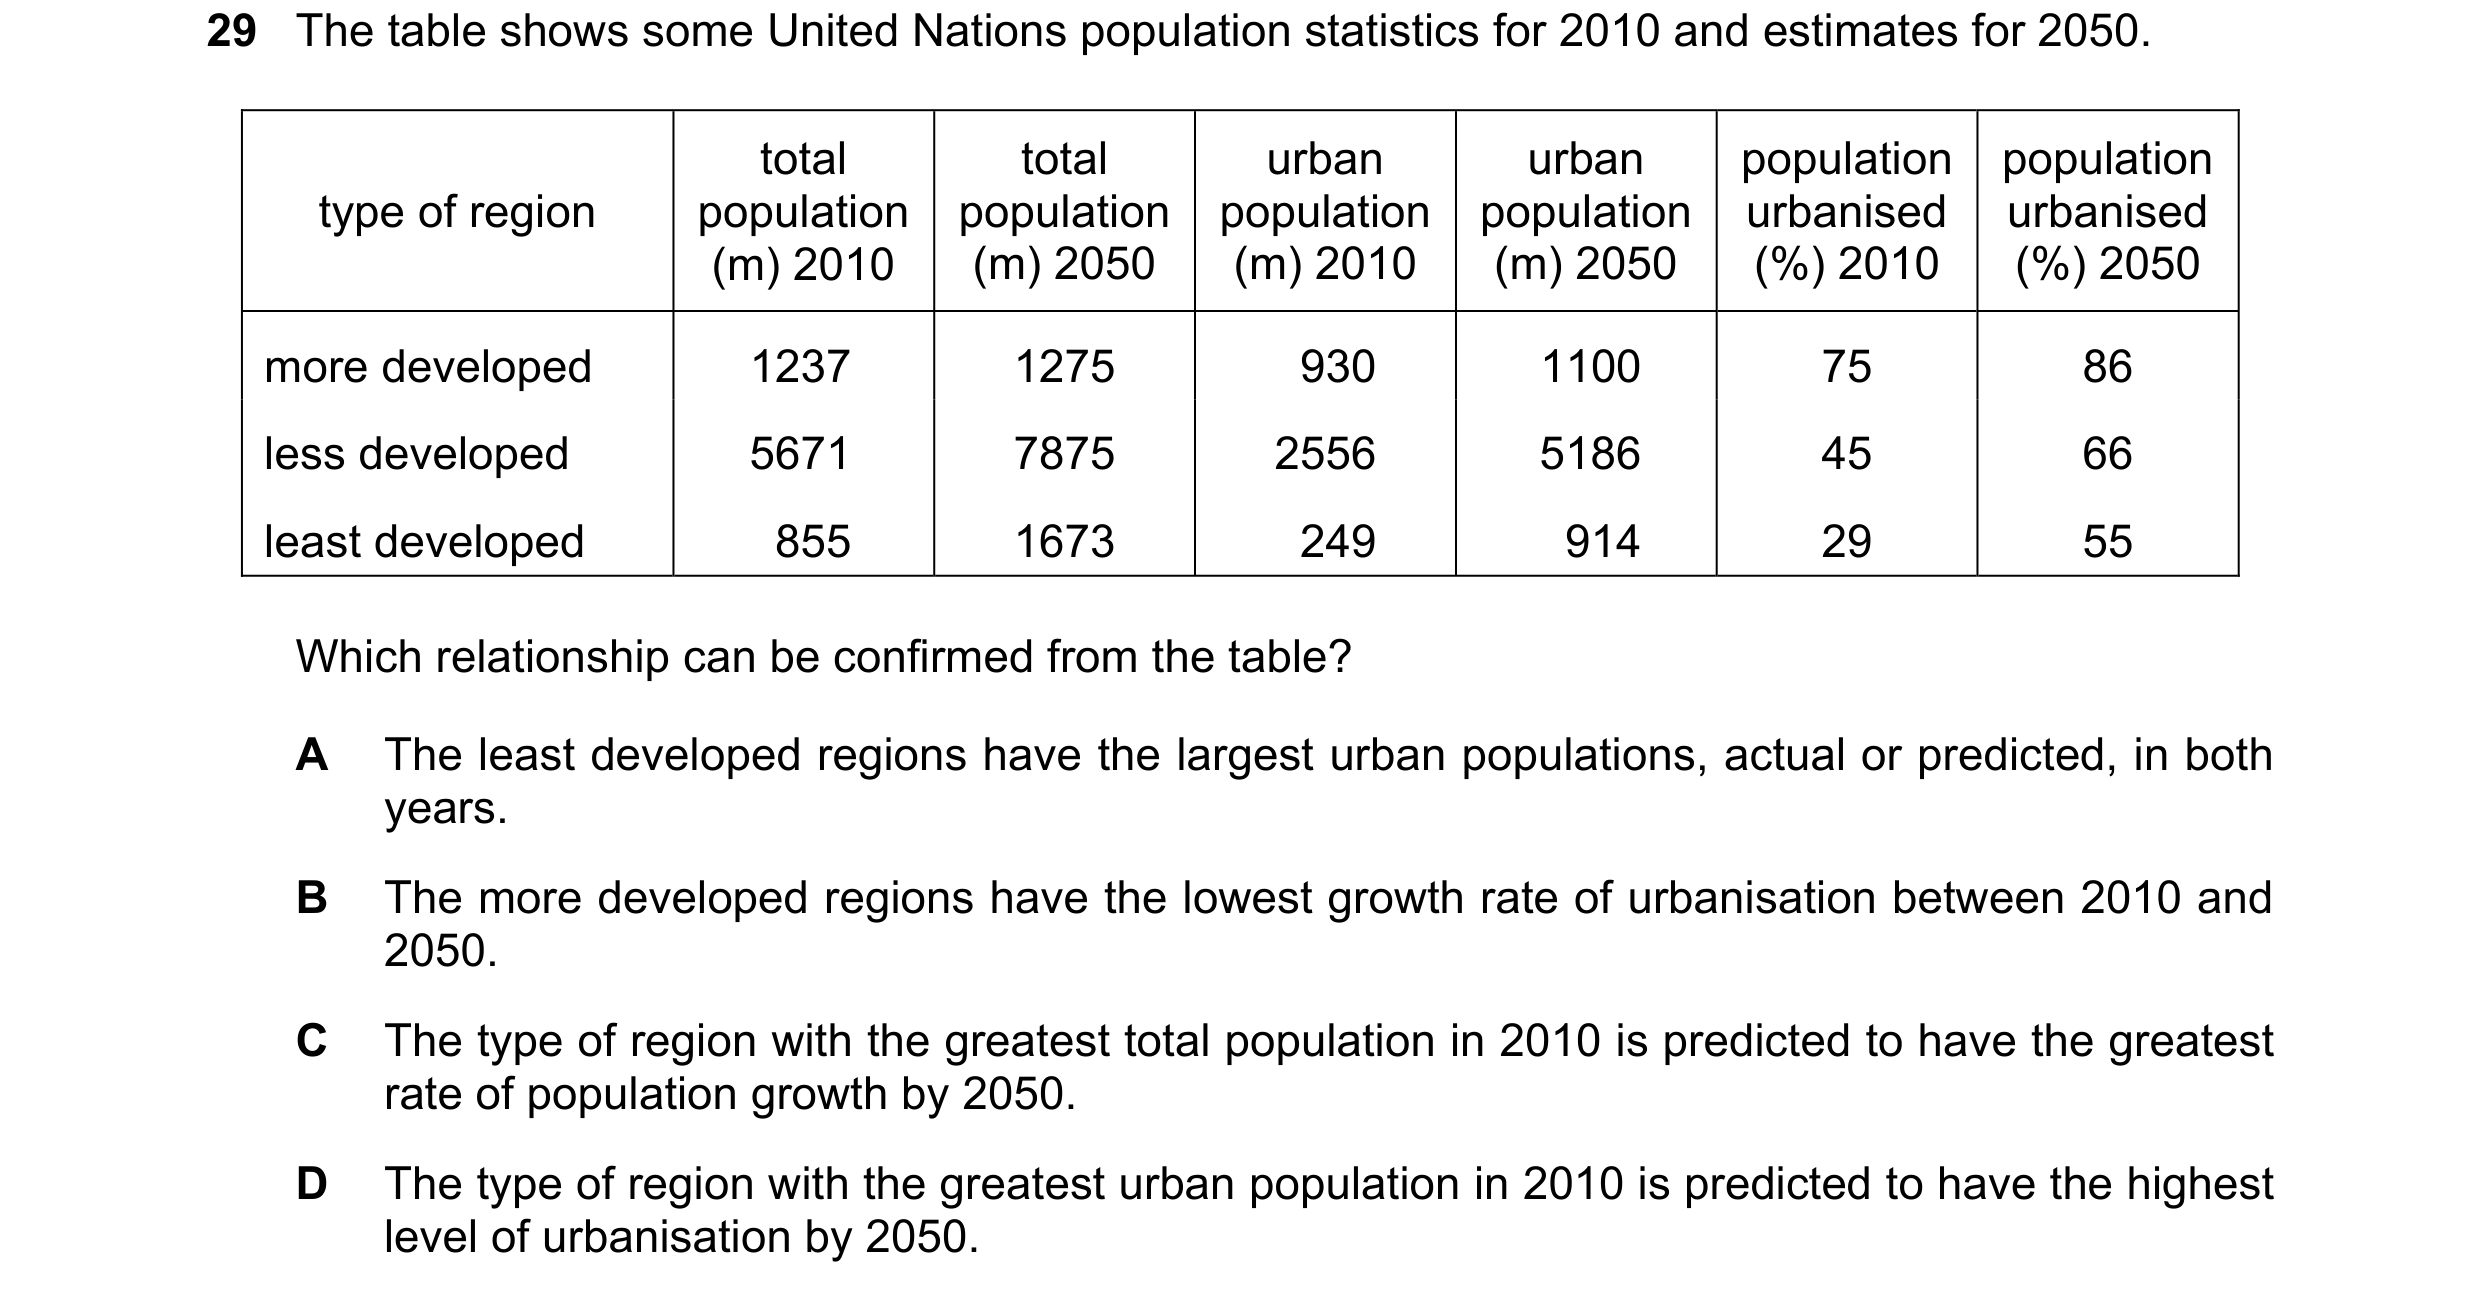
 19 / 21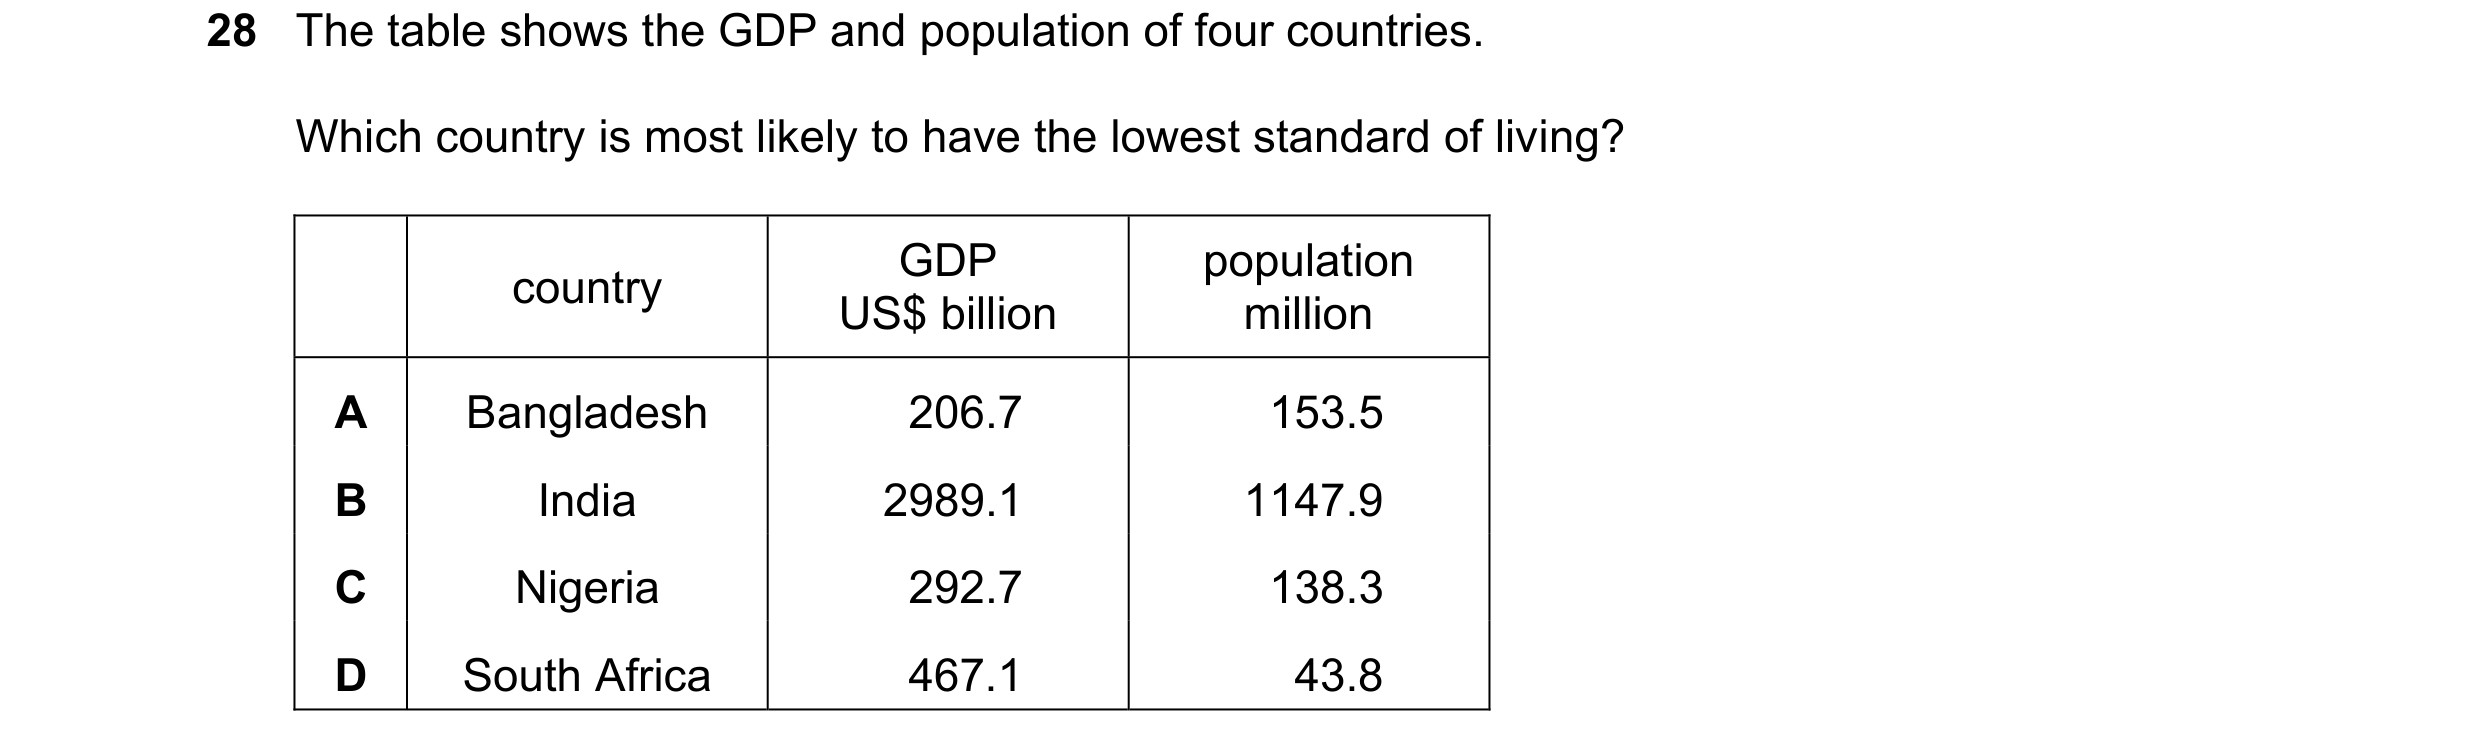
 20 / 21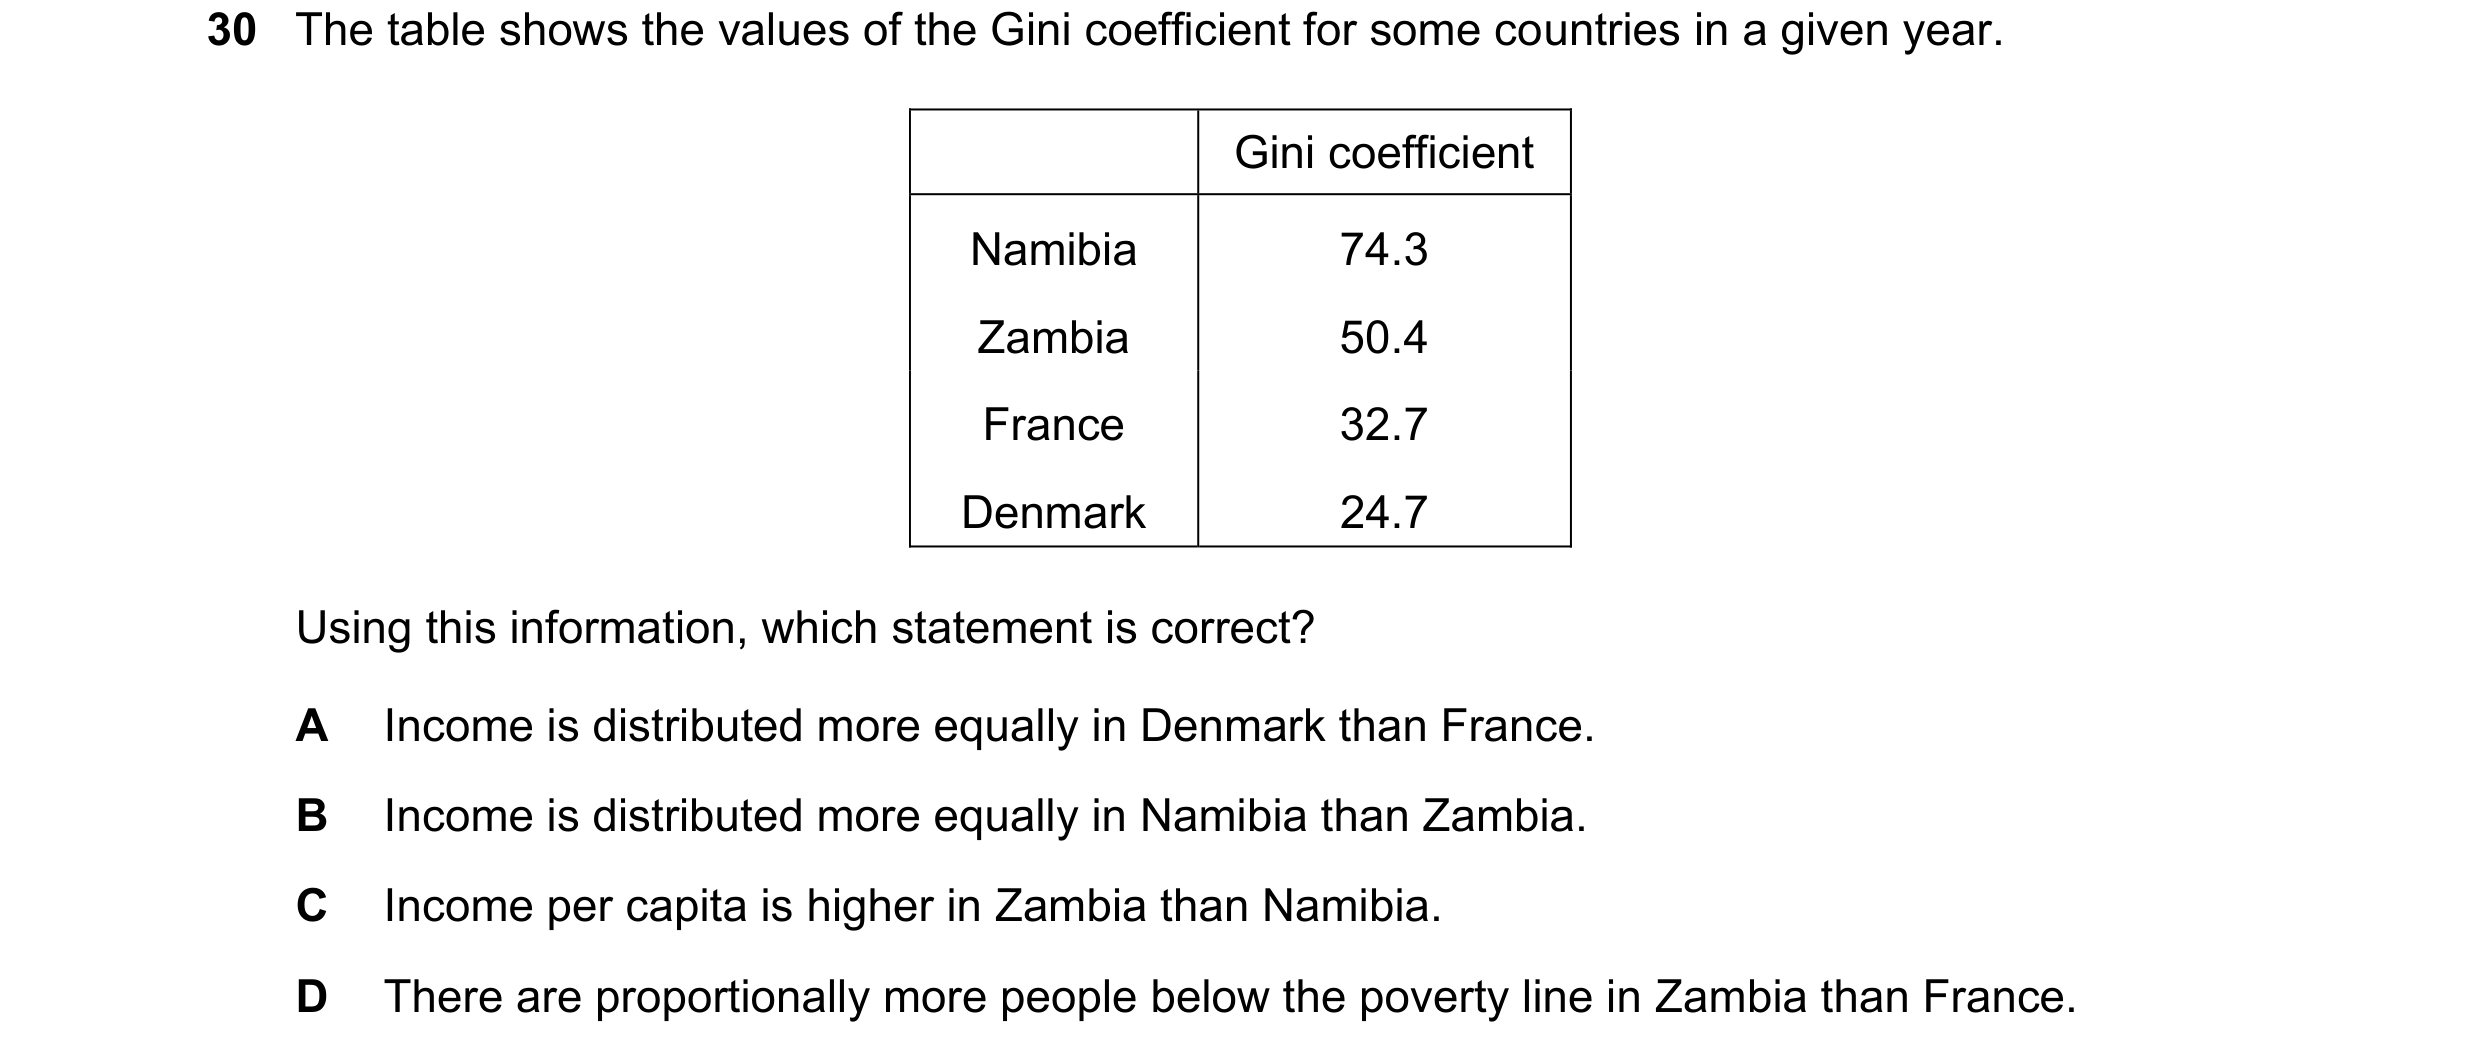
 21 / 21